UNITED STATES
SECURITIES AND EXCHANGE COMMISSION
Washington, D.C. 20549
FORM N-CSR
CERTIFIED SHAREHOLDER REPORT OF REGISTERED
MANAGEMENT INVESTMENT COMPANIES
Investment Company Act file number 811-02737
Fidelity Summer Street Trust
(Exact name of registrant as specified in charter)
245 Summer St., Boston, Massachusetts 02210
(Address of principal executive offices) (Zip code)
Cynthia Lo Bessette, Secretary
245 Summer St.
Boston, Massachusetts 02210
(Name and address of agent for service)
Registrant's telephone number, including area code:
617-563-7000
| |
Date of fiscal year end: | April 30 |
|
|
Date of reporting period: | April 30, 2021 |
Item 1.
Reports to Stockholders
Fidelity® Capital & Income Fund
Annual Report
April 30, 2021


Contents
To view a fund's proxy voting guidelines and proxy voting record for the 12-month period ended June 30, visit http://www.fidelity.com/proxyvotingresults or visit the Securities and Exchange Commission's (SEC) web site at http://www.sec.gov.
You may also call 1-800-544-8544 to request a free copy of the proxy voting guidelines.
Standard & Poor's, S&P and S&P 500 are registered service marks of The McGraw-Hill Companies, Inc. and have been licensed for use by Fidelity Distributors Corporation.
Other third-party marks appearing herein are the property of their respective owners.
All other marks appearing herein are registered or unregistered trademarks or service marks of FMR LLC or an affiliated company. © 2021 FMR LLC. All rights reserved.
This report and the financial statements contained herein are submitted for the general information of the shareholders of the Fund. This report is not authorized for distribution to prospective investors in the Fund unless preceded or accompanied by an effective prospectus.
A fund files its complete schedule of portfolio holdings with the SEC for the first and third quarters of each fiscal year on Form N-PORT. Forms N-PORT are available on the SEC’s web site at http://www.sec.gov. A fund's Forms N-PORT may be reviewed and copied at the SEC’s Public Reference Room in Washington, DC. Information regarding the operation of the SEC's Public Reference Room may be obtained by calling 1-800-SEC-0330.
For a complete list of a fund's portfolio holdings, view the most recent holdings listing, semiannual report, or annual report on Fidelity's web site at http://www.fidelity.com, http://www.institutional.fidelity.com, or http://www.401k.com, as applicable.
NOT FDIC INSURED •MAY LOSE VALUE •NO BANK GUARANTEE
Neither the Fund nor Fidelity Distributors Corporation is a bank.
Note to Shareholders:
Early in 2020, the outbreak and spread of a new coronavirus emerged as a public health emergency that had a major influence on financial markets, primarily based on its impact on the global economy and the outlook for corporate earnings. The virus causes a respiratory disease known as COVID-19. On March 11, 2020 the World Health Organization declared the COVID-19 outbreak a pandemic, citing sustained risk of further global spread.
In the weeks following, as the crisis worsened, we witnessed an escalating human tragedy with wide-scale social and economic consequences from coronavirus-containment measures. The outbreak of COVID-19 prompted a number of measures to limit the spread, including travel and border restrictions, quarantines, and restrictions on large gatherings. In turn, these resulted in lower consumer activity, diminished demand for a wide range of products and services, disruption in manufacturing and supply chains, and – given the wide variability in outcomes regarding the outbreak – significant market uncertainty and volatility. Amid the turmoil, global governments and central banks took unprecedented action to help support consumers, businesses, and the broader economies, and to limit disruption to financial systems.
The situation continues to unfold, and the extent and duration of its impact on financial markets and the economy remain highly uncertain. Extreme events such as the coronavirus crisis are “exogenous shocks” that can have significant adverse effects on mutual funds and their investments. Although multiple asset classes may be affected by market disruption, the duration and impact may not be the same for all types of assets.
Fidelity is committed to helping you stay informed amid news about COVID-19 and during increased market volatility, and we’re taking extra steps to be responsive to customer needs. We encourage you to visit our websites, where we offer ongoing updates, commentary, and analysis on the markets and our funds.
Performance: The Bottom Line
Average annual total return reflects the change in the value of an investment, assuming reinvestment of distributions from dividend income and capital gains (the profits earned upon the sale of securities that have grown in value, if any) and assuming a constant rate of performance each year. The hypothetical investment and the average annual total returns do not reflect the deduction of taxes that a shareholder would pay on fund distributions or the redemption of fund shares. During periods of reimbursement by Fidelity, a fund’s total return will be greater than it would be had the reimbursement not occurred. How a fund did yesterday is no guarantee of how it will do tomorrow.
Average Annual Total Returns
| For the periods ended April 30, 2021 | Past 1 year | Past 5 years | Past 10 years |
| Fidelity® Capital & Income Fund | 32.35% | 9.58% | 7.11% |
$10,000 Over 10 Years
Let's say hypothetically that $10,000 was invested in Fidelity® Capital & Income Fund on April 30, 2011.
The chart shows how the value of your investment would have changed, and also shows how the ICE® BofA® US High Yield Constrained Index performed over the same period.

| Period Ending Values |
| $19,871 | Fidelity® Capital & Income Fund |
| $18,348 | ICE® BofA® US High Yield Constrained Index |
Management's Discussion of Fund Performance
Market Recap: The ICE BofA
® US High Yield Constrained Index gained 20.01% for the 12 months ending April 30, 2021, as high-yield bonds staged a historic rebound following a steep but brief decline due to the early-2020 outbreak and spread of COVID-19. A confluence of powerful forces propelled risk assets, including high yield, from March 24 through late August. The rally slowed in September, when high yield modestly retreated amid Congress’s inability to reach a deal on additional fiscal stimulus, as well as uncertainty about the election. But as the calendar turned, investors grew hopeful. The rollout of two COVID-19 vaccines was underway, the U.S. Federal Reserve pledged to hold interest rates near zero until the economy recovered, and the federal government planned to deploy trillions of dollars in aid to boost consumers and the economy. For the full 12 months, lower-rated bonds (+38%) fared best. In contrast, the B and BB credit tiers rose 18% and 17%, respectively. By industry, publishing/printing (+48%) and air transportation (+47%) led the way, followed closely by energy (+44%), which was boosted by a rally in the price of oil. Energy represented 13% of the index the past 12 months. Entertainment/film also stood out, advancing roughly 41%. In contrast, notable “laggards” included cable/satellite TV and environmental (+7% each). Utilities and restaurants each gained 9%, while telecommunications, a sizable index component, rose 10% for the period.
Comments from Co-Managers Brian Chang and Mark Notkin: For the fiscal year, the fund gained 32.35%, handily topping the 20.01% result of the benchmark, the ICE BofA
® US High Yield Constrained Index. The fund's non-benchmark position in equities gained 89% the past 12 months and contributed to relative performance. Our core allocation to high-yield bonds rose 20.69%, also helping versus the benchmark, as did a much smaller non-benchmark stake in floating-rate bank debt (+50%). By industry, security selection was the primary contributor, especially in energy, gaming and technology. The top individual relative contributor was an overweight position in Penn National Gaming (+409%). Also helping was our overweighting in Chesapeake Energy, which gained about 478%. Conversely, the biggest detractor from performance versus the benchmark was the fund's position in cash, which hurt in a strong market, followed by an underweighting in energy. Stock selection in entertainment/film and an overweighting in technology also hindered the fund's relative result. The biggest individual relative detractor was an overweight position in PG&E (+8%), which was among the biggest holdings in the fund. Another notable relative detractor was an outsized stake in Charter Communications (+6%), also among our largest holdings. The fund's non-benchmark stake in Melco Crown Entertainment returned -3% and detracted. Notable changes in positioning include increased exposure to the energy industry and a lower allocation to technology.
The views expressed above reflect those of the portfolio manager(s) only through the end of the period as stated on the cover of this report and do not necessarily represent the views of Fidelity or any other person in the Fidelity organization. Any such views are subject to change at any time based upon market or other conditions and Fidelity disclaims any responsibility to update such views. These views may not be relied on as investment advice and, because investment decisions for a Fidelity fund are based on numerous factors, may not be relied on as an indication of trading intent on behalf of any Fidelity fund.
Investment Summary (Unaudited)
Top Five Holdings as of April 30, 2021
| (by issuer, excluding cash equivalents) | % of fund's net assets |
| CCO Holdings LLC/CCO Holdings Capital Corp. | 2.6 |
| Ally Financial, Inc. | 2.2 |
| TransDigm, Inc. | 2.1 |
| CSC Holdings LLC | 2.1 |
| Caesars Entertainment, Inc. | 1.8 |
| | 10.8 |
Top Five Market Sectors as of April 30, 2021
| | % of fund's net assets |
| Energy | 12.2 |
| Banks & Thrifts | 8.6 |
| Technology | 7.5 |
| Telecommunications | 7.5 |
| Healthcare | 6.8 |
Quality Diversification (% of fund's net assets)
| As of April 30, 2021 |
| | BBB | 7.5% |
| | BB | 26.3% |
| | B | 28.9% |
| | CCC,CC,C | 7.2% |
| | Not Rated | 1.2% |
| | Equities | 19.7% |
| | Short-Term Investments and Net Other Assets | 9.2% |
We have used ratings from Moody's Investors Service, Inc. Where Moody's® ratings are not available, we have used S&P® ratings. All ratings are as of the date indicated and do not reflect subsequent changes.
Asset Allocation (% of fund's net assets)
| As of April 30, 2021* |
| | Nonconvertible Bonds | 60.6% |
| | Convertible Bonds, Preferred Stocks | 0.2% |
| | Common Stocks | 19.7% |
| | Bank Loan Obligations | 3.1% |
| | Other Investments | 7.2% |
| | Short-Term Investments and Net Other Assets (Liabilities) | 9.2% |

* Foreign investments - 12.8%
Schedule of Investments April 30, 2021
Showing Percentage of Net Assets
| Corporate Bonds - 60.8% | | | |
| | | Principal Amount (000s)(a) | Value (000s) |
| Convertible Bonds - 0.2% | | | |
| Energy - 0.2% | | | |
| Forum Energy Technologies, Inc. 9% 8/4/25 | | $13,930 | $13,103 |
| Mesquite Energy, Inc.: | | | |
| 15% 7/15/23 (b)(c) | | 3,850 | 8,047 |
| 15% 7/15/23 (b)(c) | | 2,231 | 5,132 |
| | | | 26,282 |
| Nonconvertible Bonds - 60.6% | | | |
| Aerospace - 3.6% | | | |
| BBA U.S. Holdings, Inc. 5.375% 5/1/26 (d) | | 4,405 | 4,504 |
| Bombardier, Inc.: | | | |
| 6.125% 1/15/23 (d) | | 10,610 | 11,122 |
| 7.5% 12/1/24 (d) | | 8,870 | 9,003 |
| 7.5% 3/15/25 (d) | | 14,145 | 14,118 |
| 7.875% 4/15/27 (d) | | 45,265 | 45,152 |
| BWX Technologies, Inc. 5.375% 7/15/26 (d) | | 8,510 | 8,781 |
| Kaiser Aluminum Corp. 4.625% 3/1/28 (d) | | 11,215 | 11,523 |
| Moog, Inc. 4.25% 12/15/27 (d) | | 3,455 | 3,550 |
| Rolls-Royce PLC 5.75% 10/15/27 (d) | | 10,870 | 11,658 |
| Spirit Aerosystems, Inc. 7.5% 4/15/25 (d) | | 15,000 | 16,073 |
| TransDigm UK Holdings PLC 6.875% 5/15/26 | | 35,725 | 37,556 |
| TransDigm, Inc.: | | | |
| 4.625% 1/15/29 (d) | | 38,080 | 37,528 |
| 4.875% 5/1/29 (d) | | 25,000 | 24,625 |
| 5.5% 11/15/27 | | 124,228 | 129,197 |
| 6.25% 3/15/26 (d) | | 17,925 | 18,978 |
| 6.375% 6/15/26 | | 61,985 | 64,271 |
| 6.5% 5/15/25 | | 16,505 | 16,718 |
| 7.5% 3/15/27 | | 18,012 | 19,295 |
| Wolverine Escrow LLC: | | | |
| 8.5% 11/15/24 (d) | | 21,458 | 21,109 |
| 9% 11/15/26 (d) | | 22,681 | 22,444 |
| | | | 527,205 |
| Air Transportation - 1.6% | | | |
| Air Canada 2013-1 Pass Through Trust 5.375% 11/15/22 (d) | | 1,592 | 1,595 |
| Delta Air Lines, Inc. 7% 5/1/25 (d) | | 4,635 | 5,390 |
| Delta Air Lines, Inc. / SkyMiles IP Ltd.: | | | |
| 4.5% 10/20/25 (d) | | 48,285 | 51,793 |
| 4.75% 10/20/28 (d) | | 39,880 | 43,793 |
| Delta Air Lines, Inc. pass-thru trust certificates 8.021% 2/10/24 | | 3,439 | 3,580 |
| Hawaiian Airlines pass-thru certificates Series 2013-1 Class B, 4.95% 7/15/23 | | 2,783 | 2,777 |
| Hawaiian Brand Intellectual Property Ltd. / HawaiianMiles Loyalty Ltd. 5.75% 1/20/26 (d) | | 22,205 | 23,454 |
| Mileage Plus Holdings LLC 6.5% 6/20/27 (d) | | 34,530 | 37,897 |
| Spirit Loyalty Cayman Ltd. / Spirit IP Cayman Ltd. 8% 9/20/25 (d) | | 13,000 | 14,639 |
| United Airlines, Inc.: | | | |
| 4.375% 4/15/26 (d) | | 30,025 | 31,158 |
| 4.625% 4/15/29 (d) | | 18,025 | 18,732 |
| | | | 234,808 |
| Automotive & Auto Parts - 0.9% | | | |
| Allison Transmission, Inc. 5.875% 6/1/29 (d) | | 7,960 | 8,607 |
| Dana, Inc. 4.25% 9/1/30 (e) | | 8,870 | 8,959 |
| Exide Technologies: | | | |
| 11% 10/31/24 pay-in-kind (c)(d)(f)(g) | | 1,760 | 0 |
| 11% 10/31/24 pay-in-kind (c)(d)(f)(g) | | 891 | 401 |
| Ford Motor Credit Co. LLC: | | | |
| 3.375% 11/13/25 | | 26,505 | 27,118 |
| 4% 11/13/30 | | 42,253 | 43,151 |
| 5.113% 5/3/29 | | 10,330 | 11,282 |
| LCM Investments Holdings 4.875% 5/1/29 (d) | | 17,650 | 18,055 |
| Nesco Holdings II, Inc. 5.5% 4/15/29 (d) | | 14,525 | 14,961 |
| Real Hero Merger Sub 2 6.25% 2/1/29 (d) | | 3,755 | 3,885 |
| | | | 136,419 |
| Banks & Thrifts - 2.2% | | | |
| Ally Financial, Inc.: | | | |
| 8% 11/1/31 | | 20,638 | 28,371 |
| 8% 11/1/31�� | | 206,609 | 290,582 |
| | | | 318,953 |
| Broadcasting - 1.6% | | | |
| Clear Channel Outdoor Holdings, Inc. 7.75% 4/15/28 (d) | | 7,670 | 7,897 |
| Diamond Sports Group LLC/Diamond Sports Finance Co. 5.375% 8/15/26 (d) | | 22,415 | 16,363 |
| Lions Gate Capital Holdings LLC 5.5% 4/15/29 (d) | | 8,990 | 9,012 |
| Netflix, Inc.: | | | |
| 4.875% 4/15/28 | | 23,755 | 27,348 |
| 5.375% 11/15/29 (d) | | 11,075 | 13,152 |
| 5.875% 11/15/28 | | 64,825 | 78,957 |
| Nexstar Broadcasting, Inc.: | | | |
| 4.75% 11/1/28 (d) | | 22,300 | 22,718 |
| 5.625% 7/15/27 (d) | | 23,735 | 25,070 |
| Scripps Escrow II, Inc. 3.875% 1/15/29 (d) | | 2,820 | 2,803 |
| Sirius XM Radio, Inc.: | | | |
| 5% 8/1/27 (d) | | 14,525 | 15,211 |
| 5.375% 7/15/26 (d) | | 11,315 | 11,685 |
| Townsquare Media, Inc. 6.875% 2/1/26 (d) | | 5,645 | 5,885 |
| | | | 236,101 |
| Building Materials - 0.3% | | | |
| Advanced Drain Systems, Inc. 5% 9/30/27 (d) | | 2,325 | 2,433 |
| Brundage-Bone Concrete Pumping Holdings, Inc. 6% 2/1/26 (d) | | 6,555 | 6,898 |
| CP Atlas Buyer, Inc. 7% 12/1/28 (d) | | 5,480 | 5,683 |
| James Hardie International Finance Ltd. 5% 1/15/28 (d) | | 4,136 | 4,384 |
| Summit Materials LLC/Summit Materials Finance Corp.: | | | |
| 5.125% 6/1/25 (d) | | 5,095 | 5,165 |
| 5.25% 1/15/29 (d) | | 10,525 | 11,078 |
| U.S. Concrete, Inc.: | | | |
| 5.125% 3/1/29 (d) | | 8,350 | 8,621 |
| 6.375% 6/1/24 | | 1,842 | 1,879 |
| | | | 46,141 |
| Cable/Satellite TV - 5.4% | | | |
| Block Communications, Inc. 4.875% 3/1/28 (d) | | 7,830 | 7,967 |
| CCO Holdings LLC/CCO Holdings Capital Corp.: | | | |
| 4.25% 2/1/31 (d) | | 16,515 | 16,515 |
| 4.5% 8/15/30 (d) | | 21,660 | 22,037 |
| 4.5% 5/1/32 (d) | | 46,575 | 47,041 |
| 4.75% 3/1/30 (d) | | 63,365 | 66,137 |
| 5% 2/1/28 (d) | | 91,490 | 95,607 |
| 5.125% 5/1/27 (d) | | 69,885 | 73,139 |
| 5.375% 6/1/29 (d) | | 18,080 | 19,625 |
| 5.5% 5/1/26 (d) | | 17,605 | 18,168 |
| 5.75% 2/15/26 (d) | | 14,176 | 14,672 |
| 5.875% 5/1/27 (d) | | 17,965 | 18,543 |
| CSC Holdings LLC: | | | |
| 3.375% 2/15/31 (d) | | 14,140 | 13,246 |
| 4.5% 11/15/31 (d)(e) | | 30,110 | 30,110 |
| 4.625% 12/1/30 (d) | | 32,440 | 31,710 |
| 5% 11/15/31 (d)(e) | | 9,035 | 9,052 |
| 5.375% 2/1/28 (d) | | 23,655 | 24,894 |
| 5.5% 5/15/26 (d) | | 15,968 | 16,427 |
| 5.75% 1/15/30 (d) | | 129,430 | 137,600 |
| 6.5% 2/1/29 (d) | | 24,795 | 27,398 |
| 7.5% 4/1/28 (d) | | 14,375 | 15,830 |
| Radiate Holdco LLC/Radiate Financial Service Ltd.: | | | |
| 4.5% 9/15/26 (d) | | 8,350 | 8,496 |
| 6.5% 9/15/28 (d) | | 22,260 | 23,174 |
| Virgin Media Finance PLC 5% 7/15/30 (d) | | 5,510 | 5,494 |
| Ziggo Bond Co. BV: | | | |
| 5.125% 2/28/30 (d) | | 6,000 | 6,145 |
| 6% 1/15/27 (d) | | 11,435 | 11,950 |
| Ziggo BV: | | | |
| 4.875% 1/15/30 (d) | | 7,990 | 8,211 |
| 5.5% 1/15/27 (d) | | 18,188 | 18,917 |
| | | | 788,105 |
| Capital Goods - 0.1% | | | |
| ATS Automation Tooling System, Inc. 4.125% 12/15/28 (d) | | 7,895 | 7,954 |
| Stevens Holding Co., Inc. 6.125% 10/1/26 (d) | | 3,245 | 3,488 |
| | | | 11,442 |
| Chemicals - 2.9% | | | |
| CF Industries Holdings, Inc.: | | | |
| 4.95% 6/1/43 | | 59,882 | 69,763 |
| 5.15% 3/15/34 | | 26,868 | 31,436 |
| 5.375% 3/15/44 | | 53,336 | 65,241 |
| Compass Minerals International, Inc. 6.75% 12/1/27 (d) | | 24,600 | 26,507 |
| Consolidated Energy Finance SA: | | | |
| 3 month U.S. LIBOR + 3.750% 3.9339% 6/15/22 (d)(g)(h) | | 3,025 | 3,017 |
| 6.5% 5/15/26 (d) | | 53,531 | 53,130 |
| 6.875% 6/15/25 (d) | | 10,765 | 10,805 |
| Ingevity Corp. 3.875% 11/1/28 (d) | | 11,105 | 11,061 |
| Kraton Polymers LLC/Kraton Polymers Capital Corp. 4.25% 12/15/25 (d) | | 7,330 | 7,440 |
| Kronos Acquisition Holdings, Inc. / KIK Custom Products, Inc.: | | | |
| 5% 12/31/26 (d) | | 2,620 | 2,643 |
| 7% 12/31/27 (d) | | 3,325 | 3,225 |
| LSB Industries, Inc. 9.625% 5/1/23 (d) | | 6,090 | 6,303 |
| Neon Holdings, Inc. 10.125% 4/1/26 (d) | | 14,980 | 16,309 |
| Nouryon Holding BV 8% 10/1/26 (d) | | 8,580 | 9,117 |
| OCI NV 5.25% 11/1/24 (d) | | 14,870 | 15,450 |
| SCIH Salt Holdings, Inc. 4.875% 5/1/28 (d) | | 18,035 | 17,990 |
| The Chemours Co. LLC: | | | |
| 5.375% 5/15/27 | | 32,330 | 34,674 |
| 5.75% 11/15/28 (d) | | 16,765 | 17,810 |
| Tronox, Inc.: | | | |
| 4.625% 3/15/29 (d) | | 13,295 | 13,578 |
| 6.5% 5/1/25 (d) | | 8,760 | 9,357 |
| Valvoline, Inc. 4.25% 2/15/30 (d) | | 8,315 | 8,523 |
| | | | 433,379 |
| Consumer Products - 0.7% | | | |
| ANGI Homeservices, Inc. 3.875% 8/15/28 (d) | | 5,530 | 5,495 |
| Foundation Building Materials, Inc. 6% 3/1/29 (d) | | 5,845 | 5,799 |
| Magic MergerCo, Inc.: | | | |
| 5.25% 5/1/28 (d) | | 14,150 | 14,327 |
| 7.875% 5/1/29 (d) | | 14,995 | 15,407 |
| PetSmart, Inc. / PetSmart Finance Corp.: | | | |
| 4.75% 2/15/28 (d) | | 10,160 | 10,478 |
| 7.75% 2/15/29 (d) | | 8,880 | 9,621 |
| Spectrum Brands Holdings, Inc. 3.875% 3/15/31 (d) | | 8,380 | 8,212 |
| Tempur Sealy International, Inc. 4% 4/15/29 (d) | | 15,925 | 16,129 |
| The Scotts Miracle-Gro Co. 4% 4/1/31 (d) | | 11,945 | 11,826 |
| | | | 97,294 |
| Containers - 0.3% | | | |
| ARD Finance SA 6.5% 6/30/27 pay-in-kind (d)(g) | | 11,200 | 11,718 |
| Crown Cork & Seal, Inc.: | | | |
| 7.375% 12/15/26 | | 4,845 | 5,887 |
| 7.5% 12/15/96 | | 12,871 | 13,772 |
| Graham Packaging Co., Inc. 7.125% 8/15/28 (d) | | 6,000 | 6,435 |
| Intelligent Packaging Ltd. Finco, Inc. 6% 9/15/28 (d) | | 4,230 | 4,364 |
| Trivium Packaging Finance BV 5.5% 8/15/26 (d) | | 6,930 | 7,251 |
| | | | 49,427 |
| Diversified Financial Services - 1.9% | | | |
| Broadstreet Partners, Inc. 5.875% 4/15/29 (d) | | 6,970 | 7,076 |
| Cargo Aircraft Management, Inc. 4.75% 2/1/28 (d) | | 6,915 | 7,062 |
| Compass Group Diversified Holdings LLC 5.25% 4/15/29 (d) | | 17,730 | 18,705 |
| Hightower Holding LLC 6.75% 4/15/29 (d) | | 5,945 | 6,086 |
| Icahn Enterprises LP/Icahn Enterprises Finance Corp.: | | | |
| 4.375% 2/1/29 (d) | | 11,165 | 10,829 |
| 5.25% 5/15/27 (d) | | 12,000 | 12,240 |
| 5.25% 5/15/27 | | 29,665 | 30,258 |
| 6.25% 5/15/26 | | 24,085 | 25,388 |
| 6.375% 12/15/25 | | 28,275 | 29,186 |
| 6.75% 2/1/24 | | 10,075 | 10,289 |
| LPL Holdings, Inc. 4% 3/15/29 (d) | | 17,730 | 17,730 |
| MSCI, Inc. 4% 11/15/29 (d) | | 6,385 | 6,672 |
| OEC Finance Ltd.: | | | |
| 4.375% 10/25/29 pay-in-kind (d) | | 6,280 | 942 |
| 5.25% 12/27/33 pay-in-kind (d) | | 5,708 | 856 |
| 7.125% 12/26/46 pay-in-kind (d) | | 2,906 | 450 |
| Shift4 Payments LLC / Shift4 Payments Finance Sub, Inc. 4.625% 11/1/26 (d) | | 3,750 | 3,909 |
| Springleaf Finance Corp.: | | | |
| 4% 9/15/30 | | 5,610 | 5,428 |
| 5.375% 11/15/29 | | 9,400 | 10,138 |
| 6.625% 1/15/28 | | 7,305 | 8,309 |
| 6.875% 3/15/25 | | 19,480 | 22,134 |
| 7.125% 3/15/26 | | 38,380 | 44,857 |
| | | | 278,544 |
| Diversified Media - 0.4% | | | |
| Allen Media LLC 10.5% 2/15/28 (d) | | 11,405 | 12,203 |
| Terrier Media Buyer, Inc. 8.875% 12/15/27 (d) | | 40,645 | 44,151 |
| | | | 56,354 |
| Energy - 8.3% | | | |
| Antero Midstream Partners LP/Antero Midstream Finance Corp. 5.75% 1/15/28 (d) | | 17,645 | 17,980 |
| Antero Resources Corp. 5.625% 6/1/23 (Reg. S) | | 2,240 | 2,248 |
| Callon Petroleum Co.: | | | |
| 6.125% 10/1/24 | | 4,090 | 3,783 |
| 6.25% 4/15/23 | | 7,400 | 7,030 |
| CGG SA 8.75% 4/1/27(d) | | 11,985 | 12,019 |
| Cheniere Energy Partners LP 4% 3/1/31 (d) | | 31,040 | 31,583 |
| Cheniere Energy, Inc. 4.625% 10/15/28 (d) | | 22,300 | 23,251 |
| Chesapeake Energy Corp.: | | | |
| 5.875% 2/1/29 (d) | | 5,840 | 6,293 |
| 7% 10/1/24 (c)(f) | | 6,915 | 0 |
| 8% 1/15/25 (c)(f) | | 3,385 | 0 |
| 8% 6/15/27 (c)(f) | | 2,132 | 0 |
| Citgo Holding, Inc. 9.25% 8/1/24 (d) | | 27,185 | 28,001 |
| Citgo Petroleum Corp.: | | | |
| 6.375% 6/15/26 (d) | | 8,760 | 8,980 |
| 7% 6/15/25 (d) | | 22,045 | 22,734 |
| CNX Midstream Partners LP 6.5% 3/15/26 (d) | | 6,675 | 6,900 |
| CNX Resources Corp. 6% 1/15/29 (d) | | 5,345 | 5,705 |
| Comstock Resources, Inc.: | | | |
| 6.75% 3/1/29 (d) | | 20,060 | 20,491 |
| 7.5% 5/15/25 (d) | | 3,722 | 3,844 |
| 9.75% 8/15/26 | | 54,270 | 59,007 |
| Continental Resources, Inc.: | | | |
| 3.8% 6/1/24 | | 19,380 | 20,301 |
| 4.375% 1/15/28 | | 4,930 | 5,361 |
| 4.5% 4/15/23 | | 533 | 559 |
| 4.9% 6/1/44 | | 12,240 | 12,840 |
| Crestwood Midstream Partners LP/Crestwood Midstream Finance Corp.: | | | |
| 5.625% 5/1/27 (d) | | 18,015 | 18,330 |
| 5.75% 4/1/25 | | 4,790 | 4,916 |
| 6% 2/1/29 (d) | | 18,575 | 19,202 |
| CrownRock LP/CrownRock Finance, Inc. 5% 5/1/29 (d) | | 5,055 | 5,175 |
| CVR Energy, Inc.: | | | |
| 5.25% 2/15/25 (d) | | 16,990 | 17,075 |
| 5.75% 2/15/28 (d) | | 22,655 | 22,930 |
| DCP Midstream Operating LP 5.85% 5/21/43 (d)(g) | | 18,335 | 16,593 |
| Endeavor Energy Resources LP/EER Finance, Inc.: | | | |
| 5.5% 1/30/26 (d) | | 6,818 | 7,061 |
| 5.75% 1/30/28 (d) | | 21,251 | 22,685 |
| 6.625% 7/15/25 (d) | | 5,510 | 5,868 |
| Energy Transfer LP 5.5% 6/1/27 | | 16,735 | 18,179 |
| EQT Corp. 3.9% 10/1/27 | | 27,454 | 28,623 |
| Exterran Energy Solutions LP 8.125% 5/1/25 | | 11,280 | 10,152 |
| Hess Midstream Partners LP: | | | |
| 5.125% 6/15/28 (d) | | 11,235 | 11,628 |
| 5.625% 2/15/26 (d) | | 15,535 | 16,118 |
| Hilcorp Energy I LP/Hilcorp Finance Co.: | | | |
| 5.75% 2/1/29 (d) | | 5,710 | 5,810 |
| 6% 2/1/31 (d) | | 5,710 | 5,881 |
| 6.25% 11/1/28 (d) | | 12,280 | 12,746 |
| Holly Energy Partners LP/Holly Energy Finance Corp. 5% 2/1/28 (d) | | 7,615 | 7,862 |
| MEG Energy Corp. 7.125% 2/1/27 (d) | | 11,335 | 12,103 |
| Nabors Industries Ltd.: | | | |
| 7.25% 1/15/26 (d) | | 11,260 | 9,909 |
| 7.5% 1/15/28 (d) | | 9,715 | 8,464 |
| New Fortress Energy LLC: | | | |
| 6.5% 9/30/26 (d) | | 20,960 | 21,386 |
| 6.75% 9/15/25 (d) | | 46,001 | 47,597 |
| NGL Energy Operating LLC/NGL Energy Finance Corp. 7.5% 2/1/26 (d) | | 11,090 | 11,617 |
| NGL Energy Partners LP/NGL Energy Finance Corp. 6.125% 3/1/25 | | 11,961 | 10,646 |
| Nine Energy Service, Inc. 8.75% 11/1/23 (d) | | 6,245 | 2,592 |
| NuStar Logistics LP 6% 6/1/26 | | 12,025 | 13,032 |
| Occidental Petroleum Corp.: | | | |
| 2.9% 8/15/24 | | 13,380 | 13,347 |
| 3.2% 8/15/26 | | 840 | 817 |
| 3.4% 4/15/26 | | 1,085 | 1,073 |
| 3.5% 8/15/29 | | 14,690 | 14,029 |
| 4.4% 4/15/46 | | 9,300 | 8,184 |
| 4.4% 8/15/49 | | 23,525 | 20,349 |
| 4.625% 6/15/45 | | 7,660 | 6,932 |
| 5.875% 9/1/25 | | 11,055 | 12,078 |
| 6.125% 1/1/31 | | 23,465 | 26,105 |
| 6.2% 3/15/40 | | 5,785 | 6,147 |
| 6.375% 9/1/28 | | 18,145 | 20,322 |
| 6.45% 9/15/36 | | 19,110 | 21,714 |
| 6.6% 3/15/46 | | 15,305 | 16,874 |
| 6.625% 9/1/30 | | 22,115 | 25,211 |
| 7.2% 3/15/29 | | 3,964 | 4,440 |
| 7.5% 5/1/31 | | 1,100 | 1,309 |
| 8.875% 7/15/30 | | 12,405 | 15,940 |
| PBF Holding Co. LLC/PBF Finance Corp.: | | | |
| 6% 2/15/28 | | 27,530 | 20,774 |
| 7.25% 6/15/25 | | 22,875 | 19,501 |
| 9.25% 5/15/25 (d) | | 24,810 | 25,926 |
| PBF Logistics LP/PBF Logistics Finance, Inc. 6.875% 5/15/23 | | 8,455 | 8,444 |
| PDC Energy, Inc.: | | | |
| 6.125% 9/15/24 | | 3,555 | 3,644 |
| 6.25% 12/1/25 | | 7,435 | 7,547 |
| Sanchez Energy Corp. 7.25% 2/15/23 (c)(d)(f) | | 21,977 | 0 |
| SM Energy Co.: | | | |
| 5.625% 6/1/25 | | 6,330 | 6,045 |
| 6.625% 1/15/27 | | 21,320 | 20,600 |
| 6.75% 9/15/26 | | 4,550 | 4,402 |
| Southern Natural Gas Co. LLC: | | | |
| 7.35% 2/15/31 | | 23,497 | 30,852 |
| 8% 3/1/32 | | 12,475 | 17,519 |
| Southwestern Energy Co.: | | | |
| 6.45% 1/23/25 (g) | | 1,805 | 1,949 |
| 7.5% 4/1/26 | | 20,490 | 21,672 |
| 7.75% 10/1/27 | | 12,945 | 13,915 |
| Summit Midstream Holdings LLC 5.75% 4/15/25 | | 5,390 | 4,528 |
| Sunoco LP/Sunoco Finance Corp.: | | | |
| 4.5% 5/15/29 (d) | | 10,170 | 10,272 |
| 5.5% 2/15/26 | | 11,640 | 12,007 |
| Tallgrass Energy Partners LP / Tallgrass Energy Finance Corp. 7.5% 10/1/25 (d) | | 8,350 | 9,122 |
| Targa Resources Partners LP/Targa Resources Partners Finance Corp. 4.875% 2/1/31 (d) | | 10,360 | 10,810 |
| Teine Energy Ltd. 6.875% 4/15/29 (d) | | 8,990 | 9,102 |
| Tennessee Gas Pipeline Co. 7.625% 4/1/37 | | 5,445 | 7,512 |
| Ultra Resources, Inc. 11% 7/12/24 pay-in-kind (c)(f) | | 10,734 | 537 |
| Vine Energy Holdings LLC 6.75% 4/15/29 (d) | | 8,995 | 8,999 |
| W&T Offshore, Inc. 9.75% 11/1/23 (d) | | 40,815 | 36,019 |
| | | | 1,219,659 |
| Environmental - 0.2% | | | |
| Covanta Holding Corp.: | | | |
| 5% 9/1/30 | | 11,060 | 11,350 |
| 5.875% 7/1/25 | | 3,205 | 3,342 |
| 6% 1/1/27 | | 12,335 | 12,890 |
| | | | 27,582 |
| Food & Drug Retail - 1.0% | | | |
| Albertsons Companies LLC/Safeway, Inc./New Albertson's, Inc./Albertson's LLC: | | | |
| 3.5% 3/15/29 (d) | | 36,160 | 34,714 |
| 4.625% 1/15/27 (d) | | 25,300 | 26,312 |
| 4.875% 2/15/30 (d) | | 44,700 | 46,539 |
| Murphy Oil U.S.A., Inc.: | | | |
| 3.75% 2/15/31 (d) | | 5,300 | 5,221 |
| 4.75% 9/15/29 | | 6,860 | 7,203 |
| 5.625% 5/1/27 | | 6,030 | 6,319 |
| Parkland Corp. 4.5% 10/1/29 (d) | | 8,995 | 9,181 |
| SEG Holding LLC/SEG Finance Corp. 5.625% 10/15/28 (d) | | 11,130 | 11,714 |
| | | | 147,203 |
| Food/Beverage/Tobacco - 1.9% | | | |
| C&S Group Enterprises LLC 5% 12/15/28 (d) | | 8,615 | 8,561 |
| Chobani LLC/Finance Corp., Inc. 4.625% 11/15/28 (d) | | 6,285 | 6,474 |
| Del Monte Foods, Inc. 11.875% 5/15/25 (d) | | 6,310 | 7,192 |
| JBS Investments II GmbH: | | | |
| 5.75% 1/15/28 (d) | | 10,705 | 11,376 |
| 7% 1/15/26 (d) | | 11,630 | 12,358 |
| JBS U.S.A. LLC/JBS U.S.A. Finance, Inc. 6.75% 2/15/28 (d) | | 18,350 | 20,275 |
| JBS U.S.A. Lux SA / JBS Food Co.: | | | |
| 5.5% 1/15/30 (d) | | 20,180 | 22,198 |
| 6.5% 4/15/29 (d) | | 29,320 | 32,912 |
| KeHE Distributors LLC / KeHE Finance Corp. 8.625% 10/15/26 (d) | | 8,761 | 9,790 |
| Lamb Weston Holdings, Inc.: | | | |
| 4.625% 11/1/24 (d) | | 7,660 | 7,947 |
| 4.875% 11/1/26 (d) | | 7,740 | 8,030 |
| Performance Food Group, Inc. 5.5% 10/15/27 (d) | | 8,855 | 9,332 |
| Pilgrim's Pride Corp. 4.25% 4/15/31 (d) | | 11,975 | 12,098 |
| Post Holdings, Inc.: | | | |
| 4.5% 9/15/31 (d) | | 47,500 | 47,158 |
| 4.625% 4/15/30 (d) | | 15,630 | 15,786 |
| 5.5% 12/15/29 (d) | | 14,975 | 16,121 |
| Simmons Foods, Inc. 4.625% 3/1/29 (d) | | 8,340 | 8,404 |
| TreeHouse Foods, Inc. 4% 9/1/28 | | 3,695 | 3,672 |
| Triton Water Holdings, Inc. 6.25% 4/1/29 (d) | | 6,360 | 6,440 |
| United Natural Foods, Inc. 6.75% 10/15/28 (d) | | 7,750 | 8,351 |
| | | | 274,475 |
| Gaming - 1.9% | | | |
| Affinity Gaming LLC 6.875% 12/15/27 (d) | | 4,295 | 4,559 |
| Caesars Entertainment, Inc.: | | | |
| 6.25% 7/1/25 (d) | | 41,240 | 43,846 |
| 8.125% 7/1/27 (d) | | 54,990 | 61,104 |
| Caesars Resort Collection LLC 5.75% 7/1/25 (d) | | 13,750 | 14,476 |
| MCE Finance Ltd.: | | | |
| 4.875% 6/6/25 (d) | | 30,275 | 31,065 |
| 5.25% 4/26/26 (d) | | 12,015 | 12,532 |
| 5.375% 12/4/29 (d) | | 8,160 | 8,686 |
| 5.75% 7/21/28 (d) | | 5,530 | 5,948 |
| MGM Growth Properties Operating Partnership LP 3.875% 2/15/29 (d) | | 11,195 | 11,334 |
| MGM Resorts International 4.75% 10/15/28 | | 11,125 | 11,736 |
| Peninsula Pacific Entertainment LLC 8.5% 11/15/27 (d) | | 19,045 | 20,254 |
| Studio City Finance Ltd. 5% 1/15/29 (d) | | 5,700 | 5,815 |
| VICI Properties, Inc.: | | | |
| 4.25% 12/1/26 (d) | | 21,450 | 22,120 |
| 4.625% 12/1/29 (d) | | 12,240 | 12,710 |
| Wynn Macau Ltd. 5.125% 12/15/29 (d) | | 16,800 | 17,215 |
| | | | 283,400 |
| Healthcare - 4.4% | | | |
| Akumin, Inc. 7% 11/1/25 (d) | | 8,475 | 8,835 |
| AMN Healthcare 4.625% 10/1/27 (d) | | 2,765 | 2,855 |
| Bausch Health Companies, Inc.: | | | |
| 5% 2/15/29 (d) | | 51,050 | 51,129 |
| 5.25% 2/15/31 (d) | | 8,395 | 8,406 |
| Catalent Pharma Solutions 5% 7/15/27 (d) | | 3,765 | 3,939 |
| Centene Corp.: | | | |
| 4.25% 12/15/27 | | 11,560 | 12,116 |
| 5.375% 6/1/26 (d) | | 30,420 | 31,692 |
| 5.375% 8/15/26 (d) | | 7,920 | 8,308 |
| Charles River Laboratories International, Inc.: | | | |
| 3.75% 3/15/29 (d) | | 9,500 | 9,666 |
| 4% 3/15/31 (d) | | 12,085 | 12,448 |
| 4.25% 5/1/28 (d) | | 3,400 | 3,540 |
| Community Health Systems, Inc.: | | | |
| 4.75% 2/15/31 (d) | | 16,055 | 15,935 |
| 5.625% 3/15/27 (d) | | 5,640 | 5,978 |
| 6% 1/15/29 (d) | | 8,490 | 8,937 |
| 6.625% 2/15/25 (d) | | 13,150 | 13,857 |
| 8% 3/15/26 (d) | | 61,410 | 66,169 |
| 8.125% 6/30/24 (d) | | 22,423 | 23,404 |
| DaVita HealthCare Partners, Inc.: | | | |
| 3.75% 2/15/31 (d) | | 4,180 | 3,971 |
| 4.625% 6/1/30 (d) | | 31,515 | 31,909 |
| Encompass Health Corp. 5.125% 3/15/23 | | 4,294 | 4,299 |
| Horizon Pharma U.S.A., Inc. 5.5% 8/1/27 (d) | | 12,050 | 12,894 |
| IQVIA, Inc. 5% 5/15/27 (d) | | 12,070 | 12,628 |
| Jaguar Holding Co. II/Pharmaceutical Product Development LLC 5% 6/15/28 (d) | | 11,590 | 12,639 |
| Jazz Securities DAC 4.375% 1/15/29 (d) | | 12,305 | 12,582 |
| Modivcare, Inc. 5.875% 11/15/25 (d) | | 8,105 | 8,612 |
| Molina Healthcare, Inc.: | | | |
| 3.875% 11/15/30 (d) | | 10,465 | 10,779 |
| 4.375% 6/15/28 (d) | | 7,525 | 7,732 |
| Organon Finance 1 LLC: | | | |
| 4.125% 4/30/28 (d) | | 21,010 | 21,525 |
| 5.125% 4/30/31 (d) | | 18,260 | 18,947 |
| Owens & Minor, Inc. 4.5% 3/31/29 (d) | | 8,310 | 8,392 |
| Radiology Partners, Inc. 9.25% 2/1/28 (d) | | 20,865 | 22,899 |
| RP Escrow Issuer LLC 5.25% 12/15/25 (d) | | 10,405 | 10,831 |
| Syneos Health, Inc. 3.625% 1/15/29 (d) | | 8,395 | 8,206 |
| Tenet Healthcare Corp.: | | | |
| 4.625% 7/15/24 | | 6,055 | 6,146 |
| 4.625% 9/1/24 (d) | | 12,045 | 12,406 |
| 4.875% 1/1/26 (d) | | 30,115 | 31,289 |
| 5.125% 5/1/25 | | 6,055 | 6,128 |
| 5.125% 11/1/27 (d) | | 18,070 | 18,952 |
| 6.125% 10/1/28 (d) | | 19,415 | 20,483 |
| 6.25% 2/1/27 (d) | | 35,815 | 37,561 |
| U.S. Renal Care, Inc. 10.625% 7/15/27 (d) | | 13,450 | 14,223 |
| Vizient, Inc. 6.25% 5/15/27 (d) | | 2,760 | 2,924 |
| | | | 646,171 |
| Homebuilders/Real Estate - 1.9% | | | |
| Arcosa, Inc. 4.375% 4/15/29 (d) | | 8,410 | 8,601 |
| Brookfield Residential Properties, Inc./Brookfield Residential U.S. Corp. 4.875% 2/15/30 (d) | | 7,775 | 7,765 |
| DTZ U.S. Borrower LLC 6.75% 5/15/28 (d) | | 10,555 | 11,294 |
| LGI Homes, Inc. 6.875% 7/15/26 (d) | | 12,190 | 12,678 |
| MPT Operating Partnership LP/MPT Finance Corp.: | | | |
| 3.5% 3/15/31 | | 11,190 | 11,164 |
| 4.625% 8/1/29 | | 18,080 | 19,142 |
| 5% 10/15/27 | | 25,968 | 27,331 |
| Realogy Group LLC/Realogy Co-Issuer Corp.: | | | |
| 5.75% 1/15/29 (d) | | 36,785 | 38,164 |
| 7.625% 6/15/25 (d) | | 33,090 | 36,151 |
| Shea Homes Ltd. Partnership/Corp. 4.75% 4/1/29 (d) | | 8,020 | 8,104 |
| Taylor Morrison Communities, Inc./Monarch Communities, Inc.: | | | |
| 5.125% 8/1/30 (d) | | 10,725 | 11,813 |
| 5.625% 3/1/24 (d) | | 1,312 | 1,420 |
| 5.875% 6/15/27 (d) | | 9,260 | 10,510 |
| TopBuild Corp. 3.625% 3/15/29 (d) | | 5,910 | 5,851 |
| TRI Pointe Group, Inc./TRI Pointe Holdings, Inc. 5.875% 6/15/24 | | 16,130 | 17,933 |
| TRI Pointe Homes, Inc. 5.7% 6/15/28 | | 14,380 | 15,966 |
| Uniti Group LP / Uniti Group Finance, Inc.: | | | |
| 4.75% 4/15/28 (d) | | 12,060 | 12,015 |
| 6.5% 2/15/29 (d) | | 13,310 | 13,231 |
| Weekley Homes LLC/Weekley Finance Corp. 4.875% 9/15/28 (d) | | 5,045 | 5,209 |
| | | | 274,342 |
| Hotels - 0.3% | | | |
| Choice Hotels International, Inc. 5.75% 7/1/22 | | 3,035 | 3,183 |
| Hilton Domestic Operating Co., Inc.: | | | |
| 3.75% 5/1/29 (d) | | 5,595 | 5,609 |
| 4% 5/1/31 (d) | | 8,395 | 8,479 |
| 4.875% 1/15/30 | | 6,900 | 7,357 |
| Hilton Worldwide Finance LLC/Hilton Worldwide Finance Corp. 4.875% 4/1/27 | | 8,435 | 8,762 |
| NCL Finance Ltd. 6.125% 3/15/28 (d) | | 5,265 | 5,546 |
| Viking Ocean Cruises Ship VII Ltd. 5.625% 2/15/29 (d) | | 4,965 | 5,046 |
| | | | 43,982 |
| Insurance - 0.6% | | | |
| Acrisure LLC / Acrisure Finance, Inc. 7% 11/15/25 (d) | | 34,880 | 35,839 |
| Alliant Holdings Intermediate LLC: | | | |
| 4.25% 10/15/27 (d) | | 11,125 | 11,264 |
| 6.75% 10/15/27 (d) | | 16,680 | 17,514 |
| AssuredPartners, Inc.: | | | |
| 5.625% 1/15/29 (d) | | 6,550 | 6,640 |
| 7% 8/15/25 (d) | | 4,865 | 4,962 |
| HUB International Ltd. 7% 5/1/26 (d) | | 11,770 | 12,195 |
| MGIC Investment Corp. 5.25% 8/15/28 | | 7,710 | 8,134 |
| | | | 96,548 |
| Leisure - 1.5% | | | |
| Boyne U.S.A., Inc. 4.75% 5/15/29 (d) | | 6,360 | 6,535 |
| Carnival Corp.: | | | |
| 7.625% 3/1/26 (d) | | 8,415 | 9,214 |
| 9.875% 8/1/27 (d) | | 16,600 | 19,505 |
| 10.5% 2/1/26(d) | | 11,990 | 14,132 |
| 11.5% 4/1/23 (d) | | 32,585 | 37,447 |
| Merlin Entertainments PLC 5.75% 6/15/26 (d) | | 7,725 | 8,150 |
| NCL Corp. Ltd.: | | | |
| 5.875% 3/15/26 (d) | | 12,585 | 13,151 |
| 12.25% 5/15/24 (d) | | 14,720 | 17,955 |
| Royal Caribbean Cruises Ltd.: | | | |
| 10.875% 6/1/23 (d) | | 13,720 | 15,751 |
| 11.5% 6/1/25 (d) | | 19,950 | 23,092 |
| SeaWorld Parks & Entertainment, Inc. 9.5% 8/1/25 (d) | | 8,860 | 9,620 |
| Vail Resorts, Inc. 6.25% 5/15/25 (d) | | 6,250 | 6,633 |
| Viking Cruises Ltd.: | | | |
| 5.875% 9/15/27 (d) | | 11,595 | 11,363 |
| 13% 5/15/25 (d) | | 9,250 | 10,824 |
| Voc Escrow Ltd. 5% 2/15/28 (d) | | 10,755 | 10,970 |
| | | | 214,342 |
| Metals/Mining - 1.5% | | | |
| Alcoa Nederland Holding BV: | | | |
| 4.125% 3/31/29 (d) | | 15,485 | 15,814 |
| 6.125% 5/15/28 (d) | | 3,565 | 3,868 |
| 7% 9/30/26 (d) | | 6,385 | 6,720 |
| Arconic Rolled Products Corp.: | | | |
| 6% 5/15/25 (d) | | 6,630 | 7,078 |
| 6.125% 2/15/28 (d) | | 16,695 | 17,738 |
| Cleveland-Cliffs, Inc.: | | | |
| 4.625% 3/1/29 (d) | | 8,810 | 8,975 |
| 4.875% 3/1/31 (d) | | 8,810 | 8,964 |
| 5.75% 3/1/25 | | 3,141 | 3,227 |
| 5.875% 6/1/27 | | 18,030 | 18,909 |
| First Quantum Minerals Ltd.: | | | |
| 6.5% 3/1/24 (d) | | 10,955 | 11,243 |
| 6.875% 3/1/26 (d) | | 28,325 | 29,702 |
| 7.25% 4/1/23 (d) | | 3,465 | 3,521 |
| 7.5% 4/1/25 (d) | | 20,585 | 21,370 |
| FMG Resources (August 2006) Pty Ltd.: | | | |
| 4.375% 4/1/31 (d) | | 8,990 | 9,338 |
| 4.5% 9/15/27 (d) | | 9,015 | 9,792 |
| 5.125% 5/15/24 (d) | | 9,780 | 10,672 |
| HudBay Minerals, Inc. 4.5% 4/1/26 (d) | | 7,020 | 7,125 |
| Mineral Resources Ltd. 8.125% 5/1/27 (d) | | 18,015 | 19,953 |
| Murray Energy Corp.: | | | |
| 11.25% 12/31/49 (c)(d)(f) | | 8,915 | 0 |
| 12% 4/15/24 pay-in-kind (c)(d)(f)(g) | | 10,343 | 0 |
| | | | 214,009 |
| Paper - 0.4% | | | |
| Ardagh Metal Packaging Finance U.S.A. LLC/Ardagh Metal Packaging Finance PLC: | | | |
| 3.25% 9/1/28 (d) | | 5,915 | 5,834 |
| 4% 9/1/29 (d) | | 11,830 | 11,771 |
| Cascades, Inc.: | | | |
| 5.125% 1/15/26 (d) | | 5,600 | 5,936 |
| 5.375% 1/15/28 (d) | | 5,600 | 5,836 |
| Enviva Partners LP / Enviva Partners Finance Corp. 6.5% 1/15/26 (d) | | 11,230 | 11,777 |
| Mercer International, Inc. 5.125% 2/1/29 (d) | | 15,060 | 15,568 |
| | | | 56,722 |
| Publishing/Printing - 0.1% | | | |
| Clear Channel International BV 6.625% 8/1/25 (d) | | 15,860 | 16,574 |
| Restaurants - 0.4% | | | |
| 1011778 BC Unlimited Liability Co./New Red Finance, Inc.: | | | |
| 4% 10/15/30 (d) | | 39,005 | 38,030 |
| 4.375% 1/15/28 (d) | | 10,600 | 10,733 |
| Bloomin Brands, Inc. / OSI Restaurant Partners LLC 5.125% 4/15/29 (d) | | 5,565 | 5,704 |
| Yum! Brands, Inc. 4.625% 1/31/32 | | 11,975 | 12,516 |
| | | | 66,983 |
| Services - 1.9% | | | |
| AECOM 5.125% 3/15/27 | | 11,885 | 13,222 |
| Ascend Learning LLC: | | | |
| 6.875% 8/1/25 (d) | | 11,865 | 12,162 |
| 6.875% 8/1/25 (d) | | 4,115 | 4,218 |
| Booz Allen Hamilton, Inc. 3.875% 9/1/28 (d) | | 10,240 | 10,214 |
| Double Eagle III Midco 1 LLC 7.75% 12/15/25 (d) | | 11,415 | 12,923 |
| Fair Isaac Corp. 4% 6/15/28 (d) | | 2,910 | 2,950 |
| Gartner, Inc. 3.75% 10/1/30 (d) | | 11,495 | 11,524 |
| GEMS MENASA Cayman Ltd. 7.125% 7/31/26 (d) | | 8,765 | 9,181 |
| H&E Equipment Services, Inc. 3.875% 12/15/28 (d) | | 16,800 | 16,401 |
| Hertz Corp.: | | | |
| 5.5% 10/15/24 (d)(f) | | 10,890 | 11,340 |
| 6% 1/15/28 (d)(f) | | 10,285 | 11,185 |
| 6.25% 10/15/22 (f) | | 11,875 | 12,469 |
| 7.125% 8/1/26 (d)(f) | | 10,285 | 11,211 |
| IAA Spinco, Inc. 5.5% 6/15/27 (d) | | 4,680 | 4,920 |
| Iron Mountain, Inc.: | | | |
| 4.5% 2/15/31 (d) | | 22,025 | 21,965 |
| 4.875% 9/15/29 (d) | | 24,110 | 24,557 |
| KAR Auction Services, Inc. 5.125% 6/1/25 (d) | | 10,355 | 10,499 |
| Sotheby's 7.375% 10/15/27 (d) | | 4,960 | 5,346 |
| Tempo Acquisition LLC 6.75% 6/1/25 (d) | | 8,815 | 8,978 |
| The Brink's Co. 4.625% 10/15/27 (d) | | 12,180 | 12,698 |
| The GEO Group, Inc.: | | | |
| 5.125% 4/1/23 | | 9,625 | 8,807 |
| 5.875% 10/15/24 | | 14,053 | 11,285 |
| 6% 4/15/26 | | 9,655 | 6,664 |
| TriNet Group, Inc. 3.5% 3/1/29 (d) | | 8,865 | 8,654 |
| Uber Technologies, Inc. 6.25% 1/15/28 (d) | | 9,175 | 9,968 |
| WASH Multifamily Acquisition, Inc. 5.75% 4/15/26 (d) | | 9,760 | 10,138 |
| | | | 283,479 |
| Steel - 0.2% | | | |
| Algoma Steel SCA 0% 12/31/23 (c)(i) | | 1,982 | 0 |
| Commercial Metals Co. 3.875% 2/15/31 | | 6,135 | 6,135 |
| Infrabuild Australia Pty Ltd. 12% 10/1/24 (d) | | 10,980 | 11,090 |
| United States Steel Corp. 6.25% 3/15/26 | | 12,205 | 12,462 |
| | | | 29,687 |
| Super Retail - 0.8% | | | |
| Asbury Automotive Group, Inc.: | | | |
| 4.5% 3/1/28 | | 3,534 | 3,640 |
| 4.75% 3/1/30 | | 3,523 | 3,682 |
| Burlington Coat Factory Warehouse Corp. 6.25% 4/15/25 (d) | | 3,270 | 3,474 |
| Carvana Co. 5.5% 4/15/27 (d) | | 11,975 | 12,119 |
| EG Global Finance PLC 8.5% 10/30/25 (d) | | 16,085 | 17,070 |
| L Brands, Inc.: | | | |
| 6.625% 10/1/30 (d) | | 5,555 | 6,402 |
| 6.75% 7/1/36 | | 27,016 | 32,536 |
| 6.875% 11/1/35 | | 7,304 | 8,856 |
| 7.5% 6/15/29 | | 8,335 | 9,670 |
| LBM Acquisition LLC 6.25% 1/15/29 (d) | | 4,610 | 4,725 |
| Party City Holdings, Inc. 8.75% 2/15/26 (d) | | 5,875 | 6,021 |
| Penske Automotive Group, Inc. 5.5% 5/15/26 | | 8,565 | 8,843 |
| Rent-A-Center, Inc. 6.375% 2/15/29 (d) | | 3,910 | 4,240 |
| | | | 121,278 |
| Technology - 2.5% | | | |
| Banff Merger Sub, Inc. 9.75% 9/1/26 (d) | | 9,608 | 10,221 |
| Black Knight InfoServ LLC 3.625% 9/1/28 (d) | | 11,390 | 11,134 |
| Boxer Parent Co., Inc. 7.125% 10/2/25 (d) | | 5,515 | 5,928 |
| Camelot Finance SA 4.5% 11/1/26 (d) | | 10,590 | 10,961 |
| Crowdstrike Holdings, Inc. 3% 2/15/29 | | 8,870 | 8,791 |
| Go Daddy Operating Co. LLC / GD Finance Co., Inc.: | | | |
| 3.5% 3/1/29 (d) | | 11,810 | 11,501 |
| 5.25% 12/1/27 (d) | | 9,345 | 9,777 |
| NCR Corp.: | | | |
| 5% 10/1/28 (d) | | 5,530 | 5,696 |
| 5.125% 4/15/29 (d) | | 8,870 | 9,125 |
| 5.25% 10/1/30 (d) | | 5,530 | 5,724 |
| 5.75% 9/1/27 (d) | | 9,035 | 9,543 |
| 6.125% 9/1/29 (d) | | 9,035 | 9,826 |
| 8.125% 4/15/25 (d) | | 4,675 | 5,096 |
| Northwest Fiber LLC/Northwest Fiber Finance Sub, Inc. 10.75% 6/1/28 (d) | | 5,930 | 6,701 |
| NortonLifeLock, Inc. 5% 4/15/25 (d) | | 10,050 | 10,180 |
| ON Semiconductor Corp. 3.875% 9/1/28 (d) | | 11,065 | 11,390 |
| Open Text Corp.: | | | |
| 3.875% 2/15/28 (d) | | 5,690 | 5,761 |
| 5.875% 6/1/26 (d) | | 8,535 | 8,802 |
| Open Text Holdings, Inc. 4.125% 2/15/30 (d) | | 5,690 | 5,754 |
| Pitney Bowes, Inc.: | | | |
| 6.875% 3/15/27 (d) | | 5,980 | 6,100 |
| 7.25% 3/15/29 (d) | | 5,980 | 6,130 |
| PTC, Inc.: | | | |
| 3.625% 2/15/25 (d) | | 6,650 | 6,823 |
| 4% 2/15/28 (d) | | 6,575 | 6,749 |
| Rackspace Hosting, Inc. 5.375% 12/1/28 (d) | | 6,425 | 6,559 |
| RP Crown Parent, LLC 7.375% 10/15/24 (d) | | 4,060 | 4,144 |
| Sensata Technologies BV 4% 4/15/29 (d) | | 11,970 | 12,044 |
| Synaptics, Inc. 4% 6/15/29 (d) | | 7,015 | 7,019 |
| TTM Technologies, Inc. 4% 3/1/29 (d) | | 8,870 | 8,881 |
| Twilio, Inc.: | | | |
| 3.625% 3/15/29 | | 9,995 | 10,186 |
| 3.875% 3/15/31 | | 10,460 | 10,735 |
| Uber Technologies, Inc.: | | | |
| 7.5% 9/15/27 (d) | | 35,255 | 38,878 |
| 8% 11/1/26 (d) | | 51,060 | 55,257 |
| Unisys Corp. 6.875% 11/1/27 (d) | | 6,095 | 6,689 |
| Veritas U.S., Inc./Veritas Bermuda Ltd. 7.5% 9/1/25 (d) | | 19,400 | 20,079 |
| | | | 368,184 |
| Telecommunications - 6.1% | | | |
| Altice Financing SA 5% 1/15/28 (d) | | 11,280 | 11,125 |
| Altice France SA: | | | |
| 5.125% 7/15/29 (d) | | 79,325 | 79,433 |
| 5.5% 1/15/28 (d) | | 22,110 | 22,778 |
| 7.375% 5/1/26 (d) | | 100,065 | 103,747 |
| 8.125% 2/1/27 (d) | | 7,635 | 8,360 |
| C&W Senior Financing Designated Activity Co. 6.875% 9/15/27 (d) | | 42,100 | 44,731 |
| Cablevision Lightpath LLC: | | | |
| 3.875% 9/15/27 (d) | | 5,500 | 5,424 |
| 5.625% 9/15/28 (d) | | 4,350 | 4,459 |
| Frontier Communications Corp.: | | | |
| 5% 5/1/28 (d) | | 19,575 | 19,991 |
| 5.875% 10/15/27 (d) | | 10,375 | 11,023 |
| 6.75% 5/1/29 (d) | | 12,535 | 13,205 |
| GTT Communications, Inc. 7.875% 12/31/24 (d) | | 1,110 | 167 |
| Intelsat Jackson Holdings SA: | | | |
| 5.5% 8/1/23 (f) | | 31,470 | 19,256 |
| 8% 2/15/24 (d) | | 20,755 | 21,455 |
| LCPR Senior Secured Financing DAC: | | | |
| 5.125% 7/15/29 (d) | | 14,860 | 15,245 |
| 6.75% 10/15/27 (d) | | 11,285 | 12,131 |
| Level 3 Financing, Inc.: | | | |
| 3.625% 1/15/29 (d) | | 24,590 | 23,822 |
| 3.75% 7/15/29 (d) | | 24,670 | 24,053 |
| Millicom International Cellular SA 4.5% 4/27/31 (d) | | 1,725 | 1,833 |
| NGL Energy Partners LP/NGL Energy Finance Corp. 7.5% 4/15/26 | | 15,705 | 14,021 |
| Northwest Fiber LLC/Northwest Fiber Finance Sub, Inc. 6% 2/15/28 (d) | | 4,490 | 4,490 |
| Qwest Corp. 7.25% 9/15/25 | | 1,480 | 1,746 |
| Sable International Finance Ltd. 5.75% 9/7/27 (d) | | 20,710 | 21,694 |
| SBA Communications Corp.: | | | |
| 3.125% 2/1/29 (d) | | 13,305 | 12,746 |
| 3.875% 2/15/27 | | 17,015 | 17,401 |
| Sprint Capital Corp.: | | | |
| 6.875% 11/15/28 | | 76,454 | 96,334 |
| 8.75% 3/15/32 | | 66,716 | 98,906 |
| Sprint Corp. 7.625% 3/1/26 | | 10,895 | 13,360 |
| T-Mobile U.S.A., Inc.: | | | |
| 2.25% 2/15/26 | | 16,895 | 17,002 |
| 2.625% 2/15/29 | | 16,895 | 16,458 |
| 2.875% 2/15/31 | | 26,040 | 25,422 |
| 3.375% 4/15/29 | | 11,975 | 12,170 |
| 3.5% 4/15/31 | | 11,975 | 12,155 |
| Telesat Canada/Telesat LLC 5.625% 12/6/26 (d) | | 17,665 | 17,753 |
| Uniti Group, Inc. 7.875% 2/15/25 (d) | | 17,650 | 19,018 |
| Windstream Escrow LLC 7.75% 8/15/28 (d) | | 31,630 | 32,974 |
| Zayo Group Holdings, Inc. 4% 3/1/27 (d) | | 17,180 | 17,060 |
| | | | 892,948 |
| Textiles/Apparel - 0.1% | | | |
| Crocs, Inc. 4.25% 3/15/29 (d) | | 8,675 | 8,813 |
| Utilities - 2.7% | | | |
| Clearway Energy Operating LLC: | | | |
| 3.75% 2/15/31 (d) | | 13,295 | 13,105 |
| 4.75% 3/15/28 (d) | | 6,920 | 7,246 |
| NextEra Energy Partners LP: | | | |
| 4.25% 7/15/24 (d) | | 6,610 | 7,007 |
| 4.25% 9/15/24 (d) | | 428 | 452 |
| NRG Energy, Inc.: | | | |
| 3.375% 2/15/29 (d) | | 5,145 | 5,036 |
| 3.625% 2/15/31 (d) | | 10,215 | 10,008 |
| 5.75% 1/15/28 | | 9,410 | 9,998 |
| 6.625% 1/15/27 | | 26,747 | 27,876 |
| Pacific Gas & Electric Co.: | | | |
| 3.45% 7/1/25 | | 2,868 | 3,041 |
| 3.75% 7/1/28 | | 2,868 | 3,027 |
| 3.75% 8/15/42 | | 10,400 | 9,390 |
| 3.95% 12/1/47 | | 53,930 | 49,495 |
| 4% 12/1/46 | | 24,380 | 22,318 |
| 4.25% 3/15/46 | | 2,400 | 2,299 |
| 4.3% 3/15/45 | | 5,995 | 5,759 |
| 4.55% 7/1/30 | | 60,820 | 65,380 |
| 4.95% 7/1/50 | | 60,820 | 62,090 |
| PG&E Corp.: | | | |
| 5% 7/1/28 | | 22,000 | 23,045 |
| 5.25% 7/1/30 | | 8,330 | 8,892 |
| Pike Corp. 5.5% 9/1/28 (d) | | 8,695 | 8,956 |
| Vistra Operations Co. LLC: | | | |
| 5% 7/31/27 (d) | | 22,585 | 23,399 |
| 5.5% 9/1/26 (d) | | 3,485 | 3,600 |
| 5.625% 2/15/27 (d) | | 28,195 | 29,323 |
| | | | 400,742 |
|
| TOTAL NONCONVERTIBLE BONDS | | | 8,901,295 |
|
| TOTAL CORPORATE BONDS | | | |
| (Cost $8,423,984) | | | 8,927,577 |
| | | Shares | Value (000s) |
|
| Common Stocks - 19.7% | | | |
| Air Transportation - 0.2% | | | |
| Air Canada (i) | | 1,502,900 | 30,287 |
| Automotive & Auto Parts - 0.1% | | | |
| Allison Transmission Holdings, Inc. | | 249,600 | 10,351 |
| Exide Technologies (c)(i) | | 385 | 250 |
| Exide Technologies (c)(i) | | 9,824 | 10 |
| Exide Technologies (c)(i) | | 580,031 | 0 |
| UC Holdings, Inc. (c)(i) | | 677,217 | 10,300 |
|
| TOTAL AUTOMOTIVE & AUTO PARTS | | | 20,911 |
|
| Broadcasting - 0.3% | | | |
| iHeartMedia, Inc. (i) | | 104 | 2 |
| Nexstar Broadcasting Group, Inc. Class A | | 329,429 | 48,561 |
|
| TOTAL BROADCASTING | | | 48,563 |
|
| Building Materials - 0.3% | | | |
| Carrier Global Corp. | | 981,100 | 42,756 |
| Cable/Satellite TV - 0.3% | | | |
| Altice U.S.A., Inc. Class A (i) | | 1,146,900 | 41,644 |
| Capital Goods - 0.9% | | | |
| Fortive Corp. | | 347,400 | 24,603 |
| Thermo Fisher Scientific, Inc. | | 98,300 | 46,224 |
| Zebra Technologies Corp. Class A (i) | | 115,400 | 56,285 |
|
| TOTAL CAPITAL GOODS | | | 127,112 |
|
| Chemicals - 0.4% | | | |
| CF Industries Holdings, Inc. | | 608,800 | 29,606 |
| The Chemours Co. LLC | | 1,144,240 | 34,556 |
|
| TOTAL CHEMICALS | | | 64,162 |
|
| Consumer Products - 0.6% | | | |
| Reddy Ice Holdings, Inc. (c)(i) | | 496,439 | 0 |
| Reddy Ice Holdings, Inc. (c)(i) | | 199,717 | 11 |
| Tempur Sealy International, Inc. | | 2,160,700 | 82,409 |
|
| TOTAL CONSUMER PRODUCTS | | | 82,420 |
|
| Containers - 0.4% | | | |
| Berry Global Group, Inc. (i) | | 342,000 | 21,758 |
| WestRock Co. | | 660,100 | 36,801 |
|
| TOTAL CONTAINERS | | | 58,559 |
|
| Diversified Financial Services - 0.6% | | | |
| ACNR Holdings, Inc. (c) | | 37,965 | 262 |
| MasterCard, Inc. Class A | | 97,500 | 37,251 |
| OneMain Holdings, Inc. | | 806,800 | 45,883 |
| Penson Worldwide, Inc. Class A (c)(i) | | 10,322,034 | 0 |
| PJT Partners, Inc. | | 5,092 | 374 |
|
| TOTAL DIVERSIFIED FINANCIAL SERVICES | | | 83,770 |
|
| Energy - 2.7% | | | |
| Array Technologies, Inc. | | 208,059 | 5,859 |
| California Resources Corp. (i)(j) | | 5,089,439 | 120,620 |
| California Resources Corp. warrants 10/27/24 (i)(j) | | 57,076 | 228 |
| Chaparral Energy, Inc.: | | | |
| Series A warrants 10/1/24 (c)(i) | | 392 | 1 |
| Series B warrants 10/1/25 (c)(i) | | 392 | 1 |
| Chesapeake Energy Corp. (i) | | 2,880,014 | 131,242 |
| Chesapeake Energy Corp. (b) | | 22,818 | 936 |
| Chesapeake Energy Corp.: | | | |
| warrants 2/9/26 (i) | | 117,493 | 2,671 |
| warrants 2/9/26 (i) | | 130,548 | 2,578 |
| warrants 2/9/26 (i) | | 81,798 | 1,589 |
| Denbury, Inc. (i) | | 912,817 | 49,666 |
| Denbury, Inc. warrants 9/18/25 (i) | | 439,788 | 11,958 |
| Diamond Offshore Drilling, Inc. (c)(i) | | 118,484 | 605 |
| EP Energy Corp. (c) | | 841,775 | 44,336 |
| Extraction Oil & Gas, Inc. (i) | | 50,742 | 2,120 |
| Forbes Energy Services Ltd. (i) | | 193,218 | 18 |
| Goodrich Petroleum Corp. (i) | | 129,527 | 1,302 |
| Harvest Oil & Gas Corp. | | 25,482 | 657 |
| Jonah Energy LLC (c) | | 304,505 | 4,568 |
| Mesquite Energy, Inc. (c) | | 317,026 | 6,968 |
| Superior Energy Services, Inc. Class A (c) | | 110,370 | 2,826 |
| Unit Corp. (i) | | 35,664 | 464 |
| Whiting Petroleum Corp. (i) | | 130,440 | 5,227 |
|
| TOTAL ENERGY | | | 396,440 |
|
| Entertainment/Film - 0.1% | | | |
| New Cotai LLC/New Cotai Capital Corp. (b)(c) | | 3,366,627 | 11,278 |
| Environmental - 0.4% | | | |
| Darling Ingredients, Inc. (i) | | 909,117 | 63,138 |
| Food & Drug Retail - 0.1% | | | |
| Southeastern Grocers, Inc. (b)(c)(i) | | 793,345 | 12,281 |
| Food/Beverage/Tobacco - 0.5% | | | |
| JBS SA | | 12,343,900 | 68,445 |
| Gaming - 2.0% | | | |
| Boyd Gaming Corp. (i) | | 1,088,300 | 71,991 |
| Caesars Entertainment, Inc. (i) | | 1,601,636 | 156,704 |
| Penn National Gaming, Inc. (i) | | 654,000 | 58,284 |
| Studio City International Holdings Ltd. ADR (i) | | 695,700 | 7,931 |
|
| TOTAL GAMING | | | 294,910 |
|
| Healthcare - 1.8% | | | |
| Bristol-Myers Squibb Co. | | 274,100 | 17,109 |
| Charles River Laboratories International, Inc. (i) | | 112,000 | 37,234 |
| Encompass Health Corp. | | 34 | 3 |
| HCA Holdings, Inc. | | 154,200 | 31,003 |
| Humana, Inc. | | 71,000 | 31,612 |
| IQVIA Holdings, Inc. (i) | | 344,400 | 80,827 |
| Regeneron Pharmaceuticals, Inc. (i) | | 63,600 | 30,611 |
| Rotech Healthcare, Inc. (c)(i) | | 185,710 | 1,933 |
| UnitedHealth Group, Inc. | | 92,600 | 36,929 |
|
| TOTAL HEALTHCARE | | | 267,261 |
|
| Homebuilders/Real Estate - 0.4% | | | |
| American Tower Corp. | | 11,612 | 2,958 |
| Arthur J. Gallagher & Co. | | 196,100 | 28,425 |
| Lennar Corp. Class A | | 209,300 | 21,683 |
|
| TOTAL HOMEBUILDERS/REAL ESTATE | | | 53,066 |
|
| Metals/Mining - 0.2% | | | |
| Elah Holdings, Inc. (i) | | 906 | 90 |
| First Quantum Minerals Ltd. | | 1,544,300 | 35,594 |
|
| TOTAL METALS/MINING | | | 35,684 |
|
| Services - 0.7% | | | |
| ASGN, Inc. (i) | | 226,400 | 23,813 |
| Novus Holdings Ltd. (i) | | 100,408 | 12 |
| Penhall Acquisition Co.: | | | |
| Class A (c)(i) | | 26,163 | 3,041 |
| Class B (c)(i) | | 8,721 | 1,014 |
| United Rentals, Inc. (i) | | 98,494 | 31,513 |
| Visa, Inc. Class A | | 158,440 | 37,005 |
|
| TOTAL SERVICES | | | 96,398 |
|
| Steel - 0.0% | | | |
| Algoma Steel GP (c)(i) | | 198,162 | 0 |
| Algoma Steel SCA (c)(i) | | 198,162 | 0 |
|
| TOTAL STEEL | | | 0 |
|
| Super Retail - 0.5% | | | |
| Amazon.com, Inc. (i) | | 9,600 | 33,287 |
| Arena Brands Holding Corp. Class B (b)(c)(i) | | 659,302 | 2,571 |
| Lowe's Companies, Inc. | | 187,000 | 36,699 |
|
| TOTAL SUPER RETAIL | | | 72,557 |
|
| Technology - 4.4% | | | |
| Adobe, Inc. (i) | | 134,800 | 68,524 |
| Alphabet, Inc. Class A (i) | | 36,500 | 85,903 |
| CDW Corp. | | 131,500 | 23,450 |
| EPAM Systems, Inc. (i) | | 73,200 | 33,507 |
| Facebook, Inc. Class A (i) | | 204,800 | 66,576 |
| Global Payments, Inc. | | 227,524 | 48,833 |
| GoDaddy, Inc. (i) | | 246,400 | 21,392 |
| Lam Research Corp. | | 134,500 | 83,451 |
| Microchip Technology, Inc. | | 251,300 | 37,768 |
| Micron Technology, Inc. (i) | | 287,700 | 24,762 |
| Microsoft Corp. | | 308,500 | 77,798 |
| Oak Street Health, Inc. (i) | | 17,400 | 1,072 |
| ON Semiconductor Corp. (i) | | 748,538 | 29,193 |
| PayPal Holdings, Inc. (i) | | 42,400 | 11,121 |
| SS&C Technologies Holdings, Inc. | | 426,282 | 31,639 |
| Vontier Corp. (i) | | 115,960 | 3,634 |
|
| TOTAL TECHNOLOGY | | | 648,623 |
|
| Telecommunications - 1.0% | | | |
| Alibaba Group Holding Ltd. sponsored ADR (i) | | 109,200 | 25,220 |
| Palo Alto Networks, Inc. (i) | | 103,500 | 36,576 |
| T-Mobile U.S., Inc. | | 505,300 | 66,765 |
| Tencent Holdings Ltd. sponsored ADR | | 332,900 | 26,519 |
|
| TOTAL TELECOMMUNICATIONS | | | 155,080 |
|
| Transportation Ex Air/Rail - 0.2% | | | |
| Tricer Holdco SCA: | | | |
| Class A1 (b)(c)(i) | | 598,287 | 1 |
| Class A2 (b)(c)(i) | | 598,287 | 1 |
| Class A3 (b)(c)(i) | | 598,287 | 1 |
| Class A4 (b)(c)(i) | | 598,287 | 1 |
| Class A5 (b)(c)(i) | | 598,287 | 1 |
| Class A6 (b)(c)(i) | | 598,287 | 1 |
| Class A7 (b)(c)(i) | | 598,287 | 1 |
| Class A8 (b)(c)(i) | | 598,287 | 1 |
| Class A9 (b)(c)(i) | | 598,287 | 1 |
| U.S. Shipping Partners Corp. (c)(i) | | 51,736 | 0 |
| U.S. Shipping Partners Corp. warrants 12/31/29 (c)(i) | | 484,379 | 0 |
| XPO Logistics, Inc. (i) | | 176,900 | 24,610 |
|
| TOTAL TRANSPORTATION EX AIR/RAIL | | | 24,619 |
|
| Utilities - 0.6% | | | |
| NRG Energy, Inc. | | 863,100 | 30,916 |
| PG&E Corp. (i) | | 3,288,096 | 37,221 |
| Portland General Electric Co. | | 14,817 | 754 |
| Vistra Corp. | | 1,139,700 | 19,227 |
|
| TOTAL UTILITIES | | | 88,118 |
|
| TOTAL COMMON STOCKS | | | |
| (Cost $1,614,693) | | | 2,888,082 |
|
| Nonconvertible Preferred Stocks - 0.0% | | | |
| Automotive & Auto Parts - 0.0% | | | |
| Exide Technologies (c)(i) | | 858 | 799 |
| Diversified Financial Services - 0.0% | | | |
| ACNR Holdings, Inc. (c) | | 13,212 | 1,652 |
| Transportation Ex Air/Rail - 0.0% | | | |
| Tricer Holdco SCA (b)(c)(i) | | 287,159,690 | 97 |
| TOTAL NONCONVERTIBLE PREFERRED STOCKS | | | |
| (Cost $12,701) | | | 2,548 |
| | | Principal Amount (000s)(a) | Value (000s) |
|
| Bank Loan Obligations - 3.1% | | | |
| Air Transportation - 0.2% | | | |
| Dynasty Acquisition Co., Inc.: | | | |
| Tranche B 1LN, term loan 3 month U.S. LIBOR + 3.500% 3.7025% 4/8/26 (g)(h)(k) | | 2,604 | 2,528 |
| Tranche B2 1LN, term loan 3 month U.S. LIBOR + 3.500% 3.7025% 4/4/26 (g)(h)(k) | | 1,400 | 1,359 |
| SkyMiles IP Ltd. Tranche B 1LN, term loan 3 month U.S. LIBOR + 3.750% 4.75% 10/20/27 (g)(h)(k) | | 3,490 | 3,663 |
| United Airlines, Inc. Tranche B 1LN, term loan 3 month U.S. LIBOR + 3.750% 4.5% 4/14/28 (g)(h)(k) | | 26,500 | 26,793 |
|
| TOTAL AIR TRANSPORTATION | | | 34,343 |
|
| Automotive & Auto Parts - 0.2% | | | |
| Hertz International Ltd. Tranche DD, term loan 3 month EURIBOR + 0.020% 1.95% 8/30/21 (c)(g)(h)(k)(l) | EUR | 9,536 | 11,465 |
| Midas Intermediate Holdco II LLC Tranche B 1LN, term loan 3 month U.S. LIBOR + 6.750% 7.5% 12/16/25 (g)(h)(k) | | 863 | 872 |
| Truck Hero, Inc. Tranche B 1LN, term loan 3 month U.S. LIBOR + 3.750% 4.5% 1/29/28 (g)(h)(k) | | 2,135 | 2,129 |
| Wand NewCo 3, Inc. Tranche B 1LN, term loan 3 month U.S. LIBOR + 3.000% 3.1133% 2/5/26 (g)(h)(k) | | 18,170 | 17,911 |
|
| TOTAL AUTOMOTIVE & AUTO PARTS | | | 32,377 |
|
| Banks & Thrifts - 0.1% | | | |
| Citadel Securities LP Tranche B 1LN, term loan 3 month U.S. LIBOR + 2.500% 2.6133% 2/27/28 (g)(h)(k) | | 9,845 | 9,747 |
| Broadcasting - 0.0% | | | |
| Nexstar Broadcasting, Inc. Tranche B, term loan 3 month U.S. LIBOR + 2.750% 2.6151% 9/19/26 (g)(h)(k) | | 3,835 | 3,815 |
| Building Materials - 0.0% | | | |
| ACProducts, Inc. 1LN, term loan 3 month U.S. LIBOR + 6.500% 7.5% 8/13/25 (g)(h)(k) | | 4,612 | 4,710 |
| Consumer Products - 0.2% | | | |
| Kronos Acquisition Holdings, Inc. Tranche B 1LN, term loan 3 month U.S. LIBOR + 3.750% 4.25% 12/22/26 (g)(h)(k) | | 22,145 | 21,820 |
| Michaels Companies, Inc. 1LN, term loan 3 month U.S. LIBOR + 4.250% 5% 4/9/28 (g)(h)(k) | | 5,560 | 5,533 |
|
| TOTAL CONSUMER PRODUCTS | | | 27,353 |
|
| Containers - 0.0% | | | |
| AOT Packaging Products AcquisitionCo LLC: | | | |
| 1LN, term loan 3 month U.S. LIBOR + 3.250% 3.75% 3/3/28 (h)(k) | | 2,274 | 2,251 |
| Tranche DD 1LN, term loan 3 month U.S. LIBOR + 3.250% 3.75% 3/3/28 (g)(h)(k)(l) | | 511 | 506 |
| Kloeckner Pentaplast of America, Inc. Tranche B 1LN, term loan 3 month U.S. LIBOR + 4.750% 5.25% 2/4/26 (g)(h)(k) | | 1,505 | 1,500 |
|
| TOTAL CONTAINERS | | | 4,257 |
|
| Diversified Financial Services - 0.0% | | | |
| ACNR Holdings, Inc. term loan 17% 9/21/27 (c)(g)(k) | | 4,023 | 4,023 |
| New Cotai LLC 1LN, term loan 3 month U.S. LIBOR + 12.000% 14% 9/9/25 (c)(g)(h)(k) | | 955 | 955 |
|
| TOTAL DIVERSIFIED FINANCIAL SERVICES | | | 4,978 |
|
| Diversified Media - 0.1% | | | |
| Allen Media LLC Tranche B 1LN, term loan 3 month U.S. LIBOR + 5.500% 5.7025% 2/10/27 (g)(h)(k) | | 8,468 | 8,447 |
| Energy - 0.1% | | | |
| Citgo Holding, Inc. Tranche B 1LN, term loan 3 month U.S. LIBOR + 7.000% 8% 8/1/23 (g)(h)(k) | | 1,384 | 1,348 |
| EG America LLC 2LN, term loan 3 month U.S. LIBOR + 8.000% 9% 3/23/26 (g)(h)(k) | | 5,815 | 5,800 |
| Forbes Energy Services LLC Tranche B, term loan 18% 12/31/49 (c)(f)(g)(k) | | 2,190 | 4 |
| Sanchez Energy Corp.: | | | |
| 1LN, term loan 3 month U.S. LIBOR + 8.000% 0% (c)(f)(h)(k) | | 5,861 | 0 |
| term loan 3 month U.S. LIBOR + 0.000% 0% (c)(f)(h)(k) | | 2,528 | 0 |
|
| TOTAL ENERGY | | | 7,152 |
|
| Healthcare - 0.6% | | | |
| CPI Holdco LLC Tranche B 1LN, term loan 3 month U.S. LIBOR + 4.000% 4.1133% 11/4/26 (g)(h)(k) | | 594 | 594 |
| Gainwell Acquisition Corp. Tranche B 1LN, term loan 3 month U.S. LIBOR + 4.000% 4.75% 10/1/27 (g)(h)(k) | | 17,855 | 17,855 |
| Jazz Financing Lux SARL Tranche B 1LN, term loan 1 month U.S. LIBOR + 3.500% 4/22/28 (h)(k)(m) | | 6,995 | 7,010 |
| Organon & Co. Tranche B 1LN, term loan 3 month U.S. LIBOR + 3.000% 4/8/28 (h)(k)(m) | | 17,555 | 17,504 |
| U.S. Renal Care, Inc. Tranche B 1LN, term loan 3 month U.S. LIBOR + 5.000% 5.125% 6/13/26 (g)(h)(k) | | 43,025 | 42,043 |
| Valeant Pharmaceuticals International, Inc. Tranche B, term loan 3 month U.S. LIBOR + 3.000% 3.1133% 6/1/25 (g)(h)(k) | | 1,680 | 1,676 |
|
| TOTAL HEALTHCARE | | | 86,682 |
|
| Hotels - 0.1% | | | |
| Travelport Finance Luxembourg SARL 1LN, term loan 3 month U.S. LIBOR + 5.000% 5.2025% 5/29/26 (g)(h)(k) | | 9,222 | 7,923 |
| Insurance - 0.1% | | | |
| Alliant Holdings Intermediate LLC Tranche B3 1LN, term loan 3 month U.S. LIBOR + 3.750% 4.25% 11/5/27 (g)(h)(k) | | 13,580 | 13,565 |
| Services - 0.2% | | | |
| KUEHG Corp. Tranche B 2LN, term loan 3 month U.S. LIBOR + 8.250% 9.25% 8/22/25 (g)(h)(k) | | 6,055 | 5,825 |
| Maverick Purchaser Sub LLC Tranche B 1LN, term loan 3 month U.S. LIBOR + 3.500% 3.6133% 1/23/27 (g)(h)(k) | | 2,213 | 2,196 |
| Sabert Corp. Tranche B 1LN, term loan 3 month U.S. LIBOR + 4.500% 5.5% 12/10/26 (g)(h)(k) | | 7,957 | 7,952 |
| Sotheby's Tranche B 1LN, term loan 3 month U.S. LIBOR + 4.750% 5.5% 1/15/27 (g)(h)(k) | | 11,085 | 11,161 |
|
| TOTAL SERVICES | | | 27,134 |
|
| Technology - 0.6% | | | |
| Acuris Finance U.S., Inc. 1LN, term loan 3 month U.S. LIBOR + 4.000% 4.5% 2/16/28 (g)(h)(k) | | 1,670 | 1,670 |
| athenahealth, Inc. Tranche B 1LN, term loan 3 month U.S. LIBOR + 4.250% 4.4525% 2/11/26 (g)(h)(k) | | 2,225 | 2,231 |
| Boxer Parent Co., Inc. Tranche B 1LN, term loan 3 month U.S. LIBOR + 3.750% 3.8633% 10/2/25 (g)(h)(k) | | 32,256 | 32,070 |
| Camelot Finance SA Tranche B, term loan 3 month U.S. LIBOR + 3.000% 3.1133% 10/31/26 (g)(h)(k) | | 1,136 | 1,125 |
| DG Investment Intermediate Holdings, Inc.: | | | |
| Tranche B 1LN, term loan 3 month U.S. LIBOR + 3.750% 4.5% 3/31/28 (g)(h)(k) | | 1,678 | 1,671 |
| Tranche DD 1LN, term loan 3 month U.S. LIBOR + 3.750% 3.42% 3/31/28 (g)(h)(k)(l) | | 352 | 350 |
| McAfee LLC Tranche B, term loan 3 month U.S. LIBOR + 3.750% 3.8603% 9/29/24 (g)(h)(k) | | 4,080 | 4,077 |
| ON Semiconductor Corp. Tranche B 1LN, term loan 3 month U.S. LIBOR + 2.000% 2.1133% 9/19/26 (g)(h)(k) | | 7,727 | 7,708 |
| Peraton Corp. Tranche B 1LN, term loan: | | | |
| 3 month U.S. LIBOR + 3.750% 3/2/28 (h)(k)(m) | | 9,058 | 9,047 |
| 3 month U.S. LIBOR + 3.750% 4.5% 3/2/28 (g)(h)(k) | | 5,147 | 5,140 |
| RealPage, Inc. Tranche B 1LN, term loan 3 month U.S. LIBOR + 3.250% 3.75% 2/18/28 (g)(h)(k) | | 6,030 | 5,999 |
| STG-Fairway Holdings LLC Tranche B 1LN, term loan 3 month U.S. LIBOR + 3.000% 3.1133% 1/31/27 (g)(h)(k) | | 4,211 | 4,173 |
| UKG, Inc. Tranche B 1LN, term loan 3 month U.S. LIBOR + 3.250% 4% 5/4/26 (g)(h)(k) | | 10,950 | 10,953 |
| Ultimate Software Group, Inc. 2LN, term loan 3 month U.S. LIBOR + 6.750% 7.5% 5/3/27 (g)(h)(k) | | 2,310 | 2,375 |
| VS Buyer LLC Tranche B 1LN, term loan 3 month U.S. LIBOR + 3.000% 3.1133% 2/28/27 (g)(h)(k) | | 2,331 | 2,311 |
|
| TOTAL TECHNOLOGY | | | 90,900 |
|
| Telecommunications - 0.4% | | | |
| Connect Finco SARL Tranche B 1LN, term loan 3 month U.S. LIBOR + 3.500% 4.5% 12/12/26 (g)(h)(k) | | 8,960 | 8,930 |
| Frontier Communications Corp.: | | | |
| Tranche B 1LN, term loan 3 month U.S. LIBOR + 3.750% 4.5% 10/8/27 (g)(h)(k) | | 3,475 | 3,461 |
| Tranche DD 1LN, term loan 3 month U.S. LIBOR + 3.750% 4/14/28 (h)(k)(m) | | 1,700 | 1,693 |
| GTT Communications, Inc.: | | | |
| 1LN, term loan 3 month U.S. LIBOR + 5.000% 8.5% 5/31/25 (g)(h)(k) | | 1,719 | 1,750 |
| Tranche B, term loan 3 month U.S. LIBOR + 2.750% 2.95% 5/31/25 (g)(h)(k) | | 25,594 | 21,897 |
| Tranche DD 1LN, term loan 3 month U.S. LIBOR + 5.000% 8.5% 12/31/21 (g)(h)(k) | | 2,117 | 2,154 |
| Intelsat Jackson Holdings SA Tranche DD 1LN, term loan 3 month U.S. LIBOR + 5.500% 6.5% 7/13/22 (g)(h)(k) | | 5,148 | 5,200 |
| Securus Technologies Holdings Tranche B, term loan 3 month U.S. LIBOR + 4.500% 5.5% 11/1/24 (g)(h)(k) | | 7,044 | 6,511 |
| Zayo Group Holdings, Inc. 1LN, term loan 3 month U.S. LIBOR + 3.000% 3.1133% 3/9/27 (g)(h)(k) | | 7,821 | 7,738 |
|
| TOTAL TELECOMMUNICATIONS | | | 59,334 |
|
| Utilities - 0.2% | | | |
| PG&E Corp. Tranche B 1LN, term loan 3 month U.S. LIBOR + 3.000% 3.5% 6/23/25 (g)(h)(k) | | 27,299 | 27,179 |
| TOTAL BANK LOAN OBLIGATIONS | | | |
| (Cost $458,107) | | | 449,896 |
|
| Preferred Securities - 7.2% | | | |
| Banks & Thrifts - 6.3% | | | |
| Bank of America Corp.: | | | |
| 5.125% (g)(n) | | 36,030 | 39,510 |
| 5.2% (g)(n) | | 61,440 | 65,453 |
| 5.875% (g)(n) | | 102,630 | 116,506 |
| 6.25% (g)(n) | | 28,555 | 32,115 |
| Citigroup, Inc.: | | | |
| 4.7% (g)(n) | | 15,285 | 15,746 |
| 5% (g)(n) | | 60,300 | 63,725 |
| 5.9% (g)(n) | | 27,015 | 28,827 |
| 5.95% (g)(n) | | 51,015 | 54,699 |
| 6.3% (g)(n) | | 5,610 | 6,198 |
| Goldman Sachs Group, Inc.: | | | |
| 4.4% (g)(n) | | 8,035 | 8,363 |
| 4.95% (g)(n) | | 13,335 | 14,482 |
| 5% (g)(n) | | 70,565 | 72,700 |
| Huntington Bancshares, Inc. 5.7% (g)(n) | | 12,990 | 13,445 |
| JPMorgan Chase & Co.: | | | |
| 3 month U.S. LIBOR + 3.320% 3.5216% (g)(h)(n) | | 43,545 | 43,726 |
| 3 month U.S. LIBOR + 3.800% 4.005% (g)(h)(n) | | 16,855 | 17,104 |
| 4% (g)(n) | | 34,340 | 34,611 |
| 4.6% (g)(n) | | 23,365 | 24,359 |
| 5% (g)(n) | | 30,845 | 32,891 |
| 6% (g)(n) | | 69,385 | 74,780 |
| 6.125% (g)(n) | | 17,585 | 19,138 |
| 6.75% (g)(n) | | 8,330 | 9,395 |
| Wells Fargo & Co.: | | | |
| 5.875% (g)(n) | | 50,420 | 57,270 |
| 5.9% (g)(n) | | 63,075 | 69,862 |
|
| TOTAL BANKS & THRIFTS | | | 914,905 |
|
| Diversified Financial Services - 0.0% | | | |
| Odebrecht Holdco Finance Ltd. 0% 9/10/58 (d) | | 20,007 | 530 |
| OEC Finance Ltd. 7.5% pay-in-kind (d)(n) | | 1,610 | 262 |
|
| TOTAL DIVERSIFIED FINANCIAL SERVICES | | | 792 |
|
| Energy - 0.9% | | | |
| DCP Midstream Partners LP 7.375% (g)(n) | | 15,260 | 14,386 |
| Energy Transfer LP: | | | |
| 6.25% (g)(n) | | 70,123 | 60,337 |
| 6.625% (g)(n) | | 27,290 | 26,061 |
| MPLX LP 6.875% (g)(n) | | 30,450 | 31,259 |
| Summit Midstream Partners LP 9.5% (g)(n) | | 2,912 | 1,939 |
|
| TOTAL ENERGY | | | 133,982 |
|
| TOTAL PREFERRED SECURITIES | | | |
| (Cost $1,001,798) | | | 1,049,679 |
| | | Shares | Value (000s) |
|
| Money Market Funds - 9.3% | | | |
| Fidelity Cash Central Fund 0.04% (o) | | | |
| (Cost $1,367,933) | | 1,367,705,428 | 1,367,979 |
| TOTAL INVESTMENT IN SECURITIES - 100.1% | | | |
| (Cost $12,879,216) | | | 14,685,761 |
| NET OTHER ASSETS (LIABILITIES) - (0.1)% | | | (11,405) |
| NET ASSETS - 100% | | | $14,674,356 |
Currency Abbreviations
EUR – European Monetary Unit
Values shown as $0 in the Schedule of Investments may reflect amounts less than $500.
Legend
(a) Amount is stated in United States dollars unless otherwise noted.
(b) Restricted securities (including private placements) - Investment in securities not registered under the Securities Act of 1933 (excluding 144A issues). At the end of the period, the value of restricted securities (excluding 144A issues) amounted to $40,351,000 or 0.3% of net assets.
(c) Level 3 security
(d) Security exempt from registration under Rule 144A of the Securities Act of 1933. These securities may be resold in transactions exempt from registration, normally to qualified institutional buyers. At the end of the period, the value of these securities amounted to $6,047,641,000 or 41.2% of net assets.
(e) Security or a portion of the security purchased on a delayed delivery or when-issued basis.
(f) Non-income producing - Security is in default.
(g) Coupon rates for floating and adjustable rate securities reflect the rates in effect at period end.
(h) Coupon is indexed to a floating interest rate which may be multiplied by a specified factor and/or subject to caps or floors.
(i) Non-income producing
(j) Affiliated company
(k) Remaining maturities of bank loan obligations may be less than the stated maturities shown as a result of contractual or optional prepayments by the borrower. Such prepayments cannot be predicted with certainty.
(l) Position or a portion of the position represents an unfunded loan commitment. At period end, the total principal amount and market value of unfunded commitments totaled $7,254,000 and $8,599,000, respectively.
(m) The coupon rate will be determined upon settlement of the loan after period end.
(n) Security is perpetual in nature with no stated maturity date.
(o) Affiliated fund that is generally available only to investment companies and other accounts managed by Fidelity Investments. The rate quoted is the annualized seven-day yield of the fund at period end. A complete unaudited listing of the fund's holdings as of its most recent quarter end is available upon request. In addition, each Fidelity Central Fund's financial statements, which are not covered by the Fund's Report of Independent Registered Public Accounting Firm, are available on the SEC's website or upon request.
Additional information on each restricted holding is as follows:
| Security | Acquisition Date | Acquisition Cost (000s) |
| Arena Brands Holding Corp. Class B | 6/18/97 - 1/12/99 | $21,592 |
| Chesapeake Energy Corp. | 2/10/21 | $216 |
| Mesquite Energy, Inc. 15% 7/15/23 | 7/10/20 - 4/15/21 | $6,082 |
| New Cotai LLC/New Cotai Capital Corp. | 9/11/20 | $16,677 |
| Southeastern Grocers, Inc. | 6/1/18 | $5,580 |
| Tricer Holdco SCA | 10/16/09 - 12/30/17 | $10,250 |
| Tricer Holdco SCA Class A1 | 10/16/09 - 10/29/09 | $1,653 |
| Tricer Holdco SCA Class A2 | 10/16/09 - 10/29/09 | $1,653 |
| Tricer Holdco SCA Class A3 | 10/16/09 - 10/29/09 | $1,653 |
| Tricer Holdco SCA Class A4 | 10/16/09 - 10/29/09 | $1,653 |
| Tricer Holdco SCA Class A5 | 10/16/09 - 10/29/09 | $1,653 |
| Tricer Holdco SCA Class A6 | 10/16/09 - 10/29/09 | $1,653 |
| Tricer Holdco SCA Class A7 | 10/16/09 - 10/29/09 | $1,653 |
| Tricer Holdco SCA Class A8 | 10/16/09 - 10/29/09 | $1,653 |
| Tricer Holdco SCA Class A9 | 10/16/09 - 10/29/09 | $1,654 |
Affiliated Central Funds
Information regarding fiscal year to date income earned by the Fund from investments in Fidelity Central Funds is as follows:
| Fund | Income earned |
| | (Amounts in thousands) |
| Fidelity Cash Central Fund | $696 |
| Fidelity Securities Lending Cash Central Fund | 69 |
| Total | $765 |
Amounts in the income column in the above table include any capital gain distributions from underlying funds, which are presented in the corresponding line-item in the Statement of Operations, if applicable. Amount for Fidelity Securities Lending Cash Central Fund represents the income earned on investing cash collateral, less rebates paid to borrowers and any lending agent fees associated with the loan, plus any premium payments received for lending certain types of securities.
The value, beginning of period, for the Fidelity Cash Central Fund was $321,918. Net realized gain (loss) and change in net unrealized appreciation (depreciation) on Fidelity Cash Central Fund is presented in the Statement of Operations, if applicable. Purchases and sales of the Fidelity Cash Central Fund were $3,509,987 and $2,463,888, respectively, during the period.
Other Affiliated Issuers
An affiliated company is a company in which the Fund has ownership of at least 5% of the voting securities. Fiscal year to date transactions with companies which are or were affiliates are as follows:
| Affiliate (Amounts in thousands) | Value, beginning of period | Purchases | Sales Proceeds | Dividend Income | Realized Gain (loss) | Change in Unrealized appreciation (depreciation) | Value, end of period |
| California Resources Corp. | $-- | $20,267 | $-- | $-- | $-- | $-- | $-- |
| California Resources Corp. | -- | 24,203 | 23,591 | -- | (122,733) | 6,456 | 120,620 |
| California Resources Corp. warrants 10/27/24 | -- | -- | -- | -- | -- | 228 | 228 |
| Denbury, Inc. | -- | -- | 103,947 | -- | 10,070 | 23,241 | -- |
| Total | $-- | $44,470 | $127,538 | $-- | $(112,663) | $29,925 | $120,848 |
Investment Valuation
The following is a summary of the inputs used, as of April 30, 2021, involving the Fund's assets and liabilities carried at fair value. The inputs or methodology used for valuing securities may not be an indication of the risk associated with investing in those securities. For more information on valuation inputs, and their aggregation into the levels used below, please refer to the Investment Valuation section in the accompanying Notes to Financial Statements.
| | Valuation Inputs at Reporting Date: |
| Description | Total | Level 1 | Level 2 | Level 3 |
| (Amounts in thousands) | | | | |
| Investments in Securities: | | | | |
| Equities: | | | | |
| Communication Services | $347,248 | $335,970 | $-- | $11,278 |
| Consumer Discretionary | 508,138 | 494,208 | -- | 13,930 |
| Consumer Staples | 143,875 | 131,583 | -- | 12,292 |
| Energy | 390,581 | 330,340 | 936 | 59,305 |
| Financials | 76,596 | 74,682 | -- | 1,914 |
| Health Care | 314,557 | 312,624 | -- | 1,933 |
| Industrials | 197,965 | 193,804 | -- | 4,161 |
| Information Technology | 662,189 | 662,189 | -- | -- |
| Materials | 158,405 | 158,405 | -- | -- |
| Real Estate | 2,958 | 2,958 | -- | -- |
| Utilities | 88,118 | 88,118 | -- | -- |
| Corporate Bonds | 8,927,577 | -- | 8,913,460 | 14,117 |
| Bank Loan Obligations | 449,896 | -- | 433,449 | 16,447 |
| Preferred Securities | 1,049,679 | -- | 1,049,679 | -- |
| Money Market Funds | 1,367,979 | 1,367,979 | -- | -- |
| Total Investments in Securities: | $14,685,761 | $4,152,860 | $10,397,524 | $135,377 |
Other Information
Distribution of investments by country or territory of incorporation, as a percentage of Total Net Assets, is as follows (Unaudited):
| United States of America | 87.2% |
| Canada | 2.9% |
| France | 1.6% |
| Cayman Islands | 1.5% |
| Luxembourg | 1.3% |
| Others (Individually Less Than 1%) | 5.5% |
| | 100.0% |
See accompanying notes which are an integral part of the financial statements.
Financial Statements
Statement of Assets and Liabilities
| Amounts in thousands (except per-share amount) | | April 30, 2021 |
| Assets | | |
Investment in securities, at value — See accompanying schedule:
Unaffiliated issuers (cost $11,420,360) | $13,196,934 | |
| Fidelity Central Funds (cost $1,367,933) | 1,367,979 | |
| Other affiliated issuers (cost $90,923) | 120,848 | |
| Total Investment in Securities (cost $12,879,216) | | $14,685,761 |
| Cash | | 222 |
| Receivable for investments sold | | 8,856 |
| Receivable for fund shares sold | | 16,199 |
| Dividends receivable | | 3,003 |
| Interest receivable | | 138,038 |
| Distributions receivable from Fidelity Central Funds | | 62 |
| Prepaid expenses | | 5 |
| Other receivables | | 897 |
| Total assets | | 14,853,043 |
| Liabilities | | |
| Payable for investments purchased | | |
| Regular delivery | $112,032 | |
| Delayed delivery | 48,015 | |
| Payable for fund shares redeemed | 5,961 | |
| Distributions payable | 3,789 | |
| Accrued management fee | 6,600 | |
| Other affiliated payables | 1,405 | |
| Other payables and accrued expenses | 885 | |
| Total liabilities | | 178,687 |
| Net Assets | | $14,674,356 |
| Net Assets consist of: | | |
| Paid in capital | | $12,611,433 |
| Total accumulated earnings (loss) | | 2,062,923 |
| Net Assets | | $14,674,356 |
| Net Asset Value, offering price and redemption price per share ($14,674,356 ÷ 1,305,820 shares) | | $11.24 |
See accompanying notes which are an integral part of the financial statements.
Statement of Operations
| Amounts in thousands | | Year ended April 30, 2021 |
| Investment Income | | |
| Dividends | | $80,068 |
| Interest | | 453,371 |
| Income from Fidelity Central Funds (including $69 from security lending) | | 765 |
| Total income | | 534,204 |
| Expenses | | |
| Management fee | $66,297 | |
| Transfer agent fees | 13,456 | |
| Accounting fees | 1,462 | |
| Custodian fees and expenses | 114 | |
| Independent trustees' fees and expenses | 57 | |
| Registration fees | 267 | |
| Audit | 127 | |
| Legal | (193) | |
| Miscellaneous | 78 | |
| Total expenses before reductions | 81,665 | |
| Expense reductions | (131) | |
| Total expenses after reductions | | 81,534 |
| Net investment income (loss) | | 452,670 |
| Realized and Unrealized Gain (Loss) | | |
| Net realized gain (loss) on: | | |
| Investment securities: | | |
| Unaffiliated issuers | 438,949 | |
| Fidelity Central Funds | (6) | |
| Other affiliated issuers | (112,663) | |
| Foreign currency transactions | (196) | |
| Total net realized gain (loss) | | 326,084 |
| Change in net unrealized appreciation (depreciation) on: | | |
| Investment securities: | | |
| Unaffiliated issuers | 2,454,708 | |
| Fidelity Central Funds | (33) | |
| Other affiliated issuers | 29,925 | |
| Assets and liabilities in foreign currencies | 35 | |
| Total change in net unrealized appreciation (depreciation) | | 2,484,635 |
| Net gain (loss) | | 2,810,719 |
| Net increase (decrease) in net assets resulting from operations | | $3,263,389 |
See accompanying notes which are an integral part of the financial statements.
Statement of Changes in Net Assets
| Amounts in thousands | Year ended April 30, 2021 | Year ended April 30, 2020 |
| Increase (Decrease) in Net Assets | | |
| Operations | | |
| Net investment income (loss) | $452,670 | $504,273 |
| Net realized gain (loss) | 326,084 | 80,945 |
| Change in net unrealized appreciation (depreciation) | 2,484,635 | (1,461,131) |
| Net increase (decrease) in net assets resulting from operations | 3,263,389 | (875,913) |
| Distributions to shareholders | (590,301) | (594,227) |
| Share transactions | | |
| Proceeds from sales of shares | 4,006,273 | 3,247,199 |
| Reinvestment of distributions | 528,773 | 527,109 |
| Cost of shares redeemed | (2,762,146) | (3,706,922) |
| Net increase (decrease) in net assets resulting from share transactions | 1,772,900 | 67,386 |
| Total increase (decrease) in net assets | 4,445,988 | (1,402,754) |
| Net Assets | | |
| Beginning of period | 10,228,368 | 11,631,122 |
| End of period | $14,674,356 | $10,228,368 |
| Other Information | | |
| Shares | | |
| Sold | 380,581 | 335,944 |
| Issued in reinvestment of distributions | 51,182 | 53,598 |
| Redeemed | (272,181) | (397,075) |
| Net increase (decrease) | 159,582 | (7,533) |
See accompanying notes which are an integral part of the financial statements.
Financial Highlights
Fidelity Capital & Income Fund
| | | | | | |
| Years ended April 30, | 2021 | 2020 | 2019 | 2018 | 2017 |
| Selected Per–Share Data | | | | | |
| Net asset value, beginning of period | $8.92 | $10.08 | $10.12 | $10.09 | $9.24 |
| Income from Investment Operations | | | | | |
| Net investment income (loss)A | .386 | .426 | .432 | .482 | .430 |
| Net realized and unrealized gain (loss) | 2.442 | (1.085) | .207 | .065 | .824 |
| Total from investment operations | 2.828 | (.659) | .639 | .547 | 1.254 |
| Distributions from net investment income | (.390) | (.425) | (.487) | (.410) | (.405) |
| Distributions from net realized gain | (.118) | (.076) | (.192) | (.107) | – |
| Total distributions | (.508) | (.501) | (.679) | (.517) | (.405) |
| Redemption fees added to paid in capitalA | – | – | – | –B | .001 |
| Net asset value, end of period | $11.24 | $8.92 | $10.08 | $10.12 | $10.09 |
| Total ReturnC | 32.35% | (6.89)% | 6.74% | 5.51% | 13.85% |
| Ratios to Average Net AssetsD,E | | | | | |
| Expenses before reductions | .68% | .67% | .69% | .67% | .73% |
| Expenses net of fee waivers, if any | .68% | .67% | .69% | .67% | .73% |
| Expenses net of all reductions | .68% | .67% | .69% | .67% | .73% |
| Net investment income (loss) | 3.75% | 4.32% | 4.37% | 4.71% | 4.45% |
| Supplemental Data | | | | | |
| Net assets, end of period (in millions) | $14,674 | $10,228 | $11,631 | $12,053 | $11,230 |
| Portfolio turnover rateF | 37% | 46% | 43% | 39% | 39% |
A Calculated based on average shares outstanding during the period.
B Amount represents less than $.0005 per share.
C Total returns would have been lower if certain expenses had not been reduced during the applicable periods shown.
D Fees and expenses of any underlying mutual funds or exchange-traded funds (ETFs) are not included in the Fund's expense ratio. The Fund indirectly bears its proportionate share of these expenses. For additional expense information related to investments in Fidelity Central Funds, please refer to the "Investments in Fidelity Central Funds" note found in the Notes to Financial Statements section of the most recent Annual or Semi-Annual report.
E Expense ratios reflect operating expenses of the class. Expenses before reductions do not reflect amounts reimbursed, waived, or reduced through arrangements with the investment advisor, brokerage services, or other offset arrangements, if applicable, and do not represent the amount paid by the class during periods when reimbursements, waivers or reductions occur.
F Amount does not include the portfolio activity of any underlying mutual funds or exchange-traded funds (ETFs).
See accompanying notes which are an integral part of the financial statements.
Notes to Financial Statements
For the period ended April 30, 2021
(Amounts in thousands except percentages)
1. Organization.
Fidelity Capital & Income Fund (the Fund) is a fund of Fidelity Summer Street Trust (the Trust) and is authorized to issue an unlimited number of shares. Share transactions on the Statement of Changes in Net Assets may contain exchanges between affiliated funds. The Trust is registered under the Investment Company Act of 1940, as amended (the 1940 Act), as an open-end management investment company organized as a Massachusetts business trust.
2. Investments in Fidelity Central Funds.
Funds may invest in Fidelity Central Funds, which are open-end investment companies generally available only to other investment companies and accounts managed by the investment adviser and its affiliates. The Schedule of Investments lists any Fidelity Central Funds held as an investment as of period end, but does not include the underlying holdings of each Fidelity Central Fund. An investing fund indirectly bears its proportionate share of the expenses of the underlying Fidelity Central Funds.
Based on its investment objective, each Fidelity Central Fund may invest or participate in various investment vehicles or strategies that are similar to those of the investing fund. These strategies are consistent with the investment objectives of the investing fund and may involve certain economic risks which may cause a decline in value of each of the Fidelity Central Funds and thus a decline in the value of the investing fund.
| Fidelity Central Fund | Investment Manager | Investment Objective | Investment Practices | Expense Ratio(a) |
| Fidelity Money Market Central Funds | Fidelity Management & Research Company LLC (FMR) | Each fund seeks to obtain a high level of current income consistent with the preservation of capital and liquidity. | Short-term Investments | Less than .005% to .01% |
(a) Expenses expressed as a percentage of average net assets and are as of each underlying Central Fund's most recent annual or semi-annual shareholder report.
A complete unaudited list of holdings for each Fidelity Central Fund is available upon request or at the Securities and Exchange Commission website at www.sec.gov. In addition, the financial statements of the Fidelity Central Funds which contain the significant accounting policies (including investment valuation policies) of those funds, and are not covered by the Report of Independent Registered Public Accounting Firm, are available on the Securities and Exchange Commission website or upon request.
3. Significant Accounting Policies.
The Fund is an investment company and applies the accounting and reporting guidance of the Financial Accounting Standards Board (FASB) Accounting Standards Codification Topic 946 Financial Services - Investment Companies. The financial statements have been prepared in conformity with accounting principles generally accepted in the United States of America (GAAP), which require management to make certain estimates and assumptions at the date of the financial statements. Actual results could differ from those estimates. Subsequent events, if any, through the date that the financial statements were issued have been evaluated in the preparation of the financial statements. The Fund's Schedule of Investments lists any underlying mutual funds or exchange-traded funds (ETFs) but does not include the underlying holdings of these funds. The following summarizes the significant accounting policies of the Fund:
Investment Valuation. Investments are valued as of 4:00 p.m. Eastern time on the last calendar day of the period. The Board of Trustees (the Board) has delegated the day to day responsibility for the valuation of the Fund's investments to the Fair Value Committee (the Committee) established by the Fund's investment adviser. In accordance with valuation policies and procedures approved by the Board, the Fund attempts to obtain prices from one or more third party pricing vendors or brokers to value its investments. When current market prices, quotations or currency exchange rates are not readily available or reliable, investments will be fair valued in good faith by the Committee, in accordance with procedures adopted by the Board. Factors used in determining fair value vary by investment type and may include market or investment specific events, changes in interest rates and credit quality. The frequency with which these procedures are used cannot be predicted and they may be utilized to a significant extent. The Committee oversees the Fund's valuation policies and procedures and reports to the Board on the Committee's activities and fair value determinations. The Board monitors the appropriateness of the procedures used in valuing the Fund's investments and ratifies the fair value determinations of the Committee.
The Fund categorizes the inputs to valuation techniques used to value its investments into a disclosure hierarchy consisting of three levels as shown below:
- Level 1 – quoted prices in active markets for identical investments
- Level 2 – other significant observable inputs (including quoted prices for similar investments, interest rates, prepayment speeds, etc.)
- Level 3 – unobservable inputs (including the Fund's own assumptions based on the best information available)
Valuation techniques used to value the Fund's investments by major category are as follows:
Debt securities, including restricted securities, are valued based on evaluated prices received from third party pricing vendors or from brokers who make markets in such securities. Corporate bonds, bank loan obligations and preferred securities are valued by pricing vendors who utilize matrix pricing which considers yield or price of bonds of comparable quality, coupon, maturity and type or by broker-supplied prices. When independent prices are unavailable or unreliable, debt securities may be valued utilizing pricing methodologies which consider similar factors that would be used by third party pricing vendors. For foreign debt securities, when significant market or security specific events arise, valuations may be determined in good faith in accordance with procedures adopted by the Board. Debt securities are generally categorized as Level 2 in the hierarchy but may be Level 3 depending on the circumstances. The Fund invests a significant portion of its assets in below investment grade securities. The value of these securities can be more volatile due to changes in the credit quality of the issuer and is sensitive to changes in economic, market and regulatory conditions.
Equity securities, including restricted securities, for which market quotations are readily available, are valued at the last reported sale price or official closing price as reported by a third party pricing vendor on the primary market or exchange on which they are traded and are categorized as Level 1 in the hierarchy. In the event there were no sales during the day or closing prices are not available, securities are valued at the last quoted bid price or may be valued using the last available price and are generally categorized as Level 2 in the hierarchy. For equity securities, including restricted securities, where observable inputs are limited, assumptions about market activity and risk are used and these securities may be categorized as Level 3 in the hierarchy.
Investments in open-end mutual funds, including the Fidelity Central Funds, are valued at their closing net asset value (NAV) each business day and are categorized as Level 1 in the hierarchy.
Changes in valuation techniques may result in transfers in or out of an assigned level within the disclosure hierarchy. The aggregate value of investments by input level as of April 30, 2021 is included at the end of the Fund's Schedule of Investments.
Foreign Currency. Certain Funds may use foreign currency contracts to facilitate transactions in foreign-denominated securities. Gains and losses from these transactions may arise from changes in the value of the foreign currency or if the counterparties do not perform under the contracts' terms.
Foreign-denominated assets, including investment securities, and liabilities are translated into U.S. dollars at the exchange rates at period end. Purchases and sales of investment securities, income and dividends received, and expenses denominated in foreign currencies are translated into U.S. dollars at the exchange rate in effect on the transaction date.
The effects of exchange rate fluctuations on investments are included with the net realized and unrealized gain (loss) on investment securities. Other foreign currency transactions resulting in realized and unrealized gain (loss) are disclosed separately.
Investment Transactions and Income. For financial reporting purposes, the Fund's investment holdings and NAV include trades executed through the end of the last business day of the period. The NAV per share for processing shareholder transactions is calculated as of the close of business of the New York Stock Exchange (NYSE), normally 4:00 p.m. Eastern time and includes trades executed through the end of the prior business day. Gains and losses on securities sold are determined on the basis of identified cost and include proceeds received from litigation. Dividend income is recorded on the ex-dividend date, except for certain dividends from foreign securities where the ex-dividend date may have passed, which are recorded as soon as the Fund is informed of the ex-dividend date. Non-cash dividends included in dividend income, if any, are recorded at the fair market value of the securities received. Income and capital gain distributions from Fidelity Central Funds, if any, are recorded on the ex-dividend date. Certain distributions received by the Fund represent a return of capital or capital gain. The Fund determines the components of these distributions subsequent to the ex-dividend date, based upon receipt of tax filings or other correspondence relating to the underlying investment. These distributions are recorded as a reduction of cost of investments and/or as a realized gain. Interest income is accrued as earned and includes coupon interest and amortization of premium and accretion of discount on debt securities as applicable. Paid in Kind (PIK) income is recorded at the fair market value of the securities received. Investment income is recorded net of foreign taxes withheld where recovery of such taxes is uncertain. Debt obligations may be placed on non-accrual status and related interest income may be reduced by ceasing current accruals and writing off interest receivables when the collection of all or a portion of interest has become doubtful based on consistently applied procedures. A debt obligation is removed from non-accrual status when the issuer resumes interest payments or when collectability of interest is reasonably assured.
Expenses. Expenses directly attributable to a fund are charged to that fund. Expenses attributable to more than one fund are allocated among the respective funds on the basis of relative net assets or other appropriate methods. Expenses included in the accompanying financial statements reflect the expenses of that fund and do not include any expenses associated with any underlying mutual funds or exchange-traded funds. Although not included in a fund's expenses, a fund indirectly bears its proportionate share of these expenses through the net asset value of each underlying mutual fund or exchange-traded fund. Expense estimates are accrued in the period to which they relate and adjustments are made when actual amounts are known.
Deferred Trustee Compensation. Under a Deferred Compensation Plan (the Plan) for certain Funds, certain independent Trustees have elected to defer receipt of a portion of their annual compensation. Deferred amounts are invested in affiliated mutual funds, are marked-to-market and remain in a fund until distributed in accordance with the Plan. The investment of deferred amounts and the offsetting payable to the Trustees presented below are included in the accompanying Statement of Assets and Liabilities in other receivables and other payables and accrued expenses, as applicable.
| Fidelity Capital & Income Fund | $739 |
Income Tax Information and Distributions to Shareholders. Each year, the Fund intends to qualify as a regulated investment company under Subchapter M of the Internal Revenue Code, including distributing substantially all of its taxable income and realized gains. As a result, no provision for U.S. Federal income taxes is required. As of April 30, 2021, the Fund did not have any unrecognized tax benefits in the financial statements; nor is the Fund aware of any tax positions for which it is reasonably possible that the total amounts of unrecognized tax benefits will significantly change in the next twelve months. The Fund files a U.S. federal tax return, in addition to state and local tax returns as required. The Fund's federal income tax returns are subject to examination by the Internal Revenue Service (IRS) for a period of three fiscal years after they are filed. State and local tax returns may be subject to examination for an additional fiscal year depending on the jurisdiction. Foreign taxes are provided for based on the Fund's understanding of the tax rules and rates that exist in the foreign markets in which it invests.
Distributions are declared and recorded daily and paid monthly from net investment income. Distributions from realized gains, if any, are declared and recorded on the ex-dividend date. Income and capital gain distributions are determined in accordance with income tax regulations, which may differ from GAAP. In addition, the Fund claimed a portion of the payment made to redeeming shareholders as a distribution for income tax purposes.
Capital accounts within the financial statements are adjusted for permanent book-tax differences. These adjustments have no impact on net assets or the results of operations. Capital accounts are not adjusted for temporary book-tax differences which will reverse in a subsequent period.
Book-tax differences are primarily due to foreign currency transactions, market discount, partnerships, deferred trustees compensation and losses deferred due to wash sales.
As of period end, the cost and unrealized appreciation (depreciation) in securities, and derivatives if applicable, for federal income tax purposes were as follows:
| Gross unrealized appreciation | $2,217,011 |
| Gross unrealized depreciation | (372,754) |
| Net unrealized appreciation (depreciation) | $1,844,257 |
| Tax Cost | $12,841,504 |
The tax-based components of distributable earnings as of period end were as follows:
| Undistributed ordinary income | $64,559 |
| Undistributed long-term capital gain | $152,690 |
| Net unrealized appreciation (depreciation) on securities and other investments | $1,844,267 |
The tax character of distributions paid was as follows:
| | April 30, 2021 | April 30, 2020 |
| Ordinary Income | $476,147 | $ 505,526 |
| Long-term Capital Gains | 114,154 | 88,701 |
| Total | $590,301 | $ 594,227 |
Delayed Delivery Transactions and When-Issued Securities. During the period, certain Funds transacted in securities on a delayed delivery or when-issued basis. Payment and delivery may take place after the customary settlement period for that security. The price of the underlying securities and the date when the securities will be delivered and paid for are fixed at the time the transaction is negotiated. Securities purchased on a delayed delivery or when-issued basis are identified as such in the Schedule of Investments. Compensation for interest forgone in the purchase of a delayed delivery or when-issued debt security may be received. With respect to purchase commitments, each applicable Fund identifies securities as segregated in its records with a value at least equal to the amount of the commitment. Payables and receivables associated with the purchases and sales of delayed delivery securities having the same coupon, settlement date and broker are offset. Delayed delivery or when-issued securities that have been purchased from and sold to different brokers are reflected as both payables and receivables in the Statement of Assets and Liabilities under the caption "Delayed delivery", as applicable. Losses may arise due to changes in the value of the underlying securities or if the counterparty does not perform under the contract's terms, or if the issuer does not issue the securities due to political, economic, or other factors.
Restricted Securities (including Private Placements). Funds may invest in securities that are subject to legal or contractual restrictions on resale. These securities generally may be resold in transactions exempt from registration or to the public if the securities are registered. Disposal of these securities may involve time-consuming negotiations and expense, and prompt sale at an acceptable price may be difficult. Information regarding restricted securities held at period end is included at the end of the Schedule of Investments, if applicable
Loans and Other Direct Debt Instruments. Direct debt instruments are interests in amounts owed to lenders by corporate or other borrowers. These instruments may be in the form of loans, trade claims or other receivables and may include standby financing commitments such as revolving credit facilities that obligate a fund to supply additional cash to the borrower on demand. Loans may be acquired through assignment, participation, or may be made directly to a borrower. Such instruments are presented in the Bank Loan Obligations section in the Schedule of Investments. Certain funds may also invest in unfunded loan commitments, which are contractual obligations for future funding. Information regarding unfunded commitments is included at the end of the Schedule of Investments, if applicable.
4. Purchases and Sales of Investments.
Purchases and sales of securities, other than short-term securities, are noted in the table below.
| | Purchases ($) | Sales ($) |
| Fidelity Capital & Income Fund | 4,870,232 | 4,164,088 |
5. Fees and Other Transactions with Affiliates.
Management Fee. Fidelity Management & Research Company LLC (the investment adviser) and its affiliates provide the Fund with investment management related services for which the Fund pays a monthly management fee. The management fee is the sum of an individual fund fee rate that is based on an annual rate of .45% of the Fund's average net assets and an annualized group fee rate that averaged .10% during the period. The group fee rate is based upon the monthly average net assets of a group of registered investment companies with which the investment adviser has management contracts. The group fee rate decreases as assets under management increase and increases as assets under management decrease. For the reporting period, the total annual management fee rate was .55% of the Fund's average net assets.
Transfer Agent Fees. Fidelity Investments Institutional Operations Company LLC (FIIOC), an affiliate of the investment adviser, is the Fund's transfer, dividend disbursing and shareholder servicing agent. FIIOC receives account fees and asset-based fees that vary according to account size and type of account. FIIOC pays for typesetting, printing and mailing of shareholder reports, except proxy statements. For the period, the transfer agent fees were equivalent to an annual rate of .11% of average net assets.
Accounting Fees. Fidelity Service Company, Inc. (FSC), an affiliate of the investment adviser, maintains the Fund's accounting records. The accounting fee is based on the level of average net assets for each month. For the period, the fees were equivalent to the following annual rates:
| | % of Average Net Assets |
| Fidelity Capital & Income Fund | .01 |
Brokerage Commissions. A portion of portfolio transactions were placed with brokerage firms which are affiliates of the investment adviser. Brokerage commissions are included in net realized gain (loss) and change in net unrealized appreciation (depreciation) in the Statement of Operations. The commissions paid to these affiliated firms were as follows:
| | Amount |
| Fidelity Capital & Income Fund | $13 |
Interfund Trades. Funds may purchase from or sell securities to other Fidelity Funds under procedures adopted by the Board. The procedures have been designed to ensure these interfund trades are executed in accordance with Rule 17a-7 of the 1940 Act. Any interfund trades are included within the respective purchases and sales amounts shown in the Purchases and Sales of Investments note and are noted in the table below.
| | Purchases ($) | Sales ($) |
| Fidelity Capital & Income Fund | 7,658 | 267,734 |
6. Committed Line of Credit.
Certain Funds participate with other funds managed by the investment adviser or an affiliate in a $4.25 billion credit facility (the "line of credit") to be utilized for temporary or emergency purposes to fund shareholder redemptions or for other short-term liquidity purposes. The participating funds have agreed to pay commitment fees on their pro-rata portion of the line of credit, which are reflected in Miscellaneous expenses on the Statement of Operations, and are listed below.
| | Amount |
| Fidelity Capital & Income Fund | $25 |
During the period, there were no borrowings on this line of credit.
7. Security Lending.
Funds lend portfolio securities from time to time in order to earn additional income. Lending agents are used, including National Financial Services (NFS), an affiliate of the investment adviser. Pursuant to a securities lending agreement, NFS will receive a fee, which is capped at 9.9% of a fund's daily lending revenue, for its services as lending agent. A fund may lend securities to certain qualified borrowers, including NFS. On the settlement date of the loan, a fund receives collateral (in the form of U.S. Treasury obligations, letters of credit and/or cash) against the loaned securities and maintains collateral in an amount not less than 100% of the market value of the loaned securities during the period of the loan. The market value of the loaned securities is determined at the close of business of a fund and any additional required collateral is delivered to a fund on the next business day. A fund or borrower may terminate the loan at any time, and if the borrower defaults on its obligation to return the securities loaned because of insolvency or other reasons, a fund may apply collateral received from the borrower against the obligation. A fund may experience delays and costs in recovering the securities loaned. Any cash collateral received is invested in the Fidelity Securities Lending Cash Central Fund. Any loaned securities are identified as such in the Schedule of Investments, and the value of loaned securities and cash collateral at period end, as applicable, are presented in the Statement of Assets and Liabilities. Security lending income represents the income earned on investing cash collateral, less rebates paid to borrowers and any lending agent fees associated with the loan, plus any premium payments received for lending certain types of securities. Security lending income is presented in the Statement of Operations as a component of income from Fidelity Central Funds. Affiliated security lending activity, if any, was as follows:
| | Total Security Lending Fees Paid to NFS | Security Lending Income From Securities Loaned to NFS | Value of Securities Loaned to NFS at Period End |
| Fidelity Capital & Income Fund | $7 | $– | $– |
8. Expense Reductions.
Commissions paid to certain brokers with whom the investment adviser, or its affiliates, places trades on behalf of the Fund include an amount in addition to trade execution, which may be rebated back to the Fund to offset expenses. This amount totaled $73 for the period. In addition, through arrangements with the Fund's custodian, credits realized as a result of certain uninvested cash balances were used to reduce the Fund's expenses by $33.
In addition, during the period the investment adviser or an affiliate reimbursed and/or waived a portion of operating expenses in the amount of $25.
9. Other.
Fund's organizational documents provide former and current trustees and officers with a limited indemnification against liabilities arising in connection with the performance of their duties to the fund. In the normal course of business, the fund may also enter into contracts that provide general indemnifications. The fund's maximum exposure under these arrangements is unknown as this would be dependent on future claims that may be made against the fund. The risk of material loss from such claims is considered remote.
10. Coronavirus (COVID-19) Pandemic.
An outbreak of COVID-19 first detected in China during December 2019 has since spread globally and was declared a pandemic by the World Health Organization during March 2020. Developments that disrupt global economies and financial markets, such as the COVID-19 pandemic, may magnify factors that affect the Fund's performance.
Report of Independent Registered Public Accounting Firm
To the Board of Trustees of Fidelity Summer Street Trust and Shareholders of Fidelity Capital & Income Fund
Opinion on the Financial Statements
We have audited the accompanying statement of assets and liabilities, including the schedule of investments, of Fidelity Capital & Income Fund (one of the funds constituting Fidelity Summer Street Trust, referred to hereafter as the “Fund”) as of April 30, 2021, the related statement of operations for the year ended April 30, 2021, the statement of changes in net assets for each of the two years in the period ended April 30, 2021, including the related notes, and the financial highlights for each of the five years in the period ended April 30, 2021 (collectively referred to as the “financial statements”). In our opinion, the financial statements present fairly, in all material respects, the financial position of the Fund as of April 30, 2021, the results of its operations for the year then ended, the changes in its net assets for each of the two years in the period ended April 30, 2021 and the financial highlights for each of the five years in the period ended April 30, 2021 in conformity with accounting principles generally accepted in the United States of America.
Basis for Opinion
These financial statements are the responsibility of the Fund’s management. Our responsibility is to express an opinion on the Fund’s financial statements based on our audits. We are a public accounting firm registered with the Public Company Accounting Oversight Board (United States) (PCAOB) and are required to be independent with respect to the Fund in accordance with the U.S. federal securities laws and the applicable rules and regulations of the Securities and Exchange Commission and the PCAOB.
We conducted our audits of these financial statements in accordance with the standards of the PCAOB. Those standards require that we plan and perform the audit to obtain reasonable assurance about whether the financial statements are free of material misstatement, whether due to error or fraud.
Our audits included performing procedures to assess the risks of material misstatement of the financial statements, whether due to error or fraud, and performing procedures that respond to those risks. Such procedures included examining, on a test basis, evidence regarding the amounts and disclosures in the financial statements. Our audits also included evaluating the accounting principles used and significant estimates made by management, as well as evaluating the overall presentation of the financial statements. Our procedures included confirmation of securities owned as of April 30, 2021 by correspondence with the custodian, issuers of privately offered securities, agent banks and brokers; when replies were not received from brokers, we performed other auditing procedures. We believe that our audits provide a reasonable basis for our opinion.
/s/ PricewaterhouseCoopers LLP
Boston, Massachusetts
June 21, 2021
We have served as the auditor of one or more investment companies in the Fidelity group of funds since 1932.
Trustees and Officers
The Trustees, Members of the Advisory Board (if any), and officers of the trust and fund, as applicable, are listed below. The Board of Trustees governs the fund and is responsible for protecting the interests of shareholders. The Trustees are experienced executives who meet periodically throughout the year to oversee the fund's activities, review contractual arrangements with companies that provide services to the fund, oversee management of the risks associated with such activities and contractual arrangements, and review the fund's performance. Each of the Trustees oversees 308 funds.
The Trustees hold office without limit in time except that (a) any Trustee may resign; (b) any Trustee may be removed by written instrument, signed by at least two-thirds of the number of Trustees prior to such removal; (c) any Trustee who requests to be retired or who has become incapacitated by illness or injury may be retired by written instrument signed by a majority of the other Trustees; and (d) any Trustee may be removed at any special meeting of shareholders by a two-thirds vote of the outstanding voting securities of the trust. Each Trustee who is not an interested person (as defined in the 1940 Act) of the trust and the fund is referred to herein as an Independent Trustee. Each Independent Trustee shall retire not later than the last day of the calendar year in which his or her 75th birthday occurs. The Independent Trustees may waive this mandatory retirement age policy with respect to individual Trustees. Officers and Advisory Board Members hold office without limit in time, except that any officer or Advisory Board Member may resign or may be removed by a vote of a majority of the Trustees at any regular meeting or any special meeting of the Trustees. Except as indicated, each individual has held the office shown or other offices in the same company for the past five years.
The fund’s Statement of Additional Information (SAI) includes more information about the Trustees. To request a free copy, call Fidelity at 1-800-544-8544.
Experience, Skills, Attributes, and Qualifications of the Trustees. The Governance and Nominating Committee has adopted a statement of policy that describes the experience, qualifications, attributes, and skills that are necessary and desirable for potential Independent Trustee candidates (Statement of Policy). The Board believes that each Trustee satisfied at the time he or she was initially elected or appointed a Trustee, and continues to satisfy, the standards contemplated by the Statement of Policy. The Governance and Nominating Committee also engages professional search firms to help identify potential Independent Trustee candidates who have the experience, qualifications, attributes, and skills consistent with the Statement of Policy. From time to time, additional criteria based on the composition and skills of the current Independent Trustees, as well as experience or skills that may be appropriate in light of future changes to board composition, business conditions, and regulatory or other developments, have also been considered by the professional search firms and the Governance and Nominating Committee. In addition, the Board takes into account the Trustees' commitment and participation in Board and committee meetings, as well as their leadership of standing and ad hoc committees throughout their tenure.
In determining that a particular Trustee was and continues to be qualified to serve as a Trustee, the Board has considered a variety of criteria, none of which, in isolation, was controlling. The Board believes that, collectively, the Trustees have balanced and diverse experience, qualifications, attributes, and skills, which allow the Board to operate effectively in governing the fund and protecting the interests of shareholders. Information about the specific experience, skills, attributes, and qualifications of each Trustee, which in each case led to the Board's conclusion that the Trustee should serve (or continue to serve) as a trustee of the fund, is provided below.
Board Structure and Oversight Function. Robert A. Lawrence is an interested person and currently serves as Acting Chairman. The Trustees have determined that an interested Chairman is appropriate and benefits shareholders because an interested Chairman has a personal and professional stake in the quality and continuity of services provided to the fund. Independent Trustees exercise their informed business judgment to appoint an individual of their choosing to serve as Chairman, regardless of whether the Trustee happens to be independent or a member of management. The Independent Trustees have determined that they can act independently and effectively without having an Independent Trustee serve as Chairman and that a key structural component for assuring that they are in a position to do so is for the Independent Trustees to constitute a substantial majority for the Board. The Independent Trustees also regularly meet in executive session. David M. Thomas serves as Lead Independent Trustee and as such (i) acts as a liaison between the Independent Trustees and management with respect to matters important to the Independent Trustees and (ii) with management prepares agendas for Board meetings.
Fidelity® funds are overseen by different Boards of Trustees. The fund's Board oversees Fidelity's high income and certain equity funds, and other Boards oversee Fidelity's investment-grade bond, money market, asset allocation, and other equity funds. The asset allocation funds may invest in Fidelity® funds overseen by the fund's Board. The use of separate Boards, each with its own committee structure, allows the Trustees of each group of Fidelity® funds to focus on the unique issues of the funds they oversee, including common research, investment, and operational issues. On occasion, the separate Boards establish joint committees to address issues of overlapping consequences for the Fidelity® funds overseen by each Board.
The Trustees operate using a system of committees to facilitate the timely and efficient consideration of all matters of importance to the Trustees, the fund, and fund shareholders and to facilitate compliance with legal and regulatory requirements and oversight of the fund's activities and associated risks. The Board, acting through its committees, has charged FMR and its affiliates with (i) identifying events or circumstances the occurrence of which could have demonstrably adverse effects on the fund's business and/or reputation; (ii) implementing processes and controls to lessen the possibility that such events or circumstances occur or to mitigate the effects of such events or circumstances if they do occur; and (iii) creating and maintaining a system designed to evaluate continuously business and market conditions in order to facilitate the identification and implementation processes described in (i) and (ii) above. Because the day-to-day operations and activities of the fund are carried out by or through FMR, its affiliates, and other service providers, the fund's exposure to risks is mitigated but not eliminated by the processes overseen by the Trustees. While each of the Board's committees has responsibility for overseeing different aspects of the fund's activities, oversight is exercised primarily through the Operations, Audit, and Compliance Committees. Appropriate personnel, including but not limited to the fund's Chief Compliance Officer (CCO), FMR's internal auditor, the independent accountants, the fund's Treasurer and portfolio management personnel, make periodic reports to the Board's committees, as appropriate, including an annual review of Fidelity's risk management program for the Fidelity® funds. The responsibilities of each standing committee, including their oversight responsibilities, are described further under "Standing Committees of the Trustees."
Interested Trustees*:
Correspondence intended for a Trustee who is an interested person may be sent to Fidelity Investments, 245 Summer Street, Boston, Massachusetts 02210.
Name, Year of Birth; Principal Occupations and Other Relevant Experience+
Bettina Doulton (1964)
Year of Election or Appointment: 2020
Trustee
Ms. Doulton also serves as Trustee of other Fidelity® funds. Prior to her retirement, Ms. Doulton served in a variety of positions at Fidelity Investments, including as a managing director of research (2006-2007), portfolio manager to certain Fidelity® funds (1993-2005), equity analyst and portfolio assistant (1990-1993), and research assistant (1987-1990). Ms. Doulton currently owns and operates Phi Builders + Architects and Cellardoor Winery. Previously, Ms. Doulton served as a member of the Board of Brown Capital Management, LLC (2014-2018).
Robert A. Lawrence (1952)
Year of Election or Appointment: 2020
Trustee
Acting Chairman of the Board of Trustees
Mr. Lawrence also serves as Trustee of other funds. Previously, Mr. Lawrence served as a Member of the Advisory Board of certain funds. Prior to his retirement in 2008, Mr. Lawrence served as Vice President of certain Fidelity® funds (2006-2008), Senior Vice President, Head of High Income Division of Fidelity Management & Research Company (investment adviser firm, 2006-2008), and President of Fidelity Strategic Investments (investment adviser firm, 2002-2005).
* Determined to be an “Interested Trustee” by virtue of, among other things, his or her affiliation with the trust or various entities under common control with FMR.
+ The information includes the Trustee's principal occupation during the last five years and other information relating to the experience, attributes, and skills relevant to the Trustee's qualifications to serve as a Trustee, which led to the conclusion that the Trustee should serve as a Trustee for the fund.
Independent Trustees:
Correspondence intended for an Independent Trustee may be sent to Fidelity Investments, P.O. Box 55235, Boston, Massachusetts 02205-5235.
Name, Year of Birth; Principal Occupations and Other Relevant Experience+
Thomas P. Bostick (1956)
Year of Election or Appointment: 2021
Trustee
Lieutenant General Bostick also serves as Trustee of other Fidelity® funds. Prior to his retirement, General Bostick (United States Army, Retired) held a variety of positions within the U.S. Army, including Commanding General and Chief of Engineers, U.S. Army Corps of Engineers (2012-2016) and Deputy Chief of Staff and Director of Human Resources, U.S. Army (2009-2012). General Bostick currently serves as a member of the Board and Finance and Governance Committees of CSX Corporation (transportation, 2020-present) and a member of the Board and Corporate Governance and Nominating Committee of Perma-Fix Environmental Services, Inc. (nuclear waste management, 2020-present). General Bostick serves as Chief Executive Officer of Bostick Global Strategies, LLC (consulting, 2016-present) and Managing Partner, Sustainability, of Ridge-Lane Limited Partners (strategic advisory and venture development, 2016-present). Previously, General Bostick served as a Member of the Advisory Board of certain Fidelity® funds (2021), President, Intrexon Bioengineering (2018-2020) and Chief Operating Officer (2017-2020) and Senior Vice President of the Environment Sector (2016-2017) of Intrexon Corporation (biopharmaceutical company).
Dennis J. Dirks (1948)
Year of Election or Appointment: 2005
Trustee
Mr. Dirks also serves as Trustee of other Fidelity® funds. Prior to his retirement in May 2003, Mr. Dirks served as Chief Operating Officer and as a member of the Board of The Depository Trust & Clearing Corporation (financial markets infrastructure), President, Chief Operating Officer and a member of the Board of The Depository Trust Company (DTC), President and a member of the Board of the National Securities Clearing Corporation (NSCC), Chief Executive Officer and a member of the Board of the Government Securities Clearing Corporation and Chief Executive Officer and a member of the Board of the Mortgage-Backed Securities Clearing Corporation. Mr. Dirks currently serves as a member of the Finance Committee (2016-present) and Board (2017-present) and is Treasurer (2018-present) of the Asolo Repertory Theatre.
Donald F. Donahue (1950)
Year of Election or Appointment: 2018
Trustee
Mr. Donahue also serves as Trustee of other Fidelity® funds. Mr. Donahue serves as President and Chief Executive Officer of Miranda Partners, LLC (risk consulting for the financial services industry, 2012-present). Previously, Mr. Donahue served as Chief Executive Officer (2006-2012), Chief Operating Officer (2003-2006) and Managing Director, Customer Marketing and Development (1999-2003) of The Depository Trust & Clearing Corporation (financial markets infrastructure). Mr. Donahue currently serves as a member (2007-present) and Co-Chairman (2016-present) of the Board of United Way of New York and a member of the Board of NYC Leadership Academy (2012-present). Mr. Donahue previously served as a member of the Advisory Board of certain Fidelity® funds (2015-2018).
Vicki L. Fuller (1957)
Year of Election or Appointment: 2020
Trustee
Ms. Fuller also serves as Trustee of other Fidelity® funds. Previously, Ms. Fuller served as a member of the Advisory Board of certain Fidelity® funds (2018-2020), Chief Investment Officer of the New York State Common Retirement Fund (2012-2018) and held a variety of positions at AllianceBernstein L.P. (global asset management, 1985-2012), including Managing Director (2006-2012) and Senior Vice President and Senior Portfolio Manager (2001-2006). Ms. Fuller currently serves as a member of the Board, Audit Committee and Nominating and Governance Committee of The Williams Companies, Inc. (natural gas infrastructure, 2018-present), as a member of the Board, Audit Committee and Nominating and Governance Committee of two Blackstone business development companies (2020-present) and as a member of the Board of Treliant, LLC (consulting, 2019-present).
Patricia L. Kampling (1959)
Year of Election or Appointment: 2020
Trustee
Ms. Kampling also serves as Trustee of other Fidelity® funds. Prior to her retirement, Ms. Kampling served as Chairman of the Board and Chief Executive Officer (2012-2019), President and Chief Operating Officer (2011-2012) and Executive Vice President and Chief Financial Officer (2010-2011) of Alliant Energy Corporation. Ms. Kampling currently serves as a member of the Board, Finance Committee and Governance, Compensation and Nominating Committee of Xcel Energy Inc. (utilities company, 2020-present) and as a member of the Board, Audit, Finance and Risk Committee and Safety, Environmental, Technology and Operations Committee of American Water Works Company, Inc. (utilities company, 2019-present). In addition, Ms. Kampling currently serves as a member of the Board of the Nature Conservancy, Wisconsin Chapter (2019-present). Previously, Ms. Kampling served as a Member of the Advisory Board of certain Fidelity® funds (2020), a member of the Board, Compensation Committee and Executive Committee and Chair of the Audit Committee of Briggs & Stratton Corporation (manufacturing, 2011-2021), a member of the Board of Interstate Power and Light Company (2012-2019) and Wisconsin Power and Light Company (2012-2019) (each a subsidiary of Alliant Energy Corporation) and as a member of the Board and Workforce Development Committee of the Business Roundtable (2018-2019).
Thomas A. Kennedy (1955)
Year of Election or Appointment: 2021
Trustee
Mr. Kennedy also serves as Trustee of other Fidelity® funds. Previously, Mr. Kennedy served as a Member of the Advisory Board of certain Fidelity® funds (2020) and held a variety of positions at Raytheon Company (aerospace and defense, 1983-2020), including Chairman and Chief Executive Officer (2014-2020) and Executive Vice President and Chief Operating Officer (2013-2014). Mr. Kennedy currently serves as Executive Chairman of the Board of Directors of Raytheon Technologies Corporation (aerospace and defense, 2020-present). He is also a member of the Rutgers School of Engineering Industry Advisory Board (2011-present) and a member of the UCLA Engineering Dean’s Executive Board (2016-present).
Oscar Munoz (1959)
Year of Election or Appointment: 2021
Trustee
Mr. Munoz also serves as Trustee of other Fidelity® funds. Prior to his retirement, Mr. Munoz served as Executive Chairman (2020-2021), Chief Executive Officer (2015-2020), President (2015-2016) and a member of the Board (2010-2021) of United Airlines Holdings, Inc. Mr. Munoz currently serves as a member of the Board of CBRE Group, Inc. (commercial real estate, 2020-present), a member of the Board of Univision Communications, Inc. (Hispanic media, 2020-present) and a member of the Advisory Board of Salesforce.com, Inc. (cloud-based software, 2020-present). Previously, Mr. Munoz served as a Member of the Advisory Board of certain Fidelity® funds (2021).
Garnett A. Smith (1947)
Year of Election or Appointment: 2018
Trustee
Mr. Smith also serves as Trustee of other Fidelity® funds. Prior to his retirement, Mr. Smith served as Chairman and Chief Executive Officer (1990-1997) and President (1986-1990) of Inbrand Corp. (manufacturer of personal absorbent products). Prior to his employment with Inbrand Corp., he was employed by a retail fabric chain and North Carolina National Bank (now Bank of America). Mr. Smith previously served as a member of the Advisory Board of certain Fidelity® funds (2012-2013).
David M. Thomas (1949)
Year of Election or Appointment: 2008
Trustee
Lead Independent Trustee
Mr. Thomas also serves as Trustee of other Fidelity® funds. Previously, Mr. Thomas served as Executive Chairman (2005-2006) and Chairman and Chief Executive Officer (2000-2005) of IMS Health, Inc. (pharmaceutical and healthcare information solutions). Mr. Thomas currently serves as a member of the Board of Fortune Brands Home and Security (home and security products, 2004-present) and Presiding Director (2013-present) of Interpublic Group of Companies, Inc. (marketing communication).
Susan Tomasky (1953)
Year of Election or Appointment: 2020
Trustee
Ms. Tomasky also serves as Trustee of other Fidelity® funds. Prior to her retirement, Ms. Tomasky served in various executive officer positions at American Electric Power Company, Inc. (1998-2011), including most recently as President of AEP Transmission (2007-2011). Ms. Tomasky currently serves as a member of the Board and Sustainability Committee and as Chair of the Audit Committee of Marathon Petroleum Corporation (2018-present) and as a member of the Board, Corporate Governance Committee and Organization and Compensation Committee and as Chair of the Audit Committee of Public Service Enterprise Group, Inc. (utilities company, 2012-present). In addition, Ms. Tomasky currently serves as a member (2009-present) and President (2020-present) of the Board of the Royal Shakespeare Company – America (2009-present), as a member of the Board of the Columbus Association for the Performing Arts (2011-present) and as a member of the Board and Investment Committee of Kenyon College (2016-present). Previously, Ms. Tomasky served as a Member of the Advisory Board of certain Fidelity® funds (2020), as a member of the Board of the Columbus Regional Airport Authority (2007-2020), as a member of the Board (2011-2018) and Lead Independent Director (2015-2018) of Andeavor Corporation (previously Tesoro Corporation) (independent oil refiner and marketer) and as a member of the Board of Summit Midstream Partners LP (energy, 2012-2018).
Michael E. Wiley (1950)
Year of Election or Appointment: 2018
Trustee
Mr. Wiley also serves as Trustee of other Fidelity® funds. Previously, Mr. Wiley served as a member of the Advisory Board of certain Fidelity® funds (2018-2020), Chairman, President and CEO of Baker Hughes, Inc. (oilfield services, 2000-2004). Mr. Wiley also previously served as a member of the Board of Andeavor Corporation (independent oil refiner and marketer, 2005-2018), a member of the Board of Andeavor Logistics LP (natural resources logistics, 2015-2018) and a member of the Board of High Point Resources (exploration and production, 2005-2020).
+ The information includes the Trustee's principal occupation during the last five years and other information relating to the experience, attributes, and skills relevant to the Trustee's qualifications to serve as a Trustee, which led to the conclusion that the Trustee should serve as a Trustee for the fund.
Advisory Board Members and Officers:
Correspondence intended for a Member of the Advisory Board (if any) may be sent to Fidelity Investments, P.O. Box 55235, Boston, Massachusetts 02205-5235. Correspondence intended for an officer or Peter S. Lynch may be sent to Fidelity Investments, 245 Summer Street, Boston, Massachusetts 02210. Officers appear below in alphabetical order.
Name, Year of Birth; Principal Occupation
Peter S. Lynch (1944)
Year of Election or Appointment: 2003
Member of the Advisory Board
Mr. Lynch also serves as a Member of the Advisory Board of other Fidelity® funds. Mr. Lynch is Vice Chairman and a Director of Fidelity Management & Research Company LLC (investment adviser firm). In addition, Mr. Lynch serves as a Trustee of Boston College and as the Chairman of the Inner-City Scholarship Fund. Previously, Mr. Lynch served as Vice Chairman and a Director of FMR Co., Inc. (investment adviser firm) and on the Special Olympics International Board of Directors (1997-2006).
Craig S. Brown (1977)
Year of Election or Appointment: 2019
Assistant Treasurer
Mr. Brown also serves as Assistant Treasurer of other funds. Mr. Brown is an employee of Fidelity Investments (2013-present).
John J. Burke III (1964)
Year of Election or Appointment: 2018
Chief Financial Officer
Mr. Burke also serves as Chief Financial Officer of other funds. Mr. Burke serves as Head of Investment Operations for Fidelity Fund and Investment Operations (2018-present) and is an employee of Fidelity Investments (1998-present). Previously Mr. Burke served as head of Asset Management Investment Operations (2012-2018).
William C. Coffey (1969)
Year of Election or Appointment: 2019
Assistant Secretary
Mr. Coffey also serves as Assistant Secretary of other funds. He is Senior Vice President and Deputy General Counsel of FMR LLC (diversified financial services company, 2010-present), and is an employee of Fidelity Investments. Previously, Mr. Coffey served as Secretary and CLO of certain funds (2018-2019); CLO, Secretary, and Senior Vice President of Fidelity Management & Research Company and FMR Co., Inc. (investment adviser firms, 2018-2019); Secretary of Fidelity SelectCo, LLC and Fidelity Investments Money Management, Inc. (investment adviser firms, 2018-2019); CLO of Fidelity Management & Research (Hong Kong) Limited, FMR Investment Management (UK) Limited, and Fidelity Management & Research (Japan) Limited (investment adviser firms, 2018-2019); and Assistant Secretary of certain funds (2009-2018).
Timothy M. Cohen (1969)
Year of Election or Appointment: 2018
Vice President
Mr. Cohen also serves as Vice President of other funds. Mr. Cohen serves as Co-Head of Equity (2018-present), a Director of Fidelity Management & Research (Japan) Limited (investment adviser firm, 2016-present), and is an employee of Fidelity Investments. Previously, Mr. Cohen served as Executive Vice President of Fidelity SelectCo, LLC (2019), Head of Global Equity Research (2016-2018), Chief Investment Officer - Equity and a Director of Fidelity Management & Research (U.K.) Inc. (investment adviser firm, 2013-2015) and as a Director of Fidelity Management & Research (Hong Kong) Limited (investment adviser firm, 2017).
Jonathan Davis (1968)
Year of Election or Appointment: 2010
Assistant Treasurer
Mr. Davis also serves as Assistant Treasurer of other funds. Mr. Davis serves as Assistant Treasurer of FMR Capital, Inc. (2017-present) and is an employee of Fidelity Investments. Previously, Mr. Davis served as Vice President and Associate General Counsel of FMR LLC (diversified financial services company, 2003-2010).
Laura M. Del Prato (1964)
Year of Election or Appointment: 2018
Assistant Treasurer
Ms. Del Prato also serves as an officer of other funds. Ms. Del Prato is an employee of Fidelity Investments (2017-present). Previously, Ms. Del Prato served as President and Treasurer of The North Carolina Capital Management Trust: Cash Portfolio and Term Portfolio (2018-2020). Prior to joining Fidelity Investments, Ms. Del Prato served as a Managing Director and Treasurer of the JPMorgan Mutual Funds (2014-2017). Prior to JPMorgan, Ms. Del Prato served as a partner at Cohen Fund Audit Services (accounting firm, 2012-2013) and KPMG LLP (accounting firm, 2004-2012).
Colm A. Hogan (1973)
Year of Election or Appointment: 2020
Assistant Treasurer
Mr. Hogan also serves as an officer of other funds. Mr. Hogan serves as Assistant Treasurer of FMR Capital, Inc. (2017-present) and is an employee of Fidelity Investments (2005-present). Previously, Mr. Hogan served as Deputy Treasurer of certain Fidelity® funds (2016-2020) and Assistant Treasurer of certain Fidelity® funds (2016-2018).
Pamela R. Holding (1964)
Year of Election or Appointment: 2018
Vice President
Ms. Holding also serves as Vice President of other funds. Ms. Holding serves as Co-Head of Equity (2018-present) and is an employee of Fidelity Investments (2013-present). Previously, Ms. Holding served as Executive Vice President of Fidelity SelectCo, LLC (2019) and as Chief Investment Officer of Fidelity Institutional Asset Management (2013-2018).
Cynthia Lo Bessette (1969)
Year of Election or Appointment: 2019
Secretary and Chief Legal Officer (CLO)
Ms. Lo Bessette also serves as an officer of other funds. Ms. Lo Bessette serves as CLO, Secretary, and Senior Vice President of Fidelity Management & Research Company LLC (investment adviser firm, 2019-present); and CLO of Fidelity Management & Research (Hong Kong) Limited, FMR Investment Management (UK) Limited, and Fidelity Management & Research (Japan) Limited (investment adviser firms, 2019-present). She is a Senior Vice President and Deputy General Counsel of FMR LLC (diversified financial services company, 2019-present), and is an employee of Fidelity Investments. Previously, Ms. Lo Bessette served as CLO, Secretary, and Senior Vice President of FMR Co., Inc. (investment adviser firm, 2019); Secretary of Fidelity SelectCo, LLC and Fidelity Investments Money Management, Inc. (investment adviser firms, 2019). Prior to joining Fidelity Investments, Ms. Lo Bessette was Executive Vice President, General Counsel (2016-2019) and Senior Vice President, Deputy General Counsel (2015-2016) of OppenheimerFunds (investment management company) and Deputy Chief Legal Officer (2013-2015) of Jennison Associates LLC (investment adviser firm).
Chris Maher (1972)
Year of Election or Appointment: 2020
Deputy Treasurer
Mr. Maher also serves as an officer of other funds. Mr. Maher serves as Assistant Treasurer of FMR Capital, Inc. (2017-present), and is an employee of Fidelity Investments (2008-present). Previously, Mr. Maher served as Assistant Treasurer of certain funds (2013-2020); Vice President of Asset Management Compliance (2013), Vice President of the Program Management Group of FMR (investment adviser firm, 2010-2013), and Vice President of Valuation Oversight (2008-2010).
Jason P. Pogorelec (1975)
Year of Election or Appointment: 2020
Chief Compliance Officer
Mr. Pogorelec also serves as Chief Compliance Officer of other funds. Mr. Pogorelec is a senior Vice President of Asset Management Compliance for Fidelity Investments and is an employee of Fidelity Investments (2006-present). Previously, Mr. Pogorelec served as Vice President, Associate General Counsel for Fidelity Investments (2010-2020) and Assistant Secretary of certain Fidelity funds (2015-2020).
Brett Segaloff (1972)
Year of Election or Appointment: 2021
Anti-Money Laundering (AML) Officer
Mr. Segaloff also serves as an AML Officer of other funds and other related entities. He is Director, Anti-Money Laundering (2007-present) of FMR LLC (diversified financial services company) and is an employee of Fidelity Investments (1996-present).
Stacie M. Smith (1974)
Year of Election or Appointment: 2016
President and Treasurer
Ms. Smith also serves as an officer of other funds. Ms. Smith serves as Assistant Treasurer of FMR Capital, Inc. (2017-present), is an employee of Fidelity Investments (2009-present), and has served in other fund officer roles. Prior to joining Fidelity Investments, Ms. Smith served as Senior Audit Manager of Ernst & Young LLP (accounting firm, 1996-2009). Previously, Ms. Smith served as Assistant Treasurer (2013-2019) and Deputy Treasurer (2013-2016) of certain Fidelity® funds.
Marc L. Spector (1972)
Year of Election or Appointment: 2016
Assistant Treasurer
Mr. Spector also serves as an officer of other funds. Mr. Spector serves as Assistant Treasurer of FMR Capital, Inc. (2017-present) and is an employee of Fidelity Investments (2016-present). Prior to joining Fidelity Investments, Mr. Spector served as Director at the Siegfried Group (accounting firm, 2013-2016), and prior to Siegfried Group as audit senior manager at Deloitte & Touche LLP (accounting firm, 2005-2013).
Jim Wegmann (1979)
Year of Election or Appointment: 2019
Assistant Treasurer
Mr. Wegmann also serves as Assistant Treasurer of other funds. Mr. Wegmann is an employee of Fidelity Investments (2011-present).
Shareholder Expense Example
As a shareholder, you incur two types of costs: (1) transaction costs, which may include sales charges (loads) on purchase payments or redemption proceeds, as applicable and (2) ongoing costs, which generally include management fees, distribution and/or service (12b-1) fees and other Fund expenses. This Example is intended to help you understand your ongoing costs (in dollars) of investing in a fund and to compare these costs with the ongoing costs of investing in other mutual funds.
The Example is based on an investment of $1,000 invested at the beginning of the period and held for the entire period (November 1, 2020 to April 30, 2021).
Actual Expenses
The first line of the accompanying table provides information about actual account values and actual expenses. You may use the information in this line, together with the amount you invested, to estimate the expenses that you paid over the period. Simply divide your account value by $1,000.00 (for example, an $8,600 account value divided by $1,000.00 = 8.6), then multiply the result by the number in the first line for a class/Fund under the heading entitled "Expenses Paid During Period" to estimate the expenses you paid on your account during this period. If any fund is a shareholder of any underlying mutual funds or exchange-traded funds (ETFs) (the Underlying Funds), such fund indirectly bears its proportional share of the expenses of the Underlying Funds in addition to the direct expenses incurred presented in the table. These fees and expenses are not included in the annualized expense ratio used to calculate the expense estimate in the table below.
Hypothetical Example for Comparison Purposes
The second line of the accompanying table provides information about hypothetical account values and hypothetical expenses based on the actual expense ratio and an assumed rate of return of 5% per year before expenses, which is not the actual return. The hypothetical account values and expenses may not be used to estimate the actual ending account balance or expenses you paid for the period. You may use this information to compare the ongoing costs of investing in the Fund and other funds. To do so, compare this 5% hypothetical example with the 5% hypothetical examples that appear in the shareholder reports of the other funds. If any fund is a shareholder of any Underlying Funds, such fund indirectly bears its proportional share of the expenses of the Underlying Funds in addition to the direct expenses as presented in the table. These fees and expenses are not included in the annualized expense ratio used to calculate the expense estimate in the table below.
Please note that the expenses shown in the table are meant to highlight your ongoing costs only and do not reflect any transaction costs. Therefore, the second line of the table is useful in comparing ongoing costs only, and will not help you determine the relative total costs of owning different funds.
| | Annualized Expense Ratio-A | Beginning
Account Value
November 1, 2020 | Ending
Account Value
April 30, 2021 | Expenses Paid
During Period-B
November 1, 2020
to April 30, 2021 |
| Fidelity Capital & Income Fund | .68% | | | |
| Actual | | $1,000.00 | $1,168.90 | $3.66 |
| Hypothetical-C | | $1,000.00 | $1,021.42 | $3.41 |
A Annualized expense ratio reflects expenses net of applicable fee waivers.
B Expenses are equal to the annualized expense ratio, multiplied by the average account value over the period, multiplied by 181/ 365 (to reflect the one-half year period). The fees and expenses of any Underlying Funds are not included in each annualized expense ratio.
C 5% return per year before expenses
Distributions (Unaudited)
The Board of Trustees of Fidelity Capital & Income Fund voted to pay on June 7, 2021, to shareholders of record at the opening of business on June 4, 2021, a distribution of $0.155 per share derived from capital gains realized from sales of portfolio securities.
The fund hereby designates as a capital gain dividend with respect to the taxable year ended April 30, 2021, $238,904,950, or, if subsequently determined to be different, the net capital gain of such year.
A total of 0.08% of the dividends distributed during the fiscal year was derived from interest on U.S. Government securities which is generally exempt from state income tax.
The fund designates $370,316,695 of distributions paid in the calendar year 2020 as qualifying to be taxed as interest-related dividends for nonresident alien shareholders.
The fund designates 100% of the short-term capital gain dividend during the fiscal year as qualifying to be taxed as short-term capital gain dividend for nonresident alien shareholders.
The fund designates $408,135,205 of distributions paid in the calendar year 2020 as qualifying to be taxed as section 163(j) interest dividends.
The fund will notify shareholders in January 2022 of amounts for use in preparing 2021 income tax returns.
Board Approval of Investment Advisory Contracts
Fidelity Capital & Income Fund
At its January 2021 meeting, the Board of Trustees, including the Independent Trustees (together, the Board), voted to continue the management contract with Fidelity Management & Research Company LLC (FMR), and the sub-advisory agreements and sub-subadvisory agreements, in each case, where applicable (together, the Advisory Contracts) for the fund for four months from February 1, 2021 through May 31, 2021, in connection with changes to the Board's meeting calendar.
The Board considered that the approval of the fund's Advisory Contracts will not result in any changes in (i) the investment process or strategies employed in the management of the fund's assets; (ii) the fees and expenses paid by shareholders; (iii) the nature, extent or quality of services provided under the fund's Advisory Contracts; or (iv) the day-to-day management of the fund or the persons primarily responsible for such management. The Board also considered that since its last approval of the fund's Advisory Contracts, FMR had provided additional information on the fund in support of the annual contract renewal process, including competitive analyses on total expenses and management fees and in-depth reviews of fund performance and fund profitability information. The Board also considered the findings of certain ad hoc committees that had been previously formed to discuss matters relevant to all of the Fidelity funds, including economies of scale, fall-out benefits and retail vs. institutional funds. The Board concluded that the fund's Advisory Contracts are fair and reasonable, and that the fund's Advisory Contracts should be renewed, without modification, through May 31, 2021, with the understanding that the Board will consider the annual renewal for a full one year period in May 2021.
In connection with its consideration of future renewals of the fund's Advisory Contracts, the Board will consider: (i) the nature, extent and quality of services provided to the funds, including shareholder and administrative services and investment performance; (ii) the competitiveness of the management fee and total expenses for the fund; (iii) the costs of the services and profitability, including the revenues earned and the expenses incurred in conducting the business of developing, marketing, distributing, managing, administering, and servicing the fund and its shareholders, to the extent applicable; and (iv) whether there have been economies of scale in respect of the Fidelity funds, whether the Fidelity funds (including the fund) have appropriately benefited from any such economies of scale, and whether there is the potential for realization of any further economies.
Based on its evaluation of all of the conclusions noted above, and after considering all factors it believed relevant, the Board ultimately concluded that the fund's management fee structure is fair and reasonable, and that the continuation of the fund's Advisory Contracts should be approved for four months from February 1, 2021 through May 31, 2021.
Liquidity Risk Management Program
The Securities and Exchange Commission adopted Rule 22e-4 under the Investment Company Act of 1940 (the Liquidity Rule) to promote effective liquidity risk management throughout the open-end investment company industry, thereby reducing the risk that funds will be unable to meet their redemption obligations and mitigating dilution of the interests of fund shareholders.
The Fund has adopted and implemented a liquidity risk management program pursuant to the Liquidity Rule (the Program) effective December 1, 2018. The Program is reasonably designed to assess and manage the Fund’s liquidity risk and to comply with the requirements of the Liquidity Rule. The Fund’s Board of Trustees (the Board) has designated the Fund’s investment adviser as administrator of the Program. The Fidelity advisers have established a Liquidity Risk Management Committee (the LRM Committee) to manage the Program for each of the Fidelity Funds. The LRM Committee monitors the adequacy and effectiveness of implementation of the Program and on a periodic basis assesses each Fund’s liquidity risk based on a variety of factors including (1) the Fund’s investment strategy, (2) portfolio liquidity and cash flow projections during normal and reasonably foreseeable stressed conditions, (3) shareholder redemptions, (4) borrowings and other funding sources and (5) in the case of exchange-traded funds, certain additional factors including the effect of the Fund’s prices and spreads, market participants, and basket compositions on the overall liquidity of the Fund’s portfolio, as applicable.
In accordance with the Program, each of the Fund’s portfolio investments is classified into one of four liquidity categories described below based on a determination of a reasonable expectation for how long it would take to convert the investment to cash (or sell or dispose of the investment) without significantly changing its market value.
- Highly liquid investments – cash or convertible to cash within three business days or less
- Moderately liquid investments – convertible to cash in three to seven calendar days
- Less liquid investments – can be sold or disposed of, but not settled, within seven calendar days
- Illiquid investments – cannot be sold or disposed of within seven calendar days
Liquidity classification determinations take into account a variety of factors including various market, trading and investment-specific considerations, as well as market depth, and generally utilize analysis from a third-party liquidity metrics service.
The Liquidity Rule places a 15% limit on a fund’s illiquid investments and requires funds that do not primarily hold assets that are highly liquid investments to determine and maintain a minimum percentage of the fund’s net assets to be invested in highly liquid investments (highly liquid investment minimum or HLIM). The Program includes provisions reasonably designed to comply with the 15% limit on illiquid investments and for determining, periodically reviewing and complying with the HLIM requirement as applicable.
At a recent meeting of the Fund’s Board of Trustees, the LRM Committee provided a written report to the Board pertaining to the operation, adequacy, and effectiveness of implementation of the Program for the annual period from December 1, 2019 through November 30, 2020. The report concluded that the Program has been implemented and is operating effectively and is reasonably designed to assess and manage the Fund’s liquidity risk.
Proxy Voting Results
A special meeting of shareholders was held on June 9, 2020. The results of votes taken among shareholders on the proposals before them are reported below. Each vote reported represents one dollar of net asset value held on the record date for the meeting.
PROPOSAL 1
To elect a Board of Trustees.
| | # of
Votes | % of
Votes |
| Dennis J. Dirks |
| Affirmative | 16,477,844,543.945 | 94.954 |
| Withheld | 875,616,757.045 | 5.046 |
| TOTAL | 17,353,461,300.990 | 100.000 |
| Donald F. Donahue |
| Affirmative | 16,475,304,981.550 | 94.940 |
| Withheld | 878,156,319.440 | 5.060 |
| TOTAL | 17,353,461,300.990 | 100.000 |
| Bettina Doulton |
| Affirmative | 16,570,440,321.103 | 95.488 |
| Withheld | 783,020,979.887 | 4.512 |
| TOTAL | 17,353,461,300.990 | 100.000 |
| Vicki L. Fuller |
| Affirmative | 16,590,910,486.905 | 95.606 |
| Withheld | 762,550,814.085 | 4.394 |
| TOTAL | 17,353,461,300.990 | 100.00 |
| Patricia L. Kampling |
| Affirmative | 16,469,872,791.586 | 94.908 |
| Withheld | 883,588,509.404 | 5.092 |
| TOTAL | 17,353,461,300.990 | 100.000 |
| Alan J. Lacy |
| Affirmative | 16,344,655,183.636 | 94.187 |
| Withheld | 1,008,806,117.354 | 5.813 |
| TOTAL | 17,353,461,300.990 | 100.000 |
| Ned C. Lautenbach |
| Affirmative | 15,532,663,704.227 | 89.508 |
| Withheld | 1,820,797,596.763 | 10.492 |
| TOTAL | 17,353,461,300.990 | 100.000 |
| Robert A. Lawrence |
| Affirmative | 16,389,821,876.677 | 94.447 |
| Withheld | 963,639,424.313 | 5.553 |
| TOTAL | 17,353,461,300.990 | 100.000 |
| Joseph Mauriello |
| Affirmative | 16,363,427,626.626 | 94.295 |
| Withheld | 990,033,674.365 | 5.705 |
| TOTAL | 17,353,461,300.990 | 100.000 |
| Cornelia M. Small |
| Affirmative | 16,405,902,888.605 | 94.540 |
| Withheld | 947,558,412.386 | 5.460 |
| TOTAL | 17,353,461,300.990 | 100.000 |
| Garnett A. Smith |
| Affirmative | 16,371,912,270.945 | 94.344 |
| Withheld | 981,549,030.045 | 5.656 |
| TOTAL | 17,353,461,300.990 | 100.000 |
| David M. Thomas |
| Affirmative | 16,365,966,852.048 | 94.310 |
| Withheld | 987,494,448.942 | 5.690 |
| TOTAL | 17,353,461,300.990 | 100.000 |
| Susan Tomasky |
| Affirmative | 16,483,922,579.861 | 94.989 |
| Withheld | 869,538,721.129 | 5.011 |
| TOTAL | 17,353,461,300.990 | 100.000 |
| Michael E. Wiley |
| Affirmative | 16,379,083,262.890 | 94.385 |
| Withheld | 974,378,038.101 | 5.615 |
| TOTAL | 17,353,461,300.990 | 100.000 |
PROPOSAL 2
To convert a fundamental investment policy to a non-fundamental investment policy.
| | # of
Votes | % of
Votes |
| Affirmative | 4,253,916,673.122 | 68.742 |
| Against | 941,111,500.553 | 15.208 |
| Abstain | 738,945,957.033 | 11.941 |
| Broker Non-Vote | 254,227,785.000 | 4.108 |
| TOTAL | 6,188,201,915.709 | 100.000 |
PROPOSAL 5
A shareholder proposal to institute procedures to avoid holding investments in companies that contribute to genocide or crimes against humanity.
| | # of
Votes | % of
Votes |
| Affirmative | 2,146,305,818.690 | 34.684 |
| Against | 3,303,925,117.646 | 53.391 |
| Abstain | 480,748,945.773 | 7.769 |
| Broker Non-Vote | 257,222,033.600 | 4.157 |
| TOTAL | 6,188,201,915.709 | 100.000 |
| Proposal 1 reflects trust wide proposal and voting results. |
| Proposal 5 was not approved by shareholders. |

CAI-ANN-0621
1.703159.123
Fidelity® Focused High Income Fund
Annual Report
April 30, 2021
Contents
To view a fund's proxy voting guidelines and proxy voting record for the 12-month period ended June 30, visit http://www.fidelity.com/proxyvotingresults or visit the Securities and Exchange Commission's (SEC) web site at http://www.sec.gov.
You may also call 1-800-544-8544 to request a free copy of the proxy voting guidelines.
Standard & Poor's, S&P and S&P 500 are registered service marks of The McGraw-Hill Companies, Inc. and have been licensed for use by Fidelity Distributors Corporation.
Other third-party marks appearing herein are the property of their respective owners.
All other marks appearing herein are registered or unregistered trademarks or service marks of FMR LLC or an affiliated company. © 2021 FMR LLC. All rights reserved.
This report and the financial statements contained herein are submitted for the general information of the shareholders of the Fund. This report is not authorized for distribution to prospective investors in the Fund unless preceded or accompanied by an effective prospectus.
A fund files its complete schedule of portfolio holdings with the SEC for the first and third quarters of each fiscal year on Form N-PORT. Forms N-PORT are available on the SEC’s web site at http://www.sec.gov. A fund's Forms N-PORT may be reviewed and copied at the SEC’s Public Reference Room in Washington, DC. Information regarding the operation of the SEC's Public Reference Room may be obtained by calling 1-800-SEC-0330.
For a complete list of a fund's portfolio holdings, view the most recent holdings listing, semiannual report, or annual report on Fidelity's web site at http://www.fidelity.com, http://www.institutional.fidelity.com, or http://www.401k.com, as applicable.
NOT FDIC INSURED •MAY LOSE VALUE •NO BANK GUARANTEE
Neither the Fund nor Fidelity Distributors Corporation is a bank.
Note to Shareholders:
Early in 2020, the outbreak and spread of a new coronavirus emerged as a public health emergency that had a major influence on financial markets, primarily based on its impact on the global economy and the outlook for corporate earnings. The virus causes a respiratory disease known as COVID-19. On March 11, 2020 the World Health Organization declared the COVID-19 outbreak a pandemic, citing sustained risk of further global spread.
In the weeks following, as the crisis worsened, we witnessed an escalating human tragedy with wide-scale social and economic consequences from coronavirus-containment measures. The outbreak of COVID-19 prompted a number of measures to limit the spread, including travel and border restrictions, quarantines, and restrictions on large gatherings. In turn, these resulted in lower consumer activity, diminished demand for a wide range of products and services, disruption in manufacturing and supply chains, and – given the wide variability in outcomes regarding the outbreak – significant market uncertainty and volatility. Amid the turmoil, global governments and central banks took unprecedented action to help support consumers, businesses, and the broader economies, and to limit disruption to financial systems.
The situation continues to unfold, and the extent and duration of its impact on financial markets and the economy remain highly uncertain. Extreme events such as the coronavirus crisis are “exogenous shocks” that can have significant adverse effects on mutual funds and their investments. Although multiple asset classes may be affected by market disruption, the duration and impact may not be the same for all types of assets.
Fidelity is committed to helping you stay informed amid news about COVID-19 and during increased market volatility, and we’re taking extra steps to be responsive to customer needs. We encourage you to visit our websites, where we offer ongoing updates, commentary, and analysis on the markets and our funds.
Performance: The Bottom Line
Average annual total return reflects the change in the value of an investment, assuming reinvestment of distributions from dividend income and capital gains (the profits earned upon the sale of securities that have grown in value, if any) and assuming a constant rate of performance each year. The hypothetical investment and the average annual total returns do not reflect the deduction of taxes that a shareholder would pay on fund distributions or the redemption of fund shares. During periods of reimbursement by Fidelity, a fund’s total return will be greater than it would be had the reimbursement not occurred. How a fund did yesterday is no guarantee of how it will do tomorrow.
Average Annual Total Returns
| For the periods ended April 30, 2021 | Past 1 year | Past 5 years | Past 10 years |
| Fidelity® Focused High Income Fund | 11.16% | 5.96% | 5.19% |
$10,000 Over 10 Years
Let's say hypothetically that $10,000 was invested in Fidelity® Focused High Income Fund on April 30, 2011.
The chart shows how the value of your investment would have changed, and also shows how the ICE® BofA® BB US High Yield Constrained Index performed over the same period.
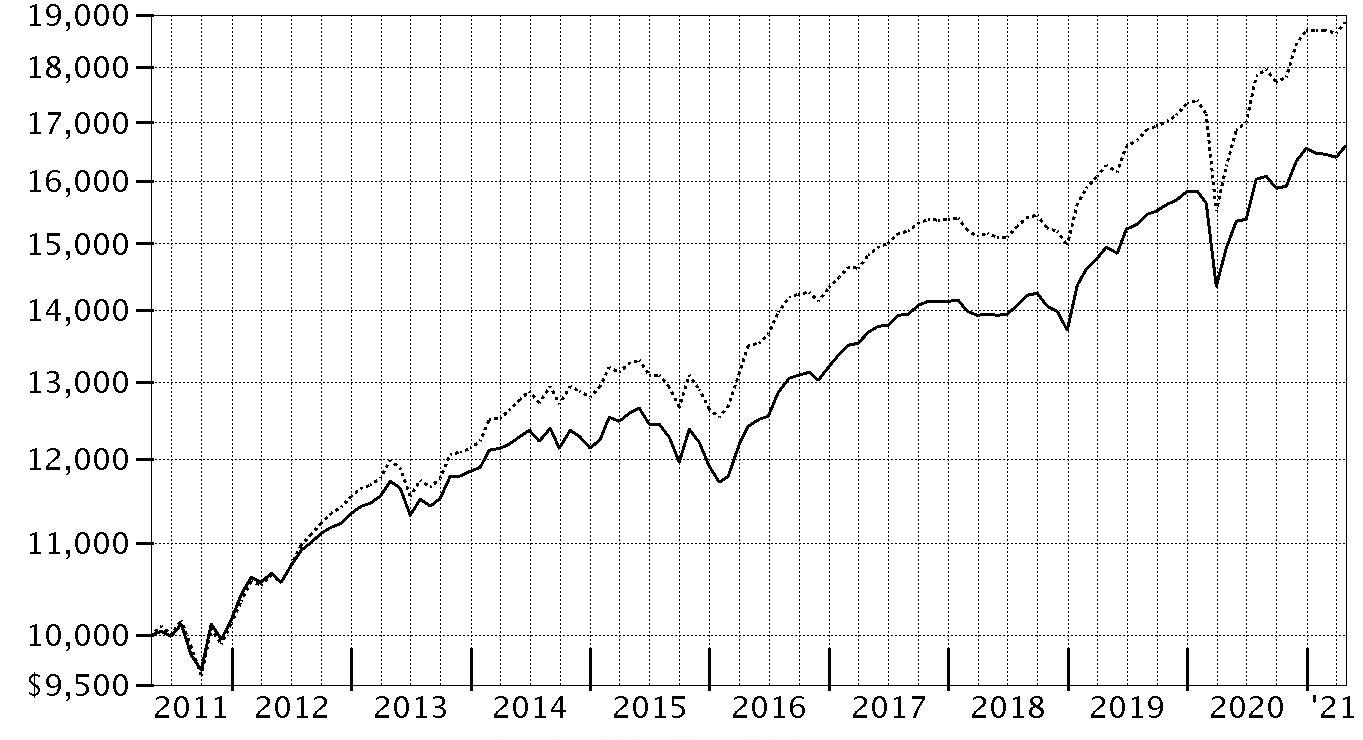
| Period Ending Values |
| $16,584 | Fidelity® Focused High Income Fund |
| $18,856 | ICE® BofA® BB US High Yield Constrained Index |
Management's Discussion of Fund Performance
Market Recap: The ICE BofA
® US High Yield Constrained Index gained 20.01% for the 12 months ending April 30, 2021, as high-yield bonds staged a historic rebound following a steep but brief decline due to the early-2020 outbreak and spread of COVID-19. A confluence of powerful forces propelled risk assets, including high yield, from March 24 through late August. The rally slowed in September, when high yield modestly retreated amid Congress’s inability to reach a deal on additional fiscal stimulus, as well as uncertainty about the election. But as the calendar turned, investors grew hopeful. The rollout of two COVID-19 vaccines was underway, the U.S. Federal Reserve pledged to hold interest rates near zero until the economy recovered, and the federal government planned to deploy trillions of dollars in aid to boost consumers and the economy. For the full 12 months, lower-rated bonds (+38%) fared best. In contrast, the B and BB credit tiers rose 18% and 17%, respectively. By industry, publishing/printing (+48%) and air transportation (+47%) led the way, followed closely by energy (+44%), which was boosted by a rally in the price of oil. Energy represented 13% of the index the past 12 months. Entertainment/film also stood out, advancing roughly 41%. In contrast, notable “laggards” included cable/satellite TV and environmental (+7% each). Utilities and restaurants each gained 9%, while telecommunications, a sizable index component, rose 10% for the period.
Comments from Co-Managers Alexandre Karam and Michael Weaver: For the fiscal year, the fund gained 11.16%, underperforming the 16.05% result of the benchmark, the ICE BofA
® BB US High Yield Constrained Index. The fund's core allocation to high-yield bonds gained 12.43% the past 12 months and detracted from performance versus the benchmark, as did our position in cash in a strong market. By industry, the primary detractor from performance versus the benchmark was an overweighting in cable/satellite TV. An underweighting and security picks in energy and an overweighting in health care also hurt. Not owning Cenovus Energy, a benchmark component that gained 59%, was the largest individual relative detractor. Another notable relative detractor was an outsized stake in JBS (+9%), among the biggest holdings in the fund. Avoiding Ford Motor, a benchmark component that gained 42%, hurt relative performance. Conversely, the biggest contributors to performance versus the benchmark were an underweighting and security selection in containers. Security selection in chemicals and gaming also helped the fund's relative result. Our top individual relative contributor was a non-benchmark stake in Crestwood Midstream (+52%), among the largest holdings at period end. The fund's non-benchmark stake in Denbury, a position not held at period end, gained 316% and helped. Another notable relative contributor was an underweighting in Occidental Petroleum (+42%), a stake we established the past 12 months. By quality, security choices among bonds rated BB detracted most versus the benchmark. Notable changes in positioning include increased exposure to the energy industry and a lower allocation to cable/satellite TV.
The views expressed above reflect those of the portfolio manager(s) only through the end of the period as stated on the cover of this report and do not necessarily represent the views of Fidelity or any other person in the Fidelity organization. Any such views are subject to change at any time based upon market or other conditions and Fidelity disclaims any responsibility to update such views. These views may not be relied on as investment advice and, because investment decisions for a Fidelity fund are based on numerous factors, may not be relied on as an indication of trading intent on behalf of any Fidelity fund.
Investment Summary (Unaudited)
Top Five Holdings as of April 30, 2021
| (by issuer, excluding cash equivalents) | % of fund's net assets |
| Sprint Capital Corp. | 3.5 |
| Vistra Operations Co. LLC | 2.9 |
| Occidental Petroleum Corp. | 2.9 |
| Crestwood Midstream Partners LP/Crestwood Midstream Finance Corp. | 2.3 |
| Tenet Healthcare Corp. | 2.2 |
| | 13.8 |
Top Five Market Sectors as of April 30, 2021
| | % of fund's net assets |
| Energy | 18.1 |
| Telecommunications | 12.0 |
| Utilities | 10.4 |
| Healthcare | 6.1 |
| Chemicals | 5.2 |
Quality Diversification (% of fund's net assets)
| As of April 30, 2021 |
| | BBB | 1.2% |
| | BB | 62.6% |
| | B | 30.4% |
| | CCC,CC,C | 1.0% |
| | Not Rated | 0.2% |
| | Equities | 0.1% |
| | Short-Term Investments and Net Other Assets | 4.5% |

We have used ratings from Moody's Investors Service, Inc. Where Moody's® ratings are not available, we have used S&P® ratings. All ratings are as of the date indicated and do not reflect subsequent changes.
Asset Allocation (% of fund's net assets)
| As of April 30, 2021* |
| | Nonconvertible Bonds | 92.6% |
| | Convertible Bonds, Preferred Stocks | 0.5% |
| | Common Stocks | 0.1% |
| | Bank Loan Obligations | 1.2% |
| | Other Investments | 1.1% |
| | Short-Term Investments and Net Other Assets (Liabilities) | 4.5% |

* Foreign investments - 15.2%
Schedule of Investments April 30, 2021
Showing Percentage of Net Assets
| Corporate Bonds - 93.1% | | | |
| | | Principal Amount | Value |
| Convertible Bonds - 0.5% | | | |
| Broadcasting - 0.5% | | | |
| DISH Network Corp.: | | | |
| 2.375% 3/15/24 | | $1,230,000 | $1,197,713 |
| 3.375% 8/15/26 | | 680,000 | 715,700 |
| | | | 1,913,413 |
| Nonconvertible Bonds - 92.6% | | | |
| Aerospace - 4.8% | | | |
| BBA U.S. Holdings, Inc.: | | | |
| 4% 3/1/28 (a) | | 1,500,000 | 1,511,250 |
| 5.375% 5/1/26 (a) | | 1,135,000 | 1,160,515 |
| BWX Technologies, Inc.: | | | |
| 4.125% 6/30/28 (a) | | 795,000 | 808,913 |
| 5.375% 7/15/26 (a) | | 3,000,000 | 3,095,400 |
| Howmet Aerospace, Inc. 6.75% 1/15/28 | | 665,000 | 797,169 |
| Kaiser Aluminum Corp.: | | | |
| 4.625% 3/1/28 (a) | | 1,730,000 | 1,777,575 |
| 6.5% 5/1/25 (a) | | 430,000 | 455,800 |
| Moog, Inc. 4.25% 12/15/27 (a) | | 1,440,000 | 1,479,600 |
| Rolls-Royce PLC 5.75% 10/15/27 (a) | | 1,115,000 | 1,195,838 |
| Science Applications International Corp. 4.875% 4/1/28 (a) | | 150,000 | 154,688 |
| TransDigm, Inc.: | | | |
| 6.25% 3/15/26 (a) | | 4,115,000 | 4,356,756 |
| 7.5% 3/15/27 | | 145,000 | 155,331 |
| 8% 12/15/25 (a) | | 1,505,000 | 1,634,806 |
| | | | 18,583,641 |
| Automotive & Auto Parts - 1.4% | | | |
| Allison Transmission, Inc. 3.75% 1/30/31 (a) | | 1,115,000 | 1,075,975 |
| Ford Motor Credit Co. LLC: | | | |
| 4% 11/13/30 | | 1,495,000 | 1,526,769 |
| 4.687% 6/9/25 | | 2,140,000 | 2,300,500 |
| 5.125% 6/16/25 | | 530,000 | 578,972 |
| | | | 5,482,216 |
| Banks & Thrifts - 0.5% | | | |
| Ally Financial, Inc. 8% 11/1/31 | | 450,000 | 632,905 |
| Quicken Loans LLC/Quicken Loans Co-Issuer, Inc. 3.625% 3/1/29 (a) | | 1,185,000 | 1,152,413 |
| | | | 1,785,318 |
| Broadcasting - 2.0% | | | |
| Diamond Sports Group LLC/Diamond Sports Finance Co. 5.375% 8/15/26 (a) | | 750,000 | 547,500 |
| Scripps Escrow II, Inc. 3.875% 1/15/29 (a) | | 410,000 | 407,470 |
| Sirius XM Radio, Inc.: | | | |
| 4.125% 7/1/30 (a) | | 2,000,000 | 2,000,000 |
| 5% 8/1/27 (a) | | 2,285,000 | 2,392,846 |
| 5.5% 7/1/29 (a) | | 625,000 | 675,391 |
| Tegna, Inc.: | | | |
| 4.625% 3/15/28 | | 1,645,000 | 1,679,956 |
| 5% 9/15/29 | | 210,000 | 217,875 |
| | | | 7,921,038 |
| Building Materials - 0.7% | | | |
| Advanced Drain Systems, Inc. 5% 9/30/27 (a) | | 1,320,000 | 1,381,552 |
| Standard Industries, Inc. 4.375% 7/15/30 (a) | | 1,300,000 | 1,303,250 |
| | | | 2,684,802 |
| Cable/Satellite TV - 4.9% | | | |
| CCO Holdings LLC/CCO Holdings Capital Corp.: | | | |
| 4.25% 2/1/31 (a) | | 3,080,000 | 3,080,000 |
| 4.5% 8/15/30 (a) | | 675,000 | 686,738 |
| 4.5% 6/1/33 (a) | | 785,000 | 791,139 |
| 5% 2/1/28 (a) | | 1,780,000 | 1,860,100 |
| 5.125% 5/1/27 (a) | | 2,110,000 | 2,208,250 |
| CSC Holdings LLC: | | | |
| 4.125% 12/1/30 (a) | | 2,835,000 | 2,820,825 |
| 5.375% 2/1/28 (a) | | 1,500,000 | 1,578,585 |
| 5.5% 4/15/27 (a) | | 1,320,000 | 1,384,111 |
| 5.75% 1/15/30 (a) | | 1,600,000 | 1,701,000 |
| Virgin Media Finance PLC 5% 7/15/30 (a) | | 105,000 | 104,693 |
| Virgin Media Secured Finance PLC: | | | |
| 4.5% 8/15/30 (a) | | 1,060,000 | 1,064,795 |
| 5.5% 5/15/29 (a) | | 740,000 | 791,245 |
| Ziggo Bond Co. BV 6% 1/15/27 (a) | | 300,000 | 313,500 |
| Ziggo BV 4.875% 1/15/30 (a) | | 475,000 | 488,167 |
| | | | 18,873,148 |
| Chemicals - 5.2% | | | |
| Axalta Coating Systems/Dutch Holding BV 4.75% 6/15/27 (a) | | 935,000 | 979,413 |
| CF Industries Holdings, Inc.: | | | |
| 4.95% 6/1/43 | | 5,000 | 5,825 |
| 5.15% 3/15/34 | | 3,055,000 | 3,574,350 |
| 5.375% 3/15/44 | | 475,000 | 581,027 |
| Consolidated Energy Finance SA: | | | |
| 3 month U.S. LIBOR + 3.750% 3.9339% 6/15/22 (a)(b)(c) | | 1,460,000 | 1,456,001 |
| 6.875% 6/15/25 (a) | | 210,000 | 210,788 |
| Methanex Corp.: | | | |
| 5.125% 10/15/27 | | 1,405,000 | 1,482,612 |
| 5.25% 12/15/29 | | 160,000 | 169,000 |
| 5.65% 12/1/44 | | 991,000 | 1,008,739 |
| NOVA Chemicals Corp. 5.25% 6/1/27 (a) | | 1,710,000 | 1,816,875 |
| Olin Corp.: | | | |
| 5% 2/1/30 | | 3,480,000 | 3,662,700 |
| 5.125% 9/15/27 | | 1,695,000 | 1,769,616 |
| 5.625% 8/1/29 | | 855,000 | 924,948 |
| The Chemours Co. LLC: | | | |
| 5.375% 5/15/27 | | 1,000,000 | 1,072,500 |
| 5.75% 11/15/28 (a) | | 505,000 | 536,472 |
| Valvoline, Inc. 4.25% 2/15/30 (a) | | 255,000 | 261,370 |
| W. R. Grace & Co.-Conn. 4.875% 6/15/27 (a) | | 505,000 | 526,463 |
| | | | 20,038,699 |
| Consumer Products - 1.8% | | | |
| Mattel, Inc.: | | | |
| 3.75% 4/1/29 (a) | | 745,000 | 763,491 |
| 5.45% 11/1/41 | | 125,000 | 142,539 |
| 6.2% 10/1/40 | | 950,000 | 1,140,000 |
| Newell Brands, Inc.: | | | |
| 5.875% 4/1/36 | | 490,000 | 608,678 |
| 6% 4/1/46 | | 2,080,000 | 2,657,876 |
| Nordstrom, Inc. 4.375% 4/1/30 | | 930,000 | 953,835 |
| Prestige Brands, Inc. 3.75% 4/1/31 (a) | | 600,000 | 575,958 |
| | | | 6,842,377 |
| Containers - 0.4% | | | |
| Ardagh Packaging Finance PLC/Ardagh MP Holdings U.S.A., Inc.: | | | |
| 4.125% 8/15/26 (a) | | 50,000 | 51,438 |
| 6% 2/15/25 (a) | | 235,000 | 242,466 |
| Trivium Packaging Finance BV 5.5% 8/15/26 (a) | | 1,215,000 | 1,271,194 |
| | | | 1,565,098 |
| Diversified Financial Services - 3.4% | | | |
| Icahn Enterprises LP/Icahn Enterprises Finance Corp.: | | | |
| 5.25% 5/15/27 (a) | | 530,000 | 540,600 |
| 5.25% 5/15/27 | | 6,175,000 | 6,298,500 |
| 6.25% 5/15/26 | | 1,620,000 | 1,707,642 |
| Ladder Capital Finance Holdings LLLP/Ladder Capital Finance Corp. 4.25% 2/1/27 (a) | | 845,000 | 829,596 |
| MSCI, Inc. 4% 11/15/29 (a) | | 2,000,000 | 2,090,000 |
| Springleaf Finance Corp.: | | | |
| 6.875% 3/15/25 | | 1,105,000 | 1,255,556 |
| 7.125% 3/15/26 | | 500,000 | 584,375 |
| | | | 13,306,269 |
| Diversified Media - 1.0% | | | |
| Lamar Media Corp. 3.625% 1/15/31 (a) | | 915,000 | 892,125 |
| Nielsen Finance LLC/Nielsen Finance Co.: | | | |
| 5.625% 10/1/28 (a) | | 910,000 | 970,288 |
| 5.875% 10/1/30 (a) | | 905,000 | 990,975 |
| Twitter, Inc. 3.875% 12/15/27 (a) | | 930,000 | 978,825 |
| | | | 3,832,213 |
| Energy - 18.0% | | | |
| Apache Corp.: | | | |
| 4.25% 1/15/30 | | 215,000 | 215,765 |
| 4.75% 4/15/43 | | 1,460,000 | 1,449,780 |
| 5.1% 9/1/40 | | 600,000 | 615,075 |
| 5.25% 2/1/42 | | 905,000 | 936,947 |
| 5.35% 7/1/49 | | 150,000 | 150,000 |
| Cheniere Energy Partners LP: | | | |
| 4% 3/1/31 (a) | | 1,625,000 | 1,653,438 |
| 5.625% 10/1/26 | | 1,235,000 | 1,287,488 |
| Cheniere Energy, Inc. 4.625% 10/15/28 (a) | | 1,085,000 | 1,131,275 |
| Citgo Petroleum Corp. 6.375% 6/15/26 (a) | | 1,160,000 | 1,189,116 |
| Continental Resources, Inc. 5.75% 1/15/31 (a) | | 1,630,000 | 1,890,800 |
| Crestwood Midstream Partners LP/Crestwood Midstream Finance Corp.: | | | |
| 5.625% 5/1/27 (a) | | 1,928,000 | 1,961,740 |
| 5.75% 4/1/25 | | 4,312,000 | 4,425,190 |
| 6% 2/1/29 (a) | | 2,500,000 | 2,584,375 |
| CVR Energy, Inc.: | | | |
| 5.25% 2/15/25 (a) | | 1,200,000 | 1,206,000 |
| 5.75% 2/15/28 (a) | | 150,000 | 151,818 |
| DCP Midstream Operating LP: | | | |
| 5.375% 7/15/25 | | 640,000 | 702,400 |
| 5.6% 4/1/44 | | 85,000 | 87,185 |
| 6.45% 11/3/36 (a) | | 380,000 | 428,648 |
| 8.125% 8/16/30 | | 25,000 | 32,500 |
| Endeavor Energy Resources LP/EER Finance, Inc.: | | | |
| 5.5% 1/30/26 (a) | | 75,000 | 77,672 |
| 5.75% 1/30/28 (a) | | 735,000 | 784,613 |
| 6.625% 7/15/25 (a) | | 170,000 | 181,050 |
| EnLink Midstream LLC 5.625% 1/15/28 (a) | | 195,000 | 201,581 |
| EnLink Midstream Partners LP: | | | |
| 5.05% 4/1/45 | | 255,000 | 209,738 |
| 5.45% 6/1/47 | | 530,000 | 446,525 |
| 5.6% 4/1/44 | | 895,000 | 771,938 |
| EQM Midstream Partners LP: | | | |
| 4.75% 1/15/31 (a) | | 985,000 | 975,042 |
| 5.5% 7/15/28 | | 800,000 | 849,760 |
| 6.5% 7/1/27 (a) | | 785,000 | 866,824 |
| 6.5% 7/15/48 | | 485,000 | 492,105 |
| EQT Corp. 3.9% 10/1/27 | | 1,450,000 | 1,511,756 |
| Hess Midstream Partners LP: | | | |
| 5.125% 6/15/28 (a) | | 1,070,000 | 1,107,450 |
| 5.625% 2/15/26 (a) | | 2,310,000 | 2,396,625 |
| Hilcorp Energy I LP/Hilcorp Finance Co. 6.25% 11/1/28 (a) | | 330,000 | 342,530 |
| Holly Energy Partners LP/Holly Energy Finance Corp. 5% 2/1/28 (a) | | 1,360,000 | 1,404,200 |
| New Fortress Energy LLC 6.5% 9/30/26 (a) | | 1,040,000 | 1,061,143 |
| Occidental Petroleum Corp.: | | | |
| 3.5% 8/15/29 | | 810,000 | 773,550 |
| 4.2% 3/15/48 | | 530,000 | 446,636 |
| 4.3% 8/15/39 | | 260,000 | 229,377 |
| 4.4% 4/15/46 | | 815,000 | 717,200 |
| 4.4% 8/15/49 | | 920,000 | 795,800 |
| 5.55% 3/15/26 | | 1,275,000 | 1,369,031 |
| 6.125% 1/1/31 | | 1,310,000 | 1,457,375 |
| 6.2% 3/15/40 | | 255,000 | 270,938 |
| 6.45% 9/15/36 | | 1,340,000 | 1,522,575 |
| 7.5% 5/1/31 | | 1,780,000 | 2,118,200 |
| 7.875% 9/15/31 | | 170,000 | 206,550 |
| 8.875% 7/15/30 | | 580,000 | 745,300 |
| PBF Holding Co. LLC/PBF Finance Corp. 9.25% 5/15/25 (a) | | 2,630,000 | 2,748,350 |
| Rockies Express Pipeline LLC: | | | |
| 4.8% 5/15/30 (a) | | 1,285,000 | 1,260,906 |
| 4.95% 7/15/29 (a) | | 495,000 | 504,281 |
| 6.875% 4/15/40 (a) | | 190,000 | 204,013 |
| Sunoco LP/Sunoco Finance Corp.: | | | |
| 4.5% 5/15/29 (a) | | 1,140,000 | 1,151,400 |
| 5.875% 3/15/28 | | 1,695,000 | 1,792,463 |
| 6% 4/15/27 | | 25,000 | 26,289 |
| Superior Plus LP / Superior General Partner, Inc. 4.5% 3/15/29 (a) | | 320,000 | 326,093 |
| Tallgrass Energy Partners LP / Tallgrass Energy Finance Corp.: | | | |
| 5.5% 1/15/28 (a) | | 225,000 | 222,188 |
| 6% 3/1/27 (a) | | 980,000 | 994,406 |
| 6% 12/31/30 (a) | | 1,190,000 | 1,192,975 |
| Targa Resources Partners LP/Targa Resources Partners Finance Corp.: | | | |
| 4% 1/15/32 (a) | | 2,110,000 | 2,073,075 |
| 4.875% 2/1/31 (a) | | 1,275,000 | 1,330,412 |
| 5.375% 2/1/27 | | 2,245,000 | 2,330,692 |
| 5.5% 3/1/30 | | 255,000 | 275,805 |
| Western Gas Partners LP: | | | |
| 3.95% 6/1/25 | | 190,000 | 198,194 |
| 4.35% 2/1/25 | | 745,000 | 787,584 |
| 4.65% 7/1/26 | | 2,500,000 | 2,676,563 |
| 5.3% 2/1/30 | | 2,375,000 | 2,591,719 |
| | | | 69,120,032 |
| Environmental - 0.7% | | | |
| Darling Ingredients, Inc. 5.25% 4/15/27 (a) | | 970,000 | 1,019,713 |
| LBC Tank Terminals Holding Netherlands BV 6.875% 5/15/23 (a) | | 900,000 | 894,375 |
| Stericycle, Inc. 3.875% 1/15/29 (a) | | 815,000 | 812,963 |
| | | | 2,727,051 |
| Food & Drug Retail - 0.7% | | | |
| Albertsons Companies LLC/Safeway, Inc./New Albertson's, Inc./Albertson's LLC 3.5% 3/15/29 (a) | | 2,670,000 | 2,563,200 |
| Murphy Oil U.S.A., Inc. 3.75% 2/15/31 (a) | | 190,000 | 187,150 |
| | | | 2,750,350 |
| Food/Beverage/Tobacco - 3.5% | | | |
| JBS U.S.A. LLC/JBS U.S.A. Finance, Inc. 6.75% 2/15/28 (a) | | 1,245,000 | 1,375,601 |
| JBS U.S.A. Lux SA / JBS Food Co.: | | | |
| 5.5% 1/15/30 (a) | | 2,525,000 | 2,777,525 |
| 6.5% 4/15/29 (a) | | 3,890,000 | 4,366,525 |
| Kraft Heinz Foods Co.: | | | |
| 3.875% 5/15/27 | | 820,000 | 893,002 |
| 4.25% 3/1/31 | | 775,000 | 854,580 |
| Post Holdings, Inc.: | | | |
| 4.625% 4/15/30 (a) | | 2,135,000 | 2,156,350 |
| 5.5% 12/15/29 (a) | | 590,000 | 635,165 |
| 5.625% 1/15/28 (a) | | 405,000 | 426,769 |
| | | | 13,485,517 |
| Gaming - 3.5% | | | |
| Caesars Resort Collection LLC 5.75% 7/1/25 (a) | | 1,095,000 | 1,152,783 |
| MCE Finance Ltd.: | | | |
| 4.875% 6/6/25 (a) | | 1,225,000 | 1,256,973 |
| 5.375% 12/4/29 (a) | | 465,000 | 494,969 |
| 5.75% 7/21/28 (a) | | 710,000 | 763,605 |
| MGM Growth Properties Operating Partnership LP: | | | |
| 4.5% 9/1/26 | | 1,300,000 | 1,373,125 |
| 4.5% 1/15/28 | | 1,525,000 | 1,589,813 |
| 4.625% 6/15/25 (a) | | 245,000 | 260,652 |
| 5.75% 2/1/27 | | 270,000 | 301,135 |
| MGM Resorts International 5.75% 6/15/25 | | 866,000 | 953,683 |
| VICI Properties, Inc.: | | | |
| 4.25% 12/1/26 (a) | | 1,210,000 | 1,247,813 |
| 4.625% 12/1/29 (a) | | 925,000 | 960,529 |
| Wynn Las Vegas LLC/Wynn Las Vegas Capital Corp.: | | | |
| 5.25% 5/15/27 (a) | | 870,000 | 918,938 |
| 5.5% 3/1/25 (a) | | 900,000 | 960,750 |
| Wynn Macau Ltd. 4.875% 10/1/24 (a) | | 830,000 | 841,205 |
| Wynn Resorts Finance LLC / Wynn Resorts Capital Corp. 5.125% 10/1/29 (a) | | 380,000 | 392,798 |
| | | | 13,468,771 |
| Healthcare - 6.1% | | | |
| Centene Corp.: | | | |
| 2.5% 3/1/31 | | 1,665,000 | 1,585,030 |
| 4.25% 12/15/27 | | 1,635,000 | 1,713,660 |
| 5.375% 6/1/26 (a) | | 1,820,000 | 1,896,076 |
| Charles River Laboratories International, Inc.: | | | |
| 3.75% 3/15/29 (a) | | 315,000 | 320,513 |
| 4.25% 5/1/28 (a) | | 90,000 | 93,719 |
| CTR Partnership LP/CareTrust Capital Corp. 5.25% 6/1/25 | | 1,195,000 | 1,230,372 |
| DaVita HealthCare Partners, Inc. 4.625% 6/1/30 (a) | | 2,465,000 | 2,495,813 |
| Hologic, Inc.: | | | |
| 3.25% 2/15/29 (a) | | 1,000,000 | 982,500 |
| 4.625% 2/1/28 (a) | | 1,650,000 | 1,740,750 |
| IQVIA, Inc. 5% 5/15/27 (a) | | 820,000 | 857,925 |
| Jazz Securities DAC 4.375% 1/15/29 (a) | | 350,000 | 357,875 |
| Organon Finance 1 LLC 4.125% 4/30/28 (a) | | 840,000 | 860,572 |
| Owens & Minor, Inc. 4.5% 3/31/29 (a) | | 280,000 | 282,747 |
| Teleflex, Inc. 4.25% 6/1/28 (a) | | 235,000 | 242,638 |
| Tenet Healthcare Corp.: | | | |
| 4.625% 6/15/28 (a) | | 5,010,000 | 5,176,537 |
| 4.875% 1/1/26 (a) | | 595,000 | 618,205 |
| 5.125% 5/1/25 | | 1,200,000 | 1,214,400 |
| 5.125% 11/1/27 (a) | | 1,200,000 | 1,258,560 |
| 6.25% 2/1/27 (a) | | 405,000 | 424,744 |
| | | | 23,352,636 |
| Homebuilders/Real Estate - 0.9% | | | |
| Howard Hughes Corp. 4.375% 2/1/31 (a) | | 700,000 | 693,000 |
| Service Properties Trust: | | | |
| 3.95% 1/15/28 | | 75,000 | 69,375 |
| 4.375% 2/15/30 | | 725,000 | 674,250 |
| 4.95% 2/15/27 | | 1,090,000 | 1,070,958 |
| 4.95% 10/1/29 | | 445,000 | 429,981 |
| 5.5% 12/15/27 | | 415,000 | 437,010 |
| | | | 3,374,574 |
| Hotels - 1.3% | | | |
| Hilton Domestic Operating Co., Inc.: | | | |
| 3.625% 2/15/32 (a) | | 1,165,000 | 1,145,684 |
| 4% 5/1/31 (a) | | 2,780,000 | 2,807,800 |
| Hilton Worldwide Finance LLC/Hilton Worldwide Finance Corp. 4.875% 4/1/27 | | 445,000 | 462,244 |
| Wyndham Hotels & Resorts, Inc. 4.375% 8/15/28 (a) | | 525,000 | 541,905 |
| | | | 4,957,633 |
| Leisure - 1.3% | | | |
| Carnival Corp. 10.5% 2/1/26 (a) | | 2,005,000 | 2,363,193 |
| Royal Caribbean Cruises Ltd.: | | | |
| 5.5% 4/1/28 (a) | | 1,200,000 | 1,258,440 |
| 9.125% 6/15/23 (a) | | 230,000 | 253,911 |
| 11.5% 6/1/25 (a) | | 995,000 | 1,151,713 |
| | | | 5,027,257 |
| Metals/Mining - 0.1% | | | |
| FMG Resources (August 2006) Pty Ltd. 4.5% 9/15/27 (a) | | 15,000 | 16,292 |
| Howmet Aerospace, Inc. 5.95% 2/1/37 | | 45,000 | 54,065 |
| HudBay Minerals, Inc. 4.5% 4/1/26 (a) | | 240,000 | 243,600 |
| | | | 313,957 |
| Publishing/Printing - 0.3% | | | |
| Meredith Corp. 6.5% 7/1/25 (a) | | 1,110,000 | 1,184,925 |
| Services - 3.8% | | | |
| AECOM 5.125% 3/15/27 | | 1,485,000 | 1,652,063 |
| Aramark Services, Inc. 5% 2/1/28 (a) | | 1,685,000 | 1,762,931 |
| ASGN, Inc. 4.625% 5/15/28 (a) | | 2,740,000 | 2,849,600 |
| Booz Allen Hamilton, Inc. 3.875% 9/1/28 (a) | | 1,395,000 | 1,391,513 |
| Gartner, Inc. 3.75% 10/1/30 (a) | | 470,000 | 471,175 |
| GEMS MENASA Cayman Ltd. 7.125% 7/31/26 (a) | | 1,030,000 | 1,078,925 |
| Iron Mountain, Inc. 4.875% 9/15/29 (a) | | 1,115,000 | 1,135,650 |
| Prime Securities Services Borrower LLC/Prime Finance, Inc. 3.375% 8/31/27 (a) | | 2,225,000 | 2,149,906 |
| Service Corp. International 5.125% 6/1/29 | | 1,425,000 | 1,538,416 |
| TriNet Group, Inc. 3.5% 3/1/29 (a) | | 710,000 | 693,138 |
| | | | 14,723,317 |
| Super Retail - 0.9% | | | |
| Hanesbrands, Inc. 4.875% 5/15/26 (a) | | 1,115,000 | 1,193,925 |
| Levi Strauss & Co. 3.5% 3/1/31 (a) | | 630,000 | 628,425 |
| The William Carter Co. 5.625% 3/15/27 (a) | | 465,000 | 488,831 |
| Wolverine World Wide, Inc. 6.375% 5/15/25 (a) | | 955,000 | 1,019,424 |
| | | | 3,330,605 |
| Technology - 3.2% | | | |
| CDK Global, Inc. 5.25% 5/15/29 (a) | | 1,995,000 | 2,139,638 |
| Crowdstrike Holdings, Inc. 3% 2/15/29 | | 525,000 | 520,301 |
| Entegris, Inc.: | | | |
| 4.375% 4/15/28 (a) | | 730,000 | 767,413 |
| 4.625% 2/10/26 (a) | | 1,400,000 | 1,448,566 |
| Gartner, Inc. 4.5% 7/1/28 (a) | | 660,000 | 693,838 |
| Match Group Holdings II LLC 4.125% 8/1/30 (a) | | 265,000 | 265,994 |
| ON Semiconductor Corp. 3.875% 9/1/28 (a) | | 545,000 | 561,009 |
| Open Text Corp. 3.875% 2/15/28 (a) | | 655,000 | 663,188 |
| Open Text Holdings, Inc. 4.125% 2/15/30 (a) | | 130,000 | 131,460 |
| Qorvo, Inc.: | | | |
| 3.375% 4/1/31 (a) | | 1,115,000 | 1,129,863 |
| 4.375% 10/15/29 | | 500,000 | 543,385 |
| Sensata Technologies BV 4% 4/15/29 (a) | | 1,240,000 | 1,247,688 |
| Sensata Technologies, Inc. 3.75% 2/15/31 (a) | | 1,165,000 | 1,156,892 |
| TTM Technologies, Inc. 4% 3/1/29 (a) | | 550,000 | 550,688 |
| Twilio, Inc. 3.875% 3/15/31 | | 350,000 | 359,188 |
| | | | 12,179,111 |
| Telecommunications - 11.8% | | | |
| Altice Financing SA: | | | |
| 5% 1/15/28 (a) | | 340,000 | 335,325 |
| 7.5% 5/15/26 (a) | | 433,000 | 449,865 |
| Altice France Holding SA 6% 2/15/28 (a) | | 3,475,000 | 3,435,906 |
| Altice France SA 7.375% 5/1/26 (a) | | 1,800,000 | 1,866,240 |
| C&W Senior Financing Designated Activity Co.: | | | |
| 6.875% 9/15/27 (a) | | 1,510,000 | 1,604,375 |
| 7.5% 10/15/26 (a) | | 3,575,000 | 3,789,500 |
| Level 3 Financing, Inc.: | | | |
| 4.25% 7/1/28 (a) | | 2,645,000 | 2,665,128 |
| 4.625% 9/15/27 (a) | | 4,200,000 | 4,331,250 |
| Lumen Technologies, Inc.: | | | |
| 5.125% 12/15/26 (a) | | 2,585,000 | 2,711,019 |
| 6.875% 1/15/28 | | 60,000 | 67,514 |
| Millicom International Cellular SA: | | | |
| 4.5% 4/27/31 (a) | | 200,000 | 212,500 |
| 5.125% 1/15/28 (a) | | 900,000 | 947,700 |
| 6.625% 10/15/26 (a) | | 1,660,500 | 1,766,668 |
| Sable International Finance Ltd. 5.75% 9/7/27 (a) | | 2,905,000 | 3,042,988 |
| SBA Communications Corp. 3.875% 2/15/27 | | 750,000 | 767,006 |
| Sprint Capital Corp.: | | | |
| 6.875% 11/15/28 | | 9,340,000 | 11,768,633 |
| 8.75% 3/15/32 | | 1,150,000 | 1,704,875 |
| Telecom Italia Capital SA: | | | |
| 6% 9/30/34 | | 295,000 | 332,037 |
| 7.2% 7/18/36 | | 2,965,000 | 3,685,495 |
| | | | 45,484,024 |
| Utilities - 10.4% | | | |
| Clearway Energy Operating LLC: | | | |
| 3.75% 2/15/31 (a) | | 1,615,000 | 1,591,889 |
| 4.75% 3/15/28 (a) | | 195,000 | 204,192 |
| 5% 9/15/26 | | 1,600,000 | 1,652,000 |
| DCP Midstream Operating LP: | | | |
| 5.125% 5/15/29 | | 3,925,000 | 4,189,938 |
| 5.625% 7/15/27 | | 1,035,000 | 1,130,386 |
| Global Partners LP/GLP Finance Corp. 7% 8/1/27 | | 997,000 | 1,065,843 |
| InterGen NV 7% 6/30/23 (a) | | 1,635,000 | 1,577,775 |
| NextEra Energy Partners LP 4.25% 9/15/24 (a) | | 158,000 | 166,888 |
| NRG Energy, Inc.: | | | |
| 3.625% 2/15/31 (a) | | 1,666,000 | 1,632,186 |
| 5.25% 6/15/29 (a) | | 625,000 | 669,531 |
| 5.75% 1/15/28 | | 865,000 | 919,063 |
| 6.625% 1/15/27 | | 2,390,000 | 2,490,858 |
| NSG Holdings II LLC/NSG Holdings, Inc. 7.75% 12/15/25 (a) | | 2,136,643 | 2,275,525 |
| PG&E Corp.: | | | |
| 5% 7/1/28 | | 5,680,000 | 5,949,800 |
| 5.25% 7/1/30 | | 2,115,000 | 2,257,763 |
| TerraForm Power Operating LLC: | | | |
| 4.75% 1/15/30 (a) | | 130,000 | 135,363 |
| 5% 1/31/28 (a) | | 1,125,000 | 1,206,563 |
| Vistra Operations Co. LLC: | | | |
| 5% 7/31/27 (a) | | 5,105,000 | 5,288,933 |
| 5.5% 9/1/26 (a) | | 2,520,000 | 2,603,488 |
| 5.625% 2/15/27 (a) | | 2,830,000 | 2,943,200 |
| | | | 39,951,184 |
|
| TOTAL NONCONVERTIBLE BONDS | | | 356,345,763 |
|
| TOTAL CORPORATE BONDS | | | |
| (Cost $347,869,104) | | | 358,259,176 |
| | | Shares | Value |
|
| Common Stocks - 0.1% | | | |
| Energy - 0.1% | | | |
| Jonah Energy LLC (d) | | | |
| (Cost $163,305) | | 11,874 | 178,110 |
| | | Principal Amount | Value |
|
| Bank Loan Obligations - 1.2% | | | |
| Gaming - 0.4% | | | |
| Golden Entertainment, Inc. Tranche B, term loan 3 month U.S. LIBOR + 3.000% 3.75% 10/20/24 (b)(c)(e) | | 1,505,000 | 1,491,199 |
| Insurance - 0.1% | | | |
| Alliant Holdings Intermediate LLC Tranche B3 1LN, term loan 3 month U.S. LIBOR + 3.750% 4.25% 11/5/27 (b)(c)(e) | | 355,000 | 354,606 |
| Technology - 0.5% | | | |
| UKG, Inc. Tranche B 1LN, term loan 3 month U.S. LIBOR + 3.250% 4% 5/4/26 (b)(c)(e) | | 1,850,712 | 1,851,285 |
| Telecommunications - 0.2% | | | |
| Intelsat Jackson Holdings SA: | | | |
| Tranche B-4, term loan 3 month U.S. LIBOR + 5.500% 8.75% 1/2/24 (b)(c)(e) | | 100,000 | 101,896 |
| Tranche DD 1LN, term loan 3 month U.S. LIBOR + 5.500% 6.5% 7/13/22 (b)(c)(e) | | 796,736 | 804,703 |
|
| TOTAL TELECOMMUNICATIONS | | | 906,599 |
|
| TOTAL BANK LOAN OBLIGATIONS | | | |
| (Cost $4,573,881) | | | 4,603,689 |
|
| Preferred Securities - 1.1% | | | |
| Banks & Thrifts - 1.1% | | | |
Ally Financial, Inc. 4.7%
(Cost $4,200,000)(b)(f) | | 4,200,000 | 4,262,389 |
| | | Shares | Value |
|
| Money Market Funds - 1.2% | | | |
| Fidelity Cash Central Fund 0.04% (g) | | | |
| (Cost $4,474,228) | | 4,473,333 | 4,474,228 |
| TOTAL INVESTMENT IN SECURITIES - 96.7% | | | |
| (Cost $361,280,518) | | | 371,777,592 |
| NET OTHER ASSETS (LIABILITIES) - 3.3% | | | 12,854,438 |
| NET ASSETS - 100% | | | $384,632,030 |
Legend
(a) Security exempt from registration under Rule 144A of the Securities Act of 1933. These securities may be resold in transactions exempt from registration, normally to qualified institutional buyers. At the end of the period, the value of these securities amounted to $225,838,728 or 58.7% of net assets.
(b) Coupon rates for floating and adjustable rate securities reflect the rates in effect at period end.
(c) Coupon is indexed to a floating interest rate which may be multiplied by a specified factor and/or subject to caps or floors.
(d) Level 3 security
(e) Remaining maturities of bank loan obligations may be less than the stated maturities shown as a result of contractual or optional prepayments by the borrower. Such prepayments cannot be predicted with certainty.
(f) Security is perpetual in nature with no stated maturity date.
(g) Affiliated fund that is generally available only to investment companies and other accounts managed by Fidelity Investments. The rate quoted is the annualized seven-day yield of the fund at period end. A complete unaudited listing of the fund's holdings as of its most recent quarter end is available upon request. In addition, each Fidelity Central Fund's financial statements, which are not covered by the Fund's Report of Independent Registered Public Accounting Firm, are available on the SEC's website or upon request.
Affiliated Central Funds
Information regarding fiscal year to date income earned by the Fund from investments in Fidelity Central Funds is as follows:
| Fund | Income earned |
| Fidelity Cash Central Fund | $19,094 |
| Total | $19,094 |
Amounts in the income column in the above table include any capital gain distributions from underlying funds, which are presented in the corresponding line-item in the Statement of Operations, if applicable.
Investment Valuation
The following is a summary of the inputs used, as of April 30, 2021, involving the Fund's assets and liabilities carried at fair value. The inputs or methodology used for valuing securities may not be an indication of the risk associated with investing in those securities. For more information on valuation inputs, and their aggregation into the levels used below, please refer to the Investment Valuation section in the accompanying Notes to Financial Statements.
| | Valuation Inputs at Reporting Date: |
| Description | Total | Level 1 | Level 2 | Level 3 |
| Investments in Securities: | | | | |
| Equities: | | | | |
| Energy | $178,110 | $-- | $-- | $178,110 |
| Corporate Bonds | 358,259,176 | -- | 358,259,176 | -- |
| Bank Loan Obligations | 4,603,689 | -- | 4,603,689 | -- |
| Preferred Securities | 4,262,389 | -- | 4,262,389 | -- |
| Money Market Funds | 4,474,228 | 4,474,228 | -- | -- |
| Total Investments in Securities: | $371,777,592 | $4,474,228 | $367,125,254 | $178,110 |
Other Information
Distribution of investments by country or territory of incorporation, as a percentage of Total Net Assets, is as follows (Unaudited):
| United States of America | 84.8% |
| Luxembourg | 3.6% |
| Multi-National | 2.6% |
| Cayman Islands | 1.9% |
| Canada | 1.6% |
| Ireland | 1.5% |
| Netherlands | 1.4% |
| Others (Individually Less Than 1%) | 2.6% |
| | 100.0% |
See accompanying notes which are an integral part of the financial statements.
Financial Statements
Statement of Assets and Liabilities
| | | April 30, 2021 |
| Assets | | |
Investment in securities, at value — See accompanying schedule:
Unaffiliated issuers (cost $356,806,290) | $367,303,364 | |
| Fidelity Central Funds (cost $4,474,228) | 4,474,228 | |
| Total Investment in Securities (cost $361,280,518) | | $371,777,592 |
| Receivable for investments sold | | 18,227,460 |
| Receivable for fund shares sold | | 365,375 |
| Interest receivable | | 5,029,274 |
| Distributions receivable from Fidelity Central Funds | | 464 |
| Prepaid expenses | | 182 |
| Other receivables | | 325 |
| Total assets | | 395,400,672 |
| Liabilities | | |
| Payable for investments purchased | $9,632,958 | |
| Payable for fund shares redeemed | 660,288 | |
| Distributions payable | 160,950 | |
| Accrued management fee | 185,985 | |
| Other affiliated payables | 58,528 | |
| Other payables and accrued expenses | 69,933 | |
| Total liabilities | | 10,768,642 |
| Net Assets | | $384,632,030 |
| Net Assets consist of: | | |
| Paid in capital | | $381,739,399 |
| Total accumulated earnings (loss) | | 2,892,631 |
| Net Assets | | $384,632,030 |
| Net Asset Value, offering price and redemption price per share ($384,632,030 ÷ 43,430,298 shares) | | $8.86 |
See accompanying notes which are an integral part of the financial statements.
Statement of Operations
| | | Year ended April 30, 2021 |
| Investment Income | | |
| Dividends | | $165,539 |
| Interest | | 20,426,608 |
| Income from Fidelity Central Funds | | 19,094 |
| Total income | | 20,611,241 |
| Expenses | | |
| Management fee | $2,445,892 | |
| Transfer agent fees | 551,501 | |
| Accounting fees and expenses | 184,855 | |
| Custodian fees and expenses | 8,999 | |
| Independent trustees' fees and expenses | 2,129 | |
| Registration fees | 44,285 | |
| Audit | 80,945 | |
| Legal | 2,251 | |
| Miscellaneous | 2,742 | |
| Total expenses before reductions | 3,323,599 | |
| Expense reductions | (2,660) | |
| Total expenses after reductions | | 3,320,939 |
| Net investment income (loss) | | 17,290,302 |
| Realized and Unrealized Gain (Loss) | | |
| Net realized gain (loss) on: | | |
| Investment securities: | | |
| Unaffiliated issuers | 4,096,526 | |
| Fidelity Central Funds | (755) | |
| Total net realized gain (loss) | | 4,095,771 |
| Change in net unrealized appreciation (depreciation) on: | | |
| Investment securities: | | |
| Unaffiliated issuers | 23,261,989 | |
| Fidelity Central Funds | (1,284) | |
| Total change in net unrealized appreciation (depreciation) | | 23,260,705 |
| Net gain (loss) | | 27,356,476 |
| Net increase (decrease) in net assets resulting from operations | | $44,646,778 |
See accompanying notes which are an integral part of the financial statements.
Statement of Changes in Net Assets
| | Year ended April 30, 2021 | Year ended April 30, 2020 |
| Increase (Decrease) in Net Assets | | |
| Operations | | |
| Net investment income (loss) | $17,290,302 | $14,239,264 |
| Net realized gain (loss) | 4,095,771 | (1,073,893) |
| Change in net unrealized appreciation (depreciation) | 23,260,705 | (18,780,418) |
| Net increase (decrease) in net assets resulting from operations | 44,646,778 | (5,615,047) |
| Distributions to shareholders | (16,992,928) | (13,902,230) |
| Share transactions | | |
| Proceeds from sales of shares | 208,034,033 | 215,542,959 |
| Reinvestment of distributions | 13,360,332 | 11,724,346 |
| Cost of shares redeemed | (211,925,810) | (163,021,665) |
| Net increase (decrease) in net assets resulting from share transactions | 9,468,555 | 64,245,640 |
| Total increase (decrease) in net assets | 37,122,405 | 44,728,363 |
| Net Assets | | |
| Beginning of period | 347,509,625 | 302,781,262 |
| End of period | $384,632,030 | $347,509,625 |
| Other Information | | |
| Shares | | |
| Sold | 24,091,503 | 24,818,287 |
| Issued in reinvestment of distributions | 1,524,250 | 1,351,795 |
| Redeemed | (24,172,829) | (19,197,228) |
| Net increase (decrease) | 1,442,924 | 6,972,854 |
See accompanying notes which are an integral part of the financial statements.
Financial Highlights
Fidelity Focused High Income Fund
| | | | | | |
| Years ended April 30, | 2021 | 2020 | 2019 | 2018 | 2017 |
| Selected Per–Share Data | | | | | |
| Net asset value, beginning of period | $8.28 | $8.65 | $8.47 | $8.67 | $8.22 |
| Income from Investment Operations | | | | | |
| Net investment income (loss)A | .340 | .374 | .399 | .380 | .397 |
| Net realized and unrealized gain (loss) | .574 | (.378) | .190 | (.219) | .423 |
| Total from investment operations | .914 | (.004) | .589 | .161 | .820 |
| Distributions from net investment income | (.334) | (.366) | (.409) | (.362) | (.373) |
| Total distributions | (.334) | (.366) | (.409) | (.362) | (.373) |
| Redemption fees added to paid in capitalA | – | – | – | .001 | .003 |
| Net asset value, end of period | $8.86 | $8.28 | $8.65 | $8.47 | $8.67 |
| Total ReturnB | 11.16% | (.16)% | 7.21% | 1.86% | 10.22% |
| Ratios to Average Net AssetsC,D | | | | | |
| Expenses before reductions | .75% | .78% | .79% | .80% | .83% |
| Expenses net of fee waivers, if any | .75% | .78% | .79% | .80% | .83% |
| Expenses net of all reductions | .75% | .78% | .78% | .79% | .82% |
| Net investment income (loss) | 3.88% | 4.31% | 4.73% | 4.38% | 4.70% |
| Supplemental Data | | | | | |
| Net assets, end of period (000 omitted) | $384,632 | $347,510 | $302,781 | $397,850 | $548,971 |
| Portfolio turnover rateE | 73% | 43% | 49% | 47% | 51% |
A Calculated based on average shares outstanding during the period.
B Total returns would have been lower if certain expenses had not been reduced during the applicable periods shown.
C Fees and expenses of any underlying mutual funds or exchange-traded funds (ETFs) are not included in the Fund's expense ratio. The Fund indirectly bears its proportionate share of these expenses. For additional expense information related to investments in Fidelity Central Funds, please refer to the "Investments in Fidelity Central Funds" note found in the Notes to Financial Statements section of the most recent Annual or Semi-Annual report.
D Expense ratios reflect operating expenses of the class. Expenses before reductions do not reflect amounts reimbursed, waived, or reduced through arrangements with the investment advisor, brokerage services, or other offset arrangements, if applicable, and do not represent the amount paid by the class during periods when reimbursements, waivers or reductions occur.
E Amount does not include the portfolio activity of any underlying mutual funds or exchange-traded funds (ETFs).
See accompanying notes which are an integral part of the financial statements.
Notes to Financial Statements
For the period ended April 30, 2021
1. Organization.
Fidelity Focused High Income Fund (the Fund) is a fund of Fidelity Summer Street Trust (the Trust) and is authorized to issue an unlimited number of shares. Share transactions on the Statement of Changes in Net Assets may contain exchanges between affiliated funds. The Trust is registered under the Investment Company Act of 1940, as amended (the 1940 Act), as an open-end management investment company organized as a Massachusetts business trust.
2. Investments in Fidelity Central Funds.
Funds may invest in Fidelity Central Funds, which are open-end investment companies generally available only to other investment companies and accounts managed by the investment adviser and its affiliates. The Schedule of Investments lists any Fidelity Central Funds held as an investment as of period end, but does not include the underlying holdings of each Fidelity Central Fund. An investing fund indirectly bears its proportionate share of the expenses of the underlying Fidelity Central Funds.
Based on its investment objective, each Fidelity Central Fund may invest or participate in various investment vehicles or strategies that are similar to those of the investing fund. These strategies are consistent with the investment objectives of the investing fund and may involve certain economic risks which may cause a decline in value of each of the Fidelity Central Funds and thus a decline in the value of the investing fund.
| Fidelity Central Fund | Investment Manager | Investment Objective | Investment Practices | Expense Ratio(a) |
| Fidelity Money Market Central Funds | Fidelity Management & Research Company LLC (FMR) | Each fund seeks to obtain a high level of current income consistent with the preservation of capital and liquidity. | Short-term Investments | Less than .005% to .01 % |
(a) Expenses expressed as a percentage of average net assets and are as of each underlying Central Fund's most recent annual or semi-annual shareholder report.
A complete unaudited list of holdings for each Fidelity Central Fund is available upon request or at the Securities and Exchange Commission website at www.sec.gov. In addition, the financial statements of the Fidelity Central Funds which contain the significant accounting policies (including investment valuation policies) of those funds, and are not covered by the Report of Independent Registered Public Accounting Firm, are available on the Securities and Exchange Commission website or upon request.
3. Significant Accounting Policies.
The Fund is an investment company and applies the accounting and reporting guidance of the Financial Accounting Standards Board (FASB) Accounting Standards Codification Topic 946 Financial Services - Investment Companies. The financial statements have been prepared in conformity with accounting principles generally accepted in the United States of America (GAAP), which require management to make certain estimates and assumptions at the date of the financial statements. Actual results could differ from those estimates. Subsequent events, if any, through the date that the financial statements were issued have been evaluated in the preparation of the financial statements. The Fund's Schedule of Investments lists any underlying mutual funds or exchange-traded funds (ETFs) but does not include the underlying holdings of these funds. The following summarizes the significant accounting policies of the Fund:
Investment Valuation. Investments are valued as of 4:00 p.m. Eastern time on the last calendar day of the period. The Board of Trustees (the Board) has delegated the day to day responsibility for the valuation of the Fund's investments to the Fair Value Committee (the Committee) established by the Fund's investment adviser. In accordance with valuation policies and procedures approved by the Board, the Fund attempts to obtain prices from one or more third party pricing vendors or brokers to value its investments. When current market prices, quotations or currency exchange rates are not readily available or reliable, investments will be fair valued in good faith by the Committee, in accordance with procedures adopted by the Board. Factors used in determining fair value vary by investment type and may include market or investment specific events, changes in interest rates and credit quality. The frequency with which these procedures are used cannot be predicted and they may be utilized to a significant extent. The Committee oversees the Fund's valuation policies and procedures and reports to the Board on the Committee's activities and fair value determinations. The Board monitors the appropriateness of the procedures used in valuing the Fund's investments and ratifies the fair value determinations of the Committee.
The Fund categorizes the inputs to valuation techniques used to value its investments into a disclosure hierarchy consisting of three levels as shown below:
- Level 1 – quoted prices in active markets for identical investments
- Level 2 – other significant observable inputs (including quoted prices for similar investments, interest rates, prepayment speeds, etc.)
- Level 3 – unobservable inputs (including the Fund's own assumptions based on the best information available)
Valuation techniques used to value the Fund's investments by major category are as follows:
Debt securities, including restricted securities, are valued based on evaluated prices received from third party pricing vendors or from brokers who make markets in such securities. Corporate bonds, bank loan obligations and preferred securities are valued by pricing vendors who utilize matrix pricing which considers yield or price of bonds of comparable quality, coupon, maturity and type or by broker-supplied prices. When independent prices are unavailable or unreliable, debt securities may be valued utilizing pricing methodologies which consider similar factors that would be used by third party pricing vendors. Debt securities are generally categorized as Level 2 in the hierarchy but may be Level 3 depending on the circumstances. The Fund invests a significant portion of its assets in below investment grade securities. The value of these securities can be more volatile due to changes in the credit quality of the issuer and is sensitive to changes in economic, market and regulatory conditions.
Equity securities, including restricted securities, for which market quotations are readily available, are valued at the last reported sale price or official closing price as reported by a third party pricing vendor on the primary market or exchange on which they are traded and are categorized as Level 1 in the hierarchy. In the event there were no sales during the day or closing prices are not available, securities are valued at the last quoted bid price or may be valued using the last available price and are generally categorized as Level 2 in the hierarchy. For foreign equity securities, when market or security specific events arise, comparisons to the valuation of American Depositary Receipts (ADRs), futures contracts, Exchange-Traded Funds (ETFs) and certain indexes as well as quoted prices for similar securities may be used and would be categorized as Level 2 in the hierarchy. For equity securities, including restricted securities, where observable inputs are limited, assumptions about market activity and risk are used and these securities may be categorized as Level 3 in the hierarchy.
Investments in open-end mutual funds, including the Fidelity Central Funds, are valued at their closing net asset value (NAV) each business day and are categorized as Level 1 in the hierarchy.
Changes in valuation techniques may result in transfers in or out of an assigned level within the disclosure hierarchy. The aggregate value of investments by input level as of April 30, 2021 is included at the end of the Fund's Schedule of Investments.
Investment Transactions and Income. For financial reporting purposes, the Fund's investment holdings and NAV include trades executed through the end of the last business day of the period. The NAV per share for processing shareholder transactions is calculated as of the close of business of the New York Stock Exchange (NYSE), normally 4:00 p.m. Eastern time and includes trades executed through the end of the prior business day. Gains and losses on securities sold are determined on the basis of identified cost and include proceeds received from litigation. Dividend income is recorded on the ex-dividend date. Income and capital gain distributions from Fidelity Central Funds, if any, are recorded on the ex-dividend date. Interest income is accrued as earned and includes coupon interest and amortization of premium and accretion of discount on debt securities as applicable. Debt obligations may be placed on non-accrual status and related interest income may be reduced by ceasing current accruals and writing off interest receivables when the collection of all or a portion of interest has become doubtful based on consistently applied procedures. A debt obligation is removed from non-accrual status when the issuer resumes interest payments or when collectability of interest is reasonably assured.
Expenses. Expenses directly attributable to a fund are charged to that fund. Expenses attributable to more than one fund are allocated among the respective funds on the basis of relative net assets or other appropriate methods. Expenses included in the accompanying financial statements reflect the expenses of that fund and do not include any expenses associated with any underlying mutual funds or exchange-traded funds. Although not included in a fund's expenses, a fund indirectly bears its proportionate share of these expenses through the net asset value of each underlying mutual fund or exchange-traded fund. Expense estimates are accrued in the period to which they relate and adjustments are made when actual amounts are known.
Income Tax Information and Distributions to Shareholders. Each year, the Fund intends to qualify as a regulated investment company under Subchapter M of the Internal Revenue Code, including distributing substantially all of its taxable income and realized gains. As a result, no provision for U.S. Federal income taxes is required. As of April 30, 2021, the Fund did not have any unrecognized tax benefits in the financial statements; nor is the Fund aware of any tax positions for which it is reasonably possible that the total amounts of unrecognized tax benefits will significantly change in the next twelve months. The Fund files a U.S. federal tax return, in addition to state and local tax returns as required. The Fund's federal income tax returns are subject to examination by the Internal Revenue Service (IRS) for a period of three fiscal years after they are filed. State and local tax returns may be subject to examination for an additional fiscal year depending on the jurisdiction.
Distributions are declared and recorded daily and paid monthly from net investment income. Distributions from realized gains, if any, are declared and recorded on the ex-dividend date. Income and capital gain distributions are determined in accordance with income tax regulations, which may differ from GAAP.
Capital accounts within the financial statements are adjusted for permanent book-tax differences. These adjustments have no impact on net assets or the results of operations. Capital accounts are not adjusted for temporary book-tax differences which will reverse in a subsequent period.
Book-tax differences are primarily due to market discount, partnerships, prior period premium and discount on debt securities, capital loss carryforwards and losses deferred due to wash sales.
As of period end, the cost and unrealized appreciation (depreciation) in securities, and derivatives if applicable, for federal income tax purposes were as follows:
| Gross unrealized appreciation | $13,431,030 |
| Gross unrealized depreciation | (2,192,218) |
| Net unrealized appreciation (depreciation) | $11,238,812 |
| Tax Cost | $360,538,780 |
The tax-based components of distributable earnings as of period end were as follows:
| Undistributed ordinary income | $394,596 |
| Capital loss carryforward | $(8,740,776) |
| Net unrealized appreciation (depreciation) on securities and other investments | $11,238,812 |
Capital loss carryforwards are only available to offset future capital gains of the Fund to the extent provided by regulations and may be limited. The capital loss carryforward information presented below, including any applicable limitation, is estimated as of fiscal period end and is subject to adjustment.
| No expiration | |
| Short-term | $(8,740,776) |
The tax character of distributions paid was as follows:
| | April 30, 2021 | April 30, 2020 |
| Ordinary Income | $16,992,928 | $ 13,902,230 |
Restricted Securities (including Private Placements). Funds may invest in securities that are subject to legal or contractual restrictions on resale. These securities generally may be resold in transactions exempt from registration or to the public if the securities are registered. Disposal of these securities may involve time-consuming negotiations and expense, and prompt sale at an acceptable price may be difficult. Information regarding restricted securities held at period end is included at the end of the Schedule of Investments, if applicable
Loans and Other Direct Debt Instruments. Direct debt instruments are interests in amounts owed to lenders by corporate or other borrowers. These instruments may be in the form of loans, trade claims or other receivables and may include standby financing commitments such as revolving credit facilities that obligate a fund to supply additional cash to the borrower on demand. Loans may be acquired through assignment, participation, or may be made directly to a borrower. Such instruments are presented in the Bank Loan Obligations section in the Schedule of Investments. Certain funds may also invest in unfunded loan commitments, which are contractual obligations for future funding. Information regarding unfunded commitments is included at the end of the Schedule of Investments, if applicable.
4. Purchases and Sales of Investments.
Purchases and sales of securities, other than short-term securities, are noted in the table below.
| | Purchases ($) | Sales ($) |
| Fidelity Focused High Income Fund | 324,180,235 | 305,420,622 |
5. Fees and Other Transactions with Affiliates.
Management Fee. Fidelity Management & Research Company LLC (the investment adviser) and its affiliates provide the Fund with investment management related services for which the Fund pays a monthly management fee. The management fee is the sum of an individual fund fee rate that is based on an annual rate of .45% of the Fund's average net assets and an annualized group fee rate that averaged .10% during the period. The group fee rate is based upon the monthly average net assets of a group of registered investment companies with which the investment adviser has management contracts. The group fee rate decreases as assets under management increase and increases as assets under management decrease. For the reporting period, the total annual management fee rate was .55% of the Fund's average net assets.
Transfer Agent Fees. Fidelity Investments Institutional Operations Company LLC (FIIOC), an affiliate of the investment adviser, is the Fund's transfer, dividend disbursing and shareholder servicing agent. FIIOC receives account fees and asset-based fees that vary according to account size and type of account. FIIOC pays for typesetting, printing and mailing of shareholder reports, except proxy statements. For the period, the transfer agent fees were equivalent to an annual rate of .12% of average net assets.
Accounting Fees. Fidelity Service Company, Inc. (FSC), an affiliate of the investment adviser, maintains the Fund's accounting records. The accounting fee is based on the level of average net assets for each month. For the period, the fees were equivalent to the following annual rates:
| | % of Average Net Assets |
| Fidelity Focused High Income Fund | .04 |
Brokerage Commissions. A portion of portfolio transactions were placed with brokerage firms which are affiliates of the investment adviser. Brokerage commissions are included in net realized gain (loss) and change in net unrealized appreciation (depreciation) in the Statement of Operations. The commissions paid to these affiliated firms were as follows:
| | Amount |
| Fidelity Focused High Income Fund | $25 |
Interfund Trades. Funds may purchase from or sell securities to other Fidelity Funds under procedures adopted by the Board. The procedures have been designed to ensure these interfund trades are executed in accordance with Rule 17a-7 of the 1940 Act. Any interfund trades are included within the respective purchases and sales amounts shown in the Purchases and Sales of Investments note.
6. Committed Line of Credit.
Certain Funds participate with other funds managed by the investment adviser or an affiliate in a $4.25 billion credit facility (the "line of credit") to be utilized for temporary or emergency purposes to fund shareholder redemptions or for other short-term liquidity purposes. The participating funds have agreed to pay commitment fees on their pro-rata portion of the line of credit, which are reflected in Miscellaneous expenses on the Statement of Operations, and are listed below.
| | Amount |
| Fidelity Focused High Income Fund | $924 |
During the period, there were no borrowings on this line of credit.
7. Expense Reductions.
Commissions paid to certain brokers with whom the investment adviser, or its affiliates, places trades on behalf of the Fund include an amount in addition to trade execution, which may be rebated back to the Fund to offset expenses. This amount totaled $91 for the period. In addition, through arrangements with the Fund's custodian, credits realized as a result of certain uninvested cash balances were used to reduce the Fund's expenses by $1,734.
In addition, during the period the investment adviser or an affiliate reimbursed and/or waived a portion of operating expenses in the amount of $835.
Effective June 1, 2021, the investment adviser contractually agreed to reimburse expenses to the extent annual operating expenses exceeded .75% of average net assets. This reimbursement will remain in place through August 31, 2022.
8. Other.
Fund's organizational documents provide former and current trustees and officers with a limited indemnification against liabilities arising in connection with the performance of their duties to the fund. In the normal course of business, the fund may also enter into contracts that provide general indemnifications. The fund's maximum exposure under these arrangements is unknown as this would be dependent on future claims that may be made against the fund. The risk of material loss from such claims is considered remote.
9. Coronavirus (COVID-19) Pandemic.
An outbreak of COVID-19 first detected in China during December 2019 has since spread globally and was declared a pandemic by the World Health Organization during March 2020. Developments that disrupt global economies and financial markets, such as the COVID-19 pandemic, may magnify factors that affect the Fund's performance.
Report of Independent Registered Public Accounting Firm
To the Board of Trustees of Fidelity Summer Street Trust and Shareholders of Fidelity Focused High Income Fund
Opinion on the Financial Statements
We have audited the accompanying statement of assets and liabilities, including the schedule of investments, of Fidelity Focused High Income Fund (one of the funds constituting Fidelity Summer Street Trust, referred to hereafter as the “Fund”) as of April 30, 2021, the related statement of operations for the year ended April 30, 2021, the statement of changes in net assets for each of the two years in the period ended April 30, 2021, including the related notes, and the financial highlights for each of the five years in the period ended April 30, 2021 (collectively referred to as the “financial statements”). In our opinion, the financial statements present fairly, in all material respects, the financial position of the Fund as of April 30, 2021, the results of its operations for the year then ended, the changes in its net assets for each of the two years in the period ended April 30, 2021 and the financial highlights for each of the five years in the period ended April 30, 2021 in conformity with accounting principles generally accepted in the United States of America.
Basis for Opinion
These financial statements are the responsibility of the Fund’s management. Our responsibility is to express an opinion on the Fund’s financial statements based on our audits. We are a public accounting firm registered with the Public Company Accounting Oversight Board (United States) (PCAOB) and are required to be independent with respect to the Fund in accordance with the U.S. federal securities laws and the applicable rules and regulations of the Securities and Exchange Commission and the PCAOB.
We conducted our audits of these financial statements in accordance with the standards of the PCAOB. Those standards require that we plan and perform the audit to obtain reasonable assurance about whether the financial statements are free of material misstatement, whether due to error or fraud.
Our audits included performing procedures to assess the risks of material misstatement of the financial statements, whether due to error or fraud, and performing procedures that respond to those risks. Such procedures included examining, on a test basis, evidence regarding the amounts and disclosures in the financial statements. Our audits also included evaluating the accounting principles used and significant estimates made by management, as well as evaluating the overall presentation of the financial statements. Our procedures included confirmation of securities owned as of April 30, 2021 by correspondence with the custodian, issuers of privately offered securities, agent banks and brokers; when replies were not received from brokers, we performed other auditing procedures. We believe that our audits provide a reasonable basis for our opinion.
/s/ PricewaterhouseCoopers LLP
Boston, Massachusetts
June 14, 2021
We have served as the auditor of one or more investment companies in the Fidelity group of funds since 1932.
Trustees and Officers
The Trustees, Members of the Advisory Board (if any), and officers of the trust and fund, as applicable, are listed below. The Board of Trustees governs the fund and is responsible for protecting the interests of shareholders. The Trustees are experienced executives who meet periodically throughout the year to oversee the fund's activities, review contractual arrangements with companies that provide services to the fund, oversee management of the risks associated with such activities and contractual arrangements, and review the fund's performance. Each of the Trustees oversees 308 funds.
The Trustees hold office without limit in time except that (a) any Trustee may resign; (b) any Trustee may be removed by written instrument, signed by at least two-thirds of the number of Trustees prior to such removal; (c) any Trustee who requests to be retired or who has become incapacitated by illness or injury may be retired by written instrument signed by a majority of the other Trustees; and (d) any Trustee may be removed at any special meeting of shareholders by a two-thirds vote of the outstanding voting securities of the trust. Each Trustee who is not an interested person (as defined in the 1940 Act) of the trust and the fund is referred to herein as an Independent Trustee. Each Independent Trustee shall retire not later than the last day of the calendar year in which his or her 75th birthday occurs. The Independent Trustees may waive this mandatory retirement age policy with respect to individual Trustees. Officers and Advisory Board Members hold office without limit in time, except that any officer or Advisory Board Member may resign or may be removed by a vote of a majority of the Trustees at any regular meeting or any special meeting of the Trustees. Except as indicated, each individual has held the office shown or other offices in the same company for the past five years.
The fund’s Statement of Additional Information (SAI) includes more information about the Trustees. To request a free copy, call Fidelity at 1-800-544-8544.
Experience, Skills, Attributes, and Qualifications of the Trustees. The Governance and Nominating Committee has adopted a statement of policy that describes the experience, qualifications, attributes, and skills that are necessary and desirable for potential Independent Trustee candidates (Statement of Policy). The Board believes that each Trustee satisfied at the time he or she was initially elected or appointed a Trustee, and continues to satisfy, the standards contemplated by the Statement of Policy. The Governance and Nominating Committee also engages professional search firms to help identify potential Independent Trustee candidates who have the experience, qualifications, attributes, and skills consistent with the Statement of Policy. From time to time, additional criteria based on the composition and skills of the current Independent Trustees, as well as experience or skills that may be appropriate in light of future changes to board composition, business conditions, and regulatory or other developments, have also been considered by the professional search firms and the Governance and Nominating Committee. In addition, the Board takes into account the Trustees' commitment and participation in Board and committee meetings, as well as their leadership of standing and ad hoc committees throughout their tenure.
In determining that a particular Trustee was and continues to be qualified to serve as a Trustee, the Board has considered a variety of criteria, none of which, in isolation, was controlling. The Board believes that, collectively, the Trustees have balanced and diverse experience, qualifications, attributes, and skills, which allow the Board to operate effectively in governing the fund and protecting the interests of shareholders. Information about the specific experience, skills, attributes, and qualifications of each Trustee, which in each case led to the Board's conclusion that the Trustee should serve (or continue to serve) as a trustee of the fund, is provided below.
Board Structure and Oversight Function. Robert A. Lawrence is an interested person and currently serves as Acting Chairman. The Trustees have determined that an interested Chairman is appropriate and benefits shareholders because an interested Chairman has a personal and professional stake in the quality and continuity of services provided to the fund. Independent Trustees exercise their informed business judgment to appoint an individual of their choosing to serve as Chairman, regardless of whether the Trustee happens to be independent or a member of management. The Independent Trustees have determined that they can act independently and effectively without having an Independent Trustee serve as Chairman and that a key structural component for assuring that they are in a position to do so is for the Independent Trustees to constitute a substantial majority for the Board. The Independent Trustees also regularly meet in executive session. David M. Thomas serves as Lead Independent Trustee and as such (i) acts as a liaison between the Independent Trustees and management with respect to matters important to the Independent Trustees and (ii) with management prepares agendas for Board meetings.
Fidelity® funds are overseen by different Boards of Trustees. The fund's Board oversees Fidelity's high income and certain equity funds, and other Boards oversee Fidelity's investment-grade bond, money market, asset allocation, and other equity funds. The asset allocation funds may invest in Fidelity® funds overseen by the fund's Board. The use of separate Boards, each with its own committee structure, allows the Trustees of each group of Fidelity® funds to focus on the unique issues of the funds they oversee, including common research, investment, and operational issues. On occasion, the separate Boards establish joint committees to address issues of overlapping consequences for the Fidelity® funds overseen by each Board.
The Trustees operate using a system of committees to facilitate the timely and efficient consideration of all matters of importance to the Trustees, the fund, and fund shareholders and to facilitate compliance with legal and regulatory requirements and oversight of the fund's activities and associated risks. The Board, acting through its committees, has charged FMR and its affiliates with (i) identifying events or circumstances the occurrence of which could have demonstrably adverse effects on the fund's business and/or reputation; (ii) implementing processes and controls to lessen the possibility that such events or circumstances occur or to mitigate the effects of such events or circumstances if they do occur; and (iii) creating and maintaining a system designed to evaluate continuously business and market conditions in order to facilitate the identification and implementation processes described in (i) and (ii) above. Because the day-to-day operations and activities of the fund are carried out by or through FMR, its affiliates, and other service providers, the fund's exposure to risks is mitigated but not eliminated by the processes overseen by the Trustees. While each of the Board's committees has responsibility for overseeing different aspects of the fund's activities, oversight is exercised primarily through the Operations, Audit, and Compliance Committees. Appropriate personnel, including but not limited to the fund's Chief Compliance Officer (CCO), FMR's internal auditor, the independent accountants, the fund's Treasurer and portfolio management personnel, make periodic reports to the Board's committees, as appropriate, including an annual review of Fidelity's risk management program for the Fidelity® funds. The responsibilities of each standing committee, including their oversight responsibilities, are described further under "Standing Committees of the Trustees."
Interested Trustees*:
Correspondence intended for a Trustee who is an interested person may be sent to Fidelity Investments, 245 Summer Street, Boston, Massachusetts 02210.
Name, Year of Birth; Principal Occupations and Other Relevant Experience+
Bettina Doulton (1964)
Year of Election or Appointment: 2020
Trustee
Ms. Doulton also serves as Trustee of other Fidelity® funds. Prior to her retirement, Ms. Doulton served in a variety of positions at Fidelity Investments, including as a managing director of research (2006-2007), portfolio manager to certain Fidelity® funds (1993-2005), equity analyst and portfolio assistant (1990-1993), and research assistant (1987-1990). Ms. Doulton currently owns and operates Phi Builders + Architects and Cellardoor Winery. Previously, Ms. Doulton served as a member of the Board of Brown Capital Management, LLC (2014-2018).
Robert A. Lawrence (1952)
Year of Election or Appointment: 2020
Trustee
Acting Chairman of the Board of Trustees
Mr. Lawrence also serves as Trustee of other funds. Previously, Mr. Lawrence served as a Member of the Advisory Board of certain funds. Prior to his retirement in 2008, Mr. Lawrence served as Vice President of certain Fidelity® funds (2006-2008), Senior Vice President, Head of High Income Division of Fidelity Management & Research Company (investment adviser firm, 2006-2008), and President of Fidelity Strategic Investments (investment adviser firm, 2002-2005).
* Determined to be an “Interested Trustee” by virtue of, among other things, his or her affiliation with the trust or various entities under common control with FMR.
+ The information includes the Trustee's principal occupation during the last five years and other information relating to the experience, attributes, and skills relevant to the Trustee's qualifications to serve as a Trustee, which led to the conclusion that the Trustee should serve as a Trustee for the fund.
Independent Trustees:
Correspondence intended for an Independent Trustee may be sent to Fidelity Investments, P.O. Box 55235, Boston, Massachusetts 02205-5235.
Name, Year of Birth; Principal Occupations and Other Relevant Experience+
Thomas P. Bostick (1956)
Year of Election or Appointment: 2021
Trustee
Lieutenant General Bostick also serves as Trustee of other Fidelity® funds. Prior to his retirement, General Bostick (United States Army, Retired) held a variety of positions within the U.S. Army, including Commanding General and Chief of Engineers, U.S. Army Corps of Engineers (2012-2016) and Deputy Chief of Staff and Director of Human Resources, U.S. Army (2009-2012). General Bostick currently serves as a member of the Board and Finance and Governance Committees of CSX Corporation (transportation, 2020-present) and a member of the Board and Corporate Governance and Nominating Committee of Perma-Fix Environmental Services, Inc. (nuclear waste management, 2020-present). General Bostick serves as Chief Executive Officer of Bostick Global Strategies, LLC (consulting, 2016-present) and Managing Partner, Sustainability, of Ridge-Lane Limited Partners (strategic advisory and venture development, 2016-present). Previously, General Bostick served as a Member of the Advisory Board of certain Fidelity® funds (2021), President, Intrexon Bioengineering (2018-2020) and Chief Operating Officer (2017-2020) and Senior Vice President of the Environment Sector (2016-2017) of Intrexon Corporation (biopharmaceutical company).
Dennis J. Dirks (1948)
Year of Election or Appointment: 2005
Trustee
Mr. Dirks also serves as Trustee of other Fidelity® funds. Prior to his retirement in May 2003, Mr. Dirks served as Chief Operating Officer and as a member of the Board of The Depository Trust & Clearing Corporation (financial markets infrastructure), President, Chief Operating Officer and a member of the Board of The Depository Trust Company (DTC), President and a member of the Board of the National Securities Clearing Corporation (NSCC), Chief Executive Officer and a member of the Board of the Government Securities Clearing Corporation and Chief Executive Officer and a member of the Board of the Mortgage-Backed Securities Clearing Corporation. Mr. Dirks currently serves as a member of the Finance Committee (2016-present) and Board (2017-present) and is Treasurer (2018-present) of the Asolo Repertory Theatre.
Donald F. Donahue (1950)
Year of Election or Appointment: 2018
Trustee
Mr. Donahue also serves as Trustee of other Fidelity® funds. Mr. Donahue serves as President and Chief Executive Officer of Miranda Partners, LLC (risk consulting for the financial services industry, 2012-present). Previously, Mr. Donahue served as Chief Executive Officer (2006-2012), Chief Operating Officer (2003-2006) and Managing Director, Customer Marketing and Development (1999-2003) of The Depository Trust & Clearing Corporation (financial markets infrastructure). Mr. Donahue currently serves as a member (2007-present) and Co-Chairman (2016-present) of the Board of United Way of New York and a member of the Board of NYC Leadership Academy (2012-present). Mr. Donahue previously served as a member of the Advisory Board of certain Fidelity® funds (2015-2018).
Vicki L. Fuller (1957)
Year of Election or Appointment: 2020
Trustee
Ms. Fuller also serves as Trustee of other Fidelity® funds. Previously, Ms. Fuller served as a member of the Advisory Board of certain Fidelity® funds (2018-2020), Chief Investment Officer of the New York State Common Retirement Fund (2012-2018) and held a variety of positions at AllianceBernstein L.P. (global asset management, 1985-2012), including Managing Director (2006-2012) and Senior Vice President and Senior Portfolio Manager (2001-2006). Ms. Fuller currently serves as a member of the Board, Audit Committee and Nominating and Governance Committee of The Williams Companies, Inc. (natural gas infrastructure, 2018-present), as a member of the Board, Audit Committee and Nominating and Governance Committee of two Blackstone business development companies (2020-present) and as a member of the Board of Treliant, LLC (consulting, 2019-present).
Patricia L. Kampling (1959)
Year of Election or Appointment: 2020
Trustee
Ms. Kampling also serves as Trustee of other Fidelity® funds. Prior to her retirement, Ms. Kampling served as Chairman of the Board and Chief Executive Officer (2012-2019), President and Chief Operating Officer (2011-2012) and Executive Vice President and Chief Financial Officer (2010-2011) of Alliant Energy Corporation. Ms. Kampling currently serves as a member of the Board, Finance Committee and Governance, Compensation and Nominating Committee of Xcel Energy Inc. (utilities company, 2020-present) and as a member of the Board, Audit, Finance and Risk Committee and Safety, Environmental, Technology and Operations Committee of American Water Works Company, Inc. (utilities company, 2019-present). In addition, Ms. Kampling currently serves as a member of the Board of the Nature Conservancy, Wisconsin Chapter (2019-present). Previously, Ms. Kampling served as a Member of the Advisory Board of certain Fidelity® funds (2020), a member of the Board, Compensation Committee and Executive Committee and Chair of the Audit Committee of Briggs & Stratton Corporation (manufacturing, 2011-2021), a member of the Board of Interstate Power and Light Company (2012-2019) and Wisconsin Power and Light Company (2012-2019) (each a subsidiary of Alliant Energy Corporation) and as a member of the Board and Workforce Development Committee of the Business Roundtable (2018-2019).
Thomas A. Kennedy (1955)
Year of Election or Appointment: 2021
Trustee
Mr. Kennedy also serves as Trustee of other Fidelity® funds. Previously, Mr. Kennedy served as a Member of the Advisory Board of certain Fidelity® funds (2020) and held a variety of positions at Raytheon Company (aerospace and defense, 1983-2020), including Chairman and Chief Executive Officer (2014-2020) and Executive Vice President and Chief Operating Officer (2013-2014). Mr. Kennedy currently serves as Executive Chairman of the Board of Directors of Raytheon Technologies Corporation (aerospace and defense, 2020-present). He is also a member of the Rutgers School of Engineering Industry Advisory Board (2011-present) and a member of the UCLA Engineering Dean’s Executive Board (2016-present).
Oscar Munoz (1959)
Year of Election or Appointment: 2021
Trustee
Mr. Munoz also serves as Trustee of other Fidelity® funds. Prior to his retirement, Mr. Munoz served as Executive Chairman (2020-2021), Chief Executive Officer (2015-2020), President (2015-2016) and a member of the Board (2010-2021) of United Airlines Holdings, Inc. Mr. Munoz currently serves as a member of the Board of CBRE Group, Inc. (commercial real estate, 2020-present), a member of the Board of Univision Communications, Inc. (Hispanic media, 2020-present) and a member of the Advisory Board of Salesforce.com, Inc. (cloud-based software, 2020-present). Previously, Mr. Munoz served as a Member of the Advisory Board of certain Fidelity® funds (2021).
Garnett A. Smith (1947)
Year of Election or Appointment: 2018
Trustee
Mr. Smith also serves as Trustee of other Fidelity® funds. Prior to his retirement, Mr. Smith served as Chairman and Chief Executive Officer (1990-1997) and President (1986-1990) of Inbrand Corp. (manufacturer of personal absorbent products). Prior to his employment with Inbrand Corp., he was employed by a retail fabric chain and North Carolina National Bank (now Bank of America). Mr. Smith previously served as a member of the Advisory Board of certain Fidelity® funds (2012-2013).
David M. Thomas (1949)
Year of Election or Appointment: 2008
Trustee
Lead Independent Trustee
Mr. Thomas also serves as Trustee of other Fidelity® funds. Previously, Mr. Thomas served as Executive Chairman (2005-2006) and Chairman and Chief Executive Officer (2000-2005) of IMS Health, Inc. (pharmaceutical and healthcare information solutions). Mr. Thomas currently serves as a member of the Board of Fortune Brands Home and Security (home and security products, 2004-present) and Presiding Director (2013-present) of Interpublic Group of Companies, Inc. (marketing communication).
Susan Tomasky (1953)
Year of Election or Appointment: 2020
Trustee
Ms. Tomasky also serves as Trustee of other Fidelity® funds. Prior to her retirement, Ms. Tomasky served in various executive officer positions at American Electric Power Company, Inc. (1998-2011), including most recently as President of AEP Transmission (2007-2011). Ms. Tomasky currently serves as a member of the Board and Sustainability Committee and as Chair of the Audit Committee of Marathon Petroleum Corporation (2018-present) and as a member of the Board, Corporate Governance Committee and Organization and Compensation Committee and as Chair of the Audit Committee of Public Service Enterprise Group, Inc. (utilities company, 2012-present). In addition, Ms. Tomasky currently serves as a member (2009-present) and President (2020-present) of the Board of the Royal Shakespeare Company – America (2009-present), as a member of the Board of the Columbus Association for the Performing Arts (2011-present) and as a member of the Board and Investment Committee of Kenyon College (2016-present). Previously, Ms. Tomasky served as a Member of the Advisory Board of certain Fidelity® funds (2020), as a member of the Board of the Columbus Regional Airport Authority (2007-2020), as a member of the Board (2011-2018) and Lead Independent Director (2015-2018) of Andeavor Corporation (previously Tesoro Corporation) (independent oil refiner and marketer) and as a member of the Board of Summit Midstream Partners LP (energy, 2012-2018).
Michael E. Wiley (1950)
Year of Election or Appointment: 2018
Trustee
Mr. Wiley also serves as Trustee of other Fidelity® funds. Previously, Mr. Wiley served as a member of the Advisory Board of certain Fidelity® funds (2018-2020), Chairman, President and CEO of Baker Hughes, Inc. (oilfield services, 2000-2004). Mr. Wiley also previously served as a member of the Board of Andeavor Corporation (independent oil refiner and marketer, 2005-2018), a member of the Board of Andeavor Logistics LP (natural resources logistics, 2015-2018) and a member of the Board of High Point Resources (exploration and production, 2005-2020).
+ The information includes the Trustee's principal occupation during the last five years and other information relating to the experience, attributes, and skills relevant to the Trustee's qualifications to serve as a Trustee, which led to the conclusion that the Trustee should serve as a Trustee for the fund.
Advisory Board Members and Officers:
Correspondence intended for a Member of the Advisory Board (if any) may be sent to Fidelity Investments, P.O. Box 55235, Boston, Massachusetts 02205-5235. Correspondence intended for an officer or Peter S. Lynch may be sent to Fidelity Investments, 245 Summer Street, Boston, Massachusetts 02210. Officers appear below in alphabetical order.
Name, Year of Birth; Principal Occupation
Peter S. Lynch (1944)
Year of Election or Appointment: 2003
Member of the Advisory Board
Mr. Lynch also serves as a Member of the Advisory Board of other Fidelity® funds. Mr. Lynch is Vice Chairman and a Director of Fidelity Management & Research Company LLC (investment adviser firm). In addition, Mr. Lynch serves as a Trustee of Boston College and as the Chairman of the Inner-City Scholarship Fund. Previously, Mr. Lynch served as Vice Chairman and a Director of FMR Co., Inc. (investment adviser firm) and on the Special Olympics International Board of Directors (1997-2006).
Craig S. Brown (1977)
Year of Election or Appointment: 2019
Assistant Treasurer
Mr. Brown also serves as Assistant Treasurer of other funds. Mr. Brown is an employee of Fidelity Investments (2013-present).
John J. Burke III (1964)
Year of Election or Appointment: 2018
Chief Financial Officer
Mr. Burke also serves as Chief Financial Officer of other funds. Mr. Burke serves as Head of Investment Operations for Fidelity Fund and Investment Operations (2018-present) and is an employee of Fidelity Investments (1998-present). Previously Mr. Burke served as head of Asset Management Investment Operations (2012-2018).
William C. Coffey (1969)
Year of Election or Appointment: 2019
Assistant Secretary
Mr. Coffey also serves as Assistant Secretary of other funds. He is Senior Vice President and Deputy General Counsel of FMR LLC (diversified financial services company, 2010-present), and is an employee of Fidelity Investments. Previously, Mr. Coffey served as Secretary and CLO of certain funds (2018-2019); CLO, Secretary, and Senior Vice President of Fidelity Management & Research Company and FMR Co., Inc. (investment adviser firms, 2018-2019); Secretary of Fidelity SelectCo, LLC and Fidelity Investments Money Management, Inc. (investment adviser firms, 2018-2019); CLO of Fidelity Management & Research (Hong Kong) Limited, FMR Investment Management (UK) Limited, and Fidelity Management & Research (Japan) Limited (investment adviser firms, 2018-2019); and Assistant Secretary of certain funds (2009-2018).
Timothy M. Cohen (1969)
Year of Election or Appointment: 2018
Vice President
Mr. Cohen also serves as Vice President of other funds. Mr. Cohen serves as Co-Head of Equity (2018-present), a Director of Fidelity Management & Research (Japan) Limited (investment adviser firm, 2016-present), and is an employee of Fidelity Investments. Previously, Mr. Cohen served as Executive Vice President of Fidelity SelectCo, LLC (2019), Head of Global Equity Research (2016-2018), Chief Investment Officer - Equity and a Director of Fidelity Management & Research (U.K.) Inc. (investment adviser firm, 2013-2015) and as a Director of Fidelity Management & Research (Hong Kong) Limited (investment adviser firm, 2017).
Jonathan Davis (1968)
Year of Election or Appointment: 2010
Assistant Treasurer
Mr. Davis also serves as Assistant Treasurer of other funds. Mr. Davis serves as Assistant Treasurer of FMR Capital, Inc. (2017-present) and is an employee of Fidelity Investments. Previously, Mr. Davis served as Vice President and Associate General Counsel of FMR LLC (diversified financial services company, 2003-2010).
Laura M. Del Prato (1964)
Year of Election or Appointment: 2018
Assistant Treasurer
Ms. Del Prato also serves as an officer of other funds. Ms. Del Prato is an employee of Fidelity Investments (2017-present). Previously, Ms. Del Prato served as President and Treasurer of The North Carolina Capital Management Trust: Cash Portfolio and Term Portfolio (2018-2020). Prior to joining Fidelity Investments, Ms. Del Prato served as a Managing Director and Treasurer of the JPMorgan Mutual Funds (2014-2017). Prior to JPMorgan, Ms. Del Prato served as a partner at Cohen Fund Audit Services (accounting firm, 2012-2013) and KPMG LLP (accounting firm, 2004-2012).
Colm A. Hogan (1973)
Year of Election or Appointment: 2020
Assistant Treasurer
Mr. Hogan also serves as an officer of other funds. Mr. Hogan serves as Assistant Treasurer of FMR Capital, Inc. (2017-present) and is an employee of Fidelity Investments (2005-present). Previously, Mr. Hogan served as Deputy Treasurer of certain Fidelity® funds (2016-2020) and Assistant Treasurer of certain Fidelity® funds (2016-2018).
Pamela R. Holding (1964)
Year of Election or Appointment: 2018
Vice President
Ms. Holding also serves as Vice President of other funds. Ms. Holding serves as Co-Head of Equity (2018-present) and is an employee of Fidelity Investments (2013-present). Previously, Ms. Holding served as Executive Vice President of Fidelity SelectCo, LLC (2019) and as Chief Investment Officer of Fidelity Institutional Asset Management (2013-2018).
Cynthia Lo Bessette (1969)
Year of Election or Appointment: 2019
Secretary and Chief Legal Officer (CLO)
Ms. Lo Bessette also serves as an officer of other funds. Ms. Lo Bessette serves as CLO, Secretary, and Senior Vice President of Fidelity Management & Research Company LLC (investment adviser firm, 2019-present); and CLO of Fidelity Management & Research (Hong Kong) Limited, FMR Investment Management (UK) Limited, and Fidelity Management & Research (Japan) Limited (investment adviser firms, 2019-present). She is a Senior Vice President and Deputy General Counsel of FMR LLC (diversified financial services company, 2019-present), and is an employee of Fidelity Investments. Previously, Ms. Lo Bessette served as CLO, Secretary, and Senior Vice President of FMR Co., Inc. (investment adviser firm, 2019); Secretary of Fidelity SelectCo, LLC and Fidelity Investments Money Management, Inc. (investment adviser firms, 2019). Prior to joining Fidelity Investments, Ms. Lo Bessette was Executive Vice President, General Counsel (2016-2019) and Senior Vice President, Deputy General Counsel (2015-2016) of OppenheimerFunds (investment management company) and Deputy Chief Legal Officer (2013-2015) of Jennison Associates LLC (investment adviser firm).
Chris Maher (1972)
Year of Election or Appointment: 2020
Deputy Treasurer
Mr. Maher also serves as an officer of other funds. Mr. Maher serves as Assistant Treasurer of FMR Capital, Inc. (2017-present), and is an employee of Fidelity Investments (2008-present). Previously, Mr. Maher served as Assistant Treasurer of certain funds (2013-2020); Vice President of Asset Management Compliance (2013), Vice President of the Program Management Group of FMR (investment adviser firm, 2010-2013), and Vice President of Valuation Oversight (2008-2010).
Jason P. Pogorelec (1975)
Year of Election or Appointment: 2020
Chief Compliance Officer
Mr. Pogorelec also serves as Chief Compliance Officer of other funds. Mr. Pogorelec is a senior Vice President of Asset Management Compliance for Fidelity Investments and is an employee of Fidelity Investments (2006-present). Previously, Mr. Pogorelec served as Vice President, Associate General Counsel for Fidelity Investments (2010-2020) and Assistant Secretary of certain Fidelity funds (2015-2020).
Brett Segaloff (1972)
Year of Election or Appointment: 2021
Anti-Money Laundering (AML) Officer
Mr. Segaloff also serves as an AML Officer of other funds and other related entities. He is Director, Anti-Money Laundering (2007-present) of FMR LLC (diversified financial services company) and is an employee of Fidelity Investments (1996-present).
Stacie M. Smith (1974)
Year of Election or Appointment: 2016
President and Treasurer
Ms. Smith also serves as an officer of other funds. Ms. Smith serves as Assistant Treasurer of FMR Capital, Inc. (2017-present), is an employee of Fidelity Investments (2009-present), and has served in other fund officer roles. Prior to joining Fidelity Investments, Ms. Smith served as Senior Audit Manager of Ernst & Young LLP (accounting firm, 1996-2009). Previously, Ms. Smith served as Assistant Treasurer (2013-2019) and Deputy Treasurer (2013-2016) of certain Fidelity® funds.
Marc L. Spector (1972)
Year of Election or Appointment: 2016
Assistant Treasurer
Mr. Spector also serves as an officer of other funds. Mr. Spector serves as Assistant Treasurer of FMR Capital, Inc. (2017-present) and is an employee of Fidelity Investments (2016-present). Prior to joining Fidelity Investments, Mr. Spector served as Director at the Siegfried Group (accounting firm, 2013-2016), and prior to Siegfried Group as audit senior manager at Deloitte & Touche LLP (accounting firm, 2005-2013).
Jim Wegmann (1979)
Year of Election or Appointment: 2019
Assistant Treasurer
Mr. Wegmann also serves as Assistant Treasurer of other funds. Mr. Wegmann is an employee of Fidelity Investments (2011-present).
Shareholder Expense Example
As a shareholder, you incur two types of costs: (1) transaction costs, which may include sales charges (loads) on purchase payments or redemption proceeds, as applicable and (2) ongoing costs, which generally include management fees, distribution and/or service (12b-1) fees and other Fund expenses. This Example is intended to help you understand your ongoing costs (in dollars) of investing in a fund and to compare these costs with the ongoing costs of investing in other mutual funds.
The Example is based on an investment of $1,000 invested at the beginning of the period and held for the entire period (November 1, 2020 to April 30, 2021).
Actual Expenses
The first line of the accompanying table provides information about actual account values and actual expenses. You may use the information in this line, together with the amount you invested, to estimate the expenses that you paid over the period. Simply divide your account value by $1,000.00 (for example, an $8,600 account value divided by $1,000.00 = 8.6), then multiply the result by the number in the first line for a class/Fund under the heading entitled "Expenses Paid During Period" to estimate the expenses you paid on your account during this period. If any fund is a shareholder of any underlying mutual funds or exchange-traded funds (ETFs) (the Underlying Funds), such fund indirectly bears its proportional share of the expenses of the Underlying Funds in addition to the direct expenses incurred presented in the table. These fees and expenses are not included in the annualized expense ratio used to calculate the expense estimate in the table below.
Hypothetical Example for Comparison Purposes
The second line of the accompanying table provides information about hypothetical account values and hypothetical expenses based on the actual expense ratio and an assumed rate of return of 5% per year before expenses, which is not the actual return. The hypothetical account values and expenses may not be used to estimate the actual ending account balance or expenses you paid for the period. You may use this information to compare the ongoing costs of investing in the Fund and other funds. To do so, compare this 5% hypothetical example with the 5% hypothetical examples that appear in the shareholder reports of the other funds. If any fund is a shareholder of any Underlying Funds, such fund indirectly bears its proportional share of the expenses of the Underlying Funds in addition to the direct expenses as presented in the table. These fees and expenses are not included in the annualized expense ratio used to calculate the expense estimate in the table below.
Please note that the expenses shown in the table are meant to highlight your ongoing costs only and do not reflect any transaction costs. Therefore, the second line of the table is useful in comparing ongoing costs only, and will not help you determine the relative total costs of owning different funds.
| | Annualized Expense Ratio-A | Beginning
Account Value
November 1, 2020 | Ending
Account Value
April 30, 2021 | Expenses Paid
During Period-B
November 1, 2020
to April 30, 2021 |
| Fidelity Focused High Income Fund | .74% | | | |
| Actual | | $1,000.00 | $1,041.70 | $3.75 |
| Hypothetical-C | | $1,000.00 | $1,021.12 | $3.71 |
A Annualized expense ratio reflects expenses net of applicable fee waivers.
B Expenses are equal to the annualized expense ratio, multiplied by the average account value over the period, multiplied by 181/ 365 (to reflect the one-half year period). The fees and expenses of any Underlying Funds are not included in each annualized expense ratio.
C 5% return per year before expenses
Distributions (Unaudited)
A total of 0.06% of the dividends distributed during the fiscal year was derived from interest on U.S. Government securities which is generally exempt from state income tax.
The fund designates $12,994,108 of distributions paid in the calendar 2020 as qualifying to be taxed as interest-related dividends for nonresident alien shareholders.
The fund designates $15,851,931 of distributions paid in the calendar year 2020, as qualifying to be taxed as section 163(j) interest dividends.
The fund will notify shareholders in January 2022 of amounts for use in preparing 2021 income tax returns.
Board Approval of Investment Advisory Contracts and Management Fees
Fidelity Focused High Income Fund
At its January 2021 meeting, the Board of Trustees, including the Independent Trustees (together, the Board), voted to continue the management contract with Fidelity Management & Research Company LLC (FMR), and the sub-advisory agreements and sub-subadvisory agreements, in each case, where applicable (together, the Advisory Contracts) for the fund for four months from February 1, 2021 through May 31, 2021, in connection with changes to the Board's meeting calendar.
The Board considered that the approval of the fund's Advisory Contracts will not result in any changes in (i) the investment process or strategies employed in the management of the fund's assets; (ii) the fees and expenses paid by shareholders; (iii) the nature, extent or quality of services provided under the fund's Advisory Contracts; or (iv) the day-to-day management of the fund or the persons primarily responsible for such management. The Board also considered that since its last approval of the fund's Advisory Contracts, FMR had provided additional information on the fund in support of the annual contract renewal process, including competitive analyses on total expenses and management fees and in-depth reviews of fund performance and fund profitability information. The Board also considered the findings of certain ad hoc committees that had been previously formed to discuss matters relevant to all of the Fidelity funds, including economies of scale, fall-out benefits and retail vs. institutional funds. The Board concluded that the fund's Advisory Contracts are fair and reasonable, and that the fund's Advisory Contracts should be renewed, without modification, through May 31, 2021, with the understanding that the Board will consider the annual renewal for a full one year period in May 2021.
In connection with its consideration of future renewals of the fund's Advisory Contracts, the Board will consider: (i) the nature, extent and quality of services provided to the funds, including shareholder and administrative services and investment performance; (ii) the competitiveness of the management fee and total expenses for the fund; (iii) the costs of the services and profitability, including the revenues earned and the expenses incurred in conducting the business of developing, marketing, distributing, managing, administering, and servicing the fund and its shareholders, to the extent applicable; and (iv) whether there have been economies of scale in respect of the Fidelity funds, whether the Fidelity funds (including the fund) have appropriately benefited from any such economies of scale, and whether there is the potential for realization of any further economies.
Based on its evaluation of all of the conclusions noted above, and after considering all factors it believed relevant, the Board ultimately concluded that the fund's management fee structure is fair and reasonable, and that the continuation of the fund's Advisory Contracts should be approved for four months from February 1, 2021 through May 31, 2021.
Liquidity Risk Management Program
The Securities and Exchange Commission adopted Rule 22e-4 under the Investment Company Act of 1940 (the Liquidity Rule) to promote effective liquidity risk management throughout the open-end investment company industry, thereby reducing the risk that funds will be unable to meet their redemption obligations and mitigating dilution of the interests of fund shareholders.
The Fund has adopted and implemented a liquidity risk management program pursuant to the Liquidity Rule (the Program) effective December 1, 2018. The Program is reasonably designed to assess and manage the Fund’s liquidity risk and to comply with the requirements of the Liquidity Rule. The Fund’s Board of Trustees (the Board) has designated the Fund’s investment adviser as administrator of the Program. The Fidelity advisers have established a Liquidity Risk Management Committee (the LRM Committee) to manage the Program for each of the Fidelity Funds. The LRM Committee monitors the adequacy and effectiveness of implementation of the Program and on a periodic basis assesses each Fund’s liquidity risk based on a variety of factors including (1) the Fund’s investment strategy, (2) portfolio liquidity and cash flow projections during normal and reasonably foreseeable stressed conditions, (3) shareholder redemptions, (4) borrowings and other funding sources and (5) in the case of exchange-traded funds, certain additional factors including the effect of the Fund’s prices and spreads, market participants, and basket compositions on the overall liquidity of the Fund’s portfolio, as applicable.
In accordance with the Program, each of the Fund’s portfolio investments is classified into one of four liquidity categories described below based on a determination of a reasonable expectation for how long it would take to convert the investment to cash (or sell or dispose of the investment) without significantly changing its market value.
- Highly liquid investments – cash or convertible to cash within three business days or less
- Moderately liquid investments – convertible to cash in three to seven calendar days
- Less liquid investments – can be sold or disposed of, but not settled, within seven calendar days
- Illiquid investments – cannot be sold or disposed of within seven calendar days
Liquidity classification determinations take into account a variety of factors including various market, trading and investment-specific considerations, as well as market depth, and generally utilize analysis from a third-party liquidity metrics service.
The Liquidity Rule places a 15% limit on a fund’s illiquid investments and requires funds that do not primarily hold assets that are highly liquid investments to determine and maintain a minimum percentage of the fund’s net assets to be invested in highly liquid investments (highly liquid investment minimum or HLIM). The Program includes provisions reasonably designed to comply with the 15% limit on illiquid investments and for determining, periodically reviewing and complying with the HLIM requirement as applicable.
At a recent meeting of the Fund’s Board of Trustees, the LRM Committee provided a written report to the Board pertaining to the operation, adequacy, and effectiveness of implementation of the Program for the annual period from December 1, 2019 through November 30, 2020. The report concluded that the Program has been implemented and is operating effectively and is reasonably designed to assess and manage the Fund’s liquidity risk.
Proxy Voting Results
A special meeting of shareholders was held on June 9, 2020. The results of votes taken among shareholders on the proposals before them are reported below. Each vote reported represents one dollar of net asset value held on the record date for the meeting.
PROPOSAL 1
To elect a Board of Trustees.
| | # of
Votes | % of
Votes |
| Dennis J. Dirks |
| Affirmative | 16,477,844,543.945 | 94.954 |
| Withheld | 875,616,757.045 | 5.046 |
| TOTAL | 17,353,461,300.990 | 100.000 |
| Donald F. Donahue |
| Affirmative | 16,475,304,981.550 | 94.940 |
| Withheld | 878,156,319.440 | 5.060 |
| TOTAL | 17,353,461,300.990 | 100.000 |
| Bettina Doulton |
| Affirmative | 16,570,440,321.103 | 95.488 |
| Withheld | 783,020,979.887 | 4.512 |
| TOTAL | 17,353,461,300.990 | 100.000 |
| Vicki L. Fuller |
| Affirmative | 16,590,910,486.905 | 95.606 |
| Withheld | 762,550,814.085 | 4.394 |
| TOTAL | 17,353,461,300.990 | 100.00 |
| Patricia L. Kampling |
| Affirmative | 16,469,872,791.586 | 94.908 |
| Withheld | 883,588,509.404 | 5.092 |
| TOTAL | 17,353,461,300.990 | 100.000 |
| Alan J. Lacy |
| Affirmative | 16,344,655,183.636 | 94.187 |
| Withheld | 1,008,806,117.354 | 5.813 |
| TOTAL | 17,353,461,300.990 | 100.000 |
| Ned C. Lautenbach |
| Affirmative | 15,532,663,704.227 | 89.508 |
| Withheld | 1,820,797,596.763 | 10.492 |
| TOTAL | 17,353,461,300.990 | 100.000 |
| Robert A. Lawrence |
| Affirmative | 16,389,821,876.677 | 94.447 |
| Withheld | 963,639,424.313 | 5.553 |
| TOTAL | 17,353,461,300.990 | 100.000 |
| Joseph Mauriello |
| Affirmative | 16,363,427,626.626 | 94.295 |
| Withheld | 990,033,674.365 | 5.705 |
| TOTAL | 17,353,461,300.990 | 100.000 |
| Cornelia M. Small |
| Affirmative | 16,405,902,888.605 | 94.540 |
| Withheld | 947,558,412.386 | 5.460 |
| TOTAL | 17,353,461,300.990 | 100.000 |
| Garnett A. Smith |
| Affirmative | 16,371,912,270.945 | 94.344 |
| Withheld | 981,549,030.045 | 5.656 |
| TOTAL | 17,353,461,300.990 | 100.000 |
| David M. Thomas |
| Affirmative | 16,365,966,852.048 | 94.310 |
| Withheld | 987,494,448.942 | 5.690 |
| TOTAL | 17,353,461,300.990 | 100.000 |
| Susan Tomasky |
| Affirmative | 16,483,922,579.861 | 94.989 |
| Withheld | 869,538,721.129 | 5.011 |
| TOTAL | 17,353,461,300.990 | 100.000 |
| Michael E. Wiley |
| Affirmative | 16,379,083,262.890 | 94.385 |
| Withheld | 974,378,038.101 | 5.615 |
| TOTAL | 17,353,461,300.990 | 100.000 |
PROPOSAL 2
To convert a fundamental investment policy to a non-fundamental investment policy.
| | # of
Votes | % of
Votes |
| Affirmative | 153,396,100.574 | 71.934 |
| Against | 32,003,972.649 | 15.008 |
| Abstain | 23,132,540.110 | 10.848 |
| Broker Non-Vote | 4,712,175.600 | 2.210 |
| TOTAL | 213,244,788.934 | 100.000 |
|
| Proposal 1 reflects trust wide proposal and voting results. |
FFH-ANN-0621
1.801606.116
Fidelity® Series High Income Fund
Annual Report
April 30, 2021
Contents
To view a fund's proxy voting guidelines and proxy voting record for the 12-month period ended June 30, visit http://www.fidelity.com/proxyvotingresults or visit the Securities and Exchange Commission's (SEC) web site at http://www.sec.gov.
You may also call 1-800-544-8544 to request a free copy of the proxy voting guidelines.
Standard & Poor's, S&P and S&P 500 are registered service marks of The McGraw-Hill Companies, Inc. and have been licensed for use by Fidelity Distributors Corporation.
Other third-party marks appearing herein are the property of their respective owners.
All other marks appearing herein are registered or unregistered trademarks or service marks of FMR LLC or an affiliated company. © 2021 FMR LLC. All rights reserved.
This report and the financial statements contained herein are submitted for the general information of the shareholders of the Fund. This report is not authorized for distribution to prospective investors in the Fund unless preceded or accompanied by an effective prospectus.
A fund files its complete schedule of portfolio holdings with the SEC for the first and third quarters of each fiscal year on Form N-PORT. Forms N-PORT are available on the SEC’s web site at http://www.sec.gov. A fund's Forms N-PORT may be reviewed and copied at the SEC’s Public Reference Room in Washington, DC. Information regarding the operation of the SEC's Public Reference Room may be obtained by calling 1-800-SEC-0330.
For a complete list of a fund's portfolio holdings, view the most recent holdings listing, semiannual report, or annual report on Fidelity's web site at http://www.fidelity.com, http://www.institutional.fidelity.com, or http://www.401k.com, as applicable.
NOT FDIC INSURED •MAY LOSE VALUE •NO BANK GUARANTEE
Neither the Fund nor Fidelity Distributors Corporation is a bank.
Note to Shareholders:
Early in 2020, the outbreak and spread of a new coronavirus emerged as a public health emergency that had a major influence on financial markets, primarily based on its impact on the global economy and the outlook for corporate earnings. The virus causes a respiratory disease known as COVID-19. On March 11, 2020 the World Health Organization declared the COVID-19 outbreak a pandemic, citing sustained risk of further global spread.
In the weeks following, as the crisis worsened, we witnessed an escalating human tragedy with wide-scale social and economic consequences from coronavirus-containment measures. The outbreak of COVID-19 prompted a number of measures to limit the spread, including travel and border restrictions, quarantines, and restrictions on large gatherings. In turn, these resulted in lower consumer activity, diminished demand for a wide range of products and services, disruption in manufacturing and supply chains, and – given the wide variability in outcomes regarding the outbreak – significant market uncertainty and volatility. Amid the turmoil, global governments and central banks took unprecedented action to help support consumers, businesses, and the broader economies, and to limit disruption to financial systems.
The situation continues to unfold, and the extent and duration of its impact on financial markets and the economy remain highly uncertain. Extreme events such as the coronavirus crisis are “exogenous shocks” that can have significant adverse effects on mutual funds and their investments. Although multiple asset classes may be affected by market disruption, the duration and impact may not be the same for all types of assets.
Fidelity is committed to helping you stay informed amid news about COVID-19 and during increased market volatility, and we’re taking extra steps to be responsive to customer needs. We encourage you to visit our websites, where we offer ongoing updates, commentary, and analysis on the markets and our funds.
Performance: The Bottom Line
Average annual total return reflects the change in the value of an investment, assuming reinvestment of distributions from dividend income and capital gains (the profits earned upon the sale of securities that have grown in value, if any) and assuming a constant rate of performance each year. The hypothetical investment and the average annual total returns do not reflect the deduction of taxes that a shareholder would pay on fund distributions or the redemption of fund shares. During periods of reimbursement by Fidelity, a fund’s total return will be greater than it would be had the reimbursement not occurred. How a fund did yesterday is no guarantee of how it will do tomorrow.
Average Annual Total Returns
| For the periods ended April 30, 2021 | Past 1 year | Past 5 years | Past 10 years |
| Fidelity® Series High Income Fund | 16.72% | 7.35% | 5.75% |
$10,000 Over 10 Years
Let's say hypothetically that $10,000 was invested in Fidelity® Series High Income Fund on April 30, 2011.
The chart shows how the value of your investment would have changed, and also shows how the ICE® BofA® US High Yield Constrained Index performed over the same period.

| Period Ending Values |
| $17,496 | Fidelity® Series High Income Fund |
| $18,348 | ICE® BofA® US High Yield Constrained Index |
Management's Discussion of Fund Performance
Market Recap: The ICE BofA
® US High Yield Constrained Index gained 20.01% for the 12 months ending April 30, 2021, as high-yield bonds staged a historic rebound following a steep but brief decline due to the early-2020 outbreak and spread of COVID-19. A confluence of powerful forces propelled risk assets, including high yield, from March 24 through late August. The rally slowed in September, when high yield modestly retreated amid Congress’s inability to reach a deal on additional fiscal stimulus, as well as uncertainty about the election. But as the calendar turned, investors grew hopeful. The rollout of two COVID-19 vaccines was underway, the U.S. Federal Reserve pledged to hold interest rates near zero until the economy recovered, and the federal government planned to deploy trillions of dollars in aid to boost consumers and the economy. For the full 12 months, lower-rated bonds (+38%) fared best. In contrast, the B and BB credit tiers rose 18% and 17%, respectively. By industry, publishing/printing (+48%) and air transportation (+47%) led the way, followed closely by energy (+44%), which was boosted by a rally in the price of oil. Energy represented 13% of the index the past 12 months. Entertainment/film also stood out, advancing roughly 41%. In contrast, notable “laggards” included cable/satellite TV and environmental (+7% each). Utilities and restaurants each gained 9%, while telecommunications, a sizable index component, rose 10% for the period.
Comments from Co-Managers Alexandre Karam and Michael Weaver: For the fiscal year, the fund gained 16.72%, trailing the 20.01% result of the benchmark, the ICE BofA
® US High Yield Constrained Index. The fund's core investment in high-yield bonds advanced 15.88% and detracted from performance versus the benchmark, as did our allocation to cash in a strong market. By industry, the largest detractor from performance versus the benchmark was an overweighting in telecommunications. Positioning in energy and an overweighting in cable/satellite TV also hurt. The fund's largest individual relative detractor was an outsized stake in JBS, which gained 9% the past year. The company was among the biggest holdings in the fund this period. Also hurting performance was our overweighting in Altice Financial, which gained 8%. The company was the fund's largest holding. Avoiding Ford Motor, a benchmark component that gained 42%, hurt relative performance. Conversely, the top contributor to performance versus the benchmark was security picks in food & drug retail. Also helping the fund's relative performance were overweightings in aerospace and gaming. The fund's top individual relative contributor was our outsized stake in Denbury, which gained about 350%. This is a position that was sold the past 12 months. Also lifting performance was our outsized stake in Bi-Lo, which gained approximately 65%. Bi-Lo was among the biggest holdings in the fund. The fund's non-benchmark stake in Sanchez Energy which was renamed Mesquite Energy in mid-2020 gained about 19% and contributed. By quality, security choices among bonds rated CCC hurt most. Notable changes in positioning include a higher allocation to the energy and aerospace industries.
The views expressed above reflect those of the portfolio manager(s) only through the end of the period as stated on the cover of this report and do not necessarily represent the views of Fidelity or any other person in the Fidelity organization. Any such views are subject to change at any time based upon market or other conditions and Fidelity disclaims any responsibility to update such views. These views may not be relied on as investment advice and, because investment decisions for a Fidelity fund are based on numerous factors, may not be relied on as an indication of trading intent on behalf of any Fidelity fund.
Investment Summary (Unaudited)
Top Five Holdings as of April 30, 2021
| (by issuer, excluding cash equivalents) | % of fund's net assets |
| TransDigm, Inc. | 2.5 |
| Occidental Petroleum Corp. | 2.4 |
| C&W Senior Financing Designated Activity Co. | 2.2 |
| Altice France SA | 2.0 |
| Southeastern Grocers, Inc. | 1.7 |
| | 10.8 |
Top Five Market Sectors as of April 30, 2021
| | % of fund's net assets |
| Energy | 15.9 |
| Telecommunications | 12.2 |
| Healthcare | 6.4 |
| Aerospace | 6.3 |
| Services | 5.7 |
Quality Diversification (% of fund's net assets)
| As of April 30, 2021 |
| | BBB | 0.1% |
| | BB | 28.8% |
| | B | 47.9% |
| | CCC,CC,C | 16.3% |
| | Not Rated | 0.7% |
| | Equities | 2.1% |
| | Short-Term Investments and Net Other Assets | 4.1% |

We have used ratings from Moody's Investors Service, Inc. Where Moody's® ratings are not available, we have used S&P® ratings. All ratings are as of the date indicated and do not reflect subsequent changes.
Asset Allocation (% of fund's net assets)
| As of April 30, 2021 * |
| | Nonconvertible Bonds | 89.2% |
| | Convertible Bonds, Preferred Stocks | 1.7% |
| | Common Stocks | 2.1% |
| | Bank Loan Obligations | 2.9% |
| | Short-Term Investments and Net Other Assets (Liabilities) | 4.1% |

* Foreign investments - 23.1%
Schedule of Investments April 30, 2021
Showing Percentage of Net Assets
| Corporate Bonds - 90.9% | | | |
| | | Principal Amount | Value |
| Convertible Bonds - 1.7% | | | |
| Broadcasting - 1.3% | | | |
| DISH Network Corp.: | | | |
| 2.375% 3/15/24 | | $5,404,000 | $5,262,145 |
| 3.375% 8/15/26 | | 16,261,000 | 17,114,703 |
| | | | 22,376,848 |
| Energy - 0.4% | | | |
| Mesquite Energy, Inc.: | | | |
| 15% 7/15/23 (a)(b) | | 1,813,773 | 3,790,786 |
| 15% 7/15/23 (a)(b) | | 1,051,450 | 2,418,335 |
| | | | 6,209,121 |
|
| TOTAL CONVERTIBLE BONDS | | | 28,585,969 |
|
| Nonconvertible Bonds - 89.2% | | | |
| Aerospace - 6.3% | | | |
| Allegheny Technologies, Inc.: | | | |
| 5.875% 12/1/27 | | 13,380,000 | 14,132,625 |
| 7.875% 8/15/23 | | 675,000 | 734,906 |
| BBA U.S. Holdings, Inc. 5.375% 5/1/26 (c) | | 7,334,000 | 7,498,868 |
| Bombardier, Inc.: | | | |
| 6% 10/15/22 (c) | | 2,055,000 | 2,055,514 |
| 6.125% 1/15/23 (c) | | 102,000 | 106,925 |
| 7.5% 12/1/24 (c) | | 315,000 | 319,725 |
| 7.5% 3/15/25 (c) | | 16,882,000 | 16,850,346 |
| 7.875% 4/15/27 (c) | | 7,768,000 | 7,748,580 |
| BWX Technologies, Inc. 4.125% 6/30/28 (c) | | 3,035,000 | 3,088,113 |
| Howmet Aerospace, Inc. 6.75% 1/15/28 | | 190,000 | 227,763 |
| Kaiser Aluminum Corp.: | | | |
| 4.625% 3/1/28 (c) | | 4,665,000 | 4,793,288 |
| 6.5% 5/1/25 (c) | | 1,655,000 | 1,754,300 |
| Moog, Inc. 4.25% 12/15/27 (c) | | 3,715,000 | 3,817,163 |
| TransDigm UK Holdings PLC 6.875% 5/15/26 | | 1,610,000 | 1,692,513 |
| TransDigm, Inc.: | | | |
| 4.625% 1/15/29 (c) | | 5,485,000 | 5,405,522 |
| 5.5% 11/15/27 | | 16,920,000 | 17,596,800 |
| 6.25% 3/15/26 (c) | | 8,871,000 | 9,392,171 |
| 7.5% 3/15/27 | | 1,455,000 | 1,558,669 |
| 8% 12/15/25 (c) | | 7,155,000 | 7,772,119 |
| | | | 106,545,910 |
| Automotive & Auto Parts - 0.3% | | | |
| Ford Motor Credit Co. LLC 5.113% 5/3/29 | | 4,460,000 | 4,871,212 |
| Real Hero Merger Sub 2 6.25% 2/1/29 (c) | | 480,000 | 496,579 |
| | | | 5,367,791 |
| Banks & Thrifts - 0.2% | | | |
| Ally Financial, Inc. 8% 11/1/31 | | 2,332,000 | 3,279,854 |
| Broadcasting - 1.4% | | | |
| Diamond Sports Group LLC/Diamond Sports Finance Co. 5.375% 8/15/26 (c) | | 6,320,000 | 4,613,600 |
| Gray Television, Inc. 4.75% 10/15/30 (c) | | 1,515,000 | 1,515,000 |
| Sinclair Television Group, Inc.: | | | |
| 5.125% 2/15/27 (c) | | 3,880,000 | 3,841,200 |
| 5.5% 3/1/30 (c) | | 1,705,000 | 1,694,344 |
| Sirius XM Radio, Inc.: | | | |
| 4.125% 7/1/30 (c) | | 985,000 | 985,000 |
| 5% 8/1/27 (c) | | 4,558,000 | 4,773,125 |
| Tegna, Inc.: | | | |
| 4.625% 3/15/28 | | 1,895,000 | 1,935,269 |
| 5% 9/15/29 | | 725,000 | 752,188 |
| Univision Communications, Inc. 6.625% 6/1/27 (c) | | 3,080,000 | 3,337,950 |
| | | | 23,447,676 |
| Building Materials - 0.4% | | | |
| Advanced Drain Systems, Inc. 5% 9/30/27 (c) | | 6,029,000 | 6,310,132 |
| Cable/Satellite TV - 4.9% | | | |
| CCO Holdings LLC/CCO Holdings Capital Corp.: | | | |
| 4.25% 2/1/31 (c) | | 3,680,000 | 3,680,000 |
| 4.5% 8/15/30 (c) | | 2,885,000 | 2,935,170 |
| 4.5% 5/1/32 (c) | | 7,935,000 | 8,014,350 |
| 4.5% 6/1/33 (c) | | 3,195,000 | 3,219,985 |
| 4.75% 3/1/30 (c) | | 4,755,000 | 4,963,031 |
| 5% 2/1/28 (c) | | 5,417,000 | 5,660,765 |
| CSC Holdings LLC: | | | |
| 4.125% 12/1/30 (c) | | 3,245,000 | 3,228,775 |
| 4.625% 12/1/30 (c) | | 11,030,000 | 10,781,825 |
| 5.75% 1/15/30 (c) | | 3,725,000 | 3,960,141 |
| 7.5% 4/1/28 (c) | | 1,885,000 | 2,075,856 |
| Dolya Holdco 18 DAC 5% 7/15/28 (c) | | 3,880,000 | 3,927,569 |
| Radiate Holdco LLC/Radiate Financial Service Ltd.: | | | |
| 4.5% 9/15/26 (c) | | 4,065,000 | 4,136,138 |
| 6.5% 9/15/28 (c) | | 8,060,000 | 8,390,944 |
| Telenet Finance Luxembourg Notes SARL 5.5% 3/1/28 (c) | | 5,400,000 | 5,718,600 |
| Virgin Media Finance PLC 5% 7/15/30 (c) | | 3,645,000 | 3,634,357 |
| Virgin Media Secured Finance PLC 4.5% 8/15/30 (c) | | 3,280,000 | 3,294,837 |
| Ziggo Bond Co. BV 5.125% 2/28/30 (c) | | 3,605,000 | 3,692,241 |
| Ziggo BV 4.875% 1/15/30 (c) | | 1,705,000 | 1,752,263 |
| | | | 83,066,847 |
| Capital Goods - 0.5% | | | |
| Vertical U.S. Newco, Inc. 5.25% 7/15/27 (c) | | 8,115,000 | 8,495,431 |
| Chemicals - 4.2% | | | |
| Axalta Coating Systems/Dutch Holding BV 4.75% 6/15/27 (c) | | 3,675,000 | 3,849,563 |
| Bausch Health Companies, Inc. 6.25% 2/15/29 (c) | | 5,465,000 | 5,779,238 |
| CF Industries Holdings, Inc.: | | | |
| 4.95% 6/1/43 | | 25,000 | 29,125 |
| 5.15% 3/15/34 | | 4,790,000 | 5,604,300 |
| 5.375% 3/15/44 | | 1,366,000 | 1,670,912 |
| Consolidated Energy Finance SA: | | | |
| 3 month U.S. LIBOR + 3.750% 3.9339% 6/15/22 (c)(d)(e) | | 829,000 | 826,729 |
| 6.5% 5/15/26 (c) | | 5,775,000 | 5,731,688 |
| 6.875% 6/15/25 (c) | | 1,110,000 | 1,114,163 |
| Kronos Acquisition Holdings, Inc. / KIK Custom Products, Inc.: | | | |
| 5% 12/31/26 (c) | | 4,470,000 | 4,509,113 |
| 7% 12/31/27 (c) | | 440,000 | 426,747 |
| Methanex Corp.: | | | |
| 5.125% 10/15/27 | | 4,800,000 | 5,065,152 |
| 5.25% 12/15/29 | | 550,000 | 580,938 |
| 5.65% 12/1/44 | | 3,277,000 | 3,335,658 |
| NOVA Chemicals Corp.: | | | |
| 4.25% 5/15/29 (c)(f) | | 1,900,000 | 1,881,000 |
| 5.25% 6/1/27 (c) | | 3,545,000 | 3,766,563 |
| Olin Corp.: | | | |
| 5% 2/1/30 | | 3,130,000 | 3,294,325 |
| 5.125% 9/15/27 | | 47,000 | 49,069 |
| 5.625% 8/1/29 | | 2,935,000 | 3,175,112 |
| The Chemours Co. LLC: | | | |
| 5.375% 5/15/27 | | 3,599,000 | 3,859,928 |
| 5.75% 11/15/28 (c) | | 12,755,000 | 13,549,892 |
| Valvoline, Inc. 4.25% 2/15/30 (c) | | 1,100,000 | 1,127,478 |
| W. R. Grace & Co.-Conn. 4.875% 6/15/27 (c) | | 1,925,000 | 2,006,813 |
| | | | 71,233,506 |
| Consumer Products - 0.6% | | | |
| Mattel, Inc.: | | | |
| 3.75% 4/1/29 (c) | | 2,720,000 | 2,787,510 |
| 5.45% 11/1/41 | | 425,000 | 484,632 |
| 6.2% 10/1/40 | | 3,304,000 | 3,964,800 |
| Newell Brands, Inc. 5.875% 4/1/36 | | 415,000 | 515,513 |
| Prestige Brands, Inc. 3.75% 4/1/31 (c) | | 2,155,000 | 2,068,649 |
| Spectrum Brands Holdings, Inc. 3.875% 3/15/31 (c) | | 1,035,000 | 1,014,300 |
| | | | 10,835,404 |
| Containers - 1.5% | | | |
| Ardagh Packaging Finance PLC/Ardagh MP Holdings U.S.A., Inc.: | | | |
| 4.125% 8/15/26 (c) | | 160,000 | 164,600 |
| 6% 2/15/25 (c) | | 1,907,000 | 1,967,585 |
| Flex Acquisition Co., Inc.: | | | |
| 6.875% 1/15/25 (c) | | 7,499,000 | 7,620,859 |
| 7.875% 7/15/26 (c) | | 5,243,000 | 5,485,489 |
| OI European Group BV 4% 3/15/23 (c) | | 66,000 | 67,815 |
| Owens-Brockway Glass Container, Inc. 5.375% 1/15/25 (c) | | 161,000 | 171,264 |
| Trivium Packaging Finance BV: | | | |
| 5.5% 8/15/26 (c) | | 5,719,000 | 5,983,504 |
| 8.5% 8/15/27 (c) | | 4,080,000 | 4,365,600 |
| | | | 25,826,716 |
| Diversified Financial Services - 2.2% | | | |
| Icahn Enterprises LP/Icahn Enterprises Finance Corp.: | | | |
| 4.375% 2/1/29 (c) | | 3,160,000 | 3,064,947 |
| 4.75% 9/15/24 | | 4,960,000 | 5,197,584 |
| 5.25% 5/15/27 (c) | | 2,145,000 | 2,187,900 |
| 5.25% 5/15/27 | | 3,320,000 | 3,386,400 |
| 6.25% 5/15/26 | | 3,535,000 | 3,726,244 |
| Ladder Capital Finance Holdings LLLP/Ladder Capital Finance Corp. 4.25% 2/1/27 (c) | | 1,525,000 | 1,497,199 |
| MSCI, Inc. 5.375% 5/15/27 (c) | | 110,000 | 117,596 |
| Quicken Loans, Inc. 5.25% 1/15/28 (c) | | 4,724,000 | 4,983,820 |
| Springleaf Finance Corp.: | | | |
| 6.875% 3/15/25 | | 1,911,000 | 2,171,374 |
| 7.125% 3/15/26 | | 3,787,000 | 4,426,056 |
| VMED O2 UK Financing I PLC 4.25% 1/31/31 (c) | | 7,460,000 | 7,217,550 |
| | | | 37,976,670 |
| Diversified Media - 1.0% | | | |
| Advantage Sales & Marketing, Inc. 6.5% 11/15/28 (c) | | 6,200,000 | 6,556,500 |
| Nielsen Finance LLC/Nielsen Finance Co.: | | | |
| 5.625% 10/1/28 (c) | | 3,100,000 | 3,305,375 |
| 5.875% 10/1/30 (c) | | 3,085,000 | 3,378,075 |
| Terrier Media Buyer, Inc. 8.875% 12/15/27 (c) | | 3,540,000 | 3,845,325 |
| | | | 17,085,275 |
| Energy - 15.0% | | | |
| Apache Corp.: | | | |
| 4.25% 1/15/30 | | 750,000 | 752,670 |
| 5.1% 9/1/40 | | 3,500,000 | 3,587,938 |
| 5.35% 7/1/49 | | 515,000 | 515,000 |
| 7.375% 8/15/47 | | 515,000 | 571,650 |
| California Resources Corp. 7.125% 2/1/26 (c) | | 2,505,000 | 2,565,922 |
| Cheniere Energy, Inc. 4.625% 10/15/28 (c) | | 3,725,000 | 3,883,871 |
| Citgo Petroleum Corp.: | | | |
| 6.375% 6/15/26 (c) | | 11,475,000 | 11,763,023 |
| 7% 6/15/25 (c) | | 6,211,000 | 6,405,094 |
| CNX Resources Corp. 6% 1/15/29 (c) | | 725,000 | 773,793 |
| Comstock Resources, Inc.: | | | |
| 6.75% 3/1/29 (c) | | 2,665,000 | 2,722,298 |
| 7.5% 5/15/25 (c) | | 739,000 | 763,258 |
| 9.75% 8/15/26 | | 3,401,000 | 3,697,839 |
| Crestwood Midstream Partners LP/Crestwood Midstream Finance Corp.: | | | |
| 5.625% 5/1/27 (c) | | 12,109,000 | 12,320,908 |
| 5.75% 4/1/25 | | 5,985,000 | 6,142,106 |
| 6% 2/1/29 (c) | | 8,858,000 | 9,156,958 |
| CVR Energy, Inc.: | | | |
| 5.25% 2/15/25 (c) | | 9,370,000 | 9,416,850 |
| 5.75% 2/15/28 (c) | | 7,100,000 | 7,186,052 |
| DCP Midstream Operating LP 8.125% 8/16/30 | | 95,000 | 123,500 |
| Endeavor Energy Resources LP/EER Finance, Inc.: | | | |
| 5.5% 1/30/26 (c) | | 785,000 | 812,962 |
| 5.75% 1/30/28 (c) | | 2,778,000 | 2,965,515 |
| 6.625% 7/15/25 (c) | | 677,000 | 721,005 |
| EnLink Midstream LLC 5.625% 1/15/28 (c) | | 665,000 | 687,444 |
| EnLink Midstream Partners LP: | | | |
| 5.05% 4/1/45 | | 875,000 | 719,688 |
| 5.45% 6/1/47 | | 1,825,000 | 1,537,563 |
| 5.6% 4/1/44 | | 320,000 | 276,000 |
| EQM Midstream Partners LP: | | | |
| 4.75% 1/15/31 (c) | | 3,420,000 | 3,385,424 |
| 5.5% 7/15/28 | | 185,000 | 196,507 |
| 6.5% 7/1/27 (c) | | 2,900,000 | 3,202,279 |
| EQT Corp. 3.9% 10/1/27 | | 2,530,000 | 2,637,753 |
| Global Partners LP/GLP Finance Corp. 6.875% 1/15/29 | | 3,460,000 | 3,741,125 |
| Hess Midstream Partners LP: | | | |
| 5.125% 6/15/28 (c) | | 3,025,000 | 3,130,875 |
| 5.625% 2/15/26 (c) | | 6,665,000 | 6,914,938 |
| Hilcorp Energy I LP/Hilcorp Finance Co. 6.25% 11/1/28 (c) | | 1,145,000 | 1,188,476 |
| Holly Energy Partners LP/Holly Energy Finance Corp. 5% 2/1/28 (c) | | 4,665,000 | 4,816,613 |
| MEG Energy Corp.: | | | |
| 5.875% 2/1/29 (c) | | 1,860,000 | 1,906,500 |
| 7.125% 2/1/27 (c) | | 1,810,000 | 1,932,682 |
| New Fortress Energy LLC: | | | |
| 6.5% 9/30/26 (c) | | 11,870,000 | 12,111,317 |
| 6.75% 9/15/25 (c) | | 11,260,000 | 11,650,609 |
| NGL Energy Operating LLC/NGL Energy Finance Corp. 7.5% 2/1/26 (c) | | 11,365,000 | 11,904,838 |
| Occidental Petroleum Corp.: | | | |
| 2.9% 8/15/24 | | 1,475,000 | 1,471,313 |
| 3.4% 4/15/26 | | 1,970,000 | 1,948,212 |
| 3.5% 8/15/29 | | 2,930,000 | 2,798,150 |
| 4.2% 3/15/48 | | 1,955,000 | 1,647,498 |
| 4.3% 8/15/39 | | 1,035,000 | 913,098 |
| 4.4% 4/15/46 | | 2,995,000 | 2,635,600 |
| 4.4% 8/15/49 | | 2,240,000 | 1,937,600 |
| 5.55% 3/15/26 | | 5,025,000 | 5,395,594 |
| 6.125% 1/1/31 | | 2,315,000 | 2,575,438 |
| 6.2% 3/15/40 | | 1,005,000 | 1,067,813 |
| 6.45% 9/15/36 | | 5,290,000 | 6,010,763 |
| 7.5% 5/1/31 | | 6,540,000 | 7,782,600 |
| 7.875% 9/15/31 | | 635,000 | 771,525 |
| 8.875% 7/15/30 | | 2,170,000 | 2,788,450 |
| PBF Holding Co. LLC/PBF Finance Corp. 9.25% 5/15/25 (c) | | 9,850,000 | 10,293,250 |
| Rockies Express Pipeline LLC: | | | |
| 4.8% 5/15/30 (c) | | 145,000 | 142,281 |
| 4.95% 7/15/29 (c) | | 1,730,000 | 1,762,438 |
| 6.875% 4/15/40 (c) | | 655,000 | 703,306 |
| Sanchez Energy Corp. 7.25% 2/15/23 (b)(c)(g) | | 10,580,000 | 1 |
| Sunoco LP/Sunoco Finance Corp.: | | | |
| 4.5% 5/15/29 (c) | | 3,885,000 | 3,923,850 |
| 5.875% 3/15/28 | | 875,000 | 925,313 |
| 6% 4/15/27 | | 115,000 | 120,928 |
| Superior Plus LP / Superior General Partner, Inc. 4.5% 3/15/29 (c) | | 1,155,000 | 1,176,991 |
| Tallgrass Energy Partners LP / Tallgrass Energy Finance Corp.: | | | |
| 5.5% 1/15/28 (c) | | 1,675,000 | 1,654,063 |
| 6% 3/1/27 (c) | | 4,060,000 | 4,119,682 |
| 6% 12/31/30 (c) | | 2,190,000 | 2,195,475 |
| 7.5% 10/1/25 (c) | | 365,000 | 398,763 |
| Targa Resources Partners LP/Targa Resources Partners Finance Corp.: | | | |
| 4% 1/15/32 (c) | | 3,070,000 | 3,016,275 |
| 4.875% 2/1/31 (c) | | 12,375,000 | 12,912,818 |
| 5.375% 2/1/27 | | 10,000 | 10,382 |
| 5.5% 3/1/30 | | 845,000 | 913,944 |
| Transocean Guardian Ltd. 5.875% 1/15/24 (c) | | 1,464,501 | 1,361,986 |
| Transocean Phoenix 2 Ltd. 7.75% 10/15/24 (c) | | 277,750 | 275,667 |
| Transocean Pontus Ltd. 6.125% 8/1/25 (c) | | 732,250 | 713,944 |
| Transocean Poseidon Ltd. 6.875% 2/1/27 (c) | | 1,010,000 | 959,500 |
| Transocean Sentry Ltd. 5.375% 5/15/23 (c) | | 1,551,467 | 1,470,015 |
| Western Gas Partners LP: | | | |
| 4.35% 2/1/25 | | 3,005,000 | 3,176,766 |
| 4.65% 7/1/26 | | 1,150,000 | 1,231,219 |
| 5.3% 2/1/30 | | 3,735,000 | 4,075,819 |
| | | | 256,067,173 |
| Environmental - 0.9% | | | |
| Darling Ingredients, Inc. 5.25% 4/15/27 (c) | | 3,875,000 | 4,073,594 |
| LBC Tank Terminals Holding Netherlands BV 6.875% 5/15/23 (c) | | 8,470,000 | 8,417,063 |
| Stericycle, Inc. 3.875% 1/15/29 (c) | | 2,775,000 | 2,768,063 |
| | | | 15,258,720 |
| Food & Drug Retail - 0.4% | | | |
| Albertsons Companies LLC/Safeway, Inc./New Albertson's, Inc./Albertson's LLC: | | | |
| 3.5% 3/15/29 (c) | | 6,455,000 | 6,196,800 |
| 4.875% 2/15/30 (c) | | 500,000 | 520,567 |
| Murphy Oil U.S.A., Inc. 3.75% 2/15/31 (c) | | 675,000 | 664,875 |
| | | | 7,382,242 |
| Food/Beverage/Tobacco - 3.5% | | | |
| C&S Group Enterprises LLC 5% 12/15/28 (c) | | 5,080,000 | 5,047,996 |
| JBS U.S.A. LLC/JBS U.S.A. Finance, Inc. 6.75% 2/15/28 (c) | | 7,672,000 | 8,476,793 |
| JBS U.S.A. Lux SA / JBS Food Co.: | | | |
| 5.5% 1/15/30 (c) | | 4,490,000 | 4,939,045 |
| 6.5% 4/15/29 (c) | | 9,811,000 | 11,012,848 |
| Performance Food Group, Inc.: | | | |
| 5.5% 10/15/27 (c) | | 3,085,000 | 3,251,096 |
| 6.875% 5/1/25 (c) | | 4,250,000 | 4,542,740 |
| Post Holdings, Inc.: | | | |
| 4.5% 9/15/31 (c) | | 3,955,000 | 3,926,524 |
| 4.625% 4/15/30 (c) | | 1,290,000 | 1,302,900 |
| 5.5% 12/15/29 (c) | | 2,815,000 | 3,030,488 |
| Primo Water Holdings, Inc.: | | | |
| 4.375% 4/30/29 (c) | | 5,030,000 | 5,018,984 |
| 5.5% 4/1/25 (c) | | 3,048,000 | 3,132,491 |
| TreeHouse Foods, Inc. 4% 9/1/28 | | 2,445,000 | 2,429,719 |
| Triton Water Holdings, Inc. 6.25% 4/1/29 (c) | | 760,000 | 769,500 |
| U.S. Foods, Inc. 4.75% 2/15/29 (c) | | 2,180,000 | 2,199,075 |
| | | | 59,080,199 |
| Gaming - 4.6% | | | |
| Affinity Gaming LLC 6.875% 12/15/27 (c) | | 4,130,000 | 4,384,016 |
| Boyd Gaming Corp.: | | | |
| 4.75% 12/1/27 | | 1,933,000 | 1,981,499 |
| 6.375% 4/1/26 | | 3,693,000 | 3,813,023 |
| Caesars Entertainment, Inc.: | | | |
| 6.25% 7/1/25 (c) | | 5,725,000 | 6,086,820 |
| 8.125% 7/1/27 (c) | | 10,480,000 | 11,645,166 |
| Caesars Resort Collection LLC 5.25% 10/15/25 (c) | | 5,030,000 | 5,070,932 |
| Golden Entertainment, Inc. 7.625% 4/15/26 (c) | | 7,980,000 | 8,513,663 |
| Golden Nugget, Inc. 6.75% 10/15/24 (c) | | 7,388,000 | 7,480,350 |
| MCE Finance Ltd.: | | | |
| 4.875% 6/6/25 (c) | | 2,855,000 | 2,929,516 |
| 5.375% 12/4/29 (c) | | 1,610,000 | 1,713,765 |
| 5.75% 7/21/28 (c) | | 2,420,000 | 2,602,710 |
| MGM Growth Properties Operating Partnership LP: | | | |
| 4.5% 1/15/28 | | 31,000 | 32,318 |
| 5.75% 2/1/27 | | 1,434,000 | 1,599,362 |
| Station Casinos LLC: | | | |
| 4.5% 2/15/28 (c) | | 7,515,000 | 7,533,788 |
| 5% 10/1/25 (c) | | 873,000 | 885,004 |
| VICI Properties, Inc. 4.25% 12/1/26 (c) | | 2,955,000 | 3,047,344 |
| Wynn Las Vegas LLC/Wynn Las Vegas Capital Corp. 5.25% 5/15/27 (c) | | 3,289,000 | 3,474,006 |
| Wynn Macau Ltd.: | | | |
| 4.875% 10/1/24 (c) | | 3,137,000 | 3,179,350 |
| 5.5% 10/1/27 (c) | | 2,575,000 | 2,688,139 |
| | | | 78,660,771 |
| Healthcare - 6.1% | | | |
| Avantor Funding, Inc. 4.625% 7/15/28 (c) | | 4,885,000 | 5,117,038 |
| Bausch Health Companies, Inc.: | | | |
| 5% 1/30/28 (c) | | 2,480,000 | 2,517,200 |
| 5% 2/15/29 (c) | | 1,010,000 | 1,011,555 |
| 5.25% 1/30/30 (c) | | 1,520,000 | 1,527,600 |
| 5.25% 2/15/31 (c) | | 3,535,000 | 3,539,808 |
| Centene Corp. 4.25% 12/15/27 | | 1,595,000 | 1,671,735 |
| Charles River Laboratories International, Inc.: | | | |
| 3.75% 3/15/29 (c) | | 1,150,000 | 1,170,125 |
| 4.25% 5/1/28 (c) | | 472,000 | 491,505 |
| Community Health Systems, Inc.: | | | |
| 4.75% 2/15/31 (c) | | 3,505,000 | 3,478,713 |
| 5.625% 3/15/27 (c) | | 2,525,000 | 2,676,500 |
| 6% 1/15/29 (c) | | 2,020,000 | 2,126,383 |
| 6.875% 4/15/29 (c) | | 1,980,000 | 2,069,100 |
| 8% 3/15/26 (c) | | 10,019,000 | 10,795,473 |
| 8.125% 6/30/24 (c) | | 2,020,000 | 2,108,375 |
| CTR Partnership LP/CareTrust Capital Corp. 5.25% 6/1/25 | | 4,651,000 | 4,788,670 |
| DaVita HealthCare Partners, Inc. 4.625% 6/1/30 (c) | | 8,715,000 | 8,823,938 |
| Hologic, Inc.: | | | |
| 3.25% 2/15/29 (c) | | 3,405,000 | 3,345,413 |
| 4.625% 2/1/28 (c) | | 6,000 | 6,330 |
| IQVIA, Inc. 5% 5/15/27 (c) | | 4,387,000 | 4,589,899 |
| Jazz Securities DAC 4.375% 1/15/29 (c) | | 2,510,000 | 2,566,475 |
| Molina Healthcare, Inc. 3.875% 11/15/30 (c) | | 1,465,000 | 1,508,950 |
| Organon Finance 1 LLC: | | | |
| 4.125% 4/30/28 (c) | | 3,400,000 | 3,483,266 |
| 5.125% 4/30/31 (c) | | 2,160,000 | 2,241,216 |
| Owens & Minor, Inc. 4.5% 3/31/29 (c) | | 1,010,000 | 1,019,908 |
| Radiology Partners, Inc. 9.25% 2/1/28 (c) | | 3,750,000 | 4,115,625 |
| RP Escrow Issuer LLC 5.25% 12/15/25 (c) | | 5,310,000 | 5,527,232 |
| Teleflex, Inc. 4.25% 6/1/28 (c) | | 930,000 | 960,225 |
| Tenet Healthcare Corp.: | | | |
| 4.625% 6/15/28 (c) | | 1,165,000 | 1,203,726 |
| 4.875% 1/1/26 (c) | | 2,570,000 | 2,670,230 |
| 5.125% 5/1/25 | | 2,027,000 | 2,051,324 |
| 6.125% 10/1/28 (c) | | 7,860,000 | 8,292,300 |
| 6.25% 2/1/27 (c) | | 2,741,000 | 2,874,624 |
| U.S. Renal Care, Inc. 10.625% 7/15/27 (c) | | 2,150,000 | 2,273,625 |
| Vizient, Inc. 6.25% 5/15/27 (c) | | 385,000 | 407,807 |
| | | | 103,051,893 |
| Homebuilders/Real Estate - 1.6% | | | |
| Howard Hughes Corp.: | | | |
| 4.125% 2/1/29 (c) | | 1,325,000 | 1,311,750 |
| 4.375% 2/1/31 (c) | | 1,325,000 | 1,311,750 |
| Realogy Group LLC/Realogy Co-Issuer Corp. 5.75% 1/15/29 (c) | | 3,140,000 | 3,257,750 |
| Service Properties Trust: | | | |
| 4.95% 2/15/27 | | 395,000 | 388,099 |
| 4.95% 10/1/29 | | 160,000 | 154,600 |
| 5.5% 12/15/27 | | 1,430,000 | 1,505,841 |
| Uniti Group LP / Uniti Group Finance, Inc.: | | | |
| 4.75% 4/15/28 (c) | | 2,020,000 | 2,012,425 |
| 6.5% 2/15/29 (c) | | 17,060,000 | 16,958,237 |
| | | | 26,900,452 |
| Hotels - 0.5% | | | |
| Hilton Domestic Operating Co., Inc.: | | | |
| 3.625% 2/15/32 (c) | | 3,710,000 | 3,648,488 |
| 3.75% 5/1/29 (c) | | 495,000 | 496,238 |
| 4% 5/1/31 (c) | | 1,790,000 | 1,807,900 |
| Hilton Worldwide Finance LLC/Hilton Worldwide Finance Corp. 4.875% 4/1/27 | | 12,000 | 12,465 |
| NCL Finance Ltd. 6.125% 3/15/28 (c) | | 640,000 | 674,125 |
| Viking Ocean Cruises Ship VII Ltd. 5.625% 2/15/29 (c) | | 630,000 | 640,238 |
| Wyndham Hotels & Resorts, Inc. 4.375% 8/15/28 (c) | | 1,785,000 | 1,842,477 |
| | | | 9,121,931 |
| Insurance - 1.8% | | | |
| Alliant Holdings Intermediate LLC: | | | |
| 4.25% 10/15/27 (c) | | 445,000 | 450,563 |
| 6.75% 10/15/27 (c) | | 14,690,000 | 15,424,500 |
| AmWINS Group, Inc. 7.75% 7/1/26 (c) | | 2,852,000 | 3,026,685 |
| AssuredPartners, Inc. 5.625% 1/15/29 (c) | | 1,355,000 | 1,373,604 |
| USI, Inc. 6.875% 5/1/25 (c) | | 9,449,000 | 9,602,546 |
| | | | 29,877,898 |
| Leisure - 1.7% | | | |
| Carnival Corp.: | | | |
| 5.75% 3/1/27 (c) | | 6,900,000 | 7,275,222 |
| 6.65% 1/15/28 | | 300,000 | 321,000 |
| 7.625% 3/1/26 (c) | | 6,535,000 | 7,155,825 |
| NCL Corp. Ltd. 5.875% 3/15/26 (c) | | 890,000 | 930,050 |
| Royal Caribbean Cruises Ltd.: | | | |
| 5.5% 4/1/28 (c) | | 4,905,000 | 5,143,874 |
| 9.125% 6/15/23 (c) | | 795,000 | 877,648 |
| 11.5% 6/1/25 (c) | | 3,395,000 | 3,929,713 |
| Viking Cruises Ltd. 13% 5/15/25 (c) | | 1,070,000 | 1,252,114 |
| Voc Escrow Ltd. 5% 2/15/28 (c) | | 1,950,000 | 1,989,000 |
| | | | 28,874,446 |
| Metals/Mining - 1.4% | | | |
| First Quantum Minerals Ltd.: | | | |
| 6.5% 3/1/24 (c) | | 2,641,000 | 2,710,326 |
| 6.875% 10/15/27 (c) | | 3,790,000 | 4,140,575 |
| 7.25% 4/1/23 (c) | | 6,245,000 | 6,346,481 |
| FMG Resources (August 2006) Pty Ltd.: | | | |
| 4.375% 4/1/31 (c) | | 3,150,000 | 3,272,063 |
| 4.5% 9/15/27 (c) | | 65,000 | 70,600 |
| Howmet Aerospace, Inc. 5.95% 2/1/37 | | 160,000 | 192,232 |
| HudBay Minerals, Inc. 4.5% 4/1/26 (c) | | 860,000 | 872,900 |
| Nufarm Australia Ltd. 5.75% 4/30/26 (c) | | 5,812,000 | 5,966,483 |
| | | | 23,571,660 |
| Paper - 0.4% | | | |
| Ardagh Metal Packaging Finance U.S.A. LLC/Ardagh Metal Packaging Finance PLC 4% 9/1/29 (c) | | 3,945,000 | 3,925,275 |
| SPA Holdings 3 OY 4.875% 2/4/28 (c) | | 2,980,000 | 2,998,625 |
| | | | 6,923,900 |
| Publishing/Printing - 0.2% | | | |
| Meredith Corp. 6.875% 2/1/26 | | 3,262,000 | 3,347,628 |
| Restaurants - 0.6% | | | |
| 1011778 BC Unlimited Liability Co./New Red Finance, Inc. 4% 10/15/30 (c) | | 6,735,000 | 6,566,625 |
| Yum! Brands, Inc. 4.625% 1/31/32 | | 3,475,000 | 3,632,070 |
| | | | 10,198,695 |
| Services - 5.7% | | | |
| Adtalem Global Education, Inc. 5.5% 3/1/28 (c) | | 5,210,000 | 5,223,025 |
| AECOM 5.125% 3/15/27 | | 2,335,000 | 2,597,688 |
| APX Group, Inc. 6.75% 2/15/27 (c) | | 3,440,000 | 3,699,135 |
| Aramark Services, Inc.: | | | |
| 4.75% 6/1/26 | | 265,000 | 271,294 |
| 5% 2/1/28 (c) | | 15,140,000 | 15,840,225 |
| 6.375% 5/1/25 (c) | | 9,035,000 | 9,610,981 |
| Ascend Learning LLC: | | | |
| 6.875% 8/1/25 (c) | | 793,000 | 812,825 |
| 6.875% 8/1/25 (c) | | 5,259,000 | 5,390,475 |
| ASGN, Inc. 4.625% 5/15/28 (c) | | 1,770,000 | 1,840,800 |
| Booz Allen Hamilton, Inc. 3.875% 9/1/28 (c) | | 4,820,000 | 4,807,950 |
| Brand Energy & Infrastructure Services, Inc. 8.5% 7/15/25 (c) | | 8,652,000 | 8,825,040 |
| Frontdoor, Inc. 6.75% 8/15/26 (c) | | 1,942,000 | 2,059,161 |
| Gartner, Inc. 3.75% 10/1/30 (c) | | 1,600,000 | 1,604,000 |
| GEMS MENASA Cayman Ltd. 7.125% 7/31/26 (c) | | 9,121,000 | 9,554,248 |
| Legends Hospitality Holding Co. LLC/Legends Hospitality Co-Issuer, Inc. 5% 2/1/26 (c) | | 5,185,000 | 5,353,513 |
| PowerTeam Services LLC 9.033% 12/4/25 (c) | | 2,020,000 | 2,239,675 |
| Service Corp. International 5.125% 6/1/29 | | 2,272,000 | 2,452,828 |
| Sotheby's 7.375% 10/15/27 (c) | | 8,795,000 | 9,479,247 |
| The GEO Group, Inc. 6% 4/15/26 | | 2,110,000 | 1,456,343 |
| TriNet Group, Inc. 3.5% 3/1/29 (c) | | 2,555,000 | 2,494,319 |
| WASH Multifamily Acquisition, Inc. 5.75% 4/15/26 (c) | | 2,135,000 | 2,217,731 |
| | | | 97,830,503 |
| Super Retail - 1.7% | | | |
| EG Global Finance PLC: | | | |
| 6.75% 2/7/25 (c) | | 3,560,000 | 3,662,172 |
| 8.5% 10/30/25 (c) | | 6,085,000 | 6,457,585 |
| L Brands, Inc.: | | | |
| 5.25% 2/1/28 | | 400,000 | 438,500 |
| 6.625% 10/1/30 (c) | | 610,000 | 703,001 |
| 6.694% 1/15/27 | | 1,430,000 | 1,651,650 |
| 6.75% 7/1/36 | | 3,580,000 | 4,311,430 |
| 6.875% 11/1/35 | | 485,000 | 588,063 |
| LBM Acquisition LLC 6.25% 1/15/29 (c) | | 615,000 | 630,375 |
| Levi Strauss & Co. 3.5% 3/1/31 (c) | | 2,235,000 | 2,229,413 |
| The William Carter Co. 5.625% 3/15/27 (c) | | 4,251,000 | 4,468,864 |
| Wolverine World Wide, Inc. 6.375% 5/15/25 (c) | | 4,100,000 | 4,376,586 |
| | | | 29,517,639 |
| Technology - 3.1% | | | |
| Arches Buyer, Inc.: | | | |
| 4.25% 6/1/28 (c) | | 3,220,000 | 3,207,925 |
| 6.125% 12/1/28 (c) | | 5,800,000 | 5,945,000 |
| Black Knight InfoServ LLC 3.625% 9/1/28 (c) | | 4,235,000 | 4,139,713 |
| CDK Global, Inc. 5.25% 5/15/29 (c) | | 745,000 | 799,013 |
| Crowdstrike Holdings, Inc. 3% 2/15/29 | | 1,845,000 | 1,828,487 |
| Gartner, Inc. 4.5% 7/1/28 (c) | | 2,505,000 | 2,633,431 |
| Northwest Fiber LLC/Northwest Fiber Finance Sub, Inc. 10.75% 6/1/28 (c) | | 4,845,000 | 5,474,850 |
| ON Semiconductor Corp. 3.875% 9/1/28 (c) | | 1,875,000 | 1,930,076 |
| Open Text Corp. 3.875% 2/15/28 (c) | | 2,815,000 | 2,850,188 |
| Rackspace Hosting, Inc. 5.375% 12/1/28 (c) | | 17,920,000 | 18,294,170 |
| Sensata Technologies BV 4% 4/15/29 (c) | | 1,740,000 | 1,750,788 |
| TTM Technologies, Inc. 4% 3/1/29 (c) | | 2,270,000 | 2,272,838 |
| Twilio, Inc. 3.875% 3/15/31 | | 1,270,000 | 1,303,338 |
| | | | 52,429,817 |
| Telecommunications - 11.6% | | | |
| Altice Financing SA: | | | |
| 5% 1/15/28 (c) | | 6,530,000 | 6,440,213 |
| 7.5% 5/15/26 (c) | | 11,375,000 | 11,818,056 |
| Altice France Holding SA 6% 2/15/28 (c) | | 7,170,000 | 7,089,338 |
| Altice France SA: | | | |
| 5.125% 1/15/29 (c) | | 7,485,000 | 7,503,787 |
| 5.125% 7/15/29 (c) | | 6,050,000 | 6,058,228 |
| 5.5% 1/15/28 (c) | | 8,350,000 | 8,602,170 |
| 7.375% 5/1/26 (c) | | 2,989,000 | 3,098,995 |
| 8.125% 2/1/27 (c) | | 7,717,000 | 8,450,115 |
| C&W Senior Financing Designated Activity Co.: | | | |
| 6.875% 9/15/27 (c) | | 22,054,000 | 23,432,375 |
| 7.5% 10/15/26 (c) | | 13,208,000 | 14,000,480 |
| Cablevision Lightpath LLC: | | | |
| 3.875% 9/15/27 (c) | | 765,000 | 754,481 |
| 5.625% 9/15/28 (c) | | 605,000 | 620,125 |
| Consolidated Communications, Inc. 5% 10/1/28 (c) | | 930,000 | 943,950 |
| Frontier Communications Corp.: | | | |
| 5% 5/1/28 (c) | | 6,640,000 | 6,781,100 |
| 5.875% 10/15/27 (c) | | 1,455,000 | 1,545,938 |
| 6.75% 5/1/29 (c) | | 3,940,000 | 4,150,632 |
| Level 3 Financing, Inc.: | | | |
| 3.625% 1/15/29 (c) | | 565,000 | 547,344 |
| 4.25% 7/1/28 (c) | | 3,945,000 | 3,975,021 |
| Lumen Technologies, Inc.: | | | |
| 4.5% 1/15/29 (c) | | 4,070,000 | 4,008,950 |
| 5.125% 12/15/26 (c) | | 6,980,000 | 7,320,275 |
| 6.875% 1/15/28 | | 260,000 | 292,562 |
| Millicom International Cellular SA: | | | |
| 4.5% 4/27/31 (c) | | 240,000 | 255,000 |
| 6.625% 10/15/26 (c) | | 4,069,800 | 4,330,013 |
| Northwest Fiber LLC/Northwest Fiber Finance Sub, Inc. 6% 2/15/28 (c) | | 560,000 | 559,972 |
| Sable International Finance Ltd. 5.75% 9/7/27 (c) | | 830,000 | 869,425 |
| Sprint Capital Corp.: | | | |
| 6.875% 11/15/28 | | 12,535,000 | 15,794,441 |
| 8.75% 3/15/32 | | 7,680,000 | 11,385,600 |
| T-Mobile U.S.A., Inc. 2.875% 2/15/31 | | 4,335,000 | 4,232,044 |
| Telecom Italia Capital SA: | | | |
| 6% 9/30/34 | | 3,032,000 | 3,412,668 |
| 7.2% 7/18/36 | | 1,449,000 | 1,801,107 |
| 7.721% 6/4/38 | | 400,000 | 524,000 |
| Uniti Group, Inc.: | | | |
| 7.125% 12/15/24 (c) | | 7,155,000 | 7,386,822 |
| 7.875% 2/15/25 (c) | | 7,425,000 | 8,000,438 |
| Windstream Escrow LLC 7.75% 8/15/28 (c) | | 5,930,000 | 6,182,025 |
| Zayo Group Holdings, Inc.: | | | |
| 4% 3/1/27 (c) | | 2,600,000 | 2,581,800 |
| 6.125% 3/1/28 (c) | | 3,040,000 | 3,127,400 |
| | | | 197,876,890 |
| Utilities - 4.9% | | | |
| Clearway Energy Operating LLC 3.75% 2/15/31 (c) | | 4,085,000 | 4,026,544 |
| DCP Midstream Operating LP: | | | |
| 5.125% 5/15/29 | | 6,994,000 | 7,466,095 |
| 5.625% 7/15/27 | | 3,920,000 | 4,281,267 |
| Global Partners LP/GLP Finance Corp. 7% 8/1/27 | | 4,632,000 | 4,951,840 |
| InterGen NV 7% 6/30/23 (c) | | 10,532,000 | 10,163,380 |
| NextEra Energy Partners LP 4.25% 9/15/24 (c) | | 416,000 | 439,400 |
| NRG Energy, Inc.: | | | |
| 3.375% 2/15/29 (c) | | 4,645,000 | 4,546,294 |
| 3.625% 2/15/31 (c) | | 1,390,000 | 1,361,788 |
| 5.25% 6/15/29 (c) | | 3,365,000 | 3,604,756 |
| 5.75% 1/15/28 | | 4,384,000 | 4,658,000 |
| 6.625% 1/15/27 | | 38,000 | 39,604 |
| NSG Holdings II LLC/NSG Holdings, Inc. 7.75% 12/15/25 (c) | | 2,376,413 | 2,530,880 |
| PG&E Corp. 5.25% 7/1/30 | | 7,980,000 | 8,518,650 |
| Pike Corp. 5.5% 9/1/28 (c) | | 7,257,000 | 7,474,710 |
| TerraForm Power Operating LLC 5% 1/31/28 (c) | | 1,355,000 | 1,453,238 |
| Vistra Operations Co. LLC: | | | |
| 5% 7/31/27 (c) | | 9,189,000 | 9,520,080 |
| 5.5% 9/1/26 (c) | | 4,647,000 | 4,800,955 |
| 5.625% 2/15/27 (c) | | 3,595,000 | 3,738,800 |
| | | | 83,576,281 |
|
| TOTAL NONCONVERTIBLE BONDS | | | 1,519,019,950 |
|
| TOTAL CORPORATE BONDS | | | |
| (Cost $1,497,843,774) | | | 1,547,605,919 |
| | | Shares | Value |
|
| Common Stocks - 2.1% | | | |
| Energy - 0.4% | | | |
| California Resources Corp. (h) | | 16,516 | 391,429 |
| California Resources Corp. warrants 10/27/24 (h) | | 2,871 | 11,484 |
| Jonah Energy LLC (b) | | 148,945 | 2,234,175 |
| Mesquite Energy, Inc. (b) | | 149,356 | 3,282,851 |
|
| TOTAL ENERGY | | | 5,919,939 |
|
| Food & Drug Retail - 1.7% | | | |
| Southeastern Grocers, Inc. (a)(b)(h) | | 1,888,443 | 29,233,057 |
| Metals/Mining - 0.0% | | | |
| Elah Holdings, Inc. (h) | | 333 | 33,130 |
| TOTAL COMMON STOCKS | | | |
| (Cost $21,017,145) | | | 35,186,126 |
| | | Principal Amount | Value |
|
| Bank Loan Obligations - 2.9% | | | |
| Cable/Satellite TV - 0.0% | | | |
| WideOpenWest Finance LLC Tranche B, term loan 3 month U.S. LIBOR + 3.250% 4.25% 8/19/23 (d)(e)(i) | | 428,706 | 427,549 |
| Energy - 0.1% | | | |
| EG America LLC Tranche B 1LN, term loan 3 month U.S. LIBOR + 4.000% 4.2025% 2/6/25 (d)(e)(i) | | 1,635,000 | 1,610,475 |
| Sanchez Energy Corp.: | | | |
| 1LN, term loan 3 month U.S. LIBOR + 8.000% 0% (b)(e)(g)(i) | | 2,735,146 | 0 |
| term loan 3 month U.S. LIBOR + 0.000% 0% (b)(e)(g)(i) | | 1,217,000 | 0 |
|
| TOTAL ENERGY | | | 1,610,475 |
|
| Food/Beverage/Tobacco - 0.0% | | | |
| EG Finco Ltd. Tranche B, term loan 3 month U.S. LIBOR + 4.000% 4.2025% 2/6/25 (d)(e)(i) | | 605,000 | 595,925 |
| Gaming - 0.8% | | | |
| Golden Entertainment, Inc. Tranche B, term loan 3 month U.S. LIBOR + 3.000% 3.75% 10/20/24 (d)(e)(i) | | 5,895,000 | 5,840,943 |
| Golden Nugget LLC Tranche B 1LN, term loan 3 month U.S. LIBOR + 2.500% 3.25% 10/4/23 (d)(e)(i) | | 7,808,381 | 7,706,559 |
|
| TOTAL GAMING | | | 13,547,502 |
|
| Healthcare - 0.3% | | | |
| Gainwell Acquisition Corp. Tranche B 1LN, term loan 3 month U.S. LIBOR + 4.000% 4.75% 10/1/27 (d)(e)(i) | | 2,965,000 | 2,965,000 |
| Insulet Corp. Tranche B 1LN, term loan 1 month U.S. LIBOR + 3.250% 4/29/28 (e)(i)(j) | | 310,000 | 310,388 |
| Jazz Financing Lux SARL Tranche B 1LN, term loan 1 month U.S. LIBOR + 3.500% 4/22/28 (e)(i)(j) | | 815,000 | 816,695 |
| U.S. Renal Care, Inc. Tranche B 1LN, term loan 3 month U.S. LIBOR + 5.000% 5.125% 6/13/26 (d)(e)(i) | | 611,894 | 597,937 |
|
| TOTAL HEALTHCARE | | | 4,690,020 |
|
| Insurance - 0.3% | | | |
| Alliant Holdings Intermediate LLC Tranche B3 1LN, term loan 3 month U.S. LIBOR + 3.750% 4.25% 11/5/27 (d)(e)(i) | | 1,535,000 | 1,533,296 |
| HUB International Ltd. Tranche B, term loan 3 month U.S. LIBOR + 3.000% 3.1757% 4/25/25 (d)(e)(i) | | 3,770,362 | 3,718,180 |
|
| TOTAL INSURANCE | | | 5,251,476 |
|
| Super Retail - 0.2% | | | |
| LBM Acquisition LLC Tranche B 1LN, term loan: | | | |
| 3 month U.S. LIBOR + 3.750% 12/18/27 (e)(i)(j) | | 734,545 | 732,503 |
| 3 month U.S. LIBOR + 3.750% 4.5% 12/18/27 (d)(e)(i) | | 3,305,455 | 3,296,265 |
|
| TOTAL SUPER RETAIL | | | 4,028,768 |
|
| Technology - 0.6% | | | |
| Acuris Finance U.S., Inc. 1LN, term loan 3 month U.S. LIBOR + 4.000% 4.5% 2/16/28 (d)(e)(i) | | 705,000 | 705,000 |
| Northwest Fiber LLC Tranche B 1LN, term loan 3 month U.S. LIBOR + 3.750% 3.8605% 4/30/27 (d)(e)(i) | | 2,490,000 | 2,478,322 |
| Tempo Acquisition LLC Tranche B 1LN, term loan 3 month U.S. LIBOR + 3.250% 3.75% 10/31/26 (d)(e)(i) | | 4,114,273 | 4,107,402 |
| UKG, Inc. Tranche B 1LN, term loan 3 month U.S. LIBOR + 3.250% 4% 5/4/26 (d)(e)(i) | | 2,109,413 | 2,110,067 |
|
| TOTAL TECHNOLOGY | | | 9,400,791 |
|
| Telecommunications - 0.6% | | | |
| GTT Communications, Inc. Tranche B, term loan 3 month U.S. LIBOR + 2.750% 2.95% 5/31/25 (d)(e)(i) | | 5,936,170 | 5,078,690 |
| Intelsat Jackson Holdings SA: | | | |
| Tranche B-4, term loan 3 month U.S. LIBOR + 5.500% 8.75% 1/2/24 (d)(e)(i) | | 475,000 | 484,006 |
| Tranche DD 1LN, term loan 3 month U.S. LIBOR + 5.500% 6.5% 7/13/22 (d)(e)(i) | | 3,638,451 | 3,674,835 |
|
| TOTAL TELECOMMUNICATIONS | | | 9,237,531 |
|
| TOTAL BANK LOAN OBLIGATIONS | | | |
| (Cost $50,395,159) | | | 48,790,037 |
| | | Shares | Value |
|
| Money Market Funds - 1.4% | | | |
| Fidelity Cash Central Fund 0.04% (k) | | | |
| (Cost $23,827,446) | | 23,822,681 | 23,827,446 |
| TOTAL INVESTMENT IN SECURITIES - 97.3% | | | |
| (Cost $1,593,083,524) | | | 1,655,409,528 |
| NET OTHER ASSETS (LIABILITIES) - 2.7% | | | 46,751,592 |
| NET ASSETS - 100% | | | $1,702,161,120 |
Legend
(a) Restricted securities (including private placements) - Investment in securities not registered under the Securities Act of 1933 (excluding 144A issues). At the end of the period, the value of restricted securities (excluding 144A issues) amounted to $35,442,218 or 2.1% of net assets.
(b) Level 3 security
(c) Security exempt from registration under Rule 144A of the Securities Act of 1933. These securities may be resold in transactions exempt from registration, normally to qualified institutional buyers. At the end of the period, the value of these securities amounted to $1,234,824,581 or 72.5% of net assets.
(d) Coupon rates for floating and adjustable rate securities reflect the rates in effect at period end.
(e) Coupon is indexed to a floating interest rate which may be multiplied by a specified factor and/or subject to caps or floors.
(f) Security or a portion of the security purchased on a delayed delivery or when-issued basis.
(g) Non-income producing - Security is in default.
(h) Non-income producing
(i) Remaining maturities of bank loan obligations may be less than the stated maturities shown as a result of contractual or optional prepayments by the borrower. Such prepayments cannot be predicted with certainty.
(j) The coupon rate will be determined upon settlement of the loan after period end.
(k) Affiliated fund that is generally available only to investment companies and other accounts managed by Fidelity Investments. The rate quoted is the annualized seven-day yield of the fund at period end. A complete unaudited listing of the fund's holdings as of its most recent quarter end is available upon request. In addition, each Fidelity Central Fund's financial statements, which are not covered by the Fund's Report of Independent Registered Public Accounting Firm, are available on the SEC's website or upon request.
Additional information on each restricted holding is as follows:
| Security | Acquisition Date | Acquisition Cost |
| Mesquite Energy, Inc. 15% 7/15/23 | 7/10/20 - 4/15/21 | $1,051,450 |
| Mesquite Energy, Inc. 15% 7/15/23 | 11/5/20 - 4/15/21 | $1,813,773 |
| Southeastern Grocers, Inc. | 6/1/18 | $13,283,234 |
Affiliated Central Funds
Information regarding fiscal year to date income earned by the Fund from investments in Fidelity Central Funds is as follows:
| Fund | Income earned |
| Fidelity Cash Central Fund | $35,990 |
| Fidelity Securities Lending Cash Central Fund | 285 |
| Total | $36,275 |
Amounts in the income column in the above table include any capital gain distributions from underlying funds, which are presented in the corresponding line-item in the Statement of Operations, if applicable. Amount for Fidelity Securities Lending Cash Central Fund represents the income earned on investing cash collateral, less rebates paid to borrowers and any lending agent fees associated with the loan, plus any premium payments received for lending certain types of securities.
Investment Valuation
The following is a summary of the inputs used, as of April 30, 2021, involving the Fund's assets and liabilities carried at fair value. The inputs or methodology used for valuing securities may not be an indication of the risk associated with investing in those securities. For more information on valuation inputs, and their aggregation into the levels used below, please refer to the Investment Valuation section in the accompanying Notes to Financial Statements.
| | Valuation Inputs at Reporting Date: |
| Description | Total | Level 1 | Level 2 | Level 3 |
| Investments in Securities: | | | | |
| Equities: | | | | |
| Consumer Staples | $29,233,057 | $-- | $-- | $29,233,057 |
| Energy | 5,919,939 | 402,913 | -- | 5,517,026 |
| Materials | 33,130 | 33,130 | -- | -- |
| Corporate Bonds | 1,547,605,919 | -- | 1,541,396,797 | 6,209,122 |
| Bank Loan Obligations | 48,790,037 | -- | 48,790,037 | -- |
| Money Market Funds | 23,827,446 | 23,827,446 | -- | -- |
| Total Investments in Securities: | $1,655,409,528 | $24,263,489 | $1,590,186,834 | $40,959,205 |
The following is a reconciliation of Investments in Securities for which Level 3 inputs were used in determining value:
| Investments in Securities: | |
| Equities - Consumer Staples | |
| Beginning Balance | $17,689,167 |
| Net Realized Gain (Loss) on Investment Securities | -- |
| Net Unrealized Gain (Loss) on Investment Securities | 11,543,890 |
| Cost of Purchases | -- |
| Proceeds of Sales | -- |
| Amortization/Accretion | -- |
| Transfers into Level 3 | -- |
| Transfers out of Level 3 | -- |
| Ending Balance | $29,233,057 |
| The change in unrealized gain (loss) for the period attributable to Level 3 securities held at April 30, 2021 | $11,543,890 |
| Equities - Other Investments in Securities | |
| Beginning Balance | $3,161,717 |
| Net Realized Gain (Loss) on Investment Securities | (1,773,624) |
| Net Unrealized Gain (Loss) on Investment Securities | 3,866,576 |
| Cost of Purchases | 9,122,141 |
| Proceeds of Sales | (4,902,665) |
| Amortization/Accretion | (139,369) |
| Transfers into Level 3 | 2,391,372 |
| Transfers out of Level 3 | -- |
| Ending Balance | $11,726,148 |
| The change in unrealized gain (loss) for the period attributable to Level 3 securities held at April 30, 2021 | $1,005,676 |
The information used in the above reconciliations represents fiscal year to date activity for any Investments in Securities identified as using Level 3 inputs at either the beginning or the end of the current fiscal period. Cost of purchases and proceeds of sales may include securities received and/or delivered through in-kind transactions. Transfers in or out of Level 3 represent the beginning value of any Security or Instrument where a change in the pricing level occurred from the beginning to the end of the period. The cost of purchases and the proceeds of sales may include securities received or delivered through corporate actions or exchanges. Realized and unrealized gains (losses) disclosed in the reconciliations are included in Net Gain (Loss) on the Fund's Statement of Operations.
Other Information
Distribution of investments by country or territory of incorporation, as a percentage of Total Net Assets, is as follows (Unaudited):
| United States of America | 76.9% |
| Canada | 5.1% |
| Luxembourg | 3.4% |
| Ireland | 2.6% |
| Netherlands | 2.2% |
| Multi-National | 2.0% |
| France | 2.0% |
| Cayman Islands | 1.8% |
| United Kingdom | 1.5% |
| Others (Individually Less Than 1%) | 2.5% |
| | 100.0% |
See accompanying notes which are an integral part of the financial statements.
Financial Statements
Statement of Assets and Liabilities
| | | April 30, 2021 |
| Assets | | |
Investment in securities, at value — See accompanying schedule:
Unaffiliated issuers (cost $1,569,256,078) | $1,631,582,082 | |
| Fidelity Central Funds (cost $23,827,446) | 23,827,446 | |
| Total Investment in Securities (cost $1,593,083,524) | | $1,655,409,528 |
| Cash | | 39,949 |
| Receivable for investments sold | | 12,835,411 |
| Receivable for fund shares sold | | 40,606,173 |
| Interest receivable | | 22,202,503 |
| Distributions receivable from Fidelity Central Funds | | 2,086 |
| Total assets | | 1,731,095,650 |
| Liabilities | | |
| Payable for investments purchased | | |
| Regular delivery | $26,854,019 | |
| Delayed delivery | 1,900,000 | |
| Payable for fund shares redeemed | 173,143 | |
| Other payables and accrued expenses | 7,368 | |
| Total liabilities | | 28,934,530 |
| Net Assets | | $1,702,161,120 |
| Net Assets consist of: | | |
| Paid in capital | | $1,985,968,481 |
| Total accumulated earnings (loss) | | (283,807,361) |
| Net Assets | | $1,702,161,120 |
| Net Asset Value, offering price and redemption price per share ($1,702,161,120 ÷ 180,262,878 shares) | | $9.44 |
See accompanying notes which are an integral part of the financial statements.
Statement of Operations
| | | Year ended April 30, 2021 |
| Investment Income | | |
| Dividends | | $211,429 |
| Interest | | 89,499,650 |
| Income from Fidelity Central Funds (including $285 from security lending) | | 36,275 |
| Total income | | 89,747,354 |
| Expenses | | |
| Custodian fees and expenses | $21,990 | |
| Independent trustees' fees and expenses | 7,893 | |
| Interest | 336 | |
| Miscellaneous | 1,733 | |
| Total expenses before reductions | 31,952 | |
| Expense reductions | (8,268) | |
| Total expenses after reductions | | 23,684 |
| Net investment income (loss) | | 89,723,670 |
| Realized and Unrealized Gain (Loss) | | |
| Net realized gain (loss) on: | | |
| Investment securities: | | |
| Unaffiliated issuers | (17,054,039) | |
| Fidelity Central Funds | 69 | |
| Total net realized gain (loss) | | (17,053,970) |
| Change in net unrealized appreciation (depreciation) on: | | |
| Investment securities: | | |
| Unaffiliated issuers | 173,084,310 | |
| Fidelity Central Funds | (4,029) | |
| Total change in net unrealized appreciation (depreciation) | | 173,080,281 |
| Net gain (loss) | | 156,026,311 |
| Net increase (decrease) in net assets resulting from operations | | $245,749,981 |
See accompanying notes which are an integral part of the financial statements.
Statement of Changes in Net Assets
| | Year ended April 30, 2021 | Year ended April 30, 2020 |
| Increase (Decrease) in Net Assets | | |
| Operations | | |
| Net investment income (loss) | $89,723,670 | $96,869,192 |
| Net realized gain (loss) | (17,053,970) | (30,157,124) |
| Change in net unrealized appreciation (depreciation) | 173,080,281 | (135,778,017) |
| Net increase (decrease) in net assets resulting from operations | 245,749,981 | (69,065,949) |
| Distributions to shareholders | (87,911,658) | (100,751,571) |
| Share transactions | | |
| Proceeds from sales of shares | 193,704,383 | 238,271,398 |
| Reinvestment of distributions | 87,889,133 | 100,586,768 |
| Cost of shares redeemed | (228,803,181) | (188,249,664) |
| Net increase (decrease) in net assets resulting from share transactions | 52,790,335 | 150,608,502 |
| Total increase (decrease) in net assets | 210,628,658 | (19,209,018) |
| Net Assets | | |
| Beginning of period | 1,491,532,462 | 1,510,741,480 |
| End of period | $1,702,161,120 | $1,491,532,462 |
| Other Information | | |
| Shares | | |
| Sold | 20,674,510 | 25,321,877 |
| Issued in reinvestment of distributions | 9,528,963 | 10,832,064 |
| Redeemed | (24,690,325) | (20,475,888) |
| Net increase (decrease) | 5,513,148 | 15,678,053 |
See accompanying notes which are an integral part of the financial statements.
Financial Highlights
Fidelity Series High Income Fund
| | | | | | |
| Years ended April 30, | 2021 | 2020 | 2019 | 2018 | 2017 |
| Selected Per–Share Data | | | | | |
| Net asset value, beginning of period | $8.54 | $9.50 | $9.56 | $9.68 | $8.96 |
| Income from Investment Operations | | | | | |
| Net investment income (loss)A | .513 | .577 | .607 | .623 | .557 |
| Net realized and unrealized gain (loss) | .890 | (.935) | (.051) | (.141) | .687 |
| Total from investment operations | 1.403 | (.358) | .556 | .482 | 1.244 |
| Distributions from net investment income | (.503) | (.598) | (.616) | (.602) | (.524) |
| Distributions from net realized gain | – | (.004) | – | – | – |
| Total distributions | (.503) | (.602) | (.616) | (.602) | (.524) |
| Net asset value, end of period | $9.44 | $8.54 | $9.50 | $9.56 | $9.68 |
| Total ReturnB | 16.72% | (4.11)% | 6.12% | 5.08% | 14.25% |
| Ratios to Average Net AssetsC,D | | | | | |
| Expenses before reductions | - %E | - %E | - %E | .06% | .69% |
| Expenses net of fee waivers, if any | - %E | - %E | - %E | .05% | .69% |
| Expenses net of all reductions | - %E | - %E | - %E | .05% | .69% |
| Net investment income (loss) | 5.58% | 6.20% | 6.44% | 6.44% | 6.00% |
| Supplemental Data | | | | | |
| Net assets, end of period (000 omitted) | $1,702,161 | $1,491,532 | $1,510,741 | $2,883,805 | $1,285,072 |
| Portfolio turnover rateF | 68% | 41%G | 69% | 49% | 44% |
A Calculated based on average shares outstanding during the period.
B Total returns would have been lower if certain expenses had not been reduced during the applicable periods shown.
C Fees and expenses of any underlying mutual funds or exchange-traded funds (ETFs) are not included in the Fund's expense ratio. The Fund indirectly bears its proportionate share of these expenses. For additional expense information related to investments in Fidelity Central Funds, please refer to the "Investments in Fidelity Central Funds" note found in the Notes to Financial Statements section of the most recent Annual or Semi-Annual report.
D Expense ratios reflect operating expenses of the class. Expenses before reductions do not reflect amounts reimbursed, waived, or reduced through arrangements with the investment advisor, brokerage services, or other offset arrangements, if applicable, and do not represent the amount paid by the class during periods when reimbursements, waivers or reductions occur.
E Amount represents less than .005%.
F Amount does not include the portfolio activity of any underlying mutual funds or exchange-traded funds (ETFs).
G Portfolio turnover rate excludes securities received or delivered in-kind.
See accompanying notes which are an integral part of the financial statements.
Notes to Financial Statements
For the period ended April 30, 2021
1. Organization.
Fidelity Series High Income Fund (the Fund) is a fund of Fidelity Summer Street Trust (the Trust) and is authorized to issue an unlimited number of shares. Shares are offered only to certain other Fidelity funds and Fidelity managed 529 plans. The Trust is registered under the Investment Company Act of 1940, as amended (the 1940 Act), as an open-end management investment company organized as a Massachusetts business trust.
2. Investments in Fidelity Central Funds.
Funds may invest in Fidelity Central Funds, which are open-end investment companies generally available only to other investment companies and accounts managed by the investment adviser and its affiliates. The Schedule of Investments lists any Fidelity Central Funds held as an investment as of period end, but does not include the underlying holdings of each Fidelity Central Fund. An investing fund indirectly bears its proportionate share of the expenses of the underlying Fidelity Central Funds.
Based on its investment objective, each Fidelity Central Fund may invest or participate in various investment vehicles or strategies that are similar to those of the investing fund. These strategies are consistent with the investment objectives of the investing fund and may involve certain economic risks which may cause a decline in value of each of the Fidelity Central Funds and thus a decline in the value of the investing fund.
| Fidelity Central Fund | Investment Manager | Investment Objective | Investment Practices | Expense Ratio(a) |
| Fidelity Money Market Central Funds | Fidelity Management & Research Company LLC (FMR) | Each fund seeks to obtain a high level of current income consistent with the preservation of capital and liquidity. | Short-term Investments | Less than .005% to .01% |
(a) Expenses expressed as a percentage of average net assets and are as of each underlying Central Fund's most recent annual or semi-annual shareholder report.
A complete unaudited list of holdings for each Fidelity Central Fund is available upon request or at the Securities and Exchange Commission website at www.sec.gov. In addition, the financial statements of the Fidelity Central Funds which contain the significant accounting policies (including investment valuation policies) of those funds, and are not covered by the Report of Independent Registered Public Accounting Firm, are available on the Securities and Exchange Commission website or upon request.
3. Significant Accounting Policies.
The Fund is an investment company and applies the accounting and reporting guidance of the Financial Accounting Standards Board (FASB) Accounting Standards Codification Topic 946 Financial Services - Investment Companies. The financial statements have been prepared in conformity with accounting principles generally accepted in the United States of America (GAAP), which require management to make certain estimates and assumptions at the date of the financial statements. Actual results could differ from those estimates. Subsequent events, if any, through the date that the financial statements were issued have been evaluated in the preparation of the financial statements. The Fund's Schedule of Investments lists any underlying mutual funds or exchange-traded funds (ETFs) but does not include the underlying holdings of these funds. The following summarizes the significant accounting policies of the Fund:
Investment Valuation. Investments are valued as of 4:00 p.m. Eastern time on the last calendar day of the period. The Board of Trustees (the Board) has delegated the day to day responsibility for the valuation of the Fund's investments to the Fair Value Committee (the Committee) established by the Fund's investment adviser. In accordance with valuation policies and procedures approved by the Board, the Fund attempts to obtain prices from one or more third party pricing vendors or brokers to value its investments. When current market prices, quotations or currency exchange rates are not readily available or reliable, investments will be fair valued in good faith by the Committee, in accordance with procedures adopted by the Board. Factors used in determining fair value vary by investment type and may include market or investment specific events, changes in interest rates and credit quality. The frequency with which these procedures are used cannot be predicted and they may be utilized to a significant extent. The Committee oversees the Fund's valuation policies and procedures and reports to the Board on the Committee's activities and fair value determinations. The Board monitors the appropriateness of the procedures used in valuing the Fund's investments and ratifies the fair value determinations of the Committee.
The Fund categorizes the inputs to valuation techniques used to value its investments into a disclosure hierarchy consisting of three levels as shown below:
- Level 1 – quoted prices in active markets for identical investments
- Level 2 – other significant observable inputs (including quoted prices for similar investments, interest rates, prepayment speeds, etc.)
- Level 3 – unobservable inputs (including the Fund's own assumptions based on the best information available)
Valuation techniques used to value the Fund's investments by major category are as follows:
Debt securities, including restricted securities, are valued based on evaluated prices received from third party pricing vendors or from brokers who make markets in such securities. Corporate bonds and bank loan obligations are valued by pricing vendors who utilize matrix pricing which considers yield or price of bonds of comparable quality, coupon, maturity and type or by broker-supplied prices. When independent prices are unavailable or unreliable, debt securities may be valued utilizing pricing methodologies which consider similar factors that would be used by third party pricing vendors. Debt securities are generally categorized as Level 2 in the hierarchy but may be Level 3 depending on the circumstances. The Fund invests a significant portion of its assets in below investment grade securities. The value of these securities can be more volatile due to changes in the credit quality of the issuer and is sensitive to changes in economic, market and regulatory conditions.
Equity securities, including restricted securities, for which market quotations are readily available, are valued at the last reported sale price or official closing price as reported by a third party pricing vendor on the primary market or exchange on which they are traded and are categorized as Level 1 in the hierarchy. In the event there were no sales during the day or closing prices are not available, securities are valued at the last quoted bid price or may be valued using the last available price and are generally categorized as Level 2 in the hierarchy. For foreign equity securities, when market or security specific events arise, comparisons to the valuation of American Depositary Receipts (ADRs), futures contracts, Exchange-Traded Funds (ETFs) and certain indexes as well as quoted prices for similar securities may be used and would be categorized as Level 2 in the hierarchy. For equity securities, including restricted securities, where observable inputs are limited, assumptions about market activity and risk are used and these securities may be categorized as Level 3 in the hierarchy. Securities, including private placements or other restricted securities, for which observable inputs are not available are valued using alternate valuation approaches, including the market approach, the income approach and cost approach, and are categorized as Level 3 in the hierarchy. The market approach considers factors including the price of recent investments in the same or a similar security or financial metrics of comparable securities. The income approach considers factors including expected future cash flows, security specific risks and corresponding discount rates. The cost approach considers factors including the value of the security's underlying assets and liabilities.
Investments in open-end mutual funds, including the Fidelity Central Funds, are valued at their closing net asset value (NAV) each business day and are categorized as Level 1 in the hierarchy.
The following provides information on Level 3 securities held by the Fund that were valued at period end based on unobservable inputs. These amounts exclude valuations provided by a broker.
| Asset Type | Fair Value | Valuation Technique(s) | Unobservable Input | Amount or Range/Weighted Average | Impact to Valuation from an Increase in Input(a) |
| Equities | $34,750,083 | Market comparable | Discount rate | 50.0% | Decrease |
| | | | Discount for lack of marketability | 10.0% | Decrease |
| | | | Enterprise Value/EBITDA multiple (EV/EBITDA) | 3.5 | Increase |
| | | Market approach | Transaction Price | $15.00 | Increase |
| | | Book Value | Book value multiple | 1.0 | Increase |
| | | Discounted cash flow | Discount rate | 8.4% | Decrease |
| | | | Discount for lack of marketability | 10.0% | Decrease
|
| | | | Growth rate | 1.5% | Increase
|
| Corporate Bonds | $6,209,122 | Market comparable | Discount rate | 50.0% | Decrease
|
| | | | Discount for lack of marketability | 10.0% | Decrease
|
| | | | Enterprise Value/EBITDA multiple (EV/EBITDA) | 3.5 | Increase |
| | | Recovery value | Recovery value | 0.0% | Increase
|
| | | Book value | Book value multiple | 1.0 | Increase
|
| Bank Loan Obligations | $- | Recovery value | Recovery value | 0.0% | Increase |
(a) Represents the directional change in the fair value of the Level 3 investments that could have resulted from an increase in the corresponding input as of period end. A decrease to the unobservable input would have had the opposite effect. Significant changes in these inputs may have resulted in a significantly higher or lower fair value measurement at period end.
Changes in valuation techniques may result in transfers in or out of an assigned level within the disclosure hierarchy. The aggregate value of investments by input level as of April 30, 2021, as well as a roll forward of Level 3 investments, is included at the end of the Fund's Schedule of Investments.
Investment Transactions and Income. For financial reporting purposes, the Fund's investment holdings and NAV include trades executed through the end of the last business day of the period. The NAV per share for processing shareholder transactions is calculated as of the close of business of the New York Stock Exchange (NYSE), normally 4:00 p.m. Eastern time and includes trades executed through the end of the prior business day. Gains and losses on securities sold are determined on the basis of identified cost. Dividend income is recorded on the ex-dividend date, except for certain dividends from foreign securities where the ex-dividend date may have passed, which are recorded as soon as the Fund is informed of the ex-dividend date. Non-cash dividends included in dividend income, if any, are recorded at the fair market value of the securities received. Income and capital gain distributions from Fidelity Central Funds, if any, are recorded on the ex-dividend date. Certain distributions received by the Fund represent a return of capital or capital gain. The Fund determines the components of these distributions subsequent to the ex-dividend date, based upon receipt of tax filings or other correspondence relating to the underlying investment. These distributions are recorded as a reduction of cost of investments and/or as a realized gain. Interest income is accrued as earned and includes coupon interest and amortization of premium and accretion of discount on debt securities as applicable. Debt obligations may be placed on non-accrual status and related interest income may be reduced by ceasing current accruals and writing off interest receivables when the collection of all or a portion of interest has become doubtful based on consistently applied procedures. A debt obligation is removed from non-accrual status when the issuer resumes interest payments or when collectability of interest is reasonably assured.
Expenses. Expenses directly attributable to a fund are charged to that fund. Expenses attributable to more than one fund are allocated among the respective funds on the basis of relative net assets or other appropriate methods. Expenses included in the accompanying financial statements reflect the expenses of that fund and do not include any expenses associated with any underlying mutual funds or exchange-traded funds. Although not included in a fund's expenses, a fund indirectly bears its proportionate share of these expenses through the net asset value of each underlying mutual fund or exchange-traded fund. Expense estimates are accrued in the period to which they relate and adjustments are made when actual amounts are known.
Income Tax Information and Distributions to Shareholders. Each year, the Fund intends to qualify as a regulated investment company under Subchapter M of the Internal Revenue Code, including distributing substantially all of its taxable income and realized gains. As a result, no provision for U.S. Federal income taxes is required. As of April 30, 2021, the Fund did not have any unrecognized tax benefits in the financial statements; nor is the Fund aware of any tax positions for which it is reasonably possible that the total amounts of unrecognized tax benefits will significantly change in the next twelve months. The Fund files a U.S. federal tax return, in addition to state and local tax returns as required. The Fund's federal income tax returns are subject to examination by the Internal Revenue Service (IRS) for a period of three fiscal years after they are filed. State and local tax returns may be subject to examination for an additional fiscal year depending on the jurisdiction.
Distributions are declared and recorded daily and paid monthly from net investment income. Distributions from realized gains, if any, are declared and recorded on the ex-dividend date. Income and capital gain distributions are determined in accordance with income tax regulations, which may differ from GAAP.
Capital accounts within the financial statements are adjusted for permanent book-tax differences. These adjustments have no impact on net assets or the results of operations. Capital accounts are not adjusted for temporary book-tax differences which will reverse in a subsequent period.
Book-tax differences are primarily due to market discount, certain conversion ratio adjustments, partnerships, prior period premium and discount on debt securities, capital loss carryforwards and losses deferred due to wash sales.
As of period end, the cost and unrealized appreciation (depreciation) in securities, and derivatives if applicable, for federal income tax purposes were as follows:
| Gross unrealized appreciation | $90,293,118 |
| Gross unrealized depreciation | (23,086,977) |
| Net unrealized appreciation (depreciation) | $ 67,206,141 |
| Tax Cost | $1,588,203,387 |
The tax-based components of distributable earnings as of period end were as follows:
| Undistributed ordinary income | $2,433,849 |
| Capital loss carryforward | $(353,447,354) |
| Net unrealized appreciation (depreciation) on securities and other investments | $67,206,141 |
Capital loss carryforwards are only available to offset future capital gains of the Fund to the extent provided by regulations and may be limited. The capital loss carryforward information presented below, including any applicable limitation, is estimated as of fiscal period end and is subject to adjustment.
| No expiration | |
| Short-term | $(30,315,127) |
| Long-term | (323,132,227) |
| Total capital loss carryforward | $(353,447,354) |
The tax character of distributions paid was as follows:
| | April 30, 2021 | April 30, 2020 |
| Ordinary Income | $87,911,658 | $ 100,751,571 |
Delayed Delivery Transactions and When-Issued Securities. During the period, certain Funds transacted in securities on a delayed delivery or when-issued basis. Payment and delivery may take place after the customary settlement period for that security. The price of the underlying securities and the date when the securities will be delivered and paid for are fixed at the time the transaction is negotiated. Securities purchased on a delayed delivery or when-issued basis are identified as such in the Schedule of Investments. Compensation for interest forgone in the purchase of a delayed delivery or when-issued debt security may be received. With respect to purchase commitments, each applicable Fund identifies securities as segregated in its records with a value at least equal to the amount of the commitment. Payables and receivables associated with the purchases and sales of delayed delivery securities having the same coupon, settlement date and broker are offset. Delayed delivery or when-issued securities that have been purchased from and sold to different brokers are reflected as both payables and receivables in the Statement of Assets and Liabilities under the caption "Delayed delivery", as applicable. Losses may arise due to changes in the value of the underlying securities or if the counterparty does not perform under the contract's terms, or if the issuer does not issue the securities due to political, economic, or other factors.
Restricted Securities (including Private Placements). Funds may invest in securities that are subject to legal or contractual restrictions on resale. These securities generally may be resold in transactions exempt from registration or to the public if the securities are registered. Disposal of these securities may involve time-consuming negotiations and expense, and prompt sale at an acceptable price may be difficult. Information regarding restricted securities held at period end is included at the end of the Schedule of Investments, if applicable.
Loans and Other Direct Debt Instruments. Direct debt instruments are interests in amounts owed to lenders by corporate or other borrowers. These instruments may be in the form of loans, trade claims or other receivables and may include standby financing commitments such as revolving credit facilities that obligate a fund to supply additional cash to the borrower on demand. Loans may be acquired through assignment, participation, or may be made directly to a borrower. Such instruments are presented in the Bank Loan Obligations section in the Schedule of Investments. Certain funds may also invest in unfunded loan commitments, which are contractual obligations for future funding. Information regarding unfunded commitments is included at the end of the Schedule of Investments, if applicable.
4. Purchases and Sales of Investments.
Purchases and sales of securities, other than short-term securities are noted in the table below.
| | Purchases ($) | Sales ($) |
| Fidelity Series High Income Fund | 1,112,559,576 | 1,065,242,400 |
5. Fees and Other Transactions with Affiliates.
Management Fee. Fidelity Management & Research Company LLC (the investment adviser) and its affiliates provide the Fund with investment management related services for which the Fund does not pay a management fee. Under the management contract, the investment adviser or an affiliate pays all ordinary operating expenses of the Fund, except custody fees, fees and expenses of the independent Trustees, and certain miscellaneous expenses such as proxy and shareholder meeting expenses.
Brokerage Commissions. A portion of portfolio transactions were placed with brokerage firms which are affiliates of the investment adviser. Brokerage commissions are included in net realized gain (loss) and change in net unrealized appreciation (depreciation) in the Statement of Operations. The commissions paid to these affiliated firms were as follows:
| | Amount |
| Fidelity Series High Income Fund | $488 |
Interfund Lending Program. Pursuant to an Exemptive Order issued by the Securities and Exchange Commission (the SEC), the Fund, along with other registered investment companies having management contracts with Fidelity Management & Research Company LLC (FMR), or other affiliated entities of FMR, may participate in an interfund lending program. This program provides an alternative credit facility allowing the Fund to borrow from, or lend money to, other participating affiliated funds. At period end, no interfund loans outstanding. Activity in this program during the period for which loans were outstanding was as follows:
| | Borrower or Lender | Average Loan Balance | Weighted Average Interest Rate | Interest Expense |
| Fidelity Series High Income Fund | Borrower | $7,239,600 | .33% | $336 |
Interfund Trades. Funds may purchase from or sell securities to other Fidelity Funds under procedures adopted by the Board. The procedures have been designed to ensure these interfund trades are executed in accordance with Rule 17a-7 of the 1940 Act. Any interfund trades are included within the respective purchases and sales amounts shown in the Purchases and Sales of Investments note.
Prior Fiscal Year Affiliated Exchanges In-Kind. During the prior period, the Fund received investments, including accrued interest, and cash valued at $112,256,713 in exchange for 11,804,071 shares of the Fund. The amount of in-kind exchanges is included in share transactions in the accompanying Statement of Changes in Net Assets.
6. Committed Line of Credit.
Certain Funds participate with other funds managed by the investment adviser or an affiliate in a $4.25 billion credit facility (the "line of credit") to be utilized for temporary or emergency purposes to fund shareholder redemptions or for other short-term liquidity purposes. The participating funds have agreed to pay commitment fees on their pro-rata portion of the line of credit, which are reflected in Miscellaneous expenses on the Statement of Operations, and are listed below. Effective during January 2021, commitment fees are borne by the investment advisor.
| | Amount |
| Fidelity Series High Income Fund | $1,733 |
During the period, there were no borrowings on this line of credit.
7. Security Lending.
Funds lend portfolio securities from time to time in order to earn additional income. Lending agents are used, including National Financial Services (NFS), an affiliate of the investment adviser. Pursuant to a securities lending agreement, NFS will receive a fee, which is capped at 9.9% of a fund's daily lending revenue, for its services as lending agent. A fund may lend securities to certain qualified borrowers, including NFS. On the settlement date of the loan, a fund receives collateral (in the form of U.S. Treasury obligations, letters of credit and/or cash) against the loaned securities and maintains collateral in an amount not less than 100% of the market value of the loaned securities during the period of the loan. The market value of the loaned securities is determined at the close of business of a fund and any additional required collateral is delivered to a fund on the next business day. A fund or borrower may terminate the loan at any time, and if the borrower defaults on its obligation to return the securities loaned because of insolvency or other reasons, a fund may apply collateral received from the borrower against the obligation. A fund may experience delays and costs in recovering the securities loaned. Any cash collateral received is invested in the Fidelity Securities Lending Cash Central Fund. Any loaned securities are identified as such in the Schedule of Investments, and the value of loaned securities and cash collateral at period end, as applicable, are presented in the Statement of Assets and Liabilities. Security lending income represents the income earned on investing cash collateral, less rebates paid to borrowers and any lending agent fees associated with the loan, plus any premium payments received for lending certain types of securities. Security lending income is presented in the Statement of Operations as a component of income from Fidelity Central Funds. Affiliated security lending activity, if any, was as follows:
| | Total Security Lending Fees Paid to NFS | Security Lending Income From Securities Loaned to NFS | Value of Securities Loaned to NFS at Period End |
| Fidelity Series High Income Fund | $25 | $– | $– |
8. Expense Reductions.
Through arrangements with the Fund's custodian, credits realized as a result of certain uninvested cash balances were used to reduce the Fund's expenses by $8,268.
9. Other.
Fund's organizational documents provide former and current trustees and officers with a limited indemnification against liabilities arising in connection with the performance of their duties to the fund. In the normal course of business, the fund may also enter into contracts that provide general indemnifications. The fund's maximum exposure under these arrangements is unknown as this would be dependent on future claims that may be made against the fund. The risk of material loss from such claims is considered remote.
At the end of the period, mutual funds and accounts managed by the investment adviser or its affiliates were the owners of record of all of the outstanding shares of the Fund.
10. Coronavirus (COVID-19) Pandemic.
An outbreak of COVID-19 first detected in China during December 2019 has since spread globally and was declared a pandemic by the World Health Organization during March 2020. Developments that disrupt global economies and financial markets, such as the COVID-19 pandemic, may magnify factors that affect the Fund's performance.
Report of Independent Registered Public Accounting Firm
To the Board of Trustees of Fidelity Summer Street Trust and Shareholders of Fidelity Series High Income Fund
Opinion on the Financial Statements and Financial Highlights
We have audited the accompanying statement of assets and liabilities of Fidelity Series High Income Fund (the "Fund"), a fund of Fidelity Summer Street Trust, including the schedule of investments, as of April 30, 2021, the related statement of operations for the year then ended, the statement of changes in net assets for each of the two years in the period then ended, the financial highlights for each of the five years in the period then ended, and the related notes. In our opinion, the financial statements and financial highlights present fairly, in all material respects, the financial position of the Fund as of April 30, 2021, and the results of its operations for the year then ended, the changes in its net assets for each of the two years in the period then ended, and the financial highlights for each of the five years in the period then ended in conformity with accounting principles generally accepted in the United States of America.
Basis for Opinion
These financial statements and financial highlights are the responsibility of the Fund's management. Our responsibility is to express an opinion on the Fund's financial statements and financial highlights based on our audits. We are a public accounting firm registered with the Public Company Accounting Oversight Board (United States) (PCAOB) and are required to be independent with respect to the Fund in accordance with the U.S. federal securities laws and the applicable rules and regulations of the Securities and Exchange Commission and the PCAOB.
We conducted our audits in accordance with the standards of the PCAOB. Those standards require that we plan and perform the audit to obtain reasonable assurance about whether the financial statements and financial highlights are free of material misstatement, whether due to error or fraud. The Fund is not required to have, nor were we engaged to perform, an audit of its internal control over financial reporting. As part of our audits we are required to obtain an understanding of internal control over financial reporting but not for the purpose of expressing an opinion on the effectiveness of the Fund’s internal control over financial reporting. Accordingly, we express no such opinion.
Our audits included performing procedures to assess the risks of material misstatement of the financial statements and financial highlights, whether due to error or fraud, and performing procedures that respond to those risks. Such procedures included examining, on a test basis, evidence regarding the amounts and disclosures in the financial statements and financial highlights. Our audits also included evaluating the accounting principles used and significant estimates made by management, as well as evaluating the overall presentation of the financial statements and financial highlights. Our procedures included confirmation of securities owned as of April 30, 2021 by correspondence with the custodian, brokers, and agent banks; when replies were not received from brokers or agent banks, we performed other auditing procedures. We believe that our audits provide a reasonable basis for our opinion.
/s/ Deloitte & Touche LLP
Boston, Massachusetts
June 22, 2021
We have served as the auditor of one or more of the Fidelity investment companies since 1999.
Trustees and Officers
The Trustees, Members of the Advisory Board (if any), and officers of the trust and fund, as applicable, are listed below. The Board of Trustees governs the fund and is responsible for protecting the interests of shareholders. The Trustees are experienced executives who meet periodically throughout the year to oversee the fund's activities, review contractual arrangements with companies that provide services to the fund, oversee management of the risks associated with such activities and contractual arrangements, and review the fund's performance. Each of the Trustees oversees 308 funds.
The Trustees hold office without limit in time except that (a) any Trustee may resign; (b) any Trustee may be removed by written instrument, signed by at least two-thirds of the number of Trustees prior to such removal; (c) any Trustee who requests to be retired or who has become incapacitated by illness or injury may be retired by written instrument signed by a majority of the other Trustees; and (d) any Trustee may be removed at any special meeting of shareholders by a two-thirds vote of the outstanding voting securities of the trust. Each Trustee who is not an interested person (as defined in the 1940 Act) of the trust and the fund is referred to herein as an Independent Trustee. Each Independent Trustee shall retire not later than the last day of the calendar year in which his or her 75th birthday occurs. The Independent Trustees may waive this mandatory retirement age policy with respect to individual Trustees. Officers and Advisory Board Members hold office without limit in time, except that any officer or Advisory Board Member may resign or may be removed by a vote of a majority of the Trustees at any regular meeting or any special meeting of the Trustees. Except as indicated, each individual has held the office shown or other offices in the same company for the past five years.
The fund’s Statement of Additional Information (SAI) includes more information about the Trustees. To request a free copy, call Fidelity at 1-800-544-8544.
Experience, Skills, Attributes, and Qualifications of the Trustees. The Governance and Nominating Committee has adopted a statement of policy that describes the experience, qualifications, attributes, and skills that are necessary and desirable for potential Independent Trustee candidates (Statement of Policy). The Board believes that each Trustee satisfied at the time he or she was initially elected or appointed a Trustee, and continues to satisfy, the standards contemplated by the Statement of Policy. The Governance and Nominating Committee also engages professional search firms to help identify potential Independent Trustee candidates who have the experience, qualifications, attributes, and skills consistent with the Statement of Policy. From time to time, additional criteria based on the composition and skills of the current Independent Trustees, as well as experience or skills that may be appropriate in light of future changes to board composition, business conditions, and regulatory or other developments, have also been considered by the professional search firms and the Governance and Nominating Committee. In addition, the Board takes into account the Trustees' commitment and participation in Board and committee meetings, as well as their leadership of standing and ad hoc committees throughout their tenure.
In determining that a particular Trustee was and continues to be qualified to serve as a Trustee, the Board has considered a variety of criteria, none of which, in isolation, was controlling. The Board believes that, collectively, the Trustees have balanced and diverse experience, qualifications, attributes, and skills, which allow the Board to operate effectively in governing the fund and protecting the interests of shareholders. Information about the specific experience, skills, attributes, and qualifications of each Trustee, which in each case led to the Board's conclusion that the Trustee should serve (or continue to serve) as a trustee of the fund, is provided below.
Board Structure and Oversight Function. Robert A. Lawrence is an interested person and currently serves as Acting Chairman. The Trustees have determined that an interested Chairman is appropriate and benefits shareholders because an interested Chairman has a personal and professional stake in the quality and continuity of services provided to the fund. Independent Trustees exercise their informed business judgment to appoint an individual of their choosing to serve as Chairman, regardless of whether the Trustee happens to be independent or a member of management. The Independent Trustees have determined that they can act independently and effectively without having an Independent Trustee serve as Chairman and that a key structural component for assuring that they are in a position to do so is for the Independent Trustees to constitute a substantial majority for the Board. The Independent Trustees also regularly meet in executive session. David M. Thomas serves as Lead Independent Trustee and as such (i) acts as a liaison between the Independent Trustees and management with respect to matters important to the Independent Trustees and (ii) with management prepares agendas for Board meetings.
Fidelity® funds are overseen by different Boards of Trustees. The fund's Board oversees Fidelity's high income and certain equity funds, and other Boards oversee Fidelity's investment-grade bond, money market, asset allocation, and other equity funds. The asset allocation funds may invest in Fidelity® funds overseen by the fund's Board. The use of separate Boards, each with its own committee structure, allows the Trustees of each group of Fidelity® funds to focus on the unique issues of the funds they oversee, including common research, investment, and operational issues. On occasion, the separate Boards establish joint committees to address issues of overlapping consequences for the Fidelity® funds overseen by each Board.
The Trustees operate using a system of committees to facilitate the timely and efficient consideration of all matters of importance to the Trustees, the fund, and fund shareholders and to facilitate compliance with legal and regulatory requirements and oversight of the fund's activities and associated risks. The Board, acting through its committees, has charged FMR and its affiliates with (i) identifying events or circumstances the occurrence of which could have demonstrably adverse effects on the fund's business and/or reputation; (ii) implementing processes and controls to lessen the possibility that such events or circumstances occur or to mitigate the effects of such events or circumstances if they do occur; and (iii) creating and maintaining a system designed to evaluate continuously business and market conditions in order to facilitate the identification and implementation processes described in (i) and (ii) above. Because the day-to-day operations and activities of the fund are carried out by or through FMR, its affiliates, and other service providers, the fund's exposure to risks is mitigated but not eliminated by the processes overseen by the Trustees. While each of the Board's committees has responsibility for overseeing different aspects of the fund's activities, oversight is exercised primarily through the Operations, Audit, and Compliance Committees. Appropriate personnel, including but not limited to the fund's Chief Compliance Officer (CCO), FMR's internal auditor, the independent accountants, the fund's Treasurer and portfolio management personnel, make periodic reports to the Board's committees, as appropriate, including an annual review of Fidelity's risk management program for the Fidelity® funds. The responsibilities of each standing committee, including their oversight responsibilities, are described further under "Standing Committees of the Trustees."
Interested Trustees*:
Correspondence intended for a Trustee who is an interested person may be sent to Fidelity Investments, 245 Summer Street, Boston, Massachusetts 02210.
Name, Year of Birth; Principal Occupations and Other Relevant Experience+
Bettina Doulton (1964)
Year of Election or Appointment: 2020
Trustee
Ms. Doulton also serves as Trustee of other Fidelity® funds. Prior to her retirement, Ms. Doulton served in a variety of positions at Fidelity Investments, including as a managing director of research (2006-2007), portfolio manager to certain Fidelity® funds (1993-2005), equity analyst and portfolio assistant (1990-1993), and research assistant (1987-1990). Ms. Doulton currently owns and operates Phi Builders + Architects and Cellardoor Winery. Previously, Ms. Doulton served as a member of the Board of Brown Capital Management, LLC (2014-2018).
Robert A. Lawrence (1952)
Year of Election or Appointment: 2020
Trustee
Acting Chairman of the Board of Trustees
Mr. Lawrence also serves as Trustee of other funds. Previously, Mr. Lawrence served as a Member of the Advisory Board of certain funds. Prior to his retirement in 2008, Mr. Lawrence served as Vice President of certain Fidelity® funds (2006-2008), Senior Vice President, Head of High Income Division of Fidelity Management & Research Company (investment adviser firm, 2006-2008), and President of Fidelity Strategic Investments (investment adviser firm, 2002-2005).
* Determined to be an “Interested Trustee” by virtue of, among other things, his or her affiliation with the trust or various entities under common control with FMR.
+ The information includes the Trustee's principal occupation during the last five years and other information relating to the experience, attributes, and skills relevant to the Trustee's qualifications to serve as a Trustee, which led to the conclusion that the Trustee should serve as a Trustee for the fund.
Independent Trustees:
Correspondence intended for an Independent Trustee may be sent to Fidelity Investments, P.O. Box 55235, Boston, Massachusetts 02205-5235.
Name, Year of Birth; Principal Occupations and Other Relevant Experience+
Thomas P. Bostick (1956)
Year of Election or Appointment: 2021
Trustee
Lieutenant General Bostick also serves as Trustee of other Fidelity® funds. Prior to his retirement, General Bostick (United States Army, Retired) held a variety of positions within the U.S. Army, including Commanding General and Chief of Engineers, U.S. Army Corps of Engineers (2012-2016) and Deputy Chief of Staff and Director of Human Resources, U.S. Army (2009-2012). General Bostick currently serves as a member of the Board and Finance and Governance Committees of CSX Corporation (transportation, 2020-present) and a member of the Board and Corporate Governance and Nominating Committee of Perma-Fix Environmental Services, Inc. (nuclear waste management, 2020-present). General Bostick serves as Chief Executive Officer of Bostick Global Strategies, LLC (consulting, 2016-present) and Managing Partner, Sustainability, of Ridge-Lane Limited Partners (strategic advisory and venture development, 2016-present). Previously, General Bostick served as a Member of the Advisory Board of certain Fidelity® funds (2021), President, Intrexon Bioengineering (2018-2020) and Chief Operating Officer (2017-2020) and Senior Vice President of the Environment Sector (2016-2017) of Intrexon Corporation (biopharmaceutical company).
Dennis J. Dirks (1948)
Year of Election or Appointment: 2005
Trustee
Mr. Dirks also serves as Trustee of other Fidelity® funds. Prior to his retirement in May 2003, Mr. Dirks served as Chief Operating Officer and as a member of the Board of The Depository Trust & Clearing Corporation (financial markets infrastructure), President, Chief Operating Officer and a member of the Board of The Depository Trust Company (DTC), President and a member of the Board of the National Securities Clearing Corporation (NSCC), Chief Executive Officer and a member of the Board of the Government Securities Clearing Corporation and Chief Executive Officer and a member of the Board of the Mortgage-Backed Securities Clearing Corporation. Mr. Dirks currently serves as a member of the Finance Committee (2016-present) and Board (2017-present) and is Treasurer (2018-present) of the Asolo Repertory Theatre.
Donald F. Donahue (1950)
Year of Election or Appointment: 2018
Trustee
Mr. Donahue also serves as Trustee of other Fidelity® funds. Mr. Donahue serves as President and Chief Executive Officer of Miranda Partners, LLC (risk consulting for the financial services industry, 2012-present). Previously, Mr. Donahue served as Chief Executive Officer (2006-2012), Chief Operating Officer (2003-2006) and Managing Director, Customer Marketing and Development (1999-2003) of The Depository Trust & Clearing Corporation (financial markets infrastructure). Mr. Donahue currently serves as a member (2007-present) and Co-Chairman (2016-present) of the Board of United Way of New York and a member of the Board of NYC Leadership Academy (2012-present). Mr. Donahue previously served as a member of the Advisory Board of certain Fidelity® funds (2015-2018).
Vicki L. Fuller (1957)
Year of Election or Appointment: 2020
Trustee
Ms. Fuller also serves as Trustee of other Fidelity® funds. Previously, Ms. Fuller served as a member of the Advisory Board of certain Fidelity® funds (2018-2020), Chief Investment Officer of the New York State Common Retirement Fund (2012-2018) and held a variety of positions at AllianceBernstein L.P. (global asset management, 1985-2012), including Managing Director (2006-2012) and Senior Vice President and Senior Portfolio Manager (2001-2006). Ms. Fuller currently serves as a member of the Board, Audit Committee and Nominating and Governance Committee of The Williams Companies, Inc. (natural gas infrastructure, 2018-present), as a member of the Board, Audit Committee and Nominating and Governance Committee of two Blackstone business development companies (2020-present) and as a member of the Board of Treliant, LLC (consulting, 2019-present).
Patricia L. Kampling (1959)
Year of Election or Appointment: 2020
Trustee
Ms. Kampling also serves as Trustee of other Fidelity® funds. Prior to her retirement, Ms. Kampling served as Chairman of the Board and Chief Executive Officer (2012-2019), President and Chief Operating Officer (2011-2012) and Executive Vice President and Chief Financial Officer (2010-2011) of Alliant Energy Corporation. Ms. Kampling currently serves as a member of the Board, Finance Committee and Governance, Compensation and Nominating Committee of Xcel Energy Inc. (utilities company, 2020-present) and as a member of the Board, Audit, Finance and Risk Committee and Safety, Environmental, Technology and Operations Committee of American Water Works Company, Inc. (utilities company, 2019-present). In addition, Ms. Kampling currently serves as a member of the Board of the Nature Conservancy, Wisconsin Chapter (2019-present). Previously, Ms. Kampling served as a Member of the Advisory Board of certain Fidelity® funds (2020), a member of the Board, Compensation Committee and Executive Committee and Chair of the Audit Committee of Briggs & Stratton Corporation (manufacturing, 2011-2021), a member of the Board of Interstate Power and Light Company (2012-2019) and Wisconsin Power and Light Company (2012-2019) (each a subsidiary of Alliant Energy Corporation) and as a member of the Board and Workforce Development Committee of the Business Roundtable (2018-2019).
Thomas A. Kennedy (1955)
Year of Election or Appointment: 2021
Trustee
Mr. Kennedy also serves as Trustee of other Fidelity® funds. Previously, Mr. Kennedy served as a Member of the Advisory Board of certain Fidelity® funds (2020) and held a variety of positions at Raytheon Company (aerospace and defense, 1983-2020), including Chairman and Chief Executive Officer (2014-2020) and Executive Vice President and Chief Operating Officer (2013-2014). Mr. Kennedy currently serves as Executive Chairman of the Board of Directors of Raytheon Technologies Corporation (aerospace and defense, 2020-present). He is also a member of the Rutgers School of Engineering Industry Advisory Board (2011-present) and a member of the UCLA Engineering Dean’s Executive Board (2016-present).
Oscar Munoz (1959)
Year of Election or Appointment: 2021
Trustee
Mr. Munoz also serves as Trustee of other Fidelity® funds. Prior to his retirement, Mr. Munoz served as Executive Chairman (2020-2021), Chief Executive Officer (2015-2020), President (2015-2016) and a member of the Board (2010-2021) of United Airlines Holdings, Inc. Mr. Munoz currently serves as a member of the Board of CBRE Group, Inc. (commercial real estate, 2020-present), a member of the Board of Univision Communications, Inc. (Hispanic media, 2020-present) and a member of the Advisory Board of Salesforce.com, Inc. (cloud-based software, 2020-present). Previously, Mr. Munoz served as a Member of the Advisory Board of certain Fidelity® funds (2021).
Garnett A. Smith (1947)
Year of Election or Appointment: 2018
Trustee
Mr. Smith also serves as Trustee of other Fidelity® funds. Prior to his retirement, Mr. Smith served as Chairman and Chief Executive Officer (1990-1997) and President (1986-1990) of Inbrand Corp. (manufacturer of personal absorbent products). Prior to his employment with Inbrand Corp., he was employed by a retail fabric chain and North Carolina National Bank (now Bank of America). Mr. Smith previously served as a member of the Advisory Board of certain Fidelity® funds (2012-2013).
David M. Thomas (1949)
Year of Election or Appointment: 2008
Trustee
Lead Independent Trustee
Mr. Thomas also serves as Trustee of other Fidelity® funds. Previously, Mr. Thomas served as Executive Chairman (2005-2006) and Chairman and Chief Executive Officer (2000-2005) of IMS Health, Inc. (pharmaceutical and healthcare information solutions). Mr. Thomas currently serves as a member of the Board of Fortune Brands Home and Security (home and security products, 2004-present) and Presiding Director (2013-present) of Interpublic Group of Companies, Inc. (marketing communication).
Susan Tomasky (1953)
Year of Election or Appointment: 2020
Trustee
Ms. Tomasky also serves as Trustee of other Fidelity® funds. Prior to her retirement, Ms. Tomasky served in various executive officer positions at American Electric Power Company, Inc. (1998-2011), including most recently as President of AEP Transmission (2007-2011). Ms. Tomasky currently serves as a member of the Board and Sustainability Committee and as Chair of the Audit Committee of Marathon Petroleum Corporation (2018-present) and as a member of the Board, Corporate Governance Committee and Organization and Compensation Committee and as Chair of the Audit Committee of Public Service Enterprise Group, Inc. (utilities company, 2012-present). In addition, Ms. Tomasky currently serves as a member (2009-present) and President (2020-present) of the Board of the Royal Shakespeare Company – America (2009-present), as a member of the Board of the Columbus Association for the Performing Arts (2011-present) and as a member of the Board and Investment Committee of Kenyon College (2016-present). Previously, Ms. Tomasky served as a Member of the Advisory Board of certain Fidelity® funds (2020), as a member of the Board of the Columbus Regional Airport Authority (2007-2020), as a member of the Board (2011-2018) and Lead Independent Director (2015-2018) of Andeavor Corporation (previously Tesoro Corporation) (independent oil refiner and marketer) and as a member of the Board of Summit Midstream Partners LP (energy, 2012-2018).
Michael E. Wiley (1950)
Year of Election or Appointment: 2018
Trustee
Mr. Wiley also serves as Trustee of other Fidelity® funds. Previously, Mr. Wiley served as a member of the Advisory Board of certain Fidelity® funds (2018-2020), Chairman, President and CEO of Baker Hughes, Inc. (oilfield services, 2000-2004). Mr. Wiley also previously served as a member of the Board of Andeavor Corporation (independent oil refiner and marketer, 2005-2018), a member of the Board of Andeavor Logistics LP (natural resources logistics, 2015-2018) and a member of the Board of High Point Resources (exploration and production, 2005-2020).
+ The information includes the Trustee's principal occupation during the last five years and other information relating to the experience, attributes, and skills relevant to the Trustee's qualifications to serve as a Trustee, which led to the conclusion that the Trustee should serve as a Trustee for the fund.
Advisory Board Members and Officers:
Correspondence intended for a Member of the Advisory Board (if any) may be sent to Fidelity Investments, P.O. Box 55235, Boston, Massachusetts 02205-5235. Correspondence intended for an officer or Peter S. Lynch may be sent to Fidelity Investments, 245 Summer Street, Boston, Massachusetts 02210. Officers appear below in alphabetical order.
Name, Year of Birth; Principal Occupation
Peter S. Lynch (1944)
Year of Election or Appointment: 2003
Member of the Advisory Board
Mr. Lynch also serves as a Member of the Advisory Board of other Fidelity® funds. Mr. Lynch is Vice Chairman and a Director of Fidelity Management & Research Company LLC (investment adviser firm). In addition, Mr. Lynch serves as a Trustee of Boston College and as the Chairman of the Inner-City Scholarship Fund. Previously, Mr. Lynch served as Vice Chairman and a Director of FMR Co., Inc. (investment adviser firm) and on the Special Olympics International Board of Directors (1997-2006).
Craig S. Brown (1977)
Year of Election or Appointment: 2019
Assistant Treasurer
Mr. Brown also serves as Assistant Treasurer of other funds. Mr. Brown is an employee of Fidelity Investments (2013-present).
John J. Burke III (1964)
Year of Election or Appointment: 2018
Chief Financial Officer
Mr. Burke also serves as Chief Financial Officer of other funds. Mr. Burke serves as Head of Investment Operations for Fidelity Fund and Investment Operations (2018-present) and is an employee of Fidelity Investments (1998-present). Previously Mr. Burke served as head of Asset Management Investment Operations (2012-2018).
William C. Coffey (1969)
Year of Election or Appointment: 2019
Assistant Secretary
Mr. Coffey also serves as Assistant Secretary of other funds. He is Senior Vice President and Deputy General Counsel of FMR LLC (diversified financial services company, 2010-present), and is an employee of Fidelity Investments. Previously, Mr. Coffey served as Secretary and CLO of certain funds (2018-2019); CLO, Secretary, and Senior Vice President of Fidelity Management & Research Company and FMR Co., Inc. (investment adviser firms, 2018-2019); Secretary of Fidelity SelectCo, LLC and Fidelity Investments Money Management, Inc. (investment adviser firms, 2018-2019); CLO of Fidelity Management & Research (Hong Kong) Limited, FMR Investment Management (UK) Limited, and Fidelity Management & Research (Japan) Limited (investment adviser firms, 2018-2019); and Assistant Secretary of certain funds (2009-2018).
Timothy M. Cohen (1969)
Year of Election or Appointment: 2018
Vice President
Mr. Cohen also serves as Vice President of other funds. Mr. Cohen serves as Co-Head of Equity (2018-present), a Director of Fidelity Management & Research (Japan) Limited (investment adviser firm, 2016-present), and is an employee of Fidelity Investments. Previously, Mr. Cohen served as Executive Vice President of Fidelity SelectCo, LLC (2019), Head of Global Equity Research (2016-2018), Chief Investment Officer - Equity and a Director of Fidelity Management & Research (U.K.) Inc. (investment adviser firm, 2013-2015) and as a Director of Fidelity Management & Research (Hong Kong) Limited (investment adviser firm, 2017).
Jonathan Davis (1968)
Year of Election or Appointment: 2010
Assistant Treasurer
Mr. Davis also serves as Assistant Treasurer of other funds. Mr. Davis serves as Assistant Treasurer of FMR Capital, Inc. (2017-present) and is an employee of Fidelity Investments. Previously, Mr. Davis served as Vice President and Associate General Counsel of FMR LLC (diversified financial services company, 2003-2010).
Laura M. Del Prato (1964)
Year of Election or Appointment: 2018
Assistant Treasurer
Ms. Del Prato also serves as an officer of other funds. Ms. Del Prato is an employee of Fidelity Investments (2017-present). Previously, Ms. Del Prato served as President and Treasurer of The North Carolina Capital Management Trust: Cash Portfolio and Term Portfolio (2018-2020). Prior to joining Fidelity Investments, Ms. Del Prato served as a Managing Director and Treasurer of the JPMorgan Mutual Funds (2014-2017). Prior to JPMorgan, Ms. Del Prato served as a partner at Cohen Fund Audit Services (accounting firm, 2012-2013) and KPMG LLP (accounting firm, 2004-2012).
Colm A. Hogan (1973)
Year of Election or Appointment: 2020
Assistant Treasurer
Mr. Hogan also serves as an officer of other funds. Mr. Hogan serves as Assistant Treasurer of FMR Capital, Inc. (2017-present) and is an employee of Fidelity Investments (2005-present). Previously, Mr. Hogan served as Deputy Treasurer of certain Fidelity® funds (2016-2020) and Assistant Treasurer of certain Fidelity® funds (2016-2018).
Pamela R. Holding (1964)
Year of Election or Appointment: 2018
Vice President
Ms. Holding also serves as Vice President of other funds. Ms. Holding serves as Co-Head of Equity (2018-present) and is an employee of Fidelity Investments (2013-present). Previously, Ms. Holding served as Executive Vice President of Fidelity SelectCo, LLC (2019) and as Chief Investment Officer of Fidelity Institutional Asset Management (2013-2018).
Cynthia Lo Bessette (1969)
Year of Election or Appointment: 2019
Secretary and Chief Legal Officer (CLO)
Ms. Lo Bessette also serves as an officer of other funds. Ms. Lo Bessette serves as CLO, Secretary, and Senior Vice President of Fidelity Management & Research Company LLC (investment adviser firm, 2019-present); and CLO of Fidelity Management & Research (Hong Kong) Limited, FMR Investment Management (UK) Limited, and Fidelity Management & Research (Japan) Limited (investment adviser firms, 2019-present). She is a Senior Vice President and Deputy General Counsel of FMR LLC (diversified financial services company, 2019-present), and is an employee of Fidelity Investments. Previously, Ms. Lo Bessette served as CLO, Secretary, and Senior Vice President of FMR Co., Inc. (investment adviser firm, 2019); Secretary of Fidelity SelectCo, LLC and Fidelity Investments Money Management, Inc. (investment adviser firms, 2019). Prior to joining Fidelity Investments, Ms. Lo Bessette was Executive Vice President, General Counsel (2016-2019) and Senior Vice President, Deputy General Counsel (2015-2016) of OppenheimerFunds (investment management company) and Deputy Chief Legal Officer (2013-2015) of Jennison Associates LLC (investment adviser firm).
Chris Maher (1972)
Year of Election or Appointment: 2020
Deputy Treasurer
Mr. Maher also serves as an officer of other funds. Mr. Maher serves as Assistant Treasurer of FMR Capital, Inc. (2017-present), and is an employee of Fidelity Investments (2008-present). Previously, Mr. Maher served as Assistant Treasurer of certain funds (2013-2020); Vice President of Asset Management Compliance (2013), Vice President of the Program Management Group of FMR (investment adviser firm, 2010-2013), and Vice President of Valuation Oversight (2008-2010).
Jason P. Pogorelec (1975)
Year of Election or Appointment: 2020
Chief Compliance Officer
Mr. Pogorelec also serves as Chief Compliance Officer of other funds. Mr. Pogorelec is a senior Vice President of Asset Management Compliance for Fidelity Investments and is an employee of Fidelity Investments (2006-present). Previously, Mr. Pogorelec served as Vice President, Associate General Counsel for Fidelity Investments (2010-2020) and Assistant Secretary of certain Fidelity funds (2015-2020).
Brett Segaloff (1972)
Year of Election or Appointment: 2021
Anti-Money Laundering (AML) Officer
Mr. Segaloff also serves as an AML Officer of other funds and other related entities. He is Director, Anti-Money Laundering (2007-present) of FMR LLC (diversified financial services company) and is an employee of Fidelity Investments (1996-present).
Stacie M. Smith (1974)
Year of Election or Appointment: 2016
President and Treasurer
Ms. Smith also serves as an officer of other funds. Ms. Smith serves as Assistant Treasurer of FMR Capital, Inc. (2017-present), is an employee of Fidelity Investments (2009-present), and has served in other fund officer roles. Prior to joining Fidelity Investments, Ms. Smith served as Senior Audit Manager of Ernst & Young LLP (accounting firm, 1996-2009). Previously, Ms. Smith served as Assistant Treasurer (2013-2019) and Deputy Treasurer (2013-2016) of certain Fidelity® funds.
Marc L. Spector (1972)
Year of Election or Appointment: 2016
Assistant Treasurer
Mr. Spector also serves as an officer of other funds. Mr. Spector serves as Assistant Treasurer of FMR Capital, Inc. (2017-present) and is an employee of Fidelity Investments (2016-present). Prior to joining Fidelity Investments, Mr. Spector served as Director at the Siegfried Group (accounting firm, 2013-2016), and prior to Siegfried Group as audit senior manager at Deloitte & Touche LLP (accounting firm, 2005-2013).
Jim Wegmann (1979)
Year of Election or Appointment: 2019
Assistant Treasurer
Mr. Wegmann also serves as Assistant Treasurer of other funds. Mr. Wegmann is an employee of Fidelity Investments (2011-present).
Shareholder Expense Example
As a shareholder, you incur two types of costs: (1) transaction costs, which may include sales charges (loads) on purchase payments or redemption proceeds, as applicable and (2) ongoing costs, which generally include management fees, distribution and/or service (12b-1) fees and other Fund expenses. This Example is intended to help you understand your ongoing costs (in dollars) of investing in a fund and to compare these costs with the ongoing costs of investing in other mutual funds.
The Example is based on an investment of $1,000 invested at the beginning of the period and held for the entire period (November 1, 2020 to April 30, 2021).
Actual Expenses
The first line of the accompanying table provides information about actual account values and actual expenses. You may use the information in this line, together with the amount you invested, to estimate the expenses that you paid over the period. Simply divide your account value by $1,000.00 (for example, an $8,600 account value divided by $1,000.00 = 8.6), then multiply the result by the number in the first line for a class/Fund under the heading entitled "Expenses Paid During Period" to estimate the expenses you paid on your account during this period. If any fund is a shareholder of any underlying mutual funds or exchange-traded funds (ETFs) (the Underlying Funds), such fund indirectly bears its proportional share of the expenses of the Underlying Funds in addition to the direct expenses incurred presented in the table. These fees and expenses are not included in the annualized expense ratio used to calculate the expense estimate in the table below.
Hypothetical Example for Comparison Purposes
The second line of the accompanying table provides information about hypothetical account values and hypothetical expenses based on the actual expense ratio and an assumed rate of return of 5% per year before expenses, which is not the actual return. The hypothetical account values and expenses may not be used to estimate the actual ending account balance or expenses you paid for the period. You may use this information to compare the ongoing costs of investing in the Fund and other funds. To do so, compare this 5% hypothetical example with the 5% hypothetical examples that appear in the shareholder reports of the other funds. If any fund is a shareholder of any Underlying Funds, such fund indirectly bears its proportional share of the expenses of the Underlying Funds in addition to the direct expenses as presented in the table. These fees and expenses are not included in the annualized expense ratio used to calculate the expense estimate in the table below.
Please note that the expenses shown in the table are meant to highlight your ongoing costs only and do not reflect any transaction costs. Therefore, the second line of the table is useful in comparing ongoing costs only, and will not help you determine the relative total costs of owning different funds.
| | Annualized Expense Ratio-A | Beginning
Account Value
November 1, 2020 | Ending
Account Value
April 30, 2021 | Expenses Paid
During Period-B
November 1, 2020
to April 30, 2021 |
| Fidelity Series High Income Fund | - %C | | | |
| Actual | | $1,000.00 | $1,067.10 | $-D |
| Hypothetical-E | | $1,000.00 | $1,024.79 | $-D |
A Annualized expense ratio reflects expenses net of applicable fee waivers.
B Expenses are equal to the annualized expense ratio, multiplied by the average account value over the period, multiplied by 181/ 365 (to reflect the one-half year period). The fees and expenses of any Underlying Funds are not included in each annualized expense ratio.
C Amount represents less than .005%.
D Amount represents less than $.005.
E 5% return per year before expenses
Distributions (Unaudited)
A total of 0.03% of the dividends distributed during the fiscal year was derived from interest on U.S. Government securities which is generally exempt from state income tax.
The fund designates $88,846,818 of distributions paid in the calendar year 2020 as qualifying to be taxed as section 163(j) interest dividends.
The fund will notify shareholders in January 2022 of amounts for use in preparing 2021 income tax returns.
Board Approval of Investment Advisory Contracts
Fidelity Series High Income Fund
At its January 2021 meeting, the Board of Trustees, including the Independent Trustees (together, the Board), voted to continue the management contract with Fidelity Management & Research Company LLC (FMR), and the sub-advisory agreements and sub-subadvisory agreements, in each case, where applicable (together, the Advisory Contracts) for the fund for four months from February 1, 2021 through May 31, 2021, in connection with changes to the Board's meeting calendar.
The Board considered that the approval of the fund's Advisory Contracts will not result in any changes in (i) the investment process or strategies employed in the management of the fund's assets; (ii) the fees and expenses paid by shareholders; (iii) the nature, extent or quality of services provided under the fund's Advisory Contracts; or (iv) the day-to-day management of the fund or the persons primarily responsible for such management. The Board also considered that since its last approval of the fund's Advisory Contracts, FMR had provided additional information on the fund in support of the annual contract renewal process, including competitive analyses on total expenses and management fees and in-depth reviews of fund performance and fund profitability information. The Board also considered the findings of certain ad hoc committees that had been previously formed to discuss matters relevant to all of the Fidelity funds, including economies of scale, fall-out benefits and retail vs. institutional funds. The Board noted that, effective August 1, 2020, the expense cap for the fund was lowered and that the expense cap arrangements were amended to remove certain exclusions. The Board concluded that the fund's Advisory Contracts are fair and reasonable, and that the fund's Advisory Contracts should be renewed, without modification, through May 31, 2021, with the understanding that the Board will consider the annual renewal for a full one year period in May 2021.
In connection with its consideration of future renewals of the fund's Advisory Contracts, the Board will consider: (i) the nature, extent and quality of services provided to the funds, including shareholder and administrative services and investment performance; (ii) the competitiveness of the management fee and total expenses for the fund; (iii) the costs of the services and profitability, including the revenues earned and the expenses incurred in conducting the business of developing, marketing, distributing, managing, administering, and servicing the fund and its shareholders, to the extent applicable; and (iv) whether there have been economies of scale in respect of the Fidelity funds, whether the Fidelity funds (including the fund) have appropriately benefited from any such economies of scale, and whether there is the potential for realization of any further economies.
Based on its evaluation of all of the conclusions noted above, and after considering all factors it believed relevant, the Board ultimately concluded that the fund's management fee structure is fair and reasonable, and that the continuation of the fund's Advisory Contracts should be approved for four months from February 1, 2021 through May 31, 2021.
Liquidity Risk Management Program
The Securities and Exchange Commission adopted Rule 22e-4 under the Investment Company Act of 1940 (the Liquidity Rule) to promote effective liquidity risk management throughout the open-end investment company industry, thereby reducing the risk that funds will be unable to meet their redemption obligations and mitigating dilution of the interests of fund shareholders.
The Fund has adopted and implemented a liquidity risk management program pursuant to the Liquidity Rule (the Program) effective December 1, 2018. The Program is reasonably designed to assess and manage the Fund’s liquidity risk and to comply with the requirements of the Liquidity Rule. The Fund’s Board of Trustees (the Board) has designated the Fund’s investment adviser as administrator of the Program. The Fidelity advisers have established a Liquidity Risk Management Committee (the LRM Committee) to manage the Program for each of the Fidelity Funds. The LRM Committee monitors the adequacy and effectiveness of implementation of the Program and on a periodic basis assesses each Fund’s liquidity risk based on a variety of factors including (1) the Fund’s investment strategy, (2) portfolio liquidity and cash flow projections during normal and reasonably foreseeable stressed conditions, (3) shareholder redemptions, (4) borrowings and other funding sources and (5) in the case of exchange-traded funds, certain additional factors including the effect of the Fund’s prices and spreads, market participants, and basket compositions on the overall liquidity of the Fund’s portfolio, as applicable.
In accordance with the Program, each of the Fund’s portfolio investments is classified into one of four liquidity categories described below based on a determination of a reasonable expectation for how long it would take to convert the investment to cash (or sell or dispose of the investment) without significantly changing its market value.
- Highly liquid investments – cash or convertible to cash within three business days or less
- Moderately liquid investments – convertible to cash in three to seven calendar days
- Less liquid investments – can be sold or disposed of, but not settled, within seven calendar days
- Illiquid investments – cannot be sold or disposed of within seven calendar days
Liquidity classification determinations take into account a variety of factors including various market, trading and investment-specific considerations, as well as market depth, and generally utilize analysis from a third-party liquidity metrics service.
The Liquidity Rule places a 15% limit on a fund’s illiquid investments and requires funds that do not primarily hold assets that are highly liquid investments to determine and maintain a minimum percentage of the fund’s net assets to be invested in highly liquid investments (highly liquid investment minimum or HLIM). The Program includes provisions reasonably designed to comply with the 15% limit on illiquid investments and for determining, periodically reviewing and complying with the HLIM requirement as applicable.
At a recent meeting of the Fund’s Board of Trustees, the LRM Committee provided a written report to the Board pertaining to the operation, adequacy, and effectiveness of implementation of the Program for the annual period from December 1, 2019 through November 30, 2020. The report concluded that the Program has been implemented and is operating effectively and is reasonably designed to assess and manage the Fund’s liquidity risk.
Proxy Voting Results
A special meeting of shareholders was held on June 9, 2020. The results of votes taken among shareholders on the proposals before them are reported below. Each vote reported represents one dollar of net asset value held on the record date for the meeting.
PROPOSAL 1
To elect a Board of Trustees.
| | # of
Votes | % of
Votes |
| Dennis J. Dirks |
| Affirmative | 16,477,844,543.945 | 94.954 |
| Withheld | 875,616,757.045 | 5.046 |
| TOTAL | 17,353,461,300.990 | 100.000 |
| Donald F. Donahue |
| Affirmative | 16,475,304,981.550 | 94.940 |
| Withheld | 878,156,319.440 | 5.060 |
| TOTAL | 17,353,461,300.990 | 100.000 |
| Bettina Doulton |
| Affirmative | 16,570,440,321.103 | 95.488 |
| Withheld | 783,020,979.887 | 4.512 |
| TOTAL | 17,353,461,300.990 | 100.000 |
| Vicki L. Fuller |
| Affirmative | 16,590,910,486.905 | 95.606 |
| Withheld | 762,550,814.085 | 4.394 |
| TOTAL | 17,353,461,300.990 | 100.00 |
| Patricia L. Kampling |
| Affirmative | 16,469,872,791.586 | 94.908 |
| Withheld | 883,588,509.404 | 5.092 |
| TOTAL | 17,353,461,300.990 | 100.000 |
| Alan J. Lacy |
| Affirmative | 16,344,655,183.636 | 94.187 |
| Withheld | 1,008,806,117.354 | 5.813 |
| TOTAL | 17,353,461,300.990 | 100.000 |
| Ned C. Lautenbach |
| Affirmative | 15,532,663,704.227 | 89.508 |
| Withheld | 1,820,797,596.763 | 10.492 |
| TOTAL | 17,353,461,300.990 | 100.000 |
| Robert A. Lawrence |
| Affirmative | 16,389,821,876.677 | 94.447 |
| Withheld | 963,639,424.313 | 5.553 |
| TOTAL | 17,353,461,300.990 | 100.000 |
| Joseph Mauriello |
| Affirmative | 16,363,427,626.626 | 94.295 |
| Withheld | 990,033,674.365 | 5.705 |
| TOTAL | 17,353,461,300.990 | 100.000 |
| Cornelia M. Small |
| Affirmative | 16,405,902,888.605 | 94.540 |
| Withheld | 947,558,412.386 | 5.460 |
| TOTAL | 17,353,461,300.990 | 100.000 |
| Garnett A. Smith |
| Affirmative | 16,371,912,270.945 | 94.344 |
| Withheld | 981,549,030.045 | 5.656 |
| TOTAL | 17,353,461,300.990 | 100.000 |
| David M. Thomas |
| Affirmative | 16,365,966,852.048 | 94.310 |
| Withheld | 987,494,448.942 | 5.690 |
| TOTAL | 17,353,461,300.990 | 100.000 |
| Susan Tomasky |
| Affirmative | 16,483,922,579.861 | 94.989 |
| Withheld | 869,538,721.129 | 5.011 |
| TOTAL | 17,353,461,300.990 | 100.000 |
| Michael E. Wiley |
| Affirmative | 16,379,083,262.890 | 94.385 |
| Withheld | 974,378,038.101 | 5.615 |
| TOTAL | 17,353,461,300.990 | 100.000 |
PROPOSAL 2
To convert a fundamental investment policy to a non-fundamental investment policy.
| | # of
Votes | % of
Votes |
| Affirmative | 1,500,900,781.485 | 100.000 |
| Against | 0.000 | 0.000 |
| Abstain | 0.000 | 0.000 |
| Broker Non-Vote | 0.000 | 0.000 |
| TOTAL | 1,500,900,781.485 | 100.000 |
|
| Proposal 1 reflects trust wide proposal and voting results. |
FSH-ANN-0621
1.924270.110
Fidelity® Global High Income Fund
Annual Report
April 30, 2021
Includes Fidelity and Fidelity Advisor share classes
Contents
To view a fund's proxy voting guidelines and proxy voting record for the 12-month period ended June 30, visit http://www.fidelity.com/proxyvotingresults or visit the Securities and Exchange Commission's (SEC) web site at http://www.sec.gov.
You may also call 1-800-544-8544 if you’re an individual investing directly with Fidelity, call 1-800-835-5092 if you’re a plan sponsor or participant with Fidelity as your recordkeeper or call 1-877-208-0098 on institutional accounts or if you’re an advisor or invest through one to request a free copy of the proxy voting guidelines.
Standard & Poor's, S&P and S&P 500 are registered service marks of The McGraw-Hill Companies, Inc. and have been licensed for use by Fidelity Distributors Corporation.
Other third-party marks appearing herein are the property of their respective owners.
All other marks appearing herein are registered or unregistered trademarks or service marks of FMR LLC or an affiliated company. © 2021 FMR LLC. All rights reserved.
This report and the financial statements contained herein are submitted for the general information of the shareholders of the Fund. This report is not authorized for distribution to prospective investors in the Fund unless preceded or accompanied by an effective prospectus.
A fund files its complete schedule of portfolio holdings with the SEC for the first and third quarters of each fiscal year on Form N-PORT. Forms N-PORT are available on the SEC’s web site at http://www.sec.gov. A fund's Forms N-PORT may be reviewed and copied at the SEC’s Public Reference Room in Washington, DC. Information regarding the operation of the SEC's Public Reference Room may be obtained by calling 1-800-SEC-0330.
For a complete list of a fund's portfolio holdings, view the most recent holdings listing, semiannual report, or annual report on Fidelity's web site at http://www.fidelity.com, http://www.institutional.fidelity.com, or http://www.401k.com, as applicable.
NOT FDIC INSURED •MAY LOSE VALUE •NO BANK GUARANTEE
Neither the Fund nor Fidelity Distributors Corporation is a bank.
Note to Shareholders:
Early in 2020, the outbreak and spread of a new coronavirus emerged as a public health emergency that had a major influence on financial markets, primarily based on its impact on the global economy and the outlook for corporate earnings. The virus causes a respiratory disease known as COVID-19. On March 11, 2020 the World Health Organization declared the COVID-19 outbreak a pandemic, citing sustained risk of further global spread.
In the weeks following, as the crisis worsened, we witnessed an escalating human tragedy with wide-scale social and economic consequences from coronavirus-containment measures. The outbreak of COVID-19 prompted a number of measures to limit the spread, including travel and border restrictions, quarantines, and restrictions on large gatherings. In turn, these resulted in lower consumer activity, diminished demand for a wide range of products and services, disruption in manufacturing and supply chains, and – given the wide variability in outcomes regarding the outbreak – significant market uncertainty and volatility. Amid the turmoil, global governments and central banks took unprecedented action to help support consumers, businesses, and the broader economies, and to limit disruption to financial systems.
The situation continues to unfold, and the extent and duration of its impact on financial markets and the economy remain highly uncertain. Extreme events such as the coronavirus crisis are “exogenous shocks” that can have significant adverse effects on mutual funds and their investments. Although multiple asset classes may be affected by market disruption, the duration and impact may not be the same for all types of assets.
Fidelity is committed to helping you stay informed amid news about COVID-19 and during increased market volatility, and we’re taking extra steps to be responsive to customer needs. We encourage you to visit our websites, where we offer ongoing updates, commentary, and analysis on the markets and our funds.
Performance: The Bottom Line
Average annual total return reflects the change in the value of an investment, assuming reinvestment of distributions from dividend income and capital gains (the profits earned upon the sale of securities that have grown in value, if any) and assuming a constant rate of performance each year. The hypothetical investment and the average annual total returns do not reflect the deduction of taxes that a shareholder would pay on fund distributions or the redemption of fund shares. During periods of reimbursement by Fidelity, a fund’s total return will be greater than it would be had the reimbursement not occurred. How a fund did yesterday is no guarantee of how it will do tomorrow.
Average Annual Total Returns
| For the periods ended April 30, 2021 | Past 1 year | Past 5 years | Life of fundA |
| Class A (incl. 4.00% sales charge) | 16.73% | 5.32% | 4.72% |
| Class M (incl. 4.00% sales charge) | 16.73% | 5.32% | 4.72% |
| Class C (incl. contingent deferred sales charge) | 19.69% | 5.39% | 4.37% |
| Fidelity® Global High Income Fund | 21.89% | 6.44% | 5.42% |
| Class I | 21.89% | 6.44% | 5.42% |
A From May 11, 2011
Class C shares' contingent deferred sales charges included in the past one year, past five years, and life of fund total return figures are 1%, 0%, and 0%, respectively.
$10,000 Over Life of Fund
Let's say hypothetically that $10,000 was invested in Fidelity® Global High Income Fund, a class of the fund, on May 11, 2011, when the fund started.
The chart shows how the value of your investment would have changed, and also shows how the ICE® BofA® Global High Yield and Emerging Markets Plus Index performed over the same period.

| Period Ending Values |
| $16,939 | Fidelity® Global High Income Fund |
| $17,246 | ICE® BofA® Global High Yield and Emerging Markets Plus Index |
Management's Discussion of Fund Performance
Market Recap: Global high-yield bonds gained 19.90% for the 12 months ending April 30, 2021, as measured by the Fidelity Global High Income Composite Index℠. The asset class continued an uptrend that began in April 2020, following a steep slide amid the outbreak and spread of the coronavirus, hampering global economic growth and trade. The Composite index rebounded in the months that followed, due to improved coronavirus trends, plans for reopening some economies, positive vaccine developments, and rapid and expansive global monetary/fiscal-policy responses. The abundant provision of liquidity from central banks and sustained progress on economic reopening underpinned a continued rally in risk assets through April 30. Against this backdrop, each of the Composite index’s regional components achieved a strong gain this period. Europe led the way, rising 27.67%, according to the ICE BofA
® Euro High Yield Constrained Index. U.S. high-yield bonds also outperformed, advancing 20.01%, as measured by the ICE BofA
® US High Yield Constrained Index. Meanwhile, Asian high-yield bonds and emerging-markets corporate debt lagged the Composite index, gaining 18.01% and 14.33%, respectively, as measured by the ICE BofA
® Asian Dollar High Yield Corporate Constrained Index and the J.P. Morgan Corporate Emerging Markets Bond Index Broad Diversified, respectively.
Comments from Co-Portfolio Manager Harley Lank: For the fiscal year, the fund's share classes (excluding sales charges, if applicable) gained about 21% to 22%, outperforming the Composite index. Security selection drove the fund’s outperformance the past 12 months, particularly within emerging markets and U.S. high yield. In the emerging-markets debt sleeve, an overweighting in Ghana contributed, as did choices and overweightings in Mexico, Brazil and Colombia. Among the fund’s U.S. high-yield holdings, stakes in energy were the key driver, as rapidly recovering oil and gas prices, plus significant increases in valuation multiples across the sector, drove material increases in our distressed positions. Security selection in Asian high yield also was additive, as the subportfolio’s pro-cyclical tilt, based on our bottom-up credit research, meaningfully boosted its return. Specifically, credit selection in China and India helped most. Overall, foreign-security returns were bolstered in part by a generally weaker U.S. dollar this period. Conversely, choices in Europe modestly detracted from relative performance, especially our picks in Belgium and Greece. Asset allocation, including an underweighting in Europe and overweighting in Asia, also weighed on performance versus the Composite index, although an underweighting in emerging-markets debt was helpful.
The views expressed above reflect those of the portfolio manager(s) only through the end of the period as stated on the cover of this report and do not necessarily represent the views of Fidelity or any other person in the Fidelity organization. Any such views are subject to change at any time based upon market or other conditions and Fidelity disclaims any responsibility to update such views. These views may not be relied on as investment advice and, because investment decisions for a Fidelity fund are based on numerous factors, may not be relied on as an indication of trading intent on behalf of any Fidelity fund.
Note to shareholders: On July 1, 2020, Tae Ho Ryu and Terrence Pang became co-lead managers of the fund's Asian high-yield subportfolio, succeeding Bryan Collins. On September 18, 2020, Nader Nazmi assumed co-management responsibilities for the fund, as well as the emerging-markets debt central sleeve, succeeding Jonathan Kelly.
Investment Summary (Unaudited)
Top Five Holdings as of April 30, 2021
| (by issuer, excluding cash equivalents) | % of fund's net assets |
| Occidental Petroleum Corp. | 1.3 |
| Ally Financial, Inc. | 1.3 |
| Citigroup, Inc. | 1.2 |
| CCO Holdings LLC/CCO Holdings Capital Corp. | 1.2 |
| CSC Holdings LLC | 1.0 |
| | 6.0 |
Top Five Countries as of April 30, 2021
| (excluding cash equivalents) | % of fund's net assets |
| United States of America | 46.3 |
| Cayman Islands | 7.4 |
| Luxembourg | 4.7 |
| Netherlands | 4.2 |
| Canada | 2.5 |
Top Five Market Sectors as of April 30, 2021
| | % of fund's net assets |
| Energy | 13.8 |
| Telecommunications | 7.6 |
| Homebuilders/Real Estate | 6.4 |
| Banks & Thrifts | 6.3 |
| Healthcare | 6.2 |
Quality Diversification (% of fund's net assets)
| As of April 30, 2021 |
| | AAA,AA,A | 0.7% |
| | BBB | 4.9% |
| | BB | 36.7% |
| | B | 30.2% |
| | CCC,CC,C | 11.9% |
| | D | 0.1% |
| | Not Rated | 3.8% |
| | Equities | 3.2% |
| | Short-Term Investments and Net Other Assets | 8.5% |
We have used ratings from Moody's Investors Service, Inc. Where Moody's® ratings are not available, we have used S&P® ratings. All ratings are as of the date indicated and do not reflect subsequent changes.
Asset Allocation (% of fund's net assets)
| As of April 30, 2021* |
| | Corporate Bonds | 79.3% |
| | Government Obligations | 0.5% |
| | Stocks | 3.2% |
| | Preferred Securities | 6.1% |
| | Other Investments | 2.4% |
| | Short-Term Investments and Net Other Assets (Liabilities) | 8.5% |

* Foreign investments - 45.2%
Schedule of Investments April 30, 2021
Showing Percentage of Net Assets
| Corporate Bonds - 79.3% | | | |
| | | Principal Amount(a) | Value |
| Convertible Bonds - 1.0% | | | |
| Broadcasting - 0.5% | | | |
| DISH Network Corp.: | | | |
| 2.375% 3/15/24 | | $120,000 | $116,850 |
| 3.375% 8/15/26 | | 392,000 | 412,580 |
| | | | 529,430 |
| Diversified Financial Services - 0.1% | | | |
| Nexi SpA 1.75% 4/24/27 (Reg. S) | EUR | 100,000 | 140,009 |
| Energy - 0.1% | | | |
| Mesquite Energy, Inc.: | | | |
| 15% 7/15/23 (b)(c) | | 24,651 | 56,697 |
| 15% 7/15/23 (b)(c) | | 42,651 | 89,141 |
| | | | 145,838 |
| Technology - 0.1% | | | |
| ams AG 2.125% 11/3/27 (Reg. S) | EUR | 100,000 | 111,700 |
| Telecommunications - 0.2% | | | |
| Cellnex Telecom SA 0.75% 11/20/31 (Reg. S) | EUR | 100,000 | 115,226 |
| Telecom Italia SpA 1.125% 3/26/22 (Reg. S) | EUR | 100,000 | 120,411 |
| | | | 235,637 |
|
| TOTAL CONVERTIBLE BONDS | | | 1,162,614 |
|
| Nonconvertible Bonds - 78.3% | | | |
| Aerospace - 1.7% | | | |
| Allegheny Technologies, Inc. 5.875% 12/1/27 | | 70,000 | 73,938 |
| BBA U.S. Holdings, Inc.: | | | |
| 4% 3/1/28 (d) | | 55,000 | 55,413 |
| 5.375% 5/1/26 (d) | | 40,000 | 40,899 |
| Bombardier, Inc.: | | | |
| 7.5% 12/1/24 (d) | | 96,000 | 97,440 |
| 7.5% 3/15/25 (d) | | 160,000 | 159,700 |
| 7.875% 4/15/27 (d) | | 260,000 | 259,350 |
| BWX Technologies, Inc. 5.375% 7/15/26 (d) | | 65,000 | 67,067 |
| Embraer Netherlands Finance BV 5.05% 6/15/25 | | 75,000 | 78,563 |
| Moog, Inc. 4.25% 12/15/27 (d) | | 20,000 | 20,550 |
| Rolls-Royce PLC: | | | |
| 4.625% 2/16/26 (Reg. S) | EUR | 100,000 | 129,732 |
| 5.75% 10/15/27 (d) | | 55,000 | 58,988 |
| TransDigm UK Holdings PLC 6.875% 5/15/26 | | 200,000 | 210,250 |
| TransDigm, Inc.: | | | |
| 5.5% 11/15/27 | | 335,000 | 348,400 |
| 7.5% 3/15/27 | | 200,000 | 214,250 |
| Wolverine Escrow LLC 8.5% 11/15/24 (d) | | 45,000 | 44,269 |
| | | | 1,858,809 |
| Air Transportation - 0.8% | | | |
| Aerovias de Mexico SA de CV 7% 2/5/25 (d)(e) | | 200,000 | 110,000 |
| Azul Investments LLP 5.875% 10/26/24 (d) | | 200,000 | 190,280 |
| Hawaiian Brand Intellectual Property Ltd. / HawaiianMiles Loyalty Ltd. 5.75% 1/20/26 (d) | | 55,000 | 58,094 |
| International Consolidated Airlines Group SA 3.75% 3/25/29 (Reg. S) | EUR | 100,000 | 119,624 |
| Mileage Plus Holdings LLC 6.5% 6/20/27 (d) | | 55,000 | 60,363 |
| Spirit Loyalty Cayman Ltd. / Spirit IP Cayman Ltd. 8% 9/20/25 (d) | | 65,000 | 73,196 |
| United Airlines, Inc.: | | | |
| 4.375% 4/15/26 (d) | | 80,000 | 83,018 |
| 4.625% 4/15/29 (d) | | 80,000 | 83,136 |
| Western Global Airlines LLC 10.375% 8/15/25 (d) | | 60,000 | 68,025 |
| | | | 845,736 |
| Automotive & Auto Parts - 1.6% | | | |
| Dana, Inc. 4.25% 9/1/30 (f) | | 40,000 | 40,400 |
| Faurecia SA 3.75% 6/15/28 (Reg. S) | EUR | 105,000 | 133,773 |
| Ford Motor Co.: | | | |
| 9% 4/22/25 | | 120,000 | 146,569 |
| 9.625% 4/22/30 | | 40,000 | 56,100 |
| Ford Motor Credit Co. LLC: | | | |
| 2.9% 2/16/28 | | 50,000 | 48,985 |
| 3.087% 1/9/23 | | 200,000 | 203,754 |
| 3.25% 9/15/25 | EUR | 100,000 | 128,367 |
| 3.375% 11/13/25 | | 35,000 | 35,809 |
| 4% 11/13/30 | | 195,000 | 199,144 |
| 5.125% 6/16/25 | | 170,000 | 185,708 |
| 5.875% 8/2/21 | | 115,000 | 116,093 |
| Jaguar Land Rover Automotive PLC 5.875% 11/15/24 (Reg. S) | EUR | 100,000 | 130,403 |
| LCM Investments Holdings 4.875% 5/1/29 (d) | | 70,000 | 71,604 |
| Metalsa SA de CV 4.9% 4/24/23 (d) | | 150,000 | 157,669 |
| Nesco Holdings II, Inc. 5.5% 4/15/29 (d) | | 45,000 | 46,350 |
| Real Hero Merger Sub 2 6.25% 2/1/29 (d) | | 20,000 | 20,691 |
| Winnebago Industries, Inc. 6.25% 7/15/28 (d) | | 45,000 | 48,780 |
| | | | 1,770,199 |
| Banks & Thrifts - 2.6% | | | |
| Ally Financial, Inc.: | | | |
| 8% 11/1/31 | | 155,000 | 213,081 |
| 8% 11/1/31 | | 868,000 | 1,220,742 |
| Banca Monte dei Paschi di Siena SpA 5.375% 1/18/28 (g) | EUR | 100,000 | 107,878 |
| Banco de Reservas de La Republica Dominicana 7% 2/1/23 (d) | | 150,000 | 154,716 |
| Banco de Sabadell SA 5.625% 5/6/26 (Reg. S) | EUR | 100,000 | 140,212 |
| Biz Finance PLC 9.625% 4/27/22 (d) | | 25,000 | 25,723 |
| Cliffton Ltd. 6.25% 10/25/25 (Reg. S) | | 250,000 | 247,375 |
| Georgia Bank Joint Stock Co. 6% 7/26/23 (d) | | 200,000 | 211,188 |
| Industrial Senior Trust 5.5% 11/1/22 (d) | | 200,000 | 208,538 |
| Mongolian Mortgage Corp. HFC LLC 8.85% 2/8/24 (Reg. S) | | 200,000 | 194,250 |
| TBC Bank JSC 5.75% 6/19/24 (d) | | 200,000 | 215,438 |
| | | | 2,939,141 |
| Broadcasting - 1.8% | | | |
| AMC Networks, Inc. 4.75% 8/1/25 | | 125,000 | 128,750 |
| Cable Onda SA 4.5% 1/30/30 (d) | | 200,000 | 212,000 |
| Clear Channel Outdoor Holdings, Inc. 7.75% 4/15/28 (d) | | 35,000 | 36,035 |
| Diamond Sports Group LLC/Diamond Sports Finance Co. 5.375% 8/15/26 (d) | | 70,000 | 51,100 |
| E.W. Scripps Co. 5.125% 5/15/25 (d) | | 30,000 | 30,789 |
| Entercom Media Corp.: | | | |
| 6.5% 5/1/27 (d) | | 40,000 | 41,000 |
| 6.75% 3/31/29 (d) | | 45,000 | 46,350 |
| Netflix, Inc.: | | | |
| 3.875% 11/15/29 (Reg. S) | EUR | 200,000 | 290,943 |
| 5.875% 11/15/28 | | 140,000 | 170,520 |
| Nexstar Broadcasting, Inc. 5.625% 7/15/27 (d) | | 75,000 | 79,219 |
| Scripps Escrow II, Inc.: | | | |
| 3.875% 1/15/29 (d) | | 50,000 | 49,692 |
| 5.375% 1/15/31 (d) | | 25,000 | 25,344 |
| Scripps Escrow, Inc. 5.875% 7/15/27 (d) | | 60,000 | 63,133 |
| Sirius XM Radio, Inc.: | | | |
| 4.125% 7/1/30 (d) | | 75,000 | 75,000 |
| 4.625% 7/15/24 (d) | | 325,000 | 333,531 |
| 5% 8/1/27 (d) | | 65,000 | 68,068 |
| Tegna, Inc. 5% 9/15/29 | | 85,000 | 88,188 |
| TV Azteca SA de CV 8.25% 8/9/24 (Reg. S) (e) | | 200,000 | 96,000 |
| Univision Communications, Inc. 6.625% 6/1/27 (d) | | 110,000 | 119,213 |
| | | | 2,004,875 |
| Building Materials - 0.9% | | | |
| Advanced Drain Systems, Inc. 5% 9/30/27 (d) | | 315,000 | 329,688 |
| BCPE Ulysses Intermediate, Inc. 7.75% 4/1/27 pay-in-kind (d)(g) | | 70,000 | 72,107 |
| CEMEX S.A.B. de CV 5.45% 11/19/29 (d) | | 200,000 | 219,038 |
| Gypsum Management & Supply, Inc. 4.625% 5/1/29 (d) | | 60,000 | 60,088 |
| James Hardie International Finance Ltd. 3.625% 10/1/26 (Reg. S) | EUR | 100,000 | 123,381 |
| Standard Industries, Inc. 2.25% 11/21/26 (Reg. S) | EUR | 100,000 | 118,116 |
| The Hillman Group, Inc. 6.375% 7/15/22 (d) | | 100,000 | 99,990 |
| | | | 1,022,408 |
| Cable/Satellite TV - 3.6% | | | |
| Altice France Holding SA 8% 5/15/27 (d) | EUR | 175,000 | 228,824 |
| CCO Holdings LLC/CCO Holdings Capital Corp.: | | | |
| 4.5% 8/15/30 (d) | | 95,000 | 96,652 |
| 4.5% 6/1/33 (d) | | 120,000 | 120,938 |
| 4.75% 3/1/30 (d) | | 140,000 | 146,125 |
| 5.125% 5/1/27 (d) | | 725,000 | 758,759 |
| 5.75% 2/15/26 (d) | | 45,000 | 46,575 |
| CSC Holdings LLC: | | | |
| 3.375% 2/15/31 (d) | | 75,000 | 70,256 |
| 4.5% 11/15/31 (d)(f) | | 65,000 | 65,000 |
| 4.625% 12/1/30 (d) | | 75,000 | 73,313 |
| 5% 11/15/31 (d)(f) | | 65,000 | 65,122 |
| 5.375% 2/1/28 (d) | | 165,000 | 173,644 |
| 5.5% 4/15/27 (d) | | 115,000 | 120,585 |
| 5.75% 1/15/30 (d) | | 100,000 | 106,313 |
| 6.5% 2/1/29 (d) | | 165,000 | 182,325 |
| 7.5% 4/1/28 (d) | | 230,000 | 253,288 |
| DISH DBS Corp.: | | | |
| 5% 3/15/23 | | 250,000 | 261,655 |
| 7.75% 7/1/26 | | 185,000 | 213,213 |
| Radiate Holdco LLC/Radiate Financial Service Ltd.: | | | |
| 4.5% 9/15/26 (d) | | 150,000 | 152,625 |
| 6.5% 9/15/28 (d) | | 110,000 | 114,517 |
| UPC Holding BV 3.875% 6/15/29 (Reg. S) | EUR | 100,000 | 121,913 |
| Virgin Media Secured Finance PLC 5.5% 5/15/29 (d) | | 170,000 | 181,773 |
| Ziggo Bond Co. BV: | | | |
| 3.375% 2/28/30 (Reg. S) | EUR | 100,000 | 118,872 |
| 5.125% 2/28/30 (d) | | 35,000 | 35,847 |
| 6% 1/15/27 (d) | | 160,000 | 167,200 |
| Ziggo BV: | | | |
| 4.25% 1/15/27 (Reg. S) | EUR | 80,000 | 100,022 |
| 4.875% 1/15/30 (d) | | 50,000 | 51,386 |
| | | | 4,026,742 |
| Capital Goods - 0.1% | | | |
| Vertical Holdco GmbH 6.625% 7/15/28 (Reg. S) | EUR | 100,000 | 128,998 |
| Chemicals - 2.9% | | | |
| Bausch Health Companies, Inc. 6.25% 2/15/29 (d) | | 40,000 | 42,300 |
| CF Industries Holdings, Inc.: | | | |
| 4.95% 6/1/43 | | 65,000 | 75,726 |
| 5.15% 3/15/34 | | 100,000 | 117,000 |
| 5.375% 3/15/44 | | 200,000 | 244,643 |
| Consolidated Energy Finance SA: | | | |
| 3 month U.S. LIBOR + 3.750% 3.9339% 6/15/22 (d)(g)(h) | | 320,000 | 319,124 |
| 6.5% 5/15/26 (d) | | 185,000 | 183,613 |
| 6.875% 6/15/25 (d) | | 200,000 | 200,750 |
| CTC BondCo GmbH 5.25% 12/15/25 | EUR | 200,000 | 243,408 |
| GrafTech Finance, Inc. 4.625% 12/15/28 (d) | | 50,000 | 51,407 |
| INEOS Quattro Finance 2 PLC 2.5% 1/15/26 (Reg. S) | EUR | 100,000 | 120,540 |
| Kraton Polymers LLC/Kraton Polymers Capital Corp. 4.25% 12/15/25 (d) | | 35,000 | 35,525 |
| Kronos Acquisition Holdings, Inc. / KIK Custom Products, Inc.: | | | |
| 5% 12/31/26 (d) | | 10,000 | 10,088 |
| 7% 12/31/27 (d) | | 15,000 | 14,548 |
| MEGlobal Canada, Inc. 5% 5/18/25 (d) | | 200,000 | 223,725 |
| NOVA Chemicals Corp. 4.25% 5/15/29 (d)(f) | | 75,000 | 74,250 |
| OCI NV 5.25% 11/1/24 (d) | | 93,000 | 96,630 |
| OCP SA 4.5% 10/22/25 (d) | | 200,000 | 212,288 |
| Sasol Financing U.S.A. LLC 4.375% 9/18/26 | | 200,000 | 203,000 |
| SCIH Salt Holdings, Inc.: | | | |
| 4.875% 5/1/28 (d) | | 70,000 | 69,825 |
| 6.625% 5/1/29 (d) | | 45,000 | 44,269 |
| The Chemours Co. LLC: | | | |
| 5.375% 5/15/27 | | 240,000 | 257,400 |
| 5.75% 11/15/28 (d) | | 145,000 | 154,036 |
| 7% 5/15/25 | | 130,000 | 133,738 |
| Tronox, Inc. 4.625% 3/15/29 (d) | | 55,000 | 56,169 |
| Valvoline, Inc. 4.25% 2/15/30 (d) | | 45,000 | 46,124 |
| W. R. Grace & Co.-Conn. 4.875% 6/15/27 (d) | | 70,000 | 72,975 |
| | | | 3,303,101 |
| Consumer Products - 1.3% | | | |
| B2W Digital Lux SARL 4.375% 12/20/30 (d) | | 200,000 | 196,600 |
| Central Garden & Pet Co. 4.125% 10/15/30 | | 35,000 | 36,101 |
| Ferrellgas LP/Ferrellgas Finance Corp.: | | | |
| 5.375% 4/1/26 (d) | | 45,000 | 44,494 |
| 5.875% 4/1/29 (d) | | 45,000 | 44,550 |
| HSE Finance SARL 5.625% 10/15/26 (Reg. S) | EUR | 100,000 | 122,630 |
| Macy's Retail Holdings LLC 5.875% 4/1/29 (d) | | 55,000 | 56,441 |
| Magic MergerCo, Inc.: | | | |
| 5.25% 5/1/28 (d) | | 65,000 | 65,813 |
| 7.875% 5/1/29 (d) | | 95,000 | 97,613 |
| Mattel, Inc.: | | | |
| 3.375% 4/1/26 (d) | | 20,000 | 20,704 |
| 3.75% 4/1/29 (d) | | 20,000 | 20,496 |
| Natura Cosmeticos SA 4.125% 5/3/28 (d) | | 200,000 | 202,250 |
| PetSmart, Inc. / PetSmart Finance Corp. 7.75% 2/15/29 (d) | | 75,000 | 81,260 |
| Prosus NV 4.027% 8/3/50 (d) | | 200,000 | 186,410 |
| Spectrum Brands Holdings, Inc. 3.875% 3/15/31 (d) | | 40,000 | 39,200 |
| Tempur Sealy International, Inc. 4% 4/15/29 (d) | | 60,000 | 60,770 |
| The Scotts Miracle-Gro Co. 4% 4/1/31 (d) | | 40,000 | 39,600 |
| TripAdvisor, Inc. 7% 7/15/25 (d) | | 35,000 | 37,800 |
| Walnut Bidco PLC 6.75% 8/1/24 (Reg. S) | EUR | 100,000 | 125,635 |
| | | | 1,478,367 |
| Containers - 0.5% | | | |
| ARD Finance SA 6.5% 6/30/27 pay-in-kind (d)(g) | | 70,000 | 73,238 |
| Ardagh Packaging Finance PLC/Ardagh MP Holdings U.S.A., Inc. 6% 2/15/25 (d) | | 50,000 | 51,589 |
| Ball Corp. 4.875% 3/15/26 | | 85,000 | 95,200 |
| Berry Global, Inc. 4.875% 7/15/26 (d) | | 40,000 | 42,362 |
| CANPACK SA and Eastern PA Land Investment Holding LLC 3.125% 11/1/25 (d) | | 35,000 | 35,553 |
| Graham Packaging Co., Inc. 7.125% 8/15/28 (d) | | 30,000 | 32,175 |
| Intelligent Packaging Ltd. Finco, Inc. 6% 9/15/28 (d) | | 20,000 | 20,633 |
| Plastipak Holdings, Inc. 6.25% 10/15/25 (d) | | 20,000 | 20,550 |
| Schoeller Packaging BV 6.375% 11/1/24 (Reg. S) | EUR | 100,000 | 125,154 |
| Trivium Packaging Finance BV 5.5% 8/15/26 (d) | | 40,000 | 41,850 |
| | | | 538,304 |
| Diversified Financial Services - 3.1% | | | |
| Altice France Holding SA 10.5% 5/15/27 (d) | | 130,000 | 146,440 |
| Broadstreet Partners, Inc. 5.875% 4/15/29 (d) | | 30,000 | 30,456 |
| FLY Leasing Ltd. 5.25% 10/15/24 | | 35,000 | 35,700 |
| Ford Credit Europe PLC 1.615% 5/11/23 (Reg. S) | EUR | 200,000 | 243,903 |
| Fortune Star (BVI) Ltd.: | | | |
| 6.75% 7/2/23 (Reg. S) | | 200,000 | 208,850 |
| 6.85% 7/2/24 (Reg. S) | | 200,000 | 211,750 |
| Garfunkelux Holdco 3 SA 6.75% 11/1/25 (Reg. S) | EUR | 100,000 | 124,733 |
| Hightower Holding LLC 6.75% 4/15/29 (d) | | 25,000 | 25,594 |
| HTA Group Ltd. 7% 12/18/25 (d) | | 200,000 | 212,850 |
| Icahn Enterprises LP/Icahn Enterprises Finance Corp.: | | | |
| 4.375% 2/1/29 (d) | | 65,000 | 63,045 |
| 4.75% 9/15/24 | | 90,000 | 94,311 |
| 5.25% 5/15/27 (d) | | 70,000 | 71,400 |
| 5.25% 5/15/27 | | 90,000 | 91,800 |
| 6.25% 5/15/26 | | 260,000 | 274,066 |
| 6.375% 12/15/25 | | 495,000 | 510,956 |
| Intertrust Group BV 3.375% 11/15/25 (Reg. S) | EUR | 100,000 | 123,100 |
| Lincoln Financing SARL 3.625% 4/1/24 (Reg. S) | EUR | 125,000 | 152,095 |
| Nexi SpA 2.125% 4/30/29 (Reg. S) | EUR | 100,000 | 118,981 |
| Park Aerospace Holdings Ltd. 4.5% 3/15/23 (d) | | 20,000 | 20,987 |
| Qtel International Finance Ltd. 2.625% 4/8/31 (d) | | 200,000 | 201,790 |
| Springleaf Finance Corp.: | | | |
| 4% 9/15/30 | | 65,000 | 62,888 |
| 6.875% 3/15/25 | | 75,000 | 85,219 |
| 8.875% 6/1/25 | | 75,000 | 82,969 |
| Verisure Holding AB: | | | |
| 3.25% 2/15/27 (Reg. S) | EUR | 100,000 | 120,606 |
| 3.875% 7/15/26 (Reg. S) | EUR | 125,000 | 153,823 |
| Yihua Overseas Investment Ltd. 8.5% 12/31/49 (Reg. S) (c)(e) | | 200,000 | 20,100 |
| | | | 3,488,412 |
| Diversified Media - 0.3% | | | |
| Allen Media LLC 10.5% 2/15/28 (d) | | 115,000 | 123,050 |
| Lamar Media Corp. 4.875% 1/15/29 | | 45,000 | 47,363 |
| Terrier Media Buyer, Inc. 8.875% 12/15/27 (d) | | 90,000 | 97,763 |
| ViacomCBS, Inc. 6.25% 2/28/57 (g) | | 90,000 | 100,907 |
| | | | 369,083 |
| Electric Utilities No Longer Use - 0.2% | | | |
| Guara Norte SARL 5.198% 6/15/34 (d) | | 200,000 | 200,750 |
| Energy - 11.7% | | | |
| Antero Midstream Partners LP/Antero Midstream Finance Corp.: | | | |
| 5.75% 3/1/27 (d) | | 140,000 | 141,575 |
| 5.75% 1/15/28 (d) | | 60,000 | 61,141 |
| Antero Resources Corp. 7.625% 2/1/29 (d) | | 55,000 | 59,645 |
| Apache Corp.: | | | |
| 4.625% 11/15/25 | | 55,000 | 58,094 |
| 4.875% 11/15/27 | | 135,000 | 142,493 |
| Archrock Partners LP / Archrock Partners Finance Corp. 6.25% 4/1/28 (d) | | 70,000 | 73,178 |
| California Resources Corp. 7.125% 2/1/26 (d) | | 95,000 | 97,310 |
| Cheniere Corpus Christi Holdings LLC 5.125% 6/30/27 | | 135,000 | 155,638 |
| Cheniere Energy Partners LP 5.625% 10/1/26 | | 90,000 | 93,825 |
| Cheniere Energy, Inc. 4.625% 10/15/28 (d) | | 180,000 | 187,677 |
| Chesapeake Energy Corp.: | | | |
| 5.5% 2/1/26 (d) | | 115,000 | 121,325 |
| 5.875% 2/1/29 (d) | | 55,000 | 59,263 |
| Citgo Holding, Inc. 9.25% 8/1/24 (d) | | 185,000 | 190,550 |
| Citgo Petroleum Corp.: | | | |
| 6.375% 6/15/26 (d) | | 70,000 | 71,757 |
| 7% 6/15/25 (d) | | 130,000 | 134,063 |
| CNX Resources Corp. 6% 1/15/29 (d) | | 25,000 | 26,683 |
| Comstock Resources, Inc.: | | | |
| 6.75% 3/1/29 (d) | | 90,000 | 91,935 |
| 7.5% 5/15/25 (d) | | 72,000 | 74,363 |
| 9.75% 8/15/26 | | 124,000 | 134,823 |
| Continental Resources, Inc.: | | | |
| 4.5% 4/15/23 | | 3,000 | 3,149 |
| 5.75% 1/15/31 (d) | | 70,000 | 81,200 |
| Crestwood Midstream Partners LP/Crestwood Midstream Finance Corp. 6% 2/1/29 (d) | | 185,000 | 191,244 |
| CrownRock LP/CrownRock Finance, Inc. 5% 5/1/29 (d) | | 25,000 | 25,594 |
| CVR Energy, Inc.: | | | |
| 5.25% 2/15/25 (d) | | 140,000 | 140,700 |
| 5.75% 2/15/28 (d) | | 140,000 | 141,697 |
| DCP Midstream Operating LP: | | | |
| 5.375% 7/15/25 | | 135,000 | 148,163 |
| 5.85% 5/21/43 (d)(g) | | 60,000 | 54,300 |
| 8.125% 8/16/30 | | 5,000 | 6,500 |
| Delek Overriding Royalty 7.494% 12/30/23 (Reg. S) (d) | | 110,000 | 112,613 |
| Endeavor Energy Resources LP/EER Finance, Inc.: | | | |
| 5.75% 1/30/28 (d) | | 125,000 | 133,438 |
| 6.625% 7/15/25 (d) | | 55,000 | 58,575 |
| Energean Israel Finance Ltd.: | | | |
| 4.5% 3/30/24 (Reg. S) (d) | | 40,000 | 40,989 |
| 4.875% 3/30/26 (Reg. S) (d) | | 40,000 | 41,250 |
| Energo-Pro A/S 4% 12/7/22 (Reg. S) | EUR | 100,000 | 119,083 |
| EnfraGen Energia Sur SA 5.375% 12/30/30 (d) | | 200,000 | 198,750 |
| EnLink Midstream LLC 5.625% 1/15/28 (d) | | 25,000 | 25,844 |
| EQM Midstream Partners LP 6.5% 7/1/27 (d) | | 70,000 | 77,296 |
| EQT Corp. 5% 1/15/29 | | 55,000 | 60,072 |
| Genesis Energy LP/Genesis Energy Finance Corp. 8% 1/15/27 | | 65,000 | 66,964 |
| GeoPark Ltd.: | | | |
| 5.5% 1/17/27 (d) | | 200,000 | 204,825 |
| 6.5% 9/21/24 (d) | | 200,000 | 208,163 |
| Global Partners LP/GLP Finance Corp. 6.875% 1/15/29 | | 55,000 | 59,469 |
| Harvest Midstream I LP 7.5% 9/1/28 (d) | | 135,000 | 145,463 |
| Hess Midstream Partners LP: | | | |
| 5.125% 6/15/28 (d) | | 80,000 | 82,800 |
| 5.625% 2/15/26 (d) | | 100,000 | 103,750 |
| Indigo Natural Resources LLC 5.375% 2/1/29 (d) | | 115,000 | 114,138 |
| Indika Energy Capital III Pte. Ltd. 5.875% 11/9/24 (d) | | 200,000 | 202,600 |
| Investment Energy Resources Ltd. 6.25% 4/26/29 (d) | | 200,000 | 212,700 |
| KLX Energy Services Holdings, Inc. 11.5% 11/1/25 (d) | | 95,000 | 61,750 |
| Kosmos Energy Ltd. 7.125% 4/4/26 (d) | | 285,000 | 276,539 |
| Leviathan Bond Ltd. 6.125% 6/30/25 (Reg. S) (d) | | 150,000 | 164,063 |
| Medco Oak Tree Pte Ltd. 7.375% 5/14/26 (d) | | 200,000 | 217,038 |
| MEG Energy Corp.: | | | |
| 5.875% 2/1/29 (d) | | 110,000 | 112,750 |
| 7.125% 2/1/27 (d) | | 140,000 | 149,489 |
| Murphy Oil Corp. 5.875% 12/1/27 | | 40,000 | 40,200 |
| Nabors Industries, Inc. 5.75% 2/1/25 | | 105,000 | 86,625 |
| New Fortress Energy LLC 6.75% 9/15/25 (d) | | 55,000 | 56,908 |
| NGL Energy Operating LLC/NGL Energy Finance Corp. 7.5% 2/1/26 (d) | | 190,000 | 199,025 |
| Northern Oil & Gas, Inc. 8.125% 3/1/28 (d) | | 90,000 | 92,495 |
| Nostrum Oil & Gas Finance BV 8% 7/25/22 (d)(e) | | 400,000 | 99,875 |
| Occidental Petroleum Corp.: | | | |
| 5.5% 12/1/25 | | 35,000 | 37,625 |
| 5.55% 3/15/26 | | 65,000 | 69,794 |
| 5.875% 9/1/25 | | 40,000 | 43,700 |
| 6.125% 1/1/31 | | 140,000 | 155,750 |
| 6.375% 9/1/28 | | 345,000 | 386,400 |
| 6.6% 3/15/46 | | 55,000 | 60,638 |
| 6.625% 9/1/30 | | 195,000 | 222,300 |
| 6.95% 7/1/24 | | 65,000 | 71,906 |
| 7.5% 5/1/31 | | 230,000 | 273,700 |
| 8.875% 7/15/30 | | 145,000 | 186,325 |
| Oleoducto Central SA 4% 7/14/27 (d) | | 200,000 | 211,750 |
| Oman Oil Co. 5.125% 5/6/28 (d) | | 200,000 | 202,190 |
| Pacific Drilling SA 12% 4/1/24 pay-in-kind (c)(d)(e)(g) | | 9,642 | 386 |
| PBF Holding Co. LLC/PBF Finance Corp.: | | | |
| 6% 2/15/28 | | 160,000 | 120,734 |
| 7.25% 6/15/25 | | 70,000 | 59,675 |
| 9.25% 5/15/25 (d) | | 145,000 | 151,525 |
| PBF Logistics LP/PBF Logistics Finance, Inc. 6.875% 5/15/23 | | 130,000 | 129,838 |
| Petrobras Global Finance BV: | | | |
| 5.093% 1/15/30 | | 63,000 | 66,575 |
| 6.9% 3/19/49 | | 25,000 | 27,996 |
| Petroleos Mexicanos: | | | |
| 4.25% 1/15/25 | | 185,000 | 186,653 |
| 4.875% 1/24/22 | | 85,000 | 86,743 |
| 5.5% 2/24/25 (Reg. S) | EUR | 200,000 | 259,280 |
| 6.49% 1/23/27 | | 175,000 | 185,063 |
| 7.69% 1/23/50 | | 75,000 | 72,188 |
| Pride International, Inc. 7.875% 8/15/40 (e) | | 95,000 | 16,150 |
| Rattler Midstream LP 5.625% 7/15/25 (d) | | 50,000 | 52,688 |
| Rio Oil Finance Trust 9.25% 7/6/24 (d) | | 52,492 | 58,293 |
| Saudi Arabian Oil Co.: | | | |
| 1.625% 11/24/25 (d) | | 200,000 | 201,810 |
| 3.5% 4/16/29 (d) | | 200,000 | 213,850 |
| Sibur Securities DAC 2.95% 7/8/25 (d) | | 200,000 | 202,750 |
| SM Energy Co.: | | | |
| 5% 1/15/24 | | 65,000 | 62,164 |
| 5.625% 6/1/25 | | 100,000 | 95,500 |
| 6.625% 1/15/27 | | 65,000 | 62,806 |
| 6.75% 9/15/26 | | 25,000 | 24,188 |
| Southwestern Energy Co. 8.375% 9/15/28 | | 60,000 | 65,923 |
| Sunoco LP/Sunoco Finance Corp.: | | | |
| 4.5% 5/15/29 (d) | | 50,000 | 50,500 |
| 5.5% 2/15/26 | | 75,000 | 77,366 |
| 6% 4/15/27 | | 175,000 | 184,021 |
| Superior Plus LP / Superior General Partner, Inc. 4.5% 3/15/29 (d) | | 45,000 | 45,857 |
| Tallgrass Energy Partners LP / Tallgrass Energy Finance Corp. 6% 12/31/30 (d) | | 55,000 | 55,138 |
| Targa Resources Partners LP/Targa Resources Partners Finance Corp.: | | | |
| 4.875% 2/1/31 (d) | | 55,000 | 57,390 |
| 5.5% 3/1/30 | | 70,000 | 75,711 |
| 5.875% 4/15/26 | | 70,000 | 73,325 |
| 6.5% 7/15/27 | | 40,000 | 43,500 |
| 6.875% 1/15/29 | | 70,000 | 78,575 |
| Tengizchevroil Finance Co. International Ltd. 3.25% 8/15/30 (d) | | 200,000 | 204,000 |
| Termocandelaria Power Ltd. 7.875% 1/30/29 (d) | | 185,000 | 200,471 |
| Transocean Sentry Ltd. 5.375% 5/15/23 (d) | | 81,656 | 77,369 |
| Transocean, Inc. 11.5% 1/30/27 (d) | | 76,000 | 72,960 |
| Transportadora de Gas del Sur SA 6.75% 5/2/25 (d) | | 70,000 | 60,738 |
| Tullow Oil PLC: | | | |
| 6.25% 4/15/22 (d) | | 200,000 | 196,000 |
| 7% 3/1/25 (d) | | 200,000 | 171,000 |
| U.S.A. Compression Partners LP 6.875% 4/1/26 | | 35,000 | 36,704 |
| Ultra Resources, Inc. 11% 7/12/24 pay-in-kind (c)(e) | | 63,329 | 3,166 |
| Valaris PLC: | | | |
| 5.2% 3/15/25 (e) | | 30,000 | 3,113 |
| 7.75% 2/1/26 (e) | | 85,000 | 8,819 |
| Vine Energy Holdings LLC 6.75% 4/15/29 (d) | | 60,000 | 60,026 |
| Viper Energy Partners LP 5.375% 11/1/27 (d) | | 30,000 | 31,349 |
| W&T Offshore, Inc. 9.75% 11/1/23 (d) | | 70,000 | 61,775 |
| YPF SA 8.5% 3/23/25 (d) | | 371,000 | 305,704 |
| | | | 13,152,857 |
| Entertainment/Film - 0.2% | | | |
| Live Nation Entertainment, Inc. 4.75% 10/15/27 (d) | | 80,000 | 80,725 |
| Petroleos Mexicanos 3.625% 11/24/25 (Reg. S) | EUR | 100,000 | 120,022 |
| | | | 200,747 |
| Environmental - 0.5% | | | |
| GFL Environmental, Inc. 4% 8/1/28 (d) | | 300,000 | 287,082 |
| LBC Tank Terminals Holding Netherlands BV 6.875% 5/15/23 (d) | | 300,000 | 298,125 |
| Stericycle, Inc. 3.875% 1/15/29 (d) | | 35,000 | 34,913 |
| | | | 620,120 |
| Food & Drug Retail - 0.8% | | | |
| Albertsons Companies LLC/Safeway, Inc./New Albertson's, Inc./Albertson's LLC: | | | |
| 3.5% 3/15/29 (d) | | 35,000 | 33,600 |
| 4.625% 1/15/27 (d) | | 130,000 | 135,200 |
| 4.875% 2/15/30 (d) | | 175,000 | 182,199 |
| Camposol SA 6% 2/3/27 (d) | | 200,000 | 204,700 |
| Emergent BioSolutions, Inc. 3.875% 8/15/28 (d) | | 35,000 | 32,813 |
| Murphy Oil U.S.A., Inc. 3.75% 2/15/31 (d) | | 25,000 | 24,625 |
| SEG Holding LLC/SEG Finance Corp. 5.625% 10/15/28 (d) | | 100,000 | 105,250 |
| Sigma Holdco BV 5.75% 5/15/26 (Reg. S) | EUR | 110,000 | 128,148 |
| Tops Markets LLC 13% 11/19/24 pay-in-kind (c)(g) | | 33,712 | 32,701 |
| | | | 879,236 |
| Food/Beverage/Tobacco - 2.7% | | | |
| Adecoagro SA 6% 9/21/27 (d) | | 150,000 | 157,219 |
| C&S Group Enterprises LLC 5% 12/15/28 (d) | | 40,000 | 39,748 |
| Central American Bottling Corp. 5.75% 1/31/27 (d) | | 200,000 | 210,500 |
| Chobani LLC/Finance Corp., Inc.: | | | |
| 4.625% 11/15/28 (d) | | 30,000 | 30,900 |
| 7.5% 4/15/25 (d) | | 15,000 | 15,581 |
| Del Monte Foods, Inc. 11.875% 5/15/25 (d) | | 80,000 | 91,176 |
| JBS Investments II GmbH: | | | |
| 5.75% 1/15/28 (d) | | 300,000 | 318,810 |
| 7% 1/15/26 (d) | | 400,000 | 425,040 |
| JBS U.S.A. LLC/JBS U.S.A. Finance, Inc. 6.75% 2/15/28 (d) | | 185,000 | 204,407 |
| JBS U.S.A. Lux SA / JBS Food Co.: | | | |
| 5.5% 1/15/30 (d) | | 120,000 | 132,001 |
| 6.5% 4/15/29 (d) | | 80,000 | 89,800 |
| KeHE Distributors LLC / KeHE Finance Corp. 8.625% 10/15/26 (d) | | 54,000 | 60,345 |
| Kraft Heinz Foods Co.: | | | |
| 2.25% 5/25/28 (Reg. S) | EUR | 100,000 | 130,136 |
| 4.375% 6/1/46 | | 15,000 | 16,076 |
| 4.875% 10/1/49 | | 85,000 | 97,423 |
| 5.5% 6/1/50 | | 25,000 | 31,059 |
| Lamb Weston Holdings, Inc. 4.875% 11/1/26 (d) | | 45,000 | 46,688 |
| MARB BondCo PLC 3.95% 1/29/31 (d) | | 200,000 | 190,600 |
| MHP SA 7.75% 5/10/24 (d) | | 200,000 | 210,475 |
| Pilgrim's Pride Corp. 4.25% 4/15/31 (d) | | 80,000 | 80,825 |
| Post Holdings, Inc.: | | | |
| 4.5% 9/15/31 (d) | | 40,000 | 39,712 |
| 4.625% 4/15/30 (d) | | 95,000 | 95,950 |
| 5.625% 1/15/28 (d) | | 110,000 | 115,913 |
| Simmons Foods, Inc. 4.625% 3/1/29 (d) | | 40,000 | 40,308 |
| TreeHouse Foods, Inc. 4% 9/1/28 | | 20,000 | 19,875 |
| Triton Water Holdings, Inc. 6.25% 4/1/29 (d) | | 30,000 | 30,375 |
| U.S. Foods, Inc. 4.75% 2/15/29 (d) | | 80,000 | 80,700 |
| United Natural Foods, Inc. 6.75% 10/15/28 (d) | | 40,000 | 43,100 |
| | | | 3,044,742 |
| Gaming - 3.2% | | | |
| Affinity Gaming LLC 6.875% 12/15/27 (d) | | 20,000 | 21,230 |
| Bally's Corp. 6.75% 6/1/27 (d) | | 75,000 | 79,787 |
| Caesars Entertainment, Inc.: | | | |
| 6.25% 7/1/25 (d) | | 110,000 | 116,952 |
| 8.125% 7/1/27 (d) | | 275,000 | 305,575 |
| Caesars Resort Collection LLC 5.25% 10/15/25 (d) | | 300,000 | 302,441 |
| GENM Capital Labuan Ltd. 3.882% 4/19/31 (d) | | 200,000 | 198,042 |
| GLP Capital LP/GLP Financing II, Inc.: | | | |
| 5.25% 6/1/25 | | 95,000 | 107,249 |
| 5.375% 4/15/26 | | 30,000 | 33,937 |
| Golden Nugget, Inc. 6.75% 10/15/24 (d) | | 130,000 | 131,625 |
| LHMC Finco SARL 6.25% 12/20/23 (Reg. S) | EUR | 100,000 | 121,847 |
| MCE Finance Ltd. 5.375% 12/4/29 (Reg. S) | | 200,000 | 212,890 |
| MGM China Holdings Ltd. 4.75% 2/1/27 (Reg. S) | | 200,000 | 205,750 |
| MGM Growth Properties Operating Partnership LP: | | | |
| 4.5% 1/15/28 | | 350,000 | 364,875 |
| 5.75% 2/1/27 | | 70,000 | 78,072 |
| NagaCorp Ltd. 7.95% 7/6/24 (Reg. S) | | 200,000 | 207,850 |
| Peninsula Pacific Entertainment LLC 8.5% 11/15/27 (d) | | 70,000 | 74,445 |
| Station Casinos LLC 5% 10/1/25 (d) | | 81,000 | 82,114 |
| Studio City Finance Ltd.: | | | |
| 6.5% 1/15/28 (d) | | 110,000 | 119,213 |
| 6.5% 1/15/28 (Reg. S) | | 200,000 | 216,750 |
| Wynn Macau Ltd.: | | | |
| 4.875% 10/1/24 (d) | | 200,000 | 202,700 |
| 5.125% 12/15/29 (Reg. S) | | 250,000 | 256,172 |
| 5.5% 1/15/26 (d) | | 200,000 | 209,250 |
| | | | 3,648,766 |
| Healthcare - 5.8% | | | |
| Avantor Funding, Inc. 4.625% 7/15/28 (d) | | 75,000 | 78,563 |
| Bausch Health Companies, Inc. 5.5% 11/1/25 (d) | | 260,000 | 268,125 |
| CAB SELAS 3.375% 2/1/28 (Reg. S) | EUR | 203,000 | 242,736 |
| Catalent Pharma Solutions 5% 7/15/27 (d) | | 20,000 | 20,925 |
| Centene Corp.: | | | |
| 3% 10/15/30 | | 55,000 | 54,567 |
| 3.375% 2/15/30 | | 60,000 | 60,225 |
| 4.25% 12/15/27 | | 70,000 | 73,368 |
| 4.625% 12/15/29 | | 105,000 | 113,663 |
| 5.375% 6/1/26 (d) | | 245,000 | 255,241 |
| 5.375% 8/15/26 (d) | | 55,000 | 57,695 |
| Charles River Laboratories International, Inc.: | | | |
| 3.75% 3/15/29 (d) | | 20,000 | 20,350 |
| 4% 3/15/31 (d) | | 55,000 | 56,650 |
| 4.25% 5/1/28 (d) | | 20,000 | 20,826 |
| Cidron Aida Finco SARL 5% 4/1/28 (Reg. S) | EUR | 258,000 | 316,074 |
| Community Health Systems, Inc.: | | | |
| 4.75% 2/15/31 (d) | | 75,000 | 74,438 |
| 5.625% 3/15/27 (d) | | 55,000 | 58,300 |
| 6% 1/15/29 (d) | | 55,000 | 57,897 |
| 6.875% 4/15/29 (d) | | 75,000 | 78,375 |
| 8% 3/15/26 (d) | | 390,000 | 420,225 |
| CTR Partnership LP/CareTrust Capital Corp. 5.25% 6/1/25 | | 100,000 | 102,960 |
| DaVita HealthCare Partners, Inc.: | | | |
| 3.75% 2/15/31 (d) | | 60,000 | 57,000 |
| 4.625% 6/1/30 (d) | | 160,000 | 162,000 |
| Encompass Health Corp. 5.75% 9/15/25 | | 15,000 | 15,506 |
| Eurofins Scientific SA 2.125% 7/25/24 (Reg. S) | EUR | 100,000 | 127,018 |
| Grifols SA 2.25% 11/15/27 (Reg. S) | EUR | 100,000 | 122,179 |
| HCA Holdings, Inc.: | | | |
| 5.375% 9/1/26 | | 85,000 | 96,506 |
| 5.875% 2/15/26 | | 85,000 | 97,644 |
| 5.875% 2/1/29 | | 45,000 | 53,100 |
| Hologic, Inc. 3.25% 2/15/29 (d) | | 55,000 | 54,038 |
| IQVIA, Inc. 5% 10/15/26 (d) | | 120,000 | 124,064 |
| Jazz Securities DAC 4.375% 1/15/29 (d) | | 55,000 | 56,238 |
| Molina Healthcare, Inc.: | | | |
| 3.875% 11/15/30 (d) | | 50,000 | 51,500 |
| 4.375% 6/15/28 (d) | | 40,000 | 41,100 |
| Organon Finance 1 LLC: | | | |
| 2.875% 4/30/28 (Reg. S) | EUR | 347,000 | 426,396 |
| 4.125% 4/30/28 (d) | | 80,000 | 81,959 |
| 5.125% 4/30/31 (d) | | 80,000 | 83,008 |
| Ortho-Clinical Diagnostics, Inc.: | | | |
| 7.25% 2/1/28 (d) | | 18,000 | 19,746 |
| 7.375% 6/1/25 (d) | | 25,000 | 26,938 |
| Radiology Partners, Inc. 9.25% 2/1/28 (d) | | 220,000 | 241,450 |
| RP Escrow Issuer LLC 5.25% 12/15/25 (d) | | 50,000 | 52,046 |
| Sabra Health Care LP 3.9% 10/15/29 | | 72,000 | 74,881 |
| Service Corp. International 3.375% 8/15/30 | | 300,000 | 290,250 |
| Surgery Center Holdings, Inc.: | | | |
| 6.75% 7/1/25 (d) | | 30,000 | 30,413 |
| 10% 4/15/27 (d) | | 15,000 | 16,448 |
| Teleflex, Inc. 4.625% 11/15/27 | | 30,000 | 31,904 |
| Tenet Healthcare Corp.: | | | |
| 4.625% 7/15/24 | | 80,000 | 81,208 |
| 6.125% 10/1/28 (d) | | 240,000 | 253,200 |
| 6.25% 2/1/27 (d) | | 195,000 | 204,506 |
| 6.75% 6/15/23 | | 300,000 | 327,600 |
| 6.875% 11/15/31 | | 10,000 | 11,150 |
| Teva Pharmaceutical Finance Netherlands III BV: | | | |
| 3.15% 10/1/26 | | 75,000 | 70,500 |
| 4.1% 10/1/46 | | 200,000 | 170,500 |
| 6% 1/31/25 | EUR | 100,000 | 130,897 |
| U.S. Renal Care, Inc. 10.625% 7/15/27 (d) | | 55,000 | 58,163 |
| Valeant Pharmaceuticals International, Inc.: | | | |
| 8.5% 1/31/27 (d) | | 55,000 | 61,256 |
| 9.25% 4/1/26 (d) | | 230,000 | 254,771 |
| Vizient, Inc. 6.25% 5/15/27 (d) | | 15,000 | 15,889 |
| | | | 6,504,175 |
| Homebuilders/Real Estate - 5.9% | | | |
| ADLER Real Estate AG 3% 4/27/26 (Reg. S) | EUR | 100,000 | 125,996 |
| Arcosa, Inc. 4.375% 4/15/29 (d) | | 40,000 | 40,908 |
| Ashton Woods U.S.A. LLC/Ashton Woods Finance Co.: | | | |
| 6.625% 1/15/28 (d) | | 5,000 | 5,363 |
| 9.875% 4/1/27 (d) | | 44,000 | 49,995 |
| China Aoyuan Group Ltd.: | | | |
| 5.88% 3/1/27 (Reg. S) | | 200,000 | 183,913 |
| 6.2% 3/24/26 (Reg. S) | | 200,000 | 188,163 |
| China Evergrande Group: | | | |
| 8.25% 3/23/22 (Reg. S) | | 200,000 | 195,788 |
| 8.75% 6/28/25 (Reg. S) | | 200,000 | 162,350 |
| China SCE Property Holdings Ltd.: | | | |
| 7.25% 4/19/23 (Reg. S) | | 200,000 | 206,850 |
| 7.375% 4/9/24 (Reg. S) | | 200,000 | 208,225 |
| China South City Holdings Ltd. 11.5% 2/12/22 (Reg. S) | | 200,000 | 192,788 |
| CIFI Holdings Group Co. Ltd. 4.375% 4/12/27 (Reg. S) | | 200,000 | 196,050 |
| Easy Tactic Ltd.: | | | |
| 5.875% 2/13/23 (Reg. S) | | 200,000 | 187,100 |
| 11.625% 9/3/24 (Reg. S) | | 200,000 | 201,250 |
| GMR Hyderabad International Airport Ltd. 4.75% 2/2/26 (Reg. S) | | 200,000 | 196,288 |
| Kaisa Group Holdings Ltd.: | | | |
| 8.5% 6/30/22 (Reg. S) | | 200,000 | 204,163 |
| 11.5% 1/30/23 (Reg. S) | | 200,000 | 206,725 |
| Kennedy-Wilson, Inc.: | | | |
| 4.75% 3/1/29 | | 55,000 | 56,856 |
| 5% 3/1/31 | | 55,000 | 56,919 |
| KWG Property Holding Ltd. 5.2% 9/21/22 (Reg. S) | | 200,000 | 201,898 |
| Modernland Overseas Pte Ltd. 6.95% 4/13/24 (e) | | 200,000 | 80,413 |
| MPT Operating Partnership LP/MPT Finance Corp.: | | | |
| 5% 10/15/27 | | 300,000 | 315,750 |
| 5.25% 8/1/26 | | 100,000 | 103,125 |
| New Home Co., Inc. 7.25% 10/15/25 (d) | | 35,000 | 36,780 |
| New Metro Global Ltd.: | | | |
| 4.8% 12/15/24 (Reg. S) | | 200,000 | 198,913 |
| 6.8% 8/5/23 (Reg. S) | | 200,000 | 207,788 |
| Realogy Group LLC/Realogy Co-Issuer Corp.: | | | |
| 5.75% 1/15/29 (d) | | 30,000 | 31,125 |
| 7.625% 6/15/25 (d) | | 25,000 | 27,313 |
| Redsun Properties Group Ltd. 9.7% 4/16/23 (Reg. S) | | 220,000 | 229,391 |
| Ronshine China Holdings Ltd. 7.1% 1/25/25 (Reg. S) | | 200,000 | 187,038 |
| Service Properties Trust 7.5% 9/15/25 | | 95,000 | 107,674 |
| Starwood Property Trust, Inc. 4.75% 3/15/25 | | 75,000 | 78,096 |
| Sunac China Holdings Ltd.: | | | |
| 6.5% 7/9/23 (Reg. S) | | 200,000 | 204,750 |
| 7.5% 2/1/24 (Reg. S) | | 200,000 | 209,725 |
| Taylor Morrison Communities, Inc./Monarch Communities, Inc.: | | | |
| 5.75% 1/15/28 (d) | | 80,000 | 90,300 |
| 5.875% 6/15/27 (d) | | 55,000 | 62,425 |
| Times China Holdings Ltd.: | | | |
| 6.6% 3/2/23 (Reg. S) | | 200,000 | 203,350 |
| 6.75% 7/8/25 (Reg. S) | | 200,000 | 204,413 |
| TRI Pointe Homes, Inc. 5.7% 6/15/28 | | 15,000 | 16,654 |
| Uniti Group LP / Uniti Group Finance, Inc.: | | | |
| 4.75% 4/15/28 (d) | | 55,000 | 54,794 |
| 6.5% 2/15/29 (d) | | 85,000 | 84,493 |
| VICI Properties, Inc.: | | | |
| 3.75% 2/15/27 (d) | | 55,000 | 55,442 |
| 4.125% 8/15/30 (d) | | 70,000 | 71,094 |
| Weekley Homes LLC/Weekley Finance Corp. 4.875% 9/15/28 (d) | | 25,000 | 25,813 |
| Yango Justice International Ltd.: | | | |
| 8.25% 11/25/23 (Reg. S) | | 220,000 | 222,723 |
| 10% 2/12/23 (Reg. S) | | 200,000 | 208,538 |
| Zhenro Properties Group Ltd. 8.7% 8/3/22 (Reg. S) | | 200,000 | 205,188 |
| | | | 6,590,696 |
| Hotels - 0.3% | | | |
| Hilton Domestic Operating Co., Inc.: | | | |
| 3.625% 2/15/32 (d) | | 40,000 | 39,337 |
| 3.75% 5/1/29 (d) | | 35,000 | 35,088 |
| 4% 5/1/31 (d) | | 35,000 | 35,350 |
| 4.875% 1/15/30 | | 120,000 | 127,952 |
| Hilton Worldwide Finance LLC/Hilton Worldwide Finance Corp. 4.875% 4/1/27 | | 40,000 | 41,550 |
| NCL Finance Ltd. 6.125% 3/15/28 (d) | | 25,000 | 26,333 |
| | | | 305,610 |
| Insurance - 1.0% | | | |
| Acrisure LLC / Acrisure Finance, Inc.: | | | |
| 7% 11/15/25 (d) | | 250,000 | 256,875 |
| 10.125% 8/1/26 (d) | | 35,000 | 39,944 |
| Alliant Holdings Intermediate LLC 6.75% 10/15/27 (d) | | 225,000 | 236,250 |
| AmWINS Group, Inc. 7.75% 7/1/26 (d) | | 15,000 | 15,919 |
| AssuredPartners, Inc. 5.625% 1/15/29 (d) | | 30,000 | 30,412 |
| HUB International Ltd. 7% 5/1/26 (d) | | 190,000 | 196,853 |
| MGIC Investment Corp. 5.25% 8/15/28 | | 40,000 | 42,200 |
| USI, Inc. 6.875% 5/1/25 (d) | | 275,000 | 279,469 |
| | | | 1,097,922 |
| Leisure - 0.9% | | | |
| Carnival Corp.: | | | |
| 5.75% 3/1/27 (d) | | 135,000 | 142,341 |
| 9.875% 8/1/27 (d) | | 210,000 | 246,750 |
| 10.5% 2/1/26 (d) | | 75,000 | 88,399 |
| NCL Corp. Ltd.: | | | |
| 5.875% 3/15/26 (d) | | 20,000 | 20,900 |
| 10.25% 2/1/26 (d) | | 115,000 | 135,292 |
| POWDR Corp. 6% 8/1/25 (d) | | 35,000 | 36,838 |
| Royal Caribbean Cruises Ltd.: | | | |
| 9.125% 6/15/23 (d) | | 85,000 | 93,837 |
| 11.5% 6/1/25 (d) | | 50,000 | 57,875 |
| SeaWorld Parks & Entertainment, Inc. 9.5% 8/1/25 (d) | | 50,000 | 54,291 |
| Vail Resorts, Inc. 6.25% 5/15/25 (d) | | 35,000 | 37,144 |
| Viking Cruises Ltd. 13% 5/15/25 (d) | | 50,000 | 58,510 |
| | | | 972,177 |
| Metals/Mining - 3.0% | | | |
| Abja Investment Co. Pte Ltd. 5.45% 1/24/28 | | 300,000 | 310,572 |
| Alcoa Nederland Holding BV 4.125% 3/31/29 (d) | | 70,000 | 71,488 |
| Alpha Natural Resources, Inc. 9.75% 4/15/18 (c)(e) | | 210,000 | 0 |
| Alrosa Finance SA 3.1% 6/25/27 (d) | | 200,000 | 200,938 |
| Antofagasta PLC 2.375% 10/14/30 (d) | | 200,000 | 194,500 |
| Cleveland-Cliffs, Inc.: | | | |
| 4.625% 3/1/29 (d) | | 40,000 | 40,750 |
| 4.875% 3/1/31 (d) | | 40,000 | 40,700 |
| First Quantum Minerals Ltd.: | | | |
| 6.5% 3/1/24 (d) | | 200,000 | 205,250 |
| 6.875% 3/1/26 (d) | | 200,000 | 209,725 |
| 6.875% 10/15/27 (d) | | 185,000 | 202,113 |
| 7.25% 4/1/23 (d) | | 325,000 | 330,281 |
| 7.5% 4/1/25 (d) | | 130,000 | 134,956 |
| FMG Resources (August 2006) Pty Ltd. 4.375% 4/1/31 (d) | | 40,000 | 41,550 |
| Freeport-McMoRan, Inc.: | | | |
| 4.625% 8/1/30 | | 55,000 | 60,706 |
| 5.4% 11/14/34 | | 30,000 | 36,075 |
| Howmet Aerospace, Inc. 5.95% 2/1/37 | | 45,000 | 54,065 |
| HudBay Minerals, Inc. 6.125% 4/1/29 (d) | | 105,000 | 111,385 |
| Industrias Penoles SA de CV 4.75% 8/6/50 (d) | | 200,000 | 205,500 |
| Joseph T. Ryerson & Son, Inc. 8.5% 8/1/28 (d) | | 45,000 | 49,723 |
| Stillwater Mining Co. 6.125% 6/27/22 (d) | | 200,000 | 200,850 |
| Vedanta Resources PLC 6.375% 7/30/22 (Reg. S) | | 400,000 | 393,950 |
| VM Holding SA 6.5% 1/18/28 (d) | | 200,000 | 223,000 |
| Volcan Compania Minera SAA 4.375% 2/11/26 (d) | | 100,000 | 98,400 |
| | | | 3,416,477 |
| Paper - 0.4% | | | |
| Ardagh Metal Packaging Finance U.S.A. LLC/Ardagh Metal Packaging Finance PLC 3% 9/1/29 | EUR | 143,000 | 172,099 |
| Berry Global, Inc. 5.625% 7/15/27 (d) | | 35,000 | 37,275 |
| Enviva Partners LP / Enviva Partners Finance Corp. 6.5% 1/15/26 (d) | | 90,000 | 94,388 |
| Mercer International, Inc. 5.125% 2/1/29 (d) | | 55,000 | 56,856 |
| Rayonier AM Products, Inc. 7.625% 1/15/26 (d) | | 45,000 | 47,813 |
| SPA Holdings 3 OY 4.875% 2/4/28 (d) | | 45,000 | 45,281 |
| | | | 453,712 |
| Publishing/Printing - 0.2% | | | |
| Clear Channel International BV 6.625% 8/1/25 (d) | | 200,000 | 209,000 |
| Restaurants - 0.3% | | | |
| 1011778 BC Unlimited Liability Co./New Red Finance, Inc. 4% 10/15/30 (d) | | 160,000 | 156,000 |
| CEC Entertainment LLC 6.75% 5/1/26 (d) | | 60,000 | 59,475 |
| Golden Nugget, Inc. 8.75% 10/1/25 (d) | | 60,000 | 63,000 |
| Yum! Brands, Inc.: | | | |
| 4.625% 1/31/32 | | 70,000 | 73,164 |
| 7.75% 4/1/25 (d) | | 20,000 | 21,850 |
| | | | 373,489 |
| Services - 2.7% | | | |
| Adtalem Global Education, Inc. 5.5% 3/1/28 (d) | | 75,000 | 75,188 |
| APX Group, Inc. 7.625% 9/1/23 | | 75,000 | 76,969 |
| ASGN, Inc. 4.625% 5/15/28 (d) | | 160,000 | 166,400 |
| Avis Budget Car Rental LLC/Avis Budget Finance, Inc. 5.375% 3/1/29 (d) | | 40,000 | 41,650 |
| Booz Allen Hamilton, Inc. 3.875% 9/1/28 (d) | | 55,000 | 54,863 |
| Brand Energy & Infrastructure Services, Inc. 8.5% 7/15/25 (d) | | 340,000 | 346,800 |
| CoreCivic, Inc. 8.25% 4/15/26 | | 100,000 | 100,500 |
| Double Eagle III Midco 1 LLC 7.75% 12/15/25 (d) | | 90,000 | 101,889 |
| GEMS MENASA Cayman Ltd. 7.125% 7/31/26 (d) | | 520,000 | 544,700 |
| H&E Equipment Services, Inc. 3.875% 12/15/28 (d) | | 90,000 | 87,863 |
| Hertz Corp.: | | | |
| 5.5% 10/15/24 (d)(e) | | 65,000 | 67,685 |
| 6% 1/15/28 (d)(e) | | 85,000 | 92,438 |
| 6.25% 10/15/22 (e) | | 60,000 | 63,000 |
| 7.125% 8/1/26 (d)(e) | | 85,000 | 92,650 |
| IAA Spinco, Inc. 5.5% 6/15/27 (d) | | 30,000 | 31,538 |
| IHS Markit Ltd.: | | | |
| 4% 3/1/26 (d) | | 35,000 | 38,728 |
| 4.75% 2/15/25 (d) | | 65,000 | 72,982 |
| Intrum AB: | | | |
| 2.75% 7/15/22 (Reg. S) | EUR | 20,000 | 24,033 |
| 4.875% 8/15/25 (Reg. S) | EUR | 200,000 | 252,695 |
| Laureate Education, Inc. 8.25% 5/1/25 (d) | | 195,000 | 203,266 |
| Legends Hospitality Holding Co. LLC/Legends Hospitality Co-Issuer, Inc. 5% 2/1/26 (d) | | 35,000 | 36,138 |
| Sabre GLBL, Inc. 7.375% 9/1/25 (d) | | 60,000 | 65,325 |
| Service Corp. International 5.125% 6/1/29 | | 35,000 | 37,786 |
| Sotheby's 7.375% 10/15/27 (d) | | 80,000 | 86,224 |
| Tempo Acquisition LLC 6.75% 6/1/25 (d) | | 55,000 | 56,015 |
| The GEO Group, Inc.: | | | |
| 5.125% 4/1/23 | | 50,000 | 45,750 |
| 5.875% 10/15/24 | | 15,000 | 12,046 |
| 6% 4/15/26 | | 170,000 | 117,336 |
| WASH Multifamily Acquisition, Inc. 5.75% 4/15/26 (d) | | 45,000 | 46,744 |
| | | | 3,039,201 |
| Steel - 1.1% | | | |
| Big River Steel LLC/BRS Finance Corp. 6.625% 1/31/29 (d) | | 165,000 | 178,200 |
| Commercial Metals Co. 3.875% 2/15/31 | | 30,000 | 30,000 |
| CSN Resources SA 7.625% 4/17/26 (d) | | 200,000 | 214,410 |
| Infrabuild Australia Pty Ltd. 12% 10/1/24 (d) | | 150,000 | 151,500 |
| JSW Steel Ltd. 5.375% 4/4/25 (Reg. S) | | 200,000 | 211,663 |
| TMK Capital SA 4.3% 2/12/27 (Reg. S) | | 200,000 | 201,100 |
| Usiminas International SARL 5.875% 7/18/26 (d) | | 200,000 | 214,788 |
| | | | 1,201,661 |
| Super Retail - 0.9% | | | |
| Academy Ltd. 6% 11/15/27 (d) | | 75,000 | 79,823 |
| Asbury Automotive Group, Inc.: | | | |
| 4.5% 3/1/28 | | 21,000 | 21,630 |
| 4.75% 3/1/30 | | 20,000 | 20,900 |
| Carvana Co.: | | | |
| 5.5% 4/15/27 (d) | | 80,000 | 80,964 |
| 5.875% 10/1/28 (d) | | 55,000 | 57,115 |
| EG Global Finance PLC: | | | |
| 6.75% 2/7/25 (d) | | 250,000 | 257,175 |
| 8.5% 10/30/25 (d) | | 50,000 | 53,062 |
| Group 1 Automotive, Inc. 4% 8/15/28 (d) | | 200,000 | 199,750 |
| L Brands, Inc. 6.625% 10/1/30 (d) | | 110,000 | 126,771 |
| LBM Acquisition LLC 6.25% 1/15/29 (d) | | 20,000 | 20,500 |
| Party City Holdings, Inc. 8.75% 2/15/26 (d) | | 30,000 | 30,748 |
| Rent-A-Center, Inc. 6.375% 2/15/29 (d) | | 20,000 | 21,690 |
| | | | 970,128 |
| Technology - 2.8% | | | |
| ams AG 6% 7/31/25 (Reg. S) | EUR | 100,000 | 127,288 |
| Arcelik A/S 5% 4/3/23 (d) | | 200,000 | 206,350 |
| Arches Buyer, Inc.: | | | |
| 4.25% 6/1/28 (d) | | 35,000 | 34,869 |
| 6.125% 12/1/28 (d) | | 10,000 | 10,250 |
| Banff Merger Sub, Inc. 9.75% 9/1/26 (d) | | 205,000 | 218,069 |
| Black Knight InfoServ LLC 3.625% 9/1/28 (d) | | 60,000 | 58,650 |
| Camelot Finance SA 4.5% 11/1/26 (d) | | 150,000 | 155,250 |
| CDK Global, Inc.: | | | |
| 4.875% 6/1/27 | | 80,000 | 84,599 |
| 5.25% 5/15/29 (d) | | 35,000 | 37,538 |
| CDW LLC/CDW Finance Corp. 4.25% 4/1/28 | | 80,000 | 83,400 |
| Crowdstrike Holdings, Inc. 3% 2/15/29 | | 70,000 | 69,374 |
| Endurance Acquisition Merger Sub 6% 2/15/29 (d) | | 40,000 | 38,300 |
| Entegris, Inc. 4.625% 2/10/26 (d) | | 85,000 | 87,949 |
| Go Daddy Operating Co. LLC / GD Finance Co., Inc. 5.25% 12/1/27 (d) | | 205,000 | 214,481 |
| Lenovo Group Ltd. 3.421% 11/2/30 (d) | | 200,000 | 202,038 |
| Match Group Holdings II LLC 5.625% 2/15/29 (d) | | 65,000 | 70,200 |
| MercadoLibre, Inc. 3.125% 1/14/31 | | 200,000 | 190,550 |
| NCR Corp. 5.125% 4/15/29 (d) | | 45,000 | 46,294 |
| Northwest Fiber LLC/Northwest Fiber Finance Sub, Inc. 10.75% 6/1/28 (d) | | 30,000 | 33,900 |
| ON Semiconductor Corp. 3.875% 9/1/28 (d) | | 70,000 | 72,056 |
| Open Text Holdings, Inc. 4.125% 2/15/30 (d) | | 95,000 | 96,067 |
| Orano SA: | | | |
| 2.75% 3/8/28 (Reg. S) | EUR | 100,000 | 125,359 |
| 3.375% 4/23/26 (Reg. S) | EUR | 100,000 | 130,158 |
| Qorvo, Inc. 4.375% 10/15/29 | | 45,000 | 48,905 |
| Rackspace Hosting, Inc. 5.375% 12/1/28 (d) | | 30,000 | 30,626 |
| Sensata Technologies BV 4% 4/15/29 (d) | | 65,000 | 65,403 |
| Solera LLC/Solera Finance, Inc. 10.5% 3/1/24 (d) | | 260,000 | 267,800 |
| Synaptics, Inc. 4% 6/15/29 (d) | | 30,000 | 30,015 |
| TTM Technologies, Inc. 4% 3/1/29 (d) | | 60,000 | 60,075 |
| Twilio, Inc.: | | | |
| 3.625% 3/15/29 | | 45,000 | 45,860 |
| 3.875% 3/15/31 | | 45,000 | 46,181 |
| Uber Technologies, Inc. 7.5% 5/15/25 (d) | | 115,000 | 124,344 |
| Unisys Corp. 6.875% 11/1/27 (d) | | 30,000 | 32,925 |
| | | | 3,145,123 |
| Telecommunications - 6.7% | | | |
| Altice France Holding SA 6% 2/15/28 (d) | | 75,000 | 74,156 |
| Altice France SA: | | | |
| 5.125% 1/15/29 (d) | | 50,000 | 50,126 |
| 5.125% 7/15/29 (d) | | 120,000 | 120,163 |
| 5.5% 1/15/28 (d) | | 130,000 | 133,926 |
| 7.375% 5/1/26 (d) | | 150,000 | 155,520 |
| 8.125% 2/1/27 (d) | | 245,000 | 268,275 |
| C&W Senior Financing Designated Activity Co.: | | | |
| 6.875% 9/15/27 (d) | | 340,000 | 361,250 |
| 7.5% 10/15/26 (d) | | 100,000 | 106,000 |
| Cablevision Lightpath LLC: | | | |
| 3.875% 9/15/27 (d) | | 30,000 | 29,588 |
| 5.625% 9/15/28 (d) | | 20,000 | 20,500 |
| Cellnex Telecom SA 2.375% 1/16/24 (Reg. S) | EUR | 100,000 | 126,447 |
| Cogent Communications Group, Inc. 3.5% 5/1/26 (d) | | 50,000 | 50,375 |
| Consolidated Communications, Inc. 5% 10/1/28 (d) | | 35,000 | 35,525 |
| Crystal Almond SARL 4.25% 10/15/24 (Reg. S) | EUR | 100,000 | 122,645 |
| Digicel Group Ltd. 6.75% 3/1/23 (d) | | 150,000 | 141,328 |
| Equinix, Inc. 5.375% 5/15/27 | | 50,000 | 53,724 |
| Frontier Communications Corp.: | | | |
| 5% 5/1/28 (d) | | 55,000 | 56,169 |
| 5.875% 10/15/27 (d) | | 50,000 | 53,125 |
| 6.75% 5/1/29 (d) | | 60,000 | 63,208 |
| Frontier Communications Holdings LLC 5.875% 11/1/29 (c) | | 14,000 | 14,105 |
| GTT Communications, Inc. 7.875% 12/31/24 (d) | | 180,000 | 27,000 |
| IHS Netherlands Holdco BV 8% 9/18/27 (d) | | 200,000 | 217,000 |
| Intelsat Jackson Holdings SA: | | | |
| 5.5% 8/1/23 (e) | | 200,000 | 122,377 |
| 8.5% 10/15/24 (d)(e) | | 45,000 | 27,900 |
| LCPR Senior Secured Financing DAC: | | | |
| 5.125% 7/15/29 (d) | | 400,000 | 410,376 |
| 6.75% 10/15/27 (d) | | 100,000 | 107,500 |
| Level 3 Financing, Inc.: | | | |
| 3.75% 7/15/29 (d) | | 95,000 | 92,625 |
| 4.25% 7/1/28 (d) | | 75,000 | 75,571 |
| Liquid Telecommunications Financing PLC 5.5% 9/4/26 (d) | | 200,000 | 210,938 |
| Lumen Technologies, Inc.: | | | |
| 4% 2/15/27 (d) | | 115,000 | 117,171 |
| 5.125% 12/15/26 (d) | | 150,000 | 157,313 |
| Millicom International Cellular SA 5.125% 1/15/28 (d) | | 225,000 | 236,925 |
| Northwest Fiber LLC/Northwest Fiber Finance Sub, Inc. 6% 2/15/28 (d) | | 20,000 | 19,999 |
| Olivetti Finance NV 7.75% 1/24/33 | EUR | 75,000 | 133,447 |
| Sable International Finance Ltd. 5.75% 9/7/27 (d) | | 325,000 | 340,438 |
| Sabre GLBL, Inc. 9.25% 4/15/25 (d) | | 45,000 | 53,775 |
| SBA Communications Corp. 3.875% 2/15/27 | | 120,000 | 122,721 |
| Sprint Capital Corp.: | | | |
| 6.875% 11/15/28 | | 165,000 | 207,904 |
| 8.75% 3/15/32 | | 530,000 | 785,725 |
| Sprint Corp. 7.625% 3/1/26 | | 70,000 | 85,838 |
| T-Mobile U.S.A., Inc. 3.5% 4/15/31 | | 45,000 | 45,675 |
| Telecom Italia SpA 2.75% 4/15/25 (Reg. S) | EUR | 100,000 | 126,566 |
| Telefonica Celular del Paraguay SA 5.875% 4/15/27 (d) | | 200,000 | 211,413 |
| Telenet Finance Luxembourg Notes SARL 3.5% 3/1/28 (Reg. S) | EUR | 200,000 | 249,772 |
| Telesat Canada/Telesat LLC 6.5% 10/15/27 (d) | | 45,000 | 44,213 |
| Turk Telekomunikasyon A/S 6.875% 2/28/25 (d) | | 200,000 | 217,850 |
| Turkcell Iletisim Hizmet A/S 5.8% 4/11/28 (d) | | 200,000 | 208,938 |
| VimpelCom Holdings BV 3.375% 11/25/27 (d) | | 200,000 | 201,444 |
| Vodafone Group PLC 3% 8/27/80 (Reg. S) (g) | EUR | 100,000 | 124,307 |
| VTR Comunicaciones SpA 5.125% 1/15/28 (d) | | 200,000 | 209,288 |
| Windstream Escrow LLC 7.75% 8/15/28 (d) | | 80,000 | 83,400 |
| Zayo Group Holdings, Inc.: | | | |
| 4% 3/1/27 (d) | | 115,000 | 114,195 |
| 6.125% 3/1/28 (d) | | 60,000 | 61,725 |
| | | | 7,487,484 |
| Textiles/Apparel - 0.2% | | | |
| Crocs, Inc. 4.25% 3/15/29 (d) | | 40,000 | 40,636 |
| CT Investment GmbH 5.5% 4/15/26 (Reg. S) | EUR | 200,000 | 243,433 |
| | | | 284,069 |
| Transportation Ex Air/Rail - 1.1% | | | |
| Autostrade per L'italia SpA: | | | |
| 1.625% 6/12/23 | EUR | 215,000 | 262,161 |
| 1.75% 6/26/26 (Reg. S) | EUR | 100,000 | 123,000 |
| 1.875% 9/26/29 (Reg. S) | EUR | 100,000 | 122,028 |
| Avolon Holdings Funding Ltd. 5.25% 5/15/24 (d) | | 135,000 | 147,598 |
| Navios Maritime Acquisition Corp./Navios Acquisition Finance U.S., Inc. 8.125% 11/15/21 (d) | | 235,000 | 177,425 |
| Navios Maritime Holdings, Inc.: | | | |
| 7.375% 1/15/22 (d) | | 90,000 | 75,206 |
| 11.25% 8/15/22 (d) | | 135,000 | 126,984 |
| Navios South American Logistics, Inc./Navios Logistics Finance U.S., Inc. 10.75% 7/1/25 (d) | | 110,000 | 122,100 |
| Teekay Corp. 9.25% 11/15/22 (d) | | 60,000 | 61,200 |
| | | | 1,217,702 |
| Utilities - 4.5% | | | |
| Clearway Energy Operating LLC 4.75% 3/15/28 (d) | | 40,000 | 41,886 |
| ContourGlobal Power Holdings SA 3.125% 1/1/28 (Reg. S) | EUR | 113,000 | 137,000 |
| DCP Midstream Operating LP: | | | |
| 5.125% 5/15/29 | | 105,000 | 112,088 |
| 5.625% 7/15/27 | | 45,000 | 49,147 |
| DPL, Inc.: | | | |
| 4.125% 7/1/25 | | 180,000 | 193,644 |
| 4.35% 4/15/29 | | 115,000 | 124,708 |
| Energias de Portugal SA 4.496% 4/30/79 (Reg. S) (g) | EUR | 100,000 | 131,045 |
| Eskom Holdings SOC Ltd. 6.75% 8/6/23 (d) | | 100,000 | 104,456 |
| Greenko Investment Co. 4.875% 8/16/23 (Reg. S) | | 200,000 | 202,663 |
| InterGen NV 7% 6/30/23 (d) | | 845,000 | 815,425 |
| NextEra Energy Partners LP: | | | |
| 4.25% 9/15/24 (d) | | 4,000 | 4,225 |
| 4.5% 9/15/27 (d) | | 35,000 | 37,783 |
| NRG Energy, Inc.: | | | |
| 3.375% 2/15/29 (d) | | 25,000 | 24,469 |
| 3.625% 2/15/31 (d) | | 50,000 | 48,985 |
| 5.25% 6/15/29 (d) | | 60,000 | 64,275 |
| 5.75% 1/15/28 | | 115,000 | 122,188 |
| NSG Holdings II LLC/NSG Holdings, Inc. 7.75% 12/15/25 (d) | | 186,550 | 198,676 |
| Pacific Gas & Electric Co.: | | | |
| 3.75% 8/15/42 | | 10,000 | 9,029 |
| 3.95% 12/1/47 | | 55,000 | 50,477 |
| 4.55% 7/1/30 | | 415,000 | 446,116 |
| 4.95% 7/1/50 | | 415,000 | 423,665 |
| PG&E Corp.: | | | |
| 5% 7/1/28 | | 75,000 | 78,563 |
| 5.25% 7/1/30 | | 205,000 | 218,838 |
| Pike Corp. 5.5% 9/1/28 (d) | | 45,000 | 46,350 |
| Public Power Corp. of Greece 3.875% 3/30/26 (Reg. S) | EUR | 142,000 | 176,003 |
| ReNew Wind Energy AP2 / ReNew Power Private Ltd. 4.5% 7/14/28 (Reg. S) | | 200,000 | 198,750 |
| Solaris Midstream Holdings LLC 7.625% 4/1/26 (d) | | 70,000 | 73,310 |
| Star Energy Geothermal Wayang Windu Ltd. 6.75% 4/24/33 (Reg. S) | | 177,340 | 201,702 |
| Teollisuuden Voima Oyj 2.125% 2/4/25 (Reg. S) | EUR | 100,000 | 124,971 |
| TerraForm Global, Inc. 6.125% 3/1/26 (d) | | 160,000 | 164,000 |
| TerraForm Power Operating LLC: | | | |
| 4.25% 1/31/23 (d) | | 150,000 | 153,938 |
| 4.75% 1/15/30 (d) | | 75,000 | 78,094 |
| 5% 1/31/28 (d) | | 50,000 | 53,625 |
| Vistra Operations Co. LLC: | | | |
| 5.5% 9/1/26 (d) | | 45,000 | 46,491 |
| 5.625% 2/15/27 (d) | | 60,000 | 62,400 |
| | | | 5,018,985 |
|
| TOTAL NONCONVERTIBLE BONDS | | | 87,809,004 |
|
| TOTAL CORPORATE BONDS | | | |
| (Cost $86,156,583) | | | 88,971,618 |
|
| Government Obligations - 0.5% | | | |
| Germany - 0.1% | | | |
| German Federal Republic 2% 8/15/23 | EUR | 90,000 | 114,965 |
| Sri Lanka - 0.4% | | | |
| Democratic Socialist Republic of Sri Lanka: | | | |
| 6.2% 5/11/27 (Reg. S) | | 200,000 | 129,788 |
| 7.55% 3/28/30 (Reg. S) | | 200,000 | 129,850 |
| 7.85% 3/14/29(Reg. S) | | 200,000 | 129,975 |
|
| TOTAL SRI LANKA | | | 389,613 |
|
| TOTAL GOVERNMENT OBLIGATIONS | | | |
| (Cost $706,926) | | | 504,578 |
| | | Shares | Value |
|
| Common Stocks - 3.0% | | | |
| Automotive & Auto Parts - 0.0% | | | |
| UC Holdings, Inc. (c)(i) | | 3,510 | 53,387 |
| Energy - 1.5% | | | |
| California Resources Corp. (i) | | 11,829 | 280,347 |
| California Resources Corp. warrants 10/27/24 (i) | | 530 | 2,120 |
| Chesapeake Energy Corp. (i) | | 7,994 | 364,287 |
| Chesapeake Energy Corp. (b) | | 85 | 3,486 |
| Denbury, Inc. (i) | | 6,960 | 378,694 |
| Denbury, Inc. warrants 9/18/25 (i) | | 1,038 | 28,223 |
| EP Energy Corp. (c) | | 7,975 | 420,043 |
| Jonah Energy LLC (c) | | 3,631 | 54,465 |
| Mesquite Energy, Inc. (c) | | 3,543 | 77,882 |
| Noble Corp. (c)(i) | | 146 | 2,555 |
| Noble Corp.: | | | |
| warrants (c)(i) | | 600 | 0 |
| warrants (c)(i) | | 600 | 0 |
| Pacific Drilling SA (c)(i) | | 19,106 | 0 |
| Superior Energy Services, Inc. Class A (c) | | 609 | 15,591 |
| Tidewater, Inc.: | | | |
| warrants 11/14/42 (i) | | 5,448 | 73,434 |
| warrants 11/14/42 (i) | | 1,897 | 25,570 |
|
| TOTAL ENERGY | | | 1,726,697 |
|
| Entertainment/Film - 0.4% | | | |
| New Cotai LLC/New Cotai Capital Corp. (b)(c) | | 125,818 | 421,490 |
| Food & Drug Retail - 0.2% | | | |
| Southeastern Grocers, Inc. (b)(c)(i) | | 7,744 | 119,877 |
| Tops Markets Corp. (c)(i) | | 165 | 58,007 |
|
| TOTAL FOOD & DRUG RETAIL | | | 177,884 |
|
| Gaming - 0.3% | | | |
| Boyd Gaming Corp. (i) | | 4,800 | 317,520 |
| Healthcare - 0.1% | | | |
| HCA Holdings, Inc. | | 400 | 80,424 |
| Services - 0.2% | | | |
| United Rentals, Inc. (i) | | 700 | 223,965 |
| Telecommunications - 0.1% | | | |
| Frontier Communications Parent | | 4,813 | 119,870 |
| Utilities - 0.2% | | | |
| NRG Energy, Inc. | | 3,200 | 114,624 |
| Vistra Corp. | | 9,795 | 165,242 |
|
| TOTAL UTILITIES | | | 279,866 |
|
| TOTAL COMMON STOCKS | | | |
| (Cost $4,402,805) | | | 3,401,103 |
|
| Convertible Preferred Stocks - 0.2% | | | |
| Utilities - 0.2% | | | |
| PG&E Corp. | | | |
| (Cost $152,083) | | 1,400 | 155,960 |
| | | Principal Amount(a) | Value |
|
| Bank Loan Obligations - 2.4% | | | |
| Aerospace - 0.1% | | | |
| TransDigm, Inc. Tranche F 1LN, term loan 3 month U.S. LIBOR + 2.250% 2.3633% 12/9/25 (g)(h)(j) | | 77,229 | 76,229 |
| Automotive & Auto Parts - 0.2% | | | |
| Hertz International Ltd. Tranche DD, term loan 3 month EURIBOR + 0.020% 1.95% 8/30/21 (c)(g)(h)(j)(k) | EUR | 135,066 | 162,384 |
| Banks & Thrifts - 0.0% | | | |
| First Eagle Holdings, Inc. Tranche B 1LN, term loan 3 month U.S. LIBOR + 2.500% 2.7025% 2/1/27 (g)(h)(j) | | 28,852 | 28,375 |
| Building Materials - 0.0% | | | |
| ACProducts, Inc. 1LN, term loan 3 month U.S. LIBOR + 6.500% 7.5% 8/13/25 (g)(h)(j) | | 24,375 | 24,893 |
| Cable/Satellite TV - 0.2% | | | |
| WideOpenWest Finance LLC Tranche B, term loan 3 month U.S. LIBOR + 3.250% 4.25% 8/19/23 (g)(h)(j) | | 226,705 | 226,093 |
| Chemicals - 0.0% | | | |
| Starfruit U.S. Holdco LLC Tranche B, term loan 3 month U.S. LIBOR + 2.750% 2.865% 10/1/25 (g)(h)(j) | | 42,959 | 42,422 |
| Consumer Products - 0.0% | | | |
| Michaels Companies, Inc. 1LN, term loan 3 month U.S. LIBOR + 4.250% 5% 4/9/28 (g)(h)(j) | | 25,000 | 24,880 |
| Diversified Financial Services - 0.1% | | | |
| BCP Renaissance Parent LLC Tranche B, term loan 3 month U.S. LIBOR + 3.500% 4.5% 10/31/24 (g)(h)(j) | | 14,580 | 14,260 |
| HarbourVest Partners LLC Tranche B 1LN, term loan 3 month U.S. LIBOR + 2.250% 2.4338% 3/1/25 (g)(h)(j) | | 15,750 | 15,645 |
| New Cotai LLC 1LN, term loan 3 month U.S. LIBOR + 12.000% 14% 9/9/25 (c)(g)(h)(j) | | 35,693 | 35,693 |
|
| TOTAL DIVERSIFIED FINANCIAL SERVICES | | | 65,598 |
|
| Energy - 0.4% | | | |
| BCP Raptor LLC Tranche B, term loan 3 month U.S. LIBOR + 4.250% 5.25% 6/24/24 (g)(h)(j) | | 48,125 | 47,583 |
| Citgo Holding, Inc. Tranche B 1LN, term loan 3 month U.S. LIBOR + 7.000% 8% 8/1/23 (g)(h)(j) | | 9,850 | 9,596 |
| Citgo Petroleum Corp. Tranche B 1LN, term loan 3 month U.S. LIBOR + 6.250% 7.25% 3/28/24 (g)(h)(j) | | 138,475 | 138,416 |
| Epic Crude Services LP Tranche B 1LN, term loan 3 month U.S. LIBOR + 5.000% 5.26% 3/1/26 (g)(h)(j) | | 267,975 | 192,176 |
| Sanchez Energy Corp.: | | | |
| 1LN, term loan 3 month U.S. LIBOR + 8.000% 0% (c)(e)(g)(h)(j) | | 65,772 | 0 |
| term loan 3 month U.S. LIBOR + 0.000% 0% (c)(e)(g)(h)(j) | | 28,000 | 0 |
|
| TOTAL ENERGY | | | 387,771 |
|
| Food & Drug Retail - 0.0% | | | |
| Tops Markets LLC 1LN, term loan 3 month U.S. LIBOR + 8.500% 9.5% 11/19/23 (c)(g)(h)(j) | | 45,786 | 46,702 |
| Healthcare - 0.3% | | | |
| U.S. Renal Care, Inc. Tranche B 1LN, term loan 3 month U.S. LIBOR + 5.000% 5.125% 6/13/26 (g)(h)(j) | | 329,975 | 322,448 |
| Hotels - 0.1% | | | |
| Travelport Finance Luxembourg SARL 1LN, term loan: | | | |
| 3 month U.S. LIBOR + 5.000% 5.2025% 5/30/26 (g)(h)(j) | | 37,089 | 31,863 |
| 3 month U.S. LIBOR + 8.000% 9% 2/28/25 (g)(h)(j) | | 37,760 | 38,482 |
|
| TOTAL HOTELS | | | 70,345 |
|
| Insurance - 0.1% | | | |
| Alliant Holdings Intermediate LLC: | | | |
| Tranche B, term loan 3 month U.S. LIBOR + 3.250% 3.3633% 5/10/25 (g)(h)(j) | | 4,813 | 4,750 |
| Tranche B-2 1LN, term loan 3 month U.S. LIBOR + 3.250% 3.3633% 5/9/25 (g)(h)(j) | | 63,863 | 62,991 |
| Tranche B3 1LN, term loan 3 month U.S. LIBOR + 3.750% 4.25% 11/5/27 (g)(h)(j) | | 60,000 | 59,933 |
|
| TOTAL INSURANCE | | | 127,674 |
|
| Leisure - 0.0% | | | |
| Alterra Mountain Co. Tranche B 1LN, term loan 3 month U.S. LIBOR + 2.750% 2.8633% 7/31/24 (g)(h)(j) | | 4,838 | 4,754 |
| Services - 0.3% | | | |
| Finastra U.S.A., Inc. Tranche 2LN, term loan 3 month U.S. LIBOR + 7.250% 8.25% 6/13/25 (g)(h)(j) | | 220,000 | 221,021 |
| KUEHG Corp. Tranche B 2LN, term loan 3 month U.S. LIBOR + 8.250% 9.25% 8/22/25 (g)(h)(j) | | 95,000 | 91,390 |
| Maverick Purchaser Sub LLC Tranche B 1LN, term loan 3 month U.S. LIBOR + 3.500% 3.6133% 1/23/27 (g)(h)(j) | | 14,888 | 14,768 |
| Spin Holdco, Inc. Tranche B 1LN, term loan 3 month U.S. LIBOR + 4.000% 4.75% 2/26/28 (g)(h)(j) | | 40,000 | 39,812 |
|
| TOTAL SERVICES | | | 366,991 |
|
| Super Retail - 0.1% | | | |
| Bass Pro Group LLC Tranche B 1LN, term loan 3 month U.S. LIBOR + 4.250% 5% 2/26/28 (g)(h)(j) | | 159,600 | 160,149 |
| Technology - 0.2% | | | |
| Endure Digital, Inc. Tranche B 1LN, term loan: | | | |
| 3 month U.S. LIBOR + 3.500% 4.25% 1/29/28 (g)(h)(j) | | 68,531 | 67,803 |
| 3 month U.S. LIBOR + 3.500% 4.25% 1/29/28 (g)(h)(j) | | 16,469 | 16,294 |
| UKG, Inc. Tranche B 1LN, term loan 3 month U.S. LIBOR + 3.250% 4% 5/4/26 (g)(h)(j) | | 74,625 | 74,649 |
| Ultimate Software Group, Inc.: | | | |
| 1LN, term loan 3 month U.S. LIBOR + 3.750% 3.8633% 5/4/26 (g)(h)(j) | | 19,700 | 19,698 |
| 2LN, term loan 3 month U.S. LIBOR + 6.750% 7.5% 5/3/27 (g)(h)(j) | | 10,000 | 10,281 |
| VS Buyer LLC Tranche B 1LN, term loan 3 month U.S. LIBOR + 3.000% 3.1133% 2/28/27 (g)(h)(j) | | 14,850 | 14,720 |
|
| TOTAL TECHNOLOGY | | | 203,445 |
|
| Telecommunications - 0.3% | | | |
| Altice France SA Tranche B 12LN, term loan 3 month U.S. LIBOR + 3.680% 3.8713% 1/31/26 (g)(h)(j) | | 376,834 | 373,442 |
| TOTAL BANK LOAN OBLIGATIONS | | | |
| (Cost $2,844,028) | | | 2,714,595 |
|
| Preferred Securities - 6.1% | | | |
| Automotive & Auto Parts - 0.1% | | | |
| Volkswagen International Finance NV 3.875% (Reg. S) (g)(l) | EUR | 100,000 | 136,596 |
| Banks & Thrifts - 3.7% | | | |
| AIB Group PLC 5.25% (Reg. S) (g)(l) | EUR | 200,000 | 258,040 |
| Alfa Bond Issuance PLC 8% (Reg. S) (g)(l) | | 200,000 | 208,073 |
| Banco BPM SpA 6.5% (Reg. S) (g)(l) | EUR | 200,000 | 261,048 |
| Banco Mercantil del Norte SA 6.875% (d)(g)(l) | | 200,000 | 206,194 |
| Bank of America Corp.: | | | |
| 4.3% (g)(l) | | 160,000 | 166,568 |
| 5.875% (g)(l) | | 275,000 | 312,181 |
| Bank of Communications Co. Ltd. 3.8% (Reg. S) (g)(l) | | 200,000 | 209,765 |
| Citigroup, Inc.: | | | |
| 4% (g)(l) | | 140,000 | 142,583 |
| 4.7% (g)(l) | | 90,000 | 92,715 |
| 5% (g)(l) | | 180,000 | 190,223 |
| 5.35% (g)(l) | | 550,000 | 581,369 |
| 5.95% (g)(l) | | 305,000 | 327,024 |
| Emirates NBD Bank PJSC 6.125% (Reg. S) (g)(l) | | 200,000 | 215,586 |
| Itau Unibanco Holding SA 6.125% (d)(g)(l) | | 375,000 | 388,114 |
| JPMorgan Chase & Co. 4.6% (g)(l) | | 135,000 | 140,746 |
| Krung Thai Bank PCL/Cayman Islands 4.4% (Reg. S) (g)(l) | | 200,000 | 202,135 |
| UniCredit SpA 9.25% (Reg. S) (g)(l) | EUR | 200,000 | 269,342 |
|
| TOTAL BANKS & THRIFTS | | | 4,171,706 |
|
| Consumer Products - 0.3% | | | |
| Cosan Overseas Ltd. 8.25% (l) | | 285,000 | 298,095 |
| Diversified Financial Services - 0.2% | | | |
| LeasePlan Corp. NV 7.375% (Reg. S) (g)(l) | EUR | 200,000 | 272,995 |
| Energy - 0.1% | | | |
| Wintershall Dea Finance 2 BV 3% (Reg. S) (g)(l) | EUR | 100,000 | 118,654 |
| Homebuilders/Real Estate - 0.5% | | | |
| CIFI Holdings Group Co. Ltd. 5.375% (Reg. S) (g)(l) | | 200,000 | 204,622 |
| RKI Overseas Finance 2017 (A) 7% (Reg. S) (l) | | 200,000 | 185,374 |
| Yuzhou Properties Co. 5.375% (Reg. S) (g)(l) | | 200,000 | 180,901 |
|
| TOTAL HOMEBUILDERS/REAL ESTATE | | | 570,897 |
|
| Technology - 0.4% | | | |
| Network i2i Ltd.: | | | |
| 3.975% (Reg. S) (g)(l) | | 200,000 | 202,275 |
| 5.65% (Reg. S) (g)(l) | | 200,000 | 212,969 |
|
| TOTAL TECHNOLOGY | | | 415,244 |
|
| Telecommunications - 0.3% | | | |
| Telefonica Europe BV: | | | |
| 2.376% (Reg. S) (g)(l) | EUR | 100,000 | 117,171 |
| 3.875% (Reg. S) (g)(l) | EUR | 200,000 | 264,242 |
|
| TOTAL TELECOMMUNICATIONS | | | 381,413 |
|
| Utilities - 0.5% | | | |
| EDF SA: | | | |
| 3.375% (g)(l) | EUR | 200,000 | 260,512 |
| 5.375% 12/31/99 (g) | EUR | 100,000 | 137,534 |
| Veolia Environnement SA 2.5% (Reg. S) (g)(l) | EUR | 100,000 | 121,067 |
|
| TOTAL UTILITIES | | | 519,113 |
|
| TOTAL PREFERRED SECURITIES | | | |
| (Cost $6,562,009) | | | 6,884,713 |
| | | Shares | Value |
|
| Money Market Funds - 8.2% | | | |
| Fidelity Cash Central Fund 0.04% (m) | | | |
| (Cost $9,212,274) | | 9,210,524 | 9,212,366 |
| TOTAL INVESTMENT IN SECURITIES - 99.7% | | | |
| (Cost $110,036,708) | | | 111,844,933 |
| NET OTHER ASSETS (LIABILITIES) - 0.3% | | | 331,046 |
| NET ASSETS - 100% | | | $112,175,979 |
Currency Abbreviations
EUR – European Monetary Unit
Legend
(a) Amount is stated in United States dollars unless otherwise noted.
(b) Restricted securities (including private placements) - Investment in securities not registered under the Securities Act of 1933 (excluding 144A issues). At the end of the period, the value of restricted securities (excluding 144A issues) amounted to $690,691 or 0.6% of net assets.
(c) Level 3 security
(d) Security exempt from registration under Rule 144A of the Securities Act of 1933. These securities may be resold in transactions exempt from registration, normally to qualified institutional buyers. At the end of the period, the value of these securities amounted to $51,187,632 or 45.6% of net assets.
(e) Non-income producing - Security is in default.
(f) Security or a portion of the security purchased on a delayed delivery or when-issued basis.
(g) Coupon rates for floating and adjustable rate securities reflect the rates in effect at period end.
(h) Coupon is indexed to a floating interest rate which may be multiplied by a specified factor and/or subject to caps or floors.
(i) Non-income producing
(j) Remaining maturities of bank loan obligations may be less than the stated maturities shown as a result of contractual or optional prepayments by the borrower. Such prepayments cannot be predicted with certainty.
(k) Position or a portion of the position represents an unfunded loan commitment. At period end, the total principal amount and market value of unfunded commitments totaled $94,546 and $113,668, respectively.
(l) Security is perpetual in nature with no stated maturity date.
(m) Affiliated fund that is generally available only to investment companies and other accounts managed by Fidelity Investments. The rate quoted is the annualized seven-day yield of the fund at period end. A complete unaudited listing of the fund's holdings as of its most recent quarter end is available upon request. In addition, each Fidelity Central Fund's financial statements, which are not covered by the Fund's Report of Independent Registered Public Accounting Firm, are available on the SEC's website or upon request.
Additional information on each restricted holding is as follows:
| Security | Acquisition Date | Acquisition Cost |
| Chesapeake Energy Corp. | 2/10/21 | $805 |
| Mesquite Energy, Inc. 15% 7/15/23 | 7/10/20 - 4/15/21 | $67,302 |
| New Cotai LLC/New Cotai Capital Corp. | 9/11/20 | $623,271 |
| Southeastern Grocers, Inc. | 6/1/18 | $54,475 |
Affiliated Central Funds
Information regarding fiscal year to date income earned by the Fund from investments in Fidelity Central Funds is as follows:
| Fund | Income earned |
| Fidelity Cash Central Fund | $4,502 |
| Fidelity Securities Lending Cash Central Fund | 2,154 |
| Total | $6,656 |
Amounts in the income column in the above table include any capital gain distributions from underlying funds, which are presented in the corresponding line-item in the Statement of Operations, if applicable. Amount for Fidelity Securities Lending Cash Central Fund represents the income earned on investing cash collateral, less rebates paid to borrowers and any lending agent fees associated with the loan, plus any premium payments received for lending certain types of securities.
The value, beginning of period, for the Fidelity Cash Central Fund was $2,978,347. Net realized gain (loss) and change in net unrealized appreciation (depreciation) on Fidelity Cash Central Fund is presented in the Statement of Operations, if applicable. Purchases and sales of the Fidelity Cash Central Fund were $75,292,137 and $69,057,490, respectively, during the period.
Investment Valuation
The following is a summary of the inputs used, as of April 30, 2021, involving the Fund's assets and liabilities carried at fair value. The inputs or methodology used for valuing securities may not be an indication of the risk associated with investing in those securities. For more information on valuation inputs, and their aggregation into the levels used below, please refer to the Investment Valuation section in the accompanying Notes to Financial Statements.
| | Valuation Inputs at Reporting Date: |
| Description | Total | Level 1 | Level 2 | Level 3 |
| Investments in Securities: | | | | |
| Equities: | | | | |
| Communication Services | $541,360 | $119,870 | $-- | $421,490 |
| Consumer Discretionary | 370,907 | 317,520 | -- | 53,387 |
| Consumer Staples | 177,884 | -- | -- | 177,884 |
| Energy | 1,726,697 | 1,053,671 | 102,490 | 570,536 |
| Health Care | 80,424 | 80,424 | -- | -- |
| Industrials | 223,965 | 223,965 | -- | -- |
| Utilities | 435,826 | 279,866 | 155,960 | -- |
| Corporate Bonds | 88,971,618 | -- | 88,755,322 | 216,296 |
| Government Obligations | 504,578 | -- | 504,578 | -- |
| Bank Loan Obligations | 2,714,595 | -- | 2,469,816 | 244,779 |
| Preferred Securities | 6,884,713 | -- | 6,884,713 | -- |
| Money Market Funds | 9,212,366 | 9,212,366 | -- | -- |
| Total Investments in Securities: | $111,844,933 | $11,287,682 | $98,872,879 | $1,684,372 |
The following is a reconciliation of Investments in Securities for which Level 3 inputs were used in determining value:
| Investments in Securities: | |
| Beginning Balance | $359,535 |
| Net Realized Gain (Loss) on Investment Securities | 9,430 |
| Net Unrealized Gain (Loss) on Investment Securities | (267,014) |
| Cost of Purchases | 1,070,790 |
| Proceeds of Sales | (120,360) |
| Amortization/Accretion | (3,558) |
| Transfers into Level 3 | 635,549 |
| Transfers out of Level 3 | -- |
| Ending Balance | $1,684,372 |
| The change in unrealized gain (loss) for the period attributable to Level 3 securities held at April 30, 2021 | $(267,014) |
The information used in the above reconciliation represents fiscal year to date activity for any Investments in Securities identified as using Level 3 inputs at either the beginning or the end of the current fiscal period. Cost of purchases and proceeds of sales may include securities received and/or delivered through in-kind transactions. Transfers in or out of Level 3 represent the beginning value of any Security or Instrument where a change in the pricing level occurred from the beginning to the end of the period. The cost of purchases and the proceeds of sales may include securities received or delivered through corporate actions or exchanges. Realized and unrealized gains (losses) disclosed in the reconciliation are included in Net Gain (Loss) on the Fund's Statement of Operations.
Other Information
Distribution of investments by country or territory of incorporation, as a percentage of Total Net Assets, is as follows (Unaudited):
| United States of America | 54.8% |
| Cayman Islands | 7.4% |
| Luxembourg | 4.7% |
| Netherlands | 4.2% |
| United Kingdom | 2.6% |
| Canada | 2.5% |
| British Virgin Islands | 2.1% |
| France | 1.8% |
| Ireland | 1.6% |
| Mexico | 1.6% |
| Multi-National | 1.5% |
| Bermuda | 1.4% |
| Italy | 1.3% |
| Mauritius | 1.0% |
| Others (Individually Less Than 1%) | 11.5% |
| | 100.0% |
See accompanying notes which are an integral part of the financial statements.
Financial Statements
Statement of Assets and Liabilities
| | | April 30, 2021 |
| Assets | | |
Investment in securities, at value — See accompanying schedule:
Unaffiliated issuers (cost $100,824,434) | $102,632,567 | |
| Fidelity Central Funds (cost $9,212,274) | 9,212,366 | |
| Total Investment in Securities (cost $110,036,708) | | $111,844,933 |
| Cash | | 98,122 |
| Foreign currency held at value (cost $180,172) | | 180,172 |
| Receivable for investments sold | | 449,121 |
| Receivable for fund shares sold | | 213,989 |
| Dividends receivable | | 1,599 |
| Interest receivable | | 1,335,222 |
| Distributions receivable from Fidelity Central Funds | | 301 |
| Prepaid expenses | | 42 |
| Receivable from investment adviser for expense reductions | | 42,765 |
| Other receivables | | 5,965 |
| Total assets | | 114,172,231 |
| Liabilities | | |
| Payable for investments purchased | | |
| Regular delivery | $1,515,845 | |
| Delayed delivery | 245,000 | |
| Payable for fund shares redeemed | 35,884 | |
| Distributions payable | 49,528 | |
| Accrued management fee | 63,116 | |
| Distribution and service plan fees payable | 5,135 | |
| Other affiliated payables | 16,115 | |
| Other payables and accrued expenses | 65,629 | |
| Total liabilities | | 1,996,252 |
| Net Assets | | $112,175,979 |
| Net Assets consist of: | | |
| Paid in capital | | $116,295,019 |
| Total accumulated earnings (loss) | | (4,119,040) |
| Net Assets | | $112,175,979 |
| Net Asset Value and Maximum Offering Price | | |
| Class A: | | |
| Net Asset Value and redemption price per share ($8,581,856 ÷ 876,615 shares)(a) | | $9.79 |
| Maximum offering price per share (100/96.00 of $9.79) | | $10.20 |
| Class M: | | |
| Net Asset Value and redemption price per share ($3,163,927 ÷ 323,224 shares)(a) | | $9.79 |
| Maximum offering price per share (100/96.00 of $9.79) | | $10.20 |
| Class C: | | |
| Net Asset Value and offering price per share ($3,248,796 ÷ 331,854 shares)(a) | | $9.79 |
| Global High Income: | | |
| Net Asset Value, offering price and redemption price per share ($89,337,528 ÷ 9,124,500 shares) | | $9.79 |
| Class I: | | |
| Net Asset Value, offering price and redemption price per share ($7,843,872 ÷ 801,146 shares) | | $9.79 |
(a) Redemption price per share is equal to net asset value less any applicable contingent deferred sales charge.
See accompanying notes which are an integral part of the financial statements.
Statement of Operations
| | | Year ended April 30, 2021 |
| Investment Income | | |
| Dividends | | $362,925 |
| Interest | | 4,966,243 |
| Income from Fidelity Central Funds (including $2,154 from security lending) | | 6,656 |
| Total income | | 5,335,824 |
| Expenses | | |
| Management fee | $689,118 | |
| Transfer agent fees | 141,963 | |
| Distribution and service plan fees | 55,297 | |
| Accounting fees | 40,908 | |
| Custodian fees and expenses | 11,427 | |
| Independent trustees' fees and expenses | 482 | |
| Registration fees | 74,291 | |
| Audit | 76,700 | |
| Legal | 3,732 | |
| Miscellaneous | 661 | |
| Total expenses before reductions | 1,094,579 | |
| Expense reductions | (54,250) | |
| Total expenses after reductions | | 1,040,329 |
| Net investment income (loss) | | 4,295,495 |
| Realized and Unrealized Gain (Loss) | | |
| Net realized gain (loss) on: | | |
| Investment securities: | | |
| Unaffiliated issuers | (1,003,762) | |
| Fidelity Central Funds | (420) | |
| Foreign currency transactions | 10,992 | |
| Total net realized gain (loss) | | (993,190) |
| Change in net unrealized appreciation (depreciation) on: | | |
| Investment securities: | | |
| Unaffiliated issuers | 15,614,712 | |
| Fidelity Central Funds | (209) | |
| Assets and liabilities in foreign currencies | 1,458 | |
| Total change in net unrealized appreciation (depreciation) | | 15,615,961 |
| Net gain (loss) | | 14,622,771 |
| Net increase (decrease) in net assets resulting from operations | | $18,918,266 |
See accompanying notes which are an integral part of the financial statements.
Statement of Changes in Net Assets
| | Year ended April 30, 2021 | Year ended April 30, 2020 |
| Increase (Decrease) in Net Assets | | |
| Operations | | |
| Net investment income (loss) | $4,295,495 | $5,725,423 |
| Net realized gain (loss) | (993,190) | (1,487,799) |
| Change in net unrealized appreciation (depreciation) | 15,615,961 | (12,444,519) |
| Net increase (decrease) in net assets resulting from operations | 18,918,266 | (8,206,895) |
| Distributions to shareholders | (4,134,980) | (5,486,858) |
| Share transactions - net increase (decrease) | 8,464,470 | (17,407,596) |
| Total increase (decrease) in net assets | 23,247,756 | (31,101,349) |
| Net Assets | | |
| Beginning of period | 88,928,223 | 120,029,572 |
| End of period | $112,175,979 | $88,928,223 |
See accompanying notes which are an integral part of the financial statements.
Financial Highlights
Fidelity Global High Income Fund Class A
| Years ended April 30, | 2021 | 2020 | 2019 | 2018 | 2017 |
| Selected Per–Share Data | | | | | |
| Net asset value, beginning of period | $8.38 | $9.48 | $9.61 | $9.54 | $9.07 |
| Income from Investment Operations | | | | | |
| Net investment income (loss)A | .391 | .445 | .468 | .462 | .463 |
| Net realized and unrealized gain (loss) | 1.394 | (1.120) | (.115) | .006 | .422 |
| Total from investment operations | 1.785 | (.675) | .353 | .468 | .885 |
| Distributions from net investment income | (.375) | (.425) | (.457) | (.399) | (.418) |
| Distributions from net realized gain | – | – | (.026) | – | – |
| Total distributions | (.375) | (.425) | (.483) | (.399) | (.418) |
| Redemption fees added to paid in capitalA | – | – | – | .001 | .003 |
| Net asset value, end of period | $9.79 | $8.38 | $9.48 | $9.61 | $9.54 |
| Total ReturnB,C | 21.59% | (7.44)% | 3.88% | 4.94% | 10.00% |
| Ratios to Average Net AssetsD,E | | | | | |
| Expenses before reductions | 1.34% | 1.34% | 1.32% | 1.31% | 1.36% |
| Expenses net of fee waivers, if any | 1.25% | 1.25% | 1.25% | 1.25% | 1.25% |
| Expenses net of all reductions | 1.25% | 1.25% | 1.25% | 1.25% | 1.25% |
| Net investment income (loss) | 4.17% | 4.77% | 5.00% | 4.75% | 4.98% |
| Supplemental Data | | | | | |
| Net assets, end of period (000 omitted) | $8,582 | $5,927 | $7,365 | $8,712 | $7,102 |
| Portfolio turnover rateF | 53% | 54% | 44% | 48% | 48% |
A Calculated based on average shares outstanding during the period.
B Total returns would have been lower if certain expenses had not been reduced during the applicable periods shown.
C Total returns do not include the effect of the sales charges.
D Fees and expenses of any underlying mutual funds or exchange-traded funds (ETFs) are not included in the Fund's expense ratio. The Fund indirectly bears its proportionate share of these expenses. For additional expense information related to investments in Fidelity Central Funds, please refer to the "Investments in Fidelity Central Funds" note found in the Notes to Financial Statements section of the most recent Annual or Semi-Annual report.
E Expense ratios reflect operating expenses of the class. Expenses before reductions do not reflect amounts reimbursed, waived, or reduced through arrangements with the investment adviser, brokerage services, or other offset arrangements, if applicable, and do not represent the amount paid by the class during periods when reimbursements, waivers or reductions occur.
F Amount does not include the portfolio activity of any underlying mutual funds or exchange-traded funds (ETFs).
See accompanying notes which are an integral part of the financial statements.
Fidelity Global High Income Fund Class M
| Years ended April 30, | 2021 | 2020 | 2019 | 2018 | 2017 |
| Selected Per–Share Data | | | | | |
| Net asset value, beginning of period | $8.38 | $9.48 | $9.61 | $9.54 | $9.07 |
| Income from Investment Operations | | | | | |
| Net investment income (loss)A | .389 | .445 | .467 | .462 | .464 |
| Net realized and unrealized gain (loss) | 1.396 | (1.120) | (.114) | .006 | .421 |
| Total from investment operations | 1.785 | (.675) | .353 | .468 | .885 |
| Distributions from net investment income | (.375) | (.425) | (.457) | (.399) | (.418) |
| Distributions from net realized gain | – | – | (.026) | – | – |
| Total distributions | (.375) | (.425) | (.483) | (.399) | (.418) |
| Redemption fees added to paid in capitalA | – | – | – | .001 | .003 |
| Net asset value, end of period | $9.79 | $8.38 | $9.48 | $9.61 | $9.54 |
| Total ReturnB,C | 21.59% | (7.44)% | 3.88% | 4.94% | 10.00% |
| Ratios to Average Net AssetsD,E | | | | | |
| Expenses before reductions | 1.41% | 1.41% | 1.40% | 1.40% | 1.50% |
| Expenses net of fee waivers, if any | 1.25% | 1.25% | 1.25% | 1.25% | 1.25% |
| Expenses net of all reductions | 1.25% | 1.25% | 1.25% | 1.25% | 1.25% |
| Net investment income (loss) | 4.16% | 4.77% | 5.00% | 4.75% | 4.98% |
| Supplemental Data | | | | | |
| Net assets, end of period (000 omitted) | $3,164 | $2,928 | $3,971 | $4,301 | $3,029 |
| Portfolio turnover rateF | 53% | 54% | 44% | 48% | 48% |
A Calculated based on average shares outstanding during the period.
B Total returns would have been lower if certain expenses had not been reduced during the applicable periods shown.
C Total returns do not include the effect of the sales charges.
D Fees and expenses of any underlying mutual funds or exchange-traded funds (ETFs) are not included in the Fund's expense ratio. The Fund indirectly bears its proportionate share of these expenses. For additional expense information related to investments in Fidelity Central Funds, please refer to the "Investments in Fidelity Central Funds" note found in the Notes to Financial Statements section of the most recent Annual or Semi-Annual report.
E Expense ratios reflect operating expenses of the class. Expenses before reductions do not reflect amounts reimbursed, waived, or reduced through arrangements with the investment adviser, brokerage services, or other offset arrangements, if applicable, and do not represent the amount paid by the class during periods when reimbursements, waivers or reductions occur.
F Amount does not include the portfolio activity of any underlying mutual funds or exchange-traded funds (ETFs).
See accompanying notes which are an integral part of the financial statements.
Fidelity Global High Income Fund Class C
| Years ended April 30, | 2021 | 2020 | 2019 | 2018 | 2017 |
| Selected Per–Share Data | | | | | |
| Net asset value, beginning of period | $8.38 | $9.48 | $9.61 | $9.54 | $9.07 |
| Income from Investment Operations | | | | | |
| Net investment income (loss)A | .319 | .375 | .398 | .390 | .394 |
| Net realized and unrealized gain (loss) | 1.396 | (1.119) | (.115) | .005 | .422 |
| Total from investment operations | 1.715 | (.744) | .283 | .395 | .816 |
| Distributions from net investment income | (.305) | (.356) | (.387) | (.326) | (.349) |
| Distributions from net realized gain | – | – | (.026) | – | – |
| Total distributions | (.305) | (.356) | (.413) | (.326) | (.349) |
| Redemption fees added to paid in capitalA | – | – | – | .001 | .003 |
| Net asset value, end of period | $9.79 | $8.38 | $9.48 | $9.61 | $9.54 |
| Total ReturnB,C | 20.69% | (8.13)% | 3.10% | 4.16% | 9.19% |
| Ratios to Average Net AssetsD,E | | | | | |
| Expenses before reductions | 2.14% | 2.11% | 2.08% | 2.08% | 2.18% |
| Expenses net of fee waivers, if any | 2.00% | 2.00% | 2.00% | 2.00% | 2.00% |
| Expenses net of all reductions | 2.00% | 2.00% | 2.00% | 2.00% | 2.00% |
| Net investment income (loss) | 3.41% | 4.02% | 4.25% | 4.00% | 4.23% |
| Supplemental Data | | | | | |
| Net assets, end of period (000 omitted) | $3,249 | $2,684 | $3,723 | $4,420 | $3,775 |
| Portfolio turnover rateF | 53% | 54% | 44% | 48% | 48% |
A Calculated based on average shares outstanding during the period.
B Total returns would have been lower if certain expenses had not been reduced during the applicable periods shown.
C Total returns do not include the effect of the contingent deferred sales charge.
D Fees and expenses of any underlying mutual funds or exchange-traded funds (ETFs) are not included in the Fund's expense ratio. The Fund indirectly bears its proportionate share of these expenses. For additional expense information related to investments in Fidelity Central Funds, please refer to the "Investments in Fidelity Central Funds" note found in the Notes to Financial Statements section of the most recent Annual or Semi-Annual report.
E Expense ratios reflect operating expenses of the class. Expenses before reductions do not reflect amounts reimbursed, waived, or reduced through arrangements with the investment adviser, brokerage services, or other offset arrangements, if applicable, and do not represent the amount paid by the class during periods when reimbursements, waivers or reductions occur.
F Amount does not include the portfolio activity of any underlying mutual funds or exchange-traded funds (ETFs).
See accompanying notes which are an integral part of the financial statements.
Fidelity Global High Income Fund
| Years ended April 30, | 2021 | 2020 | 2019 | 2018 | 2017 |
| Selected Per–Share Data | | | | | |
| Net asset value, beginning of period | $8.38 | $9.48 | $9.62 | $9.54 | $9.07 |
| Income from Investment Operations | | | | | |
| Net investment income (loss)A | .413 | .468 | .491 | .487 | .486 |
| Net realized and unrealized gain (loss) | 1.395 | (1.119) | (.125) | .015 | .423 |
| Total from investment operations | 1.808 | (.651) | .366 | .502 | .909 |
| Distributions from net investment income | (.398) | (.449) | (.480) | (.423) | (.442) |
| Distributions from net realized gain | – | – | (.026) | – | – |
| Total distributions | (.398) | (.449) | (.506) | (.423) | (.442) |
| Redemption fees added to paid in capitalA | – | – | – | .001 | .003 |
| Net asset value, end of period | $9.79 | $8.38 | $9.48 | $9.62 | $9.54 |
| Total ReturnB | 21.89% | (7.21)% | 4.03% | 5.31% | 10.28% |
| Ratios to Average Net AssetsC,D | | | | | |
| Expenses before reductions | 1.04% | 1.03% | 1.01% | 1.02% | 1.14% |
| Expenses net of fee waivers, if any | 1.00% | 1.00% | 1.00% | 1.00% | 1.00% |
| Expenses net of all reductions | 1.00% | 1.00% | 1.00% | 1.00% | 1.00% |
| Net investment income (loss) | 4.41% | 5.02% | 5.25% | 5.00% | 5.23% |
| Supplemental Data | | | | | |
| Net assets, end of period (000 omitted) | $89,338 | $73,039 | $97,619 | $125,192 | $85,188 |
| Portfolio turnover rateE | 53% | 54% | 44% | 48% | 48% |
A Calculated based on average shares outstanding during the period.
B Total returns would have been lower if certain expenses had not been reduced during the applicable periods shown.
C Fees and expenses of any underlying mutual funds or exchange-traded funds (ETFs) are not included in the Fund's expense ratio. The Fund indirectly bears its proportionate share of these expenses. For additional expense information related to investments in Fidelity Central Funds, please refer to the "Investments in Fidelity Central Funds" note found in the Notes to Financial Statements section of the most recent Annual or Semi-Annual report.
D Expense ratios reflect operating expenses of the class. Expenses before reductions do not reflect amounts reimbursed, waived, or reduced through arrangements with the investment adviser, brokerage services, or other offset arrangements, if applicable, and do not represent the amount paid by the class during periods when reimbursements, waivers or reductions occur.
E Amount does not include the portfolio activity of any underlying mutual funds or exchange-traded funds (ETFs).
See accompanying notes which are an integral part of the financial statements.
Fidelity Global High Income Fund Class I
| Years ended April 30, | 2021 | 2020 | 2019 | 2018 | 2017 |
| Selected Per–Share Data | | | | | |
| Net asset value, beginning of period | $8.38 | $9.48 | $9.62 | $9.54 | $9.07 |
| Income from Investment Operations | | | | | |
| Net investment income (loss)A | .411 | .473 | .491 | .485 | .486 |
| Net realized and unrealized gain (loss) | 1.397 | (1.124) | (.125) | .017 | .423 |
| Total from investment operations | 1.808 | (.651) | .366 | .502 | .909 |
| Distributions from net investment income | (.398) | (.449) | (.480) | (.423) | (.442) |
| Distributions from net realized gain | – | – | (.026) | – | – |
| Total distributions | (.398) | (.449) | (.506) | (.423) | (.442) |
| Redemption fees added to paid in capitalA | – | – | – | .001 | .003 |
| Net asset value, end of period | $9.79 | $8.38 | $9.48 | $9.62 | $9.54 |
| Total ReturnB | 21.89% | (7.21)% | 4.03% | 5.31% | 10.28% |
| Ratios to Average Net AssetsC,D | | | | | |
| Expenses before reductions | 1.05% | 1.03% | 1.05% | 1.03% | 1.16% |
| Expenses net of fee waivers, if any | 1.00% | 1.00% | 1.00% | 1.00% | 1.00% |
| Expenses net of all reductions | 1.00% | 1.00% | 1.00% | 1.00% | 1.00% |
| Net investment income (loss) | 4.42% | 5.02% | 5.25% | 5.00% | 5.23% |
| Supplemental Data | | | | | |
| Net assets, end of period (000 omitted) | $7,844 | $4,350 | $7,352 | $9,999 | $2,817 |
| Portfolio turnover rateE | 53% | 54% | 44% | 48% | 48% |
A Calculated based on average shares outstanding during the period.
B Total returns would have been lower if certain expenses had not been reduced during the applicable periods shown.
C Fees and expenses of any underlying mutual funds or exchange-traded funds (ETFs) are not included in the Fund's expense ratio. The Fund indirectly bears its proportionate share of these expenses. For additional expense information related to investments in Fidelity Central Funds, please refer to the "Investments in Fidelity Central Funds" note found in the Notes to Financial Statements section of the most recent Annual or Semi-Annual report.
D Expense ratios reflect operating expenses of the class. Expenses before reductions do not reflect amounts reimbursed, waived, or reduced through arrangements with the investment adviser, brokerage services, or other offset arrangements, if applicable, and do not represent the amount paid by the class during periods when reimbursements, waivers or reductions occur.
E Amount does not include the portfolio activity of any underlying mutual funds or exchange-traded funds (ETFs).
See accompanying notes which are an integral part of the financial statements.
Notes to Financial Statements
For the period ended April 30, 2021
1. Organization.
Fidelity Global High Income Fund (the Fund) is a fund of Fidelity Summer Street Trust (the Trust) and is authorized to issue an unlimited number of shares. The Trust is registered under the Investment Company Act of 1940, as amended (the 1940 Act), as an open-end management investment company organized as a Massachusetts business trust. The Fund offers Class A, Class M, Class C, Global High Income and Class I shares, each of which has equal rights as to assets and voting privileges. Each class has exclusive voting rights with respect to matters that affect that class. Class C shares will automatically convert to Class A shares after a holding period of ten years from the initial date of purchase, with certain exceptions. The Fund's investments in emerging markets can be subject to social, economic, regulatory, and political uncertainties and can be extremely volatile.
Effective June 21, 2021, Class C shares will automatically convert to Class A shares after a holding period of eight years from the initial date of purchase, with certain exceptions.
2. Investments in Fidelity Central Funds.
Funds may invest in Fidelity Central Funds, which are open-end investment companies generally available only to other investment companies and accounts managed by the investment adviser and its affiliates. The Schedule of Investments lists any Fidelity Central Funds held as an investment as of period end, but does not include the underlying holdings of each Fidelity Central Fund. An investing fund indirectly bears its proportionate share of the expenses of the underlying Fidelity Central Funds.
Based on its investment objective, each Fidelity Central Fund may invest or participate in various investment vehicles or strategies that are similar to those of the investing fund. These strategies are consistent with the investment objectives of the investing fund and may involve certain economic risks which may cause a decline in value of each of the Fidelity Central Funds and thus a decline in the value of the investing fund.
| Fidelity Central Fund | Investment Manager | Investment Objective | Investment Practices | Expense Ratio(a) |
| Fidelity Money Market Central Funds | Fidelity Management & Research Company LLC (FMR) | Each fund seeks to obtain a high level of current income consistent with the preservation of capital and liquidity. | Short-term Investments | Less than .005% to .01% |
(a) Expenses expressed as a percentage of average net assets and are as of each underlying Central Fund's most recent annual or semi-annual shareholder report.
A complete unaudited list of holdings for each Fidelity Central Fund is available upon request or at the Securities and Exchange Commission website at www.sec.gov. In addition, the financial statements of the Fidelity Central Funds which contain the significant accounting policies (including investment valuation policies) of those funds, and are not covered by the Report of Independent Registered Public Accounting Firm, are available on the Securities and Exchange Commission website or upon request.
3. Significant Accounting Policies.
The Fund is an investment company and applies the accounting and reporting guidance of the Financial Accounting Standards Board (FASB) Accounting Standards Codification Topic 946 Financial Services - Investment Companies. The financial statements have been prepared in conformity with accounting principles generally accepted in the United States of America (GAAP), which require management to make certain estimates and assumptions at the date of the financial statements. Actual results could differ from those estimates. Subsequent events, if any, through the date that the financial statements were issued have been evaluated in the preparation of the financial statements. The Fund's Schedule of Investments lists any underlying mutual funds or exchange-traded funds (ETFs) but does not include the underlying holdings of these funds. The following summarizes the significant accounting policies of the Fund:
Investment Valuation. Investments are valued as of 4:00 p.m. Eastern time on the last calendar day of the period. The Board of Trustees (the Board) has delegated the day to day responsibility for the valuation of the Fund's investments to the Fair Value Committee (the Committee) established by the Fund's investment adviser. In accordance with valuation policies and procedures approved by the Board, the Fund attempts to obtain prices from one or more third party pricing vendors or brokers to value its investments. When current market prices, quotations or currency exchange rates are not readily available or reliable, investments will be fair valued in good faith by the Committee, in accordance with procedures adopted by the Board. Factors used in determining fair value vary by investment type and may include market or investment specific events, changes in interest rates and credit quality. The frequency with which these procedures are used cannot be predicted and they may be utilized to a significant extent. The Committee oversees the Fund's valuation policies and procedures and reports to the Board on the Committee's activities and fair value determinations. The Board monitors the appropriateness of the procedures used in valuing the Fund's investments and ratifies the fair value determinations of the Committee.
The Fund categorizes the inputs to valuation techniques used to value its investments into a disclosure hierarchy consisting of three levels as shown below:
- Level 1 – quoted prices in active markets for identical investments
- Level 2 – other significant observable inputs (including quoted prices for similar investments, interest rates, prepayment speeds, etc.)
- Level 3 – unobservable inputs (including the Fund's own assumptions based on the best information available)
Valuation techniques used to value the Fund's investments by major category are as follows:
Debt securities, including restricted securities, are valued based on evaluated prices received from third party pricing vendors or from brokers who make markets in such securities. Corporate bonds, bank loan obligations, foreign government and government agency obligations and preferred securities are valued by pricing vendors who utilize matrix pricing which considers yield or price of bonds of comparable quality, coupon, maturity and type or by broker-supplied prices. When independent prices are unavailable or unreliable, debt securities may be valued utilizing pricing methodologies which consider similar factors that would be used by third party pricing vendors. For foreign debt securities, when significant market or security specific events arise, valuations may be determined in good faith in accordance with procedures adopted by the Board. Debt securities are generally categorized as Level 2 in the hierarchy but may be Level 3 depending on the circumstances. The Fund invests a significant portion of its assets in below investment grade securities. The value of these securities can be more volatile due to changes in the credit quality of the issuer and is sensitive to changes in economic, market and regulatory conditions.
Equity securities, including restricted securities, for which market quotations are readily available, are valued at the last reported sale price or official closing price as reported by a third party pricing vendor on the primary market or exchange on which they are traded and are categorized as Level 1 in the hierarchy. In the event there were no sales during the day or closing prices are not available, securities are valued at the last quoted bid price or may be valued using the last available price and are generally categorized as Level 2 in the hierarchy. For equity securities, including restricted securities, where observable inputs are limited, assumptions about market activity and risk are used and these securities may be categorized as Level 3 in the hierarchy. Securities, including private placements or other restricted securities, for which observable inputs are not available are valued using alternate valuation approaches, including the market approach, the income approach and cost approach, and are categorized as Level 3 in the hierarchy. The market approach considers factors including the price of recent investments in the same or a similar security or financial metrics of comparable securities. The income approach considers factors including expected future cash flows, security specific risks and corresponding discount rates. The cost approach considers factors including the value of the security's underlying assets and liabilities.
Investments in open-end mutual funds, including the Fidelity Central Funds, are valued at their closing net asset value (NAV) each business day and are categorized as Level 1 in the hierarchy.
The following provides information on Level 3 securities held by the Fund that were valued at period end based on unobservable inputs. These amounts exclude valuations provided by a broker.
| Asset Type | Fair Value | Valuation Technique(s) | Unobservable Input | Amount or Range/Weighted Average | Impact to Valuation from an Increase in Input(a) |
| Equities | $1,223,297 | Market comparable | Discount rate | 15.0%-50.0%/46.6% | Decrease |
| | | | Discount for lack of marketability | 10.0% | Decrease |
| | | | Enterprise Value/EBITDA multiple (EV/EBITDA) | 3.5-4.8/3.6 | Increase |
| | | Recovery value | Recovery value | 0.0% | Increase |
| | | Market approach | Transaction Price | $15.00-$351.56/$188.58 | Increase |
| | | | Premium rate | 20.0% | Increase
|
| | | | Parity price | $25.60 | Increase |
| | | Book value | Book value multiple | 1.0 | Increase |
| | | Broker quoted | Bid price | $17.50 | Increase
|
| | | Discounted cash flow | Discount rate | 8.4% | Decrease
|
| | | | Discount for lack of marketability | 10.0% | Decrease
|
| | | | Growth rate | 1.5% | Increase |
| Corporate Bonds | $216,296 | Market comparable | Discount rate | 50.0% | Decrease
|
| | | | Discount for lack of marketability | 10.0% | Decrease |
| | | | Enterprise Value/EBITDA multiple (EV/EBITDA) | 3.5 | Increase |
| | | Recovery value | Recovery value | 0.0% | Increase |
| | | Book value | Book value multiple | 1.0 | Increase |
| | | Indicative market bid | Evaluated bid | $4.00-$97.00/$60.18 | Increase |
| Bank Loan Obligations | $ 244,779 | Recovery value | Recovery value | 0.0% | Increase |
| | | Market approach | Transaction Price | $100.00 | Increase |
| | | Indicative market bid | Evaluated bid | $102.00 | Increase |
| | | Transaction Price | Transaction Price | $120.23 | Increase |
(a) Represents the directional change in the fair value of the Level 3 investments that could have resulted from an increase in the corresponding input as of period end. A decrease to the unobservable input would have had the opposite effect. Significant changes in these inputs may have resulted in a significantly higher or lower fair value measurement at period end.
Changes in valuation techniques may result in transfers in or out of an assigned level within the disclosure hierarchy. The aggregate value of investments by input level as of April 30, 2021, as well as a roll forward of Level 3 investments, is included at the end of the Fund's Schedule of Investments.
Foreign Currency. Certain Funds may use foreign currency contracts to facilitate transactions in foreign-denominated securities. Gains and losses from these transactions may arise from changes in the value of the foreign currency or if the counterparties do not perform under the contracts' terms.
Foreign-denominated assets, including investment securities, and liabilities are translated into U.S. dollars at the exchange rates at period end. Purchases and sales of investment securities, income and dividends received, and expenses denominated in foreign currencies are translated into U.S. dollars at the exchange rate in effect on the transaction date.
The effects of exchange rate fluctuations on investments are included with the net realized and unrealized gain (loss) on investment securities. Other foreign currency transactions resulting in realized and unrealized gain (loss) are disclosed separately.
Investment Transactions and Income. For financial reporting purposes, the Fund's investment holdings and NAV include trades executed through the end of the last business day of the period. The NAV per share for processing shareholder transactions is calculated as of the close of business of the New York Stock Exchange (NYSE), normally 4:00 p.m. Eastern time and includes trades executed through the end of the prior business day. Gains and losses on securities sold are determined on the basis of identified cost. Dividend income is recorded on the ex-dividend date, except for certain dividends from foreign securities where the ex-dividend date may have passed, which are recorded as soon as the Fund is informed of the ex-dividend date. Non-cash dividends included in dividend income, if any, are recorded at the fair market value of the securities received. Income and capital gain distributions from Fidelity Central Funds, if any, are recorded on the ex-dividend date. Certain distributions received by the Fund represent a return of capital or capital gain. The Fund determines the components of these distributions subsequent to the ex-dividend date, based upon receipt of tax filings or other correspondence relating to the underlying investment. These distributions are recorded as a reduction of cost of investments and/or as a realized gain. Interest income is accrued as earned and includes coupon interest and amortization of premium and accretion of discount on debt securities as applicable. Paid in Kind (PIK) income is recorded at the fair market value of the securities received. Investment income is recorded net of foreign taxes withheld where recovery of such taxes is uncertain. Debt obligations may be placed on non-accrual status and related interest income may be reduced by ceasing current accruals and writing off interest receivables when the collection of all or a portion of interest has become doubtful based on consistently applied procedures. A debt obligation is removed from non-accrual status when the issuer resumes interest payments or when collectability of interest is reasonably assured.
Class Allocations and Expenses. Investment income, realized and unrealized capital gains and losses, common expenses of a fund, and certain fund-level expense reductions, if any, are allocated daily on a pro-rata basis to each class based on the relative net assets of each class to the total net assets of a fund. Each class differs with respect to transfer agent and distribution and service plan fees incurred, as applicable. Certain expense reductions may also differ by class, if applicable. For the reporting period, the allocated portion of income and expenses to each class as a percent of its average net assets may vary due to the timing of recording these transactions in relation to fluctuating net assets of the classes. Expenses directly attributable to a fund are charged to that fund. Expenses attributable to more than one fund are allocated among the respective funds on the basis of relative net assets or other appropriate methods. Expenses included in the accompanying financial statements reflect the expenses of that fund and do not include any expenses associated with any underlying mutual funds or exchange-traded funds. Although not included in a fund's expenses, a fund indirectly bears its proportionate share of these expenses through the net asset value of each underlying mutual fund or exchange-traded fund. Expense estimates are accrued in the period to which they relate and adjustments are made when actual amounts are known.
Income Tax Information and Distributions to Shareholders. Each year, the Fund intends to qualify as a regulated investment company under Subchapter M of the Internal Revenue Code, including distributing substantially all of its taxable income and realized gains. As a result, no provision for U.S. Federal income taxes is required. As of April 30, 2021, the Fund did not have any unrecognized tax benefits in the financial statements; nor is the Fund aware of any tax positions for which it is reasonably possible that the total amounts of unrecognized tax benefits will significantly change in the next twelve months. The Fund files a U.S. federal tax return, in addition to state and local tax returns as required. The Fund's federal income tax returns are subject to examination by the Internal Revenue Service (IRS) for a period of three fiscal years after they are filed. State and local tax returns may be subject to examination for an additional fiscal year depending on the jurisdiction. Foreign taxes are provided for based on the Fund's understanding of the tax rules and rates that exist in the foreign markets in which it invests.
Distributions are declared and recorded daily and paid monthly from net investment income. Distributions from realized gains, if any, are declared and recorded on the ex-dividend date. Income and capital gain distributions are declared separately for each class. Income and capital gain distributions are determined in accordance with income tax regulations, which may differ from GAAP.
Capital accounts within the financial statements are adjusted for permanent book-tax differences. These adjustments have no impact on net assets or the results of operations. Capital accounts are not adjusted for temporary book-tax differences which will reverse in a subsequent period.
Book-tax differences are primarily due to foreign currency transactions, defaulted bonds, market discount, certain conversion ratio adjustments, capital loss carryforwards and losses deferred due to wash sales.
As of period end, the cost and unrealized appreciation (depreciation) in securities, and derivatives if applicable, for federal income tax purposes were as follows:
| Gross unrealized appreciation | $6,397,732 |
| Gross unrealized depreciation | (4,307,582) |
| Net unrealized appreciation (depreciation) | $2,090,150 |
| Tax Cost | $109,754,783 |
The tax-based components of distributable earnings as of period end were as follows:
| Undistributed ordinary income | $146,439 |
| Capital loss carryforward | $(6,359,481) |
| Net unrealized appreciation (depreciation) on securities and other investments | $2,094,002 |
Capital loss carryforwards are only available to offset future capital gains of the Fund to the extent provided by regulations and may be limited. The capital loss carryforward information presented below, including any applicable limitation, is estimated as of fiscal period end and is subject to adjustment.
| No expiration | |
| Short-term | $(917,942) |
| Long-term | (5,441,539) |
| Total capital loss carryforward | $(6,359,481) |
The tax character of distributions paid was as follows:
| | April 30, 2021 | April 30, 2020 |
| Ordinary Income | $4,134,980 | $ 5,486,858 |
Delayed Delivery Transactions and When-Issued Securities. During the period, certain Funds transacted in securities on a delayed delivery or when-issued basis. Payment and delivery may take place after the customary settlement period for that security. The price of the underlying securities and the date when the securities will be delivered and paid for are fixed at the time the transaction is negotiated. Securities purchased on a delayed delivery or when-issued basis are identified as such in the Schedule of Investments. Compensation for interest forgone in the purchase of a delayed delivery or when-issued debt security may be received. With respect to purchase commitments, each applicable Fund identifies securities as segregated in its records with a value at least equal to the amount of the commitment. Payables and receivables associated with the purchases and sales of delayed delivery securities having the same coupon, settlement date and broker are offset. Delayed delivery or when-issued securities that have been purchased from and sold to different brokers are reflected as both payables and receivables in the Statement of Assets and Liabilities under the caption "Delayed delivery", as applicable. Losses may arise due to changes in the value of the underlying securities or if the counterparty does not perform under the contract's terms, or if the issuer does not issue the securities due to political, economic, or other factors.
Restricted Securities (including Private Placements). Funds may invest in securities that are subject to legal or contractual restrictions on resale. These securities generally may be resold in transactions exempt from registration or to the public if the securities are registered. Disposal of these securities may involve time-consuming negotiations and expense, and prompt sale at an acceptable price may be difficult. Information regarding restricted securities held at period end is included at the end of the Schedule of Investments, if applicable
Loans and Other Direct Debt Instruments. Direct debt instruments are interests in amounts owed to lenders by corporate or other borrowers. These instruments may be in the form of loans, trade claims or other receivables and may include standby financing commitments such as revolving credit facilities that obligate a fund to supply additional cash to the borrower on demand. Loans may be acquired through assignment, participation, or may be made directly to a borrower. Such instruments are presented in the Bank Loan Obligations section in the Schedule of Investments. Certain funds may also invest in unfunded loan commitments, which are contractual obligations for future funding. Information regarding unfunded commitments is included at the end of the Schedule of Investments, if applicable.
4. Purchases and Sales of Investments.
Purchases and sales of securities, other than short-term securities, are noted in the table below.
| | Purchases ($) | Sales ($) |
| Fidelity Global High Income Fund | 52,281,948 | 49,293,976 |
5. Fees and Other Transactions with Affiliates.
Management Fee. Fidelity Management & Research Company LLC (the investment adviser) and its affiliates provide the Fund with investment management related services for which the Fund pays a monthly management fee. The management fee is the sum of an individual fund fee rate that is based on an annual rate of .60% of the Fund's average net assets and an annualized group fee rate that averaged .10% during the period. The group fee rate is based upon the monthly average net assets of a group of registered investment companies with which the investment adviser has management contracts. The group fee rate decreases as assets under management increase and increases as assets under management decrease. For the reporting period, the total annual management fee rate was .70% of the Fund's average net assets.
Distribution and Service Plan Fees. In accordance with Rule 12b-1 of the 1940 Act, the Fund has adopted separate Distribution and Service Plans for each class of shares. Certain classes pay Fidelity Distributors Company LLC (FDC), an affiliate of the investment adviser, separate Distribution and Service Fees, each of which is based on an annual percentage of each class' average net assets. In addition, FDC may pay financial intermediaries for selling shares of the Fund and providing shareholder support services. For the period, the Distribution and Service Fee rates, total fees and amounts retained by FDC were as follows:
| | Distribution Fee | Service Fee | Total Fees | Retained by FDC |
| Class A | -% | .25% | $17,648 | $143 |
| Class M | -% | .25% | 7,324 | 61 |
| Class C | .75% | .25% | 30,325 | 2,160 |
| | | | $55,297 | $2,364 |
Sales Load. FDC may receive a front-end sales charge of up to 4.00% for selling Class A shares and Class M shares, some of which is paid to financial intermediaries for selling shares of the Fund. Depending on the holding period, FDC may receive contingent deferred sales charges levied on Class A, Class M and Class C redemptions. The deferred sales charges are 1.00% for Class C shares, 1.00% for certain purchases of Class A shares and .25% for certain purchases of Class M shares.
For the period, sales charge amounts retained by FDC were as follows:
| | Retained by FDC |
| Class A | $851 |
| Class M | 195 |
| Class C(a) | 138 |
| | $1,184 |
(a) When Class C shares are initially sold, FDC pays commissions from its own resources to financial intermediaries through which the sales are made.
Transfer Agent Fees. Fidelity Investments Institutional Operations Company LLC (FIIOC), an affiliate of the investment adviser, is the transfer, dividend disbursing and shareholder servicing agent for each class of the Fund. FIIOC receives account fees and asset-based fees that vary according to the account size and type of account of the shareholders of the respective classes of the Fund. FIIOC pays for typesetting, printing and mailing of shareholder reports, except proxy statements.
For the period, transfer agent fees for each class were as follows:
| | Amount | % of Class-Level Average Net Assets |
| Class A | $12,609 | .18 |
| Class M | 7,414 | .25 |
| Class C | 6,991 | .23 |
| Global High Income | 107,939 | .13 |
| Class I | 7,010 | .14 |
| | $141,963 | |
Accounting Fees. Fidelity Service Company, Inc. (FSC), an affiliate of the investment adviser, maintains the Fund's accounting records. The accounting fee is based on the level of average net assets for each month. For the period, the fees were equivalent to the following annual rates:
| | % of Average Net Assets |
| Fidelity Global High Income Fund | .04 |
Brokerage Commissions. A portion of portfolio transactions were placed with brokerage firms which are affiliates of the investment adviser. Brokerage commissions are included in net realized gain (loss) and change in net unrealized appreciation (depreciation) in the Statement of Operations. The commissions paid to these affiliated firms were as follows:
| | Amount |
| Fidelity Global High Income Fund | $12 |
Interfund Trades. Funds may purchase from or sell securities to other Fidelity Funds under procedures adopted by the Board. The procedures have been designed to ensure these interfund trades are executed in accordance with Rule 17a-7 of the 1940 Act. Any interfund trades are included within the respective purchases and sales amounts shown in the Purchases and Sales of Investments note and are noted in the table below.
| | Purchases ($) | Sales ($) |
| Fidelity Global High Income Fund | – | 159,399 |
6. Committed Line of Credit.
Certain Funds participate with other funds managed by the investment adviser or an affiliate in a $4.25 billion credit facility (the "line of credit") to be utilized for temporary or emergency purposes to fund shareholder redemptions or for other short-term liquidity purposes. The participating funds have agreed to pay commitment fees on their pro-rata portion of the line of credit, which are reflected in Miscellaneous expenses on the Statement of Operations, and are listed below.
| | Amount |
| Fidelity Global High Income Fund | $204 |
During the period, there were no borrowings on this line of credit.
7. Security Lending.
Funds lend portfolio securities from time to time in order to earn additional income. Lending agents are used, including National Financial Services (NFS), an affiliate of the investment adviser. Pursuant to a securities lending agreement, NFS will receive a fee, which is capped at 9.9% of a fund's daily lending revenue, for its services as lending agent. A fund may lend securities to certain qualified borrowers, including NFS. On the settlement date of the loan, a fund receives collateral (in the form of U.S. Treasury obligations, letters of credit and/or cash) against the loaned securities and maintains collateral in an amount not less than 100% of the market value of the loaned securities during the period of the loan. The market value of the loaned securities is determined at the close of business of a fund and any additional required collateral is delivered to a fund on the next business day. A fund or borrower may terminate the loan at any time, and if the borrower defaults on its obligation to return the securities loaned because of insolvency or other reasons, a fund may apply collateral received from the borrower against the obligation. A fund may experience delays and costs in recovering the securities loaned. Any cash collateral received is invested in the Fidelity Securities Lending Cash Central Fund. Any loaned securities are identified as such in the Schedule of Investments, and the value of loaned securities and cash collateral at period end, as applicable, are presented in the Statement of Assets and Liabilities. Security lending income represents the income earned on investing cash collateral, less rebates paid to borrowers and any lending agent fees associated with the loan, plus any premium payments received for lending certain types of securities. Security lending income is presented in the Statement of Operations as a component of income from Fidelity Central Funds. Affiliated security lending activity, if any, was as follows:
| | Total Security Lending Fees Paid to NFS | Security Lending Income From Securities Loaned to NFS | Value of Securities Loaned to NFS at Period End |
| Fidelity Global High Income Fund | $212 | $– | $– |
8. Expense Reductions.
The investment adviser contractually agreed to reimburse expenses of each class to the extent annual operating expenses exceeded certain levels of class-level average net assets as noted in the table below. Some expenses, for example the compensation of the independent Trustees, and certain miscellaneous expenses such as proxy and shareholder meeting expenses, are excluded from this reimbursement.
The following classes were in reimbursement during the period:
| | Expense Limitations | Reimbursement |
| Class A | 1.25% | $6,433 |
| Class M | 1.25% | 4,778 |
| Class C | 2.00% | 4,215 |
| Global High Income | 1.00% | 35,025 |
| Class I | 1.00% | 2,475 |
| | | $52,926 |
In addition, through arrangements with the Fund's custodian, credits realized as a result of certain uninvested cash balances were used to reduce the Fund's expenses. During the period, custodian credits reduced the Fund's expenses by $1,324.
Effective June 1, 2021, the investment adviser contractually agreed to reimburse expenses to the extent annual operating expenses exceeded certain levels of class-level average net assets as noted in the table below. This reimbursement will remain in place through August 31, 2022.
| | Expense Limitations |
| Class A | 1.15% |
| Class M | 1.15% |
| Class C | 1.90% |
| Global High Income | .90% |
| Class I | .90% |
9. Distributions to Shareholders.
Distributions to shareholders of each class were as follows:
| | Year ended
April 30, 2021 | Year ended
April 30, 2020 |
| Fidelity Global High Income Fund | | |
| Distributions to shareholders | | |
| Class A | $281,112 | $319,152 |
| Class M | 117,390 | 175,538 |
| Class C | 98,593 | 133,488 |
| Global High Income | 3,421,305 | 4,505,816 |
| Class I | 216,580 | 352,864 |
| Total | $4,134,980 | $5,486,858 |
10. Share Transactions.
Share transactions for each class were as follows and may contain automatic conversions between classes or exchanges between affiliated funds:
| | Shares | Shares | Dollars | Dollars |
| | Year ended April 30, 2021 | Year ended April 30, 2020 | Year ended April 30, 2021 | Year ended April 30, 2020 |
| Fidelity Global High Income Fund | | | | |
| Class A | | | | |
| Shares sold | 221,378 | 197,034 | $2,111,483 | $1,858,939 |
| Reinvestment of distributions | 28,758 | 33,059 | 269,952 | 305,262 |
| Shares redeemed | (80,710) | (299,995) | (743,779) | (2,770,187) |
| Net increase (decrease) | 169,426 | (69,902) | $1,637,656 | $(605,986) |
| Class M | | | | |
| Shares sold | 68,909 | 77,844 | $661,837 | $706,114 |
| Reinvestment of distributions | 12,237 | 18,336 | 114,479 | 169,732 |
| Shares redeemed | (107,309) | (165,796) | (993,245) | (1,461,219) |
| Net increase (decrease) | (26,163) | (69,616) | $(216,929) | $(585,373) |
| Class C | | | | |
| Shares sold | 59,332 | 41,564 | $560,517 | $394,093 |
| Reinvestment of distributions | 10,374 | 14,119 | 97,101 | 130,433 |
| Shares redeemed | (58,096) | (128,235) | (543,818) | (1,134,831) |
| Net increase (decrease) | 11,610 | (72,552) | $113,800 | $(610,305) |
| Global High Income | | | | |
| Shares sold | 4,031,911 | 2,579,185 | $38,048,878 | $24,201,126 |
| Reinvestment of distributions | 302,882 | 399,861 | 2,836,079 | 3,695,269 |
| Shares redeemed | (3,923,855) | (4,564,449) | (36,761,620) | (41,279,073) |
| Net increase (decrease) | 410,938 | (1,585,403) | $4,123,337 | $(13,382,678) |
| Class I | | | | |
| Shares sold | 686,540 | 747,752 | $6,529,749 | $7,064,718 |
| Reinvestment of distributions | 19,080 | 32,909 | 178,711 | 305,644 |
| Shares redeemed | (423,480) | (1,037,268) | (3,901,854) | (9,593,616) |
| Net increase (decrease) | 282,140 | (256,607) | $2,806,606 | $(2,223,254) |
11. Other.
Fund's organizational documents provide former and current trustees and officers with a limited indemnification against liabilities arising in connection with the performance of their duties to the fund. In the normal course of business, the fund may also enter into contracts that provide general indemnifications. The fund's maximum exposure under these arrangements is unknown as this would be dependent on future claims that may be made against the fund. The risk of material loss from such claims is considered remote.
12. Credit Risk.
The Fund's relatively large investment in countries with limited or developing capital markets may involve greater risks than investments in more developed markets and the prices of such investments may be volatile. The yields of emerging market debt obligations reflect, among other things, perceived credit risk. The consequences of political, social or economic changes in these markets may have disruptive effects on the market prices of the Fund's investments and the income they generate, as well as the Fund's ability to repatriate such amounts.
13. Coronavirus (COVID-19) Pandemic.
An outbreak of COVID-19 first detected in China during December 2019 has since spread globally and was declared a pandemic by the World Health Organization during March 2020. Developments that disrupt global economies and financial markets, such as the COVID-19 pandemic, may magnify factors that affect the Fund's performance.
Report of Independent Registered Public Accounting Firm
To the Board of Trustees of Fidelity Summer Street Trust and Shareholders of Fidelity Global High Income Fund
Opinion on the Financial Statements
We have audited the accompanying statement of assets and liabilities, including the schedule of investments, of Fidelity Global High Income Fund (one of the funds constituting Fidelity Summer Street Trust, referred to hereafter as the “Fund”) as of April 30, 2021, the related statement of operations for the year ended April 30, 2021, the statement of changes in net assets for each of the two years in the period ended April 30, 2021, including the related notes, and the financial highlights for each of the five years in the period ended April 30, 2021 (collectively referred to as the “financial statements”). In our opinion, the financial statements present fairly, in all material respects, the financial position of the Fund as of April 30, 2021, the results of its operations for the year then ended, the changes in its net assets for each of the two years in the period ended April 30, 2021 and the financial highlights for each of the five years in the period ended April 30, 2021 in conformity with accounting principles generally accepted in the United States of America.
Basis for Opinion
These financial statements are the responsibility of the Fund’s management. Our responsibility is to express an opinion on the Fund’s financial statements based on our audits. We are a public accounting firm registered with the Public Company Accounting Oversight Board (United States) (PCAOB) and are required to be independent with respect to the Fund in accordance with the U.S. federal securities laws and the applicable rules and regulations of the Securities and Exchange Commission and the PCAOB.
We conducted our audits of these financial statements in accordance with the standards of the PCAOB. Those standards require that we plan and perform the audit to obtain reasonable assurance about whether the financial statements are free of material misstatement, whether due to error or fraud.
Our audits included performing procedures to assess the risks of material misstatement of the financial statements, whether due to error or fraud, and performing procedures that respond to those risks. Such procedures included examining, on a test basis, evidence regarding the amounts and disclosures in the financial statements. Our audits also included evaluating the accounting principles used and significant estimates made by management, as well as evaluating the overall presentation of the financial statements. Our procedures included confirmation of securities owned as of April 30, 2021 by correspondence with the custodian. We believe that our audits provide a reasonable basis for our opinion.
/s/ PricewaterhouseCoopers LLP
Boston, Massachusetts
June 21, 2021
We have served as the auditor of one or more investment companies in the Fidelity group of funds since 1932.
Trustees and Officers
The Trustees, Members of the Advisory Board (if any), and officers of the trust and fund, as applicable, are listed below. The Board of Trustees governs the fund and is responsible for protecting the interests of shareholders. The Trustees are experienced executives who meet periodically throughout the year to oversee the fund's activities, review contractual arrangements with companies that provide services to the fund, oversee management of the risks associated with such activities and contractual arrangements, and review the fund's performance. Each of the Trustees oversees 308 funds.
The Trustees hold office without limit in time except that (a) any Trustee may resign; (b) any Trustee may be removed by written instrument, signed by at least two-thirds of the number of Trustees prior to such removal; (c) any Trustee who requests to be retired or who has become incapacitated by illness or injury may be retired by written instrument signed by a majority of the other Trustees; and (d) any Trustee may be removed at any special meeting of shareholders by a two-thirds vote of the outstanding voting securities of the trust. Each Trustee who is not an interested person (as defined in the 1940 Act) of the trust and the fund is referred to herein as an Independent Trustee. Each Independent Trustee shall retire not later than the last day of the calendar year in which his or her 75th birthday occurs. The Independent Trustees may waive this mandatory retirement age policy with respect to individual Trustees. Officers and Advisory Board Members hold office without limit in time, except that any officer or Advisory Board Member may resign or may be removed by a vote of a majority of the Trustees at any regular meeting or any special meeting of the Trustees. Except as indicated, each individual has held the office shown or other offices in the same company for the past five years.
The fund's Statement of Additional Information (SAI) includes more information about the Trustees. To request a free copy, call Fidelity at 1-800-544-8544 if you’re an individual investing directly with Fidelity, call 1-800-835-5092 if you’re a plan sponsor or participant with Fidelity as your recordkeeper or call 1-877-208-0098 on institutional accounts or if you’re an advisor or invest through one.
Experience, Skills, Attributes, and Qualifications of the Trustees. The Governance and Nominating Committee has adopted a statement of policy that describes the experience, qualifications, attributes, and skills that are necessary and desirable for potential Independent Trustee candidates (Statement of Policy). The Board believes that each Trustee satisfied at the time he or she was initially elected or appointed a Trustee, and continues to satisfy, the standards contemplated by the Statement of Policy. The Governance and Nominating Committee also engages professional search firms to help identify potential Independent Trustee candidates who have the experience, qualifications, attributes, and skills consistent with the Statement of Policy. From time to time, additional criteria based on the composition and skills of the current Independent Trustees, as well as experience or skills that may be appropriate in light of future changes to board composition, business conditions, and regulatory or other developments, have also been considered by the professional search firms and the Governance and Nominating Committee. In addition, the Board takes into account the Trustees' commitment and participation in Board and committee meetings, as well as their leadership of standing and ad hoc committees throughout their tenure.
In determining that a particular Trustee was and continues to be qualified to serve as a Trustee, the Board has considered a variety of criteria, none of which, in isolation, was controlling. The Board believes that, collectively, the Trustees have balanced and diverse experience, qualifications, attributes, and skills, which allow the Board to operate effectively in governing the fund and protecting the interests of shareholders. Information about the specific experience, skills, attributes, and qualifications of each Trustee, which in each case led to the Board's conclusion that the Trustee should serve (or continue to serve) as a trustee of the fund, is provided below.
Board Structure and Oversight Function. Robert A. Lawrence is an interested person and currently serves as Acting Chairman. The Trustees have determined that an interested Chairman is appropriate and benefits shareholders because an interested Chairman has a personal and professional stake in the quality and continuity of services provided to the fund. Independent Trustees exercise their informed business judgment to appoint an individual of their choosing to serve as Chairman, regardless of whether the Trustee happens to be independent or a member of management. The Independent Trustees have determined that they can act independently and effectively without having an Independent Trustee serve as Chairman and that a key structural component for assuring that they are in a position to do so is for the Independent Trustees to constitute a substantial majority for the Board. The Independent Trustees also regularly meet in executive session. David M. Thomas serves as Lead Independent Trustee and as such (i) acts as a liaison between the Independent Trustees and management with respect to matters important to the Independent Trustees and (ii) with management prepares agendas for Board meetings.
Fidelity® funds are overseen by different Boards of Trustees. The fund's Board oversees Fidelity's high income and certain equity funds, and other Boards oversee Fidelity's investment-grade bond, money market, asset allocation, and other equity funds. The asset allocation funds may invest in Fidelity® funds overseen by the fund's Board. The use of separate Boards, each with its own committee structure, allows the Trustees of each group of Fidelity® funds to focus on the unique issues of the funds they oversee, including common research, investment, and operational issues. On occasion, the separate Boards establish joint committees to address issues of overlapping consequences for the Fidelity® funds overseen by each Board.
The Trustees operate using a system of committees to facilitate the timely and efficient consideration of all matters of importance to the Trustees, the fund, and fund shareholders and to facilitate compliance with legal and regulatory requirements and oversight of the fund's activities and associated risks. The Board, acting through its committees, has charged FMR and its affiliates with (i) identifying events or circumstances the occurrence of which could have demonstrably adverse effects on the fund's business and/or reputation; (ii) implementing processes and controls to lessen the possibility that such events or circumstances occur or to mitigate the effects of such events or circumstances if they do occur; and (iii) creating and maintaining a system designed to evaluate continuously business and market conditions in order to facilitate the identification and implementation processes described in (i) and (ii) above. Because the day-to-day operations and activities of the fund are carried out by or through FMR, its affiliates, and other service providers, the fund's exposure to risks is mitigated but not eliminated by the processes overseen by the Trustees. While each of the Board's committees has responsibility for overseeing different aspects of the fund's activities, oversight is exercised primarily through the Operations, Audit, and Compliance Committees. Appropriate personnel, including but not limited to the fund's Chief Compliance Officer (CCO), FMR's internal auditor, the independent accountants, the fund's Treasurer and portfolio management personnel, make periodic reports to the Board's committees, as appropriate, including an annual review of Fidelity's risk management program for the Fidelity® funds. The responsibilities of each standing committee, including their oversight responsibilities, are described further under "Standing Committees of the Trustees."
Interested Trustees*:
Correspondence intended for a Trustee who is an interested person may be sent to Fidelity Investments, 245 Summer Street, Boston, Massachusetts 02210.
Name, Year of Birth; Principal Occupations and Other Relevant Experience+
Bettina Doulton (1964)
Year of Election or Appointment: 2020
Trustee
Ms. Doulton also serves as Trustee of other Fidelity® funds. Prior to her retirement, Ms. Doulton served in a variety of positions at Fidelity Investments, including as a managing director of research (2006-2007), portfolio manager to certain Fidelity® funds (1993-2005), equity analyst and portfolio assistant (1990-1993), and research assistant (1987-1990). Ms. Doulton currently owns and operates Phi Builders + Architects and Cellardoor Winery. Previously, Ms. Doulton served as a member of the Board of Brown Capital Management, LLC (2014-2018).
Robert A. Lawrence (1952)
Year of Election or Appointment: 2020
Trustee
Acting Chairman of the Board of Trustees
Mr. Lawrence also serves as Trustee of other funds. Previously, Mr. Lawrence served as a Member of the Advisory Board of certain funds. Prior to his retirement in 2008, Mr. Lawrence served as Vice President of certain Fidelity® funds (2006-2008), Senior Vice President, Head of High Income Division of Fidelity Management & Research Company (investment adviser firm, 2006-2008), and President of Fidelity Strategic Investments (investment adviser firm, 2002-2005).
* Determined to be an “Interested Trustee” by virtue of, among other things, his or her affiliation with the trust or various entities under common control with FMR.
+ The information includes the Trustee's principal occupation during the last five years and other information relating to the experience, attributes, and skills relevant to the Trustee's qualifications to serve as a Trustee, which led to the conclusion that the Trustee should serve as a Trustee for the fund.
Independent Trustees:
Correspondence intended for an Independent Trustee may be sent to Fidelity Investments, P.O. Box 55235, Boston, Massachusetts 02205-5235.
Name, Year of Birth; Principal Occupations and Other Relevant Experience+
Thomas P. Bostick (1956)
Year of Election or Appointment: 2021
Trustee
Lieutenant General Bostick also serves as Trustee of other Fidelity® funds. Prior to his retirement, General Bostick (United States Army, Retired) held a variety of positions within the U.S. Army, including Commanding General and Chief of Engineers, U.S. Army Corps of Engineers (2012-2016) and Deputy Chief of Staff and Director of Human Resources, U.S. Army (2009-2012). General Bostick currently serves as a member of the Board and Finance and Governance Committees of CSX Corporation (transportation, 2020-present) and a member of the Board and Corporate Governance and Nominating Committee of Perma-Fix Environmental Services, Inc. (nuclear waste management, 2020-present). General Bostick serves as Chief Executive Officer of Bostick Global Strategies, LLC (consulting, 2016-present) and Managing Partner, Sustainability, of Ridge-Lane Limited Partners (strategic advisory and venture development, 2016-present). Previously, General Bostick served as a Member of the Advisory Board of certain Fidelity® funds (2021), President, Intrexon Bioengineering (2018-2020) and Chief Operating Officer (2017-2020) and Senior Vice President of the Environment Sector (2016-2017) of Intrexon Corporation (biopharmaceutical company).
Dennis J. Dirks (1948)
Year of Election or Appointment: 2005
Trustee
Mr. Dirks also serves as Trustee of other Fidelity® funds. Prior to his retirement in May 2003, Mr. Dirks served as Chief Operating Officer and as a member of the Board of The Depository Trust & Clearing Corporation (financial markets infrastructure), President, Chief Operating Officer and a member of the Board of The Depository Trust Company (DTC), President and a member of the Board of the National Securities Clearing Corporation (NSCC), Chief Executive Officer and a member of the Board of the Government Securities Clearing Corporation and Chief Executive Officer and a member of the Board of the Mortgage-Backed Securities Clearing Corporation. Mr. Dirks currently serves as a member of the Finance Committee (2016-present) and Board (2017-present) and is Treasurer (2018-present) of the Asolo Repertory Theatre.
Donald F. Donahue (1950)
Year of Election or Appointment: 2018
Trustee
Mr. Donahue also serves as Trustee of other Fidelity® funds. Mr. Donahue serves as President and Chief Executive Officer of Miranda Partners, LLC (risk consulting for the financial services industry, 2012-present). Previously, Mr. Donahue served as Chief Executive Officer (2006-2012), Chief Operating Officer (2003-2006) and Managing Director, Customer Marketing and Development (1999-2003) of The Depository Trust & Clearing Corporation (financial markets infrastructure). Mr. Donahue currently serves as a member (2007-present) and Co-Chairman (2016-present) of the Board of United Way of New York and a member of the Board of NYC Leadership Academy (2012-present). Mr. Donahue previously served as a member of the Advisory Board of certain Fidelity® funds (2015-2018).
Vicki L. Fuller (1957)
Year of Election or Appointment: 2020
Trustee
Ms. Fuller also serves as Trustee of other Fidelity® funds. Previously, Ms. Fuller served as a member of the Advisory Board of certain Fidelity® funds (2018-2020), Chief Investment Officer of the New York State Common Retirement Fund (2012-2018) and held a variety of positions at AllianceBernstein L.P. (global asset management, 1985-2012), including Managing Director (2006-2012) and Senior Vice President and Senior Portfolio Manager (2001-2006). Ms. Fuller currently serves as a member of the Board, Audit Committee and Nominating and Governance Committee of The Williams Companies, Inc. (natural gas infrastructure, 2018-present), as a member of the Board, Audit Committee and Nominating and Governance Committee of two Blackstone business development companies (2020-present) and as a member of the Board of Treliant, LLC (consulting, 2019-present).
Patricia L. Kampling (1959)
Year of Election or Appointment: 2020
Trustee
Ms. Kampling also serves as Trustee of other Fidelity® funds. Prior to her retirement, Ms. Kampling served as Chairman of the Board and Chief Executive Officer (2012-2019), President and Chief Operating Officer (2011-2012) and Executive Vice President and Chief Financial Officer (2010-2011) of Alliant Energy Corporation. Ms. Kampling currently serves as a member of the Board, Finance Committee and Governance, Compensation and Nominating Committee of Xcel Energy Inc. (utilities company, 2020-present) and as a member of the Board, Audit, Finance and Risk Committee and Safety, Environmental, Technology and Operations Committee of American Water Works Company, Inc. (utilities company, 2019-present). In addition, Ms. Kampling currently serves as a member of the Board of the Nature Conservancy, Wisconsin Chapter (2019-present). Previously, Ms. Kampling served as a Member of the Advisory Board of certain Fidelity® funds (2020), a member of the Board, Compensation Committee and Executive Committee and Chair of the Audit Committee of Briggs & Stratton Corporation (manufacturing, 2011-2021), a member of the Board of Interstate Power and Light Company (2012-2019) and Wisconsin Power and Light Company (2012-2019) (each a subsidiary of Alliant Energy Corporation) and as a member of the Board and Workforce Development Committee of the Business Roundtable (2018-2019).
Thomas A. Kennedy (1955)
Year of Election or Appointment: 2021
Trustee
Mr. Kennedy also serves as Trustee of other Fidelity® funds. Previously, Mr. Kennedy served as a Member of the Advisory Board of certain Fidelity® funds (2020) and held a variety of positions at Raytheon Company (aerospace and defense, 1983-2020), including Chairman and Chief Executive Officer (2014-2020) and Executive Vice President and Chief Operating Officer (2013-2014). Mr. Kennedy currently serves as Executive Chairman of the Board of Directors of Raytheon Technologies Corporation (aerospace and defense, 2020-present). He is also a member of the Rutgers School of Engineering Industry Advisory Board (2011-present) and a member of the UCLA Engineering Dean’s Executive Board (2016-present).
Oscar Munoz (1959)
Year of Election or Appointment: 2021
Trustee
Mr. Munoz also serves as Trustee of other Fidelity® funds. Prior to his retirement, Mr. Munoz served as Executive Chairman (2020-2021), Chief Executive Officer (2015-2020), President (2015-2016) and a member of the Board (2010-2021) of United Airlines Holdings, Inc. Mr. Munoz currently serves as a member of the Board of CBRE Group, Inc. (commercial real estate, 2020-present), a member of the Board of Univision Communications, Inc. (Hispanic media, 2020-present) and a member of the Advisory Board of Salesforce.com, Inc. (cloud-based software, 2020-present). Previously, Mr. Munoz served as a Member of the Advisory Board of certain Fidelity® funds (2021).
Garnett A. Smith (1947)
Year of Election or Appointment: 2018
Trustee
Mr. Smith also serves as Trustee of other Fidelity® funds. Prior to his retirement, Mr. Smith served as Chairman and Chief Executive Officer (1990-1997) and President (1986-1990) of Inbrand Corp. (manufacturer of personal absorbent products). Prior to his employment with Inbrand Corp., he was employed by a retail fabric chain and North Carolina National Bank (now Bank of America). Mr. Smith previously served as a member of the Advisory Board of certain Fidelity® funds (2012-2013).
David M. Thomas (1949)
Year of Election or Appointment: 2008
Trustee
Lead Independent Trustee
Mr. Thomas also serves as Trustee of other Fidelity® funds. Previously, Mr. Thomas served as Executive Chairman (2005-2006) and Chairman and Chief Executive Officer (2000-2005) of IMS Health, Inc. (pharmaceutical and healthcare information solutions). Mr. Thomas currently serves as a member of the Board of Fortune Brands Home and Security (home and security products, 2004-present) and Presiding Director (2013-present) of Interpublic Group of Companies, Inc. (marketing communication).
Susan Tomasky (1953)
Year of Election or Appointment: 2020
Trustee
Ms. Tomasky also serves as Trustee of other Fidelity® funds. Prior to her retirement, Ms. Tomasky served in various executive officer positions at American Electric Power Company, Inc. (1998-2011), including most recently as President of AEP Transmission (2007-2011). Ms. Tomasky currently serves as a member of the Board and Sustainability Committee and as Chair of the Audit Committee of Marathon Petroleum Corporation (2018-present) and as a member of the Board, Corporate Governance Committee and Organization and Compensation Committee and as Chair of the Audit Committee of Public Service Enterprise Group, Inc. (utilities company, 2012-present). In addition, Ms. Tomasky currently serves as a member (2009-present) and President (2020-present) of the Board of the Royal Shakespeare Company – America (2009-present), as a member of the Board of the Columbus Association for the Performing Arts (2011-present) and as a member of the Board and Investment Committee of Kenyon College (2016-present). Previously, Ms. Tomasky served as a Member of the Advisory Board of certain Fidelity® funds (2020), as a member of the Board of the Columbus Regional Airport Authority (2007-2020), as a member of the Board (2011-2018) and Lead Independent Director (2015-2018) of Andeavor Corporation (previously Tesoro Corporation) (independent oil refiner and marketer) and as a member of the Board of Summit Midstream Partners LP (energy, 2012-2018).
Michael E. Wiley (1950)
Year of Election or Appointment: 2018
Trustee
Mr. Wiley also serves as Trustee of other Fidelity® funds. Previously, Mr. Wiley served as a member of the Advisory Board of certain Fidelity® funds (2018-2020), Chairman, President and CEO of Baker Hughes, Inc. (oilfield services, 2000-2004). Mr. Wiley also previously served as a member of the Board of Andeavor Corporation (independent oil refiner and marketer, 2005-2018), a member of the Board of Andeavor Logistics LP (natural resources logistics, 2015-2018) and a member of the Board of High Point Resources (exploration and production, 2005-2020).
+ The information includes the Trustee's principal occupation during the last five years and other information relating to the experience, attributes, and skills relevant to the Trustee's qualifications to serve as a Trustee, which led to the conclusion that the Trustee should serve as a Trustee for the fund.
Advisory Board Members and Officers:
Correspondence intended for a Member of the Advisory Board (if any) may be sent to Fidelity Investments, P.O. Box 55235, Boston, Massachusetts 02205-5235. Correspondence intended for an officer or Peter S. Lynch may be sent to Fidelity Investments, 245 Summer Street, Boston, Massachusetts 02210. Officers appear below in alphabetical order.
Name, Year of Birth; Principal Occupation
Peter S. Lynch (1944)
Year of Election or Appointment: 2003
Member of the Advisory Board
Mr. Lynch also serves as a Member of the Advisory Board of other Fidelity® funds. Mr. Lynch is Vice Chairman and a Director of Fidelity Management & Research Company LLC (investment adviser firm). In addition, Mr. Lynch serves as a Trustee of Boston College and as the Chairman of the Inner-City Scholarship Fund. Previously, Mr. Lynch served as Vice Chairman and a Director of FMR Co., Inc. (investment adviser firm) and on the Special Olympics International Board of Directors (1997-2006).
Craig S. Brown (1977)
Year of Election or Appointment: 2019
Assistant Treasurer
Mr. Brown also serves as Assistant Treasurer of other funds. Mr. Brown is an employee of Fidelity Investments (2013-present).
John J. Burke III (1964)
Year of Election or Appointment: 2018
Chief Financial Officer
Mr. Burke also serves as Chief Financial Officer of other funds. Mr. Burke serves as Head of Investment Operations for Fidelity Fund and Investment Operations (2018-present) and is an employee of Fidelity Investments (1998-present). Previously Mr. Burke served as head of Asset Management Investment Operations (2012-2018).
William C. Coffey (1969)
Year of Election or Appointment: 2019
Assistant Secretary
Mr. Coffey also serves as Assistant Secretary of other funds. He is Senior Vice President and Deputy General Counsel of FMR LLC (diversified financial services company, 2010-present), and is an employee of Fidelity Investments. Previously, Mr. Coffey served as Secretary and CLO of certain funds (2018-2019); CLO, Secretary, and Senior Vice President of Fidelity Management & Research Company and FMR Co., Inc. (investment adviser firms, 2018-2019); Secretary of Fidelity SelectCo, LLC and Fidelity Investments Money Management, Inc. (investment adviser firms, 2018-2019); CLO of Fidelity Management & Research (Hong Kong) Limited, FMR Investment Management (UK) Limited, and Fidelity Management & Research (Japan) Limited (investment adviser firms, 2018-2019); and Assistant Secretary of certain funds (2009-2018).
Timothy M. Cohen (1969)
Year of Election or Appointment: 2018
Vice President
Mr. Cohen also serves as Vice President of other funds. Mr. Cohen serves as Co-Head of Equity (2018-present), a Director of Fidelity Management & Research (Japan) Limited (investment adviser firm, 2016-present), and is an employee of Fidelity Investments. Previously, Mr. Cohen served as Executive Vice President of Fidelity SelectCo, LLC (2019), Head of Global Equity Research (2016-2018), Chief Investment Officer - Equity and a Director of Fidelity Management & Research (U.K.) Inc. (investment adviser firm, 2013-2015) and as a Director of Fidelity Management & Research (Hong Kong) Limited (investment adviser firm, 2017).
Jonathan Davis (1968)
Year of Election or Appointment: 2010
Assistant Treasurer
Mr. Davis also serves as Assistant Treasurer of other funds. Mr. Davis serves as Assistant Treasurer of FMR Capital, Inc. (2017-present) and is an employee of Fidelity Investments. Previously, Mr. Davis served as Vice President and Associate General Counsel of FMR LLC (diversified financial services company, 2003-2010).
Laura M. Del Prato (1964)
Year of Election or Appointment: 2018
Assistant Treasurer
Ms. Del Prato also serves as an officer of other funds. Ms. Del Prato is an employee of Fidelity Investments (2017-present). Previously, Ms. Del Prato served as President and Treasurer of The North Carolina Capital Management Trust: Cash Portfolio and Term Portfolio (2018-2020). Prior to joining Fidelity Investments, Ms. Del Prato served as a Managing Director and Treasurer of the JPMorgan Mutual Funds (2014-2017). Prior to JPMorgan, Ms. Del Prato served as a partner at Cohen Fund Audit Services (accounting firm, 2012-2013) and KPMG LLP (accounting firm, 2004-2012).
Colm A. Hogan (1973)
Year of Election or Appointment: 2020
Assistant Treasurer
Mr. Hogan also serves as an officer of other funds. Mr. Hogan serves as Assistant Treasurer of FMR Capital, Inc. (2017-present) and is an employee of Fidelity Investments (2005-present). Previously, Mr. Hogan served as Deputy Treasurer of certain Fidelity® funds (2016-2020) and Assistant Treasurer of certain Fidelity® funds (2016-2018).
Pamela R. Holding (1964)
Year of Election or Appointment: 2018
Vice President
Ms. Holding also serves as Vice President of other funds. Ms. Holding serves as Co-Head of Equity (2018-present) and is an employee of Fidelity Investments (2013-present). Previously, Ms. Holding served as Executive Vice President of Fidelity SelectCo, LLC (2019) and as Chief Investment Officer of Fidelity Institutional Asset Management (2013-2018).
Cynthia Lo Bessette (1969)
Year of Election or Appointment: 2019
Secretary and Chief Legal Officer (CLO)
Ms. Lo Bessette also serves as an officer of other funds. Ms. Lo Bessette serves as CLO, Secretary, and Senior Vice President of Fidelity Management & Research Company LLC (investment adviser firm, 2019-present); and CLO of Fidelity Management & Research (Hong Kong) Limited, FMR Investment Management (UK) Limited, and Fidelity Management & Research (Japan) Limited (investment adviser firms, 2019-present). She is a Senior Vice President and Deputy General Counsel of FMR LLC (diversified financial services company, 2019-present), and is an employee of Fidelity Investments. Previously, Ms. Lo Bessette served as CLO, Secretary, and Senior Vice President of FMR Co., Inc. (investment adviser firm, 2019); Secretary of Fidelity SelectCo, LLC and Fidelity Investments Money Management, Inc. (investment adviser firms, 2019). Prior to joining Fidelity Investments, Ms. Lo Bessette was Executive Vice President, General Counsel (2016-2019) and Senior Vice President, Deputy General Counsel (2015-2016) of OppenheimerFunds (investment management company) and Deputy Chief Legal Officer (2013-2015) of Jennison Associates LLC (investment adviser firm).
Chris Maher (1972)
Year of Election or Appointment: 2020
Deputy Treasurer
Mr. Maher also serves as an officer of other funds. Mr. Maher serves as Assistant Treasurer of FMR Capital, Inc. (2017-present), and is an employee of Fidelity Investments (2008-present). Previously, Mr. Maher served as Assistant Treasurer of certain funds (2013-2020); Vice President of Asset Management Compliance (2013), Vice President of the Program Management Group of FMR (investment adviser firm, 2010-2013), and Vice President of Valuation Oversight (2008-2010).
Jason P. Pogorelec (1975)
Year of Election or Appointment: 2020
Chief Compliance Officer
Mr. Pogorelec also serves as Chief Compliance Officer of other funds. Mr. Pogorelec is a senior Vice President of Asset Management Compliance for Fidelity Investments and is an employee of Fidelity Investments (2006-present). Previously, Mr. Pogorelec served as Vice President, Associate General Counsel for Fidelity Investments (2010-2020) and Assistant Secretary of certain Fidelity funds (2015-2020).
Brett Segaloff (1972)
Year of Election or Appointment: 2021
Anti-Money Laundering (AML) Officer
Mr. Segaloff also serves as an AML Officer of other funds and other related entities. He is Director, Anti-Money Laundering (2007-present) of FMR LLC (diversified financial services company) and is an employee of Fidelity Investments (1996-present).
Stacie M. Smith (1974)
Year of Election or Appointment: 2016
President and Treasurer
Ms. Smith also serves as an officer of other funds. Ms. Smith serves as Assistant Treasurer of FMR Capital, Inc. (2017-present), is an employee of Fidelity Investments (2009-present), and has served in other fund officer roles. Prior to joining Fidelity Investments, Ms. Smith served as Senior Audit Manager of Ernst & Young LLP (accounting firm, 1996-2009). Previously, Ms. Smith served as Assistant Treasurer (2013-2019) and Deputy Treasurer (2013-2016) of certain Fidelity® funds.
Marc L. Spector (1972)
Year of Election or Appointment: 2016
Assistant Treasurer
Mr. Spector also serves as an officer of other funds. Mr. Spector serves as Assistant Treasurer of FMR Capital, Inc. (2017-present) and is an employee of Fidelity Investments (2016-present). Prior to joining Fidelity Investments, Mr. Spector served as Director at the Siegfried Group (accounting firm, 2013-2016), and prior to Siegfried Group as audit senior manager at Deloitte & Touche LLP (accounting firm, 2005-2013).
Jim Wegmann (1979)
Year of Election or Appointment: 2019
Assistant Treasurer
Mr. Wegmann also serves as Assistant Treasurer of other funds. Mr. Wegmann is an employee of Fidelity Investments (2011-present).
Shareholder Expense Example
As a shareholder, you incur two types of costs: (1) transaction costs, which may include sales charges (loads) on purchase payments or redemption proceeds, as applicable and (2) ongoing costs, which generally include management fees, distribution and/or service (12b-1) fees and other Fund expenses. This Example is intended to help you understand your ongoing costs (in dollars) of investing in a fund and to compare these costs with the ongoing costs of investing in other mutual funds.
The Example is based on an investment of $1,000 invested at the beginning of the period and held for the entire period (November 1, 2020 to April 30, 2021).
Actual Expenses
The first line of the accompanying table provides information about actual account values and actual expenses. You may use the information in this line, together with the amount you invested, to estimate the expenses that you paid over the period. Simply divide your account value by $1,000.00 (for example, an $8,600 account value divided by $1,000.00 = 8.6), then multiply the result by the number in the first line for a class/Fund under the heading entitled "Expenses Paid During Period" to estimate the expenses you paid on your account during this period. If any fund is a shareholder of any underlying mutual funds or exchange-traded funds (ETFs) (the Underlying Funds), such fund indirectly bears its proportional share of the expenses of the Underlying Funds in addition to the direct expenses incurred presented in the table. These fees and expenses are not included in the annualized expense ratio used to calculate the expense estimate in the table below.
Hypothetical Example for Comparison Purposes
The second line of the accompanying table provides information about hypothetical account values and hypothetical expenses based on the actual expense ratio and an assumed rate of return of 5% per year before expenses, which is not the actual return. The hypothetical account values and expenses may not be used to estimate the actual ending account balance or expenses you paid for the period. You may use this information to compare the ongoing costs of investing in the Fund and other funds. To do so, compare this 5% hypothetical example with the 5% hypothetical examples that appear in the shareholder reports of the other funds. If any fund is a shareholder of any Underlying Funds, such fund indirectly bears its proportional share of the expenses of the Underlying Funds in addition to the direct expenses as presented in the table. These fees and expenses are not included in the annualized expense ratio used to calculate the expense estimate in the table below.
Please note that the expenses shown in the table are meant to highlight your ongoing costs only and do not reflect any transaction costs. Therefore, the second line of the table is useful in comparing ongoing costs only, and will not help you determine the relative total costs of owning different funds. In addition, if these transactional costs were included, your costs would have been higher.
| | Annualized Expense Ratio-A | Beginning
Account Value
November 1, 2020 | Ending
Account Value
April 30, 2021 | Expenses Paid
During Period-B
November 1, 2020
to April 30, 2021 |
| Fidelity Global High Income Fund | | | | |
| Class A | 1.25% | | | |
| Actual | | $1,000.00 | $1,090.10 | $6.48** |
| Hypothetical-C | | $1,000.00 | $1,018.60 | $6.26** |
| Class M | 1.25% | | | |
| Actual | | $1,000.00 | $1,090.10 | $6.48** |
| Hypothetical-C | | $1,000.00 | $1,018.60 | $6.26** |
| Class C | 2.00% | | | |
| Actual | | $1,000.00 | $1,086.10 | $10.34 |
| Hypothetical-C | | $1,000.00 | $1,014.88 | $9.99** |
| Global High Income | 1.00% | | | |
| Actual | | $1,000.00 | $1,091.50 | $5.19** |
| Hypothetical-C | | $1,000.00 | $1,019.84 | $5.01** |
| Class I | 1.00% | | | |
| Actual | | $1,000.00 | $1,091.50 | $5.19** |
| Hypothetical-C | | $1,000.00 | $1,019.84 | $5.01** |
A Annualized expense ratio reflects expenses net of applicable fee waivers.
B Expenses are equal to the annualized expense ratio, multiplied by the average account value over the period, multiplied by 181/ 365 (to reflect the one-half year period). The fees and expenses of any Underlying Funds are not included in each annualized expense ratio.
C 5% return per year before expenses
** If fees and changes to the class level expense contract and/or expense cap, effective June 1, 2021, had been in effect during the current period, the restated annualized expense ratio and the expenses paid in the actual and hypothetical examples above would have been as shown in table below:
| | Annualized Expense Ratio-(a)
| Expenses Paid
|
| Fidelity Global High Income Fund | | |
| Class A | 1.15% | |
| Actual | | $5.96 |
| Hypothetical-(b) | | $5.76 |
| Class M | 1.15% | |
| Actual | | $5.96 |
| Hypothetical-(b) | | $5.76 |
| Class C | 1.90% | |
| Hypothetical-(b) | | $9.49 |
| Global High Income | .90% | |
| Actual | | $4.67 |
| Hypothetical-(b) | | $4.51 |
| Class I | .90% | |
| Actual | | $4.67 |
| Hypothetical-(b) | | $4.51 |
(a) Annualized expense ratio reflects expenses net of applicable fee waivers.
(b) 5% return per year before expenses
Distributions (Unaudited)
A total of 0.06% of the dividends distributed during the fiscal year was derived from interest on U.S. Government securities which is generally exempt from state income tax.
The fund designates $2,239,759 of distributions paid in the calendar year 2020 as qualifying to be taxed as interest-related dividends for nonresident alien shareholders.
The fund designates $4,354,018 of distributions paid in the calendar year 2020 as qualifying to be taxed as section 163(j) interest dividends.
The fund will notify shareholders in January 2022 of amounts for use in preparing 2021 income tax returns.
Board Approval of Investment Advisory Contracts
Fidelity Global High Income Fund
At its January 2021 meeting, the Board of Trustees, including the Independent Trustees (together, the Board), voted to continue the management contract with Fidelity Management & Research Company LLC (FMR), and the sub-advisory agreements and sub-subadvisory agreements, in each case, where applicable (together, the Advisory Contracts) for the fund for four months from February 1, 2021 through May 31, 2021, in connection with changes to the Board's meeting calendar.
The Board considered that the approval of the fund's Advisory Contracts will not result in any changes in (i) the investment process or strategies employed in the management of the fund's assets; (ii) the fees and expenses paid by shareholders; (iii) the nature, extent or quality of services provided under the fund's Advisory Contracts; or (iv) the day-to-day management of the fund or the persons primarily responsible for such management. The Board also considered that since its last approval of the fund's Advisory Contracts, FMR had provided additional information on the fund in support of the annual contract renewal process, including competitive analyses on total expenses and management fees and in-depth reviews of fund performance and fund profitability information. The Board also considered the findings of certain ad hoc committees that had been previously formed to discuss matters relevant to all of the Fidelity funds, including economies of scale, fall-out benefits and retail vs. institutional funds. The Board concluded that the fund's Advisory Contracts are fair and reasonable, and that the fund's Advisory Contracts should be renewed, without modification, through May 31, 2021, with the understanding that the Board will consider the annual renewal for a full one year period in May 2021.
In connection with its consideration of future renewals of the fund's Advisory Contracts, the Board will consider: (i) the nature, extent and quality of services provided to the funds, including shareholder and administrative services and investment performance; (ii) the competitiveness of the management fee and total expenses for the fund; (iii) the costs of the services and profitability, including the revenues earned and the expenses incurred in conducting the business of developing, marketing, distributing, managing, administering, and servicing the fund and its shareholders, to the extent applicable; and (iv) whether there have been economies of scale in respect of the Fidelity funds, whether the Fidelity funds (including the fund) have appropriately benefited from any such economies of scale, and whether there is the potential for realization of any further economies.
Based on its evaluation of all of the conclusions noted above, and after considering all factors it believed relevant, the Board ultimately concluded that the fund's management fee structure is fair and reasonable, and that the continuation of the fund's Advisory Contracts should be approved for four months from February 1, 2021 through May 31, 2021.
Liquidity Risk Management Program
The Securities and Exchange Commission adopted Rule 22e-4 under the Investment Company Act of 1940 (the Liquidity Rule) to promote effective liquidity risk management throughout the open-end investment company industry, thereby reducing the risk that funds will be unable to meet their redemption obligations and mitigating dilution of the interests of fund shareholders.
The Fund has adopted and implemented a liquidity risk management program pursuant to the Liquidity Rule (the Program) effective December 1, 2018. The Program is reasonably designed to assess and manage the Fund’s liquidity risk and to comply with the requirements of the Liquidity Rule. The Fund’s Board of Trustees (the Board) has designated the Fund’s investment adviser as administrator of the Program. The Fidelity advisers have established a Liquidity Risk Management Committee (the LRM Committee) to manage the Program for each of the Fidelity Funds. The LRM Committee monitors the adequacy and effectiveness of implementation of the Program and on a periodic basis assesses each Fund’s liquidity risk based on a variety of factors including (1) the Fund’s investment strategy, (2) portfolio liquidity and cash flow projections during normal and reasonably foreseeable stressed conditions, (3) shareholder redemptions, (4) borrowings and other funding sources and (5) in the case of exchange-traded funds, certain additional factors including the effect of the Fund’s prices and spreads, market participants, and basket compositions on the overall liquidity of the Fund’s portfolio, as applicable.
In accordance with the Program, each of the Fund’s portfolio investments is classified into one of four liquidity categories described below based on a determination of a reasonable expectation for how long it would take to convert the investment to cash (or sell or dispose of the investment) without significantly changing its market value.
- Highly liquid investments – cash or convertible to cash within three business days or less
- Moderately liquid investments – convertible to cash in three to seven calendar days
- Less liquid investments – can be sold or disposed of, but not settled, within seven calendar days
- Illiquid investments – cannot be sold or disposed of within seven calendar days
Liquidity classification determinations take into account a variety of factors including various market, trading and investment-specific considerations, as well as market depth, and generally utilize analysis from a third-party liquidity metrics service.
The Liquidity Rule places a 15% limit on a fund’s illiquid investments and requires funds that do not primarily hold assets that are highly liquid investments to determine and maintain a minimum percentage of the fund’s net assets to be invested in highly liquid investments (highly liquid investment minimum or HLIM). The Program includes provisions reasonably designed to comply with the 15% limit on illiquid investments and for determining, periodically reviewing and complying with the HLIM requirement as applicable.
At a recent meeting of the Fund’s Board of Trustees, the LRM Committee provided a written report to the Board pertaining to the operation, adequacy, and effectiveness of implementation of the Program for the annual period from December 1, 2019 through November 30, 2020. The report concluded that the Program has been implemented and is operating effectively and is reasonably designed to assess and manage the Fund’s liquidity risk.
Proxy Voting Results
A special meeting of shareholders was held on June 9, 2020. The results of votes taken among shareholders on the proposals before them are reported below. Each vote reported represents one dollar of net asset value held on the record date for the meeting.
PROPOSAL 1
To elect a Board of Trustees.
| | # of
Votes | % of
Votes |
| Dennis J. Dirks |
| Affirmative | 16,477,844,543.945 | 94.954 |
| Withheld | 875,616,757.045 | 5.046 |
| TOTAL | 17,353,461,300.990 | 100.000 |
| Donald F. Donahue |
| Affirmative | 16,475,304,981.550 | 94.940 |
| Withheld | 878,156,319.440 | 5.060 |
| TOTAL | 17,353,461,300.990 | 100.000 |
| Bettina Doulton |
| Affirmative | 16,570,440,321.103 | 95.488 |
| Withheld | 783,020,979.887 | 4.512 |
| TOTAL | 17,353,461,300.990 | 100.000 |
| Vicki L. Fuller |
| Affirmative | 16,590,910,486.905 | 95.606 |
| Withheld | 762,550,814.085 | 4.394 |
| TOTAL | 17,353,461,300.990 | 100.00 |
| Patricia L. Kampling |
| Affirmative | 16,469,872,791.586 | 94.908 |
| Withheld | 883,588,509.404 | 5.092 |
| TOTAL | 17,353,461,300.990 | 100.000 |
| Alan J. Lacy |
| Affirmative | 16,344,655,183.636 | 94.187 |
| Withheld | 1,008,806,117.354 | 5.813 |
| TOTAL | 17,353,461,300.990 | 100.000 |
| Ned C. Lautenbach |
| Affirmative | 15,532,663,704.227 | 89.508 |
| Withheld | 1,820,797,596.763 | 10.492 |
| TOTAL | 17,353,461,300.990 | 100.000 |
| Robert A. Lawrence |
| Affirmative | 16,389,821,876.677 | 94.447 |
| Withheld | 963,639,424.313 | 5.553 |
| TOTAL | 17,353,461,300.990 | 100.000 |
| Joseph Mauriello |
| Affirmative | 16,363,427,626.626 | 94.295 |
| Withheld | 990,033,674.365 | 5.705 |
| TOTAL | 17,353,461,300.990 | 100.000 |
| Cornelia M. Small |
| Affirmative | 16,405,902,888.605 | 94.540 |
| Withheld | 947,558,412.386 | 5.460 |
| TOTAL | 17,353,461,300.990 | 100.000 |
| Garnett A. Smith |
| Affirmative | 16,371,912,270.945 | 94.344 |
| Withheld | 981,549,030.045 | 5.656 |
| TOTAL | 17,353,461,300.990 | 100.000 |
| David M. Thomas |
| Affirmative | 16,365,966,852.048 | 94.310 |
| Withheld | 987,494,448.942 | 5.690 |
| TOTAL | 17,353,461,300.990 | 100.000 |
| Susan Tomasky |
| Affirmative | 16,483,922,579.861 | 94.989 |
| Withheld | 869,538,721.129 | 5.011 |
| TOTAL | 17,353,461,300.990 | 100.000 |
| Michael E. Wiley |
| Affirmative | 16,379,083,262.890 | 94.385 |
| Withheld | 974,378,038.101 | 5.615 |
| TOTAL | 17,353,461,300.990 | 100.000 |
PROPOSAL 2
To convert a fundamental investment policy to a non-fundamental investment policy.
| | # of
Votes | % of
Votes |
| Affirmative | 1,938,025,834.700 | 66.386 |
| Against | 471,175,917.812 | 16.140 |
| Abstain | 339,614,021.130 | 11.633 |
| Broker Non-Vote | 170,497,954.180 | 5.840 |
| TOTAL | 2,919,313,727.823 | 100.000 |
| Proposal 1 reflects trust wide proposal and voting results. |
| Proposal 2 was not approved by shareholders. |
GHI-ANN-0621
1.926249.109
Fidelity® Short Duration High Income Fund
Annual Report
April 30, 2021
Includes Fidelity and Fidelity Advisor share classes
Contents
To view a fund's proxy voting guidelines and proxy voting record for the 12-month period ended June 30, visit http://www.fidelity.com/proxyvotingresults or visit the Securities and Exchange Commission's (SEC) web site at http://www.sec.gov.
You may also call 1-800-544-8544 if you’re an individual investing directly with Fidelity, call 1-800-835-5092 if you’re a plan sponsor or participant with Fidelity as your recordkeeper or call 1-877-208-0098 on institutional accounts or if you’re an advisor or invest through one to request a free copy of the proxy voting guidelines.
Standard & Poor's, S&P and S&P 500 are registered service marks of The McGraw-Hill Companies, Inc. and have been licensed for use by Fidelity Distributors Corporation.
Other third-party marks appearing herein are the property of their respective owners.
All other marks appearing herein are registered or unregistered trademarks or service marks of FMR LLC or an affiliated company. © 2021 FMR LLC. All rights reserved.
This report and the financial statements contained herein are submitted for the general information of the shareholders of the Fund. This report is not authorized for distribution to prospective investors in the Fund unless preceded or accompanied by an effective prospectus.
A fund files its complete schedule of portfolio holdings with the SEC for the first and third quarters of each fiscal year on Form N-PORT. Forms N-PORT are available on the SEC’s web site at http://www.sec.gov. A fund's Forms N-PORT may be reviewed and copied at the SEC’s Public Reference Room in Washington, DC. Information regarding the operation of the SEC's Public Reference Room may be obtained by calling 1-800-SEC-0330.
For a complete list of a fund's portfolio holdings, view the most recent holdings listing, semiannual report, or annual report on Fidelity's web site at http://www.fidelity.com, http://www.institutional.fidelity.com, or http://www.401k.com, as applicable.
NOT FDIC INSURED •MAY LOSE VALUE •NO BANK GUARANTEE
Neither the Fund nor Fidelity Distributors Corporation is a bank.
Note to Shareholders:
Early in 2020, the outbreak and spread of a new coronavirus emerged as a public health emergency that had a major influence on financial markets, primarily based on its impact on the global economy and the outlook for corporate earnings. The virus causes a respiratory disease known as COVID-19. On March 11, 2020 the World Health Organization declared the COVID-19 outbreak a pandemic, citing sustained risk of further global spread.
In the weeks following, as the crisis worsened, we witnessed an escalating human tragedy with wide-scale social and economic consequences from coronavirus-containment measures. The outbreak of COVID-19 prompted a number of measures to limit the spread, including travel and border restrictions, quarantines, and restrictions on large gatherings. In turn, these resulted in lower consumer activity, diminished demand for a wide range of products and services, disruption in manufacturing and supply chains, and – given the wide variability in outcomes regarding the outbreak – significant market uncertainty and volatility. Amid the turmoil, global governments and central banks took unprecedented action to help support consumers, businesses, and the broader economies, and to limit disruption to financial systems.
The situation continues to unfold, and the extent and duration of its impact on financial markets and the economy remain highly uncertain. Extreme events such as the coronavirus crisis are “exogenous shocks” that can have significant adverse effects on mutual funds and their investments. Although multiple asset classes may be affected by market disruption, the duration and impact may not be the same for all types of assets.
Fidelity is committed to helping you stay informed amid news about COVID-19 and during increased market volatility, and we’re taking extra steps to be responsive to customer needs. We encourage you to visit our websites, where we offer ongoing updates, commentary, and analysis on the markets and our funds.
Performance: The Bottom Line
Average annual total return reflects the change in the value of an investment, assuming reinvestment of distributions from dividend income and capital gains (the profits earned upon the sale of securities that have grown in value, if any) and assuming a constant rate of performance each year. The hypothetical investment and the average annual total returns do not reflect the deduction of taxes that a shareholder would pay on fund distributions or the redemption of fund shares. During periods of reimbursement by Fidelity, a fund’s total return will be greater than it would be had the reimbursement not occurred. How a fund did yesterday is no guarantee of how it will do tomorrow.
Average Annual Total Returns
| For the periods ended April 30, 2021 | Past 1 year | Past 5 years | Life of fundA |
| Class A (incl. 4.00% sales charge) | 6.40% | 3.86% | 2.61% |
| Class M (incl. 4.00% sales charge) | 6.52% | 3.86% | 2.61% |
| Class C (incl. contingent deferred sales charge) | 9.01% | 3.91% | 2.40% |
| Fidelity® Short Duration High Income Fund | 11.11% | 4.95% | 3.42% |
| Class I | 11.11% | 4.95% | 3.42% |
| Class Z | 11.21% | 4.99% | 3.45% |
A From November 5, 2013
Class C shares' contingent deferred sales charges included in the past one year, past five years, and life of fund total return figures are 1%, 0%, and 0%, respectively.
The initial offering of Class Z shares took place on October 2, 2018. Returns prior to October 2, 2018, are those of Class I.
$10,000 Over Life of Fund
Let's say hypothetically that $10,000 was invested in Fidelity® Short Duration High Income Fund, a class of the fund, on November 5, 2013, when the fund started.
The chart shows how the value of your investment would have changed, and also shows how the ICE® BofA® 1-5 Year BB-B US Cash Pay High Yield Constrained Index performed over the same period.
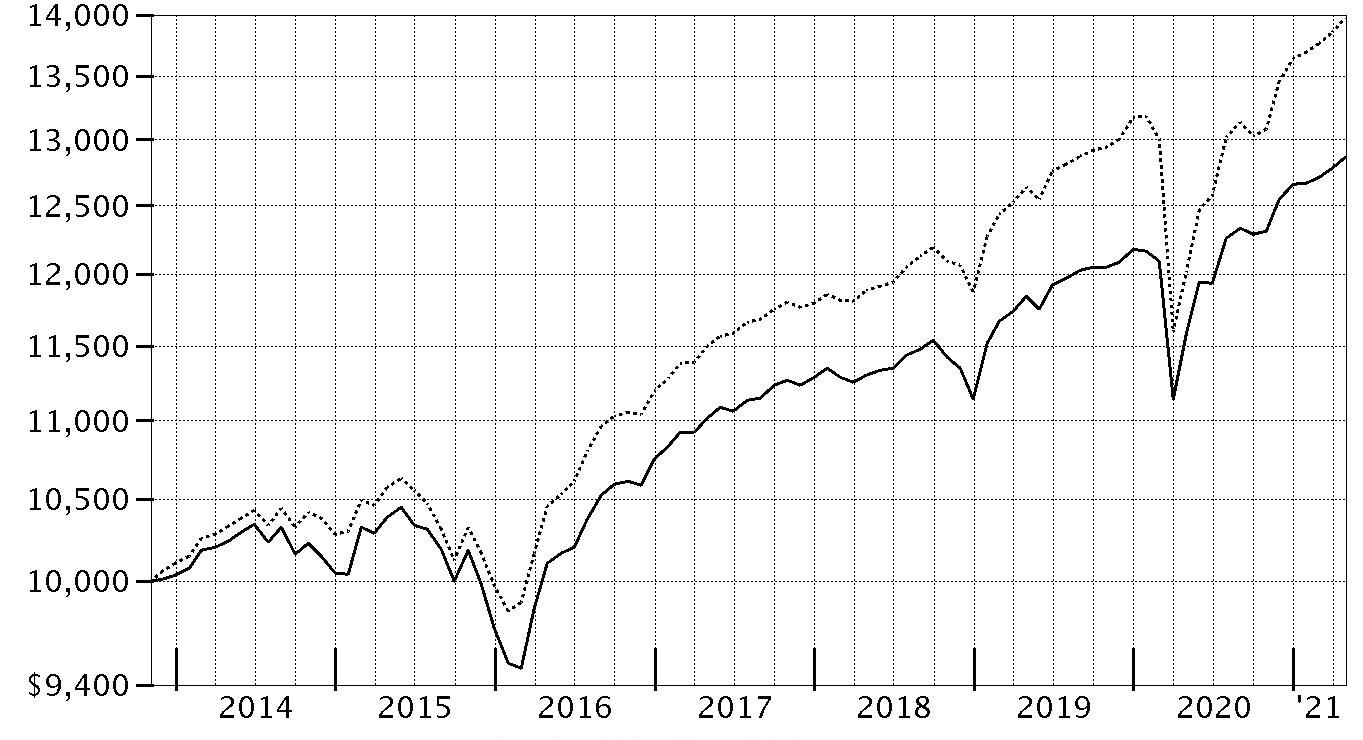
| Period Ending Values |
| $12,868 | Fidelity® Short Duration High Income Fund |
| $13,972 | ICE® BofA® 1-5 Year BB-B US Cash Pay High Yield Constrained Index |
Management's Discussion of Fund Performance
Market Recap: The ICE BofA
® US High Yield Constrained Index gained 20.01% for the 12 months ending April 30, 2021, as high-yield bonds staged a historic rebound following a steep but brief decline due to the early-2020 outbreak and spread of COVID-19. A confluence of powerful forces propelled risk assets, including high yield, from March 24 through late August. The rally slowed in September, when high yield modestly retreated amid Congress’s inability to reach a deal on additional fiscal stimulus, as well as uncertainty about the election. But as the calendar turned, investors grew hopeful. The rollout of two COVID-19 vaccines was underway, the U.S. Federal Reserve pledged to hold interest rates near zero until the economy recovered, and the federal government planned to deploy trillions of dollars in aid to boost consumers and the economy. For the full 12 months, lower-rated bonds (+38%) fared best. In contrast, the B and BB credit tiers rose 18% and 17%, respectively. By industry, publishing/printing (+48%) and air transportation (+47%) led the way, followed closely by energy (+44%), which was boosted by a rally in the price of oil. Energy represented 13% of the index the past 12 months. Entertainment/film also stood out, advancing roughly 41%. In contrast, notable “laggards” included cable/satellite TV and environmental (+7% each). Utilities and restaurants each gained 9%, while telecommunications, a sizable index component, rose 10% for the period.
Comments from Co-Managers Alexandre Karam, Eric Mollenhauer, and Kevin Nielsen: For the fiscal year, the fund's share classes (excluding sales charges, if applicable) gained roughly 10% to 11%, underperforming the 16.14% gain of the Fidelity Short Duration High Income Composite Index℠. The fund's core allocation to high-yield bonds advanced 12.26% and detracted from performance versus the Composite index, as did the fund's position in cash in a strong market. By industry, market selection was the primary detractor, especially an overweighting in telecommunications. Security selection and an underweighting in diversified financial services and an underweighting in energy also hurt. JBS, the fund's biggest individual relative detractor, gained 6% and was not held at the end of this period. Another notable relative detractor was an overweighting in Charter Communications (+4%), among our largest holdings. Also holding back performance was our outsized stake in Altice USA, which gained 6%. Altice USA was one of the biggest holdings in the fund. Conversely, the largest contributor to performance versus the Composite index was our security picks in energy. Security selection in gaming and telecommunications also helped. Our top individual relative contributor was a non-Composite stake in Denbury (+338%). The company was not held at period end. Also adding value was our overweighting in Crestwood Midstream, which gained 51%. It also helped to overweight DCP Midstream (+42%). By quality, security selection in bonds rated CCC added the most value versus the benchmark, while security choices among B-rated bonds hurt the most. Notable changes in positioning include increased exposure to the energy industry and a lower allocation to health care.
The views expressed above reflect those of the portfolio manager(s) only through the end of the period as stated on the cover of this report and do not necessarily represent the views of Fidelity or any other person in the Fidelity organization. Any such views are subject to change at any time based upon market or other conditions and Fidelity disclaims any responsibility to update such views. These views may not be relied on as investment advice and, because investment decisions for a Fidelity fund are based on numerous factors, may not be relied on as an indication of trading intent on behalf of any Fidelity fund.
Notes to shareholders: On May 20, 2020, following the end of the reporting period, the Board of Trustees approved a proposal to remove the policy of investing in investment-grade corporate bonds from the fund’s principal investment strategies and, accordingly, adjust its multi-asset Composite benchmark. Specifically, beginning July 1, 2020, the fund will no longer include investing in investment-grade corporate bonds as part of its principal investment strategy. With this change, the investment-grade component of the Composite benchmark will be eliminated, and the neutral allocation will increase from 80% to 85% for high yield, and from 10% to 15% for floating-rate leveraged loans.
On June 12, 2020, Matthew Bartlett came off of the fund.
Investment Summary (Unaudited)
Top Five Holdings as of April 30, 2021
| (by issuer, excluding cash equivalents) | % of fund's net assets |
| CCO Holdings LLC/CCO Holdings Capital Corp. | 2.9 |
| Sprint Corp. | 2.7 |
| PG&E Corp. | 2.2 |
| Occidental Petroleum Corp. | 2.0 |
| DISH DBS Corp. | 2.0 |
| | 11.8 |
Top Five Market Sectors as of April 30, 2021
| | % of fund's net assets |
| Telecommunications | 13.5 |
| Energy | 13.1 |
| Cable/Satellite TV | 8.4 |
| Gaming | 7.7 |
| Utilities | 6.1 |
Quality Diversification (% of fund's net assets)
| As of April 30, 2021 |
| | BBB | 0.9% |
| | BB | 37.2% |
| | B | 48.8% |
| | CCC,CC,C | 5.5% |
| | Not Rated | 1.7% |
| | Equities | 0.1% |
| | Short-Term Investments and Net Other Assets | 5.8% |

We have used ratings from Moody's Investors Service, Inc. Where Moody's® ratings are not available, we have used S&P® ratings. All ratings are as of the date indicated and do not reflect subsequent changes.
Asset Allocation (% of fund's net assets)
| As of April 30, 2021* |
| | Nonconvertible Bonds | 86.1% |
| | Convertible Bonds, Preferred Stocks | 0.5% |
| | Common Stocks | 0.1% |
| | Bank Loan Obligations | 7.5% |
| | Short-Term Investments and Net Other Assets (Liabilities) | 5.8% |

* Foreign investments - 17.8%
Schedule of Investments April 30, 2021
Showing Percentage of Net Assets
| Corporate Bonds - 86.6% | | | |
| | | Principal Amount | Value |
| Convertible Bonds - 0.5% | | | |
| Broadcasting - 0.4% | | | |
| DISH Network Corp. 2.375% 3/15/24 | | $510,000 | $496,613 |
| Energy - 0.1% | | | |
| Mesquite Energy, Inc.: | | | |
| 15% 7/15/23 (a)(b) | | 13,557 | 31,181 |
| 15% 7/15/23 (a)(b) | | 23,458 | 49,027 |
| | | | 80,208 |
|
| TOTAL CONVERTIBLE BONDS | | | 576,821 |
|
| Nonconvertible Bonds - 86.1% | | | |
| Aerospace - 2.3% | | | |
| Allegheny Technologies, Inc. 7.875% 8/15/23 | | 250,000 | 272,188 |
| Bombardier, Inc. 7.5% 3/15/25 (c) | | 110,000 | 109,794 |
| Kaiser Aluminum Corp. 6.5% 5/1/25 (c) | | 735,000 | 779,100 |
| Spirit Aerosystems, Inc.: | | | |
| 5.5% 1/15/25 (c) | | 100,000 | 105,750 |
| 7.5% 4/15/25 (c) | | 250,000 | 267,883 |
| TransDigm, Inc.: | | | |
| 5.5% 11/15/27 | | 535,000 | 556,400 |
| 6.25% 3/15/26 (c) | | 515,000 | 545,256 |
| 7.5% 3/15/27 | | 25,000 | 26,781 |
| | | | 2,663,152 |
| Air Transportation - 0.3% | | | |
| Western Global Airlines LLC 10.375% 8/15/25 (c) | | 250,000 | 283,438 |
| Automotive & Auto Parts - 1.6% | | | |
| Ford Motor Co. 9% 4/22/25 | | 250,000 | 305,353 |
| Ford Motor Credit Co. LLC: | | | |
| 3.375% 11/13/25 | | 150,000 | 153,467 |
| 4.25% 9/20/22 | | 600,000 | 619,830 |
| 4.687% 6/9/25 | | 455,000 | 489,125 |
| 5.125% 6/16/25 | | 250,000 | 273,100 |
| Real Hero Merger Sub 2 6.25% 2/1/29 (c) | | 30,000 | 31,036 |
| | | | 1,871,911 |
| Banks & Thrifts - 2.3% | | | |
| Ally Financial, Inc.: | | | |
| 3.875% 5/21/24 | | 970,000 | 1,051,810 |
| 5.75% 11/20/25 | | 895,000 | 1,025,586 |
| CIT Group, Inc. 4.75% 2/16/24 | | 500,000 | 545,000 |
| | | | 2,622,396 |
| Broadcasting - 1.5% | | | |
| Sirius XM Radio, Inc. 3.875% 8/1/22 (c) | | 1,265,000 | 1,271,262 |
| Univision Communications, Inc. 6.625% 6/1/27 (c) | | 375,000 | 406,406 |
| | | | 1,677,668 |
| Building Materials - 0.2% | | | |
| Advanced Drain Systems, Inc. 5% 9/30/27 (c) | | 245,000 | 256,424 |
| Cable/Satellite TV - 7.1% | | | |
| CCO Holdings LLC/CCO Holdings Capital Corp. 4% 3/1/23 (c) | | 3,315,000 | 3,350,222 |
| CSC Holdings LLC 5.875% 9/15/22 | | 2,145,000 | 2,253,108 |
| DISH DBS Corp.: | | | |
| 5.875% 7/15/22 | | 1,260,000 | 1,319,220 |
| 5.875% 11/15/24 | | 500,000 | 541,033 |
| 6.75% 6/1/21 | | 430,000 | 430,538 |
| Radiate Holdco LLC/Radiate Financial Service Ltd. 4.5% 9/15/26 (c) | | 245,000 | 249,288 |
| | | | 8,143,409 |
| Capital Goods - 0.5% | | | |
| Vertical U.S. Newco, Inc. 5.25% 7/15/27 (c) | | 525,000 | 549,612 |
| Chemicals - 2.5% | | | |
| CF Industries Holdings, Inc. 3.45% 6/1/23 | | 805,000 | 841,950 |
| Consolidated Energy Finance SA 3 month U.S. LIBOR + 3.750% 3.9339% 6/15/22 (c)(d)(e) | | 520,000 | 518,576 |
| INEOS Quattro Finance 2 PLC 3.375% 1/15/26 (c) | | 250,000 | 249,405 |
| Kronos Acquisition Holdings, Inc. / KIK Custom Products, Inc. 5% 12/31/26 (c) | | 445,000 | 448,894 |
| NOVA Chemicals Corp. 5.25% 8/1/23 (c) | | 500,000 | 505,000 |
| The Chemours Co. LLC 7% 5/15/25 | | 300,000 | 308,625 |
| | | | 2,872,450 |
| Consumer Products - 0.0% | | | |
| Mattel, Inc.: | | | |
| 5.875% 12/15/27 (c) | | 10,000 | 10,988 |
| 6.75% 12/31/25 (c) | | 31,000 | 32,566 |
| | | | 43,554 |
| Containers - 2.4% | | | |
| Ardagh Packaging Finance PLC/Ardagh MP Holdings U.S.A., Inc.: | | | |
| 4.125% 8/15/26 (c) | | 10,000 | 10,288 |
| 5.25% 8/15/27 (c) | | 500,000 | 511,043 |
| Ball Corp. 4% 11/15/23 | | 400,000 | 426,500 |
| Berry Global, Inc.: | | | |
| 4.875% 7/15/26 (c) | | 175,000 | 185,334 |
| 5.125% 7/15/23 | | 200,000 | 201,750 |
| Flex Acquisition Co., Inc. 7.875% 7/15/26 (c) | | 110,000 | 115,088 |
| OI European Group BV 4% 3/15/23 (c) | | 950,000 | 976,125 |
| Trivium Packaging Finance BV: | | | |
| 5.5% 8/15/26 (c) | | 220,000 | 230,175 |
| 8.5% 8/15/27 (c) | | 130,000 | 139,100 |
| | | | 2,795,403 |
| Diversified Financial Services - 4.1% | | | |
| Cargo Aircraft Management, Inc. 4.75% 2/1/28 (c) | | 225,000 | 229,781 |
| Icahn Enterprises LP/Icahn Enterprises Finance Corp.: | | | |
| 4.75% 9/15/24 | | 1,340,000 | 1,404,186 |
| 5.25% 5/15/27 | | 535,000 | 545,700 |
| Navient Corp. 6.125% 3/25/24 | | 500,000 | 528,125 |
| Springleaf Finance Corp.: | | | |
| 6.125% 3/15/24 | | 750,000 | 810,000 |
| 6.875% 3/15/25 | | 1,090,000 | 1,238,513 |
| | | | 4,756,305 |
| Energy - 12.9% | | | |
| Antero Resources Corp. 5% 3/1/25 | | 350,000 | 355,250 |
| Apache Corp. 4.625% 11/15/25 | | 300,000 | 316,875 |
| California Resources Corp. 7.125% 2/1/26 (c) | | 250,000 | 256,080 |
| Cheniere Energy Partners LP 5.625% 10/1/26 | | 700,000 | 729,750 |
| Chesapeake Energy Corp. 5.5% 2/1/26 (c) | | 505,000 | 532,775 |
| Citgo Holding, Inc. 9.25% 8/1/24 (c) | | 350,000 | 360,500 |
| Citgo Petroleum Corp. 6.375% 6/15/26 (c) | | 100,000 | 102,510 |
| Comstock Resources, Inc.: | | | |
| 6.75% 3/1/29 (c) | | 120,000 | 122,580 |
| 7.5% 5/15/25 (c) | | 83,000 | 85,724 |
| Continental Resources, Inc. 4.5% 4/15/23 | | 300,000 | 314,856 |
| Crestwood Midstream Partners LP/Crestwood Midstream Finance Corp. 6% 2/1/29 (c) | | 560,000 | 578,900 |
| CVR Energy, Inc. 5.25% 2/15/25 (c) | | 315,000 | 316,575 |
| DCP Midstream Operating LP 5.375% 7/15/25 | | 1,400,000 | 1,536,500 |
| Endeavor Energy Resources LP/EER Finance, Inc. 5.5% 1/30/26 (c) | | 235,000 | 243,371 |
| Energy Ventures GoM LLC / EnVen Finance Corp. 11.75% 4/15/26 (c) | | 100,000 | 102,521 |
| EQM Midstream Partners LP 6% 7/1/25 (c) | | 400,000 | 437,000 |
| Genesis Energy LP/Genesis Energy Finance Corp. 8% 1/15/27 | | 145,000 | 149,382 |
| Hess Midstream Partners LP 5.625% 2/15/26 (c) | | 150,000 | 155,625 |
| Murphy Oil Corp. 5.75% 8/15/25 | | 300,000 | 306,838 |
| Nabors Industries, Inc. 5.75% 2/1/25 | | 250,000 | 206,250 |
| New Fortress Energy LLC: | | | |
| 6.5% 9/30/26 (c) | | 215,000 | 219,371 |
| 6.75% 9/15/25 (c) | | 250,000 | 258,673 |
| NGL Energy Operating LLC/NGL Energy Finance Corp. 7.5% 2/1/26 (c) | | 400,000 | 419,000 |
| Occidental Petroleum Corp.: | | | |
| 2.9% 8/15/24 | | 600,000 | 598,500 |
| 5.875% 9/1/25 | | 1,250,000 | 1,365,625 |
| 6.95% 7/1/24 | | 300,000 | 331,875 |
| PBF Holding Co. LLC/PBF Finance Corp.: | | | |
| 7.25% 6/15/25 | | 350,000 | 298,375 |
| 9.25% 5/15/25 (c) | | 200,000 | 209,000 |
| Precision Drilling Corp. 7.125% 1/15/26 (c) | | 160,000 | 158,400 |
| Range Resources Corp.: | | | |
| 4.875% 5/15/25 | | 250,000 | 248,438 |
| 9.25% 2/1/26 | | 250,000 | 274,520 |
| Sanchez Energy Corp. 7.25% 2/15/23 (b)(c)(f) | | 135,000 | 0 |
| SM Energy Co. 10% 1/15/25 (c) | | 1,000,000 | 1,137,500 |
| Southwestern Energy Co. 6.45% 1/23/25 (d) | | 200,000 | 216,000 |
| Sunoco LP/Sunoco Finance Corp.: | | | |
| 5.5% 2/15/26 | | 70,000 | 72,209 |
| 5.875% 3/15/28 | | 60,000 | 63,450 |
| 6% 4/15/27 | | 10,000 | 10,516 |
| Tallgrass Energy Partners LP / Tallgrass Energy Finance Corp.: | | | |
| 5.5% 9/15/24 (c) | | 628,000 | 639,775 |
| 6% 12/31/30 (c) | | 130,000 | 130,325 |
| Targa Resources Partners LP/Targa Resources Partners Finance Corp.: | | | |
| 4% 1/15/32 (c) | | 150,000 | 147,375 |
| 4.25% 11/15/23 | | 125,000 | 125,088 |
| TechnipFMC PLC 6.5% 2/1/26 (c) | | 300,000 | 320,224 |
| Transocean Proteus Ltd. 6.25% 12/1/24 (c) | | 21,000 | 20,580 |
| Western Gas Partners LP 3.95% 6/1/25 | | 400,000 | 417,250 |
| | | | 14,891,931 |
| Environmental - 1.0% | | | |
| LBC Tank Terminals Holding Netherlands BV 6.875% 5/15/23 (c) | | 1,150,000 | 1,142,813 |
| Food/Beverage/Tobacco - 2.1% | | | |
| Post Holdings, Inc.: | | | |
| 4.625% 4/15/30 (c) | | 40,000 | 40,400 |
| 5.625% 1/15/28 (c) | | 125,000 | 131,719 |
| 5.75% 3/1/27 (c) | | 1,700,000 | 1,780,750 |
| Turning Point Brands, Inc. 5.625% 2/15/26 (c) | | 100,000 | 103,250 |
| U.S. Foods, Inc.: | | | |
| 4.75% 2/15/29 (c) | | 135,000 | 136,181 |
| 6.25% 4/15/25 (c) | | 75,000 | 79,665 |
| United Natural Foods, Inc. 6.75% 10/15/28 (c) | | 95,000 | 102,363 |
| | | | 2,374,328 |
| Gaming - 7.2% | | | |
| Affinity Gaming LLC 6.875% 12/15/27 (c) | | 30,000 | 31,845 |
| Caesars Entertainment, Inc. 6.25% 7/1/25 (c) | | 750,000 | 797,400 |
| Caesars Resort Collection LLC 5.75% 7/1/25 (c) | | 495,000 | 521,121 |
| Golden Nugget, Inc. 6.75% 10/15/24 (c) | | 800,000 | 810,000 |
| International Game Technology PLC 6.5% 2/15/25 (c) | | 250,000 | 276,875 |
| MCE Finance Ltd. 5.25% 4/26/26 (c) | | 1,000,000 | 1,043,000 |
| MGM Growth Properties Operating Partnership LP 4.625% 6/15/25 (c) | | 300,000 | 319,166 |
| MGM Resorts International 6% 3/15/23 | | 1,000,000 | 1,070,000 |
| Scientific Games Corp. 5% 10/15/25 (c) | | 200,000 | 206,500 |
| Station Casinos LLC 5% 10/1/25 (c) | | 582,000 | 590,003 |
| VICI Properties, Inc.: | | | |
| 3.5% 2/15/25 (c) | | 715,000 | 730,194 |
| 4.625% 12/1/29 (c) | | 285,000 | 295,947 |
| Wynn Las Vegas LLC/Wynn Las Vegas Capital Corp.: | | | |
| 4.25% 5/30/23 (c) | | 500,000 | 513,125 |
| 5.5% 3/1/25 (c) | | 500,000 | 533,750 |
| Wynn Macau Ltd. 4.875% 10/1/24 (c) | | 500,000 | 506,750 |
| | | | 8,245,676 |
| Healthcare - 5.5% | | | |
| Catalent Pharma Solutions 3.125% 2/15/29 (c) | | 260,000 | 251,550 |
| Centene Corp. 5.375% 8/15/26 (c) | | 745,000 | 781,505 |
| Community Health Systems, Inc.: | | | |
| 5.625% 3/15/27 (c) | | 500,000 | 530,000 |
| 6.875% 4/15/29 (c) | | 120,000 | 125,400 |
| CTR Partnership LP/CareTrust Capital Corp. 5.25% 6/1/25 | | 330,000 | 339,768 |
| Encompass Health Corp. 5.125% 3/15/23 | | 169,000 | 169,211 |
| Owens & Minor, Inc. 4.5% 3/31/29 (c) | | 65,000 | 65,638 |
| Tenet Healthcare Corp.: | | | |
| 4.625% 7/15/24 | | 210,000 | 213,171 |
| 5.125% 11/1/27 (c) | | 500,000 | 524,400 |
| 6.75% 6/15/23 | | 1,165,000 | 1,272,180 |
| Teva Pharmaceutical Finance Netherlands III BV 2.2% 7/21/21 | | 65,000 | 65,000 |
| Valeant Pharmaceuticals International, Inc. 9.25% 4/1/26 (c) | | 1,830,000 | 2,027,091 |
| Vizient, Inc. 6.25% 5/15/27 (c) | | 20,000 | 21,185 |
| | | | 6,386,099 |
| Homebuilders/Real Estate - 0.7% | | | |
| Realogy Group LLC/Realogy Co-Issuer Corp. 5.75% 1/15/29 (c) | | 50,000 | 51,875 |
| Service Properties Trust 7.5% 9/15/25 | | 500,000 | 566,706 |
| Uniti Group LP / Uniti Group Finance, Inc. 6.5% 2/15/29 (c) | | 140,000 | 139,165 |
| | | | 757,746 |
| Insurance - 0.0% | | | |
| Acrisure LLC / Acrisure Finance, Inc. 7% 11/15/25 (c) | | 20,000 | 20,550 |
| Alliant Holdings Intermediate LLC 6.75% 10/15/27 (c) | | 30,000 | 31,500 |
| | | | 52,050 |
| Leisure - 1.9% | | | |
| Carnival Corp. 11.5% 4/1/23 (c) | | 800,000 | 919,360 |
| NCL Corp. Ltd. 5.875% 3/15/26 (c) | | 50,000 | 52,250 |
| Royal Caribbean Cruises Ltd. 9.125% 6/15/23 (c) | | 750,000 | 827,970 |
| Silversea Cruises 7.25% 2/1/25 (c) | | 150,000 | 155,235 |
| Viking Cruises Ltd. 13% 5/15/25 (c) | | 235,000 | 274,997 |
| | | | 2,229,812 |
| Metals/Mining - 1.9% | | | |
| Cleveland-Cliffs, Inc. 4.625% 3/1/29 (c) | | 200,000 | 203,750 |
| First Quantum Minerals Ltd.: | | | |
| 6.875% 3/1/26 (c) | | 750,000 | 786,469 |
| 7.25% 4/1/23 (c) | | 535,000 | 543,694 |
| Freeport-McMoRan, Inc. 3.55% 3/1/22 | | 40,000 | 40,550 |
| Howmet Aerospace, Inc.: | | | |
| 5.125% 10/1/24 | | 250,000 | 274,063 |
| 6.875% 5/1/25 | | 250,000 | 290,000 |
| HudBay Minerals, Inc. 4.5% 4/1/26 (c) | | 55,000 | 55,825 |
| | | | 2,194,351 |
| Restaurants - 2.5% | | | |
| 1011778 BC Unlimited Liability Co./New Red Finance, Inc. 5.75% 4/15/25 (c) | | 1,000,000 | 1,060,000 |
| Yum! Brands, Inc.: | | | |
| 3.875% 11/1/23 | | 1,225,000 | 1,284,719 |
| 7.75% 4/1/25 (c) | | 500,000 | 546,250 |
| | | | 2,890,969 |
| Services - 2.9% | | | |
| Algeco Scotsman Global Finance PLC 8% 2/15/23 (c) | | 200,000 | 204,000 |
| Aramark Services, Inc. 5% 4/1/25 (c) | | 1,300,000 | 1,334,125 |
| CoreCivic, Inc. 5% 10/15/22 | | 225,000 | 236,513 |
| Diebold Nixdorf, Inc. 9.375% 7/15/25 (c) | | 100,000 | 111,375 |
| Laureate Education, Inc. 8.25% 5/1/25 (c) | | 1,075,000 | 1,120,569 |
| PowerTeam Services LLC 9.033% 12/4/25 (c) | | 120,000 | 133,050 |
| Sabre GLBL, Inc. 7.375% 9/1/25 (c) | | 200,000 | 217,750 |
| | | | 3,357,382 |
| Steel - 0.1% | | | |
| Infrabuild Australia Pty Ltd. 12% 10/1/24 (c) | | 150,000 | 151,500 |
| Super Retail - 2.3% | | | |
| Carvana Co. 5.5% 4/15/27 (c) | | 200,000 | 202,410 |
| EG Global Finance PLC 6.75% 2/7/25 (c) | | 700,000 | 720,090 |
| L Brands, Inc.: | | | |
| 6.625% 10/1/30 (c) | | 100,000 | 115,246 |
| 7.5% 6/15/29 | | 115,000 | 133,422 |
| Macy's Retail Holdings LLC 3.625% 6/1/24 | | 60,000 | 60,675 |
| Macy's, Inc. 8.375% 6/15/25 (c) | | 250,000 | 275,808 |
| Netflix, Inc. 5.75% 3/1/24 | | 1,000,000 | 1,126,875 |
| Rent-A-Center, Inc. 6.375% 2/15/29 (c) | | 30,000 | 32,534 |
| | | | 2,667,060 |
| Technology - 2.2% | | | |
| Austin BidCo, Inc. 7.125% 12/15/28 (c) | | 50,000 | 50,750 |
| CommScope, Inc.: | | | |
| 5.5% 3/1/24 (c) | | 100,000 | 103,064 |
| 6% 3/1/26 (c) | | 100,000 | 105,375 |
| Crowdstrike Holdings, Inc. 3% 2/15/29 | | 110,000 | 109,016 |
| Sensata Technologies BV: | | | |
| 4% 4/15/29 (c) | | 110,000 | 110,682 |
| 4.875% 10/15/23 (c) | | 155,000 | 166,238 |
| 5% 10/1/25 (c) | | 1,300,000 | 1,443,000 |
| Veritas U.S., Inc./Veritas Bermuda Ltd. 7.5% 9/1/25 (c) | | 400,000 | 414,000 |
| | | | 2,502,125 |
| Telecommunications - 12.2% | | | |
| Altice France SA: | | | |
| 7.375% 5/1/26 (c) | | 1,125,000 | 1,166,400 |
| 8.125% 2/1/27 (c) | | 160,000 | 175,200 |
| C&W Senior Financing Designated Activity Co.: | | | |
| 6.875% 9/15/27 (c) | | 25,000 | 26,563 |
| 7.5% 10/15/26 (c) | | 1,030,000 | 1,091,800 |
| Consolidated Communications, Inc. 5% 10/1/28 (c) | | 60,000 | 60,900 |
| Intelsat Jackson Holdings SA 8% 2/15/24 (c) | | 955,000 | 987,231 |
| Level 3 Financing, Inc.: | | | |
| 3.75% 7/15/29 (c) | | 155,000 | 151,125 |
| 4.25% 7/1/28 (c) | | 1,000,000 | 1,007,610 |
| Lumen Technologies, Inc. 6.75% 12/1/23 | | 600,000 | 662,250 |
| Northwest Fiber LLC/Northwest Fiber Finance Sub, Inc. 6% 2/15/28 (c) | | 35,000 | 34,998 |
| Sable International Finance Ltd. 5.75% 9/7/27 (c) | | 1,000,000 | 1,047,500 |
| Sabre GLBL, Inc. 9.25% 4/15/25 (c) | | 200,000 | 239,000 |
| SBA Communications Corp.: | | | |
| 3.125% 2/1/29 (c) | | 195,000 | 186,805 |
| 4.875% 9/1/24 | | 500,000 | 511,875 |
| Sprint Corp.: | | | |
| 7.25% 9/15/21 | | 500,000 | 510,600 |
| 7.875% 9/15/23 | | 2,280,000 | 2,599,200 |
| T-Mobile U.S.A., Inc. 2.625% 4/15/26 | | 320,000 | 325,504 |
| Telecom Italia SpA 5.303% 5/30/24 (c) | | 1,000,000 | 1,092,200 |
| Uniti Group, Inc.: | | | |
| 7.125% 12/15/24 (c) | | 365,000 | 376,826 |
| 7.875% 2/15/25 (c) | | 1,705,000 | 1,837,138 |
| | | | 14,090,725 |
| Transportation Ex Air/Rail - 0.1% | | | |
| Navios Maritime Holdings, Inc. 11.25% 8/15/22 (c) | | 115,000 | 108,172 |
| Utilities - 5.8% | | | |
| Clearway Energy Operating LLC 5% 9/15/26 | | 245,000 | 252,963 |
| Global Partners LP/GLP Finance Corp. 7% 8/1/27 | | 62,000 | 66,281 |
| InterGen NV 7% 6/30/23 (c) | | 200,000 | 193,000 |
| NextEra Energy Partners LP 4.25% 9/15/24 (c) | | 41,000 | 43,306 |
| NRG Energy, Inc. 5.25% 6/15/29 (c) | | 1,025,000 | 1,098,031 |
| PG&E Corp. 5% 7/1/28 | | 2,460,000 | 2,576,850 |
| Solaris Midstream Holdings LLC 7.625% 4/1/26 (c) | | 120,000 | 125,675 |
| TerraForm Power Operating LLC 4.25% 1/31/23 (c) | | 1,350,000 | 1,385,438 |
| Vistra Operations Co. LLC: | | | |
| 5% 7/31/27 (c) | | 225,000 | 233,107 |
| 5.625% 2/15/27 (c) | | 705,000 | 733,200 |
| | | | 6,707,851 |
|
| TOTAL NONCONVERTIBLE BONDS | | | 99,286,312 |
|
| TOTAL CORPORATE BONDS | | | |
| (Cost $97,687,630) | | | 99,863,133 |
| | | Shares | Value |
|
| Common Stocks - 0.1% | | | |
| Energy - 0.1% | | | |
| California Resources Corp. (g) | | 16 | 379 |
| California Resources Corp. warrants 10/27/24 (g) | | 2 | 8 |
| Forbes Energy Services Ltd. (g) | | 6,468 | 614 |
| Mesquite Energy, Inc. (b) | | 1,922 | 42,253 |
| TOTAL COMMON STOCKS | | | |
| (Cost $339,480) | | | 43,254 |
| | | Principal Amount | Value |
|
| Bank Loan Obligations - 7.5% | | | |
| Cable/Satellite TV - 1.3% | | | |
| WideOpenWest Finance LLC Tranche B, term loan 3 month U.S. LIBOR + 3.250% 4.25% 8/19/23 (d)(e)(h) | | 1,497,398 | 1,493,355 |
| Chemicals - 0.0% | | | |
| SCIH Salt Holdings, Inc. Tranche B 1LN, term loan 3 month U.S. LIBOR + 4.000% 4.75% 3/16/27 (d)(e)(h) | | 40,000 | 39,830 |
| Consumer Products - 0.0% | | | |
| Michaels Companies, Inc. 1LN, term loan 3 month U.S. LIBOR + 4.250% 5% 4/9/28 (d)(e)(h) | | 40,000 | 39,808 |
| Containers - 0.3% | | | |
| Flex Acquisition Co., Inc. Tranche B 1LN, term loan 3 month U.S. LIBOR + 3.000% 3.4516% 6/29/25 (d)(e)(h) | | 350,000 | 344,358 |
| Diversified Financial Services - 0.3% | | | |
| Broadstreet Partners, Inc. Tranche B 1LN, term loan 3 month U.S. LIBOR + 3.250% 1/27/27 (e)(h)(i) | | 350,000 | 346,462 |
| Hightower Holding LLC: | | | |
| Tranche B 1LN, term loan 3 month U.S. LIBOR + 4.000% 4.75% 4/16/28 (d)(e)(h) | | 8,000 | 7,990 |
| Tranche DD 1LN, term loan 3 month U.S. LIBOR + 4.000% 4/16/28 (e)(h)(i) | | 2,000 | 1,998 |
|
| TOTAL DIVERSIFIED FINANCIAL SERVICES | | | 356,450 |
|
| Energy - 0.0% | | | |
| Forbes Energy Services LLC Tranche B, term loan 18% 12/31/49 (b)(d)(f)(h) | | 73,317 | 125 |
| Sanchez Energy Corp.: | | | |
| 1LN, term loan 3 month U.S. LIBOR + 8.000% 0% (b)(e)(f)(h) | | 35,876 | 0 |
| term loan 3 month U.S. LIBOR + 0.000% 0% (b)(e)(f)(h) | | 15,000 | 0 |
|
| TOTAL ENERGY | | | 125 |
|
| Food & Drug Retail - 0.1% | | | |
| Tops Markets LLC 1LN, term loan 3 month U.S. LIBOR + 8.500% 9.5% 11/19/23 (b)(d)(e)(h) | | 55,498 | 56,608 |
| Food/Beverage/Tobacco - 0.1% | | | |
| Triton Water Holdings, Inc. Tranche B 1LN, term loan 3 month U.S. LIBOR + 3.500% 4% 3/31/28 (d)(e)(h) | | 55,000 | 54,785 |
| Gaming - 0.5% | | | |
| Golden Entertainment, Inc. Tranche B, term loan 3 month U.S. LIBOR + 3.000% 3.75% 10/20/24 (d)(e)(h) | | 304,298 | 301,507 |
| Golden Nugget LLC Tranche B 1LN, term loan 3 month U.S. LIBOR + 2.500% 3.25% 10/4/23 (d)(e)(h) | | 291,553 | 287,751 |
|
| TOTAL GAMING | | | 589,258 |
|
| Healthcare - 0.4% | | | |
| Insulet Corp. Tranche B 1LN, term loan 1 month U.S. LIBOR + 3.250% 4/29/28 (e)(h)(i) | | 20,000 | 20,025 |
| Jazz Financing Lux SARL Tranche B 1LN, term loan 1 month U.S. LIBOR + 3.500% 4/22/28 (e)(h)(i) | | 55,000 | 55,114 |
| Organon & Co. Tranche B 1LN, term loan 3 month U.S. LIBOR + 3.000% 4/8/28 (e)(h)(i) | | 130,000 | 129,620 |
| U.S. Renal Care, Inc. Tranche B 1LN, term loan 3 month U.S. LIBOR + 5.000% 5.125% 6/13/26 (d)(e)(h) | | 299,241 | 292,415 |
|
| TOTAL HEALTHCARE | | | 497,174 |
|
| Insurance - 0.7% | | | |
| Alliant Holdings Intermediate LLC: | | | |
| Tranche B, term loan 3 month U.S. LIBOR + 3.250% 3.3633% 5/10/25 (d)(e)(h) | | 300,000 | 296,046 |
| Tranche B3 1LN, term loan 3 month U.S. LIBOR + 3.750% 4.25% 11/5/27 (d)(e)(h) | | 105,000 | 104,883 |
| AssuredPartners, Inc. Tranche B 1LN, term loan 3 month U.S. LIBOR + 3.500% 3.6133% 2/13/27 (d)(e)(h) | | 350,000 | 346,392 |
|
| TOTAL INSURANCE | | | 747,321 |
|
| Services - 0.3% | | | |
| CoreLogic, Inc. Tranche B 1LN, term loan 3 month U.S. LIBOR + 3.500% 4/14/28 (e)(h)(i) | | 50,000 | 49,703 |
| Spin Holdco, Inc. Tranche B 1LN, term loan 3 month U.S. LIBOR + 4.000% 4.75% 2/26/28 (d)(e)(h) | | 350,000 | 348,359 |
|
| TOTAL SERVICES | | | 398,062 |
|
| Super Retail - 0.3% | | | |
| Bass Pro Group LLC Tranche B 1LN, term loan 3 month U.S. LIBOR + 4.250% 5% 2/26/28 (d)(e)(h) | | 399,000 | 400,373 |
| Technology - 1.3% | | | |
| Acuris Finance U.S., Inc. 1LN, term loan 3 month U.S. LIBOR + 4.000% 4.5% 2/16/28 (d)(e)(h) | | 15,000 | 15,000 |
| Aptean, Inc. 2LN, term loan 3 month U.S. LIBOR + 7.000% 7.75% 4/23/27 (d)(e)(h) | | 200,000 | 198,500 |
| DG Investment Intermediate Holdings, Inc.: | | | |
| 2LN, term loan 3 month U.S. LIBOR + 6.750% 7.5% 3/31/29 (d)(e)(h) | | 80,000 | 80,000 |
| Tranche B 1LN, term loan 3 month U.S. LIBOR + 3.750% 4.5% 3/31/28 (d)(e)(h) | | 12,403 | 12,350 |
| Tranche DD 1LN, term loan 3 month U.S. LIBOR + 3.750% 3.42% 3/31/28 (d)(e)(h)(j) | | 2,597 | 2,586 |
| Electro Rent Corp. Tranche B 1LN, term loan 3 month U.S. LIBOR + 5.000% 6% 1/31/24 (d)(e)(h) | | 400,000 | 399,752 |
| Maverick Bidco, Inc. Tranche B 1LN, term loan 3 month U.S. LIBOR + 3.750% 4/29/28 (e)(h)(i) | | 300,000 | 299,250 |
| Northwest Fiber LLC Tranche B 1LN, term loan 3 month U.S. LIBOR + 3.750% 3.8605% 4/30/27 (d)(e)(h) | | 155,000 | 154,273 |
| Park Place Technologies LLC 1LN, term loan 3 month U.S. LIBOR + 5.000% 6% 11/10/27 (d)(e)(h) | | 350,000 | 349,475 |
|
| TOTAL TECHNOLOGY | | | 1,511,186 |
|
| Telecommunications - 1.3% | | | |
| Cablevision Lightpath LLC Tranche B 1LN, term loan 3 month U.S. LIBOR + 3.250% 3.75% 11/30/27 (d)(e)(h) | | 349,123 | 347,552 |
| Consolidated Communications, Inc. Tranche B 1LN, term loan 3 month U.S. LIBOR + 3.500% 4.25% 10/2/27 (d)(e)(h) | | 350,000 | 349,125 |
| Intelsat Jackson Holdings SA Tranche DD 1LN, term loan 3 month U.S. LIBOR + 5.500% 6.5% 7/13/22 (d)(e)(h) | | 423,471 | 427,705 |
| Windstream Services LLC Tranche B 1LN, term loan 3 month U.S. LIBOR + 6.250% 7.25% 9/21/27 (d)(e)(h) | | 350,000 | 350,767 |
|
| TOTAL TELECOMMUNICATIONS | | | 1,475,149 |
|
| Textiles/Apparel - 0.3% | | | |
| Tory Burch LLC Tranche B 1LN, term loan 3 month U.S. LIBOR + 3.500% 4% 4/14/28 (d)(e)(h) | | 300,000 | 297,189 |
| Utilities - 0.3% | | | |
| Limetree Bay Terminals LLC term loan 3 month U.S. LIBOR + 4.000% 4.1133% 2/15/24 (d)(e)(h) | | 400,000 | 362,400 |
| PG&E Corp. Tranche B 1LN, term loan 3 month U.S. LIBOR + 3.000% 3.5% 6/23/25 (d)(e)(h) | | 24,937 | 24,828 |
|
| TOTAL UTILITIES | | | 387,228 |
|
| TOTAL BANK LOAN OBLIGATIONS | | | |
| (Cost $8,814,526) | | | 8,688,259 |
| | | Shares | Value |
|
| Money Market Funds - 7.3% | | | |
| Fidelity Cash Central Fund 0.04% (k) | | | |
| (Cost $8,444,941) | | 8,443,291 | 8,444,980 |
| TOTAL INVESTMENT IN SECURITIES - 101.5% | | | |
| (Cost $115,286,577) | | | 117,039,626 |
| NET OTHER ASSETS (LIABILITIES) - (1.5)% | | | (1,704,159) |
| NET ASSETS - 100% | | | $115,335,467 |
Legend
(a) Restricted securities (including private placements) - Investment in securities not registered under the Securities Act of 1933 (excluding 144A issues). At the end of the period, the value of restricted securities (excluding 144A issues) amounted to $80,208 or 0.1% of net assets.
(b) Level 3 security
(c) Security exempt from registration under Rule 144A of the Securities Act of 1933. These securities may be resold in transactions exempt from registration, normally to qualified institutional buyers. At the end of the period, the value of these securities amounted to $60,423,485 or 52.4% of net assets.
(d) Coupon rates for floating and adjustable rate securities reflect the rates in effect at period end.
(e) Coupon is indexed to a floating interest rate which may be multiplied by a specified factor and/or subject to caps or floors.
(f) Non-income producing - Security is in default.
(g) Non-income producing
(h) Remaining maturities of bank loan obligations may be less than the stated maturities shown as a result of contractual or optional prepayments by the borrower. Such prepayments cannot be predicted with certainty.
(i) The coupon rate will be determined upon settlement of the loan after period end.
(j) Position or a portion of the position represents an unfunded loan commitment. At period end, the total principal amount and market value of unfunded commitments totaled $623 and $621, respectively.
(k) Affiliated fund that is generally available only to investment companies and other accounts managed by Fidelity Investments. The rate quoted is the annualized seven-day yield of the fund at period end. A complete unaudited listing of the fund's holdings as of its most recent quarter end is available upon request. In addition, each Fidelity Central Fund's financial statements, which are not covered by the Fund's Report of Independent Registered Public Accounting Firm, are available on the SEC's website or upon request.
Additional information on each restricted holding is as follows:
| Security | Acquisition Date | Acquisition Cost |
| Mesquite Energy, Inc. 15% 7/15/23 | 7/10/20 - 4/15/21 | $37,015 |
Affiliated Central Funds
Information regarding fiscal year to date income earned by the Fund from investments in Fidelity Central Funds is as follows:
| Fund | Income earned |
| Fidelity Cash Central Fund | $4,644 |
| Total | $4,644 |
Amounts in the income column in the above table include any capital gain distributions from underlying funds, which are presented in the corresponding line-item in the Statement of Operations, if applicable.
The value, beginning of period, for the Fidelity Cash Central Fund was $2,237,734. Net realized gain (loss) and change in net unrealized appreciation (depreciation) on Fidelity Cash Central Fund is presented in the Statement of Operations, if applicable. Purchases and sales of the Fidelity Cash Central Fund were $101,686,211 and $95,479,033, respectively, during the period.
Investment Valuation
The following is a summary of the inputs used, as of April 30, 2021, involving the Fund's assets and liabilities carried at fair value. The inputs or methodology used for valuing securities may not be an indication of the risk associated with investing in those securities. For more information on valuation inputs, and their aggregation into the levels used below, please refer to the Investment Valuation section in the accompanying Notes to Financial Statements.
| | Valuation Inputs at Reporting Date: |
| Description | Total | Level 1 | Level 2 | Level 3 |
| Investments in Securities: | | | | |
| Equities: | | | | |
| Energy | $43,254 | $1,001 | $-- | $42,253 |
| Corporate Bonds | 99,863,133 | -- | 99,782,925 | 80,208 |
| Bank Loan Obligations | 8,688,259 | -- | 8,631,526 | 56,733 |
| Money Market Funds | 8,444,980 | 8,444,980 | -- | -- |
| Total Investments in Securities: | $117,039,626 | $8,445,981 | $108,414,451 | $179,194 |
Other Information
Distribution of investments by country or territory of incorporation, as a percentage of Total Net Assets, is as follows (Unaudited):
| United States of America | 82.2% |
| Netherlands | 3.8% |
| Canada | 2.7% |
| Cayman Islands | 2.2% |
| Luxembourg | 1.8% |
| United Kingdom | 1.5% |
| France | 1.2% |
| Others (Individually Less Than 1%) | 4.6% |
| | 100.0% |
See accompanying notes which are an integral part of the financial statements.
Financial Statements
Statement of Assets and Liabilities
| | | April 30, 2021 |
| Assets | | |
Investment in securities, at value — See accompanying schedule:
Unaffiliated issuers (cost $106,841,636) | $108,594,646 | |
| Fidelity Central Funds (cost $8,444,941) | 8,444,980 | |
| Total Investment in Securities (cost $115,286,577) | | $117,039,626 |
| Cash | | 2,031 |
| Receivable for fund shares sold | | 122,922 |
| Interest receivable | | 1,336,607 |
| Distributions receivable from Fidelity Central Funds | | 275 |
| Prepaid expenses | | 41 |
| Receivable from investment adviser for expense reductions | | 4,721 |
| Other receivables | | 826 |
| Total assets | | 118,507,049 |
| Liabilities | | |
| Payable for investments purchased | $2,809,312 | |
| Payable for fund shares redeemed | 195,659 | |
| Distributions payable | 40,223 | |
| Accrued management fee | 50,715 | |
| Distribution and service plan fees payable | 7,215 | |
| Other affiliated payables | 13,982 | |
| Other payables and accrued expenses | 54,476 | |
| Total liabilities | | 3,171,582 |
| Net Assets | | $115,335,467 |
| Net Assets consist of: | | |
| Paid in capital | | $121,719,890 |
| Total accumulated earnings (loss) | | (6,384,423) |
| Net Assets | | $115,335,467 |
| Net Asset Value and Maximum Offering Price | | |
| Class A: | | |
| Net Asset Value and redemption price per share ($17,125,524 ÷ 1,799,674 shares)(a) | | $9.52 |
| Maximum offering price per share (100/96.00 of $9.52) | | $9.92 |
| Class M: | | |
| Net Asset Value and redemption price per share ($2,289,151 ÷ 240,535 shares)(a) | | $9.52 |
| Maximum offering price per share (100/96.00 of $9.52) | | $9.92 |
| Class C: | | |
| Net Asset Value and offering price per share ($4,017,675 ÷ 422,149 shares)(a) | | $9.52 |
| Short Duration High Income: | | |
| Net Asset Value, offering price and redemption price per share ($83,065,508 ÷ 8,728,666 shares) | | $9.52 |
| Class I: | | |
| Net Asset Value, offering price and redemption price per share ($5,022,577 ÷ 527,685 shares) | | $9.52 |
| Class Z: | | |
| Net Asset Value, offering price and redemption price per share ($3,815,032 ÷ 400,854 shares) | | $9.52 |
(a) Redemption price per share is equal to net asset value less any applicable contingent deferred sales charge.
See accompanying notes which are an integral part of the financial statements.
Statement of Operations
| | | Year ended April 30, 2021 |
| Investment Income | | |
| Dividends | | $15,286 |
| Interest | | 4,135,302 |
| Income from Fidelity Central Funds | | 4,644 |
| Total income | | 4,155,232 |
| Expenses | | |
| Management fee | $535,577 | |
| Transfer agent fees | 114,683 | |
| Distribution and service plan fees | 77,306 | |
| Accounting fees and expenses | 40,481 | |
| Custodian fees and expenses | 4,301 | |
| Independent trustees' fees and expenses | 476 | |
| Registration fees | 85,342 | |
| Audit | 70,472 | |
| Legal | 1,643 | |
| Miscellaneous | 635 | |
| Total expenses before reductions | 930,916 | |
| Expense reductions | (77,197) | |
| Total expenses after reductions | | 853,719 |
| Net investment income (loss) | | 3,301,513 |
| Realized and Unrealized Gain (Loss) | | |
| Net realized gain (loss) on: | | |
| Investment securities: | | |
| Unaffiliated issuers | 25,607 | |
| Fidelity Central Funds | 208 | |
| Total net realized gain (loss) | | 25,815 |
| Change in net unrealized appreciation (depreciation) on: | | |
| Investment securities: | | |
| Unaffiliated issuers | 6,495,555 | |
| Fidelity Central Funds | (141) | |
| Total change in net unrealized appreciation (depreciation) | | 6,495,414 |
| Net gain (loss) | | 6,521,229 |
| Net increase (decrease) in net assets resulting from operations | | $9,822,742 |
See accompanying notes which are an integral part of the financial statements.
Statement of Changes in Net Assets
| | Year ended April 30, 2021 | Year ended April 30, 2020 |
| Increase (Decrease) in Net Assets | | |
| Operations | | |
| Net investment income (loss) | $3,301,513 | $4,477,003 |
| Net realized gain (loss) | 25,815 | (4,197,100) |
| Change in net unrealized appreciation (depreciation) | 6,495,414 | (4,145,629) |
| Net increase (decrease) in net assets resulting from operations | 9,822,742 | (3,865,726) |
| Distributions to shareholders | (3,306,762) | (4,465,978) |
| Share transactions - net increase (decrease) | 20,408,754 | (18,299,860) |
| Total increase (decrease) in net assets | 26,924,734 | (26,631,564) |
| Net Assets | | |
| Beginning of period | 88,410,733 | 115,042,297 |
| End of period | $115,335,467 | $88,410,733 |
See accompanying notes which are an integral part of the financial statements.
Financial Highlights
Fidelity Short Duration High Income Fund Class A
| Years ended April 30, | 2021 | 2020 | 2019 | 2018 | 2017 |
| Selected Per–Share Data | | | | | |
| Net asset value, beginning of period | $8.87 | $9.44 | $9.42 | $9.57 | $9.14 |
| Income from Investment Operations | | | | | |
| Net investment income (loss)A | .300 | .348 | .409 | .381 | .395 |
| Net realized and unrealized gain (loss) | .651 | (.571) | .004 | (.159) | .397 |
| Total from investment operations | .951 | (.223) | .413 | .222 | .792 |
| Distributions from net investment income | (.301) | (.347) | (.393) | (.373) | (.365) |
| Total distributions | (.301) | (.347) | (.393) | (.373) | (.365) |
| Redemption fees added to paid in capitalA | – | – | – | .001 | .003 |
| Net asset value, end of period | $9.52 | $8.87 | $9.44 | $9.42 | $9.57 |
| Total ReturnB,C | 10.83% | (2.47)% | 4.52% | 2.36% | 8.84% |
| Ratios to Average Net AssetsD,E | | | | | |
| Expenses before reductions | 1.15% | 1.15% | 1.15% | 1.16% | 1.22% |
| Expenses net of fee waivers, if any | 1.05% | 1.05% | 1.05% | 1.05% | 1.05% |
| Expenses net of all reductions | 1.05% | 1.05% | 1.05% | 1.05% | 1.05% |
| Net investment income (loss) | 3.21% | 3.74% | 4.37% | 4.00% | 4.21% |
| Supplemental Data | | | | | |
| Net assets, end of period (000 omitted) | $17,126 | $12,603 | $15,050 | $12,351 | $9,304 |
| Portfolio turnover rateF | 74% | 77% | 33% | 65% | 105% |
A Calculated based on average shares outstanding during the period.
B Total returns would have been lower if certain expenses had not been reduced during the applicable periods shown.
C Total returns do not include the effect of the sales charges.
D Fees and expenses of any underlying mutual funds or exchange-traded funds (ETFs) are not included in the Fund's expense ratio. The Fund indirectly bears its proportionate share of these expenses. For additional expense information related to investments in Fidelity Central Funds, please refer to the "Investments in Fidelity Central Funds" note found in the Notes to Financial Statements section of the most recent Annual or Semi-Annual report.
E Expense ratios reflect operating expenses of the class. Expenses before reductions do not reflect amounts reimbursed, waived, or reduced through arrangements with the investment adviser, brokerage services, or other offset arrangements, if applicable, and do not represent the amount paid by the class during periods when reimbursements, waivers or reductions occur.
F Amount does not include the portfolio activity of any underlying mutual funds or exchange-traded funds (ETFs).
See accompanying notes which are an integral part of the financial statements.
Fidelity Short Duration High Income Fund Class M
| Years ended April 30, | 2021 | 2020 | 2019 | 2018 | 2017 |
| Selected Per–Share Data | | | | | |
| Net asset value, beginning of period | $8.86 | $9.44 | $9.42 | $9.57 | $9.14 |
| Income from Investment Operations | | | | | |
| Net investment income (loss)A | .300 | .348 | .408 | .382 | .395 |
| Net realized and unrealized gain (loss) | .661 | (.581) | .005 | (.160) | .397 |
| Total from investment operations | .961 | (.233) | .413 | .222 | .792 |
| Distributions from net investment income | (.301) | (.347) | (.393) | (.373) | (.365) |
| Total distributions | (.301) | (.347) | (.393) | (.373) | (.365) |
| Redemption fees added to paid in capitalA | – | – | – | .001 | .003 |
| Net asset value, end of period | $9.52 | $8.86 | $9.44 | $9.42 | $9.57 |
| Total ReturnB,C | 10.96% | (2.58)% | 4.52% | 2.36% | 8.84% |
| Ratios to Average Net AssetsD,E | | | | | |
| Expenses before reductions | 1.17% | 1.16% | 1.16% | 1.16% | 1.22% |
| Expenses net of fee waivers, if any | 1.05% | 1.05% | 1.05% | 1.05% | 1.05% |
| Expenses net of all reductions | 1.05% | 1.05% | 1.05% | 1.05% | 1.05% |
| Net investment income (loss) | 3.21% | 3.74% | 4.37% | 4.00% | 4.21% |
| Supplemental Data | | | | | |
| Net assets, end of period (000 omitted) | $2,289 | $2,106 | $2,537 | $2,081 | $2,703 |
| Portfolio turnover rateF | 74% | 77% | 33% | 65% | 105% |
A Calculated based on average shares outstanding during the period.
B Total returns would have been lower if certain expenses had not been reduced during the applicable periods shown.
C Total returns do not include the effect of the sales charges.
D Fees and expenses of any underlying mutual funds or exchange-traded funds (ETFs) are not included in the Fund's expense ratio. The Fund indirectly bears its proportionate share of these expenses. For additional expense information related to investments in Fidelity Central Funds, please refer to the "Investments in Fidelity Central Funds" note found in the Notes to Financial Statements section of the most recent Annual or Semi-Annual report.
E Expense ratios reflect operating expenses of the class. Expenses before reductions do not reflect amounts reimbursed, waived, or reduced through arrangements with the investment adviser, brokerage services, or other offset arrangements, if applicable, and do not represent the amount paid by the class during periods when reimbursements, waivers or reductions occur.
F Amount does not include the portfolio activity of any underlying mutual funds or exchange-traded funds (ETFs).
See accompanying notes which are an integral part of the financial statements.
Fidelity Short Duration High Income Fund Class C
| Years ended April 30, | 2021 | 2020 | 2019 | 2018 | 2017 |
| Selected Per–Share Data | | | | | |
| Net asset value, beginning of period | $8.87 | $9.44 | $9.42 | $9.57 | $9.15 |
| Income from Investment Operations | | | | | |
| Net investment income (loss)A | .230 | .278 | .338 | .310 | .325 |
| Net realized and unrealized gain (loss) | .651 | (.571) | .005 | (.159) | .386 |
| Total from investment operations | .881 | (.293) | .343 | .151 | .711 |
| Distributions from net investment income | (.231) | (.277) | (.323) | (.302) | (.294) |
| Total distributions | (.231) | (.277) | (.323) | (.302) | (.294) |
| Redemption fees added to paid in capitalA | – | – | – | .001 | .003 |
| Net asset value, end of period | $9.52 | $8.87 | $9.44 | $9.42 | $9.57 |
| Total ReturnB,C | 10.01% | (3.20)% | 3.74% | 1.59% | 7.92% |
| Ratios to Average Net AssetsD,E | | | | | |
| Expenses before reductions | 1.94% | 1.93% | 1.92% | 1.93% | 2.00% |
| Expenses net of fee waivers, if any | 1.80% | 1.80% | 1.80% | 1.80% | 1.80% |
| Expenses net of all reductions | 1.80% | 1.80% | 1.80% | 1.80% | 1.80% |
| Net investment income (loss) | 2.46% | 2.99% | 3.61% | 3.25% | 3.46% |
| Supplemental Data | | | | | |
| Net assets, end of period (000 omitted) | $4,018 | $4,017 | $4,541 | $5,146 | $5,387 |
| Portfolio turnover rateF | 74% | 77% | 33% | 65% | 105% |
A Calculated based on average shares outstanding during the period.
B Total returns would have been lower if certain expenses had not been reduced during the applicable periods shown.
C Total returns do not include the effect of the contingent deferred sales charge.
D Fees and expenses of any underlying mutual funds or exchange-traded funds (ETFs) are not included in the Fund's expense ratio. The Fund indirectly bears its proportionate share of these expenses. For additional expense information related to investments in Fidelity Central Funds, please refer to the "Investments in Fidelity Central Funds" note found in the Notes to Financial Statements section of the most recent Annual or Semi-Annual report.
E Expense ratios reflect operating expenses of the class. Expenses before reductions do not reflect amounts reimbursed, waived, or reduced through arrangements with the investment adviser, brokerage services, or other offset arrangements, if applicable, and do not represent the amount paid by the class during periods when reimbursements, waivers or reductions occur.
F Amount does not include the portfolio activity of any underlying mutual funds or exchange-traded funds (ETFs).
See accompanying notes which are an integral part of the financial statements.
Fidelity Short Duration High Income Fund
| Years ended April 30, | 2021 | 2020 | 2019 | 2018 | 2017 |
| Selected Per–Share Data | | | | | |
| Net asset value, beginning of period | $8.87 | $9.44 | $9.42 | $9.57 | $9.15 |
| Income from Investment Operations | | | | | |
| Net investment income (loss)A | .323 | .372 | .431 | .405 | .420 |
| Net realized and unrealized gain (loss) | .651 | (.572) | .006 | (.159) | .385 |
| Total from investment operations | .974 | (.200) | .437 | .246 | .805 |
| Distributions from net investment income | (.324) | (.370) | (.417) | (.397) | (.388) |
| Total distributions | (.324) | (.370) | (.417) | (.397) | (.388) |
| Redemption fees added to paid in capitalA | – | – | – | .001 | .003 |
| Net asset value, end of period | $9.52 | $8.87 | $9.44 | $9.42 | $9.57 |
| Total ReturnB | 11.11% | (2.23)% | 4.78% | 2.61% | 9.00% |
| Ratios to Average Net AssetsC,D | | | | | |
| Expenses before reductions | .87% | .86% | .86% | .86% | .93% |
| Expenses net of fee waivers, if any | .80% | .80% | .80% | .80% | .80% |
| Expenses net of all reductions | .80% | .80% | .80% | .80% | .80% |
| Net investment income (loss) | 3.46% | 3.99% | 4.61% | 4.25% | 4.46% |
| Supplemental Data | | | | | |
| Net assets, end of period (000 omitted) | $83,066 | $63,703 | $88,429 | $83,652 | $68,646 |
| Portfolio turnover rateE | 74% | 77% | 33% | 65% | 105% |
A Calculated based on average shares outstanding during the period.
B Total returns would have been lower if certain expenses had not been reduced during the applicable periods shown.
C Fees and expenses of any underlying mutual funds or exchange-traded funds (ETFs) are not included in the Fund's expense ratio. The Fund indirectly bears its proportionate share of these expenses. For additional expense information related to investments in Fidelity Central Funds, please refer to the "Investments in Fidelity Central Funds" note found in the Notes to Financial Statements section of the most recent Annual or Semi-Annual report.
D Expense ratios reflect operating expenses of the class. Expenses before reductions do not reflect amounts reimbursed, waived, or reduced through arrangements with the investment adviser, brokerage services, or other offset arrangements, if applicable, and do not represent the amount paid by the class during periods when reimbursements, waivers or reductions occur.
E Amount does not include the portfolio activity of any underlying mutual funds or exchange-traded funds (ETFs).
See accompanying notes which are an integral part of the financial statements.
Fidelity Short Duration High Income Fund Class I
| Years ended April 30, | 2021 | 2020 | 2019 | 2018 | 2017 |
| Selected Per–Share Data | | | | | |
| Net asset value, beginning of period | $8.87 | $9.44 | $9.42 | $9.57 | $9.15 |
| Income from Investment Operations | | | | | |
| Net investment income (loss)A | .323 | .372 | .430 | .406 | .420 |
| Net realized and unrealized gain (loss) | .651 | (.572) | .007 | (.160) | .385 |
| Total from investment operations | .974 | (.200) | .437 | .246 | .805 |
| Distributions from net investment income | (.324) | (.370) | (.417) | (.397) | (.388) |
| Total distributions | (.324) | (.370) | (.417) | (.397) | (.388) |
| Redemption fees added to paid in capitalA | – | – | – | .001 | .003 |
| Net asset value, end of period | $9.52 | $8.87 | $9.44 | $9.42 | $9.57 |
| Total ReturnB | 11.11% | (2.23)% | 4.78% | 2.61% | 8.99% |
| Ratios to Average Net AssetsC,D | | | | | |
| Expenses before reductions | .92% | .89% | .89% | .91% | .96% |
| Expenses net of fee waivers, if any | .80% | .80% | .80% | .80% | .80% |
| Expenses net of all reductions | .80% | .80% | .80% | .80% | .80% |
| Net investment income (loss) | 3.46% | 3.99% | 4.60% | 4.25% | 4.46% |
| Supplemental Data | | | | | |
| Net assets, end of period (000 omitted) | $5,023 | $3,950 | $4,060 | $4,686 | $10,122 |
| Portfolio turnover rateE | 74% | 77% | 33% | 65% | 105% |
A Calculated based on average shares outstanding during the period.
B Total returns would have been lower if certain expenses had not been reduced during the applicable periods shown.
C Fees and expenses of any underlying mutual funds or exchange-traded funds (ETFs) are not included in the Fund's expense ratio. The Fund indirectly bears its proportionate share of these expenses. For additional expense information related to investments in Fidelity Central Funds, please refer to the "Investments in Fidelity Central Funds" note found in the Notes to Financial Statements section of the most recent Annual or Semi-Annual report.
D Expense ratios reflect operating expenses of the class. Expenses before reductions do not reflect amounts reimbursed, waived, or reduced through arrangements with the investment adviser, brokerage services, or other offset arrangements, if applicable, and do not represent the amount paid by the class during periods when reimbursements, waivers or reductions occur.
E Amount does not include the portfolio activity of any underlying mutual funds or exchange-traded funds (ETFs).
See accompanying notes which are an integral part of the financial statements.
Fidelity Short Duration High Income Fund Class Z
| Years ended April 30, | 2021 | 2020 | 2019 A |
| Selected Per–Share Data | | | |
| Net asset value, beginning of period | $8.87 | $9.45 | $9.46 |
| Income from Investment Operations | | | |
| Net investment income (loss)B | .331 | .378 | .261 |
| Net realized and unrealized gain (loss) | .652 | (.579) | (.016) |
| Total from investment operations | .983 | (.201) | .245 |
| Distributions from net investment income | (.333) | (.379) | (.255) |
| Total distributions | (.333) | (.379) | (.255) |
| Net asset value, end of period | $9.52 | $8.87 | $9.45 |
| Total ReturnC,D | 11.21% | (2.24)% | 2.67% |
| Ratios to Average Net AssetsE,F | | | |
| Expenses before reductions | .80% | .80% | .82%G |
| Expenses net of fee waivers, if any | .71% | .71% | .71%G |
| Expenses net of all reductions | .71% | .71% | .71%G |
| Net investment income (loss) | 3.55% | 4.08% | 4.86%G |
| Supplemental Data | | | |
| Net assets, end of period (000 omitted) | $3,815 | $2,031 | $425 |
| Portfolio turnover rateH | 74% | 77% | 33% |
A For the period October 2, 2018 (commencement of sale of shares) to April 30, 2019.
B Calculated based on average shares outstanding during the period.
C Total returns for periods of less than one year are not annualized.
D Total returns would have been lower if certain expenses had not been reduced during the applicable periods shown.
E Fees and expenses of any underlying mutual funds or exchange-traded funds (ETFs) are not included in the Fund's expense ratio. The Fund indirectly bears its proportionate share of these expenses. For additional expense information related to investments in Fidelity Central Funds, please refer to the "Investments in Fidelity Central Funds" note found in the Notes to Financial Statements section of the most recent Annual or Semi-Annual report.
F Expense ratios reflect operating expenses of the class. Expenses before reductions do not reflect amounts reimbursed, waived, or reduced through arrangements with the investment adviser, brokerage services, or other offset arrangements, if applicable, and do not represent the amount paid by the class during periods when reimbursements, waivers or reductions occur.
G Annualized
H Amount does not include the portfolio activity of any underlying mutual funds or exchange-traded funds (ETFs).
See accompanying notes which are an integral part of the financial statements.
Notes to Financial Statements
For the period ended April 30, 2021
1. Organization.
Fidelity Short Duration High Income Fund (the Fund) is a fund of Fidelity Summer Street Trust (the Trust) and is authorized to issue an unlimited number of shares. The Trust is registered under the Investment Company Act of 1940, as amended (the 1940 Act), as an open-end management investment company organized as a Massachusetts business trust. The Fund offers Class A, Class M, Class C, Short Duration High Income, Class I and Class Z shares, each of which has equal rights as to assets and voting privileges. Each class has exclusive voting rights with respect to matters that affect that class. Class C shares will automatically convert to Class A shares after a holding period of ten years from the initial date of purchase, with certain exceptions.
Effective June 21, 2021, Class C shares will automatically convert to Class A shares after a holding period of eight years from the initial date of purchase, with certain exceptions.
2. Investments in Fidelity Central Funds.
Funds may invest in Fidelity Central Funds, which are open-end investment companies generally available only to other investment companies and accounts managed by the investment adviser and its affiliates. The Schedule of Investments lists any Fidelity Central Funds held as an investment as of period end, but does not include the underlying holdings of each Fidelity Central Fund. An investing fund indirectly bears its proportionate share of the expenses of the underlying Fidelity Central Funds.
Based on its investment objective, each Fidelity Central Fund may invest or participate in various investment vehicles or strategies that are similar to those of the investing fund. These strategies are consistent with the investment objectives of the investing fund and may involve certain economic risks which may cause a decline in value of each of the Fidelity Central Funds and thus a decline in the value of the investing fund.
| Fidelity Central Fund | Investment Manager | Investment Objective | Investment Practices | Expense Ratio(a) |
| Fidelity Money Market Central Funds | Fidelity Management & Research Company LLC (FMR) | Each fund seeks to obtain a high level of current income consistent with the preservation of capital and liquidity. | Short-term Investments | Less than .005% to .01 % |
(a) Expenses expressed as a percentage of average net assets and are as of each underlying Central Fund's most recent annual or semi-annual shareholder report.
A complete unaudited list of holdings for each Fidelity Central Fund is available upon request or at the Securities and Exchange Commission website at www.sec.gov. In addition, the financial statements of the Fidelity Central Funds, which are not covered by the Report of Independent Registered Public Accounting Firm, are available on the Securities and Exchange Commission website or upon request.
3. Significant Accounting Policies.
The Fund is an investment company and applies the accounting and reporting guidance of the Financial Accounting Standards Board (FASB) Accounting Standards Codification Topic 946 Financial Services - Investment Companies. The financial statements have been prepared in conformity with accounting principles generally accepted in the United States of America (GAAP), which require management to make certain estimates and assumptions at the date of the financial statements. Actual results could differ from those estimates. Subsequent events, if any, through the date that the financial statements were issued have been evaluated in the preparation of the financial statements. The Fund's Schedule of Investments lists any underlying mutual funds or exchange-traded funds (ETFs) but does not include the underlying holdings of these funds. The following summarizes the significant accounting policies of the Fund:
Investment Valuation. Investments are valued as of 4:00 p.m. Eastern time on the last calendar day of the period. The Board of Trustees (the Board) has delegated the day to day responsibility for the valuation of the Fund's investments to the Fair Value Committee (the Committee) established by the Fund's investment adviser. In accordance with valuation policies and procedures approved by the Board, the Fund attempts to obtain prices from one or more third party pricing vendors or brokers to value its investments. When current market prices, quotations or currency exchange rates are not readily available or reliable, investments will be fair valued in good faith by the Committee, in accordance with procedures adopted by the Board. Factors used in determining fair value vary by investment type and may include market or investment specific events, changes in interest rates and credit quality. The frequency with which these procedures are used cannot be predicted and they may be utilized to a significant extent. The Committee oversees the Fund's valuation policies and procedures and reports to the Board on the Committee's activities and fair value determinations. The Board monitors the appropriateness of the procedures used in valuing the Fund's investments and ratifies the fair value determinations of the Committee.
The Fund categorizes the inputs to valuation techniques used to value its investments into a disclosure hierarchy consisting of three levels as shown below:
- Level 1 – quoted prices in active markets for identical investments
- Level 2 – other significant observable inputs (including quoted prices for similar investments, interest rates, prepayment speeds, etc.)
- Level 3 – unobservable inputs (including the Fund's own assumptions based on the best information available)
Valuation techniques used to value the Fund's investments by major category are as follows:
Debt securities, including restricted securities, are valued based on evaluated prices received from third party pricing vendors or from brokers who make markets in such securities. Corporate bonds and bank loan obligations are valued by pricing vendors who utilize matrix pricing which considers yield or price of bonds of comparable quality, coupon, maturity and type or by broker-supplied prices. When independent prices are unavailable or unreliable, debt securities may be valued utilizing pricing methodologies which consider similar factors that would be used by third party pricing vendors. Debt securities are generally categorized as Level 2 in the hierarchy but may be Level 3 depending on the circumstances. The Fund invests a significant portion of its assets in below investment grade securities. The value of these securities can be more volatile due to changes in the credit quality of the issuer and is sensitive to changes in economic, market and regulatory conditions.
Equity securities, including restricted securities, for which market quotations are readily available, are valued at the last reported sale price or official closing price as reported by a third party pricing vendor on the primary market or exchange on which they are traded and are categorized as Level 1 in the hierarchy. In the event there were no sales during the day or closing prices are not available, securities are valued at the last quoted bid price or may be valued using the last available price and are generally categorized as Level 2 in the hierarchy. For equity securities, including restricted securities, where observable inputs are limited, assumptions about market activity and risk are used and these securities may be categorized as Level 3 in the hierarchy.
Investments in open-end mutual funds, including the Fidelity Central Funds, are valued at their closing net asset value (NAV) each business day and are categorized as Level 1 in the hierarchy.
Changes in valuation techniques may result in transfers in or out of an assigned level within the disclosure hierarchy. The aggregate value of investments by input level as of April 30, 2021 is included at the end of the Fund's Schedule of Investments.
Investment Transactions and Income. For financial reporting purposes, the Fund's investment holdings and NAV include trades executed through the end of the last business day of the period. The NAV per share for processing shareholder transactions is calculated as of the close of business of the New York Stock Exchange (NYSE), normally 4:00 p.m. Eastern time and includes trades executed through the end of the prior business day. Gains and losses on securities sold are determined on the basis of identified cost. Dividend income is recorded on the ex-dividend date. Income and capital gain distributions from Fidelity Central Funds, if any, are recorded on the ex-dividend date. Interest income is accrued as earned and includes coupon interest and amortization of premium and accretion of discount on debt securities as applicable. Debt obligations may be placed on non-accrual status and related interest income may be reduced by ceasing current accruals and writing off interest receivables when the collection of all or a portion of interest has become doubtful based on consistently applied procedures. A debt obligation is removed from non-accrual status when the issuer resumes interest payments or when collectability of interest is reasonably assured.
Class Allocations and Expenses. Investment income, realized and unrealized capital gains and losses, common expenses of a fund, and certain fund-level expense reductions, if any, are allocated daily on a pro-rata basis to each class based on the relative net assets of each class to the total net assets of a fund. Each class differs with respect to transfer agent and distribution and service plan fees incurred, as applicable. Certain expense reductions may also differ by class, if applicable. For the reporting period, the allocated portion of income and expenses to each class as a percent of its average net assets may vary due to the timing of recording these transactions in relation to fluctuating net assets of the classes. Expenses directly attributable to a fund are charged to that fund. Expenses attributable to more than one fund are allocated among the respective funds on the basis of relative net assets or other appropriate methods. Expenses included in the accompanying financial statements reflect the expenses of that fund and do not include any expenses associated with any underlying mutual funds or exchange-traded funds. Although not included in a fund's expenses, a fund indirectly bears its proportionate share of these expenses through the net asset value of each underlying mutual fund or exchange-traded fund. Expense estimates are accrued in the period to which they relate and adjustments are made when actual amounts are known.
Income Tax Information and Distributions to Shareholders. Each year, the Fund intends to qualify as a regulated investment company under Subchapter M of the Internal Revenue Code, including distributing substantially all of its taxable income and realized gains. As a result, no provision for U.S. Federal income taxes is required. As of April 30, 2021, the Fund did not have any unrecognized tax benefits in the financial statements; nor is the Fund aware of any tax positions for which it is reasonably possible that the total amounts of unrecognized tax benefits will significantly change in the next twelve months. The Fund files a U.S. federal tax return, in addition to state and local tax returns as required. The Fund's federal income tax returns are subject to examination by the Internal Revenue Service (IRS) for a period of three fiscal years after they are filed. State and local tax returns may be subject to examination for an additional fiscal year depending on the jurisdiction.
Distributions are declared and recorded daily and paid monthly from net investment income. Distributions from realized gains, if any, are declared and recorded on the ex-dividend date. Income and capital gain distributions are declared separately for each class. Income and capital gain distributions are determined in accordance with income tax regulations, which may differ from GAAP.
Capital accounts within the financial statements are adjusted for permanent book-tax differences. These adjustments have no impact on net assets or the results of operations. Capital accounts are not adjusted for temporary book-tax differences which will reverse in a subsequent period.
Book-tax differences are primarily due to market discount, capital loss carryforwards and losses deferred due to wash sales.
As of period end, the cost and unrealized appreciation (depreciation) in securities, and derivatives if applicable, for federal income tax purposes were as follows:
| Gross unrealized appreciation | $2,714,573 |
| Gross unrealized depreciation | (806,422) |
| Net unrealized appreciation (depreciation) | $1,908,151 |
| Tax Cost | $115,131,475 |
The tax-based components of distributable earnings as of period end were as follows:
| Undistributed ordinary income | $32,962 |
| Capital loss carryforward | $(8,325,536) |
| Net unrealized appreciation (depreciation) on securities and other investments | $1,908,151 |
Capital loss carryforwards are only available to offset future capital gains of the Fund to the extent provided by regulations and may be limited. The capital loss carryforward information presented below, including any applicable limitation, is estimated as of fiscal period end and is subject to adjustment.
| No expiration | |
| Short-term | $(3,668,283) |
| Long-term | (4,657,253) |
| Total capital loss carryforward | $(8,325,536) |
The tax character of distributions paid was as follows:
| | April 30, 2021 | April 30, 2020 |
| Ordinary Income | $3,306,762 | $ 4,465,978 |
Restricted Securities (including Private Placements). Funds may invest in securities that are subject to legal or contractual restrictions on resale. These securities generally may be resold in transactions exempt from registration or to the public if the securities are registered. Disposal of these securities may involve time-consuming negotiations and expense, and prompt sale at an acceptable price may be difficult. Information regarding restricted securities held at period end is included at the end of the Schedule of Investments, if applicable.
Loans and Other Direct Debt Instruments. Direct debt instruments are interests in amounts owed to lenders by corporate or other borrowers. These instruments may be in the form of loans, trade claims or other receivables and may include standby financing commitments such as revolving credit facilities that obligate a fund to supply additional cash to the borrower on demand. Loans may be acquired through assignment, participation, or may be made directly to a borrower. Such instruments are presented in the Bank Loan Obligations section in the Schedule of Investments. Certain funds may also invest in unfunded loan commitments, which are contractual obligations for future funding. Information regarding unfunded commitments is included at the end of the Schedule of Investments, if applicable.
4. Purchases and Sales of Investments.
Purchases and sales of securities, other than short-term securities, are noted in the table below.
| | Purchases ($) | Sales ($) |
| Fidelity Short Duration High Income Fund | 86,269,164 | 68,942,736 |
5. Fees and Other Transactions with Affiliates.
Management Fee. Fidelity Management & Research Company LLC (the investment adviser) and its affiliates provide the Fund with investment management related services for which the Fund pays a monthly management fee. The management fee is the sum of an individual fund fee rate that is based on an annual rate of .45% of the Fund's average net assets and an annualized group fee rate that averaged .10% during the period. The group fee rate is based upon the monthly average net assets of a group of registered investment companies with which the investment adviser has management contracts. The group fee rate decreases as assets under management increase and increases as assets under management decrease. For the reporting period, the total annual management fee rate was .55% of the Fund's average net assets.
Distribution and Service Plan Fees. In accordance with Rule 12b-1 of the 1940 Act, the Fund has adopted separate Distribution and Service Plans for each class of shares. Certain classes pay Fidelity Distributors Company LLC (FDC), an affiliate of the investment adviser, separate Distribution and Service Fees, each of which is based on an annual percentage of each class' average net assets. In addition, FDC may pay financial intermediaries for selling shares of the Fund and providing shareholder support services. For the period, the Distribution and Service Fee rates, total fees and amounts retained by FDC were as follows:
| | Distribution Fee | Service Fee | Total Fees | Retained by FDC |
| Class A | -% | .25% | $35,319 | $2,172 |
| Class M | -% | .25% | 5,474 | 117 |
| Class C | .75% | .25% | 36,513 | 4,062 |
| | | | $77,306 | $6,351 |
Sales Load. FDC may receive a front-end sales charge of up to 4.00% for selling Class A shares and Class M shares, some of which is paid to financial intermediaries for selling shares of the Fund. Depending on the holding period, FDC may receive contingent deferred sales charges levied on Class A, Class M and Class C redemptions. The deferred sales charges are 1.00% for Class C shares, 1.00% for certain purchases of Class A shares and .25% for certain purchases of Class M shares.
For the period, sales charge amounts retained by FDC were as follows:
| | Retained by FDC |
| Class A | $1,708 |
| Class M | 259 |
| Class C(a) | 2,539 |
| | $4,506 |
(a) When Class C shares are initially sold, FDC pays commissions from its own resources to financial intermediaries through which the sales are made.
Transfer Agent Fees. Fidelity Investments Institutional Operations Company LLC (FIIOC), an affiliate of the investment adviser, is the transfer, dividend disbursing and shareholder servicing agent for each class of the Fund. FIIOC receives account fees and asset-based fees that vary according to the account size and type of account of the shareholders of the respective classes of the Fund, except for Class Z. FIIOC receives an asset-based fee of Class Z's average net assets. FIIOC pays for typesetting, printing and mailing of shareholder reports, except proxy statements.
For the period, transfer agent fees for each class were as follows:
| | Amount | % of Class-Level Average Net Assets |
| Class A | $20,520 | .15 |
| Class M | 3,449 | .16 |
| Class C | 6,436 | .18 |
| Short Duration High Income | 75,283 | .11 |
| Class I | 7,670 | .16 |
| Class Z | 1,325 | .05 |
| | $114,683 | |
Accounting Fees. Fidelity Service Company, Inc. (FSC), an affiliate of the investment adviser, maintains the Fund's accounting records. The accounting fee is based on the level of average net assets for each month. For the period, the fees were equivalent to the following annual rates:
| | % of Average Net Assets |
| Fidelity Short Duration High Income Fund | .04 |
Brokerage Commissions. A portion of portfolio transactions were placed with brokerage firms which are affiliates of the investment adviser. Brokerage commissions are included in net realized gain (loss) and change in net unrealized appreciation (depreciation) in the Statement of Operations. The commissions paid to these affiliated firms were as follows:
| | Amount |
| Fidelity Short Duration High Income Fund | $22 |
Interfund Trades. Funds may purchase from or sell securities to other Fidelity Funds under procedures adopted by the Board. The procedures have been designed to ensure these interfund trades are executed in accordance with Rule 17a-7 of the 1940 Act. Any interfund trades are included within the respective purchases and sales amounts shown in the Purchases and Sales of Investments note.
6. Committed Line of Credit.
Certain Funds participate with other funds managed by the investment adviser or an affiliate in a $4.25 billion credit facility (the "line of credit") to be utilized for temporary or emergency purposes to fund shareholder redemptions or for other short-term liquidity purposes. The participating funds have agreed to pay commitment fees on their pro-rata portion of the line of credit, which are reflected in Miscellaneous expenses on the Statement of Operations, and are listed below.
| | Amount |
| Fidelity Short Duration High Income Fund | $201 |
During the period, there were no borrowings on this line of credit.
7. Expense Reductions.
The investment adviser contractually agreed to reimburse expenses of each class to the extent annual operating expenses exceeded certain levels of class-level average net assets as noted in the table below. Some expenses, for example the compensation of the independent Trustees, and certain miscellaneous expenses such as proxy and shareholder meeting expenses, are excluded from this reimbursement.
The following classes were in reimbursement during the period:
| | Expense Limitations | Reimbursement |
| Class A | 1.05% | $14,486 |
| Class M | 1.05% | 2,604 |
| Class C | 1.80% | 4,916 |
| Short Duration High Income | .80% | 45,667 |
| Class I | .80% | 5,741 |
| Class Z | .71% | 2,381 |
| | | $75,795 |
Commissions paid to certain brokers with whom the investment adviser, or its affiliates, places trades on behalf of the Fund include an amount in addition to trade execution, which may be rebated back to the Fund to offset expenses. This amount totaled $85 for the period. In addition ,through arrangements with the Fund's custodian, credits realized as a result of certain uninvested cash balances were used to reduce the Fund's expenses. During the period, custodian credits reduced the Fund's expenses by $1,100.
In addition, during the period the investment adviser or an affiliate reimbursed and/or waived a portion of fund-level operating expenses in the amount of $217.
Effective June 1, 2021, the investment adviser contractually agreed to reimburse expenses to the extent annual operating expenses exceeded certain levels of class-level average net assets as noted in the table below. This reimbursement will remain in place through August 31, 2022.
| | Expense Limitations |
| Class A | 1.00% |
| Class M | 1.00% |
| Class C | 1.75% |
| Short Duration High Income | .75% |
| Class I | .75% |
| Class Z | .66% |
8. Distributions to Shareholders.
Distributions to shareholders of each class were as follows:
| | Year ended
April 30, 2021 | Year ended
April 30, 2020 |
| Fidelity Short Duration High Income Fund | | |
| Distributions to shareholders | | |
| Class A | $454,814 | $556,252 |
| Class M | 70,564 | 87,233 |
| Class C | 89,941 | 131,011 |
| Short Duration High Income | 2,434,521 | 3,441,833 |
| Class I | 163,096 | 176,433 |
| Class Z | 93,826 | 73,216 |
| Total | $3,306,762 | $4,465,978 |
9. Share Transactions.
Share transactions for each class were as follows and may contain automatic conversions between classes or exchanges between affiliated funds:
| | Shares | Shares | Dollars | Dollars |
| | Year ended April 30, 2021 | Year ended April 30, 2020 | Year ended April 30, 2021 | Year ended April 30, 2020 |
| Fidelity Short Duration High Income Fund | | | | |
| Class A | | | | |
| Shares sold | 664,200 | 738,163 | $6,244,935 | $6,904,779 |
| Reinvestment of distributions | 47,323 | 57,544 | 442,759 | 535,421 |
| Shares redeemed | (333,417) | (967,983) | (3,125,931) | (8,738,906) |
| Net increase (decrease) | 378,106 | (172,276) | $3,561,763 | $(1,298,706) |
| Class M | | | | |
| Shares sold | 62,595 | 84,494 | $585,482 | $785,458 |
| Reinvestment of distributions | 7,346 | 9,140 | 68,665 | 85,002 |
| Shares redeemed | (66,967) | (124,747) | (626,604) | (1,130,115) |
| Net increase (decrease) | 2,974 | (31,113) | $27,543 | $(259,655) |
| Class C | | | | |
| Shares sold | 188,894 | 262,330 | $1,779,685 | $2,400,007 |
| Reinvestment of distributions | 9,530 | 14,026 | 89,087 | 130,387 |
| Shares redeemed | (229,370) | (304,136) | (2,129,868) | (2,603,723) |
| Net increase (decrease) | (30,946) | (27,780) | $(261,096) | $(73,329) |
| Short Duration High Income | | | | |
| Shares sold | 5,433,537 | 3,574,469 | $50,972,991 | $33,404,598 |
| Reinvestment of distributions | 216,286 | 295,232 | 2,023,447 | 2,749,018 |
| Shares redeemed | (4,106,242) | (6,048,897) | (38,304,188) | (54,825,149) |
| Net increase (decrease) | 1,543,581 | (2,179,196) | $14,692,250 | $(18,671,533) |
| Class I | | | | |
| Shares sold | 316,249 | 281,610 | $2,952,746 | $2,620,824 |
| Reinvestment of distributions | 15,983 | 17,079 | 149,609 | 158,857 |
| Shares redeemed | (250,054) | (283,117) | (2,334,522) | (2,545,724) |
| Net increase (decrease) | 82,178 | 15,572 | $767,833 | $233,957 |
| Class Z | | | | |
| Shares sold | 354,223 | 325,736 | $3,332,491 | $3,038,787 |
| Reinvestment of distributions | 9,701 | 7,685 | 90,878 | 71,252 |
| Shares redeemed | (192,066) | (149,394) | (1,802,908) | (1,340,633) |
| Net increase (decrease) | 171,858 | 184,027 | $1,620,461 | $1,769,406 |
10. Other.
Fund's organizational documents provide former and current trustees and officers with a limited indemnification against liabilities arising in connection with the performance of their duties to the fund. In the normal course of business, the fund may also enter into contracts that provide general indemnifications. The fund's maximum exposure under these arrangements is unknown as this would be dependent on future claims that may be made against the fund. The risk of material loss from such claims is considered remote.
11. Coronavirus (COVID-19) Pandemic.
An outbreak of COVID-19 first detected in China during December 2019 has since spread globally and was declared a pandemic by the World Health Organization during March 2020. Developments that disrupt global economies and financial markets, such as the COVID-19 pandemic, may magnify factors that affect the Fund's performance.
Report of Independent Registered Public Accounting Firm
To the Board of Trustees of Fidelity Summer Street Trust and Shareholders of Fidelity Short Duration High Income Fund
Opinion on the Financial Statements and Financial Highlights
We have audited the accompanying statement of assets and liabilities of Fidelity Short Duration High Income Fund (the "Fund"), a fund of Fidelity Summer Street Trust, including the schedule of investments, as of April 30, 2021, the related statement of operations for the year then ended, the statement of changes in net assets for each of the two years in the period then ended, the financial highlights for each of the five years in the period then ended, and the related notes. In our opinion, the financial statements and financial highlights present fairly, in all material respects, the financial position of the Fund as of April 30, 2021, and the results of its operations for the year then ended, the changes in its net assets for each of the two years in the period then ended, and the financial highlights for each of the five years in the period then ended in conformity with accounting principles generally accepted in the United States of America.
Basis for Opinion
These financial statements and financial highlights are the responsibility of the Fund's management. Our responsibility is to express an opinion on the Fund's financial statements and financial highlights based on our audits. We are a public accounting firm registered with the Public Company Accounting Oversight Board (United States) (PCAOB) and are required to be independent with respect to the Fund in accordance with the U.S. federal securities laws and the applicable rules and regulations of the Securities and Exchange Commission and the PCAOB.
We conducted our audits in accordance with the standards of the PCAOB. Those standards require that we plan and perform the audit to obtain reasonable assurance about whether the financial statements and financial highlights are free of material misstatement, whether due to error or fraud. The Fund is not required to have, nor were we engaged to perform, an audit of its internal control over financial reporting. As part of our audits we are required to obtain an understanding of internal control over financial reporting but not for the purpose of expressing an opinion on the effectiveness of the Fund’s internal control over financial reporting. Accordingly, we express no such opinion.
Our audits included performing procedures to assess the risks of material misstatement of the financial statements and financial highlights, whether due to error or fraud, and performing procedures that respond to those risks. Such procedures included examining, on a test basis, evidence regarding the amounts and disclosures in the financial statements and financial highlights. Our audits also included evaluating the accounting principles used and significant estimates made by management, as well as evaluating the overall presentation of the financial statements and financial highlights. Our procedures included confirmation of securities owned as of April 30, 2021, by correspondence with the custodian, brokers and agent banks; when replies were not received from brokers or agent banks, we performed other auditing procedures. We believe that our audits provide a reasonable basis for our opinion.
/s/ Deloitte & Touche LLP
Boston, Massachusetts
June 22, 2021
We have served as the auditor of one or more of the Fidelity investment companies since 1999.
Trustees and Officers
The Trustees, Members of the Advisory Board (if any), and officers of the trust and fund, as applicable, are listed below. The Board of Trustees governs the fund and is responsible for protecting the interests of shareholders. The Trustees are experienced executives who meet periodically throughout the year to oversee the fund's activities, review contractual arrangements with companies that provide services to the fund, oversee management of the risks associated with such activities and contractual arrangements, and review the fund's performance. Each of the Trustees oversees 308 funds.
The Trustees hold office without limit in time except that (a) any Trustee may resign; (b) any Trustee may be removed by written instrument, signed by at least two-thirds of the number of Trustees prior to such removal; (c) any Trustee who requests to be retired or who has become incapacitated by illness or injury may be retired by written instrument signed by a majority of the other Trustees; and (d) any Trustee may be removed at any special meeting of shareholders by a two-thirds vote of the outstanding voting securities of the trust. Each Trustee who is not an interested person (as defined in the 1940 Act) of the trust and the fund is referred to herein as an Independent Trustee. Each Independent Trustee shall retire not later than the last day of the calendar year in which his or her 75th birthday occurs. The Independent Trustees may waive this mandatory retirement age policy with respect to individual Trustees. Officers and Advisory Board Members hold office without limit in time, except that any officer or Advisory Board Member may resign or may be removed by a vote of a majority of the Trustees at any regular meeting or any special meeting of the Trustees. Except as indicated, each individual has held the office shown or other offices in the same company for the past five years.
The fund's Statement of Additional Information (SAI) includes more information about the Trustees. To request a free copy, call Fidelity at 1-800-544-8544 if you’re an individual investing directly with Fidelity, call 1-800-835-5092 if you’re a plan sponsor or participant with Fidelity as your recordkeeper or call 1-877-208-0098 on institutional accounts or if you’re an advisor or invest through one.
Experience, Skills, Attributes, and Qualifications of the Trustees. The Governance and Nominating Committee has adopted a statement of policy that describes the experience, qualifications, attributes, and skills that are necessary and desirable for potential Independent Trustee candidates (Statement of Policy). The Board believes that each Trustee satisfied at the time he or she was initially elected or appointed a Trustee, and continues to satisfy, the standards contemplated by the Statement of Policy. The Governance and Nominating Committee also engages professional search firms to help identify potential Independent Trustee candidates who have the experience, qualifications, attributes, and skills consistent with the Statement of Policy. From time to time, additional criteria based on the composition and skills of the current Independent Trustees, as well as experience or skills that may be appropriate in light of future changes to board composition, business conditions, and regulatory or other developments, have also been considered by the professional search firms and the Governance and Nominating Committee. In addition, the Board takes into account the Trustees' commitment and participation in Board and committee meetings, as well as their leadership of standing and ad hoc committees throughout their tenure.
In determining that a particular Trustee was and continues to be qualified to serve as a Trustee, the Board has considered a variety of criteria, none of which, in isolation, was controlling. The Board believes that, collectively, the Trustees have balanced and diverse experience, qualifications, attributes, and skills, which allow the Board to operate effectively in governing the fund and protecting the interests of shareholders. Information about the specific experience, skills, attributes, and qualifications of each Trustee, which in each case led to the Board's conclusion that the Trustee should serve (or continue to serve) as a trustee of the fund, is provided below.
Board Structure and Oversight Function. Robert A. Lawrence is an interested person and currently serves as Acting Chairman. The Trustees have determined that an interested Chairman is appropriate and benefits shareholders because an interested Chairman has a personal and professional stake in the quality and continuity of services provided to the fund. Independent Trustees exercise their informed business judgment to appoint an individual of their choosing to serve as Chairman, regardless of whether the Trustee happens to be independent or a member of management. The Independent Trustees have determined that they can act independently and effectively without having an Independent Trustee serve as Chairman and that a key structural component for assuring that they are in a position to do so is for the Independent Trustees to constitute a substantial majority for the Board. The Independent Trustees also regularly meet in executive session. David M. Thomas serves as Lead Independent Trustee and as such (i) acts as a liaison between the Independent Trustees and management with respect to matters important to the Independent Trustees and (ii) with management prepares agendas for Board meetings.
Fidelity® funds are overseen by different Boards of Trustees. The fund's Board oversees Fidelity's high income and certain equity funds, and other Boards oversee Fidelity's investment-grade bond, money market, asset allocation, and other equity funds. The asset allocation funds may invest in Fidelity® funds overseen by the fund's Board. The use of separate Boards, each with its own committee structure, allows the Trustees of each group of Fidelity® funds to focus on the unique issues of the funds they oversee, including common research, investment, and operational issues. On occasion, the separate Boards establish joint committees to address issues of overlapping consequences for the Fidelity® funds overseen by each Board.
The Trustees operate using a system of committees to facilitate the timely and efficient consideration of all matters of importance to the Trustees, the fund, and fund shareholders and to facilitate compliance with legal and regulatory requirements and oversight of the fund's activities and associated risks. The Board, acting through its committees, has charged FMR and its affiliates with (i) identifying events or circumstances the occurrence of which could have demonstrably adverse effects on the fund's business and/or reputation; (ii) implementing processes and controls to lessen the possibility that such events or circumstances occur or to mitigate the effects of such events or circumstances if they do occur; and (iii) creating and maintaining a system designed to evaluate continuously business and market conditions in order to facilitate the identification and implementation processes described in (i) and (ii) above. Because the day-to-day operations and activities of the fund are carried out by or through FMR, its affiliates, and other service providers, the fund's exposure to risks is mitigated but not eliminated by the processes overseen by the Trustees. While each of the Board's committees has responsibility for overseeing different aspects of the fund's activities, oversight is exercised primarily through the Operations, Audit, and Compliance Committees. Appropriate personnel, including but not limited to the fund's Chief Compliance Officer (CCO), FMR's internal auditor, the independent accountants, the fund's Treasurer and portfolio management personnel, make periodic reports to the Board's committees, as appropriate, including an annual review of Fidelity's risk management program for the Fidelity® funds. The responsibilities of each standing committee, including their oversight responsibilities, are described further under "Standing Committees of the Trustees."
Interested Trustees*:
Correspondence intended for a Trustee who is an interested person may be sent to Fidelity Investments, 245 Summer Street, Boston, Massachusetts 02210.
Name, Year of Birth; Principal Occupations and Other Relevant Experience+
Bettina Doulton (1964)
Year of Election or Appointment: 2020
Trustee
Ms. Doulton also serves as Trustee of other Fidelity® funds. Prior to her retirement, Ms. Doulton served in a variety of positions at Fidelity Investments, including as a managing director of research (2006-2007), portfolio manager to certain Fidelity® funds (1993-2005), equity analyst and portfolio assistant (1990-1993), and research assistant (1987-1990). Ms. Doulton currently owns and operates Phi Builders + Architects and Cellardoor Winery. Previously, Ms. Doulton served as a member of the Board of Brown Capital Management, LLC (2014-2018).
Robert A. Lawrence (1952)
Year of Election or Appointment: 2020
Trustee
Acting Chairman of the Board of Trustees
Mr. Lawrence also serves as Trustee of other funds. Previously, Mr. Lawrence served as a Member of the Advisory Board of certain funds. Prior to his retirement in 2008, Mr. Lawrence served as Vice President of certain Fidelity® funds (2006-2008), Senior Vice President, Head of High Income Division of Fidelity Management & Research Company (investment adviser firm, 2006-2008), and President of Fidelity Strategic Investments (investment adviser firm, 2002-2005).
* Determined to be an “Interested Trustee” by virtue of, among other things, his or her affiliation with the trust or various entities under common control with FMR.
+ The information includes the Trustee's principal occupation during the last five years and other information relating to the experience, attributes, and skills relevant to the Trustee's qualifications to serve as a Trustee, which led to the conclusion that the Trustee should serve as a Trustee for the fund.
Independent Trustees:
Correspondence intended for an Independent Trustee may be sent to Fidelity Investments, P.O. Box 55235, Boston, Massachusetts 02205-5235.
Name, Year of Birth; Principal Occupations and Other Relevant Experience+
Thomas P. Bostick (1956)
Year of Election or Appointment: 2021
Trustee
Lieutenant General Bostick also serves as Trustee of other Fidelity® funds. Prior to his retirement, General Bostick (United States Army, Retired) held a variety of positions within the U.S. Army, including Commanding General and Chief of Engineers, U.S. Army Corps of Engineers (2012-2016) and Deputy Chief of Staff and Director of Human Resources, U.S. Army (2009-2012). General Bostick currently serves as a member of the Board and Finance and Governance Committees of CSX Corporation (transportation, 2020-present) and a member of the Board and Corporate Governance and Nominating Committee of Perma-Fix Environmental Services, Inc. (nuclear waste management, 2020-present). General Bostick serves as Chief Executive Officer of Bostick Global Strategies, LLC (consulting, 2016-present) and Managing Partner, Sustainability, of Ridge-Lane Limited Partners (strategic advisory and venture development, 2016-present). Previously, General Bostick served as a Member of the Advisory Board of certain Fidelity® funds (2021), President, Intrexon Bioengineering (2018-2020) and Chief Operating Officer (2017-2020) and Senior Vice President of the Environment Sector (2016-2017) of Intrexon Corporation (biopharmaceutical company).
Dennis J. Dirks (1948)
Year of Election or Appointment: 2005
Trustee
Mr. Dirks also serves as Trustee of other Fidelity® funds. Prior to his retirement in May 2003, Mr. Dirks served as Chief Operating Officer and as a member of the Board of The Depository Trust & Clearing Corporation (financial markets infrastructure), President, Chief Operating Officer and a member of the Board of The Depository Trust Company (DTC), President and a member of the Board of the National Securities Clearing Corporation (NSCC), Chief Executive Officer and a member of the Board of the Government Securities Clearing Corporation and Chief Executive Officer and a member of the Board of the Mortgage-Backed Securities Clearing Corporation. Mr. Dirks currently serves as a member of the Finance Committee (2016-present) and Board (2017-present) and is Treasurer (2018-present) of the Asolo Repertory Theatre.
Donald F. Donahue (1950)
Year of Election or Appointment: 2018
Trustee
Mr. Donahue also serves as Trustee of other Fidelity® funds. Mr. Donahue serves as President and Chief Executive Officer of Miranda Partners, LLC (risk consulting for the financial services industry, 2012-present). Previously, Mr. Donahue served as Chief Executive Officer (2006-2012), Chief Operating Officer (2003-2006) and Managing Director, Customer Marketing and Development (1999-2003) of The Depository Trust & Clearing Corporation (financial markets infrastructure). Mr. Donahue currently serves as a member (2007-present) and Co-Chairman (2016-present) of the Board of United Way of New York and a member of the Board of NYC Leadership Academy (2012-present). Mr. Donahue previously served as a member of the Advisory Board of certain Fidelity® funds (2015-2018).
Vicki L. Fuller (1957)
Year of Election or Appointment: 2020
Trustee
Ms. Fuller also serves as Trustee of other Fidelity® funds. Previously, Ms. Fuller served as a member of the Advisory Board of certain Fidelity® funds (2018-2020), Chief Investment Officer of the New York State Common Retirement Fund (2012-2018) and held a variety of positions at AllianceBernstein L.P. (global asset management, 1985-2012), including Managing Director (2006-2012) and Senior Vice President and Senior Portfolio Manager (2001-2006). Ms. Fuller currently serves as a member of the Board, Audit Committee and Nominating and Governance Committee of The Williams Companies, Inc. (natural gas infrastructure, 2018-present), as a member of the Board, Audit Committee and Nominating and Governance Committee of two Blackstone business development companies (2020-present) and as a member of the Board of Treliant, LLC (consulting, 2019-present).
Patricia L. Kampling (1959)
Year of Election or Appointment: 2020
Trustee
Ms. Kampling also serves as Trustee of other Fidelity® funds. Prior to her retirement, Ms. Kampling served as Chairman of the Board and Chief Executive Officer (2012-2019), President and Chief Operating Officer (2011-2012) and Executive Vice President and Chief Financial Officer (2010-2011) of Alliant Energy Corporation. Ms. Kampling currently serves as a member of the Board, Finance Committee and Governance, Compensation and Nominating Committee of Xcel Energy Inc. (utilities company, 2020-present) and as a member of the Board, Audit, Finance and Risk Committee and Safety, Environmental, Technology and Operations Committee of American Water Works Company, Inc. (utilities company, 2019-present). In addition, Ms. Kampling currently serves as a member of the Board of the Nature Conservancy, Wisconsin Chapter (2019-present). Previously, Ms. Kampling served as a Member of the Advisory Board of certain Fidelity® funds (2020), a member of the Board, Compensation Committee and Executive Committee and Chair of the Audit Committee of Briggs & Stratton Corporation (manufacturing, 2011-2021), a member of the Board of Interstate Power and Light Company (2012-2019) and Wisconsin Power and Light Company (2012-2019) (each a subsidiary of Alliant Energy Corporation) and as a member of the Board and Workforce Development Committee of the Business Roundtable (2018-2019).
Thomas A. Kennedy (1955)
Year of Election or Appointment: 2021
Trustee
Mr. Kennedy also serves as Trustee of other Fidelity® funds. Previously, Mr. Kennedy served as a Member of the Advisory Board of certain Fidelity® funds (2020) and held a variety of positions at Raytheon Company (aerospace and defense, 1983-2020), including Chairman and Chief Executive Officer (2014-2020) and Executive Vice President and Chief Operating Officer (2013-2014). Mr. Kennedy currently serves as Executive Chairman of the Board of Directors of Raytheon Technologies Corporation (aerospace and defense, 2020-present). He is also a member of the Rutgers School of Engineering Industry Advisory Board (2011-present) and a member of the UCLA Engineering Dean’s Executive Board (2016-present).
Oscar Munoz (1959)
Year of Election or Appointment: 2021
Trustee
Mr. Munoz also serves as Trustee of other Fidelity® funds. Prior to his retirement, Mr. Munoz served as Executive Chairman (2020-2021), Chief Executive Officer (2015-2020), President (2015-2016) and a member of the Board (2010-2021) of United Airlines Holdings, Inc. Mr. Munoz currently serves as a member of the Board of CBRE Group, Inc. (commercial real estate, 2020-present), a member of the Board of Univision Communications, Inc. (Hispanic media, 2020-present) and a member of the Advisory Board of Salesforce.com, Inc. (cloud-based software, 2020-present). Previously, Mr. Munoz served as a Member of the Advisory Board of certain Fidelity® funds (2021).
Garnett A. Smith (1947)
Year of Election or Appointment: 2018
Trustee
Mr. Smith also serves as Trustee of other Fidelity® funds. Prior to his retirement, Mr. Smith served as Chairman and Chief Executive Officer (1990-1997) and President (1986-1990) of Inbrand Corp. (manufacturer of personal absorbent products). Prior to his employment with Inbrand Corp., he was employed by a retail fabric chain and North Carolina National Bank (now Bank of America). Mr. Smith previously served as a member of the Advisory Board of certain Fidelity® funds (2012-2013).
David M. Thomas (1949)
Year of Election or Appointment: 2008
Trustee
Lead Independent Trustee
Mr. Thomas also serves as Trustee of other Fidelity® funds. Previously, Mr. Thomas served as Executive Chairman (2005-2006) and Chairman and Chief Executive Officer (2000-2005) of IMS Health, Inc. (pharmaceutical and healthcare information solutions). Mr. Thomas currently serves as a member of the Board of Fortune Brands Home and Security (home and security products, 2004-present) and Presiding Director (2013-present) of Interpublic Group of Companies, Inc. (marketing communication).
Susan Tomasky (1953)
Year of Election or Appointment: 2020
Trustee
Ms. Tomasky also serves as Trustee of other Fidelity® funds. Prior to her retirement, Ms. Tomasky served in various executive officer positions at American Electric Power Company, Inc. (1998-2011), including most recently as President of AEP Transmission (2007-2011). Ms. Tomasky currently serves as a member of the Board and Sustainability Committee and as Chair of the Audit Committee of Marathon Petroleum Corporation (2018-present) and as a member of the Board, Corporate Governance Committee and Organization and Compensation Committee and as Chair of the Audit Committee of Public Service Enterprise Group, Inc. (utilities company, 2012-present). In addition, Ms. Tomasky currently serves as a member (2009-present) and President (2020-present) of the Board of the Royal Shakespeare Company – America (2009-present), as a member of the Board of the Columbus Association for the Performing Arts (2011-present) and as a member of the Board and Investment Committee of Kenyon College (2016-present). Previously, Ms. Tomasky served as a Member of the Advisory Board of certain Fidelity® funds (2020), as a member of the Board of the Columbus Regional Airport Authority (2007-2020), as a member of the Board (2011-2018) and Lead Independent Director (2015-2018) of Andeavor Corporation (previously Tesoro Corporation) (independent oil refiner and marketer) and as a member of the Board of Summit Midstream Partners LP (energy, 2012-2018).
Michael E. Wiley (1950)
Year of Election or Appointment: 2018
Trustee
Mr. Wiley also serves as Trustee of other Fidelity® funds. Previously, Mr. Wiley served as a member of the Advisory Board of certain Fidelity® funds (2018-2020), Chairman, President and CEO of Baker Hughes, Inc. (oilfield services, 2000-2004). Mr. Wiley also previously served as a member of the Board of Andeavor Corporation (independent oil refiner and marketer, 2005-2018), a member of the Board of Andeavor Logistics LP (natural resources logistics, 2015-2018) and a member of the Board of High Point Resources (exploration and production, 2005-2020).
+ The information includes the Trustee's principal occupation during the last five years and other information relating to the experience, attributes, and skills relevant to the Trustee's qualifications to serve as a Trustee, which led to the conclusion that the Trustee should serve as a Trustee for the fund.
Advisory Board Members and Officers:
Correspondence intended for a Member of the Advisory Board (if any) may be sent to Fidelity Investments, P.O. Box 55235, Boston, Massachusetts 02205-5235. Correspondence intended for an officer or Peter S. Lynch may be sent to Fidelity Investments, 245 Summer Street, Boston, Massachusetts 02210. Officers appear below in alphabetical order.
Name, Year of Birth; Principal Occupation
Peter S. Lynch (1944)
Year of Election or Appointment: 2003
Member of the Advisory Board
Mr. Lynch also serves as a Member of the Advisory Board of other Fidelity® funds. Mr. Lynch is Vice Chairman and a Director of Fidelity Management & Research Company LLC (investment adviser firm). In addition, Mr. Lynch serves as a Trustee of Boston College and as the Chairman of the Inner-City Scholarship Fund. Previously, Mr. Lynch served as Vice Chairman and a Director of FMR Co., Inc. (investment adviser firm) and on the Special Olympics International Board of Directors (1997-2006).
Craig S. Brown (1977)
Year of Election or Appointment: 2019
Assistant Treasurer
Mr. Brown also serves as Assistant Treasurer of other funds. Mr. Brown is an employee of Fidelity Investments (2013-present).
John J. Burke III (1964)
Year of Election or Appointment: 2018
Chief Financial Officer
Mr. Burke also serves as Chief Financial Officer of other funds. Mr. Burke serves as Head of Investment Operations for Fidelity Fund and Investment Operations (2018-present) and is an employee of Fidelity Investments (1998-present). Previously Mr. Burke served as head of Asset Management Investment Operations (2012-2018).
William C. Coffey (1969)
Year of Election or Appointment: 2019
Assistant Secretary
Mr. Coffey also serves as Assistant Secretary of other funds. He is Senior Vice President and Deputy General Counsel of FMR LLC (diversified financial services company, 2010-present), and is an employee of Fidelity Investments. Previously, Mr. Coffey served as Secretary and CLO of certain funds (2018-2019); CLO, Secretary, and Senior Vice President of Fidelity Management & Research Company and FMR Co., Inc. (investment adviser firms, 2018-2019); Secretary of Fidelity SelectCo, LLC and Fidelity Investments Money Management, Inc. (investment adviser firms, 2018-2019); CLO of Fidelity Management & Research (Hong Kong) Limited, FMR Investment Management (UK) Limited, and Fidelity Management & Research (Japan) Limited (investment adviser firms, 2018-2019); and Assistant Secretary of certain funds (2009-2018).
Timothy M. Cohen (1969)
Year of Election or Appointment: 2018
Vice President
Mr. Cohen also serves as Vice President of other funds. Mr. Cohen serves as Co-Head of Equity (2018-present), a Director of Fidelity Management & Research (Japan) Limited (investment adviser firm, 2016-present), and is an employee of Fidelity Investments. Previously, Mr. Cohen served as Executive Vice President of Fidelity SelectCo, LLC (2019), Head of Global Equity Research (2016-2018), Chief Investment Officer - Equity and a Director of Fidelity Management & Research (U.K.) Inc. (investment adviser firm, 2013-2015) and as a Director of Fidelity Management & Research (Hong Kong) Limited (investment adviser firm, 2017).
Jonathan Davis (1968)
Year of Election or Appointment: 2010
Assistant Treasurer
Mr. Davis also serves as Assistant Treasurer of other funds. Mr. Davis serves as Assistant Treasurer of FMR Capital, Inc. (2017-present) and is an employee of Fidelity Investments. Previously, Mr. Davis served as Vice President and Associate General Counsel of FMR LLC (diversified financial services company, 2003-2010).
Laura M. Del Prato (1964)
Year of Election or Appointment: 2018
Assistant Treasurer
Ms. Del Prato also serves as an officer of other funds. Ms. Del Prato is an employee of Fidelity Investments (2017-present). Previously, Ms. Del Prato served as President and Treasurer of The North Carolina Capital Management Trust: Cash Portfolio and Term Portfolio (2018-2020). Prior to joining Fidelity Investments, Ms. Del Prato served as a Managing Director and Treasurer of the JPMorgan Mutual Funds (2014-2017). Prior to JPMorgan, Ms. Del Prato served as a partner at Cohen Fund Audit Services (accounting firm, 2012-2013) and KPMG LLP (accounting firm, 2004-2012).
Colm A. Hogan (1973)
Year of Election or Appointment: 2020
Assistant Treasurer
Mr. Hogan also serves as an officer of other funds. Mr. Hogan serves as Assistant Treasurer of FMR Capital, Inc. (2017-present) and is an employee of Fidelity Investments (2005-present). Previously, Mr. Hogan served as Deputy Treasurer of certain Fidelity® funds (2016-2020) and Assistant Treasurer of certain Fidelity® funds (2016-2018).
Pamela R. Holding (1964)
Year of Election or Appointment: 2018
Vice President
Ms. Holding also serves as Vice President of other funds. Ms. Holding serves as Co-Head of Equity (2018-present) and is an employee of Fidelity Investments (2013-present). Previously, Ms. Holding served as Executive Vice President of Fidelity SelectCo, LLC (2019) and as Chief Investment Officer of Fidelity Institutional Asset Management (2013-2018).
Cynthia Lo Bessette (1969)
Year of Election or Appointment: 2019
Secretary and Chief Legal Officer (CLO)
Ms. Lo Bessette also serves as an officer of other funds. Ms. Lo Bessette serves as CLO, Secretary, and Senior Vice President of Fidelity Management & Research Company LLC (investment adviser firm, 2019-present); and CLO of Fidelity Management & Research (Hong Kong) Limited, FMR Investment Management (UK) Limited, and Fidelity Management & Research (Japan) Limited (investment adviser firms, 2019-present). She is a Senior Vice President and Deputy General Counsel of FMR LLC (diversified financial services company, 2019-present), and is an employee of Fidelity Investments. Previously, Ms. Lo Bessette served as CLO, Secretary, and Senior Vice President of FMR Co., Inc. (investment adviser firm, 2019); Secretary of Fidelity SelectCo, LLC and Fidelity Investments Money Management, Inc. (investment adviser firms, 2019). Prior to joining Fidelity Investments, Ms. Lo Bessette was Executive Vice President, General Counsel (2016-2019) and Senior Vice President, Deputy General Counsel (2015-2016) of OppenheimerFunds (investment management company) and Deputy Chief Legal Officer (2013-2015) of Jennison Associates LLC (investment adviser firm).
Chris Maher (1972)
Year of Election or Appointment: 2020
Deputy Treasurer
Mr. Maher also serves as an officer of other funds. Mr. Maher serves as Assistant Treasurer of FMR Capital, Inc. (2017-present), and is an employee of Fidelity Investments (2008-present). Previously, Mr. Maher served as Assistant Treasurer of certain funds (2013-2020); Vice President of Asset Management Compliance (2013), Vice President of the Program Management Group of FMR (investment adviser firm, 2010-2013), and Vice President of Valuation Oversight (2008-2010).
Jason P. Pogorelec (1975)
Year of Election or Appointment: 2020
Chief Compliance Officer
Mr. Pogorelec also serves as Chief Compliance Officer of other funds. Mr. Pogorelec is a senior Vice President of Asset Management Compliance for Fidelity Investments and is an employee of Fidelity Investments (2006-present). Previously, Mr. Pogorelec served as Vice President, Associate General Counsel for Fidelity Investments (2010-2020) and Assistant Secretary of certain Fidelity funds (2015-2020).
Brett Segaloff (1972)
Year of Election or Appointment: 2021
Anti-Money Laundering (AML) Officer
Mr. Segaloff also serves as an AML Officer of other funds and other related entities. He is Director, Anti-Money Laundering (2007-present) of FMR LLC (diversified financial services company) and is an employee of Fidelity Investments (1996-present).
Stacie M. Smith (1974)
Year of Election or Appointment: 2016
President and Treasurer
Ms. Smith also serves as an officer of other funds. Ms. Smith serves as Assistant Treasurer of FMR Capital, Inc. (2017-present), is an employee of Fidelity Investments (2009-present), and has served in other fund officer roles. Prior to joining Fidelity Investments, Ms. Smith served as Senior Audit Manager of Ernst & Young LLP (accounting firm, 1996-2009). Previously, Ms. Smith served as Assistant Treasurer (2013-2019) and Deputy Treasurer (2013-2016) of certain Fidelity® funds.
Marc L. Spector (1972)
Year of Election or Appointment: 2016
Assistant Treasurer
Mr. Spector also serves as an officer of other funds. Mr. Spector serves as Assistant Treasurer of FMR Capital, Inc. (2017-present) and is an employee of Fidelity Investments (2016-present). Prior to joining Fidelity Investments, Mr. Spector served as Director at the Siegfried Group (accounting firm, 2013-2016), and prior to Siegfried Group as audit senior manager at Deloitte & Touche LLP (accounting firm, 2005-2013).
Jim Wegmann (1979)
Year of Election or Appointment: 2019
Assistant Treasurer
Mr. Wegmann also serves as Assistant Treasurer of other funds. Mr. Wegmann is an employee of Fidelity Investments (2011-present).
Shareholder Expense Example
As a shareholder, you incur two types of costs: (1) transaction costs, which may include sales charges (loads) on purchase payments or redemption proceeds, as applicable and (2) ongoing costs, which generally include management fees, distribution and/or service (12b-1) fees and other Fund expenses. This Example is intended to help you understand your ongoing costs (in dollars) of investing in a fund and to compare these costs with the ongoing costs of investing in other mutual funds.
The Example is based on an investment of $1,000 invested at the beginning of the period and held for the entire period (November 1, 2020 to April 30, 2021).
Actual Expenses
The first line of the accompanying table provides information about actual account values and actual expenses. You may use the information in this line, together with the amount you invested, to estimate the expenses that you paid over the period. Simply divide your account value by $1,000.00 (for example, an $8,600 account value divided by $1,000.00 = 8.6), then multiply the result by the number in the first line for a class/Fund under the heading entitled "Expenses Paid During Period" to estimate the expenses you paid on your account during this period. If any fund is a shareholder of any underlying mutual funds or exchange-traded funds (ETFs) (the Underlying Funds), such fund indirectly bears its proportional share of the expenses of the Underlying Funds in addition to the direct expenses incurred presented in the table. These fees and expenses are not included in the annualized expense ratio used to calculate the expense estimate in the table below.
Hypothetical Example for Comparison Purposes
The second line of the accompanying table provides information about hypothetical account values and hypothetical expenses based on the actual expense ratio and an assumed rate of return of 5% per year before expenses, which is not the actual return. The hypothetical account values and expenses may not be used to estimate the actual ending account balance or expenses you paid for the period. You may use this information to compare the ongoing costs of investing in the Fund and other funds. To do so, compare this 5% hypothetical example with the 5% hypothetical examples that appear in the shareholder reports of the other funds. If any fund is a shareholder of any Underlying Funds, such fund indirectly bears its proportional share of the expenses of the Underlying Funds in addition to the direct expenses as presented in the table. These fees and expenses are not included in the annualized expense ratio used to calculate the expense estimate in the table below.
Please note that the expenses shown in the table are meant to highlight your ongoing costs only and do not reflect any transaction costs. Therefore, the second line of the table is useful in comparing ongoing costs only, and will not help you determine the relative total costs of owning different funds. In addition, if these transactional costs were included, your costs would have been higher.
| | Annualized Expense Ratio-A | Beginning
Account Value
November 1, 2020 | Ending
Account Value
April 30, 2021 | Expenses Paid
During Period-B
November 1, 2020
to April 30, 2021 |
| Fidelity Short Duration High Income Fund | | | | |
| Class A | 1.05% | | | |
| Actual | | $1,000.00 | $1,045.00 | $5.32 |
| Hypothetical-C | | $1,000.00 | $1,019.59 | $5.26 |
| Class M | 1.05% | | | |
| Actual | | $1,000.00 | $1,045.00 | $5.32 |
| Hypothetical-C | | $1,000.00 | $1,019.59 | $5.26 |
| Class C | 1.80% | | | |
| Actual | | $1,000.00 | $1,040.00 | $9.10 |
| Hypothetical-C | | $1,000.00 | $1,015.87 | $9.00 |
| Short Duration High Income | .80% | | | |
| Actual | | $1,000.00 | $1,045.10 | $4.06** |
| Hypothetical-C | | $1,000.00 | $1,020.83 | $4.01** |
| Class I | .80% | | | |
| Actual | | $1,000.00 | $1,045.10 | $4.06** |
| Hypothetical-C | | $1,000.00 | $1,020.83 | $4.01** |
| Class Z | .71% | | | |
| Actual | | $1,000.00 | $1,045.60 | $3.60** |
| Hypothetical-C | | $1,000.00 | $1,021.27 | $3.56** |
A Annualized expense ratio reflects expenses net of applicable fee waivers.
B Expenses are equal to the annualized expense ratio, multiplied by the average account value over the period, multiplied by 181/ 365 (to reflect the one-half year period). The fees and expenses of any Underlying Funds are not included in each annualized expense ratio.
C 5% return per year before expenses
**If fees and changes to the class level expense contract and/ or expense cap, effective June 1, 2021, had been in effect during the current period, the restated annualized expense ratio and the expenses paid in the actual and hypothetical examples above
| | Annualized Expense Ratio-(a)
| Expenses Paid
|
| Fidelity Short Duration High Income Fund | | |
| Short Duration High Income | .75% | |
| Actual | | $3.80 |
| Hypothetical-(b) | | $3.76 |
| Class I | .75% | |
| Actual | | $3.80 |
| Hypothetical-(b) | | $3.76 |
| Class Z | .66% | |
| Actual | | $3.35 |
| Hypothetical-(b) | | $3.31 |
(a) Annualized expense ratio reflects expenses net of applicable fee waivers.
(b) 5% return per year before expenses
Distributions (Unaudited)
A total of 0.07% of the dividends distributed during the fiscal year was derived from interest on U.S. Government securities which is generally exempt from state income tax.
The fund designates $2,637,191 of distributions paid during the calendar year 2020 as qualifying to be taxed as interest-related dividends for nonresident alien shareholders.
The fund designates $3,390,204 of distributions paid in the calendar year 2020 as qualifying to be taxed as section 163(j) interest dividends.
The fund will notify shareholders in January 2022 of amounts for use in preparing 2021 income tax returns.
Board Approval of Investment Advisory Contracts
Fidelity Short Duration High Income Fund
At its January 2021 meeting, the Board of Trustees, including the Independent Trustees (together, the Board), voted to continue the management contract with Fidelity Management & Research Company LLC (FMR), and the sub-advisory agreements and sub-subadvisory agreements, in each case, where applicable (together, the Advisory Contracts) for the fund for four months from February 1, 2021 through May 31, 2021, in connection with changes to the Board's meeting calendar.
The Board considered that the approval of the fund's Advisory Contracts will not result in any changes in (i) the investment process or strategies employed in the management of the fund's assets; (ii) the fees and expenses paid by shareholders; (iii) the nature, extent or quality of services provided under the fund's Advisory Contracts; or (iv) the day-to-day management of the fund or the persons primarily responsible for such management. The Board also considered that since its last approval of the fund's Advisory Contracts, FMR had provided additional information on the fund in support of the annual contract renewal process, including competitive analyses on total expenses and management fees and in-depth reviews of fund performance and fund profitability information. The Board also considered the findings of certain ad hoc committees that had been previously formed to discuss matters relevant to all of the Fidelity funds, including economies of scale, fall-out benefits and retail vs. institutional funds. The Board concluded that the fund's Advisory Contracts are fair and reasonable, and that the fund's Advisory Contracts should be renewed, without modification, through May 31, 2021, with the understanding that the Board will consider the annual renewal for a full one year period in May 2021.
In connection with its consideration of future renewals of the fund's Advisory Contracts, the Board will consider: (i) the nature, extent and quality of services provided to the funds, including shareholder and administrative services and investment performance; (ii) the competitiveness of the management fee and total expenses for the fund; (iii) the costs of the services and profitability, including the revenues earned and the expenses incurred in conducting the business of developing, marketing, distributing, managing, administering, and servicing the fund and its shareholders, to the extent applicable; and (iv) whether there have been economies of scale in respect of the Fidelity funds, whether the Fidelity funds (including the fund) have appropriately benefited from any such economies of scale, and whether there is the potential for realization of any further economies.
Based on its evaluation of all of the conclusions noted above, and after considering all factors it believed relevant, the Board ultimately concluded that the fund's management fee structure is fair and reasonable, and that the continuation of the fund's Advisory Contracts should be approved for four months from February 1, 2021 through May 31, 2021.
Liquidity Risk Management Program
The Securities and Exchange Commission adopted Rule 22e-4 under the Investment Company Act of 1940 (the Liquidity Rule) to promote effective liquidity risk management throughout the open-end investment company industry, thereby reducing the risk that funds will be unable to meet their redemption obligations and mitigating dilution of the interests of fund shareholders.
The Fund has adopted and implemented a liquidity risk management program pursuant to the Liquidity Rule (the Program) effective December 1, 2018. The Program is reasonably designed to assess and manage the Fund’s liquidity risk and to comply with the requirements of the Liquidity Rule. The Fund’s Board of Trustees (the Board) has designated the Fund’s investment adviser as administrator of the Program. The Fidelity advisers have established a Liquidity Risk Management Committee (the LRM Committee) to manage the Program for each of the Fidelity Funds. The LRM Committee monitors the adequacy and effectiveness of implementation of the Program and on a periodic basis assesses each Fund’s liquidity risk based on a variety of factors including (1) the Fund’s investment strategy, (2) portfolio liquidity and cash flow projections during normal and reasonably foreseeable stressed conditions, (3) shareholder redemptions, (4) borrowings and other funding sources and (5) in the case of exchange-traded funds, certain additional factors including the effect of the Fund’s prices and spreads, market participants, and basket compositions on the overall liquidity of the Fund’s portfolio, as applicable.
In accordance with the Program, each of the Fund’s portfolio investments is classified into one of four liquidity categories described below based on a determination of a reasonable expectation for how long it would take to convert the investment to cash (or sell or dispose of the investment) without significantly changing its market value.
- Highly liquid investments – cash or convertible to cash within three business days or less
- Moderately liquid investments – convertible to cash in three to seven calendar days
- Less liquid investments – can be sold or disposed of, but not settled, within seven calendar days
- Illiquid investments – cannot be sold or disposed of within seven calendar days
Liquidity classification determinations take into account a variety of factors including various market, trading and investment-specific considerations, as well as market depth, and generally utilize analysis from a third-party liquidity metrics service.
The Liquidity Rule places a 15% limit on a fund’s illiquid investments and requires funds that do not primarily hold assets that are highly liquid investments to determine and maintain a minimum percentage of the fund’s net assets to be invested in highly liquid investments (highly liquid investment minimum or HLIM). The Program includes provisions reasonably designed to comply with the 15% limit on illiquid investments and for determining, periodically reviewing and complying with the HLIM requirement as applicable.
At a recent meeting of the Fund’s Board of Trustees, the LRM Committee provided a written report to the Board pertaining to the operation, adequacy, and effectiveness of implementation of the Program for the annual period from December 1, 2019 through November 30, 2020. The report concluded that the Program has been implemented and is operating effectively and is reasonably designed to assess and manage the Fund’s liquidity risk.
Proxy Voting Results
A special meeting of shareholders was held on June 9, 2020. The results of votes taken among shareholders on the proposals before them are reported below. Each vote reported represents one dollar of net asset value held on the record date for the meeting.
PROPOSAL 1
To elect a Board of Trustees.
| | # of
Votes | % of
Votes |
| Dennis J. Dirks |
| Affirmative | 16,477,844,543.945 | 94.954 |
| Withheld | 875,616,757.045 | 5.046 |
| TOTAL | 17,353,461,300.990 | 100.000 |
| Donald F. Donahue |
| Affirmative | 16,475,304,981.550 | 94.940 |
| Withheld | 878,156,319.440 | 5.060 |
| TOTAL | 17,353,461,300.990 | 100.000 |
| Bettina Doulton |
| Affirmative | 16,570,440,321.103 | 95.488 |
| Withheld | 783,020,979.887 | 4.512 |
| TOTAL | 17,353,461,300.990 | 100.000 |
| Vicki L. Fuller |
| Affirmative | 16,590,910,486.905 | 95.606 |
| Withheld | 762,550,814.085 | 4.394 |
| TOTAL | 17,353,461,300.990 | 100.00 |
| Patricia L. Kampling |
| Affirmative | 16,469,872,791.586 | 94.908 |
| Withheld | 883,588,509.404 | 5.092 |
| TOTAL | 17,353,461,300.990 | 100.000 |
| Alan J. Lacy |
| Affirmative | 16,344,655,183.636 | 94.187 |
| Withheld | 1,008,806,117.354 | 5.813 |
| TOTAL | 17,353,461,300.990 | 100.000 |
| Ned C. Lautenbach |
| Affirmative | 15,532,663,704.227 | 89.508 |
| Withheld | 1,820,797,596.763 | 10.492 |
| TOTAL | 17,353,461,300.990 | 100.000 |
| Robert A. Lawrence |
| Affirmative | 16,389,821,876.677 | 94.447 |
| Withheld | 963,639,424.313 | 5.553 |
| TOTAL | 17,353,461,300.990 | 100.000 |
| Joseph Mauriello |
| Affirmative | 16,363,427,626.626 | 94.295 |
| Withheld | 990,033,674.365 | 5.705 |
| TOTAL | 17,353,461,300.990 | 100.000 |
| Cornelia M. Small |
| Affirmative | 16,405,902,888.605 | 94.540 |
| Withheld | 947,558,412.386 | 5.460 |
| TOTAL | 17,353,461,300.990 | 100.000 |
| Garnett A. Smith |
| Affirmative | 16,371,912,270.945 | 94.344 |
| Withheld | 981,549,030.045 | 5.656 |
| TOTAL | 17,353,461,300.990 | 100.000 |
| David M. Thomas |
| Affirmative | 16,365,966,852.048 | 94.310 |
| Withheld | 987,494,448.942 | 5.690 |
| TOTAL | 17,353,461,300.990 | 100.000 |
| Susan Tomasky |
| Affirmative | 16,483,922,579.861 | 94.989 |
| Withheld | 869,538,721.129 | 5.011 |
| TOTAL | 17,353,461,300.990 | 100.000 |
| Michael E. Wiley |
| Affirmative | 16,379,083,262.890 | 94.385 |
| Withheld | 974,378,038.101 | 5.615 |
| TOTAL | 17,353,461,300.990 | 100.000 |
PROPOSAL 2
To convert a fundamental investment policy to a non-fundamental investment policy.
| | # of
Votes | % of
Votes |
| Affirmative | 30,615,294.449 | 60.714 |
| Against | 4,052,405.580 | 8.036 |
| Abstain | 5,129,703.683 | 10.173 |
| Broker Non-Vote | 10,628,203.010 | 21.077 |
| TOTAL | 50,425,606.722 | 100.000 |
| Proposal 1 reflects trust wide proposal and voting results. |
| Proposal 2 was not approved by shareholders. |
SDH-ANN-0621
1.969434.107
Fidelity® High Income Fund
Annual Report
April 30, 2021
Includes Fidelity and Fidelity Advisor share classes
Contents
To view a fund's proxy voting guidelines and proxy voting record for the 12-month period ended June 30, visit http://www.fidelity.com/proxyvotingresults or visit the Securities and Exchange Commission's (SEC) web site at http://www.sec.gov.
You may also call 1-800-544-8544 if you’re an individual investing directly with Fidelity, call 1-800-835-5092 if you’re a plan sponsor or participant with Fidelity as your recordkeeper or call 1-877-208-0098 on institutional accounts or if you’re an advisor or invest through one to request a free copy of the proxy voting guidelines.
Standard & Poor's, S&P and S&P 500 are registered service marks of The McGraw-Hill Companies, Inc. and have been licensed for use by Fidelity Distributors Corporation.
Other third-party marks appearing herein are the property of their respective owners.
All other marks appearing herein are registered or unregistered trademarks or service marks of FMR LLC or an affiliated company. © 2021 FMR LLC. All rights reserved.
This report and the financial statements contained herein are submitted for the general information of the shareholders of the Fund. This report is not authorized for distribution to prospective investors in the Fund unless preceded or accompanied by an effective prospectus.
A fund files its complete schedule of portfolio holdings with the SEC for the first and third quarters of each fiscal year on Form N-PORT. Forms N-PORT are available on the SEC’s web site at http://www.sec.gov. A fund's Forms N-PORT may be reviewed and copied at the SEC’s Public Reference Room in Washington, DC. Information regarding the operation of the SEC's Public Reference Room may be obtained by calling 1-800-SEC-0330.
For a complete list of a fund's portfolio holdings, view the most recent holdings listing, semiannual report, or annual report on Fidelity's web site at http://www.fidelity.com, http://www.institutional.fidelity.com, or http://www.401k.com, as applicable.
NOT FDIC INSURED •MAY LOSE VALUE •NO BANK GUARANTEE
Neither the Fund nor Fidelity Distributors Corporation is a bank.
Note to Shareholders:
Early in 2020, the outbreak and spread of a new coronavirus emerged as a public health emergency that had a major influence on financial markets, primarily based on its impact on the global economy and the outlook for corporate earnings. The virus causes a respiratory disease known as COVID-19. On March 11, 2020 the World Health Organization declared the COVID-19 outbreak a pandemic, citing sustained risk of further global spread.
In the weeks following, as the crisis worsened, we witnessed an escalating human tragedy with wide-scale social and economic consequences from coronavirus-containment measures. The outbreak of COVID-19 prompted a number of measures to limit the spread, including travel and border restrictions, quarantines, and restrictions on large gatherings. In turn, these resulted in lower consumer activity, diminished demand for a wide range of products and services, disruption in manufacturing and supply chains, and – given the wide variability in outcomes regarding the outbreak – significant market uncertainty and volatility. Amid the turmoil, global governments and central banks took unprecedented action to help support consumers, businesses, and the broader economies, and to limit disruption to financial systems.
The situation continues to unfold, and the extent and duration of its impact on financial markets and the economy remain highly uncertain. Extreme events such as the coronavirus crisis are “exogenous shocks” that can have significant adverse effects on mutual funds and their investments. Although multiple asset classes may be affected by market disruption, the duration and impact may not be the same for all types of assets.
Fidelity is committed to helping you stay informed amid news about COVID-19 and during increased market volatility, and we’re taking extra steps to be responsive to customer needs. We encourage you to visit our websites, where we offer ongoing updates, commentary, and analysis on the markets and our funds.
Performance: The Bottom Line
Average annual total return reflects the change in the value of an investment, assuming reinvestment of distributions from dividend income and capital gains (the profits earned upon the sale of securities that have grown in value, if any) and assuming a constant rate of performance each year. The hypothetical investment and the average annual total returns do not reflect the deduction of taxes that a shareholder would pay on fund distributions or the redemption of fund shares. During periods of reimbursement by Fidelity, a fund’s total return will be greater than it would be had the reimbursement not occurred. How a fund did yesterday is no guarantee of how it will do tomorrow.
Average Annual Total Returns
| For the periods ended April 30, 2021 | Past 1 year | Past 5 years | Past 10 years |
| Class A (incl. 4.00% sales charge) | 9.98% | 5.37% | 4.82% |
| Class M (incl. 4.00% sales charge) | 9.97% | 5.36% | 4.81% |
| Class C (incl. contingent deferred sales charge) | 12.68% | 5.84% | 5.05% |
| Fidelity® High Income Fund | 14.89% | 6.39% | 5.32% |
| Class I | 14.85% | 6.35% | 5.31% |
| Class Z | 14.96% | 6.41% | 5.33% |
Class A shares bear a 0.25% 12b-1 fee. The initial offering of Class A shares took place on December 4, 2018. Returns prior to December 4, 2018, are those of Fidelity® High Income Fund, the original class of the fund, which has no 12b-1 fee. Had Class A's 12b-1 fee been reflected, returns prior to December 4, 2018, would have been lower.
Class M shares bear a 0.25% 12b-1 fee. The initial offering of Class M shares took place on December 4, 2018. Returns prior to December 4, 2018, are those of of Fidelity® High Income Fund, the original class of the fund, which has no 12b-1 fee. Had Class M's 12b-1 fee been reflected, returns prior to December 4, 2018, would have been lower.
Class C shares bear a 1.00% 12b-1 fee. The initial offering of Class C shares took place on December 4, 2018. Returns prior to December 4, 2018, are those of Fidelity® High Income Fund, the original class of the fund, which has no 12b-1 fee. Had Class C's 12b-1 fee been reflected, returns prior to December 4, 2018, would have been lower.
Class C shares' contingent deferred sales charges included in the past one year, past five years and past ten years total return figures are 1%, 0% and 0%, respectively.
The initial offering of Class I shares took place on December 4, 2018. Returns prior to December 4, 2018 are those of Fidelity® High Income Fund, the original class of the fund.
The initial offering of Class Z shares took place on December 4, 2018. Returns prior to December 4, 2018 are those of Fidelity® High Income Fund, the original class of the fund.
$10,000 Over 10 Years
Let's say hypothetically that $10,000 was invested in Fidelity® High Income Fund, a class of the fund, on April 30, 2011.
The chart shows how the value of your investment would have changed, and also shows how the ICE® BofA® US High Yield Constrained Index performed over the same period.

| Period Ending Values |
| $16,796 | Fidelity® High Income Fund |
| $18,348 | ICE® BofA® US High Yield Constrained Index |
Management's Discussion of Fund Performance
Market Recap: The ICE BofA
® US High Yield Constrained Index gained 20.01% for the 12 months ending April 30, 2021, as high-yield bonds staged a historic rebound following a steep but brief decline due to the early-2020 outbreak and spread of COVID-19. A confluence of powerful forces propelled risk assets, including high yield, from March 24 through late August. The rally slowed in September, when high yield modestly retreated amid Congress’s inability to reach a deal on additional fiscal stimulus, as well as uncertainty about the election. But as the calendar turned, investors grew hopeful. The rollout of two COVID-19 vaccines was underway, the U.S. Federal Reserve pledged to hold interest rates near zero until the economy recovered, and the federal government planned to deploy trillions of dollars in aid to boost consumers and the economy. For the full 12 months, lower-rated bonds (+38%) fared best. In contrast, the B and BB credit tiers rose 18% and 17%, respectively. By industry, publishing/printing (+48%) and air transportation (+47%) led the way, followed closely by energy (+44%), which was boosted by a rally in the price of oil. Energy represented 13% of the index the past 12 months. Entertainment/film also stood out, advancing roughly 41%. In contrast, notable “laggards” included cable/satellite TV and environmental (+7% each). Utilities and restaurants each gained 9%, while telecommunications, a sizable index component, rose 10% for the period.
Comments from Co-Managers Alexandre Karam and Michael Weaver: For the fiscal year, the fund's share classes (excluding sales charges, if applicable) gained roughly 14% to 15%, underperforming the 20.01% result of the benchmark, the ICE BofA
® US High Yield Constrained Index. The fund's core allocation to high-yield bonds gained 15.80% the past 12 months and detracted from performance versus the benchmark, as did our position in cash in a strong market. By industry, the primary detractor from performance versus the benchmark was an overweighting in telecommunications. Security selection and an overweighting in energy and an overweighting in cable/satellite TV also hurt. The biggest individual relative detractor was an overweight position in Altice Financial (+8%), which was among our biggest holdings. Another notable relative detractor was an overweighting in JBS (+10%), also among the largest holdings in the fund this period. Also hindering performance was our outsized stake in Charter Communications, which gained roughly 4%. Charter Communications was one of the biggest holdings in the fund. Conversely, the top contributors to performance versus the benchmark were security selection and an underweighting in food & drug retail. Also boosting the fund's relative result were an overweighting in aerospace and an underweighting in health care. The biggest individual relative contributor was an overweight position in Denbury (+352%), a stake that was not held at the end of this period. Another notable relative contributor was an overweighting in Summit Midstream, which we sold by period end. It also helped to have outsized exposure to Crestwood Midstream (+56%), one of the largest holdings as of April 30. By quality, security choices among bonds rated CCC and B detracted the most versus the benchmark. Notable changes in positioning include increased exposure to the energy and aerospace industries.
The views expressed above reflect those of the portfolio manager(s) only through the end of the period as stated on the cover of this report and do not necessarily represent the views of Fidelity or any other person in the Fidelity organization. Any such views are subject to change at any time based upon market or other conditions and Fidelity disclaims any responsibility to update such views. These views may not be relied on as investment advice and, because investment decisions for a Fidelity fund are based on numerous factors, may not be relied on as an indication of trading intent on behalf of any Fidelity fund.
Investment Summary (Unaudited)
Top Five Holdings as of April 30, 2021
| (by issuer, excluding cash equivalents) | % of fund's net assets |
| Altice France SA | 2.4 |
| TransDigm, Inc. | 2.3 |
| Occidental Petroleum Corp. | 2.2 |
| CCO Holdings LLC/CCO Holdings Capital Corp. | 2.1 |
| C&W Senior Financing Designated Activity Co. | 1.9 |
| | 10.9 |
Top Five Market Sectors as of April 30, 2021
| | % of fund's net assets |
| Energy | 15.7 |
| Telecommunications | 12.7 |
| Cable/Satellite TV | 6.4 |
| Healthcare | 6.1 |
| Aerospace | 5.9 |
Quality Diversification (% of fund's net assets)
| As of April 30, 2021 |
| | BBB | 0.2% |
| | BB | 30.4% |
| | B | 49.1% |
| | CCC,CC,C | 15.8% |
| | Not Rated | 0.4% |
| | Equities | 0.6% |
| | Short-Term Investments and Net Other Assets | 3.5% |

We have used ratings from Moody's Investors Service, Inc. Where Moody's® ratings are not available, we have used S&P® ratings. All ratings are as of the date indicated and do not reflect subsequent changes.
Asset Allocation (% of fund's net assets)
| As of April 30, 2021* |
| | Nonconvertible Bonds | 91.6% |
| | Convertible Bonds, Preferred Stocks | 1.3% |
| | Common Stocks | 0.6% |
| | Bank Loan Obligations | 3.0% |
| | Short-Term Investments and Net Other Assets (Liabilities) | 3.5% |

* Foreign investments – 21.8%
Schedule of Investments April 30, 2021
Showing Percentage of Net Assets
| Corporate Bonds - 92.9% | | | |
| | | Principal Amount (000s) | Value (000s) |
| Convertible Bonds - 1.3% | | | |
| Broadcasting - 1.1% | | | |
| DISH Network Corp.: | | | |
| 2.375% 3/15/24 | | $17,054 | $16,606 |
| 3.375% 8/15/26 | | 78,157 | 82,260 |
| | | | 98,866 |
| Energy - 0.2% | | | |
| Mesquite Energy, Inc.: | | | |
| 15% 7/15/23 (a)(b) | | 2,944 | 6,770 |
| 15% 7/15/23 (a)(b) | | 5,081 | 10,619 |
| | | | 17,389 |
|
| TOTAL CONVERTIBLE BONDS | | | 116,255 |
|
| Nonconvertible Bonds - 91.6% | | | |
| Aerospace - 5.9% | | | |
| Allegheny Technologies, Inc.: | | | |
| 5.875% 12/1/27 | | 58,034 | 61,298 |
| 7.875% 8/15/23 | | 3,215 | 3,500 |
| BBA U.S. Holdings, Inc.: | | | |
| 4% 3/1/28 (c) | | 12,000 | 12,090 |
| 5.375% 5/1/26 (c) | | 22,816 | 23,329 |
| Bombardier, Inc.: | | | |
| 6% 10/15/22 (c) | | 9,030 | 9,032 |
| 6.125% 1/15/23 (c) | | 4,738 | 4,967 |
| 7.5% 12/1/24 (c) | | 1,325 | 1,345 |
| 7.5% 3/15/25 (c) | | 58,943 | 58,832 |
| 7.875% 4/15/27 (c) | | 38,642 | 38,545 |
| BWX Technologies, Inc.: | | | |
| 4.125% 6/30/28 (c) | | 19,980 | 20,330 |
| 5.375% 7/15/26 (c) | | 17,280 | 17,830 |
| Howmet Aerospace, Inc. 6.75% 1/15/28 | | 900 | 1,079 |
| Kaiser Aluminum Corp.: | | | |
| 4.625% 3/1/28 (c) | | 32,790 | 33,692 |
| 6.5% 5/1/25 (c) | | 9,683 | 10,264 |
| Moog, Inc. 4.25% 12/15/27 (c) | | 12,119 | 12,452 |
| Science Applications International Corp. 4.875% 4/1/28 (c) | | 1,990 | 2,052 |
| TransDigm UK Holdings PLC 6.875% 5/15/26 | | 5,135 | 5,398 |
| TransDigm, Inc.: | | | |
| 4.625% 1/15/29 (c) | | 27,275 | 26,880 |
| 5.5% 11/15/27 | | 81,787 | 85,058 |
| 6.25% 3/15/26 (c) | | 34,512 | 36,540 |
| 7.5% 3/15/27 | | 6,182 | 6,622 |
| 8% 12/15/25 (c) | | 35,940 | 39,040 |
| | | | 510,175 |
| Automotive & Auto Parts - 0.3% | | | |
| Ford Motor Credit Co. LLC: | | | |
| 4.125% 8/17/27 | | 6,250 | 6,532 |
| 5.113% 5/3/29 | | 17,265 | 18,857 |
| Real Hero Merger Sub 2 6.25% 2/1/29 (c) | | 2,355 | 2,436 |
| | | | 27,825 |
| Banks & Thrifts - 0.4% | | | |
| Ally Financial, Inc.: | | | |
| 8% 11/1/31 | | 6,242 | 8,581 |
| 8% 11/1/31 | | 20,176 | 28,377 |
| | | | 36,958 |
| Broadcasting - 1.7% | | | |
| Diamond Sports Group LLC/Diamond Sports Finance Co. 5.375% 8/15/26 (c) | | 30,205 | 22,050 |
| Gray Television, Inc. 4.75% 10/15/30 (c) | | 7,205 | 7,205 |
| Sinclair Television Group, Inc.: | | | |
| 5.125% 2/15/27 (c) | | 18,545 | 18,360 |
| 5.5% 3/1/30 (c) | | 8,135 | 8,084 |
| Sirius XM Radio, Inc.: | | | |
| 4.125% 7/1/30 (c) | | 26,000 | 26,000 |
| 5% 8/1/27 (c) | | 20,227 | 21,182 |
| 5.5% 7/1/29 (c) | | 13,105 | 14,162 |
| Tegna, Inc.: | | | |
| 4.625% 3/15/28 | | 9,565 | 9,768 |
| 5% 9/15/29 | | 3,470 | 3,600 |
| Univision Communications, Inc. 6.625% 6/1/27 (c) | | 14,610 | 15,834 |
| | | | 146,245 |
| Building Materials - 0.2% | | | |
| Advanced Drain Systems, Inc. 5% 9/30/27 (c) | | 18,966 | 19,850 |
| Cable/Satellite TV - 6.2% | | | |
| CCO Holdings LLC/CCO Holdings Capital Corp.: | | | |
| 4.25% 2/1/31 (c) | | 25,044 | 25,044 |
| 4.5% 8/15/30 (c) | | 29,635 | 30,150 |
| 4.5% 5/1/32 (c) | | 50,861 | 51,370 |
| 4.5% 6/1/33 (c) | | 15,960 | 16,085 |
| 4.75% 3/1/30 (c) | | 11,030 | 11,513 |
| 5% 2/1/28 (c) | | 22,338 | 23,343 |
| 5.125% 5/1/27 (c) | | 18,817 | 19,693 |
| CSC Holdings LLC: | | | |
| 4.125% 12/1/30 (c) | | 10,994 | 10,939 |
| 4.625% 12/1/30 (c) | | 100,969 | 98,697 |
| 5.375% 2/1/28 (c) | | 10,000 | 10,524 |
| 5.5% 4/15/27 (c) | | 12,869 | 13,494 |
| 7.5% 4/1/28 (c) | | 4,650 | 5,121 |
| Dolya Holdco 18 DAC 5% 7/15/28 (c) | | 23,443 | 23,730 |
| Radiate Holdco LLC/Radiate Financial Service Ltd.: | | | |
| 4.5% 9/15/26 (c) | | 16,894 | 17,190 |
| 6.5% 9/15/28 (c) | | 41,013 | 42,697 |
| Telenet Finance Luxembourg Notes SARL 5.5% 3/1/28 (c) | | 15,200 | 16,097 |
| Virgin Media Finance PLC 5% 7/15/30 (c) | | 16,050 | 16,003 |
| Virgin Media Secured Finance PLC: | | | |
| 4.5% 8/15/30 (c) | | 26,115 | 26,233 |
| 5.5% 5/15/29 (c) | | 9,873 | 10,557 |
| Ziggo Bond Co. BV: | | | |
| 5.125% 2/28/30 (c) | | 26,465 | 27,105 |
| 6% 1/15/27 (c) | | 2,185 | 2,283 |
| Ziggo BV: | | | |
| 4.875% 1/15/30 (c) | | 15,385 | 15,811 |
| 5.5% 1/15/27 (c) | | 18,372 | 19,108 |
| | | | 532,787 |
| Capital Goods - 0.4% | | | |
| Vertical U.S. Newco, Inc. 5.25% 7/15/27 (c) | | 36,859 | 38,587 |
| Chemicals - 5.0% | | | |
| Axalta Coating Systems/Dutch Holding BV 4.75% 6/15/27 (c) | | 12,045 | 12,617 |
| Bausch Health Companies, Inc. 6.25% 2/15/29 (c) | | 25,745 | 27,225 |
| CF Industries Holdings, Inc.: | | | |
| 4.95% 6/1/43 | | 14,797 | 17,239 |
| 5.15% 3/15/34 | | 6,929 | 8,107 |
| 5.375% 3/15/44 | | 7,284 | 8,910 |
| Consolidated Energy Finance SA: | | | |
| 3 month U.S. LIBOR + 3.750% 3.9339% 6/15/22 (c)(d)(e) | | 11,366 | 11,335 |
| 6.5% 5/15/26 (c) | | 23,785 | 23,607 |
| 6.875% 6/15/25 (c) | | 5,163 | 5,182 |
| Element Solutions, Inc. 3.875% 9/1/28 (c) | | 359 | 358 |
| Kronos Acquisition Holdings, Inc. / KIK Custom Products, Inc.: | | | |
| 5% 12/31/26 (c) | | 21,990 | 22,182 |
| 7% 12/31/27 (c) | | 2,120 | 2,056 |
| Methanex Corp.: | | | |
| 5.125% 10/15/27 | | 21,756 | 22,958 |
| 5.25% 12/15/29 | | 7,665 | 8,096 |
| 5.65% 12/1/44 | | 15,629 | 15,909 |
| NOVA Chemicals Corp.: | | | |
| 4.25% 5/15/29 (c)(f) | | 9,835 | 9,737 |
| 5.25% 6/1/27 (c) | | 17,015 | 18,078 |
| Olin Corp.: | | | |
| 5% 2/1/30 | | 26,382 | 27,767 |
| 5.125% 9/15/27 | | 2,686 | 2,804 |
| 5.625% 8/1/29 | | 33,548 | 36,293 |
| The Chemours Co. LLC: | | | |
| 5.375% 5/15/27 | | 41,489 | 44,497 |
| 5.75% 11/15/28 (c) | | 60,785 | 64,573 |
| Valvoline, Inc. 4.25% 2/15/30 (c) | | 32,930 | 33,753 |
| W. R. Grace & Co.-Conn. 4.875% 6/15/27 (c) | | 6,970 | 7,266 |
| | | | 430,549 |
| Consumer Products - 0.7% | | | |
| Central Garden & Pet Co. 4.125% 10/15/30 | | 359 | 370 |
| Mattel, Inc.: | | | |
| 3.75% 4/1/29 (c) | | 13,775 | 14,117 |
| 5.45% 11/1/41 | | 5,628 | 6,418 |
| 6.2% 10/1/40 | | 15,890 | 19,068 |
| Newell Brands, Inc. 5.875% 4/1/36 | | 1,974 | 2,452 |
| Prestige Brands, Inc. 3.75% 4/1/31 (c) | | 10,880 | 10,444 |
| Spectrum Brands Holdings, Inc. 3.875% 3/15/31 (c) | | 5,225 | 5,121 |
| | | | 57,990 |
| Containers - 1.5% | | | |
| Ardagh Packaging Finance PLC/Ardagh MP Holdings U.S.A., Inc.: | | | |
| 4.125% 8/15/26 (c) | | 735 | 756 |
| 5.25% 8/15/27 (c) | | 5,482 | 5,603 |
| 5.25% 8/15/27 (c) | | 5,939 | 6,070 |
| 6% 2/15/25 (c) | | 8,555 | 8,827 |
| Flex Acquisition Co., Inc.: | | | |
| 6.875% 1/15/25 (c) | | 32,878 | 33,412 |
| 7.875% 7/15/26 (c) | | 20,575 | 21,527 |
| OI European Group BV 4% 3/15/23 (c) | | 3,094 | 3,179 |
| Owens-Brockway Glass Container, Inc. 5.375% 1/15/25 (c) | | 7,524 | 8,004 |
| Trivium Packaging Finance BV: | | | |
| 5.5% 8/15/26 (c) | | 21,512 | 22,507 |
| 8.5% 8/15/27 (c) | | 19,496 | 20,861 |
| | | | 130,746 |
| Diversified Financial Services - 2.5% | | | |
| Icahn Enterprises LP/Icahn Enterprises Finance Corp.: | | | |
| 4.375% 2/1/29 (c) | | 15,700 | 15,228 |
| 4.75% 9/15/24 | | 15,905 | 16,667 |
| 5.25% 5/15/27 (c) | | 10,700 | 10,914 |
| 5.25% 5/15/27 | | 72,800 | 74,256 |
| 6.25% 5/15/26 | | 29,071 | 30,644 |
| Ladder Capital Finance Holdings LLLP/Ladder Capital Finance Corp. 4.25% 2/1/27 (c) | | 7,320 | 7,187 |
| MSCI, Inc. 3.875% 2/15/31 (c) | | 1,130 | 1,158 |
| Springleaf Finance Corp.: | | | |
| 6.875% 3/15/25 | | 8,214 | 9,333 |
| 7.125% 3/15/26 | | 15,263 | 17,839 |
| VMED O2 UK Financing I PLC 4.25% 1/31/31 (c) | | 30,384 | 29,397 |
| | | | 212,623 |
| Diversified Media - 0.9% | | | |
| Advantage Sales & Marketing, Inc. 6.5% 11/15/28 (c) | | 30,608 | 32,368 |
| Nielsen Finance LLC/Nielsen Finance Co.: | | | |
| 5.625% 10/1/28 (c) | | 14,272 | 15,218 |
| 5.875% 10/1/30 (c) | | 14,217 | 15,568 |
| Terrier Media Buyer, Inc. 8.875% 12/15/27 (c) | | 15,982 | 17,360 |
| | | | 80,514 |
| Energy - 15.2% | | | |
| Apache Corp.: | | | |
| 4.25% 1/15/30 | | 3,560 | 3,573 |
| 5.1% 9/1/40 | | 15,595 | 15,987 |
| 5.35% 7/1/49 | | 2,450 | 2,450 |
| 7.375% 8/15/47 | | 2,085 | 2,314 |
| California Resources Corp. 7.125% 2/1/26 (c) | | 12,225 | 12,522 |
| Cheniere Energy Partners LP 5.625% 10/1/26 | | 25,336 | 26,413 |
| Cheniere Energy, Inc. 4.625% 10/15/28 (c) | | 16,175 | 16,865 |
| Citgo Petroleum Corp.: | | | |
| 6.375% 6/15/26 (c) | | 57,728 | 59,177 |
| 7% 6/15/25 (c) | | 30,576 | 31,532 |
| CNX Resources Corp. 6% 1/15/29 (c) | | 3,450 | 3,682 |
| Comstock Resources, Inc.: | | | |
| 6.75% 3/1/29 (c) | | 13,465 | 13,754 |
| 7.5% 5/15/25 (c) | | 3,536 | 3,652 |
| 9.75% 8/15/26 | | 13,685 | 14,879 |
| Crestwood Midstream Partners LP/Crestwood Midstream Finance Corp.: | | | |
| 5.625% 5/1/27 (c) | | 62,763 | 63,861 |
| 5.75% 4/1/25 | | 47,503 | 48,750 |
| 6% 2/1/29 (c) | | 46,841 | 48,422 |
| CVR Energy, Inc.: | | | |
| 5.25% 2/15/25 (c) | | 24,704 | 24,828 |
| 5.75% 2/15/28 (c) | | 34,653 | 35,073 |
| DCP Midstream Operating LP 8.125% 8/16/30 | | 8,383 | 10,898 |
| Endeavor Energy Resources LP/EER Finance, Inc.: | | | |
| 5.5% 1/30/26 (c) | | 6,495 | 6,726 |
| 5.75% 1/30/28 (c) | | 12,633 | 13,486 |
| 6.625% 7/15/25 (c) | | 2,823 | 3,006 |
| EnLink Midstream LLC 5.625% 1/15/28 (c) | | 3,195 | 3,303 |
| EnLink Midstream Partners LP: | | | |
| 5.05% 4/1/45 | | 4,190 | 3,446 |
| 5.45% 6/1/47 | | 8,760 | 7,380 |
| 5.6% 4/1/44 | | 1,490 | 1,285 |
| EQM Midstream Partners LP: | | | |
| 4.75% 1/15/31 (c) | | 20,190 | 19,986 |
| 5.5% 7/15/28 | | 905 | 961 |
| 6.5% 7/1/27 (c) | | 11,415 | 12,605 |
| EQT Corp. 3.9% 10/1/27 | | 12,100 | 12,615 |
| Global Partners LP/GLP Finance Corp. 6.875% 1/15/29 | | 14,510 | 15,689 |
| Hess Midstream Partners LP: | | | |
| 5.125% 6/15/28 (c) | | 16,860 | 17,450 |
| 5.625% 2/15/26 (c) | | 25,030 | 25,969 |
| Hilcorp Energy I LP/Hilcorp Finance Co. 6.25% 11/1/28 (c) | | 5,470 | 5,678 |
| Holly Energy Partners LP/Holly Energy Finance Corp. 5% 2/1/28 (c) | | 14,960 | 15,446 |
| MEG Energy Corp.: | | | |
| 5.875% 2/1/29 (c) | | 9,360 | 9,594 |
| 7.125% 2/1/27 (c) | | 5,748 | 6,138 |
| New Fortress Energy LLC: | | | |
| 6.5% 9/30/26 (c) | | 59,435 | 60,643 |
| 6.75% 9/15/25 (c) | | 62,822 | 65,001 |
| NGL Energy Operating LLC/NGL Energy Finance Corp. 7.5% 2/1/26 (c) | | 56,470 | 59,152 |
| Occidental Petroleum Corp.: | | | |
| 2.9% 8/15/24 | | 4,620 | 4,608 |
| 3% 2/15/27 | | 4,535 | 4,328 |
| 3.4% 4/15/26 | | 6,655 | 6,581 |
| 3.5% 8/15/29 | | 20,205 | 19,296 |
| 4.2% 3/15/48 | | 7,435 | 6,266 |
| 4.3% 8/15/39 | | 3,290 | 2,903 |
| 4.4% 4/15/46 | | 11,340 | 9,979 |
| 4.4% 8/15/49 | | 9,200 | 7,958 |
| 5.55% 3/15/26 | | 16,090 | 17,277 |
| 6.125% 1/1/31 | | 21,450 | 23,863 |
| 6.2% 3/15/40 | | 3,200 | 3,400 |
| 6.45% 9/15/36 | | 21,705 | 24,662 |
| 6.625% 9/1/30 | | 10,315 | 11,759 |
| 7.5% 5/1/31 | | 26,965 | 32,088 |
| 7.875% 9/15/31 | | 2,230 | 2,709 |
| 8.875% 7/15/30 | | 9,235 | 11,867 |
| PBF Holding Co. LLC/PBF Finance Corp. 9.25% 5/15/25 (c) | | 52,565 | 54,930 |
| Rockies Express Pipeline LLC: | | | |
| 4.8% 5/15/30 (c) | | 3,715 | 3,645 |
| 4.95% 7/15/29 (c) | | 8,414 | 8,572 |
| 6.875% 4/15/40 (c) | | 3,128 | 3,359 |
| Sanchez Energy Corp. 7.25% 2/15/23 (b)(c)(g) | | 28,768 | 0 |
| Sunoco LP/Sunoco Finance Corp.: | | | |
| 4.5% 5/15/29 (c) | | 20,179 | 20,381 |
| 5.875% 3/15/28 | | 9,770 | 10,332 |
| 6% 4/15/27 | | 350 | 368 |
| Superior Plus LP / Superior General Partner, Inc. 4.5% 3/15/29 (c) | | 5,850 | 5,961 |
| Tallgrass Energy Partners LP / Tallgrass Energy Finance Corp.: | | | |
| 5.5% 1/15/28 (c) | | 8,250 | 8,147 |
| 6% 3/1/27 (c) | | 19,652 | 19,941 |
| 6% 12/31/30 (c) | | 10,480 | 10,506 |
| 7.5% 10/1/25 (c) | | 1,840 | 2,010 |
| Targa Resources Partners LP/Targa Resources Partners Finance Corp.: | | | |
| 4% 1/15/32 (c) | | 14,995 | 14,733 |
| 4.875% 2/1/31 (c) | | 47,385 | 49,444 |
| 5% 1/15/28 | | 2,000 | 2,106 |
| 5.375% 2/1/27 | | 460 | 478 |
| 5.5% 3/1/30 | | 8,850 | 9,572 |
| 5.875% 4/15/26 | | 7,450 | 7,804 |
| 6.5% 7/15/27 | | 4,800 | 5,220 |
| 6.875% 1/15/29 | | 15,000 | 16,838 |
| Transocean Guardian Ltd. 5.875% 1/15/24 (c) | | 7,014 | 6,523 |
| Transocean Phoenix 2 Ltd. 7.75% 10/15/24 (c) | | 1,328 | 1,318 |
| Transocean Pontus Ltd. 6.125% 8/1/25 (c) | | 3,505 | 3,418 |
| Transocean Poseidon Ltd. 6.875% 2/1/27 (c) | | 4,835 | 4,593 |
| Transocean Proteus Ltd. 6.25% 12/1/24 (c) | | 1,602 | 1,570 |
| Transocean Sentry Ltd. 5.375% 5/15/23 (c) | | 7,431 | 7,041 |
| Western Gas Partners LP: | | | |
| 4.35% 2/1/25 | | 10,035 | 10,609 |
| 4.65% 7/1/26 | | 3,750 | 4,015 |
| 5.3% 2/1/30 | | 18,845 | 20,565 |
| | | | 1,307,734 |
| Environmental - 0.7% | | | |
| Darling Ingredients, Inc. 5.25% 4/15/27 (c) | | 12,680 | 13,330 |
| LBC Tank Terminals Holding Netherlands BV 6.875% 5/15/23 (c) | | 32,658 | 32,454 |
| Stericycle, Inc. 3.875% 1/15/29 (c) | | 12,875 | 12,843 |
| | | | 58,627 |
| Food & Drug Retail - 0.4% | | | |
| Albertsons Companies LLC/Safeway, Inc./New Albertson's, Inc./Albertson's LLC: | | | |
| 3.5% 3/15/29 (c) | | 31,460 | 30,202 |
| 4.875% 2/15/30 (c) | | 2,440 | 2,540 |
| Emergent BioSolutions, Inc. 3.875% 8/15/28 (c) | | 359 | 337 |
| Murphy Oil U.S.A., Inc. 3.75% 2/15/31 (c) | | 3,305 | 3,255 |
| | | | 36,334 |
| Food/Beverage/Tobacco - 3.8% | | | |
| C&S Group Enterprises LLC 5% 12/15/28 (c) | | 24,255 | 24,102 |
| JBS U.S.A. LLC/JBS U.S.A. Finance, Inc. 6.75% 2/15/28 (c) | | 40,153 | 44,365 |
| JBS U.S.A. Lux SA / JBS Food Co.: | | | |
| 5.5% 1/15/30 (c) | | 16,176 | 17,794 |
| 6.5% 4/15/29 (c) | | 46,188 | 51,846 |
| Performance Food Group, Inc.: | | | |
| 5.5% 10/15/27 (c) | | 13,152 | 13,860 |
| 6.875% 5/1/25 (c) | | 14,109 | 15,081 |
| Post Holdings, Inc.: | | | |
| 4.5% 9/15/31 (c) | | 20,060 | 19,916 |
| 4.625% 4/15/30 (c) | | 20,281 | 20,484 |
| 5.5% 12/15/29 (c) | | 25,982 | 27,971 |
| 5.625% 1/15/28 (c) | | 11,750 | 12,382 |
| 5.75% 3/1/27 (c) | | 4,510 | 4,724 |
| Primo Water Holdings, Inc.: | | | |
| 4.375% 4/30/29 (c) | | 25,215 | 25,160 |
| 5.5% 4/1/25 (c) | | 8,092 | 8,316 |
| TreeHouse Foods, Inc. 4% 9/1/28 | | 9,915 | 9,853 |
| Triton Water Holdings, Inc. 6.25% 4/1/29 (c) | | 3,840 | 3,888 |
| U.S. Foods, Inc.: | | | |
| 4.75% 2/15/29 (c) | | 10,815 | 10,910 |
| 6.25% 4/15/25 (c) | | 13,720 | 14,573 |
| | | | 325,225 |
| Gaming - 4.6% | | | |
| Affinity Gaming LLC 6.875% 12/15/27 (c) | | 20,285 | 21,533 |
| Boyd Gaming Corp.: | | | |
| 4.75% 12/1/27 | | 5,860 | 6,007 |
| 6% 8/15/26 | | 8,224 | 8,532 |
| 6.375% 4/1/26 | | 14,929 | 15,414 |
| Caesars Entertainment, Inc.: | | | |
| 6.25% 7/1/25 (c) | | 20,964 | 22,289 |
| 8.125% 7/1/27 (c) | | 51,114 | 56,797 |
| Caesars Resort Collection LLC 5.25% 10/15/25 (c) | | 45,745 | 46,117 |
| Golden Entertainment, Inc. 7.625% 4/15/26 (c) | | 26,551 | 28,327 |
| Golden Nugget, Inc. 6.75% 10/15/24 (c) | | 24,311 | 24,615 |
| MCE Finance Ltd.: | | | |
| 4.875% 6/6/25 (c) | | 7,170 | 7,357 |
| 5.375% 12/4/29 (c) | | 7,753 | 8,253 |
| 5.75% 7/21/28 (c) | | 11,596 | 12,471 |
| MGM Growth Properties Operating Partnership LP: | | | |
| 4.5% 9/1/26 | | 22,885 | 24,172 |
| 4.5% 1/15/28 | | 1,429 | 1,490 |
| 5.75% 2/1/27 | | 4,396 | 4,903 |
| MGM Resorts International: | | | |
| 4.75% 10/15/28 | | 359 | 379 |
| 5.5% 4/15/27 | | 359 | 392 |
| Stars Group Holdings BV 7% 7/15/26 (c) | | 15,357 | 16,048 |
| Station Casinos LLC: | | | |
| 4.5% 2/15/28 (c) | | 35,080 | 35,168 |
| 5% 10/1/25 (c) | | 4,784 | 4,850 |
| VICI Properties, Inc. 4.25% 12/1/26 (c) | | 9,370 | 9,663 |
| Wynn Las Vegas LLC/Wynn Las Vegas Capital Corp. 5.25% 5/15/27 (c) | | 11,576 | 12,227 |
| Wynn Macau Ltd.: | | | |
| 4.875% 10/1/24 (c) | | 11,043 | 11,192 |
| 5.5% 10/1/27 (c) | | 8,533 | 8,908 |
| 5.625% 8/26/28 (c) | | 7,000 | 7,341 |
| | | | 394,445 |
| Healthcare - 5.8% | | | |
| AMN Healthcare 4% 4/15/29 (c) | | 359 | 359 |
| Avantor Funding, Inc. 4.625% 7/15/28 (c) | | 18,360 | 19,232 |
| Bausch Health Companies, Inc.: | | | |
| 5% 1/30/28 (c) | | 17,560 | 17,823 |
| 5% 2/15/29 (c) | | 4,835 | 4,842 |
| 5.25% 1/30/30 (c) | | 10,843 | 10,897 |
| 5.25% 2/15/31 (c) | | 16,920 | 16,943 |
| Centene Corp.: | | | |
| 3.375% 2/15/30 | | 14,870 | 14,926 |
| 4.25% 12/15/27 | | 7,145 | 7,489 |
| 4.625% 12/15/29 | | 8,735 | 9,456 |
| 5.375% 6/1/26 (c) | | 4,580 | 4,771 |
| Charles River Laboratories International, Inc.: | | | |
| 3.75% 3/15/29 (c) | | 5,825 | 5,927 |
| 4.25% 5/1/28 (c) | | 1,503 | 1,565 |
| Community Health Systems, Inc.: | | | |
| 4.75% 2/15/31 (c) | | 17,530 | 17,399 |
| 5.625% 3/15/27 (c) | | 12,090 | 12,815 |
| 6% 1/15/29 (c) | | 9,675 | 10,185 |
| 6.875% 4/15/29 (c) | | 9,670 | 10,105 |
| 8% 3/15/26 (c) | | 40,496 | 43,634 |
| 8.125% 6/30/24 (c) | | 9,675 | 10,098 |
| CTR Partnership LP/CareTrust Capital Corp. 5.25% 6/1/25 | | 8,669 | 8,926 |
| DaVita HealthCare Partners, Inc. 4.625% 6/1/30 (c) | | 43,345 | 43,887 |
| Hologic, Inc.: | | | |
| 3.25% 2/15/29 (c) | | 14,085 | 13,839 |
| 4.625% 2/1/28 (c) | | 259 | 273 |
| IQVIA, Inc. 5% 10/15/26 (c) | | 3,785 | 3,913 |
| Jazz Securities DAC 4.375% 1/15/29 (c) | | 12,765 | 13,052 |
| Molina Healthcare, Inc. 3.875% 11/15/30 (c) | | 6,605 | 6,803 |
| Organon Finance 1 LLC: | | | |
| 4.125% 4/30/28 (c) | | 16,930 | 17,345 |
| 5.125% 4/30/31 (c) | | 10,775 | 11,180 |
| Owens & Minor, Inc. 4.5% 3/31/29 (c) | | 5,115 | 5,165 |
| Radiology Partners, Inc. 9.25% 2/1/28 (c) | | 16,050 | 17,615 |
| RP Escrow Issuer LLC 5.25% 12/15/25 (c) | | 26,635 | 27,725 |
| Teleflex, Inc. 4.25% 6/1/28 (c) | | 3,015 | 3,113 |
| Tenet Healthcare Corp.: | | | |
| 4.625% 6/15/28 (c) | | 7,408 | 7,654 |
| 4.875% 1/1/26 (c) | | 8,160 | 8,478 |
| 5.125% 5/1/25 | | 31,738 | 32,119 |
| 6.125% 10/1/28 (c) | | 33,885 | 35,749 |
| 6.25% 2/1/27 (c) | | 6,139 | 6,438 |
| U.S. Renal Care, Inc. 10.625% 7/15/27 (c) | | 7,989 | 8,448 |
| Valeant Pharmaceuticals International, Inc. 8.5% 1/31/27 (c) | | 4,269 | 4,755 |
| Vizient, Inc. 6.25% 5/15/27 (c) | | 1,190 | 1,260 |
| | | | 496,203 |
| Homebuilders/Real Estate - 1.8% | | | |
| Howard Hughes Corp.: | | | |
| 4.125% 2/1/29 (c) | | 6,470 | 6,405 |
| 4.375% 2/1/31 (c) | | 6,470 | 6,405 |
| Realogy Group LLC/Realogy Co-Issuer Corp. 5.75% 1/15/29 (c) | | 15,655 | 16,242 |
| Service Properties Trust: | | | |
| 4.375% 2/15/30 | | 6,183 | 5,750 |
| 4.95% 2/15/27 | | 7,960 | 7,821 |
| 4.95% 10/1/29 | | 7,340 | 7,092 |
| 5.5% 12/15/27 | | 6,850 | 7,213 |
| Uniti Group LP / Uniti Group Finance, Inc.: | | | |
| 4.75% 4/15/28 (c) | | 10,170 | 10,132 |
| 6.5% 2/15/29 (c) | | 85,065 | 84,558 |
| | | | 151,618 |
| Hotels - 0.5% | | | |
| Hilton Domestic Operating Co., Inc.: | | | |
| 3.625% 2/15/32 (c) | | 18,115 | 17,815 |
| 3.75% 5/1/29 (c) | | 2,375 | 2,381 |
| 4% 5/1/31 (c) | | 8,565 | 8,651 |
| Hilton Worldwide Finance LLC/Hilton Worldwide Finance Corp. 4.875% 4/1/27 | | 573 | 595 |
| NCL Finance Ltd. 6.125% 3/15/28 (c) | | 3,250 | 3,423 |
| Viking Ocean Cruises Ship VII Ltd. 5.625% 2/15/29 (c) | | 3,150 | 3,201 |
| Wyndham Hotels & Resorts, Inc. 4.375% 8/15/28 (c) | | 8,610 | 8,887 |
| | | | 44,953 |
| Insurance - 1.6% | | | |
| Alliant Holdings Intermediate LLC: | | | |
| 4.25% 10/15/27 (c) | | 3,080 | 3,119 |
| 6.75% 10/15/27 (c) | | 62,543 | 65,670 |
| AmWINS Group, Inc. 7.75% 7/1/26 (c) | | 11,223 | 11,910 |
| AssuredPartners, Inc. 5.625% 1/15/29 (c) | | 6,460 | 6,549 |
| HUB International Ltd. 7% 5/1/26 (c) | | 17,540 | 18,173 |
| USI, Inc. 6.875% 5/1/25 (c) | | 35,091 | 35,661 |
| | | | 141,082 |
| Leisure - 1.7% | | | |
| Carnival Corp.: | | | |
| 5.75% 3/1/27 (c) | | 35,110 | 37,019 |
| 6.65% 1/15/28 | | 1,470 | 1,573 |
| 7.625% 3/1/26 (c) | | 32,265 | 35,330 |
| NCL Corp. Ltd. 5.875% 3/15/26 (c) | | 4,260 | 4,452 |
| Royal Caribbean Cruises Ltd.: | | | |
| 5.5% 4/1/28 (c) | | 24,480 | 25,672 |
| 9.125% 6/15/23 (c) | | 3,795 | 4,190 |
| 11.5% 6/1/25 (c) | | 16,130 | 18,670 |
| Viking Cruises Ltd. 13% 5/15/25 (c) | | 5,120 | 5,991 |
| Voc Escrow Ltd. 5% 2/15/28 (c) | | 9,410 | 9,598 |
| | | | 142,495 |
| Metals/Mining - 1.2% | | | |
| First Quantum Minerals Ltd.: | | | |
| 6.5% 3/1/24 (c) | | 13,569 | 13,925 |
| 6.875% 10/15/27 (c) | | 18,455 | 20,162 |
| 7.25% 4/1/23 (c) | | 19,939 | 20,263 |
| FMG Resources (August 2006) Pty Ltd.: | | | |
| 4.375% 4/1/31 (c) | | 15,935 | 16,552 |
| 4.5% 9/15/27 (c) | | 195 | 212 |
| Howmet Aerospace, Inc. 5.95% 2/1/37 | | 755 | 907 |
| HudBay Minerals, Inc. 4.5% 4/1/26 (c) | | 4,360 | 4,425 |
| Nufarm Australia Ltd. 5.75% 4/30/26 (c) | | 27,129 | 27,850 |
| | | | 104,296 |
| Paper - 0.4% | | | |
| Ardagh Metal Packaging Finance U.S.A. LLC/Ardagh Metal Packaging Finance PLC 4% 9/1/29 (c) | | 20,015 | 19,915 |
| SPA Holdings 3 OY 4.875% 2/4/28 (c) | | 15,055 | 15,149 |
| | | | 35,064 |
| Publishing/Printing - 0.2% | | | |
| Meredith Corp. 6.875% 2/1/26 | | 15,548 | 15,956 |
| Restaurants - 0.6% | | | |
| 1011778 BC Unlimited Liability Co./New Red Finance, Inc. 4% 10/15/30 (c) | | 36,051 | 35,150 |
| Yum! Brands, Inc. 4.625% 1/31/32 | | 17,585 | 18,380 |
| | | | 53,530 |
| Services - 5.7% | | | |
| ADT Corp. 4.875% 7/15/32 (c) | | 359 | 376 |
| Adtalem Global Education, Inc. 5.5% 3/1/28 (c) | | 26,305 | 26,371 |
| AECOM 5.125% 3/15/27 | | 20,750 | 23,084 |
| APX Group, Inc. 6.75% 2/15/27 (c) | | 12,960 | 13,936 |
| Aramark Services, Inc.: | | | |
| 4.75% 6/1/26 | | 13,365 | 13,682 |
| 5% 2/1/28 (c) | | 73,837 | 77,252 |
| 6.375% 5/1/25 (c) | | 37,115 | 39,481 |
| Ascend Learning LLC: | | | |
| 6.875% 8/1/25 (c) | | 9,588 | 9,828 |
| 6.875% 8/1/25 (c) | | 17,426 | 17,862 |
| ASGN, Inc. 4.625% 5/15/28 (c) | | 6,430 | 6,687 |
| Booz Allen Hamilton, Inc. 3.875% 9/1/28 (c) | | 18,510 | 18,464 |
| Brand Energy & Infrastructure Services, Inc. 8.5% 7/15/25 (c) | | 40,645 | 41,458 |
| Frontdoor, Inc. 6.75% 8/15/26 (c) | | 4,078 | 4,324 |
| Gartner, Inc. 3.75% 10/1/30 (c) | | 6,630 | 6,647 |
| GEMS MENASA Cayman Ltd. 7.125% 7/31/26 (c) | | 42,709 | 44,738 |
| Laureate Education, Inc. 8.25% 5/1/25 (c) | | 19,600 | 20,431 |
| Legends Hospitality Holding Co. LLC/Legends Hospitality Co-Issuer, Inc. 5% 2/1/26 (c) | | 25,555 | 26,386 |
| PowerTeam Services LLC 9.033% 12/4/25 (c) | | 9,640 | 10,688 |
| Prime Securities Services Borrower LLC/Prime Finance, Inc.: | | | |
| 3.375% 8/31/27 (c) | | 359 | 347 |
| 5.75% 4/15/26 (c) | | 359 | 393 |
| Service Corp. International 5.125% 6/1/29 | | 12,173 | 13,142 |
| Sotheby's 7.375% 10/15/27 (c) | | 41,890 | 45,149 |
| The GEO Group, Inc. 6% 4/15/26 | | 6,735 | 4,649 |
| TriNet Group, Inc. 3.5% 3/1/29 (c) | | 12,900 | 12,594 |
| WASH Multifamily Acquisition, Inc. 5.75% 4/15/26 (c) | | 10,835 | 11,255 |
| | | | 489,224 |
| Super Retail - 1.3% | | | |
| Academy Ltd. 6% 11/15/27 (c) | | 3,593 | 3,824 |
| EG Global Finance PLC: | | | |
| 6.75% 2/7/25 (c) | | 15,888 | 16,344 |
| 8.5% 10/30/25 (c) | | 19,353 | 20,538 |
| L Brands, Inc.: | | | |
| 5.25% 2/1/28 | | 1,890 | 2,072 |
| 6.625% 10/1/30 (c) | | 2,910 | 3,354 |
| 6.694% 1/15/27 | | 6,845 | 7,906 |
| 6.75% 7/1/36 | | 17,070 | 20,558 |
| 6.875% 11/1/35 | | 2,320 | 2,813 |
| LBM Acquisition LLC 6.25% 1/15/29 (c) | | 2,940 | 3,014 |
| Levi Strauss & Co. 3.5% 3/1/31 (c) | | 11,225 | 11,197 |
| The William Carter Co. 5.625% 3/15/27 (c) | | 7,749 | 8,146 |
| Wolverine World Wide, Inc. 6.375% 5/15/25 (c) | | 12,945 | 13,818 |
| | | | 113,584 |
| Technology - 3.1% | | | |
| Arches Buyer, Inc.: | | | |
| 4.25% 6/1/28 (c) | | 15,360 | 15,302 |
| 6.125% 12/1/28 (c) | | 28,390 | 29,100 |
| Black Knight InfoServ LLC 3.625% 9/1/28 (c) | | 16,470 | 16,099 |
| CDK Global, Inc. 5.25% 5/15/29 (c) | | 11,960 | 12,827 |
| Crowdstrike Holdings, Inc. 3% 2/15/29 | | 9,005 | 8,924 |
| Gartner, Inc. 4.5% 7/1/28 (c) | | 8,790 | 9,241 |
| Northwest Fiber LLC/Northwest Fiber Finance Sub, Inc. 10.75% 6/1/28 (c) | | 22,030 | 24,894 |
| ON Semiconductor Corp. 3.875% 9/1/28 (c) | | 7,205 | 7,417 |
| Open Text Holdings, Inc. 4.125% 2/15/30 (c) | | 20,092 | 20,318 |
| Rackspace Hosting, Inc. 5.375% 12/1/28 (c) | | 90,354 | 92,241 |
| Sensata Technologies BV 4% 4/15/29 (c) | | 8,805 | 8,860 |
| TTM Technologies, Inc. 4% 3/1/29 (c) | | 11,540 | 11,554 |
| Twilio, Inc. 3.875% 3/15/31 | | 6,435 | 6,604 |
| | | | 263,381 |
| Telecommunications - 12.2% | | | |
| Altice Financing SA: | | | |
| 5% 1/15/28 (c) | | 39,658 | 39,113 |
| 7.5% 5/15/26 (c) | | 27,330 | 28,395 |
| Altice France Holding SA 6% 2/15/28 (c) | | 36,048 | 35,642 |
| Altice France SA: | | | |
| 5.125% 1/15/29 (c) | | 44,309 | 44,420 |
| 5.125% 7/15/29 (c) | | 30,180 | 30,221 |
| 5.5% 1/15/28 (c) | | 45,420 | 46,792 |
| 7.375% 5/1/26 (c) | | 28,741 | 29,799 |
| 8.125% 2/1/27 (c) | | 52,833 | 57,852 |
| C&W Senior Financing Designated Activity Co.: | | | |
| 6.875% 9/15/27 (c) | | 123,217 | 130,912 |
| 7.5% 10/15/26 (c) | | 32,185 | 34,116 |
| Cablevision Lightpath LLC: | | | |
| 3.875% 9/15/27 (c) | | 4,304 | 4,245 |
| 5.625% 9/15/28 (c) | | 2,520 | 2,583 |
| Consolidated Communications, Inc. 5% 10/1/28 (c) | | 4,700 | 4,771 |
| Frontier Communications Corp.: | | | |
| 5% 5/1/28 (c) | | 32,330 | 33,017 |
| 5.875% 10/15/27 (c) | | 30,113 | 31,995 |
| 6.75% 5/1/29 (c) | | 18,805 | 19,810 |
| Level 3 Financing, Inc.: | | | |
| 3.625% 1/15/29 (c) | | 9,609 | 9,309 |
| 4.25% 7/1/28 (c) | | 24,755 | 24,943 |
| 4.625% 9/15/27 (c) | | 24,675 | 25,446 |
| Lumen Technologies, Inc.: | | | |
| 4.5% 1/15/29 (c) | | 19,405 | 19,114 |
| 5.125% 12/15/26 (c) | | 23,700 | 24,855 |
| 6.875% 1/15/28 | | 6,230 | 7,010 |
| Millicom International Cellular SA: | | | |
| 4.5% 4/27/31 (c) | | 1,020 | 1,084 |
| 5.125% 1/15/28 (c) | | 5,896 | 6,208 |
| 6.25% 3/25/29 (c) | | 3,776 | 4,209 |
| 6.625% 10/15/26 (c) | | 18,259 | 19,427 |
| Northwest Fiber LLC/Northwest Fiber Finance Sub, Inc. 6% 2/15/28 (c) | | 2,830 | 2,830 |
| Sable International Finance Ltd. 5.75% 9/7/27 (c) | | 11,453 | 11,997 |
| Sprint Capital Corp.: | | | |
| 6.875% 11/15/28 | | 37,462 | 47,203 |
| 8.75% 3/15/32 | | 37,867 | 56,138 |
| T-Mobile U.S.A., Inc. 2.875% 2/15/31 | | 21,180 | 20,677 |
| Telecom Italia Capital SA: | | | |
| 6% 9/30/34 | | 6,817 | 7,673 |
| 7.2% 7/18/36 | | 9,819 | 12,205 |
| 7.721% 6/4/38 | | 1,945 | 2,548 |
| Uniti Group, Inc.: | | | |
| 7.125% 12/15/24 (c) | | 34,663 | 35,786 |
| 7.875% 2/15/25 (c) | | 69,843 | 75,256 |
| Windstream Escrow LLC 7.75% 8/15/28 (c) | | 29,940 | 31,212 |
| Zayo Group Holdings, Inc.: | | | |
| 4% 3/1/27 (c) | | 8,315 | 8,257 |
| 6.125% 3/1/28 (c) | | 26,758 | 27,527 |
| | | | 1,054,597 |
| Utilities - 5.1% | | | |
| Clearway Energy Operating LLC: | | | |
| 3.75% 2/15/31 (c) | | 20,635 | 20,340 |
| 4.75% 3/15/28 (c) | | 3,020 | 3,162 |
| DCP Midstream Operating LP: | | | |
| 5.125% 5/15/29 | | 37,079 | 39,582 |
| 5.625% 7/15/27 | | 13,745 | 15,012 |
| EnLink Midstream Partners LP 4.4% 4/1/24�� | | 2,620 | 2,686 |
| Global Partners LP/GLP Finance Corp. 7% 8/1/27 | | 16,591 | 17,737 |
| InterGen NV 7% 6/30/23 (c) | | 38,782 | 37,425 |
| NextEra Energy Partners LP 4.25% 9/15/24 (c) | | 1,251 | 1,321 |
| NRG Energy, Inc.: | | | |
| 3.375% 2/15/29 (c) | | 23,330 | 22,834 |
| 3.625% 2/15/31 (c) | | 6,600 | 6,466 |
| 5.25% 6/15/29 (c) | | 10,490 | 11,237 |
| 5.75% 1/15/28 | | 8,281 | 8,799 |
| 6.625% 1/15/27 | | 1,757 | 1,831 |
| NSG Holdings II LLC/NSG Holdings, Inc. 7.75% 12/15/25 (c) | | 15,480 | 16,487 |
| PG&E Corp.: | | | |
| 5% 7/1/28 | | 5,490 | 5,751 |
| 5.25% 7/1/30 | | 57,065 | 60,917 |
| Pike Corp. 5.5% 9/1/28 (c) | | 32,762 | 33,745 |
| TerraForm Power Operating LLC: | | | |
| 4.75% 1/15/30 (c) | | 7,653 | 7,969 |
| 5% 1/31/28 (c) | | 12,590 | 13,503 |
| Vistra Operations Co. LLC: | | | |
| 5% 7/31/27 (c) | | 66,501 | 68,897 |
| 5.5% 9/1/26 (c) | | 11,798 | 12,189 |
| 5.625% 2/15/27 (c) | | 27,335 | 28,428 |
| | | | 436,318 |
|
| TOTAL NONCONVERTIBLE BONDS | | | 7,889,515 |
|
| TOTAL CORPORATE BONDS | | | |
| (Cost $7,788,015) | | | 8,005,770 |
| | | Shares | Value (000s) |
|
| Common Stocks - 0.6% | | | |
| Energy - 0.2% | | | |
| California Resources Corp. (h) | | 52,765 | 1,251 |
| California Resources Corp. warrants 10/27/24 (h) | | 9,174 | 37 |
| Forbes Energy Services Ltd. (h) | | 47,062 | 4 |
| Jonah Energy LLC (b) | | 416,537 | 6,248 |
| Mesquite Energy, Inc. (b) | | 418,291 | 9,194 |
|
| TOTAL ENERGY | | | 16,734 |
|
| Food & Drug Retail - 0.4% | | | |
| Southeastern Grocers, Inc. (a)(b)(h) | | 2,420,136 | 37,464 |
| Telecommunications - 0.0% | | | |
| CUI Acquisition Corp. Class E (b)(h) | | 1 | 24 |
| TOTAL COMMON STOCKS | | | |
| (Cost $42,914) | | | 54,222 |
| | | Principal Amount (000s) | Value (000s) |
|
| Bank Loan Obligations - 3.0% | | | |
| Cable/Satellite TV - 0.2% | | | |
| WideOpenWest Finance LLC Tranche B, term loan 3 month U.S. LIBOR + 3.250% 4.25% 8/19/23 (d)(e)(i) | | 19,987 | 19,933 |
| Energy - 0.1% | | | |
| EG America LLC Tranche B 1LN, term loan 3 month U.S. LIBOR + 4.000% 4.2025% 2/6/25 (d)(e)(i) | | 8,254 | 8,130 |
| Sanchez Energy Corp.: | | | |
| 1LN, term loan 3 month U.S. LIBOR + 8.000% 0% (b)(e)(g)(i) | | 7,758 | 0 |
| term loan 3 month U.S. LIBOR + 0.000% 0% (b)(e)(g)(i) | | 3,310 | 0 |
|
| TOTAL ENERGY | | | 8,130 |
|
| Food/Beverage/Tobacco - 0.0% | | | |
| EG Finco Ltd. Tranche B, term loan 3 month U.S. LIBOR + 4.000% 4.2025% 2/6/25 (d)(e)(i) | | 3,030 | 2,985 |
| Gaming - 0.7% | | | |
| Golden Entertainment, Inc. Tranche B, term loan 3 month U.S. LIBOR + 3.000% 3.75% 10/20/24 (d)(e)(i) | | 27,454 | 27,203 |
| Golden Nugget LLC Tranche B 1LN, term loan 3 month U.S. LIBOR + 2.500% 3.25% 10/4/23 (d)(e)(i) | | 33,473 | 33,037 |
|
| TOTAL GAMING | | | 60,240 |
|
| Healthcare - 0.3% | | | |
| Gainwell Acquisition Corp. Tranche B 1LN, term loan 3 month U.S. LIBOR + 4.000% 4.75% 10/1/27 (d)(e)(i) | | 14,970 | 14,970 |
| Insulet Corp. Tranche B 1LN, term loan 1 month U.S. LIBOR + 3.250% 4/29/28 (e)(i)(j) | | 1,605 | 1,607 |
| Jazz Financing Lux SARL Tranche B 1LN, term loan 1 month U.S. LIBOR + 3.500% 4/22/28 (e)(i)(j) | | 4,080 | 4,088 |
| U.S. Renal Care, Inc. Tranche B 1LN, term loan 3 month U.S. LIBOR + 5.000% 5.125% 6/13/26 (d)(e)(i) | | 2,895 | 2,829 |
|
| TOTAL HEALTHCARE | | | 23,494 |
|
| Insurance - 0.2% | | | |
| Alliant Holdings Intermediate LLC Tranche B3 1LN, term loan 3 month U.S. LIBOR + 3.750% 4.25% 11/5/27 (d)(e)(i) | | 7,955 | 7,946 |
| HUB International Ltd. Tranche B, term loan 3 month U.S. LIBOR + 3.000% 3.1757% 4/25/25 (d)(e)(i) | | 10,653 | 10,506 |
|
| TOTAL INSURANCE | | | 18,452 |
|
| Services - 0.0% | | | |
| Brand Energy & Infrastructure Services, Inc. Tranche B, term loan 3 month U.S. LIBOR + 4.250% 5.25% 6/21/24 (d)(e)(i) | | 2,132 | 2,071 |
| Super Retail - 0.2% | | | |
| LBM Acquisition LLC Tranche B 1LN, term loan: | | | |
| 3 month U.S. LIBOR + 3.750% 12/18/27 (e)(i)(j) | | 3,514 | 3,504 |
| 3 month U.S. LIBOR + 3.750% 4.5% 12/18/27 (d)(e)(i) | | 15,811 | 15,767 |
|
| TOTAL SUPER RETAIL | | | 19,271 |
|
| Technology - 0.8% | | | |
| Acuris Finance U.S., Inc. 1LN, term loan 3 month U.S. LIBOR + 4.000% 4.5% 2/16/28 (d)(e)(i) | | 3,530 | 3,530 |
| Northwest Fiber LLC Tranche B 1LN, term loan 3 month U.S. LIBOR + 3.750% 3.8605% 4/30/27 (d)(e)(i) | | 12,570 | 12,511 |
| Tempo Acquisition LLC Tranche B 1LN, term loan 3 month U.S. LIBOR + 3.250% 3.75% 10/31/26 (d)(e)(i) | | 19,641 | 19,608 |
| UKG, Inc. Tranche B 1LN, term loan 3 month U.S. LIBOR + 3.250% 4% 5/4/26 (d)(e)(i) | | 28,064 | 28,073 |
|
| TOTAL TECHNOLOGY | | | 63,722 |
|
| Telecommunications - 0.5% | | | |
| GTT Communications, Inc. Tranche B, term loan 3 month U.S. LIBOR + 2.750% 2.95% 5/31/25 (d)(e)(i) | | 30,053 | 25,712 |
| Intelsat Jackson Holdings SA: | | | |
| Tranche B-4, term loan 3 month U.S. LIBOR + 5.500% 8.75% 1/2/24 (d)(e)(i) | | 1,485 | 1,513 |
| Tranche DD 1LN, term loan 3 month U.S. LIBOR + 5.500% 6.5% 7/13/22 (d)(e)(i) | | 11,361 | 11,474 |
|
| TOTAL TELECOMMUNICATIONS | | | 38,699 |
|
| TOTAL BANK LOAN OBLIGATIONS | | | |
| (Cost $259,804) | | | 256,997 |
| | | Shares | Value (000s) |
|
| Money Market Funds - 3.4% | | | |
| Fidelity Cash Central Fund 0.04% (k) | | | |
| (Cost $291,137) | | 291,087,934 | 291,146 |
| TOTAL INVESTMENT IN SECURITIES - 99.9% | | | |
| (Cost $8,381,870) | | | 8,608,135 |
| NET OTHER ASSETS (LIABILITIES) - 0.1% | | | 4,627 |
| NET ASSETS - 100% | | | $8,612,762 |
Values shown as $0 in the Schedule of Investments may reflect amounts less than $500.
Legend
(a) Restricted securities (including private placements) - Investment in securities not registered under the Securities Act of 1933 (excluding 144A issues). At the end of the period, the value of restricted securities (excluding 144A issues) amounted to $54,853,000 or 0.6% of net assets.
(b) Level 3 security
(c) Security exempt from registration under Rule 144A of the Securities Act of 1933. These securities may be resold in transactions exempt from registration, normally to qualified institutional buyers. At the end of the period, the value of these securities amounted to $6,218,579,000 or 72.2% of net assets.
(d) Coupon rates for floating and adjustable rate securities reflect the rates in effect at period end.
(e) Coupon is indexed to a floating interest rate which may be multiplied by a specified factor and/or subject to caps or floors.
(f) Security or a portion of the security purchased on a delayed delivery or when-issued basis.
(g) Non-income producing - Security is in default.
(h) Non-income producing
(i) Remaining maturities of bank loan obligations may be less than the stated maturities shown as a result of contractual or optional prepayments by the borrower. Such prepayments cannot be predicted with certainty.
(j) The coupon rate will be determined upon settlement of the loan after period end.
(k) Affiliated fund that is generally available only to investment companies and other accounts managed by Fidelity Investments. The rate quoted is the annualized seven-day yield of the fund at period end. A complete unaudited listing of the fund's holdings as of its most recent quarter end is available upon request. In addition, each Fidelity Central Fund's financial statements, which are not covered by the Fund's Report of Independent Registered Public Accounting Firm, are available on the SEC's website or upon request.
Additional information on each restricted holding is as follows:
| Security | Acquisition Date | Acquisition Cost (000s) |
| Mesquite Energy, Inc. 15% 7/15/23 | 7/10/20 - 4/15/21 | $8,025 |
| Southeastern Grocers, Inc. | 6/1/18 | $17,023 |
Affiliated Central Funds
Information regarding fiscal year to date income earned by the Fund from investments in Fidelity Central Funds is as follows:
| Fund | Income earned |
| | (Amounts in thousands) |
| Fidelity Cash Central Fund | $272 |
| Total | $272 |
Amounts in the income column in the above table include any capital gain distributions from underlying funds, which are presented in the corresponding line-item in the Statement of Operations, if applicable.
Investment Valuation
The following is a summary of the inputs used, as of April 30, 2021, involving the Fund's assets and liabilities carried at fair value. The inputs or methodology used for valuing securities may not be an indication of the risk associated with investing in those securities. For more information on valuation inputs, and their aggregation into the levels used below, please refer to the Investment Valuation section in the accompanying Notes to Financial Statements.
| | Valuation Inputs at Reporting Date: |
| Description | Total | Level 1 | Level 2 | Level 3 |
| (Amounts in thousands) | | | | |
| Investments in Securities: | | | | |
| Equities: | | | | |
| Communication Services | $24 | $-- | $-- | $24 |
| Consumer Staples | 37,464 | -- | -- | 37,464 |
| Energy | 16,734 | 1,292 | -- | 15,442 |
| Corporate Bonds | 8,005,770 | -- | 7,988,381 | 17,389 |
| Bank Loan Obligations | 256,997 | -- | 256,997 | -- |
| Money Market Funds | 291,146 | 291,146 | -- | -- |
| Total Investments in Securities: | $8,608,135 | $292,438 | $8,245,378 | $70,319 |
Other Information
Distribution of investments by country or territory of incorporation, as a percentage of Total Net Assets, is as follows (Unaudited):
| United States of America | 78.2% |
| Canada | 4.6% |
| Luxembourg | 2.8% |
| France | 2.4% |
| Ireland | 2.4% |
| Netherlands | 2.3% |
| Multi-National | 1.9% |
| Cayman Islands | 1.5% |
| United Kingdom | 1.4% |
| Others (Individually Less Than 1%) | 2.5% |
| | 100.0% |
See accompanying notes which are an integral part of the financial statements.
Financial Statements
Statement of Assets and Liabilities
| Amounts in thousands (except per-share amounts) | | April 30, 2021 |
| Assets | | |
Investment in securities, at value — See accompanying schedule:
Unaffiliated issuers (cost $8,090,733) | $8,316,989 | |
| Fidelity Central Funds (cost $291,137) | 291,146 | |
| Total Investment in Securities (cost $8,381,870) | | $8,608,135 |
| Cash | | 125 |
| Receivable for investments sold | | 67,831 |
| Receivable for fund shares sold | | 8,200 |
| Interest receivable | | 115,622 |
| Distributions receivable from Fidelity Central Funds | | 10 |
| Prepaid expenses | | 2 |
| Other receivables | | 46 |
| Total assets | | 8,799,971 |
| Liabilities | | |
| Payable for investments purchased | | |
| Regular delivery | $163,076 | |
| Delayed delivery | 9,835 | |
| Payable for fund shares redeemed | 5,850 | |
| Distributions payable | 3,387 | |
| Accrued management fee | 3,871 | |
| Distribution and service plan fees payable | 63 | |
| Other affiliated payables | 1,007 | |
| Other payables and accrued expenses | 120 | |
| Total liabilities | | 187,209 |
| Net Assets | | $8,612,762 |
| Net Assets consist of: | | |
| Paid in capital | | $8,786,321 |
| Total accumulated earnings (loss) | | (173,559) |
| Net Assets | | $8,612,762 |
| Net Asset Value and Maximum Offering Price | | |
| Class A: | | |
| Net Asset Value and redemption price per share ($148,229 ÷ 17,026 shares)(a) | | $8.71 |
| Maximum offering price per share (100/96.00 of $8.71) | | $9.07 |
| Class M: | | |
| Net Asset Value and redemption price per share ($36,179 ÷ 4,156 shares)(a) | | $8.71 |
| Maximum offering price per share (100/96.00 of $8.71) | | $9.07 |
| Class C: | | |
| Net Asset Value and offering price per share ($29,822 ÷ 3,424 shares)(a) | | $8.71 |
| Fidelity High Income Fund: | | |
| Net Asset Value, offering price and redemption price per share ($4,139,179 ÷ 475,395 shares) | | $8.71 |
| Class I: | | |
| Net Asset Value, offering price and redemption price per share ($4,009,851 ÷ 460,604 shares) | | $8.71 |
| Class Z: | | |
| Net Asset Value, offering price and redemption price per share ($249,502 ÷ 28,659 shares) | | $8.71 |
(a) Redemption price per share is equal to net asset value less any applicable contingent deferred sales charge.
See accompanying notes which are an integral part of the financial statements.
Statement of Operations
| Amounts in thousands | | Year ended April 30, 2021 |
| Investment Income | | |
| Dividends | | $3,403 |
| Interest | | 369,953 |
| Income from Fidelity Central Funds | | 272 |
| Total income | | 373,628 |
| Expenses | | |
| Management fee | $38,785 | |
| Transfer agent fees | 8,902 | |
| Distribution and service plan fees | 823 | |
| Accounting fees and expenses | 1,257 | |
| Custodian fees and expenses | 61 | |
| Independent trustees' fees and expenses | 32 | |
| Registration fees | 325 | |
| Audit | 121 | |
| Legal | (24) | |
| Miscellaneous | 42 | |
| Total expenses before reductions | 50,324 | |
| Expense reductions | (116) | |
| Total expenses after reductions | | 50,208 |
| Net investment income (loss) | | 323,420 |
| Realized and Unrealized Gain (Loss) | | |
| Net realized gain (loss) on: | | |
| Investment securities: | | |
| Unaffiliated issuers | (56,786) | |
| Fidelity Central Funds | 7 | |
| Total net realized gain (loss) | | (56,779) |
| Change in net unrealized appreciation (depreciation) on: | | |
| Investment securities: | | |
| Unaffiliated issuers | 600,532 | |
| Fidelity Central Funds | (21) | |
| Total change in net unrealized appreciation (depreciation) | | 600,511 |
| Net gain (loss) | | 543,732 |
| Net increase (decrease) in net assets resulting from operations | | $867,152 |
See accompanying notes which are an integral part of the financial statements.
Statement of Changes in Net Assets
| Amounts in thousands | Year ended April 30, 2021 | Year ended April 30, 2020 |
| Increase (Decrease) in Net Assets | | |
| Operations | | |
| Net investment income (loss) | $323,420 | $271,845 |
| Net realized gain (loss) | (56,779) | (102,571) |
| Change in net unrealized appreciation (depreciation) | 600,511 | (437,488) |
| Net increase (decrease) in net assets resulting from operations | 867,152 | (268,214) |
| Distributions to shareholders | (315,556) | (266,971) |
| Share transactions - net increase (decrease) | 3,350,568 | 121,991 |
| Total increase (decrease) in net assets | 3,902,164 | (413,194) |
| Net Assets | | |
| Beginning of period | 4,710,598 | 5,123,792 |
| End of period | $8,612,762 | $4,710,598 |
See accompanying notes which are an integral part of the financial statements.
Financial Highlights
Fidelity High Income Fund Class A
| Years ended April 30, | 2021 | 2020 | 2019 A |
| Selected Per–Share Data | | | |
| Net asset value, beginning of period | $7.93 | $8.83 | $8.56 |
| Income from Investment Operations | | | |
| Net investment income (loss)B | .368 | .438 | .192 |
| Net realized and unrealized gain (loss) | .772 | (.908) | .286 |
| Total from investment operations | 1.140 | (.470) | .478 |
| Distributions from net investment income | (.360) | (.430) | (.208) |
| Total distributions | (.360) | (.430) | (.208) |
| Net asset value, end of period | $8.71 | $7.93 | $8.83 |
| Total ReturnC,D,E | 14.56% | (5.63)% | 5.68% |
| Ratios to Average Net AssetsF,G | | | |
| Expenses before reductions | .98% | .98% | .99%H |
| Expenses net of fee waivers, if any | .98% | .98% | .99%H |
| Expenses net of all reductions | .98% | .98% | .99%H |
| Net investment income (loss) | 4.32% | 5.04% | 5.60%H |
| Supplemental Data | | | |
| Net assets, end of period (in millions) | $148 | $144 | $170 |
| Portfolio turnover rateI | 62% | 44%J | 62%K |
A For the period December 4, 2018 (commencement of sale of shares) to April 30, 2019.
B Calculated based on average shares outstanding during the period.
C Total returns for periods of less than one year are not annualized.
D Total returns would have been lower if certain expenses had not been reduced during the applicable periods shown.
E Total returns do not include the effect of the sales charges.
F Fees and expenses of any underlying mutual funds or exchange-traded funds (ETFs) are not included in the Fund's expense ratio. The Fund indirectly bears its proportionate share of these expenses. For additional expense information related to investments in Fidelity Central Funds, please refer to the "Investments in Fidelity Central Funds" note found in the Notes to Financial Statements section of the most recent Annual or Semi-Annual report.
G Expense ratios reflect operating expenses of the class. Expenses before reductions do not reflect amounts reimbursed, waived, or reduced through arrangements with the investment adviser, brokerage services, or other offset arrangements, if applicable, and do not represent the amount paid by the class during periods when reimbursements, waivers or reductions occur.
H Annualized
I Amount does not include the portfolio activity of any underlying mutual funds or exchange-traded funds (ETFs).
J Portfolio turnover rate excludes securities received or delivered in-kind.
K The portfolio turnover rate does not include the assets acquired in the merger.
See accompanying notes which are an integral part of the financial statements.
Fidelity High Income Fund Class M
| Years ended April 30, | 2021 | 2020 | 2019 A |
| Selected Per–Share Data | | | |
| Net asset value, beginning of period | $7.93 | $8.83 | $8.56 |
| Income from Investment Operations | | | |
| Net investment income (loss)B | .367 | .438 | .191 |
| Net realized and unrealized gain (loss) | .772 | (.909) | .286 |
| Total from investment operations | 1.139 | (.471) | .477 |
| Distributions from net investment income | (.359) | (.429) | (.207) |
| Total distributions | (.359) | (.429) | (.207) |
| Net asset value, end of period | $8.71 | $7.93 | $8.83 |
| Total ReturnC,D,E | 14.55% | (5.64)% | 5.68% |
| Ratios to Average Net AssetsF,G | | | |
| Expenses before reductions | .99% | .99% | 1.01%H |
| Expenses net of fee waivers, if any | .99% | .99% | 1.01%H |
| Expenses net of all reductions | .99% | .99% | 1.01%H |
| Net investment income (loss) | 4.31% | 5.02% | 5.59%H |
| Supplemental Data | | | |
| Net assets, end of period (in millions) | $36 | $40 | $50 |
| Portfolio turnover rateI | 62% | 44%J | 62%K |
A For the period December 4, 2018 (commencement of sale of shares) to April 30, 2019.
B Calculated based on average shares outstanding during the period.
C Total returns for periods of less than one year are not annualized.
D Total returns would have been lower if certain expenses had not been reduced during the applicable periods shown.
E Total returns do not include the effect of the sales charges.
F Fees and expenses of any underlying mutual funds or exchange-traded funds (ETFs) are not included in the Fund's expense ratio. The Fund indirectly bears its proportionate share of these expenses. For additional expense information related to investments in Fidelity Central Funds, please refer to the "Investments in Fidelity Central Funds" note found in the Notes to Financial Statements section of the most recent Annual or Semi-Annual report.
G Expense ratios reflect operating expenses of the class. Expenses before reductions do not reflect amounts reimbursed, waived, or reduced through arrangements with the investment adviser, brokerage services, or other offset arrangements, if applicable, and do not represent the amount paid by the class during periods when reimbursements, waivers or reductions occur.
H Annualized
I Amount does not include the portfolio activity of any underlying mutual funds or exchange-traded funds (ETFs).
J Portfolio turnover rate excludes securities received or delivered in-kind.
K The portfolio turnover rate does not include the assets acquired in the merger.
See accompanying notes which are an integral part of the financial statements.
Fidelity High Income Fund Class C
| Years ended April 30, | 2021 | 2020 | 2019 A |
| Selected Per–Share Data | | | |
| Net asset value, beginning of period | $7.93 | $8.83 | $8.56 |
| Income from Investment Operations | | | |
| Net investment income (loss)B | .302 | .372 | .166 |
| Net realized and unrealized gain (loss) | .772 | (.909) | .285 |
| Total from investment operations | 1.074 | (.537) | .451 |
| Distributions from net investment income | (.294) | (.363) | (.181) |
| Total distributions | (.294) | (.363) | (.181) |
| Net asset value, end of period | $8.71 | $7.93 | $8.83 |
| Total ReturnC,D,E | 13.68% | (6.35)% | 5.36% |
| Ratios to Average Net AssetsF,G | | | |
| Expenses before reductions | 1.75% | 1.75% | 1.77%H |
| Expenses net of fee waivers, if any | 1.75% | 1.75% | 1.77%H |
| Expenses net of all reductions | 1.75% | 1.75% | 1.77%H |
| Net investment income (loss) | 3.55% | 4.27% | 4.84%H |
| Supplemental Data | | | |
| Net assets, end of period (in millions) | $30 | $36 | $52 |
| Portfolio turnover rateI | 62% | 44%J | 62%K |
A For the period December 4, 2018 (commencement of sale of shares) to April 30, 2019.
B Calculated based on average shares outstanding during the period.
C Total returns for periods of less than one year are not annualized.
D Total returns would have been lower if certain expenses had not been reduced during the applicable periods shown.
E Total returns do not include the effect of the contingent deferred sales charge.
F Fees and expenses of any underlying mutual funds or exchange-traded funds (ETFs) are not included in the Fund's expense ratio. The Fund indirectly bears its proportionate share of these expenses. For additional expense information related to investments in Fidelity Central Funds, please refer to the "Investments in Fidelity Central Funds" note found in the Notes to Financial Statements section of the most recent Annual or Semi-Annual report.
G Expense ratios reflect operating expenses of the class. Expenses before reductions do not reflect amounts reimbursed, waived, or reduced through arrangements with the investment adviser, brokerage services, or other offset arrangements, if applicable, and do not represent the amount paid by the class during periods when reimbursements, waivers or reductions occur.
H Annualized
I Amount does not include the portfolio activity of any underlying mutual funds or exchange-traded funds (ETFs).
J Portfolio turnover rate excludes securities received or delivered in-kind.
K The portfolio turnover rate does not include the assets acquired in the merger.
See accompanying notes which are an integral part of the financial statements.
Fidelity High Income Fund
| Years ended April 30, | 2021 | 2020 | 2019 | 2018 | 2017 |
| Selected Per–Share Data | | | | | |
| Net asset value, beginning of period | $7.93 | $8.83 | $8.83 | $8.94 | $8.31 |
| Income from Investment Operations | | | | | |
| Net investment income (loss)A | .392 | .464 | .493 | .513 | .501 |
| Net realized and unrealized gain (loss) | .772 | (.909) | –B | (.137) | .597 |
| Total from investment operations | 1.164 | (.445) | .493 | .376 | 1.098 |
| Distributions from net investment income | (.384) | (.455) | (.493) | (.486) | (.469) |
| Total distributions | (.384) | (.455) | (.493) | (.486) | (.469) |
| Redemption fees added to paid in capitalA | – | – | – | –B | .001 |
| Net asset value, end of period | $8.71 | $7.93 | $8.83 | $8.83 | $8.94 |
| Total ReturnC | 14.89% | (5.35)% | 5.83% | 4.27% | 13.56% |
| Ratios to Average Net AssetsD,E | | | | | |
| Expenses before reductions | .69% | .69% | .70% | .70% | .72% |
| Expenses net of fee waivers, if any | .69% | .69% | .70% | .70% | .72% |
| Expenses net of all reductions | .69% | .69% | .70% | .70% | .72% |
| Net investment income (loss) | 4.61% | 5.33% | 5.66% | 5.73% | 5.81% |
| Supplemental Data | | | | | |
| Net assets, end of period (in millions) | $4,139 | $3,871 | $4,392 | $4,324 | $4,492 |
| Portfolio turnover rateF | 62% | 44%G | 62%H | 51% | 52% |
A Calculated based on average shares outstanding during the period.
B Amount represents less than $.0005 per share.
C Total returns would have been lower if certain expenses had not been reduced during the applicable periods shown.
D Fees and expenses of any underlying mutual funds or exchange-traded funds (ETFs) are not included in the Fund's expense ratio. The Fund indirectly bears its proportionate share of these expenses. For additional expense information related to investments in Fidelity Central Funds, please refer to the "Investments in Fidelity Central Funds" note found in the Notes to Financial Statements section of the most recent Annual or Semi-Annual report.
E Expense ratios reflect operating expenses of the class. Expenses before reductions do not reflect amounts reimbursed, waived, or reduced through arrangements with the investment adviser, brokerage services, or other offset arrangements, if applicable, and do not represent the amount paid by the class during periods when reimbursements, waivers or reductions occur.
F Amount does not include the portfolio activity of any underlying mutual funds or exchange-traded funds (ETFs).
G Portfolio turnover rate excludes securities received or delivered in-kind.
H The portfolio turnover rate does not include the assets acquired in the merger.
See accompanying notes which are an integral part of the financial statements.
Fidelity High Income Fund Class I
| Years ended April 30, | 2021 | 2020 | 2019 A |
| Selected Per–Share Data | | | |
| Net asset value, beginning of period | $7.93 | $8.83 | $8.56 |
| Income from Investment Operations | | | |
| Net investment income (loss)B | .390 | .458 | .199 |
| Net realized and unrealized gain (loss) | .771 | (.907) | .286 |
| Total from investment operations | 1.161 | (.449) | .485 |
| Distributions from net investment income | (.381) | (.451) | (.215) |
| Total distributions | (.381) | (.451) | (.215) |
| Net asset value, end of period | $8.71 | $7.93 | $8.83 |
| Total ReturnC,D | 14.85% | (5.40)% | 5.77% |
| Ratios to Average Net AssetsE,F | | | |
| Expenses before reductions | .73% | .74% | .78%G |
| Expenses net of fee waivers, if any | .73% | .74% | .78%G |
| Expenses net of all reductions | .73% | .74% | .78%G |
| Net investment income (loss) | 4.57% | 5.28% | 5.81%G |
| Supplemental Data | | | |
| Net assets, end of period (in millions) | $4,010 | $558 | $448 |
| Portfolio turnover rateH | 62% | 44%I | 62%J |
A For the period December 4, 2018 (commencement of sale of shares) to April 30, 2019.
B Calculated based on average shares outstanding during the period.
C Total returns for periods of less than one year are not annualized.
D Total returns would have been lower if certain expenses had not been reduced during the applicable periods shown.
E Fees and expenses of any underlying mutual funds or exchange-traded funds (ETFs) are not included in the Fund's expense ratio. The Fund indirectly bears its proportionate share of these expenses. For additional expense information related to investments in Fidelity Central Funds, please refer to the "Investments in Fidelity Central Funds" note found in the Notes to Financial Statements section of the most recent Annual or Semi-Annual report.
F Expense ratios reflect operating expenses of the class. Expenses before reductions do not reflect amounts reimbursed, waived, or reduced through arrangements with the investment adviser, brokerage services, or other offset arrangements, if applicable, and do not represent the amount paid by the class during periods when reimbursements, waivers or reductions occur.
G Annualized
H Amount does not include the portfolio activity of any underlying mutual funds or exchange-traded funds (ETFs).
I Portfolio turnover rate excludes securities received or delivered in-kind.
J The portfolio turnover rate does not include the assets acquired in the merger.
See accompanying notes which are an integral part of the financial statements.
Fidelity High Income Fund Class Z
| Years ended April 30, | 2021 | 2020 | 2019 A |
| Selected Per–Share Data | | | |
| Net asset value, beginning of period | $7.93 | $8.83 | $8.56 |
| Income from Investment Operations | | | |
| Net investment income (loss)B | .399 | .464 | .201 |
| Net realized and unrealized gain (loss) | .770 | (.904) | .289 |
| Total from investment operations | 1.169 | (.440) | .490 |
| Distributions from net investment income | (.389) | (.460) | (.220) |
| Total distributions | (.389) | (.460) | (.220) |
| Net asset value, end of period | $8.71 | $7.93 | $8.83 |
| Total ReturnC,D | 14.96% | (5.30)% | 5.83% |
| Ratios to Average Net AssetsE,F | | | |
| Expenses before reductions | .63% | .63% | .64%G |
| Expenses net of fee waivers, if any | .63% | .63% | .64%G |
| Expenses net of all reductions | .62% | .63% | .63%G |
| Net investment income (loss) | 4.67% | 5.39% | 5.85%G |
| Supplemental Data | | | |
| Net assets, end of period (in millions) | $250 | $61 | $13 |
| Portfolio turnover rateH | 62% | 44%I | 62%J |
A For the period December 4, 2018 (commencement of sale of shares) to April 30, 2019.
B Calculated based on average shares outstanding during the period.
C Total returns for periods of less than one year are not annualized.
D Total returns would have been lower if certain expenses had not been reduced during the applicable periods shown.
E Fees and expenses of any underlying mutual funds or exchange-traded funds (ETFs) are not included in the Fund's expense ratio. The Fund indirectly bears its proportionate share of these expenses. For additional expense information related to investments in Fidelity Central Funds, please refer to the "Investments in Fidelity Central Funds" note found in the Notes to Financial Statements section of the most recent Annual or Semi-Annual report.
F Expense ratios reflect operating expenses of the class. Expenses before reductions do not reflect amounts reimbursed, waived, or reduced through arrangements with the investment adviser, brokerage services, or other offset arrangements, if applicable, and do not represent the amount paid by the class during periods when reimbursements, waivers or reductions occur.
G Annualized
H Amount does not include the portfolio activity of any underlying mutual funds or exchange-traded funds (ETFs).
I Portfolio turnover rate excludes securities received or delivered in-kind.
J The portfolio turnover rate does not include the assets acquired in the merger.
See accompanying notes which are an integral part of the financial statements.
Notes to Financial Statements
For the period ended April 30, 2021
(Amounts in thousands except percentages)
1. Organization.
Fidelity High Income Fund (the Fund) is a fund of Fidelity Summer Street Trust (the Trust) and is authorized to issue an unlimited number of shares. The Trust is registered under the Investment Company Act of 1940, as amended (the 1940 Act), as an open-end management investment company organized as a Massachusetts business trust. The Fund offers Class A, Class M, Class C, Fidelity High Income Fund, Class I and Class Z shares, each of which has equal rights as to assets and voting privileges. Each class has exclusive voting rights with respect to matters that affect that class. Class C shares will automatically convert to Class A shares after a holding period of ten years from the initial date of purchase, with certain exceptions.
Effective June 21, 2021, Class C shares will automatically convert to Class A shares after a holding period of eight years from the initial date of purchase, with certain exceptions.
2. Investments in Fidelity Central Funds.
Funds may invest in Fidelity Central Funds, which are open-end investment companies generally available only to other investment companies and accounts managed by the investment adviser and its affiliates. The Schedule of Investments lists any Fidelity Central Funds held as an investment as of period end, but does not include the underlying holdings of each Fidelity Central Fund. An investing fund indirectly bears its proportionate share of the expenses of the underlying Fidelity Central Funds.
Based on its investment objective, each Fidelity Central Fund may invest or participate in various investment vehicles or strategies that are similar to those of the investing fund. These strategies are consistent with the investment objectives of the investing fund and may involve certain economic risks which may cause a decline in value of each of the Fidelity Central Funds and thus a decline in the value of the investing fund.
| Fidelity Central Fund | Investment Manager | Investment Objective | Investment Practices | Expense Ratio(a) |
| Fidelity Money Market Central Funds | Fidelity Management & Research Company LLC (FMR) | Each fund seeks to obtain a high level of current income consistent with the preservation of capital and liquidity. | Short-term Investments | Less than .005% to .01% |
(a) Expenses expressed as a percentage of average net assets and are as of each underlying Central Fund's most recent annual or semi-annual shareholder report.
A complete unaudited list of holdings for each Fidelity Central Fund is available upon request or at the Securities and Exchange Commission website at www.sec.gov. In addition, the financial statements of the Fidelity Central Funds which contain the significant accounting policies (including investment valuation policies) of those funds, and are not covered by the Report of Independent Registered Public Accounting Firm, are available on the Securities and Exchange Commission website or upon request.
3. Significant Accounting Policies.
The Fund is an investment company and applies the accounting and reporting guidance of the Financial Accounting Standards Board (FASB) Accounting Standards Codification Topic 946 Financial Services - Investment Companies. The financial statements have been prepared in conformity with accounting principles generally accepted in the United States of America (GAAP), which require management to make certain estimates and assumptions at the date of the financial statements. Actual results could differ from those estimates. Subsequent events, if any, through the date that the financial statements were issued have been evaluated in the preparation of the financial statements. The Fund's Schedule of Investments lists any underlying mutual funds or exchange-traded funds (ETFs) but does not include the underlying holdings of these funds. The following summarizes the significant accounting policies of the Fund:
Investment Valuation. Investments are valued as of 4:00 p.m. Eastern time on the last calendar day of the period. The Board of Trustees (the Board) has delegated the day to day responsibility for the valuation of the Fund's investments to the Fair Value Committee (the Committee) established by the Fund's investment adviser. In accordance with valuation policies and procedures approved by the Board, the Fund attempts to obtain prices from one or more third party pricing vendors or brokers to value its investments. When current market prices, quotations or currency exchange rates are not readily available or reliable, investments will be fair valued in good faith by the Committee, in accordance with procedures adopted by the Board. Factors used in determining fair value vary by investment type and may include market or investment specific events, changes in interest rates and credit quality. The frequency with which these procedures are used cannot be predicted and they may be utilized to a significant extent. The Committee oversees the Fund's valuation policies and procedures and reports to the Board on the Committee's activities and fair value determinations. The Board monitors the appropriateness of the procedures used in valuing the Fund's investments and ratifies the fair value determinations of the Committee.
The Fund categorizes the inputs to valuation techniques used to value its investments into a disclosure hierarchy consisting of three levels as shown below:
- Level 1 – quoted prices in active markets for identical investments
- Level 2 – other significant observable inputs (including quoted prices for similar investments, interest rates, prepayment speeds, etc.)
- Level 3 – unobservable inputs (including the Fund's own assumptions based on the best information available)
Valuation techniques used to value the Fund's investments by major category are as follows:
Debt securities, including restricted securities, are valued based on evaluated prices received from third party pricing vendors or from brokers who make markets in such securities. Corporate bonds and bank loan obligations are valued by pricing vendors who utilize matrix pricing which considers yield or price of bonds of comparable quality, coupon, maturity and type or by broker-supplied prices. When independent prices are unavailable or unreliable, debt securities may be valued utilizing pricing methodologies which consider similar factors that would be used by third party pricing vendors. Debt securities are generally categorized as Level 2 in the hierarchy but may be Level 3 depending on the circumstances. The Fund invests a significant portion of its assets in below investment grade securities. The value of these securities can be more volatile due to changes in the credit quality of the issuer and is sensitive to changes in economic, market and regulatory conditions.
Equity securities, including restricted securities, for which market quotations are readily available, are valued at the last reported sale price or official closing price as reported by a third party pricing vendor on the primary market or exchange on which they are traded and are categorized as Level 1 in the hierarchy. In the event there were no sales during the day or closing prices are not available, securities are valued at the last quoted bid price or may be valued using the last available price and are generally categorized as Level 2 in the hierarchy. For foreign equity securities, when market or security specific events arise, comparisons to the valuation of American Depositary Receipts (ADRs), futures contracts, ETFs and certain indexes as well as quoted prices for similar securities may be used and would be categorized as Level 2 in the hierarchy. For equity securities, including restricted securities, where observable inputs are limited, assumptions about market activity and risk are used and these securities may be categorized as Level 3 in the hierarchy.
Investments in open-end mutual funds, including the Fidelity Central Funds, are valued at their closing net asset value (NAV) each business day and are categorized as Level 1 in the hierarchy.
Changes in valuation techniques may result in transfers in or out of an assigned level within the disclosure hierarchy. The aggregate value of investments by input level as of April 30, 2021 is included at the end of the Fund's Schedule of Investments.
Investment Transactions and Income. For financial reporting purposes, the Fund's investment holdings and NAV include trades executed through the end of the last business day of the period. The NAV per share for processing shareholder transactions is calculated as of the close of business of the New York Stock Exchange (NYSE), normally 4:00 p.m. Eastern time and includes trades executed through the end of the prior business day. Gains and losses on securities sold are determined on the basis of identified cost and include proceeds received from litigation. Dividend income is recorded on the ex-dividend date, except for certain dividends from foreign securities where the ex-dividend date may have passed, which are recorded as soon as the Fund is informed of the ex-dividend date. Non-cash dividends included in dividend income, if any, are recorded at the fair market value of the securities received. Income and capital gain distributions from Fidelity Central Funds, if any, are recorded on the ex-dividend date. Certain distributions received by the Fund represent a return of capital or capital gain. The Fund determines the components of these distributions subsequent to the ex-dividend date, based upon receipt of tax filings or other correspondence relating to the underlying investment. These distributions are recorded as a reduction of cost of investments and/or as a realized gain. Interest income is accrued as earned and includes coupon interest and amortization of premium and accretion of discount on debt securities as applicable. Debt obligations may be placed on non-accrual status and related interest income may be reduced by ceasing current accruals and writing off interest receivables when the collection of all or a portion of interest has become doubtful based on consistently applied procedures. A debt obligation is removed from non-accrual status when the issuer resumes interest payments or when collectability of interest is reasonably assured.
Class Allocations and Expenses. Investment income, realized and unrealized capital gains and losses, common expenses of a fund, and certain fund-level expense reductions, if any, are allocated daily on a pro-rata basis to each class based on the relative net assets of each class to the total net assets of a fund. Each class differs with respect to transfer agent and distribution and service plan fees incurred, as applicable. Certain expense reductions may also differ by class, if applicable. For the reporting period, the allocated portion of income and expenses to each class as a percent of its average net assets may vary due to the timing of recording these transactions in relation to fluctuating net assets of the classes. Expenses directly attributable to a fund are charged to that fund. Expenses attributable to more than one fund are allocated among the respective funds on the basis of relative net assets or other appropriate methods. Expenses included in the accompanying financial statements reflect the expenses of that fund and do not include any expenses associated with any underlying mutual funds or exchange-traded funds. Although not included in a fund's expenses, a fund indirectly bears its proportionate share of these expenses through the net asset value of each underlying mutual fund or exchange-traded fund. Expense estimates are accrued in the period to which they relate and adjustments are made when actual amounts are known.
Income Tax Information and Distributions to Shareholders. Each year, the Fund intends to qualify as a regulated investment company under Subchapter M of the Internal Revenue Code, including distributing substantially all of its taxable income and realized gains. As a result, no provision for U.S. Federal income taxes is required. As of April 30, 2021, the Fund did not have any unrecognized tax benefits in the financial statements; nor is the Fund aware of any tax positions for which it is reasonably possible that the total amounts of unrecognized tax benefits will significantly change in the next twelve months. The Fund files a U.S. federal tax return, in addition to state and local tax returns as required. The Fund's federal income tax returns are subject to examination by the Internal Revenue Service (IRS) for a period of three fiscal years after they are filed. State and local tax returns may be subject to examination for an additional fiscal year depending on the jurisdiction.
Distributions are declared and recorded daily and paid monthly from net investment income. Distributions from realized gains, if any, are declared and recorded on the ex-dividend date. Income and capital gain distributions are declared separately for each class. Income and capital gain distributions are determined in accordance with income tax regulations, which may differ from GAAP.
Capital accounts within the financial statements are adjusted for permanent book-tax differences. These adjustments have no impact on net assets or the results of operations. Capital accounts are not adjusted for temporary book-tax differences which will reverse in a subsequent period.
Book-tax differences are primarily due to certain conversion ratio adjustments, prior period premium and discount on debt securities, defaulted bonds, market discount, partnerships, capital loss carryforwards and losses deferred due to wash sales.
As of period end, the cost and unrealized appreciation (depreciation) in securities, and derivatives if applicable, for federal income tax purposes were as follows:
| Gross unrealized appreciation | $336,638 |
| Gross unrealized depreciation | (91,941) |
| Net unrealized appreciation (depreciation) | $244,697 |
| Tax Cost | $8,363,438 |
The tax-based components of distributable earnings as of period end were as follows:
| Undistributed ordinary income | $9,341 |
| Capital loss carryforward | $(427,596) |
| Net unrealized appreciation (depreciation) on securities and other investments | $244,697 |
Capital loss carryforwards are only available to offset future capital gains of the Fund to the extent provided by regulations and may be limited. The capital loss carryforward information presented below, including any applicable limitation, is estimated as of fiscal period end and is subject to adjustment.
| No expiration | |
| Short-term | $(105,140) |
| Long-term | (322,456) |
| Total capital loss carryforward | $(427,596) |
The tax character of distributions paid was as follows:
| | April 30, 2021 | April 30, 2020 |
| Ordinary Income | $315,556 | $ 266,971 |
Delayed Delivery Transactions and When-Issued Securities. During the period, certain Funds transacted in securities on a delayed delivery or when-issued basis. Payment and delivery may take place after the customary settlement period for that security. The price of the underlying securities and the date when the securities will be delivered and paid for are fixed at the time the transaction is negotiated. Securities purchased on a delayed delivery or when-issued basis are identified as such in the Schedule of Investments. Compensation for interest forgone in the purchase of a delayed delivery or when-issued debt security may be received. With respect to purchase commitments, each applicable Fund identifies securities as segregated in its records with a value at least equal to the amount of the commitment. Payables and receivables associated with the purchases and sales of delayed delivery securities having the same coupon, settlement date and broker are offset. Delayed delivery or when-issued securities that have been purchased from and sold to different brokers are reflected as both payables and receivables in the Statement of Assets and Liabilities under the caption "Delayed delivery", as applicable. Losses may arise due to changes in the value of the underlying securities or if the counterparty does not perform under the contract's terms, or if the issuer does not issue the securities due to political, economic, or other factors.
Restricted Securities (including Private Placements). Funds may invest in securities that are subject to legal or contractual restrictions on resale. These securities generally may be resold in transactions exempt from registration or to the public if the securities are registered. Disposal of these securities may involve time-consuming negotiations and expense, and prompt sale at an acceptable price may be difficult. Information regarding restricted securities held at period end is included at the end of the Schedule of Investments, if applicable.
Loans and Other Direct Debt Instruments. Direct debt instruments are interests in amounts owed to lenders by corporate or other borrowers. These instruments may be in the form of loans, trade claims or other receivables and may include standby financing commitments such as revolving credit facilities that obligate a fund to supply additional cash to the borrower on demand. Loans may be acquired through assignment, participation, or may be made directly to a borrower. Such instruments are presented in the Bank Loan Obligations section in the Schedule of Investments. Certain funds may also invest in unfunded loan commitments, which are contractual obligations for future funding. Information regarding unfunded commitments is included at the end of the Schedule of Investments, if applicable.
4. Purchases and Sales of Investments.
Purchases and sales of securities, other than short-term securities, are noted in the table below.
| | Purchases ($) | Sales ($) |
| Fidelity High Income Fund | 7,508,298 | 4,204,298 |
5. Fees and Other Transactions with Affiliates.
Management Fee. Fidelity Management & Research Company LLC (the investment adviser) and its affiliates provide the Fund with investment management related services for which the Fund pays a monthly management fee. The management fee is the sum of an individual fund fee rate that is based on an annual rate of .45% of the Fund's average net assets and an annualized group fee rate that averaged .10% during the period. The group fee rate is based upon the monthly average net assets of a group of registered investment companies with which the investment adviser has management contracts. The group fee rate decreases as assets under management increase and increases as assets under management decrease. For the reporting period, the total annual management fee rate was .55% of the Fund's average net assets.
Distribution and Service Plan Fees. In accordance with Rule 12b-1 of the 1940 Act, the Fund has adopted separate Distribution and Service Plans for each class of shares. Certain classes pay Fidelity Distributors Company LLC (FDC), an affiliate of the investment adviser, separate Distribution and Service Fees, each of which is based on an annual percentage of each class' average net assets. In addition, FDC may pay financial intermediaries for selling shares of the Fund and providing shareholder support services. For the period, the Distribution and Service Fee rates, total fees and amounts retained by FDC were as follows:
| | Distribution Fee | Service Fee | Total Fees | Retained by FDC |
| Class A | -% | .25% | $370 | $6 |
| Class M | -% | .25% | 100 | 1 |
| Class C | .75% | .25% | 353 | 25 |
| | | | $823 | $32 |
Sales Load. FDC may receive a front-end sales charge of up to 4.00% for selling Class A shares and Class M shares, some of which is paid to financial intermediaries for selling shares of the Fund. Depending on the holding period, FDC may receive contingent deferred sales charges levied on Class A, Class M and Class C redemptions. The deferred sales charges are 1.00% for Class C shares, 1.00% for certain purchases of Class A shares and .25% for certain purchases of Class M shares.
For the period, sales charge amounts retained by FDC were as follows:
| | Retained by FDC |
| Class A | $12 |
| Class M | 1 |
| Class C(a) | 1 |
| | $14 |
(a) When Class C shares are initially sold, FDC pays commissions from its own resources to financial intermediaries through which the sales are made.
Transfer Agent Fees. Fidelity Investments Institutional Operations Company LLC (FIIOC), an affiliate of the investment adviser, is the transfer, dividend disbursing and shareholder servicing agent for each class of the Fund. FIIOC receives account fees and asset-based fees that vary according to the account size and type of account of the shareholders of the respective classes of the Fund except for Class Z. FIIOC receives an asset-based fee of Class Z's average net assets. FIIOC pays for typesetting, printing and mailing of shareholder reports, except proxy statements.
For the period, transfer agent fees for each class were as follows:
| | Amount | % of Class-Level Average Net Assets |
| Class A | $224 | .15 |
| Class M | 65 | .16 |
| Class C | 62 | .18 |
| Fidelity High Income Fund | 4,736 | .11 |
| Class I | 3,720 | .15 |
| Class Z | 95 | .05 |
| | $8,902 | |
Accounting Fees. Fidelity Service Company, Inc. (FSC), an affiliate of the investment adviser, maintains the Fund's accounting records. The accounting fee is based on the level of average net assets for each month. For the period, the fees were equivalent to the following annual rates:
| | % of Average Net Assets |
| Fidelity High Income Fund | .02 |
Brokerage Commissions. A portion of portfolio transactions were placed with brokerage firms which are affiliates of the investment adviser. Brokerage commissions are included in net realized gain (loss) and change in net unrealized appreciation (depreciation) in the Statement of Operations. The commissions paid to these affiliated firms were as follows:
| | Amount |
| Fidelity High Income Fund | $4 |
Interfund Trades. Funds may purchase from or sell securities to other Fidelity Funds under procedures adopted by the Board. The procedures have been designed to ensure these interfund trades are executed in accordance with Rule 17a-7 of the 1940 Act. Any interfund trades are included within the respective purchases and sales amounts shown in the Purchases and Sales of Investments note.
Prior Fiscal Year Affiliated Redemptions In-Kind. During the prior period, 12,631 shares of the Fund were redeemed in-kind for investments, including accrued interest, and cash with a value of $112,257. The Fund had a net realized gain of $4,389 on investments delivered through in-kind redemptions. The amount of the in-kind redemptions is included in share transactions in the accompanying Statement of Changes in Net Assets as well as the Notes to Financial Statements. The Fund recognized no gain or loss for federal income tax purposes.
6. Committed Line of Credit.
Certain Funds participate with other funds managed by the investment adviser or an affiliate in a $4.25 billion credit facility (the "line of credit") to be utilized for temporary or emergency purposes to fund shareholder redemptions or for other short-term liquidity purposes. The participating funds have agreed to pay commitment fees on their pro-rata portion of the line of credit, which are reflected in Miscellaneous expenses on the Statement of Operations, and are listed below.
| | Amount |
| Fidelity High Income Fund | $14 |
During the period, there were no borrowings on this line of credit.
7. Expense Reductions.
Commissions paid to certain brokers with whom the investment adviser, or its affiliates, places trades on behalf of the Fund include an amount in addition to trade execution, which may be rebated back to the Fund to offset expenses. This amount totaled $84 for the period. In addition, through arrangements with the Fund's custodian, credits realized as a result of certain uninvested cash balances were used to reduce the Fund's expenses. During the period, custodian credits reduced the Fund's expenses by $19.
In addition, during the period the investment adviser or an affiliate reimbursed and/or waived a portion of fund-level operating expenses in the amount of $13.
8. Distributions to Shareholders.
Distributions to shareholders of each class were as follows:
| | Year ended
April 30, 2021 | Year ended
April 30, 2020 |
| Fidelity High Income Fund | | |
| Distributions to shareholders | | |
| Class A | $6,259 | $8,150 |
| Class M | 1,679 | 2,479 |
| Class C | 1,222 | 1,908 |
| Fidelity High Income Fund | 189,847 | 225,692 |
| Class I | 107,936 | 26,243 |
| Class Z | 8,613 | 2,499 |
| Total | $315,556 | $266,971 |
9. Share Transactions.
Share transactions for each class were as follows and may contain automatic conversions between classes or exchanges between affiliated funds:
| | Shares | Shares | Dollars | Dollars |
| | Year ended April 30, 2021 | Year ended April 30, 2020 | Year ended April 30, 2021 | Year ended April 30, 2020 |
| Fidelity High Income Fund | | | | |
| Class A | | | | |
| Shares sold | 2,258 | 2,794 | $19,321 | $24,364 |
| Reinvestment of distributions | 654 | 830 | 5,572 | 7,189 |
| Shares redeemed | (4,027) | (4,721) | (34,214) | (40,339) |
| Net increase (decrease) | (1,115) | (1,097) | $(9,321) | $(8,786) |
| Class M | | | | |
| Shares sold | 417 | 929 | $3,545 | $8,069 |
| Reinvestment of distributions | 179 | 265 | 1,524 | 2,295 |
| Shares redeemed | (1,542) | (1,745) | (13,162) | (14,688) |
| Net increase (decrease) | (946) | (551) | $(8,093) | $(4,324) |
| Class C | | | | |
| Shares sold | 490 | 495 | $4,159 | $4,250 |
| Reinvestment of distributions | 133 | 201 | 1,134 | 1,741 |
| Shares redeemed | (1,765) | (2,003) | (15,113) | (17,129) |
| Net increase (decrease) | (1,142) | (1,307) | $(9,820) | $(11,138) |
| Fidelity High Income Fund | | | | |
| Shares sold | 154,848 | 164,477 | $1,314,275 | $1,383,939 |
| Reinvestment of distributions | 18,289 | 20,940 | 155,903 | 181,398 |
| Shares redeemed | (186,129) | (194,580)(a) | (1,590,238) | (1,639,874)(a) |
| Net increase (decrease) | (12,992) | (9,163) | $(120,060) | $(74,537) |
| Class I | | | | |
| Shares sold | 427,069 | 45,132 | $3,636,803 | $386,113 |
| Reinvestment of distributions | 11,329 | 2,710 | 97,348 | 23,418 |
| Shares redeemed | (48,201) | (28,148)(a) | (412,228) | (243,683)(a) |
| Net increase (decrease) | 390,197 | 19,694 | $3,321,923 | $165,848 |
| Class Z | | | | |
| Shares sold | 29,771 | 8,794 | $251,887 | $75,919 |
| Reinvestment of distributions | 945 | 237 | 8,117 | 2,038 |
| Shares redeemed | (9,762) | (2,742) | (84,065) | (23,029) |
| Net increase (decrease) | 20,954 | 6,289 | $175,939 | $54,928 |
(a) Amount includes in-kind redemptions (see the Prior Fiscal Year Affiliated Redemptions In-Kind note for additional details).
10. Other.
Fund's organizational documents provide former and current trustees and officers with a limited indemnification against liabilities arising in connection with the performance of their duties to the fund. In the normal course of business, the fund may also enter into contracts that provide general indemnifications. The fund's maximum exposure under these arrangements is unknown as this would be dependent on future claims that may be made against the fund. The risk of material loss from such claims is considered remote.
11. Coronavirus (COVID-19) Pandemic.
An outbreak of COVID-19 first detected in China during December 2019 has since spread globally and was declared a pandemic by the World Health Organization during March 2020. Developments that disrupt global economies and financial markets, such as the COVID-19 pandemic, may magnify factors that affect the Fund's performance.
Report of Independent Registered Public Accounting Firm
To the Board of Trustees of Fidelity Summer Street Trust and Shareholders of Fidelity High Income Fund
Opinion on the Financial Statements
We have audited the accompanying statement of assets and liabilities, including the schedule of investments, of Fidelity High Income Fund (one of the funds constituting Fidelity Summer Street Trust, referred to hereafter as the “Fund”) as of April 30, 2021, the related statement of operations for the year ended April 30, 2021, the statement of changes in net assets for each of the two years in the period ended April 30, 2021, including the related notes, and the financial highlights for each of the periods indicated therein (collectively referred to as the “financial statements”). In our opinion, the financial statements present fairly, in all material respects, the financial position of the Fund as of April 30, 2021, the results of its operations for the year then ended, the changes in its net assets for each of the two years in the period ended April 30, 2021 and the financial highlights for each of the periods indicated therein in conformity with accounting principles generally accepted in the United States of America.
Basis for Opinion
These financial statements are the responsibility of the Fund’s management. Our responsibility is to express an opinion on the Fund’s financial statements based on our audits. We are a public accounting firm registered with the Public Company Accounting Oversight Board (United States) (PCAOB) and are required to be independent with respect to the Fund in accordance with the U.S. federal securities laws and the applicable rules and regulations of the Securities and Exchange Commission and the PCAOB.
We conducted our audits of these financial statements in accordance with the standards of the PCAOB. Those standards require that we plan and perform the audit to obtain reasonable assurance about whether the financial statements are free of material misstatement, whether due to error or fraud.
Our audits included performing procedures to assess the risks of material misstatement of the financial statements, whether due to error or fraud, and performing procedures that respond to those risks. Such procedures included examining, on a test basis, evidence regarding the amounts and disclosures in the financial statements. Our audits also included evaluating the accounting principles used and significant estimates made by management, as well as evaluating the overall presentation of the financial statements. Our procedures included confirmation of securities owned as of April 30, 2021 by correspondence with the custodian, issuers of privately offered securities, agent banks and brokers; when replies were not received from brokers, we performed other auditing procedures. We believe that our audits provide a reasonable basis for our opinion.
/s/ PricewaterhouseCoopers LLP
Boston, Massachusetts
June 21, 2021
We have served as the auditor of one or more investment companies in the Fidelity group of funds since 1932.
Trustees and Officers
The Trustees, Members of the Advisory Board (if any), and officers of the trust and fund, as applicable, are listed below. The Board of Trustees governs the fund and is responsible for protecting the interests of shareholders. The Trustees are experienced executives who meet periodically throughout the year to oversee the fund's activities, review contractual arrangements with companies that provide services to the fund, oversee management of the risks associated with such activities and contractual arrangements, and review the fund's performance. Each of the Trustees oversees 308 funds.
The Trustees hold office without limit in time except that (a) any Trustee may resign; (b) any Trustee may be removed by written instrument, signed by at least two-thirds of the number of Trustees prior to such removal; (c) any Trustee who requests to be retired or who has become incapacitated by illness or injury may be retired by written instrument signed by a majority of the other Trustees; and (d) any Trustee may be removed at any special meeting of shareholders by a two-thirds vote of the outstanding voting securities of the trust. Each Trustee who is not an interested person (as defined in the 1940 Act) of the trust and the fund is referred to herein as an Independent Trustee. Each Independent Trustee shall retire not later than the last day of the calendar year in which his or her 75th birthday occurs. The Independent Trustees may waive this mandatory retirement age policy with respect to individual Trustees. Officers and Advisory Board Members hold office without limit in time, except that any officer or Advisory Board Member may resign or may be removed by a vote of a majority of the Trustees at any regular meeting or any special meeting of the Trustees. Except as indicated, each individual has held the office shown or other offices in the same company for the past five years.
The fund's Statement of Additional Information (SAI) includes more information about the Trustees. To request a free copy, call Fidelity at 1-800-544-8544 if you’re an individual investing directly with Fidelity, call 1-800-835-5092 if you’re a plan sponsor or participant with Fidelity as your recordkeeper or call 1-877-208-0098 on institutional accounts or if you’re an advisor or invest through one.
Experience, Skills, Attributes, and Qualifications of the Trustees. The Governance and Nominating Committee has adopted a statement of policy that describes the experience, qualifications, attributes, and skills that are necessary and desirable for potential Independent Trustee candidates (Statement of Policy). The Board believes that each Trustee satisfied at the time he or she was initially elected or appointed a Trustee, and continues to satisfy, the standards contemplated by the Statement of Policy. The Governance and Nominating Committee also engages professional search firms to help identify potential Independent Trustee candidates who have the experience, qualifications, attributes, and skills consistent with the Statement of Policy. From time to time, additional criteria based on the composition and skills of the current Independent Trustees, as well as experience or skills that may be appropriate in light of future changes to board composition, business conditions, and regulatory or other developments, have also been considered by the professional search firms and the Governance and Nominating Committee. In addition, the Board takes into account the Trustees' commitment and participation in Board and committee meetings, as well as their leadership of standing and ad hoc committees throughout their tenure.
In determining that a particular Trustee was and continues to be qualified to serve as a Trustee, the Board has considered a variety of criteria, none of which, in isolation, was controlling. The Board believes that, collectively, the Trustees have balanced and diverse experience, qualifications, attributes, and skills, which allow the Board to operate effectively in governing the fund and protecting the interests of shareholders. Information about the specific experience, skills, attributes, and qualifications of each Trustee, which in each case led to the Board's conclusion that the Trustee should serve (or continue to serve) as a trustee of the fund, is provided below.
Board Structure and Oversight Function. Robert A. Lawrence is an interested person and currently serves as Acting Chairman. The Trustees have determined that an interested Chairman is appropriate and benefits shareholders because an interested Chairman has a personal and professional stake in the quality and continuity of services provided to the fund. Independent Trustees exercise their informed business judgment to appoint an individual of their choosing to serve as Chairman, regardless of whether the Trustee happens to be independent or a member of management. The Independent Trustees have determined that they can act independently and effectively without having an Independent Trustee serve as Chairman and that a key structural component for assuring that they are in a position to do so is for the Independent Trustees to constitute a substantial majority for the Board. The Independent Trustees also regularly meet in executive session. David M. Thomas serves as Lead Independent Trustee and as such (i) acts as a liaison between the Independent Trustees and management with respect to matters important to the Independent Trustees and (ii) with management prepares agendas for Board meetings.
Fidelity® funds are overseen by different Boards of Trustees. The fund's Board oversees Fidelity's high income and certain equity funds, and other Boards oversee Fidelity's investment-grade bond, money market, asset allocation, and other equity funds. The asset allocation funds may invest in Fidelity® funds overseen by the fund's Board. The use of separate Boards, each with its own committee structure, allows the Trustees of each group of Fidelity® funds to focus on the unique issues of the funds they oversee, including common research, investment, and operational issues. On occasion, the separate Boards establish joint committees to address issues of overlapping consequences for the Fidelity® funds overseen by each Board.
The Trustees operate using a system of committees to facilitate the timely and efficient consideration of all matters of importance to the Trustees, the fund, and fund shareholders and to facilitate compliance with legal and regulatory requirements and oversight of the fund's activities and associated risks. The Board, acting through its committees, has charged FMR and its affiliates with (i) identifying events or circumstances the occurrence of which could have demonstrably adverse effects on the fund's business and/or reputation; (ii) implementing processes and controls to lessen the possibility that such events or circumstances occur or to mitigate the effects of such events or circumstances if they do occur; and (iii) creating and maintaining a system designed to evaluate continuously business and market conditions in order to facilitate the identification and implementation processes described in (i) and (ii) above. Because the day-to-day operations and activities of the fund are carried out by or through FMR, its affiliates, and other service providers, the fund's exposure to risks is mitigated but not eliminated by the processes overseen by the Trustees. While each of the Board's committees has responsibility for overseeing different aspects of the fund's activities, oversight is exercised primarily through the Operations, Audit, and Compliance Committees. Appropriate personnel, including but not limited to the fund's Chief Compliance Officer (CCO), FMR's internal auditor, the independent accountants, the fund's Treasurer and portfolio management personnel, make periodic reports to the Board's committees, as appropriate, including an annual review of Fidelity's risk management program for the Fidelity® funds. The responsibilities of each standing committee, including their oversight responsibilities, are described further under "Standing Committees of the Trustees."
Interested Trustees*:
Correspondence intended for a Trustee who is an interested person may be sent to Fidelity Investments, 245 Summer Street, Boston, Massachusetts 02210.
Name, Year of Birth; Principal Occupations and Other Relevant Experience+
Bettina Doulton (1964)
Year of Election or Appointment: 2020
Trustee
Ms. Doulton also serves as Trustee of other Fidelity® funds. Prior to her retirement, Ms. Doulton served in a variety of positions at Fidelity Investments, including as a managing director of research (2006-2007), portfolio manager to certain Fidelity® funds (1993-2005), equity analyst and portfolio assistant (1990-1993), and research assistant (1987-1990). Ms. Doulton currently owns and operates Phi Builders + Architects and Cellardoor Winery. Previously, Ms. Doulton served as a member of the Board of Brown Capital Management, LLC (2014-2018).
Robert A. Lawrence (1952)
Year of Election or Appointment: 2020
Trustee
Acting Chairman of the Board of Trustees
Mr. Lawrence also serves as Trustee of other funds. Previously, Mr. Lawrence served as a Member of the Advisory Board of certain funds. Prior to his retirement in 2008, Mr. Lawrence served as Vice President of certain Fidelity® funds (2006-2008), Senior Vice President, Head of High Income Division of Fidelity Management & Research Company (investment adviser firm, 2006-2008), and President of Fidelity Strategic Investments (investment adviser firm, 2002-2005).
* Determined to be an “Interested Trustee” by virtue of, among other things, his or her affiliation with the trust or various entities under common control with FMR.
+ The information includes the Trustee's principal occupation during the last five years and other information relating to the experience, attributes, and skills relevant to the Trustee's qualifications to serve as a Trustee, which led to the conclusion that the Trustee should serve as a Trustee for the fund.
Independent Trustees:
Correspondence intended for an Independent Trustee may be sent to Fidelity Investments, P.O. Box 55235, Boston, Massachusetts 02205-5235.
Name, Year of Birth; Principal Occupations and Other Relevant Experience+
Thomas P. Bostick (1956)
Year of Election or Appointment: 2021
Trustee
Lieutenant General Bostick also serves as Trustee of other Fidelity® funds. Prior to his retirement, General Bostick (United States Army, Retired) held a variety of positions within the U.S. Army, including Commanding General and Chief of Engineers, U.S. Army Corps of Engineers (2012-2016) and Deputy Chief of Staff and Director of Human Resources, U.S. Army (2009-2012). General Bostick currently serves as a member of the Board and Finance and Governance Committees of CSX Corporation (transportation, 2020-present) and a member of the Board and Corporate Governance and Nominating Committee of Perma-Fix Environmental Services, Inc. (nuclear waste management, 2020-present). General Bostick serves as Chief Executive Officer of Bostick Global Strategies, LLC (consulting, 2016-present) and Managing Partner, Sustainability, of Ridge-Lane Limited Partners (strategic advisory and venture development, 2016-present). Previously, General Bostick served as a Member of the Advisory Board of certain Fidelity® funds (2021), President, Intrexon Bioengineering (2018-2020) and Chief Operating Officer (2017-2020) and Senior Vice President of the Environment Sector (2016-2017) of Intrexon Corporation (biopharmaceutical company).
Dennis J. Dirks (1948)
Year of Election or Appointment: 2005
Trustee
Mr. Dirks also serves as Trustee of other Fidelity® funds. Prior to his retirement in May 2003, Mr. Dirks served as Chief Operating Officer and as a member of the Board of The Depository Trust & Clearing Corporation (financial markets infrastructure), President, Chief Operating Officer and a member of the Board of The Depository Trust Company (DTC), President and a member of the Board of the National Securities Clearing Corporation (NSCC), Chief Executive Officer and a member of the Board of the Government Securities Clearing Corporation and Chief Executive Officer and a member of the Board of the Mortgage-Backed Securities Clearing Corporation. Mr. Dirks currently serves as a member of the Finance Committee (2016-present) and Board (2017-present) and is Treasurer (2018-present) of the Asolo Repertory Theatre.
Donald F. Donahue (1950)
Year of Election or Appointment: 2018
Trustee
Mr. Donahue also serves as Trustee of other Fidelity® funds. Mr. Donahue serves as President and Chief Executive Officer of Miranda Partners, LLC (risk consulting for the financial services industry, 2012-present). Previously, Mr. Donahue served as Chief Executive Officer (2006-2012), Chief Operating Officer (2003-2006) and Managing Director, Customer Marketing and Development (1999-2003) of The Depository Trust & Clearing Corporation (financial markets infrastructure). Mr. Donahue currently serves as a member (2007-present) and Co-Chairman (2016-present) of the Board of United Way of New York and a member of the Board of NYC Leadership Academy (2012-present). Mr. Donahue previously served as a member of the Advisory Board of certain Fidelity® funds (2015-2018).
Vicki L. Fuller (1957)
Year of Election or Appointment: 2020
Trustee
Ms. Fuller also serves as Trustee of other Fidelity® funds. Previously, Ms. Fuller served as a member of the Advisory Board of certain Fidelity® funds (2018-2020), Chief Investment Officer of the New York State Common Retirement Fund (2012-2018) and held a variety of positions at AllianceBernstein L.P. (global asset management, 1985-2012), including Managing Director (2006-2012) and Senior Vice President and Senior Portfolio Manager (2001-2006). Ms. Fuller currently serves as a member of the Board, Audit Committee and Nominating and Governance Committee of The Williams Companies, Inc. (natural gas infrastructure, 2018-present), as a member of the Board, Audit Committee and Nominating and Governance Committee of two Blackstone business development companies (2020-present) and as a member of the Board of Treliant, LLC (consulting, 2019-present).
Patricia L. Kampling (1959)
Year of Election or Appointment: 2020
Trustee
Ms. Kampling also serves as Trustee of other Fidelity® funds. Prior to her retirement, Ms. Kampling served as Chairman of the Board and Chief Executive Officer (2012-2019), President and Chief Operating Officer (2011-2012) and Executive Vice President and Chief Financial Officer (2010-2011) of Alliant Energy Corporation. Ms. Kampling currently serves as a member of the Board, Finance Committee and Governance, Compensation and Nominating Committee of Xcel Energy Inc. (utilities company, 2020-present) and as a member of the Board, Audit, Finance and Risk Committee and Safety, Environmental, Technology and Operations Committee of American Water Works Company, Inc. (utilities company, 2019-present). In addition, Ms. Kampling currently serves as a member of the Board of the Nature Conservancy, Wisconsin Chapter (2019-present). Previously, Ms. Kampling served as a Member of the Advisory Board of certain Fidelity® funds (2020), a member of the Board, Compensation Committee and Executive Committee and Chair of the Audit Committee of Briggs & Stratton Corporation (manufacturing, 2011-2021), a member of the Board of Interstate Power and Light Company (2012-2019) and Wisconsin Power and Light Company (2012-2019) (each a subsidiary of Alliant Energy Corporation) and as a member of the Board and Workforce Development Committee of the Business Roundtable (2018-2019).
Thomas A. Kennedy (1955)
Year of Election or Appointment: 2021
Trustee
Mr. Kennedy also serves as Trustee of other Fidelity® funds. Previously, Mr. Kennedy served as a Member of the Advisory Board of certain Fidelity® funds (2020) and held a variety of positions at Raytheon Company (aerospace and defense, 1983-2020), including Chairman and Chief Executive Officer (2014-2020) and Executive Vice President and Chief Operating Officer (2013-2014). Mr. Kennedy currently serves as Executive Chairman of the Board of Directors of Raytheon Technologies Corporation (aerospace and defense, 2020-present). He is also a member of the Rutgers School of Engineering Industry Advisory Board (2011-present) and a member of the UCLA Engineering Dean’s Executive Board (2016-present).
Oscar Munoz (1959)
Year of Election or Appointment: 2021
Trustee
Mr. Munoz also serves as Trustee of other Fidelity® funds. Prior to his retirement, Mr. Munoz served as Executive Chairman (2020-2021), Chief Executive Officer (2015-2020), President (2015-2016) and a member of the Board (2010-2021) of United Airlines Holdings, Inc. Mr. Munoz currently serves as a member of the Board of CBRE Group, Inc. (commercial real estate, 2020-present), a member of the Board of Univision Communications, Inc. (Hispanic media, 2020-present) and a member of the Advisory Board of Salesforce.com, Inc. (cloud-based software, 2020-present). Previously, Mr. Munoz served as a Member of the Advisory Board of certain Fidelity® funds (2021).
Garnett A. Smith (1947)
Year of Election or Appointment: 2018
Trustee
Mr. Smith also serves as Trustee of other Fidelity® funds. Prior to his retirement, Mr. Smith served as Chairman and Chief Executive Officer (1990-1997) and President (1986-1990) of Inbrand Corp. (manufacturer of personal absorbent products). Prior to his employment with Inbrand Corp., he was employed by a retail fabric chain and North Carolina National Bank (now Bank of America). Mr. Smith previously served as a member of the Advisory Board of certain Fidelity® funds (2012-2013).
David M. Thomas (1949)
Year of Election or Appointment: 2008
Trustee
Lead Independent Trustee
Mr. Thomas also serves as Trustee of other Fidelity® funds. Previously, Mr. Thomas served as Executive Chairman (2005-2006) and Chairman and Chief Executive Officer (2000-2005) of IMS Health, Inc. (pharmaceutical and healthcare information solutions). Mr. Thomas currently serves as a member of the Board of Fortune Brands Home and Security (home and security products, 2004-present) and Presiding Director (2013-present) of Interpublic Group of Companies, Inc. (marketing communication).
Susan Tomasky (1953)
Year of Election or Appointment: 2020
Trustee
Ms. Tomasky also serves as Trustee of other Fidelity® funds. Prior to her retirement, Ms. Tomasky served in various executive officer positions at American Electric Power Company, Inc. (1998-2011), including most recently as President of AEP Transmission (2007-2011). Ms. Tomasky currently serves as a member of the Board and Sustainability Committee and as Chair of the Audit Committee of Marathon Petroleum Corporation (2018-present) and as a member of the Board, Corporate Governance Committee and Organization and Compensation Committee and as Chair of the Audit Committee of Public Service Enterprise Group, Inc. (utilities company, 2012-present). In addition, Ms. Tomasky currently serves as a member (2009-present) and President (2020-present) of the Board of the Royal Shakespeare Company – America (2009-present), as a member of the Board of the Columbus Association for the Performing Arts (2011-present) and as a member of the Board and Investment Committee of Kenyon College (2016-present). Previously, Ms. Tomasky served as a Member of the Advisory Board of certain Fidelity® funds (2020), as a member of the Board of the Columbus Regional Airport Authority (2007-2020), as a member of the Board (2011-2018) and Lead Independent Director (2015-2018) of Andeavor Corporation (previously Tesoro Corporation) (independent oil refiner and marketer) and as a member of the Board of Summit Midstream Partners LP (energy, 2012-2018).
Michael E. Wiley (1950)
Year of Election or Appointment: 2018
Trustee
Mr. Wiley also serves as Trustee of other Fidelity® funds. Previously, Mr. Wiley served as a member of the Advisory Board of certain Fidelity® funds (2018-2020), Chairman, President and CEO of Baker Hughes, Inc. (oilfield services, 2000-2004). Mr. Wiley also previously served as a member of the Board of Andeavor Corporation (independent oil refiner and marketer, 2005-2018), a member of the Board of Andeavor Logistics LP (natural resources logistics, 2015-2018) and a member of the Board of High Point Resources (exploration and production, 2005-2020).
+ The information includes the Trustee's principal occupation during the last five years and other information relating to the experience, attributes, and skills relevant to the Trustee's qualifications to serve as a Trustee, which led to the conclusion that the Trustee should serve as a Trustee for the fund.
Advisory Board Members and Officers:
Correspondence intended for a Member of the Advisory Board (if any) may be sent to Fidelity Investments, P.O. Box 55235, Boston, Massachusetts 02205-5235. Correspondence intended for an officer or Peter S. Lynch may be sent to Fidelity Investments, 245 Summer Street, Boston, Massachusetts 02210. Officers appear below in alphabetical order.
Name, Year of Birth; Principal Occupation
Peter S. Lynch (1944)
Year of Election or Appointment: 2003
Member of the Advisory Board
Mr. Lynch also serves as a Member of the Advisory Board of other Fidelity® funds. Mr. Lynch is Vice Chairman and a Director of Fidelity Management & Research Company LLC (investment adviser firm). In addition, Mr. Lynch serves as a Trustee of Boston College and as the Chairman of the Inner-City Scholarship Fund. Previously, Mr. Lynch served as Vice Chairman and a Director of FMR Co., Inc. (investment adviser firm) and on the Special Olympics International Board of Directors (1997-2006).
Craig S. Brown (1977)
Year of Election or Appointment: 2019
Assistant Treasurer
Mr. Brown also serves as Assistant Treasurer of other funds. Mr. Brown is an employee of Fidelity Investments (2013-present).
John J. Burke III (1964)
Year of Election or Appointment: 2018
Chief Financial Officer
Mr. Burke also serves as Chief Financial Officer of other funds. Mr. Burke serves as Head of Investment Operations for Fidelity Fund and Investment Operations (2018-present) and is an employee of Fidelity Investments (1998-present). Previously Mr. Burke served as head of Asset Management Investment Operations (2012-2018).
William C. Coffey (1969)
Year of Election or Appointment: 2019
Assistant Secretary
Mr. Coffey also serves as Assistant Secretary of other funds. He is Senior Vice President and Deputy General Counsel of FMR LLC (diversified financial services company, 2010-present), and is an employee of Fidelity Investments. Previously, Mr. Coffey served as Secretary and CLO of certain funds (2018-2019); CLO, Secretary, and Senior Vice President of Fidelity Management & Research Company and FMR Co., Inc. (investment adviser firms, 2018-2019); Secretary of Fidelity SelectCo, LLC and Fidelity Investments Money Management, Inc. (investment adviser firms, 2018-2019); CLO of Fidelity Management & Research (Hong Kong) Limited, FMR Investment Management (UK) Limited, and Fidelity Management & Research (Japan) Limited (investment adviser firms, 2018-2019); and Assistant Secretary of certain funds (2009-2018).
Timothy M. Cohen (1969)
Year of Election or Appointment: 2018
Vice President
Mr. Cohen also serves as Vice President of other funds. Mr. Cohen serves as Co-Head of Equity (2018-present), a Director of Fidelity Management & Research (Japan) Limited (investment adviser firm, 2016-present), and is an employee of Fidelity Investments. Previously, Mr. Cohen served as Executive Vice President of Fidelity SelectCo, LLC (2019), Head of Global Equity Research (2016-2018), Chief Investment Officer - Equity and a Director of Fidelity Management & Research (U.K.) Inc. (investment adviser firm, 2013-2015) and as a Director of Fidelity Management & Research (Hong Kong) Limited (investment adviser firm, 2017).
Jonathan Davis (1968)
Year of Election or Appointment: 2010
Assistant Treasurer
Mr. Davis also serves as Assistant Treasurer of other funds. Mr. Davis serves as Assistant Treasurer of FMR Capital, Inc. (2017-present) and is an employee of Fidelity Investments. Previously, Mr. Davis served as Vice President and Associate General Counsel of FMR LLC (diversified financial services company, 2003-2010).
Laura M. Del Prato (1964)
Year of Election or Appointment: 2018
Assistant Treasurer
Ms. Del Prato also serves as an officer of other funds. Ms. Del Prato is an employee of Fidelity Investments (2017-present). Previously, Ms. Del Prato served as President and Treasurer of The North Carolina Capital Management Trust: Cash Portfolio and Term Portfolio (2018-2020). Prior to joining Fidelity Investments, Ms. Del Prato served as a Managing Director and Treasurer of the JPMorgan Mutual Funds (2014-2017). Prior to JPMorgan, Ms. Del Prato served as a partner at Cohen Fund Audit Services (accounting firm, 2012-2013) and KPMG LLP (accounting firm, 2004-2012).
Colm A. Hogan (1973)
Year of Election or Appointment: 2020
Assistant Treasurer
Mr. Hogan also serves as an officer of other funds. Mr. Hogan serves as Assistant Treasurer of FMR Capital, Inc. (2017-present) and is an employee of Fidelity Investments (2005-present). Previously, Mr. Hogan served as Deputy Treasurer of certain Fidelity® funds (2016-2020) and Assistant Treasurer of certain Fidelity® funds (2016-2018).
Pamela R. Holding (1964)
Year of Election or Appointment: 2018
Vice President
Ms. Holding also serves as Vice President of other funds. Ms. Holding serves as Co-Head of Equity (2018-present) and is an employee of Fidelity Investments (2013-present). Previously, Ms. Holding served as Executive Vice President of Fidelity SelectCo, LLC (2019) and as Chief Investment Officer of Fidelity Institutional Asset Management (2013-2018).
Cynthia Lo Bessette (1969)
Year of Election or Appointment: 2019
Secretary and Chief Legal Officer (CLO)
Ms. Lo Bessette also serves as an officer of other funds. Ms. Lo Bessette serves as CLO, Secretary, and Senior Vice President of Fidelity Management & Research Company LLC (investment adviser firm, 2019-present); and CLO of Fidelity Management & Research (Hong Kong) Limited, FMR Investment Management (UK) Limited, and Fidelity Management & Research (Japan) Limited (investment adviser firms, 2019-present). She is a Senior Vice President and Deputy General Counsel of FMR LLC (diversified financial services company, 2019-present), and is an employee of Fidelity Investments. Previously, Ms. Lo Bessette served as CLO, Secretary, and Senior Vice President of FMR Co., Inc. (investment adviser firm, 2019); Secretary of Fidelity SelectCo, LLC and Fidelity Investments Money Management, Inc. (investment adviser firms, 2019). Prior to joining Fidelity Investments, Ms. Lo Bessette was Executive Vice President, General Counsel (2016-2019) and Senior Vice President, Deputy General Counsel (2015-2016) of OppenheimerFunds (investment management company) and Deputy Chief Legal Officer (2013-2015) of Jennison Associates LLC (investment adviser firm).
Chris Maher (1972)
Year of Election or Appointment: 2020
Deputy Treasurer
Mr. Maher also serves as an officer of other funds. Mr. Maher serves as Assistant Treasurer of FMR Capital, Inc. (2017-present), and is an employee of Fidelity Investments (2008-present). Previously, Mr. Maher served as Assistant Treasurer of certain funds (2013-2020); Vice President of Asset Management Compliance (2013), Vice President of the Program Management Group of FMR (investment adviser firm, 2010-2013), and Vice President of Valuation Oversight (2008-2010).
Jason P. Pogorelec (1975)
Year of Election or Appointment: 2020
Chief Compliance Officer
Mr. Pogorelec also serves as Chief Compliance Officer of other funds. Mr. Pogorelec is a senior Vice President of Asset Management Compliance for Fidelity Investments and is an employee of Fidelity Investments (2006-present). Previously, Mr. Pogorelec served as Vice President, Associate General Counsel for Fidelity Investments (2010-2020) and Assistant Secretary of certain Fidelity funds (2015-2020).
Brett Segaloff (1972)
Year of Election or Appointment: 2021
Anti-Money Laundering (AML) Officer
Mr. Segaloff also serves as an AML Officer of other funds and other related entities. He is Director, Anti-Money Laundering (2007-present) of FMR LLC (diversified financial services company) and is an employee of Fidelity Investments (1996-present).
Stacie M. Smith (1974)
Year of Election or Appointment: 2016
President and Treasurer
Ms. Smith also serves as an officer of other funds. Ms. Smith serves as Assistant Treasurer of FMR Capital, Inc. (2017-present), is an employee of Fidelity Investments (2009-present), and has served in other fund officer roles. Prior to joining Fidelity Investments, Ms. Smith served as Senior Audit Manager of Ernst & Young LLP (accounting firm, 1996-2009). Previously, Ms. Smith served as Assistant Treasurer (2013-2019) and Deputy Treasurer (2013-2016) of certain Fidelity® funds.
Marc L. Spector (1972)
Year of Election or Appointment: 2016
Assistant Treasurer
Mr. Spector also serves as an officer of other funds. Mr. Spector serves as Assistant Treasurer of FMR Capital, Inc. (2017-present) and is an employee of Fidelity Investments (2016-present). Prior to joining Fidelity Investments, Mr. Spector served as Director at the Siegfried Group (accounting firm, 2013-2016), and prior to Siegfried Group as audit senior manager at Deloitte & Touche LLP (accounting firm, 2005-2013).
Jim Wegmann (1979)
Year of Election or Appointment: 2019
Assistant Treasurer
Mr. Wegmann also serves as Assistant Treasurer of other funds. Mr. Wegmann is an employee of Fidelity Investments (2011-present).
Shareholder Expense Example
As a shareholder, you incur two types of costs: (1) transaction costs, which may include sales charges (loads) on purchase payments or redemption proceeds, as applicable and (2) ongoing costs, which generally include management fees, distribution and/or service (12b-1) fees and other Fund expenses. This Example is intended to help you understand your ongoing costs (in dollars) of investing in a fund and to compare these costs with the ongoing costs of investing in other mutual funds.
The Example is based on an investment of $1,000 invested at the beginning of the period and held for the entire period (November 1, 2020 to April 30, 2021).
Actual Expenses
The first line of the accompanying table provides information about actual account values and actual expenses. You may use the information in this line, together with the amount you invested, to estimate the expenses that you paid over the period. Simply divide your account value by $1,000.00 (for example, an $8,600 account value divided by $1,000.00 = 8.6), then multiply the result by the number in the first line for a class/Fund under the heading entitled "Expenses Paid During Period" to estimate the expenses you paid on your account during this period. If any fund is a shareholder of any underlying mutual funds or exchange-traded funds (ETFs) (the Underlying Funds), such fund indirectly bears its proportional share of the expenses of the Underlying Funds in addition to the direct expenses incurred presented in the table. These fees and expenses are not included in the annualized expense ratio used to calculate the expense estimate in the table below.
Hypothetical Example for Comparison Purposes
The second line of the accompanying table provides information about hypothetical account values and hypothetical expenses based on the actual expense ratio and an assumed rate of return of 5% per year before expenses, which is not the actual return. The hypothetical account values and expenses may not be used to estimate the actual ending account balance or expenses you paid for the period. You may use this information to compare the ongoing costs of investing in the Fund and other funds. To do so, compare this 5% hypothetical example with the 5% hypothetical examples that appear in the shareholder reports of the other funds. If any fund is a shareholder of any Underlying Funds, such fund indirectly bears its proportional share of the expenses of the Underlying Funds in addition to the direct expenses as presented in the table. These fees and expenses are not included in the annualized expense ratio used to calculate the expense estimate in the table below.
Please note that the expenses shown in the table are meant to highlight your ongoing costs only and do not reflect any transaction costs. Therefore, the second line of the table is useful in comparing ongoing costs only, and will not help you determine the relative total costs of owning different funds. In addition, if these transactional costs were included, your costs would have been higher.
| | Annualized Expense Ratio-A | Beginning
Account Value
November 1, 2020 | Ending
Account Value
April 30, 2021 | Expenses Paid
During Period-B
November 1, 2020
to April 30, 2021 |
| Fidelity High Income Fund | | | | |
| Class A | .98% | | | |
| Actual | | $1,000.00 | $1,060.10 | $5.01 |
| Hypothetical-C | | $1,000.00 | $1,019.93 | $4.91 |
| Class M | .99% | | | |
| Actual | | $1,000.00 | $1,060.00 | $5.06 |
| Hypothetical-C | | $1,000.00 | $1,019.89 | $4.96 |
| Class C | 1.76% | | | |
| Actual | | $1,000.00 | $1,056.00 | $8.97 |
| Hypothetical-C | | $1,000.00 | $1,016.07 | $8.80 |
| Fidelity High Income Fund | .69% | | | |
| Actual | | $1,000.00 | $1,061.60 | $3.53 |
| Hypothetical-C | | $1,000.00 | $1,021.37 | $3.46 |
| Class I | .73% | | | |
| Actual | | $1,000.00 | $1,061.40 | $3.73 |
| Hypothetical-C | | $1,000.00 | $1,021.17 | $3.66 |
| Class Z | .63% | | | |
| Actual | | $1,000.00 | $1,061.90 | $3.22 |
| Hypothetical-C | | $1,000.00 | $1,021.67 | $3.16 |
A Annualized expense ratio reflects expenses net of applicable fee waivers.
B Expenses are equal to the annualized expense ratio, multiplied by the average account value over the period, multiplied by 181/ 365 (to reflect the one-half year period). The fees and expenses of any Underlying Funds are not included in each annualized expense ratio.
C 5% return per year before expenses
Distributions (Unaudited)
A total of 0.05% of the dividends distributed during the fiscal year was derived from interest on U.S. Government securities which is generally exempt from state income tax.
The fund designates $ 210,783,984 of distributions paid in the calendar year 2020 as qualifying to be taxed as interest-related dividends for nonresident alien shareholders.
The fund designates $ 277,696,012 of distributions paid in the calendar year 2020 as qualifying to be taxed as section 163(j) interest dividends.
The fund will notify shareholders in January 2022 of amounts for use in preparing 2021 income tax returns.
Board Approval of Investment Advisory Contracts
Fidelity High Income Fund
At its January 2021 meeting, the Board of Trustees, including the Independent Trustees (together, the Board), voted to continue the management contract with Fidelity Management & Research Company LLC (FMR), and the sub-advisory agreements and sub-subadvisory agreements, in each case, where applicable (together, the Advisory Contracts) for the fund for four months from February 1, 2021 through May 31, 2021, in connection with changes to the Board's meeting calendar.
The Board considered that the approval of the fund's Advisory Contracts will not result in any changes in (i) the investment process or strategies employed in the management of the fund's assets; (ii) the fees and expenses paid by shareholders; (iii) the nature, extent or quality of services provided under the fund's Advisory Contracts; or (iv) the day-to-day management of the fund or the persons primarily responsible for such management. The Board also considered that since its last approval of the fund's Advisory Contracts, FMR had provided additional information on the fund in support of the annual contract renewal process, including competitive analyses on total expenses and management fees and in-depth reviews of fund performance and fund profitability information. The Board also considered the findings of certain ad hoc committees that had been previously formed to discuss matters relevant to all of the Fidelity funds, including economies of scale, fall-out benefits and retail vs. institutional funds. The Board concluded that the fund's Advisory Contracts are fair and reasonable, and that the fund's Advisory Contracts should be renewed, without modification, through May 31, 2021, with the understanding that the Board will consider the annual renewal for a full one year period in May 2021.
In connection with its consideration of future renewals of the fund's Advisory Contracts, the Board will consider: (i) the nature, extent and quality of services provided to the funds, including shareholder and administrative services and investment performance; (ii) the competitiveness of the management fee and total expenses for the fund; (iii) the costs of the services and profitability, including the revenues earned and the expenses incurred in conducting the business of developing, marketing, distributing, managing, administering, and servicing the fund and its shareholders, to the extent applicable; and (iv) whether there have been economies of scale in respect of the Fidelity funds, whether the Fidelity funds (including the fund) have appropriately benefited from any such economies of scale, and whether there is the potential for realization of any further economies.
Based on its evaluation of all of the conclusions noted above, and after considering all factors it believed relevant, the Board ultimately concluded that the fund's management fee structure is fair and reasonable, and that the continuation of the fund's Advisory Contracts should be approved for four months from February 1, 2021 through May 31, 2021.
Liquidity Risk Management Program
The Securities and Exchange Commission adopted Rule 22e-4 under the Investment Company Act of 1940 (the Liquidity Rule) to promote effective liquidity risk management throughout the open-end investment company industry, thereby reducing the risk that funds will be unable to meet their redemption obligations and mitigating dilution of the interests of fund shareholders.
The Fund has adopted and implemented a liquidity risk management program pursuant to the Liquidity Rule (the Program) effective December 1, 2018. The Program is reasonably designed to assess and manage the Fund’s liquidity risk and to comply with the requirements of the Liquidity Rule. The Fund’s Board of Trustees (the Board) has designated the Fund’s investment adviser as administrator of the Program. The Fidelity advisers have established a Liquidity Risk Management Committee (the LRM Committee) to manage the Program for each of the Fidelity Funds. The LRM Committee monitors the adequacy and effectiveness of implementation of the Program and on a periodic basis assesses each Fund’s liquidity risk based on a variety of factors including (1) the Fund’s investment strategy, (2) portfolio liquidity and cash flow projections during normal and reasonably foreseeable stressed conditions, (3) shareholder redemptions, (4) borrowings and other funding sources and (5) in the case of exchange-traded funds, certain additional factors including the effect of the Fund’s prices and spreads, market participants, and basket compositions on the overall liquidity of the Fund’s portfolio, as applicable.
In accordance with the Program, each of the Fund’s portfolio investments is classified into one of four liquidity categories described below based on a determination of a reasonable expectation for how long it would take to convert the investment to cash (or sell or dispose of the investment) without significantly changing its market value.
- Highly liquid investments – cash or convertible to cash within three business days or less
- Moderately liquid investments – convertible to cash in three to seven calendar days
- Less liquid investments – can be sold or disposed of, but not settled, within seven calendar days
- Illiquid investments – cannot be sold or disposed of within seven calendar days
Liquidity classification determinations take into account a variety of factors including various market, trading and investment-specific considerations, as well as market depth, and generally utilize analysis from a third-party liquidity metrics service.
The Liquidity Rule places a 15% limit on a fund’s illiquid investments and requires funds that do not primarily hold assets that are highly liquid investments to determine and maintain a minimum percentage of the fund’s net assets to be invested in highly liquid investments (highly liquid investment minimum or HLIM). The Program includes provisions reasonably designed to comply with the 15% limit on illiquid investments and for determining, periodically reviewing and complying with the HLIM requirement as applicable.
At a recent meeting of the Fund’s Board of Trustees, the LRM Committee provided a written report to the Board pertaining to the operation, adequacy, and effectiveness of implementation of the Program for the annual period from December 1, 2019 through November 30, 2020. The report concluded that the Program has been implemented and is operating effectively and is reasonably designed to assess and manage the Fund’s liquidity risk.
Proxy Voting Results
A special meeting of shareholders was held on June 9, 2020. The results of votes taken among shareholders on the proposals before them are reported below. Each vote reported represents one dollar of net asset value held on the record date for the meeting.
PROPOSAL 1
To elect a Board of Trustees.
| | # of
Votes | % of
Votes |
| Dennis J. Dirks |
| Affirmative | 16,477,844,543.945 | 94.954 |
| Withheld | 875,616,757.045 | 5.046 |
| TOTAL | 17,353,461,300.990 | 100.000 |
| Donald F. Donahue |
| Affirmative | 16,475,304,981.550 | 94.940 |
| Withheld | 878,156,319.440 | 5.060 |
| TOTAL | 17,353,461,300.990 | 100.000 |
| Bettina Doulton |
| Affirmative | 16,570,440,321.103 | 95.488 |
| Withheld | 783,020,979.887 | 4.512 |
| TOTAL | 17,353,461,300.990 | 100.000 |
| Vicki L. Fuller |
| Affirmative | 16,590,910,486.905 | 95.606 |
| Withheld | 762,550,814.085 | 4.394 |
| TOTAL | 17,353,461,300.990 | 100.00 |
| Patricia L. Kampling |
| Affirmative | 16,469,872,791.586 | 94.908 |
| Withheld | 883,588,509.404 | 5.092 |
| TOTAL | 17,353,461,300.990 | 100.000 |
| Alan J. Lacy |
| Affirmative | 16,344,655,183.636 | 94.187 |
| Withheld | 1,008,806,117.354 | 5.813 |
| TOTAL | 17,353,461,300.990 | 100.000 |
| Ned C. Lautenbach |
| Affirmative | 15,532,663,704.227 | 89.508 |
| Withheld | 1,820,797,596.763 | 10.492 |
| TOTAL | 17,353,461,300.990 | 100.000 |
| Robert A. Lawrence |
| Affirmative | 16,389,821,876.677 | 94.447 |
| Withheld | 963,639,424.313 | 5.553 |
| TOTAL | 17,353,461,300.990 | 100.000 |
| Joseph Mauriello |
| Affirmative | 16,363,427,626.626 | 94.295 |
| Withheld | 990,033,674.365 | 5.705 |
| TOTAL | 17,353,461,300.990 | 100.000 |
| Cornelia M. Small |
| Affirmative | 16,405,902,888.605 | 94.540 |
| Withheld | 947,558,412.386 | 5.460 |
| TOTAL | 17,353,461,300.990 | 100.000 |
| Garnett A. Smith |
| Affirmative | 16,371,912,270.945 | 94.344 |
| Withheld | 981,549,030.045 | 5.656 |
| TOTAL | 17,353,461,300.990 | 100.000 |
| David M. Thomas |
| Affirmative | 16,365,966,852.048 | 94.310 |
| Withheld | 987,494,448.942 | 5.690 |
| TOTAL | 17,353,461,300.990 | 100.000 |
| Susan Tomasky |
| Affirmative | 16,483,922,579.861 | 94.989 |
| Withheld | 869,538,721.129 | 5.011 |
| TOTAL | 17,353,461,300.990 | 100.000 |
| Michael E. Wiley |
| Affirmative | 16,379,083,262.890 | 94.385 |
| Withheld | 974,378,038.101 | 5.615 |
| TOTAL | 17,353,461,300.990 | 100.000 |
PROPOSAL 2
To convert a fundamental investment policy to a non-fundamental investment policy.
| | # of
Votes | % of
Votes |
| Affirmative | 1,938,025,834.700 | 66.386 |
| Against | 471,175,917.812 | 16.140 |
| Abstain | 339,614,021.130 | 11.633 |
| Broker Non-Vote | 170,497,954.180 | 5.840 |
| TOTAL | 2,919,313,727.823 | 100.000 |
| Proposal 1 reflects trust wide proposal and voting results. |
| Proposal 2 was not approved by shareholders. |
SPH-ANN-0621
1.703464.123
Fidelity® U.S. Low Volatility Equity Fund
Annual Report
April 30, 2021
Contents
To view a fund's proxy voting guidelines and proxy voting record for the 12-month period ended June 30, visit http://www.fidelity.com/proxyvotingresults or visit the Securities and Exchange Commission's (SEC) web site at http://www.sec.gov.
You may also call 1-800-544-8544 to request a free copy of the proxy voting guidelines.
Standard & Poor's, S&P and S&P 500 are registered service marks of The McGraw-Hill Companies, Inc. and have been licensed for use by Fidelity Distributors Corporation.
Other third-party marks appearing herein are the property of their respective owners.
All other marks appearing herein are registered or unregistered trademarks or service marks of FMR LLC or an affiliated company. © 2021 FMR LLC. All rights reserved.
This report and the financial statements contained herein are submitted for the general information of the shareholders of the Fund. This report is not authorized for distribution to prospective investors in the Fund unless preceded or accompanied by an effective prospectus.
A fund files its complete schedule of portfolio holdings with the SEC for the first and third quarters of each fiscal year on Form N-PORT. Forms N-PORT are available on the SEC’s web site at http://www.sec.gov. A fund's Forms N-PORT may be reviewed and copied at the SEC’s Public Reference Room in Washington, DC. Information regarding the operation of the SEC's Public Reference Room may be obtained by calling 1-800-SEC-0330.
For a complete list of a fund's portfolio holdings, view the most recent holdings listing, semiannual report, or annual report on Fidelity's web site at http://www.fidelity.com, http://www.institutional.fidelity.com, or http://www.401k.com, as applicable.
NOT FDIC INSURED •MAY LOSE VALUE •NO BANK GUARANTEE
Neither the Fund nor Fidelity Distributors Corporation is a bank.
Note to Shareholders:
Early in 2020, the outbreak and spread of a new coronavirus emerged as a public health emergency that had a major influence on financial markets, primarily based on its impact on the global economy and the outlook for corporate earnings. The virus causes a respiratory disease known as COVID-19. On March 11, 2020 the World Health Organization declared the COVID-19 outbreak a pandemic, citing sustained risk of further global spread.
In the weeks following, as the crisis worsened, we witnessed an escalating human tragedy with wide-scale social and economic consequences from coronavirus-containment measures. The outbreak of COVID-19 prompted a number of measures to limit the spread, including travel and border restrictions, quarantines, and restrictions on large gatherings. In turn, these resulted in lower consumer activity, diminished demand for a wide range of products and services, disruption in manufacturing and supply chains, and – given the wide variability in outcomes regarding the outbreak – significant market uncertainty and volatility. Amid the turmoil, global governments and central banks took unprecedented action to help support consumers, businesses, and the broader economies, and to limit disruption to financial systems.
The situation continues to unfold, and the extent and duration of its impact on financial markets and the economy remain highly uncertain. Extreme events such as the coronavirus crisis are “exogenous shocks” that can have significant adverse effects on mutual funds and their investments. Although multiple asset classes may be affected by market disruption, the duration and impact may not be the same for all types of assets.
Fidelity is committed to helping you stay informed amid news about COVID-19 and during increased market volatility, and we’re taking extra steps to be responsive to customer needs. We encourage you to visit our websites, where we offer ongoing updates, commentary, and analysis on the markets and our funds.
Performance: The Bottom Line
Average annual total return reflects the change in the value of an investment, assuming reinvestment of distributions from dividend income and capital gains (the profits earned upon the sale of securities that have grown in value, if any) and assuming a constant rate of performance each year. The hypothetical investment and the average annual total returns do not reflect the deduction of taxes that a shareholder would pay on fund distributions or the redemption of fund shares. During periods of reimbursement by Fidelity, a fund’s total return will be greater than it would be had the reimbursement not occurred. How a fund did yesterday is no guarantee of how it will do tomorrow.
Average Annual Total Returns
| For the periods ended April 30, 2021 | Past 1 year | Life of fundA |
| Fidelity® U.S. Low Volatility Equity Fund | 25.27% | 10.48% |
A From November 5, 2019
$10,000 Over Life of Fund
Let's say hypothetically that $10,000 was invested in Fidelity® U.S. Low Volatility Equity Fund on November 5, 2019, when the fund started.
The chart shows how the value of your investment would have changed, and also shows how the Russell 3000® Index performed over the same period.
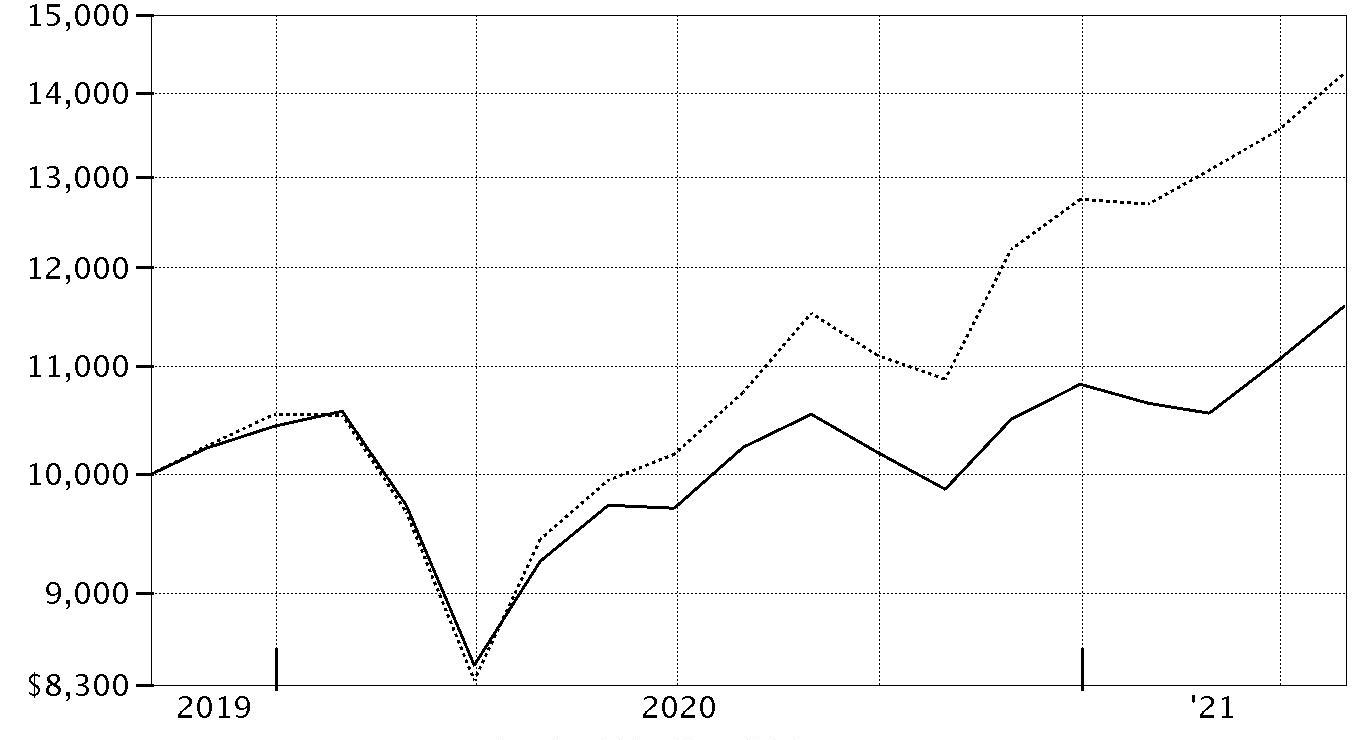
| Period Ending Values |
| $11,596 | Fidelity® U.S. Low Volatility Equity Fund |
| $14,250 | Russell 3000® Index |
Management's Discussion of Fund Performance
Market Recap: The S&P 500
® index gained 28.85% for the six months ending April 30, 2021, with U.S. equities rising on the prospect of a surge in economic growth amid widespread COVID-19 vaccinations, fiscal stimulus that included a third round of relief payments and fresh spending programs. In November, stocks shrugged off a two-month retreat by gaining 11%, as investors digested results of the U.S. elections. The momentum continued in December, with the approval of two breakthrough COVID-19 vaccines and prospects for additional government stimulus. As the calendar turned, investors saw reasons to be hopeful. The rollout of two COVID-19 vaccines was underway, the U.S. Federal Reserve pledged to hold interest rates near zero until the economy recovered, and the federal government would deploy trillions of dollars in aid to boost consumers and the economy. This backdrop fueled a powerful market rotation, with small-cap value stocks usurping long-standing leadership from large growth shares. As part of the “reopening” trade, investors moved out of tech-driven mega-caps that had thrived due to the work-from-home trend in favor of cheap smaller companies they believed stood to benefit from a broad cyclical recovery. Reflecting this shift, the energy sector gained 76% for the six months, boosted by a sharp rally in the price of oil. Financials (+54%) rode strength among banks (+69%). Conversely, notable “laggards” included the defensive utilities (+9%) and consumer staples (+13%) sectors.
Comments from Portfolio Manager Zach Dewhirst: For the fiscal year ending April 30, 2021, the fund gained 25.27%, underperforming the 50.92% result of the benchmark Russell 3000
® Index. Versus the benchmark, security selection detracted significantly, especially in the information technology sector. Stock selection in materials and industrials also hurt. Not owning Tesla, a benchmark component that gained about 354%, detracted more than any other fund position. Also hampering performance was the fund’s lighter-than-benchmark stake in Apple, which gained roughly 80%. Apple was not held at period end. A non-benchmark stake in Barrick Gold, one of the fund's biggest holdings this period, returned about -16%, and hurt the relative result as well. Conversely, an overweighting in materials helped the fund’s relative result to a degree, as did an underweighting in energy. Not owning Johnson & Johnson, a benchmark component that gained about 11%, added more value than any other position. It also helped to avoiding semiconductor maker Intel (-2%) and pharmaceuticals giant Merck (-3%). Notable changes in positioning included increased exposure to the communication services sector and a lower allocation to utilities.
The views expressed above reflect those of the portfolio manager(s) only through the end of the period as stated on the cover of this report and do not necessarily represent the views of Fidelity or any other person in the Fidelity organization. Any such views are subject to change at any time based upon market or other conditions and Fidelity disclaims any responsibility to update such views. These views may not be relied on as investment advice and, because investment decisions for a Fidelity fund are based on numerous factors, may not be relied on as an indication of trading intent on behalf of any Fidelity fund.
Investment Summary (Unaudited)
Top Five Stocks as of April 30, 2021
| | % of fund's net assets |
| Microsoft Corp. | 1.1 |
| D.R. Horton, Inc. | 1.1 |
| T-Mobile U.S., Inc. | 1.0 |
| Lennar Corp. Class A | 1.0 |
| BJ's Wholesale Club Holdings, Inc. | 1.0 |
| | 5.2 |
Top Five Market Sectors as of April 30, 2021
| | % of fund's net assets |
| Health Care | 15.2 |
| Information Technology | 14.8 |
| Consumer Discretionary | 11.9 |
| Consumer Staples | 11.9 |
| Financials | 11.7 |
Asset Allocation (% of fund's net assets)
| As of April 30, 2021* |
| | Stocks | 99.7% |
| | Short-Term Investments and Net Other Assets (Liabilities) | 0.3% |

* Foreign investments – 13.2%
Schedule of Investments April 30, 2021
Showing Percentage of Net Assets
| Common Stocks - 99.7% | | | |
| | | Shares | Value |
| COMMUNICATION SERVICES - 9.4% | | | |
| Diversified Telecommunication Services - 1.7% | | | |
| HKT Trust/HKT Ltd. unit | | 745,626 | $1,082,767 |
| Liberty Global PLC Class C (a) | | 106,800 | 2,890,008 |
| Verizon Communications, Inc. | | 39,300 | 2,271,147 |
| | | | 6,243,922 |
| Entertainment - 3.1% | | | |
| Activision Blizzard, Inc. | | 33,497 | 3,054,591 |
| Electronic Arts, Inc. | | 19,454 | 2,764,024 |
| Netflix, Inc. (a) | | 4,795 | 2,462,089 |
| Zynga, Inc. (a) | | 259,500 | 2,807,790 |
| | | | 11,088,494 |
| Interactive Media & Services - 2.0% | | | |
| Alphabet, Inc. Class A (a) | | 1,531 | 3,603,209 |
| Facebook, Inc. Class A (a) | | 10,785 | 3,505,988 |
| | | | 7,109,197 |
| Media - 1.6% | | | |
| Charter Communications, Inc. Class A (a) | | 4,300 | 2,895,835 |
| Comcast Corp. Class A | | 49,700 | 2,790,655 |
| | | | 5,686,490 |
| Wireless Telecommunication Services - 1.0% | | | |
| T-Mobile U.S., Inc. | | 28,676 | 3,788,960 |
|
| TOTAL COMMUNICATION SERVICES | | | 33,917,063 |
|
| CONSUMER DISCRETIONARY - 11.9% | | | |
| Diversified Consumer Services - 0.8% | | | |
| Service Corp. International | | 51,620 | 2,758,573 |
| Hotels, Restaurants & Leisure - 1.6% | | | |
| Domino's Pizza, Inc. | | 6,700 | 2,829,678 |
| Starbucks Corp. | | 26,460 | 3,029,405 |
| | | | 5,859,083 |
| Household Durables - 3.0% | | | |
| D.R. Horton, Inc. | | 38,646 | 3,798,515 |
| Lennar Corp. Class A | | 36,214 | 3,751,770 |
| NVR, Inc. (a) | | 657 | 3,296,892 |
| | | | 10,847,177 |
| Internet & Direct Marketing Retail - 0.9% | | | |
| Amazon.com, Inc. (a) | | 950 | 3,294,049 |
| Leisure Products - 0.5% | | | |
| Sturm, Ruger & Co., Inc. | | 26,138 | 1,697,402 |
| Multiline Retail - 2.8% | | | |
| Dollar General Corp. | | 15,807 | 3,394,553 |
| Dollar Tree, Inc. (a) | | 29,820 | 3,426,318 |
| Target Corp. | | 16,200 | 3,357,612 |
| | | | 10,178,483 |
| Specialty Retail - 2.3% | | | |
| Murphy U.S.A., Inc. | | 18,900 | 2,634,660 |
| Ross Stores, Inc. | | 19,343 | 2,532,772 |
| TJX Companies, Inc. | | 46,108 | 3,273,668 |
| | | | 8,441,100 |
|
| TOTAL CONSUMER DISCRETIONARY | | | 43,075,867 |
|
| CONSUMER STAPLES - 11.9% | | | |
| Beverages - 2.3% | | | |
| Keurig Dr. Pepper, Inc. | | 72,950 | 2,615,258 |
| Monster Beverage Corp. (a) | | 35,962 | 3,490,112 |
| The Coca-Cola Co. | | 43,253 | 2,334,797 |
| | | | 8,440,167 |
| Food & Staples Retailing - 4.1% | | | |
| BJ's Wholesale Club Holdings, Inc. (a) | | 83,393 | 3,725,165 |
| Costco Wholesale Corp. | | 7,367 | 2,741,187 |
| Grocery Outlet Holding Corp. (a)(b) | | 53,215 | 2,149,354 |
| Kroger Co. | | 74,145 | 2,709,258 |
| Performance Food Group Co. (a) | | 22,495 | 1,320,457 |
| U.S. Foods Holding Corp. (a) | | 50,394 | 2,089,335 |
| | | | 14,734,756 |
| Food Products - 3.5% | | | |
| Conagra Brands, Inc. | | 60,092 | 2,228,812 |
| Lamb Weston Holdings, Inc. | | 26,733 | 2,152,007 |
| Mondelez International, Inc. | | 45,013 | 2,737,241 |
| Nestle SA (Reg. S) | | 18,335 | 2,187,928 |
| Sanderson Farms, Inc. | | 19,731 | 3,246,341 |
| | | | 12,552,329 |
| Household Products - 2.0% | | | |
| Kimberly-Clark Corp. | | 16,851 | 2,246,575 |
| Procter & Gamble Co. | | 19,286 | 2,573,138 |
| Reynolds Consumer Products, Inc. | | 79,700 | 2,336,804 |
| | | | 7,156,517 |
|
| TOTAL CONSUMER STAPLES | | | 42,883,769 |
|
| FINANCIALS - 11.7% | | | |
| Capital Markets - 3.3% | | | |
| Cboe Global Markets, Inc. | | 26,100 | 2,724,057 |
| Intercontinental Exchange, Inc. | | 24,301 | 2,860,471 |
| NASDAQ, Inc. | | 21,660 | 3,498,956 |
| Virtu Financial, Inc. Class A | | 102,900 | 3,048,927 |
| | | | 12,132,411 |
| Diversified Financial Services - 0.8% | | | |
| Berkshire Hathaway, Inc. Class B (a) | | 10,348 | 2,845,183 |
| Insurance - 7.6% | | | |
| Allstate Corp. | | 20,285 | 2,572,138 |
| Assurant, Inc. | | 16,626 | 2,587,006 |
| Axis Capital Holdings Ltd. | | 42,635 | 2,379,033 |
| Brown & Brown, Inc. | | 63,334 | 3,368,102 |
| Chubb Ltd. | | 16,599 | 2,848,222 |
| Marsh & McLennan Companies, Inc. | | 18,716 | 2,539,761 |
| Old Republic International Corp. | | 102,022 | 2,511,782 |
| The Travelers Companies, Inc. | | 16,761 | 2,592,256 |
| Tokio Marine Holdings, Inc. | | 36,141 | 1,729,503 |
| White Mountains Insurance Group Ltd. | | 2,036 | 2,372,815 |
| Willis Towers Watson PLC | | 7,086 | 1,834,282 |
| | | | 27,334,900 |
|
| TOTAL FINANCIALS | | | 42,312,494 |
|
| HEALTH CARE - 15.2% | | | |
| Biotechnology - 4.4% | | | |
| Alexion Pharmaceuticals, Inc. (a) | | 20,188 | 3,405,312 |
| Amgen, Inc. | | 9,417 | 2,256,690 |
| Blueprint Medicines Corp. (a) | | 13,600 | 1,309,952 |
| Regeneron Pharmaceuticals, Inc. (a) | | 5,354 | 2,576,880 |
| Seagen, Inc. (a) | | 12,300 | 1,768,248 |
| United Therapeutics Corp. (a) | | 11,400 | 2,297,784 |
| Vertex Pharmaceuticals, Inc. (a) | | 10,572 | 2,306,810 |
| | | | 15,921,676 |
| Health Care Equipment & Supplies - 2.3% | | | |
| Becton, Dickinson & Co. | | 10,385 | 2,583,892 |
| Danaher Corp. | | 14,355 | 3,645,309 |
| Masimo Corp. (a) | | 9,768 | 2,272,721 |
| | | | 8,501,922 |
| Health Care Providers & Services - 2.3% | | | |
| Humana, Inc. | | 6,376 | 2,838,850 |
| Premier, Inc. | | 66,245 | 2,341,761 |
| UnitedHealth Group, Inc. | | 7,591 | 3,027,291 |
| | | | 8,207,902 |
| Life Sciences Tools & Services - 1.6% | | | |
| Bio-Rad Laboratories, Inc. Class A (a) | | 4,500 | 2,835,585 |
| Thermo Fisher Scientific, Inc. | | 6,412 | 3,015,115 |
| | | | 5,850,700 |
| Pharmaceuticals - 4.6% | | | |
| AstraZeneca PLC (United Kingdom) | | 21,231 | 2,259,912 |
| Bristol-Myers Squibb Co. | | 39,698 | 2,477,949 |
| Eli Lilly & Co. | | 16,556 | 3,025,940 |
| Jazz Pharmaceuticals PLC (a) | | 11,211 | 1,843,088 |
| Recordati SpA | | 44,204 | 2,436,133 |
| Roche Holding AG (participation certificate) | | 6,768 | 2,207,423 |
| Sanofi SA sponsored ADR | | 45,300 | 2,372,361 |
| | | | 16,622,806 |
|
| TOTAL HEALTH CARE | | | 55,105,006 |
|
| INDUSTRIALS - 11.4% | | | |
| Aerospace & Defense - 1.2% | | | |
| Lockheed Martin Corp. | | 5,861 | 2,230,462 |
| Northrop Grumman Corp. | | 6,378 | 2,260,618 |
| | | | 4,491,080 |
| Air Freight & Logistics - 1.5% | | | |
| C.H. Robinson Worldwide, Inc. | | 25,900 | 2,514,372 |
| Expeditors International of Washington, Inc. | | 26,500 | 2,911,290 |
| | | | 5,425,662 |
| Commercial Services & Supplies - 1.6% | | | |
| Waste Connection, Inc. (United States) | | 25,450 | 3,031,350 |
| Waste Management, Inc. | | 20,306 | 2,801,619 |
| | | | 5,832,969 |
| Industrial Conglomerates - 0.8% | | | |
| Roper Technologies, Inc. | | 6,700 | 2,991,148 |
| Machinery - 0.9% | | | |
| IDEX Corp. | | 13,797 | 3,093,287 |
| Professional Services - 2.3% | | | |
| Booz Allen Hamilton Holding Corp. Class A | | 31,288 | 2,595,340 |
| FTI Consulting, Inc. (a) | | 21,900 | 3,040,815 |
| Verisk Analytics, Inc. | | 14,364 | 2,703,305 |
| | | | 8,339,460 |
| Road & Rail - 3.1% | | | |
| Knight-Swift Transportation Holdings, Inc. Class A | | 51,800 | 2,440,816 |
| Landstar System, Inc. | | 20,168 | 3,474,543 |
| Old Dominion Freight Lines, Inc. | | 10,700 | 2,758,567 |
| Schneider National, Inc. Class B | | 100,515 | 2,435,478 |
| | | | 11,109,404 |
|
| TOTAL INDUSTRIALS | | | 41,283,010 |
|
| INFORMATION TECHNOLOGY - 14.8% | | | |
| Communications Equipment - 1.7% | | | |
| Cisco Systems, Inc. | | 54,600 | 2,779,686 |
| F5 Networks, Inc. (a) | | 11,660 | 2,177,622 |
| Juniper Networks, Inc. | | 47,202 | 1,198,459 |
| | | | 6,155,767 |
| Electronic Equipment & Components - 2.1% | | | |
| Keyence Corp. | | 5,167 | 2,494,886 |
| Keysight Technologies, Inc. (a) | | 21,298 | 3,074,366 |
| TE Connectivity Ltd. | | 16,086 | 2,163,084 |
| | | | 7,732,336 |
| IT Services - 5.9% | | | |
| Accenture PLC Class A | | 11,637 | 3,374,381 |
| Akamai Technologies, Inc. (a) | | 20,611 | 2,240,416 |
| Black Knight, Inc. (a) | | 35,293 | 2,555,919 |
| Fidelity National Information Services, Inc. | | 15,968 | 2,441,507 |
| Fiserv, Inc. (a) | | 19,710 | 2,367,565 |
| MasterCard, Inc. Class A | | 7,531 | 2,877,294 |
| Maximus, Inc. | | 29,957 | 2,745,259 |
| Visa, Inc. Class A | | 12,194 | 2,848,031 |
| | | | 21,450,372 |
| Software - 5.1% | | | |
| Adobe, Inc. (a) | | 6,408 | 3,257,443 |
| Citrix Systems, Inc. | | 19,200 | 2,377,920 |
| Microsoft Corp. | | 15,656 | 3,948,131 |
| NortonLifeLock, Inc. | | 120,700 | 2,608,327 |
| Oracle Corp. Japan | | 17,111 | 1,604,792 |
| Salesforce.com, Inc. (a) | | 12,243 | 2,819,808 |
| SAP SE sponsored ADR | | 12,100 | 1,693,274 |
| | | | 18,309,695 |
|
| TOTAL INFORMATION TECHNOLOGY | | | 53,648,170 |
|
| MATERIALS - 4.5% | | | |
| Containers & Packaging - 1.5% | | | |
| Aptargroup, Inc. | | 20,066 | 3,026,153 |
| Silgan Holdings, Inc. | | 59,800 | 2,521,766 |
| | | | 5,547,919 |
| Metals & Mining - 3.0% | | | |
| Agnico Eagle Mines Ltd. (Canada) | | 35,448 | 2,215,446 |
| Barrick Gold Corp. (Canada) | | 119,776 | 2,552,116 |
| Newmont Corp. | | 52,872 | 3,299,742 |
| Royal Gold, Inc. | | 25,142 | 2,812,384 |
| | | | 10,879,688 |
|
| TOTAL MATERIALS | | | 16,427,607 |
|
| REAL ESTATE - 4.5% | | | |
| Equity Real Estate Investment Trusts (REITs) - 4.5% | | | |
| Alexandria Real Estate Equities, Inc. | | 14,033 | 2,541,376 |
| American Tower Corp. | | 10,884 | 2,772,917 |
| CoreSite Realty Corp. | | 21,300 | 2,587,737 |
| CubeSmart | | 75,344 | 3,190,065 |
| Equinix, Inc. | | 3,957 | 2,852,047 |
| UDR, Inc. | | 47,340 | 2,198,943 |
| | | | 16,143,085 |
| UTILITIES - 4.4% | | | |
| Electric Utilities - 3.1% | | | |
| Duke Energy Corp. | | 25,970 | 2,614,919 |
| Evergy, Inc. | | 35,581 | 2,276,117 |
| NextEra Energy, Inc. | | 37,088 | 2,874,691 |
| Portland General Electric Co. | | 30,102 | 1,530,988 |
| PPL Corp. | | 66,211 | 1,928,726 |
| | | | 11,225,441 |
| Multi-Utilities - 0.6% | | | |
| Dominion Energy, Inc. | | 27,289 | 2,180,391 |
| Water Utilities - 0.7% | | | |
| American Water Works Co., Inc. | | 16,000 | 2,495,840 |
|
| TOTAL UTILITIES | | | 15,901,672 |
|
| TOTAL COMMON STOCKS | | | |
| (Cost $295,649,867) | | | 360,697,743 |
|
| Money Market Funds - 0.7% | | | |
| Fidelity Cash Central Fund 0.04% (c) | | 853,833 | 854,004 |
| Fidelity Securities Lending Cash Central Fund 0.04% (c)(d) | | 1,665,658 | 1,665,825 |
| TOTAL MONEY MARKET FUNDS | | | |
| (Cost $2,519,829) | | | 2,519,829 |
| TOTAL INVESTMENT IN SECURITIES - 100.4% | | | |
| (Cost $298,169,696) | | | 363,217,572 |
| NET OTHER ASSETS (LIABILITIES) - (0.4)% | | | (1,518,248) |
| NET ASSETS - 100% | | | $361,699,324 |
Legend
(a) Non-income producing
(b) Security or a portion of the security is on loan at period end.
(c) Affiliated fund that is generally available only to investment companies and other accounts managed by Fidelity Investments. The rate quoted is the annualized seven-day yield of the fund at period end. A complete unaudited listing of the fund's holdings as of its most recent quarter end is available upon request. In addition, each Fidelity Central Fund's financial statements, which are not covered by the Fund's Report of Independent Registered Public Accounting Firm, are available on the SEC's website or upon request.
(d) Investment made with cash collateral received from securities on loan.
Affiliated Central Funds
Information regarding fiscal year to date income earned by the Fund from investments in Fidelity Central Funds is as follows:
| Fund | Income earned |
| Fidelity Cash Central Fund | $1,251 |
| Fidelity Securities Lending Cash Central Fund | 923 |
| Total | $2,174 |
Amounts in the income column in the above table include any capital gain distributions from underlying funds, which are presented in the corresponding line-item in the Statement of Operations, if applicable. Amount for Fidelity Securities Lending Cash Central Fund represents the income earned on investing cash collateral, less rebates paid to borrowers and any lending agent fees associated with the loan, plus any premium payments received for lending certain types of securities.
Investment Valuation
The following is a summary of the inputs used, as of April 30, 2021, involving the Fund's assets and liabilities carried at fair value. The inputs or methodology used for valuing securities may not be an indication of the risk associated with investing in those securities. For more information on valuation inputs, and their aggregation into the levels used below, please refer to the Investment Valuation section in the accompanying Notes to Financial Statements.
| | Valuation Inputs at Reporting Date: |
| Description | Total | Level 1 | Level 2 | Level 3 |
| Investments in Securities: | | | | |
| Equities: | | | | |
| Communication Services | $33,917,063 | $33,917,063 | $-- | $-- |
| Consumer Discretionary | 43,075,867 | 43,075,867 | -- | -- |
| Consumer Staples | 42,883,769 | 40,695,841 | 2,187,928 | -- |
| Financials | 42,312,494 | 42,312,494 | -- | -- |
| Health Care | 55,105,006 | 50,637,671 | 4,467,335 | -- |
| Industrials | 41,283,010 | 41,283,010 | -- | -- |
| Information Technology | 53,648,170 | 53,648,170 | -- | -- |
| Materials | 16,427,607 | 16,427,607 | -- | -- |
| Real Estate | 16,143,085 | 16,143,085 | -- | -- |
| Utilities | 15,901,672 | 15,901,672 | -- | -- |
| Money Market Funds | 2,519,829 | 2,519,829 | -- | -- |
| Total Investments in Securities: | $363,217,572 | $356,562,309 | $6,655,263 | $-- |
Other Information
Distribution of investments by country or territory of incorporation, as a percentage of Total Net Assets, is as follows (Unaudited):
| United States of America | 86.8% |
| Switzerland | 2.6% |
| Canada | 2.1% |
| United Kingdom | 1.9% |
| Japan | 1.6% |
| Ireland | 1.4% |
| Bermuda | 1.4% |
| Others (Individually Less Than 1%) | 2.2% |
| | 100.0% |
See accompanying notes which are an integral part of the financial statements.
Financial Statements
Statement of Assets and Liabilities
| | | April 30, 2021 |
| Assets | | |
Investment in securities, at value (including securities loaned of $1,611,561) — See accompanying schedule:
Unaffiliated issuers (cost $295,649,867) | $360,697,743 | |
| Fidelity Central Funds (cost $2,519,829) | 2,519,829 | |
| Total Investment in Securities (cost $298,169,696) | | $363,217,572 |
| Cash | | 24,797 |
| Receivable for fund shares sold | | 210,143 |
| Dividends receivable | | 197,233 |
| Distributions receivable from Fidelity Central Funds | | 137 |
| Prepaid expenses | | 138 |
| Other receivables | | 1,470 |
| Total assets | | 363,651,490 |
| Liabilities | | |
| Payable for fund shares redeemed | $41,740 | |
| Accrued management fee | 155,933 | |
| Other affiliated payables | 58,653 | |
| Other payables and accrued expenses | 30,015 | |
| Collateral on securities loaned | 1,665,825 | |
| Total liabilities | | 1,952,166 |
| Net Assets | | $361,699,324 |
| Net Assets consist of: | | |
| Paid in capital | | $294,788,770 |
| Total accumulated earnings (loss) | | 66,910,554 |
| Net Assets | | $361,699,324 |
| Net Asset Value, offering price and redemption price per share ($361,699,324 ÷ 31,475,147 shares) | | $11.49 |
See accompanying notes which are an integral part of the financial statements.
Statement of Operations
| | | Year ended April 30, 2021 |
| Investment Income | | |
| Dividends | | $5,012,503 |
| Income from Fidelity Central Funds (including $923 from security lending) | | 2,174 |
| Total income | | 5,014,677 |
| Expenses | | |
| Management fee | $1,712,528 | |
| Transfer agent fees | 549,887 | |
| Accounting fees | 126,003 | |
| Custodian fees and expenses | 9,262 | |
| Independent trustees' fees and expenses | 1,346 | |
| Registration fees | 41,913 | |
| Audit | 43,354 | |
| Legal | 249 | |
| Miscellaneous | 761 | |
| Total expenses before reductions | 2,485,303 | |
| Expense reductions | (9,520) | |
| Total expenses after reductions | | 2,475,783 |
| Net investment income (loss) | | 2,538,894 |
| Realized and Unrealized Gain (Loss) | | |
| Net realized gain (loss) on: | | |
| Investment securities: | | |
| Unaffiliated issuers | 1,888,504 | |
| Fidelity Central Funds | (99) | |
| Foreign currency transactions | 1,151 | |
| Total net realized gain (loss) | | 1,889,556 |
| Change in net unrealized appreciation (depreciation) on: | | |
| Investment securities: | | |
| Unaffiliated issuers (net of increase in deferred foreign taxes of $1,802,418) | 68,104,385 | |
| Assets and liabilities in foreign currencies | 483 | |
| Total change in net unrealized appreciation (depreciation) | | 68,104,868 |
| Net gain (loss) | | 69,994,424 |
| Net increase (decrease) in net assets resulting from operations | | $72,533,318 |
See accompanying notes which are an integral part of the financial statements.
Statement of Changes in Net Assets
| | Year ended April 30, 2021 | For the period
November 5, 2019 (commencement of operations) to April 30, 2020 |
| Increase (Decrease) in Net Assets | | |
| Operations | | |
| Net investment income (loss) | $2,538,894 | $61,363 |
| Net realized gain (loss) | 1,889,556 | (585,484) |
| Change in net unrealized appreciation (depreciation) | 68,104,868 | (4,858,894) |
| Net increase (decrease) in net assets resulting from operations | 72,533,318 | (5,383,015) |
| Distributions to shareholders | (2,028,140) | (9,940) |
| Share transactions | | |
| Proceeds from sales of shares | 35,089,962 | 303,645,984 |
| Reinvestment of distributions | 2,019,281 | 9,899 |
| Cost of shares redeemed | (40,605,178) | (3,572,847) |
| Net increase (decrease) in net assets resulting from share transactions | (3,495,935) | 300,083,036 |
| Total increase (decrease) in net assets | 67,009,243 | 294,690,081 |
| Net Assets | | |
| Beginning of period | 294,690,081 | – |
| End of period | $361,699,324 | $294,690,081 |
| Other Information | | |
| Shares | | |
| Sold | 3,335,657 | 32,321,840 |
| Issued in reinvestment of distributions | 193,786 | 970 |
| Redeemed | (3,985,178) | (391,928) |
| Net increase (decrease) | (455,735) | 31,930,882 |
See accompanying notes which are an integral part of the financial statements.
Financial Highlights
Fidelity U.S. Low Volatility Equity Fund
| | | |
| Years ended April 30, | 2021 | 2020 A |
| Selected Per–Share Data | | |
| Net asset value, beginning of period | $9.23 | $10.00 |
| Income from Investment Operations | | |
| Net investment income (loss)B | .08 | .05 |
| Net realized and unrealized gain (loss) | 2.25 | (.79) |
| Total from investment operations | 2.33 | (.74) |
| Distributions from net investment income | (.07) | (.03) |
| Total distributions | (.07) | (.03) |
| Net asset value, end of period | $11.49 | $9.23 |
| Total ReturnC,D | 25.27% | (7.44)% |
| Ratios to Average Net AssetsE,F | | |
| Expenses before reductions | .77% | 2.28%G |
| Expenses net of fee waivers, if any | .77% | .95%G |
| Expenses net of all reductions | .77% | .95%G |
| Net investment income (loss) | .79% | 1.46%G |
| Supplemental Data | | |
| Net assets, end of period (000 omitted) | $361,699 | $294,690 |
| Portfolio turnover rateH | 39% | 101%I,J |
A For the period November 5, 2019 (commencement of operations) to April 30, 2020.
B Calculated based on average shares outstanding during the period.
C Total returns for periods of less than one year are not annualized.
D Total returns would have been lower if certain expenses had not been reduced during the applicable periods shown.
E Fees and expenses of any underlying mutual funds or exchange-traded funds (ETFs) are not included in the Fund's expense ratio. The Fund indirectly bears its proportionate share of these expenses. For additional expense information related to investments in Fidelity Central Funds, please refer to the "Investments in Fidelity Central Funds" note found in the Notes to Financial Statements section of the most recent Annual or Semi-Annual report.
F Expense ratios reflect operating expenses of the class. Expenses before reductions do not reflect amounts reimbursed, waived, or reduced through arrangements with the investment advisor, brokerage services, or other offset arrangements, if applicable, and do not represent the amount paid by the class during periods when reimbursements, waivers or reductions occur.
G Annualized
H Amount does not include the portfolio activity of any underlying mutual funds or exchange-traded funds (ETFs).
I Portfolio turnover rate excludes securities received or delivered in-kind.
J Amount not annualized.
See accompanying notes which are an integral part of the financial statements.
Notes to Financial Statements
For the period ended April 30, 2021
1. Organization.
Fidelity U.S. Low Volatility Equity Fund (the Fund) is a fund of Fidelity Summer Street Trust (the Trust) and is authorized to issue an unlimited number of shares. Share transactions on the Statement of Changes in Net Assets may contain exchanges between affiliated funds. The Trust is registered under the Investment Company Act of 1940, as amended (the 1940 Act), as an open-end management investment company organized as a Massachusetts business trust.
2. Investments in Fidelity Central Funds.
Funds may invest in Fidelity Central Funds, which are open-end investment companies generally available only to other investment companies and accounts managed by the investment adviser and its affiliates. The Schedule of Investments lists any Fidelity Central Funds held as an investment as of period end, but does not include the underlying holdings of each Fidelity Central Fund. An investing fund indirectly bears its proportionate share of the expenses of the underlying Fidelity Central Funds.
Based on its investment objective, each Fidelity Central Fund may invest or participate in various investment vehicles or strategies that are similar to those of the investing fund. These strategies are consistent with the investment objectives of the investing fund and may involve certain economic risks which may cause a decline in value of each of the Fidelity Central Funds and thus a decline in the value of the investing fund.
| Fidelity Central Fund | Investment Manager | Investment Objective | Investment Practices | Expense Ratio(a) |
| Fidelity Money Market Central Funds | Fidelity Management & Research Company LLC (FMR) | Each fund seeks to obtain a high level of current income consistent with the preservation of capital and liquidity. | Short-term Investments | Less than .005% to .01% |
(a) Expenses expressed as a percentage of average net assets and are as of each underlying Central Fund's most recent annual or semi-annual shareholder report.
A complete unaudited list of holdings for each Fidelity Central Fund is available upon request or at the Securities and Exchange Commission website at www.sec.gov. In addition, the financial statements of the Fidelity Central Funds which contain the significant accounting policies (including investment valuation policies) of those funds, and are not covered by the Report of Independent Registered Public Accounting Firm, are available on the Securities and Exchange Commission website or upon request.
3. Significant Accounting Policies.
The Fund is an investment company and applies the accounting and reporting guidance of the Financial Accounting Standards Board (FASB) Accounting Standards Codification Topic 946 Financial Services - Investment Companies. The financial statements have been prepared in conformity with accounting principles generally accepted in the United States of America (GAAP), which require management to make certain estimates and assumptions at the date of the financial statements. Actual results could differ from those estimates. Subsequent events, if any, through the date that the financial statements were issued have been evaluated in the preparation of the financial statements. The Fund's Schedule of Investments lists any underlying mutual funds or exchange-traded funds (ETFs) but does not include the underlying holdings of these funds. The following summarizes the significant accounting policies of the Fund:
Investment Valuation. Investments are valued as of 4:00 p.m. Eastern time on the last calendar day of the period. The Board of Trustees (the Board) has delegated the day to day responsibility for the valuation of the Fund's investments to the Fair Value Committee (the Committee) established by the Fund's investment adviser. In accordance with valuation policies and procedures approved by the Board, the Fund attempts to obtain prices from one or more third party pricing vendors or brokers to value its investments. When current market prices, quotations or currency exchange rates are not readily available or reliable, investments will be fair valued in good faith by the Committee, in accordance with procedures adopted by the Board. Factors used in determining fair value vary by investment type and may include market or investment specific events. The frequency with which these procedures are used cannot be predicted and they may be utilized to a significant extent. The Committee oversees the Fund's valuation policies and procedures and reports to the Board on the Committee's activities and fair value determinations. The Board monitors the appropriateness of the procedures used in valuing the Fund's investments and ratifies the fair value determinations of the Committee.
The Fund categorizes the inputs to valuation techniques used to value its investments into a disclosure hierarchy consisting of three levels as shown below:
- Level 1 – quoted prices in active markets for identical investments
- Level 2 – other significant observable inputs (including quoted prices for similar investments, interest rates, prepayment speeds, etc.)
- Level 3 – unobservable inputs (including the Fund's own assumptions based on the best information available)
Valuation techniques used to value the Fund's investments by major category are as follows:
Equity securities, including restricted securities, for which market quotations are readily available, are valued at the last reported sale price or official closing price as reported by a third party pricing vendor on the primary market or exchange on which they are traded and are categorized as Level 1 in the hierarchy. In the event there were no sales during the day or closing prices are not available, securities are valued at the last quoted bid price or may be valued using the last available price and are generally categorized as Level 2 in the hierarchy. For foreign equity securities, when market or security specific events arise, comparisons to the valuation of American Depositary Receipts (ADRs), futures contracts, ETFs and certain indexes as well as quoted prices for similar securities may be used and would be categorized as Level 2 in the hierarchy. For equity securities, including restricted securities, where observable inputs are limited, assumptions about market activity and risk are used and these securities may be categorized as Level 3 in the hierarchy.
Investments in open-end mutual funds, including the Fidelity Central Funds, are valued at their closing net asset value (NAV) each business day and are categorized as Level 1 in the hierarchy.
Changes in valuation techniques may result in transfers in or out of an assigned level within the disclosure hierarchy. The aggregate value of investments by input level as of April 30, 2021 is included at the end of the Fund's Schedule of Investments.
Foreign Currency. Certain Funds may use foreign currency contracts to facilitate transactions in foreign-denominated securities. Gains and losses from these transactions may arise from changes in the value of the foreign currency or if the counterparties do not perform under the contracts' terms.
Foreign-denominated assets, including investment securities, and liabilities are translated into U.S. dollars at the exchange rates at period end. Purchases and sales of investment securities, income and dividends received, and expenses denominated in foreign currencies are translated into U.S. dollars at the exchange rate in effect on the transaction date.
The effects of exchange rate fluctuations on investments are included with the net realized and unrealized gain (loss) on investment securities. Other foreign currency transactions resulting in realized and unrealized gain (loss) are disclosed separately.
Investment Transactions and Income. For financial reporting purposes, the Fund's investment holdings and NAV include trades executed through the end of the last business day of the period. The NAV per share for processing shareholder transactions is calculated as of the close of business of the New York Stock Exchange (NYSE), normally 4:00 p.m. Eastern time and includes trades executed through the end of the prior business day. Gains and losses on securities sold are determined on the basis of identified cost. Dividend income is recorded on the ex-dividend date, except for certain dividends from foreign securities where the ex-dividend date may have passed, which are recorded as soon as the Fund is informed of the ex-dividend date. Non-cash dividends included in dividend income, if any, are recorded at the fair market value of the securities received. Income and capital gain distributions from Fidelity Central Funds, if any, are recorded on the ex-dividend date. Certain distributions received by the Fund represent a return of capital or capital gain. The Fund determines the components of these distributions subsequent to the ex-dividend date, based upon receipt of tax filings or other correspondence relating to the underlying investment. These distributions are recorded as a reduction of cost of investments and/or as a realized gain. Investment income is recorded net of foreign taxes withheld where recovery of such taxes is uncertain.
Expenses. Expenses directly attributable to a fund are charged to that fund. Expenses attributable to more than one fund are allocated among the respective funds on the basis of relative net assets or other appropriate methods. Expenses included in the accompanying financial statements reflect the expenses of that fund and do not include any expenses associated with any underlying mutual funds or exchange-traded funds. Although not included in a fund's expenses, a fund indirectly bears its proportionate share of these expenses through the net asset value of each underlying mutual fund or exchange-traded fund. Expense estimates are accrued in the period to which they relate and adjustments are made when actual amounts are known.
Income Tax Information and Distributions to Shareholders. Each year, the Fund intends to qualify as a regulated investment company under Subchapter M of the Internal Revenue Code, including distributing substantially all of its taxable income and realized gains. As a result, no provision for U.S. Federal income taxes is required. As of April 30, 2021, the Fund did not have any unrecognized tax benefits in the financial statements; nor is the Fund aware of any tax positions for which it is reasonably possible that the total amounts of unrecognized tax benefits will significantly change in the next twelve months. The Fund files a U.S. federal tax return, in addition to state and local tax returns as required. The Fund's federal income tax returns are subject to examination by the Internal Revenue Service (IRS) for a period of three fiscal years after they are filed. State and local tax returns may be subject to examination for an additional fiscal year depending on the jurisdiction. Foreign taxes are provided for based on the Fund's understanding of the tax rules and rates that exist in the foreign markets in which it invests.
Distributions are declared and recorded on the ex-dividend date. Income and capital gain distributions are determined in accordance with income tax regulations, which may differ from GAAP. In addition, the Fund claimed a portion of the payment made to redeeming shareholders as a distribution for income tax purposes.
Capital accounts within the financial statements are adjusted for permanent book-tax differences. These adjustments have no impact on net assets or the results of operations. Capital accounts are not adjusted for temporary book-tax differences which will reverse in a subsequent period.
Book-tax differences are primarily due to foreign currency transactions, capital loss carryforwards and losses deferred due to wash sales.
As of period end, the cost and unrealized appreciation (depreciation) in securities, and derivatives if applicable, for federal income tax purposes were as follows:
| Gross unrealized appreciation | $70,547,218 |
| Gross unrealized depreciation | (4,128,358) |
| Net unrealized appreciation (depreciation) | $66,418,860 |
| Tax Cost | $296,798,712 |
The tax-based components of distributable earnings as of period end were as follows:
| Undistributed ordinary income | $678,581 |
| Undistributed long-term capital gain | $101,601 |
| Net unrealized appreciation (depreciation) on securities and other investments | $66,419,376 |
Capital loss carryforwards are only available to offset future capital gains of the Fund to the extent provided by regulations and may be limited. The capital loss carryforward information presented below, including any applicable limitation, is estimated as of fiscal period end and is subject to adjustment.
| No expiration | |
| Short-term | $(289,005) |
Due to large subscriptions in a prior period, approximately $289,005 of the Fund's realized capital losses are subject to limitation. Due to this limitation, the Fund will only be permitted to use approximately $148,547 of those losses per year to offset capital gains.
The tax character of distributions paid was as follows:
| | April 30, 2021 | April 30, 2020(a) |
| Ordinary Income | $2,028,140 | $ 9,940 |
| Total | $2,028,140 | $ 9,940 |
(a) For the period November 5, 2019 (commencement of operations) to April 30, 2020.
4. Purchases and Sales of Investments.
Purchases and sales of securities, other than short-term securities, are noted in the table below.
| | Purchases ($) | Sales ($) |
| Fidelity U.S. Low Volatility Equity Fund | 123,307,836 | 126,193,540 |
5. Fees and Other Transactions with Affiliates.
Management Fee. Fidelity Management & Research Company LLC (the investment adviser) and its affiliates provide the Fund with investment management related services for which the Fund pays a monthly management fee. The management fee is the sum of an individual fund fee rate that is based on an annual rate of .30% of the Fund's average net assets and an annualized group fee rate that averaged .23% during the period. The group fee rate is based upon the monthly average net assets of a group of registered investment companies with which the investment adviser has management contracts. The group fee rate decreases as assets under management increase and increases as assets under management decrease. For the reporting period, the total annual management fee rate was .53% of the Fund's average net assets.
Transfer Agent Fees. Fidelity Investments Institutional Operations Company LLC (FIIOC), an affiliate of the investment adviser, is the Fund's transfer, dividend disbursing and shareholder servicing agent. FIIOC receives account fees and asset-based fees that vary according to account size and type of account. FIIOC pays for typesetting, printing and mailing of shareholder reports, except proxy statements. For the period, the transfer agent fees were equivalent to an annual rate of .17% of average net assets.
Accounting Fees. Fidelity Service Company, Inc. (FSC), an affiliate of the investment adviser, maintains the Fund's accounting records. The accounting fee is based on the level of average net assets for each month. For the period, the fees were equivalent to the following annual rates:
| | % of Average Net Assets |
| Fidelity U.S. Low Volatility Equity Fund | .04 |
Brokerage Commissions. A portion of portfolio transactions were placed with brokerage firms which are affiliates of the investment adviser. Brokerage commissions are included in net realized gain (loss) and change in net unrealized appreciation (depreciation) in the Statement of Operations. The commissions paid to these affiliated firms were as follows:
| | Amount |
| Fidelity U.S. Low Volatility Equity Fund | $3,297 |
Interfund Trades. Funds may purchase from or sell securities to other Fidelity Funds under procedures adopted by the Board. The procedures have been designed to ensure these interfund trades are executed in accordance with Rule 17a-7 of the 1940 Act. Any interfund trades are included within the respective purchases and sales amounts shown in the Purchases and Sales of Investments note and are noted in the table below.
| | Purchases ($) | Sales ($) |
| Fidelity U.S. Low Volatility Equity Fund | 8,549,778 | 5,333,676 |
Prior Fiscal Year Affiliated Exchanges In-Kind. During the prior period, VIP FundsManager 20% Portfolio, VIP FundsManager 50% Portfolio, VIP FundsManager 60% Portfolio, VIP FundsManager 70% Portfolio, and VIP FundsManager 85% Portfolio (the Investing Funds) completed exchange in-kind transactions with the Fund. The Investing Funds delivered investments and cash valued at $289,970,779, in exchange for 30,946,721 shares of the Fund, as presented in the accompanying table. The value of investments delivered from the Investing Funds is included in proceeds from sales of shares in the accompanying Statements of Changes in Net Assets. Each Fund did not recognize gain or loss for federal income tax purposes. Details of the transactions are presented in the accompanying table:
Fund
| | Value of investments, including accrued interest, delivered from Investing Fund | Exchanged number of shares |
| VIP FundsManager 20% Portfolio | $5,912,068 | 630,957 |
| VIP FundsManager 50% Portfolio | 101,614,757 | 10,844,691 |
| VIP FundsManager 60% Portfolio | 127,748,659 | 13,633,795 |
| VIP FundsManager 70% Portfolio | 38,918,062 | 4,153,475 |
| VIP FundsManager 85% Portfolio | 15,777,233 | 1,683,803 |
| Total | 289,970,779 | 30,946,721 |
6. Committed Line of Credit.
Certain Funds participate with other funds managed by the investment adviser or an affiliate in a $4.25 billion credit facility (the "line of credit") to be utilized for temporary or emergency purposes to fund shareholder redemptions or for other short-term liquidity purposes. The participating funds have agreed to pay commitment fees on their pro-rata portion of the line of credit, which are reflected in Miscellaneous expenses on the Statement of Operations, and are listed below.
| | Amount |
| Fidelity U.S. Low Volatility Equity Fund | $614 |
During the period, there were no borrowings on this line of credit.
7. Security Lending.
Funds lend portfolio securities from time to time in order to earn additional income. Lending agents are used, including National Financial Services (NFS), an affiliate of the investment adviser. Pursuant to a securities lending agreement, NFS will receive a fee, which is capped at 9.9% of a fund's daily lending revenue, for its services as lending agent. A fund may lend securities to certain qualified borrowers, including NFS. On the settlement date of the loan, a fund receives collateral (in the form of U.S. Treasury obligations, letters of credit and/or cash) against the loaned securities and maintains collateral in an amount not less than 100% of the market value of the loaned securities during the period of the loan. The market value of the loaned securities is determined at the close of business of a fund and any additional required collateral is delivered to a fund on the next business day. A fund or borrower may terminate the loan at any time, and if the borrower defaults on its obligation to return the securities loaned because of insolvency or other reasons, a fund may apply collateral received from the borrower against the obligation. A fund may experience delays and costs in recovering the securities loaned. Any cash collateral received is invested in the Fidelity Securities Lending Cash Central Fund. Any loaned securities are identified as such in the Schedule of Investments, and the value of loaned securities and cash collateral at period end, as applicable, are presented in the Statement of Assets and Liabilities. Security lending income represents the income earned on investing cash collateral, less rebates paid to borrowers and any lending agent fees associated with the loan, plus any premium payments received for lending certain types of securities. Security lending income is presented in the Statement of Operations as a component of income from Fidelity Central Funds. Affiliated security lending activity, if any, was as follows:
| | Total Security Lending Fees Paid to NFS | Security Lending Income From Securities Loaned to NFS | Value of Securities Loaned to NFS at Period End |
| Fidelity U.S. Low Volatility Equity Fund | $95 | $– | $– |
8. Expense Reductions.
Commissions paid to certain brokers with whom the investment adviser, or its affiliates, places trades on behalf of the Fund include an amount in addition to trade execution, which may be rebated back to the Fund to offset expenses. This amount totaled $9,025 for the period.
In addition, during the period the investment adviser or an affiliate reimbursed and/or waived a portion of operating expenses in the amount of $495.
Effective June 1, 2021, the investment adviser contractually agreed to reimburse expenses to the extent annual operating expenses exceeded .90% of average net assets. This reimbursement will remain in place through August 31, 2022.
9. Other.
Fund's organizational documents provide former and current trustees and officers with a limited indemnification against liabilities arising in connection with the performance of their duties to the fund. In the normal course of business, the fund may also enter into contracts that provide general indemnifications. The fund's maximum exposure under these arrangements is unknown as this would be dependent on future claims that may be made against the fund. The risk of material loss from such claims is considered remote.
At the end of the period, the following mutual funds managed by the investment adviser or its affiliates were the owners of record of 10% or more of the total outstanding shares.
| | VIP FundsManager 50% Portfolio | VIP FundsManager 60% Portfolio | VIP FundsManager 70% Portfolio |
| Fidelity U.S. Low Volatility Equity Fund | 30% | 43% | 13% |
Mutual funds managed by the investment adviser or its affiliates, in aggregate, were the owners of record of more than 20% of the total outstanding shares.
| Fund | % of shares held |
| Fidelity U.S. Low Volatility Equity Fund | 95% |
10. Coronavirus (COVID-19) Pandemic.
An outbreak of COVID-19 first detected in China during December 2019 has since spread globally and was declared a pandemic by the World Health Organization during March 2020. Developments that disrupt global economies and financial markets, such as the COVID-19 pandemic, may magnify factors that affect the Fund's performance.
Report of Independent Registered Public Accounting Firm
To the Board of Trustees of Fidelity Summer Street Trust and Shareholders of Fidelity U.S. Low Volatility Equity Fund
Opinion on the Financial Statements
We have audited the accompanying statement of assets and liabilities, including the schedule of investments, of Fidelity U.S. Low Volatility Equity Fund (one of the funds constituting Fidelity Summer Street Trust, referred to hereafter as the “Fund”) as of April 30, 2021, the related statement of operations for the year ended April 30, 2021, and the statement of changes in net assets and the financial highlights for the year ended April 30, 2021 and for the period November 5, 2019 (commencement of operations) to April 30, 2020, including the related notes (collectively referred to as the “financial statements”). In our opinion, the financial statements present fairly, in all material respects, the financial position of the Fund as of April 30, 2021, the results of its operations for the year ended April 30, 2021 and the changes in its net assets and the financial highlights for the year ended April 30, 2021 and for the period November 5, 2019 (commencement of operations) to April 30, 2020 in conformity with accounting principles generally accepted in the United States of America.
Basis for Opinion
These financial statements are the responsibility of the Fund’s management. Our responsibility is to express an opinion on the Fund’s financial statements based on our audits. We are a public accounting firm registered with the Public Company Accounting Oversight Board (United States) (PCAOB) and are required to be independent with respect to the Fund in accordance with the U.S. federal securities laws and the applicable rules and regulations of the Securities and Exchange Commission and the PCAOB.
We conducted our audits of these financial statements in accordance with the standards of the PCAOB. Those standards require that we plan and perform the audit to obtain reasonable assurance about whether the financial statements are free of material misstatement, whether due to error or fraud.
Our audits included performing procedures to assess the risks of material misstatement of the financial statements, whether due to error or fraud, and performing procedures that respond to those risks. Such procedures included examining, on a test basis, evidence regarding the amounts and disclosures in the financial statements. Our audits also included evaluating the accounting principles used and significant estimates made by management, as well as evaluating the overall presentation of the financial statements. Our procedures included confirmation of securities owned as of April 30, 2021 by correspondence with the custodian. We believe that our audits provide a reasonable basis for our opinion.
/s/ PricewaterhouseCoopers LLP
Boston, Massachusetts
June 14, 2021
We have served as the auditor of one or more investment companies in the Fidelity group of funds since 1932.
Trustees and Officers
The Trustees, Members of the Advisory Board (if any), and officers of the trust and fund, as applicable, are listed below. The Board of Trustees governs the fund and is responsible for protecting the interests of shareholders. The Trustees are experienced executives who meet periodically throughout the year to oversee the fund's activities, review contractual arrangements with companies that provide services to the fund, oversee management of the risks associated with such activities and contractual arrangements, and review the fund's performance. Each of the Trustees oversees 308 funds.
The Trustees hold office without limit in time except that (a) any Trustee may resign; (b) any Trustee may be removed by written instrument, signed by at least two-thirds of the number of Trustees prior to such removal; (c) any Trustee who requests to be retired or who has become incapacitated by illness or injury may be retired by written instrument signed by a majority of the other Trustees; and (d) any Trustee may be removed at any special meeting of shareholders by a two-thirds vote of the outstanding voting securities of the trust. Each Trustee who is not an interested person (as defined in the 1940 Act) of the trust and the fund is referred to herein as an Independent Trustee. Each Independent Trustee shall retire not later than the last day of the calendar year in which his or her 75th birthday occurs. The Independent Trustees may waive this mandatory retirement age policy with respect to individual Trustees. Officers and Advisory Board Members hold office without limit in time, except that any officer or Advisory Board Member may resign or may be removed by a vote of a majority of the Trustees at any regular meeting or any special meeting of the Trustees. Except as indicated, each individual has held the office shown or other offices in the same company for the past five years.
The fund’s Statement of Additional Information (SAI) includes more information about the Trustees. To request a free copy, call Fidelity at 1-800-544-8544 from SAI front cover.
Experience, Skills, Attributes, and Qualifications of the Trustees. The Governance and Nominating Committee has adopted a statement of policy that describes the experience, qualifications, attributes, and skills that are necessary and desirable for potential Independent Trustee candidates (Statement of Policy). The Board believes that each Trustee satisfied at the time he or she was initially elected or appointed a Trustee, and continues to satisfy, the standards contemplated by the Statement of Policy. The Governance and Nominating Committee also engages professional search firms to help identify potential Independent Trustee candidates who have the experience, qualifications, attributes, and skills consistent with the Statement of Policy. From time to time, additional criteria based on the composition and skills of the current Independent Trustees, as well as experience or skills that may be appropriate in light of future changes to board composition, business conditions, and regulatory or other developments, have also been considered by the professional search firms and the Governance and Nominating Committee. In addition, the Board takes into account the Trustees' commitment and participation in Board and committee meetings, as well as their leadership of standing and ad hoc committees throughout their tenure.
In determining that a particular Trustee was and continues to be qualified to serve as a Trustee, the Board has considered a variety of criteria, none of which, in isolation, was controlling. The Board believes that, collectively, the Trustees have balanced and diverse experience, qualifications, attributes, and skills, which allow the Board to operate effectively in governing the fund and protecting the interests of shareholders. Information about the specific experience, skills, attributes, and qualifications of each Trustee, which in each case led to the Board's conclusion that the Trustee should serve (or continue to serve) as a trustee of the fund, is provided below.
Board Structure and Oversight Function. Robert A. Lawrence is an interested person and currently serves as Acting Chairman. The Trustees have determined that an interested Chairman is appropriate and benefits shareholders because an interested Chairman has a personal and professional stake in the quality and continuity of services provided to the fund. Independent Trustees exercise their informed business judgment to appoint an individual of their choosing to serve as Chairman, regardless of whether the Trustee happens to be independent or a member of management. The Independent Trustees have determined that they can act independently and effectively without having an Independent Trustee serve as Chairman and that a key structural component for assuring that they are in a position to do so is for the Independent Trustees to constitute a substantial majority for the Board. The Independent Trustees also regularly meet in executive session. David M. Thomas serves as Lead Independent Trustee and as such (i) acts as a liaison between the Independent Trustees and management with respect to matters important to the Independent Trustees and (ii) with management prepares agendas for Board meetings.
Fidelity® funds are overseen by different Boards of Trustees. The fund's Board oversees Fidelity's high income and certain equity funds, and other Boards oversee Fidelity's investment-grade bond, money market, asset allocation, and other equity funds. The asset allocation funds may invest in Fidelity® funds overseen by the fund's Board. The use of separate Boards, each with its own committee structure, allows the Trustees of each group of Fidelity® funds to focus on the unique issues of the funds they oversee, including common research, investment, and operational issues. On occasion, the separate Boards establish joint committees to address issues of overlapping consequences for the Fidelity® funds overseen by each Board.
The Trustees operate using a system of committees to facilitate the timely and efficient consideration of all matters of importance to the Trustees, the fund, and fund shareholders and to facilitate compliance with legal and regulatory requirements and oversight of the fund's activities and associated risks. The Board, acting through its committees, has charged FMR and its affiliates with (i) identifying events or circumstances the occurrence of which could have demonstrably adverse effects on the fund's business and/or reputation; (ii) implementing processes and controls to lessen the possibility that such events or circumstances occur or to mitigate the effects of such events or circumstances if they do occur; and (iii) creating and maintaining a system designed to evaluate continuously business and market conditions in order to facilitate the identification and implementation processes described in (i) and (ii) above. Because the day-to-day operations and activities of the fund are carried out by or through FMR, its affiliates, and other service providers, the fund's exposure to risks is mitigated but not eliminated by the processes overseen by the Trustees. While each of the Board's committees has responsibility for overseeing different aspects of the fund's activities, oversight is exercised primarily through the Operations, Audit, and Compliance Committees. Appropriate personnel, including but not limited to the fund's Chief Compliance Officer (CCO), FMR's internal auditor, the independent accountants, the fund's Treasurer and portfolio management personnel, make periodic reports to the Board's committees, as appropriate, including an annual review of Fidelity's risk management program for the Fidelity® funds. The responsibilities of each standing committee, including their oversight responsibilities, are described further under "Standing Committees of the Trustees."
Interested Trustees*:
Correspondence intended for a Trustee who is an interested person may be sent to Fidelity Investments, 245 Summer Street, Boston, Massachusetts 02210.
Name, Year of Birth; Principal Occupations and Other Relevant Experience+
Bettina Doulton (1964)
Year of Election or Appointment: 2020
Trustee
Ms. Doulton also serves as Trustee of other Fidelity® funds. Prior to her retirement, Ms. Doulton served in a variety of positions at Fidelity Investments, including as a managing director of research (2006-2007), portfolio manager to certain Fidelity® funds (1993-2005), equity analyst and portfolio assistant (1990-1993), and research assistant (1987-1990). Ms. Doulton currently owns and operates Phi Builders + Architects and Cellardoor Winery. Previously, Ms. Doulton served as a member of the Board of Brown Capital Management, LLC (2014-2018).
Robert A. Lawrence (1952)
Year of Election or Appointment: 2020
Trustee
Acting Chairman of the Board of Trustees
Mr. Lawrence also serves as Trustee of other funds. Previously, Mr. Lawrence served as a Member of the Advisory Board of certain funds. Prior to his retirement in 2008, Mr. Lawrence served as Vice President of certain Fidelity® funds (2006-2008), Senior Vice President, Head of High Income Division of Fidelity Management & Research Company (investment adviser firm, 2006-2008), and President of Fidelity Strategic Investments (investment adviser firm, 2002-2005).
* Determined to be an “Interested Trustee” by virtue of, among other things, his or her affiliation with the trust or various entities under common control with FMR.
+ The information includes the Trustee's principal occupation during the last five years and other information relating to the experience, attributes, and skills relevant to the Trustee's qualifications to serve as a Trustee, which led to the conclusion that the Trustee should serve as a Trustee for the fund.
Independent Trustees:
Correspondence intended for an Independent Trustee may be sent to Fidelity Investments, P.O. Box 55235, Boston, Massachusetts 02205-5235.
Name, Year of Birth; Principal Occupations and Other Relevant Experience+
Thomas P. Bostick (1956)
Year of Election or Appointment: 2021
Trustee
Lieutenant General Bostick also serves as Trustee of other Fidelity® funds. Prior to his retirement, General Bostick (United States Army, Retired) held a variety of positions within the U.S. Army, including Commanding General and Chief of Engineers, U.S. Army Corps of Engineers (2012-2016) and Deputy Chief of Staff and Director of Human Resources, U.S. Army (2009-2012). General Bostick currently serves as a member of the Board and Finance and Governance Committees of CSX Corporation (transportation, 2020-present) and a member of the Board and Corporate Governance and Nominating Committee of Perma-Fix Environmental Services, Inc. (nuclear waste management, 2020-present). General Bostick serves as Chief Executive Officer of Bostick Global Strategies, LLC (consulting, 2016-present) and Managing Partner, Sustainability, of Ridge-Lane Limited Partners (strategic advisory and venture development, 2016-present). Previously, General Bostick served as a Member of the Advisory Board of certain Fidelity® funds (2021), President, Intrexon Bioengineering (2018-2020) and Chief Operating Officer (2017-2020) and Senior Vice President of the Environment Sector (2016-2017) of Intrexon Corporation (biopharmaceutical company).
Dennis J. Dirks (1948)
Year of Election or Appointment: 2005
Trustee
Mr. Dirks also serves as Trustee of other Fidelity® funds. Prior to his retirement in May 2003, Mr. Dirks served as Chief Operating Officer and as a member of the Board of The Depository Trust & Clearing Corporation (financial markets infrastructure), President, Chief Operating Officer and a member of the Board of The Depository Trust Company (DTC), President and a member of the Board of the National Securities Clearing Corporation (NSCC), Chief Executive Officer and a member of the Board of the Government Securities Clearing Corporation and Chief Executive Officer and a member of the Board of the Mortgage-Backed Securities Clearing Corporation. Mr. Dirks currently serves as a member of the Finance Committee (2016-present) and Board (2017-present) and is Treasurer (2018-present) of the Asolo Repertory Theatre.
Donald F. Donahue (1950)
Year of Election or Appointment: 2018
Trustee
Mr. Donahue also serves as Trustee of other Fidelity® funds. Mr. Donahue serves as President and Chief Executive Officer of Miranda Partners, LLC (risk consulting for the financial services industry, 2012-present). Previously, Mr. Donahue served as Chief Executive Officer (2006-2012), Chief Operating Officer (2003-2006) and Managing Director, Customer Marketing and Development (1999-2003) of The Depository Trust & Clearing Corporation (financial markets infrastructure). Mr. Donahue currently serves as a member (2007-present) and Co-Chairman (2016-present) of the Board of United Way of New York and a member of the Board of NYC Leadership Academy (2012-present). Mr. Donahue previously served as a member of the Advisory Board of certain Fidelity® funds (2015-2018).
Vicki L. Fuller (1957)
Year of Election or Appointment: 2020
Trustee
Ms. Fuller also serves as Trustee of other Fidelity® funds. Previously, Ms. Fuller served as a member of the Advisory Board of certain Fidelity® funds (2018-2020), Chief Investment Officer of the New York State Common Retirement Fund (2012-2018) and held a variety of positions at AllianceBernstein L.P. (global asset management, 1985-2012), including Managing Director (2006-2012) and Senior Vice President and Senior Portfolio Manager (2001-2006). Ms. Fuller currently serves as a member of the Board, Audit Committee and Nominating and Governance Committee of The Williams Companies, Inc. (natural gas infrastructure, 2018-present), as a member of the Board, Audit Committee and Nominating and Governance Committee of two Blackstone business development companies (2020-present) and as a member of the Board of Treliant, LLC (consulting, 2019-present).
Patricia L. Kampling (1959)
Year of Election or Appointment: 2020
Trustee
Ms. Kampling also serves as Trustee of other Fidelity® funds. Prior to her retirement, Ms. Kampling served as Chairman of the Board and Chief Executive Officer (2012-2019), President and Chief Operating Officer (2011-2012) and Executive Vice President and Chief Financial Officer (2010-2011) of Alliant Energy Corporation. Ms. Kampling currently serves as a member of the Board, Finance Committee and Governance, Compensation and Nominating Committee of Xcel Energy Inc. (utilities company, 2020-present) and as a member of the Board, Audit, Finance and Risk Committee and Safety, Environmental, Technology and Operations Committee of American Water Works Company, Inc. (utilities company, 2019-present). In addition, Ms. Kampling currently serves as a member of the Board of the Nature Conservancy, Wisconsin Chapter (2019-present). Previously, Ms. Kampling served as a Member of the Advisory Board of certain Fidelity® funds (2020), a member of the Board, Compensation Committee and Executive Committee and Chair of the Audit Committee of Briggs & Stratton Corporation (manufacturing, 2011-2021), a member of the Board of Interstate Power and Light Company (2012-2019) and Wisconsin Power and Light Company (2012-2019) (each a subsidiary of Alliant Energy Corporation) and as a member of the Board and Workforce Development Committee of the Business Roundtable (2018-2019).
Thomas A. Kennedy (1955)
Year of Election or Appointment: 2021
Trustee
Mr. Kennedy also serves as Trustee of other Fidelity® funds. Previously, Mr. Kennedy served as a Member of the Advisory Board of certain Fidelity® funds (2020) and held a variety of positions at Raytheon Company (aerospace and defense, 1983-2020), including Chairman and Chief Executive Officer (2014-2020) and Executive Vice President and Chief Operating Officer (2013-2014). Mr. Kennedy currently serves as Executive Chairman of the Board of Directors of Raytheon Technologies Corporation (aerospace and defense, 2020-present). He is also a member of the Rutgers School of Engineering Industry Advisory Board (2011-present) and a member of the UCLA Engineering Dean’s Executive Board (2016-present).
Oscar Munoz (1959)
Year of Election or Appointment: 2021
Trustee
Mr. Munoz also serves as Trustee of other Fidelity® funds. Prior to his retirement, Mr. Munoz served as Executive Chairman (2020-2021), Chief Executive Officer (2015-2020), President (2015-2016) and a member of the Board (2010-2021) of United Airlines Holdings, Inc. Mr. Munoz currently serves as a member of the Board of CBRE Group, Inc. (commercial real estate, 2020-present), a member of the Board of Univision Communications, Inc. (Hispanic media, 2020-present) and a member of the Advisory Board of Salesforce.com, Inc. (cloud-based software, 2020-present). Previously, Mr. Munoz served as a Member of the Advisory Board of certain Fidelity® funds (2021).
Garnett A. Smith (1947)
Year of Election or Appointment: 2018
Trustee
Mr. Smith also serves as Trustee of other Fidelity® funds. Prior to his retirement, Mr. Smith served as Chairman and Chief Executive Officer (1990-1997) and President (1986-1990) of Inbrand Corp. (manufacturer of personal absorbent products). Prior to his employment with Inbrand Corp., he was employed by a retail fabric chain and North Carolina National Bank (now Bank of America). Mr. Smith previously served as a member of the Advisory Board of certain Fidelity® funds (2012-2013).
David M. Thomas (1949)
Year of Election or Appointment: 2008
Trustee
Lead Independent Trustee
Mr. Thomas also serves as Trustee of other Fidelity® funds. Previously, Mr. Thomas served as Executive Chairman (2005-2006) and Chairman and Chief Executive Officer (2000-2005) of IMS Health, Inc. (pharmaceutical and healthcare information solutions). Mr. Thomas currently serves as a member of the Board of Fortune Brands Home and Security (home and security products, 2004-present) and Presiding Director (2013-present) of Interpublic Group of Companies, Inc. (marketing communication).
Susan Tomasky (1953)
Year of Election or Appointment: 2020
Trustee
Ms. Tomasky also serves as Trustee of other Fidelity® funds. Prior to her retirement, Ms. Tomasky served in various executive officer positions at American Electric Power Company, Inc. (1998-2011), including most recently as President of AEP Transmission (2007-2011). Ms. Tomasky currently serves as a member of the Board and Sustainability Committee and as Chair of the Audit Committee of Marathon Petroleum Corporation (2018-present) and as a member of the Board, Corporate Governance Committee and Organization and Compensation Committee and as Chair of the Audit Committee of Public Service Enterprise Group, Inc. (utilities company, 2012-present). In addition, Ms. Tomasky currently serves as a member (2009-present) and President (2020-present) of the Board of the Royal Shakespeare Company – America (2009-present), as a member of the Board of the Columbus Association for the Performing Arts (2011-present) and as a member of the Board and Investment Committee of Kenyon College (2016-present). Previously, Ms. Tomasky served as a Member of the Advisory Board of certain Fidelity® funds (2020), as a member of the Board of the Columbus Regional Airport Authority (2007-2020), as a member of the Board (2011-2018) and Lead Independent Director (2015-2018) of Andeavor Corporation (previously Tesoro Corporation) (independent oil refiner and marketer) and as a member of the Board of Summit Midstream Partners LP (energy, 2012-2018).
Michael E. Wiley (1950)
Year of Election or Appointment: 2018
Trustee
Mr. Wiley also serves as Trustee of other Fidelity® funds. Previously, Mr. Wiley served as a member of the Advisory Board of certain Fidelity® funds (2018-2020), Chairman, President and CEO of Baker Hughes, Inc. (oilfield services, 2000-2004). Mr. Wiley also previously served as a member of the Board of Andeavor Corporation (independent oil refiner and marketer, 2005-2018), a member of the Board of Andeavor Logistics LP (natural resources logistics, 2015-2018) and a member of the Board of High Point Resources (exploration and production, 2005-2020).
+ The information includes the Trustee's principal occupation during the last five years and other information relating to the experience, attributes, and skills relevant to the Trustee's qualifications to serve as a Trustee, which led to the conclusion that the Trustee should serve as a Trustee for the fund.
Advisory Board Members and Officers:
Correspondence intended for a Member of the Advisory Board (if any) may be sent to Fidelity Investments, P.O. Box 55235, Boston, Massachusetts 02205-5235. Correspondence intended for an officer or Peter S. Lynch may be sent to Fidelity Investments, 245 Summer Street, Boston, Massachusetts 02210. Officers appear below in alphabetical order.
Name, Year of Birth; Principal Occupation
Peter S. Lynch (1944)
Year of Election or Appointment: 2003
Member of the Advisory Board
Mr. Lynch also serves as a Member of the Advisory Board of other Fidelity® funds. Mr. Lynch is Vice Chairman and a Director of Fidelity Management & Research Company LLC (investment adviser firm). In addition, Mr. Lynch serves as a Trustee of Boston College and as the Chairman of the Inner-City Scholarship Fund. Previously, Mr. Lynch served as Vice Chairman and a Director of FMR Co., Inc. (investment adviser firm) and on the Special Olympics International Board of Directors (1997-2006).
Craig S. Brown (1977)
Year of Election or Appointment: 2019
Assistant Treasurer
Mr. Brown also serves as Assistant Treasurer of other funds. Mr. Brown is an employee of Fidelity Investments (2013-present).
John J. Burke III (1964)
Year of Election or Appointment: 2018
Chief Financial Officer
Mr. Burke also serves as Chief Financial Officer of other funds. Mr. Burke serves as Head of Investment Operations for Fidelity Fund and Investment Operations (2018-present) and is an employee of Fidelity Investments (1998-present). Previously Mr. Burke served as head of Asset Management Investment Operations (2012-2018).
William C. Coffey (1969)
Year of Election or Appointment: 2019
Assistant Secretary
Mr. Coffey also serves as Assistant Secretary of other funds. He is Senior Vice President and Deputy General Counsel of FMR LLC (diversified financial services company, 2010-present), and is an employee of Fidelity Investments. Previously, Mr. Coffey served as Secretary and CLO of certain funds (2018-2019); CLO, Secretary, and Senior Vice President of Fidelity Management & Research Company and FMR Co., Inc. (investment adviser firms, 2018-2019); Secretary of Fidelity SelectCo, LLC and Fidelity Investments Money Management, Inc. (investment adviser firms, 2018-2019); CLO of Fidelity Management & Research (Hong Kong) Limited, FMR Investment Management (UK) Limited, and Fidelity Management & Research (Japan) Limited (investment adviser firms, 2018-2019); and Assistant Secretary of certain funds (2009-2018).
Timothy M. Cohen (1969)
Year of Election or Appointment: 2018
Vice President
Mr. Cohen also serves as Vice President of other funds. Mr. Cohen serves as Co-Head of Equity (2018-present), a Director of Fidelity Management & Research (Japan) Limited (investment adviser firm, 2016-present), and is an employee of Fidelity Investments. Previously, Mr. Cohen served as Executive Vice President of Fidelity SelectCo, LLC (2019), Head of Global Equity Research (2016-2018), Chief Investment Officer - Equity and a Director of Fidelity Management & Research (U.K.) Inc. (investment adviser firm, 2013-2015) and as a Director of Fidelity Management & Research (Hong Kong) Limited (investment adviser firm, 2017).
Jonathan Davis (1968)
Year of Election or Appointment: 2010
Assistant Treasurer
Mr. Davis also serves as Assistant Treasurer of other funds. Mr. Davis serves as Assistant Treasurer of FMR Capital, Inc. (2017-present) and is an employee of Fidelity Investments. Previously, Mr. Davis served as Vice President and Associate General Counsel of FMR LLC (diversified financial services company, 2003-2010).
Laura M. Del Prato (1964)
Year of Election or Appointment: 2018
Assistant Treasurer
Ms. Del Prato also serves as an officer of other funds. Ms. Del Prato is an employee of Fidelity Investments (2017-present). Previously, Ms. Del Prato served as President and Treasurer of The North Carolina Capital Management Trust: Cash Portfolio and Term Portfolio (2018-2020). Prior to joining Fidelity Investments, Ms. Del Prato served as a Managing Director and Treasurer of the JPMorgan Mutual Funds (2014-2017). Prior to JPMorgan, Ms. Del Prato served as a partner at Cohen Fund Audit Services (accounting firm, 2012-2013) and KPMG LLP (accounting firm, 2004-2012).
Colm A. Hogan (1973)
Year of Election or Appointment: 2020
Assistant Treasurer
Mr. Hogan also serves as an officer of other funds. Mr. Hogan serves as Assistant Treasurer of FMR Capital, Inc. (2017-present) and is an employee of Fidelity Investments (2005-present). Previously, Mr. Hogan served as Deputy Treasurer of certain Fidelity® funds (2016-2020) and Assistant Treasurer of certain Fidelity® funds (2016-2018).
Pamela R. Holding (1964)
Year of Election or Appointment: 2018
Vice President
Ms. Holding also serves as Vice President of other funds. Ms. Holding serves as Co-Head of Equity (2018-present) and is an employee of Fidelity Investments (2013-present). Previously, Ms. Holding served as Executive Vice President of Fidelity SelectCo, LLC (2019) and as Chief Investment Officer of Fidelity Institutional Asset Management (2013-2018).
Cynthia Lo Bessette (1969)
Year of Election or Appointment: 2019
Secretary and Chief Legal Officer (CLO)
Ms. Lo Bessette also serves as an officer of other funds. Ms. Lo Bessette serves as CLO, Secretary, and Senior Vice President of Fidelity Management & Research Company LLC (investment adviser firm, 2019-present); and CLO of Fidelity Management & Research (Hong Kong) Limited, FMR Investment Management (UK) Limited, and Fidelity Management & Research (Japan) Limited (investment adviser firms, 2019-present). She is a Senior Vice President and Deputy General Counsel of FMR LLC (diversified financial services company, 2019-present), and is an employee of Fidelity Investments. Previously, Ms. Lo Bessette served as CLO, Secretary, and Senior Vice President of FMR Co., Inc. (investment adviser firm, 2019); Secretary of Fidelity SelectCo, LLC and Fidelity Investments Money Management, Inc. (investment adviser firms, 2019). Prior to joining Fidelity Investments, Ms. Lo Bessette was Executive Vice President, General Counsel (2016-2019) and Senior Vice President, Deputy General Counsel (2015-2016) of OppenheimerFunds (investment management company) and Deputy Chief Legal Officer (2013-2015) of Jennison Associates LLC (investment adviser firm).
Chris Maher (1972)
Year of Election or Appointment: 2020
Deputy Treasurer
Mr. Maher also serves as an officer of other funds. Mr. Maher serves as Assistant Treasurer of FMR Capital, Inc. (2017-present), and is an employee of Fidelity Investments (2008-present). Previously, Mr. Maher served as Assistant Treasurer of certain funds (2013-2020); Vice President of Asset Management Compliance (2013), Vice President of the Program Management Group of FMR (investment adviser firm, 2010-2013), and Vice President of Valuation Oversight (2008-2010).
Jason P. Pogorelec (1975)
Year of Election or Appointment: 2020
Chief Compliance Officer
Mr. Pogorelec also serves as Chief Compliance Officer of other funds. Mr. Pogorelec is a senior Vice President of Asset Management Compliance for Fidelity Investments and is an employee of Fidelity Investments (2006-present). Previously, Mr. Pogorelec served as Vice President, Associate General Counsel for Fidelity Investments (2010-2020) and Assistant Secretary of certain Fidelity funds (2015-2020).
Brett Segaloff (1972)
Year of Election or Appointment: 2021
Anti-Money Laundering (AML) Officer
Mr. Segaloff also serves as an AML Officer of other funds and other related entities. He is Director, Anti-Money Laundering (2007-present) of FMR LLC (diversified financial services company) and is an employee of Fidelity Investments (1996-present).
Stacie M. Smith (1974)
Year of Election or Appointment: 2016
President and Treasurer
Ms. Smith also serves as an officer of other funds. Ms. Smith serves as Assistant Treasurer of FMR Capital, Inc. (2017-present), is an employee of Fidelity Investments (2009-present), and has served in other fund officer roles. Prior to joining Fidelity Investments, Ms. Smith served as Senior Audit Manager of Ernst & Young LLP (accounting firm, 1996-2009). Previously, Ms. Smith served as Assistant Treasurer (2013-2019) and Deputy Treasurer (2013-2016) of certain Fidelity® funds.
Marc L. Spector (1972)
Year of Election or Appointment: 2016
Assistant Treasurer
Mr. Spector also serves as an officer of other funds. Mr. Spector serves as Assistant Treasurer of FMR Capital, Inc. (2017-present) and is an employee of Fidelity Investments (2016-present). Prior to joining Fidelity Investments, Mr. Spector served as Director at the Siegfried Group (accounting firm, 2013-2016), and prior to Siegfried Group as audit senior manager at Deloitte & Touche LLP (accounting firm, 2005-2013).
Jim Wegmann (1979)
Year of Election or Appointment: 2019
Assistant Treasurer
Mr. Wegmann also serves as Assistant Treasurer of other funds. Mr. Wegmann is an employee of Fidelity Investments (2011-present).
Shareholder Expense Example
As a shareholder, you incur two types of costs: (1) transaction costs, which may include sales charges (loads) on purchase payments or redemption proceeds, as applicable and (2) ongoing costs, which generally include management fees, distribution and/or service (12b-1) fees and other Fund expenses. This Example is intended to help you understand your ongoing costs (in dollars) of investing in a fund and to compare these costs with the ongoing costs of investing in other mutual funds.
The Example is based on an investment of $1,000 invested at the beginning of the period and held for the entire period (November 1, 2020 to April 30, 2021).
Actual Expenses
The first line of the accompanying table provides information about actual account values and actual expenses. You may use the information in this line, together with the amount you invested, to estimate the expenses that you paid over the period. Simply divide your account value by $1,000.00 (for example, an $8,600 account value divided by $1,000.00 = 8.6), then multiply the result by the number in the first line for a class/Fund under the heading entitled "Expenses Paid During Period" to estimate the expenses you paid on your account during this period. If any fund is a shareholder of any underlying mutual funds or exchange-traded funds (ETFs) (the Underlying Funds), such fund indirectly bears its proportional share of the expenses of the Underlying Funds in addition to the direct expenses incurred presented in the table. These fees and expenses are not included in the annualized expense ratio used to calculate the expense estimate in the table below.
Hypothetical Example for Comparison Purposes
The second line of the accompanying table provides information about hypothetical account values and hypothetical expenses based on the actual expense ratio and an assumed rate of return of 5% per year before expenses, which is not the actual return. The hypothetical account values and expenses may not be used to estimate the actual ending account balance or expenses you paid for the period. You may use this information to compare the ongoing costs of investing in the Fund and other funds. To do so, compare this 5% hypothetical example with the 5% hypothetical examples that appear in the shareholder reports of the other funds. If any fund is a shareholder of any Underlying Funds, such fund indirectly bears its proportional share of the expenses of the Underlying Funds in addition to the direct expenses as presented in the table. These fees and expenses are not included in the annualized expense ratio used to calculate the expense estimate in the table below.
Please note that the expenses shown in the table are meant to highlight your ongoing costs only and do not reflect any transaction costs. Therefore, the second line of the table is useful in comparing ongoing costs only, and will not help you determine the relative total costs of owning different funds.
| | Annualized Expense Ratio-A | Beginning
Account Value
November 1, 2020 | Ending
Account Value
April 30, 2021 | Expenses Paid
During Period-B
November 1, 2020
to April 30, 2021 |
| Fidelity U.S. Low Volatility Equity Fund | .76% | | | |
| Actual | | $1,000.00 | $1,174.70 | $4.10 |
| Hypothetical-C | | $1,000.00 | $1,021.03 | $3.81 |
A Annualized expense ratio reflects expenses net of applicable fee waivers.
B Expenses are equal to the annualized expense ratio, multiplied by the average account value over the period, multiplied by 181/ 365 (to reflect the one-half year period). The fees and expenses of any Underlying Funds are not included in each annualized expense ratio.
C 5% return per year before expenses
Distributions (Unaudited)
The Board of Trustees of Fidelity U.S. Low Volatility Equity Fund voted to pay on June 7th, 2021, to shareholders of record at the opening of business on June 4th, 2021, a distribution of $.008 per share derived from capital gains realized from sales of portfolio securities and a dividend of $.018 per share from net investment income.
The fund hereby designates as a capital gain dividend with respect to the taxable year ended April 30th, 2021, $101,601, or, if subsequently determined to be different, the net capital gain of such year.
The fund designates 99% and 100% of the dividends distributed in June and December, respectively during the fiscal year as qualifying for the dividends–received deduction for corporate shareholders.
The fund designates 100% of the dividend distributed during the fiscal year as amounts which may be taken into account as a dividend for the purposes of the maximum rate under section 1(h)(11) of the Internal Revenue Code.
The fund will notify shareholders in January 2022 of amounts for use in preparing 2021 income tax returns.
Board Approval of Investment Advisory Contracts
Fidelity U.S. Low Volatility Equity Fund
At its January 2021 meeting, the Board of Trustees, including the Independent Trustees (together, the Board), voted to continue the management contract with Fidelity Management & Research Company LLC (FMR), and the sub-advisory agreements and sub-subadvisory agreements, in each case, where applicable (together, the Advisory Contracts) for the fund for four months from February 1, 2021 through May 31, 2021, in connection with changes to the Board's meeting calendar.
The Board considered that the approval of the fund's Advisory Contracts will not result in any changes in (i) the investment process or strategies employed in the management of the fund's assets; (ii) the fees and expenses paid by shareholders; (iii) the nature, extent or quality of services provided under the fund's Advisory Contracts; or (iv) the day-to-day management of the fund or the persons primarily responsible for such management. The Board also considered that since its last approval of the fund's Advisory Contracts, FMR had provided additional information on the fund in support of the annual contract renewal process, including competitive analyses on total expenses and management fees and in-depth reviews of fund performance and fund profitability information. The Board also considered the findings of certain ad hoc committees that had been previously formed to discuss matters relevant to all of the Fidelity funds, including economies of scale, fall-out benefits and retail vs. institutional funds. The Board concluded that the fund's Advisory Contracts are fair and reasonable, and that the fund's Advisory Contracts should be renewed, without modification, through May 31, 2021, with the understanding that the Board will consider the annual renewal for a full one year period in May 2021.
In connection with its consideration of future renewals of the fund's Advisory Contracts, the Board will consider: (i) the nature, extent and quality of services provided to the funds, including shareholder and administrative services and investment performance; (ii) the competitiveness of the management fee and total expenses for the fund; (iii) the costs of the services and profitability, including the revenues earned and the expenses incurred in conducting the business of developing, marketing, distributing, managing, administering, and servicing the fund and its shareholders, to the extent applicable; and (iv) whether there have been economies of scale in respect of the Fidelity funds, whether the Fidelity funds (including the fund) have appropriately benefited from any such economies of scale, and whether there is the potential for realization of any further economies.
Based on its evaluation of all of the conclusions noted above, and after considering all factors it believed relevant, the Board ultimately concluded that the fund's management fee structure is fair and reasonable, and that the continuation of the fund's Advisory Contracts should be approved for four months from February 1, 2021 through May 31, 2021.
Liquidity Risk Management Program
The Securities and Exchange Commission adopted Rule 22e-4 under the Investment Company Act of 1940 (the Liquidity Rule) to promote effective liquidity risk management throughout the open-end investment company industry, thereby reducing the risk that funds will be unable to meet their redemption obligations and mitigating dilution of the interests of fund shareholders.
The Fund has adopted and implemented a liquidity risk management program pursuant to the Liquidity Rule (the Program) effective December 1, 2018. The Program is reasonably designed to assess and manage the Fund’s liquidity risk and to comply with the requirements of the Liquidity Rule. The Fund’s Board of Trustees (the Board) has designated the Fund’s investment adviser as administrator of the Program. The Fidelity advisers have established a Liquidity Risk Management Committee (the LRM Committee) to manage the Program for each of the Fidelity Funds. The LRM Committee monitors the adequacy and effectiveness of implementation of the Program and on a periodic basis assesses each Fund’s liquidity risk based on a variety of factors including (1) the Fund’s investment strategy, (2) portfolio liquidity and cash flow projections during normal and reasonably foreseeable stressed conditions, (3) shareholder redemptions, (4) borrowings and other funding sources and (5) in the case of exchange-traded funds, certain additional factors including the effect of the Fund’s prices and spreads, market participants, and basket compositions on the overall liquidity of the Fund’s portfolio, as applicable.
In accordance with the Program, each of the Fund’s portfolio investments is classified into one of four liquidity categories described below based on a determination of a reasonable expectation for how long it would take to convert the investment to cash (or sell or dispose of the investment) without significantly changing its market value.
- Highly liquid investments – cash or convertible to cash within three business days or less
- Moderately liquid investments – convertible to cash in three to seven calendar days
- Less liquid investments – can be sold or disposed of, but not settled, within seven calendar days
- Illiquid investments – cannot be sold or disposed of within seven calendar days
Liquidity classification determinations take into account a variety of factors including various market, trading and investment-specific considerations, as well as market depth, and generally utilize analysis from a third-party liquidity metrics service.
The Liquidity Rule places a 15% limit on a fund’s illiquid investments and requires funds that do not primarily hold assets that are highly liquid investments to determine and maintain a minimum percentage of the fund’s net assets to be invested in highly liquid investments (highly liquid investment minimum or HLIM). The Program includes provisions reasonably designed to comply with the 15% limit on illiquid investments and for determining, periodically reviewing and complying with the HLIM requirement as applicable.
At a recent meeting of the Fund’s Board of Trustees, the LRM Committee provided a written report to the Board pertaining to the operation, adequacy, and effectiveness of implementation of the Program for the annual period from December 1, 2019 through November 30, 2020. The report concluded that the Program has been implemented and is operating effectively and is reasonably designed to assess and manage the Fund’s liquidity risk.
Proxy Voting Results
A special meeting of shareholders was held on June 9, 2020. The results of votes taken among shareholders on the proposal before them are reported below. Each vote reported represents one dollar of net asset value held on the record date for the meeting.
PROPOSAL 1
To elect a Board of Trustees.
| | # of
Votes | % of
Votes |
| Dennis J. Dirks |
| Affirmative | 16,477,844,543.945 | 94.954 |
| Withheld | 875,616,757.045 | 5.046 |
| TOTAL | 17,353,461,300.990 | 100.000 |
| Donald F. Donahue |
| Affirmative | 16,475,304,981.550 | 94.940 |
| Withheld | 878,156,319.440 | 5.060 |
| TOTAL | 17,353,461,300.990 | 100.000 |
| Bettina Doulton |
| Affirmative | 16,570,440,321.103 | 95.488 |
| Withheld | 783,020,979.887 | 4.512 |
| TOTAL | 17,353,461,300.990 | 100.000 |
| Vicki L. Fuller |
| Affirmative | 16,590,910,486.905 | 95.606 |
| Withheld | 762,550,814.085 | 4.394 |
| TOTAL | 17,353,461,300.990 | 100.00 |
| Patricia L. Kampling |
| Affirmative | 16,469,872,791.586 | 94.908 |
| Withheld | 883,588,509.404 | 5.092 |
| TOTAL | 17,353,461,300.990 | 100.000 |
| Alan J. Lacy |
| Affirmative | 16,344,655,183.636 | 94.187 |
| Withheld | 1,008,806,117.354 | 5.813 |
| TOTAL | 17,353,461,300.990 | 100.000 |
| Ned C. Lautenbach |
| Affirmative | 15,532,663,704.227 | 89.508 |
| Withheld | 1,820,797,596.763 | 10.492 |
| TOTAL | 17,353,461,300.990 | 100.000 |
| Robert A. Lawrence |
| Affirmative | 16,389,821,876.677 | 94.447 |
| Withheld | 963,639,424.313 | 5.553 |
| TOTAL | 17,353,461,300.990 | 100.000 |
| Joseph Mauriello |
| Affirmative | 16,363,427,626.626 | 94.295 |
| Withheld | 990,033,674.365 | 5.705 |
| TOTAL | 17,353,461,300.990 | 100.000 |
| Cornelia M. Small |
| Affirmative | 16,405,902,888.605 | 94.540 |
| Withheld | 947,558,412.386 | 5.460 |
| TOTAL | 17,353,461,300.990 | 100.000 |
| Garnett A. Smith |
| Affirmative | 16,371,912,270.945 | 94.344 |
| Withheld | 981,549,030.045 | 5.656 |
| TOTAL | 17,353,461,300.990 | 100.000 |
| David M. Thomas |
| Affirmative | 16,365,966,852.048 | 94.310 |
| Withheld | 987,494,448.942 | 5.690 |
| TOTAL | 17,353,461,300.990 | 100.000 |
| Susan Tomasky |
| Affirmative | 16,483,922,579.861 | 94.989 |
| Withheld | 869,538,721.129 | 5.011 |
| TOTAL | 17,353,461,300.990 | 100.000 |
| Michael E. Wiley |
| Affirmative | 16,379,083,262.890 | 94.385 |
| Withheld | 974,378,038.101 | 5.615 |
| TOTAL | 17,353,461,300.990 | 100.000 |
|
| Proposal 1 reflects trust wide proposal and voting results. |
USL-ANN-0621
1.9896228.101
Fidelity® Women's Leadership Fund
Annual Report
April 30, 2021
Includes Fidelity and Fidelity Advisor share classes
Contents
To view a fund's proxy voting guidelines and proxy voting record for the 12-month period ended June 30, visit http://www.fidelity.com/proxyvotingresults or visit the Securities and Exchange Commission's (SEC) web site at http://www.sec.gov.
You may also call 1-800-544-8544 if you’re an individual investing directly with Fidelity, call 1-800-835-5092 if you’re a plan sponsor or participant with Fidelity as your recordkeeper or call 1-877-208-0098 on institutional accounts or if you’re an advisor or invest through one to request a free copy of the proxy voting guidelines.
Standard & Poor's, S&P and S&P 500 are registered service marks of The McGraw-Hill Companies, Inc. and have been licensed for use by Fidelity Distributors Corporation.
Other third-party marks appearing herein are the property of their respective owners.
All other marks appearing herein are registered or unregistered trademarks or service marks of FMR LLC or an affiliated company. © 2021 FMR LLC. All rights reserved.
This report and the financial statements contained herein are submitted for the general information of the shareholders of the Fund. This report is not authorized for distribution to prospective investors in the Fund unless preceded or accompanied by an effective prospectus.
A fund files its complete schedule of portfolio holdings with the SEC for the first and third quarters of each fiscal year on Form N-PORT. Forms N-PORT are available on the SEC’s web site at http://www.sec.gov. A fund's Forms N-PORT may be reviewed and copied at the SEC’s Public Reference Room in Washington, DC. Information regarding the operation of the SEC's Public Reference Room may be obtained by calling 1-800-SEC-0330.
For a complete list of a fund's portfolio holdings, view the most recent holdings listing, semiannual report, or annual report on Fidelity's web site at http://www.fidelity.com, http://www.institutional.fidelity.com, or http://www.401k.com, as applicable.
NOT FDIC INSURED •MAY LOSE VALUE •NO BANK GUARANTEE
Neither the Fund nor Fidelity Distributors Corporation is a bank.
Note to Shareholders:
Early in 2020, the outbreak and spread of a new coronavirus emerged as a public health emergency that had a major influence on financial markets, primarily based on its impact on the global economy and the outlook for corporate earnings. The virus causes a respiratory disease known as COVID-19. On March 11, 2020 the World Health Organization declared the COVID-19 outbreak a pandemic, citing sustained risk of further global spread.
In the weeks following, as the crisis worsened, we witnessed an escalating human tragedy with wide-scale social and economic consequences from coronavirus-containment measures. The outbreak of COVID-19 prompted a number of measures to limit the spread, including travel and border restrictions, quarantines, and restrictions on large gatherings. In turn, these resulted in lower consumer activity, diminished demand for a wide range of products and services, disruption in manufacturing and supply chains, and – given the wide variability in outcomes regarding the outbreak – significant market uncertainty and volatility. Amid the turmoil, global governments and central banks took unprecedented action to help support consumers, businesses, and the broader economies, and to limit disruption to financial systems.
The situation continues to unfold, and the extent and duration of its impact on financial markets and the economy remain highly uncertain. Extreme events such as the coronavirus crisis are “exogenous shocks” that can have significant adverse effects on mutual funds and their investments. Although multiple asset classes may be affected by market disruption, the duration and impact may not be the same for all types of assets.
Fidelity is committed to helping you stay informed amid news about COVID-19 and during increased market volatility, and we’re taking extra steps to be responsive to customer needs. We encourage you to visit our websites, where we offer ongoing updates, commentary, and analysis on the markets and our funds.
Performance: The Bottom Line
Average annual total return reflects the change in the value of an investment, assuming reinvestment of distributions from dividend income and capital gains (the profits earned upon the sale of securities that have grown in value, if any) and assuming a constant rate of performance each year. The hypothetical investment and the average annual total returns do not reflect the deduction of taxes that a shareholder would pay on fund distributions or the redemption of fund shares. During periods of reimbursement by Fidelity, a fund’s total return will be greater than it would be had the reimbursement not occurred. How a fund did yesterday is no guarantee of how it will do tomorrow.
Average Annual Total Returns
| For the periods ended April 30, 2021 | Past 1 year | Life of fundA |
| Class A (incl. 5.75% sales charge) | 47.06% | 20.15% |
| Class M (incl. 3.50% sales charge) | 50.20% | 21.25% |
| Class C (incl. contingent deferred sales charge) | 53.93% | 22.84% |
| Fidelity® Women's Leadership Fund | 56.44% | 24.05% |
| Class I | 56.52% | 24.08% |
| Class Z | 56.63% | 24.26% |
A From May 1, 2019
Class C shares' contingent deferred sales charges included in the past one year and life of fund total return figures are 1% and 0%, respectively.
$10,000 Over Life of Fund
Let's say hypothetically that $10,000 was invested in Fidelity® Women's Leadership Fund, a class of the fund, on May 1, 2019, when the fund started.
The chart shows how the value of your investment would have changed, and also shows how the Russell 3000® Index performed over the same period.
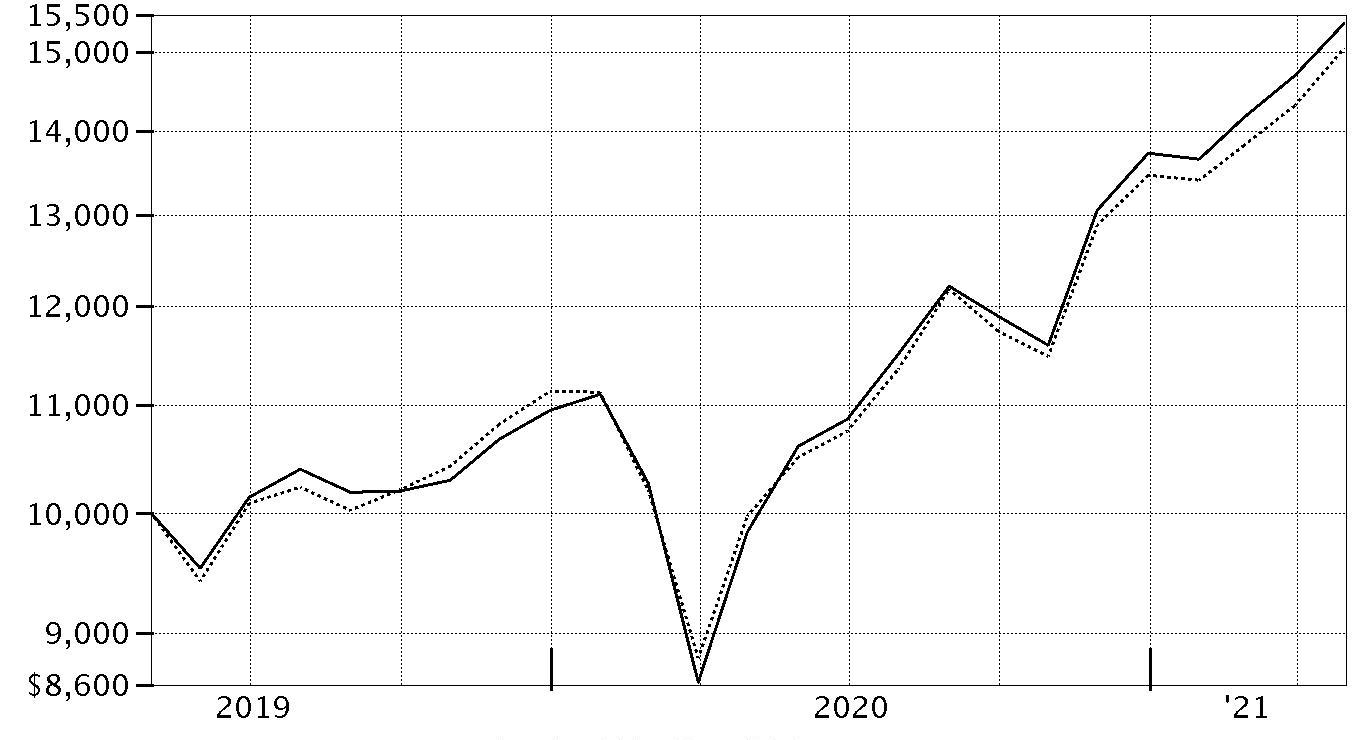
| Period Ending Values |
| $15,389 | Fidelity® Women's Leadership Fund |
| $15,051 | Russell 3000® Index |
Management's Discussion of Fund Performance
Market Recap: The S&P 500
® index gained 45.98% for the 12 months ending April 30, 2021, as U.S. equities staged a historic rebound following a steep but brief decline due to the early-2020 outbreak and spread of COVID-19. A confluence of powerful forces propelled risk assets, returning the stock market to pre-pandemic highs by late August. The rally slowed in September, when stocks began a two-month retreat amid Congress’s inability to reach a deal on additional fiscal stimulus, as well as uncertainty about the election. But as the calendar turned, investors grew hopeful. The rollout of two COVID-19 vaccines was underway, the U.S. Federal Reserve pledged to hold interest rates near zero until the economy recovered, and the federal government planned to deploy trillions of dollars in aid to boost consumers and the economy. This backdrop fueled a sharp market rotation, with small-cap value stocks usurping long-standing leadership from large growth shares. As part of the “reopening” trade, investors moved out of tech-driven mega-caps that had thrived due to the work-from-home trend in favor of cheap smaller companies that stood to benefit from a broad cyclical recovery. Reflecting this shift, the financials sector (+63%) led the way for the full period, riding momentum among banks, whose profit outlook improved amid rising long-term interest rates and a steeper yield curve. Materials (+63%) and industrials (+61%) closely followed. Conversely, notable “laggards” included the defensive utilities (+21%) and consumer staples (+23%) sectors.
Comments from Portfolio Manager Nicole Connolly: For the fiscal year ending April 30, 2021, the fund's share classes (excluding sales charges, if applicable) gained about 55% to 57%, roughly in line with the 55.18% advance of the MSCI USA Women's Leadership Index and outpacing the broad-based Russell 3000
® Index. Versus the MSCI index, security selection was the primary contributor, especially in the consumer discretionary sector. An underweighting and stock selection in consumer staples and stock picks in utilities also bolstered the fund's relative result. Our non-benchmark stake in Bed Bath & Beyond was the fund's largest individual relative contributor, driven by a gain of roughly 349%. Bed Bath & Beyond was not held at period end. The fund's non-benchmark stake in Williams-Sonoma gained roughly 191%. Another notable relative contributor was an overweighting in Sunrun (+242%). This period we increased our stake. Conversely, the biggest detractor from performance versus the benchmark was an underweighting in the communication services sector, primarily within the media & entertainment industry. Security selection in materials and industrials also hindered relative performance. Lastly, the fund's position in cash, at about 3% on average, was a notable detractor. An underweighting in Snap, a stake we established this period, was the fund's largest individual relative detractor. The stock gained about 52% for the fund while we owned it, but advanced 174% as part of the index the past 12 months. Also hampering relative performance was an underweighting in ViacomCBS, an index component that gained about 142%. This was a position we established the past year. Our non-index position in GlaxoSmithKline (-7%) was a key detractor. We added to our stake the past 12 months. Notable changes in positioning include a higher allocation to the communication services and consumer discretionary sectors.
The views expressed above reflect those of the portfolio manager(s) only through the end of the period as stated on the cover of this report and do not necessarily represent the views of Fidelity or any other person in the Fidelity organization. Any such views are subject to change at any time based upon market or other conditions and Fidelity disclaims any responsibility to update such views. These views may not be relied on as investment advice and, because investment decisions for a Fidelity fund are based on numerous factors, may not be relied on as an indication of trading intent on behalf of any Fidelity fund.
Investment Summary (Unaudited)
Top Five Stocks as of April 30, 2021
| | % of fund's net assets |
| Microsoft Corp. | 3.1 |
| The Walt Disney Co. | 2.0 |
| Accenture PLC Class A | 1.9 |
| Anthem, Inc. | 1.8 |
| Salesforce.com, Inc. | 1.7 |
| | 10.5 |
Top Five Market Sectors as of April 30, 2021
| | % of fund's net assets |
| Information Technology | 27.1 |
| Consumer Discretionary | 15.5 |
| Health Care | 13.8 |
| Financials | 11.5 |
| Industrials | 9.9 |
Asset Allocation (% of fund's net assets)
| As of April 30, 2021 * |
| | Stocks | 98.0% |
| | Short-Term Investments and Net Other Assets (Liabilities) | 2.0% |

* Foreign investments - 13.0%
Schedule of Investments April 30, 2021
Showing Percentage of Net Assets
| Common Stocks - 98.0% | | | |
| | | Shares | Value |
| COMMUNICATION SERVICES - 8.1% | | | |
| Entertainment - 2.0% | | | |
| The Walt Disney Co. (a) | | 12,512 | $2,327,482 |
| Interactive Media & Services - 3.3% | | | |
| Bumble, Inc. (b) | | 8,380 | 504,811 |
| Facebook, Inc. Class A (a) | | 2,681 | 871,539 |
| IAC (a) | | 2,418 | 612,890 |
| Match Group, Inc. (a) | | 1,817 | 282,780 |
| Snap, Inc. Class A (a) | | 14,810 | 915,554 |
| TripAdvisor, Inc. (a) | | 15,394 | 725,519 |
| | | | 3,913,093 |
| Media - 2.8% | | | |
| Cable One, Inc. | | 287 | 513,730 |
| Interpublic Group of Companies, Inc. | | 31,710 | 1,006,793 |
| Meredith Corp. (a) | | 24,860 | 773,146 |
| The New York Times Co. Class A | | 6,543 | 297,118 |
| ViacomCBS, Inc. Class B | | 15,345 | 629,452 |
| | | | 3,220,239 |
|
| TOTAL COMMUNICATION SERVICES | | | 9,460,814 |
|
| CONSUMER DISCRETIONARY - 15.5% | | | |
| Automobiles - 0.7% | | | |
| General Motors Co. (a) | | 13,099 | 749,525 |
| Diversified Consumer Services - 0.4% | | | |
| Bright Horizons Family Solutions, Inc. (a) | | 3,513 | 508,788 |
| Hotels, Restaurants & Leisure - 2.5% | | | |
| Airbnb, Inc. Class A | | 572 | 98,790 |
| Marriott International, Inc. Class A | | 7,301 | 1,084,345 |
| Starbucks Corp. | | 11,991 | 1,372,850 |
| Trainline PLC (a)(c) | | 63,294 | 399,998 |
| | | | 2,955,983 |
| Household Durables - 1.1% | | | |
| Taylor Morrison Home Corp. (a) | | 42,093 | 1,313,723 |
| Internet & Direct Marketing Retail - 1.9% | | | |
| Amazon.com, Inc. (a) | | 414 | 1,435,512 |
| Etsy, Inc. (a) | | 4,048 | 804,702 |
| thredUP, Inc. (a) | | 300 | 5,151 |
| | | | 2,245,365 |
| Multiline Retail - 0.7% | | | |
| Kohl's Corp. | | 14,630 | 858,196 |
| Specialty Retail - 6.4% | | | |
| Aritzia LP (a) | | 15,893 | 396,565 |
| Best Buy Co., Inc. | | 10,385 | 1,207,464 |
| Burlington Stores, Inc. (a) | | 2,273 | 741,748 |
| Gap, Inc. | | 31,056 | 1,027,954 |
| Lowe's Companies, Inc. | | 5,278 | 1,035,808 |
| Ross Stores, Inc. | | 2,330 | 305,090 |
| Signet Jewelers Ltd. (a) | | 11,791 | 704,512 |
| Ulta Beauty, Inc. (a) | | 2,689 | 885,622 |
| Williams-Sonoma, Inc. | | 6,415 | 1,095,361 |
| | | | 7,400,124 |
| Textiles, Apparel & Luxury Goods - 1.8% | | | |
| LVMH Moet Hennessy Louis Vuitton SE | | 873 | 657,675 |
| PVH Corp. | | 5,355 | 606,079 |
| Tapestry, Inc. | | 16,475 | 788,329 |
| | | | 2,052,083 |
|
| TOTAL CONSUMER DISCRETIONARY | | | 18,083,787 |
|
| CONSUMER STAPLES - 4.4% | | | |
| Beverages - 0.7% | | | |
| Duckhorn Portfolio, Inc. (a) | | 12,760 | 238,740 |
| The Coca-Cola Co. | | 11,701 | 631,620 |
| | | | 870,360 |
| Food & Staples Retailing - 0.2% | | | |
| Loblaw Companies Ltd. | | 3,516 | 195,230 |
| Food Products - 1.5% | | | |
| General Mills, Inc. | | 13,568 | 825,748 |
| Laird Superfood, Inc. (b) | | 5,588 | 204,018 |
| The Hershey Co. | | 4,064 | 667,715 |
| | | | 1,697,481 |
| Household Products - 0.4% | | | |
| The Clorox Co. | | 2,689 | 490,743 |
| Personal Products - 1.6% | | | |
| Estee Lauder Companies, Inc. Class A | | 3,140 | 985,332 |
| Shiseido Co. Ltd. | | 6,165 | 447,215 |
| Unilever PLC (Netherlands) | | 8,358 | 488,152 |
| | | | 1,920,699 |
|
| TOTAL CONSUMER STAPLES | | | 5,174,513 |
|
| ENERGY - 0.7% | | | |
| Oil, Gas & Consumable Fuels - 0.7% | | | |
| Equinor ASA | | 13,275 | 270,316 |
| Renewable Energy Group, Inc. (a) | | 8,724 | 484,356 |
| | | | 754,672 |
| FINANCIALS - 11.5% | | | |
| Banks - 4.0% | | | |
| Bank of America Corp. | | 44,026 | 1,784,374 |
| Citigroup, Inc. | | 23,115 | 1,646,713 |
| First Horizon National Corp. | | 28,284 | 517,314 |
| First United Corp. | | 14,604 | 247,100 |
| JPMorgan Chase & Co. | | 3,183 | 489,577 |
| | | | 4,685,078 |
| Capital Markets - 3.6% | | | |
| Coinbase Global, Inc. (a) | | 600 | 178,584 |
| Macquarie Group Ltd. | | 3,882 | 479,945 |
| Morningstar, Inc. | | 4,909 | 1,300,934 |
| MSCI, Inc. | | 694 | 337,124 |
| NASDAQ, Inc. | | 11,927 | 1,926,688 |
| | | | 4,223,275 |
| Consumer Finance - 1.0% | | | |
| American Express Co. | | 7,679 | 1,177,575 |
| Insurance - 2.0% | | | |
| Hartford Financial Services Group, Inc. | | 11,198 | 738,620 |
| Progressive Corp. | | 16,032 | 1,615,064 |
| | | | 2,353,684 |
| Thrifts & Mortgage Finance - 0.9% | | | |
| NMI Holdings, Inc. (a) | | 38,838 | 1,003,574 |
|
| TOTAL FINANCIALS | | | 13,443,186 |
|
| HEALTH CARE - 13.8% | | | |
| Biotechnology - 1.9% | | | |
| AbbVie, Inc. | | 4,898 | 546,127 |
| Veracyte, Inc. (a) | | 9,834 | 489,242 |
| Vertex Pharmaceuticals, Inc. (a) | | 2,939 | 641,290 |
| Zai Lab Ltd. ADR (a) | | 3,290 | 546,831 |
| | | | 2,223,490 |
| Health Care Equipment & Supplies - 2.2% | | | |
| Hologic, Inc. (a) | | 15,314 | 1,003,833 |
| Insulet Corp. (a) | | 1,131 | 333,894 |
| Outset Medical, Inc. | | 2,300 | 137,816 |
| Stryker Corp. | | 4,382 | 1,150,845 |
| | | | 2,626,388 |
| Health Care Providers & Services - 4.5% | | | |
| 1Life Healthcare, Inc. (a) | | 16,449 | 715,696 |
| AMN Healthcare Services, Inc. (a) | | 6,800 | 539,240 |
| Anthem, Inc. | | 5,440 | 2,063,882 |
| Cigna Corp. | | 5,932 | 1,477,127 |
| Innovage Holding Corp. (a) | | 16,450 | 418,817 |
| | | | 5,214,762 |
| Pharmaceuticals - 5.2% | | | |
| AstraZeneca PLC sponsored ADR (b) | | 30,106 | 1,597,725 |
| Eli Lilly & Co. | | 5,875 | 1,073,774 |
| GlaxoSmithKline PLC | | 74,033 | 1,368,113 |
| Merck KGaA | | 3,712 | 652,231 |
| UCB SA | | 4,400 | 407,640 |
| Zoetis, Inc. Class A | | 5,426 | 938,861 |
| | | | 6,038,344 |
|
| TOTAL HEALTH CARE | | | 16,102,984 |
|
| INDUSTRIALS - 9.9% | | | |
| Air Freight & Logistics - 0.5% | | | |
| United Parcel Service, Inc. Class B | | 2,753 | 561,227 |
| Airlines - 0.7% | | | |
| Southwest Airlines Co. (a) | | 13,612 | 854,561 |
| Commercial Services & Supplies - 0.7% | | | |
| Stericycle, Inc. (a) | | 2,620 | 199,854 |
| Tomra Systems ASA | | 11,512 | 576,430 |
| | | | 776,284 |
| Electrical Equipment - 3.0% | | | |
| AMETEK, Inc. | | 9,764 | 1,317,457 |
| nVent Electric PLC | | 20,295 | 617,983 |
| Sunrun, Inc. (a) | | 13,459 | 659,491 |
| Vestas Wind Systems A/S | | 22,566 | 941,983 |
| | | | 3,536,914 |
| Machinery - 2.2% | | | |
| Federal Signal Corp. | | 41,478 | 1,718,434 |
| Otis Worldwide Corp. | | 10,964 | 853,767 |
| | | | 2,572,201 |
| Professional Services - 2.8% | | | |
| Leidos Holdings, Inc. | | 9,635 | 975,833 |
| Manpower, Inc. | | 9,354 | 1,130,805 |
| Science Applications International Corp. | | 8,009 | 716,165 |
| Verisk Analytics, Inc. | | 2,257 | 424,767 |
| | | | 3,247,570 |
|
| TOTAL INDUSTRIALS | | | 11,548,757 |
|
| INFORMATION TECHNOLOGY - 27.1% | | | |
| Communications Equipment - 0.6% | | | |
| Arista Networks, Inc. (a) | | 2,185 | 688,646 |
| Electronic Equipment & Components - 1.8% | | | |
| CDW Corp. | | 8,267 | 1,474,254 |
| Insight Enterprises, Inc. (a) | | 5,454 | 547,418 |
| | | | 2,021,672 |
| IT Services - 10.0% | | | |
| Accenture PLC Class A | | 7,762 | 2,250,747 |
| Automatic Data Processing, Inc. | | 2,231 | 417,175 |
| Capgemini SA | | 8,978 | 1,644,975 |
| Genpact Ltd. | | 12,156 | 577,775 |
| MasterCard, Inc. Class A | | 3,206 | 1,224,884 |
| PayPal Holdings, Inc. (a) | | 6,398 | 1,678,131 |
| Square, Inc. (a) | | 2,774 | 679,131 |
| Twilio, Inc. Class A (a) | | 2,741 | 1,008,140 |
| Visa, Inc. Class A | | 4,950 | 1,156,122 |
| WEX, Inc. (a) | | 5,036 | 1,033,438 |
| | | | 11,670,518 |
| Semiconductors & Semiconductor Equipment - 2.7% | | | |
| Advanced Micro Devices, Inc. (a) | | 9,667 | 789,021 |
| NVIDIA Corp. | | 2,924 | 1,755,511 |
| Universal Display Corp. | | 2,815 | 629,687 |
| | | | 3,174,219 |
| Software - 10.6% | | | |
| Adobe, Inc. (a) | | 3,730 | 1,896,108 |
| Ceridian HCM Holding, Inc. (a) | | 5,836 | 551,385 |
| HubSpot, Inc. (a) | | 2,937 | 1,546,184 |
| Intuit, Inc. | | 3,620 | 1,492,019 |
| Microsoft Corp. | | 14,335 | 3,614,994 |
| Pagerduty, Inc. (a)(b) | | 13,201 | 560,514 |
| Rapid7, Inc. (a) | | 9,446 | 767,488 |
| Salesforce.com, Inc. (a) | | 8,467 | 1,950,119 |
| | | | 12,378,811 |
| Technology Hardware, Storage & Peripherals - 1.4% | | | |
| Apple, Inc. | | 12,655 | 1,663,626 |
|
| TOTAL INFORMATION TECHNOLOGY | | | 31,597,492 |
|
| MATERIALS - 1.6% | | | |
| Chemicals - 0.3% | | | |
| Valvoline, Inc. | | 10,140 | 318,396 |
| Containers & Packaging - 0.2% | | | |
| Ball Corp. | | 3,038 | 284,478 |
| Metals & Mining - 1.1% | | | |
| Commercial Metals Co. | | 7,218 | 210,910 |
| Newmont Corp. | | 17,411 | 1,086,621 |
| | | | 1,297,531 |
|
| TOTAL MATERIALS | | | 1,900,405 |
|
| REAL ESTATE - 2.3% | | | |
| Equity Real Estate Investment Trusts (REITs) - 2.3% | | | |
| Equity Lifestyle Properties, Inc. | | 14,757 | 1,024,136 |
| Store Capital Corp. | | 30,609 | 1,095,496 |
| Ventas, Inc. | | 9,686 | 537,186 |
| | | | 2,656,818 |
| UTILITIES - 3.1% | | | |
| Electric Utilities - 2.4% | | | |
| Allete, Inc. | | 8,126 | 571,745 |
| Duke Energy Corp. | | 3,437 | 346,072 |
| NextEra Energy, Inc. | | 5,781 | 448,085 |
| ORSTED A/S (c) | | 6,069 | 885,222 |
| SSE PLC | | 27,538 | 558,300 |
| | | | 2,809,424 |
| Water Utilities - 0.7% | | | |
| American Water Works Co., Inc. | | 5,063 | 789,777 |
|
| TOTAL UTILITIES | | | 3,599,201 |
|
| TOTAL COMMON STOCKS | | | |
| (Cost $91,323,228) | | | 114,322,629 |
|
| Money Market Funds - 4.5% | | | |
| Fidelity Cash Central Fund 0.04% (d) | | 2,783,911 | 2,784,468 |
| Fidelity Securities Lending Cash Central Fund 0.04% (d)(e) | | 2,443,281 | 2,443,525 |
| TOTAL MONEY MARKET FUNDS | | | |
| (Cost $5,227,993) | | | 5,227,993 |
| TOTAL INVESTMENT IN SECURITIES - 102.5% | | | |
| (Cost $96,551,221) | | | 119,550,622 |
| NET OTHER ASSETS (LIABILITIES) - (2.5)% | | | (2,970,824) |
| NET ASSETS - 100% | | | $116,579,798 |
Legend
(a) Non-income producing
(b) Security or a portion of the security is on loan at period end.
(c) Security exempt from registration under Rule 144A of the Securities Act of 1933. These securities may be resold in transactions exempt from registration, normally to qualified institutional buyers. At the end of the period, the value of these securities amounted to $1,285,220 or 1.1% of net assets.
(d) Affiliated fund that is generally available only to investment companies and other accounts managed by Fidelity Investments. The rate quoted is the annualized seven-day yield of the fund at period end. A complete unaudited listing of the fund's holdings as of its most recent quarter end is available upon request. In addition, each Fidelity Central Fund's financial statements, which are not covered by the Fund's Report of Independent Registered Public Accounting Firm, are available on the SEC's website or upon request.
(e) Investment made with cash collateral received from securities on loan.
Affiliated Central Funds
Information regarding fiscal year to date income earned by the Fund from investments in Fidelity Central Funds is as follows:
| Fund | Income earned |
| Fidelity Cash Central Fund | $1,936 |
| Fidelity Securities Lending Cash Central Fund | 5,169 |
| Total | $7,105 |
Amounts in the income column in the above table include any capital gain distributions from underlying funds, which are presented in the corresponding line-item in the Statement of Operations, if applicable. Amount for Fidelity Securities Lending Cash Central Fund represents the income earned on investing cash collateral, less rebates paid to borrowers and any lending agent fees associated with the loan, plus any premium payments received for lending certain types of securities.
Investment Valuation
The following is a summary of the inputs used, as of April 30, 2021, involving the Fund's assets and liabilities carried at fair value. The inputs or methodology used for valuing securities may not be an indication of the risk associated with investing in those securities. For more information on valuation inputs, and their aggregation into the levels used below, please refer to the Investment Valuation section in the accompanying Notes to Financial Statements.
| | Valuation Inputs at Reporting Date: |
| Description | Total | Level 1 | Level 2 | Level 3 |
| Investments in Securities: | | | | |
| Equities: | | | | |
| Communication Services | $9,460,814 | $9,460,814 | $-- | $-- |
| Consumer Discretionary | 18,083,787 | 17,426,112 | 657,675 | -- |
| Consumer Staples | 5,174,513 | 5,174,513 | -- | -- |
| Energy | 754,672 | 754,672 | -- | -- |
| Financials | 13,443,186 | 13,443,186 | -- | -- |
| Health Care | 16,102,984 | 14,734,871 | 1,368,113 | -- |
| Industrials | 11,548,757 | 11,548,757 | -- | -- |
| Information Technology | 31,597,492 | 31,597,492 | -- | -- |
| Materials | 1,900,405 | 1,900,405 | -- | -- |
| Real Estate | 2,656,818 | 2,656,818 | -- | -- |
| Utilities | 3,599,201 | 3,599,201 | -- | -- |
| Money Market Funds | 5,227,993 | 5,227,993 | -- | -- |
| Total Investments in Securities: | $119,550,622 | $117,524,834 | $2,025,788 | $-- |
| Net unrealized depreciation on unfunded commitments | $(6,334) | $-- | $(6,334) | $-- |
Other Information
Distribution of investments by country or territory of incorporation, as a percentage of Total Net Assets, is as follows (Unaudited):
| United States of America | 87.0% |
| Ireland | 2.4% |
| United Kingdom | 2.4% |
| France | 2.0% |
| Denmark | 1.5% |
| Bermuda | 1.1% |
| Others (Individually Less Than 1%) | 3.6% |
| | 100.0% |
See accompanying notes which are an integral part of the financial statements.
Financial Statements
Statement of Assets and Liabilities
| | | April 30, 2021 |
| Assets | | |
Investment in securities, at value (including securities loaned of $2,379,971) — See accompanying schedule:
Unaffiliated issuers (cost $91,323,228) | $114,322,629 | |
| Fidelity Central Funds (cost $5,227,993) | 5,227,993 | |
| Total Investment in Securities (cost $96,551,221) | | $119,550,622 |
| Foreign currency held at value (cost $26) | | 26 |
| Receivable for fund shares sold | | 363,857 |
| Dividends receivable | | 60,901 |
| Distributions receivable from Fidelity Central Funds | | 315 |
| Prepaid expenses | | 14 |
| Receivable from investment adviser for expense reductions | | 42,361 |
| Other receivables | | 2,047 |
| Total assets | | 120,020,143 |
| Liabilities | | |
| Payable for investments purchased | $834,603 | |
| Payable for fund shares redeemed | 37,326 | |
| Net unrealized depreciation on unfunded commitments | 6,334 | |
| Accrued management fee | 49,978 | |
| Distribution and service plan fees payable | 1,828 | |
| Other affiliated payables | 24,043 | |
| Other payables and accrued expenses | 42,708 | |
| Collateral on securities loaned | 2,443,525 | |
| Total liabilities | | 3,440,345 |
| Net Assets | | $116,579,798 |
| Net Assets consist of: | | |
| Paid in capital | | $92,352,407 |
| Total accumulated earnings (loss) | | 24,227,391 |
| Net Assets | | $116,579,798 |
| Net Asset Value and Maximum Offering Price | | |
| Class A: | | |
| Net Asset Value and redemption price per share ($2,864,867 ÷ 187,534 shares)(a) | | $15.28 |
| Maximum offering price per share (100/94.25 of $15.28) | | $16.21 |
| Class M: | | |
| Net Asset Value and redemption price per share ($973,829 ÷ 63,984 shares)(a) | | $15.22 |
| Maximum offering price per share (100/96.50 of $15.22) | | $15.77 |
| Class C: | | |
| Net Asset Value and offering price per share ($936,715 ÷ 62,092 shares)(a) | | $15.09 |
| Fidelity Women's Leadership Fund: | | |
| Net Asset Value, offering price and redemption price per share ($98,887,623 ÷ 6,458,819 shares) | | $15.31 |
| Class I: | | |
| Net Asset Value, offering price and redemption price per share ($3,874,136 ÷ 253,105 shares) | | $15.31 |
| Class Z: | | |
| Net Asset Value, offering price and redemption price per share ($9,042,628 ÷ 589,250 shares) | | $15.35 |
(a) Redemption price per share is equal to net asset value less any applicable contingent deferred sales charge.
See accompanying notes which are an integral part of the financial statements.
Statement of Operations
| | | Year ended April 30, 2021 |
| Investment Income | | |
| Dividends | | $748,876 |
| Income from Fidelity Central Funds (including $5,169 from security lending) | | 7,105 |
| Total income | | 755,981 |
| Expenses | | |
| Management fee | | |
| Basic fee | $331,284 | |
| Performance adjustment | 2,551 | |
| Transfer agent fees | 153,805 | |
| Distribution and service plan fees | 14,967 | |
| Accounting fees | 24,409 | |
| Custodian fees and expenses | 18,853 | |
| Independent trustees' fees and expenses | 244 | |
| Registration fees | 91,281 | |
| Audit | 50,638 | |
| Legal | 46 | |
| Miscellaneous | 331 | |
| Total expenses before reductions | 688,409 | |
| Expense reductions | (62,372) | |
| Total expenses after reductions | | 626,037 |
| Net investment income (loss) | | 129,944 |
| Realized and Unrealized Gain (Loss) | | |
| Net realized gain (loss) on: | | |
| Investment securities: | | |
| Unaffiliated issuers | 2,646,380 | |
| Fidelity Central Funds | (113) | |
| Foreign currency transactions | 1,726 | |
| Total net realized gain (loss) | | 2,647,993 |
| Change in net unrealized appreciation (depreciation) on: | | |
| Investment securities: | | |
| Unaffiliated issuers | 23,246,957 | |
| Fidelity Central Funds | (52) | |
| Unfunded commitments | (6,334) | |
| Assets and liabilities in foreign currencies | 139 | |
| Total change in net unrealized appreciation (depreciation) | | 23,240,710 |
| Net gain (loss) | | 25,888,703 |
| Net increase (decrease) in net assets resulting from operations | | $26,018,647 |
See accompanying notes which are an integral part of the financial statements.
Statement of Changes in Net Assets
| | Year ended April 30, 2021 | For the period May 1, 2019 (commencement of operations) to April 30, 2020 |
| Increase (Decrease) in Net Assets | | |
| Operations | | |
| Net investment income (loss) | $129,944 | $106,560 |
| Net realized gain (loss) | 2,647,993 | (1,438,851) |
| Change in net unrealized appreciation (depreciation) | 23,240,710 | (247,516) |
| Net increase (decrease) in net assets resulting from operations | 26,018,647 | (1,579,807) |
| Distributions to shareholders | (112,730) | (61,425) |
| Share transactions - net increase (decrease) | 63,644,346 | 28,670,767 |
| Total increase (decrease) in net assets | 89,550,263 | 27,029,535 |
| Net Assets | | |
| Beginning of period | 27,029,535 | – |
| End of period | $116,579,798 | $27,029,535 |
See accompanying notes which are an integral part of the financial statements.
Financial Highlights
Fidelity Women's Leadership Fund Class A
| Years ended April 30, | 2021 | 2020A |
| Selected Per–Share Data | | |
| Net asset value, beginning of period | $9.80 | $10.00 |
| Income from Investment Operations | | |
| Net investment income (loss)B | –C | .04 |
| Net realized and unrealized gain (loss) | 5.49 | (.22) |
| Total from investment operations | 5.49 | (.18) |
| Distributions from net investment income | (.01) | (.02) |
| Total distributions | (.01) | (.02) |
| Net asset value, end of period | $15.28 | $9.80 |
| Total ReturnD,E | 56.03% | (1.84)% |
| Ratios to Average Net AssetsF,G | | |
| Expenses before reductions | 1.28% | 2.50% |
| Expenses net of fee waivers, if any | 1.25% | 1.25% |
| Expenses net of all reductions | 1.24% | 1.25% |
| Net investment income (loss) | (.03)% | .37% |
| Supplemental Data | | |
| Net assets, end of period (000 omitted) | $2,865 | $769 |
| Portfolio turnover rateH | 35% | 52% |
A For the period May 1, 2019 (commencement of operations) to April 30, 2020.
B Calculated based on average shares outstanding during the period.
C Amount represents less than $.005 per share.
D Total returns would have been lower if certain expenses had not been reduced during the applicable periods shown.
E Total returns do not include the effect of the sales charges.
F Fees and expenses of any underlying mutual funds or exchange-traded funds (ETFs) are not included in the Fund's expense ratio. The Fund indirectly bears its proportionate share of these expenses. For additional expense information related to investments in Fidelity Central Funds, please refer to the "Investments in Fidelity Central Funds" note found in the Notes to Financial Statements section of the most recent Annual or Semi-Annual report.
G Expense ratios reflect operating expenses of the class. Expenses before reductions do not reflect amounts reimbursed, waived, or reduced through arrangements with the investment adviser, brokerage services, or other offset arrangements, if applicable, and do not represent the amount paid by the class during periods when reimbursements, waivers or reductions occur.
H Amount does not include the portfolio activity of any underlying mutual funds or exchange-traded funds (ETFs).
See accompanying notes which are an integral part of the financial statements.
Fidelity Women's Leadership Fund Class M
| Years ended April 30, | 2021 | 2020A |
| Selected Per–Share Data | | |
| Net asset value, beginning of period | $9.78 | $10.00 |
| Income from Investment Operations | | |
| Net investment income (loss)B | (.04) | .01 |
| Net realized and unrealized gain (loss) | 5.48 | (.22) |
| Total from investment operations | 5.44 | (.21) |
| Distributions from net investment income | –C | (.01) |
| Total distributions | –C | (.01) |
| Net asset value, end of period | $15.22 | $9.78 |
| Total ReturnD,E | 55.65% | (2.12)% |
| Ratios to Average Net AssetsF,G | | |
| Expenses before reductions | 1.52% | 2.86% |
| Expenses net of fee waivers, if any | 1.50% | 1.50% |
| Expenses net of all reductions | 1.49% | 1.50% |
| Net investment income (loss) | (.28)% | .12% |
| Supplemental Data | | |
| Net assets, end of period (000 omitted) | $974 | $443 |
| Portfolio turnover rateH | 35% | 52% |
A For the period May 1, 2019 (commencement of operations) to April 30, 2020.
B Calculated based on average shares outstanding during the period.
C Amount represents less than $.005 per share.
D Total returns would have been lower if certain expenses had not been reduced during the applicable periods shown.
E Total returns do not include the effect of the sales charges.
F Fees and expenses of any underlying mutual funds or exchange-traded funds (ETFs) are not included in the Fund's expense ratio. The Fund indirectly bears its proportionate share of these expenses. For additional expense information related to investments in Fidelity Central Funds, please refer to the "Investments in Fidelity Central Funds" note found in the Notes to Financial Statements section of the most recent Annual or Semi-Annual report.
G Expense ratios reflect operating expenses of the class. Expenses before reductions do not reflect amounts reimbursed, waived, or reduced through arrangements with the investment adviser, brokerage services, or other offset arrangements, if applicable, and do not represent the amount paid by the class during periods when reimbursements, waivers or reductions occur.
H Amount does not include the portfolio activity of any underlying mutual funds or exchange-traded funds (ETFs).
See accompanying notes which are an integral part of the financial statements.
Fidelity Women's Leadership Fund Class C
| Years ended April 30, | 2021 | 2020A |
| Selected Per–Share Data | | |
| Net asset value, beginning of period | $9.74 | $10.00 |
| Income from Investment Operations | | |
| Net investment income (loss)B | (.10) | (.04) |
| Net realized and unrealized gain (loss) | 5.45 | (.22) |
| Total from investment operations | 5.35 | (.26) |
| Net asset value, end of period | $15.09 | $9.74 |
| Total ReturnC,D | 54.93% | (2.60)% |
| Ratios to Average Net AssetsE,F | | |
| Expenses before reductions | 1.99% | 3.36% |
| Expenses net of fee waivers, if any | 1.99% | 2.00% |
| Expenses net of all reductions | 1.98% | 2.00% |
| Net investment income (loss) | (.77)% | (.38)% |
| Supplemental Data | | |
| Net assets, end of period (000 omitted) | $937 | $468 |
| Portfolio turnover rateG | 35% | 52% |
A For the period May 1, 2019 (commencement of operations) to April 30, 2020.
B Calculated based on average shares outstanding during the period.
C Total returns would have been lower if certain expenses had not been reduced during the applicable periods shown.
D Total returns do not include the effect of the contingent deferred sales charge.
E Fees and expenses of any underlying mutual funds or exchange-traded funds (ETFs) are not included in the Fund's expense ratio. The Fund indirectly bears its proportionate share of these expenses. For additional expense information related to investments in Fidelity Central Funds, please refer to the "Investments in Fidelity Central Funds" note found in the Notes to Financial Statements section of the most recent Annual or Semi-Annual report.
F Expense ratios reflect operating expenses of the class. Expenses before reductions do not reflect amounts reimbursed, waived, or reduced through arrangements with the investment adviser, brokerage services, or other offset arrangements, if applicable, and do not represent the amount paid by the class during periods when reimbursements, waivers or reductions occur.
G Amount does not include the portfolio activity of any underlying mutual funds or exchange-traded funds (ETFs).
See accompanying notes which are an integral part of the financial statements.
Fidelity Women's Leadership Fund
| Years ended April 30, | 2021 | 2020A |
| Selected Per–Share Data | | |
| Net asset value, beginning of period | $9.81 | $10.00 |
| Income from Investment Operations | | |
| Net investment income (loss)B | .03 | .06 |
| Net realized and unrealized gain (loss) | 5.50 | (.22) |
| Total from investment operations | 5.53 | (.16) |
| Distributions from net investment income | (.03) | (.03) |
| Total distributions | (.03) | (.03) |
| Net asset value, end of period | $15.31 | $9.81 |
| Total ReturnC | 56.44% | (1.63)% |
| Ratios to Average Net AssetsD,E | | |
| Expenses before reductions | 1.10% | 2.19% |
| Expenses net of fee waivers, if any | 1.00% | 1.00% |
| Expenses net of all reductions | .99% | 1.00% |
| Net investment income (loss) | .22% | .62% |
| Supplemental Data | | |
| Net assets, end of period (000 omitted) | $98,888 | $22,272 |
| Portfolio turnover rateF | 35% | 52% |
A For the period May 1, 2019 (commencement of operations) to April 30, 2020.
B Calculated based on average shares outstanding during the period.
C Total returns would have been lower if certain expenses had not been reduced during the applicable periods shown.
D Fees and expenses of any underlying mutual funds or exchange-traded funds (ETFs) are not included in the Fund's expense ratio. The Fund indirectly bears its proportionate share of these expenses. For additional expense information related to investments in Fidelity Central Funds, please refer to the "Investments in Fidelity Central Funds" note found in the Notes to Financial Statements section of the most recent Annual or Semi-Annual report.
E Expense ratios reflect operating expenses of the class. Expenses before reductions do not reflect amounts reimbursed, waived, or reduced through arrangements with the investment adviser, brokerage services, or other offset arrangements, if applicable, and do not represent the amount paid by the class during periods when reimbursements, waivers or reductions occur.
F Amount does not include the portfolio activity of any underlying mutual funds or exchange-traded funds (ETFs).
See accompanying notes which are an integral part of the financial statements.
Fidelity Women's Leadership Fund Class I
| Years ended April 30, | 2021 | 2020A |
| Selected Per–Share Data | | |
| Net asset value, beginning of period | $9.81 | $10.00 |
| Income from Investment Operations | | |
| Net investment income (loss)B | .03 | .06 |
| Net realized and unrealized gain (loss) | 5.51 | (.22) |
| Total from investment operations | 5.54 | (.16) |
| Distributions from net investment income | (.04) | (.03) |
| Total distributions | (.04) | (.03) |
| Net asset value, end of period | $15.31 | $9.81 |
| Total ReturnC | 56.52% | (1.63)% |
| Ratios to Average Net AssetsD,E | | |
| Expenses before reductions | .98% | 2.22% |
| Expenses net of fee waivers, if any | .98% | 1.00% |
| Expenses net of all reductions | .97% | 1.00% |
| Net investment income (loss) | .24% | .62% |
| Supplemental Data | | |
| Net assets, end of period (000 omitted) | $3,874 | $702 |
| Portfolio turnover rateF | 35% | 52% |
A For the period May 1, 2019 (commencement of operations) to April 30, 2020.
B Calculated based on average shares outstanding during the period.
C Total returns would have been lower if certain expenses had not been reduced during the applicable periods shown.
D Fees and expenses of any underlying mutual funds or exchange-traded funds (ETFs) are not included in the Fund's expense ratio. The Fund indirectly bears its proportionate share of these expenses. For additional expense information related to investments in Fidelity Central Funds, please refer to the "Investments in Fidelity Central Funds" note found in the Notes to Financial Statements section of the most recent Annual or Semi-Annual report.
E Expense ratios reflect operating expenses of the class. Expenses before reductions do not reflect amounts reimbursed, waived, or reduced through arrangements with the investment adviser, brokerage services, or other offset arrangements, if applicable, and do not represent the amount paid by the class during periods when reimbursements, waivers or reductions occur.
F Amount does not include the portfolio activity of any underlying mutual funds or exchange-traded funds (ETFs).
See accompanying notes which are an integral part of the financial statements.
Fidelity Women's Leadership Fund Class Z
| Years ended April 30, | 2021 | 2020A |
| Selected Per–Share Data | | |
| Net asset value, beginning of period | $9.83 | $10.00 |
| Income from Investment Operations | | |
| Net investment income (loss)B | .05 | .08 |
| Net realized and unrealized gain (loss) | 5.51 | (.22) |
| Total from investment operations | 5.56 | (.14) |
| Distributions from net investment income | (.04) | (.03) |
| Total distributions | (.04) | (.03) |
| Net asset value, end of period | $15.35 | $9.83 |
| Total ReturnC | 56.63% | (1.43)% |
| Ratios to Average Net AssetsD,E | | |
| Expenses before reductions | .87% | 1.88% |
| Expenses net of fee waivers, if any | .85% | .85% |
| Expenses net of all reductions | .84% | .85% |
| Net investment income (loss) | .37% | .76% |
| Supplemental Data | | |
| Net assets, end of period (000 omitted) | $9,043 | $2,376 |
| Portfolio turnover rateF | 35% | 52% |
A For the period May 1, 2019 (commencement of operations) to April 30, 2020.
B Calculated based on average shares outstanding during the period.
C Total returns would have been lower if certain expenses had not been reduced during the applicable periods shown.
D Fees and expenses of any underlying mutual funds or exchange-traded funds (ETFs) are not included in the Fund's expense ratio. The Fund indirectly bears its proportionate share of these expenses. For additional expense information related to investments in Fidelity Central Funds, please refer to the "Investments in Fidelity Central Funds" note found in the Notes to Financial Statements section of the most recent Annual or Semi-Annual report.
E Expense ratios reflect operating expenses of the class. Expenses before reductions do not reflect amounts reimbursed, waived, or reduced through arrangements with the investment adviser, brokerage services, or other offset arrangements, if applicable, and do not represent the amount paid by the class during periods when reimbursements, waivers or reductions occur.
F Amount does not include the portfolio activity of any underlying mutual funds or exchange-traded funds (ETFs).
See accompanying notes which are an integral part of the financial statements.
Notes to Financial Statements
For the period ended April 30, 2021
1. Organization.
Fidelity Women's Leadership Fund (the Fund) is a fund of Fidelity Summer Street Trust (the Trust) and is authorized to issue an unlimited number of shares. The Trust is registered under the Investment Company Act of 1940, as amended (the 1940 Act), as an open-end management investment company organized as a Massachusetts business trust. The Fund offers Class A, Class M, Class C, Fidelity Women's Leadership Fund, Class I and Class Z shares, each of which has equal rights as to assets and voting privileges. Each class has exclusive voting rights with respect to matters that affect that class. Class C shares will automatically convert to Class A shares after a holding period of ten years from the initial date of purchase, with certain exceptions.
Effective June 21, 2021, Class C shares will automatically convert to Class A shares after a holding period of eight years from the initial date of purchase, with certain exceptions.
2. Investments in Fidelity Central Funds.
Funds may invest in Fidelity Central Funds, which are open-end investment companies generally available only to other investment companies and accounts managed by the investment adviser and its affiliates. The Schedule of Investments lists any Fidelity Central Funds held as an investment as of period end, but does not include the underlying holdings of each Fidelity Central Fund. An investing fund indirectly bears its proportionate share of the expenses of the underlying Fidelity Central Funds.
Based on its investment objective, each Fidelity Central Fund may invest or participate in various investment vehicles or strategies that are similar to those of the investing fund. These strategies are consistent with the investment objectives of the investing fund and may involve certain economic risks which may cause a decline in value of each of the Fidelity Central Funds and thus a decline in the value of the investing fund.
| Fidelity Central Fund | Investment Manager | Investment Objective | Investment Practices | Expense Ratio(a) |
| Fidelity Money Market Central Funds | Fidelity Management & Research Company LLC (FMR) | Each fund seeks to obtain a high level of current income consistent with the preservation of capital and liquidity. | Short-term Investments | Less than .005% to .01% |
(a) Expenses expressed as a percentage of average net assets and are as of each underlying Central Fund's most recent annual or semi-annual shareholder report.
A complete unaudited list of holdings for each Fidelity Central Fund is available upon request or at the Securities and Exchange Commission website at www.sec.gov. In addition, the financial statements of the Fidelity Central Funds which contain the significant accounting policies (including investment valuation policies) of those funds, and are not covered by the Report of Independent Registered Public Accounting Firm, are available on the Securities and Exchange Commission website or upon request.
3. Significant Accounting Policies.
The Fund is an investment company and applies the accounting and reporting guidance of the Financial Accounting Standards Board (FASB) Accounting Standards Codification Topic 946 Financial Services - Investment Companies. The financial statements have been prepared in conformity with accounting principles generally accepted in the United States of America (GAAP), which require management to make certain estimates and assumptions at the date of the financial statements. Actual results could differ from those estimates. Subsequent events, if any, through the date that the financial statements were issued have been evaluated in the preparation of the financial statements. The Fund's Schedule of Investments lists any underlying mutual funds or exchange-traded funds (ETFs) but does not include the underlying holdings of these funds. The following summarizes the significant accounting policies of the Fund:
Investment Valuation. Investments are valued as of 4:00 p.m. Eastern time on the last calendar day of the period. The Board of Trustees (the Board) has delegated the day to day responsibility for the valuation of the Fund's investments to the Fair Value Committee (the Committee) established by the Fund's investment adviser. In accordance with valuation policies and procedures approved by the Board, the Fund attempts to obtain prices from one or more third party pricing vendors or brokers to value its investments. When current market prices, quotations or currency exchange rates are not readily available or reliable, investments will be fair valued in good faith by the Committee, in accordance with procedures adopted by the Board. Factors used in determining fair value vary by investment type and may include market or investment specific events. The frequency with which these procedures are used cannot be predicted and they may be utilized to a significant extent. The Committee oversees the Fund's valuation policies and procedures and reports to the Board on the Committee's activities and fair value determinations. The Board monitors the appropriateness of the procedures used in valuing the Fund's investments and ratifies the fair value determinations of the Committee.
The Fund categorizes the inputs to valuation techniques used to value its investments into a disclosure hierarchy consisting of three levels as shown below:
- Level 1 – quoted prices in active markets for identical investments
- Level 2 – other significant observable inputs (including quoted prices for similar investments, interest rates, prepayment speeds, etc.)
- Level 3 – unobservable inputs (including the Fund's own assumptions based on the best information available)
Valuation techniques used to value the Fund's investments by major category are as follows:
Equity securities, including restricted securities, for which market quotations are readily available, are valued at the last reported sale price or official closing price as reported by a third party pricing vendor on the primary market or exchange on which they are traded and are categorized as Level 1 in the hierarchy. In the event there were no sales during the day or closing prices are not available, securities are valued at the last quoted bid price or may be valued using the last available price and are generally categorized as Level 2 in the hierarchy. For foreign equity securities, when market or security specific events arise, comparisons to the valuation of American Depositary Receipts (ADRs), futures contracts, Exchange-Traded Funds (ETFs) and certain indexes as well as quoted prices for similar securities may be used and would be categorized as Level 2 in the hierarchy. For equity securities, including restricted securities, where observable inputs are limited, assumptions about market activity and risk are used and these securities may be categorized as Level 3 in the hierarchy.
Investments in open-end mutual funds, including the Fidelity Central Funds, are valued at their closing net asset value (NAV) each business day and are categorized as Level 1 in the hierarchy.
Changes in valuation techniques may result in transfers in or out of an assigned level within the disclosure hierarchy. The aggregate value of investments by input level as of April 30, 2021 is included at the end of the Fund's Schedule of Investments.
Foreign Currency. Certain Funds may use foreign currency contracts to facilitate transactions in foreign-denominated securities. Gains and losses from these transactions may arise from changes in the value of the foreign currency or if the counterparties do not perform under the contracts' terms.
Foreign-denominated assets, including investment securities, and liabilities are translated into U.S. dollars at the exchange rates at period end. Purchases and sales of investment securities, income and dividends received, and expenses denominated in foreign currencies are translated into U.S. dollars at the exchange rate in effect on the transaction date.
The effects of exchange rate fluctuations on investments are included with the net realized and unrealized gain (loss) on investment securities. Other foreign currency transactions resulting in realized and unrealized gain (loss) are disclosed separately.
Investment Transactions and Income. For financial reporting purposes, the Fund's investment holdings and NAV include trades executed through the end of the last business day of the period. The NAV per share for processing shareholder transactions is calculated as of the close of business of the New York Stock Exchange (NYSE), normally 4:00 p.m. Eastern time and includes trades executed through the end of the prior business day. Gains and losses on securities sold are determined on the basis of identified cost. Dividend income is recorded on the ex-dividend date, except for certain dividends from foreign securities where the ex-dividend date may have passed, which are recorded as soon as the Fund is informed of the ex-dividend date. Non-cash dividends included in dividend income, if any, are recorded at the fair market value of the securities received. Income and capital gain distributions from Fidelity Central Funds, if any, are recorded on the ex-dividend date. Certain distributions received by the Fund represent a return of capital or capital gain. The Fund determines the components of these distributions subsequent to the ex-dividend date, based upon receipt of tax filings or other correspondence relating to the underlying investment. These distributions are recorded as a reduction of cost of investments and/or as a realized gain. Investment income is recorded net of foreign taxes withheld where recovery of such taxes is uncertain.
Class Allocations and Expenses. Investment income, realized and unrealized capital gains and losses, common expenses of a fund, and certain fund-level expense reductions, if any, are allocated daily on a pro-rata basis to each class based on the relative net assets of each class to the total net assets of a fund. Each class differs with respect to transfer agent and distribution and service plan fees incurred, as applicable. Certain expense reductions may also differ by class, if applicable. For the reporting period, the allocated portion of income and expenses to each class as a percent of its average net assets may vary due to the timing of recording these transactions in relation to fluctuating net assets of the classes. Expenses directly attributable to a fund are charged to that fund. Expenses attributable to more than one fund are allocated among the respective funds on the basis of relative net assets or other appropriate methods. Expenses included in the accompanying financial statements reflect the expenses of that fund and do not include any expenses associated with any underlying mutual funds or exchange-traded funds. Although not included in a fund's expenses, a fund indirectly bears its proportionate share of these expenses through the net asset value of each underlying mutual fund or exchange-traded fund. Expense estimates are accrued in the period to which they relate and adjustments are made when actual amounts are known.
Income Tax Information and Distributions to Shareholders. Each year, the Fund intends to qualify as a regulated investment company under Subchapter M of the Internal Revenue Code, including distributing substantially all of its taxable income and realized gains. As a result, no provision for U.S. Federal income taxes is required. As of April 30, 2021, the Fund did not have any unrecognized tax benefits in the financial statements; nor is the Fund aware of any tax positions for which it is reasonably possible that the total amounts of unrecognized tax benefits will significantly change in the next twelve months. The Fund files a U.S. federal tax return, in addition to state and local tax returns as required. The Fund's federal income tax returns are subject to examination by the Internal Revenue Service (IRS) for a period of three fiscal years after they are filed. State and local tax returns may be subject to examination for an additional fiscal year depending on the jurisdiction. Foreign taxes are provided for based on the Fund's understanding of the tax rules and rates that exist in the foreign markets in which it invests.
Distributions are declared and recorded on the ex-dividend date. Income and capital gain distributions are declared separately for each class. Income and capital gain distributions are determined in accordance with income tax regulations, which may differ from GAAP. In addition, the Fund claimed a portion of the payment made to redeeming shareholders as a distribution for income tax purposes.
Capital accounts within the financial statements are adjusted for permanent book-tax differences. These adjustments have no impact on net assets or the results of operations. Capital accounts are not adjusted for temporary book-tax differences which will reverse in a subsequent period.
Book-tax differences are primarily due to foreign currency transactions, capital loss carryforwards and losses deferred due to wash sales.
As of period end, the cost and unrealized appreciation (depreciation) in securities, and derivatives if applicable, for federal income tax purposes were as follows:
| Gross unrealized appreciation | $24,083,032 |
| Gross unrealized depreciation | (1,251,395) |
| Net unrealized appreciation (depreciation) | $22,831,637 |
| Tax Cost | $96,712,652 |
The tax-based components of distributable earnings as of period end were as follows:
| Undistributed ordinary income | $890,364 |
| Undistributed long-term capital gain | $505,015 |
| Net unrealized appreciation (depreciation) on securities and other investments | $22,832,014 |
The tax character of distributions paid was as follows:
| | April 30, 2021 | April 30, 2020 |
| Ordinary Income | $112,731 | $ 61,425 |
Restricted Securities (including Private Placements). Funds may invest in securities that are subject to legal or contractual restrictions on resale. These securities generally may be resold in transactions exempt from registration or to the public if the securities are registered. Disposal of these securities may involve time-consuming negotiations and expense, and prompt sale at an acceptable price may be difficult. Information regarding restricted securities held at period end is included at the end of the Schedule of Investments, if applicable.
Special Purpose Acquisition Companies. Funds may invest in stock, warrants, and other securities of special purpose acquisition companies (SPACs) or similar special purpose entities. A SPAC is a publicly traded company that raises investment capital via an initial public offering (IPO) for the purpose of acquiring the equity securities of one or more existing companies via merger, business combination, acquisition or other similar transactions within a designated time frame.
Private Investment in Public Equity. Funds may acquire equity securities of an issuer through a private investment in a public equity (PIPE) transaction, including through commitments to purchase securities on a when-issued basis. A PIPE typically involves the purchase of securities directly from a publicly traded company in a private placement transaction. Securities purchased through PIPE transactions will be restricted from trading and considered illiquid until a resale registration statement for the shares is filed and declared effective.
At period end, the Fund had commitments to purchase when-issued securities through PIPE transactions with SPACs. The commitments are contingent upon the SPACs acquiring the securities of target companies. Unrealized appreciation (depreciation) on these commitments is separately presented in the Statements of Assets and Liabilities as Unrealized appreciation (depreciation) on unfunded commitments, and in the Statement of Operations as Change in unrealized appreciation (depreciation) on unfunded commitments.
4. Purchases and Sales of Investments.
Purchases and sales of securities, other than short-term securities, are noted in the table below.
| | Purchases ($) | Sales ($) |
| Fidelity Women's Leadership Fund | 83,311,978 | 21,066,755 |
5. Fees and Other Transactions with Affiliates.
Management Fee. Fidelity Management & Research Company LLC (the investment adviser) and its affiliates provide the Fund with investment management related services for which the Fund pays a monthly management fee. The management fee is the sum of an individual fund fee rate that is based on an annual rate of .30% of the Fund's average net assets and an annualized group fee rate that averaged .23% during the period. The group fee rate is based upon the monthly average net assets of a group of registered investment companies with which the investment adviser has management contracts. The group fee rate decreases as assets under management increase and increases as assets under management decrease. In addition, the management fee is subject to a performance adjustment (up to a maximum of +/- .10% of the Fund's average net assets over a 36 month performance period). The upward or downward adjustment to the management fee is based on the relative investment performance of Fidelity Women's Leadership Fund as compared to its benchmark index, the Russell 3000 Index, over the same 36 month performance period. The Fund's performance adjustment took effect in May 2020. Subsequent months will be added until the performance period includes 36 months. For the reporting period, the total annual management fee rate, including the performance adjustment, was .53% of the Fund's average net assets. The performance adjustment included in the management fee rate may be higher or lower than the maximum performance adjustment rate due to the difference between the average net assets for the reporting and performance periods.
Distribution and Service Plan Fees. In accordance with Rule 12b-1 of the 1940 Act, the Fund has adopted separate Distribution and Service Plans for each class of shares. Certain classes pay Fidelity Distributors Company LLC (FDC), an affiliate of the investment adviser, separate Distribution and Service Fees, each of which is based on an annual percentage of each class' average net assets. In addition, FDC may pay financial intermediaries for selling shares of the Fund and providing shareholder support services. For the period, the Distribution and Service Fee rates, total fees and amounts retained by FDC were as follows:
| | Distribution Fee | Service Fee | Total Fees | Retained by FDC |
| Class A | -% | .25% | $3,907 | $368 |
| Class M | .25% | .25% | 3,624 | 795 |
| Class C | .75% | .25% | 7,436 | 5032 |
| | | | $14,967 | $6,195 |
Sales Load. FDC may receive a front-end sales charge of up to 5.75% for selling Class A shares and 3.50% for selling Class M shares, some of which is paid to financial intermediaries for selling shares of the Fund. Depending on the holding period, FDC may receive contingent deferred sales charges levied on Class A, Class M and Class C redemptions. The deferred sales charges are 1.00% for Class C shares, 1.00% for certain purchases of Class A shares and .25% for certain purchases of Class M shares.
For the period, sales charge amounts retained by FDC were as follows:
| | Retained by FDC |
| Class A | $5,185 |
| Class M | 1,225 |
| Class C(a) | 50 |
| | $6,460 |
(a) When Class C shares are initially sold, FDC pays commissions from its own resources to financial intermediaries through which the sales are made.
Transfer Agent Fees. Fidelity Investments Institutional Operations Company LLC (FIIOC), an affiliate of the investment adviser, is the transfer, dividend disbursing and shareholder servicing agent for each class of the Fund. FIIOC receives account fees and asset-based fees that vary according to the account size and type of account of the shareholders of the respective classes of the Fund, except for Class Z. FIIOC receives an asset-based fee of Class Z's average net assets. FIIOC pays for typesetting, printing and mailing of shareholder reports, except proxy statements.
For the period, transfer agent fees for each class were as follows:
| | Amount | % of Class-Level Average Net Assets |
| Class A | $2,984 | .19 |
| Class M | 1,377 | .19 |
| Class C | 1,162 | .16 |
| Fidelity Women's Leadership Fund | 143,892 | .27 |
| Class I | 2,148 | .13 |
| Class Z | 2,242 | .04 |
| | $153,805 | |
Accounting Fees. Fidelity Service Company, Inc. (FSC), an affiliate of the investment adviser, maintains the Fund's accounting records. The accounting fee is based on the level of average net assets for each month. For the period, the fees were equivalent to the following annual rates:
| | % of Average Net Assets |
| Fidelity Women's Leadership Fund | .04 |
Brokerage Commissions. A portion of portfolio transactions were placed with brokerage firms which are affiliates of the investment adviser. Brokerage commissions are included in net realized gain (loss) and change in net unrealized appreciation (depreciation) in the Statement of Operations. The commissions paid to these affiliated firms were as follows:
| | Amount |
| Fidelity Women's Leadership Fund | $590 |
Interfund Trades. Funds may purchase from or sell securities to other Fidelity Funds under procedures adopted by the Board. The procedures have been designed to ensure these interfund trades are executed in accordance with Rule 17a-7 of the 1940 Act. Any interfund trades are included within the respective purchases and sales amounts shown in the Purchases and Sales of Investments note and are noted in the table below.
| | Purchases ($) | Sales ($) |
| Fidelity Women's Leadership Fund | 1,243,600 | 1,390,121 |
Other. During the period, the investment adviser reimbursed the Fund for certain losses in the amount of $16,539.
6. Committed Line of Credit.
Certain Funds participate with other funds managed by the investment adviser or an affiliate in a $4.25 billion credit facility (the "line of credit") to be utilized for temporary or emergency purposes to fund shareholder redemptions or for other short-term liquidity purposes. The participating funds have agreed to pay commitment fees on their pro-rata portion of the line of credit, which are reflected in Miscellaneous expenses on the Statement of Operations, and are listed below.
| | Amount |
| Fidelity Women's Leadership Fund | $114 |
During the period, there were no borrowings on this line of credit.
7. Security Lending.
Funds lend portfolio securities from time to time in order to earn additional income. Lending agents are used, including National Financial Services (NFS), an affiliate of the investment adviser. Pursuant to a securities lending agreement, NFS will receive a fee, which is capped at 9.9% of a fund's daily lending revenue, for its services as lending agent. A fund may lend securities to certain qualified borrowers, including NFS. On the settlement date of the loan, a fund receives collateral (in the form of U.S. Treasury obligations, letters of credit and/or cash) against the loaned securities and maintains collateral in an amount not less than 100% of the market value of the loaned securities during the period of the loan. The market value of the loaned securities is determined at the close of business of a fund and any additional required collateral is delivered to a fund on the next business day. A fund or borrower may terminate the loan at any time, and if the borrower defaults on its obligation to return the securities loaned because of insolvency or other reasons, a fund may apply collateral received from the borrower against the obligation. A fund may experience delays and costs in recovering the securities loaned. Any cash collateral received is invested in the Fidelity Securities Lending Cash Central Fund. Any loaned securities are identified as such in the Schedule of Investments, and the value of loaned securities and cash collateral at period end, as applicable, are presented in the Statement of Assets and Liabilities. Security lending income represents the income earned on investing cash collateral, less rebates paid to borrowers and any lending agent fees associated with the loan, plus any premium payments received for lending certain types of securities. Security lending income is presented in the Statement of Operations as a component of income from Fidelity Central Funds. Affiliated security lending activity, if any, was as follows:
| | Total Security Lending Fees Paid to NFS | Security Lending Income From Securities Loaned to NFS | Value of Securities Loaned to NFS at Period End |
| Fidelity Women's Leadership Fund | $506 | $– | $– |
8. Expense Reductions.
The investment adviser contractually agreed to reimburse expenses of each class to the extent annual operating expenses exceeded certain levels of class-level average net assets as noted in the table below. Some expenses, for example the compensation of the independent Trustees are excluded from this reimbursement.
The following classes were in reimbursement during the period:
| | Expense Limitations | Reimbursement |
| Class A | 1.25% | $461 |
| Class M | 1.50% | 156 |
| Class C | 2.00% | – |
| Fidelity Women's Leadership Fund | 1.00% | 55,710 |
| Class I | 1.00% | – |
| Class Z | .85% | 1,154 |
| | | $57,481 |
Commissions paid to certain brokers with whom the investment adviser, or its affiliates, places trades on behalf of the Fund include an amount in addition to trade execution, which may be rebated back to the Fund to offset expenses. This amount totaled $4,743 for the period
In addition, during the period the investment adviser or an affiliate reimbursed and/or waived a portion of fund-level operating expenses in the amount of $148.
Effective June 1, 2021, the investment adviser contractually agreed to reimburse expenses to the extent annual operating expenses exceeded certain levels of class-level average net assets as noted in the table below. This reimbursement will remain in place through August 31, 2022.
| | Expense Limitations |
| Class A | 1.15% |
| Class M | 1.40% |
| Class C | 1.90% |
| Fidelity Women's Leadership Fund | .90% |
| Class I | .90% |
| Class Z | .75% |
9. Distributions to Shareholders.
Distributions to shareholders of each class were as follows:
| | Year ended
April 30, 2021 | Year ended
April 30, 2020 |
| Fidelity Women's Leadership Fund | | |
| Distributions to shareholders | | |
| Class A | $624 | $1,124 |
| Class M | 105 | 307 |
| Fidelity Women's Leadership Fund | 93,607 | 51,980 |
| Class I | 3,961 | 1,486 |
| Class Z | 14,433 | 6,528 |
| Total | $112,730 | $61,425 |
10. Share Transactions.
Share transactions for each class were as follows and may contain automatic conversions between classes or exchanges between affiliated funds:
| | Shares | Shares | Dollars | Dollars |
| | Year ended April 30, 2021 | Year ended April 30, 2020 | Year ended April 30, 2021 | Year ended April 30, 2020 |
| Fidelity Women's Leadership Fund | | | | |
| Class A | | | | |
| Shares sold | 130,547 | 80,039 | $1,741,533 | $809,764 |
| Reinvestment of distributions | 56 | 103 | 624 | 1,124 |
| Shares redeemed | (21,509) | (1,702) | (292,612) | (15,681) |
| Net increase (decrease) | 109,094 | 78,440 | $1,449,545 | $795,207 |
| Class M | | | | |
| Shares sold | 40,717 | 46,220 | $526,821 | $479,639 |
| Reinvestment of distributions | 10 | 28 | 105 | 307 |
| Shares redeemed | (22,046) | (945) | (306,908) | (9,259) |
| Net increase (decrease) | 18,681 | 45,303 | $220,018 | $470,687 |
| Class C | | | | |
| Shares sold | 46,841 | 48,236 | $620,306 | $512,663 |
| Shares redeemed | (32,790) | (195) | (472,777) | (2,000) |
| Net increase (decrease) | 14,051 | 48,041 | $147,529 | $510,663 |
| Fidelity Women's Leadership Fund | | | | |
| Shares sold | 5,053,221 | 2,817,326 | $65,814,179 | $28,987,122 |
| Reinvestment of distributions | 7,216 | 4,612 | 89,644 | 50,270 |
| Shares redeemed | (870,966) | (552,590) | (11,068,699) | (5,444,931) |
| Net increase (decrease) | 4,189,471 | 2,269,348 | $54,835,124 | $23,592,461 |
| Class I | | | | |
| Shares sold | 210,365 | 78,405 | $2,876,586 | $812,024 |
| Reinvestment of distributions | 306 | 127 | 3,907 | 1,383 |
| Shares redeemed | (29,107) | (6,991) | (387,271) | (68,276) |
| Net increase (decrease) | 181,564 | 71,541 | $2,493,222 | $745,131 |
| Class Z | | | | |
| Shares sold | 448,196 | 382,936 | $5,772,349 | $3,866,272 |
| Reinvestment of distributions | 1,011 | 521 | 12,846 | 5,680 |
| Shares redeemed | (101,683) | (141,731) | (1,286,287) | (1,315,334) |
| Net increase (decrease) | 347,524 | 241,726 | $4,498,908 | $2,556,618 |
11. Other.
Fund's organizational documents provide former and current trustees and officers with a limited indemnification against liabilities arising in connection with the performance of their duties to the fund. In the normal course of business, the fund may also enter into contracts that provide general indemnifications. The fund's maximum exposure under these arrangements is unknown as this would be dependent on future claims that may be made against the fund. The risk of material loss from such claims is considered remote.
12. Coronavirus (COVID-19) Pandemic.
An outbreak of COVID-19 first detected in China during December 2019 has since spread globally and was declared a pandemic by the World Health Organization during March 2020. Developments that disrupt global economies and financial markets, such as the COVID-19 pandemic, may magnify factors that affect the Fund's performance.
Report of Independent Registered Public Accounting Firm
To the Board of Trustees of Fidelity Summer Street Trust and Shareholders of Fidelity Women's Leadership Fund
Opinion on the Financial Statements and Financial Highlights
We have audited the accompanying statement of assets and liabilities of Fidelity Women’s Leadership Fund (the "Fund"), a fund of Fidelity Summer Street Trust, including the schedule of investments, as of April 30, 2021, the related statement of operations for the year then ended, the statement of changes in net assets and the financial highlights for the year then ended and for the period from May 1, 2019 (commencement of operations) through April 30, 2020, and the related notes. In our opinion, the financial statements and financial highlights present fairly, in all material respects, the financial position of the Fund as of April 30, 2021, the results of its operations for the year then ended, the changes in its net assets and the financial highlights for the year then ended and for the period from May 1, 2019 (commencement of operations) through April 30, 2020, in conformity with accounting principles generally accepted in the United States of America.
Basis for Opinion
These financial statements and financial highlights are the responsibility of the Fund's management. Our responsibility is to express an opinion on the Fund's financial statements and financial highlights based on our audits. We are a public accounting firm registered with the Public Company Accounting Oversight Board (United States) (PCAOB) and are required to be independent with respect to the Fund in accordance with the U.S. federal securities laws and the applicable rules and regulations of the Securities and Exchange Commission and the PCAOB.
We conducted our audits in accordance with the standards of the PCAOB. Those standards require that we plan and perform the audit to obtain reasonable assurance about whether the financial statements and financial highlights are free of material misstatement, whether due to error or fraud. The Fund is not required to have, nor were we engaged to perform, an audit of its internal control over financial reporting. As part of our audits we are required to obtain an understanding of internal control over financial reporting but not for the purpose of expressing an opinion on the effectiveness of the Fund’s internal control over financial reporting. Accordingly, we express no such opinion.
Our audits included performing procedures to assess the risks of material misstatement of the financial statements and financial highlights, whether due to error or fraud, and performing procedures that respond to those risks. Such procedures included examining, on a test basis, evidence regarding the amounts and disclosures in the financial statements and financial highlights. Our audits also included evaluating the accounting principles used and significant estimates made by management, as well as evaluating the overall presentation of the financial statements and financial highlights. Our procedures included confirmation of securities owned as of April 30, 2021, by correspondence with the custodian, issuers of privately offered securities and brokers; when replies were not received from issuers of privately offered securities and brokers, we performed other auditing procedures. We believe that our audits provide a reasonable basis for our opinion.
/s/ Deloitte & Touche LLP
Boston, Massachusetts
June 14, 2021
We have served as the auditor of one or more of the Fidelity investment companies since 1999.
Trustees and Officers
The Trustees, Members of the Advisory Board (if any), and officers of the trust and fund, as applicable, are listed below. The Board of Trustees governs the fund and is responsible for protecting the interests of shareholders. The Trustees are experienced executives who meet periodically throughout the year to oversee the fund's activities, review contractual arrangements with companies that provide services to the fund, oversee management of the risks associated with such activities and contractual arrangements, and review the fund's performance. Each of the Trustees oversees 308 funds.
The Trustees hold office without limit in time except that (a) any Trustee may resign; (b) any Trustee may be removed by written instrument, signed by at least two-thirds of the number of Trustees prior to such removal; (c) any Trustee who requests to be retired or who has become incapacitated by illness or injury may be retired by written instrument signed by a majority of the other Trustees; and (d) any Trustee may be removed at any special meeting of shareholders by a two-thirds vote of the outstanding voting securities of the trust. Each Trustee who is not an interested person (as defined in the 1940 Act) of the trust and the fund is referred to herein as an Independent Trustee. Each Independent Trustee shall retire not later than the last day of the calendar year in which his or her 75th birthday occurs. The Independent Trustees may waive this mandatory retirement age policy with respect to individual Trustees. Officers and Advisory Board Members hold office without limit in time, except that any officer or Advisory Board Member may resign or may be removed by a vote of a majority of the Trustees at any regular meeting or any special meeting of the Trustees. Except as indicated, each individual has held the office shown or other offices in the same company for the past five years.
The fund's Statement of Additional Information (SAI) includes more information about the Trustees. To request a free copy, call Fidelity at 1-800-544-8544 if you’re an individual investing directly with Fidelity, call 1-800-835-5092 if you’re a plan sponsor or participant with Fidelity as your recordkeeper or call 1-877-208-0098 on institutional accounts or if you’re an advisor or invest through one.
Experience, Skills, Attributes, and Qualifications of the Trustees. The Governance and Nominating Committee has adopted a statement of policy that describes the experience, qualifications, attributes, and skills that are necessary and desirable for potential Independent Trustee candidates (Statement of Policy). The Board believes that each Trustee satisfied at the time he or she was initially elected or appointed a Trustee, and continues to satisfy, the standards contemplated by the Statement of Policy. The Governance and Nominating Committee also engages professional search firms to help identify potential Independent Trustee candidates who have the experience, qualifications, attributes, and skills consistent with the Statement of Policy. From time to time, additional criteria based on the composition and skills of the current Independent Trustees, as well as experience or skills that may be appropriate in light of future changes to board composition, business conditions, and regulatory or other developments, have also been considered by the professional search firms and the Governance and Nominating Committee. In addition, the Board takes into account the Trustees' commitment and participation in Board and committee meetings, as well as their leadership of standing and ad hoc committees throughout their tenure.
In determining that a particular Trustee was and continues to be qualified to serve as a Trustee, the Board has considered a variety of criteria, none of which, in isolation, was controlling. The Board believes that, collectively, the Trustees have balanced and diverse experience, qualifications, attributes, and skills, which allow the Board to operate effectively in governing the fund and protecting the interests of shareholders. Information about the specific experience, skills, attributes, and qualifications of each Trustee, which in each case led to the Board's conclusion that the Trustee should serve (or continue to serve) as a trustee of the fund, is provided below.
Board Structure and Oversight Function. Robert A. Lawrence is an interested person and currently serves as Acting Chairman. The Trustees have determined that an interested Chairman is appropriate and benefits shareholders because an interested Chairman has a personal and professional stake in the quality and continuity of services provided to the fund. Independent Trustees exercise their informed business judgment to appoint an individual of their choosing to serve as Chairman, regardless of whether the Trustee happens to be independent or a member of management. The Independent Trustees have determined that they can act independently and effectively without having an Independent Trustee serve as Chairman and that a key structural component for assuring that they are in a position to do so is for the Independent Trustees to constitute a substantial majority for the Board. The Independent Trustees also regularly meet in executive session. David M. Thomas serves as Lead Independent Trustee and as such (i) acts as a liaison between the Independent Trustees and management with respect to matters important to the Independent Trustees and (ii) with management prepares agendas for Board meetings.
Fidelity® funds are overseen by different Boards of Trustees. The fund's Board oversees Fidelity's high income and certain equity funds, and other Boards oversee Fidelity's investment-grade bond, money market, asset allocation, and other equity funds. The asset allocation funds may invest in Fidelity® funds overseen by the fund's Board. The use of separate Boards, each with its own committee structure, allows the Trustees of each group of Fidelity® funds to focus on the unique issues of the funds they oversee, including common research, investment, and operational issues. On occasion, the separate Boards establish joint committees to address issues of overlapping consequences for the Fidelity® funds overseen by each Board.
The Trustees operate using a system of committees to facilitate the timely and efficient consideration of all matters of importance to the Trustees, the fund, and fund shareholders and to facilitate compliance with legal and regulatory requirements and oversight of the fund's activities and associated risks. The Board, acting through its committees, has charged FMR and its affiliates with (i) identifying events or circumstances the occurrence of which could have demonstrably adverse effects on the fund's business and/or reputation; (ii) implementing processes and controls to lessen the possibility that such events or circumstances occur or to mitigate the effects of such events or circumstances if they do occur; and (iii) creating and maintaining a system designed to evaluate continuously business and market conditions in order to facilitate the identification and implementation processes described in (i) and (ii) above. Because the day-to-day operations and activities of the fund are carried out by or through FMR, its affiliates, and other service providers, the fund's exposure to risks is mitigated but not eliminated by the processes overseen by the Trustees. While each of the Board's committees has responsibility for overseeing different aspects of the fund's activities, oversight is exercised primarily through the Operations, Audit, and Compliance Committees. Appropriate personnel, including but not limited to the fund's Chief Compliance Officer (CCO), FMR's internal auditor, the independent accountants, the fund's Treasurer and portfolio management personnel, make periodic reports to the Board's committees, as appropriate, including an annual review of Fidelity's risk management program for the Fidelity® funds. The responsibilities of each standing committee, including their oversight responsibilities, are described further under "Standing Committees of the Trustees."
Interested Trustees*:
Correspondence intended for a Trustee who is an interested person may be sent to Fidelity Investments, 245 Summer Street, Boston, Massachusetts 02210.
Name, Year of Birth; Principal Occupations and Other Relevant Experience+
Bettina Doulton (1964)
Year of Election or Appointment: 2020
Trustee
Ms. Doulton also serves as Trustee of other Fidelity® funds. Prior to her retirement, Ms. Doulton served in a variety of positions at Fidelity Investments, including as a managing director of research (2006-2007), portfolio manager to certain Fidelity® funds (1993-2005), equity analyst and portfolio assistant (1990-1993), and research assistant (1987-1990). Ms. Doulton currently owns and operates Phi Builders + Architects and Cellardoor Winery. Previously, Ms. Doulton served as a member of the Board of Brown Capital Management, LLC (2014-2018).
Robert A. Lawrence (1952)
Year of Election or Appointment: 2020
Trustee
Acting Chairman of the Board of Trustees
Mr. Lawrence also serves as Trustee of other funds. Previously, Mr. Lawrence served as a Member of the Advisory Board of certain funds. Prior to his retirement in 2008, Mr. Lawrence served as Vice President of certain Fidelity® funds (2006-2008), Senior Vice President, Head of High Income Division of Fidelity Management & Research Company (investment adviser firm, 2006-2008), and President of Fidelity Strategic Investments (investment adviser firm, 2002-2005).
* Determined to be an “Interested Trustee” by virtue of, among other things, his or her affiliation with the trust or various entities under common control with FMR.
+ The information includes the Trustee's principal occupation during the last five years and other information relating to the experience, attributes, and skills relevant to the Trustee's qualifications to serve as a Trustee, which led to the conclusion that the Trustee should serve as a Trustee for the fund.
Independent Trustees:
Correspondence intended for an Independent Trustee may be sent to Fidelity Investments, P.O. Box 55235, Boston, Massachusetts 02205-5235.
Name, Year of Birth; Principal Occupations and Other Relevant Experience+
Thomas P. Bostick (1956)
Year of Election or Appointment: 2021
Trustee
Lieutenant General Bostick also serves as Trustee of other Fidelity® funds. Prior to his retirement, General Bostick (United States Army, Retired) held a variety of positions within the U.S. Army, including Commanding General and Chief of Engineers, U.S. Army Corps of Engineers (2012-2016) and Deputy Chief of Staff and Director of Human Resources, U.S. Army (2009-2012). General Bostick currently serves as a member of the Board and Finance and Governance Committees of CSX Corporation (transportation, 2020-present) and a member of the Board and Corporate Governance and Nominating Committee of Perma-Fix Environmental Services, Inc. (nuclear waste management, 2020-present). General Bostick serves as Chief Executive Officer of Bostick Global Strategies, LLC (consulting, 2016-present) and Managing Partner, Sustainability, of Ridge-Lane Limited Partners (strategic advisory and venture development, 2016-present). Previously, General Bostick served as a Member of the Advisory Board of certain Fidelity® funds (2021), President, Intrexon Bioengineering (2018-2020) and Chief Operating Officer (2017-2020) and Senior Vice President of the Environment Sector (2016-2017) of Intrexon Corporation (biopharmaceutical company).
Dennis J. Dirks (1948)
Year of Election or Appointment: 2005
Trustee
Mr. Dirks also serves as Trustee of other Fidelity® funds. Prior to his retirement in May 2003, Mr. Dirks served as Chief Operating Officer and as a member of the Board of The Depository Trust & Clearing Corporation (financial markets infrastructure), President, Chief Operating Officer and a member of the Board of The Depository Trust Company (DTC), President and a member of the Board of the National Securities Clearing Corporation (NSCC), Chief Executive Officer and a member of the Board of the Government Securities Clearing Corporation and Chief Executive Officer and a member of the Board of the Mortgage-Backed Securities Clearing Corporation. Mr. Dirks currently serves as a member of the Finance Committee (2016-present) and Board (2017-present) and is Treasurer (2018-present) of the Asolo Repertory Theatre.
Donald F. Donahue (1950)
Year of Election or Appointment: 2018
Trustee
Mr. Donahue also serves as Trustee of other Fidelity® funds. Mr. Donahue serves as President and Chief Executive Officer of Miranda Partners, LLC (risk consulting for the financial services industry, 2012-present). Previously, Mr. Donahue served as Chief Executive Officer (2006-2012), Chief Operating Officer (2003-2006) and Managing Director, Customer Marketing and Development (1999-2003) of The Depository Trust & Clearing Corporation (financial markets infrastructure). Mr. Donahue currently serves as a member (2007-present) and Co-Chairman (2016-present) of the Board of United Way of New York and a member of the Board of NYC Leadership Academy (2012-present). Mr. Donahue previously served as a member of the Advisory Board of certain Fidelity® funds (2015-2018).
Vicki L. Fuller (1957)
Year of Election or Appointment: 2020
Trustee
Ms. Fuller also serves as Trustee of other Fidelity® funds. Previously, Ms. Fuller served as a member of the Advisory Board of certain Fidelity® funds (2018-2020), Chief Investment Officer of the New York State Common Retirement Fund (2012-2018) and held a variety of positions at AllianceBernstein L.P. (global asset management, 1985-2012), including Managing Director (2006-2012) and Senior Vice President and Senior Portfolio Manager (2001-2006). Ms. Fuller currently serves as a member of the Board, Audit Committee and Nominating and Governance Committee of The Williams Companies, Inc. (natural gas infrastructure, 2018-present), as a member of the Board, Audit Committee and Nominating and Governance Committee of two Blackstone business development companies (2020-present) and as a member of the Board of Treliant, LLC (consulting, 2019-present).
Patricia L. Kampling (1959)
Year of Election or Appointment: 2020
Trustee
Ms. Kampling also serves as Trustee of other Fidelity® funds. Prior to her retirement, Ms. Kampling served as Chairman of the Board and Chief Executive Officer (2012-2019), President and Chief Operating Officer (2011-2012) and Executive Vice President and Chief Financial Officer (2010-2011) of Alliant Energy Corporation. Ms. Kampling currently serves as a member of the Board, Finance Committee and Governance, Compensation and Nominating Committee of Xcel Energy Inc. (utilities company, 2020-present) and as a member of the Board, Audit, Finance and Risk Committee and Safety, Environmental, Technology and Operations Committee of American Water Works Company, Inc. (utilities company, 2019-present). In addition, Ms. Kampling currently serves as a member of the Board of the Nature Conservancy, Wisconsin Chapter (2019-present). Previously, Ms. Kampling served as a Member of the Advisory Board of certain Fidelity® funds (2020), a member of the Board, Compensation Committee and Executive Committee and Chair of the Audit Committee of Briggs & Stratton Corporation (manufacturing, 2011-2021), a member of the Board of Interstate Power and Light Company (2012-2019) and Wisconsin Power and Light Company (2012-2019) (each a subsidiary of Alliant Energy Corporation) and as a member of the Board and Workforce Development Committee of the Business Roundtable (2018-2019).
Thomas A. Kennedy (1955)
Year of Election or Appointment: 2021
Trustee
Mr. Kennedy also serves as Trustee of other Fidelity® funds. Previously, Mr. Kennedy served as a Member of the Advisory Board of certain Fidelity® funds (2020) and held a variety of positions at Raytheon Company (aerospace and defense, 1983-2020), including Chairman and Chief Executive Officer (2014-2020) and Executive Vice President and Chief Operating Officer (2013-2014). Mr. Kennedy currently serves as Executive Chairman of the Board of Directors of Raytheon Technologies Corporation (aerospace and defense, 2020-present). He is also a member of the Rutgers School of Engineering Industry Advisory Board (2011-present) and a member of the UCLA Engineering Dean’s Executive Board (2016-present).
Oscar Munoz (1959)
Year of Election or Appointment: 2021
Trustee
Mr. Munoz also serves as Trustee of other Fidelity® funds. Prior to his retirement, Mr. Munoz served as Executive Chairman (2020-2021), Chief Executive Officer (2015-2020), President (2015-2016) and a member of the Board (2010-2021) of United Airlines Holdings, Inc. Mr. Munoz currently serves as a member of the Board of CBRE Group, Inc. (commercial real estate, 2020-present), a member of the Board of Univision Communications, Inc. (Hispanic media, 2020-present) and a member of the Advisory Board of Salesforce.com, Inc. (cloud-based software, 2020-present). Previously, Mr. Munoz served as a Member of the Advisory Board of certain Fidelity® funds (2021).
Garnett A. Smith (1947)
Year of Election or Appointment: 2018
Trustee
Mr. Smith also serves as Trustee of other Fidelity® funds. Prior to his retirement, Mr. Smith served as Chairman and Chief Executive Officer (1990-1997) and President (1986-1990) of Inbrand Corp. (manufacturer of personal absorbent products). Prior to his employment with Inbrand Corp., he was employed by a retail fabric chain and North Carolina National Bank (now Bank of America). Mr. Smith previously served as a member of the Advisory Board of certain Fidelity® funds (2012-2013).
David M. Thomas (1949)
Year of Election or Appointment: 2008
Trustee
Lead Independent Trustee
Mr. Thomas also serves as Trustee of other Fidelity® funds. Previously, Mr. Thomas served as Executive Chairman (2005-2006) and Chairman and Chief Executive Officer (2000-2005) of IMS Health, Inc. (pharmaceutical and healthcare information solutions). Mr. Thomas currently serves as a member of the Board of Fortune Brands Home and Security (home and security products, 2004-present) and Presiding Director (2013-present) of Interpublic Group of Companies, Inc. (marketing communication).
Susan Tomasky (1953)
Year of Election or Appointment: 2020
Trustee
Ms. Tomasky also serves as Trustee of other Fidelity® funds. Prior to her retirement, Ms. Tomasky served in various executive officer positions at American Electric Power Company, Inc. (1998-2011), including most recently as President of AEP Transmission (2007-2011). Ms. Tomasky currently serves as a member of the Board and Sustainability Committee and as Chair of the Audit Committee of Marathon Petroleum Corporation (2018-present) and as a member of the Board, Corporate Governance Committee and Organization and Compensation Committee and as Chair of the Audit Committee of Public Service Enterprise Group, Inc. (utilities company, 2012-present). In addition, Ms. Tomasky currently serves as a member (2009-present) and President (2020-present) of the Board of the Royal Shakespeare Company – America (2009-present), as a member of the Board of the Columbus Association for the Performing Arts (2011-present) and as a member of the Board and Investment Committee of Kenyon College (2016-present). Previously, Ms. Tomasky served as a Member of the Advisory Board of certain Fidelity® funds (2020), as a member of the Board of the Columbus Regional Airport Authority (2007-2020), as a member of the Board (2011-2018) and Lead Independent Director (2015-2018) of Andeavor Corporation (previously Tesoro Corporation) (independent oil refiner and marketer) and as a member of the Board of Summit Midstream Partners LP (energy, 2012-2018).
Michael E. Wiley (1950)
Year of Election or Appointment: 2018
Trustee
Mr. Wiley also serves as Trustee of other Fidelity® funds. Previously, Mr. Wiley served as a member of the Advisory Board of certain Fidelity® funds (2018-2020), Chairman, President and CEO of Baker Hughes, Inc. (oilfield services, 2000-2004). Mr. Wiley also previously served as a member of the Board of Andeavor Corporation (independent oil refiner and marketer, 2005-2018), a member of the Board of Andeavor Logistics LP (natural resources logistics, 2015-2018) and a member of the Board of High Point Resources (exploration and production, 2005-2020).
+ The information includes the Trustee's principal occupation during the last five years and other information relating to the experience, attributes, and skills relevant to the Trustee's qualifications to serve as a Trustee, which led to the conclusion that the Trustee should serve as a Trustee for the fund.
Advisory Board Members and Officers:
Correspondence intended for a Member of the Advisory Board (if any) may be sent to Fidelity Investments, P.O. Box 55235, Boston, Massachusetts 02205-5235. Correspondence intended for an officer or Peter S. Lynch may be sent to Fidelity Investments, 245 Summer Street, Boston, Massachusetts 02210. Officers appear below in alphabetical order.
Name, Year of Birth; Principal Occupation
Peter S. Lynch (1944)
Year of Election or Appointment: 2003
Member of the Advisory Board
Mr. Lynch also serves as a Member of the Advisory Board of other Fidelity® funds. Mr. Lynch is Vice Chairman and a Director of Fidelity Management & Research Company LLC (investment adviser firm). In addition, Mr. Lynch serves as a Trustee of Boston College and as the Chairman of the Inner-City Scholarship Fund. Previously, Mr. Lynch served as Vice Chairman and a Director of FMR Co., Inc. (investment adviser firm) and on the Special Olympics International Board of Directors (1997-2006).
Craig S. Brown (1977)
Year of Election or Appointment: 2019
Assistant Treasurer
Mr. Brown also serves as Assistant Treasurer of other funds. Mr. Brown is an employee of Fidelity Investments (2013-present).
John J. Burke III (1964)
Year of Election or Appointment: 2018
Chief Financial Officer
Mr. Burke also serves as Chief Financial Officer of other funds. Mr. Burke serves as Head of Investment Operations for Fidelity Fund and Investment Operations (2018-present) and is an employee of Fidelity Investments (1998-present). Previously Mr. Burke served as head of Asset Management Investment Operations (2012-2018).
William C. Coffey (1969)
Year of Election or Appointment: 2019
Assistant Secretary
Mr. Coffey also serves as Assistant Secretary of other funds. He is Senior Vice President and Deputy General Counsel of FMR LLC (diversified financial services company, 2010-present), and is an employee of Fidelity Investments. Previously, Mr. Coffey served as Secretary and CLO of certain funds (2018-2019); CLO, Secretary, and Senior Vice President of Fidelity Management & Research Company and FMR Co., Inc. (investment adviser firms, 2018-2019); Secretary of Fidelity SelectCo, LLC and Fidelity Investments Money Management, Inc. (investment adviser firms, 2018-2019); CLO of Fidelity Management & Research (Hong Kong) Limited, FMR Investment Management (UK) Limited, and Fidelity Management & Research (Japan) Limited (investment adviser firms, 2018-2019); and Assistant Secretary of certain funds (2009-2018).
Timothy M. Cohen (1969)
Year of Election or Appointment: 2018
Vice President
Mr. Cohen also serves as Vice President of other funds. Mr. Cohen serves as Co-Head of Equity (2018-present), a Director of Fidelity Management & Research (Japan) Limited (investment adviser firm, 2016-present), and is an employee of Fidelity Investments. Previously, Mr. Cohen served as Executive Vice President of Fidelity SelectCo, LLC (2019), Head of Global Equity Research (2016-2018), Chief Investment Officer - Equity and a Director of Fidelity Management & Research (U.K.) Inc. (investment adviser firm, 2013-2015) and as a Director of Fidelity Management & Research (Hong Kong) Limited (investment adviser firm, 2017).
Jonathan Davis (1968)
Year of Election or Appointment: 2010
Assistant Treasurer
Mr. Davis also serves as Assistant Treasurer of other funds. Mr. Davis serves as Assistant Treasurer of FMR Capital, Inc. (2017-present) and is an employee of Fidelity Investments. Previously, Mr. Davis served as Vice President and Associate General Counsel of FMR LLC (diversified financial services company, 2003-2010).
Laura M. Del Prato (1964)
Year of Election or Appointment: 2018
Assistant Treasurer
Ms. Del Prato also serves as an officer of other funds. Ms. Del Prato is an employee of Fidelity Investments (2017-present). Previously, Ms. Del Prato served as President and Treasurer of The North Carolina Capital Management Trust: Cash Portfolio and Term Portfolio (2018-2020). Prior to joining Fidelity Investments, Ms. Del Prato served as a Managing Director and Treasurer of the JPMorgan Mutual Funds (2014-2017). Prior to JPMorgan, Ms. Del Prato served as a partner at Cohen Fund Audit Services (accounting firm, 2012-2013) and KPMG LLP (accounting firm, 2004-2012).
Colm A. Hogan (1973)
Year of Election or Appointment: 2020
Assistant Treasurer
Mr. Hogan also serves as an officer of other funds. Mr. Hogan serves as Assistant Treasurer of FMR Capital, Inc. (2017-present) and is an employee of Fidelity Investments (2005-present). Previously, Mr. Hogan served as Deputy Treasurer of certain Fidelity® funds (2016-2020) and Assistant Treasurer of certain Fidelity® funds (2016-2018).
Pamela R. Holding (1964)
Year of Election or Appointment: 2018
Vice President
Ms. Holding also serves as Vice President of other funds. Ms. Holding serves as Co-Head of Equity (2018-present) and is an employee of Fidelity Investments (2013-present). Previously, Ms. Holding served as Executive Vice President of Fidelity SelectCo, LLC (2019) and as Chief Investment Officer of Fidelity Institutional Asset Management (2013-2018).
Cynthia Lo Bessette (1969)
Year of Election or Appointment: 2019
Secretary and Chief Legal Officer (CLO)
Ms. Lo Bessette also serves as an officer of other funds. Ms. Lo Bessette serves as CLO, Secretary, and Senior Vice President of Fidelity Management & Research Company LLC (investment adviser firm, 2019-present); and CLO of Fidelity Management & Research (Hong Kong) Limited, FMR Investment Management (UK) Limited, and Fidelity Management & Research (Japan) Limited (investment adviser firms, 2019-present). She is a Senior Vice President and Deputy General Counsel of FMR LLC (diversified financial services company, 2019-present), and is an employee of Fidelity Investments. Previously, Ms. Lo Bessette served as CLO, Secretary, and Senior Vice President of FMR Co., Inc. (investment adviser firm, 2019); Secretary of Fidelity SelectCo, LLC and Fidelity Investments Money Management, Inc. (investment adviser firms, 2019). Prior to joining Fidelity Investments, Ms. Lo Bessette was Executive Vice President, General Counsel (2016-2019) and Senior Vice President, Deputy General Counsel (2015-2016) of OppenheimerFunds (investment management company) and Deputy Chief Legal Officer (2013-2015) of Jennison Associates LLC (investment adviser firm).
Chris Maher (1972)
Year of Election or Appointment: 2020
Deputy Treasurer
Mr. Maher also serves as an officer of other funds. Mr. Maher serves as Assistant Treasurer of FMR Capital, Inc. (2017-present), and is an employee of Fidelity Investments (2008-present). Previously, Mr. Maher served as Assistant Treasurer of certain funds (2013-2020); Vice President of Asset Management Compliance (2013), Vice President of the Program Management Group of FMR (investment adviser firm, 2010-2013), and Vice President of Valuation Oversight (2008-2010).
Jason P. Pogorelec (1975)
Year of Election or Appointment: 2020
Chief Compliance Officer
Mr. Pogorelec also serves as Chief Compliance Officer of other funds. Mr. Pogorelec is a senior Vice President of Asset Management Compliance for Fidelity Investments and is an employee of Fidelity Investments (2006-present). Previously, Mr. Pogorelec served as Vice President, Associate General Counsel for Fidelity Investments (2010-2020) and Assistant Secretary of certain Fidelity funds (2015-2020).
Brett Segaloff (1972)
Year of Election or Appointment: 2021
Anti-Money Laundering (AML) Officer
Mr. Segaloff also serves as an AML Officer of other funds and other related entities. He is Director, Anti-Money Laundering (2007-present) of FMR LLC (diversified financial services company) and is an employee of Fidelity Investments (1996-present).
Stacie M. Smith (1974)
Year of Election or Appointment: 2016
President and Treasurer
Ms. Smith also serves as an officer of other funds. Ms. Smith serves as Assistant Treasurer of FMR Capital, Inc. (2017-present), is an employee of Fidelity Investments (2009-present), and has served in other fund officer roles. Prior to joining Fidelity Investments, Ms. Smith served as Senior Audit Manager of Ernst & Young LLP (accounting firm, 1996-2009). Previously, Ms. Smith served as Assistant Treasurer (2013-2019) and Deputy Treasurer (2013-2016) of certain Fidelity® funds.
Marc L. Spector (1972)
Year of Election or Appointment: 2016
Assistant Treasurer
Mr. Spector also serves as an officer of other funds. Mr. Spector serves as Assistant Treasurer of FMR Capital, Inc. (2017-present) and is an employee of Fidelity Investments (2016-present). Prior to joining Fidelity Investments, Mr. Spector served as Director at the Siegfried Group (accounting firm, 2013-2016), and prior to Siegfried Group as audit senior manager at Deloitte & Touche LLP (accounting firm, 2005-2013).
Jim Wegmann (1979)
Year of Election or Appointment: 2019
Assistant Treasurer
Mr. Wegmann also serves as Assistant Treasurer of other funds. Mr. Wegmann is an employee of Fidelity Investments (2011-present).
Shareholder Expense Example
As a shareholder, you incur two types of costs: (1) transaction costs, which may include sales charges (loads) on purchase payments or redemption proceeds, as applicable and (2) ongoing costs, which generally include management fees, distribution and/or service (12b-1) fees and other Fund expenses. This Example is intended to help you understand your ongoing costs (in dollars) of investing in a fund and to compare these costs with the ongoing costs of investing in other mutual funds.
The Example is based on an investment of $1,000 invested at the beginning of the period and held for the entire period (November 1, 2020 to April 30, 2021).
Actual Expenses
The first line of the accompanying table provides information about actual account values and actual expenses. You may use the information in this line, together with the amount you invested, to estimate the expenses that you paid over the period. Simply divide your account value by $1,000.00 (for example, an $8,600 account value divided by $1,000.00 = 8.6), then multiply the result by the number in the first line for a class/Fund under the heading entitled "Expenses Paid During Period" to estimate the expenses you paid on your account during this period. If any fund is a shareholder of any underlying mutual funds or exchange-traded funds (ETFs) (the Underlying Funds), such fund indirectly bears its proportional share of the expenses of the Underlying Funds in addition to the direct expenses incurred presented in the table. These fees and expenses are not included in the annualized expense ratio used to calculate the expense estimate in the table below.
Hypothetical Example for Comparison Purposes
The second line of the accompanying table provides information about hypothetical account values and hypothetical expenses based on the actual expense ratio and an assumed rate of return of 5% per year before expenses, which is not the actual return. The hypothetical account values and expenses may not be used to estimate the actual ending account balance or expenses you paid for the period. You may use this information to compare the ongoing costs of investing in the Fund and other funds. To do so, compare this 5% hypothetical example with the 5% hypothetical examples that appear in the shareholder reports of the other funds. If any fund is a shareholder of any Underlying Funds, such fund indirectly bears its proportional share of the expenses of the Underlying Funds in addition to the direct expenses as presented in the table. These fees and expenses are not included in the annualized expense ratio used to calculate the expense estimate in the table below.
Please note that the expenses shown in the table are meant to highlight your ongoing costs only and do not reflect any transaction costs. Therefore, the second line of the table is useful in comparing ongoing costs only, and will not help you determine the relative total costs of owning different funds. In addition, if these transactional costs were included, your costs would have been higher.
| | Annualized Expense Ratio-A | Beginning
Account Value
November 1, 2020 | Ending
Account Value
April 30, 2021 | Expenses Paid
During Period-B
November 1, 2020
to April 30, 2021 |
| Fidelity Women's Leadership Fund | | | | |
| Class A | 1.25% | | | |
| Actual | | $1,000.00 | $1,325.20 | $7.21** |
| Hypothetical-C | | $1,000.00 | $1,018.60 | $6.26** |
| Class M | 1.50% | | | |
| Actual | | $1,000.00 | $1,323.50 | $8.64** |
| Hypothetical-C | | $1,000.00 | $1,017.36 | $7.50** |
| Class C | 1.97% | | | |
| Actual | | $1,000.00 | $1,321.40 | $11.34 |
| Hypothetical-C | | $1,000.00 | $1,015.03 | $9.84 |
| Fidelity Women's Leadership Fund | 1.00% | | | |
| Actual | | $1,000.00 | $1,326.80 | $5.77** |
| Hypothetical-C | | $1,000.00 | $1,019.84 | $5.01** |
| Class I | .96% | | | |
| Actual | | $1,000.00 | $1,327.50 | $5.54** |
| Hypothetical-C | | $1,000.00 | $1,020.03 | $4.81** |
| Class Z | .85% | | | |
| Actual | | $1,000.00 | $1,328.90 | $4.91** |
| Hypothetical-C | | $1,000.00 | $1,020.58 | $4.26** |
A Annualized expense ratio reflects expenses net of applicable fee waivers.
B Expenses are equal to the annualized expense ratio, multiplied by the average account value over the period, multiplied by 181/ 365 (to reflect the one-half year period). The fees and expenses of any Underlying Funds are not included in each annualized expense ratio.
C 5% return per year before expenses
** If fees and changes to the class level expense contract and/or expense cap, effective June 1, 2021, had been in effect during the current period, the restated annualized expense ratio and the expenses paid in the actual and hypothetical examples above would have been as shown in table below:
| | Annualized Expense Ratio-(a)
| Expenses Paid
|
| Fidelity Women's Leadership Fund | | |
| Class A | 1.15% | |
| Actual | | $6.63 |
| Hypothetical-(b) | | $5.76 |
| Class M | 1.40% | |
| Actual | | $8.07 |
| Hypothetical-(b) | | $7.00 |
| Fidelity Women's Leadership Fund | .90% | |
| Actual | | $5.19 |
| Hypothetical-(b) | | $4.51 |
| Class I | .90% | |
| Actual | | $5.19 |
| Hypothetical-(b) | | $4.51 |
| Class Z | .75% | |
| Actual | | $4.33 |
| Hypothetical-(b) | | $3.76 |
(a) Annualized expense ratio reflects expenses net of applicable fee waivers.
(b) 5% return per year before expenses
Distributions (Unaudited)
The Board of Trustees of Fidelity Women's Leadership Fund voted to pay to shareholders of record at the opening of business on record date, the following distributions per share derived from capital gains realized from sales of portfolio securities, and dividends derived from net investment income:
| | Pay Date | Record Date | Dividends | Capital Gains |
| Fidelity Women's Leadership Fund | | | | |
| Class A | 06/07/2021 | 06/04/2021 | $0.000 | $0.167 |
| Class M | 06/07/2021 | 06/04/2021 | $0.000 | $0.149 |
| Class C | 06/07/2021 | 06/04/2021 | $0.000 | $0.129 |
| Fidelity Women's Leadership Fund | 06/07/2021 | 06/04/2021 | $0.007 | $0.170 |
| Class I | 06/07/2021 | 06/04/2021 | $0.008 | $0.170 |
| Class Z | 06/07/2021 | 06/04/2021 | $0.013 | $0.170 |
|
The fund hereby designates as a capital gain dividend with respect to the taxable year ended April 30, 2021 $505,014, or, if subsequently determined to be different, the net capital gain of such year.
Class A, Class M, Fidelity Women's Leadership Fund, Class I and Class Z designate 100% of the dividends distributed during the fiscal year as qualifying for the dividends–received deduction for corporate shareholders.
Class A, Class M, Fidelity Women's Leadership Fund, Class I and Class Z designate 100% of the dividends distributed during the fiscal year as amounts which may be taken into account as a dividend for purposes of the maximum rate under section 1(h)(11) of the Internal Revenue Code.
The fund will notify shareholders in January 2022 of amounts for use in preparing 2021 income tax returns.
Board Approval of Investment Advisory Contracts
Fidelity Women's Leadership Fund
At its January 2021 meeting, the Board of Trustees, including the Independent Trustees (together, the Board), voted to continue the management contract with Fidelity Management & Research Company LLC (FMR), and the sub-advisory agreements and sub-subadvisory agreements, in each case, where applicable (together, the Advisory Contracts) for the fund for four months from February 1, 2021 through May 31, 2021, in connection with changes to the Board's meeting calendar.
The Board considered that the approval of the fund's Advisory Contracts will not result in any changes in (i) the investment process or strategies employed in the management of the fund's assets; (ii) the fees and expenses paid by shareholders; (iii) the nature, extent or quality of services provided under the fund's Advisory Contracts; or (iv) the day-to-day management of the fund or the persons primarily responsible for such management. The Board also considered that since its last approval of the fund's Advisory Contracts, FMR had provided additional information on the fund in support of the annual contract renewal process, including competitive analyses on total expenses and management fees and in-depth reviews of fund performance and fund profitability information. The Board also considered the findings of certain ad hoc committees that had been previously formed to discuss matters relevant to all of the Fidelity funds, including economies of scale, fall-out benefits and retail vs. institutional funds. The Board concluded that the fund's Advisory Contracts are fair and reasonable, and that the fund's Advisory Contracts should be renewed, without modification, through May 31, 2021, with the understanding that the Board will consider the annual renewal for a full one year period in May 2021.
In connection with its consideration of future renewals of the fund's Advisory Contracts, the Board will consider: (i) the nature, extent and quality of services provided to the funds, including shareholder and administrative services and investment performance; (ii) the competitiveness of the management fee and total expenses for the fund; (iii) the costs of the services and profitability, including the revenues earned and the expenses incurred in conducting the business of developing, marketing, distributing, managing, administering, and servicing the fund and its shareholders, to the extent applicable; and (iv) whether there have been economies of scale in respect of the Fidelity funds, whether the Fidelity funds (including the fund) have appropriately benefited from any such economies of scale, and whether there is the potential for realization of any further economies.
Based on its evaluation of all of the conclusions noted above, and after considering all factors it believed relevant, the Board ultimately concluded that the fund's management fee structure is fair and reasonable, and that the continuation of the fund's Advisory Contracts should be approved for four months from February 1, 2021 through May 31, 2021.
Liquidity Risk Management Program
The Securities and Exchange Commission adopted Rule 22e-4 under the Investment Company Act of 1940 (the Liquidity Rule) to promote effective liquidity risk management throughout the open-end investment company industry, thereby reducing the risk that funds will be unable to meet their redemption obligations and mitigating dilution of the interests of fund shareholders.
The Fund has adopted and implemented a liquidity risk management program pursuant to the Liquidity Rule (the Program) effective December 1, 2018. The Program is reasonably designed to assess and manage the Fund’s liquidity risk and to comply with the requirements of the Liquidity Rule. The Fund’s Board of Trustees (the Board) has designated the Fund’s investment adviser as administrator of the Program. The Fidelity advisers have established a Liquidity Risk Management Committee (the LRM Committee) to manage the Program for each of the Fidelity Funds. The LRM Committee monitors the adequacy and effectiveness of implementation of the Program and on a periodic basis assesses each Fund’s liquidity risk based on a variety of factors including (1) the Fund’s investment strategy, (2) portfolio liquidity and cash flow projections during normal and reasonably foreseeable stressed conditions, (3) shareholder redemptions, (4) borrowings and other funding sources and (5) in the case of exchange-traded funds, certain additional factors including the effect of the Fund’s prices and spreads, market participants, and basket compositions on the overall liquidity of the Fund’s portfolio, as applicable
In accordance with the Program, each of the Fund’s portfolio investments is classified into one of four liquidity categories described below based on a determination of a reasonable expectation for how long it would take to convert the investment to cash (or sell or dispose of the investment) without significantly changing its market value.
- Highly liquid investments – cash or convertible to cash within three business days or less
- Moderately liquid investments – convertible to cash in three to seven calendar days
- Less liquid investments – can be sold or disposed of, but not settled, within seven calendar days
- Illiquid investments – cannot be sold or disposed of within seven calendar days
Liquidity classification determinations take into account a variety of factors including various market, trading and investment-specific considerations, as well as market depth, and generally utilize analysis from a third-party liquidity metrics service.
The Liquidity Rule places a 15% limit on a fund’s illiquid investments and requires funds that do not primarily hold assets that are highly liquid investments to determine and maintain a minimum percentage of the fund’s net assets to be invested in highly liquid investments (highly liquid investment minimum or HLIM). The Program includes provisions reasonably designed to comply with the 15% limit on illiquid investments and for determining, periodically reviewing and complying with the HLIM requirement as applicable.
At a recent meeting of the Fund’s Board of Trustees, the LRM Committee provided a written report to the Board pertaining to the operation, adequacy, and effectiveness of implementation of the Program for the annual period from December 1, 2019 through November 30, 2020. The report concluded that the Program has been implemented and is operating effectively and is reasonably designed to assess and manage the Fund’s liquidity risk.
Proxy Voting Results
A special meeting of shareholders was held on June 9, 2020. The results of votes taken among shareholders on the proposal before them are reported below. Each vote reported represents one dollar of net asset value held on the record date for the meeting.
PROPOSAL 1
To elect a Board of Trustees.
| | # of
Votes | % of
Votes |
| Dennis J. Dirks |
| Affirmative | 16,477,844,543.945 | 94.954 |
| Withheld | 875,616,757.045 | 5.046 |
| TOTAL | 17,353,461,300.990 | 100.000 |
| Donald F. Donahue |
| Affirmative | 16,475,304,981.550 | 94.940 |
| Withheld | 878,156,319.440 | 5.060 |
| TOTAL | 17,353,461,300.990 | 100.000 |
| Bettina Doulton |
| Affirmative | 16,570,440,321.103 | 95.488 |
| Withheld | 783,020,979.887 | 4.512 |
| TOTAL | 17,353,461,300.990 | 100.000 |
| Vicki L. Fuller |
| Affirmative | 16,590,910,486.905 | 95.606 |
| Withheld | 762,550,814.085 | 4.394 |
| TOTAL | 17,353,461,300.990 | 100.00 |
| Patricia L. Kampling |
| Affirmative | 16,469,872,791.586 | 94.908 |
| Withheld | 883,588,509.404 | 5.092 |
| TOTAL | 17,353,461,300.990 | 100.000 |
| Alan J. Lacy |
| Affirmative | 16,344,655,183.636 | 94.187 |
| Withheld | 1,008,806,117.354 | 5.813 |
| TOTAL | 17,353,461,300.990 | 100.000 |
| Ned C. Lautenbach |
| Affirmative | 15,532,663,704.227 | 89.508 |
| Withheld | 1,820,797,596.763 | 10.492 |
| TOTAL | 17,353,461,300.990 | 100.000 |
| Robert A. Lawrence |
| Affirmative | 16,389,821,876.677 | 94.447 |
| Withheld | 963,639,424.313 | 5.553 |
| TOTAL | 17,353,461,300.990 | 100.000 |
| Joseph Mauriello |
| Affirmative | 16,363,427,626.626 | 94.295 |
| Withheld | 990,033,674.365 | 5.705 |
| TOTAL | 17,353,461,300.990 | 100.000 |
| Cornelia M. Small |
| Affirmative | 16,405,902,888.605 | 94.540 |
| Withheld | 947,558,412.386 | 5.460 |
| TOTAL | 17,353,461,300.990 | 100.000 |
| Garnett A. Smith |
| Affirmative | 16,371,912,270.945 | 94.344 |
| Withheld | 981,549,030.045 | 5.656 |
| TOTAL | 17,353,461,300.990 | 100.000 |
| David M. Thomas |
| Affirmative | 16,365,966,852.048 | 94.310 |
| Withheld | 987,494,448.942 | 5.690 |
| TOTAL | 17,353,461,300.990 | 100.000 |
| Susan Tomasky |
| Affirmative | 16,483,922,579.861 | 94.989 |
| Withheld | 869,538,721.129 | 5.011 |
| TOTAL | 17,353,461,300.990 | 100.000 |
| Michael E. Wiley |
| Affirmative | 16,379,083,262.890 | 94.385 |
| Withheld | 974,378,038.101 | 5.615 |
| TOTAL | 17,353,461,300.990 | 100.000 |
|
| Proposal 1 reflects trust wide proposal and voting results. |
WLF-ANN-0621
1.9893105.101
Item 2.
Code of Ethics
As of the end of the period, April 30, 2021, Fidelity Summer Street Trust (the trust) has adopted a code of ethics, as defined in Item 2 of Form N-CSR, that applies to its President and Treasurer and its Chief Financial Officer. A copy of the code of ethics is filed as an exhibit to this Form N-CSR.
Item 3.
Audit Committee Financial Expert
The Board of Trustees of the trust has determined that Donald F. Donahue is an audit committee financial expert, as defined in Item 3 of Form N-CSR. Mr. Donahue is independent for purposes of Item 3 of Form N-CSR.
Item 4.
Principal Accountant Fees and Services
Fees and Services
The following table presents fees billed by Deloitte & Touche LLP, the member firms of Deloitte Touche Tohmatsu, and their respective affiliates (collectively, “Deloitte Entities”) in each of the last two fiscal years for services rendered to Fidelity Series High Income Fund, Fidelity Short Duration High Income Fund and Fidelity Women’s Leadership Fund (the “Funds”):
Services Billed by Deloitte Entities
April 30, 2021 FeesA
| | | | |
| Audit Fees | Audit-Related Fees | Tax Fees | All Other Fees |
Fidelity Series High Income Fund | $51,000 | $- | $10,500 | $1,300 |
Fidelity Short Duration High Income Fund | $53,400 | $- | $8,800 | $1,300 |
Fidelity Women’s Leadership Fund | $38,200 | $- | $6,900 | $900 |
| | | | |
| Audit Fees | Audit-Related Fees | Tax Fees | All Other Fees |
Fidelity Series High Income Fund | $52,400 | $100 | $8,500 | $1,200 |
Fidelity Short Duration High Income Fund | $54,900 | $100 | $8,500 | $1,200 |
Fidelity Women’s Leadership Fund | $34,200 | $- | $6,900 | $700 |
A Amounts may reflect rounding.
B Fidelity Women’s Leadership Fund commenced operations on May 1, 2019.
The following table presents fees billed by PricewaterhouseCoopers LLP (“PwC”) in each of the last two fiscal years for services rendered to Fidelity Capital & Income Fund, Fidelity Focused High Income Fund, Fidelity Global High Income Fund, Fidelity High Income Fund and Fidelity U.S. Low Volatility Equity Fund (the “Funds”):
Services Billed by PwC
April 30, 2021 FeesA
| | | | |
| Audit Fees | Audit-Related Fees | Tax Fees | All Other Fees |
Fidelity Capital & Income Fund | $100,600 | $8,800 | $11,200 | $3,300 |
Fidelity Focused High Income Fund | $63,300 | $5,700 | $8,100 | $2,200 |
Fidelity Global High Income Fund | $59,000 | $5,400 | $8,700 | $2,000 |
Fidelity High Income Fund | $93,200 | $8,300 | $13,900 | $3,100 |
Fidelity U.S. Low Volatility Equity Fund | $28,000 | $2,700 | $10,800 | $1,000 |
| | | | |
| Audit Fees | Audit-Related Fees | Tax Fees | All Other Fees |
Fidelity Capital & Income Fund | $102,100 | $8,700 | $11,400 | $3,700 |
Fidelity Focused High Income Fund | $64,500 | $5,600 | $8,100 | $2,400 |
Fidelity Global High Income Fund | $60,200 | $5,400 | $8,700 | $2,200 |
Fidelity High Income Fund | $101,500 | $8,200 | $11,400 | $3,400 |
Fidelity U.S. Low Volatility Equity Fund | $25,400 | $1,400 | $9,000 | $500 |
A Amounts may reflect rounding.
B Fidelity U.S. Low Volatility Equity Fund commenced operations on November 5, 2019.
The following table(s) present(s) fees billed by Deloitte Entities and PwC that were required to be approved by the Audit Committee for services that relate directly to the operations and financial reporting of the Fund(s) and that are rendered on behalf of Fidelity Management & Research Company LLC ("FMR") and entities controlling, controlled by, or under common control with FMR (not including any sub-adviser whose role is primarily portfolio management and is subcontracted with or overseen by another investment adviser) that provide ongoing services to the Fund(s) (“Fund Service Providers”):
Services Billed by Deloitte Entities
| | |
| April 30, 2021A | April 30, 2020A,B
|
Audit-Related Fees | $- | $- |
Tax Fees | $- | $3,000 |
All Other Fees | $- | $- |
A Amounts may reflect rounding.
B May include amounts billed prior to the Fidelity Women’s Leadership Fund’s commencement of operations.
Services Billed by PwC
| | |
| April 30, 2021A | April 30, 2020A,B |
Audit-Related Fees | $9,015,700 | $8,884,200 |
Tax Fees | $14,300 | $17,700 |
All Other Fees | $- | $- |
A Amounts may reflect rounding.
B May include amounts billed prior to the Fidelity U.S. Low Volatility Equity Fund’s commencement of operations.
“Audit-Related Fees” represent fees billed for assurance and related services that are reasonably related to the performance of the fund audit or the review of the fund's financial statements and that are not reported under Audit Fees.
“Tax Fees” represent fees billed for tax compliance, tax advice or tax planning that relate directly to the operations and financial reporting of the fund.
“All Other Fees” represent fees billed for services provided to the fund or Fund Service Provider, a significant portion of which are assurance related, that relate directly to the operations and financial reporting of the fund, excluding those services that are reported under Audit Fees, Audit-Related Fees or Tax Fees.
Assurance services must be performed by an independent public accountant.
* * *
The aggregate non-audit fees billed by Deloitte Entities and PwC for services rendered to the Fund(s), FMR (not including any sub-adviser whose role is primarily portfolio management and is subcontracted with or overseen by another investment adviser), and any Fund Service Provider for each of the last two fiscal years of the Fund(s) are as follows:
| | |
Billed By | April 30, 2021A | April 30, 2020A,B |
Deloitte Entities | $551,300 | $531,800 |
PwC | $14,245,900 | $14,312,200 |
|
|
|
A Amounts may reflect rounding.
B May include amounts billed prior to the Fidelity Women’s Leadership Fund and Fidelity U.S. Low Volatility Equity Funds’ commencement of operations.
The trust's Audit Committee has considered non-audit services that were not pre-approved that were provided by Deloitte Entities and PwC to Fund Service Providers to be compatible with maintaining the independence of Deloitte Entities and PwC in its(their) audit of the Fund(s), taking into account representations from Deloitte Entities and PwC, in accordance with Public Company Accounting Oversight Board rules, regarding its independence from the Fund(s) and its(their) related entities and FMR’s review of the appropriateness and permissibility under applicable law of such non-audit services prior to their provision to the Fund(s) Service Providers.
Audit Committee Pre-Approval Policies and Procedures
The trust’s Audit Committee must pre-approve all audit and non-audit services provided by a fund’s independent registered public accounting firm relating to the operations or financial reporting of the fund. Prior to the commencement of any audit or non-audit services to a fund, the Audit Committee reviews the services to determine whether they are appropriate and permissible under applicable law.
The Audit Committee has adopted policies and procedures to, among other purposes, provide a framework for the Committee’s consideration of non-audit services by the audit firms that audit the Fidelity funds. The policies and procedures require that any non-audit service provided by a fund audit firm to a Fidelity fund and any non-audit service provided by a fund auditor to a Fund Service Provider that relates directly to the
operations and financial reporting of a Fidelity fund (“Covered Service”) are subject to approval by the Audit Committee before such service is provided.
All Covered Services must be approved in advance of provision of the service either: (i) by formal resolution of the Audit Committee, or (ii) by oral or written approval of the service by the Chair of the Audit Committee (or if the Chair is unavailable, such other member of the Audit Committee as may be designated by the Chair to act in the Chair’s absence). The approval contemplated by (ii) above is permitted where the Treasurer determines that action on such an engagement is necessary before the next meeting of the Audit Committee.
Non-audit services provided by a fund audit firm to a Fund Service Provider that do not relate directly to the operations and financial reporting of a Fidelity fund are reported to the Audit Committee periodically.
Non-Audit Services Approved Pursuant to Rule 2-01(c)(7)(i)(C) and (ii) of Regulation S-X (“De Minimis Exception”)
There were no non-audit services approved or required to be approved by the Audit Committee pursuant to the De Minimis Exception during the Fund’s(s’) last two fiscal years relating to services provided to (i) the Fund(s) or (ii) any Fund Service Provider that relate directly to the operations and financial reporting of the Fund(s).
Item 5.
Audit Committee of Listed Registrants
Not applicable.
Item 6.
Investments
(a)
Not applicable.
(b)
Not applicable.
Item 7.
Disclosure of Proxy Voting Policies and Procedures for Closed-End Management Investment Companies
Not applicable.
Item 8.
Portfolio Managers of Closed-End Management Investment Companies
Not applicable.
Item 9.
Purchase of Equity Securities by Closed-End Management Investment Company and Affiliated Purchasers
Not applicable.
Item 10.
Submission of Matters to a Vote of Security Holders
There were no material changes to the procedures by which shareholders may recommend nominees to the trust’s Board of Trustees.
Item 11.
Controls and Procedures
(a)(i) The President and Treasurer and the Chief Financial Officer have concluded that the trust’s disclosure controls and procedures (as defined in Rule 30a-3(c) under the Investment Company Act) provide reasonable assurances that material information relating to the trust is made known to them by the appropriate persons, based on their evaluation of these controls and procedures as of a date within 90 days of the filing date of this report.
(a)(ii) There was no change in the trust’s internal control over financial reporting (as defined in Rule 30a-3(d) under the Investment Company Act) that occurred during the period covered by this report that has materially affected, or is reasonably likely to materially affect, the trust’s internal control over financial reporting.
Item 12.
Disclosure of Securities Lending Activities for Closed-End Management
Investment Companies
Not applicable.
Item 13.
Exhibits
SIGNATURES
Pursuant to the requirements of the Securities Exchange Act of 1934 and the Investment Company Act of 1940, the registrant has duly caused this report to be signed on its behalf by the undersigned, thereunto duly authorized.
Fidelity Summer Street Trust
| |
By: | /s/Stacie M. Smith |
| Stacie M. Smith |
| President and Treasurer |
|
|
Date: | June 22, 2021 |
Pursuant to the requirements of the Securities Exchange Act of 1934 and the Investment Company Act of 1940, this report has been signed below by the following persons on behalf of the registrant and in the capacities and on the dates indicated.
| |
By: | /s/Stacie M. Smith |
| Stacie M. Smith |
| President and Treasurer |
|
|
Date: | June 22, 2021 |
| |
By: | /s/John J. Burke III |
| John J. Burke III |
| Chief Financial Officer |
|
|
Date: | June 22, 2021 |