Fidelity® Series Floating Rate High Income Fund
Annual Report
September 30, 2021


Contents
To view a fund's proxy voting guidelines and proxy voting record for the 12-month period ended June 30, visit http://www.fidelity.com/proxyvotingresults or visit the Securities and Exchange Commission's (SEC) web site at http://www.sec.gov.
You may also call 1-800-544-8544 to request a free copy of the proxy voting guidelines.
Standard & Poor's, S&P and S&P 500 are registered service marks of The McGraw-Hill Companies, Inc. and have been licensed for use by Fidelity Distributors Corporation.
Other third-party marks appearing herein are the property of their respective owners.
All other marks appearing herein are registered or unregistered trademarks or service marks of FMR LLC or an affiliated company. © 2021 FMR LLC. All rights reserved.
This report and the financial statements contained herein are submitted for the general information of the shareholders of the Fund. This report is not authorized for distribution to prospective investors in the Fund unless preceded or accompanied by an effective prospectus.
A fund files its complete schedule of portfolio holdings with the SEC for the first and third quarters of each fiscal year on Form N-PORT. Forms N-PORT are available on the SEC’s web site at http://www.sec.gov. A fund's Forms N-PORT may be reviewed and copied at the SEC’s Public Reference Room in Washington, DC. Information regarding the operation of the SEC's Public Reference Room may be obtained by calling 1-800-SEC-0330.
For a complete list of a fund's portfolio holdings, view the most recent holdings listing, semiannual report, or annual report on Fidelity's web site at http://www.fidelity.com, http://www.institutional.fidelity.com, or http://www.401k.com, as applicable.
NOT FDIC INSURED •MAY LOSE VALUE •NO BANK GUARANTEE
Neither the Fund nor Fidelity Distributors Corporation is a bank.
Note to Shareholders:
Early in 2020, the outbreak and spread of COVID-19 emerged as a public health emergency that had a major influence on financial markets, primarily based on its impact on the global economy and corporate earnings. On March 11, 2020, the World Health Organization declared the COVID-19 outbreak a pandemic, citing sustained risk of further global spread. The pandemic prompted a number of measures to limit the spread of COVID-19, including travel and border restrictions, quarantines, and restrictions on large gatherings. In turn, these resulted in lower consumer activity, diminished demand for a wide range of products and services, disruption in manufacturing and supply chains, and – given the wide variability in outcomes regarding the outbreak – significant market uncertainty and volatility. To help stem the turmoil, the U.S. government took unprecedented action – in concert with the U.S. Federal Reserve and central banks around the world – to help support consumers, businesses, and the broader economy, and to limit disruption to the financial system.
In general, the overall impact of the pandemic lessened in 2021, amid a resilient economy and widespread distribution of three COVID-19 vaccines granted emergency use authorization from the U.S. Food and Drug Administration (FDA) early in the year. Still, the situation remains dynamic, and the extent and duration of its influence on financial markets and the economy is highly uncertain, due in part to a recent spike in cases based on highly contagious variants of the coronavirus.
Extreme events such as the COVID-19 crisis are exogenous shocks that can have significant adverse effects on mutual funds and their investments. Although multiple asset classes may be affected by market disruption, the duration and impact may not be the same for all types of assets. Fidelity is committed to helping you stay informed amid news about COVID-19 and during increased market volatility, and we continue to take extra steps to be responsive to customer needs. We encourage you to visit us online, where we offer ongoing updates, commentary, and analysis on the markets and our funds.
Performance: The Bottom Line
Average annual total return reflects the change in the value of an investment, assuming reinvestment of distributions from dividend income and capital gains (the profits earned upon the sale of securities that have grown in value, if any) and assuming a constant rate of performance each year. The hypothetical investment and the average annual total returns do not reflect the deduction of taxes that a shareholder would pay on fund distributions or the redemption of fund shares. During periods of reimbursement by Fidelity, a fund’s total return will be greater than it would be had the reimbursement not occurred. How a fund did yesterday is no guarantee of how it will do tomorrow.
Average Annual Total Returns
| For the periods ended September 30, 2021 | Past 1 year | Past 5 years | Life of fundA |
| Fidelity® Series Floating Rate High Income Fund | 9.44% | 5.08% | 5.14% |
A From October 20, 2011
$10,000 Over Life of Fund
Let's say hypothetically that $10,000 was invested in Fidelity® Series Floating Rate High Income Fund on October 20, 2011, when the fund started.
The chart shows how the value of your investment would have changed, and also shows how the S&P®/LSTA Leveraged Performing Loan Index performed over the same period.
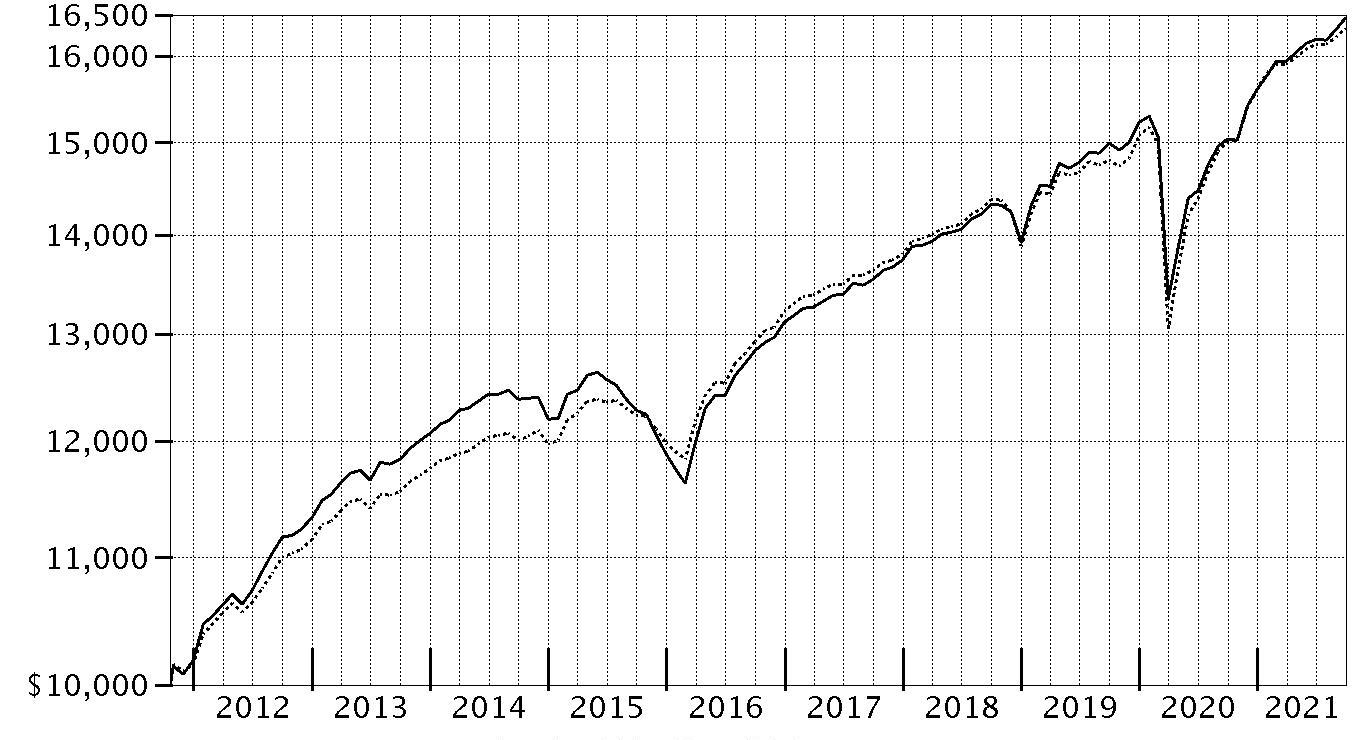
| Period Ending Values |
| $16,461 | Fidelity® Series Floating Rate High Income Fund |
| $16,332 | S&P®/LSTA Leveraged Performing Loan Index |
Management's Discussion of Fund Performance
Market Recap: Floating-rate bank loans advanced 8.82% for the 12 months ending September 30, 2021, as measured by the S&P/LSTA
® Leveraged Performing Loan Index, lagging high-yield bonds but substantially outperforming investment-grade corporate credit and the broad investment-grade fixed-income market. Loans posted strong gains during the early months of the period, as encouraging COVID-19 vaccine news bolstered investor optimism about the strength of the economic recovery in 2021. Better-than-expected corporate earnings also fueled strength in the asset class. The rally paused in March, when loans with higher-quality credit ratings underperformed because heavy new issuance outweighed demand. The positive trend resumed in April, lifted by an improved tone for risk assets, consistent retail fund inflows and strong origination of collateralized loan obligations (CLOs). Except for a modest pullback in July, loans registered modest, income-driven gains for the rest of the period, aided by advancing COVID-19 vaccination campaigns, accelerating economic growth, strong earnings and continued solid demand from CLOs. Roughly half of the industry groups within the S&P/LSTA index posted double-digit gains, led by air transport (+17%), oil & gas (+16%), publishing (+13%), and leisure goods/activities/movies (+13%). Several major industries also topped the benchmark, including health care and retailers (ex food & drug), with each gaining about 9%. Notable "laggards" included utilities (+5%), insurance (+6%), and cable & satellite TV (+6%). From a credit-rating perspective, lower-quality loans far outstripped the benchmark, signaling a comfort level with risk as investors sought higher yields.
Comments from Co-Portfolio Managers Eric Mollenhauer and Kevin Nielsen: For the fiscal year ending September 30, 2021, the fund gained 9.44%, outperforming the 8.82% result of the benchmark S&P/LSTA
® Leveraged Performing Loan Index. The fund's core investment in floating-rate leveraged loans gained 8.34% and detracted from performance versus the benchmark. By industry, security selection was the primary contributor, especially in oil & gas. Security selection in utilities and nonferrous metals/minerals also lifted the fund's relative result. California Resources, the fund's largest individual contributor, rose roughly 164% this period. Our second-largest contributor was Chesapeake Energy, which gained approximately 307% the past 12 months. Another contributor this period was Denbury. The fund's investment in securities issued by Denbury gained about 292% the past 12 months. All of these contributors were non-benchmark positions. Conversely, the primary detractor from performance versus the benchmark was security picks in business equipment & services. Positioning in health care and security selection in electronics/electrical also hurt relative performance. Not owning American Airlines, a benchmark component that gained 38%, was the largest individual relative detractor. Our second-largest relative detractor this period was avoiding Envision Health, a benchmark component that gained 31%. Also hindering performance was our outsized stake in Sinclair, which returned -10%. By quality, security selection in unrated bonds added the most value versus the benchmark, while positioning among CCC-rated bonds hurt the most. Notable changes in positioning included lower allocations to the cable & satellite television and electronics/electrical industries.
The views expressed above reflect those of the portfolio manager(s) only through the end of the period as stated on the cover of this report and do not necessarily represent the views of Fidelity or any other person in the Fidelity organization. Any such views are subject to change at any time based upon market or other conditions and Fidelity disclaims any responsibility to update such views. These views may not be relied on as investment advice and, because investment decisions for a Fidelity fund are based on numerous factors, may not be relied on as an indication of trading intent on behalf of any Fidelity fund.
Investment Summary (Unaudited)
Top Five Holdings as of September 30, 2021
| (by issuer, excluding cash equivalents) | % of fund's net assets |
| Bass Pro Group LLC | 2.6 |
| Intelsat Jackson Holdings SA | 2.1 |
| Caesars Resort Collection LLC | 1.8 |
| Asurion LLC | 1.8 |
| TransDigm, Inc. | 1.0 |
| | 9.3 |
Top Five Market Sectors as of September 30, 2021
| | % of fund's net assets |
| Technology | 15.0 |
| Services | 8.4 |
| Healthcare | 7.6 |
| Telecommunications | 7.2 |
| Gaming | 5.5 |
Quality Diversification (% of fund's net assets)
| As of September 30, 2021 |
| | BBB | 2.3% |
| | BB | 24.4% |
| | B | 58.7% |
| | CCC,CC,C | 4.5% |
| | Not Rated | 5.4% |
| | Equities | 2.0% |
| | Short-Term Investments and Net Other Assets | 2.7% |

We have used ratings from Moody's Investors Service, Inc. Where Moody's® ratings are not available, we have used S&P® ratings. All ratings are as of the date indicated and do not reflect subsequent changes.
Asset Allocation (% of fund's net assets)
| As of September 30, 2021* |
| | Bank Loan Obligations | 92.8% |
| | Nonconvertible Bonds | 2.5% |
| | Convertible Bonds, Preferred Stocks | 0.1% |
| | Common Stocks | 1.9% |
| | Short-Term Investments and Net Other Assets (Liabilities) | 2.7% |

* Foreign investments - 12.4%
Schedule of Investments September 30, 2021
Showing Percentage of Net Assets
| Bank Loan Obligations - 92.8% | | | |
| | | Principal Amount | Value |
| Aerospace - 1.5% | | | |
| ADS Tactical, Inc. Tranche B 1LN, term loan 3 month U.S. LIBOR + 5.750% 6.75% 3/19/26 (a)(b)(c) | | $557,938 | $559,332 |
| Gemini HDPE LLC Tranche B 1LN, term loan 3 month U.S. LIBOR + 3.000% 3.5% 12/31/27 (a)(b)(c) | | 295,687 | 295,687 |
| Jazz Acquisition, Inc. 1LN, term loan 3 month U.S. LIBOR + 4.250% 4.33% 6/19/26 (a)(b)(c) | | 122,500 | 118,978 |
| TransDigm, Inc.: | | | |
| Tranche E 1LN, term loan 3 month U.S. LIBOR + 2.250% 2.3341% 5/30/25 (a)(b)(c) | | 947,292 | 935,356 |
| Tranche F 1LN, term loan 3 month U.S. LIBOR + 2.250% 2.3341% 12/9/25 (a)(b)(c) | | 368,438 | 363,832 |
| Tranche G 1LN, term loan 3 month U.S. LIBOR + 2.250% 2.3341% 8/22/24 (a)(b)(c) | | 1,201,795 | 1,188,275 |
| WP CPP Holdings LLC: | | | |
| Tranche B 1LN, term loan 3 month U.S. LIBOR + 3.750% 4.75% 4/30/25 (a)(b)(c) | | 489,105 | 475,195 |
| Tranche B 2LN, term loan 3 month U.S. LIBOR + 7.750% 8.75% 4/30/26 (a)(b)(c) | | 235,000 | 231,108 |
|
| TOTAL AEROSPACE | | | 4,167,763 |
|
| Air Transportation - 2.0% | | | |
| AAdvantage Loyalty IP Ltd. Tranche B 1LN, term loan 3 month U.S. LIBOR + 4.750% 5.5% 4/20/28 (a)(b)(c) | | 960,000 | 992,131 |
| Air Canada Tranche B 1LN, term loan 1 month U.S. LIBOR + 3.500% 4.25% 8/11/28 (a)(b)(c) | | 385,000 | 386,282 |
| Dynasty Acquisition Co., Inc.: | | | |
| Tranche B 1LN, term loan 3 month U.S. LIBOR + 3.500% 3.6315% 4/8/26 (a)(b)(c) | | 484,380 | 473,332 |
| Tranche B2 1LN, term loan 3 month U.S. LIBOR + 3.500% 3.6315% 4/4/26 (a)(b)(c) | | 260,420 | 254,479 |
| Mileage Plus Holdings LLC Tranche B 1LN, term loan 3 month U.S. LIBOR + 5.250% 6.25% 7/2/27 (a)(b)(c) | | 930,000 | 987,548 |
| SkyMiles IP Ltd. Tranche B 1LN, term loan 3 month U.S. LIBOR + 3.750% 4.75% 10/20/27 (a)(b)(c) | | 820,000 | 871,611 |
| United Airlines, Inc. Tranche B 1LN, term loan 3 month U.S. LIBOR + 3.750% 4.5% 4/21/28 (a)(b)(c) | | 1,482,550 | 1,491,653 |
| WestJet Airlines Ltd. 1LN, term loan 3 month U.S. LIBOR + 2.750% 4% 12/11/26 (a)(b)(c) | | 360,354 | 351,305 |
|
| TOTAL AIR TRANSPORTATION | | | 5,808,341 |
|
| Automotive & Auto Parts - 0.8% | | | |
| American Trailer World Corp. Tranche B 1LN, term loan 3 month U.S. LIBOR + 3.750% 4.5% 3/5/28 (a)(b)(c) | | 184,538 | 183,569 |
| Clarios Global LP Tranche B 1LN, term loan 3 month U.S. LIBOR + 3.250% 3.3341% 4/30/26 (a)(b)(c) | | 252,784 | 251,520 |
| CWGS Group LLC Tranche B 1LN, term loan 1 month U.S. LIBOR + 2.500% 3.25% 6/3/28 (a)(b)(c) | | 562,175 | 559,083 |
| Les Schwab Tire Centers Tranche B 1LN, term loan 3 month U.S. LIBOR + 3.250% 4% 11/2/27 (a)(b)(c) | | 565,725 | 564,667 |
| Midas Intermediate Holdco II LLC Tranche B 1LN, term loan 3 month U.S. LIBOR + 7.750% 7.5% 12/16/25 (a)(b)(c) | | 341,362 | 324,373 |
| Truck Hero, Inc. Tranche B 1LN, term loan 3 month U.S. LIBOR + 3.250% 4% 1/29/28 (a)(b)(c) | | 457,700 | 456,460 |
|
| TOTAL AUTOMOTIVE & AUTO PARTS | | | 2,339,672 |
|
| Banks & Thrifts - 0.9% | | | |
| Citadel Securities LP Tranche B 1LN, term loan 3 month U.S. LIBOR + 2.500% 2.5841% 2/27/28 (a)(b)(c) | | 800,975 | 793,254 |
| Deerfield Dakota Holding LLC Tranche B 1LN, term loan 3 month U.S. LIBOR + 3.750% 4.75% 4/9/27 (a)(b)(c) | | 657,306 | 658,641 |
| eResearchTechnology, Inc. Tranche B 1LN, term loan 3 month U.S. LIBOR + 4.500% 5.5% 2/4/27 (a)(b)(c) | | 333,312 | 334,772 |
| Russell Investments U.S. Institutional Holdco, Inc. Tranche B 1LN, term loan 3 month U.S. LIBOR + 3.500% 4.5% 5/30/25 (a)(b)(c) | | 242,689 | 242,993 |
| Superannuation & Investments U.S. LLC 1LN, term loan 1 month U.S. LIBOR + 3.750% 9/24/28 (b)(c)(d)(e) | | 185,000 | 183,844 |
| Victory Capital Holdings, Inc. Tranche B 1LN, term loan 3 month U.S. LIBOR + 2.250% 2.3948% 7/1/26 (a)(b)(c) | | 252,386 | 251,439 |
|
| TOTAL BANKS & THRIFTS | | | 2,464,943 |
|
| Broadcasting - 2.0% | | | |
| AppLovin Corp. Tranche B, term loan 3 month U.S. LIBOR + 3.250% 3.3341% 8/15/25 (a)(b)(c) | | 1,245,644 | 1,243,502 |
| Diamond Sports Group LLC Tranche B 1LN, term loan 3 month U.S. LIBOR + 3.250% 3.34% 8/24/26 (a)(b)(c) | | 1,685,600 | 1,046,235 |
| Entercom Media Corp. Tranche B 2LN, term loan 3 month U.S. LIBOR + 2.500% 2.5851% 11/17/24 (a)(b)(c) | | 376,665 | 370,781 |
| Nexstar Broadcasting, Inc. Tranche B, term loan 3 month U.S. LIBOR + 2.500% 2.586% 9/19/26 (a)(b)(c) | | 750,482 | 749,356 |
| Sinclair Television Group, Inc. Tranche B 1LN, term loan 3 month U.S. LIBOR + 2.500% 2.59% 9/30/26 (a)(b)(c) | | 470,400 | 461,876 |
| Springer Nature Deutschland GmbH Tranche B18 1LN, term loan 3 month U.S. LIBOR + 3.000% 3.75% 8/14/26 (a)(b)(c) | | 653,261 | 652,680 |
| Univision Communications, Inc. Tranche B 1LN, term loan: | | | |
| 1 month U.S. LIBOR + 3.250% 5/6/28 (b)(c)(d) | | 820,000 | 818,098 |
| 1 month U.S. LIBOR + 3.250% 4% 3/24/26 (a)(b)(c) | | 243,129 | 242,689 |
|
| TOTAL BROADCASTING | | | 5,585,217 |
|
| Building Materials - 1.8% | | | |
| Acproducts Holdings, Inc. Tranche B 1LN, term loan 1 month U.S. LIBOR + 4.250% 4.75% 5/17/28 (a)(b)(c) | | 558,600 | 557,304 |
| APi Group DE, Inc. Tranche B 1LN, term loan 3 month U.S. LIBOR + 2.500% 2.5841% 10/1/26 (a)(b)(c) | | 593,750 | 589,671 |
| Hamilton Holdco LLC Tranche B 1LN, term loan 3 month U.S. LIBOR + 2.000% 2.14% 1/4/27 (a)(b)(c) | | 287,003 | 285,209 |
| Ingersoll-Rand Services Co. Tranche B 1LN, term loan 3 month U.S. LIBOR + 1.750% 1.8341% 2/28/27 (a)(b)(c) | | 650,100 | 640,888 |
| SRS Distribution, Inc. Tranche B 1LN, term loan 1 month U.S. LIBOR + 3.750% 4.25% 6/4/28 (a)(b)(c) | | 1,240,000 | 1,239,479 |
| Traverse Midstream Partners Ll Tranche B, term loan 3 month U.S. LIBOR + 5.500% 6.5% 9/27/24 (a)(b)(c) | | 274,640 | 274,640 |
| USIC Holdings, Inc. Tranche B 1LN, term loan 1 month U.S. LIBOR + 3.500% 4.25% 5/7/28 (a)(b)(c) | | 395,000 | 394,506 |
| Ventia Deco LLC Tranche B, term loan 3 month U.S. LIBOR + 4.000% 5% 5/21/26 (a)(b)(c) | | 594,248 | 596,477 |
| White Capital Buyer LLC Tranche B 1LN, term loan 3 month U.S. LIBOR + 4.000% 4.5% 10/19/27 (a)(b)(c) | | 486,325 | 487,429 |
|
| TOTAL BUILDING MATERIALS | | | 5,065,603 |
|
| Cable/Satellite TV - 2.7% | | | |
| Charter Communication Operating LLC Tranche B2 1LN, term loan 3 month U.S. LIBOR + 1.750% 1.84% 2/1/27 (a)(b)(c) | | 2,452,992 | 2,436,974 |
| Coral-U.S. Co.-Borrower LLC Tranche B, term loan 3 month U.S. LIBOR + 2.250% 2.3341% 1/31/28 (a)(b)(c) | | 1,340,000 | 1,321,361 |
| CSC Holdings LLC: | | | |
| Tranche B 5LN, term loan 3 month U.S. LIBOR + 2.500% 2.5838% 4/15/27 (a)(b)(c) | | 359,426 | 354,857 |
| Tranche B3 1LN, term loan 3 month U.S. LIBOR + 2.250% 2.3338% 1/15/26 (a)(b)(c) | | 487,500 | 480,188 |
| DIRECTV Financing LLC 1LN, term loan 1 month U.S. LIBOR + 5.000% 5.75% 8/2/27 (a)(b)(c) | | 865,000 | 865,268 |
| LCPR Loan Financing LLC 1LN, term loan 3 month U.S. LIBOR + 3.750% 3.8338% 9/25/28 (a)(b)(c) | | 305,000 | 305,000 |
| Neptune Finco Corp. Tranche B, term loan 3 month U.S. LIBOR + 2.250% 2.3338% 7/17/25 (a)(b)(c) | | 925,184 | 911,307 |
| Virgin Media Bristol LLC Tranche N, term loan 3 month U.S. LIBOR + 2.500% 2.5838% 1/31/28 (a)(b)(c) | | 500,000 | 496,440 |
| WideOpenWest Finance LLC Tranche B, term loan 3 month U.S. LIBOR + 3.250% 4.25% 8/19/23 (a)(b)(c) | | 632,111 | 631,846 |
|
| TOTAL CABLE/SATELLITE TV | | | 7,803,241 |
|
| Capital Goods - 0.9% | | | |
| Altra Industrial Motion Corp. Tranche B 1LN, term loan 3 month U.S. LIBOR + 2.000% 2.0841% 10/1/25 (a)(b)(c) | | 170,519 | 169,411 |
| CPM Holdings, Inc.: | | | |
| 2LN, term loan 3 month U.S. LIBOR + 8.250% 8.336% 11/15/26 (a)(b)(c) | | 107,727 | 105,842 |
| Tranche B 1LN, term loan 3 month U.S. LIBOR + 3.500% 3.586% 11/15/25 (a)(b)(c) | | 427,899 | 425,118 |
| MHI Holdings LLC Tranche B 1LN, term loan 3 month U.S. LIBOR + 5.000% 5.0841% 9/20/26 (a)(b)(c) | | 521,412 | 523,628 |
| Resideo Funding, Inc. Tranche B 1LN, term loan 3 month U.S. LIBOR + 2.250% 2.75% 2/12/28 (a)(b)(c) | | 279,300 | 279,300 |
| Standard Industries, Inc. Tranche B 1LN, term loan 1 month U.S. LIBOR + 2.500% 8/6/28 (b)(c)(d) | | 485,000 | 485,262 |
| TNT Crane & Rigging LLC 2LN, term loan 3 month U.S. LIBOR + 8.750% 9.75% 4/16/25 (a)(b)(c)(e) | | 187,774 | 180,263 |
| Vertical U.S. Newco, Inc. Tranche B 1LN, term loan 1 month U.S. LIBOR + 3.500% 4% 7/31/27 (a)(b)(c) | | 301,961 | 302,381 |
|
| TOTAL CAPITAL GOODS | | | 2,471,205 |
|
| Chemicals - 2.5% | | | |
| ARC Falcon I, Inc.: | | | |
| Tranche B 1LN, term loan 1 month U.S. LIBOR + 3.750% 9/22/28 (b)(c)(d) | | 279,236 | 279,004 |
| Tranche DD 1LN, term loan 1 month U.S. LIBOR + 3.750% 9/22/28 (b)(c)(d) | | 40,764 | 40,731 |
| Aruba Investment Holdings LLC: | | | |
| 2LN, term loan 3 month U.S. LIBOR + 7.750% 8.5% 11/24/28 (a)(b)(c) | | 85,000 | 85,213 |
| Tranche B 1LN, term loan 3 month U.S. LIBOR + 4.000% 4.75% 11/24/27 (a)(b)(c) | | 318,400 | 318,798 |
| Cimpress U.S.A., Inc. Tranche B 1LN, term loan 1 month U.S. LIBOR + 3.500% 4% 5/17/28 (a)(b)(c) | | 374,063 | 373,947 |
| Consolidated Energy Finance SA Tranche B 1LN, term loan 3 month U.S. LIBOR + 3.500% 4% 5/7/25 (a)(b)(c)(e) | | 374,063 | 364,711 |
| Element Solutions, Inc. Tranche B 1LN, term loan 3 month U.S. LIBOR + 2.000% 2.0841% 1/31/26 (a)(b)(c) | | 364,744 | 364,062 |
| Herens U.S. Holdco Corp. Tranche B 1LN, term loan 3 month U.S. LIBOR + 4.000% 4.75% 7/3/28 (a)(b)(c) | | 329,175 | 330,057 |
| Hexion, Inc. Tranche B 1LN, term loan 3 month U.S. LIBOR + 3.500% 3.65% 7/1/26 (a)(b)(c) | | 254,150 | 254,150 |
| ICP Group Tranche B 1LN, term loan 3 month U.S. LIBOR + 3.750% 4.5% 12/29/27 (a)(b)(c) | | 273,625 | 273,283 |
| INEOS U.S. Petrochem LLC Tranche B 1LN, term loan 3 month U.S. LIBOR + 2.750% 3.25% 1/20/26 (a)(b)(c) | | 1,067,325 | 1,067,325 |
| Messer Industries U.S.A., Inc. Tranche B 1LN, term loan 3 month U.S. LIBOR + 2.500% 2.6315% 3/1/26 (a)(b)(c) | | 462,858 | 460,197 |
| Olympus Water U.S. Holding Corp. Tranche B 1LN, term loan 1 month U.S. LIBOR + 3.750% 9/21/28 (b)(c)(d) | | 440,000 | 439,358 |
| Oxea Corp. Tranche B2, term loan 3 month U.S. LIBOR + 3.250% 3.375% 10/11/24 (a)(b)(c) | | 285,111 | 283,614 |
| SCIH Salt Holdings, Inc. Tranche B 1LN, term loan 3 month U.S. LIBOR + 4.000% 4.75% 3/16/27 (a)(b)(c) | | 203,936 | 204,031 |
| Starfruit U.S. Holdco LLC Tranche B, term loan 3 month U.S. LIBOR + 2.750% 2.8318% 10/1/25 (a)(b)(c) | | 1,405,600 | 1,395,410 |
| The Chemours Co. LLC Tranche B 1LN, term loan 3 month U.S. LIBOR + 1.750% 1.84% 4/3/25 (a)(b)(c) | | 392,030 | 383,351 |
| Tronox Finance LLC Tranche B 1LN, term loan 3 month U.S. LIBOR + 2.250% 2.3663% 3/11/28 (a)(b)(c) | | 233,402 | 232,340 |
|
| TOTAL CHEMICALS | | | 7,149,582 |
|
| Conglomerates - 0.0% | | | |
| TGP Holdings III LLC Tranche DD 1LN, term loan 1 month U.S. LIBOR + 3.500% 6/29/28 (b)(c)(f) | | 6,407 | 6,403 |
| Consumer Products - 2.1% | | | |
| BCPE Empire Holdings, Inc.: | | | |
| 1LN, term loan: | | | |
| 1 month U.S. LIBOR + 4.000% 4.5% 6/11/26 (a)(b)(c) | | 214,118 | 213,315 |
| 3 month U.S. LIBOR + 4.000% 4.0841% 6/11/26 (a)(b)(c) | | 245,153 | 243,518 |
| Tranche B 1LN, term loan 1 month U.S. LIBOR + 4.000% 4.5% 6/12/26 (a)(b)(c)(e) | | 249,375 | 248,285 |
| Tranche DD 1LN, term loan 1 month U.S. LIBOR + 4.000% 6/11/26 (b)(c)(f) | | 110,882 | 110,467 |
| Bombardier Recreational Products, Inc. Tranche B 1LN, term loan 3 month U.S. LIBOR + 2.000% 2.0841% 5/23/27 (a)(b)(c) | | 203,965 | 202,117 |
| Buzz Merger Sub Ltd. Tranche B 1LN, term loan 3 month U.S. LIBOR + 2.750% 2.8341% 1/29/27 (a)(b)(c) | | 123,125 | 122,817 |
| CNT Holdings I Corp. Tranche B 1LN, term loan 3 month U.S. LIBOR + 3.750% 4.5% 11/8/27 (a)(b)(c) | | 498,750 | 499,064 |
| Diamond BC BV Tranche B 1LN, term loan 1 month U.S. LIBOR + 3.000% 9/14/28 (b)(c)(d) | | 430,000 | 430,297 |
| Energizer Holdings, Inc. Tranche B 1LN, term loan 3 month U.S. LIBOR + 2.250% 2.75% 12/16/27 (a)(b)(c) | | 363,175 | 362,721 |
| Gannett Holdings LLC Tranche B 1LN, term loan 3 month U.S. LIBOR + 7.000% 7.75% 2/9/26 (a)(b)(c) | | 188,592 | 189,418 |
| Hunter Fan Co. 1LN, term loan 3 month U.S. LIBOR + 5.000% 5.75% 5/7/28 (a)(b)(c) | | 300,000 | 299,439 |
| Kronos Acquisition Holdings, Inc. Tranche B 1LN, term loan 3 month U.S. LIBOR + 3.750% 4.25% 12/22/26 (a)(b)(c) | | 471,438 | 459,317 |
| Mattress Firm, Inc. Tranche B 1LN, term loan 1 month U.S. LIBOR + 4.250% 9/21/28 (b)(c)(d) | | 370,000 | 369,308 |
| Michaels Companies, Inc. 1LN, term loan 3 month U.S. LIBOR + 4.250% 5% 4/15/28 (a)(b)(c) | | 723,188 | 723,513 |
| Petco Health & Wellness Co., Inc. Tranche B 1LN, term loan 3 month U.S. LIBOR + 3.250% 4% 3/4/28 (a)(b)(c) | | 333,325 | 333,205 |
| Rodan & Fields LLC Tranche B, term loan 3 month U.S. LIBOR + 4.000% 4.0838% 6/15/25 (a)(b)(c) | | 472,247 | 345,132 |
| TGP Holdings III LLC Tranche B 1LN, term loan 1 month U.S. LIBOR + 3.500% 4.25% 6/29/28 (a)(b)(c) | | 48,593 | 48,563 |
| TKC Holdings, Inc. 1LN, term loan 1 month U.S. LIBOR + 5.500% 6.5% 5/3/28 (a)(b)(c) | | 343,480 | 342,192 |
| Woof Holdings LLC: | | | |
| Tranche B 1LN, term loan 3 month U.S. LIBOR + 3.750% 4.5% 12/21/27 (a)(b)(c) | | 328,350 | 328,557 |
| Tranche B 2LN, term loan 3 month U.S. LIBOR + 7.250% 8% 12/21/28 (a)(b)(c) | | 85,000 | 85,691 |
|
| TOTAL CONSUMER PRODUCTS | | | 5,956,936 |
|
| Containers - 2.9% | | | |
| AOT Packaging Products AcquisitionCo LLC: | | | |
| 1LN, term loan 3 month U.S. LIBOR + 3.250% 3.75% 3/3/28 (a)(b)(c) | | 484,528 | 481,562 |
| Tranche DD 1LN, term loan 3 month U.S. LIBOR + 3.250% 3.4208% 3/3/28 (a)(b)(c)(f) | | 109,165 | 108,496 |
| Berlin Packaging, LLC Tranche B 1LN, term loan: | | | |
| 1 month U.S. LIBOR + 3.750% 4.25% 3/11/28 (a)(b)(c) | | 905,000 | 903,679 |
| 3 month U.S. LIBOR + 3.250% 3.75% 3/11/28 (a)(b)(c) | | 89,551 | 88,745 |
| Berry Global, Inc. Tranche Z 1LN, term loan 3 month U.S. LIBOR + 1.750% 1.8563% 7/1/26 (a)(b)(c) | | 473,358 | 470,400 |
| BWAY Holding Co. Tranche B, term loan 3 month U.S. LIBOR + 3.250% 3.3341% 4/3/24 (a)(b)(c) | | 239,375 | 234,250 |
| Canister International Group, Inc. 1LN, term loan 3 month U.S. LIBOR + 4.750% 4.8341% 12/21/26 (a)(b)(c) | | 246,250 | 246,046 |
| Charter NEX U.S., Inc. 1LN, term loan 1 month U.S. LIBOR + 3.750% 4.5% 12/1/27 (a)(b)(c) | | 467,650 | 468,454 |
| Flex Acquisition Co., Inc. Tranche B 1LN, term loan: | | | |
| 3 month U.S. LIBOR + 3.000% 3.1449% 6/29/25 (a)(b)(c) | | 725,298 | 720,685 |
| 3 month U.S. LIBOR + 3.500% 4% 3/2/28 (a)(b)(c) | | 1,075,936 | 1,073,397 |
| Graham Packaging Co., Inc. Tranche B 1LN, term loan 3 month U.S. LIBOR + 3.000% 3.75% 8/4/27 (a)(b)(c) | | 774,936 | 774,076 |
| Kloeckner Pentaplast of America, Inc. Tranche B 1LN, term loan 3 month U.S. LIBOR + 4.750% 5.25% 2/12/26 (a)(b)(c) | | 318,400 | 318,999 |
| Pixelle Specialty Solutions LLC Tranche B 1LN, term loan 3 month U.S. LIBOR + 6.500% 7.5% 10/31/24 (a)(b)(c) | | 122,633 | 122,352 |
| Pregis TopCo Corp. 1LN, term loan: | | | |
| 1 month U.S. LIBOR + 4.000% 4.5% 8/1/26(a)(b)(c) | | 250,000 | 250,000 |
| 3 month U.S. LIBOR + 4.000% 4.0841% 7/31/26 (a)(b)(c) | | 245,625 | 245,829 |
| Printpack Holdings, Inc. Tranche B, term loan 3 month U.S. LIBOR + 3.000% 4% 7/26/23 (a)(b)(c) | | 201,813 | 200,804 |
| Reynolds Consumer Products LLC Tranche B 1LN, term loan 3 month U.S. LIBOR + 1.750% 1.8341% 1/30/27 (a)(b)(c) | | 600,333 | 598,496 |
| Reynolds Group Holdings, Inc. Tranche B 1LN, term loan: | | | |
| 1 month U.S. LIBOR + 3.500% 4% 9/20/28 (a)(b)(c) | | 430,000 | 429,355 |
| 3 month U.S. LIBOR + 3.250% 3.3341% 2/5/26 (a)(b)(c) | | 372,188 | 369,396 |
| Ring Container Technologies Group LLC Tranche B 1LN, term loan 1 month U.S. LIBOR + 3.750% 8/12/28 (b)(c)(d) | | 305,000 | 305,153 |
|
| TOTAL CONTAINERS | | | 8,410,174 |
|
| Diversified Financial Services - 2.6% | | | |
| ACNR Holdings, Inc. term loan 17% 9/21/27 (a)(c)(e) | | 291,016 | 293,926 |
| AlixPartners LLP Tranche B 1LN, term loan 3 month U.S. LIBOR + 2.750% 3.25% 2/4/28 (a)(b)(c) | | 587,050 | 585,254 |
| Avolon TLB Borrower 1 (U.S.) LLC Tranche B3 1LN, term loan 3 month U.S. LIBOR + 1.750% 2.5% 1/15/25 (a)(b)(c) | | 277,628 | 276,415 |
| AVSC Holding Corp. Tranche B2 1LN, term loan 3 month U.S. LIBOR + 5.500% 6.5% 10/15/26 (a)(b)(c) | | 371,324 | 342,016 |
| BCP Renaissance Parent LLC Tranche B, term loan 3 month U.S. LIBOR + 3.500% 4.5% 10/31/24 (a)(b)(c) | | 435,270 | 431,353 |
| Finco I LLC Tranche B 1LN, term loan 3 month U.S. LIBOR + 2.500% 2.5841% 6/27/25 (a)(b)(c) | | 123,750 | 123,198 |
| Fly Funding II SARL Tranche B 1LN, term loan 3 month U.S. LIBOR + 1.750% 1.88% 8/9/25 (a)(b)(c) | | 338,273 | 333,622 |
| Focus Financial Partners LLC: | | | |
| Tranche B 1LN, term loan 1 month U.S. LIBOR + 2.500% 3% 6/24/28 (a)(b)(c) | | 101,309 | 100,954 |
| Tranche B-DD 1LN, term loan 1 month U.S. LIBOR + 2.500% 6/30/28 (b)(c)(f) | | 23,438 | 23,355 |
| Tranche B3 1LN, term loan 3 month U.S. LIBOR + 2.000% 2.0841% 7/3/24 (a)(b)(c) | | 436,143 | 432,689 |
| GT Polaris, Inc. Tranche B 1LN, term loan 3 month U.S. LIBOR + 3.750% 4.5% 9/24/27 (a)(b)(c) | | 317,604 | 317,604 |
| HarbourVest Partners LLC Tranche B 1LN, term loan 3 month U.S. LIBOR + 2.250% 2.3761% 3/1/25 (a)(b)(c) | | 805,206 | 799,675 |
| Hightower Holding LLC: | | | |
| Tranche B 1LN, term loan 3 month U.S. LIBOR + 4.000% 4.75% 4/21/28 (a)(b)(c) | | 252,000 | 251,685 |
| Tranche DD 1LN, term loan 3 month U.S. LIBOR + 1.500% 4/21/28 (b)(c)(f) | | 63,000 | 62,921 |
| Kingpin Intermediate Holdings LLC Tranche B 1LN, term loan 3 month U.S. LIBOR + 3.500% 4.5% 7/3/24 (a)(b)(c) | | 244,950 | 244,337 |
| KREF Holdings X LLC Tranche B 1LN, term loan 3 month U.S. LIBOR + 4.750% 5.75% 9/1/27 (a)(b)(c) | | 367,225 | 367,225 |
| Paysafe Holdings U.S. Corp. Tranche B 1LN, term loan 1 month U.S. LIBOR + 2.750% 3.25% 6/10/28 (a)(b)(c) | | 89,775 | 88,720 |
| Recess Holdings, Inc. Tranche B, term loan 3 month U.S. LIBOR + 3.750% 4.75% 9/29/24 (a)(b)(c) | | 257,176 | 255,676 |
| RPI Intermediate Finance Trust Tranche B 1LN, term loan 3 month U.S. LIBOR + 1.750% 1.8341% 2/11/27 (a)(b)(c) | | 970,136 | 966,498 |
| TransUnion LLC Tranche B5 1LN, term loan 3 month U.S. LIBOR + 1.750% 1.8341% 11/16/26 (a)(b)(c) | | 753,458 | 748,395 |
| UFC Holdings LLC Tranche B 1LN, term loan 3 month U.S. LIBOR + 2.750% 3.5% 4/29/26 (a)(b)(c) | | 253,883 | 253,177 |
|
| TOTAL DIVERSIFIED FINANCIAL SERVICES | | | 7,298,695 |
|
| Diversified Media - 1.4% | | | |
| Advantage Sales & Marketing, Inc. Tranche B 1LN, term loan 3 month U.S. LIBOR + 5.250% 6% 10/28/27 (a)(b)(c) | | 845,750 | 848,922 |
| Allen Media LLC Tranche B 1LN, term loan 3 month U.S. LIBOR + 5.500% 5.6315% 2/10/27 (a)(b)(c) | | 1,127,644 | 1,125,885 |
| Lamar Media Corp. Tranche B 1LN, term loan 3 month U.S. LIBOR + 1.500% 1.5826% 1/30/27 (a)(b)(c) | | 250,000 | 247,735 |
| Terrier Media Buyer, Inc. Tranche B 1LN, term loan 3 month U.S. LIBOR + 3.500% 3.5841% 12/17/26 (a)(b)(c) | | 1,826,200 | 1,821,635 |
|
| TOTAL DIVERSIFIED MEDIA | | | 4,044,177 |
|
| Energy - 3.7% | | | |
| Apro LLC Tranche B 1LN, term loan 1 month U.S. LIBOR + 3.750% 4.5% 11/14/26 (a)(b)(c) | | 491,555 | 491,555 |
| Array Technologies, Inc. Tranche B 1LN, term loan 3 month U.S. LIBOR + 3.250% 3.75% 10/14/27 (a)(b)(c) | | 433,484 | 432,131 |
| BCP Raptor II LLC Tranche B, term loan 3 month U.S. LIBOR + 4.750% 4.8341% 11/3/25 (a)(b)(c) | | 485,989 | 480,279 |
| BCP Raptor LLC Tranche B, term loan 3 month U.S. LIBOR + 4.250% 5.25% 6/24/24 (a)(b)(c) | | 559,968 | 557,767 |
| Brazos Delaware II LLC Tranche B, term loan 3 month U.S. LIBOR + 4.000% 4.0835% 5/21/25 (a)(b)(c) | | 270,976 | 266,656 |
| BW Gas & Convenience Holdings LLC Tranche B 1LN, term loan 3 month U.S. LIBOR + 3.500% 4% 3/17/28 (a)(b)(c)(e) | | 279,300 | 279,300 |
| ChampionX Holding, Inc. Tranche B 1LN, term loan 3 month U.S. LIBOR + 5.000% 6% 6/3/27 (a)(b)(c) | | 342,000 | 347,130 |
| Citgo Holding, Inc. Tranche B 1LN, term loan 3 month U.S. LIBOR + 7.000% 8% 8/1/23 (a)(b)(c) | | 303,800 | 299,547 |
| Citgo Petroleum Corp. Tranche B 1LN, term loan 3 month U.S. LIBOR + 6.250% 7.25% 3/28/24 (a)(b)(c) | | 812,563 | 811,888 |
| CQP Holdco LP / BIP-V Chinook Holdco LLC Tranche B 1LN, term loan 1 month U.S. LIBOR + 3.750% 4.25% 6/4/28 (a)(b)(c) | | 1,351,613 | 1,347,112 |
| EG America LLC Tranche B 1LN, term loan 3 month U.S. LIBOR + 4.000% 4.1315% 2/6/25 (a)(b)(c) | | 380,708 | 379,220 |
| EG Finco Ltd. Tranche B, term loan 3 month U.S. LIBOR + 4.000% 4.1315% 2/6/25 (a)(b)(c) | | 303,975 | 302,786 |
| Epic Crude Services LP Tranche B 1LN, term loan 3 month U.S. LIBOR + 5.000% 5.1208% 3/1/26 (a)(b)(c) | | 393,382 | 294,379 |
| Esdec Solar Group BV Tranche B 1LN, term loan 1 month U.S. LIBOR + 5.000% 5.75% 8/27/28 (a)(b)(c)(e) | | 250,000 | 249,375 |
| GIP II Blue Holding LP Tranche B 1LN, term loan 1 month U.S. LIBOR + 4.500% 9/22/28 (b)(c)(d) | | 560,000 | 558,953 |
| GIP III Stetson I LP Tranche B, term loan 3 month U.S. LIBOR + 4.250% 4.3341% 7/18/25 (a)(b)(c) | | 714,062 | 684,350 |
| Gulf Finance LLC Tranche B 1LN, term loan 3 month U.S. LIBOR + 5.250% 6.25% 8/25/23 (a)(b)(c) | | 326,349 | 313,158 |
| Hamilton Projs. Acquiror LLC Tranche B 1LN, term loan 3 month U.S. LIBOR + 4.750% 5.75% 6/17/27 (a)(b)(c) | | 283,163 | 284,050 |
| ITT Holdings LLC Tranche B 1LN, term loan 1 month U.S. LIBOR + 2.750% 3.25% 7/30/28 (a)(b)(c) | | 200,000 | 199,584 |
| Lower Cadence Holdings LLC Tranche B 1LN, term loan 3 month U.S. LIBOR + 4.000% 4.0841% 5/22/26 (a)(b)(c) | | 330,170 | 329,757 |
| Murphy U.S.A., Inc. Tranche B 1LN, term loan 3 month U.S. LIBOR + 1.750% 2.25% 1/29/28 (a)(b)(c) | | 448,875 | 448,875 |
| Rockwood Service Corp. Tranche B 1LN, term loan 3 month U.S. LIBOR + 4.000% 4.0841% 1/23/27 (a)(b)(c) | | 658,646 | 659,061 |
| Terra-Gen Finance Co. LLC Tranche B, term loan 3 month U.S. LIBOR + 4.250% 5.25% 12/9/21 (a)(b)(c) | | 172,620 | 170,966 |
| WaterBridge Operating LLC Tranche B 1LN, term loan 3 month U.S. LIBOR + 5.750% 6.75% 6/21/26 (a)(b)(c) | | 368,438 | 358,567 |
|
| TOTAL ENERGY | | | 10,546,446 |
|
| Entertainment/Film - 0.3% | | | |
| AP Core Holdings II LLC: | | | |
| Tranche B1 1LN, term loan 1 month U.S. LIBOR + 5.500% 6.25% 9/1/27 (a)(b)(c) | | 200,000 | 200,750 |
| Tranche B2 1LN, term loan 1 month U.S. LIBOR + 5.500% 6.25% 9/1/27 (a)(b)(c) | | 200,000 | 200,500 |
| SMG U.S. Midco 2, Inc. 1LN, term loan 3 month U.S. LIBOR + 2.500% 2.6156% 1/23/25 (a)(b)(c) | | 321,516 | 315,488 |
|
| TOTAL ENTERTAINMENT/FILM | | | 716,738 |
|
| Environmental - 0.4% | | | |
| Clean Harbors, Inc. Tranche B 1LN, term loan 1 month U.S. LIBOR + 2.000% 9/21/28 (b)(c)(d) | | 145,000 | 144,939 |
| Erm Emerald U.S., Inc. Tranche B 1LN, term loan 3 month U.S. LIBOR + 3.250% 3.3341% 7/12/26 (a)(b)(c) | | 244,375 | 241,748 |
| Madison IAQ LLC Tranche B 1LN, term loan 1 month U.S. LIBOR + 3.250% 3.75% 6/21/28 (a)(b)(c) | | 730,000 | 728,781 |
|
| TOTAL ENVIRONMENTAL | | | 1,115,468 |
|
| Food & Drug Retail - 0.9% | | | |
| Froneri U.S., Inc. Tranche B 1LN, term loan 3 month U.S. LIBOR + 2.250% 2.3341% 1/29/27 (a)(b)(c) | | 656,688 | 648,479 |
| GOBP Holdings, Inc. Tranche B 1LN, term loan 3 month U.S. LIBOR + 2.750% 2.8785% 10/22/25 (a)(b)(c) | | 222,882 | 222,419 |
| JBS U.S.A. Lux SA Tranche B 1LN, term loan 3 month U.S. LIBOR + 2.000% 2.0841% 5/1/26 (a)(b)(c) | | 1,356,475 | 1,349,842 |
| JP Intermediate B LLC Tranche B, term loan 3 month U.S. LIBOR + 5.500% 6.5% 11/20/25 (a)(b)(c) | | 493,560 | 463,946 |
|
| TOTAL FOOD & DRUG RETAIL | | | 2,684,686 |
|
| Food/Beverage/Tobacco - 1.2% | | | |
| 8th Avenue Food & Provisions, Inc.: | | | |
| 2LN, term loan 3 month U.S. LIBOR + 7.750% 7.836% 10/1/26 (a)(b)(c) | | 80,000 | 79,100 |
| Tranche B 1LN, term loan 3 month U.S. LIBOR + 3.750% 3.836% 10/1/25 (a)(b)(c) | | 234,000 | 230,783 |
| Atkins Nutritional Holdings II, Inc. Tranche B 1LN, term loan 3 month U.S. LIBOR + 3.750% 4.75% 7/7/24 (a)(b)(c) | | 198,478 | 198,834 |
| BellRing Brands LLC Tranche B 1LN, term loan 3 month U.S. LIBOR + 4.000% 4.75% 10/21/24 (a)(b)(c) | | 273,742 | 274,700 |
| Chobani LLC Tranche B 1LN, term loan 3 month U.S. LIBOR + 3.500% 4.5% 10/23/27 (a)(b)(c) | | 673,200 | 674,163 |
| Shearer's Foods, Inc. Tranche B 1LN, term loan 3 month U.S. LIBOR + 3.500% 4.25% 9/23/27 (a)(b)(c) | | 592,108 | 591,102 |
| Triton Water Holdings, Inc. Tranche B 1LN, term loan 3 month U.S. LIBOR + 3.500% 4% 3/31/28 (a)(b)(c) | | 788,025 | 786,551 |
| U.S. Foods, Inc. Tranche B, term loan 3 month U.S. LIBOR + 1.750% 1.8341% 6/27/23 (a)(b)(c) | | 598,187 | 594,448 |
|
| TOTAL FOOD/BEVERAGE/TOBACCO | | | 3,429,681 |
|
| Gaming - 5.3% | | | |
| Aristocrat International Pty Ltd.: | | | |
| Tranche B 1LN, term loan 3 month U.S. LIBOR + 3.750% 4.75% 10/19/24 (a)(b)(c) | | 153,063 | 153,780 |
| Tranche B 3LN, term loan 3 month U.S. LIBOR + 1.750% 1.8843% 10/19/24 (a)(b)(c) | | 74,897 | 74,367 |
| Bally's Corp. Tranche B 1LN, term loan: | | | |
| 1 month U.S. LIBOR + 3.250% 8/6/28 (b)(c)(d) | | 905,000 | 904,376 |
| 3 month U.S. LIBOR + 8.000% 10.25% 5/10/26 (a)(b)(c) | | 429,563 | 448,893 |
| Boyd Gaming Corp. Tranche B 1LN, term loan 3 month U.S. LIBOR + 2.250% 2.3219% 9/15/23 (a)(b)(c) | | 446,563 | 445,866 |
| Caesars Resort Collection LLC: | | | |
| Tranche B 1LN, term loan 3 month U.S. LIBOR + 2.750% 2.8341% 12/22/24 (a)(b)(c) | | 3,081,987 | 3,061,892 |
| Tranche B 1LN, term loan 3 month U.S. LIBOR + 4.500% 3.5833% 7/20/25 (a)(b)(c) | | 1,960,200 | 1,960,906 |
| Churchill Downs, Inc. Tranche B 1LN, term loan 3 month U.S. LIBOR + 2.000% 2.09% 3/17/28 (a)(b)(c) | | 298,500 | 295,515 |
| Cypress Intermediate Holdings, Inc. Tranche B 1LN, term loan 1 month U.S. LIBOR + 2.500% 3% 9/21/28 (a)(b)(c) | | 350,000 | 349,563 |
| Golden Entertainment, Inc. Tranche B, term loan 3 month U.S. LIBOR + 3.000% 3.75% 10/20/24 (a)(b)(c) | | 1,060,334 | 1,056,358 |
| Golden Nugget LLC Tranche B 1LN, term loan 3 month U.S. LIBOR + 2.500% 3.25% 10/4/23 (a)(b)(c) | | 2,235,292 | 2,223,512 |
| GVC Holdings Gibraltar Ltd. Tranche B4 1LN, term loan 1 month U.S. LIBOR + 2.500% 3% 3/16/27 (a)(b)(c) | | 279,300 | 278,778 |
| J&J Ventures Gaming LLC 1LN, term loan 3 month U.S. LIBOR + 4.000% 4.75% 4/26/28 (a)(b)(c) | | 285,000 | 286,069 |
| PCI Gaming Authority 1LN, term loan 3 month U.S. LIBOR + 2.500% 2.5841% 5/29/26 (a)(b)(c) | | 312,145 | 310,819 |
| Penn National Gaming, Inc. Tranche B, term loan 3 month U.S. LIBOR + 2.250% 3% 10/15/25 (a)(b)(c) | | 223,797 | 223,363 |
| Playtika Holding Corp. Tranche B 1LN, term loan 3 month U.S. LIBOR + 2.750% 2.8341% 3/11/28 (a)(b)(c) | | 701,475 | 700,914 |
| Scientific Games Corp. Tranche B 5LN, term loan 3 month U.S. LIBOR + 2.750% 2.8341% 8/14/24 (a)(b)(c) | | 448,036 | 445,854 |
| Stars Group Holdings BV Tranche B, term loan 3 month U.S. LIBOR + 2.250% 2.3818% 7/10/25 (a)(b)(c) | | 904,174 | 900,783 |
| Station Casinos LLC Tranche B 1LN, term loan 3 month U.S. LIBOR + 2.250% 2.5% 2/7/27 (a)(b)(c) | | 1,084,393 | 1,073,375 |
|
| TOTAL GAMING | | | 15,194,983 |
|
| Healthcare - 7.5% | | | |
| AHP Health Partners, Inc. Tranche B 1LN, term loan 1 month U.S. LIBOR + 3.500% 4% 8/23/28 (a)(b)(c) | | 210,000 | 210,525 |
| Avantor Funding, Inc. Tranche B5 1LN, term loan 1 month U.S. LIBOR + 2.250% 2.75% 11/6/27 (a)(b)(c) | | 248,750 | 249,061 |
| Da Vinci Purchaser Corp. Tranche B 1LN, term loan 3 month U.S. LIBOR + 4.000% 5% 12/13/26 (a)(b)(c) | | 662,244 | 664,522 |
| Elanco Animal Health, Inc. Tranche B 1LN, term loan 3 month U.S. LIBOR + 1.750% 1.836% 8/1/27 (a)(b)(c) | | 1,690,323 | 1,668,586 |
| Gainwell Acquisition Corp. Tranche B 1LN, term loan 3 month U.S. LIBOR + 4.000% 4.75% 10/1/27 (a)(b)(c) | | 2,150,541 | 2,153,681 |
| Horizon Pharma U.S.A., Inc. Tranche B 1LN, term loan 3 month U.S. LIBOR + 2.000% 2.5% 3/15/28 (a)(b)(c) | | 283,575 | 282,917 |
| Indigo Merger Sub, Inc. Tranche B 1LN, term loan 1 month U.S. LIBOR + 2.500% 3% 7/1/28 (a)(b)(c) | | 398,910 | 400,182 |
| Insulet Corp. Tranche B 1LN, term loan 1 month U.S. LIBOR + 3.250% 3.75% 5/4/28 (a)(b)(c) | | 523,688 | 524,562 |
| Jazz Financing Lux SARL Tranche B 1LN, term loan 1 month U.S. LIBOR + 3.500% 4% 5/5/28 (a)(b)(c) | | 1,371,563 | 1,373,112 |
| Mamba Purchaser, Inc. Tranche B 1LN, term loan 1 month U.S. LIBOR + 3.750% 9/29/28 (b)(c)(d) | | 210,000 | 209,870 |
| Maravai Intermediate Holdings LLC Tranche B 1LN, term loan 3 month U.S. LIBOR + 3.750% 4.75% 10/19/27 (a)(b)(c) | | 595,091 | 596,579 |
| MED ParentCo LP: | | | |
| 1LN, term loan 3 month U.S. LIBOR + 4.250% 4.3341% 8/31/26 (a)(b)(c) | | 279,539 | 278,708 |
| 2LN, term loan 3 month U.S. LIBOR + 8.250% 8.3341% 8/30/27 (a)(b)(c) | | 180,000 | 179,249 |
| Mozart Borrower LP Tranche B 1LN, term loan 1 month U.S. LIBOR + 3.250% 9/30/28 (b)(c)(d) | | 2,405,000 | 2,399,733 |
| Organon & Co. Tranche B 1LN, term loan 3 month U.S. LIBOR + 3.000% 3.5% 6/2/28 (a)(b)(c) | | 1,346,625 | 1,348,793 |
| Ortho-Clinical Diagnostics, Inc. Tranche B 1LN, term loan 3 month U.S. LIBOR + 3.000% 3.0833% 6/30/25 (a)(b)(c) | | 501,842 | 501,214 |
| Packaging Coordinators Midco, Inc. Tranche B 1LN, term loan 3 month U.S. LIBOR + 3.500% 4.25% 11/30/27 (a)(b)(c) | | 373,125 | 373,360 |
| Pathway Vet Alliance LLC Tranche B 1LN, term loan 3 month U.S. LIBOR + 3.750% 3.8341% 3/31/27 (a)(b)(c) | | 477,933 | 476,638 |
| Phoenix Newco, Inc. Tranche B 1LN, term loan 1 month U.S. LIBOR + 3.500% 8/10/28 (b)(c)(d) | | 1,250,000 | 1,250,200 |
| PPD, Inc. Tranche B 1LN, term loan 3 month U.S. LIBOR + 2.000% 2.5% 1/13/28 (a)(b)(c) | | 830,825 | 829,097 |
| Radiology Partners, Inc. Tranche B 1LN, term loan 3 month U.S. LIBOR + 4.250% 4.3337% 7/9/25 (a)(b)(c) | | 390,000 | 389,513 |
| RadNet Management, Inc. Tranche B 1LN, term loan 3 month U.S. LIBOR + 3.000% 3.75% 4/23/28 (a)(b)(c) | | 229,425 | 228,948 |
| RegionalCare Hospital Partners Holdings, Inc. Tranche B, term loan 3 month U.S. LIBOR + 3.750% 3.8341% 11/16/25 (a)(b)(c) | | 488,602 | 487,688 |
| Surgery Center Holdings, Inc. Tranche B 1LN, term loan 1 month U.S. LIBOR + 3.750% 4.5% 8/31/26 (a)(b)(c) | | 243,070 | 243,305 |
| U.S. Anesthesia Partners, Inc.: | | | |
| Tranche B 1LN, term loan 1 month U.S. LIBOR + 4.250% 9/22/28 (b)(c)(d) | | 635,000 | 635,692 |
| Tranche B, term loan 3 month U.S. LIBOR + 3.000% 4% 6/23/24 (a)(b)(c) | | 632,720 | 632,523 |
| U.S. Radiology Specialists, Inc. Tranche B 1LN, term loan 3 month U.S. LIBOR + 5.500% 6.25% 12/15/27 (a)(b)(c) | | 282,863 | 283,878 |
| U.S. Renal Care, Inc. Tranche B 1LN, term loan 3 month U.S. LIBOR + 5.000% 5.0841% 6/13/26 (a)(b)(c) | | 842,477 | 840,632 |
| Upstream Newco, Inc. 1LN, term loan 1 month U.S. LIBOR + 4.250% 4.3341% 11/20/26 (a)(b)(c) | | 525,558 | 525,232 |
| Valeant Pharmaceuticals International, Inc.: | | | |
| Tranche B 2LN, term loan 3 month U.S. LIBOR + 2.750% 2.8341% 11/27/25 (a)(b)(c) | | 826,738 | 824,257 |
| Tranche B, term loan 3 month U.S. LIBOR + 3.000% 3.0841% 6/1/25 (a)(b)(c) | | 300,920 | 300,469 |
|
| TOTAL HEALTHCARE | | | 21,362,726 |
|
| Homebuilders/Real Estate - 0.8% | | | |
| DTZ U.S. Borrower LLC Tranche B 1LN, term loan 3 month U.S. LIBOR + 2.750% 2.8341% 8/21/25 (a)(b)(c) | | 971,715 | 962,241 |
| Landry's Finance Acquisition Co. Tranche B 1LN, term loan 3 month U.S. LIBOR + 12.000% 13% 10/4/23 (a)(b)(c) | | 180,000 | 194,400 |
| Lightstone Holdco LLC: | | | |
| Tranche B 1LN, term loan 3 month U.S. LIBOR + 3.750% 4.75% 1/30/24 (a)(b)(c) | | 678,660 | 558,293 |
| Tranche C 1LN, term loan 3 month U.S. LIBOR + 3.750% 4.75% 1/30/24 (a)(b)(c) | | 38,277 | 31,489 |
| Ryan Specialty Group LLC Tranche B 1LN, term loan 3 month U.S. LIBOR + 3.000% 3.75% 9/1/27 (a)(b)(c) | | 643,500 | 642,857 |
|
| TOTAL HOMEBUILDERS/REAL ESTATE | | | 2,389,280 |
|
| Hotels - 1.7% | | | |
| Aimbridge Acquisition Co., Inc.: | | | |
| Tranche B 1LN, term loan 3 month U.S. LIBOR + 4.750% 5.5% 2/1/26 (a)(b)(c) | | 123,753 | 122,670 |
| Tranche B, term loan 3 month U.S. LIBOR + 3.750% 3.8341% 2/1/26 (a)(b)(c) | | 532,875 | 523,326 |
| ASP LS Acquisition Corp. Tranche B 1LN, term loan 3 month U.S. LIBOR + 4.500% 5.25% 4/30/28 (a)(b)(c) | | 225,000 | 225,187 |
| Four Seasons Holdings, Inc. Tranche B, term loan 3 month U.S. LIBOR + 2.000% 2.0868% 11/30/23 (a)(b)(c) | | 706,913 | 704,262 |
| Hilton Grand Vacations Borrower LLC Tranche B 1LN, term loan 1 month U.S. LIBOR + 3.000% 3.5% 8/2/28 (a)(b)(c) | | 1,285,000 | 1,287,891 |
| Hilton Worldwide Finance LLC Tranche B 1LN, term loan 3 month U.S. LIBOR + 1.750% 1.836% 6/21/26 (a)(b)(c) | | 126,445 | 125,330 |
| Marriott Ownership Resorts, Inc. Tranche B 1LN, term loan 3 month U.S. LIBOR + 1.750% 1.8341% 8/31/25 (a)(b)(c) | | 178,650 | 175,300 |
| Oravel Stays Singapore Pte Ltd. Tranche B 1LN, term loan 1 month U.S. LIBOR + 8.250% 9% 6/23/26 (a)(b)(c) | | 260,000 | 273,000 |
| Travelport Finance Luxembourg SARL 1LN, term loan: | | | |
| 3 month U.S. LIBOR + 2.500% 9.75% 2/28/25 (a)(b)(c) | | 712,699 | 738,663 |
| 3 month U.S. LIBOR + 6.250% 6.8815% 5/29/26 (a)(b)(c) | | 791,216 | 678,136 |
|
| TOTAL HOTELS | | | 4,853,765 |
|
| Insurance - 4.8% | | | |
| Acrisure LLC Tranche B 1LN, term loan 3 month U.S. LIBOR + 3.500% 3.6315% 2/13/27 (a)(b)(c) | | 1,506,662 | 1,491,279 |
| Alliant Holdings Intermediate LLC: | | | |
| Tranche B, term loan 3 month U.S. LIBOR + 3.250% 3.3341% 5/10/25 (a)(b)(c) | | 451,513 | 448,127 |
| Tranche B-2 1LN, term loan 3 month U.S. LIBOR + 3.250% 3.3341% 5/9/25 (a)(b)(c) | | 244,375 | 242,376 |
| Tranche B3 1LN, term loan 3 month U.S. LIBOR + 3.750% 4.25% 11/5/27 (a)(b)(c) | | 791,472 | 791,693 |
| AmeriLife Holdings LLC Tranche B 1LN, term loan 3 month U.S. LIBOR + 4.000% 4.0841% 3/18/27 (a)(b)(c) | | 716,005 | 713,771 |
| AmWINS Group, Inc. Tranche B 1LN, term loan 3 month U.S. LIBOR + 2.250% 3% 2/19/28 (a)(b)(c) | | 835,397 | 830,075 |
| AssuredPartners, Inc. Tranche B 1LN, term loan 3 month U.S. LIBOR + 3.500% 3.5841% 2/13/27 (a)(b)(c) | | 447,038 | 444,056 |
| Asurion LLC: | | | |
| Tranche B 6LN, term loan 3 month U.S. LIBOR + 3.000% 3.2091% 11/3/23 (a)(b)(c) | | 1,438,731 | 1,429,739 |
| Tranche B 7LN, term loan 3 month U.S. LIBOR + 3.000% 3.0841% 11/3/24 (a)(b)(c) | | 483,750 | 478,308 |
| Tranche B3 2LN, term loan 3 month U.S. LIBOR + 5.250% 5.3341% 1/31/28 (a)(b)(c) | | 1,005,000 | 1,001,442 |
| Tranche B4 2LN, term loan 1 month U.S. LIBOR + 5.250% 5.3341% 1/20/29 (a)(b)(c) | | 525,000 | 522,244 |
| Tranche B8 1LN, term loan 3 month U.S. LIBOR + 3.250% 3.3341% 12/23/26 (a)(b)(c) | | 992,500 | 977,255 |
| Tranche B9 1LN, term loan 3 month U.S. LIBOR + 3.250% 3.3341% 7/31/27 (a)(b)(c) | | 602,421 | 593,234 |
| HUB International Ltd.: | | | |
| Tranche B 1LN, term loan 3 month U.S. LIBOR + 3.250% 4% 4/25/25 (a)(b)(c) | | 859,753 | 859,753 |
| Tranche B, term loan 3 month U.S. LIBOR + 2.750% 2.8753% 4/25/25 (a)(b)(c) | | 1,491,884 | 1,476,816 |
| USI, Inc.: | | | |
| 1LN, term loan 3 month U.S. LIBOR + 3.250% 3.3815% 12/2/26 (a)(b)(c) | | 122,814 | 121,931 |
| Tranche B, term loan 3 month U.S. LIBOR + 3.000% 3.1315% 5/16/24 (a)(b)(c) | | 1,290,281 | 1,280,836 |
|
| TOTAL INSURANCE | | | 13,702,935 |
|
| Leisure - 2.7% | | | |
| Alterra Mountain Co. Tranche B 1LN, term loan 1 month U.S. LIBOR + 3.500% 4% 7/21/28 (a)(b)(c) | | 662,767 | 660,281 |
| Callaway Golf Co. Tranche B, term loan 3 month U.S. LIBOR + 4.500% 4.586% 1/4/26 (a)(b)(c) | | 375,150 | 376,868 |
| Carnival Corp. Tranche B 1LN, term loan 3 month U.S. LIBOR + 3.000% 3.75% 6/30/25 (a)(b)(c) | | 410,850 | 408,155 |
| City Football Group Ltd. Tranche B 1LN, term loan 1 month U.S. LIBOR + 3.500% 4% 7/21/28 (a)(b)(c) | | 715,000 | 711,425 |
| Crown Finance U.S., Inc. Tranche B 1LN, term loan: | | | |
| 1 month U.S. LIBOR + 8.250% 9.25% 5/23/24 (a)(b)(c) | | 113,933 | 121,623 |
| 3 month U.S. LIBOR + 2.500% 3.5% 2/28/25 (a)(b)(c) | | 885,298 | 727,662 |
| 3 month U.S. LIBOR + 2.750% 3.75% 9/30/26 (a)(b)(c) | | 368,429 | 300,269 |
| 15.25% 5/23/24 (c) | | 177,842 | 219,265 |
| Delta 2 SARL Tranche B, term loan 3 month U.S. LIBOR + 2.500% 3.5% 2/1/24 (a)(b)(c) | | 1,540,956 | 1,535,177 |
| Equinox Holdings, Inc.: | | | |
| Tranche 2LN, term loan 3 month U.S. LIBOR + 7.000% 8% 9/8/24 (a)(b)(c) | | 250,000 | 217,293 |
| Tranche B-1, term loan 3 month U.S. LIBOR + 3.000% 4% 3/8/24 (a)(b)(c) | | 716,400 | 662,183 |
| Herschend Entertainment Co. LLC Tranche B 1LN, term loan 1 month U.S. LIBOR + 3.750% 4.25% 8/18/28 (a)(b)(c) | | 190,000 | 189,645 |
| MajorDrive Holdings IV LLC 1LN, term loan 3 month U.S. LIBOR + 4.000% 4.5% 5/12/28 (a)(b)(c) | | 344,138 | 344,674 |
| PlayPower, Inc. Tranche B 1LN, term loan 3 month U.S. LIBOR + 5.500% 5.6315% 5/10/26 (a)(b)(c) | | 113,257 | 111,181 |
| SeaWorld Parks & Entertainment, Inc. Tranche B 1LN, term loan 1 month U.S. LIBOR + 3.000% 3.5% 8/13/28 (a)(b)(c) | | 300,000 | 298,689 |
| SP PF Buyer LLC Tranche B 1LN, term loan 3 month U.S. LIBOR + 4.500% 4.5841% 12/21/25 (a)(b)(c) | | 365,625 | 358,952 |
| United PF Holdings LLC: | | | |
| 1LN, term loan 3 month U.S. LIBOR + 4.000% 4.1315% 12/30/26 (a)(b)(c) | | 363,983 | 355,491 |
| 2LN, term loan 3 month U.S. LIBOR + 8.500% 8.6315% 12/30/27 (a)(b)(c)(e) | | 125,000 | 116,250 |
| Tranche B 1LN, term loan 3 month U.S. LIBOR + 8.500% 9.5% 12/30/26 (a)(b)(c)(e) | | 133,650 | 133,650 |
|
| TOTAL LEISURE | | | 7,848,733 |
|
| Metals/Mining - 0.1% | | | |
| American Rock Salt Co. LLC 1LN, term loan 1 month U.S. LIBOR + 4.000% 4.75% 6/4/28 (a)(b)(c) | | 249,375 | 250,373 |
| Paper - 0.1% | | | |
| Neenah, Inc. Tranche B 1LN, term loan 3 month U.S. LIBOR + 3.000% 3.5% 4/6/28 (a)(b)(c) | | 248,141 | 248,761 |
| Publishing/Printing - 1.0% | | | |
| Cengage Learning, Inc. Tranche B 1LN, term loan 1 month U.S. LIBOR + 4.750% 5.75% 7/14/26 (a)(b)(c) | | 425,000 | 427,465 |
| Harland Clarke Holdings Corp. 1LN, term loan 1 month U.S. LIBOR + 7.750% 8.75% 8/31/26 (a)(b)(c) | | 469,832 | 439,589 |
| Learning Care Group (U.S.) No 2, Inc. Tranche B 1LN, term loan: | | | |
| 3 month U.S. LIBOR + 3.250% 4.25% 3/13/25 (a)(b)(c) | | 109,561 | 107,849 |
| 3 month U.S. LIBOR + 8.500% 9.5% 3/13/25 (a)(b)(c) | | 335,750 | 335,750 |
| Proquest LLC Tranche B 1LN, term loan 3 month U.S. LIBOR + 3.250% 3.3341% 10/17/26 (a)(b)(c) | | 419,244 | 418,757 |
| Recorded Books, Inc. Tranche B 1LN, term loan 3 month U.S. LIBOR + 4.000% 4.0831% 8/29/25 (a)(b)(c) | | 341,027 | 341,132 |
| RLG Holdings LLC: | | | |
| Tranche B 1LN, term loan 1 month U.S. LIBOR + 4.250% 5% 7/8/28 (a)(b)(c) | | 227,424 | 227,568 |
| Tranche DD 1LN, term loan 1 month U.S. LIBOR + 3.250% 3.1313% 7/8/28 (a)(b)(c)(f) | | 57,576 | 57,612 |
| Scripps (E.W.) Co. Tranche B 1LN, term loan 3 month U.S. LIBOR + 3.000% 3.75% 1/7/28 (a)(b)(c) | | 368,688 | 369,200 |
|
| TOTAL PUBLISHING/PRINTING | | | 2,724,922 |
|
| Railroad - 0.6% | | | |
| AIT Worldwide Logistics Holdings, Inc. 1LN, term loan 3 month U.S. LIBOR + 4.750% 5.5% 4/6/28 (a)(b)(c) | | 295,000 | 295,738 |
| First Student Bidco, Inc.: | | | |
| Tranche B 1LN, term loan 1 month U.S. LIBOR + 3.000% 3.5% 7/21/28 (a)(b)(c) | | 430,931 | 428,346 |
| Tranche C 1LN, term loan 1 month U.S. LIBOR + 3.000% 3.5% 7/21/28 (a)(b)(c) | | 159,069 | 158,114 |
| Genesee & Wyoming, Inc. 1LN, term loan 3 month U.S. LIBOR + 2.000% 2.1315% 12/30/26 (a)(b)(c) | | 526,975 | 523,502 |
| Worldwide Express, Inc. 1LN, term loan 1 month U.S. LIBOR + 4.250% 5% 7/22/28 (a)(b)(c) | | 435,000 | 436,209 |
|
| TOTAL RAILROAD | | | 1,841,909 |
|
| Restaurants - 0.7% | | | |
| Burger King Worldwide, Inc. Tranche B 1LN, term loan 3 month U.S. LIBOR + 1.750% 1.8368% 11/19/26 (a)(b)(c) | | 733,163 | 723,690 |
| PFC Acquisition Corp. Tranche B 1LN, term loan 3 month U.S. LIBOR + 6.250% 6.3341% 3/1/26 (a)(b)(c) | | 365,625 | 359,958 |
| Whatabrands LLC Tranche B 1LN, term loan 1 month U.S. LIBOR + 3.250% 3.75% 7/21/28 (a)(b)(c) | | 920,000 | 918,638 |
|
| TOTAL RESTAURANTS | | | 2,002,286 |
|
| Services - 8.2% | | | |
| ABG Intermediate Holdings 2 LLC Tranche B 1LN, term loan 3 month U.S. LIBOR + 5.250% 6.25% 9/29/24 (a)(b)(c) | | 133,650 | 133,650 |
| Adtalem Global Education, Inc. Tranche B 1LN, term loan 3 month U.S. LIBOR + 4.500% 5.25% 8/12/28 (a)(b)(c) | | 690,000 | 690,345 |
| AEA International Holdings Luxembourg SARL Tranche B 1LN, term loan 3 month U.S. LIBOR + 3.750% 4.25% 9/7/28 (a)(b)(c)(e) | | 215,000 | 214,731 |
| All-Star Bidco AB Tranche B1 1LN, term loan 1 month U.S. LIBOR + 3.500% 7/21/28 (b)(c)(d) | | 315,000 | 314,080 |
| Allied Universal Holdco LLC Tranche B 1LN, term loan 1 month U.S. LIBOR + 3.750% 4.25% 5/14/28 (a)(b)(c) | | 500,000 | 500,225 |
| APX Group, Inc. Tranche B 1LN, term loan 1 month U.S. LIBOR + 3.500% 4% 7/9/28 (a)(b)(c) | | 425,000 | 423,538 |
| Aramark Services, Inc.: | | | |
| Tranche B 3LN, term loan 3 month U.S. LIBOR + 1.750% 1.8341% 3/11/25 (a)(b)(c) | | 114,325 | 111,705 |
| Tranche B-4 1LN, term loan 3 month U.S. LIBOR + 1.750% 1.8341% 1/15/27 (a)(b)(c) | | 592,138 | 577,482 |
| Ascend Learning LLC: | | | |
| Tranche B 1LN, term loan 3 month U.S. LIBOR + 3.750% 4.75% 7/12/24 (a)(b)(c) | | 247,500 | 247,624 |
| Tranche B, term loan 3 month U.S. LIBOR + 3.000% 4% 7/12/24 (a)(b)(c) | | 806,917 | 806,199 |
| Brand Energy & Infrastructure Services, Inc. Tranche B, term loan 3 month U.S. LIBOR + 4.250% 5.25% 6/21/24 (a)(b)(c) | | 1,334,413 | 1,321,669 |
| Cast & Crew Payroll LLC Tranche B 1LN, term loan 3 month U.S. LIBOR + 3.750% 3.8341% 2/7/26 (a)(b)(c) | | 476,696 | 474,512 |
| CHG Healthcare Services, Inc. 1LN, term loan 1 month U.S. LIBOR + 3.500% 9/30/28 (b)(c)(d) | | 280,000 | 280,300 |
| Conservice Midco LLC Tranche B 1LN, term loan 3 month U.S. LIBOR + 4.250% 4.3815% 5/13/27 (a)(b)(c) | | 311,850 | 312,046 |
| CoreCivic, Inc. Tranche B 1LN, term loan 3 month U.S. LIBOR + 4.500% 5.5% 12/18/24 (a)(b)(c) | | 326,219 | 322,754 |
| CoreLogic, Inc. Tranche B 1LN, term loan 3 month U.S. LIBOR + 3.500% 4% 6/2/28 (a)(b)(c) | | 1,010,000 | 1,008,738 |
| Creative Artists Agency LLC Tranche B 1LN, term loan 3 month U.S. LIBOR + 3.750% 3.8341% 11/26/26 (a)(b)(c) | | 368,438 | 366,308 |
| EAB Global, Inc. Tranche B 1LN, term loan 1 month U.S. LIBOR + 3.500% 4% 8/16/28 (a)(b)(c) | | 170,000 | 169,023 |
| EmployBridge LLC Tranche B 1LN, term loan 1 month U.S. LIBOR + 4.750% 5.5% 7/19/28 (a)(b)(c) | | 510,000 | 506,430 |
| Ensemble RCM LLC 1LN, term loan 3 month U.S. LIBOR + 3.750% 3.8785% 8/1/26 (a)(b)(c) | | 615,601 | 616,592 |
| Filtration Group Corp. Tranche B, term loan 3 month U.S. LIBOR + 3.000% 3.0841% 3/29/25 (a)(b)(c) | | 454,621 | 452,066 |
| Finastra U.S.A., Inc.: | | | |
| Tranche 2LN, term loan 3 month U.S. LIBOR + 7.250% 8.25% 6/13/25 (a)(b)(c) | | 530,000 | 532,470 |
| Tranche B 1LN, term loan 3 month U.S. LIBOR + 3.500% 4.5% 6/13/24 (a)(b)(c) | | 1,432,727 | 1,420,334 |
| Flexera Software LLC Tranche B 1LN, term loan 3 month U.S. LIBOR + 3.750% 4.5% 3/3/28 (a)(b)(c) | | 198,500 | 198,562 |
| Franchise Group, Inc. Tranche B 1LN, term loan 3 month U.S. LIBOR + 4.750% 5.5% 3/10/26 (a)(b)(c) | | 521,885 | 523,842 |
| GEMS MENASA Cayman Ltd. Tranche B 1LN, term loan 3 month U.S. LIBOR + 5.000% 6% 7/30/26 (a)(b)(c) | | 844,042 | 844,304 |
| Greeneden U.S. Holdings II LLC Tranche B 1LN, term loan 3 month U.S. LIBOR + 4.000% 4.75% 12/1/27 (a)(b)(c) | | 373,125 | 374,259 |
| Ion Trading Finance Ltd. Tranche B 1LN, term loan 3 month U.S. LIBOR + 4.750% 4.9166% 3/26/28 (a)(b)(c) | | 1,241,888 | 1,243,291 |
| KNS Acquisitions, Inc. Tranche B 1LN, term loan 3 month U.S. LIBOR + 6.250% 7% 4/21/27 (a)(b)(c) | | 275,000 | 273,455 |
| KUEHG Corp. Tranche B, term loan 3 month U.S. LIBOR + 3.750% 4.75% 2/21/25 (a)(b)(c) | | 708,733 | 701,448 |
| Lakeshore Intermediate LLC 1LN, term loan 1 month U.S. LIBOR + 3.500% 9/29/28 (b)(c)(d)(e) | | 190,000 | 189,525 |
| Life Time, Inc. Tranche B 1LN, term loan 3 month U.S. LIBOR + 4.750% 5.75% 12/15/24 (a)(b)(c) | | 835,800 | 841,550 |
| Maverick Purchaser Sub LLC: | | | |
| Tranche B 1LN, term loan: | | | |
| 3 month U.S. LIBOR + 3.500% 3.5841% 1/23/27 (a)(b)(c) | | 696,187 | 694,447 |
| 3 month U.S. LIBOR + 4.750% 5.5% 2/3/27 (a)(b)(c) | | 124,375 | 125,090 |
| Tranche B 2LN, term loan 1 month U.S. LIBOR + 8.750% 1/31/28 (b)(c)(d) | | 200,000 | 200,000 |
| Nielsen Holdings PLC Tranche B 1LN, term loan 3 month U.S. LIBOR + 4.000% 4.0841% 3/5/28 (a)(b)(c) | | 338,300 | 338,906 |
| PowerTeam Services LLC Tranche B 1LN, term loan 1 month U.S. LIBOR + 3.500% 4.5% 3/6/25 (a)(b)(c) | | 334,163 | 332,285 |
| Sabert Corp. Tranche B 1LN, term loan 3 month U.S. LIBOR + 4.500% 5.5% 12/10/26 (a)(b)(c) | | 599,766 | 600,516 |
| Sabre GLBL, Inc.: | | | |
| Tranche B-1 1LN, term loan 1 month U.S. LIBOR + 3.500% 4% 12/17/27 (a)(b)(c) | | 67,293 | 66,893 |
| Tranche B-2 1LN, term loan 1 month U.S. LIBOR + 3.500% 4% 12/17/27 (a)(b)(c) | | 107,269 | 106,632 |
| Signal Parent, Inc. Tranche B 1LN, term loan 3 month U.S. LIBOR + 3.500% 4.25% 4/1/28 (a)(b)(c) | | 558,600 | 551,618 |
| Sotheby's Tranche B 1LN, term loan 1 month U.S. LIBOR + 4.500% 5% 1/15/27 (a)(b)(c) | | 589,093 | 590,566 |
| Spin Holdco, Inc. Tranche B 1LN, term loan 3 month U.S. LIBOR + 4.000% 4.75% 3/4/28 (a)(b)(c) | | 1,496,250 | 1,499,826 |
| The GEO Group, Inc. Tranche B 1LN, term loan 3 month U.S. LIBOR + 2.000% 2.75% 3/23/24 (a)(b)(c) | | 244,872 | 225,921 |
| Uber Technologies, Inc. Tranche B 1LN, term loan: | | | |
| 3 month U.S. LIBOR + 3.500% 3.5841% 4/4/25 (a)(b)(c) | | 724,385 | 724,182 |
| 3 month U.S. LIBOR + 3.500% 3.5841% 2/25/27 (a)(b)(c) | | 500,511 | 500,096 |
|
| TOTAL SERVICES | | | 23,550,035 |
|
| Steel - 0.2% | | | |
| JMC Steel Group, Inc. 1LN, term loan 3 month U.S. LIBOR + 2.000% 2.0833% 1/24/27 (a)(b)(c) | | 485,387 | 479,825 |
| Super Retail - 4.3% | | | |
| Academy Ltd. Tranche B 1LN, term loan 1 month U.S. LIBOR + 2.750% 4.5% 11/6/27 (a)(b)(c) | | 466,406 | 466,873 |
| Ambience Merger Sub, Inc. Tranche B 1LN, term loan 1 month U.S. LIBOR + 4.250% 4.75% 7/24/28 (a)(b)(c) | | 255,000 | 255,319 |
| Bass Pro Group LLC Tranche B 1LN, term loan 3 month U.S. LIBOR + 4.250% 5% 3/5/28 (a)(b)(c) | | 7,364,350 | 7,386,427 |
| BJ's Wholesale Club, Inc. Tranche B 1LN, term loan 3 month U.S. LIBOR + 2.000% 2.0826% 2/3/24 (a)(b)(c) | | 542,822 | 542,969 |
| Empire Today LLC Tranche B 1LN, term loan 3 month U.S. LIBOR + 5.000% 5.75% 4/1/28 (a)(b)(c) | | 279,300 | 277,205 |
| Harbor Freight Tools U.S.A., Inc. Tranche B 1LN, term loan 1 month U.S. LIBOR + 2.750% 3.25% 10/19/27 (a)(b)(c) | | 992,500 | 991,448 |
| LBM Acquisition LLC Tranche B 1LN, term loan 3 month U.S. LIBOR + 3.750% 4.5% 12/18/27 (a)(b)(c) | | 497,730 | 492,753 |
| Red Ventures LLC Tranche B 1LN, term loan 3 month U.S. LIBOR + 2.500% 2.5841% 11/8/24 (a)(b)(c) | | 844,129 | 835,899 |
| Rent-A-Center, Inc. Tranche B 1LN, term loan 1 month U.S. LIBOR + 3.250% 3.75% 2/17/28 (a)(b)(c) | | 403,588 | 404,596 |
| WW International, Inc. Tranche B 1LN, term loan 3 month U.S. LIBOR + 3.500% 4% 4/13/28 (a)(b)(c) | | 518,700 | 517,730 |
|
| TOTAL SUPER RETAIL | | | 12,171,219 |
|
| Technology - 14.9% | | | |
| Acuris Finance U.S., Inc. 1LN, term loan 3 month U.S. LIBOR + 4.000% 4.5% 2/16/28 (a)(b)(c) | | 240,365 | 241,009 |
| Anastasia Parent LLC Tranche B, term loan 3 month U.S. LIBOR + 3.750% 3.8815% 8/10/25 (a)(b)(c) | | 803,806 | 676,202 |
| Aptean, Inc. 1LN, term loan 3 month U.S. LIBOR + 4.250% 4.3341% 4/23/26 (a)(b)(c) | | 362,834 | 360,566 |
| Arches Buyer, Inc. Tranche B 1LN, term loan 3 month U.S. LIBOR + 3.250% 3.75% 12/4/27 (a)(b)(c) | | 734,450 | 730,322 |
| athenahealth, Inc. Tranche B 1LN, term loan 3 month U.S. LIBOR + 4.250% 4.3771% 2/11/26 (a)(b)(c) | | 2,035,616 | 2,039,687 |
| Boxer Parent Co., Inc. Tranche B 1LN, term loan 3 month U.S. LIBOR + 3.750% 3.8815% 10/2/25 (a)(b)(c) | | 424,443 | 421,879 |
| Camelot Finance SA: | | | |
| Tranche B 1LN, term loan 3 month U.S. LIBOR + 3.000% 4% 10/31/26 (a)(b)(c) | | 1,240,625 | 1,243,342 |
| Tranche B, term loan 3 month U.S. LIBOR + 3.000% 3.0841% 10/31/26 (a)(b)(c) | | 588,177 | 586,459 |
| Ceridian HCM Holding, Inc. Tranche B, term loan 3 month U.S. LIBOR + 2.500% 2.5719% 4/30/25 (a)(b)(c) | | 970,000 | 955,935 |
| Cloudera, Inc. Tranche B 1LN, term loan 3 month U.S. LIBOR + 2.500% 3.25% 12/22/27 (a)(b)(c) | | 223,875 | 223,595 |
| CMI Marketing, Inc. Tranche B 1LN, term loan 3 month U.S. LIBOR + 4.750% 5.5% 3/23/28 (a)(b)(c) | | 275,000 | 276,031 |
| CommerceHub, Inc.: | | | |
| Tranche B 1LN, term loan 3 month U.S. LIBOR + 4.000% 4.75% 12/29/27 (a)(b)(c) | | 312,638 | 312,769 |
| Tranche B 2LN, term loan 3 month U.S. LIBOR + 7.000% 7.75% 12/29/28 (a)(b)(c) | | 85,000 | 86,594 |
| CommScope, Inc. Tranche B 1LN, term loan 3 month U.S. LIBOR + 3.250% 3.3341% 4/4/26 (a)(b)(c) | | 1,308,300 | 1,300,398 |
| ConnectWise LLC Tranche B 1LN, term loan 3 month U.S. LIBOR + 3.500% 9/24/28 (b)(c)(d) | | 660,000 | 658,350 |
| Cvent, Inc. Tranche B, term loan 3 month U.S. LIBOR + 3.750% 3.8341% 11/29/24 (a)(b)(c) | | 239,795 | 238,709 |
| DCert Buyer, Inc.: | | | |
| 1LN, term loan 3 month U.S. LIBOR + 4.000% 4.0841% 10/16/26 (a)(b)(c) | | 1,329,750 | 1,329,378 |
| Tranche B 2LN, term loan 3 month U.S. LIBOR + 7.000% 7.0841% 2/19/29 (a)(b)(c) | | 305,000 | 307,223 |
| Dell International LLC Tranche B 1LN, term loan 3 month U.S. LIBOR + 1.750% 2% 9/19/25 (a)(b)(c) | | 411,501 | 411,300 |
| DG Investment Intermediate Holdings, Inc.: | | | |
| 2LN, term loan 3 month U.S. LIBOR + 6.750% 7.5% 3/31/29 (a)(b)(c) | | 95,000 | 95,475 |
| Tranche B 1LN, term loan 3 month U.S. LIBOR + 3.750% 4.5% 3/31/28 (a)(b)(c) | | 342,281 | 343,441 |
| Tranche DD 1LN, term loan 3 month U.S. LIBOR + 3.750% 4.4425% 3/31/28 (a)(b)(c)(f) | | 71,696 | 71,939 |
| Dynatrace LLC 1LN, term loan 3 month U.S. LIBOR + 2.250% 2.3341% 8/23/25 (a)(b)(c) | | 117,778 | 117,214 |
| Emerald TopCo, Inc. 1LN, term loan 3 month U.S. LIBOR + 3.500% 3.6284% 7/22/26 (a)(b)(c) | | 244,693 | 243,012 |
| Epicor Software Corp. Tranche B 1LN, term loan 3 month U.S. LIBOR + 3.250% 4% 7/31/27 (a)(b)(c) | | 608,850 | 608,576 |
| EXC Holdings III Corp. Tranche B, term loan 3 month U.S. LIBOR + 3.500% 4.5% 12/2/24 (a)(b)(c) | | 268,116 | 268,786 |
| Go Daddy Operating Co. LLC: | | | |
| Tranche B 1LN, term loan 3 month U.S. LIBOR + 2.000% 2.0841% 8/10/27 (a)(b)(c) | | 370,313 | 367,998 |
| Tranche B, term loan 3 month U.S. LIBOR + 1.750% 1.8341% 2/15/24 (a)(b)(c) | | 288,357 | 286,520 |
| Hunter U.S. Bidco, Inc. Tranche B 1LN, term loan 1 month U.S. LIBOR + 4.250% 4.75% 8/19/28 (a)(b)(c) | | 470,000 | 471,763 |
| Hyland Software, Inc. Tranche B 1LN, term loan 3 month U.S. LIBOR + 3.500% 4.25% 7/1/24 (a)(b)(c) | | 668,901 | 669,248 |
| Icon Luxembourg Sarl Tranche B 1LN, term loan 1 month U.S. LIBOR + 2.500% 3% 7/1/28 (a)(b)(c) | | 1,601,078 | 1,606,185 |
| Imprivata, Inc. Tranche B 1LN, term loan 3 month U.S. LIBOR + 3.500% 4% 12/1/27 (a)(b)(c) | | 467,650 | 467,552 |
| Liftoff Mobile, Inc. Tranche B 1LN, term loan 1 month U.S. LIBOR + 3.750% 9/30/28 (b)(c)(d) | | 450,000 | 448,313 |
| MA FinanceCo. LLC: | | | |
| Tranche B 1LN, term loan 3 month U.S. LIBOR + 4.250% 5.25% 6/5/25 (a)(b)(c) | | 243,750 | 245,044 |
| Tranche B 3LN, term loan 3 month U.S. LIBOR + 2.750% 2.8341% 6/21/24 (a)(b)(c) | | 321,091 | 317,479 |
| McAfee LLC Tranche B, term loan 3 month U.S. LIBOR + 3.750% 3.8368% 9/29/24 (a)(b)(c) | | 1,003,985 | 1,004,116 |
| MH Sub I LLC: | | | |
| Tranche B 2LN, term loan 3 month U.S. LIBOR + 6.250% 6.336% 2/23/29 (a)(b)(c) | | 85,000 | 86,195 |
| Tranche B, term loan 3 month U.S. LIBOR + 3.500% 3.5841% 9/15/24 (a)(b)(c) | | 529,117 | 527,313 |
| NAVEX TopCo, Inc.: | | | |
| 2LN, term loan 3 month U.S. LIBOR + 7.000% 7.09% 9/4/26 (a)(b)(c) | | 85,000 | 82,592 |
| Tranche B 1LN, term loan 3 month U.S. LIBOR + 3.250% 3.34% 9/5/25 (a)(b)(c) | | 334,650 | 331,387 |
| Osmosis Debt Merger Sub, Inc.: | | | |
| Tranche B 1LN, term loan 1 month U.S. LIBOR + 4.000% 4.5% 7/30/28 (a)(b)(c) | | 271,111 | 271,857 |
| Tranche DD 1LN, term loan 1 month U.S. LIBOR + 4.000% 7/30/28 (b)(c)(d) | | 33,889 | 33,982 |
| Park Place Technologies LLC 1LN, term loan 3 month U.S. LIBOR + 5.000% 6% 11/10/27 (a)(b)(c) | | 379,021 | 377,994 |
| Peraton Corp. Tranche B 1LN, term loan 3 month U.S. LIBOR + 3.750% 4.5% 2/1/28 (a)(b)(c) | | 2,577,050 | 2,577,462 |
| PointClickCare Technologies, Inc. Tranche B 1LN, term loan 3 month U.S. LIBOR + 3.000% 3.75% 12/29/27 (a)(b)(c) | | 233,825 | 233,533 |
| Polaris Newco LLC Tranche B 1LN, term loan 1 month U.S. LIBOR + 4.000% 4.5% 6/2/28 (a)(b)(c) | | 1,290,000 | 1,292,425 |
| Project Boost Purchaser LLC 1LN, term loan 3 month U.S. LIBOR + 3.500% 3.5841% 5/30/26 (a)(b)(c) | | 367,500 | 365,490 |
| Proofpoint, Inc. Tranche B 1LN, term loan 1 month U.S. LIBOR + 3.250% 3.75% 6/9/28 (a)(b)(c) | | 1,255,000 | 1,248,098 |
| Rackspace Technology Global, Inc. Tranche B 1LN, term loan 3 month U.S. LIBOR + 2.750% 3.5% 2/15/28 (a)(b)(c) | | 1,174,474 | 1,165,536 |
| RealPage, Inc. Tranche B 1LN, term loan 3 month U.S. LIBOR + 3.250% 3.75% 4/22/28 (a)(b)(c) | | 710,000 | 707,558 |
| Renaissance Holding Corp. Tranche B 1LN, term loan 3 month U.S. LIBOR + 3.250% 3.3341% 5/31/25 (a)(b)(c) | | 421,844 | 418,001 |
| Seattle Spinco, Inc. Tranche B 3LN, term loan 3 month U.S. LIBOR + 2.750% 2.8341% 6/21/24 (a)(b)(c) | | 2,226,903 | 2,201,850 |
| Severin Acquisition LLC Tranche B 1LN, term loan 3 month U.S. LIBOR + 3.250% 3.3374% 8/1/25 (a)(b)(c) | | 284,030 | 282,375 |
| Sophia LP 1LN, term loan 3 month U.S. LIBOR + 3.750% 4.5% 10/7/27 (a)(b)(c) | | 942,875 | 946,015 |
| SS&C Technologies, Inc.: | | | |
| Tranche B 3LN, term loan 3 month U.S. LIBOR + 1.750% 1.8341% 4/16/25 (a)(b)(c) | | 357,411 | 353,526 |
| Tranche B 4LN, term loan 3 month U.S. LIBOR + 1.750% 1.8341% 4/16/25 (a)(b)(c) | | 270,647 | 267,705 |
| Tranche B 5LN, term loan 3 month U.S. LIBOR + 1.750% 1.8341% 4/16/25 (a)(b)(c) | | 1,050,808 | 1,040,741 |
| STG-Fairway Holdings LLC Tranche B 1LN, term loan 3 month U.S. LIBOR + 3.250% 2.8341% 1/31/27 (a)(b)(c) | | 224,114 | 223,834 |
| Tempo Acquisition LLC Tranche B, term loan 3 month U.S. LIBOR + 2.750% 2.8341% 5/1/24 (a)(b)(c) | | 110,631 | 110,527 |
| TTM Technologies, Inc. Tranche B, term loan 3 month U.S. LIBOR + 2.500% 2.586% 9/28/24 (a)(b)(c) | | 661,092 | 661,369 |
| UKG, Inc.: | | | |
| 1LN, term loan 3 month U.S. LIBOR + 3.750% 3.8341% 5/4/26 (a)(b)(c) | | 788,900 | 790,020 |
| 2LN, term loan 3 month U.S. LIBOR + 6.750% 7.5% 5/3/27 (a)(b)(c) | | 570,000 | 579,023 |
| Tranche B 1LN, term loan 3 month U.S. LIBOR + 3.250% 4% 5/4/26 (a)(b)(c) | | 1,539,479 | 1,541,527 |
| Verscend Holding Corp. Tranche B 1LN, term loan 3 month U.S. LIBOR + 4.000% 4.0841% 8/27/25 (a)(b)(c) | | 869,239 | 869,961 |
| VFH Parent LLC Tranche B 1LN, term loan 3 month U.S. LIBOR + 3.000% 3.0818% 3/1/26 (a)(b)(c) | | 566,784 | 565,769 |
| Virgin Pulse, Inc. Tranche B 1LN, term loan 3 month U.S. LIBOR + 4.000% 4.75% 4/6/28 (a)(b)(c) | | 280,000 | 279,300 |
| VM Consolidated, Inc. Tranche B 1LN, term loan 3 month U.S. LIBOR + 3.250% 3.4166% 3/19/28 (a)(b)(c) | | 468,336 | 467,263 |
| VS Buyer LLC Tranche B 1LN, term loan 3 month U.S. LIBOR + 3.000% 3.0841% 2/28/27 (a)(b)(c) | | 523,375 | 522,721 |
| Weber-Stephen Products LLC Tranche B 1LN, term loan 3 month U.S. LIBOR + 3.250% 4% 10/30/27 (a)(b)(c) | | 342,896 | 343,496 |
| WEX, Inc. Tranche B 1LN, term loan 3 month U.S. LIBOR + 2.250% 2.3341% 4/1/28 (a)(b)(c) | | 268,650 | 267,382 |
| Xperi Holding Corp. Tranche B 1LN, term loan 1 month U.S. LIBOR + 3.500% 3.5841% 6/8/28 (a)(b)(c) | | 273,811 | 273,041 |
| Zelis Payments Buyer, Inc. Tranche B 1LN, term loan 3 month U.S. LIBOR + 3.500% 3.586% 9/30/26 (a)(b)(c) | | 315,613 | 314,177 |
|
| TOTAL TECHNOLOGY | | | 42,653,454 |
|
| Telecommunications - 6.6% | | | |
| Altice Financing SA Tranche B, term loan 3 month U.S. LIBOR + 2.750% 2.9004% 1/31/26 (a)(b)(c) | | 481,250 | 472,467 |
| Altice France SA: | | | |
| Tranche B 11LN, term loan 3 month U.S. LIBOR + 2.750% 2.8785% 7/31/25 (a)(b)(c) | | 23,762 | 23,356 |
| Tranche B 13LN, term loan 3 month U.S. LIBOR + 4.000% 4.1248% 8/14/26 (a)(b)(c) | | 1,215,625 | 1,210,556 |
| Blucora, Inc. Tranche B, term loan 3 month U.S. LIBOR + 4.000% 5% 5/22/24 (a)(b)(c) | | 248,996 | 249,307 |
| Cablevision Lightpath LLC Tranche B 1LN, term loan 3 month U.S. LIBOR + 3.250% 3.75% 11/30/27 (a)(b)(c) | | 212,426 | 212,585 |
| Connect Finco SARL Tranche B 1LN, term loan 3 month U.S. LIBOR + 3.500% 4.5% 12/12/26 (a)(b)(c) | | 615,625 | 615,847 |
| Consolidated Communications, Inc. Tranche B 1LN, term loan 3 month U.S. LIBOR + 3.500% 4.25% 10/2/27 (a)(b)(c) | | 264,182 | 264,306 |
| Crown Subsea Communications Holding, Inc. Tranche B 1LN, term loan 1 month U.S. LIBOR + 5.000% 5.75% 4/20/27 (a)(b)(c) | | 212,363 | 213,601 |
| Evo Payments International LLC Tranche B, term loan 3 month U.S. LIBOR + 3.250% 3.34% 12/22/23 (a)(b)(c) | | 440,135 | 439,127 |
| Frontier Communications Corp. Tranche B 1LN, term loan 3 month U.S. LIBOR + 3.750% 4.5% 10/8/27 (a)(b)(c) | | 1,298,475 | 1,295,631 |
| GTT Communications, Inc. Tranche B, term loan 3 month U.S. LIBOR + 0.000% 2.88% 5/31/25 (a)(b)(c)(g) | | 512,216 | 432,290 |
| Intelsat Jackson Holdings SA: | | | |
| Tranche B, term loan 3 month U.S. LIBOR + 3.750% 8% 11/27/23 (a)(b)(c) | | 2,535,000 | 2,563,062 |
| Tranche B-4, term loan 3 month U.S. LIBOR + 5.500% 8.75% 1/2/24 (a)(b)(c) | | 1,000,000 | 1,014,380 |
| Tranche B-5, term loan 8.625% 1/2/24 (c) | | 650,000 | 659,211 |
| Tranche DD 1LN, term loan 3 month U.S. LIBOR + 4.750% 5.3917% 7/13/22 (a)(b)(c)(f) | | 1,722,573 | 1,732,616 |
| Iridium Satellite LLC Tranche B 1LN, term loan 1 month U.S. LIBOR + 2.500% 3.25% 11/4/26 (a)(b)(c) | | 464,287 | 464,454 |
| Level 3 Financing, Inc. Tranche B 1LN, term loan 3 month U.S. LIBOR + 1.750% 1.8341% 3/1/27 (a)(b)(c) | | 457,985 | 452,177 |
| Lumen Technologies, Inc. Tranche B 1LN, term loan 3 month U.S. LIBOR + 2.250% 2.3341% 3/15/27 (a)(b)(c) | | 157,594 | 155,733 |
| Northwest Fiber LLC Tranche B 1LN, term loan 3 month U.S. LIBOR + 3.750% 3.8326% 4/30/27 (a)(b)(c) | | 701,724 | 700,671 |
| Radiate Holdco LLC Tranche B 1LN, term loan 3 month U.S. LIBOR + 3.500% 4.25% 9/10/26 (a)(b)(c) | | 1,315,063 | 1,313,169 |
| Securus Technologies Holdings Tranche B, term loan: | | | |
| 3 month U.S. LIBOR + 4.500% 5.5% 11/1/24 (a)(b)(c) | | 722,928 | 687,006 |
| 3 month U.S. LIBOR + 8.250% 9.25% 11/1/25 (a)(b)(c) | | 1,100,000 | 1,006,225 |
| Telesat LLC Tranche B, term loan 3 month U.S. LIBOR + 2.750% 2.84% 11/22/26 (a)(b)(c) | | 406,816 | 366,207 |
| Windstream Services LLC Tranche B 1LN, term loan 3 month U.S. LIBOR + 6.250% 7.25% 9/21/27 (a)(b)(c) | | 587,848 | 589,612 |
| Zayo Group Holdings, Inc. 1LN, term loan 3 month U.S. LIBOR + 3.000% 3.0841% 3/9/27 (a)(b)(c) | | 1,763,763 | 1,747,307 |
|
| TOTAL TELECOMMUNICATIONS | | | 18,880,903 |
|
| Textiles/Apparel - 0.2% | | | |
| Canada Goose, Inc. Tranche B 1LN, term loan 3 month U.S. LIBOR + 3.500% 4.25% 10/7/27 (a)(b)(c) | | 243,166 | 243,470 |
| Tory Burch LLC Tranche B 1LN, term loan 3 month U.S. LIBOR + 3.500% 4% 4/14/28 (a)(b)(c) | | 438,900 | 439,449 |
|
| TOTAL TEXTILES/APPAREL | | | 682,919 |
|
| Utilities - 2.5% | | | |
| Brookfield WEC Holdings, Inc. Tranche B 1LN, term loan 3 month U.S. LIBOR + 2.750% 3.25% 8/1/25 (a)(b)(c) | | 1,789,471 | 1,776,247 |
| Granite Generation LLC 1LN, term loan 3 month U.S. LIBOR + 3.750% 4.75% 11/1/26 (a)(b)(c) | | 343,848 | 337,487 |
| Green Energy Partners/Stonewall LLC Tranche B 1LN, term loan 3 month U.S. LIBOR + 5.500% 6.5% 11/13/21 (a)(b)(c) | | 830,400 | 755,664 |
| Limetree Bay Terminals LLC term loan 3 month U.S. LIBOR + 4.000% 5% 2/15/24 (a)(b)(c) | | 923,459 | 778,014 |
| LMBE-MC HoldCo II LLC Tranche B, term loan 3 month U.S. LIBOR + 4.000% 5% 12/3/25 (a)(b)(c) | | 123,425 | 117,563 |
| PG&E Corp. Tranche B 1LN, term loan 3 month U.S. LIBOR + 3.000% 3.5% 6/23/25 (a)(b)(c) | | 1,002,313 | 984,461 |
| Pike Corp. Tranche B 1LN, term loan 3 month U.S. LIBOR + 3.000% 3.09% 1/21/28 (a)(b)(c) | | 359,589 | 359,345 |
| Vertiv Group Corp. Tranche B 1LN, term loan 3 month U.S. LIBOR + 2.750% 2.8325% 3/2/27 (a)(b)(c) | | 1,150,775 | 1,143,100 |
| Vistra Operations Co. LLC Tranche B 3LN, term loan 3 month U.S. LIBOR + 1.750% 1.8341% 12/31/25 (a)(b)(c) | | 852,716 | 845,826 |
|
| TOTAL UTILITIES | | | 7,097,707 |
|
| TOTAL BANK LOAN OBLIGATIONS | | | |
| (Cost $265,318,073) | | | 265,001,706 |
|
| Nonconvertible Bonds - 2.5% | | | |
| Aerospace - 0.2% | | | |
| TransDigm, Inc.: | | | |
| 6.25% 3/15/26 (h) | | 500,000 | 521,250 |
| 8% 12/15/25 (h) | | 55,000 | 58,644 |
|
| TOTAL AEROSPACE | | | 579,894 |
|
| Air Transportation - 0.1% | | | |
| American Airlines, Inc. / AAdvantage Loyalty IP Ltd. 5.5% 4/20/26 (h) | | 165,000 | 173,456 |
| Delta Air Lines, Inc. / SkyMiles IP Ltd. 4.5% 10/20/25 (h) | | 115,000 | 123,050 |
|
| TOTAL AIR TRANSPORTATION | | | 296,506 |
|
| Broadcasting - 0.1% | | | |
| Univision Communications, Inc.: | | | |
| 6.625% 6/1/27 (h) | | 170,000 | 184,663 |
| 9.5% 5/1/25 (h) | | 170,000 | 184,450 |
|
| TOTAL BROADCASTING | | | 369,113 |
|
| Chemicals - 0.2% | | | |
| Consolidated Energy Finance SA 3 month U.S. LIBOR + 3.750% 3.866% 6/15/22 (a)(b)(h) | | 436,000 | 435,464 |
| Kronos Acquisition Holdings, Inc. / KIK Custom Products, Inc. 5% 12/31/26 (h) | | 5,000 | 4,993 |
|
| TOTAL CHEMICALS | | | 440,457 |
|
| Containers - 0.2% | | | |
| Ardagh Packaging Finance PLC/Ardagh MP Holdings U.S.A., Inc. 4.125% 8/15/26 (h) | | 415,000 | 430,533 |
| Trivium Packaging Finance BV 5.5% 8/15/26 (h) | | 145,000 | 151,860 |
|
| TOTAL CONTAINERS | | | 582,393 |
|
| Energy - 0.1% | | | |
| New Fortress Energy, Inc. 6.75% 9/15/25 (h) | | 75,000 | 72,188 |
| PBF Holding Co. LLC/PBF Finance Corp. 9.25% 5/15/25 (h) | | 165,000 | 155,513 |
| Transocean Poseidon Ltd. 6.875% 2/1/27 (h) | | 140,000 | 139,290 |
|
| TOTAL ENERGY | | | 366,991 |
|
| Gaming - 0.2% | | | |
| Golden Entertainment, Inc. 7.625% 4/15/26 (h) | | 250,000 | 263,750 |
| Sugarhouse HSP Gaming Prop Mezz LP/Sugarhouse HSP Gaming Finance Corp. 5.875% 5/15/25 (h) | | 300,000 | 300,000 |
| VICI Properties, Inc.: | | | |
| 3.5% 2/15/25 (h) | | 35,000 | 35,700 |
| 4.25% 12/1/26 (h) | | 50,000 | 52,217 |
|
| TOTAL GAMING | | | 651,667 |
|
| Healthcare - 0.1% | | | |
| Bausch Health Companies, Inc. 5.5% 11/1/25 (h) | | 235,000 | 238,525 |
| HCRX Investments Holdco LP 4.5% 8/1/29 (h) | | 15,000 | 15,075 |
| Tenet Healthcare Corp. 4.625% 7/15/24 | | 104,000 | 105,560 |
|
| TOTAL HEALTHCARE | | | 359,160 |
|
| Hotels - 0.1% | | | |
| Marriott Ownership Resorts, Inc. 6.125% 9/15/25 (h) | | 265,000 | 279,906 |
| Leisure - 0.1% | | | |
| Royal Caribbean Cruises Ltd.: | | | |
| 9.125% 6/15/23 (h) | | 40,000 | 43,472 |
| 10.875% 6/1/23 (h) | | 190,000 | 212,800 |
|
| TOTAL LEISURE | | | 256,272 |
|
| Paper - 0.0% | | | |
| Ardagh Metal Packaging Finance U.S.A. LLC/Ardagh Metal Packaging Finance PLC 3.25% 9/1/28 (h) | | 135,000 | 134,663 |
| Services - 0.2% | | | |
| Adtalem Global Education, Inc. 5.5% 3/1/28 (h) | | 165,000 | 166,548 |
| Aramark Services, Inc. 6.375% 5/1/25 (h) | | 90,000 | 94,613 |
| Sotheby's 7.375% 10/15/27 (h) | | 200,000 | 211,500 |
|
| TOTAL SERVICES | | | 472,661 |
|
| Super Retail - 0.1% | | | |
| EG Global Finance PLC: | | | |
| 6.75% 2/7/25 (h) | | 125,000 | 127,813 |
| 8.5% 10/30/25 (h) | | 260,000 | 270,725 |
|
| TOTAL SUPER RETAIL | | | 398,538 |
|
| Technology - 0.1% | | | |
| CommScope, Inc. 6% 3/1/26 (h) | | 150,000 | 155,750 |
| SSL Robotics LLC 9.75% 12/31/23 (h) | | 103,000 | 111,626 |
|
| TOTAL TECHNOLOGY | | | 267,376 |
|
| Telecommunications - 0.6% | | | |
| Altice Financing SA 5.75% 8/15/29 (h) | | 1,000,000 | 972,150 |
| Altice France SA: | | | |
| 5.125% 1/15/29 (h) | | 25,000 | 24,500 |
| 7.375% 5/1/26 (h) | | 393,000 | 407,820 |
| Frontier Communications Holdings LLC 5% 5/1/28 (h) | | 160,000 | 168,000 |
|
| TOTAL TELECOMMUNICATIONS | | | 1,572,470 |
|
| Transportation Ex Air/Rail - 0.1% | | | |
| Avolon Holdings Funding Ltd. 5.125% 10/1/23 (h) | | 205,000 | 220,257 |
| TOTAL NONCONVERTIBLE BONDS | | | |
| (Cost $7,040,533) | | | 7,248,324 |
| | | Shares | Value |
|
| Common Stocks - 1.9% | | | |
| Capital Goods - 0.2% | | | |
| TNT Crane & Rigging LLC (e)(i) | | 22,401 | 544,120 |
| TNT Crane & Rigging LLC warrants 10/31/25 (e)(i) | | 3,037 | 10,022 |
|
| TOTAL CAPITAL GOODS | | | 554,142 |
|
| Diversified Financial Services - 0.0% | | | |
| ACNR Holdings, Inc. (e)(i) | | 1,891 | 66,185 |
| Energy - 1.2% | | | |
| California Resources Corp. (i) | | 30,579 | 1,253,739 |
| California Resources Corp. warrants 10/27/24 (i) | | 920 | 11,040 |
| Chesapeake Energy Corp. | | 20,902 | 1,287,354 |
| Chesapeake Energy Corp. (j) | | 137 | 8,438 |
| Denbury, Inc. (i) | | 9,205 | 646,651 |
| EP Energy Corp. (e)(i) | | 3,190 | 286,303 |
|
| TOTAL ENERGY | | | 3,493,525 |
|
| Entertainment/Film - 0.0% | | | |
| Cineworld Group PLC warrants 11/23/25 (i) | | 53,143 | 28,628 |
| Publishing/Printing - 0.1% | | | |
| Cenveo Corp. (e)(i) | | 7,037 | 205,199 |
| Restaurants - 0.1% | | | |
| CEC Entertainment, Inc. (e)(i) | | 15,069 | 271,242 |
| Super Retail - 0.0% | | | |
| David's Bridal, Inc. rights (e)(i) | | 156 | 0 |
| Utilities - 0.3% | | | |
| TexGen Power LLC (e)(i) | | 25,327 | 919,117 |
| TOTAL COMMON STOCKS | | | |
| (Cost $3,938,954) | | | 5,538,038 |
|
| Nonconvertible Preferred Stocks - 0.1% | | | |
| Diversified Financial Services - 0.1% | | | |
| ACNR Holdings, Inc. (e)(i) | | | |
| (Cost $135,375) | | 1,083 | 194,940 |
|
| Other - 0.0% | | | |
| Other - 0.0% | | | |
| Tribune Co. Claim (e)(i) | | | |
| (Cost $29,756) | | 30,115 | 20,177 |
|
| Money Market Funds - 6.8% | | | |
| Fidelity Cash Central Fund 0.06% (k) | | | |
| (Cost $19,248,300) | | 19,245,758 | 19,249,607 |
| TOTAL INVESTMENT IN SECURITIES - 104.1% | | | |
| (Cost $295,710,991) | | | 297,252,792 |
| NET OTHER ASSETS (LIABILITIES) - (4.1)% | | | (11,718,730) |
| NET ASSETS - 100% | | | $285,534,062 |
Legend
(a) Coupon rates for floating and adjustable rate securities reflect the rates in effect at period end.
(b) Coupon is indexed to a floating interest rate which may be multiplied by a specified factor and/or subject to caps or floors.
(c) Remaining maturities of bank loan obligations may be less than the stated maturities shown as a result of contractual or optional prepayments by the borrower. Such prepayments cannot be predicted with certainty.
(d) The coupon rate will be determined upon settlement of the loan after period end.
(e) Level 3 security
(f) Position or a portion of the position represents an unfunded loan commitment. At period end, the total principal amount and market value of unfunded commitments totaled $605,672 and $606,368, respectively.
(g) Non-income producing - Security is in default.
(h) Security exempt from registration under Rule 144A of the Securities Act of 1933. These securities may be resold in transactions exempt from registration, normally to qualified institutional buyers. At the end of the period, the value of these securities amounted to $7,142,764 or 2.5% of net assets.
(i) Non-income producing
(j) Restricted securities (including private placements) - Investment in securities not registered under the Securities Act of 1933 (excluding 144A issues). At the end of the period, the value of restricted securities (excluding 144A issues) amounted to $8,438 or 0.0% of net assets.
(k) Affiliated fund that is generally available only to investment companies and other accounts managed by Fidelity Investments. The rate quoted is the annualized seven-day yield of the fund at period end. A complete unaudited listing of the fund's holdings as of its most recent quarter end is available upon request. In addition, each Fidelity Central Fund's financial statements, which are not covered by the Fund's Report of Independent Registered Public Accounting Firm, are available on the SEC's website or upon request.
Additional information on each restricted holding is as follows:
| Security | Acquisition Date | Acquisition Cost |
| Chesapeake Energy Corp. | 2/10/21 | $1,297 |
Affiliated Central Funds
Fiscal year to date information regarding the Fund's investments in Fidelity Central Funds, including the ownership percentage, is presented below.
| Fund | Value, beginning of period | Purchases | Sales Proceeds | Dividend Income | Realized Gain/Loss | Change in Unrealized appreciation (depreciation) | Value, end of period | % ownership, end of period |
| Fidelity Cash Central Fund 0.06% | $13,618,084 | $91,219,435 | $85,587,774 | $9,361 | $619 | $(757) | $19,249,607 | 0.0% |
| Total | $13,618,084 | $91,219,435 | $85,587,774 | $9,361 | $619 | $(757) | $19,249,607 | |
Amounts in the income column in the above table include any capital gain distributions from underlying funds, which are presented in the corresponding line-item in the Statement of Operations, if applicable.
Investment Valuation
The following is a summary of the inputs used, as of September 30, 2021, involving the Fund's assets and liabilities carried at fair value. The inputs or methodology used for valuing securities may not be an indication of the risk associated with investing in those securities. For more information on valuation inputs, and their aggregation into the levels used below, please refer to the Investment Valuation section in the accompanying Notes to Financial Statements.
| | Valuation Inputs at Reporting Date: |
| Description | Total | Level 1 | Level 2 | Level 3 |
| Investments in Securities: | | | | |
| Equities: | | | | |
| Communication Services | $28,628 | $-- | $28,628 | $-- |
| Consumer Discretionary | 271,242 | -- | -- | 271,242 |
| Energy | 3,493,525 | 3,207,222 | -- | 286,303 |
| Financials | 261,125 | -- | -- | 261,125 |
| Industrials | 759,341 | -- | -- | 759,341 |
| Utilities | 919,117 | -- | -- | 919,117 |
| Bank Loan Obligations | 265,001,706 | -- | 262,547,846 | 2,453,860 |
| Corporate Bonds | 7,248,324 | -- | 7,248,324 | -- |
| Other | 20,177 | -- | -- | 20,177 |
| Money Market Funds | 19,249,607 | 19,249,607 | -- | -- |
| Total Investments in Securities: | $297,252,792 | $22,456,829 | $269,824,798 | $4,971,165 |
The following is a reconciliation of Investments in Securities for which Level 3 inputs were used in determining value:
| Investments in Securities: | |
| Beginning Balance | $4,736,534 |
| Net Realized Gain (Loss) on Investment Securities | (2,482,384) |
| Net Unrealized Gain (Loss) on Investment Securities | 3,371,628 |
| Cost of Purchases | 1,747,112 |
| Proceeds of Sales | (1,917,002) |
| Amortization/Accretion | (38,657) |
| Transfers into Level 3 | 656,499 |
| Transfers out of Level 3 | (1,102,565) |
| Ending Balance | $4,971,165 |
| The change in unrealized gain (loss) for the period attributable to Level 3 securities held at September 30, 2021 | $880,727 |
The information used in the above reconciliation represents fiscal year to date activity for any Investments in Securities identified as using Level 3 inputs at either the beginning or the end of the current fiscal period. Cost of purchases and proceeds of sales may include securities received and/or delivered through in-kind transactions. Transfers in or out of Level 3 represent the beginning value of any Security or Instrument where a change in the pricing level occurred from the beginning to the end of the period. The cost of purchases and the proceeds of sales may include securities received or delivered through corporate actions or exchanges. Realized and unrealized gains (losses) disclosed in the reconciliation are included in Net Gain (Loss) on the Fund's Statement of Operations.
Other Information
Distribution of investments by country or territory of incorporation, as a percentage of Total Net Assets, is as follows (Unaudited):
| United States of America | 87.6% |
| Luxembourg | 6.5% |
| Canada | 1.1% |
| Cayman Islands | 1.1% |
| Others (Individually Less Than 1%) | 3.7% |
| | 100.0% |
See accompanying notes which are an integral part of the financial statements.
Financial Statements
Statement of Assets and Liabilities
| | | September 30, 2021 |
| Assets | | |
Investment in securities, at value — See accompanying schedule:
Unaffiliated issuers (cost $276,462,691) | $278,003,185 | |
| Fidelity Central Funds (cost $19,248,300) | 19,249,607 | |
| Total Investment in Securities (cost $295,710,991) | | $297,252,792 |
| Cash | | 801,853 |
| Receivable for investments sold | | 1,780,987 |
| Receivable for fund shares sold | | 6,582 |
| Dividends receivable | | 47 |
| Interest receivable | | 920,503 |
| Distributions receivable from Fidelity Central Funds | | 839 |
| Receivable from investment adviser for expense reductions | | 2,977 |
| Other receivables | | 223 |
| Total assets | | 300,766,803 |
| Liabilities | | |
| Payable for investments purchased | $13,657,344 | |
| Payable for fund shares redeemed | 1,553,204 | |
| Other payables and accrued expenses | 22,193 | |
| Total liabilities | | 15,232,741 |
| Net Assets | | $285,534,062 |
| Net Assets consist of: | | |
| Paid in capital | | $313,508,099 |
| Total accumulated earnings (loss) | | (27,974,037) |
| Net Assets | | $285,534,062 |
| Net Asset Value, offering price and redemption price per share ($285,534,062 ÷ 30,714,806 shares) | | $9.30 |
See accompanying notes which are an integral part of the financial statements.
Statement of Operations
| | | Year ended September 30, 2021 |
| Investment Income | | |
| Dividends | | $398,714 |
| Interest | | 11,406,388 |
| Income from Fidelity Central Funds | | 9,361 |
| Total income | | 11,814,463 |
| Expenses | | |
| Custodian fees and expenses | $31,514 | |
| Independent trustees' fees and expenses | 1,122 | |
| Miscellaneous | 141 | |
| Total expenses before reductions | 32,777 | |
| Expense reductions | (23,487) | |
| Total expenses after reductions | | 9,290 |
| Net investment income (loss) | | 11,805,173 |
| Realized and Unrealized Gain (Loss) | | |
| Net realized gain (loss) on: | | |
| Investment securities: | | |
| Unaffiliated issuers | (4,316,736) | |
| Fidelity Central Funds | 619 | |
| Total net realized gain (loss) | | (4,316,117) |
| Change in net unrealized appreciation (depreciation) on: | | |
| Investment securities: | | |
| Unaffiliated issuers | 17,326,935 | |
| Fidelity Central Funds | (757) | |
| Total change in net unrealized appreciation (depreciation) | | 17,326,178 |
| Net gain (loss) | | 13,010,061 |
| Net increase (decrease) in net assets resulting from operations | | $24,815,234 |
See accompanying notes which are an integral part of the financial statements.
Statement of Changes in Net Assets
| | Year ended September 30, 2021 | Year ended September 30, 2020 |
| Increase (Decrease) in Net Assets | | |
| Operations | | |
| Net investment income (loss) | $11,805,173 | $14,175,669 |
| Net realized gain (loss) | (4,316,117) | (3,896,128) |
| Change in net unrealized appreciation (depreciation) | 17,326,178 | (9,773,586) |
| Net increase (decrease) in net assets resulting from operations | 24,815,234 | 505,955 |
| Distributions to shareholders | (11,648,675) | (13,895,333) |
| Share transactions | | |
| Proceeds from sales of shares | 41,439,460 | 44,614,005 |
| Reinvestment of distributions | 11,644,865 | 13,868,082 |
| Cost of shares redeemed | (49,776,970) | (40,615,969) |
| Net increase (decrease) in net assets resulting from share transactions | 3,307,355 | 17,866,118 |
| Total increase (decrease) in net assets | 16,473,914 | 4,476,740 |
| Net Assets | | |
| Beginning of period | 269,060,148 | 264,583,408 |
| End of period | $285,534,062 | $269,060,148 |
| Other Information | | |
| Shares | | |
| Sold | 4,514,578 | 4,901,203 |
| Issued in reinvestment of distributions | 1,271,508 | 1,564,970 |
| Redeemed | (5,434,758) | (4,592,438) |
| Net increase (decrease) | 351,328 | 1,873,735 |
See accompanying notes which are an integral part of the financial statements.
Financial Highlights
Fidelity Series Floating Rate High Income Fund
| | | | | | |
| Years ended September 30, | 2021 | 2020 | 2019 | 2018 | 2017 |
| Selected Per–Share Data | | | | | |
| Net asset value, beginning of period | $8.86 | $9.29 | $9.52 | $9.49 | $9.42 |
| Income from Investment Operations | | | | | |
| Net investment income (loss)A | .388 | .463 | .547 | .540 | .445 |
| Net realized and unrealized gain (loss) | .435 | (.439) | (.131) | (.001) | .053 |
| Total from investment operations | .823 | .024 | .416 | .539 | .498 |
| Distributions from net investment income | (.383) | (.454) | (.646) | (.509) | (.428) |
| Total distributions | (.383) | (.454) | (.646) | (.509) | (.428) |
| Net asset value, end of period | $9.30 | $8.86 | $9.29 | $9.52 | $9.49 |
| Total ReturnB | 9.44% | .37% | 4.61% | 5.82% | 5.38% |
| Ratios to Average Net AssetsC,D | | | | | |
| Expenses before reductions | .01% | .01% | .01% | .01% | .49% |
| Expenses net of fee waivers, if any | - %E | .01% | .01% | .01% | .49% |
| Expenses net of all reductions | - %E | .01% | .01% | - %E | .48% |
| Net investment income (loss) | 4.24% | 5.22% | 5.87% | 5.68% | 4.71% |
| Supplemental Data | | | | | |
| Net assets, end of period (000 omitted) | $285,534 | $269,060 | $264,583 | $461,203 | $448,936 |
| Portfolio turnover rateF | 45% | 37% | 33% | 52% | 75% |
A Calculated based on average shares outstanding during the period.
B Total returns would have been lower if certain expenses had not been reduced during the applicable periods shown.
C Fees and expenses of any underlying mutual funds or exchange-traded funds (ETFs) are not included in the Fund's expense ratio. The Fund indirectly bears its proportionate share of these expenses. For additional expense information related to investments in Fidelity Central Funds, please refer to the "Investments in Fidelity Central Funds" note found in the Notes to Financial Statements section of the most recent Annual or Semi-Annual report.
D Expense ratios reflect operating expenses of the class. Expenses before reductions do not reflect amounts reimbursed, waived, or reduced through arrangements with the investment adviser, brokerage services, or other offset arrangements, if applicable, and do not represent the amount paid by the class during periods when reimbursements, waivers or reductions occur.
E Amount represents less than .005%.
F Amount does not include the portfolio activity of any underlying mutual funds or exchange-traded funds (ETFs).
See accompanying notes which are an integral part of the financial statements.
Notes to Financial Statements
For the period ended September 30, 2021
1. Organization.
Fidelity Series Floating Rate High Income Fund (the Fund) is a fund of Fidelity Summer Street Trust (the Trust) and is authorized to issue an unlimited number of shares. Shares are offered only to certain other Fidelity funds and Fidelity managed 529 plans. The Trust is registered under the Investment Company Act of 1940, as amended (the 1940 Act), as an open-end management investment company organized as a Massachusetts business trust.
2. Investments in Fidelity Central Funds.
Funds may invest in Fidelity Central Funds, which are open-end investment companies generally available only to other investment companies and accounts managed by the investment adviser and its affiliates. The Schedule of Investments lists any Fidelity Central Funds held as an investment as of period end, but does not include the underlying holdings of each Fidelity Central Fund. An investing fund indirectly bears its proportionate share of the expenses of the underlying Fidelity Central Funds.
Based on its investment objective, each Fidelity Central Fund may invest or participate in various investment vehicles or strategies that are similar to those of the investing fund. These strategies are consistent with the investment objectives of the investing fund and may involve certain economic risks which may cause a decline in value of each of the Fidelity Central Funds and thus a decline in the value of the investing fund.
| Fidelity Central Fund | Investment Manager | Investment Objective | Investment Practices | Expense Ratio(a) |
| Fidelity Money Market Central Funds | Fidelity Management & Research Company LLC (FMR) | Each fund seeks to obtain a high level of current income consistent with the preservation of capital and liquidity. | Short-term Investments | Less than .005% |
(a) Expenses expressed as a percentage of average net assets and are as of each underlying Central Fund's most recent annual or semi-annual shareholder report.
A complete unaudited list of holdings for each Fidelity Central Fund is available upon request or at the Securities and Exchange Commission website at www.sec.gov. In addition, the financial statements of the Fidelity Central Funds which contain the significant accounting policies (including investment valuation policies) of those funds, and are not covered by the Report of Independent Registered Public Accounting Firm, are available on the Securities and Exchange Commission website or upon request.
3. Significant Accounting Policies.
The Fund is an investment company and applies the accounting and reporting guidance of the Financial Accounting Standards Board (FASB) Accounting Standards Codification Topic 946 Financial Services - Investment Companies. The financial statements have been prepared in conformity with accounting principles generally accepted in the United States of America (GAAP), which require management to make certain estimates and assumptions at the date of the financial statements. Actual results could differ from those estimates. Subsequent events, if any, through the date that the financial statements were issued have been evaluated in the preparation of the financial statements. The Fund's Schedule of Investments lists any underlying mutual funds or exchange-traded funds (ETFs) but does not include the underlying holdings of these funds. The following summarizes the significant accounting policies of the Fund:
Investment Valuation. Investments are valued as of 4:00 p.m. Eastern time on the last calendar day of the period. The Board of Trustees (the Board) has delegated the day to day responsibility for the valuation of the Fund's investments to the Fair Value Committee (the Committee) established by the Fund's investment adviser. In accordance with valuation policies and procedures approved by the Board, the Fund attempts to obtain prices from one or more third party pricing vendors or brokers to value its investments. When current market prices, quotations or currency exchange rates are not readily available or reliable, investments will be fair valued in good faith by the Committee, in accordance with procedures adopted by the Board. Factors used in determining fair value vary by investment type and may include market or investment specific events, changes in interest rates and credit quality. The frequency with which these procedures are used cannot be predicted and they may be utilized to a significant extent. The Committee oversees the Fund's valuation policies and procedures and reports to the Board on the Committee's activities and fair value determinations. The Board monitors the appropriateness of the procedures used in valuing the Fund's investments and ratifies the fair value determinations of the Committee.
The Fund categorizes the inputs to valuation techniques used to value its investments into a disclosure hierarchy consisting of three levels as shown below:
- Level 1 – quoted prices in active markets for identical investments
- Level 2 – other significant observable inputs (including quoted prices for similar investments, interest rates, prepayment speeds, etc.)
- Level 3 – unobservable inputs (including the Fund's own assumptions based on the best information available)
Valuation techniques used to value the Fund's investments by major category are as follows:
Debt securities, including restricted securities, are valued based on evaluated prices received from third party pricing vendors or from brokers who make markets in such securities. Corporate bonds and bank loan obligations are valued by pricing vendors who utilize matrix pricing which considers yield or price of bonds of comparable quality, coupon, maturity and type or by broker-supplied prices. When independent prices are unavailable or unreliable, debt securities may be valued utilizing pricing methodologies which consider similar factors that would be used by third party pricing vendors. Debt securities are generally categorized as Level 2 in the hierarchy but may be Level 3 depending on the circumstances. The Fund invests a significant portion of its assets in below investment grade securities. The value of these securities can be more volatile due to changes in the credit quality of the issuer and is sensitive to changes in economic, market and regulatory conditions.
Equity securities, including restricted securities, for which market quotations are readily available, are valued at the last reported sale price or official closing price as reported by a third party pricing vendor on the primary market or exchange on which they are traded and are categorized as Level 1 in the hierarchy. In the event there were no sales during the day or closing prices are not available, securities are valued at the last quoted bid price or may be valued using the last available price and are generally categorized as Level 2 in the hierarchy. For foreign equity securities, when market or security specific events arise, comparisons to the valuation of American Depositary Receipts (ADRs), futures contracts, Exchange-Traded Funds (ETFs) and certain indexes as well as quoted prices for similar securities may be used and would be categorized as Level 2 in the hierarchy. For equity securities, including restricted securities, where observable inputs are limited, assumptions about market activity and risk are used and these securities may be categorized as Level 3 in the hierarchy.
Investments in open-end mutual funds, including the Fidelity Central Funds, are valued at their closing net asset value (NAV) each business day and are categorized as Level 1 in the hierarchy.
The following provides information on Level 3 securities held by the Fund that were valued at period end based on unobservable inputs. These amounts exclude valuations provided by a broker.
| Asset Type | Fair Value | Valuation Technique(s) | Unobservable Input | Amount or Range/Weighted Average | Impact to Valuation from an Increase in Input(a) |
| Equities | $2,497,128 | Market comparable | Discount rate | 45.0% | Decrease |
| | | | Enterprise value/EBITDA multiple (EV/EBITDA) | 3.8 - 8.4 / 5.5 | Increase |
| | | | Strike price | $31.17 | Increase |
| | | Recovery value | Recovery value | 0.0% | Increase |
| | | Market approach | Transaction price | $89.75 | Increase |
| | | | Parity price | $29.16 | Increase |
| | | Indicative market price | Mid price | $35.00 | Increase |
| | | | Bid price | $18.00 - $180.00 / $85.74 | Increase |
| Bank Loan Obligations | $2,453,860 | Market approach | Parity price | $96.00 | Increase |
| | | Indicative market price | Evaluated bid | $93.00 - $100.00 / $98.95 | Increase |
| | | | Bid price | $101.00 | Increase |
| Other | $20,177 | Recovery value | Recovery value | 0.7% | Increase |
(a) Represents the directional change in the fair value of the Level 3 investments that could have resulted from an increase in the corresponding input as of period end. A decrease to the unobservable input would have had the opposite effect. Significant changes in these inputs may have resulted in a significantly higher or lower fair value measurement at period end.
Changes in valuation techniques may result in transfers in or out of an assigned level within the disclosure hierarchy. The aggregate value of investments by input level as of September 30, 2021, as well as a roll forward of Level 3 investments, is included at the end of the Fund's Schedule of Investments.
Investment Transactions and Income. For financial reporting purposes, the Fund's investment holdings and NAV include trades executed through the end of the last business day of the period. The NAV per share for processing shareholder transactions is calculated as of the close of business of the New York Stock Exchange (NYSE), normally 4:00 p.m. Eastern time and includes trades executed through the end of the prior business day. Gains and losses on securities sold are determined on the basis of identified cost. Dividend income is recorded on the ex-dividend date, except for certain dividends from foreign securities where the ex-dividend date may have passed, which are recorded as soon as the Fund is informed of the ex-dividend date. Non-cash dividends included in dividend income, if any, are recorded at the fair market value of the securities received. Income and capital gain distributions from Fidelity Central Funds, if any, are recorded on the ex-dividend date. Certain distributions received by the Fund represent a return of capital or capital gain. The Fund determines the components of these distributions subsequent to the ex-dividend date, based upon receipt of tax filings or other correspondence relating to the underlying investment. These distributions are recorded as a reduction of cost of investments and/or as a realized gain. Interest income is accrued as earned and includes coupon interest and amortization of premium and accretion of discount on debt securities as applicable. Debt obligations may be placed on non-accrual status and related interest income may be reduced by ceasing current accruals and writing off interest receivables when the collection of all or a portion of interest has become doubtful based on consistently applied procedures. A debt obligation is removed from non-accrual status when the issuer resumes interest payments or when collectability of interest is reasonably assured. The Fund earns certain fees in connection with its floating rate loan purchasing activities. These fees are in addition to interest payments earned and may include amendment fees, consent fees and prepayment fees. These fees are recorded as Interest in the accompanying financial statements.
Expenses. Expenses directly attributable to a fund are charged to that fund. Expenses attributable to more than one fund are allocated among the respective funds on the basis of relative net assets or other appropriate methods. Expenses included in the accompanying financial statements reflect the expenses of that fund and do not include any expenses associated with any underlying mutual funds or exchange-traded funds. Although not included in a fund's expenses, a fund indirectly bears its proportionate share of these expenses through the net asset value of each underlying mutual fund or exchange-traded fund. Expense estimates are accrued in the period to which they relate and adjustments are made when actual amounts are known.
Income Tax Information and Distributions to Shareholders. Each year, the Fund intends to qualify as a regulated investment company under Subchapter M of the Internal Revenue Code, including distributing substantially all of its taxable income and realized gains. As a result, no provision for U.S. Federal income taxes is required. As of September 30, 2021, the Fund did not have any unrecognized tax benefits in the financial statements; nor is the Fund aware of any tax positions for which it is reasonably possible that the total amounts of unrecognized tax benefits will significantly change in the next twelve months. The Fund files a U.S. federal tax return, in addition to state and local tax returns as required. The Fund's federal income tax returns are subject to examination by the Internal Revenue Service (IRS) for a period of three fiscal years after they are filed. State and local tax returns may be subject to examination for an additional fiscal year depending on the jurisdiction.
Distributions are declared and recorded daily and paid monthly from net investment income. Distributions from realized gains, if any, are declared and recorded on the ex-dividend date. Income and capital gain distributions are determined in accordance with income tax regulations, which may differ from GAAP.
Capital accounts within the financial statements are adjusted for permanent book-tax differences. These adjustments have no impact on net assets or the results of operations. Capital accounts are not adjusted for temporary book-tax differences which will reverse in a subsequent period.
Book-tax differences are primarily due to market discount, capital loss carryforwards and losses deferred due to wash sales.
As of period end, the cost and unrealized appreciation (depreciation) in securities, and derivatives if applicable, for federal income tax purposes were as follows:
| Gross unrealized appreciation | $5,964,785 |
| Gross unrealized depreciation | (3,750,581) |
| Net unrealized appreciation (depreciation) | $2,214,204 |
| Tax Cost | $295,038,588 |
The tax-based components of distributable earnings as of period end were as follows:
| Undistributed ordinary income | $237,296 |
| Capital loss carryforward | $(30,425,538) |
| Net unrealized appreciation (depreciation) on securities and other investments | $2,214,204 |
Capital loss carryforwards are only available to offset future capital gains of the Fund to the extent provided by regulations and may be limited. The capital loss carryforward information presented below, including any applicable limitation, is estimated as of fiscal period end and is subject to adjustment.
| No expiration | |
| Short-term | $(662,427) |
| Long-term | (29,763,111) |
| Total capital loss carryforward | $(30,425,538) |
The tax character of distributions paid was as follows:
| | September 30, 2021 | September 30, 2020 |
| Ordinary Income | $11,648,675 | $ 13,895,333 |
Restricted Securities (including Private Placements). Funds may invest in securities that are subject to legal or contractual restrictions on resale. These securities generally may be resold in transactions exempt from registration or to the public if the securities are registered. Disposal of these securities may involve time-consuming negotiations and expense, and prompt sale at an acceptable price may be difficult. Information regarding restricted securities held at period end is included at the end of the Schedule of Investments, if applicable.
Loans and Other Direct Debt Instruments. Direct debt instruments are interests in amounts owed to lenders by corporate or other borrowers. These instruments may be in the form of loans, trade claims or other receivables and may include standby financing commitments such as revolving credit facilities that obligate a fund to supply additional cash to the borrower on demand. Loans may be acquired through assignment, participation, or may be made directly to a borrower. Such instruments are presented in the Bank Loan Obligations section in the Schedule of Investments. Certain funds may also invest in unfunded loan commitments, which are contractual obligations for future funding. Information regarding unfunded commitments is included at the end of the Schedule of Investments, if applicable.
New Accounting Pronouncement. In March 2020, the Financial Accounting Standards Board (FASB) issued an Accounting Standards Update (ASU), ASU 2020-04, which provides optional, temporary relief with respect to the financial reporting of contracts subject to certain types of modifications due to the planned discontinuation of the London Interbank Offered Rate (LIBOR) and other IBOR-based reference rates. The temporary relief provided by ASU 2020-04 is effective for certain reference rate-related contract modifications that occur during the period March 12, 2020 through December 31, 2022. Management is currently evaluating the potential impact of ASU 2020-04 to the financial statements.
4. Purchases and Sales of Investments.
Purchases and sales of securities, other than short-term securities and in-kind transactions, as applicable, are noted in the table below.
| | Purchases ($) | Sales ($) |
| Fidelity Series Floating Rate High Income Fund | 123,088,497 | 121,304,825 |
5. Fees and Other Transactions with Affiliates.
Management Fee. Fidelity Management & Research Company LLC (the investment adviser) and its affiliates provide the Fund with investment management related services for which the Fund does not pay a management fee. Under the management contract, the investment adviser or an affiliate pays all ordinary operating expenses of the Fund, except custody fees, fees and expenses of the independent Trustees, and certain miscellaneous expenses such as proxy and shareholder meeting expenses.
Brokerage Commissions. A portion of portfolio transactions were placed with brokerage firms which are affiliates of the investment adviser. Brokerage commissions are included in net realized gain (loss) and change in net unrealized appreciation (depreciation) in the Statement of Operations. The commissions paid to these affiliated firms were as follows:
| | Amount |
| Fidelity Series Floating Rate High Income Fund | $44 |
Interfund Trades. Funds may purchase from or sell securities to other Fidelity Funds under procedures adopted by the Board. The procedures have been designed to ensure these interfund trades are executed in accordance with Rule 17a-7 of the 1940 Act. Any interfund trades are included within the respective purchases and sales amounts shown in the Purchases and Sales of Investments note and are noted in the table below.
| | Purchases ($) | Sales ($) |
| Fidelity Series Floating Rate High Income Fund | – | 19,220 |
6. Committed Line of Credit.
Certain Funds participate with other funds managed by the investment adviser or an affiliate in a $4.25 billion credit facility (the "line of credit") to be utilized for temporary or emergency purposes to fund shareholder redemptions or for other short-term liquidity purposes. The participating funds have agreed to pay commitment fees on their pro-rata portion of the line of credit, which are reflected in Miscellaneous expenses on the Statement of Operations, and are listed below. Effective during January 2021, commitment fees are borne by the investment adviser. During the period, there were no borrowings on this line of credit.
| | Amount |
| Fidelity Series Floating Rate High Income Fund | $141 |
7. Expense Reductions.
The investment adviser contractually agreed to reimburse the Fund to the extent annual operating expenses exceeded .003% of average net assets. This reimbursement will remain in place through January 31, 2025. Some expenses, for example the compensation of the independent Trustees, and certain other expenses such as interest expense, are excluded from this reimbursement. During the period this reimbursement reduced the Fund's expenses by $23,157.
In addition, through arrangements with the Fund's custodian, credits realized as a result of certain uninvested cash balances were used to reduce the Fund's expenses by $330.
8. Other.
Fund's organizational documents provide former and current trustees and officers with a limited indemnification against liabilities arising in connection with the performance of their duties to the fund. In the normal course of business, the fund may also enter into contracts that provide general indemnifications. The fund's maximum exposure under these arrangements is unknown as this would be dependent on future claims that may be made against the fund. The risk of material loss from such claims is considered remote.
At the end of the period, mutual funds and accounts managed by the investment adviser or its affiliates were the owners of record of all of the outstanding shares of the Fund.
9. Coronavirus (COVID-19) Pandemic.
An outbreak of COVID-19 first detected in China during December 2019 has since spread globally and was declared a pandemic by the World Health Organization during March 2020. Developments that disrupt global economies and financial markets, such as the COVID-19 pandemic, may magnify factors that affect the Fund's performance.
Report of Independent Registered Public Accounting Firm
To the Board of Trustees of Fidelity Summer Street Trust and Shareholders of Fidelity Series Floating Rate High Income Fund
Opinion on the Financial Statements and Financial Highlights
We have audited the accompanying statement of assets and liabilities of Fidelity Series Floating Rate High Income Fund (the "Fund"), a fund of Fidelity Summer Street Trust, including the schedule of investments, as of September 30, 2021, the related statement of operations for the year then ended, the statement of changes in net assets for each of the two years in the period then ended, the financial highlights for each of the five years in the period then ended, and the related notes. In our opinion, the financial statements and financial highlights present fairly, in all material respects, the financial position of the Fund as of September 30, 2021, and the results of its operations for the year then ended, the changes in its net assets for each of the two years in the period then ended, and the financial highlights for each of the five years in the period then ended in conformity with accounting principles generally accepted in the United States of America.
Basis for Opinion
These financial statements and financial highlights are the responsibility of the Fund's management. Our responsibility is to express an opinion on the Fund's financial statements and financial highlights based on our audits. We are a public accounting firm registered with the Public Company Accounting Oversight Board (United States) (PCAOB) and are required to be independent with respect to the Fund in accordance with the U.S. federal securities laws and the applicable rules and regulations of the Securities and Exchange Commission and the PCAOB.
We conducted our audits in accordance with the standards of the PCAOB. Those standards require that we plan and perform the audit to obtain reasonable assurance about whether the financial statements and financial highlights are free of material misstatement, whether due to error or fraud. The Fund is not required to have, nor were we engaged to perform, an audit of its internal control over financial reporting. As part of our audits we are required to obtain an understanding of internal control over financial reporting but not for the purpose of expressing an opinion on the effectiveness of the Fund’s internal control over financial reporting. Accordingly, we express no such opinion.
Our audits included performing procedures to assess the risks of material misstatement of the financial statements and financial highlights, whether due to error or fraud, and performing procedures that respond to those risks. Such procedures included examining, on a test basis, evidence regarding the amounts and disclosures in the financial statements and financial highlights. Our audits also included evaluating the accounting principles used and significant estimates made by management, as well as evaluating the overall presentation of the financial statements and financial highlights. Our procedures included confirmation of securities owned as of September 30, 2021, by correspondence with the custodian, brokers and agent banks; when replies were not received from brokers or agent banks, we performed other auditing procedures. We believe that our audits provide a reasonable basis for our opinion.
/s/ Deloitte & Touche LLP
Boston, Massachusetts
November 15, 2021
We have served as the auditor of one or more of the Fidelity investment companies since 1999.
Trustees and Officers
The Trustees, Members of the Advisory Board (if any), and officers of the trust and fund, as applicable, are listed below. The Board of Trustees governs the fund and is responsible for protecting the interests of shareholders. The Trustees are experienced executives who meet periodically throughout the year to oversee the fund's activities, review contractual arrangements with companies that provide services to the fund, oversee management of the risks associated with such activities and contractual arrangements, and review the fund's performance. Each of the Trustees oversees 313 funds.
The Trustees hold office without limit in time except that (a) any Trustee may resign; (b) any Trustee may be removed by written instrument, signed by at least two-thirds of the number of Trustees prior to such removal; (c) any Trustee who requests to be retired or who has become incapacitated by illness or injury may be retired by written instrument signed by a majority of the other Trustees; and (d) any Trustee may be removed at any special meeting of shareholders by a two-thirds vote of the outstanding voting securities of the trust. Each Trustee who is not an interested person (as defined in the 1940 Act) of the trust and the fund is referred to herein as an Independent Trustee. Each Independent Trustee shall retire not later than the last day of the calendar year in which his or her 75th birthday occurs. The Independent Trustees may waive this mandatory retirement age policy with respect to individual Trustees. Officers and Advisory Board Members hold office without limit in time, except that any officer or Advisory Board Member may resign or may be removed by a vote of a majority of the Trustees at any regular meeting or any special meeting of the Trustees. Except as indicated, each individual has held the office shown or other offices in the same company for the past five years.
The fund’s Statement of Additional Information (SAI) includes more information about the Trustees. To request a free copy, call Fidelity at 1-800-544-8544.
Experience, Skills, Attributes, and Qualifications of the Trustees. The Governance and Nominating Committee has adopted a statement of policy that describes the experience, qualifications, attributes, and skills that are necessary and desirable for potential Independent Trustee candidates (Statement of Policy). The Board believes that each Trustee satisfied at the time he or she was initially elected or appointed a Trustee, and continues to satisfy, the standards contemplated by the Statement of Policy. The Governance and Nominating Committee also engages professional search firms to help identify potential Independent Trustee candidates who have the experience, qualifications, attributes, and skills consistent with the Statement of Policy. From time to time, additional criteria based on the composition and skills of the current Independent Trustees, as well as experience or skills that may be appropriate in light of future changes to board composition, business conditions, and regulatory or other developments, have also been considered by the professional search firms and the Governance and Nominating Committee. In addition, the Board takes into account the Trustees' commitment and participation in Board and committee meetings, as well as their leadership of standing and ad hoc committees throughout their tenure.
In determining that a particular Trustee was and continues to be qualified to serve as a Trustee, the Board has considered a variety of criteria, none of which, in isolation, was controlling. The Board believes that, collectively, the Trustees have balanced and diverse experience, qualifications, attributes, and skills, which allow the Board to operate effectively in governing the fund and protecting the interests of shareholders. Information about the specific experience, skills, attributes, and qualifications of each Trustee, which in each case led to the Board's conclusion that the Trustee should serve (or continue to serve) as a trustee of the fund, is provided below.
Board Structure and Oversight Function. Robert A. Lawrence is an interested person and currently serves as Acting Chairman. The Trustees have determined that an interested Chairman is appropriate and benefits shareholders because an interested Chairman has a personal and professional stake in the quality and continuity of services provided to the fund. Independent Trustees exercise their informed business judgment to appoint an individual of their choosing to serve as Chairman, regardless of whether the Trustee happens to be independent or a member of management. The Independent Trustees have determined that they can act independently and effectively without having an Independent Trustee serve as Chairman and that a key structural component for assuring that they are in a position to do so is for the Independent Trustees to constitute a substantial majority for the Board. The Independent Trustees also regularly meet in executive session. David M. Thomas serves as Lead Independent Trustee and as such (i) acts as a liaison between the Independent Trustees and management with respect to matters important to the Independent Trustees and (ii) with management prepares agendas for Board meetings.
Fidelity® funds are overseen by different Boards of Trustees. The fund's Board oversees Fidelity's high income and certain equity funds, and other Boards oversee Fidelity's investment-grade bond, money market, asset allocation, and other equity funds. The asset allocation funds may invest in Fidelity® funds overseen by the fund's Board. The use of separate Boards, each with its own committee structure, allows the Trustees of each group of Fidelity® funds to focus on the unique issues of the funds they oversee, including common research, investment, and operational issues. On occasion, the separate Boards establish joint committees to address issues of overlapping consequences for the Fidelity® funds overseen by each Board.
The Trustees operate using a system of committees to facilitate the timely and efficient consideration of all matters of importance to the Trustees, the fund, and fund shareholders and to facilitate compliance with legal and regulatory requirements and oversight of the fund's activities and associated risks. The Board, acting through its committees, has charged FMR and its affiliates with (i) identifying events or circumstances the occurrence of which could have demonstrably adverse effects on the fund's business and/or reputation; (ii) implementing processes and controls to lessen the possibility that such events or circumstances occur or to mitigate the effects of such events or circumstances if they do occur; and (iii) creating and maintaining a system designed to evaluate continuously business and market conditions in order to facilitate the identification and implementation processes described in (i) and (ii) above. Because the day-to-day operations and activities of the fund are carried out by or through FMR, its affiliates, and other service providers, the fund's exposure to risks is mitigated but not eliminated by the processes overseen by the Trustees. While each of the Board's committees has responsibility for overseeing different aspects of the fund's activities, oversight is exercised primarily through the Operations, Audit, and Compliance Committees. Appropriate personnel, including but not limited to the fund's Chief Compliance Officer (CCO), FMR's internal auditor, the independent accountants, the fund's Treasurer and portfolio management personnel, make periodic reports to the Board's committees, as appropriate, including an annual review of Fidelity's risk management program for the Fidelity® funds. The responsibilities of each standing committee, including their oversight responsibilities, are described further under "Standing Committees of the Trustees."
Interested Trustees*:
Correspondence intended for a Trustee who is an interested person may be sent to Fidelity Investments, 245 Summer Street, Boston, Massachusetts 02210.
Name, Year of Birth; Principal Occupations and Other Relevant Experience+
Bettina Doulton (1964)
Year of Election or Appointment: 2020
Trustee
Ms. Doulton also serves as Trustee of other Fidelity® funds. Prior to her retirement, Ms. Doulton served in a variety of positions at Fidelity Investments, including as a managing director of research (2006-2007), portfolio manager to certain Fidelity® funds (1993-2005), equity analyst and portfolio assistant (1990-1993), and research assistant (1987-1990). Ms. Doulton currently owns and operates Phi Builders + Architects and Cellardoor Winery. Previously, Ms. Doulton served as a member of the Board of Brown Capital Management, LLC (2014-2018).
Robert A. Lawrence (1952)
Year of Election or Appointment: 2020
Trustee
Acting Chairman of the Board of Trustees
Mr. Lawrence also serves as Trustee of other funds. Previously, Mr. Lawrence served as a Member of the Advisory Board of certain funds. Prior to his retirement in 2008, Mr. Lawrence served as Vice President of certain Fidelity® funds (2006-2008), Senior Vice President, Head of High Income Division of Fidelity Management & Research Company (investment adviser firm, 2006-2008), and President of Fidelity Strategic Investments (investment adviser firm, 2002-2005).
* Determined to be an “Interested Trustee” by virtue of, among other things, his or her affiliation with the trust or various entities under common control with FMR.
+ The information includes the Trustee's principal occupation during the last five years and other information relating to the experience, attributes, and skills relevant to the Trustee's qualifications to serve as a Trustee, which led to the conclusion that the Trustee should serve as a Trustee for the fund.
Independent Trustees:
Correspondence intended for an Independent Trustee may be sent to Fidelity Investments, P.O. Box 55235, Boston, Massachusetts 02205-5235.
Name, Year of Birth; Principal Occupations and Other Relevant Experience+
Thomas P. Bostick (1956)
Year of Election or Appointment: 2021
Trustee
Lieutenant General Bostick also serves as Trustee of other Fidelity® funds. Prior to his retirement, General Bostick (United States Army, Retired) held a variety of positions within the U.S. Army, including Commanding General and Chief of Engineers, U.S. Army Corps of Engineers (2012-2016) and Deputy Chief of Staff and Director of Human Resources, U.S. Army (2009-2012). General Bostick currently serves as a member of the Board and Finance and Governance Committees of CSX Corporation (transportation, 2020-present) and a member of the Board and Corporate Governance and Nominating Committee of Perma-Fix Environmental Services, Inc. (nuclear waste management, 2020-present). General Bostick serves as Chief Executive Officer of Bostick Global Strategies, LLC (consulting, 2016-present) and Managing Partner, Sustainability, of Ridge-Lane Limited Partners (strategic advisory and venture development, 2016-present). Previously, General Bostick served as a Member of the Advisory Board of certain Fidelity® funds (2021), President, Intrexon Bioengineering (2018-2020) and Chief Operating Officer (2017-2020) and Senior Vice President of the Environment Sector (2016-2017) of Intrexon Corporation (biopharmaceutical company).
Dennis J. Dirks (1948)
Year of Election or Appointment: 2005
Trustee
Mr. Dirks also serves as Trustee of other Fidelity® funds. Prior to his retirement in May 2003, Mr. Dirks served as Chief Operating Officer and as a member of the Board of The Depository Trust & Clearing Corporation (financial markets infrastructure), President, Chief Operating Officer and a member of the Board of The Depository Trust Company (DTC), President and a member of the Board of the National Securities Clearing Corporation (NSCC), Chief Executive Officer and a member of the Board of the Government Securities Clearing Corporation and Chief Executive Officer and a member of the Board of the Mortgage-Backed Securities Clearing Corporation. Mr. Dirks currently serves as a member of the Finance Committee (2016-present) and Board (2017-present) and is Treasurer (2018-present) of the Asolo Repertory Theatre.
Donald F. Donahue (1950)
Year of Election or Appointment: 2018
Trustee
Mr. Donahue also serves as Trustee of other Fidelity® funds. Mr. Donahue serves as President and Chief Executive Officer of Miranda Partners, LLC (risk consulting for the financial services industry, 2012-present). Previously, Mr. Donahue served as Chief Executive Officer (2006-2012), Chief Operating Officer (2003-2006) and Managing Director, Customer Marketing and Development (1999-2003) of The Depository Trust & Clearing Corporation (financial markets infrastructure). Mr. Donahue currently serves as a member (2007-present) and Co-Chairman (2016-present) of the Board of United Way of New York and a member of the Board of NYC Leadership Academy (2012-present). Mr. Donahue previously served as a member of the Advisory Board of certain Fidelity® funds (2015-2018).
Vicki L. Fuller (1957)
Year of Election or Appointment: 2020
Trustee
Ms. Fuller also serves as Trustee of other Fidelity® funds. Previously, Ms. Fuller served as a member of the Advisory Board of certain Fidelity® funds (2018-2020), Chief Investment Officer of the New York State Common Retirement Fund (2012-2018) and held a variety of positions at AllianceBernstein L.P. (global asset management, 1985-2012), including Managing Director (2006-2012) and Senior Vice President and Senior Portfolio Manager (2001-2006). Ms. Fuller currently serves as a member of the Board, Audit Committee and Nominating and Governance Committee of The Williams Companies, Inc. (natural gas infrastructure, 2018-present), as a member of the Board, Audit Committee and Nominating and Governance Committee of two Blackstone business development companies (2020-present) and as a member of the Board of Treliant, LLC (consulting, 2019-present).
Patricia L. Kampling (1959)
Year of Election or Appointment: 2020
Trustee
Ms. Kampling also serves as Trustee of other Fidelity® funds. Prior to her retirement, Ms. Kampling served as Chairman of the Board and Chief Executive Officer (2012-2019), President and Chief Operating Officer (2011-2012) and Executive Vice President and Chief Financial Officer (2010-2011) of Alliant Energy Corporation. Ms. Kampling currently serves as a member of the Board, Finance Committee and Governance, Compensation and Nominating Committee of Xcel Energy Inc. (utilities company, 2020-present) and as a member of the Board, Audit, Finance and Risk Committee and Safety, Environmental, Technology and Operations Committee of American Water Works Company, Inc. (utilities company, 2019-present). In addition, Ms. Kampling currently serves as a member of the Board of the Nature Conservancy, Wisconsin Chapter (2019-present). Previously, Ms. Kampling served as a Member of the Advisory Board of certain Fidelity® funds (2020), a member of the Board, Compensation Committee and Executive Committee and Chair of the Audit Committee of Briggs & Stratton Corporation (manufacturing, 2011-2021), a member of the Board of Interstate Power and Light Company (2012-2019) and Wisconsin Power and Light Company (2012-2019) (each a subsidiary of Alliant Energy Corporation) and as a member of the Board and Workforce Development Committee of the Business Roundtable (2018-2019).
Thomas A. Kennedy (1955)
Year of Election or Appointment: 2021
Trustee
Mr. Kennedy also serves as Trustee of other Fidelity® funds. Previously, Mr. Kennedy served as a Member of the Advisory Board of certain Fidelity® funds (2020) and held a variety of positions at Raytheon Company (aerospace and defense, 1983-2020), including Chairman and Chief Executive Officer (2014-2020) and Executive Vice President and Chief Operating Officer (2013-2014). Mr. Kennedy currently serves as Executive Chairman of the Board of Directors of Raytheon Technologies Corporation (aerospace and defense, 2020-present). He is also a member of the Rutgers School of Engineering Industry Advisory Board (2011-present) and a member of the UCLA Engineering Dean’s Executive Board (2016-present).
Oscar Munoz (1959)
Year of Election or Appointment: 2021
Trustee
Mr. Munoz also serves as Trustee of other Fidelity® funds. Prior to his retirement, Mr. Munoz served as Executive Chairman (2020-2021), Chief Executive Officer (2015-2020), President (2015-2016) and a member of the Board (2010-2021) of United Airlines Holdings, Inc. Mr. Munoz currently serves as a member of the Board of CBRE Group, Inc. (commercial real estate, 2020-present), a member of the Board of Univision Communications, Inc. (Hispanic media, 2020-present) and a member of the Advisory Board of Salesforce.com, Inc. (cloud-based software, 2020-present). Previously, Mr. Munoz served as a Member of the Advisory Board of certain Fidelity® funds (2021).
Garnett A. Smith (1947)
Year of Election or Appointment: 2018
Trustee
Mr. Smith also serves as Trustee of other Fidelity® funds. Prior to his retirement, Mr. Smith served as Chairman and Chief Executive Officer (1990-1997) and President (1986-1990) of Inbrand Corp. (manufacturer of personal absorbent products). Prior to his employment with Inbrand Corp., he was employed by a retail fabric chain and North Carolina National Bank (now Bank of America). Mr. Smith previously served as a member of the Advisory Board of certain Fidelity® funds (2012-2013).
David M. Thomas (1949)
Year of Election or Appointment: 2008
Trustee
Lead Independent Trustee
Mr. Thomas also serves as Trustee of other Fidelity® funds. Previously, Mr. Thomas served as Executive Chairman (2005-2006) and Chairman and Chief Executive Officer (2000-2005) of IMS Health, Inc. (pharmaceutical and healthcare information solutions). Mr. Thomas currently serves as a member of the Board of Fortune Brands Home and Security (home and security products, 2004-present) and Presiding Director (2013-present) of Interpublic Group of Companies, Inc. (marketing communication).
Susan Tomasky (1953)
Year of Election or Appointment: 2020
Trustee
Ms. Tomasky also serves as Trustee of other Fidelity® funds. Prior to her retirement, Ms. Tomasky served in various executive officer positions at American Electric Power Company, Inc. (1998-2011), including most recently as President of AEP Transmission (2007-2011). Ms. Tomasky currently serves as a member of the Board and Sustainability Committee and as Chair of the Audit Committee of Marathon Petroleum Corporation (2018-present) and as a member of the Board, Corporate Governance Committee and Organization and Compensation Committee and as Chair of the Audit Committee of Public Service Enterprise Group, Inc. (utilities company, 2012-present). In addition, Ms. Tomasky currently serves as a member (2009-present) and President (2020-present) of the Board of the Royal Shakespeare Company – America (2009-present), as a member of the Board of the Columbus Association for the Performing Arts (2011-present) and as a member of the Board and Investment Committee of Kenyon College (2016-present). Previously, Ms. Tomasky served as a Member of the Advisory Board of certain Fidelity® funds (2020), as a member of the Board of the Columbus Regional Airport Authority (2007-2020), as a member of the Board (2011-2018) and Lead Independent Director (2015-2018) of Andeavor Corporation (previously Tesoro Corporation) (independent oil refiner and marketer) and as a member of the Board of Summit Midstream Partners LP (energy, 2012-2018).
Michael E. Wiley (1950)
Year of Election or Appointment: 2018
Trustee
Mr. Wiley also serves as Trustee of other Fidelity® funds. Previously, Mr. Wiley served as a member of the Advisory Board of certain Fidelity® funds (2018-2020), Chairman, President and CEO of Baker Hughes, Inc. (oilfield services, 2000-2004). Mr. Wiley also previously served as a member of the Board of Andeavor Corporation (independent oil refiner and marketer, 2005-2018), a member of the Board of Andeavor Logistics LP (natural resources logistics, 2015-2018) and a member of the Board of High Point Resources (exploration and production, 2005-2020).
+ The information includes the Trustee's principal occupation during the last five years and other information relating to the experience, attributes, and skills relevant to the Trustee's qualifications to serve as a Trustee, which led to the conclusion that the Trustee should serve as a Trustee for the fund.
Advisory Board Members and Officers:
Correspondence intended for a Member of the Advisory Board (if any) may be sent to Fidelity Investments, P.O. Box 55235, Boston, Massachusetts 02205-5235. Correspondence intended for an officer or Peter S. Lynch may be sent to Fidelity Investments, 245 Summer Street, Boston, Massachusetts 02210. Officers appear below in alphabetical order.
Name, Year of Birth; Principal Occupation
Peter S. Lynch (1944)
Year of Election or Appointment: 2003
Member of the Advisory Board
Mr. Lynch also serves as a Member of the Advisory Board of other Fidelity® funds. Mr. Lynch is Vice Chairman and a Director of Fidelity Management & Research Company LLC (investment adviser firm). In addition, Mr. Lynch serves as a Trustee of Boston College and as the Chairman of the Inner-City Scholarship Fund. Previously, Mr. Lynch served as Vice Chairman and a Director of FMR Co., Inc. (investment adviser firm) and on the Special Olympics International Board of Directors (1997-2006).
Craig S. Brown (1977)
Year of Election or Appointment: 2019
Assistant Treasurer
Mr. Brown also serves as an officer of other funds. Mr. Brown serves as Assistant Treasurer of FIMM, LLC (2021-present) and is an employee of Fidelity Investments (2013-present).
John J. Burke III (1964)
Year of Election or Appointment: 2018
Chief Financial Officer
Mr. Burke also serves as Chief Financial Officer of other funds. Mr. Burke serves as Head of Investment Operations for Fidelity Fund and Investment Operations (2018-present) and is an employee of Fidelity Investments (1998-present). Previously Mr. Burke served as head of Asset Management Investment Operations (2012-2018).
William C. Coffey (1969)
Year of Election or Appointment: 2019
Assistant Secretary
Mr. Coffey also serves as Assistant Secretary of other funds. He is Senior Vice President and Deputy General Counsel of FMR LLC (diversified financial services company, 2010-present), and is an employee of Fidelity Investments. Previously, Mr. Coffey served as Secretary and CLO of certain funds (2018-2019); CLO, Secretary, and Senior Vice President of Fidelity Management & Research Company and FMR Co., Inc. (investment adviser firms, 2018-2019); Secretary of Fidelity SelectCo, LLC and Fidelity Investments Money Management, Inc. (investment adviser firms, 2018-2019); CLO of Fidelity Management & Research (Hong Kong) Limited, FMR Investment Management (UK) Limited, and Fidelity Management & Research (Japan) Limited (investment adviser firms, 2018-2019); and Assistant Secretary of certain funds (2009-2018).
Timothy M. Cohen (1969)
Year of Election or Appointment: 2018
Vice President
Mr. Cohen also serves as Vice President of other funds. Mr. Cohen serves as Co-Head of Equity (2018-present), a Director of Fidelity Management & Research (Japan) Limited (investment adviser firm, 2016-present), and is an employee of Fidelity Investments. Previously, Mr. Cohen served as Executive Vice President of Fidelity SelectCo, LLC (2019), Head of Global Equity Research (2016-2018), Chief Investment Officer - Equity and a Director of Fidelity Management & Research (U.K.) Inc. (investment adviser firm, 2013-2015) and as a Director of Fidelity Management & Research (Hong Kong) Limited (investment adviser firm, 2017).
Jonathan Davis (1968)
Year of Election or Appointment: 2010
Assistant Treasurer
Mr. Davis also serves as an officer of other funds. Mr. Davis serves as Assistant Treasurer of FIMM, LLC (2021-present), FMR Capital, Inc. (2017-present), FD Funds GP LLC (2021-present), FD Funds Holding LLC (2021-present), and FD Funds Management LLC (2021-present); and is an employee of Fidelity Investments. Previously, Mr. Davis served as Vice President and Associate General Counsel of FMR LLC (diversified financial services company, 2003-2010).
Laura M. Del Prato (1964)
Year of Election or Appointment: 2018
Assistant Treasurer
Ms. Del Prato also serves as an officer of other funds. Ms. Del Prato serves as Assistant Treasurer of FIMM, LLC (2021-present) and is an employee of Fidelity Investments (2017-present). Previously, Ms. Del Prato served as President and Treasurer of The North Carolina Capital Management Trust: Cash Portfolio and Term Portfolio (2018-2020). Prior to joining Fidelity Investments, Ms. Del Prato served as a Managing Director and Treasurer of the JPMorgan Mutual Funds (2014-2017). Prior to JPMorgan, Ms. Del Prato served as a partner at Cohen Fund Audit Services (accounting firm, 2012-2013) and KPMG LLP (accounting firm, 2004-2012).
Colm A. Hogan (1973)
Year of Election or Appointment: 2020
Assistant Treasurer
Mr. Hogan also serves as an officer of other funds. Mr. Hogan serves as Assistant Treasurer of FIMM, LLC (2021-present) and FMR Capital, Inc. (2017-present) and is an employee of Fidelity Investments (2005-present). Previously, Mr. Hogan served as Deputy Treasurer of certain Fidelity® funds (2016-2020) and Assistant Treasurer of certain Fidelity® funds (2016-2018).
Pamela R. Holding (1964)
Year of Election or Appointment: 2018
Vice President
Ms. Holding also serves as Vice President of other funds. Ms. Holding serves as Co-Head of Equity (2018-present) and is an employee of Fidelity Investments (2013-present). Previously, Ms. Holding served as Executive Vice President of Fidelity SelectCo, LLC (2019) and as Chief Investment Officer of Fidelity Institutional Asset Management (2013-2018).
Cynthia Lo Bessette (1969)
Year of Election or Appointment: 2019
Secretary and Chief Legal Officer (CLO)
Ms. Lo Bessette also serves as an officer of other funds. Ms. Lo Bessette serves as CLO, Secretary, and Senior Vice President of Fidelity Management & Research Company LLC (investment adviser firm, 2019-present); CLO of Fidelity Management & Research (Hong Kong) Limited, FMR Investment Management (UK) Limited, and Fidelity Management & Research (Japan) Limited (investment adviser firms, 2019-present); Secretary of FD Funds GP LLC (2021-present), FD Funds Holding LLC (2021-present), and FD Funds Management LLC (2021-present); and Assistant Secretary of FIMM, LLC (2019-present). She is a Senior Vice President and Deputy General Counsel of FMR LLC (diversified financial services company, 2019-present), and is an employee of Fidelity Investments. Previously, Ms. Lo Bessette served as CLO, Secretary, and Senior Vice President of FMR Co., Inc. (investment adviser firm, 2019); Secretary of Fidelity SelectCo, LLC and Fidelity Investments Money Management, Inc. (investment adviser firms, 2019). Prior to joining Fidelity Investments, Ms. Lo Bessette was Executive Vice President, General Counsel (2016-2019) and Senior Vice President, Deputy General Counsel (2015-2016) of OppenheimerFunds (investment management company) and Deputy Chief Legal Officer (2013-2015) of Jennison Associates LLC (investment adviser firm).
Chris Maher (1972)
Year of Election or Appointment: 2020
Deputy Treasurer
Mr. Maher also serves as an officer of other funds. Mr. Maher serves as Assistant Treasurer of FIMM, LLC (2021-present) and FMR Capital, Inc. (2017-present), and is an employee of Fidelity Investments (2008-present). Previously, Mr. Maher served as Assistant Treasurer of certain funds (2013-2020); Vice President of Asset Management Compliance (2013), Vice President of the Program Management Group of FMR (investment adviser firm, 2010-2013), and Vice President of Valuation Oversight (2008-2010).
Jason P. Pogorelec (1975)
Year of Election or Appointment: 2020
Chief Compliance Officer
Mr. Pogorelec also serves as Chief Compliance Officer of other funds. Mr. Pogorelec is a senior Vice President of Asset Management Compliance for Fidelity Investments and is an employee of Fidelity Investments (2006-present). Previously, Mr. Pogorelec served as Vice President, Associate General Counsel for Fidelity Investments (2010-2020) and Assistant Secretary of certain Fidelity funds (2015-2020).
Brett Segaloff (1972)
Year of Election or Appointment: 2021
Anti-Money Laundering (AML) Officer
Mr. Segaloff also serves as an AML Officer of other funds and other related entities. He is Director, Anti-Money Laundering (2007-present) of FMR LLC (diversified financial services company) and is an employee of Fidelity Investments (1996-present).
Stacie M. Smith (1974)
Year of Election or Appointment: 2016
President and Treasurer
Ms. Smith also serves as an officer of other funds. Ms. Smith serves as Assistant Treasurer of FIMM, LLC (2021-present) and FMR Capital, Inc. (2017-present), is an employee of Fidelity Investments (2009-present), and has served in other fund officer roles. Prior to joining Fidelity Investments, Ms. Smith served as Senior Audit Manager of Ernst & Young LLP (accounting firm, 1996-2009). Previously, Ms. Smith served as Assistant Treasurer (2013-2019) and Deputy Treasurer (2013-2016) of certain Fidelity® funds.
Jim Wegmann (1979)
Year of Election or Appointment: 2019
Assistant Treasurer
Mr. Wegmann also serves as an officer of other funds. Mr. Wegmann serves as Assistant Treasurer of FIMM, LLC (2021-present) and is an employee of Fidelity Investments (2011-present).
Shareholder Expense Example
As a shareholder, you incur two types of costs: (1) transaction costs, which may include sales charges (loads) on purchase payments or redemption proceeds, as applicable and (2) ongoing costs, which generally include management fees, distribution and/or service (12b-1) fees and other Fund expenses. This Example is intended to help you understand your ongoing costs (in dollars) of investing in a fund and to compare these costs with the ongoing costs of investing in other mutual funds.
The Example is based on an investment of $1,000 invested at the beginning of the period and held for the entire period (April 1, 2021 to September 30, 2021).
Actual Expenses
The first line of the accompanying table provides information about actual account values and actual expenses. You may use the information in this line, together with the amount you invested, to estimate the expenses that you paid over the period. Simply divide your account value by $1,000.00 (for example, an $8,600 account value divided by $1,000.00 = 8.6), then multiply the result by the number in the first line for a class/Fund under the heading entitled "Expenses Paid During Period" to estimate the expenses you paid on your account during this period. If any fund is a shareholder of any underlying mutual funds or exchange-traded funds (ETFs) (the Underlying Funds), such fund indirectly bears its proportional share of the expenses of the Underlying Funds in addition to the direct expenses incurred presented in the table. These fees and expenses are not included in the annualized expense ratio used to calculate the expense estimate in the table below.
Hypothetical Example for Comparison Purposes
The second line of the accompanying table provides information about hypothetical account values and hypothetical expenses based on the actual expense ratio and an assumed rate of return of 5% per year before expenses, which is not the actual return. The hypothetical account values and expenses may not be used to estimate the actual ending account balance or expenses you paid for the period. You may use this information to compare the ongoing costs of investing in the Fund and other funds. To do so, compare this 5% hypothetical example with the 5% hypothetical examples that appear in the shareholder reports of the other funds. If any fund is a shareholder of any Underlying Funds, such fund indirectly bears its proportional share of the expenses of the Underlying Funds in addition to the direct expenses as presented in the table. These fees and expenses are not included in the annualized expense ratio used to calculate the expense estimate in the table below.
Please note that the expenses shown in the table are meant to highlight your ongoing costs only and do not reflect any transaction costs. Therefore, the second line of the table is useful in comparing ongoing costs only, and will not help you determine the relative total costs of owning different funds.
| | Annualized Expense Ratio-A | Beginning
Account Value
April 1, 2021 | Ending
Account Value
September 30, 2021 | Expenses Paid
During Period-B
April 1, 2021
to September 30, 2021 |
| Fidelity Series Floating Rate High Income Fund | - %-C | | | |
| Actual | | $1,000.00 | $1,032.60 | $--D |
| Hypothetical-E | | $1,000.00 | $1,025.07 | $--D |
A Annualized expense ratio reflects expenses net of applicable fee waivers.
B Expenses are equal to the annualized expense ratio, multiplied by the average account value over the period, multiplied by 183/ 365 (to reflect the one-half year period). The fees and expenses of any Underlying Funds are not included in each annualized expense ratio.
C Amount represents less than .005%.
D Amount represents less than $.005.
E 5% return per year before expenses
Distributions (Unaudited)
A total of 0.04% of the dividends distributed during the fiscal year was derived from interest on U.S. Government securities which is generally exempt from state income tax.
The fund designates $ 12,279,033 of distributions paid in the calendar year 2020 as qualifying to be taxed as section 163(j) interest dividends.
The fund will notify shareholders in January 2022 of amounts for use in preparing 2021 income tax returns.
Board Approval of Investment Advisory Contracts and Management Fees
Fidelity Series Floating Rate High Income Fund
Each year, the Board of Trustees, including the Independent Trustees (together, the Board), votes on the renewal of the management contract with Fidelity Management & Research Company LLC (FMR) and the sub-advisory agreements (together, the Advisory Contracts) for the fund. FMR and the sub-advisers are referred to herein as the Investment Advisers. The Board, assisted by the advice of fund counsel and Independent Trustees' counsel, requests and considers a broad range of information relevant to the renewal of the Advisory Contracts throughout the year.
The Board meets regularly and, at each of its meetings, covers an extensive agenda of topics and materials and considers factors that are relevant to its annual consideration of the renewal of the fund's Advisory Contracts, including the services and support provided to the fund and its shareholders. The Board has established various standing committees (Committees), each composed of and chaired by Independent Trustees with varying backgrounds, to which the Board has assigned specific subject matter responsibilities in order to enhance effective decision-making by the Board. The Board, acting directly and through its Committees, requests and receives information concerning the annual consideration of the renewal of the fund's Advisory Contracts. The Board also meets as needed to review matters specifically related to the Board's annual consideration of the renewal of the Advisory Contracts. Members of the Board may also meet with trustees of other Fidelity funds through joint ad hoc committees to discuss certain matters relevant to all of the Fidelity funds.
At its May 2021 meeting, the Board unanimously determined to renew the fund's Advisory Contracts. In considering whether to renew the Advisory Contracts for the fund, the Board considered all factors it believed relevant and reached a determination, with the assistance of fund counsel and Independent Trustees' counsel and through the exercise of its business judgment, that the renewal of the Advisory Contracts was in the best interests of the fund and its shareholders and the fact that no fee is payable under the management contract was fair and reasonable.
Nature, Extent, and Quality of Services Provided. The Board considered Fidelity's staffing as it relates to the fund, including the backgrounds of investment personnel of Fidelity, and also considered the fund's investment objective, strategies, and related investment philosophy. The Independent Trustees also had discussions with senior management of Fidelity's investment operations and investment groups. The Board considered the structure of the investment personnel compensation program and whether this structure provides appropriate incentives to act in the best interests of the fund.
Resources Dedicated to Investment Management and Support Services. The Board and the Fund Oversight and Research Committees reviewed the general qualifications and capabilities of Fidelity's investment staff, including its size, education, experience, and resources, as well as Fidelity's approach to recruiting, training, managing, and compensating investment personnel. The Board noted that Fidelity has continued to increase the resources devoted to non-U.S. offices, including expansion of Fidelity's global investment organization. The Board also noted that Fidelity's analysts have extensive resources, tools and capabilities that allow them to conduct sophisticated quantitative and fundamental analysis, as well as credit analysis of issuers, counterparties and guarantors. Further, the Board considered that Fidelity's investment professionals have sufficient access to global information and data so as to provide competitive investment results over time, and that those professionals also have access to sophisticated tools that permit them to assess portfolio construction and risk and performance attribution characteristics continuously, as well as to transmit new information and research conclusions rapidly around the world. Additionally, in its deliberations, the Board considered Fidelity's trading, risk management, compliance, and technology and operations capabilities and resources, which are integral parts of the investment management process. The Board also considered Fidelity's investments in business continuity planning, and its success in continuously providing services to the fund notwithstanding the severe disruptions caused by the COVID-19 pandemic.
Administrative Services. The Board considered (i) the nature, extent, quality, and cost of advisory and administrative services performed by the Investment Advisers and their affiliates under the Advisory Contracts and under separate agreements covering transfer agency, pricing and bookkeeping, and securities lending services for the fund; (ii) the nature and extent of the supervision of third party service providers, principally custodians, subcustodians, and pricing vendors; and (iii) the resources devoted to, and the record of compliance with, the fund's compliance policies and procedures. The Board also reviewed the allocation of fund brokerage, including allocations to brokers affiliated with the Investment Advisers, the use of brokerage commissions to pay fund expenses, and the use of "soft" commission dollars to pay for research services.
Investment Performance. The Board considered whether the fund has operated in accordance with its investment objective, as well as its record of compliance with its investment restrictions. The Board reviewed the fund's absolute investment performance, as well as the fund's relative investment performance, but did not consider performance to be a material factor in its decision to renew the fund's Advisory Contracts, as the fund is not publicly offered as a stand-alone investment product. In this regard, the Board noted that the fund is designed to offer an investment option for other investment companies and 529 plans managed by Fidelity and ultimately to enhance the performance of those investment companies and 529 plans.
Based on its review, the Board concluded that the nature, extent, and quality of services provided to the fund under the Advisory Contracts should continue to benefit the shareholders of the fund.
Competitiveness of Management Fee and Total Expense Ratio. The Board considered that the fund does not pay FMR a management fee for investment advisory services, but that FMR receives fees for providing services to funds that invest in the fund. The Board noted that FMR or an affiliate undertakes to pay all operating expenses of the fund, except transfer agent fees, 12b-1 fees, Independent Trustee fees and expenses, custodian fees and expenses, proxy and shareholder meeting expenses, interest, taxes, and extraordinary expenses (such as litigation expenses). The Board further noted that the fund pays its non-operating expenses, including brokerage commissions and fees and expenses associated with the fund's securities lending program, if applicable.
The Board further considered that FMR has contractually agreed to reimburse the fund to the extent that total operating expenses, with certain exceptions, as a percentage of its average net assets, exceed 0.003% through January 31, 2024.
Based on its review, the Board considered that the fund does not pay a management fee and concluded that the total expense ratio of the fund was reasonable in light of the services that the fund and its shareholders receive and the other factors considered.
Costs of the Services and Profitability. The Board considered the level of Fidelity's profits in respect of all the Fidelity funds.
A public accounting firm has been engaged annually by the Board as part of the Board's assessment of Fidelity's profitability analysis. The engagement includes the review and assessment of the methodologies used by Fidelity in determining the revenues and expenses attributable to Fidelity's mutual fund business, and completion of agreed-upon procedures in respect of the mathematical accuracy of certain fund profitability information and its conformity to established allocation methodologies. After considering the reports issued under the engagement and information provided by Fidelity, the Board concluded that while other allocation methods may also be reasonable, Fidelity's profitability methodologies are reasonable in all material respects.
The Board also reviewed Fidelity's non-fund businesses and potential indirect benefits such businesses may have received as a result of their association with Fidelity's mutual fund business (i.e., fall-out benefits) as well as cases where Fidelity's affiliates may benefit from the funds' business. The Board considered areas where potential indirect benefits to the Fidelity funds from their relationships with Fidelity may exist. The Board also considered that in 2019 a joint ad hoc committee created by it and the boards of other Fidelity funds evaluated potential fall-out benefits (PFOB Committee). The Board noted that it considered the PFOB Committee's findings in connection with its consideration of the renewal of the Advisory Contracts.
The Board concluded that the costs of the services provided by and the profits realized by Fidelity in connection with the operation of the fund were not relevant to the renewal of the Advisory Contracts because the fund pays no advisory fees and FMR bears all expenses of the fund with certain exceptions.
Economies of Scale. The Board concluded that because the fund pays no advisory fees and FMR bears all expenses of the fund with certain exceptions, the realization of economies of scale was not a material factor in the Board's decision to renew the fund's Advisory Contracts.
Additional Information Requested by the Board. In order to develop fully the factual basis for consideration of the Fidelity funds' advisory contracts, the Board requested and received additional information on certain topics, including: (i) fund flow and performance trends, in particular the underperformance of certain funds and strategies, and Fidelity's long-term strategies for certain funds; (ii) consideration of expanding the use of performance fees for additional funds; (iii) Fidelity's pricing philosophy compared to competitors; (iv) metrics for evaluating index fund and ETF performance and information about ETF trading characteristics; (v) the methodology with respect to evaluating competitive fund data and peer group classifications and fee and expense comparisons; (vi) the expense structures for different funds and classes and information about the differences between various expense structures; (vii) group fee breakpoints; (viii) information regarding other accounts managed by Fidelity and sub-advisory arrangements; and (ix) Fidelity's philosophies and strategies for evaluating funds and classes with lower or declining asset levels.
Based on its evaluation of all of the conclusions noted above, and after considering all factors it believed relevant, the Board concluded that the advisory fee arrangements are fair and reasonable, and that the fund's Advisory Contracts should be renewed.

SFR-ANN-1121
1.924290.109