UNITED STATES
SECURITIES AND EXCHANGE COMMISSION
Washington, D.C. 20549
FORM N-CSR
CERTIFIED SHAREHOLDER REPORT OF REGISTERED
MANAGEMENT INVESTMENT COMPANIES
Investment Company Act file number 811-02737
Fidelity Summer Street Trust
(Exact name of registrant as specified in charter)
245 Summer St., Boston, Massachusetts 02210
(Address of principal executive offices) (Zip code)
Cynthia Lo Bessette, Secretary
245 Summer St.
Boston, Massachusetts 02210
(Name and address of agent for service)
Registrant's telephone number, including area code:
617-563-7000
| |
Date of fiscal year end: | May 31 |
|
|
Date of reporting period: | May 31, 2022 |
Item 1.
Reports to Stockholders
Fidelity® Disruptive Automation Fund
Fidelity® Disruptive Communications Fund
Fidelity® Disruptive Finance Fund
Fidelity® Disruptive Medicine Fund
Fidelity® Disruptive Technology Fund
Annual Report
May 31, 2022


Contents
To view a fund's proxy voting guidelines and proxy voting record for the 12-month period ended June 30, visit http://www.fidelity.com/proxyvotingresults or visit the Securities and Exchange Commission's (SEC) web site at http://www.sec.gov.
You may also call 1-800-544-8544 if you’re an individual investing directly with Fidelity, call 1-800-835-5092 if you’re a plan sponsor or participant with Fidelity as your recordkeeper or call 1-877-208-0098 on institutional accounts or if you’re an advisor or invest through one to request a free copy of the proxy voting guidelines.
You may also call 1-800-544-8544 to request a free copy of the proxy voting guidelines.
Standard & Poor's, S&P and S&P 500 are registered service marks of The McGraw-Hill Companies, Inc. and have been licensed for use by Fidelity Distributors Corporation.
Other third-party marks appearing herein are the property of their respective owners.
All other marks appearing herein are registered or unregistered trademarks or service marks of FMR LLC or an affiliated company. © 2022 FMR LLC. All rights reserved.
This report and the financial statements contained herein are submitted for the general information of the shareholders of the Funds. This report is not authorized for distribution to prospective investors in the Funds unless preceded or accompanied by an effective prospectus.
A fund files its complete schedule of portfolio holdings with the SEC for the first and third quarters of each fiscal year on Form N-PORT. Forms N-PORT are available on the SEC’s web site at http://www.sec.gov. A fund's Forms N-PORT may be reviewed and copied at the SEC’s Public Reference Room in Washington, DC. Information regarding the operation of the SEC's Public Reference Room may be obtained by calling 1-800-SEC-0330.
For a complete list of a fund's portfolio holdings, view the most recent holdings listing, semiannual report, or annual report on Fidelity's web site at http://www.fidelity.com, http://www.institutional.fidelity.com, or http://www.401k.com, as applicable.
NOT FDIC INSURED •MAY LOSE VALUE •NO BANK GUARANTEE
Neither the Funds nor Fidelity Distributors Corporation is a bank.
Note to Shareholders:
Early in 2020, the outbreak and spread of COVID-19 emerged as a public health emergency that had a major influence on financial markets, primarily based on its impact on the global economy and corporate earnings. On March 11, 2020, the World Health Organization declared the COVID-19 outbreak a pandemic, citing sustained risk of further global spread. The pandemic prompted a number of measures to limit the spread of COVID-19, including travel and border restrictions, quarantines, and restrictions on large gatherings. In turn, these resulted in lower consumer activity, diminished demand for a wide range of products and services, disruption in manufacturing and supply chains, and – given the wide variability in outcomes regarding the outbreak – significant market uncertainty and volatility. To help stem the turmoil, the U.S. government took unprecedented action – in concert with the U.S. Federal Reserve and central banks around the world – to help support consumers, businesses, and the broader economy, and to limit disruption to the financial system.
In general, the overall impact of the pandemic lessened in 2021, amid a resilient economy and widespread distribution of three COVID-19 vaccines granted emergency use authorization from the U.S. Food and Drug Administration (FDA) early in the year. Still, the situation remains dynamic, and the extent and duration of its influence on financial markets and the economy is highly uncertain, due in part to a recent spike in cases based on highly contagious variants of the coronavirus.
Extreme events such as the COVID-19 crisis are exogenous shocks that can have significant adverse effects on mutual funds and their investments. Although multiple asset classes may be affected by market disruption, the duration and impact may not be the same for all types of assets. Fidelity is committed to helping you stay informed amid news about COVID-19 and during increased market volatility, and we continue to take extra steps to be responsive to customer needs. We encourage you to visit us online, where we offer ongoing updates, commentary, and analysis on the markets and our funds.
Fidelity® Disruptive Automation Fund
Performance: The Bottom Line
Average annual total return reflects the change in the value of an investment, assuming reinvestment of distributions from dividend income and capital gains (the profits earned upon the sale of securities that have grown in value, if any) and assuming a constant rate of performance each year. The hypothetical investment and the average annual total returns do not reflect the deduction of taxes that a shareholder would pay on fund distributions or the redemption of fund shares. During periods of reimbursement by Fidelity, a fund’s total return will be greater than it would be had the reimbursement not occurred. How a fund did yesterday is no guarantee of how it will do tomorrow.
Average Annual Total Returns
| For the periods ended May 31, 2022 | Past 1 year | Life of fundA |
| Fidelity® Disruptive Automation Fund | (16.75)% | 22.06% |
| Loyalty Class 1 | (16.52)% | 22.35% |
| Loyalty Class 2 | (16.32)% | 22.65% |
| Class F | (15.93)% | 23.25% |
A From April 16, 2020
$10,000 Over Life of Fund
Let's say hypothetically that $10,000 was invested in Fidelity® Disruptive Automation Fund, a class of the fund, on April 16, 2020, when the fund started.
The chart shows how the value of your investment would have changed, and also shows how the MSCI ACWI (All Country World Index) Index performed over the same period.
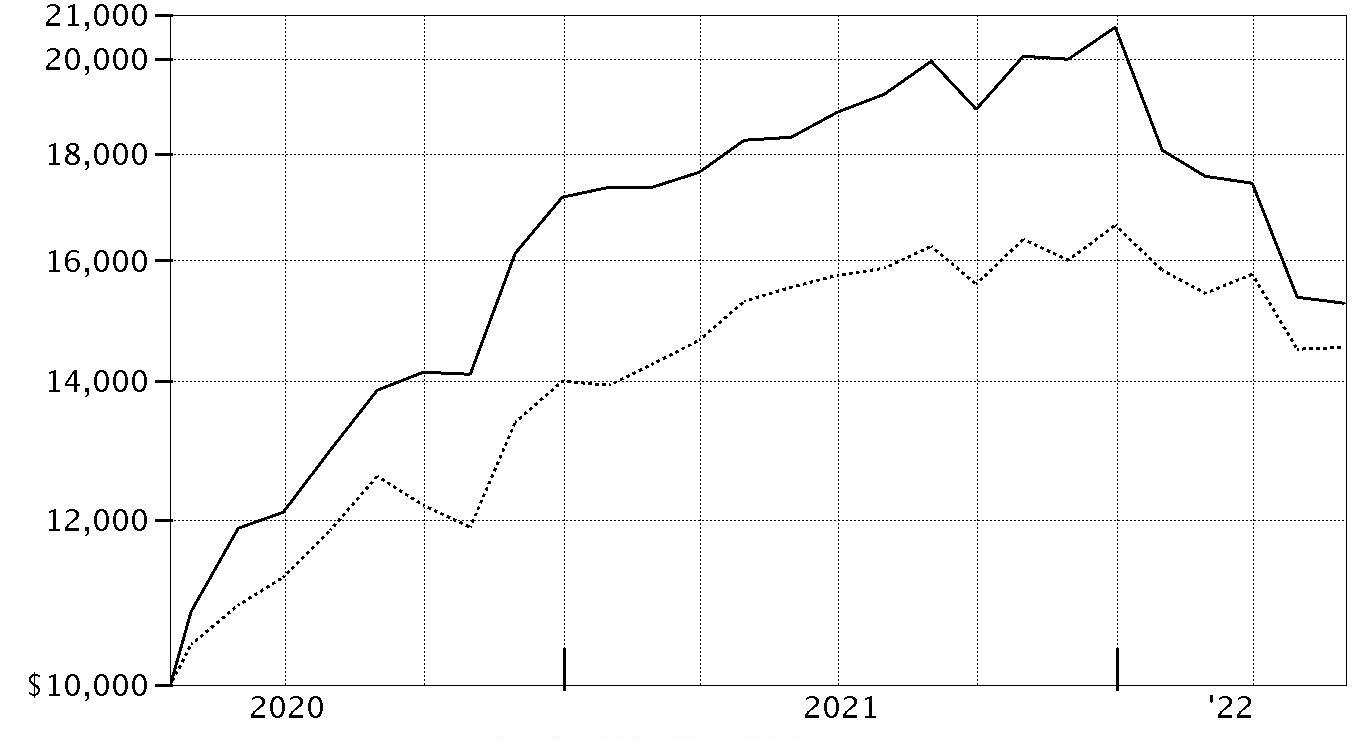
| Period Ending Values |
| $15,269 | Fidelity® Disruptive Automation Fund |
| $14,529 | MSCI ACWI (All Country World Index) Index |
Fidelity® Disruptive Automation Fund
Management's Discussion of Fund Performance
Market Recap: Global equities returned -6.49% for the 12 months ending May 31, 2022, according to the MSCI ACWI (All Country World Index) Index. After posting an 18.90% gain in 2021, global stocks retreated to begin the new year amid several headwinds that stoked volatility, uncertainty and investor anxiety. Chief among these was accelerated efforts by some central banks to hike interest rates and aggressively wind down extraordinary monetary policy support in an attempt to rein in high inflation. In addition, geopolitical unrest rose as Russia invaded Ukraine in late February and escalated its attack through period end. Other factors influencing stocks included surging global commodity prices, rising sovereign bond yields in some markets, global supply constraint and disruption, and the potential for variants of the coronavirus to upend global economic growth. Against this backdrop, the index returned -4.90% in January and -2.56% in February, falling on mixed corporate earnings. Volatility eased in March and the index gained 2.21% for the month. April saw a reversal (-7.98%), amid angst about the economic toll of “zero-COVID” lockdowns in China, and then the index had a flattish May (+0.16%). For the full 12 months, emerging markets (-20%) lagged most, followed by Japan (-13%) and Europe ex U.K. (-12%). Conversely, the U.K. and Canada (+3%) led. By sector, communication services (-23%) and consumer discretionary (-21%) fared worst, whereas energy (+48%) rode a surge in commodity prices and topped the market by a wide margin.
Comments from Co-Managers Charlie Hebard and Christopher Lee: For the fiscal year ending May 31, 2022, the fund's share classes returned roughly -17% to -16%, underperforming the -10.14% return of the MSCI All Country World Industrials Equal Weighted Index Net MA, as well as the broad-based MSCI All Country World Index (Net MA). By region, stock picks in emerging markets, specifically Taiwan and Japan, hurt the fund's relative result. By industry, the primary detractors from performance versus the benchmark were an overweighting and stock selection in industrial machinery. Weak picks in electronic equipment & instruments also hurt. Also hurting performance was an underweighting in aerospace & defense. The biggest individual relative detractor was an overweight position in Hiwin Technologies (-40%). Another notable relative detractor was an overweighting in Misumi Group (-30%). This period we increased our stakes in both Hiwin and Musimi. The fund's non-benchmark stake in Renishaw, one of our largest holdings as of May 31, returned -34%. Conversely, stock picks in the U.S. and an underweighting in Europe ex U.K., specifically Netherlands, contributed most to the fund's relative result. By industry, the primary contributor to performance versus the benchmark was security selection in semiconductors. An underweighting in construction machinery & heavy trucks also bolstered the fund's relative performance. Also lifting the fund's relative result was an underweighting in building products. Nvidia, the fund's largest individual contributor, rose roughly 14% this period. We reduced our stake in the company the past twelve months. Our second-largest contributor was Synopsys, which gained approximately 25% the past year. Another contributor this period was Microsoft. The shares gained 10% the past twelve months. All these contributors were non-benchmark positions.
The views expressed above reflect those of the portfolio manager(s) only through the end of the period as stated on the cover of this report and do not necessarily represent the views of Fidelity or any other person in the Fidelity organization. Any such views are subject to change at any time based upon market or other conditions and Fidelity disclaims any responsibility to update such views. These views may not be relied on as investment advice and, because investment decisions for a Fidelity fund are based on numerous factors, may not be relied on as an indication of trading intent on behalf of any Fidelity fund.
Fidelity® Disruptive Automation Fund
Investment Summary (Unaudited)
Top Ten Stocks as of May 31, 2022
| | % of fund's net assets |
| Roper Technologies, Inc. | 5.5 |
| Alphabet, Inc. Class C | 4.6 |
| SMC Corp. | 4.3 |
| PTC, Inc. | 4.3 |
| Taiwan Semiconductor Manufacturing Co. Ltd. | 4.2 |
| Teradyne, Inc. | 4.1 |
| Hexagon AB (B Shares) | 4.0 |
| Renishaw PLC | 3.8 |
| Keyence Corp. | 3.7 |
| ANSYS, Inc. | 3.6 |
| | 42.1 |
Market Sectors as of May 31, 2022
| | % of fund's net assets |
| Information Technology | 51.7 |
| Industrials | 38.6 |
| Communication Services | 4.6 |
| Health Care | 3.6 |
| Consumer Discretionary | 0.8 |
Asset Allocation (% of fund's net assets)
| As of May 31, 2022 * |
| | Stocks | 99.3% |
| | Short-Term Investments and Net Other Assets (Liabilities) | 0.7% |

* Foreign investments - 53.1%
Geographic Diversification (% of fund's net assets)
| As of May 31, 2022 |
| | United States of America* | 46.9% |
| | Japan | 21.7% |
| | Taiwan | 7.3% |
| | United Kingdom | 4.9% |
| | Sweden | 4.0% |
| | China | 3.6% |
| | Germany | 3.0% |
| | Ireland | 2.6% |
| | France | 2.2% |
| | Other | 3.8% |

* Includes Short-Term investments and Net Other Assets (Liabilities).
Fidelity® Disruptive Automation Fund
Schedule of Investments May 31, 2022
Showing Percentage of Net Assets
| Common Stocks - 99.3% | | | |
| | | Shares | Value |
| COMMUNICATION SERVICES - 4.6% | | | |
| Interactive Media & Services - 4.6% | | | |
| Alphabet, Inc. Class C (a) | | 2,464 | $5,619,842 |
| CONSUMER DISCRETIONARY - 0.8% | | | |
| Internet & Direct Marketing Retail - 0.8% | | | |
| Amazon.com, Inc. (a) | | 410 | 985,718 |
| HEALTH CARE - 3.6% | | | |
| Health Care Equipment & Supplies - 3.6% | | | |
| Intuitive Surgical, Inc. (a) | | 19,726 | 4,490,427 |
| INDUSTRIALS - 38.6% | | | |
| Electrical Equipment - 5.4% | | | |
| AMETEK, Inc. | | 24,630 | 2,991,806 |
| Rockwell Automation, Inc. | | 11,055 | 2,356,926 |
| Sensata Technologies, Inc. PLC | | 28,768 | 1,381,727 |
| | | | 6,730,459 |
| Industrial Conglomerates - 4.7% | | | |
| Honeywell International, Inc. | | 16,048 | 3,107,214 |
| Siemens AG | | 20,910 | 2,760,183 |
| | | | 5,867,397 |
| Machinery - 25.1% | | | |
| Airtac International Group | | 46,078 | 1,498,529 |
| AutoStore Holdings Ltd. | | 616,143 | 1,467,281 |
| Daifuku Co. Ltd. | | 18,148 | 1,144,691 |
| FANUC Corp. | | 25,573 | 4,168,378 |
| HIWIN Technologies Corp. | | 495,590 | 3,811,462 |
| Kardex AG | | 9,478 | 1,727,225 |
| Misumi Group, Inc. | | 169,262 | 3,835,299 |
| Nabtesco Corp. | | 42,137 | 1,004,860 |
| Shenzhen Inovance Technology Co. Ltd. (A Shares) | | 480,209 | 4,406,954 |
| SMC Corp. | | 10,345 | 5,348,630 |
| THK Co. Ltd. | | 125,393 | 2,571,465 |
| | | | 30,984,774 |
| Professional Services - 3.4% | | | |
| Recruit Holdings Co. Ltd. | | 114,431 | 4,141,737 |
|
| TOTAL INDUSTRIALS | | | 47,724,367 |
|
| INFORMATION TECHNOLOGY - 51.7% | | | |
| Electronic Equipment & Components - 13.2% | | | |
| Cognex Corp. | | 16,870 | 816,845 |
| Hexagon AB (B Shares) | | 408,348 | 4,982,372 |
| Keyence Corp. | | 11,407 | 4,535,156 |
| National Instruments Corp. | | 35,285 | 1,246,266 |
| Renishaw PLC | | 92,481 | 4,735,995 |
| | | | 16,316,634 |
| IT Services - 2.6% | | | |
| Accenture PLC Class A | | 10,779 | 3,217,100 |
| Semiconductors & Semiconductor Equipment - 11.2% | | | |
| NVIDIA Corp. | | 19,297 | 3,603,136 |
| Taiwan Semiconductor Manufacturing Co. Ltd. | | 271,885 | 5,136,996 |
| Teradyne, Inc. (b) | | 46,847 | 5,118,503 |
| | | | 13,858,635 |
| Software - 24.7% | | | |
| Altair Engineering, Inc. Class A (a) | | 21,184 | 1,164,273 |
| ANSYS, Inc. (a) | | 17,273 | 4,497,198 |
| Autodesk, Inc. (a) | | 5,844 | 1,214,091 |
| Dassault Systemes SA | | 65,261 | 2,751,641 |
| Manhattan Associates, Inc. (a) | | 8,194 | 990,900 |
| Microsoft Corp. | | 11,751 | 3,194,744 |
| Nemetschek Se | | 13,273 | 947,004 |
| PTC, Inc. (a) | | 45,416 | 5,292,326 |
| Roper Technologies, Inc. | | 15,377 | 6,803,400 |
| Synopsys, Inc. (a) | | 10,434 | 3,330,533 |
| Unity Software, Inc. (a) | | 8,641 | 345,381 |
| | | | 30,531,491 |
|
| TOTAL INFORMATION TECHNOLOGY | | | 63,923,860 |
|
| TOTAL COMMON STOCKS | | | |
| (Cost $126,594,500) | | | 122,744,214 |
|
| Money Market Funds - 4.9% | | | |
| Fidelity Cash Central Fund 0.82% (c) | | 850,205 | 850,375 |
| Fidelity Securities Lending Cash Central Fund 0.82% (c)(d) | | 5,229,377 | 5,229,900 |
| TOTAL MONEY MARKET FUNDS | | | |
| (Cost $6,080,275) | | | 6,080,275 |
| TOTAL INVESTMENT IN SECURITIES - 104.2% | | | |
| (Cost $132,674,775) | | | 128,824,489 |
| NET OTHER ASSETS (LIABILITIES) - (4.2)% | | | (5,184,080) |
| NET ASSETS - 100% | | | $123,640,409 |
Legend
(a) Non-income producing
(b) Security or a portion of the security is on loan at period end.
(c) Affiliated fund that is generally available only to investment companies and other accounts managed by Fidelity Investments. The rate quoted is the annualized seven-day yield of the fund at period end. A complete unaudited listing of the fund's holdings as of its most recent quarter end is available upon request. In addition, each Fidelity Central Fund's financial statements, which are not covered by the Fund's Report of Independent Registered Public Accounting Firm, are available on the SEC's website or upon request.
(d) Investment made with cash collateral received from securities on loan.
Affiliated Central Funds
Fiscal year to date information regarding the Fund's investments in Fidelity Central Funds, including the ownership percentage, is presented below.
| Fund | Value, beginning of period | Purchases | Sales Proceeds | Dividend Income | Realized Gain/Loss | Change in Unrealized appreciation (depreciation) | Value, end of period | % ownership, end of period |
| Fidelity Cash Central Fund 0.82% | $3,078,210 | $40,366,050 | $42,593,885 | $1,339 | $-- | $-- | $850,375 | 0.0% |
| Fidelity Securities Lending Cash Central Fund 0.82% | 596,275 | 21,968,652 | 17,335,027 | 1,829 | -- | -- | 5,229,900 | 0.0% |
| Total | $3,674,485 | $62,334,702 | $59,928,912 | $3,168 | $-- | $-- | $6,080,275 | |
Amounts in the income column in the above table include any capital gain distributions from underlying funds, which are presented in the corresponding line-item in the Statement of Operations, if applicable. Amount for Fidelity Securities Lending Cash Central Fund represents the income earned on investing cash collateral, less rebates paid to borrowers and any lending agent fees associated with the loan, plus any premium payments received for lending certain types of securities.
Investment Valuation
The following is a summary of the inputs used, as of May 31, 2022, involving the Fund's assets and liabilities carried at fair value. The inputs or methodology used for valuing securities may not be an indication of the risk associated with investing in those securities. For more information on valuation inputs, and their aggregation into the levels used below, please refer to the Investment Valuation section in the accompanying Notes to Financial Statements.
| | Valuation Inputs at Reporting Date: |
| Description | Total | Level 1 | Level 2 | Level 3 |
| Investments in Securities: | | | | |
| Equities: | | | | |
| Communication Services | $5,619,842 | $5,619,842 | $-- | $-- |
| Consumer Discretionary | 985,718 | 985,718 | -- | -- |
| Health Care | 4,490,427 | 4,490,427 | -- | -- |
| Industrials | 47,724,367 | 25,995,448 | 21,728,919 | -- |
| Information Technology | 63,923,860 | 46,517,695 | 17,406,165 | -- |
| Money Market Funds | 6,080,275 | 6,080,275 | -- | -- |
| Total Investments in Securities: | $128,824,489 | $89,689,405 | $39,135,084 | $-- |
See accompanying notes which are an integral part of the financial statements.
Fidelity® Disruptive Automation Fund
Financial Statements
Statement of Assets and Liabilities
| | | May 31, 2022 |
| Assets | | |
Investment in securities, at value (including securities loaned of $5,113,368) — See accompanying schedule:
Unaffiliated issuers (cost $126,594,500) | $122,744,214 | |
| Fidelity Central Funds (cost $6,080,275) | 6,080,275 | |
| Total Investment in Securities (cost $132,674,775) | | $128,824,489 |
| Receivable for fund shares sold | | 157,969 |
| Dividends receivable | | 194,777 |
| Distributions receivable from Fidelity Central Funds | | 408 |
| Other receivables | | 978 |
| Total assets | | 129,178,621 |
| Liabilities | | |
| Payable for fund shares redeemed | $241,649 | |
| Accrued management fee | 66,663 | |
| Collateral on securities loaned | 5,229,900 | |
| Total liabilities | | 5,538,212 |
| Net Assets | | $123,640,409 |
| Net Assets consist of: | | |
| Paid in capital | | $128,069,303 |
| Total accumulated earnings (loss) | | (4,428,894) |
| Net Assets | | $123,640,409 |
| Net Asset Value and Maximum Offering Price | | |
| Fidelity Disruptive Automation Fund: | | |
| Net Asset Value, offering price and redemption price per share ($36,333,062 ÷ 2,433,433 shares) | | $14.93 |
| Loyalty Class 1: | | |
| Net Asset Value, offering price and redemption price per share ($60,357,404 ÷ 4,051,160 shares) | | $14.90 |
| Loyalty Class 2: | | |
| Net Asset Value, offering price and redemption price per share ($154,261 ÷ 10,291 shares) | | $14.99 |
| Class F: | | |
| Net Asset Value, offering price and redemption price per share ($26,795,682 ÷ 1,782,369 shares) | | $15.03�� |
See accompanying notes which are an integral part of the financial statements.
Statement of Operations
| | | Year ended May 31, 2022 |
| Investment Income | | |
| Dividends | | $1,260,189 |
| Income from Fidelity Central Funds (including $1,829 from security lending) | | 3,168 |
| Income before foreign taxes withheld | | 1,263,357 |
| Less foreign taxes withheld | | (145,145) |
| Total income | | 1,118,212 |
| Expenses | | |
| Management fee | $1,136,245 | |
| Independent trustees' fees and expenses | 558 | |
| Total expenses before reductions | 1,136,803 | |
| Expense reductions | (2) | |
| Total expenses after reductions | | 1,136,801 |
| Net investment income (loss) | | (18,589) |
| Realized and Unrealized Gain (Loss) | | |
| Net realized gain (loss) on: | | |
| Investment securities: | | |
| Unaffiliated issuers | 1,715,964 | |
| Foreign currency transactions | (24,043) | |
| Total net realized gain (loss) | | 1,691,921 |
| Change in net unrealized appreciation (depreciation) on: | | |
| Investment securities: | | |
| Unaffiliated issuers | (28,542,075) | |
| Assets and liabilities in foreign currencies | (9,313) | |
| Total change in net unrealized appreciation (depreciation) | | (28,551,388) |
| Net gain (loss) | | (26,859,467) |
| Net increase (decrease) in net assets resulting from operations | | $(26,878,056) |
See accompanying notes which are an integral part of the financial statements.
Statement of Changes in Net Assets
| | Year ended May 31, 2022 | Year ended May 31, 2021 |
| Increase (Decrease) in Net Assets | | |
| Operations | | |
| Net investment income (loss) | $(18,589) | $264,541 |
| Net realized gain (loss) | 1,691,921 | 2,199,756 |
| Change in net unrealized appreciation (depreciation) | (28,551,388) | 23,949,593 |
| Net increase (decrease) in net assets resulting from operations | (26,878,056) | 26,413,890 |
| Distributions to shareholders | (4,074,695) | (332,565) |
| Share transactions - net increase (decrease) | 1,799,212 | 117,088,107 |
| Total increase (decrease) in net assets | (29,153,539) | 143,169,432 |
| Net Assets | | |
| Beginning of period | 152,793,948 | 9,624,516 |
| End of period | $123,640,409 | $152,793,948 |
See accompanying notes which are an integral part of the financial statements.
Financial Highlights
Fidelity Disruptive Automation Fund
| Years ended May 31, | 2022 | 2021 | 2020 A |
| Selected Per–Share Data | | | |
| Net asset value, beginning of period | $18.28 | $11.90 | $10.00 |
| Income from Investment Operations | | | |
| Net investment income (loss)B,C | (.06) | .01 | (.01) |
| Net realized and unrealized gain (loss) | (2.92) | 6.42 | 1.91 |
| Total from investment operations | (2.98) | 6.43 | 1.90 |
| Distributions from net investment income | – | (.04) | – |
| Distributions from net realized gain | (.37) | (.02) | – |
| Total distributions | (.37) | (.05)D | – |
| Net asset value, end of period | $14.93 | $18.28 | $11.90 |
| Total ReturnE,F | (16.75)% | 54.13% | 19.00% |
| Ratios to Average Net AssetsC,G,H | | | |
| Expenses before reductions | 1.00% | 1.01%I | 1.01%I,J |
| Expenses net of fee waivers, if any | 1.00% | 1.01%I | 1.01%I,J |
| Expenses net of all reductions | 1.00% | 1.01%I | 1.01%I,J |
| Net investment income (loss) | (.33)% | .06% | (.47)%J |
| Supplemental Data | | | |
| Net assets, end of period (000 omitted) | $36,333 | $111,910 | $5,308 |
| Portfolio turnover rateK | 22% | 14% | 6%L |
A For the period April 16, 2020 (commencement of operations) through May 31, 2020.
B Calculated based on average shares outstanding during the period.
C Net investment income (loss) is affected by the timing of the declaration of dividends by any underlying mutual funds or exchange-traded funds (ETFs). Net investment income (loss) of any such underlying funds is not included in the Fund's net investment income (loss) ratio.
D Total distributions per share do not sum due to rounding.
E Total returns for periods of less than one year are not annualized.
F Total returns would have been lower if certain expenses had not been reduced during the applicable periods shown.
G Fees and expenses of any underlying mutual funds or exchange-traded funds (ETFs) are not included in the Fund's expense ratio. The Fund indirectly bears its proportionate share of these expenses. For additional expense information related to investments in Fidelity Central Funds, please refer to the "Investments in Fidelity Central Funds" note found in the Notes to Financial Statements section of the most recent Annual or Semi-Annual report.
H Expense ratios reflect operating expenses of the class. Expenses before reductions do not reflect amounts reimbursed, waived, or reduced through arrangements with the investment adviser, brokerage services, or other offset arrangements, if applicable, and do not represent the amount paid by the class during periods when reimbursements, waivers or reductions occur.
I On certain classes, the size and fluctuation of net assets and expense amounts may cause ratios to differ from contractual rates.
J Annualized
K Amount does not include the portfolio activity of any underlying mutual funds or exchange-traded funds (ETFs).
L Amount not annualized.
See accompanying notes which are an integral part of the financial statements.
Fidelity Disruptive Automation Fund Loyalty Class 1
| Years ended May 31, | 2022 | 2021 | 2020 A |
| Selected Per–Share Data | | | |
| Net asset value, beginning of period | $18.34 | $11.90 | $10.00 |
| Income from Investment Operations | | | |
| Net investment income (loss)B,C | – | .02 | –D |
| Net realized and unrealized gain (loss) | (2.91) | 6.46 | 1.90 |
| Total from investment operations | (2.91) | 6.48 | 1.90 |
| Distributions from net investment income | – | (.03) | – |
| Distributions from net realized gain | (.53) | (.01) | – |
| Total distributions | (.53) | (.04) | – |
| Net asset value, end of period | $14.90 | $18.34 | $11.90 |
| Total ReturnE,F | (16.52)% | 54.47% | 19.00% |
| Ratios to Average Net AssetsC,G,H | | | |
| Expenses before reductions | .75% | .76%I | .75%J |
| Expenses net of fee waivers, if any | .75% | .76%I | .75%J |
| Expenses net of all reductions | .75% | .76%I | .75%J |
| Net investment income (loss) | (.02)% | .10% | (.21)%J |
| Supplemental Data | | | |
| Net assets, end of period (000 omitted) | $60,357 | $6,792 | $119 |
| Portfolio turnover rateK | 22% | 14% | 6%L |
A For the period April 16, 2020 (commencement of operations) through May 31, 2020.
B Calculated based on average shares outstanding during the period.
C Net investment income (loss) is affected by the timing of the declaration of dividends by any underlying mutual funds or exchange-traded funds (ETFs). Net investment income (loss) of any such underlying funds is not included in the Fund's net investment income (loss) ratio.
D Amount represents less than $.005 per share.
E Total returns for periods of less than one year are not annualized.
F Total returns would have been lower if certain expenses had not been reduced during the applicable periods shown.
G Fees and expenses of any underlying mutual funds or exchange-traded funds (ETFs) are not included in the Fund's expense ratio. The Fund indirectly bears its proportionate share of these expenses. For additional expense information related to investments in Fidelity Central Funds, please refer to the "Investments in Fidelity Central Funds" note found in the Notes to Financial Statements section of the most recent Annual or Semi-Annual report.
H Expense ratios reflect operating expenses of the class. Expenses before reductions do not reflect amounts reimbursed, waived, or reduced through arrangements with the investment adviser, brokerage services, or other offset arrangements, if applicable, and do not represent the amount paid by the class during periods when reimbursements, waivers or reductions occur.
I On certain classes, the size and fluctuation of net assets and expense amounts may cause ratios to differ from contractual rates.
J Annualized
K Amount does not include the portfolio activity of any underlying mutual funds or exchange-traded funds (ETFs).
L Amount not annualized.
See accompanying notes which are an integral part of the financial statements.
Fidelity Disruptive Automation Fund Loyalty Class 2
| Years ended May 31, | 2022 | 2021 | 2020 A |
| Selected Per–Share Data | | | |
| Net asset value, beginning of period | $18.37 | $11.90 | $10.00 |
| Income from Investment Operations | | | |
| Net investment income (loss)B,C | .04 | .12 | –D |
| Net realized and unrealized gain (loss) | (2.92) | 6.41 | 1.90 |
| Total from investment operations | (2.88) | 6.53 | 1.90 |
| Distributions from net investment income | – | (.05) | – |
| Distributions from net realized gain | (.50) | (.01) | – |
| Total distributions | (.50) | (.06) | – |
| Net asset value, end of period | $14.99 | $18.37 | $11.90 |
| Total ReturnE,F | (16.32)% | 54.91% | 19.00% |
| Ratios to Average Net AssetsC,G,H | | | |
| Expenses before reductions | .50% | .50% | .50%I |
| Expenses net of fee waivers, if any | .50% | .50% | .50%I |
| Expenses net of all reductions | .50% | .50% | .50%I |
| Net investment income (loss) | .20% | .75% | .04%I |
| Supplemental Data | | | |
| Net assets, end of period (000 omitted) | $154 | $184 | $119 |
| Portfolio turnover rateJ | 22% | 14% | 6%K |
A For the period April 16, 2020 (commencement of operations) through May 31, 2020.
B Calculated based on average shares outstanding during the period.
C Net investment income (loss) is affected by the timing of the declaration of dividends by any underlying mutual funds or exchange-traded funds (ETFs). Net investment income (loss) of any such underlying funds is not included in the Fund's net investment income (loss) ratio.
D Amount represents less than $.005 per share.
E Total returns for periods of less than one year are not annualized.
F Total returns would have been lower if certain expenses had not been reduced during the applicable periods shown.
G Fees and expenses of any underlying mutual funds or exchange-traded funds (ETFs) are not included in the Fund's expense ratio. The Fund indirectly bears its proportionate share of these expenses. For additional expense information related to investments in Fidelity Central Funds, please refer to the "Investments in Fidelity Central Funds" note found in the Notes to Financial Statements section of the most recent Annual or Semi-Annual report.
H Expense ratios reflect operating expenses of the class. Expenses before reductions do not reflect amounts reimbursed, waived, or reduced through arrangements with the investment adviser, brokerage services, or other offset arrangements, if applicable, and do not represent the amount paid by the class during periods when reimbursements, waivers or reductions occur.
I Annualized
J Amount does not include the portfolio activity of any underlying mutual funds or exchange-traded funds (ETFs).
K Amount not annualized.
See accompanying notes which are an integral part of the financial statements.
Fidelity Disruptive Automation Fund Class F
| Years ended May 31, | 2022 | 2021 | 2020 A |
| Selected Per–Share Data | | | |
| Net asset value, beginning of period | $18.42 | $11.91 | $10.00 |
| Income from Investment Operations | | | |
| Net investment income (loss)B,C | .13 | .19 | .01 |
| Net realized and unrealized gain (loss) | (2.93) | 6.43 | 1.90 |
| Total from investment operations | (2.80) | 6.62 | 1.91 |
| Distributions from net investment income | – | (.09) | – |
| Distributions from net realized gain | (.59) | (.02) | – |
| Total distributions | (.59) | (.11) | – |
| Net asset value, end of period | $15.03 | $18.42 | $11.91 |
| Total ReturnD,E | (15.93)% | 55.67% | 19.10% |
| Ratios to Average Net AssetsC,F,G | | | |
| Expenses before reductions | -% | -% | - %H |
| Expenses net of fee waivers, if any | -% | -% | - %H |
| Expenses net of all reductions | -% | -% | - %H |
| Net investment income (loss) | .69% | 1.14% | .54%H |
| Supplemental Data | | | |
| Net assets, end of period (000 omitted) | $26,796 | $33,908 | $4,078 |
| Portfolio turnover rateI | 22% | 14% | 6%J |
A For the period April 16, 2020 (commencement of operations) through May 31, 2020.
B Calculated based on average shares outstanding during the period.
C Net investment income (loss) is affected by the timing of the declaration of dividends by any underlying mutual funds or exchange-traded funds (ETFs). Net investment income (loss) of any such underlying funds is not included in the Fund's net investment income (loss) ratio.
D Total returns for periods of less than one year are not annualized.
E Total returns would have been lower if certain expenses had not been reduced during the applicable periods shown.
F Fees and expenses of any underlying mutual funds or exchange-traded funds (ETFs) are not included in the Fund's expense ratio. The Fund indirectly bears its proportionate share of these expenses. For additional expense information related to investments in Fidelity Central Funds, please refer to the "Investments in Fidelity Central Funds" note found in the Notes to Financial Statements section of the most recent Annual or Semi-Annual report.
G Expense ratios reflect operating expenses of the class. Expenses before reductions do not reflect amounts reimbursed, waived, or reduced through arrangements with the investment adviser, brokerage services, or other offset arrangements, if applicable, and do not represent the amount paid by the class during periods when reimbursements, waivers or reductions occur.
H Annualized
I Amount does not include the portfolio activity of any underlying mutual funds or exchange-traded funds (ETFs).
J Amount not annualized.
See accompanying notes which are an integral part of the financial statements.
Fidelity® Disruptive Communications Fund
Performance: The Bottom Line
Average annual total return reflects the change in the value of an investment, assuming reinvestment of distributions from dividend income and capital gains (the profits earned upon the sale of securities that have grown in value, if any) and assuming a constant rate of performance each year. The hypothetical investment and the average annual total returns do not reflect the deduction of taxes that a shareholder would pay on fund distributions or the redemption of fund shares. During periods of reimbursement by Fidelity, a fund’s total return will be greater than it would be had the reimbursement not occurred. How a fund did yesterday is no guarantee of how it will do tomorrow.
Average Annual Total Returns
| For the periods ended May 31, 2022 | Past 1 year | Life of fundA |
| Fidelity® Disruptive Communications Fund | (28.39)% | 10.46% |
| Loyalty Class 1 | (28.19)% | 10.78% |
| Loyalty Class 2 | (27.99)% | 11.06% |
| Class F | (27.66)% | 11.60% |
A From April 16, 2020
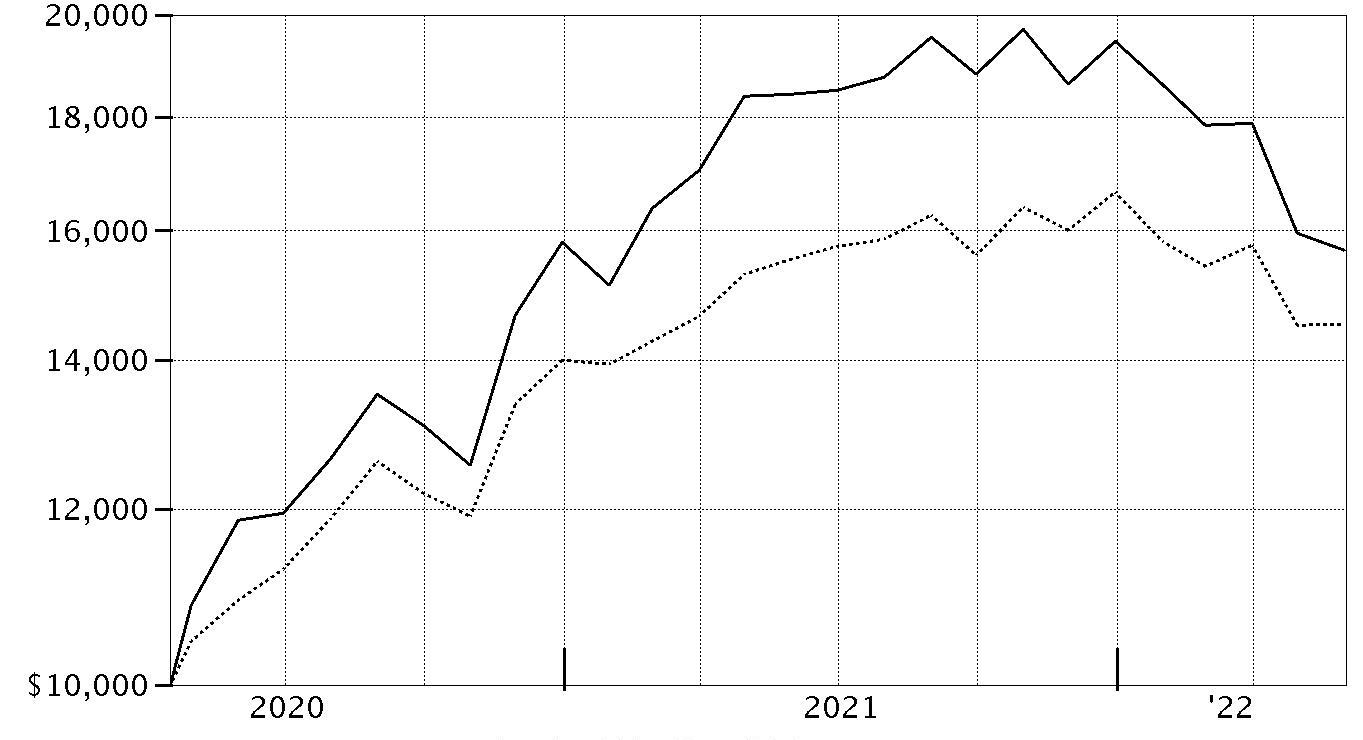
$10,000 Over Life of Fund
Let's say hypothetically that $10,000 was invested in Fidelity® Disruptive Communications Fund, a class of the fund, on April 16, 2020, when the fund started.
The chart shows how the value of your investment would have changed, and also shows how the MSCI ACWI (All Country World Index) Index performed over the same period.

| Period Ending Values |
| $12,353 | Fidelity® Disruptive Communications Fund |
| $14,529 | MSCI ACWI (All Country World Index) Index |
Fidelity® Disruptive Communications Fund
Management's Discussion of Fund Performance
Market Recap: Global equities returned -6.49% for the 12 months ending May 31, 2022, according to the MSCI ACWI (All Country World Index) Index. After posting an 18.90% gain in 2021, global stocks retreated to begin the new year amid several headwinds that stoked volatility, uncertainty and investor anxiety. Chief among these was accelerated efforts by some central banks to hike interest rates and aggressively wind down extraordinary monetary policy support in an attempt to rein in high inflation. In addition, geopolitical unrest rose as Russia invaded Ukraine in late February and escalated its attack through period end. Other factors influencing stocks included surging global commodity prices, rising sovereign bond yields in some markets, global supply constraint and disruption, and the potential for variants of the coronavirus to upend global economic growth. Against this backdrop, the index returned -4.90% in January and -2.56% in February, falling on mixed corporate earnings. Volatility eased in March and the index gained 2.21% for the month. April saw a reversal (-7.98%), amid angst about the economic toll of “zero-COVID” lockdowns in China, and then the index had a flattish May (+0.16%). For the full 12 months, emerging markets (-20%) lagged most, followed by Japan (-13%) and Europe ex U.K. (-12%). Conversely, the U.K. and Canada (+3%) led. By sector, communication services (-23%) and consumer discretionary (-21%) fared worst, whereas energy (+48%) rode a surge in commodity prices and topped the market by a wide margin.
Comments from Co-Managers Charlie Hebard and Christopher Lee: For the fiscal year ending May 31, 2022, the fund's share classes returned roughly -28%, trailing the -18.71% result of the MSCI All Country World Communication Services Equal Weighted Index Net MA, as well as the broad-based MSCI All Country World Index (Net MA). By region, an overweighting in the U.S. and stock picks and an underweighting in Asia Pacific ex Japan, primarily driven by Singapore, detracted from the fund's relative result. By industry, the largest detractor from performance versus the benchmark was an underweighting in integrated telecommunication services. Weak picks in application software also hurt. Also hurting performance were stock picks in interactive home entertainment. The fund's biggest individual relative detractor was an outsized stake in Snap, which returned about -77% the past twelve months. We increased our position in this company. Also hindering performance was our overweighting in Sea, which returned roughly -68%. We added to our stake the past year. The fund's non-benchmark stake in Zoom Video Communications, a position not held at period end, returned roughly -69%. In contrast, stock picks in the U.S. contributed most to the fund's relative result. By industry, the top contributor to performance versus the benchmark was stock selection in internet services & infrastructure. An underweighting in movies & entertainment also lifted the fund's relative result. Also helping the fund's relative result were stock picks in communications equipment. Our non-benchmark stake in Cloudflare was the fund's biggest individual relative contributor, despite a 12-month result of approximately -32%; we decreased our position in the company at the right time to lock in earlier gains. The fund's non-benchmark stake in Arista Networks, one of the fund's largest holdings, gained 20%. Another notable relative contributor was an outsized stake in T-Mobile (-6%), which was our biggest holding.
The views expressed above reflect those of the portfolio manager(s) only through the end of the period as stated on the cover of this report and do not necessarily represent the views of Fidelity or any other person in the Fidelity organization. Any such views are subject to change at any time based upon market or other conditions and Fidelity disclaims any responsibility to update such views. These views may not be relied on as investment advice and, because investment decisions for a Fidelity fund are based on numerous factors, may not be relied on as an indication of trading intent on behalf of any Fidelity fund.
Fidelity® Disruptive Communications Fund
Investment Summary (Unaudited)
Top Ten Stocks as of May 31, 2022
| | % of fund's net assets |
| T-Mobile U.S., Inc. | 9.3 |
| Activision Blizzard, Inc. | 8.0 |
| Alphabet, Inc. Class A | 7.1 |
| American Tower Corp. | 6.8 |
| Arista Networks, Inc. | 5.5 |
| Liberty Broadband Corp. Class A | 5.5 |
| Meta Platforms, Inc. Class A | 5.3 |
| Amazon.com, Inc. | 5.0 |
| NVIDIA Corp. | 3.9 |
| Twitter, Inc. | 3.9 |
| | 60.3 |
Market Sectors as of May 31, 2022
| | % of fund's net assets |
| Communication Services | 58.0 |
| Information Technology | 22.1 |
| Consumer Discretionary | 8.5 |
| Real Estate | 6.8 |
| Energy | 3.4 |
| Industrials | 1.3 |
Asset Allocation (% of fund's net assets)
| As of May 31, 2022 * |
| | Stocks | 100.1% |
| | Short-Term Investments and Net Other Assets (Liabilities)** | (0.1)% |

* Foreign investments - 17.3%
** Short-Term Investments and Net Other Assets (Liabilities) are not included in the pie chart
Geographic Diversification (% of fund's net assets)
| As of May 31, 2022 |
| | United States of America* | 82.7% |
| | Cayman Islands | 4.2% |
| | India | 3.4% |
| | Japan | 2.9% |
| | Spain | 2.8% |
| | United Kingdom | 1.5% |
| | Netherlands | 1.5% |
| | Bermuda | 1.0% |

* Includes Short-Term investments and Net Other Assets (Liabilities).
Fidelity® Disruptive Communications Fund
Schedule of Investments May 31, 2022
Showing Percentage of Net Assets
| Common Stocks - 100.1% | | | |
| | | Shares | Value |
| COMMUNICATION SERVICES - 58.0% | | | |
| Diversified Telecommunication Services - 5.3% | | | |
| Cellnex Telecom SA (a) | | 29,416 | $1,327,520 |
| Liberty Global PLC Class A (b) | | 28,064 | 682,516 |
| Liberty Latin America Ltd. Class C (b) | | 49,230 | 468,177 |
| | | | 2,478,213 |
| Entertainment - 11.8% | | | |
| Activision Blizzard, Inc. | | 48,276 | 3,759,735 |
| Netflix, Inc. (b) | | 1,944 | 383,823 |
| Roku, Inc. Class A (b) | | 2,977 | 282,517 |
| Sea Ltd. ADR (b) | | 13,343 | 1,102,932 |
| | | | 5,529,007 |
| Interactive Media & Services - 22.8% | | | |
| Alphabet, Inc. Class A (b) | | 1,460 | 3,321,850 |
| Angi, Inc. (b) | | 161,816 | 888,370 |
| Bumble, Inc. (b) | | 15,991 | 455,744 |
| Meta Platforms, Inc. Class A (b) | | 12,979 | 2,513,254 |
| Snap, Inc. Class A (b) | | 60,382 | 851,990 |
| Tencent Holdings Ltd. | | 18,911 | 864,580 |
| Twitter, Inc. (b) | | 46,499 | 1,841,360 |
| | | | 10,737,148 |
| Media - 8.8% | | | |
| DISH Network Corp. Class A (b) | | 69,094 | 1,577,416 |
| Liberty Broadband Corp. Class A (b) | | 21,160 | 2,581,732 |
| | | | 4,159,148 |
| Wireless Telecommunication Services - 9.3% | | | |
| T-Mobile U.S., Inc. (b) | | 32,857 | 4,379,512 |
|
| TOTAL COMMUNICATION SERVICES | | | 27,283,028 |
|
| CONSUMER DISCRETIONARY - 8.5% | | | |
| Internet & Direct Marketing Retail - 8.5% | | | |
| Amazon.com, Inc. (b) | | 976 | 2,346,489 |
| Doordash, Inc. (b) | | 3,397 | 261,263 |
| Rakuten Group, Inc. | | 127,591 | 713,285 |
| Uber Technologies, Inc. (b) | | 29,765 | 690,548 |
| | | | 4,011,585 |
| ENERGY - 3.4% | | | |
| Oil, Gas & Consumable Fuels - 3.4% | | | |
| Reliance Industries Ltd. sponsored GDR (a) | | 24,214 | 1,627,181 |
| INDUSTRIALS - 1.3% | | | |
| Construction & Engineering - 1.3% | | | |
| Dycom Industries, Inc. (b) | | 6,722 | 625,885 |
| INFORMATION TECHNOLOGY - 22.1% | | | |
| Communications Equipment - 5.5% | | | |
| Arista Networks, Inc. (b) | | 25,401 | 2,598,014 |
| IT Services - 3.7% | | | |
| Akamai Technologies, Inc. (b) | | 7,821 | 790,234 |
| Cloudflare, Inc. (b) | | 3,910 | 218,960 |
| Twilio, Inc. Class A (b) | | 7,082 | 744,814 |
| | | | 1,754,008 |
| Semiconductors & Semiconductor Equipment - 8.6% | | | |
| Impinj, Inc. (b) | | 5,936 | 277,864 |
| NVIDIA Corp. | | 9,887 | 1,846,101 |
| NXP Semiconductors NV | | 3,572 | 677,823 |
| onsemi (b) | | 9,605 | 582,831 |
| Renesas Electronics Corp. (b) | | 55,470 | 647,881 |
| | | | 4,032,500 |
| Software - 4.3% | | | |
| RingCentral, Inc. (b) | | 4,322 | 272,891 |
| Unity Software, Inc. (b) | | 4,898 | 195,773 |
| Zscaler, Inc. (b) | | 10,002 | 1,531,206 |
| | | | 1,999,870 |
|
| TOTAL INFORMATION TECHNOLOGY | | | 10,384,392 |
|
| REAL ESTATE - 6.8% | | | |
| Equity Real Estate Investment Trusts (REITs) - 6.8% | | | |
| American Tower Corp. | | 12,456 | 3,190,355 |
| TOTAL COMMON STOCKS | | | |
| (Cost $53,609,655) | | | 47,122,426 |
|
| Money Market Funds - 0.0% | | | |
| Fidelity Cash Central Fund 0.82% (c) | | | |
| (Cost $895) | | 894 | 895 |
| TOTAL INVESTMENT IN SECURITIES - 100.1% | | | |
| (Cost $53,610,550) | | | 47,123,321 |
| NET OTHER ASSETS (LIABILITIES) - (0.1)% | | | (49,039) |
| NET ASSETS - 100% | | | $47,074,282 |
Legend
(a) Security exempt from registration under Rule 144A of the Securities Act of 1933. These securities may be resold in transactions exempt from registration, normally to qualified institutional buyers. At the end of the period, the value of these securities amounted to $2,954,701 or 6.3% of net assets.
(b) Non-income producing
(c) Affiliated fund that is generally available only to investment companies and other accounts managed by Fidelity Investments. The rate quoted is the annualized seven-day yield of the fund at period end. A complete unaudited listing of the fund's holdings as of its most recent quarter end is available upon request. In addition, each Fidelity Central Fund's financial statements, which are not covered by the Fund's Report of Independent Registered Public Accounting Firm, are available on the SEC's website or upon request.
Affiliated Central Funds
Fiscal year to date information regarding the Fund's investments in Fidelity Central Funds, including the ownership percentage, is presented below.
| Fund | Value, beginning of period | Purchases | Sales Proceeds | Dividend Income | Realized Gain/Loss | Change in Unrealized appreciation (depreciation) | Value, end of period | % ownership, end of period |
| Fidelity Cash Central Fund 0.82% | $1,995,920 | $18,304,857 | $20,299,882 | $529 | $-- | $-- | $895 | 0.0% |
| Fidelity Securities Lending Cash Central Fund 0.82% | 2,969,975 | 23,133,428 | 26,103,403 | 1,451 | -- | -- | -- | 0.0% |
| Total | $4,965,895 | $41,438,285 | $46,403,285 | $1,980 | $-- | $-- | $895 | |
Amounts in the income column in the above table include any capital gain distributions from underlying funds, which are presented in the corresponding line-item in the Statement of Operations, if applicable. Amount for Fidelity Securities Lending Cash Central Fund represents the income earned on investing cash collateral, less rebates paid to borrowers and any lending agent fees associated with the loan, plus any premium payments received for lending certain types of securities.
Investment Valuation
The following is a summary of the inputs used, as of May 31, 2022, involving the Fund's assets and liabilities carried at fair value. The inputs or methodology used for valuing securities may not be an indication of the risk associated with investing in those securities. For more information on valuation inputs, and their aggregation into the levels used below, please refer to the Investment Valuation section in the accompanying Notes to Financial Statements.
| | Valuation Inputs at Reporting Date: |
| Description | Total | Level 1 | Level 2 | Level 3 |
| Investments in Securities: | | | | |
| Equities: | | | | |
| Communication Services | $27,283,028 | $25,090,928 | $2,192,100 | $-- |
| Consumer Discretionary | 4,011,585 | 3,298,300 | 713,285 | -- |
| Energy | 1,627,181 | 1,627,181 | -- | -- |
| Industrials | 625,885 | 625,885 | -- | -- |
| Information Technology | 10,384,392 | 9,736,511 | 647,881 | -- |
| Real Estate | 3,190,355 | 3,190,355 | -- | -- |
| Money Market Funds | 895 | 895 | -- | -- |
| Total Investments in Securities: | $47,123,321 | $43,570,055 | $3,553,266 | $-- |
See accompanying notes which are an integral part of the financial statements.
Fidelity® Disruptive Communications Fund
Financial Statements
Statement of Assets and Liabilities
| | | May 31, 2022 |
| Assets | | |
Investment in securities, at value — See accompanying schedule:
Unaffiliated issuers (cost $53,609,655) | $47,122,426 | |
| Fidelity Central Funds (cost $895) | 895 | |
| Total Investment in Securities (cost $53,610,550) | | $47,123,321 |
| Receivable for fund shares sold | | 33,412 |
| Dividends receivable | | 3,856 |
| Distributions receivable from Fidelity Central Funds | | 47 |
| Other receivables | | 605 |
| Total assets | | 47,161,241 |
| Liabilities | | |
| Payable for fund shares redeemed | $71,283 | |
| Accrued management fee | 15,676 | |
| Total liabilities | | 86,959 |
| Net Assets | | $47,074,282 |
| Net Assets consist of: | | |
| Paid in capital | | $58,091,439 |
| Total accumulated earnings (loss) | | (11,017,157) |
| Net Assets | | $47,074,282 |
| Net Asset Value and Maximum Offering Price | | |
| Fidelity Disruptive Communications Fund: | | |
| Net Asset Value, offering price and redemption price per share ($7,746,231 ÷ 666,370 shares) | | $11.62 |
| Loyalty Class 1: | | |
| Net Asset Value, offering price and redemption price per share ($14,469,985 ÷ 1,248,854 shares) | | $11.59 |
| Loyalty Class 2: | | |
| Net Asset Value, offering price and redemption price per share ($124,918 ÷ 10,716 shares) | | $11.66 |
| Class F: | | |
| Net Asset Value, offering price and redemption price per share ($24,733,148 ÷ 2,116,149 shares) | | $11.69 |
See accompanying notes which are an integral part of the financial statements.
Statement of Operations
| | | Year ended May 31, 2022 |
| Investment Income | | |
| Dividends | | $116,705 |
| Non-Cash dividends | | 38,082 |
| Income from Fidelity Central Funds (including $1,451 from security lending) | | 1,980 |
| Total income | | 156,767 |
| Expenses | | |
| Management fee | $335,172 | |
| Independent trustees' fees and expenses | 254 | |
| Total expenses before reductions | 335,426 | |
| Expense reductions | (15) | |
| Total expenses after reductions | | 335,411 |
| Net investment income (loss) | | (178,644) |
| Realized and Unrealized Gain (Loss) | | |
| Net realized gain (loss) on: | | |
| Investment securities: | | |
| Unaffiliated issuers | (2,270,135) | |
| Foreign currency transactions | 8 | |
| Total net realized gain (loss) | | (2,270,127) |
| Change in net unrealized appreciation (depreciation) on: | | |
| Investment securities: | | |
| Unaffiliated issuers | (17,889,897) | |
| Assets and liabilities in foreign currencies | (39) | |
| Total change in net unrealized appreciation (depreciation) | | (17,889,936) |
| Net gain (loss) | | (20,160,063) |
| Net increase (decrease) in net assets resulting from operations | | $(20,338,707) |
See accompanying notes which are an integral part of the financial statements.
Statement of Changes in Net Assets
| | Year ended May 31, 2022 | Year ended May 31, 2021 |
| Increase (Decrease) in Net Assets | | |
| Operations | | |
| Net investment income (loss) | $(178,644) | $(164,603) |
| Net realized gain (loss) | (2,270,127) | 3,217,759 |
| Change in net unrealized appreciation (depreciation) | (17,889,936) | 10,870,997 |
| Net increase (decrease) in net assets resulting from operations | (20,338,707) | 13,924,153 |
| Distributions to shareholders | (4,360,933) | (684,195) |
| Share transactions - net increase (decrease) | (1,888,994) | 53,282,135 |
| Total increase (decrease) in net assets | (26,588,634) | 66,522,093 |
| Net Assets | | |
| Beginning of period | 73,662,916 | 7,140,823 |
| End of period | $47,074,282 | $73,662,916 |
See accompanying notes which are an integral part of the financial statements.
Financial Highlights
Fidelity Disruptive Communications Fund
| Years ended May 31, | 2022 | 2021 | 2020 A |
| Selected Per–Share Data | | | |
| Net asset value, beginning of period | $17.02 | $11.58 | $10.00 |
| Income from Investment Operations | | | |
| Net investment income (loss)B,C | (.13) | (.13) | –D |
| Net realized and unrealized gain (loss) | (4.45) | 5.78 | 1.58 |
| Total from investment operations | (4.58) | 5.65 | 1.58 |
| Distributions from net investment income | – | –D | – |
| Distributions from net realized gain | (.82) | (.20) | – |
| Total distributions | (.82) | (.21)E | – |
| Net asset value, end of period | $11.62 | $17.02 | $11.58 |
| Total ReturnF,G | (28.39)% | 48.96% | 15.80% |
| Ratios to Average Net AssetsC,H,I | | | |
| Expenses before reductions | .99%J | 1.01%J | 1.01%J,K |
| Expenses net of fee waivers, if any | .99%J | 1.01%J | 1.01%J,K |
| Expenses net of all reductions | .99%J | 1.01%J | 1.01%J,K |
| Net investment income (loss) | (.81)% | (.83)% | (.23)%K |
| Supplemental Data | | | |
| Net assets, end of period (000 omitted) | $7,746 | $36,731 | $2,880 |
| Portfolio turnover rateL | 32% | 39% | - %M |
A For the period April 16, 2020 (commencement of operations) through May 31, 2020.
B Calculated based on average shares outstanding during the period.
C Net investment income (loss) is affected by the timing of the declaration of dividends by any underlying mutual funds or exchange-traded funds (ETFs). Net investment income (loss) of any such underlying funds is not included in the Fund's net investment income (loss) ratio.
D Amount represents less than $.005 per share.
E Total distributions per share do not sum due to rounding.
F Total returns for periods of less than one year are not annualized.
G Total returns would have been lower if certain expenses had not been reduced during the applicable periods shown.
H Fees and expenses of any underlying mutual funds or exchange-traded funds (ETFs) are not included in the Fund's expense ratio. The Fund indirectly bears its proportionate share of these expenses. For additional expense information related to investments in Fidelity Central Funds, please refer to the "Investments in Fidelity Central Funds" note found in the Notes to Financial Statements section of the most recent Annual or Semi-Annual report.
I Expense ratios reflect operating expenses of the class. Expenses before reductions do not reflect amounts reimbursed, waived, or reduced through arrangements with the investment adviser, brokerage services, or other offset arrangements, if applicable, and do not represent the amount paid by the class during periods when reimbursements, waivers or reductions occur.
J On certain classes, the size and fluctuation of net assets and expense amounts may cause ratios to differ from contractual rates.
K Annualized
L Amount does not include the portfolio activity of any underlying mutual funds or exchange-traded funds (ETFs).
M Amount not annualized.
See accompanying notes which are an integral part of the financial statements.
Fidelity Disruptive Communications Fund Loyalty Class 1
| Years ended May 31, | 2022 | 2021 | 2020 A |
| Selected Per–Share Data | | | |
| Net asset value, beginning of period | $17.09 | $11.58 | $10.00 |
| Income from Investment Operations | | | |
| Net investment income (loss)B,C | (.08) | (.09) | –D |
| Net realized and unrealized gain (loss) | (4.44) | 5.80 | 1.58 |
| Total from investment operations | (4.52) | 5.71 | 1.58 |
| Distributions from net investment income | – | – | – |
| Distributions from net realized gain | (.98) | (.20) | – |
| Total distributions | (.98) | (.20) | – |
| Net asset value, end of period | $11.59 | $17.09 | $11.58 |
| Total ReturnE,F | (28.19)% | 49.47% | 15.80% |
| Ratios to Average Net AssetsC,G,H | | | |
| Expenses before reductions | .75% | .76%I | .75%J |
| Expenses net of fee waivers, if any | .75% | .76%I | .75%J |
| Expenses net of all reductions | .75% | .75% | .75%J |
| Net investment income (loss) | (.51)% | (.57)% | .04%J |
| Supplemental Data | | | |
| Net assets, end of period (000 omitted) | $14,470 | $3,476 | $116 |
| Portfolio turnover rateK | 32% | 39% | - %L |
A For the period April 16, 2020 (commencement of operations) through May 31, 2020.
B Calculated based on average shares outstanding during the period.
C Net investment income (loss) is affected by the timing of the declaration of dividends by any underlying mutual funds or exchange-traded funds (ETFs). Net investment income (loss) of any such underlying funds is not included in the Fund's net investment income (loss) ratio.
D Amount represents less than $.005 per share.
E Total returns for periods of less than one year are not annualized.
F Total returns would have been lower if certain expenses had not been reduced during the applicable periods shown.
G Fees and expenses of any underlying mutual funds or exchange-traded funds (ETFs) are not included in the Fund's expense ratio. The Fund indirectly bears its proportionate share of these expenses. For additional expense information related to investments in Fidelity Central Funds, please refer to the "Investments in Fidelity Central Funds" note found in the Notes to Financial Statements section of the most recent Annual or Semi-Annual report.
H Expense ratios reflect operating expenses of the class. Expenses before reductions do not reflect amounts reimbursed, waived, or reduced through arrangements with the investment adviser, brokerage services, or other offset arrangements, if applicable, and do not represent the amount paid by the class during periods when reimbursements, waivers or reductions occur.
I On certain classes, the size and fluctuation of net assets and expense amounts may cause ratios to differ from contractual rates.
J Annualized
K Amount does not include the portfolio activity of any underlying mutual funds or exchange-traded funds (ETFs).
L Amount not annualized.
See accompanying notes which are an integral part of the financial statements.
Fidelity Disruptive Communications Fund Loyalty Class 2
| Years ended May 31, | 2022 | 2021 | 2020 A |
| Selected Per–Share Data | | | |
| Net asset value, beginning of period | $17.11 | $11.59 | $10.00 |
| Income from Investment Operations | | | |
| Net investment income (loss)B,C | (.04) | (.05) | –D |
| Net realized and unrealized gain (loss) | (4.47) | 5.79 | 1.59 |
| Total from investment operations | (4.51) | 5.74 | 1.59 |
| Distributions from net investment income | – | – | – |
| Distributions from net realized gain | (.94) | (.22) | – |
| Total distributions | (.94) | (.22) | – |
| Net asset value, end of period | $11.66 | $17.11 | $11.59 |
| Total ReturnE,F | (27.99)% | 49.70% | 15.90% |
| Ratios to Average Net AssetsC,G,H | | | |
| Expenses before reductions | .50% | .50% | .50%I |
| Expenses net of fee waivers, if any | .50% | .50% | .50%I |
| Expenses net of all reductions | .50% | .50% | .50%I |
| Net investment income (loss) | (.28)% | (.32)% | .29%I |
| Supplemental Data | | | |
| Net assets, end of period (000 omitted) | $125 | $174 | $116 |
| Portfolio turnover rateJ | 32% | 39% | - %K |
A For the period April 16, 2020 (commencement of operations) through May 31, 2020.
B Calculated based on average shares outstanding during the period.
C Net investment income (loss) is affected by the timing of the declaration of dividends by any underlying mutual funds or exchange-traded funds (ETFs). Net investment income (loss) of any such underlying funds is not included in the Fund's net investment income (loss) ratio.
D Amount represents less than $.005 per share.
E Total returns for periods of less than one year are not annualized.
F Total returns would have been lower if certain expenses had not been reduced during the applicable periods shown.
G Fees and expenses of any underlying mutual funds or exchange-traded funds (ETFs) are not included in the Fund's expense ratio. The Fund indirectly bears its proportionate share of these expenses. For additional expense information related to investments in Fidelity Central Funds, please refer to the "Investments in Fidelity Central Funds" note found in the Notes to Financial Statements section of the most recent Annual or Semi-Annual report.
H Expense ratios reflect operating expenses of the class. Expenses before reductions do not reflect amounts reimbursed, waived, or reduced through arrangements with the investment adviser, brokerage services, or other offset arrangements, if applicable, and do not represent the amount paid by the class during periods when reimbursements, waivers or reductions occur.
I Annualized
J Amount does not include the portfolio activity of any underlying mutual funds or exchange-traded funds (ETFs).
K Amount not annualized.
See accompanying notes which are an integral part of the financial statements.
Fidelity Disruptive Communications Fund Class F
| Years ended May 31, | 2022 | 2021 | 2020 A |
| Selected Per–Share Data | | | |
| Net asset value, beginning of period | $17.16 | $11.59 | $10.00 |
| Income from Investment Operations | | | |
| Net investment income (loss)B,C | .04 | .03 | .01 |
| Net realized and unrealized gain (loss) | (4.48) | 5.80 | 1.58 |
| Total from investment operations | (4.44) | 5.83 | 1.59 |
| Distributions from net investment income | – | –D | – |
| Distributions from net realized gain | (1.03) | (.26) | – |
| Total distributions | (1.03) | (.26) | – |
| Net asset value, end of period | $11.69 | $17.16 | $11.59 |
| Total ReturnE,F | (27.66)% | 50.57% | 15.90% |
| Ratios to Average Net AssetsC,G,H | | | |
| Expenses before reductions | -% | -% | - %I |
| Expenses net of fee waivers, if any | -% | -% | - %I |
| Expenses net of all reductions | -% | -% | - %I |
| Net investment income (loss) | .23% | .18% | .79%I |
| Supplemental Data | | | |
| Net assets, end of period (000 omitted) | $24,733 | $33,282 | $4,029 |
| Portfolio turnover rateJ | 32% | 39% | - %K |
A For the period April 16, 2020 (commencement of operations) through May 31, 2020.
B Calculated based on average shares outstanding during the period.
C Net investment income (loss) is affected by the timing of the declaration of dividends by any underlying mutual funds or exchange-traded funds (ETFs). Net investment income (loss) of any such underlying funds is not included in the Fund's net investment income (loss) ratio.
D Amount represents less than $.005 per share.
E Total returns for periods of less than one year are not annualized.
F Total returns would have been lower if certain expenses had not been reduced during the applicable periods shown.
G Fees and expenses of any underlying mutual funds or exchange-traded funds (ETFs) are not included in the Fund's expense ratio. The Fund indirectly bears its proportionate share of these expenses. For additional expense information related to investments in Fidelity Central Funds, please refer to the "Investments in Fidelity Central Funds" note found in the Notes to Financial Statements section of the most recent Annual or Semi-Annual report.
H Expense ratios reflect operating expenses of the class. Expenses before reductions do not reflect amounts reimbursed, waived, or reduced through arrangements with the investment adviser, brokerage services, or other offset arrangements, if applicable, and do not represent the amount paid by the class during periods when reimbursements, waivers or reductions occur.
I Annualized
J Amount does not include the portfolio activity of any underlying mutual funds or exchange-traded funds (ETFs).
K Amount not annualized.
See accompanying notes which are an integral part of the financial statements.
Fidelity® Disruptive Finance Fund
Performance: The Bottom Line
Average annual total return reflects the change in the value of an investment, assuming reinvestment of distributions from dividend income and capital gains (the profits earned upon the sale of securities that have grown in value, if any) and assuming a constant rate of performance each year. The hypothetical investment and the average annual total returns do not reflect the deduction of taxes that a shareholder would pay on fund distributions or the redemption of fund shares. During periods of reimbursement by Fidelity, a fund’s total return will be greater than it would be had the reimbursement not occurred. How a fund did yesterday is no guarantee of how it will do tomorrow.
Average Annual Total Returns
| For the periods ended May 31, 2022 | Past 1 year | Life of fundA |
| Fidelity® Disruptive Finance Fund | (14.88)% | 23.59% |
| Loyalty Class 1 | (14.68)% | 23.89% |
| Loyalty Class 2 | (14.44)% | 24.21% |
| Class F | (14.04)% | 24.83% |
A From April 16, 2020
$10,000 Over Life of Fund
Let's say hypothetically that $10,000 was invested in Fidelity® Disruptive Finance Fund, a class of the fund, on April 16, 2020, when the fund started.
The chart shows how the value of your investment would have changed, and also shows how the MSCI ACWI (All Country World Index) Index performed over the same period.
| Period Ending Values |
| $15,678 | Fidelity® Disruptive Finance Fund |
| $14,529 | MSCI ACWI (All Country World Index) Index |
Fidelity® Disruptive Finance Fund
Management's Discussion of Fund Performance
Market Recap: Global equities returned -6.49% for the 12 months ending May 31, 2022, according to the MSCI ACWI (All Country World Index) Index. After posting an 18.90% gain in 2021, global stocks retreated to begin the new year amid several headwinds that stoked volatility, uncertainty and investor anxiety. Chief among these was accelerated efforts by some central banks to hike interest rates and aggressively wind down extraordinary monetary policy support in an attempt to rein in high inflation. In addition, geopolitical unrest rose as Russia invaded Ukraine in late February and escalated its attack through period end. Other factors influencing stocks included surging global commodity prices, rising sovereign bond yields in some markets, global supply constraint and disruption, and the potential for variants of the coronavirus to upend global economic growth. Against this backdrop, the index returned -4.90% in January and -2.56% in February, falling on mixed corporate earnings. Volatility eased in March and the index gained 2.21% for the month. April saw a reversal (-7.98%), amid angst about the economic toll of “zero-COVID” lockdowns in China, and then the index had a flattish May (+0.16%). For the full 12 months, emerging markets (-20%) lagged most, followed by Japan (-13%) and Europe ex U.K. (-12%). Conversely, the U.K. and Canada (+3%) led. By sector, communication services (-23%) and consumer discretionary (-21%) fared worst, whereas energy (+48%) rode a surge in commodity prices and topped the market by a wide margin.
Comments from Co-Managers Charlie Hebard and Christopher Lee: For the fiscal year ending May 31, 2022, the fund's share classes returned roughly -15% to -14%, underperforming the -6.93% return of the MSCI All Country World Financials Equal Weighted Index (Net MA), as well as the broad-based MSCI All Country World Index (Net MA). By region, an overweighting and stock picks in the U.S. and security selection in Europe ex U.K., specifically Netherlands, hindered the fund's relative result. By industry, the primary detractor from performance versus the benchmark was our stock selection in data processing & outsourced services. An underweighting in diversified banks also hindered the fund's relative result. Also hindering our result was stock selection in real estate services. PayPal Holdings, the fund's biggest individual detractor, returned roughly -68% this period. Our second-largest detractor was Doma Holdings, which returned about -69% the past 12 months. This was a position we established during the period. Another detractor was Block, which returned approximately -62% the past twelve months. This was a position we established the past year. All these detractors were non-benchmark positions. Conversely, an underweighting in Europe ex U.K. and Asia Pacific ex Japan, specifically Hong Kong, contributed most to the fund's relative result. By industry, the primary contributors to performance versus the benchmark were an underweighting and security selection in investment banking & brokerage. Security selection in consumer finance and an overweighting in insurance brokers also bolstered the fund's relative performance. The biggest individual relative contributor was an overweight position in Arch Capital Group (+19%). Arch Capital was among the fund's largest holdings. Also adding value was our outsized stake in Apollo Asset Management, which gained about 28%. Apollo was not held at period end. Another notable relative contributor was an overweighting in Arthur J Gallaghar (+12%), which was one of the fund's biggest holdings.
The views expressed above reflect those of the portfolio manager(s) only through the end of the period as stated on the cover of this report and do not necessarily represent the views of Fidelity or any other person in the Fidelity organization. Any such views are subject to change at any time based upon market or other conditions and Fidelity disclaims any responsibility to update such views. These views may not be relied on as investment advice and, because investment decisions for a Fidelity fund are based on numerous factors, may not be relied on as an indication of trading intent on behalf of any Fidelity fund.
Fidelity® Disruptive Finance Fund
Investment Summary (Unaudited)
Top Ten Stocks as of May 31, 2022
| | % of fund's net assets |
| Visa, Inc. Class A | 7.1 |
| Arch Capital Group Ltd. | 6.3 |
| MasterCard, Inc. Class A | 6.1 |
| BRP Group, Inc. | 5.3 |
| Equifax, Inc. | 5.0 |
| Capital One Financial Corp. | 4.8 |
| BlackRock, Inc. Class A | 4.6 |
| Arthur J. Gallagher & Co. | 3.9 |
| Signature Bank | 3.8 |
| Apollo Global Management, Inc. | 3.3 |
| | 50.2 |
Market Sectors as of May 31, 2022
| | % of fund's net assets |
| Financials | 63.1 |
| Information Technology | 25.7 |
| Industrials | 6.6 |
| Real Estate | 2.7 |
| Communication Services | 1.0 |
| Consumer Discretionary | 0.7 |
Asset Allocation (% of fund's net assets)
| As of May 31, 2022 * |
| | Stocks | 99.8% |
| | Short-Term Investments and Net Other Assets (Liabilities) | 0.2% |

* Foreign investments - 22.5%
Geographic Diversification (% of fund's net assets)
| As of May 31, 2022 |
| | United States of America* | 77.5% |
| | Bermuda | 7.8% |
| | Canada | 4.2% |
| | Singapore | 3.3% |
| | Norway | 3.1% |
| | Netherlands | 2.1% |
| | France | 1.3% |
| | Sweden | 0.7% |

* Includes Short-Term investments and Net Other Assets (Liabilities).
Fidelity® Disruptive Finance Fund
Schedule of Investments May 31, 2022
Showing Percentage of Net Assets
| Common Stocks - 99.8% | | | |
| | | Shares | Value |
| COMMUNICATION SERVICES - 1.0% | | | |
| Interactive Media & Services - 1.0% | | | |
| NerdWallet, Inc. (a) | | 56,533 | $657,479 |
| CONSUMER DISCRETIONARY - 0.7% | | | |
| Internet & Direct Marketing Retail - 0.7% | | | |
| MercadoLibre, Inc. (b) | | 575 | 451,881 |
| FINANCIALS - 63.1% | | | |
| Banks - 14.3% | | | |
| DBS Group Holdings Ltd. | | 94,775 | 2,140,315 |
| DNB Bank ASA | | 100,239 | 2,032,870 |
| Meta Financial Group, Inc. | | 17,989 | 747,803 |
| Signature Bank | | 11,346 | 2,453,799 |
| Silvergate Capital Corp. (b) | | 4,599 | 361,022 |
| SVB Financial Group (b) | | 3,337 | 1,630,358 |
| | | | 9,366,167 |
| Capital Markets - 19.1% | | | |
| Avanza Bank Holding AB | | 20,140 | 484,220 |
| BlackRock, Inc. Class A | | 4,491 | 3,004,838 |
| Brookfield Asset Management, Inc. Class A | | 41,387 | 2,094,182 |
| Cboe Global Markets, Inc. | | 9,747 | 1,094,686 |
| Coinbase Global, Inc. (a)(b) | | 4,565 | 356,527 |
| Intercontinental Exchange, Inc. | | 20,699 | 2,119,371 |
| MSCI, Inc. | | 2,295 | 1,015,193 |
| Tradeweb Markets, Inc. Class A | | 15,720 | 1,062,829 |
| Virtu Financial, Inc. Class A | | 48,071 | 1,256,095 |
| | | | 12,487,941 |
| Consumer Finance - 6.4% | | | |
| Ally Financial, Inc. | | 22,936 | 1,010,101 |
| Capital One Financial Corp. | | 24,728 | 3,161,722 |
| | | | 4,171,823 |
| Diversified Financial Services - 3.3% | | | |
| Apollo Global Management, Inc. | | 37,307 | 2,150,375 |
| Insurance - 17.0% | | | |
| Arch Capital Group Ltd. (b) | | 87,231 | 4,139,983 |
| Arthur J. Gallagher & Co. | | 15,613 | 2,528,369 |
| BRP Group, Inc. (b) | | 135,702 | 3,422,404 |
| Hiscox Ltd. | | 85,183 | 992,243 |
| | | | 11,082,999 |
| Thrifts & Mortgage Finance - 3.0% | | | |
| NMI Holdings, Inc. (b) | | 74,072 | 1,378,480 |
| PennyMac Financial Services, Inc. | | 11,412 | 559,416 |
| | | | 1,937,896 |
|
| TOTAL FINANCIALS | | | 41,197,201 |
|
| INDUSTRIALS - 6.6% | | | |
| Professional Services - 6.6% | | | |
| Equifax, Inc. | | 16,120 | 3,265,590 |
| Verisk Analytics, Inc. | | 5,821 | 1,018,209 |
| | | | 4,283,799 |
| INFORMATION TECHNOLOGY - 25.7% | | | |
| IT Services - 21.8% | | | |
| Adyen BV (b)(c) | | 880 | 1,362,826 |
| Block, Inc.: | | | |
| Class A (b) | | 7,627 | 667,439 |
| Class A unit (b) | | 3,180 | 287,548 |
| Flywire Corp. (b) | | 25,888 | 499,897 |
| MasterCard, Inc. Class A | | 11,070 | 3,961,621 |
| Nuvei Corp. (b)(c) | | 13,057 | 668,618 |
| PayPal Holdings, Inc. (b) | | 7,792 | 663,956 |
| Repay Holdings Corp. (b) | | 51,258 | 638,162 |
| Visa, Inc. Class A | | 21,670 | 4,597,726 |
| Worldline SA (b)(c) | | 20,674 | 845,946 |
| | | | 14,193,739 |
| Software - 3.9% | | | |
| Black Knight, Inc. (b) | | 29,289 | 1,989,016 |
| BTRS Holdings, Inc. (b) | | 118,254 | 587,722 |
| | | | 2,576,738 |
|
| TOTAL INFORMATION TECHNOLOGY | | | 16,770,477 |
|
| REAL ESTATE - 2.7% | | | |
| Equity Real Estate Investment Trusts (REITs) - 1.6% | | | |
| American Homes 4 Rent Class A | | 28,437 | 1,051,032 |
| Real Estate Management & Development - 1.1% | | | |
| Doma Holdings, Inc. Class A (b) | | 382,507 | 726,763 |
|
| TOTAL REAL ESTATE | | | 1,777,795 |
|
| TOTAL COMMON STOCKS | | | |
| (Cost $62,758,681) | | | 65,138,632 |
|
| Money Market Funds - 1.4% | | | |
| Fidelity Cash Central Fund 0.82% (d) | | 129,078 | 129,104 |
| Fidelity Securities Lending Cash Central Fund 0.82% (d)(e) | | 798,145 | 798,225 |
| TOTAL MONEY MARKET FUNDS | | | |
| (Cost $927,329) | | | 927,329 |
| TOTAL INVESTMENT IN SECURITIES - 101.2% | | | |
| (Cost $63,686,010) | | | 66,065,961 |
| NET OTHER ASSETS (LIABILITIES) - (1.2)% | | | (804,497) |
| NET ASSETS - 100% | | | $65,261,464 |
Legend
(a) Security or a portion of the security is on loan at period end.
(b) Non-income producing
(c) Security exempt from registration under Rule 144A of the Securities Act of 1933. These securities may be resold in transactions exempt from registration, normally to qualified institutional buyers. At the end of the period, the value of these securities amounted to $2,877,390 or 4.4% of net assets.
(d) Affiliated fund that is generally available only to investment companies and other accounts managed by Fidelity Investments. The rate quoted is the annualized seven-day yield of the fund at period end. A complete unaudited listing of the fund's holdings as of its most recent quarter end is available upon request. In addition, each Fidelity Central Fund's financial statements, which are not covered by the Fund's Report of Independent Registered Public Accounting Firm, are available on the SEC's website or upon request.
(e) Investment made with cash collateral received from securities on loan.
Affiliated Central Funds
Fiscal year to date information regarding the Fund's investments in Fidelity Central Funds, including the ownership percentage, is presented below.
| Fund | Value, beginning of period | Purchases | Sales Proceeds | Dividend Income | Realized Gain/Loss | Change in Unrealized appreciation (depreciation) | Value, end of period | % ownership, end of period |
| Fidelity Cash Central Fund 0.82% | $787,091 | $22,350,042 | $23,008,029 | $606 | $-- | $-- | $129,104 | 0.0% |
| Fidelity Securities Lending Cash Central Fund 0.82% | 3,060,400 | 29,753,302 | 32,015,477 | 3,781 | -- | -- | 798,225 | 0.0% |
| Total | $3,847,491 | $52,103,344 | $55,023,506 | $4,387 | $-- | $-- | $927,329 | |
Amounts in the income column in the above table include any capital gain distributions from underlying funds, which are presented in the corresponding line-item in the Statement of Operations, if applicable. Amount for Fidelity Securities Lending Cash Central Fund represents the income earned on investing cash collateral, less rebates paid to borrowers and any lending agent fees associated with the loan, plus any premium payments received for lending certain types of securities.
Investment Valuation
The following is a summary of the inputs used, as of May 31, 2022, involving the Fund's assets and liabilities carried at fair value. The inputs or methodology used for valuing securities may not be an indication of the risk associated with investing in those securities. For more information on valuation inputs, and their aggregation into the levels used below, please refer to the Investment Valuation section in the accompanying Notes to Financial Statements.
| | Valuation Inputs at Reporting Date: |
| Description | Total | Level 1 | Level 2 | Level 3 |
| Investments in Securities: | | | | |
| Equities: | | | | |
| Communication Services | $657,479 | $657,479 | $-- | $-- |
| Consumer Discretionary | 451,881 | 451,881 | -- | -- |
| Financials | 41,197,201 | 39,164,331 | 2,032,870 | -- |
| Industrials | 4,283,799 | 4,283,799 | -- | -- |
| Information Technology | 16,770,477 | 14,561,705 | 2,208,772 | -- |
| Real Estate | 1,777,795 | 1,777,795 | -- | -- |
| Money Market Funds | 927,329 | 927,329 | -- | -- |
| Total Investments in Securities: | $66,065,961 | $61,824,319 | $4,241,642 | $-- |
See accompanying notes which are an integral part of the financial statements.
Fidelity® Disruptive Finance Fund
Financial Statements
Statement of Assets and Liabilities
| | | May 31, 2022 |
| Assets | | |
Investment in securities, at value (including securities loaned of $798,373) — See accompanying schedule:
Unaffiliated issuers (cost $62,758,681) | $65,138,632 | |
| Fidelity Central Funds (cost $927,329) | 927,329 | |
| Total Investment in Securities (cost $63,686,010) | | $66,065,961 |
| Receivable for fund shares sold | | 74,154 |
| Dividends receivable | | 56,751 |
| Distributions receivable from Fidelity Central Funds | | 548 |
| Other receivables | | 1,283 |
| Total assets | | 66,198,697 |
| Liabilities | | |
| Payable for fund shares redeemed | $110,964 | |
| Accrued management fee | 28,044 | |
| Collateral on securities loaned | 798,225 | |
| Total liabilities | | 937,233 |
| Net Assets | | $65,261,464 |
| Net Assets consist of: | | |
| Paid in capital | | $61,196,924 |
| Total accumulated earnings (loss) | | 4,064,540 |
| Net Assets | | $65,261,464 |
| Net Asset Value and Maximum Offering Price | | |
| Fidelity Disruptive Finance Fund: | | |
| Net Asset Value, offering price and redemption price per share ($18,485,587 ÷ 1,214,684 shares) | | $15.22 |
| Loyalty Class 1: | | |
| Net Asset Value, offering price and redemption price per share ($20,775,356 ÷ 1,365,722 shares) | | $15.21 |
| Loyalty Class 2: | | |
| Net Asset Value, offering price and redemption price per share ($158,441 ÷ 10,356 shares) | | $15.30 |
| Class F: | | |
| Net Asset Value, offering price and redemption price per share ($25,842,080 ÷ 1,684,787 shares) | | $15.34 |
See accompanying notes which are an integral part of the financial statements.
Statement of Operations
| | | Year ended May 31, 2022 |
| Investment Income | | |
| Dividends | | $1,094,637 |
| Interest | | 49 |
| Income from Fidelity Central Funds (including $3,781 from security lending) | | 4,387 |
| Income before foreign taxes withheld | | 1,099,073 |
| Less foreign taxes withheld | | (80,346) |
| Total income | | 1,018,727 |
| Expenses | | |
| Management fee | $489,062 | |
| Independent trustees' fees and expenses | 307 | |
| Total expenses before reductions | 489,369 | |
| Expense reductions | (116) | |
| Total expenses after reductions | | 489,253 |
| Net investment income (loss) | | 529,474 |
| Realized and Unrealized Gain (Loss) | | |
| Net realized gain (loss) on: | | |
| Investment securities: | | |
| Unaffiliated issuers | 3,338,924 | |
| Foreign currency transactions | (5,402) | |
| Total net realized gain (loss) | | 3,333,522 |
| Change in net unrealized appreciation (depreciation) on: | | |
| Investment securities: | | |
| Unaffiliated issuers | (16,077,538) | |
| Assets and liabilities in foreign currencies | 216 | |
| Total change in net unrealized appreciation (depreciation) | | (16,077,322) |
| Net gain (loss) | | (12,743,800) |
| Net increase (decrease) in net assets resulting from operations | | $(12,214,326) |
See accompanying notes which are an integral part of the financial statements.
Statement of Changes in Net Assets
| | Year ended May 31, 2022 | Year ended May 31, 2021 |
| Increase (Decrease) in Net Assets | | |
| Operations | | |
| Net investment income (loss) | $529,474 | $499,196 |
| Net realized gain (loss) | 3,333,522 | 549,994 |
| Change in net unrealized appreciation (depreciation) | (16,077,322) | 17,920,809 |
| Net increase (decrease) in net assets resulting from operations | (12,214,326) | 18,969,999 |
| Distributions to shareholders | (2,188,878) | (553,515) |
| Share transactions - net increase (decrease) | (7,220,651) | 61,783,456 |
| Total increase (decrease) in net assets | (21,623,855) | 80,199,940 |
| Net Assets | | |
| Beginning of period | 86,885,319 | 6,685,379 |
| End of period | $65,261,464 | $86,885,319 |
See accompanying notes which are an integral part of the financial statements.
Financial Highlights
Fidelity Disruptive Finance Fund
| Years ended May 31, | 2022 | 2021 | 2020 A |
| Selected Per–Share Data | | | |
| Net asset value, beginning of period | $18.20 | $11.86 | $10.00 |
| Income from Investment Operations | | | |
| Net investment income (loss)B,C | .02 | .11D | .03 |
| Net realized and unrealized gain (loss) | (2.67) | 6.41 | 1.83 |
| Total from investment operations | (2.65) | 6.52 | 1.86 |
| Distributions from net investment income | (.04) | (.05) | – |
| Distributions from net realized gain | (.29) | (.13) | – |
| Total distributions | (.33) | (.18) | – |
| Net asset value, end of period | $15.22 | $18.20 | $11.86 |
| Total ReturnE,F | (14.88)% | 55.31% | 18.60% |
| Ratios to Average Net AssetsC,G,H | | | |
| Expenses before reductions | 1.00% | 1.01%I | 1.01%I,J |
| Expenses net of fee waivers, if any | 1.00% | 1.01%I | 1.01%I,J |
| Expenses net of all reductions | 1.00% | 1.01%I | 1.01%I,J |
| Net investment income (loss) | .12% | .72%D | 1.99%J |
| Supplemental Data | | | |
| Net assets, end of period (000 omitted) | $18,486 | $48,219 | $2,373 |
| Portfolio turnover rateK | 43% | 18% | - %L,M |
A For the period April 16, 2020 (commencement of operations) through May 31, 2020.
B Calculated based on average shares outstanding during the period.
C Net investment income (loss) is affected by the timing of the declaration of dividends by any underlying mutual funds or exchange-traded funds (ETFs). Net investment income (loss) of any such underlying funds is not included in the Fund's net investment income (loss) ratio.
D Net investment income per share reflects one or more large, non-recurring dividend(s) which amounted to $.04 per share. Excluding such non-recurring dividend(s), the ratio of net investment income (loss) to average net assets would have been .49%.
E Total returns for periods of less than one year are not annualized.
F Total returns would have been lower if certain expenses had not been reduced during the applicable periods shown.
G Fees and expenses of any underlying mutual funds or exchange-traded funds (ETFs) are not included in the Fund's expense ratio. The Fund indirectly bears its proportionate share of these expenses. For additional expense information related to investments in Fidelity Central Funds, please refer to the "Investments in Fidelity Central Funds" note found in the Notes to Financial Statements section of the most recent Annual or Semi-Annual report.
H Expense ratios reflect operating expenses of the class. Expenses before reductions do not reflect amounts reimbursed, waived, or reduced through arrangements with the investment adviser, brokerage services, or other offset arrangements, if applicable, and do not represent the amount paid by the class during periods when reimbursements, waivers or reductions occur.
I On certain classes, the size and fluctuation of net assets and expense amounts may cause ratios to differ from contractual rates.
J Annualized
K Amount does not include the portfolio activity of any underlying mutual funds or exchange-traded funds (ETFs).
L Amount represents less than 1%.
M Amount not annualized.
See accompanying notes which are an integral part of the financial statements.
Fidelity Disruptive Finance Fund Loyalty Class 1
| Years ended May 31, | 2022 | 2021 | 2020 A |
| Selected Per–Share Data | | | |
| Net asset value, beginning of period | $18.28 | $11.86 | $10.00 |
| Income from Investment Operations | | | |
| Net investment income (loss)B,C | .08 | .20D | .03 |
| Net realized and unrealized gain (loss) | (2.68) | 6.38 | 1.83 |
| Total from investment operations | (2.60) | 6.58 | 1.86 |
| Distributions from net investment income | (.18) | (.03) | – |
| Distributions from net realized gain | (.29) | (.13) | – |
| Total distributions | (.47) | (.16) | – |
| Net asset value, end of period | $15.21 | $18.28 | $11.86 |
| Total ReturnE,F | (14.68)%�� | 55.73% | 18.60% |
| Ratios to Average Net AssetsC,G,H | | | |
| Expenses before reductions | .76%I | .75% | .75%J |
| Expenses net of fee waivers, if any | .76%I | .75% | .75%J |
| Expenses net of all reductions | .76%I | .75% | .75%J |
| Net investment income (loss) | .48% | 1.30%D | 2.26%J |
| Supplemental Data | | | |
| Net assets, end of period (000 omitted) | $20,775 | $2,668 | $119 |
| Portfolio turnover rateK | 43% | 18% | - %L,M |
A For the period April 16, 2020 (commencement of operations) through May 31, 2020.
B Calculated based on average shares outstanding during the period.
C Net investment income (loss) is affected by the timing of the declaration of dividends by any underlying mutual funds or exchange-traded funds (ETFs). Net investment income (loss) of any such underlying funds is not included in the Fund's net investment income (loss) ratio.
D Net investment income per share reflects one or more large, non-recurring dividend(s) which amounted to $.04 per share. Excluding such non-recurring dividend(s), the ratio of net investment income (loss) to average net assets would have been 1.07%.
E Total returns for periods of less than one year are not annualized.
F Total returns would have been lower if certain expenses had not been reduced during the applicable periods shown.
G Fees and expenses of any underlying mutual funds or exchange-traded funds (ETFs) are not included in the Fund's expense ratio. The Fund indirectly bears its proportionate share of these expenses. For additional expense information related to investments in Fidelity Central Funds, please refer to the "Investments in Fidelity Central Funds" note found in the Notes to Financial Statements section of the most recent Annual or Semi-Annual report.
H Expense ratios reflect operating expenses of the class. Expenses before reductions do not reflect amounts reimbursed, waived, or reduced through arrangements with the investment adviser, brokerage services, or other offset arrangements, if applicable, and do not represent the amount paid by the class during periods when reimbursements, waivers or reductions occur.
I On certain classes, the size and fluctuation of net assets and expense amounts may cause ratios to differ from contractual rates.
J Annualized
K Amount does not include the portfolio activity of any underlying mutual funds or exchange-traded funds (ETFs).
L Amount represents less than 1%.
M Amount not annualized.
See accompanying notes which are an integral part of the financial statements.
Fidelity Disruptive Finance Fund Loyalty Class 2
| Years ended May 31, | 2022 | 2021 | 2020 A |
| Selected Per–Share Data | | | |
| Net asset value, beginning of period | $18.30 | $11.87 | $10.00 |
| Income from Investment Operations | | | |
| Net investment income (loss)B,C | .12 | .15D | .03 |
| Net realized and unrealized gain (loss) | (2.69) | 6.46 | 1.84 |
| Total from investment operations | (2.57) | 6.61 | 1.87 |
| Distributions from net investment income | (.14) | (.05) | – |
| Distributions from net realized gain | (.29) | (.13) | – |
| Total distributions | (.43) | (.18) | – |
| Net asset value, end of period | $15.30 | $18.30 | $11.87 |
| Total ReturnE,F | (14.44)% | 56.03% | 18.70% |
| Ratios to Average Net AssetsC,G,H | | | |
| Expenses before reductions | .50% | .50% | .50%I |
| Expenses net of fee waivers, if any | .50% | .50% | .50%I |
| Expenses net of all reductions | .50% | .50% | .50%I |
| Net investment income (loss) | .66% | 1.03%D | 2.51%I |
| Supplemental Data | | | |
| Net assets, end of period (000 omitted) | $158 | $185 | $119 |
| Portfolio turnover rateJ | 43% | 18% | - %K,L |
A For the period April 16, 2020 (commencement of operations) through May 31, 2020.
B Calculated based on average shares outstanding during the period.
C Net investment income (loss) is affected by the timing of the declaration of dividends by any underlying mutual funds or exchange-traded funds (ETFs). Net investment income (loss) of any such underlying funds is not included in the Fund's net investment income (loss) ratio.
D Net investment income per share reflects one or more large, non-recurring dividend(s) which amounted to $.03 per share. Excluding such non-recurring dividend(s), the ratio of net investment income (loss) to average net assets would have been .80%.
E Total returns for periods of less than one year are not annualized.
F Total returns would have been lower if certain expenses had not been reduced during the applicable periods shown.
G Fees and expenses of any underlying mutual funds or exchange-traded funds (ETFs) are not included in the Fund's expense ratio. The Fund indirectly bears its proportionate share of these expenses. For additional expense information related to investments in Fidelity Central Funds, please refer to the "Investments in Fidelity Central Funds" note found in the Notes to Financial Statements section of the most recent Annual or Semi-Annual report.
H Expense ratios reflect operating expenses of the class. Expenses before reductions do not reflect amounts reimbursed, waived, or reduced through arrangements with the investment adviser, brokerage services, or other offset arrangements, if applicable, and do not represent the amount paid by the class during periods when reimbursements, waivers or reductions occur.
I Annualized
J Amount does not include the portfolio activity of any underlying mutual funds or exchange-traded funds (ETFs).
K Amount represents less than 1%.
L Amount not annualized.
See accompanying notes which are an integral part of the financial statements.
Fidelity Disruptive Finance Fund Class F
| Years ended May 31, | 2022 | 2021 | 2020 A |
| Selected Per–Share Data | | | |
| Net asset value, beginning of period | $18.35 | $11.87 | $10.00 |
| Income from Investment Operations | | | |
| Net investment income (loss)B,C | .21 | .26D | .04 |
| Net realized and unrealized gain (loss) | (2.70) | 6.45 | 1.83 |
| Total from investment operations | (2.49) | 6.71 | 1.87 |
| Distributions from net investment income | (.23) | (.10) | – |
| Distributions from net realized gain | (.29) | (.13) | – |
| Total distributions | (.52) | (.23) | – |
| Net asset value, end of period | $15.34 | $18.35 | $11.87 |
| Total ReturnE,F | (14.04)% | 56.95% | 18.70% |
| Ratios to Average Net AssetsC,G,H | | | |
| Expenses before reductions | -% | -% | - %I |
| Expenses net of fee waivers, if any | -% | -% | - %I |
| Expenses net of all reductions | -% | -% | - %I |
| Net investment income (loss) | 1.14% | 1.68%D | 3.01%I |
| Supplemental Data | | | |
| Net assets, end of period (000 omitted) | $25,842 | $35,814 | $4,075 |
| Portfolio turnover rateJ | 43% | 18% | - %K,L |
A For the period April 16, 2020 (commencement of operations) through May 31, 2020.
B Calculated based on average shares outstanding during the period.
C Net investment income (loss) is affected by the timing of the declaration of dividends by any underlying mutual funds or exchange-traded funds (ETFs). Net investment income (loss) of any such underlying funds is not included in the Fund's net investment income (loss) ratio.
D Net investment income per share reflects one or more large, non-recurring dividend(s) which amounted to $.04 per share. Excluding such non-recurring dividend(s), the ratio of net investment income (loss) to average net assets would have been 1.45%.
E Total returns for periods of less than one year are not annualized.
F Total returns would have been lower if certain expenses had not been reduced during the applicable periods shown.
G Fees and expenses of any underlying mutual funds or exchange-traded funds (ETFs) are not included in the Fund's expense ratio. The Fund indirectly bears its proportionate share of these expenses. For additional expense information related to investments in Fidelity Central Funds, please refer to the "Investments in Fidelity Central Funds" note found in the Notes to Financial Statements section of the most recent Annual or Semi-Annual report.
H Expense ratios reflect operating expenses of the class. Expenses before reductions do not reflect amounts reimbursed, waived, or reduced through arrangements with the investment adviser, brokerage services, or other offset arrangements, if applicable, and do not represent the amount paid by the class during periods when reimbursements, waivers or reductions occur.
I Annualized
J Amount does not include the portfolio activity of any underlying mutual funds or exchange-traded funds (ETFs).
K Amount represents less than 1%.
L Amount not annualized.
See accompanying notes which are an integral part of the financial statements.
Fidelity® Disruptive Medicine Fund
Performance: The Bottom Line
Average annual total return reflects the change in the value of an investment, assuming reinvestment of distributions from dividend income and capital gains (the profits earned upon the sale of securities that have grown in value, if any) and assuming a constant rate of performance each year. The hypothetical investment and the average annual total returns do not reflect the deduction of taxes that a shareholder would pay on fund distributions or the redemption of fund shares. During periods of reimbursement by Fidelity, a fund’s total return will be greater than it would be had the reimbursement not occurred. How a fund did yesterday is no guarantee of how it will do tomorrow.
Average Annual Total Returns
| For the periods ended May 31, 2022 | Past 1 year | Life of fundA |
| Fidelity® Disruptive Medicine Fund | (22.68)% | 0.60% |
| Loyalty Class 1 | (22.46)% | 0.86% |
| Loyalty Class 2 | (22.33)% | 1.09% |
| Class F | (21.89)% | 1.59% |
A From April 16, 2020
$10,000 Over Life of Fund
Let's say hypothetically that $10,000 was invested in Fidelity® Disruptive Medicine Fund, a class of the fund, on April 16, 2020, when the fund started.
The chart shows how the value of your investment would have changed, and also shows how the MSCI ACWI (All Country World Index) Index performed over the same period.
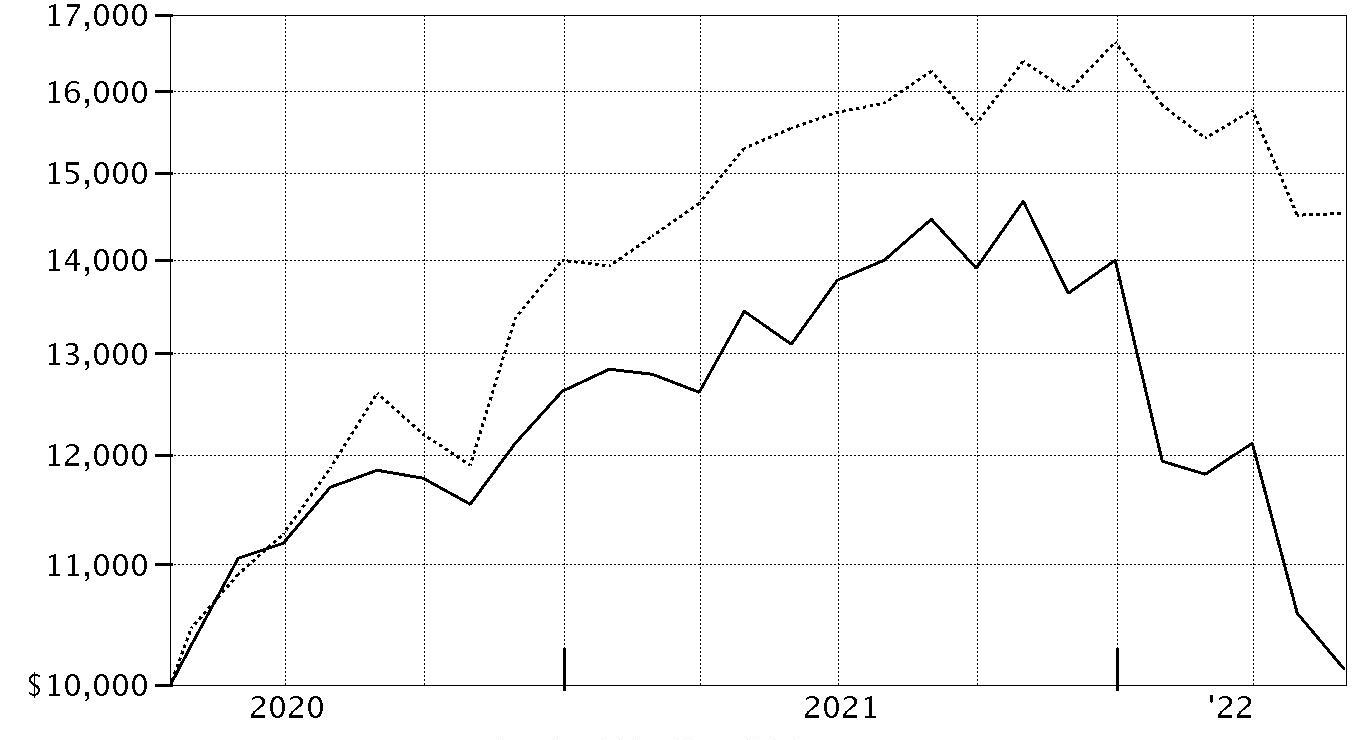
| Period Ending Values |
| $10,128 | Fidelity® Disruptive Medicine Fund |
| $14,529 | MSCI ACWI (All Country World Index) Index |
Fidelity® Disruptive Medicine Fund
Management's Discussion of Fund Performance
Market Recap: Global equities returned -6.49% for the 12 months ending May 31, 2022, according to the MSCI ACWI (All Country World Index) Index. After posting an 18.90% gain in 2021, global stocks retreated to begin the new year amid several headwinds that stoked volatility, uncertainty and investor anxiety. Chief among these was accelerated efforts by some central banks to hike interest rates and aggressively wind down extraordinary monetary policy support in an attempt to rein in high inflation. In addition, geopolitical unrest rose as Russia invaded Ukraine in late February and escalated its attack through period end. Other factors influencing stocks included surging global commodity prices, rising sovereign bond yields in some markets, global supply constraint and disruption, and the potential for variants of the coronavirus to upend global economic growth. Against this backdrop, the index returned -4.90% in January and -2.56% in February, falling on mixed corporate earnings. Volatility eased in March and the index gained 2.21% for the month. April saw a reversal (-7.98%), amid angst about the economic toll of “zero-COVID” lockdowns in China, and then the index had a flattish May (+0.16%). For the full 12 months, emerging markets (-20%) lagged most, followed by Japan (-13%) and Europe ex U.K. (-12%). Conversely, the U.K. and Canada (+3%) led. By sector, communication services (-23%) and consumer discretionary (-21%) fared worst, whereas energy (+48%) rode a surge in commodity prices and topped the market by a wide margin.
Comments from Co-Managers Charlie Hebard and Christopher Lee: For the fiscal year ending May 31, 2022, the fund's share classes returned about -23% to -22%, outperforming the -23.79% result of the MSCI All Country World Health Care Equal Weighted Index (Net MA), but underperforming the broad-based MSCI All Country World Index (Net MA). By region, an overweighting in the U.S. and an underweighting in emerging markets, primarily driven by China, contributed most to the fund's relative result. By industry, the top contributors to performance versus the benchmark were an overweighting and stock selection in managed health care. Security selection in pharmaceuticals and an underweighting in health care supplies also helped. The fund's largest individual relative contributor was an outsized stake in UnitedHealth Group, which gained 22% the past year. The company was among our largest holdings. Also bolstering performance was an overweighting in Regeneron Pharmaceuticals, which gained about 32%. Regeneron Pharmaceuticals was among our biggest holdings. Another notable relative contributor was an outsized stake in Centene (+11%), which was one of our largest holdings. In contrast, stock picks in the U.S. and an underweighting in Japan hindered the fund's relative result. By industry, the largest detractor from performance versus the benchmark was an underweighting in pharmaceuticals. Stock picks and an overweighting in biotechnology and security selection in health care services also hindered relative performance. The fund's biggest individual relative detractor was an overweighting in 10x Genomics, which returned -72% the past twelve months. We added to our stake in this company. The fund's non-benchmark stake in TG Therapeutics returned approximately -87%. The fund's stake in Mirati Therapeutics, a non-benchmark position we established this period, returned -67%.
The views expressed above reflect those of the portfolio manager(s) only through the end of the period as stated on the cover of this report and do not necessarily represent the views of Fidelity or any other person in the Fidelity organization. Any such views are subject to change at any time based upon market or other conditions and Fidelity disclaims any responsibility to update such views. These views may not be relied on as investment advice and, because investment decisions for a Fidelity fund are based on numerous factors, may not be relied on as an indication of trading intent on behalf of any Fidelity fund.
Fidelity® Disruptive Medicine Fund
Investment Summary (Unaudited)
Top Ten Stocks as of May 31, 2022
| | % of fund's net assets |
| Humana, Inc. | 4.5 |
| Danaher Corp. | 4.5 |
| UnitedHealth Group, Inc. | 4.5 |
| Royalty Pharma PLC | 4.4 |
| Vertex Pharmaceuticals, Inc. | 4.2 |
| Boston Scientific Corp. | 4.1 |
| Regeneron Pharmaceuticals, Inc. | 4.0 |
| Centene Corp. | 3.9 |
| Insulet Corp. | 3.4 |
| Alnylam Pharmaceuticals, Inc. | 3.2 |
| | 40.7 |
Market Sectors as of May 31, 2022
| | % of fund's net assets |
| Health Care | 99.6 |
Asset Allocation (% of fund's net assets)
| As of May 31, 2022 * |
| | Stocks | 99.6% |
| | Short-Term Investments and Net Other Assets (Liabilities) | 0.4% |

* Foreign investments - 11.2%
Geographic Diversification (% of fund's net assets)
| As of May 31, 2022 |
| | United States of America* | 88.8% |
| | Switzerland | 3.0% |
| | France | 2.6% |
| | Netherlands | 2.5% |
| | Australia | 1.1% |
| | Cayman Islands | 1.0% |
| | Denmark | 0.6% |
| | Sweden | 0.3% |
| | Canada | 0.1% |

* Includes Short-Term investments and Net Other Assets (Liabilities).
Fidelity® Disruptive Medicine Fund
Schedule of Investments May 31, 2022
Showing Percentage of Net Assets
| Common Stocks - 99.6% | | | |
| | | Shares | Value |
| HEALTH CARE - 99.6% | | | |
| Biotechnology - 28.9% | | | |
| ADC Therapeutics SA (a) | | 3,214 | $21,984 |
| Alnylam Pharmaceuticals, Inc. (a) | | 13,475 | 1,695,155 |
| Argenx SE ADR (a) | | 4,155 | 1,285,142 |
| Ascendis Pharma A/S sponsored ADR (a) | | 3,865 | 326,631 |
| Beam Therapeutics, Inc. (a)(b) | | 4,111 | 144,625 |
| Blueprint Medicines Corp. (a) | | 12,128 | 667,040 |
| Cerevel Therapeutics Holdings (a)(b) | | 31,165 | 814,341 |
| Cyteir Therapeutics, Inc. | | 21,472 | 40,797 |
| Cytokinetics, Inc. (a) | | 15,126 | 603,527 |
| Graphite Bio, Inc. | | 66,468 | 156,200 |
| Innovent Biologics, Inc. (a)(c) | | 65,856 | 204,352 |
| Instil Bio, Inc. (a)(b) | | 54,690 | 328,413 |
| Intellia Therapeutics, Inc. (a) | | 2,765 | 127,577 |
| Janux Therapeutics, Inc. | | 17,674 | 196,712 |
| Keros Therapeutics, Inc. (a) | | 4,995 | 168,831 |
| Kymera Therapeutics, Inc. (a) | | 6,192 | 88,360 |
| Legend Biotech Corp. ADR (a) | | 12,470 | 527,356 |
| Mirati Therapeutics, Inc. (a) | | 10,823 | 423,829 |
| Regeneron Pharmaceuticals, Inc. (a) | | 3,160 | 2,100,578 |
| Relay Therapeutics, Inc. (a)(b) | | 10,553 | 171,803 |
| Revolution Medicines, Inc. (a)(b) | | 11,650 | 197,817 |
| Seagen, Inc. (a) | | 8,137 | 1,104,028 |
| Stoke Therapeutics, Inc. (a) | | 13,940 | 168,813 |
| Tenaya Therapeutics, Inc. (a) | | 22,835 | 152,995 |
| TG Therapeutics, Inc. (a) | | 24,018 | 106,160 |
| Twist Bioscience Corp. (a) | | 7,317 | 249,071 |
| Tyra Biosciences, Inc. (b) | | 15,098 | 103,119 |
| Vertex Pharmaceuticals, Inc. (a) | | 8,270 | 2,221,736 |
| Verve Therapeutics, Inc. | | 15,126 | 229,310 |
| Xenon Pharmaceuticals, Inc. (a) | | 2,845 | 74,966 |
| Zai Lab Ltd. ADR (a) | | 9,967 | 290,040 |
| Zentalis Pharmaceuticals, Inc. (a) | | 6,676 | 160,958 |
| | | | 15,152,266 |
| Health Care Equipment & Supplies - 22.1% | | | |
| Align Technology, Inc. (a) | | 1,283 | 356,212 |
| Atricure, Inc. (a) | | 12,187 | 495,158 |
| Boston Scientific Corp. (a) | | 52,590 | 2,156,716 |
| DexCom, Inc. (a) | | 2,629 | 783,284 |
| Insulet Corp. (a) | | 8,348 | 1,782,131 |
| Intuitive Surgical, Inc. (a) | | 4,534 | 1,032,120 |
| Masimo Corp. (a) | | 5,779 | 811,545 |
| Nanosonics Ltd. (a) | | 208,832 | 573,996 |
| Nevro Corp. (a) | | 675 | 29,417 |
| Penumbra, Inc. (a) | | 8,639 | 1,269,242 |
| Stryker Corp. | | 6,314 | 1,480,633 |
| Tandem Diabetes Care, Inc. (a) | | 7,164 | 488,370 |
| ViewRay, Inc. (a) | | 110,417 | 319,105 |
| | | | 11,577,929 |
| Health Care Providers & Services - 15.3% | | | |
| agilon health, Inc. (a) | | 18,426 | 351,937 |
| Centene Corp. (a) | | 25,106 | 2,044,633 |
| Guardant Health, Inc. (a) | | 6,961 | 285,262 |
| Humana, Inc. | | 5,219 | 2,370,625 |
| Oak Street Health, Inc. (a) | | 33,894 | 639,919 |
| UnitedHealth Group, Inc. | | 4,722 | 2,345,795 |
| | | | 8,038,171 |
| Health Care Technology - 3.5% | | | |
| Doximity, Inc. (b) | | 7,200 | 251,928 |
| Inspire Medical Systems, Inc. (a) | | 4,175 | 738,265 |
| Phreesia, Inc. (a) | | 13,552 | 245,833 |
| Veeva Systems, Inc. Class A (a) | | 3,355 | 571,222 |
| | | | 1,807,248 |
| Life Sciences Tools & Services - 24.2% | | | |
| 10X Genomics, Inc. (a) | | 29,448 | 1,507,443 |
| Bio-Techne Corp. | | 2,604 | 962,777 |
| Bruker Corp. | | 26,617 | 1,663,030 |
| Charles River Laboratories International, Inc. (a) | | 4,089 | 957,153 |
| Danaher Corp. | | 8,925 | 2,354,594 |
| Lonza Group AG | | 2,655 | 1,600,715 |
| Maravai LifeSciences Holdings, Inc. (a) | | 18,782 | 585,059 |
| Olink Holding AB ADR (a)(b) | | 11,974 | 140,814 |
| Sartorius Stedim Biotech | | 3,906 | 1,346,464 |
| Thermo Fisher Scientific, Inc. | | 2,770 | 1,572,169 |
| | | | 12,690,218 |
| Pharmaceuticals - 5.6% | | | |
| Arvinas Holding Co. LLC (a) | | 8,160 | 340,190 |
| Royalty Pharma PLC | | 56,453 | 2,322,476 |
| Theseus Pharmaceuticals, Inc. (b) | | 39,125 | 264,094 |
| | | | 2,926,760 |
| TOTAL COMMON STOCKS | | | |
| (Cost $60,657,149) | | | 52,192,592 |
|
| Money Market Funds - 3.4% | | | |
| Fidelity Cash Central Fund 0.82% (d) | | 154,025 | 154,056 |
| Fidelity Securities Lending Cash Central Fund 0.82% (d)(e) | | 1,644,161 | 1,644,325 |
| TOTAL MONEY MARKET FUNDS | | | |
| (Cost $1,798,381) | | | 1,798,381 |
| TOTAL INVESTMENT IN SECURITIES - 103.0% | | | |
| (Cost $62,455,530) | | | 53,990,973 |
| NET OTHER ASSETS (LIABILITIES) - (3.0)% | | | (1,593,360) |
| NET ASSETS - 100% | | | $52,397,613 |
Legend
(a) Non-income producing
(b) Security or a portion of the security is on loan at period end.
(c) Security exempt from registration under Rule 144A of the Securities Act of 1933. These securities may be resold in transactions exempt from registration, normally to qualified institutional buyers. At the end of the period, the value of these securities amounted to $204,352 or 0.4% of net assets.
(d) Affiliated fund that is generally available only to investment companies and other accounts managed by Fidelity Investments. The rate quoted is the annualized seven-day yield of the fund at period end. A complete unaudited listing of the fund's holdings as of its most recent quarter end is available upon request. In addition, each Fidelity Central Fund's financial statements, which are not covered by the Fund's Report of Independent Registered Public Accounting Firm, are available on the SEC's website or upon request.
(e) Investment made with cash collateral received from securities on loan.
Affiliated Central Funds
Fiscal year to date information regarding the Fund's investments in Fidelity Central Funds, including the ownership percentage, is presented below.
| Fund | Value, beginning of period | Purchases | Sales Proceeds | Dividend Income | Realized Gain/Loss | Change in Unrealized appreciation (depreciation) | Value, end of period | % ownership, end of period |
| Fidelity Cash Central Fund 0.82% | $1,620,592 | $24,346,314 | $25,812,850 | $715 | $-- | $-- | $154,056 | 0.0% |
| Fidelity Securities Lending Cash Central Fund 0.82% | 4,950,950 | 24,337,438 | 27,644,063 | 26,513 | -- | -- | 1,644,325 | 0.0% |
| Total | $6,571,542 | $48,683,752 | $53,456,913 | $27,228 | $-- | $-- | $1,798,381 | |
Amounts in the income column in the above table include any capital gain distributions from underlying funds, which are presented in the corresponding line-item in the Statement of Operations, if applicable. Amount for Fidelity Securities Lending Cash Central Fund represents the income earned on investing cash collateral, less rebates paid to borrowers and any lending agent fees associated with the loan, plus any premium payments received for lending certain types of securities.
Investment Valuation
The following is a summary of the inputs used, as of May 31, 2022, involving the Fund's assets and liabilities carried at fair value. The inputs or methodology used for valuing securities may not be an indication of the risk associated with investing in those securities. For more information on valuation inputs, and their aggregation into the levels used below, please refer to the Investment Valuation section in the accompanying Notes to Financial Statements.
| | Valuation Inputs at Reporting Date: |
| Description | Total | Level 1 | Level 2 | Level 3 |
| Investments in Securities: | | | | |
| Equities: | | | | |
| Health Care | $52,192,592 | $50,591,877 | $1,600,715 | $-- |
| Money Market Funds | 1,798,381 | 1,798,381 | -- | -- |
| Total Investments in Securities: | $53,990,973 | $52,390,258 | $1,600,715 | $-- |
See accompanying notes which are an integral part of the financial statements.
Fidelity® Disruptive Medicine Fund
Financial Statements
Statement of Assets and Liabilities
| | | May 31, 2022 |
| Assets | | |
Investment in securities, at value (including securities loaned of $1,549,769) — See accompanying schedule:
Unaffiliated issuers (cost $60,657,149) | $52,192,592 | |
| Fidelity Central Funds (cost $1,798,381) | 1,798,381 | |
| Total Investment in Securities (cost $62,455,530) | | $53,990,973 |
| Receivable for fund shares sold | | 112,127 |
| Dividends receivable | | 22,341 |
| Distributions receivable from Fidelity Central Funds | | 2,576 |
| Other receivables | | 1,239 |
| Total assets | | 54,129,256 |
| Liabilities | | |
| Payable for fund shares redeemed | $67,391 | |
| Accrued management fee | 19,927 | |
| Collateral on securities loaned | 1,644,325 | |
| Total liabilities | | 1,731,643 |
| Net Assets | | $52,397,613 |
| Net Assets consist of: | | |
| Paid in capital | | $64,205,697 |
| Total accumulated earnings (loss) | | (11,808,084) |
| Net Assets | | $52,397,613 |
| Net Asset Value and Maximum Offering Price | | |
| Fidelity Disruptive Medicine Fund: | | |
| Net Asset Value, offering price and redemption price per share ($11,026,536 ÷ 1,107,045 shares) | | $9.96 |
| Loyalty Class 1: | | |
| Net Asset Value, offering price and redemption price per share ($16,745,718 ÷ 1,678,732 shares) | | $9.98 |
| Loyalty Class 2: | | |
| Net Asset Value, offering price and redemption price per share ($102,330 ÷ 10,201 shares) | | $10.03 |
| Class F: | | |
| Net Asset Value, offering price and redemption price per share ($24,523,029 ÷ 2,430,122 shares) | | $10.09 |
See accompanying notes which are an integral part of the financial statements.
Statement of Operations
| | | Year ended May 31, 2022 |
| Investment Income | | |
| Dividends | | $186,903 |
| Income from Fidelity Central Funds (including $26,513 from security lending) | | 27,228 |
| Total income | | 214,131 |
| Expenses | | |
| Management fee | $355,683 | |
| Independent trustees' fees and expenses | 255 | |
| Total expenses before reductions | 355,938 | |
| Expense reductions | (9) | |
| Total expenses after reductions | | 355,929 |
| Net investment income (loss) | | (141,798) |
| Realized and Unrealized Gain (Loss) | | |
| Net realized gain (loss) on: | | |
| Investment securities: | | |
| Unaffiliated issuers | (3,260,439) | |
| Foreign currency transactions | 2,170 | |
| Total net realized gain (loss) | | (3,258,269) |
| Change in net unrealized appreciation (depreciation) on: | | |
| Investment securities: | | |
| Unaffiliated issuers | (13,445,475) | |
| Assets and liabilities in foreign currencies | (788) | |
| Total change in net unrealized appreciation (depreciation) | | (13,446,263) |
| Net gain (loss) | | (16,704,532) |
| Net increase (decrease) in net assets resulting from operations | | $(16,846,330) |
See accompanying notes which are an integral part of the financial statements.
Statement of Changes in Net Assets
| | Year ended May 31, 2022 | Year ended May 31, 2021 |
| Increase (Decrease) in Net Assets | | |
| Operations | | |
| Net investment income (loss) | $(141,798) | $(55,877) |
| Net realized gain (loss) | (3,258,269) | 1,454,032 |
| Change in net unrealized appreciation (depreciation) | (13,446,263) | 4,512,574 |
| Net increase (decrease) in net assets resulting from operations | (16,846,330) | 5,910,729 |
| Distributions to shareholders | (869,901) | (423,439) |
| Share transactions - net increase (decrease) | 1,922,239 | 52,904,154 |
| Total increase (decrease) in net assets | (15,793,992) | 58,391,444 |
| Net Assets | | |
| Beginning of period | 68,191,605 | 9,800,161 |
| End of period | $52,397,613 | $68,191,605 |
See accompanying notes which are an integral part of the financial statements.
Financial Highlights
Fidelity Disruptive Medicine Fund
| Years ended May 31, | 2022 | 2021 | 2020 A |
| Selected Per–Share Data | | | |
| Net asset value, beginning of period | $13.00 | $11.06 | $10.00 |
| Income from Investment Operations | | | |
| Net investment income (loss)B,C | (.09) | (.07) | (.01) |
| Net realized and unrealized gain (loss) | (2.82) | 2.10 | 1.07 |
| Total from investment operations | (2.91) | 2.03 | 1.06 |
| Distributions from net realized gain | (.13) | (.09) | – |
| Total distributions | (.13) | (.09) | – |
| Net asset value, end of period | $9.96 | $13.00 | $11.06 |
| Total ReturnD,E | (22.68)% | 18.44% | 10.60% |
| Ratios to Average Net AssetsC,F,G | | | |
| Expenses before reductions | 1.00% | 1.01%H | 1.01%H,I |
| Expenses net of fee waivers, if any | 1.00% | 1.01%H | 1.01%H,I |
| Expenses net of all reductions | 1.00% | 1.01%H | 1.01%H,I |
| Net investment income (loss) | (.70)% | (.58)% | (.75)%I |
| Supplemental Data | | | |
| Net assets, end of period (000 omitted) | $11,027 | $32,331 | $5,666 |
| Portfolio turnover rateJ | 47% | 44% | - %K,L |
A For the period April 16, 2020 (commencement of operations) through May 31, 2020.
B Calculated based on average shares outstanding during the period.
C Net investment income (loss) is affected by the timing of the declaration of dividends by any underlying mutual funds or exchange-traded funds (ETFs). Net investment income (loss) of any such underlying funds is not included in the Fund's net investment income (loss) ratio.
D Total returns for periods of less than one year are not annualized.
E Total returns would have been lower if certain expenses had not been reduced during the applicable periods shown.
F Fees and expenses of any underlying mutual funds or exchange-traded funds (ETFs) are not included in the Fund's expense ratio. The Fund indirectly bears its proportionate share of these expenses. For additional expense information related to investments in Fidelity Central Funds, please refer to the "Investments in Fidelity Central Funds" note found in the Notes to Financial Statements section of the most recent Annual or Semi-Annual report.
G Expense ratios reflect operating expenses of the class. Expenses before reductions do not reflect amounts reimbursed, waived, or reduced through arrangements with the investment adviser, brokerage services, or other offset arrangements, if applicable, and do not represent the amount paid by the class during periods when reimbursements, waivers or reductions occur.
H On certain classes, the size and fluctuation of net assets and expense amounts may cause ratios to differ from contractual rates.
I Annualized
J Amount does not include the portfolio activity of any underlying mutual funds or exchange-traded funds (ETFs).
K Amount represents less than 1%.
L Amount not annualized.
See accompanying notes which are an integral part of the financial statements.
Fidelity Disruptive Medicine Fund Loyalty Class 1
| Years ended May 31, | 2022 | 2021 | 2020 A |
| Selected Per–Share Data | | | |
| Net asset value, beginning of period | $13.04 | $11.05 | $10.00 |
| Income from Investment Operations | | | |
| Net investment income (loss)B,C | (.06) | (.03) | (.01) |
| Net realized and unrealized gain (loss) | (2.82) | 2.11 | 1.06 |
| Total from investment operations | (2.88) | 2.08 | 1.05 |
| Distributions from net realized gain | (.18) | (.09) | – |
| Total distributions | (.18) | (.09) | – |
| Net asset value, end of period | $9.98 | $13.04 | $11.05 |
| Total ReturnD,E | (22.46)% | 18.86% | 10.50% |
| Ratios to Average Net AssetsC,F,G | | | |
| Expenses before reductions | .75% | .76%H | .75%I |
| Expenses net of fee waivers, if any | .75% | .76%H | .75%I |
| Expenses net of all reductions | .75% | .76%H | .75%I |
| Net investment income (loss) | (.46)% | (.25)% | (.48)%I |
| Supplemental Data | | | |
| Net assets, end of period (000 omitted) | $16,746 | $3,786 | $111 |
| Portfolio turnover rateJ | 47% | 44% | - %K,L |
A For the period April 16, 2020 (commencement of operations) through May 31, 2020.
B Calculated based on average shares outstanding during the period.
C Net investment income (loss) is affected by the timing of the declaration of dividends by any underlying mutual funds or exchange-traded funds (ETFs). Net investment income (loss) of any such underlying funds is not included in the Fund's net investment income (loss) ratio.
D Total returns for periods of less than one year are not annualized.
E Total returns would have been lower if certain expenses had not been reduced during the applicable periods shown.
F Fees and expenses of any underlying mutual funds or exchange-traded funds (ETFs) are not included in the Fund's expense ratio. The Fund indirectly bears its proportionate share of these expenses. For additional expense information related to investments in Fidelity Central Funds, please refer to the "Investments in Fidelity Central Funds" note found in the Notes to Financial Statements section of the most recent Annual or Semi-Annual report.
G Expense ratios reflect operating expenses of the class. Expenses before reductions do not reflect amounts reimbursed, waived, or reduced through arrangements with the investment adviser, brokerage services, or other offset arrangements, if applicable, and do not represent the amount paid by the class during periods when reimbursements, waivers or reductions occur.
H On certain classes, the size and fluctuation of net assets and expense amounts may cause ratios to differ from contractual rates.
I Annualized
J Amount does not include the portfolio activity of any underlying mutual funds or exchange-traded funds (ETFs).
K Amount represents less than 1%.
L Amount not annualized.
See accompanying notes which are an integral part of the financial statements.
Fidelity Disruptive Medicine Fund Loyalty Class 2
| Years ended May 31, | 2022 | 2021 | 2020 A |
| Selected Per–Share Data | | | |
| Net asset value, beginning of period | $13.06 | $11.06 | $10.00 |
| Income from Investment Operations | | | |
| Net investment income (loss)B,C | (.03) | (.01) | –D |
| Net realized and unrealized gain (loss) | (2.84) | 2.12 | 1.06 |
| Total from investment operations | (2.87) | 2.11 | 1.06 |
| Distributions from net realized gain | (.16) | (.11) | – |
| Total distributions | (.16) | (.11) | – |
| Net asset value, end of period | $10.03 | $13.06 | $11.06 |
| Total ReturnE,F | (22.33)% | 19.10% | 10.60% |
| Ratios to Average Net AssetsC,G,H | | | |
| Expenses before reductions | .50% | .50% | .50%I |
| Expenses net of fee waivers, if any | .50% | .50% | .50%I |
| Expenses net of all reductions | .50% | .50% | .50%I |
| Net investment income (loss) | (.21)% | (.11)% | (.23)%I |
| Supplemental Data | | | |
| Net assets, end of period (000 omitted) | $102 | $132 | $111 |
| Portfolio turnover rateJ | 47% | 44% | - %K,L |
A For the period April 16, 2020 (commencement of operations) through May 31, 2020.
B Calculated based on average shares outstanding during the period.
C Net investment income (loss) is affected by the timing of the declaration of dividends by any underlying mutual funds or exchange-traded funds (ETFs). Net investment income (loss) of any such underlying funds is not included in the Fund's net investment income (loss) ratio.
D Amount represents less than $.005 per share.
E Total returns for periods of less than one year are not annualized.
F Total returns would have been lower if certain expenses had not been reduced during the applicable periods shown.
G Fees and expenses of any underlying mutual funds or exchange-traded funds (ETFs) are not included in the Fund's expense ratio. The Fund indirectly bears its proportionate share of these expenses. For additional expense information related to investments in Fidelity Central Funds, please refer to the "Investments in Fidelity Central Funds" note found in the Notes to Financial Statements section of the most recent Annual or Semi-Annual report.
H Expense ratios reflect operating expenses of the class. Expenses before reductions do not reflect amounts reimbursed, waived, or reduced through arrangements with the investment adviser, brokerage services, or other offset arrangements, if applicable, and do not represent the amount paid by the class during periods when reimbursements, waivers or reductions occur.
I Annualized
J Amount does not include the portfolio activity of any underlying mutual funds or exchange-traded funds (ETFs).
K Amount represents less than 1%.
L Amount not annualized.
See accompanying notes which are an integral part of the financial statements.
Fidelity Disruptive Medicine Fund Class F
| Years ended May 31, | 2022 | 2021 | 2020 A |
| Selected Per–Share Data | | | |
| Net asset value, beginning of period | $13.09 | $11.07 | $10.00 |
| Income from Investment Operations | | | |
| Net investment income (loss)B,C | .04 | .06 | –D |
| Net realized and unrealized gain (loss) | (2.86) | 2.10 | 1.07 |
| Total from investment operations | (2.82) | 2.16 | 1.07 |
| Distributions from net realized gain | (.18) | (.14) | – |
| Total distributions | (.18) | (.14) | – |
| Net asset value, end of period | $10.09 | $13.09 | $11.07 |
| Total ReturnE,F | (21.89)% | 19.60% | 10.70% |
| Ratios to Average Net AssetsC,G,H | | | |
| Expenses before reductions | -% | -% | - %I |
| Expenses net of fee waivers, if any | -% | -% | - %I |
| Expenses net of all reductions | -% | -% | - %I |
| Net investment income (loss) | .29% | .45% | .27%I |
| Supplemental Data | | | |
| Net assets, end of period (000 omitted) | $24,523 | $31,943 | $3,914 |
| Portfolio turnover rateJ | 47% | 44% | - %K,L |
A For the period April 16, 2020 (commencement of operations) through May 31, 2020.
B Calculated based on average shares outstanding during the period.
C Net investment income (loss) is affected by the timing of the declaration of dividends by any underlying mutual funds or exchange-traded funds (ETFs). Net investment income (loss) of any such underlying funds is not included in the Fund's net investment income (loss) ratio.
D Amount represents less than $.005 per share.
E Total returns for periods of less than one year are not annualized.
F Total returns would have been lower if certain expenses had not been reduced during the applicable periods shown.
G Fees and expenses of any underlying mutual funds or exchange-traded funds (ETFs) are not included in the Fund's expense ratio. The Fund indirectly bears its proportionate share of these expenses. For additional expense information related to investments in Fidelity Central Funds, please refer to the "Investments in Fidelity Central Funds" note found in the Notes to Financial Statements section of the most recent Annual or Semi-Annual report.
H Expense ratios reflect operating expenses of the class. Expenses before reductions do not reflect amounts reimbursed, waived, or reduced through arrangements with the investment adviser, brokerage services, or other offset arrangements, if applicable, and do not represent the amount paid by the class during periods when reimbursements, waivers or reductions occur.
I Annualized
J Amount does not include the portfolio activity of any underlying mutual funds or exchange-traded funds (ETFs).
K Amount represents less than 1%.
L Amount not annualized.
See accompanying notes which are an integral part of the financial statements.
Fidelity® Disruptive Technology Fund
Performance: The Bottom Line
Average annual total return reflects the change in the value of an investment, assuming reinvestment of distributions from dividend income and capital gains (the profits earned upon the sale of securities that have grown in value, if any) and assuming a constant rate of performance each year. The hypothetical investment and the average annual total returns do not reflect the deduction of taxes that a shareholder would pay on fund distributions or the redemption of fund shares. During periods of reimbursement by Fidelity, a fund’s total return will be greater than it would be had the reimbursement not occurred. How a fund did yesterday is no guarantee of how it will do tomorrow.
Average Annual Total Returns
| For the periods ended May 31, 2022 | Past 1 year | Life of fundA |
| Fidelity® Disruptive Technology Fund | (33.85)% | 9.05% |
| Loyalty Class 1 | (33.65)% | 9.31% |
| Loyalty Class 2 | (33.49)% | 9.58% |
| Class F | (33.19)% | 10.12% |
A From April 16, 2020
$10,000 Over Life of Fund
Let's say hypothetically that $10,000 was invested in Fidelity® Disruptive Technology Fund, a class of the fund, on April 16, 2020, when the fund started.
The chart shows how the value of your investment would have changed, and also shows how the MSCI ACWI (All Country World Index) Index performed over the same period.

| Period Ending Values |
| $12,018 | Fidelity® Disruptive Technology Fund |
| $14,529 | MSCI ACWI (All Country World Index) Index |
Fidelity® Disruptive Technology Fund
Management's Discussion of Fund Performance
Market Recap: Global equities returned -6.49% for the 12 months ending May 31, 2022, according to the MSCI ACWI (All Country World Index) Index. After posting an 18.90% gain in 2021, global stocks retreated to begin the new year amid several headwinds that stoked volatility, uncertainty and investor anxiety. Chief among these was accelerated efforts by some central banks to hike interest rates and aggressively wind down extraordinary monetary policy support in an attempt to rein in high inflation. In addition, geopolitical unrest rose as Russia invaded Ukraine in late February and escalated its attack through period end. Other factors influencing stocks included surging global commodity prices, rising sovereign bond yields in some markets, global supply constraint and disruption, and the potential for variants of the coronavirus to upend global economic growth. Against this backdrop, the index returned -4.90% in January and -2.56% in February, falling on mixed corporate earnings. Volatility eased in March and the index gained 2.21% for the month. April saw a reversal (-7.98%), amid angst about the economic toll of “zero-COVID” lockdowns in China, and then the index had a flattish May (+0.16%). For the full 12 months, emerging markets (-20%) lagged most, followed by Japan (-13%) and Europe ex U.K. (-12%). Conversely, the U.K. and Canada (+3%) led. By sector, communication services (-23%) and consumer discretionary (-21%) fared worst, whereas energy (+48%) rode a surge in commodity prices and topped the market by a wide margin.
Comments from Co-Managers Charlie Hebard and Christopher Lee: For the fiscal year ending May 31, 2022, the fund's share classes returned roughly -34% to -33%, underperforming the -17.58% return of the MSCI All Country World Information Technology Equal Weighted Index (Net MA), as well as the broad-based MSCI All Country World Index (Net MA). By region, stock picks in the U.S. and emerging markets hurt the fund's relative result. By industry, the primary detractor from performance versus the benchmark was our stock picks in interactive media & services. Weak picks in internet & direct marketing retail also hampered the fund's relative result. Also detracting from performance was security selection in movies & entertainment. Sea, the fund's top individual detractor, returned approximately -70% this period. This was a position we established the past twelve months. Our second-largest detractor was Netflix, which returned roughly -61% the past year. This was among the fund's biggest holdings this period. Another detractor this period was Yandex. The stock returned -95% the past twelve months. All these detractors were non-benchmark positions. Conversely, an underweighting in emerging markets, specifically China, and an overweighting in the U.S. contributed most to the fund's relative result. By industry, the primary contributor to performance versus the benchmark was stock selection in systems software. Strong picks in internet services & infrastructure also helped. Also boosting the fund's relative performance was stock selection in wireless telecommunication services. The biggest individual relative contributor was an overweight position in Microsoft (+11%), the fund's largest holding. Also bolstering performance was our overweighting in Nvidia, which gained 18%. Nvidia was among the fund's largest holdings the past twelve months. The fund's non-benchmark stake in Alphabet, one of the fund's biggest holdings, returned about -4% and notably contributed.
The views expressed above reflect those of the portfolio manager(s) only through the end of the period as stated on the cover of this report and do not necessarily represent the views of Fidelity or any other person in the Fidelity organization. Any such views are subject to change at any time based upon market or other conditions and Fidelity disclaims any responsibility to update such views. These views may not be relied on as investment advice and, because investment decisions for a Fidelity fund are based on numerous factors, may not be relied on as an indication of trading intent on behalf of any Fidelity fund.
Fidelity® Disruptive Technology Fund
Investment Summary (Unaudited)
Top Ten Stocks as of May 31, 2022
| | % of fund's net assets |
| Microsoft Corp. | 5.4 |
| ASML Holding NV (Netherlands) | 5.2 |
| Adobe, Inc. | 5.2 |
| Taiwan Semiconductor Manufacturing Co. Ltd. sponsored ADR | 5.0 |
| Alphabet, Inc. Class C | 4.3 |
| Amazon.com, Inc. | 4.2 |
| Salesforce.com, Inc. | 4.2 |
| Workday, Inc. Class A | 3.9 |
| Marvell Technology, Inc. | 3.9 |
| T-Mobile U.S., Inc. | 3.3 |
| | 44.6 |
Market Sectors as of May 31, 2022
| | % of fund's net assets |
| Information Technology | 65.5 |
| Communication Services | 20.4 |
| Consumer Discretionary | 13.3 |
Asset Allocation (% of fund's net assets)
| As of May 31, 2022 * |
| | Stocks | 99.2% |
| | Short-Term Investments and Net Other Assets (Liabilities) | 0.8% |

* Foreign investments - 30.7%
Geographic Diversification (% of fund's net assets)
| As of May 31, 2022 |
| | United States of America* | 69.3% |
| | Netherlands | 7.4% |
| | Taiwan | 5.0% |
| | Cayman Islands | 4.5% |
| | Japan | 4.1% |
| | Mauritius | 2.4% |
| | Korea (South) | 2.1% |
| | Ireland | 1.7% |
| | United Kingdom | 1.6% |
| | Other | 1.9% |

* Includes Short-Term investments and Net Other Assets (Liabilities).
Fidelity® Disruptive Technology Fund
Schedule of Investments May 31, 2022
Showing Percentage of Net Assets
| Common Stocks - 99.2% | | | |
| | | Shares | Value |
| COMMUNICATION SERVICES - 20.4% | | | |
| Entertainment - 5.3% | | | |
| Netflix, Inc. (a) | | 10,921 | $2,156,242 |
| Roku, Inc. Class A (a) | | 3,427 | 325,222 |
| Sea Ltd. ADR (a) | | 31,240 | 2,582,298 |
| Spotify Technology SA (a) | | 4,886 | 550,994 |
| | | | 5,614,756 |
| Interactive Media & Services - 11.8% | | | |
| Alphabet, Inc. Class C (a) | | 2,001 | 4,563,841 |
| Kakao Corp. | | 10,364 | 709,055 |
| Meta Platforms, Inc. Class A (a) | | 10,802 | 2,091,699 |
| Snap, Inc. Class A (a) | | 39,471 | 556,936 |
| Tencent Holdings Ltd. | | 25,898 | 1,184,015 |
| Yandex NV Series A (a)(b) | | 47,740 | 163,741 |
| Z Holdings Corp. | | 1,004,363 | 3,310,883 |
| | | | 12,580,170 |
| Wireless Telecommunication Services - 3.3% | | | |
| T-Mobile U.S., Inc. (a) | | 25,927 | 3,455,810 |
|
| TOTAL COMMUNICATION SERVICES | | | 21,650,736 |
|
| CONSUMER DISCRETIONARY - 13.3% | | | |
| Automobiles - 0.9% | | | |
| Tesla, Inc. (a) | | 1,303 | 988,013 |
| Hotels, Restaurants & Leisure - 3.3% | | | |
| Airbnb, Inc. Class A (a) | | 7,624 | 921,513 |
| MakeMyTrip Ltd. (a)(c) | | 94,239 | 2,606,651 |
| | | | 3,528,164 |
| Internet & Direct Marketing Retail - 8.5% | | | |
| Amazon.com, Inc. (a) | | 1,860 | 4,471,793 |
| Delivery Hero AG (a)(d) | | 10,169 | 390,171 |
| Doordash, Inc. (a) | | 7,650 | 588,362 |
| Farfetch Ltd. Class A(a) | | 81,855 | 734,239 |
| Global-e Online Ltd. (a) | | 23,388 | 450,687 |
| Lyft, Inc. (a) | | 27,387 | 484,202 |
| Uber Technologies, Inc. (a) | | 30,754 | 713,493 |
| ZOZO, Inc. | | 50,473 | 1,076,229 |
| | | | 8,909,176 |
| Specialty Retail - 0.6% | | | |
| Auto1 Group SE (a)(d) | | 59,522 | 638,040 |
|
| TOTAL CONSUMER DISCRETIONARY | | | 14,063,393 |
|
| INFORMATION TECHNOLOGY - 65.5% | | | |
| Electronic Equipment & Components - 1.4% | | | |
| Samsung SDI Co. Ltd. | | 3,146 | 1,455,995 |
| IT Services - 9.4% | | | |
| Accenture PLC Class A | | 6,021 | 1,797,028 |
| Adyen BV (a)(d) | | 1,451 | 2,247,114 |
| Block, Inc. Class A (a) | | 8,170 | 714,957 |
| MongoDB, Inc. Class A (a) | | 9,527 | 2,259,328 |
| Paymentus Holdings, Inc. (a)(c) | | 39,539 | 600,597 |
| Snowflake, Inc. (a) | | 10,245 | 1,307,774 |
| Twilio, Inc. Class A (a) | | 9,509 | 1,000,062 |
| | | | 9,926,860 |
| Semiconductors & Semiconductor Equipment - 22.1% | | | |
| ASML Holding NV (Netherlands) | | 9,538 | 5,488,691 |
| Enphase Energy, Inc. (a) | | 15,853 | 2,951,670 |
| Marvell Technology, Inc. | | 69,509 | 4,111,457 |
| NVIDIA Corp. | | 18,407 | 3,436,955 |
| SolarEdge Technologies, Inc. (a) | | 7,793 | 2,125,852 |
| Taiwan Semiconductor Manufacturing Co. Ltd. sponsored ADR | | 56,021 | 5,338,801 |
| | | | 23,453,426 |
| Software - 30.7% | | | |
| Adobe, Inc. (a) | | 13,149 | 5,476,296 |
| Amplitude, Inc. (a)(c) | | 36,066 | 679,483 |
| Atlassian Corp. PLC (a) | | 9,782 | 1,734,544 |
| Bill.Com Holdings, Inc. (a) | | 7,638 | 903,117 |
| Confluent, Inc. (c) | | 33,760 | 713,349 |
| Crowdstrike Holdings, Inc. (a) | | 8,698 | 1,391,593 |
| HashiCorp, Inc. (c) | | 31,589 | 1,106,247 |
| HubSpot, Inc. (a) | | 5,847 | 1,974,473 |
| Intuit, Inc. | | 7,100 | 2,942,666 |
| Kingdee International Software Group Co. Ltd. (a) | | 473,795 | 934,645 |
| Microsoft Corp. | | 20,972 | 5,701,657 |
| Qualtrics International, Inc. (a) | | 31,104 | 441,677 |
| Salesforce.com, Inc. (a) | | 27,890 | 4,469,094 |
| Workday, Inc. Class A (a) | | 26,523 | 4,145,545 |
| | | | 32,614,386 |
| Technology Hardware, Storage & Peripherals - 1.9% | | | |
| Apple, Inc. | | 13,766 | 2,048,931 |
|
| TOTAL INFORMATION TECHNOLOGY | | | 69,499,598 |
|
| TOTAL COMMON STOCKS | | | |
| (Cost $142,408,179) | | | 105,213,727 |
|
| Money Market Funds - 5.8% | | | |
| Fidelity Cash Central Fund 0.82% (e) | | 907,664 | 907,846 |
| Fidelity Securities Lending Cash Central Fund 0.82% (e)(f) | | 5,284,691 | 5,285,219 |
| TOTAL MONEY MARKET FUNDS | | | |
| (Cost $6,193,065) | | | 6,193,065 |
| TOTAL INVESTMENT IN SECURITIES - 105.0% | | | |
| (Cost $148,601,244) | | | 111,406,792 |
| NET OTHER ASSETS (LIABILITIES) - (5.0)% | | | (5,292,601) |
| NET ASSETS - 100% | | | $106,114,191 |
Legend
(a) Non-income producing
(b) Level 3 security
(c) Security or a portion of the security is on loan at period end.
(d) Security exempt from registration under Rule 144A of the Securities Act of 1933. These securities may be resold in transactions exempt from registration, normally to qualified institutional buyers. At the end of the period, the value of these securities amounted to $3,275,325 or 3.1% of net assets.
(e) Affiliated fund that is generally available only to investment companies and other accounts managed by Fidelity Investments. The rate quoted is the annualized seven-day yield of the fund at period end. A complete unaudited listing of the fund's holdings as of its most recent quarter end is available upon request. In addition, each Fidelity Central Fund's financial statements, which are not covered by the Fund's Report of Independent Registered Public Accounting Firm, are available on the SEC's website or upon request.
(f) Investment made with cash collateral received from securities on loan.
Affiliated Central Funds
Fiscal year to date information regarding the Fund's investments in Fidelity Central Funds, including the ownership percentage, is presented below.
| Fund | Value, beginning of period | Purchases | Sales Proceeds | Dividend Income | Realized Gain/Loss | Change in Unrealized appreciation (depreciation) | Value, end of period | % ownership, end of period |
| Fidelity Cash Central Fund 0.82% | $1,205,966 | $46,205,312 | $46,503,432 | $1,882 | $-- | $-- | $907,846 | 0.0% |
| Fidelity Securities Lending Cash Central Fund 0.82% | 2,271,625 | 64,417,665 | 61,404,071 | 10,622 | -- | -- | 5,285,219 | 0.0% |
| Total | $3,477,591 | $110,622,977 | $107,907,503 | $12,504 | $-- | $-- | $6,193,065 | |
Amounts in the income column in the above table include any capital gain distributions from underlying funds, which are presented in the corresponding line-item in the Statement of Operations, if applicable. Amount for Fidelity Securities Lending Cash Central Fund represents the income earned on investing cash collateral, less rebates paid to borrowers and any lending agent fees associated with the loan, plus any premium payments received for lending certain types of securities.
Investment Valuation
The following is a summary of the inputs used, as of May 31, 2022, involving the Fund's assets and liabilities carried at fair value. The inputs or methodology used for valuing securities may not be an indication of the risk associated with investing in those securities. For more information on valuation inputs, and their aggregation into the levels used below, please refer to the Investment Valuation section in the accompanying Notes to Financial Statements.
| | Valuation Inputs at Reporting Date: |
| Description | Total | Level 1 | Level 2 | Level 3 |
| Investments in Securities: | | | | |
| Equities: | | | | |
| Communication Services | $21,650,736 | $16,992,097 | $4,494,898 | $163,741 |
| Consumer Discretionary | 14,063,393 | 14,063,393 | -- | -- |
| Information Technology | 69,499,598 | 61,763,793 | 7,735,805 | -- |
| Money Market Funds | 6,193,065 | 6,193,065 | -- | -- |
| Total Investments in Securities: | $111,406,792 | $99,012,348 | $12,230,703 | $163,741 |
The following is a reconciliation of Investments in Securities for which Level 3 inputs were used in determining value:
| Investments in Securities: | |
| Communication Services | |
| Beginning Balance | $-- |
| Net Realized Gain (Loss) on Investment Securities | (94,547) |
| Net Unrealized Gain (Loss) on Investment Securities | (3,045,096) |
| Cost of Purchases | -- |
| Proceeds of Sales | (276,033) |
| Amortization/Accretion | -- |
| Transfers into Level 3 | 3,579,417 |
| Transfers out of Level 3 | -- |
| Ending Balance | $163,741 |
| The change in unrealized gain (loss) for the period attributable to Level 3 securities held at May 31, 2022 | $(3,045,096) |
The information used in the above reconciliation represents fiscal year to date activity for any Investments in Securities identified as using Level 3 inputs at either the beginning or the end of the current fiscal period. Transfers into Level 3 were attributable to a lack of observable market data resulting from decreases in market activity, decreases in liquidity, security restructurings or corporate actions. Transfers out of Level 3 were attributable to observable market data becoming available for those securities. Cost of purchases and proceeds of sales may include securities received and/or delivered through in-kind transactions. Transfers in or out of Level 3 represent the beginning value of any Security or Instrument where a change in the pricing level occurred from the beginning to the end of the period. The cost of purchases and the proceeds of sales may include securities received or delivered through corporate actions or exchanges. Realized and unrealized gains (losses) disclosed in the reconciliation{s} are included in Net Gain (Loss) on the Fund's Statement of Operations.
See accompanying notes which are an integral part of the financial statements.
Fidelity® Disruptive Technology Fund
Financial Statements
Statement of Assets and Liabilities
| | | May 31, 2022 |
| Assets | | |
Investment in securities, at value (including securities loaned of $4,937,071) — See accompanying schedule:
Unaffiliated issuers (cost $142,408,179) | $105,213,727 | |
| Fidelity Central Funds (cost $6,193,065) | 6,193,065 | |
| Total Investment in Securities (cost $148,601,244) | | $111,406,792 |
| Receivable for fund shares sold | | 93,954 |
| Dividends receivable | | 72,280 |
| Distributions receivable from Fidelity Central Funds | | 5,718 |
| Other receivables | | 1,680 |
| Total assets | | 111,580,424 |
| Liabilities | | |
| Payable for fund shares redeemed | $123,098 | |
| Accrued management fee | 57,916 | |
| Collateral on securities loaned | 5,285,219 | |
| Total liabilities | | 5,466,233 |
| Net Assets | | $106,114,191 |
| Net Assets consist of: | | |
| Paid in capital | | $142,402,858 |
| Total accumulated earnings (loss) | | (36,288,667) |
| Net Assets | | $106,114,191 |
| Net Asset Value and Maximum Offering Price | | |
| Fidelity Disruptive Technology Fund: | | |
| Net Asset Value, offering price and redemption price per share ($34,801,732 ÷ 2,946,666 shares) | | $11.81 |
| Loyalty Class 1: | | |
| Net Asset Value, offering price and redemption price per share ($46,694,125 ÷ 3,947,285 shares) | | $11.83 |
| Loyalty Class 2: | | |
| Net Asset Value, offering price and redemption price per share ($121,431 ÷ 10,206 shares) | | $11.90 |
| Class F: | | |
| Net Asset Value, offering price and redemption price per share ($24,496,903 ÷ 2,046,037 shares) | | $11.97 |
See accompanying notes which are an integral part of the financial statements.
Statement of Operations
| | | Year ended May 31, 2022 |
| Investment Income | | |
| Dividends | | $399,223 |
| Non-Cash dividends | | 48,041 |
| Income from Fidelity Central Funds (including $10,622 from security lending) | | 12,504 |
| Income before foreign taxes withheld | | 459,768 |
| Less foreign taxes withheld | | (48,843) |
| Total income | | 410,925 |
| Expenses | | |
| Management fee | $1,219,105 | |
| Independent trustees' fees and expenses | 603 | |
| Total expenses before reductions | 1,219,708 | |
| Expense reductions | (2) | |
| Total expenses after reductions | | 1,219,706 |
| Net investment income (loss) | | (808,781) |
| Realized and Unrealized Gain (Loss) | | |
| Net realized gain (loss) on: | | |
| Investment securities: | | |
| Unaffiliated issuers | 2,345,219 | |
| Foreign currency transactions | (1,202) | |
| Total net realized gain (loss) | | 2,344,017 |
| Change in net unrealized appreciation (depreciation) on: | | |
| Investment securities: | | |
| Unaffiliated issuers | (57,700,795) | |
| Assets and liabilities in foreign currencies | (3,137) | |
| Total change in net unrealized appreciation (depreciation) | | (57,703,932) |
| Net gain (loss) | | (55,359,915) |
| Net increase (decrease) in net assets resulting from operations | | $(56,168,696) |
See accompanying notes which are an integral part of the financial statements.
Statement of Changes in Net Assets
| | Year ended May 31, 2022 | Year ended May 31, 2021 |
| Increase (Decrease) in Net Assets | | |
| Operations | | |
| Net investment income (loss) | $(808,781) | $(609,356) |
| Net realized gain (loss) | 2,344,017 | 3,211,992 |
| Change in net unrealized appreciation (depreciation) | (57,703,932) | 19,747,237 |
| Net increase (decrease) in net assets resulting from operations | (56,168,696) | 22,349,873 |
| Distributions to shareholders | (2,859,572) | (482,032) |
| Share transactions - net increase (decrease) | (5,482,616) | 138,300,525 |
| Total increase (decrease) in net assets | (64,510,884) | 160,168,366�� |
| Net Assets | | |
| Beginning of period | 170,625,075 | 10,456,709 |
| End of period | $106,114,191 | $170,625,075 |
See accompanying notes which are an integral part of the financial statements.
Financial Highlights
Fidelity Disruptive Technology Fund
| Years ended May 31, | 2022 | 2021 | 2020 A |
| Selected Per–Share Data | | | |
| Net asset value, beginning of period | $18.10 | $11.49 | $10.00 |
| Income from Investment Operations | | | |
| Net investment income (loss)B,C | (.14) | (.13) | (.01) |
| Net realized and unrealized gain (loss) | (5.88) | 6.81 | 1.50 |
| Total from investment operations | (6.02) | 6.68 | 1.49 |
| Distributions from net realized gain | (.27) | (.07) | – |
| Total distributions | (.27) | (.07) | – |
| Net asset value, end of period | $11.81 | $18.10 | $11.49 |
| Total ReturnD,E | (33.85)% | 58.13% | 14.90% |
| Ratios to Average Net AssetsC,F,G | | | |
| Expenses before reductions | .99%H | 1.01%H | 1.01%H,I |
| Expenses net of fee waivers, if any | .99%H | 1.01%H | 1.01%H,I |
| Expenses net of all reductions | .99%H | 1.01%H | 1.01%H,I |
| Net investment income (loss) | (.78)% | (.77)% | (.62)%I |
| Supplemental Data | | | |
| Net assets, end of period (000 omitted) | $34,802 | $130,244 | $6,198 |
| Portfolio turnover rateJ | 33% | 29% | - %K |
A For the period April 16, 2020 (commencement of operations) through May 31, 2020.
B Calculated based on average shares outstanding during the period.
C Net investment income (loss) is affected by the timing of the declaration of dividends by any underlying mutual funds or exchange-traded funds (ETFs). Net investment income (loss) of any such underlying funds is not included in the Fund's net investment income (loss) ratio.
D Total returns for periods of less than one year are not annualized.
E Total returns would have been lower if certain expenses had not been reduced during the applicable periods shown.
F Fees and expenses of any underlying mutual funds or exchange-traded funds (ETFs) are not included in the Fund's expense ratio. The Fund indirectly bears its proportionate share of these expenses. For additional expense information related to investments in Fidelity Central Funds, please refer to the "Investments in Fidelity Central Funds" note found in the Notes to Financial Statements section of the most recent Annual or Semi-Annual report.
G Expense ratios reflect operating expenses of the class. Expenses before reductions do not reflect amounts reimbursed, waived, or reduced through arrangements with the investment adviser, brokerage services, or other offset arrangements, if applicable, and do not represent the amount paid by the class during periods when reimbursements, waivers or reductions occur.
H On certain classes, the size and fluctuation of net assets and expense amounts may cause ratios to differ from contractual rates.
I Annualized
J Amount does not include the portfolio activity of any underlying mutual funds or exchange-traded funds (ETFs).
K Amount not annualized.
See accompanying notes which are an integral part of the financial statements.
Fidelity Disruptive Technology Fund Loyalty Class 1
| Years ended May 31, | 2022 | 2021 | 2020 A |
| Selected Per–Share Data | | | |
| Net asset value, beginning of period | $18.15 | $11.49 | $10.00 |
| Income from Investment Operations | | | |
| Net investment income (loss)B,C | (.08) | (.07) | –D |
| Net realized and unrealized gain (loss) | (5.89) | 6.78 | 1.49 |
| Total from investment operations | (5.97) | 6.71 | 1.49 |
| Distributions from net realized gain | (.35) | (.05) | – |
| Total distributions | (.35) | (.05) | – |
| Net asset value, end of period | $11.83 | $18.15 | $11.49 |
| Total ReturnE,F | (33.65)% | 58.46% | 14.90% |
| Ratios to Average Net AssetsC,G,H | | | |
| Expenses before reductions | .75% | .76%I | .75%J |
| Expenses net of fee waivers, if any | .75% | .76%I | .75%J |
| Expenses net of all reductions | .75% | .76%I | .75%J |
| Net investment income (loss) | (.46)% | (.44)% | (.36)%J |
| Supplemental Data | | | |
| Net assets, end of period (000 omitted) | $46,694 | $7,600 | $115 |
| Portfolio turnover rateK | 33% | 29% | - %L |
A For the period April 16, 2020 (commencement of operations) through May 31, 2020.
B Calculated based on average shares outstanding during the period.
C Net investment income (loss) is affected by the timing of the declaration of dividends by any underlying mutual funds or exchange-traded funds (ETFs). Net investment income (loss) of any such underlying funds is not included in the Fund's net investment income (loss) ratio.
D Amount represents less than $.005 per share.
E Total returns for periods of less than one year are not annualized.
F Total returns would have been lower if certain expenses had not been reduced during the applicable periods shown.
G Fees and expenses of any underlying mutual funds or exchange-traded funds (ETFs) are not included in the Fund's expense ratio. The Fund indirectly bears its proportionate share of these expenses. For additional expense information related to investments in Fidelity Central Funds, please refer to the "Investments in Fidelity Central Funds" note found in the Notes to Financial Statements section of the most recent Annual or Semi-Annual report.
H Expense ratios reflect operating expenses of the class. Expenses before reductions do not reflect amounts reimbursed, waived, or reduced through arrangements with the investment adviser, brokerage services, or other offset arrangements, if applicable, and do not represent the amount paid by the class during periods when reimbursements, waivers or reductions occur.
I On certain classes, the size and fluctuation of net assets and expense amounts may cause ratios to differ from contractual rates.
J Annualized
K Amount does not include the portfolio activity of any underlying mutual funds or exchange-traded funds (ETFs).
L Amount not annualized.
See accompanying notes which are an integral part of the financial statements.
Fidelity Disruptive Technology Fund Loyalty Class 2
| Years ended May 31, | 2022 | 2021 | 2020 A |
| Selected Per–Share Data | | | |
| Net asset value, beginning of period | $18.18 | $11.50 | $10.00 |
| Income from Investment Operations | | | |
| Net investment income (loss)B,C | (.04) | (.05) | –D |
| Net realized and unrealized gain (loss) | (5.93) | 6.81 | 1.50 |
| Total from investment operations | (5.97) | 6.76 | 1.50 |
| Distributions from net realized gain | (.31) | (.08) | – |
| Total distributions | (.31) | (.08) | – |
| Net asset value, end of period | $11.90 | $18.18 | $11.50 |
| Total ReturnE,F | (33.49)% | 58.79% | 15.00% |
| Ratios to Average Net AssetsC,G,H | | | |
| Expenses before reductions | .50% | .50% | .50%I |
| Expenses net of fee waivers, if any | .50% | .50% | .50%I |
| Expenses net of all reductions | .50% | .50% | .50%I |
| Net investment income (loss) | (.25)% | (.28)% | (.10)%I |
| Supplemental Data | | | |
| Net assets, end of period (000 omitted) | $121 | $183 | $115 |
| Portfolio turnover rateJ | 33% | 29% | - %K |
A For the period April 16, 2020 (commencement of operations) through May 31, 2020.
B Calculated based on average shares outstanding during the period.
C Net investment income (loss) is affected by the timing of the declaration of dividends by any underlying mutual funds or exchange-traded funds (ETFs). Net investment income (loss) of any such underlying funds is not included in the Fund's net investment income (loss) ratio.
D Amount represents less than $.005 per share.
E Total returns for periods of less than one year are not annualized.
F Total returns would have been lower if certain expenses had not been reduced during the applicable periods shown.
G Fees and expenses of any underlying mutual funds or exchange-traded funds (ETFs) are not included in the Fund's expense ratio. The Fund indirectly bears its proportionate share of these expenses. For additional expense information related to investments in Fidelity Central Funds, please refer to the "Investments in Fidelity Central Funds" note found in the Notes to Financial Statements section of the most recent Annual or Semi-Annual report.
H Expense ratios reflect operating expenses of the class. Expenses before reductions do not reflect amounts reimbursed, waived, or reduced through arrangements with the investment adviser, brokerage services, or other offset arrangements, if applicable, and do not represent the amount paid by the class during periods when reimbursements, waivers or reductions occur.
I Annualized
J Amount does not include the portfolio activity of any underlying mutual funds or exchange-traded funds (ETFs).
K Amount not annualized.
See accompanying notes which are an integral part of the financial statements.
Fidelity Disruptive Technology Fund Class F
| Years ended May 31, | 2022 | 2021 | 2020 A |
| Selected Per–Share Data | | | |
| Net asset value, beginning of period | $18.24 | $11.51 | $10.00 |
| Income from Investment Operations | | | |
| Net investment income (loss)B,C | .04 | .04 | .01 |
| Net realized and unrealized gain (loss) | (5.96) | 6.81 | 1.50 |
| Total from investment operations | (5.92) | 6.85 | 1.51 |
| Distributions from net realized gain | (.35) | (.12) | – |
| Total distributions | (.35) | (.12) | – |
| Net asset value, end of period | $11.97 | $18.24 | $11.51 |
| Total ReturnD,E | (33.19)% | 59.58% | 15.10% |
| Ratios to Average Net AssetsC,F,G | | | |
| Expenses before reductions | -% | -% | - %H |
| Expenses net of fee waivers, if any | -% | -% | - %H |
| Expenses net of all reductions | -% | -% | - %H |
| Net investment income (loss) | .25% | .23% | .39%H |
| Supplemental Data | | | |
| Net assets, end of period (000 omitted) | $24,497 | $32,598 | $4,029 |
| Portfolio turnover rateI | 33% | 29% | - %J |
A For the period April 16, 2020 (commencement of operations) through May 31, 2020.
B Calculated based on average shares outstanding during the period.
C Net investment income (loss) is affected by the timing of the declaration of dividends by any underlying mutual funds or exchange-traded funds (ETFs). Net investment income (loss) of any such underlying funds is not included in the Fund's net investment income (loss) ratio.
D Total returns for periods of less than one year are not annualized.
E Total returns would have been lower if certain expenses had not been reduced during the applicable periods shown.
F Fees and expenses of any underlying mutual funds or exchange-traded funds (ETFs) are not included in the Fund's expense ratio. The Fund indirectly bears its proportionate share of these expenses. For additional expense information related to investments in Fidelity Central Funds, please refer to the "Investments in Fidelity Central Funds" note found in the Notes to Financial Statements section of the most recent Annual or Semi-Annual report.
G Expense ratios reflect operating expenses of the class. Expenses before reductions do not reflect amounts reimbursed, waived, or reduced through arrangements with the investment adviser, brokerage services, or other offset arrangements, if applicable, and do not represent the amount paid by the class during periods when reimbursements, waivers or reductions occur.
H Annualized
I Amount does not include the portfolio activity of any underlying mutual funds or exchange-traded funds (ETFs).
J Amount not annualized.
See accompanying notes which are an integral part of the financial statements.
Notes to Financial Statements
For the period ended May 31, 2022
1. Organization.
Fidelity Disruptive Automation Fund, Fidelity Disruptive Communications Fund, Fidelity Disruptive Finance Fund, Fidelity Disruptive Medicine Fund and Fidelity Disruptive Technology Fund (the Funds) are non-diversified funds of Fidelity Summer Street Trust (the Trust). The Trust is registered under the Investment Company Act of 1940, as amended (the 1940 Act), as an open-end management investment company organized as a Massachusetts business trust. Each Fund is authorized to issue an unlimited number of shares. Each Fund offers Fidelity Disruptive Fund, Loyalty Class 1, Loyalty Class 2 and Class F shares. Each class has equal rights as to assets and voting privileges, except for matters affecting a single class. For certain accounts, Fidelity Disruptive Fund shares will automatically convert to Loyalty Class 1 shares after a holding period of one year from the initial date of purchase; and then from Loyalty Class 1 shares to Loyalty Class 2 shares after another holding period of two years. Investments in emerging markets, if applicable, can be subject to social, economic, regulatory, and political uncertainties and can be extremely volatile.
2. Investments in Fidelity Central Funds.
Funds may invest in Fidelity Central Funds, which are open-end investment companies generally available only to other investment companies and accounts managed by the investment adviser and its affiliates. The Schedule of Investments lists any Fidelity Central Funds held as an investment as of period end, but does not include the underlying holdings of each Fidelity Central Fund. An investing fund indirectly bears its proportionate share of the expenses of the underlying Fidelity Central Funds.
Based on its investment objective, each Fidelity Central Fund may invest or participate in various investment vehicles or strategies that are similar to those of the investing fund. These strategies are consistent with the investment objectives of the investing fund and may involve certain economic risks which may cause a decline in value of each of the Fidelity Central Funds and thus a decline in the value of the investing fund.
| Fidelity Central Fund | Investment Manager | Investment Objective | Investment Practices | Expense Ratio(a) |
| Fidelity Money Market Central Funds | Fidelity Management & Research Company LLC (FMR) | Each fund seeks to obtain a high level of current income consistent with the preservation of capital and liquidity. | Short-term Investments | Less than .005% |
(a) Expenses expressed as a percentage of average net assets and are as of each underlying Central Fund's most recent annual or semi-annual shareholder report.
A complete unaudited list of holdings for each Fidelity Central Fund is available upon request or at the Securities and Exchange Commission website at www.sec.gov. In addition, the financial statements of the Fidelity Central Funds which contain the significant accounting policies (including investment valuation policies) of those funds, and are not covered by the Report of Independent Registered Public Accounting Firm, are available on the Securities and Exchange Commission website or upon request.
3. Significant Accounting Policies.
Each Fund is an investment company and applies the accounting and reporting guidance of the Financial Accounting Standards Board (FASB) Accounting Standards Codification Topic 946 Financial Services - Investment Companies. The financial statements have been prepared in conformity with accounting principles generally accepted in the United States of America (GAAP), which require management to make certain estimates and assumptions at the date of the financial statements. Actual results could differ from those estimates. Subsequent events, if any, through the date that the financial statements were issued have been evaluated in the preparation of the financial statements. Each Fund's Schedule of Investments lists any underlying mutual funds or exchange-traded funds (ETFs) but does not include the underlying holdings of these funds. The following summarizes the significant accounting policies of each Fund:
Investment Valuation. Investments are valued as of 4:00 p.m. Eastern time on the last calendar day of the period. The Board of Trustees (the Board) has delegated the day to day responsibility for the valuation of each Fund's investments to the Fair Value Committee (the Committee) established by each Fund's investment adviser. In accordance with valuation policies and procedures approved by the Board, each Fund attempts to obtain prices from one or more third party pricing vendors or brokers to value its investments. When current market prices, quotations or currency exchange rates are not readily available or reliable, investments will be fair valued in good faith by the Committee, in accordance with procedures adopted by the Board. Factors used in determining fair value vary by investment type and may include market or investment specific events. The frequency with which these procedures are used cannot be predicted and they may be utilized to a significant extent. The Committee oversees each Fund's valuation policies and procedures and reports to the Board on the Committee's activities and fair value determinations. The Board monitors the appropriateness of the procedures used in valuing each Fund's investments and ratifies the fair value determinations of the Committee.
Each Fund categorizes the inputs to valuation techniques used to value its investments into a disclosure hierarchy consisting of three levels as shown below:
- Level 1 – unadjusted quoted prices in active markets for identical investments
- Level 2 – other significant observable inputs (including quoted prices for similar investments, interest rates, prepayment speeds, etc.)
- Level 3 – unobservable inputs (including the Fund's own assumptions based on the best information available)
Valuation techniques used to value each Fund's investments by major category are as follows:
Equity securities, including restricted securities, for which market quotations are readily available, are valued at the last reported sale price or official closing price as reported by a third party pricing vendor on the primary market or exchange on which they are traded and are categorized as Level 1 in the hierarchy. In the event there were no sales during the day or closing prices are not available, securities are valued at the last quoted bid price or may be valued using the last available price and are generally categorized as Level 2 in the hierarchy. For foreign equity securities, when market or security specific events arise, comparisons to the valuation of American Depositary Receipts (ADRs, futures contracts, Exchange-Traded Funds (ETFs) and certain indexes as well as quoted prices for similar securities may be used and would be categorized as Level 2 in the hierarchy. For equity securities, including restricted securities, where observable inputs are limited, assumptions about market activity and risk are used and these securities may be categorized as Level 3 in the hierarchy.
Investments in open-end mutual funds, including the Fidelity Central Funds, are valued at their closing net asset value (NAV) each business day and are categorized as Level 1 in the hierarchy.
Changes in valuation techniques may result in transfers in or out of an assigned level within the disclosure hierarchy. The aggregate value of investments by input level as of May 31, 2022, as well as a roll forward of Level 3 investments, is included at the end of each Fund's Schedule of Investments.
Foreign Currency. Certain Funds may use foreign currency contracts to facilitate transactions in foreign-denominated securities. Gains and losses from these transactions may arise from changes in the value of the foreign currency or if the counterparties do not perform under the contracts' terms.
Foreign-denominated assets, including investment securities, and liabilities are translated into U.S. dollars at the exchange rates at period end. Purchases and sales of investment securities, income and dividends received, and expenses denominated in foreign currencies are translated into U.S. dollars at the exchange rate in effect on the transaction date.
The effects of exchange rate fluctuations on investments are included with the net realized and unrealized gain (loss) on investment securities. Other foreign currency transactions resulting in realized and unrealized gain (loss) are disclosed separately.
Investment Transactions and Income. For financial reporting purposes, the Funds' investment holdings and NAV include trades executed through the end of the last business day of the period. The NAV per share for processing shareholder transactions is calculated as of the close of business of the New York Stock Exchange (NYSE), normally 4:00 p.m. Eastern time and includes trades executed through the end of the prior business day. Gains and losses on securities sold are determined on the basis of identified cost. Commissions paid to certain brokers with whom the investment adviser, or its affiliates, places trades on behalf of a fund include an amount in addition to trade execution, which may be rebated back to a fund. Any such rebates are included in net realized gain (loss) on investments in the Statement of Operations. Dividend income is recorded on the ex-dividend date, except for certain dividends from foreign securities where the ex-dividend date may have passed, which are recorded as soon as the Funds are informed of the ex-dividend date. Non-cash dividends included in dividend income, if any, are recorded at the fair market value of the securities received. Income and capital gain distributions from Fidelity Central Funds, if any, are recorded on the ex-dividend date. Certain distributions received by the Funds represent a return of capital or capital gain. The Funds determine the components of these distributions subsequent to the ex-dividend date, based upon receipt of tax filings or other correspondence relating to the underlying investment. These distributions are recorded as a reduction of cost of investments and/or as a realized gain. Interest income is accrued as earned and includes coupon interest and amortization of premium and accretion of discount on debt securities as applicable. Investment income is recorded net of foreign taxes withheld where recovery of such taxes is uncertain. Funds may file withholding tax reclaims in certain jurisdictions to recover a portion of amounts previously withheld. Any withholding tax reclaims income is included in the Statement of Operations in dividends or foreign taxes withheld, as applicable. Any receivables for withholding tax reclaims are included in the Statement of Assets and Liabilities in dividends receivable.
Class Allocations and Expenses. Investment income, realized and unrealized capital gains and losses, common expenses of a fund, and certain fund-level expense reductions, if any, are allocated daily on a pro-rata basis to each class based on the relative net assets of each class to the total net assets of a fund. Each class differs with respect to transfer agent and distribution and service plan fees incurred, as applicable. Certain expense reductions may also differ by class, if applicable. For the reporting period, the allocated portion of income and expenses to each class as a percent of its average net assets may vary due to the timing of recording these transactions in relation to fluctuating net assets of the classes. Expenses directly attributable to a fund are charged to that fund. Expenses attributable to more than one fund are allocated among the respective funds on the basis of relative net assets or other appropriate methods. Expenses included in the accompanying financial statements reflect the expenses of that fund and do not include any expenses associated with any underlying mutual funds or exchange-traded funds. Although not included in a fund's expenses, a fund indirectly bears its proportionate share of these expenses through the net asset value of each underlying mutual fund or exchange-traded fund. Expense estimates are accrued in the period to which they relate and adjustments are made when actual amounts are known.
Income Tax Information and Distributions to Shareholders. Each year, each Fund intends to qualify as a regulated investment company under Subchapter M of the Internal Revenue Code, including distributing substantially all of its taxable income and realized gains. As a result, no provision for U.S. Federal income taxes is required. As of May 31, 2022, each Fund did not have any unrecognized tax benefits in the financial statements; nor is each Fund aware of any tax positions for which it is reasonably possible that the total amounts of unrecognized tax benefits will significantly change in the next twelve months. Each Fund files a U.S. federal tax return, in addition to state and local tax returns as required. Each Fund's federal income tax returns are subject to examination by the Internal Revenue Service (IRS) for a period of three fiscal years after they are filed. State and local tax returns may be subject to examination for an additional fiscal year depending on the jurisdiction. Foreign taxes are provided for based on each Fund's understanding of the tax rules and rates that exist in the foreign markets in which it invests.
Distributions are declared and recorded on the ex-dividend date. Income and capital gain distributions are declared separately for each class. Income and capital gain distributions are determined in accordance with income tax regulations, which may differ from GAAP. In addition, certain Funds claimed a portion of the payment made to redeeming shareholders as a distribution for income tax purposes.
Capital accounts within the financial statements are adjusted for permanent book-tax differences. These adjustments have no impact on net assets or the results of operations. Capital accounts are not adjusted for temporary book-tax differences which will reverse in a subsequent period.
Book-tax differences are primarily due to foreign currency transactions, passive foreign investment companies (PFIC), net operating losses, capital loss carryforwards and losses deferred due to wash sales and excise tax regulations.
As of period end, the cost and unrealized appreciation (depreciation) in securities, and derivatives if applicable, for federal income tax purposes were as follows for each Fund:
| | Tax cost | Gross unrealized appreciation | Gross unrealized depreciation | Net unrealized appreciation (depreciation) |
| Fidelity Disruptive Automation Fund | $132,725,625 | $12,973,804 | $(16,874,940) | $(3,901,136) |
| Fidelity Disruptive Communications Fund | 53,808,950 | 5,585,331 | (12,270,960) | (6,685,629) |
| Fidelity Disruptive Finance Fund | 63,798,856 | 10,278,189 | (8,011,084) | 2,267,105 |
| Fidelity Disruptive Medicine Fund | 62,628,097 | 5,120,025 | (13,757,149) | (8,637,124) |
| Fidelity Disruptive Technology Fund | 148,745,687 | 9,757,998 | (47,096,893) | (37,338,895) |
The tax-based components of distributable earnings as of period end were as follows for each Fund:
| | Undistributed ordinary income | Undistributed long-term capital gain | Capital loss carryforward | Net unrealized appreciation (depreciation) on securities and other investments |
| Fidelity Disruptive Automation Fund | $– | $– | $– | $(3,910,027) |
| Fidelity Disruptive Communications Fund | – | – | – | (6,685,629) |
| Fidelity Disruptive Finance Fund | 140,302 | 3,333,224 | – | 2,267,477 |
| Fidelity Disruptive Medicine Fund | – | – | (3,145,154) | (8,637,712) |
| Fidelity Disruptive Technology Fund | – | 1,200,012 | – | (37,341,750) |
Capital loss carryforwards are only available to offset future capital gains of the Funds to the extent provided by regulations and may be limited. The capital loss carryforward information presented below, including any applicable limitation, is estimated as of fiscal period end and is subject to adjustment.
| | Short-term | Total capital loss carryfoward |
| Fidelity Disruptive Medicine Fund | (3,145,154) | (3,145,154) |
Certain of the Funds intend to elect to defer to the next fiscal year capital losses recognized during the period November 1, 2021 to May 31, 2022 and ordinary losses recognized during the period January 1, 2022 to May 31, 2022. Loss deferrals were as follows:
| | Capital losses | Ordinary losses |
| Fidelity Disruptive Automation Fund | $(518,865) | $(–) |
| Fidelity Disruptive Communications Fund | (4,315,626) | (15,902) |
| Fidelity Disruptive Finance Fund | (1,676,464) | (–) |
| Fidelity Disruptive Medicine Fund | (–) | (25,217) |
| Fidelity Disruptive Technology Fund | (–) | (146,929) |
The tax character of distributions paid was as follows:
| May 31, 2022 | | | | | |
| | Ordinary Income | Long-term Capital Gains | Total |
| Fidelity Disruptive Automation Fund | $2,442,978 | $1,631,717 | $4,074,695 |
| Fidelity Disruptive Communications Fund | 3,514,571 | 846,362 | 4,360,933 |
| Fidelity Disruptive Finance Fund | 1,565,554 | 623,324 | 2,188,878 |
| Fidelity Disruptive Medicine Fund | 869,901 | – | 869,901 |
| Fidelity Disruptive Technology Fund | 1,590,680 | 1,268,892 | 2,859,572 |
| May 31, 2021 | | | | | |
| | Ordinary Income | Total |
| Fidelity Disruptive Automation Fund | $332,565 | $332,565 |
| Fidelity Disruptive Communications Fund | 684,195 | 684,195 |
| Fidelity Disruptive Finance Fund | 553,515 | 553,515 |
| Fidelity Disruptive Medicine Fund | 423,439 | 423,439 |
| Fidelity Disruptive Technology Fund | 482,032 | 482,032 |
Restricted Securities (including Private Placements). Funds may invest in securities that are subject to legal or contractual restrictions on resale. These securities generally may be resold in transactions exempt from registration or to the public if the securities are registered. Disposal of these securities may involve time-consuming negotiations and expense, and prompt sale at an acceptable price may be difficult. Information regarding restricted securities held at period end is included at the end of the Schedule of Investments, if applicable.
4. Purchases and Sales of Investments.
Purchases and sales of securities, other than short-term securities and in-kind transactions, as applicable, are noted in the table below.
| | Purchases ($) | Sales ($) |
| Fidelity Disruptive Automation Fund | 35,270,755 | 35,557,335 |
| Fidelity Disruptive Communications Fund | 22,723,904 | 27,135,116 |
| Fidelity Disruptive Finance Fund | 37,504,483 | 45,431,508 |
| Fidelity Disruptive Medicine Fund | 36,694,889 | 33,436,601 |
| Fidelity Disruptive Technology Fund | 54,868,588 | 63,819,758 |
5. Fees and Other Transactions with Affiliates.
Management Fee and Expense Contract. Fidelity Management & Research Company LLC (the investment adviser) and its affiliates provide each Fund with investment management related services for which each Class of each Fund pays a monthly all-inclusive management fee based on an annual percentage of class-level average net assets. Under the management contract, the investment adviser pays all other operating expenses, except the compensation of the independent Trustees and certain miscellaneous expenses, such as proxy and shareholder meeting expenses.
Under the expense contract, the investment adviser pays all other class-level operating expenses as necessary, except the compensation of the independent Trustees and certain miscellaneous expenses, such as proxy and shareholder meeting expenses, so that total expenses of Loyalty Class 1, Loyalty Class 2 and Class F do not exceed an annual percentage of class-level average net assets.
For the reporting period, the annual management fee and expense contract rates were as follows:
| | Management Fee Annual % of Class-Level Average Net Assets | Expense Contract Annual % of Class-Level Average Net Assets |
| Fidelity Disruptive Automation Fund | | |
| Fidelity Disruptive Automation Fund | 1.00% | N/A |
| Loyalty Class 1 | 1.00% | .75% |
| Loyalty Class 2 | 1.00% | .50% |
| Class F | 1.00% | .00% |
| Fidelity Disruptive Communications Fund | | |
| Fidelity Disruptive Communications Fund | 1.00% | N/A |
| Loyalty Class 1 | 1.00% | .75% |
| Loyalty Class 2 | 1.00% | .50% |
| Class F | 1.00% | .00% |
| Fidelity Disruptive Finance Fund | | |
| Fidelity Disruptive Finance Fund | 1.00% | N/A |
| Loyalty Class 1 | 1.00% | .75% |
| Loyalty Class 2 | 1.00% | .50% |
| Class F | 1.00% | .00% |
| Fidelity Disruptive Medicine Fund | | |
| Fidelity Disruptive Medicine Fund | 1.00% | N/A |
| Loyalty Class 1 | 1.00%�� | .75% |
| Loyalty Class 2 | 1.00% | .50% |
| Class F | 1.00% | .00% |
| Fidelity Disruptive Technology Fund | | |
| Fidelity Disruptive Technology Fund | 1.00% | N/A |
| Loyalty Class 1 | 1.00% | .75% |
| Loyalty Class 2 | 1.00% | .50% |
| Class F | 1.00% | .00% |
Brokerage Commissions. A portion of portfolio transactions were placed with brokerage firms which are affiliates of the investment adviser. Brokerage commissions are included in net realized gain (loss) and change in net unrealized appreciation (depreciation) in the Statement of Operations. The commissions paid to these affiliated firms were as follows:
| | Amount |
| Fidelity Disruptive Automation Fund | $87 |
| Fidelity Disruptive Communications Fund | 193 |
| Fidelity Disruptive Finance Fund | 1,427 |
| Fidelity Disruptive Medicine Fund | 1,088 |
| Fidelity Disruptive Technology Fund | 254 |
Interfund Trades. Funds may purchase from or sell securities to other Fidelity Funds under procedures adopted by the Board. The procedures have been designed to ensure these interfund trades are executed in accordance with Rule 17a-7 of the 1940 Act. Any interfund trades are included within the respective purchases and sales amounts shown in the Purchases and Sales of Investments note. Interfund trades during the period are noted in the table below.
| | Purchases ($) | Sales ($) | Realized Gain (Loss) ($) |
| Fidelity Disruptive Automation Fund | 4,751,450 | 1,843,727 | 323,816 |
| Fidelity Disruptive Communications Fund | 1,449,570 | 1,654,544 | 151,065 |
| Fidelity Disruptive Finance Fund | 1,739,368 | 498,322 | (19,369) |
| Fidelity Disruptive Medicine Fund | 1,401,123 | 308,028 | (52,537) |
| Fidelity Disruptive Technology Fund | 10,237,051 | 1,682,169 | 278,005 |
6. Committed Line of Credit.
Certain Funds participate with other funds managed by the investment adviser or an affiliate in a $4.25 billion credit facility (the "line of credit") to be utilized for temporary or emergency purposes to fund shareholder redemptions or for other short-term liquidity purposes. The participating funds have agreed to pay commitment fees on their pro-rata portion of the line of credit, which are reflected in Miscellaneous expenses on the Statement of Operations, and are listed below. During the period, there were no borrowings on this line of credit.
7. Security Lending.
Funds lend portfolio securities from time to time in order to earn additional income. Lending agents are used, including National Financial Services (NFS), an affiliate of the investment adviser. Pursuant to a securities lending agreement, NFS will receive a fee, which is capped at 9.9% of a fund's daily lending revenue, for its services as lending agent. A fund may lend securities to certain qualified borrowers, including NFS. On the settlement date of the loan, a fund receives collateral (in the form of U.S. Treasury obligations, letters of credit and/or cash) against the loaned securities and maintains collateral in an amount not less than 100% of the market value of the loaned securities during the period of the loan. The market value of the loaned securities is determined at the close of business of a fund and any additional required collateral is delivered to a fund on the next business day. A fund or borrower may terminate the loan at any time, and if the borrower defaults on its obligation to return the securities loaned because of insolvency or other reasons, a fund may apply collateral received from the borrower against the obligation. A fund may experience delays and costs in recovering the securities loaned. Any cash collateral received is invested in the Fidelity Securities Lending Cash Central Fund. Any loaned securities are identified as such in the Schedule of Investments, and the value of loaned securities and cash collateral at period end, as applicable, are presented in the Statement of Assets and Liabilities. Security lending income represents the income earned on investing cash collateral, less rebates paid to borrowers and any lending agent fees associated with the loan, plus any premium payments received for lending certain types of securities. Security lending income is presented in the Statement of Operations as a component of income from Fidelity Central Funds. Affiliated security lending activity, if any, was as follows:
| | Total Security Lending Fees Paid to NFS | Security Lending Income From Securities Loaned to NFS | Value of Securities Loaned to NFS at Period End |
| Fidelity Disruptive Automation Fund | $197 | $– | $– |
| Fidelity Disruptive Communications Fund | $137 | $– | $– |
| Fidelity Disruptive Finance Fund | $414 | $1,542 | $638,702 |
| Fidelity Disruptive Medicine Fund | $2,856 | $282 | $– |
| Fidelity Disruptive Technology Fund | $1,222 | $– | $– |
8. Expense Reductions.
Through arrangements with each applicable Fund's custodian, credits realized as a result of certain uninvested cash balances were used to reduce each applicable Fund's or class' expenses. All of the applicable expense reductions are noted in the table below.
| | Custodian credits |
| Fidelity Disruptive Automation Fund | $2 |
| Fidelity Disruptive Communications Fund | 15 |
| Fidelity Disruptive Finance Fund | 116 |
| Fidelity Disruptive Medicine Fund | 9 |
| Fidelity Disruptive Technology Fund | 2 |
9. Distributions to Shareholders.
Distributions to shareholders of each class were as follows:
| | Year ended
May 31, 2022 | Year ended
May 31, 2021 |
| Fidelity Disruptive Automation Fund | | |
| Distributions to shareholders | | |
| Fidelity Disruptive Automation Fund | $1,812,440 | $205,853 |
| Loyalty Class 1 | 1,093,147 | 380 |
| Loyalty Class 2 | 5,010 | 580 |
| Class F | 1,164,098 | 125,752 |
| Total | $4,074,695 | $332,565 |
| Fidelity Disruptive Communications Fund | | |
| Distributions to shareholders | | |
| Fidelity Disruptive Communications Fund | $1,427,817 | $357,886 |
| Loyalty Class 1 | 778,546 | 1,960 |
| Loyalty Class 2 | 9,700 | 2,160 |
| Class F | 2,144,870 | 322,189 |
| Total | $4,360,933 | $684,195 |
| Fidelity Disruptive Finance Fund | | |
| Distributions to shareholders | | |
| Fidelity Disruptive Finance Fund | $736,400 | $275,435 |
| Loyalty Class 1 | 350,964 | 1,550 |
| Loyalty Class 2 | 4,381 | 1,791 |
| Class F | 1,097,133 | 274,739 |
| Total | $2,188,878 | $553,515 |
| Fidelity Disruptive Medicine Fund | | |
| Distributions to shareholders | | |
| Fidelity Disruptive Medicine Fund | $313,911 | $201,834 |
| Loyalty Class 1 | 95,065 | 880 |
| Loyalty Class 2 | 1,584 | 1,050 |
| Class F | 459,341 | 219,675 |
| Total | $869,901 | $423,439 |
| Fidelity Disruptive Technology Fund | | |
| Distributions to shareholders | | |
| Fidelity Disruptive Technology Fund | $1,574,286 | $337,814 |
| Loyalty Class 1 | 619,752 | 540 |
| Loyalty Class 2 | 3,166 | 760 |
| Class F | 662,368 | 142,918 |
| Total | $2,859,572 | $482,032 |
10. Share Transactions.
Share transactions for each class were as follows and may contain in-kind transactions, automatic conversions between classes or exchanges between affiliated funds:
| | Shares | Shares | Dollars | Dollars |
| | Year ended May 31, 2022 | Year endedMay 31, 2021 | Year ended May 31, 2022 | Year endedMay 31, 2021 |
| Fidelity Disruptive Automation Fund | | | | |
| Fidelity Disruptive Automation Fund | | | | |
| Shares sold | 2,752,234 | 8,109,797 | $51,921,559 | $128,749,652 |
| Reinvestment of distributions | 88,636 | 11,823 | 1,722,187 | 192,321 |
| Shares redeemed | (6,530,903) | (2,444,212) | (120,981,122) | (41,466,263) |
| Net increase (decrease) | (3,690,033) | 5,677,408 | $(67,337,376) | $87,475,710 |
| Loyalty Class 1 | | | | |
| Shares sold | 4,560,941 | 361,542 | $84,668,905 | $6,514,213 |
| Reinvestment of distributions | 51,313 | 23 | 1,010,135 | 380 |
| Shares redeemed | (931,384) | (1,275) | (15,777,057) | (22,450) |
| Net increase (decrease) | 3,680,870 | 360,290 | $69,901,983 | $6,492,143 |
| Loyalty Class 2 | | | | |
| Reinvestment of distributions | 256 | 35 | $5,010 | $580 |
| Net increase (decrease) | 256 | 35 | $5,010 | $580 |
| Class F | | | | |
| Shares sold | 331,731 | 1,529,549 | $6,114,342 | $23,645,930 |
| Reinvestment of distributions | 59,316 | 7,711 | 1,164,098 | 125,752 |
| Shares redeemed | (449,808) | (38,462) | (8,048,845) | (652,008) |
| Net increase (decrease) | (58,761) | 1,498,798 | $(770,405) | $23,119,674 |
| Fidelity Disruptive Communications Fund | | | | |
| Fidelity Disruptive Communications Fund | | | | |
| Shares sold | 778,402 | 2,862,562 | $13,145,562 | $41,588,156 |
| Reinvestment of distributions | 79,255 | 22,027 | 1,353,700 | 337,011 |
| Shares redeemed | (2,348,937) | (975,678) | (38,618,424) | (15,178,956) |
| Net increase (decrease) | (1,491,280) | 1,908,911 | $(24,119,162) | $26,746,211 |
| Loyalty Class 1 | | | | |
| Shares sold | 1,560,001 | 194,211 | $25,719,807 | $3,230,591 |
| Reinvestment of distributions | 43,190 | 128 | 711,850 | 1,960 |
| Shares redeemed | (557,772) | (904) | (8,111,660) | (14,898) |
| Net increase (decrease) | 1,045,419 | 193,435 | $18,319,997 | $3,217,653 |
| Loyalty Class 2 | | | | |
| Reinvestment of distributions | 575 | 141 | $9,700 | $2,160 |
| Net increase (decrease) | 575 | 141 | $9,700 | $2,160 |
| Class F | | | | |
| Shares sold | 499,239 | 1,612,655 | $8,186,239 | $23,645,930 |
| Reinvestment of distributions | 127,405 | 21,004 | 2,144,870 | 322,189 |
| Shares redeemed | (450,224) | (41,481) | (6,430,638) | (652,008) |
| Net increase (decrease) | 176,420 | 1,592,178 | $3,900,471 | $23,316,111 |
| Fidelity Disruptive Finance Fund | | | | |
| Fidelity Disruptive Finance Fund | | | | |
| Shares sold | 1,522,405 | 3,347,128 | $28,354,963 | $50,143,900 |
| Reinvestment of distributions | 37,862 | 17,533 | 699,750 | 261,234 |
| Shares redeemed | (2,995,268) | (915,047) | (54,505,311) | (14,349,747) |
| Net increase (decrease) | (1,435,001) | 2,449,614 | $(25,450,598) | $36,055,387 |
| Loyalty Class 1 | | | | |
| Shares sold | 1,495,157 | 135,962 | $27,284,785 | $2,458,603 |
| Reinvestment of distributions | 17,088 | 104 | 315,495 | 1,550 |
| Shares redeemed | (292,449) | (140) | (5,046,813) | (2,536) |
| Net increase (decrease) | 1,219,796 | 135,926 | $22,553,467 | $2,457,617 |
| Loyalty Class 2 | | | | |
| Reinvestment of distributions | 236 | 120 | $4,380 | $1,791 |
| Net increase (decrease) | 236 | 120 | $4,380 | $1,791 |
| Class F | | | | |
| Shares sold | 262,444 | 1,630,409 | $4,963,476 | $23,645,930 |
| Reinvestment of distributions | 59,129 | 18,435 | 1,097,133 | 274,739 |
| Shares redeemed | (588,999) | (39,917) | (10,388,509) | (652,008) |
| Net increase (decrease) | (267,426) | 1,608,927 | $(4,327,900) | $23,268,661 |
| Fidelity Disruptive Medicine Fund | | | | |
| Fidelity Disruptive Medicine Fund | | | | |
| Shares sold | 1,365,657 | 3,763,088 | $18,194,183 | $46,047,685 |
| Reinvestment of distributions | 21,668 | 15,875 | 297,724 | 192,401 |
| Shares redeemed | (2,767,183) | (1,804,525) | (35,824,976) | (22,618,198) |
| Net increase (decrease) | (1,379,858) | 1,974,438 | $(17,333,069) | $23,621,888 |
| Loyalty Class 1 | | | | |
| Shares sold | 1,803,906 | 289,585 | $23,287,853 | $3,783,085 |
| Reinvestment of distributions | 6,145 | 72 | 84,377 | 880 |
| Shares redeemed | (421,676) | (9,300) | (4,950,843) | (122,534) |
| Net increase (decrease) | 1,388,375 | 280,357 | $18,421,387 | $3,661,431 |
| Loyalty Class 2 | | | | |
| Reinvestment of distributions | 115 | 86 | $1,584 | $1,050 |
| Net increase (decrease) | 115 | 86 | $1,584 | $1,050 |
| Class F | | | | |
| Shares sold | 612,276 | 2,119,467 | $8,148,906 | $26,052,118 |
| Reinvestment of distributions | 33,286 | 18,080 | 459,341 | 219,675 |
| Shares redeemed | (654,892) | (51,731) | (7,775,910) | (652,008) |
| Net increase (decrease) | (9,330) | 2,085,816 | $832,337 | $25,619,785 |
| Fidelity Disruptive Technology Fund | | | | |
| Fidelity Disruptive Technology Fund | | | | |
| Shares sold | 3,479,218 | 10,735,733 | $62,077,719 | $178,439,651 |
| Reinvestment of distributions | 77,426 | 18,945 | 1,510,441 | 324,533 |
| Shares redeemed | (7,805,680) | (4,098,155) | (142,978,770) | (70,888,776) |
| Net increase (decrease) | (4,249,036) | 6,656,523 | $(79,390,610) | $107,875,408 |
| Loyalty Class 1 | | | | |
| Shares sold | 5,021,866 | 416,027 | $92,457,308 | $7,416,389 |
| Reinvestment of distributions | 28,742 | 31 | 564,426 | 540 |
| Shares redeemed | (1,521,976) | (7,405) | (24,013,647) | (129,412) |
| Net increase (decrease) | 3,528,632 | 408,653 | $69,008,087 | $7,287,517 |
| Loyalty Class 2 | | | | |
| Reinvestment of distributions | 162 | 44 | $3,166 | $760 |
| Net increase (decrease) | 162 | 44 | $3,166 | $760 |
| Class F | | | | |
| Shares sold | 592,417 | 1,466,428 | $10,092,143 | $23,645,930 |
| Reinvestment of distributions | 33,738 | 8,319 | 662,368 | 142,918 |
| Shares redeemed | (367,127) | (37,913) | (5,857,770) | (652,008) |
| Net increase (decrease) | 259,028 | 1,436,834 | $4,896,741 | $23,136,840 |
11. Other.
A fund's organizational documents provide former and current trustees and officers with a limited indemnification against liabilities arising in connection with the performance of their duties to the fund. In the normal course of business, a fund may also enter into contracts that provide general indemnifications. A fund's maximum exposure under these arrangements is unknown as this would be dependent on future claims that may be made against a fund. The risk of material loss from such claims is considered remote.
Funds do not invest in underlying mutual funds for the purpose of exercising management or control; however, investments by funds within their principal investment strategies may represent a significant portion of the underlying mutual fund's net assets. At the end of the period, certain Funds were the owners of record of 10% or more of the total outstanding shares of the following underlying mutual funds as shown below.
| Fund | Fidelity Disruptors Fund |
| Fidelity Disruptive Automation Fund | 21% |
| Fidelity Disruptive Communications Fund | 52% |
| Fidelity Disruptive Finance Fund | 39% |
| Fidelity Disruptive Medicine Fund | 46% |
| Fidelity Disruptive Technology Fund | 23% |
12. Coronavirus (COVID-19) Pandemic.
An outbreak of COVID-19 first detected in China during December 2019 has since spread globally and was declared a pandemic by the World Health Organization during March 2020. Developments that disrupt global economies and financial markets, such as the COVID-19 pandemic, may magnify factors that affect the Funds' performance.
Report of Independent Registered Public Accounting Firm
To the Board of Trustees of Fidelity Summer Street Trust and Shareholders of Fidelity Disruptive Automation Fund, Fidelity Disruptive Communications Fund, Fidelity Disruptive Finance Fund, Fidelity Disruptive Medicine Fund and Fidelity Disruptive Technology Fund
Opinions on the Financial Statements
We have audited the accompanying statements of assets and liabilities, including the schedules of investments, of Fidelity Disruptive Automation Fund, Fidelity Disruptive Communications Fund, Fidelity Disruptive Finance Fund, Fidelity Disruptive Medicine Fund and Fidelity Disruptive Technology Fund (five of the funds constituting Fidelity Summer Street Trust, hereafter collectively referred to as the “Funds”) as of May 31, 2022, the related statements of operations for the year ended May 31, 2022, the statements of changes in net assets for each of the two years in the period ended May 31, 2022, including the related notes, and the financial highlights for each of the two years in the period ended May 31, 2022 and for the period April 16, 2020 (commencement of operations) through May 31, 2020 (collectively referred to as the “financial statements”). In our opinion, the financial statements present fairly, in all material respects, the financial position of each of the Funds as of May 31, 2022, the results of each of their operations for the year then ended, the changes in each of their net assets for each of the two years in the period ended May 31, 2022 and each of the financial highlights for each of the two years in the period ended May 31, 2022 and for the period April 16, 2020 (commencement of operations) through May 31, 2020 in conformity with accounting principles generally accepted in the United States of America.
Basis for Opinions
These financial statements are the responsibility of the Funds’ management. Our responsibility is to express an opinion on the Funds’ financial statements based on our audits. We are a public accounting firm registered with the Public Company Accounting Oversight Board (United States) (PCAOB) and are required to be independent with respect to the Funds in accordance with the U.S. federal securities laws and the applicable rules and regulations of the Securities and Exchange Commission and the PCAOB.
We conducted our audits of these financial statements in accordance with the standards of the PCAOB. Those standards require that we plan and perform the audit to obtain reasonable assurance about whether the financial statements are free of material misstatement, whether due to error or fraud.
Our audits included performing procedures to assess the risks of material misstatement of the financial statements, whether due to error or fraud, and performing procedures that respond to those risks. Such procedures included examining, on a test basis, evidence regarding the amounts and disclosures in the financial statements. Our audits also included evaluating the accounting principles used and significant estimates made by management, as well as evaluating the overall presentation of the financial statements. Our procedures included confirmation of securities owned as of May 31, 2022 by correspondence with the custodian. We believe that our audits provide a reasonable basis for our opinions.
/s/ PricewaterhouseCoopers LLP
Boston, Massachusetts
July 15, 2022
We have served as the auditor of one or more investment companies in the Fidelity group of funds since 1932.
Trustees and Officers
The Trustees, Members of the Advisory Board (if any), and officers of the trust and funds, as applicable, are listed below. The Board of Trustees governs each fund and is responsible for protecting the interests of shareholders. The Trustees are experienced executives who meet periodically throughout the year to oversee each fund's activities, review contractual arrangements with companies that provide services to each fund, oversee management of the risks associated with such activities and contractual arrangements, and review each fund's performance. Each of the Trustees oversees 325 funds.
The Trustees hold office without limit in time except that (a) any Trustee may resign; (b) any Trustee may be removed by written instrument, signed by at least two-thirds of the number of Trustees prior to such removal; (c) any Trustee who requests to be retired or who has become incapacitated by illness or injury may be retired by written instrument signed by a majority of the other Trustees; and (d) any Trustee may be removed at any special meeting of shareholders by a two-thirds vote of the outstanding voting securities of the trust. Each Trustee who is not an interested person (as defined in the 1940 Act) of the trust and the funds is referred to herein as an Independent Trustee. Each Independent Trustee shall retire not later than the last day of the calendar year in which his or her 75th birthday occurs. The Independent Trustees may waive this mandatory retirement age policy with respect to individual Trustees. Officers and Advisory Board Members hold office without limit in time, except that any officer or Advisory Board Member may resign or may be removed by a vote of a majority of the Trustees at any regular meeting or any special meeting of the Trustees. Except as indicated, each individual has held the office shown or other offices in the same company for the past five years.
Each fund's Statement of Additional Information (SAI) includes more information about the Trustees. To request a free copy, call Fidelity at 1-800-544-8544 if you’re an individual investing directly with Fidelity, call 1-800-835-5092 if you’re a plan sponsor or participant with Fidelity as your recordkeeper or call 1-877-208-0098 on institutional accounts or if you’re an advisor or invest through one.
Each fund’s Statement of Additional Information (SAI) includes more information about the Trustees. To request a free copy, call Fidelity at 1-800-544-8544.
Experience, Skills, Attributes, and Qualifications of the Trustees. The Governance and Nominating Committee has adopted a statement of policy that describes the experience, qualifications, attributes, and skills that are necessary and desirable for potential Independent Trustee candidates (Statement of Policy). The Board believes that each Trustee satisfied at the time he or she was initially elected or appointed a Trustee, and continues to satisfy, the standards contemplated by the Statement of Policy. The Governance and Nominating Committee also engages professional search firms to help identify potential Independent Trustee candidates who have the experience, qualifications, attributes, and skills consistent with the Statement of Policy. From time to time, additional criteria based on the composition and skills of the current Independent Trustees, as well as experience or skills that may be appropriate in light of future changes to board composition, business conditions, and regulatory or other developments, have also been considered by the professional search firms and the Governance and Nominating Committee. In addition, the Board takes into account the Trustees' commitment and participation in Board and committee meetings, as well as their leadership of standing and ad hoc committees throughout their tenure.
In determining that a particular Trustee was and continues to be qualified to serve as a Trustee, the Board has considered a variety of criteria, none of which, in isolation, was controlling. The Board believes that, collectively, the Trustees have balanced and diverse experience, qualifications, attributes, and skills, which allow the Board to operate effectively in governing each fund and protecting the interests of shareholders. Information about the specific experience, skills, attributes, and qualifications of each Trustee, which in each case led to the Board's conclusion that the Trustee should serve (or continue to serve) as a trustee of the funds, is provided below.
Board Structure and Oversight Function. Robert A. Lawrence is an interested person and currently serves as Chair. The Trustees have determined that an interested Chair is appropriate and benefits shareholders because an interested Chair has a personal and professional stake in the quality and continuity of services provided to the funds. Independent Trustees exercise their informed business judgment to appoint an individual of their choosing to serve as Chair, regardless of whether the Trustee happens to be independent or a member of management. The Independent Trustees have determined that they can act independently and effectively without having an Independent Trustee serve as Chair and that a key structural component for assuring that they are in a position to do so is for the Independent Trustees to constitute a substantial majority for the Board. The Independent Trustees also regularly meet in executive session. David M. Thomas serves as Lead Independent Trustee and as such (i) acts as a liaison between the Independent Trustees and management with respect to matters important to the Independent Trustees and (ii) with management prepares agendas for Board meetings.
Fidelity® funds are overseen by different Boards of Trustees. The funds' Board oversees Fidelity's high income and certain equity funds, and other Boards oversee Fidelity's investment-grade bond, money market, asset allocation, and other equity funds. The asset allocation funds may invest in Fidelity® funds overseen by the funds' Board. The use of separate Boards, each with its own committee structure, allows the Trustees of each group of Fidelity® funds to focus on the unique issues of the funds they oversee, including common research, investment, and operational issues. On occasion, the separate Boards establish joint committees to address issues of overlapping consequences for the Fidelity® funds overseen by each Board.
The Trustees operate using a system of committees to facilitate the timely and efficient consideration of all matters of importance to the Trustees, each fund, and fund shareholders and to facilitate compliance with legal and regulatory requirements and oversight of the funds' activities and associated risks. The Board, acting through its committees, has charged FMR and its affiliates with (i) identifying events or circumstances the occurrence of which could have demonstrably adverse effects on the funds' business and/or reputation; (ii) implementing processes and controls to lessen the possibility that such events or circumstances occur or to mitigate the effects of such events or circumstances if they do occur; and (iii) creating and maintaining a system designed to evaluate continuously business and market conditions in order to facilitate the identification and implementation processes described in (i) and (ii) above. Because the day-to-day operations and activities of the funds are carried out by or through FMR, its affiliates, and other service providers, the funds' exposure to risks is mitigated but not eliminated by the processes overseen by the Trustees. While each of the Board's committees has responsibility for overseeing different aspects of the funds' activities, oversight is exercised primarily through the Operations, Audit, and Compliance Committees. Appropriate personnel, including but not limited to the funds' Chief Compliance Officer (CCO), FMR's internal auditor, the independent accountants, the funds' Treasurer and portfolio management personnel, make periodic reports to the Board's committees, as appropriate, including an annual review of Fidelity's risk management program for the Fidelity® funds. The responsibilities of each standing committee, including their oversight responsibilities, are described further under "Standing Committees of the Trustees."
Interested Trustees*:
Correspondence intended for a Trustee who is an interested person may be sent to Fidelity Investments, 245 Summer Street, Boston, Massachusetts 02210.
Name, Year of Birth; Principal Occupations and Other Relevant Experience+
Bettina Doulton (1964)
Year of Election or Appointment: 2020
Trustee
Ms. Doulton also serves as Trustee of other Fidelity® funds. Prior to her retirement, Ms. Doulton served in a variety of positions at Fidelity Investments, including as a managing director of research (2006-2007), portfolio manager to certain Fidelity® funds (1993-2005), equity analyst and portfolio assistant (1990-1993), and research assistant (1987-1990). Ms. Doulton currently owns and operates Phi Builders + Architects and Cellardoor Winery. Previously, Ms. Doulton served as a member of the Board of Brown Capital Management, LLC (2014-2018).
Robert A. Lawrence (1952)
Year of Election or Appointment: 2020
Trustee
Chair of the Board of Trustees
Mr. Lawrence also serves as Trustee of other funds. Previously, Mr. Lawrence served as a Trustee and Member of the Advisory Board of certain funds. Prior to his retirement in 2008, Mr. Lawrence served as Vice President of certain Fidelity® funds (2006-2008), Senior Vice President, Head of High Income Division of Fidelity Management & Research Company (investment adviser firm, 2006-2008), and President of Fidelity Strategic Investments (investment adviser firm, 2002-2005).
* Determined to be an “Interested Trustee” by virtue of, among other things, his or her affiliation with the trust or various entities under common control with FMR.
+ The information includes the Trustee's principal occupation during the last five years and other information relating to the experience, attributes, and skills relevant to the Trustee's qualifications to serve as a Trustee, which led to the conclusion that the Trustee should serve as a Trustee for each fund.
Independent Trustees:
Correspondence intended for an Independent Trustee may be sent to Fidelity Investments, P.O. Box 55235, Boston, Massachusetts 02205-5235.
Name, Year of Birth; Principal Occupations and Other Relevant Experience+
Thomas P. Bostick (1956)
Year of Election or Appointment: 2021
Trustee
Lieutenant General Bostick also serves as Trustee of other Fidelity® funds. Prior to his retirement, General Bostick (United States Army, Retired) held a variety of positions within the U.S. Army, including Commanding General and Chief of Engineers, U.S. Army Corps of Engineers (2012-2016) and Deputy Chief of Staff and Director of Human Resources, U.S. Army (2009-2012). General Bostick currently serves as a member of the Board and Finance and Governance Committees of CSX Corporation (transportation, 2020-present) and a member of the Board and Corporate Governance and Nominating Committee of Perma-Fix Environmental Services, Inc. (nuclear waste management, 2020-present). General Bostick serves as Chief Executive Officer of Bostick Global Strategies, LLC (consulting, 2016-present) and as a member of the Board of HireVue, Inc. (video interview and assessment, 2020-present). Previously, General Bostick served as a Member of the Advisory Board of certain Fidelity® funds (2021), President, Intrexon Bioengineering (2018-2020) and Chief Operating Officer (2017-2020) and Senior Vice President of the Environment Sector (2016-2017) of Intrexon Corporation (biopharmaceutical company).
Dennis J. Dirks (1948)
Year of Election or Appointment: 2005
Trustee
Mr. Dirks also serves as Trustee of other Fidelity® funds. Prior to his retirement in May 2003, Mr. Dirks served as Chief Operating Officer and as a member of the Board of The Depository Trust & Clearing Corporation (financial markets infrastructure), President, Chief Operating Officer and a member of the Board of The Depository Trust Company (DTC), President and a member of the Board of the National Securities Clearing Corporation (NSCC), Chief Executive Officer and a member of the Board of the Government Securities Clearing Corporation and Chief Executive Officer and a member of the Board of the Mortgage-Backed Securities Clearing Corporation. Mr. Dirks currently serves as a member of the Finance Committee (2016-present) and Board (2017-present) and is Treasurer (2018-present) of the Asolo Repertory Theatre.
Donald F. Donahue (1950)
Year of Election or Appointment: 2018
Trustee
Mr. Donahue also serves as Trustee of other Fidelity® funds. Mr. Donahue serves as President and Chief Executive Officer of Miranda Partners, LLC (risk consulting for the financial services industry, 2012-present). Previously, Mr. Donahue served as Chief Executive Officer (2006-2012), Chief Operating Officer (2003-2006) and Managing Director, Customer Marketing and Development (1999-2003) of The Depository Trust & Clearing Corporation (financial markets infrastructure). Mr. Donahue currently serves as a member (2007-present) and Co-Chairman (2016-present) of the Board of United Way of New York and a member of the Board of The Leadership Academy (previously NYC Leadership Academy) (2012-present). Mr. Donahue previously served as a member of the Advisory Board of certain Fidelity® funds (2015-2018).
Vicki L. Fuller (1957)
Year of Election or Appointment: 2020
Trustee
Ms. Fuller also serves as Trustee of other Fidelity® funds. Previously, Ms. Fuller served as a member of the Advisory Board of certain Fidelity® funds (2018-2020), Chief Investment Officer of the New York State Common Retirement Fund (2012-2018) and held a variety of positions at AllianceBernstein L.P. (global asset management, 1985-2012), including Managing Director (2006-2012) and Senior Vice President and Senior Portfolio Manager (2001-2006). Ms. Fuller currently serves as a member of the Board, Audit Committee and Nominating and Governance Committee of two Blackstone business development companies (2020-present), as a member of the Board of Treliant, LLC (consulting, 2019-present), as a member of the Advisory Board of Ariel Alternatives, LLC (private equity, 2021-present) and as a member of the Board and Chair of the Audit Committee of Gusto, Inc. (software, 2021-present). In addition, Ms. Fuller currently serves as a member of the Board of Roosevelt University (2019-present) and as a member of the Executive Board of New York University’s Stern School of Business. Ms. Fuller previously served as a member of the Board, Audit Committee and Nominating and Governance Committee of The Williams Companies, Inc. (natural gas infrastructure, 2018-2021).
Patricia L. Kampling (1959)
Year of Election or Appointment: 2020
Trustee
Ms. Kampling also serves as Trustee of other Fidelity® funds. Prior to her retirement, Ms. Kampling served as Chairman of the Board and Chief Executive Officer (2012-2019), President and Chief Operating Officer (2011-2012) and Executive Vice President and Chief Financial Officer (2010-2011) of Alliant Energy Corporation. Ms. Kampling currently serves as a member of the Board, Finance Committee and Governance, Compensation and Nominating Committee of Xcel Energy Inc. (utilities company, 2020-present) and as a member of the Board, Audit, Finance and Risk Committee and Safety, Environmental, Technology and Operations Committee and Chair of the Executive Development and Compensation Committee of American Water Works Company, Inc. (utilities company, 2019-present). In addition, Ms. Kampling currently serves as a member of the Board of the Nature Conservancy, Wisconsin Chapter (2019-present). Previously, Ms. Kampling served as a Member of the Advisory Board of certain Fidelity® funds (2020), a member of the Board, Compensation Committee and Executive Committee and Chair of the Audit Committee of Briggs & Stratton Corporation (manufacturing, 2011-2021), a member of the Board of Interstate Power and Light Company (2012-2019) and Wisconsin Power and Light Company (2012-2019) (each a subsidiary of Alliant Energy Corporation) and as a member of the Board and Workforce Development Committee of the Business Roundtable (2018-2019).
Thomas A. Kennedy (1955)
Year of Election or Appointment: 2021
Trustee
Mr. Kennedy also serves as Trustee of other Fidelity® funds. Previously, Mr. Kennedy served as a Member of the Advisory Board of certain Fidelity® funds (2020) and held a variety of positions at Raytheon Company (aerospace and defense, 1983-2020), including Chairman and Chief Executive Officer (2014-2020) and Executive Vice President and Chief Operating Officer (2013-2014). Mr. Kennedy currently serves as Executive Chairman of the Board of Directors of Raytheon Technologies Corporation (aerospace and defense, 2020-present). He is also a member of the Rutgers School of Engineering Industry Advisory Board (2011-present) and a member of the UCLA Engineering Dean’s Executive Board (2016-present).
Oscar Munoz (1959)
Year of Election or Appointment: 2021
Trustee
Mr. Munoz also serves as Trustee of other Fidelity® funds. Prior to his retirement, Mr. Munoz served as Executive Chairman (2020-2021), Chief Executive Officer (2015-2020), President (2015-2016) and a member of the Board (2010-2021) of United Airlines Holdings, Inc. Mr. Munoz currently serves as a member of the Board of CBRE Group, Inc. (commercial real estate, 2020-present), a member of the Board of Univision Communications, Inc. (Hispanic media, 2020-present) and a member of the Advisory Board of Salesforce.com, Inc. (cloud-based software, 2020-present). Previously, Mr. Munoz served as a Member of the Advisory Board of certain Fidelity® funds (2021).
Garnett A. Smith (1947)
Year of Election or Appointment: 2018
Trustee
Mr. Smith also serves as Trustee of other Fidelity® funds. Prior to his retirement, Mr. Smith served as Chairman and Chief Executive Officer (1990-1997) and President (1986-1990) of Inbrand Corp. (manufacturer of personal absorbent products). Prior to his employment with Inbrand Corp., he was employed by a retail fabric chain and North Carolina National Bank (now Bank of America). Mr. Smith previously served as a member of the Advisory Board of certain Fidelity® funds (2012-2013).
David M. Thomas (1949)
Year of Election or Appointment: 2008
Trustee
Lead Independent Trustee
Mr. Thomas also serves as Trustee of other Fidelity® funds. Previously, Mr. Thomas served as Executive Chairman (2005-2006) and Chairman and Chief Executive Officer (2000-2005) of IMS Health, Inc. (pharmaceutical and healthcare information solutions). Mr. Thomas currently serves as a member of the Board of Fortune Brands Home and Security (home and security products, 2004-present) and as Director (2013-present) and Non-Executive Chairman of the Board (2022-present) of Interpublic Group of Companies, Inc. (marketing communication).
Susan Tomasky (1953)
Year of Election or Appointment: 2020
Trustee
Ms. Tomasky also serves as Trustee of other Fidelity® funds. Prior to her retirement, Ms. Tomasky served in various executive officer positions at American Electric Power Company, Inc. (1998-2011), including most recently as President of AEP Transmission (2007-2011). Ms. Tomasky currently serves as a member of the Board and Sustainability Committee and as Chair of the Audit Committee of Marathon Petroleum Corporation (2018-present) and as a member of the Board, Executive Committee, Corporate Governance Committee and Organization and Compensation Committee and as Chair of the Audit Committee of Public Service Enterprise Group, Inc. (utilities company, 2012-present) and as a member of the Board of its subsidiary company, Public Service Electric and Gas Co. (2021-present). In addition, Ms. Tomasky currently serves as a member (2009-present) and President (2020-present) of the Board of the Royal Shakespeare Company – America (2009-present), as a member of the Board of the Columbus Association for the Performing Arts (2011-present) and as a member of the Board and Kenyon in the World Committee of Kenyon College (2016-present). Previously, Ms. Tomasky served as a Member of the Advisory Board of certain Fidelity® funds (2020), as a member of the Board of the Columbus Regional Airport Authority (2007-2020), as a member of the Board (2011-2018) and Lead Independent Director (2015-2018) of Andeavor Corporation (previously Tesoro Corporation) (independent oil refiner and marketer) and as a member of the Board of Summit Midstream Partners LP (energy, 2012-2018).
Michael E. Wiley (1950)
Year of Election or Appointment: 2018
Trustee
Mr. Wiley also serves as Trustee of other Fidelity® funds. Previously, Mr. Wiley served as a member of the Advisory Board of certain Fidelity® funds (2018-2020), Chairman, President and CEO of Baker Hughes, Inc. (oilfield services, 2000-2004). Mr. Wiley also previously served as a member of the Board of Andeavor Corporation (independent oil refiner and marketer, 2005-2018), a member of the Board of Andeavor Logistics LP (natural resources logistics, 2015-2018) and a member of the Board of High Point Resources (exploration and production, 2005-2020).
+ The information includes the Trustee's principal occupation during the last five years and other information relating to the experience, attributes, and skills relevant to the Trustee's qualifications to serve as a Trustee, which led to the conclusion that the Trustee should serve as a Trustee for each fund.
Advisory Board Members and Officers:
Correspondence intended for a Member of the Advisory Board (if any) may be sent to Fidelity Investments, P.O. Box 55235, Boston, Massachusetts 02205-5235. Correspondence intended for an officer or Peter S. Lynch may be sent to Fidelity Investments, 245 Summer Street, Boston, Massachusetts 02210. Officers appear below in alphabetical order.
Name, Year of Birth; Principal Occupation
Peter S. Lynch (1944)
Year of Election or Appointment: 2003
Member of the Advisory Board
Mr. Lynch also serves as a Member of the Advisory Board of other Fidelity® funds. Mr. Lynch is Vice Chairman and a Director of Fidelity Management & Research Company LLC (investment adviser firm). In addition, Mr. Lynch serves as a Trustee of Boston College and as the Chairman of the Inner-City Scholarship Fund. Previously, Mr. Lynch served as Vice Chairman and a Director of FMR Co., Inc. (investment adviser firm) and on the Special Olympics International Board of Directors (1997-2006).
Craig S. Brown (1977)
Year of Election or Appointment: 2019
Assistant Treasurer
Mr. Brown also serves as an officer of other funds. Mr. Brown serves as Assistant Treasurer of FIMM, LLC (2021-present) and is an employee of Fidelity Investments (2013-present).
John J. Burke III (1964)
Year of Election or Appointment: 2018
Chief Financial Officer
Mr. Burke also serves as Chief Financial Officer of other funds. Mr. Burke serves as Head of Investment Operations for Fidelity Fund and Investment Operations (2018-present) and is an employee of Fidelity Investments (1998-present). Previously Mr. Burke served as head of Asset Management Investment Operations (2012-2018).
William C. Coffey (1969)
Year of Election or Appointment: 2019
Assistant Secretary
Mr. Coffey also serves as Assistant Secretary of other funds. He is Senior Vice President and Deputy General Counsel of FMR LLC (diversified financial services company, 2010-present), and is an employee of Fidelity Investments. Previously, Mr. Coffey served as Secretary and CLO of certain funds (2018-2019); CLO, Secretary, and Senior Vice President of Fidelity Management & Research Company and FMR Co., Inc. (investment adviser firms, 2018-2019); Secretary of Fidelity SelectCo, LLC and Fidelity Investments Money Management, Inc. (investment adviser firms, 2018-2019); CLO of Fidelity Management & Research (Hong Kong) Limited, FMR Investment Management (UK) Limited, and Fidelity Management & Research (Japan) Limited (investment adviser firms, 2018-2019); and Assistant Secretary of certain funds (2009-2018).
Timothy M. Cohen (1969)
Year of Election or Appointment: 2018
Vice President
Mr. Cohen also serves as Vice President of other funds. Mr. Cohen serves as Co-Head of Equity (2018-present), a Director of Fidelity Management & Research (Japan) Limited (investment adviser firm, 2016-present), and is an employee of Fidelity Investments. Previously, Mr. Cohen served as Executive Vice President of Fidelity SelectCo, LLC (2019), Head of Global Equity Research (2016-2018), Chief Investment Officer - Equity and a Director of Fidelity Management & Research (U.K.) Inc. (investment adviser firm, 2013-2015) and as a Director of Fidelity Management & Research (Hong Kong) Limited (investment adviser firm, 2017).
Jonathan Davis (1968)
Year of Election or Appointment: 2010
Assistant Treasurer
Mr. Davis also serves as an officer of other funds. Mr. Davis serves as Assistant Treasurer of FIMM, LLC (2021-present), FMR Capital, Inc. (2017-present), FD Funds GP LLC (2021-present), FD Funds Holding LLC (2021-present), and FD Funds Management LLC (2021-present); and is an employee of Fidelity Investments. Previously, Mr. Davis served as Vice President and Associate General Counsel of FMR LLC (diversified financial services company, 2003-2010).
Laura M. Del Prato (1964)
Year of Election or Appointment: 2018
Assistant Treasurer
Ms. Del Prato also serves as an officer of other funds. Ms. Del Prato serves as Assistant Treasurer of FIMM, LLC (2021-present) and is an employee of Fidelity Investments (2017-present). Previously, Ms. Del Prato served as President and Treasurer of The North Carolina Capital Management Trust: Cash Portfolio and Term Portfolio (2018-2020). Prior to joining Fidelity Investments, Ms. Del Prato served as a Managing Director and Treasurer of the JPMorgan Mutual Funds (2014-2017). Prior to JPMorgan, Ms. Del Prato served as a partner at Cohen Fund Audit Services (accounting firm, 2012-2013) and KPMG LLP (accounting firm, 2004-2012).
Colm A. Hogan (1973)
Year of Election or Appointment: 2020
Assistant Treasurer
Mr. Hogan also serves as an officer of other funds. Mr. Hogan serves as Assistant Treasurer of FIMM, LLC (2021-present) and FMR Capital, Inc. (2017-present) and is an employee of Fidelity Investments (2005-present). Previously, Mr. Hogan served as Deputy Treasurer of certain Fidelity® funds (2016-2020) and Assistant Treasurer of certain Fidelity® funds (2016-2018).
Pamela R. Holding (1964)
Year of Election or Appointment: 2018
Vice President
Ms. Holding also serves as Vice President of other funds. Ms. Holding serves as Co-Head of Equity (2018-present) and is an employee of Fidelity Investments (2013-present). Previously, Ms. Holding served as Executive Vice President of Fidelity SelectCo, LLC (2019) and as Chief Investment Officer of Fidelity Institutional Asset Management (2013-2018).
Cynthia Lo Bessette (1969)
Year of Election or Appointment: 2019
Secretary and Chief Legal Officer (CLO)
Ms. Lo Bessette also serves as an officer of other funds. Ms. Lo Bessette serves as CLO, Secretary, and Senior Vice President of Fidelity Management & Research Company LLC (investment adviser firm, 2019-present); CLO of Fidelity Management & Research (Hong Kong) Limited, FMR Investment Management (UK) Limited, and Fidelity Management & Research (Japan) Limited (investment adviser firms, 2019-present); Secretary of FD Funds GP LLC (2021-present), FD Funds Holding LLC (2021-present), and FD Funds Management LLC (2021-present); and Assistant Secretary of FIMM, LLC (2019-present). She is a Senior Vice President and Deputy General Counsel of FMR LLC (diversified financial services company, 2019-present), and is an employee of Fidelity Investments. Previously, Ms. Lo Bessette served as CLO, Secretary, and Senior Vice President of FMR Co., Inc. (investment adviser firm, 2019); Secretary of Fidelity SelectCo, LLC and Fidelity Investments Money Management, Inc. (investment adviser firms, 2019). Prior to joining Fidelity Investments, Ms. Lo Bessette was Executive Vice President, General Counsel (2016-2019) and Senior Vice President, Deputy General Counsel (2015-2016) of OppenheimerFunds (investment management company) and Deputy Chief Legal Officer (2013-2015) of Jennison Associates LLC (investment adviser firm).
Chris Maher (1972)
Year of Election or Appointment: 2020
Deputy Treasurer
Mr. Maher also serves as an officer of other funds. Mr. Maher serves as Assistant Treasurer of FIMM, LLC (2021-present) and FMR Capital, Inc. (2017-present), and is an employee of Fidelity Investments (2008-present). Previously, Mr. Maher served as Assistant Treasurer of certain funds (2013-2020); Vice President of Asset Management Compliance (2013), Vice President of the Program Management Group of FMR (investment adviser firm, 2010-2013), and Vice President of Valuation Oversight (2008-2010).
Jason P. Pogorelec (1975)
Year of Election or Appointment: 2020
Chief Compliance Officer
Mr. Pogorelec also serves as Chief Compliance Officer of other funds. Mr. Pogorelec is a senior Vice President of Asset Management Compliance for Fidelity Investments and is an employee of Fidelity Investments (2006-present). Previously, Mr. Pogorelec served as Vice President, Associate General Counsel for Fidelity Investments (2010-2020) and Assistant Secretary of certain Fidelity funds (2015-2020).
Brett Segaloff (1972)
Year of Election or Appointment: 2021
Anti-Money Laundering (AML) Officer
Mr. Segaloff also serves as an AML Officer of other funds and other related entities. He is Director, Anti-Money Laundering (2007-present) of FMR LLC (diversified financial services company) and is an employee of Fidelity Investments (1996-present).
Stacie M. Smith (1974)
Year of Election or Appointment: 2016
President and Treasurer
Ms. Smith also serves as an officer of other funds. Ms. Smith serves as Assistant Treasurer of FIMM, LLC (2021-present) and FMR Capital, Inc. (2017-present), is an employee of Fidelity Investments (2009-present), and has served in other fund officer roles. Prior to joining Fidelity Investments, Ms. Smith served as Senior Audit Manager of Ernst & Young LLP (accounting firm, 1996-2009). Previously, Ms. Smith served as Assistant Treasurer (2013-2019) and Deputy Treasurer (2013-2016) of certain Fidelity® funds.
Jim Wegmann (1979)
Year of Election or Appointment: 2019
Assistant Treasurer
Mr. Wegmann also serves as an officer of other funds. Mr. Wegmann serves as Assistant Treasurer of FIMM, LLC (2021-present) and is an employee of Fidelity Investments (2011-present). Previously, Mr. Wegmann served as Assistant Treasurer of certain Fidelity® funds (2019-2021).
Shareholder Expense Example
As a shareholder, you incur two types of costs: (1) transaction costs, which may include sales charges (loads) on purchase payments or redemption proceeds, as applicable and (2) ongoing costs, which generally include management fees, distribution and/or service (12b-1) fees and other Fund expenses. This Example is intended to help you understand your ongoing costs (in dollars) of investing in a fund and to compare these costs with the ongoing costs of investing in other mutual funds.
The Example is based on an investment of $1,000 invested at the beginning of the period and held for the entire period (December 1, 2021 to May 31, 2022).
Actual Expenses
The first line of the accompanying table provides information about actual account values and actual expenses. You may use the information in this line, together with the amount you invested, to estimate the expenses that you paid over the period. Simply divide your account value by $1,000.00 (for example, an $8,600 account value divided by $1,000.00 = 8.6), then multiply the result by the number in the first line for a class/Fund under the heading entitled "Expenses Paid During Period" to estimate the expenses you paid on your account during this period. If any fund is a shareholder of any underlying mutual funds or exchange-traded funds (ETFs) (the Underlying Funds), such fund indirectly bears its proportional share of the expenses of the Underlying Funds in addition to the direct expenses incurred presented in the table. These fees and expenses are not included in the annualized expense ratio used to calculate the expense estimate in the table below.
Hypothetical Example for Comparison Purposes
The second line of the accompanying table provides information about hypothetical account values and hypothetical expenses based on the actual expense ratio and an assumed rate of return of 5% per year before expenses, which is not the actual return. The hypothetical account values and expenses may not be used to estimate the actual ending account balance or expenses you paid for the period. You may use this information to compare the ongoing costs of investing in the Fund and other funds. To do so, compare this 5% hypothetical example with the 5% hypothetical examples that appear in the shareholder reports of the other funds. If any fund is a shareholder of any Underlying Funds, such fund indirectly bears its proportional share of the expenses of the Underlying Funds in addition to the direct expenses as presented in the table. These fees and expenses are not included in the annualized expense ratio used to calculate the expense estimate in the table below.
| | Annualized Expense Ratio-A | Beginning
Account Value
December 1, 2021 | Ending
Account Value
May 31, 2022 | Expenses Paid
During Period-B
December 1, 2021
to May 31, 2022 |
| Fidelity Disruptive Automation Fund | | | | |
| Fidelity Disruptive Automation Fund | 1.00% | | | |
| Actual | | $1,000.00 | $763.80 | $4.40 |
| Hypothetical-C | | $1,000.00 | $1,019.95 | $5.04 |
| Loyalty Class 1 | .75% | | | |
| Actual | | $1,000.00 | $764.80 | $3.30 |
| Hypothetical-C | | $1,000.00 | $1,021.19 | $3.78 |
| Loyalty Class 2 | .50% | | | |
| Actual | | $1,000.00 | $765.80 | $2.20 |
| Hypothetical-C | | $1,000.00 | $1,022.44 | $2.52 |
| Class F | - % | | | |
| Actual | | $1,000.00 | $767.70 | $- |
| Hypothetical-C | | $1,000.00 | $1,024.93 | $- |
| Fidelity Disruptive Communications Fund | | | | |
| Fidelity Disruptive Communications Fund | 1.00% | | | |
| Actual | | $1,000.00 | $714.80 | $4.28 |
| Hypothetical-C | | $1,000.00 | $1,019.95 | $5.04 |
| Loyalty Class 1 | .75% | | | |
| Actual | | $1,000.00 | $716.10 | $3.21 |
| Hypothetical-C | | $1,000.00 | $1,021.19 | $3.78 |
| Loyalty Class 2 | .50% | | | |
| Actual | | $1,000.00 | $716.90 | $2.14 |
| Hypothetical-C | | $1,000.00 | $1,022.44 | $2.52 |
| Class F | - % | | | |
| Actual | | $1,000.00 | $718.40 | $- |
| Hypothetical-C | | $1,000.00 | $1,024.93 | $- |
| Fidelity Disruptive Finance Fund | | | | |
| Fidelity Disruptive Finance Fund | 1.00% | | | |
| Actual | | $1,000.00 | $842.20 | $4.59 |
| Hypothetical-C | | $1,000.00 | $1,019.95 | $5.04 |
| Loyalty Class 1 | .75% | | | |
| Actual | | $1,000.00 | $843.00 | $3.45 |
| Hypothetical-C | | $1,000.00 | $1,021.19 | $3.78 |
| Loyalty Class 2 | .50% | | | |
| Actual | | $1,000.00 | $844.40 | $2.30 |
| Hypothetical-C | | $1,000.00 | $1,022.44 | $2.52 |
| Class F | - % | | | |
| Actual | | $1,000.00 | $846.30 | $- |
| Hypothetical-C | | $1,000.00 | $1,024.93 | $- |
| Fidelity Disruptive Medicine Fund | | | | |
| Fidelity Disruptive Medicine Fund | 1.00% | | | |
| Actual | | $1,000.00 | $742.70 | $4.34 |
| Hypothetical-C | | $1,000.00 | $1,019.95 | $5.04 |
| Loyalty Class 1 | .75% | | | |
| Actual | | $1,000.00 | $743.70 | $3.26 |
| Hypothetical-C | | $1,000.00 | $1,021.19 | $3.78 |
| Loyalty Class 2 | .50% | | | |
| Actual | | $1,000.00 | $744.10 | $2.17 |
| Hypothetical-C | | $1,000.00 | $1,022.44 | $2.52 |
| Class F | - % | | | |
| Actual | | $1,000.00 | $746.30 | $- |
| Hypothetical-C | | $1,000.00 | $1,024.93 | $- |
| Fidelity Disruptive Technology Fund | | | | |
| Fidelity Disruptive Technology Fund | 1.00% | | | |
| Actual | | $1,000.00 | $585.80 | $3.95 |
| Hypothetical-C | | $1,000.00 | $1,019.95 | $5.04 |
| Loyalty Class 1 | .75% | | | |
| Actual | | $1,000.00 | $586.50 | $2.97 |
| Hypothetical-C | | $1,000.00 | $1,021.19 | $3.78 |
| Loyalty Class 2 | .50% | | | |
| Actual | | $1,000.00 | $587.30 | $1.98 |
| Hypothetical-C | | $1,000.00 | $1,022.44 | $2.52 |
| Class F | - % | | | |
| Actual | | $1,000.00 | $588.70 | $- |
| Hypothetical-C | | $1,000.00 | $1,024.93 | $- |
A Annualized expense ratio reflects expenses net of applicable fee waivers.
B Expenses are equal to the annualized expense ratio, multiplied by the average account value over the period, multiplied by 182/ 365 (to reflect the one-half year period). The fees and expenses of any Underlying Funds are not included in each annualized expense ratio.
C 5% return per year before expenses
Distributions (Unaudited)
The dividend and capital gains distributions for the fund(s) are available on Fidelity.com or Institutional.Fidelity.com.
The funds hereby designate as capital gain dividend the amounts noted below for the taxable year ended May 31, 2022, or, if subsequently determined to be different, the net capital gain of such year.
| Fidelity Disruptive Automation Fund | $1,624,932 |
| Fidelity Disruptive Communications Fund | $694,264 |
| Fidelity Disruptive Finance Fund | $4,283,150 |
| Fidelity Disruptive Technology Fund | $2,484,801 |
|
The funds hereby designate the percentages noted below of the short-term capital gain dividends distributed during the fiscal year as qualifying to be taxed as short-term capital gain dividends for nonresident alien shareholders:
| | July, 2021 | December, 2021 |
| Fidelity Disruptive Automation Fund | 100% | 100% |
| Fidelity Disruptive Communications Fund | 100% | 99.77% |
| Fidelity Disruptive Finance Fund | 100% | 100% |
| Fidelity Disruptive Medicine Fund | 100% | – |
| Fidelity Disruptive Technology Fund | 100% | – |
|
A percentage of the dividends distributed during the fiscal year for the following funds qualify for the dividends–received deduction for corporate shareholders:
| | Fidelity Disruptive | Loyalty 1 | Loyalty 2 | Class F |
| Fidelity Disruptive Automation Fund | | | | |
| July 2021 | 7% | 5% | 6% | 5% |
| December 2021 | 100% | 21% | 22% | 13% |
| Fidelity Disruptive Communications Fund | | | | |
| July 2021 | 1% | 1% | 1% | 1% |
| December 2021 | 0% | 0% | 0% | 0% |
| Fidelity Disruptive Finance Fund | | | | |
| July 2021 | 100% | 72% | 100% | 69% |
| December 2021 | 47% | 31% | 32% | 26% |
| Fidelity Disruptive Medicine Fund | | | | |
| July 2021 | 5% | 4% | 4% | 4% |
| December 2021 | – | – | – | – |
| Fidelity Disruptive Technology Fund | | | | |
| July 2021 | 5% | 3% | 3% | 4% |
| December 2021 | – | – | – | – |
|
A percentage of the dividends distributed during the fiscal year for the following funds may be taken into account as a dividend for purposes of the maximum rate under section 1(h)(11) of the Internal Revenue Code.
| | Fidelity Disruptive | Loyalty 1 | Loyalty 2 | Class F |
| Fidelity Disruptive Automation Fund | | | | |
| July 2021 | 33% | 23% | 28% | 23% |
| December 2021 | 100% | 100% | 100% | 78% |
| Fidelity Disruptive Communications Fund | | | | |
| July 2021 | 2% | 2% | 2% | 2% |
| December 2021 | 2% | 1% | 1% | 1% |
| Fidelity Disruptive Finance Fund | | | | |
| July 2021 | 100% | 100% | 100% | 100% |
| December 2021 | 65% | 43% | 44% | 36% |
| Fidelity Disruptive Medicine Fund | | | | |
| July 2021 | 15% | 11% | 12% | 10% |
| December 2021 | – | – | – | – |
| Fidelity Disruptive Technology Fund | | | | |
| July 2021 | 12% | 8% | 8% | 9% |
| December 2021 | – | – | – | – |
|
A percentage of the dividends distributed during the fiscal year for the following funds qualify as a section 199A dividend:
| | Fidelity Disruptive | Loyalty 1 | Loyalty 2 | Class F |
| Fidelity Disruptive Automation Fund | | | | |
| July 2021 | 0% | 0% | 0% | 0% |
| December 2021 | 0% | 0% | 0% | 0% |
| Fidelity Disruptive Communications Fund | | | | |
| July 2021 | 1% | 1% | 1% | 1% |
| December 2021 | 6% | 4% | 4% | 3% |
| Fidelity Disruptive Finance Fund | | | | |
| July 2021 | 0% | 0% | 0% | 0% |
| December 2021 | 3% | 2% | 2% | 2% |
| Fidelity Disruptive Medicine Fund | | | | |
| July 2021 | 0% | 0% | 0% | 0% |
| December 2021 | – | – | – | – |
| Fidelity Disruptive Technology Fund | | | | |
| July 2021 | 0% | 0% | 0% | 0% |
| December 2021 | – | – | – | – |
|
The amounts per share which represent income derived from sources within, and taxes paid to, foreign countries or possessions of the United States are as follows:
| | Pay Date | Income | Taxes |
| Fidelity Disruptive Automation Fund | | | |
| Fidelity Disruptive | 07/12/21 | $0.0667 | $0.0100 |
| Loyalty 1 | 07/12/21 | $0.0941 | $0.0100 |
| Loyalty 2 | 07/12/21 | $0.0823 | $0.0100 |
| Class F | 07/12/21 | $0.0952 | $0.0100 |
| Fidelity Disruptive | 12/13/21 | $0.0000 | $0.0000 |
| Loyalty 1 | 12/13/21 | $0.0000 | $0.0000 |
| Loyalty 2 | 12/13/21 | $0.0000 | $0.0000 |
| Class F | 12/13/21 | $0.0000 | $0.0000 |
|
The funds will notify shareholders in January 2023 of amounts for use in preparing 2022 income tax returns.
Board Approval of Investment Advisory Contracts and Management Fees
Fidelity Disruptive Automation Fund
Fidelity Disruptive Communications FundFidelity Disruptive Finance FundFidelity Disruptive Medicine FundFidelity Disruptive Technology FundEach year, the Board of Trustees, including the Independent Trustees (together, the Board), votes on the renewal of the management contract with Fidelity Management & Research Company LLC (FMR) and the sub-advisory agreements (together, the Advisory Contracts) for each fund. FMR and the sub-advisers are referred to herein as the Investment Advisers. The Board, assisted by the advice of fund counsel and Independent Trustees' counsel, requests and considers a broad range of information relevant to the renewal of the Advisory Contracts throughout the year.
The Board meets regularly and, at each of its meetings, covers an extensive agenda of topics and materials and considers factors that are relevant to its annual consideration of the renewal of each fund's Advisory Contracts, including the services and support provided to each fund and its shareholders. The Board has established various standing committees (Committees), each composed of and chaired by Independent Trustees with varying backgrounds, to which the Board has assigned specific subject matter responsibilities in order to enhance effective decision-making by the Board. The Board, acting directly and through its Committees, requests and receives information concerning the annual consideration of the renewal of each fund's Advisory Contracts. The Board also meets as needed to review matters specifically related to the Board's annual consideration of the renewal of the Advisory Contracts. Members of the Board may also meet with trustees of other Fidelity funds through joint ad hoc committees to discuss certain matters relevant to all of the Fidelity funds.
At its May 2022 meeting, the Board unanimously determined to renew each fund's Advisory Contracts. In reaching its determination, the Board considered all factors it believed relevant, including (i) the nature, extent, and quality of the services provided to each fund and its shareholders (including the investment performance of each fund); (ii) the competitiveness relative to peer funds of each fund's management fee and the total expense ratio of a representative class (retail class) of each fund; (iii) the total costs of the services provided by and the profits realized by Fidelity from its relationships with each fund; and (iv) the extent to which, if any, economies of scale exist and are realized as each fund grows, and whether any economies of scale are appropriately shared with fund shareholders.
In considering whether to renew the Advisory Contracts for each fund, the Board reached a determination, with the assistance of fund counsel and Independent Trustees' counsel and through the exercise of its business judgment, that the renewal of the Advisory Contracts was in the best interests of each fund and its shareholders and that the compensation payable under the Advisory Contracts was fair and reasonable. The Board's decision to renew the Advisory Contracts was not based on any single factor, but rather was based on a comprehensive consideration of all the information provided to the Board at its meetings throughout the year. The Board, in reaching its determination to renew the Advisory Contracts, was aware that shareholders of each fund have a broad range of investment choices available to them, including a wide choice among funds offered by Fidelity's competitors, and that each fund's shareholders, who have the opportunity to review and weigh the disclosure provided by the fund in its prospectus and other public disclosures, have chosen to invest in that fund, which is part of the Fidelity family of funds.
Nature, Extent, and Quality of Services Provided. The Board considered Fidelity's staffing as it relates to the funds, including the backgrounds of investment personnel of Fidelity, and also considered the funds' investment objectives, strategies, and related investment philosophies. The Independent Trustees also had discussions with senior management of Fidelity's investment operations and investment groups. The Board considered the structure of the investment personnel compensation program and whether this structure provides appropriate incentives to act in the best interests of each fund. Additionally, the Board considered the portfolio managers' investments, if any, in the funds that they manage. The Board also considered the steps Fidelity had taken to ensure the continued provision of high quality services to the Fidelity funds during the COVID-19 pandemic, including the expansion of staff in client facing positions to maintain service levels in periods of high volumes and volatility.
Resources Dedicated to Investment Management and Support Services. The Board and the Fund Oversight and Research Committees reviewed the general qualifications and capabilities of Fidelity's investment staff, including its size, education, experience, and resources, as well as Fidelity's approach to recruiting, training, managing, and compensating investment personnel. The Board noted the resources devoted to expansion of Fidelity's global investment organization, and that Fidelity's analysts have extensive resources, tools and capabilities that allow them to conduct sophisticated quantitative and fundamental analysis, as well as credit analysis of issuers, counterparties, and guarantors. Further, the Board considered that Fidelity's investment professionals have sufficient access to global information and data so as to provide competitive investment results over time, and that those professionals also have access to sophisticated tools that permit them to assess portfolio construction and risk and performance attribution characteristics continuously, as well as to transmit new information and research conclusions rapidly around the world. Additionally, in its deliberations, the Board considered Fidelity's trading, risk management, compliance, and technology and operations capabilities and resources, which are integral parts of the investment management process.
Shareholder and Administrative Services. The Board considered (i) the nature, extent, quality, and cost of advisory, administrative, and shareholder services performed by the Investment Advisers and their affiliates under the Advisory Contracts and under separate agreements covering transfer agency, pricing and bookkeeping, and securities lending services for each fund; (ii) the nature and extent of the supervision of third party service providers, principally custodians, subcustodians, and pricing vendors; and (iii) the resources devoted to, and the record of compliance with, each fund's compliance policies and procedures. The Board also reviewed the allocation of fund brokerage, including allocations to brokers affiliated with the Investment Advisers, the use of brokerage commissions to pay fund expenses, and the use of "soft" commission dollars to pay for research services.
The Board noted that the growth of fund assets over time across the complex allows Fidelity to reinvest in the development of services designed to enhance the value and convenience of the Fidelity funds as investment vehicles. These services include 24-hour access to account information and market information over the Internet and through telephone representatives, investor education materials and asset allocation tools. The Board also considered that it reviews customer service metrics such as telephone response times, continuity of services on the website and metrics addressing services at Fidelity Investor Centers.
Investment in a Large Fund Family. The Board considered the benefits to shareholders of investing in a Fidelity fund, including the benefits of investing in a fund that is part of a large family of funds offering a variety of investment disciplines and providing a large variety of mutual fund investor services. The Board noted that Fidelity had taken, or had made recommendations that resulted in the Fidelity funds taking, a number of actions over the previous year that benefited particular funds, including: (i) continuing to dedicate additional resources to Fidelity's investment research process, which includes meetings with management of issuers of securities in which the funds invest; (ii) continuing efforts to enhance Fidelity's global research capabilities; (iii) launching new funds and ETFs with innovative structures, strategies and pricing and making other enhancements to meet client needs; (iv) launching new share classes of existing funds; (v) eliminating purchase minimums and broadening eligibility requirements for certain funds and share classes; (vi) reducing management fees and total expenses for certain target date funds and classes and index funds; (vii) lowering expenses for certain existing funds and classes by implementing or lowering expense caps; (viii) rationalizing product lines and gaining increased efficiencies from fund mergers and liquidations; (ix) continuing to develop, acquire and implement systems and technology to improve services to the funds and shareholders, strengthen information security, and increase efficiency; and (x) continuing to implement enhancements to further strengthen Fidelity's product line to increase investors' probability of success in achieving their investment goals, including retirement income goals.
Investment Performance. The Board considered whether each fund has operated in accordance with its investment objective, as well as its record of compliance with its investment restrictions and its performance history. The Board noted that the Fidelity Disruptive Automation Fund, the Fidelity Disruptive Communications Fund, the Fidelity Disruptive Finance Fund, the Fidelity Disruptive Medicine Fund and the Fidelity Disruptive Technology Fund each had portfolio manager changes in July 2020 and November 2020. The Board will continue to closely monitor each fund's performance, taking into account the portfolio manager changes.
The Board took into account discussions that occur at Board meetings throughout the year with representatives of the Investment Advisers about fund investment performance. In this regard the Board noted that as part of regularly scheduled fund reviews and other reports to the Board on fund performance, the Board considers annualized return information for each fund for different time periods, measured against an appropriate securities market index (benchmark index). The Board also reviews and considers information about performance attribution. In its evaluation of fund investment performance, the Board gave particular attention to information indicating changes in performance of certain Fidelity funds for specific time periods and discussed with the Investment Advisers the reasons for any overperformance or underperformance.
In addition to reviewing absolute and relative fund performance, the Independent Trustees periodically consider the appropriateness of fund performance metrics in evaluating the results achieved. In general, the Independent Trustees believe that fund performance should be evaluated based on net performance (after fees and expenses) of the representative class, compared to appropriate benchmark indices, over appropriate time periods that may include full market cycles, taking into account relevant factors including the following: general market conditions; issuer-specific information; and fund cash flows and other factors.
The Independent Trustees recognize that shareholders evaluate performance on a net basis over their own holding periods, for which one-, three-, and five-year periods are often used as a proxy. For this reason, the performance information reviewed by the Board also included net total return information for each fund and an appropriate benchmark index for the most recent one-year period ended September 30, 2021, as shown below. Peer groups are not shown below because the funds do not generally utilize a peer group for performance comparison purposes.
Fidelity Disruptive Automation Fund

Fidelity Disruptive Communications Fund
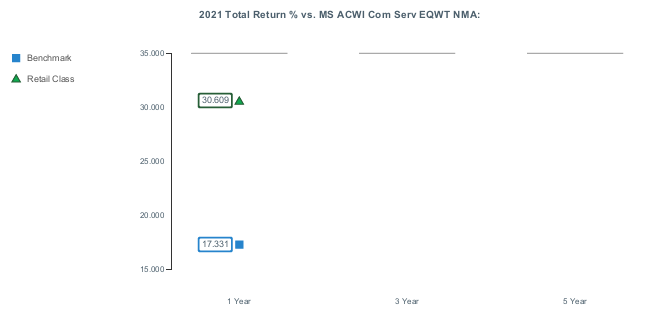
Fidelity Disruptive Finance Fund
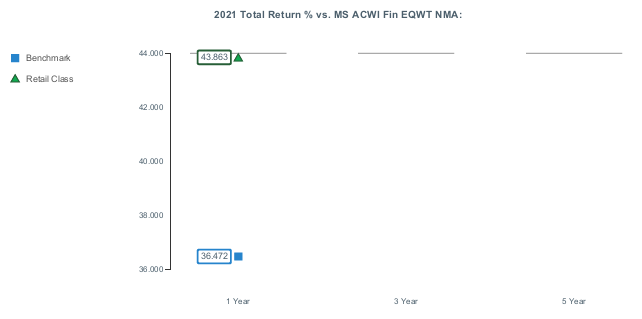
Fidelity Disruptive Medicine Fund
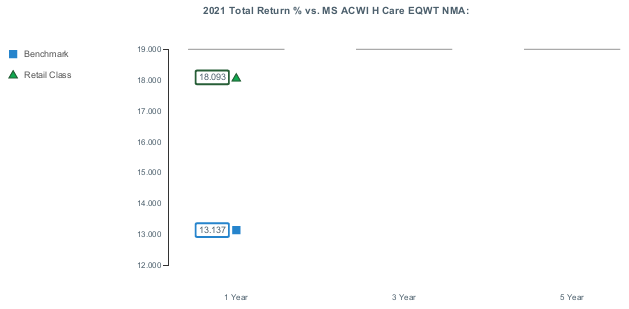
Fidelity Disruptive Technology Fund
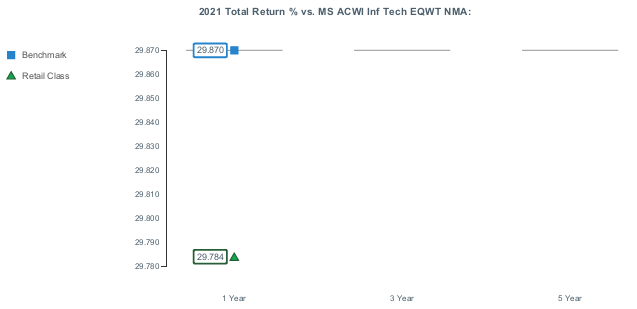
Based on its review, the Board concluded that the nature, extent, and quality of services provided to each fund under the Advisory Contracts should continue to benefit the shareholders of each fund.
Competitiveness of Management Fee and Total Expense Ratio. The Board considered each fund's management fee and total expense ratio compared to "mapped groups" of competitive funds and classes created for the purpose of facilitating the Trustees' competitive analysis of management fees and total expenses. Fidelity creates "mapped groups" by combining similar Lipper investment objective categories that have comparable investment mandates. For this purpose, all sector focused equity funds are grouped in the same mapped group. Combining Lipper investment objective categories aids the Board's management fee and total expense ratio comparisons by broadening the competitive group used for comparison.
Management Fee. The Board considered two proprietary management fee comparisons for the 12-month (or shorter) periods ended September 30 shown in basis points (BP) in the charts below. The group of Lipper funds used by the Board for management fee comparisons is referred to below as the "Total Mapped Group." The Total Mapped Group comparison focuses on a fund's standing in terms of gross management fees before expense reimbursements or caps relative to the total universe of funds with comparable investment mandates (
i.e., sector equities), regardless of whether their management fee structures also are comparable. Funds with comparable management fee structures have similar management fee contractual arrangements (
e.g., flat rate charged for advisory services, all-inclusive fee rate,
etc.). "TMG %" represents the percentage of funds in the Total Mapped Group that had management fees that were lower than a fund's. For example, a hypothetical TMG % of 20% would mean that 80% of the funds in the Total Mapped Group had higher, and 20% had lower, management fees than a fund. The funds' actual TMG %s and the number of funds in the Total Mapped Group are in the charts below. The "Asset-Sized Peer Group" (ASPG) comparison focuses on a fund's standing relative to a subset of non-Fidelity funds within the Total Mapped Group that are similar in size and management fee structure. For example, if a fund is in the first quartile of the ASPG, the fund's management fee ranks in the least expensive or lowest 25% of funds in the ASPG. The ASPG represents at least 15% of the funds in the Total Mapped Group with comparable asset size and management fee structures, subject to a minimum of 50 funds (or all funds in the Total Mapped Group if fewer than 50). Additional information, such as the ASPG quartile in which a fund's management fee rate ranked, is also included in the charts and was considered by the Board.
Fidelity Disruptive Automation Fund
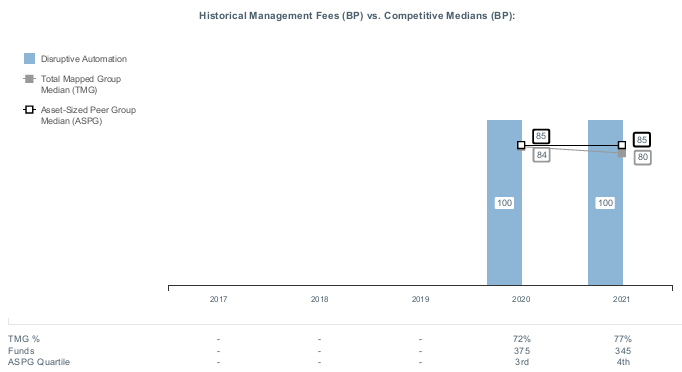
Fidelity Disruptive Communications Fund
Fidelity Disruptive Finance Fund

Fidelity Disruptive Medicine Fund
Fidelity Disruptive Technology Fund
The Board noted that each fund's management fee rate ranked above the median of its Total Mapped Group and above the median of its ASPG for the period ended September 30, 2021. The Board considered that each fund has a unitary fee that covers expenses beyond portfolio management, whereas the majority of funds within each fund's Total Mapped Group and ASPG do not have management fees that cover services and fees beyond portfolio management.
The Board also considered that, for funds subject to the group fee, FMR agreed to voluntarily waive fees over a specified period of time in amounts designed to account for assets converted from certain funds to certain collective investment trusts.
Based on its review, the Board concluded that each fund's management fee is fair and reasonable in light of the services that the fund receives and the other factors considered.
Total Expense Ratio. In its review of the total expense ratio of the representative class (the retail class) of each fund, the Board considered the fund's unitary fee rate as well as other fund or class expenses, as applicable, such as transfer agent fees, pricing and bookkeeping fees, and custodial, legal, and audit fees. The Board also noted that Fidelity may agree to waive fees or reimburse expenses from time to time, and the extent to which, if any, it has done so for the fund. Each fund's representative class is compared to those funds and classes in the Total Mapped Group (used by the Board for management fee comparisons) that have a similar sales load structure. The Board also considered a total expense ASPG comparison for the representative class, which focuses on the total expenses of the representative class relative to a subset of non-Fidelity funds within the total expense similar sales load structure group. The total expense ASPG is limited to 15 larger and 15 smaller classes in fund average assets for a total of 30 classes, where possible. The total expense ASPG comparison excludes performance adjustments and fund-paid 12b-1 fees to eliminate variability in fee structures.
The Board noted that the total net expense ratio of the retail class of each fund ranked above the similar sales load structure group competitive median and below the ASPG competitive median for the period ended September 30, 2021. The Board considered that, in general, various factors can affect total expense ratios. The Board noted the funds' unique loyalty pricing structure.
The Board considered that current contractual arrangements for each fund oblige FMR to pay all "class-level" expenses of each class of each fund to the extent necessary to limit total operating expenses, with certain exceptions, as follows: Loyalty Class 1: 0.75%; Loyalty Class 2: 0.50%; and Class F: 0.00%. These contractual arrangements may not be amended to increase the fees or expenses payable except by a vote of a majority of the Board. The Board also considered these contractual arrangements reflect each fund's unique loyalty pricing structure where shareholders that hold fund shares over longer periods of time are eligible to have their retail class shares converted to Loyalty Class 1 and Loyalty Class 2, depending on their holding period.
Fees Charged to Other Fidelity Clients. The Board also considered Fidelity fee structures and other information with respect to clients of Fidelity, such as other funds advised or subadvised by Fidelity, pension plan clients, and other institutional clients with similar mandates. The Board noted that a joint ad hoc committee created by it and the boards of other Fidelity funds periodically reviews and compares Fidelity's institutional investment advisory business with its business of providing services to the Fidelity funds and also noted the most recent findings of the committee. The Board noted that the committee's review included a consideration of the differences in services provided, fees charged, and costs incurred, as well as competition in the markets serving the different categories of clients.
Based on its review of total expense ratios and fees charged to other Fidelity clients, the Board concluded that the total expense ratio of each class of each fund was reasonable in light of the services that the fund and its shareholders receive and the other factors considered.
Costs of the Services and Profitability. The Board considered the revenues earned and the expenses incurred by Fidelity in conducting the business of developing, marketing, distributing, managing, administering, and servicing each fund and servicing each fund's shareholders. The Board also considered the level of Fidelity's profits in respect of all the Fidelity funds.
On an annual basis, Fidelity presents to the Board information about the profitability of its relationships with each fund. Fidelity calculates profitability information for each fund, as well as aggregate profitability information for groups of Fidelity funds and all Fidelity funds, using a series of detailed revenue and cost allocation methodologies which originate with the books and records of Fidelity on which Fidelity's audited financial statements are based. The Audit Committee of the Board reviews any significant changes from the prior year's methodologies and the full Board approves such changes.
A public accounting firm has been engaged annually by the Board as part of the Board's assessment of Fidelity's profitability analysis. The engagement includes the review and assessment of the methodologies used by Fidelity in determining the revenues and expenses attributable to Fidelity's mutual fund business, and completion of agreed-upon procedures in respect of the mathematical accuracy of certain fund profitability information and its conformity to established allocation methodologies. After considering the reports issued under the engagement and information provided by Fidelity, the Board concluded that while other allocation methods may also be reasonable, Fidelity's profitability methodologies are reasonable in all material respects.
The Board also reviewed Fidelity's non-fund businesses and potential indirect benefits such businesses may have received as a result of their association with Fidelity's mutual fund business (i.e., fall-out benefits) as well as cases where Fidelity's affiliates may benefit from the funds' business. The Board considered areas where potential indirect benefits to the Fidelity funds from their relationships with Fidelity may exist. The Board's consideration of these matters was informed by the findings of a joint ad hoc committee created by it and the boards of other Fidelity funds to evaluate potential fall-out benefits.
The Board considered the costs of the services provided by and the profits realized by Fidelity in connection with the operation of each fund and was satisfied that the profitability was not excessive.
Economies of Scale. The Board considered whether there have been economies of scale in respect of the management of the Fidelity funds, whether the Fidelity funds (including each fund) have appropriately benefited from any such economies of scale, and whether there is potential for realization of any further economies of scale. The Board considered the extent to which each fund will benefit from economies of scale as assets grow through increased services to the fund, through waivers or reimbursements, or through fee or expense ratio reductions. The Board recognized that, due to the fund's current contractual arrangements, its expense ratio will not decline if the fund's operating costs decrease as assets grow, or rise as assets decrease. The Board also noted that a committee (the Economies of Scale Committee) created by it and the boards of other Fidelity funds periodically analyzes whether Fidelity attains economies of scale in respect of the management and servicing of the Fidelity funds, whether the Fidelity funds have appropriately benefited from such economies of scale, and whether there is potential for realization of any further economies of scale.
The Board concluded, taking into account the analysis of the Economies of Scale Committee, that economies of scale, if any, are being appropriately shared between fund shareholders and Fidelity.
Additional Information Requested by the Board. In order to develop fully the factual basis for consideration of the Fidelity funds' advisory contracts, the Board requested and received additional information on certain topics, including: (i) fund flow and performance trends, in particular the underperformance of certain funds and strategies, and Fidelity's long-term strategies for certain funds, including any consideration of fund liquidations or mergers; (ii) the operation of performance fees, competitor use of performance fees, and consideration of the expansion of performance fees to additional funds; (iii) Fidelity's pricing philosophy compared to competitors; (iv) fund profitability methodology and data; (v) evaluation of competitive fund data and peer group classifications and fee and expense comparisons; (vi) the management fee and expense structures for different funds and classes and information about the differences between various fee and expense structures; (vii) group fee breakpoints and related voluntary fee waivers; and (viii) information regarding other accounts managed by Fidelity and the funds' sub-advisory arrangements.
Based on its evaluation of all of the conclusions noted above, and after considering all factors it believed relevant, the Board concluded that the advisory fee arrangements are fair and reasonable and that each fund's Advisory Contracts should be renewed.
Liquidity Risk Management Program
The Securities and Exchange Commission adopted Rule 22e-4 under the Investment Company Act of 1940 (the Liquidity Rule) to promote effective liquidity risk management throughout the open-end investment company industry, thereby reducing the risk that funds will be unable to meet their redemption obligations and mitigating dilution of the interests of fund shareholders.
The Funds have adopted and implemented a liquidity risk management program pursuant to the Liquidity Rule (the Program) effective December 1, 2018. The Program is reasonably designed to assess and manage each Fund’s liquidity risk and to comply with the requirements of the Liquidity Rule. Each Fund’s Board of Trustees (the Board) has designated each Fund’s investment adviser as administrator of the Program. The Fidelity advisers have established a Liquidity Risk Management Committee (the LRM Committee) to manage the Program for each of the Fidelity Funds. The LRM Committee monitors the adequacy and effectiveness of implementation of the Program and on a periodic basis assesses each Fund’s liquidity risk based on a variety of factors including (1) the Fund’s investment strategy, (2) portfolio liquidity and cash flow projections during normal and reasonably foreseeable stressed conditions, (3) shareholder redemptions, (4) borrowings and other funding sources and (5) in the case of exchange-traded funds, certain additional factors including the effect of the Fund’s prices and spreads, market participants, and basket compositions on the overall liquidity of the Fund’s portfolio, as applicable.
In accordance with the Program, each of the Fund’s portfolio investments is classified into one of four liquidity categories described below based on a determination of a reasonable expectation for how long it would take to convert the investment to cash (or sell or dispose of the investment) without significantly changing its market value.
- Highly liquid investments – cash or convertible to cash within three business days or less
- Moderately liquid investments – convertible to cash in three to seven calendar days
- Less liquid investments – can be sold or disposed of, but not settled, within seven calendar days
- Illiquid investments – cannot be sold or disposed of within seven calendar days
Liquidity classification determinations take into account a variety of factors including various market, trading and investment-specific considerations, as well as market depth, and generally utilize analysis from a third-party liquidity metrics service.
The Liquidity Rule places a 15% limit on a fund’s illiquid investments and requires funds that do not primarily hold assets that are highly liquid investments to determine and maintain a minimum percentage of the fund’s net assets to be invested in highly liquid investments (highly liquid investment minimum or HLIM). The Program includes provisions reasonably designed to comply with the 15% limit on illiquid investments and for determining, periodically reviewing and complying with the HLIM requirement as applicable.
At a recent meeting of the Fund’s Board of Trustees, the LRM Committee provided a written report to the Board pertaining to the operation, adequacy, and effectiveness of implementation of the Program for the annual period from December 1, 2020 through November 30, 2021. The report concluded that the Program has been implemented and is operating effectively and is reasonably designed to assess and manage the Fund’s liquidity risk.

DSS-ANN-0722
1.9897372.102
Fidelity® Agricultural Productivity Fund
Fidelity® Water Sustainability Fund
Annual Report
May 31, 2022
Contents
To view a fund's proxy voting guidelines and proxy voting record for the 12-month period ended June 30, visit http://www.fidelity.com/proxyvotingresults or visit the Securities and Exchange Commission's (SEC) web site at http://www.sec.gov.
You may also call 1-800-544-8544 to request a free copy of the proxy voting guidelines.
Standard & Poor's, S&P and S&P 500 are registered service marks of The McGraw-Hill Companies, Inc. and have been licensed for use by Fidelity Distributors Corporation.
Other third-party marks appearing herein are the property of their respective owners.
All other marks appearing herein are registered or unregistered trademarks or service marks of FMR LLC or an affiliated company. © 2022 FMR LLC. All rights reserved.
This report and the financial statements contained herein are submitted for the general information of the shareholders of the Funds. This report is not authorized for distribution to prospective investors in the Funds unless preceded or accompanied by an effective prospectus.
A fund files its complete schedule of portfolio holdings with the SEC for the first and third quarters of each fiscal year on Form N-PORT. Forms N-PORT are available on the SEC’s web site at http://www.sec.gov. A fund's Forms N-PORT may be reviewed and copied at the SEC’s Public Reference Room in Washington, DC. Information regarding the operation of the SEC's Public Reference Room may be obtained by calling 1-800-SEC-0330.
For a complete list of a fund's portfolio holdings, view the most recent holdings listing, semiannual report, or annual report on Fidelity's web site at http://www.fidelity.com, http://www.institutional.fidelity.com, or http://www.401k.com, as applicable.
NOT FDIC INSURED •MAY LOSE VALUE •NO BANK GUARANTEE
Neither the Funds nor Fidelity Distributors Corporation is a bank.
Note to Shareholders:
Early in 2020, the outbreak and spread of COVID-19 emerged as a public health emergency that had a major influence on financial markets, primarily based on its impact on the global economy and corporate earnings. On March 11, 2020, the World Health Organization declared the COVID-19 outbreak a pandemic, citing sustained risk of further global spread. The pandemic prompted a number of measures to limit the spread of COVID-19, including travel and border restrictions, quarantines, and restrictions on large gatherings. In turn, these resulted in lower consumer activity, diminished demand for a wide range of products and services, disruption in manufacturing and supply chains, and – given the wide variability in outcomes regarding the outbreak – significant market uncertainty and volatility. To help stem the turmoil, the U.S. government took unprecedented action – in concert with the U.S. Federal Reserve and central banks around the world – to help support consumers, businesses, and the broader economy, and to limit disruption to the financial system.
In general, the overall impact of the pandemic lessened in 2021, amid a resilient economy and widespread distribution of three COVID-19 vaccines granted emergency use authorization from the U.S. Food and Drug Administration (FDA) early in the year. Still, the situation remains dynamic, and the extent and duration of its influence on financial markets and the economy is highly uncertain, due in part to a recent spike in cases based on highly contagious variants of the coronavirus.
Extreme events such as the COVID-19 crisis are exogenous shocks that can have significant adverse effects on mutual funds and their investments. Although multiple asset classes may be affected by market disruption, the duration and impact may not be the same for all types of assets. Fidelity is committed to helping you stay informed amid news about COVID-19 and during increased market volatility, and we continue to take extra steps to be responsive to customer needs. We encourage you to visit us online, where we offer ongoing updates, commentary, and analysis on the markets and our funds.
Fidelity® Agricultural Productivity Fund
Performance: The Bottom Line
Average annual total return reflects the change in the value of an investment, assuming reinvestment of distributions from dividend income and capital gains (the profits earned upon the sale of securities that have grown in value, if any) and assuming a constant rate of performance each year. The hypothetical investment and the average annual total returns do not reflect the deduction of taxes that a shareholder would pay on fund distributions or the redemption of fund shares. During periods of reimbursement by Fidelity, a fund’s total return will be greater than it would be had the reimbursement not occurred. How a fund did yesterday is no guarantee of how it will do tomorrow.
Average Annual Total Returns
| For the periods ended May 31, 2022 | Past 1 year | Life of fundA |
| Fidelity® Agricultural Productivity Fund | 15.24% | 44.59% |
A From April 16, 2020
$10,000 Over Life of Fund
Let's say hypothetically that $10,000 was invested in Fidelity® Agricultural Productivity Fund on April 16, 2020, when the fund started.
The chart shows how the value of your investment would have changed, and also shows how the MSCI ACWI (All Country World Index) Index performed over the same period.
| Period Ending Values |
| $21,880 | Fidelity® Agricultural Productivity Fund |
| $14,529 | MSCI ACWI (All Country World Index) Index |
Fidelity® Agricultural Productivity Fund
Management's Discussion of Fund Performance
Market Recap: Global equities returned -6.49% for the 12 months ending May 31, 2022, according to the MSCI ACWI (All Country World Index) Index. After posting an 18.90% gain in 2021, global stocks retreated to begin the new year amid several headwinds that stoked volatility, uncertainty and investor anxiety. Chief among these was accelerated efforts by some central banks to hike interest rates and aggressively wind down extraordinary monetary policy support in an attempt to rein in high inflation. In addition, geopolitical unrest rose as Russia invaded Ukraine in late February and escalated its attack through period end. Other factors influencing stocks included surging global commodity prices, rising sovereign bond yields in some markets, global supply constraint and disruption, and the potential for variants of the coronavirus to upend global economic growth. Against this backdrop, the index returned -4.90% in January and -2.56% in February, falling on mixed corporate earnings. Volatility eased in March and the index gained 2.21% for the month. April saw a reversal (-7.98%), amid angst about the economic toll of “zero-COVID” lockdowns in China, and then the index had a flattish May (+0.16%). For the full 12 months, emerging markets (-20%) lagged most, followed by Japan (-13%) and Europe ex U.K. (-12%). Conversely, the U.K. and Canada (+3%) led. By sector, communication services (-23%) and consumer discretionary (-21%) fared worst, whereas energy (+48%) rode a surge in commodity prices and topped the market by a wide margin.
Comments from Co-Portfolio Managers Steven Calhoun and David Wagner: For the fiscal year ending May 31, 2022, the fund gained 15.24%, outperforming the 13.03% advance of the MSCI ACWI Select Agriculture Producers IMI 25/50 Index (Net MA), as well as the broad-based MSCI All Country World Index (Net MA). By country, underweighting Japan, stock picks in the U.S. and an overweighting in Canada contributed most to the fund's relative result the past 12 months. Versus the industry index, security selection in fertilizers & agricultural chemicals boosted the fund's relative result most. Also boosting performance was stock selection in agricultural products. The fund's top individual relative contributor was an overweighting in CF Industries Holdings, which gained 89% the past twelve months. The company was among our largest holdings. Also lifting performance was our outsized stake in Mosaic, which gained 72%. Mosaic was among the fund's biggest holdings. Another notable relative contributor was an overweighting in Nutrien (+60%). We increased our stakes in CF Industries, Mosaic and Nutrien during the period. Foreign holdings contributed overall despite continued U.S. dollar strength. In contrast, an overweighting and stock picks in the U.K. notably detracted from the fund's relative result. A lack of exposure to Israel and stock choices in Norway also hurt relative performance. From an industry perspective, security selection in packaged foods & meats was the largest detractor versus the benchmark. In terms of individual stocks, a non-benchmark stake in Nomad Foods was the fund's largest individual relative detractor, due to its approximate -26% result. Positions in Nomad Foods were sold the past year. Another notable relative detractor was an outsized stake in Toro (-25%). This period we increased the fund's stake in Toro. Also holding back performance was an underweighting and untimely positioning in SABIC Agri-Nutrients, which gained 47%. We established a position in the company the past twelve months.
The views expressed above reflect those of the portfolio manager(s) only through the end of the period as stated on the cover of this report and do not necessarily represent the views of Fidelity or any other person in the Fidelity organization. Any such views are subject to change at any time based upon market or other conditions and Fidelity disclaims any responsibility to update such views. These views may not be relied on as investment advice and, because investment decisions for a Fidelity fund are based on numerous factors, may not be relied on as an indication of trading intent on behalf of any Fidelity fund.
Fidelity® Agricultural Productivity Fund
Investment Summary (Unaudited)
Top Ten Stocks as of May 31, 2022
| | % of fund's net assets |
| Deere & Co. | 18.5 |
| Nutrien Ltd. | 11.3 |
| Corteva, Inc. | 11.0 |
| Archer Daniels Midland Co. | 8.7 |
| FMC Corp. | 4.5 |
| CF Industries Holdings, Inc. | 4.3 |
| The Mosaic Co. | 4.3 |
| CNH Industrial NV | 4.3 |
| Lamb Weston Holdings, Inc. | 4.2 |
| Bunge Ltd. | 3.2 |
| | 74.3 |
Market Sectors as of May 31, 2022
| | % of fund's net assets |
| Materials | 42.5 |
| Consumer Staples | 28.2 |
| Industrials | 27.8 |
Asset Allocation (% of fund's net assets)
| As of May 31, 2022* |
| | Stocks | 98.5% |
| | Short-Term Investments and Net Other Assets (Liabilities) | 1.5% |

* Foreign investments - 31.1%
Geographic Diversification (% of fund's net assets)
| As of May 31, 2022 |
| | United States of America* | 68.9% |
| | Canada | 11.3% |
| | Netherlands | 5.9% |
| | Bermuda | 3.2% |
| | Norway | 2.5% |
| | Chile | 2.5% |
| | Saudi Arabia | 1.3% |
| | Japan | 1.2% |
| | Germany | 1.1% |
| | Other | 2.1% |

* Includes Short-Term investments and Net Other Assets (Liabilities).
Percentages are based on country or territory of incorporation and are adjusted for the effect of futures contracts, if applicable.
Fidelity® Agricultural Productivity Fund
Schedule of Investments May 31, 2022
Showing Percentage of Net Assets
| Common Stocks - 96.0% | | | |
| | | Shares | Value |
| CONSUMER STAPLES - 28.2% | | | |
| Food Products - 28.2% | | | |
| Adecoagro SA (a) | | 61,845 | $687,098 |
| Archer Daniels Midland Co. | | 158,516 | 14,396,423 |
| Bunge Ltd. | | 44,687 | 5,287,366 |
| Darling Ingredients, Inc. (b) | | 56,317 | 4,509,302 |
| First Resources Ltd. | | 742,534 | 1,051,433 |
| Ingredion, Inc. | | 45,927 | 4,348,828 |
| Lamb Weston Holdings, Inc. | | 103,067 | 6,965,268 |
| Mowi ASA | | 161,613 | 4,219,372 |
| Origin Enterprises PLC | | 183,321 | 882,667 |
| Sakata Seed Corp. | | 57,412 | 1,975,649 |
| The Simply Good Foods Co. (b) | | 66,866 | 2,671,965 |
| | | | 46,995,371 |
| INDUSTRIALS - 27.8% | | | |
| Machinery - 27.8% | | | |
| AGCO Corp. | | 39,113 | 5,011,549 |
| CNH Industrial NV | | 476,957 | 7,101,956 |
| Deere & Co. | | 85,860 | 30,718,992 |
| Toro Co. | | 41,281 | 3,405,270 |
| | | | 46,237,767 |
| MATERIALS - 40.0% | | | |
| Chemicals - 40.0% | | | |
| CF Industries Holdings, Inc. | | 73,444 | 7,254,064 |
| Corteva, Inc. | | 292,185 | 18,296,625 |
| Fertiglobe PLC | | 642,494 | 930,580 |
| FMC Corp. | | 60,756 | 7,447,470 |
| K+S AG | | 63,415 | 1,778,909 |
| Nutrien Ltd. | | 193,543 | 18,914,377 |
| OCI NV | | 75,669 | 2,664,490 |
| Sabic Agriculture-Nutrients Co. | | 56,337 | 2,208,116 |
| The Mosaic Co. | | 114,674 | 7,184,326 |
| | | | 66,678,957 |
| TOTAL COMMON STOCKS | | | |
| (Cost $146,354,867) | | | 159,912,095 |
|
| Nonconvertible Preferred Stocks - 2.5% | | | |
| MATERIALS - 2.5% | | | |
| Chemicals - 2.5% | | | |
| Sociedad Quimica y Minera de Chile SA (PN-B) | | | |
| (Cost $2,876,716) | | 38,782 | 4,142,465 |
|
| Money Market Funds - 1.7% | | | |
| Fidelity Cash Central Fund 0.82% (c) | | 2,644,161 | 2,644,690 |
| Fidelity Securities Lending Cash Central Fund 0.82% (c)(d) | | 117,288 | 117,300 |
| TOTAL MONEY MARKET FUNDS | | | |
| (Cost $2,761,990) | | | 2,761,990 |
| TOTAL INVESTMENT IN SECURITIES - 100.2% | | | |
| (Cost $151,993,573) | | | 166,816,550 |
| NET OTHER ASSETS (LIABILITIES) - (0.2)% | | | (271,306) |
| NET ASSETS - 100% | | | $166,545,244 |
Legend
(a) Security or a portion of the security is on loan at period end.
(b) Non-income producing
(c) Affiliated fund that is generally available only to investment companies and other accounts managed by Fidelity Investments. The rate quoted is the annualized seven-day yield of the fund at period end. A complete unaudited listing of the fund's holdings as of its most recent quarter end is available upon request. In addition, each Fidelity Central Fund's financial statements, which are not covered by the Fund's Report of Independent Registered Public Accounting Firm, are available on the SEC's website or upon request.
(d) Investment made with cash collateral received from securities on loan.
Affiliated Central Funds
Fiscal year to date information regarding the Fund's investments in Fidelity Central Funds, including the ownership percentage, is presented below.
| Fund | Value, beginning of period | Purchases | Sales Proceeds | Dividend Income | Realized Gain/Loss | Change in Unrealized appreciation (depreciation) | Value, end of period | % ownership, end of period |
| Fidelity Cash Central Fund 0.82% | $2,210,415 | $73,523,507 | $73,089,232 | $4,814 | $-- | $-- | $2,644,690 | 0.0% |
| Fidelity Securities Lending Cash Central Fund 0.82% | -- | 2,271,930 | 2,154,630 | 1,425 | -- | -- | 117,300 | 0.0% |
| Total | $2,210,415 | $75,795,437 | $75,243,862 | $6,239 | $-- | $-- | $2,761,990 | |
Amounts in the income column in the above table include any capital gain distributions from underlying funds, which are presented in the corresponding line-item in the Statement of Operations, if applicable. Amount for Fidelity Securities Lending Cash Central Fund represents the income earned on investing cash collateral, less rebates paid to borrowers and any lending agent fees associated with the loan, plus any premium payments received for lending certain types of securities.
Investment Valuation
The following is a summary of the inputs used, as of May 31, 2022, involving the Fund's assets and liabilities carried at fair value. The inputs or methodology used for valuing securities may not be an indication of the risk associated with investing in those securities. For more information on valuation inputs, and their aggregation into the levels used below, please refer to the Investment Valuation section in the accompanying Notes to Financial Statements.
| | Valuation Inputs at Reporting Date: |
| Description | Total | Level 1 | Level 2 | Level 3 |
| Investments in Securities: | | | | |
| Equities: | | | | |
| Consumer Staples | $46,995,371 | $46,995,371 | $-- | $-- |
| Industrials | 46,237,767 | 46,237,767 | -- | -- |
| Materials | 70,821,422 | 70,821,422 | -- | -- |
| Money Market Funds | 2,761,990 | 2,761,990 | -- | -- |
| Total Investments in Securities: | $166,816,550 | $166,816,550 | $-- | $-- |
See accompanying notes which are an integral part of the financial statements.
Fidelity® Agricultural Productivity Fund
Financial Statements
Statement of Assets and Liabilities
| | | May 31, 2022 |
| Assets | | |
Investment in securities, at value (including securities loaned of $113,322) — See accompanying schedule:
Unaffiliated issuers (cost $149,231,583) | $164,054,560 | |
| Fidelity Central Funds (cost $2,761,990) | 2,761,990 | |
| Total Investment in Securities (cost $151,993,573) | | $166,816,550 |
| Foreign currency held at value (cost $25,230) | | 25,231 |
| Receivable for fund shares sold | | 666,936 |
| Dividends receivable | | 346,721 |
| Distributions receivable from Fidelity Central Funds | | 2,228 |
| Prepaid expenses | | 10 |
| Receivable from investment adviser for expense reductions | | 18,581 |
| Other receivables | | 4,324 |
| Total assets | | 167,880,581 |
| Liabilities | | |
| Payable for investments purchased | $92 | |
| Payable for fund shares redeemed | 1,062,220 | |
| Accrued management fee | 92,603 | |
| Other affiliated payables | 36,449 | |
| Other payables and accrued expenses | 26,673 | |
| Collateral on securities loaned | 117,300 | |
| Total liabilities | | 1,335,337 |
| Net Assets | | $166,545,244 |
| Net Assets consist of: | | |
| Paid in capital | | $154,792,098 |
| Total accumulated earnings (loss) | | 11,753,146 |
| Net Assets | | $166,545,244 |
| Net Asset Value, offering price and redemption price per share ($166,545,244 ÷ 7,707,497 shares) | | $21.61 |
See accompanying notes which are an integral part of the financial statements.
Statement of Operations
| | | Year ended May 31, 2022 |
| Investment Income | | |
| Dividends | | $1,153,325 |
| Special dividends | | 192,290 |
| Income from Fidelity Central Funds (including $1,425 from security lending) | | 6,239 |
| Total income | | 1,351,854 |
| Expenses | | |
| Management fee | $507,183 | |
| Transfer agent fees | 192,350 | |
| Accounting fees | 38,935 | |
| Custodian fees and expenses | 19,853 | |
| Independent trustees' fees and expenses | 217 | |
| Registration fees | 54,237 | |
| Audit | 51,295 | |
| Legal | 29 | |
| Miscellaneous | 294 | |
| Total expenses before reductions | 864,393 | |
| Expense reductions | (120,272) | |
| Total expenses after reductions | | 744,121 |
| Net investment income (loss) | | 607,733 |
| Realized and Unrealized Gain (Loss) | | |
| Net realized gain (loss) on: | | |
| Investment securities: | | |
| Unaffiliated issuers | (3,399,377) | |
| Foreign currency transactions | (23,988) | |
| Total net realized gain (loss) | | (3,423,365) |
| Change in net unrealized appreciation (depreciation) on: | | |
| Investment securities: | | |
| Unaffiliated issuers | 7,151,429 | |
| Assets and liabilities in foreign currencies | 741 | |
| Total change in net unrealized appreciation (depreciation) | | 7,152,170 |
| Net gain (loss) | | 3,728,805 |
| Net increase (decrease) in net assets resulting from operations | | $4,336,538 |
See accompanying notes which are an integral part of the financial statements.
Statement of Changes in Net Assets
| | Year ended May 31, 2022 | Year ended May 31, 2021 |
| Increase (Decrease) in Net Assets | | |
| Operations | | |
| Net investment income (loss) | $607,733 | $156,526 |
| Net realized gain (loss) | (3,423,365) | 141,775 |
| Change in net unrealized appreciation (depreciation) | 7,152,170 | 7,514,794 |
| Net increase (decrease) in net assets resulting from operations | 4,336,538 | 7,813,095 |
| Distributions to shareholders | (407,469) | (48,567) |
| Share transactions | | |
| Proceeds from sales of shares | 173,532,384 | 65,561,138 |
| Reinvestment of distributions | 359,937 | 46,379 |
| Cost of shares redeemed | (74,170,058) | (13,867,822) |
| Net increase (decrease) in net assets resulting from share transactions | 99,722,263 | 51,739,695 |
| Total increase (decrease) in net assets | 103,651,332 | 59,504,223 |
| Net Assets | | |
| Beginning of period | 62,893,912 | 3,389,689 |
| End of period | $166,545,244 | $62,893,912 |
| Other Information | | |
| Shares | | |
| Sold | 8,214,591 | 3,817,500 |
| Issued in reinvestment of distributions | 19,892 | 3,314 |
| Redeemed | (3,856,315) | (802,208) |
| Net increase (decrease) | 4,378,168 | 3,018,606 |
See accompanying notes which are an integral part of the financial statements.
Financial Highlights
Fidelity Agricultural Productivity Fund
| | | | |
| Years ended May 31, | 2022 | 2021 | 2020 A |
| Selected Per–Share Data | | | |
| Net asset value, beginning of period | $18.89 | $10.91 | $10.00 |
| Income from Investment Operations | | | |
| Net investment income (loss)B,C | .16D | .13E | .03 |
| Net realized and unrealized gain (loss) | 2.69 | 7.92 | .88 |
| Total from investment operations | 2.85 | 8.05 | .91 |
| Distributions from net investment income | (.09) | (.07) | – |
| Distributions from net realized gain | (.04) | –F | – |
| Total distributions | (.13) | (.07) | – |
| Net asset value, end of period | $21.61 | $18.89 | $10.91 |
| Total ReturnG,H | 15.24% | 74.02% | 9.10% |
| Ratios to Average Net AssetsC,I,J | | | |
| Expenses before reductions | 1.15% | 1.59% | 7.25%K,L |
| Expenses net of fee waivers, if any | .99% | 1.00% | .97%K,L,M |
| Expenses net of all reductions | .99% | .98% | .97%K,L,M |
| Net investment income (loss) | .81%D | .80%E | 2.42%K,L |
| Supplemental Data | | | |
| Net assets, end of period (000 omitted) | $166,545 | $62,894 | $3,390 |
| Portfolio turnover rateN | 50% | 19% | 4%O |
A For the period April 16, 2020 (commencement of operations) through May 31, 2020.
B Calculated based on average shares outstanding during the period.
C Net investment income (loss) is affected by the timing of the declaration of dividends by any underlying mutual funds or exchange-traded funds (ETFs). Net investment income (loss) of any such underlying funds is not included in the Fund's net investment income (loss) ratio.
D Net investment income per share reflects one or more large, non-recurring dividend(s) which amounted to $.05 per share. Excluding such non-recurring dividend(s), the ratio of net investment income (loss) to average net assets would have been .55%.
E Net investment income per share reflects one or more large, non-recurring dividend(s) which amounted to $.04 per share. Excluding such non-recurring dividend(s), the ratio of net investment income (loss) to average net assets would have been .57%.
F Amount represents less than $.005 per share.
G Total returns for periods of less than one year are not annualized.
H Total returns would have been lower if certain expenses had not been reduced during the applicable periods shown.
I Fees and expenses of any underlying mutual funds or exchange-traded funds (ETFs) are not included in the Fund's expense ratio. The Fund indirectly bears its proportionate share of these expenses. For additional expense information related to investments in Fidelity Central Funds, please refer to the "Investments in Fidelity Central Funds" note found in the Notes to Financial Statements section of the most recent Annual or Semi-Annual report.
J Expense ratios reflect operating expenses of the class. Expenses before reductions do not reflect amounts reimbursed, waived, or reduced through arrangements with the investment adviser, brokerage services, or other offset arrangements, if applicable, and do not represent the amount paid by the class during periods when reimbursements, waivers or reductions occur.
K Annualized
L Audit fees are not annualized.
M The size and fluctuation of net assets and expense amounts may cause ratios to differ from contractual rates.
N Amount does not include the portfolio activity of any underlying mutual funds or exchange-traded funds (ETFs).
O Amount not annualized.
See accompanying notes which are an integral part of the financial statements.
Fidelity® Water Sustainability Fund
Performance: The Bottom Line
Average annual total return reflects the change in the value of an investment, assuming reinvestment of distributions from dividend income and capital gains (the profits earned upon the sale of securities that have grown in value, if any) and assuming a constant rate of performance each year. The hypothetical investment and the average annual total returns do not reflect the deduction of taxes that a shareholder would pay on fund distributions or the redemption of fund shares. During periods of reimbursement by Fidelity, a fund’s total return will be greater than it would be had the reimbursement not occurred. How a fund did yesterday is no guarantee of how it will do tomorrow.
Average Annual Total Returns
| For the periods ended May 31, 2022 | Past 1 year | Life of fundA |
| Fidelity® Water Sustainability Fund | (7.44)% | 16.97% |
A From April 16, 2020
$10,000 Over Life of Fund
Let's say hypothetically that $10,000 was invested in Fidelity® Water Sustainability Fund on April 16, 2020, when the fund started.
The chart shows how the value of your investment would have changed, and also shows how the MSCI ACWI (All Country World Index) Index performed over the same period.

| Period Ending Values |
| $13,950 | Fidelity® Water Sustainability Fund |
| $14,529 | MSCI ACWI (All Country World Index) Index |
Fidelity® Water Sustainability Fund
Management's Discussion of Fund Performance
Market Recap: Global equities returned -6.49% for the 12 months ending May 31, 2022, according to the MSCI ACWI (All Country World Index) Index. After posting an 18.90% gain in 2021, global stocks retreated to begin the new year amid several headwinds that stoked volatility, uncertainty and investor anxiety. Chief among these was accelerated efforts by some central banks to hike interest rates and aggressively wind down extraordinary monetary policy support in an attempt to rein in high inflation. In addition, geopolitical unrest rose as Russia invaded Ukraine in late February and escalated its attack through period end. Other factors influencing stocks included surging global commodity prices, rising sovereign bond yields in some markets, global supply constraint and disruption, and the potential for variants of the coronavirus to upend global economic growth. Against this backdrop, the index returned -4.90% in January and -2.56% in February, falling on mixed corporate earnings. Volatility eased in March and the index gained 2.21% for the month. April saw a reversal (-7.98%), amid angst about the economic toll of “zero-COVID” lockdowns in China, and then the index had a flattish May (+0.16%). For the full 12 months, emerging markets (-20%) lagged most, followed by Japan (-13%) and Europe ex U.K. (-12%). Conversely, the U.K. and Canada (+3%) led. By sector, communication services (-23%) and consumer discretionary (-21%) fared worst, whereas energy (+48%) rode a surge in commodity prices and topped the market by a wide margin.
Comments from Portfolio Manager Janet Glazer: For the fiscal year ending May 31, 2022, the fund returned -7.44%, outperforming the -8.24% return of the S&P Global Water Index, but underperforming the broad-based MSCI All Country World Index (Net MA). By region, a large overweighting and stock picks in the U.S., as well as an underweighting in Europe ex U.K., specifically Switzerland, contributed most to the fund's relative result. Looking at industry weightings, out-of-benchmark exposure to electrical components & equipment lifted relative performance most, followed by favorable picks and an overweighting in industrial machinery and a non-benchmark stake in application software. Our top individual relative contributor was an out-of-benchmark position in Regal Rexnord (-1%). The company was not held at period end. Also helping performance was our lighter-than-benchmark stake in Xylem, which returned -28%. The fund's non-benchmark stake in Roper Technologies – another relative contributor – returned roughly -1%. We added to our stake in the company the past twelve months, and it was the fund’s largest holding as of May 31. Conversely, an underweighting and stock picks in the U.K. and an out-of-benchmark allocation to Sweden hurt the fund's relative result. By industry, the primary detractors from performance versus the benchmark were stock selection in building products and an underweighting in water utilities. The biggest individual relative detractor was a sizable overweighting in Zurn Water Solutions (-43%). Although Zurn was among the fund's largest holdings at the beginning of the period, we considerably reduced the position. Other notable relative detractors included an underweighting in Olin (+37%) and a lighter-than-benchmark stake in Severn Trent (+7%). The latter was among the fund’s biggest holdings as of May 31.
The views expressed above reflect those of the portfolio manager(s) only through the end of the period as stated on the cover of this report and do not necessarily represent the views of Fidelity or any other person in the Fidelity organization. Any such views are subject to change at any time based upon market or other conditions and Fidelity disclaims any responsibility to update such views. These views may not be relied on as investment advice and, because investment decisions for a Fidelity fund are based on numerous factors, may not be relied on as an indication of trading intent on behalf of any Fidelity fund.
Fidelity® Water Sustainability Fund
Investment Summary (Unaudited)
Top Ten Stocks as of May 31, 2022
| | % of fund's net assets |
| Roper Technologies, Inc. | 15.0 |
| American Water Works Co., Inc. | 12.0 |
| Teledyne Technologies, Inc. | 9.6 |
| Tetra Tech, Inc. | 8.0 |
| Danaher Corp. | 4.9 |
| IDEX Corp. | 4.9 |
| Veolia Environnement SA | 4.9 |
| Severn Trent PLC | 4.7 |
| Ingersoll Rand, Inc. | 4.7 |
| Advanced Drain Systems, Inc. | 4.7 |
| | 73.4 |
Market Sectors as of May 31, 2022
| | % of fund's net assets |
| Industrials | 34.7 |
| Information Technology | 30.1 |
| Utilities | 27.0 |
| Health Care | 4.9 |
| Materials | 2.9 |
| Energy | 0.3 |
Asset Allocation (% of fund's net assets)
| As of May 31, 2022 * |
| | Stocks | 99.9% |
| | Short-Term Investments and Net Other Assets (Liabilities) | 0.1% |

* Foreign investments - 16.3%
Geographic Diversification (% of fund's net assets)
| As of May 31, 2022 |
| | United States of America* | 83.7% |
| | United Kingdom | 9.3% |
| | France | 4.9% |
| | Switzerland | 1.4% |
| | Brazil | 0.5% |
| | Japan | 0.2% |

* Includes Short-Term investments and Net Other Assets (Liabilities).
Percentages are based on country or territory of incorporation and are adjusted for the effect of futures contracts, if applicable.
Fidelity® Water Sustainability Fund
Schedule of Investments May 31, 2022
Showing Percentage of Net Assets
| Common Stocks - 99.4% | | | |
| | | Shares | Value |
| ENERGY - 0.3% | | | |
| Energy Equipment & Services - 0.3% | | | |
| Select Energy Services, Inc. Class A (a) | | 37,839 | $320,496 |
| HEALTH CARE - 4.9% | | | |
| Life Sciences Tools & Services - 4.9% | | | |
| Danaher Corp. | | 17,629 | 4,650,883 |
| INDUSTRIALS - 34.7% | | | |
| Building Products - 5.8% | | | |
| Advanced Drain Systems, Inc. (b) | | 40,464 | 4,431,213 |
| Zurn Water Solutions Corp. | | 34,545 | 995,587 |
| | | | 5,426,800 |
| Commercial Services & Supplies - 8.0% | | | |
| Tetra Tech, Inc. (b) | | 55,908 | 7,545,903 |
| Machinery - 20.9% | | | |
| Chart Industries, Inc. (a) | | 10,071 | 1,771,287 |
| Energy Recovery, Inc. (a) | | 4,198 | 84,842 |
| Evoqua Water Technologies Corp. (a) | | 111,837 | 3,980,279 |
| Georg Fischer AG (Reg.) | | 24,360 | 1,368,853 |
| IDEX Corp. | | 24,068 | 4,610,225 |
| Ingersoll Rand, Inc. | | 94,558 | 4,458,410 |
| Mueller Water Products, Inc. Class A | | 41,681 | 497,254 |
| Organo Corp. | | 1,889 | 143,948 |
| Watts Water Technologies, Inc. Class A | | 9,892 | 1,294,170 |
| Xylem, Inc. | | 18,161 | 1,530,064 |
| | | | 19,739,332 |
|
| TOTAL INDUSTRIALS | | | 32,712,035 |
|
| INFORMATION TECHNOLOGY - 30.1% | | | |
| Electronic Equipment & Components - 15.1% | | | |
| Badger Meter, Inc. | | 10,359 | 819,811 |
| Halma PLC | | 155,251 | 4,360,632 |
| Teledyne Technologies, Inc. (a) | | 22,408 | 9,078,601 |
| | | | 14,259,044 |
| Software - 15.0% | | | |
| Roper Technologies, Inc. | | 31,827 | 14,081,539 |
|
| TOTAL INFORMATION TECHNOLOGY | | | 28,340,583 |
|
| MATERIALS - 2.9% | | | |
| Chemicals - 2.9% | | | |
| Olin Corp. | | 41,696 | 2,743,180 |
| UTILITIES - 26.5% | | | |
| Multi-Utilities - 4.9% | | | |
| Veolia Environnement SA | | 163,288 | 4,569,821 |
| Water Utilities - 21.6% | | | |
| American States Water Co. | | 18,637 | 1,476,982 |
| American Water Works Co., Inc. | | 74,710 | 11,299,888 |
| Essential Utilities, Inc. | | 20,672 | 956,287 |
| Middlesex Water Co. | | 24,445 | 2,078,558 |
| Severn Trent PLC | | 121,605 | 4,466,785 |
| York Water Co. | | 1,682 | 68,928 |
| | | | 20,347,428 |
|
| TOTAL UTILITIES | | | 24,917,249 |
|
| TOTAL COMMON STOCKS | | | |
| (Cost $96,289,595) | | | 93,684,426 |
|
| Nonconvertible Preferred Stocks - 0.5% | | | |
| UTILITIES - 0.5% | | | |
| Water Utilities - 0.5% | | | |
| Companhia de Saneamento Basico do Estado de Sao Paulo (SABESP) sponsored ADR | | | |
| (Cost $364,557) | | 46,061 | 443,567 |
|
| Money Market Funds - 4.2% | | | |
| Fidelity Cash Central Fund 0.82% (c) | | 76,697 | 76,712 |
| Fidelity Securities Lending Cash Central Fund 0.82% (c)(d) | | 3,878,134 | 3,878,522 |
| TOTAL MONEY MARKET FUNDS | | | |
| (Cost $3,955,234) | | | 3,955,234 |
| TOTAL INVESTMENT IN SECURITIES - 104.1% | | | |
| (Cost $100,609,386) | | | 98,083,227 |
| NET OTHER ASSETS (LIABILITIES) - (4.1)% | | | (3,850,260) |
| NET ASSETS - 100% | | | $94,232,967 |
Legend
(a) Non-income producing
(b) Security or a portion of the security is on loan at period end.
(c) Affiliated fund that is generally available only to investment companies and other accounts managed by Fidelity Investments. The rate quoted is the annualized seven-day yield of the fund at period end. A complete unaudited listing of the fund's holdings as of its most recent quarter end is available upon request. In addition, each Fidelity Central Fund's financial statements, which are not covered by the Fund's Report of Independent Registered Public Accounting Firm, are available on the SEC's website or upon request.
(d) Investment made with cash collateral received from securities on loan.
Affiliated Central Funds
Fiscal year to date information regarding the Fund's investments in Fidelity Central Funds, including the ownership percentage, is presented below.
| Fund | Value, beginning of period | Purchases | Sales Proceeds | Dividend Income | Realized Gain/Loss | Change in Unrealized appreciation (depreciation) | Value, end of period | % ownership, end of period |
| Fidelity Cash Central Fund 0.82% | $1,764,151 | $36,169,959 | $37,857,398 | $1,042 | $-- | $-- | $76,712 | 0.0% |
| Fidelity Securities Lending Cash Central Fund 0.82% | -- | 38,740,923 | 34,862,401 | 1,014 | -- | -- | 3,878,522 | 0.0% |
| Total | $1,764,151 | $74,910,882 | $72,719,799 | $2,056 | $-- | $-- | $3,955,234 | |
Amounts in the income column in the above table include any capital gain distributions from underlying funds, which are presented in the corresponding line-item in the Statement of Operations, if applicable. Amount for Fidelity Securities Lending Cash Central Fund represents the income earned on investing cash collateral, less rebates paid to borrowers and any lending agent fees associated with the loan, plus any premium payments received for lending certain types of securities.
Investment Valuation
The following is a summary of the inputs used, as of May 31, 2022, involving the Fund's assets and liabilities carried at fair value. The inputs or methodology used for valuing securities may not be an indication of the risk associated with investing in those securities. For more information on valuation inputs, and their aggregation into the levels used below, please refer to the Investment Valuation section in the accompanying Notes to Financial Statements.
| | Valuation Inputs at Reporting Date: |
| Description | Total | Level 1 | Level 2 | Level 3 |
| Investments in Securities: | | | | |
| Equities: | | | | |
| Energy | $320,496 | $320,496 | $-- | $-- |
| Health Care | 4,650,883 | 4,650,883 | -- | -- |
| Industrials | 32,712,035 | 32,712,035 | -- | -- |
| Information Technology | 28,340,583 | 28,340,583 | -- | -- |
| Materials | 2,743,180 | 2,743,180 | -- | -- |
| Utilities | 25,360,816 | 20,790,995 | 4,569,821 | -- |
| Money Market Funds | 3,955,234 | 3,955,234 | -- | -- |
| Total Investments in Securities: | $98,083,227 | $93,513,406 | $4,569,821 | $-- |
See accompanying notes which are an integral part of the financial statements.
Fidelity® Water Sustainability Fund
Financial Statements
Statement of Assets and Liabilities
| | | May 31, 2022 |
| Assets | | |
Investment in securities, at value (including securities loaned of $3,758,757) — See accompanying schedule:
Unaffiliated issuers (cost $96,654,152) | $94,127,993 | |
| Fidelity Central Funds (cost $3,955,234) | 3,955,234 | |
| Total Investment in Securities (cost $100,609,386) | | $98,083,227 |
| Receivable for fund shares sold | | 23,974 |
| Dividends receivable | | 115,018 |
| Distributions receivable from Fidelity Central Funds | | 394 |
| Prepaid expenses | | 10 |
| Receivable from investment adviser for expense reductions | | 8,122 |
| Other receivables | | 2,295 |
| Total assets | | 98,233,040 |
| Liabilities | | |
| Payable for fund shares redeemed | $28,323 | |
| Accrued management fee | 52,253 | |
| Other affiliated payables | 27,216 | |
| Other payables and accrued expenses | 13,759 | |
| Collateral on securities loaned | 3,878,522 | |
| Total liabilities | | 4,000,073 |
| Net Assets | | $94,232,967 |
| Net Assets consist of: | | |
| Paid in capital | | $100,207,872 |
| Total accumulated earnings (loss) | | (5,974,905) |
| Net Assets | | $94,232,967 |
| Net Asset Value, offering price and redemption price per share ($94,232,967 ÷ 6,960,275 shares) | | $13.54 |
See accompanying notes which are an integral part of the financial statements.
Statement of Operations
| | | Year ended May 31, 2022 |
| Investment Income | | |
| Dividends | | $691,391 |
| Income from Fidelity Central Funds (including $1,014 from security lending) | | 2,056 |
| Total income | | 693,447 |
| Expenses | | |
| Management fee | $658,592 | |
| Transfer agent fees | 268,662 | |
| Accounting fees | 50,578 | |
| Custodian fees and expenses | 7,578 | |
| Independent trustees' fees and expenses | 304 | |
| Registration fees | 37,028 | |
| Audit | 60,849 | |
| Legal | 39 | |
| Miscellaneous | 342 | |
| Total expenses before reductions | 1,083,972 | |
| Expense reductions | (111,876) | |
| Total expenses after reductions | | 972,096 |
| Net investment income (loss) | | (278,649) |
| Realized and Unrealized Gain (Loss) | | |
| Net realized gain (loss) on: | | |
| Investment securities: | | |
| Unaffiliated issuers | (1,252,643) | |
| Foreign currency transactions | 51,226 | |
| Total net realized gain (loss) | | (1,201,417) |
| Change in net unrealized appreciation (depreciation) on: | | |
| Investment securities: | | |
| Unaffiliated issuers | (10,177,701) | |
| Assets and liabilities in foreign currencies | (324) | |
| Total change in net unrealized appreciation (depreciation) | | (10,178,025) |
| Net gain (loss) | | (11,379,442) |
| Net increase (decrease) in net assets resulting from operations | | $(11,658,091) |
See accompanying notes which are an integral part of the financial statements.
Statement of Changes in Net Assets
| | Year ended May 31, 2022 | Year ended May 31, 2021 |
| Increase (Decrease) in Net Assets | | |
| Operations | | |
| Net investment income (loss) | $(278,649) | $26,716 |
| Net realized gain (loss) | (1,201,417) | 243,463 |
| Change in net unrealized appreciation (depreciation) | (10,178,025) | 7,381,203 |
| Net increase (decrease) in net assets resulting from operations | (11,658,091) | 7,651,382 |
| Distributions to shareholders | (1,680,405) | (367,592) |
| Share transactions | | |
| Proceeds from sales of shares | 89,360,090 | 52,460,597 |
| Reinvestment of distributions | 1,573,631 | 346,063 |
| Cost of shares redeemed | (39,135,950) | (8,680,251) |
| Net increase (decrease) in net assets resulting from share transactions | 51,797,771 | 44,126,409 |
| Total increase (decrease) in net assets | 38,459,275 | 51,410,199 |
| Net Assets | | |
| Beginning of period | 55,773,692 | 4,363,493 |
| End of period | $94,232,967 | $55,773,692 |
| Other Information | | |
| Shares | | |
| Sold | 5,677,575 | 3,977,304 |
| Issued in reinvestment of distributions | 95,180 | 26,718 |
| Redeemed | (2,570,640) | (651,609) |
| Net increase (decrease) | 3,202,115 | 3,352,413 |
See accompanying notes which are an integral part of the financial statements.
Financial Highlights
Fidelity Water Sustainability Fund
| | | | |
| Years ended May 31, | 2022 | 2021 | 2020 A |
| Selected Per–Share Data | | | |
| Net asset value, beginning of period | $14.84 | $10.75 | $10.00 |
| Income from Investment Operations | | | |
| Net investment income (loss)B,C | (.04) | .01 | .02 |
| Net realized and unrealized gain (loss) | (1.02) | 4.28 | .73 |
| Total from investment operations | (1.06) | 4.29 | .75 |
| Distributions from net investment income | –D | (.02) | – |
| Distributions from net realized gain | (.24) | (.18) | – |
| Total distributions | (.24) | (.20) | – |
| Net asset value, end of period | $13.54 | $14.84 | $10.75 |
| Total ReturnE,F | (7.44)% | 40.20% | 7.50% |
| Ratios to Average Net AssetsC,G,H | | | |
| Expenses before reductions | 1.11% | 1.44% | 4.15%I,J |
| Expenses net of fee waivers, if any | 1.00% | 1.00% | .97%I,J,K |
| Expenses net of all reductions | 1.00% | .98% | .97%I,J,K |
| Net investment income (loss) | (.29)% | .11% | 1.39%I,J |
| Supplemental Data | | | |
| Net assets, end of period (000 omitted) | $94,233 | $55,774 | $4,363 |
| Portfolio turnover rateL | 55% | 95% | 13%M |
A For the period April 16, 2020 (commencement of operations) through May 31, 2020.
B Calculated based on average shares outstanding during the period.
C Net investment income (loss) is affected by the timing of the declaration of dividends by any underlying mutual funds or exchange-traded funds (ETFs). Net investment income (loss) of any such underlying funds is not included in the Fund's net investment income (loss) ratio.
D Amount represents less than $.005 per share.
E Total returns for periods of less than one year are not annualized.
F Total returns would have been lower if certain expenses had not been reduced during the applicable periods shown.
G Fees and expenses of any underlying mutual funds or exchange-traded funds (ETFs) are not included in the Fund's expense ratio. The Fund indirectly bears its proportionate share of these expenses. For additional expense information related to investments in Fidelity Central Funds, please refer to the "Investments in Fidelity Central Funds" note found in the Notes to Financial Statements section of the most recent Annual or Semi-Annual report.
H Expense ratios reflect operating expenses of the class. Expenses before reductions do not reflect amounts reimbursed, waived, or reduced through arrangements with the investment adviser, brokerage services, or other offset arrangements, if applicable, and do not represent the amount paid by the class during periods when reimbursements, waivers or reductions occur.
I Annualized
J The size and fluctuation of net assets and expense amounts may cause ratios to differ from contractual rates.
K Audit fees are not annualized.
L Amount does not include the portfolio activity of any underlying mutual funds or exchange-traded funds (ETFs).
M Amount not annualized.
See accompanying notes which are an integral part of the financial statements.
Notes to Financial Statements
For the period ended May 31, 2022
1. Organization.
Fidelity Agricultural Productivity Fund and Fidelity Water Sustainability Fund (the Funds) are non-diversified funds of Fidelity Summer Street Trust (the Trust). Each Fund is authorized to issue an unlimited number of shares. Share transactions on the Statement of Changes in Net Assets may contain exchanges between affiliated funds. The Trust is registered under the Investment Company Act of 1940, as amended (the 1940 Act), as an open-end management investment company organized as a Massachusetts business trust. Application of FMR's environmental, social, and governance (ESG) ratings process and/or its sustainable investing exclusion criteria may affect the Funds' exposure to certain issuers, sectors, regions, and countries and may affect the Funds' performance depending on whether certain investments are in or out of favor. The criteria related to the Funds' ESG ratings process and/or adherence to its sustainable investing exclusion criteria may result in the Funds forgoing opportunities to buy certain securities when it might otherwise be advantageous to do so, or selling securities for ESG reasons when it might be otherwise disadvantageous for it to do so. As a result, the Funds' performance may at times be better or worse than the performance of funds that do not use ESG or sustainability criteria. There are significant differences in interpretations of what it means for an issuer to have positive ESG factors. While the investment adviser believes its definitions are reasonable, the portfolio decisions it makes may differ with other investors' or advisers' views.
2. Investments in Fidelity Central Funds.
Funds may invest in Fidelity Central Funds, which are open-end investment companies generally available only to other investment companies and accounts managed by the investment adviser and its affiliates. The Schedule of Investments lists any Fidelity Central Funds held as an investment as of period end, but does not include the underlying holdings of each Fidelity Central Fund. An investing fund indirectly bears its proportionate share of the expenses of the underlying Fidelity Central Funds.
Based on its investment objective, each Fidelity Central Fund may invest or participate in various investment vehicles or strategies that are similar to those of the investing fund. These strategies are consistent with the investment objectives of the investing fund and may involve certain economic risks which may cause a decline in value of each of the Fidelity Central Funds and thus a decline in the value of the investing fund.
| Fidelity Central Fund | Investment Manager | Investment Objective | Investment Practices | Expense Ratio(a) |
| Fidelity Money Market Central Funds | Fidelity Management & Research Company LLC (FMR) | Each fund seeks to obtain a high level of current income consistent with the preservation of capital and liquidity. | Short-term Investments | Less than .005% |
(a) Expenses expressed as a percentage of average net assets and are as of each underlying Central Fund's most recent annual or semi-annual shareholder report.
A complete unaudited list of holdings for each Fidelity Central Fund is available upon request or at the Securities and Exchange Commission website at www.sec.gov. In addition, the financial statements of the Fidelity Central Funds which contain the significant accounting policies (including investment valuation policies) of those funds, and are not covered by the Report of Independent Registered Public Accounting Firm, are available on the Securities and Exchange Commission website or upon request.
3. Significant Accounting Policies.
Each Fund is an investment company and applies the accounting and reporting guidance of the Financial Accounting Standards Board (FASB) Accounting Standards Codification Topic 946 Financial Services - Investment Companies. The financial statements have been prepared in conformity with accounting principles generally accepted in the United States of America (GAAP), which require management to make certain estimates and assumptions at the date of the financial statements. Actual results could differ from those estimates. Subsequent events, if any, through the date that the financial statements were issued have been evaluated in the preparation of the financial statements. Each Fund's Schedule of Investments lists any underlying mutual funds or exchange-traded funds (ETFs) but does not include the underlying holdings of these funds. The following summarizes the significant accounting policies of each Fund:
Investment Valuation. Investments are valued as of 4:00 p.m. Eastern time on the last calendar day of the period. The Board of Trustees (the Board) has delegated the day to day responsibility for the valuation of each Fund's investments to the Fair Value Committee (the Committee) established by each Fund's investment adviser. In accordance with valuation policies and procedures approved by the Board, each Fund attempts to obtain prices from one or more third party pricing vendors or brokers to value its investments. When current market prices, quotations or currency exchange rates are not readily available or reliable, investments will be fair valued in good faith by the Committee, in accordance with procedures adopted by the Board. Factors used in determining fair value vary by investment type and may include market or investment specific events. The frequency with which these procedures are used cannot be predicted and they may be utilized to a significant extent. The Committee oversees each Fund's valuation policies and procedures and reports to the Board on the Committee's activities and fair value determinations. The Board monitors the appropriateness of the procedures used in valuing each Fund's investments and ratifies the fair value determinations of the Committee.
Each Fund categorizes the inputs to valuation techniques used to value its investments into a disclosure hierarchy consisting of three levels as shown below:
- Level 1 – unadjusted quoted prices in active markets for identical investments
- Level 2 – other significant observable inputs (including quoted prices for similar investments, interest rates, prepayment speeds, etc.)
- Level 3 – unobservable inputs (including the Fund's own assumptions based on the best information available)
Valuation techniques used to value each Fund's investments by major category are as follows:
Equity securities, including restricted securities, for which market quotations are readily available, are valued at the last reported sale price or official closing price as reported by a third party pricing vendor on the primary market or exchange on which they are traded and are categorized as Level 1 in the hierarchy. In the event there were no sales during the day or closing prices are not available, securities are valued at the last quoted bid price or may be valued using the last available price and are generally categorized as Level 2 in the hierarchy. For foreign equity securities, when market or security specific events arise, comparisons to the valuation of American Depositary Receipts (ADRs), futures contracts, ETFs and certain indexes as well as quoted prices for similar securities may be used and would be categorized as Level 2 in the hierarchy. For equity securities, including restricted securities, where observable inputs are limited, assumptions about market activity and risk are used and these securities may be categorized as Level 3 in the hierarchy.
Investments in open-end mutual funds, including the Fidelity Central Funds, are valued at their closing net asset value (NAV) each business day and are categorized as Level 1 in the hierarchy.
Changes in valuation techniques may result in transfers in or out of an assigned level within the disclosure hierarchy. The aggregate value of investments by input level as of May 31, 2022 is included at the end of each Fund's Schedule of Investments.
Foreign Currency. Certain Funds may use foreign currency contracts to facilitate transactions in foreign-denominated securities. Gains and losses from these transactions may arise from changes in the value of the foreign currency or if the counterparties do not perform under the contracts' terms.
Foreign-denominated assets, including investment securities, and liabilities are translated into U.S. dollars at the exchange rates at period end. Purchases and sales of investment securities, income and dividends received, and expenses denominated in foreign currencies are translated into U.S. dollars at the exchange rate in effect on the transaction date.
The effects of exchange rate fluctuations on investments are included with the net realized and unrealized gain (loss) on investment securities. Other foreign currency transactions resulting in realized and unrealized gain (loss) are disclosed separately.
Investment Transactions and Income. For financial reporting purposes, the Funds' investment holdings and NAV include trades executed through the end of the last business day of the period. The NAV per share for processing shareholder transactions is calculated as of the close of business of the New York Stock Exchange (NYSE), normally 4:00 p.m. Eastern time and includes trades executed through the end of the prior business day. Gains and losses on securities sold are determined on the basis of identified cost. Commissions paid to certain brokers with whom the investment adviser, or its affiliates, places trades on behalf of a fund include an amount in addition to trade execution, which may be rebated back to a fund. Any such rebates are included in net realized gain (loss) on investments in the Statement of Operations. Dividend income is recorded on the ex-dividend date, except for certain dividends from foreign securities where the ex-dividend date may have passed, which are recorded as soon as the Funds are informed of the ex-dividend date. Non-cash dividends included in dividend income, if any, are recorded at the fair market value of the securities received. Income and capital gain distributions from Fidelity Central Funds, if any, are recorded on the ex-dividend date. Large, non-recurring dividends recognized by the Funds are presented separately on the Statement of Operations as "Special Dividends" and the impact of these dividends is presented in the Financial Highlights. Investment income is recorded net of foreign taxes withheld where recovery of such taxes is uncertain. Funds may file withholding tax reclaims in certain jurisdictions to recover a portion of amounts previously withheld. Any withholding tax reclaims income is included in the Statement of Operations in dividends. Any receivables for withholding tax reclaims are included in the Statement of Assets and Liabilities in dividends receivable.
Expenses. Expenses directly attributable to a fund are charged to that fund. Expenses attributable to more than one fund are allocated among the respective funds on the basis of relative net assets or other appropriate methods. Expenses included in the accompanying financial statements reflect the expenses of that fund and do not include any expenses associated with any underlying mutual funds or exchange-traded funds. Although not included in a fund's expenses, a fund indirectly bears its proportionate share of these expenses through the net asset value of each underlying mutual fund or exchange-traded fund. Expense estimates are accrued in the period to which they relate and adjustments are made when actual amounts are known.
Income Tax Information and Distributions to Shareholders. Each year, each Fund intends to qualify as a regulated investment company under Subchapter M of the Internal Revenue Code, including distributing substantially all of its taxable income and realized gains. As a result, no provision for U.S. Federal income taxes is required. As of May 31, 2022, each Fund did not have any unrecognized tax benefits in the financial statements; nor is each Fund aware of any tax positions for which it is reasonably possible that the total amounts of unrecognized tax benefits will significantly change in the next twelve months. Each Fund files a U.S. federal tax return, in addition to state and local tax returns as required. Each Fund's federal income tax returns are subject to examination by the Internal Revenue Service (IRS) for a period of three fiscal years after they are filed. State and local tax returns may be subject to examination for an additional fiscal year depending on the jurisdiction. Foreign taxes are provided for based on each Fund's understanding of the tax rules and rates that exist in the foreign markets in which it invests.
Distributions are declared and recorded on the ex-dividend date. Income and capital gain distributions are determined in accordance with income tax regulations, which may differ from GAAP. In addition, the Funds claimed a portion of the payment made to redeeming shareholders as a distribution for income tax purposes.
Capital accounts within the financial statements are adjusted for permanent book-tax differences. These adjustments have no impact on net assets or the results of operations. Capital accounts are not adjusted for temporary book-tax differences which will reverse in a subsequent period.
Book-tax differences are primarily due to foreign currency transactions, net operating losses, capital loss carryforwards and losses deferred due to wash sales and excise tax regulations.
As of period end, the cost and unrealized appreciation (depreciation) in securities, and derivatives if applicable, for federal income tax purposes were as follows for each Fund:
| | Tax cost | Gross unrealized appreciation | Gross unrealized depreciation | Net unrealized appreciation (depreciation) |
| Fidelity Agricultural Productivity Fund | $152,646,245 | $21,908,057 | $(7,737,752) | $14,170,305 |
| Fidelity Water Sustainability Fund | 100,917,027 | 5,273,560 | (8,107,360) | (2,833,800) |
The tax-based components of distributable earnings as of period end were as follows for each Fund:
| | Undistributed ordinary income | Capital loss carryforward | Net unrealized appreciation (depreciation) on securities and other investments |
| Fidelity Agricultural Productivity Fund | $383,302 | $(2,800,265) | 14,170,108 |
| Fidelity Water Sustainability Fund | – | – | (2,834,066) |
Capital loss carryforwards are only available to offset future capital gains of the Funds to the extent provided by regulations and may be limited. The capital loss carryforward information presented below, including any applicable limitation, is estimated as of fiscal period end and is subject to adjustment.
| | Short-term |
| Fidelity Agricultural Productivity Fund | $(2,800,265) |
Certain of the Funds intend to elect to defer to the next fiscal year capital losses recognized during the period November 1, 2021 to May 31, 2022 and ordinary losses recognized during the period January 1, 2022 to May 31, 2022. Loss deferrals were as follows:
| | Capital losses | Ordinary losses |
| Fidelity Water Sustainability Fund | $(3,044,659) | $(96,180) |
The tax character of distributions paid was as follows:
| May 31, 2022 | | | |
| | Ordinary Income | Long-term Capital Gains | Total |
| Fidelity Agricultural Productivity Fund | $407,469 | $– | $407,469 |
| Fidelity Water Sustainability Fund | 1,054,020 | 626,386 | 1,680,406 |
| May 31, 2021 | |
| | Ordinary Income |
| Fidelity Agricultural Productivity Fund | $48,567 |
| Fidelity Water Sustainability Fund | 367,592 |
4. Purchases and Sales of Investments.
Purchases and sales of securities, other than short-term securities and in-kind transactions, as applicable, are noted in the table below.
| | Purchases ($) | Sales ($) |
| Fidelity Agricultural Productivity Fund | 139,153,024 | 38,100,704 |
| Fidelity Water Sustainability Fund | 102,602,242 | 52,402,453 |
5. Fees and Other Transactions with Affiliates.
Management Fee. Fidelity Management & Research Company LLC (the investment adviser) and its affiliates provide the Funds with investment management related services for which the Funds pay a monthly management fee. The management fee is the sum of an individual fund fee rate and an annualized group fee rate. The individual fund fee rate is applied to each Fund's average net assets. The group fee rate is based upon the monthly average net assets of a group of registered investment companies with which the investment adviser has management contracts. The group fee rate decreases as assets under management increase and increases as assets under management decrease. For the reporting period, each Fund's annual management fee rate expressed as a percentage of each Fund's average net assets was as follows:
| | Individual Rate | Group Rate | Total |
| Fidelity Agricultural Productivity Fund | .45% | .22% | .68% |
| Fidelity Water Sustainability Fund | .45% | .22% | .68% |
Transfer Agent Fees. Fidelity Investments Institutional Operations Company LLC (FIIOC), an affiliate of the investment adviser, is the Funds' transfer, dividend disbursing and shareholder servicing agent. FIIOC receives account fees and asset-based fees that vary according to account size and type of account. FIIOC pays for typesetting, printing and mailing of shareholder reports, except proxy statements. For the period, transfer agent fees were equivalent to the following annual rates expressed as a percentage of average net assets:
| Fidelity Agricultural Productivity Fund | .26% |
| Fidelity Water Sustainability Fund | .28% |
Accounting Fees. Fidelity Service Company, Inc. (FSC), an affiliate of the investment adviser, maintains each Fund's accounting records. The accounting fee is based on the level of average net assets for each month. For the period, the fees were equivalent to the following annual rates:
| | % of Average Net Assets |
| Fidelity Agricultural Productivity Fund | .05 |
| Fidelity Water Sustainability Fund | .05 |
Brokerage Commissions. A portion of portfolio transactions were placed with brokerage firms which are affiliates of the investment adviser. Brokerage commissions are included in net realized gain (loss) and change in net unrealized appreciation (depreciation) in the Statement of Operations. The commissions paid to these affiliated firms were as follows:
| | Amount |
| Fidelity Agricultural Productivity Fund | $548 |
| Fidelity Water Sustainability Fund | 1,131 |
Interfund Trades. Funds may purchase from or sell securities to other Fidelity Funds under procedures adopted by the Board. The procedures have been designed to ensure these interfund trades are executed in accordance with Rule 17a-7 of the 1940 Act. Any interfund trades are included within the respective purchases and sales amounts shown in the Purchases and Sales of Investments note. Interfund trades during the period are noted in the table below.
| | Purchases ($) | Sales ($) | Realized Gain (Loss) ($) |
| Fidelity Agricultural Productivity Fund | 3,706,839 | 2,857,143 | (296,999) |
| Fidelity Water Sustainability Fund | 1,991,137 | 545,027 | (47,702) |
6. Committed Line of Credit.
Certain Funds participate with other funds managed by the investment adviser or an affiliate in a $4.25 billion credit facility (the "line of credit") to be utilized for temporary or emergency purposes to fund shareholder redemptions or for other short-term liquidity purposes. The participating funds have agreed to pay commitment fees on their pro-rata portion of the line of credit, which are reflected in Miscellaneous expenses on the Statement of Operations, and are listed below. During the period, there were no borrowings on this line of credit.
| | Amount |
| Fidelity Agricultural Productivity Fund | $91 |
| Fidelity Water Sustainability Fund | 144 |
7. Security Lending.
Funds lend portfolio securities from time to time in order to earn additional income. Lending agents are used, including National Financial Services (NFS), an affiliate of the investment adviser. Pursuant to a securities lending agreement, NFS will receive a fee, which is capped at 9.9% of a fund's daily lending revenue, for its services as lending agent. A fund may lend securities to certain qualified borrowers, including NFS. On the settlement date of the loan, a fund receives collateral (in the form of U.S. Treasury obligations, letters of credit and/or cash) against the loaned securities and maintains collateral in an amount not less than 100% of the market value of the loaned securities during the period of the loan. The market value of the loaned securities is determined at the close of business of a fund and any additional required collateral is delivered to a fund on the next business day. A fund or borrower may terminate the loan at any time, and if the borrower defaults on its obligation to return the securities loaned because of insolvency or other reasons, a fund may apply collateral received from the borrower against the obligation. A fund may experience delays and costs in recovering the securities loaned. Any cash collateral received is invested in the Fidelity Securities Lending Cash Central Fund. Any loaned securities are identified as such in the Schedule of Investments, and the value of loaned securities and cash collateral at period end, as applicable, are presented in the Statement of Assets and Liabilities. Security lending income represents the income earned on investing cash collateral, less rebates paid to borrowers and any lending agent fees associated with the loan, plus any premium payments received for lending certain types of securities. Security lending income is presented in the Statement of Operations as a component of income from Fidelity Central Funds. Affiliated security lending activity, if any, was as follows:
| | Total Security Lending Fees Paid to NFS | Security Lending Income From Securities Loaned to NFS | Value of Securities Loaned to NFS at Period End |
| Fidelity Agricultural Productivity Fund | $154 | $– | $– |
| Fidelity Water Sustainability Fund | $100 | $– | $– |
8. Expense Reductions.
The investment adviser contractually agreed to reimburse expenses of each Fund to the extent annual operating expenses exceeded certain levels of average net assets as noted in the table below. Some expenses, for example the compensation of the independent Trustees, and certain miscellaneous expenses such as proxy and shareholder meeting expenses, are excluded from this reimbursement.
The following Funds were in reimbursement during the period:
| | Expense Limitations | Reimbursement |
| Fidelity Agricultural Productivity Fund | 1.00% | $118,532 |
| Fidelity Water Sustainability Fund | 1.00% | $109,141 |
In addition, during the period the investment adviser or an affiliate reimbursed and/or waived a portion of operating expenses as follows:
| | Amount |
| Fidelity Agricultural Productivity Fund | $1,740 |
| Fidelity Water Sustainability Fund | 2,735 |
Effective June 1, 2022, the investment adviser contractually agreed to reimburse expenses of each Fund to the extent annual operating expenses exceeded certain levels of average net assets as noted in the table below. This reimbursement will remain in place through September 30, 2023. Some expenses, for example the compensation of the independent Trustees, and certain miscellaneous expenses such as proxy and shareholder meeting expenses, are excluded from this reimbursement.
| | Expense Limitations |
| Fidelity Agricultural Productivity Fund | .95% |
| Fidelity Water Sustainability Fund | .95% |
9. Other.
A fund's organizational documents provide former and current trustees and officers with a limited indemnification against liabilities arising in connection with the performance of their duties to the fund. In the normal course of business, a fund may also enter into contracts that provide general indemnifications. A fund's maximum exposure under these arrangements is unknown as this would be dependent on future claims that may be made against a fund. The risk of material loss from such claims is considered remote.
10. Coronavirus (COVID-19) Pandemic.
An outbreak of COVID-19 first detected in China during December 2019 has since spread globally and was declared a pandemic by the World Health Organization during March 2020. Developments that disrupt global economies and financial markets, such as the COVID-19 pandemic, may magnify factors that affect the Funds' performance.
Report of Independent Registered Public Accounting Firm
To the Board of Trustees of Fidelity Summer Street Trust and Shareholders of Fidelity Agricultural Productivity Fund and Fidelity Water Sustainability Fund
Opinion on the Financial Statements and Financial Highlights
We have audited the accompanying statements of assets and liabilities of Fidelity Agricultural Productivity Fund and Fidelity Water Sustainability Fund (the "Funds"), each a fund of Fidelity Summer Street Trust, including the schedules of investments, as of May 31, 2022, the related statements of operations for the year then ended, the statements of changes in net assets for each of the two years in the period then ended, the financial highlights for each of the two years in the period then ended and for the period from April 16, 2020 (commencement of operations) through May 31, 2020, and the related notes. In our opinion, the financial statements and financial highlights present fairly, in all material respects, the financial position of the Funds as of May 31, 2022, and the results of their operations for the year then ended, the changes in their net assets for each of the two years in the period then ended, and the financial highlights for each of the two years in the period then ended and for the period from April 16,2020 (commencement of operations) through May 31, 2020, in conformity with accounting principles generally accepted in the United States of America.
Basis for Opinion
These financial statements and financial highlights are the responsibility of the Funds’ management. Our responsibility is to express an opinion on the Funds’ financial statements and financial highlights based on our audits. We are a public accounting firm registered with the Public Company Accounting Oversight Board (United States) (PCAOB) and are required to be independent with respect to the Funds in accordance with the U.S. federal securities laws and the applicable rules and regulations of the Securities and Exchange Commission and the PCAOB.
We conducted our audits in accordance with the standards of the PCAOB. Those standards require that we plan and perform the audit to obtain reasonable assurance about whether the financial statements and financial highlights are free of material misstatement, whether due to error or fraud. The Funds are not required to have, nor were we engaged to perform, an audit of their internal control over financial reporting. As part of our audits we are required to obtain an understanding of internal control over financial reporting but not for the purpose of expressing an opinion on the effectiveness of the Funds’ internal control over financial reporting. Accordingly, we express no such opinion.
Our audits included performing procedures to assess the risks of material misstatement of the financial statements and financial highlights, whether due to error or fraud, and performing procedures that respond to those risks. Such procedures included examining, on a test basis, evidence regarding the amounts and disclosures in the financial statements and financial highlights. Our audits also included evaluating the accounting principles used and significant estimates made by management, as well as evaluating the overall presentation of the financial statements and financial highlights. Our procedures included confirmation of securities owned as of May 31, 2022, by correspondence with the custodian and brokers; when replies were not received from brokers, we performed other auditing procedures. We believe that our audits provide a reasonable basis for our opinion.
/s/ Deloitte & Touche LLP
Boston, Massachusetts
July 15, 2022
We have served as the auditor of one or more of the Fidelity investment companies since 1999.
Trustees and Officers
The Trustees, Members of the Advisory Board (if any), and officers of the trust and funds, as applicable, are listed below. The Board of Trustees governs each fund and is responsible for protecting the interests of shareholders. The Trustees are experienced executives who meet periodically throughout the year to oversee each fund's activities, review contractual arrangements with companies that provide services to each fund, oversee management of the risks associated with such activities and contractual arrangements, and review each fund's performance. Each of the Trustees oversees 325 funds.
The Trustees hold office without limit in time except that (a) any Trustee may resign; (b) any Trustee may be removed by written instrument, signed by at least two-thirds of the number of Trustees prior to such removal; (c) any Trustee who requests to be retired or who has become incapacitated by illness or injury may be retired by written instrument signed by a majority of the other Trustees; and (d) any Trustee may be removed at any special meeting of shareholders by a two-thirds vote of the outstanding voting securities of the trust. Each Trustee who is not an interested person (as defined in the 1940 Act) of the trust and the funds is referred to herein as an Independent Trustee. Each Independent Trustee shall retire not later than the last day of the calendar year in which his or her 75th birthday occurs. The Independent Trustees may waive this mandatory retirement age policy with respect to individual Trustees. Officers and Advisory Board Members hold office without limit in time, except that any officer or Advisory Board Member may resign or may be removed by a vote of a majority of the Trustees at any regular meeting or any special meeting of the Trustees. Except as indicated, each individual has held the office shown or other offices in the same company for the past five years.
Each fund’s Statement of Additional Information (SAI) includes more information about the Trustees. To request a free copy, call Fidelity at 1-800-544-8544.
Experience, Skills, Attributes, and Qualifications of the Trustees. The Governance and Nominating Committee has adopted a statement of policy that describes the experience, qualifications, attributes, and skills that are necessary and desirable for potential Independent Trustee candidates (Statement of Policy). The Board believes that each Trustee satisfied at the time he or she was initially elected or appointed a Trustee, and continues to satisfy, the standards contemplated by the Statement of Policy. The Governance and Nominating Committee also engages professional search firms to help identify potential Independent Trustee candidates who have the experience, qualifications, attributes, and skills consistent with the Statement of Policy. From time to time, additional criteria based on the composition and skills of the current Independent Trustees, as well as experience or skills that may be appropriate in light of future changes to board composition, business conditions, and regulatory or other developments, have also been considered by the professional search firms and the Governance and Nominating Committee. In addition, the Board takes into account the Trustees' commitment and participation in Board and committee meetings, as well as their leadership of standing and ad hoc committees throughout their tenure.
In determining that a particular Trustee was and continues to be qualified to serve as a Trustee, the Board has considered a variety of criteria, none of which, in isolation, was controlling. The Board believes that, collectively, the Trustees have balanced and diverse experience, qualifications, attributes, and skills, which allow the Board to operate effectively in governing each fund and protecting the interests of shareholders. Information about the specific experience, skills, attributes, and qualifications of each Trustee, which in each case led to the Board's conclusion that the Trustee should serve (or continue to serve) as a trustee of the funds, is provided below.
Board Structure and Oversight Function. Robert A. Lawrence is an interested person and currently serves as Chair. The Trustees have determined that an interested Chair is appropriate and benefits shareholders because an interested Chair has a personal and professional stake in the quality and continuity of services provided to the funds. Independent Trustees exercise their informed business judgment to appoint an individual of their choosing to serve as Chair, regardless of whether the Trustee happens to be independent or a member of management. The Independent Trustees have determined that they can act independently and effectively without having an Independent Trustee serve as Chair and that a key structural component for assuring that they are in a position to do so is for the Independent Trustees to constitute a substantial majority for the Board. The Independent Trustees also regularly meet in executive session. David M. Thomas serves as Lead Independent Trustee and as such (i) acts as a liaison between the Independent Trustees and management with respect to matters important to the Independent Trustees and (ii) with management prepares agendas for Board meetings.
Fidelity® funds are overseen by different Boards of Trustees. The funds' Board oversees Fidelity's high income and certain equity funds, and other Boards oversee Fidelity's investment-grade bond, money market, asset allocation, and other equity funds. The asset allocation funds may invest in Fidelity® funds overseen by the funds' Board. The use of separate Boards, each with its own committee structure, allows the Trustees of each group of Fidelity® funds to focus on the unique issues of the funds they oversee, including common research, investment, and operational issues. On occasion, the separate Boards establish joint committees to address issues of overlapping consequences for the Fidelity® funds overseen by each Board.
The Trustees operate using a system of committees to facilitate the timely and efficient consideration of all matters of importance to the Trustees, each fund, and fund shareholders and to facilitate compliance with legal and regulatory requirements and oversight of the funds' activities and associated risks. The Board, acting through its committees, has charged FMR and its affiliates with (i) identifying events or circumstances the occurrence of which could have demonstrably adverse effects on the funds' business and/or reputation; (ii) implementing processes and controls to lessen the possibility that such events or circumstances occur or to mitigate the effects of such events or circumstances if they do occur; and (iii) creating and maintaining a system designed to evaluate continuously business and market conditions in order to facilitate the identification and implementation processes described in (i) and (ii) above. Because the day-to-day operations and activities of the funds are carried out by or through FMR, its affiliates, and other service providers, the funds' exposure to risks is mitigated but not eliminated by the processes overseen by the Trustees. While each of the Board's committees has responsibility for overseeing different aspects of the funds' activities, oversight is exercised primarily through the Operations, Audit, and Compliance Committees. Appropriate personnel, including but not limited to the funds' Chief Compliance Officer (CCO), FMR's internal auditor, the independent accountants, the funds' Treasurer and portfolio management personnel, make periodic reports to the Board's committees, as appropriate, including an annual review of Fidelity's risk management program for the Fidelity® funds. The responsibilities of each standing committee, including their oversight responsibilities, are described further under "Standing Committees of the Trustees."
Interested Trustees*:
Correspondence intended for a Trustee who is an interested person may be sent to Fidelity Investments, 245 Summer Street, Boston, Massachusetts 02210.
Name, Year of Birth; Principal Occupations and Other Relevant Experience+
Bettina Doulton (1964)
Year of Election or Appointment: 2020
Trustee
Ms. Doulton also serves as Trustee of other Fidelity® funds. Prior to her retirement, Ms. Doulton served in a variety of positions at Fidelity Investments, including as a managing director of research (2006-2007), portfolio manager to certain Fidelity® funds (1993-2005), equity analyst and portfolio assistant (1990-1993), and research assistant (1987-1990). Ms. Doulton currently owns and operates Phi Builders + Architects and Cellardoor Winery. Previously, Ms. Doulton served as a member of the Board of Brown Capital Management, LLC (2014-2018).
Robert A. Lawrence (1952)
Year of Election or Appointment: 2020
Trustee
Chair of the Board of Trustees
Mr. Lawrence also serves as Trustee of other funds. Previously, Mr. Lawrence served as a Trustee and Member of the Advisory Board of certain funds. Prior to his retirement in 2008, Mr. Lawrence served as Vice President of certain Fidelity® funds (2006-2008), Senior Vice President, Head of High Income Division of Fidelity Management & Research Company (investment adviser firm, 2006-2008), and President of Fidelity Strategic Investments (investment adviser firm, 2002-2005).
* Determined to be an “Interested Trustee” by virtue of, among other things, his or her affiliation with the trust or various entities under common control with FMR.
+ The information includes the Trustee's principal occupation during the last five years and other information relating to the experience, attributes, and skills relevant to the Trustee's qualifications to serve as a Trustee, which led to the conclusion that the Trustee should serve as a Trustee for each fund.
Independent Trustees:
Correspondence intended for an Independent Trustee may be sent to Fidelity Investments, P.O. Box 55235, Boston, Massachusetts 02205-5235.
Name, Year of Birth; Principal Occupations and Other Relevant Experience+
Thomas P. Bostick (1956)
Year of Election or Appointment: 2021
Trustee
Lieutenant General Bostick also serves as Trustee of other Fidelity® funds. Prior to his retirement, General Bostick (United States Army, Retired) held a variety of positions within the U.S. Army, including Commanding General and Chief of Engineers, U.S. Army Corps of Engineers (2012-2016) and Deputy Chief of Staff and Director of Human Resources, U.S. Army (2009-2012). General Bostick currently serves as a member of the Board and Finance and Governance Committees of CSX Corporation (transportation, 2020-present) and a member of the Board and Corporate Governance and Nominating Committee of Perma-Fix Environmental Services, Inc. (nuclear waste management, 2020-present). General Bostick serves as Chief Executive Officer of Bostick Global Strategies, LLC (consulting, 2016-present) and as a member of the Board of HireVue, Inc. (video interview and assessment, 2020-present). Previously, General Bostick served as a Member of the Advisory Board of certain Fidelity® funds (2021), President, Intrexon Bioengineering (2018-2020) and Chief Operating Officer (2017-2020) and Senior Vice President of the Environment Sector (2016-2017) of Intrexon Corporation (biopharmaceutical company).
Dennis J. Dirks (1948)
Year of Election or Appointment: 2005
Trustee
Mr. Dirks also serves as Trustee of other Fidelity® funds. Prior to his retirement in May 2003, Mr. Dirks served as Chief Operating Officer and as a member of the Board of The Depository Trust & Clearing Corporation (financial markets infrastructure), President, Chief Operating Officer and a member of the Board of The Depository Trust Company (DTC), President and a member of the Board of the National Securities Clearing Corporation (NSCC), Chief Executive Officer and a member of the Board of the Government Securities Clearing Corporation and Chief Executive Officer and a member of the Board of the Mortgage-Backed Securities Clearing Corporation. Mr. Dirks currently serves as a member of the Finance Committee (2016-present) and Board (2017-present) and is Treasurer (2018-present) of the Asolo Repertory Theatre.
Donald F. Donahue (1950)
Year of Election or Appointment: 2018
Trustee
Mr. Donahue also serves as Trustee of other Fidelity® funds. Mr. Donahue serves as President and Chief Executive Officer of Miranda Partners, LLC (risk consulting for the financial services industry, 2012-present). Previously, Mr. Donahue served as Chief Executive Officer (2006-2012), Chief Operating Officer (2003-2006) and Managing Director, Customer Marketing and Development (1999-2003) of The Depository Trust & Clearing Corporation (financial markets infrastructure). Mr. Donahue currently serves as a member (2007-present) and Co-Chairman (2016-present) of the Board of United Way of New York and a member of the Board of The Leadership Academy (previously NYC Leadership Academy) (2012-present). Mr. Donahue previously served as a member of the Advisory Board of certain Fidelity® funds (2015-2018).
Vicki L. Fuller (1957)
Year of Election or Appointment: 2020
Trustee
Ms. Fuller also serves as Trustee of other Fidelity® funds. Previously, Ms. Fuller served as a member of the Advisory Board of certain Fidelity® funds (2018-2020), Chief Investment Officer of the New York State Common Retirement Fund (2012-2018) and held a variety of positions at AllianceBernstein L.P. (global asset management, 1985-2012), including Managing Director (2006-2012) and Senior Vice President and Senior Portfolio Manager (2001-2006). Ms. Fuller currently serves as a member of the Board, Audit Committee and Nominating and Governance Committee of two Blackstone business development companies (2020-present), as a member of the Board of Treliant, LLC (consulting, 2019-present), as a member of the Advisory Board of Ariel Alternatives, LLC (private equity, 2021-present) and as a member of the Board and Chair of the Audit Committee of Gusto, Inc. (software, 2021-present). In addition, Ms. Fuller currently serves as a member of the Board of Roosevelt University (2019-present) and as a member of the Executive Board of New York University’s Stern School of Business. Ms. Fuller previously served as a member of the Board, Audit Committee and Nominating and Governance Committee of The Williams Companies, Inc. (natural gas infrastructure, 2018-2021).
Patricia L. Kampling (1959)
Year of Election or Appointment: 2020
Trustee
Ms. Kampling also serves as Trustee of other Fidelity® funds. Prior to her retirement, Ms. Kampling served as Chairman of the Board and Chief Executive Officer (2012-2019), President and Chief Operating Officer (2011-2012) and Executive Vice President and Chief Financial Officer (2010-2011) of Alliant Energy Corporation. Ms. Kampling currently serves as a member of the Board, Finance Committee and Governance, Compensation and Nominating Committee of Xcel Energy Inc. (utilities company, 2020-present) and as a member of the Board, Audit, Finance and Risk Committee and Safety, Environmental, Technology and Operations Committee and Chair of the Executive Development and Compensation Committee of American Water Works Company, Inc. (utilities company, 2019-present). In addition, Ms. Kampling currently serves as a member of the Board of the Nature Conservancy, Wisconsin Chapter (2019-present). Previously, Ms. Kampling served as a Member of the Advisory Board of certain Fidelity® funds (2020), a member of the Board, Compensation Committee and Executive Committee and Chair of the Audit Committee of Briggs & Stratton Corporation (manufacturing, 2011-2021), a member of the Board of Interstate Power and Light Company (2012-2019) and Wisconsin Power and Light Company (2012-2019) (each a subsidiary of Alliant Energy Corporation) and as a member of the Board and Workforce Development Committee of the Business Roundtable (2018-2019).
Thomas A. Kennedy (1955)
Year of Election or Appointment: 2021
Trustee
Mr. Kennedy also serves as Trustee of other Fidelity® funds. Previously, Mr. Kennedy served as a Member of the Advisory Board of certain Fidelity® funds (2020) and held a variety of positions at Raytheon Company (aerospace and defense, 1983-2020), including Chairman and Chief Executive Officer (2014-2020) and Executive Vice President and Chief Operating Officer (2013-2014). Mr. Kennedy currently serves as Executive Chairman of the Board of Directors of Raytheon Technologies Corporation (aerospace and defense, 2020-present). He is also a member of the Rutgers School of Engineering Industry Advisory Board (2011-present) and a member of the UCLA Engineering Dean’s Executive Board (2016-present).
Oscar Munoz (1959)
Year of Election or Appointment: 2021
Trustee
Mr. Munoz also serves as Trustee of other Fidelity® funds. Prior to his retirement, Mr. Munoz served as Executive Chairman (2020-2021), Chief Executive Officer (2015-2020), President (2015-2016) and a member of the Board (2010-2021) of United Airlines Holdings, Inc. Mr. Munoz currently serves as a member of the Board of CBRE Group, Inc. (commercial real estate, 2020-present), a member of the Board of Univision Communications, Inc. (Hispanic media, 2020-present) and a member of the Advisory Board of Salesforce.com, Inc. (cloud-based software, 2020-present). Previously, Mr. Munoz served as a Member of the Advisory Board of certain Fidelity® funds (2021).
Garnett A. Smith (1947)
Year of Election or Appointment: 2018
Trustee
Mr. Smith also serves as Trustee of other Fidelity® funds. Prior to his retirement, Mr. Smith served as Chairman and Chief Executive Officer (1990-1997) and President (1986-1990) of Inbrand Corp. (manufacturer of personal absorbent products). Prior to his employment with Inbrand Corp., he was employed by a retail fabric chain and North Carolina National Bank (now Bank of America). Mr. Smith previously served as a member of the Advisory Board of certain Fidelity® funds (2012-2013).
David M. Thomas (1949)
Year of Election or Appointment: 2008
Trustee
Lead Independent Trustee
Mr. Thomas also serves as Trustee of other Fidelity® funds. Previously, Mr. Thomas served as Executive Chairman (2005-2006) and Chairman and Chief Executive Officer (2000-2005) of IMS Health, Inc. (pharmaceutical and healthcare information solutions). Mr. Thomas currently serves as a member of the Board of Fortune Brands Home and Security (home and security products, 2004-present) and as Director (2013-present) and Non-Executive Chairman of the Board (2022-present) of Interpublic Group of Companies, Inc. (marketing communication).
Susan Tomasky (1953)
Year of Election or Appointment: 2020
Trustee
Ms. Tomasky also serves as Trustee of other Fidelity® funds. Prior to her retirement, Ms. Tomasky served in various executive officer positions at American Electric Power Company, Inc. (1998-2011), including most recently as President of AEP Transmission (2007-2011). Ms. Tomasky currently serves as a member of the Board and Sustainability Committee and as Chair of the Audit Committee of Marathon Petroleum Corporation (2018-present) and as a member of the Board, Executive Committee, Corporate Governance Committee and Organization and Compensation Committee and as Chair of the Audit Committee of Public Service Enterprise Group, Inc. (utilities company, 2012-present) and as a member of the Board of its subsidiary company, Public Service Electric and Gas Co. (2021-present). In addition, Ms. Tomasky currently serves as a member (2009-present) and President (2020-present) of the Board of the Royal Shakespeare Company – America (2009-present), as a member of the Board of the Columbus Association for the Performing Arts (2011-present) and as a member of the Board and Kenyon in the World Committee of Kenyon College (2016-present). Previously, Ms. Tomasky served as a Member of the Advisory Board of certain Fidelity® funds (2020), as a member of the Board of the Columbus Regional Airport Authority (2007-2020), as a member of the Board (2011-2018) and Lead Independent Director (2015-2018) of Andeavor Corporation (previously Tesoro Corporation) (independent oil refiner and marketer) and as a member of the Board of Summit Midstream Partners LP (energy, 2012-2018).
Michael E. Wiley (1950)
Year of Election or Appointment: 2018
Trustee
Mr. Wiley also serves as Trustee of other Fidelity® funds. Previously, Mr. Wiley served as a member of the Advisory Board of certain Fidelity® funds (2018-2020), Chairman, President and CEO of Baker Hughes, Inc. (oilfield services, 2000-2004). Mr. Wiley also previously served as a member of the Board of Andeavor Corporation (independent oil refiner and marketer, 2005-2018), a member of the Board of Andeavor Logistics LP (natural resources logistics, 2015-2018) and a member of the Board of High Point Resources (exploration and production, 2005-2020).
+ The information includes the Trustee's principal occupation during the last five years and other information relating to the experience, attributes, and skills relevant to the Trustee's qualifications to serve as a Trustee, which led to the conclusion that the Trustee should serve as a Trustee for each fund.
Advisory Board Members and Officers:
Correspondence intended for a Member of the Advisory Board (if any) may be sent to Fidelity Investments, P.O. Box 55235, Boston, Massachusetts 02205-5235. Correspondence intended for an officer or Peter S. Lynch may be sent to Fidelity Investments, 245 Summer Street, Boston, Massachusetts 02210. Officers appear below in alphabetical order.
Name, Year of Birth; Principal Occupation
Peter S. Lynch (1944)
Year of Election or Appointment: 2003
Member of the Advisory Board
Mr. Lynch also serves as a Member of the Advisory Board of other Fidelity® funds. Mr. Lynch is Vice Chairman and a Director of Fidelity Management & Research Company LLC (investment adviser firm). In addition, Mr. Lynch serves as a Trustee of Boston College and as the Chairman of the Inner-City Scholarship Fund. Previously, Mr. Lynch served as Vice Chairman and a Director of FMR Co., Inc. (investment adviser firm) and on the Special Olympics International Board of Directors (1997-2006).
Craig S. Brown (1977)
Year of Election or Appointment: 2019
Assistant Treasurer
Mr. Brown also serves as an officer of other funds. Mr. Brown serves as Assistant Treasurer of FIMM, LLC (2021-present) and is an employee of Fidelity Investments (2013-present).
John J. Burke III (1964)
Year of Election or Appointment: 2018
Chief Financial Officer
Mr. Burke also serves as Chief Financial Officer of other funds. Mr. Burke serves as Head of Investment Operations for Fidelity Fund and Investment Operations (2018-present) and is an employee of Fidelity Investments (1998-present). Previously Mr. Burke served as head of Asset Management Investment Operations (2012-2018).
William C. Coffey (1969)
Year of Election or Appointment: 2019
Assistant Secretary
Mr. Coffey also serves as Assistant Secretary of other funds. He is Senior Vice President and Deputy General Counsel of FMR LLC (diversified financial services company, 2010-present), and is an employee of Fidelity Investments. Previously, Mr. Coffey served as Secretary and CLO of certain funds (2018-2019); CLO, Secretary, and Senior Vice President of Fidelity Management & Research Company and FMR Co., Inc. (investment adviser firms, 2018-2019); Secretary of Fidelity SelectCo, LLC and Fidelity Investments Money Management, Inc. (investment adviser firms, 2018-2019); CLO of Fidelity Management & Research (Hong Kong) Limited, FMR Investment Management (UK) Limited, and Fidelity Management & Research (Japan) Limited (investment adviser firms, 2018-2019); and Assistant Secretary of certain funds (2009-2018).
Timothy M. Cohen (1969)
Year of Election or Appointment: 2018
Vice President
Mr. Cohen also serves as Vice President of other funds. Mr. Cohen serves as Co-Head of Equity (2018-present), a Director of Fidelity Management & Research (Japan) Limited (investment adviser firm, 2016-present), and is an employee of Fidelity Investments. Previously, Mr. Cohen served as Executive Vice President of Fidelity SelectCo, LLC (2019), Head of Global Equity Research (2016-2018), Chief Investment Officer - Equity and a Director of Fidelity Management & Research (U.K.) Inc. (investment adviser firm, 2013-2015) and as a Director of Fidelity Management & Research (Hong Kong) Limited (investment adviser firm, 2017).
Jonathan Davis (1968)
Year of Election or Appointment: 2010
Assistant Treasurer
Mr. Davis also serves as an officer of other funds. Mr. Davis serves as Assistant Treasurer of FIMM, LLC (2021-present), FMR Capital, Inc. (2017-present), FD Funds GP LLC (2021-present), FD Funds Holding LLC (2021-present), and FD Funds Management LLC (2021-present); and is an employee of Fidelity Investments. Previously, Mr. Davis served as Vice President and Associate General Counsel of FMR LLC (diversified financial services company, 2003-2010).
Laura M. Del Prato (1964)
Year of Election or Appointment: 2018
Assistant Treasurer
Ms. Del Prato also serves as an officer of other funds. Ms. Del Prato serves as Assistant Treasurer of FIMM, LLC (2021-present) and is an employee of Fidelity Investments (2017-present). Previously, Ms. Del Prato served as President and Treasurer of The North Carolina Capital Management Trust: Cash Portfolio and Term Portfolio (2018-2020). Prior to joining Fidelity Investments, Ms. Del Prato served as a Managing Director and Treasurer of the JPMorgan Mutual Funds (2014-2017). Prior to JPMorgan, Ms. Del Prato served as a partner at Cohen Fund Audit Services (accounting firm, 2012-2013) and KPMG LLP (accounting firm, 2004-2012).
Colm A. Hogan (1973)
Year of Election or Appointment: 2020
Assistant Treasurer
Mr. Hogan also serves as an officer of other funds. Mr. Hogan serves as Assistant Treasurer of FIMM, LLC (2021-present) and FMR Capital, Inc. (2017-present) and is an employee of Fidelity Investments (2005-present). Previously, Mr. Hogan served as Deputy Treasurer of certain Fidelity® funds (2016-2020) and Assistant Treasurer of certain Fidelity® funds (2016-2018).
Pamela R. Holding (1964)
Year of Election or Appointment: 2018
Vice President
Ms. Holding also serves as Vice President of other funds. Ms. Holding serves as Co-Head of Equity (2018-present) and is an employee of Fidelity Investments (2013-present). Previously, Ms. Holding served as Executive Vice President of Fidelity SelectCo, LLC (2019) and as Chief Investment Officer of Fidelity Institutional Asset Management (2013-2018).
Cynthia Lo Bessette (1969)
Year of Election or Appointment: 2019
Secretary and Chief Legal Officer (CLO)
Ms. Lo Bessette also serves as an officer of other funds. Ms. Lo Bessette serves as CLO, Secretary, and Senior Vice President of Fidelity Management & Research Company LLC (investment adviser firm, 2019-present); CLO of Fidelity Management & Research (Hong Kong) Limited, FMR Investment Management (UK) Limited, and Fidelity Management & Research (Japan) Limited (investment adviser firms, 2019-present); Secretary of FD Funds GP LLC (2021-present), FD Funds Holding LLC (2021-present), and FD Funds Management LLC (2021-present); and Assistant Secretary of FIMM, LLC (2019-present). She is a Senior Vice President and Deputy General Counsel of FMR LLC (diversified financial services company, 2019-present), and is an employee of Fidelity Investments. Previously, Ms. Lo Bessette served as CLO, Secretary, and Senior Vice President of FMR Co., Inc. (investment adviser firm, 2019); Secretary of Fidelity SelectCo, LLC and Fidelity Investments Money Management, Inc. (investment adviser firms, 2019). Prior to joining Fidelity Investments, Ms. Lo Bessette was Executive Vice President, General Counsel (2016-2019) and Senior Vice President, Deputy General Counsel (2015-2016) of OppenheimerFunds (investment management company) and Deputy Chief Legal Officer (2013-2015) of Jennison Associates LLC (investment adviser firm).
Chris Maher (1972)
Year of Election or Appointment: 2020
Deputy Treasurer
Mr. Maher also serves as an officer of other funds. Mr. Maher serves as Assistant Treasurer of FIMM, LLC (2021-present) and FMR Capital, Inc. (2017-present), and is an employee of Fidelity Investments (2008-present). Previously, Mr. Maher served as Assistant Treasurer of certain funds (2013-2020); Vice President of Asset Management Compliance (2013), Vice President of the Program Management Group of FMR (investment adviser firm, 2010-2013), and Vice President of Valuation Oversight (2008-2010).
Jason P. Pogorelec (1975)
Year of Election or Appointment: 2020
Chief Compliance Officer
Mr. Pogorelec also serves as Chief Compliance Officer of other funds. Mr. Pogorelec is a senior Vice President of Asset Management Compliance for Fidelity Investments and is an employee of Fidelity Investments (2006-present). Previously, Mr. Pogorelec served as Vice President, Associate General Counsel for Fidelity Investments (2010-2020) and Assistant Secretary of certain Fidelity funds (2015-2020).
Brett Segaloff (1972)
Year of Election or Appointment: 2021
Anti-Money Laundering (AML) Officer
Mr. Segaloff also serves as an AML Officer of other funds and other related entities. He is Director, Anti-Money Laundering (2007-present) of FMR LLC (diversified financial services company) and is an employee of Fidelity Investments (1996-present).
Stacie M. Smith (1974)
Year of Election or Appointment: 2016
President and Treasurer
Ms. Smith also serves as an officer of other funds. Ms. Smith serves as Assistant Treasurer of FIMM, LLC (2021-present) and FMR Capital, Inc. (2017-present), is an employee of Fidelity Investments (2009-present), and has served in other fund officer roles. Prior to joining Fidelity Investments, Ms. Smith served as Senior Audit Manager of Ernst & Young LLP (accounting firm, 1996-2009). Previously, Ms. Smith served as Assistant Treasurer (2013-2019) and Deputy Treasurer (2013-2016) of certain Fidelity® funds.
Jim Wegmann (1979)
Year of Election or Appointment: 2019
Assistant Treasurer
Mr. Wegmann also serves as an officer of other funds. Mr. Wegmann serves as Assistant Treasurer of FIMM, LLC (2021-present) and is an employee of Fidelity Investments (2011-present). Previously, Mr. Wegmann served as Assistant Treasurer of certain Fidelity® funds (2019-2021).
Shareholder Expense Example
As a shareholder, you incur two types of costs: (1) transaction costs, which may include sales charges (loads) on purchase payments or redemption proceeds, as applicable and (2) ongoing costs, which generally include management fees, distribution and/or service (12b-1) fees and other Fund expenses. This Example is intended to help you understand your ongoing costs (in dollars) of investing in a fund and to compare these costs with the ongoing costs of investing in other mutual funds.
The Example is based on an investment of $1,000 invested at the beginning of the period and held for the entire period (December 1, 2021 to May 31, 2022).
Actual Expenses
The first line of the accompanying table provides information about actual account values and actual expenses. You may use the information in this line, together with the amount you invested, to estimate the expenses that you paid over the period. Simply divide your account value by $1,000.00 (for example, an $8,600 account value divided by $1,000.00 = 8.6), then multiply the result by the number in the first line for a class/Fund under the heading entitled "Expenses Paid During Period" to estimate the expenses you paid on your account during this period. If any fund is a shareholder of any underlying mutual funds or exchange-traded funds (ETFs) (the Underlying Funds), such fund indirectly bears its proportional share of the expenses of the Underlying Funds in addition to the direct expenses incurred presented in the table. These fees and expenses are not included in the annualized expense ratio used to calculate the expense estimate in the table below.
Hypothetical Example for Comparison Purposes
The second line of the accompanying table provides information about hypothetical account values and hypothetical expenses based on the actual expense ratio and an assumed rate of return of 5% per year before expenses, which is not the actual return. The hypothetical account values and expenses may not be used to estimate the actual ending account balance or expenses you paid for the period. You may use this information to compare the ongoing costs of investing in the Fund and other funds. To do so, compare this 5% hypothetical example with the 5% hypothetical examples that appear in the shareholder reports of the other funds. If any fund is a shareholder of any Underlying Funds, such fund indirectly bears its proportional share of the expenses of the Underlying Funds in addition to the direct expenses as presented in the table. These fees and expenses are not included in the annualized expense ratio used to calculate the expense estimate in the table below.
Please note that the expenses shown in the table are meant to highlight your ongoing costs only and do not reflect any transaction costs. Therefore, the second line of the table is useful in comparing ongoing costs only, and will not help you determine the relative total costs of owning different funds. In addition, if these transactional costs were included, your costs would have been higher.
| | Annualized Expense Ratio-A | Beginning
Account Value
December 1, 2021 | Ending
Account Value
May 31, 2022 | Expenses Paid
During Period-B
December 1, 2021
to May 31, 2022 |
| Fidelity Agricultural Productivity Fund | .99% | | | |
| Actual | | $1,000.00 | $1,225.80 | $5.49 |
| Hypothetical-C | | $1,000.00 | $1,020.00 | $4.99 |
| Fidelity Water Sustainability Fund | 1.00% | | | |
| Actual | | $1,000.00 | $838.80 | $4.58 |
| Hypothetical-C | | $1,000.00 | $1,019.95 | $5.04 |
A Annualized expense ratio reflects expenses net of applicable fee waivers.
B Expenses are equal to the annualized expense ratio, multiplied by the average account value over the period, multiplied by 182/ 365 (to reflect the one-half year period). The fees and expenses of any Underlying Funds are not included in each annualized expense ratio.
C 5% return per year before expenses
Distributions (Unaudited)
The dividend and capital gains distributions for the fund(s) are available on Fidelity.com or Institutional.Fidelity.com.
The funds hereby designate as capital gain dividend the amounts noted below for the taxable year ended May 31, 2022, or, if subsequently determined to be different, the net capital gain of such year.
| Fidelity Water Sustainability Fund | $615,865 |
|
A percentage of the dividends distributed during the fiscal year for the following funds qualify for the dividends–received deduction for corporate shareholders:
| Fidelity Agricultural Productivity Fund | |
| July 2021 | 69% |
| December 2021 | 100% |
| Fidelity Water Sustainability Fund | |
| July 2021 | 90% |
| December 2021 | 26% |
|
A percentage of the dividends distributed during the fiscal year for the following funds may be taken into account as a dividend for purposes of the maximum rate under section 1(h)(11) of the Internal Revenue Code.
| Fidelity Agricultural Productivity Fund | |
| July 2021 | 100% |
| December 2021 | 100% |
| Fidelity Water Sustainability Fund | |
| July 2021 | 92% |
| December 2021 | 33% |
|
The funds hereby designate the percentages noted below of the short-term capital gain dividends distributed during the fiscal year as qualifying to be taxed as short-term capital gain dividends for nonresident alien shareholders:
| Fidelity Agricultural Productivity Fund | |
| July 2021 | 100% |
| December 2021 | – |
| Fidelity Water Sustainability Fund | |
| July 2021 | 100% |
| December 2021 | 100% |
|
The funds will notify shareholders in January 2023 of amounts for use in preparing 2022 income tax returns.
Board Approval of Investment Advisory Contracts and Management Fees
Fidelity Agricultural Productivity Fund
Fidelity Water Sustainability Fund
Each year, the Board of Trustees, including the Independent Trustees (together, the Board), votes on the renewal of the management contract with Fidelity Management & Research Company LLC (FMR) and the sub-advisory agreements (together, the Advisory Contracts) for each fund. FMR and the sub-advisers are referred to herein as the Investment Advisers. The Board, assisted by the advice of fund counsel and Independent Trustees' counsel, requests and considers a broad range of information relevant to the renewal of the Advisory Contracts throughout the year.
The Board meets regularly and, at each of its meetings, covers an extensive agenda of topics and materials and considers factors that are relevant to its annual consideration of the renewal of each fund's Advisory Contracts, including the services and support provided to each fund and its shareholders. The Board has established various standing committees (Committees), each composed of and chaired by Independent Trustees with varying backgrounds, to which the Board has assigned specific subject matter responsibilities in order to enhance effective decision-making by the Board. The Board, acting directly and through its Committees, requests and receives information concerning the annual consideration of the renewal of each fund's Advisory Contracts. The Board also meets as needed to review matters specifically related to the Board's annual consideration of the renewal of the Advisory Contracts. Members of the Board may also meet with trustees of other Fidelity funds through joint ad hoc committees to discuss certain matters relevant to all of the Fidelity funds.
At its May 2022 meeting, the Board unanimously determined to renew each fund's Advisory Contracts. In reaching its determination, the Board considered all factors it believed relevant, including (i) the nature, extent, and quality of the services provided to each fund and its shareholders (including the investment performance of each fund); (ii) the competitiveness relative to peer funds of each fund's management fee and total expense ratio; (iii) the total costs of the services provided by and the profits realized by Fidelity from its relationships with each fund; and (iv) the extent to which, if any, economies of scale exist and are realized as each fund grows, and whether any economies of scale are appropriately shared with fund shareholders.
In considering whether to renew the Advisory Contracts for each fund, the Board reached a determination, with the assistance of fund counsel and Independent Trustees' counsel and through the exercise of its business judgment, that the renewal of the Advisory Contracts was in the best interests of each fund and its shareholders and that the compensation payable under the Advisory Contracts was fair and reasonable. The Board's decision to renew the Advisory Contracts was not based on any single factor, but rather was based on a comprehensive consideration of all the information provided to the Board at its meetings throughout the year. The Board, in reaching its determination to renew the Advisory Contracts, was aware that shareholders of each fund have a broad range of investment choices available to them, including a wide choice among funds offered by Fidelity's competitors, and that each fund's shareholders, who have the opportunity to review and weigh the disclosure provided by the fund in its prospectus and other public disclosures, have chosen to invest in that fund, which is part of the Fidelity family of funds.
Nature, Extent, and Quality of Services Provided. The Board considered Fidelity's staffing as it relates to the funds, including the backgrounds of investment personnel of Fidelity, and also considered the funds' investment objectives, strategies, and related investment philosophies. The Independent Trustees also had discussions with senior management of Fidelity's investment operations and investment groups. The Board considered the structure of the investment personnel compensation program and whether this structure provides appropriate incentives to act in the best interests of each fund. Additionally, the Board considered the portfolio managers' investments, if any, in the funds that they manage. The Board also considered the steps Fidelity had taken to ensure the continued provision of high quality services to the Fidelity funds during the COVID-19 pandemic, including the expansion of staff in client facing positions to maintain service levels in periods of high volumes and volatility.
Resources Dedicated to Investment Management and Support Services. The Board and the Fund Oversight and Research Committees reviewed the general qualifications and capabilities of Fidelity's investment staff, including its size, education, experience, and resources, as well as Fidelity's approach to recruiting, training, managing, and compensating investment personnel. The Board noted the resources devoted to expansion of Fidelity's global investment organization, and that Fidelity's analysts have extensive resources, tools, and capabilities that allow them to conduct sophisticated quantitative and fundamental analysis, as well as credit analysis of issuers, counterparties, and guarantors. Further, the Board considered that Fidelity's investment professionals have sufficient access to global information and data so as to provide competitive investment results over time, and that those professionals also have access to sophisticated tools that permit them to assess portfolio construction and risk and performance attribution characteristics continuously, as well as to transmit new information and research conclusions rapidly around the world. Additionally, in its deliberations, the Board considered Fidelity's trading, risk management, compliance, and technology and operations capabilities and resources, which are integral parts of the investment management process.
Shareholder and Administrative Services. The Board considered (i) the nature, extent, quality, and cost of advisory, administrative, and shareholder services performed by the Investment Advisers and their affiliates under the Advisory Contracts and under separate agreements covering transfer agency, pricing and bookkeeping, and securities lending services for each fund; (ii) the nature and extent of the supervision of third party service providers, principally custodians, subcustodians, and pricing vendors; and (iii) the resources devoted to, and the record of compliance with, each fund's compliance policies and procedures. The Board also reviewed the allocation of fund brokerage, including allocations to brokers affiliated with the Investment Advisers, the use of brokerage commissions to pay fund expenses, and the use of "soft" commission dollars to pay for research services.
The Board noted that the growth of fund assets over time across the complex allows Fidelity to reinvest in the development of services designed to enhance the value and convenience of the Fidelity funds as investment vehicles. These services include 24-hour access to account information and market information over the Internet and through telephone representatives, investor education materials, and asset allocation tools. The Board also considered that it reviews customer service metrics such as telephone response times, continuity of services on the website and metrics addressing services at Fidelity Investor Centers.
Investment in a Large Fund Family. The Board considered the benefits to shareholders of investing in a Fidelity fund, including the benefits of investing in a fund that is part of a large family of funds offering a variety of investment disciplines and providing a large variety of mutual fund investor services. The Board noted that Fidelity had taken, or had made recommendations that resulted in the Fidelity funds taking, a number of actions over the previous year that benefited particular funds, including: (i) continuing to dedicate additional resources to Fidelity's investment research process, which includes meetings with management of issuers of securities in which the funds invest; (ii) continuing efforts to enhance Fidelity's global research capabilities; (iii) launching new funds and ETFs with innovative structures, strategies and pricing and making other enhancements to meet client needs; (iv) launching new share classes of existing funds; (v) eliminating purchase minimums and broadening eligibility requirements for certain funds and share classes; (vi) reducing management fees and total expenses for certain target date funds and classes and index funds; (vii) lowering expenses for certain existing funds and classes by implementing or lowering expense caps; (viii) rationalizing product lines and gaining increased efficiencies from fund mergers and liquidations; (ix) continuing to develop, acquire and implement systems and technology to improve services to the funds and shareholders, strengthen information security, and increase efficiency; and (x) continuing to implement enhancements to further strengthen Fidelity's product line to increase investors' probability of success in achieving their investment goals, including retirement income goals.
Investment Performance. The Board considered whether the fund has operated in accordance with its investment objective, as well as its record of compliance with its investment restrictions and its performance history.
The Board took into account discussions that occur at Board meetings throughout the year with representatives of the Investment Advisers about fund investment performance. In this regard the Board noted that as part of regularly scheduled fund reviews and other reports to the Board on fund performance, the Board considers annualized return information for each fund for different time periods, measured against an appropriate securities market index (benchmark index). The Board also reviews and considers information about performance attribution. In its evaluation of fund investment performance, the Board gave particular attention to information indicating changes in performance of certain Fidelity funds for specific time periods and discussed with the Investment Advisers the reasons for any overperformance or underperformance.
In addition to reviewing absolute and relative fund performance, the Independent Trustees periodically consider the appropriateness of fund performance metrics in evaluating the results achieved. In general, the Independent Trustees believe that fund performance should be evaluated based on net performance (after fees and expenses) of the fund compared to appropriate benchmark indices, over appropriate time periods that may include full market cycles, taking into account relevant factors including the following: general market conditions; issuer-specific information; and fund cash flows and other factors.
The Independent Trustees recognize that shareholders evaluate performance on a net basis over their own holding periods, for which one-, three-, and five-year periods are often used as a proxy. For this reason, the performance information reviewed by the Board also included net total return information for each fund and an appropriate benchmark index for the most recent one year period ended September 30, 2021, as shown below.
Fidelity Agricultural Productivity Fund
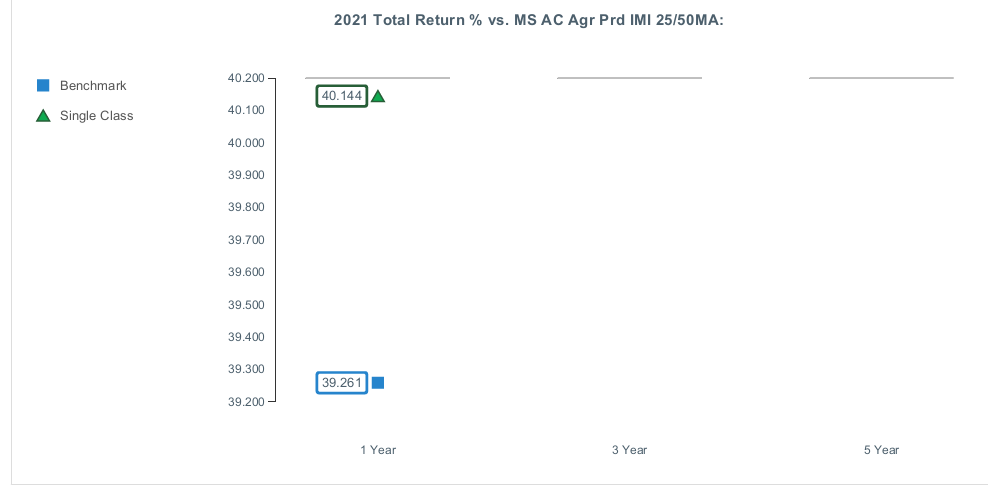
Fidelity Water Sustainability Fund
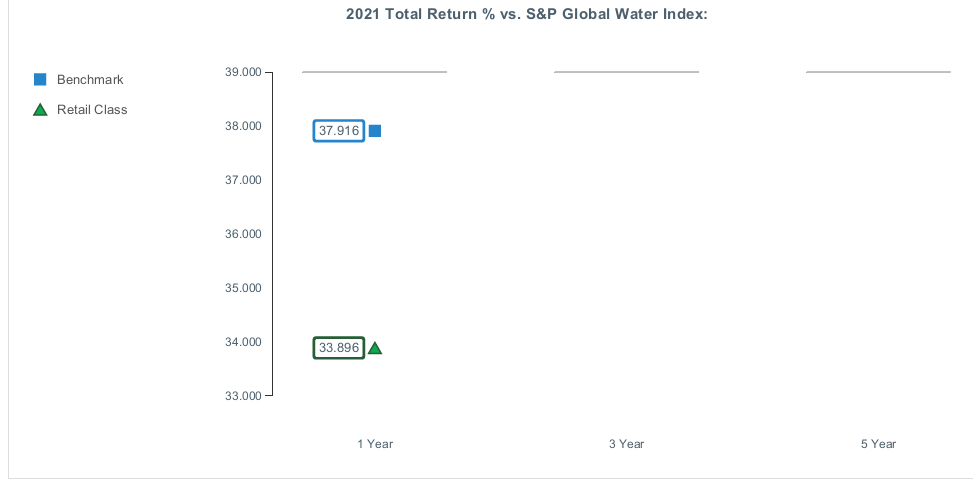
Based on its review, the Board concluded that the nature, extent, and quality of services provided to each fund under the Advisory Contracts should continue to benefit the shareholders of each fund.
Competitiveness of Management Fee and Total Expense Ratio. The Board considered each fund's management fee and total expense ratio compared to "mapped groups" of competitive funds and classes created for the purpose of facilitating the Trustees' competitive analysis of management fees and total expenses. Fidelity creates "mapped groups" by combining similar Lipper investment objective categories that have comparable investment mandates. For this purpose, all sector focused equity funds are grouped in the same mapped group. Combining Lipper investment objective categories aids the Board's management fee and total expense ratio comparisons by broadening the competitive group used for comparison.
Management Fee. The Board considered two proprietary management fee comparisons for the 12-month (or shorter) periods ended September 30 shown in basis points (BP) in the charts below. The group of Lipper funds used by the Board for management fee comparisons is referred to below as the "Total Mapped Group." The Total Mapped Group comparison focuses on a fund's standing in terms of gross management fees before expense reimbursements or caps, relative to the total universe of funds with comparable investment mandates (i.e., sector equities), regardless of whether their management fee structures also are comparable. Funds with comparable management fee structures have similar management fee contractual arrangements (
e.g., flat rate charged for advisory services, all-inclusive fee rate,
etc.). "TMG %" represents the percentage of funds in the Total Mapped Group that had management fees that were lower than a fund's. For example, a hypothetical TMG % of 20% would mean that 80% of the funds in the Total Mapped Group had higher, and 20% had lower, management fees than a fund. The funds' actual TMG % and the number of funds in the Total Mapped Group are in the charts below. The "Asset-Sized Peer Group" (ASPG) comparison focuses on a fund's standing relative to a subset of non-Fidelity funds within the Total Mapped Group that are similar in size and management fee structure. For example, if a fund is in the first quartile of the ASPG, the fund's management fee ranks in the least expensive or lowest 25% of funds in the ASPG. The ASPG represents at least 15% of the funds in the Total Mapped Group with comparable asset size and management fee structures, subject to a minimum of 50 funds (or all funds in the Total Mapped Group if fewer than 50). Additional information, such as the ASPG quartile in which a fund's management fee rate ranked, is also included in the charts and was considered by the Board.
Fidelity Agricultural Productivity Fund
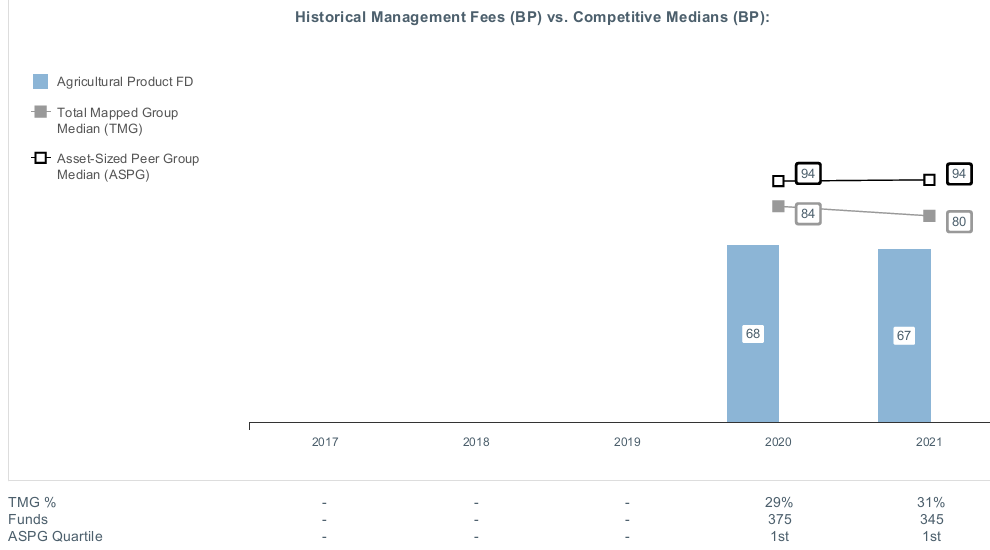
Fidelity Water Sustainability Fund

The Board noted that each fund's management fee rate ranked below the median of its Total Mapped Group and below the median of its ASPG for the 12-month period ended September 30, 2021.
The Board also considered that, for funds subject to the group fee, FMR agreed to voluntarily waive fees over a specified period of time in amounts designed to account for assets converted from certain funds to certain collective investment trusts.
Based on its review, the Board concluded that each fund's management fee is fair and reasonable in light of the services that the fund receives and the other factors considered.
Total Expense Ratio. In its review of each fund's total expense ratio, the Board considered the fund's management fee rate as well as other fund expenses, such as transfer agent fees, pricing and bookkeeping fees, and custodial, legal, and audit fees. The Board also noted that Fidelity may agree to waive fees or reimburse expenses from time to time, and the extent to which, if any, it has done so for each fund. Each fund is compared to those funds and classes in the Total Mapped Group (used by the Board for management fee comparisons) that have a similar sales load structure. The Board also considered a total expense ASPG comparison for each fund, which focuses on the total expenses of the fund relative to a subset of non-Fidelity funds within the total expense similar sales load structure group. The total expense ASPG is limited to 15 larger and 15 smaller classes in fund average assets for a total of 30 classes, where possible. The total expense ASPG comparison excludes performance adjustments and fund-paid 12b-1 fees to eliminate variability in fee structures.
The Board noted that each fund's total net expense ratio ranked above the similar sales load structure group competitive median and below the ASPG competitive median for the period ended September 30, 2021. The Board considered that, in general, various factors can affect total expense ratios. With respect to Fidelity Agricultural Productivity Fund, the fund's total expense ratio was above the similar sales load structure group competitive median primarily as a result of higher fixed other expenses due to lower asset levels. With respect to Fidelity Water Sustainability Fund, when compared to other thematic funds in its similar sales load structure group, the fund's total expense ratio was below the median.
The Board considered that FMR has contractually agreed to reimburse each fund to the extent that total operating expenses, with certain expenses, as a percentage of their respective average net assets, exceed 1.00% through September 30, 2022.
Fees Charged to Other Fidelity Clients. The Board also considered Fidelity fee structures and other information with respect to clients of Fidelity, such as other funds advised or subadvised by Fidelity, pension plan clients, and other institutional clients with similar mandates. The Board noted that a joint ad hoc committee created by it and the boards of other Fidelity funds periodically reviews and compares Fidelity's institutional investment advisory business with its business of providing services to the Fidelity funds and also noted the most recent findings of the committee. The Board noted that the committee's review included a consideration of the differences in services provided, fees charged, and costs incurred, as well as competition in the markets serving the different categories of clients.
Based on its review of total expense ratios and fees charged to other Fidelity clients, the Board concluded that the total expense ratio of each fund was reasonable in light of the services that the fund and its shareholders receive and the other factors considered.
Costs of the Services and Profitability. The Board considered the revenues earned and the expenses incurred by Fidelity in conducting the business of developing, marketing, distributing, managing, administering and servicing each fund and servicing each fund's shareholders. The Board also considered the level of Fidelity's profits in respect of all the Fidelity funds.
On an annual basis, Fidelity presents to the Board information about the profitability of its relationships with each fund. Fidelity calculates profitability information for each fund, as well as aggregate profitability information for groups of Fidelity funds and all Fidelity funds, using a series of detailed revenue and cost allocation methodologies which originate with the books and records of Fidelity on which Fidelity's audited financial statements are based. The Audit Committee of the Board reviews any significant changes from the prior year's methodologies and the full Board approves such changes.
A public accounting firm has been engaged annually by the Board as part of the Board's assessment of Fidelity's profitability analysis. The engagement includes the review and assessment of the methodologies used by Fidelity in determining the revenues and expenses attributable to Fidelity's mutual fund business, and completion of agreed-upon procedures in respect of the mathematical accuracy of certain fund profitability information and its conformity to established allocation methodologies. After considering the reports issued under the engagement and information provided by Fidelity, the Board concluded that while other allocation methods may also be reasonable, Fidelity's profitability methodologies are reasonable in all material respects.
The Board also reviewed Fidelity's non-fund businesses and potential indirect benefits such businesses may have received as a result of their association with Fidelity's mutual fund business (i.e., fall-out benefits) as well as cases where Fidelity's affiliates may benefit from the funds' business. The Board considered areas where potential indirect benefits to the Fidelity funds from their relationships with Fidelity may exist. The Board's consideration of these matters was informed by the findings of a joint ad hoc committee created by it and the boards of other Fidelity funds to evaluate potential fall-out benefits.
The Board considered the costs of the services provided by and the profits realized by Fidelity in connection with the operation of each fund and was satisfied that the profitability was not excessive.
Economies of Scale. The Board considered whether there have been economies of scale in respect of the management of the Fidelity funds, whether the Fidelity funds (including each fund) have appropriately benefited from any such economies of scale, and whether there is potential for realization of any further economies of scale. The Board considered the extent to which each fund will benefit from economies of scale as assets grow through increased services to the fund, through waivers or reimbursements, or through fee or expense ratio reductions. The Board also noted that a committee (the Economies of Scale Committee) created by it and the boards of other Fidelity funds periodically analyzes whether Fidelity attains economies of scale in respect of the management and servicing of the Fidelity funds, whether the Fidelity funds have appropriately benefited from such economies of scale, and whether there is potential for realization of any further economies of scale.
The Board recognized that each fund's management contract incorporates a "group fee" structure, which provides for lower group fee rates as total "group assets" increase, and for higher group fee rates as total "group assets" decrease ("group assets" as defined in the management contracts). FMR calculates the group fee rates based on a tiered asset "breakpoint" schedule that varies based on asset class. The Board considered that the group fee is designed to deliver the benefits of economies of scale to fund shareholders when total Fidelity fund assets increase, even if assets of any particular fund are unchanged or have declined, because some portion of Fidelity's costs are attributable to services provided to all Fidelity funds, and all funds benefit if those costs can be allocated among more assets. The Board further considered that Fidelity agreed to impose a temporary fee waiver in the form of additional breakpoints to the current breakpoint schedule. The Board concluded that, given the group fee structure, fund shareholders will benefit from lower management fees as "group assets" increase at the fund complex level, regardless of whether Fidelity achieves any such economies of scale.
The Board concluded, taking into account the analysis of the Economies of Scale Committee, that economies of scale, if any, are being appropriately shared between fund shareholders and Fidelity.
Additional Information Requested by the Board. In order to develop fully the factual basis for consideration of the Fidelity funds' advisory contracts, the Board requested and received additional information on certain topics, including: (i) fund flow and performance trends, in particular the underperformance of certain funds and strategies, and Fidelity's long-term strategies for certain funds, including any consideration of fund liquidations or mergers; (ii) the operation of performance fees, competitor use of performance fees, and consideration of the expansion of performance fees to additional funds; (iii) Fidelity's pricing philosophy compared to competitors; (iv) fund profitability methodology and data; (v) evaluation of competitive fund data and peer group classifications and fee and expense comparisons; (vi) the management fee and expense structures for different funds and classes and information about the differences between various fee and expense structures; (vii) group fee breakpoints and related voluntary fee waivers; and (viii) information regarding other accounts managed by Fidelity and the funds' sub-advisory arrangements.
Based on its evaluation of all of the conclusions noted above, and after considering all factors it believed relevant, the Board concluded that the advisory fee arrangements are fair and reasonable and that each fund's Advisory Contracts should be renewed.
Liquidity Risk Management Program
The Securities and Exchange Commission adopted Rule 22e-4 under the Investment Company Act of 1940 (the Liquidity Rule) to promote effective liquidity risk management throughout the open-end investment company industry, thereby reducing the risk that funds will be unable to meet their redemption obligations and mitigating dilution of the interests of fund shareholders.
The Funds have adopted and implemented a liquidity risk management program pursuant to the Liquidity Rule (the Program) effective December 1, 2018. The Program is reasonably designed to assess and manage each Fund’s liquidity risk and to comply with the requirements of the Liquidity Rule. Each Fund’s Board of Trustees (the Board) has designated each Fund’s investment adviser as administrator of the Program. The Fidelity advisers have established a Liquidity Risk Management Committee (the LRM Committee) to manage the Program for each of the Fidelity Funds. The LRM Committee monitors the adequacy and effectiveness of implementation of the Program and on a periodic basis assesses each Fund’s liquidity risk based on a variety of factors including (1) the Fund’s investment strategy, (2) portfolio liquidity and cash flow projections during normal and reasonably foreseeable stressed conditions, (3) shareholder redemptions, (4) borrowings and other funding sources and (5) in the case of exchange-traded funds, certain additional factors including the effect of the Fund’s prices and spreads, market participants, and basket compositions on the overall liquidity of the Fund’s portfolio, as applicable.
In accordance with the Program, each of the Fund’s portfolio investments is classified into one of four liquidity categories described below based on a determination of a reasonable expectation for how long it would take to convert the investment to cash (or sell or dispose of the investment) without significantly changing its market value.
- Highly liquid investments – cash or convertible to cash within three business days or less
- Moderately liquid investments – convertible to cash in three to seven calendar days
- Less liquid investments – can be sold or disposed of, but not settled, within seven calendar days
- Illiquid investments – cannot be sold or disposed of within seven calendar days
Liquidity classification determinations take into account a variety of factors including various market, trading and investment-specific considerations, as well as market depth, and generally utilize analysis from a third-party liquidity metrics service.
The Liquidity Rule places a 15% limit on a fund’s illiquid investments and requires funds that do not primarily hold assets that are highly liquid investments to determine and maintain a minimum percentage of the fund’s net assets to be invested in highly liquid investments (highly liquid investment minimum or HLIM). The Program includes provisions reasonably designed to comply with the 15% limit on illiquid investments and for determining, periodically reviewing and complying with the HLIM requirement as applicable.
At a recent meeting of the Fund’s Board of Trustees, the LRM Committee provided a written report to the Board pertaining to the operation, adequacy, and effectiveness of implementation of the Program for the annual period from December 1, 2020 through November 30, 2021. The report concluded that the Program has been implemented and is operating effectively and is reasonably designed to assess and manage the Fund’s liquidity risk.
DAS-DSW-ANN-0722
1.9897392.102
Fidelity® Disruptors Fund
Annual Report
May 31, 2022
Contents
To view a fund's proxy voting guidelines and proxy voting record for the 12-month period ended June 30, visit http://www.fidelity.com/proxyvotingresults or visit the Securities and Exchange Commission's (SEC) web site at http://www.sec.gov.
You may also call 1-800-544-8544 to request a free copy of the proxy voting guidelines.
Standard & Poor's, S&P and S&P 500 are registered service marks of The McGraw-Hill Companies, Inc. and have been licensed for use by Fidelity Distributors Corporation.
Other third-party marks appearing herein are the property of their respective owners.
All other marks appearing herein are registered or unregistered trademarks or service marks of FMR LLC or an affiliated company. © 2022 FMR LLC. All rights reserved.
This report and the financial statements contained herein are submitted for the general information of the shareholders of the Fund. This report is not authorized for distribution to prospective investors in the Fund unless preceded or accompanied by an effective prospectus.
A fund files its complete schedule of portfolio holdings with the SEC for the first and third quarters of each fiscal year on Form N-PORT. Forms N-PORT are available on the SEC’s web site at http://www.sec.gov. A fund's Forms N-PORT may be reviewed and copied at the SEC’s Public Reference Room in Washington, DC. Information regarding the operation of the SEC's Public Reference Room may be obtained by calling 1-800-SEC-0330.
For a complete list of a fund's portfolio holdings, view the most recent holdings listing, semiannual report, or annual report on Fidelity's web site at http://www.fidelity.com, http://www.institutional.fidelity.com, or http://www.401k.com, as applicable.
NOT FDIC INSURED •MAY LOSE VALUE •NO BANK GUARANTEE
Neither the Fund nor Fidelity Distributors Corporation is a bank.
Note to Shareholders:
Early in 2020, the outbreak and spread of COVID-19 emerged as a public health emergency that had a major influence on financial markets, primarily based on its impact on the global economy and corporate earnings. On March 11, 2020, the World Health Organization declared the COVID-19 outbreak a pandemic, citing sustained risk of further global spread. The pandemic prompted a number of measures to limit the spread of COVID-19, including travel and border restrictions, quarantines, and restrictions on large gatherings. In turn, these resulted in lower consumer activity, diminished demand for a wide range of products and services, disruption in manufacturing and supply chains, and – given the wide variability in outcomes regarding the outbreak – significant market uncertainty and volatility. To help stem the turmoil, the U.S. government took unprecedented action – in concert with the U.S. Federal Reserve and central banks around the world – to help support consumers, businesses, and the broader economy, and to limit disruption to the financial system.
In general, the overall impact of the pandemic lessened in 2021, amid a resilient economy and widespread distribution of three COVID-19 vaccines granted emergency use authorization from the U.S. Food and Drug Administration (FDA) early in the year. Still, the situation remains dynamic, and the extent and duration of its influence on financial markets and the economy is highly uncertain, due in part to a recent spike in cases based on highly contagious variants of the coronavirus.
Extreme events such as the COVID-19 crisis are exogenous shocks that can have significant adverse effects on mutual funds and their investments. Although multiple asset classes may be affected by market disruption, the duration and impact may not be the same for all types of assets. Fidelity is committed to helping you stay informed amid news about COVID-19 and during increased market volatility, and we continue to take extra steps to be responsive to customer needs. We encourage you to visit us online, where we offer ongoing updates, commentary, and analysis on the markets and our funds.
Performance: The Bottom Line
Average annual total return reflects the change in the value of an investment, assuming reinvestment of distributions from dividend income and capital gains (the profits earned upon the sale of securities that have grown in value, if any) and assuming a constant rate of performance each year. The hypothetical investment and the average annual total returns do not reflect the deduction of taxes that a shareholder would pay on fund distributions or the redemption of fund shares. During periods of reimbursement by Fidelity, a fund’s total return will be greater than it would be had the reimbursement not occurred. How a fund did yesterday is no guarantee of how it will do tomorrow.
Average Annual Total Returns
| For the periods ended May 31, 2022 | Past 1 year | Life of fundA |
| Fidelity® Disruptors Fund | (23.29)% | 13.34% |
| Loyalty Class 1 | (23.07)% | 13.66% |
| Loyalty Class 2 | (22.86)% | 13.94% |
A From April 16, 2020
$10,000 Over Life of Fund
Let's say hypothetically that $10,000 was invested in Fidelity® Disruptors Fund, a class of the fund, on April 16, 2020, when the fund started.
The chart shows how the value of your investment would have changed, and also shows how the MSCI ACWI (All Country World Index) Index performed over the same period.
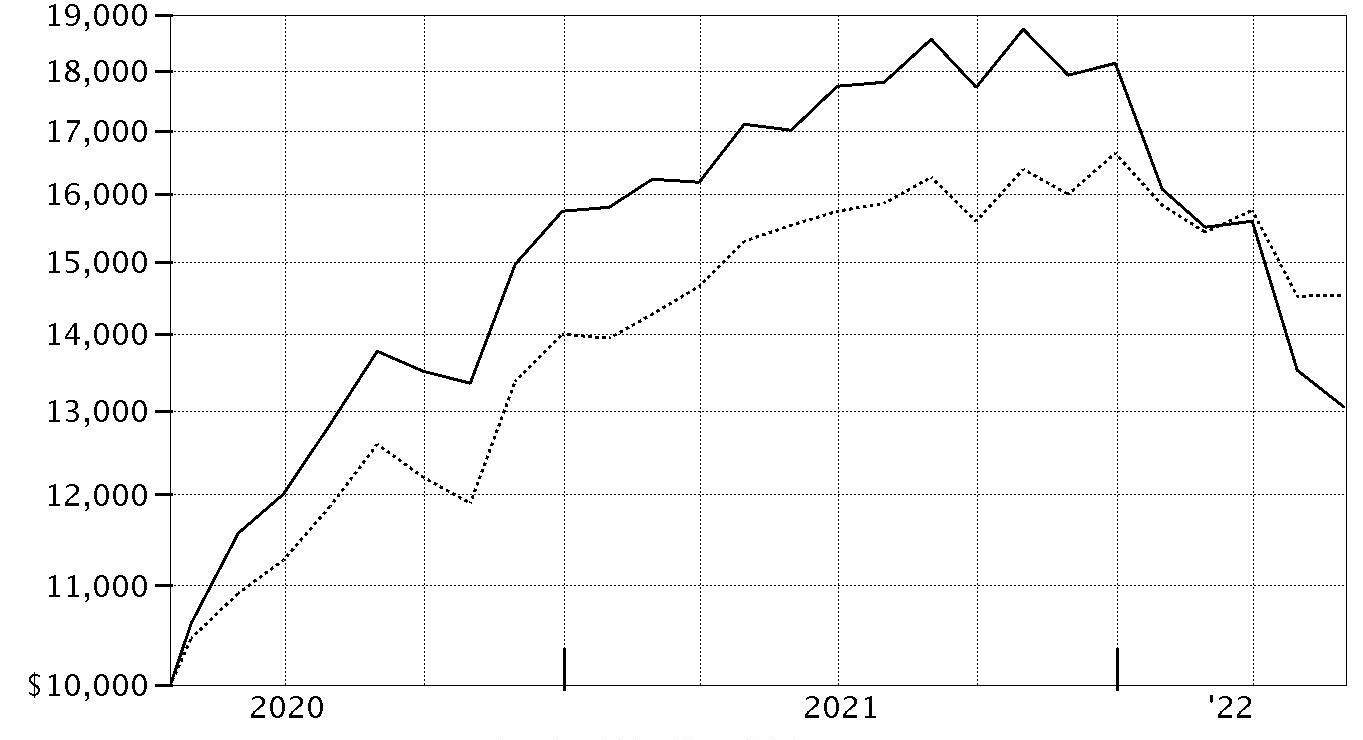
| Period Ending Values |
| $13,046 | Fidelity® Disruptors Fund |
| $14,529 | MSCI ACWI (All Country World Index) Index |
Management's Discussion of Fund Performance
Market Recap: Global equities returned -6.49% for the 12 months ending May 31, 2022, according to the MSCI ACWI (All Country World Index) Index. After posting an 18.90% gain in 2021, global stocks retreated to begin the new year amid several headwinds that stoked volatility, uncertainty and investor anxiety. Chief among these was accelerated efforts by some central banks to hike interest rates and aggressively wind down extraordinary monetary policy support in an attempt to rein in high inflation. In addition, geopolitical unrest rose as Russia invaded Ukraine in late February and escalated its attack through period end. Other factors influencing stocks included surging global commodity prices, rising sovereign bond yields in some markets, global supply constraint and disruption, and the potential for variants of the coronavirus to upend global economic growth. Against this backdrop, the index returned -4.90% in January and -2.56% in February, falling on mixed corporate earnings. Volatility eased in March and the index gained 2.21% for the month. April saw a reversal (-7.98%), amid angst about the economic toll of “zero-COVID” lockdowns in China, and then the index had a flattish May (+0.16%). For the full 12 months, emerging markets (-20%) lagged most, followed by Japan (-13%) and Europe ex U.K. (-12%). Conversely, the U.K. and Canada (+3%) led. By sector, communication services (-23%) and consumer discretionary (-21%) fared worst, whereas energy (+48%) rode a surge in commodity prices and topped the market by a wide margin.
Comments from Co-Managers Charlie Hebard and Christopher Lee: For the fiscal year ending May 31, 2022, the fund's share classes returned roughly -23%, underperforming the -6.49% return of the broad-based MSCI All Country World Index (Net MA). By region, stock picks in the U.S., Singapore and Japan hurt the fund's relative result. By industry, the primary detractor from performance versus the benchmark was stock selection in biotechnology. An overweighting in application software and positioning in interactive media & services also notably hampered the fund's relative result. Our overweight stake in Sea, the fund's top individual detractor relative to the benchmark, returned approximately -68% this period. Our second-largest detractor was Snap, which returned roughly -77% the past year. We boosted exposure to both Sea and Snap during the reporting period. An underweighting in index component Apple was another top detractor this period. The stock returned 20% the past twelve months. Conversely, an underweighting in emerging markets, specifically South Korea, China and Hong Kong, and security selection in Belgium contributed to the fund's relative result. By industry, the primary contributor to performance versus the benchmark was stock selection in internet services & infrastructure. An overweight position in managed health care also helped the fund's relative result, as did strong picks in communications equipment and wireless telecommunication services. The biggest individual relative contributor was our positioning in Cloudflare. Also bolstering performance were overweight stakes in Arch Capital Group (+19%) and Nvidia (+15%). Nvidia was among the fund's largest holdings the past twelve months. The fund's higher-than-index stake in Regeneron Pharmaceuticals, returned about 32% and notably contributed. We pared our positions in Cloudflare, Arch, Nvidia and Regeneron during the period.
The views expressed above reflect those of the portfolio manager(s) only through the end of the period as stated on the cover of this report and do not necessarily represent the views of Fidelity or any other person in the Fidelity organization. Any such views are subject to change at any time based upon market or other conditions and Fidelity disclaims any responsibility to update such views. These views may not be relied on as investment advice and, because investment decisions for a Fidelity fund are based on numerous factors, may not be relied on as an indication of trading intent on behalf of any Fidelity fund.
Investment Summary (Unaudited)
The information in the following tables is based on the direct investments of the Fund.
Top Holdings as of May 31, 2022
| | % of fund's net assets |
| Fidelity Disruptive Automation Fund Class F | 21.2 |
| Fidelity Disruptive Finance Fund Class F | 20.4 |
| Fidelity Disruptive Communications Fund Class F | 19.6 |
| Fidelity Disruptive Medicine Fund Class F | 19.4 |
| Fidelity Disruptive Technology Fund Class F | 19.4 |
| | 100.0 |
Asset Allocation (% of fund's net assets)
| Period end |
| | Domestic Equity Funds | 100.0% |

Schedule of Investments May 31, 2022
Showing Percentage of Net Assets
| Domestic Equity Funds - 100.0% | | | |
| | | Shares | Value |
| Fidelity Disruptive Automation Fund Class F (a) | | 1,771,997 | $26,633,114 |
| Fidelity Disruptive Communications Fund Class F (a) | | 2,105,350 | 24,611,541 |
| Fidelity Disruptive Finance Fund Class F (a) | | 1,674,348 | 25,684,493 |
| Fidelity Disruptive Medicine Fund Class F (a) | | 2,419,874 | 24,416,531 |
| Fidelity Disruptive Technology Fund Class F (a) | | 2,035,785 | 24,368,348 |
| TOTAL DOMESTIC EQUITY FUNDS | | | |
| (Cost $136,967,987) | | | 125,714,027 |
| TOTAL INVESTMENT IN SECURITIES - 100.0% | | | |
| (Cost $136,967,987) | | | 125,714,027 |
| NET OTHER ASSETS (LIABILITIES) - 0.0% | | | (3,842) |
| NET ASSETS - 100% | | | $125,710,185 |
Legend
(a) Affiliated Fund
Affiliated Underlying Funds
Fiscal year to date information regarding the Fund's investments in affiliated Underlying Funds is presented below. Exchanges between classes of the same affiliated Underlying Funds may occur, and are excluded from purchases and sales below if applicable. If an underlying Fund changes its name, the name presented below is the name in effect at period end.
| Affiliate | Value, beginning of period | Purchases | Sales Proceeds | Dividend Income | Realized Gain (loss) | Change in Unrealized appreciation (depreciation) | Value, end of period |
| Fidelity Disruptive Automation Fund Class F | $33,783,122 | $7,272,445 | $8,048,845 | $1,158,103 | $(468,966) | $(5,904,642) | $26,633,114 |
| Fidelity Disruptive Communications Fund Class F | 33,111,240 | 10,320,482 | 6,430,638 | 2,134,243 | (1,230,271) | (11,159,272) | 24,611,541 |
| Fidelity Disruptive Finance Fund Class F | 35,636,818 | 6,055,290 | 10,388,509 | 1,091,816 | (251,611) | (5,367,495) | 25,684,493 |
| Fidelity Disruptive Medicine Fund Class F | 31,824,338 | 8,606,386 | 7,775,910 | 457,480 | (1,006,974) | (7,231,309) | 24,416,531 |
| Fidelity Disruptive Technology Fund Class F | 32,269,196 | 10,750,952 | 5,857,770 | 658,808 | (1,025,458) | (11,768,572) | 24,368,348 |
| Total | $166,624,714 | $43,005,555 | $38,501,672 | $5,500,450 | $(3,983,280) | $(41,431,290) | $125,714,027 |
Amounts in the income column in the above table include any capital gain distributions from underlying funds, which are presented in the corresponding line-item in the Statement of Operations, if applicable.
Investment Valuation
The following is a summary of the inputs used, as of May 31, 2022, involving the Fund's assets and liabilities carried at fair value. The inputs or methodology used for valuing securities may not be an indication of the risk associated with investing in those securities. For more information on valuation inputs, and their aggregation into the levels used below, please refer to the Investment Valuation section in the accompanying Notes to Financial Statements.
| | Valuation Inputs at Reporting Date: |
| Description | Total | Level 1 | Level 2 | Level 3 |
| Investments in Securities: | | | | |
| Domestic Equity Funds | $125,714,027 | $125,714,027 | $-- | $-- |
| Total Investments in Securities: | $125,714,027 | $125,714,027 | $-- | $-- |
See accompanying notes which are an integral part of the financial statements.
Financial Statements
Statement of Assets and Liabilities
| | | May 31, 2022 |
| Assets | | |
Investment in securities, at value — See accompanying schedule:
| | |
| Affiliated issuers (cost $136,967,987) | $125,714,027 | |
| Total Investment in Securities (cost $136,967,987) | | $125,714,027 |
| Cash | | 312 |
| Receivable for fund shares sold | | 408,090 |
| Total assets | | 126,122,429 |
| Liabilities | | |
| Payable for investments purchased | $64,001 | |
| Payable for fund shares redeemed | 260,997 | |
| Accrued management fee | 87,246 | |
| Total liabilities | | 412,244 |
| Net Assets | | $125,710,185 |
| Net Assets consist of: | | |
| Paid in capital | | $140,432,620 |
| Total accumulated earnings (loss) | | (14,722,435) |
| Net Assets | | $125,710,185 |
| Net Asset Value and Maximum Offering Price | | |
| Fidelity Disruptors Fund: | | |
| Net Asset Value, offering price and redemption price per share ($48,579,148 ÷ 3,794,076 shares) | | $12.80 |
| Loyalty Class 1: | | |
| Net Asset Value, offering price and redemption price per share ($76,999,130 ÷ 6,002,544 shares) | | $12.83 |
| Loyalty Class 2: | | |
| Net Asset Value, offering price and redemption price per share ($131,907 ÷ 10,242 shares) | | $12.88 |
See accompanying notes which are an integral part of the financial statements.
Statement of Operations
| | | Year ended May 31, 2022 |
| Investment Income | | |
| Dividends: | | |
| Affiliated issuers | | $484,598 |
| Expenses | | |
| Management fee | $1,548,137 | |
| Independent trustees' fees and expenses | 602 | |
| Total expenses | | 1,548,739 |
| Net investment income (loss) | | (1,064,141) |
| Realized and Unrealized Gain (Loss) | | |
| Net realized gain (loss) on: | | |
| Investment securities: | | |
| Affiliated issuers | (3,983,280) | |
| Capital gain distributions from underlying funds: | | |
| Affiliated issuers | 5,015,852 | |
| Total net realized gain (loss) | | 1,032,572 |
| Change in net unrealized appreciation (depreciation) on: | | |
| Investment securities: | | |
| Affiliated issuers | (41,431,290) | |
| Total change in net unrealized appreciation (depreciation) | | (41,431,290) |
| Net gain (loss) | | (40,398,718) |
| Net increase (decrease) in net assets resulting from operations | | $(41,462,859) |
See accompanying notes which are an integral part of the financial statements.
Statement of Changes in Net Assets
| | Year ended May 31, 2022 | Year ended May 31, 2021 |
| Increase (Decrease) in Net Assets | | |
| Operations | | |
| Net investment income (loss) | $(1,064,141) | $(739,123) |
| Net realized gain (loss) | 1,032,572 | 759,989 |
| Change in net unrealized appreciation (depreciation) | (41,431,290) | 28,724,935 |
| Net increase (decrease) in net assets resulting from operations | (41,462,859) | 28,745,801 |
| Distributions to shareholders | (2,740,280) | (722,470) |
| Share transactions - net increase (decrease) | 3,294,782 | 119,053,329 |
| Total increase (decrease) in net assets | (40,908,357) | 147,076,660 |
| Net Assets | | |
| Beginning of period | 166,618,542 | 19,541,882 |
| End of period | $125,710,185 | $166,618,542 |
See accompanying notes which are an integral part of the financial statements.
Financial Highlights
Fidelity Disruptors Fund
| Years ended May 31, | 2022 | 2021 | 2020 A |
| Selected Per–Share Data | | | |
| Net asset value, beginning of period | $16.89 | $11.57 | $10.00 |
| Income from Investment Operations | | | |
| Net investment income (loss)B,C | (.12) | (.12) | (.01) |
| Net realized and unrealized gain (loss) | (3.75) | 5.55 | 1.58 |
| Total from investment operations | (3.87) | 5.43 | 1.57 |
| Distributions from net realized gain | (.22) | (.11) | – |
| Total distributions | (.22) | (.11) | – |
| Net asset value, end of period | $12.80 | $16.89 | $11.57 |
| Total ReturnD,E | (23.29)% | 46.99% | 15.70% |
| Ratios to Average Net AssetsC,F,G | | | |
| Expenses before reductions | 1.00% | 1.01%H | 1.01%H,I |
| Expenses net of fee waivers, if any | 1.00% | 1.01%H | 1.01%H,I |
| Expenses net of all reductions | 1.00% | 1.01%H | 1.01%H,I |
| Net investment income (loss) | (.69)% | (.77)% | (1.01)%I |
| Supplemental Data | | | |
| Net assets, end of period (000 omitted) | $48,579 | $141,385 | $19,310 |
| Portfolio turnover rateJ | 22% | 3% | 0 %K |
A For the period April 16, 2020 (commencement of operations) through May 31, 2020.
B Calculated based on average shares outstanding during the period.
C Net investment income (loss) is affected by the timing of the declaration of dividends by any underlying mutual funds or exchange-traded funds (ETFs). Net investment income (loss) of any such underlying funds is not included in the Fund's net investment income (loss) ratio.
D Total returns for periods of less than one year are not annualized.
E Total returns would have been lower if certain expenses had not been reduced during the applicable periods shown.
F Fees and expenses of any underlying mutual funds or exchange-traded funds (ETFs) are not included in the Fund's expense ratio. The Fund indirectly bears its proportionate share of these expenses.
G Expense ratios reflect operating expenses of the class. Expenses before reductions do not reflect amounts reimbursed, waived, or reduced through arrangements with the investment adviser, brokerage services, or other offset arrangements, if applicable, and do not represent the amount paid by the class during periods when reimbursements, waivers or reductions occur.
H On certain classes, the size and fluctuation of net assets and expense amounts may cause ratios to differ from contractual rates.
I Annualized
J Amount does not include the portfolio activity of any underlying mutual funds or exchange-traded funds (ETFs).
K Amount not annualized.
See accompanying notes which are an integral part of the financial statements.
Fidelity Disruptors Fund Loyalty Class 1
| Years ended May 31, | 2022 | 2021 | 2020 A |
| Selected Per–Share Data | | | |
| Net asset value, beginning of period | $16.95 | $11.58 | $10.00 |
| Income from Investment Operations | | | |
| Net investment income (loss)B,C | (.08) | (.12) | (.01) |
| Net realized and unrealized gain (loss) | (3.75) | 5.59 | 1.59 |
| Total from investment operations | (3.83) | 5.47 | 1.58 |
| Distributions from net realized gain | (.29) | (.10) | – |
| Total distributions | (.29) | (.10) | – |
| Net asset value, end of period | $12.83 | $16.95 | $11.58 |
| Total ReturnD,E | (23.07)% | 47.32% | 15.80% |
| Ratios to Average Net AssetsC,F,G | | | |
| Expenses before reductions | .75% | .77%H | .75%I |
| Expenses net of fee waivers, if any | .75% | .77%H | .75%I |
| Expenses net of all reductions | .75% | .77%H | .75%I |
| Net investment income (loss) | (.51)% | (.74)% | (.75)%I |
| Supplemental Data | | | |
| Net assets, end of period (000 omitted) | $76,999 | $25,062 | $116 |
| Portfolio turnover rateJ | 22% | 3% | 0%K |
A For the period April 16, 2020 (commencement of operations) through May 31, 2020.
B Calculated based on average shares outstanding during the period.
C Net investment income (loss) is affected by the timing of the declaration of dividends by any underlying mutual funds or exchange-traded funds (ETFs). Net investment income (loss) of any such underlying funds is not included in the Fund's net investment income (loss) ratio.
D Total returns for periods of less than one year are not annualized.
E Total returns would have been lower if certain expenses had not been reduced during the applicable periods shown.
F Fees and expenses of any underlying mutual funds or exchange-traded funds (ETFs) are not included in the Fund's expense ratio. The Fund indirectly bears its proportionate share of these expenses.
G Expense ratios reflect operating expenses of the class. Expenses before reductions do not reflect amounts reimbursed, waived, or reduced through arrangements with the investment adviser, brokerage services, or other offset arrangements, if applicable, and do not represent the amount paid by the class during periods when reimbursements, waivers or reductions occur.
H On certain classes, the size and fluctuation of net assets and expense amounts may cause ratios to differ from contractual rates.
I Annualized
J Amount does not include the portfolio activity of any underlying mutual funds or exchange-traded funds (ETFs).
K Amount not annualized.
See accompanying notes which are an integral part of the financial statements.
Fidelity Disruptors Fund Loyalty Class 2
| Years ended May 31, | 2022 | 2021 | 2020 A |
| Selected Per–Share Data | | | |
| Net asset value, beginning of period | $16.97 | $11.58 | $10.00 |
| Income from Investment Operations | | | |
| Net investment income (loss)B,C | (.04) | (.04) | (.01) |
| Net realized and unrealized gain (loss) | (3.76) | 5.55 | 1.59 |
| Total from investment operations | (3.80) | 5.51 | 1.58 |
| Distributions from net realized gain | (.29) | (.12) | – |
| Total distributions | (.29) | (.12) | – |
| Net asset value, end of period | $12.88 | $16.97 | $11.58 |
| Total ReturnD,E | (22.86)% | 47.69% | 15.80% |
| Ratios to Average Net AssetsC,F,G | | | |
| Expenses before reductions | .50% | .50% | .50%H |
| Expenses net of fee waivers, if any | .50% | .50% | .50%H |
| Expenses net of all reductions | .50% | .50% | .50%H |
| Net investment income (loss) | (.22)% | (.26)% | (.50)%H |
| Supplemental Data | | | |
| Net assets, end of period (000 omitted) | $132 | $171 | $116 |
| Portfolio turnover rateI | 22% | 3% | 0%J |
A For the period April 16, 2020 (commencement of operations) through May 31, 2020.
B Calculated based on average shares outstanding during the period.
C Net investment income (loss) is affected by the timing of the declaration of dividends by any underlying mutual funds or exchange-traded funds (ETFs). Net investment income (loss) of any such underlying funds is not included in the Fund's net investment income (loss) ratio.
D Total returns for periods of less than one year are not annualized.
E Total returns would have been lower if certain expenses had not been reduced during the applicable periods shown.
F Fees and expenses of any underlying mutual funds or exchange-traded funds (ETFs) are not included in the Fund's expense ratio. The Fund indirectly bears its proportionate share of these expenses.
G Expense ratios reflect operating expenses of the class. Expenses before reductions do not reflect amounts reimbursed, waived, or reduced through arrangements with the investment adviser, brokerage services, or other offset arrangements, if applicable, and do not represent the amount paid by the class during periods when reimbursements, waivers or reductions occur.
H Annualized
I Amount does not include the portfolio activity of any underlying mutual funds or exchange-traded funds (ETFs).
J Amount not annualized.
See accompanying notes which are an integral part of the financial statements.
Notes to Financial Statements
For the period ended May 31, 2022
1. Organization.
Fidelity Disruptors Fund (the Fund) is a fund of Fidelity Summer Street Trust (the Trust). The Trust is registered under the Investment Company Act of 1940, as amended (the 1940 Act), as an open-end management investment company organized as a Massachusetts business trust. The Fund is authorized to issue an unlimited number of shares. The Fund offers Fidelity Disruptors Fund, Loyalty Class 1 and Loyalty Class 2 shares. Each class has equal rights as to assets and voting privileges, except for matters affecting a single class. For certain accounts, Fidelity Disruptors Fund shares will automatically convert to Loyalty Class 1 shares after a holding period of one year from the initial date of purchase; and then from Loyalty Class 1 shares to Loyalty Class 2 shares after another holding period of two years.
2. Significant Accounting Policies.
The Fund is an investment company and applies the accounting and reporting guidance of the Financial Accounting Standards Board (FASB) Accounting Standards Codification Topic 946 Financial Services - Investment Companies. The financial statements have been prepared in conformity with accounting principles generally accepted in the United States of America (GAAP), which require management to make certain estimates and assumptions at the date of the financial statements. Actual results could differ from those estimates. Subsequent events, if any, through the date that the financial statements were issued have been evaluated in the preparation of the financial statements. The Fund's Schedule of Investments lists any underlying mutual funds or exchange-traded funds (ETFs) but does not include the underlying holdings of these funds. The following summarizes the significant accounting policies of the Fund:
Investment Valuation. Investments are valued as of 4:00 p.m. Eastern time on the last calendar day of the period. The Fund categorizes the inputs to valuation techniques used to value its investments into a disclosure hierarchy consisting of three levels as shown below:
- Level 1 – unadjusted quoted prices in active markets for identical investments
- Level 2 – other significant observable inputs (including quoted prices for similar investments, interest rates, prepayment speeds, etc.)
- Level 3 – unobservable inputs (including the Fund's own assumptions based on the best information available)
Valuation techniques used to value the Fund's investments by major category are as follows. Investments in open-end mutual funds are valued at their closing net asset value (NAV) each business day and are categorized as Level 1 in the hierarchy. The aggregate value of investments by input level as of May 31, 2022 is included at the end of the Fund's Schedule of Investments.
Investment Transactions and Income. For financial reporting purposes, the Fund's investment holdings and NAV include trades executed through the end of the last business day of the period. The NAV per share for processing shareholder transactions is calculated as of the close of business of the New York Stock Exchange (NYSE), normally 4:00 p.m. Eastern time and includes trades executed through the end of the prior business day. Gains and losses on securities sold are determined on the basis of identified cost. Income and capital gain distributions from any underlying mutual funds or exchange-traded funds (ETFs) are recorded on the ex-dividend date.
Class Allocations and Expenses. Investment income, realized and unrealized capital gains and losses, common expenses of a fund, and certain fund-level expense reductions, if any, are allocated daily on a pro-rata basis to each class based on the relative net assets of each class to the total net assets of a fund. Each class differs with respect to transfer agent and distribution and service plan fees incurred, as applicable. Certain expense reductions may also differ by class, if applicable. For the reporting period, the allocated portion of income and expenses to each class as a percent of its average net assets may vary due to the timing of recording these transactions in relation to fluctuating net assets of the classes. Expenses directly attributable to a fund are charged to that fund. Expenses attributable to more than one fund are allocated among the respective funds on the basis of relative net assets or other appropriate methods. Expenses included in the accompanying financial statements reflect the expenses of that fund and do not include any expenses associated with any underlying mutual funds or exchange-traded funds. Although not included in a fund's expenses, a fund indirectly bears its proportionate share of these expenses through the net asset value of each underlying mutual fund or exchange-traded fund. Expense estimates are accrued in the period to which they relate and adjustments are made when actual amounts are known.
Income Tax Information and Distributions to Shareholders. Each year, the Fund intends to qualify as a regulated investment company under Subchapter M of the Internal Revenue Code, including distributing substantially all of its taxable income and realized gains. As a result, no provision for U.S. Federal income taxes is required. As of May 31, 2022, the Fund did not have any unrecognized tax benefits in the financial statements; nor is the Fund aware of any tax positions for which it is reasonably possible that the total amounts of unrecognized tax benefits will significantly change in the next twelve months. The Fund files a U.S. federal tax return, in addition to state and local tax returns as required. The Fund's federal income tax returns are subject to examination by the Internal Revenue Service (IRS) for a period of three fiscal years after they are filed. State and local tax returns may be subject to examination for an additional fiscal year depending on the jurisdiction.
Distributions are declared and recorded on the ex-dividend date. Income and capital gain distributions are declared separately for each class. Income and capital gain distributions are determined in accordance with income tax regulations, which may differ from GAAP.
Capital accounts within the financial statements are adjusted for permanent book-tax differences. These adjustments have no impact on net assets or the results of operations. Capital accounts are not adjusted for temporary book-tax differences which will reverse in a subsequent period.
Book-tax differences are primarily due to the short-term gain distributions from the underlying mutual funds or exchange-traded funds (ETFs), and losses deferred due to wash sales and excise tax regulations.
As of period end, the cost and unrealized appreciation (depreciation) in securities, and derivatives if applicable, for federal income tax purposes were as follows:
| Gross unrealized appreciation | $6,979,029 |
| Gross unrealized depreciation | (18,983,909) |
| Net unrealized appreciation (depreciation) | $(12,004,880) |
| Tax Cost | $137,718,907 |
The tax-based components of distributable earnings as of period end were as follows:
| Net unrealized appreciation (depreciation) on securities and other investments | $(12,004,880) |
The Fund intends to elect to defer to its next fiscal year $2,717,555 of capital losses recognized during the period November 1, 2021 to May 31, 2022.
The tax character of distributions paid was as follows:
| | May 31, 2022 | May 31, 2021 |
| Ordinary Income | $2,610,566 | $ 722,470 |
| Long-term Capital Gains | 129,714 | – |
| Total | $2,740,280 | $ 722,470 |
3. Purchases and Sales of Investments.
Purchases and sales of securities, other than short-term securities and in-kind transactions, as applicable, are noted in the table below.
| | Purchases ($) | Sales ($) |
| Fidelity Disruptors Fund | 43,005,554 | 38,501,671 |
4. Fees and Other Transactions with Affiliates.
Management Fee and Expense Contract. Fidelity Management & Research Company LLC (the investment adviser) and its affiliates provide the Fund with investment management related services for which each Class of the Fund pays a monthly all-inclusive management fee based on an annual percentage of class-level average net assets. Under the management contract, the investment adviser pays all other operating expenses, except the compensation of the independent Trustees and certain miscellaneous expenses, such as proxy and shareholder meeting expenses.
Under the expense contract, the investment adviser pays all other class-level operating expenses as necessary, except the compensation of the independent Trustees and certain miscellaneous expenses, such as proxy and shareholder meeting expenses, so that total expenses of Loyalty Class 1 and Loyalty Class 2 do not exceed an annual percentage of class-level average net assets.
For the reporting period, the annual management fee and expense contract rates were as follows:
| | Management Fee Annual % of Class-Level Average Net Assets | Expense Contract Annual % of Class-Level Average Net Assets |
| Fidelity Disruptors Fund | 1.00% | N/A |
| Loyalty Class 1 | 1.00% | .75% |
| Loyalty Class 2 | 1.00% | .50% |
Interfund Trades. Funds may purchase from or sell securities to other Fidelity Funds under procedures adopted by the Board. The procedures have been designed to ensure these interfund trades are executed in accordance with Rule 17a-7 of the 1940 Act. Any interfund trades are included within the respective purchases and sales amounts shown in the Purchases and Sales of Investments note. During the period there were no interfund trades.
5. Committed Line of Credit.
Certain Funds participate with other funds managed by the investment adviser or an affiliate in a $4.25 billion credit facility (the "line of credit") to be utilized for temporary or emergency purposes to fund shareholder redemptions or for other short-term liquidity purposes. The participating funds have agreed to pay commitment fees on their pro-rata portion of the line of credit, which are reflected in Miscellaneous expenses on the Statement of Operations, and are listed below. During the period, there were no borrowings on this line of credit.
6. Distributions to Shareholders.
Distributions to shareholders of each class were as follows:
| | Year ended
May 31, 2022 | Year ended
May 31, 2021 |
| Fidelity Disruptors Fund | | |
| Distributions to shareholders | | |
| Fidelity Disruptors Fund | $1,248,331 | $720,250 |
| Loyalty Class 1 | 1,488,996 | 1,010 |
| Loyalty Class 2 | 2,953 | 1,210 |
| Total | $2,740,280 | $722,470 |
7. Share Transactions.
Share transactions for each class were as follows and may contain in-kind transactions, automatic conversions between classes or exchanges between affiliated funds:
| | Shares | Shares | Dollars | Dollars |
| | Year ended May 31, 2022 | Year ended May 31, 2021 | Year ended May 31, 2022 | Year ended May 31, 2021 |
| Fidelity Disruptors Fund | | | | |
| Fidelity Disruptors Fund | | | | |
| Shares sold | 3,364,718 | 10,651,496 | $57,885,306 | $157,172,221 |
| Reinvestment of distributions | 64,582 | 44,103 | 1,155,369 | 684,040 |
| Shares redeemed | (8,005,363) | (3,993,829) | (134,859,195) | (63,519,506) |
| Net increase (decrease) | (4,576,063) | 6,701,770 | $(75,818,520) | $94,336,755 |
| Loyalty Class 1 | | | | |
| Shares sold | 5,960,783 | 1,488,583 | $101,335,523 | $25,040,970 |
| Reinvestment of distributions | 77,695 | 65 | 1,391,522 | 1,010 |
| Shares redeemed | (1,514,632) | (19,950) | (23,616,696) | (326,616) |
| Net increase (decrease) | 4,523,846 | 1,468,698 | $79,110,349 | $24,715,364 |
| Loyalty Class 2 | | | | |
| Reinvestment of distributions | 164 | 78 | $2,953 | $1,210 |
| Net increase (decrease) | 164 | 78 | $2,953 | $1,210 |
8. Other.
A fund's organizational documents provide former and current trustees and officers with a limited indemnification against liabilities arising in connection with the performance of their duties to the fund. In the normal course of business, a fund may also enter into contracts that provide general indemnifications. A fund's maximum exposure under these arrangements is unknown as this would be dependent on future claims that may be made against a fund. The risk of material loss from such claims is considered remote.
Funds do not invest in underlying mutual funds for the purpose of exercising management or control; however, investments by funds within their principal investment strategies may represent a significant portion of the underlying mutual fund's net assets. At the end of the period, certain Funds were the owners of record of 10% or more of the total outstanding shares of the following underlying mutual funds as shown below.
| Fund | Fidelity Disruptors Fund |
| Fidelity Disruptive Automation Fund | 21% |
| Fidelity Disruptive Communications Fund | 52% |
| Fidelity Disruptive Finance Fund | 39% |
| Fidelity Disruptive Medicine Fund | 46% |
| Fidelity Disruptive Technology Fund | 23% |
9. Coronavirus (COVID-19) Pandemic.
An outbreak of COVID-19 first detected in China during December 2019 has since spread globally and was declared a pandemic by the World Health Organization during March 2020. Developments that disrupt global economies and financial markets, such as the COVID-19 pandemic, may magnify factors that affect the Fund's performance.
Report of Independent Registered Public Accounting Firm
To the Board of Trustees of Fidelity Summer Street Trust and Shareholders of Fidelity Disruptors Fund
Opinion on the Financial Statements and Financial Highlights
We have audited the accompanying statement of assets and liabilities of Fidelity Disruptors Fund (the "Fund"), a fund of Fidelity Summer Street Trust, including the schedule of investments, as of May 31, 2022, the related statement of operations for the year then ended, the statement of changes in net assets for each of the two years in the period then ended, the financial highlights for each of the two years in the period then ended and for the period from April 16, 2020 (commencement of operations) through May 31, 2020, and the related notes. In our opinion, the financial statements and financial highlights present fairly, in all material respects, the financial position of the Fund as of May 31, 2022, and the results of its operations for the year then ended, the changes in its net assets for each of the two years in the period then ended, and the financial highlights for each of the two years in the period then ended and for the period from April 16, 2020 (commencement of operations) through May 31, 2020, in conformity with accounting principles generally accepted in the United States of America.
Basis for Opinion
These financial statements and financial highlights are the responsibility of the Fund's management. Our responsibility is to express an opinion on the Fund's financial statements and financial highlights based on our audits. We are a public accounting firm registered with the Public Company Accounting Oversight Board (United States) (PCAOB) and are required to be independent with respect to the Fund in accordance with the U.S. federal securities laws and the applicable rules and regulations of the Securities and Exchange Commission and the PCAOB.
We conducted our audits in accordance with the standards of the PCAOB. Those standards require that we plan and perform the audit to obtain reasonable assurance about whether the financial statements and financial highlights are free of material misstatement, whether due to error or fraud. The Fund is not required to have, nor were we engaged to perform, an audit of its internal control over financial reporting. As part of our audits we are required to obtain an understanding of internal control over financial reporting but not for the purpose of expressing an opinion on the effectiveness of the Fund’s internal control over financial reporting. Accordingly, we express no such opinion.
Our audits included performing procedures to assess the risks of material misstatement of the financial statements and financial highlights, whether due to error or fraud, and performing procedures that respond to those risks. Such procedures included examining, on a test basis, evidence regarding the amounts and disclosures in the financial statements and financial highlights. Our audits also included evaluating the accounting principles used and significant estimates made by management, as well as evaluating the overall presentation of the financial statements and financial highlights. Our procedures included confirmation of securities owned as of May 31, 2022, by correspondence with the custodian and brokers; when replies were not received from brokers, we performed other auditing procedures. We believe that our audits provide a reasonable basis for our opinion.
/s/ Deloitte & Touche LLP
Boston, Massachusetts
July 15, 2022
We have served as the auditor of one or more of the Fidelity investment companies since 1999.
Trustees and Officers
The Trustees, Members of the Advisory Board (if any), and officers of the trust and fund, as applicable, are listed below. The Board of Trustees governs the fund and is responsible for protecting the interests of shareholders. The Trustees are experienced executives who meet periodically throughout the year to oversee the fund's activities, review contractual arrangements with companies that provide services to the fund, oversee management of the risks associated with such activities and contractual arrangements, and review the fund's performance. If the interests of the fund and an underlying Fidelity® fund were to diverge, a conflict of interest could arise and affect how the Trustees and Members of the Advisory Board fulfill their fiduciary duties to the affected funds. FMR has structured the fund to avoid these potential conflicts, although there may be situations where a conflict of interest is unavoidable. In such instances, FMR, the Trustees, and Members of the Advisory Board would take reasonable steps to minimize and, if possible, eliminate the conflict. Each of Trustees oversees 325 funds.
The Trustees hold office without limit in time except that (a) any Trustee may resign; (b) any Trustee may be removed by written instrument, signed by at least two-thirds of the number of Trustees prior to such removal; (c) any Trustee who requests to be retired or who has become incapacitated by illness or injury may be retired by written instrument signed by a majority of the other Trustees; and (d) any Trustee may be removed at any special meeting of shareholders by a two-thirds vote of the outstanding voting securities of the trust. Each Trustee who is not an interested person (as defined in the 1940 Act) of the trust and the fund is referred to herein as an Independent Trustee. Each Independent Trustee shall retire not later than the last day of the calendar year in which his or her 75th birthday occurs. The Independent Trustees may waive this mandatory retirement age policy with respect to individual Trustees. Officers and Advisory Board Members hold office without limit in time, except that any officer or Advisory Board Member may resign or may be removed by a vote of a majority of the Trustees at any regular meeting or any special meeting of the Trustees. Except as indicated, each individual has held the office shown or other offices in the same company for the past five years.
The fund’s Statement of Additional Information (SAI) includes more information about the Trustees. To request a free copy, call Fidelity at 1-800-544-8544.
Experience, Skills, Attributes, and Qualifications of the Trustees. The Governance and Nominating Committee has adopted a statement of policy that describes the experience, qualifications, attributes, and skills that are necessary and desirable for potential Independent Trustee candidates (Statement of Policy). The Board believes that each Trustee satisfied at the time he or she was initially elected or appointed a Trustee, and continues to satisfy, the standards contemplated by the Statement of Policy. The Governance and Nominating Committee also engages professional search firms to help identify potential Independent Trustee candidates who have the experience, qualifications, attributes, and skills consistent with the Statement of Policy. From time to time, additional criteria based on the composition and skills of the current Independent Trustees, as well as experience or skills that may be appropriate in light of future changes to board composition, business conditions, and regulatory or other developments, have also been considered by the professional search firms and the Governance and Nominating Committee. In addition, the Board takes into account the Trustees' commitment and participation in Board and committee meetings, as well as their leadership of standing and ad hoc committees throughout their tenure.
In determining that a particular Trustee was and continues to be qualified to serve as a Trustee, the Board has considered a variety of criteria, none of which, in isolation, was controlling. The Board believes that, collectively, the Trustees have balanced and diverse experience, qualifications, attributes, and skills, which allow the Board to operate effectively in governing the fund and protecting the interests of shareholders. Information about the specific experience, skills, attributes, and qualifications of each Trustee, which in each case led to the Board's conclusion that the Trustee should serve (or continue to serve) as a trustee of the fund, is provided below.
Board Structure and Oversight Function. Robert A. Lawrence is an interested person and currently serves as Chair. The Trustees have determined that an interested Chair is appropriate and benefits shareholders because an interested Chair has a personal and professional stake in the quality and continuity of services provided to the fund. Independent Trustees exercise their informed business judgment to appoint an individual of their choosing to serve as Chair, regardless of whether the Trustee happens to be independent or a member of management. The Independent Trustees have determined that they can act independently and effectively without having an Independent Trustee serve as Chair and that a key structural component for assuring that they are in a position to do so is for the Independent Trustees to constitute a substantial majority for the Board. The Independent Trustees also regularly meet in executive session. David M. Thomas serves as Lead Independent Trustee and as such (i) acts as a liaison between the Independent Trustees and management with respect to matters important to the Independent Trustees and (ii) with management prepares agendas for Board meetings.
Fidelity® funds are overseen by different Boards of Trustees. The fund's Board oversees Fidelity's high income and certain equity funds, and other Boards oversee Fidelity's investment-grade bond, money market, asset allocation, and other equity funds. The asset allocation funds may invest in Fidelity® funds overseen by the fund's Board. The use of separate Boards, each with its own committee structure, allows the Trustees of each group of Fidelity® funds to focus on the unique issues of the funds they oversee, including common research, investment, and operational issues. On occasion, the separate Boards establish joint committees to address issues of overlapping consequences for the Fidelity® funds overseen by each Board.
The Trustees operate using a system of committees to facilitate the timely and efficient consideration of all matters of importance to the Trustees, the fund, and fund shareholders and to facilitate compliance with legal and regulatory requirements and oversight of the fund's activities and associated risks. The Board, acting through its committees, has charged FMR and its affiliates with (i) identifying events or circumstances the occurrence of which could have demonstrably adverse effects on the fund's business and/or reputation; (ii) implementing processes and controls to lessen the possibility that such events or circumstances occur or to mitigate the effects of such events or circumstances if they do occur; and (iii) creating and maintaining a system designed to evaluate continuously business and market conditions in order to facilitate the identification and implementation processes described in (i) and (ii) above. Because the day-to-day operations and activities of the fund are carried out by or through FMR, its affiliates, and other service providers, the fund's exposure to risks is mitigated but not eliminated by the processes overseen by the Trustees. While each of the Board's committees has responsibility for overseeing different aspects of the fund's activities, oversight is exercised primarily through the Operations, Audit, and Compliance Committees. Appropriate personnel, including but not limited to the fund's Chief Compliance Officer (CCO), FMR's internal auditor, the independent accountants, the fund's Treasurer and portfolio management personnel, make periodic reports to the Board's committees, as appropriate, including an annual review of Fidelity's risk management program for the Fidelity® funds. The responsibilities of each standing committee, including their oversight responsibilities, are described further under "Standing Committees of the Trustees."
Interested Trustees*:
Correspondence intended for a Trustee who is an interested person may be sent to Fidelity Investments, 245 Summer Street, Boston, Massachusetts 02210.
Name, Year of Birth; Principal Occupations and Other Relevant Experience+
Bettina Doulton (1964)
Year of Election or Appointment: 2020
Trustee
Ms. Doulton also serves as Trustee of other Fidelity® funds. Prior to her retirement, Ms. Doulton served in a variety of positions at Fidelity Investments, including as a managing director of research (2006-2007), portfolio manager to certain Fidelity® funds (1993-2005), equity analyst and portfolio assistant (1990-1993), and research assistant (1987-1990). Ms. Doulton currently owns and operates Phi Builders + Architects and Cellardoor Winery. Previously, Ms. Doulton served as a member of the Board of Brown Capital Management, LLC (2014-2018).
Robert A. Lawrence (1952)
Year of Election or Appointment: 2020
Trustee
Chair of the Board of Trustees
Mr. Lawrence also serves as Trustee of other funds. Previously, Mr. Lawrence served as a Trustee and Member of the Advisory Board of certain funds. Prior to his retirement in 2008, Mr. Lawrence served as Vice President of certain Fidelity® funds (2006-2008), Senior Vice President, Head of High Income Division of Fidelity Management & Research Company (investment adviser firm, 2006-2008), and President of Fidelity Strategic Investments (investment adviser firm, 2002-2005).
* Determined to be an “Interested Trustee” by virtue of, among other things, his or her affiliation with the trust or various entities under common control with FMR.
+ The information includes the Trustee's principal occupation during the last five years and other information relating to the experience, attributes, and skills relevant to the Trustee's qualifications to serve as a Trustee, which led to the conclusion that the Trustee should serve as a Trustee for the fund.
Independent Trustees:
Correspondence intended for an Independent Trustee may be sent to Fidelity Investments, P.O. Box 55235, Boston, Massachusetts 02205-5235.
Name, Year of Birth; Principal Occupations and Other Relevant Experience+
Thomas P. Bostick (1956)
Year of Election or Appointment: 2021
Trustee
Lieutenant General Bostick also serves as Trustee of other Fidelity® funds. Prior to his retirement, General Bostick (United States Army, Retired) held a variety of positions within the U.S. Army, including Commanding General and Chief of Engineers, U.S. Army Corps of Engineers (2012-2016) and Deputy Chief of Staff and Director of Human Resources, U.S. Army (2009-2012). General Bostick currently serves as a member of the Board and Finance and Governance Committees of CSX Corporation (transportation, 2020-present) and a member of the Board and Corporate Governance and Nominating Committee of Perma-Fix Environmental Services, Inc. (nuclear waste management, 2020-present). General Bostick serves as Chief Executive Officer of Bostick Global Strategies, LLC (consulting, 2016-present) and as a member of the Board of HireVue, Inc. (video interview and assessment, 2020-present). Previously, General Bostick served as a Member of the Advisory Board of certain Fidelity® funds (2021), President, Intrexon Bioengineering (2018-2020) and Chief Operating Officer (2017-2020) and Senior Vice President of the Environment Sector (2016-2017) of Intrexon Corporation (biopharmaceutical company).
Dennis J. Dirks (1948)
Year of Election or Appointment: 2005
Trustee
Mr. Dirks also serves as Trustee of other Fidelity® funds. Prior to his retirement in May 2003, Mr. Dirks served as Chief Operating Officer and as a member of the Board of The Depository Trust & Clearing Corporation (financial markets infrastructure), President, Chief Operating Officer and a member of the Board of The Depository Trust Company (DTC), President and a member of the Board of the National Securities Clearing Corporation (NSCC), Chief Executive Officer and a member of the Board of the Government Securities Clearing Corporation and Chief Executive Officer and a member of the Board of the Mortgage-Backed Securities Clearing Corporation. Mr. Dirks currently serves as a member of the Finance Committee (2016-present) and Board (2017-present) and is Treasurer (2018-present) of the Asolo Repertory Theatre.
Donald F. Donahue (1950)
Year of Election or Appointment: 2018
Trustee
Mr. Donahue also serves as Trustee of other Fidelity® funds. Mr. Donahue serves as President and Chief Executive Officer of Miranda Partners, LLC (risk consulting for the financial services industry, 2012-present). Previously, Mr. Donahue served as Chief Executive Officer (2006-2012), Chief Operating Officer (2003-2006) and Managing Director, Customer Marketing and Development (1999-2003) of The Depository Trust & Clearing Corporation (financial markets infrastructure). Mr. Donahue currently serves as a member (2007-present) and Co-Chairman (2016-present) of the Board of United Way of New York and a member of the Board of The Leadership Academy (previously NYC Leadership Academy) (2012-present). Mr. Donahue previously served as a member of the Advisory Board of certain Fidelity® funds (2015-2018).
Vicki L. Fuller (1957)
Year of Election or Appointment: 2020
Trustee
Ms. Fuller also serves as Trustee of other Fidelity® funds. Previously, Ms. Fuller served as a member of the Advisory Board of certain Fidelity® funds (2018-2020), Chief Investment Officer of the New York State Common Retirement Fund (2012-2018) and held a variety of positions at AllianceBernstein L.P. (global asset management, 1985-2012), including Managing Director (2006-2012) and Senior Vice President and Senior Portfolio Manager (2001-2006). Ms. Fuller currently serves as a member of the Board, Audit Committee and Nominating and Governance Committee of two Blackstone business development companies (2020-present), as a member of the Board of Treliant, LLC (consulting, 2019-present), as a member of the Advisory Board of Ariel Alternatives, LLC (private equity, 2021-present) and as a member of the Board and Chair of the Audit Committee of Gusto, Inc. (software, 2021-present). In addition, Ms. Fuller currently serves as a member of the Board of Roosevelt University (2019-present) and as a member of the Executive Board of New York University’s Stern School of Business. Ms. Fuller previously served as a member of the Board, Audit Committee and Nominating and Governance Committee of The Williams Companies, Inc. (natural gas infrastructure, 2018-2021).
Patricia L. Kampling (1959)
Year of Election or Appointment: 2020
Trustee
Ms. Kampling also serves as Trustee of other Fidelity® funds. Prior to her retirement, Ms. Kampling served as Chairman of the Board and Chief Executive Officer (2012-2019), President and Chief Operating Officer (2011-2012) and Executive Vice President and Chief Financial Officer (2010-2011) of Alliant Energy Corporation. Ms. Kampling currently serves as a member of the Board, Finance Committee and Governance, Compensation and Nominating Committee of Xcel Energy Inc. (utilities company, 2020-present) and as a member of the Board, Audit, Finance and Risk Committee and Safety, Environmental, Technology and Operations Committee and Chair of the Executive Development and Compensation Committee of American Water Works Company, Inc. (utilities company, 2019-present). In addition, Ms. Kampling currently serves as a member of the Board of the Nature Conservancy, Wisconsin Chapter (2019-present). Previously, Ms. Kampling served as a Member of the Advisory Board of certain Fidelity® funds (2020), a member of the Board, Compensation Committee and Executive Committee and Chair of the Audit Committee of Briggs & Stratton Corporation (manufacturing, 2011-2021), a member of the Board of Interstate Power and Light Company (2012-2019) and Wisconsin Power and Light Company (2012-2019) (each a subsidiary of Alliant Energy Corporation) and as a member of the Board and Workforce Development Committee of the Business Roundtable (2018-2019).
Thomas A. Kennedy (1955)
Year of Election or Appointment: 2021
Trustee
Mr. Kennedy also serves as Trustee of other Fidelity® funds. Previously, Mr. Kennedy served as a Member of the Advisory Board of certain Fidelity® funds (2020) and held a variety of positions at Raytheon Company (aerospace and defense, 1983-2020), including Chairman and Chief Executive Officer (2014-2020) and Executive Vice President and Chief Operating Officer (2013-2014). Mr. Kennedy currently serves as Executive Chairman of the Board of Directors of Raytheon Technologies Corporation (aerospace and defense, 2020-present). He is also a member of the Rutgers School of Engineering Industry Advisory Board (2011-present) and a member of the UCLA Engineering Dean’s Executive Board (2016-present).
Oscar Munoz (1959)
Year of Election or Appointment: 2021
Trustee
Mr. Munoz also serves as Trustee of other Fidelity® funds. Prior to his retirement, Mr. Munoz served as Executive Chairman (2020-2021), Chief Executive Officer (2015-2020), President (2015-2016) and a member of the Board (2010-2021) of United Airlines Holdings, Inc. Mr. Munoz currently serves as a member of the Board of CBRE Group, Inc. (commercial real estate, 2020-present), a member of the Board of Univision Communications, Inc. (Hispanic media, 2020-present) and a member of the Advisory Board of Salesforce.com, Inc. (cloud-based software, 2020-present). Previously, Mr. Munoz served as a Member of the Advisory Board of certain Fidelity® funds (2021).
Garnett A. Smith (1947)
Year of Election or Appointment: 2018
Trustee
Mr. Smith also serves as Trustee of other Fidelity® funds. Prior to his retirement, Mr. Smith served as Chairman and Chief Executive Officer (1990-1997) and President (1986-1990) of Inbrand Corp. (manufacturer of personal absorbent products). Prior to his employment with Inbrand Corp., he was employed by a retail fabric chain and North Carolina National Bank (now Bank of America). Mr. Smith previously served as a member of the Advisory Board of certain Fidelity® funds (2012-2013).
David M. Thomas (1949)
Year of Election or Appointment: 2008
Trustee
Lead Independent Trustee
Mr. Thomas also serves as Trustee of other Fidelity® funds. Previously, Mr. Thomas served as Executive Chairman (2005-2006) and Chairman and Chief Executive Officer (2000-2005) of IMS Health, Inc. (pharmaceutical and healthcare information solutions). Mr. Thomas currently serves as a member of the Board of Fortune Brands Home and Security (home and security products, 2004-present) and as Director (2013-present) and Non-Executive Chairman of the Board (2022-present) of Interpublic Group of Companies, Inc. (marketing communication).
Susan Tomasky (1953)
Year of Election or Appointment: 2020
Trustee
Ms. Tomasky also serves as Trustee of other Fidelity® funds. Prior to her retirement, Ms. Tomasky served in various executive officer positions at American Electric Power Company, Inc. (1998-2011), including most recently as President of AEP Transmission (2007-2011). Ms. Tomasky currently serves as a member of the Board and Sustainability Committee and as Chair of the Audit Committee of Marathon Petroleum Corporation (2018-present) and as a member of the Board, Executive Committee, Corporate Governance Committee and Organization and Compensation Committee and as Chair of the Audit Committee of Public Service Enterprise Group, Inc. (utilities company, 2012-present) and as a member of the Board of its subsidiary company, Public Service Electric and Gas Co. (2021-present). In addition, Ms. Tomasky currently serves as a member (2009-present) and President (2020-present) of the Board of the Royal Shakespeare Company – America (2009-present), as a member of the Board of the Columbus Association for the Performing Arts (2011-present) and as a member of the Board and Kenyon in the World Committee of Kenyon College (2016-present). Previously, Ms. Tomasky served as a Member of the Advisory Board of certain Fidelity® funds (2020), as a member of the Board of the Columbus Regional Airport Authority (2007-2020), as a member of the Board (2011-2018) and Lead Independent Director (2015-2018) of Andeavor Corporation (previously Tesoro Corporation) (independent oil refiner and marketer) and as a member of the Board of Summit Midstream Partners LP (energy, 2012-2018).
Michael E. Wiley (1950)
Year of Election or Appointment: 2018
Trustee
Mr. Wiley also serves as Trustee of other Fidelity® funds. Previously, Mr. Wiley served as a member of the Advisory Board of certain Fidelity® funds (2018-2020), Chairman, President and CEO of Baker Hughes, Inc. (oilfield services, 2000-2004). Mr. Wiley also previously served as a member of the Board of Andeavor Corporation (independent oil refiner and marketer, 2005-2018), a member of the Board of Andeavor Logistics LP (natural resources logistics, 2015-2018) and a member of the Board of High Point Resources (exploration and production, 2005-2020).
+ The information includes the Trustee's principal occupation during the last five years and other information relating to the experience, attributes, and skills relevant to the Trustee's qualifications to serve as a Trustee, which led to the conclusion that the Trustee should serve as a Trustee for the fund.
Advisory Board Members and Officers:
Correspondence intended for a Member of the Advisory Board (if any) may be sent to Fidelity Investments, P.O. Box 55235, Boston, Massachusetts 02205-5235. Correspondence intended for an officer or Peter S. Lynch may be sent to Fidelity Investments, 245 Summer Street, Boston, Massachusetts 02210. Officers appear below in alphabetical order.
Name, Year of Birth; Principal Occupation
Peter S. Lynch (1944)
Year of Election or Appointment: 2003
Member of the Advisory Board
Mr. Lynch also serves as a Member of the Advisory Board of other Fidelity® funds. Mr. Lynch is Vice Chairman and a Director of Fidelity Management & Research Company LLC (investment adviser firm). In addition, Mr. Lynch serves as a Trustee of Boston College and as the Chairman of the Inner-City Scholarship Fund. Previously, Mr. Lynch served as Vice Chairman and a Director of FMR Co., Inc. (investment adviser firm) and on the Special Olympics International Board of Directors (1997-2006).
Craig S. Brown (1977)
Year of Election or Appointment: 2019
Assistant Treasurer
Mr. Brown also serves as an officer of other funds. Mr. Brown serves as Assistant Treasurer of FIMM, LLC (2021-present) and is an employee of Fidelity Investments (2013-present).
John J. Burke III (1964)
Year of Election or Appointment: 2018
Chief Financial Officer
Mr. Burke also serves as Chief Financial Officer of other funds. Mr. Burke serves as Head of Investment Operations for Fidelity Fund and Investment Operations (2018-present) and is an employee of Fidelity Investments (1998-present). Previously Mr. Burke served as head of Asset Management Investment Operations (2012-2018).
William C. Coffey (1969)
Year of Election or Appointment: 2019
Assistant Secretary
Mr. Coffey also serves as Assistant Secretary of other funds. He is Senior Vice President and Deputy General Counsel of FMR LLC (diversified financial services company, 2010-present), and is an employee of Fidelity Investments. Previously, Mr. Coffey served as Secretary and CLO of certain funds (2018-2019); CLO, Secretary, and Senior Vice President of Fidelity Management & Research Company and FMR Co., Inc. (investment adviser firms, 2018-2019); Secretary of Fidelity SelectCo, LLC and Fidelity Investments Money Management, Inc. (investment adviser firms, 2018-2019); CLO of Fidelity Management & Research (Hong Kong) Limited, FMR Investment Management (UK) Limited, and Fidelity Management & Research (Japan) Limited (investment adviser firms, 2018-2019); and Assistant Secretary of certain funds (2009-2018).
Timothy M. Cohen (1969)
Year of Election or Appointment: 2018
Vice President
Mr. Cohen also serves as Vice President of other funds. Mr. Cohen serves as Co-Head of Equity (2018-present), a Director of Fidelity Management & Research (Japan) Limited (investment adviser firm, 2016-present), and is an employee of Fidelity Investments. Previously, Mr. Cohen served as Executive Vice President of Fidelity SelectCo, LLC (2019), Head of Global Equity Research (2016-2018), Chief Investment Officer - Equity and a Director of Fidelity Management & Research (U.K.) Inc. (investment adviser firm, 2013-2015) and as a Director of Fidelity Management & Research (Hong Kong) Limited (investment adviser firm, 2017).
Jonathan Davis (1968)
Year of Election or Appointment: 2010
Assistant Treasurer
Mr. Davis also serves as an officer of other funds. Mr. Davis serves as Assistant Treasurer of FIMM, LLC (2021-present), FMR Capital, Inc. (2017-present), FD Funds GP LLC (2021-present), FD Funds Holding LLC (2021-present), and FD Funds Management LLC (2021-present); and is an employee of Fidelity Investments. Previously, Mr. Davis served as Vice President and Associate General Counsel of FMR LLC (diversified financial services company, 2003-2010).
Laura M. Del Prato (1964)
Year of Election or Appointment: 2018
Assistant Treasurer
Ms. Del Prato also serves as an officer of other funds. Ms. Del Prato serves as Assistant Treasurer of FIMM, LLC (2021-present) and is an employee of Fidelity Investments (2017-present). Previously, Ms. Del Prato served as President and Treasurer of The North Carolina Capital Management Trust: Cash Portfolio and Term Portfolio (2018-2020). Prior to joining Fidelity Investments, Ms. Del Prato served as a Managing Director and Treasurer of the JPMorgan Mutual Funds (2014-2017). Prior to JPMorgan, Ms. Del Prato served as a partner at Cohen Fund Audit Services (accounting firm, 2012-2013) and KPMG LLP (accounting firm, 2004-2012).
Colm A. Hogan (1973)
Year of Election or Appointment: 2020
Assistant Treasurer
Mr. Hogan also serves as an officer of other funds. Mr. Hogan serves as Assistant Treasurer of FIMM, LLC (2021-present) and FMR Capital, Inc. (2017-present) and is an employee of Fidelity Investments (2005-present). Previously, Mr. Hogan served as Deputy Treasurer of certain Fidelity® funds (2016-2020) and Assistant Treasurer of certain Fidelity® funds (2016-2018).
Pamela R. Holding (1964)
Year of Election or Appointment: 2018
Vice President
Ms. Holding also serves as Vice President of other funds. Ms. Holding serves as Co-Head of Equity (2018-present) and is an employee of Fidelity Investments (2013-present). Previously, Ms. Holding served as Executive Vice President of Fidelity SelectCo, LLC (2019) and as Chief Investment Officer of Fidelity Institutional Asset Management (2013-2018).
Cynthia Lo Bessette (1969)
Year of Election or Appointment: 2019
Secretary and Chief Legal Officer (CLO)
Ms. Lo Bessette also serves as an officer of other funds. Ms. Lo Bessette serves as CLO, Secretary, and Senior Vice President of Fidelity Management & Research Company LLC (investment adviser firm, 2019-present); CLO of Fidelity Management & Research (Hong Kong) Limited, FMR Investment Management (UK) Limited, and Fidelity Management & Research (Japan) Limited (investment adviser firms, 2019-present); Secretary of FD Funds GP LLC (2021-present), FD Funds Holding LLC (2021-present), and FD Funds Management LLC (2021-present); and Assistant Secretary of FIMM, LLC (2019-present). She is a Senior Vice President and Deputy General Counsel of FMR LLC (diversified financial services company, 2019-present), and is an employee of Fidelity Investments. Previously, Ms. Lo Bessette served as CLO, Secretary, and Senior Vice President of FMR Co., Inc. (investment adviser firm, 2019); Secretary of Fidelity SelectCo, LLC and Fidelity Investments Money Management, Inc. (investment adviser firms, 2019). Prior to joining Fidelity Investments, Ms. Lo Bessette was Executive Vice President, General Counsel (2016-2019) and Senior Vice President, Deputy General Counsel (2015-2016) of OppenheimerFunds (investment management company) and Deputy Chief Legal Officer (2013-2015) of Jennison Associates LLC (investment adviser firm).
Chris Maher (1972)
Year of Election or Appointment: 2020
Deputy Treasurer
Mr. Maher also serves as an officer of other funds. Mr. Maher serves as Assistant Treasurer of FIMM, LLC (2021-present) and FMR Capital, Inc. (2017-present), and is an employee of Fidelity Investments (2008-present). Previously, Mr. Maher served as Assistant Treasurer of certain funds (2013-2020); Vice President of Asset Management Compliance (2013), Vice President of the Program Management Group of FMR (investment adviser firm, 2010-2013), and Vice President of Valuation Oversight (2008-2010).
Jason P. Pogorelec (1975)
Year of Election or Appointment: 2020
Chief Compliance Officer
Mr. Pogorelec also serves as Chief Compliance Officer of other funds. Mr. Pogorelec is a senior Vice President of Asset Management Compliance for Fidelity Investments and is an employee of Fidelity Investments (2006-present). Previously, Mr. Pogorelec served as Vice President, Associate General Counsel for Fidelity Investments (2010-2020) and Assistant Secretary of certain Fidelity funds (2015-2020).
Brett Segaloff (1972)
Year of Election or Appointment: 2021
Anti-Money Laundering (AML) Officer
Mr. Segaloff also serves as an AML Officer of other funds and other related entities. He is Director, Anti-Money Laundering (2007-present) of FMR LLC (diversified financial services company) and is an employee of Fidelity Investments (1996-present).
Stacie M. Smith (1974)
Year of Election or Appointment: 2016
President and Treasurer
Ms. Smith also serves as an officer of other funds. Ms. Smith serves as Assistant Treasurer of FIMM, LLC (2021-present) and FMR Capital, Inc. (2017-present), is an employee of Fidelity Investments (2009-present), and has served in other fund officer roles. Prior to joining Fidelity Investments, Ms. Smith served as Senior Audit Manager of Ernst & Young LLP (accounting firm, 1996-2009). Previously, Ms. Smith served as Assistant Treasurer (2013-2019) and Deputy Treasurer (2013-2016) of certain Fidelity® funds.
Jim Wegmann (1979)
Year of Election or Appointment: 2019
Assistant Treasurer
Mr. Wegmann also serves as an officer of other funds. Mr. Wegmann serves as Assistant Treasurer of FIMM, LLC (2021-present) and is an employee of Fidelity Investments (2011-present). Previously, Mr. Wegmann served as Assistant Treasurer of certain Fidelity® funds (2019-2021).
Shareholder Expense Example
As a shareholder, you incur two types of costs: (1) transaction costs, which may include sales charges (loads) on purchase payments or redemption proceeds, as applicable and (2) ongoing costs, which generally include management fees, distribution and/or service (12b-1) fees and other Fund expenses. This Example is intended to help you understand your ongoing costs (in dollars) of investing in a fund and to compare these costs with the ongoing costs of investing in other mutual funds.
The Example is based on an investment of $1,000 invested at the beginning of the period and held for the entire period (December 1, 2021 to May 31, 2022).
Actual Expenses
The first line of the accompanying table provides information about actual account values and actual expenses. You may use the information in this line, together with the amount you invested, to estimate the expenses that you paid over the period. Simply divide your account value by $1,000.00 (for example, an $8,600 account value divided by $1,000.00 = 8.6), then multiply the result by the number in the first line for a class/Fund under the heading entitled "Expenses Paid During Period" to estimate the expenses you paid on your account during this period. If any fund is a shareholder of any underlying mutual funds or exchange-traded funds (ETFs) (the Underlying Funds), such fund indirectly bears its proportional share of the expenses of the Underlying Funds in addition to the direct expenses incurred presented in the table. These fees and expenses are not included in the annualized expense ratio used to calculate the expense estimate in the table below.
Hypothetical Example for Comparison Purposes
The second line of the accompanying table provides information about hypothetical account values and hypothetical expenses based on the actual expense ratio and an assumed rate of return of 5% per year before expenses, which is not the actual return. The hypothetical account values and expenses may not be used to estimate the actual ending account balance or expenses you paid for the period. You may use this information to compare the ongoing costs of investing in the Fund and other funds. To do so, compare this 5% hypothetical example with the 5% hypothetical examples that appear in the shareholder reports of the other funds. If any fund is a shareholder of any Underlying Funds, such fund indirectly bears its proportional share of the expenses of the Underlying Funds in addition to the direct expenses as presented in the table. These fees and expenses are not included in the annualized expense ratio used to calculate the expense estimate in the table below.
Please note that the expenses shown in the table are meant to highlight your ongoing costs only and do not reflect any transaction costs. Therefore, the second line of the table is useful in comparing ongoing costs only, and will not help you determine the relative total costs of owning different funds. In addition, if these transactional costs were included, your costs would have been higher.
| | Annualized Expense Ratio-A | Beginning
Account Value
December 1, 2021 | Ending
Account Value
May 31, 2022 | Expenses Paid
During Period-B
December 1, 2021
to May 31, 2022 |
| Fidelity Disruptors Fund | | | | |
| Fidelity Disruptors Fund | 1.00% | | | |
| Actual | | $1,000.00 | $727.50 | $4.31 |
| Hypothetical-C | | $1,000.00 | $1,019.95 | $5.04 |
| Loyalty Class 1 | .75% | | | |
| Actual | | $1,000.00 | $728.90 | $3.23 |
| Hypothetical-C | | $1,000.00 | $1,021.19 | $3.78 |
| Loyalty Class 2 | .50% | | | |
| Actual | | $1,000.00 | $729.70 | $2.16 |
| Hypothetical-C | | $1,000.00 | $1,022.44 | $2.52 |
A Annualized expense ratio reflects expenses net of applicable fee waivers.
B Expenses are equal to the annualized expense ratio, multiplied by the average account value over the period, multiplied by 182/ 365 (to reflect the one-half year period). The fees and expenses of any Underlying Funds are not included in each annualized expense ratio.
C 5% return per year before expenses
Distributions (Unaudited)
The dividend and capital gains distributions for the fund(s) are available on Fidelity.com or Institutional.Fidelity.com.
The fund hereby designates as a capital gain dividend with respect to the taxable year ended May 31, 2022, $128,425, or, if subsequently determined to be different, the net capital gain of such year.
The fund designates 100% of the short-term capital gain dividends distributed in December during the fiscal year as qualifying to be taxed as short-term capital gain dividends for nonresident alien shareholders.
Fidelity Disruptors Fund designates 18%; Loyalty Class 1 designates 14%; and Loyalty Class 2 designates 14%; of the dividends distributed in December during the fiscal year as qualifying for the dividends–received deduction for corporate shareholders.
Fidelity Disruptors Fund designates 40%; Loyalty Class 1 designates 29%; and Loyalty Class 2 designates 29%; of the dividends distributed in December during the fiscal year as amounts which may be taken into account as a dividend for purposes of the maximum rate under section 1(h)(11) of the Internal Revenue Code.
Fidelity Disruptors Fund designates 2%; Loyalty Class 1 designates 1%; and Loyalty Class 2 designates 1%; of the dividends distributed in December during the fiscal year as a section 199A dividend.
The fund will notify shareholders in January 2023 of amounts for use in preparing 2022 income tax returns.
Board Approval of Investment Advisory Contracts and Management Fees
Fidelity Disruptors Fund
Each year, the Board of Trustees, including the Independent Trustees (together, the Board), votes on the renewal of the management contract with Fidelity Management & Research Company LLC (FMR) and the sub-advisory agreements (together, the Advisory Contracts) for the fund. FMR and the sub-advisers are referred to herein as the Investment Advisers. The Board, assisted by the advice of fund counsel and Independent Trustees' counsel, requests and considers a broad range of information relevant to the renewal of the Advisory Contracts throughout the year.
The Board meets regularly and, at each of its meetings, covers an extensive agenda of topics and materials and considers factors that are relevant to its annual consideration of the renewal of the fund's Advisory Contracts, including the services and support provided to the fund and its shareholders. The Board has established various standing committees (Committees), each composed of and chaired by Independent Trustees with varying backgrounds, to which the Board has assigned specific subject matter responsibilities in order to enhance effective decision-making by the Board. The Board, acting directly and through its Committees, requests and receives information concerning the annual consideration of the renewal of the fund's Advisory Contracts. The Board also meets as needed to review matters specifically related to the Board's annual consideration of the renewal of the Advisory Contracts. Members of the Board may also meet with trustees of other Fidelity funds through joint ad hoc committees to discuss certain matters relevant to all of the Fidelity funds.
At its May 2022 meeting, the Board unanimously determined to renew the fund's Advisory Contracts. In reaching its determination, the Board considered all factors it believed relevant, including (i) the nature, extent, and quality of the services provided to the fund and its shareholders (including the investment performance of the fund); (ii) the competitiveness relative to peer funds of the fund's management fee and the total expense ratio of a representative class (retail class); (iii) the total costs of the services provided by and the profits realized by Fidelity from its relationships with the fund; and (iv) the extent to which, if any, economies of scale exist and are realized as the fund grows, and whether any economies of scale are appropriately shared with fund shareholders.
In considering whether to renew the Advisory Contracts for the fund, the Board reached a determination, with the assistance of fund counsel and Independent Trustees' counsel and through the exercise of its business judgment, that the renewal of the Advisory Contracts was in the best interests of the fund and its shareholders and that the compensation payable under the Advisory Contracts was fair and reasonable. The Board's decision to renew the Advisory Contracts was not based on any single factor, but rather was based on a comprehensive consideration of all the information provided to the Board at its meetings throughout the year. The Board, in reaching its determination to renew the Advisory Contracts, was aware that shareholders of the fund have a broad range of investment choices available to them, including a wide choice among funds offered by Fidelity's competitors, and that the fund's shareholders, who have the opportunity to review and weigh the disclosure provided by the fund in its prospectus and other public disclosures, have chosen to invest in this fund, which is part of the Fidelity family of funds.
Nature, Extent, and Quality of Services Provided. The Board considered Fidelity's staffing as it relates to the fund, including the backgrounds of investment personnel of Fidelity, and also considered the fund's investment objective, strategies, and related investment philosophy. The Independent Trustees also had discussions with senior management of Fidelity's investment operations and investment groups. The Board considered the structure of the investment personnel compensation program and whether this structure provides appropriate incentives to act in the best interests of the fund. Additionally, the Board considered the portfolio managers' investments, if any, in the funds that they manage. The Board also considered the steps Fidelity had taken to ensure the continued provision of high quality services to the Fidelity funds during the COVID-19 pandemic, including the expansion of staff in client facing positions to maintain service levels in periods of high volumes and volatility.
Resources Dedicated to Investment Management and Support Services. The Board and the Fund Oversight and Research Committees reviewed the general qualifications and capabilities of Fidelity's investment staff, including its size, education, experience, and resources, as well as Fidelity's approach to recruiting, training, managing, and compensating investment personnel. The Board noted the resources devoted to expansion of Fidelity's global investment organization, and that Fidelity's analysts have extensive resources, tools, and capabilities that allow them to conduct sophisticated quantitative and fundamental analysis, as well as credit analysis of issuers, counterparties, and guarantors. Further, the Board considered that Fidelity's investment professionals have sufficient access to global information and data so as to provide competitive investment results over time, and that those professionals also have access to sophisticated tools that permit them to assess portfolio construction and risk and performance attribution characteristics continuously, as well as to transmit new information and research conclusions rapidly around the world. Additionally, in its deliberations, the Board considered Fidelity's trading, risk management, compliance, and technology and operations capabilities and resources, which are integral parts of the investment management process.
Shareholder and Administrative Services. The Board considered (i) the nature, extent, quality, and cost of advisory, administrative, and shareholder services performed by the Investment Advisers and their affiliates under the Advisory Contracts and under separate agreements covering transfer agency, pricing and bookkeeping, and securities lending services for the fund; (ii) the nature and extent of the supervision of third party service providers, principally custodians, subcustodians, and pricing vendors; and (iii) the resources devoted to, and the record of compliance with, the fund's compliance policies and procedures. The Board also reviewed the allocation of fund brokerage, including allocations to brokers affiliated with the Investment Advisers, the use of brokerage commissions to pay fund expenses, and the use of "soft" commission dollars to pay for research services.
The Board noted that the growth of fund assets over time across the complex allows Fidelity to reinvest in the development of services designed to enhance the value and convenience of the Fidelity funds as investment vehicles. These services include 24-hour access to account information and market information over the Internet and through telephone representatives, investor education materials, and asset allocation tools. The Board also considered that it reviews customer service metrics such as telephone response times, continuity of services on the website and metrics addressing services at Fidelity Investor Centers.
Investment in a Large Fund Family. The Board considered the benefits to shareholders of investing in a Fidelity fund, including the benefits of investing in a fund that is part of a large family of funds offering a variety of investment disciplines and providing a large variety of mutual fund investor services. The Board noted that Fidelity had taken, or had made recommendations that resulted in the Fidelity funds taking, a number of actions over the previous year that benefited particular funds, including: (i) continuing to dedicate additional resources to Fidelity's investment research process, which includes meetings with management of issuers of securities in which the funds invest; (ii) continuing efforts to enhance Fidelity's global research capabilities; (iii) launching new funds and ETFs with innovative structures, strategies and pricing and making other enhancements to meet client needs; (iv) launching new share classes of existing funds; (v) eliminating purchase minimums and broadening eligibility requirements for certain funds and share classes; (vi) reducing management fees and total expenses for certain target date funds and classes and index funds; (vii) lowering expenses for certain existing funds and classes by implementing or lowering expense caps; (viii) rationalizing product lines and gaining increased efficiencies from fund mergers and liquidations; (ix) continuing to develop, acquire and implement systems and technology to improve services to the funds and shareholders, strengthen information security, and increase efficiency; and (x) continuing to implement enhancements to further strengthen Fidelity's product line to increase investors' probability of success in achieving their investment goals, including retirement income goals.
Investment Performance. The Board considered whether the fund has operated in accordance with its investment objective, as well as its record of compliance with its investment restrictions and its performance history. The Board noted that the fund had portfolio manager changes in July 2020 and November 2020. The Board will continue to monitor closely the fund's performance, taking into account the portfolio manager changes.
The Board took into account discussions that occur at Board meetings throughout the year with representatives of the Investment Advisers about fund investment performance. In this regard the Board noted that as part of regularly scheduled fund reviews and other reports to the Board on fund performance, the Board considers annualized return information for the fund for different time periods, measured against an appropriate securities market index (benchmark index). The Board also reviews and considers information about performance attribution. In its evaluation of fund investment performance, the Board gave particular attention to information indicating changes in performance of certain Fidelity funds for specific time periods and discussed with the Investment Advisers the reasons for any overperformance or underperformance.
In addition to reviewing absolute and relative fund performance, the Independent Trustees periodically consider the appropriateness of fund performance metrics in evaluating the results achieved. In general, the Independent Trustees believe that fund performance should be evaluated based on net performance (after fees and expenses) of the representative class, compared to appropriate benchmark indices, over appropriate time periods that may include full market cycles, and compared to peer groups, as applicable, over the same periods, taking into account relevant factors including the following: general market conditions; issuer-specific information; and fund cash flows and other factors.
The Independent Trustees recognize that shareholders evaluate performance on a net basis over their own holding periods, for which one-, three-, and five-year periods are often used as a proxy. For this reason, the performance information reviewed by the Board also included net cumulative total return information for the fund and an appropriate benchmark index for the most recent one-year period ended September 30, 2021, as shown below.
Fidelity Disruptors Fund
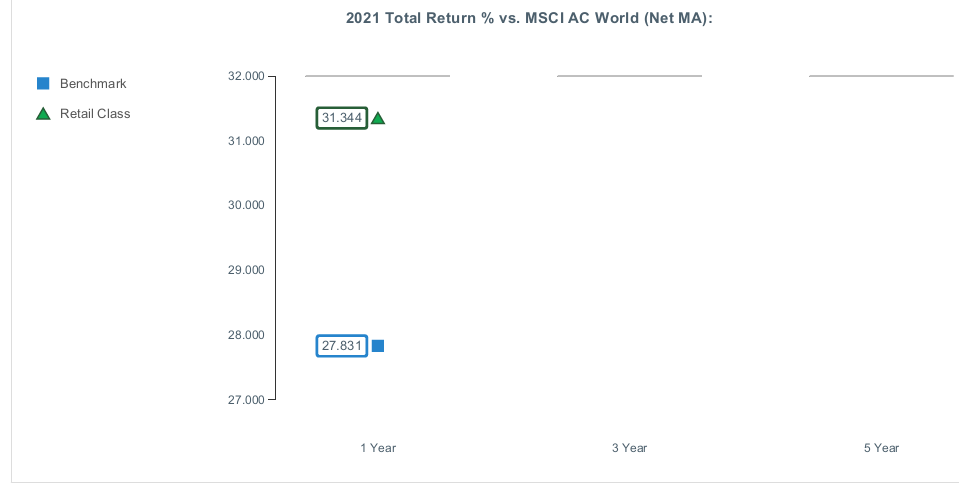
Based on its review, the Board concluded that the nature, extent, and quality of services provided to the fund under the Advisory Contracts should continue to benefit the shareholders of the fund.
Competitiveness of Management Fee and Total Expense Ratio. The Board considered the fund's management fee and total expense ratio compared to "mapped groups" of competitive funds and classes created for the purpose of facilitating the Trustees' competitive analysis of management fees and total expenses. Fidelity creates "mapped groups" by combining similar Lipper investment objective categories that have comparable investment mandates. Combining Lipper investment objective categories aids the Board's management fee and total expense ratio comparisons by broadening the competitive group used for comparison.
Management Fee. The Board considered two proprietary management fee comparisons for the period ended September 30 shown in basis points (BP) in the chart below. The group of Lipper funds used by the Board for management fee comparisons is referred to below as the "Total Mapped Group." The Total Mapped Group comparison focuses on a fund's standing in terms of gross management fees before expense reimbursements or caps relative to the total universe of funds with comparable investment mandates, regardless of whether their management fee structures also are comparable. Funds with comparable investment mandates offer exposure to similar types of securities. Funds with comparable management fee structures have similar management fee contractual arrangements (
e.g., flat rate charged for advisory services, all-inclusive fee rate,
etc.). "TMG %" represents the percentage of funds in the Total Mapped Group that had management fees that were lower than the fund's. For example, a hypothetical TMG % of 20% would mean that 80% of the funds in the Total Mapped Group had higher, and 20% had lower, management fees than the fund. The fund's actual TMG %s and the number of funds in the Total Mapped Group are in the chart below. The "Asset-Sized Peer Group" (ASPG) comparison focuses on a fund's standing relative to a subset of non-Fidelity funds within the Total Mapped Group that are similar in size and management fee structure. For example, if a fund is in the first quartile of the ASPG, the fund's management fee ranks in the least expensive or lowest 25% of funds in the ASPG. The ASPG represents at least 15% of the funds in the Total Mapped Group with comparable asset size and management fee structures, subject to a minimum of 50 funds (or all funds in the Total Mapped Group if fewer than 50). Additional information, such as the ASPG quartile in which the fund's management fee rate ranked is also included in the chart and was considered by the Board.
Fidelity Disruptors Fund
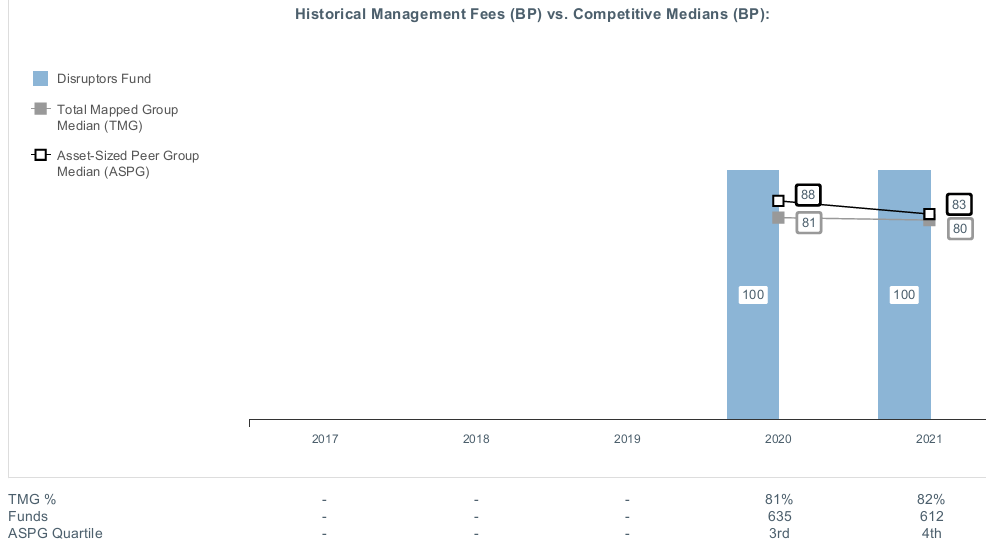
The Board noted that the fund's management fee rate ranked above the median of its Total Mapped Group and above the median of its ASPG for the period ended September 30, 2021. The Board considered that the fund has a unitary fee that covers expenses beyond advisory services, whereas the majority of funds within the fund's Total Mapped Group and ASPG do not have management fees that cover non-advisory services and fees. When compared to the total expenses of the fund's competitors, the fund is below median.
The Board also considered that, for funds subject to the group fee, FMR agreed to voluntarily waive fees over a specified period of time in amounts designed to account for assets converted from certain funds to certain collective investment trusts.
Based on its review, the Board concluded that the fund's management fee is fair and reasonable in light of the services that the fund receives and the other factors considered.
Total Expense Ratio. In its review of the total expense ratio of the representative class (retail class), the Board considered the fund's unitary fee rate as well as other fund expenses paid by FMR under the fund's management contract, such as transfer agent fees, pricing and bookkeeping fees, and custodial, legal, and audit fees. The Board also noted that Fidelity may agree to waive fees or reimburse expenses from time to time, and the extent to which, if any, it has done so for the fund. The fund is compared to those funds and classes in the Total Mapped Group (used by the Board for management fee comparisons) that have a similar sales load structure. The Board also considered a total expense ASPG comparison for the fund, which focuses on the total expenses of the fund relative to a subset of non-Fidelity funds within the total expense similar sales load structure group. The total expense ASPG is limited to 15 larger and 15 smaller classes in fund average assets for a total of 30 classes, where possible. The total expense ASPG comparison excludes performance adjustments and fund-paid 12b-1 fees to eliminate variability in fee structures.
The Board noted that the fund's total net expense ratio ranked below the similar sales load structure group competitive median and below the ASPG competitive median for the period ended September 30, 2021.
The Board considered that current contractual arrangements for the fund oblige FMR to pay all "class-level" expenses of each class of each fund to the extent necessary to limit total operating expenses, with certain exceptions, as follows: Loyalty Class 1: 0.75% and Loyalty Class 2: 0.50%. These contractual arrangements may not be amended to increase the fees or expenses payable except by a vote of a majority of the Board.
Fees Charged to Other Fidelity Clients. The Board also considered Fidelity fee structures and other information with respect to clients of Fidelity, such as other funds advised or subadvised by Fidelity, pension plan clients, and other institutional clients with similar mandates. The Board noted that a joint ad hoc committee created by it and the boards of other Fidelity funds periodically reviews and compares Fidelity's institutional investment advisory business with its business of providing services to the Fidelity funds and also noted the most recent findings of the committee. The Board noted that the committee's review included a consideration of the differences in services provided, fees charged, and costs incurred, as well as competition in the markets serving the different categories of clients.
Based on its review of total expense ratios and fees charged to other Fidelity clients, the Board concluded that the total expense ratio of each class of the fund was reasonable in light of the services that the fund and its shareholders receive and the other factors considered.
Costs of the Services and Profitability. The Board considered the revenues earned and the expenses incurred by Fidelity in conducting the business of developing, marketing, distributing, managing, administering and servicing the fund and servicing the fund's shareholders. The Board also considered the level of Fidelity's profits in respect of all the Fidelity funds.
On an annual basis, Fidelity presents to the Board information about the profitability of its relationships with the fund. Fidelity calculates profitability information for each fund, as well as aggregate profitability information for groups of Fidelity funds and all Fidelity funds, using a series of detailed revenue and cost allocation methodologies which originate with the books and records of Fidelity on which Fidelity's audited financial statements are based. The Audit Committee of the Board reviews any significant changes from the prior year's methodologies and the full Board approves such changes.
A public accounting firm has been engaged annually by the Board as part of the Board's assessment of Fidelity's profitability analysis. The engagement includes the review and assessment of the methodologies used by Fidelity in determining the revenues and expenses attributable to Fidelity's mutual fund business, and completion of agreed-upon procedures in respect of the mathematical accuracy of certain fund profitability information and its conformity to established allocation methodologies. After considering the reports issued under the engagement and information provided by Fidelity, the Board concluded that while other allocation methods may also be reasonable, Fidelity's profitability methodologies are reasonable in all material respects.
The Board also reviewed Fidelity's non-fund businesses and potential indirect benefits such businesses may have received as a result of their association with Fidelity's mutual fund business (i.e., fall-out benefits) as well as cases where Fidelity's affiliates may benefit from the funds' business. The Board considered areas where potential indirect benefits to the Fidelity funds from their relationships with Fidelity may exist. The Board's consideration of these matters was informed by the findings of a joint ad hoc committee created by it and the boards of other Fidelity funds to evaluate potential fall-out benefits.
The Board considered the costs of the services provided by and the profits realized by Fidelity in connection with the operation of the fund and was satisfied that the profitability was not excessive.
Economies of Scale. The Board considered whether there have been economies of scale in respect of the management of the Fidelity funds, whether the Fidelity funds (including the fund) have appropriately benefited from any such economies of scale, and whether there is potential for realization of any further economies of scale. The Board considered the extent to which the fund will benefit from economies of scale as assets grow through increased services to the fund, through waivers or reimbursements, or through fee or expense ratio reductions. The Board recognized that, due to the fund's current contractual arrangements, its expense ratio will not decline if the fund's operating costs decrease as assets grow, or rise as assets decrease. The Board also noted that a committee (the Economies of Scale Committee) created by it and the boards of other Fidelity funds periodically analyzes whether Fidelity attains economies of scale in respect of the management and servicing of the Fidelity funds, whether the Fidelity funds have appropriately benefited from such economies of scale, and whether there is potential for realization of any further economies of scale.
The Board concluded, taking into account the analysis of the Economies of Scale Committee, that economies of scale, if any, are being appropriately shared between fund shareholders and Fidelity.
Additional Information Requested by the Board. In order to develop fully the factual basis for consideration of the Fidelity funds' advisory contracts, the Board requested and received additional information on certain topics, including: (i) fund flow and performance trends, in particular the underperformance of certain funds and strategies, and Fidelity's long-term strategies for certain funds, including any consideration of fund liquidations or mergers; (ii) the operation of performance fees, competitor use of performance fees, and consideration of the expansion of performance fees to additional funds; (iii) Fidelity's pricing philosophy compared to competitors; (iv) fund profitability methodology and data; (v) evaluation of competitive fund data and peer group classifications and fee and expense comparisons; (vi) the management fee and expense structures for different funds and classes and information about the differences between various fee and expense structures; (vii) group fee breakpoints and related voluntary fee waivers; and (viii) information regarding other accounts managed by Fidelity and the funds' sub-advisory arrangements.
Based on its evaluation of all of the conclusions noted above, and after considering all factors it believed relevant, the Board concluded that the advisory fee arrangements are fair and reasonable and that the fund's Advisory Contracts should be renewed.
Liquidity Risk Management Program
The Securities and Exchange Commission adopted Rule 22e-4 under the Investment Company Act of 1940 (the Liquidity Rule) to promote effective liquidity risk management throughout the open-end investment company industry, thereby reducing the risk that funds will be unable to meet their redemption obligations and mitigating dilution of the interests of fund shareholders.
The Fund has adopted and implemented a liquidity risk management program pursuant to the Liquidity Rule (the Program) effective December 1, 2018. The Program is reasonably designed to assess and manage the Fund’s liquidity risk and to comply with the requirements of the Liquidity Rule. The Fund’s Board of Trustees (the Board) has designated the Fund’s investment adviser as administrator of the Program. The Fidelity advisers have established a Liquidity Risk Management Committee (the LRM Committee) to manage the Program for each of the Fidelity Funds. The LRM Committee monitors the adequacy and effectiveness of implementation of the Program and on a periodic basis assesses each Fund’s liquidity risk based on a variety of factors including (1) the Fund’s investment strategy, (2) portfolio liquidity and cash flow projections during normal and reasonably foreseeable stressed conditions, (3) shareholder redemptions, (4) borrowings and other funding sources and (5) in the case of exchange-traded funds, certain additional factors including the effect of the Fund’s prices and spreads, market participants, and basket compositions on the overall liquidity of the Fund’s portfolio, as applicable.
In accordance with the Program, each of the Fund’s portfolio investments is classified into one of four liquidity categories described below based on a determination of a reasonable expectation for how long it would take to convert the investment to cash (or sell or dispose of the investment) without significantly changing its market value.
- Highly liquid investments – cash or convertible to cash within three business days or less
- Moderately liquid investments – convertible to cash in three to seven calendar days
- Less liquid investments – can be sold or disposed of, but not settled, within seven calendar days
- Illiquid investments – cannot be sold or disposed of within seven calendar days
Liquidity classification determinations take into account a variety of factors including various market, trading and investment-specific considerations, as well as market depth, and generally utilize analysis from a third-party liquidity metrics service.
The Liquidity Rule places a 15% limit on a fund’s illiquid investments and requires funds that do not primarily hold assets that are highly liquid investments to determine and maintain a minimum percentage of the fund’s net assets to be invested in highly liquid investments (highly liquid investment minimum or HLIM). The Program includes provisions reasonably designed to comply with the 15% limit on illiquid investments and for determining, periodically reviewing and complying with the HLIM requirement as applicable.
At a recent meeting of the Fund’s Board of Trustees, the LRM Committee provided a written report to the Board pertaining to the operation, adequacy, and effectiveness of implementation of the Program for the annual period from December 1, 2020 through November 30, 2021. The report concluded that the Program has been implemented and is operating effectively and is reasonably designed to assess and manage the Fund’s liquidity risk.
DSL-ANN-0722
1.9898909.102
Fidelity® SAI Sustainable U.S. Equity Fund
Offered exclusively to certain clients of the Adviser, or its affiliates, including Strategic Advisers LLC (SAI) - not available for sale to the general public. Fidelity SAI is a product name of Fidelity® funds dedicated to certain programs affiliated with SAI.
Annual Report
May 31, 2022
Contents
To view a fund's proxy voting guidelines and proxy voting record for the 12-month period ended June 30, visit http://www.fidelity.com/proxyvotingresults or visit the Securities and Exchange Commission's (SEC) web site at http://www.sec.gov.
You may also call 1-800-544-3455 to request a free copy of the proxy voting guidelines.
Standard & Poor's, S&P and S&P 500 are registered service marks of The McGraw-Hill Companies, Inc. and have been licensed for use by Fidelity Distributors Corporation.
Other third-party marks appearing herein are the property of their respective owners.
All other marks appearing herein are registered or unregistered trademarks or service marks of FMR LLC or an affiliated company. © 2022 FMR LLC. All rights reserved.
This report and the financial statements contained herein are submitted for the general information of the shareholders of the Fund. This report is not authorized for distribution to prospective investors in the Fund unless preceded or accompanied by an effective prospectus.
A fund files its complete schedule of portfolio holdings with the SEC for the first and third quarters of each fiscal year on Form N-PORT. Forms N-PORT are available on the SEC’s web site at http://www.sec.gov. A fund's Forms N-PORT may be reviewed and copied at the SEC’s Public Reference Room in Washington, DC. Information regarding the operation of the SEC's Public Reference Room may be obtained by calling 1-800-SEC-0330.
For a complete list of a fund's portfolio holdings, view the most recent holdings listing, semiannual report, or annual report on Fidelity's web site at http://www.fidelity.com, http://www.institutional.fidelity.com, or http://www.401k.com, as applicable.
NOT FDIC INSURED •MAY LOSE VALUE •NO BANK GUARANTEE
Neither the Fund nor Fidelity Distributors Corporation is a bank.
Note to Shareholders:
Early in 2020, the outbreak and spread of COVID-19 emerged as a public health emergency that had a major influence on financial markets, primarily based on its impact on the global economy and corporate earnings. On March 11, 2020, the World Health Organization declared the COVID-19 outbreak a pandemic, citing sustained risk of further global spread. The pandemic prompted a number of measures to limit the spread of COVID-19, including travel and border restrictions, quarantines, and restrictions on large gatherings. In turn, these resulted in lower consumer activity, diminished demand for a wide range of products and services, disruption in manufacturing and supply chains, and – given the wide variability in outcomes regarding the outbreak – significant market uncertainty and volatility. To help stem the turmoil, the U.S. government took unprecedented action – in concert with the U.S. Federal Reserve and central banks around the world – to help support consumers, businesses, and the broader economy, and to limit disruption to the financial system.
In general, the overall impact of the pandemic lessened in 2021, amid a resilient economy and widespread distribution of three COVID-19 vaccines granted emergency use authorization from the U.S. Food and Drug Administration (FDA) early in the year. Still, the situation remains dynamic, and the extent and duration of its influence on financial markets and the economy is highly uncertain, due in part to a recent spike in cases based on highly contagious variants of the coronavirus.
Extreme events such as the COVID-19 crisis are exogenous shocks that can have significant adverse effects on mutual funds and their investments. Although multiple asset classes may be affected by market disruption, the duration and impact may not be the same for all types of assets. Fidelity is committed to helping you stay informed amid news about COVID-19 and during increased market volatility, and we continue to take extra steps to be responsive to customer needs. We encourage you to visit us online, where we offer ongoing updates, commentary, and analysis on the markets and our funds.
Investment Summary (Unaudited)
Top Ten Stocks as of May 31, 2022
| | % of fund's net assets |
| Microsoft Corp. | 6.4 |
| Prologis (REIT), Inc. | 2.7 |
| Danaher Corp. | 2.6 |
| Merck & Co., Inc. | 2.5 |
| The Travelers Companies, Inc. | 2.4 |
| Cigna Corp. | 2.2 |
| Marriott International, Inc. Class A | 2.2 |
| Cheniere Energy, Inc. | 2.2 |
| Apple, Inc. | 2.1 |
| Valero Energy Corp. | 2.1 |
| | 27.4 |
Market Sectors as of May 31, 2022
| | % of fund's net assets |
| Information Technology | 24.8 |
| Health Care | 15.4 |
| Financials | 12.7 |
| Consumer Discretionary | 10.0 |
| Industrials | 9.5 |
| Consumer Staples | 7.2 |
| Communication Services | 5.5 |
| Materials | 5.3 |
| Energy | 4.8 |
| Real Estate | 2.7 |
| Utilities | 2.6 |
Asset Allocation (% of fund's net assets)
| As of May 31, 2022* |
| | Stocks | 100.5% |
| | Short-Term Investments and Net Other Assets (Liabilities) | (0.5)% |

* Foreign investments - 11.3%
Short-Term Investments and Net Other Assets (Liabilities) are not included in the pie chart..
Geographic Diversification (% of fund's net assets)
| As of May 31, 2022 |
| | United States of America* | 88.7% |
| | Ireland | 4.9% |
| | France | 2.0% |
| | Switzerland | 1.3% |
| | Denmark | 1.2% |
| | Sweden | 1.0% |
| | Belgium | 0.9% |

* Includes Short-Term investments and Net Other Assets (Liabilities).
Percentages are based on country or territory of incorporation and are adjusted for the effect of futures contracts, if applicable.
Schedule of Investments May 31, 2022
Showing Percentage of Net Assets
| Common Stocks - 100.5% | | | |
| | | Shares | Value |
| COMMUNICATION SERVICES - 5.5% | | | |
| Diversified Telecommunication Services - 1.4% | | | |
| Verizon Communications, Inc. | | 247 | $12,669 |
| Interactive Media & Services - 1.7% | | | |
| Alphabet, Inc. Class A (a) | | 7 | 15,927 |
| Media - 2.4% | | | |
| Cable One, Inc. | | 6 | 7,819 |
| Comcast Corp. Class A | | 218 | 9,653 |
| Interpublic Group of Companies, Inc. | | 149 | 4,802 |
| | | | 22,274 |
|
| TOTAL COMMUNICATION SERVICES | | | 50,870 |
|
| CONSUMER DISCRETIONARY - 10.0% | | | |
| Automobiles - 0.6% | | | |
| General Motors Co. (a) | | 154 | 5,957 |
| Diversified Consumer Services - 0.9% | | | |
| Bright Horizons Family Solutions, Inc. (a) | | 93 | 8,421 |
| Hotels, Restaurants & Leisure - 2.2% | | | |
| Marriott International, Inc. Class A | | 117 | 20,075 |
| Household Durables - 1.1% | | | |
| Taylor Morrison Home Corp. (a) | | 361 | 10,458 |
| Internet & Direct Marketing Retail - 1.9% | | | |
| Amazon.com, Inc. (a) | | 3 | 7,213 |
| eBay, Inc. | | 210 | 10,221 |
| | | | 17,434 |
| Specialty Retail - 2.3% | | | |
| Gap, Inc. | | 544 | 6,000 |
| The Home Depot, Inc. | | 52 | 15,743 |
| | | | 21,743 |
| Textiles, Apparel & Luxury Goods - 1.0% | | | |
| LVMH Moet Hennessy Louis Vuitton SE | | 14 | 9,039 |
|
| TOTAL CONSUMER DISCRETIONARY | | | 93,127 |
|
| CONSUMER STAPLES - 7.2% | | | |
| Beverages - 1.7% | | | |
| Keurig Dr. Pepper, Inc. | | 443 | 15,390 |
| Food Products - 2.0% | | | |
| Darling Ingredients, Inc. (a) | | 235 | 18,816 |
| Household Products - 2.9% | | | |
| Kimberly-Clark Corp. | | 68 | 9,045 |
| Procter & Gamble Co. | | 119 | 17,598 |
| | | | 26,643 |
| Personal Products - 0.6% | | | |
| Estee Lauder Companies, Inc. Class A | | 24 | 6,112 |
|
| TOTAL CONSUMER STAPLES | | | 66,961 |
|
| ENERGY - 4.8% | | | |
| Oil, Gas & Consumable Fuels - 4.8% | | | |
| Cheniere Energy, Inc. | | 145 | 19,832 |
| Denbury, Inc. (a) | | 66 | 4,827 |
| Valero Energy Corp. | | 150 | 19,440 |
| | | | 44,099 |
| FINANCIALS - 12.7% | | | |
| Banks - 1.9% | | | |
| Bank of America Corp. | | 481 | 17,893 |
| Capital Markets - 5.5% | | | |
| BlackRock, Inc. Class A | | 13 | 8,698 |
| Moody's Corp.�� | | 50 | 15,079 |
| Northern Trust Corp. | | 136 | 15,198 |
| State Street Corp. | | 161 | 11,671 |
| | | | 50,646 |
| Consumer Finance - 2.9% | | | |
| American Express Co. | | 73 | 12,324 |
| Discover Financial Services | | 130 | 14,754 |
| | | | 27,078 |
| Insurance - 2.4% | | | |
| The Travelers Companies, Inc. | | 122 | 21,843 |
|
| TOTAL FINANCIALS | | | 117,460 |
|
| HEALTH CARE - 15.4% | | | |
| Biotechnology - 2.8% | | | |
| Amgen, Inc. | | 55 | 14,121 |
| Vertex Pharmaceuticals, Inc. (a) | | 45 | 12,089 |
| | | | 26,210 |
| Health Care Providers & Services - 2.4% | | | |
| Cigna Corp. | | 76 | 20,390 |
| Guardant Health, Inc. (a) | | 44 | 1,803 |
| | | | 22,193 |
| Life Sciences Tools & Services - 4.4% | | | |
| Bio-Rad Laboratories, Inc. Class A (a) | | 13 | 6,991 |
| Danaher Corp. | | 92 | 24,271 |
| ICON PLC (a) | | 43 | 9,623 |
| | | | 40,885 |
| Pharmaceuticals - 5.8% | | | |
| Merck & Co., Inc. | | 248 | 22,823 |
| Roche Holding AG (participation certificate) | | 37 | 12,609 |
| UCB SA | | 91 | 8,026 |
| Zoetis, Inc. Class A | | 59 | 10,085 |
| | | | 53,543 |
|
| TOTAL HEALTH CARE | | | 142,831 |
|
| INDUSTRIALS - 9.5% | | | |
| Air Freight & Logistics - 1.1% | | | |
| United Parcel Service, Inc. Class B | | 56 | 10,206 |
| Building Products - 1.8% | | | |
| ASSA ABLOY AB (B Shares) | | 393 | 9,688 |
| Johnson Controls International PLC | | 131 | 7,141 |
| | | | 16,829 |
| Electrical Equipment - 1.4% | | | |
| Acuity Brands, Inc. | | 46 | 8,051 |
| Generac Holdings, Inc. (a) | | 19 | 4,695 |
| | | | 12,746 |
| Machinery - 1.6% | | | |
| Deere & Co. | | 25 | 8,945 |
| Ingersoll Rand, Inc. | | 127 | 5,988 |
| | | | 14,933 |
| Professional Services - 3.6% | | | |
| KBR, Inc. | | 278 | 13,833 |
| Manpower, Inc. | | 108 | 9,678 |
| Verisk Analytics, Inc. | | 57 | 9,970 |
| | | | 33,481 |
|
| TOTAL INDUSTRIALS | | | 88,195 |
|
| INFORMATION TECHNOLOGY - 24.8% | | | |
| IT Services - 5.3% | | | |
| Accenture PLC Class A | | 53 | 15,818 |
| Capgemini SA | | 46 | 8,914 |
| Concentrix Corp. | | 33 | 5,111 |
| MasterCard, Inc. Class A | | 35 | 12,525 |
| PayPal Holdings, Inc. (a) | | 80 | 6,817 |
| | | | 49,185 |
| Semiconductors & Semiconductor Equipment - 5.2% | | | |
| Advanced Micro Devices, Inc. (a) | | 81 | 8,251 |
| NVIDIA Corp. | | 90 | 16,805 |
| onsemi (a) | | 212 | 12,864 |
| SolarEdge Technologies, Inc. (a) | | 38 | 10,366 |
| | | | 48,286 |
| Software - 12.2% | | | |
| Adobe, Inc. (a) | | 33 | 13,744 |
| Intuit, Inc. | | 30 | 12,434 |
| Microsoft Corp. | | 219 | 59,537 |
| Rapid7, Inc. (a) | | 133 | 9,426 |
| Salesforce.com, Inc. (a) | | 112 | 17,947 |
| | | | 113,088 |
| Technology Hardware, Storage & Peripherals - 2.1% | | | |
| Apple, Inc. | | 132 | 19,647 |
|
| TOTAL INFORMATION TECHNOLOGY | | | 230,206 |
|
| MATERIALS - 5.3% | | | |
| Chemicals - 2.0% | | | |
| Eastman Chemical Co. | | 52 | 5,728 |
| Linde PLC | | 39 | 12,663 |
| | | | 18,391 |
| Containers & Packaging - 3.3% | | | |
| Avery Dennison Corp. | | 75 | 12,942 |
| Crown Holdings, Inc. | | 97 | 10,131 |
| O-I Glass, Inc. (a) | | 496 | 8,159 |
| | | | 31,232 |
|
| TOTAL MATERIALS | | | 49,623 |
|
| REAL ESTATE - 2.7% | | | |
| Equity Real Estate Investment Trusts (REITs) - 2.7% | | | |
| Prologis (REIT), Inc. | | 194 | 24,731 |
| UTILITIES - 2.6% | | | |
| Electric Utilities - 2.1% | | | |
| NextEra Energy, Inc. | | 109 | 8,250 |
| ORSTED A/S (b) | | 101 | 11,384 |
| | | | 19,634 |
| Water Utilities - 0.5% | | | |
| American Water Works Co., Inc. | | 31 | 4,689 |
|
| TOTAL UTILITIES | | | 24,323 |
|
| TOTAL COMMON STOCKS | | | |
| (Cost $1,001,618) | | | 932,426 |
|
| Money Market Funds - 0.5% | | | |
| Fidelity Cash Central Fund 0.82% (c) | | | |
| (Cost $4,355) | | 4,354 | 4,355 |
| TOTAL INVESTMENT IN SECURITIES - 101.0% | | | |
| (Cost $1,005,973) | | | 936,781 |
| NET OTHER ASSETS (LIABILITIES) - (1.0)% | | | (9,041) |
| NET ASSETS - 100% | | | $927,740 |
Legend
(a) Non-income producing
(b) Security exempt from registration under Rule 144A of the Securities Act of 1933. These securities may be resold in transactions exempt from registration, normally to qualified institutional buyers. At the end of the period, the value of these securities amounted to $11,384 or 1.2% of net assets.
(c) Affiliated fund that is generally available only to investment companies and other accounts managed by Fidelity Investments. The rate quoted is the annualized seven-day yield of the fund at period end. A complete unaudited listing of the fund's holdings as of its most recent quarter end is available upon request. In addition, each Fidelity Central Fund's financial statements, which are not covered by the Fund's Report of Independent Registered Public Accounting Firm, are available on the SEC's website or upon request.
Affiliated Central Funds
Fiscal year to date information regarding the Fund's investments in Fidelity Central Funds, including the ownership percentage, is presented below.
| Fund | Value, beginning of period | Purchases | Sales Proceeds | Dividend Income | Realized Gain/Loss | Change in Unrealized appreciation (depreciation) | Value, end of period | % ownership, end of period |
| Fidelity Cash Central Fund 0.82% | $-- | $1,000,000 | $995,645 | $50 | $-- | $-- | $4,355 | 0.0% |
| Total | $-- | $1,000,000 | $995,645 | $50 | $-- | $-- | $4,355 | |
Amounts in the income column in the above table include any capital gain distributions from underlying funds, which are presented in the corresponding line-item in the Statement of Operations, if applicable.
Investment Valuation
The following is a summary of the inputs used, as of May 31, 2022, involving the Fund's assets and liabilities carried at fair value. The inputs or methodology used for valuing securities may not be an indication of the risk associated with investing in those securities. For more information on valuation inputs, and their aggregation into the levels used below, please refer to the Investment Valuation section in the accompanying Notes to Financial Statements.
| | Valuation Inputs at Reporting Date: |
| Description | Total | Level 1 | Level 2 | Level 3 |
| Investments in Securities: | | | | |
| Equities: | | | | |
| Communication Services | $50,870 | $50,870 | $-- | $-- |
| Consumer Discretionary | 93,127 | 84,088 | 9,039 | -- |
| Consumer Staples | 66,961 | 66,961 | -- | -- |
| Energy | 44,099 | 44,099 | -- | -- |
| Financials | 117,460 | 117,460 | -- | -- |
| Health Care | 142,831 | 130,222 | 12,609 | -- |
| Industrials | 88,195 | 78,507 | 9,688 | -- |
| Information Technology | 230,206 | 230,206 | -- | -- |
| Materials | 49,623 | 49,623 | -- | -- |
| Real Estate | 24,731 | 24,731 | -- | -- |
| Utilities | 24,323 | 12,939 | 11,384 | -- |
| Money Market Funds | 4,355 | 4,355 | -- | -- |
| Total Investments in Securities: | $936,781 | $894,061 | $42,720 | $-- |
See accompanying notes which are an integral part of the financial statements.
Financial Statements
Statement of Assets and Liabilities
| | | May 31, 2022 |
| Assets | | |
Investment in securities, at value — See accompanying schedule:
Unaffiliated issuers (cost $1,001,618) | $932,426 | |
| Fidelity Central Funds (cost $4,355) | 4,355 | |
| Total Investment in Securities (cost $1,005,973) | | $936,781 |
| Dividends receivable | | 1,061 |
| Distributions receivable from Fidelity Central Funds | | 4 |
| Receivable from investment adviser for expense reductions | | 21,620 |
| Total assets | | 959,466 |
| Liabilities | | |
| Payable for investments purchased | $116 | |
| Accrued management fee | 396 | |
| Audit Fee Payable | 27,014 | |
| Registration fee payable | 3,727 | |
| Other payables and accrued expenses | 473 | |
| Total liabilities | | 31,726 |
| Net Assets | | $927,740 |
| Net Assets consist of: | | |
| Paid in capital | | $1,003,085 |
| Total accumulated earnings (loss) | | (75,345) |
| Net Assets | | $927,740 |
| Net Asset Value, offering price and redemption price per share ($927,740 ÷ 100,331 shares) | | $9.25 |
See accompanying notes which are an integral part of the financial statements.
Statement of Operations
| | | For the period
April 14, 2022 (commencement of operations) through
May 31, 2022 |
| Investment Income | | |
| Dividends | | $1,501 |
| Income from Fidelity Central Funds | | 50 |
| Total income | | 1,551 |
| Expenses | | |
| Management fee | $629 | |
| Custodian fees and expenses | 386 | |
| Registration fees | 4,063 | |
| Audit | 27,198 | |
| Total expenses before reductions | 32,276 | |
| Expense reductions | (31,573) | |
| Total expenses after reductions | | 703 |
| Net investment income (loss) | | 848 |
| Realized and Unrealized Gain (Loss) | | |
| Net realized gain (loss) on: | | |
| Investment securities: | | |
| Unaffiliated issuers | (6,940) | |
| Foreign currency transactions | (61) | |
| Total net realized gain (loss) | | (7,001) |
| Change in net unrealized appreciation (depreciation) on investment securities | | (69,192) |
| Net gain (loss) | | (76,193) |
| Net increase (decrease) in net assets resulting from operations | | $(75,345) |
See accompanying notes which are an integral part of the financial statements.
Statement of Changes in Net Assets
| | For the period
April 14, 2022 (commencement of operations) through
May 31, 2022 |
| Increase (Decrease) in Net Assets | |
| Operations | |
| Net investment income (loss) | $848 |
| Net realized gain (loss) | (7,001) |
| Change in net unrealized appreciation (depreciation) | (69,192) |
| Net increase (decrease) in net assets resulting from operations | (75,345) |
| Share transactions | |
| Proceeds from sales of shares | 1,003,695 |
| Cost of shares redeemed | (610) |
| Net increase (decrease) in net assets resulting from share transactions | 1,003,085 |
| Total increase (decrease) in net assets | 927,740 |
| Net Assets | |
| Beginning of period | – |
| End of period | $927,740 |
| Other Information | |
| Shares | |
| Sold | 100,392 |
| Redeemed | (61) |
| Net increase (decrease) | 100,331 |
See accompanying notes which are an integral part of the financial statements.
Financial Highlights
Fidelity SAI Sustainable U.S. Equity Fund
| | |
| Years ended May 31, | 2022 A |
| Selected Per–Share Data | |
| Net asset value, beginning of period | $10.00 |
| Income from Investment Operations | |
| Net investment income (loss)B,C | .01 |
| Net realized and unrealized gain (loss) | (.76) |
| Total from investment operations | (.75) |
| Net asset value, end of period | $9.25 |
| Total ReturnD,E | (7.50)% |
| Ratios to Average Net AssetsC,F,G | |
| Expenses before reductions | 7.28%H,I |
| Expenses net of fee waivers, if any | .60%H,I |
| Expenses net of all reductions | .60%H,I |
| Net investment income (loss) | .73%H,I |
| Supplemental Data | |
| Net assets, end of period (000 omitted) | $928 |
| Portfolio turnover rateJ | 2%K |
A For the period April 14, 2022 (commencement of operations) through May 31, 2022.
B Calculated based on average shares outstanding during the period.
C Net investment income (loss) is affected by the timing of the declaration of dividends by any underlying mutual funds or exchange-traded funds (ETFs). Net investment income (loss) of any such underlying funds is not included in the Fund's net investment income (loss) ratio.
D Total returns for periods of less than one year are not annualized.
E Total returns would have been lower if certain expenses had not been reduced during the applicable periods shown.
F Fees and expenses of any underlying mutual funds or exchange-traded funds (ETFs) are not included in the Fund's expense ratio. The Fund indirectly bears its proportionate share of these expenses. For additional expense information related to investments in Fidelity Central Funds, please refer to the "Investments in Fidelity Central Funds" note found in the Notes to Financial Statements section of the most recent Annual or Semi-Annual report.
G Expense ratios reflect operating expenses of the class. Expenses before reductions do not reflect amounts reimbursed, waived, or reduced through arrangements with the investment adviser, brokerage services, or other offset arrangements, if applicable, and do not represent the amount paid by the class during periods when reimbursements, waivers or reductions occur.
H Annualized
I Audit fees are not annualized.
J Amount does not include the portfolio activity of any underlying mutual funds or exchange-traded funds (ETFs).
K Amount not annualized.
See accompanying notes which are an integral part of the financial statements.
Notes to Financial Statements
For the period ended May 31, 2022
1. Organization.
Fidelity SAI Sustainable U.S. Equity Fund (the Fund) is a fund of Fidelity Summer Street Trust (the Trust) and is authorized to issue an unlimited number of shares. Shares are offered exclusively to certain clients of Fidelity Management & Research Company LLC (FMR) or its affiliates. The Trust is registered under the Investment Company Act of 1940, as amended (the 1940 Act), as an open-end management investment company organized as a Massachusetts business trust. Application of FMR's environmental, social, and governance (ESG) ratings process and/or its sustainable investing exclusion criteria may affect the Fund's exposure to certain issuers, sectors, regions, and countries and may affect the Fund's performance depending on whether certain investments are in or out of favor. The criteria related to the Fund's ESG ratings process and/or adherence to its sustainable investing exclusion criteria may result in the Fund forgoing opportunities to buy certain securities when it might otherwise be advantageous to do so, or selling securities for ESG reasons when it might be otherwise disadvantageous for it to do so. As a result, the Fund's performance may at times be better or worse than the performance of funds that do not use ESG or sustainability criteria. There are significant differences in interpretations of what it means for an issuer to have positive ESG factors. While the investment adviser believes its definitions are reasonable, the portfolio decisions it makes may differ with other investors' or advisers' views.
2. Investments in Fidelity Central Funds.
Funds may invest in Fidelity Central Funds, which are open-end investment companies generally available only to other investment companies and accounts managed by the investment adviser and its affiliates. The Schedule of Investments lists any Fidelity Central Funds held as an investment as of period end, but does not include the underlying holdings of each Fidelity Central Fund. An investing fund indirectly bears its proportionate share of the expenses of the underlying Fidelity Central Funds.
Based on its investment objective, each Fidelity Central Fund may invest or participate in various investment vehicles or strategies that are similar to those of the investing fund. These strategies are consistent with the investment objectives of the investing fund and may involve certain economic risks which may cause a decline in value of each of the Fidelity Central Funds and thus a decline in the value of the investing fund.
| Fidelity Central Fund | Investment Manager | Investment Objective | Investment Practices | Expense Ratio(a) |
| Fidelity Money Market Central Funds | Fidelity Management & Research Company LLC (FMR) | Each fund seeks to obtain a high level of current income consistent with the preservation of capital and liquidity. | Short-term Investments | Less than .005% |
(a) Expenses expressed as a percentage of average net assets and are as of each underlying Central Fund's most recent annual or semi-annual shareholder report.
A complete unaudited list of holdings for each Fidelity Central Fund is available upon request or at the Securities and Exchange Commission website at www.sec.gov. In addition, the financial statements of the Fidelity Central Funds which contain the significant accounting policies (including investment valuation policies) of those funds, and are not covered by the Report of Independent Registered Public Accounting Firm, are available on the Securities and Exchange Commission website or upon request.
3. Significant Accounting Policies.
The Fund is an investment company and applies the accounting and reporting guidance of the Financial Accounting Standards Board (FASB) Accounting Standards Codification Topic 946 Financial Services - Investment Companies. The financial statements have been prepared in conformity with accounting principles generally accepted in the United States of America (GAAP), which require management to make certain estimates and assumptions at the date of the financial statements. Actual results could differ from those estimates. Subsequent events, if any, through the date that the financial statements were issued have been evaluated in the preparation of the financial statements. The Fund's Schedule of Investments lists any underlying mutual funds or exchange-traded funds (ETFs) but does not include the underlying holdings of these funds. The following summarizes the significant accounting policies of the Fund:
Investment Valuation. Investments are valued as of 4:00 p.m. Eastern time on the last calendar day of the period. The Board of Trustees (the Board) has delegated the day to day responsibility for the valuation of the Fund's investments to the Fair Value Committee (the Committee) established by the Fund's investment adviser. In accordance with valuation policies and procedures approved by the Board, the Fund attempts to obtain prices from one or more third party pricing vendors or brokers to value its investments. When current market prices, quotations or currency exchange rates are not readily available or reliable, investments will be fair valued in good faith by the Committee, in accordance with procedures adopted by the Board. Factors used in determining fair value vary by investment type and may include market or investment specific events. The frequency with which these procedures are used cannot be predicted and they may be utilized to a significant extent. The Committee oversees the Fund's valuation policies and procedures and reports to the Board on the Committee's activities and fair value determinations. The Board monitors the appropriateness of the procedures used in valuing the Fund's investments and ratifies the fair value determinations of the Committee.
The Fund categorizes the inputs to valuation techniques used to value its investments into a disclosure hierarchy consisting of three levels as shown below:
- Level 1 – unadjusted quoted prices in active markets for identical investments
- Level 2 – other significant observable inputs (including quoted prices for similar investments, interest rates, prepayment speeds, etc.)
- Level 3 – unobservable inputs (including the Fund's own assumptions based on the best information available)
Valuation techniques used to value the Fund's investments by major category are as follows:
Equity securities, including restricted securities, for which market quotations are readily available, are valued at the last reported sale price or official closing price as reported by a third party pricing vendor on the primary market or exchange on which they are traded and are categorized as Level 1 in the hierarchy. In the event there were no sales during the day or closing prices are not available, securities are valued at the last quoted bid price or may be valued using the last available price and are generally categorized as Level 2 in the hierarchy. For foreign equity securities, when market or security specific events arise, comparisons to the valuation of American Depositary Receipts (ADRs)ADRs, futures contracts, ETFs and certain indexes as well as quoted prices for similar securities may be used and would be categorized as Level 2 in the hierarchy. For equity securities, including restricted securities, where observable inputs are limited, assumptions about market activity and risk are used and these securities may be categorized as Level 3 in the hierarchy.
Investments in open-end mutual funds, including the Fidelity Central Funds, are valued at their closing net asset value (NAV) each business day and are categorized as Level 1 in the hierarchy.
Changes in valuation techniques may result in transfers in or out of an assigned level within the disclosure hierarchy. The aggregate value of investments by input level as of May 31, 2022 is included at the end of the Fund's Schedule of Investments.
Foreign Currency. Certain Funds may use foreign currency contracts to facilitate transactions in foreign-denominated securities. Gains and losses from these transactions may arise from changes in the value of the foreign currency or if the counterparties do not perform under the contracts' terms.
Foreign-denominated assets, including investment securities, and liabilities are translated into U.S. dollars at the exchange rates at period end. Purchases and sales of investment securities, income and dividends received, and expenses denominated in foreign currencies are translated into U.S. dollars at the exchange rate in effect on the transaction date.
The effects of exchange rate fluctuations on investments are included with the net realized and unrealized gain (loss) on investment securities. Other foreign currency transactions resulting in realized and unrealized gain (loss) are disclosed separately.
Investment Transactions and Income. For financial reporting purposes, the Fund's investment holdings and NAV include trades executed through the end of the last business day of the period. The NAV per share for processing shareholder transactions is calculated as of the close of business of the New York Stock Exchange (NYSE), normally 4:00 p.m. Eastern time and includes trades executed through the end of the prior business day. Gains and losses on securities sold are determined on the basis of identified cost. Commissions paid to certain brokers with whom the investment adviser, or its affiliates, places trades on behalf of a fund include an amount in addition to trade execution, which may be rebated back to a fund. Any such rebates are included in net realized gain (loss) on investments in the Statement of Operations. Dividend income is recorded on the ex-dividend date, except for certain dividends from foreign securities where the ex-dividend date may have passed, which are recorded as soon as the Fund is informed of the ex-dividend date. Non-cash dividends included in dividend income, if any, are recorded at the fair market value of the securities received. Income and capital gain distributions from Fidelity Central Funds, if any, are recorded on the ex-dividend date. Investment income is recorded net of foreign taxes withheld where recovery of such taxes is uncertain. Funds may file withholding tax reclaims in certain jurisdictions to recover a portion of amounts previously withheld. Any withholding tax reclaims income is included in the Statement of Operations in dividends. Any receivables for withholding tax reclaims are included in the Statement of Assets and Liabilities in dividends receivable.
Expenses. Expenses directly attributable to a fund are charged to that fund. Expenses attributable to more than one fund are allocated among the respective funds on the basis of relative net assets or other appropriate methods. Expenses included in the accompanying financial statements reflect the expenses of that fund and do not include any expenses associated with any underlying mutual funds or exchange-traded funds. Although not included in a fund's expenses, a fund indirectly bears its proportionate share of these expenses through the net asset value of each underlying mutual fund or exchange-traded fund. Expense estimates are accrued in the period to which they relate and adjustments are made when actual amounts are known.
Income Tax Information and Distributions to Shareholders. Each year, the Fund intends to qualify as a regulated investment company under Subchapter M of the Internal Revenue Code, including distributing substantially all of its taxable income and realized gains. As a result, no provision for U.S. Federal income taxes is required. As of May 31, 2022, the Fund did not have any unrecognized tax benefits in the financial statements; nor is the Fund aware of any tax positions for which it is reasonably possible that the total amounts of unrecognized tax benefits will significantly change in the next twelve months. The Fund files a U.S. federal tax return, in addition to state and local tax returns as required. The Fund's federal income tax returns are subject to examination by the Internal Revenue Service (IRS) for a period of three fiscal years after they are filed. State and local tax returns may be subject to examination for an additional fiscal year depending on the jurisdiction. Foreign taxes are provided for based on the Fund's understanding of the tax rules and rates that exist in the foreign markets in which it invests.
Distributions are declared and recorded on the ex-dividend date. Income and capital gain distributions are determined in accordance with income tax regulations, which may differ from GAAP.
Capital accounts within the financial statements are adjusted for permanent book-tax differences. These adjustments have no impact on net assets or the results of operations. Capital accounts are not adjusted for temporary book-tax differences which will reverse in a subsequent period.
Book-tax differences are primarily due to foreign currency transactions, capital loss carryforwards and losses deferred due to wash sales.
As of period end, the cost and unrealized appreciation (depreciation) in securities, and derivatives if applicable, for federal income tax purposes were as follows:
| Gross unrealized appreciation | $12,545 |
| Gross unrealized depreciation | (82,421) |
| Net unrealized appreciation (depreciation) | $(69,876) |
| Tax Cost | $1,006,657 |
The tax-based components of distributable earnings as of period end were as follows:
| Undistributed ordinary income | $786 |
| Capital loss carryforward | $(6,255) |
| Net unrealized appreciation (depreciation) on securities and other investments | $(69,876) |
Capital loss carryforwards are only available to offset future capital gains of the Fund to the extent provided by regulations and may be limited. The capital loss carryforward information presented below, including any applicable limitation, is estimated as of fiscal period end and is subject to adjustment.
| Short-term | $(6,255) |
| Total capital loss carryforward | $(6,255) |
Restricted Securities (including Private Placements). Funds may invest in securities that are subject to legal or contractual restrictions on resale. These securities generally may be resold in transactions exempt from registration or to the public if the securities are registered. Disposal of these securities may involve time-consuming negotiations and expense, and prompt sale at an acceptable price may be difficult. Information regarding restricted securities held at period end is included at the end of the Schedule of Investments, if applicable.
4. Purchases and Sales of Investments.
Purchases and sales of securities, other than short-term securities and in-kind transactions, as applicable, are noted in the table below.
| | Purchases ($) | Sales ($) |
| Fidelity SAI Sustainable U.S. Equity Fund | 1,028,694 | 20,136 |
5. Fees and Other Transactions with Affiliates.
Management Fee. Fidelity Management & Research Company LLC (the investment adviser) and its affiliates provide the Fund with investment management related services for which the Fund pays a monthly management fee. The management fee is the sum of an individual fund fee rate that is based on an annual rate of .30% of the Fund's average net assets and an annualized group fee rate that averaged .22% during the period. The group fee rate is based upon the monthly average net assets of a group of registered investment companies with which the investment adviser has management contracts. The group fee rate decreases as assets under management increase and increases as assets under management decrease. For the reporting period, the total annualized management fee rate was .52% of the Fund's average net assets.
Brokerage Commissions. A portion of portfolio transactions were placed with brokerage firms which are affiliates of the investment adviser. Brokerage commissions are included in net realized gain (loss) and change in net unrealized appreciation (depreciation) in the Statement of Operations. The commissions paid to these affiliated firms were as follows:
| | Amount |
| Fidelity SAI Sustainable U.S. Equity Fund | $6 |
Interfund Trades. Funds may purchase from or sell securities to other Fidelity Funds under procedures adopted by the Board. The procedures have been designed to ensure these interfund trades are executed in accordance with Rule 17a-7 of the 1940 Act. Any interfund trades are included within the respective purchases and sales amounts shown in the Purchases and Sales of Investments note. Interfund trades during the period are noted in the table below.
| | Purchases ($) | Sales ($) | Realized Gain (Loss) ($) |
| Fidelity SAI Sustainable U.S. Equity Fund | 6,262 | – | – |
6. Expense Reductions.
The investment adviser contractually agreed to reimburse the Fund to the extent annual operating expenses exceeded .60% of average net assets. This reimbursement will remain in place through September 30, 2023. Some expenses, for example the compensation of the independent Trustees, and certain miscellaneous expenses such as proxy and shareholder meeting expenses, are excluded from this reimbursement. During the period this reimbursement reduced the Fund's expenses by $31,573.
7. Other.
A fund's organizational documents provide former and current trustees and officers with a limited indemnification against liabilities arising in connection with the performance of their duties to the fund. In the normal course of business, a fund may also enter into contracts that provide general indemnifications. A fund's maximum exposure under these arrangements is unknown as this would be dependent on future claims that may be made against a fund. The risk of material loss from such claims is considered remote.
At the end of the period, the investment adviser or its affiliates were owners of record of more than 10% of the outstanding shares as follows:
| Fund | Affiliated % |
| Fidelity SAI Sustainable U.S. Equity Fund | 100% |
8. Coronavirus (COVID-19) Pandemic.
An outbreak of COVID-19 first detected in China during December 2019 has since spread globally and was declared a pandemic by the World Health Organization during March 2020. Developments that disrupt global economies and financial markets, such as the COVID-19 pandemic, may magnify factors that affect the Fund's performance.
Report of Independent Registered Public Accounting Firm
To the Board of Trustees of Fidelity Summer Street Trust and Shareholders of Fidelity SAI Sustainable U.S. Equity Fund
Opinion on the Financial Statements
We have audited the accompanying statement of assets and liabilities, including the schedule of investments, of Fidelity SAI Sustainable U.S. Equity Fund (one of the funds constituting Fidelity Summer Street Trust, referred to hereafter as the “Fund”) as of May 31, 2022, and the related statements of operations and changes in net assets, including the related notes, and the financial highlights for the period April 14, 2022 (commencement of operations) through May 31, 2022 (collectively referred to as the “financial statements”). In our opinion, the financial statements present fairly, in all material respects, the financial position of the Fund as of May 31, 2022, and the results of its operations, changes in its net assets, and the financial highlights for the period April 14, 2022 (commencement of operations) through May 31, 2022 in conformity with accounting principles generally accepted in the United States of America.
Basis for Opinion
These financial statements are the responsibility of the Fund’s management. Our responsibility is to express an opinion on the Fund’s financial statements based on our audit. We are a public accounting firm registered with the Public Company Accounting Oversight Board (United States) (PCAOB) and are required to be independent with respect to the Fund in accordance with the U.S. federal securities laws and the applicable rules and regulations of the Securities and Exchange Commission and the PCAOB.
We conducted our audit of these financial statements in accordance with the standards of the PCAOB. Those standards require that we plan and perform the audit to obtain reasonable assurance about whether the financial statements are free of material misstatement, whether due to error or fraud.
Our audit included performing procedures to assess the risks of material misstatement of the financial statements, whether due to error or fraud, and performing procedures that respond to those risks. Such procedures included examining, on a test basis, evidence regarding the amounts and disclosures in the financial statements. Our audit also included evaluating the accounting principles used and significant estimates made by management, as well as evaluating the overall presentation of the financial statements. Our procedures included confirmation of securities owned as of May 31, 2022 by correspondence with the custodian and brokers; when replies were not received from brokers, we performed other auditing procedures. We believe that our audit provides a reasonable basis for our opinion.
/s/ PricewaterhouseCoopers LLP
Boston, Massachusetts
July 15, 2022
We have served as the auditor of one or more investment companies in the Fidelity group of funds since 1932.
Trustees and Officers
The Trustees, Members of the Advisory Board (if any), and officers of the trust and fund, as applicable, are listed below. The Board of Trustees governs the fund and is responsible for protecting the interests of shareholders. The Trustees are experienced executives who meet periodically throughout the year to oversee the fund's activities, review contractual arrangements with companies that provide services to the fund, oversee management of the risks associated with such activities and contractual arrangements, and review the fund's performance. Each of the Trustees oversees 325 funds.
The Trustees hold office without limit in time except that (a) any Trustee may resign; (b) any Trustee may be removed by written instrument, signed by at least two-thirds of the number of Trustees prior to such removal; (c) any Trustee who requests to be retired or who has become incapacitated by illness or injury may be retired by written instrument signed by a majority of the other Trustees; and (d) any Trustee may be removed at any special meeting of shareholders by a two-thirds vote of the outstanding voting securities of the trust. Each Trustee who is not an interested person (as defined in the 1940 Act) of the trust and the fund is referred to herein as an Independent Trustee. Each Independent Trustee shall retire not later than the last day of the calendar year in which his or her 75th birthday occurs. The Independent Trustees may waive this mandatory retirement age policy with respect to individual Trustees. Officers and Advisory Board Members hold office without limit in time, except that any officer or Advisory Board Member may resign or may be removed by a vote of a majority of the Trustees at any regular meeting or any special meeting of the Trustees. Except as indicated, each individual has held the office shown or other offices in the same company for the past five years.
The fund’s Statement of Additional Information (SAI) includes more information about the Trustees. To request a free copy, call Fidelity at 1-800-544-3455.
Experience, Skills, Attributes, and Qualifications of the Trustees. The Governance and Nominating Committee has adopted a statement of policy that describes the experience, qualifications, attributes, and skills that are necessary and desirable for potential Independent Trustee candidates (Statement of Policy). The Board believes that each Trustee satisfied at the time he or she was initially elected or appointed a Trustee, and continues to satisfy, the standards contemplated by the Statement of Policy. The Governance and Nominating Committee also engages professional search firms to help identify potential Independent Trustee candidates who have the experience, qualifications, attributes, and skills consistent with the Statement of Policy. From time to time, additional criteria based on the composition and skills of the current Independent Trustees, as well as experience or skills that may be appropriate in light of future changes to board composition, business conditions, and regulatory or other developments, have also been considered by the professional search firms and the Governance and Nominating Committee. In addition, the Board takes into account the Trustees' commitment and participation in Board and committee meetings, as well as their leadership of standing and ad hoc committees throughout their tenure.
In determining that a particular Trustee was and continues to be qualified to serve as a Trustee, the Board has considered a variety of criteria, none of which, in isolation, was controlling. The Board believes that, collectively, the Trustees have balanced and diverse experience, qualifications, attributes, and skills, which allow the Board to operate effectively in governing the fund and protecting the interests of shareholders. Information about the specific experience, skills, attributes, and qualifications of each Trustee, which in each case led to the Board's conclusion that the Trustee should serve (or continue to serve) as a trustee of the fund, is provided below.
Board Structure and Oversight Function. Robert A. Lawrence is an interested person and currently serves as Chair. The Trustees have determined that an interested Chair is appropriate and benefits shareholders because an interested Chair has a personal and professional stake in the quality and continuity of services provided to the fund. Independent Trustees exercise their informed business judgment to appoint an individual of their choosing to serve as Chair, regardless of whether the Trustee happens to be independent or a member of management. The Independent Trustees have determined that they can act independently and effectively without having an Independent Trustee serve as Chair and that a key structural component for assuring that they are in a position to do so is for the Independent Trustees to constitute a substantial majority for the Board. The Independent Trustees also regularly meet in executive session. David M. Thomas serves as Lead Independent Trustee and as such (i) acts as a liaison between the Independent Trustees and management with respect to matters important to the Independent Trustees and (ii) with management prepares agendas for Board meetings.
Fidelity® funds are overseen by different Boards of Trustees. The fund's Board oversees Fidelity's high income and certain equity funds, and other Boards oversee Fidelity's investment-grade bond, money market, asset allocation, and other equity funds. The asset allocation funds may invest in Fidelity® funds overseen by the fund's Board. The use of separate Boards, each with its own committee structure, allows the Trustees of each group of Fidelity® funds to focus on the unique issues of the funds they oversee, including common research, investment, and operational issues. On occasion, the separate Boards establish joint committees to address issues of overlapping consequences for the Fidelity® funds overseen by each Board.
The Trustees operate using a system of committees to facilitate the timely and efficient consideration of all matters of importance to the Trustees, the fund, and fund shareholders and to facilitate compliance with legal and regulatory requirements and oversight of the fund's activities and associated risks. The Board, acting through its committees, has charged FMR and its affiliates with (i) identifying events or circumstances the occurrence of which could have demonstrably adverse effects on the fund's business and/or reputation; (ii) implementing processes and controls to lessen the possibility that such events or circumstances occur or to mitigate the effects of such events or circumstances if they do occur; and (iii) creating and maintaining a system designed to evaluate continuously business and market conditions in order to facilitate the identification and implementation processes described in (i) and (ii) above. Because the day-to-day operations and activities of the fund are carried out by or through FMR, its affiliates, and other service providers, the fund's exposure to risks is mitigated but not eliminated by the processes overseen by the Trustees. While each of the Board's committees has responsibility for overseeing different aspects of the fund's activities, oversight is exercised primarily through the Operations, Audit, and Compliance Committees. Appropriate personnel, including but not limited to the fund's Chief Compliance Officer (CCO), FMR's internal auditor, the independent accountants, the fund's Treasurer and portfolio management personnel, make periodic reports to the Board's committees, as appropriate, including an annual review of Fidelity's risk management program for the Fidelity® funds. The responsibilities of each standing committee, including their oversight responsibilities, are described further under "Standing Committees of the Trustees."
Interested Trustees*:
Correspondence intended for a Trustee who is an interested person may be sent to Fidelity Investments, 245 Summer Street, Boston, Massachusetts 02210.
Name, Year of Birth; Principal Occupations and Other Relevant Experience+
Bettina Doulton (1964)
Year of Election or Appointment: 2020
Trustee
Ms. Doulton also serves as Trustee of other Fidelity® funds. Prior to her retirement, Ms. Doulton served in a variety of positions at Fidelity Investments, including as a managing director of research (2006-2007), portfolio manager to certain Fidelity® funds (1993-2005), equity analyst and portfolio assistant (1990-1993), and research assistant (1987-1990). Ms. Doulton currently owns and operates Phi Builders + Architects and Cellardoor Winery. Previously, Ms. Doulton served as a member of the Board of Brown Capital Management, LLC (2014-2018).
Robert A. Lawrence (1952)
Year of Election or Appointment: 2020
Trustee
Chair of the Board of Trustees
Mr. Lawrence also serves as Trustee of other funds. Previously, Mr. Lawrence served as a Trustee and Member of the Advisory Board of certain funds. Prior to his retirement in 2008, Mr. Lawrence served as Vice President of certain Fidelity® funds (2006-2008), Senior Vice President, Head of High Income Division of Fidelity Management & Research Company (investment adviser firm, 2006-2008), and President of Fidelity Strategic Investments (investment adviser firm, 2002-2005).
* Determined to be an “Interested Trustee” by virtue of, among other things, his or her affiliation with the trust or various entities under common control with FMR.
+ The information includes the Trustee's principal occupation during the last five years and other information relating to the experience, attributes, and skills relevant to the Trustee's qualifications to serve as a Trustee, which led to the conclusion that the Trustee should serve as a Trustee for the fund.
Independent Trustees:
Correspondence intended for an Independent Trustee may be sent to Fidelity Investments, P.O. Box 55235, Boston, Massachusetts 02205-5235.
Name, Year of Birth; Principal Occupations and Other Relevant Experience+
Thomas P. Bostick (1956)
Year of Election or Appointment: 2021
Trustee
Lieutenant General Bostick also serves as Trustee of other Fidelity® funds. Prior to his retirement, General Bostick (United States Army, Retired) held a variety of positions within the U.S. Army, including Commanding General and Chief of Engineers, U.S. Army Corps of Engineers (2012-2016) and Deputy Chief of Staff and Director of Human Resources, U.S. Army (2009-2012). General Bostick currently serves as a member of the Board and Finance and Governance Committees of CSX Corporation (transportation, 2020-present) and a member of the Board and Corporate Governance and Nominating Committee of Perma-Fix Environmental Services, Inc. (nuclear waste management, 2020-present). General Bostick serves as Chief Executive Officer of Bostick Global Strategies, LLC (consulting, 2016-present) and as a member of the Board of HireVue, Inc. (video interview and assessment, 2020-present). Previously, General Bostick served as a Member of the Advisory Board of certain Fidelity® funds (2021), President, Intrexon Bioengineering (2018-2020) and Chief Operating Officer (2017-2020) and Senior Vice President of the Environment Sector (2016-2017) of Intrexon Corporation (biopharmaceutical company).
Dennis J. Dirks (1948)
Year of Election or Appointment: 2005
Trustee
Mr. Dirks also serves as Trustee of other Fidelity® funds. Prior to his retirement in May 2003, Mr. Dirks served as Chief Operating Officer and as a member of the Board of The Depository Trust & Clearing Corporation (financial markets infrastructure), President, Chief Operating Officer and a member of the Board of The Depository Trust Company (DTC), President and a member of the Board of the National Securities Clearing Corporation (NSCC), Chief Executive Officer and a member of the Board of the Government Securities Clearing Corporation and Chief Executive Officer and a member of the Board of the Mortgage-Backed Securities Clearing Corporation. Mr. Dirks currently serves as a member of the Finance Committee (2016-present) and Board (2017-present) and is Treasurer (2018-present) of the Asolo Repertory Theatre.
Donald F. Donahue (1950)
Year of Election or Appointment: 2018
Trustee
Mr. Donahue also serves as Trustee of other Fidelity® funds. Mr. Donahue serves as President and Chief Executive Officer of Miranda Partners, LLC (risk consulting for the financial services industry, 2012-present). Previously, Mr. Donahue served as Chief Executive Officer (2006-2012), Chief Operating Officer (2003-2006) and Managing Director, Customer Marketing and Development (1999-2003) of The Depository Trust & Clearing Corporation (financial markets infrastructure). Mr. Donahue currently serves as a member (2007-present) and Co-Chairman (2016-present) of the Board of United Way of New York and a member of the Board of The Leadership Academy (previously NYC Leadership Academy) (2012-present). Mr. Donahue previously served as a member of the Advisory Board of certain Fidelity® funds (2015-2018).
Vicki L. Fuller (1957)
Year of Election or Appointment: 2020
Trustee
Ms. Fuller also serves as Trustee of other Fidelity® funds. Previously, Ms. Fuller served as a member of the Advisory Board of certain Fidelity® funds (2018-2020), Chief Investment Officer of the New York State Common Retirement Fund (2012-2018) and held a variety of positions at AllianceBernstein L.P. (global asset management, 1985-2012), including Managing Director (2006-2012) and Senior Vice President and Senior Portfolio Manager (2001-2006). Ms. Fuller currently serves as a member of the Board, Audit Committee and Nominating and Governance Committee of two Blackstone business development companies (2020-present), as a member of the Board of Treliant, LLC (consulting, 2019-present), as a member of the Advisory Board of Ariel Alternatives, LLC (private equity, 2021-present) and as a member of the Board and Chair of the Audit Committee of Gusto, Inc. (software, 2021-present). In addition, Ms. Fuller currently serves as a member of the Board of Roosevelt University (2019-present) and as a member of the Executive Board of New York University’s Stern School of Business. Ms. Fuller previously served as a member of the Board, Audit Committee and Nominating and Governance Committee of The Williams Companies, Inc. (natural gas infrastructure, 2018-2021).
Patricia L. Kampling (1959)
Year of Election or Appointment: 2020
Trustee
Ms. Kampling also serves as Trustee of other Fidelity® funds. Prior to her retirement, Ms. Kampling served as Chairman of the Board and Chief Executive Officer (2012-2019), President and Chief Operating Officer (2011-2012) and Executive Vice President and Chief Financial Officer (2010-2011) of Alliant Energy Corporation. Ms. Kampling currently serves as a member of the Board, Finance Committee and Governance, Compensation and Nominating Committee of Xcel Energy Inc. (utilities company, 2020-present) and as a member of the Board, Audit, Finance and Risk Committee and Safety, Environmental, Technology and Operations Committee and Chair of the Executive Development and Compensation Committee of American Water Works Company, Inc. (utilities company, 2019-present). In addition, Ms. Kampling currently serves as a member of the Board of the Nature Conservancy, Wisconsin Chapter (2019-present). Previously, Ms. Kampling served as a Member of the Advisory Board of certain Fidelity® funds (2020), a member of the Board, Compensation Committee and Executive Committee and Chair of the Audit Committee of Briggs & Stratton Corporation (manufacturing, 2011-2021), a member of the Board of Interstate Power and Light Company (2012-2019) and Wisconsin Power and Light Company (2012-2019) (each a subsidiary of Alliant Energy Corporation) and as a member of the Board and Workforce Development Committee of the Business Roundtable (2018-2019).
Thomas A. Kennedy (1955)
Year of Election or Appointment: 2021
Trustee
Mr. Kennedy also serves as Trustee of other Fidelity® funds. Previously, Mr. Kennedy served as a Member of the Advisory Board of certain Fidelity® funds (2020) and held a variety of positions at Raytheon Company (aerospace and defense, 1983-2020), including Chairman and Chief Executive Officer (2014-2020) and Executive Vice President and Chief Operating Officer (2013-2014). Mr. Kennedy currently serves as Executive Chairman of the Board of Directors of Raytheon Technologies Corporation (aerospace and defense, 2020-present). He is also a member of the Rutgers School of Engineering Industry Advisory Board (2011-present) and a member of the UCLA Engineering Dean’s Executive Board (2016-present).
Oscar Munoz (1959)
Year of Election or Appointment: 2021
Trustee
Mr. Munoz also serves as Trustee of other Fidelity® funds. Prior to his retirement, Mr. Munoz served as Executive Chairman (2020-2021), Chief Executive Officer (2015-2020), President (2015-2016) and a member of the Board (2010-2021) of United Airlines Holdings, Inc. Mr. Munoz currently serves as a member of the Board of CBRE Group, Inc. (commercial real estate, 2020-present), a member of the Board of Univision Communications, Inc. (Hispanic media, 2020-present) and a member of the Advisory Board of Salesforce.com, Inc. (cloud-based software, 2020-present). Previously, Mr. Munoz served as a Member of the Advisory Board of certain Fidelity® funds (2021).
Garnett A. Smith (1947)
Year of Election or Appointment: 2018
Trustee
Mr. Smith also serves as Trustee of other Fidelity® funds. Prior to his retirement, Mr. Smith served as Chairman and Chief Executive Officer (1990-1997) and President (1986-1990) of Inbrand Corp. (manufacturer of personal absorbent products). Prior to his employment with Inbrand Corp., he was employed by a retail fabric chain and North Carolina National Bank (now Bank of America). Mr. Smith previously served as a member of the Advisory Board of certain Fidelity® funds (2012-2013).
David M. Thomas (1949)
Year of Election or Appointment: 2008
Trustee
Lead Independent Trustee
Mr. Thomas also serves as Trustee of other Fidelity® funds. Previously, Mr. Thomas served as Executive Chairman (2005-2006) and Chairman and Chief Executive Officer (2000-2005) of IMS Health, Inc. (pharmaceutical and healthcare information solutions). Mr. Thomas currently serves as a member of the Board of Fortune Brands Home and Security (home and security products, 2004-present) and as Director (2013-present) and Non-Executive Chairman of the Board (2022-present) of Interpublic Group of Companies, Inc. (marketing communication).
Susan Tomasky (1953)
Year of Election or Appointment: 2020
Trustee
Ms. Tomasky also serves as Trustee of other Fidelity® funds. Prior to her retirement, Ms. Tomasky served in various executive officer positions at American Electric Power Company, Inc. (1998-2011), including most recently as President of AEP Transmission (2007-2011). Ms. Tomasky currently serves as a member of the Board and Sustainability Committee and as Chair of the Audit Committee of Marathon Petroleum Corporation (2018-present) and as a member of the Board, Executive Committee, Corporate Governance Committee and Organization and Compensation Committee and as Chair of the Audit Committee of Public Service Enterprise Group, Inc. (utilities company, 2012-present) and as a member of the Board of its subsidiary company, Public Service Electric and Gas Co. (2021-present). In addition, Ms. Tomasky currently serves as a member (2009-present) and President (2020-present) of the Board of the Royal Shakespeare Company – America (2009-present), as a member of the Board of the Columbus Association for the Performing Arts (2011-present) and as a member of the Board and Kenyon in the World Committee of Kenyon College (2016-present). Previously, Ms. Tomasky served as a Member of the Advisory Board of certain Fidelity® funds (2020), as a member of the Board of the Columbus Regional Airport Authority (2007-2020), as a member of the Board (2011-2018) and Lead Independent Director (2015-2018) of Andeavor Corporation (previously Tesoro Corporation) (independent oil refiner and marketer) and as a member of the Board of Summit Midstream Partners LP (energy, 2012-2018).
Michael E. Wiley (1950)
Year of Election or Appointment: 2018
Trustee
Mr. Wiley also serves as Trustee of other Fidelity® funds. Previously, Mr. Wiley served as a member of the Advisory Board of certain Fidelity® funds (2018-2020), Chairman, President and CEO of Baker Hughes, Inc. (oilfield services, 2000-2004). Mr. Wiley also previously served as a member of the Board of Andeavor Corporation (independent oil refiner and marketer, 2005-2018), a member of the Board of Andeavor Logistics LP (natural resources logistics, 2015-2018) and a member of the Board of High Point Resources (exploration and production, 2005-2020).
+ The information includes the Trustee's principal occupation during the last five years and other information relating to the experience, attributes, and skills relevant to the Trustee's qualifications to serve as a Trustee, which led to the conclusion that the Trustee should serve as a Trustee for the fund.
Advisory Board Members and Officers:
Correspondence intended for a Member of the Advisory Board (if any) may be sent to Fidelity Investments, P.O. Box 55235, Boston, Massachusetts 02205-5235. Correspondence intended for an officer or Peter S. Lynch may be sent to Fidelity Investments, 245 Summer Street, Boston, Massachusetts 02210. Officers appear below in alphabetical order.
Name, Year of Birth; Principal Occupation
Peter S. Lynch (1944)
Year of Election or Appointment: 2003
Member of the Advisory Board
Mr. Lynch also serves as a Member of the Advisory Board of other Fidelity® funds. Mr. Lynch is Vice Chairman and a Director of Fidelity Management & Research Company LLC (investment adviser firm). In addition, Mr. Lynch serves as a Trustee of Boston College and as the Chairman of the Inner-City Scholarship Fund. Previously, Mr. Lynch served as Vice Chairman and a Director of FMR Co., Inc. (investment adviser firm) and on the Special Olympics International Board of Directors (1997-2006).
Craig S. Brown (1977)
Year of Election or Appointment: 2019
Assistant Treasurer
Mr. Brown also serves as an officer of other funds. Mr. Brown serves as Assistant Treasurer of FIMM, LLC (2021-present) and is an employee of Fidelity Investments (2013-present).
John J. Burke III (1964)
Year of Election or Appointment: 2018
Chief Financial Officer
Mr. Burke also serves as Chief Financial Officer of other funds. Mr. Burke serves as Head of Investment Operations for Fidelity Fund and Investment Operations (2018-present) and is an employee of Fidelity Investments (1998-present). Previously Mr. Burke served as head of Asset Management Investment Operations (2012-2018).
William C. Coffey (1969)
Year of Election or Appointment: 2019
Assistant Secretary
Mr. Coffey also serves as Assistant Secretary of other funds. He is Senior Vice President and Deputy General Counsel of FMR LLC (diversified financial services company, 2010-present), and is an employee of Fidelity Investments. Previously, Mr. Coffey served as Secretary and CLO of certain funds (2018-2019); CLO, Secretary, and Senior Vice President of Fidelity Management & Research Company and FMR Co., Inc. (investment adviser firms, 2018-2019); Secretary of Fidelity SelectCo, LLC and Fidelity Investments Money Management, Inc. (investment adviser firms, 2018-2019); CLO of Fidelity Management & Research (Hong Kong) Limited, FMR Investment Management (UK) Limited, and Fidelity Management & Research (Japan) Limited (investment adviser firms, 2018-2019); and Assistant Secretary of certain funds (2009-2018).
Timothy M. Cohen (1969)
Year of Election or Appointment: 2018
Vice President
Mr. Cohen also serves as Vice President of other funds. Mr. Cohen serves as Co-Head of Equity (2018-present), a Director of Fidelity Management & Research (Japan) Limited (investment adviser firm, 2016-present), and is an employee of Fidelity Investments. Previously, Mr. Cohen served as Executive Vice President of Fidelity SelectCo, LLC (2019), Head of Global Equity Research (2016-2018), Chief Investment Officer - Equity and a Director of Fidelity Management & Research (U.K.) Inc. (investment adviser firm, 2013-2015) and as a Director of Fidelity Management & Research (Hong Kong) Limited (investment adviser firm, 2017).
Jonathan Davis (1968)
Year of Election or Appointment: 2010
Assistant Treasurer
Mr. Davis also serves as an officer of other funds. Mr. Davis serves as Assistant Treasurer of FIMM, LLC (2021-present), FMR Capital, Inc. (2017-present), FD Funds GP LLC (2021-present), FD Funds Holding LLC (2021-present), and FD Funds Management LLC (2021-present); and is an employee of Fidelity Investments. Previously, Mr. Davis served as Vice President and Associate General Counsel of FMR LLC (diversified financial services company, 2003-2010).
Laura M. Del Prato (1964)
Year of Election or Appointment: 2018
Assistant Treasurer
Ms. Del Prato also serves as an officer of other funds. Ms. Del Prato serves as Assistant Treasurer of FIMM, LLC (2021-present) and is an employee of Fidelity Investments (2017-present). Previously, Ms. Del Prato served as President and Treasurer of The North Carolina Capital Management Trust: Cash Portfolio and Term Portfolio (2018-2020). Prior to joining Fidelity Investments, Ms. Del Prato served as a Managing Director and Treasurer of the JPMorgan Mutual Funds (2014-2017). Prior to JPMorgan, Ms. Del Prato served as a partner at Cohen Fund Audit Services (accounting firm, 2012-2013) and KPMG LLP (accounting firm, 2004-2012).
Colm A. Hogan (1973)
Year of Election or Appointment: 2020
Assistant Treasurer
Mr. Hogan also serves as an officer of other funds. Mr. Hogan serves as Assistant Treasurer of FIMM, LLC (2021-present) and FMR Capital, Inc. (2017-present) and is an employee of Fidelity Investments (2005-present). Previously, Mr. Hogan served as Deputy Treasurer of certain Fidelity® funds (2016-2020) and Assistant Treasurer of certain Fidelity® funds (2016-2018).
Pamela R. Holding (1964)
Year of Election or Appointment: 2018
Vice President
Ms. Holding also serves as Vice President of other funds. Ms. Holding serves as Co-Head of Equity (2018-present) and is an employee of Fidelity Investments (2013-present). Previously, Ms. Holding served as Executive Vice President of Fidelity SelectCo, LLC (2019) and as Chief Investment Officer of Fidelity Institutional Asset Management (2013-2018).
Cynthia Lo Bessette (1969)
Year of Election or Appointment: 2019
Secretary and Chief Legal Officer (CLO)
Ms. Lo Bessette also serves as an officer of other funds. Ms. Lo Bessette serves as CLO, Secretary, and Senior Vice President of Fidelity Management & Research Company LLC (investment adviser firm, 2019-present); CLO of Fidelity Management & Research (Hong Kong) Limited, FMR Investment Management (UK) Limited, and Fidelity Management & Research (Japan) Limited (investment adviser firms, 2019-present); Secretary of FD Funds GP LLC (2021-present), FD Funds Holding LLC (2021-present), and FD Funds Management LLC (2021-present); and Assistant Secretary of FIMM, LLC (2019-present). She is a Senior Vice President and Deputy General Counsel of FMR LLC (diversified financial services company, 2019-present), and is an employee of Fidelity Investments. Previously, Ms. Lo Bessette served as CLO, Secretary, and Senior Vice President of FMR Co., Inc. (investment adviser firm, 2019); Secretary of Fidelity SelectCo, LLC and Fidelity Investments Money Management, Inc. (investment adviser firms, 2019). Prior to joining Fidelity Investments, Ms. Lo Bessette was Executive Vice President, General Counsel (2016-2019) and Senior Vice President, Deputy General Counsel (2015-2016) of OppenheimerFunds (investment management company) and Deputy Chief Legal Officer (2013-2015) of Jennison Associates LLC (investment adviser firm).
Chris Maher (1972)
Year of Election or Appointment: 2020
Deputy Treasurer
Mr. Maher also serves as an officer of other funds. Mr. Maher serves as Assistant Treasurer of FIMM, LLC (2021-present) and FMR Capital, Inc. (2017-present), and is an employee of Fidelity Investments (2008-present). Previously, Mr. Maher served as Assistant Treasurer of certain funds (2013-2020); Vice President of Asset Management Compliance (2013), Vice President of the Program Management Group of FMR (investment adviser firm, 2010-2013), and Vice President of Valuation Oversight (2008-2010).
Jason P. Pogorelec (1975)
Year of Election or Appointment: 2020
Chief Compliance Officer
Mr. Pogorelec also serves as Chief Compliance Officer of other funds. Mr. Pogorelec is a senior Vice President of Asset Management Compliance for Fidelity Investments and is an employee of Fidelity Investments (2006-present). Previously, Mr. Pogorelec served as Vice President, Associate General Counsel for Fidelity Investments (2010-2020) and Assistant Secretary of certain Fidelity funds (2015-2020).
Brett Segaloff (1972)
Year of Election or Appointment: 2021
Anti-Money Laundering (AML) Officer
Mr. Segaloff also serves as an AML Officer of other funds and other related entities. He is Director, Anti-Money Laundering (2007-present) of FMR LLC (diversified financial services company) and is an employee of Fidelity Investments (1996-present).
Stacie M. Smith (1974)
Year of Election or Appointment: 2016
President and Treasurer
Ms. Smith also serves as an officer of other funds. Ms. Smith serves as Assistant Treasurer of FIMM, LLC (2021-present) and FMR Capital, Inc. (2017-present), is an employee of Fidelity Investments (2009-present), and has served in other fund officer roles. Prior to joining Fidelity Investments, Ms. Smith served as Senior Audit Manager of Ernst & Young LLP (accounting firm, 1996-2009). Previously, Ms. Smith served as Assistant Treasurer (2013-2019) and Deputy Treasurer (2013-2016) of certain Fidelity® funds.
Jim Wegmann (1979)
Year of Election or Appointment: 2019
Assistant Treasurer
Mr. Wegmann also serves as an officer of other funds. Mr. Wegmann serves as Assistant Treasurer of FIMM, LLC (2021-present) and is an employee of Fidelity Investments (2011-present). Previously, Mr. Wegmann served as Assistant Treasurer of certain Fidelity® funds (2019-2021).
Shareholder Expense Example
As a shareholder, you incur two types of costs: (1) transaction costs, which may include sales charges (loads) on purchase payments or redemption proceeds, as applicable and (2) ongoing costs, which generally include management fees, distribution and/or service (12b-1) fees and other Fund expenses. This Example is intended to help you understand your ongoing costs (in dollars) of investing in a fund and to compare these costs with the ongoing costs of investing in other mutual funds.
The actual expense Example is based on an investment of $1,000 invested at the beginning of the period and held for the entire period (April 14, 2022 to May 31, 2022). The hypothetical expense Example is based on an investment of $1,000 invested for the one-half year period (December 1, 2021 to May 31, 2022).
Actual Expenses
The first line of the accompanying table provides information about actual account values and actual expenses. You may use the information in this line, together with the amount you invested, to estimate the expenses that you paid over the period. Simply divide your account value by $1,000.00 (for example, an $8,600 account value divided by $1,000.00 = 8.6), then multiply the result by the number in the first line for a class/Fund under the heading entitled "Expenses Paid During Period" to estimate the expenses you paid on your account during this period. If any fund is a shareholder of any underlying mutual funds or exchange-traded funds (ETFs) (the Underlying Funds), such fund indirectly bears its proportional share of the expenses of the Underlying Funds in addition to the direct expenses incurred presented in the table. These fees and expenses are not included in the annualized expense ratio used to calculate the expense estimate in the table below.
Hypothetical Example for Comparison Purposes
The second line of the accompanying table provides information about hypothetical account values and hypothetical expenses based on the actual expense ratio and an assumed rate of return of 5% per year before expenses, which is not the actual return. The hypothetical account values and expenses may not be used to estimate the actual ending account balance or expenses you paid for the period. You may use this information to compare the ongoing costs of investing in the Fund and other funds. To do so, compare this 5% hypothetical example with the 5% hypothetical examples that appear in the shareholder reports of the other funds. If any fund is a shareholder of any Underlying Funds, such fund indirectly bears its proportional share of the expenses of the Underlying Funds in addition to the direct expenses as presented in the table. These fees and expenses are not included in the annualized expense ratio used to calculate the expense estimate in the table below.
Please note that the expenses shown in the table are meant to highlight your ongoing costs only and do not reflect any transaction costs. Therefore, the second line of the table is useful in comparing ongoing costs only, and will not help you determine the relative total costs of owning different funds. In addition, if these transactional costs were included, your costs would have been higher.
| | Annualized Expense Ratio-A | Beginning
Account Value
| Ending
Account Value
May 31, 2022 | Expenses Paid
During Period-
|
| Fidelity SAI Sustainable U.S. Equity Fund | .60% | | | |
| Actual | | $1,000.00 | $925.00 | $.76B |
| Hypothetical-C | | $1,000.00 | $1,021.94 | $3.02D |
A Annualized expense ratio reflects expenses net of applicable fee waivers.
B Actual expenses are equal to the annualized expense ratio, multiplied by the average account value over the period, multiplied by 48/365 (to reflect the period April 14, 2022 to May 31, 2022.
C 5% return per year before expenses
D Hypothetical expenses are equal to the annualized expense ratio, multiplied by the average account value over the period, multiplied by 182/365 (to reflect the one-half year period).
Distributions (Unaudited)
The dividend and capital gains distributions for the fund(s) are available on Fidelity.com or Institutional.Fidelity.com.
The fund will notify shareholders in January 2023 of amounts for use in preparing 2022 income tax returns.
Board Approval of Investment Advisory Contracts and Management Fees
Fidelity SAI Sustainable U.S. Equity Fund
At its January 2022 meeting, the Board of Trustees, including the Independent Trustees (together, the Board), voted to approve the management contract with Fidelity Management & Research Company LLC (FMR) and the sub-advisory agreements with affiliates of FMR (together, the Advisory Contracts) for the fund. FMR and the sub-advisers are collectively referred to herein as the Investment Advisers. The Board, assisted by the advice of fund counsel and Independent Trustees' counsel, considered a broad range of information.
Nature, Extent, and Quality of Services Provided. The Board considered Fidelity's staffing as it relates to the fund, including the backgrounds of investment personnel of Fidelity, and also considered the fund's investment objective, strategies, and related investment philosophy. The Board considered the structure of the investment personnel compensation program and whether this structure provides appropriate incentives to act in the best interests of the fund.
Resources Dedicated to Investment Management and Support Services. The Board and the Fund Oversight and Research Committees reviewed the general qualifications and capabilities of Fidelity's investment staff, including its size, education, experience, and resources, as well as Fidelity's approach to recruiting, training, managing, and compensating investment personnel. The Board noted the resources devoted to Fidelity's global investment organization and that Fidelity's analysts have extensive resources, tools and capabilities that allow them to conduct sophisticated quantitative and fundamental analysis, as well as credit analysis of issuers, counterparties and guarantors. Further, the Board considered that Fidelity's investment professionals have sufficient access to global information and data so as to provide competitive investment results over time, and that those professionals also have access to sophisticated tools that permit them to assess portfolio construction and risk and performance attribution characteristics continuously, as well as to transmit new information and research conclusions rapidly around the world. Additionally, in its deliberations, the Board considered Fidelity's trading, risk management, compliance, cybersecurity, and technology and operations capabilities and resources, which are integral parts of the investment management process.
Shareholder and Administrative Services. The Board considered the nature, extent, quality, and cost of advisory, administrative, and shareholder services to be performed by the Investment Advisers and their affiliates under the Advisory Contracts and under separate agreements covering transfer agency, pricing and bookkeeping, and securities lending services for the fund. The Board also considered the nature and extent of the supervision of third party service providers, principally custodians, subcustodians, and pricing vendors.
The Board noted that the growth of fund assets over time across the complex allows Fidelity to reinvest in the development of services designed to enhance the value and convenience of the Fidelity funds as investment vehicles. These services include 24-hour access to account information and market information over the Internet and through telephone representatives, investor education materials and asset allocation tools. The Board also considered that it reviews customer service metrics such as telephone response times, continuity of services on the website and metrics addressing services at Fidelity Investor Centers.
Investment Performance. The fund is a new fund and therefore had no historical performance for the Board to review at the time it approved the fund's Advisory Contracts. The Board considered the Investment Advisers' strength in fundamental, research-driven security selection, which the Board is familiar with through its supervision of other Fidelity funds. The Board also considered the fact that it oversees funds managed by FMR that have similar investment objectives and policies as the fund, including other sustainable investing funds.
Based on its review, the Board concluded that the nature, extent, and quality of services to be provided to the fund under the Advisory Contracts should benefit the shareholders of the fund.
Competitiveness of Management Fee and Total Expense Ratio ..In reviewing the Advisory Contracts, the Board considered the fund's proposed management fee rate and the projected total expense ratio of the fund. The Board noted that the fund's proposed management fee rate is below the median fee rate of funds with similar Lipper investment objective categories and comparable investment mandates, regardless of whether their management fee structures are comparable. The Board also considered that the projected total expense ratio of the fund is below the median of those funds and classes used by the Board for management fee comparisons that have a similar sales load structure.
The Board also noted that FMR has contractually agreed to reimburse the fund to the extent that total operating expenses (excluding interest, certain taxes, fees and expenses of the Independent Trustees, proxy and shareholder meeting expenses, extraordinary expenses, and acquired fund fees and expenses (including fees and expenses associated with a wholly owned subsidiary), if any, as well as non-operating expenses such as brokerage commissions and fees and expenses associated with the fund's securities lending program, if applicable), as a percentage of its average net assets exceed 0.60% through September 30, 2023.
Based on its review, the Board concluded that the fund's management fee and projected total expense ratio were reasonable in light of the services that the fund and its shareholders will receive and the other factors considered.
Costs of the Services and Profitability. The fund is a new fund and therefore no revenue, cost, or profitability data was available for the Board to review in respect of the fund at the time it approved the Advisory Contracts. In connection with its future renewal of the fund's Advisory Contracts, the Board will consider the revenues earned and the expenses incurred by Fidelity in conducting the business of developing, marketing, distributing, managing, administering and servicing the fund and servicing the fund's shareholders.
Economies of Scale. The Board will consider economies of scale when there is operating experience to permit assessment thereof. It noted that, notwithstanding the entrepreneurial risk associated with a new fund, the management fee was at a level normally associated, by comparison with competitors, with very high fund net assets, and Fidelity asserted to the Board that the level of the fee anticipated economies of scale at lower asset levels even before, if ever, economies of scale are achieved. The Board also noted that the fund and its shareholders would have access to the very considerable number and variety of services available through Fidelity and its affiliates.
Based on its evaluation of all of the conclusions noted above, and after considering all factors it believed relevant, the Board concluded that the advisory fee arrangements are fair and reasonable, and that the fund's Advisory Contracts should be approved.
EFS-ANN-0722
1.9904862.100
Fidelity® SAI Sustainable Future Fund
Offered exclusively to certain clients of the Adviser, or its affiliates, including Strategic Advisers LLC (SAI) - not available for sale to the general public. Fidelity SAI is a product name of Fidelity® funds dedicated to certain programs affiliated with SAI.
Annual Report
May 31, 2022
Contents
To view a fund's proxy voting guidelines and proxy voting record for the 12-month period ended June 30, visit http://www.fidelity.com/proxyvotingresults or visit the Securities and Exchange Commission's (SEC) web site at http://www.sec.gov.
You may also call 1-800-544-3455 to request a free copy of the proxy voting guidelines.
Standard & Poor's, S&P and S&P 500 are registered service marks of The McGraw-Hill Companies, Inc. and have been licensed for use by Fidelity Distributors Corporation.
Other third-party marks appearing herein are the property of their respective owners.
All other marks appearing herein are registered or unregistered trademarks or service marks of FMR LLC or an affiliated company. © 2022 FMR LLC. All rights reserved.
This report and the financial statements contained herein are submitted for the general information of the shareholders of the Fund. This report is not authorized for distribution to prospective investors in the Fund unless preceded or accompanied by an effective prospectus.
A fund files its complete schedule of portfolio holdings with the SEC for the first and third quarters of each fiscal year on Form N-PORT. Forms N-PORT are available on the SEC’s web site at http://www.sec.gov. A fund's Forms N-PORT may be reviewed and copied at the SEC’s Public Reference Room in Washington, DC. Information regarding the operation of the SEC's Public Reference Room may be obtained by calling 1-800-SEC-0330.
For a complete list of a fund's portfolio holdings, view the most recent holdings listing, semiannual report, or annual report on Fidelity's web site at http://www.fidelity.com, http://www.institutional.fidelity.com, or http://www.401k.com, as applicable.
NOT FDIC INSURED •MAY LOSE VALUE •NO BANK GUARANTEE
Neither the Fund nor Fidelity Distributors Corporation is a bank.
Note to Shareholders:
Early in 2020, the outbreak and spread of COVID-19 emerged as a public health emergency that had a major influence on financial markets, primarily based on its impact on the global economy and corporate earnings. On March 11, 2020, the World Health Organization declared the COVID-19 outbreak a pandemic, citing sustained risk of further global spread. The pandemic prompted a number of measures to limit the spread of COVID-19, including travel and border restrictions, quarantines, and restrictions on large gatherings. In turn, these resulted in lower consumer activity, diminished demand for a wide range of products and services, disruption in manufacturing and supply chains, and – given the wide variability in outcomes regarding the outbreak – significant market uncertainty and volatility. To help stem the turmoil, the U.S. government took unprecedented action – in concert with the U.S. Federal Reserve and central banks around the world – to help support consumers, businesses, and the broader economy, and to limit disruption to the financial system.
In general, the overall impact of the pandemic lessened in 2021, amid a resilient economy and widespread distribution of three COVID-19 vaccines granted emergency use authorization from the U.S. Food and Drug Administration (FDA) early in the year. Still, the situation remains dynamic, and the extent and duration of its influence on financial markets and the economy is highly uncertain, due in part to a recent spike in cases based on highly contagious variants of the coronavirus.
Extreme events such as the COVID-19 crisis are exogenous shocks that can have significant adverse effects on mutual funds and their investments. Although multiple asset classes may be affected by market disruption, the duration and impact may not be the same for all types of assets. Fidelity is committed to helping you stay informed amid news about COVID-19 and during increased market volatility, and we continue to take extra steps to be responsive to customer needs. We encourage you to visit us online, where we offer ongoing updates, commentary, and analysis on the markets and our funds.
Investment Summary (Unaudited)
Top Ten Stocks as of May 31, 2022
| | % of fund's net assets |
| Microsoft Corp. | 6.3 |
| Alphabet, Inc. Class C | 4.9 |
| Apple, Inc. | 4.6 |
| MasterCard, Inc. Class A | 2.9 |
| UnitedHealth Group, Inc. | 2.9 |
| Eli Lilly & Co. | 2.5 |
| The Coca-Cola Co. | 2.1 |
| Deere & Co. | 2.0 |
| Baker Hughes Co. Class A | 1.9 |
| Newmont Corp. | 1.7 |
| | 31.8 |
Market Sectors as of May 31, 2022
| | % of fund's net assets |
| Information Technology | 23.3 |
| Health Care | 16.8 |
| Financials | 10.5 |
| Industrials | 9.1 |
| Communication Services | 8.1 |
| Consumer Discretionary | 8.1 |
| Energy | 7.4 |
| Consumer Staples | 5.8 |
| Materials | 4.9 |
| Real Estate | 2.4 |
| Utilities | 1.2 |
Asset Allocation (% of fund's net assets)
| As of May 31, 2022* |
| | Stocks | 97.6% |
| | Short-Term Investments and Net Other Assets (Liabilities) | 2.4% |

* Foreign investments - 7.0%
Schedule of Investments May 31, 2022
Showing Percentage of Net Assets
| Common Stocks - 97.6% | | | |
| | | Shares | Value |
| COMMUNICATION SERVICES - 8.1% | | | |
| Diversified Telecommunication Services - 1.5% | | | |
| Verizon Communications, Inc. | | 273 | $14,002 |
| Entertainment - 0.3% | | | |
| Electronic Arts, Inc. | | 21 | 2,912 |
| Interactive Media & Services - 5.5% | | | |
| Alphabet, Inc. Class C (a) | | 20 | 45,616 |
| Meta Platforms, Inc. Class A (a) | | 29 | 5,616 |
| | | | 51,232 |
| Wireless Telecommunication Services - 0.8% | | | |
| T-Mobile U.S., Inc. (a) | | 59 | 7,864 |
|
| TOTAL COMMUNICATION SERVICES | | | 76,010 |
|
| CONSUMER DISCRETIONARY - 8.1% | | | |
| Auto Components - 0.2% | | | |
| Lear Corp. | | 13 | 1,832 |
| Automobiles - 0.3% | | | |
| Tesla, Inc. (a) | | 4 | 3,033 |
| Hotels, Restaurants & Leisure - 2.7% | | | |
| Booking Holdings, Inc. (a) | | 1 | 2,244 |
| Hilton Worldwide Holdings, Inc. | | 78 | 10,987 |
| Marriott International, Inc. Class A | | 70 | 12,011 |
| | | | 25,242 |
| Internet & Direct Marketing Retail - 1.3% | | | |
| Amazon.com, Inc. (a) | | 5 | 12,021 |
| Multiline Retail - 1.7% | | | |
| Dollar General Corp. | | 41 | 9,034 |
| Target Corp. | | 43 | 6,961 |
| | | | 15,995 |
| Specialty Retail - 1.5% | | | |
| Lowe's Companies, Inc. | | 36 | 7,031 |
| The Home Depot, Inc. | | 23 | 6,963 |
| | | | 13,994 |
| Textiles, Apparel & Luxury Goods - 0.4% | | | |
| NIKE, Inc. Class B | | 31 | 3,684 |
|
| TOTAL CONSUMER DISCRETIONARY | | | 75,801 |
|
| CONSUMER STAPLES - 5.8% | | | |
| Beverages - 4.8% | | | |
| Diageo PLC | | 340 | 15,797 |
| Keurig Dr. Pepper, Inc. | | 265 | 9,206 |
| The Coca-Cola Co. | | 318 | 20,155 |
| | | | 45,158 |
| Household Products - 1.0% | | | |
| Kimberly-Clark Corp. | | 28 | 3,725 |
| The Clorox Co. | | 35 | 5,088 |
| | | | 8,813 |
|
| TOTAL CONSUMER STAPLES | | | 53,971 |
|
| ENERGY - 7.4% | | | |
| Energy Equipment & Services - 3.8% | | | |
| Baker Hughes Co. Class A | | 499 | 17,954 |
| Halliburton Co. | | 274 | 11,097 |
| Schlumberger Ltd. | | 142 | 6,526 |
| | | | 35,577 |
| Oil, Gas & Consumable Fuels - 3.6% | | | |
| Cheniere Energy, Inc. | | 51 | 6,975 |
| EOG Resources, Inc. | | 45 | 6,163 |
| EQT Corp. | | 301 | 14,364 |
| Neste OYJ | | 48 | 2,201 |
| Range Resources Corp. (a) | | 123 | 4,176 |
| | | | 33,879 |
|
| TOTAL ENERGY | | | 69,456 |
|
| FINANCIALS - 10.5% | | | |
| Banks - 4.3% | | | |
| Bank of America Corp. | | 402 | 14,954 |
| Huntington Bancshares, Inc. | | 1,119 | 15,532 |
| Wells Fargo & Co. | | 207 | 9,474 |
| | | | 39,960 |
| Capital Markets - 3.6% | | | |
| BlackRock, Inc. Class A | | 10 | 6,691 |
| Intercontinental Exchange, Inc. | | 131 | 13,413 |
| Morgan Stanley | | 86 | 7,408 |
| Raymond James Financial, Inc. | | 64 | 6,303 |
| | | | 33,815 |
| Consumer Finance - 0.8% | | | |
| American Express Co. | | 47 | 7,935 |
| Insurance - 1.8% | | | |
| Arthur J. Gallagher & Co. | | 64 | 10,364 |
| MetLife, Inc. | | 100 | 6,739 |
| | | | 17,103 |
|
| TOTAL FINANCIALS | | | 98,813 |
|
| HEALTH CARE - 16.8% | | | |
| Biotechnology - 3.9% | | | |
| AbbVie, Inc. | | 82 | 12,084 |
| Regeneron Pharmaceuticals, Inc. (a) | | 19 | 12,630 |
| Vertex Pharmaceuticals, Inc. (a) | | 45 | 12,089 |
| | | | 36,803 |
| Health Care Equipment & Supplies - 0.4% | | | |
| Intuitive Surgical, Inc. (a) | | 16 | 3,642 |
| Health Care Providers & Services - 5.1% | | | |
| Centene Corp. (a) | | 87 | 7,085 |
| Cigna Corp. | | 14 | 3,756 |
| Humana, Inc. | | 22 | 9,993 |
| UnitedHealth Group, Inc. | | 54 | 26,826 |
| | | | 47,660 |
| Life Sciences Tools & Services - 2.3% | | | |
| Agilent Technologies, Inc. | | 85 | 10,843 |
| Thermo Fisher Scientific, Inc. | | 19 | 10,784 |
| | | | 21,627 |
| Pharmaceuticals - 5.1% | | | |
| AstraZeneca PLC sponsored ADR | | 109 | 7,246 |
| Bristol-Myers Squibb Co. | | 115 | 8,677 |
| Eli Lilly & Co. | | 75 | 23,508 |
| Zoetis, Inc. Class A | | 48 | 8,205 |
| | | | 47,636 |
|
| TOTAL HEALTH CARE | | | 157,368 |
|
| INDUSTRIALS - 9.1% | | | |
| Aerospace & Defense - 1.9% | | | |
| Lockheed Martin Corp. | | 19 | 8,362 |
| Northrop Grumman Corp. | | 21 | 9,827 |
| | | | 18,189 |
| Building Products - 1.6% | | | |
| Carrier Global Corp. | | 136 | 5,346 |
| The AZEK Co., Inc. (a) | | 172 | 3,624 |
| Trane Technologies PLC | | 40 | 5,522 |
| | | | 14,492 |
| Construction & Engineering - 0.5% | | | |
| Quanta Services, Inc. | | 37 | 4,403 |
| Electrical Equipment - 0.8% | | | |
| Eaton Corp. PLC | | 56 | 7,762 |
| Industrial Conglomerates - 0.9% | | | |
| Honeywell International, Inc. | | 44 | 8,519 |
| Machinery - 2.7% | | | |
| Caterpillar, Inc. | | 14 | 3,022 |
| Deere & Co. | | 52 | 18,605 |
| Otis Worldwide Corp. | | 53 | 3,943 |
| | | | 25,570 |
| Professional Services - 0.2% | | | |
| Equifax, Inc. | | 9 | 1,823 |
| Road & Rail - 0.5% | | | |
| Canadian Pacific Railway Ltd. | | 66 | 4,715 |
|
| TOTAL INDUSTRIALS | | | 85,473 |
|
| INFORMATION TECHNOLOGY - 23.3% | | | |
| IT Services - 6.0% | | | |
| Accenture PLC Class A | | 45 | 13,431 |
| MasterCard, Inc. Class A | | 76 | 27,198 |
| Visa, Inc. Class A | | 72 | 15,276 |
| | | | 55,905 |
| Semiconductors & Semiconductor Equipment - 5.5% | | | |
| Applied Materials, Inc. | | 57 | 6,686 |
| Lam Research Corp. | | 13 | 6,760 |
| Marvell Technology, Inc. | | 253 | 14,965 |
| NVIDIA Corp. | | 79 | 14,751 |
| Qualcomm, Inc. | | 59 | 8,450 |
| | | | 51,612 |
| Software - 7.2% | | | |
| Adobe, Inc. (a) | | 16 | 6,664 |
| Intuit, Inc. | | 6 | 2,487 |
| Microsoft Corp. | | 216 | 58,725 |
| | | | 67,876 |
| Technology Hardware, Storage & Peripherals - 4.6% | | | |
| Apple, Inc. | | 288 | 42,866 |
|
| TOTAL INFORMATION TECHNOLOGY | | | 218,259 |
|
| MATERIALS - 4.9% | | | |
| Chemicals - 2.0% | | | |
| CF Industries Holdings, Inc. | | 72 | 7,111 |
| The Mosaic Co. | | 72 | 4,511 |
| Valvoline, Inc. | | 227 | 7,595 |
| | | | 19,217 |
| Containers & Packaging - 0.3% | | | |
| Avery Dennison Corp. | | 16 | 2,761 |
| Metals & Mining - 2.6% | | | |
| Newmont Corp. | | 238 | 16,148 |
| Steel Dynamics, Inc. | | 92 | 7,855 |
| | | | 24,003 |
|
| TOTAL MATERIALS | | | 45,981 |
|
| REAL ESTATE - 2.4% | | | |
| Equity Real Estate Investment Trusts (REITs) - 1.8% | | | |
| American Tower Corp. | | 17 | 4,354 |
| Prologis (REIT), Inc. | | 31 | 3,952 |
| SL Green Realty Corp. | | 99 | 6,115 |
| Weyerhaeuser Co. | | 48 | 1,897 |
| | | | 16,318 |
| Real Estate Management & Development - 0.6% | | | |
| CBRE Group, Inc. (a) | | 71 | 5,882 |
|
| TOTAL REAL ESTATE | | | 22,200 |
|
| UTILITIES - 1.2% | | | |
| Electric Utilities - 1.2% | | | |
| NextEra Energy, Inc. | | 121 | 9,158 |
| Verbund AG | | 18 | 1,790 |
| | | | 10,948 |
| TOTAL COMMON STOCKS | | | |
| (Cost $978,894) | | | 914,280 |
|
| Money Market Funds - 2.1% | | | |
| Fidelity Cash Central Fund 0.82% (b) | | | |
| (Cost $19,723) | | 19,719 | 19,723 |
| TOTAL INVESTMENT IN SECURITIES - 99.7% | | | |
| (Cost $998,617) | | | 934,003 |
| NET OTHER ASSETS (LIABILITIES) - 0.3% | | | 2,411 |
| NET ASSETS - 100% | | | $936,414 |
Legend
(a) Non-income producing
(b) Affiliated fund that is generally available only to investment companies and other accounts managed by Fidelity Investments. The rate quoted is the annualized seven-day yield of the fund at period end. A complete unaudited listing of the fund's holdings as of its most recent quarter end is available upon request. In addition, each Fidelity Central Fund's financial statements, which are not covered by the Fund's Report of Independent Registered Public Accounting Firm, are available on the SEC's website or upon request.
Affiliated Central Funds
Fiscal year to date information regarding the Fund's investments in Fidelity Central Funds, including the ownership percentage, is presented below.
| Fund | Value, beginning of period | Purchases | Sales Proceeds | Dividend Income | Realized Gain/Loss | Change in Unrealized appreciation (depreciation) | Value, end of period | % ownership, end of period |
| Fidelity Cash Central Fund 0.82% | $-- | $1,000,000 | $980,277 | $58 | $-- | $-- | $19,723 | 0.0% |
| Total | $-- | $1,000,000 | $980,277 | $58 | $-- | $-- | $19,723 | |
Amounts in the income column in the above table include any capital gain distributions from underlying funds, which are presented in the corresponding line-item in the Statement of Operations, if applicable.
Investment Valuation
The following is a summary of the inputs used, as of May 31, 2022, involving the Fund's assets and liabilities carried at fair value. The inputs or methodology used for valuing securities may not be an indication of the risk associated with investing in those securities. For more information on valuation inputs, and their aggregation into the levels used below, please refer to the Investment Valuation section in the accompanying Notes to Financial Statements.
| | Valuation Inputs at Reporting Date: |
| Description | Total | Level 1 | Level 2 | Level 3 |
| Investments in Securities: | | | | |
| Equities: | | | | |
| Communication Services | $76,010 | $76,010 | $-- | $-- |
| Consumer Discretionary | 75,801 | 75,801 | -- | -- |
| Consumer Staples | 53,971 | 38,174 | 15,797 | -- |
| Energy | 69,456 | 69,456 | -- | -- |
| Financials | 98,813 | 98,813 | -- | -- |
| Health Care | 157,368 | 157,368 | -- | -- |
| Industrials | 85,473 | 85,473 | -- | -- |
| Information Technology | 218,259 | 218,259 | -- | -- |
| Materials | 45,981 | 45,981 | -- | -- |
| Real Estate | 22,200 | 22,200 | -- | -- |
| Utilities | 10,948 | 10,948 | -- | -- |
| Money Market Funds | 19,723 | 19,723 | -- | -- |
| Total Investments in Securities: | $934,003 | $918,206 | $15,797 | $-- |
See accompanying notes which are an integral part of the financial statements.
Financial Statements
Statement of Assets and Liabilities
| | | May 31, 2022 |
| Assets | | |
Investment in securities, at value — See accompanying schedule:
Unaffiliated issuers (cost $978,894) | $914,280 | |
| Fidelity Central Funds (cost $19,723) | 19,723 | |
| Total Investment in Securities (cost $998,617) | | $934,003 |
| Cash | | 11,513 |
| Dividends receivable | | 900 |
| Distributions receivable from Fidelity Central Funds | | 13 |
| Receivable from investment adviser for expense reductions | | 21,379 |
| Total assets | | 967,808 |
| Liabilities | | |
| Accrued management fee | $400 | |
| Audit fee payable | 27,014 | |
| Registration fee payable | 3,727 | |
| Other payables and accrued expenses | 253 | |
| Total liabilities | | 31,394 |
| Net Assets | | $936,414 |
| Net Assets consist of: | | |
| Paid in capital | | $1,002,331 |
| Total accumulated earnings (loss) | | (65,917) |
| Net Assets | | $936,414 |
| Net Asset Value, offering price and redemption price per share ($936,414 ÷ 100,250 shares) | | $9.34 |
See accompanying notes which are an integral part of the financial statements.
Statement of Operations
| | | For the period
April 14, 2022 (commencement of operations) through
May 31, 2022 |
| Investment Income | | |
| Dividends | | $1,268 |
| Income from Fidelity Central Funds | | 58 |
| Total income | | 1,326 |
| Expenses | | |
| Management fee | $633 | |
| Custodian fees and expenses | 167 | |
| Registration fees | 4,063 | |
| Audit | 27,198 | |
| Total expenses before reductions | 32,061 | |
| Expense reductions | (31,353) | |
| Total expenses after reductions | | 708 |
| Net investment income (loss) | | 618 |
| Realized and Unrealized Gain (Loss) | | |
| Net realized gain (loss) on: | | |
| Investment securities: | | |
| Unaffiliated issuers | (1,915) | |
| Foreign currency transactions | (6) | |
| Total net realized gain (loss) | | (1,921) |
| Change in net unrealized appreciation (depreciation) on investment securities | | (64,614) |
| Net gain (loss) | | (66,535) |
| Net increase (decrease) in net assets resulting from operations | | $(65,917) |
See accompanying notes which are an integral part of the financial statements.
Statement of Changes in Net Assets
| | For the period
April 14, 2022 (commencement of operations) through
May 31, 2022 |
| Increase (Decrease) in Net Assets | |
| Operations | |
| Net investment income (loss) | $618 |
| Net realized gain (loss) | (1,921) |
| Change in net unrealized appreciation (depreciation) | (64,614) |
| Net increase (decrease) in net assets resulting from operations | (65,917) |
| Share transactions | |
| Proceeds from sales of shares | 1,002,483 |
| Cost of shares redeemed | (152) |
| Net increase (decrease) in net assets resulting from share transactions | 1,002,331 |
| Total increase (decrease) in net assets | 936,414 |
| Net Assets | |
| Beginning of period | – |
| End of period | $936,414 |
| Other Information | |
| Shares | |
| Sold | 100,265 |
| Redeemed | (15) |
| Net increase (decrease) | 100,250 |
See accompanying notes which are an integral part of the financial statements.
Financial Highlights
Fidelity SAI Sustainable Future Fund
| | |
| Years ended May 31, | 2022 A |
| Selected Per–Share Data | |
| Net asset value, beginning of period | $10.00 |
| Income from Investment Operations | |
| Net investment income (loss)B,C | .01 |
| Net realized and unrealized gain (loss) | (.67) |
| Total from investment operations | (.66) |
| Net asset value, end of period | $9.34 |
| Total ReturnD,E | (6.60)% |
| Ratios to Average Net AssetsC,F,G | |
| Expenses before reductions | 7.05%H,I |
| Expenses net of fee waivers, if any | .60%H,I |
| Expenses net of all reductions | .60%H,I |
| Net investment income (loss) | .53%H,I |
| Supplemental Data | |
| Net assets, end of period (000 omitted) | $936 |
| Portfolio turnover rateJ | 1%K |
A For the period April 14, 2022 (commencement of operations) through May 31, 2022.
B Calculated based on average shares outstanding during the period.
C Net investment income (loss) is affected by the timing of the declaration of dividends by any underlying mutual funds or exchange-traded funds (ETFs). Net investment income (loss) of any such underlying funds is not included in the Fund's net investment income (loss) ratio.
D Total returns for periods of less than one year are not annualized.
E Total returns would have been lower if certain expenses had not been reduced during the applicable periods shown.
F Fees and expenses of any underlying mutual funds or exchange-traded funds (ETFs) are not included in the Fund's expense ratio. The Fund indirectly bears its proportionate share of these expenses. For additional expense information related to investments in Fidelity Central Funds, please refer to the "Investments in Fidelity Central Funds" note found in the Notes to Financial Statements section of the most recent Annual or Semi-Annual report.
G Expense ratios reflect operating expenses of the class. Expenses before reductions do not reflect amounts reimbursed, waived, or reduced through arrangements with the investment adviser, brokerage services, or other offset arrangements, if applicable, and do not represent the amount paid by the class during periods when reimbursements, waivers or reductions occur.
H Annualized
I Audit fees are not annualized.
J Amount does not include the portfolio activity of any underlying mutual funds or exchange-traded funds (ETFs).
K Amount not annualized.
See accompanying notes which are an integral part of the financial statements.
Notes to Financial Statements
For the period ended May 31, 2022
1. Organization.
Fidelity SAI Sustainable Future Fund (the Fund) is a fund of Fidelity Summer Street Trust (the Trust) and is authorized to issue an unlimited number of shares. Shares are offered exclusively to certain clients of Fidelity Management & Research Company LLC (FMR) or its affiliates. The Trust is registered under the Investment Company Act of 1940, as amended (the 1940 Act), as an open-end management investment company organized as a Massachusetts business trust. Application of FMR's environmental, social, and governance (ESG) ratings process and/or its sustainable investing exclusion criteria may affect the Fund's exposure to certain issuers, sectors, regions, and countries and may affect the Fund's performance depending on whether certain investments are in or out of favor. The criteria related to the Fund's ESG ratings process and/or adherence to its sustainable investing exclusion criteria may result in the Fund forgoing opportunities to buy certain securities when it might otherwise be advantageous to do so, or selling securities for ESG reasons when it might be otherwise disadvantageous for it to do so. As a result, the Fund's performance may at times be better or worse than the performance of funds that do not use ESG or sustainability criteria. There are significant differences in interpretations of what it means for an issuer to have positive ESG factors. While the investment adviser believes its definitions are reasonable, the portfolio decisions it makes may differ with other investors' or advisers' views.
2. Investments in Fidelity Central Funds.
Funds may invest in Fidelity Central Funds, which are open-end investment companies generally available only to other investment companies and accounts managed by the investment adviser and its affiliates. The Schedule of Investments lists any Fidelity Central Funds held as an investment as of period end, but does not include the underlying holdings of each Fidelity Central Fund. An investing fund indirectly bears its proportionate share of the expenses of the underlying Fidelity Central Funds.
Based on its investment objective, each Fidelity Central Fund may invest or participate in various investment vehicles or strategies that are similar to those of the investing fund. These strategies are consistent with the investment objectives of the investing fund and may involve certain economic risks which may cause a decline in value of each of the Fidelity Central Funds and thus a decline in the value of the investing fund.
| Fidelity Central Fund | Investment Manager | Investment Objective | Investment Practices | Expense Ratio(a) |
| Fidelity Money Market Central Funds | Fidelity Management & Research Company LLC (FMR) | Each fund seeks to obtain a high level of current income consistent with the preservation of capital and liquidity. | Short-term Investments | Less than .005% |
(a) Expenses expressed as a percentage of average net assets and are as of each underlying Central Fund's most recent annual or semi-annual shareholder report.
A complete unaudited list of holdings for each Fidelity Central Fund is available upon request or at the Securities and Exchange Commission website at www.sec.gov. In addition, the financial statements of the Fidelity Central Funds which contain the significant accounting policies (including investment valuation policies) of those funds, and are not covered by the Report of Independent Registered Public Accounting Firm, are available on the Securities and Exchange Commission website or upon request.
3. Significant Accounting Policies.
The Fund is an investment company and applies the accounting and reporting guidance of the Financial Accounting Standards Board (FASB) Accounting Standards Codification Topic 946 Financial Services - Investment Companies. The financial statements have been prepared in conformity with accounting principles generally accepted in the United States of America (GAAP), which require management to make certain estimates and assumptions at the date of the financial statements. Actual results could differ from those estimates. Subsequent events, if any, through the date that the financial statements were issued have been evaluated in the preparation of the financial statements. The Fund's Schedule of Investments lists any underlying mutual funds or exchange-traded funds (ETFs) but does not include the underlying holdings of these funds. The following summarizes the significant accounting policies of the Fund:
Investment Valuation. Investments are valued as of 4:00 p.m. Eastern time on the last calendar day of the period. The Board of Trustees (the Board) has delegated the day to day responsibility for the valuation of the Fund's investments to the Fair Value Committee (the Committee) established by the Fund's investment adviser. In accordance with valuation policies and procedures approved by the Board, the Fund attempts to obtain prices from one or more third party pricing vendors or brokers to value its investments. When current market prices, quotations or currency exchange rates are not readily available or reliable, investments will be fair valued in good faith by the Committee, in accordance with procedures adopted by the Board. Factors used in determining fair value vary by investment type and may include market or investment specific events. The frequency with which these procedures are used cannot be predicted and they may be utilized to a significant extent. The Committee oversees the Fund's valuation policies and procedures and reports to the Board on the Committee's activities and fair value determinations. The Board monitors the appropriateness of the procedures used in valuing the Fund's investments and ratifies the fair value determinations of the Committee.
The Fund categorizes the inputs to valuation techniques used to value its investments into a disclosure hierarchy consisting of three levels as shown below:
- Level 1 – unadjusted quoted prices in active markets for identical investments
- Level 2 – other significant observable inputs (including quoted prices for similar investments, interest rates, prepayment speeds, etc.)
- Level 3 – unobservable inputs (including the Fund's own assumptions based on the best information available)
Valuation techniques used to value the Fund's investments by major category are as follows:
Equity securities, including restricted securities, for which market quotations are readily available, are valued at the last reported sale price or official closing price as reported by a third party pricing vendor on the primary market or exchange on which they are traded and are categorized as Level 1 in the hierarchy. In the event there were no sales during the day or closing prices are not available, securities are valued at the last quoted bid price or may be valued using the last available price and are generally categorized as Level 2 in the hierarchy. For foreign equity securities, when market or security specific events arise, comparisons to the valuation of American Depositary Receipts (ADRs), futures contracts, ETFs and certain indexes as well as quoted prices for similar securities may be used and would be categorized as Level 2 in the hierarchy. For equity securities, including restricted securities, where observable inputs are limited, assumptions about market activity and risk are used and these securities may be categorized as Level 3 in the hierarchy.
Investments in open-end mutual funds, including the Fidelity Central Funds, are valued at their closing net asset value (NAV) each business day and are categorized as Level 1 in the hierarchy.
Changes in valuation techniques may result in transfers in or out of an assigned level within the disclosure hierarchy. The aggregate value of investments by input level as of May 31, 2022 is included at the end of the Fund's Schedule of Investments.
Foreign Currency. Certain Funds may use foreign currency contracts to facilitate transactions in foreign-denominated securities. Gains and losses from these transactions may arise from changes in the value of the foreign currency or if the counterparties do not perform under the contracts' terms.
Foreign-denominated assets, including investment securities, and liabilities are translated into U.S. dollars at the exchange rates at period end. Purchases and sales of investment securities, income and dividends received, and expenses denominated in foreign currencies are translated into U.S. dollars at the exchange rate in effect on the transaction date.
The effects of exchange rate fluctuations on investments are included with the net realized and unrealized gain (loss) on investment securities. Other foreign currency transactions resulting in realized and unrealized gain (loss) are disclosed separately.
Investment Transactions and Income. For financial reporting purposes, the Fund's investment holdings and NAV include trades executed through the end of the last business day of the period. The NAV per share for processing shareholder transactions is calculated as of the close of business of the New York Stock Exchange (NYSE), normally 4:00 p.m. Eastern time and includes trades executed through the end of the prior business day. Gains and losses on securities sold are determined on the basis of identified cost. Commissions paid to certain brokers with whom the investment adviser, or its affiliates, places trades on behalf of a fund include an amount in addition to trade execution, which may be rebated back to a fund. Any such rebates are included in net realized gain (loss) on investments in the Statement of Operations. Dividend income is recorded on the ex-dividend date, except for certain dividends from foreign securities where the ex-dividend date may have passed, which are recorded as soon as the Fund is informed of the ex-dividend date. Non-cash dividends included in dividend income, if any, are recorded at the fair market value of the securities received. Income and capital gain distributions from Fidelity Central Funds, if any, are recorded on the ex-dividend date. Investment income is recorded net of foreign taxes withheld where recovery of such taxes is uncertain. Funds may file withholding tax reclaims in certain jurisdictions to recover a portion of amounts previously withheld. Any withholding tax reclaims income is included in the Statement of Operations in dividends. Any receivables for withholding tax reclaims are included in the Statement of Assets and Liabilities in dividends receivable.
Expenses. Expenses directly attributable to a fund are charged to that fund. Expenses attributable to more than one fund are allocated among the respective funds on the basis of relative net assets or other appropriate methods. Expenses included in the accompanying financial statements reflect the expenses of that fund and do not include any expenses associated with any underlying mutual funds or exchange-traded funds. Although not included in a fund's expenses, a fund indirectly bears its proportionate share of these expenses through the net asset value of each underlying mutual fund or exchange-traded fund. Expense estimates are accrued in the period to which they relate and adjustments are made when actual amounts are known.
Income Tax Information and Distributions to Shareholders. Each year, the Fund intends to qualify as a regulated investment company under Subchapter M of the Internal Revenue Code, including distributing substantially all of its taxable income and realized gains. As a result, no provision for U.S. Federal income taxes is required. As of May 31, 2022, the Fund did not have any unrecognized tax benefits in the financial statements; nor is the Fund aware of any tax positions for which it is reasonably possible that the total amounts of unrecognized tax benefits will significantly change in the next twelve months. The Fund files a U.S. federal tax return, in addition to state and local tax returns as required. The Fund's federal income tax returns are subject to examination by the Internal Revenue Service (IRS) for a period of three fiscal years after they are filed. State and local tax returns may be subject to examination for an additional fiscal year depending on the jurisdiction. Foreign taxes are provided for based on the Fund's understanding of the tax rules and rates that exist in the foreign markets in which it invests.
Distributions are declared and recorded on the ex-dividend date. Income and capital gain distributions are determined in accordance with income tax regulations, which may differ from GAAP.
Capital accounts within the financial statements are adjusted for permanent book-tax differences. These adjustments have no impact on net assets or the results of operations. Capital accounts are not adjusted for temporary book-tax differences which will reverse in a subsequent period.
Book-tax differences are primarily due to foreign currency transactions and capital loss carryforwards.
As of period end, the cost and unrealized appreciation (depreciation) in securities, and derivatives if applicable, for federal income tax purposes were as follows:
| Gross unrealized appreciation | $6,199 |
| Gross unrealized depreciation | (70,813) |
| Net unrealized appreciation (depreciation) | $(64,614) |
| Tax Cost | $998,617 |
The tax-based components of distributable earnings as of period end were as follows:
| Undistributed ordinary income | $682 |
| Capital loss carryforward | $(1,915) |
| Net unrealized appreciation (depreciation) on securities and other investments | $(64,614) |
Capital loss carryforwards are only available to offset future capital gains of the Fund to the extent provided by regulations and may be limited. The capital loss carryforward information presented below, including any applicable limitation, is estimated as of fiscal period end and is subject to adjustment.
| No expiration | |
| Short-term | $(1,915) |
4. Purchases and Sales of Investments.
Purchases and sales of securities, other than short-term securities and in-kind transactions, as applicable, are noted in the table below.
| | Purchases ($) | Sales ($) |
| Fidelity SAI Sustainable Future Fund | 994,630 | 13,820 |
5. Fees and Other Transactions with Affiliates.
Management Fee. Fidelity Management & Research Company LLC (the investment adviser) and its affiliates provide the Fund with investment management related services for which the Fund pays a monthly management fee. The management fee is the sum of an individual fund fee rate that is based on an annual rate of .30% of the Fund's average net assets and an annualized group fee rate that averaged .22% during the period. The group fee rate is based upon the monthly average net assets of a group of registered investment companies with which the investment adviser has management contracts. The group fee rate decreases as assets under management increase and increases as assets under management decrease. For the reporting period, the total annualized management fee rate was .52% of the Fund's average net assets.
Brokerage Commissions. A portion of portfolio transactions were placed with brokerage firms which are affiliates of the investment adviser. Brokerage commissions are included in net realized gain (loss) and change in net unrealized appreciation (depreciation) in the Statement of Operations. The commissions paid to these affiliated firms were as follows:
| | Amount |
| Fidelity SAI Sustainable Future Fund | $6 |
Interfund Trades. Funds may purchase from or sell securities to other Fidelity Funds under procedures adopted by the Board. The procedures have been designed to ensure these interfund trades are executed in accordance with Rule 17a-7 of the 1940 Act. Any interfund trades are included within the respective purchases and sales amounts shown in the Purchases and Sales of Investments note. Interfund trades during the period are noted in the table below.
| | Purchases ($) | Sales ($) | Realized Gain (Loss) ($) |
| Fidelity SAI Sustainable Future Fund | 4,677 | – | – |
6. Expense Reductions.
The investment adviser contractually agreed to reimburse the Fund to the extent annual operating expenses exceeded .60% of average net assets. This reimbursement will remain in place through September 30, 2023. Some expenses, for example the compensation of the independent Trustees, and certain miscellaneous expenses such as proxy and shareholder meeting expenses, are excluded from this reimbursement. During the period this reimbursement reduced the Fund's expenses by $31,353.
7. Other.
A fund's organizational documents provide former and current trustees and officers with a limited indemnification against liabilities arising in connection with the performance of their duties to the fund. In the normal course of business, a fund may also enter into contracts that provide general indemnifications. A fund's maximum exposure under these arrangements is unknown as this would be dependent on future claims that may be made against a fund. The risk of material loss from such claims is considered remote.
At the end of the period, the investment adviser or its affiliates were owners of record of more than 10% of the outstanding shares as follows:
| Fund | Affiliated % |
| Fidelity SAI Sustainable Future Fund | 100% |
8. Coronavirus (COVID-19) Pandemic.
An outbreak of COVID-19 first detected in China during December 2019 has since spread globally and was declared a pandemic by the World Health Organization during March 2020. Developments that disrupt global economies and financial markets, such as the COVID-19 pandemic, may magnify factors that affect the Fund's performance.
Report of Independent Registered Public Accounting Firm
To the Board of Trustees of Fidelity Summer Street Trust and Shareholders of Fidelity SAI Sustainable Future Fund
Opinion on the Financial Statements
We have audited the accompanying statement of assets and liabilities, including the schedule of investments, of Fidelity SAI Sustainable Future Fund (one of the funds constituting Fidelity Summer Street Trust, referred to hereafter as the “Fund”) as of May 31, 2022, and the related statements of operations and changes in net assets, including the related notes, and the financial highlights for the period April 14, 2022 (commencement of operations) through May 31, 2022 (collectively referred to as the “financial statements”). In our opinion, the financial statements present fairly, in all material respects, the financial position of the Fund as of May 31, 2022, and the results of its operations, changes in its net assets, and the financial highlights for the period April 14, 2022 (commencement of operations) through May 31, 2022 in conformity with accounting principles generally accepted in the United States of America.
Basis for Opinion
These financial statements are the responsibility of the Fund’s management. Our responsibility is to express an opinion on the Fund’s financial statements based on our audit. We are a public accounting firm registered with the Public Company Accounting Oversight Board (United States) (PCAOB) and are required to be independent with respect to the Fund in accordance with the U.S. federal securities laws and the applicable rules and regulations of the Securities and Exchange Commission and the PCAOB.
We conducted our audit of these financial statements in accordance with the standards of the PCAOB. Those standards require that we plan and perform the audit to obtain reasonable assurance about whether the financial statements are free of material misstatement, whether due to error or fraud.
Our audit included performing procedures to assess the risks of material misstatement of the financial statements, whether due to error or fraud, and performing procedures that respond to those risks. Such procedures included examining, on a test basis, evidence regarding the amounts and disclosures in the financial statements. Our audit also included evaluating the accounting principles used and significant estimates made by management, as well as evaluating the overall presentation of the financial statements. Our procedures included confirmation of securities owned as of May 31, 2022 by correspondence with the custodian. We believe that our audit provides a reasonable basis for our opinion.
/s/ PricewaterhouseCoopers LLP
Boston, Massachusetts
July 15, 2022
We have served as the auditor of one or more investment companies in the Fidelity group of funds since 1932.
Trustees and Officers
The Trustees, Members of the Advisory Board (if any), and officers of the trust and fund, as applicable, are listed below. The Board of Trustees governs the fund and is responsible for protecting the interests of shareholders. The Trustees are experienced executives who meet periodically throughout the year to oversee the fund's activities, review contractual arrangements with companies that provide services to the fund, oversee management of the risks associated with such activities and contractual arrangements, and review the fund's performance. Each of the Trustees oversees 325 funds.
The Trustees hold office without limit in time except that (a) any Trustee may resign; (b) any Trustee may be removed by written instrument, signed by at least two-thirds of the number of Trustees prior to such removal; (c) any Trustee who requests to be retired or who has become incapacitated by illness or injury may be retired by written instrument signed by a majority of the other Trustees; and (d) any Trustee may be removed at any special meeting of shareholders by a two-thirds vote of the outstanding voting securities of the trust. Each Trustee who is not an interested person (as defined in the 1940 Act) of the trust and the fund is referred to herein as an Independent Trustee. Each Independent Trustee shall retire not later than the last day of the calendar year in which his or her 75th birthday occurs. The Independent Trustees may waive this mandatory retirement age policy with respect to individual Trustees. Officers and Advisory Board Members hold office without limit in time, except that any officer or Advisory Board Member may resign or may be removed by a vote of a majority of the Trustees at any regular meeting or any special meeting of the Trustees. Except as indicated, each individual has held the office shown or other offices in the same company for the past five years.
The fund’s Statement of Additional Information (SAI) includes more information about the Trustees. To request a free copy, call Fidelity at 1-800-544-3455.
Experience, Skills, Attributes, and Qualifications of the Trustees. The Governance and Nominating Committee has adopted a statement of policy that describes the experience, qualifications, attributes, and skills that are necessary and desirable for potential Independent Trustee candidates (Statement of Policy). The Board believes that each Trustee satisfied at the time he or she was initially elected or appointed a Trustee, and continues to satisfy, the standards contemplated by the Statement of Policy. The Governance and Nominating Committee also engages professional search firms to help identify potential Independent Trustee candidates who have the experience, qualifications, attributes, and skills consistent with the Statement of Policy. From time to time, additional criteria based on the composition and skills of the current Independent Trustees, as well as experience or skills that may be appropriate in light of future changes to board composition, business conditions, and regulatory or other developments, have also been considered by the professional search firms and the Governance and Nominating Committee. In addition, the Board takes into account the Trustees' commitment and participation in Board and committee meetings, as well as their leadership of standing and ad hoc committees throughout their tenure.
In determining that a particular Trustee was and continues to be qualified to serve as a Trustee, the Board has considered a variety of criteria, none of which, in isolation, was controlling. The Board believes that, collectively, the Trustees have balanced and diverse experience, qualifications, attributes, and skills, which allow the Board to operate effectively in governing the fund and protecting the interests of shareholders. Information about the specific experience, skills, attributes, and qualifications of each Trustee, which in each case led to the Board's conclusion that the Trustee should serve (or continue to serve) as a trustee of the fund, is provided below.
Board Structure and Oversight Function. Robert A. Lawrence is an interested person and currently serves as Chair. The Trustees have determined that an interested Chair is appropriate and benefits shareholders because an interested Chair has a personal and professional stake in the quality and continuity of services provided to the fund. Independent Trustees exercise their informed business judgment to appoint an individual of their choosing to serve as Chair, regardless of whether the Trustee happens to be independent or a member of management. The Independent Trustees have determined that they can act independently and effectively without having an Independent Trustee serve as Chair and that a key structural component for assuring that they are in a position to do so is for the Independent Trustees to constitute a substantial majority for the Board. The Independent Trustees also regularly meet in executive session. David M. Thomas serves as Lead Independent Trustee and as such (i) acts as a liaison between the Independent Trustees and management with respect to matters important to the Independent Trustees and (ii) with management prepares agendas for Board meetings.
Fidelity® funds are overseen by different Boards of Trustees. The fund's Board oversees Fidelity's high income and certain equity funds, and other Boards oversee Fidelity's investment-grade bond, money market, asset allocation, and other equity funds. The asset allocation funds may invest in Fidelity® funds overseen by the fund's Board. The use of separate Boards, each with its own committee structure, allows the Trustees of each group of Fidelity® funds to focus on the unique issues of the funds they oversee, including common research, investment, and operational issues. On occasion, the separate Boards establish joint committees to address issues of overlapping consequences for the Fidelity® funds overseen by each Board.
The Trustees operate using a system of committees to facilitate the timely and efficient consideration of all matters of importance to the Trustees, the fund, and fund shareholders and to facilitate compliance with legal and regulatory requirements and oversight of the fund's activities and associated risks. The Board, acting through its committees, has charged FMR and its affiliates with (i) identifying events or circumstances the occurrence of which could have demonstrably adverse effects on the fund's business and/or reputation; (ii) implementing processes and controls to lessen the possibility that such events or circumstances occur or to mitigate the effects of such events or circumstances if they do occur; and (iii) creating and maintaining a system designed to evaluate continuously business and market conditions in order to facilitate the identification and implementation processes described in (i) and (ii) above. Because the day-to-day operations and activities of the fund are carried out by or through FMR, its affiliates, and other service providers, the fund's exposure to risks is mitigated but not eliminated by the processes overseen by the Trustees. While each of the Board's committees has responsibility for overseeing different aspects of the fund's activities, oversight is exercised primarily through the Operations, Audit, and Compliance Committees. Appropriate personnel, including but not limited to the fund's Chief Compliance Officer (CCO), FMR's internal auditor, the independent accountants, the fund's Treasurer and portfolio management personnel, make periodic reports to the Board's committees, as appropriate, including an annual review of Fidelity's risk management program for the Fidelity® funds. The responsibilities of each standing committee, including their oversight responsibilities, are described further under "Standing Committees of the Trustees."
Interested Trustees*:
Correspondence intended for a Trustee who is an interested person may be sent to Fidelity Investments, 245 Summer Street, Boston, Massachusetts 02210.
Name, Year of Birth; Principal Occupations and Other Relevant Experience+
Bettina Doulton (1964)
Year of Election or Appointment: 2020
Trustee
Ms. Doulton also serves as Trustee of other Fidelity® funds. Prior to her retirement, Ms. Doulton served in a variety of positions at Fidelity Investments, including as a managing director of research (2006-2007), portfolio manager to certain Fidelity® funds (1993-2005), equity analyst and portfolio assistant (1990-1993), and research assistant (1987-1990). Ms. Doulton currently owns and operates Phi Builders + Architects and Cellardoor Winery. Previously, Ms. Doulton served as a member of the Board of Brown Capital Management, LLC (2014-2018).
Robert A. Lawrence (1952)
Year of Election or Appointment: 2020
Trustee
Chair of the Board of Trustees
Mr. Lawrence also serves as Trustee of other funds. Previously, Mr. Lawrence served as a Trustee and Member of the Advisory Board of certain funds. Prior to his retirement in 2008, Mr. Lawrence served as Vice President of certain Fidelity® funds (2006-2008), Senior Vice President, Head of High Income Division of Fidelity Management & Research Company (investment adviser firm, 2006-2008), and President of Fidelity Strategic Investments (investment adviser firm, 2002-2005).
* Determined to be an “Interested Trustee” by virtue of, among other things, his or her affiliation with the trust or various entities under common control with FMR.
+ The information includes the Trustee's principal occupation during the last five years and other information relating to the experience, attributes, and skills relevant to the Trustee's qualifications to serve as a Trustee, which led to the conclusion that the Trustee should serve as a Trustee for the fund.
Independent Trustees:
Correspondence intended for an Independent Trustee may be sent to Fidelity Investments, P.O. Box 55235, Boston, Massachusetts 02205-5235.
Name, Year of Birth; Principal Occupations and Other Relevant Experience+
Thomas P. Bostick (1956)
Year of Election or Appointment: 2021
Trustee
Lieutenant General Bostick also serves as Trustee of other Fidelity® funds. Prior to his retirement, General Bostick (United States Army, Retired) held a variety of positions within the U.S. Army, including Commanding General and Chief of Engineers, U.S. Army Corps of Engineers (2012-2016) and Deputy Chief of Staff and Director of Human Resources, U.S. Army (2009-2012). General Bostick currently serves as a member of the Board and Finance and Governance Committees of CSX Corporation (transportation, 2020-present) and a member of the Board and Corporate Governance and Nominating Committee of Perma-Fix Environmental Services, Inc. (nuclear waste management, 2020-present). General Bostick serves as Chief Executive Officer of Bostick Global Strategies, LLC (consulting, 2016-present) and as a member of the Board of HireVue, Inc. (video interview and assessment, 2020-present). Previously, General Bostick served as a Member of the Advisory Board of certain Fidelity® funds (2021), President, Intrexon Bioengineering (2018-2020) and Chief Operating Officer (2017-2020) and Senior Vice President of the Environment Sector (2016-2017) of Intrexon Corporation (biopharmaceutical company).
Dennis J. Dirks (1948)
Year of Election or Appointment: 2005
Trustee
Mr. Dirks also serves as Trustee of other Fidelity® funds. Prior to his retirement in May 2003, Mr. Dirks served as Chief Operating Officer and as a member of the Board of The Depository Trust & Clearing Corporation (financial markets infrastructure), President, Chief Operating Officer and a member of the Board of The Depository Trust Company (DTC), President and a member of the Board of the National Securities Clearing Corporation (NSCC), Chief Executive Officer and a member of the Board of the Government Securities Clearing Corporation and Chief Executive Officer and a member of the Board of the Mortgage-Backed Securities Clearing Corporation. Mr. Dirks currently serves as a member of the Finance Committee (2016-present) and Board (2017-present) and is Treasurer (2018-present) of the Asolo Repertory Theatre.
Donald F. Donahue (1950)
Year of Election or Appointment: 2018
Trustee
Mr. Donahue also serves as Trustee of other Fidelity® funds. Mr. Donahue serves as President and Chief Executive Officer of Miranda Partners, LLC (risk consulting for the financial services industry, 2012-present). Previously, Mr. Donahue served as Chief Executive Officer (2006-2012), Chief Operating Officer (2003-2006) and Managing Director, Customer Marketing and Development (1999-2003) of The Depository Trust & Clearing Corporation (financial markets infrastructure). Mr. Donahue currently serves as a member (2007-present) and Co-Chairman (2016-present) of the Board of United Way of New York and a member of the Board of The Leadership Academy (previously NYC Leadership Academy) (2012-present). Mr. Donahue previously served as a member of the Advisory Board of certain Fidelity® funds (2015-2018).
Vicki L. Fuller (1957)
Year of Election or Appointment: 2020
Trustee
Ms. Fuller also serves as Trustee of other Fidelity® funds. Previously, Ms. Fuller served as a member of the Advisory Board of certain Fidelity® funds (2018-2020), Chief Investment Officer of the New York State Common Retirement Fund (2012-2018) and held a variety of positions at AllianceBernstein L.P. (global asset management, 1985-2012), including Managing Director (2006-2012) and Senior Vice President and Senior Portfolio Manager (2001-2006). Ms. Fuller currently serves as a member of the Board, Audit Committee and Nominating and Governance Committee of two Blackstone business development companies (2020-present), as a member of the Board of Treliant, LLC (consulting, 2019-present), as a member of the Advisory Board of Ariel Alternatives, LLC (private equity, 2021-present) and as a member of the Board and Chair of the Audit Committee of Gusto, Inc. (software, 2021-present). In addition, Ms. Fuller currently serves as a member of the Board of Roosevelt University (2019-present) and as a member of the Executive Board of New York University’s Stern School of Business. Ms. Fuller previously served as a member of the Board, Audit Committee and Nominating and Governance Committee of The Williams Companies, Inc. (natural gas infrastructure, 2018-2021).
Patricia L. Kampling (1959)
Year of Election or Appointment: 2020
Trustee
Ms. Kampling also serves as Trustee of other Fidelity® funds. Prior to her retirement, Ms. Kampling served as Chairman of the Board and Chief Executive Officer (2012-2019), President and Chief Operating Officer (2011-2012) and Executive Vice President and Chief Financial Officer (2010-2011) of Alliant Energy Corporation. Ms. Kampling currently serves as a member of the Board, Finance Committee and Governance, Compensation and Nominating Committee of Xcel Energy Inc. (utilities company, 2020-present) and as a member of the Board, Audit, Finance and Risk Committee and Safety, Environmental, Technology and Operations Committee and Chair of the Executive Development and Compensation Committee of American Water Works Company, Inc. (utilities company, 2019-present). In addition, Ms. Kampling currently serves as a member of the Board of the Nature Conservancy, Wisconsin Chapter (2019-present). Previously, Ms. Kampling served as a Member of the Advisory Board of certain Fidelity® funds (2020), a member of the Board, Compensation Committee and Executive Committee and Chair of the Audit Committee of Briggs & Stratton Corporation (manufacturing, 2011-2021), a member of the Board of Interstate Power and Light Company (2012-2019) and Wisconsin Power and Light Company (2012-2019) (each a subsidiary of Alliant Energy Corporation) and as a member of the Board and Workforce Development Committee of the Business Roundtable (2018-2019).
Thomas A. Kennedy (1955)
Year of Election or Appointment: 2021
Trustee
Mr. Kennedy also serves as Trustee of other Fidelity® funds. Previously, Mr. Kennedy served as a Member of the Advisory Board of certain Fidelity® funds (2020) and held a variety of positions at Raytheon Company (aerospace and defense, 1983-2020), including Chairman and Chief Executive Officer (2014-2020) and Executive Vice President and Chief Operating Officer (2013-2014). Mr. Kennedy currently serves as Executive Chairman of the Board of Directors of Raytheon Technologies Corporation (aerospace and defense, 2020-present). He is also a member of the Rutgers School of Engineering Industry Advisory Board (2011-present) and a member of the UCLA Engineering Dean’s Executive Board (2016-present).
Oscar Munoz (1959)
Year of Election or Appointment: 2021
Trustee
Mr. Munoz also serves as Trustee of other Fidelity® funds. Prior to his retirement, Mr. Munoz served as Executive Chairman (2020-2021), Chief Executive Officer (2015-2020), President (2015-2016) and a member of the Board (2010-2021) of United Airlines Holdings, Inc. Mr. Munoz currently serves as a member of the Board of CBRE Group, Inc. (commercial real estate, 2020-present), a member of the Board of Univision Communications, Inc. (Hispanic media, 2020-present) and a member of the Advisory Board of Salesforce.com, Inc. (cloud-based software, 2020-present). Previously, Mr. Munoz served as a Member of the Advisory Board of certain Fidelity® funds (2021).
Garnett A. Smith (1947)
Year of Election or Appointment: 2018
Trustee
Mr. Smith also serves as Trustee of other Fidelity® funds. Prior to his retirement, Mr. Smith served as Chairman and Chief Executive Officer (1990-1997) and President (1986-1990) of Inbrand Corp. (manufacturer of personal absorbent products). Prior to his employment with Inbrand Corp., he was employed by a retail fabric chain and North Carolina National Bank (now Bank of America). Mr. Smith previously served as a member of the Advisory Board of certain Fidelity® funds (2012-2013).
David M. Thomas (1949)
Year of Election or Appointment: 2008
Trustee
Lead Independent Trustee
Mr. Thomas also serves as Trustee of other Fidelity® funds. Previously, Mr. Thomas served as Executive Chairman (2005-2006) and Chairman and Chief Executive Officer (2000-2005) of IMS Health, Inc. (pharmaceutical and healthcare information solutions). Mr. Thomas currently serves as a member of the Board of Fortune Brands Home and Security (home and security products, 2004-present) and as Director (2013-present) and Non-Executive Chairman of the Board (2022-present) of Interpublic Group of Companies, Inc. (marketing communication).
Susan Tomasky (1953)
Year of Election or Appointment: 2020
Trustee
Ms. Tomasky also serves as Trustee of other Fidelity® funds. Prior to her retirement, Ms. Tomasky served in various executive officer positions at American Electric Power Company, Inc. (1998-2011), including most recently as President of AEP Transmission (2007-2011). Ms. Tomasky currently serves as a member of the Board and Sustainability Committee and as Chair of the Audit Committee of Marathon Petroleum Corporation (2018-present) and as a member of the Board, Executive Committee, Corporate Governance Committee and Organization and Compensation Committee and as Chair of the Audit Committee of Public Service Enterprise Group, Inc. (utilities company, 2012-present) and as a member of the Board of its subsidiary company, Public Service Electric and Gas Co. (2021-present). In addition, Ms. Tomasky currently serves as a member (2009-present) and President (2020-present) of the Board of the Royal Shakespeare Company – America (2009-present), as a member of the Board of the Columbus Association for the Performing Arts (2011-present) and as a member of the Board and Kenyon in the World Committee of Kenyon College (2016-present). Previously, Ms. Tomasky served as a Member of the Advisory Board of certain Fidelity® funds (2020), as a member of the Board of the Columbus Regional Airport Authority (2007-2020), as a member of the Board (2011-2018) and Lead Independent Director (2015-2018) of Andeavor Corporation (previously Tesoro Corporation) (independent oil refiner and marketer) and as a member of the Board of Summit Midstream Partners LP (energy, 2012-2018).
Michael E. Wiley (1950)
Year of Election or Appointment: 2018
Trustee
Mr. Wiley also serves as Trustee of other Fidelity® funds. Previously, Mr. Wiley served as a member of the Advisory Board of certain Fidelity® funds (2018-2020), Chairman, President and CEO of Baker Hughes, Inc. (oilfield services, 2000-2004). Mr. Wiley also previously served as a member of the Board of Andeavor Corporation (independent oil refiner and marketer, 2005-2018), a member of the Board of Andeavor Logistics LP (natural resources logistics, 2015-2018) and a member of the Board of High Point Resources (exploration and production, 2005-2020).
+ The information includes the Trustee's principal occupation during the last five years and other information relating to the experience, attributes, and skills relevant to the Trustee's qualifications to serve as a Trustee, which led to the conclusion that the Trustee should serve as a Trustee for the fund.
Advisory Board Members and Officers:
Correspondence intended for a Member of the Advisory Board (if any) may be sent to Fidelity Investments, P.O. Box 55235, Boston, Massachusetts 02205-5235. Correspondence intended for an officer or Peter S. Lynch may be sent to Fidelity Investments, 245 Summer Street, Boston, Massachusetts 02210. Officers appear below in alphabetical order.
Name, Year of Birth; Principal Occupation
Peter S. Lynch (1944)
Year of Election or Appointment: 2003
Member of the Advisory Board
Mr. Lynch also serves as a Member of the Advisory Board of other Fidelity® funds. Mr. Lynch is Vice Chairman and a Director of Fidelity Management & Research Company LLC (investment adviser firm). In addition, Mr. Lynch serves as a Trustee of Boston College and as the Chairman of the Inner-City Scholarship Fund. Previously, Mr. Lynch served as Vice Chairman and a Director of FMR Co., Inc. (investment adviser firm) and on the Special Olympics International Board of Directors (1997-2006).
Craig S. Brown (1977)
Year of Election or Appointment: 2019
Assistant Treasurer
Mr. Brown also serves as an officer of other funds. Mr. Brown serves as Assistant Treasurer of FIMM, LLC (2021-present) and is an employee of Fidelity Investments (2013-present).
John J. Burke III (1964)
Year of Election or Appointment: 2018
Chief Financial Officer
Mr. Burke also serves as Chief Financial Officer of other funds. Mr. Burke serves as Head of Investment Operations for Fidelity Fund and Investment Operations (2018-present) and is an employee of Fidelity Investments (1998-present). Previously Mr. Burke served as head of Asset Management Investment Operations (2012-2018).
William C. Coffey (1969)
Year of Election or Appointment: 2019
Assistant Secretary
Mr. Coffey also serves as Assistant Secretary of other funds. He is Senior Vice President and Deputy General Counsel of FMR LLC (diversified financial services company, 2010-present), and is an employee of Fidelity Investments. Previously, Mr. Coffey served as Secretary and CLO of certain funds (2018-2019); CLO, Secretary, and Senior Vice President of Fidelity Management & Research Company and FMR Co., Inc. (investment adviser firms, 2018-2019); Secretary of Fidelity SelectCo, LLC and Fidelity Investments Money Management, Inc. (investment adviser firms, 2018-2019); CLO of Fidelity Management & Research (Hong Kong) Limited, FMR Investment Management (UK) Limited, and Fidelity Management & Research (Japan) Limited (investment adviser firms, 2018-2019); and Assistant Secretary of certain funds (2009-2018).
Timothy M. Cohen (1969)
Year of Election or Appointment: 2018
Vice President
Mr. Cohen also serves as Vice President of other funds. Mr. Cohen serves as Co-Head of Equity (2018-present), a Director of Fidelity Management & Research (Japan) Limited (investment adviser firm, 2016-present), and is an employee of Fidelity Investments. Previously, Mr. Cohen served as Executive Vice President of Fidelity SelectCo, LLC (2019), Head of Global Equity Research (2016-2018), Chief Investment Officer - Equity and a Director of Fidelity Management & Research (U.K.) Inc. (investment adviser firm, 2013-2015) and as a Director of Fidelity Management & Research (Hong Kong) Limited (investment adviser firm, 2017).
Jonathan Davis (1968)
Year of Election or Appointment: 2010
Assistant Treasurer
Mr. Davis also serves as an officer of other funds. Mr. Davis serves as Assistant Treasurer of FIMM, LLC (2021-present), FMR Capital, Inc. (2017-present), FD Funds GP LLC (2021-present), FD Funds Holding LLC (2021-present), and FD Funds Management LLC (2021-present); and is an employee of Fidelity Investments. Previously, Mr. Davis served as Vice President and Associate General Counsel of FMR LLC (diversified financial services company, 2003-2010).
Laura M. Del Prato (1964)
Year of Election or Appointment: 2018
Assistant Treasurer
Ms. Del Prato also serves as an officer of other funds. Ms. Del Prato serves as Assistant Treasurer of FIMM, LLC (2021-present) and is an employee of Fidelity Investments (2017-present). Previously, Ms. Del Prato served as President and Treasurer of The North Carolina Capital Management Trust: Cash Portfolio and Term Portfolio (2018-2020). Prior to joining Fidelity Investments, Ms. Del Prato served as a Managing Director and Treasurer of the JPMorgan Mutual Funds (2014-2017). Prior to JPMorgan, Ms. Del Prato served as a partner at Cohen Fund Audit Services (accounting firm, 2012-2013) and KPMG LLP (accounting firm, 2004-2012).
Colm A. Hogan (1973)
Year of Election or Appointment: 2020
Assistant Treasurer
Mr. Hogan also serves as an officer of other funds. Mr. Hogan serves as Assistant Treasurer of FIMM, LLC (2021-present) and FMR Capital, Inc. (2017-present) and is an employee of Fidelity Investments (2005-present). Previously, Mr. Hogan served as Deputy Treasurer of certain Fidelity® funds (2016-2020) and Assistant Treasurer of certain Fidelity® funds (2016-2018).
Pamela R. Holding (1964)
Year of Election or Appointment: 2018
Vice President
Ms. Holding also serves as Vice President of other funds. Ms. Holding serves as Co-Head of Equity (2018-present) and is an employee of Fidelity Investments (2013-present). Previously, Ms. Holding served as Executive Vice President of Fidelity SelectCo, LLC (2019) and as Chief Investment Officer of Fidelity Institutional Asset Management (2013-2018).
Cynthia Lo Bessette (1969)
Year of Election or Appointment: 2019
Secretary and Chief Legal Officer (CLO)
Ms. Lo Bessette also serves as an officer of other funds. Ms. Lo Bessette serves as CLO, Secretary, and Senior Vice President of Fidelity Management & Research Company LLC (investment adviser firm, 2019-present); CLO of Fidelity Management & Research (Hong Kong) Limited, FMR Investment Management (UK) Limited, and Fidelity Management & Research (Japan) Limited (investment adviser firms, 2019-present); Secretary of FD Funds GP LLC (2021-present), FD Funds Holding LLC (2021-present), and FD Funds Management LLC (2021-present); and Assistant Secretary of FIMM, LLC (2019-present). She is a Senior Vice President and Deputy General Counsel of FMR LLC (diversified financial services company, 2019-present), and is an employee of Fidelity Investments. Previously, Ms. Lo Bessette served as CLO, Secretary, and Senior Vice President of FMR Co., Inc. (investment adviser firm, 2019); Secretary of Fidelity SelectCo, LLC and Fidelity Investments Money Management, Inc. (investment adviser firms, 2019). Prior to joining Fidelity Investments, Ms. Lo Bessette was Executive Vice President, General Counsel (2016-2019) and Senior Vice President, Deputy General Counsel (2015-2016) of OppenheimerFunds (investment management company) and Deputy Chief Legal Officer (2013-2015) of Jennison Associates LLC (investment adviser firm).
Chris Maher (1972)
Year of Election or Appointment: 2020
Deputy Treasurer
Mr. Maher also serves as an officer of other funds. Mr. Maher serves as Assistant Treasurer of FIMM, LLC (2021-present) and FMR Capital, Inc. (2017-present), and is an employee of Fidelity Investments (2008-present). Previously, Mr. Maher served as Assistant Treasurer of certain funds (2013-2020); Vice President of Asset Management Compliance (2013), Vice President of the Program Management Group of FMR (investment adviser firm, 2010-2013), and Vice President of Valuation Oversight (2008-2010).
Jason P. Pogorelec (1975)
Year of Election or Appointment: 2020
Chief Compliance Officer
Mr. Pogorelec also serves as Chief Compliance Officer of other funds. Mr. Pogorelec is a senior Vice President of Asset Management Compliance for Fidelity Investments and is an employee of Fidelity Investments (2006-present). Previously, Mr. Pogorelec served as Vice President, Associate General Counsel for Fidelity Investments (2010-2020) and Assistant Secretary of certain Fidelity funds (2015-2020).
Brett Segaloff (1972)
Year of Election or Appointment: 2021
Anti-Money Laundering (AML) Officer
Mr. Segaloff also serves as an AML Officer of other funds and other related entities. He is Director, Anti-Money Laundering (2007-present) of FMR LLC (diversified financial services company) and is an employee of Fidelity Investments (1996-present).
Stacie M. Smith (1974)
Year of Election or Appointment: 2016
President and Treasurer
Ms. Smith also serves as an officer of other funds. Ms. Smith serves as Assistant Treasurer of FIMM, LLC (2021-present) and FMR Capital, Inc. (2017-present), is an employee of Fidelity Investments (2009-present), and has served in other fund officer roles. Prior to joining Fidelity Investments, Ms. Smith served as Senior Audit Manager of Ernst & Young LLP (accounting firm, 1996-2009). Previously, Ms. Smith served as Assistant Treasurer (2013-2019) and Deputy Treasurer (2013-2016) of certain Fidelity® funds.
Jim Wegmann (1979)
Year of Election or Appointment: 2019
Assistant Treasurer
Mr. Wegmann also serves as an officer of other funds. Mr. Wegmann serves as Assistant Treasurer of FIMM, LLC (2021-present) and is an employee of Fidelity Investments (2011-present). Previously, Mr. Wegmann served as Assistant Treasurer of certain Fidelity® funds (2019-2021).
Shareholder Expense Example
As a shareholder, you incur two types of costs: (1) transaction costs, which may include sales charges (loads) on purchase payments or redemption proceeds, as applicable and (2) ongoing costs, which generally include management fees, distribution and/or service (12b-1) fees and other Fund expenses. This Example is intended to help you understand your ongoing costs (in dollars) of investing in a fund and to compare these costs with the ongoing costs of investing in other mutual funds.
The actual expense Example is based on an investment of $1,000 invested at the beginning of the period and held for the entire period (April 14, 2022 to May 31, 2022). The hypothetical expense Example is based on an investment of $1,000 invested for the one-half year period (December 1, 2021 to May 31, 2022).
Actual Expenses
The first line of the accompanying table provides information about actual account values and actual expenses. You may use the information in this line, together with the amount you invested, to estimate the expenses that you paid over the period. Simply divide your account value by $1,000.00 (for example, an $8,600 account value divided by $1,000.00 = 8.6), then multiply the result by the number in the first line for a class/Fund under the heading entitled "Expenses Paid During Period" to estimate the expenses you paid on your account during this period. If any fund is a shareholder of any underlying mutual funds or exchange-traded funds (ETFs) (the Underlying Funds), such fund indirectly bears its proportional share of the expenses of the Underlying Funds in addition to the direct expenses incurred presented in the table. These fees and expenses are not included in the annualized expense ratio used to calculate the expense estimate in the table below.
Hypothetical Example for Comparison Purposes
The second line of the accompanying table provides information about hypothetical account values and hypothetical expenses based on the actual expense ratio and an assumed rate of return of 5% per year before expenses, which is not the actual return. The hypothetical account values and expenses may not be used to estimate the actual ending account balance or expenses you paid for the period. You may use this information to compare the ongoing costs of investing in the Fund and other funds. To do so, compare this 5% hypothetical example with the 5% hypothetical examples that appear in the shareholder reports of the other funds. If any fund is a shareholder of any Underlying Funds, such fund indirectly bears its proportional share of the expenses of the Underlying Funds in addition to the direct expenses as presented in the table. These fees and expenses are not included in the annualized expense ratio used to calculate the expense estimate in the table below.
Please note that the expenses shown in the table are meant to highlight your ongoing costs only and do not reflect any transaction costs. Therefore, the second line of the table is useful in comparing ongoing costs only, and will not help you determine the relative total costs of owning different funds. In addition, if these transactional costs were included, your costs would have been higher.
| | Annualized Expense Ratio-A | Beginning
Account Value
| Ending
Account Value
May 31, 2022 | Expenses Paid
During Period
|
| Fidelity SAI Sustainable Future Fund | .60% | | | |
| Actual | | $1,000.00 | $934.00 | $.76-B |
| Hypothetical-C | | $1,000.00 | $1,021.94 | $3.02-D |
A Annualized expense ratio reflects expenses net of applicable fee waivers.
B Actual expenses are equal to the annualized expense ratio, multiplied by the average account value over the period, multiplied by 48/365 (to reflect the period April 14, 2022 to May 31, 2022).
C 5% return per year before expenses
D Hypothetical expenses are equal to the annualized expense ratio, multiplied by the average account value over the period, multiplied by 182/365 (to reflect the one-half year period).
Distributions (Unaudited)
The dividend and capital gains distributions for the fund(s) are available on Fidelity.com or Institutional.Fidelity.com.
The fund will notify shareholders in January 2023 of amounts for use in preparing 2022 income tax returns.
Board Approval of Investment Advisory Contracts and Management Fees
Fidelity SAI Sustainable Future Fund
At its January 2022 meeting, the Board of Trustees, including the Independent Trustees (together, the Board), voted to approve the management contract with Fidelity Management & Research Company LLC (FMR) and the sub-advisory agreements with affiliates of FMR (together, the Advisory Contracts) for the fund. FMR and the sub-advisers are collectively referred to herein as the Investment Advisers. The Board, assisted by the advice of fund counsel and Independent Trustees' counsel, considered a broad range of information.
Nature, Extent, and Quality of Services Provided. The Board considered Fidelity's staffing as it relates to the fund, including the backgrounds of investment personnel of Fidelity, and also considered the fund's investment objective, strategies, and related investment philosophy. The Board considered the structure of the investment personnel compensation program and whether this structure provides appropriate incentives to act in the best interests of the fund.
Resources Dedicated to Investment Management and Support Services. The Board and the Fund Oversight and Research Committees reviewed the general qualifications and capabilities of Fidelity's investment staff, including its size, education, experience, and resources, as well as Fidelity's approach to recruiting, training, managing, and compensating investment personnel. The Board noted the resources devoted to Fidelity's global investment organization and that Fidelity's analysts have extensive resources, tools and capabilities that allow them to conduct sophisticated quantitative and fundamental analysis, as well as credit analysis of issuers, counterparties and guarantors. Further, the Board considered that Fidelity's investment professionals have sufficient access to global information and data so as to provide competitive investment results over time, and that those professionals also have access to sophisticated tools that permit them to assess portfolio construction and risk and performance attribution characteristics continuously, as well as to transmit new information and research conclusions rapidly around the world. Additionally, in its deliberations, the Board considered Fidelity's trading, risk management, compliance, cybersecurity, and technology and operations capabilities and resources, which are integral parts of the investment management process.
Shareholder and Administrative Services. The Board considered the nature, extent, quality, and cost of advisory, administrative, and shareholder services to be performed by the Investment Advisers and their affiliates under the Advisory Contracts and under separate agreements covering transfer agency, pricing and bookkeeping, and securities lending services for the fund. The Board also considered the nature and extent of the supervision of third party service providers, principally custodians, subcustodians, and pricing vendors.
The Board noted that the growth of fund assets over time across the complex allows Fidelity to reinvest in the development of services designed to enhance the value and convenience of the Fidelity funds as investment vehicles. These services include 24-hour access to account information and market information over the Internet and through telephone representatives, investor education materials and asset allocation tools. The Board also considered that it reviews customer service metrics such as telephone response times, continuity of services on the website and metrics addressing services at Fidelity Investor Centers.
Investment Performance. The fund is a new fund and therefore had no historical performance for the Board to review at the time it approved the fund's Advisory Contracts. The Board considered the Investment Advisers' strength in fundamental, research-driven security selection, which the Board is familiar with through its supervision of other Fidelity funds. The Board also considered the fact that it oversees funds managed by FMR that have similar investment objectives and policies as the fund, including other sustainable investing funds.
Based on its review, the Board concluded that the nature, extent, and quality of services to be provided to the fund under the Advisory Contracts should benefit the shareholders of the fund.
Competitiveness of Management Fee and Total Expense Ratio ..In reviewing the Advisory Contracts, the Board considered the fund's proposed management fee rate and the projected total expense ratio of the fund. The Board noted that the fund's proposed management fee rate is below the median fee rate of funds with similar Lipper investment objective categories and comparable investment mandates, regardless of whether their management fee structures are comparable. The Board also considered that the projected total expense ratio of the fund is below the median of those funds and classes used by the Board for management fee comparisons that have a similar sales load structure.
The Board also noted that FMR has contractually agreed to reimburse the fund to the extent that total operating expenses (excluding interest, certain taxes, fees and expenses of the Independent Trustees, proxy and shareholder meeting expenses, extraordinary expenses, and acquired fund fees and expenses (including fees and expenses associated with a wholly owned subsidiary), if any, as well as non-operating expenses such as brokerage commissions and fees and expenses associated with the fund's securities lending program, if applicable), as a percentage of its average net assets exceed 0.60% through September 30, 2023.
Based on its review, the Board concluded that the fund's management fee and projected total expense ratio were reasonable in light of the services that the fund and its shareholders will receive and the other factors considered.
Costs of the Services and Profitability. The fund is a new fund and therefore no revenue, cost, or profitability data was available for the Board to review in respect of the fund at the time it approved the Advisory Contracts. In connection with its future renewal of the fund's Advisory Contracts, the Board will consider the revenues earned and the expenses incurred by Fidelity in conducting the business of developing, marketing, distributing, managing, administering and servicing the fund and servicing the fund's shareholders.
Economies of Scale. The Board will consider economies of scale when there is operating experience to permit assessment thereof. It noted that, notwithstanding the entrepreneurial risk associated with a new fund, the management fee was at a level normally associated, by comparison with competitors, with very high fund net assets, and Fidelity asserted to the Board that the level of the fee anticipated economies of scale at lower asset levels even before, if ever, economies of scale are achieved. The Board also noted that the fund and its shareholders would have access to the very considerable number and variety of services available through Fidelity and its affiliates.
Based on its evaluation of all of the conclusions noted above, and after considering all factors it believed relevant, the Board concluded that the advisory fee arrangements are fair and reasonable, and that the fund's Advisory Contracts should be approved.
FSP-ANN-0722
1.9905643.100
Fidelity® SAI Sustainable Sector Fund
Offered exclusively to certain clients of the Adviser, or its affiliates, including Strategic Advisers LLC (SAI) - not available for sale to the general public. Fidelity SAI is a product name of Fidelity® funds dedicated to certain programs affiliated with SAI.
Annual Report
May 31, 2022
Contents
To view a fund's proxy voting guidelines and proxy voting record for the 12-month period ended June 30, visit http://www.fidelity.com/proxyvotingresults or visit the Securities and Exchange Commission's (SEC) web site at http://www.sec.gov.
You may also call 1-800-544-3455 to request a free copy of the proxy voting guidelines.
Standard & Poor's, S&P and S&P 500 are registered service marks of The McGraw-Hill Companies, Inc. and have been licensed for use by Fidelity Distributors Corporation.
Other third-party marks appearing herein are the property of their respective owners.
All other marks appearing herein are registered or unregistered trademarks or service marks of FMR LLC or an affiliated company. © 2022 FMR LLC. All rights reserved.
This report and the financial statements contained herein are submitted for the general information of the shareholders of the Fund. This report is not authorized for distribution to prospective investors in the Fund unless preceded or accompanied by an effective prospectus.
A fund files its complete schedule of portfolio holdings with the SEC for the first and third quarters of each fiscal year on Form N-PORT. Forms N-PORT are available on the SEC’s web site at http://www.sec.gov. A fund's Forms N-PORT may be reviewed and copied at the SEC’s Public Reference Room in Washington, DC. Information regarding the operation of the SEC's Public Reference Room may be obtained by calling 1-800-SEC-0330.
For a complete list of a fund's portfolio holdings, view the most recent holdings listing, semiannual report, or annual report on Fidelity's web site at http://www.fidelity.com, http://www.institutional.fidelity.com, or http://www.401k.com, as applicable.
NOT FDIC INSURED •MAY LOSE VALUE •NO BANK GUARANTEE
Neither the Fund nor Fidelity Distributors Corporation is a bank.
Note to Shareholders:
Early in 2020, the outbreak and spread of COVID-19 emerged as a public health emergency that had a major influence on financial markets, primarily based on its impact on the global economy and corporate earnings. On March 11, 2020, the World Health Organization declared the COVID-19 outbreak a pandemic, citing sustained risk of further global spread. The pandemic prompted a number of measures to limit the spread of COVID-19, including travel and border restrictions, quarantines, and restrictions on large gatherings. In turn, these resulted in lower consumer activity, diminished demand for a wide range of products and services, disruption in manufacturing and supply chains, and – given the wide variability in outcomes regarding the outbreak – significant market uncertainty and volatility. To help stem the turmoil, the U.S. government took unprecedented action – in concert with the U.S. Federal Reserve and central banks around the world – to help support consumers, businesses, and the broader economy, and to limit disruption to the financial system.
In general, the overall impact of the pandemic lessened in 2021, amid a resilient economy and widespread distribution of three COVID-19 vaccines granted emergency use authorization from the U.S. Food and Drug Administration (FDA) early in the year. Still, the situation remains dynamic, and the extent and duration of its influence on financial markets and the economy is highly uncertain, due in part to a recent spike in cases based on highly contagious variants of the coronavirus.
Extreme events such as the COVID-19 crisis are exogenous shocks that can have significant adverse effects on mutual funds and their investments. Although multiple asset classes may be affected by market disruption, the duration and impact may not be the same for all types of assets. Fidelity is committed to helping you stay informed amid news about COVID-19 and during increased market volatility, and we continue to take extra steps to be responsive to customer needs. We encourage you to visit us online, where we offer ongoing updates, commentary, and analysis on the markets and our funds.
Investment Summary (Unaudited)
Top Ten Stocks as of May 31, 2022
| | % of fund's net assets |
| Microsoft Corp. | 6.8 |
| Apple, Inc. | 5.7 |
| Alphabet, Inc. Class A | 4.1 |
| Amazon.com, Inc. | 3.5 |
| Meta Platforms, Inc. Class A | 2.1 |
| UnitedHealth Group, Inc. | 2.0 |
| The Coca-Cola Co. | 1.9 |
| NVIDIA Corp. | 1.8 |
| Procter & Gamble Co. | 1.6 |
| Visa, Inc. Class A | 1.6 |
| | 31.1 |
Market Sectors as of May 31, 2022
| | % of fund's net assets |
| Information Technology | 25.6 |
| Health Care | 13.7 |
| Financials | 11.6 |
| Consumer Discretionary | 10.7 |
| Communication Services | 9.3 |
| Industrials | 8.2 |
| Consumer Staples | 6.1 |
| Energy | 4.5 |
| Utilities | 3.1 |
| Real Estate | 3.0 |
| Materials | 3.0 |
Asset Allocation (% of fund's net assets)
| As of May 31, 2022* |
| | Stocks | 98.8% |
| | Short-Term Investments and Net Other Assets (Liabilities) | 1.2% |

* Foreign investments - 9.7%
Schedule of Investments May 31, 2022
Showing Percentage of Net Assets
| Common Stocks - 98.8% | | | |
| | | Shares | Value |
| COMMUNICATION SERVICES - 9.3% | | | |
| Diversified Telecommunication Services - 0.4% | | | |
| AT&T, Inc. | | 323 | $6,877 |
| Entertainment - 1.5% | | | |
| Cinemark Holdings, Inc. (a) | | 137 | 2,326 |
| Netflix, Inc. (a) | | 26 | 5,133 |
| Sea Ltd. ADR (a) | | 45 | 3,720 |
| Take-Two Interactive Software, Inc. (a) | | 35 | 4,359 |
| The Walt Disney Co. (a) | | 95 | 10,492 |
| Warner Bros Discovery, Inc. (a) | | 84 | 1,550 |
| | | | 27,580 |
| Interactive Media & Services - 6.5% | | | |
| Alphabet, Inc. Class A (a) | | 34 | 77,358 |
| Meta Platforms, Inc. Class A (a) | | 203 | 39,309 |
| Snap, Inc. Class A (a) | | 251 | 3,542 |
| Tongdao Liepin Group (a) | | 449 | 687 |
| Twitter, Inc. (a) | | 53 | 2,099 |
| | | | 122,995 |
| Media - 0.3% | | | |
| Comcast Corp. Class A | | 122 | 5,402 |
| Wireless Telecommunication Services - 0.6% | | | |
| T-Mobile U.S., Inc. (a) | | 92 | 12,263 |
|
| TOTAL COMMUNICATION SERVICES | | | 175,117 |
|
| CONSUMER DISCRETIONARY - 10.7% | | | |
| Auto Components - 0.1% | | | |
| Lear Corp. | | 16 | 2,255 |
| Automobiles - 1.5% | | | |
| Ferrari NV | | 8 | 1,560 |
| Tesla, Inc. (a) | | 35 | 26,539 |
| | | | 28,099 |
| Distributors - 0.3% | | | |
| LKQ Corp. | | 100 | 5,139 |
| Hotels, Restaurants & Leisure - 1.5% | | | |
| Booking Holdings, Inc. (a) | | 5 | 11,218 |
| Compass Group PLC | | 165 | 3,699 |
| Marriott International, Inc. Class A | | 78 | 13,383 |
| | | | 28,300 |
| Household Durables - 0.2% | | | |
| Mohawk Industries, Inc. (a) | | 24 | 3,395 |
| Internet & Direct Marketing Retail - 3.8% | | | |
| Amazon.com, Inc. (a) | | 27 | 64,913 |
| eBay, Inc. | | 99 | 4,818 |
| Farfetch Ltd. Class A (a) | | 87 | 780 |
| | | | 70,511 |
| Multiline Retail - 0.4% | | | |
| Dollar General Corp. | | 28 | 6,170 |
| Nordstrom, Inc. | | 77 | 2,035 |
| | | | 8,205 |
| Specialty Retail - 2.2% | | | |
| Burlington Stores, Inc. (a) | | 7 | 1,178 |
| Industria de Diseno Textil SA | | 149 | 3,592 |
| Lowe's Companies, Inc. | | 85 | 16,601 |
| The Home Depot, Inc. | | 32 | 9,688 |
| TJX Companies, Inc. | | 145 | 9,218 |
| | | | 40,277 |
| Textiles, Apparel & Luxury Goods - 0.7% | | | |
| NIKE, Inc. Class B | | 38 | 4,516 |
| PVH Corp. | | 49 | 3,473 |
| Tapestry, Inc. | | 167 | 5,762 |
| | | | 13,751 |
|
| TOTAL CONSUMER DISCRETIONARY | | | 199,932 |
|
| CONSUMER STAPLES - 6.1% | | | |
| Beverages - 1.9% | | | |
| The Coca-Cola Co. | | 548 | 34,732 |
| Food & Staples Retailing - 0.9% | | | |
| Sysco Corp. | | 208 | 17,509 |
| Food Products - 0.7% | | | |
| Bunge Ltd. | | 97 | 11,477 |
| Local Bounti Corp. (a) | | 155 | 842 |
| | | | 12,319 |
| Household Products - 1.6% | | | |
| Procter & Gamble Co. | | 203 | 30,020 |
| Personal Products - 1.0% | | | |
| Estee Lauder Companies, Inc. Class A | | 75 | 19,099 |
|
| TOTAL CONSUMER STAPLES | | | 113,679 |
|
| ENERGY - 4.5% | | | |
| Energy Equipment & Services - 1.0% | | | |
| Baker Hughes Co. Class A | | 134 | 4,821 |
| Schlumberger Ltd. | | 139 | 6,388 |
| U.S. Silica Holdings, Inc. (a) | | 248 | 4,385 |
| Weatherford International PLC (a) | | 61 | 2,064 |
| | | | 17,658 |
| Oil, Gas & Consumable Fuels - 3.5% | | | |
| Canadian Natural Resources Ltd. | | 189 | 12,508 |
| Harbour Energy PLC | | 710 | 3,437 |
| Hess Corp. | | 95 | 11,692 |
| Imperial Oil Ltd. | | 164 | 8,983 |
| MEG Energy Corp. (a) | | 637 | 11,115 |
| Phillips 66 Co. | | 73 | 7,359 |
| Valero Energy Corp. | | 86 | 11,146 |
| | | | 66,240 |
|
| TOTAL ENERGY | | | 83,898 |
|
| FINANCIALS - 11.6% | | | |
| Banks - 5.7% | | | |
| Bank of America Corp. | | 606 | 22,543 |
| BankUnited, Inc. | | 49 | 2,041 |
| BNP Paribas SA | | 31 | 1,774 |
| Citizens Financial Group, Inc. | | 122 | 5,048 |
| Comerica, Inc. | | 44 | 3,661 |
| Eurobank Ergasias Services and Holdings SA ADR (a) | | 3,299 | 1,847 |
| First Horizon National Corp. | | 45 | 1,027 |
| JPMorgan Chase & Co. | | 100 | 13,223 |
| PNC Financial Services Group, Inc. | | 42 | 7,367 |
| Societe Generale Series A | | 70 | 1,886 |
| Standard Chartered PLC (United Kingdom) | | 143 | 1,137 |
| SVB Financial Group (a) | | 9 | 4,397 |
| U.S. Bancorp | | 203 | 10,773 |
| UniCredit SpA | | 142 | 1,665 |
| Wells Fargo & Co. | | 620 | 28,377 |
| | | | 106,766 |
| Capital Markets - 2.2% | | | |
| Bank of New York Mellon Corp. | | 300 | 13,983 |
| BlackRock, Inc. Class A | | 9 | 6,022 |
| Cboe Global Markets, Inc. | | 11 | 1,235 |
| Goldman Sachs Group, Inc. | | 10 | 3,269 |
| Intercontinental Exchange, Inc. | | 78 | 7,986 |
| State Street Corp. | | 63 | 4,567 |
| TMX Group Ltd. | | 44 | 4,788 |
| | | | 41,850 |
| Consumer Finance - 0.7% | | | |
| American Express Co. | | 40 | 6,753 |
| Capital One Financial Corp. | | 33 | 4,219 |
| OneMain Holdings, Inc. | | 54 | 2,379 |
| | | | 13,351 |
| Insurance - 3.0% | | | |
| AIA Group Ltd. | | 183 | 1,896 |
| Arthur J. Gallagher & Co. | | 36 | 5,830 |
| Globe Life, Inc. | | 43 | 4,196 |
| Hartford Financial Services Group, Inc. | | 106 | 7,686 |
| Marsh & McLennan Companies, Inc. | | 80 | 12,796 |
| Prudential PLC | | 50 | 652 |
| The Travelers Companies, Inc. | | 115 | 20,590 |
| Willis Towers Watson PLC | | 10 | 2,111 |
| | | | 55,757 |
|
| TOTAL FINANCIALS | | | 217,724 |
|
| HEALTH CARE - 13.7% | | | |
| Biotechnology - 2.0% | | | |
| AbbVie, Inc. | | 39 | 5,747 |
| Alnylam Pharmaceuticals, Inc. (a) | | 23 | 2,893 |
| Argenx SE ADR (a) | | 21 | 6,495 |
| Atara Biotherapeutics, Inc. (a) | | 174 | 905 |
| Beam Therapeutics, Inc. (a) | | 31 | 1,091 |
| Imago BioSciences, Inc. | | 55 | 889 |
| Innovent Biologics, Inc. (a)(b) | | 646 | 2,005 |
| Legend Biotech Corp. ADR (a) | | 49 | 2,072 |
| Regeneron Pharmaceuticals, Inc. (a) | | 11 | 7,312 |
| Vertex Pharmaceuticals, Inc. (a) | | 12 | 3,224 |
| Xencor, Inc. (a) | | 106 | 2,367 |
| Zai Lab Ltd. (a) | | 497 | 1,577 |
| Zentalis Pharmaceuticals, Inc. (a) | | 41 | 989 |
| | | | 37,566 |
| Health Care Equipment & Supplies - 2.0% | | | |
| Boston Scientific Corp. (a) | | 412 | 16,896 |
| Hologic, Inc. (a) | | 25 | 1,882 |
| Intuitive Surgical, Inc. (a) | | 13 | 2,959 |
| Masimo Corp. (a) | | 20 | 2,809 |
| Penumbra, Inc. (a) | | 48 | 7,052 |
| ResMed, Inc. | | 23 | 4,680 |
| Tandem Diabetes Care, Inc. (a) | | 27 | 1,841 |
| | | | 38,119 |
| Health Care Providers & Services - 4.2% | | | |
| agilon health, Inc. (a) | | 225 | 4,298 |
| Centene Corp. (a) | | 93 | 7,574 |
| Cigna Corp. | | 42 | 11,268 |
| HCA Holdings, Inc. | | 14 | 2,946 |
| Humana, Inc. | | 30 | 13,627 |
| LifeStance Health Group, Inc. | | 202 | 1,505 |
| UnitedHealth Group, Inc. | | 74 | 36,762 |
| | | | 77,980 |
| Health Care Technology - 0.1% | | | |
| Doximity, Inc. | | 32 | 1,120 |
| Life Sciences Tools & Services - 3.4% | | | |
| 10X Genomics, Inc. (a) | | 36 | 1,843 |
| Agilent Technologies, Inc. | | 45 | 5,740 |
| Avantor, Inc. (a) | | 68 | 2,179 |
| Bio-Rad Laboratories, Inc. Class A (a) | | 7 | 3,765 |
| Bruker Corp. | | 77 | 4,811 |
| Charles River Laboratories International, Inc. (a) | | 19 | 4,448 |
| Danaher Corp. | | 66 | 17,412 |
| Lonza Group AG | | 6 | 3,617 |
| Thermo Fisher Scientific, Inc. | | 29 | 16,460 |
| West Pharmaceutical Services, Inc. | | 13 | 4,035 |
| | | | 64,310 |
| Pharmaceuticals - 2.0% | | | |
| Arvinas Holding Co. LLC (a) | | 28 | 1,167 |
| AstraZeneca PLC (United Kingdom) | | 32 | 4,229 |
| Bristol-Myers Squibb Co. | | 85 | 6,413 |
| Eli Lilly & Co. | | 56 | 17,553 |
| Merck & Co., Inc. | | 40 | 3,681 |
| Roche Holding AG (participation certificate) | | 10 | 3,408 |
| UCB SA | | 13 | 1,147 |
| | | | 37,598 |
|
| TOTAL HEALTH CARE | | | 256,693 |
|
| INDUSTRIALS - 8.2% | | | |
| Aerospace & Defense - 1.1% | | | |
| Lockheed Martin Corp. | | 47 | 20,685 |
| Airlines - 0.6% | | | |
| Delta Air Lines, Inc. (a) | | 259 | 10,798 |
| Building Products - 0.9% | | | |
| Trane Technologies PLC | | 117 | 16,153 |
| Electrical Equipment - 1.9% | | | |
| AMETEK, Inc. | | 175 | 21,257 |
| Emerson Electric Co. | | 160 | 14,186 |
| | | | 35,443 |
| Machinery - 2.1% | | | |
| Caterpillar, Inc. | | 93 | 20,074 |
| Fortive Corp. | | 319 | 19,705 |
| | | | 39,779 |
| Professional Services - 0.1% | | | |
| Equifax, Inc. | | 14 | 2,836 |
| Road & Rail - 1.5% | | | |
| CSX Corp. | | 681 | 21,649 |
| Uber Technologies, Inc. (a) | | 244 | 5,661 |
| | | | 27,310 |
|
| TOTAL INDUSTRIALS | | | 153,004 |
|
| INFORMATION TECHNOLOGY - 25.6% | | | |
| Electronic Equipment & Components - 0.4% | | | |
| Amphenol Corp. Class A | | 99 | 7,015 |
| IT Services - 3.6% | | | |
| Accenture PLC Class A | | 9 | 2,686 |
| Block, Inc. Class A (a) | | 70 | 6,126 |
| Capgemini SA | | 21 | 4,069 |
| Cognizant Technology Solutions Corp. Class A | | 124 | 9,263 |
| Dlocal Ltd. | | 112 | 3,229 |
| MasterCard, Inc. Class A | | 14 | 5,010 |
| MongoDB, Inc. Class A (a) | | 16 | 3,794 |
| Twilio, Inc. Class A (a) | | 36 | 3,786 |
| Visa, Inc. Class A | | 137 | 29,067 |
| Worldline SA (a)(b) | | 14 | 573 |
| | | | 67,603 |
| Semiconductors & Semiconductor Equipment - 5.3% | | | |
| Advanced Micro Devices, Inc. (a) | | 18 | 1,833 |
| ASML Holding NV (Netherlands) | | 6 | 3,453 |
| Lam Research Corp. | | 19 | 9,881 |
| Marvell Technology, Inc. | | 109 | 6,447 |
| Micron Technology, Inc. | | 177 | 13,070 |
| NVIDIA Corp. | | 180 | 33,610 |
| NXP Semiconductors NV | | 47 | 8,919 |
| Renesas Electronics Corp. (a) | | 676 | 7,896 |
| SolarEdge Technologies, Inc. (a) | | 17 | 4,637 |
| Taiwan Semiconductor Manufacturing Co. Ltd. sponsored ADR | | 101 | 9,625 |
| | | | 99,371 |
| Software - 10.6% | | | |
| Adobe, Inc. (a) | | 42 | 17,492 |
| Anaplan, Inc. (a) | | 53 | 3,477 |
| Autodesk, Inc. (a) | | 34 | 7,064 |
| Black Knight, Inc. (a) | | 18 | 1,222 |
| Coupa Software, Inc. (a) | | 33 | 2,270 |
| Elastic NV (a) | | 26 | 1,603 |
| HubSpot, Inc. (a) | | 15 | 5,065 |
| Intuit, Inc. | | 25 | 10,362 |
| Microsoft Corp. | | 469 | 127,500 |
| Otonomo Technologies Ltd. (a) | | 348 | 456 |
| Salesforce.com, Inc. (a) | | 84 | 13,460 |
| Synopsys, Inc. (a) | | 21 | 6,703 |
| Workday, Inc. Class A (a) | | 19 | 2,970 |
| | | | 199,644 |
| Technology Hardware, Storage & Peripherals - 5.7% | | | |
| Apple, Inc. | | 713 | 106,123 |
|
| TOTAL INFORMATION TECHNOLOGY | | | 479,756 |
|
| MATERIALS - 3.0% | | | |
| Chemicals - 3.0% | | | |
| CF Industries Holdings, Inc. | | 170 | 16,791 |
| Linde PLC | | 56 | 18,182 |
| Sherwin-Williams Co. | | 63 | 16,887 |
| Valvoline, Inc. | | 153 | 5,119 |
| | | | 56,979 |
| REAL ESTATE - 3.0% | | | |
| Equity Real Estate Investment Trusts (REITs) - 2.9% | | | |
| Alexandria Real Estate Equities, Inc. | | 9 | 1,494 |
| American Tower Corp. | | 32 | 8,196 |
| Corporate Office Properties Trust (SBI) | | 96 | 2,653 |
| Crown Castle International Corp. | | 61 | 11,569 |
| CubeSmart | | 55 | 2,449 |
| Equity Lifestyle Properties, Inc. | | 61 | 4,618 |
| Host Hotels & Resorts, Inc. | | 251 | 5,017 |
| Mid-America Apartment Communities, Inc. | | 15 | 2,715 |
| Prologis (REIT), Inc. | | 47 | 5,992 |
| Simon Property Group, Inc. | | 29 | 3,325 |
| Ventas, Inc. | | 44 | 2,497 |
| Washington REIT (SBI) | | 48 | 1,166 |
| Welltower, Inc. | | 40 | 3,564 |
| | | | 55,255 |
| Real Estate Management & Development - 0.1% | | | |
| WeWork, Inc. (a) | | 273 | 1,990 |
|
| TOTAL REAL ESTATE | | | 57,245 |
|
| UTILITIES - 3.1% | | | |
| Electric Utilities - 1.8% | | | |
| Edison International | | 51 | 3,565 |
| Exelon Corp. | | 122 | 5,996 |
| FirstEnergy Corp. | | 87 | 3,738 |
| NextEra Energy, Inc. | | 142 | 10,748 |
| PG&E Corp. (a) | | 324 | 3,953 |
| Southern Co. | | 74 | 5,599 |
| | | | 33,599 |
| Independent Power and Renewable Electricity Producers - 0.4% | | | |
| The AES Corp. | | 196 | 4,320 |
| Vistra Corp. | | 94 | 2,479 |
| | | | 6,799 |
| Multi-Utilities - 0.9% | | | |
| CenterPoint Energy, Inc. | | 100 | 3,205 |
| Dominion Energy, Inc. | | 60 | 5,053 |
| NiSource, Inc. | | 74 | 2,327 |
| Public Service Enterprise Group, Inc. | | 31 | 2,125 |
| Sempra Energy | | 29 | 4,752 |
| | | | 17,462 |
|
| TOTAL UTILITIES | | | 57,860 |
|
| TOTAL COMMON STOCKS | | | |
| (Cost $1,977,311) | | | 1,851,887 |
|
| Money Market Funds - 1.1% | | | |
| Fidelity Cash Central Fund 0.82% (c) | | | |
| (Cost $20,845) | | 20,841 | 20,845 |
| TOTAL INVESTMENT IN SECURITIES - 99.9% | | | |
| (Cost $1,998,156) | | | 1,872,732 |
| NET OTHER ASSETS (LIABILITIES) - 0.1% | | | 2,377 |
| NET ASSETS - 100% | | | $1,875,109 |
Legend
(a) Non-income producing
(b) Security exempt from registration under Rule 144A of the Securities Act of 1933. These securities may be resold in transactions exempt from registration, normally to qualified institutional buyers. At the end of the period, the value of these securities amounted to $2,578 or 0.1% of net assets.
(c) Affiliated fund that is generally available only to investment companies and other accounts managed by Fidelity Investments. The rate quoted is the annualized seven-day yield of the fund at period end. A complete unaudited listing of the fund's holdings as of its most recent quarter end is available upon request. In addition, each Fidelity Central Fund's financial statements, which are not covered by the Fund's Report of Independent Registered Public Accounting Firm, are available on the SEC's website or upon request.
Affiliated Central Funds
Fiscal year to date information regarding the Fund's investments in Fidelity Central Funds, including the ownership percentage, is presented below.
| Fund | Value, beginning of period | Purchases | Sales Proceeds | Dividend Income | Realized Gain/Loss | Change in Unrealized appreciation (depreciation) | Value, end of period | % ownership, end of period |
| Fidelity Cash Central Fund 0.82% | $-- | $2,000,000 | $1,979,155 | $104 | $-- | $-- | $20,845 | 0.0% |
| Total | $-- | $2,000,000 | $1,979,155 | $104 | $-- | $-- | $20,845 | |
Amounts in the income column in the above table include any capital gain distributions from underlying funds, which are presented in the corresponding line-item in the Statement of Operations, if applicable.
Investment Valuation
The following is a summary of the inputs used, as of May 31, 2022, involving the Fund's assets and liabilities carried at fair value. The inputs or methodology used for valuing securities may not be an indication of the risk associated with investing in those securities. For more information on valuation inputs, and their aggregation into the levels used below, please refer to the Investment Valuation section in the accompanying Notes to Financial Statements.
| | Valuation Inputs at Reporting Date: |
| Description | Total | Level 1 | Level 2 | Level 3 |
| Investments in Securities: | | | | |
| Equities: | | | | |
| Communication Services | $175,117 | $175,117 | $-- | $-- |
| Consumer Discretionary | 199,932 | 192,641 | 7,291 | -- |
| Consumer Staples | 113,679 | 113,679 | -- | -- |
| Energy | 83,898 | 83,898 | -- | -- |
| Financials | 217,724 | 208,714 | 9,010 | -- |
| Health Care | 256,693 | 245,439 | 11,254 | -- |
| Industrials | 153,004 | 153,004 | -- | -- |
| Information Technology | 479,756 | 467,834 | 11,922 | -- |
| Materials | 56,979 | 56,979 | -- | -- |
| Real Estate | 57,245 | 57,245 | -- | -- |
| Utilities | 57,860 | 57,860 | -- | -- |
| Money Market Funds | 20,845 | 20,845 | -- | -- |
| Total Investments in Securities: | $1,872,732 | $1,833,255 | $39,477 | $-- |
See accompanying notes which are an integral part of the financial statements.
Financial Statements
Statement of Assets and Liabilities
| | | May 31, 2022 |
| Assets | | |
Investment in securities, at value — See accompanying schedule:
Unaffiliated issuers (cost $1,977,311) | $1,851,887 | |
| Fidelity Central Funds (cost $20,845) | 20,845 | |
| Total Investment in Securities (cost $1,998,156) | | $1,872,732 |
| Cash | | 7,683 |
| Receivable for investments sold | | 3,416 |
| Dividends receivable | | 1,687 |
| Distributions receivable from Fidelity Central Funds | | 14 |
| Receivable from investment adviser for expense reductions | | 21,645 |
| Total assets | | 1,907,177 |
| Liabilities | | |
| Accrued management fee | $648 | |
| Audit fee payable | 27,014 | |
| Registration fee payable | 3,727 | |
| Other payables and accrued expenses | 679 | |
| Total liabilities | | 32,068 |
| Net Assets | | $1,875,109 |
| Net Assets consist of: | | |
| Paid in capital | | $2,004,489 |
| Total accumulated earnings (loss) | | (129,380) |
| Net Assets | | $1,875,109 |
| Net Asset Value, offering price and redemption price per share ($1,875,109 ÷ 200,478 shares) | | $9.35 |
See accompanying notes which are an integral part of the financial statements.
Statement of Operations
| | | For the period
April 14, 2022 (commencement of operations) through
May 31, 2022 |
| Investment Income | | |
| Dividends | | $2,994 |
| Income from Fidelity Central Funds | | 104 |
| Total income | | 3,098 |
| Expenses | | |
| Management fee | $1,029 | |
| Custodian fees and expenses | 505 | |
| Registration fees | 4,150 | |
| Audit | 27,198 | |
| Total expenses before reductions | 32,882 | |
| Expense reductions | (31,697) | |
| Total expenses after reductions | | 1,185 |
| Net investment income (loss) | | 1,913 |
| Realized and Unrealized Gain (Loss) | | |
| Net realized gain (loss) on: | | |
| Investment securities: | | |
| Unaffiliated issuers | (5,806) | |
| Foreign currency transactions | (64) | |
| Total net realized gain (loss) | | (5,870) |
| Change in net unrealized appreciation (depreciation) on: | | |
| Investment securities: | | |
| Unaffiliated issuers | (125,424) | |
| Assets and liabilities in foreign currencies | 1 | |
| Total change in net unrealized appreciation (depreciation) | | (125,423) |
| Net gain (loss) | | (131,293) |
| Net increase (decrease) in net assets resulting from operations | | $(129,380) |
See accompanying notes which are an integral part of the financial statements.
Statement of Changes in Net Assets
| | For the period
April 14, 2022 (commencement of operations) through
May 31, 2022 |
| Increase (Decrease) in Net Assets | |
| Operations | |
| Net investment income (loss) | $1,913 |
| Net realized gain (loss) | (5,870) |
| Change in net unrealized appreciation (depreciation) | (125,423) |
| Net increase (decrease) in net assets resulting from operations | (129,380) |
| Share transactions | |
| Proceeds from sales of shares | 2,004,590 |
| Cost of shares redeemed | (101) |
| Net increase (decrease) in net assets resulting from share transactions | 2,004,489 |
| Total increase (decrease) in net assets | 1,875,109 |
| Net Assets | |
| Beginning of period | – |
| End of period | $1,875,109 |
| Other Information | |
| Shares | |
| Sold | 200,488 |
| Redeemed | (10) |
| Net increase (decrease) | 200,478 |
See accompanying notes which are an integral part of the financial statements.
Financial Highlights
Fidelity SAI Sustainable Sector Fund
| | |
| Years ended May 31, | 2022 A |
| Selected Per–Share Data | |
| Net asset value, beginning of period | $10.00 |
| Income from Investment Operations | |
| Net investment income (loss)B,C | .01 |
| Net realized and unrealized gain (loss) | (.66) |
| Total from investment operations | (.65) |
| Net asset value, end of period | $9.35 |
| Total ReturnD,E | (6.50)% |
| Ratios to Average Net AssetsC,F,G | |
| Expenses before reductions | 3.86%H,I |
| Expenses net of fee waivers, if any | .50%H,I |
| Expenses net of all reductions | .50%H,I |
| Net investment income (loss) | .81%H,I |
| Supplemental Data | |
| Net assets, end of period (000 omitted) | $1,875 |
| Portfolio turnover rateJ | 3%K |
A For the period April 14, 2022 (commencement of operations) through May 31, 2022.
B Calculated based on average shares outstanding during the period.
C Net investment income (loss) is affected by the timing of the declaration of dividends by any underlying mutual funds or exchange-traded funds (ETFs). Net investment income (loss) of any such underlying funds is not included in the Fund's net investment income (loss) ratio.
D Total returns for periods of less than one year are not annualized.
E Total returns would have been lower if certain expenses had not been reduced during the applicable periods shown.
F Fees and expenses of any underlying mutual funds or exchange-traded funds (ETFs) are not included in the Fund's expense ratio. The Fund indirectly bears its proportionate share of these expenses. For additional expense information related to investments in Fidelity Central Funds, please refer to the "Investments in Fidelity Central Funds" note found in the Notes to Financial Statements section of the most recent Annual or Semi-Annual report.
G Expense ratios reflect operating expenses of the class. Expenses before reductions do not reflect amounts reimbursed, waived, or reduced through arrangements with the investment adviser, brokerage services, or other offset arrangements, if applicable, and do not represent the amount paid by the class during periods when reimbursements, waivers or reductions occur.
H Annualized
I Audit fees are not annualized.
J Amount does not include the portfolio activity of any underlying mutual funds or exchange-traded funds (ETFs).
K Amount not annualized.
See accompanying notes which are an integral part of the financial statements.
Notes to Financial Statements
For the period ended May 31, 2022
1. Organization.
Fidelity SAI Sustainable Sector Fund (the Fund) is a fund of Fidelity Summer Street Trust (the Trust) and is authorized to issue an unlimited number of shares. Shares are offered exclusively to certain clients of Fidelity Management & Research Company LLC (FMR) or its affiliates. The Trust is registered under the Investment Company Act of 1940, as amended (the 1940 Act), as an open-end management investment company organized as a Massachusetts business trust. Application of FMR's environmental, social, and governance (ESG) ratings process and/or its sustainable investing exclusion criteria may affect the Fund's exposure to certain issuers, sectors, regions, and countries and may affect the Fund's performance depending on whether certain investments are in or out of favor. The criteria related to the Fund's ESG ratings process and/or adherence to its sustainable investing exclusion criteria may result in the Fund forgoing opportunities to buy certain securities when it might otherwise be advantageous to do so, or selling securities for ESG reasons when it might be otherwise disadvantageous for it to do so. As a result, the Fund's performance may at times be better or worse than the performance of funds that do not use ESG or sustainability criteria. There are significant differences in interpretations of what it means for an issuer to have positive ESG factors. While the investment adviser believes its definitions are reasonable, the portfolio decisions it makes may differ with other investors' or advisers' views.
2. Investments in Fidelity Central Funds.
Funds may invest in Fidelity Central Funds, which are open-end investment companies generally available only to other investment companies and accounts managed by the investment adviser and its affiliates. The Schedule of Investments lists any Fidelity Central Funds held as an investment as of period end, but does not include the underlying holdings of each Fidelity Central Fund. An investing fund indirectly bears its proportionate share of the expenses of the underlying Fidelity Central Funds.
Based on its investment objective, each Fidelity Central Fund may invest or participate in various investment vehicles or strategies that are similar to those of the investing fund. These strategies are consistent with the investment objectives of the investing fund and may involve certain economic risks which may cause a decline in value of each of the Fidelity Central Funds and thus a decline in the value of the investing fund.
| Fidelity Central Fund | Investment Manager | Investment Objective | Investment Practices | Expense Ratio(a) |
| Fidelity Money Market Central Funds | Fidelity Management & Research Company LLC (FMR) | Each fund seeks to obtain a high level of current income consistent with the preservation of capital and liquidity. | Short-term Investments | Less than .005% |
(a) Expenses expressed as a percentage of average net assets and are as of each underlying Central Fund's most recent annual or semi-annual shareholder report.
A complete unaudited list of holdings for each Fidelity Central Fund is available upon request or at the Securities and Exchange Commission website at www.sec.gov. In addition, the financial statements of the Fidelity Central Funds which contain the significant accounting policies (including investment valuation policies) of those funds, and are not covered by the Report of Independent Registered Public Accounting Firm, are available on the Securities and Exchange Commission website or upon request.
3. Significant Accounting Policies.
The Fund is an investment company and applies the accounting and reporting guidance of the Financial Accounting Standards Board (FASB) Accounting Standards Codification Topic 946 Financial Services - Investment Companies. The financial statements have been prepared in conformity with accounting principles generally accepted in the United States of America (GAAP), which require management to make certain estimates and assumptions at the date of the financial statements. Actual results could differ from those estimates. Subsequent events, if any, through the date that the financial statements were issued have been evaluated in the preparation of the financial statements. The Fund's Schedule of Investments lists any underlying mutual funds or exchange-traded funds (ETFs) but does not include the underlying holdings of these funds. The following summarizes the significant accounting policies of the Fund:
Investment Valuation. Investments are valued as of 4:00 p.m. Eastern time on the last calendar day of the period. The Board of Trustees (the Board) has delegated the day to day responsibility for the valuation of the Fund's investments to the Fair Value Committee (the Committee) established by the Fund's investment adviser. In accordance with valuation policies and procedures approved by the Board, the Fund attempts to obtain prices from one or more third party pricing vendors or brokers to value its investments. When current market prices, quotations or currency exchange rates are not readily available or reliable, investments will be fair valued in good faith by the Committee, in accordance with procedures adopted by the Board. Factors used in determining fair value vary by investment type and may include market or investment specific events. The frequency with which these procedures are used cannot be predicted and they may be utilized to a significant extent. The Committee oversees the Fund's valuation policies and procedures and reports to the Board on the Committee's activities and fair value determinations. The Board monitors the appropriateness of the procedures used in valuing the Fund's investments and ratifies the fair value determinations of the Committee.
The Fund categorizes the inputs to valuation techniques used to value its investments into a disclosure hierarchy consisting of three levels as shown below:
- Level 1 – unadjusted quoted prices in active markets for identical investments
- Level 2 – other significant observable inputs (including quoted prices for similar investments, interest rates, prepayment speeds, etc.)
- Level 3 – unobservable inputs (including the Fund's own assumptions based on the best information available)
Valuation techniques used to value the Fund's investments by major category are as follows:
Equity securities, including restricted securities, for which market quotations are readily available, are valued at the last reported sale price or official closing price as reported by a third party pricing vendor on the primary market or exchange on which they are traded and are categorized as Level 1 in the hierarchy. In the event there were no sales during the day or closing prices are not available, securities are valued at the last quoted bid price or may be valued using the last available price and are generally categorized as Level 2 in the hierarchy. For foreign equity securities, when market or security specific events arise, comparisons to the valuation of American Depositary Receipts (ADRs), futures contracts, ETFs and certain indexes as well as quoted prices for similar securities may be used and would be categorized as Level 2 in the hierarchy. For equity securities, including restricted securities, where observable inputs are limited, assumptions about market activity and risk are used and these securities may be categorized as Level 3 in the hierarchy.
Investments in open-end mutual funds, including the Fidelity Central Funds, are valued at their closing net asset value (NAV) each business day and are categorized as Level 1 in the hierarchy.
Changes in valuation techniques may result in transfers in or out of an assigned level within the disclosure hierarchy. The aggregate value of investments by input level as of May 31, 2022 is included at the end of the Fund's Schedule of Investments.
Foreign Currency. Certain Funds may use foreign currency contracts to facilitate transactions in foreign-denominated securities. Gains and losses from these transactions may arise from changes in the value of the foreign currency or if the counterparties do not perform under the contracts' terms.
Foreign-denominated assets, including investment securities, and liabilities are translated into U.S. dollars at the exchange rates at period end. Purchases and sales of investment securities, income and dividends received, and expenses denominated in foreign currencies are translated into U.S. dollars at the exchange rate in effect on the transaction date.
The effects of exchange rate fluctuations on investments are included with the net realized and unrealized gain (loss) on investment securities. Other foreign currency transactions resulting in realized and unrealized gain (loss) are disclosed separately.
Investment Transactions and Income. For financial reporting purposes, the Fund's investment holdings and NAV include trades executed through the end of the last business day of the period. The NAV per share for processing shareholder transactions is calculated as of the close of business of the New York Stock Exchange (NYSE), normally 4:00 p.m. Eastern time and includes trades executed through the end of the prior business day. Gains and losses on securities sold are determined on the basis of identified cost. Commissions paid to certain brokers with whom the investment adviser, or its affiliates, places trades on behalf of a fund include an amount in addition to trade execution, which may be rebated back to a fund. Any such rebates are included in net realized gain (loss) on investments in the Statement of Operations. Dividend income is recorded on the ex-dividend date, except for certain dividends from foreign securities where the ex-dividend date may have passed, which are recorded as soon as the Fund is informed of the ex-dividend date. Non-cash dividends included in dividend income, if any, are recorded at the fair market value of the securities received. Income and capital gain distributions from Fidelity Central Funds, if any, are recorded on the ex-dividend date. Certain distributions received by the Fund represent a return of capital or capital gain. The Fund determines the components of these distributions subsequent to the ex-dividend date, based upon receipt of tax filings or other correspondence relating to the underlying investment. These distributions are recorded as a reduction of cost of investments and/or as a realized gain. Investment income is recorded net of foreign taxes withheld where recovery of such taxes is uncertain. Funds may file withholding tax reclaims in certain jurisdictions to recover a portion of amounts previously withheld. Any withholding tax reclaims income is included in the Statement of Operations in dividends. Any receivables for withholding tax reclaims are included in the Statement of Assets and Liabilities in dividends receivable.
Expenses. Expenses directly attributable to a fund are charged to that fund. Expenses attributable to more than one fund are allocated among the respective funds on the basis of relative net assets or other appropriate methods. Expenses included in the accompanying financial statements reflect the expenses of that fund and do not include any expenses associated with any underlying mutual funds or exchange-traded funds. Although not included in a fund's expenses, a fund indirectly bears its proportionate share of these expenses through the net asset value of each underlying mutual fund or exchange-traded fund. Expense estimates are accrued in the period to which they relate and adjustments are made when actual amounts are known.
Income Tax Information and Distributions to Shareholders. Each year, the Fund intends to qualify as a regulated investment company under Subchapter M of the Internal Revenue Code, including distributing substantially all of its taxable income and realized gains. As a result, no provision for U.S. Federal income taxes is required. As of May 31, 2022, the Fund did not have any unrecognized tax benefits in the financial statements; nor is the Fund aware of any tax positions for which it is reasonably possible that the total amounts of unrecognized tax benefits will significantly change in the next twelve months. The Fund files a U.S. federal tax return, in addition to state and local tax returns as required. The Fund's federal income tax returns are subject to examination by the Internal Revenue Service (IRS) for a period of three fiscal years after they are filed. State and local tax returns may be subject to examination for an additional fiscal year depending on the jurisdiction. Foreign taxes are provided for based on the Fund's understanding of the tax rules and rates that exist in the foreign markets in which it invests.
Distributions are declared and recorded on the ex-dividend date. Income and capital gain distributions are determined in accordance with income tax regulations, which may differ from GAAP.
Capital accounts within the financial statements are adjusted for permanent book-tax differences. These adjustments have no impact on net assets or the results of operations. Capital accounts are not adjusted for temporary book-tax differences which will reverse in a subsequent period.
Book-tax differences are primarily due to foreign currency transactions, capital loss carryforwards and losses deferred due to wash sales.
As of period end, the cost and unrealized appreciation (depreciation) in securities, and derivatives if applicable, for federal income tax purposes were as follows:
| Gross unrealized appreciation | $21,057 |
| Gross unrealized depreciation | (147,466) |
| Net unrealized appreciation (depreciation) | $(126,409) |
| Tax Cost | $1,999,141 |
The tax-based components of distributable earnings as of period end were as follows:
| Undistributed ordinary income | $1,849 |
| Capital loss carryforward | $(4,821) |
| Net unrealized appreciation (depreciation) on securities and other investments | $(126,409) |
Capital loss carryforwards are only available to offset future capital gains of the Fund to the extent provided by regulations and may be limited. The capital loss carryforward information presented below, including any applicable limitation, is estimated as of fiscal period end and is subject to adjustment.
| Short-term | $(4,821) |
| Total capital loss carryforward | $(4,821) |
Restricted Securities (including Private Placements). Funds may invest in securities that are subject to legal or contractual restrictions on resale. These securities generally may be resold in transactions exempt from registration or to the public if the securities are registered. Disposal of these securities may involve time-consuming negotiations and expense, and prompt sale at an acceptable price may be difficult. Information regarding restricted securities held at period end is included at the end of the Schedule of Investments, if applicable.
4. Purchases and Sales of Investments.
Purchases and sales of securities, other than short-term securities and in-kind transactions, as applicable, are noted in the table below.
| | Purchases ($) | Sales ($) |
| Fidelity SAI Sustainable Sector Fund | 2,040,541 | 57,424 |
5. Fees and Other Transactions with Affiliates.
Management Fee. Fidelity Management & Research Company LLC (the investment adviser) and its affiliates provide the Fund with investment management related services for which the Fund pays a monthly management fee. The management fee is the sum of an individual fund fee rate that is based on an annual rate of .20% of the Fund's average net assets and an annualized group fee rate that averaged .22% during the period. The group fee rate is based upon the monthly average net assets of a group of registered investment companies with which the investment adviser has management contracts. The group fee rate decreases as assets under management increase and increases as assets under management decrease. For the reporting period, the total annualized management fee rate was .43% of the Fund's average net assets.
Brokerage Commissions. A portion of portfolio transactions were placed with brokerage firms which are affiliates of the investment adviser. Brokerage commissions are included in net realized gain (loss) and change in net unrealized appreciation (depreciation) in the Statement of Operations. The commissions paid to these affiliated firms were as follows:
| | Amount |
| Fidelity SAI Sustainable Sector Fund | $16 |
Interfund Trades. Funds may purchase from or sell securities to other Fidelity Funds under procedures adopted by the Board. The procedures have been designed to ensure these interfund trades are executed in accordance with Rule 17a-7 of the 1940 Act. Any interfund trades are included within the respective purchases and sales amounts shown in the Purchases and Sales of Investments note. Interfund trades during the period are noted in the table below.
| | Purchases ($) | Sales ($) | Realized Gain (Loss) ($) |
| Fidelity SAI Sustainable Sector Fund | 4,558 | 973 | 4 |
6. Expense Reductions.
The investment adviser contractually agreed to reimburse the Fund to the extent annual operating expenses exceeded .50% of average net assets. This reimbursement will remain in place through September 30, 2023. Some expenses, for example the compensation of the independent Trustees, and certain miscellaneous expenses such as proxy and shareholder meeting expenses, are excluded from this reimbursement. During the period this reimbursement reduced the Fund's expenses by $31,697.
7. Other.
A fund's organizational documents provide former and current trustees and officers with a limited indemnification against liabilities arising in connection with the performance of their duties to the fund. In the normal course of business, a fund may also enter into contracts that provide general indemnifications. A fund's maximum exposure under these arrangements is unknown as this would be dependent on future claims that may be made against a fund. The risk of material loss from such claims is considered remote.
At the end of the period, the investment adviser or its affiliates were owners of record of more than 10% of the outstanding shares as follows:
| Fund | Affiliated % |
| Fidelity SAI Sustainable Sector Fund | 100% |
8. Coronavirus (COVID-19) Pandemic.
An outbreak of COVID-19 first detected in China during December 2019 has since spread globally and was declared a pandemic by the World Health Organization during March 2020. Developments that disrupt global economies and financial markets, such as the COVID-19 pandemic, may magnify factors that affect the Fund's performance.
Report of Independent Registered Public Accounting Firm
To the Board of Trustees of Fidelity Summer Street Trust and Shareholders of Fidelity SAI Sustainable Sector Fund
Opinion on the Financial Statements
We have audited the accompanying statement of assets and liabilities, including the schedule of investments, of Fidelity SAI Sustainable Sector Fund (one of the funds constituting Fidelity Summer Street Trust, referred to hereafter as the “Fund”) as of May 31, 2022, and the related statements of operations and changes in net assets, including the related notes, and the financial highlights for the period April 14, 2022 (commencement of operations) through May 31, 2022 (collectively referred to as the “financial statements”). In our opinion, the financial statements present fairly, in all material respects, the financial position of the Fund as of May 31, 2022, and the results of its operations, changes in its net assets, and the financial highlights for the period April 14, 2022 (commencement of operations) through May 31, 2022 in conformity with accounting principles generally accepted in the United States of America.
Basis for Opinion
These financial statements are the responsibility of the Fund’s management. Our responsibility is to express an opinion on the Fund’s financial statements based on our audit. We are a public accounting firm registered with the Public Company Accounting Oversight Board (United States) (PCAOB) and are required to be independent with respect to the Fund in accordance with the U.S. federal securities laws and the applicable rules and regulations of the Securities and Exchange Commission and the PCAOB.
We conducted our audit of these financial statements in accordance with the standards of the PCAOB. Those standards require that we plan and perform the audit to obtain reasonable assurance about whether the financial statements are free of material misstatement, whether due to error or fraud.
Our audit included performing procedures to assess the risks of material misstatement of the financial statements, whether due to error or fraud, and performing procedures that respond to those risks. Such procedures included examining, on a test basis, evidence regarding the amounts and disclosures in the financial statements. Our audit also included evaluating the accounting principles used and significant estimates made by management, as well as evaluating the overall presentation of the financial statements. Our procedures included confirmation of securities owned as of May 31, 2022 by correspondence with the custodian. We believe that our audit provides a reasonable basis for our opinion.
/s/ PricewaterhouseCoopers LLP
Boston, Massachusetts
July 15, 2022
We have served as the auditor of one or more investment companies in the Fidelity group of funds since 1932.
Trustees and Officers
The Trustees, Members of the Advisory Board (if any), and officers of the trust and fund, as applicable, are listed below. The Board of Trustees governs the fund and is responsible for protecting the interests of shareholders. The Trustees are experienced executives who meet periodically throughout the year to oversee the fund's activities, review contractual arrangements with companies that provide services to the fund, oversee management of the risks associated with such activities and contractual arrangements, and review the fund's performance. Each of the Trustees oversees 325 funds.
The Trustees hold office without limit in time except that (a) any Trustee may resign; (b) any Trustee may be removed by written instrument, signed by at least two-thirds of the number of Trustees prior to such removal; (c) any Trustee who requests to be retired or who has become incapacitated by illness or injury may be retired by written instrument signed by a majority of the other Trustees; and (d) any Trustee may be removed at any special meeting of shareholders by a two-thirds vote of the outstanding voting securities of the trust. Each Trustee who is not an interested person (as defined in the 1940 Act) of the trust and the fund is referred to herein as an Independent Trustee. Each Independent Trustee shall retire not later than the last day of the calendar year in which his or her 75th birthday occurs. The Independent Trustees may waive this mandatory retirement age policy with respect to individual Trustees. Officers and Advisory Board Members hold office without limit in time, except that any officer or Advisory Board Member may resign or may be removed by a vote of a majority of the Trustees at any regular meeting or any special meeting of the Trustees. Except as indicated, each individual has held the office shown or other offices in the same company for the past five years.
The fund’s Statement of Additional Information (SAI) includes more information about the Trustees. To request a free copy, call Fidelity at 1-800-544-3455.
Experience, Skills, Attributes, and Qualifications of the Trustees. The Governance and Nominating Committee has adopted a statement of policy that describes the experience, qualifications, attributes, and skills that are necessary and desirable for potential Independent Trustee candidates (Statement of Policy). The Board believes that each Trustee satisfied at the time he or she was initially elected or appointed a Trustee, and continues to satisfy, the standards contemplated by the Statement of Policy. The Governance and Nominating Committee also engages professional search firms to help identify potential Independent Trustee candidates who have the experience, qualifications, attributes, and skills consistent with the Statement of Policy. From time to time, additional criteria based on the composition and skills of the current Independent Trustees, as well as experience or skills that may be appropriate in light of future changes to board composition, business conditions, and regulatory or other developments, have also been considered by the professional search firms and the Governance and Nominating Committee. In addition, the Board takes into account the Trustees' commitment and participation in Board and committee meetings, as well as their leadership of standing and ad hoc committees throughout their tenure.
In determining that a particular Trustee was and continues to be qualified to serve as a Trustee, the Board has considered a variety of criteria, none of which, in isolation, was controlling. The Board believes that, collectively, the Trustees have balanced and diverse experience, qualifications, attributes, and skills, which allow the Board to operate effectively in governing the fund and protecting the interests of shareholders. Information about the specific experience, skills, attributes, and qualifications of each Trustee, which in each case led to the Board's conclusion that the Trustee should serve (or continue to serve) as a trustee of the fund, is provided below.
Board Structure and Oversight Function. Robert A. Lawrence is an interested person and currently serves as Chair. The Trustees have determined that an interested Chair is appropriate and benefits shareholders because an interested Chair has a personal and professional stake in the quality and continuity of services provided to the fund. Independent Trustees exercise their informed business judgment to appoint an individual of their choosing to serve as Chair, regardless of whether the Trustee happens to be independent or a member of management. The Independent Trustees have determined that they can act independently and effectively without having an Independent Trustee serve as Chair and that a key structural component for assuring that they are in a position to do so is for the Independent Trustees to constitute a substantial majority for the Board. The Independent Trustees also regularly meet in executive session. David M. Thomas serves as Lead Independent Trustee and as such (i) acts as a liaison between the Independent Trustees and management with respect to matters important to the Independent Trustees and (ii) with management prepares agendas for Board meetings.
Fidelity® funds are overseen by different Boards of Trustees. The fund's Board oversees Fidelity's high income and certain equity funds, and other Boards oversee Fidelity's investment-grade bond, money market, asset allocation, and other equity funds. The asset allocation funds may invest in Fidelity® funds overseen by the fund's Board. The use of separate Boards, each with its own committee structure, allows the Trustees of each group of Fidelity® funds to focus on the unique issues of the funds they oversee, including common research, investment, and operational issues. On occasion, the separate Boards establish joint committees to address issues of overlapping consequences for the Fidelity® funds overseen by each Board.
The Trustees operate using a system of committees to facilitate the timely and efficient consideration of all matters of importance to the Trustees, the fund, and fund shareholders and to facilitate compliance with legal and regulatory requirements and oversight of the fund's activities and associated risks. The Board, acting through its committees, has charged FMR and its affiliates with (i) identifying events or circumstances the occurrence of which could have demonstrably adverse effects on the fund's business and/or reputation; (ii) implementing processes and controls to lessen the possibility that such events or circumstances occur or to mitigate the effects of such events or circumstances if they do occur; and (iii) creating and maintaining a system designed to evaluate continuously business and market conditions in order to facilitate the identification and implementation processes described in (i) and (ii) above. Because the day-to-day operations and activities of the fund are carried out by or through FMR, its affiliates, and other service providers, the fund's exposure to risks is mitigated but not eliminated by the processes overseen by the Trustees. While each of the Board's committees has responsibility for overseeing different aspects of the fund's activities, oversight is exercised primarily through the Operations, Audit, and Compliance Committees. Appropriate personnel, including but not limited to the fund's Chief Compliance Officer (CCO), FMR's internal auditor, the independent accountants, the fund's Treasurer and portfolio management personnel, make periodic reports to the Board's committees, as appropriate, including an annual review of Fidelity's risk management program for the Fidelity® funds. The responsibilities of each standing committee, including their oversight responsibilities, are described further under "Standing Committees of the Trustees."
Interested Trustees*:
Correspondence intended for a Trustee who is an interested person may be sent to Fidelity Investments, 245 Summer Street, Boston, Massachusetts 02210.
Name, Year of Birth; Principal Occupations and Other Relevant Experience+
Bettina Doulton (1964)
Year of Election or Appointment: 2020
Trustee
Ms. Doulton also serves as Trustee of other Fidelity® funds. Prior to her retirement, Ms. Doulton served in a variety of positions at Fidelity Investments, including as a managing director of research (2006-2007), portfolio manager to certain Fidelity® funds (1993-2005), equity analyst and portfolio assistant (1990-1993), and research assistant (1987-1990). Ms. Doulton currently owns and operates Phi Builders + Architects and Cellardoor Winery. Previously, Ms. Doulton served as a member of the Board of Brown Capital Management, LLC (2014-2018).
Robert A. Lawrence (1952)
Year of Election or Appointment: 2020
Trustee
Chair of the Board of Trustees
Mr. Lawrence also serves as Trustee of other funds. Previously, Mr. Lawrence served as a Trustee and Member of the Advisory Board of certain funds. Prior to his retirement in 2008, Mr. Lawrence served as Vice President of certain Fidelity® funds (2006-2008), Senior Vice President, Head of High Income Division of Fidelity Management & Research Company (investment adviser firm, 2006-2008), and President of Fidelity Strategic Investments (investment adviser firm, 2002-2005).
* Determined to be an “Interested Trustee” by virtue of, among other things, his or her affiliation with the trust or various entities under common control with FMR.
+ The information includes the Trustee's principal occupation during the last five years and other information relating to the experience, attributes, and skills relevant to the Trustee's qualifications to serve as a Trustee, which led to the conclusion that the Trustee should serve as a Trustee for the fund.
Independent Trustees:
Correspondence intended for an Independent Trustee may be sent to Fidelity Investments, P.O. Box 55235, Boston, Massachusetts 02205-5235.
Name, Year of Birth; Principal Occupations and Other Relevant Experience+
Thomas P. Bostick (1956)
Year of Election or Appointment: 2021
Trustee
Lieutenant General Bostick also serves as Trustee of other Fidelity® funds. Prior to his retirement, General Bostick (United States Army, Retired) held a variety of positions within the U.S. Army, including Commanding General and Chief of Engineers, U.S. Army Corps of Engineers (2012-2016) and Deputy Chief of Staff and Director of Human Resources, U.S. Army (2009-2012). General Bostick currently serves as a member of the Board and Finance and Governance Committees of CSX Corporation (transportation, 2020-present) and a member of the Board and Corporate Governance and Nominating Committee of Perma-Fix Environmental Services, Inc. (nuclear waste management, 2020-present). General Bostick serves as Chief Executive Officer of Bostick Global Strategies, LLC (consulting, 2016-present) and as a member of the Board of HireVue, Inc. (video interview and assessment, 2020-present). Previously, General Bostick served as a Member of the Advisory Board of certain Fidelity® funds (2021), President, Intrexon Bioengineering (2018-2020) and Chief Operating Officer (2017-2020) and Senior Vice President of the Environment Sector (2016-2017) of Intrexon Corporation (biopharmaceutical company).
Dennis J. Dirks (1948)
Year of Election or Appointment: 2005
Trustee
Mr. Dirks also serves as Trustee of other Fidelity® funds. Prior to his retirement in May 2003, Mr. Dirks served as Chief Operating Officer and as a member of the Board of The Depository Trust & Clearing Corporation (financial markets infrastructure), President, Chief Operating Officer and a member of the Board of The Depository Trust Company (DTC), President and a member of the Board of the National Securities Clearing Corporation (NSCC), Chief Executive Officer and a member of the Board of the Government Securities Clearing Corporation and Chief Executive Officer and a member of the Board of the Mortgage-Backed Securities Clearing Corporation. Mr. Dirks currently serves as a member of the Finance Committee (2016-present) and Board (2017-present) and is Treasurer (2018-present) of the Asolo Repertory Theatre.
Donald F. Donahue (1950)
Year of Election or Appointment: 2018
Trustee
Mr. Donahue also serves as Trustee of other Fidelity® funds. Mr. Donahue serves as President and Chief Executive Officer of Miranda Partners, LLC (risk consulting for the financial services industry, 2012-present). Previously, Mr. Donahue served as Chief Executive Officer (2006-2012), Chief Operating Officer (2003-2006) and Managing Director, Customer Marketing and Development (1999-2003) of The Depository Trust & Clearing Corporation (financial markets infrastructure). Mr. Donahue currently serves as a member (2007-present) and Co-Chairman (2016-present) of the Board of United Way of New York and a member of the Board of The Leadership Academy (previously NYC Leadership Academy) (2012-present). Mr. Donahue previously served as a member of the Advisory Board of certain Fidelity® funds (2015-2018).
Vicki L. Fuller (1957)
Year of Election or Appointment: 2020
Trustee
Ms. Fuller also serves as Trustee of other Fidelity® funds. Previously, Ms. Fuller served as a member of the Advisory Board of certain Fidelity® funds (2018-2020), Chief Investment Officer of the New York State Common Retirement Fund (2012-2018) and held a variety of positions at AllianceBernstein L.P. (global asset management, 1985-2012), including Managing Director (2006-2012) and Senior Vice President and Senior Portfolio Manager (2001-2006). Ms. Fuller currently serves as a member of the Board, Audit Committee and Nominating and Governance Committee of two Blackstone business development companies (2020-present), as a member of the Board of Treliant, LLC (consulting, 2019-present), as a member of the Advisory Board of Ariel Alternatives, LLC (private equity, 2021-present) and as a member of the Board and Chair of the Audit Committee of Gusto, Inc. (software, 2021-present). In addition, Ms. Fuller currently serves as a member of the Board of Roosevelt University (2019-present) and as a member of the Executive Board of New York University’s Stern School of Business. Ms. Fuller previously served as a member of the Board, Audit Committee and Nominating and Governance Committee of The Williams Companies, Inc. (natural gas infrastructure, 2018-2021).
Patricia L. Kampling (1959)
Year of Election or Appointment: 2020
Trustee
Ms. Kampling also serves as Trustee of other Fidelity® funds. Prior to her retirement, Ms. Kampling served as Chairman of the Board and Chief Executive Officer (2012-2019), President and Chief Operating Officer (2011-2012) and Executive Vice President and Chief Financial Officer (2010-2011) of Alliant Energy Corporation. Ms. Kampling currently serves as a member of the Board, Finance Committee and Governance, Compensation and Nominating Committee of Xcel Energy Inc. (utilities company, 2020-present) and as a member of the Board, Audit, Finance and Risk Committee and Safety, Environmental, Technology and Operations Committee and Chair of the Executive Development and Compensation Committee of American Water Works Company, Inc. (utilities company, 2019-present). In addition, Ms. Kampling currently serves as a member of the Board of the Nature Conservancy, Wisconsin Chapter (2019-present). Previously, Ms. Kampling served as a Member of the Advisory Board of certain Fidelity® funds (2020), a member of the Board, Compensation Committee and Executive Committee and Chair of the Audit Committee of Briggs & Stratton Corporation (manufacturing, 2011-2021), a member of the Board of Interstate Power and Light Company (2012-2019) and Wisconsin Power and Light Company (2012-2019) (each a subsidiary of Alliant Energy Corporation) and as a member of the Board and Workforce Development Committee of the Business Roundtable (2018-2019).
Thomas A. Kennedy (1955)
Year of Election or Appointment: 2021
Trustee
Mr. Kennedy also serves as Trustee of other Fidelity® funds. Previously, Mr. Kennedy served as a Member of the Advisory Board of certain Fidelity® funds (2020) and held a variety of positions at Raytheon Company (aerospace and defense, 1983-2020), including Chairman and Chief Executive Officer (2014-2020) and Executive Vice President and Chief Operating Officer (2013-2014). Mr. Kennedy currently serves as Executive Chairman of the Board of Directors of Raytheon Technologies Corporation (aerospace and defense, 2020-present). He is also a member of the Rutgers School of Engineering Industry Advisory Board (2011-present) and a member of the UCLA Engineering Dean’s Executive Board (2016-present).
Oscar Munoz (1959)
Year of Election or Appointment: 2021
Trustee
Mr. Munoz also serves as Trustee of other Fidelity® funds. Prior to his retirement, Mr. Munoz served as Executive Chairman (2020-2021), Chief Executive Officer (2015-2020), President (2015-2016) and a member of the Board (2010-2021) of United Airlines Holdings, Inc. Mr. Munoz currently serves as a member of the Board of CBRE Group, Inc. (commercial real estate, 2020-present), a member of the Board of Univision Communications, Inc. (Hispanic media, 2020-present) and a member of the Advisory Board of Salesforce.com, Inc. (cloud-based software, 2020-present). Previously, Mr. Munoz served as a Member of the Advisory Board of certain Fidelity® funds (2021).
Garnett A. Smith (1947)
Year of Election or Appointment: 2018
Trustee
Mr. Smith also serves as Trustee of other Fidelity® funds. Prior to his retirement, Mr. Smith served as Chairman and Chief Executive Officer (1990-1997) and President (1986-1990) of Inbrand Corp. (manufacturer of personal absorbent products). Prior to his employment with Inbrand Corp., he was employed by a retail fabric chain and North Carolina National Bank (now Bank of America). Mr. Smith previously served as a member of the Advisory Board of certain Fidelity® funds (2012-2013).
David M. Thomas (1949)
Year of Election or Appointment: 2008
Trustee
Lead Independent Trustee
Mr. Thomas also serves as Trustee of other Fidelity® funds. Previously, Mr. Thomas served as Executive Chairman (2005-2006) and Chairman and Chief Executive Officer (2000-2005) of IMS Health, Inc. (pharmaceutical and healthcare information solutions). Mr. Thomas currently serves as a member of the Board of Fortune Brands Home and Security (home and security products, 2004-present) and as Director (2013-present) and Non-Executive Chairman of the Board (2022-present) of Interpublic Group of Companies, Inc. (marketing communication).
Susan Tomasky (1953)
Year of Election or Appointment: 2020
Trustee
Ms. Tomasky also serves as Trustee of other Fidelity® funds. Prior to her retirement, Ms. Tomasky served in various executive officer positions at American Electric Power Company, Inc. (1998-2011), including most recently as President of AEP Transmission (2007-2011). Ms. Tomasky currently serves as a member of the Board and Sustainability Committee and as Chair of the Audit Committee of Marathon Petroleum Corporation (2018-present) and as a member of the Board, Executive Committee, Corporate Governance Committee and Organization and Compensation Committee and as Chair of the Audit Committee of Public Service Enterprise Group, Inc. (utilities company, 2012-present) and as a member of the Board of its subsidiary company, Public Service Electric and Gas Co. (2021-present). In addition, Ms. Tomasky currently serves as a member (2009-present) and President (2020-present) of the Board of the Royal Shakespeare Company – America (2009-present), as a member of the Board of the Columbus Association for the Performing Arts (2011-present) and as a member of the Board and Kenyon in the World Committee of Kenyon College (2016-present). Previously, Ms. Tomasky served as a Member of the Advisory Board of certain Fidelity® funds (2020), as a member of the Board of the Columbus Regional Airport Authority (2007-2020), as a member of the Board (2011-2018) and Lead Independent Director (2015-2018) of Andeavor Corporation (previously Tesoro Corporation) (independent oil refiner and marketer) and as a member of the Board of Summit Midstream Partners LP (energy, 2012-2018).
Michael E. Wiley (1950)
Year of Election or Appointment: 2018
Trustee
Mr. Wiley also serves as Trustee of other Fidelity® funds. Previously, Mr. Wiley served as a member of the Advisory Board of certain Fidelity® funds (2018-2020), Chairman, President and CEO of Baker Hughes, Inc. (oilfield services, 2000-2004). Mr. Wiley also previously served as a member of the Board of Andeavor Corporation (independent oil refiner and marketer, 2005-2018), a member of the Board of Andeavor Logistics LP (natural resources logistics, 2015-2018) and a member of the Board of High Point Resources (exploration and production, 2005-2020).
+ The information includes the Trustee's principal occupation during the last five years and other information relating to the experience, attributes, and skills relevant to the Trustee's qualifications to serve as a Trustee, which led to the conclusion that the Trustee should serve as a Trustee for the fund.
Advisory Board Members and Officers:
Correspondence intended for a Member of the Advisory Board (if any) may be sent to Fidelity Investments, P.O. Box 55235, Boston, Massachusetts 02205-5235. Correspondence intended for an officer or Peter S. Lynch may be sent to Fidelity Investments, 245 Summer Street, Boston, Massachusetts 02210. Officers appear below in alphabetical order.
Name, Year of Birth; Principal Occupation
Peter S. Lynch (1944)
Year of Election or Appointment: 2003
Member of the Advisory Board
Mr. Lynch also serves as a Member of the Advisory Board of other Fidelity® funds. Mr. Lynch is Vice Chairman and a Director of Fidelity Management & Research Company LLC (investment adviser firm). In addition, Mr. Lynch serves as a Trustee of Boston College and as the Chairman of the Inner-City Scholarship Fund. Previously, Mr. Lynch served as Vice Chairman and a Director of FMR Co., Inc. (investment adviser firm) and on the Special Olympics International Board of Directors (1997-2006).
Craig S. Brown (1977)
Year of Election or Appointment: 2019
Assistant Treasurer
Mr. Brown also serves as an officer of other funds. Mr. Brown serves as Assistant Treasurer of FIMM, LLC (2021-present) and is an employee of Fidelity Investments (2013-present).
John J. Burke III (1964)
Year of Election or Appointment: 2018
Chief Financial Officer
Mr. Burke also serves as Chief Financial Officer of other funds. Mr. Burke serves as Head of Investment Operations for Fidelity Fund and Investment Operations (2018-present) and is an employee of Fidelity Investments (1998-present). Previously Mr. Burke served as head of Asset Management Investment Operations (2012-2018).
William C. Coffey (1969)
Year of Election or Appointment: 2019
Assistant Secretary
Mr. Coffey also serves as Assistant Secretary of other funds. He is Senior Vice President and Deputy General Counsel of FMR LLC (diversified financial services company, 2010-present), and is an employee of Fidelity Investments. Previously, Mr. Coffey served as Secretary and CLO of certain funds (2018-2019); CLO, Secretary, and Senior Vice President of Fidelity Management & Research Company and FMR Co., Inc. (investment adviser firms, 2018-2019); Secretary of Fidelity SelectCo, LLC and Fidelity Investments Money Management, Inc. (investment adviser firms, 2018-2019); CLO of Fidelity Management & Research (Hong Kong) Limited, FMR Investment Management (UK) Limited, and Fidelity Management & Research (Japan) Limited (investment adviser firms, 2018-2019); and Assistant Secretary of certain funds (2009-2018).
Timothy M. Cohen (1969)
Year of Election or Appointment: 2018
Vice President
Mr. Cohen also serves as Vice President of other funds. Mr. Cohen serves as Co-Head of Equity (2018-present), a Director of Fidelity Management & Research (Japan) Limited (investment adviser firm, 2016-present), and is an employee of Fidelity Investments. Previously, Mr. Cohen served as Executive Vice President of Fidelity SelectCo, LLC (2019), Head of Global Equity Research (2016-2018), Chief Investment Officer - Equity and a Director of Fidelity Management & Research (U.K.) Inc. (investment adviser firm, 2013-2015) and as a Director of Fidelity Management & Research (Hong Kong) Limited (investment adviser firm, 2017).
Jonathan Davis (1968)
Year of Election or Appointment: 2010
Assistant Treasurer
Mr. Davis also serves as an officer of other funds. Mr. Davis serves as Assistant Treasurer of FIMM, LLC (2021-present), FMR Capital, Inc. (2017-present), FD Funds GP LLC (2021-present), FD Funds Holding LLC (2021-present), and FD Funds Management LLC (2021-present); and is an employee of Fidelity Investments. Previously, Mr. Davis served as Vice President and Associate General Counsel of FMR LLC (diversified financial services company, 2003-2010).
Laura M. Del Prato (1964)
Year of Election or Appointment: 2018
Assistant Treasurer
Ms. Del Prato also serves as an officer of other funds. Ms. Del Prato serves as Assistant Treasurer of FIMM, LLC (2021-present) and is an employee of Fidelity Investments (2017-present). Previously, Ms. Del Prato served as President and Treasurer of The North Carolina Capital Management Trust: Cash Portfolio and Term Portfolio (2018-2020). Prior to joining Fidelity Investments, Ms. Del Prato served as a Managing Director and Treasurer of the JPMorgan Mutual Funds (2014-2017). Prior to JPMorgan, Ms. Del Prato served as a partner at Cohen Fund Audit Services (accounting firm, 2012-2013) and KPMG LLP (accounting firm, 2004-2012).
Colm A. Hogan (1973)
Year of Election or Appointment: 2020
Assistant Treasurer
Mr. Hogan also serves as an officer of other funds. Mr. Hogan serves as Assistant Treasurer of FIMM, LLC (2021-present) and FMR Capital, Inc. (2017-present) and is an employee of Fidelity Investments (2005-present). Previously, Mr. Hogan served as Deputy Treasurer of certain Fidelity® funds (2016-2020) and Assistant Treasurer of certain Fidelity® funds (2016-2018).
Pamela R. Holding (1964)
Year of Election or Appointment: 2018
Vice President
Ms. Holding also serves as Vice President of other funds. Ms. Holding serves as Co-Head of Equity (2018-present) and is an employee of Fidelity Investments (2013-present). Previously, Ms. Holding served as Executive Vice President of Fidelity SelectCo, LLC (2019) and as Chief Investment Officer of Fidelity Institutional Asset Management (2013-2018).
Cynthia Lo Bessette (1969)
Year of Election or Appointment: 2019
Secretary and Chief Legal Officer (CLO)
Ms. Lo Bessette also serves as an officer of other funds. Ms. Lo Bessette serves as CLO, Secretary, and Senior Vice President of Fidelity Management & Research Company LLC (investment adviser firm, 2019-present); CLO of Fidelity Management & Research (Hong Kong) Limited, FMR Investment Management (UK) Limited, and Fidelity Management & Research (Japan) Limited (investment adviser firms, 2019-present); Secretary of FD Funds GP LLC (2021-present), FD Funds Holding LLC (2021-present), and FD Funds Management LLC (2021-present); and Assistant Secretary of FIMM, LLC (2019-present). She is a Senior Vice President and Deputy General Counsel of FMR LLC (diversified financial services company, 2019-present), and is an employee of Fidelity Investments. Previously, Ms. Lo Bessette served as CLO, Secretary, and Senior Vice President of FMR Co., Inc. (investment adviser firm, 2019); Secretary of Fidelity SelectCo, LLC and Fidelity Investments Money Management, Inc. (investment adviser firms, 2019). Prior to joining Fidelity Investments, Ms. Lo Bessette was Executive Vice President, General Counsel (2016-2019) and Senior Vice President, Deputy General Counsel (2015-2016) of OppenheimerFunds (investment management company) and Deputy Chief Legal Officer (2013-2015) of Jennison Associates LLC (investment adviser firm).
Chris Maher (1972)
Year of Election or Appointment: 2020
Deputy Treasurer
Mr. Maher also serves as an officer of other funds. Mr. Maher serves as Assistant Treasurer of FIMM, LLC (2021-present) and FMR Capital, Inc. (2017-present), and is an employee of Fidelity Investments (2008-present). Previously, Mr. Maher served as Assistant Treasurer of certain funds (2013-2020); Vice President of Asset Management Compliance (2013), Vice President of the Program Management Group of FMR (investment adviser firm, 2010-2013), and Vice President of Valuation Oversight (2008-2010).
Jason P. Pogorelec (1975)
Year of Election or Appointment: 2020
Chief Compliance Officer
Mr. Pogorelec also serves as Chief Compliance Officer of other funds. Mr. Pogorelec is a senior Vice President of Asset Management Compliance for Fidelity Investments and is an employee of Fidelity Investments (2006-present). Previously, Mr. Pogorelec served as Vice President, Associate General Counsel for Fidelity Investments (2010-2020) and Assistant Secretary of certain Fidelity funds (2015-2020).
Brett Segaloff (1972)
Year of Election or Appointment: 2021
Anti-Money Laundering (AML) Officer
Mr. Segaloff also serves as an AML Officer of other funds and other related entities. He is Director, Anti-Money Laundering (2007-present) of FMR LLC (diversified financial services company) and is an employee of Fidelity Investments (1996-present).
Stacie M. Smith (1974)
Year of Election or Appointment: 2016
President and Treasurer
Ms. Smith also serves as an officer of other funds. Ms. Smith serves as Assistant Treasurer of FIMM, LLC (2021-present) and FMR Capital, Inc. (2017-present), is an employee of Fidelity Investments (2009-present), and has served in other fund officer roles. Prior to joining Fidelity Investments, Ms. Smith served as Senior Audit Manager of Ernst & Young LLP (accounting firm, 1996-2009). Previously, Ms. Smith served as Assistant Treasurer (2013-2019) and Deputy Treasurer (2013-2016) of certain Fidelity® funds.
Jim Wegmann (1979)
Year of Election or Appointment: 2019
Assistant Treasurer
Mr. Wegmann also serves as an officer of other funds. Mr. Wegmann serves as Assistant Treasurer of FIMM, LLC (2021-present) and is an employee of Fidelity Investments (2011-present). Previously, Mr. Wegmann served as Assistant Treasurer of certain Fidelity® funds (2019-2021).
Shareholder Expense Example
As a shareholder, you incur two types of costs: (1) transaction costs, which may include sales charges (loads) on purchase payments or redemption proceeds, as applicable and (2) ongoing costs, which generally include management fees, distribution and/or service (12b-1) fees and other Fund expenses. This Example is intended to help you understand your ongoing costs (in dollars) of investing in a fund and to compare these costs with the ongoing costs of investing in other mutual funds.
The actual expense Example is based on an investment of $1,000 invested at the beginning of the period and held for the entire period (April 14, 2022 to May 31, 2022). The hypothetical expense Example is based on an investment of $1,000 invested for the one-half year period (December 1, 2021 to May 31, 2022).
Actual Expenses
The first line of the accompanying table provides information about actual account values and actual expenses. You may use the information in this line, together with the amount you invested, to estimate the expenses that you paid over the period. Simply divide your account value by $1,000.00 (for example, an $8,600 account value divided by $1,000.00 = 8.6), then multiply the result by the number in the first line for a class/Fund under the heading entitled "Expenses Paid During Period" to estimate the expenses you paid on your account during this period. If any fund is a shareholder of any underlying mutual funds or exchange-traded funds (ETFs) (the Underlying Funds), such fund indirectly bears its proportional share of the expenses of the Underlying Funds in addition to the direct expenses incurred presented in the table. These fees and expenses are not included in the annualized expense ratio used to calculate the expense estimate in the table below.
Hypothetical Example for Comparison Purposes
The second line of the accompanying table provides information about hypothetical account values and hypothetical expenses based on the actual expense ratio and an assumed rate of return of 5% per year before expenses, which is not the actual return. The hypothetical account values and expenses may not be used to estimate the actual ending account balance or expenses you paid for the period. You may use this information to compare the ongoing costs of investing in the Fund and other funds. To do so, compare this 5% hypothetical example with the 5% hypothetical examples that appear in the shareholder reports of the other funds. If any fund is a shareholder of any Underlying Funds, such fund indirectly bears its proportional share of the expenses of the Underlying Funds in addition to the direct expenses as presented in the table. These fees and expenses are not included in the annualized expense ratio used to calculate the expense estimate in the table below.
Please note that the expenses shown in the table are meant to highlight your ongoing costs only and do not reflect any transaction costs. Therefore, the second line of the table is useful in comparing ongoing costs only, and will not help you determine the relative total costs of owning different funds. In addition, if these transactional costs were included, your costs would have been higher.
| | Annualized Expense Ratio-A | Beginning
Account Value
| Ending
Account Value
May 31, 2022 | Expenses Paid
During Period
|
| Fidelity SAI Sustainable Sector Fund | .50% | | | |
| Actual | | $1,000.00 | $935.00 | $.64-B |
| Hypothetical-C | | $1,000.00 | $1,022.44 | $2.52-D |
A Annualized expense ratio reflects expenses net of applicable fee waivers.
B Actual expenses are equal to the annualized expense ratio, multiplied by the average account value over the period, multiplied by 48/365 (to reflect the period April 14,2022 to May 31, 2022).
C 5% return per year before expenses
D Hypothetical expenses are equal to the annualized expense ratio, multiplied by the average account value over the period, multiplied by 182/365 (to reflect the one-half year period).
Distributions (Unaudited)
The dividend and capital gains distributions for the fund(s) are available on Fidelity.com or Institutional.Fidelity.com.
The fund will notify shareholders in January 2023 of amounts for use in preparing 2022 income tax returns.
Board Approval of Investment Advisory Contracts and Management Fees
Fidelity SAI Sustainable Sector Fund
At its January 2022 meeting, the Board of Trustees, including the Independent Trustees (together, the Board), voted to approve the management contract with Fidelity Management & Research Company LLC (FMR) and the sub-advisory agreements with affiliates of FMR (together, the Advisory Contracts) for the fund. FMR and the sub-advisers are collectively referred to herein as the Investment Advisers. The Board, assisted by the advice of fund counsel and Independent Trustees' counsel, considered a broad range of information.
Nature, Extent, and Quality of Services Provided. The Board considered Fidelity's staffing as it relates to the fund, including the backgrounds of investment personnel of Fidelity, and also considered the fund's investment objective, strategies, and related investment philosophy. The Board considered the structure of the investment personnel compensation program and whether this structure provides appropriate incentives to act in the best interests of the fund.
Resources Dedicated to Investment Management and Support Services. The Board and the Fund Oversight and Research Committees reviewed the general qualifications and capabilities of Fidelity's investment staff, including its size, education, experience, and resources, as well as Fidelity's approach to recruiting, training, managing, and compensating investment personnel. The Board noted the resources devoted to Fidelity's global investment organization and that Fidelity's analysts have extensive resources, tools and capabilities that allow them to conduct sophisticated quantitative and fundamental analysis, as well as credit analysis of issuers, counterparties and guarantors. Further, the Board considered that Fidelity's investment professionals have sufficient access to global information and data so as to provide competitive investment results over time, and that those professionals also have access to sophisticated tools that permit them to assess portfolio construction and risk and performance attribution characteristics continuously, as well as to transmit new information and research conclusions rapidly around the world. Additionally, in its deliberations, the Board considered Fidelity's trading, risk management, compliance, cybersecurity, and technology and operations capabilities and resources, which are integral parts of the investment management process.
Shareholder and Administrative Services. The Board considered the nature, extent, quality, and cost of advisory, administrative, and shareholder services to be performed by the Investment Advisers and their affiliates under the Advisory Contracts and under separate agreements covering transfer agency, pricing and bookkeeping, and securities lending services for the fund. The Board also considered the nature and extent of the supervision of third party service providers, principally custodians, subcustodians, and pricing vendors.
The Board noted that the growth of fund assets over time across the complex allows Fidelity to reinvest in the development of services designed to enhance the value and convenience of the Fidelity funds as investment vehicles. These services include 24-hour access to account information and market information over the Internet and through telephone representatives, investor education materials and asset allocation tools. The Board also considered that it reviews customer service metrics such as telephone response times, continuity of services on the website and metrics addressing services at Fidelity Investor Centers.
Investment Performance. The fund is a new fund and therefore had no historical performance for the Board to review at the time it approved the fund's Advisory Contracts. The Board considered the Investment Advisers' strength in fundamental, research-driven security selection, which the Board is familiar with through its supervision of other Fidelity funds. The Board also considered the fact that it oversees funds managed by FMR that have similar investment objectives and policies as the fund, including other sustainable investing funds.
Based on its review, the Board concluded that the nature, extent, and quality of services to be provided to the fund under the Advisory Contracts should benefit the shareholders of the fund.
Competitiveness of Management Fee and Total Expense Ratio ..In reviewing the Advisory Contracts, the Board considered the fund's proposed management fee rate and the projected total expense ratio of the fund. The Board noted that the fund's proposed management fee rate is below the median fee rate of funds with similar Lipper investment objective categories and comparable investment mandates, regardless of whether their management fee structures are comparable. The Board also considered that the projected total expense ratio of the fund is below the median of those funds and classes used by the Board for management fee comparisons that have a similar sales load structure.
The Board also noted that FMR has contractually agreed to reimburse the fund to the extent that total operating expenses (excluding interest, certain taxes, fees and expenses of the Independent Trustees, proxy and shareholder meeting expenses, extraordinary expenses, and acquired fund fees and expenses (including fees and expenses associated with a wholly owned subsidiary), if any, as well as non-operating expenses such as brokerage commissions and fees and expenses associated with the fund's securities lending program, if applicable), as a percentage of its average net assets exceed 0.50% through September 30, 2023.
Based on its review, the Board concluded that the fund's management fee and projected total expense ratio were reasonable in light of the services that the fund and its shareholders will receive and the other factors considered.
Costs of the Services and Profitability. The fund is a new fund and therefore no revenue, cost, or profitability data was available for the Board to review in respect of the fund at the time it approved the Advisory Contracts. In connection with its future renewal of the fund's Advisory Contracts, the Board will consider the revenues earned and the expenses incurred by Fidelity in conducting the business of developing, marketing, distributing, managing, administering and servicing the fund and servicing the fund's shareholders.
Economies of Scale. The Board will consider economies of scale when there is operating experience to permit assessment thereof. It noted that, notwithstanding the entrepreneurial risk associated with a new fund, the management fee was at a level normally associated, by comparison with competitors, with very high fund net assets, and Fidelity asserted to the Board that the level of the fee anticipated economies of scale at lower asset levels even before, if ever, economies of scale are achieved. The Board also noted that the fund and its shareholders would have access to the very considerable number and variety of services available through Fidelity and its affiliates.
Based on its evaluation of all of the conclusions noted above, and after considering all factors it believed relevant, the Board concluded that the advisory fee arrangements are fair and reasonable, and that the fund's Advisory Contracts should be approved.
SES-ANN-0722
1.9905645.100
Fidelity® Climate Action Fund
Annual Report
May 31, 2022
Includes Fidelity and Fidelity Advisor share classes
Contents
To view a fund's proxy voting guidelines and proxy voting record for the 12-month period ended June 30, visit http://www.fidelity.com/proxyvotingresults or visit the Securities and Exchange Commission's (SEC) web site at http://www.sec.gov.
You may also call 1-800-544-8544 if you’re an individual investing directly with Fidelity, call 1-800-835-5092 if you’re a plan sponsor or participant with Fidelity as your recordkeeper or call 1-877-208-0098 on institutional accounts or if you’re an advisor or invest through one to request a free copy of the proxy voting guidelines.
Standard & Poor's, S&P and S&P 500 are registered service marks of The McGraw-Hill Companies, Inc. and have been licensed for use by Fidelity Distributors Corporation.
Other third-party marks appearing herein are the property of their respective owners.
All other marks appearing herein are registered or unregistered trademarks or service marks of FMR LLC or an affiliated company. © 2022 FMR LLC. All rights reserved.
This report and the financial statements contained herein are submitted for the general information of the shareholders of the Fund. This report is not authorized for distribution to prospective investors in the Fund unless preceded or accompanied by an effective prospectus.
A fund files its complete schedule of portfolio holdings with the SEC for the first and third quarters of each fiscal year on Form N-PORT. Forms N-PORT are available on the SEC’s web site at http://www.sec.gov. A fund's Forms N-PORT may be reviewed and copied at the SEC’s Public Reference Room in Washington, DC. Information regarding the operation of the SEC's Public Reference Room may be obtained by calling 1-800-SEC-0330.
For a complete list of a fund's portfolio holdings, view the most recent holdings listing, semiannual report, or annual report on Fidelity's web site at http://www.fidelity.com, http://www.institutional.fidelity.com, or http://www.401k.com, as applicable.
NOT FDIC INSURED •MAY LOSE VALUE •NO BANK GUARANTEE
Neither the Fund nor Fidelity Distributors Corporation is a bank.
Note to Shareholders:
Early in 2020, the outbreak and spread of COVID-19 emerged as a public health emergency that had a major influence on financial markets, primarily based on its impact on the global economy and corporate earnings. On March 11, 2020, the World Health Organization declared the COVID-19 outbreak a pandemic, citing sustained risk of further global spread. The pandemic prompted a number of measures to limit the spread of COVID-19, including travel and border restrictions, quarantines, and restrictions on large gatherings. In turn, these resulted in lower consumer activity, diminished demand for a wide range of products and services, disruption in manufacturing and supply chains, and – given the wide variability in outcomes regarding the outbreak – significant market uncertainty and volatility. To help stem the turmoil, the U.S. government took unprecedented action – in concert with the U.S. Federal Reserve and central banks around the world – to help support consumers, businesses, and the broader economy, and to limit disruption to the financial system.
In general, the overall impact of the pandemic lessened in 2021, amid a resilient economy and widespread distribution of three COVID-19 vaccines granted emergency use authorization from the U.S. Food and Drug Administration (FDA) early in the year. Still, the situation remains dynamic, and the extent and duration of its influence on financial markets and the economy is highly uncertain, due in part to a recent spike in cases based on highly contagious variants of the coronavirus.
Extreme events such as the COVID-19 crisis are exogenous shocks that can have significant adverse effects on mutual funds and their investments. Although multiple asset classes may be affected by market disruption, the duration and impact may not be the same for all types of assets. Fidelity is committed to helping you stay informed amid news about COVID-19 and during increased market volatility, and we continue to take extra steps to be responsive to customer needs. We encourage you to visit us online, where we offer ongoing updates, commentary, and analysis on the markets and our funds.
Performance: The Bottom Line
Average annual total return reflects the change in the value of an investment, assuming reinvestment of distributions from dividend income and capital gains (the profits earned upon the sale of securities that have grown in value, if any) and assuming a constant rate of performance each year. The hypothetical investment and the average annual total returns do not reflect the deduction of taxes that a shareholder would pay on fund distributions or the redemption of fund shares. During periods of reimbursement by Fidelity, a fund’s total return will be greater than it would be had the reimbursement not occurred. How a fund did yesterday is no guarantee of how it will do tomorrow.
Average annual total returns for Fidelity® Climate Action Fund will be reported once the fund is a year old.
$10,000 Over Life of Fund
Let's say hypothetically that $10,000 was invested in Fidelity® Climate Action Fund, a class of the fund, on June 15, 2021, when the fund started.
The chart shows how the value of your investment would have changed, and also shows how the MSCI World Index performed over the same period.
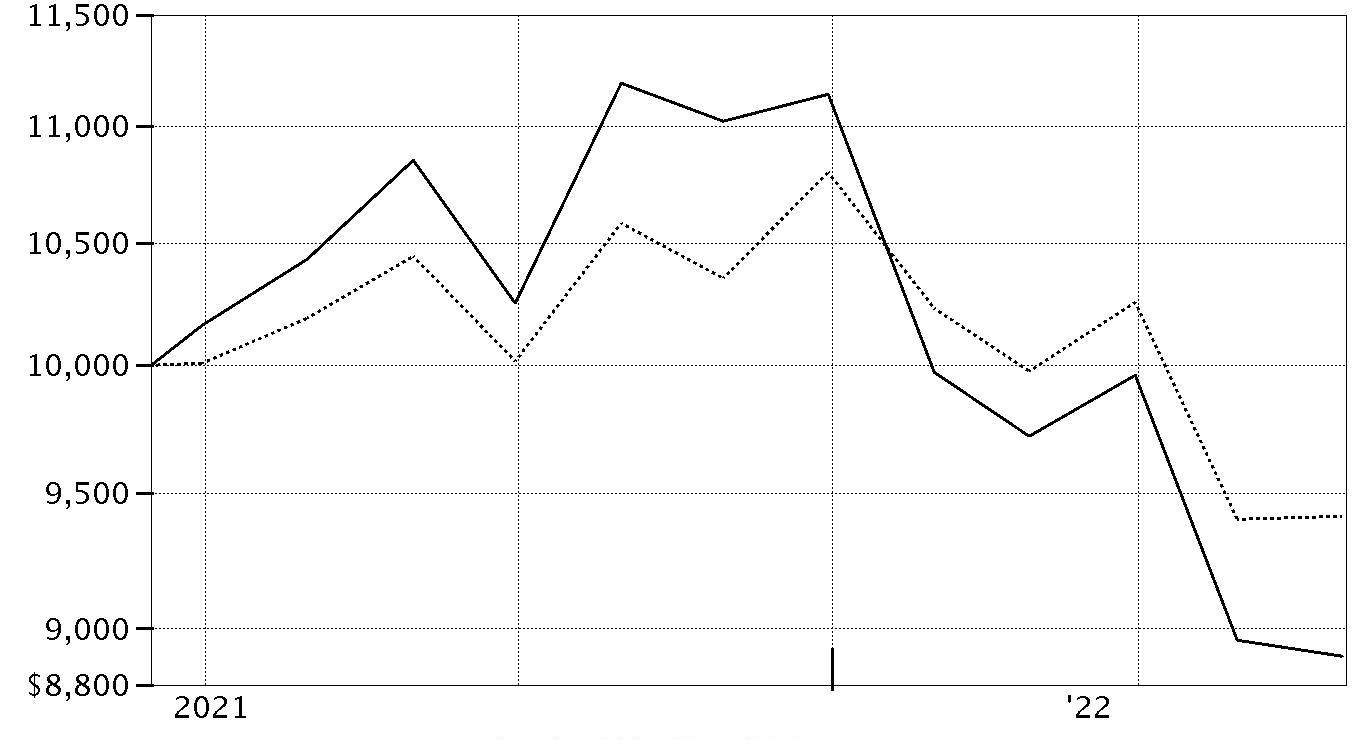
| Period Ending Values |
| $8,900 | Fidelity® Climate Action Fund |
| $9,415 | MSCI World Index |
Management's Discussion of Fund Performance
Market Recap: Global equities returned -6.49% for the 12 months ending May 31, 2022, according to the MSCI ACWI (All Country World Index) Index. After posting an 18.90% gain in 2021, global stocks retreated to begin the new year amid several headwinds that stoked volatility, uncertainty and investor anxiety. Chief among these was accelerated efforts by some central banks to hike interest rates and aggressively wind down extraordinary monetary policy support in an attempt to rein in high inflation. In addition, geopolitical unrest rose as Russia invaded Ukraine in late February and escalated its attack through period end. Other factors influencing stocks included surging global commodity prices, rising sovereign bond yields in some markets, global supply constraint and disruption, and the potential for variants of the coronavirus to upend global economic growth. Against this backdrop, the index returned -4.90% in January and -2.56% in February, falling on mixed corporate earnings. Volatility eased in March and the index gained 2.21% for the month. April saw a reversal (-7.98%), amid angst about the economic toll of “zero-COVID” lockdowns in China, and then the index had a flattish May (+0.16%). For the full 12 months, emerging markets (-20%) lagged most, followed by Japan (-13%) and Europe ex U.K. (-12%). Conversely, the U.K. and Canada (+3%) led. By sector, communication services (-23%) and consumer discretionary (-21%) fared worst, whereas energy (+48%) rode a surge in commodity prices and topped the market by a wide margin.
Comments from Portfolio Manager Asher Anolic: From inception on June 15, 2021, through May 31, 2022, the fund's share classes (excluding sales charges, if applicable) returned roughly -11%, underperforming the -6.97% result of its benchmark, the MSCI World Climate Change Index. We look to invest in stocks of climate-aware companies that are working to address climate change or its impacts either indirectly through their corporate strategy, or directly through the technology, services or products they provide. Versus the MSCI index, security selection in the consumer discretionary sector detracted most from the fund’s performance, especially our decision to avoid Apple, a large index component. Shares of the consumer electronics company gained about 15% during the reporting period, making it the fund’s biggest individual detractor. Apple did not fit our investment profile during the period. Elsewhere, stock choices in consumer staples hurt, as did an overweight in industrials. Among other individual stocks, larger-than-index positions in Etsy (-60%), the online retailer of handmade or vintage items, French luxury apparel and accessories brand owner Kering (-38%) and Spanish wireless telecom infrastructure and services firm Cellnex Telecom (-29%) weighed on the fund's relative result. Conversely, positioning in the communication services sector notably contributed to the fund's relative performance. Stock selection in real estate also added relative value. The fund's biggest individual relative contributor was not owning index component Amazon.com (-29%), an e-commerce company. Overweighting health care services firm Anthem (+21%) and Belgium-based utilities company Elia Group (+34%) also added value versus the benchmark this period.
The views expressed above reflect those of the portfolio manager(s) only through the end of the period as stated on the cover of this report and do not necessarily represent the views of Fidelity or any other person in the Fidelity organization. Any such views are subject to change at any time based upon market or other conditions and Fidelity disclaims any responsibility to update such views. These views may not be relied on as investment advice and, because investment decisions for a Fidelity fund are based on numerous factors, may not be relied on as an indication of trading intent on behalf of any Fidelity fund.
Investment Summary (Unaudited)
Top Ten Stocks as of May 31, 2022
| | % of fund's net assets |
| Microsoft Corp. | 5.1 |
| Alphabet, Inc. Class A | 3.2 |
| Anthem, Inc. | 2.4 |
| MasterCard, Inc. Class A | 2.3 |
| Accenture PLC Class A | 2.0 |
| The Home Depot, Inc. | 2.0 |
| Danaher Corp. | 1.9 |
| Prologis (REIT), Inc. | 1.9 |
| American Express Co. | 1.9 |
| Deere & Co. | 1.8 |
| | 24.5 |
Market Sectors as of May 31, 2022
| | % of fund's net assets |
| Information Technology | 23.3 |
| Industrials | 17.0 |
| Financials | 13.9 |
| Consumer Discretionary | 11.9 |
| Health Care | 11.0 |
| Consumer Staples | 4.8 |
| Utilities | 4.3 |
| Communication Services | 4.1 |
| Materials | 3.5 |
| Real Estate | 3.1 |
| Energy | 1.1 |
Asset Allocation (% of fund's net assets)
| As of May 31, 2022* |
| | Stocks | 97.9% |
| | Convertible Securities | 0.1% |
| | Short-Term Investments and Net Other Assets (Liabilities) | 2.0% |

* Foreign investments - 34.5%
Geographic Diversification (% of fund's net assets)
| As of May 31, 2022 |
| | United States of America* | 65.5% |
| | Ireland | 5.1% |
| | France | 4.3% |
| | Japan | 2.9% |
| | Belgium | 2.4% |
| | Netherlands | 2.4% |
| | Switzerland | 2.4% |
| | Canada | 2.3% |
| | Denmark | 2.1% |
| | Other | 10.6% |

* Includes Short-Term investments and Net Other Assets (Liabilities).
Percentages are based on country or territory of incorporation and are adjusted for the effect of futures contracts, if applicable.
Schedule of Investments May 31, 2022
Showing Percentage of Net Assets
| Common Stocks - 97.9% | | | |
| | | Shares | Value |
| COMMUNICATION SERVICES - 4.1% | | | |
| Diversified Telecommunication Services - 0.9% | | | |
| Cellnex Telecom SA (a) | | 4,056 | $183,044 |
| Interactive Media & Services - 3.2% | | | |
| Alphabet, Inc. Class A (b) | | 282 | 641,618 |
|
| TOTAL COMMUNICATION SERVICES | | | 824,662 |
|
| CONSUMER DISCRETIONARY - 11.8% | | | |
| Automobiles - 3.1% | | | |
| Tesla, Inc. (b) | | 396 | 300,271 |
| Toyota Motor Corp. | | 13,234 | 220,170 |
| XPeng, Inc. ADR (b) | | 4,260 | 100,110 |
| | | | 620,551 |
| Hotels, Restaurants & Leisure - 2.1% | | | |
| Compass Group PLC | | 8,851 | 198,407 |
| Hilton Worldwide Holdings, Inc. | | 1,629 | 229,461 |
| | | | 427,868 |
| Household Durables - 1.7% | | | |
| Chervon Holdings Ltd. | | 5,263 | 31,388 |
| Sony Group Corp. | | 3,325 | 311,850 |
| | | | 343,238 |
| Internet & Direct Marketing Retail - 0.4% | | | |
| Etsy, Inc. (b) | | 763 | 61,895 |
| thredUP, Inc. (b) | | 5,179 | 21,648 |
| | | | 83,543 |
| Specialty Retail - 2.0% | | | |
| The Home Depot, Inc. | | 1,299 | 393,272 |
| Textiles, Apparel & Luxury Goods - 2.5% | | | |
| Kering SA | | 278 | 152,909 |
| NIKE, Inc. Class B | | 2,769 | 329,096 |
| On Holding AG | | 1,094 | 22,591 |
| | | | 504,596 |
|
| TOTAL CONSUMER DISCRETIONARY | | | 2,373,068 |
|
| CONSUMER STAPLES - 4.8% | | | |
| Food & Staples Retailing - 1.5% | | | |
| Kesko Oyj | | 7,484 | 187,363 |
| Walmart, Inc. | | 832 | 107,020 |
| | | | 294,383 |
| Food Products - 0.1% | | | |
| Oatly Group AB ADR (b) | | 3,621 | 14,955 |
| Household Products - 1.6% | | | |
| Colgate-Palmolive Co. | | 4,148 | 326,904 |
| Personal Products - 1.6% | | | |
| L'Oreal SA | | 929 | 328,133 |
|
| TOTAL CONSUMER STAPLES | | | 964,375 |
|
| ENERGY - 1.1% | | | |
| Energy Equipment & Services - 1.1% | | | |
| Baker Hughes Co. Class A | | 6,436 | 231,567 |
| FINANCIALS - 13.9% | | | |
| Banks - 3.5% | | | |
| Amalgamated Financial Corp. | | 9,763 | 212,150 |
| KBC Group NV | | 3,208 | 200,528 |
| The Toronto-Dominion Bank | | 3,800 | 290,396 |
| | | | 703,074 |
| Capital Markets - 8.1% | | | |
| Impax Asset Management Group PLC | | 5,836 | 59,640 |
| Intercontinental Exchange, Inc. | | 3,143 | 321,812 |
| Moody's Corp. | | 538 | 162,245 |
| Morgan Stanley | | 3,355 | 289,000 |
| Morningstar, Inc. | | 976 | 250,861 |
| MSCI, Inc. | | 615 | 272,045 |
| S&P Global, Inc. | | 815 | 284,826 |
| | | | 1,640,429 |
| Consumer Finance - 1.9% | | | |
| American Express Co. | | 2,244 | 378,832 |
| Insurance - 0.4% | | | |
| Marsh & McLennan Companies, Inc. | | 518 | 82,854 |
|
| TOTAL FINANCIALS | | | 2,805,189 |
|
| HEALTH CARE - 11.0% | | | |
| Biotechnology - 1.0% | | | |
| Regeneron Pharmaceuticals, Inc. (b) | | 311 | 206,734 |
| Health Care Equipment & Supplies - 0.8% | | | |
| STERIS PLC | | 689 | 157,230 |
| Health Care Providers & Services - 2.4% | | | |
| Anthem, Inc. | | 964 | 491,264 |
| Life Sciences Tools & Services - 5.0% | | | |
| Agilent Technologies, Inc. | | 2,654 | 338,544 |
| Avantor, Inc. (b) | | 927 | 29,701 |
| Danaher Corp. | | 1,469 | 387,552 |
| Eurofins Scientific SA | | 743 | 69,252 |
| Mettler-Toledo International, Inc. (b) | | 148 | 190,346 |
| | | | 1,015,395 |
| Pharmaceuticals - 1.8% | | | |
| Roche Holding AG (participation certificate) | | 866 | 295,125 |
| Sanofi SA | | 564 | 60,173 |
| | | | 355,298 |
|
| TOTAL HEALTH CARE | | | 2,225,921 |
|
| INDUSTRIALS - 17.0% | | | |
| Aerospace & Defense - 1.5% | | | |
| BWX Technologies, Inc. | | 1,609 | 82,381 |
| Hexcel Corp. | | 3,670 | 210,842 |
| | | | 293,223 |
| Building Products - 2.3% | | | |
| Daikin Industries Ltd. | | 431 | 69,308 |
| Kingspan Group PLC (Ireland) | | 1,663 | 137,112 |
| Nibe Industrier AB (B Shares) | | 10,949 | 95,409 |
| Trane Technologies PLC | | 1,135 | 156,698 |
| | | | 458,527 |
| Commercial Services & Supplies - 1.3% | | | |
| Aker Carbon Capture A/S (b) | | 39,776 | 90,861 |
| Smart Metering Systems PLC | | 6,187 | 65,488 |
| Tetra Tech, Inc. | | 737 | 99,473 |
| | | | 255,822 |
| Construction & Engineering - 1.8% | | | |
| Fluor Corp. (b) | | 4,269 | 120,514 |
| Quanta Services, Inc. | | 1,991 | 236,929 |
| | | | 357,443 |
| Electrical Equipment - 5.8% | | | |
| Acuity Brands, Inc. | | 1,537 | 269,006 |
| Ceres Power Holdings PLC (b) | | 8,121 | 68,563 |
| Eaton Corp. PLC�� | | 1,196 | 165,766 |
| Fluence Energy, Inc. | | 3,700 | 36,260 |
| Heliogen, Inc. (b) | | 6,723 | 26,018 |
| Schneider Electric SA | | 2,315 | 321,535 |
| Shoals Technologies Group, Inc. (b) | | 1,422 | 22,183 |
| Sunrun, Inc. (b) | | 2,622 | 68,487 |
| Vestas Wind Systems A/S | | 7,850 | 200,507 |
| | | | 1,178,325 |
| Machinery - 2.2% | | | |
| Deere & Co. | | 1,041 | 372,449 |
| Kornit Digital Ltd. (b) | | 1,084 | 45,495 |
| Westinghouse Air Brake Tech Co. | | 323 | 30,511 |
| | | | 448,455 |
| Professional Services - 2.1% | | | |
| KBR, Inc. | | 6,166 | 306,820 |
| Verisk Analytics, Inc. | | 693 | 121,220 |
| | | | 428,040 |
|
| TOTAL INDUSTRIALS | | | 3,419,835 |
|
| INFORMATION TECHNOLOGY - 23.3% | | | |
| Electronic Equipment & Components - 1.3% | | | |
| Teledyne Technologies, Inc. (b) | | 646 | 261,727 |
| IT Services - 5.5% | | | |
| Accenture PLC Class A | | 1,337 | 399,041 |
| Amadeus IT Holding SA Class A (b) | | 3,895 | 242,361 |
| MasterCard, Inc. Class A | | 1,337 | 478,472 |
| | | | 1,119,874 |
| Semiconductors & Semiconductor Equipment - 8.0% | | | |
| Aixtron AG | | 5,859 | 172,596 |
| Allegro MicroSystems LLC (b) | | 4,185 | 107,764 |
| Enphase Energy, Inc. (b) | | 1,287 | 239,627 |
| NVIDIA Corp. | | 1,673 | 312,383 |
| onsemi (b) | | 3,085 | 187,198 |
| REC Silicon ASA (b) | | 30,936 | 61,029 |
| SolarEdge Technologies, Inc. (b) | | 1,177 | 321,074 |
| STMicroelectronics NV (NY Shares) unit | | 3,465 | 138,877 |
| Wolfspeed, Inc. (b) | | 873 | 65,676 |
| | | | 1,606,224 |
| Software - 8.5% | | | |
| Aspen Technology, Inc. (b) | | 1,134 | 219,418 |
| Autodesk, Inc. (b) | | 1,056 | 219,384 |
| Microsoft Corp. | | 3,842 | 1,044,519 |
| Salesforce.com, Inc. (b) | | 865 | 138,608 |
| Volue A/S (b) | | 29,677 | 99,740 |
| | | | 1,721,669 |
|
| TOTAL INFORMATION TECHNOLOGY | | | 4,709,494 |
|
| MATERIALS - 3.5% | | | |
| Chemicals - 2.7% | | | |
| Aker Clean Hydrogen A/S (b) | | 81,278 | 43,099 |
| Koninklijke DSM NV | | 2,035 | 343,649 |
| Koninklijke DSM NV rights (b)(c) | | 2,035 | 3,714 |
| Sika AG | | 569 | 157,948 |
| | | | 548,410 |
| Metals & Mining - 0.8% | | | |
| 5E Advanced Materials, Inc. (b) | | 542 | 13,387 |
| Lynas Rare Earths Ltd. (b) | | 13,712 | 96,105 |
| MP Materials Corp. (b) | | 1,197 | 47,198 |
| | | | 156,690 |
|
| TOTAL MATERIALS | | | 705,100 |
|
| REAL ESTATE - 3.1% | | | |
| Equity Real Estate Investment Trusts (REITs) - 3.1% | | | |
| Prologis (REIT), Inc. | | 2,979 | 379,763 |
| Weyerhaeuser Co. | | 6,063 | 239,610 |
| | | | 619,373 |
| UTILITIES - 4.3% | | | |
| Electric Utilities - 3.4% | | | |
| ELIA GROUP SA/NV | | 1,754 | 288,665 |
| ORSTED A/S (a) | | 1,996 | 224,968 |
| Verbund AG | | 1,742 | 173,267 |
| | | | 686,900 |
| Independent Power and Renewable Electricity Producers - 0.9% | | | |
| Brookfield Renewable Corp. | | 4,937 | 178,621 |
|
| TOTAL UTILITIES | | | 865,521 |
|
| TOTAL COMMON STOCKS | | | |
| (Cost $22,094,834) | | | 19,744,105 |
|
| Convertible Preferred Stocks - 0.1% | | | |
| CONSUMER DISCRETIONARY - 0.1% | | | |
| Textiles, Apparel & Luxury Goods - 0.1% | | | |
| CelLink Corp. Series D (d)(e) | | | |
| (Cost $8,330) | | 400 | 8,330 |
|
| Money Market Funds - 2.0% | | | |
| Fidelity Cash Central Fund 0.82% (f) | | | |
| (Cost $409,555) | | 409,473 | 409,555 |
| TOTAL INVESTMENT IN SECURITIES - 100.0% | | | |
| (Cost $22,512,719) | | | 20,161,990 |
| NET OTHER ASSETS (LIABILITIES) - 0.0% | | | (2,008) |
| NET ASSETS - 100% | | | $20,159,982 |
Legend
(a) Security exempt from registration under Rule 144A of the Securities Act of 1933. These securities may be resold in transactions exempt from registration, normally to qualified institutional buyers. At the end of the period, the value of these securities amounted to $408,012 or 2.0% of net assets.
(b) Non-income producing
(c) Security or a portion of the security purchased on a delayed delivery or when-issued basis.
(d) Restricted securities (including private placements) - Investment in securities not registered under the Securities Act of 1933 (excluding 144A issues). At the end of the period, the value of restricted securities (excluding 144A issues) amounted to $8,330 or 0.0% of net assets.
(e) Level 3 security
(f) Affiliated fund that is generally available only to investment companies and other accounts managed by Fidelity Investments. The rate quoted is the annualized seven-day yield of the fund at period end. A complete unaudited listing of the fund's holdings as of its most recent quarter end is available upon request. In addition, each Fidelity Central Fund's financial statements, which are not covered by the Fund's Report of Independent Registered Public Accounting Firm, are available on the SEC's website or upon request.
Additional information on each restricted holding is as follows:
| Security | Acquisition Date | Acquisition Cost |
| CelLink Corp. Series D | 1/20/22 | $8,330 |
Affiliated Central Funds
Fiscal year to date information regarding the Fund's investments in Fidelity Central Funds, including the ownership percentage, is presented below.
| Fund | Value, beginning of period | Purchases | Sales Proceeds | Dividend Income | Realized Gain/Loss | Change in Unrealized appreciation (depreciation) | Value, end of period | % ownership, end of period |
| Fidelity Cash Central Fund 0.82% | $-- | $13,605,766 | $13,196,211 | $675 | $-- | $-- | $409,555 | 0.0% |
| Total | $-- | $13,605,766 | $13,196,211 | $675 | $-- | $-- | $409,555 | |
Amounts in the income column in the above table include any capital gain distributions from underlying funds, which are presented in the corresponding line-item in the Statement of Operations, if applicable.
Investment Valuation
The following is a summary of the inputs used, as of May 31, 2022, involving the Fund's assets and liabilities carried at fair value. The inputs or methodology used for valuing securities may not be an indication of the risk associated with investing in those securities. For more information on valuation inputs, and their aggregation into the levels used below, please refer to the Investment Valuation section in the accompanying Notes to Financial Statements.
| | Valuation Inputs at Reporting Date: |
| Description | Total | Level 1 | Level 2 | Level 3 |
| Investments in Securities: | | | | |
| Equities: | | | | |
| Communication Services | $824,662 | $641,618 | $183,044 | $-- |
| Consumer Discretionary | 2,381,398 | 1,489,732 | 883,336 | 8,330 |
| Consumer Staples | 964,375 | 636,242 | 328,133 | -- |
| Energy | 231,567 | 231,567 | -- | -- |
| Financials | 2,805,189 | 2,604,661 | 200,528 | -- |
| Health Care | 2,225,921 | 1,930,796 | 295,125 | -- |
| Industrials | 3,419,835 | 2,828,485 | 591,350 | -- |
| Information Technology | 4,709,494 | 4,467,133 | 242,361 | -- |
| Materials | 705,100 | 447,333 | 257,767 | -- |
| Real Estate | 619,373 | 619,373 | -- | -- |
| Utilities | 865,521 | 640,553 | 224,968 | -- |
| Money Market Funds | 409,555 | 409,555 | -- | -- |
| Total Investments in Securities: | $20,161,990 | $16,947,048 | $3,206,612 | $8,330 |
Other Information
The composition of credit quality ratings as a percentage of Total Net Assets is as follows (Unaudited):
| Equities | 98.0% |
| Short-Term Investments and Net Other Assets | 2.0% |
| | 100.0% |
We have used ratings from Moody's Investors Service, Inc. Where Moody's® ratings are not available, we have used S&P® ratings. All ratings are as of the date indicated and do not reflect subsequent changes.
See accompanying notes which are an integral part of the financial statements.
Financial Statements
Statement of Assets and Liabilities
| | | May 31, 2022 |
| Assets | | |
Investment in securities, at value — See accompanying schedule:
Unaffiliated issuers (cost $22,103,164) | $19,752,435 | |
| Fidelity Central Funds (cost $409,555) | 409,555 | |
| Total Investment in Securities (cost $22,512,719) | | $20,161,990 |
| Foreign currency held at value (cost $3,947) | | 3,918 |
| Receivable for investments sold | | 56,175 |
| Receivable for fund shares sold | | 16,017 |
| Dividends receivable | | 13,637 |
| Reclaims receivable | | 10,488 |
| Distributions receivable from Fidelity Central Funds | | 269 |
| Receivable from investment adviser for expense reductions | | 62,062 |
| Other receivables | | 780 |
| Total assets | | 20,325,336 |
| Liabilities | | |
| Payable for investments purchased | | |
| Regular delivery | $84,754 | |
| Delayed delivery | 3,714 | |
| Payable for fund shares redeemed | 47,001 | |
| Accrued management fee | 10,997 | |
| Distribution and service plan fees payable | 355 | |
| Other affiliated payables | 5,316 | |
| Other payables and accrued expenses | 13,217 | |
| Total liabilities | | 165,354 |
| Net Assets | | $20,159,982 |
| Net Assets consist of: | | |
| Paid in capital | | $24,081,890 |
| Total accumulated earnings (loss) | | (3,921,908) |
| Net Assets | | $20,159,982 |
| Net Asset Value and Maximum Offering Price | | |
| Class A: | | |
| Net Asset Value and redemption price per share ($405,011 ÷ 45,613 shares)(a) | | $8.88 |
| Maximum offering price per share (100/94.25 of $8.88) | | $9.42 |
| Class M: | | |
| Net Asset Value and redemption price per share ($132,289 ÷ 14,936 shares)(a) | | $8.86 |
| Maximum offering price per share (100/96.50 of $8.86) | | $9.18 |
| Class C: | | |
| Net Asset Value and offering price per share ($265,077 ÷ 30,069 shares)(a) | | $8.82 |
| Fidelity Climate Action Fund: | | |
| Net Asset Value, offering price and redemption price per share ($19,056,661 ÷ 2,140,907 shares) | | $8.90 |
| Class I: | | |
| Net Asset Value, offering price and redemption price per share ($192,254 ÷ 21,601 shares) | | $8.90 |
| Class Z: | | |
| Net Asset Value, offering price and redemption price per share ($108,690 ÷ 12,196 shares) | | $8.91 |
(a) Redemption price per share is equal to net asset value less any applicable contingent deferred sales charge.
See accompanying notes which are an integral part of the financial statements.
Statement of Operations
| | | For the period
June 15, 2021 (commencement of operations) through
May 31, 2022 |
| Investment Income | | |
| Dividends | | $192,994 |
| Foreign tax reclaims | | 9,966 |
| Income from Fidelity Central Funds | | 675 |
| Income before foreign taxes withheld | | 203,635 |
| Less foreign taxes withheld | | (25,135) |
| Total income | | 178,500 |
| Expenses | | |
| Management fee | $109,907 | |
| Transfer agent fees | 43,459 | |
| Distribution and service plan fees | 4,030 | |
| Accounting fees and expenses | 6,339 | |
| Custodian fees and expenses | 49,741 | |
| Independent trustees' fees and expenses | 44 | |
| Registration fees | 178,414 | |
| Audit | 44,259 | |
| Legal | 3 | |
| Miscellaneous | 431 | |
| Total expenses before reductions | 436,627 | |
| Expense reductions | (263,344) | |
| Total expenses after reductions | | 173,283 |
| Net investment income (loss) | | 5,217 |
| Realized and Unrealized Gain (Loss) | | |
| Net realized gain (loss) on: | | |
| Investment securities: | | |
| Unaffiliated issuers | (1,573,764) | |
| Foreign currency transactions | (2,549) | |
| Total net realized gain (loss) | | (1,576,313) |
| Change in net unrealized appreciation (depreciation) on: | | |
| Investment securities: | | |
| Unaffiliated issuers | (2,350,729) | |
| Assets and liabilities in foreign currencies | (67) | |
| Total change in net unrealized appreciation (depreciation) | | (2,350,796) |
| Net gain (loss) | | (3,927,109) |
| Net increase (decrease) in net assets resulting from operations | | $(3,921,892) |
See accompanying notes which are an integral part of the financial statements.
Statement of Changes in Net Assets
| | For the period
June 15, 2021 (commencement of operations) through
May 31, 2022 |
| Increase (Decrease) in Net Assets | |
| Operations | |
| Net investment income (loss) | $5,217 |
| Net realized gain (loss) | (1,576,313) |
| Change in net unrealized appreciation (depreciation) | (2,350,796) |
| Net increase (decrease) in net assets resulting from operations | (3,921,892) |
| Share transactions - net increase (decrease) | 24,081,874 |
| Total increase (decrease) in net assets | 20,159,982 |
| Net Assets | |
| Beginning of period | – |
| End of period | $20,159,982 |
See accompanying notes which are an integral part of the financial statements.
Financial Highlights
Fidelity Climate Action Fund Class A
| Years ended May 31, | 2022 A |
| Selected Per–Share Data | |
| Net asset value, beginning of period | $10.00 |
| Income from Investment Operations | |
| Net investment income (loss)B,C | (.02) |
| Net realized and unrealized gain (loss) | (1.10) |
| Total from investment operations | (1.12) |
| Net asset value, end of period | $8.88 |
| Total ReturnD,E,F | (11.20)% |
| Ratios to Average Net AssetsC,G,H | |
| Expenses before reductions | 2.95%I |
| Expenses net of fee waivers, if any | 1.29%I |
| Expenses net of all reductions | 1.29%I |
| Net investment income (loss) | (.19)%I |
| Supplemental Data | |
| Net assets, end of period (000 omitted) | $405 |
| Portfolio turnover rateJ | 57%I |
A For the period June 15, 2021 (commencement of operations) through May 31, 2022.
B Calculated based on average shares outstanding during the period.
C Net investment income (loss) is affected by the timing of the declaration of dividends by any underlying mutual funds or exchange-traded funds (ETFs). Net investment income (loss) of any such underlying funds is not included in the Fund's net investment income (loss) ratio.
D Total returns for periods of less than one year are not annualized.
E Total returns would have been lower if certain expenses had not been reduced during the applicable periods shown.
F Total returns do not include the effect of the sales charges.
G Fees and expenses of any underlying mutual funds or exchange-traded funds (ETFs) are not included in the Fund's expense ratio. The Fund indirectly bears its proportionate share of these expenses. For additional expense information related to investments in Fidelity Central Funds, please refer to the "Investments in Fidelity Central Funds" note found in the Notes to Financial Statements section of the most recent Annual or Semi-Annual report.
H Expense ratios reflect operating expenses of the class. Expenses before reductions do not reflect amounts reimbursed, waived, or reduced through arrangements with the investment adviser, brokerage services, or other offset arrangements, if applicable, and do not represent the amount paid by the class during periods when reimbursements, waivers or reductions occur.
I Annualized
J Amount does not include the portfolio activity of any underlying mutual funds or exchange-traded funds (ETFs).
See accompanying notes which are an integral part of the financial statements.
Fidelity Climate Action Fund Class M
| Years ended May 31, | 2022 A |
| Selected Per–Share Data | |
| Net asset value, beginning of period | $10.00 |
| Income from Investment Operations | |
| Net investment income (loss)B,C | (.04) |
| Net realized and unrealized gain (loss) | (1.10) |
| Total from investment operations | (1.14) |
| Net asset value, end of period | $8.86 |
| Total ReturnD,E,F | (11.40)% |
| Ratios to Average Net AssetsC,G,H | |
| Expenses before reductions | 3.33%I |
| Expenses net of fee waivers, if any | 1.55%I |
| Expenses net of all reductions | 1.55%I |
| Net investment income (loss) | (.45)%I |
| Supplemental Data | |
| Net assets, end of period (000 omitted) | $132 |
| Portfolio turnover rateJ | 57%I |
A For the period June 15, 2021 (commencement of operations) through May 31, 2022.
B Calculated based on average shares outstanding during the period.
C Net investment income (loss) is affected by the timing of the declaration of dividends by any underlying mutual funds or exchange-traded funds (ETFs). Net investment income (loss) of any such underlying funds is not included in the Fund's net investment income (loss) ratio.
D Total returns for periods of less than one year are not annualized.
E Total returns would have been lower if certain expenses had not been reduced during the applicable periods shown.
F Total returns do not include the effect of the sales charges.
G Fees and expenses of any underlying mutual funds or exchange-traded funds (ETFs) are not included in the Fund's expense ratio. The Fund indirectly bears its proportionate share of these expenses. For additional expense information related to investments in Fidelity Central Funds, please refer to the "Investments in Fidelity Central Funds" note found in the Notes to Financial Statements section of the most recent Annual or Semi-Annual report.
H Expense ratios reflect operating expenses of the class. Expenses before reductions do not reflect amounts reimbursed, waived, or reduced through arrangements with the investment adviser, brokerage services, or other offset arrangements, if applicable, and do not represent the amount paid by the class during periods when reimbursements, waivers or reductions occur.
I Annualized
J Amount does not include the portfolio activity of any underlying mutual funds or exchange-traded funds (ETFs).
See accompanying notes which are an integral part of the financial statements.
Fidelity Climate Action Fund Class C
| Years ended May 31, | 2022 A |
| Selected Per–Share Data | |
| Net asset value, beginning of period | $10.00 |
| Income from Investment Operations | |
| Net investment income (loss)B,C | (.09) |
| Net realized and unrealized gain (loss) | (1.09) |
| Total from investment operations | (1.18) |
| Net asset value, end of period | $8.82 |
| Total ReturnD,E,F | (11.80)% |
| Ratios to Average Net AssetsC,G,H | |
| Expenses before reductions | 3.55%I |
| Expenses net of fee waivers, if any | 2.04%I |
| Expenses net of all reductions | 2.04%I |
| Net investment income (loss) | (.94)%I |
| Supplemental Data | |
| Net assets, end of period (000 omitted) | $265 |
| Portfolio turnover rateJ | 57%I |
A For the period June 15, 2021 (commencement of operations) through May 31, 2022.
B Calculated based on average shares outstanding during the period.
C Net investment income (loss) is affected by the timing of the declaration of dividends by any underlying mutual funds or exchange-traded funds (ETFs). Net investment income (loss) of any such underlying funds is not included in the Fund's net investment income (loss) ratio.
D Total returns for periods of less than one year are not annualized.
E Total returns would have been lower if certain expenses had not been reduced during the applicable periods shown.
F Total returns do not include the effect of the contingent deferred sales charge.
G Fees and expenses of any underlying mutual funds or exchange-traded funds (ETFs) are not included in the Fund's expense ratio. The Fund indirectly bears its proportionate share of these expenses. For additional expense information related to investments in Fidelity Central Funds, please refer to the "Investments in Fidelity Central Funds" note found in the Notes to Financial Statements section of the most recent Annual or Semi-Annual report.
H Expense ratios reflect operating expenses of the class. Expenses before reductions do not reflect amounts reimbursed, waived, or reduced through arrangements with the investment adviser, brokerage services, or other offset arrangements, if applicable, and do not represent the amount paid by the class during periods when reimbursements, waivers or reductions occur.
I Annualized
J Amount does not include the portfolio activity of any underlying mutual funds or exchange-traded funds (ETFs).
See accompanying notes which are an integral part of the financial statements.
Fidelity Climate Action Fund
| Years ended May 31, | 2022 A |
| Selected Per–Share Data | |
| Net asset value, beginning of period | $10.00 |
| Income from Investment Operations | |
| Net investment income (loss)B,C | .01 |
| Net realized and unrealized gain (loss) | (1.11) |
| Total from investment operations | (1.10) |
| Net asset value, end of period | $8.90 |
| Total ReturnD,E | (11.00)% |
| Ratios to Average Net AssetsC,F,G | |
| Expenses before reductions | 2.66%H |
| Expenses net of fee waivers, if any | 1.05%H |
| Expenses net of all reductions | 1.05%H |
| Net investment income (loss) | .06%H |
| Supplemental Data | |
| Net assets, end of period (000 omitted) | $19,057 |
| Portfolio turnover rateI | 57%H |
A For the period June 15, 2021 (commencement of operations) through May 31, 2022.
B Calculated based on average shares outstanding during the period.
C Net investment income (loss) is affected by the timing of the declaration of dividends by any underlying mutual funds or exchange-traded funds (ETFs). Net investment income (loss) of any such underlying funds is not included in the Fund's net investment income (loss) ratio.
D Total returns for periods of less than one year are not annualized.
E Total returns would have been lower if certain expenses had not been reduced during the applicable periods shown.
F Fees and expenses of any underlying mutual funds or exchange-traded funds (ETFs) are not included in the Fund's expense ratio. The Fund indirectly bears its proportionate share of these expenses. For additional expense information related to investments in Fidelity Central Funds, please refer to the "Investments in Fidelity Central Funds" note found in the Notes to Financial Statements section of the most recent Annual or Semi-Annual report.
G Expense ratios reflect operating expenses of the class. Expenses before reductions do not reflect amounts reimbursed, waived, or reduced through arrangements with the investment adviser, brokerage services, or other offset arrangements, if applicable, and do not represent the amount paid by the class during periods when reimbursements, waivers or reductions occur.
H Annualized
I Amount does not include the portfolio activity of any underlying mutual funds or exchange-traded funds (ETFs).
See accompanying notes which are an integral part of the financial statements.
Fidelity Climate Action Fund Class I
| Years ended May 31, | 2022 A |
| Selected Per–Share Data | |
| Net asset value, beginning of period | $10.00 |
| Income from Investment Operations | |
| Net investment income (loss)B,C | .01 |
| Net realized and unrealized gain (loss) | (1.11) |
| Total from investment operations | (1.10) |
| Net asset value, end of period | $8.90 |
| Total ReturnD,E | (11.00)% |
| Ratios to Average Net AssetsC,F,G | |
| Expenses before reductions | 2.93%H |
| Expenses net of fee waivers, if any | 1.04%H |
| Expenses net of all reductions | 1.04%H |
| Net investment income (loss) | .06%H |
| Supplemental Data | |
| Net assets, end of period (000 omitted) | $192 |
| Portfolio turnover rateI | 57%H |
A For the period June 15, 2021 (commencement of operations) through May 31, 2022.
B Calculated based on average shares outstanding during the period.
C Net investment income (loss) is affected by the timing of the declaration of dividends by any underlying mutual funds or exchange-traded funds (ETFs). Net investment income (loss) of any such underlying funds is not included in the Fund's net investment income (loss) ratio.
D Total returns for periods of less than one year are not annualized.
E Total returns would have been lower if certain expenses had not been reduced during the applicable periods shown.
F Fees and expenses of any underlying mutual funds or exchange-traded funds (ETFs) are not included in the Fund's expense ratio. The Fund indirectly bears its proportionate share of these expenses. For additional expense information related to investments in Fidelity Central Funds, please refer to the "Investments in Fidelity Central Funds" note found in the Notes to Financial Statements section of the most recent Annual or Semi-Annual report.
G Expense ratios reflect operating expenses of the class. Expenses before reductions do not reflect amounts reimbursed, waived, or reduced through arrangements with the investment adviser, brokerage services, or other offset arrangements, if applicable, and do not represent the amount paid by the class during periods when reimbursements, waivers or reductions occur.
H Annualized
I Amount does not include the portfolio activity of any underlying mutual funds or exchange-traded funds (ETFs).
See accompanying notes which are an integral part of the financial statements.
Fidelity Climate Action Fund Class Z
| Years ended May 31, | 2022 A |
| Selected Per–Share Data | |
| Net asset value, beginning of period | $10.00 |
| Income from Investment Operations | |
| Net investment income (loss)B,C | .02 |
| Net realized and unrealized gain (loss) | (1.11) |
| Total from investment operations | (1.09) |
| Net asset value, end of period | $8.91 |
| Total ReturnD,E | (10.90)% |
| Ratios to Average Net AssetsC,F,G | |
| Expenses before reductions | 3.00%H |
| Expenses net of fee waivers, if any | .90%H |
| Expenses net of all reductions | .90%H |
| Net investment income (loss) | .20%H |
| Supplemental Data | |
| Net assets, end of period (000 omitted) | $109 |
| Portfolio turnover rateI | 57%H |
A For the period June 15, 2021 (commencement of operations) through May 31, 2022.
B Calculated based on average shares outstanding during the period.
C Net investment income (loss) is affected by the timing of the declaration of dividends by any underlying mutual funds or exchange-traded funds (ETFs). Net investment income (loss) of any such underlying funds is not included in the Fund's net investment income (loss) ratio.
D Total returns for periods of less than one year are not annualized.
E Total returns would have been lower if certain expenses had not been reduced during the applicable periods shown.
F Fees and expenses of any underlying mutual funds or exchange-traded funds (ETFs) are not included in the Fund's expense ratio. The Fund indirectly bears its proportionate share of these expenses. For additional expense information related to investments in Fidelity Central Funds, please refer to the "Investments in Fidelity Central Funds" note found in the Notes to Financial Statements section of the most recent Annual or Semi-Annual report.
G Expense ratios reflect operating expenses of the class. Expenses before reductions do not reflect amounts reimbursed, waived, or reduced through arrangements with the investment adviser, brokerage services, or other offset arrangements, if applicable, and do not represent the amount paid by the class during periods when reimbursements, waivers or reductions occur.
H Annualized
I Amount does not include the portfolio activity of any underlying mutual funds or exchange-traded funds (ETFs).
See accompanying notes which are an integral part of the financial statements.
Notes to Financial Statements
For the period ended May 31, 2022
1. Organization.
Fidelity Climate Action Fund (the Fund) is a fund of Fidelity Summer Street Trust (the Trust) and is authorized to issue an unlimited number of shares. The Trust is registered under the Investment Company Act of 1940, as amended (the 1940 Act), as an open-end management investment company organized as a Massachusetts business trust. The Fund offers Class A, Class M, Class C, Climate Action, Class I and Class Z shares, each of which has equal rights as to assets and voting privileges. Each class has exclusive voting rights with respect to matters that affect that class. Effective June 21, 2021, Class C shares will automatically convert to Class A shares after a holding period of eight years from the initial date of purchase, with certain exceptions. Prior to June 21, 2021, Class C shares automatically converted to Class A shares after a holding period of ten years from the initial date of purchase, with certain exceptions. Because the Fund focuses its investments in equity securities of climate aware companies, it will be more susceptible to events or factors affecting these companies. The Fund is particularly exposed to such developments as changes in global and regional climates, environmental protection regulatory actions, changes in government standards and subsidy levels, changes in taxation and other domestic and international political, regulatory, and economic developments. Application of FMR's environmental, social, and governance (ESG) ratings process and/or its sustainable investing exclusion criteria may affect the Fund's exposure to certain issuers, sectors, regions, and countries and may affect the Fund's performance depending on whether certain investments are in or out of favor. The criteria related to the Fund's ESG ratings process and/or adherence to its sustainable investing exclusion criteria may result in the Fund forgoing opportunities to buy certain securities when it might otherwise be advantageous to do so, or selling securities for ESG reasons when it might be otherwise disadvantageous for it to do so. As a result, the Fund's performance may at times be better or worse than the performance of funds that do not use ESG or sustainability criteria. There are significant differences in interpretations of what it means for an issuer to have positive ESG factors. While the investment adviser believes its definitions are reasonable, the portfolio decisions it makes may differ with other investors' or advisers' views.
2. Investments in Fidelity Central Funds.
Funds may invest in Fidelity Central Funds, which are open-end investment companies generally available only to other investment companies and accounts managed by the investment adviser and its affiliates. The Schedule of Investments lists any Fidelity Central Funds held as an investment as of period end, but does not include the underlying holdings of each Fidelity Central Fund. An investing fund indirectly bears its proportionate share of the expenses of the underlying Fidelity Central Funds.
Based on its investment objective, each Fidelity Central Fund may invest or participate in various investment vehicles or strategies that are similar to those of the investing fund. These strategies are consistent with the investment objectives of the investing fund and may involve certain economic risks which may cause a decline in value of each of the Fidelity Central Funds and thus a decline in the value of the investing fund.
| Fidelity Central Fund | Investment Manager | Investment Objective | Investment Practices | Expense Ratio(a) |
| Fidelity Money Market Central Funds | Fidelity Management & Research Company LLC (FMR) | Each fund seeks to obtain a high level of current income consistent with the preservation of capital and liquidity. | Short-term Investments | Less than .005% |
(a) Expenses expressed as a percentage of average net assets and are as of each underlying Central Fund's most recent annual or semi-annual shareholder report.
A complete unaudited list of holdings for each Fidelity Central Fund is available upon request or at the Securities and Exchange Commission website at www.sec.gov. In addition, the financial statements of the Fidelity Central Funds which contain the significant accounting policies (including investment valuation policies) of those funds, and are not covered by the Report of Independent Registered Public Accounting Firm, are available on the Securities and Exchange Commission website or upon request.
3. Significant Accounting Policies.
The Fund is an investment company and applies the accounting and reporting guidance of the Financial Accounting Standards Board (FASB) Accounting Standards Codification Topic 946 Financial Services - Investment Companies. The financial statements have been prepared in conformity with accounting principles generally accepted in the United States of America (GAAP), which require management to make certain estimates and assumptions at the date of the financial statements. Actual results could differ from those estimates. Subsequent events, if any, through the date that the financial statements were issued have been evaluated in the preparation of the financial statements. The Fund's Schedule of Investments lists any underlying mutual funds or exchange-traded funds (ETFs) but does not include the underlying holdings of these funds. The following summarizes the significant accounting policies of the Fund:
Investment Valuation. Investments are valued as of 4:00 p.m. Eastern time on the last calendar day of the period. The Board of Trustees (the Board) has delegated the day to day responsibility for the valuation of the Fund's investments to the Fair Value Committee (the Committee) established by the Fund's investment adviser. In accordance with valuation policies and procedures approved by the Board, the Fund attempts to obtain prices from one or more third party pricing vendors or brokers to value its investments. When current market prices, quotations or currency exchange rates are not readily available or reliable, investments will be fair valued in good faith by the Committee, in accordance with procedures adopted by the Board. Factors used in determining fair value vary by investment type and may include market or investment specific events. The frequency with which these procedures are used cannot be predicted and they may be utilized to a significant extent. The Committee oversees the Fund's valuation policies and procedures and reports to the Board on the Committee's activities and fair value determinations. The Board monitors the appropriateness of the procedures used in valuing the Fund's investments and ratifies the fair value determinations of the Committee.
The Fund categorizes the inputs to valuation techniques used to value its investments into a disclosure hierarchy consisting of three levels as shown below:
- Level 1 – unadjusted quoted prices in active markets for identical investments
- Level 2 – other significant observable inputs (including quoted prices for similar investments, interest rates, prepayment speeds, etc.)
- Level 3 – unobservable inputs (including the Fund's own assumptions based on the best information available)
Valuation techniques used to value the Fund's investments by major category are as follows:
Equity securities, including restricted securities, for which market quotations are readily available, are valued at the last reported sale price or official closing price as reported by a third party pricing vendor on the primary market or exchange on which they are traded and are categorized as Level 1 in the hierarchy. In the event there were no sales during the day or closing prices are not available, securities are valued at the last quoted bid price or may be valued using the last available price and are generally categorized as Level 2 in the hierarchy. For foreign equity securities, when market or security specific events arise, comparisons to the valuation of American Depositary Receipts (ADRs), futures contracts, Exchange-Traded Funds (ETFs) and certain indexes as well as quoted prices for similar securities may be used and would be categorized as Level 2 in the hierarchy. For equity securities, including restricted securities, where observable inputs are limited, assumptions about market activity and risk are used and these securities may be categorized as Level 3 in the hierarchy.
Investments in open-end mutual funds, including the Fidelity Central Funds, are valued at their closing net asset value (NAV) each business day and are categorized as Level 1 in the hierarchy.
Changes in valuation techniques may result in transfers in or out of an assigned level within the disclosure hierarchy. The aggregate value of investments by input level as of May 31, 2022 is included at the end of the Fund's Schedule of Investments.
Foreign Currency. Certain Funds may use foreign currency contracts to facilitate transactions in foreign-denominated securities. Gains and losses from these transactions may arise from changes in the value of the foreign currency or if the counterparties do not perform under the contracts' terms.
Foreign-denominated assets, including investment securities, and liabilities are translated into U.S. dollars at the exchange rates at period end. Purchases and sales of investment securities, income and dividends received, and expenses denominated in foreign currencies are translated into U.S. dollars at the exchange rate in effect on the transaction date.
The effects of exchange rate fluctuations on investments are included with the net realized and unrealized gain (loss) on investment securities. Other foreign currency transactions resulting in realized and unrealized gain (loss) are disclosed separately.
Investment Transactions and Income. For financial reporting purposes, the Fund's investment holdings and NAV include trades executed through the end of the last business day of the period. The NAV per share for processing shareholder transactions is calculated as of the close of business of the New York Stock Exchange (NYSE), normally 4:00 p.m. Eastern time and includes trades executed through the end of the prior business day. Gains and losses on securities sold are determined on the basis of identified cost. Commissions paid to certain brokers with whom the investment adviser, or its affiliates, places trades on behalf of a fund include an amount in addition to trade execution, which may be rebated back to a fund. Any such rebates are included in net realized gain (loss) on investments in the Statement of Operations. Dividend income is recorded on the ex-dividend date, except for certain dividends from foreign securities where the ex-dividend date may have passed, which are recorded as soon as the Fund is informed of the ex-dividend date. Non-cash dividends included in dividend income, if any, are recorded at the fair market value of the securities received. Income and capital gain distributions from Fidelity Central Funds, if any, are recorded on the ex-dividend date. Certain distributions received by the Fund represent a return of capital or capital gain. The Fund determines the components of these distributions subsequent to the ex-dividend date, based upon receipt of tax filings or other correspondence relating to the underlying investment. These distributions are recorded as a reduction of cost of investments and/or as a realized gain. Investment income is recorded net of foreign taxes withheld where recovery of such taxes is uncertain. Funds may file withholding tax reclaims in certain jurisdictions to recover a portion of amounts previously withheld. Any withholding tax reclaims income is included in the Statement of Operations in foreign tax reclaims. Any receivables for withholding tax reclaims are included in the Statement of Assets and Liabilities in reclaims receivable.
Class Allocations and Expenses. Investment income, realized and unrealized capital gains and losses, common expenses of a fund, and certain fund-level expense reductions, if any, are allocated daily on a pro-rata basis to each class based on the relative net assets of each class to the total net assets of a fund. Each class differs with respect to transfer agent and distribution and service plan fees incurred, as applicable. Certain expense reductions may also differ by class, if applicable. For the reporting period, the allocated portion of income and expenses to each class as a percent of its average net assets may vary due to the timing of recording these transactions in relation to fluctuating net assets of the classes. Expenses directly attributable to a fund are charged to that fund. Expenses attributable to more than one fund are allocated among the respective funds on the basis of relative net assets or other appropriate methods. Expenses included in the accompanying financial statements reflect the expenses of that fund and do not include any expenses associated with any underlying mutual funds or exchange-traded funds. Although not included in a fund's expenses, a fund indirectly bears its proportionate share of these expenses through the net asset value of each underlying mutual fund or exchange-traded fund. Expense estimates are accrued in the period to which they relate and adjustments are made when actual amounts are known.
Income Tax Information and Distributions to Shareholders. Each year, the Fund intends to qualify as a regulated investment company under Subchapter M of the Internal Revenue Code, including distributing substantially all of its taxable income and realized gains. As a result, no provision for U.S. Federal income taxes is required. As of May 31, 2022, the Fund did not have any unrecognized tax benefits in the financial statements; nor is the Fund aware of any tax positions for which it is reasonably possible that the total amounts of unrecognized tax benefits will significantly change in the next twelve months. The Fund files a U.S. federal tax return, in addition to state and local tax returns as required. The Fund's federal income tax returns are subject to examination by the Internal Revenue Service (IRS) for a period of three fiscal years after they are filed. State and local tax returns may be subject to examination for an additional fiscal year depending on the jurisdiction. Foreign taxes are provided for based on the Fund's understanding of the tax rules and rates that exist in the foreign markets in which it invests.
Distributions are declared and recorded on the ex-dividend date. Income and capital gain distributions are declared separately for each class. Income and capital gain distributions are determined in accordance with income tax regulations, which may differ from GAAP. In addition, the Fund claimed a portion of the payment made to redeeming shareholders as a distribution for income tax purposes.
Capital accounts within the financial statements are adjusted for permanent book-tax differences. These adjustments have no impact on net assets or the results of operations. Capital accounts are not adjusted for temporary book-tax differences which will reverse in a subsequent period.
Book-tax differences are primarily due to foreign currency transactions, capital loss carryforwards and losses deferred due to wash sales.
As of period end, the cost and unrealized appreciation (depreciation) in securities, and derivatives if applicable, for federal income tax purposes were as follows:
| Gross unrealized appreciation | $580,773 |
| Gross unrealized depreciation | (3,064,497) |
| Net unrealized appreciation (depreciation) | $(2,483,724) |
| Tax Cost | $22,645,714 |
The tax-based components of distributable earnings as of period end were as follows:
| Undistributed ordinary income | $2,652 |
| Capital loss carryforward | $(1,440,770) |
| Net unrealized appreciation (depreciation) on securities and other investments | $(2,483,791) |
Capital loss carryforwards are only available to offset future capital gains of the Fund to the extent provided by regulations and may be limited. The capital loss carryforward information presented below, including any applicable limitation, is estimated as of fiscal period end and is subject to adjustment.
| Short-term | $(1,437,874) |
| Long-term | (2,896) |
| Total capital loss carryforward | $(1,440,770) |
Delayed Delivery Transactions and When-Issued Securities. During the period, certain Funds transacted in securities on a delayed delivery or when-issued basis. Payment and delivery may take place after the customary settlement period for that security. The price of the underlying securities and the date when the securities will be delivered and paid for are fixed at the time the transaction is negotiated. Securities purchased on a delayed delivery or when-issued basis are identified as such in the Schedule of Investments. Compensation for interest forgone in the purchase of a delayed delivery or when-issued debt security may be received. With respect to purchase commitments, each applicable Fund identifies securities as segregated in its records with a value at least equal to the amount of the commitment. Payables and receivables associated with the purchases and sales of delayed delivery securities having the same coupon, settlement date and broker are offset. Delayed delivery or when-issued securities that have been purchased from and sold to different brokers are reflected as both payables and receivables in the Statement of Assets and Liabilities under the caption "Delayed delivery", as applicable. Losses may arise due to changes in the value of the underlying securities or if the counterparty does not perform under the contract's terms, or if the issuer does not issue the securities due to political, economic, or other factors.
Restricted Securities (including Private Placements). Funds may invest in securities that are subject to legal or contractual restrictions on resale. These securities generally may be resold in transactions exempt from registration or to the public if the securities are registered. Disposal of these securities may involve time-consuming negotiations and expense, and prompt sale at an acceptable price may be difficult. Information regarding restricted securities held at period end is included at the end of the Schedule of Investments, if applicable.
4. Purchases and Sales of Investments.
Purchases and sales of securities, other than short-term securities and in-kind transactions, as applicable, are noted in the table below.
| | Purchases ($) | Sales ($) |
| Fidelity Climate Action Fund | 33,234,620 | 9,346,913 |
5. Fees and Other Transactions with Affiliates.
Management Fee. Fidelity Management & Research Company LLC (the investment adviser) and its affiliates provide the Fund with investment management related services for which the Fund pays a monthly management fee. The management fee is the sum of an individual fund fee rate that is based on an annual rate of .45% of the Fund's average net assets and an annualized group fee rate that averaged .22% during the period. The group fee rate is based upon the monthly average net assets of a group of registered investment companies with which the investment adviser has management contracts. The group fee rate decreases as assets under management increase and increases as assets under management decrease. In addition, the management fee is subject to a performance adjustment (up to a maximum of +/- .10% of the Fund's average net assets over a 36 month performance period). The upward or downward adjustment to the management fee is based on the relative investment performance of Climate Action as compared to its benchmark index, the MSCI World Index, over the same 36 month performance period. The Fund's performance adjustment will not take effect until June 1, 2022. Subsequent months will be added until the performance period includes 36 months. For the reporting period, the total annualized management fee rate was .68% of the Fund's average net assets.
Distribution and Service Plan Fees. In accordance with Rule 12b-1 of the 1940 Act, the Fund has adopted separate Distribution and Service Plans for each class of shares. Certain classes pay Fidelity Distributors Company LLC (FDC), an affiliate of the investment adviser, separate Distribution and Service Fees, each of which is based on an annual percentage of each class' average net assets. In addition, FDC may pay financial intermediaries for selling shares of the Fund and providing shareholder support services. For the period, the Distribution and Service Fee rates, total fees and amounts retained by FDC were as follows:
| | Distribution Fee | Service Fee | Total Fees | Retained by FDC |
| Class A | -% | .25% | $752 | $245 |
| Class M | .25% | .25% | 730 | 489 |
| Class C | .75% | .25% | 2,548 | 2,422 |
| | | | $4,030 | $3,156 |
Sales Load. FDC may receive a front-end sales charge of up to 5.75% for selling Class A shares and 3.50% for selling Class M shares, some of which is paid to financial intermediaries for selling shares of the Fund. Depending on the holding period, FDC may receive contingent deferred sales charges levied on Class A, Class M and Class C redemptions. The deferred sales charges are 1.00% for Class C shares, 1.00% for certain purchases of Class A shares and .25% for certain purchases of Class M shares.
For the period, sales charge amounts retained by FDC were as follows:
| | Retained by FDC |
| Class A | $198 |
| Class M | 2 |
| | $200 |
Transfer Agent Fees. Fidelity Investments Institutional Operations Company LLC (FIIOC), an affiliate of the investment adviser, is the transfer, dividend disbursing and shareholder servicing agent for each class of the Fund. FIIOC receives account fees and asset-based fees that vary according to the account size and type of account of the shareholders of the respective classes of the Fund, except for Class Z. FIIOC receives an asset-based fee of Class Z's average net assets. FIIOC pays for typesetting, printing and mailing of shareholder reports, except proxy statements.
For the period, transfer agent fees for each class were as follows:
| | Amount | % of Class-Level Average Net Assets(a) |
| Class A | $640 | .21 |
| Class M | 200 | .14 |
| Class C | 379 | .15 |
| Fidelity Climate Action Fund | 41,962 | .28 |
| Class I | 233 | .15 |
| Class Z | 45 | .04 |
| | $43,459 | |
(a) Annualized
Accounting Fees. Fidelity Service Company, Inc. (FSC), an affiliate of the investment adviser, maintains the Fund's accounting records. The accounting fee is based on the level of average net assets for each month. For the period, the fees were equivalent to the following annualized rates:
| | % of Average Net Assets |
| Fidelity Climate Action Fund | .04 |
Brokerage Commissions. A portion of portfolio transactions were placed with brokerage firms which are affiliates of the investment adviser. Brokerage commissions are included in net realized gain (loss) and change in net unrealized appreciation (depreciation) in the Statement of Operations. The commissions paid to these affiliated firms were as follows:
| | Amount |
| Fidelity Climate Action Fund | $179 |
Interfund Trades. Funds may purchase from or sell securities to other Fidelity Funds under procedures adopted by the Board. The procedures have been designed to ensure these interfund trades are executed in accordance with Rule 17a-7 of the 1940 Act. Any interfund trades are included within the respective purchases and sales amounts shown in the Purchases and Sales of Investments note. Interfund trades during the period are noted in the table below.
| | Purchases ($) | Sales ($) | Realized Gain (Loss) ($) |
| Fidelity Climate Action Fund | 538,162 | 252,732 | (25,789) |
6. Committed Line of Credit.
Certain Funds participate with other funds managed by the investment adviser or an affiliate in a $4.25 billion credit facility (the "line of credit") to be utilized for temporary or emergency purposes to fund shareholder redemptions or for other short-term liquidity purposes. The participating funds have agreed to pay commitment fees on their pro-rata portion of the line of credit, which are reflected in Miscellaneous expenses on the Statement of Operations, and are listed below. During the period, there were no borrowings on this line of credit.
| | Amount |
| Fidelity Climate Action Fund | $1 |
7. Expense Reductions.
The investment adviser contractually agreed to reimburse expenses of each class to the extent annual operating expenses exceeded certain levels of class-level average net assets as noted in the table below. This reimbursement will remain in place through September 30, 2023. Some expenses, for example the compensation of the independent Trustees are excluded from this reimbursement.
The following classes were in reimbursement during the period:
| | Expense Limitations | Reimbursement |
| Class A | 1.30% | $4,946 |
| Class M | 1.55% | 2,602 |
| Class C | 2.05% | 3,821 |
| Fidelity Climate Action Fund | 1.05% | 246,428 |
| Class I | 1.05% | 2,857 |
| Class Z | .90% | 2,275 |
| | | $262,929 |
In addition, during the period the investment adviser or an affiliate reimbursed and/or waived a portion of fund-level operating expenses in the amount of $415.
8. Share Transactions.
Share transactions for each class were as follows and may contain in-kind transactions, automatic conversions between classes or exchanges between affiliated funds:
| | Shares | Dollars |
| | Year ended May 31, 2022(a) | Year ended May 31, 2022(a) |
| Fidelity Climate Action Fund | | |
| Class A | | |
| Shares sold | 69,899 | $727,430 |
| Shares redeemed | (24,286) | (224,337) |
| Net increase (decrease) | 45,613 | $503,093 |
| Class M | | |
| Shares sold | 20,283 | $205,303 |
| Shares redeemed | (5,347) | (54,128) |
| Net increase (decrease) | 14,936 | $151,175 |
| Class C | | |
| Shares sold | 48,324 | $508,720 |
| Shares redeemed | (18,255) | (174,926) |
| Net increase (decrease) | 30,069 | $333,794 |
| Fidelity Climate Action Fund | | |
| Shares sold | 2,931,754 | $30,765,171 |
| Shares redeemed | (790,847) | (8,022,973) |
| Net increase (decrease) | 2,140,907 | $22,742,198 |
| Class I | | |
| Shares sold | 21,601 | $227,485 |
| Net increase (decrease) | 21,601 | $227,485 |
| Class Z | | |
| Shares sold | 12,403 | $126,011 |
| Shares redeemed | (207) | (1,882) |
| Net increase (decrease) | 12,196 | $124,129 |
(a) For the period June 15, 2021 (commencement of operations) through May 31, 2022.
9. Other.
A fund's organizational documents provide former and current trustees and officers with a limited indemnification against liabilities arising in connection with the performance of their duties to the fund. In the normal course of business, a fund may also enter into contracts that provide general indemnifications. A fund's maximum exposure under these arrangements is unknown as this would be dependent on future claims that may be made against a fund. The risk of material loss from such claims is considered remote.
10. Coronavirus (COVID-19) Pandemic.
An outbreak of COVID-19 first detected in China during December 2019 has since spread globally and was declared a pandemic by the World Health Organization during March 2020. Developments that disrupt global economies and financial markets, such as the COVID-19 pandemic, may magnify factors that affect the Fund's performance.
Report of Independent Registered Public Accounting Firm
To the Board of Trustees of Fidelity Summer Street Trust and Shareholders of Fidelity Climate Action Fund
Opinion on the Financial Statements and Financial Highlights
We have audited the accompanying statement of assets and liabilities of Fidelity Climate Action Fund (the "Fund"), a fund of Fidelity Summer Street Trust, including the schedule of investments, as of May 31, 2022, the related statement of operations, the statement of changes in net assets and the financial highlights for the period from June 15, 2021 (commencement of operations) through May 31, 2022, and the related notes. In our opinion, the financial statements and financial highlights present fairly, in all material respects, the financial position of the Fund as of May 31, 2022, the results of its operations, the changes in its net assets and the financial highlights for the period from June 15, 2021 (commencement of operations) through May 31, 2022, in conformity with accounting principles generally accepted in the United States of America.
Basis for Opinion
These financial statements and financial highlights are the responsibility of the Fund's management. Our responsibility is to express an opinion on the Fund's financial statements and financial highlights based on our audit. We are a public accounting firm registered with the Public Company Accounting Oversight Board (United States) (PCAOB) and are required to be independent with respect to the Fund in accordance with the U.S. federal securities laws and the applicable rules and regulations of the Securities and Exchange Commission and the PCAOB.
We conducted our audit in accordance with the standards of the PCAOB. Those standards require that we plan and perform the audit to obtain reasonable assurance about whether the financial statements and financial highlights are free of material misstatement, whether due to error or fraud. The Fund is not required to have, nor were we engaged to perform, an audit of its internal control over financial reporting. As part of our audit we are required to obtain an understanding of internal control over financial reporting but not for the purpose of expressing an opinion on the effectiveness of the Fund’s internal control over financial reporting. Accordingly, we express no such opinion.
Our audit included performing procedures to assess the risks of material misstatement of the financial statements and financial highlights, whether due to error or fraud, and performing procedures that respond to those risks. Such procedures included examining, on a test basis, evidence regarding the amounts and disclosures in the financial statements and financial highlights. Our audit also included evaluating the accounting principles used and significant estimates made by management, as well as evaluating the overall presentation of the financial statements and financial highlights. Our procedures included confirmation of securities owned as of May 31, 2022, by correspondence with the custodian and brokers; when replies were not received from brokers, we performed other auditing procedures. We believe that our audit provide a reasonable basis for our opinion.
/s/ Deloitte & Touche LLP
Boston, Massachusetts
July 14, 2022
We have served as the auditor of one or more of the Fidelity investment companies since 1999.
Trustees and Officers
The Trustees, Members of the Advisory Board (if any), and officers of the trust and fund, as applicable, are listed below. The Board of Trustees governs the fund and is responsible for protecting the interests of shareholders. The Trustees are experienced executives who meet periodically throughout the year to oversee the fund's activities, review contractual arrangements with companies that provide services to the fund, oversee management of the risks associated with such activities and contractual arrangements, and review the fund's performance. Each of the Trustees oversees 325 funds.
The Trustees hold office without limit in time except that (a) any Trustee may resign; (b) any Trustee may be removed by written instrument, signed by at least two-thirds of the number of Trustees prior to such removal; (c) any Trustee who requests to be retired or who has become incapacitated by illness or injury may be retired by written instrument signed by a majority of the other Trustees; and (d) any Trustee may be removed at any special meeting of shareholders by a two-thirds vote of the outstanding voting securities of the trust. Each Trustee who is not an interested person (as defined in the 1940 Act) of the trust and the fund is referred to herein as an Independent Trustee. Each Independent Trustee shall retire not later than the last day of the calendar year in which his or her 75th birthday occurs. The Independent Trustees may waive this mandatory retirement age policy with respect to individual Trustees. Officers and Advisory Board Members hold office without limit in time, except that any officer or Advisory Board Member may resign or may be removed by a vote of a majority of the Trustees at any regular meeting or any special meeting of the Trustees. Except as indicated, each individual has held the office shown or other offices in the same company for the past five years.
The fund's Statement of Additional Information (SAI) includes more information about the Trustees. To request a free copy, call Fidelity at 1-800-544-8544 if you’re an individual investing directly with Fidelity, call 1-800-835-5092 if you’re a plan sponsor or participant with Fidelity as your recordkeeper or call 1-877-208-0098 on institutional accounts or if you’re an advisor or invest through one.
Experience, Skills, Attributes, and Qualifications of the Trustees. The Governance and Nominating Committee has adopted a statement of policy that describes the experience, qualifications, attributes, and skills that are necessary and desirable for potential Independent Trustee candidates (Statement of Policy). The Board believes that each Trustee satisfied at the time he or she was initially elected or appointed a Trustee, and continues to satisfy, the standards contemplated by the Statement of Policy. The Governance and Nominating Committee also engages professional search firms to help identify potential Independent Trustee candidates who have the experience, qualifications, attributes, and skills consistent with the Statement of Policy. From time to time, additional criteria based on the composition and skills of the current Independent Trustees, as well as experience or skills that may be appropriate in light of future changes to board composition, business conditions, and regulatory or other developments, have also been considered by the professional search firms and the Governance and Nominating Committee. In addition, the Board takes into account the Trustees' commitment and participation in Board and committee meetings, as well as their leadership of standing and ad hoc committees throughout their tenure.
In determining that a particular Trustee was and continues to be qualified to serve as a Trustee, the Board has considered a variety of criteria, none of which, in isolation, was controlling. The Board believes that, collectively, the Trustees have balanced and diverse experience, qualifications, attributes, and skills, which allow the Board to operate effectively in governing the fund and protecting the interests of shareholders. Information about the specific experience, skills, attributes, and qualifications of each Trustee, which in each case led to the Board's conclusion that the Trustee should serve (or continue to serve) as a trustee of the fund, is provided below.
Board Structure and Oversight Function. Robert A. Lawrence is an interested person and currently serves as Chair. The Trustees have determined that an interested Chair is appropriate and benefits shareholders because an interested Chair has a personal and professional stake in the quality and continuity of services provided to the fund. Independent Trustees exercise their informed business judgment to appoint an individual of their choosing to serve as Chair, regardless of whether the Trustee happens to be independent or a member of management. The Independent Trustees have determined that they can act independently and effectively without having an Independent Trustee serve as Chair and that a key structural component for assuring that they are in a position to do so is for the Independent Trustees to constitute a substantial majority for the Board. The Independent Trustees also regularly meet in executive session. David M. Thomas serves as Lead Independent Trustee and as such (i) acts as a liaison between the Independent Trustees and management with respect to matters important to the Independent Trustees and (ii) with management prepares agendas for Board meetings.
Fidelity® funds are overseen by different Boards of Trustees. The fund's Board oversees Fidelity's high income and certain equity funds, and other Boards oversee Fidelity's investment-grade bond, money market, asset allocation, and other equity funds. The asset allocation funds may invest in Fidelity® funds overseen by the fund's Board. The use of separate Boards, each with its own committee structure, allows the Trustees of each group of Fidelity® funds to focus on the unique issues of the funds they oversee, including common research, investment, and operational issues. On occasion, the separate Boards establish joint committees to address issues of overlapping consequences for the Fidelity® funds overseen by each Board.
The Trustees operate using a system of committees to facilitate the timely and efficient consideration of all matters of importance to the Trustees, the fund, and fund shareholders and to facilitate compliance with legal and regulatory requirements and oversight of the fund's activities and associated risks. The Board, acting through its committees, has charged FMR and its affiliates with (i) identifying events or circumstances the occurrence of which could have demonstrably adverse effects on the fund's business and/or reputation; (ii) implementing processes and controls to lessen the possibility that such events or circumstances occur or to mitigate the effects of such events or circumstances if they do occur; and (iii) creating and maintaining a system designed to evaluate continuously business and market conditions in order to facilitate the identification and implementation processes described in (i) and (ii) above. Because the day-to-day operations and activities of the fund are carried out by or through FMR, its affiliates, and other service providers, the fund's exposure to risks is mitigated but not eliminated by the processes overseen by the Trustees. While each of the Board's committees has responsibility for overseeing different aspects of the fund's activities, oversight is exercised primarily through the Operations, Audit, and Compliance Committees. Appropriate personnel, including but not limited to the fund's Chief Compliance Officer (CCO), FMR's internal auditor, the independent accountants, the fund's Treasurer and portfolio management personnel, make periodic reports to the Board's committees, as appropriate, including an annual review of Fidelity's risk management program for the Fidelity® funds. The responsibilities of each standing committee, including their oversight responsibilities, are described further under "Standing Committees of the Trustees."
Interested Trustees*:
Correspondence intended for a Trustee who is an interested person may be sent to Fidelity Investments, 245 Summer Street, Boston, Massachusetts 02210.
Name, Year of Birth; Principal Occupations and Other Relevant Experience+
Bettina Doulton (1964)
Year of Election or Appointment: 2020
Trustee
Ms. Doulton also serves as Trustee of other Fidelity® funds. Prior to her retirement, Ms. Doulton served in a variety of positions at Fidelity Investments, including as a managing director of research (2006-2007), portfolio manager to certain Fidelity® funds (1993-2005), equity analyst and portfolio assistant (1990-1993), and research assistant (1987-1990). Ms. Doulton currently owns and operates Phi Builders + Architects and Cellardoor Winery. Previously, Ms. Doulton served as a member of the Board of Brown Capital Management, LLC (2014-2018).
Robert A. Lawrence (1952)
Year of Election or Appointment: 2020
Trustee
Chair of the Board of Trustees
Mr. Lawrence also serves as Trustee of other funds. Previously, Mr. Lawrence served as a Trustee and Member of the Advisory Board of certain funds. Prior to his retirement in 2008, Mr. Lawrence served as Vice President of certain Fidelity® funds (2006-2008), Senior Vice President, Head of High Income Division of Fidelity Management & Research Company (investment adviser firm, 2006-2008), and President of Fidelity Strategic Investments (investment adviser firm, 2002-2005).
* Determined to be an “Interested Trustee” by virtue of, among other things, his or her affiliation with the trust or various entities under common control with FMR.
+ The information includes the Trustee's principal occupation during the last five years and other information relating to the experience, attributes, and skills relevant to the Trustee's qualifications to serve as a Trustee, which led to the conclusion that the Trustee should serve as a Trustee for the fund.
Independent Trustees:
Correspondence intended for an Independent Trustee may be sent to Fidelity Investments, P.O. Box 55235, Boston, Massachusetts 02205-5235.
Name, Year of Birth; Principal Occupations and Other Relevant Experience+
Thomas P. Bostick (1956)
Year of Election or Appointment: 2021
Trustee
Lieutenant General Bostick also serves as Trustee of other Fidelity® funds. Prior to his retirement, General Bostick (United States Army, Retired) held a variety of positions within the U.S. Army, including Commanding General and Chief of Engineers, U.S. Army Corps of Engineers (2012-2016) and Deputy Chief of Staff and Director of Human Resources, U.S. Army (2009-2012). General Bostick currently serves as a member of the Board and Finance and Governance Committees of CSX Corporation (transportation, 2020-present) and a member of the Board and Corporate Governance and Nominating Committee of Perma-Fix Environmental Services, Inc. (nuclear waste management, 2020-present). General Bostick serves as Chief Executive Officer of Bostick Global Strategies, LLC (consulting, 2016-present) and as a member of the Board of HireVue, Inc. (video interview and assessment, 2020-present). Previously, General Bostick served as a Member of the Advisory Board of certain Fidelity® funds (2021), President, Intrexon Bioengineering (2018-2020) and Chief Operating Officer (2017-2020) and Senior Vice President of the Environment Sector (2016-2017) of Intrexon Corporation (biopharmaceutical company).
Dennis J. Dirks (1948)
Year of Election or Appointment: 2005
Trustee
Mr. Dirks also serves as Trustee of other Fidelity® funds. Prior to his retirement in May 2003, Mr. Dirks served as Chief Operating Officer and as a member of the Board of The Depository Trust & Clearing Corporation (financial markets infrastructure), President, Chief Operating Officer and a member of the Board of The Depository Trust Company (DTC), President and a member of the Board of the National Securities Clearing Corporation (NSCC), Chief Executive Officer and a member of the Board of the Government Securities Clearing Corporation and Chief Executive Officer and a member of the Board of the Mortgage-Backed Securities Clearing Corporation. Mr. Dirks currently serves as a member of the Finance Committee (2016-present) and Board (2017-present) and is Treasurer (2018-present) of the Asolo Repertory Theatre.
Donald F. Donahue (1950)
Year of Election or Appointment: 2018
Trustee
Mr. Donahue also serves as Trustee of other Fidelity® funds. Mr. Donahue serves as President and Chief Executive Officer of Miranda Partners, LLC (risk consulting for the financial services industry, 2012-present). Previously, Mr. Donahue served as Chief Executive Officer (2006-2012), Chief Operating Officer (2003-2006) and Managing Director, Customer Marketing and Development (1999-2003) of The Depository Trust & Clearing Corporation (financial markets infrastructure). Mr. Donahue currently serves as a member (2007-present) and Co-Chairman (2016-present) of the Board of United Way of New York and a member of the Board of The Leadership Academy (previously NYC Leadership Academy) (2012-present). Mr. Donahue previously served as a member of the Advisory Board of certain Fidelity® funds (2015-2018).
Vicki L. Fuller (1957)
Year of Election or Appointment: 2020
Trustee
Ms. Fuller also serves as Trustee of other Fidelity® funds. Previously, Ms. Fuller served as a member of the Advisory Board of certain Fidelity® funds (2018-2020), Chief Investment Officer of the New York State Common Retirement Fund (2012-2018) and held a variety of positions at AllianceBernstein L.P. (global asset management, 1985-2012), including Managing Director (2006-2012) and Senior Vice President and Senior Portfolio Manager (2001-2006). Ms. Fuller currently serves as a member of the Board, Audit Committee and Nominating and Governance Committee of two Blackstone business development companies (2020-present), as a member of the Board of Treliant, LLC (consulting, 2019-present), as a member of the Advisory Board of Ariel Alternatives, LLC (private equity, 2021-present) and as a member of the Board and Chair of the Audit Committee of Gusto, Inc. (software, 2021-present). In addition, Ms. Fuller currently serves as a member of the Board of Roosevelt University (2019-present) and as a member of the Executive Board of New York University’s Stern School of Business. Ms. Fuller previously served as a member of the Board, Audit Committee and Nominating and Governance Committee of The Williams Companies, Inc. (natural gas infrastructure, 2018-2021).
Patricia L. Kampling (1959)
Year of Election or Appointment: 2020
Trustee
Ms. Kampling also serves as Trustee of other Fidelity® funds. Prior to her retirement, Ms. Kampling served as Chairman of the Board and Chief Executive Officer (2012-2019), President and Chief Operating Officer (2011-2012) and Executive Vice President and Chief Financial Officer (2010-2011) of Alliant Energy Corporation. Ms. Kampling currently serves as a member of the Board, Finance Committee and Governance, Compensation and Nominating Committee of Xcel Energy Inc. (utilities company, 2020-present) and as a member of the Board, Audit, Finance and Risk Committee and Safety, Environmental, Technology and Operations Committee and Chair of the Executive Development and Compensation Committee of American Water Works Company, Inc. (utilities company, 2019-present). In addition, Ms. Kampling currently serves as a member of the Board of the Nature Conservancy, Wisconsin Chapter (2019-present). Previously, Ms. Kampling served as a Member of the Advisory Board of certain Fidelity® funds (2020), a member of the Board, Compensation Committee and Executive Committee and Chair of the Audit Committee of Briggs & Stratton Corporation (manufacturing, 2011-2021), a member of the Board of Interstate Power and Light Company (2012-2019) and Wisconsin Power and Light Company (2012-2019) (each a subsidiary of Alliant Energy Corporation) and as a member of the Board and Workforce Development Committee of the Business Roundtable (2018-2019).
Thomas A. Kennedy (1955)
Year of Election or Appointment: 2021
Trustee
Mr. Kennedy also serves as Trustee of other Fidelity® funds. Previously, Mr. Kennedy served as a Member of the Advisory Board of certain Fidelity® funds (2020) and held a variety of positions at Raytheon Company (aerospace and defense, 1983-2020), including Chairman and Chief Executive Officer (2014-2020) and Executive Vice President and Chief Operating Officer (2013-2014). Mr. Kennedy currently serves as Executive Chairman of the Board of Directors of Raytheon Technologies Corporation (aerospace and defense, 2020-present). He is also a member of the Rutgers School of Engineering Industry Advisory Board (2011-present) and a member of the UCLA Engineering Dean’s Executive Board (2016-present).
Oscar Munoz (1959)
Year of Election or Appointment: 2021
Trustee
Mr. Munoz also serves as Trustee of other Fidelity® funds. Prior to his retirement, Mr. Munoz served as Executive Chairman (2020-2021), Chief Executive Officer (2015-2020), President (2015-2016) and a member of the Board (2010-2021) of United Airlines Holdings, Inc. Mr. Munoz currently serves as a member of the Board of CBRE Group, Inc. (commercial real estate, 2020-present), a member of the Board of Univision Communications, Inc. (Hispanic media, 2020-present) and a member of the Advisory Board of Salesforce.com, Inc. (cloud-based software, 2020-present). Previously, Mr. Munoz served as a Member of the Advisory Board of certain Fidelity® funds (2021).
Garnett A. Smith (1947)
Year of Election or Appointment: 2018
Trustee
Mr. Smith also serves as Trustee of other Fidelity® funds. Prior to his retirement, Mr. Smith served as Chairman and Chief Executive Officer (1990-1997) and President (1986-1990) of Inbrand Corp. (manufacturer of personal absorbent products). Prior to his employment with Inbrand Corp., he was employed by a retail fabric chain and North Carolina National Bank (now Bank of America). Mr. Smith previously served as a member of the Advisory Board of certain Fidelity® funds (2012-2013).
David M. Thomas (1949)
Year of Election or Appointment: 2008
Trustee
Lead Independent Trustee
Mr. Thomas also serves as Trustee of other Fidelity® funds. Previously, Mr. Thomas served as Executive Chairman (2005-2006) and Chairman and Chief Executive Officer (2000-2005) of IMS Health, Inc. (pharmaceutical and healthcare information solutions). Mr. Thomas currently serves as a member of the Board of Fortune Brands Home and Security (home and security products, 2004-present) and as Director (2013-present) and Non-Executive Chairman of the Board (2022-present) of Interpublic Group of Companies, Inc. (marketing communication).
Susan Tomasky (1953)
Year of Election or Appointment: 2020
Trustee
Ms. Tomasky also serves as Trustee of other Fidelity® funds. Prior to her retirement, Ms. Tomasky served in various executive officer positions at American Electric Power Company, Inc. (1998-2011), including most recently as President of AEP Transmission (2007-2011). Ms. Tomasky currently serves as a member of the Board and Sustainability Committee and as Chair of the Audit Committee of Marathon Petroleum Corporation (2018-present) and as a member of the Board, Executive Committee, Corporate Governance Committee and Organization and Compensation Committee and as Chair of the Audit Committee of Public Service Enterprise Group, Inc. (utilities company, 2012-present) and as a member of the Board of its subsidiary company, Public Service Electric and Gas Co. (2021-present). In addition, Ms. Tomasky currently serves as a member (2009-present) and President (2020-present) of the Board of the Royal Shakespeare Company – America (2009-present), as a member of the Board of the Columbus Association for the Performing Arts (2011-present) and as a member of the Board and Kenyon in the World Committee of Kenyon College (2016-present). Previously, Ms. Tomasky served as a Member of the Advisory Board of certain Fidelity® funds (2020), as a member of the Board of the Columbus Regional Airport Authority (2007-2020), as a member of the Board (2011-2018) and Lead Independent Director (2015-2018) of Andeavor Corporation (previously Tesoro Corporation) (independent oil refiner and marketer) and as a member of the Board of Summit Midstream Partners LP (energy, 2012-2018).
Michael E. Wiley (1950)
Year of Election or Appointment: 2018
Trustee
Mr. Wiley also serves as Trustee of other Fidelity® funds. Previously, Mr. Wiley served as a member of the Advisory Board of certain Fidelity® funds (2018-2020), Chairman, President and CEO of Baker Hughes, Inc. (oilfield services, 2000-2004). Mr. Wiley also previously served as a member of the Board of Andeavor Corporation (independent oil refiner and marketer, 2005-2018), a member of the Board of Andeavor Logistics LP (natural resources logistics, 2015-2018) and a member of the Board of High Point Resources (exploration and production, 2005-2020).
+ The information includes the Trustee's principal occupation during the last five years and other information relating to the experience, attributes, and skills relevant to the Trustee's qualifications to serve as a Trustee, which led to the conclusion that the Trustee should serve as a Trustee for the fund.
Advisory Board Members and Officers:
Correspondence intended for a Member of the Advisory Board (if any) may be sent to Fidelity Investments, P.O. Box 55235, Boston, Massachusetts 02205-5235. Correspondence intended for an officer or Peter S. Lynch may be sent to Fidelity Investments, 245 Summer Street, Boston, Massachusetts 02210. Officers appear below in alphabetical order.
Name, Year of Birth; Principal Occupation
Peter S. Lynch (1944)
Year of Election or Appointment: 2003
Member of the Advisory Board
Mr. Lynch also serves as a Member of the Advisory Board of other Fidelity® funds. Mr. Lynch is Vice Chairman and a Director of Fidelity Management & Research Company LLC (investment adviser firm). In addition, Mr. Lynch serves as a Trustee of Boston College and as the Chairman of the Inner-City Scholarship Fund. Previously, Mr. Lynch served as Vice Chairman and a Director of FMR Co., Inc. (investment adviser firm) and on the Special Olympics International Board of Directors (1997-2006).
Craig S. Brown (1977)
Year of Election or Appointment: 2019
Assistant Treasurer
Mr. Brown also serves as an officer of other funds. Mr. Brown serves as Assistant Treasurer of FIMM, LLC (2021-present) and is an employee of Fidelity Investments (2013-present).
John J. Burke III (1964)
Year of Election or Appointment: 2018
Chief Financial Officer
Mr. Burke also serves as Chief Financial Officer of other funds. Mr. Burke serves as Head of Investment Operations for Fidelity Fund and Investment Operations (2018-present) and is an employee of Fidelity Investments (1998-present). Previously Mr. Burke served as head of Asset Management Investment Operations (2012-2018).
William C. Coffey (1969)
Year of Election or Appointment: 2019
Assistant Secretary
Mr. Coffey also serves as Assistant Secretary of other funds. He is Senior Vice President and Deputy General Counsel of FMR LLC (diversified financial services company, 2010-present), and is an employee of Fidelity Investments. Previously, Mr. Coffey served as Secretary and CLO of certain funds (2018-2019); CLO, Secretary, and Senior Vice President of Fidelity Management & Research Company and FMR Co., Inc. (investment adviser firms, 2018-2019); Secretary of Fidelity SelectCo, LLC and Fidelity Investments Money Management, Inc. (investment adviser firms, 2018-2019); CLO of Fidelity Management & Research (Hong Kong) Limited, FMR Investment Management (UK) Limited, and Fidelity Management & Research (Japan) Limited (investment adviser firms, 2018-2019); and Assistant Secretary of certain funds (2009-2018).
Timothy M. Cohen (1969)
Year of Election or Appointment: 2018
Vice President
Mr. Cohen also serves as Vice President of other funds. Mr. Cohen serves as Co-Head of Equity (2018-present), a Director of Fidelity Management & Research (Japan) Limited (investment adviser firm, 2016-present), and is an employee of Fidelity Investments. Previously, Mr. Cohen served as Executive Vice President of Fidelity SelectCo, LLC (2019), Head of Global Equity Research (2016-2018), Chief Investment Officer - Equity and a Director of Fidelity Management & Research (U.K.) Inc. (investment adviser firm, 2013-2015) and as a Director of Fidelity Management & Research (Hong Kong) Limited (investment adviser firm, 2017).
Jonathan Davis (1968)
Year of Election or Appointment: 2010
Assistant Treasurer
Mr. Davis also serves as an officer of other funds. Mr. Davis serves as Assistant Treasurer of FIMM, LLC (2021-present), FMR Capital, Inc. (2017-present), FD Funds GP LLC (2021-present), FD Funds Holding LLC (2021-present), and FD Funds Management LLC (2021-present); and is an employee of Fidelity Investments. Previously, Mr. Davis served as Vice President and Associate General Counsel of FMR LLC (diversified financial services company, 2003-2010).
Laura M. Del Prato (1964)
Year of Election or Appointment: 2018
Assistant Treasurer
Ms. Del Prato also serves as an officer of other funds. Ms. Del Prato serves as Assistant Treasurer of FIMM, LLC (2021-present) and is an employee of Fidelity Investments (2017-present). Previously, Ms. Del Prato served as President and Treasurer of The North Carolina Capital Management Trust: Cash Portfolio and Term Portfolio (2018-2020). Prior to joining Fidelity Investments, Ms. Del Prato served as a Managing Director and Treasurer of the JPMorgan Mutual Funds (2014-2017). Prior to JPMorgan, Ms. Del Prato served as a partner at Cohen Fund Audit Services (accounting firm, 2012-2013) and KPMG LLP (accounting firm, 2004-2012).
Colm A. Hogan (1973)
Year of Election or Appointment: 2020
Assistant Treasurer
Mr. Hogan also serves as an officer of other funds. Mr. Hogan serves as Assistant Treasurer of FIMM, LLC (2021-present) and FMR Capital, Inc. (2017-present) and is an employee of Fidelity Investments (2005-present). Previously, Mr. Hogan served as Deputy Treasurer of certain Fidelity® funds (2016-2020) and Assistant Treasurer of certain Fidelity® funds (2016-2018).
Pamela R. Holding (1964)
Year of Election or Appointment: 2018
Vice President
Ms. Holding also serves as Vice President of other funds. Ms. Holding serves as Co-Head of Equity (2018-present) and is an employee of Fidelity Investments (2013-present). Previously, Ms. Holding served as Executive Vice President of Fidelity SelectCo, LLC (2019) and as Chief Investment Officer of Fidelity Institutional Asset Management (2013-2018).
Cynthia Lo Bessette (1969)
Year of Election or Appointment: 2019
Secretary and Chief Legal Officer (CLO)
Ms. Lo Bessette also serves as an officer of other funds. Ms. Lo Bessette serves as CLO, Secretary, and Senior Vice President of Fidelity Management & Research Company LLC (investment adviser firm, 2019-present); CLO of Fidelity Management & Research (Hong Kong) Limited, FMR Investment Management (UK) Limited, and Fidelity Management & Research (Japan) Limited (investment adviser firms, 2019-present); Secretary of FD Funds GP LLC (2021-present), FD Funds Holding LLC (2021-present), and FD Funds Management LLC (2021-present); and Assistant Secretary of FIMM, LLC (2019-present). She is a Senior Vice President and Deputy General Counsel of FMR LLC (diversified financial services company, 2019-present), and is an employee of Fidelity Investments. Previously, Ms. Lo Bessette served as CLO, Secretary, and Senior Vice President of FMR Co., Inc. (investment adviser firm, 2019); Secretary of Fidelity SelectCo, LLC and Fidelity Investments Money Management, Inc. (investment adviser firms, 2019). Prior to joining Fidelity Investments, Ms. Lo Bessette was Executive Vice President, General Counsel (2016-2019) and Senior Vice President, Deputy General Counsel (2015-2016) of OppenheimerFunds (investment management company) and Deputy Chief Legal Officer (2013-2015) of Jennison Associates LLC (investment adviser firm).
Chris Maher (1972)
Year of Election or Appointment: 2020
Deputy Treasurer
Mr. Maher also serves as an officer of other funds. Mr. Maher serves as Assistant Treasurer of FIMM, LLC (2021-present) and FMR Capital, Inc. (2017-present), and is an employee of Fidelity Investments (2008-present). Previously, Mr. Maher served as Assistant Treasurer of certain funds (2013-2020); Vice President of Asset Management Compliance (2013), Vice President of the Program Management Group of FMR (investment adviser firm, 2010-2013), and Vice President of Valuation Oversight (2008-2010).
Jason P. Pogorelec (1975)
Year of Election or Appointment: 2020
Chief Compliance Officer
Mr. Pogorelec also serves as Chief Compliance Officer of other funds. Mr. Pogorelec is a senior Vice President of Asset Management Compliance for Fidelity Investments and is an employee of Fidelity Investments (2006-present). Previously, Mr. Pogorelec served as Vice President, Associate General Counsel for Fidelity Investments (2010-2020) and Assistant Secretary of certain Fidelity funds (2015-2020).
Brett Segaloff (1972)
Year of Election or Appointment: 2021
Anti-Money Laundering (AML) Officer
Mr. Segaloff also serves as an AML Officer of other funds and other related entities. He is Director, Anti-Money Laundering (2007-present) of FMR LLC (diversified financial services company) and is an employee of Fidelity Investments (1996-present).
Stacie M. Smith (1974)
Year of Election or Appointment: 2016
President and Treasurer
Ms. Smith also serves as an officer of other funds. Ms. Smith serves as Assistant Treasurer of FIMM, LLC (2021-present) and FMR Capital, Inc. (2017-present), is an employee of Fidelity Investments (2009-present), and has served in other fund officer roles. Prior to joining Fidelity Investments, Ms. Smith served as Senior Audit Manager of Ernst & Young LLP (accounting firm, 1996-2009). Previously, Ms. Smith served as Assistant Treasurer (2013-2019) and Deputy Treasurer (2013-2016) of certain Fidelity® funds.
Jim Wegmann (1979)
Year of Election or Appointment: 2019
Assistant Treasurer
Mr. Wegmann also serves as an officer of other funds. Mr. Wegmann serves as Assistant Treasurer of FIMM, LLC (2021-present) and is an employee of Fidelity Investments (2011-present). Previously, Mr. Wegmann served as Assistant Treasurer of certain Fidelity® funds (2019-2021).
Shareholder Expense Example
As a shareholder, you incur two types of costs: (1) transaction costs, which may include sales charges (loads) on purchase payments or redemption proceeds, as applicable and (2) ongoing costs, which generally include management fees, distribution and/or service (12b-1) fees and other Fund expenses. This Example is intended to help you understand your ongoing costs (in dollars) of investing in a fund and to compare these costs with the ongoing costs of investing in other mutual funds.
The Example is based on an investment of $1,000 invested at the beginning of the period and held for the entire period (December 1, 2021 to May 31, 2022).
Actual Expenses
The first line of the accompanying table provides information about actual account values and actual expenses. You may use the information in this line, together with the amount you invested, to estimate the expenses that you paid over the period. Simply divide your account value by $1,000.00 (for example, an $8,600 account value divided by $1,000.00 = 8.6), then multiply the result by the number in the first line for a class/Fund under the heading entitled "Expenses Paid During Period" to estimate the expenses you paid on your account during this period. If any fund is a shareholder of any underlying mutual funds or exchange-traded funds (ETFs) (the Underlying Funds), such fund indirectly bears its proportional share of the expenses of the Underlying Funds in addition to the direct expenses incurred presented in the table. These fees and expenses are not included in the annualized expense ratio used to calculate the expense estimate in the table below.
Hypothetical Example for Comparison Purposes
The second line of the accompanying table provides information about hypothetical account values and hypothetical expenses based on the actual expense ratio and an assumed rate of return of 5% per year before expenses, which is not the actual return. The hypothetical account values and expenses may not be used to estimate the actual ending account balance or expenses you paid for the period. You may use this information to compare the ongoing costs of investing in the Fund and other funds. To do so, compare this 5% hypothetical example with the 5% hypothetical examples that appear in the shareholder reports of the other funds. If any fund is a shareholder of any Underlying Funds, such fund indirectly bears its proportional share of the expenses of the Underlying Funds in addition to the direct expenses as presented in the table. These fees and expenses are not included in the annualized expense ratio used to calculate the expense estimate in the table below.
Please note that the expenses shown in the table are meant to highlight your ongoing costs only and do not reflect any transaction costs. Therefore, the second line of the table is useful in comparing ongoing costs only, and will not help you determine the relative total costs of owning different funds. In addition, if these transactional costs were included, your costs would have been higher.
| | Annualized Expense Ratio-A | Beginning
Account Value
December 1, 2021 | Ending
Account Value
May 31, 2022 | Expenses Paid
During Period-B
December 1, 2021
to May 31, 2022 |
| Fidelity Climate Action Fund | | | | |
| Class A | 1.28% | | | |
| Actual | | $1,000.00 | $806.50 | $5.76 |
| Hypothetical-C | | $1,000.00 | $1,018.55 | $6.44 |
| Class M | 1.55% | | | |
| Actual | | $1,000.00 | $805.50 | $6.98 |
| Hypothetical-C | | $1,000.00 | $1,017.20 | $7.80 |
| Class C | 2.03% | | | |
| Actual | | $1,000.00 | $804.00 | $9.13 |
| Hypothetical-C | | $1,000.00 | $1,014.81 | $10.20 |
| Fidelity Climate Action Fund | 1.05% | | | |
| Actual | | $1,000.00 | $807.60 | $4.73 |
| Hypothetical-C | | $1,000.00 | $1,019.70 | $5.29 |
| Class I | 1.04% | | | |
| Actual | | $1,000.00 | $807.60 | $4.69 |
| Hypothetical-C | | $1,000.00 | $1,019.75 | $5.24 |
| Class Z | .90% | | | |
| Actual | | $1,000.00 | $807.80 | $4.06 |
| Hypothetical-C | | $1,000.00 | $1,020.44 | $4.53 |
A Annualized expense ratio reflects expenses net of applicable fee waivers.
B Expenses are equal to the annualized expense ratio, multiplied by the average account value over the period, multiplied by 182/ 365 (to reflect the one-half year period). The fees and expenses of any Underlying Funds are not included in each annualized expense ratio.
C 5% return per year before expenses
Distributions (Unaudited)
The dividend and capital gains distributions for the fund(s) are available on Fidelity.com or Institutional.Fidelity.com.
The fund will notify shareholders in January 2023 of amounts for use in preparing 2022 income tax returns.
Board Approval of Investment Advisory Contracts and Management Fees
Fidelity Climate Action Fund
Each year, the Board of Trustees, including the Independent Trustees (together, the Board), votes on the renewal of the management contract with Fidelity Management & Research Company LLC (FMR) and the sub-advisory agreements (together, the Advisory Contracts) for the fund. FMR and the sub-advisers are referred to herein as the Investment Advisers. The Board, assisted by the advice of fund counsel and Independent Trustees' counsel, requests and considers a broad range of information relevant to the renewal of the Advisory Contracts throughout the year.
The Board meets regularly and, at each of its meetings, covers an extensive agenda of topics and materials and considers factors that are relevant to its annual consideration of the renewal of the fund's Advisory Contracts, including the services and support provided to the fund and its shareholders. The Board has established various standing committees (Committees), each composed of and chaired by Independent Trustees with varying backgrounds, to which the Board has assigned specific subject matter responsibilities in order to enhance effective decision-making by the Board. The Board, acting directly and through its Committees, requests and receives information concerning the annual consideration of the renewal of the fund's Advisory Contracts. The Board also meets as needed to review matters specifically related to the Board's annual consideration of the renewal of the Advisory Contracts. Members of the Board may also meet with trustees of other Fidelity funds through joint ad hoc committees to discuss certain matters relevant to all of the Fidelity funds.
At its May 2022 meeting, the Board unanimously determined to renew the fund's Advisory Contracts. In reaching its determination, the Board considered all factors it believed relevant, including (i) the nature, extent, and quality of the services provided to the fund and its shareholders (including the investment performance of the fund); (ii) the competitiveness relative to peer funds of the fund's management fee and the total expense ratio of a representative class (retail class); (iii) the total costs of the services provided by and the profits realized by Fidelity from its relationships with the fund; and (iv) the extent to which, if any, economies of scale exist and are realized as the fund grows, and whether any economies of scale are appropriately shared with fund shareholders.
In considering whether to renew the Advisory Contracts for the fund, the Board reached a determination, with the assistance of fund counsel and Independent Trustees' counsel and through the exercise of its business judgment, that the renewal of the Advisory Contracts was in the best interests of the fund and its shareholders and that the compensation payable under the Advisory Contracts was fair and reasonable. The Board's decision to renew the Advisory Contracts was not based on any single factor, but rather was based on a comprehensive consideration of all the information provided to the Board at its meetings throughout the year. The Board, in reaching its determination to renew the Advisory Contracts, was aware that shareholders of the fund have a broad range of investment choices available to them, including a wide choice among funds offered by Fidelity's competitors, and that the fund's shareholders, who have the opportunity to review and weigh the disclosure provided by the fund in its prospectus and other public disclosures, have chosen to invest in this fund, which is part of the Fidelity family of funds.
Nature, Extent, and Quality of Services Provided. The Board considered Fidelity's staffing as it relates to the fund, including the backgrounds of investment personnel of Fidelity, and also considered the fund's investment objective, strategies, and related investment philosophy. The Independent Trustees also had discussions with senior management of Fidelity's investment operations and investment groups. The Board considered the structure of the investment personnel compensation program and whether this structure provides appropriate incentives to act in the best interests of the fund. Additionally, the Board considered the portfolio managers' investments, if any, in the funds that they manage. The Board also considered the steps Fidelity had taken to ensure the continued provision of high quality services to the Fidelity funds during the COVID-19 pandemic, including the expansion of staff in client facing positions to maintain service levels in periods of high volumes and volatility.
Resources Dedicated to Investment Management and Support Services. The Board and the Fund Oversight and Research Committees reviewed the general qualifications and capabilities of Fidelity's investment staff, including its size, education, experience, and resources, as well as Fidelity's approach to recruiting, training, managing, and compensating investment personnel. The Board noted the resources devoted to expansion of Fidelity's global investment organization, and that Fidelity's analysts have extensive resources, tools, and capabilities that allow them to conduct sophisticated quantitative and fundamental analysis, as well as credit analysis of issuers, counterparties, and guarantors. Further, the Board considered that Fidelity's investment professionals have sufficient access to global information and data so as to provide competitive investment results over time, and that those professionals also have access to sophisticated tools that permit them to assess portfolio construction and risk and performance attribution characteristics continuously, as well as to transmit new information and research conclusions rapidly around the world. Additionally, in its deliberations, the Board considered Fidelity's trading, risk management, compliance, and technology and operations capabilities and resources, which are integral parts of the investment management process.
Shareholder and Administrative Services. The Board considered (i) the nature, extent, quality, and cost of advisory, administrative, and shareholder services performed by the Investment Advisers and their affiliates under the Advisory Contracts and under separate agreements covering transfer agency, pricing and bookkeeping, and securities lending services for the fund; (ii) the nature and extent of the supervision of third party service providers, principally custodians, subcustodians, and pricing vendors; and (iii) the resources devoted to, and the record of compliance with, the fund's compliance policies and procedures. The Board also reviewed the allocation of fund brokerage, including allocations to brokers affiliated with the Investment Advisers, the use of brokerage commissions to pay fund expenses, and the use of "soft" commission dollars to pay for research services.
The Board noted that the growth of fund assets over time across the complex allows Fidelity to reinvest in the development of services designed to enhance the value and convenience of the Fidelity funds as investment vehicles. These services include 24-hour access to account information and market information over the Internet and through telephone representatives, investor education materials, and asset allocation tools. The Board also considered that it reviews customer service metrics such as telephone response times, continuity of services on the website and metrics addressing services at Fidelity Investor Centers.
Investment in a Large Fund Family. The Board considered the benefits to shareholders of investing in a Fidelity fund, including the benefits of investing in a fund that is part of a large family of funds offering a variety of investment disciplines and providing a large variety of mutual fund investor services. The Board noted that Fidelity had taken, or had made recommendations that resulted in the Fidelity funds taking, a number of actions over the previous year that benefited particular funds, including: (i) continuing to dedicate additional resources to Fidelity's investment research process, which includes meetings with management of issuers of securities in which the funds invest; (ii) continuing efforts to enhance Fidelity's global research capabilities; (iii) launching new funds and ETFs with innovative structures, strategies and pricing and making other enhancements to meet client needs; (iv) launching new share classes of existing funds; (v) eliminating purchase minimums and broadening eligibility requirements for certain funds and share classes; (vi) reducing management fees and total expenses for certain target date funds and classes and index funds; (vii) lowering expenses for certain existing funds and classes by implementing or lowering expense caps; (viii) rationalizing product lines and gaining increased efficiencies from fund mergers and liquidations; (ix) continuing to develop, acquire and implement systems and technology to improve services to the funds and shareholders, strengthen information security, and increase efficiency; and (x) continuing to implement enhancements to further strengthen Fidelity's product line to increase investors' probability of success in achieving their investment goals, including retirement income goals.
Investment Performance. The Board considered whether the fund has operated in accordance with its investment objective, as well as its record of compliance with its investment restrictions. As the fund recently commenced operations, the Board did not believe that it was appropriate to assign significant weight to its limited investment performance history.
Based on its review, the Board concluded that the nature, extent, and quality of services provided to the fund under the Advisory Contracts should continue to benefit the shareholders of the fund.
Competitiveness of Management Fee and Total Expense Ratio. The Board considered the fund's management fee and total expense ratio compared to "mapped groups" of competitive funds and classes created for the purpose of facilitating the Trustees' competitive analysis of management fees and total expenses. Fidelity creates "mapped groups" by combining similar Lipper investment objective categories that have comparable investment mandates. Combining Lipper investment objective categories aids the Board's management fee and total expense ratio comparisons by broadening the competitive group used for comparison.
Management Fee. The Board considered two proprietary management fee comparisons for the period of the fund's operations shown in basis points (BP) in the chart below. The group of Lipper funds used by the Board for management fee comparisons is referred to below as the "Total Mapped Group." The Total Mapped Group comparison focuses on a fund's standing in terms of gross management fees before expense reimbursements or caps, and without giving effect to the fund's performance adjustment, relative to the total universe of funds with comparable investment mandates, regardless of whether their management fee structures also are comparable. Funds with comparable investment mandates offer exposure to similar types of securities. Funds with comparable management fee structures have similar management fee contractual arrangements (
e.g., flat rate charged for advisory services, all-inclusive fee rate,
etc.). "TMG %" represents the percentage of funds in the Total Mapped Group that had management fees that were lower than the fund's. For example, a hypothetical TMG % of 20% would mean that 80% of the funds in the Total Mapped Group had higher, and 20% had lower, management fees than the fund. The fund's actual TMG % and the number of funds in the Total Mapped Group are in the chart below. The "Asset-Sized Peer Group" (ASPG) comparison focuses on a fund's standing relative to a subset of non-Fidelity funds within the Total Mapped Group that are similar in size and management fee structure without taking into account performance adjustments, if any. For example, if a fund is in the first quartile of the ASPG, the fund's management fee ranks in the least expensive or lowest 25% of funds in the ASPG. The ASPG represents at least 15% of the funds in the Total Mapped Group with comparable asset size and management fee structures, subject to a minimum of 50 funds (or all funds in the Total Mapped Group if fewer than 50). Additional information, such as the ASPG quartile in which the fund's management fee rate ranked and the impact of the fund's performance adjustment, is also included in the chart and was considered by the Board.
Fidelity Climate Action Fund
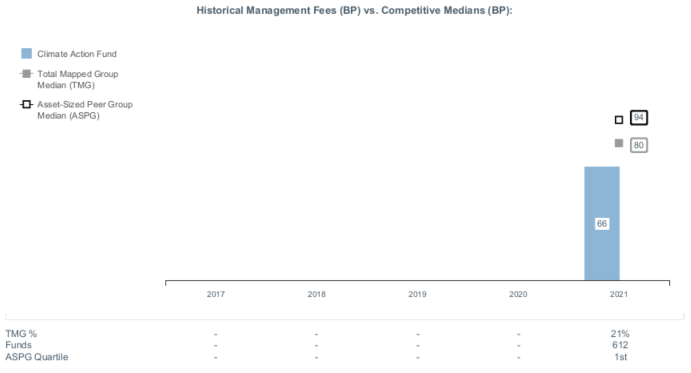
The Board noted that the fund's management fee rate ranked below the median of its Total Mapped Group and below the median of its ASPG for the 12-month period ended September 30, 2021. The Board also noted the effect of the fund's performance adjustment, if any, on the fund's management fee ranking.
The Board also considered that, for funds subject to the group fee, FMR agreed to voluntarily waive fees over a specified period of time in amounts designed to account for assets converted from certain funds to certain collective investment trusts.
Based on its review, the Board concluded that the fund's management fee is fair and reasonable in light of the services that the fund receives and the other factors considered.
Total Expense Ratio. In its review of the total expense ratio of the representative class (retail class), the Board considered the fund's management fee rate as well as other fund or class expenses, as applicable, such as transfer agent fees, pricing and bookkeeping fees, and custodial, legal, and audit fees. The Board noted the impact of the fund's performance adjustment. The Board also noted that Fidelity may agree to waive fees or reimburse expenses from time to time, and the extent to which, if any, it has done so for the fund. The fund's representative class is compared to those funds and classes in the Total Mapped Group (used by the Board for management fee comparisons) that have a similar sales load structure. The Board also considered a total expense ASPG comparison for the representative class, which focuses on the total expenses of the representative class relative to a subset of non-Fidelity funds within the total expense similar sales load structure group. The total expense ASPG is limited to 15 larger and 15 smaller classes in fund average assets for a total of 30 classes, where possible. The total expense ASPG comparison excludes performance adjustments and fund-paid 12b-1 fees to eliminate variability in fee structures.
The Board noted that the total net expense ratio of the retail class ranked below the similar sales load structure group competitive median and above the ASPG competitive median for the 12-month period ended September 30, 2021. The Board considered that, in general, various factors can affect total expense ratios. The Board also considered that Fidelity believes that, because the ASPG is composed of funds/classes with varied types of servicing arrangements, such funds/classes are not directly comparable to the retail class of the fund.
The Board further considered that FMR has contractually agreed to reimburse Class A, Class M, Class C, Class I, Class Z, and the retail class of the fund to the extent that total operating expenses, with certain exceptions, as a percentage of their respective average net assets, exceed 1.30%, 1.55%, 2.05%, 1.05%, 0.90%, and 1.05% through September 30, 2022.
Fees Charged to Other Fidelity Clients. The Board also considered Fidelity fee structures and other information with respect to clients of Fidelity, such as other funds advised or subadvised by Fidelity, pension plan clients, and other institutional clients with similar mandates. The Board noted that a joint ad hoc committee created by it and the boards of other Fidelity funds periodically reviews and compares Fidelity's institutional investment advisory business with its business of providing services to the Fidelity funds and also noted the most recent findings of the committee. The Board noted that the committee's review included a consideration of the differences in services provided, fees charged, and costs incurred, as well as competition in the markets serving the different categories of clients.
Based on its review of total expense ratios and fees charged to other Fidelity clients, the Board concluded that the total expense ratio of each class of the fund was reasonable in light of the services that the fund and its shareholders receive and the other factors considered.
Costs of the Services and Profitability. The Board considered the revenues earned and the expenses incurred by Fidelity in conducting the business of developing, marketing, distributing, managing, administering and servicing the fund and servicing the fund's shareholders. The Board also considered the level of Fidelity's profits in respect of all the Fidelity funds.
On an annual basis, Fidelity presents to the Board information about the profitability of its relationships with the fund. Fidelity calculates profitability information for each fund, as well as aggregate profitability information for groups of Fidelity funds and all Fidelity funds, using a series of detailed revenue and cost allocation methodologies which originate with the books and records of Fidelity on which Fidelity's audited financial statements are based. The Audit Committee of the Board reviews any significant changes from the prior year's methodologies and the full Board approves such changes.
A public accounting firm has been engaged annually by the Board as part of the Board's assessment of Fidelity's profitability analysis. The engagement includes the review and assessment of the methodologies used by Fidelity in determining the revenues and expenses attributable to Fidelity's mutual fund business, and completion of agreed-upon procedures in respect of the mathematical accuracy of certain fund profitability information and its conformity to established allocation methodologies. After considering the reports issued under the engagement and information provided by Fidelity, the Board concluded that while other allocation methods may also be reasonable, Fidelity's profitability methodologies are reasonable in all material respects.
The Board also reviewed Fidelity's non-fund businesses and potential indirect benefits such businesses may have received as a result of their association with Fidelity's mutual fund business (i.e., fall-out benefits) as well as cases where Fidelity's affiliates may benefit from the funds' business. The Board considered areas where potential indirect benefits to the Fidelity funds from their relationships with Fidelity may exist. The Board's consideration of these matters was informed by the findings of a joint ad hoc committee created by it and the boards of other Fidelity funds to evaluate potential fall-out benefits.
The Board considered the costs of the services provided by and the profits realized by Fidelity in connection with the operation of the fund and was satisfied that the profitability was not excessive.
Economies of Scale. The Board considered whether there have been economies of scale in respect of the management of the Fidelity funds, whether the Fidelity funds (including the fund) have appropriately benefited from any such economies of scale, and whether there is potential for realization of any further economies of scale. The Board considered the extent to which the fund will benefit from economies of scale as assets grow through increased services to the fund, through waivers or reimbursements, or through fee or expense ratio reductions. The Board also noted that a committee (the Economies of Scale Committee) created by it and the boards of other Fidelity funds periodically analyzes whether Fidelity attains economies of scale in respect of the management and servicing of the Fidelity funds, whether the Fidelity funds have appropriately benefited from such economies of scale, and whether there is potential for realization of any further economies of scale.
The Board recognized that the fund's management contract incorporates a "group fee" structure, which provides for lower group fee rates as total "group assets" increase, and for higher group fee rates as total "group assets" decrease ("group assets" as defined in the management contract). FMR calculates the group fee rates based on a tiered asset "breakpoint" schedule that varies based on asset class. The Board considered that the group fee is designed to deliver the benefits of economies of scale to fund shareholders when total Fidelity fund assets increase, even if assets of any particular fund are unchanged or have declined, because some portion of Fidelity's costs are attributable to services provided to all Fidelity funds, and all funds benefit if those costs can be allocated among more assets. The Board further considered that Fidelity agreed to impose a temporary fee waiver in the form of additional breakpoints to the current breakpoint schedule. The Board concluded that, given the group fee structure, fund shareholders will benefit from lower management fees as "group assets" increase at the fund complex level, regardless of whether Fidelity achieves any such economies of scale.
The Board concluded, taking into account the analysis of the Economies of Scale Committee, that economies of scale, if any, are being appropriately shared between fund shareholders and Fidelity.
Additional Information Requested by the Board. In order to develop fully the factual basis for consideration of the Fidelity funds' advisory contracts, the Board requested and received additional information on certain topics, including: (i) fund flow and performance trends, in particular the underperformance of certain funds and strategies, and Fidelity's long-term strategies for certain funds, including any consideration of fund liquidations or mergers; (ii) the operation of performance fees, competitor use of performance fees and consideration of the expansion of performance fees to additional funds; (iii) Fidelity's pricing philosophy compared to competitors; (iv) fund profitability methodology and data; (v) evaluation of competitive fund data and peer group classifications and fee and expense comparisons; (vi) the management fee and expense structures for different funds and classes and information about the differences between various fee and expense structures; (vii) group fee breakpoints and related voluntary fee waivers; and (viii) information regarding other accounts managed by Fidelity and the funds' sub-advisory arrangements.
Based on its evaluation of all of the conclusions noted above, and after considering all factors it believed relevant, the Board concluded that the advisory fee arrangements are fair and reasonable and that the fund's Advisory Contracts should be renewed.
Liquidity Risk Management Program
The Securities and Exchange Commission adopted Rule 22e-4 under the Investment Company Act of 1940 (the Liquidity Rule) to promote effective liquidity risk management throughout the open-end investment company industry, thereby reducing the risk that funds will be unable to meet their redemption obligations and mitigating dilution of the interests of fund shareholders.
The Fund has adopted and implemented a liquidity risk management program pursuant to the Liquidity Rule (the Program) effective December 1, 2018. The Program is reasonably designed to assess and manage the Fund’s liquidity risk and to comply with the requirements of the Liquidity Rule. The Fund’s Board of Trustees (the Board) has designated the Fund’s investment adviser as administrator of the Program. The Fidelity advisers have established a Liquidity Risk Management Committee (the LRM Committee) to manage the Program for each of the Fidelity Funds. The LRM Committee monitors the adequacy and effectiveness of implementation of the Program and on a periodic basis assesses each Fund’s liquidity risk based on a variety of factors including (1) the Fund’s investment strategy, (2) portfolio liquidity and cash flow projections during normal and reasonably foreseeable stressed conditions, (3) shareholder redemptions, (4) borrowings and other funding sources and (5) in the case of exchange-traded funds, certain additional factors including the effect of the Fund’s prices and spreads, market participants, and basket compositions on the overall liquidity of the Fund’s portfolio, as applicable.
In accordance with the Program, each of the Fund’s portfolio investments is classified into one of four liquidity categories described below based on a determination of a reasonable expectation for how long it would take to convert the investment to cash (or sell or dispose of the investment) without significantly changing its market value.
- Highly liquid investments – cash or convertible to cash within three business days or less
- Moderately liquid investments – convertible to cash in three to seven calendar days
- Less liquid investments – can be sold or disposed of, but not settled, within seven calendar days
- Illiquid investments – cannot be sold or disposed of within seven calendar days
Liquidity classification determinations take into account a variety of factors including various market, trading and investment-specific considerations, as well as market depth, and generally utilize analysis from a third-party liquidity metrics service.
The Liquidity Rule places a 15% limit on a fund’s illiquid investments and requires funds that do not primarily hold assets that are highly liquid investments to determine and maintain a minimum percentage of the fund’s net assets to be invested in highly liquid investments (highly liquid investment minimum or HLIM). The Program includes provisions reasonably designed to comply with the 15% limit on illiquid investments and for determining, periodically reviewing and complying with the HLIM requirement as applicable.
At a recent meeting of the Fund’s Board of Trustees, the LRM Committee provided a written report to the Board pertaining to the operation, adequacy, and effectiveness of implementation of the Program for the annual period from December 1, 2020 through November 30, 2021. The report concluded that the Program has been implemented and is operating effectively and is reasonably designed to assess and manage the Fund’s liquidity risk.
CLA-ANN-0722
1.9901890.100
Fidelity® Sustainable U.S. Equity Fund (formerly Fidelity® Sustainability U.S. Equity Fund)
Annual Report
May 31, 2022
Includes Fidelity and Fidelity Advisor share classes
Contents
To view a fund's proxy voting guidelines and proxy voting record for the 12-month period ended June 30, visit http://www.fidelity.com/proxyvotingresults or visit the Securities and Exchange Commission's (SEC) web site at http://www.sec.gov.
You may also call 1-800-544-8544 if you’re an individual investing directly with Fidelity, call 1-800-835-5092 if you’re a plan sponsor or participant with Fidelity as your recordkeeper or call 1-877-208-0098 on institutional accounts or if you’re an advisor or invest through one to request a free copy of the proxy voting guidelines.
Standard & Poor's, S&P and S&P 500 are registered service marks of The McGraw-Hill Companies, Inc. and have been licensed for use by Fidelity Distributors Corporation.
Other third-party marks appearing herein are the property of their respective owners.
All other marks appearing herein are registered or unregistered trademarks or service marks of FMR LLC or an affiliated company. © 2022 FMR LLC. All rights reserved.
This report and the financial statements contained herein are submitted for the general information of the shareholders of the Fund. This report is not authorized for distribution to prospective investors in the Fund unless preceded or accompanied by an effective prospectus.
A fund files its complete schedule of portfolio holdings with the SEC for the first and third quarters of each fiscal year on Form N-PORT. Forms N-PORT are available on the SEC’s web site at http://www.sec.gov. A fund's Forms N-PORT may be reviewed and copied at the SEC’s Public Reference Room in Washington, DC. Information regarding the operation of the SEC's Public Reference Room may be obtained by calling 1-800-SEC-0330.
For a complete list of a fund's portfolio holdings, view the most recent holdings listing, semiannual report, or annual report on Fidelity's web site at http://www.fidelity.com, http://www.institutional.fidelity.com, or http://www.401k.com, as applicable.
NOT FDIC INSURED •MAY LOSE VALUE •NO BANK GUARANTEE
Neither the Fund nor Fidelity Distributors Corporation is a bank.
Note to Shareholders:
Early in 2020, the outbreak and spread of COVID-19 emerged as a public health emergency that had a major influence on financial markets, primarily based on its impact on the global economy and corporate earnings. On March 11, 2020, the World Health Organization declared the COVID-19 outbreak a pandemic, citing sustained risk of further global spread. The pandemic prompted a number of measures to limit the spread of COVID-19, including travel and border restrictions, quarantines, and restrictions on large gatherings. In turn, these resulted in lower consumer activity, diminished demand for a wide range of products and services, disruption in manufacturing and supply chains, and – given the wide variability in outcomes regarding the outbreak – significant market uncertainty and volatility. To help stem the turmoil, the U.S. government took unprecedented action – in concert with the U.S. Federal Reserve and central banks around the world – to help support consumers, businesses, and the broader economy, and to limit disruption to the financial system.
In general, the overall impact of the pandemic lessened in 2021, amid a resilient economy and widespread distribution of three COVID-19 vaccines granted emergency use authorization from the U.S. Food and Drug Administration (FDA) early in the year. Still, the situation remains dynamic, and the extent and duration of its influence on financial markets and the economy is highly uncertain, due in part to a recent spike in cases based on highly contagious variants of the coronavirus.
Extreme events such as the COVID-19 crisis are exogenous shocks that can have significant adverse effects on mutual funds and their investments. Although multiple asset classes may be affected by market disruption, the duration and impact may not be the same for all types of assets. Fidelity is committed to helping you stay informed amid news about COVID-19 and during increased market volatility, and we continue to take extra steps to be responsive to customer needs. We encourage you to visit us online, where we offer ongoing updates, commentary, and analysis on the markets and our funds.
Performance: The Bottom Line
Average annual total return reflects the change in the value of an investment, assuming reinvestment of distributions from dividend income and capital gains (the profits earned upon the sale of securities that have grown in value, if any) and assuming a constant rate of performance each year. The hypothetical investment and the average annual total returns do not reflect the deduction of taxes that a shareholder would pay on fund distributions or the redemption of fund shares. During periods of reimbursement by Fidelity, a fund’s total return will be greater than it would be had the reimbursement not occurred. How a fund did yesterday is no guarantee of how it will do tomorrow.
Average annual total returns for Fidelity® Sustainable U.S. Equity Fund will be reported once the fund is a year old.
$10,000 Over Life of Fund
Let's say hypothetically that $10,000 was invested in Fidelity® Sustainable U.S. Equity Fund, a class of the fund, on June 15, 2021, when the fund started.
The chart shows how the value of your investment would have changed, and also shows how the Russell 3000® Index performed over the same period.
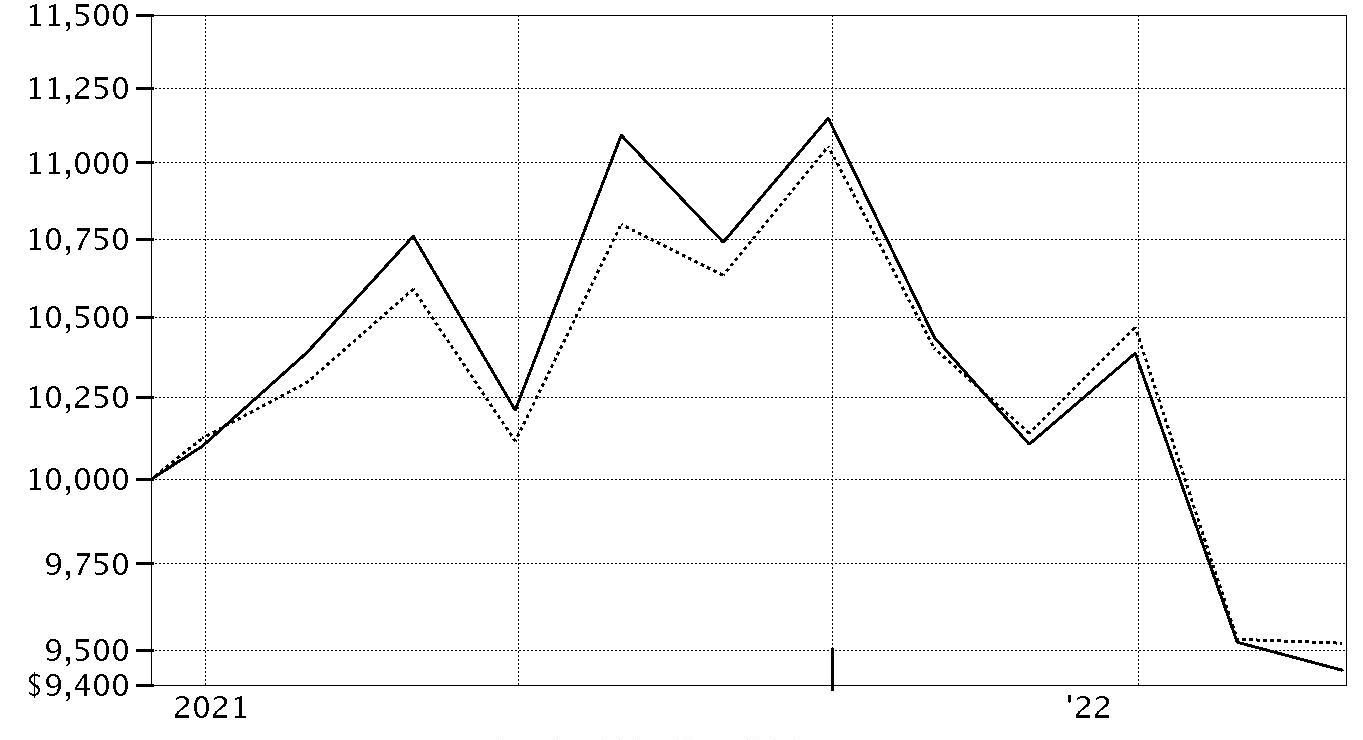
| Period Ending Values |
| $9,442 | Fidelity® Sustainable U.S. Equity Fund |
| $9,518 | Russell 3000® Index |
Management's Discussion of Fund Performance
Market Recap: The S&P 500
® index returned -0.30% for the 12 months ending May 31, 2022. Large-cap stocks retreated to begin the new year amid several notable headwinds that stoked volatility, uncertainty and anxiety. Chief among these was the U.S. Federal Reserve’s accelerated plan to hike interest rates and aggressively wind down its balance sheet to rein in historically high inflation. In addition, geopolitical unrest rose as Russia invaded Ukraine in late February and escalated its attack through period end. Other factors influencing stocks included surging commodity prices, rising bond yields, supply constraint and disruption, and the potential for variants of the coronavirus to upend the U.S. economy. Against this backdrop, the S&P 500
® index returned -5.17% in January and -2.99% in February, falling on mixed corporate earnings, particularly among some highflying tech firms. In April, the index returned -8.72% amid clearer signals of the Fed’s intension to tighten monetary policy and angst about the economic toll of “zero-COVID” lockdowns in China. It was the largest monthly decline for the S&P 500
® since March 2020. In early May, the Fed approved a rare half-percentage-point interest rate increase and announced plans to shrink its $9 trillion asset portfolio starting in June. For the full 12 months, the growth-oriented communication services (-21%) and consumer discretionary (-12%) sectors lagged most. In contrast, energy (+76%) rode a surge in commodity prices and led, followed by utilities (+18%).
Comments from Co-Portfolio Managers Nicole Connolly and Michael Robertson: Since inception on June 15, 2021, through May 31, 2022, the fund's share classes (excluding sales charges, if applicable) returned roughly -5% to -6%, trailing the -3.48% result of the MSCI USA IMI ESG Leaders Index and the -5.08% result of the Russell 3000
® Index. Versus the MSCI ESG index, stock selection in the consumer discretionary sector notably detracted, especially in the retailing industry. Picks in the software & services segment of the information technology sector also hurt relative performance this period. In retailing, an overweight position in apparel retailer Gap (-65%) was the fund's largest individual relative detractor. In software & services, larger-than-index stakes in digital payments provider PayPal Holdings (-69%) and cloud-based software firm Salesforce (-34%) also notably held back the fund's relative result. The fund's foreign holdings detracted overall, hampered in part by continued U.S. dollar strength. Conversely, stock selection and an overweighting in energy contributed to the fund's relative performance, as did positioning in the semiconductors & semiconductor equipment industry within the information technology sector. Underweighting the communications services sector also helped. An overweight position in ON Semiconductor (+64%) boosted relative performance more than any other individual investment this period. A higher-than-index position in refining firm Valero Energy (+62%) also notably contributed. Not owning a position in index component Meta Platforms also helped our relative result, as the stock returned about -43%.
The views expressed above reflect those of the portfolio manager(s) only through the end of the period as stated on the cover of this report and do not necessarily represent the views of Fidelity or any other person in the Fidelity organization. Any such views are subject to change at any time based upon market or other conditions and Fidelity disclaims any responsibility to update such views. These views may not be relied on as investment advice and, because investment decisions for a Fidelity fund are based on numerous factors, may not be relied on as an indication of trading intent on behalf of any Fidelity fund.
Investment Summary (Unaudited)
Top Ten Stocks as of May 31, 2022
| | % of fund's net assets |
| Microsoft Corp. | 6.2 |
| Prologis (REIT), Inc. | 2.6 |
| Danaher Corp. | 2.6 |
| Merck & Co., Inc. | 2.4 |
| The Travelers Companies, Inc. | 2.2 |
| Cigna Corp. | 2.1 |
| Marriott International, Inc. Class A | 2.1 |
| Cheniere Energy, Inc. | 2.1 |
| Apple, Inc. | 2.1 |
| Valero Energy Corp. | 2.0 |
| | 26.4 |
Market Sectors as of May 31, 2022
| | % of fund's net assets |
| Information Technology | 24.2 |
| Health Care | 15.1 |
| Financials | 12.2 |
| Consumer Discretionary | 10.7 |
| Industrials | 9.2 |
| Consumer Staples | 7.0 |
| Communication Services | 5.3 |
| Materials | 5.2 |
| Energy | 4.6 |
| Real Estate | 2.6 |
| Utilities | 2.6 |
Asset Allocation (% of fund's net assets)
| As of May 31, 2022 * |
| | Stocks | 98.5% |
| | Convertible Securities | 0.2% |
| | Short-Term Investments and Net Other Assets (Liabilities) | 1.3% |

* Foreign investments - 10.9%
Geographic Diversification (% of fund's net assets)
| As of May 31, 2022 |
| | United States of America* | 89.1% |
| | Ireland | 4.8% |
| | France | 1.8% |
| | Switzerland | 1.3% |
| | Denmark | 1.2% |
| | Sweden | 1.0% |
| | Belgium | 0.8% |

* Includes Short-Term investments and Net Other Assets (Liabilities).
Schedule of Investments May 31, 2022
Showing Percentage of Net Assets
| Common Stocks - 98.5% | | | |
| | | Shares | Value |
| COMMUNICATION SERVICES - 5.3% | | | |
| Diversified Telecommunication Services - 1.3% | | | |
| Verizon Communications, Inc. | | 4,198 | $215,315 |
| Interactive Media & Services - 1.6% | | | |
| Alphabet, Inc. Class A (a) | | 112 | 254,827 |
| Media - 2.4% | | | |
| Cable One, Inc. | | 106 | 138,129 |
| Comcast Corp. Class A | | 3,678 | 162,862 |
| Interpublic Group of Companies, Inc. | | 2,552 | 82,251 |
| | | | 383,242 |
|
| TOTAL COMMUNICATION SERVICES | | | 853,384 |
|
| CONSUMER DISCRETIONARY - 10.7% | | | |
| Automobiles - 0.6% | | | |
| General Motors Co. (a) | | 2,570 | 99,408 |
| Diversified Consumer Services - 1.7% | | | |
| Adtalem Global Education, Inc. (a) | | 3,862 | 125,978 |
| Bright Horizons Family Solutions, Inc. (a) | | 1,560 | 141,258 |
| | | | 267,236 |
| Hotels, Restaurants & Leisure - 2.1% | | | |
| Marriott International, Inc. Class A | | 1,968 | 337,669 |
| Household Durables - 1.1% | | | |
| Taylor Morrison Home Corp. (a) | | 6,109 | 176,978 |
| Internet & Direct Marketing Retail - 2.0% | | | |
| Amazon.com, Inc. (a) | | 61 | 146,656 |
| eBay, Inc. | | 3,547 | 172,632 |
| | | | 319,288 |
| Specialty Retail - 2.3% | | | |
| Gap, Inc. | | 9,158 | 101,013 |
| The Home Depot, Inc. | | 867 | 262,484 |
| | | | 363,497 |
| Textiles, Apparel & Luxury Goods - 0.9% | | | |
| LVMH Moet Hennessy Louis Vuitton SE | | 234 | 151,077 |
|
| TOTAL CONSUMER DISCRETIONARY | | | 1,715,153 |
|
| CONSUMER STAPLES - 7.0% | | | |
| Beverages - 1.6% | | | |
| Keurig Dr. Pepper, Inc. | | 7,416 | 257,632 |
| Food Products - 2.0% | | | |
| Darling Ingredients, Inc. (a) | | 3,948 | 316,116 |
| Household Products - 2.8% | | | |
| Kimberly-Clark Corp. | | 1,130 | 150,313 |
| Procter & Gamble Co. | | 2,011 | 297,387 |
| | | | 447,700 |
| Personal Products - 0.6% | | | |
| Estee Lauder Companies, Inc. Class A | | 411 | 104,661 |
|
| TOTAL CONSUMER STAPLES | | | 1,126,109 |
|
| ENERGY - 4.6% | | | |
| Oil, Gas & Consumable Fuels - 4.6% | | | |
| Cheniere Energy, Inc. | | 2,435 | 333,035 |
| Denbury, Inc. (a) | | 1,142 | 83,526 |
| Valero Energy Corp. | | 2,518 | 326,333 |
| | | | 742,894 |
| FINANCIALS - 12.2% | | | |
| Banks - 1.9% | | | |
| Bank of America Corp. | | 8,082 | 300,650 |
| Capital Markets - 5.3% | | | |
| BlackRock, Inc. Class A | | 220 | 147,198 |
| Moody's Corp. | | 836 | 252,113 |
| Northern Trust Corp. | | 2,300 | 257,025 |
| State Street Corp. | | 2,722 | 197,318 |
| | | | 853,654 |
| Consumer Finance - 2.8% | | | |
| American Express Co. | | 1,218 | 205,623 |
| Discover Financial Services | | 2,197 | 249,338 |
| | | | 454,961 |
| Insurance - 2.2% | | | |
| The Travelers Companies, Inc. | | 1,984 | 355,215 |
|
| TOTAL FINANCIALS | | | 1,964,480 |
|
| HEALTH CARE - 14.9% | | | |
| Biotechnology - 2.7% | | | |
| Amgen, Inc. | | 924 | 237,228 |
| Vertex Pharmaceuticals, Inc. (a) | | 746 | 200,413 |
| | | | 437,641 |
| Health Care Providers & Services - 2.3% | | | |
| Cigna Corp. | | 1,272 | 341,265 |
| Guardant Health, Inc. (a) | | 768 | 31,473 |
| | | | 372,738 |
| Life Sciences Tools & Services - 4.3% | | | |
| Bio-Rad Laboratories, Inc. Class A (a) | | 221 | 118,852 |
| Danaher Corp. | | 1,550 | 408,921 |
| ICON PLC (a) | | 712 | 159,338 |
| | | | 687,111 |
| Pharmaceuticals - 5.6% | | | |
| Merck & Co., Inc. | | 4,178 | 384,501 |
| Roche Holding AG (participation certificate) | | 625 | 212,994 |
| UCB SA | | 1,519 | 133,980 |
| Zoetis, Inc. Class A | | 1,004 | 171,614 |
| | | | 903,089 |
|
| TOTAL HEALTH CARE | | | 2,400,579 |
|
| INDUSTRIALS - 9.2% | | | |
| Air Freight & Logistics - 1.0% | | | |
| United Parcel Service, Inc. Class B | | 924 | 168,399 |
| Building Products - 1.8% | | | |
| ASSA ABLOY AB (B Shares) | | 6,625 | 163,313 |
| Johnson Controls International PLC | | 2,188 | 119,268 |
| | | | 282,581 |
| Electrical Equipment - 1.3% | | | |
| Acuity Brands, Inc. | | 784 | 137,216 |
| Generac Holdings, Inc. (a) | | 324 | 80,054 |
| | | | 217,270 |
| Machinery - 1.6% | | | |
| Deere & Co. | | 420 | 150,268 |
| Ingersoll Rand, Inc. | | 2,138 | 100,807 |
| | | | 251,075 |
| Professional Services - 3.5% | | | |
| KBR, Inc. | | 4,648 | 231,284 |
| Manpower, Inc. | | 1,801 | 161,388 |
| Verisk Analytics, Inc. | | 971 | 169,847 |
| | | | 562,519 |
|
| TOTAL INDUSTRIALS | | | 1,481,844 |
|
| INFORMATION TECHNOLOGY - 24.2% | | | |
| IT Services - 5.1% | | | |
| Accenture PLC Class A | | 890 | 265,629 |
| Capgemini SA | | 764 | 148,045 |
| Concentrix Corp. | | 560 | 86,738 |
| MasterCard, Inc. Class A | | 597 | 213,648 |
| PayPal Holdings, Inc. (a) | | 1,318 | 112,307 |
| | | | 826,367 |
| Semiconductors & Semiconductor Equipment - 5.1% | | | |
| Advanced Micro Devices, Inc. (a) | | 1,363 | 138,835 |
| NVIDIA Corp. | | 1,536 | 286,802 |
| onsemi (a) | | 3,587 | 217,659 |
| SolarEdge Technologies, Inc. (a) | | 634 | 172,949 |
| | | | 816,245 |
| Software - 11.9% | | | |
| Adobe, Inc. (a) | | 559 | 232,812 |
| Intuit, Inc. | | 521 | 215,934 |
| Microsoft Corp. | | 3,682 | 1,001,025 |
| Rapid7, Inc. (a) | | 2,244 | 159,032 |
| Salesforce.com, Inc. (a) | | 1,895 | 303,655 |
| | | | 1,912,458 |
| Technology Hardware, Storage & Peripherals - 2.1% | | | |
| Apple, Inc. | | 2,231 | 332,062 |
|
| TOTAL INFORMATION TECHNOLOGY | | | 3,887,132 |
|
| MATERIALS - 5.2% | | | |
| Chemicals - 1.9% | | | |
| Eastman Chemical Co. | | 868 | 95,619 |
| Linde PLC | | 653 | 212,016 |
| | | | 307,635 |
| Containers & Packaging - 3.3% | | | |
| Avery Dennison Corp. | | 1,254 | 216,390 |
| Crown Holdings, Inc. | | 1,636 | 170,864 |
| O-I Glass, Inc. (a) | | 8,345 | 137,275 |
| | | | 524,529 |
|
| TOTAL MATERIALS | | | 832,164 |
|
| REAL ESTATE - 2.6% | | | |
| Equity Real Estate Investment Trusts (REITs) - 2.6% | | | |
| Prologis (REIT), Inc. | | 3,265 | 416,222 |
| UTILITIES - 2.6% | | | |
| Electric Utilities - 2.1% | | | |
| NextEra Energy, Inc. | | 1,816 | 137,453 |
| ORSTED A/S (b) | | 1,718 | 193,635 |
| | | | 331,088 |
| Water Utilities - 0.5% | | | |
| American Water Works Co., Inc. | | 532 | 80,465 |
|
| TOTAL UTILITIES | | | 411,553 |
|
| TOTAL COMMON STOCKS | | | |
| (Cost $17,277,616) | | | 15,831,514 |
|
| Convertible Preferred Stocks - 0.2% | | | |
| HEALTH CARE - 0.2% | | | |
| Health Care Providers & Services - 0.2% | | | |
| Somatus, Inc. Series E (c)(d) | | | |
| (Cost $32,287) | | 37 | 32,287 |
|
| Money Market Funds - 0.7% | | | |
| Fidelity Cash Central Fund 0.82% (e) | | | |
| (Cost $109,161) | | 109,140 | 109,161 |
| TOTAL INVESTMENT IN SECURITIES - 99.4% | | | |
| (Cost $17,419,064) | | | 15,972,962 |
| NET OTHER ASSETS (LIABILITIES) - 0.6% | | | 89,806 |
| NET ASSETS - 100% | | | $16,062,768 |
Legend
(a) Non-income producing
(b) Security exempt from registration under Rule 144A of the Securities Act of 1933. These securities may be resold in transactions exempt from registration, normally to qualified institutional buyers. At the end of the period, the value of these securities amounted to $193,635 or 1.2% of net assets.
(c) Restricted securities (including private placements) - Investment in securities not registered under the Securities Act of 1933 (excluding 144A issues). At the end of the period, the value of restricted securities (excluding 144A issues) amounted to $32,287 or 0.2% of net assets.
(d) Level 3 security
(e) Affiliated fund that is generally available only to investment companies and other accounts managed by Fidelity Investments. The rate quoted is the annualized seven-day yield of the fund at period end. A complete unaudited listing of the fund's holdings as of its most recent quarter end is available upon request. In addition, each Fidelity Central Fund's financial statements, which are not covered by the Fund's Report of Independent Registered Public Accounting Firm, are available on the SEC's website or upon request.
Additional information on each restricted holding is as follows:
| Security | Acquisition Date | Acquisition Cost |
| Somatus, Inc. Series E | 1/31/22 | $32,287 |
Affiliated Central Funds
Fiscal year to date information regarding the Fund's investments in Fidelity Central Funds, including the ownership percentage, is presented below.
| Fund | Value, beginning of period | Purchases | Sales Proceeds | Dividend Income | Realized Gain/Loss | Change in Unrealized appreciation (depreciation) | Value, end of period | % ownership, end of period |
| Fidelity Cash Central Fund 0.82% | $-- | $11,825,796 | $11,716,635 | $279 | $-- | $-- | $109,161 | 0.0% |
| Total | $-- | $11,825,796 | $11,716,635 | $279 | $-- | $-- | $109,161 | |
Amounts in the income column in the above table include any capital gain distributions from underlying funds, which are presented in the corresponding line-item in the Statement of Operations, if applicable.
Investment Valuation
The following is a summary of the inputs used, as of May 31, 2022, involving the Fund's assets and liabilities carried at fair value. The inputs or methodology used for valuing securities may not be an indication of the risk associated with investing in those securities. For more information on valuation inputs, and their aggregation into the levels used below, please refer to the Investment Valuation section in the accompanying Notes to Financial Statements.
| | Valuation Inputs at Reporting Date: |
| Description | Total | Level 1 | Level 2 | Level 3 |
| Investments in Securities: | | | | |
| Equities: | | | | |
| Communication Services | $853,384 | $853,384 | $-- | $-- |
| Consumer Discretionary | 1,715,153 | 1,564,076 | 151,077 | -- |
| Consumer Staples | 1,126,109 | 1,126,109 | -- | -- |
| Energy | 742,894 | 742,894 | -- | -- |
| Financials | 1,964,480 | 1,964,480 | -- | -- |
| Health Care | 2,432,866 | 2,187,585 | 212,994 | 32,287 |
| Industrials | 1,481,844 | 1,318,531 | 163,313 | -- |
| Information Technology | 3,887,132 | 3,887,132 | -- | -- |
| Materials | 832,164 | 832,164 | -- | -- |
| Real Estate | 416,222 | 416,222 | -- | -- |
| Utilities | 411,553 | 217,918 | 193,635 | -- |
| Money Market Funds | 109,161 | 109,161 | -- | -- |
| Total Investments in Securities: | $15,972,962 | $15,219,656 | $721,019 | $32,287 |
See accompanying notes which are an integral part of the financial statements.
Financial Statements
Statement of Assets and Liabilities
| | | May 31, 2022 |
| Assets | | |
Investment in securities, at value — See accompanying schedule:
Unaffiliated issuers (cost $17,309,903) | $15,863,801 | |
| Fidelity Central Funds (cost $109,161) | 109,161 | |
| Total Investment in Securities (cost $17,419,064) | | $15,972,962 |
| Cash | | 14,202 |
| Receivable for fund shares sold | | 47,915 |
| Dividends receivable | | 19,054 |
| Distributions receivable from Fidelity Central Funds | | 114 |
| Receivable from investment adviser for expense reductions | | 62,239 |
| Other receivables | | 211 |
| Total assets | | 16,116,697 |
| Liabilities | | |
| Payable for investments purchased | $22,727 | |
| Payable for fund shares redeemed | 9,620 | |
| Accrued management fee | 6,557 | |
| Transfer agent fee payable | 3,487 | |
| Distribution and service plan fees payable | 444 | |
| Other affiliated payables | 486 | |
| Other payables and accrued expenses | 10,608 | |
| Total liabilities | | 53,929 |
| Net Assets | | $16,062,768 |
| Net Assets consist of: | | |
| Paid in capital | | $17,975,826 |
| Total accumulated earnings (loss) | | (1,913,058) |
| Net Assets | | $16,062,768 |
| Net Asset Value and Maximum Offering Price | | |
| Class A: | | |
| Net Asset Value and redemption price per share ($633,477 ÷ 67,505 shares)(a) | | $9.38 |
| Maximum offering price per share (100/94.25 of $9.38) | | $9.95 |
| Class M: | | |
| Net Asset Value and redemption price per share ($258,356 ÷ 27,561 shares)(a) | | $9.37 |
| Maximum offering price per share (100/96.50 of $9.37) | | $9.71 |
| Class C: | | |
| Net Asset Value and offering price per share ($273,030 ÷ 29,225 shares)(a) | | $9.34 |
| Fidelity Sustainable U.S. Equity Fund: | | |
| Net Asset Value, offering price and redemption price per share ($14,668,933 ÷ 1,560,808 shares) | | $9.40 |
| Class I: | | |
| Net Asset Value, offering price and redemption price per share ($115,974 ÷ 12,342 shares) | | $9.40 |
| Class Z: | | |
| Net Asset Value, offering price and redemption price per share ($112,998 ÷ 12,009 shares) | | $9.41 |
(a) Redemption price per share is equal to net asset value less any applicable contingent deferred sales charge.
See accompanying notes which are an integral part of the financial statements.
Statement of Operations
| | | For the period
June 15, 2021 (commencement of operations) through
May 31, 2022 |
| Investment Income | | |
| Dividends | | $118,754 |
| Income from Fidelity Central Funds | | 279 |
| Total income | | 119,033 |
| Expenses | | |
| Management fee | $55,167 | |
| Transfer agent fees | 27,866 | |
| Distribution and service plan fees | 3,395 | |
| Accounting fees and expenses | 4,091 | |
| Custodian fees and expenses | 30,363 | |
| Independent trustees' fees and expenses | 28 | |
| Registration fees | 176,448 | |
| Audit | 44,259 | |
| Legal | 2 | |
| Miscellaneous | 431 | |
| Total expenses before reductions | 342,050 | |
| Expense reductions | (245,267) | |
| Total expenses after reductions | | 96,783 |
| Net investment income (loss) | | 22,250 |
| Realized and Unrealized Gain (Loss) | | |
| Net realized gain (loss) on: | | |
| Investment securities: | | |
| Unaffiliated issuers | (425,950) | |
| Foreign currency transactions | 378 | |
| Total net realized gain (loss) | | (425,572) |
| Change in net unrealized appreciation (depreciation) on: | | |
| Investment securities: | | |
| Unaffiliated issuers | (1,446,102) | |
| Assets and liabilities in foreign currencies | (65) | |
| Total change in net unrealized appreciation (depreciation) | | (1,446,167) |
| Net gain (loss) | | (1,871,739) |
| Net increase (decrease) in net assets resulting from operations | | $(1,849,489) |
See accompanying notes which are an integral part of the financial statements.
Statement of Changes in Net Assets
| | For the period
June 15, 2021 (commencement of operations) through
May 31, 2022 |
| Increase (Decrease) in Net Assets | |
| Operations | |
| Net investment income (loss) | $22,250 |
| Net realized gain (loss) | (425,572) |
| Change in net unrealized appreciation (depreciation) | (1,446,167) |
| Net increase (decrease) in net assets resulting from operations | (1,849,489) |
| Distributions to shareholders | (58,306) |
| Share transactions - net increase (decrease) | 17,970,563 |
| Total increase (decrease) in net assets | 16,062,768 |
| Net Assets | |
| Beginning of period | – |
| End of period | $16,062,768 |
See accompanying notes which are an integral part of the financial statements.
Financial Highlights
Fidelity Sustainable U.S. Equity Fund Class A
| Years ended May 31, | 2022 A |
| Selected Per–Share Data | |
| Net asset value, beginning of period | $10.00 |
| Income from Investment Operations | |
| Net investment income (loss)B,C | –D |
| Net realized and unrealized gain (loss) | (.58) |
| Total from investment operations | (.58) |
| Distributions from net investment income | – |
| Distributions from net realized gain | (.04) |
| Total distributions | (.04) |
| Net asset value, end of period | $9.38 |
| Total ReturnE,F,G | (5.87)% |
| Ratios to Average Net AssetsC,H,I | |
| Expenses before reductions | 3.52%J |
| Expenses net of fee waivers, if any | 1.14%J |
| Expenses net of all reductions | 1.14%J |
| Net investment income (loss) | - %J,K |
| Supplemental Data | |
| Net assets, end of period (000 omitted) | $633 |
| Portfolio turnover rateL | 55%J |
A For the period June 15, 2021 (commencement of operations) through May 31, 2022.
B Calculated based on average shares outstanding during the period.
C Net investment income (loss) is affected by the timing of the declaration of dividends by any underlying mutual funds or exchange-traded funds (ETFs). Net investment income (loss) of any such underlying funds is not included in the Fund's net investment income (loss) ratio.
D Amount represents less than $.005 per share.
E Total returns for periods of less than one year are not annualized.
F Total returns would have been lower if certain expenses had not been reduced during the applicable periods shown.
G Total returns do not include the effect of the sales charges.
H Fees and expenses of any underlying mutual funds or exchange-traded funds (ETFs) are not included in the Fund's expense ratio. The Fund indirectly bears its proportionate share of these expenses. For additional expense information related to investments in Fidelity Central Funds, please refer to the "Investments in Fidelity Central Funds" note found in the Notes to Financial Statements section of the most recent Annual or Semi-Annual report.
I Expense ratios reflect operating expenses of the class. Expenses before reductions do not reflect amounts reimbursed, waived, or reduced through arrangements with the investment adviser, brokerage services, or other offset arrangements, if applicable, and do not represent the amount paid by the class during periods when reimbursements, waivers or reductions occur.
J Annualized
K Amount represents less than .005%.
L Amount does not include the portfolio activity of any underlying mutual funds or exchange-traded funds (ETFs).
See accompanying notes which are an integral part of the financial statements.
Fidelity Sustainable U.S. Equity Fund Class M
| Years ended May 31, | 2022 A |
| Selected Per–Share Data | |
| Net asset value, beginning of period | $10.00 |
| Income from Investment Operations | |
| Net investment income (loss)B,C | (.02) |
| Net realized and unrealized gain (loss) | (.59) |
| Total from investment operations | (.61) |
| Distributions from net investment income | – |
| Distributions from net realized gain | (.02) |
| Total distributions | (.02) |
| Net asset value, end of period | $9.37 |
| Total ReturnD,E,F | (6.10)% |
| Ratios to Average Net AssetsC,G,H | |
| Expenses before reductions | 4.05%I |
| Expenses net of fee waivers, if any | 1.39%I |
| Expenses net of all reductions | 1.39%I |
| Net investment income (loss) | (.26)%I |
| Supplemental Data | |
| Net assets, end of period (000 omitted) | $258 |
| Portfolio turnover rateJ | 55%I |
A For the period June 15, 2021 (commencement of operations) through May 31, 2022.
B Calculated based on average shares outstanding during the period.
C Net investment income (loss) is affected by the timing of the declaration of dividends by any underlying mutual funds or exchange-traded funds (ETFs). Net investment income (loss) of any such underlying funds is not included in the Fund's net investment income (loss) ratio.
D Total returns for periods of less than one year are not annualized.
E Total returns would have been lower if certain expenses had not been reduced during the applicable periods shown.
F Total returns do not include the effect of the sales charges.
G Fees and expenses of any underlying mutual funds or exchange-traded funds (ETFs) are not included in the Fund's expense ratio. The Fund indirectly bears its proportionate share of these expenses. For additional expense information related to investments in Fidelity Central Funds, please refer to the "Investments in Fidelity Central Funds" note found in the Notes to Financial Statements section of the most recent Annual or Semi-Annual report.
H Expense ratios reflect operating expenses of the class. Expenses before reductions do not reflect amounts reimbursed, waived, or reduced through arrangements with the investment adviser, brokerage services, or other offset arrangements, if applicable, and do not represent the amount paid by the class during periods when reimbursements, waivers or reductions occur.
I Annualized
J Amount does not include the portfolio activity of any underlying mutual funds or exchange-traded funds (ETFs).
See accompanying notes which are an integral part of the financial statements.
Fidelity Sustainable U.S. Equity Fund Class C
| Years ended May 31, | 2022 A |
| Selected Per–Share Data | |
| Net asset value, beginning of period | $10.00 |
| Income from Investment Operations | |
| Net investment income (loss)B,C | (.07) |
| Net realized and unrealized gain (loss) | (.58) |
| Total from investment operations | (.65) |
| Distributions from net investment income | – |
| Distributions from net realized gain | (.01) |
| Total distributions | (.01) |
| Net asset value, end of period | $9.34 |
| Total ReturnD,E,F | (6.53)% |
| Ratios to Average Net AssetsC,G,H | |
| Expenses before reductions | 4.65%I |
| Expenses net of fee waivers, if any | 1.89%I |
| Expenses net of all reductions | 1.89%I |
| Net investment income (loss) | (.75)%I |
| Supplemental Data | |
| Net assets, end of period (000 omitted) | $273 |
| Portfolio turnover rateJ | 55%I |
A For the period June 15, 2021 (commencement of operations) through May 31, 2022.
B Calculated based on average shares outstanding during the period.
C Net investment income (loss) is affected by the timing of the declaration of dividends by any underlying mutual funds or exchange-traded funds (ETFs). Net investment income (loss) of any such underlying funds is not included in the Fund's net investment income (loss) ratio.
D Total returns for periods of less than one year are not annualized.
E Total returns would have been lower if certain expenses had not been reduced during the applicable periods shown.
F Total returns do not include the effect of the contingent deferred sales charge.
G Fees and expenses of any underlying mutual funds or exchange-traded funds (ETFs) are not included in the Fund's expense ratio. The Fund indirectly bears its proportionate share of these expenses. For additional expense information related to investments in Fidelity Central Funds, please refer to the "Investments in Fidelity Central Funds" note found in the Notes to Financial Statements section of the most recent Annual or Semi-Annual report.
H Expense ratios reflect operating expenses of the class. Expenses before reductions do not reflect amounts reimbursed, waived, or reduced through arrangements with the investment adviser, brokerage services, or other offset arrangements, if applicable, and do not represent the amount paid by the class during periods when reimbursements, waivers or reductions occur.
I Annualized
J Amount does not include the portfolio activity of any underlying mutual funds or exchange-traded funds (ETFs).
See accompanying notes which are an integral part of the financial statements.
Fidelity Sustainable U.S. Equity Fund
| Years ended May 31, | 2022 A |
| Selected Per–Share Data | |
| Net asset value, beginning of period | $10.00 |
| Income from Investment Operations | |
| Net investment income (loss)B,C | .02 |
| Net realized and unrealized gain (loss) | (.57) |
| Total from investment operations | (.55) |
| Distributions from net investment income | (.01) |
| Distributions from net realized gain | (.04) |
| Total distributions | (.05) |
| Net asset value, end of period | $9.40 |
| Total ReturnD,E | (5.58)% |
| Ratios to Average Net AssetsC,F,G | |
| Expenses before reductions | 3.21%H |
| Expenses net of fee waivers, if any | .89%H |
| Expenses net of all reductions | .89%H |
| Net investment income (loss) | .24%H |
| Supplemental Data | |
| Net assets, end of period (000 omitted) | $14,669 |
| Portfolio turnover rateI | 55%H |
A For the period June 15, 2021 (commencement of operations) through May 31, 2022.
B Calculated based on average shares outstanding during the period.
C Net investment income (loss) is affected by the timing of the declaration of dividends by any underlying mutual funds or exchange-traded funds (ETFs). Net investment income (loss) of any such underlying funds is not included in the Fund's net investment income (loss) ratio.
D Total returns for periods of less than one year are not annualized.
E Total returns would have been lower if certain expenses had not been reduced during the applicable periods shown.
F Fees and expenses of any underlying mutual funds or exchange-traded funds (ETFs) are not included in the Fund's expense ratio. The Fund indirectly bears its proportionate share of these expenses. For additional expense information related to investments in Fidelity Central Funds, please refer to the "Investments in Fidelity Central Funds" note found in the Notes to Financial Statements section of the most recent Annual or Semi-Annual report.
G Expense ratios reflect operating expenses of the class. Expenses before reductions do not reflect amounts reimbursed, waived, or reduced through arrangements with the investment adviser, brokerage services, or other offset arrangements, if applicable, and do not represent the amount paid by the class during periods when reimbursements, waivers or reductions occur.
H Annualized
I Amount does not include the portfolio activity of any underlying mutual funds or exchange-traded funds (ETFs).
See accompanying notes which are an integral part of the financial statements.
Fidelity Sustainable U.S. Equity Fund Class I
| Years ended May 31, | 2022 A |
| Selected Per–Share Data | |
| Net asset value, beginning of period | $10.00 |
| Income from Investment Operations | |
| Net investment income (loss)B,C | .02 |
| Net realized and unrealized gain (loss) | (.57) |
| Total from investment operations | (.55) |
| Distributions from net investment income | (.01) |
| Distributions from net realized gain | (.04) |
| Total distributions | (.05) |
| Net asset value, end of period | $9.40 |
| Total ReturnD,E | (5.58)% |
| Ratios to Average Net AssetsC,F,G | |
| Expenses before reductions | 3.76%H |
| Expenses net of fee waivers, if any | .90%H |
| Expenses net of all reductions | .90%H |
| Net investment income (loss) | .24%H |
| Supplemental Data | |
| Net assets, end of period (000 omitted) | $116 |
| Portfolio turnover rateI | 55%H |
A For the period June 15, 2021 (commencement of operations) through May 31, 2022.
B Calculated based on average shares outstanding during the period.
C Net investment income (loss) is affected by the timing of the declaration of dividends by any underlying mutual funds or exchange-traded funds (ETFs). Net investment income (loss) of any such underlying funds is not included in the Fund's net investment income (loss) ratio.
D Total returns for periods of less than one year are not annualized.
E Total returns would have been lower if certain expenses had not been reduced during the applicable periods shown.
F Fees and expenses of any underlying mutual funds or exchange-traded funds (ETFs) are not included in the Fund's expense ratio. The Fund indirectly bears its proportionate share of these expenses. For additional expense information related to investments in Fidelity Central Funds, please refer to the "Investments in Fidelity Central Funds" note found in the Notes to Financial Statements section of the most recent Annual or Semi-Annual report.
G Expense ratios reflect operating expenses of the class. Expenses before reductions do not reflect amounts reimbursed, waived, or reduced through arrangements with the investment adviser, brokerage services, or other offset arrangements, if applicable, and do not represent the amount paid by the class during periods when reimbursements, waivers or reductions occur.
H Annualized
I Amount does not include the portfolio activity of any underlying mutual funds or exchange-traded funds (ETFs).
See accompanying notes which are an integral part of the financial statements.
Fidelity Sustainable U.S. Equity Fund Class Z
| Years ended May 31, | 2022 A |
| Selected Per–Share Data | |
| Net asset value, beginning of period | $10.00 |
| Income from Investment Operations | |
| Net investment income (loss)B,C | .04 |
| Net realized and unrealized gain (loss) | (.58) |
| Total from investment operations | (.54) |
| Distributions from net investment income | (.01) |
| Distributions from net realized gain | (.04) |
| Total distributions | (.05) |
| Net asset value, end of period | $9.41 |
| Total ReturnD,E | (5.48)% |
| Ratios to Average Net AssetsC,F,G | |
| Expenses before reductions | 3.72%H |
| Expenses net of fee waivers, if any | .75%H |
| Expenses net of all reductions | .75%H |
| Net investment income (loss) | .39%H |
| Supplemental Data | |
| Net assets, end of period (000 omitted) | $113 |
| Portfolio turnover rateI | 55%H |
A For the period June 15, 2021 (commencement of operations) through May 31, 2022.
B Calculated based on average shares outstanding during the period.
C Net investment income (loss) is affected by the timing of the declaration of dividends by any underlying mutual funds or exchange-traded funds (ETFs). Net investment income (loss) of any such underlying funds is not included in the Fund's net investment income (loss) ratio.
D Total returns for periods of less than one year are not annualized.
E Total returns would have been lower if certain expenses had not been reduced during the applicable periods shown.
F Fees and expenses of any underlying mutual funds or exchange-traded funds (ETFs) are not included in the Fund's expense ratio. The Fund indirectly bears its proportionate share of these expenses. For additional expense information related to investments in Fidelity Central Funds, please refer to the "Investments in Fidelity Central Funds" note found in the Notes to Financial Statements section of the most recent Annual or Semi-Annual report.
G Expense ratios reflect operating expenses of the class. Expenses before reductions do not reflect amounts reimbursed, waived, or reduced through arrangements with the investment adviser, brokerage services, or other offset arrangements, if applicable, and do not represent the amount paid by the class during periods when reimbursements, waivers or reductions occur.
H Annualized
I Amount does not include the portfolio activity of any underlying mutual funds or exchange-traded funds (ETFs).
See accompanying notes which are an integral part of the financial statements.
Notes to Financial Statements
For the period ended May 31, 2022
1. Organization.
Fidelity Sustainable U.S. Equity Fund (the Fund) (formerly Fidelity Sustainability U.S. Equity Fund) is a fund of Fidelity Summer Street Trust (the Trust) and is authorized to issue an unlimited number of shares. The Trust is registered under the Investment Company Act of 1940, as amended (the 1940 Act), as an open-end management investment company organized as a Massachusetts business trust. The Fund offers Class A, Class M, Class C, Fidelity Sustainable U.S. Equity Fund, Class I and Class Z shares, each of which has equal rights as to assets and voting privileges. Each class has exclusive voting rights with respect to matters that affect that class. Effective June 21, 2021, Class C shares will automatically convert to Class A shares after a holding period of eight years from the initial date of purchase, with certain exceptions. Prior to June 21, 2021, Class C shares automatically converted to Class A shares after a holding period of ten years from the initial date of purchase, with certain exceptions. Application of FMR's environmental, social, and governance (ESG) ratings process and/or its sustainable investing exclusion criteria may affect the Fund's exposure to certain issuers, sectors, regions, and countries and may affect the Fund's performance depending on whether certain investments are in or out of favor. The criteria related to the Fund's ESG ratings process and/or adherence to its sustainable investing exclusion criteria may result in the Fund forgoing opportunities to buy certain securities when it might otherwise be advantageous to do so, or selling securities for ESG reasons when it might be otherwise disadvantageous for it to do so. As a result, the Fund's performance may at times be better or worse than the performance of funds that do not use ESG or sustainability criteria. There are significant differences in interpretations of what it means for an issuer to have positive ESG factors. While the investment adviser believes its definitions are reasonable, the portfolio decisions it makes may differ with other investors' or advisers' views.
2. Investments in Fidelity Central Funds.
Funds may invest in Fidelity Central Funds, which are open-end investment companies generally available only to other investment companies and accounts managed by the investment adviser and its affiliates. The Schedule of Investments lists any Fidelity Central Funds held as an investment as of period end, but does not include the underlying holdings of each Fidelity Central Fund. An investing fund indirectly bears its proportionate share of the expenses of the underlying Fidelity Central Funds.
Based on its investment objective, each Fidelity Central Fund may invest or participate in various investment vehicles or strategies that are similar to those of the investing fund. These strategies are consistent with the investment objectives of the investing fund and may involve certain economic risks which may cause a decline in value of each of the Fidelity Central Funds and thus a decline in the value of the investing fund.
| Fidelity Central Fund | Investment Manager | Investment Objective | Investment Practices | Expense Ratio(a) |
| Fidelity Money Market Central Funds | Fidelity Management & Research Company LLC (FMR) | Each fund seeks to obtain a high level of current income consistent with the preservation of capital and liquidity. | Short-term Investments | Less than .005% |
(a) Expenses expressed as a percentage of average net assets and are as of each underlying Central Fund's most recent annual or semi-annual shareholder report.
A complete unaudited list of holdings for each Fidelity Central Fund is available upon request or at the Securities and Exchange Commission website at www.sec.gov. In addition, the financial statements of the Fidelity Central Funds which contain the significant accounting policies (including investment valuation policies) of those funds, and are not covered by the Report of Independent Registered Public Accounting Firm, are available on the Securities and Exchange Commission website or upon request.
3. Significant Accounting Policies.
The Fund is an investment company and applies the accounting and reporting guidance of the Financial Accounting Standards Board (FASB) Accounting Standards Codification Topic 946 Financial Services - Investment Companies. The financial statements have been prepared in conformity with accounting principles generally accepted in the United States of America (GAAP), which require management to make certain estimates and assumptions at the date of the financial statements. Actual results could differ from those estimates. Subsequent events, if any, through the date that the financial statements were issued have been evaluated in the preparation of the financial statements. The Fund's Schedule of Investments lists any underlying mutual funds or exchange-traded funds (ETFs) but does not include the underlying holdings of these funds. The following summarizes the significant accounting policies of the Fund:
Investment Valuation. Investments are valued as of 4:00 p.m. Eastern time on the last calendar day of the period. The Board of Trustees (the Board) has delegated the day to day responsibility for the valuation of the Fund's investments to the Fair Value Committee (the Committee) established by the Fund's investment adviser. In accordance with valuation policies and procedures approved by the Board, the Fund attempts to obtain prices from one or more third party pricing vendors or brokers to value its investments. When current market prices, quotations or currency exchange rates are not readily available or reliable, investments will be fair valued in good faith by the Committee, in accordance with procedures adopted by the Board. Factors used in determining fair value vary by investment type and may include market or investment specific events. The frequency with which these procedures are used cannot be predicted and they may be utilized to a significant extent. The Committee oversees the Fund's valuation policies and procedures and reports to the Board on the Committee's activities and fair value determinations. The Board monitors the appropriateness of the procedures used in valuing the Fund's investments and ratifies the fair value determinations of the Committee.
The Fund categorizes the inputs to valuation techniques used to value its investments into a disclosure hierarchy consisting of three levels as shown below:
- Level 1 – unadjusted quoted prices in active markets for identical investments
- Level 2 – other significant observable inputs (including quoted prices for similar investments, interest rates, prepayment speeds, etc.)
- Level 3 – unobservable inputs (including the Fund's own assumptions based on the best information available)
Valuation techniques used to value the Fund's investments by major category are as follows:
Equity securities, including restricted securities, for which market quotations are readily available, are valued at the last reported sale price or official closing price as reported by a third party pricing vendor on the primary market or exchange on which they are traded and are categorized as Level 1 in the hierarchy. In the event there were no sales during the day or closing prices are not available, securities are valued at the last quoted bid price or may be valued using the last available price and are generally categorized as Level 2 in the hierarchy. For foreign equity securities, when market or security specific events arise, comparisons to the valuation of American Depositary Receipts (ADRs), futures contracts, ETFs and certain indexes as well as quoted prices for similar securities may be used and would be categorized as Level 2 in the hierarchy. For equity securities, including restricted securities, where observable inputs are limited, assumptions about market activity and risk are used and these securities may be categorized as Level 3 in the hierarchy.
Investments in open-end mutual funds, including the Fidelity Central Funds, are valued at their closing net asset value (NAV) each business day and are categorized as Level 1 in the hierarchy.
Changes in valuation techniques may result in transfers in or out of an assigned level within the disclosure hierarchy. The aggregate value of investments by input level as of May 31, 2022 is included at the end of the Fund's Schedule of Investments.
Foreign Currency. Certain Funds may use foreign currency contracts to facilitate transactions in foreign-denominated securities. Gains and losses from these transactions may arise from changes in the value of the foreign currency or if the counterparties do not perform under the contracts' terms.
Foreign-denominated assets, including investment securities, and liabilities are translated into U.S. dollars at the exchange rates at period end. Purchases and sales of investment securities, income and dividends received, and expenses denominated in foreign currencies are translated into U.S. dollars at the exchange rate in effect on the transaction date.
The effects of exchange rate fluctuations on investments are included with the net realized and unrealized gain (loss) on investment securities. Other foreign currency transactions resulting in realized and unrealized gain (loss) are disclosed separately.
Investment Transactions and Income. For financial reporting purposes, the Fund's investment holdings and NAV include trades executed through the end of the last business day of the period. The NAV per share for processing shareholder transactions is calculated as of the close of business of the New York Stock Exchange (NYSE), normally 4:00 p.m. Eastern time and includes trades executed through the end of the prior business day. Gains and losses on securities sold are determined on the basis of identified cost. Commissions paid to certain brokers with whom the investment adviser, or its affiliates, places trades on behalf of a fund include an amount in addition to trade execution, which may be rebated back to a fund. Any such rebates are included in net realized gain (loss) on investments in the Statement of Operations. Dividend income is recorded on the ex-dividend date, except for certain dividends from foreign securities where the ex-dividend date may have passed, which are recorded as soon as the Fund is informed of the ex-dividend date. Non-cash dividends included in dividend income, if any, are recorded at the fair market value of the securities received. Income and capital gain distributions from Fidelity Central Funds, if any, are recorded on the ex-dividend date. Certain distributions received by the Fund represent a return of capital or capital gain. The Fund determines the components of these distributions subsequent to the ex-dividend date, based upon receipt of tax filings or other correspondence relating to the underlying investment. These distributions are recorded as a reduction of cost of investments and/or as a realized gain. Investment income is recorded net of foreign taxes withheld where recovery of such taxes is uncertain. Funds may file withholding tax reclaims in certain jurisdictions to recover a portion of amounts previously withheld. Any withholding tax reclaims income is included in the Statement of Operations in dividends. Any receivables for withholding tax reclaims are included in the Statement of Assets and Liabilities in dividends receivable.
Class Allocations and Expenses. Investment income, realized and unrealized capital gains and losses, common expenses of a fund, and certain fund-level expense reductions, if any, are allocated daily on a pro-rata basis to each class based on the relative net assets of each class to the total net assets of a fund. Each class differs with respect to transfer agent and distribution and service plan fees incurred, as applicable. Certain expense reductions may also differ by class, if applicable. For the reporting period, the allocated portion of income and expenses to each class as a percent of its average net assets may vary due to the timing of recording these transactions in relation to fluctuating net assets of the classes. Expenses directly attributable to a fund are charged to that fund. Expenses attributable to more than one fund are allocated among the respective funds on the basis of relative net assets or other appropriate methods. Expenses included in the accompanying financial statements reflect the expenses of that fund and do not include any expenses associated with any underlying mutual funds or exchange-traded funds. Although not included in a fund's expenses, a fund indirectly bears its proportionate share of these expenses through the net asset value of each underlying mutual fund or exchange-traded fund. Expense estimates are accrued in the period to which they relate and adjustments are made when actual amounts are known.
Income Tax Information and Distributions to Shareholders. Each year, the Fund intends to qualify as a regulated investment company under Subchapter M of the Internal Revenue Code, including distributing substantially all of its taxable income and realized gains. As a result, no provision for U.S. Federal income taxes is required. As of May 31, 2022, the Fund did not have any unrecognized tax benefits in the financial statements; nor is the Fund aware of any tax positions for which it is reasonably possible that the total amounts of unrecognized tax benefits will significantly change in the next twelve months. The Fund files a U.S. federal tax return, in addition to state and local tax returns as required. The Fund's federal income tax returns are subject to examination by the Internal Revenue Service (IRS) for a period of three fiscal years after they are filed. State and local tax returns may be subject to examination for an additional fiscal year depending on the jurisdiction. Foreign taxes are provided for based on the Fund's understanding of the tax rules and rates that exist in the foreign markets in which it invests.
Distributions are declared and recorded on the ex-dividend date. Income and capital gain distributions are declared separately for each class. Income and capital gain distributions are determined in accordance with income tax regulations, which may differ from GAAP. In addition, the Fund claimed a portion of the payment made to redeeming shareholders as a distribution for income tax purposes.
Capital accounts within the financial statements are adjusted for permanent book-tax differences. These adjustments have no impact on net assets or the results of operations. Capital accounts are not adjusted for temporary book-tax differences which will reverse in a subsequent period.
Book-tax differences are primarily due to foreign currency transactions, losses deferred due to wash sales, and excise tax regulations.
As of period end, the cost and unrealized appreciation (depreciation) in securities, and derivatives if applicable, for federal income tax purposes were as follows:
| Gross unrealized appreciation | $709,375 |
| Gross unrealized depreciation | (2,319,659) |
| Net unrealized appreciation (depreciation) | $(1,610,284) |
| Tax Cost | $17,583,246 |
The tax-based components of distributable earnings as of period end were as follows:
| Undistributed ordinary income | $10,127 |
| Net unrealized appreciation (depreciation) on securities and other investments | $(1,610,349) |
The Fund intends to elect to defer to its next fiscal year $312,835 of capital losses recognized during the period November 1, 2021 to May 31, 2022.
Due to large subscriptions in the period, Fidelity Sustainability U.S. Equity Fund is subject to an annual limit on its use of some of its unrealized capital losses to offset capital gains in future periods. If those losses are realized and the limitation prevents the Fund from using any of those losses in a future period, those capital losses will be available to offset capital gains in subsequent periods.
The tax character of distributions paid was as follows:
| | May 31, 2022(a) |
| Ordinary Income | $58,306 |
| Total | $58,306 |
(a) For the period June 15, 2021 (commencement of operations) through May 31, 2022.
Restricted Securities (including Private Placements). Funds may invest in securities that are subject to legal or contractual restrictions on resale. These securities generally may be resold in transactions exempt from registration or to the public if the securities are registered. Disposal of these securities may involve time-consuming negotiations and expense, and prompt sale at an acceptable price may be difficult. Information regarding restricted securities held at period end is included at the end of the Schedule of Investments, if applicable.
4. Purchases and Sales of Investments.
Purchases and sales of securities, other than short-term securities and in-kind transactions, as applicable, are noted in the table below.
| | Purchases ($) | Sales ($) |
| Fidelity Sustainable U.S. Equity Fund | 23,602,170 | 5,864,999 |
5. Fees and Other Transactions with Affiliates.
Management Fee. Fidelity Management & Research Company LLC (the investment adviser) and its affiliates provide the Fund with investment management related services for which the Fund pays a monthly management fee. The management fee is the sum of an individual fund fee rate that is based on an annual rate of .30% of the Fund's average net assets and an annualized group fee rate that averaged .22% during the period. The group fee rate is based upon the monthly average net assets of a group of registered investment companies with which the investment adviser has management contracts. The group fee rate decreases as assets under management increase and increases as assets under management decrease. In addition, the management fee is subject to a performance adjustment (up to a maximum of +/- .10% of the Fund's average net assets over a 36 month performance period). The upward or downward adjustment to the management fee is based on the relative investment performance of Fidelity Sustainable U.S. Equity Fund as compared to its benchmark index, the Russell 3000 Index, over the same 36 month performance period. The Fund's performance adjustment will not take effect until June 1, 2022. Subsequent months will be added until the performance period includes 36 months. For the reporting period, the total annualized management fee rate was .53% of the Fund's average net assets.
Distribution and Service Plan Fees. In accordance with Rule 12b-1 of the 1940 Act, the Fund has adopted separate Distribution and Service Plans for each class of shares. Certain classes pay Fidelity Distributors Company LLC (FDC), an affiliate of the investment adviser, separate Distribution and Service Fees, each of which is based on an annual percentage of each class' average net assets. In addition, FDC may pay financial intermediaries for selling shares of the Fund and providing shareholder support services. For the period, the Distribution and Service Fee rates, total fees and amounts retained by FDC were as follows:
| | Distribution Fee | Service Fee | Total Fees | Retained by FDC |
| Class A | -% | .25% | $907 | $616 |
| Class M | .25% | .25% | 876 | 515 |
| Class C | .75% | .25% | 1,612 | 1,357 |
| | | | $3,395 | $2,488 |
Sales Load. FDC may receive a front-end sales charge of up to 5.75% for selling Class A shares and 3.50% for selling Class M shares, some of which is paid to financial intermediaries for selling shares of the Fund. Depending on the holding period, FDC may receive contingent deferred sales charges levied on Class A, Class M and Class C redemptions. The deferred sales charges are 1.00% for Class C shares, 1.00% for certain purchases of Class A shares and .25% for certain purchases of Class M shares.
For the period, sales charge amounts retained by FDC were as follows:
| | Retained by FDC |
| Class A | $1,477 |
| Class M | 438 |
| | $1,915 |
Transfer Agent Fees. Fidelity Investments Institutional Operations Company LLC (FIIOC), an affiliate of the investment adviser, is the transfer, dividend disbursing and shareholder servicing agent for each class of the Fund. FIIOC receives account fees and asset-based fees that vary according to the account size and type of account of the shareholders of the respective classes of the Fund, except for Class Z. FIIOC receives an asset-based fee of Class Z's average net assets. FIIOC pays for typesetting, printing and mailing of shareholder reports, except proxy statements.
For the period, transfer agent fees for each class were as follows:
| | Amount | % of Class-Level Average Net Assets(a) |
| Class A | $684 | .19 |
| Class M | 369 | .21 |
| Class C | 301 | .19 |
| Fidelity Sustainable U.S. Equity Fund | 26,344 | .28 |
| Class I | 123 | .11 |
| Class Z | 45 | .04 |
| | $27,866 | |
(a) Annualized
Accounting Fees. Fidelity Service Company, Inc. (FSC), an affiliate of the investment adviser, maintains the Fund's accounting records. The accounting fee is based on the level of average net assets for each month. For the period, the fees were equivalent to the following annualized rates:
| | % of Average Net Assets |
| Fidelity Sustainable U.S. Equity Fund | .04 |
Brokerage Commissions. A portion of portfolio transactions were placed with brokerage firms which are affiliates of the investment adviser. Brokerage commissions are included in net realized gain (loss) and change in net unrealized appreciation (depreciation) in the Statement of Operations. The commissions paid to these affiliated firms were as follows:
| | Amount |
| Fidelity Sustainable U.S. Equity Fund | $162 |
Interfund Trades. Funds may purchase from or sell securities to other Fidelity Funds under procedures adopted by the Board. The procedures have been designed to ensure these interfund trades are executed in accordance with Rule 17a-7 of the 1940 Act. Any interfund trades are included within the respective purchases and sales amounts shown in the Purchases and Sales of Investments note. Interfund trades during the period are noted in the table below.
| | Purchases ($) | Sales ($) | Realized Gain (Loss) ($) |
| Fidelity Sustainable U.S. Equity Fund | 358,082 | 393,623 | (6,609) |
6. Committed Line of Credit.
Certain Funds participate with other funds managed by the investment adviser or an affiliate in a $4.25 billion credit facility (the "line of credit") to be utilized for temporary or emergency purposes to fund shareholder redemptions or for other short-term liquidity purposes. The participating funds have agreed to pay commitment fees on their pro-rata portion of the line of credit, which are reflected in Miscellaneous expenses on the Statement of Operations, and are listed below. During the period, there were no borrowings on this line of credit.
| | Amount |
| Fidelity Sustainable U.S. Equity Fund | $1 |
7. Expense Reductions.
The investment adviser contractually agreed to reimburse expenses of each class to the extent annual operating expenses exceeded certain levels of class-level average net assets as noted in the table below. This reimbursement will remain in place through September 30, 2023. Some expenses, for example the compensation of the independent Trustees are excluded from this reimbursement.
The following classes were in reimbursement during the period:
| | Expense Limitations | Reimbursement |
| Class A | 1.15% | $8,577 |
| Class M | 1.40% | 4,625 |
| Class C | 1.90% | 4,431 |
| Fidelity Sustainable U.S. Equity Fund | .90% | 221,059 |
| Class I | .90% | 3,161 |
| Class Z | .75% | 3,190 |
| | | $245,043 |
During the period, custodian credits reduced the Fund's expenses by $3.
In addition, during the period the investment adviser or an affiliate reimbursed and/or waived a portion of fund-level operating expenses in the amount of $221.
8. Distributions to Shareholders.
Distributions to shareholders of each class were as follows:
| | Year ended
May 31, 2022(a) |
| Fidelity Sustainable U.S. Equity Fund | |
| Distributions to shareholders | |
| Class A | $1,154 |
| Class M | 328 |
| Class C | 138 |
| Fidelity Sustainable U.S. Equity Fund | 55,616 |
| Class I | 590 |
| Class Z | 480 |
| Total | $58,306 |
(a) For the period June 15, 2021 (commencement of operations) through May 31, 2022.
9. Share Transactions.
Share transactions for each class were as follows and may contain in-kind transactions, automatic conversions between classes or exchanges between affiliated funds:
| | Shares | Dollars |
| | Year ended May 31, 2022(a) | Year ended May 31, 2022(a) |
| Fidelity Sustainable U.S. Equity Fund | | |
| Class A | | |
| Shares sold | 73,664 | $763,410 |
| Reinvestment of distributions | 108 | 1,154 |
| Shares redeemed | (6,267) | (60,042) |
| Net increase (decrease) | 67,505 | $704,522 |
| Class M | | |
| Shares sold | 27,530 | $285,645 |
| Reinvestment of distributions | 31 | 328 |
| Net increase (decrease) | 27,561 | $285,973 |
| Class C | | |
| Shares sold | 30,322 | $306,710 |
| Reinvestment of distributions | 13 | 138 |
| Shares redeemed | (1,110) | (10,221) |
| Net increase (decrease) | 29,225 | $296,627 |
| Fidelity Sustainable U.S. Equity Fund | | |
| Shares sold | 2,019,003 | $21,143,713 |
| Reinvestment of distributions | 4,747 | 50,883 |
| Shares redeemed | (462,942) | (4,758,254) |
| Net increase (decrease) | 1,560,808 | $16,436,342 |
| Class I | | |
| Shares sold | 12,287 | $125,000 |
| Reinvestment of distributions | 55 | 590 |
| Net increase (decrease) | 12,342 | $125,590 |
| Class Z | | |
| Shares sold | 11,964 | $121,029 |
| Reinvestment of distributions | 45 | 480 |
| Net increase (decrease) | 12,009 | $121,509 |
(a) For the period June 15, 2021 (commencement of operations) through May 31, 2022.
10. Other.
A fund's organizational documents provide former and current trustees and officers with a limited indemnification against liabilities arising in connection with the performance of their duties to the fund. In the normal course of business, a fund may also enter into contracts that provide general indemnifications. A fund's maximum exposure under these arrangements is unknown as this would be dependent on future claims that may be made against a fund. The risk of material loss from such claims is considered remote.
11. Coronavirus (COVID-19) Pandemic.
An outbreak of COVID-19 first detected in China during December 2019 has since spread globally and was declared a pandemic by the World Health Organization during March 2020. Developments that disrupt global economies and financial markets, such as the COVID-19 pandemic, may magnify factors that affect the Fund's performance.
Report of Independent Registered Public Accounting Firm
To the Board of Trustees of Fidelity Summer Street Trust and Shareholders of Fidelity Sustainable U.S. Equity Fund
Opinion on the Financial Statements and Financial Highlights
We have audited the accompanying statement of assets and liabilities of Fidelity Sustainable U.S. Equity Fund (formerly Fidelity Sustainability U.S. Equity Fund)(the "Fund"), a fund of Fidelity Summer Street Trust, including the schedule of investments, as of May 31, 2022, the related statement of operations, the statement of changes in net assets and the financial highlights for the period from June 15, 2021 (commencement of operations) through May 31, 2022, and the related notes. In our opinion, the financial statements and financial highlights present fairly, in all material respects, the financial position of the Fund as of May 31, 2022, the results of its operations, the changes in its net assets and the financial highlights for the period from June 15, 2021 (commencement of operations) through May 31, 2022, in conformity with accounting principles generally accepted in the United States of America.
Basis for Opinion
These financial statements and financial highlights are the responsibility of the Fund's management. Our responsibility is to express an opinion on the Fund's financial statements and financial highlights based on our audit. We are a public accounting firm registered with the Public Company Accounting Oversight Board (United States) (PCAOB) and are required to be independent with respect to the Fund in accordance with the U.S. federal securities laws and the applicable rules and regulations of the Securities and Exchange Commission and the PCAOB.
We conducted our audit in accordance with the standards of the PCAOB. Those standards require that we plan and perform the audit to obtain reasonable assurance about whether the financial statements and financial highlights are free of material misstatement, whether due to error or fraud. The Fund is not required to have, nor were we engaged to perform, an audit of its internal control over financial reporting. As part of our audit we are required to obtain an understanding of internal control over financial reporting but not for the purpose of expressing an opinion on the effectiveness of the Fund’s internal control over financial reporting. Accordingly, we express no such opinion.
Our audit included performing procedures to assess the risks of material misstatement of the financial statements and financial highlights, whether due to error or fraud, and performing procedures that respond to those risks. Such procedures included examining, on a test basis, evidence regarding the amounts and disclosures in the financial statements and financial highlights. Our audit also included evaluating the accounting principles used and significant estimates made by management, as well as evaluating the overall presentation of the financial statements and financial highlights. Our procedures included confirmation of securities owned as of May 31, 2022, by correspondence with the custodian and brokers; when replies were not received from brokers, we performed other auditing procedures. We believe that our audit provide a reasonable basis for our opinion.
/s/ Deloitte & Touche LLP
Boston, Massachusetts
July 14, 2022
We have served as the auditor of one or more of the Fidelity investment companies since 1999.
Trustees and Officers
The Trustees, Members of the Advisory Board (if any), and officers of the trust and fund, as applicable, are listed below. The Board of Trustees governs the fund and is responsible for protecting the interests of shareholders. The Trustees are experienced executives who meet periodically throughout the year to oversee the fund's activities, review contractual arrangements with companies that provide services to the fund, oversee management of the risks associated with such activities and contractual arrangements, and review the fund's performance. Each of the Trustees oversees 325 funds.
The Trustees hold office without limit in time except that (a) any Trustee may resign; (b) any Trustee may be removed by written instrument, signed by at least two-thirds of the number of Trustees prior to such removal; (c) any Trustee who requests to be retired or who has become incapacitated by illness or injury may be retired by written instrument signed by a majority of the other Trustees; and (d) any Trustee may be removed at any special meeting of shareholders by a two-thirds vote of the outstanding voting securities of the trust. Each Trustee who is not an interested person (as defined in the 1940 Act) of the trust and the fund is referred to herein as an Independent Trustee. Each Independent Trustee shall retire not later than the last day of the calendar year in which his or her 75th birthday occurs. The Independent Trustees may waive this mandatory retirement age policy with respect to individual Trustees. Officers and Advisory Board Members hold office without limit in time, except that any officer or Advisory Board Member may resign or may be removed by a vote of a majority of the Trustees at any regular meeting or any special meeting of the Trustees. Except as indicated, each individual has held the office shown or other offices in the same company for the past five years.
The fund's Statement of Additional Information (SAI) includes more information about the Trustees. To request a free copy, call Fidelity at 1-800-544-8544 if you’re an individual investing directly with Fidelity, call 1-800-835-5092 if you’re a plan sponsor or participant with Fidelity as your recordkeeper or call 1-877-208-0098 on institutional accounts or if you’re an advisor or invest through one.
Experience, Skills, Attributes, and Qualifications of the Trustees. The Governance and Nominating Committee has adopted a statement of policy that describes the experience, qualifications, attributes, and skills that are necessary and desirable for potential Independent Trustee candidates (Statement of Policy). The Board believes that each Trustee satisfied at the time he or she was initially elected or appointed a Trustee, and continues to satisfy, the standards contemplated by the Statement of Policy. The Governance and Nominating Committee also engages professional search firms to help identify potential Independent Trustee candidates who have the experience, qualifications, attributes, and skills consistent with the Statement of Policy. From time to time, additional criteria based on the composition and skills of the current Independent Trustees, as well as experience or skills that may be appropriate in light of future changes to board composition, business conditions, and regulatory or other developments, have also been considered by the professional search firms and the Governance and Nominating Committee. In addition, the Board takes into account the Trustees' commitment and participation in Board and committee meetings, as well as their leadership of standing and ad hoc committees throughout their tenure.
In determining that a particular Trustee was and continues to be qualified to serve as a Trustee, the Board has considered a variety of criteria, none of which, in isolation, was controlling. The Board believes that, collectively, the Trustees have balanced and diverse experience, qualifications, attributes, and skills, which allow the Board to operate effectively in governing the fund and protecting the interests of shareholders. Information about the specific experience, skills, attributes, and qualifications of each Trustee, which in each case led to the Board's conclusion that the Trustee should serve (or continue to serve) as a trustee of the fund, is provided below.
Board Structure and Oversight Function. Robert A. Lawrence is an interested person and currently serves as Chair. The Trustees have determined that an interested Chair is appropriate and benefits shareholders because an interested Chair has a personal and professional stake in the quality and continuity of services provided to the fund. Independent Trustees exercise their informed business judgment to appoint an individual of their choosing to serve as Chair, regardless of whether the Trustee happens to be independent or a member of management. The Independent Trustees have determined that they can act independently and effectively without having an Independent Trustee serve as Chair and that a key structural component for assuring that they are in a position to do so is for the Independent Trustees to constitute a substantial majority for the Board. The Independent Trustees also regularly meet in executive session. David M. Thomas serves as Lead Independent Trustee and as such (i) acts as a liaison between the Independent Trustees and management with respect to matters important to the Independent Trustees and (ii) with management prepares agendas for Board meetings.
Fidelity® funds are overseen by different Boards of Trustees. The fund's Board oversees Fidelity's high income and certain equity funds, and other Boards oversee Fidelity's investment-grade bond, money market, asset allocation, and other equity funds. The asset allocation funds may invest in Fidelity® funds overseen by the fund's Board. The use of separate Boards, each with its own committee structure, allows the Trustees of each group of Fidelity® funds to focus on the unique issues of the funds they oversee, including common research, investment, and operational issues. On occasion, the separate Boards establish joint committees to address issues of overlapping consequences for the Fidelity® funds overseen by each Board.
The Trustees operate using a system of committees to facilitate the timely and efficient consideration of all matters of importance to the Trustees, the fund, and fund shareholders and to facilitate compliance with legal and regulatory requirements and oversight of the fund's activities and associated risks. The Board, acting through its committees, has charged FMR and its affiliates with (i) identifying events or circumstances the occurrence of which could have demonstrably adverse effects on the fund's business and/or reputation; (ii) implementing processes and controls to lessen the possibility that such events or circumstances occur or to mitigate the effects of such events or circumstances if they do occur; and (iii) creating and maintaining a system designed to evaluate continuously business and market conditions in order to facilitate the identification and implementation processes described in (i) and (ii) above. Because the day-to-day operations and activities of the fund are carried out by or through FMR, its affiliates, and other service providers, the fund's exposure to risks is mitigated but not eliminated by the processes overseen by the Trustees. While each of the Board's committees has responsibility for overseeing different aspects of the fund's activities, oversight is exercised primarily through the Operations, Audit, and Compliance Committees. Appropriate personnel, including but not limited to the fund's Chief Compliance Officer (CCO), FMR's internal auditor, the independent accountants, the fund's Treasurer and portfolio management personnel, make periodic reports to the Board's committees, as appropriate, including an annual review of Fidelity's risk management program for the Fidelity® funds. The responsibilities of each standing committee, including their oversight responsibilities, are described further under "Standing Committees of the Trustees."
Interested Trustees*:
Correspondence intended for a Trustee who is an interested person may be sent to Fidelity Investments, 245 Summer Street, Boston, Massachusetts 02210.
Name, Year of Birth; Principal Occupations and Other Relevant Experience+
Bettina Doulton (1964)
Year of Election or Appointment: 2020
Trustee
Ms. Doulton also serves as Trustee of other Fidelity® funds. Prior to her retirement, Ms. Doulton served in a variety of positions at Fidelity Investments, including as a managing director of research (2006-2007), portfolio manager to certain Fidelity® funds (1993-2005), equity analyst and portfolio assistant (1990-1993), and research assistant (1987-1990). Ms. Doulton currently owns and operates Phi Builders + Architects and Cellardoor Winery. Previously, Ms. Doulton served as a member of the Board of Brown Capital Management, LLC (2014-2018).
Robert A. Lawrence (1952)
Year of Election or Appointment: 2020
Trustee
Chair of the Board of Trustees
Mr. Lawrence also serves as Trustee of other funds. Previously, Mr. Lawrence served as a Trustee and Member of the Advisory Board of certain funds. Prior to his retirement in 2008, Mr. Lawrence served as Vice President of certain Fidelity® funds (2006-2008), Senior Vice President, Head of High Income Division of Fidelity Management & Research Company (investment adviser firm, 2006-2008), and President of Fidelity Strategic Investments (investment adviser firm, 2002-2005).
* Determined to be an “Interested Trustee” by virtue of, among other things, his or her affiliation with the trust or various entities under common control with FMR.
+ The information includes the Trustee's principal occupation during the last five years and other information relating to the experience, attributes, and skills relevant to the Trustee's qualifications to serve as a Trustee, which led to the conclusion that the Trustee should serve as a Trustee for the fund.
Independent Trustees:
Correspondence intended for an Independent Trustee may be sent to Fidelity Investments, P.O. Box 55235, Boston, Massachusetts 02205-5235.
Name, Year of Birth; Principal Occupations and Other Relevant Experience+
Thomas P. Bostick (1956)
Year of Election or Appointment: 2021
Trustee
Lieutenant General Bostick also serves as Trustee of other Fidelity® funds. Prior to his retirement, General Bostick (United States Army, Retired) held a variety of positions within the U.S. Army, including Commanding General and Chief of Engineers, U.S. Army Corps of Engineers (2012-2016) and Deputy Chief of Staff and Director of Human Resources, U.S. Army (2009-2012). General Bostick currently serves as a member of the Board and Finance and Governance Committees of CSX Corporation (transportation, 2020-present) and a member of the Board and Corporate Governance and Nominating Committee of Perma-Fix Environmental Services, Inc. (nuclear waste management, 2020-present). General Bostick serves as Chief Executive Officer of Bostick Global Strategies, LLC (consulting, 2016-present) and as a member of the Board of HireVue, Inc. (video interview and assessment, 2020-present). Previously, General Bostick served as a Member of the Advisory Board of certain Fidelity® funds (2021), President, Intrexon Bioengineering (2018-2020) and Chief Operating Officer (2017-2020) and Senior Vice President of the Environment Sector (2016-2017) of Intrexon Corporation (biopharmaceutical company).
Dennis J. Dirks (1948)
Year of Election or Appointment: 2005
Trustee
Mr. Dirks also serves as Trustee of other Fidelity® funds. Prior to his retirement in May 2003, Mr. Dirks served as Chief Operating Officer and as a member of the Board of The Depository Trust & Clearing Corporation (financial markets infrastructure), President, Chief Operating Officer and a member of the Board of The Depository Trust Company (DTC), President and a member of the Board of the National Securities Clearing Corporation (NSCC), Chief Executive Officer and a member of the Board of the Government Securities Clearing Corporation and Chief Executive Officer and a member of the Board of the Mortgage-Backed Securities Clearing Corporation. Mr. Dirks currently serves as a member of the Finance Committee (2016-present) and Board (2017-present) and is Treasurer (2018-present) of the Asolo Repertory Theatre.
Donald F. Donahue (1950)
Year of Election or Appointment: 2018
Trustee
Mr. Donahue also serves as Trustee of other Fidelity® funds. Mr. Donahue serves as President and Chief Executive Officer of Miranda Partners, LLC (risk consulting for the financial services industry, 2012-present). Previously, Mr. Donahue served as Chief Executive Officer (2006-2012), Chief Operating Officer (2003-2006) and Managing Director, Customer Marketing and Development (1999-2003) of The Depository Trust & Clearing Corporation (financial markets infrastructure). Mr. Donahue currently serves as a member (2007-present) and Co-Chairman (2016-present) of the Board of United Way of New York and a member of the Board of The Leadership Academy (previously NYC Leadership Academy) (2012-present). Mr. Donahue previously served as a member of the Advisory Board of certain Fidelity® funds (2015-2018).
Vicki L. Fuller (1957)
Year of Election or Appointment: 2020
Trustee
Ms. Fuller also serves as Trustee of other Fidelity® funds. Previously, Ms. Fuller served as a member of the Advisory Board of certain Fidelity® funds (2018-2020), Chief Investment Officer of the New York State Common Retirement Fund (2012-2018) and held a variety of positions at AllianceBernstein L.P. (global asset management, 1985-2012), including Managing Director (2006-2012) and Senior Vice President and Senior Portfolio Manager (2001-2006). Ms. Fuller currently serves as a member of the Board, Audit Committee and Nominating and Governance Committee of two Blackstone business development companies (2020-present), as a member of the Board of Treliant, LLC (consulting, 2019-present), as a member of the Advisory Board of Ariel Alternatives, LLC (private equity, 2021-present) and as a member of the Board and Chair of the Audit Committee of Gusto, Inc. (software, 2021-present). In addition, Ms. Fuller currently serves as a member of the Board of Roosevelt University (2019-present) and as a member of the Executive Board of New York University’s Stern School of Business. Ms. Fuller previously served as a member of the Board, Audit Committee and Nominating and Governance Committee of The Williams Companies, Inc. (natural gas infrastructure, 2018-2021).
Patricia L. Kampling (1959)
Year of Election or Appointment: 2020
Trustee
Ms. Kampling also serves as Trustee of other Fidelity® funds. Prior to her retirement, Ms. Kampling served as Chairman of the Board and Chief Executive Officer (2012-2019), President and Chief Operating Officer (2011-2012) and Executive Vice President and Chief Financial Officer (2010-2011) of Alliant Energy Corporation. Ms. Kampling currently serves as a member of the Board, Finance Committee and Governance, Compensation and Nominating Committee of Xcel Energy Inc. (utilities company, 2020-present) and as a member of the Board, Audit, Finance and Risk Committee and Safety, Environmental, Technology and Operations Committee and Chair of the Executive Development and Compensation Committee of American Water Works Company, Inc. (utilities company, 2019-present). In addition, Ms. Kampling currently serves as a member of the Board of the Nature Conservancy, Wisconsin Chapter (2019-present). Previously, Ms. Kampling served as a Member of the Advisory Board of certain Fidelity® funds (2020), a member of the Board, Compensation Committee and Executive Committee and Chair of the Audit Committee of Briggs & Stratton Corporation (manufacturing, 2011-2021), a member of the Board of Interstate Power and Light Company (2012-2019) and Wisconsin Power and Light Company (2012-2019) (each a subsidiary of Alliant Energy Corporation) and as a member of the Board and Workforce Development Committee of the Business Roundtable (2018-2019).
Thomas A. Kennedy (1955)
Year of Election or Appointment: 2021
Trustee
Mr. Kennedy also serves as Trustee of other Fidelity® funds. Previously, Mr. Kennedy served as a Member of the Advisory Board of certain Fidelity® funds (2020) and held a variety of positions at Raytheon Company (aerospace and defense, 1983-2020), including Chairman and Chief Executive Officer (2014-2020) and Executive Vice President and Chief Operating Officer (2013-2014). Mr. Kennedy currently serves as Executive Chairman of the Board of Directors of Raytheon Technologies Corporation (aerospace and defense, 2020-present). He is also a member of the Rutgers School of Engineering Industry Advisory Board (2011-present) and a member of the UCLA Engineering Dean’s Executive Board (2016-present).
Oscar Munoz (1959)
Year of Election or Appointment: 2021
Trustee
Mr. Munoz also serves as Trustee of other Fidelity® funds. Prior to his retirement, Mr. Munoz served as Executive Chairman (2020-2021), Chief Executive Officer (2015-2020), President (2015-2016) and a member of the Board (2010-2021) of United Airlines Holdings, Inc. Mr. Munoz currently serves as a member of the Board of CBRE Group, Inc. (commercial real estate, 2020-present), a member of the Board of Univision Communications, Inc. (Hispanic media, 2020-present) and a member of the Advisory Board of Salesforce.com, Inc. (cloud-based software, 2020-present). Previously, Mr. Munoz served as a Member of the Advisory Board of certain Fidelity® funds (2021).
Garnett A. Smith (1947)
Year of Election or Appointment: 2018
Trustee
Mr. Smith also serves as Trustee of other Fidelity® funds. Prior to his retirement, Mr. Smith served as Chairman and Chief Executive Officer (1990-1997) and President (1986-1990) of Inbrand Corp. (manufacturer of personal absorbent products). Prior to his employment with Inbrand Corp., he was employed by a retail fabric chain and North Carolina National Bank (now Bank of America). Mr. Smith previously served as a member of the Advisory Board of certain Fidelity® funds (2012-2013).
David M. Thomas (1949)
Year of Election or Appointment: 2008
Trustee
Lead Independent Trustee
Mr. Thomas also serves as Trustee of other Fidelity® funds. Previously, Mr. Thomas served as Executive Chairman (2005-2006) and Chairman and Chief Executive Officer (2000-2005) of IMS Health, Inc. (pharmaceutical and healthcare information solutions). Mr. Thomas currently serves as a member of the Board of Fortune Brands Home and Security (home and security products, 2004-present) and as Director (2013-present) and Non-Executive Chairman of the Board (2022-present) of Interpublic Group of Companies, Inc. (marketing communication).
Susan Tomasky (1953)
Year of Election or Appointment: 2020
Trustee
Ms. Tomasky also serves as Trustee of other Fidelity® funds. Prior to her retirement, Ms. Tomasky served in various executive officer positions at American Electric Power Company, Inc. (1998-2011), including most recently as President of AEP Transmission (2007-2011). Ms. Tomasky currently serves as a member of the Board and Sustainability Committee and as Chair of the Audit Committee of Marathon Petroleum Corporation (2018-present) and as a member of the Board, Executive Committee, Corporate Governance Committee and Organization and Compensation Committee and as Chair of the Audit Committee of Public Service Enterprise Group, Inc. (utilities company, 2012-present) and as a member of the Board of its subsidiary company, Public Service Electric and Gas Co. (2021-present). In addition, Ms. Tomasky currently serves as a member (2009-present) and President (2020-present) of the Board of the Royal Shakespeare Company – America (2009-present), as a member of the Board of the Columbus Association for the Performing Arts (2011-present) and as a member of the Board and Kenyon in the World Committee of Kenyon College (2016-present). Previously, Ms. Tomasky served as a Member of the Advisory Board of certain Fidelity® funds (2020), as a member of the Board of the Columbus Regional Airport Authority (2007-2020), as a member of the Board (2011-2018) and Lead Independent Director (2015-2018) of Andeavor Corporation (previously Tesoro Corporation) (independent oil refiner and marketer) and as a member of the Board of Summit Midstream Partners LP (energy, 2012-2018).
Michael E. Wiley (1950)
Year of Election or Appointment: 2018
Trustee
Mr. Wiley also serves as Trustee of other Fidelity® funds. Previously, Mr. Wiley served as a member of the Advisory Board of certain Fidelity® funds (2018-2020), Chairman, President and CEO of Baker Hughes, Inc. (oilfield services, 2000-2004). Mr. Wiley also previously served as a member of the Board of Andeavor Corporation (independent oil refiner and marketer, 2005-2018), a member of the Board of Andeavor Logistics LP (natural resources logistics, 2015-2018) and a member of the Board of High Point Resources (exploration and production, 2005-2020).
+ The information includes the Trustee's principal occupation during the last five years and other information relating to the experience, attributes, and skills relevant to the Trustee's qualifications to serve as a Trustee, which led to the conclusion that the Trustee should serve as a Trustee for the fund.
Advisory Board Members and Officers:
Correspondence intended for a Member of the Advisory Board (if any) may be sent to Fidelity Investments, P.O. Box 55235, Boston, Massachusetts 02205-5235. Correspondence intended for an officer or Peter S. Lynch may be sent to Fidelity Investments, 245 Summer Street, Boston, Massachusetts 02210. Officers appear below in alphabetical order.
Name, Year of Birth; Principal Occupation
Peter S. Lynch (1944)
Year of Election or Appointment: 2003
Member of the Advisory Board
Mr. Lynch also serves as a Member of the Advisory Board of other Fidelity® funds. Mr. Lynch is Vice Chairman and a Director of Fidelity Management & Research Company LLC (investment adviser firm). In addition, Mr. Lynch serves as a Trustee of Boston College and as the Chairman of the Inner-City Scholarship Fund. Previously, Mr. Lynch served as Vice Chairman and a Director of FMR Co., Inc. (investment adviser firm) and on the Special Olympics International Board of Directors (1997-2006).
Craig S. Brown (1977)
Year of Election or Appointment: 2019
Assistant Treasurer
Mr. Brown also serves as an officer of other funds. Mr. Brown serves as Assistant Treasurer of FIMM, LLC (2021-present) and is an employee of Fidelity Investments (2013-present).
John J. Burke III (1964)
Year of Election or Appointment: 2018
Chief Financial Officer
Mr. Burke also serves as Chief Financial Officer of other funds. Mr. Burke serves as Head of Investment Operations for Fidelity Fund and Investment Operations (2018-present) and is an employee of Fidelity Investments (1998-present). Previously Mr. Burke served as head of Asset Management Investment Operations (2012-2018).
William C. Coffey (1969)
Year of Election or Appointment: 2019
Assistant Secretary
Mr. Coffey also serves as Assistant Secretary of other funds. He is Senior Vice President and Deputy General Counsel of FMR LLC (diversified financial services company, 2010-present), and is an employee of Fidelity Investments. Previously, Mr. Coffey served as Secretary and CLO of certain funds (2018-2019); CLO, Secretary, and Senior Vice President of Fidelity Management & Research Company and FMR Co., Inc. (investment adviser firms, 2018-2019); Secretary of Fidelity SelectCo, LLC and Fidelity Investments Money Management, Inc. (investment adviser firms, 2018-2019); CLO of Fidelity Management & Research (Hong Kong) Limited, FMR Investment Management (UK) Limited, and Fidelity Management & Research (Japan) Limited (investment adviser firms, 2018-2019); and Assistant Secretary of certain funds (2009-2018).
Timothy M. Cohen (1969)
Year of Election or Appointment: 2018
Vice President
Mr. Cohen also serves as Vice President of other funds. Mr. Cohen serves as Co-Head of Equity (2018-present), a Director of Fidelity Management & Research (Japan) Limited (investment adviser firm, 2016-present), and is an employee of Fidelity Investments. Previously, Mr. Cohen served as Executive Vice President of Fidelity SelectCo, LLC (2019), Head of Global Equity Research (2016-2018), Chief Investment Officer - Equity and a Director of Fidelity Management & Research (U.K.) Inc. (investment adviser firm, 2013-2015) and as a Director of Fidelity Management & Research (Hong Kong) Limited (investment adviser firm, 2017).
Jonathan Davis (1968)
Year of Election or Appointment: 2010
Assistant Treasurer
Mr. Davis also serves as an officer of other funds. Mr. Davis serves as Assistant Treasurer of FIMM, LLC (2021-present), FMR Capital, Inc. (2017-present), FD Funds GP LLC (2021-present), FD Funds Holding LLC (2021-present), and FD Funds Management LLC (2021-present); and is an employee of Fidelity Investments. Previously, Mr. Davis served as Vice President and Associate General Counsel of FMR LLC (diversified financial services company, 2003-2010).
Laura M. Del Prato (1964)
Year of Election or Appointment: 2018
Assistant Treasurer
Ms. Del Prato also serves as an officer of other funds. Ms. Del Prato serves as Assistant Treasurer of FIMM, LLC (2021-present) and is an employee of Fidelity Investments (2017-present). Previously, Ms. Del Prato served as President and Treasurer of The North Carolina Capital Management Trust: Cash Portfolio and Term Portfolio (2018-2020). Prior to joining Fidelity Investments, Ms. Del Prato served as a Managing Director and Treasurer of the JPMorgan Mutual Funds (2014-2017). Prior to JPMorgan, Ms. Del Prato served as a partner at Cohen Fund Audit Services (accounting firm, 2012-2013) and KPMG LLP (accounting firm, 2004-2012).
Colm A. Hogan (1973)
Year of Election or Appointment: 2020
Assistant Treasurer
Mr. Hogan also serves as an officer of other funds. Mr. Hogan serves as Assistant Treasurer of FIMM, LLC (2021-present) and FMR Capital, Inc. (2017-present) and is an employee of Fidelity Investments (2005-present). Previously, Mr. Hogan served as Deputy Treasurer of certain Fidelity® funds (2016-2020) and Assistant Treasurer of certain Fidelity® funds (2016-2018).
Pamela R. Holding (1964)
Year of Election or Appointment: 2018
Vice President
Ms. Holding also serves as Vice President of other funds. Ms. Holding serves as Co-Head of Equity (2018-present) and is an employee of Fidelity Investments (2013-present). Previously, Ms. Holding served as Executive Vice President of Fidelity SelectCo, LLC (2019) and as Chief Investment Officer of Fidelity Institutional Asset Management (2013-2018).
Cynthia Lo Bessette (1969)
Year of Election or Appointment: 2019
Secretary and Chief Legal Officer (CLO)
Ms. Lo Bessette also serves as an officer of other funds. Ms. Lo Bessette serves as CLO, Secretary, and Senior Vice President of Fidelity Management & Research Company LLC (investment adviser firm, 2019-present); CLO of Fidelity Management & Research (Hong Kong) Limited, FMR Investment Management (UK) Limited, and Fidelity Management & Research (Japan) Limited (investment adviser firms, 2019-present); Secretary of FD Funds GP LLC (2021-present), FD Funds Holding LLC (2021-present), and FD Funds Management LLC (2021-present); and Assistant Secretary of FIMM, LLC (2019-present). She is a Senior Vice President and Deputy General Counsel of FMR LLC (diversified financial services company, 2019-present), and is an employee of Fidelity Investments. Previously, Ms. Lo Bessette served as CLO, Secretary, and Senior Vice President of FMR Co., Inc. (investment adviser firm, 2019); Secretary of Fidelity SelectCo, LLC and Fidelity Investments Money Management, Inc. (investment adviser firms, 2019). Prior to joining Fidelity Investments, Ms. Lo Bessette was Executive Vice President, General Counsel (2016-2019) and Senior Vice President, Deputy General Counsel (2015-2016) of OppenheimerFunds (investment management company) and Deputy Chief Legal Officer (2013-2015) of Jennison Associates LLC (investment adviser firm).
Chris Maher (1972)
Year of Election or Appointment: 2020
Deputy Treasurer
Mr. Maher also serves as an officer of other funds. Mr. Maher serves as Assistant Treasurer of FIMM, LLC (2021-present) and FMR Capital, Inc. (2017-present), and is an employee of Fidelity Investments (2008-present). Previously, Mr. Maher served as Assistant Treasurer of certain funds (2013-2020); Vice President of Asset Management Compliance (2013), Vice President of the Program Management Group of FMR (investment adviser firm, 2010-2013), and Vice President of Valuation Oversight (2008-2010).
Jason P. Pogorelec (1975)
Year of Election or Appointment: 2020
Chief Compliance Officer
Mr. Pogorelec also serves as Chief Compliance Officer of other funds. Mr. Pogorelec is a senior Vice President of Asset Management Compliance for Fidelity Investments and is an employee of Fidelity Investments (2006-present). Previously, Mr. Pogorelec served as Vice President, Associate General Counsel for Fidelity Investments (2010-2020) and Assistant Secretary of certain Fidelity funds (2015-2020).
Brett Segaloff (1972)
Year of Election or Appointment: 2021
Anti-Money Laundering (AML) Officer
Mr. Segaloff also serves as an AML Officer of other funds and other related entities. He is Director, Anti-Money Laundering (2007-present) of FMR LLC (diversified financial services company) and is an employee of Fidelity Investments (1996-present).
Stacie M. Smith (1974)
Year of Election or Appointment: 2016
President and Treasurer
Ms. Smith also serves as an officer of other funds. Ms. Smith serves as Assistant Treasurer of FIMM, LLC (2021-present) and FMR Capital, Inc. (2017-present), is an employee of Fidelity Investments (2009-present), and has served in other fund officer roles. Prior to joining Fidelity Investments, Ms. Smith served as Senior Audit Manager of Ernst & Young LLP (accounting firm, 1996-2009). Previously, Ms. Smith served as Assistant Treasurer (2013-2019) and Deputy Treasurer (2013-2016) of certain Fidelity® funds.
Jim Wegmann (1979)
Year of Election or Appointment: 2019
Assistant Treasurer
Mr. Wegmann also serves as an officer of other funds. Mr. Wegmann serves as Assistant Treasurer of FIMM, LLC (2021-present) and is an employee of Fidelity Investments (2011-present). Previously, Mr. Wegmann served as Assistant Treasurer of certain Fidelity® funds (2019-2021).
Shareholder Expense Example
As a shareholder, you incur two types of costs: (1) transaction costs, which may include sales charges (loads) on purchase payments or redemption proceeds, as applicable and (2) ongoing costs, which generally include management fees, distribution and/or service (12b-1) fees and other Fund expenses. This Example is intended to help you understand your ongoing costs (in dollars) of investing in a fund and to compare these costs with the ongoing costs of investing in other mutual funds.
The Example is based on an investment of $1,000 invested at the beginning of the period and held for the entire period (December 1, 2021 to May 31, 2022).
Actual Expenses
The first line of the accompanying table provides information about actual account values and actual expenses. You may use the information in this line, together with the amount you invested, to estimate the expenses that you paid over the period. Simply divide your account value by $1,000.00 (for example, an $8,600 account value divided by $1,000.00 = 8.6), then multiply the result by the number in the first line for a class/Fund under the heading entitled "Expenses Paid During Period" to estimate the expenses you paid on your account during this period. If any fund is a shareholder of any underlying mutual funds or exchange-traded funds (ETFs) (the Underlying Funds), such fund indirectly bears its proportional share of the expenses of the Underlying Funds in addition to the direct expenses incurred presented in the table. These fees and expenses are not included in the annualized expense ratio used to calculate the expense estimate in the table below.
Hypothetical Example for Comparison Purposes
The second line of the accompanying table provides information about hypothetical account values and hypothetical expenses based on the actual expense ratio and an assumed rate of return of 5% per year before expenses, which is not the actual return. The hypothetical account values and expenses may not be used to estimate the actual ending account balance or expenses you paid for the period. You may use this information to compare the ongoing costs of investing in the Fund and other funds. To do so, compare this 5% hypothetical example with the 5% hypothetical examples that appear in the shareholder reports of the other funds. If any fund is a shareholder of any Underlying Funds, such fund indirectly bears its proportional share of the expenses of the Underlying Funds in addition to the direct expenses as presented in the table. These fees and expenses are not included in the annualized expense ratio used to calculate the expense estimate in the table below.
Please note that the expenses shown in the table are meant to highlight your ongoing costs only and do not reflect any transaction costs. Therefore, the second line of the table is useful in comparing ongoing costs only, and will not help you determine the relative total costs of owning different funds. In addition, if these transactional costs were included, your costs would have been higher.
| | Annualized Expense Ratio-A | Beginning
Account Value
December 1, 2021 | Ending
Account Value
May 31, 2022 | Expenses Paid
During Period-B
December 1, 2021
to May 31, 2022 |
| Fidelity Sustainable U.S. Equity Fund | | | | |
| Class A | 1.14% | | | |
| Actual | | $1,000.00 | $877.30 | $5.34 |
| Hypothetical-C | | $1,000.00 | $1,019.25 | $5.74 |
| Class M | 1.39% | | | |
| Actual | | $1,000.00 | $875.90 | $6.50 |
| Hypothetical-C | | $1,000.00 | $1,018.00 | $6.99 |
| Class C | 1.88% | | | |
| Actual | | $1,000.00 | $874.40 | $8.79 |
| Hypothetical-C | | $1,000.00 | $1,015.56 | $9.45 |
| Fidelity Sustainable U.S. Equity Fund | .89% | | | |
| Actual | | $1,000.00 | $879.20 | $4.17 |
| Hypothetical-C | | $1,000.00 | $1,020.49 | $4.48 |
| Class I | .90% | | | |
| Actual | | $1,000.00 | $879.20 | $4.22 |
| Hypothetical-C | | $1,000.00 | $1,020.44 | $4.53 |
| Class Z | .75% | | | |
| Actual | | $1,000.00 | $879.30 | $3.51 |
| Hypothetical-C | | $1,000.00 | $1,021.19 | $3.78 |
A Annualized expense ratio reflects expenses net of applicable fee waivers.
B Expenses are equal to the annualized expense ratio, multiplied by the average account value over the period, multiplied by 182/ 365 (to reflect the one-half year period). The fees and expenses of any Underlying Funds are not included in each annualized expense ratio.
C 5% return per year before expenses
Distributions (Unaudited)
The dividend and capital gains distributions for the fund(s) are available on Fidelity.com or Institutional.Fidelity.com.
The fund designates 99.70% of the short-term capital gain dividends distributed during the fiscal year as qualifying to be taxed as short-term capital gain dividends for nonresident alien shareholders.
Class A designates 78%; Class M designates 100%; Class C designates 100%; Fidelity Sustainable U.S. Equity Fund designates 62%; Class I designates 62%; and Class Z designates 62%; of the dividends distributed during the fiscal year as qualifying for the dividends–received deduction for corporate shareholders.
Class A designates 86%; Class M designates 100%; Class C designates 100%; Fidelity Sustainable U.S. Equity Fund designates 68%; Class I designates 68%; and Class Z designates 68%; of the dividends distributed during the fiscal year as amounts which may be taken into account as a dividend for purposes of the maximum rate under section 1(h)(11) of the Internal Revenue Code.
Class A designates 5%; Fidelity Sustainable U.S. Equity Fund designates 4%; Class I designates 4%; and Class Z designates 4%; of the dividends distributed during the fiscal year as a section 199A dividend.
The fund will notify shareholders in January 2023 of amounts for use in preparing 2022 income tax returns.
Board Approval of Investment Advisory Contracts and Management Fees
Fidelity Sustainable U.S. Equity Fund (formerly known as Fidelity Sustainability U.S. Equity Fund)
Each year, the Board of Trustees, including the Independent Trustees (together, the Board), votes on the renewal of the management contract with Fidelity Management & Research Company LLC (FMR) and the sub-advisory agreements (together, the Advisory Contracts) for the fund. FMR and the sub-advisers are referred to herein as the Investment Advisers. The Board, assisted by the advice of fund counsel and Independent Trustees' counsel, requests and considers a broad range of information relevant to the renewal of the Advisory Contracts throughout the year.
The Board meets regularly and, at each of its meetings, covers an extensive agenda of topics and materials and considers factors that are relevant to its annual consideration of the renewal of the fund's Advisory Contracts, including the services and support provided to the fund and its shareholders. The Board has established various standing committees (Committees), each composed of and chaired by Independent Trustees with varying backgrounds, to which the Board has assigned specific subject matter responsibilities in order to enhance effective decision-making by the Board. The Board, acting directly and through its Committees, requests and receives information concerning the annual consideration of the renewal of the fund's Advisory Contracts. The Board also meets as needed to review matters specifically related to the Board's annual consideration of the renewal of the Advisory Contracts. Members of the Board may also meet with trustees of other Fidelity funds through joint ad hoc committees to discuss certain matters relevant to all of the Fidelity funds.
At its May 2022 meeting, the Board unanimously determined to renew the fund's Advisory Contracts. In reaching its determination, the Board considered all factors it believed relevant, including (i) the nature, extent, and quality of the services provided to the fund and its shareholders (including the investment performance of the fund); (ii) the competitiveness relative to peer funds of the fund's management fee and total expense ratio of a representative class (retail class); (iii) the total costs of the services provided by and the profits realized by Fidelity from its relationships with the fund; and (iv) the extent to which, if any, economies of scale exist and are realized as the fund grows, and whether any economies of scale are appropriately shared with fund shareholders.
In considering whether to renew the Advisory Contracts for the fund, the Board reached a determination, with the assistance of fund counsel and Independent Trustees' counsel and through the exercise of its business judgment, that the renewal of the Advisory Contracts was in the best interests of the fund and its shareholders and that the compensation payable under the Advisory Contracts was fair and reasonable. The Board's decision to renew the Advisory Contracts was not based on any single factor, but rather was based on a comprehensive consideration of all the information provided to the Board at its meetings throughout the year. The Board, in reaching its determination to renew the Advisory Contracts, was aware that shareholders of the fund have a broad range of investment choices available to them, including a wide choice among funds offered by Fidelity's competitors, and that the fund's shareholders, who have the opportunity to review and weigh the disclosure provided by the fund in its prospectus and other public disclosures, have chosen to invest in this fund, which is part of the Fidelity family of funds.
Nature, Extent, and Quality of Services Provided. The Board considered Fidelity's staffing as it relates to the fund, including the backgrounds of investment personnel of Fidelity, and also considered the fund's investment objective, strategies, and related investment philosophy. The Independent Trustees also had discussions with senior management of Fidelity's investment operations and investment groups. The Board considered the structure of the investment personnel compensation program and whether this structure provides appropriate incentives to act in the best interests of the fund. Additionally, the Board considered the portfolio managers' investments, if any, in the funds that they manage. The Board also considered the steps Fidelity had taken to ensure the continued provision of high quality services to the Fidelity funds during the COVID-19 pandemic, including the expansion of staff in client facing positions to maintain service levels in periods of high volumes and volatility.
Resources Dedicated to Investment Management and Support Services. The Board and the Fund Oversight and Research Committees reviewed the general qualifications and capabilities of Fidelity's investment staff, including its size, education, experience, and resources, as well as Fidelity's approach to recruiting, training, managing, and compensating investment personnel. The Board noted the resources devoted to expansion of Fidelity's global investment organization, and that Fidelity's analysts have extensive resources, tools, and capabilities that allow them to conduct sophisticated quantitative and fundamental analysis, as well as credit analysis of issuers, counterparties, and guarantors. Further, the Board considered that Fidelity's investment professionals have sufficient access to global information and data so as to provide competitive investment results over time, and that those professionals also have access to sophisticated tools that permit them to assess portfolio construction and risk and performance attribution characteristics continuously, as well as to transmit new information and research conclusions rapidly around the world. Additionally, in its deliberations, the Board considered Fidelity's trading, risk management, compliance, and technology and operations capabilities and resources, which are integral parts of the investment management process.
Shareholder and Administrative Services. The Board considered (i) the nature, extent, quality, and cost of advisory, administrative, and shareholder services performed by the Investment Advisers and their affiliates under the Advisory Contracts and under separate agreements covering transfer agency, pricing and bookkeeping, and securities lending services for the fund; (ii) the nature and extent of the supervision of third party service providers, principally custodians, subcustodians, and pricing vendors; and (iii) the resources devoted to, and the record of compliance with, the fund's compliance policies and procedures. The Board also reviewed the allocation of fund brokerage, including allocations to brokers affiliated with the Investment Advisers, the use of brokerage commissions to pay fund expenses, and the use of "soft" commission dollars to pay for research services.
The Board noted that the growth of fund assets over time across the complex allows Fidelity to reinvest in the development of services designed to enhance the value and convenience of the Fidelity funds as investment vehicles. These services include 24-hour access to account information and market information over the Internet and through telephone representatives, investor education materials, and asset allocation tools. The Board also considered that it reviews customer service metrics such as telephone response times, continuity of services on the website and metrics addressing services at Fidelity Investor Centers.
Investment in a Large Fund Family. The Board considered the benefits to shareholders of investing in a Fidelity fund, including the benefits of investing in a fund that is part of a large family of funds offering a variety of investment disciplines and providing a large variety of mutual fund investor services. The Board noted that Fidelity had taken, or had made recommendations that resulted in the Fidelity funds taking, a number of actions over the previous year that benefited particular funds, including: (i) continuing to dedicate additional resources to Fidelity's investment research process, which includes meetings with management of issuers of securities in which the funds invest; (ii) continuing efforts to enhance Fidelity's global research capabilities; (iii) launching new funds and ETFs with innovative structures, strategies and pricing and making other enhancements to meet client needs; (iv) launching new share classes of existing funds; (v) eliminating purchase minimums and broadening eligibility requirements for certain funds and share classes; (vi) reducing management fees and total expenses for certain target date funds and classes and index funds; (vii) lowering expenses for certain existing funds and classes by implementing or lowering expense caps; (viii) rationalizing product lines and gaining increased efficiencies from fund mergers and liquidations; (ix) continuing to develop, acquire and implement systems and technology to improve services to the funds and shareholders, strengthen information security, and increase efficiency; and (x) continuing to implement enhancements to further strengthen Fidelity's product line to increase investors' probability of success in achieving their investment goals, including retirement income goals.
Investment Performance. The Board considered whether the fund has operated in accordance with its investment objective, as well as its record of compliance with its investment restrictions. As the fund recently commenced operations, the Board did not believe that it was appropriate to assign significant weight to its limited investment performance.
Based on its review, the Board concluded that the nature, extent, and quality of services provided to the fund under the Advisory Contracts should continue to benefit the shareholders of the fund.
Competitiveness of Management Fee and Total Expense Ratio. The Board considered the fund's management fee and total expense ratio compared to "mapped groups" of competitive funds and classes created for the purpose of facilitating the Trustees' competitive analysis of management fees and total expenses. Fidelity creates "mapped groups" by combining similar Lipper investment objective categories that have comparable investment mandates. Combining Lipper investment objective categories aids the Board's management fee and total expense ratio comparisons by broadening the competitive group used for comparison.
Management Fee. The Board considered two proprietary management fee comparisons for the period of the fund's operations ended September 30 shown in basis points (BP) in the chart below. The group of Lipper funds used by the Board for management fee comparisons is referred to below as the "Total Mapped Group." The Total Mapped Group comparison focuses on a fund's standing in terms of gross management fees before expense reimbursements or caps, relative to the total universe of funds with comparable investment mandates, regardless of whether their management fee structures also are comparable. Funds with comparable investment mandates offer exposure to similar types of securities. Funds with comparable management fee structures have similar management fee contractual arrangements (
e.g., flat rate charged for advisory services, all-inclusive fee rate,
etc.). "TMG %" represents the percentage of funds in the Total Mapped Group that had management fees that were lower than the fund's. For example, a hypothetical TMG % of 20% would mean that 80% of the funds in the Total Mapped Group had higher, and 20% had lower, management fees than the fund. The fund's actual TMG % and the number of funds in the Total Mapped Group are in the chart below. The "Asset-Sized Peer Group" (ASPG) comparison focuses on a fund's standing relative to a subset of non-Fidelity funds within the Total Mapped Group that are similar in size and management fee structure. For example, if a fund is in the first quartile of the ASPG, the fund's management fee ranks in the least expensive or lowest 25% of funds in the ASPG. The ASPG represents at least 15% of the funds in the Total Mapped Group with comparable asset size and management fee structures, subject to a minimum of 50 funds (or all funds in the Total Mapped Group if fewer than 50). Additional information, such as the ASPG quartile in which the fund's management fee rate ranked, is also included in the chart and was considered by the Board.
Fidelity Sustainable U.S. Equity Fund
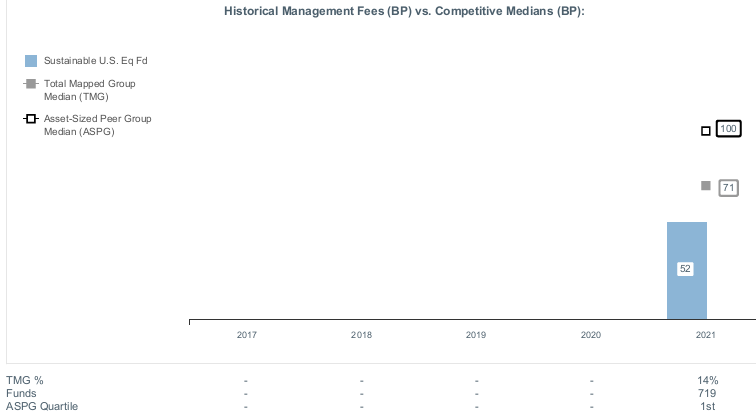
The Board noted that the fund's management fee rate ranked below the median of its Total Mapped Group and below the median of its ASPG for the period ended September 30, 2021.
The Board also considered that, for funds subject to the group fee, FMR agreed to voluntarily waive fees over a specified period of time in amounts designed to account for assets converted from certain funds to certain collective investment trusts.
Based on its review, the Board concluded that the fund's management fee is fair and reasonable in light of the services that the fund receives and the other factors considered.
Total Expense Ratio. In its review of the total expense ratio of the representative class (retail class), the Board considered the fund's management fee rate as well as other fund or class expenses, as applicable, such as transfer agent fees, pricing and bookkeeping fees, fund-paid 12b-1 fees, and custodial, legal, and audit fees. The Board also noted that Fidelity may agree to waive fees or reimburse expenses from time to time, and the extent to which, if any, it has done so for the fund. The fund's representative class is compared to those funds and classes in the Total Mapped Group (used by the Board for management fee comparisons) that have a similar sales load structure. The Board also considered a total expense ASPG comparison, which focuses on the total expenses of the representative class relative to a subset of non-Fidelity funds within the total expense similar sales load structure group. The total expense ASPG is limited to 15 larger and 15 smaller classes in fund average assets for a total of 30 classes, where possible. The total expense ASPG comparison excludes performance adjustments and fund-paid 12b-1 fees to eliminate variability in fee structures.
The Board noted that the total net expense ratio of the retail class ranked below the similar sales load structure group competitive median and below the ASPG competitive median for the period ended September 30, 2021. The Board considered that, in general, various factors can affect total expense ratios.
The Board further considered that FMR has contractually agreed to reimburse Class A, Class M, Class C, Class I, Class Z, and the retail class of the fund to the extent that total operating expenses, with certain exceptions, as a percentage of their respective average net assets, exceed 1.15%, 1.40%, 1.90%, 0.90%, 0.75%, and 0.90% through September 30, 2022.
Fees Charged to Other Fidelity Clients. The Board also considered Fidelity fee structures and other information with respect to clients of Fidelity, such as other funds advised or subadvised by Fidelity, pension plan clients, and other institutional clients with similar mandates. The Board noted that a joint ad hoc committee created by it and the boards of other Fidelity funds periodically reviews and compares Fidelity's institutional investment advisory business with its business of providing services to the Fidelity funds and also noted the most recent findings of the committee. The Board noted that the committee's review included a consideration of the differences in services provided, fees charged, and costs incurred, as well as competition in the markets serving the different categories of clients.
Based on its review of total expense ratios and fees charged to other Fidelity clients, the Board concluded that the total expense ratio of each class of the fund was reasonable in light of the services that the fund and its shareholders receive and the other factors considered.
Costs of the Services and Profitability. The Board considered the revenues earned and the expenses incurred by Fidelity in conducting the business of developing, marketing, distributing, managing, administering and servicing the fund and servicing the fund's shareholders. The Board also considered the level of Fidelity's profits in respect of all the Fidelity funds.
On an annual basis, Fidelity presents to the Board information about the profitability of its relationships with the fund. Fidelity calculates profitability information for each fund, as well as aggregate profitability information for groups of Fidelity funds and all Fidelity funds, using a series of detailed revenue and cost allocation methodologies which originate with the books and records of Fidelity on which Fidelity's audited financial statements are based. The Audit Committee of the Board reviews any significant changes from the prior year's methodologies and the full Board approves such changes.
A public accounting firm has been engaged annually by the Board as part of the Board's assessment of Fidelity's profitability analysis. The engagement includes the review and assessment of the methodologies used by Fidelity in determining the revenues and expenses attributable to Fidelity's mutual fund business, and completion of agreed-upon procedures in respect of the mathematical accuracy of certain fund profitability information and its conformity to established allocation methodologies. After considering the reports issued under the engagement and information provided by Fidelity, the Board concluded that while other allocation methods may also be reasonable, Fidelity's profitability methodologies are reasonable in all material respects.
The Board also reviewed Fidelity's non-fund businesses and potential indirect benefits such businesses may have received as a result of their association with Fidelity's mutual fund business (i.e., fall-out benefits) as well as cases where Fidelity's affiliates may benefit from the funds' business. The Board considered areas where potential indirect benefits to the Fidelity funds from their relationships with Fidelity may exist. The Board's consideration of these matters was informed by the findings of a joint ad hoc committee created by it and the boards of other Fidelity funds to evaluate potential fall-out benefits.
The Board considered the costs of the services provided by and the profits realized by Fidelity in connection with the operation of the fund and was satisfied that the profitability was not excessive.
Economies of Scale. The Board considered whether there have been economies of scale in respect of the management of the Fidelity funds, whether the Fidelity funds (including the fund) have appropriately benefited from any such economies of scale, and whether there is potential for realization of any further economies of scale. The Board considered the extent to which the fund will benefit from economies of scale as assets grow through increased services to the fund, through waivers or reimbursements, or through fee or expense ratio reductions. The Board also noted that a committee (the Economies of Scale Committee) created by it and the boards of other Fidelity funds periodically analyzes whether Fidelity attains economies of scale in respect of the management and servicing of the Fidelity funds, whether the Fidelity funds have appropriately benefited from such economies of scale, and whether there is potential for realization of any further economies of scale.
The Board recognized that the fund's management contract incorporates a "group fee" structure, which provides for lower group fee rates as total "group assets" increase, and for higher group fee rates as total "group assets" decrease ("group assets" as defined in the management contract). FMR calculates the group fee rates based on a tiered asset "breakpoint" schedule that varies based on asset class. The Board considered that the group fee is designed to deliver the benefits of economies of scale to fund shareholders when total Fidelity fund assets increase, even if assets of any particular fund are unchanged or have declined, because some portion of Fidelity's costs are attributable to services provided to all Fidelity funds, and all funds benefit if those costs can be allocated among more assets. The Board further considered that Fidelity agreed to impose a temporary fee waiver in the form of additional breakpoints to the current breakpoint schedule. The Board concluded that, given the group fee structure, fund shareholders will benefit from lower management fees as "group assets" increase at the fund complex level, regardless of whether Fidelity achieves any such economies of scale.
The Board concluded, taking into account the analysis of the Economies of Scale Committee, that economies of scale, if any, are being appropriately shared between fund shareholders and Fidelity.
Additional Information Requested by the Board. In order to develop fully the factual basis for consideration of the Fidelity funds' advisory contracts, the Board requested and received additional information on certain topics, including: (i) fund flow and performance trends, in particular the underperformance of certain funds and strategies, and Fidelity's long-term strategies for certain funds, including any consideration of fund liquidations or mergers; (ii) the operation of performance fees, competitor use of performance fees, and consideration of the expansion of performance fees to additional funds; (iii) Fidelity's pricing philosophy compared to competitors; (iv) fund profitability methodology and data; (v) evaluation of competitive fund data and peer group classifications and fee and expense comparisons; (vi) the management fee and expense structures for different funds and classes and information about the differences between various fee and expense structures; (vii) group fee breakpoints and related voluntary fee waivers; and (viii) information regarding other accounts managed by Fidelity and the funds' sub-advisory arrangements.
Based on its evaluation of all of the conclusions noted above, and after considering all factors it believed relevant, the Board concluded that the advisory fee arrangements are fair and reasonable and that the fund's Advisory Contracts should be renewed.
Liquidity Risk Management Program
The Securities and Exchange Commission adopted Rule 22e-4 under the Investment Company Act of 1940 (the Liquidity Rule) to promote effective liquidity risk management throughout the open-end investment company industry, thereby reducing the risk that funds will be unable to meet their redemption obligations and mitigating dilution of the interests of fund shareholders.
The Fund has adopted and implemented a liquidity risk management program pursuant to the Liquidity Rule (the Program) effective December 1, 2018. The Program is reasonably designed to assess and manage the Fund’s liquidity risk and to comply with the requirements of the Liquidity Rule. The Fund’s Board of Trustees (the Board) has designated the Fund’s investment adviser as administrator of the Program. The Fidelity advisers have established a Liquidity Risk Management Committee (the LRM Committee) to manage the Program for each of the Fidelity Funds. The LRM Committee monitors the adequacy and effectiveness of implementation of the Program and on a periodic basis assesses each Fund’s liquidity risk based on a variety of factors including (1) the Fund’s investment strategy, (2) portfolio liquidity and cash flow projections during normal and reasonably foreseeable stressed conditions, (3) shareholder redemptions, (4) borrowings and other funding sources and (5) in the case of exchange-traded funds, certain additional factors including the effect of the Fund’s prices and spreads, market participants, and basket compositions on the overall liquidity of the Fund’s portfolio, as applicable.
In accordance with the Program, each of the Fund’s portfolio investments is classified into one of four liquidity categories described below based on a determination of a reasonable expectation for how long it would take to convert the investment to cash (or sell or dispose of the investment) without significantly changing its market value.
- Highly liquid investments – cash or convertible to cash within three business days or less
- Moderately liquid investments – convertible to cash in three to seven calendar days
- Less liquid investments – can be sold or disposed of, but not settled, within seven calendar days
- Illiquid investments – cannot be sold or disposed of within seven calendar days
Liquidity classification determinations take into account a variety of factors including various market, trading and investment-specific considerations, as well as market depth, and generally utilize analysis from a third-party liquidity metrics service.
The Liquidity Rule places a 15% limit on a fund’s illiquid investments and requires funds that do not primarily hold assets that are highly liquid investments to determine and maintain a minimum percentage of the fund’s net assets to be invested in highly liquid investments (highly liquid investment minimum or HLIM). The Program includes provisions reasonably designed to comply with the 15% limit on illiquid investments and for determining, periodically reviewing and complying with the HLIM requirement as applicable.
At a recent meeting of the Fund’s Board of Trustees, the LRM Committee provided a written report to the Board pertaining to the operation, adequacy, and effectiveness of implementation of the Program for the annual period from December 1, 2020 through November 30, 2021. The report concluded that the Program has been implemented and is operating effectively and is reasonably designed to assess and manage the Fund’s liquidity risk.
SUS-ANN-0722
1.9901904.100
Item 2.
Code of Ethics
As of the end of the period, May 31, 2022, Fidelity Summer Street Trust (the trust) has adopted a code of ethics, as defined in Item 2 of Form N-CSR, that applies to its President and Treasurer and its Chief Financial Officer. A copy of the code of ethics is filed as an exhibit to this Form N-CSR.
Item 3.
Audit Committee Financial Expert
The Board of Trustees of the trust has determined that Donald F. Donahue is an audit committee financial expert, as defined in Item 3 of Form N-CSR. Mr. Donahue is independent for purposes of Item 3 of Form N-CSR.
Item 4.
Principal Accountant Fees and Services
Fees and Services
The following table presents fees billed by Deloitte & Touche LLP, the member firms of Deloitte Touche Tohmatsu, and their respective affiliates (collectively, “Deloitte Entities”) in each of the last two fiscal years for services rendered to Fidelity Agricultural Productivity Fund, Fidelity Climate Action Fund, Fidelity Disruptors Fund, Fidelity Sustainable U.S. Equity Fund, and Fidelity Water Sustainability Fund (the “Funds”):
Services Billed by Deloitte Entities
May 31, 2022 FeesA,B
| | | | |
| Audit Fees | Audit-Related Fees | Tax Fees | All Other Fees |
Fidelity Agricultural Productivity Fund | $30,200 | $- | $7,100 | $700 |
Fidelity Climate Action Fund | $32,400 | $- | $7,100 | $800 |
Fidelity Disruptors Fund | $14,800 | $- | $7,100 | $400 |
Fidelity Sustainable U.S. Equity Fund | $32,400 | $- | $7,100 | $800 |
Fidelity Water Sustainability Fund | $39,300 | $- | $7,300 | $800 |
| | | | |
| Audit Fees | Audit-Related Fees | Tax Fees | All Other Fees |
Fidelity Agricultural Productivity Fund | $29,400 | $- | $7,100 | $700 |
Fidelity Climate Action Fund | $- | $- | $- | $- |
Fidelity Disruptors Fund | $14,400 | $- | $6,900 | $400 |
Fidelity Sustainable U.S. Equity Fund | $- | $- | $- | $- |
Fidelity Water Sustainability Fund | $29,400 | $- | $7,100 | $700 |
A Amounts may reflect rounding.
B Fidelity Climate Action Fund and Fidelity Sustainable U.S. Equity Fund commenced operations on June 15, 2021.
The following table presents fees billed by PricewaterhouseCoopers LLP (“PwC”) in each of the last two fiscal years for services rendered to Fidelity Disruptive Automation Fund, Fidelity Disruptive Communications Fund, Fidelity Disruptive Finance Fund, Fidelity Disruptive Medicine Fund, Fidelity Disruptive Technology Fund, Fidelity SAI Sustainable Future Fund, Fidelity SAI Sustainable Sector Fund, and Fidelity SAI Sustainable U.S. Equity Fund (the “Funds”):
Services Billed by PwC
| | | | |
May 31, 2022 FeesA,B
| Audit Fees | Audit-Related Fees | Tax Fees | All Other Fees |
Fidelity Disruptive Automation Fund | $34,100 | $3,200 | $7,600 | $1,100 |
Fidelity Disruptive Communications Fund | $34,100 | $3,200 | $7,600 | $1,100 |
Fidelity Disruptive Finance Fund | $34,100 | $3,200 | $7,600 | $1,100 |
Fidelity Disruptive Medicine Fund | $34,100 | $3,200 | $7,600 | $1,100 |
Fidelity Disruptive Technology Fund | $34,100 | $3,200 | $7,600 | $1,100 |
Fidelity SAI Sustainable Future Fund | $24,300 | $200 | $6,100 | $100 |
Fidelity SAI Sustainable Sector Fund | $24,300 | $200 | $6,100 | $100 |
Fidelity SAI Sustainable U.S. Equity Fund | $24,300 | $200 | $6,100 | $100 |
|
|
|
|
|
|
|
|
|
|
|
|
|
|
|
| | | | |
| Audit Fees | Audit-Related Fees | Tax Fees | All Other Fees |
Fidelity Disruptive Automation Fund | $33,100 | $2,900 | $7,400 | $1,100 |
Fidelity Disruptive Communications Fund | $33,100 | $2,900 | $7,400 | $1,100 |
Fidelity Disruptive Finance Fund | $33,100 | $2,900 | $7,400 | $1,100 |
Fidelity Disruptive Medicine Fund | $33,100 | $2,900 | $7,400 | $1,100 |
Fidelity Disruptive Technology Fund | $34,500 | $2,900 | $7,400 | $1,100 |
Fidelity SAI Sustainable Future Fund | $- | $- | $- | $- |
Fidelity SAI Sustainable Sector Fund | $- | $- | $- | $- |
Fidelity SAI Sustainable U.S. Equity Fund | $- | $- | $- | $- |
A Amounts may reflect rounding.
B Fidelity SAI Sustainable Future Fund, Fidelity SAI Sustainable Sector Fund, and Fidelity SAI Sustainable U.S. Equity Fund commenced operations on April 14, 2022.
The following table(s) present(s) fees billed by Deloitte Entities and PwC that were required to be approved by the Audit Committee for services that relate directly to the operations and financial reporting of the Fund(s) and that are rendered on behalf of Fidelity Management & Research Company LLC ("FMR") and entities controlling, controlled by, or under common control with FMR (not including any sub-adviser whose role is primarily portfolio management and is subcontracted with or overseen by another investment adviser) that provide ongoing services to the Fund(s) (“Fund Service Providers”):
Services Billed by Deloitte Entities
| | |
| May 31, 2022A,B | May 31, 2021A,B
|
Audit-Related Fees | $- | $- |
Tax Fees | $- | $- |
All Other Fees | $- | $- |
A Amounts may reflect rounding.
B May include amounts billed prior to the Fidelity Climate Action Fund and Fidelity Sustainable U.S. Equity Fund’s commencement of operations.
Services Billed by PwC
| | |
| May 31, 2022A,B | May 31, 2021 A,B |
Audit-Related Fees | $7,914,600 | $9,015,700 |
Tax Fees | $353,200 | $14,300 |
All Other Fees | $- | $- |
A Amounts may reflect rounding.
B May include amounts billed prior to the Fidelity SAI Sustainable Future Fund, Fidelity SAI Sustainable Sector Fund, and Fidelity SAI Sustainable U.S. Equity Fund’s commencement of operations.
“Audit-Related Fees” represent fees billed for assurance and related services that are reasonably related to the performance of the fund audit or the review of the fund's financial statements and that are not reported under Audit Fees.
“Tax Fees” represent fees billed for tax compliance, tax advice or tax planning that relate directly to the operations and financial reporting of the fund.
“All Other Fees” represent fees billed for services provided to the fund or Fund Service Provider, a significant portion of which are assurance related, that relate directly to the operations and financial reporting of the fund, excluding those services that are reported under Audit Fees, Audit-Related Fees or Tax Fees.
Assurance services must be performed by an independent public accountant.
* * *
The aggregate non-audit fees billed by Deloitte Entities and PwC for services rendered to the Fund(s), FMR (not including any sub-adviser whose role is primarily portfolio management and is subcontracted with or overseen by another investment adviser), and any Fund Service Provider for each of the last two fiscal years of the Fund(s) are as follows:
| | | |
Billed By | May 31, 2022A,B | May 31, 2021A,B |
|
Deloitte Entities | $496,800 | $544,500 |
|
PwC | $13,363,900 | $14,339,700 |
|
A Amounts may reflect rounding.
B May include amounts billed prior to the Fidelity Climate Action Fund, Fidelity Sustainable U.S. Equity Fund, Fidelity SAI Sustainable Future Fund, Fidelity SAI Sustainable Sector Fund, and Fidelity SAI Sustainable U.S. Equity Fund’s commencement of operations.
The trust's Audit Committee has considered non-audit services that were not pre-approved that were provided by Deloitte Entities and PwC to Fund Service Providers to be compatible with maintaining the independence of Deloitte Entities and PwC in its(their) audit of the Fund(s), taking into account representations from Deloitte Entities and PwC, in accordance with Public Company Accounting Oversight Board rules, regarding its independence from the Fund(s) and its(their) related entities and FMR’s review of the appropriateness and permissibility under applicable law of such non-audit services prior to their provision to the Fund(s) Service Providers.
Audit Committee Pre-Approval Policies and Procedures
The trust’s Audit Committee must pre-approve all audit and non-audit services provided by a fund’s independent registered public accounting firm relating to the operations or financial reporting of the fund. Prior to the commencement of any audit or non-audit services to a fund, the Audit Committee reviews the services to determine whether they are appropriate and permissible under applicable law.
The Audit Committee has adopted policies and procedures to, among other purposes, provide a framework for the Committee’s consideration of non-audit services by the audit firms that audit the Fidelity funds. The policies and procedures require that any non-audit service provided by a fund audit firm to a Fidelity fund and any non-audit service provided by a fund auditor to a Fund Service Provider that relates directly to the operations and financial reporting of a Fidelity fund (“Covered Service”) are subject to approval by the Audit Committee before such service is provided.
All Covered Services must be approved in advance of provision of the service either: (i) by formal resolution of the Audit Committee, or (ii) by oral or written approval of the service by the Chair of the Audit Committee (or if the Chair is unavailable, such other member of the Audit Committee as may be designated by the Chair to act in the Chair’s absence). The approval contemplated by (ii) above is permitted where the Treasurer determines that action on such an engagement is necessary before the next meeting of the Audit Committee.
Non-audit services provided by a fund audit firm to a Fund Service Provider that do not relate directly to the operations and financial reporting of a Fidelity fund are reported to the Audit Committee periodically.
Non-Audit Services Approved Pursuant to Rule 2-01(c)(7)(i)(C) and (ii) of Regulation S-X (“De Minimis Exception”)
There were no non-audit services approved or required to be approved by the Audit Committee pursuant to the De Minimis Exception during the Fund’s(s’) last two fiscal years relating to services provided to (i) the Fund(s) or (ii) any Fund Service Provider that relate directly to the operations and financial reporting of the Fund(s).
Item 5.
Audit Committee of Listed Registrants
Not applicable.
Item 6.
Investments
(a)
Not applicable.
(b)
Not applicable.
Item 7.
Disclosure of Proxy Voting Policies and Procedures for Closed-End Management Investment Companies
Not applicable.
Item 8.
Portfolio Managers of Closed-End Management Investment Companies
Not applicable.
Item 9.
Purchase of Equity Securities by Closed-End Management Investment Company and Affiliated Purchasers
Not applicable.
Item 10.
Submission of Matters to a Vote of Security Holders
There were no material changes to the procedures by which shareholders may recommend nominees to the trust’s Board of Trustees.
Item 11.
Controls and Procedures
(a)(i) The President and Treasurer and the Chief Financial Officer have concluded that the trust’s disclosure controls and procedures (as defined in Rule 30a-3(c) under the Investment Company Act) provide reasonable assurances that material information relating to the trust is made known to them by the appropriate persons, based on their evaluation of these controls and procedures as of a date within 90 days of the filing date of this report.
(a)(ii) There was no change in the trust’s internal control over financial reporting (as defined in Rule 30a-3(d) under the Investment Company Act) that occurred during the
period covered by this report that has materially affected, or is reasonably likely to materially affect, the trust’s internal control over financial reporting.
Item 12.
Disclosure of Securities Lending Activities for Closed-End Management
Investment Companies
Not applicable.
Item 13.
Exhibits
SIGNATURES
Pursuant to the requirements of the Securities Exchange Act of 1934 and the Investment Company Act of 1940, the registrant has duly caused this report to be signed on its behalf by the undersigned, thereunto duly authorized.
Fidelity Summer Street Trust
| |
By: | /s/Stacie M. Smith |
| Stacie M. Smith |
| President and Treasurer |
|
|
Date: | July 21, 2022 |
Pursuant to the requirements of the Securities Exchange Act of 1934 and the Investment Company Act of 1940, this report has been signed below by the following persons on behalf of the registrant and in the capacities and on the dates indicated.
| |
By: | /s/Stacie M. Smith |
| Stacie M. Smith |
| President and Treasurer |
|
|
Date: | July 21, 2022 |
| |
By: | /s/John J. Burke III |
| John J. Burke III |
| Chief Financial Officer |
|
|
Date: | July 21, 2022 |