UNITED STATES
SECURITIES AND EXCHANGE COMMISSION
Washington, D.C. 20549
FORM N-CSR
CERTIFIED SHAREHOLDER REPORT OF REGISTERED
MANAGEMENT INVESTMENT COMPANIES
Investment Company Act file number 811-02737
Fidelity Summer Street Trust
(Exact name of registrant as specified in charter)
245 Summer St., Boston, Massachusetts 02210
(Address of principal executive offices) (Zip code)
Cynthia Lo Bessette, Secretary
245 Summer St.
Boston, Massachusetts 02210
(Name and address of agent for service)
Registrant's telephone number, including area code:
617-563-7000
| |
Date of fiscal year end: | April 30 |
|
|
Date of reporting period: | April 30, 2022 |
Item 1.
Reports to Stockholders
Fidelity® Capital & Income Fund
Annual Report
April 30, 2022


Contents
To view a fund's proxy voting guidelines and proxy voting record for the 12-month period ended June 30, visit http://www.fidelity.com/proxyvotingresults or visit the Securities and Exchange Commission's (SEC) web site at http://www.sec.gov.
You may also call 1-800-544-8544 to request a free copy of the proxy voting guidelines.
Standard & Poor's, S&P and S&P 500 are registered service marks of The McGraw-Hill Companies, Inc. and have been licensed for use by Fidelity Distributors Corporation.
Other third-party marks appearing herein are the property of their respective owners.
All other marks appearing herein are registered or unregistered trademarks or service marks of FMR LLC or an affiliated company. © 2022 FMR LLC. All rights reserved.
This report and the financial statements contained herein are submitted for the general information of the shareholders of the Fund. This report is not authorized for distribution to prospective investors in the Fund unless preceded or accompanied by an effective prospectus.
A fund files its complete schedule of portfolio holdings with the SEC for the first and third quarters of each fiscal year on Form N-PORT. Forms N-PORT are available on the SEC’s web site at http://www.sec.gov. A fund's Forms N-PORT may be reviewed and copied at the SEC’s Public Reference Room in Washington, DC. Information regarding the operation of the SEC's Public Reference Room may be obtained by calling 1-800-SEC-0330.
For a complete list of a fund's portfolio holdings, view the most recent holdings listing, semiannual report, or annual report on Fidelity's web site at http://www.fidelity.com, http://www.institutional.fidelity.com, or http://www.401k.com, as applicable.
NOT FDIC INSURED •MAY LOSE VALUE •NO BANK GUARANTEE
Neither the Fund nor Fidelity Distributors Corporation is a bank.
Note to Shareholders:
Early in 2020, the outbreak and spread of COVID-19 emerged as a public health emergency that had a major influence on financial markets, primarily based on its impact on the global economy and corporate earnings. On March 11, 2020, the World Health Organization declared the COVID-19 outbreak a pandemic, citing sustained risk of further global spread. The pandemic prompted a number of measures to limit the spread of COVID-19, including travel and border restrictions, quarantines, and restrictions on large gatherings. In turn, these resulted in lower consumer activity, diminished demand for a wide range of products and services, disruption in manufacturing and supply chains, and – given the wide variability in outcomes regarding the outbreak – significant market uncertainty and volatility. To help stem the turmoil, the U.S. government took unprecedented action – in concert with the U.S. Federal Reserve and central banks around the world – to help support consumers, businesses, and the broader economy, and to limit disruption to the financial system.
In general, the overall impact of the pandemic lessened in 2021, amid a resilient economy and widespread distribution of three COVID-19 vaccines granted emergency use authorization from the U.S. Food and Drug Administration (FDA) early in the year. Still, the situation remains dynamic, and the extent and duration of its influence on financial markets and the economy is highly uncertain, due in part to a recent spike in cases based on highly contagious variants of the coronavirus.
Extreme events such as the COVID-19 crisis are exogenous shocks that can have significant adverse effects on mutual funds and their investments. Although multiple asset classes may be affected by market disruption, the duration and impact may not be the same for all types of assets. Fidelity is committed to helping you stay informed amid news about COVID-19 and during increased market volatility, and we continue to take extra steps to be responsive to customer needs. We encourage you to visit us online, where we offer ongoing updates, commentary, and analysis on the markets and our funds.
Performance: The Bottom Line
Average annual total return reflects the change in the value of an investment, assuming reinvestment of distributions from dividend income and capital gains (the profits earned upon the sale of securities that have grown in value, if any) and assuming a constant rate of performance each year. The hypothetical investment and the average annual total returns do not reflect the deduction of taxes that a shareholder would pay on fund distributions or the redemption of fund shares. During periods of reimbursement by Fidelity, a fund’s total return will be greater than it would be had the reimbursement not occurred. How a fund did yesterday is no guarantee of how it will do tomorrow.
Average Annual Total Returns
| For the periods ended April 30, 2022 | Past 1 year | Past 5 years | Past 10 years |
| Fidelity® Capital & Income Fund | (3.27)% | 6.07% | 6.83% |
$10,000 Over 10 Years
Let's say hypothetically that $10,000 was invested in Fidelity® Capital & Income Fund on April 30, 2012.
The chart shows how the value of your investment would have changed, and also shows how the ICE® BofA® US High Yield Constrained Index performed over the same period.

| Period Ending Values |
| $19,370 | Fidelity® Capital & Income Fund |
| $16,592 | ICE® BofA® US High Yield Constrained Index |
Management's Discussion of Fund Performance
Market Recap: The ICE BofA
® US High Yield Constrained Index returned -4.96% for the 12 months ending April 30, 2022. After posting a solid gain in 2021, high-yield bonds retreated to begin the new year amid several major headwinds that stoked volatility, uncertainty and investor anxiety. Chief among these was the U.S. Federal Reserve’s accelerated plan to hike interest rates and aggressively wind down its balance sheet in an attempt to rein in historically high inflation. In addition, geopolitical unrest rose as Russia invaded Ukraine in late February and escalated its attack through period end. Other factors influencing high yield included surging commodity prices, rising bond yields, supply constraint and disruption, and the potential for variants of the coronavirus to upend the economy. Against this dynamic backdrop, the index returned -2.74% in January and -0.90% in February amid an intensifying flight from risk. Volatility eased in March and credit fundamentals remained healthy, but high yield still lost ground (-0.92%) for the month. April saw the downtrend continue, with the index returning -3.63% amid clearer signals of the Fed’s intension to tighten monetary policy and angst about the economic toll of “zero-COVID” lockdowns in China. For the full 12 months, higher-duration BB-rated bonds slightly trailed lower-quality credits. By sector, energy rode a surge in commodity prices and led the way with a modest gain. All other groups declined. Notable laggards included cable/satellite TV, telecommunications, health care, utilities and food/beverage/tobacco.
Comments from Co-Managers Mark Notkin and Brian Chang: For the fiscal year ending April 30, 2022, the fund returned -3.27%, outperforming the -4.96% result of the benchmark ICE BofA
® US High Yield/US High Yield Constrained Blend Index. The fund's core allocation to high-yield bonds resulted -4.90% and contributed to performance versus the benchmark. By industry, security selection was the primary contributor, especially in energy. Security selection in chemicals and health care also helped. The biggest individual relative contributor was an overweight position in California Resources (+72%). Also helping performance was our outsized stake in Chesapeake Energy, which gained 84%. Another key contributor was our non-benchmark position in EP Energy (+88%). Conversely, the biggest detractor from performance versus the benchmark was our security picks in gaming. Security selection in technology and super retail also hurt the fund's relative performance. Our largest individual relative detractor was a non-benchmark stake in Meta Platforms (-41%). Another notable relative detractor was an overweighting in Eldorado Resorts (-16%), which was among the biggest holdings in the fund. Also hurting performance was our outsized stake in Penn National Gaming, which returned about -45%. Penn National Gaming was not held at period end. By quality, positioning and picks among unrated bonds added the most value versus the benchmark, whereas security choices and positioning among bonds rated BBB hurt the most. Notable changes in positioning include increased exposure to the services industry and a lower allocation to cable/satellite TV.
The views expressed above reflect those of the portfolio manager(s) only through the end of the period as stated on the cover of this report and do not necessarily represent the views of Fidelity or any other person in the Fidelity organization. Any such views are subject to change at any time based upon market or other conditions and Fidelity disclaims any responsibility to update such views. These views may not be relied on as investment advice and, because investment decisions for a Fidelity fund are based on numerous factors, may not be relied on as an indication of trading intent on behalf of any Fidelity fund.
Investment Summary (Unaudited)
Top Bond Issuers as of April 30, 2022
| (by issuer, excluding cash equivalents) | % of fund's net assets |
| CCO Holdings LLC/CCO Holdings Capital Corp. | 2.5 |
| TransDigm, Inc. | 2.1 |
| Bank of America Corp. | 1.8 |
| JPMorgan Chase & Co. | 1.7 |
| Ally Financial, Inc. | 1.7 |
| Caesars Entertainment, Inc. | 1.5 |
| Altice France SA | 1.5 |
| Tenet Healthcare Corp. | 1.2 |
| Occidental Petroleum Corp. | 1.2 |
| Citigroup, Inc. | 1.1 |
| | 16.3 |
Top Five Market Sectors as of April 30, 2022
| | % of fund's net assets |
| Energy | 11.8 |
| Banks & Thrifts | 9.1 |
| Technology | 7.5 |
| Telecommunications | 6.1 |
| Healthcare | 5.5 |
Quality Diversification (% of fund's net assets)
| As of April 30, 2022 |
| | BBB | 9.2% |
| | BB | 25.4% |
| | B | 32.7% |
| | CCC,CC,C | 6.9% |
| | Not Rated | 1.2% |
| | Equities | 12.4% |
| | Short-Term Investments and Net Other Assets | 12.2% |

We have used ratings from Moody's Investors Service, Inc. Where Moody's® ratings are not available, we have used S&P® ratings. All ratings are as of the date indicated and do not reflect subsequent changes.
Asset Allocation (% of fund's net assets)
| As of April 30, 2022* |
| | Nonconvertible Bonds | 62.6% |
| | Convertible Bonds, Preferred Stocks | 0.3% |
| | Common Stocks | 11.6% |
| | Bank Loan Obligations | 4.9% |
| | Preferred Securities | 7.6% |
| | Other | 0.8% |
| | Short-Term Investments and Net Other Assets (Liabilities) | 12.2% |

* Foreign investments - 12.5%
Geographic Diversification (% of fund's net assets)
| As of April 30, 2022 |
| | United States of America* | 87.5% |
| | Canada | 3.1% |
| | Multi-National | 1.6% |
| | France | 1.6% |
| | Netherlands | 0.9% |
| | United Kingdom | 0.9% |
| | Cayman Islands | 0.7% |
| | Luxembourg | 0.8% |
| | Ireland | 0.6% |
| | Other | 2.3% |

* Includes Short-Term investments and Net Other Assets (Liabilities).
Percentages are based on country or territory of incorporation and are adjusted for the effect of futures contracts, if applicable.
Schedule of Investments April 30, 2022
Showing Percentage of Net Assets
| Corporate Bonds - 62.9% | | | |
| | | Principal Amount (000s) | Value (000s) |
| Convertible Bonds - 0.3% | | | |
| Diversified Financial Services - 0.0% | | | |
| New Cotai LLC 5% 2/24/27 (a) | | $3,865 | $3,811 |
| Energy - 0.3% | | | |
| Mesquite Energy, Inc. 15% 7/15/23 (a)(b) | | 2,495 | 12,874 |
| Mesquite Energy, Inc. 15% 7/15/23 (a)(b) | | 4,306 | 20,022 |
| | | | 32,896 |
|
| TOTAL CONVERTIBLE BONDS | | | 36,707 |
|
| Nonconvertible Bonds - 62.6% | | | |
| Aerospace - 3.3% | | | |
| Allegheny Technologies, Inc.: | | | |
| 4.875% 10/1/29 | | 6,080 | 5,532 |
| 5.125% 10/1/31 | | 5,395 | 4,873 |
| Bombardier, Inc.: | | | |
| 6% 2/15/28 (c) | | 6,075 | 5,255 |
| 7.125% 6/15/26 (c) | | 12,110 | 11,141 |
| 7.5% 12/1/24 (c) | | 7,092 | 7,057 |
| 7.5% 3/15/25 (c) | | 12,259 | 11,891 |
| 7.875% 4/15/27 (c) | | 45,265 | 42,168 |
| Kaiser Aluminum Corp. 4.625% 3/1/28 (c) | | 11,215 | 10,290 |
| Moog, Inc. 4.25% 12/15/27 (c) | | 3,455 | 3,217 |
| Rolls-Royce PLC 5.75% 10/15/27 (c) | | 10,870 | 10,477 |
| Spirit Aerosystems, Inc. 7.5% 4/15/25 (c) | | 15,000 | 15,188 |
| TransDigm UK Holdings PLC 6.875% 5/15/26 | | 35,725 | 35,546 |
| TransDigm, Inc.: | | | |
| 4.625% 1/15/29 | | 38,080 | 33,136 |
| 4.875% 5/1/29 | | 25,000 | 21,906 |
| 5.5% 11/15/27 | | 124,228 | 113,669 |
| 6.25% 3/15/26 (c) | | 17,925 | 17,835 |
| 6.375% 6/15/26 | | 61,985 | 61,207 |
| 7.5% 3/15/27 | | 18,012 | 18,147 |
| | | | 428,535 |
| Air Transportation - 1.6% | | | |
| Air Canada 3.875% 8/15/26 (c) | | 9,105 | 8,419 |
| Delta Air Lines, Inc. 7% 5/1/25 (c) | | 2,708 | 2,899 |
| Delta Air Lines, Inc. / SkyMiles IP Ltd.: | | | |
| 4.5% 10/20/25 (c) | | 48,285 | 47,958 |
| 4.75% 10/20/28 (c) | | 39,880 | 39,515 |
| Hawaiian Brand Intellectual Property Ltd. / HawaiianMiles Loyalty Ltd. 5.75% 1/20/26 (c) | | 22,205 | 21,653 |
| Mileage Plus Holdings LLC 6.5% 6/20/27 (c) | | 34,530 | 35,220 |
| Spirit Loyalty Cayman Ltd. / Spirit IP Cayman Ltd. 8% 9/20/25 (c) | | 7,779 | 8,215 |
| United Airlines, Inc.: | | | |
| 4.375% 4/15/26 (c) | | 30,025 | 28,989 |
| 4.625% 4/15/29 (c) | | 18,025 | 16,538 |
| | | | 209,406 |
| Automotive - 0.1% | | | |
| Ford Motor Credit Co. LLC 3.625% 6/17/31 | | 15,745 | 13,088 |
| Automotive & Auto Parts - 1.6% | | | |
| Allison Transmission, Inc. 5.875% 6/1/29 (c) | | 7,960 | 7,858 |
| Arko Corp. 5.125% 11/15/29 (c) | | 9,105 | 8,058 |
| Dana, Inc.: | | | |
| 4.25% 9/1/30 | | 8,870 | 7,603 |
| 4.5% 2/15/32 | | 9,135 | 7,536 |
| Exide Technologies: | | | |
| 11% 10/31/24 pay-in-kind (a)(c)(d)(e) | | 1,760 | 0 |
| 11% 10/31/24 pay-in-kind (a)(c)(d)(e) | | 891 | 401 |
| Ford Motor Co. 3.25% 2/12/32 | | 29,640 | 24,083 |
| Ford Motor Credit Co. LLC: | | | |
| 3.375% 11/13/25 | | 26,505 | 25,450 |
| 4% 11/13/30 | | 42,253 | 36,549 |
| 5.113% 5/3/29 | | 10,330 | 9,788 |
| LCM Investments Holdings 4.875% 5/1/29 (c) | | 24,415 | 21,395 |
| McLaren Finance PLC 7.5% 8/1/26 (c) | | 8,290 | 7,953 |
| Nesco Holdings II, Inc. 5.5% 4/15/29 (c) | | 14,525 | 13,687 |
| PECF USS Intermediate Holding III Corp. 8% 11/15/29 (c) | | 5,530 | 5,101 |
| Rivian Holdco & Rivian LLC & Rivian Automotive LLC 6 month U.S. LIBOR + 5.620% 7.1766% 10/15/26 (c)(e)(f) | | 30,350 | 29,288 |
| | | | 204,750 |
| Banks & Thrifts - 1.8% | | | |
| Ally Financial, Inc.: | | | |
| 8% 11/1/31 | | 20,638 | 24,155 |
| 8% 11/1/31 | | 151,039 | 179,665 |
| CQP Holdco LP / BIP-V Chinook Holdco LLC 5.5% 6/15/31 (c) | | 27,225 | 25,110 |
| Jane Street Group LLC/JSG Finance, Inc. 4.5% 11/15/29 (c) | | 8,740 | 8,093 |
| | | | 237,023 |
| Broadcasting - 1.3% | | | |
| Clear Channel Outdoor Holdings, Inc. 7.5% 6/1/29 (c) | | 12,070 | 11,390 |
| Diamond Sports Group LLC/Diamond Sports Finance Co. 5.375% 8/15/26 (c) | | 46,565 | 17,229 |
| Gray Escrow II, Inc. 5.375% 11/15/31 (c) | | 18,765 | 16,175 |
| Lions Gate Capital Holdings LLC 5.5% 4/15/29 (c) | | 8,990 | 7,970 |
| Nexstar Broadcasting, Inc.: | | | |
| 4.75% 11/1/28 (c) | | 22,300 | 20,237 |
| 5.625% 7/15/27 (c) | | 23,735 | 23,097 |
| Scripps Escrow II, Inc. 3.875% 1/15/29 (c) | | 2,820 | 2,507 |
| Sirius XM Radio, Inc.: | | | |
| 3.125% 9/1/26 (c) | | 9,100 | 8,383 |
| 3.875% 9/1/31 (c) | | 12,130 | 10,244 |
| 4% 7/15/28 (c) | | 23,630 | 21,356 |
| 5% 8/1/27 (c) | | 14,525 | 14,017 |
| Townsquare Media, Inc. 6.875% 2/1/26 (c) | | 5,645 | 5,620 |
| Univision Communications, Inc. 4.5% 5/1/29 (c) | | 12,060 | 10,824 |
| | | | 169,049 |
| Building Materials - 0.5% | | | |
| Advanced Drain Systems, Inc. 5% 9/30/27 (c) | | 2,325 | 2,247 |
| Brundage-Bone Concrete Pumping Holdings, Inc. 6% 2/1/26 (c) | | 6,555 | 6,129 |
| CP Atlas Buyer, Inc. 7% 12/1/28 (c) | | 5,480 | 4,576 |
| James Hardie International Finance Ltd. 5% 1/15/28 (c) | | 4,136 | 3,990 |
| MIWD Holdco II LLC / MIWD Finance Corp. 5.5% 2/1/30 (c) | | 4,125 | 3,568 |
| Oscar Acquisition Co. LLC / Oscar Finance, Inc. 9.5% 4/15/30 (c) | | 9,050 | 8,257 |
| SRS Distribution, Inc.: | | | |
| 4.625% 7/1/28 (c) | | 11,605 | 10,624 |
| 6% 12/1/29 (c) | | 11,220 | 9,846 |
| 6.125% 7/1/29 (c) | | 6,380 | 5,630 |
| Summit Materials LLC/Summit Materials Finance Corp. 5.25% 1/15/29 (c) | | 10,525 | 9,867 |
| Victors Merger Corp. 6.375% 5/15/29 (c) | | 12,060 | 7,236 |
| | | | 71,970 |
| Cable/Satellite TV - 4.0% | | | |
| Block Communications, Inc. 4.875% 3/1/28 (c) | | 7,830 | 7,321 |
| CCO Holdings LLC/CCO Holdings Capital Corp.: | | | |
| 4.25% 2/1/31 (c) | | 16,515 | 13,919 |
| 4.5% 8/15/30 (c) | | 21,660 | 18,898 |
| 4.5% 5/1/32 | | 46,575 | 39,177 |
| 4.75% 3/1/30 (c) | | 63,365 | 56,632 |
| 4.75% 2/1/32 (c) | | 26,255 | 22,562 |
| 5% 2/1/28 (c) | | 91,490 | 87,144 |
| 5.125% 5/1/27 (c) | | 69,885 | 68,123 |
| 5.375% 6/1/29 (c) | | 18,080 | 17,131 |
| 5.5% 5/1/26 (c) | | 8,759 | 8,781 |
| CSC Holdings LLC: | | | |
| 3.375% 2/15/31 (c) | | 14,140 | 11,043 |
| 4.5% 11/15/31 (c) | | 30,110 | 24,731 |
| 5.375% 2/1/28 (c) | | 23,655 | 21,718 |
| 6.5% 2/1/29 (c) | | 24,795 | 23,555 |
| DISH DBS Corp.: | | | |
| 5.25% 12/1/26 (c) | | 15,220 | 13,974 |
| 5.75% 12/1/28 (c) | | 15,220 | 13,614 |
| Dolya Holdco 18 DAC 5% 7/15/28 (c) | | 6,600 | 5,996 |
| Radiate Holdco LLC/Radiate Financial Service Ltd.: | | | |
| 4.5% 9/15/26 (c) | | 8,350 | 7,689 |
| 6.5% 9/15/28 (c) | | 22,260 | 19,589 |
| VZ Secured Financing BV 5% 1/15/32 (c) | | 24,310 | 20,967 |
| Ziggo Bond Co. BV: | | | |
| 5.125% 2/28/30 (c) | | 6,000 | 5,205 |
| 6% 1/15/27 (c) | | 11,435 | 11,206 |
| Ziggo BV 4.875% 1/15/30 (c) | | 7,990 | 7,081 |
| | | | 526,056 |
| Capital Goods - 0.1% | | | |
| ATS Automation Tooling System, Inc. 4.125% 12/15/28 (c) | | 7,895 | 7,125 |
| Stevens Holding Co., Inc. 6.125% 10/1/26 (c) | | 3,245 | 3,253 |
| | | | 10,378 |
| Chemicals - 1.5% | | | |
| Compass Minerals International, Inc. 6.75% 12/1/27 (c) | | 24,600 | 24,904 |
| Gpd Companies, Inc. 10.125% 4/1/26 (c) | | 14,980 | 15,617 |
| Ingevity Corp. 3.875% 11/1/28 (c) | | 11,105 | 9,939 |
| Kronos Acquisition Holdings, Inc. / KIK Custom Products, Inc. 5% 12/31/26 (c) | | 3,835 | 3,394 |
| LSB Industries, Inc. 6.25% 10/15/28 (c) | | 21,105 | 20,682 |
| Olympus Water U.S. Holding Corp. 4.25% 10/1/28 (c) | | 12,145 | 10,732 |
| SCIH Salt Holdings, Inc. 4.875% 5/1/28 (c) | | 7,820 | 6,761 |
| SCIL IV LLC / SCIL U.S.A. Holdings LLC 5.375% 11/1/26 (c) | | 14,015 | 12,789 |
| The Chemours Co. LLC: | | | |
| 5.375% 5/15/27 | | 32,330 | 31,198 |
| 5.75% 11/15/28 (c) | | 16,765 | 15,717 |
| Tronox, Inc. 4.625% 3/15/29 (c) | | 13,295 | 11,866 |
| Valvoline, Inc. 4.25% 2/15/30 (c) | | 8,315 | 7,213 |
| W.R. Grace Holding LLC 5.625% 8/15/29 (c) | | 28,310 | 24,117 |
| | | | 194,929 |
| Consumer Products - 1.4% | | | |
| Angi Group LLC 3.875% 8/15/28 (c) | | 5,530 | 4,379 |
| Diamond BC BV 4.625% 10/1/29 (c) | | 7,285 | 6,267 |
| Foundation Building Materials, Inc. 6% 3/1/29 (c) | | 5,845 | 4,756 |
| Gannett Holdings LLC 6% 11/1/26 (c) | | 8,785 | 7,994 |
| HFC Prestige Products, Inc./HFC Prestige International U.S. LLC 4.75% 1/15/29 (c) | | 8,760 | 7,796 |
| Macy's Retail Holdings LLC: | | | �� |
| 5.875% 3/15/30 (c) | | 6,235 | 5,851 |
| 6.125% 3/15/32 (c) | | 6,015 | 5,564 |
| Michaels Companies, Inc. 5.25% 5/1/28 (c) | | 14,150 | 12,161 |
| Millennium Escrow Corp. 6.625% 8/1/26 (c) | | 12,120 | 11,199 |
| Nordstrom, Inc.: | | | |
| 4.25% 8/1/31 | | 25,145 | 21,313 |
| 4.375% 4/1/30 | | 3,790 | 3,298 |
| 5% 1/15/44 | | 1,785 | 1,480 |
| 6.95% 3/15/28 | | 550 | 562 |
| PetSmart, Inc. / PetSmart Finance Corp.: | | | |
| 4.75% 2/15/28 (c) | | 10,160 | 9,449 |
| 7.75% 2/15/29 (c) | | 8,880 | 8,836 |
| Ritchie Bros. Holdings, Inc. 4.75% 12/15/31 (c) | | 6,670 | 6,670 |
| Spectrum Brands Holdings, Inc. 3.875% 3/15/31 (c) | | 8,380 | 7,018 |
| Tempur Sealy International, Inc.: | | | |
| 3.875% 10/15/31 (c) | | 15,965 | 13,228 |
| 4% 4/15/29 (c) | | 15,925 | 13,795 |
| The Scotts Miracle-Gro Co. 4% 4/1/31 | | 11,945 | 9,825 |
| TKC Holdings, Inc.: | | | |
| 6.875% 5/15/28 (c) | | 13,375 | 12,773 |
| 10.5% 5/15/29 (c) | | 12,660 | 12,185 |
| | | | 186,399 |
| Containers - 0.4% | | | |
| Crown Cork & Seal, Inc.: | | | |
| 7.375% 12/15/26 | | 4,845 | 5,148 |
| 7.5% 12/15/96 | | 12,871 | 13,804 |
| Graham Packaging Co., Inc. 7.125% 8/15/28 (c) | | 6,000 | 5,410 |
| Graphic Packaging International, Inc. 3.75% 2/1/30 (c) | | 7,880 | 6,909 |
| Intelligent Packaging Ltd. Finco, Inc. 6% 9/15/28 (c) | | 4,230 | 3,976 |
| LABL, Inc. 5.875% 11/1/28 (c) | | 14,730 | 13,468 |
| Trivium Packaging Finance BV 5.5% 8/15/26 (c) | | 6,930 | 6,696 |
| | | | 55,411 |
| Diversified Financial Services - 2.1% | | | |
| Broadstreet Partners, Inc. 5.875% 4/15/29 (c) | | 15,505 | 13,451 |
| Cargo Aircraft Management, Inc. 4.75% 2/1/28 (c) | | 6,915 | 6,466 |
| Coinbase Global, Inc.: | | | |
| 3.375% 10/1/28 (c) | | 9,110 | 7,073 |
| 3.625% 10/1/31 (c) | | 9,110 | 6,730 |
| Compass Group Diversified Holdings LLC: | | | |
| 5% 1/15/32 (c) | | 6,090 | 5,177 |
| 5.25% 4/15/29 (c) | | 17,730 | 15,913 |
| Hightower Holding LLC 6.75% 4/15/29 (c) | | 5,945 | 5,477 |
| Icahn Enterprises LP/Icahn Enterprises Finance Corp.: | | | |
| 4.375% 2/1/29 | | 11,165 | 9,632 |
| 5.25% 5/15/27 | | 41,665 | 38,748 |
| 6.25% 5/15/26 | | 24,085 | 23,878 |
| 6.375% 12/15/25 | | 28,275 | 28,063 |
| LPL Holdings, Inc. 4% 3/15/29 (c) | | 17,730 | 16,134 |
| MSCI, Inc.: | | | |
| 3.25% 8/15/33 (c) | | 9,110 | 7,698 |
| 4% 11/15/29 (c) | | 6,385 | 5,881 |
| OEC Finance Ltd.: | | | |
| 4.375% 10/25/29 pay-in-kind (c) | | 6,699 | 234 |
| 5.25% 12/27/33 pay-in-kind (c) | | 6,136 | 215 |
| OneMain Finance Corp.: | | | |
| 4% 9/15/30 | | 5,610 | 4,593 |
| 5.375% 11/15/29 | | 9,400 | 8,437 |
| 6.625% 1/15/28 | | 7,305 | 7,215 |
| 6.875% 3/15/25 | | 19,480 | 19,577 |
| 7.125% 3/15/26 | | 38,380 | 38,860 |
| Shift4 Payments LLC / Shift4 Payments Finance Sub, Inc. 4.625% 11/1/26 (c) | | 3,750 | 3,591 |
| | | | 273,043 |
| Diversified Media - 0.4% | | | |
| Nielsen Finance LLC/Nielsen Finance Co.: | | | |
| 4.5% 7/15/29 (c) | | 6,050 | 5,718 |
| 4.75% 7/15/31 (c) | | 6,040 | 5,709 |
| Terrier Media Buyer, Inc. 8.875% 12/15/27 (c) | | 40,645 | 39,726 |
| | | | 51,153 |
| Energy - 8.1% | | | |
| Antero Midstream Partners LP/Antero Midstream Finance Corp.: | | | |
| 5.375% 6/15/29 (c) | | 9,060 | 8,492 |
| 5.75% 1/15/28 (c) | | 17,645 | 17,156 |
| Atlantica Sustainable Infrastructure PLC 4.125% 6/15/28 (c) | | 7,820 | 7,116 |
| Callon Petroleum Co. 6.125% 10/1/24 | | 4,090 | 4,038 |
| CGG SA 8.75% 4/1/27 (c) | | 11,985 | 11,897 |
| Cheniere Energy Partners LP: | | | |
| 3.25% 1/31/32 (c) | | 9,110 | 7,789 |
| 4% 3/1/31 | | 31,040 | 28,094 |
| Cheniere Energy, Inc. 4.625% 10/15/28 | | 22,300 | 21,575 |
| Chesapeake Energy Corp.: | | | |
| 5.875% 2/1/29 (c) | | 5,840 | 5,774 |
| 6.75% 4/15/29 (c) | | 8,995 | 9,051 |
| 7% 10/1/24 (a)(d) | | 6,915 | 0 |
| 8% 1/15/25 (a)(d) | | 3,385 | 0 |
| 8% 6/15/27 (a)(d) | | 2,132 | 0 |
| Citgo Holding, Inc. 9.25% 8/1/24 (c) | | 27,185 | 27,015 |
| Citgo Petroleum Corp.: | | | |
| 6.375% 6/15/26 (c) | | 8,760 | 8,706 |
| 7% 6/15/25 (c) | | 22,045 | 21,894 |
| CNX Midstream Partners LP 4.75% 4/15/30 (c) | | 6,435 | 5,920 |
| CNX Resources Corp. 6% 1/15/29 (c) | | 5,345 | 5,273 |
| Colgate Energy Partners III LLC 5.875% 7/1/29 (c) | | 8,645 | 8,559 |
| Comstock Resources, Inc.: | | | |
| 5.875% 1/15/30 (c) | | 25,285 | 24,332 |
| 6.75% 3/1/29 (c) | | 20,060 | 20,284 |
| 7.5% 5/15/25 (c) | | 3,722 | 3,798 |
| Crestwood Midstream Partners LP/Crestwood Midstream Finance Corp.: | | | |
| 5.625% 5/1/27 (c) | | 18,015 | 17,542 |
| 5.75% 4/1/25 | | 4,790 | 4,733 |
| 6% 2/1/29 (c) | | 25,785 | 25,080 |
| CrownRock LP/CrownRock Finance, Inc. 5% 5/1/29 (c) | | 5,055 | 4,947 |
| CVR Energy, Inc.: | | | |
| 5.25% 2/15/25 (c) | | 16,990 | 16,436 |
| 5.75% 2/15/28 (c) | | 22,655 | 21,234 |
| DCP Midstream Operating LP 5.85% 5/21/43 (c)(e) | | 18,335 | 16,664 |
| Delek Logistics Partners LP 7.125% 6/1/28 (c) | | 17,655 | 16,876 |
| DT Midstream, Inc.: | | | |
| 4.125% 6/15/29 (c) | | 9,070 | 8,254 |
| 4.375% 6/15/31 (c) | | 9,070 | 8,126 |
| Endeavor Energy Resources LP/EER Finance, Inc.: | | | |
| 5.75% 1/30/28 (c) | | 21,251 | 21,306 |
| 6.625% 7/15/25 (c) | | 5,510 | 5,662 |
| Energy Transfer LP 5.5% 6/1/27 | | 16,735 | 16,720 |
| Exterran Energy Solutions LP 8.125% 5/1/25 | | 11,280 | 11,308 |
| Hess Midstream Partners LP: | | | |
| 4.25% 2/15/30 (c) | | 9,875 | 9,058 |
| 5.125% 6/15/28 (c) | | 11,235 | 10,870 |
| 5.5% 10/15/30 (c) | | 6,060 | 5,971 |
| 5.625% 2/15/26 (c) | | 15,535 | 15,535 |
| Hilcorp Energy I LP/Hilcorp Finance Co. 6.25% 11/1/28 (c) | | 12,280 | 12,227 |
| Holly Energy Partners LP/Holly Energy Finance Corp.: | | | |
| 5% 2/1/28 (c) | | 7,615 | 7,245 |
| 6.375% 4/15/27 (c) | | 6,050 | 6,171 |
| MEG Energy Corp. 7.125% 2/1/27 (c) | | 11,335 | 11,511 |
| Mesquite Energy, Inc. 7.25% 2/15/23 (a)(c)(d) | | 21,977 | 0 |
| Nabors Industries Ltd.: | | | |
| 7.25% 1/15/26 (c) | | 11,260 | 11,004 |
| 7.5% 1/15/28 (c) | | 9,715 | 9,302 |
| New Fortress Energy, Inc.: | | | |
| 6.5% 9/30/26 (c) | | 20,960 | 20,286 |
| 6.75% 9/15/25 (c) | | 6,896 | 6,780 |
| NGL Energy Operating LLC/NGL Energy Finance Corp. 7.5% 2/1/26 (c) | | 11,090 | 10,448 |
| NGL Energy Partners LP/NGL Energy Finance Corp. 6.125% 3/1/25 | | 11,961 | 10,034 |
| Nine Energy Service, Inc. 8.75% 11/1/23 (c) | | 6,245 | 3,934 |
| NuStar Logistics LP 6% 6/1/26 | | 12,025 | 11,997 |
| Occidental Petroleum Corp.: | | | |
| 3.5% 8/15/29 | | 14,690 | 13,717 |
| 4.625% 6/15/45 | | 11,935 | 10,294 |
| 5.875% 9/1/25 | | 11,055 | 11,354 |
| 6.125% 1/1/31 | | 23,465 | 24,663 |
| 6.2% 3/15/40 | | 5,785 | 5,988 |
| 6.375% 9/1/28 | | 18,145 | 19,052 |
| 6.45% 9/15/36 | | 19,110 | 20,734 |
| 6.6% 3/15/46 | | 11,465 | 12,497 |
| 6.625% 9/1/30 | | 22,115 | 23,967 |
| 7.2% 3/15/29 | | 3,964 | 4,281 |
| 7.5% 5/1/31 | | 1,100 | 1,254 |
| 8.875% 7/15/30 | | 12,405 | 14,900 |
| PBF Holding Co. LLC/PBF Finance Corp.: | | | |
| 6% 2/15/28 | | 27,530 | 24,226 |
| 7.25% 6/15/25 | | 22,875 | 22,087 |
| 9.25% 5/15/25 (c) | | 33,870 | 35,055 |
| PBF Logistics LP/PBF Logistics Finance, Inc. 6.875% 5/15/23 | | 8,455 | 8,434 |
| PDC Energy, Inc. 6.125% 9/15/24 | | 1,777 | 1,781 |
| Renewable Energy Group, Inc. 5.875% 6/1/28 (c) | | 6,340 | 6,715 |
| SM Energy Co.: | | | |
| 5.625% 6/1/25 | | 6,330 | 6,188 |
| 6.625% 1/15/27 | | 21,320 | 21,211 |
| 6.75% 9/15/26 | | 4,550 | 4,527 |
| Southern Natural Gas Co. LLC: | | | |
| 7.35% 2/15/31 | | 23,497 | 27,023 |
| 8% 3/1/32 | | 12,475 | 15,157 |
| Southwestern Energy Co.: | | | |
| 5.375% 3/15/30 | | 12,145 | 11,991 |
| 5.95% 1/23/25 (e) | | 244 | 248 |
| 7.75% 10/1/27 | | 12,945 | 13,509 |
| Suburban Propane Partners LP/Suburban Energy Finance Corp. 5% 6/1/31 (c) | | 12,070 | 10,976 |
| Summit Midstream Holdings LLC: | | | |
| 5.75% 4/15/25 | | 5,390 | 4,312 |
| 8.5% (c)(g) | | 9,110 | 8,505 |
| Sunoco LP/Sunoco Finance Corp.: | | | |
| 4.5% 5/15/29 | | 10,170 | 9,145 |
| 4.5% 4/30/30 (c) | | 12,185 | 10,995 |
| Tallgrass Energy Partners LP / Tallgrass Energy Finance Corp.: | | | |
| 6% 9/1/31 (c) | | 9,110 | 8,313 |
| 7.5% 10/1/25 (c) | | 8,350 | 8,521 |
| Targa Resources Partners LP/Targa Resources Partners Finance Corp. 4.875% 2/1/31 | | 10,360 | 9,959 |
| Teine Energy Ltd. 6.875% 4/15/29 (c) | | 8,990 | 8,945 |
| Tennessee Gas Pipeline Co. 7.625% 4/1/37 | | 5,445 | 6,410 |
| Venture Global Calcasieu Pass LLC: | | | |
| 3.875% 8/15/29 (c) | | 7,585 | 6,921 |
| 4.125% 8/15/31 (c) | | 7,585 | 6,883 |
| | | | 1,064,762 |
| Environmental - 0.5% | | | |
| Covanta Holding Corp.: | | | |
| 4.875% 12/1/29 (c) | | 18,165 | 16,527 |
| 5% 9/1/30 | | 11,060 | 9,982 |
| GFL Environmental, Inc.: | | | |
| 4% 8/1/28 (c) | | 9,105 | 8,012 |
| 4.75% 6/15/29 (c) | | 12,095 | 10,976 |
| Madison IAQ LLC: | | | |
| 4.125% 6/30/28 (c) | | 11,390 | 9,995 |
| 5.875% 6/30/29 (c) | | 9,085 | 7,404 |
| | | | 62,896 |
| Food & Drug Retail - 1.2% | | | |
| Albertsons Companies LLC/Safeway, Inc./New Albertson's, Inc./Albertson's LLC: | | | |
| 3.5% 3/15/29 (c) | | 36,160 | 30,461 |
| 4.625% 1/15/27 (c) | | 25,300 | 23,698 |
| 4.875% 2/15/30 (c) | | 44,700 | 40,456 |
| BellRing Brands, Inc. 7% 3/15/30 (c) | | 14,740 | 14,408 |
| Murphy Oil U.S.A., Inc.: | | | |
| 3.75% 2/15/31 (c) | | 5,300 | 4,655 |
| 4.75% 9/15/29 | | 6,860 | 6,500 |
| 5.625% 5/1/27 | | 6,030 | 5,947 |
| Parkland Corp.: | | | |
| 4.5% 10/1/29 (c) | | 8,995 | 7,874 |
| 4.625% 5/1/30 (c) | | 12,175 | 10,653 |
| SEG Holding LLC/SEG Finance Corp. 5.625% 10/15/28 (c) | | 11,130 | 10,862 |
| | | | 155,514 |
| Food/Beverage/Tobacco - 1.9% | | | |
| C&S Group Enterprises LLC 5% 12/15/28 (c) | | 8,615 | 7,334 |
| Chobani LLC/Finance Corp., Inc. 4.625% 11/15/28 (c) | | 6,285 | 5,657 |
| Del Monte Foods, Inc. 11.875% 5/15/25 (c) | | 6,310 | 6,890 |
| JBS U.S.A. LLC/JBS U.S.A. Finance, Inc. 6.75% 2/15/28 (c) | | 18,350 | 18,947 |
| JBS U.S.A. Lux SA / JBS Food Co.: | | | |
| 5.5% 1/15/30 (c) | | 20,180 | 19,928 |
| 6.5% 4/15/29 (c) | | 29,320 | 30,346 |
| KeHE Distributors LLC / KeHE Finance Corp. 8.625% 10/15/26 (c) | | 7,777 | 8,234 |
| Lamb Weston Holdings, Inc.: | | | |
| 4.125% 1/31/30 (c) | | 12,150 | 10,842 |
| 4.375% 1/31/32 (c) | | 6,075 | 5,427 |
| Performance Food Group, Inc.: | | | |
| 4.25% 8/1/29 (c) | | 8,495 | 7,550 |
| 5.5% 10/15/27 (c) | | 8,855 | 8,593 |
| Pilgrim's Pride Corp. 4.25% 4/15/31 (c) | | 21,020 | 19,181 |
| Post Holdings, Inc.: | | | |
| 4.5% 9/15/31 (c) | | 47,500 | 39,501 |
| 4.625% 4/15/30 (c) | | 15,630 | 13,364 |
| 5.5% 12/15/29 (c) | | 21,040 | 19,146 |
| Simmons Foods, Inc. 4.625% 3/1/29 (c) | | 8,340 | 7,526 |
| TreeHouse Foods, Inc. 4% 9/1/28 | | 3,695 | 3,011 |
| Triton Water Holdings, Inc. 6.25% 4/1/29 (c) | | 6,360 | 5,264 |
| U.S. Foods, Inc. 4.625% 6/1/30 (c) | | 7,520 | 6,730 |
| United Natural Foods, Inc. 6.75% 10/15/28 (c) | | 7,750 | 7,756 |
| | | | 251,227 |
| Gaming - 3.0% | | | |
| Affinity Gaming LLC 6.875% 12/15/27 (c) | | 4,295 | 4,023 |
| Boyd Gaming Corp. 4.75% 6/15/31 (c) | | 15,120 | 13,673 |
| Caesars Entertainment, Inc.: | | | |
| 4.625% 10/15/29 (c) | | 18,245 | 15,645 |
| 6.25% 7/1/25 (c) | | 41,240 | 41,688 |
| 8.125% 7/1/27 (c) | | 54,990 | 57,465 |
| Caesars Resort Collection LLC 5.75% 7/1/25 (c) | | 13,750 | 14,042 |
| CDI Escrow Issuer, Inc. 5.75% 4/1/30 (c) | | 6,040 | 5,822 |
| Fertitta Entertainment LLC / Fertitta Entertainment Finance Co., Inc.: | | | |
| 4.625% 1/15/29 (c) | | 25,865 | 23,466 |
| 6.75% 1/15/30 (c) | | 24,400 | 21,109 |
| Jacobs Entertainment, Inc. 6.75% 2/15/29 (c) | | 8,585 | 8,411 |
| Melco Resorts Finance Ltd.: | | | |
| 4.875% 6/6/25 (c) | | 20,410 | 18,239 |
| 5.25% 4/26/26 (c) | | 12,015 | 10,519 |
| 5.375% 12/4/29 (c) | | 8,160 | 6,530 |
| 5.75% 7/21/28 (c) | | 5,530 | 4,593 |
| MGM Resorts International 4.75% 10/15/28 | | 11,125 | 10,219 |
| Peninsula Pacific Entertainment LLC 8.5% 11/15/27 (c) | | 19,045 | 20,854 |
| Premier Entertainment Sub LLC: | | | |
| 5.625% 9/1/29 (c) | | 35,005 | 28,004 |
| 5.875% 9/1/31 (c) | | 24,325 | 19,156 |
| Station Casinos LLC 4.625% 12/1/31 (c) | | 9,135 | 7,656 |
| Studio City Finance Ltd. 5% 1/15/29 (c) | | 5,700 | 3,886 |
| VICI Properties LP / VICI Note Co.: | | | |
| 3.875% 2/15/29 (c) | | 11,195 | 10,616 |
| 4.25% 12/1/26 (c) | | 21,450 | 20,327 |
| 4.625% 12/1/29 (c) | | 12,240 | 11,493 |
| Wynn Macau Ltd. 5.125% 12/15/29 (c) | | 16,800 | 13,272 |
| | | | 390,708 |
| Healthcare - 4.5% | | | |
| 180 Medical, Inc. 3.875% 10/15/29 (c) | | 6,495 | 5,781 |
| Avantor Funding, Inc. 3.875% 11/1/29 (c) | | 6,075 | 5,451 |
| Cano Health, Inc. 6.25% 10/1/28 (c) | | 4,050 | 3,736 |
| Catalent Pharma Solutions: | | | |
| 3.5% 4/1/30 (c) | | 6,070 | 5,280 |
| 5% 7/15/27 (c) | | 3,765 | 3,647 |
| Centene Corp. 4.25% 12/15/27 | | 11,560 | 11,213 |
| Charles River Laboratories International, Inc.: | | | |
| 3.75% 3/15/29 (c) | | 9,500 | 8,598 |
| 4% 3/15/31 (c) | | 12,085 | 10,790 |
| 4.25% 5/1/28 (c) | | 3,400 | 3,245 |
| Community Health Systems, Inc.: | | | |
| 4.75% 2/15/31 (c) | | 16,055 | 13,607 |
| 5.25% 5/15/30 (c) | | 18,245 | 15,994 |
| 5.625% 3/15/27 (c) | | 5,640 | 5,376 |
| 6% 1/15/29 (c) | | 8,490 | 8,025 |
| 6.125% 4/1/30 (c) | | 24,105 | 19,826 |
| 8% 3/15/26 (c) | | 61,410 | 63,486 |
| DaVita HealthCare Partners, Inc.: | | | |
| 3.75% 2/15/31 (c) | | 4,180 | 3,407 |
| 4.625% 6/1/30 (c) | | 31,515 | 27,418 |
| Grifols Escrow Issuer SA 4.75% 10/15/28 (c) | | 6,075 | 5,543 |
| HealthEquity, Inc. 4.5% 10/1/29 (c) | | 6,410 | 5,857 |
| Horizon Pharma U.S.A., Inc. 5.5% 8/1/27 (c) | | 12,050 | 12,047 |
| IQVIA, Inc. 5% 5/15/27 (c) | | 12,070 | 11,959 |
| Jazz Securities DAC 4.375% 1/15/29 (c) | | 12,305 | 11,336 |
| Minerva Merger Sub, Inc. 6.5% 2/15/30 (c) | | 12,105 | 11,142 |
| ModivCare Escrow Issuer, Inc. 5% 10/1/29 (c) | | 7,010 | 6,134 |
| Modivcare, Inc. 5.875% 11/15/25 (c) | | 8,105 | 7,943 |
| Molina Healthcare, Inc.: | | | |
| 3.875% 11/15/30 (c) | | 10,465 | 9,439 |
| 3.875% 5/15/32 (c) | | 12,160 | 10,676 |
| 4.375% 6/15/28 (c) | | 7,525 | 7,033 |
| Option Care Health, Inc. 4.375% 10/31/29 (c) | | 6,680 | 6,005 |
| Organon & Co. / Organon Foreign Debt Co-Issuer BV: | | | |
| 4.125% 4/30/28 (c) | | 21,010 | 19,546 |
| 5.125% 4/30/31 (c) | | 18,260 | 16,502 |
| Owens & Minor, Inc. 4.5% 3/31/29 (c) | | 8,310 | 7,475 |
| Radiology Partners, Inc. 9.25% 2/1/28 (c) | | 20,865 | 19,822 |
| RP Escrow Issuer LLC 5.25% 12/15/25 (c) | | 10,405 | 9,677 |
| Syneos Health, Inc. 3.625% 1/15/29 (c) | | 8,395 | 7,427 |
| Tenet Healthcare Corp.: | | | |
| 4.25% 6/1/29 (c) | | 17,640 | 15,938 |
| 4.375% 1/15/30 (c) | | 43,755 | 39,811 |
| 4.625% 7/15/24 | | 2,495 | 2,488 |
| 4.625% 9/1/24 (c) | | 12,045 | 11,940 |
| 4.875% 1/1/26 (c) | | 30,115 | 29,488 |
| 5.125% 11/1/27 (c) | | 18,070 | 17,545 |
| 6.125% 10/1/28 (c) | | 19,415 | 18,637 |
| 6.25% 2/1/27 (c) | | 35,815 | 35,546 |
| Teva Pharmaceutical Finance Netherlands III BV: | | | |
| 4.75% 5/9/27 | | 6,085 | 5,568 |
| 5.125% 5/9/29 | | 6,085 | 5,522 |
| Vizient, Inc. 6.25% 5/15/27 (c) | | 2,760 | 2,850 |
| | | | 585,776 |
| Homebuilders/Real Estate - 2.1% | | | |
| Arcosa, Inc. 4.375% 4/15/29 (c) | | 8,410 | 7,673 |
| Ashton Woods U.S.A. LLC/Ashton Woods Finance Co. 4.625% 4/1/30 (c) | | 8,940 | 7,320 |
| Brookfield Residential Properties, Inc./Brookfield Residential U.S. Corp. 4.875% 2/15/30 (c) | | 7,775 | 6,492 |
| Century Communities, Inc. 3.875% 8/15/29 (c) | | 9,110 | 7,676 |
| DTZ U.S. Borrower LLC 6.75% 5/15/28 (c) | | 10,555 | 10,766 |
| MPT Operating Partnership LP/MPT Finance Corp.: | | | |
| 3.5% 3/15/31 | | 11,190 | 9,525 |
| 4.625% 8/1/29 | | 18,080 | 16,706 |
| 5% 10/15/27 | | 38,043 | 36,503 |
| Realogy Group LLC/Realogy Co-Issuer Corp. 5.75% 1/15/29 (c) | | 36,785 | 30,761 |
| Realogy Group LLC/Realogy Co.-Issuer Corp. 5.25% 4/15/30 (c) | | 12,170 | 9,860 |
| Shea Homes Ltd. Partnership/Corp. 4.75% 4/1/29 (c) | | 8,020 | 6,941 |
| Taylor Morrison Communities, Inc./Monarch Communities, Inc.: | | | |
| 5.125% 8/1/30 (c) | | 10,725 | 9,787 |
| 5.625% 3/1/24 (c) | | 1,312 | 1,319 |
| 5.875% 6/15/27 (c) | | 9,260 | 9,192 |
| TopBuild Corp. 3.625% 3/15/29 (c) | | 5,910 | 5,149 |
| TRI Pointe Group, Inc./TRI Pointe Holdings, Inc. 5.875% 6/15/24 | | 16,130 | 16,377 |
| TRI Pointe Homes, Inc. 5.7% 6/15/28 | | 14,380 | 13,780 |
| Uniti Group LP / Uniti Group Finance, Inc.: | | | |
| 4.75% 4/15/28 (c) | | 31,410 | 28,033 |
| 6.5% 2/15/29 (c) | | 39,880 | 34,413 |
| Weekley Homes LLC/Weekley Finance Corp. 4.875% 9/15/28 (c) | | 5,045 | 4,456 |
| | | | 272,729 |
| Hotels - 0.2% | | | |
| Choice Hotels International, Inc. 5.75% 7/1/22 | | 3,035 | 3,054 |
| Hilton Domestic Operating Co., Inc.: | | | |
| 3.75% 5/1/29 (c) | | 5,595 | 5,069 |
| 4% 5/1/31 (c) | | 8,395 | 7,508 |
| 4.875% 1/15/30 | | 6,900 | 6,656 |
| Hilton Worldwide Finance LLC/Hilton Worldwide Finance Corp. 4.875% 4/1/27 | | 8,435 | 8,351 |
| | | | 30,638 |
| Insurance - 1.0% | | | |
| Acrisure LLC / Acrisure Finance, Inc.: | | | |
| 6% 8/1/29 (c) | | 9,105 | 7,955 |
| 7% 11/15/25 (c) | | 34,880 | 33,957 |
| Alliant Holdings Intermediate LLC: | | | |
| 4.25% 10/15/27 (c) | | 11,125 | 10,274 |
| 5.875% 11/1/29 (c) | | 9,115 | 8,500 |
| 6.75% 10/15/27 (c) | | 16,680 | 15,773 |
| AmWINS Group, Inc. 4.875% 6/30/29 (c) | | 8,805 | 8,059 |
| AssuredPartners, Inc.: | | | |
| 5.625% 1/15/29 (c) | | 6,550 | 5,760 |
| 7% 8/15/25 (c) | | 4,865 | 4,798 |
| HUB International Ltd.: | | | |
| 5.625% 12/1/29 (c) | | 13,275 | 12,180 |
| 7% 5/1/26 (c) | | 11,770 | 11,666 |
| MGIC Investment Corp. 5.25% 8/15/28 | | 7,710 | 7,238 |
| | | | 126,160 |
| Leisure - 1.3% | | | |
| Boyne U.S.A., Inc. 4.75% 5/15/29 (c) | | 6,360 | 5,899 |
| Carnival Corp.: | | | |
| 4% 8/1/28 (c) | | 18,190 | 16,394 |
| 7.625% 3/1/26 (c) | | 8,415 | 8,247 |
| 9.875% 8/1/27 (c) | | 16,600 | 17,891 |
| 10.5% 2/1/26 (c) | | 11,990 | 13,189 |
| Merlin Entertainments PLC 5.75% 6/15/26 (c) | | 7,725 | 7,551 |
| NCL Corp. Ltd.: | | | |
| 5.875% 3/15/26 (c) | | 12,585 | 11,626 |
| 5.875% 2/15/27 (c) | | 12,100 | 11,534 |
| NCL Finance Ltd. 6.125% 3/15/28 (c) | | 5,265 | 4,739 |
| Royal Caribbean Cruises Ltd.: | | | |
| 5.375% 7/15/27 (c) | | 9,125 | 8,385 |
| 10.875% 6/1/23 (c) | | 13,720 | 14,355 |
| 11.5% 6/1/25 (c) | | 11,874 | 12,898 |
| SeaWorld Parks & Entertainment, Inc. 5.25% 8/15/29 (c) | | 12,145 | 11,051 |
| Vail Resorts, Inc. 6.25% 5/15/25 (c) | | 6,250 | 6,391 |
| Viking Cruises Ltd. 13% 5/15/25 (c) | | 9,250 | 10,123 |
| Viking Ocean Cruises Ship VII Ltd. 5.625% 2/15/29 (c) | | 4,965 | 4,382 |
| Voc Escrow Ltd. 5% 2/15/28 (c) | | 10,755 | 9,706 |
| | | | 174,361 |
| Metals/Mining - 1.8% | | | |
| Alcoa Nederland Holding BV: | | | |
| 4.125% 3/31/29 (c) | | 15,485 | 14,497 |
| 6.125% 5/15/28 (c) | | 3,565 | 3,627 |
| Arconic Corp.: | | | |
| 6% 5/15/25 (c) | | 6,630 | 6,653 |
| 6.125% 2/15/28 (c) | | 16,695 | 16,173 |
| Cleveland-Cliffs, Inc.: | | | |
| 4.625% 3/1/29 (c) | | 23,720 | 22,233 |
| 4.875% 3/1/31 (c) | | 11,440 | 10,582 |
| 5.875% 6/1/27 | | 18,030 | 17,940 |
| Eldorado Gold Corp. 6.25% 9/1/29 (c) | | 13,719 | 13,170 |
| ERO Copper Corp. 6.5% 2/15/30 (c) | | 9,085 | 8,152 |
| First Quantum Minerals Ltd.: | | | |
| 6.5% 3/1/24 (c) | | 10,955 | 10,982 |
| 6.875% 3/1/26 (c) | | 28,325 | 28,224 |
| 7.25% 4/1/23 (c) | | 1,656 | 1,657 |
| 7.5% 4/1/25 (c) | | 20,585 | 20,791 |
| FMG Resources Pty Ltd.: | | | |
| 4.375% 4/1/31 (c) | | 8,990 | 7,955 |
| 4.5% 9/15/27 (c) | | 9,015 | 8,542 |
| 5.125% 5/15/24 (c) | | 9,780 | 9,878 |
| HudBay Minerals, Inc. 4.5% 4/1/26 (c) | | 7,020 | 6,490 |
| Mineral Resources Ltd.: | | | |
| 8% 11/1/27 (c) | | 6,040 | 6,017 |
| 8.125% 5/1/27 (c) | | 18,015 | 18,289 |
| 8.5% 5/1/30 (c) | | 4,475 | 4,419 |
| Murray Energy Corp.: | | | |
| 11.25% 4/15/21 (a)(c)(d) | | 8,915 | 0 |
| 12% 4/15/24 pay-in-kind (a)(c)(d)(e) | | 10,343 | 0 |
| | | | 236,271 |
| Paper - 0.7% | | | |
| Ardagh Metal Packaging Finance U.S.A. LLC/Ardagh Metal Packaging Finance PLC: | | | |
| 3.25% 9/1/28 (c) | | 5,915 | 5,161 |
| 4% 9/1/29 (c) | | 11,830 | 10,139 |
| Cascades, Inc.: | | | |
| 5.125% 1/15/26 (c) | | 5,600 | 5,446 |
| 5.375% 1/15/28 (c) | | 5,600 | 5,404 |
| Clydesdale Acquisition Holdings, Inc.: | | | |
| 6.625% 4/15/29 (c) | | 7,185 | 7,167 |
| 8.75% 4/15/30 (c) | | 15,065 | 13,769 |
| Enviva Partners LP / Enviva Partners Finance Corp. 6.5% 1/15/26 (c) | | 11,230 | 11,443 |
| Glatfelter Corp. 4.75% 11/15/29 (c) | | 9,105 | 7,284 |
| Intertape Polymer Group, Inc. 4.375% 6/15/29 (c) | | 9,050 | 9,311 |
| Mercer International, Inc. 5.125% 2/1/29 | | 15,060 | 13,989 |
| | | | 89,113 |
| Publishing/Printing - 0.1% | | | |
| Clear Channel International BV 6.625% 8/1/25 (c) | | 15,860 | 16,027 |
| Railroad - 0.1% | | | |
| First Student Bidco, Inc./First Transit Parent, Inc. 4% 7/31/29 (c) | | 9,095 | 8,140 |
| Restaurants - 0.6% | | | |
| 1011778 BC Unlimited Liability Co./New Red Finance, Inc.: | | | |
| 3.875% 1/15/28 (c) | | 12,115 | 11,146 |
| 4% 10/15/30 (c) | | 39,005 | 33,343 |
| 4.375% 1/15/28 (c) | | 10,600 | 9,673 |
| Bloomin Brands, Inc. / OSI Restaurant Partners LLC 5.125% 4/15/29 (c) | | 5,565 | 5,175 |
| Papa John's International, Inc. 3.875% 9/15/29 (c) | | 5,560 | 4,863 |
| Yum! Brands, Inc. 4.625% 1/31/32 | | 11,975 | 10,882 |
| | | | 75,082 |
| Services - 2.6% | | | |
| Adtalem Global Education, Inc. 5.5% 3/1/28 (c) | | 9,010 | 8,272 |
| AECOM 5.125% 3/15/27 | | 11,885 | 11,751 |
| Allied Universal Holdco LLC / Allied Universal Finance Corp. 6% 6/1/29 (c) | | 17,735 | 14,676 |
| Atlas Luxco 4 SARL / Allied Universal Holdco LLC / Allied Universal Finance Corp.: | | | |
| 4.625% 6/1/28 (c) | | 21,690 | 19,196 |
| 4.625% 6/1/28 (c) | | 14,365 | 12,605 |
| Booz Allen Hamilton, Inc.: | | | |
| 3.875% 9/1/28 (c) | | 10,240 | 9,433 |
| 4% 7/1/29 (c) | | 5,920 | 5,461 |
| CoreCivic, Inc. 8.25% 4/15/26 | | 32,260 | 33,138 |
| Fair Isaac Corp. 4% 6/15/28 (c) | | 2,910 | 2,659 |
| Gartner, Inc.: | | | |
| 3.625% 6/15/29 (c) | | 8,610 | 7,706 |
| 3.75% 10/1/30 (c) | | 11,495 | 10,251 |
| GEMS MENASA Cayman Ltd. 7.125% 7/31/26 (c) | | 8,765 | 8,741 |
| H&E Equipment Services, Inc. 3.875% 12/15/28 (c) | | 16,800 | 14,634 |
| Hertz Corp.: | | | |
| 4.625% 12/1/26 (c) | | 5,180 | 4,722 |
| 5% 12/1/29 (c) | | 10,055 | 8,798 |
| 5.5% 10/15/24 (a)(c)(d) | | 10,890 | 14 |
| 6% 1/15/28 (a)(c)(d) | | 10,285 | 604 |
| 6.25% 10/15/22 (a)(d) | | 11,875 | 15 |
| 7.125% 8/1/26 (a)(c)(d) | | 10,285 | 591 |
| IAA, Inc. 5.5% 6/15/27 (c) | | 4,680 | 4,575 |
| Iron Mountain, Inc.: | | | |
| 4.5% 2/15/31 (c) | | 22,025 | 18,873 |
| 4.875% 9/15/29 (c) | | 24,110 | 22,086 |
| KAR Auction Services, Inc. 5.125% 6/1/25 (c) | | 10,355 | 10,471 |
| Service Corp. International 4% 5/15/31 | | 12,070 | 10,863 |
| Sotheby's 7.375% 10/15/27 (c) | | 4,960 | 4,891 |
| Sotheby's/Bidfair Holdings, Inc. 5.875% 6/1/29 (c) | | 9,045 | 8,496 |
| The Brink's Co. 4.625% 10/15/27 (c) | | 12,180 | 11,541 |
| The GEO Group, Inc.: | | | |
| 5.125% 4/1/23 | | 9,625 | 9,180 |
| 5.875% 10/15/24 | | 14,053 | 12,507 |
| 6% 4/15/26 | | 9,655 | 7,792 |
| TriNet Group, Inc. 3.5% 3/1/29 (c) | | 8,865 | 8,034 |
| Uber Technologies, Inc.: | | | |
| 4.5% 8/15/29 (c) | | 27,335 | 23,543 |
| 6.25% 1/15/28 (c) | | 9,175 | 9,083 |
| WASH Multifamily Acquisition, Inc. 5.75% 4/15/26 (c) | | 9,760 | 9,492 |
| | | | 344,694 |
| Steel - 0.1% | | | |
| Algoma Steel SCA 0% 12/31/23 (a) | | 1,982 | 0 |
| Commercial Metals Co. 3.875% 2/15/31 | | 6,135 | 5,407 |
| Infrabuild Australia Pty Ltd. 12% 10/1/24 (c) | | 10,980 | 11,090 |
| Roller Bearing Co. of America, Inc. 4.375% 10/15/29 (c) | | 4,375 | 3,938 |
| | | | 20,435 |
| Super Retail - 1.0% | | | |
| Asbury Automotive Group, Inc.: | | | |
| 4.5% 3/1/28 | | 3,534 | 3,295 |
| 4.625% 11/15/29 (c) | | 10,005 | 9,006 |
| 4.75% 3/1/30 | | 3,523 | 3,157 |
| 5% 2/15/32 (c) | | 10,800 | 9,585 |
| At Home Group, Inc. 4.875% 7/15/28 (c) | | 6,055 | 5,003 |
| Bath & Body Works, Inc.: | | | |
| 6.625% 10/1/30 (c) | | 5,555 | 5,525 |
| 6.75% 7/1/36 | | 27,016 | 26,206 |
| 6.875% 11/1/35 | | 7,304 | 7,136 |
| 7.5% 6/15/29 | | 8,335 | 8,617 |
| Carvana Co.: | | | |
| 4.875% 9/1/29 (c) | | 21,255 | 15,512 |
| 5.5% 4/15/27 (c) | | 11,975 | 9,583 |
| EG Global Finance PLC 8.5% 10/30/25 (c) | | 16,085 | 16,085 |
| Lithia Motors, Inc. 3.875% 6/1/29 (c) | | 13,230 | 11,946 |
| | | | 130,656 |
| Technology - 3.3% | | | |
| Acuris Finance U.S. 5% 5/1/28 (c) | | 9,045 | 8,276 |
| Black Knight InfoServ LLC 3.625% 9/1/28 (c) | | 11,390 | 10,564 |
| Block, Inc. 3.5% 6/1/31 (c) | | 12,070 | 10,109 |
| CA Magnum Holdings 5.375% (c)(g) | | 4,870 | 4,675 |
| Camelot Finance SA 4.5% 11/1/26 (c) | | 10,590 | 9,955 |
| Clarivate Science Holdings Corp.: | | | |
| 3.875% 7/1/28 (c) | | 10,695 | 9,519 |
| 4.875% 7/1/29 (c) | | 10,115 | 8,914 |
| Crowdstrike Holdings, Inc. 3% 2/15/29 | | 8,870 | 7,894 |
| Elastic NV 4.125% 7/15/29 (c) | | 17,090 | 15,296 |
| Go Daddy Operating Co. LLC / GD Finance Co., Inc.: | | | |
| 3.5% 3/1/29 (c) | | 11,810 | 10,480 |
| 5.25% 12/1/27 (c) | | 9,345 | 9,245 |
| II-VI, Inc. 5% 12/15/29 (c) | | 9,495 | 8,902 |
| ION Trading Technologies Ltd. 5.75% 5/15/28 (c) | | 12,040 | 11,272 |
| Iron Mountain Information Management Services, Inc. 5% 7/15/32 (c) | | 9,100 | 8,019 |
| MicroStrategy, Inc. 6.125% 6/15/28 (c) | | 23,020 | 21,090 |
| NCR Corp.: | | | |
| 5% 10/1/28 (c) | | 5,530 | 5,281 |
| 5.125% 4/15/29 (c) | | 8,870 | 8,449 |
| 5.25% 10/1/30 (c) | | 5,530 | 5,226 |
| 5.75% 9/1/27 (c) | | 9,035 | 8,696 |
| 6.125% 9/1/29 (c) | | 9,035 | 8,651 |
| Northwest Fiber LLC/Northwest Fiber Finance Sub, Inc. 10.75% 6/1/28 (c) | | 5,930 | 6,078 |
| NortonLifeLock, Inc. 5% 4/15/25 (c) | | 10,050 | 10,038 |
| onsemi 3.875% 9/1/28 (c) | | 11,065 | 10,265 |
| Open Text Corp.: | | | |
| 3.875% 2/15/28 (c) | | 5,690 | 5,182 |
| 3.875% 12/1/29 (c) | | 6,700 | 5,954 |
| Open Text Holdings, Inc.: | | | |
| 4.125% 2/15/30 (c) | | 5,690 | 5,050 |
| 4.125% 12/1/31 (c) | | 5,485 | 4,755 |
| Pitney Bowes, Inc.: | | | |
| 6.875% 3/15/27 (c) | | 5,980 | 5,527 |
| 7.25% 3/15/29 (c) | | 5,980 | 5,467 |
| PTC, Inc.: | | | |
| 3.625% 2/15/25 (c) | | 6,650 | 6,442 |
| 4% 2/15/28 (c) | | 6,575 | 6,094 |
| Rackspace Hosting, Inc. 5.375% 12/1/28 (c) | | 6,425 | 5,235 |
| Roblox Corp. 3.875% 5/1/30 (c) | | 9,120 | 7,843 |
| Sensata Technologies BV 4% 4/15/29 (c) | | 11,970 | 10,671 |
| Synaptics, Inc. 4% 6/15/29 (c) | | 7,015 | 6,185 |
| TTM Technologies, Inc. 4% 3/1/29 (c) | | 8,870 | 7,761 |
| Twilio, Inc.: | | | |
| 3.625% 3/15/29 | | 9,995 | 8,820 |
| 3.875% 3/15/31 | | 10,460 | 8,990 |
| Uber Technologies, Inc.: | | | |
| 7.5% 9/15/27 (c) | | 35,255 | 36,276 |
| 8% 11/1/26 (c) | | 51,060 | 53,485 |
| Unisys Corp. 6.875% 11/1/27 (c) | | 6,095 | 6,116 |
| Veritas U.S., Inc./Veritas Bermuda Ltd. 7.5% 9/1/25 (c) | | 19,400 | 17,096 |
| | | | 429,843 |
| Telecommunications - 5.6% | | | |
| Altice Financing SA: | | | |
| 5% 1/15/28 (c) | | 11,280 | 9,416 |
| 5.75% 8/15/29 (c) | | 24,290 | 20,465 |
| Altice France SA: | | | |
| 5.125% 7/15/29 (c) | | 79,325 | 67,153 |
| 5.5% 1/15/28 (c) | | 24,740 | 21,802 |
| 5.5% 10/15/29 (c) | | 106,150 | 90,493 |
| 8.125% 2/1/27 (c) | | 7,635 | 7,692 |
| C&W Senior Financing Designated Activity Co. 6.875% 9/15/27 (c) | | 42,100 | 40,732 |
| Cablevision Lightpath LLC: | | | |
| 3.875% 9/15/27 (c) | | 5,500 | 4,837 |
| 5.625% 9/15/28 (c) | | 4,350 | 3,727 |
| Frontier Communications Holdings LLC: | | | |
| 5% 5/1/28 (c) | | 19,575 | 17,863 |
| 5.875% 10/15/27 (c) | | 10,375 | 9,934 |
| 6% 1/15/30 (c) | | 12,185 | 10,602 |
| 6.75% 5/1/29 (c) | | 12,535 | 11,295 |
| Intelsat Jackson Holdings SA 6.5% 3/15/30 (c) | | 25,303 | 23,823 |
| LCPR Senior Secured Financing DAC: | | | |
| 5.125% 7/15/29 (c) | | 14,860 | 13,527 |
| 6.75% 10/15/27 (c) | | 10,157 | 10,094 |
| Level 3 Financing, Inc.: | | | |
| 3.625% 1/15/29 (c) | | 24,590 | 19,956 |
| 3.75% 7/15/29 (c) | | 24,670 | 20,044 |
| Millicom International Cellular SA 4.5% 4/27/31 (c) | | 1,725 | 1,487 |
| NGL Energy Partners LP/NGL Energy Finance Corp. 7.5% 4/15/26 | | 15,705 | 13,153 |
| Northwest Fiber LLC/Northwest Fiber Finance Sub, Inc.: | | | |
| 4.75% 4/30/27 (c) | | 6,070 | 5,522 |
| 6% 2/15/28 (c) | | 4,490 | 3,757 |
| Qwest Corp. 7.25% 9/15/25 | | 1,480 | 1,606 |
| Sable International Finance Ltd. 5.75% 9/7/27 (c) | | 18,690 | 18,404 |
| SBA Communications Corp.: | | | |
| 3.125% 2/1/29 | | 13,305 | 11,412 |
| 3.875% 2/15/27 | | 17,015 | 16,151 |
| Sprint Capital Corp.: | | | |
| 6.875% 11/15/28 | | 70,044 | 76,880 |
| 8.75% 3/15/32 | | 21,176 | 26,911 |
| Sprint Corp. 7.625% 3/1/26 | | 10,895 | 11,834 |
| T-Mobile U.S.A., Inc. 3.5% 4/15/31 | | 4,490 | 3,980 |
| Uniti Group, Inc.: | | | |
| 6% 1/15/30 (c) | | 15,190 | 12,668 |
| 7.875% 2/15/25 (c) | | 17,650 | 17,959 |
| Virgin Media Finance PLC 5% 7/15/30 (c) | | 21,860 | 19,018 |
| VMED O2 UK Financing I PLC 4.75% 7/15/31 (c) | | 21,200 | 18,179 |
| Windstream Escrow LLC 7.75% 8/15/28 (c) | | 61,245 | 58,336 |
| Zayo Group Holdings, Inc. 4% 3/1/27 (c) | | 17,180 | 14,947 |
| | | | 735,659 |
| Textiles/Apparel - 0.3% | | | |
| Crocs, Inc.: | | | |
| 4.125% 8/15/31 (c) | | 6,075 | 4,848 |
| 4.25% 3/15/29 (c) | | 8,675 | 7,374 |
| Foot Locker, Inc. 4% 10/1/29 (c) | | 6,070 | 5,053 |
| Kontoor Brands, Inc. 4.125% 11/15/29 (c) | | 5,320 | 4,615 |
| Victoria's Secret & Co. 4.625% 7/15/29 (c) | | 22,560 | 18,507 |
| | | | 40,397 |
| Transportation Ex Air/Rail - 0.1% | | | |
| Seaspan Corp. 5.5% 8/1/29 (c) | | 9,095 | 8,026 |
| Utilities - 2.4% | | | |
| Clearway Energy Operating LLC: | | | |
| 3.75% 2/15/31 (c) | | 13,295 | 11,434 |
| 3.75% 1/15/32 (c) | | 6,075 | 5,149 |
| 4.75% 3/15/28 (c) | | 6,920 | 6,539 |
| NRG Energy, Inc.: | | | |
| 3.375% 2/15/29 (c) | | 5,145 | 4,360 |
| 3.625% 2/15/31 (c) | | 10,215 | 8,504 |
| 3.875% 2/15/32 (c) | | 15,190 | 12,680 |
| 5.75% 1/15/28 | | 9,410 | 9,198 |
| 6.625% 1/15/27 | | 8,283 | 8,387 |
| Pacific Gas & Electric Co.: | | | |
| 3.45% 7/1/25 | | 2,868 | 2,749 |
| 3.75% 7/1/28 | | 2,868 | 2,635 |
| 3.75% 8/15/42 | | 10,400 | 7,634 |
| 3.95% 12/1/47 | | 53,930 | 39,425 |
| 4% 12/1/46 | | 24,380 | 18,128 |
| 4.25% 3/15/46 | | 2,400 | 1,835 |
| 4.3% 3/15/45 | | 5,995 | 4,645 |
| 4.55% 7/1/30 | | 44,763 | 41,454 |
| PG&E Corp.: | | | |
| 5% 7/1/28 | | 22,000 | 20,244 |
| 5.25% 7/1/30 | | 8,330 | 7,570 |
| Pike Corp. 5.5% 9/1/28 (c) | | 28,165 | 25,560 |
| Vistra Operations Co. LLC: | | | |
| 4.375% 5/1/29 (c) | | 23,230 | 21,081 |
| 5% 7/31/27 (c) | | 22,585 | 21,512 |
| 5.5% 9/1/26 (c) | | 3,485 | 3,473 |
| 5.625% 2/15/27 (c) | | 28,195 | 27,772 |
| | | | 311,968 |
|
| TOTAL NONCONVERTIBLE BONDS | | | 8,192,272 |
|
| TOTAL CORPORATE BONDS | | | |
| (Cost $8,783,773) | | | 8,228,979 |
| | | Shares | Value (000s) |
|
| Common Stocks - 11.6% | | | |
| Air Transportation - 0.0% | | | |
| GXO Logistics, Inc. (h) | | 32,737 | 1,938 |
| Automotive & Auto Parts - 0.0% | | | |
| Exide Technologies (a)(h) | | 9,824 | 10 |
| Exide Technologies (a)(h) | | 580,031 | 0 |
| Exide Technologies (a)(h) | | 385 | 250 |
| UC Holdings, Inc. (a)(h) | | 677,217 | 3,081 |
|
| TOTAL AUTOMOTIVE & AUTO PARTS | | | 3,341 |
|
| Banks & Thrifts - 0.0% | | | |
| Algoma Steel Group, Inc. | | 425,798 | 4,075 |
| Broadcasting - 0.5% | | | |
| iHeartMedia, Inc. (h) | | 104 | 2 |
| Nexstar Broadcasting Group, Inc. Class A | | 374,090 | 59,263 |
|
| TOTAL BROADCASTING | | | 59,265 |
|
| Building Materials - 0.1% | | | |
| Carrier Global Corp. | | 319,800 | 12,239 |
| Capital Goods - 0.2% | | | |
| Zebra Technologies Corp. Class A (h) | | 71,415 | 26,399 |
| Chemicals - 0.6% | | | |
| CF Industries Holdings, Inc. | | 398,902 | 38,626 |
| The Chemours Co. LLC | | 1,144,240 | 37,840 |
|
| TOTAL CHEMICALS | | | 76,466 |
|
| Consumer Products - 0.5% | | | |
| Reddy Ice Holdings, Inc. (a)(h) | | 199,717 | 11 |
| Tapestry, Inc. | | 344,400 | 11,338 |
| Tempur Sealy International, Inc. | | 1,309,133 | 35,491 |
| Ulta Beauty, Inc. (h) | | 31,100 | 12,340 |
|
| TOTAL CONSUMER PRODUCTS | | | 59,180 |
|
| Containers - 0.4% | | | |
| Berry Global Group, Inc. (h) | | 342,000 | 19,272 |
| WestRock Co. | | 660,100 | 32,695 |
|
| TOTAL CONTAINERS | | | 51,967 |
|
| Diversified Financial Services - 0.3% | | | |
| Axis Energy Services, LLC Class A (a) | | 11,616 | 4 |
| OneMain Holdings, Inc. | | 777,400 | 35,706 |
| PJT Partners, Inc. | | 5,092 | 336 |
|
| TOTAL DIVERSIFIED FINANCIAL SERVICES | | | 36,046 |
|
| Energy - 2.2% | | | |
| Array Technologies, Inc. (h) | | 208,059 | 1,359 |
| California Resources Corp. | | 3,376,738 | 135,779 |
| California Resources Corp. warrants 10/27/24 (h) | | 57,076 | 683 |
| Chaparral Energy, Inc.: | | | |
| Series A warrants 10/1/24 (a)(h) | | 392 | 1 |
| Series B warrants 10/1/25 (a)(h) | | 392 | 1 |
| Cheniere Energy, Inc. | | 349,900 | 47,520 |
| Chesapeake Energy Corp. (i) | | 474,596 | 38,926 |
| Chesapeake Energy Corp. (b)(h) | | 22,818 | 1,872 |
| Civitas Resources, Inc. | | 60,298 | 3,535 |
| Denbury, Inc. warrants 9/18/25 (h) | | 323,875 | 11,660 |
| Diamond Offshore Drilling, Inc. (h) | | 118,485 | 930 |
| EP Energy Corp. (a)(h) | | 841,775 | 7,812 |
| Forbes Energy Services Ltd. (a)(h) | | 193,218 | 0 |
| Jonah Energy Parent LLC (a)(h) | | 304,505 | 20,533 |
| Mesquite Energy, Inc. (a)(h) | | 317,026 | 17,677 |
| PureWest Energy (a) | | 17,812 | 214 |
| PureWest Energy rights (a)(h) | | 10,734 | 0 |
| Superior Energy Services, Inc. Class A (a)(h) | | 110,370 | 2,826 |
| Unit Corp. (h) | | 37,978 | 2,265 |
|
| TOTAL ENERGY | | | 293,593 |
|
| Entertainment/Film - 0.0% | | | |
| New Cotai LLC/New Cotai Capital Corp. (a)(b)(h) | | 3,366,626 | 0 |
| Environmental - 0.3% | | | |
| Darling Ingredients, Inc. (h) | | 449,216 | 32,968 |
| Food & Drug Retail - 0.1% | | | |
| Southeastern Grocers, Inc. (a)(b)(h) | | 793,345 | 18,659 |
| Food/Beverage/Tobacco - 0.4% | | | |
| JBS SA | | 6,507,500 | 49,820 |
| Gaming - 1.0% | | | |
| Boyd Gaming Corp. | | 515,300 | 31,217 |
| Caesars Entertainment, Inc. (h) | | 1,335,236 | 88,499 |
| Studio City International Holdings Ltd.: | | | |
| ADR (c) | | 631,958 | 2,408 |
| ADR (h) | | 695,700 | 2,651 |
|
| TOTAL GAMING | | | 124,775 |
|
| Healthcare - 0.4% | | | |
| Charles River Laboratories International, Inc. (h) | | 88,400 | 21,349 |
| Encompass Health Corp. | | 34 | 2 |
| IQVIA Holdings, Inc. (h) | | 151,200 | 32,960 |
|
| TOTAL HEALTHCARE | | | 54,311 |
|
| Metals/Mining - 0.3% | | | |
| Elah Holdings, Inc. (h) | | 906 | 68 |
| First Quantum Minerals Ltd. | | 1,544,300 | 44,274 |
|
| TOTAL METALS/MINING | | | 44,342 |
|
| Services - 0.2% | | | |
| ASGN, Inc. (h) | | 226,400 | 25,685 |
| Penhall Acquisition Co.: | | | |
| Class A (a)(h) | | 26,163 | 3,615 |
| Class B (a)(h) | | 8,721 | 1,205 |
|
| TOTAL SERVICES | | | 30,505 |
|
| Steel - 0.0% | | | |
| Algoma Steel SCA (a)(h) | | 198,162 | 0 |
| Super Retail - 0.6% | | | |
| Arena Brands Holding Corp. Class B (a)(b)(h) | | 659,302 | 1,790 |
| Bath & Body Works, Inc. | | 298,900 | 15,809 |
| Lowe's Companies, Inc. | | 94,600 | 18,705 |
| PVH Corp. | | 210,600 | 15,327 |
| RH (h) | | 35,500 | 11,932 |
| Williams-Sonoma, Inc. | | 124,600 | 16,258 |
|
| TOTAL SUPER RETAIL | | | 79,821 |
|
| Technology - 2.9% | | | |
| Adobe, Inc. (h) | | 92,700 | 36,705 |
| CDW Corp. | | 131,500 | 21,458 |
| Global Payments, Inc. | | 309,624 | 42,412 |
| Lam Research Corp. | | 109,100 | 50,814 |
| Marvell Technology, Inc. | | 551,400 | 32,025 |
| Meta Platforms, Inc. Class A (h) | | 125,100 | 25,079 |
| Microchip Technology, Inc. | | 502,600 | 32,770 |
| Microsoft Corp. | | 100,400 | 27,863 |
| NVIDIA Corp. | | 107,800 | 19,994 |
| NXP Semiconductors NV | | 100,000 | 17,090 |
| onsemi (h) | | 748,538 | 39,006 |
| SS&C Technologies Holdings, Inc. | | 426,282 | 27,563 |
|
| TOTAL TECHNOLOGY | | | 372,779 |
|
| Telecommunications - 0.2% | | | |
| GTT Communications, Inc. rights (a)(h) | | 472,864 | 473 |
| T-Mobile U.S., Inc. (h) | | 176,000 | 21,673 |
|
| TOTAL TELECOMMUNICATIONS | | | 22,146 |
|
| Textiles/Apparel - 0.0% | | | |
| Victoria's Secret & Co. (h) | | 99,633 | 4,695 |
| Transportation Ex Air/Rail - 0.0% | | | |
| Tricer Holdco SCA: | | | |
| Class A1 (a)(b)(h) | | 598,287 | 1 |
| Class A2 (a)(b)(h) | | 598,287 | 1 |
| Class A3 (a)(b)(h) | | 598,287 | 1 |
| Class A4 (a)(b)(h) | | 598,287 | 1 |
| Class A5 (a)(b)(h) | | 598,287 | 1 |
| Class A6 (a)(b)(h) | | 598,287 | 1 |
| Class A7 (a)(b)(h) | | 598,287 | 1 |
| Class A8 (a)(b)(h) | | 598,287 | 1 |
| Class A9 (a)(b)(h) | | 598,287 | 1 |
|
| TOTAL TRANSPORTATION EX AIR/RAIL | | | 9 |
|
| Utilities - 0.4% | | | |
| NRG Energy, Inc. | | 777,600 | 27,916 |
| PG&E Corp. (h) | | 2,097,796 | 26,537 |
| Portland General Electric Co. | | 14,817 | 701 |
|
| TOTAL UTILITIES | | | 55,154 |
|
| TOTAL COMMON STOCKS | | | |
| (Cost $967,460) | | | 1,514,493 |
|
| Nonconvertible Preferred Stocks - 0.0% | | | |
| Automotive & Auto Parts - 0.0% | | | |
| Exide Technologies (a)(h) | | 858 | 799 |
| Transportation Ex Air/Rail - 0.0% | | | |
| Tricer Holdco SCA (a)(b)(h) | | 287,159,690 | 97 |
| TOTAL NONCONVERTIBLE PREFERRED STOCKS | | | |
| (Cost $11,049) | | | 896 |
| | | Principal Amount (000s) | Value (000s) |
|
| Bank Loan Obligations - 4.9% | | | |
| Air Transportation - 0.3% | | | |
| Air Canada Tranche B 1LN, term loan 1 month U.S. LIBOR + 3.500% 4.25% 8/11/28 (e)(f)(j) | | 9,105 | 9,003 |
| Dynasty Acquisition Co., Inc.: | | | |
| Tranche B 1LN, term loan 3 month U.S. LIBOR + 3.500% 4.506% 4/8/26 (e)(f)(j) | | 2,578 | 2,524 |
| Tranche B2 1LN, term loan 3 month U.S. LIBOR + 3.500% 4.506% 4/4/26 (e)(f)(j) | | 1,386 | 1,357 |
| SkyMiles IP Ltd. Tranche B 1LN, term loan 3 month U.S. LIBOR + 3.750% 4.75% 10/20/27 (e)(f)(j) | | 3,490 | 3,602 |
| United Airlines, Inc. Tranche B 1LN, term loan 3 month U.S. LIBOR + 3.750% 4.5% 4/21/28 (e)(f)(j) | | 26,235 | 25,988 |
|
| TOTAL AIR TRANSPORTATION | | | 42,474 |
|
| Automotive & Auto Parts - 0.2% | | | |
| Midas Intermediate Holdco II LLC Tranche B 1LN, term loan 3 month U.S. LIBOR + 7.750% 8.5% 12/16/25 (e)(f)(j) | | 881 | 810 |
| PECF USS Intermediate Holding III Corp. Tranche B 1LN, term loan 1 month U.S. LIBOR + 4.250% 4.7579% 12/17/28 (e)(f)(j) | | 2,304 | 2,267 |
| Wand NewCo 3, Inc. Tranche B 1LN, term loan 3 month U.S. LIBOR + 3.000% 3.4574% 2/5/26 (e)(f)(j) | | 17,986 | 17,143 |
|
| TOTAL AUTOMOTIVE & AUTO PARTS | | | 20,220 |
|
| Banks & Thrifts - 0.1% | | | |
| Citadel Securities LP Tranche B 1LN, term loan 3 month U.S. LIBOR + 2.500% 3.3148% 2/27/28 (e)(f)(j) | | 9,747 | 9,663 |
| Broadcasting - 0.1% | | | |
| Diamond Sports Group LLC 1LN, term loan U.S. Secured Overnight Fin. Rate (SOFR) Indx + 8.000% 9% 5/25/26 (e)(f)(j) | | 6,813 | 6,914 |
| Nexstar Broadcasting, Inc. Tranche B, term loan 3 month U.S. LIBOR + 2.500% 2.9551% 9/19/26 (e)(f)(j) | | 3,835 | 3,797 |
| Univision Communications, Inc. Tranche B 1LN, term loan 1 month U.S. LIBOR + 3.250% 4.0137% 1/31/29 (e)(f)(j) | | 7,500 | 7,397 |
|
| TOTAL BROADCASTING | | | 18,108 |
|
| Building Materials - 0.4% | | | |
| Acproducts Holdings, Inc. Tranche B 1LN, term loan 1 month U.S. LIBOR + 4.250% 4.75% 5/17/28 (e)(f)(j) | | 23,830 | 19,779 |
| Hunter Douglas, Inc. Tranche B 1LN, term loan U.S. Secured Overnight Fin. Rate (SOFR) Indx + 3.500% 4% 2/25/29 (e)(f)(j) | | 22,755 | 21,623 |
| SRS Distribution, Inc. Tranche B 1LN, term loan 1 month U.S. LIBOR + 3.500% 4.0187% 6/4/28 (e)(f)(j) | | 6,456 | 6,214 |
|
| TOTAL BUILDING MATERIALS | | | 47,616 |
|
| Chemicals - 0.0% | | | |
| Olympus Water U.S. Holding Corp. Tranche B 1LN, term loan 1 month U.S. LIBOR + 3.750% 4.8125% 11/9/28 (e)(f)(j) | | 3,696 | 3,619 |
| W.R. Grace Holding LLC Tranche B 1LN, term loan 1 month U.S. LIBOR + 3.750% 4.8125% 9/22/28 (e)(f)(j) | | 2,778 | 2,751 |
|
| TOTAL CHEMICALS | | | 6,370 |
|
| Consumer Products - 0.2% | | | |
| Kronos Acquisition Holdings, Inc. Tranche B 1LN, term loan 3 month U.S. LIBOR + 3.750% 4.25% 12/22/26 (e)(f)(j) | | 20,152 | 18,694 |
| Michaels Companies, Inc. 1LN, term loan 3 month U.S. LIBOR + 4.250% 5.256% 4/15/28 (e)(f)(j) | | 5,518 | 5,020 |
|
| TOTAL CONSUMER PRODUCTS | | | 23,714 |
|
| Containers - 0.0%�� | | | |
| Kloeckner Pentaplast of America, Inc. Tranche B 1LN, term loan 3 month U.S. LIBOR + 4.750% 5.5544% 2/9/26 (e)(f)(j) | | 1,490 | 1,324 |
| Energy - 0.0% | | | |
| Citgo Holding, Inc. Tranche B 1LN, term loan 3 month U.S. LIBOR + 7.000% 8% 8/1/23 (e)(f)(j) | | 1,370 | 1,354 |
| Forbes Energy Services LLC Tranche B, term loan 0% 12/31/49 (a)(d)(e)(j) | | 1,810 | 0 |
| Mesquite Energy, Inc.: | | | |
| 1LN, term loan 3 month U.S. LIBOR + 8.000% 0% (a)(d)(f)(j) | | 5,861 | 0 |
| term loan 3 month U.S. LIBOR + 0.000% 0% (a)(d)(f)(j) | | 2,528 | 0 |
|
| TOTAL ENERGY | | | 1,354 |
|
| Environmental - 0.0% | | | |
| Covanta Holding Corp.: | | | |
| Tranche B 1LN, term loan 1 month U.S. LIBOR + 2.500% 3.2637% 11/30/28 (e)(f)(j) | | 2,214 | 2,202 |
| Tranche C 1LN, term loan 1 month U.S. LIBOR + 2.500% 3.2637% 11/30/28 (e)(f)(j) | | 166 | 165 |
| Madison IAQ LLC Tranche B 1LN, term loan 1 month U.S. LIBOR + 3.250% 4.5244% 6/21/28 (e)(f)(j) | | 3,007 | 2,913 |
|
| TOTAL ENVIRONMENTAL | | | 5,280 |
|
| Food/Beverage/Tobacco - 0.0% | | | |
| Bengal Debt Merger Sub LLC 1LN, term loan U.S. Secured Overnight Fin. Rate (SOFR) Indx + 3.250% 4.0011% 1/24/29 (e)(f)(j) | | 2,285 | 2,239 |
| Gaming - 0.0% | | | |
| Fertitta Entertainment LLC NV Tranche B 1LN, term loan U.S. Secured Overnight Fin. Rate (SOFR) Indx + 4.000% 4.7004% 1/27/29 (e)(f)(j) | | 3,865 | 3,845 |
| Light & Wonder, Inc. 1LN, term loan CME TERM SOFR 1 MONTH INDEX + 3.250% 3.5728% 4/7/29 (e)(f)(j) | | 2,385 | 2,372 |
|
| TOTAL GAMING | | | 6,217 |
|
| Healthcare - 0.6% | | | |
| Gainwell Acquisition Corp. Tranche B 1LN, term loan 3 month U.S. LIBOR + 4.000% 5.006% 10/1/27 (e)(f)(j) | | 17,676 | 17,598 |
| Jazz Financing Lux SARL Tranche B 1LN, term loan 1 month U.S. LIBOR + 3.500% 4.2637% 5/5/28 (e)(f)(j) | | 6,943 | 6,929 |
| Organon & Co. Tranche B 1LN, term loan 3 month U.S. LIBOR + 3.000% 3.5625% 6/2/28 (e)(f)(j) | | 16,926 | 16,831 |
| Phoenix Newco, Inc. Tranche B 1LN, term loan 1 month U.S. LIBOR + 3.500% 4% 11/15/28 (e)(f)(j) | | 7,195 | 7,139 |
| PRA Health Sciences, Inc. Tranche B 1LN, term loan 1 month U.S. LIBOR + 2.250% 3.3125% 7/3/28 (e)(f)(j) | | 2,015 | 2,002 |
| U.S. Renal Care, Inc. Tranche B 1LN, term loan 3 month U.S. LIBOR + 5.000% 5.5% 6/13/26 (e)(f)(j) | | 38,095 | 33,618 |
| Valeant Pharmaceuticals International, Inc. Tranche B, term loan 3 month U.S. LIBOR + 3.000% 3.4574% 6/1/25 (e)(f)(j) | | 1,336 | 1,327 |
|
| TOTAL HEALTHCARE | | | 85,444 |
|
| Hotels - 0.1% | | | |
| Carnival Finance LLC Tranche B 1LN, term loan 1 month U.S. LIBOR + 3.250% 4% 10/18/28 (e)(f)(j) | | 8,035 | 7,904 |
| Insurance - 0.2% | | | |
| Acrisure LLC Tranche B 1LN, term loan 1 month U.S. LIBOR + 4.250% 5.0137% 2/15/27 (e)(f)(j) | | 1,441 | 1,429 |
| Alliant Holdings Intermediate LLC Tranche B3 1LN, term loan 1 month U.S. LIBOR + 3.500% 4.0513% 11/6/27 (e)(f)(j) | | 13,452 | 13,345 |
| HUB International Ltd. Tranche B 1LN, term loan 3 month U.S. LIBOR + 3.250% 4.3479% 4/25/25 (e)(f)(j) | | 5,706 | 5,672 |
|
| TOTAL INSURANCE | | | 20,446 |
|
| Paper - 0.1% | | | |
| Clydesdale Acquisition Holdings, Inc. 1LN, term loan CME TERM SOFR 1 MONTH INDEX + 4.250% 4.7834% 3/30/29 (e)(f)(j) | | 9,060 | 8,934 |
| Services - 0.8% | | | |
| ABG Intermediate Holdings 2 LLC: | | | |
| Tranche B 2LN, term loan 3 month U.S. LIBOR + 6.000% 6.8011% 12/20/29 (e)(f)(j) | | 1,145 | 1,134 |
| Tranche B1 LN, term loan U.S. Secured Overnight Fin. Rate (SOFR) Indx + 3.500% 4% 12/21/28 (e)(f)(j) | | 648 | 643 |
| Tranche B2 1LN, term loan U.S. Secured Overnight Fin. Rate (SOFR) Indx + 3.500% 4% 1/31/29 (e)(f)(j) | | 4,133 | 4,097 |
| Tranche B3 1LN, term loan U.S. Secured Overnight Fin. Rate (SOFR) Indx + 3.500% 4% 12/21/28 (e)(f)(j) | | 648 | 643 |
| Ascend Learning LLC: | | | |
| 2LN, term loan 1 month U.S. LIBOR + 5.750% 6.25% 12/10/29 (e)(f)(j) | | 15,190 | 14,981 |
| Tranche B 1LN, term loan 1 month U.S. LIBOR + 3.500% 4.2637% 12/10/28 (e)(f)(j) | | 43,641 | 43,072 |
| KUEHG Corp. Tranche B 2LN, term loan 3 month U.S. LIBOR + 8.250% 9.256% 8/22/25 (e)(f)(j) | | 6,055 | 6,017 |
| Sabert Corp. Tranche B 1LN, term loan 3 month U.S. LIBOR + 4.500% 5.5% 12/10/26 (e)(f)(j) | | 7,710 | 7,286 |
| Sotheby's Tranche B 1LN, term loan 1 month U.S. LIBOR + 4.500% 5.5443% 1/15/27 (e)(f)(j) | | 10,974 | 10,943 |
| Spin Holdco, Inc. Tranche B 1LN, term loan 3 month U.S. LIBOR + 4.000% 4.75% 3/4/28 (e)(f)(j) | | 18,105 | 18,010 |
|
| TOTAL SERVICES | | | 106,826 |
|
| Technology - 1.3% | | | |
| Acuris Finance U.S., Inc. 1LN, term loan 3 month U.S. LIBOR + 4.000% 4.8004% 2/16/28 (e)(f)(j) | | 1,131 | 1,123 |
| Athenahealth Group, Inc.: | | | |
| Tranche B 1LN, term loan U.S. Secured Overnight Fin. Rate (SOFR) Indx + 3.500% 4.009% 2/15/29 (e)(f)(j) | | 28,423 | 27,996 |
| Tranche DD 1LN, term loan U.S. Secured Overnight Fin. Rate (SOFR) Indx + 3.500% 2/15/29 (f)(j)(k)(l) | | 4,817 | 4,745 |
| Boxer Parent Co., Inc. Tranche B 1LN, term loan 3 month U.S. LIBOR + 3.750% 4.5137% 10/2/25 (e)(f)(j) | | 31,886 | 31,460 |
| Camelot Finance SA Tranche B, term loan 3 month U.S. LIBOR + 3.000% 3.7637% 10/31/26 (e)(f)(j) | | 1,124 | 1,109 |
| DG Investment Intermediate Holdings, Inc. Tranche B 1LN, term loan 3 month U.S. LIBOR + 3.500% 4.2637% 3/31/28 (e)(f)(j) | | 2,015 | 1,992 |
| Hunter U.S. Bidco, Inc. Tranche B 1LN, term loan 1 month U.S. LIBOR + 4.250% 5.256% 8/19/28 (e)(f)(j) | | 11,516 | 11,415 |
| Icon Luxembourg Sarl Tranche B 1LN, term loan 1 month U.S. LIBOR + 2.250% 3.3125% 7/3/28 (e)(f)(j) | | 8,087 | 8,035 |
| onsemi Tranche B 1LN, term loan 3 month U.S. LIBOR + 2.000% 2.7637% 9/19/26 (e)(f)(j) | | 7,649 | 7,614 |
| Peraton Corp. Tranche B 1LN, term loan 3 month U.S. LIBOR + 3.750% 4.5137% 2/1/28 (e)(f)(j) | | 13,809 | 13,686 |
| Polaris Newco LLC Tranche B 1LN, term loan 1 month U.S. LIBOR + 4.000% 4.7637% 6/2/28 (e)(f)(j) | | 6,741 | 6,662 |
| Proofpoint, Inc. Tranche B 1LN, term loan 1 month U.S. LIBOR + 3.250% 3.7579% 8/31/28 (e)(f)(j) | | 6,588 | 6,476 |
| RealPage, Inc. Tranche B 1LN, term loan 3 month U.S. LIBOR + 3.250% 3.75% 4/22/28 (e)(f)(j) | | 6,000 | 5,899 |
| STG-Fairway Holdings LLC Tranche B 1LN, term loan 3 month U.S. LIBOR + 2.750% 3.5137% 1/31/27 (e)(f)(j) | | 3,110 | 3,091 |
| Ultimate Software Group, Inc.: | | | |
| 1LN, term loan 1 month U.S. LIBOR + 3.250% 4.2116% 5/3/26 (e)(f)(j) | | 28,324 | 28,006 |
| 2LN, term loan 1 month U.S. LIBOR + 5.250% 6.2116% 5/3/27 (e)(f)(j) | | 4,000 | 3,959 |
| VS Buyer LLC Tranche B 1LN, term loan 3 month U.S. LIBOR + 3.000% 3.7637% 2/28/27 (e)(f)(j) | | 2,308 | 2,283 |
|
| TOTAL TECHNOLOGY | | | 165,551 |
|
| Telecommunications - 0.3% | | | |
| Connect U.S. Finco LLC Tranche B 1LN, term loan 3 month U.S. LIBOR + 3.500% 4.5% 12/12/26 (e)(f)(j) | | 8,869 | 8,809 |
| Frontier Communications Holdings LLC Tranche B 1LN, term loan 3 month U.S. LIBOR + 3.750% 4.8125% 5/1/28 (e)(f)(j) | | 5,123 | 5,029 |
| GTT Communications, Inc. Tranche B, term loan 3 month U.S. LIBOR + 4.750% 7.25% 5/31/25 (e)(f)(j) | | 12,942 | 10,493 |
| Securus Technologies Holdings Tranche B, term loan 3 month U.S. LIBOR + 4.500% 5.506% 11/1/24 (e)(f)(j) | | 6,971 | 6,628 |
| Zayo Group Holdings, Inc. 1LN, term loan 3 month U.S. LIBOR + 3.000% 3.7637% 3/9/27 (e)(f)(j) | | 7,821 | 7,409 |
|
| TOTAL TELECOMMUNICATIONS | | | 38,368 |
|
| Utilities - 0.2% | | | |
| PG&E Corp. Tranche B 1LN, term loan 3 month U.S. LIBOR + 3.000% 3.8125% 6/23/25 (e)(f)(j) | | 27,024 | 26,635 |
| TOTAL BANK LOAN OBLIGATIONS | | | |
| (Cost $666,861) | | | 644,687 |
|
| Preferred Securities - 7.6% | | | |
| Banks & Thrifts - 6.4% | | | |
| Ally Financial, Inc. 4.7% (e)(g) | | 17,635 | 15,355 |
| Bank of America Corp.: | | | |
| 5.125% (e)(g) | | 36,030 | 35,790 |
| 5.2% (e)(g) | | 61,440 | 61,844 |
| 5.875% (e)(g) | | 102,630 | 99,018 |
| 6.25% (e)(g) | | 28,555 | 29,173 |
| Citigroup, Inc.: | | | |
| 4.7% (e)(g) | | 15,285 | 14,057 |
| 5% (e)(g) | | 60,300 | 57,452 |
| 5.9% (e)(g) | | 27,015 | 27,796 |
| 5.95% (e)(g) | | 51,015 | 51,770 |
| 6.3% (e)(g) | | 5,610 | 5,710 |
| Goldman Sachs Group, Inc.: | | | |
| 4.4% (e)(g) | | 8,035 | 7,591 |
| 4.95% (e)(g) | | 13,335 | 12,981 |
| 5% (e)(g) | | 70,565 | 68,501 |
| Huntington Bancshares, Inc. 5.7% (e)(g) | | 12,990 | 12,266 |
| JPMorgan Chase & Co.: | | | |
| 3 month U.S. LIBOR + 3.320% 4.2869% (e)(f)(g) | | 43,545 | 43,102 |
| 4% (e)(g) | | 34,340 | 32,010 |
| 4.6% (e)(g) | | 23,365 | 21,769 |
| 5% (e)(g) | | 30,845 | 29,611 |
| 6% (e)(g) | | 69,385 | 70,582 |
| 6.125% (e)(g) | | 17,585 | 17,668 |
| 6.75% (e)(g) | | 8,330 | 8,615 |
| Wells Fargo & Co.: | | | |
| 5.875% (e)(g) | | 50,420 | 51,913 |
| 5.9% (e)(g) | | 63,075 | 63,135 |
|
| TOTAL BANKS & THRIFTS | | | 837,709 |
|
| Diversified Financial Services - 0.0% | | | |
| OEC Finance Ltd. 7.5% pay-in-kind (c)(g) | | 1,498 | 67 |
| Energy - 1.2% | | | |
| DCP Midstream Partners LP 7.375% (e)(g) | | 15,260 | 14,921 |
| Energy Transfer LP: | | | |
| 6.25% (e)(g) | | 81,527 | 70,354 |
| 6.625% (e)(g) | | 30,505 | 26,806 |
| 7.125% (e)(g) | | 9,130 | 8,915 |
| MPLX LP 6.875% (e)(g) | | 30,450 | 30,244 |
| Summit Midstream Partners LP 9.5% (e)(g) | | 2,912 | 2,399 |
|
| TOTAL ENERGY | | | 153,639 |
|
| TOTAL PREFERRED SECURITIES | | | |
| (Cost $1,024,359) | | | 991,415 |
| | | Shares | Value (000s) |
|
| Other - 0.8% | | | |
| Other - 0.8% | | | |
| Fidelity Direct Lending Fund, LP (b)(m) | | | |
| (Cost $105,867) | | 10,586,112 | 105,967 |
|
| Money Market Funds - 12.2% | | | |
| Fidelity Cash Central Fund 0.32% (n) | | 1,557,953,476 | 1,558,265 |
| Fidelity Securities Lending Cash Central Fund 0.32% (n)(o) | | 36,674,490 | 36,678 |
| TOTAL MONEY MARKET FUNDS | | | |
| (Cost $1,594,897) | | | 1,594,943 |
| TOTAL INVESTMENT IN SECURITIES - 100.0% | | | |
| (Cost $13,154,266) | | | 13,081,380 |
| NET OTHER ASSETS (LIABILITIES) - 0.0% | | | (4,380) |
| NET ASSETS - 100% | | | $13,077,000 |
Values shown as $0 in the Schedule of Investments may reflect amounts less than $500.
Legend
(a) Level 3 security
(b) Restricted securities (including private placements) - Investment in securities not registered under the Securities Act of 1933 (excluding 144A issues). At the end of the period, the value of restricted securities (excluding 144A issues) amounted to $161,290,000 or 1.2% of net assets.
(c) Security exempt from registration under Rule 144A of the Securities Act of 1933. These securities may be resold in transactions exempt from registration, normally to qualified institutional buyers. At the end of the period, the value of these securities amounted to $6,098,548,000 or 46.6% of net assets.
(d) Non-income producing - Security is in default.
(e) Coupon rates for floating and adjustable rate securities reflect the rates in effect at period end.
(f) Coupon is indexed to a floating interest rate which may be multiplied by a specified factor and/or subject to caps or floors.
(g) Security is perpetual in nature with no stated maturity date.
(h) Non-income producing
(i) Security or a portion of the security is on loan at period end.
(j) Remaining maturities of bank loan obligations may be less than the stated maturities shown as a result of contractual or optional prepayments by the borrower. Such prepayments cannot be predicted with certainty.
(k) The coupon rate will be determined upon settlement of the loan after period end.
(l) Position or a portion of the position represents an unfunded loan commitment. At period end, the total principal amount and market value of unfunded commitments totaled $1,753,623 and $1,733,895, respectively.
(m) Affiliated Fund
(n) Affiliated fund that is generally available only to investment companies and other accounts managed by Fidelity Investments. The rate quoted is the annualized seven-day yield of the fund at period end. A complete unaudited listing of the fund's holdings as of its most recent quarter end is available upon request. In addition, each Fidelity Central Fund's financial statements, which are not covered by the Fund's Report of Independent Registered Public Accounting Firm, are available on the SEC's website or upon request.
(o) Investment made with cash collateral received from securities on loan.
Additional information on each restricted holding is as follows:
| Security | Acquisition Date | Acquisition Cost (000s) |
| Arena Brands Holding Corp. Class B | 6/18/97 - 1/12/99 | $21,592 |
| Chesapeake Energy Corp. | 2/10/21 | $216 |
| Fidelity Direct Lending Fund, LP | 12/9/21 - 4/29/22 | $105,866 |
| Mesquite Energy, Inc. 15% 7/15/23 | 7/10/20 - 1/18/22 | $2,496 |
| Mesquite Energy, Inc. 15% 7/15/23 | 11/5/20 - 1/18/22 | $4,307 |
| New Cotai LLC/New Cotai Capital Corp. | 9/11/20 | $16,677 |
| Southeastern Grocers, Inc. | 6/1/18 | $5,580 |
| Tricer Holdco SCA | 10/16/09 - 12/30/17 | $10,250 |
| Tricer Holdco SCA Class A1 | 10/16/09 - 10/29/09 | $1,653 |
| Tricer Holdco SCA Class A2 | 10/16/09 - 10/29/09 | $1,653 |
| Tricer Holdco SCA Class A3 | 10/16/09 - 10/29/09 | $1,653 |
| Tricer Holdco SCA Class A4 | 10/16/09 - 10/29/09 | $1,653 |
| Tricer Holdco SCA Class A5 | 10/16/09 - 10/29/09 | $1,653 |
| Tricer Holdco SCA Class A6 | 10/16/09 - 10/29/09 | $1,653 |
| Tricer Holdco SCA Class A7 | 10/16/09 - 10/29/09 | $1,653 |
| Tricer Holdco SCA Class A8 | 10/16/09 - 10/29/09 | $1,653 |
| Tricer Holdco SCA Class A9 | 10/16/09 - 10/29/09 | $1,654 |
Affiliated Central Funds
Fiscal year to date information regarding the Fund's investments in Fidelity Central Funds, including the ownership percentage, is presented below.
| Fund (Amounts in thousands) | Value, beginning of period | Purchases | Sales Proceeds | Dividend Income | Realized Gain/Loss | Change in Unrealized appreciation (depreciation) | Value, end of period | % ownership, end of period |
| Fidelity Cash Central Fund 0.32% | $1,367,979 | $3,889,075 | $3,698,789 | $1,154 | $-- | $-- | $1,558,265 | 3.0% |
| Fidelity Securities Lending Cash Central Fund 0.32% | -- | 497,193 | 460,515 | 30 | -- | -- | 36,678 | 0.1% |
| Total | $1,367,979 | $4,386,268 | $4,159,304 | $1,184 | $-- | $-- | $1,594,943 | |
Amounts in the income column in the above table include any capital gain distributions from underlying funds, which are presented in the corresponding line-item in the Statement of Operations, if applicable. Amount for Fidelity Securities Lending Cash Central Fund represents the income earned on investing cash collateral, less rebates paid to borrowers and any lending agent fees associated with the loan, plus any premium payments received for lending certain types of securities.
Affiliated Underlying Funds
Fiscal year to date information regarding the Fund's investments in affiliated Underlying Funds is presented below. Exchanges between classes of the same affiliated Underlying Funds may occur, and are excluded from purchases and sales below if applicable. If an underlying Fund changes its name, the name presented below is the name in effect at period end.
| Affiliate (Amounts in thousands) | Value, beginning of period | Purchases | Sales Proceeds | Dividend Income | Realized Gain (loss) | Change in Unrealized appreciation (depreciation) | Value, end of period |
| Fidelity Direct Lending Fund, LP | $-- | $105,867 | $-- | $1,803 | $-- | $100 | $105,967 |
| Total | $-- | $105,867 | $-- | $1,803 | $-- | $100 | $105,967 |
Amounts in the income column in the above table include any capital gain distributions from underlying funds, which are presented in the corresponding line-item in the Statement of Operations, if applicable.
Other Affiliated Issuers
An affiliated company is a company in which the Fund has ownership of at least 5% of the voting securities. Fiscal year to date transactions with companies which are or were affiliates are presented in the table below. Certain corporate actions, such as mergers, are excluded from the amounts in this table if applicable.
| Affiliate (Amounts in thousands) | Value, beginning of period | Purchases | Sales Proceeds | Dividend Income | Realized Gain (loss) | Change in Unrealized appreciation (depreciation) | Value, end of period |
| California Resources Corp. | $120,620 | $-- | $72,025 | $1,276 | $(2,238) | $89,422 | $-- |
| California Resources Corp. warrants 10/27/24 | 228 | -- | -- | -- | -- | 455 | -- |
| Total | $120,848 | $-- | $72,025 | $1,276 | $(2,238) | $89,877 | $-- |
Investment Valuation
The following is a summary of the inputs used, as of April 30, 2022, involving the Fund's assets and liabilities carried at fair value. The inputs or methodology used for valuing securities may not be an indication of the risk associated with investing in those securities. For more information on valuation inputs, and their aggregation into the levels used below, please refer to the Investment Valuation section in the accompanying Notes to Financial Statements.
Amounts in this Investment Valuation section exclude the value of Fidelity Direct Lending Fund, LP as presented in the Schedule of Investments. Fidelity Direct Lending Fund, LP is valued using NAV as a practical expedient.
| | Valuation Inputs at Reporting Date: |
| Description | Total | Level 1 | Level 2 | Level 3 |
| (Amounts in thousands) | | | | |
| Investments in Securities: | | | | |
| Equities: | | | | |
| Communication Services | $106,017 | $106,017 | $-- | $-- |
| Consumer Discretionary | 272,600 | 266,670 | -- | 5,930 |
| Consumer Staples | 101,458 | 82,788 | -- | 18,670 |
| Energy | 292,020 | 243,170 | -- | 48,850 |
| Financials | 36,046 | 36,042 | -- | 4 |
| Health Care | 54,311 | 54,311 | -- | -- |
| Industrials | 46,147 | 41,221 | -- | 4,926 |
| Information Technology | 374,572 | 374,099 | -- | 473 |
| Materials | 176,850 | 176,850 | -- | -- |
| Utilities | 55,368 | 55,154 | -- | 214 |
| Corporate Bonds | 8,228,979 | -- | 8,190,647 | 38,332 |
| Bank Loan Obligations | 644,687 | -- | 644,687 | -- |
| Preferred Securities | 991,415 | -- | 991,415 | -- |
| Money Market Funds | 1,594,943 | 1,594,943 | -- | -- |
| Total Investments in Securities: | $12,975,413 | $3,031,265 | $9,826,749 | $117,399 |
The following is a reconciliation of Investments in Securities for which Level 3 inputs were used in determining value:
| (Amounts in thousands) | |
| Investments in Securities: | |
| Beginning Balance | $135,377 |
| Net Realized Gain (Loss) on Investment Securities | (22,884) |
| Net Unrealized Gain (Loss) on Investment Securities | 93,898 |
| Cost of Purchases | 7,519 |
| Proceeds of Sales | (144,688) |
| Amortization/Accretion | 2,560 |
| Transfers into Level 3 | 46,222 |
| Transfers out of Level 3 | (605) |
| Ending Balance | $117,399 |
| The change in unrealized gain (loss) for the period attributable to Level 3 securities held at April 30, 2022 | $48,040 |
The information used in the above reconciliation represents fiscal year to date activity for any Investments in Securities identified as using Level 3 inputs at either the beginning or the end of the current fiscal period. Cost of purchases and proceeds of sales may include securities received and/or delivered through in-kind transactions. Transfers in or out of Level 3 represent the beginning value of any Security or Instrument where a change in the pricing level occurred from the beginning to the end of the period. The cost of purchases and the proceeds of sales may include securities received or delivered through corporate actions or exchanges. Realized and unrealized gains (losses) disclosed in the reconciliation are included in Net Gain (Loss) on the Fund's Statement of Operations.
See accompanying notes which are an integral part of the financial statements.
Financial Statements
Statement of Assets and Liabilities
| Amounts in thousands (except per-share amount) | | April 30, 2022 |
| Assets | | |
Investment in securities, at value (including securities loaned of $34,879) — See accompanying schedule:
Unaffiliated issuers (cost $11,453,502) | $11,380,470 | |
| Fidelity Central Funds (cost $1,594,897) | 1,594,943 | |
| Other affiliated issuers (cost $105,867) | 105,967 | |
| Total Investment in Securities (cost $13,154,266) | | $13,081,380 |
| Cash | | 567 |
| Receivable for investments sold | | 19,087 |
| Receivable for fund shares sold | | 4,423 |
| Dividends receivable | | 1,016 |
| Interest receivable | | 137,948 |
| Distributions receivable from Fidelity Central Funds | | 356 |
| Prepaid expenses | | 5 |
| Other receivables | | 506 |
| Total assets | | 13,245,288 |
| Liabilities | | |
| Payable for investments purchased | $104,675 | |
| Payable for fund shares redeemed | 14,518 | |
| Distributions payable | 4,291 | |
| Accrued management fee | 6,133 | |
| Other affiliated payables | 1,384 | |
| Other payables and accrued expenses | 609 | |
| Collateral on securities loaned | 36,678 | |
| Total liabilities | | 168,288 |
| Net Assets | | $13,077,000 |
| Net Assets consist of: | | |
| Paid in capital | | $12,488,741 |
| Total accumulated earnings (loss) | | 588,259 |
| Net Assets | | $13,077,000 |
| Net Asset Value, offering price and redemption price per share ($13,077,000 ÷ 1,285,330 shares) | | $10.17 |
See accompanying notes which are an integral part of the financial statements.
Statement of Operations
| Amounts in thousands | | Year ended April 30, 2022 |
| Investment Income | | |
| Dividends (including $3,079 earned from other affiliated issuers) | | $86,374 |
| Interest | | 530,183 |
| Income from Fidelity Central Funds (including $30 from security lending) | | 1,184 |
| Total income | | 617,741 |
| Expenses | | |
| Management fee | $81,101 | |
| Transfer agent fees | 16,096 | |
| Accounting fees | 1,575 | |
| Custodian fees and expenses | 47 | |
| Independent trustees' fees and expenses | 52 | |
| Registration fees | 259 | |
| Audit | 122 | |
| Legal | 672 | |
| Miscellaneous | 60 | |
| Total expenses before reductions | 99,984 | |
| Expense reductions | (237) | |
| Total expenses after reductions | | 99,747 |
| Net investment income (loss) | | 517,994 |
| Realized and Unrealized Gain (Loss) | | |
| Net realized gain (loss) on: | | |
| Investment securities: | | |
| Unaffiliated issuers | 937,510 | |
| Affiliated issuers | (2,238) | |
| Foreign currency transactions | 59 | |
| Total net realized gain (loss) | | 935,331 |
| Change in net unrealized appreciation (depreciation) on: | | |
| Investment securities: | | |
| Unaffiliated issuers | (1,969,408) | |
| Affiliated issuers | 89,977 | |
| Assets and liabilities in foreign currencies | (10) | |
| Total change in net unrealized appreciation (depreciation) | | (1,879,441) |
| Net gain (loss) | | (944,110) |
| Net increase (decrease) in net assets resulting from operations | | $(426,116) |
See accompanying notes which are an integral part of the financial statements.
Statement of Changes in Net Assets
| Amounts in thousands | Year ended April 30, 2022 | Year ended April 30, 2021 |
| Increase (Decrease) in Net Assets | | |
| Operations | | |
| Net investment income (loss) | $517,994 | $452,670 |
| Net realized gain (loss) | 935,331 | 326,084 |
| Change in net unrealized appreciation (depreciation) | (1,879,441) | 2,484,635 |
| Net increase (decrease) in net assets resulting from operations | (426,116) | 3,263,389 |
| Distributions to shareholders | (986,974) | (590,301) |
| Share transactions | | |
| Proceeds from sales of shares | 3,210,567 | 4,006,273 |
| Reinvestment of distributions | 888,209 | 528,773 |
| Cost of shares redeemed | (4,283,042) | (2,762,146) |
| Net increase (decrease) in net assets resulting from share transactions | (184,266) | 1,772,900 |
| Total increase (decrease) in net assets | (1,597,356) | 4,445,988 |
| Net Assets | | |
| Beginning of period | 14,674,356 | 10,228,368 |
| End of period | $13,077,000 | $14,674,356 |
| Other Information | | |
| Shares | | |
| Sold | 287,825 | 380,581 |
| Issued in reinvestment of distributions | 80,218 | 51,182 |
| Redeemed | (388,533) | (272,181) |
| Net increase (decrease) | (20,490) | 159,582 |
See accompanying notes which are an integral part of the financial statements.
Financial Highlights
Fidelity Capital & Income Fund
| | | | | | |
| Years ended April 30, | 2022 | 2021 | 2020 | 2019 | 2018 |
| Selected Per–Share Data | | | | | |
| Net asset value, beginning of period | $11.24 | $8.92 | $10.08 | $10.12 | $10.09 |
| Income from Investment Operations | | | | | |
| Net investment income (loss)A,B | .387 | .386 | .426 | .432 | .482 |
| Net realized and unrealized gain (loss) | (.714) | 2.442 | (1.085) | .207 | .065 |
| Total from investment operations | (.327) | 2.828 | (.659) | .639 | .547 |
| Distributions from net investment income | (.390) | (.390) | (.425) | (.487) | (.410) |
| Distributions from net realized gain | (.353) | (.118) | (.076) | (.192) | (.107) |
| Total distributions | (.743) | (.508) | (.501) | (.679) | (.517) |
| Redemption fees added to paid in capitalA | – | – | – | – | –C |
| Net asset value, end of period | $10.17 | $11.24 | $8.92 | $10.08 | $10.12 |
| Total ReturnD | (3.27)% | 32.35% | (6.89)% | 6.74% | 5.51% |
| Ratios to Average Net AssetsB,E,F | | | | | |
| Expenses before reductions | .67% | .68% | .67% | .69% | .67% |
| Expenses net of fee waivers, if any | .67% | .68% | .67% | .69% | .67% |
| Expenses net of all reductions | .67% | .68% | .67% | .69% | .67% |
| Net investment income (loss) | 3.49% | 3.75% | 4.32% | 4.37% | 4.71% |
| Supplemental Data | | | | | |
| Net assets, end of period (in millions) | $13,077 | $14,674 | $10,228 | $11,631 | $12,053 |
| Portfolio turnover rateG | 28% | 37% | 46% | 43% | 39% |
A Calculated based on average shares outstanding during the period.
B Net investment income (loss) is affected by the timing of the declaration of dividends by any underlying mutual funds or exchange-traded funds (ETFs). Net investment income (loss) of any such underlying funds is not included in the Fund's net investment income (loss) ratio.
C Amount represents less than $.0005 per share.
D Total returns would have been lower if certain expenses had not been reduced during the applicable periods shown.
E Fees and expenses of any underlying mutual funds or exchange-traded funds (ETFs) are not included in the Fund's expense ratio. The Fund indirectly bears its proportionate share of these expenses. For additional expense information related to investments in Fidelity Central Funds, please refer to the "Investments in Fidelity Central Funds" note found in the Notes to Financial Statements section of the most recent Annual or Semi-Annual report. For additional expense information related to investments in Fidelity Direct Lending Fund, LP, please refer to the Investment in Fidelity Direct Lending Fund, LP note found in the Notes to Financial Statements section of the most recent Annual or Semi-Annual report.
F Expense ratios reflect operating expenses of the class. Expenses before reductions do not reflect amounts reimbursed, waived, or reduced through arrangements with the investment adviser, brokerage services, or other offset arrangements, if applicable, and do not represent the amount paid by the class during periods when reimbursements, waivers or reductions occur.
G Amount does not include the portfolio activity of any underlying mutual funds or exchange-traded funds (ETFs).
See accompanying notes which are an integral part of the financial statements.
Notes to Financial Statements
For the period ended April 30, 2022
(Amounts in thousands except percentages)
1. Organization.
Fidelity Capital & Income Fund (the Fund) is a fund of Fidelity Summer Street Trust (the Trust) and is authorized to issue an unlimited number of shares. Share transactions on the Statement of Changes in Net Assets may contain exchanges between affiliated funds. The Trust is registered under the Investment Company Act of 1940, as amended (the 1940 Act), as an open-end management investment company organized as a Massachusetts business trust.
2. Investments in Fidelity Central Funds.
Funds may invest in Fidelity Central Funds, which are open-end investment companies generally available only to other investment companies and accounts managed by the investment adviser and its affiliates. The Schedule of Investments lists any Fidelity Central Funds held as an investment as of period end, but does not include the underlying holdings of each Fidelity Central Fund. An investing fund indirectly bears its proportionate share of the expenses of the underlying Fidelity Central Funds.
Based on its investment objective, each Fidelity Central Fund may invest or participate in various investment vehicles or strategies that are similar to those of the investing fund. These strategies are consistent with the investment objectives of the investing fund and may involve certain economic risks which may cause a decline in value of each of the Fidelity Central Funds and thus a decline in the value of the investing fund.
| Fidelity Central Fund | Investment Manager | Investment Objective | Investment Practices | Expense Ratio(a) |
| Fidelity Money Market Central Funds | Fidelity Management & Research Company LLC (FMR) | Each fund seeks to obtain a high level of current income consistent with the preservation of capital and liquidity. | Short-term Investments | Less than .005% |
(a) Expenses expressed as a percentage of average net assets and are as of each underlying Central Fund's most recent annual or semi-annual shareholder report.
A complete unaudited list of holdings for each Fidelity Central Fund is available upon request or at the Securities and Exchange Commission website at www.sec.gov. In addition, the financial statements of the Fidelity Central Funds which contain the significant accounting policies (including investment valuation policies) of those funds, and are not covered by the Report of Independent Registered Public Accounting Firm, are available on the Securities and Exchange Commission website or upon request.
3. Investment in Fidelity Direct Lending Fund, LP.
The Fund invests in Fidelity Direct Lending Fund, LP, which is a limited partnership available only to certain investment companies managed by the investment adviser and its affiliates. The Fund's limited partnership interest is not registered under the Securities Act of 1933, and is subject to substantial restrictions on transfer. The Fund has no redemption rights under the partnership agreement. There will be no trading market for the partnership interest, and the Fund most likely will hold its shares until Fidelity Direct Lending Fund, LP converts by operation of law to a Delaware corporation, trust, or other limited liability entity and (i) registers as a closed-end management investment company under the 1940 Act or (ii) elects to be treated as a business development company under the 1940 Act.
Based on its investment objective, Fidelity Direct Lending Fund, LP may invest or participate in various investments or strategies that are similar to those in which the Fund may invest or participate. These strategies are consistent with the investment objectives of the Fund and may involve certain economic risks which may cause a decline in value of Fidelity Direct Lending Fund, LP and thus a decline in the value of the Fund. The Fidelity Direct Lending Fund, LP intends to invest primarily in direct loans made to private U.S. companies, specifically small- and middle-market companies.
The Schedule of Investments lists Fidelity Direct Lending Fund, LP as an investment as of period end, but does not include the underlying holdings of Fidelity Direct Lending Fund, LP. Fidelity Direct Lending Fund, LP represented less than 5% of the Fund's net assets at period end. The Fund indirectly bears its proportionate share of the expenses of Fidelity Direct Lending Fund, LP, which commenced operations on December 8, 2021. The annual expense ratio for Fidelity Direct Lending Fund, LP is estimated to be a maximum of .20%.
4. Significant Accounting Policies.
The Fund is an investment company and applies the accounting and reporting guidance of the Financial Accounting Standards Board (FASB) Accounting Standards Codification Topic 946 Financial Services - Investment Companies. The financial statements have been prepared in conformity with accounting principles generally accepted in the United States of America (GAAP), which require management to make certain estimates and assumptions at the date of the financial statements. Actual results could differ from those estimates. Subsequent events, if any, through the date that the financial statements were issued have been evaluated in the preparation of the financial statements. The Fund's Schedule of Investments lists any underlying mutual funds or exchange-traded funds (ETFs) but does not include the underlying holdings of these funds. The following summarizes the significant accounting policies of the Fund:
Investment Valuation. Investments are valued as of 4:00 p.m. Eastern time on the last calendar day of the period. The Board of Trustees (the Board) has delegated the day to day responsibility for the valuation of the Fund's investments to the Fair Value Committee (the Committee) established by the Fund's investment adviser. In accordance with valuation policies and procedures approved by the Board, the Fund attempts to obtain prices from one or more third party pricing vendors or brokers to value its investments. When current market prices, quotations or currency exchange rates are not readily available or reliable, investments will be fair valued in good faith by the Committee, in accordance with procedures adopted by the Board. Factors used in determining fair value vary by investment type and may include market or investment specific events, changes in interest rates and credit quality. The frequency with which these procedures are used cannot be predicted and they may be utilized to a significant extent. The Committee oversees the Fund's valuation policies and procedures and reports to the Board on the Committee's activities and fair value determinations. The Board monitors the appropriateness of the procedures used in valuing the Fund's investments and ratifies the fair value determinations of the Committee.
The Fund categorizes the inputs to valuation techniques used to value its investments into a disclosure hierarchy consisting of three levels as shown below:
- Level 1 – unadjusted quoted prices in active markets for identical investments
- Level 2 – other significant observable inputs (including quoted prices for similar investments, interest rates, prepayment speeds, etc.)
- Level 3 – unobservable inputs (including the Fund's own assumptions based on the best information available)
Valuation techniques used to value the Fund's investments by major category are as follows:
Debt securities, including restricted securities, are valued based on evaluated prices received from third party pricing vendors or from brokers who make markets in such securities. Corporate bonds, bank loan obligations, and preferred securities are valued by pricing vendors who utilize matrix pricing which considers yield or price of bonds of comparable quality, coupon, maturity and type or by broker-supplied prices. When independent prices are unavailable or unreliable, debt securities may be valued utilizing pricing methodologies which consider similar factors that would be used by third party pricing vendors. Debt securities are generally categorized as Level 2 in the hierarchy but may be Level 3 depending on the circumstances. The Fund invests a significant portion of its assets in below investment grade securities. The value of these securities can be more volatile due to changes in the credit quality of the issuer and is sensitive to changes in economic, market and regulatory conditions.
Equity securities, including restricted securities, for which market quotations are readily available, are valued at the last reported sale price or official closing price as reported by a third party pricing vendor on the primary market or exchange on which they are traded and are categorized as Level 1 in the hierarchy. In the event there were no sales during the day or closing prices are not available, securities are valued at the last quoted bid price or may be valued using the last available price and are generally categorized as Level 2 in the hierarchy. For equity securities, including restricted securities, where observable inputs are limited, assumptions about market activity and risk are used and these securities may be categorized as Level 3 in the hierarchy.
Investments in open-end mutual funds, including the Fidelity Central Funds, are valued at their closing net asset value (NAV) each business day and are categorized as Level 1 in the hierarchy.
Fidelity Direct Lending Fund, LP is valued using NAV as a practical expedient in accordance with the specialized accounting guidance for investment companies.
Changes in valuation techniques may result in transfers in or out of an assigned level within the disclosure hierarchy. The aggregate value of investments by input level as of April 30, 2022 is included at the end of the Fund's Schedule of Investments.
Foreign Currency. Certain Funds may use foreign currency contracts to facilitate transactions in foreign-denominated securities. Gains and losses from these transactions may arise from changes in the value of the foreign currency or if the counterparties do not perform under the contracts' terms.
Foreign-denominated assets, including investment securities, and liabilities are translated into U.S. dollars at the exchange rates at period end. Purchases and sales of investment securities, income and dividends received, and expenses denominated in foreign currencies are translated into U.S. dollars at the exchange rate in effect on the transaction date.
The effects of exchange rate fluctuations on investments are included with the net realized and unrealized gain (loss) on investment securities. Other foreign currency transactions resulting in realized and unrealized gain (loss) are disclosed separately.
Investment Transactions and Income. For financial reporting purposes, the Fund's investment holdings and NAV include trades executed through the end of the last business day of the period. The NAV per share for processing shareholder transactions is calculated as of the close of business of the New York Stock Exchange (NYSE), normally 4:00 p.m. Eastern time and includes trades executed through the end of the prior business day. Gains and losses on securities sold are determined on the basis of identified cost and include proceeds received from litigation. Commissions paid to certain brokers with whom the investment adviser, or its affiliates, places trades on behalf of a fund include an amount in addition to trade execution, which may be rebated back to a fund. Any such rebates are included in net realized gain (loss) on investments in the Statement of Operations. Dividend income is recorded on the ex-dividend date, except for certain dividends from foreign securities where the ex-dividend date may have passed, which are recorded as soon as the Fund is informed of the ex-dividend date. Non-cash dividends included in dividend income, if any, are recorded at the fair market value of the securities received. Income and capital gain distributions from Fidelity Central Funds, if any, are recorded on the ex-dividend date. Certain distributions received by the Fund represent a return of capital or capital gain. The Fund determines the components of these distributions subsequent to the ex-dividend date, based upon receipt of tax filings or other correspondence relating to the underlying investment. These distributions are recorded as a reduction of cost of investments and/or as a realized gain. Interest income is accrued as earned and includes coupon interest and amortization of premium and accretion of discount on debt securities as applicable. Paid in Kind (PIK) income is recorded at the fair market value of the securities received. Investment income is recorded net of foreign taxes withheld where recovery of such taxes is uncertain. Debt obligations may be placed on non-accrual status and related interest income may be reduced by ceasing current accruals and writing off interest receivables when the collection of all or a portion of interest has become doubtful based on consistently applied procedures. A debt obligation is removed from non-accrual status when the issuer resumes interest payments or when collectability of interest is reasonably assured.
Expenses. Expenses directly attributable to a fund are charged to that fund. Expenses attributable to more than one fund are allocated among the respective funds on the basis of relative net assets or other appropriate methods. Expenses included in the accompanying financial statements reflect the expenses of that fund and do not include any expenses associated with any underlying mutual funds or exchange-traded funds. Although not included in a fund's expenses, a fund indirectly bears its proportionate share of these expenses through the net asset value of each underlying mutual fund or exchange-traded fund. Expense estimates are accrued in the period to which they relate and adjustments are made when actual amounts are known.
Deferred Trustee Compensation. Under a Deferred Compensation Plan (the Plan) for certain Funds, certain independent Trustees have elected to defer receipt of a portion of their annual compensation. Deferred amounts are invested in affiliated mutual funds, are marked-to-market and remain in a fund until distributed in accordance with the Plan. The investment of deferred amounts and the offsetting payable to the Trustees presented below are included in the accompanying Statement of Assets and Liabilities in other receivables and other payables and accrued expenses, as applicable.
| Fidelity Capital & Income Fund | $503 |
Income Tax Information and Distributions to Shareholders. Each year, the Fund intends to qualify as a regulated investment company under Subchapter M of the Internal Revenue Code, including distributing substantially all of its taxable income and realized gains. As a result, no provision for U.S. Federal income taxes is required. As of April 30, 2022, the Fund did not have any unrecognized tax benefits in the financial statements; nor is the Fund aware of any tax positions for which it is reasonably possible that the total amounts of unrecognized tax benefits will significantly change in the next twelve months. The Fund files a U.S. federal tax return, in addition to state and local tax returns as required. The Fund's federal income tax returns are subject to examination by the Internal Revenue Service (IRS) for a period of three fiscal years after they are filed. State and local tax returns may be subject to examination for an additional fiscal year depending on the jurisdiction. Foreign taxes are provided for based on the Fund's understanding of the tax rules and rates that exist in the foreign markets in which it invests.
Distributions are declared and recorded daily and paid monthly from net investment income. Distributions from realized gains, if any, are declared and recorded on the ex-dividend date. Income and capital gain distributions are determined in accordance with income tax regulations, which may differ from GAAP. In addition, the Fund claimed a portion of the payment made to redeeming shareholders as a distribution for income tax purposes.
Capital accounts within the financial statements are adjusted for permanent book-tax differences. These adjustments have no impact on net assets or the results of operations. Capital accounts are not adjusted for temporary book-tax differences which will reverse in a subsequent period.
Book-tax differences are primarily due to foreign currency transactions, defaulted bonds, market discount, partnerships and losses deferred due to wash sales.
As of period end, the cost and unrealized appreciation (depreciation) in securities, and derivatives if applicable, for federal income tax purposes were as follows:
| Gross unrealized appreciation | $910,101 |
| Gross unrealized depreciation | (958,756) |
| Net unrealized appreciation (depreciation) | $(48,655) |
| Tax Cost | $13,130,035 |
The tax-based components of distributable earnings as of period end were as follows:
| Undistributed long-term capital gain | $637,299 |
| Net unrealized appreciation (depreciation) on securities and other investments | $(48,655) |
The tax character of distributions paid was as follows:
| | April 30, 2022 | April 30, 2021 |
| Ordinary Income | $618,934 | $ 476,147 |
| Long-term Capital Gains | 368,040 | 114,154 |
| Total | $986,974 | $ 590,301 |
Restricted Securities (including Private Placements). Funds may invest in securities that are subject to legal or contractual restrictions on resale. These securities generally may be resold in transactions exempt from registration or to the public if the securities are registered. Disposal of these securities may involve time-consuming negotiations and expense, and prompt sale at an acceptable price may be difficult. Information regarding restricted securities held at period end is included at the end of the Schedule of Investments, if applicable.
Loans and Other Direct Debt Instruments. Direct debt instruments are interests in amounts owed to lenders by corporate or other borrowers. These instruments may be in the form of loans, trade claims or other receivables and may include standby financing commitments such as revolving credit facilities that obligate a fund to supply additional cash to the borrower on demand. Loans may be acquired through assignment, participation, or may be made directly to a borrower. Such instruments are presented in the Bank Loan Obligations section in the Schedule of Investments. Certain funds may also invest in unfunded loan commitments, which are contractual obligations for future funding. Information regarding unfunded commitments is included at the end of the Schedule of Investments, if applicable.
Commitments. A commitment is an agreement to acquire an investment at a future date (subject to conditions) in connection with a potential public or non-public offering. The amount of commitments outstanding at period end are presented in the table below. These commitments are not included in the net assets of the Fund at period end.
| | Investment to be Acquired | Commitment Amount |
| Fidelity Capital & Income Fund | Fidelity Direct Lending Fund, LP | $280,333 |
5. Purchases and Sales of Investments.
Purchases and sales of securities, other than short-term securities and in-kind transactions, as applicable, are noted in the table below.
| | Purchases ($) | Sales ($) |
| Fidelity Capital & Income Fund | 3,730,191 | 4,606,742 |
6. Fees and Other Transactions with Affiliates.
Management Fee. Fidelity Management & Research Company LLC (the investment adviser) and its affiliates provide the Fund with investment management related services for which the Fund pays a monthly management fee. The management fee is the sum of an individual fund fee rate that is based on an annual rate of .45% of the Fund's average net assets and an annualized group fee rate that averaged .10% during the period. The group fee rate is based upon the monthly average net assets of a group of registered investment companies with which the investment adviser has management contracts. The group fee rate decreases as assets under management increase and increases as assets under management decrease. For the reporting period, the total annual management fee rate was .55% of the Fund's average net assets.
Transfer Agent Fees. Fidelity Investments Institutional Operations Company LLC (FIIOC), an affiliate of the investment adviser, is the Fund's transfer, dividend disbursing and shareholder servicing agent. FIIOC receives account fees and asset-based fees that vary according to account size and type of account. FIIOC pays for typesetting, printing and mailing of shareholder reports, except proxy statements. For the period, the transfer agent fees were equivalent to an annual rate of .11% of average net assets.
Accounting Fees. Fidelity Service Company, Inc. (FSC), an affiliate of the investment adviser, maintains the Fund's accounting records. The accounting fee is based on the level of average net assets for each month. For the period, the fees were equivalent to the following annual rates:
| | % of Average Net Assets |
| Fidelity Capital & Income Fund | .01 |
Brokerage Commissions. A portion of portfolio transactions were placed with brokerage firms which are affiliates of the investment adviser. Brokerage commissions are included in net realized gain (loss) and change in net unrealized appreciation (depreciation) in the Statement of Operations. The commissions paid to these affiliated firms were as follows:
| | Amount |
| Fidelity Capital & Income Fund | $10 |
Interfund Trades. Funds may purchase from or sell securities to other Fidelity Funds under procedures adopted by the Board. The procedures have been designed to ensure these interfund trades are executed in accordance with Rule 17a-7 of the 1940 Act. Any interfund trades are included within the respective purchases and sales amounts shown in the Purchases and Sales of Investments note. Interfund trades during the period are noted in the table below.
| | Purchases ($) | Sales ($) | Realized Gain (Loss) ($) |
| Fidelity Capital & Income Fund | 36,577 | 67,749 | 40,628 |
7. Committed Line of Credit.
Certain Funds participate with other funds managed by the investment adviser or an affiliate in a $4.25 billion credit facility (the "line of credit") to be utilized for temporary or emergency purposes to fund shareholder redemptions or for other short-term liquidity purposes. The participating funds have agreed to pay commitment fees on their pro-rata portion of the line of credit, which are reflected in Miscellaneous expenses on the Statement of Operations, and are listed below. During the period, there were no borrowings on this line of credit.
| | Amount |
| Fidelity Capital & Income Fund | $25 |
8. Security Lending.
Funds lend portfolio securities from time to time in order to earn additional income. Lending agents are used, including National Financial Services (NFS), an affiliate of the investment adviser. Pursuant to a securities lending agreement, NFS will receive a fee, which is capped at 9.9% of a fund's daily lending revenue, for its services as lending agent. A fund may lend securities to certain qualified borrowers, including NFS. On the settlement date of the loan, a fund receives collateral (in the form of U.S. Treasury obligations, letters of credit and/or cash) against the loaned securities and maintains collateral in an amount not less than 100% of the market value of the loaned securities during the period of the loan. The market value of the loaned securities is determined at the close of business of a fund and any additional required collateral is delivered to a fund on the next business day. A fund or borrower may terminate the loan at any time, and if the borrower defaults on its obligation to return the securities loaned because of insolvency or other reasons, a fund may apply collateral received from the borrower against the obligation. A fund may experience delays and costs in recovering the securities loaned. Any cash collateral received is invested in the Fidelity Securities Lending Cash Central Fund. Any loaned securities are identified as such in the Schedule of Investments, and the value of loaned securities and cash collateral at period end, as applicable, are presented in the Statement of Assets and Liabilities. Security lending income represents the income earned on investing cash collateral, less rebates paid to borrowers and any lending agent fees associated with the loan, plus any premium payments received for lending certain types of securities. Security lending income is presented in the Statement of Operations as a component of income from Fidelity Central Funds. Affiliated security lending activity, if any, was as follows:
| | Total Security Lending Fees Paid to NFS | Security Lending Income From Securities Loaned to NFS | Value of Securities Loaned to NFS at Period End |
| Fidelity Capital & Income Fund | $3 | $– | $– |
9. Expense Reductions.
Through arrangements with the Fund's custodian, credits realized as a result of certain uninvested cash balances were used to reduce the Fund's expenses by $2.
In addition, during the period the investment adviser or an affiliate reimbursed and/or waived a portion of operating expenses in the amount of $235.
10. Other.
A fund's organizational documents provide former and current trustees and officers with a limited indemnification against liabilities arising in connection with the performance of their duties to the fund. In the normal course of business, a fund may also enter into contracts that provide general indemnifications. A fund's maximum exposure under these arrangements is unknown as this would be dependent on future claims that may be made against a fund. The risk of material loss from such claims is considered remote.
11. Coronavirus (COVID-19) Pandemic.
An outbreak of COVID-19 first detected in China during December 2019 has since spread globally and was declared a pandemic by the World Health Organization during March 2020. Developments that disrupt global economies and financial markets, such as the COVID-19 pandemic, may magnify factors that affect the Fund's performance.
Report of Independent Registered Public Accounting Firm
To the Board of Trustees of Fidelity Summer Street Trust and Shareholders of Fidelity Capital & Income Fund
Opinion on the Financial Statements
We have audited the accompanying statement of assets and liabilities, including the schedule of investments, of Fidelity Capital & Income Fund (one of the funds constituting Fidelity Summer Street Trust, referred to hereafter as the “Fund”) as of April 30, 2022, the related statement of operations for the year ended April 30, 2022, the statement of changes in net assets for each of the two years in the period ended April 30, 2022, including the related notes, and the financial highlights for each of the five years in the period ended April 30, 2022 (collectively referred to as the “financial statements”). In our opinion, the financial statements present fairly, in all material respects, the financial position of the Fund as of April 30, 2022, the results of its operations for the year then ended, the changes in its net assets for each of the two years in the period ended April 30, 2022 and the financial highlights for each of the five years in the period ended April 30, 2022 in conformity with accounting principles generally accepted in the United States of America.
Basis for Opinion
These financial statements are the responsibility of the Fund’s management. Our responsibility is to express an opinion on the Fund’s financial statements based on our audits. We are a public accounting firm registered with the Public Company Accounting Oversight Board (United States) (PCAOB) and are required to be independent with respect to the Fund in accordance with the U.S. federal securities laws and the applicable rules and regulations of the Securities and Exchange Commission and the PCAOB.
We conducted our audits of these financial statements in accordance with the standards of the PCAOB. Those standards require that we plan and perform the audit to obtain reasonable assurance about whether the financial statements are free of material misstatement, whether due to error or fraud.
Our audits included performing procedures to assess the risks of material misstatement of the financial statements, whether due to error or fraud, and performing procedures that respond to those risks. Such procedures included examining, on a test basis, evidence regarding the amounts and disclosures in the financial statements. Our audits also included evaluating the accounting principles used and significant estimates made by management, as well as evaluating the overall presentation of the financial statements. Our procedures included confirmation of securities owned as of April 30, 2022 by correspondence with the custodians, issuers of privately offered securities, agent banks and brokers; when replies were not received from brokers, we performed other auditing procedures. We believe that our audits provide a reasonable basis for our opinion.
/s/ PricewaterhouseCoopers LLP
Boston, Massachusetts
June 14, 2022
We have served as the auditor of one or more investment companies in the Fidelity group of funds since 1932.
Trustees and Officers
The Trustees, Members of the Advisory Board (if any), and officers of the trust and fund, as applicable, are listed below. The Board of Trustees governs the fund and is responsible for protecting the interests of shareholders. The Trustees are experienced executives who meet periodically throughout the year to oversee the fund's activities, review contractual arrangements with companies that provide services to the fund, oversee management of the risks associated with such activities and contractual arrangements, and review the fund's performance. Each of the Trustees oversees 324 funds.
The Trustees hold office without limit in time except that (a) any Trustee may resign; (b) any Trustee may be removed by written instrument, signed by at least two-thirds of the number of Trustees prior to such removal; (c) any Trustee who requests to be retired or who has become incapacitated by illness or injury may be retired by written instrument signed by a majority of the other Trustees; and (d) any Trustee may be removed at any special meeting of shareholders by a two-thirds vote of the outstanding voting securities of the trust. Each Trustee who is not an interested person (as defined in the 1940 Act) of the trust and the fund is referred to herein as an Independent Trustee. Each Independent Trustee shall retire not later than the last day of the calendar year in which his or her 75th birthday occurs. The Independent Trustees may waive this mandatory retirement age policy with respect to individual Trustees. Officers and Advisory Board Members hold office without limit in time, except that any officer or Advisory Board Member may resign or may be removed by a vote of a majority of the Trustees at any regular meeting or any special meeting of the Trustees. Except as indicated, each individual has held the office shown or other offices in the same company for the past five years.
The fund’s Statement of Additional Information (SAI) includes more information about the Trustees. To request a free copy, call Fidelity at 1-800-544-8544.
Experience, Skills, Attributes, and Qualifications of the Trustees. The Governance and Nominating Committee has adopted a statement of policy that describes the experience, qualifications, attributes, and skills that are necessary and desirable for potential Independent Trustee candidates (Statement of Policy). The Board believes that each Trustee satisfied at the time he or she was initially elected or appointed a Trustee, and continues to satisfy, the standards contemplated by the Statement of Policy. The Governance and Nominating Committee also engages professional search firms to help identify potential Independent Trustee candidates who have the experience, qualifications, attributes, and skills consistent with the Statement of Policy. From time to time, additional criteria based on the composition and skills of the current Independent Trustees, as well as experience or skills that may be appropriate in light of future changes to board composition, business conditions, and regulatory or other developments, have also been considered by the professional search firms and the Governance and Nominating Committee. In addition, the Board takes into account the Trustees' commitment and participation in Board and committee meetings, as well as their leadership of standing and ad hoc committees throughout their tenure.
In determining that a particular Trustee was and continues to be qualified to serve as a Trustee, the Board has considered a variety of criteria, none of which, in isolation, was controlling. The Board believes that, collectively, the Trustees have balanced and diverse experience, qualifications, attributes, and skills, which allow the Board to operate effectively in governing the fund and protecting the interests of shareholders. Information about the specific experience, skills, attributes, and qualifications of each Trustee, which in each case led to the Board's conclusion that the Trustee should serve (or continue to serve) as a trustee of the fund, is provided below.
Board Structure and Oversight Function. Robert A. Lawrence is an interested person and currently serves as Chair. The Trustees have determined that an interested Chair is appropriate and benefits shareholders because an interested Chair has a personal and professional stake in the quality and continuity of services provided to the fund. Independent Trustees exercise their informed business judgment to appoint an individual of their choosing to serve as Chair, regardless of whether the Trustee happens to be independent or a member of management. The Independent Trustees have determined that they can act independently and effectively without having an Independent Trustee serve as Chair and that a key structural component for assuring that they are in a position to do so is for the Independent Trustees to constitute a substantial majority for the Board. The Independent Trustees also regularly meet in executive session. David M. Thomas serves as Lead Independent Trustee and as such (i) acts as a liaison between the Independent Trustees and management with respect to matters important to the Independent Trustees and (ii) with management prepares agendas for Board meetings.
Fidelity® funds are overseen by different Boards of Trustees. The fund's Board oversees Fidelity's high income and certain equity funds, and other Boards oversee Fidelity's investment-grade bond, money market, asset allocation, and other equity funds. The asset allocation funds may invest in Fidelity® funds overseen by the fund's Board. The use of separate Boards, each with its own committee structure, allows the Trustees of each group of Fidelity® funds to focus on the unique issues of the funds they oversee, including common research, investment, and operational issues. On occasion, the separate Boards establish joint committees to address issues of overlapping consequences for the Fidelity® funds overseen by each Board.
The Trustees operate using a system of committees to facilitate the timely and efficient consideration of all matters of importance to the Trustees, the fund, and fund shareholders and to facilitate compliance with legal and regulatory requirements and oversight of the fund's activities and associated risks. The Board, acting through its committees, has charged FMR and its affiliates with (i) identifying events or circumstances the occurrence of which could have demonstrably adverse effects on the fund's business and/or reputation; (ii) implementing processes and controls to lessen the possibility that such events or circumstances occur or to mitigate the effects of such events or circumstances if they do occur; and (iii) creating and maintaining a system designed to evaluate continuously business and market conditions in order to facilitate the identification and implementation processes described in (i) and (ii) above. Because the day-to-day operations and activities of the fund are carried out by or through FMR, its affiliates, and other service providers, the fund's exposure to risks is mitigated but not eliminated by the processes overseen by the Trustees. While each of the Board's committees has responsibility for overseeing different aspects of the fund's activities, oversight is exercised primarily through the Operations, Audit, and Compliance Committees. Appropriate personnel, including but not limited to the fund's Chief Compliance Officer (CCO), FMR's internal auditor, the independent accountants, the fund's Treasurer and portfolio management personnel, make periodic reports to the Board's committees, as appropriate, including an annual review of Fidelity's risk management program for the Fidelity® funds. The responsibilities of each standing committee, including their oversight responsibilities, are described further under "Standing Committees of the Trustees."
Interested Trustees*:
Correspondence intended for a Trustee who is an interested person may be sent to Fidelity Investments, 245 Summer Street, Boston, Massachusetts 02210.
Name, Year of Birth; Principal Occupations and Other Relevant Experience+
Bettina Doulton (1964)
Year of Election or Appointment: 2020
Trustee
Ms. Doulton also serves as Trustee of other Fidelity® funds. Prior to her retirement, Ms. Doulton served in a variety of positions at Fidelity Investments, including as a managing director of research (2006-2007), portfolio manager to certain Fidelity® funds (1993-2005), equity analyst and portfolio assistant (1990-1993), and research assistant (1987-1990). Ms. Doulton currently owns and operates Phi Builders + Architects and Cellardoor Winery. Previously, Ms. Doulton served as a member of the Board of Brown Capital Management, LLC (2014-2018).
Robert A. Lawrence (1952)
Year of Election or Appointment: 2020
Trustee
Chair of the Board of Trustees
Mr. Lawrence also serves as Trustee of other funds. Previously, Mr. Lawrence served as a Member of the Advisory Board of certain funds. Prior to his retirement in 2008, Mr. Lawrence served as Vice President of certain Fidelity® funds (2006-2008), Senior Vice President, Head of High Income Division of Fidelity Management & Research Company (investment adviser firm, 2006-2008), and President of Fidelity Strategic Investments (investment adviser firm, 2002-2005).
* Determined to be an “Interested Trustee” by virtue of, among other things, his or her affiliation with the trust or various entities under common control with FMR.
+ The information includes the Trustee's principal occupation during the last five years and other information relating to the experience, attributes, and skills relevant to the Trustee's qualifications to serve as a Trustee, which led to the conclusion that the Trustee should serve as a Trustee for the fund.
Independent Trustees:
Correspondence intended for an Independent Trustee may be sent to Fidelity Investments, P.O. Box 55235, Boston, Massachusetts 02205-5235.
Name, Year of Birth; Principal Occupations and Other Relevant Experience+
Thomas P. Bostick (1956)
Year of Election or Appointment: 2021
Trustee
Lieutenant General Bostick also serves as Trustee of other Fidelity® funds. Prior to his retirement, General Bostick (United States Army, Retired) held a variety of positions within the U.S. Army, including Commanding General and Chief of Engineers, U.S. Army Corps of Engineers (2012-2016) and Deputy Chief of Staff and Director of Human Resources, U.S. Army (2009-2012). General Bostick currently serves as a member of the Board and Finance and Governance Committees of CSX Corporation (transportation, 2020-present) and a member of the Board and Corporate Governance and Nominating Committee of Perma-Fix Environmental Services, Inc. (nuclear waste management, 2020-present). General Bostick serves as Chief Executive Officer of Bostick Global Strategies, LLC (consulting, 2016-present) and as a member of the Board of HireVue, Inc. (video interview and assessment, 2020-present). Previously, General Bostick served as a Member of the Advisory Board of certain Fidelity® funds (2021), President, Intrexon Bioengineering (2018-2020) and Chief Operating Officer (2017-2020) and Senior Vice President of the Environment Sector (2016-2017) of Intrexon Corporation (biopharmaceutical company).
Dennis J. Dirks (1948)
Year of Election or Appointment: 2005
Trustee
Mr. Dirks also serves as Trustee of other Fidelity® funds. Prior to his retirement in May 2003, Mr. Dirks served as Chief Operating Officer and as a member of the Board of The Depository Trust & Clearing Corporation (financial markets infrastructure), President, Chief Operating Officer and a member of the Board of The Depository Trust Company (DTC), President and a member of the Board of the National Securities Clearing Corporation (NSCC), Chief Executive Officer and a member of the Board of the Government Securities Clearing Corporation and Chief Executive Officer and a member of the Board of the Mortgage-Backed Securities Clearing Corporation. Mr. Dirks currently serves as a member of the Finance Committee (2016-present) and Board (2017-present) and is Treasurer (2018-present) of the Asolo Repertory Theatre.
Donald F. Donahue (1950)
Year of Election or Appointment: 2018
Trustee
Mr. Donahue also serves as Trustee of other Fidelity® funds. Mr. Donahue serves as President and Chief Executive Officer of Miranda Partners, LLC (risk consulting for the financial services industry, 2012-present). Previously, Mr. Donahue served as Chief Executive Officer (2006-2012), Chief Operating Officer (2003-2006) and Managing Director, Customer Marketing and Development (1999-2003) of The Depository Trust & Clearing Corporation (financial markets infrastructure). Mr. Donahue currently serves as a member (2007-present) and Co-Chairman (2016-present) of the Board of United Way of New York and a member of the Board of The Leadership Academy (previously NYC Leadership Academy) (2012-present). Mr. Donahue previously served as a member of the Advisory Board of certain Fidelity® funds (2015-2018).
Vicki L. Fuller (1957)
Year of Election or Appointment: 2020
Trustee
Ms. Fuller also serves as Trustee of other Fidelity® funds. Previously, Ms. Fuller served as a member of the Advisory Board of certain Fidelity® funds (2018-2020), Chief Investment Officer of the New York State Common Retirement Fund (2012-2018) and held a variety of positions at AllianceBernstein L.P. (global asset management, 1985-2012), including Managing Director (2006-2012) and Senior Vice President and Senior Portfolio Manager (2001-2006). Ms. Fuller currently serves as a member of the Board, Audit Committee and Nominating and Governance Committee of two Blackstone business development companies (2020-present), as a member of the Board of Treliant, LLC (consulting, 2019-present), as a member of the Advisory Board of Ariel Alternatives, LLC (private equity, 2021-present) and as a member of the Board and Chair of the Audit Committee of Gusto, Inc. (software, 2021-present). In addition, Ms. Fuller currently serves as a member of the Board of Roosevelt University (2019-present) and as a member of the Executive Board of New York University’s Stern School of Business. Ms. Fuller previously served as a member of the Board, Audit Committee and Nominating and Governance Committee of The Williams Companies, Inc. (natural gas infrastructure, 2018-2021).
Patricia L. Kampling (1959)
Year of Election or Appointment: 2020
Trustee
Ms. Kampling also serves as Trustee of other Fidelity® funds. Prior to her retirement, Ms. Kampling served as Chairman of the Board and Chief Executive Officer (2012-2019), President and Chief Operating Officer (2011-2012) and Executive Vice President and Chief Financial Officer (2010-2011) of Alliant Energy Corporation. Ms. Kampling currently serves as a member of the Board, Finance Committee and Governance, Compensation and Nominating Committee of Xcel Energy Inc. (utilities company, 2020-present) and as a member of the Board, Audit, Finance and Risk Committee and Safety, Environmental, Technology and Operations Committee and Chair of the Executive Development and Compensation Committee of American Water Works Company, Inc. (utilities company, 2019-present). In addition, Ms. Kampling currently serves as a member of the Board of the Nature Conservancy, Wisconsin Chapter (2019-present). Previously, Ms. Kampling served as a Member of the Advisory Board of certain Fidelity® funds (2020), a member of the Board, Compensation Committee and Executive Committee and Chair of the Audit Committee of Briggs & Stratton Corporation (manufacturing, 2011-2021), a member of the Board of Interstate Power and Light Company (2012-2019) and Wisconsin Power and Light Company (2012-2019) (each a subsidiary of Alliant Energy Corporation) and as a member of the Board and Workforce Development Committee of the Business Roundtable (2018-2019).
Thomas A. Kennedy (1955)
Year of Election or Appointment: 2021
Trustee
Mr. Kennedy also serves as Trustee of other Fidelity® funds. Previously, Mr. Kennedy served as a Member of the Advisory Board of certain Fidelity® funds (2020) and held a variety of positions at Raytheon Company (aerospace and defense, 1983-2020), including Chairman and Chief Executive Officer (2014-2020) and Executive Vice President and Chief Operating Officer (2013-2014). Mr. Kennedy currently serves as Executive Chairman of the Board of Directors of Raytheon Technologies Corporation (aerospace and defense, 2020-present). He is also a member of the Rutgers School of Engineering Industry Advisory Board (2011-present) and a member of the UCLA Engineering Dean’s Executive Board (2016-present).
Oscar Munoz (1959)
Year of Election or Appointment: 2021
Trustee
Mr. Munoz also serves as Trustee of other Fidelity® funds. Prior to his retirement, Mr. Munoz served as Executive Chairman (2020-2021), Chief Executive Officer (2015-2020), President (2015-2016) and a member of the Board (2010-2021) of United Airlines Holdings, Inc. Mr. Munoz currently serves as a member of the Board of CBRE Group, Inc. (commercial real estate, 2020-present), a member of the Board of Univision Communications, Inc. (Hispanic media, 2020-present) and a member of the Advisory Board of Salesforce.com, Inc. (cloud-based software, 2020-present). Previously, Mr. Munoz served as a Member of the Advisory Board of certain Fidelity® funds (2021).
Garnett A. Smith (1947)
Year of Election or Appointment: 2018
Trustee
Mr. Smith also serves as Trustee of other Fidelity® funds. Prior to his retirement, Mr. Smith served as Chairman and Chief Executive Officer (1990-1997) and President (1986-1990) of Inbrand Corp. (manufacturer of personal absorbent products). Prior to his employment with Inbrand Corp., he was employed by a retail fabric chain and North Carolina National Bank (now Bank of America). Mr. Smith previously served as a member of the Advisory Board of certain Fidelity® funds (2012-2013).
David M. Thomas (1949)
Year of Election or Appointment: 2008
Trustee
Lead Independent Trustee
Mr. Thomas also serves as Trustee of other Fidelity® funds. Previously, Mr. Thomas served as Executive Chairman (2005-2006) and Chairman and Chief Executive Officer (2000-2005) of IMS Health, Inc. (pharmaceutical and healthcare information solutions). Mr. Thomas currently serves as a member of the Board of Fortune Brands Home and Security (home and security products, 2004-present) and as Director (2013-present) and Non-Executive Chairman of the Board (2022-present) of Interpublic Group of Companies, Inc. (marketing communication).
Susan Tomasky (1953)
Year of Election or Appointment: 2020
Trustee
Ms. Tomasky also serves as Trustee of other Fidelity® funds. Prior to her retirement, Ms. Tomasky served in various executive officer positions at American Electric Power Company, Inc. (1998-2011), including most recently as President of AEP Transmission (2007-2011). Ms. Tomasky currently serves as a member of the Board and Sustainability Committee and as Chair of the Audit Committee of Marathon Petroleum Corporation (2018-present) and as a member of the Board, Executive Committee, Corporate Governance Committee and Organization and Compensation Committee and as Chair of the Audit Committee of Public Service Enterprise Group, Inc. (utilities company, 2012-present) and as a member of the Board of its subsidiary company, Public Service Electric and Gas Co. (2021-present). In addition, Ms. Tomasky currently serves as a member (2009-present) and President (2020-present) of the Board of the Royal Shakespeare Company – America (2009-present), as a member of the Board of the Columbus Association for the Performing Arts (2011-present) and as a member of the Board and Kenyon in the World Committee of Kenyon College (2016-present). Previously, Ms. Tomasky served as a Member of the Advisory Board of certain Fidelity® funds (2020), as a member of the Board of the Columbus Regional Airport Authority (2007-2020), as a member of the Board (2011-2018) and Lead Independent Director (2015-2018) of Andeavor Corporation (previously Tesoro Corporation) (independent oil refiner and marketer) and as a member of the Board of Summit Midstream Partners LP (energy, 2012-2018).
Michael E. Wiley (1950)
Year of Election or Appointment: 2018
Trustee
Mr. Wiley also serves as Trustee of other Fidelity® funds. Previously, Mr. Wiley served as a member of the Advisory Board of certain Fidelity® funds (2018-2020), Chairman, President and CEO of Baker Hughes, Inc. (oilfield services, 2000-2004). Mr. Wiley also previously served as a member of the Board of Andeavor Corporation (independent oil refiner and marketer, 2005-2018), a member of the Board of Andeavor Logistics LP (natural resources logistics, 2015-2018) and a member of the Board of High Point Resources (exploration and production, 2005-2020).
+ The information includes the Trustee's principal occupation during the last five years and other information relating to the experience, attributes, and skills relevant to the Trustee's qualifications to serve as a Trustee, which led to the conclusion that the Trustee should serve as a Trustee for the fund.
Advisory Board Members and Officers:
Correspondence intended for a Member of the Advisory Board (if any) may be sent to Fidelity Investments, P.O. Box 55235, Boston, Massachusetts 02205-5235. Correspondence intended for an officer or Peter S. Lynch may be sent to Fidelity Investments, 245 Summer Street, Boston, Massachusetts 02210. Officers appear below in alphabetical order.
Name, Year of Birth; Principal Occupation
Peter S. Lynch (1944)
Year of Election or Appointment: 2003
Member of the Advisory Board
Mr. Lynch also serves as a Member of the Advisory Board of other Fidelity® funds. Mr. Lynch is Vice Chairman and a Director of Fidelity Management & Research Company LLC (investment adviser firm). In addition, Mr. Lynch serves as a Trustee of Boston College and as the Chairman of the Inner-City Scholarship Fund. Previously, Mr. Lynch served as Vice Chairman and a Director of FMR Co., Inc. (investment adviser firm) and on the Special Olympics International Board of Directors (1997-2006).
Craig S. Brown (1977)
Year of Election or Appointment: 2019
Assistant Treasurer
Mr. Brown also serves as an officer of other funds. Mr. Brown serves as Assistant Treasurer of FIMM, LLC (2021-present) and is an employee of Fidelity Investments (2013-present).
John J. Burke III (1964)
Year of Election or Appointment: 2018
Chief Financial Officer
Mr. Burke also serves as Chief Financial Officer of other funds. Mr. Burke serves as Head of Investment Operations for Fidelity Fund and Investment Operations (2018-present) and is an employee of Fidelity Investments (1998-present). Previously Mr. Burke served as head of Asset Management Investment Operations (2012-2018).
William C. Coffey (1969)
Year of Election or Appointment: 2019
Assistant Secretary
Mr. Coffey also serves as Assistant Secretary of other funds. He is Senior Vice President and Deputy General Counsel of FMR LLC (diversified financial services company, 2010-present), and is an employee of Fidelity Investments. Previously, Mr. Coffey served as Secretary and CLO of certain funds (2018-2019); CLO, Secretary, and Senior Vice President of Fidelity Management & Research Company and FMR Co., Inc. (investment adviser firms, 2018-2019); Secretary of Fidelity SelectCo, LLC and Fidelity Investments Money Management, Inc. (investment adviser firms, 2018-2019); CLO of Fidelity Management & Research (Hong Kong) Limited, FMR Investment Management (UK) Limited, and Fidelity Management & Research (Japan) Limited (investment adviser firms, 2018-2019); and Assistant Secretary of certain funds (2009-2018).
Timothy M. Cohen (1969)
Year of Election or Appointment: 2018
Vice President
Mr. Cohen also serves as Vice President of other funds. Mr. Cohen serves as Co-Head of Equity (2018-present), a Director of Fidelity Management & Research (Japan) Limited (investment adviser firm, 2016-present), and is an employee of Fidelity Investments. Previously, Mr. Cohen served as Executive Vice President of Fidelity SelectCo, LLC (2019), Head of Global Equity Research (2016-2018), Chief Investment Officer - Equity and a Director of Fidelity Management & Research (U.K.) Inc. (investment adviser firm, 2013-2015) and as a Director of Fidelity Management & Research (Hong Kong) Limited (investment adviser firm, 2017).
Jonathan Davis (1968)
Year of Election or Appointment: 2010
Assistant Treasurer
Mr. Davis also serves as an officer of other funds. Mr. Davis serves as Assistant Treasurer of FIMM, LLC (2021-present), FMR Capital, Inc. (2017-present), FD Funds GP LLC (2021-present), FD Funds Holding LLC (2021-present), and FD Funds Management LLC (2021-present); and is an employee of Fidelity Investments. Previously, Mr. Davis served as Vice President and Associate General Counsel of FMR LLC (diversified financial services company, 2003-2010).
Laura M. Del Prato (1964)
Year of Election or Appointment: 2018
Assistant Treasurer
Ms. Del Prato also serves as an officer of other funds. Ms. Del Prato serves as Assistant Treasurer of FIMM, LLC (2021-present) and is an employee of Fidelity Investments (2017-present). Previously, Ms. Del Prato served as President and Treasurer of The North Carolina Capital Management Trust: Cash Portfolio and Term Portfolio (2018-2020). Prior to joining Fidelity Investments, Ms. Del Prato served as a Managing Director and Treasurer of the JPMorgan Mutual Funds (2014-2017). Prior to JPMorgan, Ms. Del Prato served as a partner at Cohen Fund Audit Services (accounting firm, 2012-2013) and KPMG LLP (accounting firm, 2004-2012).
Colm A. Hogan (1973)
Year of Election or Appointment: 2020
Assistant Treasurer
Mr. Hogan also serves as an officer of other funds. Mr. Hogan serves as Assistant Treasurer of FIMM, LLC (2021-present) and FMR Capital, Inc. (2017-present) and is an employee of Fidelity Investments (2005-present). Previously, Mr. Hogan served as Deputy Treasurer of certain Fidelity® funds (2016-2020) and Assistant Treasurer of certain Fidelity® funds (2016-2018).
Pamela R. Holding (1964)
Year of Election or Appointment: 2018
Vice President
Ms. Holding also serves as Vice President of other funds. Ms. Holding serves as Co-Head of Equity (2018-present) and is an employee of Fidelity Investments (2013-present). Previously, Ms. Holding served as Executive Vice President of Fidelity SelectCo, LLC (2019) and as Chief Investment Officer of Fidelity Institutional Asset Management (2013-2018).
Cynthia Lo Bessette (1969)
Year of Election or Appointment: 2019
Secretary and Chief Legal Officer (CLO)
Ms. Lo Bessette also serves as an officer of other funds. Ms. Lo Bessette serves as CLO, Secretary, and Senior Vice President of Fidelity Management & Research Company LLC (investment adviser firm, 2019-present); CLO of Fidelity Management & Research (Hong Kong) Limited, FMR Investment Management (UK) Limited, and Fidelity Management & Research (Japan) Limited (investment adviser firms, 2019-present); Secretary of FD Funds GP LLC (2021-present), FD Funds Holding LLC (2021-present), and FD Funds Management LLC (2021-present); and Assistant Secretary of FIMM, LLC (2019-present). She is a Senior Vice President and Deputy General Counsel of FMR LLC (diversified financial services company, 2019-present), and is an employee of Fidelity Investments. Previously, Ms. Lo Bessette served as CLO, Secretary, and Senior Vice President of FMR Co., Inc. (investment adviser firm, 2019); Secretary of Fidelity SelectCo, LLC and Fidelity Investments Money Management, Inc. (investment adviser firms, 2019). Prior to joining Fidelity Investments, Ms. Lo Bessette was Executive Vice President, General Counsel (2016-2019) and Senior Vice President, Deputy General Counsel (2015-2016) of OppenheimerFunds (investment management company) and Deputy Chief Legal Officer (2013-2015) of Jennison Associates LLC (investment adviser firm).
Chris Maher (1972)
Year of Election or Appointment: 2020
Deputy Treasurer
Mr. Maher also serves as an officer of other funds. Mr. Maher serves as Assistant Treasurer of FIMM, LLC (2021-present) and FMR Capital, Inc. (2017-present), and is an employee of Fidelity Investments (2008-present). Previously, Mr. Maher served as Assistant Treasurer of certain funds (2013-2020); Vice President of Asset Management Compliance (2013), Vice President of the Program Management Group of FMR (investment adviser firm, 2010-2013), and Vice President of Valuation Oversight (2008-2010).
Jason P. Pogorelec (1975)
Year of Election or Appointment: 2020
Chief Compliance Officer
Mr. Pogorelec also serves as Chief Compliance Officer of other funds. Mr. Pogorelec is a senior Vice President of Asset Management Compliance for Fidelity Investments and is an employee of Fidelity Investments (2006-present). Previously, Mr. Pogorelec served as Vice President, Associate General Counsel for Fidelity Investments (2010-2020) and Assistant Secretary of certain Fidelity funds (2015-2020).
Brett Segaloff (1972)
Year of Election or Appointment: 2021
Anti-Money Laundering (AML) Officer
Mr. Segaloff also serves as an AML Officer of other funds and other related entities. He is Director, Anti-Money Laundering (2007-present) of FMR LLC (diversified financial services company) and is an employee of Fidelity Investments (1996-present).
Stacie M. Smith (1974)
Year of Election or Appointment: 2016
President and Treasurer
Ms. Smith also serves as an officer of other funds. Ms. Smith serves as Assistant Treasurer of FIMM, LLC (2021-present) and FMR Capital, Inc. (2017-present), is an employee of Fidelity Investments (2009-present), and has served in other fund officer roles. Prior to joining Fidelity Investments, Ms. Smith served as Senior Audit Manager of Ernst & Young LLP (accounting firm, 1996-2009). Previously, Ms. Smith served as Assistant Treasurer (2013-2019) and Deputy Treasurer (2013-2016) of certain Fidelity® funds.
Jim Wegmann (1979)
Year of Election or Appointment: 2019
Assistant Treasurer
Mr. Wegmann also serves as an officer of other funds. Mr. Wegmann serves as Assistant Treasurer of FIMM, LLC (2021-present) and is an employee of Fidelity Investments (2011-present). Previously, Mr. Wegmann served as Assistant Treasurer of certain Fidelity® funds (2019-2021).
Shareholder Expense Example
As a shareholder, you incur two types of costs: (1) transaction costs, which may include sales charges (loads) on purchase payments or redemption proceeds, as applicable and (2) ongoing costs, which generally include management fees, distribution and/or service (12b-1) fees and other Fund expenses. This Example is intended to help you understand your ongoing costs (in dollars) of investing in a fund and to compare these costs with the ongoing costs of investing in other mutual funds.
The Example is based on an investment of $1,000 invested at the beginning of the period and held for the entire period (November 1, 2021 to April 30, 2022).
Actual Expenses
The first line of the accompanying table provides information about actual account values and actual expenses. You may use the information in this line, together with the amount you invested, to estimate the expenses that you paid over the period. Simply divide your account value by $1,000.00 (for example, an $8,600 account value divided by $1,000.00 = 8.6), then multiply the result by the number in the first line for a class/Fund under the heading entitled "Expenses Paid During Period" to estimate the expenses you paid on your account during this period. If any fund is a shareholder of any underlying mutual funds or exchange-traded funds (ETFs) (the Underlying Funds), such fund indirectly bears its proportional share of the expenses of the Underlying Funds in addition to the direct expenses incurred presented in the table. These fees and expenses are not included in the annualized expense ratio used to calculate the expense estimate in the table below.
Hypothetical Example for Comparison Purposes
The second line of the accompanying table provides information about hypothetical account values and hypothetical expenses based on the actual expense ratio and an assumed rate of return of 5% per year before expenses, which is not the actual return. The hypothetical account values and expenses may not be used to estimate the actual ending account balance or expenses you paid for the period. You may use this information to compare the ongoing costs of investing in the Fund and other funds. To do so, compare this 5% hypothetical example with the 5% hypothetical examples that appear in the shareholder reports of the other funds. If any fund is a shareholder of any Underlying Funds, such fund indirectly bears its proportional share of the expenses of the Underlying Funds in addition to the direct expenses as presented in the table. These fees and expenses are not included in the annualized expense ratio used to calculate the expense estimate in the table below.
Please note that the expenses shown in the table are meant to highlight your ongoing costs only and do not reflect any transaction costs. Therefore, the second line of the table is useful in comparing ongoing costs only, and will not help you determine the relative total costs of owning different funds. In addition, if these transactional costs were included, your costs would have been higher.
| | Annualized Expense Ratio-A | Beginning
Account Value
November 1, 2021 | Ending
Account Value
April 30, 2022 | Expenses Paid
During Period-B
November 1, 2021
to April 30, 2022 |
| Fidelity Capital & Income Fund | .68% | | | |
| Actual | | $1,000.00 | $925.50 | $3.25 |
| Hypothetical-C | | $1,000.00 | $1,021.42 | $3.41 |
A Annualized expense ratio reflects expenses net of applicable fee waivers.
B Expenses are equal to the annualized expense ratio, multiplied by the average account value over the period, multiplied by 181/ 365 (to reflect the one-half year period). The fees and expenses of any Underlying Funds are not included in each annualized expense ratio.
C 5% return per year before expenses
Distributions (Unaudited)
The dividend and capital gains distributions for the fund(s) are available on Fidelity.com or Institutional.Fidelity.com.
The fund hereby designates as a capital gain dividend with respect to the taxable year ended April 30, 2022, $891,896,910, or, if subsequently determined to be different, the net capital gain of such year.
A total of 0.01% of the dividends distributed during the fiscal year was derived from interest on U.S. Government securities which is generally exempt from state income tax.
The fund designates $388,239,205 of distributions paid in the calendar year 2021 as qualifying to be taxed as interest-related dividends for nonresident alien shareholders.
The fund designates 100% of the short-term capital gain dividends distributed in June and December during the fiscal year as qualifying to be taxed as short-term capital gain dividends for nonresident alien shareholders.
The fund designates $424,239,605 of distributions paid in the calendar year 2021 as qualifying to be taxed as section 163(j) interest dividends.
The fund will notify shareholders in January 2023 of amounts for use in preparing 2022 income tax returns.
Liquidity Risk Management Program
The Securities and Exchange Commission adopted Rule 22e-4 under the Investment Company Act of 1940 (the Liquidity Rule) to promote effective liquidity risk management throughout the open-end investment company industry, thereby reducing the risk that funds will be unable to meet their redemption obligations and mitigating dilution of the interests of fund shareholders.
The Fund has adopted and implemented a liquidity risk management program pursuant to the Liquidity Rule (the Program) effective December 1, 2018. The Program is reasonably designed to assess and manage the Fund’s liquidity risk and to comply with the requirements of the Liquidity Rule. The Fund’s Board of Trustees (the Board) has designated the Fund’s investment adviser as administrator of the Program. The Fidelity advisers have established a Liquidity Risk Management Committee (the LRM Committee) to manage the Program for each of the Fidelity Funds. The LRM Committee monitors the adequacy and effectiveness of implementation of the Program and on a periodic basis assesses each Fund’s liquidity risk based on a variety of factors including (1) the Fund’s investment strategy, (2) portfolio liquidity and cash flow projections during normal and reasonably foreseeable stressed conditions, (3) shareholder redemptions, (4) borrowings and other funding sources and (5) in the case of exchange-traded funds, certain additional factors including the effect of the Fund’s prices and spreads, market participants, and basket compositions on the overall liquidity of the Fund’s portfolio, as applicable.
In accordance with the Program, each of the Fund’s portfolio investments is classified into one of four liquidity categories described below based on a determination of a reasonable expectation for how long it would take to convert the investment to cash (or sell or dispose of the investment) without significantly changing its market value.
- Highly liquid investments – cash or convertible to cash within three business days or less
- Moderately liquid investments – convertible to cash in three to seven calendar days
- Less liquid investments – can be sold or disposed of, but not settled, within seven calendar days
- Illiquid investments – cannot be sold or disposed of within seven calendar days
Liquidity classification determinations take into account a variety of factors including various market, trading and investment-specific considerations, as well as market depth, and generally utilize analysis from a third-party liquidity metrics service.
The Liquidity Rule places a 15% limit on a fund’s illiquid investments and requires funds that do not primarily hold assets that are highly liquid investments to determine and maintain a minimum percentage of the fund’s net assets to be invested in highly liquid investments (highly liquid investment minimum or HLIM). The Program includes provisions reasonably designed to comply with the 15% limit on illiquid investments and for determining, periodically reviewing and complying with the HLIM requirement as applicable.
At a recent meeting of the Fund’s Board of Trustees, the LRM Committee provided a written report to the Board pertaining to the operation, adequacy, and effectiveness of implementation of the Program for the annual period from December 1, 2020 through November 30, 2021. The report concluded that the Program has been implemented and is operating effectively and is reasonably designed to assess and manage the Fund’s liquidity risk.

CAI-ANN-0622
1.703159.124
Fidelity® High Income Fund
Annual Report
April 30, 2022
Includes Fidelity and Fidelity Advisor share classes
Contents
To view a fund's proxy voting guidelines and proxy voting record for the 12-month period ended June 30, visit http://www.fidelity.com/proxyvotingresults or visit the Securities and Exchange Commission's (SEC) web site at http://www.sec.gov.
You may also call 1-800-544-8544 if you’re an individual investing directly with Fidelity, call 1-800-835-5092 if you’re a plan sponsor or participant with Fidelity as your recordkeeper or call 1-877-208-0098 on institutional accounts or if you’re an advisor or invest through one to request a free copy of the proxy voting guidelines.
Standard & Poor's, S&P and S&P 500 are registered service marks of The McGraw-Hill Companies, Inc. and have been licensed for use by Fidelity Distributors Corporation.
Other third-party marks appearing herein are the property of their respective owners.
All other marks appearing herein are registered or unregistered trademarks or service marks of FMR LLC or an affiliated company. © 2022 FMR LLC. All rights reserved.
This report and the financial statements contained herein are submitted for the general information of the shareholders of the Fund. This report is not authorized for distribution to prospective investors in the Fund unless preceded or accompanied by an effective prospectus.
A fund files its complete schedule of portfolio holdings with the SEC for the first and third quarters of each fiscal year on Form N-PORT. Forms N-PORT are available on the SEC’s web site at http://www.sec.gov. A fund's Forms N-PORT may be reviewed and copied at the SEC’s Public Reference Room in Washington, DC. Information regarding the operation of the SEC's Public Reference Room may be obtained by calling 1-800-SEC-0330.
For a complete list of a fund's portfolio holdings, view the most recent holdings listing, semiannual report, or annual report on Fidelity's web site at http://www.fidelity.com, http://www.institutional.fidelity.com, or http://www.401k.com, as applicable.
NOT FDIC INSURED •MAY LOSE VALUE •NO BANK GUARANTEE
Neither the Fund nor Fidelity Distributors Corporation is a bank.
Note to Shareholders:
Early in 2020, the outbreak and spread of COVID-19 emerged as a public health emergency that had a major influence on financial markets, primarily based on its impact on the global economy and corporate earnings. On March 11, 2020, the World Health Organization declared the COVID-19 outbreak a pandemic, citing sustained risk of further global spread. The pandemic prompted a number of measures to limit the spread of COVID-19, including travel and border restrictions, quarantines, and restrictions on large gatherings. In turn, these resulted in lower consumer activity, diminished demand for a wide range of products and services, disruption in manufacturing and supply chains, and – given the wide variability in outcomes regarding the outbreak – significant market uncertainty and volatility. To help stem the turmoil, the U.S. government took unprecedented action – in concert with the U.S. Federal Reserve and central banks around the world – to help support consumers, businesses, and the broader economy, and to limit disruption to the financial system.
In general, the overall impact of the pandemic lessened in 2021, amid a resilient economy and widespread distribution of three COVID-19 vaccines granted emergency use authorization from the U.S. Food and Drug Administration (FDA) early in the year. Still, the situation remains dynamic, and the extent and duration of its influence on financial markets and the economy is highly uncertain, due in part to a recent spike in cases based on highly contagious variants of the coronavirus.
Extreme events such as the COVID-19 crisis are exogenous shocks that can have significant adverse effects on mutual funds and their investments. Although multiple asset classes may be affected by market disruption, the duration and impact may not be the same for all types of assets. Fidelity is committed to helping you stay informed amid news about COVID-19 and during increased market volatility, and we continue to take extra steps to be responsive to customer needs. We encourage you to visit us online, where we offer ongoing updates, commentary, and analysis on the markets and our funds.
Performance: The Bottom Line
Average annual total return reflects the change in the value of an investment, assuming reinvestment of distributions from dividend income and capital gains (the profits earned upon the sale of securities that have grown in value, if any) and assuming a constant rate of performance each year. The hypothetical investment and the average annual total returns do not reflect the deduction of taxes that a shareholder would pay on fund distributions or the redemption of fund shares. During periods of reimbursement by Fidelity, a fund’s total return will be greater than it would be had the reimbursement not occurred. How a fund did yesterday is no guarantee of how it will do tomorrow.
Average Annual Total Returns
| For the periods ended April 30, 2022 | Past 1 year | Past 5 years | Past 10 years |
| Class A (incl. 4.00% sales charge) | (8.82)% | 1.67% | 3.78% |
| Class M (incl. 4.00% sales charge) | (8.83)% | 1.66% | 3.78% |
| Class C (incl. contingent deferred sales charge) | (6.66)% | 1.96% | 3.93% |
| Fidelity® High Income Fund | (4.75)% | 2.71% | 4.31% |
| Class I | (4.68)% | 2.69% | 4.30% |
| Class Z | (4.68)% | 2.75% | 4.33% |
Class A shares bear a 0.25% 12b-1 fee. The initial offering of Class A shares took place on December 4, 2018. Returns prior to December 4, 2018, are those of Fidelity® High Income Fund, the original class of the fund, which has no 12b-1 fee. Had Class A's 12b-1 fee been reflected, returns prior to December 4, 2018, would have been lower.
Class M shares bear a 0.25% 12b-1 fee. The initial offering of Class M shares took place on December 4, 2018. Returns prior to December 4, 2018, are those of of Fidelity® High Income Fund, the original class of the fund, which has no 12b-1 fee. Had Class M's 12b-1 fee been reflected, returns prior to December 4, 2018, would have been lower.
Class C shares bear a 1.00% 12b-1 fee. The initial offering of Class C shares took place on December 4, 2018. Returns prior to December 4, 2018, are those of Fidelity® High Income Fund, the original class of the fund, which has no 12b-1 fee. Had Class C's 12b-1 fee been reflected, returns prior to December 4, 2018, would have been lower.
Class C shares' contingent deferred sales charges included in the past one year, past five years and past ten years total return figures are 1%, 0% and 0%, respectively.
The initial offering of Class I shares took place on December 4, 2018. Returns prior to December 4, 2018 are those of Fidelity® High Income Fund, the original class of the fund.
The initial offering of Class Z shares took place on December 4, 2018. Returns prior to December 4, 2018 are those of Fidelity® High Income Fund, the original class of the fund.
$10,000 Over 10 Years
Let's say hypothetically that $10,000 was invested in Fidelity® High Income Fund, a class of the fund, on April 30, 2012.
The chart shows how the value of your investment would have changed, and also shows how the ICE® BofA® US High Yield Constrained Index performed over the same period.
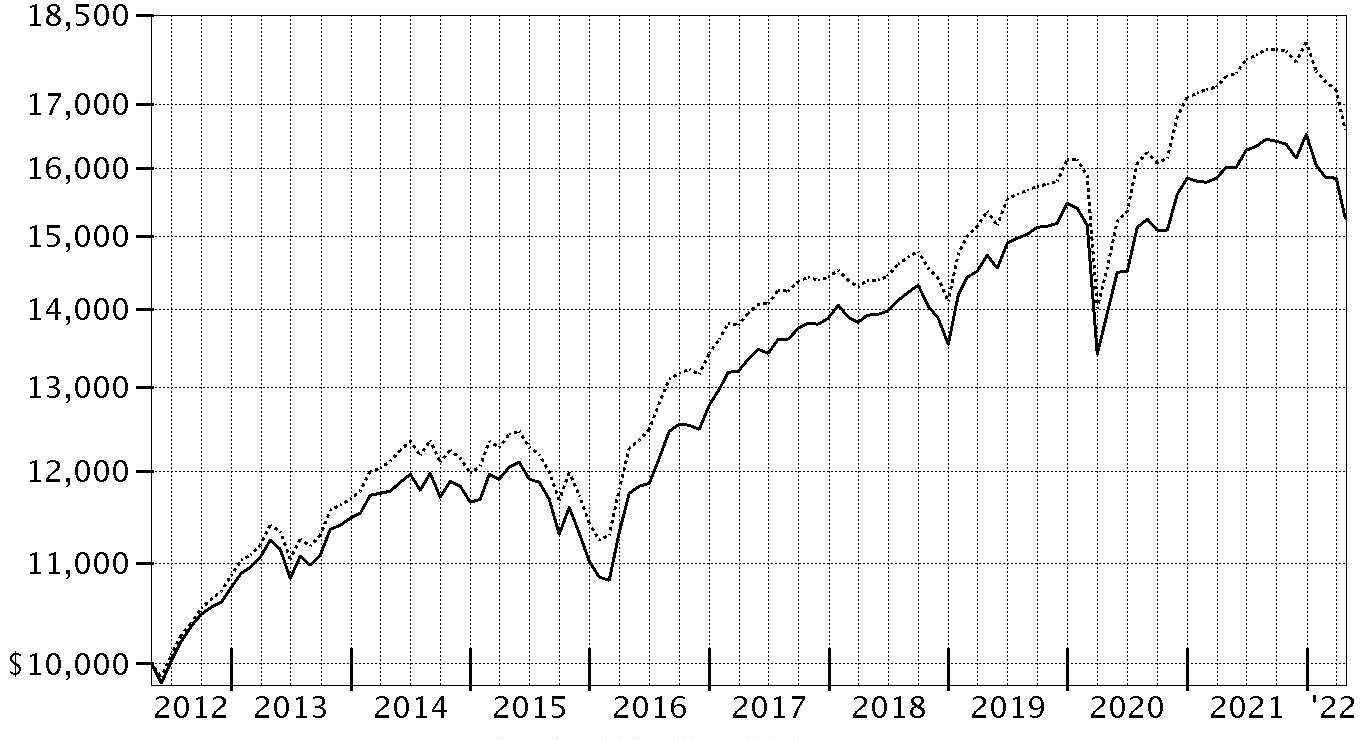
| Period Ending Values |
| $15,251 | Fidelity® High Income Fund |
| $16,592 | ICE® BofA® US High Yield Constrained Index |
Management's Discussion of Fund Performance
Market Recap: The ICE BofA
® US High Yield Constrained Index returned -4.96% for the 12 months ending April 30, 2022. After posting a solid gain in 2021, high-yield bonds retreated to begin the new year amid several major headwinds that stoked volatility, uncertainty and investor anxiety. Chief among these was the U.S. Federal Reserve’s accelerated plan to hike interest rates and aggressively wind down its balance sheet in an attempt to rein in historically high inflation. In addition, geopolitical unrest rose as Russia invaded Ukraine in late February and escalated its attack through period end. Other factors influencing high yield included surging commodity prices, rising bond yields, supply constraint and disruption, and the potential for variants of the coronavirus to upend the economy. Against this dynamic backdrop, the index returned -2.74% in January and -0.90% in February amid an intensifying flight from risk. Volatility eased in March and credit fundamentals remained healthy, but high yield still lost ground (-0.92%) for the month. April saw the downtrend continue, with the index returning -3.63% amid clearer signals of the Fed’s intension to tighten monetary policy and angst about the economic toll of “zero-COVID” lockdowns in China. For the full 12 months, higher-duration BB-rated bonds slightly trailed lower-quality credits. By sector, energy rode a surge in commodity prices and led the way with a modest gain. All other groups declined. Notable laggards included cable/satellite TV, telecommunications, health care, utilities and food/beverage/tobacco.
Comments from Co-Managers Benjamin Harrison, Alexandre Karam, and Michael Weaver: For the fiscal year, the fund's share classes (excluding sales charges, if applicable) returned about -6% to -5%, roughly in line with the -4.96% result of the benchmark ICE BofA
® US High Yield/US High Yield Constrained Blend Index. The fund's core allocation to high-yield bonds returned -5.59% and detracted from performance versus the benchmark. Much smaller non-benchmark positions in floating-rate bank loans (+0.74%) equities (+115%) and convertible bonds (+34%) contributed to the fund's relative result, as did a small position in cash. By industry, the primary contributors to performance versus the benchmark were security selection and an overweighting in energy. Security selection and an overweighting in services and security picks in food & drug retail also bolstered the fund's relative result. Our top individual relative contributor was a non-benchmark stake in Mesquite Energy (+116%). Also lifting performance was our overweighting in Bi-Lo, which gained 76%. Another key contributor was our non-benchmark position in Jonah Energy (+350%). Conversely, the biggest detractor from performance versus the benchmark was an overweighting in telecommunications. Security selection in technology and broadcasting also hurt the fund's relative result. The biggest individual relative detractor was an overweight position in Altice Financial (-10%). Also holding back performance was our outsized stake in Rackspace Hosting, which returned about -14%. Also hurting performance was our overweighting in Uniti Group, which returned -8% and was the largest holding in the fund. By quality, positioning and picks among bonds rated B added the most value versus the benchmark, whereas security choices among CCC-rated bonds hurt the most. Notable changes in positioning include decreased exposure to the cable/satellite TV industry and a higher allocation to health care.
The views expressed above reflect those of the portfolio manager(s) only through the end of the period as stated on the cover of this report and do not necessarily represent the views of Fidelity or any other person in the Fidelity organization. Any such views are subject to change at any time based upon market or other conditions and Fidelity disclaims any responsibility to update such views. These views may not be relied on as investment advice and, because investment decisions for a Fidelity fund are based on numerous factors, may not be relied on as an indication of trading intent on behalf of any Fidelity fund.
Note to shareholders: On January 3, 2022, Benjamin Harrison assumed co-management responsibilities for the fund.
Investment Summary (Unaudited)
Top Bond Issuers as of April 30, 2022
| (by issuer, excluding cash equivalents) | % of fund's net assets |
| Uniti Group LP / Uniti Group Finance, Inc. | 2.1 |
| New Fortress Energy, Inc. | 1.9 |
| Icahn Enterprises LP/Icahn Enterprises Finance Corp. | 1.9 |
| Community Health Systems, Inc. | 1.8 |
| Bombardier, Inc. | 1.7 |
| Crestwood Midstream Partners LP/Crestwood Midstream Finance Corp. | 1.7 |
| Carnival Corp. | 1.6 |
| Altice France SA | 1.6 |
| C&W Senior Financing Designated Activity Co. | 1.5 |
| Rackspace Hosting, Inc. | 1.4 |
| | 17.2 |
Top Five Market Sectors as of April 30, 2022
| | % of fund's net assets |
| Energy | 16.5 |
| Telecommunications | 10.5 |
| Healthcare | 8.8 |
| Technology | 6.1 |
| Services | 5.7 |
Quality Diversification (% of fund's net assets)
| As of April 30, 2022 |
| | BBB | 0.8% |
| | BB | 27.5% |
| | B | 49.8% |
| | CCC,CC,C | 15.4% |
| | Not Rated | 1.7% |
| | Equities | 2.5% |
| | Short-Term Investments and Net Other Assets | 2.3% |

We have used ratings from Moody's Investors Service, Inc. Where Moody's® ratings are not available, we have used S&P® ratings. All ratings are as of the date indicated and do not reflect subsequent changes.
Asset Allocation (% of fund's net assets)
| As of April 30, 2022* |
| | Nonconvertible Bonds | 90.5% |
| | Convertible Bonds, Preferred Stocks | 1.2% |
| | Common Stocks | 2.1% |
| | Bank Loan Obligations | 3.5% |
| | Other | 0.4% |
| | Short-Term Investments and Net Other Assets (Liabilities) | 2.3% |

* Foreign investments - 21.2%
Geographic Diversification (% of fund's net assets)
| As of April 30, 2022 |
| | United States of America* | 78.8% |
| | Canada | 4.5% |
| | Luxembourg | 3.0% |
| | Ireland | 2.0% |
| | Netherlands | 1.8% |
| | France | 1.7% |
| | Panama | 1.6% |
| | United Kingdom | 1.6% |
| | Multi-National | 1.3% |
| | Other | 3.7% |

* Includes Short-Term investments and Net Other Assets (Liabilities).
Percentages are based on country or territory of incorporation and are adjusted for the effect of futures contracts, if applicable.
Schedule of Investments April 30, 2022
Showing Percentage of Net Assets
| Corporate Bonds - 91.7% | | | |
| | | Principal Amount (000s) | Value (000s) |
| Convertible Bonds - 1.2% | | | |
| Broadcasting - 0.6% | | | |
| DISH Network Corp.: | | | |
| 2.375% 3/15/24 | | $8,705 | $8,091 |
| 3.375% 8/15/26 | | 13,603 | 11,665 |
| | | | 19,756 |
| Energy - 0.6% | | | |
| Mesquite Energy, Inc. 15% 7/15/23 (a)(b) | | 1,681 | 8,675 |
| Mesquite Energy, Inc. 15% 7/15/23 (a)(b) | | 2,898 | 13,475 |
| | | | 22,150 |
|
| TOTAL CONVERTIBLE BONDS | | | 41,906 |
|
| Nonconvertible Bonds - 90.5% | | | |
| Aerospace - 5.0% | | | |
| Allegheny Technologies, Inc.: | | | |
| 4.875% 10/1/29 | | 5,260 | 4,786 |
| 5.875% 12/1/27 | | 26,284 | 25,364 |
| Bombardier, Inc.: | | | |
| 6% 2/15/28 (c) | | 9,185 | 7,945 |
| 7.125% 6/15/26 (c) | | 10,745 | 9,885 |
| 7.5% 3/15/25 (c) | | 15,233 | 14,776 |
| 7.875% 4/15/27 (c) | | 30,807 | 28,699 |
| BWX Technologies, Inc. 4.125% 6/30/28 (c) | | 13,723 | 12,728 |
| Kaiser Aluminum Corp.: | | | |
| 4.5% 6/1/31 (c) | | 4,970 | 4,287 |
| 4.625% 3/1/28 (c) | | 13,920 | 12,772 |
| Moog, Inc. 4.25% 12/15/27 (c) | | 6,189 | 5,764 |
| Science Applications International Corp. 4.875% 4/1/28 (c) | | 1,015 | 969 |
| TransDigm, Inc.: | | | |
| 4.625% 1/15/29 | | 5,930 | 5,160 |
| 5.5% 11/15/27 | | 45,217 | 41,374 |
| 7.5% 3/15/27 | | 3,157 | 3,181 |
| | | | 177,690 |
| Automotive & Auto Parts - 0.3% | | | |
| Ford Motor Credit Co. LLC: | | | |
| 2.9% 2/10/29 | | 6,905 | 5,748 |
| 3.815% 11/2/27 | | 4,080 | 3,713 |
| | | | 9,461 |
| Banks & Thrifts - 0.1% | | | |
| Jane Street Group LLC/JSG Finance, Inc. 4.5% 11/15/29 (c) | | 2,430 | 2,250 |
| Broadcasting - 1.4% | | | |
| Diamond Sports Group LLC/Diamond Sports Finance Co. 5.375% 8/15/26 (c) | | 22,770 | 8,425 |
| Sinclair Television Group, Inc.: | | | |
| 5.125% 2/15/27 (c) | | 9,465 | 8,292 |
| 5.5% 3/1/30 (c) | | 4,065 | 3,324 |
| Sirius XM Radio, Inc.: | | | |
| 4% 7/15/28 (c) | | 7,130 | 6,444 |
| 4.125% 7/1/30 (c) | | 2,105 | 1,848 |
| 5.5% 7/1/29 (c) | | 6,685 | 6,429 |
| TEGNA, Inc.: | | | |
| 4.625% 3/15/28 | | 4,880 | 4,696 |
| 5% 9/15/29 | | 1,775 | 1,722 |
| Univision Communications, Inc.: | | | |
| 4.5% 5/1/29 (c) | | 5,615 | 5,039 |
| 6.625% 6/1/27 (c) | | 3,655 | 3,664 |
| | | | 49,883 |
| Building Materials - 0.5% | | | |
| Advanced Drain Systems, Inc. 5% 9/30/27 (c) | | 7,831 | 7,567 |
| Builders FirstSource, Inc. 4.25% 2/1/32 (c) | | 5,595 | 4,777 |
| SRS Distribution, Inc.: | | | |
| 4.625% 7/1/28 (c) | | 3,455 | 3,163 |
| 6% 12/1/29 (c) | | 3,095 | 2,716 |
| | | | 18,223 |
| Cable/Satellite TV - 3.3% | | | |
| CCO Holdings LLC/CCO Holdings Capital Corp.: | | | |
| 4.25% 2/1/31 (c) | | 11,784 | 9,932 |
| 4.5% 8/15/30 (c) | | 15,130 | 13,201 |
| 4.5% 5/1/32 | | 1,401 | 1,178 |
| 4.5% 6/1/33 (c) | | 8,145 | 6,664 |
| 4.75% 3/1/30 (c) | | 5,630 | 5,032 |
| CSC Holdings LLC: | | | |
| 4.125% 12/1/30 (c) | | 3,539 | 2,920 |
| 4.625% 12/1/30 (c) | | 17,824 | 13,635 |
| 5.375% 2/1/28 (c) | | 16,930 | 15,544 |
| 5.75% 1/15/30 (c) | | 3,475 | 2,884 |
| 7.5% 4/1/28 (c) | | 2,935 | 2,706 |
| Dolya Holdco 18 DAC 5% 7/15/28 (c) | | 4,188 | 3,805 |
| Radiate Holdco LLC/Radiate Financial Service Ltd.: | | | |
| 4.5% 9/15/26 (c) | | 6,479 | 5,966 |
| 6.5% 9/15/28 (c) | | 20,933 | 18,421 |
| Telenet Finance Luxembourg Notes SARL 5.5% 3/1/28 (c) | | 7,800 | 7,449 |
| Ziggo Bond Co. BV 5.125% 2/28/30 (c) | | 4,250 | 3,687 |
| Ziggo BV 4.875% 1/15/30 (c) | | 6,005 | 5,322 |
| | | | 118,346 |
| Capital Goods - 0.7% | | | |
| Mueller Water Products, Inc. 4% 6/15/29 (c) | | 4,935 | 4,417 |
| Vertical Holdco GmbH 7.625% 7/15/28 (c) | | 2,705 | 2,604 |
| Vertical U.S. Newco, Inc. 5.25% 7/15/27 (c) | | 18,814 | 17,625 |
| | | | 24,646 |
| Chemicals - 3.9% | | | |
| Axalta Coating Systems LLC 3.375% 2/15/29 (c) | | 3,355 | 2,903 |
| Axalta Coating Systems/Dutch Holding BV 4.75% 6/15/27 (c) | | 3,045 | 2,893 |
| CVR Partners LP 6.125% 6/15/28 (c) | | 5,875 | 5,758 |
| Element Solutions, Inc. 3.875% 9/1/28 (c) | | 6,534 | 5,840 |
| Kronos Acquisition Holdings, Inc. / KIK Custom Products, Inc.: | | | |
| 5% 12/31/26 (c) | | 11,080 | 9,806 |
| 7% 12/31/27 (c) | | 1,080 | 853 |
| LSB Industries, Inc. 6.25% 10/15/28 (c) | | 10,150 | 9,946 |
| Methanex Corp.: | | | |
| 5.125% 10/15/27 | | 11,101 | 10,657 |
| 5.65% 12/1/44 | | 5,504 | 4,816 |
| NOVA Chemicals Corp.: | | | |
| 4.25% 5/15/29 (c) | | 5,020 | 4,342 |
| 5% 5/1/25 (c) | | 2,270 | 2,247 |
| 5.25% 6/1/27 (c) | | 13,000 | 12,318 |
| Nufarm Australia Ltd. 5% 1/27/30 (c) | | 6,520 | 6,161 |
| Olympus Water U.S. Holding Corp.: | | | |
| 4.25% 10/1/28 (c) | | 5,155 | 4,555 |
| 6.25% 10/1/29 (c) | | 5,435 | 4,511 |
| SCIL IV LLC / SCIL U.S.A. Holdings LLC 5.375% 11/1/26 (c) | | 3,935 | 3,591 |
| The Chemours Co. LLC: | | | |
| 4.625% 11/15/29 (c) | | 7,595 | 6,579 |
| 5.375% 5/15/27 | | 12,389 | 11,955 |
| 5.75% 11/15/28 (c) | | 19,700 | 18,469 |
| Valvoline, Inc. 4.25% 2/15/30 (c) | | 4,610 | 3,999 |
| W.R. Grace Holding LLC 5.625% 8/15/29 (c) | | 8,100 | 6,900 |
| | | | 139,099 |
| Consumer Products - 0.5% | | | |
| Central Garden & Pet Co. 4.125% 10/15/30 | | 184 | 159 |
| Diamond BC BV 4.625% 10/1/29 (c) | | 9,223 | 7,934 |
| Michaels Companies, Inc.: | | | |
| 5.25% 5/1/28 (c) | | 3,550 | 3,051 |
| 7.875% 5/1/29 (c) | | 2,730 | 2,150 |
| Nordstrom, Inc.: | | | |
| 4.25% 8/1/31 | | 4,150 | 3,517 |
| 4.375% 4/1/30 | | 2,760 | 2,402 |
| | | | 19,213 |
| Containers - 0.8% | | | |
| Graphic Packaging International, Inc. 3.75% 2/1/30 (c) | | 2,160 | 1,894 |
| OI European Group BV 4.75% 2/15/30 (c) | | 1,885 | 1,659 |
| Sealed Air Corp. 5% 4/15/29 (c) | | 5,450 | 5,409 |
| Trivium Packaging Finance BV: | | | |
| 5.5% 8/15/26 (c) | | 8,787 | 8,490 |
| 8.5% 8/15/27 (c) | | 9,951 | 9,827 |
| | | | 27,279 |
| Diversified Financial Services - 3.4% | | | |
| Coinbase Global, Inc. 3.375% 10/1/28 (c) | | 11,430 | 8,875 |
| Hightower Holding LLC 6.75% 4/15/29 (c) | | 5,410 | 4,984 |
| Icahn Enterprises LP/Icahn Enterprises Finance Corp.: | | | |
| 4.375% 2/1/29 | | 7,160 | 6,177 |
| 5.25% 5/15/27 | | 50,400 | 46,872 |
| 6.25% 5/15/26 | | 14,841 | 14,714 |
| Ladder Capital Finance Holdings LLLP/Ladder Capital Finance Corp.: | | | |
| 4.25% 2/1/27 (c) | | 40 | 37 |
| 4.75% 6/15/29 (c) | | 7,545 | 6,768 |
| OneMain Finance Corp.: | | | |
| 3.5% 1/15/27 | | 8,300 | 7,292 |
| 3.875% 9/15/28 | | 15,215 | 12,933 |
| 7.125% 3/15/26 | | 11,800 | 11,948 |
| | | | 120,600 |
| Diversified Media - 1.2% | | | |
| Advantage Sales & Marketing, Inc. 6.5% 11/15/28 (c) | | 20,448 | 18,582 |
| Nielsen Finance LLC/Nielsen Finance Co.: | | | |
| 4.5% 7/15/29 (c) | | 4,940 | 4,669 |
| 5.625% 10/1/28 (c) | | 7,287 | 7,061 |
| 5.875% 10/1/30 (c) | | 4,002 | 3,838 |
| Terrier Media Buyer, Inc. 8.875% 12/15/27 (c) | | 8,157 | 7,973 |
| | | | 42,123 |
| Energy - 14.6% | | | |
| Apache Corp. 4.25% 1/15/30 | | 1,960 | 1,821 |
| Atlantica Sustainable Infrastructure PLC 4.125% 6/15/28 (c) | | 6,465 | 5,883 |
| Cheniere Energy, Inc. 4.625% 10/15/28 | | 1,790 | 1,732 |
| Citgo Petroleum Corp.: | | | |
| 6.375% 6/15/26 (c) | | 28,468 | 28,291 |
| 7% 6/15/25 (c) | | 18,608 | 18,480 |
| Colgate Energy Partners III LLC 5.875% 7/1/29 (c) | | 7,855 | 7,776 |
| Comstock Resources, Inc.: | | | |
| 5.875% 1/15/30 (c) | | 6,180 | 5,947 |
| 6.75% 3/1/29 (c) | | 10,655 | 10,774 |
| 7.5% 5/15/25 (c) | | 1,806 | 1,843 |
| Crestwood Midstream Partners LP/Crestwood Midstream Finance Corp.: | | | |
| 5.625% 5/1/27 (c) | | 27,898 | 27,166 |
| 5.75% 4/1/25 | | 14,257 | 14,087 |
| 6% 2/1/29 (c) | | 17,536 | 17,057 |
| CrownRock LP/CrownRock Finance, Inc.: | | | |
| 5% 5/1/29 (c) | | 2,510 | 2,456 |
| 5.625% 10/15/25 (c) | | 560 | 560 |
| CVR Energy, Inc.: | | | |
| 5.25% 2/15/25 (c) | | 19,539 | 18,902 |
| 5.75% 2/15/28 (c) | | 19,073 | 17,877 |
| Delek Logistics Partners LP 7.125% 6/1/28 (c) | | 12,355 | 11,810 |
| DT Midstream, Inc. 4.125% 6/15/29 (c) | | 4,090 | 3,722 |
| Endeavor Energy Resources LP/EER Finance, Inc. 5.75% 1/30/28 (c) | | 1,123 | 1,126 |
| EnLink Midstream LLC 5.625% 1/15/28 (c) | | 1,630 | 1,615 |
| EQM Midstream Partners LP 6.5% 7/1/27 (c) | | 3,522 | 3,557 |
| Global Partners LP/GLP Finance Corp. 6.875% 1/15/29 | | 7,405 | 7,220 |
| Harvest Midstream I LP 7.5% 9/1/28 (c) | | 7,970 | 8,087 |
| Hess Midstream Partners LP: | | | |
| 4.25% 2/15/30 (c) | | 2,880 | 2,642 |
| 5.125% 6/15/28 (c) | | 8,610 | 8,330 |
| Hilcorp Energy I LP/Hilcorp Finance Co.: | | | |
| 5.75% 2/1/29 (c) | | 1,960 | 1,921 |
| 6.25% 11/1/28 (c) | | 1,960 | 1,951 |
| Holly Energy Partners LP/Holly Energy Finance Corp.: | | | |
| 5% 2/1/28 (c) | | 7,640 | 7,269 |
| 6.375% 4/15/27 (c) | | 3,160 | 3,223 |
| MEG Energy Corp.: | | | |
| 5.875% 2/1/29 (c) | | 4,780 | 4,679 |
| 7.125% 2/1/27 (c) | | 2,933 | 2,978 |
| Mesquite Energy, Inc. 7.25% 2/15/23 (b)(c)(d) | | 28,768 | 0 |
| New Fortress Energy, Inc.: | | | |
| 6.5% 9/30/26 (c) | | 31,115 | 30,114 |
| 6.75% 9/15/25 (c) | | 33,087 | 32,529 |
| NGL Energy Operating LLC/NGL Energy Finance Corp. 7.5% 2/1/26 (c) | | 28,825 | 27,156 |
| NGL Energy Partners LP/NGL Energy Finance Corp. 7.5% 11/1/23 | | 5,470 | 5,073 |
| Occidental Petroleum Corp.: | | | |
| 6.125% 1/1/31 | | 10,950 | 11,509 |
| 6.45% 9/15/36 | | 3,650 | 3,960 |
| 6.625% 9/1/30 | | 5,265 | 5,706 |
| 7.5% 5/1/31 | | 13,760 | 15,686 |
| 7.875% 9/15/31 | | 1,135 | 1,327 |
| 8.875% 7/15/30 | | 4,715 | 5,663 |
| PBF Holding Co. LLC/PBF Finance Corp. 9.25% 5/15/25 (c) | | 25,305 | 26,191 |
| Rockies Express Pipeline LLC: | | | |
| 4.8% 5/15/30 (c) | | 1,900 | 1,740 |
| 4.95% 7/15/29 (c) | | 4,294 | 4,019 |
| 6.875% 4/15/40 (c) | | 1,598 | 1,518 |
| SM Energy Co.: | | | |
| 5.625% 6/1/25 | | 5,210 | 5,093 |
| 6.5% 7/15/28 | | 4,405 | 4,343 |
| 6.75% 9/15/26 | | 1,235 | 1,229 |
| Southwestern Energy Co. 4.75% 2/1/32 | | 4,080 | 3,858 |
| Sunoco LP/Sunoco Finance Corp.: | | | |
| 4.5% 5/15/29 | | 5,094 | 4,581 |
| 5.875% 3/15/28 | | 4,990 | 4,915 |
| Superior Plus LP / Superior General Partner, Inc. 4.5% 3/15/29 (c) | | 2,990 | 2,732 |
| Tallgrass Energy Partners LP / Tallgrass Energy Finance Corp.: | | | |
| 5.5% 1/15/28 (c) | | 9,865 | 9,196 |
| 6% 3/1/27 (c) | | 21,017 | 20,176 |
| 6% 12/31/30 (c) | | 8,825 | 8,163 |
| 6% 9/1/31 (c) | | 9,425 | 8,600 |
| 7.5% 10/1/25 (c) | | 935 | 954 |
| Transocean Guardian Ltd. 5.875% 1/15/24 (c) | | 2,993 | 2,864 |
| Transocean Phoenix 2 Ltd. 7.75% 10/15/24 (c) | | 556 | 560 |
| Transocean Pontus Ltd. 6.125% 8/1/25 (c) | | 1,516 | 1,489 |
| Transocean Poseidon Ltd. 6.875% 2/1/27 (c) | | 2,311 | 2,224 |
| Transocean Proteus Ltd. 6.25% 12/1/24 (c) | | 680 | 668 |
| Transocean Sentry Ltd. 5.375% 5/15/23 (c) | | 6,424 | 6,231 |
| Venture Global Calcasieu Pass LLC: | | | |
| 3.875% 8/15/29 (c) | | 5,530 | 5,046 |
| 4.125% 8/15/31 (c) | | 5,475 | 4,969 |
| | | | 520,864 |
| Environmental - 1.0% | | | |
| Madison IAQ LLC: | | | |
| 4.125% 6/30/28 (c) | | 10,535 | 9,244 |
| 5.875% 6/30/29 (c) | | 24,280 | 19,788 |
| Stericycle, Inc.: | | | |
| 3.875% 1/15/29 (c) | | 6,570 | 5,794 |
| 5.375% 7/15/24 (c) | | 1,385 | 1,380 |
| | | | 36,206 |
| Food & Drug Retail - 1.0% | | | |
| Albertsons Companies LLC/Safeway, Inc./New Albertson's, Inc./Albertson's LLC: | | | |
| 3.5% 3/15/29 (c) | | 25,263 | 21,282 |
| 4.875% 2/15/30 (c) | | 6,320 | 5,720 |
| Emergent BioSolutions, Inc. 3.875% 8/15/28 (c) | | 8,639 | 7,332 |
| Murphy Oil U.S.A., Inc. 3.75% 2/15/31 (c) | | 1,685 | 1,480 |
| | | | 35,814 |
| Food/Beverage/Tobacco - 2.5% | | | |
| C&S Group Enterprises LLC 5% 12/15/28 (c) | | 16,365 | 13,931 |
| JBS U.S.A. Lux SA / JBS Food Co.: | | | |
| 5.5% 1/15/30 (c) | | 8,256 | 8,153 |
| 6.5% 4/15/29 (c) | | 5,113 | 5,292 |
| Lamb Weston Holdings, Inc. 4.125% 1/31/30 (c) | | 11,855 | 10,579 |
| Performance Food Group, Inc. 5.5% 10/15/27 (c) | | 6,712 | 6,513 |
| Post Holdings, Inc.: | | | |
| 4.625% 4/15/30 (c) | | 3,916 | 3,348 |
| 5.5% 12/15/29 (c) | | 3,837 | 3,492 |
| Primo Water Holdings, Inc. 4.375% 4/30/29 (c) | | 12,870 | 11,202 |
| TreeHouse Foods, Inc. 4% 9/1/28 | | 5,060 | 4,123 |
| Triton Water Holdings, Inc. 6.25% 4/1/29 (c) | | 20,435 | 16,915 |
| U.S. Foods, Inc.: | | | |
| 4.625% 6/1/30 (c) | | 2,045 | 1,830 |
| 4.75% 2/15/29 (c) | | 5,520 | 5,099 |
| | | | 90,477 |
| Gaming - 3.0% | | | |
| Affinity Gaming LLC 6.875% 12/15/27 (c) | | 10,355 | 9,699 |
| Caesars Entertainment, Inc.: | | | |
| 4.625% 10/15/29 (c) | | 5,200 | 4,459 |
| 8.125% 7/1/27 (c) | | 34,639 | 36,198 |
| Fertitta Entertainment LLC / Fertitta Entertainment Finance Co., Inc. 6.75% 1/15/30 (c) | | 11,230 | 9,715 |
| Golden Entertainment, Inc. 7.625% 4/15/26 (c) | | 13,551 | 13,856 |
| Jacobs Entertainment, Inc. 6.75% 2/15/29 (c) | | 2,400 | 2,351 |
| Melco Resorts Finance Ltd.: | | | |
| 5.375% 12/4/29 (c) | | 3,958 | 3,167 |
| 5.75% 7/21/28 (c) | | 5,916 | 4,913 |
| MGM Resorts International: | | | |
| 4.75% 10/15/28 | | 184 | 169 |
| 5.5% 4/15/27 | | 184 | 178 |
| Premier Entertainment Sub LLC: | | | |
| 5.625% 9/1/29 (c) | | 6,920 | 5,536 |
| 5.875% 9/1/31 (c) | | 3,290 | 2,591 |
| Station Casinos LLC 4.5% 2/15/28 (c) | | 4,745 | 4,307 |
| Wynn Las Vegas LLC/Wynn Las Vegas Capital Corp. 5.25% 5/15/27 (c) | | 5,906 | 5,432 |
| Wynn Macau Ltd.: | | | |
| 5.5% 10/1/27 (c) | | 4,358 | 3,552 |
| 5.625% 8/26/28 (c) | | 3,575 | 2,873 |
| | | | 108,996 |
| Healthcare - 8.4% | | | |
| 180 Medical, Inc. 3.875% 10/15/29 (c) | | 6,530 | 5,812 |
| AMN Healthcare 4% 4/15/29 (c) | | 8,354 | 7,560 |
| Avantor Funding, Inc.: | | | |
| 3.875% 11/1/29 (c) | | 11,090 | 9,950 |
| 4.625% 7/15/28 (c) | | 9,370 | 8,914 |
| Bausch Health Companies, Inc.: | | | |
| 5% 1/30/28 (c) | | 5,270 | 3,888 |
| 7% 1/15/28 (c) | | 10,380 | 8,564 |
| Cano Health, Inc. 6.25% 10/1/28 (c) | | 8,235 | 7,597 |
| Catalent Pharma Solutions 3.5% 4/1/30 (c) | | 10,850 | 9,437 |
| Charles River Laboratories International, Inc.: | | | |
| 3.75% 3/15/29 (c) | | 2,975 | 2,692 |
| 4.25% 5/1/28 (c) | | 768 | 733 |
| Community Health Systems, Inc.: | | | |
| 4.75% 2/15/31 (c) | | 8,950 | 7,585 |
| 5.25% 5/15/30 (c) | | 9,740 | 8,539 |
| 5.625% 3/15/27 (c) | | 25,470 | 24,279 |
| 6% 1/15/29 (c) | | 9,165 | 8,663 |
| 6.125% 4/1/30 (c) | | 7,445 | 6,124 |
| 6.875% 4/15/29 (c) | | 9,010 | 7,902 |
| 8% 3/15/26 (c) | | 2,845 | 2,941 |
| CTR Partnership LP/CareTrust Capital Corp. 3.875% 6/30/28 (c) | | 5,375 | 4,864 |
| DaVita HealthCare Partners, Inc. 4.625% 6/1/30 (c) | | 10,540 | 9,170 |
| Embecta Corp. 5% 2/15/30 (c) | | 2,745 | 2,477 |
| Grifols Escrow Issuer SA 4.75% 10/15/28 (c) | | 7,652 | 6,982 |
| HealthEquity, Inc. 4.5% 10/1/29 (c) | | 3,705 | 3,385 |
| Hologic, Inc.: | | | |
| 3.25% 2/15/29 (c) | | 7,190 | 6,405 |
| 4.625% 2/1/28 (c) | | 134 | 131 |
| Jazz Securities DAC 4.375% 1/15/29 (c) | | 13,950 | 12,851 |
| MEDNAX, Inc. 5.375% 2/15/30 (c) | | 4,550 | 4,239 |
| Minerva Merger Sub, Inc. 6.5% 2/15/30 (c) | | 18,060 | 16,623 |
| ModivCare Escrow Issuer, Inc. 5% 10/1/29 (c) | | 2,030 | 1,776 |
| Molina Healthcare, Inc. 3.875% 11/15/30 (c) | | 3,370 | 3,040 |
| Option Care Health, Inc. 4.375% 10/31/29 (c) | | 8,310 | 7,470 |
| Organon & Co. / Organon Foreign Debt Co-Issuer BV: | | | |
| 4.125% 4/30/28 (c) | | 13,850 | 12,885 |
| 5.125% 4/30/31 (c) | | 820 | 741 |
| Owens & Minor, Inc. 4.5% 3/31/29 (c) | | 2,610 | 2,348 |
| Radiology Partners, Inc. 9.25% 2/1/28 (c) | | 8,190 | 7,781 |
| RP Escrow Issuer LLC 5.25% 12/15/25 (c) | | 13,595 | 12,643 |
| Teleflex, Inc. 4.25% 6/1/28 (c) | | 1,540 | 1,451 |
| Tenet Healthcare Corp.: | | | |
| 4.25% 6/1/29 (c) | | 10,395 | 9,392 |
| 4.375% 1/15/30 (c) | | 4,965 | 4,518 |
| 4.625% 6/15/28 (c) | | 11,758 | 11,082 |
| 6.125% 10/1/28 (c) | | 18,650 | 17,903 |
| 6.25% 2/1/27 (c) | | 3,134 | 3,110 |
| Valeant Pharmaceuticals International, Inc. 8.5% 1/31/27 (c) | | 5,149 | 4,872 |
| Vizient, Inc. 6.25% 5/15/27 (c) | | 2,224 | 2,296 |
| | | | 301,615 |
| Homebuilders/Real Estate - 3.7% | | | |
| Ashton Woods U.S.A. LLC/Ashton Woods Finance Co. 4.625% 8/1/29 (c) | | 2,515 | 2,116 |
| Howard Hughes Corp.: | | | |
| 4.125% 2/1/29 (c) | | 3,300 | 2,971 |
| 4.375% 2/1/31 (c) | | 3,300 | 2,935 |
| Kennedy-Wilson, Inc. 4.75% 2/1/30 | | 13,055 | 11,782 |
| MPT Operating Partnership LP/MPT Finance Corp. 5% 10/15/27 | | 13,955 | 13,390 |
| Railworks Holdings LP 8.25% 11/15/28 (c) | | 7,220 | 7,166 |
| Realogy Group LLC/Realogy Co-Issuer Corp. 5.75% 1/15/29 (c) | | 11,980 | 10,018 |
| TopBuild Corp. 4.125% 2/15/32 (c) | | 9,350 | 8,056 |
| Uniti Group LP / Uniti Group Finance, Inc.: | | | |
| 4.75% 4/15/28 (c) | | 19,735 | 17,613 |
| 6.5% 2/15/29 (c) | | 65,680 | 56,683 |
| | | | 132,730 |
| Hotels - 0.5% | | | |
| Hilton Domestic Operating Co., Inc.: | | | |
| 3.625% 2/15/32 (c) | | 9,245 | 7,829 |
| 3.75% 5/1/29 (c) | | 1,215 | 1,101 |
| 4% 5/1/31 (c) | | 4,375 | 3,913 |
| Wyndham Hotels & Resorts, Inc. 4.375% 8/15/28 (c) | | 4,395 | 4,096 |
| | | | 16,939 |
| Insurance - 1.5% | | | |
| Alliant Holdings Intermediate LLC: | | | |
| 4.25% 10/15/27 (c) | | 12,485 | 11,531 |
| 6.75% 10/15/27 (c) | | 31,923 | 30,187 |
| AmWINS Group, Inc. 4.875% 6/30/29 (c) | | 11,105 | 10,165 |
| AssuredPartners, Inc. 5.625% 1/15/29 (c) | | 3,295 | 2,898 |
| | | | 54,781 |
| Leisure - 3.3% | | | |
| Carnival Corp.: | | | |
| 4% 8/1/28 (c) | | 10,320 | 9,301 |
| 5.75% 3/1/27 (c) | | 17,925 | 16,231 |
| 6% 5/1/29 (c) | | 13,860 | 12,439 |
| 6.65% 1/15/28 | | 750 | 694 |
| 7.625% 3/1/26 (c) | | 19,060 | 18,679 |
| MajorDrive Holdings IV LLC 6.375% 6/1/29 (c) | | 3,585 | 2,841 |
| NCL Corp. Ltd.: | | | |
| 3.625% 12/15/24 (c) | | 9,685 | 9,007 |
| 5.875% 3/15/26 (c) | | 2,175 | 2,009 |
| 7.75% 2/15/29 (c) | | 4,840 | 4,695 |
| NCL Finance Ltd. 6.125% 3/15/28 (c) | | 1,660 | 1,494 |
| Royal Caribbean Cruises Ltd.: | | | |
| 4.25% 7/1/26 (c) | | 10,620 | 9,598 |
| 5.375% 7/15/27 (c) | | 3,900 | 3,584 |
| 5.5% 8/31/26 (c) | | 10,740 | 10,007 |
| 5.5% 4/1/28 (c) | | 12,495 | 11,402 |
| Viking Ocean Cruises Ship VII Ltd. 5.625% 2/15/29 (c) | | 1,605 | 1,416 |
| Voc Escrow Ltd. 5% 2/15/28 (c) | | 4,805 | 4,337 |
| | | | 117,734 |
| Metals/Mining - 0.8% | | | |
| Eldorado Gold Corp. 6.25% 9/1/29 (c) | | 1,505 | 1,445 |
| ERO Copper Corp. 6.5% 2/15/30 (c) | | 11,180 | 10,032 |
| First Quantum Minerals Ltd. 6.875% 10/15/27 (c) | | 9,420 | 9,381 |
| HudBay Minerals, Inc. 4.5% 4/1/26 (c) | | 2,225 | 2,057 |
| Mineral Resources Ltd. 8.5% 5/1/30 (c) | | 3,355 | 3,313 |
| PMHC II, Inc. 9% 2/15/30 (c) | | 5,155 | 4,150 |
| | | | 30,378 |
| Paper - 0.7% | | | |
| Ardagh Metal Packaging Finance U.S.A. LLC/Ardagh Metal Packaging Finance PLC 4% 9/1/29 (c) | | 3,020 | 2,588 |
| Clydesdale Acquisition Holdings, Inc. 6.625% 4/15/29 (c) | | 1,950 | 1,945 |
| Glatfelter Corp. 4.75% 11/15/29 (c) | | 3,520 | 2,816 |
| Intertape Polymer Group, Inc. 4.375% 6/15/29 (c) | | 8,940 | 9,198 |
| SPA Holdings 3 OY 4.875% 2/4/28 (c) | | 11,670 | 10,294 |
| | | | 26,841 |
| Publishing/Printing - 0.1% | | | |
| News Corp. 5.125% 2/15/32 (c) | | 4,070 | 3,887 |
| Railroad - 0.3% | | | |
| First Student Bidco, Inc./First Transit Parent, Inc. 4% 7/31/29 (c) | | 13,385 | 11,980 |
| Restaurants - 0.4% | | | |
| 1011778 BC Unlimited Liability Co./New Red Finance, Inc. 4% 10/15/30 (c) | | 7,316 | 6,254 |
| Yum! Brands, Inc. 4.625% 1/31/32 | | 8,980 | 8,161 |
| | | | 14,415 |
| Services - 5.5% | | | |
| ADT Corp. 4.125% 8/1/29 (c) | | 4,110 | 3,490 |
| Adtalem Global Education, Inc. 5.5% 3/1/28 (c) | | 12,028 | 11,043 |
| Allied Universal Holdco LLC / Allied Universal Finance Corp. 6% 6/1/29 (c) | | 4,685 | 3,877 |
| APX Group, Inc. 6.75% 2/15/27 (c) | | 2,720 | 2,696 |
| Aramark Services, Inc. 5% 2/1/28 (c) | | 9,187 | 8,567 |
| ASGN, Inc. 4.625% 5/15/28 (c) | | 4,615 | 4,287 |
| Atlas Luxco 4 SARL / Allied Universal Holdco LLC / Allied Universal Finance Corp. 4.625% 6/1/28 (c) | | 6,148 | 5,395 |
| Booz Allen Hamilton, Inc. 3.875% 9/1/28 (c) | | 8,250 | 7,600 |
| Brand Energy & Infrastructure Services, Inc. 8.5% 7/15/25 (c) | | 20,855 | 18,613 |
| CoreCivic, Inc.: | | | |
| 4.75% 10/15/27 | | 5,690 | 5,063 |
| 8.25% 4/15/26 | | 24,050 | 24,705 |
| Fair Isaac Corp. 4% 6/15/28 (c) | | 5,065 | 4,627 |
| Gartner, Inc.: | | | |
| 3.625% 6/15/29 (c) | | 2,550 | 2,282 |
| 3.75% 10/1/30 (c) | | 3,385 | 3,019 |
| GEMS MENASA Cayman Ltd. 7.125% 7/31/26 (c) | | 21,799 | 21,740 |
| Legends Hospitality Holding Co. LLC/Legends Hospitality Co-Issuer, Inc. 5% 2/1/26 (c) | | 13,045 | 12,242 |
| Prime Securities Services Borrower LLC/Prime Finance, Inc.: | | | |
| 3.375% 8/31/27 (c) | | 184 | 157 |
| 5.75% 4/15/26 (c) | | 184 | 176 |
| Service Corp. International: | | | |
| 4% 5/15/31 | | 6,490 | 5,841 |
| 5.125% 6/1/29 | | 5,213 | 5,142 |
| Sotheby's 7.375% 10/15/27 (c) | | 18,725 | 18,464 |
| The GEO Group, Inc. 6% 4/15/26 | | 3,435 | 2,772 |
| TriNet Group, Inc. 3.5% 3/1/29 (c) | | 10,195 | 9,239 |
| WASH Multifamily Acquisition, Inc. 5.75% 4/15/26 (c) | | 15,507 | 15,081 |
| | | | 196,118 |
| Steel - 0.3% | | | |
| Commercial Metals Co. 4.125% 1/15/30 | | 4,160 | 3,786 |
| Roller Bearing Co. of America, Inc. 4.375% 10/15/29 (c) | | 7,505 | 6,755 |
| | | | 10,541 |
| Super Retail - 1.6% | | | |
| Bath & Body Works, Inc.: | | | |
| 5.25% 2/1/28 | | 965 | 926 |
| 6.625% 10/1/30 (c) | | 1,485 | 1,477 |
| 6.694% 1/15/27 | | 3,495 | 3,600 |
| Carvana Co.: | | | |
| 4.875% 9/1/29 (c) | | 3,275 | 2,390 |
| 5.5% 4/15/27 (c) | | 5,520 | 4,417 |
| 5.625% 10/1/25 (c) | | 6,335 | 5,486 |
| 5.875% 10/1/28 (c) | | 1,360 | 1,081 |
| 10.25% 5/1/30 (c) | | 3,590 | 3,469 |
| EG Global Finance PLC: | | | |
| 6.75% 2/7/25 (c) | | 8,108 | 7,881 |
| 8.5% 10/30/25 (c) | | 9,878 | 9,878 |
| LBM Acquisition LLC 6.25% 1/15/29 (c) | | 5,580 | 4,541 |
| Levi Strauss & Co. 3.5% 3/1/31 (c) | | 5,730 | 4,956 |
| Wolverine World Wide, Inc. 4% 8/15/29 (c) | | 8,395 | 7,134 |
| | | | 57,236 |
| Technology - 6.0% | | | |
| Acuris Finance U.S. 5% 5/1/28 (c) | | 15,710 | 14,375 |
| Arches Buyer, Inc.: | | | |
| 4.25% 6/1/28 (c) | | 7,840 | 6,968 |
| 6.125% 12/1/28 (c) | | 7,705 | 6,703 |
| Black Knight InfoServ LLC 3.625% 9/1/28 (c) | | 8,405 | 7,795 |
| Clarivate Science Holdings Corp.: | | | |
| 3.875% 7/1/28 (c) | | 3,175 | 2,826 |
| 4.875% 7/1/29 (c) | | 3,000 | 2,644 |
| CommScope, Inc.: | | | |
| 4.75% 9/1/29 (c) | | 3,600 | 3,010 |
| 6% 3/1/26 (c) | | 9,940 | 9,375 |
| 7.125% 7/1/28 (c) | | 6,360 | 5,072 |
| 8.25% 3/1/27 (c) | | 1,925 | 1,636 |
| Elastic NV 4.125% 7/15/29 (c) | | 10,400 | 9,308 |
| Entegris Escrow Corp. 4.75% 4/15/29 (c) | | 5,560 | 5,359 |
| Gartner, Inc. 4.5% 7/1/28 (c) | | 4,490 | 4,303 |
| II-VI, Inc. 5% 12/15/29 (c) | | 10,975 | 10,289 |
| ION Trading Technologies Ltd. 5.75% 5/15/28 (c) | | 12,845 | 12,026 |
| MicroStrategy, Inc. 6.125% 6/15/28 (c) | | 5,895 | 5,401 |
| Northwest Fiber LLC/Northwest Fiber Finance Sub, Inc. 10.75% 6/1/28 (c) | | 5,540 | 5,678 |
| onsemi 3.875% 9/1/28 (c) | | 3,675 | 3,409 |
| Open Text Corp. 3.875% 12/1/29 (c) | | 10,960 | 9,740 |
| Rackspace Hosting, Inc.: | | | |
| 3.5% 2/15/28 (c) | | 7,610 | 6,582 |
| 5.375% 12/1/28 (c) | | 54,444 | 44,357 |
| Roblox Corp. 3.875% 5/1/30 (c) | | 4,035 | 3,470 |
| Sensata Technologies BV 4% 4/15/29 (c) | | 4,495 | 4,007 |
| TTM Technologies, Inc. 4% 3/1/29 (c) | | 19,390 | 16,966 |
| Twilio, Inc. 3.875% 3/15/31 | | 3,285 | 2,823 |
| Uber Technologies, Inc. 8% 11/1/26 (c) | | 9,595 | 10,051 |
| | | | 214,173 |
| Telecommunications - 10.0% | | | |
| Altice Financing SA: | | | |
| 5% 1/15/28 (c) | | 20,243 | 16,897 |
| 5.75% 8/15/29 (c) | | 34,360 | 28,949 |
| Altice France Holding SA 6% 2/15/28 (c) | | 16,553 | 13,677 |
| Altice France SA: | | | |
| 5.125% 1/15/29 (c) | | 19,114 | 16,220 |
| 5.125% 7/15/29 (c) | | 15,405 | 13,041 |
| 5.5% 1/15/28 (c) | | 18,565 | 16,360 |
| 5.5% 10/15/29 (c) | | 13,505 | 11,513 |
| C&W Senior Financing Designated Activity Co. 6.875% 9/15/27 (c) | | 54,907 | 53,123 |
| Cablevision Lightpath LLC: | | | |
| 3.875% 9/15/27 (c) | | 2,199 | 1,934 |
| 5.625% 9/15/28 (c) | | 1,290 | 1,105 |
| Consolidated Communications, Inc. 5% 10/1/28 (c) | | 2,395 | 1,957 |
| Frontier Communications Holdings LLC: | | | |
| 5% 5/1/28 (c) | | 15,515 | 14,158 |
| 5.875% 10/15/27 (c) | | 11,453 | 10,966 |
| 5.875% 11/1/29 | | 9,519 | 8,263 |
| 6% 1/15/30 (c) | | 5,455 | 4,746 |
| 6.75% 5/1/29 (c) | | 7,595 | 6,844 |
| Intelsat Jackson Holdings SA 6.5% 3/15/30 (c) | | 8,320 | 7,833 |
| Level 3 Financing, Inc.: | | | |
| 3.625% 1/15/29 (c) | | 4,904 | 3,980 |
| 4.25% 7/1/28 (c) | | 18,115 | 15,307 |
| 4.625% 9/15/27 (c) | | 6,330 | 5,689 |
| Lumen Technologies, Inc.: | | | |
| 4.5% 1/15/29 (c) | | 21,185 | 16,739 |
| 5.125% 12/15/26 (c) | | 7,910 | 7,119 |
| Millicom International Cellular SA: | | | |
| 4.5% 4/27/31 (c) | | 5,482 | 4,725 |
| 5.125% 1/15/28 (c) | | 3,011 | 2,847 |
| Northwest Fiber LLC/Northwest Fiber Finance Sub, Inc. 6% 2/15/28 (c) | | 1,445 | 1,209 |
| Sable International Finance Ltd. 5.75% 9/7/27 (c) | | 1,577 | 1,553 |
| SBA Communications Corp. 3.125% 2/1/29 | | 4,140 | 3,551 |
| Telecom Italia Capital SA: | | | |
| 6% 9/30/34 | | 3,477 | 3,037 |
| 7.2% 7/18/36 | | 5,009 | 4,518 |
| 7.721% 6/4/38 | | 995 | 934 |
| Uniti Group, Inc. 6% 1/15/30 (c) | | 17,815 | 14,857 |
| Virgin Media Secured Finance PLC 4.5% 8/15/30 (c) | | 13,330 | 11,569 |
| VMED O2 UK Financing I PLC 4.25% 1/31/31 (c) | | 4,079 | 3,446 |
| Windstream Escrow LLC 7.75% 8/15/28 (c) | | 23,445 | 22,331 |
| Zayo Group Holdings, Inc.: | | | |
| 4% 3/1/27 (c) | | 4,245 | 3,693 |
| 6.125% 3/1/28 (c) | | 3,438 | 2,879 |
| | | | 357,569 |
| Textiles/Apparel - 0.3% | | | |
| Foot Locker, Inc. 4% 10/1/29 (c) | | 10,410 | 8,666 |
| Kontoor Brands, Inc. 4.125% 11/15/29 (c) | | 1,460 | 1,267 |
| | | | 9,933 |
| Transportation Ex Air/Rail - 0.5% | | | |
| Golar LNG Ltd. 7% 10/20/25 (c) | | 4,050 | 4,046 |
| Great Lakes Dredge & Dock Corp. 5.25% 6/1/29 (c) | | 2,635 | 2,464 |
| Seaspan Corp. 5.5% 8/1/29 (c) | | 14,455 | 12,757 |
| | | | 19,267 |
| Utilities - 3.4% | | | |
| Clearway Energy Operating LLC: | | | |
| 3.75% 2/15/31 (c) | | 4,505 | 3,874 |
| 4.75% 3/15/28 (c) | | 1,540 | 1,455 |
| Global Partners LP/GLP Finance Corp. 7% 8/1/27 | | 8,471 | 8,280 |
| InterGen NV 7% 6/30/23 (c) | | 19,797 | 19,302 |
| NRG Energy, Inc.: | | | |
| 3.375% 2/15/29 (c) | | 6,740 | 5,712 |
| 5.25% 6/15/29 (c) | | 5,350 | 5,039 |
| NSG Holdings II LLC/NSG Holdings, Inc. 7.75% 12/15/25 (c) | | 5,961 | 6,095 |
| PG&E Corp.: | | | |
| 5% 7/1/28 | | 14,760 | 13,582 |
| 5.25% 7/1/30 | | 24,510 | 22,274 |
| Pike Corp. 5.5% 9/1/28 (c) | | 25,157 | 22,830 |
| Vistra Operations Co. LLC: | | | |
| 5% 7/31/27 (c) | | 8,646 | 8,235 |
| 5.625% 2/15/27 (c) | | 6,375 | 6,279 |
| | | | 122,957 |
|
| TOTAL NONCONVERTIBLE BONDS | | | 3,240,264 |
|
| TOTAL CORPORATE BONDS | | | |
| (Cost $3,636,201) | | | 3,282,170 |
| | | Shares | Value (000s) |
|
| Common Stocks - 2.1% | | | |
| Cable/Satellite TV - 0.1% | | | |
| Altice U.S.A., Inc. Class A (e) | | 267,294 | 2,480 |
| Energy - 1.0% | | | |
| California Resources Corp. warrants 10/27/24 (e) | | 4,683 | 56 |
| Forbes Energy Services Ltd. (b)(e) | | 47,062 | 0 |
| Jonah Energy Parent LLC (b)(e) | | 212,612 | 14,336 |
| Mesquite Energy, Inc. (b)(e) | | 213,506 | 11,905 |
| New Fortress Energy, Inc. | | 137,895 | 5,348 |
| Pioneer Natural Resources Co. | | 16,200 | 3,766 |
|
| TOTAL ENERGY | | | 35,411 |
|
| Food & Drug Retail - 0.8% | | | |
| Southeastern Grocers, Inc. (a)(b)(e) | | 1,235,303 | 29,054 |
| Gaming - 0.1% | | | |
| Caesars Entertainment, Inc. (e) | | 54,586 | 3,618 |
| Telecommunications - 0.0% | | | |
| CUI Acquisition Corp. Class E (b)(e) | | 1 | 24 |
| GTT Communications, Inc. rights (b)(e) | | 447,381 | 447 |
|
| TOTAL TELECOMMUNICATIONS | | | 471 |
|
| Utilities - 0.1% | | | |
| EQT Corp. | | 113,600 | 4,516 |
| TOTAL COMMON STOCKS | | | |
| (Cost $40,772) | | | 75,550 |
| | | Principal Amount (000s) | Value (000s) |
|
| Bank Loan Obligations - 3.5% | | | |
| Broadcasting - 0.3% | | | |
| Diamond Sports Group LLC: | | | |
| 1LN, term loan U.S. Secured Overnight Fin. Rate (SOFR) Indx + 8.000% 9% 5/25/26 (f)(g)(h) | | 5,029 | 5,104 |
| 2LN, term loan 3 month U.S. LIBOR + 3.250% 3.6555% 8/24/26 (f)(g)(h) | | 11,569 | 3,832 |
|
| TOTAL BROADCASTING | | | 8,936 |
|
| Building Materials - 0.1% | | | |
| Acproducts Holdings, Inc. Tranche B 1LN, term loan 1 month U.S. LIBOR + 4.250% 4.75% 5/17/28 (f)(g)(h) | | 5,470 | 4,540 |
| Chemicals - 0.3% | | | |
| Consolidated Energy Finance SA Tranche B 1LN, term loan 3 month U.S. LIBOR + 3.500% 4.0287% 5/7/25 (b)(f)(g)(h) | | 7,083 | 6,924 |
| Olympus Water U.S. Holding Corp. Tranche B 1LN, term loan 1 month U.S. LIBOR + 3.750% 4.8125% 11/9/28 (f)(g)(h) | | 5,256 | 5,147 |
|
| TOTAL CHEMICALS | | | 12,071 |
|
| Consumer Products - 0.1% | | | |
| Michaels Companies, Inc. 1LN, term loan 3 month U.S. LIBOR + 4.250% 5.256% 4/15/28 (f)(g)(h) | | 4,078 | 3,710 |
| Energy - 0.3% | | | |
| EG America LLC Tranche B 1LN, term loan 3 month U.S. LIBOR + 4.000% 5.006% 2/6/25 (f)(g)(h) | | 6,037 | 5,901 |
| EG Finco Ltd. Tranche B, term loan 3 month U.S. LIBOR + 4.000% 5.006% 2/6/25 (f)(g)(h) | | 4,138 | 4,045 |
| Mesquite Energy, Inc.: | | | |
| 1LN, term loan 3 month U.S. LIBOR + 8.000% 0% (b)(d)(g)(h) | | 3,958 | 0 |
| term loan 3 month U.S. LIBOR + 0.000% 0% (b)(d)(g)(h) | | 1,690 | 0 |
|
| TOTAL ENERGY | | | 9,946 |
|
| Gaming - 0.2% | | | |
| Fertitta Entertainment LLC NV Tranche B 1LN, term loan U.S. Secured Overnight Fin. Rate (SOFR) Indx + 4.000% 4.7004% 1/27/29 (f)(g)(h) | | 7,636 | 7,596 |
| Healthcare - 0.4% | | | |
| Da Vinci Purchaser Corp. Tranche B 1LN, term loan 3 month U.S. LIBOR + 4.000% 5.006% 12/13/26 (f)(g)(h) | | 348 | 347 |
| Gainwell Acquisition Corp. Tranche B 1LN, term loan 3 month U.S. LIBOR + 4.000% 5.006% 10/1/27 (f)(g)(h) | | 8,650 | 8,612 |
| U.S. Renal Care, Inc. Tranche B 1LN, term loan 3 month U.S. LIBOR + 5.000% 5.5% 6/13/26 (f)(g)(h) | | 5,490 | 4,845 |
|
| TOTAL HEALTHCARE | | | 13,804 |
|
| Insurance - 0.2% | | | |
| HUB International Ltd. Tranche B, term loan 3 month U.S. LIBOR + 3.000% 4.2132% 4/25/25 (f)(g)(h) | | 9,051 | 8,927 |
| Leisure - 0.4% | | | |
| City Football Group Ltd. Tranche B 1LN, term loan 1 month U.S. LIBOR + 3.500% 4.5983% 7/21/28 (f)(g)(h) | | 13,219 | 12,847 |
| Paper - 0.1% | | | |
| Clydesdale Acquisition Holdings, Inc. 1LN, term loan CME TERM SOFR 1 MONTH INDEX + 4.250% 4.7834% 3/30/29 (f)(g)(h) | | 2,455 | 2,421 |
| Services - 0.2% | | | |
| Ascend Learning LLC: | | | |
| 2LN, term loan 1 month U.S. LIBOR + 5.750% 6.25% 12/10/29 (f)(g)(h) | | 610 | 602 |
| Tranche B 1LN, term loan 1 month U.S. LIBOR + 3.500% 4.2637% 12/10/28 (f)(g)(h) | | 5,645 | 5,571 |
| Brand Energy & Infrastructure Services, Inc. Tranche B, term loan 3 month U.S. LIBOR + 4.250% 5.3964% 6/21/24 (f)(g)(h) | | 1,902 | 1,804 |
| CoreCivic, Inc. Tranche B 1LN, term loan 3 month U.S. LIBOR + 4.500% 5.5% 12/18/24 (f)(g)(h) | | 679 | 673 |
|
| TOTAL SERVICES | | | 8,650 |
|
| Super Retail - 0.2% | | | |
| LBM Acquisition LLC Tranche B 1LN, term loan 3 month U.S. LIBOR + 3.750% 4.5% 12/18/27 (f)(g)(h) | | 7,628 | 7,183 |
| Technology - 0.1% | | | |
| CommScope, Inc. Tranche B 1LN, term loan 3 month U.S. LIBOR + 3.250% 4.0137% 4/4/26(f)(g)(h) | | 4,132 | 3,968 |
| Telecommunications - 0.5% | | | |
| GTT Communications, Inc. Tranche B, term loan 3 month U.S. LIBOR + 4.750% 7.25% 5/31/25 (f)(g)(h) | | 17,149 | 13,904 |
| Northwest Fiber LLC Tranche B 1LN, term loan 3 month U.S. LIBOR + 3.750% 4.3013% 4/30/27 (f)(g)(h) | | 5,351 | 5,259 |
|
| TOTAL TELECOMMUNICATIONS | | | 19,163 |
|
| Utilities - 0.1% | | | |
| PG&E Corp. Tranche B 1LN, term loan 3 month U.S. LIBOR + 3.000% 3.8125% 6/23/25 (f)(g)(h) | | 2,043 | 2,014 |
| TOTAL BANK LOAN OBLIGATIONS | | | |
| (Cost $136,483) | | | 125,776 |
| | | Shares | Value (000s) |
|
| Other - 0.4% | | | |
| Other - 0.4% | | | |
| Fidelity Direct Lending Fund, LP (a)(i) | | | |
| (Cost $14,937) | | 1,493,610 | 14,951 |
|
| Money Market Funds - 2.0% | | | |
| Fidelity Cash Central Fund 0.32% (j) | | | |
| (Cost $69,623) | | 69,609,402 | 69,623 |
| TOTAL INVESTMENT IN SECURITIES - 99.7% | | | |
| (Cost $3,898,016) | | | 3,568,070 |
| NET OTHER ASSETS (LIABILITIES) - 0.3% | | | 10,734 |
| NET ASSETS - 100% | | | $3,578,804 |
Values shown as $0 in the Schedule of Investments may reflect amounts less than $500.
Legend
(a) Restricted securities (including private placements) - Investment in securities not registered under the Securities Act of 1933 (excluding 144A issues). At the end of the period, the value of restricted securities (excluding 144A issues) amounted to $66,155,000 or 1.8% of net assets.
(b) Level 3 security
(c) Security exempt from registration under Rule 144A of the Securities Act of 1933. These securities may be resold in transactions exempt from registration, normally to qualified institutional buyers. At the end of the period, the value of these securities amounted to $2,754,503,000 or 77.0% of net assets.
(d) Non-income producing - Security is in default.
(e) Non-income producing
(f) Coupon rates for floating and adjustable rate securities reflect the rates in effect at period end.
(g) Coupon is indexed to a floating interest rate which may be multiplied by a specified factor and/or subject to caps or floors.
(h) Remaining maturities of bank loan obligations may be less than the stated maturities shown as a result of contractual or optional prepayments by the borrower. Such prepayments cannot be predicted with certainty.
(i) Affiliated Fund
(j) Affiliated fund that is generally available only to investment companies and other accounts managed by Fidelity Investments. The rate quoted is the annualized seven-day yield of the fund at period end. A complete unaudited listing of the fund's holdings as of its most recent quarter end is available upon request. In addition, each Fidelity Central Fund's financial statements, which are not covered by the Fund's Report of Independent Registered Public Accounting Firm, are available on the SEC's website or upon request.
Additional information on each restricted holding is as follows:
| Security | Acquisition Date | Acquisition Cost (000s) |
| Fidelity Direct Lending Fund, LP | 12/9/21 - 4/29/22 | $14,937 |
| Mesquite Energy, Inc. 15% 7/15/23 | 7/10/20 - 1/18/22 | $1,682 |
| Mesquite Energy, Inc. 15% 7/15/23 | 11/5/20 - 1/18/22 | $2,899 |
| Southeastern Grocers, Inc. | 6/1/18 | $8,689 |
Affiliated Central Funds
Fiscal year to date information regarding the Fund's investments in Fidelity Central Funds, including the ownership percentage, is presented below.
| Fund (Amounts in thousands) | Value, beginning of period | Purchases | Sales Proceeds | Dividend Income | Realized Gain/Loss | Change in Unrealized appreciation (depreciation) | Value, end of period | % ownership, end of period |
| Fidelity Cash Central Fund 0.32% | $291,146 | $1,982,289 | $2,203,812 | $86 | $9 | $(9) | $69,623 | 0.1% |
| Fidelity Securities Lending Cash Central Fund 0.32% | -- | 145,618 | 145,618 | 75 | -- | -- | -- | 0.0% |
| Total | $291,146 | $2,127,907 | $2,349,430 | $161 | $9 | $(9) | $69,623 | |
Amounts in the income column in the above table include any capital gain distributions from underlying funds, which are presented in the corresponding line-item in the Statement of Operations, if applicable. Amount for Fidelity Securities Lending Cash Central Fund represents the income earned on investing cash collateral, less rebates paid to borrowers and any lending agent fees associated with the loan, plus any premium payments received for lending certain types of securities.
Affiliated Underlying Funds
Fiscal year to date information regarding the Fund's investments in affiliated Underlying Funds is presented below. Exchanges between classes of the same affiliated Underlying Funds may occur, and are excluded from purchases and sales below if applicable. If an underlying Fund changes its name, the name presented below is the name in effect at period end.
| Affiliate (Amounts in thousands) | Value, beginning of period | Purchases | Sales Proceeds | Dividend Income | Realized Gain (loss) | Change in Unrealized appreciation (depreciation) | Value, end of period |
| Fidelity Direct Lending Fund, LP | $-- | $14,937 | $-- | $250 | $-- | $14 | $14,951 |
| Total | $-- | $14,937 | $-- | $250 | $-- | $14 | $14,951 |
Amounts in the income column in the above table include any capital gain distributions from underlying funds, which are presented in the corresponding line-item in the Statement of Operations, if applicable.
Investment Valuation
The following is a summary of the inputs used, as of April 30, 2022, involving the Fund's assets and liabilities carried at fair value. The inputs or methodology used for valuing securities may not be an indication of the risk associated with investing in those securities. For more information on valuation inputs, and their aggregation into the levels used below, please refer to the Investment Valuation section in the accompanying Notes to Financial Statements.
Amounts in this Investment Valuation section exclude the value of Fidelity Direct Lending Fund, LP as presented in the Schedule of Investments. Fidelity Direct Lending Fund, LP is valued using NAV as a practical expedient.
| | Valuation Inputs at Reporting Date: |
| Description | Total | Level 1 | Level 2 | Level 3 |
| (Amounts in thousands) | | | | |
| Investments in Securities: | | | | |
| Equities: | | | | |
| Communication Services | $2,504 | $2,480 | $-- | $24 |
| Consumer Discretionary | 3,618 | 3,618 | -- | -- |
| Consumer Staples | 29,054 | -- | -- | 29,054 |
| Energy | 39,927 | 13,686 | -- | 26,241 |
| Information Technology | 447 | -- | -- | 447 |
| Corporate Bonds | 3,282,170 | -- | 3,260,020 | 22,150 |
| Bank Loan Obligations | 125,776 | -- | 118,852 | 6,924 |
| Money Market Funds | 69,623 | 69,623 | -- | -- |
| Total Investments in Securities: | $3,553,119 | $89,407 | $3,378,872 | $84,840 |
The following is a reconciliation of Investments in Securities for which Level 3 inputs were used in determining value:
| (Amounts in thousands) | |
| Investments in Securities: | |
| Equities - Consumer Staples | |
| Beginning Balance | $37,464 |
| Net Realized Gain (Loss) on Investment Securities | 14,206 |
| Net Unrealized Gain (Loss) on Investment Securities | (75) |
| Cost of Purchases | -- |
| Proceeds of Sales | (22,541) |
| Amortization/Accretion | -- |
| Transfers into Level 3 | -- |
| Transfers out of Level 3 | -- |
| Ending Balance | $29,054 |
| The change in unrealized gain (loss) for the period attributable to Level 3 securities held at April 30, 2022 | $(75) |
| Other Investments in Securities | |
| Beginning Balance | $32,855 |
| Net Realized Gain (Loss) on Investment Securities | 18,238 |
| Net Unrealized Gain (Loss) on Investment Securities | 28,714 |
| Cost of Purchases | 21,237 |
| Proceeds of Sales | (45,313) |
| Amortization/Accretion | 51 |
| Transfers into Level 3 | 4 |
| Transfers out of Level 3 | -- |
| Ending Balance | $55,786 |
| The change in unrealized gain (loss) for the period attributable to Level 3 securities held at April 30, 2022 | $28,714 |
The information used in the above reconciliation represents fiscal year to date activity for any Investments in Securities identified as using Level 3 inputs at either the beginning or the end of the current fiscal period. Cost of purchases and proceeds of sales may include securities received and/or delivered through in-kind transactions. Transfers in or out of Level 3 represent the beginning value of any Security or Instrument where a change in the pricing level occurred from the beginning to the end of the period. The cost of purchases and the proceeds of sales may include securities received or delivered through corporate actions or exchanges. Realized and unrealized gains (losses) disclosed in the reconciliation are included in Net Gain (Loss) on the Fund's Statement of Operations.
See accompanying notes which are an integral part of the financial statements.
Financial Statements
Statement of Assets and Liabilities
| Amounts in thousands (except per-share amounts) | | April 30, 2022 |
| Assets | | |
Investment in securities, at value — See accompanying schedule:
Unaffiliated issuers (cost $3,813,456) | $3,483,496 | |
| Fidelity Central Funds (cost $69,623) | 69,623 | |
| Other affiliated issuers (cost $14,937) | 14,951 | |
| Total Investment in Securities (cost $3,898,016) | | $3,568,070 |
| Cash | | 6 |
| Receivable for investments sold | | 3,267 |
| Receivable for fund shares sold | | 901 |
| Dividends receivable | | 61 |
| Interest receivable | | 53,163 |
| Distributions receivable from Fidelity Central Funds | | 17 |
| Prepaid expenses | | 3 |
| Total assets | | 3,625,488 |
| Liabilities | | |
| Payable for investments purchased | $37,542 | |
| Payable for fund shares redeemed | 4,378 | |
| Distributions payable | 2,478 | |
| Accrued management fee | 1,686 | |
| Distribution and service plan fees payable | 49 | |
| Other affiliated payables | 462 | |
| Other payables and accrued expenses | 89 | |
| Total liabilities | | 46,684 |
| Net Assets | | $3,578,804 |
| Net Assets consist of: | | |
| Paid in capital | | $4,290,106 |
| Total accumulated earnings (loss) | | (711,302) |
| Net Assets | | $3,578,804 |
| Net Asset Value and Maximum Offering Price | | |
| Class A: | | |
| Net Asset Value and redemption price per share ($131,926 ÷ 16,686 shares)(a) | | $7.91 |
| Maximum offering price per share (100/96.00 of $7.91) | | $8.24 |
| Class M: | | |
| Net Asset Value and redemption price per share ($30,231 ÷ 3,824 shares)(a) | | $7.91 |
| Maximum offering price per share (100/96.00 of $7.91) | | $8.24 |
| Class C: | | |
| Net Asset Value and offering price per share ($17,027 ÷ 2,153 shares)(a) | | $7.91 |
| Fidelity High Income Fund: | | |
| Net Asset Value, offering price and redemption price per share ($3,181,308 ÷ 402,339 shares) | | $7.91 |
| Class I: | | |
| Net Asset Value, offering price and redemption price per share ($84,814 ÷ 10,722 shares) | | $7.91 |
| Class Z: | | |
| Net Asset Value, offering price and redemption price per share ($133,498 ÷ 16,884 shares) | | $7.91 |
(a) Redemption price per share is equal to net asset value less any applicable contingent deferred sales charge.
See accompanying notes which are an integral part of the financial statements.
Statement of Operations
| Amounts in thousands | | Year ended April 30, 2022 |
| Investment Income | | |
| Dividends (including $250 earned from other affiliated issuers) | | $4,277 |
| Interest | | 252,886 |
| Income from Fidelity Central Funds (including $75 from security lending) | | 161 |
| Total income | | 257,324 |
| Expenses | | |
| Management fee | $28,013 | |
| Transfer agent fees | 5,824 | |
| Distribution and service plan fees | 678 | |
| Accounting fees | 1,177 | |
| Custodian fees and expenses | 28 | |
| Independent trustees' fees and expenses | 20 | |
| Registration fees | 193 | |
| Audit | 105 | |
| Legal | 517 | |
| Interest | 1 | |
| Miscellaneous | 29 | |
| Total expenses before reductions | 36,585 | |
| Expense reductions | (153) | |
| Total expenses after reductions | | 36,432 |
| Net investment income (loss) | | 220,892 |
| Realized and Unrealized Gain (Loss) | | |
| Net realized gain (loss) on: | | |
| Investment securities: | | |
| Unaffiliated issuers | 38,961 | |
| Redemptions in-kind with affiliated entities | 172,034 | |
| Fidelity Central Funds | 9 | |
| Total net realized gain (loss) | | 211,004 |
| Change in net unrealized appreciation (depreciation) on: | | |
| Investment securities: | | |
| Unaffiliated issuers | (556,216) | |
| Fidelity Central Funds | (9) | |
| Other affiliated issuers | 14 | |
| Total change in net unrealized appreciation (depreciation) | | (556,211) |
| Net gain (loss) | | (345,207) |
| Net increase (decrease) in net assets resulting from operations | | $(124,315) |
See accompanying notes which are an integral part of the financial statements.
Statement of Changes in Net Assets
| Amounts in thousands | Year ended April 30, 2022 | Year ended April 30, 2021 |
| Increase (Decrease) in Net Assets | | |
| Operations | | |
| Net investment income (loss) | $220,892 | $323,420 |
| Net realized gain (loss) | 211,004 | (56,779) |
| Change in net unrealized appreciation (depreciation) | (556,211) | 600,511 |
| Net increase (decrease) in net assets resulting from operations | (124,315) | 867,152 |
| Distributions to shareholders | (240,456) | (315,556) |
| Share transactions - net increase (decrease) | (4,669,187) | 3,350,568 |
| Total increase (decrease) in net assets | (5,033,958) | 3,902,164 |
| Net Assets | | |
| Beginning of period | 8,612,762 | 4,710,598 |
| End of period | $3,578,804 | $8,612,762 |
See accompanying notes which are an integral part of the financial statements.
Financial Highlights
Fidelity High Income Fund Class A
| Years ended April 30, | 2022 | 2021 | 2020 | 2019 A |
| Selected Per–Share Data | | | | |
| Net asset value, beginning of period | $8.71 | $7.93 | $8.83 | $8.56 |
| Income from Investment Operations | | | | |
| Net investment income (loss)B,C | .345 | .368 | .438 | .192 |
| Net realized and unrealized gain (loss) | (.760) | .772 | (.908) | .286 |
| Total from investment operations | (.415) | 1.140 | (.470) | .478 |
| Distributions from net investment income | (.385) | (.360) | (.430) | (.208) |
| Total distributions | (.385) | (.360) | (.430) | (.208) |
| Net asset value, end of period | $7.91 | $8.71 | $7.93 | $8.83 |
| Total ReturnD,E,F | (5.02)% | 14.56% | (5.63)% | 5.68% |
| Ratios to Average Net AssetsC,G,H | | | | |
| Expenses before reductions | .99% | .98% | .98% | .99%I |
| Expenses net of fee waivers, if any | .99% | .98% | .98% | .99%I |
| Expenses net of all reductions | .99% | .98% | .98% | .99%I |
| Net investment income (loss) | 4.02% | 4.32% | 5.04% | 5.60%I |
| Supplemental Data | | | | |
| Net assets, end of period (in millions) | $132 | $148 | $144 | $170 |
| Portfolio turnover rateJ | 54%K | 62% | 44%K | 62%L |
A For the period December 4, 2018 (commencement of sale of shares) through April 30, 2019.
B Calculated based on average shares outstanding during the period.
C Net investment income (loss) is affected by the timing of the declaration of dividends by any underlying mutual funds or exchange-traded funds (ETFs). Net investment income (loss) of any such underlying funds is not included in the Fund's net investment income (loss) ratio.
D Total returns for periods of less than one year are not annualized.
E Total returns would have been lower if certain expenses had not been reduced during the applicable periods shown.
F Total returns do not include the effect of the sales charges.
G Fees and expenses of any underlying mutual funds or exchange-traded funds (ETFs) are not included in the Fund's expense ratio. The Fund indirectly bears its proportionate share of these expenses. For additional expense information related to investments in Fidelity Central Funds, please refer to the "Investments in Fidelity Central Funds" note found in the Notes to Financial Statements section of the most recent Annual or Semi-Annual report. For additional expense information related to investments in Fidelity Direct Lending Fund, LP, please refer to the Investment in Fidelity Direct Lending Fund, LP note found in the Notes to Financial Statements section of the most recent Annual or Semi-Annual report.
H Expense ratios reflect operating expenses of the class. Expenses before reductions do not reflect amounts reimbursed, waived, or reduced through arrangements with the investment adviser, brokerage services, or other offset arrangements, if applicable, and do not represent the amount paid by the class during periods when reimbursements, waivers or reductions occur.
I Annualized
J Amount does not include the portfolio activity of any underlying mutual funds or exchange-traded funds (ETFs).
K Portfolio turnover rate excludes securities received or delivered in-kind.
L The portfolio turnover rate does not include the assets acquired in the merger.
See accompanying notes which are an integral part of the financial statements.
Fidelity High Income Fund Class M
| Years ended April 30, | 2022 | 2021 | 2020 | 2019 A |
| Selected Per–Share Data | | | | |
| Net asset value, beginning of period | $8.71 | $7.93 | $8.83 | $8.56 |
| Income from Investment Operations | | | | |
| Net investment income (loss)B,C | .345 | .367 | .438 | .191 |
| Net realized and unrealized gain (loss) | (.761) | .772 | (.909) | .286 |
| Total from investment operations | (.416) | 1.139 | (.471) | .477 |
| Distributions from net investment income | (.384) | (.359) | (.429) | (.207) |
| Total distributions | (.384) | (.359) | (.429) | (.207) |
| Net asset value, end of period | $7.91 | $8.71 | $7.93 | $8.83 |
| Total ReturnD,E,F | (5.03)% | 14.55% | (5.64)% | 5.68% |
| Ratios to Average Net AssetsC,G,H | | | | |
| Expenses before reductions | 1.00% | .99% | .99% | 1.01%I |
| Expenses net of fee waivers, if any | 1.00% | .99% | .99% | 1.01%I |
| Expenses net of all reductions | 1.00% | .99% | .99% | 1.01%I |
| Net investment income (loss) | 4.01% | 4.31% | 5.02% | 5.59%I |
| Supplemental Data | | | | |
| Net assets, end of period (in millions) | $30 | $36 | $40 | $50 |
| Portfolio turnover rateJ | 54%K | 62% | 44%K | 62%L |
A For the period December 4, 2018 (commencement of sale of shares) through April 30, 2019.
B Calculated based on average shares outstanding during the period.
C Net investment income (loss) is affected by the timing of the declaration of dividends by any underlying mutual funds or exchange-traded funds (ETFs). Net investment income (loss) of any such underlying funds is not included in the Fund's net investment income (loss) ratio.
D Total returns for periods of less than one year are not annualized.
E Total returns would have been lower if certain expenses had not been reduced during the applicable periods shown.
F Total returns do not include the effect of the sales charges.
G Fees and expenses of any underlying mutual funds or exchange-traded funds (ETFs) are not included in the Fund's expense ratio. The Fund indirectly bears its proportionate share of these expenses. For additional expense information related to investments in Fidelity Central Funds, please refer to the "Investments in Fidelity Central Funds" note found in the Notes to Financial Statements section of the most recent Annual or Semi-Annual report. For additional expense information related to investments in Fidelity Direct Lending Fund, LP, please refer to the Investment in Fidelity Direct Lending Fund, LP note found in the Notes to Financial Statements section of the most recent Annual or Semi-Annual report.
H Expense ratios reflect operating expenses of the class. Expenses before reductions do not reflect amounts reimbursed, waived, or reduced through arrangements with the investment adviser, brokerage services, or other offset arrangements, if applicable, and do not represent the amount paid by the class during periods when reimbursements, waivers or reductions occur.
I Annualized
J Amount does not include the portfolio activity of any underlying mutual funds or exchange-traded funds (ETFs).
K Portfolio turnover rate excludes securities received or delivered in-kind.
L The portfolio turnover rate does not include the assets acquired in the merger.
See accompanying notes which are an integral part of the financial statements.
Fidelity High Income Fund Class C
| Years ended April 30, | 2022 | 2021 | 2020 | 2019 A |
| Selected Per–Share Data | | | | |
| Net asset value, beginning of period | $8.71 | $7.93 | $8.83 | $8.56 |
| Income from Investment Operations | | | | |
| Net investment income (loss)B,C | .281 | .302 | .372 | .166 |
| Net realized and unrealized gain (loss) | (.763) | .772 | (.909) | .285 |
| Total from investment operations | (.482) | 1.074 | (.537) | .451 |
| Distributions from net investment income | (.318) | (.294) | (.363) | (.181) |
| Total distributions | (.318) | (.294) | (.363) | (.181) |
| Net asset value, end of period | $7.91 | $8.71 | $7.93 | $8.83 |
| Total ReturnD,E,F | (5.75)% | 13.68% | (6.35)% | 5.36% |
| Ratios to Average Net AssetsC,G,H | | | | |
| Expenses before reductions | 1.76% | 1.75% | 1.75% | 1.77%I |
| Expenses net of fee waivers, if any | 1.76% | 1.75% | 1.75% | 1.77%I |
| Expenses net of all reductions | 1.76% | 1.75% | 1.75% | 1.77%I |
| Net investment income (loss) | 3.25% | 3.55% | 4.27% | 4.84%I |
| Supplemental Data | | | | |
| Net assets, end of period (in millions) | $17 | $30 | $36 | $52 |
| Portfolio turnover rateJ | 54%K | 62% | 44%K | 62%L |
A For the period December 4, 2018 (commencement of sale of shares) through April 30, 2019.
B Calculated based on average shares outstanding during the period.
C Net investment income (loss) is affected by the timing of the declaration of dividends by any underlying mutual funds or exchange-traded funds (ETFs). Net investment income (loss) of any such underlying funds is not included in the Fund's net investment income (loss) ratio.
D Total returns for periods of less than one year are not annualized.
E Total returns would have been lower if certain expenses had not been reduced during the applicable periods shown.
F Total returns do not include the effect of the contingent deferred sales charge.
G Fees and expenses of any underlying mutual funds or exchange-traded funds (ETFs) are not included in the Fund's expense ratio. The Fund indirectly bears its proportionate share of these expenses. For additional expense information related to investments in Fidelity Central Funds, please refer to the "Investments in Fidelity Central Funds" note found in the Notes to Financial Statements section of the most recent Annual or Semi-Annual report. For additional expense information related to investments in Fidelity Direct Lending Fund, LP, please refer to the Investment in Fidelity Direct Lending Fund, LP note found in the Notes to Financial Statements section of the most recent Annual or Semi-Annual report.
H Expense ratios reflect operating expenses of the class. Expenses before reductions do not reflect amounts reimbursed, waived, or reduced through arrangements with the investment adviser, brokerage services, or other offset arrangements, if applicable, and do not represent the amount paid by the class during periods when reimbursements, waivers or reductions occur.
I Annualized
J Amount does not include the portfolio activity of any underlying mutual funds or exchange-traded funds (ETFs).
K Portfolio turnover rate excludes securities received or delivered in-kind.
L The portfolio turnover rate does not include the assets acquired in the merger.
See accompanying notes which are an integral part of the financial statements.
Fidelity High Income Fund
| Years ended April 30, | 2022 | 2021 | 2020 | 2019 | 2018 |
| Selected Per–Share Data | | | | | |
| Net asset value, beginning of period | $8.71 | $7.93 | $8.83 | $8.83 | $8.94 |
| Income from Investment Operations | | | | | |
| Net investment income (loss)A,B | .371 | .392 | .464 | .493 | .513 |
| Net realized and unrealized gain (loss) | (.761) | .772 | (.909) | –C | (.137) |
| Total from investment operations | (.390) | 1.164 | (.445) | .493 | .376 |
| Distributions from net investment income | (.410) | (.384) | (.455) | (.493) | (.486) |
| Total distributions | (.410) | (.384) | (.455) | (.493) | (.486) |
| Redemption fees added to paid in capitalA | – | – | – | – | –C |
| Net asset value, end of period | $7.91 | $8.71 | $7.93 | $8.83 | $8.83 |
| Total ReturnD | (4.75)% | 14.89% | (5.35)% | 5.83% | 4.27% |
| Ratios to Average Net AssetsB,E,F | | | | | |
| Expenses before reductions | .70% | .69% | .69% | .70% | .70% |
| Expenses net of fee waivers, if any | .70% | .69% | .69% | .70% | .70% |
| Expenses net of all reductions | .70% | .69% | .69% | .70% | .70% |
| Net investment income (loss) | 4.31% | 4.61% | 5.33% | 5.66% | 5.73% |
| Supplemental Data | | | | | |
| Net assets, end of period (in millions) | $3,181 | $4,139 | $3,871 | $4,392 | $4,324 |
| Portfolio turnover rateG | 54%H | 62% | 44%H | 62%I | 51% |
A Calculated based on average shares outstanding during the period.
B Net investment income (loss) is affected by the timing of the declaration of dividends by any underlying mutual funds or exchange-traded funds (ETFs). Net investment income (loss) of any such underlying funds is not included in the Fund's net investment income (loss) ratio.
C Amount represents less than $.0005 per share.
D Total returns would have been lower if certain expenses had not been reduced during the applicable periods shown.
E Fees and expenses of any underlying mutual funds or exchange-traded funds (ETFs) are not included in the Fund's expense ratio. The Fund indirectly bears its proportionate share of these expenses. For additional expense information related to investments in Fidelity Central Funds, please refer to the "Investments in Fidelity Central Funds" note found in the Notes to Financial Statements section of the most recent Annual or Semi-Annual report. For additional expense information related to investments in Fidelity Direct Lending Fund, LP, please refer to the Investment in Fidelity Direct Lending Fund, LP note found in the Notes to Financial Statements section of the most recent Annual or Semi-Annual report.
F Expense ratios reflect operating expenses of the class. Expenses before reductions do not reflect amounts reimbursed, waived, or reduced through arrangements with the investment adviser, brokerage services, or other offset arrangements, if applicable, and do not represent the amount paid by the class during periods when reimbursements, waivers or reductions occur.
G Amount does not include the portfolio activity of any underlying mutual funds or exchange-traded funds (ETFs).
H Portfolio turnover rate excludes securities received or delivered in-kind.
I The portfolio turnover rate does not include the assets acquired in the merger.
See accompanying notes which are an integral part of the financial statements.
Fidelity High Income Fund Class I
| Years ended April 30, | 2022 | 2021 | 2020 | 2019 A |
| Selected Per–Share Data | | | | |
| Net asset value, beginning of period | $8.71 | $7.93 | $8.83 | $8.56 |
| Income from Investment Operations | | | | |
| Net investment income (loss)B,C | .390 | .390 | .458 | .199 |
| Net realized and unrealized gain (loss) | (.774) | .771 | (.907) | .286 |
| Total from investment operations | (.384) | 1.161 | (.449) | .485 |
| Distributions from net investment income | (.416) | (.381) | (.451) | (.215) |
| Total distributions | (.416) | (.381) | (.451) | (.215) |
| Net asset value, end of period | $7.91 | $8.71 | $7.93 | $8.83 |
| Total ReturnD,E | (4.68)% | 14.85% | (5.40)% | 5.77% |
| Ratios to Average Net AssetsC,F,G | | | | |
| Expenses before reductions | .72% | .73% | .74% | .78%H |
| Expenses net of fee waivers, if any | .71% | .73% | .74% | .78%H |
| Expenses net of all reductions | .71% | .73% | .74% | .78%H |
| Net investment income (loss) | 4.29% | 4.57% | 5.28% | 5.81%H |
| Supplemental Data | | | | |
| Net assets, end of period (in millions) | $85 | $4,010 | $558 | $448 |
| Portfolio turnover rateI | 54%J | 62% | 44%J | 62%K |
A For the period December 4, 2018 (commencement of sale of shares) through April 30, 2019.
B Calculated based on average shares outstanding during the period.
C Net investment income (loss) is affected by the timing of the declaration of dividends by any underlying mutual funds or exchange-traded funds (ETFs). Net investment income (loss) of any such underlying funds is not included in the Fund's net investment income (loss) ratio.
D Total returns for periods of less than one year are not annualized.
E Total returns would have been lower if certain expenses had not been reduced during the applicable periods shown.
F Fees and expenses of any underlying mutual funds or exchange-traded funds (ETFs) are not included in the Fund's expense ratio. The Fund indirectly bears its proportionate share of these expenses. For additional expense information related to investments in Fidelity Central Funds, please refer to the "Investments in Fidelity Central Funds" note found in the Notes to Financial Statements section of the most recent Annual or Semi-Annual report. For additional expense information related to investments in Fidelity Direct Lending Fund, LP, please refer to the Investment in Fidelity Direct Lending Fund, LP note found in the Notes to Financial Statements section of the most recent Annual or Semi-Annual report.
G Expense ratios reflect operating expenses of the class. Expenses before reductions do not reflect amounts reimbursed, waived, or reduced through arrangements with the investment adviser, brokerage services, or other offset arrangements, if applicable, and do not represent the amount paid by the class during periods when reimbursements, waivers or reductions occur.
H Annualized
I Amount does not include the portfolio activity of any underlying mutual funds or exchange-traded funds (ETFs).
J Portfolio turnover rate excludes securities received or delivered in-kind.
K The portfolio turnover rate does not include the assets acquired in the merger.
See accompanying notes which are an integral part of the financial statements.
Fidelity High Income Fund Class Z
| Years ended April 30, | 2022 | 2021 | 2020 | 2019 A |
| Selected Per–Share Data | | | | |
| Net asset value, beginning of period | $8.71 | $7.93 | $8.83 | $8.56 |
| Income from Investment Operations | | | | |
| Net investment income (loss)B,C | .378 | .399 | .464 | .201 |
| Net realized and unrealized gain (loss) | (.763) | .770 | (.904) | .289 |
| Total from investment operations | (.385) | 1.169 | (.440) | .490 |
| Distributions from net investment income | (.415) | (.389) | (.460) | (.220) |
| Total distributions | (.415) | (.389) | (.460) | (.220) |
| Net asset value, end of period | $7.91 | $8.71 | $7.93 | $8.83 |
| Total ReturnD,E | (4.68)% | 14.96% | (5.30)% | 5.83% |
| Ratios to Average Net AssetsC,F,G | | | | |
| Expenses before reductions | .64% | .63% | .63% | .64%H |
| Expenses net of fee waivers, if any | .63% | .63% | .63% | .64%H |
| Expenses net of all reductions | .63% | .62% | .63% | .63%H |
| Net investment income (loss) | 4.37% | 4.67% | 5.39% | 5.85%H |
| Supplemental Data | | | | |
| Net assets, end of period (in millions) | $133 | $250 | $61 | $13 |
| Portfolio turnover rateI | 54%J | 62% | 44%J | 62%K |
A For the period December 4, 2018 (commencement of sale of shares) through April 30, 2019.
B Calculated based on average shares outstanding during the period.
C Net investment income (loss) is affected by the timing of the declaration of dividends by any underlying mutual funds or exchange-traded funds (ETFs). Net investment income (loss) of any such underlying funds is not included in the Fund's net investment income (loss) ratio.
D Total returns for periods of less than one year are not annualized.
E Total returns would have been lower if certain expenses had not been reduced during the applicable periods shown.
F Fees and expenses of any underlying mutual funds or exchange-traded funds (ETFs) are not included in the Fund's expense ratio. The Fund indirectly bears its proportionate share of these expenses. For additional expense information related to investments in Fidelity Central Funds, please refer to the "Investments in Fidelity Central Funds" note found in the Notes to Financial Statements section of the most recent Annual or Semi-Annual report. For additional expense information related to investments in Fidelity Direct Lending Fund, LP, please refer to the Investment in Fidelity Direct Lending Fund, LP note found in the Notes to Financial Statements section of the most recent Annual or Semi-Annual report.
G Expense ratios reflect operating expenses of the class. Expenses before reductions do not reflect amounts reimbursed, waived, or reduced through arrangements with the investment adviser, brokerage services, or other offset arrangements, if applicable, and do not represent the amount paid by the class during periods when reimbursements, waivers or reductions occur.
H Annualized
I Amount does not include the portfolio activity of any underlying mutual funds or exchange-traded funds (ETFs).
J Portfolio turnover rate excludes securities received or delivered in-kind.
K The portfolio turnover rate does not include the assets acquired in the merger.
See accompanying notes which are an integral part of the financial statements.
Notes to Financial Statements
For the period ended April 30, 2022
(Amounts in thousands except percentages)
1. Organization.
Fidelity High Income Fund (the Fund) is a fund of Fidelity Summer Street Trust (the Trust) and is authorized to issue an unlimited number of shares. The Trust is registered under the Investment Company Act of 1940, as amended (the 1940 Act), as an open-end management investment company organized as a Massachusetts business trust. The Fund offers Class A, Class M, Class C, Fidelity High Income Fund, Class I and Class Z shares, each of which has equal rights as to assets and voting privileges. Each class has exclusive voting rights with respect to matters that affect that class. Effective June 21, 2021, Class C shares will automatically convert to Class A shares after a holding period of eight years from the initial date of purchase, with certain exceptions. Prior to June 21, 2021, Class C shares automatically converted to Class A shares after a holding period of ten years from the initial date of purchase, with certain exceptions.
2. Investments in Fidelity Central Funds.
Funds may invest in Fidelity Central Funds, which are open-end investment companies generally available only to other investment companies and accounts managed by the investment adviser and its affiliates. The Schedule of Investments lists any Fidelity Central Funds held as an investment as of period end, but does not include the underlying holdings of each Fidelity Central Fund. An investing fund indirectly bears its proportionate share of the expenses of the underlying Fidelity Central Funds.
Based on its investment objective, each Fidelity Central Fund may invest or participate in various investment vehicles or strategies that are similar to those of the investing fund. These strategies are consistent with the investment objectives of the investing fund and may involve certain economic risks which may cause a decline in value of each of the Fidelity Central Funds and thus a decline in the value of the investing fund.
| Fidelity Central Fund | Investment Manager | Investment Objective | Investment Practices | Expense Ratio(a) |
| Fidelity Money Market Central Funds | Fidelity Management & Research Company LLC (FMR) | Each fund seeks to obtain a high level of current income consistent with the preservation of capital and liquidity. | Short-term Investments | Less than .005% |
(a) Expenses expressed as a percentage of average net assets and are as of each underlying Central Fund's most recent annual or semi-annual shareholder report.
A complete unaudited list of holdings for each Fidelity Central Fund is available upon request or at the Securities and Exchange Commission website at www.sec.gov. In addition, the financial statements of the Fidelity Central Funds which contain the significant accounting policies (including investment valuation policies) of those funds, and are not covered by the Report of Independent Registered Public Accounting Firm, are available on the Securities and Exchange Commission website or upon request.
3. Investment in Fidelity Direct Lending Fund, LP.
The Fund invests in Fidelity Direct Lending Fund, LP, which is a limited partnership available only to certain investment companies managed by the investment adviser and its affiliates. The Fund's limited partnership interest is not registered under the Securities Act of 1933, and is subject to substantial restrictions on transfer. The Fund has no redemption rights under the partnership agreement. There will be no trading market for the partnership interest, and the Fund most likely will hold its shares until Fidelity Direct Lending Fund, LP converts by operation of law to a Delaware corporation, trust, or other limited liability entity and (i) registers as a closed-end management investment company under the 1940 Act or (ii) elects to be treated as a business development company under the 1940 Act.
Based on its investment objective, Fidelity Direct Lending Fund, LP may invest or participate in various investments or strategies that are similar to those in which the Fund may invest or participate. These strategies are consistent with the investment objectives of the Fund and may involve certain economic risks which may cause a decline in value of Fidelity Direct Lending Fund, LP and thus a decline in the value of the Fund. The Fidelity Direct Lending Fund, LP intends to invest primarily in direct loans made to private U.S. companies, specifically small- and middle-market companies.
The Schedule of Investments lists Fidelity Direct Lending Fund, LP as an investment as of period end, but does not include the underlying holdings of Fidelity Direct Lending Fund, LP. Fidelity Direct Lending Fund, LP represented less than 5% of the Fund's net assets at period end. The Fund indirectly bears its proportionate share of the expenses of Fidelity Direct Lending Fund, LP, which commenced operations on December 8, 2021. The annual expense ratio for Fidelity Direct Lending Fund, LP is estimated to be a maximum of .20%.
4. Significant Accounting Policies.
The Fund is an investment company and applies the accounting and reporting guidance of the Financial Accounting Standards Board (FASB) Accounting Standards Codification Topic 946 Financial Services - Investment Companies. The financial statements have been prepared in conformity with accounting principles generally accepted in the United States of America (GAAP), which require management to make certain estimates and assumptions at the date of the financial statements. Actual results could differ from those estimates. Subsequent events, if any, through the date that the financial statements were issued have been evaluated in the preparation of the financial statements. The Fund's Schedule of Investments lists any underlying mutual funds or exchange-traded funds (ETFs) but does not include the underlying holdings of these funds. The following summarizes the significant accounting policies of the Fund:
Investment Valuation. Investments are valued as of 4:00 p.m. Eastern time on the last calendar day of the period. The Board of Trustees (the Board) has delegated the day to day responsibility for the valuation of the Fund's investments to the Fair Value Committee (the Committee) established by the Fund's investment adviser. In accordance with valuation policies and procedures approved by the Board, the Fund attempts to obtain prices from one or more third party pricing vendors or brokers to value its investments. When current market prices, quotations or currency exchange rates are not readily available or reliable, investments will be fair valued in good faith by the Committee, in accordance with procedures adopted by the Board. Factors used in determining fair value vary by investment type and may include market or investment specific events, changes in interest rates and credit quality. The frequency with which these procedures are used cannot be predicted and they may be utilized to a significant extent. The Committee oversees the Fund's valuation policies and procedures and reports to the Board on the Committee's activities and fair value determinations. The Board monitors the appropriateness of the procedures used in valuing the Fund's investments and ratifies the fair value determinations of the Committee.
The Fund categorizes the inputs to valuation techniques used to value its investments into a disclosure hierarchy consisting of three levels as shown below:
- Level 1 – unadjusted quoted prices in active markets for identical investments
- Level 2 – other significant observable inputs (including quoted prices for similar investments, interest rates, prepayment speeds, etc.)
- Level 3 – unobservable inputs (including the Fund's own assumptions based on the best information available)
Valuation techniques used to value the Fund's investments by major category are as follows:
Debt securities, including restricted securities, are valued based on evaluated prices received from third party pricing vendors or from brokers who make markets in such securities. Corporate bonds and bank loan obligations are valued by pricing vendors who utilize matrix pricing which considers yield or price of bonds of comparable quality, coupon, maturity and type or by broker-supplied prices. When independent prices are unavailable or unreliable, debt securities may be valued utilizing pricing methodologies which consider similar factors that would be used by third party pricing vendors. Debt securities are generally categorized as Level 2 in the hierarchy but may be Level 3 depending on the circumstances. The Fund invests a significant portion of its assets in below investment grade securities. The value of these securities can be more volatile due to changes in the credit quality of the issuer and is sensitive to changes in economic, market and regulatory conditions.
Equity securities, including restricted securities, for which market quotations are readily available, are valued at the last reported sale price or official closing price as reported by a third party pricing vendor on the primary market or exchange on which they are traded and are categorized as Level 1 in the hierarchy. In the event there were no sales during the day or closing prices are not available, securities are valued at the last quoted bid price or may be valued using the last available price and are generally categorized as Level 2 in the hierarchy. For equity securities, including restricted securities, where observable inputs are limited, assumptions about market activity and risk are used and these securities may be categorized as Level 3 in the hierarchy. Securities, including private placements or other restricted securities, for which observable inputs are not available are valued using alternate valuation approaches, including the market approach, the income approach and cost approach, and are categorized as Level 3 in the hierarchy. The market approach considers factors including the price of recent investments in the same or a similar security or financial metrics of comparable securities. The income approach considers factors including expected future cash flows, security specific risks and corresponding discount rates. The cost approach considers factors including the value of the security's underlying assets and liabilities.
Investments in open-end mutual funds, including the Fidelity Central Funds, are valued at their closing net asset value (NAV) each business day and are categorized as Level 1 in the hierarchy.
Fidelity Direct Lending Fund, LP is valued using NAV as a practical expedient in accordance with the specialized accounting guidance for investment companies.
The following provides information on Level 3 securities held by the Fund that were valued at period end based on unobservable inputs. These amounts exclude valuations provided by a broker and valuations using NAV as a practical expedient.
| Asset Type | Fair Value | Valuation Technique(s) | Unobservable Input | Amount or Range/Weighted Average | Impact to Valuation from an Increase in Input(a) |
| Equities | $55,766 | Market approach | Liquidation preference | $1.00 | Increase |
| | | Recovery value | Recovery value | $45,228.15 | Increase |
| | | Market comparable | Enterprise value/EBITDA multiple (EV/EBITDA) | 2.6 - 3.8 / 3.2 | Increase |
| | | | Book value multiple | 1.0 | Increase |
| | | | Discount rate | 10.0% | Decrease |
| | | | Discount for lack of marketability | 10.0% | Decrease |
| | | | Comparable sales - land ($/Acre) | $5,500.00 - $6,000.00 / $,5773.16 | Increase |
| | | | Daily production multiple ($/Million cubic feet per day) | $2,500.00 | Increase |
| | | | Daily production multiple ($/Barrels of oil equivalent per day) | $17,500.00 | Increase |
| | | Discounted cash flow | Weighted average cost of capital (WACC) | 8.9% | Decrease |
| | | | Discount for lack of marketability | 10.0% | Decrease |
| | | | Growth rate | 1.5% | Increase |
| Corporate Bond | $22,150 | Recovery value | Recovery value | $0.00 | Increase |
| | | Market comparable | Enterprise value/EBITDA multiple (EV/EBITDA) | 2.6 | Increase |
| | | | Book value multiple | 1.00 | Increase |
| | | | Discount rate | 10.0% | Decrease |
| | | | Discount for lack of marketability | 10.0% | Decrease |
| | | | Comparable sales - land ($/Acre) | $5,500.00 | Increase |
| | | | Daily production multiple ($/Barrels of oil equivalent per day) | $17,500.00 | Increase |
| Bank Loan Obligations | $6,924 | Indicative market price | Evaluated bid | $97.75 | Increase |
| | | Recovery value | Recovery value | $0.00 | Increase |
(a) Represents the directional change in the fair value of the Level 3 investments that could have resulted from an increase in the corresponding input as of period end. A decrease to the unobservable input would have had the opposite effect. Significant changes in these inputs may have resulted in a significantly higher or lower fair value measurement at period end.
Changes in valuation techniques may result in transfers in or out of an assigned level within the disclosure hierarchy. The aggregate value of investments by input level as of April 30, 2022, as well as a roll forward of Level 3 investments, is included at the end of the Fund's Schedule of Investments.
Investment Transactions and Income. For financial reporting purposes, the Fund's investment holdings and NAV include trades executed through the end of the last business day of the period. The NAV per share for processing shareholder transactions is calculated as of the close of business of the New York Stock Exchange (NYSE), normally 4:00 p.m. Eastern time and includes trades executed through the end of the prior business day. Gains and losses on securities sold are determined on the basis of identified cost and include proceeds received from litigation. Commissions paid to certain brokers with whom the investment adviser, or its affiliates, places trades on behalf of a fund include an amount in addition to trade execution, which may be rebated back to a fund. Any such rebates are included in net realized gain (loss) on investments in the Statement of Operations. Dividend income is recorded on the ex-dividend date, except for certain dividends from foreign securities where the ex-dividend date may have passed, which are recorded as soon as the Fund is informed of the ex-dividend date. Non-cash dividends included in dividend income, if any, are recorded at the fair market value of the securities received. Income and capital gain distributions from Fidelity Central Funds, if any, are recorded on the ex-dividend date. Interest income is accrued as earned and includes coupon interest and amortization of premium and accretion of discount on debt securities as applicable. Debt obligations may be placed on non-accrual status and related interest income may be reduced by ceasing current accruals and writing off interest receivables when the collection of all or a portion of interest has become doubtful based on consistently applied procedures. A debt obligation is removed from non-accrual status when the issuer resumes interest payments or when collectability of interest is reasonably assured.
Class Allocations and Expenses. Investment income, realized and unrealized capital gains and losses, common expenses of a fund, and certain fund-level expense reductions, if any, are allocated daily on a pro-rata basis to each class based on the relative net assets of each class to the total net assets of a fund. Each class differs with respect to transfer agent and distribution and service plan fees incurred, as applicable. Certain expense reductions may also differ by class, if applicable. For the reporting period, the allocated portion of income and expenses to each class as a percent of its average net assets may vary due to the timing of recording these transactions in relation to fluctuating net assets of the classes. Expenses directly attributable to a fund are charged to that fund. Expenses attributable to more than one fund are allocated among the respective funds on the basis of relative net assets or other appropriate methods. Expenses included in the accompanying financial statements reflect the expenses of that fund and do not include any expenses associated with any underlying mutual funds or exchange-traded funds. Although not included in a fund's expenses, a fund indirectly bears its proportionate share of these expenses through the net asset value of each underlying mutual fund or exchange-traded fund. Expense estimates are accrued in the period to which they relate and adjustments are made when actual amounts are known.
Income Tax Information and Distributions to Shareholders. Each year, the Fund intends to qualify as a regulated investment company under Subchapter M of the Internal Revenue Code, including distributing substantially all of its taxable income and realized gains. As a result, no provision for U.S. Federal income taxes is required. As of April 30, 2022, the Fund did not have any unrecognized tax benefits in the financial statements; nor is the Fund aware of any tax positions for which it is reasonably possible that the total amounts of unrecognized tax benefits will significantly change in the next twelve months. The Fund files a U.S. federal tax return, in addition to state and local tax returns as required. The Fund's federal income tax returns are subject to examination by the Internal Revenue Service (IRS) for a period of three fiscal years after they are filed. State and local tax returns may be subject to examination for an additional fiscal year depending on the jurisdiction.
Distributions are declared and recorded daily and paid monthly from net investment income. Distributions from realized gains, if any, are declared and recorded on the ex-dividend date. Income and capital gain distributions are declared separately for each class. Income and capital gain distributions are determined in accordance with income tax regulations, which may differ from GAAP.
Capital accounts within the financial statements are adjusted for permanent book-tax differences. These adjustments have no impact on net assets or the results of operations. Capital accounts are not adjusted for temporary book-tax differences which will reverse in a subsequent period.
Book-tax differences are primarily due to prior period premium and discount on debt securities, market discount, redemptions in kind, partnerships, capital loss carryforwards and losses deferred due to wash sales.
As of period end, the cost and unrealized appreciation (depreciation) in securities, and derivatives if applicable, for federal income tax purposes were as follows:
| Gross unrealized appreciation | $70,594 |
| Gross unrealized depreciation | (395,193) |
| Net unrealized appreciation (depreciation) | $(324,599) |
| Tax Cost | $3,892,669 |
The tax-based components of distributable earnings as of period end were as follows:
| Undistributed ordinary income | $2,182 |
| Capital loss carryforward | $(388,885) |
| Net unrealized appreciation (depreciation) on securities and other investments | $(324,599) |
Capital loss carryforwards are only available to offset future capital gains of the Fund to the extent provided by regulations and may be limited. The capital loss carryforward information presented below, including any applicable limitation, is estimated as of fiscal period end and is subject to adjustment.
| Short-term | $(94,633) |
| Long-term | (294,252) |
| Total capital loss carryforward | $(388,885) |
The tax character of distributions paid was as follows:
| | April 30, 2022 | April 30, 2021 |
| Ordinary Income | $240,456 | $ 315,556 |
Restricted Securities (including Private Placements). Funds may invest in securities that are subject to legal or contractual restrictions on resale. These securities generally may be resold in transactions exempt from registration or to the public if the securities are registered. Disposal of these securities may involve time-consuming negotiations and expense, and prompt sale at an acceptable price may be difficult. Information regarding restricted securities held at period end is included at the end of the Schedule of Investments, if applicable.
Loans and Other Direct Debt Instruments. Direct debt instruments are interests in amounts owed to lenders by corporate or other borrowers. These instruments may be in the form of loans, trade claims or other receivables and may include standby financing commitments such as revolving credit facilities that obligate a fund to supply additional cash to the borrower on demand. Loans may be acquired through assignment, participation, or may be made directly to a borrower. Such instruments are presented in the Bank Loan Obligations section in the Schedule of Investments. Certain funds may also invest in unfunded loan commitments, which are contractual obligations for future funding. Information regarding unfunded commitments is included at the end of the Schedule of Investments, if applicable.
Commitments. A commitment is an agreement to acquire an investment at a future date (subject to conditions) in connection with a potential public or non-public offering. The amount of commitments outstanding at period end are presented in the table below. These commitments are not included in the net assets of the Fund at period end.
| | Investment to be Acquired | Commitment Amount |
| Fidelity High Income Fund | Fidelity Direct Lending Fund, LP | $40,063 |
5. Purchases and Sales of Investments.
Purchases and sales of securities, other than short-term securities and in-kind transactions, as applicable, are noted in the table below.
| | Purchases ($) | Sales ($) |
| Fidelity High Income Fund | 2,666,265 | 3,059,206 |
6. Fees and Other Transactions with Affiliates.
Management Fee. Fidelity Management & Research Company LLC (the investment adviser) and its affiliates provide the Fund with investment management related services for which the Fund pays a monthly management fee. The management fee is the sum of an individual fund fee rate that is based on an annual rate of .45% of the Fund's average net assets and an annualized group fee rate that averaged .10% during the period. The group fee rate is based upon the monthly average net assets of a group of registered investment companies with which the investment adviser has management contracts. The group fee rate decreases as assets under management increase and increases as assets under management decrease. For the reporting period, the total annual management fee rate was .54% of the Fund's average net assets.
Distribution and Service Plan Fees. In accordance with Rule 12b-1 of the 1940 Act, the Fund has adopted separate Distribution and Service Plans for each class of shares. Certain classes pay Fidelity Distributors Company LLC (FDC), an affiliate of the investment adviser, separate Distribution and Service Fees, each of which is based on an annual percentage of each class' average net assets. In addition, FDC may pay financial intermediaries for selling shares of the Fund and providing shareholder support services. For the period, the Distribution and Service Fee rates, total fees and amounts retained by FDC were as follows:
| | Distribution Fee | Service Fee | Total Fees | Retained by FDC |
| Class A | -% | .25% | $366 | $4 |
| Class M | -% | .25% | 85 | 1 |
| Class C | .75% | .25% | 227 | 24 |
| | | | $678 | $29 |
Sales Load. FDC may receive a front-end sales charge of up to 4.00% for selling Class A shares and Class M shares, some of which is paid to financial intermediaries for selling shares of the Fund. Depending on the holding period, FDC may receive contingent deferred sales charges levied on Class A, Class M and Class C redemptions. The deferred sales charges are 1.00% for Class C shares, 1.00% for certain purchases of Class A shares and .25% for certain purchases of Class M shares.
For the period, sales charge amounts retained by FDC were as follows:
| | Retained by FDC |
| Class A | $12 |
| Class M | 2 |
| Class C(a) | 1 |
| | $15 |
(a) When Class C shares are initially sold, FDC pays commissions from its own resources to financial intermediaries through which the sales are made.
Transfer Agent Fees. Fidelity Investments Institutional Operations Company LLC (FIIOC), an affiliate of the investment adviser, is the transfer, dividend disbursing and shareholder servicing agent for each class of the Fund. FIIOC receives account fees and asset-based fees that vary according to the account size and type of account of the shareholders of the respective classes of the Fund, except for Class Z. FIIOC receives an asset-based fee of Class Z's average net assets. FIIOC pays for typesetting, printing and mailing of shareholder reports, except proxy statements.
For the period, transfer agent fees for each class were as follows:
| | Amount | % of Class-Level Average Net Assets |
| Class A | $223 | .15 |
| Class M | 55 | .16 |
| Class C | 40 | .18 |
| Fidelity High Income Fund | 4,282 | .11 |
| Class I | 1,003 | .14 |
| Class Z | 221 | .05 |
| | $5,824 | |
During the period, the investment adviser or its affiliates waived a portion of these fees.
Accounting Fees. Fidelity Service Company, Inc. (FSC), an affiliate of the investment adviser, maintains the Fund's accounting records. The accounting fee is based on the level of average net assets for each month. For the period, the fees were equivalent to the following annual rates:
| | % of Average Net Assets |
| Fidelity High Income Fund | .02 |
Brokerage Commissions. A portion of portfolio transactions were placed with brokerage firms which are affiliates of the investment adviser. Brokerage commissions are included in net realized gain (loss) and change in net unrealized appreciation (depreciation) in the Statement of Operations. The commissions paid to these affiliated firms were as follows:
| | Amount |
| Fidelity High Income Fund | $–(a) |
(a) In the amount represents less than 500.
Interfund Lending Program. Pursuant to an Exemptive Order issued by the Securities and Exchange Commission (the SEC), the Fund, along with other registered investment companies having management contracts with Fidelity Management & Research Company LLC (FMR), or other affiliated entities of FMR, may participate in an interfund lending program. This program provides an alternative credit facility allowing the Fund to borrow from, or lend money to, other participating affiliated funds. At period end, there were no interfund loans outstanding. Activity in this program during the period for which loans were outstanding was as follows:
| | Borrower or Lender | Average Loan Balance | Weighted Average Interest Rate | Interest Expense |
| Fidelity High Income Fund | Borrower | $36,951 | .32% | $1 |
Interfund Trades. Funds may purchase from or sell securities to other Fidelity Funds under procedures adopted by the Board. The procedures have been designed to ensure these interfund trades are executed in accordance with Rule 17a-7 of the 1940 Act. Any interfund trades are included within the respective purchases and sales amounts shown in the Purchases and Sales of Investments note. Interfund trades during the period are noted in the table below.
| | Purchases ($) | Sales ($) | Realized Gain (Loss) ($) |
| Fidelity High Income Fund | 7 | – | – |
Affiliated Redemptions In-Kind. Shares that were redeemed in-kind for investments, including accrued interest and cash, if any, are shown in the table below. The net realized gain or loss on investments delivered through in-kind redemptions is included in the accompanying Statement of Operations. The amount of the in-kind redemptions is included in share transactions in the accompanying Statement of Changes in Net Assets. There was no gain or loss for federal income tax purposes.
| | Shares | Total net realized gain or loss
($) | Total Proceeds
($) | Participating classes |
| Fidelity High Income Fund | 479,966 | 172,034 | 4,188,784 | Class I & Class Z |
7. Committed Line of Credit.
Certain Funds participate with other funds managed by the investment adviser or an affiliate in a $4.25 billion credit facility (the "line of credit") to be utilized for temporary or emergency purposes to fund shareholder redemptions or for other short-term liquidity purposes. The participating funds have agreed to pay commitment fees on their pro-rata portion of the line of credit, which are reflected in Miscellaneous expenses on the Statement of Operations, and are listed below. During the period, there were no borrowings on this line of credit.
| | Amount |
| Fidelity High Income Fund | $9 |
8. Security Lending.
Funds lend portfolio securities from time to time in order to earn additional income. Lending agents are used, including National Financial Services (NFS), an affiliate of the investment adviser. Pursuant to a securities lending agreement, NFS will receive a fee, which is capped at 9.9% of a fund's daily lending revenue, for its services as lending agent. A fund may lend securities to certain qualified borrowers, including NFS. On the settlement date of the loan, a fund receives collateral (in the form of U.S. Treasury obligations, letters of credit and/or cash) against the loaned securities and maintains collateral in an amount not less than 100% of the market value of the loaned securities during the period of the loan. The market value of the loaned securities is determined at the close of business of a fund and any additional required collateral is delivered to a fund on the next business day. A fund or borrower may terminate the loan at any time, and if the borrower defaults on its obligation to return the securities loaned because of insolvency or other reasons, a fund may apply collateral received from the borrower against the obligation. A fund may experience delays and costs in recovering the securities loaned. Any cash collateral received is invested in the Fidelity Securities Lending Cash Central Fund. Any loaned securities are identified as such in the Schedule of Investments, and the value of loaned securities and cash collateral at period end, as applicable, are presented in the Statement of Assets and Liabilities. Security lending income represents the income earned on investing cash collateral, less rebates paid to borrowers and any lending agent fees associated with the loan, plus any premium payments received for lending certain types of securities. Security lending income is presented in the Statement of Operations as a component of income from Fidelity Central Funds. Affiliated security lending activity, if any, was as follows:
| | Total Security Lending Fees Paid to NFS | Security Lending Income From Securities Loaned to NFS | Value of Securities Loaned to NFS at Period End |
| Fidelity High Income Fund | $8 | $–(a) | $– |
(a) In the amount of less than five hundred dollars.
9. Expense Reductions.
Effective July 1, 2021, FIIOC voluntarily agreed to waive Class I transfer agent fees to the extent that they exceeded certain levels of class-level average net assets as noted in the table below. This waiver will remain in place through June 30, 2022.
| | Transfer Agent Fees Limitation | Waiver |
| Class I | .15% | $65 |
Effective July 1, 2022, FIIOC voluntarily agreed to waive Class I transfer agent fees to the extent that they exceed .19% of class-level average net assets. This waiver will remain in place through June 30, 2023.
Through arrangements with the Fund's custodian, credits realized as a result of certain uninvested cash balances were used to reduce the Fund's expenses. During the period, custodian credits reduced the Fund's expenses by $1.
In addition, during the period the investment adviser or an affiliate reimbursed and/or waived a portion of fund-level operating expenses in the amount of $87.
10. Distributions to Shareholders.
Distributions to shareholders of each class were as follows:
| | Year ended
April 30, 2022 | Year ended
April 30, 2021 |
| Fidelity High Income Fund | | |
| Distributions to shareholders | | |
| Class A | $6,554 | $6,259 |
| Class M | 1,513 | 1,679 |
| Class C | 831 | 1,222 |
| Fidelity High Income Fund | 178,412 | 189,847 |
| Class I | 31,049 | 107,936 |
| Class Z | 22,097 | 8,613 |
| Total | $240,456 | $315,556 |
11. Share Transactions.
Share transactions for each class were as follows and may contain in-kind transactions, automatic conversions between classes or exchanges between affiliated funds:
| | Shares | Shares | Dollars | Dollars |
| | Year ended April 30, 2022 | Year ended April 30, 2021 | Year ended April 30, 2022 | Year ended April 30, 2021 |
| Fidelity High Income Fund | | | | |
| Class A | | | | |
| Shares sold | 2,452 | 2,258 | $21,067 | $19,321 |
| Reinvestment of distributions | 699 | 654 | 5,992 | 5,572 |
| Shares redeemed | (3,491) | (4,027) | (29,901) | (34,214) |
| Net increase (decrease) | (340) | (1,115) | $(2,842) | $(9,321) |
| Class M | | | | |
| Shares sold | 322 | 417 | $2,710 | $3,545 |
| Reinvestment of distributions | 158 | 179 | 1,351 | 1,524 |
| Shares redeemed | (812) | (1,542) | (6,983) | (13,162) |
| Net increase (decrease) | (332) | (946) | $(2,922) | $(8,093) |
| Class C | | | | |
| Shares sold | 356 | 490 | $3,077 | $4,159 |
| Reinvestment of distributions | 90 | 133 | 771 | 1,134 |
| Shares redeemed | (1,717) | (1,765) | (14,804) | (15,113) |
| Net increase (decrease) | (1,271) | (1,142) | $(10,956) | $(9,820) |
| Fidelity High Income Fund | | | | |
| Shares sold | 80,328 | 154,848 | $693,806 | $1,314,275 |
| Reinvestment of distributions | 16,883 | 18,289 | 144,797 | 155,903 |
| Shares redeemed | (170,267) | (186,129) | (1,465,748) | (1,590,238) |
| Net increase (decrease) | (73,056) | (12,992) | $(627,145) | $(120,060) |
| Class I | | | | |
| Shares sold | 31,952 | 427,069 | $277,895 | $3,636,803 |
| Reinvestment of distributions | 3,376 | 11,329 | 29,375 | 97,348 |
| Shares redeemed | (485,210) | (48,201) | (4,252,953) | (412,228) |
| Net increase (decrease) | (449,882) | 390,197 | $(3,945,683) | $3,321,923 |
| Class Z | | | | |
| Shares sold | 51,130 | 29,771 | $445,549 | $251,887 |
| Reinvestment of distributions | 2,488 | 945 | 21,382 | 8,117 |
| Shares redeemed | (65,393) | (9,762) | (546,569) | (84,065) |
| Net increase (decrease) | (11,775) | 20,954 | $(79,638) | $175,939 |
12. Other.
A fund's organizational documents provide former and current trustees and officers with a limited indemnification against liabilities arising in connection with the performance of their duties to the fund. In the normal course of business, a fund may also enter into contracts that provide general indemnifications. A fund's maximum exposure under these arrangements is unknown as this would be dependent on future claims that may be made against a fund. The risk of material loss from such claims is considered remote.
13. Coronavirus (COVID-19) Pandemic.
An outbreak of COVID-19 first detected in China during December 2019 has since spread globally and was declared a pandemic by the World Health Organization during March 2020. Developments that disrupt global economies and financial markets, such as the COVID-19 pandemic, may magnify factors that affect the Fund's performance.
Report of Independent Registered Public Accounting Firm
To the Board of Trustees of Fidelity Summer Street Trust and Shareholders of Fidelity High Income Fund
Opinion on the Financial Statements
We have audited the accompanying statement of assets and liabilities, including the schedule of investments, of Fidelity High Income Fund (one of the funds constituting Fidelity Summer Street Trust, referred to hereafter as the “Fund”) as of April 30, 2022, the related statement of operations for the year ended April 30, 2022, the statement of changes in net assets for each of the two years in the period ended April 30, 2022, including the related notes, and the financial highlights for each of the periods indicated therein (collectively referred to as the “financial statements”). In our opinion, the financial statements present fairly, in all material respects, the financial position of the Fund as of April 30, 2022, the results of its operations for the year then ended, the changes in its net assets for each of the two years in the period ended April 30, 2022 and the financial highlights for each of the periods indicated therein in conformity with accounting principles generally accepted in the United States of America.
Basis for Opinion
These financial statements are the responsibility of the Fund’s management. Our responsibility is to express an opinion on the Fund’s financial statements based on our audits. We are a public accounting firm registered with the Public Company Accounting Oversight Board (United States) (PCAOB) and are required to be independent with respect to the Fund in accordance with the U.S. federal securities laws and the applicable rules and regulations of the Securities and Exchange Commission and the PCAOB.
We conducted our audits of these financial statements in accordance with the standards of the PCAOB. Those standards require that we plan and perform the audit to obtain reasonable assurance about whether the financial statements are free of material misstatement, whether due to error or fraud.
Our audits included performing procedures to assess the risks of material misstatement of the financial statements, whether due to error or fraud, and performing procedures that respond to those risks. Such procedures included examining, on a test basis, evidence regarding the amounts and disclosures in the financial statements. Our audits also included evaluating the accounting principles used and significant estimates made by management, as well as evaluating the overall presentation of the financial statements. Our procedures included confirmation of securities owned as of April 30, 2022 by correspondence with the custodian, issuers of privately offered securities, agent banks and brokers; when replies were not received from brokers, we performed other auditing procedures. We believe that our audits provide a reasonable basis for our opinion.
/s/ PricewaterhouseCoopers LLP
Boston, Massachusetts
June 14, 2022
We have served as the auditor of one or more investment companies in the Fidelity group of funds since 1932.
Trustees and Officers
The Trustees, Members of the Advisory Board (if any), and officers of the trust and fund, as applicable, are listed below. The Board of Trustees governs the fund and is responsible for protecting the interests of shareholders. The Trustees are experienced executives who meet periodically throughout the year to oversee the fund's activities, review contractual arrangements with companies that provide services to the fund, oversee management of the risks associated with such activities and contractual arrangements, and review the fund's performance. Each of the Trustees oversees 324 funds.
The Trustees hold office without limit in time except that (a) any Trustee may resign; (b) any Trustee may be removed by written instrument, signed by at least two-thirds of the number of Trustees prior to such removal; (c) any Trustee who requests to be retired or who has become incapacitated by illness or injury may be retired by written instrument signed by a majority of the other Trustees; and (d) any Trustee may be removed at any special meeting of shareholders by a two-thirds vote of the outstanding voting securities of the trust. Each Trustee who is not an interested person (as defined in the 1940 Act) of the trust and the fund is referred to herein as an Independent Trustee. Each Independent Trustee shall retire not later than the last day of the calendar year in which his or her 75th birthday occurs. The Independent Trustees may waive this mandatory retirement age policy with respect to individual Trustees. Officers and Advisory Board Members hold office without limit in time, except that any officer or Advisory Board Member may resign or may be removed by a vote of a majority of the Trustees at any regular meeting or any special meeting of the Trustees. Except as indicated, each individual has held the office shown or other offices in the same company for the past five years.
The fund's Statement of Additional Information (SAI) includes more information about the Trustees. To request a free copy, call Fidelity at 1-800-544-8544 if you’re an individual investing directly with Fidelity, call 1-800-835-5092 if you’re a plan sponsor or participant with Fidelity as your recordkeeper or call 1-877-208-0098 on institutional accounts or if you’re an advisor or invest through one.
Experience, Skills, Attributes, and Qualifications of the Trustees. The Governance and Nominating Committee has adopted a statement of policy that describes the experience, qualifications, attributes, and skills that are necessary and desirable for potential Independent Trustee candidates (Statement of Policy). The Board believes that each Trustee satisfied at the time he or she was initially elected or appointed a Trustee, and continues to satisfy, the standards contemplated by the Statement of Policy. The Governance and Nominating Committee also engages professional search firms to help identify potential Independent Trustee candidates who have the experience, qualifications, attributes, and skills consistent with the Statement of Policy. From time to time, additional criteria based on the composition and skills of the current Independent Trustees, as well as experience or skills that may be appropriate in light of future changes to board composition, business conditions, and regulatory or other developments, have also been considered by the professional search firms and the Governance and Nominating Committee. In addition, the Board takes into account the Trustees' commitment and participation in Board and committee meetings, as well as their leadership of standing and ad hoc committees throughout their tenure.
In determining that a particular Trustee was and continues to be qualified to serve as a Trustee, the Board has considered a variety of criteria, none of which, in isolation, was controlling. The Board believes that, collectively, the Trustees have balanced and diverse experience, qualifications, attributes, and skills, which allow the Board to operate effectively in governing the fund and protecting the interests of shareholders. Information about the specific experience, skills, attributes, and qualifications of each Trustee, which in each case led to the Board's conclusion that the Trustee should serve (or continue to serve) as a trustee of the fund, is provided below.
Board Structure and Oversight Function. Robert A. Lawrence is an interested person and currently serves as Chair. The Trustees have determined that an interested Chair is appropriate and benefits shareholders because an interested Chair has a personal and professional stake in the quality and continuity of services provided to the fund. Independent Trustees exercise their informed business judgment to appoint an individual of their choosing to serve as Chair, regardless of whether the Trustee happens to be independent or a member of management. The Independent Trustees have determined that they can act independently and effectively without having an Independent Trustee serve as Chair and that a key structural component for assuring that they are in a position to do so is for the Independent Trustees to constitute a substantial majority for the Board. The Independent Trustees also regularly meet in executive session. David M. Thomas serves as Lead Independent Trustee and as such (i) acts as a liaison between the Independent Trustees and management with respect to matters important to the Independent Trustees and (ii) with management prepares agendas for Board meetings.
Fidelity® funds are overseen by different Boards of Trustees. The fund's Board oversees Fidelity's high income and certain equity funds, and other Boards oversee Fidelity's investment-grade bond, money market, asset allocation, and other equity funds. The asset allocation funds may invest in Fidelity® funds overseen by the fund's Board. The use of separate Boards, each with its own committee structure, allows the Trustees of each group of Fidelity® funds to focus on the unique issues of the funds they oversee, including common research, investment, and operational issues. On occasion, the separate Boards establish joint committees to address issues of overlapping consequences for the Fidelity® funds overseen by each Board.
The Trustees operate using a system of committees to facilitate the timely and efficient consideration of all matters of importance to the Trustees, the fund, and fund shareholders and to facilitate compliance with legal and regulatory requirements and oversight of the fund's activities and associated risks. The Board, acting through its committees, has charged FMR and its affiliates with (i) identifying events or circumstances the occurrence of which could have demonstrably adverse effects on the fund's business and/or reputation; (ii) implementing processes and controls to lessen the possibility that such events or circumstances occur or to mitigate the effects of such events or circumstances if they do occur; and (iii) creating and maintaining a system designed to evaluate continuously business and market conditions in order to facilitate the identification and implementation processes described in (i) and (ii) above. Because the day-to-day operations and activities of the fund are carried out by or through FMR, its affiliates, and other service providers, the fund's exposure to risks is mitigated but not eliminated by the processes overseen by the Trustees. While each of the Board's committees has responsibility for overseeing different aspects of the fund's activities, oversight is exercised primarily through the Operations, Audit, and Compliance Committees. Appropriate personnel, including but not limited to the fund's Chief Compliance Officer (CCO), FMR's internal auditor, the independent accountants, the fund's Treasurer and portfolio management personnel, make periodic reports to the Board's committees, as appropriate, including an annual review of Fidelity's risk management program for the Fidelity® funds. The responsibilities of each standing committee, including their oversight responsibilities, are described further under "Standing Committees of the Trustees."
Interested Trustees*:
Correspondence intended for a Trustee who is an interested person may be sent to Fidelity Investments, 245 Summer Street, Boston, Massachusetts 02210.
Name, Year of Birth; Principal Occupations and Other Relevant Experience+
Bettina Doulton (1964)
Year of Election or Appointment: 2020
Trustee
Ms. Doulton also serves as Trustee of other Fidelity® funds. Prior to her retirement, Ms. Doulton served in a variety of positions at Fidelity Investments, including as a managing director of research (2006-2007), portfolio manager to certain Fidelity® funds (1993-2005), equity analyst and portfolio assistant (1990-1993), and research assistant (1987-1990). Ms. Doulton currently owns and operates Phi Builders + Architects and Cellardoor Winery. Previously, Ms. Doulton served as a member of the Board of Brown Capital Management, LLC (2014-2018).
Robert A. Lawrence (1952)
Year of Election or Appointment: 2020
Trustee
Chair of the Board of Trustees
Mr. Lawrence also serves as Trustee of other funds. Previously, Mr. Lawrence served as a Member of the Advisory Board of certain funds. Prior to his retirement in 2008, Mr. Lawrence served as Vice President of certain Fidelity® funds (2006-2008), Senior Vice President, Head of High Income Division of Fidelity Management & Research Company (investment adviser firm, 2006-2008), and President of Fidelity Strategic Investments (investment adviser firm, 2002-2005).
* Determined to be an “Interested Trustee” by virtue of, among other things, his or her affiliation with the trust or various entities under common control with FMR.
+ The information includes the Trustee's principal occupation during the last five years and other information relating to the experience, attributes, and skills relevant to the Trustee's qualifications to serve as a Trustee, which led to the conclusion that the Trustee should serve as a Trustee for the fund.
Independent Trustees:
Correspondence intended for an Independent Trustee may be sent to Fidelity Investments, P.O. Box 55235, Boston, Massachusetts 02205-5235.
Name, Year of Birth; Principal Occupations and Other Relevant Experience+
Thomas P. Bostick (1956)
Year of Election or Appointment: 2021
Trustee
Lieutenant General Bostick also serves as Trustee of other Fidelity® funds. Prior to his retirement, General Bostick (United States Army, Retired) held a variety of positions within the U.S. Army, including Commanding General and Chief of Engineers, U.S. Army Corps of Engineers (2012-2016) and Deputy Chief of Staff and Director of Human Resources, U.S. Army (2009-2012). General Bostick currently serves as a member of the Board and Finance and Governance Committees of CSX Corporation (transportation, 2020-present) and a member of the Board and Corporate Governance and Nominating Committee of Perma-Fix Environmental Services, Inc. (nuclear waste management, 2020-present). General Bostick serves as Chief Executive Officer of Bostick Global Strategies, LLC (consulting, 2016-present) and as a member of the Board of HireVue, Inc. (video interview and assessment, 2020-present). Previously, General Bostick served as a Member of the Advisory Board of certain Fidelity® funds (2021), President, Intrexon Bioengineering (2018-2020) and Chief Operating Officer (2017-2020) and Senior Vice President of the Environment Sector (2016-2017) of Intrexon Corporation (biopharmaceutical company).
Dennis J. Dirks (1948)
Year of Election or Appointment: 2005
Trustee
Mr. Dirks also serves as Trustee of other Fidelity® funds. Prior to his retirement in May 2003, Mr. Dirks served as Chief Operating Officer and as a member of the Board of The Depository Trust & Clearing Corporation (financial markets infrastructure), President, Chief Operating Officer and a member of the Board of The Depository Trust Company (DTC), President and a member of the Board of the National Securities Clearing Corporation (NSCC), Chief Executive Officer and a member of the Board of the Government Securities Clearing Corporation and Chief Executive Officer and a member of the Board of the Mortgage-Backed Securities Clearing Corporation. Mr. Dirks currently serves as a member of the Finance Committee (2016-present) and Board (2017-present) and is Treasurer (2018-present) of the Asolo Repertory Theatre.
Donald F. Donahue (1950)
Year of Election or Appointment: 2018
Trustee
Mr. Donahue also serves as Trustee of other Fidelity® funds. Mr. Donahue serves as President and Chief Executive Officer of Miranda Partners, LLC (risk consulting for the financial services industry, 2012-present). Previously, Mr. Donahue served as Chief Executive Officer (2006-2012), Chief Operating Officer (2003-2006) and Managing Director, Customer Marketing and Development (1999-2003) of The Depository Trust & Clearing Corporation (financial markets infrastructure). Mr. Donahue currently serves as a member (2007-present) and Co-Chairman (2016-present) of the Board of United Way of New York and a member of the Board of The Leadership Academy (previously NYC Leadership Academy) (2012-present). Mr. Donahue previously served as a member of the Advisory Board of certain Fidelity® funds (2015-2018).
Vicki L. Fuller (1957)
Year of Election or Appointment: 2020
Trustee
Ms. Fuller also serves as Trustee of other Fidelity® funds. Previously, Ms. Fuller served as a member of the Advisory Board of certain Fidelity® funds (2018-2020), Chief Investment Officer of the New York State Common Retirement Fund (2012-2018) and held a variety of positions at AllianceBernstein L.P. (global asset management, 1985-2012), including Managing Director (2006-2012) and Senior Vice President and Senior Portfolio Manager (2001-2006). Ms. Fuller currently serves as a member of the Board, Audit Committee and Nominating and Governance Committee of two Blackstone business development companies (2020-present), as a member of the Board of Treliant, LLC (consulting, 2019-present), as a member of the Advisory Board of Ariel Alternatives, LLC (private equity, 2021-present) and as a member of the Board and Chair of the Audit Committee of Gusto, Inc. (software, 2021-present). In addition, Ms. Fuller currently serves as a member of the Board of Roosevelt University (2019-present) and as a member of the Executive Board of New York University’s Stern School of Business. Ms. Fuller previously served as a member of the Board, Audit Committee and Nominating and Governance Committee of The Williams Companies, Inc. (natural gas infrastructure, 2018-2021).
Patricia L. Kampling (1959)
Year of Election or Appointment: 2020
Trustee
Ms. Kampling also serves as Trustee of other Fidelity® funds. Prior to her retirement, Ms. Kampling served as Chairman of the Board and Chief Executive Officer (2012-2019), President and Chief Operating Officer (2011-2012) and Executive Vice President and Chief Financial Officer (2010-2011) of Alliant Energy Corporation. Ms. Kampling currently serves as a member of the Board, Finance Committee and Governance, Compensation and Nominating Committee of Xcel Energy Inc. (utilities company, 2020-present) and as a member of the Board, Audit, Finance and Risk Committee and Safety, Environmental, Technology and Operations Committee and Chair of the Executive Development and Compensation Committee of American Water Works Company, Inc. (utilities company, 2019-present). In addition, Ms. Kampling currently serves as a member of the Board of the Nature Conservancy, Wisconsin Chapter (2019-present). Previously, Ms. Kampling served as a Member of the Advisory Board of certain Fidelity® funds (2020), a member of the Board, Compensation Committee and Executive Committee and Chair of the Audit Committee of Briggs & Stratton Corporation (manufacturing, 2011-2021), a member of the Board of Interstate Power and Light Company (2012-2019) and Wisconsin Power and Light Company (2012-2019) (each a subsidiary of Alliant Energy Corporation) and as a member of the Board and Workforce Development Committee of the Business Roundtable (2018-2019).
Thomas A. Kennedy (1955)
Year of Election or Appointment: 2021
Trustee
Mr. Kennedy also serves as Trustee of other Fidelity® funds. Previously, Mr. Kennedy served as a Member of the Advisory Board of certain Fidelity® funds (2020) and held a variety of positions at Raytheon Company (aerospace and defense, 1983-2020), including Chairman and Chief Executive Officer (2014-2020) and Executive Vice President and Chief Operating Officer (2013-2014). Mr. Kennedy currently serves as Executive Chairman of the Board of Directors of Raytheon Technologies Corporation (aerospace and defense, 2020-present). He is also a member of the Rutgers School of Engineering Industry Advisory Board (2011-present) and a member of the UCLA Engineering Dean’s Executive Board (2016-present).
Oscar Munoz (1959)
Year of Election or Appointment: 2021
Trustee
Mr. Munoz also serves as Trustee of other Fidelity® funds. Prior to his retirement, Mr. Munoz served as Executive Chairman (2020-2021), Chief Executive Officer (2015-2020), President (2015-2016) and a member of the Board (2010-2021) of United Airlines Holdings, Inc. Mr. Munoz currently serves as a member of the Board of CBRE Group, Inc. (commercial real estate, 2020-present), a member of the Board of Univision Communications, Inc. (Hispanic media, 2020-present) and a member of the Advisory Board of Salesforce.com, Inc. (cloud-based software, 2020-present). Previously, Mr. Munoz served as a Member of the Advisory Board of certain Fidelity® funds (2021).
Garnett A. Smith (1947)
Year of Election or Appointment: 2018
Trustee
Mr. Smith also serves as Trustee of other Fidelity® funds. Prior to his retirement, Mr. Smith served as Chairman and Chief Executive Officer (1990-1997) and President (1986-1990) of Inbrand Corp. (manufacturer of personal absorbent products). Prior to his employment with Inbrand Corp., he was employed by a retail fabric chain and North Carolina National Bank (now Bank of America). Mr. Smith previously served as a member of the Advisory Board of certain Fidelity® funds (2012-2013).
David M. Thomas (1949)
Year of Election or Appointment: 2008
Trustee
Lead Independent Trustee
Mr. Thomas also serves as Trustee of other Fidelity® funds. Previously, Mr. Thomas served as Executive Chairman (2005-2006) and Chairman and Chief Executive Officer (2000-2005) of IMS Health, Inc. (pharmaceutical and healthcare information solutions). Mr. Thomas currently serves as a member of the Board of Fortune Brands Home and Security (home and security products, 2004-present) and as Director (2013-present) and Non-Executive Chairman of the Board (2022-present) of Interpublic Group of Companies, Inc. (marketing communication).
Susan Tomasky (1953)
Year of Election or Appointment: 2020
Trustee
Ms. Tomasky also serves as Trustee of other Fidelity® funds. Prior to her retirement, Ms. Tomasky served in various executive officer positions at American Electric Power Company, Inc. (1998-2011), including most recently as President of AEP Transmission (2007-2011). Ms. Tomasky currently serves as a member of the Board and Sustainability Committee and as Chair of the Audit Committee of Marathon Petroleum Corporation (2018-present) and as a member of the Board, Executive Committee, Corporate Governance Committee and Organization and Compensation Committee and as Chair of the Audit Committee of Public Service Enterprise Group, Inc. (utilities company, 2012-present) and as a member of the Board of its subsidiary company, Public Service Electric and Gas Co. (2021-present). In addition, Ms. Tomasky currently serves as a member (2009-present) and President (2020-present) of the Board of the Royal Shakespeare Company – America (2009-present), as a member of the Board of the Columbus Association for the Performing Arts (2011-present) and as a member of the Board and Kenyon in the World Committee of Kenyon College (2016-present). Previously, Ms. Tomasky served as a Member of the Advisory Board of certain Fidelity® funds (2020), as a member of the Board of the Columbus Regional Airport Authority (2007-2020), as a member of the Board (2011-2018) and Lead Independent Director (2015-2018) of Andeavor Corporation (previously Tesoro Corporation) (independent oil refiner and marketer) and as a member of the Board of Summit Midstream Partners LP (energy, 2012-2018).
Michael E. Wiley (1950)
Year of Election or Appointment: 2018
Trustee
Mr. Wiley also serves as Trustee of other Fidelity® funds. Previously, Mr. Wiley served as a member of the Advisory Board of certain Fidelity® funds (2018-2020), Chairman, President and CEO of Baker Hughes, Inc. (oilfield services, 2000-2004). Mr. Wiley also previously served as a member of the Board of Andeavor Corporation (independent oil refiner and marketer, 2005-2018), a member of the Board of Andeavor Logistics LP (natural resources logistics, 2015-2018) and a member of the Board of High Point Resources (exploration and production, 2005-2020).
+ The information includes the Trustee's principal occupation during the last five years and other information relating to the experience, attributes, and skills relevant to the Trustee's qualifications to serve as a Trustee, which led to the conclusion that the Trustee should serve as a Trustee for the fund.
Advisory Board Members and Officers:
Correspondence intended for a Member of the Advisory Board (if any) may be sent to Fidelity Investments, P.O. Box 55235, Boston, Massachusetts 02205-5235. Correspondence intended for an officer or Peter S. Lynch may be sent to Fidelity Investments, 245 Summer Street, Boston, Massachusetts 02210. Officers appear below in alphabetical order.
Name, Year of Birth; Principal Occupation
Peter S. Lynch (1944)
Year of Election or Appointment: 2003
Member of the Advisory Board
Mr. Lynch also serves as a Member of the Advisory Board of other Fidelity® funds. Mr. Lynch is Vice Chairman and a Director of Fidelity Management & Research Company LLC (investment adviser firm). In addition, Mr. Lynch serves as a Trustee of Boston College and as the Chairman of the Inner-City Scholarship Fund. Previously, Mr. Lynch served as Vice Chairman and a Director of FMR Co., Inc. (investment adviser firm) and on the Special Olympics International Board of Directors (1997-2006).
Craig S. Brown (1977)
Year of Election or Appointment: 2019
Assistant Treasurer
Mr. Brown also serves as an officer of other funds. Mr. Brown serves as Assistant Treasurer of FIMM, LLC (2021-present) and is an employee of Fidelity Investments (2013-present).
John J. Burke III (1964)
Year of Election or Appointment: 2018
Chief Financial Officer
Mr. Burke also serves as Chief Financial Officer of other funds. Mr. Burke serves as Head of Investment Operations for Fidelity Fund and Investment Operations (2018-present) and is an employee of Fidelity Investments (1998-present). Previously Mr. Burke served as head of Asset Management Investment Operations (2012-2018).
William C. Coffey (1969)
Year of Election or Appointment: 2019
Assistant Secretary
Mr. Coffey also serves as Assistant Secretary of other funds. He is Senior Vice President and Deputy General Counsel of FMR LLC (diversified financial services company, 2010-present), and is an employee of Fidelity Investments. Previously, Mr. Coffey served as Secretary and CLO of certain funds (2018-2019); CLO, Secretary, and Senior Vice President of Fidelity Management & Research Company and FMR Co., Inc. (investment adviser firms, 2018-2019); Secretary of Fidelity SelectCo, LLC and Fidelity Investments Money Management, Inc. (investment adviser firms, 2018-2019); CLO of Fidelity Management & Research (Hong Kong) Limited, FMR Investment Management (UK) Limited, and Fidelity Management & Research (Japan) Limited (investment adviser firms, 2018-2019); and Assistant Secretary of certain funds (2009-2018).
Timothy M. Cohen (1969)
Year of Election or Appointment: 2018
Vice President
Mr. Cohen also serves as Vice President of other funds. Mr. Cohen serves as Co-Head of Equity (2018-present), a Director of Fidelity Management & Research (Japan) Limited (investment adviser firm, 2016-present), and is an employee of Fidelity Investments. Previously, Mr. Cohen served as Executive Vice President of Fidelity SelectCo, LLC (2019), Head of Global Equity Research (2016-2018), Chief Investment Officer - Equity and a Director of Fidelity Management & Research (U.K.) Inc. (investment adviser firm, 2013-2015) and as a Director of Fidelity Management & Research (Hong Kong) Limited (investment adviser firm, 2017).
Jonathan Davis (1968)
Year of Election or Appointment: 2010
Assistant Treasurer
Mr. Davis also serves as an officer of other funds. Mr. Davis serves as Assistant Treasurer of FIMM, LLC (2021-present), FMR Capital, Inc. (2017-present), FD Funds GP LLC (2021-present), FD Funds Holding LLC (2021-present), and FD Funds Management LLC (2021-present); and is an employee of Fidelity Investments. Previously, Mr. Davis served as Vice President and Associate General Counsel of FMR LLC (diversified financial services company, 2003-2010).
Laura M. Del Prato (1964)
Year of Election or Appointment: 2018
Assistant Treasurer
Ms. Del Prato also serves as an officer of other funds. Ms. Del Prato serves as Assistant Treasurer of FIMM, LLC (2021-present) and is an employee of Fidelity Investments (2017-present). Previously, Ms. Del Prato served as President and Treasurer of The North Carolina Capital Management Trust: Cash Portfolio and Term Portfolio (2018-2020). Prior to joining Fidelity Investments, Ms. Del Prato served as a Managing Director and Treasurer of the JPMorgan Mutual Funds (2014-2017). Prior to JPMorgan, Ms. Del Prato served as a partner at Cohen Fund Audit Services (accounting firm, 2012-2013) and KPMG LLP (accounting firm, 2004-2012).
Colm A. Hogan (1973)
Year of Election or Appointment: 2020
Assistant Treasurer
Mr. Hogan also serves as an officer of other funds. Mr. Hogan serves as Assistant Treasurer of FIMM, LLC (2021-present) and FMR Capital, Inc. (2017-present) and is an employee of Fidelity Investments (2005-present). Previously, Mr. Hogan served as Deputy Treasurer of certain Fidelity® funds (2016-2020) and Assistant Treasurer of certain Fidelity® funds (2016-2018).
Pamela R. Holding (1964)
Year of Election or Appointment: 2018
Vice President
Ms. Holding also serves as Vice President of other funds. Ms. Holding serves as Co-Head of Equity (2018-present) and is an employee of Fidelity Investments (2013-present). Previously, Ms. Holding served as Executive Vice President of Fidelity SelectCo, LLC (2019) and as Chief Investment Officer of Fidelity Institutional Asset Management (2013-2018).
Cynthia Lo Bessette (1969)
Year of Election or Appointment: 2019
Secretary and Chief Legal Officer (CLO)
Ms. Lo Bessette also serves as an officer of other funds. Ms. Lo Bessette serves as CLO, Secretary, and Senior Vice President of Fidelity Management & Research Company LLC (investment adviser firm, 2019-present); CLO of Fidelity Management & Research (Hong Kong) Limited, FMR Investment Management (UK) Limited, and Fidelity Management & Research (Japan) Limited (investment adviser firms, 2019-present); Secretary of FD Funds GP LLC (2021-present), FD Funds Holding LLC (2021-present), and FD Funds Management LLC (2021-present); and Assistant Secretary of FIMM, LLC (2019-present). She is a Senior Vice President and Deputy General Counsel of FMR LLC (diversified financial services company, 2019-present), and is an employee of Fidelity Investments. Previously, Ms. Lo Bessette served as CLO, Secretary, and Senior Vice President of FMR Co., Inc. (investment adviser firm, 2019); Secretary of Fidelity SelectCo, LLC and Fidelity Investments Money Management, Inc. (investment adviser firms, 2019). Prior to joining Fidelity Investments, Ms. Lo Bessette was Executive Vice President, General Counsel (2016-2019) and Senior Vice President, Deputy General Counsel (2015-2016) of OppenheimerFunds (investment management company) and Deputy Chief Legal Officer (2013-2015) of Jennison Associates LLC (investment adviser firm).
Chris Maher (1972)
Year of Election or Appointment: 2020
Deputy Treasurer
Mr. Maher also serves as an officer of other funds. Mr. Maher serves as Assistant Treasurer of FIMM, LLC (2021-present) and FMR Capital, Inc. (2017-present), and is an employee of Fidelity Investments (2008-present). Previously, Mr. Maher served as Assistant Treasurer of certain funds (2013-2020); Vice President of Asset Management Compliance (2013), Vice President of the Program Management Group of FMR (investment adviser firm, 2010-2013), and Vice President of Valuation Oversight (2008-2010).
Jason P. Pogorelec (1975)
Year of Election or Appointment: 2020
Chief Compliance Officer
Mr. Pogorelec also serves as Chief Compliance Officer of other funds. Mr. Pogorelec is a senior Vice President of Asset Management Compliance for Fidelity Investments and is an employee of Fidelity Investments (2006-present). Previously, Mr. Pogorelec served as Vice President, Associate General Counsel for Fidelity Investments (2010-2020) and Assistant Secretary of certain Fidelity funds (2015-2020).
Brett Segaloff (1972)
Year of Election or Appointment: 2021
Anti-Money Laundering (AML) Officer
Mr. Segaloff also serves as an AML Officer of other funds and other related entities. He is Director, Anti-Money Laundering (2007-present) of FMR LLC (diversified financial services company) and is an employee of Fidelity Investments (1996-present).
Stacie M. Smith (1974)
Year of Election or Appointment: 2016
President and Treasurer
Ms. Smith also serves as an officer of other funds. Ms. Smith serves as Assistant Treasurer of FIMM, LLC (2021-present) and FMR Capital, Inc. (2017-present), is an employee of Fidelity Investments (2009-present), and has served in other fund officer roles. Prior to joining Fidelity Investments, Ms. Smith served as Senior Audit Manager of Ernst & Young LLP (accounting firm, 1996-2009). Previously, Ms. Smith served as Assistant Treasurer (2013-2019) and Deputy Treasurer (2013-2016) of certain Fidelity® funds.
Jim Wegmann (1979)
Year of Election or Appointment: 2019
Assistant Treasurer
Mr. Wegmann also serves as an officer of other funds. Mr. Wegmann serves as Assistant Treasurer of FIMM, LLC (2021-present) and is an employee of Fidelity Investments (2011-present). Previously, Mr. Wegmann served as Assistant Treasurer of certain Fidelity® funds (2019-2021).
Shareholder Expense Example
As a shareholder, you incur two types of costs: (1) transaction costs, which may include sales charges (loads) on purchase payments or redemption proceeds, as applicable and (2) ongoing costs, which generally include management fees, distribution and/or service (12b-1) fees and other Fund expenses. This Example is intended to help you understand your ongoing costs (in dollars) of investing in a fund and to compare these costs with the ongoing costs of investing in other mutual funds.
The Example is based on an investment of $1,000 invested at the beginning of the period and held for the entire period (November 1, 2021 to April 30, 2022).
Actual Expenses
The first line of the accompanying table provides information about actual account values and actual expenses. You may use the information in this line, together with the amount you invested, to estimate the expenses that you paid over the period. Simply divide your account value by $1,000.00 (for example, an $8,600 account value divided by $1,000.00 = 8.6), then multiply the result by the number in the first line for a class/Fund under the heading entitled "Expenses Paid During Period" to estimate the expenses you paid on your account during this period. If any fund is a shareholder of any underlying mutual funds or exchange-traded funds (ETFs) (the Underlying Funds), such fund indirectly bears its proportional share of the expenses of the Underlying Funds in addition to the direct expenses incurred presented in the table. These fees and expenses are not included in the annualized expense ratio used to calculate the expense estimate in the table below.
Hypothetical Example for Comparison Purposes
The second line of the accompanying table provides information about hypothetical account values and hypothetical expenses based on the actual expense ratio and an assumed rate of return of 5% per year before expenses, which is not the actual return. The hypothetical account values and expenses may not be used to estimate the actual ending account balance or expenses you paid for the period. You may use this information to compare the ongoing costs of investing in the Fund and other funds. To do so, compare this 5% hypothetical example with the 5% hypothetical examples that appear in the shareholder reports of the other funds. If any fund is a shareholder of any Underlying Funds, such fund indirectly bears its proportional share of the expenses of the Underlying Funds in addition to the direct expenses as presented in the table. These fees and expenses are not included in the annualized expense ratio used to calculate the expense estimate in the table below.
Please note that the expenses shown in the table are meant to highlight your ongoing costs only and do not reflect any transaction costs. Therefore, the second line of the table is useful in comparing ongoing costs only, and will not help you determine the relative total costs of owning different funds. In addition, if these transactional costs were included, your costs would have been higher.
| | Annualized Expense Ratio-A | Beginning
Account Value
November 1, 2021 | Ending
Account Value
April 30, 2022 | Expenses Paid
During Period-B
November 1, 2021
to April 30, 2022 |
| Fidelity High Income Fund | | | | |
| Class A | 1.01% | | | |
| Actual | | $1,000.00 | $930.70 | $4.83 |
| Hypothetical-C | | $1,000.00 | $1,019.79 | $5.06 |
| Class M | 1.02% | | | |
| Actual | | $1,000.00 | $930.60 | $4.88 |
| Hypothetical-C | | $1,000.00 | $1,019.74 | $5.11 |
| Class C | 1.79% | | | |
| Actual | | $1,000.00 | $926.00 | $8.55 |
| Hypothetical-C | | $1,000.00 | $1,015.92 | $8.95 |
| Fidelity High Income Fund | .72% | | | |
| Actual | | $1,000.00 | $932.00 | $3.45 |
| Hypothetical-C | | $1,000.00 | $1,021.22 | $3.61 |
| Class I | .96% | | | |
| Actual | | $1,000.00 | $930.80 | $4.60 |
| Hypothetical-C | | $1,000.00 | $1,020.03 | $4.81 |
| Class Z | .65% | | | |
| Actual | | $1,000.00 | $932.40 | $3.11 |
| Hypothetical-C | | $1,000.00 | $1,021.57 | $3.26 |
A Annualized expense ratio reflects expenses net of applicable fee waivers.
B Expenses are equal to the annualized expense ratio, multiplied by the average account value over the period, multiplied by 181/ 365 (to reflect the one-half year period). The fees and expenses of any Underlying Funds are not included in each annualized expense ratio.
C 5% return per year before expenses
Distributions (Unaudited)
The dividend and capital gains distributions for the fund(s) are available on Fidelity.com or Institutional.Fidelity.com.
The fund designates $ 217,988,740 of distributions paid in the calendar year 2021 as qualifying to be taxed as interest-related dividends for nonresident alien shareholders.
The fund designates $ 282,034,640 of distributions paid in the calendar year 2021 as qualifying to be taxed as section 163(j) interest dividends.
The fund will notify shareholders in January 2023 of amounts for use in preparing 2022 income tax returns.
Liquidity Risk Management Program
The Securities and Exchange Commission adopted Rule 22e-4 under the Investment Company Act of 1940 (the Liquidity Rule) to promote effective liquidity risk management throughout the open-end investment company industry, thereby reducing the risk that funds will be unable to meet their redemption obligations and mitigating dilution of the interests of fund shareholders.
The Fund has adopted and implemented a liquidity risk management program pursuant to the Liquidity Rule (the Program) effective December 1, 2018. The Program is reasonably designed to assess and manage the Fund’s liquidity risk and to comply with the requirements of the Liquidity Rule. The Fund’s Board of Trustees (the Board) has designated the Fund’s investment adviser as administrator of the Program. The Fidelity advisers have established a Liquidity Risk Management Committee (the LRM Committee) to manage the Program for each of the Fidelity Funds. The LRM Committee monitors the adequacy and effectiveness of implementation of the Program and on a periodic basis assesses each Fund’s liquidity risk based on a variety of factors including (1) the Fund’s investment strategy, (2) portfolio liquidity and cash flow projections during normal and reasonably foreseeable stressed conditions, (3) shareholder redemptions, (4) borrowings and other funding sources and (5) in the case of exchange-traded funds, certain additional factors including the effect of the Fund’s prices and spreads, market participants, and basket compositions on the overall liquidity of the Fund’s portfolio, as applicable.
In accordance with the Program, each of the Fund’s portfolio investments is classified into one of four liquidity categories described below based on a determination of a reasonable expectation for how long it would take to convert the investment to cash (or sell or dispose of the investment) without significantly changing its market value.
- Highly liquid investments – cash or convertible to cash within three business days or less
- Moderately liquid investments – convertible to cash in three to seven calendar days
- Less liquid investments – can be sold or disposed of, but not settled, within seven calendar days
- Illiquid investments – cannot be sold or disposed of within seven calendar days
Liquidity classification determinations take into account a variety of factors including various market, trading and investment-specific considerations, as well as market depth, and generally utilize analysis from a third-party liquidity metrics service.
The Liquidity Rule places a 15% limit on a fund’s illiquid investments and requires funds that do not primarily hold assets that are highly liquid investments to determine and maintain a minimum percentage of the fund’s net assets to be invested in highly liquid investments (highly liquid investment minimum or HLIM). The Program includes provisions reasonably designed to comply with the 15% limit on illiquid investments and for determining, periodically reviewing and complying with the HLIM requirement as applicable.
At a recent meeting of the Fund’s Board of Trustees, the LRM Committee provided a written report to the Board pertaining to the operation, adequacy, and effectiveness of implementation of the Program for the annual period from December 1, 2020 through November 30, 2021. The report concluded that the Program has been implemented and is operating effectively and is reasonably designed to assess and manage the Fund’s liquidity risk.
SPH-ANN-0622
1.703464.124
Fidelity® Focused High Income Fund
Annual Report
April 30, 2022
Contents
To view a fund's proxy voting guidelines and proxy voting record for the 12-month period ended June 30, visit http://www.fidelity.com/proxyvotingresults or visit the Securities and Exchange Commission's (SEC) web site at http://www.sec.gov.
You may also call 1-800-544-8544 to request a free copy of the proxy voting guidelines.
Standard & Poor's, S&P and S&P 500 are registered service marks of The McGraw-Hill Companies, Inc. and have been licensed for use by Fidelity Distributors Corporation.
Other third-party marks appearing herein are the property of their respective owners.
All other marks appearing herein are registered or unregistered trademarks or service marks of FMR LLC or an affiliated company. © 2022 FMR LLC. All rights reserved.
This report and the financial statements contained herein are submitted for the general information of the shareholders of the Fund. This report is not authorized for distribution to prospective investors in the Fund unless preceded or accompanied by an effective prospectus.
A fund files its complete schedule of portfolio holdings with the SEC for the first and third quarters of each fiscal year on Form N-PORT. Forms N-PORT are available on the SEC’s web site at http://www.sec.gov. A fund's Forms N-PORT may be reviewed and copied at the SEC’s Public Reference Room in Washington, DC. Information regarding the operation of the SEC's Public Reference Room may be obtained by calling 1-800-SEC-0330.
For a complete list of a fund's portfolio holdings, view the most recent holdings listing, semiannual report, or annual report on Fidelity's web site at http://www.fidelity.com, http://www.institutional.fidelity.com, or http://www.401k.com, as applicable.
NOT FDIC INSURED •MAY LOSE VALUE •NO BANK GUARANTEE
Neither the Fund nor Fidelity Distributors Corporation is a bank.
Note to Shareholders:
Early in 2020, the outbreak and spread of COVID-19 emerged as a public health emergency that had a major influence on financial markets, primarily based on its impact on the global economy and corporate earnings. On March 11, 2020, the World Health Organization declared the COVID-19 outbreak a pandemic, citing sustained risk of further global spread. The pandemic prompted a number of measures to limit the spread of COVID-19, including travel and border restrictions, quarantines, and restrictions on large gatherings. In turn, these resulted in lower consumer activity, diminished demand for a wide range of products and services, disruption in manufacturing and supply chains, and – given the wide variability in outcomes regarding the outbreak – significant market uncertainty and volatility. To help stem the turmoil, the U.S. government took unprecedented action – in concert with the U.S. Federal Reserve and central banks around the world – to help support consumers, businesses, and the broader economy, and to limit disruption to the financial system.
In general, the overall impact of the pandemic lessened in 2021, amid a resilient economy and widespread distribution of three COVID-19 vaccines granted emergency use authorization from the U.S. Food and Drug Administration (FDA) early in the year. Still, the situation remains dynamic, and the extent and duration of its influence on financial markets and the economy is highly uncertain, due in part to a recent spike in cases based on highly contagious variants of the coronavirus.
Extreme events such as the COVID-19 crisis are exogenous shocks that can have significant adverse effects on mutual funds and their investments. Although multiple asset classes may be affected by market disruption, the duration and impact may not be the same for all types of assets. Fidelity is committed to helping you stay informed amid news about COVID-19 and during increased market volatility, and we continue to take extra steps to be responsive to customer needs. We encourage you to visit us online, where we offer ongoing updates, commentary, and analysis on the markets and our funds.
Performance: The Bottom Line
Average annual total return reflects the change in the value of an investment, assuming reinvestment of distributions from dividend income and capital gains (the profits earned upon the sale of securities that have grown in value, if any) and assuming a constant rate of performance each year. The hypothetical investment and the average annual total returns do not reflect the deduction of taxes that a shareholder would pay on fund distributions or the redemption of fund shares. During periods of reimbursement by Fidelity, a fund’s total return will be greater than it would be had the reimbursement not occurred. How a fund did yesterday is no guarantee of how it will do tomorrow.
Average Annual Total Returns
| For the periods ended April 30, 2022 | Past 1 year | Past 5 years | Past 10 years |
| Fidelity® Focused High Income Fund | (6.41)% | 2.55% | 3.82% |
$10,000 Over 10 Years
Let's say hypothetically that $10,000 was invested in Fidelity® Focused High Income Fund on April 30, 2012.
The chart shows how the value of your investment would have changed, and also shows how the ICE® BofA® BB US High Yield Constrained Index performed over the same period.

| Period Ending Values |
| $14,544 | Fidelity® Focused High Income Fund |
| $16,726 | ICE® BofA® BB US High Yield Constrained Index |
Management's Discussion of Fund Performance
Market Recap: The ICE BofA
® US High Yield Constrained Index returned -4.96% for the 12 months ending April 30, 2022. After posting a solid gain in 2021, high-yield bonds retreated to begin the new year amid several major headwinds that stoked volatility, uncertainty and investor anxiety. Chief among these was the U.S. Federal Reserve’s accelerated plan to hike interest rates and aggressively wind down its balance sheet in an attempt to rein in historically high inflation. In addition, geopolitical unrest rose as Russia invaded Ukraine in late February and escalated its attack through period end. Other factors influencing high yield included surging commodity prices, rising bond yields, supply constraint and disruption, and the potential for variants of the coronavirus to upend the economy. Against this dynamic backdrop, the index returned -2.74% in January and -0.90% in February amid an intensifying flight from risk. Volatility eased in March and credit fundamentals remained healthy, but high yield still lost ground (-0.92%) for the month. April saw the downtrend continue, with the index returning -3.63% amid clearer signals of the Fed’s intension to tighten monetary policy and angst about the economic toll of “zero-COVID” lockdowns in China. For the full 12 months, higher-duration BB-rated bonds slightly trailed lower-quality credits. By sector, energy rode a surge in commodity prices and led the way with a modest gain. All other groups declined. Notable laggards included cable/satellite TV, telecommunications, health care, utilities and food/beverage/tobacco.
Comments from Co-Managers Benjamin Harrison, Alexandre Karam, and Michael Weaver: For the fiscal year, the fund returned -6.41%, trailing the -5.65% result of the benchmark ICE BofA
® BB US High Yield Constrained Index. The fund's core investment in high-yield bonds returned -5.84% and detracted from performance versus the benchmark. By industry, security selection was the primary detractor, especially in consumer products. The fund's largest individual relative detractor was an outsized stake in Newell Brands, which returned -22% the past year. Also holding back performance was our overweighting in Telecom Italia Capital, which returned -22%. The fund's out-of-benchmark stake in Diamond Sports returned -40% and also detracted. Conversely, the largest contributor to performance versus the benchmark was positioning in energy. Security selection in utilities and chemicals also helped. Our non-benchmark stake in Jonah Energy was the fund's biggest individual relative contributor, driven by a gain of about 350%. Also helping performance was our outsized stake in Crestwood Midstream, which gained 1%. Crestwood Midstream was among the biggest holdings in the fund. The fund's out-of-benchmark stake in TransDigm gained approximately 1%. By quality, positioning and picks among bonds rated B added the most value versus the benchmark, while security choices among BB-rated bonds hurt the most. Notable changes in positioning include reduced exposure to the utilities industry and a higher allocation to services.
The views expressed above reflect those of the portfolio manager(s) only through the end of the period as stated on the cover of this report and do not necessarily represent the views of Fidelity or any other person in the Fidelity organization. Any such views are subject to change at any time based upon market or other conditions and Fidelity disclaims any responsibility to update such views. These views may not be relied on as investment advice and, because investment decisions for a Fidelity fund are based on numerous factors, may not be relied on as an indication of trading intent on behalf of any Fidelity fund.
Note to shareholders: On January 3, 2022, Benjamin Harrison assumed co-management responsibilities for the fund.
Investment Summary (Unaudited)
Top Bond Issuers as of April 30, 2022
| (by issuer, excluding cash equivalents) | % of fund's net assets |
| Occidental Petroleum Corp. | 2.4 |
| Sprint Capital Corp. | 1.9 |
| VICI Properties LP / VICI Note Co. | 1.9 |
| CCO Holdings LLC/CCO Holdings Capital Corp. | 1.8 |
| Crestwood Midstream Partners LP/Crestwood Midstream Finance Corp. | 1.8 |
| Icahn Enterprises LP/Icahn Enterprises Finance Corp. | 1.7 |
| PG&E Corp. | 1.6 |
| Ford Motor Credit Co. LLC | 1.6 |
| Level 3 Financing, Inc. | 1.5 |
| HCA Holdings, Inc. | 1.5 |
| | 17.7 |
Top Five Market Sectors as of April 30, 2022
| | % of fund's net assets |
| Energy | 17.9 |
| Telecommunications | 9.3 |
| Healthcare | 7.8 |
| Utilities | 6.5 |
| Services | 5.0 |
Quality Diversification (% of fund's net assets)
| As of April 30, 2022 |
| | BBB | 5.4% |
| | BB | 61.5% |
| | B | 26.3% |
| | CCC,CC,C | 0.6% |
| | Equities | 0.3% |
| | Short-Term Investments and Net Other Assets | 5.9% |

We have used ratings from Moody's Investors Service, Inc. Where Moody's® ratings are not available, we have used S&P® ratings. All ratings are as of the date indicated and do not reflect subsequent changes.
Asset Allocation (% of fund's net assets)
| As of April 30, 2022* |
| | Nonconvertible Bonds | 91.0% |
| | Convertible Bonds, Preferred Stocks | 0.6% |
| | Common Stocks | 0.3% |
| | Bank Loan Obligations | 0.9% |
| | Preferred Securities | 1.3% |
| | Short-Term Investments and Net Other Assets (Liabilities) | 5.9% |

* Foreign investments - 13.5%
Geographic Diversification (% of fund's net assets)
| As of April 30, 2022 |
| | United States of America* | 86.5% |
| | Luxembourg | 2.5% |
| | Netherlands | 2.0% |
| | Canada | 1.8% |
| | Cayman Islands | 1.6% |
| | Multi-National | 1.6% |
| | Panama | 1.1% |
| | Liberia | 0.7% |
| | United Kingdom | 0.7% |
| | Other | 1.5% |

* Includes Short-Term investments and Net Other Assets (Liabilities).
Percentages are based on country or territory of incorporation and are adjusted for the effect of futures contracts, if applicable.
Schedule of Investments April 30, 2022
Showing Percentage of Net Assets
| Corporate Bonds - 91.6% | | | |
| | | Principal Amount | Value |
| Convertible Bonds - 0.6% | | | |
| Broadcasting - 0.6% | | | |
| DISH Network Corp.: | | | |
| 2.375% 3/15/24 | | $1,230,000 | $1,143,285 |
| 3.375% 8/15/26 | | 680,000 | 583,100 |
| | | | 1,726,385 |
| Nonconvertible Bonds - 91.0% | | | |
| Aerospace - 2.5% | | | |
| BWX Technologies, Inc. 4.125% 6/30/28 (a) | | 795,000 | 737,363 |
| Howmet Aerospace, Inc. 6.75% 1/15/28 | | 665,000 | 704,900 |
| Kaiser Aluminum Corp. 4.625% 3/1/28 (a) | | 1,730,000 | 1,587,275 |
| Moog, Inc. 4.25% 12/15/27 (a) | | 1,025,000 | 954,531 |
| Rolls-Royce PLC 5.75% 10/15/27 (a) | | 1,115,000 | 1,074,670 |
| Science Applications International Corp. 4.875% 4/1/28(a) | | 150,000 | 143,250 |
| TransDigm, Inc.: | | | |
| 7.5% 3/15/27 | | 145,000 | 146,088 |
| 8% 12/15/25 (a) | | 1,505,000 | 1,566,434 |
| | | | 6,914,511 |
| Air Transportation - 0.3% | | | |
| United Airlines, Inc. 4.375% 4/15/26 (a) | | 750,000 | 724,125 |
| Automotive & Auto Parts - 2.2% | | | |
| Allison Transmission, Inc. 3.75% 1/30/31 (a) | | 1,115,000 | 964,475 |
| Dana, Inc. 4.5% 2/15/32 | | 380,000 | 313,500 |
| Ford Motor Credit Co. LLC: | | | |
| 2.7% 8/10/26 | | 305,000 | 271,901 |
| 4% 11/13/30 | | 1,495,000 | 1,293,175 |
| 4.687% 6/9/25 | | 2,140,000 | 2,098,206 |
| 5.125% 6/16/25 | | 530,000 | 528,675 |
| LCM Investments Holdings 4.875% 5/1/29 (a) | | 165,000 | 144,593 |
| Thor Industries, Inc. 4% 10/15/29 (a) | | 500,000 | 422,555 |
| | | | 6,037,080 |
| Banks & Thrifts - 0.4% | | | |
| Jane Street Group LLC/JSG Finance, Inc. 4.5% 11/15/29 (a) | | 210,000 | 194,464 |
| Quicken Loans LLC/Quicken Loans Co-Issuer, Inc. 3.625% 3/1/29 (a) | | 1,185,000 | 1,013,175 |
| | | | 1,207,639 |
| Broadcasting - 2.1% | | | |
| Diamond Sports Group LLC/Diamond Sports Finance Co. 5.375% 8/15/26 (a) | | 1,390,000 | 514,300 |
| Scripps Escrow II, Inc. 3.875% 1/15/29 (a) | | 410,000 | 364,449 |
| Sirius XM Radio, Inc.: | | | |
| 3.875% 9/1/31 (a) | | 390,000 | 329,359 |
| 5% 8/1/27 (a) | | 2,285,000 | 2,205,025 |
| 5.5% 7/1/29 (a) | | 625,000 | 601,038 |
| TEGNA, Inc.: | | | |
| 4.625% 3/15/28 | | 1,645,000 | 1,582,819 |
| 5% 9/15/29 | | 210,000 | 203,700 |
| | | | 5,800,690 |
| Building Materials - 1.0% | | | |
| Advanced Drain Systems, Inc. 5% 9/30/27 (a) | | 1,320,000 | 1,275,450 |
| Builders FirstSource, Inc. 4.25% 2/1/32 (a) | | 355,000 | 303,081 |
| Standard Industries, Inc./New Jersey 4.375% 7/15/30 (a) | | 1,300,000 | 1,084,012 |
| | | | 2,662,543 |
| Cable/Satellite TV - 4.0% | | | |
| CCO Holdings LLC/CCO Holdings Capital Corp.: | | | |
| 4.5% 8/15/30 (a) | | 675,000 | 588,938 |
| 4.5% 6/1/33 (a) | | 785,000 | 642,224 |
| 5% 2/1/28 (a) | | 1,780,000 | 1,695,450 |
| 5.125% 5/1/27 (a) | | 2,110,000 | 2,056,786 |
| CSC Holdings LLC: | | | |
| 4.125% 12/1/30 (a) | | 1,360,000 | 1,122,000 |
| 5.375% 2/1/28 (a) | | 1,500,000 | 1,377,203 |
| 5.5% 4/15/27 (a) | | 1,320,000 | 1,274,368 |
| VZ Secured Financing BV 5% 1/15/32 (a) | | 1,770,000 | 1,526,625 |
| Ziggo Bond Co. BV 6% 1/15/27 (a) | | 300,000 | 294,000 |
| Ziggo BV 4.875% 1/15/30 (a) | | 475,000 | 420,969 |
| | | | 10,998,563 |
| Chemicals - 4.3% | | | |
| Axalta Coating Systems/Dutch Holding BV 4.75% 6/15/27 (a) | | 935,000 | 888,250 |
| CF Industries Holdings, Inc.: | | | |
| 4.95% 6/1/43 | | 5,000 | 4,844 |
| 5.15% 3/15/34 | | 1,545,000 | 1,595,182 |
| LSB Industries, Inc. 6.25% 10/15/28 (a) | | 235,000 | 230,286 |
| Methanex Corp.: | | | |
| 5.125% 10/15/27 | | 1,405,000 | 1,348,800 |
| 5.25% 12/15/29 | | 160,000 | 152,000 |
| 5.65% 12/1/44 | | 991,000 | 867,125 |
| NOVA Chemicals Corp. 5.25% 6/1/27 (a) | | 1,710,000 | 1,620,225 |
| Nufarm Australia Ltd. 5% 1/27/30 (a) | | 865,000 | 817,425 |
| Olin Corp. 5.125% 9/15/27 | | 1,695,000 | 1,679,237 |
| SPCM SA 3.125% 3/15/27 (a) | | 385,000 | 339,763 |
| The Chemours Co. LLC: | | | |
| 4.625% 11/15/29 (a) | | 385,000 | 333,506 |
| 5.375% 5/15/27 | | 1,000,000 | 965,000 |
| 5.75% 11/15/28 (a) | | 505,000 | 473,438 |
| Valvoline, Inc. 4.25% 2/15/30 (a) | | 255,000 | 221,213 |
| W.R. Grace Holding LLC 4.875% 6/15/27 (a) | | 505,000 | 474,801 |
| | | | 12,011,095 |
| Consumer Products - 0.8% | | | |
| Newell Brands, Inc. 5.875% 4/1/36 (b) | | 490,000 | 468,332 |
| Nordstrom, Inc. 4.375% 4/1/30 | | 930,000 | 809,351 |
| Prestige Brands, Inc. 3.75% 4/1/31 (a) | | 600,000 | 508,650 |
| Tempur Sealy International, Inc. 3.875% 10/15/31 (a) | | 395,000 | 327,289 |
| | | | 2,113,622 |
| Containers - 1.0% | | | |
| Ardagh Packaging Finance PLC/Ardagh MP Holdings U.S.A., Inc. 4.125% 8/15/26 (a) | | 50,000 | 46,250 |
| Ball Corp. 3.125% 9/15/31 | | 1,340,000 | 1,121,299 |
| Graphic Packaging International, Inc. 3.75% 2/1/30 (a) | | 190,000 | 166,579 |
| OI European Group BV 4.75% 2/15/30 (a) | | 390,000 | 343,200 |
| Trivium Packaging Finance BV 5.5% 8/15/26 (a) | | 1,215,000 | 1,173,994 |
| | | | 2,851,322 |
| Diversified Financial Services - 4.4% | | | |
| Coinbase Global, Inc.: | | | |
| 3.375% 10/1/28 (a) | | 965,000 | 749,255 |
| 3.625% 10/1/31 (a) | | 965,000 | 712,874 |
| Hightower Holding LLC 6.75% 4/15/29 (a) | | 1,105,000 | 1,018,037 |
| Icahn Enterprises LP/Icahn Enterprises Finance Corp.: | | | |
| 5.25% 5/15/27 | | 3,405,000 | 3,166,650 |
| 6.25% 5/15/26 | | 1,620,000 | 1,606,100 |
| Ladder Capital Finance Holdings LLLP/Ladder Capital Finance Corp. 4.25% 2/1/27 (a) | | 845,000 | 776,724 |
| LPL Holdings, Inc. 4% 3/15/29 (a) | | 1,520,000 | 1,383,200 |
| MSCI, Inc. 3.25% 8/15/33 (a) | | 310,000 | 261,950 |
| OneMain Finance Corp.: | | | |
| 3.5% 1/15/27 | | 1,145,000 | 1,005,905 |
| 6.875% 3/15/25 | | 1,105,000 | 1,110,525 |
| 7.125% 3/15/26 | | 500,000 | 506,250 |
| | | | 12,297,470 |
| Diversified Media - 0.6% | | | |
| Lamar Media Corp. 3.625% 1/15/31 | | 915,000 | 796,050 |
| Nielsen Finance LLC/Nielsen Finance Co. 5.625% 10/1/28 (a) | | 910,000 | 881,817 |
| | | | 1,677,867 |
| Energy - 17.6% | | | |
| Apache Corp.: | | | |
| 4.25% 1/15/30 | | 215,000 | 199,748 |
| 5.1% 9/1/40 | | 600,000 | 543,000 |
| 5.25% 2/1/42 | | 905,000 | 832,600 |
| 5.35% 7/1/49 | | 150,000 | 131,625 |
| Cheniere Energy Partners LP: | | | |
| 3.25% 1/31/32 (a) | | 385,000 | 329,175 |
| 4% 3/1/31 | | 1,625,000 | 1,470,796 |
| Cheniere Energy, Inc. 4.625% 10/15/28 | | 1,085,000 | 1,049,738 |
| Citgo Petroleum Corp. 6.375% 6/15/26 (a) | | 1,160,000 | 1,152,808 |
| CNX Midstream Partners LP 4.75% 4/15/30 (a) | | 160,000 | 147,200 |
| Colgate Energy Partners III LLC 5.875% 7/1/29 (a) | | 200,000 | 198,000 |
| Continental Resources, Inc. 5.75% 1/15/31 (a) | | 1,630,000 | 1,666,414 |
| Crestwood Midstream Partners LP/Crestwood Midstream Finance Corp.: | | | |
| 5.625% 5/1/27 (a) | | 1,928,000 | 1,877,390 |
| 5.75% 4/1/25 | | 3,007,000 | 2,971,126 |
| CVR Energy, Inc.: | | | |
| 5.25% 2/15/25 (a) | | 1,200,000 | 1,160,880 |
| 5.75% 2/15/28 (a) | | 150,000 | 140,592 |
| DCP Midstream Operating LP: | | | |
| 5.375% 7/15/25 | | 640,000 | 643,200 |
| 5.6% 4/1/44 | | 85,000 | 81,258 |
| 6.45% 11/3/36 (a) | | 380,000 | 424,876 |
| 8.125% 8/16/30 | | 25,000 | 29,375 |
| Endeavor Energy Resources LP/EER Finance, Inc.: | | | |
| 5.75% 1/30/28 (a) | | 735,000 | 736,896 |
| 6.625% 7/15/25 (a) | | 170,000 | 174,675 |
| EnLink Midstream LLC 5.625% 1/15/28 (a) | | 195,000 | 193,225 |
| EnLink Midstream Partners LP: | | | |
| 5.05% 4/1/45 | | 255,000 | 196,327 |
| 5.45% 6/1/47 | | 530,000 | 429,300 |
| 5.6% 4/1/44 | | 895,000 | 738,442 |
| EQM Midstream Partners LP: | | | |
| 4.75% 1/15/31 (a) | | 985,000 | 878,226 |
| 5.5% 7/15/28 | | 800,000 | 764,000 |
| 6.5% 7/1/27 (a) | | 785,000 | 792,850 |
| 6.5% 7/15/48 | | 485,000 | 446,200 |
| EQT Corp. 3.9% 10/1/27 | | 1,450,000 | 1,388,332 |
| Hess Midstream Partners LP: | | | |
| 5.125% 6/15/28 (a) | | 1,070,000 | 1,035,225 |
| 5.625% 2/15/26 (a) | | 2,310,000 | 2,310,000 |
| Hilcorp Energy I LP/Hilcorp Finance Co. 6.25% 11/1/28 (a) | | 330,000 | 328,565 |
| Holly Energy Partners LP/Holly Energy Finance Corp.: | | | |
| 5% 2/1/28 (a) | | 1,360,000 | 1,293,918 |
| 6.375% 4/15/27 (a) | | 270,000 | 275,400 |
| New Fortress Energy, Inc. 6.5% 9/30/26 (a) | | 1,040,000 | 1,006,533 |
| Occidental Petroleum Corp.: | | | |
| 3.5% 8/15/29 | | 810,000 | 756,338 |
| 4.2% 3/15/48 | | 530,000 | 439,238 |
| 4.3% 8/15/39 | | 260,000 | 220,831 |
| 4.4% 4/15/46 | | 815,000 | 698,944 |
| 4.4% 8/15/49 | | 920,000 | 780,441 |
| 5.55% 3/15/26 | | 1,275,000 | 1,306,875 |
| 6.125% 1/1/31 | | 1,310,000 | 1,376,889 |
| 6.2% 3/15/40 | | 255,000 | 263,961 |
| 7.875% 9/15/31 | | 170,000 | 198,761 |
| 8.875% 7/15/30 | | 580,000 | 696,632 |
| PBF Holding Co. LLC/PBF Finance Corp. 9.25% 5/15/25 (a) | | 2,630,000 | 2,722,050 |
| Rockies Express Pipeline LLC: | | | |
| 4.8% 5/15/30 (a) | | 1,285,000 | 1,176,989 |
| 4.95% 7/15/29 (a) | | 495,000 | 463,335 |
| 6.875% 4/15/40 (a) | | 190,000 | 180,500 |
| Sunoco LP/Sunoco Finance Corp.: | | | |
| 4.5% 5/15/29 | | 1,140,000 | 1,025,122 |
| 5.875% 3/15/28 | | 1,695,000 | 1,669,575 |
| 6% 4/15/27 | | 25,000 | 25,187 |
| Superior Plus LP / Superior General Partner, Inc. 4.5% 3/15/29 (a) | | 320,000 | 292,400 |
| Tallgrass Energy Partners LP / Tallgrass Energy Finance Corp.: | | | |
| 5.5% 1/15/28 (a) | | 225,000 | 209,736 |
| 6% 3/1/27 (a) | | 980,000 | 940,800 |
| 6% 12/31/30 (a) | | 1,190,000 | 1,100,750 |
| Targa Resources Partners LP/Targa Resources Partners Finance Corp. 5.5% 3/1/30 | | 255,000 | 252,769 |
| Venture Global Calcasieu Pass LLC: | | | |
| 3.875% 8/15/29 (a) | | 480,000 | 438,000 |
| 3.875% 11/1/33 (a) | | 380,000 | 330,619 |
| 4.125% 8/15/31 (a) | | 460,000 | 417,450 |
| Western Gas Partners LP: | | | |
| 4.55% 2/1/30 | | 2,375,000 | 2,181,889 |
| 4.65% 7/1/26 | | 808,000 | 796,890 |
| | | | 49,000,886 |
| Environmental - 1.1% | | | |
| Darling Ingredients, Inc. 5.25% 4/15/27 (a) | | 970,000 | 970,000 |
| Madison IAQ LLC 4.125% 6/30/28 (a) | | 1,630,000 | 1,430,325 |
| Stericycle, Inc. 3.875% 1/15/29 (a) | | 815,000 | 718,708 |
| | | | 3,119,033 |
| Food & Drug Retail - 1.8% | | | |
| Albertsons Companies LLC/Safeway, Inc./New Albertson's, Inc./Albertson's LLC 3.5% 3/15/29 (a) | | 3,810,000 | 3,209,544 |
| BellRing Brands, Inc. 7% 3/15/30 (a) | | 350,000 | 342,125 |
| Emergent BioSolutions, Inc. 3.875% 8/15/28 (a) | | 1,590,000 | 1,349,513 |
| Murphy Oil U.S.A., Inc. 3.75% 2/15/31 (a) | | 190,000 | 166,890 |
| | | | 5,068,072 |
| Food/Beverage/Tobacco - 3.1% | | | |
| JBS U.S.A. Lux SA / JBS Food Co. 5.5% 1/15/30 (a) | | 2,525,000 | 2,493,438 |
| Kraft Heinz Foods Co.: | | | |
| 3% 6/1/26 | | 1,385,000 | 1,323,829 |
| 3.875% 5/15/27 | | 1,820,000 | 1,779,736 |
| Post Holdings, Inc.: | | | |
| 4.625% 4/15/30 (a) | | 2,135,000 | 1,825,425 |
| 5.5% 12/15/29 (a) | | 590,000 | 536,900 |
| 5.625% 1/15/28 (a) | | 405,000 | 382,928 |
| U.S. Foods, Inc. 4.625% 6/1/30 (a) | | 180,000 | 161,100 |
| | | | 8,503,356 |
| Gaming - 3.4% | | | |
| Melco Resorts Finance Ltd.: | | | |
| 4.875% 6/6/25 (a) | | 1,225,000 | 1,094,672 |
| 5.375% 12/4/29 (a) | | 465,000 | 372,098 |
| 5.75% 7/21/28 (a) | | 710,000 | 589,655 |
| MGM Resorts International 5.75% 6/15/25 | | 866,000 | 860,137 |
| VICI Properties LP / VICI Note Co.: | | | |
| 4.25% 12/1/26 (a) | | 1,210,000 | 1,146,632 |
| 4.5% 9/1/26 (a) | | 1,300,000 | 1,287,000 |
| 4.5% 1/15/28 (a) | | 1,525,000 | 1,502,125 |
| 4.625% 6/15/25 (a) | | 245,000 | 243,775 |
| 4.625% 12/1/29 (a) | | 925,000 | 868,575 |
| 5.75% 2/1/27 (a) | | 270,000 | 278,100 |
| Wynn Las Vegas LLC/Wynn Las Vegas Capital Corp. 5.25% 5/15/27 (a) | | 870,000 | 800,113 |
| Wynn Resorts Finance LLC / Wynn Resorts Capital Corp. 5.125% 10/1/29 (a) | | 380,000 | 332,736 |
| | | | 9,375,618 |
| Healthcare - 7.8% | | | |
| 180 Medical, Inc. 3.875% 10/15/29 (a) | | 200,000 | 178,000 |
| Avantor Funding, Inc. 4.625% 7/15/28 (a) | | 1,195,000 | 1,136,792 |
| Catalent Pharma Solutions 3.5% 4/1/30 (a) | | 1,700,000 | 1,478,677 |
| Centene Corp.: | | | |
| 2.45% 7/15/28 | | 75,000 | 65,441 |
| 2.5% 3/1/31 | | 1,665,000 | 1,384,031 |
| 4.25% 12/15/27 | | 1,635,000 | 1,585,950 |
| Charles River Laboratories International, Inc.: | | | |
| 3.75% 3/15/29 (a) | | 315,000 | 285,075 |
| 4.25% 5/1/28 (a) | | 90,000 | 85,908 |
| DaVita HealthCare Partners, Inc. 4.625% 6/1/30 (a) | | 2,465,000 | 2,144,550 |
| Grifols Escrow Issuer SA 4.75% 10/15/28 (a) | | 200,000 | 182,500 |
| HCA Holdings, Inc. 5.375% 9/1/26 | | 3,960,000 | 4,053,064 |
| HealthEquity, Inc. 4.5% 10/1/29 (a) | | 160,000 | 146,200 |
| Hologic, Inc. 4.625% 2/1/28 (a) | | 1,650,000 | 1,613,898 |
| IQVIA, Inc. 5% 5/15/27 (a) | | 820,000 | 812,472 |
| Jazz Securities DAC 4.375% 1/15/29 (a) | | 350,000 | 322,438 |
| Molina Healthcare, Inc. 3.875% 5/15/32 (a) | | 510,000 | 447,770 |
| Organon & Co. / Organon Foreign Debt Co-Issuer BV 4.125% 4/30/28 (a) | | 840,000 | 781,452 |
| Owens & Minor, Inc. 4.5% 3/31/29 (a) | | 280,000 | 251,880 |
| RP Escrow Issuer LLC 5.25% 12/15/25 (a) | | 1,035,000 | 962,550 |
| Teleflex, Inc. 4.25% 6/1/28 (a) | | 235,000 | 221,488 |
| Tenet Healthcare Corp.: | | | |
| 4.625% 6/15/28 (a) | | 1,810,000 | 1,705,925 |
| 4.875% 1/1/26 (a) | | 595,000 | 582,609 |
| 5.125% 11/1/27 (a) | | 1,200,000 | 1,165,158 |
| | | | 21,593,828 |
| Homebuilders/Real Estate - 2.0% | | | |
| Century Communities, Inc. 3.875% 8/15/29 (a) | | 460,000 | 387,591 |
| HAT Holdings I LLC/HAT Holdings II LLC 3.375% 6/15/26 (a) | | 495,000 | 454,672 |
| Howard Hughes Corp. 4.375% 2/1/31 (a) | | 700,000 | 622,594 |
| Kennedy-Wilson, Inc. 4.75% 2/1/30 | | 770,000 | 694,925 |
| Ryan Specialty Group LLC 4.375% 2/1/30 (a) | | 540,000 | 492,496 |
| Service Properties Trust: | | | |
| 3.95% 1/15/28 | | 75,000 | 59,438 |
| 4.375% 2/15/30 | | 725,000 | 556,423 |
| 4.95% 2/15/27 | | 1,090,000 | 944,564 |
| 4.95% 10/1/29 | | 445,000 | 355,694 |
| 5.5% 12/15/27 | | 415,000 | 377,650 |
| TopBuild Corp. 4.125% 2/15/32 (a) | | 810,000 | 697,861 |
| | | | 5,643,908 |
| Hotels - 1.6% | | | |
| Hilton Domestic Operating Co., Inc.: | | | |
| 3.625% 2/15/32 (a) | | 1,165,000 | 986,604 |
| 4% 5/1/31 (a) | | 2,780,000 | 2,486,293 |
| Hilton Worldwide Finance LLC/Hilton Worldwide Finance Corp. 4.875% 4/1/27 | | 445,000 | 440,550 |
| Wyndham Hotels & Resorts, Inc. 4.375% 8/15/28 (a) | | 525,000 | 489,321 |
| | | | 4,402,768 |
| Insurance - 0.4% | | | |
| Alliant Holdings Intermediate LLC 4.25% 10/15/27 (a) | | 1,075,000 | 992,816 |
| Leisure - 1.9% | | | |
| Carnival Corp.: | | | |
| 7.625% 3/1/26 (a) | | 675,000 | 661,500 |
| 10.5% 2/1/26 (a) | | 2,005,000 | 2,205,500 |
| NCL Corp. Ltd. 5.875% 2/15/27 (a) | | 350,000 | 333,634 |
| Royal Caribbean Cruises Ltd.: | | | |
| 5.5% 4/1/28 (a) | | 1,200,000 | 1,095,000 |
| 9.125% 6/15/23 (a) | | 230,000 | 237,437 |
| 11.5% 6/1/25 (a) | | 593,000 | 644,146 |
| | | | 5,177,217 |
| Metals/Mining - 0.4% | | | |
| FMG Resources Pty Ltd. 4.5% 9/15/27 (a) | | 15,000 | 14,213 |
| Howmet Aerospace, Inc. 5.95% 2/1/37 | | 45,000 | 45,475 |
| HudBay Minerals, Inc. 4.5% 4/1/26 (a) | | 240,000 | 221,893 |
| Mineral Resources Ltd. 8% 11/1/27 (a) | | 400,000 | 398,500 |
| Novelis Corp. 3.875% 8/15/31 (a) | | 385,000 | 330,138 |
| | | | 1,010,219 |
| Paper - 0.1% | | | |
| Glatfelter Corp. 4.75% 11/15/29 (a) | | 310,000 | 248,000 |
| Restaurants - 0.1% | | | |
| Yum! Brands, Inc. 3.625% 3/15/31 | | 500,000 | 429,631 |
| Services - 4.7% | | | |
| ADT Corp.: | | | |
| 4.125% 8/1/29 (a) | | 385,000 | 326,877 |
| 4.875% 7/15/32 (a) | | 565,000 | 478,131 |
| AECOM 5.125% 3/15/27 | | 1,485,000 | 1,468,294 |
| Aramark Services, Inc. 5% 2/1/28 (a) | | 1,685,000 | 1,571,347 |
| ASGN, Inc. 4.625% 5/15/28 (a) | | 2,740,000 | 2,545,460 |
| Booz Allen Hamilton, Inc. 4% 7/1/29 (a) | | 155,000 | 142,970 |
| Fair Isaac Corp. 4% 6/15/28 (a) | | 450,000 | 411,129 |
| Gartner, Inc. 3.625% 6/15/29 (a) | | 220,000 | 196,900 |
| GEMS MENASA Cayman Ltd. 7.125% 7/31/26 (a) | | 1,030,000 | 1,027,219 |
| Iron Mountain, Inc. 4.875% 9/15/29 (a) | | 1,115,000 | 1,021,390 |
| Prime Securities Services Borrower LLC/Prime Finance, Inc. 3.375% 8/31/27 (a) | | 2,225,000 | 1,899,015 |
| Service Corp. International 5.125% 6/1/29 | | 1,425,000 | 1,405,660 |
| TriNet Group, Inc. 3.5% 3/1/29 (a) | | 710,000 | 643,438 |
| | | | 13,137,830 |
| Steel - 0.0% | | | |
| Roller Bearing Co. of America, Inc. 4.375% 10/15/29 (a) | | 110,000 | 99,000 |
| Super Retail - 1.4% | | | |
| Asbury Automotive Group, Inc.: | | | |
| 4.625% 11/15/29 (a) | | 245,000 | 220,532 |
| 5% 2/15/32 (a) | | 260,000 | 230,750 |
| Bath & Body Works, Inc. 6.625% 10/1/30 (a) | | 1,170,000 | 1,163,688 |
| Gap, Inc. 3.875% 10/1/31 (a) | | 385,000 | 306,922 |
| Hanesbrands, Inc. 4.875% 5/15/26 (a) | | 1,115,000 | 1,089,913 |
| Levi Strauss & Co. 3.5% 3/1/31 (a) | | 630,000 | 544,950 |
| The William Carter Co. 5.625% 3/15/27 (a) | | 465,000 | 463,349 |
| | | | 4,020,104 |
| Technology - 3.9% | | | |
| Block, Inc. 2.75% 6/1/26 (a) | | 380,000 | 346,568 |
| Crowdstrike Holdings, Inc. 3% 2/15/29 | | 525,000 | 467,250 |
| Entegris, Inc. 4.375% 4/15/28 (a) | | 730,000 | 677,075 |
| Gartner, Inc. 4.5% 7/1/28 (a) | | 660,000 | 632,554 |
| II-VI, Inc. 5% 12/15/29 (a) | | 1,600,000 | 1,500,000 |
| Match Group Holdings II LLC: | | | |
| 3.625% 10/1/31 (a) | | 575,000 | 478,343 |
| 4.125% 8/1/30 (a) | | 265,000 | 236,844 |
| MicroStrategy, Inc. 6.125% 6/15/28 (a) | | 540,000 | 494,732 |
| onsemi 3.875% 9/1/28 (a) | | 545,000 | 505,599 |
| Open Text Corp. 3.875% 2/15/28 (a) | | 655,000 | 596,563 |
| Open Text Holdings, Inc. 4.125% 2/15/30 (a) | | 130,000 | 115,375 |
| Qorvo, Inc.: | | | |
| 3.375% 4/1/31 (a) | | 1,115,000 | 933,902 |
| 4.375% 10/15/29 | | 500,000 | 464,525 |
| Roblox Corp. 3.875% 5/1/30 (a) | | 935,000 | 804,100 |
| Sensata Technologies, Inc. 3.75% 2/15/31 (a) | | 1,165,000 | 985,054 |
| TTM Technologies, Inc. 4% 3/1/29 (a) | | 550,000 | 481,250 |
| Twilio, Inc. 3.875% 3/15/31 | | 350,000 | 300,815 |
| Viavi Solutions, Inc. 3.75% 10/1/29 (a) | | 770,000 | 692,792 |
| | | | 10,713,341 |
| Telecommunications - 9.3% | | | |
| Altice Financing SA: | | | |
| 5% 1/15/28 (a) | | 340,000 | 283,808 |
| 5.75% 8/15/29 (a) | | 1,380,000 | 1,162,664 |
| C&W Senior Financing Designated Activity Co. 6.875% 9/15/27 (a) | | 1,510,000 | 1,460,925 |
| Level 3 Financing, Inc.: | | | |
| 4.25% 7/1/28 (a) | | 2,645,000 | 2,235,025 |
| 4.625% 9/15/27 (a) | | 2,100,000 | 1,887,375 |
| Lumen Technologies, Inc.: | | | |
| 5.125% 12/15/26 (a) | | 2,585,000 | 2,326,500 |
| 6.875% 1/15/28 | | 60,000 | 57,150 |
| Millicom International Cellular SA: | | | |
| 4.5% 4/27/31 (a) | | 1,890,000 | 1,628,944 |
| 5.125% 1/15/28 (a) | | 900,000 | 850,950 |
| Sable International Finance Ltd. 5.75% 9/7/27 (a) | | 2,610,000 | 2,570,041 |
| SBA Communications Corp. 3.875% 2/15/27 | | 750,000 | 711,900 |
| Sprint Capital Corp.: | | | |
| 6.875% 11/15/28 | | 3,545,000 | 3,890,957 |
| 8.75% 3/15/32 | | 1,150,000 | 1,461,449 |
| Telecom Italia Capital SA: | | | |
| 6% 9/30/34 | | 295,000 | 257,671 |
| 7.2% 7/18/36 | | 2,965,000 | 2,674,619 |
| Virgin Media Finance PLC 5% 7/15/30 (a) | | 105,000 | 91,350 |
| Virgin Media Secured Finance PLC 5.5% 5/15/29 (a) | | 740,000 | 684,500 |
| Windstream Escrow LLC 7.75% 8/15/28 (a) | | 1,560,000 | 1,485,900 |
| | | | 25,721,728 |
| Textiles/Apparel - 0.2% | | | |
| Crocs, Inc. 4.125% 8/15/31 (a) | | 405,000 | 323,214 |
| Foot Locker, Inc. 4% 10/1/29 (a) | | 200,000 | 166,500 |
| Kontoor Brands, Inc. 4.125% 11/15/29 (a) | | 130,000 | 112,775 |
| | | | 602,489 |
| Transportation Ex Air/Rail - 0.1% | | | |
| Seaspan Corp. 5.5% 8/1/29 (a) | | 385,000 | 339,763 |
| Utilities - 6.5% | | | |
| Clearway Energy Operating LLC: | | | |
| 3.75% 2/15/31 (a) | | 1,615,000 | 1,388,900 |
| 4.75% 3/15/28 (a) | | 195,000 | 184,275 |
| DCP Midstream Operating LP 5.625% 7/15/27 | | 1,035,000 | 1,050,132 |
| Global Partners LP/GLP Finance Corp. 7% 8/1/27 | | 997,000 | 974,568 |
| InterGen NV 7% 6/30/23 (a) | | 1,635,000 | 1,594,125 |
| NextEra Energy Partners LP 4.25% 9/15/24 (a) | | 158,000 | 155,235 |
| NRG Energy, Inc.: | | | |
| 3.625% 2/15/31 (a) | | 1,666,000 | 1,386,945 |
| 5.25% 6/15/29 (a) | | 625,000 | 588,669 |
| 5.75% 1/15/28 | | 865,000 | 845,538 |
| 6.625% 1/15/27 | | 729,000 | 738,113 |
| NSG Holdings II LLC/NSG Holdings, Inc. 7.75% 12/15/25 (a) | | 1,611,564 | 1,647,824 |
| PG&E Corp.: | | | |
| 5% 7/1/28 | | 2,685,000 | 2,470,710 |
| 5.25% 7/1/30 | | 2,115,000 | 1,922,091 |
| Pike Corp. 5.5% 9/1/28 (a) | | 1,100,000 | 998,250 |
| TerraForm Power Operating LLC 4.75% 1/15/30 (a) | | 130,000 | 117,000 |
| Vertiv Group Corp. 4.125% 11/15/28 (a) | | 945,000 | 823,331 |
| Vistra Operations Co. LLC 5% 7/31/27 (a) | | 1,395,000 | 1,328,738 |
| | | | 18,214,444 |
|
| TOTAL NONCONVERTIBLE BONDS | | | 252,710,578 |
|
| TOTAL CORPORATE BONDS | | | |
| (Cost $275,687,573) | | | 254,436,963 |
| | | Shares | Value |
|
| Common Stocks - 0.3% | | | |
| Energy - 0.3% | | | |
| Jonah Energy Parent LLC (c)(d) | | | |
| (Cost $163,305) | | 11,874 | 800,664 |
| | | Principal Amount | Value |
|
| Bank Loan Obligations - 0.9% | | | |
| Broadcasting - 0.1% | | | |
| Diamond Sports Group LLC: | | | |
| 1LN, term loan U.S. Secured Overnight Fin. Rate (SOFR) Indx + 8.000% 9% 5/25/26 (e)(f)(g) | | 233,927 | 237,398 |
| 2LN, term loan 3 month U.S. LIBOR + 3.250% 3.6555% 8/24/26 (e)(f)(g) | | 208,409 | 69,035 |
|
| TOTAL BROADCASTING | | | 306,433 |
|
| Gaming - 0.4% | | | |
| Golden Entertainment, Inc. Tranche B, term loan 3 month U.S. LIBOR + 3.000% 3.77% 10/20/24 (e)(f)(g) | | 1,218,426 | 1,213,102 |
| Insurance - 0.1% | | | |
| Alliant Holdings Intermediate LLC Tranche B3 1LN, term loan 1 month U.S. LIBOR + 3.500% 4.0513% 11/6/27 (e)(f)(g) | | 352,230 | 349,412 |
| Services - 0.3% | | | |
| ABG Intermediate Holdings 2 LLC: | | | |
| Tranche B1 LN, term loan U.S. Secured Overnight Fin. Rate (SOFR) Indx + 3.500% 4% 12/21/28 (e)(f)(g) | | 16,119 | 15,978 |
| Tranche B2 1LN, term loan U.S. Secured Overnight Fin. Rate (SOFR) Indx + 3.500% 4% 1/31/29 (e)(f)(g) | | 102,761 | 101,862 |
| Tranche B3 1LN, term loan U.S. Secured Overnight Fin. Rate (SOFR) Indx + 3.500% 4% 12/21/28 (e)(f)(g) | | 16,119 | 15,978 |
| Ascend Learning LLC: | | | |
| 2LN, term loan 1 month U.S. LIBOR + 5.750% 6.25% 12/10/29 (e)(f)(g) | | 50,000 | 49,313 |
| Tranche B 1LN, term loan 1 month U.S. LIBOR + 3.500% 4.2637% 12/10/28 (e)(f)(g) | | 503,737 | 497,169 |
|
| TOTAL SERVICES | | | 680,300 |
|
| TOTAL BANK LOAN OBLIGATIONS | | | |
| (Cost $2,583,436) | | | 2,549,247 |
|
| Preferred Securities - 1.3% | | | |
| Banks & Thrifts - 1.3% | | | |
Ally Financial, Inc. 4.7%
(Cost $4,200,000)(e)(h) | | 4,200,000 | 3,668,282 |
| | | Shares | Value |
|
| Money Market Funds - 4.7% | | | |
| Fidelity Cash Central Fund 0.32% (i) | | | |
| (Cost $13,061,727) | | 13,059,115 | 13,061,727 |
| TOTAL INVESTMENT IN SECURITIES - 98.8% | | | |
| (Cost $295,696,041) | | | 274,516,883 |
| NET OTHER ASSETS (LIABILITIES) - 1.2% | | | 3,416,403 |
| NET ASSETS - 100% | | | $277,933,286 |
Legend
(a) Security exempt from registration under Rule 144A of the Securities Act of 1933. These securities may be resold in transactions exempt from registration, normally to qualified institutional buyers. At the end of the period, the value of these securities amounted to $167,641,575 or 60.3% of net assets.
(b) Security initially issued at one coupon which converts to a higher coupon at a specified date. The rate shown is the rate at period end.
(c) Non-income producing
(d) Level 3 security
(e) Coupon rates for floating and adjustable rate securities reflect the rates in effect at period end.
(f) Coupon is indexed to a floating interest rate which may be multiplied by a specified factor and/or subject to caps or floors.
(g) Remaining maturities of bank loan obligations may be less than the stated maturities shown as a result of contractual or optional prepayments by the borrower. Such prepayments cannot be predicted with certainty.
(h) Security is perpetual in nature with no stated maturity date.
(i) Affiliated fund that is generally available only to investment companies and other accounts managed by Fidelity Investments. The rate quoted is the annualized seven-day yield of the fund at period end. A complete unaudited listing of the fund's holdings as of its most recent quarter end is available upon request. In addition, each Fidelity Central Fund's financial statements, which are not covered by the Fund's Report of Independent Registered Public Accounting Firm, are available on the SEC's website or upon request.
Affiliated Central Funds
Fiscal year to date information regarding the Fund's investments in Fidelity Central Funds, including the ownership percentage, is presented below.
| Fund | Value, beginning of period | Purchases | Sales Proceeds | Dividend Income | Realized Gain/Loss | Change in Unrealized appreciation (depreciation) | Value, end of period | % ownership, end of period |
| Fidelity Cash Central Fund 0.32% | $4,474,228 | $165,207,532 | $156,620,033 | $10,872 | $-- | $-- | $13,061,727 | 0.0% |
| Total | $4,474,228 | $165,207,532 | $156,620,033 | $10,872 | $-- | $-- | $13,061,727 | |
Amounts in the income column in the above table include any capital gain distributions from underlying funds, which are presented in the corresponding line-item in the Statement of Operations, if applicable.
Investment Valuation
The following is a summary of the inputs used, as of April 30, 2022, involving the Fund's assets and liabilities carried at fair value. The inputs or methodology used for valuing securities may not be an indication of the risk associated with investing in those securities. For more information on valuation inputs, and their aggregation into the levels used below, please refer to the Investment Valuation section in the accompanying Notes to Financial Statements.
| | Valuation Inputs at Reporting Date: |
| Description | Total | Level 1 | Level 2 | Level 3 |
| Investments in Securities: | | | | |
| Equities: | | | | |
| Energy | $800,664 | $-- | $-- | $800,664 |
| Corporate Bonds | 254,436,963 | -- | 254,436,963 | -- |
| Bank Loan Obligations | 2,549,247 | -- | 2,549,247 | -- |
| Preferred Securities | 3,668,282 | -- | 3,668,282 | -- |
| Money Market Funds | 13,061,727 | 13,061,727 | -- | -- |
| Total Investments in Securities: | $274,516,883 | $13,061,727 | $260,654,492 | $800,664 |
See accompanying notes which are an integral part of the financial statements.
Financial Statements
Statement of Assets and Liabilities
| | | April 30, 2022 |
| Assets | | |
Investment in securities, at value — See accompanying schedule:
Unaffiliated issuers (cost $282,634,314) | $261,455,156 | |
| Fidelity Central Funds (cost $13,061,727) | 13,061,727 | |
| Total Investment in Securities (cost $295,696,041) | | $274,516,883 |
| Cash | | 8,351 |
| Receivable for investments sold | | 995,125 |
| Receivable for fund shares sold | | 145,864 |
| Interest receivable | | 3,667,068 |
| Distributions receivable from Fidelity Central Funds | | 1,698 |
| Prepaid expenses | | 125 |
| Receivable from investment adviser for expense reductions | | 6,202 |
| Total assets | | 279,341,316 |
| Liabilities | | |
| Payable for investments purchased | $400,000 | |
| Payable for fund shares redeemed | 607,912 | |
| Distributions payable | 143,653 | |
| Accrued management fee | 140,696 | |
| Other affiliated payables | 50,304 | |
| Other payables and accrued expenses | 65,465 | |
| Total liabilities | | 1,408,030 |
| Net Assets | | $277,933,286 |
| Net Assets consist of: | | |
| Paid in capital | | $309,084,001 |
| Total accumulated earnings (loss) | | (31,150,715) |
| Net Assets | | $277,933,286 |
| Net Asset Value, offering price and redemption price per share ($277,933,286 ÷ 34,772,631 shares) | | $7.99 |
See accompanying notes which are an integral part of the financial statements.
Statement of Operations
| | | Year ended April 30, 2022 |
| Investment Income | | |
| Dividends | | $160,662 |
| Interest | | 15,805,242 |
| Income from Fidelity Central Funds | | 10,872 |
| Total income | | 15,976,776 |
| Expenses | | |
| Management fee | $1,999,966 | |
| Transfer agent fees | 492,057 | |
| Accounting fees and expenses | 151,792 | |
| Custodian fees and expenses | 5,196 | |
| Independent trustees' fees and expenses | 1,334 | |
| Registration fees | 28,702 | |
| Audit | 77,639 | |
| Legal | 952 | |
| Interest | 1,113 | |
| Miscellaneous | 1,518 | |
| Total expenses before reductions | 2,760,269 | |
| Expense reductions | (27,480) | |
| Total expenses after reductions | | 2,732,789 |
| Net investment income (loss) | | 13,243,987 |
| Realized and Unrealized Gain (Loss) | | |
| Net realized gain (loss) on: | | |
| Investment securities: | | |
| Unaffiliated issuers | (2,092,913) | |
| Total net realized gain (loss) | | (2,092,913) |
| Change in net unrealized appreciation (depreciation) on investment securities | | (31,676,232) |
| Net gain (loss) | | (33,769,145) |
| Net increase (decrease) in net assets resulting from operations | | $(20,525,158) |
See accompanying notes which are an integral part of the financial statements.
Statement of Changes in Net Assets
| | Year ended April 30, 2022 | Year ended April 30, 2021 |
| Increase (Decrease) in Net Assets | | |
| Operations | | |
| Net investment income (loss) | $13,243,987 | $17,290,302 |
| Net realized gain (loss) | (2,092,913) | 4,095,771 |
| Change in net unrealized appreciation (depreciation) | (31,676,232) | 23,260,705 |
| Net increase (decrease) in net assets resulting from operations | (20,525,158) | 44,646,778 |
| Distributions to shareholders | (13,518,187) | (16,992,928) |
| Share transactions | | |
| Proceeds from sales of shares | 48,014,625 | 208,034,033 |
| Reinvestment of distributions | 11,416,988 | 13,360,332 |
| Cost of shares redeemed | (132,087,012) | (211,925,810) |
| Net increase (decrease) in net assets resulting from share transactions | (72,655,399) | 9,468,555 |
| Total increase (decrease) in net assets | (106,698,744) | 37,122,405 |
| Net Assets | | |
| Beginning of period | 384,632,030 | 347,509,625 |
| End of period | $277,933,286 | $384,632,030 |
| Other Information | | |
| Shares | | |
| Sold | 5,431,596 | 24,091,503 |
| Issued in reinvestment of distributions | 1,308,964 | 1,524,250 |
| Redeemed | (15,398,227) | (24,172,829) |
| Net increase (decrease) | (8,657,667) | 1,442,924 |
See accompanying notes which are an integral part of the financial statements.
Financial Highlights
Fidelity Focused High Income Fund
| | | | | | |
| Years ended April 30, | 2022 | 2021 | 2020 | 2019 | 2018 |
| Selected Per–Share Data | | | | | |
| Net asset value, beginning of period | $8.86 | $8.28 | $8.65 | $8.47 | $8.67 |
| Income from Investment Operations | | | | | |
| Net investment income (loss)A,B | .317 | .340 | .374 | .399 | .380 |
| Net realized and unrealized gain (loss) | (.863) | .574 | (.378) | .190 | (.219) |
| Total from investment operations | (.546) | .914 | (.004) | .589 | .161 |
| Distributions from net investment income | (.324) | (.334) | (.366) | (.409) | (.362) |
| Total distributions | (.324) | (.334) | (.366) | (.409) | (.362) |
| Redemption fees added to paid in capitalA | – | – | – | – | .001 |
| Net asset value, end of period | $7.99 | $8.86 | $8.28 | $8.65 | $8.47 |
| Total ReturnC | (6.41)% | 11.16% | (.16)% | 7.21% | 1.86% |
| Ratios to Average Net AssetsB,D,E | | | | | |
| Expenses before reductions | .75% | .75% | .78% | .79% | .80% |
| Expenses net of fee waivers, if any | .75% | .75% | .78% | .79% | .80% |
| Expenses net of all reductions | .75% | .75% | .78% | .78% | .79% |
| Net investment income (loss) | 3.62% | 3.88% | 4.31% | 4.73% | 4.38% |
| Supplemental Data | | | | | |
| Net assets, end of period (000 omitted) | $277,933 | $384,632 | $347,510 | $302,781 | $397,850 |
| Portfolio turnover rateF | 20% | 73% | 43% | 49% | 47% |
A Calculated based on average shares outstanding during the period.
B Net investment income (loss) is affected by the timing of the declaration of dividends by any underlying mutual funds or exchange-traded funds (ETFs). Net investment income (loss) of any such underlying funds is not included in the Fund's net investment income (loss) ratio.
C Total returns would have been lower if certain expenses had not been reduced during the applicable periods shown.
D Fees and expenses of any underlying mutual funds or exchange-traded funds (ETFs) are not included in the Fund's expense ratio. The Fund indirectly bears its proportionate share of these expenses. For additional expense information related to investments in Fidelity Central Funds, please refer to the "Investments in Fidelity Central Funds" note found in the Notes to Financial Statements section of the most recent Annual or Semi-Annual report.
E Expense ratios reflect operating expenses of the class. Expenses before reductions do not reflect amounts reimbursed, waived, or reduced through arrangements with the investment adviser, brokerage services, or other offset arrangements, if applicable, and do not represent the amount paid by the class during periods when reimbursements, waivers or reductions occur.
F Amount does not include the portfolio activity of any underlying mutual funds or exchange-traded funds (ETFs).
See accompanying notes which are an integral part of the financial statements.
Notes to Financial Statements
For the period ended April 30, 2022
1. Organization.
Fidelity Focused High Income Fund (the Fund) is a fund of Fidelity Summer Street Trust (the Trust) and is authorized to issue an unlimited number of shares. Share transactions on the Statement of Changes in Net Assets may contain exchanges between affiliated funds. The Trust is registered under the Investment Company Act of 1940, as amended (the 1940 Act), as an open-end management investment company organized as a Massachusetts business trust.
2. Investments in Fidelity Central Funds.
Funds may invest in Fidelity Central Funds, which are open-end investment companies generally available only to other investment companies and accounts managed by the investment adviser and its affiliates. The Schedule of Investments lists any Fidelity Central Funds held as an investment as of period end, but does not include the underlying holdings of each Fidelity Central Fund. An investing fund indirectly bears its proportionate share of the expenses of the underlying Fidelity Central Funds.
Based on its investment objective, each Fidelity Central Fund may invest or participate in various investment vehicles or strategies that are similar to those of the investing fund. These strategies are consistent with the investment objectives of the investing fund and may involve certain economic risks which may cause a decline in value of each of the Fidelity Central Funds and thus a decline in the value of the investing fund.
| Fidelity Central Fund | Investment Manager | Investment Objective | Investment Practices | Expense Ratio(a) |
| Fidelity Money Market Central Funds | Fidelity Management & Research Company LLC (FMR) | Each fund seeks to obtain a high level of current income consistent with the preservation of capital and liquidity. | Short-term Investments | Less than .005% |
(a) Expenses expressed as a percentage of average net assets and are as of each underlying Central Fund's most recent annual or semi-annual shareholder report.
A complete unaudited list of holdings for each Fidelity Central Fund is available upon request or at the Securities and Exchange Commission website at www.sec.gov. In addition, the financial statements of the Fidelity Central Funds which contain the significant accounting policies (including investment valuation policies) of those funds, and are not covered by the Report of Independent Registered Public Accounting Firm, are available on the Securities and Exchange Commission website or upon request.
3. Significant Accounting Policies.
The Fund is an investment company and applies the accounting and reporting guidance of the Financial Accounting Standards Board (FASB) Accounting Standards Codification Topic 946 Financial Services - Investment Companies. The financial statements have been prepared in conformity with accounting principles generally accepted in the United States of America (GAAP), which require management to make certain estimates and assumptions at the date of the financial statements. Actual results could differ from those estimates. Subsequent events, if any, through the date that the financial statements were issued have been evaluated in the preparation of the financial statements. The Fund's Schedule of Investments lists any underlying mutual funds or exchange-traded funds (ETFs) but does not include the underlying holdings of these funds. The following summarizes the significant accounting policies of the Fund:
Investment Valuation. Investments are valued as of 4:00 p.m. Eastern time on the last calendar day of the period. The Board of Trustees (the Board) has delegated the day to day responsibility for the valuation of the Fund's investments to the Fair Value Committee (the Committee) established by the Fund's investment adviser. In accordance with valuation policies and procedures approved by the Board, the Fund attempts to obtain prices from one or more third party pricing vendors or brokers to value its investments. When current market prices, quotations or currency exchange rates are not readily available or reliable, investments will be fair valued in good faith by the Committee, in accordance with procedures adopted by the Board. Factors used in determining fair value vary by investment type and may include market or investment specific events, changes in interest rates and credit quality. The frequency with which these procedures are used cannot be predicted and they may be utilized to a significant extent. The Committee oversees the Fund's valuation policies and procedures and reports to the Board on the Committee's activities and fair value determinations. The Board monitors the appropriateness of the procedures used in valuing the Fund's investments and ratifies the fair value determinations of the Committee.
The Fund categorizes the inputs to valuation techniques used to value its investments into a disclosure hierarchy consisting of three levels as shown below:
- Level 1 – unadjusted quoted prices in active markets for identical investments
- Level 2 – other significant observable inputs (including quoted prices for similar investments, interest rates, prepayment speeds, etc.)
- Level 3 – unobservable inputs (including the Fund's own assumptions based on the best information available)
Valuation techniques used to value the Fund's investments by major category are as follows:
Debt securities, including restricted securities, are valued based on evaluated prices received from third party pricing vendors or from brokers who make markets in such securities. Corporate bonds, bank loan obligations and preferred securities are valued by pricing vendors who utilize matrix pricing which considers yield or price of bonds of comparable quality, coupon, maturity and type or by broker-supplied prices. When independent prices are unavailable or unreliable, debt securities may be valued utilizing pricing methodologies which consider similar factors that would be used by third party pricing vendors. Debt securities are generally categorized as Level 2 in the hierarchy but may be Level 3 depending on the circumstances. The Fund invests a significant portion of its assets in below investment grade securities. The value of these securities can be more volatile due to changes in the credit quality of the issuer and is sensitive to changes in economic, market and regulatory conditions.
Equity securities, including restricted securities, for which market quotations are readily available, are valued at the last reported sale price or official closing price as reported by a third party pricing vendor on the primary market or exchange on which they are traded and are categorized as Level 1 in the hierarchy. In the event there were no sales during the day or closing prices are not available, securities are valued at the last quoted bid price or may be valued using the last available price and are generally categorized as Level 2 in the hierarchy. For foreign equity securities, when market or security specific events arise, comparisons to the valuation of American Depositary Receipts (ADRs), futures contracts, Exchange-Traded Funds (ETFs) and certain indexes as well as quoted prices for similar securities may be used and would be categorized as Level 2 in the hierarchy. For equity securities, including restricted securities, where observable inputs are limited, assumptions about market activity and risk are used and these securities may be categorized as Level 3 in the hierarchy.
Investments in open-end mutual funds, including the Fidelity Central Funds, are valued at their closing net asset value (NAV) each business day and are categorized as Level 1 in the hierarchy.
Changes in valuation techniques may result in transfers in or out of an assigned level within the disclosure hierarchy. The aggregate value of investments by input level as of April 30, 2022 is included at the end of the Fund's Schedule of Investments.
Investment Transactions and Income. For financial reporting purposes, the Fund's investment holdings and NAV include trades executed through the end of the last business day of the period. The NAV per share for processing shareholder transactions is calculated as of the close of business of the New York Stock Exchange (NYSE), normally 4:00 p.m. Eastern time and includes trades executed through the end of the prior business day. Gains and losses on securities sold are determined on the basis of identified cost and include proceeds received from litigation. Commissions paid to certain brokers with whom the investment adviser, or its affiliates, places trades on behalf of a fund include an amount in addition to trade execution, which may be rebated back to a fund. Any such rebates are included in net realized gain (loss) on investments in the Statement of Operations. Dividend income is recorded on the ex-dividend date. Income and capital gain distributions from Fidelity Central Funds, if any, are recorded on the ex-dividend date. Interest income is accrued as earned and includes coupon interest and amortization of premium and accretion of discount on debt securities as applicable. Debt obligations may be placed on non-accrual status and related interest income may be reduced by ceasing current accruals and writing off interest receivables when the collection of all or a portion of interest has become doubtful based on consistently applied procedures. A debt obligation is removed from non-accrual status when the issuer resumes interest payments or when collectability of interest is reasonably assured.
Expenses. Expenses directly attributable to a fund are charged to that fund. Expenses attributable to more than one fund are allocated among the respective funds on the basis of relative net assets or other appropriate methods. Expenses included in the accompanying financial statements reflect the expenses of that fund and do not include any expenses associated with any underlying mutual funds or exchange-traded funds. Although not included in a fund's expenses, a fund indirectly bears its proportionate share of these expenses through the net asset value of each underlying mutual fund or exchange-traded fund. Expense estimates are accrued in the period to which they relate and adjustments are made when actual amounts are known.
Income Tax Information and Distributions to Shareholders. Each year, the Fund intends to qualify as a regulated investment company under Subchapter M of the Internal Revenue Code, including distributing substantially all of its taxable income and realized gains. As a result, no provision for U.S. Federal income taxes is required. As of April 30, 2022, the Fund did not have any unrecognized tax benefits in the financial statements; nor is the Fund aware of any tax positions for which it is reasonably possible that the total amounts of unrecognized tax benefits will significantly change in the next twelve months. The Fund files a U.S. federal tax return, in addition to state and local tax returns as required. The Fund's federal income tax returns are subject to examination by the Internal Revenue Service (IRS) for a period of three fiscal years after they are filed. State and local tax returns may be subject to examination for an additional fiscal year depending on the jurisdiction.
Distributions are declared and recorded daily and paid monthly from net investment income. Distributions from realized gains, if any, are declared and recorded on the ex-dividend date. Income and capital gain distributions are determined in accordance with income tax regulations, which may differ from GAAP.
Capital accounts within the financial statements are adjusted for permanent book-tax differences. These adjustments have no impact on net assets or the results of operations. Capital accounts are not adjusted for temporary book-tax differences which will reverse in a subsequent period.
Book-tax differences are primarily due to market discount, prior period premium and discount on debt securities and capital loss carryforwards.
As of period end, the cost and unrealized appreciation (depreciation) in securities, and derivatives if applicable, for federal income tax purposes were as follows:
| Gross unrealized appreciation | $3,493,880 |
| Gross unrealized depreciation | (23,892,686) |
| Net unrealized appreciation (depreciation) | $(20,398,806) |
| Tax Cost | $294,915,689 |
The tax-based components of distributable earnings as of period end were as follows:
| Undistributed ordinary income | $64,664 |
| Capital loss carryforward | $(10,816,572) |
| Net unrealized appreciation (depreciation) on securities and other investments | $(20,398,806) |
Capital loss carryforwards are only available to offset future capital gains of the Fund to the extent provided by regulations and may be limited. The capital loss carryforward information presented below, including any applicable limitation, is estimated as of fiscal period end and is subject to adjustment.
| Short-term | $(9,345,990) |
| Long-term | (1,470,582) |
| Total capital loss carryforward | $(10,816,572) |
The tax character of distributions paid was as follows:
| | April 30, 2022 | April 30, 2021 |
| Ordinary Income | $13,518,187 | $ 16,992,928 |
Restricted Securities (including Private Placements). Funds may invest in securities that are subject to legal or contractual restrictions on resale. These securities generally may be resold in transactions exempt from registration or to the public if the securities are registered. Disposal of these securities may involve time-consuming negotiations and expense, and prompt sale at an acceptable price may be difficult. Information regarding restricted securities held at period end is included at the end of the Schedule of Investments, if applicable.
Loans and Other Direct Debt Instruments. Direct debt instruments are interests in amounts owed to lenders by corporate or other borrowers. These instruments may be in the form of loans, trade claims or other receivables and may include standby financing commitments such as revolving credit facilities that obligate a fund to supply additional cash to the borrower on demand. Loans may be acquired through assignment, participation, or may be made directly to a borrower. Such instruments are presented in the Bank Loan Obligations section in the Schedule of Investments. Certain funds may also invest in unfunded loan commitments, which are contractual obligations for future funding. Information regarding unfunded commitments is included at the end of the Schedule of Investments, if applicable.
4. Purchases and Sales of Investments.
Purchases and sales of securities, other than short-term securities and in-kind transactions, as applicable, are noted in the table below.
| | Purchases ($) | Sales ($) |
| Fidelity Focused High Income Fund | 70,395,315 | 141,089,044 |
5. Fees and Other Transactions with Affiliates.
Management Fee. Fidelity Management & Research Company LLC (the investment adviser) and its affiliates provide the Fund with investment management related services for which the Fund pays a monthly management fee. The management fee is the sum of an individual fund fee rate that is based on an annual rate of .45% of the Fund's average net assets and an annualized group fee rate that averaged .10% during the period. The group fee rate is based upon the monthly average net assets of a group of registered investment companies with which the investment adviser has management contracts. The group fee rate decreases as assets under management increase and increases as assets under management decrease. For the reporting period, the total annual management fee rate was .55% of the Fund's average net assets.
Transfer Agent Fees. Fidelity Investments Institutional Operations Company LLC (FIIOC), an affiliate of the investment adviser, is the Fund's transfer, dividend disbursing and shareholder servicing agent. FIIOC receives account fees and asset-based fees that vary according to account size and type of account. FIIOC pays for typesetting, printing and mailing of shareholder reports, except proxy statements. For the period, the transfer agent fees were equivalent to an annual rate of .13% of average net assets.
Accounting Fees. Fidelity Service Company, Inc. (FSC), an affiliate of the investment adviser, maintains the Fund's accounting records. The accounting fee is based on the level of average net assets for each month. For the period, the fees were equivalent to the following annual rates:
| | % of Average Net Assets |
| Fidelity Focused High Income Fund | .04 |
Interfund Lending Program. Pursuant to an Exemptive Order issued by the Securities and Exchange Commission (the SEC), the Fund, along with other registered investment companies having management contracts with Fidelity Management & Research Company LLC (FMR), or other affiliated entities of FMR, may participate in an interfund lending program. This program provides an alternative credit facility allowing the Fund to borrow from, or lend money to, other participating affiliated funds. At period end, there were no interfund loans outstanding. Activity in this program during the period for which loans were outstanding was as follows:
| | Borrower or Lender | Average Loan Balance | Weighted Average Interest Rate | Interest Expense |
| Fidelity Focused High Income Fund | Borrower | $23,641,000 | .57% | $1,113 |
Interfund Trades. Funds may purchase from or sell securities to other Fidelity Funds under procedures adopted by the Board. The procedures have been designed to ensure these interfund trades are executed in accordance with Rule 17a-7 of the 1940 Act. Any interfund trades are included within the respective purchases and sales amounts shown in the Purchases and Sales of Investments note. During the period there were no interfund trades.
6. Committed Line of Credit.
Certain Funds participate with other funds managed by the investment adviser or an affiliate in a $4.25 billion credit facility (the "line of credit") to be utilized for temporary or emergency purposes to fund shareholder redemptions or for other short-term liquidity purposes. The participating funds have agreed to pay commitment fees on their pro-rata portion of the line of credit, which are reflected in Miscellaneous expenses on the Statement of Operations, and are listed below. During the period, there were no borrowings on this line of credit.
| | Amount |
| Fidelity Focused High Income Fund | $618 |
7. Expense Reductions.
Effective June 1, 2021, the investment adviser contractually agreed to reimburse the Fund to the extent annual operating expenses exceeded .75% of average net assets. This reimbursement will remain in place through August 31, 2023. Some expenses, for example the compensation of the independent Trustees, and certain miscellaneous expenses such as proxy and shareholder meeting expenses, are excluded from this reimbursement. During the period this reimbursement reduced the Fund's expenses by $21,403.
Through arrangements with the Fund's custodian, credits realized as a result of certain uninvested cash balances were used to reduce the Fund's expenses by $99.
In addition, during the period the investment adviser or an affiliate reimbursed and/or waived a portion of operating expenses in the amount of $5,978.
8. Other.
A fund's organizational documents provide former and current trustees and officers with a limited indemnification against liabilities arising in connection with the performance of their duties to the fund. In the normal course of business, a fund may also enter into contracts that provide general indemnifications. A fund's maximum exposure under these arrangements is unknown as this would be dependent on future claims that may be made against a fund. The risk of material loss from such claims is considered remote.
9. Coronavirus (COVID-19) Pandemic.
An outbreak of COVID-19 first detected in China during December 2019 has since spread globally and was declared a pandemic by the World Health Organization during March 2020. Developments that disrupt global economies and financial markets, such as the COVID-19 pandemic, may magnify factors that affect the Fund's performance.
Report of Independent Registered Public Accounting Firm
To the Board of Trustees of Fidelity Summer Street Trust and Shareholders of Fidelity Focused High Income Fund
Opinion on the Financial Statements
We have audited the accompanying statement of assets and liabilities, including the schedule of investments, of Fidelity Focused High Income Fund (one of the funds constituting Fidelity Summer Street Trust, referred to hereafter as the “Fund”) as of April 30, 2022, the related statement of operations for the year ended April 30, 2022, the statement of changes in net assets for each of the two years in the period ended April 30, 2022, including the related notes, and the financial highlights for each of the five years in the period ended April 30, 2022 (collectively referred to as the “financial statements”). In our opinion, the financial statements present fairly, in all material respects, the financial position of the Fund as of April 30, 2022, the results of its operations for the year then ended, the changes in its net assets for each of the two years in the period ended April 30, 2022 and the financial highlights for each of the five years in the period ended April 30, 2022 in conformity with accounting principles generally accepted in the United States of America.
Basis for Opinion
These financial statements are the responsibility of the Fund’s management. Our responsibility is to express an opinion on the Fund’s financial statements based on our audits. We are a public accounting firm registered with the Public Company Accounting Oversight Board (United States) (PCAOB) and are required to be independent with respect to the Fund in accordance with the U.S. federal securities laws and the applicable rules and regulations of the Securities and Exchange Commission and the PCAOB.
We conducted our audits of these financial statements in accordance with the standards of the PCAOB. Those standards require that we plan and perform the audit to obtain reasonable assurance about whether the financial statements are free of material misstatement, whether due to error or fraud.
Our audits included performing procedures to assess the risks of material misstatement of the financial statements, whether due to error or fraud, and performing procedures that respond to those risks. Such procedures included examining, on a test basis, evidence regarding the amounts and disclosures in the financial statements. Our audits also included evaluating the accounting principles used and significant estimates made by management, as well as evaluating the overall presentation of the financial statements. Our procedures included confirmation of securities owned as of April 30, 2022 by correspondence with the custodian, agent banks, brokers and issuers of privately offered securities. We believe that our audits provide a reasonable basis for our opinion.
/s/ PricewaterhouseCoopers LLP
Boston, Massachusetts
June 14, 2022
We have served as the auditor of one or more investment companies in the Fidelity group of funds since 1932.
Trustees and Officers
The Trustees, Members of the Advisory Board (if any), and officers of the trust and fund, as applicable, are listed below. The Board of Trustees governs the fund and is responsible for protecting the interests of shareholders. The Trustees are experienced executives who meet periodically throughout the year to oversee the fund's activities, review contractual arrangements with companies that provide services to the fund, oversee management of the risks associated with such activities and contractual arrangements, and review the fund's performance. Each of the Trustees oversees 324 funds.
The Trustees hold office without limit in time except that (a) any Trustee may resign; (b) any Trustee may be removed by written instrument, signed by at least two-thirds of the number of Trustees prior to such removal; (c) any Trustee who requests to be retired or who has become incapacitated by illness or injury may be retired by written instrument signed by a majority of the other Trustees; and (d) any Trustee may be removed at any special meeting of shareholders by a two-thirds vote of the outstanding voting securities of the trust. Each Trustee who is not an interested person (as defined in the 1940 Act) of the trust and the fund is referred to herein as an Independent Trustee. Each Independent Trustee shall retire not later than the last day of the calendar year in which his or her 75th birthday occurs. The Independent Trustees may waive this mandatory retirement age policy with respect to individual Trustees. Officers and Advisory Board Members hold office without limit in time, except that any officer or Advisory Board Member may resign or may be removed by a vote of a majority of the Trustees at any regular meeting or any special meeting of the Trustees. Except as indicated, each individual has held the office shown or other offices in the same company for the past five years.
The fund’s Statement of Additional Information (SAI) includes more information about the Trustees. To request a free copy, call Fidelity at 1-800-544-8544.
Experience, Skills, Attributes, and Qualifications of the Trustees. The Governance and Nominating Committee has adopted a statement of policy that describes the experience, qualifications, attributes, and skills that are necessary and desirable for potential Independent Trustee candidates (Statement of Policy). The Board believes that each Trustee satisfied at the time he or she was initially elected or appointed a Trustee, and continues to satisfy, the standards contemplated by the Statement of Policy. The Governance and Nominating Committee also engages professional search firms to help identify potential Independent Trustee candidates who have the experience, qualifications, attributes, and skills consistent with the Statement of Policy. From time to time, additional criteria based on the composition and skills of the current Independent Trustees, as well as experience or skills that may be appropriate in light of future changes to board composition, business conditions, and regulatory or other developments, have also been considered by the professional search firms and the Governance and Nominating Committee. In addition, the Board takes into account the Trustees' commitment and participation in Board and committee meetings, as well as their leadership of standing and ad hoc committees throughout their tenure.
In determining that a particular Trustee was and continues to be qualified to serve as a Trustee, the Board has considered a variety of criteria, none of which, in isolation, was controlling. The Board believes that, collectively, the Trustees have balanced and diverse experience, qualifications, attributes, and skills, which allow the Board to operate effectively in governing the fund and protecting the interests of shareholders. Information about the specific experience, skills, attributes, and qualifications of each Trustee, which in each case led to the Board's conclusion that the Trustee should serve (or continue to serve) as a trustee of the fund, is provided below.
Board Structure and Oversight Function. Robert A. Lawrence is an interested person and currently serves as Chair. The Trustees have determined that an interested Chair is appropriate and benefits shareholders because an interested Chair has a personal and professional stake in the quality and continuity of services provided to the fund. Independent Trustees exercise their informed business judgment to appoint an individual of their choosing to serve as Chair, regardless of whether the Trustee happens to be independent or a member of management. The Independent Trustees have determined that they can act independently and effectively without having an Independent Trustee serve as Chair and that a key structural component for assuring that they are in a position to do so is for the Independent Trustees to constitute a substantial majority for the Board. The Independent Trustees also regularly meet in executive session. David M. Thomas serves as Lead Independent Trustee and as such (i) acts as a liaison between the Independent Trustees and management with respect to matters important to the Independent Trustees and (ii) with management prepares agendas for Board meetings.
Fidelity® funds are overseen by different Boards of Trustees. The fund's Board oversees Fidelity's high income and certain equity funds, and other Boards oversee Fidelity's investment-grade bond, money market, asset allocation, and other equity funds. The asset allocation funds may invest in Fidelity® funds overseen by the fund's Board. The use of separate Boards, each with its own committee structure, allows the Trustees of each group of Fidelity® funds to focus on the unique issues of the funds they oversee, including common research, investment, and operational issues. On occasion, the separate Boards establish joint committees to address issues of overlapping consequences for the Fidelity® funds overseen by each Board.
The Trustees operate using a system of committees to facilitate the timely and efficient consideration of all matters of importance to the Trustees, the fund, and fund shareholders and to facilitate compliance with legal and regulatory requirements and oversight of the fund's activities and associated risks. The Board, acting through its committees, has charged FMR and its affiliates with (i) identifying events or circumstances the occurrence of which could have demonstrably adverse effects on the fund's business and/or reputation; (ii) implementing processes and controls to lessen the possibility that such events or circumstances occur or to mitigate the effects of such events or circumstances if they do occur; and (iii) creating and maintaining a system designed to evaluate continuously business and market conditions in order to facilitate the identification and implementation processes described in (i) and (ii) above. Because the day-to-day operations and activities of the fund are carried out by or through FMR, its affiliates, and other service providers, the fund's exposure to risks is mitigated but not eliminated by the processes overseen by the Trustees. While each of the Board's committees has responsibility for overseeing different aspects of the fund's activities, oversight is exercised primarily through the Operations, Audit, and Compliance Committees. Appropriate personnel, including but not limited to the fund's Chief Compliance Officer (CCO), FMR's internal auditor, the independent accountants, the fund's Treasurer and portfolio management personnel, make periodic reports to the Board's committees, as appropriate, including an annual review of Fidelity's risk management program for the Fidelity® funds. The responsibilities of each standing committee, including their oversight responsibilities, are described further under "Standing Committees of the Trustees."
Interested Trustees*:
Correspondence intended for a Trustee who is an interested person may be sent to Fidelity Investments, 245 Summer Street, Boston, Massachusetts 02210.
Name, Year of Birth; Principal Occupations and Other Relevant Experience+
Bettina Doulton (1964)
Year of Election or Appointment: 2020
Trustee
Ms. Doulton also serves as Trustee of other Fidelity® funds. Prior to her retirement, Ms. Doulton served in a variety of positions at Fidelity Investments, including as a managing director of research (2006-2007), portfolio manager to certain Fidelity® funds (1993-2005), equity analyst and portfolio assistant (1990-1993), and research assistant (1987-1990). Ms. Doulton currently owns and operates Phi Builders + Architects and Cellardoor Winery. Previously, Ms. Doulton served as a member of the Board of Brown Capital Management, LLC (2014-2018).
Robert A. Lawrence (1952)
Year of Election or Appointment: 2020
Trustee
Chair of the Board of Trustees
Mr. Lawrence also serves as Trustee of other funds. Previously, Mr. Lawrence served as a Member of the Advisory Board of certain funds. Prior to his retirement in 2008, Mr. Lawrence served as Vice President of certain Fidelity® funds (2006-2008), Senior Vice President, Head of High Income Division of Fidelity Management & Research Company (investment adviser firm, 2006-2008), and President of Fidelity Strategic Investments (investment adviser firm, 2002-2005).
* Determined to be an “Interested Trustee” by virtue of, among other things, his or her affiliation with the trust or various entities under common control with FMR.
+ The information includes the Trustee's principal occupation during the last five years and other information relating to the experience, attributes, and skills relevant to the Trustee's qualifications to serve as a Trustee, which led to the conclusion that the Trustee should serve as a Trustee for the fund.
Independent Trustees:
Correspondence intended for an Independent Trustee may be sent to Fidelity Investments, P.O. Box 55235, Boston, Massachusetts 02205-5235.
Name, Year of Birth; Principal Occupations and Other Relevant Experience+
Thomas P. Bostick (1956)
Year of Election or Appointment: 2021
Trustee
Lieutenant General Bostick also serves as Trustee of other Fidelity® funds. Prior to his retirement, General Bostick (United States Army, Retired) held a variety of positions within the U.S. Army, including Commanding General and Chief of Engineers, U.S. Army Corps of Engineers (2012-2016) and Deputy Chief of Staff and Director of Human Resources, U.S. Army (2009-2012). General Bostick currently serves as a member of the Board and Finance and Governance Committees of CSX Corporation (transportation, 2020-present) and a member of the Board and Corporate Governance and Nominating Committee of Perma-Fix Environmental Services, Inc. (nuclear waste management, 2020-present). General Bostick serves as Chief Executive Officer of Bostick Global Strategies, LLC (consulting, 2016-present) and as a member of the Board of HireVue, Inc. (video interview and assessment, 2020-present). Previously, General Bostick served as a Member of the Advisory Board of certain Fidelity® funds (2021), President, Intrexon Bioengineering (2018-2020) and Chief Operating Officer (2017-2020) and Senior Vice President of the Environment Sector (2016-2017) of Intrexon Corporation (biopharmaceutical company).
Dennis J. Dirks (1948)
Year of Election or Appointment: 2005
Trustee
Mr. Dirks also serves as Trustee of other Fidelity® funds. Prior to his retirement in May 2003, Mr. Dirks served as Chief Operating Officer and as a member of the Board of The Depository Trust & Clearing Corporation (financial markets infrastructure), President, Chief Operating Officer and a member of the Board of The Depository Trust Company (DTC), President and a member of the Board of the National Securities Clearing Corporation (NSCC), Chief Executive Officer and a member of the Board of the Government Securities Clearing Corporation and Chief Executive Officer and a member of the Board of the Mortgage-Backed Securities Clearing Corporation. Mr. Dirks currently serves as a member of the Finance Committee (2016-present) and Board (2017-present) and is Treasurer (2018-present) of the Asolo Repertory Theatre.
Donald F. Donahue (1950)
Year of Election or Appointment: 2018
Trustee
Mr. Donahue also serves as Trustee of other Fidelity® funds. Mr. Donahue serves as President and Chief Executive Officer of Miranda Partners, LLC (risk consulting for the financial services industry, 2012-present). Previously, Mr. Donahue served as Chief Executive Officer (2006-2012), Chief Operating Officer (2003-2006) and Managing Director, Customer Marketing and Development (1999-2003) of The Depository Trust & Clearing Corporation (financial markets infrastructure). Mr. Donahue currently serves as a member (2007-present) and Co-Chairman (2016-present) of the Board of United Way of New York and a member of the Board of The Leadership Academy (previously NYC Leadership Academy) (2012-present). Mr. Donahue previously served as a member of the Advisory Board of certain Fidelity® funds (2015-2018).
Vicki L. Fuller (1957)
Year of Election or Appointment: 2020
Trustee
Ms. Fuller also serves as Trustee of other Fidelity® funds. Previously, Ms. Fuller served as a member of the Advisory Board of certain Fidelity® funds (2018-2020), Chief Investment Officer of the New York State Common Retirement Fund (2012-2018) and held a variety of positions at AllianceBernstein L.P. (global asset management, 1985-2012), including Managing Director (2006-2012) and Senior Vice President and Senior Portfolio Manager (2001-2006). Ms. Fuller currently serves as a member of the Board, Audit Committee and Nominating and Governance Committee of two Blackstone business development companies (2020-present), as a member of the Board of Treliant, LLC (consulting, 2019-present), as a member of the Advisory Board of Ariel Alternatives, LLC (private equity, 2021-present) and as a member of the Board and Chair of the Audit Committee of Gusto, Inc. (software, 2021-present). In addition, Ms. Fuller currently serves as a member of the Board of Roosevelt University (2019-present) and as a member of the Executive Board of New York University’s Stern School of Business. Ms. Fuller previously served as a member of the Board, Audit Committee and Nominating and Governance Committee of The Williams Companies, Inc. (natural gas infrastructure, 2018-2021).
Patricia L. Kampling (1959)
Year of Election or Appointment: 2020
Trustee
Ms. Kampling also serves as Trustee of other Fidelity® funds. Prior to her retirement, Ms. Kampling served as Chairman of the Board and Chief Executive Officer (2012-2019), President and Chief Operating Officer (2011-2012) and Executive Vice President and Chief Financial Officer (2010-2011) of Alliant Energy Corporation. Ms. Kampling currently serves as a member of the Board, Finance Committee and Governance, Compensation and Nominating Committee of Xcel Energy Inc. (utilities company, 2020-present) and as a member of the Board, Audit, Finance and Risk Committee and Safety, Environmental, Technology and Operations Committee and Chair of the Executive Development and Compensation Committee of American Water Works Company, Inc. (utilities company, 2019-present). In addition, Ms. Kampling currently serves as a member of the Board of the Nature Conservancy, Wisconsin Chapter (2019-present). Previously, Ms. Kampling served as a Member of the Advisory Board of certain Fidelity® funds (2020), a member of the Board, Compensation Committee and Executive Committee and Chair of the Audit Committee of Briggs & Stratton Corporation (manufacturing, 2011-2021), a member of the Board of Interstate Power and Light Company (2012-2019) and Wisconsin Power and Light Company (2012-2019) (each a subsidiary of Alliant Energy Corporation) and as a member of the Board and Workforce Development Committee of the Business Roundtable (2018-2019).
Thomas A. Kennedy (1955)
Year of Election or Appointment: 2021
Trustee
Mr. Kennedy also serves as Trustee of other Fidelity® funds. Previously, Mr. Kennedy served as a Member of the Advisory Board of certain Fidelity® funds (2020) and held a variety of positions at Raytheon Company (aerospace and defense, 1983-2020), including Chairman and Chief Executive Officer (2014-2020) and Executive Vice President and Chief Operating Officer (2013-2014). Mr. Kennedy currently serves as Executive Chairman of the Board of Directors of Raytheon Technologies Corporation (aerospace and defense, 2020-present). He is also a member of the Rutgers School of Engineering Industry Advisory Board (2011-present) and a member of the UCLA Engineering Dean’s Executive Board (2016-present).
Oscar Munoz (1959)
Year of Election or Appointment: 2021
Trustee
Mr. Munoz also serves as Trustee of other Fidelity® funds. Prior to his retirement, Mr. Munoz served as Executive Chairman (2020-2021), Chief Executive Officer (2015-2020), President (2015-2016) and a member of the Board (2010-2021) of United Airlines Holdings, Inc. Mr. Munoz currently serves as a member of the Board of CBRE Group, Inc. (commercial real estate, 2020-present), a member of the Board of Univision Communications, Inc. (Hispanic media, 2020-present) and a member of the Advisory Board of Salesforce.com, Inc. (cloud-based software, 2020-present). Previously, Mr. Munoz served as a Member of the Advisory Board of certain Fidelity® funds (2021).
Garnett A. Smith (1947)
Year of Election or Appointment: 2018
Trustee
Mr. Smith also serves as Trustee of other Fidelity® funds. Prior to his retirement, Mr. Smith served as Chairman and Chief Executive Officer (1990-1997) and President (1986-1990) of Inbrand Corp. (manufacturer of personal absorbent products). Prior to his employment with Inbrand Corp., he was employed by a retail fabric chain and North Carolina National Bank (now Bank of America). Mr. Smith previously served as a member of the Advisory Board of certain Fidelity® funds (2012-2013).
David M. Thomas (1949)
Year of Election or Appointment: 2008
Trustee
Lead Independent Trustee
Mr. Thomas also serves as Trustee of other Fidelity® funds. Previously, Mr. Thomas served as Executive Chairman (2005-2006) and Chairman and Chief Executive Officer (2000-2005) of IMS Health, Inc. (pharmaceutical and healthcare information solutions). Mr. Thomas currently serves as a member of the Board of Fortune Brands Home and Security (home and security products, 2004-present) and as Director (2013-present) and Non-Executive Chairman of the Board (2022-present) of Interpublic Group of Companies, Inc. (marketing communication).
Susan Tomasky (1953)
Year of Election or Appointment: 2020
Trustee
Ms. Tomasky also serves as Trustee of other Fidelity® funds. Prior to her retirement, Ms. Tomasky served in various executive officer positions at American Electric Power Company, Inc. (1998-2011), including most recently as President of AEP Transmission (2007-2011). Ms. Tomasky currently serves as a member of the Board and Sustainability Committee and as Chair of the Audit Committee of Marathon Petroleum Corporation (2018-present) and as a member of the Board, Executive Committee, Corporate Governance Committee and Organization and Compensation Committee and as Chair of the Audit Committee of Public Service Enterprise Group, Inc. (utilities company, 2012-present) and as a member of the Board of its subsidiary company, Public Service Electric and Gas Co. (2021-present). In addition, Ms. Tomasky currently serves as a member (2009-present) and President (2020-present) of the Board of the Royal Shakespeare Company – America (2009-present), as a member of the Board of the Columbus Association for the Performing Arts (2011-present) and as a member of the Board and Kenyon in the World Committee of Kenyon College (2016-present). Previously, Ms. Tomasky served as a Member of the Advisory Board of certain Fidelity® funds (2020), as a member of the Board of the Columbus Regional Airport Authority (2007-2020), as a member of the Board (2011-2018) and Lead Independent Director (2015-2018) of Andeavor Corporation (previously Tesoro Corporation) (independent oil refiner and marketer) and as a member of the Board of Summit Midstream Partners LP (energy, 2012-2018).
Michael E. Wiley (1950)
Year of Election or Appointment: 2018
Trustee
Mr. Wiley also serves as Trustee of other Fidelity® funds. Previously, Mr. Wiley served as a member of the Advisory Board of certain Fidelity® funds (2018-2020), Chairman, President and CEO of Baker Hughes, Inc. (oilfield services, 2000-2004). Mr. Wiley also previously served as a member of the Board of Andeavor Corporation (independent oil refiner and marketer, 2005-2018), a member of the Board of Andeavor Logistics LP (natural resources logistics, 2015-2018) and a member of the Board of High Point Resources (exploration and production, 2005-2020).
+ The information includes the Trustee's principal occupation during the last five years and other information relating to the experience, attributes, and skills relevant to the Trustee's qualifications to serve as a Trustee, which led to the conclusion that the Trustee should serve as a Trustee for the fund.
Advisory Board Members and Officers:
Correspondence intended for a Member of the Advisory Board (if any) may be sent to Fidelity Investments, P.O. Box 55235, Boston, Massachusetts 02205-5235. Correspondence intended for an officer or Peter S. Lynch may be sent to Fidelity Investments, 245 Summer Street, Boston, Massachusetts 02210. Officers appear below in alphabetical order.
Name, Year of Birth; Principal Occupation
Peter S. Lynch (1944)
Year of Election or Appointment: 2003
Member of the Advisory Board
Mr. Lynch also serves as a Member of the Advisory Board of other Fidelity® funds. Mr. Lynch is Vice Chairman and a Director of Fidelity Management & Research Company LLC (investment adviser firm). In addition, Mr. Lynch serves as a Trustee of Boston College and as the Chairman of the Inner-City Scholarship Fund. Previously, Mr. Lynch served as Vice Chairman and a Director of FMR Co., Inc. (investment adviser firm) and on the Special Olympics International Board of Directors (1997-2006).
Craig S. Brown (1977)
Year of Election or Appointment: 2019
Assistant Treasurer
Mr. Brown also serves as an officer of other funds. Mr. Brown serves as Assistant Treasurer of FIMM, LLC (2021-present) and is an employee of Fidelity Investments (2013-present).
John J. Burke III (1964)
Year of Election or Appointment: 2018
Chief Financial Officer
Mr. Burke also serves as Chief Financial Officer of other funds. Mr. Burke serves as Head of Investment Operations for Fidelity Fund and Investment Operations (2018-present) and is an employee of Fidelity Investments (1998-present). Previously Mr. Burke served as head of Asset Management Investment Operations (2012-2018).
William C. Coffey (1969)
Year of Election or Appointment: 2019
Assistant Secretary
Mr. Coffey also serves as Assistant Secretary of other funds. He is Senior Vice President and Deputy General Counsel of FMR LLC (diversified financial services company, 2010-present), and is an employee of Fidelity Investments. Previously, Mr. Coffey served as Secretary and CLO of certain funds (2018-2019); CLO, Secretary, and Senior Vice President of Fidelity Management & Research Company and FMR Co., Inc. (investment adviser firms, 2018-2019); Secretary of Fidelity SelectCo, LLC and Fidelity Investments Money Management, Inc. (investment adviser firms, 2018-2019); CLO of Fidelity Management & Research (Hong Kong) Limited, FMR Investment Management (UK) Limited, and Fidelity Management & Research (Japan) Limited (investment adviser firms, 2018-2019); and Assistant Secretary of certain funds (2009-2018).
Timothy M. Cohen (1969)
Year of Election or Appointment: 2018
Vice President
Mr. Cohen also serves as Vice President of other funds. Mr. Cohen serves as Co-Head of Equity (2018-present), a Director of Fidelity Management & Research (Japan) Limited (investment adviser firm, 2016-present), and is an employee of Fidelity Investments. Previously, Mr. Cohen served as Executive Vice President of Fidelity SelectCo, LLC (2019), Head of Global Equity Research (2016-2018), Chief Investment Officer - Equity and a Director of Fidelity Management & Research (U.K.) Inc. (investment adviser firm, 2013-2015) and as a Director of Fidelity Management & Research (Hong Kong) Limited (investment adviser firm, 2017).
Jonathan Davis (1968)
Year of Election or Appointment: 2010
Assistant Treasurer
Mr. Davis also serves as an officer of other funds. Mr. Davis serves as Assistant Treasurer of FIMM, LLC (2021-present), FMR Capital, Inc. (2017-present), FD Funds GP LLC (2021-present), FD Funds Holding LLC (2021-present), and FD Funds Management LLC (2021-present); and is an employee of Fidelity Investments. Previously, Mr. Davis served as Vice President and Associate General Counsel of FMR LLC (diversified financial services company, 2003-2010).
Laura M. Del Prato (1964)
Year of Election or Appointment: 2018
Assistant Treasurer
Ms. Del Prato also serves as an officer of other funds. Ms. Del Prato serves as Assistant Treasurer of FIMM, LLC (2021-present) and is an employee of Fidelity Investments (2017-present). Previously, Ms. Del Prato served as President and Treasurer of The North Carolina Capital Management Trust: Cash Portfolio and Term Portfolio (2018-2020). Prior to joining Fidelity Investments, Ms. Del Prato served as a Managing Director and Treasurer of the JPMorgan Mutual Funds (2014-2017). Prior to JPMorgan, Ms. Del Prato served as a partner at Cohen Fund Audit Services (accounting firm, 2012-2013) and KPMG LLP (accounting firm, 2004-2012).
Colm A. Hogan (1973)
Year of Election or Appointment: 2020
Assistant Treasurer
Mr. Hogan also serves as an officer of other funds. Mr. Hogan serves as Assistant Treasurer of FIMM, LLC (2021-present) and FMR Capital, Inc. (2017-present) and is an employee of Fidelity Investments (2005-present). Previously, Mr. Hogan served as Deputy Treasurer of certain Fidelity® funds (2016-2020) and Assistant Treasurer of certain Fidelity® funds (2016-2018).
Pamela R. Holding (1964)
Year of Election or Appointment: 2018
Vice President
Ms. Holding also serves as Vice President of other funds. Ms. Holding serves as Co-Head of Equity (2018-present) and is an employee of Fidelity Investments (2013-present). Previously, Ms. Holding served as Executive Vice President of Fidelity SelectCo, LLC (2019) and as Chief Investment Officer of Fidelity Institutional Asset Management (2013-2018).
Cynthia Lo Bessette (1969)
Year of Election or Appointment: 2019
Secretary and Chief Legal Officer (CLO)
Ms. Lo Bessette also serves as an officer of other funds. Ms. Lo Bessette serves as CLO, Secretary, and Senior Vice President of Fidelity Management & Research Company LLC (investment adviser firm, 2019-present); CLO of Fidelity Management & Research (Hong Kong) Limited, FMR Investment Management (UK) Limited, and Fidelity Management & Research (Japan) Limited (investment adviser firms, 2019-present); Secretary of FD Funds GP LLC (2021-present), FD Funds Holding LLC (2021-present), and FD Funds Management LLC (2021-present); and Assistant Secretary of FIMM, LLC (2019-present). She is a Senior Vice President and Deputy General Counsel of FMR LLC (diversified financial services company, 2019-present), and is an employee of Fidelity Investments. Previously, Ms. Lo Bessette served as CLO, Secretary, and Senior Vice President of FMR Co., Inc. (investment adviser firm, 2019); Secretary of Fidelity SelectCo, LLC and Fidelity Investments Money Management, Inc. (investment adviser firms, 2019). Prior to joining Fidelity Investments, Ms. Lo Bessette was Executive Vice President, General Counsel (2016-2019) and Senior Vice President, Deputy General Counsel (2015-2016) of OppenheimerFunds (investment management company) and Deputy Chief Legal Officer (2013-2015) of Jennison Associates LLC (investment adviser firm).
Chris Maher (1972)
Year of Election or Appointment: 2020
Deputy Treasurer
Mr. Maher also serves as an officer of other funds. Mr. Maher serves as Assistant Treasurer of FIMM, LLC (2021-present) and FMR Capital, Inc. (2017-present), and is an employee of Fidelity Investments (2008-present). Previously, Mr. Maher served as Assistant Treasurer of certain funds (2013-2020); Vice President of Asset Management Compliance (2013), Vice President of the Program Management Group of FMR (investment adviser firm, 2010-2013), and Vice President of Valuation Oversight (2008-2010).
Jason P. Pogorelec (1975)
Year of Election or Appointment: 2020
Chief Compliance Officer
Mr. Pogorelec also serves as Chief Compliance Officer of other funds. Mr. Pogorelec is a senior Vice President of Asset Management Compliance for Fidelity Investments and is an employee of Fidelity Investments (2006-present). Previously, Mr. Pogorelec served as Vice President, Associate General Counsel for Fidelity Investments (2010-2020) and Assistant Secretary of certain Fidelity funds (2015-2020).
Brett Segaloff (1972)
Year of Election or Appointment: 2021
Anti-Money Laundering (AML) Officer
Mr. Segaloff also serves as an AML Officer of other funds and other related entities. He is Director, Anti-Money Laundering (2007-present) of FMR LLC (diversified financial services company) and is an employee of Fidelity Investments (1996-present).
Stacie M. Smith (1974)
Year of Election or Appointment: 2016
President and Treasurer
Ms. Smith also serves as an officer of other funds. Ms. Smith serves as Assistant Treasurer of FIMM, LLC (2021-present) and FMR Capital, Inc. (2017-present), is an employee of Fidelity Investments (2009-present), and has served in other fund officer roles. Prior to joining Fidelity Investments, Ms. Smith served as Senior Audit Manager of Ernst & Young LLP (accounting firm, 1996-2009). Previously, Ms. Smith served as Assistant Treasurer (2013-2019) and Deputy Treasurer (2013-2016) of certain Fidelity® funds.
Jim Wegmann (1979)
Year of Election or Appointment: 2019
Assistant Treasurer
Mr. Wegmann also serves as an officer of other funds. Mr. Wegmann serves as Assistant Treasurer of FIMM, LLC (2021-present) and is an employee of Fidelity Investments (2011-present). Previously, Mr. Wegmann served as Assistant Treasurer of certain Fidelity® funds (2019-2021).
Shareholder Expense Example
As a shareholder, you incur two types of costs: (1) transaction costs, which may include sales charges (loads) on purchase payments or redemption proceeds, as applicable and (2) ongoing costs, which generally include management fees, distribution and/or service (12b-1) fees and other Fund expenses. This Example is intended to help you understand your ongoing costs (in dollars) of investing in a fund and to compare these costs with the ongoing costs of investing in other mutual funds.
The Example is based on an investment of $1,000 invested at the beginning of the period and held for the entire period (November 1, 2021 to April 30, 2022).
Actual Expenses
The first line of the accompanying table provides information about actual account values and actual expenses. You may use the information in this line, together with the amount you invested, to estimate the expenses that you paid over the period. Simply divide your account value by $1,000.00 (for example, an $8,600 account value divided by $1,000.00 = 8.6), then multiply the result by the number in the first line for a class/Fund under the heading entitled "Expenses Paid During Period" to estimate the expenses you paid on your account during this period. If any fund is a shareholder of any underlying mutual funds or exchange-traded funds (ETFs) (the Underlying Funds), such fund indirectly bears its proportional share of the expenses of the Underlying Funds in addition to the direct expenses incurred presented in the table. These fees and expenses are not included in the annualized expense ratio used to calculate the expense estimate in the table below.
Hypothetical Example for Comparison Purposes
The second line of the accompanying table provides information about hypothetical account values and hypothetical expenses based on the actual expense ratio and an assumed rate of return of 5% per year before expenses, which is not the actual return. The hypothetical account values and expenses may not be used to estimate the actual ending account balance or expenses you paid for the period. You may use this information to compare the ongoing costs of investing in the Fund and other funds. To do so, compare this 5% hypothetical example with the 5% hypothetical examples that appear in the shareholder reports of the other funds. If any fund is a shareholder of any Underlying Funds, such fund indirectly bears its proportional share of the expenses of the Underlying Funds in addition to the direct expenses as presented in the table. These fees and expenses are not included in the annualized expense ratio used to calculate the expense estimate in the table below.
Please note that the expenses shown in the table are meant to highlight your ongoing costs only and do not reflect any transaction costs. Therefore, the second line of the table is useful in comparing ongoing costs only, and will not help you determine the relative total costs of owning different funds. In addition, if these transactional costs were included, your costs would have been higher.
| | Annualized Expense Ratio-A | Beginning
Account Value
November 1, 2021 | Ending
Account Value
April 30, 2022 | Expenses Paid
During Period-B
November 1, 2021
to April 30, 2022 |
| Fidelity Focused High Income Fund | .75% | | | |
| Actual | | $1,000.00 | $915.90 | $3.56 |
| Hypothetical-C | | $1,000.00 | $1,021.08 | $3.76 |
A Annualized expense ratio reflects expenses net of applicable fee waivers.
B Expenses are equal to the annualized expense ratio, multiplied by the average account value over the period, multiplied by 181/ 365 (to reflect the one-half year period). The fees and expenses of any Underlying Funds are not included in each annualized expense ratio.
C 5% return per year before expenses
Distributions (Unaudited)
The dividend and capital gains distributions for the fund(s) are available on Fidelity.com or Institutional.Fidelity.com.
A total of 0.01% of the dividends distributed during the fiscal year was derived from interest on U.S. Government securities which is generally exempt from state income tax.
The fund designates $11,959,235 of distributions paid in the calendar year 2021 as qualifying to be taxed as interest-related dividends for nonresident alien shareholders.
The fund designates $13,508,659 of distributions paid in the calendar year 2021 as qualifying to be taxed as section 163(j) interest dividends.
The fund will notify shareholders in January 2023 of amounts for use in preparing 2022 income tax returns.
Liquidity Risk Management Program
The Securities and Exchange Commission adopted Rule 22e-4 under the Investment Company Act of 1940 (the Liquidity Rule) to promote effective liquidity risk management throughout the open-end investment company industry, thereby reducing the risk that funds will be unable to meet their redemption obligations and mitigating dilution of the interests of fund shareholders.
The Fund has adopted and implemented a liquidity risk management program pursuant to the Liquidity Rule (the Program) effective December 1, 2018. The Program is reasonably designed to assess and manage the Fund’s liquidity risk and to comply with the requirements of the Liquidity Rule. The Fund’s Board of Trustees (the Board) has designated the Fund’s investment adviser as administrator of the Program. The Fidelity advisers have established a Liquidity Risk Management Committee (the LRM Committee) to manage the Program for each of the Fidelity Funds. The LRM Committee monitors the adequacy and effectiveness of implementation of the Program and on a periodic basis assesses each Fund’s liquidity risk based on a variety of factors including (1) the Fund’s investment strategy, (2) portfolio liquidity and cash flow projections during normal and reasonably foreseeable stressed conditions, (3) shareholder redemptions, (4) borrowings and other funding sources and (5) in the case of exchange-traded funds, certain additional factors including the effect of the Fund’s prices and spreads, market participants, and basket compositions on the overall liquidity of the Fund’s portfolio, as applicable.
In accordance with the Program, each of the Fund’s portfolio investments is classified into one of four liquidity categories described below based on a determination of a reasonable expectation for how long it would take to convert the investment to cash (or sell or dispose of the investment) without significantly changing its market value.
- Highly liquid investments – cash or convertible to cash within three business days or less
- Moderately liquid investments – convertible to cash in three to seven calendar days
- Less liquid investments – can be sold or disposed of, but not settled, within seven calendar days
- Illiquid investments – cannot be sold or disposed of within seven calendar days
Liquidity classification determinations take into account a variety of factors including various market, trading and investment-specific considerations, as well as market depth, and generally utilize analysis from a third-party liquidity metrics service.
The Liquidity Rule places a 15% limit on a fund’s illiquid investments and requires funds that do not primarily hold assets that are highly liquid investments to determine and maintain a minimum percentage of the fund’s net assets to be invested in highly liquid investments (highly liquid investment minimum or HLIM). The Program includes provisions reasonably designed to comply with the 15% limit on illiquid investments and for determining, periodically reviewing and complying with the HLIM requirement as applicable.
At a recent meeting of the Fund’s Board of Trustees, the LRM Committee provided a written report to the Board pertaining to the operation, adequacy, and effectiveness of implementation of the Program for the annual period from December 1, 2020 through November 30, 2021. The report concluded that the Program has been implemented and is operating effectively and is reasonably designed to assess and manage the Fund’s liquidity risk.
FFH-ANN-0622
1.801606.117
Fidelity® Series High Income Fund
Annual Report
April 30, 2022
Contents
To view a fund's proxy voting guidelines and proxy voting record for the 12-month period ended June 30, visit http://www.fidelity.com/proxyvotingresults or visit the Securities and Exchange Commission's (SEC) web site at http://www.sec.gov.
You may also call 1-800-544-8544 to request a free copy of the proxy voting guidelines.
Standard & Poor's, S&P and S&P 500 are registered service marks of The McGraw-Hill Companies, Inc. and have been licensed for use by Fidelity Distributors Corporation.
Other third-party marks appearing herein are the property of their respective owners.
All other marks appearing herein are registered or unregistered trademarks or service marks of FMR LLC or an affiliated company. © 2022 FMR LLC. All rights reserved.
This report and the financial statements contained herein are submitted for the general information of the shareholders of the Fund. This report is not authorized for distribution to prospective investors in the Fund unless preceded or accompanied by an effective prospectus.
A fund files its complete schedule of portfolio holdings with the SEC for the first and third quarters of each fiscal year on Form N-PORT. Forms N-PORT are available on the SEC’s web site at http://www.sec.gov. A fund's Forms N-PORT may be reviewed and copied at the SEC’s Public Reference Room in Washington, DC. Information regarding the operation of the SEC's Public Reference Room may be obtained by calling 1-800-SEC-0330.
For a complete list of a fund's portfolio holdings, view the most recent holdings listing, semiannual report, or annual report on Fidelity's web site at http://www.fidelity.com, http://www.institutional.fidelity.com, or http://www.401k.com, as applicable.
NOT FDIC INSURED •MAY LOSE VALUE •NO BANK GUARANTEE
Neither the Fund nor Fidelity Distributors Corporation is a bank.
Note to Shareholders:
Early in 2020, the outbreak and spread of COVID-19 emerged as a public health emergency that had a major influence on financial markets, primarily based on its impact on the global economy and corporate earnings. On March 11, 2020, the World Health Organization declared the COVID-19 outbreak a pandemic, citing sustained risk of further global spread. The pandemic prompted a number of measures to limit the spread of COVID-19, including travel and border restrictions, quarantines, and restrictions on large gatherings. In turn, these resulted in lower consumer activity, diminished demand for a wide range of products and services, disruption in manufacturing and supply chains, and – given the wide variability in outcomes regarding the outbreak – significant market uncertainty and volatility. To help stem the turmoil, the U.S. government took unprecedented action – in concert with the U.S. Federal Reserve and central banks around the world – to help support consumers, businesses, and the broader economy, and to limit disruption to the financial system.
In general, the overall impact of the pandemic lessened in 2021, amid a resilient economy and widespread distribution of three COVID-19 vaccines granted emergency use authorization from the U.S. Food and Drug Administration (FDA) early in the year. Still, the situation remains dynamic, and the extent and duration of its influence on financial markets and the economy is highly uncertain, due in part to a recent spike in cases based on highly contagious variants of the coronavirus.
Extreme events such as the COVID-19 crisis are exogenous shocks that can have significant adverse effects on mutual funds and their investments. Although multiple asset classes may be affected by market disruption, the duration and impact may not be the same for all types of assets. Fidelity is committed to helping you stay informed amid news about COVID-19 and during increased market volatility, and we continue to take extra steps to be responsive to customer needs. We encourage you to visit us online, where we offer ongoing updates, commentary, and analysis on the markets and our funds.
Performance: The Bottom Line
Average annual total return reflects the change in the value of an investment, assuming reinvestment of distributions from dividend income and capital gains (the profits earned upon the sale of securities that have grown in value, if any) and assuming a constant rate of performance each year. The hypothetical investment and the average annual total returns do not reflect the deduction of taxes that a shareholder would pay on fund distributions or the redemption of fund shares. During periods of reimbursement by Fidelity, a fund’s total return will be greater than it would be had the reimbursement not occurred. How a fund did yesterday is no guarantee of how it will do tomorrow.
Average Annual Total Returns
| For the periods ended April 30, 2022 | Past 1 year | Past 5 years | Past 10 years |
| Fidelity® Series High Income Fund | (2.24)% | 4.06% | 5.03% |
$10,000 Over 10 Years
Let's say hypothetically that $10,000 was invested in Fidelity® Series High Income Fund on April 30, 2012.
The chart shows how the value of your investment would have changed, and also shows how the ICE® BofA® US High Yield Constrained Index performed over the same period.
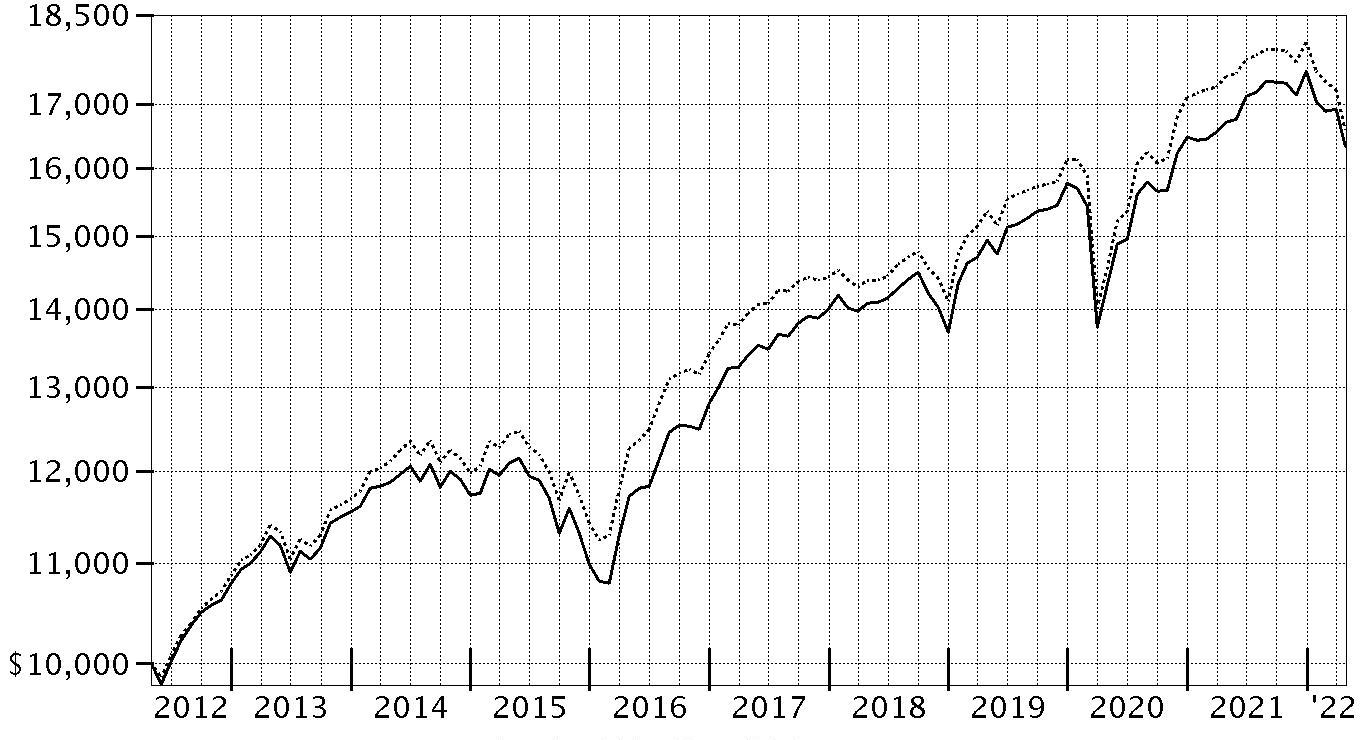
| Period Ending Values |
| $16,342 | Fidelity® Series High Income Fund |
| $16,592 | ICE® BofA® US High Yield Constrained Index |
Management's Discussion of Fund Performance
Market Recap: The ICE BofA
® US High Yield Constrained Index returned -4.96% for the 12 months ending April 30, 2022. After posting a solid gain in 2021, high-yield bonds retreated to begin the new year amid several major headwinds that stoked volatility, uncertainty and investor anxiety. Chief among these was the U.S. Federal Reserve’s accelerated plan to hike interest rates and aggressively wind down its balance sheet in an attempt to rein in historically high inflation. In addition, geopolitical unrest rose as Russia invaded Ukraine in late February and escalated its attack through period end. Other factors influencing high yield included surging commodity prices, rising bond yields, supply constraint and disruption, and the potential for variants of the coronavirus to upend the economy. Against this dynamic backdrop, the index returned -2.74% in January and -0.90% in February amid an intensifying flight from risk. Volatility eased in March and credit fundamentals remained healthy, but high yield still lost ground (-0.92%) for the month. April saw the downtrend continue, with the index returning -3.63% amid clearer signals of the Fed’s intension to tighten monetary policy and angst about the economic toll of “zero-COVID” lockdowns in China. For the full 12 months, higher-duration BB-rated bonds slightly trailed lower-quality credits. By sector, energy rode a surge in commodity prices and led the way with a modest gain. All other groups declined. Notable laggards included cable/satellite TV, telecommunications, health care, utilities and food/beverage/tobacco.
Comments from Co-Managers Benjamin Harrison, Alexandre Karam, and Michael Weaver: For the fiscal year, the fund returned -2.24%, outperforming the -4.96% result of the benchmark ICE BofA
® US High Yield Constrained Index. The fund's core allocation to high-yield bonds returned -5.41% and detracted from performance versus the benchmark. By industry, security selection was the primary contributor, especially in food & drug retail. Security selection and an overweighting in services and security picks in energy also lifted the fund's relative result. The biggest individual relative contributor was an overweight position in Bi-Lo (+78%). Bi-Lo was among the largest holdings in the fund. The fund's non-benchmark stake in Mesquite Energy, one of the biggest holdings as of April 30, gained 116%. The fund's out-of-benchmark stake in Jonah Energy gained about 350%. Conversely, the largest detractor from performance versus the benchmark was an overweighting in telecommunications. Security selection in technology and broadcasting also hurt the fund's relative performance. The biggest individual relative detractor was an overweight position in Altice Financial (-10%). Altice Financial was among our largest holdings. Also hampering performance was our outsized stake in Rackspace Hosting, which returned -14%. Another notable relative detractor was an overweighting in Altice USA (-17%). By quality, security selection in unrated bonds added the most value versus the benchmark, while security choices among CCC-rated bonds hurt the most. Notable changes in positioning include decreased exposure to the gaming industry and a higher allocation to health care.
The views expressed above reflect those of the portfolio manager(s) only through the end of the period as stated on the cover of this report and do not necessarily represent the views of Fidelity or any other person in the Fidelity organization. Any such views are subject to change at any time based upon market or other conditions and Fidelity disclaims any responsibility to update such views. These views may not be relied on as investment advice and, because investment decisions for a Fidelity fund are based on numerous factors, may not be relied on as an indication of trading intent on behalf of any Fidelity fund.
Note to shareholders: On January 3, 2022, Benjamin Harrison assumed co-management responsibilities for the fund.
Investment Summary (Unaudited)
Top Bond Issuers as of April 30, 2022
| (by issuer, excluding cash equivalents) | % of fund's net assets |
| Uniti Group LP / Uniti Group Finance, Inc. | 1.9 |
| New Fortress Energy, Inc. | 1.8 |
| Community Health Systems, Inc. | 1.8 |
| Altice France SA | 1.6 |
| Mesquite Energy, Inc. | 1.7 |
| Crestwood Midstream Partners LP/Crestwood Midstream Finance Corp. | 1.6 |
| Southeastern Grocers, Inc. | 1.5 |
| Bombardier, Inc. | 1.5 |
| Carnival Corp. | 1.5 |
| C&W Senior Financing Designated Activity Co. | 1.3 |
| | 16.2 |
Top Five Market Sectors as of April 30, 2022
| | % of fund's net assets |
| Energy | 16.9 |
| Telecommunications | 10.1 |
| Healthcare | 9.1 |
| Services | 6.2 |
| Technology | 6.1 |
Quality Diversification (% of fund's net assets)
| As of April 30, 2022 |
| | BBB | 1.4% |
| | BB | 25.6% |
| | B | 50.1% |
| | CCC,CC,C | 14.5% |
| | Not Rated | 2.2% |
| | Equities | 3.6% |
| | Short-Term Investments and Net Other Assets | 2.6% |

We have used ratings from Moody's Investors Service, Inc. Where Moody's® ratings are not available, we have used S&P® ratings. All ratings are as of the date indicated and do not reflect subsequent changes.
Asset Allocation (% of fund's net assets)
| As of April 30, 2022* |
| | Nonconvertible Bonds | 88.4% |
| | Convertible Bonds, Preferred Stocks | 1.6% |
| | Common Stocks | 3.3% |
| | Bank Loan Obligations | 3.8% |
| | Other | 0.3% |
| | Short-Term Investments and Net Other Assets (Liabilities) | 2.6% |

* Foreign investments - 21.3%
Geographic Diversification (% of fund's net assets)
| As of April 30, 2022 |
| | United States of America* | 78.7% |
| | Canada | 4.5% |
| | Luxembourg | 2.9% |
| | Netherlands | 2.0% |
| | Ireland | 1.7% |
| | France | 1.7% |
| | United Kingdom | 1.7% |
| | Multi-National | 1.6% |
| | Panama | 1.5% |
| | Other | 3.7% |

* Includes Short-Term investments and Net Other Assets (Liabilities).
Percentages are based on country or territory of incorporation and are adjusted for the effect of futures contracts, if applicable.
Schedule of Investments April 30, 2022
Showing Percentage of Net Assets
| Corporate Bonds - 90.0% | | | |
| | | Principal Amount | Value |
| Convertible Bonds - 1.6% | | | |
| Broadcasting - 0.5% | | | |
| DISH Network Corp.: | | | |
| 2.375% 3/15/24 | | $3,506,000 | $3,258,827 |
| 3.375% 8/15/26 | | 5,466,000 | 4,687,095 |
| | | | 7,945,922 |
| Energy - 1.1% | | | |
| Mesquite Energy, Inc. 15% 7/15/23 (a)(b) | | 1,175,827 | 6,067,267 |
| Mesquite Energy, Inc. 15% 7/15/23 (a)(b) | | 2,028,327 | 9,431,721 |
| | | | 15,498,988 |
|
| TOTAL CONVERTIBLE BONDS | | | 23,444,910 |
|
| Nonconvertible Bonds - 88.4% | | | |
| Aerospace - 4.4% | | | |
| Allegheny Technologies, Inc.: | | | |
| 4.875% 10/1/29 | | 2,995,000 | 2,725,180 |
| 5.875% 12/1/27 | | 10,750,000 | 10,373,750 |
| Bombardier, Inc.: | | | |
| 6% 2/15/28 (c) | | 3,555,000 | 3,075,075 |
| 7.125% 6/15/26 (c) | | 4,175,000 | 3,841,000 |
| 7.5% 3/15/25 (c) | | 5,166,000 | 5,011,020 |
| 7.875% 4/15/27 (c) | | 10,718,000 | 9,984,567 |
| BWX Technologies, Inc. 4.125% 6/30/28 (c) | | 3,997,000 | 3,707,218 |
| Kaiser Aluminum Corp.: | | | |
| 4.5% 6/1/31 (c) | | 1,920,000 | 1,656,000 |
| 4.625% 3/1/28 (c) | | 3,880,000 | 3,559,900 |
| Moog, Inc. 4.25% 12/15/27 (c) | | 3,715,000 | 3,459,594 |
| TransDigm, Inc.: | | | |
| 4.625% 1/15/29 | | 2,335,000 | 2,031,870 |
| 5.5% 11/15/27 | | 15,420,000 | 14,109,300 |
| 7.5% 3/15/27 | | 1,455,000 | 1,465,913 |
| | | | 65,000,387 |
| Automotive & Auto Parts - 0.3% | | | |
| Ford Motor Credit Co. LLC: | | | |
| 2.9% 2/10/29 | | 2,715,000 | 2,260,238 |
| 3.815% 11/2/27 | | 1,640,000 | 1,492,400 |
| | | | 3,752,638 |
| Banks & Thrifts - 0.1% | | | |
| Jane Street Group LLC/JSG Finance, Inc. 4.5% 11/15/29 (c) | | 970,000 | 898,239 |
| Broadcasting - 1.3% | | | |
| Diamond Sports Group LLC/Diamond Sports Finance Co. 5.375% 8/15/26 (c) | | 9,005,000 | 3,331,850 |
| Sinclair Television Group, Inc.: | | | |
| 5.125% 2/15/27 (c) | | 3,880,000 | 3,398,996 |
| 5.5% 3/1/30 (c) | | 1,670,000 | 1,365,509 |
| Sirius XM Radio, Inc.: | | | |
| 4% 7/15/28 (c) | | 2,505,000 | 2,263,894 |
| 4.125% 7/1/30 (c) | | 845,000 | 741,986 |
| TEGNA, Inc.: | | | |
| 4.625% 3/15/28 | | 1,895,000 | 1,823,369 |
| 5% 9/15/29 | | 725,000 | 703,250 |
| Univision Communications, Inc.: | | | |
| 4.5% 5/1/29 (c) | | 2,170,000 | 1,947,575 |
| 6.625% 6/1/27 (c) | | 3,080,000 | 3,087,700 |
| | | | 18,664,129 |
| Building Materials - 0.5% | | | |
| Advanced Drain Systems, Inc. 5% 9/30/27 (c) | | 4,029,000 | 3,893,021 |
| Builders FirstSource, Inc. 4.25% 2/1/32 (c) | | 2,210,000 | 1,886,788 |
| SRS Distribution, Inc.: | | | |
| 4.625% 7/1/28 (c) | | 1,335,000 | 1,222,206 |
| 6% 12/1/29 (c) | | 1,230,000 | 1,079,325 |
| | | | 8,081,340 |
| Cable/Satellite TV - 3.7% | | | |
| CCO Holdings LLC/CCO Holdings Capital Corp.: | | | |
| 4.25% 2/1/31 (c) | | 3,680,000 | 3,101,504 |
| 4.5% 8/15/30 (c) | | 2,885,000 | 2,517,163 |
| 4.5% 5/1/32 | | 4,540,000 | 3,818,844 |
| 4.5% 6/1/33 (c) | | 3,195,000 | 2,613,893 |
| 4.75% 3/1/30 (c) | | 4,755,000 | 4,249,781 |
| CSC Holdings LLC: | | | |
| 4.125% 12/1/30 (c) | | 2,050,000 | 1,691,250 |
| 4.625% 12/1/30 (c) | | 6,510,000 | 4,980,150 |
| 5.375% 2/1/28 (c) | | 4,690,000 | 4,306,053 |
| 5.75% 1/15/30 (c) | | 3,435,000 | 2,851,050 |
| 7.5% 4/1/28 (c) | | 4,070,000 | 3,751,930 |
| Dolya Holdco 18 DAC 5% 7/15/28 (c) | | 1,680,000 | 1,526,213 |
| Radiate Holdco LLC/Radiate Financial Service Ltd.: | | | |
| 4.5% 9/15/26 (c) | | 3,625,000 | 3,338,226 |
| 6.5% 9/15/28 (c) | | 8,060,000 | 7,092,800 |
| Telenet Finance Luxembourg Notes SARL 5.5% 3/1/28 (c) | | 5,400,000 | 5,157,000 |
| Ziggo Bond Co. BV 5.125% 2/28/30 (c) | | 2,090,000 | 1,813,075 |
| Ziggo BV 4.875% 1/15/30 (c) | | 1,705,000 | 1,511,056 |
| | | | 54,319,988 |
| Capital Goods - 0.7% | | | |
| Mueller Water Products, Inc. 4% 6/15/29 (c) | | 1,905,000 | 1,704,975 |
| Vertical Holdco GmbH 7.625% 7/15/28 (c) | | 1,130,000 | 1,087,625 |
| Vertical U.S. Newco, Inc. 5.25% 7/15/27 (c) | | 7,365,000 | 6,899,679 |
| | | | 9,692,279 |
| Chemicals - 3.8% | | | |
| Axalta Coating Systems LLC 3.375% 2/15/29 (c) | | 1,320,000 | 1,142,104 |
| Axalta Coating Systems/Dutch Holding BV 4.75% 6/15/27 (c) | | 1,600,000 | 1,520,000 |
| CVR Partners LP 6.125% 6/15/28 (c) | | 2,377,000 | 2,329,460 |
| Element Solutions, Inc. 3.875% 9/1/28 (c) | | 2,499,000 | 2,233,481 |
| Kronos Acquisition Holdings, Inc. / KIK Custom Products, Inc.: | | | |
| 5% 12/31/26 (c) | | 4,400,000 | 3,894,000 |
| 7% 12/31/27 (c) | | 440,000 | 347,600 |
| LSB Industries, Inc. 6.25% 10/15/28 (c) | | 4,080,000 | 3,998,155 |
| Methanex Corp.: | | | |
| 5.125% 10/15/27 | | 4,800,000 | 4,608,000 |
| 5.65% 12/1/44 | | 2,262,000 | 1,979,250 |
| NOVA Chemicals Corp.: | | | |
| 4.25% 5/15/29 (c) | | 1,900,000 | 1,643,500 |
| 5% 5/1/25 (c) | | 940,000 | 930,600 |
| 5.25% 6/1/27 (c) | | 5,320,000 | 5,040,700 |
| Nufarm Australia Ltd. 5% 1/27/30 (c) | | 2,575,000 | 2,433,375 |
| Olympus Water U.S. Holding Corp.: | | | |
| 4.25% 10/1/28 (c) | | 2,030,000 | 1,793,830 |
| 6.25% 10/1/29 (c) | | 2,255,000 | 1,871,650 |
| SCIL IV LLC / SCIL U.S.A. Holdings LLC 5.375% 11/1/26 (c) | | 1,550,000 | 1,414,375 |
| The Chemours Co. LLC: | | | |
| 4.625% 11/15/29 (c) | | 1,645,000 | 1,424,981 |
| 5.375% 5/15/27 | | 2,604,000 | 2,512,860 |
| 5.75% 11/15/28 (c) | | 12,755,000 | 11,957,813 |
| W.R. Grace Holding LLC 5.625% 8/15/29 (c) | | 3,140,000 | 2,674,966 |
| | | | 55,750,700 |
| Consumer Products - 0.5% | | | |
| Diamond BC BV 4.625% 10/1/29 (c) | | 3,275,000 | 2,817,253 |
| Michaels Companies, Inc.: | | | |
| 5.25% 5/1/28 (c) | | 1,425,000 | 1,224,674 |
| 7.875% 5/1/29 (c) | | 1,100,000 | 866,250 |
| Nordstrom, Inc.: | | | |
| 4.25% 8/1/31 | | 1,630,000 | 1,381,566 |
| 4.375% 4/1/30 | | 1,090,000 | 948,594 |
| | | | 7,238,337 |
| Containers - 0.8% | | | |
| Graphic Packaging International, Inc. 3.75% 2/1/30 (c) | | 860,000 | 753,988 |
| OI European Group BV 4.75% 2/15/30 (c) | | 750,000 | 660,000 |
| Sealed Air Corp. 5% 4/15/29 (c) | | 2,240,000 | 2,223,200 |
| Trivium Packaging Finance BV: | | | |
| 5.5% 8/15/26 (c) | | 4,574,000 | 4,419,628 |
| 8.5% 8/15/27 (c) | | 4,080,000 | 4,029,000 |
| | | | 12,085,816 |
| Diversified Financial Services - 2.4% | | | |
| Coinbase Global, Inc. 3.375% 10/1/28 (c) | | 4,505,000 | 3,497,817 |
| Hightower Holding LLC 6.75% 4/15/29 (c) | | 2,245,000 | 2,068,319 |
| Icahn Enterprises LP/Icahn Enterprises Finance Corp.: | | | |
| 4.375% 2/1/29 | | 3,160,000 | 2,726,227 |
| 5.25% 5/15/27 | | 7,725,000 | 7,184,250 |
| 6.25% 5/15/26 | | 4,350,000 | 4,312,677 |
| Ladder Capital Finance Holdings LLLP/Ladder Capital Finance Corp.: | | | |
| 4.25% 2/1/27 (c) | | 670,000 | 615,864 |
| 4.75% 6/15/29 (c) | | 2,920,000 | 2,619,474 |
| OneMain Finance Corp.: | | | |
| 3.5% 1/15/27 | | 3,265,000 | 2,868,368 |
| 3.875% 9/15/28 | | 5,940,000 | 5,049,000 |
| 7.125% 3/15/26 | | 4,845,000 | 4,905,563 |
| | | | 35,847,559 |
| Diversified Media - 1.1% | | | |
| Advantage Sales & Marketing, Inc. 6.5% 11/15/28 (c) | | 8,065,000 | 7,329,069 |
| Nielsen Finance LLC/Nielsen Finance Co.: | | | |
| 4.5% 7/15/29 (c) | | 1,905,000 | 1,800,320 |
| 5.625% 10/1/28 (c) | | 3,100,000 | 3,003,993 |
| 5.875% 10/1/30 (c) | | 1,460,000 | 1,400,198 |
| Terrier Media Buyer, Inc. 8.875% 12/15/27 (c) | | 3,540,000 | 3,459,961 |
| | | | 16,993,541 |
| Energy - 14.0% | | | |
| Apache Corp. 4.25% 1/15/30 | | 775,000 | 720,022 |
| Atlantica Sustainable Infrastructure PLC 4.125% 6/15/28 (c) | | 2,540,000 | 2,311,400 |
| CGG SA 8.75% 4/1/27 (c) | | 750,000 | 744,495 |
| Cheniere Energy, Inc. 4.625% 10/15/28 | | 3,725,000 | 3,603,938 |
| Citgo Petroleum Corp.: | | | |
| 6.375% 6/15/26 (c) | | 11,475,000 | 11,403,855 |
| 7% 6/15/25 (c) | | 7,970,000 | 7,915,246 |
| Colgate Energy Partners III LLC 5.875% 7/1/29 (c) | | 3,418,000 | 3,383,820 |
| Comstock Resources, Inc.: | | | |
| 5.875% 1/15/30 (c) | | 3,470,000 | 3,339,216 |
| 6.75% 3/1/29 (c) | | 4,110,000 | 4,155,950 |
| 7.5% 5/15/25 (c) | | 739,000 | 754,150 |
| Crestwood Midstream Partners LP/Crestwood Midstream Finance Corp.: | | | |
| 5.625% 5/1/27 (c) | | 11,009,000 | 10,720,014 |
| 5.75% 4/1/25 | | 5,685,000 | 5,617,178 |
| 6% 2/1/29 (c) | | 7,223,000 | 7,025,523 |
| CrownRock LP/CrownRock Finance, Inc.: | | | |
| 5% 5/1/29 (c) | | 1,295,000 | 1,267,301 |
| 5.625% 10/15/25 (c) | | 230,000 | 230,000 |
| CVR Energy, Inc.: | | | |
| 5.25% 2/15/25 (c) | | 9,370,000 | 9,064,538 |
| 5.75% 2/15/28 (c) | | 7,100,000 | 6,654,688 |
| Delek Logistics Partners LP 7.125% 6/1/28 (c) | | 4,755,000 | 4,545,114 |
| DT Midstream, Inc. 4.125% 6/15/29 (c) | | 1,640,000 | 1,492,400 |
| Endeavor Energy Resources LP/EER Finance, Inc. 5.75% 1/30/28 (c) | | 433,000 | 434,117 |
| EnLink Midstream LLC 5.625% 1/15/28 (c) | | 665,000 | 658,948 |
| EQM Midstream Partners LP 6.5% 7/1/27 (c) | | 1,412,000 | 1,426,120 |
| Global Partners LP/GLP Finance Corp. 6.875% 1/15/29 | | 3,460,000 | 3,373,716 |
| Harvest Midstream I LP 7.5% 9/1/28 (c) | | 3,085,000 | 3,130,226 |
| Hess Midstream Partners LP: | | | |
| 4.25% 2/15/30 (c) | | 1,115,000 | 1,022,778 |
| 5.125% 6/15/28 (c) | | 3,025,000 | 2,926,688 |
| Hilcorp Energy I LP/Hilcorp Finance Co.: | | | |
| 5.75% 2/1/29 (c) | | 775,000 | 759,500 |
| 6.25% 11/1/28 (c) | | 775,000 | 771,629 |
| Holly Energy Partners LP/Holly Energy Finance Corp. 5% 2/1/28 (c) | | 4,665,000 | 4,438,328 |
| MEG Energy Corp.: | | | |
| 5.875% 2/1/29 (c) | | 1,860,000 | 1,820,698 |
| 7.125% 2/1/27 (c) | | 1,810,000 | 1,838,055 |
| Mesquite Energy, Inc. 7.25% 2/15/23 (b)(c)(d) | | 10,580,000 | 1 |
| New Fortress Energy, Inc.: | | | |
| 6.5% 9/30/26 (c) | | 12,170,000 | 11,778,369 |
| 6.75% 9/15/25 (c) | | 12,800,000 | 12,584,192 |
| NGL Energy Operating LLC/NGL Energy Finance Corp. 7.5% 2/1/26 (c) | | 10,365,000 | 9,764,711 |
| NGL Energy Partners LP/NGL Energy Finance Corp. 7.5% 11/1/23 | | 2,185,000 | 2,026,588 |
| Occidental Petroleum Corp.: | | | |
| 6.125% 1/1/31 | | 2,315,000 | 2,433,204 |
| 6.45% 9/15/36 | | 1,745,000 | 1,893,325 |
| 7.5% 5/1/31 | | 6,540,000 | 7,455,600 |
| 7.875% 9/15/31 | | 635,000 | 742,429 |
| 8.875% 7/15/30 | | 2,170,000 | 2,606,365 |
| PBF Holding Co. LLC/PBF Finance Corp. 9.25% 5/15/25 (c) | | 10,065,000 | 10,417,275 |
| Rockies Express Pipeline LLC: | | | |
| 4.8% 5/15/30 (c) | | 145,000 | 132,812 |
| 4.95% 7/15/29 (c) | | 1,730,000 | 1,619,332 |
| 6.875% 4/15/40 (c) | | 655,000 | 622,250 |
| SM Energy Co.: | | | |
| 5.625% 6/1/25 | | 2,035,000 | 1,989,213 |
| 6.5% 7/15/28 | | 1,720,000 | 1,695,662 |
| 6.75% 9/15/26 | | 475,000 | 472,606 |
| Southwestern Energy Co. 4.75% 2/1/32 | | 1,640,000 | 1,550,833 |
| Sunoco LP/Sunoco Finance Corp.: | | | |
| 4.5% 5/15/29 | | 1,920,000 | 1,726,522 |
| 5.875% 3/15/28 | | 875,000 | 861,875 |
| Superior Plus LP / Superior General Partner, Inc. 4.5% 3/15/29 (c) | | 1,155,000 | 1,055,381 |
| Tallgrass Energy Partners LP / Tallgrass Energy Finance Corp.: | | | |
| 5.5% 1/15/28 (c) | | 3,875,000 | 3,612,120 |
| 6% 3/1/27 (c) | | 7,565,000 | 7,262,400 |
| 6% 12/31/30 (c) | | 3,525,000 | 3,260,625 |
| 6% 9/1/31 (c) | | 3,695,000 | 3,371,688 |
| 7.5% 10/1/25 (c) | | 365,000 | 372,490 |
| Transocean Guardian Ltd. 5.875% 1/15/24 (c) | | 1,224,922 | 1,172,447 |
| Transocean Phoenix 2 Ltd. 7.75% 10/15/24 (c) | | 227,250 | 228,954 |
| Transocean Pontus Ltd. 6.125% 8/1/25 (c) | | 621,150 | 610,249 |
| Transocean Poseidon Ltd. 6.875% 2/1/27 (c) | | 946,875 | 911,102 |
| Transocean Sentry Ltd. 5.375% 5/15/23 (c) | | 1,553,841 | 1,507,226 |
| Venture Global Calcasieu Pass LLC: | | | |
| 3.875% 8/15/29 (c) | | 2,135,000 | 1,948,188 |
| 4.125% 8/15/31 (c) | | 2,115,000 | 1,919,363 |
| | | | 207,155,048 |
| Environmental - 1.0% | | | |
| Madison IAQ LLC: | | | |
| 4.125% 6/30/28 (c) | | 3,730,000 | 3,273,075 |
| 5.875% 6/30/29 (c) | | 10,110,000 | 8,239,650 |
| Stericycle, Inc.: | | | |
| 3.875% 1/15/29 (c) | | 2,775,000 | 2,447,134 |
| 5.375% 7/15/24 (c) | | 575,000 | 573,022 |
| | | | 14,532,881 |
| Food & Drug Retail - 0.9% | | | |
| Albertsons Companies LLC/Safeway, Inc./New Albertson's, Inc./Albertson's LLC: | | | |
| 3.5% 3/15/29 (c) | | 9,110,000 | 7,674,264 |
| 4.875% 2/15/30 (c) | | 2,455,000 | 2,221,910 |
| Emergent BioSolutions, Inc. 3.875% 8/15/28 (c) | | 3,440,000 | 2,919,700 |
| Murphy Oil U.S.A., Inc. 3.75% 2/15/31 (c) | | 675,000 | 592,900 |
| | | | 13,408,774 |
| Food/Beverage/Tobacco - 2.8% | | | |
| C&S Group Enterprises LLC 5% 12/15/28 (c) | | 6,635,000 | 5,648,044 |
| JBS U.S.A. Lux SA / JBS Food Co.: | | | |
| 5.5% 1/15/30 (c) | | 4,490,000 | 4,433,875 |
| 6.5% 4/15/29 (c) | | 4,136,000 | 4,280,760 |
| Lamb Weston Holdings, Inc. 4.125% 1/31/30 (c) | | 4,660,000 | 4,158,491 |
| Performance Food Group, Inc.: | | | |
| 4.25% 8/1/29 (c) | | 965,000 | 857,624 |
| 5.5% 10/15/27 (c) | | 3,085,000 | 2,993,761 |
| Post Holdings, Inc.: | | | |
| 4.625% 4/15/30 (c) | | 1,290,000 | 1,102,950 |
| 5.5% 12/15/29 (c) | | 1,575,000 | 1,433,250 |
| Primo Water Holdings, Inc. 4.375% 4/30/29 (c) | | 5,030,000 | 4,378,187 |
| TreeHouse Foods, Inc. 4% 9/1/28 | | 2,445,000 | 1,992,235 |
| Triton Water Holdings, Inc. 6.25% 4/1/29 (c) | | 9,450,000 | 7,822,143 |
| U.S. Foods, Inc.: | | | |
| 4.625% 6/1/30 (c) | | 820,000 | 733,900 |
| 4.75% 2/15/29 (c) | | 2,180,000 | 2,013,666 |
| | | | 41,848,886 |
| Gaming - 3.1% | | | |
| Affinity Gaming LLC 6.875% 12/15/27 (c) | | 4,130,000 | 3,868,323 |
| Caesars Entertainment, Inc.: | | | |
| 4.625% 10/15/29 (c) | | 2,035,000 | 1,745,013 |
| 6.25% 7/1/25 (c) | | 2,675,000 | 2,704,077 |
| 8.125% 7/1/27 (c) | | 7,849,000 | 8,202,205 |
| Fertitta Entertainment LLC / Fertitta Entertainment Finance Co., Inc. 6.75% 1/15/30 (c) | | 4,500,000 | 3,893,040 |
| Golden Entertainment, Inc. 7.625% 4/15/26 (c) | | 7,980,000 | 8,159,550 |
| Jacobs Entertainment, Inc. 6.75% 2/15/29 (c) | | 975,000 | 955,208 |
| Melco Resorts Finance Ltd.: | | | |
| 5.375% 12/4/29 (c) | | 1,610,000 | 1,288,338 |
| 5.75% 7/21/28 (c) | | 2,420,000 | 2,009,810 |
| Premier Entertainment Sub LLC: | | | |
| 5.625% 9/1/29 (c) | | 2,725,000 | 2,180,000 |
| 5.875% 9/1/31 (c) | | 1,295,000 | 1,019,813 |
| Station Casinos LLC 4.5% 2/15/28 (c) | | 1,665,000 | 1,511,279 |
| Wynn Las Vegas LLC/Wynn Las Vegas Capital Corp. 5.25% 5/15/27 (c) | | 3,289,000 | 3,024,795 |
| Wynn Macau Ltd.: | | | |
| 4.875% 10/1/24 (c) | | 3,137,000 | 2,803,694 |
| 5.5% 10/1/27 (c) | | 2,575,000 | 2,098,625 |
| | | | 45,463,770 |
| Healthcare - 8.5% | | | |
| 180 Medical, Inc. 3.875% 10/15/29 (c) | | 2,565,000 | 2,282,850 |
| AMN Healthcare 4% 4/15/29 (c) | | 3,205,000 | 2,900,525 |
| Avantor Funding, Inc.: | | | |
| 3.875% 11/1/29 (c) | | 4,360,000 | 3,911,923 |
| 4.625% 7/15/28 (c) | | 4,885,000 | 4,647,052 |
| Bausch Health Companies, Inc.: | | | |
| 5% 1/30/28 (c) | | 2,480,000 | 1,829,422 |
| 7% 1/15/28 (c) | | 4,015,000 | 3,312,375 |
| Cano Health, Inc. 6.25% 10/1/28 (c) | | 3,310,000 | 3,053,475 |
| Catalent Pharma Solutions 3.5% 4/1/30 (c) | | 4,245,000 | 3,692,343 |
| Charles River Laboratories International, Inc.: | | | |
| 3.75% 3/15/29 (c) | | 1,150,000 | 1,040,750 |
| 4.25% 5/1/28 (c) | | 472,000 | 450,538 |
| Community Health Systems, Inc.: | | | |
| 4.75% 2/15/31 (c) | | 3,505,000 | 2,970,488 |
| 5.25% 5/15/30 (c) | | 3,850,000 | 3,375,103 |
| 5.625% 3/15/27 (c) | | 10,035,000 | 9,565,788 |
| 6% 1/15/29 (c) | | 3,665,000 | 3,464,121 |
| 6.125% 4/1/30 (c) | | 2,885,000 | 2,372,913 |
| 6.875% 4/15/29 (c) | | 3,575,000 | 3,135,347 |
| 8% 3/15/26 (c) | | 1,190,000 | 1,230,222 |
| CTR Partnership LP/CareTrust Capital Corp. 3.875% 6/30/28 (c) | | 2,070,000 | 1,873,350 |
| DaVita HealthCare Partners, Inc. 4.625% 6/1/30 (c) | | 4,770,000 | 4,149,900 |
| Embecta Corp. 5% 2/15/30 (c) | | 1,110,000 | 1,001,775 |
| Grifols Escrow Issuer SA 4.75% 10/15/28 (c) | | 3,010,000 | 2,746,625 |
| HealthEquity, Inc. 4.5% 10/1/29 (c) | | 4,830,000 | 4,413,413 |
| Hologic, Inc.: | | | |
| 3.25% 2/15/29 (c) | | 3,405,000 | 3,033,395 |
| 4.625% 2/1/28 (c) | | 6,000 | 5,869 |
| Jazz Securities DAC 4.375% 1/15/29 (c) | | 4,880,000 | 4,495,700 |
| MEDNAX, Inc. 5.375% 2/15/30 (c) | | 1,880,000 | 1,751,690 |
| Minerva Merger Sub, Inc. 6.5% 2/15/30 (c) | | 7,460,000 | 6,866,482 |
| ModivCare Escrow Issuer, Inc. 5% 10/1/29 (c) | | 785,000 | 686,875 |
| Molina Healthcare, Inc. 3.875% 11/15/30 (c) | | 1,465,000 | 1,321,415 |
| Option Care Health, Inc. 4.375% 10/31/29 (c) | | 3,270,000 | 2,939,632 |
| Organon & Co. / Organon Foreign Debt Co-Issuer BV: | | | |
| 4.125% 4/30/28 (c) | | 4,935,000 | 4,591,031 |
| 5.125% 4/30/31 (c) | | 2,160,000 | 1,952,100 |
| Owens & Minor, Inc. 4.5% 3/31/29 (c) | | 1,010,000 | 908,569 |
| Radiology Partners, Inc. 9.25% 2/1/28 (c) | | 3,750,000 | 3,562,500 |
| RP Escrow Issuer LLC 5.25% 12/15/25 (c) | | 5,310,000 | 4,938,300 |
| Teleflex, Inc. 4.25% 6/1/28 (c) | | 930,000 | 876,525 |
| Tenet Healthcare Corp.: | | | |
| 4.25% 6/1/29 (c) | | 4,015,000 | 3,627,512 |
| 4.375% 1/15/30 (c) | | 1,990,000 | 1,810,641 |
| 4.625% 6/15/28 (c) | | 3,850,000 | 3,628,625 |
| 6.125% 10/1/28 (c) | | 7,670,000 | 7,362,817 |
| 6.25% 2/1/27 (c) | | 2,741,000 | 2,720,443 |
| Valeant Pharmaceuticals International, Inc. 8.5% 1/31/27 (c) | | 1,155,000 | 1,092,942 |
| Vizient, Inc. 6.25% 5/15/27 (c) | | 385,000 | 397,513 |
| | | | 125,990,874 |
| Homebuilders/Real Estate - 3.4% | | | |
| Ashton Woods U.S.A. LLC/Ashton Woods Finance Co. 4.625% 8/1/29 (c) | | 985,000 | 828,823 |
| Howard Hughes Corp.: | | | |
| 4.125% 2/1/29 (c) | | 1,325,000 | 1,193,008 |
| 4.375% 2/1/31 (c) | | 1,325,000 | 1,178,482 |
| Kennedy-Wilson, Inc. 4.75% 2/1/30 | | 5,055,000 | 4,562,138 |
| MPT Operating Partnership LP/MPT Finance Corp. 5% 10/15/27 | | 5,825,000 | 5,589,146 |
| Railworks Holdings LP 8.25% 11/15/28 (c) | | 2,855,000 | 2,833,588 |
| Realogy Group LLC/Realogy Co-Issuer Corp. 5.75% 1/15/29 (c) | | 4,680,000 | 3,913,650 |
| TopBuild Corp. 4.125% 2/15/32 (c) | | 3,680,000 | 3,170,528 |
| Uniti Group LP / Uniti Group Finance, Inc.: | | | |
| 4.75% 4/15/28 (c) | | 7,795,000 | 6,957,038 |
| 6.5% 2/15/29 (c) | | 23,441,000 | 20,227,473 |
| | | | 50,453,874 |
| Hotels - 0.5% | | | |
| Hilton Domestic Operating Co., Inc.: | | | |
| 3.625% 2/15/32 (c) | | 3,710,000 | 3,141,888 |
| 3.75% 5/1/29 (c) | | 495,000 | 448,480 |
| 4% 5/1/31 (c) | | 1,790,000 | 1,600,887 |
| Wyndham Hotels & Resorts, Inc. 4.375% 8/15/28 (c) | | 1,785,000 | 1,663,691 |
| | | | 6,854,946 |
| Insurance - 1.5% | | | |
| Alliant Holdings Intermediate LLC: | | | |
| 4.25% 10/15/27 (c) | | 4,740,000 | 4,377,627 |
| 6.75% 10/15/27 (c) | | 13,390,000 | 12,661,986 |
| AmWINS Group, Inc. 4.875% 6/30/29 (c) | | 4,315,000 | 3,949,649 |
| AssuredPartners, Inc. 5.625% 1/15/29 (c) | | 1,355,000 | 1,191,668 |
| | | | 22,180,930 |
| Leisure - 3.1% | | | |
| Carnival Corp.: | | | |
| 4% 8/1/28 (c) | | 4,020,000 | 3,623,025 |
| 5.75% 3/1/27 (c) | | 6,900,000 | 6,248,054 |
| 6% 5/1/29 (c) | | 5,450,000 | 4,891,375 |
| 6.65% 1/15/28 | | 300,000 | 277,500 |
| 7.625% 3/1/26 (c) | | 6,815,000 | 6,678,700 |
| MajorDrive Holdings IV LLC 6.375% 6/1/29 (c) | | 1,485,000 | 1,176,863 |
| NCL Corp. Ltd.: | | | |
| 3.625% 12/15/24 (c) | | 3,860,000 | 3,589,800 |
| 5.875% 3/15/26 (c) | | 890,000 | 822,191 |
| 7.75% 2/15/29 (c) | | 2,010,000 | 1,949,700 |
| NCL Finance Ltd. 6.125% 3/15/28 (c) | | 640,000 | 576,000 |
| Royal Caribbean Cruises Ltd.: | | | |
| 4.25% 7/1/26 (c) | | 4,110,000 | 3,714,413 |
| 5.375% 7/15/27 (c) | | 1,535,000 | 1,410,581 |
| 5.5% 8/31/26 (c) | | 4,160,000 | 3,876,267 |
| 5.5% 4/1/28 (c) | | 4,905,000 | 4,475,813 |
| Viking Ocean Cruises Ship VII Ltd. 5.625% 2/15/29 (c) | | 630,000 | 555,975 |
| Voc Escrow Ltd. 5% 2/15/28 (c) | | 1,950,000 | 1,759,875 |
| | | | 45,626,132 |
| Metals/Mining - 0.9% | | | |
| Eldorado Gold Corp. 6.25% 9/1/29 (c) | | 1,005,000 | 964,800 |
| ERO Copper Corp. 6.5% 2/15/30 (c) | | 4,410,000 | 3,957,137 |
| First Quantum Minerals Ltd. 6.875% 10/15/27 (c) | | 3,790,000 | 3,774,129 |
| HudBay Minerals, Inc. 4.5% 4/1/26 (c) | | 860,000 | 795,117 |
| Mineral Resources Ltd. 8.5% 5/1/30 (c) | | 1,400,000 | 1,382,500 |
| PMHC II, Inc. 9% 2/15/30 (c) | | 2,130,000 | 1,714,650 |
| | | | 12,588,333 |
| Paper - 0.7% | | | |
| Ardagh Metal Packaging Finance U.S.A. LLC/Ardagh Metal Packaging Finance PLC 4% 9/1/29 (c) | | 1,165,000 | 998,440 |
| Clydesdale Acquisition Holdings, Inc. 6.625% 4/15/29 (c) | | 815,000 | 812,963 |
| Glatfelter Corp. 4.75% 11/15/29 (c) | | 1,385,000 | 1,108,000 |
| Intertape Polymer Group, Inc. 4.375% 6/15/29 (c) | | 3,450,000 | 3,549,636 |
| SPA Holdings 3 OY 4.875% 2/4/28 (c) | | 4,520,000 | 3,987,087 |
| | | | 10,456,126 |
| Publishing/Printing - 0.1% | | | |
| News Corp. 5.125% 2/15/32 (c) | | 1,685,000 | 1,609,175 |
| Railroad - 0.3% | | | |
| First Student Bidco, Inc./First Transit Parent, Inc. 4% 7/31/29 (c) | | 5,195,000 | 4,649,525 |
| Restaurants - 0.4% | | | |
| 1011778 BC Unlimited Liability Co./New Red Finance, Inc. 4% 10/15/30 (c) | | 2,680,000 | 2,290,998 |
| Yum! Brands, Inc. 4.625% 1/31/32 | | 3,475,000 | 3,157,906 |
| | | | 5,448,904 |
| Services - 6.0% | | | |
| ADT Corp. 4.125% 8/1/29 (c) | | 1,705,000 | 1,447,596 |
| Adtalem Global Education, Inc. 5.5% 3/1/28 (c) | | 4,346,000 | 3,990,171 |
| Allied Universal Holdco LLC / Allied Universal Finance Corp. 6% 6/1/29 (c) | | 1,835,000 | 1,518,463 |
| APX Group, Inc. 6.75% 2/15/27 (c) | | 1,280,000 | 1,268,800 |
| Aramark Services, Inc. 5% 2/1/28 (c) | | 5,060,000 | 4,718,703 |
| ASGN, Inc. 4.625% 5/15/28 (c) | | 2,280,000 | 2,118,120 |
| Atlas Luxco 4 SARL / Allied Universal Holdco LLC / Allied Universal Finance Corp. 4.625% 6/1/28 (c) | | 2,559,000 | 2,245,523 |
| Booz Allen Hamilton, Inc. 3.875% 9/1/28 (c) | | 9,795,000 | 9,022,762 |
| Brand Energy & Infrastructure Services, Inc. 8.5% 7/15/25 (c) | | 8,697,000 | 7,762,073 |
| CoreCivic, Inc.: | | | |
| 4.75% 10/15/27 | | 2,286,000 | 2,034,004 |
| 8.25% 4/15/26 | | 9,400,000 | 9,655,868 |
| Fair Isaac Corp. 4% 6/15/28 (c) | | 2,035,000 | 1,859,217 |
| Gartner, Inc.: | | | |
| 3.625% 6/15/29 (c) | | 985,000 | 881,575 |
| 3.75% 10/1/30 (c) | | 1,600,000 | 1,426,880 |
| GEMS MENASA Cayman Ltd. 7.125% 7/31/26 (c) | | 9,121,000 | 9,096,373 |
| Legends Hospitality Holding Co. LLC/Legends Hospitality Co-Issuer, Inc. 5% 2/1/26 (c) | | 5,185,000 | 4,865,863 |
| PowerTeam Services LLC 9.033% 12/4/25 (c) | | 840,000 | 795,014 |
| Service Corp. International: | | | |
| 4% 5/15/31 | | 2,505,000 | 2,254,500 |
| 5.125% 6/1/29 | | 2,272,000 | 2,241,164 |
| Sotheby's 7.375% 10/15/27 (c) | | 7,700,000 | 7,592,585 |
| The GEO Group, Inc. 6% 4/15/26 | | 2,110,000 | 1,702,770 |
| TriNet Group, Inc. 3.5% 3/1/29 (c) | | 3,950,000 | 3,579,688 |
| WASH Multifamily Acquisition, Inc. 5.75% 4/15/26 (c) | | 5,967,000 | 5,802,908 |
| | | | 87,880,620 |
| Steel - 0.3% | | | |
| Commercial Metals Co. 4.125% 1/15/30 | | 1,640,000 | 1,492,400 |
| Roller Bearing Co. of America, Inc. 4.375% 10/15/29 (c) | | 2,955,000 | 2,659,500 |
| | | | 4,151,900 |
| Super Retail - 1.7% | | | |
| Bath & Body Works, Inc.: | | | |
| 5.25% 2/1/28 | | 400,000 | 384,000 |
| 6.625% 10/1/30 (c) | | 610,000 | 606,709 |
| 6.694% 1/15/27 | | 1,430,000 | 1,473,014 |
| Carvana Co.: | | | |
| 4.875% 9/1/29 (c) | | 1,330,000 | 970,634 |
| 5.5% 4/15/27 (c) | | 2,175,000 | 1,740,544 |
| 5.625% 10/1/25 (c) | | 2,500,000 | 2,165,150 |
| 5.875% 10/1/28 (c) | | 550,000 | 437,132 |
| 10.25% 5/1/30 (c) | | 1,495,000 | 1,444,544 |
| EG Global Finance PLC: | | | |
| 6.75% 2/7/25 (c) | | 3,560,000 | 3,460,142 |
| 8.5% 10/30/25 (c) | | 6,085,000 | 6,085,000 |
| LBM Acquisition LLC 6.25% 1/15/29 (c) | | 2,315,000 | 1,883,831 |
| Levi Strauss & Co. 3.5% 3/1/31 (c) | | 2,235,000 | 1,933,275 |
| Wolverine World Wide, Inc. 4% 8/15/29 (c) | | 3,250,000 | 2,761,980 |
| | | | 25,345,955 |
| Technology - 6.0% | | | |
| Acuris Finance U.S. 5% 5/1/28 (c) | | 5,520,000 | 5,050,800 |
| Arches Buyer, Inc.: | | | |
| 4.25% 6/1/28 (c) | | 3,220,000 | 2,861,711 |
| 6.125% 12/1/28 (c) | | 4,250,000 | 3,697,500 |
| Black Knight InfoServ LLC 3.625% 9/1/28 (c) | | 4,235,000 | 3,927,751 |
| Clarivate Science Holdings Corp.: | | | |
| 3.875% 7/1/28 (c) | | 1,230,000 | 1,094,700 |
| 4.875% 7/1/29 (c) | | 1,160,000 | 1,022,285 |
| CommScope, Inc.: | | | |
| 4.75% 9/1/29 (c) | | 1,415,000 | 1,183,067 |
| 6% 3/1/26 (c) | | 3,570,000 | 3,367,224 |
| 7.125% 7/1/28 (c) | | 2,505,000 | 1,997,738 |
| 8.25% 3/1/27 (c) | | 770,000 | 654,500 |
| Elastic NV 4.125% 7/15/29 (c) | | 4,035,000 | 3,611,325 |
| Entegris Escrow Corp. 4.75% 4/15/29 (c) | | 2,285,000 | 2,202,192 |
| Gartner, Inc. 4.5% 7/1/28 (c) | | 2,505,000 | 2,400,831 |
| II-VI, Inc. 5% 12/15/29 (c) | | 4,350,000 | 4,078,125 |
| ION Trading Technologies Ltd. 5.75% 5/15/28 (c) | | 5,095,000 | 4,770,194 |
| MicroStrategy, Inc. 6.125% 6/15/28 (c) | | 2,350,000 | 2,153,000 |
| Northwest Fiber LLC/Northwest Fiber Finance Sub, Inc. 10.75% 6/1/28 (c) | | 2,385,000 | 2,444,625 |
| onsemi 3.875% 9/1/28 (c) | | 1,875,000 | 1,739,447 |
| Open Text Corp.: | | | |
| 3.875% 2/15/28 (c) | | 2,815,000 | 2,563,856 |
| 3.875% 12/1/29 (c) | | 3,970,000 | 3,527,980 |
| Rackspace Hosting, Inc.: | | | |
| 3.5% 2/15/28 (c) | | 3,210,000 | 2,776,233 |
| 5.375% 12/1/28 (c) | | 19,245,000 | 15,679,479 |
| Roblox Corp. 3.875% 5/1/30 (c) | | 4,200,000 | 3,612,000 |
| Sensata Technologies BV 4% 4/15/29 (c) | | 1,740,000 | 1,551,149 |
| TTM Technologies, Inc. 4% 3/1/29 (c) | | 6,735,000 | 5,893,125 |
| Twilio, Inc. 3.875% 3/15/31 | | 1,270,000 | 1,091,527 |
| Uber Technologies, Inc. 8% 11/1/26 (c) | | 4,000,000 | 4,190,000 |
| | | | 89,142,364 |
| Telecommunications - 9.6% | | | |
| Altice Financing SA: | | | |
| 5% 1/15/28 (c) | | 5,930,000 | 4,949,949 |
| 5.75% 8/15/29 (c) | | 13,650,000 | 11,500,262 |
| Altice France Holding SA 6% 2/15/28 (c) | | 6,520,000 | 5,387,150 |
| Altice France SA: | | | |
| 5.125% 1/15/29 (c) | | 7,210,000 | 6,118,298 |
| 5.125% 7/15/29 (c) | | 6,050,000 | 5,121,688 |
| 5.5% 1/15/28 (c) | | 8,350,000 | 7,358,438 |
| 5.5% 10/15/29 (c) | | 6,400,000 | 5,456,000 |
| C&W Senior Financing Designated Activity Co. 6.875% 9/15/27 (c) | | 20,054,000 | 19,402,245 |
| Cablevision Lightpath LLC: | | | |
| 3.875% 9/15/27 (c) | | 765,000 | 672,726 |
| 5.625% 9/15/28 (c) | | 605,000 | 518,412 |
| Consolidated Communications, Inc. 5% 10/1/28 (c) | | 930,000 | 759,996 |
| Frontier Communications Holdings LLC: | | | |
| 5% 5/1/28 (c) | | 7,905,000 | 7,213,668 |
| 5.875% 10/15/27 (c) | | 2,830,000 | 2,709,725 |
| 5.875% 11/1/29 | | 3,685,000 | 3,199,041 |
| 6% 1/15/30 (c) | | 2,115,000 | 1,840,240 |
| 6.75% 5/1/29 (c) | | 3,940,000 | 3,550,334 |
| Intelsat Jackson Holdings SA 6.5% 3/15/30 (c) | | 3,350,000 | 3,153,992 |
| Level 3 Financing, Inc.: | | | |
| 3.625% 1/15/29 (c) | | 565,000 | 458,531 |
| 4.25% 7/1/28 (c) | | 6,130,000 | 5,179,850 |
| Lumen Technologies, Inc.: | | | |
| 4.5% 1/15/29 (c) | | 7,680,000 | 6,068,352 |
| 5.125% 12/15/26 (c) | | 3,255,000 | 2,929,500 |
| Millicom International Cellular SA 4.5% 4/27/31 (c) | | 2,550,000 | 2,197,781 |
| Northwest Fiber LLC/Northwest Fiber Finance Sub, Inc. 6% 2/15/28 (c) | | 560,000 | 468,552 |
| Sable International Finance Ltd. 5.75% 9/7/27 (c) | | 748,000 | 736,548 |
| SBA Communications Corp. 3.125% 2/1/29 | | 1,630,000 | 1,398,133 |
| Sprint Capital Corp.: | | | |
| 6.875% 11/15/28 | | 2,010,000 | 2,206,156 |
| 8.75% 3/15/32 | | 2,935,000 | 3,729,871 |
| Telecom Italia Capital SA: | | | |
| 6% 9/30/34 | | 3,032,000 | 2,648,331 |
| 7.2% 7/18/36 | | 1,449,000 | 1,307,091 |
| 7.721% 6/4/38 | | 400,000 | 375,500 |
| Uniti Group, Inc. 6% 1/15/30 (c) | | 6,360,000 | 5,303,890 |
| Virgin Media Secured Finance PLC 4.5% 8/15/30 (c) | | 2,980,000 | 2,586,223 |
| VMED O2 UK Financing I PLC 4.25% 1/31/31 (c) | | 3,745,000 | 3,164,263 |
| Windstream Escrow LLC 7.75% 8/15/28 (c) | | 8,570,000 | 8,162,925 |
| Zayo Group Holdings, Inc.: | | | |
| 4% 3/1/27 (c) | | 2,600,000 | 2,262,000 |
| 6.125% 3/1/28 (c) | | 1,755,000 | 1,469,813 |
| | | | 141,565,474 |
| Textiles/Apparel - 0.3% | | | |
| Foot Locker, Inc. 4% 10/1/29 (c) | | 4,100,000 | 3,413,250 |
| Kontoor Brands, Inc. 4.125% 11/15/29 (c) | | 580,000 | 503,150 |
| | | | 3,916,400 |
| Transportation Ex Air/Rail - 0.5% | | | |
| Golar LNG Ltd. 7% 10/20/25 (c) | | 1,690,000 | 1,688,204 |
| Great Lakes Dredge & Dock Corp. 5.25% 6/1/29 (c) | | 1,020,000 | 953,700 |
| Seaspan Corp. 5.5% 8/1/29 (c) | | 5,095,000 | 4,496,338 |
| | | | 7,138,242 |
| Utilities - 3.2% | | | |
| Clearway Energy Operating LLC 3.75% 2/15/31 (c) | | 1,750,000 | 1,505,000 |
| Global Partners LP/GLP Finance Corp. 7% 8/1/27 | | 4,632,000 | 4,527,780 |
| InterGen NV 7% 6/30/23 (c) | | 10,532,000 | 10,268,700 |
| NRG Energy, Inc.: | | | |
| 3.375% 2/15/29 (c) | | 2,360,000 | 2,000,100 |
| 5.25% 6/15/29 (c) | | 2,565,000 | 2,415,897 |
| NSG Holdings II LLC/NSG Holdings, Inc. 7.75% 12/15/25 (c) | | 1,792,411 | 1,832,740 |
| PG&E Corp.: | | | |
| 5% 7/1/28 | | 4,670,000 | 4,297,287 |
| 5.25% 7/1/30 | | 7,280,000 | 6,615,991 |
| Pike Corp. 5.5% 9/1/28 (c) | | 9,627,000 | 8,736,503 |
| Vistra Operations Co. LLC: | | | |
| 5% 7/31/27 (c) | | 3,349,000 | 3,189,923 |
| 5.625% 2/15/27 (c) | | 2,465,000 | 2,428,025 |
| | | | 47,817,946 |
|
| TOTAL NONCONVERTIBLE BONDS | | | 1,303,552,032 |
|
| TOTAL CORPORATE BONDS | | | |
| (Cost $1,448,542,402) | | | 1,326,996,942 |
| | | Shares | Value |
|
| Common Stocks - 3.3% | | | |
| Cable/Satellite TV - 0.1% | | | |
| Altice U.S.A., Inc. Class A (e) | | 105,200 | 976,256 |
| Energy - 1.5% | | | |
| California Resources Corp. warrants 10/27/24 (e) | | 2,871 | 34,380 |
| Jonah Energy Parent LLC (b)(e) | | 148,945 | 10,043,361 |
| Mesquite Energy, Inc. (b)(e) | | 149,356 | 8,328,106 |
| New Fortress Energy, Inc. | | 57,500 | 2,229,850 |
| Pioneer Natural Resources Co. | | 6,200 | 1,441,314 |
|
| TOTAL ENERGY | | | 22,077,011 |
|
| Food & Drug Retail - 1.5% | | | |
| Southeastern Grocers, Inc. (a)(b)(e) | | 963,443 | 22,660,158 |
| Gaming - 0.1% | | | |
| Caesars Entertainment, Inc. (e) | | 22,400 | 1,484,672 |
| Metals/Mining - 0.0% | | | |
| Elah Holdings, Inc. (e) | | 333 | 24,975 |
| Telecommunications - 0.0% | | | |
| GTT Communications, Inc. rights (b)(e) | | 160,059 | 160,059 |
| Utilities - 0.1% | | | |
| EQT Corp. | | 43,200 | 1,717,200 |
| TOTAL COMMON STOCKS | | | |
| (Cost $20,144,856) | | | 49,100,331 |
| | | Principal Amount | Value |
|
| Bank Loan Obligations - 3.8% | | | |
| Broadcasting - 0.2% | | | |
| Diamond Sports Group LLC: | | | |
| 1LN, term loan U.S. Secured Overnight Fin. Rate (SOFR) Indx + 8.000% 9% 5/25/26 (f)(g)(h) | | 1,975,370 | 2,004,685 |
| 2LN, term loan 3 month U.S. LIBOR + 3.250% 3.6555% 8/24/26 (f)(g)(h) | | 4,485,755 | 1,485,906 |
|
| TOTAL BROADCASTING | | | 3,490,591 |
|
| Building Materials - 0.1% | | | |
| Acproducts Holdings, Inc. Tranche B 1LN, term loan 1 month U.S. LIBOR + 4.250% 4.75% 5/17/28 (f)(g)(h) | | 2,154,148 | 1,787,943 |
| Chemicals - 0.3% | | | |
| Consolidated Energy Finance SA Tranche B 1LN, term loan 3 month U.S. LIBOR + 3.500% 4.0287% 5/7/25 (b)(f)(g)(h) | | 2,747,504 | 2,685,685 |
| Olympus Water U.S. Holding Corp. Tranche B 1LN, term loan 1 month U.S. LIBOR + 3.750% 4.8125% 11/9/28 (f)(g)(h) | | 2,064,825 | 2,021,980 |
|
| TOTAL CHEMICALS | | | 4,707,665 |
|
| Consumer Products - 0.1% | | | |
| Michaels Companies, Inc. 1LN, term loan 3 month U.S. LIBOR + 4.250% 5.256% 4/15/28 (f)(g)(h) | | 1,636,754 | 1,488,939 |
| Energy - 0.3% | | | |
| EG America LLC Tranche B 1LN, term loan 3 month U.S. LIBOR + 4.000% 5.006% 2/6/25 (f)(g)(h) | | 2,388,718 | 2,334,972 |
| EG Finco Ltd. Tranche B, term loan 3 month U.S. LIBOR + 4.000% 5.006% 2/6/25 (f)(g)(h) | | 1,603,299 | 1,567,225 |
| Mesquite Energy, Inc.: | | | |
| 1LN, term loan 3 month U.S. LIBOR + 8.000% 0% (b)(d)(g)(h) | | 2,735,146 | 0 |
| term loan 3 month U.S. LIBOR + 0.000% 0% (b)(d)(g)(h) | | 1,217,000 | 0 |
|
| TOTAL ENERGY | | | 3,902,197 |
|
| Gaming - 0.3% | | | |
| Fertitta Entertainment LLC NV Tranche B 1LN, term loan U.S. Secured Overnight Fin. Rate (SOFR) Indx + 4.000% 4.7004% 1/27/29 (f)(g)(h) | | 4,805,276 | 4,779,856 |
| Healthcare - 0.6% | | | |
| Da Vinci Purchaser Corp. Tranche B 1LN, term loan 3 month U.S. LIBOR + 4.000% 5.006% 12/13/26 (f)(g)(h) | | 129,342 | 128,938 |
| Gainwell Acquisition Corp. Tranche B 1LN, term loan 3 month U.S. LIBOR + 4.000% 5.006% 10/1/27 (f)(g)(h) | | 6,914,975 | 6,884,756 |
| U.S. Renal Care, Inc. Tranche B 1LN, term loan 3 month U.S. LIBOR + 5.000% 5.5% 6/13/26 (f)(g)(h) | | 2,148,070 | 1,895,672 |
|
| TOTAL HEALTHCARE | | | 8,909,366 |
|
| Insurance - 0.3% | | | |
| HUB International Ltd. Tranche B, term loan 3 month U.S. LIBOR + 3.000% 4.2132% 4/25/25 (f)(g)(h) | | 4,410,648 | 4,350,001 |
| Leisure - 0.4% | | | |
| City Football Group Ltd. Tranche B 1LN, term loan 1 month U.S. LIBOR + 3.500% 4.5983% 7/21/28 (f)(g)(h) | | 5,122,163 | 4,978,127 |
| Paper - 0.1% | | | |
| Clydesdale Acquisition Holdings, Inc. 1LN, term loan CME TERM SOFR 1 MONTH INDEX + 4.250% 4.7834% 3/30/29 (f)(g)(h) | | 1,025,000 | 1,010,783 |
| Services - 0.2% | | | |
| Ascend Learning LLC: | | | |
| 2LN, term loan 1 month U.S. LIBOR + 5.750% 6.25% 12/10/29 (f)(g)(h) | | 225,000 | 221,906 |
| Tranche B 1LN, term loan 1 month U.S. LIBOR + 3.500% 4.2637% 12/10/28 (f)(g)(h) | | 2,264,325 | 2,234,798 |
| Brand Energy & Infrastructure Services, Inc. Tranche B, term loan 3 month U.S. LIBOR + 4.250% 5.3964% 6/21/24 (f)(g)(h) | | 344,097 | 326,266 |
| CoreCivic, Inc. Tranche B 1LN, term loan 3 month U.S. LIBOR + 4.500% 5.5% 12/18/24 (f)(g)(h) | | 242,463 | 240,240 |
|
| TOTAL SERVICES | | | 3,023,210 |
|
| Super Retail - 0.2% | | | |
| LBM Acquisition LLC Tranche B 1LN, term loan 3 month U.S. LIBOR + 3.750% 4.5% 12/18/27 (f)(g)(h) | | 3,162,121 | 2,977,674 |
| Technology - 0.1% | | | |
| CommScope, Inc. Tranche B 1LN, term loan 3 month U.S. LIBOR + 3.250% 4.0137% 4/4/26 (f)(g)(h) | | 1,621,684 | 1,557,222 |
| Telecommunications - 0.5% | | | |
| GTT Communications, Inc. Tranche B, term loan 3 month U.S. LIBOR + 4.750% 7.25% 5/31/25 (f)(g)(h) | | 6,203,519 | 5,029,627 |
| Northwest Fiber LLC Tranche B 1LN, term loan 3 month U.S. LIBOR + 3.750% 4.3013% 4/30/27 (f)(g)(h) | | 2,465,100 | 2,422,996 |
|
| TOTAL TELECOMMUNICATIONS | | | 7,452,623 |
|
| Utilities - 0.1% | | | |
| PG&E Corp. Tranche B 1LN, term loan 3 month U.S. LIBOR + 3.000% 3.8125% 6/23/25 (f)(g)(h) | | 1,317,483 | 1,298,551 |
| TOTAL BANK LOAN OBLIGATIONS | | | |
| (Cost $61,002,022) | | | 55,714,748 |
| | | Shares | Value |
|
| Other - 0.3% | | | |
| Other - 0.3% | | | |
| Fidelity Direct Lending Fund, LP (a)(i) | | | |
| (Cost $4,615,889) | | 461,562 | 4,620,231 |
|
| Money Market Funds - 3.3% | | | |
| Fidelity Cash Central Fund 0.32% (j) | | | |
| (Cost $49,396,894) | | 49,387,017 | 49,396,894 |
| TOTAL INVESTMENT IN SECURITIES - 100.7% | | | |
| (Cost $1,583,702,063) | | | 1,485,829,146 |
| NET OTHER ASSETS (LIABILITIES) - (0.7)% | | | (10,947,348) |
| NET ASSETS - 100% | | | $1,474,881,798 |
Legend
(a) Restricted securities (including private placements) - Investment in securities not registered under the Securities Act of 1933 (excluding 144A issues). At the end of the period, the value of restricted securities (excluding 144A issues) amounted to $42,779,377 or 2.9% of net assets.
(b) Level 3 security
(c) Security exempt from registration under Rule 144A of the Securities Act of 1933. These securities may be resold in transactions exempt from registration, normally to qualified institutional buyers. At the end of the period, the value of these securities amounted to $1,117,289,134 or 75.8% of net assets.
(d) Non-income producing - Security is in default.
(e) Non-income producing
(f) Coupon rates for floating and adjustable rate securities reflect the rates in effect at period end.
(g) Coupon is indexed to a floating interest rate which may be multiplied by a specified factor and/or subject to caps or floors.
(h) Remaining maturities of bank loan obligations may be less than the stated maturities shown as a result of contractual or optional prepayments by the borrower. Such prepayments cannot be predicted with certainty.
(i) Affiliated Fund
(j) Affiliated fund that is generally available only to investment companies and other accounts managed by Fidelity Investments. The rate quoted is the annualized seven-day yield of the fund at period end. A complete unaudited listing of the fund's holdings as of its most recent quarter end is available upon request. In addition, each Fidelity Central Fund's financial statements, which are not covered by the Fund's Report of Independent Registered Public Accounting Firm, are available on the SEC's website or upon request.
Additional information on each restricted holding is as follows:
| Security | Acquisition Date | Acquisition Cost |
| Fidelity Direct Lending Fund, LP | 12/9/21 - 4/29/22 | $4,615,889 |
| Mesquite Energy, Inc. 15% 7/15/23 | 7/10/20 - 1/18/22 | $1,175,827 |
| Mesquite Energy, Inc. 15% 7/15/23 | 11/5/20 - 1/18/22 | $2,028,327 |
| Southeastern Grocers, Inc. | 6/1/18 | $6,776,820 |
Affiliated Central Funds
Fiscal year to date information regarding the Fund's investments in Fidelity Central Funds, including the ownership percentage, is presented below.
| Fund | Value, beginning of period | Purchases | Sales Proceeds | Dividend Income | Realized Gain/Loss | Change in Unrealized appreciation (depreciation) | Value, end of period | % ownership, end of period |
| Fidelity Cash Central Fund 0.32% | $23,827,446 | $551,112,385 | $525,542,937 | $30,132 | $-- | $-- | $49,396,894 | 0.1% |
| Fidelity Securities Lending Cash Central Fund 0.32% | -- | 28,726,030 | 28,726,030 | 50,889 | -- | -- | -- | 0.0% |
| Total | $23,827,446 | $579,838,415 | $554,268,967 | $81,021 | $-- | $-- | $49,396,894 | |
Amounts in the income column in the above table include any capital gain distributions from underlying funds, which are presented in the corresponding line-item in the Statement of Operations, if applicable. Amount for Fidelity Securities Lending Cash Central Fund represents the income earned on investing cash collateral, less rebates paid to borrowers and any lending agent fees associated with the loan, plus any premium payments received for lending certain types of securities.
Affiliated Underlying Funds
Fiscal year to date information regarding the Fund's investments in affiliated Underlying Funds is presented below. Exchanges between classes of the same affiliated Underlying Funds may occur, and are excluded from purchases and sales below if applicable. If an underlying Fund changes its name, the name presented below is the name in effect at period end.
| Affiliate | Value, beginning of period | Purchases | Sales Proceeds | Dividend Income | Realized Gain (loss) | Change in Unrealized appreciation (depreciation) | Value, end of period |
| Fidelity Direct Lending Fund, LP | $-- | $4,615,889 | $-- | $77,329 | $-- | $4,342 | $4,620,231 |
| Total | $-- | $4,615,889 | $-- | $77,329 | $-- | $4,342 | $4,620,231 |
Amounts in the income column in the above table include any capital gain distributions from underlying funds, which are presented in the corresponding line-item in the Statement of Operations, if applicable.
Investment Valuation
The following is a summary of the inputs used, as of April 30, 2022, involving the Fund's assets and liabilities carried at fair value. The inputs or methodology used for valuing securities may not be an indication of the risk associated with investing in those securities. For more information on valuation inputs, and their aggregation into the levels used below, please refer to the Investment Valuation section in the accompanying Notes to Financial Statements.
Amounts in this Investment Valuation section exclude the value of Fidelity Direct Lending Fund, LP as presented in the Schedule of Investments. Fidelity Direct Lending Fund, LP is valued using NAV as a practical expedient.
| | Valuation Inputs at Reporting Date: |
| Description | Total | Level 1 | Level 2 | Level 3 |
| Investments in Securities: | | | | |
| Equities: | | | | |
| Communication Services | $976,256 | $976,256 | $-- | $-- |
| Consumer Discretionary | 1,484,672 | 1,484,672 | -- | -- |
| Consumer Staples | 22,660,158 | -- | -- | 22,660,158 |
| Energy | 23,794,211 | 5,422,744 | -- | 18,371,467 |
| Information Technology | 160,059 | -- | -- | 160,059 |
| Materials | 24,975 | 24,975 | -- | -- |
| Corporate Bonds | 1,326,996,942 | -- | 1,311,497,953 | 15,498,989 |
| Bank Loan Obligations | 55,714,748 | -- | 53,029,063 | 2,685,685 |
| Money Market Funds | 49,396,894 | 49,396,894 | -- | -- |
| Total Investments in Securities: | $1,481,208,915 | $57,305,541 | $1,364,527,016 | $59,376,358 |
The following is a reconciliation of Investments in Securities for which Level 3 inputs were used in determining value:
| Investments in Securities: | |
| Equities - Consumer Staples | |
| Beginning Balance | $29,233,057 |
| Net Realized Gain (Loss) on Investment Securities | 15,562,336 |
| Net Unrealized Gain (Loss) on Investment Securities | (66,485) |
| Cost of Purchases | -- |
| Proceeds of Sales | (22,068,750) |
| Amortization/Accretion | -- |
| Transfers into Level 3 | -- |
| Transfers out of Level 3 | -- |
| Ending Balance | $22,660,158 |
| The change in unrealized gain (loss) for the period attributable to Level 3 securities held at April 30, 2022 | $(66,485) |
| Equities - Energy | |
| Beginning Balance | $5,517,026 |
| Net Realized Gain (Loss) on Investment Securities | -- |
| Net Unrealized Gain (Loss) on Investment Securities | 12,854,441 |
| Cost of Purchases | -- |
| Proceeds of Sales | -- |
| Amortization/Accretion | -- |
| Transfers into Level 3 | -- |
| Transfers out of Level 3 | -- |
| Ending Balance | $18,371,467 |
| The change in unrealized gain (loss) for the period attributable to Level 3 securities held at April 30, 2022 | $12,854,441 |
| Corporate Bonds | |
| Beginning Balance | $6,209,122 |
| Net Realized Gain (Loss) on Investment Securities | -- |
| Net Unrealized Gain (Loss) on Investment Securities | 8,950,936 |
| Cost of Purchases | 338,931 |
| Proceeds of Sales | -- |
| Amortization/Accretion | -- |
| Transfers into Level 3 | -- |
| Transfers out of Level 3 | -- |
| Ending Balance | $15,498,989 |
| The change in unrealized gain (loss) for the period attributable to Level 3 securities held at April 30, 2022 | $8,950,936 |
| Other Investments in Securities | |
| Beginning Balance | $-- |
| Net Realized Gain (Loss) on Investment Securities | 2,591 |
| Net Unrealized Gain (Loss) on Investment Securities | (6,585) |
| Cost of Purchases | 4,172,184 |
| Proceeds of Sales | (1,340,696) |
| Amortization/Accretion | 18,250 |
| Transfers into Level 3 | -- |
| Transfers out of Level 3 | -- |
| Ending Balance | $2,845,744 |
| The change in unrealized gain (loss) for the period attributable to Level 3 securities held at April 30, 2022 | $(6,585) |
The information used in the above reconciliations represents fiscal year to date activity for any Investments in Securities identified as using Level 3 inputs at either the beginning or the end of the current fiscal period. Cost of purchases and proceeds of sales may include securities received and/or delivered through in-kind transactions. Transfers in or out of Level 3 represent the beginning value of any Security or Instrument where a change in the pricing level occurred from the beginning to the end of the period. The cost of purchases and the proceeds of sales may include securities received or delivered through corporate actions or exchanges. Realized and unrealized gains (losses) disclosed in the reconciliations are included in Net Gain (Loss) on the Fund's Statement of Operations.
See accompanying notes which are an integral part of the financial statements.
Financial Statements
Statement of Assets and Liabilities
| | | April 30, 2022 |
| Assets | | |
Investment in securities, at value — See accompanying schedule:
Unaffiliated issuers (cost $1,529,689,280) | $1,431,812,021 | |
| Fidelity Central Funds (cost $49,396,894) | 49,396,894 | |
| Other affiliated issuers (cost $4,615,889) | 4,620,231 | |
| Total Investment in Securities (cost $1,583,702,063) | | $1,485,829,146 |
| Cash | | 38,734 |
| Receivable for investments sold | | 8,899,125 |
| Receivable for fund shares sold | | 291,515 |
| Dividends receivable | | 18,955 |
| Interest receivable | | 21,152,984 |
| Distributions receivable from Fidelity Central Funds | | 8,764 |
| Receivable from investment adviser for expense reductions | | 221,795 |
| Total assets | | 1,516,461,018 |
| Liabilities | | |
| Payable for investments purchased | $16,226,998 | |
| Payable for fund shares redeemed | 25,348,700 | |
| Other payables and accrued expenses | 3,522 | |
| Total liabilities | | 41,579,220 |
| Net Assets | | $1,474,881,798 |
| Net Assets consist of: | | |
| Paid in capital | | $1,880,840,489 |
| Total accumulated earnings (loss) | | (405,958,691) |
| Net Assets | | $1,474,881,798 |
| Net Asset Value, offering price and redemption price per share ($1,474,881,798 ÷ 168,789,392 shares) | | $8.74 |
See accompanying notes which are an integral part of the financial statements.
Statement of Operations
| | | Year ended April 30, 2022 |
| Investment Income | | |
| Dividends (including $77,329 earned from other affiliated issuers) | | $5,758,848 |
| Interest | | 84,724,449 |
| Income from Fidelity Central Funds (including $50,889 from security lending) | | 81,021 |
| Total income | | 90,564,318 |
| Expenses | | |
| Custodian fees and expenses | $14,993 | |
| Independent trustees' fees and expenses | 5,875 | |
| Legal | 327,735 | |
| Interest | 171 | |
| Total expenses before reductions | 348,774 | |
| Expense reductions | (293,055) | |
| Total expenses after reductions | | 55,719 |
| Net investment income (loss) | | 90,508,599 |
| Realized and Unrealized Gain (Loss) | | |
| Net realized gain (loss) on: | | |
| Investment securities: | | |
| Unaffiliated issuers | 38,259,087 | |
| Total net realized gain (loss) | | 38,259,087 |
| Change in net unrealized appreciation (depreciation) on: | | |
| Investment securities: | | |
| Unaffiliated issuers | (160,203,263) | |
| Affiliated issuers | 4,342 | |
| Total change in net unrealized appreciation (depreciation) | | (160,198,921) |
| Net gain (loss) | | (121,939,834) |
| Net increase (decrease) in net assets resulting from operations | | $(31,431,235) |
See accompanying notes which are an integral part of the financial statements.
Statement of Changes in Net Assets
| | Year ended April 30, 2022 | Year ended April 30, 2021 |
| Increase (Decrease) in Net Assets | | |
| Operations | | |
| Net investment income (loss) | $90,508,599 | $89,723,670 |
| Net realized gain (loss) | 38,259,087 | (17,053,970) |
| Change in net unrealized appreciation (depreciation) | (160,198,921) | 173,080,281 |
| Net increase (decrease) in net assets resulting from operations | (31,431,235) | 245,749,981 |
| Distributions to shareholders | (90,722,492) | (87,911,658) |
| Share transactions | | |
| Proceeds from sales of shares | 116,542,416 | 193,704,383 |
| Reinvestment of distributions | 90,722,337 | 87,889,133 |
| Cost of shares redeemed | (312,390,348) | (228,803,181) |
| Net increase (decrease) in net assets resulting from share transactions | (105,125,595) | 52,790,335 |
| Total increase (decrease) in net assets | (227,279,322) | 210,628,658 |
| Net Assets | | |
| Beginning of period | 1,702,161,120 | 1,491,532,462 |
| End of period | $1,474,881,798 | $1,702,161,120 |
| Other Information | | |
| Shares | | |
| Sold | 12,377,370 | 20,674,510 |
| Issued in reinvestment of distributions | 9,668,837 | 9,528,963 |
| Redeemed | (33,519,693) | (24,690,325) |
| Net increase (decrease) | (11,473,486) | 5,513,148 |
See accompanying notes which are an integral part of the financial statements.
Financial Highlights
Fidelity Series High Income Fund
| | | | | | |
| Years ended April 30, | 2022 | 2021 | 2020 | 2019 | 2018 |
| Selected Per–Share Data | | | | | |
| Net asset value, beginning of period | $9.44 | $8.54 | $9.50 | $9.56 | $9.68 |
| Income from Investment Operations | | | | | |
| Net investment income (loss)A,B | .510 | .513 | .577 | .607 | .623 |
| Net realized and unrealized gain (loss) | (.699) | .890 | (.935) | (.051) | (.141) |
| Total from investment operations | (.189) | 1.403 | (.358) | .556 | .482 |
| Distributions from net investment income | (.511) | (.503) | (.598) | (.616) | (.602) |
| Distributions from net realized gain | – | – | (.004) | – | – |
| Total distributions | (.511) | (.503) | (.602) | (.616) | (.602) |
| Net asset value, end of period | $8.74 | $9.44 | $8.54 | $9.50 | $9.56 |
| Total ReturnC | (2.24)% | 16.72% | (4.11)% | 6.12% | 5.08% |
| Ratios to Average Net AssetsB,D,E | | | | | |
| Expenses before reductions | .02% | - %F | - %F | - %F | .06% |
| Expenses net of fee waivers, if any | - %F | - %F | - %F | - %F | .05% |
| Expenses net of all reductions | - %F | - %F | - %F | - %F | .05% |
| Net investment income (loss) | 5.42% | 5.58% | 6.20% | 6.44% | 6.44% |
| Supplemental Data | | | | | |
| Net assets, end of period (000 omitted) | $1,474,882 | $1,702,161 | $1,491,532 | $1,510,741 | $2,883,805 |
| Portfolio turnover rateG | 49% | 68% | 41%H | 69% | 49% |
A Calculated based on average shares outstanding during the period.
B Net investment income (loss) is affected by the timing of the declaration of dividends by any underlying mutual funds or exchange-traded funds (ETFs). Net investment income (loss) of any such underlying funds is not included in the Fund's net investment income (loss) ratio.
C Total returns would have been lower if certain expenses had not been reduced during the applicable periods shown.
D Fees and expenses of any underlying mutual funds or exchange-traded funds (ETFs) are not included in the Fund's expense ratio. The Fund indirectly bears its proportionate share of these expenses. For additional expense information related to investments in Fidelity Central Funds, please refer to the "Investments in Fidelity Central Funds" note found in the Notes to Financial Statements section of the most recent Annual or Semi-Annual report. For additional expense information related to investments in Fidelity Direct Lending Fund, LP, please refer to the Investment in Fidelity Direct Lending Fund, LP note found in the Notes to Financial Statements section of the most recent Annual or Semi-Annual report.
E Expense ratios reflect operating expenses of the class. Expenses before reductions do not reflect amounts reimbursed, waived, or reduced through arrangements with the investment adviser, brokerage services, or other offset arrangements, if applicable, and do not represent the amount paid by the class during periods when reimbursements, waivers or reductions occur.
F Amount represents less than .005%.
G Amount does not include the portfolio activity of any underlying mutual funds or exchange-traded funds (ETFs).
H Portfolio turnover rate excludes securities received or delivered in-kind.
See accompanying notes which are an integral part of the financial statements.
Notes to Financial Statements
For the period ended April 30, 2022
1. Organization.
Fidelity Series High Income Fund (the Fund) is a fund of Fidelity Summer Street Trust (the Trust) and is authorized to issue an unlimited number of shares. Shares are offered only to certain other Fidelity funds, Fidelity managed 529 plans, and Fidelity managed collective investment trusts. The Trust is registered under the Investment Company Act of 1940, as amended (the 1940 Act), as an open-end management investment company organized as a Massachusetts business trust.
2. Investments in Fidelity Central Funds.
Funds may invest in Fidelity Central Funds, which are open-end investment companies generally available only to other investment companies and accounts managed by the investment adviser and its affiliates. The Schedule of Investments lists any Fidelity Central Funds held as an investment as of period end, but does not include the underlying holdings of each Fidelity Central Fund. An investing fund indirectly bears its proportionate share of the expenses of the underlying Fidelity Central Funds.
Based on its investment objective, each Fidelity Central Fund may invest or participate in various investment vehicles or strategies that are similar to those of the investing fund. These strategies are consistent with the investment objectives of the investing fund and may involve certain economic risks which may cause a decline in value of each of the Fidelity Central Funds and thus a decline in the value of the investing fund.
| Fidelity Central Fund | Investment Manager | Investment Objective | Investment Practices | Expense Ratio(a) |
| Fidelity Money Market Central Funds | Fidelity Management & Research Company LLC (FMR) | Each fund seeks to obtain a high level of current income consistent with the preservation of capital and liquidity. | Short-term Investments | Less than .005% |
(a) Expenses expressed as a percentage of average net assets and are as of each underlying Central Fund's most recent annual or semi-annual shareholder report.
A complete unaudited list of holdings for each Fidelity Central Fund is available upon request or at the Securities and Exchange Commission website at www.sec.gov. In addition, the financial statements of the Fidelity Central Funds which contain the significant accounting policies (including investment valuation policies) of those funds, and are not covered by the Report of Independent Registered Public Accounting Firm, are available on the Securities and Exchange Commission website or upon request.
3. Investment in Fidelity Direct Lending Fund, LP.
The Fund invests in Fidelity Direct Lending Fund, LP, which is a limited partnership available only to certain investment companies managed by the investment adviser and its affiliates. The Fund's limited partnership interest is not registered under the Securities Act of 1933, and is subject to substantial restrictions on transfer. The Fund has no redemption rights under the partnership agreement. There will be no trading market for the partnership interest, and the Fund most likely will hold its shares until Fidelity Direct Lending Fund, LP converts by operation of law to a Delaware corporation, trust, or other limited liability entity and (i) registers as a closed-end management investment company under the 1940 Act or (ii) elects to be treated as a business development company under the 1940 Act.
Based on its investment objective, Fidelity Direct Lending Fund, LP may invest or participate in various investments or strategies that are similar to those in which the Fund may invest or participate. These strategies are consistent with the investment objectives of the Fund and may involve certain economic risks which may cause a decline in value of Fidelity Direct Lending Fund, LP and thus a decline in the value of the Fund. The Fidelity Direct Lending Fund, LP intends to invest primarily in direct loans made to private U.S. companies, specifically small- and middle-market companies.
The Schedule of Investments lists Fidelity Direct Lending Fund, LP as an investment as of period end, but does not include the underlying holdings of Fidelity Direct Lending Fund, LP. Fidelity Direct Lending Fund, LP represented less than 5% of the Fund's net assets at period end. The Fund indirectly bears its proportionate share of the expenses of Fidelity Direct Lending Fund, LP, which commenced operations on December 8, 2021. The annual expense ratio for Fidelity Direct Lending Fund, LP is estimated to be a maximum of .20%.
4. Significant Accounting Policies.
The Fund is an investment company and applies the accounting and reporting guidance of the Financial Accounting Standards Board (FASB) Accounting Standards Codification Topic 946 Financial Services - Investment Companies. The financial statements have been prepared in conformity with accounting principles generally accepted in the United States of America (GAAP), which require management to make certain estimates and assumptions at the date of the financial statements. Actual results could differ from those estimates. Subsequent events, if any, through the date that the financial statements were issued have been evaluated in the preparation of the financial statements. The Fund's Schedule of Investments lists any underlying mutual funds or exchange-traded funds (ETFs) but does not include the underlying holdings of these funds. The following summarizes the significant accounting policies of the Fund:
Investment Valuation. Investments are valued as of 4:00 p.m. Eastern time on the last calendar day of the period. The Board of Trustees (the Board) has delegated the day to day responsibility for the valuation of the Fund's investments to the Fair Value Committee (the Committee) established by the Fund's investment adviser. In accordance with valuation policies and procedures approved by the Board, the Fund attempts to obtain prices from one or more third party pricing vendors or brokers to value its investments. When current market prices, quotations or currency exchange rates are not readily available or reliable, investments will be fair valued in good faith by the Committee, in accordance with procedures adopted by the Board. Factors used in determining fair value vary by investment type and may include market or investment specific events, changes in interest rates and credit quality. The frequency with which these procedures are used cannot be predicted and they may be utilized to a significant extent. The Committee oversees the Fund's valuation policies and procedures and reports to the Board on the Committee's activities and fair value determinations. The Board monitors the appropriateness of the procedures used in valuing the Fund's investments and ratifies the fair value determinations of the Committee.
The Fund categorizes the inputs to valuation techniques used to value its investments into a disclosure hierarchy consisting of three levels as shown below:
- Level 1 – unadjusted quoted prices in active markets for identical investments
- Level 2 – other significant observable inputs (including quoted prices for similar investments, interest rates, prepayment speeds, etc.)
- Level 3 – unobservable inputs (including the Fund's own assumptions based on the best information available)
Valuation techniques used to value the Fund's investments by major category are as follows:
Debt securities, including restricted securities, are valued based on evaluated prices received from third party pricing vendors or from brokers who make markets in such securities. Corporate bonds and bank loan obligations are valued by pricing vendors who utilize matrix pricing which considers yield or price of bonds of comparable quality, coupon, maturity and type or by broker-supplied prices. When independent prices are unavailable or unreliable, debt securities may be valued utilizing pricing methodologies which consider similar factors that would be used by third party pricing vendors. Debt securities are generally categorized as Level 2 in the hierarchy but may be Level 3 depending on the circumstances. The Fund invests a significant portion of its assets in below investment grade securities. The value of these securities can be more volatile due to changes in the credit quality of the issuer and is sensitive to changes in economic, market and regulatory conditions.
Equity securities, including restricted securities, for which market quotations are readily available, are valued at the last reported sale price or official closing price as reported by a third party pricing vendor on the primary market or exchange on which they are traded and are categorized as Level 1 in the hierarchy. In the event there were no sales during the day or closing prices are not available, securities are valued at the last quoted bid price or may be valued using the last available price and are generally categorized as Level 2 in the hierarchy. For foreign equity securities, when market or security specific events arise, comparisons to the valuation of American Depositary Receipts (ADRs), futures contracts, Exchange-Traded Funds (ETFs)and certain indexes as well as quoted prices for similar securities may be used and would be categorized as Level 2 in the hierarchy. For equity securities, including restricted securities, where observable inputs are limited, assumptions about market activity and risk are used and these securities may be categorized as Level 3 in the hierarchy. Securities, including private placements or other restricted securities, for which observable inputs are not available are valued using alternate valuation approaches, including the market approach, the income approach and cost approach, and are categorized as Level 3 in the hierarchy. The market approach considers factors including the price of recent investments in the same or a similar security or financial metrics of comparable securities. The income approach considers factors including expected future cash flows, security specific risks and corresponding discount rates. The cost approach considers factors including the value of the security's underlying assets and liabilities.
Investments in open-end mutual funds, including the Fidelity Central Funds, are valued at their closing net asset value (NAV) each business day and are categorized as Level 1 in the hierarchy.
Fidelity Direct Lending Fund, LP is valued using NAV as a practical expedient in accordance with the specialized accounting guidance for investment companies.
The following provides information on Level 3 securities held by the Fund that were valued at period end based on unobservable inputs. These amounts exclude valuations provided by a broker and valuations using NAV as a practical expedient.
| Asset Type | Fair Value | Valuation Technique(s) | Unobservable Input | Amount or Range/Weighted Average | Impact to Valuation from an Increase in Input(a) |
| Equities | $41,191,684 | Market approach | Liquidation preference | $1.00 | Increase |
| | | Market comparable | Enterprise value/EBITDA multiple (EV/EBITDA) | 2.6 – 3.8 / 3.2 | Increase |
| | | | Book value multiple | 1.0 | Increase |
| | | | Discount rate | 10.0% | Decrease |
| | | | Discount for lack of marketability | 10.0% | Decrease |
| | | | Comparable sales – land ($/Acre) | $5,500.00 - $6,000.00 / $5,773.34 | Increase |
| | | | Daily production multiple ($/Million cubic feet per day) | $2,500.00 | Increase |
| | | | Daily production multiple ($/Barrels of oil equivalent per day) | $17,500.00 | Increase |
| | | Discounted cash flow | Weighted average cost of capital (WACC) | 8.9% | Decrease |
| | | | Discount for lack of marketability | 10.0% | Decrease |
| | | | Growth rate | 1.5% | Increase |
| Corporate Bonds | $15,498,989 | Recovery value | Recovery value | $0.00 | Increase |
| | | Market comparable | Enterprise value/EBITDA multiple (EV/EBITDA) | 2.6 | Increase |
| | | | Book value multiple | 1.0
| Increase |
| | | | Discount rate | 10.0%
| Decrease
|
| | | | Discount for lack of marketability | 10.0%
| Decrease
|
| | | | Comparable sales – land ($/Acre) | $5,500.00 | Increase |
| | | | Daily production multiple ($/Barrels of oil equivalent per day) | $17,500.00 | Increase |
| Bank Loan Obligations | $2,685,685 | Indicative market price | Evaluated bid | $97.75 | Increase
|
| | | Recovery value | Recovery value | $0.00 | Increase
|
(a) Represents the directional change in the fair value of the Level 3 investments that could have resulted from an increase in the corresponding input as of period end. A decrease to the unobservable input would have had the opposite effect. Significant changes in these inputs may have resulted in a significantly higher or lower fair value measurement at period end.
Changes in valuation techniques may result in transfers in or out of an assigned level within the disclosure hierarchy. The aggregate value of investments by input level as of April 30, 2022, as well as a roll forward of Level 3 investments, is included at the end of the Fund's Schedule of Investments.
Investment Transactions and Income. For financial reporting purposes, the Fund's investment holdings and NAV include trades executed through the end of the last business day of the period. The NAV per share for processing shareholder transactions is calculated as of the close of business of the New York Stock Exchange (NYSE), normally 4:00 p.m. Eastern time and includes trades executed through the end of the prior business day. Gains and losses on securities sold are determined on the basis of identified cost and include proceeds received from litigation. Commissions paid to certain brokers with whom the investment adviser, or its affiliates, places trades on behalf of a fund include an amount in addition to trade execution, which may be rebated back to a fund. Any such rebates are included in net realized gain (loss) on investments in the Statement of Operations. Dividend income is recorded on the ex-dividend date, except for certain dividends from foreign securities where the ex-dividend date may have passed, which are recorded as soon as the Fund is informed of the ex-dividend date. Non-cash dividends included in dividend income, if any, are recorded at the fair market value of the securities received. Income and capital gain distributions from Fidelity Central Funds, if any, are recorded on the ex-dividend date. Interest income is accrued as earned and includes coupon interest and amortization of premium and accretion of discount on debt securities as applicable. Debt obligations may be placed on non-accrual status and related interest income may be reduced by ceasing current accruals and writing off interest receivables when the collection of all or a portion of interest has become doubtful based on consistently applied procedures. A debt obligation is removed from non-accrual status when the issuer resumes interest payments or when collectability of interest is reasonably assured.
Expenses. Expenses directly attributable to a fund are charged to that fund. Expenses attributable to more than one fund are allocated among the respective funds on the basis of relative net assets or other appropriate methods. Expenses included in the accompanying financial statements reflect the expenses of that fund and do not include any expenses associated with any underlying mutual funds or exchange-traded funds. Although not included in a fund's expenses, a fund indirectly bears its proportionate share of these expenses through the net asset value of each underlying mutual fund or exchange-traded fund. Expense estimates are accrued in the period to which they relate and adjustments are made when actual amounts are known.
Income Tax Information and Distributions to Shareholders. Each year, the Fund intends to qualify as a regulated investment company under Subchapter M of the Internal Revenue Code, including distributing substantially all of its taxable income and realized gains. As a result, no provision for U.S. Federal income taxes is required. As of April 30, 2022, the Fund did not have any unrecognized tax benefits in the financial statements; nor is the Fund aware of any tax positions for which it is reasonably possible that the total amounts of unrecognized tax benefits will significantly change in the next twelve months. The Fund files a U.S. federal tax return, in addition to state and local tax returns as required. The Fund's federal income tax returns are subject to examination by the Internal Revenue Service (IRS) for a period of three fiscal years after they are filed. State and local tax returns may be subject to examination for an additional fiscal year depending on the jurisdiction.
Distributions are declared and recorded daily and paid monthly from net investment income. Distributions from realized gains, if any, are declared and recorded on the ex-dividend date. Income and capital gain distributions are determined in accordance with income tax regulations, which may differ from GAAP.
Capital accounts within the financial statements are adjusted for permanent book-tax differences. These adjustments have no impact on net assets or the results of operations. Capital accounts are not adjusted for temporary book-tax differences which will reverse in a subsequent period.
Book-tax differences are primarily due to market discount, prior period premium and discount on debt securities, capital loss carryforwards and losses deferred due to wash sales.
As of period end, the cost and unrealized appreciation (depreciation) in securities, and derivatives if applicable, for federal income tax purposes were as follows:
| Gross unrealized appreciation | $52,360,436 |
| Gross unrealized depreciation | (145,191,873) |
| Net unrealized appreciation (depreciation) | $(92,831,437) |
| Tax Cost | $1,578,660,583 |
The tax-based components of distributable earnings as of period end were as follows:
| Undistributed ordinary income | $2,156,502 |
| Capital loss carryforward | $(315,283,758) |
| Net unrealized appreciation (depreciation) on securities and other investments | $(92,831,437) |
Capital loss carryforwards are only available to offset future capital gains of the Fund to the extent provided by regulations and may be limited. The capital loss carryforward information presented below, including any applicable limitation, is estimated as of fiscal period end and is subject to adjustment.
| Short-term | $(30,226,419) |
| Long-term | (285,057,339) |
| Total capital loss carryforward | $(315,283,758) |
The tax character of distributions paid was as follows:
| | April 30, 2022 | April 30, 2021 |
| Ordinary Income | $90,722,492 | $ 87,911,658 |
Restricted Securities (including Private Placements). Funds may invest in securities that are subject to legal or contractual restrictions on resale. These securities generally may be resold in transactions exempt from registration or to the public if the securities are registered. Disposal of these securities may involve time-consuming negotiations and expense, and prompt sale at an acceptable price may be difficult. Information regarding restricted securities held at period end is included at the end of the Schedule of Investments, if applicable.
Loans and Other Direct Debt Instruments. Direct debt instruments are interests in amounts owed to lenders by corporate or other borrowers. These instruments may be in the form of loans, trade claims or other receivables and may include standby financing commitments such as revolving credit facilities that obligate a fund to supply additional cash to the borrower on demand. Loans may be acquired through assignment, participation, or may be made directly to a borrower. Such instruments are presented in the Bank Loan Obligations section in the Schedule of Investments. Certain funds may also invest in unfunded loan commitments, which are contractual obligations for future funding. Information regarding unfunded commitments is included at the end of the Schedule of Investments, if applicable.
Commitments. A commitment is an agreement to acquire an investment at a future date (subject to conditions) in connection with a potential public or non-public offering. The amount of commitments outstanding at period end are presented in the table below. These commitments are not included in the net assets of the Fund at period end.
| | Investment to be Acquired | Commitment Amount |
| Fidelity Series High Income Fund | Fidelity Direct Lending Fund, LP | $12,384,111 |
5. Purchases and Sales of Investments.
Purchases and sales of securities, other than short-term securities and in-kind transactions, as applicable, are noted in the table below.
| | Purchases ($) | Sales ($) |
| Fidelity Series High Income Fund | 790,509,985 | 861,181,094 |
6. Fees and Other Transactions with Affiliates.
Management Fee. Fidelity Management & Research Company LLC (the investment adviser) and its affiliates provide the Fund with investment management related services for which the Fund does not pay a management fee. Under the management contract, the investment adviser or an affiliate pays all ordinary operating expenses of the Fund, except custody fees, fees and expenses of the independent Trustees, and certain miscellaneous expenses such as proxy and shareholder meeting expenses.
Brokerage Commissions. A portion of portfolio transactions were placed with brokerage firms which are affiliates of the investment adviser. Brokerage commissions are included in net realized gain (loss) and change in net unrealized appreciation (depreciation) in the Statement of Operations. The commissions paid to these affiliated firms were as follows:
| | Amount |
| Fidelity Series High Income Fund | $63 |
Interfund Lending Program. Pursuant to an Exemptive Order issued by the Securities and Exchange Commission (the SEC), the Fund, along with other registered investment companies having management contracts with Fidelity Management & Research Company LLC (FMR), or other affiliated entities of FMR, may participate in an interfund lending program. This program provides an alternative credit facility allowing the Fund to borrow from, or lend money to, other participating affiliated funds. At period end, there were no interfund loans outstanding. Activity in this program during the period for which loans were outstanding was as follows:
| | Borrower or Lender | Average Loan Balance | Weighted Average Interest Rate | Interest Expense |
| Fidelity Series High Income Fund | Borrower | $7,551,500 | .41% | $171 |
Interfund Trades. Funds may purchase from or sell securities to other Fidelity Funds under procedures adopted by the Board. The procedures have been designed to ensure these interfund trades are executed in accordance with Rule 17a-7 of the 1940 Act. Any interfund trades are included within the respective purchases and sales amounts shown in the Purchases and Sales of Investments note. Interfund trades during the period are noted in the table below.
| | Purchases ($) | Sales ($) | Realized Gain (Loss) ($) |
| Fidelity Series High Income Fund | 7,495 | – | – |
7. Committed Line of Credit.
Certain Funds participate with other funds managed by the investment adviser or an affiliate in a $4.25 billion credit facility (the "line of credit") to be utilized for temporary or emergency purposes to fund shareholder redemptions or for other short-term liquidity purposes. The commitment fees on the pro-rata portion of the line of credit are borne by the investment adviser. During the period, there were no borrowings on this line of credit.
8. Security Lending.
Funds lend portfolio securities from time to time in order to earn additional income. Lending agents are used, including National Financial Services (NFS), an affiliate of the investment adviser. Pursuant to a securities lending agreement, NFS will receive a fee, which is capped at 9.9% of a fund's daily lending revenue, for its services as lending agent. A fund may lend securities to certain qualified borrowers, including NFS. On the settlement date of the loan, a fund receives collateral (in the form of U.S. Treasury obligations, letters of credit and/or cash) against the loaned securities and maintains collateral in an amount not less than 100% of the market value of the loaned securities during the period of the loan. The market value of the loaned securities is determined at the close of business of a fund and any additional required collateral is delivered to a fund on the next business day. A fund or borrower may terminate the loan at any time, and if the borrower defaults on its obligation to return the securities loaned because of insolvency or other reasons, a fund may apply collateral received from the borrower against the obligation. A fund may experience delays and costs in recovering the securities loaned. Any cash collateral received is invested in the Fidelity Securities Lending Cash Central Fund. Any loaned securities are identified as such in the Schedule of Investments, and the value of loaned securities and cash collateral at period end, as applicable, are presented in the Statement of Assets and Liabilities. Security lending income represents the income earned on investing cash collateral, less rebates paid to borrowers and any lending agent fees associated with the loan, plus any premium payments received for lending certain types of securities. Security lending income is presented in the Statement of Operations as a component of income from Fidelity Central Funds. Affiliated security lending activity, if any, was as follows:
| | Total Security Lending Fees Paid to NFS | Security Lending Income From Securities Loaned to NFS | Value of Securities Loaned to NFS at Period End |
| Fidelity Series High Income Fund | $5,404 | $– | $– |
9. Expense Reductions.
The investment adviser contractually agreed to reimburse the Fund to the extent annual operating expenses exceeded .003% of average net assets. This reimbursement will remain in place through August 31, 2025. Some expenses, for example the compensation of the independent Trustees, and certain other expenses such as interest expense, are excluded from this reimbursement. During the period this reimbursement reduced the Fund's expenses by $292,639.
Through arrangements with the Fund's custodian, credits realized as a result of certain uninvested cash balances were used to reduce the Fund's expenses by $416.
10. Other.
A fund's organizational documents provide former and current trustees and officers with a limited indemnification against liabilities arising in connection with the performance of their duties to the fund. In the normal course of business, a fund may also enter into contracts that provide general indemnifications. A fund's maximum exposure under these arrangements is unknown as this would be dependent on future claims that may be made against a fund. The risk of material loss from such claims is considered remote.
At the end of the period, mutual funds and accounts managed by the investment adviser or its affiliates were the owners of record of all of the outstanding shares of the Fund.
11. Coronavirus (COVID-19) Pandemic.
An outbreak of COVID-19 first detected in China during December 2019 has since spread globally and was declared a pandemic by the World Health Organization during March 2020. Developments that disrupt global economies and financial markets, such as the COVID-19 pandemic, may magnify factors that affect the Fund's performance.
Report of Independent Registered Public Accounting Firm
To the Board of Trustees of Fidelity Summer Street Trust and Shareholders of Fidelity Series High Income Fund
Opinion on the Financial Statements and Financial Highlights
We have audited the accompanying statement of assets and liabilities of Fidelity Series High Income Fund (the "Fund"), a fund of Fidelity Summer Street Trust, including the schedule of investments, as of April 30, 2022, the related statement of operations for the year then ended, the statement of changes in net assets for each of the two years in the period then ended, the financial highlights for each of the five years in the period then ended, and the related notes. In our opinion, the financial statements and financial highlights present fairly, in all material respects, the financial position of the Fund as of April 30, 2022, and the results of its operations for the year then ended, the changes in its net assets for each of the two years in the period then ended, and the financial highlights for each of the five years in the period then ended in conformity with accounting principles generally accepted in the United States of America.
Basis for Opinion
These financial statements and financial highlights are the responsibility of the Fund's management. Our responsibility is to express an opinion on the Fund's financial statements and financial highlights based on our audits. We are a public accounting firm registered with the Public Company Accounting Oversight Board (United States) (PCAOB) and are required to be independent with respect to the Fund in accordance with the U.S. federal securities laws and the applicable rules and regulations of the Securities and Exchange Commission and the PCAOB.
We conducted our audits in accordance with the standards of the PCAOB. Those standards require that we plan and perform the audit to obtain reasonable assurance about whether the financial statements and financial highlights are free of material misstatement, whether due to error or fraud. The Fund is not required to have, nor were we engaged to perform, an audit of its internal control over financial reporting. As part of our audits we are required to obtain an understanding of internal control over financial reporting but not for the purpose of expressing an opinion on the effectiveness of the Fund’s internal control over financial reporting. Accordingly, we express no such opinion.
Our audits included performing procedures to assess the risks of material misstatement of the financial statements and financial highlights, whether due to error or fraud, and performing procedures that respond to those risks. Such procedures included examining, on a test basis, evidence regarding the amounts and disclosures in the financial statements and financial highlights. Our audits also included evaluating the accounting principles used and significant estimates made by management, as well as evaluating the overall presentation of the financial statements and financial highlights. Our procedures included confirmation of securities owned as of April 30, 2022, by correspondence with the custodian, brokers and agent banks; when replies were not received from brokers or agent banks, we performed other auditing procedures. We believe that our audits provide a reasonable basis for our opinion.
/s/ Deloitte & Touche LLP
Boston, Massachusetts
June 15, 2022
We have served as the auditor of one or more of the Fidelity investment companies since 1999.
Trustees and Officers
The Trustees, Members of the Advisory Board (if any), and officers of the trust and fund, as applicable, are listed below. The Board of Trustees governs the fund and is responsible for protecting the interests of shareholders. The Trustees are experienced executives who meet periodically throughout the year to oversee the fund's activities, review contractual arrangements with companies that provide services to the fund, oversee management of the risks associated with such activities and contractual arrangements, and review the fund's performance. Each of the Trustees oversees 324 funds.
The Trustees hold office without limit in time except that (a) any Trustee may resign; (b) any Trustee may be removed by written instrument, signed by at least two-thirds of the number of Trustees prior to such removal; (c) any Trustee who requests to be retired or who has become incapacitated by illness or injury may be retired by written instrument signed by a majority of the other Trustees; and (d) any Trustee may be removed at any special meeting of shareholders by a two-thirds vote of the outstanding voting securities of the trust. Each Trustee who is not an interested person (as defined in the 1940 Act) of the trust and the fund is referred to herein as an Independent Trustee. Each Independent Trustee shall retire not later than the last day of the calendar year in which his or her 75th birthday occurs. The Independent Trustees may waive this mandatory retirement age policy with respect to individual Trustees. Officers and Advisory Board Members hold office without limit in time, except that any officer or Advisory Board Member may resign or may be removed by a vote of a majority of the Trustees at any regular meeting or any special meeting of the Trustees. Except as indicated, each individual has held the office shown or other offices in the same company for the past five years.
The fund’s Statement of Additional Information (SAI) includes more information about the Trustees. To request a free copy, call Fidelity at 1-800-544-8544.
Experience, Skills, Attributes, and Qualifications of the Trustees. The Governance and Nominating Committee has adopted a statement of policy that describes the experience, qualifications, attributes, and skills that are necessary and desirable for potential Independent Trustee candidates (Statement of Policy). The Board believes that each Trustee satisfied at the time he or she was initially elected or appointed a Trustee, and continues to satisfy, the standards contemplated by the Statement of Policy. The Governance and Nominating Committee also engages professional search firms to help identify potential Independent Trustee candidates who have the experience, qualifications, attributes, and skills consistent with the Statement of Policy. From time to time, additional criteria based on the composition and skills of the current Independent Trustees, as well as experience or skills that may be appropriate in light of future changes to board composition, business conditions, and regulatory or other developments, have also been considered by the professional search firms and the Governance and Nominating Committee. In addition, the Board takes into account the Trustees' commitment and participation in Board and committee meetings, as well as their leadership of standing and ad hoc committees throughout their tenure.
In determining that a particular Trustee was and continues to be qualified to serve as a Trustee, the Board has considered a variety of criteria, none of which, in isolation, was controlling. The Board believes that, collectively, the Trustees have balanced and diverse experience, qualifications, attributes, and skills, which allow the Board to operate effectively in governing the fund and protecting the interests of shareholders. Information about the specific experience, skills, attributes, and qualifications of each Trustee, which in each case led to the Board's conclusion that the Trustee should serve (or continue to serve) as a trustee of the fund, is provided below.
Board Structure and Oversight Function. Robert A. Lawrence is an interested person and currently serves as Chair. The Trustees have determined that an interested Chair is appropriate and benefits shareholders because an interested Chair has a personal and professional stake in the quality and continuity of services provided to the fund. Independent Trustees exercise their informed business judgment to appoint an individual of their choosing to serve as Chair, regardless of whether the Trustee happens to be independent or a member of management. The Independent Trustees have determined that they can act independently and effectively without having an Independent Trustee serve as Chair and that a key structural component for assuring that they are in a position to do so is for the Independent Trustees to constitute a substantial majority for the Board. The Independent Trustees also regularly meet in executive session. David M. Thomas serves as Lead Independent Trustee and as such (i) acts as a liaison between the Independent Trustees and management with respect to matters important to the Independent Trustees and (ii) with management prepares agendas for Board meetings.
Fidelity® funds are overseen by different Boards of Trustees. The fund's Board oversees Fidelity's high income and certain equity funds, and other Boards oversee Fidelity's investment-grade bond, money market, asset allocation, and other equity funds. The asset allocation funds may invest in Fidelity® funds overseen by the fund's Board. The use of separate Boards, each with its own committee structure, allows the Trustees of each group of Fidelity® funds to focus on the unique issues of the funds they oversee, including common research, investment, and operational issues. On occasion, the separate Boards establish joint committees to address issues of overlapping consequences for the Fidelity® funds overseen by each Board.
The Trustees operate using a system of committees to facilitate the timely and efficient consideration of all matters of importance to the Trustees, the fund, and fund shareholders and to facilitate compliance with legal and regulatory requirements and oversight of the fund's activities and associated risks. The Board, acting through its committees, has charged FMR and its affiliates with (i) identifying events or circumstances the occurrence of which could have demonstrably adverse effects on the fund's business and/or reputation; (ii) implementing processes and controls to lessen the possibility that such events or circumstances occur or to mitigate the effects of such events or circumstances if they do occur; and (iii) creating and maintaining a system designed to evaluate continuously business and market conditions in order to facilitate the identification and implementation processes described in (i) and (ii) above. Because the day-to-day operations and activities of the fund are carried out by or through FMR, its affiliates, and other service providers, the fund's exposure to risks is mitigated but not eliminated by the processes overseen by the Trustees. While each of the Board's committees has responsibility for overseeing different aspects of the fund's activities, oversight is exercised primarily through the Operations, Audit, and Compliance Committees. Appropriate personnel, including but not limited to the fund's Chief Compliance Officer (CCO), FMR's internal auditor, the independent accountants, the fund's Treasurer and portfolio management personnel, make periodic reports to the Board's committees, as appropriate, including an annual review of Fidelity's risk management program for the Fidelity® funds. The responsibilities of each standing committee, including their oversight responsibilities, are described further under "Standing Committees of the Trustees."
Interested Trustees*:
Correspondence intended for a Trustee who is an interested person may be sent to Fidelity Investments, 245 Summer Street, Boston, Massachusetts 02210.
Name, Year of Birth; Principal Occupations and Other Relevant Experience+
Bettina Doulton (1964)
Year of Election or Appointment: 2020
Trustee
Ms. Doulton also serves as Trustee of other Fidelity® funds. Prior to her retirement, Ms. Doulton served in a variety of positions at Fidelity Investments, including as a managing director of research (2006-2007), portfolio manager to certain Fidelity® funds (1993-2005), equity analyst and portfolio assistant (1990-1993), and research assistant (1987-1990). Ms. Doulton currently owns and operates Phi Builders + Architects and Cellardoor Winery. Previously, Ms. Doulton served as a member of the Board of Brown Capital Management, LLC (2014-2018).
Robert A. Lawrence (1952)
Year of Election or Appointment: 2020
Trustee
Chair of the Board of Trustees
Mr. Lawrence also serves as Trustee of other funds. Previously, Mr. Lawrence served as a Member of the Advisory Board of certain funds. Prior to his retirement in 2008, Mr. Lawrence served as Vice President of certain Fidelity® funds (2006-2008), Senior Vice President, Head of High Income Division of Fidelity Management & Research Company (investment adviser firm, 2006-2008), and President of Fidelity Strategic Investments (investment adviser firm, 2002-2005).
* Determined to be an “Interested Trustee” by virtue of, among other things, his or her affiliation with the trust or various entities under common control with FMR.
+ The information includes the Trustee's principal occupation during the last five years and other information relating to the experience, attributes, and skills relevant to the Trustee's qualifications to serve as a Trustee, which led to the conclusion that the Trustee should serve as a Trustee for the fund.
Independent Trustees:
Correspondence intended for an Independent Trustee may be sent to Fidelity Investments, P.O. Box 55235, Boston, Massachusetts 02205-5235.
Name, Year of Birth; Principal Occupations and Other Relevant Experience+
Thomas P. Bostick (1956)
Year of Election or Appointment: 2021
Trustee
Lieutenant General Bostick also serves as Trustee of other Fidelity® funds. Prior to his retirement, General Bostick (United States Army, Retired) held a variety of positions within the U.S. Army, including Commanding General and Chief of Engineers, U.S. Army Corps of Engineers (2012-2016) and Deputy Chief of Staff and Director of Human Resources, U.S. Army (2009-2012). General Bostick currently serves as a member of the Board and Finance and Governance Committees of CSX Corporation (transportation, 2020-present) and a member of the Board and Corporate Governance and Nominating Committee of Perma-Fix Environmental Services, Inc. (nuclear waste management, 2020-present). General Bostick serves as Chief Executive Officer of Bostick Global Strategies, LLC (consulting, 2016-present) and as a member of the Board of HireVue, Inc. (video interview and assessment, 2020-present). Previously, General Bostick served as a Member of the Advisory Board of certain Fidelity® funds (2021), President, Intrexon Bioengineering (2018-2020) and Chief Operating Officer (2017-2020) and Senior Vice President of the Environment Sector (2016-2017) of Intrexon Corporation (biopharmaceutical company).
Dennis J. Dirks (1948)
Year of Election or Appointment: 2005
Trustee
Mr. Dirks also serves as Trustee of other Fidelity® funds. Prior to his retirement in May 2003, Mr. Dirks served as Chief Operating Officer and as a member of the Board of The Depository Trust & Clearing Corporation (financial markets infrastructure), President, Chief Operating Officer and a member of the Board of The Depository Trust Company (DTC), President and a member of the Board of the National Securities Clearing Corporation (NSCC), Chief Executive Officer and a member of the Board of the Government Securities Clearing Corporation and Chief Executive Officer and a member of the Board of the Mortgage-Backed Securities Clearing Corporation. Mr. Dirks currently serves as a member of the Finance Committee (2016-present) and Board (2017-present) and is Treasurer (2018-present) of the Asolo Repertory Theatre.
Donald F. Donahue (1950)
Year of Election or Appointment: 2018
Trustee
Mr. Donahue also serves as Trustee of other Fidelity® funds. Mr. Donahue serves as President and Chief Executive Officer of Miranda Partners, LLC (risk consulting for the financial services industry, 2012-present). Previously, Mr. Donahue served as Chief Executive Officer (2006-2012), Chief Operating Officer (2003-2006) and Managing Director, Customer Marketing and Development (1999-2003) of The Depository Trust & Clearing Corporation (financial markets infrastructure). Mr. Donahue currently serves as a member (2007-present) and Co-Chairman (2016-present) of the Board of United Way of New York and a member of the Board of The Leadership Academy (previously NYC Leadership Academy) (2012-present). Mr. Donahue previously served as a member of the Advisory Board of certain Fidelity® funds (2015-2018).
Vicki L. Fuller (1957)
Year of Election or Appointment: 2020
Trustee
Ms. Fuller also serves as Trustee of other Fidelity® funds. Previously, Ms. Fuller served as a member of the Advisory Board of certain Fidelity® funds (2018-2020), Chief Investment Officer of the New York State Common Retirement Fund (2012-2018) and held a variety of positions at AllianceBernstein L.P. (global asset management, 1985-2012), including Managing Director (2006-2012) and Senior Vice President and Senior Portfolio Manager (2001-2006). Ms. Fuller currently serves as a member of the Board, Audit Committee and Nominating and Governance Committee of two Blackstone business development companies (2020-present), as a member of the Board of Treliant, LLC (consulting, 2019-present), as a member of the Advisory Board of Ariel Alternatives, LLC (private equity, 2021-present) and as a member of the Board and Chair of the Audit Committee of Gusto, Inc. (software, 2021-present). In addition, Ms. Fuller currently serves as a member of the Board of Roosevelt University (2019-present) and as a member of the Executive Board of New York University’s Stern School of Business. Ms. Fuller previously served as a member of the Board, Audit Committee and Nominating and Governance Committee of The Williams Companies, Inc. (natural gas infrastructure, 2018-2021).
Patricia L. Kampling (1959)
Year of Election or Appointment: 2020
Trustee
Ms. Kampling also serves as Trustee of other Fidelity® funds. Prior to her retirement, Ms. Kampling served as Chairman of the Board and Chief Executive Officer (2012-2019), President and Chief Operating Officer (2011-2012) and Executive Vice President and Chief Financial Officer (2010-2011) of Alliant Energy Corporation. Ms. Kampling currently serves as a member of the Board, Finance Committee and Governance, Compensation and Nominating Committee of Xcel Energy Inc. (utilities company, 2020-present) and as a member of the Board, Audit, Finance and Risk Committee and Safety, Environmental, Technology and Operations Committee and Chair of the Executive Development and Compensation Committee of American Water Works Company, Inc. (utilities company, 2019-present). In addition, Ms. Kampling currently serves as a member of the Board of the Nature Conservancy, Wisconsin Chapter (2019-present). Previously, Ms. Kampling served as a Member of the Advisory Board of certain Fidelity® funds (2020), a member of the Board, Compensation Committee and Executive Committee and Chair of the Audit Committee of Briggs & Stratton Corporation (manufacturing, 2011-2021), a member of the Board of Interstate Power and Light Company (2012-2019) and Wisconsin Power and Light Company (2012-2019) (each a subsidiary of Alliant Energy Corporation) and as a member of the Board and Workforce Development Committee of the Business Roundtable (2018-2019).
Thomas A. Kennedy (1955)
Year of Election or Appointment: 2021
Trustee
Mr. Kennedy also serves as Trustee of other Fidelity® funds. Previously, Mr. Kennedy served as a Member of the Advisory Board of certain Fidelity® funds (2020) and held a variety of positions at Raytheon Company (aerospace and defense, 1983-2020), including Chairman and Chief Executive Officer (2014-2020) and Executive Vice President and Chief Operating Officer (2013-2014). Mr. Kennedy currently serves as Executive Chairman of the Board of Directors of Raytheon Technologies Corporation (aerospace and defense, 2020-present). He is also a member of the Rutgers School of Engineering Industry Advisory Board (2011-present) and a member of the UCLA Engineering Dean’s Executive Board (2016-present).
Oscar Munoz (1959)
Year of Election or Appointment: 2021
Trustee
Mr. Munoz also serves as Trustee of other Fidelity® funds. Prior to his retirement, Mr. Munoz served as Executive Chairman (2020-2021), Chief Executive Officer (2015-2020), President (2015-2016) and a member of the Board (2010-2021) of United Airlines Holdings, Inc. Mr. Munoz currently serves as a member of the Board of CBRE Group, Inc. (commercial real estate, 2020-present), a member of the Board of Univision Communications, Inc. (Hispanic media, 2020-present) and a member of the Advisory Board of Salesforce.com, Inc. (cloud-based software, 2020-present). Previously, Mr. Munoz served as a Member of the Advisory Board of certain Fidelity® funds (2021).
Garnett A. Smith (1947)
Year of Election or Appointment: 2018
Trustee
Mr. Smith also serves as Trustee of other Fidelity® funds. Prior to his retirement, Mr. Smith served as Chairman and Chief Executive Officer (1990-1997) and President (1986-1990) of Inbrand Corp. (manufacturer of personal absorbent products). Prior to his employment with Inbrand Corp., he was employed by a retail fabric chain and North Carolina National Bank (now Bank of America). Mr. Smith previously served as a member of the Advisory Board of certain Fidelity® funds (2012-2013).
David M. Thomas (1949)
Year of Election or Appointment: 2008
Trustee
Lead Independent Trustee
Mr. Thomas also serves as Trustee of other Fidelity® funds. Previously, Mr. Thomas served as Executive Chairman (2005-2006) and Chairman and Chief Executive Officer (2000-2005) of IMS Health, Inc. (pharmaceutical and healthcare information solutions). Mr. Thomas currently serves as a member of the Board of Fortune Brands Home and Security (home and security products, 2004-present) and as Director (2013-present) and Non-Executive Chairman of the Board (2022-present) of Interpublic Group of Companies, Inc. (marketing communication).
Susan Tomasky (1953)
Year of Election or Appointment: 2020
Trustee
Ms. Tomasky also serves as Trustee of other Fidelity® funds. Prior to her retirement, Ms. Tomasky served in various executive officer positions at American Electric Power Company, Inc. (1998-2011), including most recently as President of AEP Transmission (2007-2011). Ms. Tomasky currently serves as a member of the Board and Sustainability Committee and as Chair of the Audit Committee of Marathon Petroleum Corporation (2018-present) and as a member of the Board, Executive Committee, Corporate Governance Committee and Organization and Compensation Committee and as Chair of the Audit Committee of Public Service Enterprise Group, Inc. (utilities company, 2012-present) and as a member of the Board of its subsidiary company, Public Service Electric and Gas Co. (2021-present). In addition, Ms. Tomasky currently serves as a member (2009-present) and President (2020-present) of the Board of the Royal Shakespeare Company – America (2009-present), as a member of the Board of the Columbus Association for the Performing Arts (2011-present) and as a member of the Board and Kenyon in the World Committee of Kenyon College (2016-present). Previously, Ms. Tomasky served as a Member of the Advisory Board of certain Fidelity® funds (2020), as a member of the Board of the Columbus Regional Airport Authority (2007-2020), as a member of the Board (2011-2018) and Lead Independent Director (2015-2018) of Andeavor Corporation (previously Tesoro Corporation) (independent oil refiner and marketer) and as a member of the Board of Summit Midstream Partners LP (energy, 2012-2018).
Michael E. Wiley (1950)
Year of Election or Appointment: 2018
Trustee
Mr. Wiley also serves as Trustee of other Fidelity® funds. Previously, Mr. Wiley served as a member of the Advisory Board of certain Fidelity® funds (2018-2020), Chairman, President and CEO of Baker Hughes, Inc. (oilfield services, 2000-2004). Mr. Wiley also previously served as a member of the Board of Andeavor Corporation (independent oil refiner and marketer, 2005-2018), a member of the Board of Andeavor Logistics LP (natural resources logistics, 2015-2018) and a member of the Board of High Point Resources (exploration and production, 2005-2020).
+ The information includes the Trustee's principal occupation during the last five years and other information relating to the experience, attributes, and skills relevant to the Trustee's qualifications to serve as a Trustee, which led to the conclusion that the Trustee should serve as a Trustee for the fund.
Advisory Board Members and Officers:
Correspondence intended for a Member of the Advisory Board (if any) may be sent to Fidelity Investments, P.O. Box 55235, Boston, Massachusetts 02205-5235. Correspondence intended for an officer or Peter S. Lynch may be sent to Fidelity Investments, 245 Summer Street, Boston, Massachusetts 02210. Officers appear below in alphabetical order.
Name, Year of Birth; Principal Occupation
Peter S. Lynch (1944)
Year of Election or Appointment: 2003
Member of the Advisory Board
Mr. Lynch also serves as a Member of the Advisory Board of other Fidelity® funds. Mr. Lynch is Vice Chairman and a Director of Fidelity Management & Research Company LLC (investment adviser firm). In addition, Mr. Lynch serves as a Trustee of Boston College and as the Chairman of the Inner-City Scholarship Fund. Previously, Mr. Lynch served as Vice Chairman and a Director of FMR Co., Inc. (investment adviser firm) and on the Special Olympics International Board of Directors (1997-2006).
Craig S. Brown (1977)
Year of Election or Appointment: 2019
Assistant Treasurer
Mr. Brown also serves as an officer of other funds. Mr. Brown serves as Assistant Treasurer of FIMM, LLC (2021-present) and is an employee of Fidelity Investments (2013-present).
John J. Burke III (1964)
Year of Election or Appointment: 2018
Chief Financial Officer
Mr. Burke also serves as Chief Financial Officer of other funds. Mr. Burke serves as Head of Investment Operations for Fidelity Fund and Investment Operations (2018-present) and is an employee of Fidelity Investments (1998-present). Previously Mr. Burke served as head of Asset Management Investment Operations (2012-2018).
William C. Coffey (1969)
Year of Election or Appointment: 2019
Assistant Secretary
Mr. Coffey also serves as Assistant Secretary of other funds. He is Senior Vice President and Deputy General Counsel of FMR LLC (diversified financial services company, 2010-present), and is an employee of Fidelity Investments. Previously, Mr. Coffey served as Secretary and CLO of certain funds (2018-2019); CLO, Secretary, and Senior Vice President of Fidelity Management & Research Company and FMR Co., Inc. (investment adviser firms, 2018-2019); Secretary of Fidelity SelectCo, LLC and Fidelity Investments Money Management, Inc. (investment adviser firms, 2018-2019); CLO of Fidelity Management & Research (Hong Kong) Limited, FMR Investment Management (UK) Limited, and Fidelity Management & Research (Japan) Limited (investment adviser firms, 2018-2019); and Assistant Secretary of certain funds (2009-2018).
Timothy M. Cohen (1969)
Year of Election or Appointment: 2018
Vice President
Mr. Cohen also serves as Vice President of other funds. Mr. Cohen serves as Co-Head of Equity (2018-present), a Director of Fidelity Management & Research (Japan) Limited (investment adviser firm, 2016-present), and is an employee of Fidelity Investments. Previously, Mr. Cohen served as Executive Vice President of Fidelity SelectCo, LLC (2019), Head of Global Equity Research (2016-2018), Chief Investment Officer - Equity and a Director of Fidelity Management & Research (U.K.) Inc. (investment adviser firm, 2013-2015) and as a Director of Fidelity Management & Research (Hong Kong) Limited (investment adviser firm, 2017).
Jonathan Davis (1968)
Year of Election or Appointment: 2010
Assistant Treasurer
Mr. Davis also serves as an officer of other funds. Mr. Davis serves as Assistant Treasurer of FIMM, LLC (2021-present), FMR Capital, Inc. (2017-present), FD Funds GP LLC (2021-present), FD Funds Holding LLC (2021-present), and FD Funds Management LLC (2021-present); and is an employee of Fidelity Investments. Previously, Mr. Davis served as Vice President and Associate General Counsel of FMR LLC (diversified financial services company, 2003-2010).
Laura M. Del Prato (1964)
Year of Election or Appointment: 2018
Assistant Treasurer
Ms. Del Prato also serves as an officer of other funds. Ms. Del Prato serves as Assistant Treasurer of FIMM, LLC (2021-present) and is an employee of Fidelity Investments (2017-present). Previously, Ms. Del Prato served as President and Treasurer of The North Carolina Capital Management Trust: Cash Portfolio and Term Portfolio (2018-2020). Prior to joining Fidelity Investments, Ms. Del Prato served as a Managing Director and Treasurer of the JPMorgan Mutual Funds (2014-2017). Prior to JPMorgan, Ms. Del Prato served as a partner at Cohen Fund Audit Services (accounting firm, 2012-2013) and KPMG LLP (accounting firm, 2004-2012).
Colm A. Hogan (1973)
Year of Election or Appointment: 2020
Assistant Treasurer
Mr. Hogan also serves as an officer of other funds. Mr. Hogan serves as Assistant Treasurer of FIMM, LLC (2021-present) and FMR Capital, Inc. (2017-present) and is an employee of Fidelity Investments (2005-present). Previously, Mr. Hogan served as Deputy Treasurer of certain Fidelity® funds (2016-2020) and Assistant Treasurer of certain Fidelity® funds (2016-2018).
Pamela R. Holding (1964)
Year of Election or Appointment: 2018
Vice President
Ms. Holding also serves as Vice President of other funds. Ms. Holding serves as Co-Head of Equity (2018-present) and is an employee of Fidelity Investments (2013-present). Previously, Ms. Holding served as Executive Vice President of Fidelity SelectCo, LLC (2019) and as Chief Investment Officer of Fidelity Institutional Asset Management (2013-2018).
Cynthia Lo Bessette (1969)
Year of Election or Appointment: 2019
Secretary and Chief Legal Officer (CLO)
Ms. Lo Bessette also serves as an officer of other funds. Ms. Lo Bessette serves as CLO, Secretary, and Senior Vice President of Fidelity Management & Research Company LLC (investment adviser firm, 2019-present); CLO of Fidelity Management & Research (Hong Kong) Limited, FMR Investment Management (UK) Limited, and Fidelity Management & Research (Japan) Limited (investment adviser firms, 2019-present); Secretary of FD Funds GP LLC (2021-present), FD Funds Holding LLC (2021-present), and FD Funds Management LLC (2021-present); and Assistant Secretary of FIMM, LLC (2019-present). She is a Senior Vice President and Deputy General Counsel of FMR LLC (diversified financial services company, 2019-present), and is an employee of Fidelity Investments. Previously, Ms. Lo Bessette served as CLO, Secretary, and Senior Vice President of FMR Co., Inc. (investment adviser firm, 2019); Secretary of Fidelity SelectCo, LLC and Fidelity Investments Money Management, Inc. (investment adviser firms, 2019). Prior to joining Fidelity Investments, Ms. Lo Bessette was Executive Vice President, General Counsel (2016-2019) and Senior Vice President, Deputy General Counsel (2015-2016) of OppenheimerFunds (investment management company) and Deputy Chief Legal Officer (2013-2015) of Jennison Associates LLC (investment adviser firm).
Chris Maher (1972)
Year of Election or Appointment: 2020
Deputy Treasurer
Mr. Maher also serves as an officer of other funds. Mr. Maher serves as Assistant Treasurer of FIMM, LLC (2021-present) and FMR Capital, Inc. (2017-present), and is an employee of Fidelity Investments (2008-present). Previously, Mr. Maher served as Assistant Treasurer of certain funds (2013-2020); Vice President of Asset Management Compliance (2013), Vice President of the Program Management Group of FMR (investment adviser firm, 2010-2013), and Vice President of Valuation Oversight (2008-2010).
Jason P. Pogorelec (1975)
Year of Election or Appointment: 2020
Chief Compliance Officer
Mr. Pogorelec also serves as Chief Compliance Officer of other funds. Mr. Pogorelec is a senior Vice President of Asset Management Compliance for Fidelity Investments and is an employee of Fidelity Investments (2006-present). Previously, Mr. Pogorelec served as Vice President, Associate General Counsel for Fidelity Investments (2010-2020) and Assistant Secretary of certain Fidelity funds (2015-2020).
Brett Segaloff (1972)
Year of Election or Appointment: 2021
Anti-Money Laundering (AML) Officer
Mr. Segaloff also serves as an AML Officer of other funds and other related entities. He is Director, Anti-Money Laundering (2007-present) of FMR LLC (diversified financial services company) and is an employee of Fidelity Investments (1996-present).
Stacie M. Smith (1974)
Year of Election or Appointment: 2016
President and Treasurer
Ms. Smith also serves as an officer of other funds. Ms. Smith serves as Assistant Treasurer of FIMM, LLC (2021-present) and FMR Capital, Inc. (2017-present), is an employee of Fidelity Investments (2009-present), and has served in other fund officer roles. Prior to joining Fidelity Investments, Ms. Smith served as Senior Audit Manager of Ernst & Young LLP (accounting firm, 1996-2009). Previously, Ms. Smith served as Assistant Treasurer (2013-2019) and Deputy Treasurer (2013-2016) of certain Fidelity® funds.
Jim Wegmann (1979)
Year of Election or Appointment: 2019
Assistant Treasurer
Mr. Wegmann also serves as an officer of other funds. Mr. Wegmann serves as Assistant Treasurer of FIMM, LLC (2021-present) and is an employee of Fidelity Investments (2011-present). Previously, Mr. Wegmann served as Assistant Treasurer of certain Fidelity® funds (2019-2021).
Shareholder Expense Example
As a shareholder, you incur two types of costs: (1) transaction costs, which may include sales charges (loads) on purchase payments or redemption proceeds, as applicable and (2) ongoing costs, which generally include management fees, distribution and/or service (12b-1) fees and other Fund expenses. This Example is intended to help you understand your ongoing costs (in dollars) of investing in a fund and to compare these costs with the ongoing costs of investing in other mutual funds.
The Example is based on an investment of $1,000 invested at the beginning of the period and held for the entire period (November 1, 2021 to April 30, 2022).
Actual Expenses
The first line of the accompanying table provides information about actual account values and actual expenses. You may use the information in this line, together with the amount you invested, to estimate the expenses that you paid over the period. Simply divide your account value by $1,000.00 (for example, an $8,600 account value divided by $1,000.00 = 8.6), then multiply the result by the number in the first line for a class/Fund under the heading entitled "Expenses Paid During Period" to estimate the expenses you paid on your account during this period. If any fund is a shareholder of any underlying mutual funds or exchange-traded funds (ETFs) (the Underlying Funds), such fund indirectly bears its proportional share of the expenses of the Underlying Funds in addition to the direct expenses incurred presented in the table. These fees and expenses are not included in the annualized expense ratio used to calculate the expense estimate in the table below.
Hypothetical Example for Comparison Purposes
The second line of the accompanying table provides information about hypothetical account values and hypothetical expenses based on the actual expense ratio and an assumed rate of return of 5% per year before expenses, which is not the actual return. The hypothetical account values and expenses may not be used to estimate the actual ending account balance or expenses you paid for the period. You may use this information to compare the ongoing costs of investing in the Fund and other funds. To do so, compare this 5% hypothetical example with the 5% hypothetical examples that appear in the shareholder reports of the other funds. If any fund is a shareholder of any Underlying Funds, such fund indirectly bears its proportional share of the expenses of the Underlying Funds in addition to the direct expenses as presented in the table. These fees and expenses are not included in the annualized expense ratio used to calculate the expense estimate in the table below.
Please note that the expenses shown in the table are meant to highlight your ongoing costs only and do not reflect any transaction costs. Therefore, the second line of the table is useful in comparing ongoing costs only, and will not help you determine the relative total costs of owning different funds. In addition, if these transactional costs were included, your costs would have been higher.
| | Annualized Expense Ratio-A | Beginning
Account Value
November 1, 2021 | Ending
Account Value
April 30, 2022 | Expenses Paid
During Period-B
November 1, 2021
to April 30, 2022 |
| Fidelity Series High Income Fund | - %-C | | | |
| Actual | | $1,000.00 | $942.00 | $--D |
| Hypothetical-E | | $1,000.00 | $1,024.79 | $--D |
A Annualized expense ratio reflects expenses net of applicable fee waivers.
B Expenses are equal to the annualized expense ratio, multiplied by the average account value over the period, multiplied by 181/ 365 (to reflect the one-half year period). The fees and expenses of any Underlying Funds are not included in each annualized expense ratio.
C Amount represents less than .005%.
D Amount represents less than $.005.
E 5% return per year before expenses
Distributions (Unaudited)
The dividend and capital gains distributions for the fund(s) are available on Fidelity.com or Institutional.Fidelity.com.
The fund designates $85,612,365 of distributions paid in the calendar year 2021 as qualifying to be taxed as section 163(j) interest dividends.
The fund will notify shareholders in January 2023 of amounts for use in preparing 2022 income tax returns.
Liquidity Risk Management Program
The Securities and Exchange Commission adopted Rule 22e-4 under the Investment Company Act of 1940 (the Liquidity Rule) to promote effective liquidity risk management throughout the open-end investment company industry, thereby reducing the risk that funds will be unable to meet their redemption obligations and mitigating dilution of the interests of fund shareholders.
The Fund has adopted and implemented a liquidity risk management program pursuant to the Liquidity Rule (the Program) effective December 1, 2018. The Program is reasonably designed to assess and manage the Fund���s liquidity risk and to comply with the requirements of the Liquidity Rule. The Fund’s Board of Trustees (the Board) has designated the Fund’s investment adviser as administrator of the Program. The Fidelity advisers have established a Liquidity Risk Management Committee (the LRM Committee) to manage the Program for each of the Fidelity Funds. The LRM Committee monitors the adequacy and effectiveness of implementation of the Program and on a periodic basis assesses each Fund’s liquidity risk based on a variety of factors including (1) the Fund’s investment strategy, (2) portfolio liquidity and cash flow projections during normal and reasonably foreseeable stressed conditions, (3) shareholder redemptions, (4) borrowings and other funding sources and (5) in the case of exchange-traded funds, certain additional factors including the effect of the Fund’s prices and spreads, market participants, and basket compositions on the overall liquidity of the Fund’s portfolio, as applicable.
In accordance with the Program, each of the Fund’s portfolio investments is classified into one of four liquidity categories described below based on a determination of a reasonable expectation for how long it would take to convert the investment to cash (or sell or dispose of the investment) without significantly changing its market value.
- Highly liquid investments – cash or convertible to cash within three business days or less
- Moderately liquid investments – convertible to cash in three to seven calendar days
- Less liquid investments – can be sold or disposed of, but not settled, within seven calendar days
- Illiquid investments – cannot be sold or disposed of within seven calendar days
Liquidity classification determinations take into account a variety of factors including various market, trading and investment-specific considerations, as well as market depth, and generally utilize analysis from a third-party liquidity metrics service.
The Liquidity Rule places a 15% limit on a fund’s illiquid investments and requires funds that do not primarily hold assets that are highly liquid investments to determine and maintain a minimum percentage of the fund’s net assets to be invested in highly liquid investments (highly liquid investment minimum or HLIM). The Program includes provisions reasonably designed to comply with the 15% limit on illiquid investments and for determining, periodically reviewing and complying with the HLIM requirement as applicable.
At a recent meeting of the Fund’s Board of Trustees, the LRM Committee provided a written report to the Board pertaining to the operation, adequacy, and effectiveness of implementation of the Program for the annual period from December 1, 2020 through November 30, 2021. The report concluded that the Program has been implemented and is operating effectively and is reasonably designed to assess and manage the Fund’s liquidity risk.
FSH-ANN-0622
1.924270.111
Fidelity® Global High Income Fund
Annual Report
April 30, 2022
Includes Fidelity and Fidelity Advisor share classes
Contents
To view a fund's proxy voting guidelines and proxy voting record for the 12-month period ended June 30, visit http://www.fidelity.com/proxyvotingresults or visit the Securities and Exchange Commission's (SEC) web site at http://www.sec.gov.
You may also call 1-800-544-8544 if you’re an individual investing directly with Fidelity, call 1-800-835-5092 if you’re a plan sponsor or participant with Fidelity as your recordkeeper or call 1-877-208-0098 on institutional accounts or if you’re an advisor or invest through one to request a free copy of the proxy voting guidelines.
Standard & Poor's, S&P and S&P 500 are registered service marks of The McGraw-Hill Companies, Inc. and have been licensed for use by Fidelity Distributors Corporation.
Other third-party marks appearing herein are the property of their respective owners.
All other marks appearing herein are registered or unregistered trademarks or service marks of FMR LLC or an affiliated company. © 2022 FMR LLC. All rights reserved.
This report and the financial statements contained herein are submitted for the general information of the shareholders of the Fund. This report is not authorized for distribution to prospective investors in the Fund unless preceded or accompanied by an effective prospectus.
A fund files its complete schedule of portfolio holdings with the SEC for the first and third quarters of each fiscal year on Form N-PORT. Forms N-PORT are available on the SEC’s web site at http://www.sec.gov. A fund's Forms N-PORT may be reviewed and copied at the SEC’s Public Reference Room in Washington, DC. Information regarding the operation of the SEC's Public Reference Room may be obtained by calling 1-800-SEC-0330.
For a complete list of a fund's portfolio holdings, view the most recent holdings listing, semiannual report, or annual report on Fidelity's web site at http://www.fidelity.com, http://www.institutional.fidelity.com, or http://www.401k.com, as applicable.
NOT FDIC INSURED •MAY LOSE VALUE •NO BANK GUARANTEE
Neither the Fund nor Fidelity Distributors Corporation is a bank.
Note to Shareholders:
Early in 2020, the outbreak and spread of COVID-19 emerged as a public health emergency that had a major influence on financial markets, primarily based on its impact on the global economy and corporate earnings. On March 11, 2020, the World Health Organization declared the COVID-19 outbreak a pandemic, citing sustained risk of further global spread. The pandemic prompted a number of measures to limit the spread of COVID-19, including travel and border restrictions, quarantines, and restrictions on large gatherings. In turn, these resulted in lower consumer activity, diminished demand for a wide range of products and services, disruption in manufacturing and supply chains, and – given the wide variability in outcomes regarding the outbreak – significant market uncertainty and volatility. To help stem the turmoil, the U.S. government took unprecedented action – in concert with the U.S. Federal Reserve and central banks around the world – to help support consumers, businesses, and the broader economy, and to limit disruption to the financial system.
In general, the overall impact of the pandemic lessened in 2021, amid a resilient economy and widespread distribution of three COVID-19 vaccines granted emergency use authorization from the U.S. Food and Drug Administration (FDA) early in the year. Still, the situation remains dynamic, and the extent and duration of its influence on financial markets and the economy is highly uncertain, due in part to a recent spike in cases based on highly contagious variants of the coronavirus.
Extreme events such as the COVID-19 crisis are exogenous shocks that can have significant adverse effects on mutual funds and their investments. Although multiple asset classes may be affected by market disruption, the duration and impact may not be the same for all types of assets. Fidelity is committed to helping you stay informed amid news about COVID-19 and during increased market volatility, and we continue to take extra steps to be responsive to customer needs. We encourage you to visit us online, where we offer ongoing updates, commentary, and analysis on the markets and our funds.
Performance: The Bottom Line
Average annual total return reflects the change in the value of an investment, assuming reinvestment of distributions from dividend income and capital gains (the profits earned upon the sale of securities that have grown in value, if any) and assuming a constant rate of performance each year. The hypothetical investment and the average annual total returns do not reflect the deduction of taxes that a shareholder would pay on fund distributions or the redemption of fund shares. During periods of reimbursement by Fidelity, a fund’s total return will be greater than it would be had the reimbursement not occurred. How a fund did yesterday is no guarantee of how it will do tomorrow.
Average Annual Total Returns
| For the periods ended April 30, 2022 | Past 1 year | Past 5 years | Past 10 years |
| Class A (incl. 4.00% sales charge) | (11.33)% | 1.70% | 3.70% |
| Class M (incl. 4.00% sales charge) | (11.33)% | 1.70% | 3.69% |
| Class C (incl. contingent deferred sales charge) | (9.21)% | 1.77% | 3.50% |
| Fidelity® Global High Income Fund | (7.40)% | 2.79% | 4.39% |
| Class I | (7.40)% | 2.79% | 4.39% |
Class C shares' contingent deferred sales charges included in the past one year, past five years, and past ten years total return figures are 1%, 0%, and 0%, respectively.
$10,000 Over 10 Years
Let's say hypothetically that $10,000 was invested in Fidelity® Global High Income Fund, a class of the fund, on April 30, 2012.
The chart shows how the value of your investment would have changed, and also shows how the ICE® BofA® Global High Yield and Emerging Markets Plus Index performed over the same period.
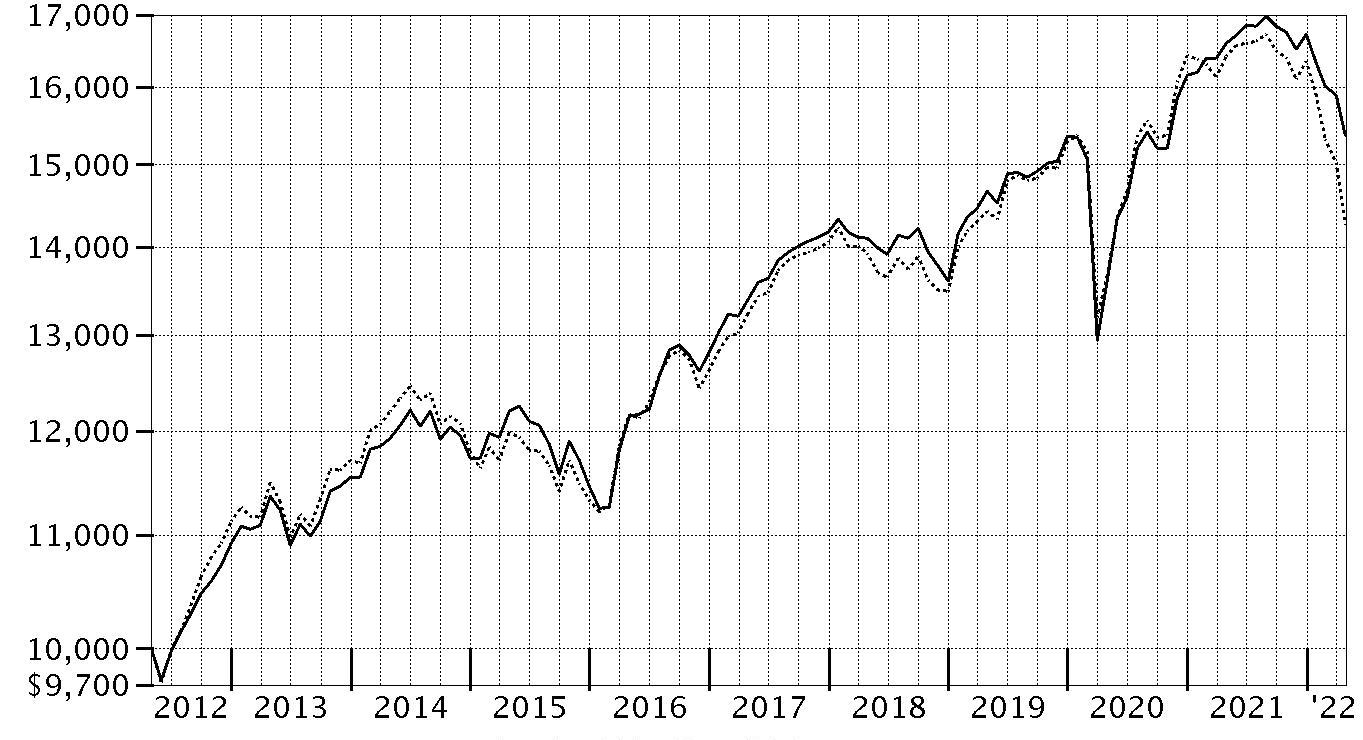
| Period Ending Values |
| $15,368 | Fidelity® Global High Income Fund |
| $14,254 | ICE® BofA® Global High Yield and Emerging Markets Plus Index |
Management's Discussion of Fund Performance
Market Recap: Global high-yield bonds returned -9.40% for the 12 months ending April 30, 2022, as measured by the Fidelity Global High Income Composite Index
SM, amid several headwinds that stoked volatility, uncertainty and investor anxiety. Chief among these was accelerated plans among some central banks to hike interest rates and aggressively wind down extraordinary monetary policy support in attempts to rein in high inflation. In addition, geopolitical unrest rose as Russia invaded Ukraine in late February and escalated its attack through period end. Other factors influencing the asset class included surging global commodity prices, rising sovereign bond yields in some markets, global supply constraint and disruption, a broadly strong U.S. dollar, and the potential for variants of the coronavirus to upend global economic growth. Against this backdrop, U.S. high-yield bonds and emerging-markets debt fared best, with the ICE BofA
® US High Yield Constrained Index and the J.P. Morgan Corporate Emerging Markets Bond Index Broad Diversified returning -4.96% and -9.70%, respectively. Europe returned -18.09%, as measured by the ICE BofA
® Euro High Yield Constrained Index. Meanwhile, Asian high-yield bonds fell the most, returning -31.43%, according to the ICE BofA
® Asian Dollar High Yield Corporate Constrained Index, due to concerns about China’s property market and slowing growth.
Comments from Co-Portfolio Manager Harley Lank: For the fiscal year, the fund's share classes (excluding sales charges, if applicable) returned about -7% to -8%, topping the -9.40% result of the Composite index. Security selection among all four of the fund's regional subportfolios contributed to performance versus the Composite index the past 12 months, led by U.S. high yield. Here, security selection among energy issuers was the big driver, specifically our holdings in formerly distressed oil & gas exploration companies that have gone through a restructuring, including EP Energy (+88%), Chesapeake Energy (+88%) and California Resources (+72%). These non-Composite securities benefited from the surge in energy prices. In the Asian high-yield subportfolio, we were helped the most by our picks in China, where we reduced the sleeve's exposure as we became more concerned about this market’s challenging regulatory backdrop. Among emerging-markets debt issuers, security selection in Russia and Mexico were helpful. Lastly, choices in Germany led the European high-yield sleeve. Meanwhile, asset allocation detracted from our relative result, due to our decision to overweight Asian high yield. Yield spreads were historically high in this asset class, which we thought boosted the potential for a higher return. However, Asian high yield underperformed the past 12 months.
The views expressed above reflect those of the portfolio manager(s) only through the end of the period as stated on the cover of this report and do not necessarily represent the views of Fidelity or any other person in the Fidelity organization. Any such views are subject to change at any time based upon market or other conditions and Fidelity disclaims any responsibility to update such views. These views may not be relied on as investment advice and, because investment decisions for a Fidelity fund are based on numerous factors, may not be relied on as an indication of trading intent on behalf of any Fidelity fund.
Investment Summary (Unaudited)
Top Bond Issuers as of April 30, 2022
| (by issuer, excluding cash equivalents) | % of fund's net assets |
| German Federal Republic | 1.4 |
| Occidental Petroleum Corp. | 1.4 |
| CSC Holdings LLC | 1.2 |
| Citigroup, Inc. | 1.1 |
| Icahn Enterprises LP/Icahn Enterprises Finance Corp. | 1.1 |
| Altice France SA | 1.0 |
| Community Health Systems, Inc. | 1.0 |
| Tenet Healthcare Corp. | 0.9 |
| CCO Holdings LLC/CCO Holdings Capital Corp. | 0.9 |
| InterGen NV | 0.8 |
| | 10.8 |
Geographic Diversification (% of fund's net assets)
| As of April 30, 2022 |
| | United States of America* | 55.1% |
| | Luxembourg | 4.7% |
| | Netherlands | 3.8% |
| | Cayman Islands | 3.7% |
| | United Kingdom | 3.1% |
| | Canada | 2.9% |
| | France | 2.6% |
| | British Virgin Islands | 2.4% |
| | Germany | 2.2% |
| | Other | 19.5% |

* Includes Short-Term investments and Net Other Assets (Liabilities).
Percentages are based on country or territory of incorporation and are adjusted for the effect of futures contracts, if applicable.
Top Five Market Sectors as of April 30, 2022
| | % of fund's net assets |
| Energy | 14.5 |
| Telecommunications | 8.4 |
| Healthcare | 6.5 |
| Banks & Thrifts | 6.1 |
| Technology | 5.5 |
Quality Diversification (% of fund's net assets)
| As of April 30, 2022 |
| | AAA,AA,A | 0.6% |
| | BBB | 5.4% |
| | BB | 37.9% |
| | B | 33.8% |
| | CCC,CC,C | 10.4% |
| | D | 0.1% |
| | Not Rated | 4.4% |
| | Equities | 2.5% |
| | Short-Term Investments and Net Other Assets | 4.9% |

We have used ratings from Moody's Investors Service, Inc. Where Moody's® ratings are not available, we have used S&P® ratings. All ratings are as of the date indicated and do not reflect subsequent changes.
Asset Allocation (% of fund's net assets)
| As of April 30, 2022 * |
| | Corporate Bonds | 82.7% |
| | Government Obligations | 1.7% |
| | Stocks | 2.5% |
| | Preferred Securities | 5.4% |
| | Other Investments | 2.8% |
| | Short-Term Investments and Net Other Assets (Liabilities) | 4.9% |

* Foreign investments - 44.9%
Schedule of Investments April 30, 2022
Showing Percentage of Net Assets
| Corporate Bonds - 82.7% | | | |
| | | Principal Amount(a) | Value |
| Convertible Bonds - 1.6% | | | |
| Banks & Thrifts - 0.3% | | | |
| Citigroup Global Markets Funding Luxembourg SCA 0% 7/25/24 (Reg. S) | HKD | $2,000,000 | $274,372 |
| Broadcasting - 0.7% | | | |
| DISH Network Corp.: | | | |
| 2.375% 3/15/24 | | 120,000 | 111,540 |
| 3.375% 8/15/26 | | 646,000 | 553,945 |
| | | | 665,485 |
| Diversified Financial Services - 0.1% | | | |
| New Cotai LLC 5% 2/24/27 (b) | | 144,457 | 142,435 |
| Energy - 0.4% | | | |
| Mesquite Energy, Inc. 15% 7/15/23 (b)(c) | | 27,566 | 142,241 |
| Mesquite Energy, Inc. 15% 7/15/23 (b)(c) | | 47,694 | 221,777 |
| | | | 364,018 |
| Telecommunications - 0.1% | | | |
| Cellnex Telecom SA 0.75% 11/20/31 (Reg. S) | EUR | 100,000 | 88,527 |
|
| TOTAL CONVERTIBLE BONDS | | | 1,534,837 |
|
| Nonconvertible Bonds - 81.1% | | | |
| Aerospace - 1.5% | | | |
| Allegheny Technologies, Inc.: | | | |
| 4.875% 10/1/29 | | 35,000 | 31,847 |
| 5.125% 10/1/31 | | 25,000 | 22,582 |
| 5.875% 12/1/27 | | 70,000 | 67,550 |
| Bombardier, Inc.: | | | |
| 6% 2/15/28 (d) | | 110,000 | 95,150 |
| 7.125% 6/15/26 (d) | | 100,000 | 92,000 |
| 7.5% 12/1/24 (d) | | 78,000 | 77,610 |
| 7.5% 3/15/25 (d) | | 138,000 | 133,860 |
| 7.875% 4/15/27 (d) | | 260,000 | 242,208 |
| Embraer Netherlands Finance BV 5.05% 6/15/25 | | 75,000 | 73,931 |
| Moog, Inc. 4.25% 12/15/27 (d) | | 20,000 | 18,625 |
| Rolls-Royce PLC 5.75% 10/15/27 (d) | | 55,000 | 53,011 |
| TransDigm, Inc.: | | | |
| 4.875% 5/1/29 | | 200,000 | 175,250 |
| 5.5% 11/15/27 | | 335,000 | 306,525 |
| Wesco Aircraft Holdings, Inc. 8.5% 11/15/24 (d) | | 45,000 | 25,020 |
| | | | 1,415,169 |
| Air Transportation - 0.8% | | | |
| Air Canada 3.875% 8/15/26 (d) | | 135,000 | 124,831 |
| Azul Investments LLP 5.875% 10/26/24 (d) | | 200,000 | 178,225 |
| Deutsche Lufthansa AG 2.875% 5/16/27 (Reg. S) | EUR | 100,000 | 93,363 |
| Hawaiian Brand Intellectual Property Ltd. / HawaiianMiles Loyalty Ltd. 5.75% 1/20/26 (d) | | 55,000 | 53,633 |
| Mileage Plus Holdings LLC 6.5% 6/20/27 (d) | | 55,000 | 56,099 |
| Spirit Loyalty Cayman Ltd. / Spirit IP Cayman Ltd. 8% 9/20/25 (d) | | 38,896 | 41,075 |
| United Airlines, Inc.: | | | |
| 4.375% 4/15/26 (d) | | 80,000 | 77,240 |
| 4.625% 4/15/29 (d) | | 80,000 | 73,400 |
| Western Global Airlines LLC 10.375% 8/15/25 (d) | | 60,000 | 61,523 |
| | | | 759,389 |
| Automotive - 0.2% | | | |
| Ford Motor Credit Co. LLC 3.625% 6/17/31 | | 200,000 | 166,250 |
| Automotive & Auto Parts - 1.9% | | | |
| Albion Financing 1 SARL 5.25% 10/15/26 (Reg. S) | EUR | 119,000 | 118,917 |
| Dana, Inc. 4.25% 9/1/30 | | 40,000 | 34,288 |
| Faurecia SA: | | | |
| 2.375% 6/15/29 (Reg. S) | EUR | 100,000 | 84,923 |
| 2.75% 2/15/27 (Reg. S) | EUR | 136,000 | 125,472 |
| Ford Motor Co. 3.25% 2/12/32 | | 140,000 | 113,750 |
| Ford Motor Credit Co. LLC: | | | |
| 2.9% 2/16/28 | | 50,000 | 43,000 |
| 3.087% 1/9/23 | | 200,000 | 200,176 |
| 3.25% 9/15/25 | EUR | 100,000 | 103,217 |
| 5.125% 6/16/25 | | 170,000 | 169,575 |
| Jaguar Land Rover Automotive PLC 6.875% 11/15/26 (Reg. S) | EUR | 100,000 | 103,017 |
| LCM Investments Holdings 4.875% 5/1/29 (d) | | 70,000 | 61,342 |
| Nesco Holdings II, Inc. 5.5% 4/15/29 (d) | | 45,000 | 42,405 |
| PECF USS Intermediate Holding III Corp. 8% 11/15/29 (d) | | 25,000 | 23,063 |
| Real Hero Merger Sub 2 6.25% 2/1/29 (d) | | 20,000 | 16,221 |
| Renault SA 2.5% 4/1/28 (Reg. S) | EUR | 100,000 | 88,794 |
| Rivian Holdco & Rivian LLC & Rivian Automotive LLC 6 month U.S. LIBOR + 5.620% 7.1766% 10/15/26 (d)(e)(f) | | 305,000 | 294,325 |
| Thor Industries, Inc. 4% 10/15/29 (d) | | 100,000 | 84,511 |
| Winnebago Industries, Inc. 6.25% 7/15/28 (d) | | 45,000 | 44,663 |
| ZF Finance GmbH 2% 5/6/27 (Reg. S) | EUR | 100,000 | 90,198 |
| | | | 1,841,857 |
| Banks & Thrifts - 2.7% | | | |
| Access Bank PLC 6.125% 9/21/26 (d) | | 200,000 | 186,850 |
| Ally Financial, Inc.: | | | |
| 8% 11/1/31 | | 155,000 | 181,418 |
| 8% 11/1/31 | | 188,000 | 223,648 |
| Banca Monte dei Paschi di Siena SpA 5.375% 1/18/28 (e) | EUR | 100,000 | 66,462 |
| Banco Comercial Portugues SA: | | | |
| 1.75% 4/7/28 (Reg. S) (e) | EUR | 100,000 | 89,936 |
| 4% 5/17/32 (Reg. S) (e) | EUR | 100,000 | 92,596 |
| Banco de Credito Social Cooperativo SA 5.25% 11/27/31 (Reg. S) (e) | EUR | 100,000 | 100,505 |
| Banco de Reservas de La Republica Dominicana 7% 2/1/23 (d) | | 150,000 | 151,875 |
| Banco de Sabadell SA 5.625% 5/6/26 (Reg. S) | EUR | 100,000 | 110,897 |
| BankMuscat SAOG 4.75% 3/17/26 (Reg. S) | | 200,000 | 199,750 |
| BBVA Bancomer SA Texas Branch 6.75% 9/30/22 (d) | | 25,000 | 25,250 |
| Cliffton Ltd. 6.25% 10/25/25 (Reg. S) | | 250,000 | 236,250 |
| CQP Holdco LP / BIP-V Chinook Holdco LLC 5.5% 6/15/31 (d) | | 250,000 | 230,575 |
| Industrial Senior Trust 5.5% 11/1/22 (d) | | 200,000 | 200,665 |
| Mongolian Mortgage Corp. HFC LLC 8.85% 2/8/24 (Reg. S) | | 200,000 | 176,022 |
| TBC Bank JSC 5.75% 6/19/24 (d) | | 200,000 | 191,000 |
| VistaJet Malta Finance PLC / XO Management Holding, Inc. 6.375% 2/1/30 (d) | | 130,000 | 113,448 |
| | | | 2,577,147 |
| Broadcasting - 1.5% | | | |
| Cable Onda SA 4.5% 1/30/30 (d) | | 200,000 | 186,215 |
| Clear Channel Outdoor Holdings, Inc.: | | | |
| 7.5% 6/1/29 (d) | | 75,000 | 70,778 |
| 7.75% 4/15/28 (d) | | 35,000 | 32,988 |
| Diamond Sports Group LLC/Diamond Sports Finance Co. 5.375% 8/15/26 (d) | | 70,000 | 25,900 |
| Gray Escrow II, Inc. 5.375% 11/15/31 (d) | | 90,000 | 77,576 |
| Nexstar Broadcasting, Inc. 5.625% 7/15/27 (d) | | 75,000 | 72,985 |
| Scripps Escrow II, Inc.: | | | |
| 3.875% 1/15/29 (d) | | 50,000 | 44,445 |
| 5.375% 1/15/31 (d) | | 25,000 | 22,253 |
| Scripps Escrow, Inc. 5.875% 7/15/27 (d) | | 60,000 | 57,300 |
| Sirius XM Radio, Inc.: | | | |
| 4% 7/15/28 (d) | | 315,000 | 284,681 |
| 4.125% 7/1/30 (d) | | 175,000 | 153,666 |
| Summer (BC) Holdco B SARL 5.75% 10/31/26 (Reg. S) | EUR | 100,000 | 103,962 |
| TEGNA, Inc. 5% 9/15/29 | | 85,000 | 82,450 |
| TV Azteca SA de CV 8.25% 8/9/24 (Reg. S) (g) | | 200,000 | 127,475 |
| Univision Communications, Inc. 6.625% 6/1/27 (d) | | 110,000 | 110,275 |
| | | | 1,452,949 |
| Building Materials - 1.4% | | | |
| Advanced Drain Systems, Inc. 5% 9/30/27 (d) | | 315,000 | 304,369 |
| CEMEX S.A.B. de CV 5.45% 11/19/29 (d) | | 200,000 | 191,610 |
| Dar Al-Arkan Sukuk Co. Ltd. 6.875% 3/21/23 (Reg. S) | | 200,000 | 203,413 |
| James Hardie International Finance Ltd. 3.625% 10/1/26 (Reg. S) | EUR | 100,000 | 104,760 |
| MIWD Holdco II LLC / MIWD Finance Corp. 5.5% 2/1/30 (d) | | 20,000 | 17,300 |
| PGT Innovations, Inc. 4.375% 10/1/29 (d) | | 365,000 | 320,262 |
| SRS Distribution, Inc.: | | | |
| 4.625% 7/1/28 (d) | | 55,000 | 50,353 |
| 6% 12/1/29 (d) | | 55,000 | 48,263 |
| 6.125% 7/1/29 (d) | | 30,000 | 26,474 |
| Victors Merger Corp. 6.375% 5/15/29 (d) | | 100,000 | 60,000 |
| | | | 1,326,804 |
| Cable/Satellite TV - 3.2% | | | |
| Altice France Holding SA 8% 5/15/27 (d) | EUR | 175,000 | 186,979 |
| CCO Holdings LLC/CCO Holdings Capital Corp.: | | | |
| 4.25% 2/1/31 (d) | | 100,000 | 84,280 |
| 4.25% 1/15/34 (d) | | 115,000 | 91,425 |
| 4.5% 8/15/30 (d) | | 195,000 | 170,138 |
| 4.5% 6/1/33 (d) | | 120,000 | 98,174 |
| 5.125% 5/1/27 (d) | | 425,000 | 414,282 |
| CSC Holdings LLC: | | | |
| 3.375% 2/15/31 (d) | | 175,000 | 136,672 |
| 4.5% 11/15/31 (d) | | 65,000 | 53,389 |
| 4.625% 12/1/30 (d) | | 75,000 | 57,375 |
| 5% 11/15/31 (d) | | 65,000 | 50,266 |
| 5.375% 2/1/28 (d) | | 255,000 | 234,124 |
| 5.5% 4/15/27 (d) | | 115,000 | 111,024 |
| 5.75% 1/15/30 (d) | | 100,000 | 83,000 |
| 6.5% 2/1/29 (d) | | 165,000 | 156,750 |
| 7.5% 4/1/28 (d) | | 230,000 | 212,026 |
| DIRECTV Financing LLC / DIRECTV Financing Co-Obligor, Inc. 5.875% 8/15/27 (d) | | 80,000 | 75,300 |
| DISH DBS Corp.: | | | |
| 5% 3/15/23 | | 250,000 | 247,670 |
| 5.25% 12/1/26 (d) | | 45,000 | 41,317 |
| 5.75% 12/1/28 (d) | | 45,000 | 40,252 |
| Radiate Holdco LLC/Radiate Financial Service Ltd.: | | | |
| 4.5% 9/15/26 (d) | | 150,000 | 138,134 |
| 6.5% 9/15/28 (d) | | 110,000 | 96,800 |
| Ziggo Bond Co. BV: | | | |
| 3.375% 2/28/30 (Reg. S) | EUR | 100,000 | 87,910 |
| 5.125% 2/28/30 (d) | | 35,000 | 30,363 |
| 6% 1/15/27 (d) | | 160,000 | 156,800 |
| Ziggo BV 4.875% 1/15/30 (d) | | 50,000 | 44,313 |
| | | | 3,098,763 |
| Chemicals - 2.7% | | | |
| CF Industries Holdings, Inc.: | | | |
| 5.15% 3/15/34 | | 45,000 | 46,462 |
| 5.375% 3/15/44 | | 80,000 | 81,153 |
| Consolidated Energy Finance SA 6.5% 5/15/26 (d) | | 95,000 | 97,019 |
| CVR Partners LP 6.125% 6/15/28 (d) | | 90,000 | 88,200 |
| ENN Clean Energy International Investment Ltd.: | | | |
| 3.375% 5/12/26 (d) | | 200,000 | 184,354 |
| 3.375% 5/12/26 (Reg. S) | | 200,000 | 184,354 |
| Kobe U.S. Midco 2, Inc. 9.25% 11/1/26 pay-in-kind (d)(e) | | 185,000 | 179,450 |
| Kronos Acquisition Holdings, Inc. / KIK Custom Products, Inc.: | | | |
| 5% 12/31/26 (d) | | 10,000 | 8,850 |
| 7% 12/31/27 (d) | | 15,000 | 11,850 |
| LSB Industries, Inc. 6.25% 10/15/28 (d) | | 20,000 | 19,599 |
| MEGlobal Canada, Inc. 5% 5/18/25 (d) | | 200,000 | 203,225 |
| NOVA Chemicals Corp. 4.25% 5/15/29 (d) | | 75,000 | 64,875 |
| OCP SA: | | | |
| 3.75% 6/23/31 (d) | | 200,000 | 168,980 |
| 4.5% 10/22/25 (d) | | 200,000 | 199,600 |
| Sasol Financing U.S.A. LLC 4.375% 9/18/26 | | 200,000 | 186,000 |
| SCIH Salt Holdings, Inc.: | | | |
| 4.875% 5/1/28 (d) | | 70,000 | 60,518 |
| 6.625% 5/1/29 (d) | | 45,000 | 35,895 |
| The Chemours Co. LLC: | | | |
| 4.625% 11/15/29 (d) | | 70,000 | 60,638 |
| 5.375% 5/15/27 | | 240,000 | 231,600 |
| 5.75% 11/15/28 (d) | | 245,000 | 229,688 |
| Tronox, Inc. 4.625% 3/15/29 (d) | | 55,000 | 49,088 |
| Valvoline, Inc. 4.25% 2/15/30 (d) | | 45,000 | 39,038 |
| W.R. Grace Holding LLC: | | | |
| 4.875% 6/15/27 (d) | | 70,000 | 65,814 |
| 5.625% 8/15/29 (d) | | 70,000 | 59,633 |
| | | | 2,555,883 |
| Consumer Products - 1.5% | | | |
| B2W Digital Lux SARL 4.375% 12/20/30 (d) | | 200,000 | 165,350 |
| Central Garden & Pet Co. 4.125% 10/15/30 | | 35,000 | 30,255 |
| Ferrellgas LP/Ferrellgas Finance Corp.: | | | |
| 5.375% 4/1/26 (d) | | 45,000 | 40,725 |
| 5.875% 4/1/29 (d) | | 45,000 | 39,271 |
| Gannett Holdings LLC 6% 11/1/26 (d) | | 45,000 | 40,950 |
| Kernel Holding SA 6.75% 10/27/27 (d) | | 100,000 | 52,500 |
| Macy's Retail Holdings LLC: | | | |
| 5.875% 3/15/30 (d) | | 30,000 | 28,151 |
| 6.125% 3/15/32 (d) | | 35,000 | 32,375 |
| Mattel, Inc. 3.375% 4/1/26 (d) | | 20,000 | 19,450 |
| Meituan 2.125% 10/28/25 (d) | | 200,000 | 178,260 |
| Michaels Companies, Inc.: | | | |
| 5.25% 5/1/28 (d) | | 65,000 | 55,862 |
| 7.875% 5/1/29 (d) | | 95,000 | 74,813 |
| Natura Cosmeticos SA 4.125% 5/3/28 (d) | | 200,000 | 178,720 |
| PetSmart, Inc. / PetSmart Finance Corp. 7.75% 2/15/29 (d) | | 75,000 | 74,625 |
| Prosus NV 4.027% 8/3/50 (d) | | 200,000 | 138,000 |
| SIG PLC 5.25% 11/30/26 (Reg. S) | EUR | 112,000 | 113,310 |
| Tempur Sealy International, Inc.: | | | |
| 3.875% 10/15/31 (d) | | 75,000 | 62,144 |
| 4% 4/15/29 (d) | | 60,000 | 51,976 |
| The Scotts Miracle-Gro Co. 4% 4/1/31 | | 40,000 | 32,900 |
| TKC Holdings, Inc. 10.5% 5/15/29 (d) | | 75,000 | 72,188 |
| | | | 1,481,825 |
| Containers - 0.5% | | | |
| ARD Finance SA 6.5% 6/30/27 pay-in-kind (d)(e) | | 70,000 | 58,800 |
| Ball Corp. 4.875% 3/15/26 | | 85,000 | 85,000 |
| Berry Global, Inc. 4.875% 7/15/26 (d) | | 40,000 | 39,754 |
| Graham Packaging Co., Inc. 7.125% 8/15/28 (d) | | 30,000 | 27,050 |
| Graphic Packaging International, Inc. 3.75% 2/1/30 (d) | | 35,000 | 30,686 |
| Schoeller Packaging BV 6.375% 11/1/24 (Reg. S) | EUR | 200,000 | 204,660 |
| Trivium Packaging Finance BV 5.5% 8/15/26 (d) | | 40,000 | 38,650 |
| | | | 484,600 |
| Diversified Financial Services - 3.8% | | | |
| Broadstreet Partners, Inc. 5.875% 4/15/29 (d) | | 30,000 | 26,025 |
| Coinbase Global, Inc.: | | | |
| 3.375% 10/1/28 (d) | | 300,000 | 232,929 |
| 3.625% 10/1/31 (d) | | 185,000 | 136,665 |
| Cullinan Holdco SCSp 4.625% 10/15/26 (Reg. S) | EUR | 104,000 | 99,720 |
| Dovalue SpA 3.375% 7/31/26 (Reg. S) | EUR | 125,000 | 123,614 |
| FLY Leasing Ltd. 7% 10/15/24 (d) | | 105,000 | 94,303 |
| Fortune Star (BVI) Ltd.: | | | |
| 6.75% 7/2/23 (Reg. S) | | 200,000 | 195,663 |
| 6.85% 7/2/24 (Reg. S) | | 200,000 | 188,000 |
| Garfunkelux Holdco 3 SA 6.75% 11/1/25 (Reg. S) | EUR | 100,000 | 102,989 |
| Hightower Holding LLC 6.75% 4/15/29 (d) | | 25,000 | 23,033 |
| HTA Group Ltd. 7% 12/18/25 (d) | | 200,000 | 196,288 |
| Icahn Enterprises LP/Icahn Enterprises Finance Corp.: | | | |
| 4.375% 2/1/29 | | 165,000 | 142,350 |
| 4.75% 9/15/24 | | 90,000 | 87,750 |
| 5.25% 5/15/27 | | 260,000 | 241,800 |
| 6.25% 5/15/26 | | 260,000 | 257,769 |
| 6.375% 12/15/25 | | 295,000 | 292,788 |
| Intertrust Group BV 3.375% 11/15/25 (Reg. S) | EUR | 100,000 | 104,094 |
| Lincoln Financing SARL 3.625% 4/1/24 (Reg. S) | EUR | 100,000 | 104,579 |
| Nexi SpA 2.125% 4/30/29 (Reg. S) | EUR | 100,000 | 89,934 |
| OneMain Finance Corp.: | | | |
| 4% 9/15/30 | | 165,000 | 135,080 |
| 7.125% 3/15/26 | | 200,000 | 202,500 |
| Park Aerospace Holdings Ltd. 4.5% 3/15/23 (d) | | 20,000 | 20,059 |
| Qtel International Finance Ltd. 2.625% 4/8/31 (d) | | 200,000 | 180,000 |
| Verisure Holding AB: | | | |
| 3.25% 2/15/27 (Reg. S) | EUR | 100,000 | 94,761 |
| 3.875% 7/15/26 (Reg. S) | EUR | 125,000 | 123,957 |
| Vivion Investments SARL 3% 8/8/24 (Reg. S) | EUR | 100,000 | 96,395 |
| Yihua Overseas Investment Ltd. 8.5% 10/16/20 (Reg. S) (b)(g) | | 200,000 | 20,100 |
| | | | 3,613,145 |
| Diversified Media - 0.6% | | | |
| Allen Media LLC 10.5% 2/15/28 (d) | | 155,000 | 139,888 |
| Lamar Media Corp. 4.875% 1/15/29 | | 45,000 | 42,919 |
| Terrier Media Buyer, Inc. 8.875% 12/15/27 (d) | | 90,000 | 87,965 |
| Twitter, Inc. 5% 3/1/30 (d) | | 340,000 | 347,235 |
| | | | 618,007 |
| Energy - 12.3% | | | |
| Antero Midstream Partners LP/Antero Midstream Finance Corp.: | | | |
| 5.75% 3/1/27 (d) | | 140,000 | 136,322 |
| 5.75% 1/15/28 (d) | | 60,000 | 58,339 |
| Archrock Partners LP / Archrock Partners Finance Corp. 6.25% 4/1/28 (d) | | 70,000 | 67,900 |
| Atlantica Sustainable Infrastructure PLC 4.125% 6/15/28 (d) | | 200,000 | 182,000 |
| California Resources Corp. 7.125% 2/1/26 (d) | | 95,000 | 96,629 |
| Canacol Energy Ltd. 5.75% 11/24/28 (d) | | 200,000 | 181,413 |
| Cheniere Energy, Inc. 4.625% 10/15/28 | | 95,000 | 91,913 |
| China Oil & Gas Group Ltd. 4.7% 6/30/26 (Reg. S) | | 200,000 | 190,725 |
| Citgo Holding, Inc. 9.25% 8/1/24 (d) | | 70,000 | 69,563 |
| Citgo Petroleum Corp.: | | | |
| 6.375% 6/15/26 (d) | | 70,000 | 69,566 |
| 7% 6/15/25 (d) | | 130,000 | 129,107 |
| CNX Resources Corp. 6% 1/15/29 (d) | | 25,000 | 24,664 |
| Colgate Energy Partners III LLC 5.875% 7/1/29 (d) | | 80,000 | 79,200 |
| Comstock Resources, Inc.: | | | |
| 5.875% 1/15/30 (d) | | 50,000 | 48,116 |
| 6.75% 3/1/29 (d) | | 90,000 | 91,006 |
| Crestwood Midstream Partners LP/Crestwood Midstream Finance Corp. 6% 2/1/29 (d) | | 285,000 | 277,208 |
| CrownRock LP/CrownRock Finance, Inc. 5% 5/1/29 (d) | | 25,000 | 24,465 |
| CVR Energy, Inc.: | | | |
| 5.25% 2/15/25 (d) | | 140,000 | 135,436 |
| 5.75% 2/15/28 (d) | | 140,000 | 131,219 |
| DCP Midstream Operating LP: | | | |
| 5.85% 5/21/43 (d)(e) | | 60,000 | 54,532 |
| 8.125% 8/16/30 | | 5,000 | 5,875 |
| Delek Logistics Partners LP 7.125% 6/1/28 (d) | | 45,000 | 43,014 |
| Delek Overriding Royalty Levia 7.494% 12/30/23 (Reg. S) (d) | | 110,000 | 112,613 |
| DT Midstream, Inc.: | | | |
| 4.125% 6/15/29 (d) | | 75,000 | 68,250 |
| 4.375% 6/15/31 (d) | | 75,000 | 67,191 |
| EDP Finance BV 1.875% 9/21/29 (Reg. S) | EUR | 100,000 | 102,305 |
| Endeavor Energy Resources LP/EER Finance, Inc.: | | | |
| 5.75% 1/30/28 (d) | | 125,000 | 125,323 |
| 6.625% 7/15/25 (d) | | 55,000 | 56,513 |
| Energean Israel Finance Ltd.: | | | |
| 4.5% 3/30/24 (Reg. S) (d) | | 40,000 | 38,880 |
| 4.875% 3/30/26 (Reg. S) (d) | | 40,000 | 37,080 |
| EnfraGen Energia Sur SA 5.375% 12/30/30 (d) | | 200,000 | 143,576 |
| EnLink Midstream LLC 5.625% 1/15/28 (d) | | 25,000 | 24,772 |
| EQM Midstream Partners LP 6.5% 7/1/27 (d) | | 70,000 | 70,700 |
| EQT Corp.: | | | |
| 3.125% 5/15/26 (d) | | 50,000 | 47,139 |
| 3.625% 5/15/31 (d) | | 50,000 | 45,255 |
| 5% 1/15/29 | | 55,000 | 54,829 |
| Genesis Energy LP/Genesis Energy Finance Corp. 8% 1/15/27 | | 65,000 | 63,748 |
| GeoPark Ltd.: | | | |
| 5.5% 1/17/27 (d) | | 200,000 | 180,538 |
| 6.5% 9/21/24 (d) | | 200,000 | 204,225 |
| Global Partners LP/GLP Finance Corp. 6.875% 1/15/29 | | 55,000 | 53,628 |
| Harvest Midstream I LP 7.5% 9/1/28 (d) | | 135,000 | 136,979 |
| Hess Midstream Partners LP: | | | |
| 4.25% 2/15/30 (d) | | 50,000 | 45,865 |
| 5.125% 6/15/28 (d) | | 80,000 | 77,400 |
| 5.5% 10/15/30 (d) | | 30,000 | 29,559 |
| 5.625% 2/15/26 (d) | | 100,000 | 100,000 |
| India Clean Energy Holdings 4.5% 4/18/27 (Reg. S) | | 200,000 | 169,000 |
| Indika Energy Capital III Pte. Ltd. 5.875% 11/9/24 (d) | | 200,000 | 196,038 |
| Investment Energy Resources Ltd. 6.25% 4/26/29 (d) | | 200,000 | 197,300 |
| KLX Energy Services Holdings, Inc. 11.5% 11/1/25 (d) | | 95,000 | 61,513 |
| Kosmos Energy Ltd. 7.125% 4/4/26 (d) | | 285,000 | 278,285 |
| Leeward Renewable Energy LLC 4.25% 7/1/29 (d) | | 170,000 | 152,150 |
| Leviathan Bond Ltd. 6.125% 6/30/25 (Reg. S) (d) | | 150,000 | 148,500 |
| MC Brazil Downstream Trading SARL 7.25% 6/30/31 (d) | | 320,000 | 278,400 |
| Medco Oak Tree Pte Ltd. 7.375% 5/14/26 (d) | | 200,000 | 198,000 |
| MEG Energy Corp. 5.875% 2/1/29 (d) | | 110,000 | 107,676 |
| Nabors Industries, Inc. 5.75% 2/1/25 | | 105,000 | 100,356 |
| New Fortress Energy, Inc. 6.75% 9/15/25 (d) | | 55,000 | 54,073 |
| NGL Energy Operating LLC/NGL Energy Finance Corp. 7.5% 2/1/26 (d) | | 190,000 | 178,996 |
| Northern Oil & Gas, Inc. 8.125% 3/1/28 (d) | | 90,000 | 89,550 |
| Nostrum Oil & Gas Finance BV 8% 7/25/22 (d)(g) | | 400,000 | 112,250 |
| Occidental Petroleum Corp.: | | | |
| 5.5% 12/1/25 | | 35,000 | 35,613 |
| 5.875% 9/1/25 | | 40,000 | 41,083 |
| 6.125% 1/1/31 | | 80,000 | 84,085 |
| 6.375% 9/1/28 | | 345,000 | 362,250 |
| 6.6% 3/15/46 | | 55,000 | 59,950 |
| 6.625% 9/1/30 | | 195,000 | 211,331 |
| 6.95% 7/1/24 | | 65,000 | 68,169 |
| 7.5% 5/1/31 | | 230,000 | 262,200 |
| 8.875% 7/15/30 | | 145,000 | 174,158 |
| Oleoducto Central SA 4% 7/14/27 (d) | | 200,000 | 181,538 |
| Oman Oil Co. 5.125% 5/6/28 (d) | | 200,000 | 194,225 |
| PBF Holding Co. LLC/PBF Finance Corp.: | | | |
| 6% 2/15/28 | | 160,000 | 140,800 |
| 7.25% 6/15/25 | | 70,000 | 67,589 |
| 9.25% 5/15/25 (d) | | 65,000 | 67,275 |
| PBF Logistics LP/PBF Logistics Finance, Inc. 6.875% 5/15/23 | | 130,000 | 129,682 |
| Petrobras Global Finance BV 5.6% 1/3/31 | | 65,000 | 63,798 |
| Petroleos Mexicanos: | | | |
| 4.25% 1/15/25 | | 185,000 | 178,988 |
| 6.49% 1/23/27 | | 175,000 | 167,510 |
| 7.69% 1/23/50 | | 75,000 | 58,538 |
| Petrorio Luxembourg SARL 6.125% 6/9/26 (d) | | 100,000 | 96,125 |
| Repsol International Finance BV 4.5% 3/25/75 (Reg. S) (e) | EUR | 100,000 | 105,627 |
| Rio Oil Finance Trust 9.25% 7/6/24 (d) | | 38,788 | 40,275 |
| Saudi Arabian Oil Co.: | | | |
| 1.625% 11/24/25 (d) | | 200,000 | 185,600 |
| 3.5% 4/16/29 (d) | | 200,000 | 193,250 |
| SM Energy Co.: | | | |
| 6.5% 7/15/28 | | 25,000 | 24,646 |
| 6.625% 1/15/27 | | 65,000 | 64,667 |
| 6.75% 9/15/26 | | 25,000 | 24,874 |
| Southwestern Energy Co.: | | | |
| 4.75% 2/1/32 | | 65,000 | 61,466 |
| 5.375% 2/1/29 | | 115,000 | 113,597 |
| 8.375% 9/15/28 | | 60,000 | 64,875 |
| SUEK Securities DAC 3.375% 9/15/26 (d) | | 200,000 | 10,000 |
| Sunoco LP/Sunoco Finance Corp.: | | | |
| 4.5% 5/15/29 | | 50,000 | 44,962 |
| 6% 4/15/27 | | 175,000 | 176,311 |
| Tallgrass Energy Partners LP / Tallgrass Energy Finance Corp. 6% 12/31/30 (d) | | 55,000 | 50,875 |
| Targa Resources Partners LP/Targa Resources Partners Finance Corp.: | | | |
| 6.5% 7/15/27 | | 40,000 | 41,206 |
| 6.875% 1/15/29 | | 70,000 | 73,826 |
| Tengizchevroil Finance Co. International Ltd. 3.25% 8/15/30 (d) | | 200,000 | 160,700 |
| Termocandelaria Power Ltd. 7.875% 1/30/29 (d) | | 170,000 | 164,932 |
| Transocean Sentry Ltd. 5.375% 5/15/23 (d) | | 70,819 | 68,694 |
| Transportadora de Gas del Sur SA 6.75% 5/2/25 (d) | | 70,000 | 65,350 |
| Tullow Oil PLC: | | | |
| 7% 3/1/25 (d) | | 200,000 | 161,500 |
| 10.25% 5/15/26 (d) | | 415,000 | 408,775 |
| U.S.A. Compression Partners LP 6.875% 4/1/26 | | 35,000 | 34,300 |
| Valaris Ltd. 8.25% 4/30/28 pay-in-kind (e) | | 10,000 | 10,250 |
| Venture Global Calcasieu Pass LLC: | | | |
| 3.875% 8/15/29 (d) | | 70,000 | 63,875 |
| 4.125% 8/15/31 (d) | | 70,000 | 63,525 |
| Viper Energy Partners LP 5.375% 11/1/27 (d) | | 30,000 | 29,870 |
| YPF SA 8.5% 3/23/25 (d) | | 278,250 | 255,781 |
| | | | 11,805,183 |
| Entertainment/Film - 0.1% | | | |
| Live Nation Entertainment, Inc. 4.75% 10/15/27 (d) | | 80,000 | 75,160 |
| Environmental - 0.3% | | | |
| Covanta Holding Corp. 4.875% 12/1/29(d) | | 40,000 | 36,392 |
| Madison IAQ LLC: | | | |
| 4.125% 6/30/28 (d) | | 55,000 | 48,263 |
| 5.875% 6/30/29 (d) | | 85,000 | 69,275 |
| Paprec Holding SA 3.5% 7/1/28 (Reg. S) | EUR | 113,000 | 110,371 |
| Stericycle, Inc. 3.875% 1/15/29 (d) | | 35,000 | 30,865 |
| | | | 295,166 |
| Food & Drug Retail - 0.8% | | | |
| Albertsons Companies LLC/Safeway, Inc./New Albertson's, Inc./Albertson's LLC: | | | |
| 3.5% 3/15/29 (d) | | 35,000 | 29,484 |
| 4.625% 1/15/27 (d) | | 130,000 | 121,768 |
| 4.875% 2/15/30 (d) | | 275,000 | 248,890 |
| BellRing Brands, Inc. 7% 3/15/30 (d) | | 70,000 | 68,425 |
| Camposol SA 6% 2/3/27 (d) | | 200,000 | 182,975 |
| Emergent BioSolutions, Inc. 3.875% 8/15/28 (d) | | 35,000 | 29,706 |
| Murphy Oil U.S.A., Inc. 3.75% 2/15/31 (d) | | 25,000 | 21,959 |
| SEG Holding LLC/SEG Finance Corp. 5.625% 10/15/28 (d) | | 100,000 | 97,589 |
| | | | 800,796 |
| Food/Beverage/Tobacco - 2.3% | | | |
| Adecoagro SA 6% 9/21/27 (d) | | 150,000 | 147,227 |
| C&S Group Enterprises LLC 5% 12/15/28 (d) | | 40,000 | 34,050 |
| Central American Bottling Corp. 5.25% 4/27/29 (d) | | 200,000 | 189,000 |
| Chobani LLC/Finance Corp., Inc.: | | | |
| 4.625% 11/15/28 (d) | | 30,000 | 27,000 |
| 7.5% 4/15/25 (d) | | 15,000 | 14,063 |
| Del Monte Foods, Inc. 11.875% 5/15/25 (d) | | 80,000 | 87,358 |
| JBS Finance Luxembourg SARL 2.5% 1/15/27 (d) | | 200,000 | 179,452 |
| JBS U.S.A. LLC/JBS U.S.A. Finance, Inc. 6.75% 2/15/28 (d) | | 185,000 | 191,014 |
| JBS U.S.A. Lux SA / JBS Food Co.: | | | |
| 5.5% 1/15/30 (d) | | 120,000 | 118,500 |
| 6.5% 4/15/29 (d) | | 80,000 | 82,800 |
| KeHE Distributors LLC / KeHE Finance Corp. 8.625% 10/15/26 (d) | | 48,000 | 50,820 |
| Kraft Heinz Foods Co.: | | | |
| 2.25% 5/25/28 (Reg. S) | EUR | 100,000 | 102,656 |
| 4.375% 6/1/46 | | 15,000 | 13,142 |
| 4.875% 10/1/49 | | 85,000 | 79,142 |
| 5.5% 6/1/50 | | 25,000 | 25,247 |
| Lamb Weston Holdings, Inc. 4.125% 1/31/30 (d) | | 70,000 | 62,467 |
| MARB BondCo PLC 3.95% 1/29/31 (d) | | 200,000 | 165,985 |
| MHP SA 7.75% 5/10/24 (d) | | 100,000 | 50,500 |
| NBM U.S. Holdings, Inc. 6.625% 8/6/29 (d) | | 85,000 | 87,061 |
| Performance Food Group, Inc.: | | | |
| 4.25% 8/1/29 (d) | | 40,000 | 35,549 |
| 5.5% 10/15/27 (d) | | 100,000 | 97,043 |
| Post Holdings, Inc. 4.625% 4/15/30 (d) | | 195,000 | 166,725 |
| Simmons Foods, Inc. 4.625% 3/1/29 (d) | | 40,000 | 36,095 |
| TreeHouse Foods, Inc. 4% 9/1/28 | | 20,000 | 16,296 |
| Triton Water Holdings, Inc. 6.25% 4/1/29 (d) | | 30,000 | 24,832 |
| U.S. Foods, Inc.: | | | |
| 4.625% 6/1/30 (d) | | 35,000 | 31,325 |
| 4.75% 2/15/29 (d) | | 80,000 | 73,896 |
| United Natural Foods, Inc. 6.75% 10/15/28 (d) | | 40,000 | 40,029 |
| | | | 2,229,274 |
| Gaming - 2.8% | | | |
| Affinity Gaming LLC 6.875% 12/15/27 (d) | | 20,000 | 18,733 |
| Caesars Entertainment, Inc.: | | | |
| 4.625% 10/15/29 (d) | | 90,000 | 77,175 |
| 6.25% 7/1/25 (d) | | 110,000 | 111,196 |
| 8.125% 7/1/27 (d) | | 75,000 | 78,375 |
| CDI Escrow Issuer, Inc. 5.75% 4/1/30 (d) | | 135,000 | 130,128 |
| Cirsa Finance International SARL 6.25% 12/20/23 (Reg. S) | EUR | 84,917 | 89,062 |
| Fertitta Entertainment LLC / Fertitta Entertainment Finance Co., Inc.: | | | |
| 4.625% 1/15/29 (d) | | 90,000 | 81,652 |
| 6.75% 1/15/30 (d) | | 160,000 | 138,419 |
| GENM Capital Labuan Ltd. 3.882% 4/19/31 (d) | | 200,000 | 164,913 |
| GLP Capital LP/GLP Financing II, Inc.: | | | |
| 5.25% 6/1/25 | | 95,000 | 96,691 |
| 5.375% 4/15/26 | | 30,000 | 30,604 |
| Jacobs Entertainment, Inc. 6.75% 2/15/29 (d) | | 40,000 | 39,188 |
| Melco Resorts Finance Ltd. 5.375% 12/4/29 (Reg. S) | | 200,000 | 160,042 |
| MGM China Holdings Ltd. 4.75% 2/1/27 (Reg. S) | | 200,000 | 168,000 |
| NagaCorp Ltd. 7.95% 7/6/24 (Reg. S) | | 200,000 | 180,725 |
| Peninsula Pacific Entertainment LLC 8.5% 11/15/27 (d) | | 70,000 | 76,650 |
| Station Casinos LLC 4.625% 12/1/31 (d) | | 115,000 | 96,376 |
| Studio City Finance Ltd.: | | | |
| 5% 1/15/29 (Reg. S) | | 200,000 | 136,350 |
| 6.5% 1/15/28 (d) | | 110,000 | 84,150 |
| 6.5% 1/15/28 (Reg. S) | | 200,000 | 153,000 |
| VICI Properties LP / VICI Note Co.: | | | |
| 4.5% 1/15/28 (d) | | 350,000 | 344,750 |
| 5.75% 2/1/27 (d) | | 70,000 | 72,100 |
| Wynn Macau Ltd. 5.125% 12/15/29 (Reg. S) | | 250,000 | 197,500 |
| | | | 2,725,779 |
| Healthcare - 6.4% | | | |
| AHP Health Partners, Inc. 5.75% 7/15/29 (d) | | 80,000 | 72,200 |
| Avantor Funding, Inc.: | | | |
| 3.875% 11/1/29 (d) | | 70,000 | 62,806 |
| 4.625% 7/15/28 (d) | | 175,000 | 166,476 |
| Bayer AG: | | | |
| 3.125% 11/12/79 (Reg. S) (e) | EUR | 100,000 | 97,154 |
| 5.375% 3/25/82 (Reg. S) (e) | EUR | 200,000 | 210,768 |
| Catalent Pharma Solutions 5% 7/15/27 (d) | | 20,000 | 19,375 |
| Centene Corp.: | | | |
| 3.375% 2/15/30 | | 160,000 | 142,952 |
| 4.25% 12/15/27 | | 70,000 | 67,900 |
| 4.625% 12/15/29 | | 105,000 | 101,695 |
| Charles River Laboratories International, Inc.: | | | |
| 3.75% 3/15/29 (d) | | 20,000 | 18,100 |
| 4% 3/15/31 (d) | | 55,000 | 49,105 |
| 4.25% 5/1/28 (d) | | 120,000 | 114,544 |
| Chrome Bidco SASU 3.5% 5/31/28 (Reg. S) | EUR | 175,000 | 166,155 |
| Chrome HoldCo 5% 5/31/29 (Reg. S) | EUR | 100,000 | 91,785 |
| Community Health Systems, Inc.: | | | |
| 4.75% 2/15/31 (d) | | 75,000 | 63,563 |
| 5.25% 5/15/30 (d) | | 155,000 | 135,881 |
| 5.625% 3/15/27 (d) | | 55,000 | 52,428 |
| 6% 1/15/29 (d) | | 55,000 | 51,985 |
| 6.125% 4/1/30 (d) | | 170,000 | 139,825 |
| 6.875% 4/15/29 (d) | | 75,000 | 65,777 |
| 8% 3/15/26 (d) | | 390,000 | 403,182 |
| DaVita HealthCare Partners, Inc.: | | | |
| 3.75% 2/15/31 (d) | | 60,000 | 48,900 |
| 4.625% 6/1/30 (d) | | 160,000 | 139,200 |
| Encompass Health Corp. 5.75% 9/15/25 | | 15,000 | 15,263 |
| Eurofins Scientific SA 2.125% 7/25/24 (Reg. S) | EUR | 100,000 | 106,779 |
| Grifols Escrow Issuer SA 4.75% 10/15/28 (d) | | 200,000 | 182,500 |
| Grifols SA 2.25% 11/15/27 (Reg. S) | EUR | 100,000 | 95,220 |
| HCA Holdings, Inc. 5.875% 2/1/29 | | 45,000 | 46,874 |
| HealthEquity, Inc. 4.5% 10/1/29 (d) | | 30,000 | 27,413 |
| Hologic, Inc. 3.25% 2/15/29 (d) | | 55,000 | 48,998 |
| Jazz Securities DAC 4.375% 1/15/29 (d) | | 55,000 | 50,669 |
| Minerva Merger Sub, Inc. 6.5% 2/15/30 (d) | | 265,000 | 243,917 |
| Molina Healthcare, Inc.: | | | |
| 3.875% 11/15/30 (d) | | 50,000 | 45,100 |
| 3.875% 5/15/32 (d) | | 100,000 | 87,798 |
| 4.375% 6/15/28 (d) | | 40,000 | 37,386 |
| Mozart Debt Merger Sub, Inc. 3.875% 4/1/29 (d) | | 135,000 | 117,958 |
| Option Care Health, Inc. 4.375% 10/31/29 (d) | | 30,000 | 26,969 |
| Organon & Co. / Organon Foreign Debt Co-Issuer BV: | | | |
| 2.875% 4/30/28 (Reg. S) | EUR | 147,000 | 139,565 |
| 4.125% 4/30/28 (d) | | 80,000 | 74,424 |
| 5.125% 4/30/31 (d) | | 80,000 | 72,300 |
| Ortho-Clinical Diagnostics, Inc.: | | | |
| 7.25% 2/1/28 (d) | | 18,000 | 18,180 |
| 7.375% 6/1/25 (d) | | 25,000 | 25,438 |
| Owens & Minor, Inc. 6.625% 4/1/30 (d) | | 165,000 | 161,517 |
| Radiology Partners, Inc. 9.25% 2/1/28 (d) | | 170,000 | 161,500 |
| RP Escrow Issuer LLC 5.25% 12/15/25 (d) | | 50,000 | 46,500 |
| Sabra Health Care LP 3.9% 10/15/29 | | 72,000 | 65,773 |
| Service Corp. International 3.375% 8/15/30 | | 300,000 | 258,000 |
| Surgery Center Holdings, Inc.: | | | |
| 6.75% 7/1/25 (d) | | 30,000 | 29,438 |
| 10% 4/15/27 (d) | | 70,000 | 73,150 |
| Teleflex, Inc. 4.625% 11/15/27 | | 30,000 | 29,400 |
| Tenet Healthcare Corp.: | | | |
| 4.25% 6/1/29 (d) | | 250,000 | 225,873 |
| 4.375% 1/15/30 (d) | | 210,000 | 191,073 |
| 4.625% 7/15/24 | | 32,000 | 31,913 |
| 6.125% 10/1/28 (d) | | 240,000 | 230,388 |
| 6.25% 2/1/27 (d) | | 195,000 | 193,538 |
| 6.875% 11/15/31 | | 10,000 | 10,361 |
| Teva Pharmaceutical Finance Netherlands III BV: | | | |
| 3.15% 10/1/26 | | 75,000 | 64,314 |
| 4.1% 10/1/46 | | 200,000 | 142,886 |
| 4.375% 5/9/30 | EUR | 100,000 | 93,099 |
| 6% 1/31/25 | EUR | 100,000 | 107,077 |
| Valeant Pharmaceuticals International, Inc. 9.25% 4/1/26 (d) | | 65,000 | 64,526 |
| Vizient, Inc. 6.25% 5/15/27 (d) | | 15,000 | 15,488 |
| | | | 6,140,321 |
| Homebuilders/Real Estate - 3.4% | | | |
| ADLER Real Estate AG 1.875% 4/27/23 (Reg. S) | EUR | 100,000 | 91,306 |
| Arcosa, Inc. 4.375% 4/15/29 (d) | | 40,000 | 36,496 |
| Ashton Woods U.S.A. LLC/Ashton Woods Finance Co.: | | | |
| 4.625% 8/1/29 (d) | | 40,000 | 33,658 |
| 6.625% 1/15/28 (d) | | 5,000 | 4,862 |
| China Aoyuan Group Ltd.: | | | |
| 5.88% 3/1/27 (Reg. S) | | 200,000 | 43,038 |
| 6.2% 3/24/26 (Reg. S) | | 200,000 | 43,600 |
| China Evergrande Group: | | | |
| 8.25% 3/23/22 (Reg. S) | | 200,000 | 24,163 |
| 8.75% 6/28/25 (Reg. S) | | 200,000 | 22,000 |
| China SCE Property Holdings Ltd.: | | | |
| 7.25% 4/19/23 (Reg. S) | | 200,000 | 156,000 |
| 7.375% 4/9/24 (Reg. S) | | 200,000 | 135,000 |
| CIFI Holdings Group Co. Ltd. 4.375% 4/12/27 (Reg. S) | | 200,000 | 146,000 |
| Easy Tactic Ltd. 11.625% 9/3/24 (Reg. S) | | 200,000 | 41,225 |
| Jinke Properties Group Co. Ltd. 6.85% 5/28/24 (Reg. S) | | 200,000 | 70,725 |
| Kaisa Group Holdings Ltd. 11.5% 1/30/23 (Reg. S) | | 200,000 | 42,600 |
| Kennedy-Wilson, Inc.: | | | |
| 4.75% 3/1/29 | | 55,000 | 50,733 |
| 5% 3/1/31 | | 55,000 | 49,639 |
| KWG Group Holdings Ltd. 5.2% 9/21/22 (Reg. S) | | 200,000 | 133,000 |
| Modernland Overseas Pte Ltd. 3% 4/30/27 pay-in-kind (e) | | 106,828 | 48,360 |
| MPT Operating Partnership LP/MPT Finance Corp. 5% 10/15/27 | | 300,000 | 287,853 |
| New Home Co., Inc. 7.25% 10/15/25 (d) | | 35,000 | 33,075 |
| New Metro Global Ltd.: | | | |
| 4.8% 12/15/24 (Reg. S) | | 200,000 | 133,000 |
| 6.8% 8/5/23 (Reg. S) | | 200,000 | 142,000 |
| Powerlong Real Estate Holding Ltd.: | | | |
| 5.95% 4/30/25 (Reg. S) | | 200,000 | 78,000 |
| 6.25% 8/10/24 (Reg. S) | | 200,000 | 83,000 |
| Realogy Group LLC/Realogy Co-Issuer Corp. 5.75% 1/15/29 (d) | | 30,000 | 25,088 |
| Realogy Group LLC/Realogy Co.-Issuer Corp. 5.25% 4/15/30 (d) | | 110,000 | 89,121 |
| Redsun Properties Group Ltd. 9.7% 4/16/23 (Reg. S) | | 220,000 | 51,700 |
| RKPF Overseas 2020 A Ltd. 5.125% 7/26/26 (Reg. S) | | 200,000 | 142,000 |
| Scenery Journey Ltd. 11.5% 10/24/22 (Reg. S) | | 200,000 | 22,100 |
| Starwood Property Trust, Inc. 4.75% 3/15/25 | | 75,000 | 74,003 |
| Sunac China Holdings Ltd.: | | | |
| 6.5% 7/9/23 (Reg. S) | | 200,000 | 50,000 |
| 7.5% 2/1/24 (Reg. S) | | 200,000 | 46,000 |
| Taylor Morrison Communities, Inc./Monarch Communities, Inc.: | | | |
| 5.75% 1/15/28 (d) | | 80,000 | 78,200 |
| 5.875% 6/15/27 (d) | | 55,000 | 54,597 |
| Times China Holdings Ltd. 6.75% 7/8/25 (Reg. S) | | 200,000 | 89,000 |
| TRI Pointe Homes, Inc. 5.7% 6/15/28 | | 15,000 | 14,374 |
| Uniti Group LP / Uniti Group Finance, Inc.: | | | |
| 4.75% 4/15/28 (d) | | 55,000 | 49,088 |
| 6.5% 2/15/29 (d) | | 85,000 | 73,347 |
| VICI Properties LP / VICI Note Co. 3.75% 2/15/27 (d) | | 205,000 | 189,051 |
| Weekley Homes LLC/Weekley Finance Corp. 4.875% 9/15/28 (d) | | 25,000 | 22,082 |
| Yango Justice International Ltd. 8.25% 11/25/23 (Reg. S) | | 220,000 | 15,400 |
| Yanlord Land Group Ltd. 6.8% 2/27/24 (Reg. S) | | 250,000 | 240,625 |
| | | | 3,255,109 |
| Hotels - 0.5% | | | |
| Hilton Domestic Operating Co., Inc.: | | | |
| 3.625% 2/15/32 (d) | | 40,000 | 33,875 |
| 3.75% 5/1/29 (d) | | 35,000 | 31,711 |
| 4% 5/1/31 (d) | | 35,000 | 31,302 |
| 4.875% 1/15/30 | | 320,000 | 308,704 |
| Hilton Worldwide Finance LLC/Hilton Worldwide Finance Corp. 4.875% 4/1/27 | | 40,000 | 39,600 |
| Lindblad Expeditions LLC 6.75% 2/15/27 (d) | | 65,000 | 63,781 |
| | | | 508,973 |
| Insurance - 1.2% | | | |
| Acrisure LLC / Acrisure Finance, Inc.: | | | |
| 7% 11/15/25 (d) | | 250,000 | 243,388 |
| 10.125% 8/1/26 (d) | | 35,000 | 36,400 |
| Alliant Holdings Intermediate LLC: | | | |
| 5.875% 11/1/29 (d) | | 90,000 | 83,925 |
| 6.75% 10/15/27 (d) | | 225,000 | 212,767 |
| AmWINS Group, Inc. 4.875% 6/30/29 (d) | | 40,000 | 36,613 |
| AssuredPartners, Inc. 5.625% 1/15/29 (d) | | 30,000 | 26,384 |
| HUB International Ltd.: | | | |
| 5.625% 12/1/29 (d) | | 60,000 | 55,050 |
| 7% 5/1/26 (d) | | 190,000 | 188,322 |
| MGIC Investment Corp. 5.25% 8/15/28 | | 40,000 | 37,552 |
| USI, Inc. 6.875% 5/1/25 (d) | | 275,000 | 270,801 |
| | | | 1,191,202 |
| Leisure - 1.3% | | | |
| Carnival Corp.: | | | |
| 5.75% 3/1/27 (d) | | 135,000 | 122,245 |
| 9.875% 8/1/27 (d) | | 210,000 | 226,326 |
| 10.5% 2/1/26 (d) | | 75,000 | 82,500 |
| NCL Corp. Ltd.: | | | |
| 5.875% 3/15/26 (d) | | 20,000 | 18,476 |
| 5.875% 2/15/27 (d) | | 90,000 | 85,792 |
| 7.75% 2/15/29 (d) | | 80,000 | 77,600 |
| NCL Finance Ltd. 6.125% 3/15/28 (d) | | 25,000 | 22,500 |
| Royal Caribbean Cruises Ltd.: | | | |
| 4.25% 7/1/26 (d) | | 130,000 | 117,488 |
| 5.375% 7/15/27 (d) | | 60,000 | 55,137 |
| 5.5% 8/31/26 (d) | | 135,000 | 125,792 |
| 9.125% 6/15/23 (d) | | 85,000 | 87,748 |
| 11.5% 6/1/25 (d) | | 30,000 | 32,588 |
| Studio City Co. Ltd. 7% 2/15/27 (d) | | 75,000 | 70,078 |
| Vail Resorts, Inc. 6.25% 5/15/25 (d) | | 35,000 | 35,788 |
| Viking Cruises Ltd. 13% 5/15/25 (d) | | 50,000 | 54,720 |
| | | | 1,214,778 |
| Metals/Mining - 3.5% | | | |
| Abja Investment Co. Pte Ltd. 5.45% 1/24/28 | | 200,000 | 197,000 |
| Alcoa Nederland Holding BV 4.125% 3/31/29 (d) | | 70,000 | 65,533 |
| Alpha Natural Resources, Inc. 9.75% 4/15/18 (b)(g) | | 210,000 | 0 |
| Antofagasta PLC 2.375% 10/14/30 (d) | | 200,000 | 163,100 |
| Cleveland-Cliffs, Inc.: | | | |
| 4.625% 3/1/29 (d) | | 40,000 | 37,492 |
| 4.875% 3/1/31 (d) | | 40,000 | 37,000 |
| Endeavour Mining PLC 5% 10/14/26 (d) | | 200,000 | 181,000 |
| ERO Copper Corp. 6.5% 2/15/30 (d) | | 230,000 | 206,381 |
| First Quantum Minerals Ltd.: | | | |
| 6.5% 3/1/24 (d) | | 200,000 | 200,500 |
| 6.875% 3/1/26 (d) | | 200,000 | 199,288 |
| 6.875% 10/15/27 (d) | | 185,000 | 184,225 |
| 7.5% 4/1/25 (d) | | 130,000 | 131,300 |
| FMG Resources Pty Ltd.: | | | |
| 4.375% 4/1/31 (d) | | 40,000 | 35,397 |
| 5.875% 4/15/30 (d) | | 130,000 | 129,064 |
| Freeport-McMoRan, Inc. 5.4% 11/14/34 | | 30,000 | 30,712 |
| Gcm Mining Corp. 6.875% 8/9/26 (d) | | 200,000 | 176,000 |
| Howmet Aerospace, Inc. 5.95% 2/1/37 | | 45,000 | 45,475 |
| HudBay Minerals, Inc. 6.125% 4/1/29 (d) | | 105,000 | 99,358 |
| Industrias Penoles SA de CV 4.75% 8/6/50 (d) | | 200,000 | 168,163 |
| Joseph T. Ryerson & Son, Inc. 8.5% 8/1/28 (d) | | 29,000 | 31,175 |
| Mineral Resources Ltd.: | | | |
| 8% 11/1/27 (d) | | 85,000 | 84,681 |
| 8.5% 5/1/30 (d) | | 20,000 | 19,750 |
| Novelis Corp. 3.875% 8/15/31 (d) | | 115,000 | 98,613 |
| PT Freeport Indonesia 5.315% 4/14/32 (d) | | 200,000 | 193,400 |
| Stillwater Mining Co. 4% 11/16/26 (d) | | 200,000 | 182,500 |
| Vedanta Resources PLC 6.375% 7/30/22 (Reg. S) | | 200,000 | 199,100 |
| VM Holding SA 6.5% 1/18/28 (d) | | 200,000 | 199,500 |
| Volcan Compania Minera SAA 4.375% 2/11/26 (d) | | 100,000 | 89,550 |
| | | | 3,385,257 |
| Paper - 0.5% | | | |
| Berry Global, Inc. 5.625% 7/15/27 (d) | | 35,000 | 34,869 |
| Clydesdale Acquisition Holdings, Inc.: | | | |
| 6.625% 4/15/29 (d) | | 35,000 | 34,913 |
| 8.75% 4/15/30 (d) | | 200,000 | 182,788 |
| Enviva Partners LP / Enviva Partners Finance Corp. 6.5% 1/15/26 (d) | | 90,000 | 91,706 |
| Intertape Polymer Group, Inc. 4.375% 6/15/29 (d) | | 40,000 | 41,155 |
| Mercer International, Inc. 5.125% 2/1/29 | | 55,000 | 51,090 |
| SPA Holdings 3 OY 4.875% 2/4/28 (d) | | 45,000 | 39,694 |
| | | | 476,215 |
| Publishing/Printing - 0.2% | | | |
| Clear Channel International BV 6.625% 8/1/25 (d) | | 200,000 | 202,112 |
| Restaurants - 0.6% | | | |
| 1011778 BC Unlimited Liability Co./New Red Finance, Inc. 4% 10/15/30 (d) | | 160,000 | 136,776 |
| Carrols Restaurant Group, Inc. 5.875% 7/1/29 (d) | | 170,000 | 128,775 |
| CEC Entertainment LLC 6.75% 5/1/26 (d) | | 60,000 | 56,400 |
| Papa John's International, Inc. 3.875% 9/15/29 (d) | | 25,000 | 21,868 |
| Yum! Brands, Inc.: | | | |
| 4.625% 1/31/32 | | 70,000 | 63,613 |
| 4.75% 1/15/30 (d) | | 200,000 | 190,250 |
| | | | 597,682 |
| Services - 3.2% | | | |
| Adtalem Global Education, Inc. 5.5% 3/1/28 (d) | | 146,000 | 134,046 |
| Allied Universal Holdco LLC / Allied Universal Finance Corp. 6% 6/1/29 (d) | | 30,000 | 24,825 |
| APCOA Parking Holdings GmbH 4.625% 1/15/27 (Reg. S) | EUR | 100,000 | 97,340 |
| ASGN, Inc. 4.625% 5/15/28 (d) | | 160,000 | 148,640 |
| Atlas Luxco 4 SARL / Allied Universal Holdco LLC / Allied Universal Finance Corp. 4.625% 6/1/28 (d) | | 38,000 | 33,345 |
| Avis Budget Car Rental LLC/Avis Budget Finance, Inc. 5.375% 3/1/29 (d) | | 40,000 | 37,500 |
| Booz Allen Hamilton, Inc.: | | | |
| 3.875% 9/1/28 (d) | | 55,000 | 50,664 |
| 4% 7/1/29 (d) | | 30,000 | 27,672 |
| Brand Energy & Infrastructure Services, Inc. 8.5% 7/15/25 (d) | | 440,000 | 392,700 |
| CoreCivic, Inc. 8.25% 4/15/26 | | 100,000 | 102,722 |
| GEMS MENASA Cayman Ltd. 7.125% 7/31/26 (d) | | 520,000 | 518,596 |
| H&E Equipment Services, Inc. 3.875% 12/15/28 (d) | | 90,000 | 78,394 |
| Hertz Corp.: | | | |
| 4.625% 12/1/26 (d) | | 55,000 | 50,134 |
| 5% 12/1/29 (d) | | 70,000 | 61,250 |
| 5.5% 10/15/24 (b)(d)(g) | | 65,000 | 81 |
| 6% 1/15/28 (b)(d)(g) | | 85,000 | 4,994 |
| 6.25% 10/15/22 (b)(g) | | 60,000 | 75 |
| 7.125% 8/1/26 (b)(d)(g) | | 85,000 | 4,888 |
| Intrum AB 4.875% 8/15/25 (Reg. S) | EUR | 200,000 | 207,561 |
| Legends Hospitality Holding Co. LLC/Legends Hospitality Co-Issuer, Inc. 5% 2/1/26 (d) | | 35,000 | 32,846 |
| PeopleCert Wisdom Issuer PLC 5.75% 9/15/26 (Reg. S) | EUR | 114,000 | 116,512 |
| Sabre GLBL, Inc. 7.375% 9/1/25 (d) | | 60,000 | 60,687 |
| Service Corp. International 5.125% 6/1/29 | | 35,000 | 34,525 |
| Sotheby's 7.375% 10/15/27 (d) | | 80,000 | 78,884 |
| The Bidvest Group UK PLC 3.625% 9/23/26 (d) | | 200,000 | 183,000 |
| The GEO Group, Inc.: | | | |
| 5.125% 4/1/23 | | 50,000 | 47,688 |
| 5.875% 10/15/24 | | 15,000 | 13,350 |
| 6% 4/15/26 | | 170,000 | 137,190 |
| Uber Technologies, Inc. 4.5% 8/15/29 (d) | | 395,000 | 340,198 |
| WASH Multifamily Acquisition, Inc. 5.75% 4/15/26 (d) | | 45,000 | 43,763 |
| | | | 3,064,070 |
| Steel - 0.9% | | | |
| Big River Steel LLC/BRS Finance Corp. 6.625% 1/31/29 (d) | | 132,000 | 134,970 |
| Commercial Metals Co. 3.875% 2/15/31 | | 30,000 | 26,438 |
| Infrabuild Australia Pty Ltd. 12% 10/1/24 (d) | | 155,000 | 156,550 |
| JSW Steel Ltd. 3.95% 4/5/27 (d) | | 200,000 | 177,500 |
| Roller Bearing Co. of America, Inc. 4.375% 10/15/29 (d) | | 20,000 | 18,000 |
| TMK Capital SA 4.3% 2/12/27 (Reg. S) | | 200,000 | 30,000 |
| Usiminas International SARL 5.875% 7/18/26 (d) | | 200,000 | 200,288 |
| Vallourec SA 8.5% 6/30/26 (Reg. S) | EUR | 100,000 | 105,623 |
| | | | 849,369 |
| Super Retail - 1.1% | | | |
| Academy Ltd. 6% 11/15/27 (d) | | 75,000 | 74,813 |
| Asbury Automotive Group, Inc.: | | | |
| 4.5% 3/1/28 | | 21,000 | 19,583 |
| 4.625% 11/15/29 (d) | | 45,000 | 40,506 |
| 4.75% 3/1/30 | | 20,000 | 17,924 |
| 5% 2/15/32 (d) | | 45,000 | 39,938 |
| At Home Group, Inc.: | | | |
| 4.875% 7/15/28 (d) | | 35,000 | 28,919 |
| 7.125% 7/15/29 (d) | | 45,000 | 33,516 |
| Bath & Body Works, Inc. 6.625% 10/1/30 (d) | | 110,000 | 109,407 |
| Carvana Co.: | | | |
| 4.875% 9/1/29 (d) | | 110,000 | 80,278 |
| 5.875% 10/1/28 (d) | | 55,000 | 43,713 |
| EG Global Finance PLC: | | | |
| 6.75% 2/7/25 (d) | | 250,000 | 242,988 |
| 8.5% 10/30/25 (d) | | 50,000 | 50,000 |
| Gap, Inc.: | | | |
| 3.625% 10/1/29 (d) | | 45,000 | 36,603 |
| 3.875% 10/1/31 (d) | | 80,000 | 63,776 |
| Group 1 Automotive, Inc. 4% 8/15/28 (d) | | 200,000 | 179,946 |
| | | | 1,061,910 |
| Technology - 4.6% | | | |
| Acuris Finance U.S. 5% 5/1/28 (d) | | 170,000 | 155,550 |
| Arcelik A/S 5% 4/3/23 (d) | | 200,000 | 198,850 |
| Arches Buyer, Inc.: | | | |
| 4.25% 6/1/28 (d) | | 35,000 | 31,106 |
| 6.125% 12/1/28 (d) | | 10,000 | 8,700 |
| Black Knight InfoServ LLC 3.625% 9/1/28 (d) | | 60,000 | 55,647 |
| Block, Inc.: | | | |
| 2.75% 6/1/26 (d) | | 75,000 | 68,402 |
| 3.5% 6/1/31 (d) | | 75,000 | 62,813 |
| CA Magnum Holdings 5.375% (d)(h) | | 400,000 | 384,000 |
| Camelot Finance SA 4.5% 11/1/26 (d) | | 150,000 | 141,000 |
| Castor SpA 6% 2/15/29 (Reg. S) | EUR | 182,000 | 186,763 |
| CDK Global, Inc.: | | | |
| 4.875% 6/1/27 | | 80,000 | 80,400 |
| 5.25% 5/15/29 (d) | | 35,000 | 35,277 |
| CDW LLC/CDW Finance Corp. 4.25% 4/1/28 | | 80,000 | 74,538 |
| Cellnex Finance Co. SA 1% 9/15/27 (Reg. S) | EUR | 100,000 | 91,870 |
| Crowdstrike Holdings, Inc. 3% 2/15/29 | | 70,000 | 62,300 |
| Elastic NV 4.125% 7/15/29 (d) | | 40,000 | 35,800 |
| Energizer Gamma Acquistion BV 3.5% 6/30/29 (Reg. S) | EUR | 124,000 | 109,103 |
| Go Daddy Operating Co. LLC / GD Finance Co., Inc. 5.25% 12/1/27 (d) | | 205,000 | 202,804 |
| II-VI, Inc. 5% 12/15/29 (d) | | 45,000 | 42,188 |
| ION Trading Technologies Ltd. 5.75% 5/15/28 (d) | | 200,000 | 187,250 |
| Lenovo Group Ltd. 3.421% 11/2/30 (d) | | 200,000 | 175,288 |
| Match Group Holdings II LLC: | | | |
| 4.125% 8/1/30 (d) | | 100,000 | 89,375 |
| 5% 12/15/27 (d) | | 100,000 | 97,500 |
| 5.625% 2/15/29 (d) | | 65,000 | 62,725 |
| MercadoLibre, Inc. 3.125% 1/14/31 | | 200,000 | 162,600 |
| MicroStrategy, Inc. 6.125% 6/15/28 (d) | | 185,000 | 169,491 |
| NCR Corp. 5.125% 4/15/29 (d) | | 45,000 | 42,863 |
| Northwest Fiber LLC/Northwest Fiber Finance Sub, Inc. 10.75% 6/1/28 (d) | | 30,000 | 30,750 |
| onsemi 3.875% 9/1/28 (d) | | 70,000 | 64,939 |
| Open Text Corp. 3.875% 12/1/29 (d) | | 70,000 | 62,206 |
| Open Text Holdings, Inc.: | | | |
| 4.125% 2/15/30 (d) | | 95,000 | 84,313 |
| 4.125% 12/1/31 (d) | | 70,000 | 60,678 |
| Orano SA: | | | |
| 2.75% 3/8/28 (Reg. S) | EUR | 100,000 | 99,078 |
| 3.375% 4/23/26 (Reg. S) | EUR | 100,000 | 105,501 |
| Qorvo, Inc. 4.375% 10/15/29 | | 45,000 | 41,807 |
| Rackspace Hosting, Inc.: | | | |
| 3.5% 2/15/28 (d) | | 100,000 | 86,487 |
| 5.375% 12/1/28 (d) | | 30,000 | 24,442 |
| Roblox Corp. 3.875% 5/1/30 (d) | | 185,000 | 159,100 |
| Sensata Technologies BV 4% 4/15/29 (d) | | 65,000 | 57,945 |
| SoftBank Group Corp. 4.625% 7/6/28 (Reg. S) | | 200,000 | 171,750 |
| Synaptics, Inc. 4% 6/15/29 (d) | | 30,000 | 26,449 |
| TTM Technologies, Inc. 4% 3/1/29 (d) | | 60,000 | 52,500 |
| Twilio, Inc.: | | | |
| 3.625% 3/15/29 | | 45,000 | 39,710 |
| 3.875% 3/15/31 | | 45,000 | 38,676 |
| Uber Technologies, Inc.: | | | |
| 7.5% 5/15/25 (d) | | 115,000 | 118,739 |
| 7.5% 9/15/27 (d) | | 90,000 | 92,607 |
| Unisys Corp. 6.875% 11/1/27 (d) | | 30,000 | 30,103 |
| | | | 4,461,983 |
| Telecommunications - 7.7% | | | |
| Altice Financing SA 5.75% 8/15/29 (d) | | 225,000 | 189,565 |
| Altice France Holding SA 6% 2/15/28 (d) | | 75,000 | 61,969 |
| Altice France SA: | | | |
| 4.25% 10/15/29 (Reg. S) | EUR | 120,000 | 109,146 |
| 5.125% 1/15/29 (d) | | 50,000 | 42,429 |
| 5.125% 7/15/29 (d) | | 120,000 | 101,587 |
| 5.5% 1/15/28 (d) | | 130,000 | 114,563 |
| 8.125% 2/1/27 (d) | | 245,000 | 246,838 |
| AXIAN Telecom 7.375% 2/16/27 (d) | | 200,000 | 193,750 |
| C&W Senior Financing Designated Activity Co. 6.875% 9/15/27 (d) | | 340,000 | 328,950 |
| Cablevision Lightpath LLC: | | | |
| 3.875% 9/15/27 (d) | | 30,000 | 26,381 |
| 5.625% 9/15/28 (d) | | 20,000 | 17,138 |
| Cellnex Telecom SA 1.75% 10/23/30 (Reg. S) | EUR | 100,000 | 86,615 |
| Cogent Communications Group, Inc. 3.5% 5/1/26 (d) | | 50,000 | 47,207 |
| Consolidated Communications, Inc. 5% 10/1/28 (d) | | 135,000 | 110,322 |
| CT Trust 5.125% 2/3/32 (d) | | 200,000 | 185,560 |
| Digicel Group Ltd. 6.75% 3/1/23 (d) | | 150,000 | 132,750 |
| Frontier Communications Holdings LLC: | | | |
| 5% 5/1/28 (d) | | 55,000 | 50,190 |
| 5.875% 10/15/27 (d) | | 50,000 | 47,875 |
| 5.875% 11/1/29 | | 14,771 | 12,823 |
| 6% 1/15/30 (d) | | 95,000 | 82,659 |
| 6.75% 5/1/29 (d) | | 60,000 | 54,066 |
| Holdco SASU 5.125% 10/15/26 (Reg. S) | EUR | 115,000 | 117,247 |
| IHS Netherlands Holdco BV 8% 9/18/27 (d) | | 200,000 | 200,038 |
| Intelsat Jackson Holdings SA: | | | |
| 5.5% 8/1/23 (b)(g) | | 200,000 | 0 |
| 6.5% 3/15/30 (d) | | 335,000 | 315,399 |
| 8.5% 10/15/24 (b)(d)(g) | | 45,000 | 0 |
| LCPR Senior Secured Financing DAC: | | | |
| 5.125% 7/15/29 (d) | | 400,000 | 364,122 |
| 6.75% 10/15/27 (d) | | 90,000 | 89,440 |
| Level 3 Financing, Inc.: | | | |
| 3.75% 7/15/29 (d) | | 95,000 | 77,188 |
| 4.25% 7/1/28 (d) | | 75,000 | 63,375 |
| Liquid Telecommunications Financing PLC 5.5% 9/4/26 (d) | | 200,000 | 191,500 |
| Lumen Technologies, Inc.: | | | |
| 5.125% 12/15/26 (d) | | 150,000 | 135,000 |
| 5.375% 6/15/29 (d) | | 200,000 | 162,862 |
| Millicom International Cellular SA 5.125% 1/15/28 (d) | | 225,000 | 212,738 |
| Northwest Fiber LLC/Northwest Fiber Finance Sub, Inc.: | | | |
| 4.75% 4/30/27 (d) | | 50,000 | 45,484 |
| 6% 2/15/28 (d) | | 20,000 | 16,734 |
| Olivetti Finance NV 7.75% 1/24/33 | EUR | 75,000 | 89,254 |
| Sable International Finance Ltd. 5.75% 9/7/27 (d) | | 180,000 | 177,244 |
| Sabre GLBL, Inc. 9.25% 4/15/25 (d) | | 45,000 | 47,994 |
| SBA Communications Corp.: | | | |
| 3.125% 2/1/29 | | 100,000 | 85,775 |
| 3.875% 2/15/27 | | 220,000 | 208,824 |
| Sprint Capital Corp. 8.75% 3/15/32 | | 530,000 | 673,537 |
| Telecom Italia SpA 2.75% 4/15/25 (Reg. S) | EUR | 100,000 | 100,086 |
| Telefonica Celular del Paraguay SA 5.875% 4/15/27 (d) | | 200,000 | 200,975 |
| Telenet Finance Luxembourg Notes SARL 3.5% 3/1/28 (Reg. S) | EUR | 100,000 | 99,532 |
| Turk Telekomunikasyon A/S 6.875% 2/28/25 (d) | | 200,000 | 194,600 |
| Turkcell Iletisim Hizmet A/S 5.8% 4/11/28 (d) | | 200,000 | 178,900 |
| Uniti Group, Inc. 6% 1/15/30 (d) | | 210,000 | 175,128 |
| Virgin Media Secured Finance PLC 5.5% 5/15/29 (d) | | 170,000 | 157,250 |
| Vodafone Group PLC 3% 8/27/80 (Reg. S) (e) | EUR | 100,000 | 91,733 |
| VTR Comunicaciones SpA 5.125% 1/15/28 (d) | | 176,000 | 157,388 |
| Windstream Escrow LLC 7.75% 8/15/28 (d) | | 295,000 | 280,988 |
| WP/AP Telecom Holdings III BV 5.5% 1/15/30 (Reg. S) | EUR | 131,000 | 121,966 |
| Zayo Group Holdings, Inc.: | | | |
| 4% 3/1/27 (d) | | 115,000 | 100,050 |
| 6.125% 3/1/28 (d) | | 60,000 | 50,250 |
| | | | 7,424,984 |
| Textiles/Apparel - 0.2% | | | |
| Crocs, Inc.: | | | |
| 4.125% 8/15/31 (d) | | 75,000 | 59,855 |
| 4.25% 3/15/29 (d) | | 40,000 | 34,000 |
| CT Investment GmbH 5.5% 4/15/26 (Reg. S) | EUR | 100,000 | 98,374 |
| Victoria's Secret & Co. 4.625% 7/15/29 (d) | | 50,000 | 41,018 |
| | | | 233,247 |
| Transportation Ex Air/Rail - 0.8% | | | |
| Autostrade per L'italia SpA: | | | |
| 1.625% 6/12/23 | EUR | 115,000 | 121,234 |
| 1.75% 6/26/26 (Reg. S) | EUR | 100,000 | 100,484 |
| 1.875% 9/26/29 (Reg. S) | EUR | 100,000 | 94,814 |
| 2% 12/4/28 (Reg. S) | EUR | 100,000 | 97,055 |
| 2% 1/15/30 (Reg. S) | EUR | 100,000 | 94,844 |
| Great Lakes Dredge & Dock Corp. 5.25% 6/1/29 (d) | | 40,000 | 37,400 |
| Navios Maritime Holdings, Inc. 11.25% 8/15/22 (d) | | 13,000 | 12,886 |
| Navios South American Logistics, Inc./Navios Logistics Finance U.S., Inc. 10.75% 7/1/25 (d) | | 110,000 | 112,269 |
| Seaspan Corp. 5.5% 8/1/29 (d) | | 110,000 | 97,075 |
| | | | 768,061 |
| Utilities - 4.1% | | | |
| Clearway Energy Operating LLC 4.75% 3/15/28 (d) | | 40,000 | 37,800 |
| DPL, Inc.: | | | |
| 4.125% 7/1/25 | | 180,000 | 172,800 |
| 4.35% 4/15/29 | | 215,000 | 196,725 |
| Eskom Holdings SOC Ltd. 6.75% 8/6/23 (d) | | 100,000 | 97,064 |
| Greenko Investment Co. 4.875% 8/16/23 (Reg. S) | | 200,000 | 197,413 |
| InterGen NV 7% 6/30/23 (d) | | 845,000 | 823,875 |
| Mong Duong Finance Holdings BV 5.125% 5/7/29 (d) | | 100,000 | 89,250 |
| NextEra Energy Partners LP 4.25% 9/15/24 (d) | | 4,000 | 3,930 |
| NRG Energy, Inc.: | | | |
| 3.875% 2/15/32 (d) | | 45,000 | 37,564 |
| 5.25% 6/15/29 (d) | | 60,000 | 56,512 |
| Pacific Gas & Electric Co.: | | | |
| 3.75% 8/15/42 | | 10,000 | 7,341 |
| 3.95% 12/1/47 | | 55,000 | 40,207 |
| 4.55% 7/1/30 | | 415,000 | 384,326 |
| 4.95% 7/1/50 | | 415,000 | 346,037 |
| PG&E Corp.: | | | |
| 5% 7/1/28 | | 375,000 | 345,071 |
| 5.25% 7/1/30 | | 205,000 | 186,302 |
| Pike Corp. 5.5% 9/1/28 (d) | | 180,000 | 163,350 |
| Solaris Midstream Holdings LLC 7.625% 4/1/26 (d) | | 70,000 | 71,750 |
| Star Energy Geothermal Wayang Windu Ltd. 6.75% 4/24/33 (Reg. S) | | 164,540 | 171,821 |
| Teollisuuden Voima Oyj 1.375% 6/23/28 (Reg. S) | EUR | 198,000 | 186,981 |
| TerraForm Global, Inc. 6.125% 3/1/26 (d) | | 160,000 | 157,200 |
| Vertiv Group Corp. 4.125% 11/15/28 (d) | | 95,000 | 82,769 |
| Vistra Operations Co. LLC 5.625% 2/15/27 (d) | | 60,000 | 59,100 |
| | | | 3,915,188 |
|
| TOTAL NONCONVERTIBLE BONDS | | | 78,073,607 |
|
| TOTAL CORPORATE BONDS | | | |
| (Cost $89,643,065) | | | 79,608,444 |
|
| Government Obligations - 1.7% | | | |
| Germany - 1.4% | | | |
| German Federal Republic 0% 9/16/22 (Reg. S) | EUR | 1,265,000 | 1,337,315 |
| Sri Lanka - 0.3% | | | |
| Democratic Socialist Republic of Sri Lanka: | | | |
| 6.2% 5/11/27 (Reg. S) (g) | | 200,000 | 85,022 |
| 7.55% 3/28/30 (Reg. S) (g) | | 200,000 | 84,522 |
| 7.85% 3/14/29(Reg. S) (g) | | 200,000 | 84,522 |
|
| TOTAL SRI LANKA | | | 254,066 |
|
| TOTAL GOVERNMENT OBLIGATIONS | | | |
| (Cost $1,984,821) | | | 1,591,381 |
| | | Shares | Value |
|
| Common Stocks - 2.3% | | | |
| Automotive & Auto Parts - 0.0% | | | |
| UC Holdings, Inc. (b)(i) | | 3,510 | 15,971 |
| Energy - 1.5% | | | |
| California Resources Corp. | | 5,929 | 238,405 |
| California Resources Corp. warrants 10/27/24 (i) | | 530 | 6,347 |
| Chesapeake Energy Corp. | | 3,594 | 294,780 |
| Chesapeake Energy Corp. (c)(i) | | 85 | 6,972 |
| Denbury, Inc. (i) | | 2,860 | 182,983 |
| Denbury, Inc. warrants 9/18/25 (i) | | 1,038 | 37,368 |
| EP Energy Corp. (b)(i) | | 7,975 | 74,008 |
| Jonah Energy Parent LLC (b)(i) | | 3,631 | 244,838 |
| Mesquite Energy, Inc. (b)(i) | | 3,543 | 197,574 |
| Noble Corp. (i)(j) | | 146 | 4,662 |
| Noble Corp. (d) | | 58 | 1,852 |
| Noble Corp.: | | | |
| warrants 2/5/28 (i) | | 600 | 10,800 |
| warrants 2/5/28 (i) | | 600 | 8,400 |
| PureWest Energy (b) | | 105 | 1,261 |
| PureWest Energy rights (b)(i) | | 63 | 0 |
| Superior Energy Services, Inc. Class A (b)(i) | | 609 | 15,591 |
| Tidewater, Inc.: | | | |
| warrants 11/14/42 (i) | | 5,448 | 119,593 |
| warrants 11/14/42 (i) | | 1,897 | 41,642 |
|
| TOTAL ENERGY | | | 1,487,076 |
|
| Entertainment/Film - 0.0% | | | |
| New Cotai LLC/New Cotai Capital Corp. (b)(c)(i) | | 125,816 | 1 |
| Food & Drug Retail - 0.2% | | | |
| Northeast Grocery, Inc. (b)(c) | | 12,754 | 5,075 |
| Southeastern Grocers, Inc. (b)(c)(i) | | 7,744 | 182,139 |
|
| TOTAL FOOD & DRUG RETAIL | | | 187,214 |
|
| Healthcare - 0.1% | | | |
| HCA Holdings, Inc. | | 400 | 85,820 |
| Telecommunications - 0.0% | | | |
| Intelsat Jackson Holdings SA: | | | |
| Series A rights (b)(i) | | 240 | 0 |
| Series B rights (b)(i) | | 240 | 0 |
|
| TOTAL TELECOMMUNICATIONS | | | 0 |
|
| Textiles/Apparel - 0.1% | | | |
| Intelsat Emergence SA (b) | | 2,304 | 89,879 |
| Utilities - 0.4% | | | |
| NRG Energy, Inc. | | 3,200 | 114,880 |
| Vistra Corp. | | 9,795 | 245,071 |
|
| TOTAL UTILITIES | | | 359,951 |
|
| TOTAL COMMON STOCKS | | | |
| (Cost $1,921,958) | | | 2,225,912 |
|
| Convertible Preferred Stocks - 0.2% | | | |
| Utilities - 0.2% | | | |
| PG&E Corp. | | | �� |
| (Cost $152,083) | | 1,400 | 165,480 |
| | | Principal Amount | Value |
|
| Bank Loan Obligations - 2.8% | | | |
| Aerospace - 0.1% | | | |
| TransDigm, Inc. Tranche F 1LN, term loan 3 month U.S. LIBOR + 2.250% 3.0137% 12/9/25 (e)(f)(k) | | 76,447 | 74,918 |
| Banks & Thrifts - 0.0% | | | |
| First Eagle Holdings, Inc. Tranche B 1LN, term loan 3 month U.S. LIBOR + 2.500% 3.506% 2/1/27 (e)(f)(k) | | 28,552 | 27,986 |
| Broadcasting - 0.0% | | | |
| Diamond Sports Group LLC 1LN, term loan U.S. Secured Overnight Fin. Rate (SOFR) Indx + 8.000% 9% 5/25/26 (e)(f)(k) | | 10,241 | 10,393 |
| Building Materials - 0.1% | | | |
| Hunter Douglas, Inc. Tranche B 1LN, term loan U.S. Secured Overnight Fin. Rate (SOFR) Indx + 3.500% 4% 2/25/29 (e)(f)(k) | | 50,000 | 47,513 |
| Chemicals - 0.2% | | | |
| Consolidated Energy Finance SA Tranche B 1LN, term loan 3 month U.S. LIBOR + 3.500% 4.0287% 5/7/25 (b)(e)(f)(k) | | 168,725 | 164,929 |
| Starfruit U.S. Holdco LLC Tranche B, term loan 3 month U.S. LIBOR + 3.000% 4.006% 10/1/25 (e)(f)(k) | | 33,514 | 32,997 |
|
| TOTAL CHEMICALS | | | 197,926 |
|
| Consumer Products - 0.1% | | | |
| Conair Holdings LLC Tranche B 1LN, term loan 1 month U.S. LIBOR + 3.750% 4.756% 5/17/28 (e)(f)(k) | | 14,925 | 14,597 |
| Michaels Companies, Inc. 1LN, term loan 3 month U.S. LIBOR + 4.250% 5.256% 4/15/28 (e)(f)(k) | | 24,813 | 22,572 |
| The Golub Corp. 2LN, term loan 3 month U.S. LIBOR + 13.500% 15.5% 5/8/26 (b)(e)(f)(k) | | 73,239 | 73,239 |
|
| TOTAL CONSUMER PRODUCTS | | | 110,408 |
|
| Diversified Financial Services - 0.4% | | | |
| BCP Renaissance Parent LLC Tranche B3 1LN, term loan U.S. Secured Overnight Fin. Rate (SOFR) Indx + 3.500% 4.5% 10/31/26 (e)(f)(k) | | 13,048 | 12,909 |
| HarbourVest Partners LLC Tranche B 1LN, term loan 3 month U.S. LIBOR + 2.250% 3.2884% 3/1/25 (e)(f)(k) | | 15,291 | 15,114 |
| Softbank SVF II Cayman LP 1LN, term loan 3 month U.S. LIBOR + 5.000% 5% 12/31/24 (b)(e)(f)(k) | | 332,713 | 332,713 |
|
| TOTAL DIVERSIFIED FINANCIAL SERVICES | | | 360,736 |
|
| Energy - 0.3% | | | |
| BCP Raptor LLC Tranche B, term loan 3 month U.S. LIBOR + 4.250% 5.25% 6/24/24 (e)(f)(k) | | 47,618 | 47,462 |
| Citgo Holding, Inc. Tranche B 1LN, term loan 3 month U.S. LIBOR + 7.000% 8% 8/1/23 (e)(f)(k) | | 9,750 | 9,640 |
| Citgo Petroleum Corp. Tranche B 1LN, term loan 3 month U.S. LIBOR + 6.250% 7.25% 3/28/24 (e)(f)(k) | | 137,062 | 136,498 |
| Epic Crude Services LP Tranche B 1LN, term loan 3 month U.S. LIBOR + 5.000% 5.51% 3/1/26 (e)(f)(k) | | 96,136 | 82,704 |
| Mesquite Energy, Inc.: | | | |
| 1LN, term loan 3 month U.S. LIBOR + 8.000% 0% (b)(f)(g)(k) | | 65,772 | 0 |
| term loan 3 month U.S. LIBOR + 0.000% 0% (b)(f)(g)(k) | | 28,000 | 0 |
|
| TOTAL ENERGY | | | 276,304 |
|
| Gaming - 0.0% | | | |
| Scientific Games Holdings LP term loan U.S. Secured Overnight Fin. Rate (SOFR) Indx + 3.500% 4.1751% 2/4/29 (e)(f)(k) | | 15,000 | 14,834 |
| Healthcare - 0.0% | | | |
| Electron BidCo, Inc. Tranche B 1LN, term loan 1 month U.S. LIBOR + 3.250% 4.0137% 11/1/28 (e)(f)(k) | | 10,000 | 9,906 |
| Phoenix Newco, Inc. Tranche B 1LN, term loan 1 month U.S. LIBOR + 3.500% 4% 11/15/28 (e)(f)(k) | | 35,000 | 34,727 |
|
| TOTAL HEALTHCARE | | | 44,633 |
|
| Hotels - 0.0% | | | |
| Travelport Finance Luxembourg SARL 1LN, term loan 3 month U.S. LIBOR + 6.750% 7.756% 5/30/26 (e)(f)(k) | | 37,203 | 31,224 |
| Insurance - 0.1% | | | |
| Acrisure LLC Tranche B 1LN, term loan 1 month U.S. LIBOR + 4.250% 5.0137% 2/15/27 (e)(f)(k) | | 4,988 | 4,946 |
| Alliant Holdings Intermediate LLC: | | | |
| Tranche B, term loan 3 month U.S. LIBOR + 3.250% 4.0137% 5/10/25 (e)(f)(k) | | 4,764 | 4,714 |
| Tranche B-2 1LN, term loan 3 month U.S. LIBOR + 3.250% 4.0137% 5/9/25 (e)(f)(k) | | 63,213 | 62,524 |
|
| TOTAL INSURANCE | | | 72,184 |
|
| Leisure - 0.0% | | | |
| Alterra Mountain Co. Tranche B 1LN, term loan 1 month U.S. LIBOR + 3.500% 4.2637% 8/17/28 (e)(f)(k) | | 4,801 | 4,762 |
| Railroad - 0.0% | | | |
| Einstein Merger Sub, Inc. 2LN, term loan 3 month U.S. LIBOR + 7.250% 8.4889% 10/25/28 (b)(e)(f)(k) | | 30,000 | 29,850 |
| Services - 0.4% | | | |
| ABG Intermediate Holdings 2 LLC Tranche B 2LN, term loan 3 month U.S. LIBOR + 6.000% 6.8011% 12/20/29 (e)(f)(k) | | 5,000 | 4,950 |
| Ascend Learning LLC 2LN, term loan 1 month U.S. LIBOR + 5.750% 6.25% 12/10/29 (e)(f)(k) | | 10,000 | 9,863 |
| Finastra U.S.A., Inc. Tranche 2LN, term loan 3 month U.S. LIBOR + 7.250% 8.25% 6/13/25 (e)(f)(k) | | 220,000 | 210,925 |
| KUEHG Corp. Tranche B 2LN, term loan 3 month U.S. LIBOR + 8.250% 9.256% 8/22/25 (e)(f)(k) | | 95,000 | 94,406 |
| Maverick Purchaser Sub LLC Tranche B 1LN, term loan 3 month U.S. LIBOR + 3.500% 3.9574% 1/23/27 (e)(f)(k) | | 14,738 | 14,632 |
| Spin Holdco, Inc. Tranche B 1LN, term loan 3 month U.S. LIBOR + 4.000% 4.75% 3/4/28 (e)(f)(k) | | 39,600 | 39,392 |
|
| TOTAL SERVICES | | | 374,168 |
|
| Super Retail - 0.2% | | | |
| Bass Pro Group LLC Tranche B 1LN, term loan 3 month U.S. LIBOR + 3.750% 4.5137% 3/5/28 (e)(f)(k) | | 158,006 | 156,228 |
| Technology - 0.5% | | | |
| Anastasia Parent LLC Tranche B, term loan 3 month U.S. LIBOR + 3.750% 4.756% 8/10/25 (e)(f)(k) | | 115,724 | 102,271 |
| Athenahealth Group, Inc.: | | | |
| Tranche B 1LN, term loan U.S. Secured Overnight Fin. Rate (SOFR) Indx + 3.500% 4.009% 2/15/29 (e)(f)(k) | | 85,507 | 84,225 |
| Tranche DD 1LN, term loan U.S. Secured Overnight Fin. Rate (SOFR) Indx + 3.500% 2/15/29 (f)(k)(l)(m) | | 14,493 | 14,275 |
| MH Sub I LLC 1LN, term loan 3 month U.S. LIBOR + 3.750% 4.75% 9/15/24 (e)(f)(k) | | 14,924 | 14,841 |
| UKG, Inc. 1LN, term loan 3 month U.S. LIBOR + 3.750% 4.756% 5/4/26 (e)(f)(k) | | 19,500 | 19,392 |
| Ultimate Software Group, Inc.: | | | |
| 1LN, term loan 1 month U.S. LIBOR + 3.250% 4.2116% 5/3/26 (e)(f)(k) | | 198,753 | 196,517 |
| 2LN, term loan 1 month U.S. LIBOR + 5.250% 6.2116% 5/3/27 (e)(f)(k) | | 20,000 | 19,795 |
| VS Buyer LLC Tranche B 1LN, term loan 3 month U.S. LIBOR + 3.000% 3.7637% 2/28/27 (e)(f)(k) | | 14,700 | 14,542 |
|
| TOTAL TECHNOLOGY | | | 465,858 |
|
| Telecommunications - 0.4% | | | |
| Altice France SA Tranche B 12LN, term loan 3 month U.S. LIBOR + 3.680% 4.7318% 1/31/26 (e)(f)(k) | | 372,929 | 368,618 |
| TOTAL BANK LOAN OBLIGATIONS | | | |
| (Cost $2,760,615) | | | 2,668,543 |
|
| Preferred Securities - 5.4% | | | |
| Automotive & Auto Parts - 0.1% | | | |
| Volkswagen International Finance NV 4.375% 12/31/99 (Reg. S) (e)(h) | EUR | 100,000 | 97,353 |
| Banks & Thrifts - 3.1% | | | |
| AIB Group PLC 5.25% (Reg. S) (e)(h) | EUR | 200,000 | 204,537 |
| Axis Bank GIFT City 4.1% (Reg. S) (e)(h) | | 200,000 | 185,703 |
| Banco Mercantil del Norte SA 6.875% (d)(e)(h) | | 200,000 | 199,357 |
| Bangkok Bank Ltd. PCL 5% (Reg. S) (e)(h) | | 200,000 | 195,597 |
| Bank of America Corp.: | | | |
| 4.3% (e)(h) | | 60,000 | 54,906 |
| 5.875% (e)(h) | | 190,000 | 183,313 |
| Bank of Communications Co. Ltd. 3.8% (Reg. S) (e)(h) | | 200,000 | 201,815 |
| Citigroup, Inc.: | | | |
| 4% (e)(h) | | 140,000 | 127,841 |
| 4.7% (e)(h) | | 90,000 | 82,772 |
| 5% (e)(h) | | 180,000 | 171,499 |
| 5.35% (e)(h) | | 350,000 | 353,389 |
| 5.95% (e)(h) | | 305,000 | 309,512 |
| Emirates NBD Bank PJSC 6.125% (Reg. S) (e)(h) | | 200,000 | 202,115 |
| Itau Unibanco Holding SA 6.125% (d)(e)(h) | | 200,000 | 197,228 |
| JPMorgan Chase & Co. 4.6% (e)(h) | | 135,000 | 125,777 |
| Tinkoff Credit Systems 6% (d)(e)(h) | | 100,000 | 5,668 |
| UniCredit SpA 9.25% (Reg. S) (e)(h) | EUR | 200,000 | 220,143 |
|
| TOTAL BANKS & THRIFTS | | | 3,021,172 |
|
| Building Materials - 0.2% | | | |
| CEMEX S.A.B. de CV 5.125% (d)(e)(h) | | 200,000 | 183,061 |
| Diversified Financial Services - 0.4% | | | |
| CAS Capital No 1 Ltd. 4% (Reg. S) (e)(h) | | 200,000 | 189,409 |
| LeasePlan Corp. NV 7.375% (Reg. S) (e)(h) | EUR | 200,000 | 224,382 |
|
| TOTAL DIVERSIFIED FINANCIAL SERVICES | | | 413,791 |
|
| Homebuilders/Real Estate - 0.5% | | | |
| CIFI Holdings Group Co. Ltd. 5.375% (Reg. S) (e)(h) | | 200,000 | 173,560 |
| CPI Property Group SA 4.875% 12/31/99 (Reg. S) (e)(h) | EUR | 100,000 | 96,388 |
| RKI Overseas Finance 2017 (A) 7% (Reg. S) (h) | | 200,000 | 134,962 |
| Yuzhou Properties Co. 5.375% (Reg. S) (e)(h) | | 200,000 | 18,964 |
|
| TOTAL HOMEBUILDERS/REAL ESTATE | | | 423,874 |
|
| Technology - 0.4% | | | |
| Network i2i Ltd.: | | | |
| 3.975% (Reg. S) (e)(h) | | 200,000 | 186,167 |
| 5.65% (Reg. S) (e)(h) | | 200,000 | 197,751 |
|
| TOTAL TECHNOLOGY | | | 383,918 |
|
| Telecommunications - 0.2% | | | |
| Telefonica Europe BV 3.875% (Reg. S) (e)(h) | EUR | 200,000 | 209,368 |
| Utilities - 0.5% | | | |
| EDF SA: | | | |
| 3.375% (e)(h) | EUR | 200,000 | 182,461 |
| 5% (Reg. S) (e)(h) | EUR | 100,000 | 104,686 |
| 5.375% 12/31/99 (Reg. S) (e)(h) | EUR | 100,000 | 106,816 |
| Veolia Environnement SA 2.5% (Reg. S) (e)(h) | EUR | 100,000 | 91,873 |
|
| TOTAL UTILITIES | | | 485,836 |
|
| TOTAL PREFERRED SECURITIES | | | |
| (Cost $5,941,217) | | | 5,218,373 |
| | | Shares | Value |
|
| Money Market Funds - 3.5% | | | |
| Fidelity Cash Central Fund 0.32% (n) | | 3,384,796 | 3,385,473 |
| Fidelity Securities Lending Cash Central Fund 0.32% (n)(o) | | 3,300 | 3,300 |
| TOTAL MONEY MARKET FUNDS | | | |
| (Cost $3,388,680) | | | 3,388,773 |
| TOTAL INVESTMENT IN SECURITIES - 98.6% | | | |
| (Cost $105,792,439) | | | 94,866,906 |
| NET OTHER ASSETS (LIABILITIES) - 1.4% | | | 1,379,224 |
| NET ASSETS - 100% | | | $96,246,130 |
Currency Abbreviations
EUR – European Monetary Unit
HKD – Hong Kong dollar
Legend
(a) Amount is stated in United States dollars unless otherwise noted.
(b) Level 3 security
(c) Restricted securities (including private placements) - Investment in securities not registered under the Securities Act of 1933 (excluding 144A issues). At the end of the period, the value of restricted securities (excluding 144A issues) amounted to $558,205 or 0.6% of net assets.
(d) Security exempt from registration under Rule 144A of the Securities Act of 1933. These securities may be resold in transactions exempt from registration, normally to qualified institutional buyers. At the end of the period, the value of these securities amounted to $52,249,793 or 54.3% of net assets.
(e) Coupon rates for floating and adjustable rate securities reflect the rates in effect at period end.
(f) Coupon is indexed to a floating interest rate which may be multiplied by a specified factor and/or subject to caps or floors.
(g) Non-income producing - Security is in default.
(h) Security is perpetual in nature with no stated maturity date.
(i) Non-income producing
(j) Security or a portion of the security is on loan at period end.
(k) Remaining maturities of bank loan obligations may be less than the stated maturities shown as a result of contractual or optional prepayments by the borrower. Such prepayments cannot be predicted with certainty.
(l) The coupon rate will be determined upon settlement of the loan after period end.
(m) Position represents an unfunded loan commitment. At period end, the total principal amount and market value of unfunded commitments totaled $14,493 and $14,275, respectively.
(n) Affiliated fund that is generally available only to investment companies and other accounts managed by Fidelity Investments. The rate quoted is the annualized seven-day yield of the fund at period end. A complete unaudited listing of the fund's holdings as of its most recent quarter end is available upon request. In addition, each Fidelity Central Fund's financial statements, which are not covered by the Fund's Report of Independent Registered Public Accounting Firm, are available on the SEC's website or upon request.
(o) Investment made with cash collateral received from securities on loan.
Additional information on each restricted holding is as follows:
| Security | Acquisition Date | Acquisition Cost |
| Chesapeake Energy Corp. | 2/10/21 | $805 |
| Mesquite Energy, Inc. 15% 7/15/23 | 7/10/20 - 1/18/22 | $27,566 |
| Mesquite Energy, Inc. 15% 7/15/23 | 11/5/20 - 1/18/22 | $47,694 |
| New Cotai LLC/New Cotai Capital Corp. | 9/11/20 | $623,261 |
| Northeast Grocery, Inc. | 11/8/21 | $5,075 |
| Southeastern Grocers, Inc. | 6/1/18 | $54,475 |
Affiliated Central Funds
Fiscal year to date information regarding the Fund's investments in Fidelity Central Funds, including the ownership percentage, is presented below.
| Fund | Value, beginning of period | Purchases | Sales Proceeds | Dividend Income | Realized Gain/Loss | Change in Unrealized appreciation (depreciation) | Value, end of period | % ownership, end of period |
| Fidelity Cash Central Fund 0.32% | $9,212,366 | $65,713,685 | $71,540,579 | $4,288 | $1 | $-- | $3,385,473 | 0.0% |
| Fidelity Securities Lending Cash Central Fund 0.32% | -- | 51,776 | 48,476 | 3 | -- | -- | 3,300 | 0.0% |
| Total | $9,212,366 | $65,765,461 | $71,589,055 | $4,291 | $1 | $-- | $3,388,773 | |
Amounts in the income column in the above table include any capital gain distributions from underlying funds, which are presented in the corresponding line-item in the Statement of Operations, if applicable. Amount for Fidelity Securities Lending Cash Central Fund represents the income earned on investing cash collateral, less rebates paid to borrowers and any lending agent fees associated with the loan, plus any premium payments received for lending certain types of securities.
Investment Valuation
The following is a summary of the inputs used, as of April 30, 2022, involving the Fund's assets and liabilities carried at fair value. The inputs or methodology used for valuing securities may not be an indication of the risk associated with investing in those securities. For more information on valuation inputs, and their aggregation into the levels used below, please refer to the Investment Valuation section in the accompanying Notes to Financial Statements.
| | Valuation Inputs at Reporting Date: |
| Description | Total | Level 1 | Level 2 | Level 3 |
| Investments in Securities: | | | | |
| Equities: | | | | |
| Communication Services | $89,880 | $-- | $-- | $89,880 |
| Consumer Discretionary | 15,971 | -- | -- | 15,971 |
| Consumer Staples | 187,214 | -- | -- | 187,214 |
| Energy | 1,485,815 | 781,769 | 172,035 | 532,011 |
| Health Care | 85,820 | 85,820 | -- | -- |
| Utilities | 526,692 | 359,951 | 165,480 | 1,261 |
| Corporate Bonds | 79,608,444 | -- | 79,071,853 | 536,591 |
| Government Obligations | 1,591,381 | -- | 1,591,381 | -- |
| Bank Loan Obligations | 2,668,543 | -- | 2,067,812 | 600,731 |
| Preferred Securities | 5,218,373 | -- | 5,218,373 | -- |
| Money Market Funds | 3,388,773 | 3,388,773 | -- | -- |
| Total Investments in Securities: | $94,866,906 | $4,616,313 | $88,286,934 | $1,963,659 |
The following is a reconciliation of Investments in Securities for which Level 3 inputs were used in determining value:
| Investments in Securities: | |
| Investments in Securities | |
| Beginning Balance | $1,684,372 |
| Net Realized Gain (Loss) on Investment Securities | (280,323) |
| Net Unrealized Gain (Loss) on Investment Securities | 724,136 |
| Cost of Purchases | 855,330 |
| Proceeds of Sales | (1,485,262) |
| Amortization/Accretion | 16,017 |
| Transfers into Level 3 | 466,049 |
| Transfers out of Level 3 | (16,660) |
| Ending Balance | $1,963,659 |
| The change in unrealized gain (loss) for the period attributable to Level 3 securities held at April 30, 2022 | $288,474 |
The information used in the above reconciliation represents fiscal year to date activity for any Investments in Securities identified as using Level 3 inputs at either the beginning or the end of the current fiscal period. Cost of purchases and proceeds of sales may include securities received and/or delivered through in-kind transactions. Transfers in or out of Level 3 represent the beginning value of any Security or Instrument where a change in the pricing level occurred from the beginning to the end of the period. The cost of purchases and the proceeds of sales may include securities received or delivered through corporate actions or exchanges. Realized and unrealized gains (losses) disclosed in the reconciliation are included in Net Gain (Loss) on the Fund's Statement of Operations.
See accompanying notes which are an integral part of the financial statements.
Financial Statements
Statement of Assets and Liabilities
| | | April 30, 2022 |
| Assets | | |
Investment in securities, at value (including securities loaned of $3,193) — See accompanying schedule:
Unaffiliated issuers (cost $102,403,759) | $91,478,133 | |
| Fidelity Central Funds (cost $3,388,680) | 3,388,773 | |
| Total Investment in Securities (cost $105,792,439) | | $94,866,906 |
| Cash | | 69,332 |
| Foreign currency held at value (cost $3,077) | | 3,064 |
| Receivable for investments sold | | 250,313 |
| Receivable for fund shares sold | | 60,767 |
| Dividends receivable | | 1,120 |
| Interest receivable | | 1,371,704 |
| Distributions receivable from Fidelity Central Funds | | 740 |
| Prepaid expenses | | 38 |
| Receivable from investment adviser for expense reductions | | 58,292 |
| Total assets | | 96,682,276 |
| Liabilities | | |
| Payable for investments purchased | $121,084 | |
| Payable for fund shares redeemed | 92,196 | |
| Distributions payable | 55,147 | |
| Accrued management fee | 57,437 | |
| Distribution and service plan fees payable | 5,643 | |
| Other affiliated payables | 16,447 | |
| Other payables and accrued expenses | 84,892 | |
| Collateral on securities loaned | 3,300 | |
| Total liabilities | | 436,146 |
| Net Assets | | $96,246,130 |
| Net Assets consist of: | | |
| Paid in capital | | $113,176,337 |
| Total accumulated earnings (loss) | | (16,930,207) |
| Net Assets | | $96,246,130 |
| Net Asset Value and Maximum Offering Price | | |
| Class A: | | |
| Net Asset Value and redemption price per share ($15,467,066 ÷ 1,780,028 shares)(a) | | $8.69 |
| Maximum offering price per share (100/96.00 of $8.69) | | $9.05 |
| Class M: | | |
| Net Asset Value and redemption price per share ($3,118,112 ÷ 358,898 shares)(a) | | $8.69 |
| Maximum offering price per share (100/96.00 of $8.69) | | $9.05 |
| Class C: | | |
| Net Asset Value and offering price per share ($2,245,687 ÷ 258,447 shares)(a) | | $8.69 |
| Global High Income: | | |
| Net Asset Value, offering price and redemption price per share ($72,440,763 ÷ 8,336,047 shares) | | $8.69 |
| Class I: | | |
| Net Asset Value, offering price and redemption price per share ($2,974,502 ÷ 342,294 shares) | | $8.69 |
(a) Redemption price per share is equal to net asset value less any applicable contingent deferred sales charge.
See accompanying notes which are an integral part of the financial statements.
Statement of Operations
| | | Year ended April 30, 2022 |
| Investment Income | | |
| Dividends | | $400,724 |
| Interest | | 5,335,236 |
| Income from Fidelity Central Funds (including $3 from security lending) | | 4,291 |
| Total income | | 5,740,251 |
| Expenses | | |
| Management fee | $791,787 | |
| Transfer agent fees | 165,322 | |
| Distribution and service plan fees | 63,107 | |
| Accounting fees | 47,157 | |
| Custodian fees and expenses | 17,762 | |
| Independent trustees' fees and expenses | 397 | |
| Registration fees | 71,788 | |
| Audit | 96,323 | |
| Legal | 4,846 | |
| Miscellaneous | 514 | |
| Total expenses before reductions | 1,259,003 | |
| Expense reductions | (165,625) | |
| Total expenses after reductions | | 1,093,378 |
| Net investment income (loss) | | 4,646,873 |
| Realized and Unrealized Gain (Loss) | | |
| Net realized gain (loss) on: | | |
| Investment securities: | | |
| Unaffiliated issuers | (39,040) | |
| Foreign currency transactions | (14,217) | |
| Total net realized gain (loss) | | (53,257) |
| Change in net unrealized appreciation (depreciation) on: | | |
| Investment securities: | | |
| Unaffiliated issuers | (12,733,759) | |
| Fidelity Central Funds | 1 | |
| Assets and liabilities in foreign currencies | (9,436) | |
| Total change in net unrealized appreciation (depreciation) | | (12,743,194) |
| Net gain (loss) | | (12,796,451) |
| Net increase (decrease) in net assets resulting from operations | | $(8,149,578) |
See accompanying notes which are an integral part of the financial statements.
Statement of Changes in Net Assets
| | Year ended April 30, 2022 | Year ended April 30, 2021 |
| Increase (Decrease) in Net Assets | | |
| Operations | | |
| Net investment income (loss) | $4,646,873 | $4,295,495 |
| Net realized gain (loss) | (53,257) | (993,190) |
| Change in net unrealized appreciation (depreciation) | (12,743,194) | 15,615,961 |
| Net increase (decrease) in net assets resulting from operations | (8,149,578) | 18,918,266 |
| Distributions to shareholders | (4,704,486) | (4,134,980) |
| Share transactions - net increase (decrease) | (3,075,785) | 8,464,470 |
| Total increase (decrease) in net assets | (15,929,849) | 23,247,756 |
| Net Assets | | |
| Beginning of period | 112,175,979 | 88,928,223 |
| End of period | $96,246,130 | $112,175,979 |
See accompanying notes which are an integral part of the financial statements.
Financial Highlights
Fidelity Global High Income Fund Class A
| Years ended April 30, | 2022 | 2021 | 2020 | 2019 | 2018 |
| Selected Per–Share Data | | | | | |
| Net asset value, beginning of period | $9.79 | $8.38 | $9.48 | $9.61 | $9.54 |
| Income from Investment Operations | | | | | |
| Net investment income (loss)A,B | .367 | .391 | .445 | .468 | .462 |
| Net realized and unrealized gain (loss) | (1.089) | 1.394 | (1.120) | (.115) | .006 |
| Total from investment operations | (.722) | 1.785 | (.675) | .353 | .468 |
| Distributions from net investment income | (.378) | (.375) | (.425) | (.457) | (.399) |
| Distributions from net realized gain | – | – | – | (.026) | – |
| Total distributions | (.378) | (.375) | (.425) | (.483) | (.399) |
| Redemption fees added to paid in capitalA | – | – | – | – | .001 |
| Net asset value, end of period | $8.69 | $9.79 | $8.38 | $9.48 | $9.61 |
| Total ReturnC,D | (7.64)% | 21.59% | (7.44)% | 3.88% | 4.94% |
| Ratios to Average Net AssetsB,E,F | | | | | |
| Expenses before reductions | 1.37% | 1.34% | 1.34% | 1.32% | 1.31% |
| Expenses net of fee waivers, if any | 1.16% | 1.25% | 1.25% | 1.25% | 1.25% |
| Expenses net of all reductions | 1.16% | 1.25% | 1.25% | 1.25% | 1.25% |
| Net investment income (loss) | 3.89% | 4.17% | 4.77% | 5.00% | 4.75% |
| Supplemental Data | | | | | |
| Net assets, end of period (000 omitted) | $15,467 | $8,582 | $5,927 | $7,365 | $8,712 |
| Portfolio turnover rateG | 45% | 53% | 54% | 44% | 48% |
A Calculated based on average shares outstanding during the period.
B Net investment income (loss) is affected by the timing of the declaration of dividends by any underlying mutual funds or exchange-traded funds (ETFs). Net investment income (loss) of any such underlying funds is not included in the Fund's net investment income (loss) ratio.
C Total returns would have been lower if certain expenses had not been reduced during the applicable periods shown.
D Total returns do not include the effect of the sales charges.
E Fees and expenses of any underlying mutual funds or exchange-traded funds (ETFs) are not included in the Fund's expense ratio. The Fund indirectly bears its proportionate share of these expenses. For additional expense information related to investments in Fidelity Central Funds, please refer to the "Investments in Fidelity Central Funds" note found in the Notes to Financial Statements section of the most recent Annual or Semi-Annual report.
F Expense ratios reflect operating expenses of the class. Expenses before reductions do not reflect amounts reimbursed, waived, or reduced through arrangements with the investment adviser, brokerage services, or other offset arrangements, if applicable, and do not represent the amount paid by the class during periods when reimbursements, waivers or reductions occur.
G Amount does not include the portfolio activity of any underlying mutual funds or exchange-traded funds (ETFs).
See accompanying notes which are an integral part of the financial statements.
Fidelity Global High Income Fund Class M
| Years ended April 30, | 2022 | 2021 | 2020 | 2019 | 2018 |
| Selected Per–Share Data | | | | | |
| Net asset value, beginning of period | $9.79 | $8.38 | $9.48 | $9.61 | $9.54 |
| Income from Investment Operations | | | | | |
| Net investment income (loss)A,B | .372 | .389 | .445 | .467 | .462 |
| Net realized and unrealized gain (loss) | (1.094) | 1.396 | (1.120) | (.114) | .006 |
| Total from investment operations | (.722) | 1.785 | (.675) | .353 | .468 |
| Distributions from net investment income | (.378) | (.375) | (.425) | (.457) | (.399) |
| Distributions from net realized gain | – | – | – | (.026) | – |
| Total distributions | (.378) | (.375) | (.425) | (.483) | (.399) |
| Redemption fees added to paid in capitalA | – | – | – | – | .001 |
| Net asset value, end of period | $8.69 | $9.79 | $8.38 | $9.48 | $9.61 |
| Total ReturnC,D | (7.64)% | 21.59% | (7.44)% | 3.88% | 4.94% |
| Ratios to Average Net AssetsB,E,F | | | | | |
| Expenses before reductions | 1.41% | 1.41% | 1.41% | 1.40% | 1.40% |
| Expenses net of fee waivers, if any | 1.16% | 1.25% | 1.25% | 1.25% | 1.25% |
| Expenses net of all reductions | 1.16% | 1.25% | 1.25% | 1.25% | 1.25% |
| Net investment income (loss) | 3.89% | 4.16% | 4.77% | 5.00% | 4.75% |
| Supplemental Data | | | | | |
| Net assets, end of period (000 omitted) | $3,118 | $3,164 | $2,928 | $3,971 | $4,301 |
| Portfolio turnover rateG | 45% | 53% | 54% | 44% | 48% |
A Calculated based on average shares outstanding during the period.
B Net investment income (loss) is affected by the timing of the declaration of dividends by any underlying mutual funds or exchange-traded funds (ETFs). Net investment income (loss) of any such underlying funds is not included in the Fund's net investment income (loss) ratio.
C Total returns would have been lower if certain expenses had not been reduced during the applicable periods shown.
D Total returns do not include the effect of the sales charges.
E Fees and expenses of any underlying mutual funds or exchange-traded funds (ETFs) are not included in the Fund's expense ratio. The Fund indirectly bears its proportionate share of these expenses. For additional expense information related to investments in Fidelity Central Funds, please refer to the "Investments in Fidelity Central Funds" note found in the Notes to Financial Statements section of the most recent Annual or Semi-Annual report.
F Expense ratios reflect operating expenses of the class. Expenses before reductions do not reflect amounts reimbursed, waived, or reduced through arrangements with the investment adviser, brokerage services, or other offset arrangements, if applicable, and do not represent the amount paid by the class during periods when reimbursements, waivers or reductions occur.
G Amount does not include the portfolio activity of any underlying mutual funds or exchange-traded funds (ETFs).
See accompanying notes which are an integral part of the financial statements.
Fidelity Global High Income Fund Class C
| Years ended April 30, | 2022 | 2021 | 2020 | 2019 | 2018 |
| Selected Per–Share Data | | | | | |
| Net asset value, beginning of period | $9.79 | $8.38 | $9.48 | $9.61 | $9.54 |
| Income from Investment Operations | | | | | |
| Net investment income (loss)A,B | .301 | .319 | .375 | .398 | .390 |
| Net realized and unrealized gain (loss) | (1.094) | 1.396 | (1.119) | (.115) | .005 |
| Total from investment operations | (.793) | 1.715 | (.744) | .283 | .395 |
| Distributions from net investment income | (.307) | (.305) | (.356) | (.387) | (.326) |
| Distributions from net realized gain | – | – | – | (.026) | – |
| Total distributions | (.307) | (.305) | (.356) | (.413) | (.326) |
| Redemption fees added to paid in capitalA | – | – | – | – | .001 |
| Net asset value, end of period | $8.69 | $9.79 | $8.38 | $9.48 | $9.61 |
| Total ReturnC,D | (8.33)% | 20.69% | (8.13)% | 3.10% | 4.16% |
| Ratios to Average Net AssetsB,E,F | | | | | |
| Expenses before reductions | 2.12% | 2.14% | 2.11% | 2.08% | 2.08% |
| Expenses net of fee waivers, if any | 1.91% | 2.00% | 2.00% | 2.00% | 2.00% |
| Expenses net of all reductions | 1.91% | 2.00% | 2.00% | 2.00% | 2.00% |
| Net investment income (loss) | 3.14% | 3.41% | 4.02% | 4.25% | 4.00% |
| Supplemental Data | | | | | |
| Net assets, end of period (000 omitted) | $2,246 | $3,249 | $2,684 | $3,723 | $4,420 |
| Portfolio turnover rateG | 45% | 53% | 54% | 44% | 48% |
A Calculated based on average shares outstanding during the period.
B Net investment income (loss) is affected by the timing of the declaration of dividends by any underlying mutual funds or exchange-traded funds (ETFs). Net investment income (loss) of any such underlying funds is not included in the Fund's net investment income (loss) ratio.
C Total returns would have been lower if certain expenses had not been reduced during the applicable periods shown.
D Total returns do not include the effect of the contingent deferred sales charge.
E Fees and expenses of any underlying mutual funds or exchange-traded funds (ETFs) are not included in the Fund's expense ratio. The Fund indirectly bears its proportionate share of these expenses. For additional expense information related to investments in Fidelity Central Funds, please refer to the "Investments in Fidelity Central Funds" note found in the Notes to Financial Statements section of the most recent Annual or Semi-Annual report.
F Expense ratios reflect operating expenses of the class. Expenses before reductions do not reflect amounts reimbursed, waived, or reduced through arrangements with the investment adviser, brokerage services, or other offset arrangements, if applicable, and do not represent the amount paid by the class during periods when reimbursements, waivers or reductions occur.
G Amount does not include the portfolio activity of any underlying mutual funds or exchange-traded funds (ETFs).
See accompanying notes which are an integral part of the financial statements.
Fidelity Global High Income Fund
| Years ended April 30, | 2022 | 2021 | 2020 | 2019 | 2018 |
| Selected Per–Share Data | | | | | |
| Net asset value, beginning of period | $9.79 | $8.38 | $9.48 | $9.62 | $9.54 |
| Income from Investment Operations | | | | | |
| Net investment income (loss)A,B | .397 | .413 | .468 | .491 | .487 |
| Net realized and unrealized gain (loss) | (1.094) | 1.395 | (1.119) | (.125) | .015 |
| Total from investment operations | (.697) | 1.808 | (.651) | .366 | .502 |
| Distributions from net investment income | (.403) | (.398) | (.449) | (.480) | (.423) |
| Distributions from net realized gain | – | – | – | (.026) | – |
| Total distributions | (.403) | (.398) | (.449) | (.506) | (.423) |
| Redemption fees added to paid in capitalA | – | – | – | – | .001 |
| Net asset value, end of period | $8.69 | $9.79 | $8.38 | $9.48 | $9.62 |
| Total ReturnC | (7.40)% | 21.89% | (7.21)% | 4.03% | 5.31% |
| Ratios to Average Net AssetsB,D,E | | | | | |
| Expenses before reductions | 1.04% | 1.04% | 1.03% | 1.01% | 1.02% |
| Expenses net of fee waivers, if any | .91% | 1.00% | 1.00% | 1.00% | 1.00% |
| Expenses net of all reductions | .91% | 1.00% | 1.00% | 1.00% | 1.00% |
| Net investment income (loss) | 4.15% | 4.41% | 5.02% | 5.25% | 5.00% |
| Supplemental Data | | | | | |
| Net assets, end of period (000 omitted) | $72,441 | $89,338 | $73,039 | $97,619 | $125,192 |
| Portfolio turnover rateF | 45% | 53% | 54% | 44% | 48% |
A Calculated based on average shares outstanding during the period.
B Net investment income (loss) is affected by the timing of the declaration of dividends by any underlying mutual funds or exchange-traded funds (ETFs). Net investment income (loss) of any such underlying funds is not included in the Fund's net investment income (loss) ratio.
C Total returns would have been lower if certain expenses had not been reduced during the applicable periods shown.
D Fees and expenses of any underlying mutual funds or exchange-traded funds (ETFs) are not included in the Fund's expense ratio. The Fund indirectly bears its proportionate share of these expenses. For additional expense information related to investments in Fidelity Central Funds, please refer to the "Investments in Fidelity Central Funds" note found in the Notes to Financial Statements section of the most recent Annual or Semi-Annual report.
E Expense ratios reflect operating expenses of the class. Expenses before reductions do not reflect amounts reimbursed, waived, or reduced through arrangements with the investment adviser, brokerage services, or other offset arrangements, if applicable, and do not represent the amount paid by the class during periods when reimbursements, waivers or reductions occur.
F Amount does not include the portfolio activity of any underlying mutual funds or exchange-traded funds (ETFs).
See accompanying notes which are an integral part of the financial statements.
Fidelity Global High Income Fund Class I
| Years ended April 30, | 2022 | 2021 | 2020 | 2019 | 2018 |
| Selected Per–Share Data | | | | | |
| Net asset value, beginning of period | $9.79 | $8.38 | $9.48 | $9.62 | $9.54 |
| Income from Investment Operations | | | | | |
| Net investment income (loss)A,B | .400 | .411 | .473 | .491 | .485 |
| Net realized and unrealized gain (loss) | (1.097) | 1.397 | (1.124) | (.125) | .017 |
| Total from investment operations | (.697) | 1.808 | (.651) | .366 | .502 |
| Distributions from net investment income | (.403) | (.398) | (.449) | (.480) | (.423) |
| Distributions from net realized gain | – | – | – | (.026) | – |
| Total distributions | (.403) | (.398) | (.449) | (.506) | (.423) |
| Redemption fees added to paid in capitalA | – | – | – | – | .001 |
| Net asset value, end of period | $8.69 | $9.79 | $8.38 | $9.48 | $9.62 |
| Total ReturnC | (7.40)% | 21.89% | (7.21)% | 4.03% | 5.31% |
| Ratios to Average Net AssetsB,D,E | | | | | |
| Expenses before reductions | 1.05% | 1.05% | 1.03% | 1.05% | 1.03% |
| Expenses net of fee waivers, if any | .91% | 1.00% | 1.00% | 1.00% | 1.00% |
| Expenses net of all reductions | .91% | 1.00% | 1.00% | 1.00% | 1.00% |
| Net investment income (loss) | 4.14% | 4.42% | 5.02% | 5.25% | 5.00% |
| Supplemental Data | | | | | |
| Net assets, end of period (000 omitted) | $2,975 | $7,844 | $4,350 | $7,352 | $9,999 |
| Portfolio turnover rateF | 45% | 53% | 54% | 44% | 48% |
A Calculated based on average shares outstanding during the period.
B Net investment income (loss) is affected by the timing of the declaration of dividends by any underlying mutual funds or exchange-traded funds (ETFs). Net investment income (loss) of any such underlying funds is not included in the Fund's net investment income (loss) ratio.
C Total returns would have been lower if certain expenses had not been reduced during the applicable periods shown.
D Fees and expenses of any underlying mutual funds or exchange-traded funds (ETFs) are not included in the Fund's expense ratio. The Fund indirectly bears its proportionate share of these expenses. For additional expense information related to investments in Fidelity Central Funds, please refer to the "Investments in Fidelity Central Funds" note found in the Notes to Financial Statements section of the most recent Annual or Semi-Annual report.
E Expense ratios reflect operating expenses of the class. Expenses before reductions do not reflect amounts reimbursed, waived, or reduced through arrangements with the investment adviser, brokerage services, or other offset arrangements, if applicable, and do not represent the amount paid by the class during periods when reimbursements, waivers or reductions occur.
F Amount does not include the portfolio activity of any underlying mutual funds or exchange-traded funds (ETFs).
See accompanying notes which are an integral part of the financial statements.
Notes to Financial Statements
For the period ended April 30, 2022
1. Organization.
Fidelity Global High Income Fund (the Fund) is a fund of Fidelity Summer Street Trust (the Trust) and is authorized to issue an unlimited number of shares. The Trust is registered under the Investment Company Act of 1940, as amended (the 1940 Act), as an open-end management investment company organized as a Massachusetts business trust. The Fund offers Class A, Class M, Class C, Global High Income, and Class I shares, each of which has equal rights as to assets and voting privileges. Each class has exclusive voting rights with respect to matters that affect that class. Effective June 21, 2021, Class C shares will automatically convert to Class A shares after a holding period of eight years from the initial date of purchase, with certain exceptions. Prior to June 21, 2021, Class C shares automatically converted to Class A shares after a holding period of ten years from the initial date of purchase, with certain exceptions. The Fund's investments in emerging markets can be subject to social, economic, regulatory, and political uncertainties and can be extremely volatile.
2. Investments in Fidelity Central Funds.
Funds may invest in Fidelity Central Funds, which are open-end investment companies generally available only to other investment companies and accounts managed by the investment adviser and its affiliates. The Schedule of Investments lists any Fidelity Central Funds held as an investment as of period end, but does not include the underlying holdings of each Fidelity Central Fund. An investing fund indirectly bears its proportionate share of the expenses of the underlying Fidelity Central Funds.
Based on its investment objective, each Fidelity Central Fund may invest or participate in various investment vehicles or strategies that are similar to those of the investing fund. These strategies are consistent with the investment objectives of the investing fund and may involve certain economic risks which may cause a decline in value of each of the Fidelity Central Funds and thus a decline in the value of the investing fund.
| Fidelity Central Fund | Investment Manager | Investment Objective | Investment Practices | Expense Ratio(a) |
| Fidelity Money Market Central Funds | Fidelity Management & Research Company LLC (FMR) | Each fund seeks to obtain a high level of current income consistent with the preservation of capital and liquidity. | Short-term Investments | Less than .005% |
(a) Expenses expressed as a percentage of average net assets and are as of each underlying Central Fund's most recent annual or semi-annual shareholder report.
A complete unaudited list of holdings for each Fidelity Central Fund is available upon request or at the Securities and Exchange Commission website at www.sec.gov. In addition, the financial statements of the Fidelity Central Funds which contain the significant accounting policies (including investment valuation policies) of those funds, and are not covered by the Report of Independent Registered Public Accounting Firm, are available on the Securities and Exchange Commission website or upon request.
3. Significant Accounting Policies.
The Fund is an investment company and applies the accounting and reporting guidance of the Financial Accounting Standards Board (FASB) Accounting Standards Codification Topic 946 Financial Services - Investment Companies. The financial statements have been prepared in conformity with accounting principles generally accepted in the United States of America (GAAP), which require management to make certain estimates and assumptions at the date of the financial statements. Actual results could differ from those estimates. Subsequent events, if any, through the date that the financial statements were issued have been evaluated in the preparation of the financial statements. The Fund's Schedule of Investments lists any underlying mutual funds or exchange-traded funds (ETFs) but does not include the underlying holdings of these funds. The following summarizes the significant accounting policies of the Fund:
Investment Valuation. Investments are valued as of 4:00 p.m. Eastern time on the last calendar day of the period. The Board of Trustees (the Board) has delegated the day to day responsibility for the valuation of the Fund's investments to the Fair Value Committee (the Committee) established by the Fund's investment adviser. In accordance with valuation policies and procedures approved by the Board, the Fund attempts to obtain prices from one or more third party pricing vendors or brokers to value its investments. When current market prices, quotations or currency exchange rates are not readily available or reliable, investments will be fair valued in good faith by the Committee, in accordance with procedures adopted by the Board. Factors used in determining fair value vary by investment type and may include market or investment specific events, changes in interest rates and credit quality. The frequency with which these procedures are used cannot be predicted and they may be utilized to a significant extent. The Committee oversees the Fund's valuation policies and procedures and reports to the Board on the Committee's activities and fair value determinations. The Board monitors the appropriateness of the procedures used in valuing the Fund's investments and ratifies the fair value determinations of the Committee.
The Fund categorizes the inputs to valuation techniques used to value its investments into a disclosure hierarchy consisting of three levels as shown below:
- Level 1 – unadjusted quoted prices in active markets for identical investments
- Level 2 – other significant observable inputs (including quoted prices for similar investments, interest rates, prepayment speeds, etc.)
- Level 3 – unobservable inputs (including the Fund's own assumptions based on the best information available)
Valuation techniques used to value the Fund's investments by major category are as follows:
Debt securities, including restricted securities, are valued based on evaluated prices received from third party pricing vendors or from brokers who make markets in such securities. Corporate bonds, bank loan obligations, foreign government and government agency obligations and preferred securities are valued by pricing vendors who utilize matrix pricing which considers yield or price of bonds of comparable quality, coupon, maturity and type or by broker-supplied prices. When independent prices are unavailable or unreliable, debt securities may be valued utilizing pricing methodologies which consider similar factors that would be used by third party pricing vendors. For foreign debt securities, when significant market or security specific events arise, valuations may be determined in good faith in accordance with procedures adopted by the Board. Debt securities are generally categorized as Level 2 in the hierarchy but may be Level 3 depending on the circumstances. The Fund invests a significant portion of its assets in below investment grade securities. The value of these securities can be more volatile due to changes in the credit quality of the issuer and is sensitive to changes in economic, market and regulatory conditions.
Equity securities, including restricted securities, for which market quotations are readily available, are valued at the last reported sale price or official closing price as reported by a third party pricing vendor on the primary market or exchange on which they are traded and are categorized as Level 1 in the hierarchy. In the event there were no sales during the day or closing prices are not available, securities are valued at the last quoted bid price or may be valued using the last available price and are generally categorized as Level 2 in the hierarchy. For foreign equity securities, when market or security specific events arise, comparisons to the valuation of American Depositary Receipts (ADRs), futures contracts, ETFs and certain indexes as well as quoted prices for similar securities may be used and would be categorized as Level 2 in the hierarchy. For equity securities, including restricted securities, where observable inputs are limited, assumptions about market activity and risk are used and these securities may be categorized as Level 3 in the hierarchy. Securities, including private placements or other restricted securities, for which observable inputs are not available are valued using alternate valuation approaches, including the market approach, the income approach and cost approach, and are categorized as Level 3 in the hierarchy. The market approach considers factors including the price of recent investments in the same or a similar security or financial metrics of comparable securities. The income approach considers factors including expected future cash flows, security specific risks and corresponding discount rates. The cost approach considers factors including the value of the security's underlying assets and liabilities.
Investments in open-end mutual funds, including the Fidelity Central Funds, are valued at their closing net asset value (NAV) each business day and are categorized as Level 1 in the hierarchy.
The following provides information on Level 3 securities held by the Fund that were valued at period end based on unobservable inputs. These amounts exclude valuations provided by a broker.
| Asset Type | Fair Value | Valuation Technique(s) | Unobservable Input | Amount or Range/Weighted Average | Impact to Valuation from an Increase in Input(a) |
| Equities | $ 826,337 | Market approach | Parity price | $0.40 - $25.60 / $18.99 | Increase |
| | | Recovery value | Recovery value | $0.00 - $10.12 / $10.12 | Increase |
| | | | Discount rate | 11.7% | Decrease
|
| | | Market comparable | Enterprise value/EBITDA multiple (EV/EBITDA) | 2.6 – 5.0 / 3.55 | Increase |
| | | | Book value multiple | 1.0 | Increase |
| | | | Enterprise value / Revenue multiple (EV/R) | 0.3 | Increase |
| | | | Discount rate | 10.0% - 30.0% / 11.50% | Decrease |
| | | | Discount for lack of marketability | 10.0% | Decrease |
| | | | Comparable sales – land ($/Acre) | $5,500.00 - $6,000.00 / $5,776.71 | Increase |
| | | | Daily production multiple ($/Million cubic feet per day) | $2,500.00 | Increase |
| | | | Daily production multiple ($/Barrels of oil equivalent per day) | $17,500.00 | Increase |
| | Book value | | Book value multiple | 1.0 | Increase |
| | Discounted cash flow | | Weighted average cost of capital (WACC) | 8.9% | Decrease |
| | | | Discount rate | 7.0% | Decrease |
| | | | Discount for lack of marketability | 10.0% | Decrease |
| | | | Growth rate | 1.5% | Inrease |
| Corporate Bonds | $ 536,591 | Indicative market price | Evaluated bid | $0.13 - $10.05 / $8.61 | Increase |
| | | Recovery value | Recovery value | $0.00 | Increase |
| | | Market comparable | Enterprise value/EBITDA multiple (EV/EBITDA) | 2.6 | Increase |
| | | | Book value multiple | 1.0 | Increase |
| | | | Discount rate | 10.0% | Decrease |
| | | | Discount for lack of marketability | 10.0% | Decrease |
| | | | Comparable sales - land ($/Acre) | $5,500.00 | Increase |
| | | | Daily production multiple ($/Barrels of oil equivalent per day) | $17,500.00 | Increase |
| | | Book value | Book value multiple | 1.0 | Increase |
| Bank Loan Obligations | $600,731 | Indicative market price | Evaluated bid | $97.75 | Increase |
| | | Market approach | Transaction price | $99.50 - $100.00 / $99.96 | Increase |
| | | | Parity price | $100.00 | Increase |
| | | Recovery value | Recovery value | $0.00 | Increase |
(a) Represents the directional change in the fair value of the Level 3 investments that could have resulted from an increase in the corresponding input as of period end. A decrease to the unobservable input would have had the opposite effect. Significant changes in these inputs may have resulted in a significantly higher or lower fair value measurement at period end.
Changes in valuation techniques may result in transfers in or out of an assigned level within the disclosure hierarchy. The aggregate value of investments by input level as of April 30, 2022, as well as a roll forward of Level 3 investments, is included at the end of the Fund's Schedule of Investments.
Foreign Currency. Certain Funds may use foreign currency contracts to facilitate transactions in foreign-denominated securities. Gains and losses from these transactions may arise from changes in the value of the foreign currency or if the counterparties do not perform under the contracts' terms.
Foreign-denominated assets, including investment securities, and liabilities are translated into U.S. dollars at the exchange rates at period end. Purchases and sales of investment securities, income and dividends received, and expenses denominated in foreign currencies are translated into U.S. dollars at the exchange rate in effect on the transaction date.
The effects of exchange rate fluctuations on investments are included with the net realized and unrealized gain (loss) on investment securities. Other foreign currency transactions resulting in realized and unrealized gain (loss) are disclosed separately.
Investment Transactions and Income. For financial reporting purposes, the Fund's investment holdings and NAV include trades executed through the end of the last business day of the period. The NAV per share for processing shareholder transactions is calculated as of the close of business of the New York Stock Exchange (NYSE), normally 4:00 p.m. Eastern time and includes trades executed through the end of the prior business day. Gains and losses on securities sold are determined on the basis of identified cost and include proceeds received from litigation. Commissions paid to certain brokers with whom the investment adviser, or its affiliates, places trades on behalf of a fund include an amount in addition to trade execution, which may be rebated back to a fund. Any such rebates are included in net realized gain (loss) on investments in the Statement of Operations. Dividend income is recorded on the ex-dividend date, except for certain dividends from foreign securities where the ex-dividend date may have passed, which are recorded as soon as the Fund is informed of the ex-dividend date. Non-cash dividends included in dividend income, if any, are recorded at the fair market value of the securities received. Income and capital gain distributions from Fidelity Central Funds, if any, are recorded on the ex-dividend date. Certain distributions received by the Fund represent a return of capital or capital gain. The Fund determines the components of these distributions subsequent to the ex-dividend date, based upon receipt of tax filings or other correspondence relating to the underlying investment. These distributions are recorded as a reduction of cost of investments and/or as a realized gain. Interest income is accrued as earned and includes coupon interest and amortization of premium and accretion of discount on debt securities as applicable. Paid in Kind (PIK) income is recorded at the fair market value of the securities received. Investment income is recorded net of foreign taxes withheld where recovery of such taxes is uncertain. Debt obligations may be placed on non-accrual status and related interest income may be reduced by ceasing current accruals and writing off interest receivables when the collection of all or a portion of interest has become doubtful based on consistently applied procedures. A debt obligation is removed from non-accrual status when the issuer resumes interest payments or when collectability of interest is reasonably assured.
Class Allocations and Expenses. Investment income, realized and unrealized capital gains and losses, common expenses of a fund, and certain fund-level expense reductions, if any, are allocated daily on a pro-rata basis to each class based on the relative net assets of each class to the total net assets of a fund. Each class differs with respect to transfer agent and distribution and service plan fees incurred, as applicable. Certain expense reductions may also differ by class, if applicable. For the reporting period, the allocated portion of income and expenses to each class as a percent of its average net assets may vary due to the timing of recording these transactions in relation to fluctuating net assets of the classes. Expenses directly attributable to a fund are charged to that fund. Expenses attributable to more than one fund are allocated among the respective funds on the basis of relative net assets or other appropriate methods. Expenses included in the accompanying financial statements reflect the expenses of that fund and do not include any expenses associated with any underlying mutual funds or exchange-traded funds. Although not included in a fund's expenses, a fund indirectly bears its proportionate share of these expenses through the net asset value of each underlying mutual fund or exchange-traded fund. Expense estimates are accrued in the period to which they relate and adjustments are made when actual amounts are known.
Income Tax Information and Distributions to Shareholders. Each year, the Fund intends to qualify as a regulated investment company under Subchapter M of the Internal Revenue Code, including distributing substantially all of its taxable income and realized gains. As a result, no provision for U.S. Federal income taxes is required. As of April 30, 2022, the Fund did not have any unrecognized tax benefits in the financial statements; nor is the Fund aware of any tax positions for which it is reasonably possible that the total amounts of unrecognized tax benefits will significantly change in the next twelve months. The Fund files a U.S. federal tax return, in addition to state and local tax returns as required. The Fund's federal income tax returns are subject to examination by the Internal Revenue Service (IRS) for a period of three fiscal years after they are filed. State and local tax returns may be subject to examination for an additional fiscal year depending on the jurisdiction. Foreign taxes are provided for based on the Fund's understanding of the tax rules and rates that exist in the foreign markets in which it invests.
Distributions are declared and recorded daily and paid monthly from net investment income. Distributions from realized gains, if any, are declared and recorded on the ex-dividend date. Income and capital gain distributions are declared separately for each class. Income and capital gain distributions are determined in accordance with income tax regulations, which may differ from GAAP.
Capital accounts within the financial statements are adjusted for permanent book-tax differences. These adjustments have no impact on net assets or the results of operations. Capital accounts are not adjusted for temporary book-tax differences which will reverse in a subsequent period.
Book-tax differences are primarily due to foreign currency transactions, defaulted bonds, market discount, certain conversion ratio adjustments, capital loss carryforwards and losses deferred due to wash sales.
As of period end, the cost and unrealized appreciation (depreciation) in securities, and derivatives if applicable, for federal income tax purposes were as follows:
| Gross unrealized appreciation | $2,279,418 |
| Gross unrealized depreciation | (13,006,322) |
| Net unrealized appreciation (depreciation) | $(10,726,904) |
| Tax Cost | $105,593,810 |
The tax-based components of distributable earnings as of period end were as follows:
| Capital Loss Carryforward | $(6,082,015) |
| Net unrealized appreciation (depreciation) on securities and other investments | $(10,734,979) |
Capital loss carryforwards are only available to offset future capital gains of the Fund to the extent provided by regulations and may be limited. The capital loss carryforward information presented below, including any applicable limitation, is estimated as of fiscal period end and is subject to adjustment.
| No expiration | |
| Short-term | $(832,705) |
| Long-term | (5,249,310) |
| Total capital loss carryforward | $(6,082,015) |
The tax character of distributions paid was as follows:
| | April 30, 2022 | April 30, 2021 |
| Ordinary Income | $4,704,486 | $ 4,134,980 |
Restricted Securities (including Private Placements). Funds may invest in securities that are subject to legal or contractual restrictions on resale. These securities generally may be resold in transactions exempt from registration or to the public if the securities are registered. Disposal of these securities may involve time-consuming negotiations and expense, and prompt sale at an acceptable price may be difficult. Information regarding restricted securities held at period end is included at the end of the Schedule of Investments, if applicable.
Loans and Other Direct Debt Instruments. Direct debt instruments are interests in amounts owed to lenders by corporate or other borrowers. These instruments may be in the form of loans, trade claims or other receivables and may include standby financing commitments such as revolving credit facilities that obligate a fund to supply additional cash to the borrower on demand. Loans may be acquired through assignment, participation, or may be made directly to a borrower. Such instruments are presented in the Bank Loan Obligations section in the Schedule of Investments. Certain funds may also invest in unfunded loan commitments, which are contractual obligations for future funding. Information regarding unfunded commitments is included at the end of the Schedule of Investments, if applicable.
4. Purchases and Sales of Investments.
Purchases and sales of securities, other than short-term securities and in-kind transactions, as applicable, are noted in the table below.
| | Purchases ($) | Sales ($) |
| Fidelity Global High Income Fund | 47,951,759 | 47,724,761 |
5. Fees and Other Transactions with Affiliates.
Management Fee. Fidelity Management & Research Company LLC (the investment adviser) and its affiliates provide the Fund with investment management related services for which the Fund pays a monthly management fee. The management fee is the sum of an individual fund fee rate that is based on an annual rate of .60% of the Fund's average net assets and an annualized group fee rate that averaged .10% during the period. The group fee rate is based upon the monthly average net assets of a group of registered investment companies with which the investment adviser has management contracts. The group fee rate decreases as assets under management increase and increases as assets under management decrease. For the reporting period, the total annual management fee rate was .70% of the Fund's average net assets.
Distribution and Service Plan Fees. In accordance with Rule 12b-1 of the 1940 Act, the Fund has adopted separate Distribution and Service Plans for each class of shares. Certain classes pay Fidelity Distributors Company LLC (FDC), an affiliate of the investment adviser, separate Distribution and Service Fees, each of which is based on an annual percentage of each class' average net assets. In addition, FDC may pay financial intermediaries for selling shares of the Fund and providing shareholder support services. For the period, the Distribution and Service Fee rates, total fees and amounts retained by FDC were as follows:
| | Distribution Fee | Service Fee | Total Fees | Retained by FDC |
| Class A | -% | .25% | $27,021 | $969 |
| Class M | -% | .25% | 8,591 | 12 |
| Class C | .75% | .25% | 27,495 | 1,858 |
| | | | $63,107 | $2,839 |
Sales Load. FDC may receive a front-end sales charge of up to 4.00% for selling Class A shares and Class M shares, some of which is paid to financial intermediaries for selling shares of the Fund. Depending on the holding period, FDC may receive contingent deferred sales charges levied on Class A, Class M and Class C redemptions. The deferred sales charges are 1.00% for Class C shares, 1.00% for certain purchases of Class A shares and .25% for certain purchases of Class M shares.
For the period, sales charge amounts retained by FDC were as follows:
| | Retained by FDC |
| Class A | $1,512 |
| Class M | 1,013 |
| Class C(a) | 36 |
| | $2,561 |
(a) When Class C shares are initially sold, FDC pays commissions from its own resources to financial intermediaries through which the sales are made.
Transfer Agent Fees. Fidelity Investments Institutional Operations Company LLC (FIIOC), an affiliate of the investment adviser, is the transfer, dividend disbursing and shareholder servicing agent for each class of the Fund. FIIOC receives account fees and asset-based fees that vary according to the account size and type of account of the shareholders of the respective classes of the Fund. FIIOC pays for typesetting, printing and mailing of shareholder reports, except proxy statements.
For the period, transfer agent fees for each class were as follows:
| | Amount | % of Class-Level Average Net Assets |
| Class A | $19,545 | .18 |
| Class M | 8,504 | .25 |
| Class C | 5,855 | .21 |
| Global High Income | 121,310 | .13 |
| Class I | 10,108 | .16 |
| | $165,322 | |
Accounting Fees. Fidelity Service Company, Inc. (FSC), an affiliate of the investment adviser, maintains the Fund's accounting records. The accounting fee is based on the level of average net assets for each month. For the period, the fees were equivalent to the following annual rates:
| | % of Average Net Assets |
| Fidelity Global High Income Fund | .04 |
Brokerage Commissions. A portion of portfolio transactions were placed with brokerage firms which are affiliates of the investment adviser. Brokerage commissions are included in net realized gain (loss) and change in net unrealized appreciation (depreciation) in the Statement of Operations. The commissions paid to these affiliated firms were as follows:
| | Amount |
| Fidelity Global High Income Fund | $11 |
Interfund Trades. Funds may purchase from or sell securities to other Fidelity Funds under procedures adopted by the Board. The procedures have been designed to ensure these interfund trades are executed in accordance with Rule 17a-7 of the 1940 Act. Any interfund trades are included within the respective purchases and sales amounts shown in the Purchases and Sales of Investments note. Interfund trades during the period are noted in the table below.
| | Purchases ($) | Sales ($) | Realized Gain (Loss) ($) |
| Fidelity Global High Income Fund | – | 128,583 | 77,679 |
6. Committed Line of Credit.
Certain Funds participate with other funds managed by the investment adviser or an affiliate in a $4.25 billion credit facility (the "line of credit") to be utilized for temporary or emergency purposes to fund shareholder redemptions or for other short-term liquidity purposes. The participating funds have agreed to pay commitment fees on their pro-rata portion of the line of credit, which are reflected in Miscellaneous expenses on the Statement of Operations, and are listed below. During the period, there were no borrowings on this line of credit.
| | Amount |
| Fidelity Global High Income Fund | $189 |
7. Security Lending.
Funds lend portfolio securities from time to time in order to earn additional income. Lending agents are used, including National Financial Services (NFS), an affiliate of the investment adviser. Pursuant to a securities lending agreement, NFS will receive a fee, which is capped at 9.9% of a fund's daily lending revenue, for its services as lending agent. A fund may lend securities to certain qualified borrowers, including NFS. On the settlement date of the loan, a fund receives collateral (in the form of U.S. Treasury obligations, letters of credit and/or cash) against the loaned securities and maintains collateral in an amount not less than 100% of the market value of the loaned securities during the period of the loan. The market value of the loaned securities is determined at the close of business of a fund and any additional required collateral is delivered to a fund on the next business day. A fund or borrower may terminate the loan at any time, and if the borrower defaults on its obligation to return the securities loaned because of insolvency or other reasons, a fund may apply collateral received from the borrower against the obligation. A fund may experience delays and costs in recovering the securities loaned. Any cash collateral received is invested in the Fidelity Securities Lending Cash Central Fund. Any loaned securities are identified as such in the Schedule of Investments, and the value of loaned securities and cash collateral at period end, as applicable, are presented in the Statement of Assets and Liabilities. Security lending income represents the income earned on investing cash collateral, less rebates paid to borrowers and any lending agent fees associated with the loan, plus any premium payments received for lending certain types of securities. Security lending income is presented in the Statement of Operations as a component of income from Fidelity Central Funds. Affiliated security lending activity, if any, was as follows:
| | Total Security Lending Fees Paid to NFS | Security Lending Income From Securities Loaned to NFS | Value of Securities Loaned to NFS at Period End |
| Fidelity Global High Income Fund | $– | $– | $– |
8. Expense Reductions.
The investment adviser contractually agreed to reimburse expenses of each class to the extent annual operating expenses exceeded certain levels of class-level average net assets as noted in the table below. This reimbursement will remain in place through August 31, 2023. Some expenses, for example the compensation of the independent Trustees, and certain miscellaneous expenses such as proxy and shareholder meeting expenses, are excluded from this reimbursement.
The following classes were in reimbursement during the period:
| | Expense Limitations | Reimbursement |
| Class A | 1.25%/1.15%(a) | $22,724 |
| Class M | 1.25%/1.15%(a) | 8,447 |
| Class C | 2.00%/1.90%(a) | 5,660 |
| Global High Income | 1.00%/.90%(a) | 117,925 |
| Class I | 1.00%/.90%(a) | 8,996 |
| | | $163,752 |
(a) Expense limitation effective June 1, 2021.
Through arrangements with the Fund's custodian, credits realized as a result of certain uninvested cash balances were used to reduce the Fund's expenses. During the period, custodian credits reduced the Fund's expenses by $71.
In addition, during the period the investment adviser or an affiliate reimbursed and/or waived a portion of fund-level operating expenses in the amount of $1,802.
9. Distributions to Shareholders.
Distributions to shareholders of each class were as follows:
| | Year ended
April 30, 2022 | Year ended
April 30, 2021 |
| Fidelity Global High Income Fund | | |
| Distributions to shareholders | | |
| Class A | $427,363 | $281,112 |
| Class M | 136,678 | 117,390 |
| Class C | 87,509 | 98,593 |
| Global High Income | 3,787,445 | 3,421,305 |
| Class I | 265,491 | 216,580 |
| Total | $4,704,486 | $4,134,980 |
10. Share Transactions.
Share transactions for each class were as follows and may contain in-kind transactions, automatic conversions between classes or exchanges between affiliated funds:
| | Shares | Shares | Dollars | Dollars |
| | Year ended April 30, 2022 | Year ended April 30, 2021 | Year ended April 30, 2022 | Year ended April 30, 2021 |
| Fidelity Global High Income Fund | | | | |
| Class A | | | | |
| Shares sold | 994,468 | 221,378 | $9,310,968 | $2,111,483 |
| Reinvestment of distributions | 44,175 | 28,758 | 415,544 | 269,952 |
| Shares redeemed | (135,230) | (80,710) | (1,259,170) | (743,779) |
| Net increase (decrease) | 903,413 | 169,426 | $8,467,342 | $1,637,656 |
| Class M | | | | |
| Shares sold | 91,576 | 68,909 | $895,377 | $661,837 |
| Reinvestment of distributions | 14,136 | 12,237 | 134,232 | 114,479 |
| Shares redeemed | (70,038) | (107,309) | (666,034) | (993,245) |
| Net increase (decrease) | 35,674 | (26,163) | $363,575 | $(216,929) |
| Class C | | | | |
| Shares sold | 18,127 | 59,332 | $174,518 | $560,517 |
| Reinvestment of distributions | 9,080 | 10,374 | 86,380 | 97,101 |
| Shares redeemed | (100,614) | (58,096) | (966,704) | (543,818) |
| Net increase (decrease) | (73,407) | 11,610 | $(705,806) | $113,800 |
| Global High Income | | | | |
| Shares sold | 3,066,135 | 4,031,911 | $29,769,948 | $38,048,878 |
| Reinvestment of distributions | 326,573 | 302,882 | 3,111,366 | 2,836,079 |
| Shares redeemed | (4,181,161) | (3,923,855) | (39,815,297) | (36,761,620) |
| Net increase (decrease) | (788,453) | 410,938 | $(6,933,983) | $4,123,337 |
| Class I | | | | |
| Shares sold | 209,270 | 686,540 | $2,024,964 | $6,529,749 |
| Reinvestment of distributions | 24,069 | 19,080 | 230,486 | 178,711 |
| Shares redeemed | (692,191) | (423,480) | (6,522,363) | (3,901,854) |
| Net increase (decrease) | (458,852) | 282,140 | $(4,266,913) | $2,806,606 |
11. Other.
A fund's organizational documents provide former and current trustees and officers with a limited indemnification against liabilities arising in connection with the performance of their duties to the fund. In the normal course of business, a fund may also enter into contracts that provide general indemnifications. A fund's maximum exposure under these arrangements is unknown as this would be dependent on future claims that may be made against a fund. The risk of material loss from such claims is considered remote.
12. Credit Risk.
The Fund's relatively large investment in countries with limited or developing capital markets may involve greater risks than investments in more developed markets and the prices of such investments may be volatile. The yields of emerging market debt obligations reflect, among other things, perceived credit risk. The consequences of political, social or economic changes in these markets may have disruptive effects on the market prices of the Fund's investments and the income they generate, as well as the Fund's ability to repatriate such amounts.
13. Coronavirus (COVID-19) Pandemic.
An outbreak of COVID-19 first detected in China during December 2019 has since spread globally and was declared a pandemic by the World Health Organization during March 2020. Developments that disrupt global economies and financial markets, such as the COVID-19 pandemic, may magnify factors that affect the Fund's performance.
Report of Independent Registered Public Accounting Firm
To the Board of Trustees of Fidelity Summer Street Trust and Shareholders of Fidelity Global High Income Fund
Opinion on the Financial Statements
We have audited the accompanying statement of assets and liabilities, including the schedule of investments, of Fidelity Global High Income Fund (one of the funds constituting Fidelity Summer Street Trust, referred to hereafter as the “Fund”) as of April 30, 2022, the related statement of operations for the year ended April 30, 2022, the statement of changes in net assets for each of the two years in the period ended April 30, 2022, including the related notes, and the financial highlights for each of the five years in the period ended April 30, 2022 (collectively referred to as the “financial statements”). In our opinion, the financial statements present fairly, in all material respects, the financial position of the Fund as of April 30, 2022, the results of its operations for the year then ended, the changes in its net assets for each of the two years in the period ended April 30, 2022 and the financial highlights for each of the five years in the period ended April 30, 2022 in conformity with accounting principles generally accepted in the United States of America.
Basis for Opinion
These financial statements are the responsibility of the Fund’s management. Our responsibility is to express an opinion on the Fund’s financial statements based on our audits. We are a public accounting firm registered with the Public Company Accounting Oversight Board (United States) (PCAOB) and are required to be independent with respect to the Fund in accordance with the U.S. federal securities laws and the applicable rules and regulations of the Securities and Exchange Commission and the PCAOB.
We conducted our audits of these financial statements in accordance with the standards of the PCAOB. Those standards require that we plan and perform the audit to obtain reasonable assurance about whether the financial statements are free of material misstatement, whether due to error or fraud.
Our audits included performing procedures to assess the risks of material misstatement of the financial statements, whether due to error or fraud, and performing procedures that respond to those risks. Such procedures included examining, on a test basis, evidence regarding the amounts and disclosures in the financial statements. Our audits also included evaluating the accounting principles used and significant estimates made by management, as well as evaluating the overall presentation of the financial statements. Our procedures included confirmation of securities owned as of April 30, 2022 by correspondence with the custodian, issuers of privately held securities, agent banks and brokers. We believe that our audits provide a reasonable basis for our opinion.
/s/ PricewaterhouseCoopers LLP
Boston, Massachusetts
June 14, 2022
We have served as the auditor of one or more investment companies in the Fidelity group of funds since 1932.
Trustees and Officers
The Trustees, Members of the Advisory Board (if any), and officers of the trust and fund, as applicable, are listed below. The Board of Trustees governs the fund and is responsible for protecting the interests of shareholders. The Trustees are experienced executives who meet periodically throughout the year to oversee the fund's activities, review contractual arrangements with companies that provide services to the fund, oversee management of the risks associated with such activities and contractual arrangements, and review the fund's performance. Each of the Trustees oversees 324 funds.
The Trustees hold office without limit in time except that (a) any Trustee may resign; (b) any Trustee may be removed by written instrument, signed by at least two-thirds of the number of Trustees prior to such removal; (c) any Trustee who requests to be retired or who has become incapacitated by illness or injury may be retired by written instrument signed by a majority of the other Trustees; and (d) any Trustee may be removed at any special meeting of shareholders by a two-thirds vote of the outstanding voting securities of the trust. Each Trustee who is not an interested person (as defined in the 1940 Act) of the trust and the fund is referred to herein as an Independent Trustee. Each Independent Trustee shall retire not later than the last day of the calendar year in which his or her 75th birthday occurs. The Independent Trustees may waive this mandatory retirement age policy with respect to individual Trustees. Officers and Advisory Board Members hold office without limit in time, except that any officer or Advisory Board Member may resign or may be removed by a vote of a majority of the Trustees at any regular meeting or any special meeting of the Trustees. Except as indicated, each individual has held the office shown or other offices in the same company for the past five years.
The fund's Statement of Additional Information (SAI) includes more information about the Trustees. To request a free copy, call Fidelity at 1-800-544-8544 if you’re an individual investing directly with Fidelity, call 1-800-835-5092 if you’re a plan sponsor or participant with Fidelity as your recordkeeper or call 1-877-208-0098 on institutional accounts or if you’re an advisor or invest through one.
Experience, Skills, Attributes, and Qualifications of the Trustees. The Governance and Nominating Committee has adopted a statement of policy that describes the experience, qualifications, attributes, and skills that are necessary and desirable for potential Independent Trustee candidates (Statement of Policy). The Board believes that each Trustee satisfied at the time he or she was initially elected or appointed a Trustee, and continues to satisfy, the standards contemplated by the Statement of Policy. The Governance and Nominating Committee also engages professional search firms to help identify potential Independent Trustee candidates who have the experience, qualifications, attributes, and skills consistent with the Statement of Policy. From time to time, additional criteria based on the composition and skills of the current Independent Trustees, as well as experience or skills that may be appropriate in light of future changes to board composition, business conditions, and regulatory or other developments, have also been considered by the professional search firms and the Governance and Nominating Committee. In addition, the Board takes into account the Trustees' commitment and participation in Board and committee meetings, as well as their leadership of standing and ad hoc committees throughout their tenure.
In determining that a particular Trustee was and continues to be qualified to serve as a Trustee, the Board has considered a variety of criteria, none of which, in isolation, was controlling. The Board believes that, collectively, the Trustees have balanced and diverse experience, qualifications, attributes, and skills, which allow the Board to operate effectively in governing the fund and protecting the interests of shareholders. Information about the specific experience, skills, attributes, and qualifications of each Trustee, which in each case led to the Board's conclusion that the Trustee should serve (or continue to serve) as a trustee of the fund, is provided below.
Board Structure and Oversight Function. Robert A. Lawrence is an interested person and currently serves as Chair. The Trustees have determined that an interested Chair is appropriate and benefits shareholders because an interested Chair has a personal and professional stake in the quality and continuity of services provided to the fund. Independent Trustees exercise their informed business judgment to appoint an individual of their choosing to serve as Chair, regardless of whether the Trustee happens to be independent or a member of management. The Independent Trustees have determined that they can act independently and effectively without having an Independent Trustee serve as Chair and that a key structural component for assuring that they are in a position to do so is for the Independent Trustees to constitute a substantial majority for the Board. The Independent Trustees also regularly meet in executive session. David M. Thomas serves as Lead Independent Trustee and as such (i) acts as a liaison between the Independent Trustees and management with respect to matters important to the Independent Trustees and (ii) with management prepares agendas for Board meetings.
Fidelity® funds are overseen by different Boards of Trustees. The fund's Board oversees Fidelity's high income and certain equity funds, and other Boards oversee Fidelity's investment-grade bond, money market, asset allocation, and other equity funds. The asset allocation funds may invest in Fidelity® funds overseen by the fund's Board. The use of separate Boards, each with its own committee structure, allows the Trustees of each group of Fidelity® funds to focus on the unique issues of the funds they oversee, including common research, investment, and operational issues. On occasion, the separate Boards establish joint committees to address issues of overlapping consequences for the Fidelity® funds overseen by each Board.
The Trustees operate using a system of committees to facilitate the timely and efficient consideration of all matters of importance to the Trustees, the fund, and fund shareholders and to facilitate compliance with legal and regulatory requirements and oversight of the fund's activities and associated risks. The Board, acting through its committees, has charged FMR and its affiliates with (i) identifying events or circumstances the occurrence of which could have demonstrably adverse effects on the fund's business and/or reputation; (ii) implementing processes and controls to lessen the possibility that such events or circumstances occur or to mitigate the effects of such events or circumstances if they do occur; and (iii) creating and maintaining a system designed to evaluate continuously business and market conditions in order to facilitate the identification and implementation processes described in (i) and (ii) above. Because the day-to-day operations and activities of the fund are carried out by or through FMR, its affiliates, and other service providers, the fund's exposure to risks is mitigated but not eliminated by the processes overseen by the Trustees. While each of the Board's committees has responsibility for overseeing different aspects of the fund's activities, oversight is exercised primarily through the Operations, Audit, and Compliance Committees. Appropriate personnel, including but not limited to the fund's Chief Compliance Officer (CCO), FMR's internal auditor, the independent accountants, the fund's Treasurer and portfolio management personnel, make periodic reports to the Board's committees, as appropriate, including an annual review of Fidelity's risk management program for the Fidelity® funds. The responsibilities of each standing committee, including their oversight responsibilities, are described further under "Standing Committees of the Trustees."
Interested Trustees*:
Correspondence intended for a Trustee who is an interested person may be sent to Fidelity Investments, 245 Summer Street, Boston, Massachusetts 02210.
Name, Year of Birth; Principal Occupations and Other Relevant Experience+
Bettina Doulton (1964)
Year of Election or Appointment: 2020
Trustee
Ms. Doulton also serves as Trustee of other Fidelity® funds. Prior to her retirement, Ms. Doulton served in a variety of positions at Fidelity Investments, including as a managing director of research (2006-2007), portfolio manager to certain Fidelity® funds (1993-2005), equity analyst and portfolio assistant (1990-1993), and research assistant (1987-1990). Ms. Doulton currently owns and operates Phi Builders + Architects and Cellardoor Winery. Previously, Ms. Doulton served as a member of the Board of Brown Capital Management, LLC (2014-2018).
Robert A. Lawrence (1952)
Year of Election or Appointment: 2020
Trustee
Chair of the Board of Trustees
Mr. Lawrence also serves as Trustee of other funds. Previously, Mr. Lawrence served as a Member of the Advisory Board of certain funds. Prior to his retirement in 2008, Mr. Lawrence served as Vice President of certain Fidelity® funds (2006-2008), Senior Vice President, Head of High Income Division of Fidelity Management & Research Company (investment adviser firm, 2006-2008), and President of Fidelity Strategic Investments (investment adviser firm, 2002-2005).
* Determined to be an “Interested Trustee” by virtue of, among other things, his or her affiliation with the trust or various entities under common control with FMR.
+ The information includes the Trustee's principal occupation during the last five years and other information relating to the experience, attributes, and skills relevant to the Trustee's qualifications to serve as a Trustee, which led to the conclusion that the Trustee should serve as a Trustee for the fund.
Independent Trustees:
Correspondence intended for an Independent Trustee may be sent to Fidelity Investments, P.O. Box 55235, Boston, Massachusetts 02205-5235.
Name, Year of Birth; Principal Occupations and Other Relevant Experience+
Thomas P. Bostick (1956)
Year of Election or Appointment: 2021
Trustee
Lieutenant General Bostick also serves as Trustee of other Fidelity® funds. Prior to his retirement, General Bostick (United States Army, Retired) held a variety of positions within the U.S. Army, including Commanding General and Chief of Engineers, U.S. Army Corps of Engineers (2012-2016) and Deputy Chief of Staff and Director of Human Resources, U.S. Army (2009-2012). General Bostick currently serves as a member of the Board and Finance and Governance Committees of CSX Corporation (transportation, 2020-present) and a member of the Board and Corporate Governance and Nominating Committee of Perma-Fix Environmental Services, Inc. (nuclear waste management, 2020-present). General Bostick serves as Chief Executive Officer of Bostick Global Strategies, LLC (consulting, 2016-present) and as a member of the Board of HireVue, Inc. (video interview and assessment, 2020-present). Previously, General Bostick served as a Member of the Advisory Board of certain Fidelity® funds (2021), President, Intrexon Bioengineering (2018-2020) and Chief Operating Officer (2017-2020) and Senior Vice President of the Environment Sector (2016-2017) of Intrexon Corporation (biopharmaceutical company).
Dennis J. Dirks (1948)
Year of Election or Appointment: 2005
Trustee
Mr. Dirks also serves as Trustee of other Fidelity® funds. Prior to his retirement in May 2003, Mr. Dirks served as Chief Operating Officer and as a member of the Board of The Depository Trust & Clearing Corporation (financial markets infrastructure), President, Chief Operating Officer and a member of the Board of The Depository Trust Company (DTC), President and a member of the Board of the National Securities Clearing Corporation (NSCC), Chief Executive Officer and a member of the Board of the Government Securities Clearing Corporation and Chief Executive Officer and a member of the Board of the Mortgage-Backed Securities Clearing Corporation. Mr. Dirks currently serves as a member of the Finance Committee (2016-present) and Board (2017-present) and is Treasurer (2018-present) of the Asolo Repertory Theatre.
Donald F. Donahue (1950)
Year of Election or Appointment: 2018
Trustee
Mr. Donahue also serves as Trustee of other Fidelity® funds. Mr. Donahue serves as President and Chief Executive Officer of Miranda Partners, LLC (risk consulting for the financial services industry, 2012-present). Previously, Mr. Donahue served as Chief Executive Officer (2006-2012), Chief Operating Officer (2003-2006) and Managing Director, Customer Marketing and Development (1999-2003) of The Depository Trust & Clearing Corporation (financial markets infrastructure). Mr. Donahue currently serves as a member (2007-present) and Co-Chairman (2016-present) of the Board of United Way of New York and a member of the Board of The Leadership Academy (previously NYC Leadership Academy) (2012-present). Mr. Donahue previously served as a member of the Advisory Board of certain Fidelity® funds (2015-2018).
Vicki L. Fuller (1957)
Year of Election or Appointment: 2020
Trustee
Ms. Fuller also serves as Trustee of other Fidelity® funds. Previously, Ms. Fuller served as a member of the Advisory Board of certain Fidelity® funds (2018-2020), Chief Investment Officer of the New York State Common Retirement Fund (2012-2018) and held a variety of positions at AllianceBernstein L.P. (global asset management, 1985-2012), including Managing Director (2006-2012) and Senior Vice President and Senior Portfolio Manager (2001-2006). Ms. Fuller currently serves as a member of the Board, Audit Committee and Nominating and Governance Committee of two Blackstone business development companies (2020-present), as a member of the Board of Treliant, LLC (consulting, 2019-present), as a member of the Advisory Board of Ariel Alternatives, LLC (private equity, 2021-present) and as a member of the Board and Chair of the Audit Committee of Gusto, Inc. (software, 2021-present). In addition, Ms. Fuller currently serves as a member of the Board of Roosevelt University (2019-present) and as a member of the Executive Board of New York University’s Stern School of Business. Ms. Fuller previously served as a member of the Board, Audit Committee and Nominating and Governance Committee of The Williams Companies, Inc. (natural gas infrastructure, 2018-2021).
Patricia L. Kampling (1959)
Year of Election or Appointment: 2020
Trustee
Ms. Kampling also serves as Trustee of other Fidelity® funds. Prior to her retirement, Ms. Kampling served as Chairman of the Board and Chief Executive Officer (2012-2019), President and Chief Operating Officer (2011-2012) and Executive Vice President and Chief Financial Officer (2010-2011) of Alliant Energy Corporation. Ms. Kampling currently serves as a member of the Board, Finance Committee and Governance, Compensation and Nominating Committee of Xcel Energy Inc. (utilities company, 2020-present) and as a member of the Board, Audit, Finance and Risk Committee and Safety, Environmental, Technology and Operations Committee and Chair of the Executive Development and Compensation Committee of American Water Works Company, Inc. (utilities company, 2019-present). In addition, Ms. Kampling currently serves as a member of the Board of the Nature Conservancy, Wisconsin Chapter (2019-present). Previously, Ms. Kampling served as a Member of the Advisory Board of certain Fidelity® funds (2020), a member of the Board, Compensation Committee and Executive Committee and Chair of the Audit Committee of Briggs & Stratton Corporation (manufacturing, 2011-2021), a member of the Board of Interstate Power and Light Company (2012-2019) and Wisconsin Power and Light Company (2012-2019) (each a subsidiary of Alliant Energy Corporation) and as a member of the Board and Workforce Development Committee of the Business Roundtable (2018-2019).
Thomas A. Kennedy (1955)
Year of Election or Appointment: 2021
Trustee
Mr. Kennedy also serves as Trustee of other Fidelity® funds. Previously, Mr. Kennedy served as a Member of the Advisory Board of certain Fidelity® funds (2020) and held a variety of positions at Raytheon Company (aerospace and defense, 1983-2020), including Chairman and Chief Executive Officer (2014-2020) and Executive Vice President and Chief Operating Officer (2013-2014). Mr. Kennedy currently serves as Executive Chairman of the Board of Directors of Raytheon Technologies Corporation (aerospace and defense, 2020-present). He is also a member of the Rutgers School of Engineering Industry Advisory Board (2011-present) and a member of the UCLA Engineering Dean’s Executive Board (2016-present).
Oscar Munoz (1959)
Year of Election or Appointment: 2021
Trustee
Mr. Munoz also serves as Trustee of other Fidelity® funds. Prior to his retirement, Mr. Munoz served as Executive Chairman (2020-2021), Chief Executive Officer (2015-2020), President (2015-2016) and a member of the Board (2010-2021) of United Airlines Holdings, Inc. Mr. Munoz currently serves as a member of the Board of CBRE Group, Inc. (commercial real estate, 2020-present), a member of the Board of Univision Communications, Inc. (Hispanic media, 2020-present) and a member of the Advisory Board of Salesforce.com, Inc. (cloud-based software, 2020-present). Previously, Mr. Munoz served as a Member of the Advisory Board of certain Fidelity® funds (2021).
Garnett A. Smith (1947)
Year of Election or Appointment: 2018
Trustee
Mr. Smith also serves as Trustee of other Fidelity® funds. Prior to his retirement, Mr. Smith served as Chairman and Chief Executive Officer (1990-1997) and President (1986-1990) of Inbrand Corp. (manufacturer of personal absorbent products). Prior to his employment with Inbrand Corp., he was employed by a retail fabric chain and North Carolina National Bank (now Bank of America). Mr. Smith previously served as a member of the Advisory Board of certain Fidelity® funds (2012-2013).
David M. Thomas (1949)
Year of Election or Appointment: 2008
Trustee
Lead Independent Trustee
Mr. Thomas also serves as Trustee of other Fidelity® funds. Previously, Mr. Thomas served as Executive Chairman (2005-2006) and Chairman and Chief Executive Officer (2000-2005) of IMS Health, Inc. (pharmaceutical and healthcare information solutions). Mr. Thomas currently serves as a member of the Board of Fortune Brands Home and Security (home and security products, 2004-present) and as Director (2013-present) and Non-Executive Chairman of the Board (2022-present) of Interpublic Group of Companies, Inc. (marketing communication).
Susan Tomasky (1953)
Year of Election or Appointment: 2020
Trustee
Ms. Tomasky also serves as Trustee of other Fidelity® funds. Prior to her retirement, Ms. Tomasky served in various executive officer positions at American Electric Power Company, Inc. (1998-2011), including most recently as President of AEP Transmission (2007-2011). Ms. Tomasky currently serves as a member of the Board and Sustainability Committee and as Chair of the Audit Committee of Marathon Petroleum Corporation (2018-present) and as a member of the Board, Executive Committee, Corporate Governance Committee and Organization and Compensation Committee and as Chair of the Audit Committee of Public Service Enterprise Group, Inc. (utilities company, 2012-present) and as a member of the Board of its subsidiary company, Public Service Electric and Gas Co. (2021-present). In addition, Ms. Tomasky currently serves as a member (2009-present) and President (2020-present) of the Board of the Royal Shakespeare Company – America (2009-present), as a member of the Board of the Columbus Association for the Performing Arts (2011-present) and as a member of the Board and Kenyon in the World Committee of Kenyon College (2016-present). Previously, Ms. Tomasky served as a Member of the Advisory Board of certain Fidelity® funds (2020), as a member of the Board of the Columbus Regional Airport Authority (2007-2020), as a member of the Board (2011-2018) and Lead Independent Director (2015-2018) of Andeavor Corporation (previously Tesoro Corporation) (independent oil refiner and marketer) and as a member of the Board of Summit Midstream Partners LP (energy, 2012-2018).
Michael E. Wiley (1950)
Year of Election or Appointment: 2018
Trustee
Mr. Wiley also serves as Trustee of other Fidelity® funds. Previously, Mr. Wiley served as a member of the Advisory Board of certain Fidelity® funds (2018-2020), Chairman, President and CEO of Baker Hughes, Inc. (oilfield services, 2000-2004). Mr. Wiley also previously served as a member of the Board of Andeavor Corporation (independent oil refiner and marketer, 2005-2018), a member of the Board of Andeavor Logistics LP (natural resources logistics, 2015-2018) and a member of the Board of High Point Resources (exploration and production, 2005-2020).
+ The information includes the Trustee's principal occupation during the last five years and other information relating to the experience, attributes, and skills relevant to the Trustee's qualifications to serve as a Trustee, which led to the conclusion that the Trustee should serve as a Trustee for the fund.
Advisory Board Members and Officers:
Correspondence intended for a Member of the Advisory Board (if any) may be sent to Fidelity Investments, P.O. Box 55235, Boston, Massachusetts 02205-5235. Correspondence intended for an officer or Peter S. Lynch may be sent to Fidelity Investments, 245 Summer Street, Boston, Massachusetts 02210. Officers appear below in alphabetical order.
Name, Year of Birth; Principal Occupation
Peter S. Lynch (1944)
Year of Election or Appointment: 2003
Member of the Advisory Board
Mr. Lynch also serves as a Member of the Advisory Board of other Fidelity® funds. Mr. Lynch is Vice Chairman and a Director of Fidelity Management & Research Company LLC (investment adviser firm). In addition, Mr. Lynch serves as a Trustee of Boston College and as the Chairman of the Inner-City Scholarship Fund. Previously, Mr. Lynch served as Vice Chairman and a Director of FMR Co., Inc. (investment adviser firm) and on the Special Olympics International Board of Directors (1997-2006).
Craig S. Brown (1977)
Year of Election or Appointment: 2019
Assistant Treasurer
Mr. Brown also serves as an officer of other funds. Mr. Brown serves as Assistant Treasurer of FIMM, LLC (2021-present) and is an employee of Fidelity Investments (2013-present).
John J. Burke III (1964)
Year of Election or Appointment: 2018
Chief Financial Officer
Mr. Burke also serves as Chief Financial Officer of other funds. Mr. Burke serves as Head of Investment Operations for Fidelity Fund and Investment Operations (2018-present) and is an employee of Fidelity Investments (1998-present). Previously Mr. Burke served as head of Asset Management Investment Operations (2012-2018).
William C. Coffey (1969)
Year of Election or Appointment: 2019
Assistant Secretary
Mr. Coffey also serves as Assistant Secretary of other funds. He is Senior Vice President and Deputy General Counsel of FMR LLC (diversified financial services company, 2010-present), and is an employee of Fidelity Investments. Previously, Mr. Coffey served as Secretary and CLO of certain funds (2018-2019); CLO, Secretary, and Senior Vice President of Fidelity Management & Research Company and FMR Co., Inc. (investment adviser firms, 2018-2019); Secretary of Fidelity SelectCo, LLC and Fidelity Investments Money Management, Inc. (investment adviser firms, 2018-2019); CLO of Fidelity Management & Research (Hong Kong) Limited, FMR Investment Management (UK) Limited, and Fidelity Management & Research (Japan) Limited (investment adviser firms, 2018-2019); and Assistant Secretary of certain funds (2009-2018).
Timothy M. Cohen (1969)
Year of Election or Appointment: 2018
Vice President
Mr. Cohen also serves as Vice President of other funds. Mr. Cohen serves as Co-Head of Equity (2018-present), a Director of Fidelity Management & Research (Japan) Limited (investment adviser firm, 2016-present), and is an employee of Fidelity Investments. Previously, Mr. Cohen served as Executive Vice President of Fidelity SelectCo, LLC (2019), Head of Global Equity Research (2016-2018), Chief Investment Officer - Equity and a Director of Fidelity Management & Research (U.K.) Inc. (investment adviser firm, 2013-2015) and as a Director of Fidelity Management & Research (Hong Kong) Limited (investment adviser firm, 2017).
Jonathan Davis (1968)
Year of Election or Appointment: 2010
Assistant Treasurer
Mr. Davis also serves as an officer of other funds. Mr. Davis serves as Assistant Treasurer of FIMM, LLC (2021-present), FMR Capital, Inc. (2017-present), FD Funds GP LLC (2021-present), FD Funds Holding LLC (2021-present), and FD Funds Management LLC (2021-present); and is an employee of Fidelity Investments. Previously, Mr. Davis served as Vice President and Associate General Counsel of FMR LLC (diversified financial services company, 2003-2010).
Laura M. Del Prato (1964)
Year of Election or Appointment: 2018
Assistant Treasurer
Ms. Del Prato also serves as an officer of other funds. Ms. Del Prato serves as Assistant Treasurer of FIMM, LLC (2021-present) and is an employee of Fidelity Investments (2017-present). Previously, Ms. Del Prato served as President and Treasurer of The North Carolina Capital Management Trust: Cash Portfolio and Term Portfolio (2018-2020). Prior to joining Fidelity Investments, Ms. Del Prato served as a Managing Director and Treasurer of the JPMorgan Mutual Funds (2014-2017). Prior to JPMorgan, Ms. Del Prato served as a partner at Cohen Fund Audit Services (accounting firm, 2012-2013) and KPMG LLP (accounting firm, 2004-2012).
Colm A. Hogan (1973)
Year of Election or Appointment: 2020
Assistant Treasurer
Mr. Hogan also serves as an officer of other funds. Mr. Hogan serves as Assistant Treasurer of FIMM, LLC (2021-present) and FMR Capital, Inc. (2017-present) and is an employee of Fidelity Investments (2005-present). Previously, Mr. Hogan served as Deputy Treasurer of certain Fidelity® funds (2016-2020) and Assistant Treasurer of certain Fidelity® funds (2016-2018).
Pamela R. Holding (1964)
Year of Election or Appointment: 2018
Vice President
Ms. Holding also serves as Vice President of other funds. Ms. Holding serves as Co-Head of Equity (2018-present) and is an employee of Fidelity Investments (2013-present). Previously, Ms. Holding served as Executive Vice President of Fidelity SelectCo, LLC (2019) and as Chief Investment Officer of Fidelity Institutional Asset Management (2013-2018).
Cynthia Lo Bessette (1969)
Year of Election or Appointment: 2019
Secretary and Chief Legal Officer (CLO)
Ms. Lo Bessette also serves as an officer of other funds. Ms. Lo Bessette serves as CLO, Secretary, and Senior Vice President of Fidelity Management & Research Company LLC (investment adviser firm, 2019-present); CLO of Fidelity Management & Research (Hong Kong) Limited, FMR Investment Management (UK) Limited, and Fidelity Management & Research (Japan) Limited (investment adviser firms, 2019-present); Secretary of FD Funds GP LLC (2021-present), FD Funds Holding LLC (2021-present), and FD Funds Management LLC (2021-present); and Assistant Secretary of FIMM, LLC (2019-present). She is a Senior Vice President and Deputy General Counsel of FMR LLC (diversified financial services company, 2019-present), and is an employee of Fidelity Investments. Previously, Ms. Lo Bessette served as CLO, Secretary, and Senior Vice President of FMR Co., Inc. (investment adviser firm, 2019); Secretary of Fidelity SelectCo, LLC and Fidelity Investments Money Management, Inc. (investment adviser firms, 2019). Prior to joining Fidelity Investments, Ms. Lo Bessette was Executive Vice President, General Counsel (2016-2019) and Senior Vice President, Deputy General Counsel (2015-2016) of OppenheimerFunds (investment management company) and Deputy Chief Legal Officer (2013-2015) of Jennison Associates LLC (investment adviser firm).
Chris Maher (1972)
Year of Election or Appointment: 2020
Deputy Treasurer
Mr. Maher also serves as an officer of other funds. Mr. Maher serves as Assistant Treasurer of FIMM, LLC (2021-present) and FMR Capital, Inc. (2017-present), and is an employee of Fidelity Investments (2008-present). Previously, Mr. Maher served as Assistant Treasurer of certain funds (2013-2020); Vice President of Asset Management Compliance (2013), Vice President of the Program Management Group of FMR (investment adviser firm, 2010-2013), and Vice President of Valuation Oversight (2008-2010).
Jason P. Pogorelec (1975)
Year of Election or Appointment: 2020
Chief Compliance Officer
Mr. Pogorelec also serves as Chief Compliance Officer of other funds. Mr. Pogorelec is a senior Vice President of Asset Management Compliance for Fidelity Investments and is an employee of Fidelity Investments (2006-present). Previously, Mr. Pogorelec served as Vice President, Associate General Counsel for Fidelity Investments (2010-2020) and Assistant Secretary of certain Fidelity funds (2015-2020).
Brett Segaloff (1972)
Year of Election or Appointment: 2021
Anti-Money Laundering (AML) Officer
Mr. Segaloff also serves as an AML Officer of other funds and other related entities. He is Director, Anti-Money Laundering (2007-present) of FMR LLC (diversified financial services company) and is an employee of Fidelity Investments (1996-present).
Stacie M. Smith (1974)
Year of Election or Appointment: 2016
President and Treasurer
Ms. Smith also serves as an officer of other funds. Ms. Smith serves as Assistant Treasurer of FIMM, LLC (2021-present) and FMR Capital, Inc. (2017-present), is an employee of Fidelity Investments (2009-present), and has served in other fund officer roles. Prior to joining Fidelity Investments, Ms. Smith served as Senior Audit Manager of Ernst & Young LLP (accounting firm, 1996-2009). Previously, Ms. Smith served as Assistant Treasurer (2013-2019) and Deputy Treasurer (2013-2016) of certain Fidelity® funds.
Jim Wegmann (1979)
Year of Election or Appointment: 2019
Assistant Treasurer
Mr. Wegmann also serves as an officer of other funds. Mr. Wegmann serves as Assistant Treasurer of FIMM, LLC (2021-present) and is an employee of Fidelity Investments (2011-present). Previously, Mr. Wegmann served as Assistant Treasurer of certain Fidelity® funds (2019-2021).
Shareholder Expense Example
As a shareholder, you incur two types of costs: (1) transaction costs, which may include sales charges (loads) on purchase payments or redemption proceeds, as applicable and (2) ongoing costs, which generally include management fees, distribution and/or service (12b-1) fees and other Fund expenses. This Example is intended to help you understand your ongoing costs (in dollars) of investing in a fund and to compare these costs with the ongoing costs of investing in other mutual funds.
The Example is based on an investment of $1,000 invested at the beginning of the period and held for the entire period (November 1, 2021 to April 30, 2022).
Actual Expenses
The first line of the accompanying table provides information about actual account values and actual expenses. You may use the information in this line, together with the amount you invested, to estimate the expenses that you paid over the period. Simply divide your account value by $1,000.00 (for example, an $8,600 account value divided by $1,000.00 = 8.6), then multiply the result by the number in the first line for a class/Fund under the heading entitled "Expenses Paid During Period" to estimate the expenses you paid on your account during this period. If any fund is a shareholder of any underlying mutual funds or exchange-traded funds (ETFs) (the Underlying Funds), such fund indirectly bears its proportional share of the expenses of the Underlying Funds in addition to the direct expenses incurred presented in the table. These fees and expenses are not included in the annualized expense ratio used to calculate the expense estimate in the table below.
Hypothetical Example for Comparison Purposes
The second line of the accompanying table provides information about hypothetical account values and hypothetical expenses based on the actual expense ratio and an assumed rate of return of 5% per year before expenses, which is not the actual return. The hypothetical account values and expenses may not be used to estimate the actual ending account balance or expenses you paid for the period. You may use this information to compare the ongoing costs of investing in the Fund and other funds. To do so, compare this 5% hypothetical example with the 5% hypothetical examples that appear in the shareholder reports of the other funds. If any fund is a shareholder of any Underlying Funds, such fund indirectly bears its proportional share of the expenses of the Underlying Funds in addition to the direct expenses as presented in the table. These fees and expenses are not included in the annualized expense ratio used to calculate the expense estimate in the table below.
Please note that the expenses shown in the table are meant to highlight your ongoing costs only and do not reflect any transaction costs. Therefore, the second line of the table is useful in comparing ongoing costs only, and will not help you determine the relative total costs of owning different funds. In addition, if these transactional costs were included, your costs would have been higher.
| | Annualized Expense Ratio-A | Beginning
Account Value
November 1, 2021 | Ending
Account Value
April 30, 2022 | Expenses Paid
During Period-B
November 1, 2021
to April 30, 2022 |
| Fidelity Global High Income Fund | | | | |
| Class A | 1.15% | | | |
| Actual | | $1,000.00 | $916.00 | $5.46 |
| Hypothetical-C | | $1,000.00 | $1,019.09 | $5.76 |
| Class M | 1.15% | | | |
| Actual | | $1,000.00 | $917.00 | $5.47 |
| Hypothetical-C | | $1,000.00 | $1,019.09 | $5.76 |
| Class C | 1.91% | | | |
| Actual | | $1,000.00 | $912.60 | $9.06 |
| Hypothetical-C | | $1,000.00 | $1,015.32 | $9.54 |
| Global High Income | .91% | | | |
| Actual | | $1,000.00 | $917.20 | $4.33 |
| Hypothetical-C | | $1,000.00 | $1,020.28 | $4.56 |
| Class I | .91% | | | |
| Actual | | $1,000.00 | $917.20 | $4.33 |
| Hypothetical-C | | $1,000.00 | $1,020.28 | $4.56 |
A Annualized expense ratio reflects expenses net of applicable fee waivers.
B Expenses are equal to the annualized expense ratio, multiplied by the average account value over the period, multiplied by 181/ 365 (to reflect the one-half year period). The fees and expenses of any Underlying Funds are not included in each annualized expense ratio.
C 5% return per year before expenses
Distributions (Unaudited)
The dividend and capital gains distributions for the fund(s) are available on Fidelity.com or Institutional.Fidelity.com.
A total of 0.01% of the dividends distributed during the fiscal year was derived from interest on U.S. Government securities which is generally exempt from state income tax.
The fund designates $2,194,386 of distributions paid in the calendar year 2021 as qualifying to be taxed as interest-related dividends for nonresident alien shareholders.
The fund designates $4,023,643 of distributions paid in the calendar year 2021 as qualifying to be taxed as section 163(j) interest dividends.
The fund will notify shareholders in January 2023 of amounts for use in preparing 2022 income tax returns.
Liquidity Risk Management Program
The Securities and Exchange Commission adopted Rule 22e-4 under the Investment Company Act of 1940 (the Liquidity Rule) to promote effective liquidity risk management throughout the open-end investment company industry, thereby reducing the risk that funds will be unable to meet their redemption obligations and mitigating dilution of the interests of fund shareholders.
The Fund has adopted and implemented a liquidity risk management program pursuant to the Liquidity Rule (the Program) effective December 1, 2018. The Program is reasonably designed to assess and manage the Fund’s liquidity risk and to comply with the requirements of the Liquidity Rule. The Fund’s Board of Trustees (the Board) has designated the Fund’s investment adviser as administrator of the Program. The Fidelity advisers have established a Liquidity Risk Management Committee (the LRM Committee) to manage the Program for each of the Fidelity Funds. The LRM Committee monitors the adequacy and effectiveness of implementation of the Program and on a periodic basis assesses each Fund’s liquidity risk based on a variety of factors including (1) the Fund’s investment strategy, (2) portfolio liquidity and cash flow projections during normal and reasonably foreseeable stressed conditions, (3) shareholder redemptions, (4) borrowings and other funding sources and (5) in the case of exchange-traded funds, certain additional factors including the effect of the Fund’s prices and spreads, market participants, and basket compositions on the overall liquidity of the Fund’s portfolio, as applicable.
In accordance with the Program, each of the Fund’s portfolio investments is classified into one of four liquidity categories described below based on a determination of a reasonable expectation for how long it would take to convert the investment to cash (or sell or dispose of the investment) without significantly changing its market value.
- Highly liquid investments – cash or convertible to cash within three business days or less
- Moderately liquid investments – convertible to cash in three to seven calendar days
- Less liquid investments – can be sold or disposed of, but not settled, within seven calendar days
- Illiquid investments – cannot be sold or disposed of within seven calendar days
Liquidity classification determinations take into account a variety of factors including various market, trading and investment-specific considerations, as well as market depth, and generally utilize analysis from a third-party liquidity metrics service.
The Liquidity Rule places a 15% limit on a fund’s illiquid investments and requires funds that do not primarily hold assets that are highly liquid investments to determine and maintain a minimum percentage of the fund’s net assets to be invested in highly liquid investments (highly liquid investment minimum or HLIM). The Program includes provisions reasonably designed to comply with the 15% limit on illiquid investments and for determining, periodically reviewing and complying with the HLIM requirement as applicable.
At a recent meeting of the Fund’s Board of Trustees, the LRM Committee provided a written report to the Board pertaining to the operation, adequacy, and effectiveness of implementation of the Program for the annual period from December 1, 2020 through November 30, 2021. The report concluded that the Program has been implemented and is operating effectively and is reasonably designed to assess and manage the Fund’s liquidity risk.
GHI-ANN-0622
1.926249.110
Fidelity® Short Duration High Income Fund
Annual Report
April 30, 2022
Includes Fidelity and Fidelity Advisor share classes
Contents
To view a fund's proxy voting guidelines and proxy voting record for the 12-month period ended June 30, visit http://www.fidelity.com/proxyvotingresults or visit the Securities and Exchange Commission's (SEC) web site at http://www.sec.gov.
You may also call 1-800-544-8544 if you’re an individual investing directly with Fidelity, call 1-800-835-5092 if you’re a plan sponsor or participant with Fidelity as your recordkeeper or call 1-877-208-0098 on institutional accounts or if you’re an advisor or invest through one to request a free copy of the proxy voting guidelines.
Standard & Poor's, S&P and S&P 500 are registered service marks of The McGraw-Hill Companies, Inc. and have been licensed for use by Fidelity Distributors Corporation.
Other third-party marks appearing herein are the property of their respective owners.
All other marks appearing herein are registered or unregistered trademarks or service marks of FMR LLC or an affiliated company. © 2022 FMR LLC. All rights reserved.
This report and the financial statements contained herein are submitted for the general information of the shareholders of the Fund. This report is not authorized for distribution to prospective investors in the Fund unless preceded or accompanied by an effective prospectus.
A fund files its complete schedule of portfolio holdings with the SEC for the first and third quarters of each fiscal year on Form N-PORT. Forms N-PORT are available on the SEC’s web site at http://www.sec.gov. A fund's Forms N-PORT may be reviewed and copied at the SEC’s Public Reference Room in Washington, DC. Information regarding the operation of the SEC's Public Reference Room may be obtained by calling 1-800-SEC-0330.
For a complete list of a fund's portfolio holdings, view the most recent holdings listing, semiannual report, or annual report on Fidelity's web site at http://www.fidelity.com, http://www.institutional.fidelity.com, or http://www.401k.com, as applicable.
NOT FDIC INSURED •MAY LOSE VALUE •NO BANK GUARANTEE
Neither the Fund nor Fidelity Distributors Corporation is a bank.
Note to Shareholders:
Early in 2020, the outbreak and spread of COVID-19 emerged as a public health emergency that had a major influence on financial markets, primarily based on its impact on the global economy and corporate earnings. On March 11, 2020, the World Health Organization declared the COVID-19 outbreak a pandemic, citing sustained risk of further global spread. The pandemic prompted a number of measures to limit the spread of COVID-19, including travel and border restrictions, quarantines, and restrictions on large gatherings. In turn, these resulted in lower consumer activity, diminished demand for a wide range of products and services, disruption in manufacturing and supply chains, and – given the wide variability in outcomes regarding the outbreak – significant market uncertainty and volatility. To help stem the turmoil, the U.S. government took unprecedented action – in concert with the U.S. Federal Reserve and central banks around the world – to help support consumers, businesses, and the broader economy, and to limit disruption to the financial system.
In general, the overall impact of the pandemic lessened in 2021, amid a resilient economy and widespread distribution of three COVID-19 vaccines granted emergency use authorization from the U.S. Food and Drug Administration (FDA) early in the year. Still, the situation remains dynamic, and the extent and duration of its influence on financial markets and the economy is highly uncertain, due in part to a recent spike in cases based on highly contagious variants of the coronavirus.
Extreme events such as the COVID-19 crisis are exogenous shocks that can have significant adverse effects on mutual funds and their investments. Although multiple asset classes may be affected by market disruption, the duration and impact may not be the same for all types of assets. Fidelity is committed to helping you stay informed amid news about COVID-19 and during increased market volatility, and we continue to take extra steps to be responsive to customer needs. We encourage you to visit us online, where we offer ongoing updates, commentary, and analysis on the markets and our funds.
Performance: The Bottom Line
Average annual total return reflects the change in the value of an investment, assuming reinvestment of distributions from dividend income and capital gains (the profits earned upon the sale of securities that have grown in value, if any) and assuming a constant rate of performance each year. The hypothetical investment and the average annual total returns do not reflect the deduction of taxes that a shareholder would pay on fund distributions or the redemption of fund shares. During periods of reimbursement by Fidelity, a fund’s total return will be greater than it would be had the reimbursement not occurred. How a fund did yesterday is no guarantee of how it will do tomorrow.
Average Annual Total Returns
| For the periods ended April 30, 2022 | Past 1 year | Past 5 years | Life of fundA |
| Class A (incl. 4.00% sales charge) | (6.49)% | 1.58% | 1.98% |
| Class M (incl. 4.00% sales charge) | (6.49)% | 1.58% | 1.98% |
| Class C (incl. contingent deferred sales charge) | (4.27)% | 1.65% | 1.75% |
| Fidelity® Short Duration High Income Fund | (2.35)% | 2.67% | 2.73% |
| Class I | (2.35)% | 2.67% | 2.73% |
| Class Z | (2.27)% | 2.73% | 2.76% |
A From November 5, 2013
Class C shares' contingent deferred sales charges included in the past one year, past five years, and life of fund total return figures are 1%, 0%, and 0%, respectively.
The initial offering of Class Z shares took place on October 2, 2018. Returns prior to October 2, 2018, are those of Class I.
$10,000 Over Life of Fund
Let's say hypothetically that $10,000 was invested in Fidelity® Short Duration High Income Fund, a class of the fund, on November 5, 2013, when the fund started.
The chart shows how the value of your investment would have changed, and also shows how the ICE® BofA® 1-5 Year BB-B US Cash Pay High Yield Constrained Index performed over the same period.

| Period Ending Values |
| $12,565 | Fidelity® Short Duration High Income Fund |
| $13,732 | ICE® BofA® 1-5 Year BB-B US Cash Pay High Yield Constrained Index |
Management's Discussion of Fund Performance
Market Recap: The ICE BofA
® US High Yield Constrained Index returned -4.96% for the 12 months ending April 30, 2022. After posting a solid gain in 2021, high-yield bonds retreated to begin the new year amid several major headwinds that stoked volatility, uncertainty and investor anxiety. Chief among these was the U.S. Federal Reserve’s accelerated plan to hike interest rates and aggressively wind down its balance sheet in an attempt to rein in historically high inflation. In addition, geopolitical unrest rose as Russia invaded Ukraine in late February and escalated its attack through period end. Other factors influencing high yield included surging commodity prices, rising bond yields, supply constraint and disruption, and the potential for variants of the coronavirus to upend the economy. Against this dynamic backdrop, the index returned -2.74% in January and -0.90% in February amid an intensifying flight from risk. Volatility eased in March and credit fundamentals remained healthy, but high yield still lost ground (-0.92%) for the month. April saw the downtrend continue, with the index returning -3.63% amid clearer signals of the Fed’s intension to tighten monetary policy and angst about the economic toll of “zero-COVID” lockdowns in China. For the full 12 months, higher-duration BB-rated bonds slightly trailed lower-quality credits. By sector, energy rode a surge in commodity prices and led the way with a modest gain. All other groups declined. Notable laggards included cable/satellite TV, telecommunications, health care, utilities and food/beverage/tobacco.
Comments from - Co-Managers Benjamin Harrison, Alexandre Karam and Eric Mollenhauer: For the fiscal year, the fund's share classes (excluding sales charges, if applicable) returned roughly -3% to -2%, underperforming the -1.02% return of the Fidelity Short Duration High Income Fund Composite Index, as well as the ICE BofA
® 1-5 Year BB-B US Cash Pay High Yield Constrained Index. The fund's core allocation to high-yield bonds returned -2.20% and detracted from performance versus the Composite index. By industry, market selection was the primary relative detractor, especially an overweighting in cable/satellite TV. Security selection in broadcasting and health care also hurt. Melco Crown, the fund's largest individual detractor, resulted roughly -14% this period. Our second-largest detractor was PG&E, which returned about -7% the past 12 months. Another detractor this period was Diamond Sports. The fund's investment in securities issued by Diamond Sports returned -29% the past 12 months. This was a position we established the past year. All of these detractors were non-Composite positions. Conversely, the largest contributor to performance versus the Composite index was our security picks in cable/satellite TV. Security selection in telecommunications and chemicals also helped the fund's relative result. Our top individual relative contributor was a non-Composite stake in Mesquite Energy (+116%). Also lifting performance was our outsized stake in Charter Communications, which gained 3%. Charter Communications was among our biggest holdings. Avoiding Talen Energy, an index component that returned roughly -45%, aided relative performance. By quality, security selection in unrated bonds added the most value versus the Composite, while security choices among CCC-rated bonds hurt the most. Notable changes in positioning include increased exposure to the services industry and a lower allocation to utilities..
The views expressed above reflect those of the portfolio manager(s) only through the end of the period as stated on the cover of this report and do not necessarily represent the views of Fidelity or any other person in the Fidelity organization. Any such views are subject to change at any time based upon market or other conditions and Fidelity disclaims any responsibility to update such views. These views may not be relied on as investment advice and, because investment decisions for a Fidelity fund are based on numerous factors, may not be relied on as an indication of trading intent on behalf of any Fidelity fund.
Note to shareholders: On January 3, 2022, Benjamin Harrison assumed co-management responsibilities for the fund and the fund's U.S. high-yield subportfolio.
Investment Summary (Unaudited)
Top Bond Issuers as of April 30, 2022
| (by issuer, excluding cash equivalents) | % of fund's net assets |
| Occidental Petroleum Corp. | 3.2 |
| CCO Holdings LLC/CCO Holdings Capital Corp. | 2.6 |
| Icahn Enterprises LP/Icahn Enterprises Finance Corp. | 2.3 |
| Valeant Pharmaceuticals International, Inc. | 2.0 |
| Sprint Corp. | 1.9 |
| Ford Motor Credit Co. LLC | 1.7 |
| OneMain Finance Corp. | 1.5 |
| VICI Properties LP / VICI Note Co. | 1.5 |
| DISH DBS Corp. | 1.5 |
| Ally Financial, Inc. | 1.5 |
| | 19.7 |
Top Five Market Sectors as of April 30, 2022
| | % of fund's net assets |
| Energy | 15.8 |
| Telecommunications | 10.4 |
| Healthcare | 7.3 |
| Gaming | 6.6 |
| Diversified Financial Services | 5.8 |
Quality Diversification (% of fund's net assets)
| As of April 30, 2022 |
| | BBB | 3.3% |
| | BB | 37.5% |
| | B | 47.1% |
| | CCC,CC,C | 5.3% |
| | Not Rated | 1.0% |
| | Equities | 0.1% |
| | Short-Term Investments and Net Other Assets | 5.7% |
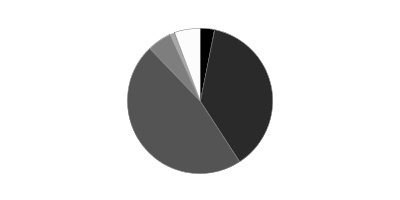
We have used ratings from Moody's Investors Service, Inc. Where Moody's® ratings are not available, we have used S&P® ratings. All ratings are as of the date indicated and do not reflect subsequent changes.
Asset Allocation (% of fund's net assets)
| As of April 30, 2022 * |
| | Nonconvertible Bonds | 83.2% |
| | Convertible Bonds, Preferred Stocks | 1.0% |
| | Common Stocks | 0.1% |
| | Bank Loan Obligations | 10.0% |
| | Short-Term Investments and Net Other Assets (Liabilities) | 5.7% |

* Foreign investments - 16.4%
Geographic Diversification (% of fund's net assets)
| As of April 30, 2022 |
| | United States of America* | 83.6% |
| | Canada | 3.2% |
| | Netherlands | 2.2% |
| | United Kingdom | 1.7% |
| | Cayman Islands | 1.6% |
| | Multi-National | 1.6% |
| | Liberia | 1.4% |
| | Panama | 1.2% |
| | Luxembourg | 1.0% |
| | Other | 2.5% |

* Includes Short-Term investments and Net Other Assets (Liabilities).
Percentages are based on country or territory of incorporation and are adjusted for the effect of futures contracts, if applicable.
Schedule of Investments April 30, 2022
Showing Percentage of Net Assets
| Corporate Bonds - 84.2% | | | |
| | | Principal Amount | Value |
| Convertible Bonds - 1.0% | | | |
| Broadcasting - 0.8% | | | |
| DISH Network Corp.: | | | |
| 2.375% 3/15/24 | | $510,000 | $474,045 |
| 3.375% 8/15/26 | | 700,000 | 600,250 |
| | | | 1,074,295 |
| Energy - 0.2% | | | |
| Mesquite Energy, Inc. 15% 7/15/23 (a)(b) | | 15,159 | 78,220 |
| Mesquite Energy, Inc. 15% 7/15/23 (a)(b) | | 26,231 | 121,974 |
| | | | 200,194 |
|
| TOTAL CONVERTIBLE BONDS | | | 1,274,489 |
|
| Nonconvertible Bonds - 83.2% | | | |
| Aerospace - 2.3% | | | |
| Bombardier, Inc.: | | | |
| 6% 2/15/28 (c) | | 125,000 | 108,125 |
| 7.125% 6/15/26 (c) | | 165,000 | 151,800 |
| 7.5% 3/15/25 (c) | | 614,000 | 595,580 |
| Spirit Aerosystems, Inc.: | | | |
| 5.5% 1/15/25 (c) | | 100,000 | 99,000 |
| 7.5% 4/15/25 (c) | | 250,000 | 253,125 |
| TransDigm, Inc.: | | | |
| 5.5% 11/15/27 | | 1,335,000 | 1,221,525 |
| 6.25% 3/15/26 (c) | | 515,000 | 512,425 |
| 7.5% 3/15/27 | | 25,000 | 25,188 |
| | | | 2,966,768 |
| Air Transportation - 1.3% | | | |
| American Airlines, Inc. / AAdvantage Loyalty IP Ltd. 5.5% 4/20/26 (c) | | 800,000 | 793,000 |
| United Airlines, Inc. 4.375% 4/15/26 (c) | | 600,000 | 579,300 |
| Western Global Airlines LLC 10.375% 8/15/25 (c) | | 250,000 | 256,345 |
| | | | 1,628,645 |
| Automotive & Auto Parts - 1.7% | | | |
| Ford Motor Credit Co. LLC: | | | |
| 2.3% 2/10/25 | | 540,000 | 501,498 |
| 3.375% 11/13/25 | | 400,000 | 384,072 |
| 4.25% 9/20/22 | | 600,000 | 601,899 |
| 4.687% 6/9/25 | | 455,000 | 446,114 |
| 5.125% 6/16/25 | | 250,000 | 249,375 |
| Real Hero Merger Sub 2 6.25% 2/1/29 (c) | | 30,000 | 24,332 |
| | | | 2,207,290 |
| Banks & Thrifts - 1.7% | | | |
| Ally Financial, Inc.: | | | |
| 3.875% 5/21/24 | | 970,000 | 973,337 |
| 5.75% 11/20/25 | | 895,000 | 919,438 |
| VistaJet Malta Finance PLC / XO Management Holding, Inc. 7.875% 5/1/27 (c) | | 235,000 | 221,065 |
| | | | 2,113,840 |
| Broadcasting - 0.8% | | | |
| Diamond Sports Group LLC/Diamond Sports Finance Co. 5.375% 8/15/26 (c) | | 410,000 | 151,700 |
| Sirius XM Radio, Inc. 3.125% 9/1/26 (c) | | 495,000 | 456,019 |
| Univision Communications, Inc. 6.625% 6/1/27 (c) | | 375,000 | 375,938 |
| | | | 983,657 |
| Building Materials - 0.4% | | | |
| Advanced Drain Systems, Inc. 5% 9/30/27 (c) | | 245,000 | 236,731 |
| Global Infrastructure Solutions, Inc. 5.625% 6/1/29 (c) | | 185,000 | 168,604 |
| SRS Distribution, Inc. 4.625% 7/1/28 (c) | | 95,000 | 86,973 |
| | | | 492,308 |
| Cable/Satellite TV - 5.2% | | | |
| CCO Holdings LLC/CCO Holdings Capital Corp. 4% 3/1/23 (c) | | 3,315,000 | 3,314,989 |
| CSC Holdings LLC 5.875% 9/15/22 | | 845,000 | 849,521 |
| DISH DBS Corp.: | | | |
| 5.25% 12/1/26 (c) | | 300,000 | 275,445 |
| 5.875% 11/15/24 | | 1,100,000 | 1,067,000 |
| 7.75% 7/1/26 | | 650,000 | 611,432 |
| Radiate Holdco LLC/Radiate Financial Service Ltd. 4.5% 9/15/26 (c) | | 595,000 | 547,930 |
| | | | 6,666,317 |
| Capital Goods - 0.4% | | | |
| Vertical U.S. Newco, Inc. 5.25% 7/15/27 (c) | | 525,000 | 491,831 |
| Chemicals - 1.5% | | | |
| INEOS Quattro Finance 2 PLC 3.375% 1/15/26 (c) | | 250,000 | 228,250 |
| LSB Industries, Inc. 6.25% 10/15/28 (c) | | 490,000 | 480,171 |
| NOVA Chemicals Corp.: | | | |
| 4.875% 6/1/24 (c) | | 300,000 | 295,875 |
| 5% 5/1/25 (c) | | 400,000 | 396,000 |
| Rhodia Acetow Management GmbH 10.5% 2/15/27 (c) | | 130,000 | 115,050 |
| SPCM SA 3.125% 3/15/27 (c) | | 395,000 | 348,588 |
| | | | 1,863,934 |
| Consumer Products - 1.0% | | | |
| Coty, Inc. 5% 4/15/26 (c) | | 200,000 | 189,970 |
| Gannett Holdings LLC 6% 11/1/26 (c) | | 75,000 | 68,250 |
| Mattel, Inc. 5.875% 12/15/27 (c) | | 210,000 | 214,830 |
| Newell Brands, Inc. 4.7% 4/1/26 | | 800,000 | 793,152 |
| | | | 1,266,202 |
| Containers - 2.5% | | | |
| Ardagh Packaging Finance PLC/Ardagh MP Holdings U.S.A., Inc.: | | | |
| 4.125% 8/15/26 (c) | | 610,000 | 564,250 |
| 5.25% 8/15/27 (c) | | 500,000 | 426,895 |
| Ball Corp.: | | | |
| 4% 11/15/23 | | 400,000 | 399,024 |
| 5.25% 7/1/25 | | 400,000 | 410,000 |
| Berry Global, Inc. 4.875% 7/15/26 (c) | | 175,000 | 173,924 |
| Trivium Packaging Finance BV: | | | |
| 5.5% 8/15/26 (c) | | 220,000 | 212,575 |
| 8.5% 8/15/27 (c) | | 1,050,000 | 1,036,875 |
| | | | 3,223,543 |
| Diversified Financial Services - 5.5% | | | |
| Cargo Aircraft Management, Inc. 4.75% 2/1/28 (c) | | 225,000 | 210,375 |
| Freedom Mortgage Corp. 6.625% 1/15/27 (c) | | 250,000 | 216,375 |
| Hightower Holding LLC 6.75% 4/15/29 (c) | | 400,000 | 368,520 |
| Icahn Enterprises LP/Icahn Enterprises Finance Corp.: | | | |
| 4.75% 9/15/24 | | 1,840,000 | 1,794,000 |
| 5.25% 5/15/27 | | 535,000 | 497,550 |
| 6.25% 5/15/26 | | 690,000 | 684,080 |
| Navient Corp.: | | | |
| 6.125% 3/25/24 | | 1,000,000 | 1,005,625 |
| 6.75% 6/15/26 | | 250,000 | 245,635 |
| OneMain Finance Corp.: | | | |
| 3.5% 1/15/27 | | 235,000 | 206,452 |
| 6.125% 3/15/24 | | 750,000 | 752,873 |
| 6.875% 3/15/25 | | 1,090,000 | 1,095,450 |
| | | | 7,076,935 |
| Diversified Media - 0.5% | | | |
| Advantage Sales & Marketing, Inc. 6.5% 11/15/28 (c) | | 660,000 | 599,775 |
| Energy - 15.5% | | | |
| Berry Petroleum Co. LLC 7% 2/15/26 (c) | | 100,000 | 97,000 |
| Buckeye Partners LP 4.125% 3/1/25 (c) | | 400,000 | 383,476 |
| California Resources Corp. 7.125% 2/1/26 (c) | | 250,000 | 254,288 |
| Calumet Specialty Products Partners LP/Calumet Finance Corp. 11% 4/15/25 (c) | | 10,000 | 10,000 |
| Chesapeake Energy Corp. 5.5% 2/1/26 (c) | | 505,000 | 500,740 |
| Citgo Holding, Inc. 9.25% 8/1/24 (c) | | 350,000 | 347,813 |
| Citgo Petroleum Corp. 6.375% 6/15/26 (c) | | 450,000 | 447,210 |
| Colgate Energy Partners III LLC 5.875% 7/1/29 (c) | | 70,000 | 69,300 |
| Comstock Resources, Inc.: | | | |
| 6.75% 3/1/29 (c) | | 120,000 | 121,342 |
| 7.5% 5/15/25 (c) | | 83,000 | 84,702 |
| Continental Resources, Inc.: | | | |
| 2.268% 11/15/26 (c) | | 300,000 | 274,059 |
| 4.5% 4/15/23 | | 300,000 | 303,360 |
| Crestwood Midstream Partners LP/Crestwood Midstream Finance Corp. 6% 2/1/29 (c) | | 860,000 | 836,488 |
| CrownRock LP/CrownRock Finance, Inc. 5.625% 10/15/25 (c) | | 800,000 | 800,000 |
| CVR Energy, Inc. 5.25% 2/15/25 (c) | | 615,000 | 594,951 |
| DCP Midstream Operating LP 5.375% 7/15/25 | | 1,400,000 | 1,407,000 |
| Delek Logistics Partners LP 7.125% 6/1/28 (c) | | 80,000 | 76,469 |
| Energy Ventures GoM LLC / EnVen Finance Corp. 11.75% 4/15/26 (c) | | 92,000 | 95,220 |
| EnLink Midstream Partners LP 4.85% 7/15/26 | | 400,000 | 389,000 |
| EQM Midstream Partners LP 6% 7/1/25 (c) | | 400,000 | 396,420 |
| EQT Corp. 3.125% 5/15/26 (c) | | 500,000 | 471,390 |
| Genesis Energy LP/Genesis Energy Finance Corp. 8% 1/15/27 | | 145,000 | 142,207 |
| Gulfport Energy Corp. 8% 5/17/26 | | 100,000 | 102,857 |
| Hess Midstream Partners LP 5.625% 2/15/26 (c) | | 150,000 | 150,000 |
| Holly Energy Partners LP/Holly Energy Finance Corp. 6.375% 4/15/27 (c) | | 105,000 | 107,100 |
| Magnolia Oil & Gas Operating LLC 6% 8/1/26 (c) | | 300,000 | 300,000 |
| Mesquite Energy, Inc. 7.25% 2/15/23 (b)(c)(d) | | 135,000 | 0 |
| Murphy Oil Corp. 5.75% 8/15/25 | | 300,000 | 300,000 |
| Nabors Industries, Inc. 5.75% 2/1/25 | | 250,000 | 238,943 |
| New Fortress Energy, Inc.: | | | |
| 6.5% 9/30/26 (c) | | 215,000 | 208,081 |
| 6.75% 9/15/25 (c) | | 650,000 | 639,041 |
| NGL Energy Operating LLC/NGL Energy Finance Corp. 7.5% 2/1/26 (c) | | 1,150,000 | 1,083,398 |
| NuStar Logistics LP 6% 6/1/26 | | 400,000 | 399,056 |
| Oasis Petroleum, Inc. 6.375% 6/1/26 (c) | | 100,000 | 100,486 |
| Occidental Petroleum Corp.: | | | |
| 3.2% 8/15/26 | | 500,000 | 470,000 |
| 3.4% 4/15/26 | | 400,000 | 381,000 |
| 5.875% 9/1/25 | | 2,250,000 | 2,310,908 |
| 6.95% 7/1/24 | | 900,000 | 943,875 |
| PBF Holding Co. LLC/PBF Finance Corp.: | | | |
| 7.25% 6/15/25 | | 350,000 | 337,943 |
| 9.25% 5/15/25 (c) | | 700,000 | 724,500 |
| PDC Energy, Inc. 5.75% 5/15/26 | | 250,000 | 243,290 |
| Precision Drilling Corp. 7.125% 1/15/26 (c) | | 160,000 | 160,438 |
| Range Resources Corp. 4.875% 5/15/25 | | 250,000 | 247,500 |
| SM Energy Co. 10% 1/15/25 (c) | | 1,000,000 | 1,080,220 |
| Southwestern Energy Co. 5.95% 1/23/25 (e) | | 28,000 | 28,403 |
| Sunnova Energy Corp. 5.875% 9/1/26 (c) | | 210,000 | 192,150 |
| Sunoco LP/Sunoco Finance Corp.: | | | |
| 5.875% 3/15/28 | | 60,000 | 59,100 |
| 6% 4/15/27 | | 10,000 | 10,075 |
| Transocean Proteus Ltd. 6.25% 12/1/24 (c) | | 317,500 | 311,944 |
| Western Gas Partners LP 4.65% 7/1/26 | | 500,000 | 493,125 |
| | | | 19,725,868 |
| Food & Drug Retail - 1.0% | | | |
| Albertsons Companies LLC/Safeway, Inc./New Albertson's, Inc./Albertson's LLC 3.25% 3/15/26 (c) | | 1,350,000 | 1,231,875 |
| Food/Beverage/Tobacco - 0.9% | | | |
| Post Holdings, Inc.: | | | |
| 5.625% 1/15/28 (c) | | 125,000 | 118,188 |
| 5.75% 3/1/27 (c) | | 596,000 | 587,805 |
| Turning Point Brands, Inc. 5.625% 2/15/26 (c) | | 100,000 | 95,160 |
| U.S. Foods, Inc. 6.25% 4/15/25 (c) | | 275,000 | 282,510 |
| United Natural Foods, Inc. 6.75% 10/15/28 (c) | | 95,000 | 95,069 |
| | | | 1,178,732 |
| Gaming - 6.2% | | | |
| Affinity Gaming LLC 6.875% 12/15/27 (c) | | 30,000 | 28,099 |
| Caesars Entertainment, Inc.: | | | |
| 6.25% 7/1/25 (c) | | 750,000 | 758,153 |
| 8.125% 7/1/27 (c) | | 500,000 | 522,500 |
| Caesars Resort Collection LLC 5.75% 7/1/25 (c) | | 495,000 | 505,519 |
| Golden Entertainment, Inc. 7.625% 4/15/26 (c) | | 500,000 | 511,250 |
| International Game Technology PLC: | | | |
| 4.125% 4/15/26 (c) | | 200,000 | 187,902 |
| 6.5% 2/15/25 (c) | | 250,000 | 254,375 |
| Melco Resorts Finance Ltd. 5.25% 4/26/26 (c) | | 1,000,000 | 875,500 |
| MGM Resorts International 6% 3/15/23 | | 1,000,000 | 1,012,570 |
| Raptor Acquisition Corp. / Raptor Co-Issuer LLC 4.875% 11/1/26 (c) | | 95,000 | 90,049 |
| Studio City Finance Ltd. 5% 1/15/29 (c) | | 225,000 | 153,394 |
| VICI Properties LP / VICI Note Co.: | | | |
| 3.5% 2/15/25 (c) | | 715,000 | 686,414 |
| 4.625% 6/15/25 (c) | | 300,000 | 298,500 |
| 5.625% 5/1/24 (c) | | 1,000,000 | 1,010,000 |
| Wynn Las Vegas LLC/Wynn Las Vegas Capital Corp.: | | | |
| 4.25% 5/30/23 (c) | | 500,000 | 490,000 |
| 5.5% 3/1/25 (c) | | 500,000 | 483,750 |
| | | | 7,867,975 |
| Healthcare - 6.3% | | | |
| Community Health Systems, Inc.: | | | |
| 5.625% 3/15/27 (c) | | 1,550,000 | 1,477,526 |
| 6.875% 4/15/29 (c) | | 120,000 | 105,242 |
| HCA Holdings, Inc. 5.875% 2/15/26 | | 1,750,000 | 1,812,125 |
| Owens & Minor, Inc. 4.5% 3/31/29 (c) | | 65,000 | 58,472 |
| RP Escrow Issuer LLC 5.25% 12/15/25 (c) | | 200,000 | 186,000 |
| Tenet Healthcare Corp.: | | | |
| 4.625% 7/15/24 | | 86,000 | 85,766 |
| 5.125% 11/1/27 (c) | | 500,000 | 485,483 |
| 6.75% 6/15/23 | | 1,165,000 | 1,198,441 |
| Valeant Pharmaceuticals International, Inc. 9.25% 4/1/26 (c) | | 2,580,000 | 2,561,166 |
| Vizient, Inc. 6.25% 5/15/27 (c) | | 20,000 | 20,650 |
| | | | 7,990,871 |
| Homebuilders/Real Estate - 1.3% | | | |
| Brookfield Property REIT, Inc./BPR Nimbus LLC/BPR Cumulus LLC/GGSI Sellco LLC 5.75% 5/15/26 (c) | | 250,000 | 242,033 |
| Kennedy-Wilson, Inc. 4.75% 2/1/30 | | 185,000 | 166,963 |
| Railworks Holdings LP 8.25% 11/15/28 (c) | | 230,000 | 228,275 |
| Service Properties Trust: | | | |
| 4.35% 10/1/24 | | 400,000 | 370,576 |
| 7.5% 9/15/25 | | 700,000 | 698,691 |
| | | | 1,706,538 |
| Insurance - 0.2% | | | |
| Acrisure LLC / Acrisure Finance, Inc. 7% 11/15/25 (c) | | 20,000 | 19,471 |
| Alliant Holdings Intermediate LLC 6.75% 10/15/27 (c) | | 30,000 | 28,369 |
| Enact Holdings, Inc. 6.5% 8/15/25 (c) | | 200,000 | 198,976 |
| | | | 246,816 |
| Leisure - 3.2% | | | |
| Carnival Corp. 7.625% 3/1/26 (c) | | 1,600,000 | 1,568,000 |
| NCL Corp. Ltd.: | | | |
| 5.875% 3/15/26 (c) | | 400,000 | 369,524 |
| 5.875% 2/15/27 (c) | | 175,000 | 166,817 |
| Royal Caribbean Cruises Ltd.: | | | |
| 5.375% 7/15/27 (c) | | 120,000 | 110,273 |
| 5.5% 8/31/26 (c) | | 885,000 | 824,639 |
| 9.125% 6/15/23 (c) | | 750,000 | 774,251 |
| Viking Cruises Ltd. 13% 5/15/25 (c) | | 235,000 | 257,184 |
| | | | 4,070,688 |
| Metals/Mining - 1.2% | | | |
| First Quantum Minerals Ltd.: | | | |
| 6.875% 3/1/26 (c) | | 750,000 | 747,328 |
| 7.25% 4/1/23 (c) | | 329,000 | 329,247 |
| Howmet Aerospace, Inc.: | | | |
| 5.125% 10/1/24 | | 250,000 | 254,375 |
| 6.875% 5/1/25 | | 8,000 | 8,460 |
| HudBay Minerals, Inc. 4.5% 4/1/26 (c) | | 55,000 | 50,851 |
| Novelis Corp. 3.25% 11/15/26 (c) | | 150,000 | 136,868 |
| | | | 1,527,129 |
| Restaurants - 2.0% | | | |
| 1011778 BC Unlimited Liability Co./New Red Finance, Inc.: | | | |
| 3.875% 1/15/28 (c) | | 300,000 | 276,000 |
| 5.75% 4/15/25 (c) | | 1,000,000 | 1,021,425 |
| Yum! Brands, Inc. 3.875% 11/1/23 | | 1,225,000 | 1,235,290 |
| | | | 2,532,715 |
| Services - 3.3% | | | |
| Aramark Services, Inc. 5% 4/1/25 (c) | | 1,300,000 | 1,288,625 |
| Brand Energy & Infrastructure Services, Inc. 8.5% 7/15/25 (c) | | 1,106,000 | 987,105 |
| CoreCivic, Inc.: | | | |
| 4.75% 10/15/27 | | 35,000 | 31,142 |
| 8.25% 4/15/26 | | 250,000 | 256,805 |
| Diebold Nixdorf, Inc. 9.375% 7/15/25 (c) | | 100,000 | 88,500 |
| Life Time, Inc. 5.75% 1/15/26 (c) | | 125,000 | 121,288 |
| PowerTeam Services LLC 9.033% 12/4/25 (c) | | 120,000 | 113,573 |
| Prime Securities Services Borrower LLC/Prime Finance, Inc. 5.75% 4/15/26 (c) | | 350,000 | 335,563 |
| Sabre GLBL, Inc. 7.375% 9/1/25 (c) | | 200,000 | 202,289 |
| Sotheby's 7.375% 10/15/27 (c) | | 500,000 | 493,025 |
| WASH Multifamily Acquisition, Inc. 5.75% 4/15/26 (c) | | 240,000 | 233,400 |
| | | | 4,151,315 |
| Steel - 0.1% | | | |
| Infrabuild Australia Pty Ltd. 12% 10/1/24 (c) | | 150,000 | 151,500 |
| Super Retail - 2.0% | | | |
| At Home Group, Inc. 4.875% 7/15/28 (c) | | 60,000 | 49,575 |
| Bath & Body Works, Inc. 7.5% 6/15/29 | | 115,000 | 118,889 |
| Carvana Co. 5.5% 4/15/27 (c) | | 200,000 | 160,050 |
| EG Global Finance PLC: | | | |
| 6.75% 2/7/25 (c) | | 700,000 | 680,365 |
| 8.5% 10/30/25 (c) | | 800,000 | 800,000 |
| Hanesbrands, Inc. 4.875% 5/15/26 (c) | | 400,000 | 391,000 |
| Rent-A-Center, Inc. 6.375% 2/15/29 (c) | | 30,000 | 25,879 |
| Staples, Inc. 7.5% 4/15/26 (c) | | 400,000 | 382,000 |
| | | | 2,607,758 |
| Technology - 2.6% | | | |
| Camelot Finance SA 4.5% 11/1/26 (c) | | 600,000 | 564,000 |
| CommScope, Inc. 6% 3/1/26 (c) | | 600,000 | 565,920 |
| MicroStrategy, Inc. 6.125% 6/15/28 (c) | | 85,000 | 77,874 |
| MoneyGram International, Inc. 5.375% 8/1/26 (c) | | 250,000 | 255,015 |
| Sensata Technologies BV: | | | |
| 4.875% 10/15/23 (c) | | 155,000 | 155,395 |
| 5% 10/1/25 (c) | | 1,300,000 | 1,290,250 |
| Veritas U.S., Inc./Veritas Bermuda Ltd. 7.5% 9/1/25 (c) | | 400,000 | 352,500 |
| Virtusa Corp. 7.125% 12/15/28 (c) | | 50,000 | 45,000 |
| | | | 3,305,954 |
| Telecommunications - 8.9% | | | |
| Altice France SA 8.125% 2/1/27 (c) | | 160,000 | 161,200 |
| C&W Senior Financing Designated Activity Co. 6.875% 9/15/27 (c) | | 25,000 | 24,188 |
| Consolidated Communications, Inc. 5% 10/1/28 (c) | | 60,000 | 49,032 |
| Lumen Technologies, Inc.: | | | |
| 4% 2/15/27 (c) | | 1,000,000 | 889,290 |
| 5.625% 4/1/25 | | 200,000 | 195,000 |
| 6.75% 12/1/23 | | 600,000 | 609,750 |
| Northwest Fiber LLC/Northwest Fiber Finance Sub, Inc. 4.75% 4/30/27 (c) | | 95,000 | 86,420 |
| Sable International Finance Ltd. 5.75% 9/7/27 (c) | | 902,000 | 888,190 |
| Sabre GLBL, Inc. 9.25% 4/15/25 (c) | | 200,000 | 213,306 |
| SBA Communications Corp. 3.875% 2/15/27 | | 700,000 | 664,440 |
| Sprint Corp. 7.875% 9/15/23 | | 2,280,000 | 2,394,000 |
| T-Mobile U.S.A., Inc.: | | | |
| 2.25% 2/15/26 (c) | | 810,000 | 743,175 |
| 2.625% 4/15/26 | | 320,000 | 297,600 |
| Telecom Italia SpA 5.303% 5/30/24 (c) | | 1,300,000 | 1,275,625 |
| Uniti Group, Inc. 7.875% 2/15/25 (c) | | 1,705,000 | 1,734,838 |
| Windstream Escrow LLC 7.75% 8/15/28 (c) | | 570,000 | 542,925 |
| Zayo Group Holdings, Inc. 4% 3/1/27 (c) | | 700,000 | 609,000 |
| | | | 11,377,979 |
| Transportation Ex Air/Rail - 0.0% | | | |
| Great Lakes Dredge & Dock Corp. 5.25% 6/1/29 (c) | | 70,000 | 65,450 |
| Utilities - 3.7% | | | |
| Global Partners LP/GLP Finance Corp. 7% 8/1/27 | | 62,000 | 60,605 |
| InterGen NV 7% 6/30/23 (c) | | 200,000 | 195,000 |
| NextEra Energy Partners LP 4.25% 9/15/24 (c) | | 41,000 | 40,283 |
| NRG Energy, Inc. 5.25% 6/15/29 (c) | | 1,025,000 | 965,417 |
| PG&E Corp. 5% 7/1/28 | | 1,210,000 | 1,113,430 |
| Solaris Midstream Holdings LLC 7.625% 4/1/26 (c) | | 120,000 | 123,000 |
| TerraForm Power Operating LLC 4.25% 1/31/23 (c) | | 1,350,000 | 1,351,688 |
| Vistra Operations Co. LLC: | | | |
| 5% 7/31/27 (c) | | 225,000 | 214,313 |
| 5.625% 2/15/27 (c) | | 705,000 | 694,425 |
| | | | 4,758,161 |
|
| TOTAL NONCONVERTIBLE BONDS | | | 106,078,369 |
|
| TOTAL CORPORATE BONDS | | | |
| (Cost $112,609,975) | | | 107,352,858 |
| | | Shares | Value |
|
| Common Stocks - 0.1% | | | |
| Diversified Financial Services - 0.0% | | | |
| Axis Energy Services, LLC Class A (b) | | 389 | 125 |
| Lime Tree Bay Cayman Ltd. (b) | | 80 | 2,698 |
|
| TOTAL DIVERSIFIED FINANCIAL SERVICES | | | 2,823 |
|
| Energy - 0.1% | | | |
| California Resources Corp. warrants 10/27/24 (f) | | 2 | 24 |
| Forbes Energy Services Ltd. (b)(f) | | 6,468 | 1 |
| Mesquite Energy, Inc. (b)(f) | | 1,922 | 107,190 |
|
| TOTAL ENERGY | | | 107,215 |
|
| TOTAL COMMON STOCKS | | | |
| (Cost $339,106) | | | 110,038 |
| | | Principal Amount | Value |
|
| Bank Loan Obligations - 10.0% | | | |
| Broadcasting - 0.2% | | | |
| Diamond Sports Group LLC: | | | |
| 1LN, term loan U.S. Secured Overnight Fin. Rate (SOFR) Indx + 8.000% 9% 5/25/26 (e)(g)(h) | | 89,095 | 90,418 |
| 2LN, term loan 3 month U.S. LIBOR + 3.250% 3.6555% 8/24/26 (e)(g)(h) | | 198,485 | 65,748 |
| Univision Communications, Inc. Tranche B 1LN, term loan 1 month U.S. LIBOR + 3.250% 4.0137% 1/31/29 (e)(g)(h) | | 60,000 | 59,175 |
|
| TOTAL BROADCASTING | | | 215,341 |
|
| Building Materials - 0.5% | | | |
| Acproducts Holdings, Inc. Tranche B 1LN, term loan 1 month U.S. LIBOR + 4.250% 4.75% 5/17/28 (e)(g)(h) | | 183,613 | 152,398 |
| Oscar AcquisitionCo LLC 1LN, term loan CME TERM SOFR 1 MONTH INDEX + 4.500% 4/29/29 (g)(h)(i) | | 500,000 | 478,750 |
| SRS Distribution, Inc. Tranche B 1LN, term loan 1 month U.S. LIBOR + 3.500% 4.0187% 6/4/28 (e)(g)(h) | | 54,588 | 52,540 |
|
| TOTAL BUILDING MATERIALS | | | 683,688 |
|
| Chemicals - 0.3% | | | |
| Consolidated Energy Finance SA Tranche B 1LN, term loan 3 month U.S. LIBOR + 3.500% 4.0287% 5/7/25 (b)(e)(g)(h) | | 287,825 | 281,349 |
| Olympus Water U.S. Holding Corp. Tranche B 1LN, term loan 1 month U.S. LIBOR + 3.750% 4.8125% 11/9/28 (e)(g)(h) | | 29,925 | 29,304 |
| SCIH Salt Holdings, Inc. Tranche B 1LN, term loan 3 month U.S. LIBOR + 4.000% 4.75% 3/16/27 (e)(g)(h) | | 32,676 | 31,546 |
| W.R. Grace Holding LLC Tranche B 1LN, term loan 1 month U.S. LIBOR + 3.750% 4.8125% 9/22/28 (e)(g)(h) | | 24,938 | 24,694 |
|
| TOTAL CHEMICALS | | | 366,893 |
|
| Consumer Products - 0.1% | | | |
| Conair Holdings LLC Tranche B 1LN, term loan 1 month U.S. LIBOR + 3.750% 4.756% 5/17/28 (e)(g)(h) | | 24,875 | 24,328 |
| Diamond BC BV Tranche B 1LN, term loan 1 month U.S. LIBOR + 2.750% 3.989% 9/29/28 (e)(g)(h) | | 19,950 | 19,221 |
| Michaels Companies, Inc. 1LN, term loan 3 month U.S. LIBOR + 4.250% 5.256% 4/15/28 (e)(g)(h) | | 39,700 | 36,115 |
|
| TOTAL CONSUMER PRODUCTS | | | 79,664 |
|
| Diversified Financial Services - 0.3% | | | |
| Broadstreet Partners, Inc. Tranche B 1LN, term loan 3 month U.S. LIBOR + 3.000% 3.763% 1/27/27 (e)(g)(h) | | 346,465 | 340,755 |
| Hightower Holding LLC Tranche B 1LN, term loan 3 month U.S. LIBOR + 4.000% 5.0983% 4/21/28 (e)(g)(h) | | 9,950 | 9,801 |
|
| TOTAL DIVERSIFIED FINANCIAL SERVICES | | | 350,556 |
|
| Energy - 0.0% | | | |
| DT Midstream, Inc. Tranche B 1LN, term loan 1 month U.S. LIBOR + 2.000% 2.5% 6/12/28 (e)(g)(h) | | 15,973 | 15,943 |
| Forbes Energy Services LLC Tranche B, term loan 0% 12/31/49 (b)(d)(e)(h) | | 60,604 | 0 |
| Mesquite Energy, Inc.: | | | |
| 1LN, term loan 3 month U.S. LIBOR + 8.000% 0% (b)(d)(g)(h) | | 35,876 | 0 |
| term loan 3 month U.S. LIBOR + 0.000% 0% (b)(d)(g)(h) | | 15,000 | 0 |
|
| TOTAL ENERGY | | | 15,943 |
|
| Environmental - 0.5% | | | |
| LRS Holdings LLC Tranche B 1LN, term loan 1 month U.S. LIBOR + 4.250% 5.0137% 6/28/28 (e)(g)(h) | | 698,250 | 691,268 |
| Food & Drug Retail - 0.2% | | | |
| TKC Midco 1 LLC 1LN, term loan 12% 2/8/27 (e)(h) | | 200,000 | 198,000 |
| Food/Beverage/Tobacco - 0.0% | | | |
| Triton Water Holdings, Inc. Tranche B 1LN, term loan 3 month U.S. LIBOR + 3.500% 4.506% 3/31/28 (e)(g)(h) | | 54,588 | 52,943 |
| Gaming - 0.4% | | | |
| Fertitta Entertainment LLC NV Tranche B 1LN, term loan U.S. Secured Overnight Fin. Rate (SOFR) Indx + 4.000% 4.7004% 1/27/29 (e)(g)(h) | | 324,078 | 322,364 |
| Golden Entertainment, Inc. Tranche B, term loan 3 month U.S. LIBOR + 3.000% 3.77% 10/20/24 (e)(g)(h) | | 246,355 | 245,278 |
|
| TOTAL GAMING | | | 567,642 |
|
| Healthcare - 1.0% | | | |
| Confluent Health LLC: | | | |
| Tranche B 1LN, term loan 1 month U.S. LIBOR + 4.000% 4.7637% 11/30/28 (e)(g)(h) | | 12,345 | 12,237 |
| Tranche DD 1LN, term loan 1 month U.S. LIBOR + 4.000% 4.0961% 11/30/28 (e)(g)(h)(j) | | 2,655 | 2,632 |
| Insulet Corp. Tranche B 1LN, term loan 1 month U.S. LIBOR + 3.250% 4.0137% 5/4/28 (e)(g)(h) | | 19,850 | 19,817 |
| Jazz Financing Lux SARL Tranche B 1LN, term loan 1 month U.S. LIBOR + 3.500% 4.2637% 5/5/28 (e)(g)(h) | | 54,588 | 54,478 |
| Medical Solutions Holdings, Inc.: | | | |
| 1LN, term loan 1 month U.S. LIBOR + 3.500% 4% 11/1/28 (e)(g)(h) | | 336,000 | 332,724 |
| Tranche DD 1LN, term loan 1 month U.S. LIBOR + 3.500% 11/1/28 (g)(h)(i)(j) | | 64,000 | 63,376 |
| Mozart Borrower LP Tranche B 1LN, term loan 1 month U.S. LIBOR + 3.250% 4.0137% 10/21/28 (e)(g)(h) | | 115,000 | 112,988 |
| Organon & Co. Tranche B 1LN, term loan 3 month U.S. LIBOR + 3.000% 3.5625% 6/2/28 (e)(g)(h) | | 125,342 | 124,637 |
| Packaging Coordinators Midco, Inc. Tranche B 1LN, term loan 3 month U.S. LIBOR + 3.750% 4.756% 11/30/27 (e)(g)(h) | | 14,925 | 14,831 |
| Phoenix Newco, Inc. Tranche B 1LN, term loan 1 month U.S. LIBOR + 3.500% 4% 11/15/28 (e)(g)(h) | | 60,000 | 59,531 |
| RadNet Management, Inc. Tranche B 1LN, term loan 3 month U.S. LIBOR + 3.000% 3.75% 4/23/28 (e)(g)(h) | | 347,375 | 343,655 |
| U.S. Anesthesia Partners, Inc. Tranche B 1LN, term loan 1 month U.S. LIBOR + 4.250% 4.75% 10/1/28 (e)(g)(h) | | 29,850 | 29,469 |
| U.S. Renal Care, Inc. Tranche B 1LN, term loan 3 month U.S. LIBOR + 5.000% 5.5% 6/13/26 (e)(g)(h) | | 166,866 | 147,259 |
|
| TOTAL HEALTHCARE | | | 1,317,634 |
|
| Hotels - 0.0% | | | |
| Hilton Grand Vacations Borrower LLC Tranche B 1LN, term loan 1 month U.S. LIBOR + 3.000% 3.7637% 8/2/28 (e)(g)(h) | | 49,750 | 49,492 |
| Insurance - 0.6% | | | |
| Alliant Holdings Intermediate LLC: | | | |
| Tranche B, term loan 3 month U.S. LIBOR + 3.250% 4.0137% 5/10/25 (e)(g)(h) | | 296,915 | 293,836 |
| Tranche B3 1LN, term loan 1 month U.S. LIBOR + 3.500% 4.0513% 11/6/27 (e)(g)(h) | | 104,475 | 103,639 |
| AssuredPartners, Inc. Tranche B 1LN, term loan 3 month U.S. LIBOR + 3.500% 4.2637% 2/13/27 (e)(g)(h) | | 346,456 | 341,546 |
|
| TOTAL INSURANCE | | | 739,021 |
|
| Leisure - 0.3% | | | |
| Hayward Industries, Inc. Tranche B 1LN, term loan 1 month U.S. LIBOR + 2.500% 3.2637% 5/28/28 (e)(g)(h) | | 397,000 | 392,204 |
| MajorDrive Holdings IV LLC 1LN, term loan 3 month U.S. LIBOR + 4.000% 4.5625% 5/12/28 (e)(g)(h) | | 24,813 | 24,353 |
|
| TOTAL LEISURE | | | 416,557 |
|
| Paper - 0.1% | | | |
| Clydesdale Acquisition Holdings, Inc. 1LN, term loan CME TERM SOFR 1 MONTH INDEX + 4.250% 4.7834% 3/30/29 (e)(g)(h) | | 80,000 | 78,890 |
| Services - 0.8% | | | |
| ABG Intermediate Holdings 2 LLC: | | | |
| Tranche B1 LN, term loan U.S. Secured Overnight Fin. Rate (SOFR) Indx + 3.500% 4% 12/21/28 (e)(g)(h) | | 5,970 | 5,918 |
| Tranche B2 1LN, term loan U.S. Secured Overnight Fin. Rate (SOFR) Indx + 3.500% 4% 1/31/29 (e)(g)(h) | | 38,060 | 37,727 |
| Tranche B3 1LN, term loan U.S. Secured Overnight Fin. Rate (SOFR) Indx + 3.500% 4% 12/21/28 (e)(g)(h) | | 5,970 | 5,918 |
| Allied Universal Holdco LLC Tranche B 1LN, term loan 1 month U.S. LIBOR + 3.750% 4.5137% 5/14/28 (e)(g)(h) | | 19,900 | 19,363 |
| Ascend Learning LLC: | | | |
| 2LN, term loan 1 month U.S. LIBOR + 5.750% 6.25% 12/10/29 (e)(g)(h) | | 20,000 | 19,725 |
| Tranche B 1LN, term loan 1 month U.S. LIBOR + 3.500% 4.2637% 12/10/28 (e)(g)(h) | | 184,538 | 182,131 |
| CHG Healthcare Services, Inc. 1LN, term loan 1 month U.S. LIBOR + 3.500% 4.9985% 9/30/28 (e)(g)(h) | | 14,925 | 14,817 |
| CoreLogic, Inc. Tranche B 1LN, term loan 3 month U.S. LIBOR + 3.500% 4.3125% 6/2/28 (e)(g)(h) | | 49,750 | 46,641 |
| Spin Holdco, Inc. Tranche B 1LN, term loan 3 month U.S. LIBOR + 4.000% 4.75% 3/4/28 (e)(g)(h) | | 643,500 | 640,122 |
|
| TOTAL SERVICES | | | 972,362 |
|
| Super Retail - 1.1% | | | |
| Bass Pro Group LLC Tranche B 1LN, term loan 3 month U.S. LIBOR + 3.750% 4.5137% 3/5/28 (e)(g)(h) | | 892,515 | 882,474 |
| Empire Today LLC Tranche B 1LN, term loan 3 month U.S. LIBOR + 5.000% 5.75% 4/1/28 (e)(g)(h) | | 497,494 | 461,177 |
|
| TOTAL SUPER RETAIL | | | 1,343,651 |
|
| Technology - 1.7% | | | |
| Acuris Finance U.S., Inc. 1LN, term loan 3 month U.S. LIBOR + 4.000% 4.8004% 2/16/28 (e)(g)(h) | | 10,156 | 10,090 |
| Aptean, Inc. 2LN, term loan 3 month U.S. LIBOR + 7.000% 7.7637% 4/23/27 (e)(g)(h) | | 200,000 | 197,416 |
| Athenahealth Group, Inc.: | | | |
| Tranche B 1LN, term loan U.S. Secured Overnight Fin. Rate (SOFR) Indx + 3.500% 4.009% 2/15/29 (e)(g)(h) | | 333,478 | 328,476 |
| Tranche DD 1LN, term loan U.S. Secured Overnight Fin. Rate (SOFR) Indx + 3.500% 2/15/29 (g)(h)(i)(j) | | 56,522 | 55,674 |
| DG Investment Intermediate Holdings, Inc.: | | | |
| 2LN, term loan 3 month U.S. LIBOR + 6.750% 7.5137% 3/31/29 (e)(g)(h) | | 80,000 | 79,600 |
| Tranche B 1LN, term loan 3 month U.S. LIBOR + 3.500% 4.2637% 3/31/28 (e)(g)(h) | | 14,888 | 14,717 |
| Electro Rent Corp. Tranche B 1LN, term loan 3 month U.S. LIBOR + 5.000% 6.0983% 1/31/24 (e)(g)(h) | | 395,822 | 395,427 |
| Maverick Bidco, Inc. Tranche B 1LN, term loan 3 month U.S. LIBOR + 3.750% 4.9889% 5/18/28 (e)(g)(h) | | 298,500 | 295,703 |
| Park Place Technologies LLC 1LN, term loan 3 month U.S. LIBOR + 5.000% 6% 11/10/27 (e)(g)(h) | | 346,500 | 345,263 |
| Rackspace Technology Global, Inc. Tranche B 1LN, term loan 3 month U.S. LIBOR + 2.750% 3.5% 2/15/28 (e)(g)(h) | | 396,000 | 386,266 |
|
| TOTAL TECHNOLOGY | | | 2,108,632 |
|
| Telecommunications - 1.5% | | | |
| Cablevision Lightpath LLC Tranche B 1LN, term loan 3 month U.S. LIBOR + 3.250% 3.8041% 11/30/27 (e)(g)(h) | | 345,614 | 342,158 |
| Consolidated Communications, Inc. Tranche B 1LN, term loan 3 month U.S. LIBOR + 3.500% 4.3125% 10/2/27 (e)(g)(h) | | 700,000 | 648,025 |
| Intelsat Jackson Holdings SA 1LN, term loan U.S. Secured Overnight Fin. Rate (SOFR) Indx + 4.250% 4.9195% 2/1/29 (e)(g)(h) | | 498,729 | 483,767 |
| Northwest Fiber LLC Tranche B 1LN, term loan 3 month U.S. LIBOR + 3.750% 4.3013% 4/30/27 (e)(g)(h) | | 153,450 | 150,829 |
| Windstream Services LLC Tranche B 1LN, term loan 3 month U.S. LIBOR + 6.250% 7.25% 9/21/27 (e)(g)(h) | | 346,427 | 344,840 |
|
| TOTAL TELECOMMUNICATIONS | | �� | 1,969,619 |
|
| Textiles/Apparel - 0.2% | | | |
| Tory Burch LLC Tranche B 1LN, term loan 3 month U.S. LIBOR + 3.000% 3.7637% 4/14/28 (e)(g)(h) | | 297,750 | 288,073 |
| Utilities - 0.2% | | | |
| Limetree Bay Terminals LLC Tranche B 1LN, term loan 3 month U.S. LIBOR + 4.000% 5% 2/15/24 (e)(g)(h) | | 458,862 | 298,260 |
| PG&E Corp. Tranche B 1LN, term loan 3 month U.S. LIBOR + 3.000% 3.8125% 6/23/25 (e)(g)(h) | | 24,686 | 24,331 |
|
| TOTAL UTILITIES | | | 322,591 |
|
| TOTAL BANK LOAN OBLIGATIONS | | | |
| (Cost $13,360,683) | | | 12,828,460 |
| | | Shares | Value |
|
| Money Market Funds - 5.0% | | | |
| Fidelity Cash Central Fund 0.32% (k) | | | |
| (Cost $6,370,611) | | 6,369,376 | 6,370,650 |
| TOTAL INVESTMENT IN SECURITIES - 99.3% | | | |
| (Cost $132,680,375) | | | 126,662,006 |
| NET OTHER ASSETS (LIABILITIES) - 0.7% | | | 837,626 |
| NET ASSETS - 100% | | | $127,499,632 |
Legend
(a) Restricted securities (including private placements) - Investment in securities not registered under the Securities Act of 1933 (excluding 144A issues). At the end of the period, the value of restricted securities (excluding 144A issues) amounted to $200,194 or 0.2% of net assets.
(b) Level 3 security
(c) Security exempt from registration under Rule 144A of the Securities Act of 1933. These securities may be resold in transactions exempt from registration, normally to qualified institutional buyers. At the end of the period, the value of these securities amounted to $68,951,569 or 54.1% of net assets.
(d) Non-income producing - Security is in default.
(e) Coupon rates for floating and adjustable rate securities reflect the rates in effect at period end.
(f) Non-income producing
(g) Coupon is indexed to a floating interest rate which may be multiplied by a specified factor and/or subject to caps or floors.
(h) Remaining maturities of bank loan obligations may be less than the stated maturities shown as a result of contractual or optional prepayments by the borrower. Such prepayments cannot be predicted with certainty.
(i) The coupon rate will be determined upon settlement of the loan after period end.
(j) Position or a portion of the position represents an unfunded loan commitment. At period end, the total principal amount and market value of unfunded commitments totaled $123,004 and $121,805, respectively.
(k) Affiliated fund that is generally available only to investment companies and other accounts managed by Fidelity Investments. The rate quoted is the annualized seven-day yield of the fund at period end. A complete unaudited listing of the fund's holdings as of its most recent quarter end is available upon request. In addition, each Fidelity Central Fund's financial statements, which are not covered by the Fund's Report of Independent Registered Public Accounting Firm, are available on the SEC's website or upon request.
Additional information on each restricted holding is as follows:
| Security | Acquisition Date | Acquisition Cost |
| Mesquite Energy, Inc. 15% 7/15/23 | 7/10/20 - 1/18/22 | $15,159 |
| Mesquite Energy, Inc. 15% 7/15/23 | 11/5/20 - 1/18/22 | $26,231 |
Affiliated Central Funds
Fiscal year to date information regarding the Fund's investments in Fidelity Central Funds, including the ownership percentage, is presented below.
| Fund | Value, beginning of period | Purchases | Sales Proceeds | Dividend Income | Realized Gain/Loss | Change in Unrealized appreciation (depreciation) | Value, end of period | % ownership, end of period |
| Fidelity Cash Central Fund 0.32% | $8,444,980 | $107,892,400 | $109,966,730 | $6,118 | $-- | $-- | $6,370,650 | 0.0% |
| Total | $8,444,980 | $107,892,400 | $109,966,730 | $6,118 | $-- | $-- | $6,370,650 | |
Amounts in the income column in the above table include any capital gain distributions from underlying funds, which are presented in the corresponding line-item in the Statement of Operations, if applicable.
Investment Valuation
The following is a summary of the inputs used, as of April 30, 2022, involving the Fund's assets and liabilities carried at fair value. The inputs or methodology used for valuing securities may not be an indication of the risk associated with investing in those securities. For more information on valuation inputs, and their aggregation into the levels used below, please refer to the Investment Valuation section in the accompanying Notes to Financial Statements.
| | Valuation Inputs at Reporting Date: |
| Description | Total | Level 1 | Level 2 | Level 3 |
| Investments in Securities: | | | | |
| Equities: | | | | |
| Energy | $107,215 | $24 | $-- | $107,191 |
| Financials | 2,823 | -- | -- | 2,823 |
| Corporate Bonds | 107,352,858 | -- | 107,152,664 | 200,194 |
| Bank Loan Obligations | 12,828,460 | -- | 12,547,111 | 281,349 |
| Money Market Funds | 6,370,650 | 6,370,650 | -- | -- |
| Total Investments in Securities: | $126,662,006 | $6,370,674 | $119,699,775 | $591,557 |
See accompanying notes which are an integral part of the financial statements.
Financial Statements
Statement of Assets and Liabilities
| | | April 30, 2022 |
| Assets | | |
Investment in securities, at value — See accompanying schedule:
Unaffiliated issuers (cost $126,309,764) | $120,291,356 | |
| Fidelity Central Funds (cost $6,370,611) | 6,370,650 | |
| Total Investment in Securities (cost $132,680,375) | | $126,662,006 |
| Cash | | 30,956 |
| Receivable for investments sold | | 25,080 |
| Receivable for fund shares sold | | 172,449 |
| Interest receivable | | 1,614,158 |
| Distributions receivable from Fidelity Central Funds | | 1,520 |
| Prepaid expenses | | 39 |
| Receivable from investment adviser for expense reductions | | 9,871 |
| Total assets | | 128,516,079 |
| Liabilities | | |
| Payable for investments purchased | $605,504 | |
| Payable for fund shares redeemed | 267,664 | |
| Distributions payable | 48,692 | |
| Accrued management fee | 57,494 | |
| Distribution and service plan fees payable | 8,330 | |
| Other affiliated payables | 15,648 | |
| Other payables and accrued expenses | 13,115 | |
| Total liabilities | | 1,016,447 |
| Net Assets | | $127,499,632 |
| Net Assets consist of: | | |
| Paid in capital | | $141,452,607 |
| Total accumulated earnings (loss) | | (13,952,975) |
| Net Assets | | $127,499,632 |
| Net Asset Value and Maximum Offering Price | | |
| Class A: | | |
| Net Asset Value and redemption price per share ($22,553,544 ÷ 2,511,942 shares)(a) | | $8.98 |
| Maximum offering price per share (100/96.00 of $8.98) | | $9.35 |
| Class M: | | |
| Net Asset Value and redemption price per share ($2,811,911 ÷ 313,129 shares)(a) | | $8.98 |
| Maximum offering price per share (100/96.00 of $8.98) | | $9.35 |
| Class C: | | |
| Net Asset Value and offering price per share ($3,883,916 ÷ 432,396 shares)(a) | | $8.98 |
| Short Duration High Income: | | |
| Net Asset Value, offering price and redemption price per share ($87,949,014 ÷ 9,795,666 shares) | | $8.98 |
| Class I: | | |
| Net Asset Value, offering price and redemption price per share ($5,054,841 ÷ 562,819 shares) | | $8.98 |
| Class Z: | | |
| Net Asset Value, offering price and redemption price per share ($5,246,406 ÷ 584,245 shares) | | $8.98 |
(a) Redemption price per share is equal to net asset value less any applicable contingent deferred sales charge.
See accompanying notes which are an integral part of the financial statements.
Statement of Operations
| | | Year ended April 30, 2022 |
| Investment Income | | |
| Interest | | $5,474,611 |
| Income from Fidelity Central Funds | | 6,118 |
| Total income | | 5,480,729 |
| Expenses | | |
| Management fee | $701,632 | |
| Transfer agent fees | 139,805 | |
| Distribution and service plan fees | 92,941 | |
| Accounting fees and expenses | 53,252 | |
| Custodian fees and expenses | 9,280 | |
| Independent trustees' fees and expenses | 435 | |
| Registration fees | 95,435 | |
| Audit | 72,033 | |
| Legal | 3,560 | |
| Miscellaneous | 534 | |
| Total expenses before reductions | 1,168,907 | |
| Expense reductions | (112,951) | |
| Total expenses after reductions | | 1,055,956 |
| Net investment income (loss) | | 4,424,773 |
| Realized and Unrealized Gain (Loss) | | |
| Net realized gain (loss) on: | | |
| Investment securities: | | |
| Unaffiliated issuers | 118,598 | |
| Total net realized gain (loss) | | 118,598 |
| Change in net unrealized appreciation (depreciation) on investment securities | | (7,771,418) |
| Net gain (loss) | | (7,652,820) |
| Net increase (decrease) in net assets resulting from operations | | $(3,228,047) |
See accompanying notes which are an integral part of the financial statements.
Statement of Changes in Net Assets
| | Year ended April 30, 2022 | Year ended April 30, 2021 |
| Increase (Decrease) in Net Assets | | |
| Operations | | |
| Net investment income (loss) | $4,424,773 | $3,301,513 |
| Net realized gain (loss) | 118,598 | 25,815 |
| Change in net unrealized appreciation (depreciation) | (7,771,418) | 6,495,414 |
| Net increase (decrease) in net assets resulting from operations | (3,228,047) | 9,822,742 |
| Distributions to shareholders | (4,340,504) | (3,306,762) |
| Share transactions - net increase (decrease) | 19,732,716 | 20,408,754 |
| Total increase (decrease) in net assets | 12,164,165 | 26,924,734 |
| Net Assets | | |
| Beginning of period | 115,335,467 | 88,410,733 |
| End of period | $127,499,632 | $115,335,467 |
See accompanying notes which are an integral part of the financial statements.
Financial Highlights
Fidelity Short Duration High Income Fund Class A
| Years ended April 30, | 2022 | 2021 | 2020 | 2019 | 2018 |
| Selected Per–Share Data | | | | | |
| Net asset value, beginning of period | $9.52 | $8.87 | $9.44 | $9.42 | $9.57 |
| Income from Investment Operations | | | | | |
| Net investment income (loss)A,B | .307 | .300 | .348 | .409 | .381 |
| Net realized and unrealized gain (loss) | (.546) | .651 | (.571) | .004 | (.159) |
| Total from investment operations | (.239) | .951 | (.223) | .413 | .222 |
| Distributions from net investment income | (.301) | (.301) | (.347) | (.393) | (.373) |
| Total distributions | (.301) | (.301) | (.347) | (.393) | (.373) |
| Redemption fees added to paid in capitalA | – | – | – | – | .001 |
| Net asset value, end of period | $8.98 | $9.52 | $8.87 | $9.44 | $9.42 |
| Total ReturnC,D | (2.60)% | 10.83% | (2.47)% | 4.52% | 2.36% |
| Ratios to Average Net AssetsB,E,F | | | | | |
| Expenses before reductions | 1.13% | 1.15% | 1.15% | 1.15% | 1.16% |
| Expenses net of fee waivers, if any | 1.01% | 1.05% | 1.05% | 1.05% | 1.05% |
| Expenses net of all reductions | 1.01% | 1.05% | 1.05% | 1.05% | 1.05% |
| Net investment income (loss) | 3.27% | 3.21% | 3.74% | 4.37% | 4.00% |
| Supplemental Data | | | | | |
| Net assets, end of period (000 omitted) | $22,554 | $17,126 | $12,603 | $15,050 | $12,351 |
| Portfolio turnover rateG | 42% | 74% | 77% | 33% | 65% |
A Calculated based on average shares outstanding during the period.
B Net investment income (loss) is affected by the timing of the declaration of dividends by any underlying mutual funds or exchange-traded funds (ETFs). Net investment income (loss) of any such underlying funds is not included in the Fund's net investment income (loss) ratio.
C Total returns would have been lower if certain expenses had not been reduced during the applicable periods shown.
D Total returns do not include the effect of the sales charges.
E Fees and expenses of any underlying mutual funds or exchange-traded funds (ETFs) are not included in the Fund's expense ratio. The Fund indirectly bears its proportionate share of these expenses. For additional expense information related to investments in Fidelity Central Funds, please refer to the "Investments in Fidelity Central Funds" note found in the Notes to Financial Statements section of the most recent Annual or Semi-Annual report.
F Expense ratios reflect operating expenses of the class. Expenses before reductions do not reflect amounts reimbursed, waived, or reduced through arrangements with the investment adviser, brokerage services, or other offset arrangements, if applicable, and do not represent the amount paid by the class during periods when reimbursements, waivers or reductions occur.
G Amount does not include the portfolio activity of any underlying mutual funds or exchange-traded funds (ETFs).
See accompanying notes which are an integral part of the financial statements.
Fidelity Short Duration High Income Fund Class M
| Years ended April 30, | 2022 | 2021 | 2020 | 2019 | 2018 |
| Selected Per–Share Data | | | | | |
| Net asset value, beginning of period | $9.52 | $8.86 | $9.44 | $9.42 | $9.57 |
| Income from Investment Operations | | | | | |
| Net investment income (loss)A,B | .307 | .300 | .348 | .408 | .382 |
| Net realized and unrealized gain (loss) | (.546) | .661 | (.581) | .005 | (.160) |
| Total from investment operations | (.239) | .961 | (.233) | .413 | .222 |
| Distributions from net investment income | (.301) | (.301) | (.347) | (.393) | (.373) |
| Total distributions | (.301) | (.301) | (.347) | (.393) | (.373) |
| Redemption fees added to paid in capitalA | – | – | – | – | .001 |
| Net asset value, end of period | $8.98 | $9.52 | $8.86 | $9.44 | $9.42 |
| Total ReturnC,D | (2.60)% | 10.96% | (2.58)% | 4.52% | 2.36% |
| Ratios to Average Net AssetsB,E,F | | | | | |
| Expenses before reductions | 1.13% | 1.17% | 1.16% | 1.16% | 1.16% |
| Expenses net of fee waivers, if any | 1.01% | 1.05% | 1.05% | 1.05% | 1.05% |
| Expenses net of all reductions | 1.01% | 1.05% | 1.05% | 1.05% | 1.05% |
| Net investment income (loss) | 3.27% | 3.21% | 3.74% | 4.37% | 4.00% |
| Supplemental Data | | | | | |
| Net assets, end of period (000 omitted) | $2,812 | $2,289 | $2,106 | $2,537 | $2,081 |
| Portfolio turnover rateG | 42% | 74% | 77% | 33% | 65% |
A Calculated based on average shares outstanding during the period.
B Net investment income (loss) is affected by the timing of the declaration of dividends by any underlying mutual funds or exchange-traded funds (ETFs). Net investment income (loss) of any such underlying funds is not included in the Fund's net investment income (loss) ratio.
C Total returns would have been lower if certain expenses had not been reduced during the applicable periods shown.
D Total returns do not include the effect of the sales charges.
E Fees and expenses of any underlying mutual funds or exchange-traded funds (ETFs) are not included in the Fund's expense ratio. The Fund indirectly bears its proportionate share of these expenses. For additional expense information related to investments in Fidelity Central Funds, please refer to the "Investments in Fidelity Central Funds" note found in the Notes to Financial Statements section of the most recent Annual or Semi-Annual report.
F Expense ratios reflect operating expenses of the class. Expenses before reductions do not reflect amounts reimbursed, waived, or reduced through arrangements with the investment adviser, brokerage services, or other offset arrangements, if applicable, and do not represent the amount paid by the class during periods when reimbursements, waivers or reductions occur.
G Amount does not include the portfolio activity of any underlying mutual funds or exchange-traded funds (ETFs).
See accompanying notes which are an integral part of the financial statements.
Fidelity Short Duration High Income Fund Class C
| Years ended April 30, | 2022 | 2021 | 2020 | 2019 | 2018 |
| Selected Per–Share Data | | | | | |
| Net asset value, beginning of period | $9.52 | $8.87 | $9.44 | $9.42 | $9.57 |
| Income from Investment Operations | | | | | |
| Net investment income (loss)A,B | .237 | .230 | .278 | .338 | .310 |
| Net realized and unrealized gain (loss) | (.546) | .651 | (.571) | .005 | (.159) |
| Total from investment operations | (.309) | .881 | (.293) | .343 | .151 |
| Distributions from net investment income | (.231) | (.231) | (.277) | (.323) | (.302) |
| Total distributions | (.231) | (.231) | (.277) | (.323) | (.302) |
| Redemption fees added to paid in capitalA | – | – | – | – | .001 |
| Net asset value, end of period | $8.98 | $9.52 | $8.87 | $9.44 | $9.42 |
| Total ReturnC,D | (3.33)% | 10.01% | (3.20)% | 3.74% | 1.59% |
| Ratios to Average Net AssetsB,E,F | | | | | |
| Expenses before reductions | 1.91% | 1.94% | 1.93% | 1.92% | 1.93% |
| Expenses net of fee waivers, if any | 1.76% | 1.80% | 1.80% | 1.80% | 1.80% |
| Expenses net of all reductions | 1.76% | 1.80% | 1.80% | 1.80% | 1.80% |
| Net investment income (loss) | 2.52% | 2.46% | 2.99% | 3.61% | 3.25% |
| Supplemental Data | | | | | |
| Net assets, end of period (000 omitted) | $3,884 | $4,018 | $4,017 | $4,541 | $5,146 |
| Portfolio turnover rateG | 42% | 74% | 77% | 33% | 65% |
A Calculated based on average shares outstanding during the period.
B Net investment income (loss) is affected by the timing of the declaration of dividends by any underlying mutual funds or exchange-traded funds (ETFs). Net investment income (loss) of any such underlying funds is not included in the Fund's net investment income (loss) ratio.
C Total returns would have been lower if certain expenses had not been reduced during the applicable periods shown.
D Total returns do not include the effect of the contingent deferred sales charge.
E Fees and expenses of any underlying mutual funds or exchange-traded funds (ETFs) are not included in the Fund's expense ratio. The Fund indirectly bears its proportionate share of these expenses. For additional expense information related to investments in Fidelity Central Funds, please refer to the "Investments in Fidelity Central Funds" note found in the Notes to Financial Statements section of the most recent Annual or Semi-Annual report.
F Expense ratios reflect operating expenses of the class. Expenses before reductions do not reflect amounts reimbursed, waived, or reduced through arrangements with the investment adviser, brokerage services, or other offset arrangements, if applicable, and do not represent the amount paid by the class during periods when reimbursements, waivers or reductions occur.
G Amount does not include the portfolio activity of any underlying mutual funds or exchange-traded funds (ETFs).
See accompanying notes which are an integral part of the financial statements.
Fidelity Short Duration High Income Fund
| Years ended April 30, | 2022 | 2021 | 2020 | 2019 | 2018 |
| Selected Per–Share Data | | | | | |
| Net asset value, beginning of period | $9.52 | $8.87 | $9.44 | $9.42 | $9.57 |
| Income from Investment Operations | | | | | |
| Net investment income (loss)A,B | .331 | .323 | .372 | .431 | .405 |
| Net realized and unrealized gain (loss) | (.546) | .651 | (.572) | .006 | (.159) |
| Total from investment operations | (.215) | .974 | (.200) | .437 | .246 |
| Distributions from net investment income | (.325) | (.324) | (.370) | (.417) | (.397) |
| Total distributions | (.325) | (.324) | (.370) | (.417) | (.397) |
| Redemption fees added to paid in capitalA | – | – | – | – | .001 |
| Net asset value, end of period | $8.98 | $9.52 | $8.87 | $9.44 | $9.42 |
| Total ReturnC | (2.35)% | 11.11% | (2.23)% | 4.78% | 2.61% |
| Ratios to Average Net AssetsB,D,E | | | | | |
| Expenses before reductions | .83% | .87% | .86% | .86% | .86% |
| Expenses net of fee waivers, if any | .75% | .80% | .80% | .80% | .80% |
| Expenses net of all reductions | .75% | .80% | .80% | .80% | .80% |
| Net investment income (loss) | 3.52% | 3.46% | 3.99% | 4.61% | 4.25% |
| Supplemental Data | | | | | |
| Net assets, end of period (000 omitted) | $87,949 | $83,066 | $63,703 | $88,429 | $83,652 |
| Portfolio turnover rateF | 42% | 74% | 77% | 33% | 65% |
A Calculated based on average shares outstanding during the period.
B Net investment income (loss) is affected by the timing of the declaration of dividends by any underlying mutual funds or exchange-traded funds (ETFs). Net investment income (loss) of any such underlying funds is not included in the Fund's net investment income (loss) ratio.
C Total returns would have been lower if certain expenses had not been reduced during the applicable periods shown.
D Fees and expenses of any underlying mutual funds or exchange-traded funds (ETFs) are not included in the Fund's expense ratio. The Fund indirectly bears its proportionate share of these expenses. For additional expense information related to investments in Fidelity Central Funds, please refer to the "Investments in Fidelity Central Funds" note found in the Notes to Financial Statements section of the most recent Annual or Semi-Annual report.
E Expense ratios reflect operating expenses of the class. Expenses before reductions do not reflect amounts reimbursed, waived, or reduced through arrangements with the investment adviser, brokerage services, or other offset arrangements, if applicable, and do not represent the amount paid by the class during periods when reimbursements, waivers or reductions occur.
F Amount does not include the portfolio activity of any underlying mutual funds or exchange-traded funds (ETFs).
See accompanying notes which are an integral part of the financial statements.
Fidelity Short Duration High Income Fund Class I
| Years ended April 30, | 2022 | 2021 | 2020 | 2019 | 2018 |
| Selected Per–Share Data | | | | | |
| Net asset value, beginning of period | $9.52 | $8.87 | $9.44 | $9.42 | $9.57 |
| Income from Investment Operations | | | | | |
| Net investment income (loss)A,B | .331 | .323 | .372 | .430 | .406 |
| Net realized and unrealized gain (loss) | (.546) | .651 | (.572) | .007 | (.160) |
| Total from investment operations | (.215) | .974 | (.200) | .437 | .246 |
| Distributions from net investment income | (.325) | (.324) | (.370) | (.417) | (.397) |
| Total distributions | (.325) | (.324) | (.370) | (.417) | (.397) |
| Redemption fees added to paid in capitalA | – | – | – | – | .001 |
| Net asset value, end of period | $8.98 | $9.52 | $8.87 | $9.44 | $9.42 |
| Total ReturnC | (2.35)% | 11.11% | (2.23)% | 4.78% | 2.61% |
| Ratios to Average Net AssetsB,D,E | | | | | |
| Expenses before reductions | .88% | .92% | .89% | .89% | .91% |
| Expenses net of fee waivers, if any | .76% | .80% | .80% | .80% | .80% |
| Expenses net of all reductions | .76% | .80% | .80% | .80% | .80% |
| Net investment income (loss) | 3.52% | 3.46% | 3.99% | 4.60% | 4.25% |
| Supplemental Data | | | | | |
| Net assets, end of period (000 omitted) | $5,055 | $5,023 | $3,950 | $4,060 | $4,686 |
| Portfolio turnover rateF | 42% | 74% | 77% | 33% | 65% |
A Calculated based on average shares outstanding during the period.
B Net investment income (loss) is affected by the timing of the declaration of dividends by any underlying mutual funds or exchange-traded funds (ETFs). Net investment income (loss) of any such underlying funds is not included in the Fund's net investment income (loss) ratio.
C Total returns would have been lower if certain expenses had not been reduced during the applicable periods shown.
D Fees and expenses of any underlying mutual funds or exchange-traded funds (ETFs) are not included in the Fund's expense ratio. The Fund indirectly bears its proportionate share of these expenses. For additional expense information related to investments in Fidelity Central Funds, please refer to the "Investments in Fidelity Central Funds" note found in the Notes to Financial Statements section of the most recent Annual or Semi-Annual report.
E Expense ratios reflect operating expenses of the class. Expenses before reductions do not reflect amounts reimbursed, waived, or reduced through arrangements with the investment adviser, brokerage services, or other offset arrangements, if applicable, and do not represent the amount paid by the class during periods when reimbursements, waivers or reductions occur.
F Amount does not include the portfolio activity of any underlying mutual funds or exchange-traded funds (ETFs).
See accompanying notes which are an integral part of the financial statements.
Fidelity Short Duration High Income Fund Class Z
| Years ended April 30, | 2022 | 2021 | 2020 | 2019 A |
| Selected Per–Share Data | | | | |
| Net asset value, beginning of period | $9.52 | $8.87 | $9.45 | $9.46 |
| Income from Investment Operations | | | | |
| Net investment income (loss)B,C | .339 | .331 | .378 | .261 |
| Net realized and unrealized gain (loss) | (.546) | .652 | (.579) | (.016) |
| Total from investment operations | (.207) | .983 | (.201) | .245 |
| Distributions from net investment income | (.333) | (.333) | (.379) | (.255) |
| Total distributions | (.333) | (.333) | (.379) | (.255) |
| Net asset value, end of period | $8.98 | $9.52 | $8.87 | $9.45 |
| Total ReturnD,E | (2.27)% | 11.21% | (2.24)% | 2.67% |
| Ratios to Average Net AssetsC,F,G | | | | |
| Expenses before reductions | .78% | .80% | .80% | .82%H |
| Expenses net of fee waivers, if any | .66% | .71% | .71% | .71%H |
| Expenses net of all reductions | .66% | .71% | .71% | .71%H |
| Net investment income (loss) | 3.61% | 3.55% | 4.08% | 4.86%H |
| Supplemental Data | | | | |
| Net assets, end of period (000 omitted) | $5,246 | $3,815 | $2,031 | $425 |
| Portfolio turnover rateI | 42% | 74% | 77% | 33% |
A For the period October 2, 2018 (commencement of sale of shares) through April 30, 2019.
B Calculated based on average shares outstanding during the period.
C Net investment income (loss) is affected by the timing of the declaration of dividends by any underlying mutual funds or exchange-traded funds (ETFs). Net investment income (loss) of any such underlying funds is not included in the Fund's net investment income (loss) ratio.
D Total returns for periods of less than one year are not annualized.
E Total returns would have been lower if certain expenses had not been reduced during the applicable periods shown.
F Fees and expenses of any underlying mutual funds or exchange-traded funds (ETFs) are not included in the Fund's expense ratio. The Fund indirectly bears its proportionate share of these expenses. For additional expense information related to investments in Fidelity Central Funds, please refer to the "Investments in Fidelity Central Funds" note found in the Notes to Financial Statements section of the most recent Annual or Semi-Annual report.
G Expense ratios reflect operating expenses of the class. Expenses before reductions do not reflect amounts reimbursed, waived, or reduced through arrangements with the investment adviser, brokerage services, or other offset arrangements, if applicable, and do not represent the amount paid by the class during periods when reimbursements, waivers or reductions occur.
H Annualized
I Amount does not include the portfolio activity of any underlying mutual funds or exchange-traded funds (ETFs).
See accompanying notes which are an integral part of the financial statements.
Notes to Financial Statements
For the period ended April 30, 2022
1. Organization.
Fidelity Short Duration High Income Fund (the Fund) is a fund of Fidelity Summer Street Trust (the Trust) and is authorized to issue an unlimited number of shares. The Trust is registered under the Investment Company Act of 1940, as amended (the 1940 Act), as an open-end management investment company organized as a Massachusetts business trust. The Fund offers Class A, Class M, Class C, Short Duration High Income, Class I and Class Z shares, each of which has equal rights as to assets and voting privileges. Each class has exclusive voting rights with respect to matters that affect that class. Effective June 21, 2021, Class C shares will automatically convert to Class A shares after a holding period of eight years from the initial date of purchase, with certain exceptions. Prior to June 21, 2021, Class C shares automatically converted to Class A shares after a holding period of ten years from the initial date of purchase, with certain exceptions.
2. Investments in Fidelity Central Funds.
Funds may invest in Fidelity Central Funds, which are open-end investment companies generally available only to other investment companies and accounts managed by the investment adviser and its affiliates. The Schedule of Investments lists any Fidelity Central Funds held as an investment as of period end, but does not include the underlying holdings of each Fidelity Central Fund. An investing fund indirectly bears its proportionate share of the expenses of the underlying Fidelity Central Funds.
Based on its investment objective, each Fidelity Central Fund may invest or participate in various investment vehicles or strategies that are similar to those of the investing fund. These strategies are consistent with the investment objectives of the investing fund and may involve certain economic risks which may cause a decline in value of each of the Fidelity Central Funds and thus a decline in the value of the investing fund.
| Fidelity Central Fund | Investment Manager | Investment Objective | Investment Practices | Expense Ratio(a) |
| Fidelity Money Market Central Funds | Fidelity Management & Research Company LLC (FMR) | Each fund seeks to obtain a high level of current income consistent with the preservation of capital and liquidity. | Short-term Investments | Less than .005% |
(a) Expenses expressed as a percentage of average net assets and are as of each underlying Central Fund's most recent annual or semi-annual shareholder report.
A complete unaudited list of holdings for each Fidelity Central Fund is available upon request or at the Securities and Exchange Commission website at www.sec.gov. In addition, the financial statements of the Fidelity Central Funds which contain the significant accounting policies (including investment valuation policies) of those funds, and are not covered by the Report of Independent Registered Public Accounting Firm, are available on the Securities and Exchange Commission website or upon request.
3. Significant Accounting Policies.
The Fund is an investment company and applies the accounting and reporting guidance of the Financial Accounting Standards Board (FASB) Accounting Standards Codification Topic 946 Financial Services - Investment Companies. The financial statements have been prepared in conformity with accounting principles generally accepted in the United States of America (GAAP), which require management to make certain estimates and assumptions at the date of the financial statements. Actual results could differ from those estimates. Subsequent events, if any, through the date that the financial statements were issued have been evaluated in the preparation of the financial statements. The Fund's Schedule of Investments lists any underlying mutual funds or exchange-traded funds (ETFs) but does not include the underlying holdings of these funds. The following summarizes the significant accounting policies of the Fund:
Investment Valuation. Investments are valued as of 4:00 p.m. Eastern time on the last calendar day of the period. The Board of Trustees (the Board) has delegated the day to day responsibility for the valuation of the Fund's investments to the Fair Value Committee (the Committee) established by the Fund's investment adviser. In accordance with valuation policies and procedures approved by the Board, the Fund attempts to obtain prices from one or more third party pricing vendors or brokers to value its investments. When current market prices, quotations or currency exchange rates are not readily available or reliable, investments will be fair valued in good faith by the Committee, in accordance with procedures adopted by the Board. Factors used in determining fair value vary by investment type and may include market or investment specific events, changes in interest rates and credit quality. The frequency with which these procedures are used cannot be predicted and they may be utilized to a significant extent. The Committee oversees the Fund's valuation policies and procedures and reports to the Board on the Committee's activities and fair value determinations. The Board monitors the appropriateness of the procedures used in valuing the Fund's investments and ratifies the fair value determinations of the Committee.
The Fund categorizes the inputs to valuation techniques used to value its investments into a disclosure hierarchy consisting of three levels as shown below:
- Level 1 – unadjusted quoted prices in active markets for identical investments
- Level 2 – other significant observable inputs (including quoted prices for similar investments, interest rates, prepayment speeds, etc.)
- Level 3 – unobservable inputs (including the Fund's own assumptions based on the best information available)
Valuation techniques used to value the Fund's investments by major category are as follows:
Debt securities, including restricted securities, are valued based on evaluated prices received from third party pricing vendors or from brokers who make markets in such securities. Corporate bonds and bank loan obligations are valued by pricing vendors who utilize matrix pricing which considers yield or price of bonds of comparable quality, coupon, maturity and type or by broker-supplied prices. When independent prices are unavailable or unreliable, debt securities may be valued utilizing pricing methodologies which consider similar factors that would be used by third party pricing vendors. Debt securities are generally categorized as Level 2 in the hierarchy but may be Level 3 depending on the circumstances. The Fund invests a significant portion of its assets in below investment grade securities. The value of these securities can be more volatile due to changes in the credit quality of the issuer and is sensitive to changes in economic, market and regulatory conditions.
Equity securities, including restricted securities, for which market quotations are readily available, are valued at the last reported sale price or official closing price as reported by a third party pricing vendor on the primary market or exchange on which they are traded and are categorized as Level 1 in the hierarchy. In the event there were no sales during the day or closing prices are not available, securities are valued at the last quoted bid price or may be valued using the last available price and are generally categorized as Level 2 in the hierarchy. For foreign equity securities, when market or security specific events arise, comparisons to the valuation of American Depositary Receipts (ADRs), futures contracts, ETFs and certain indexes as well as quoted prices for similar securities may be used and would be categorized as Level 2 in the hierarchy. For equity securities, including restricted securities, where observable inputs are limited, assumptions about market activity and risk are used and these securities may be categorized as Level 3 in the hierarchy.
Investments in open-end mutual funds, including the Fidelity Central Funds, are valued at their closing net asset value (NAV) each business day and are categorized as Level 1 in the hierarchy.
Changes in valuation techniques may result in transfers in or out of an assigned level within the disclosure hierarchy. The aggregate value of investments by input level as of April 30, 2022 is included at the end of the Fund's Schedule of Investments.
Investment Transactions and Income. For financial reporting purposes, the Fund's investment holdings and NAV include trades executed through the end of the last business day of the period. The NAV per share for processing shareholder transactions is calculated as of the close of business of the New York Stock Exchange (NYSE), normally 4:00 p.m. Eastern time and includes trades executed through the end of the prior business day. Gains and losses on securities sold are determined on the basis of identified cost. Commissions paid to certain brokers with whom the investment adviser, or its affiliates, places trades on behalf of a fund include an amount in addition to trade execution, which may be rebated back to a fund. Any such rebates are included in net realized gain (loss) on investments in the Statement of Operations. Income and capital gain distributions from Fidelity Central Funds, if any, are recorded on the ex-dividend date. Interest income is accrued as earned and includes coupon interest and amortization of premium and accretion of discount on debt securities as applicable. Debt obligations may be placed on non-accrual status and related interest income may be reduced by ceasing current accruals and writing off interest receivables when the collection of all or a portion of interest has become doubtful based on consistently applied procedures. A debt obligation is removed from non-accrual status when the issuer resumes interest payments or when collectability of interest is reasonably assured.
Class Allocations and Expenses. Investment income, realized and unrealized capital gains and losses, common expenses of a fund, and certain fund-level expense reductions, if any, are allocated daily on a pro-rata basis to each class based on the relative net assets of each class to the total net assets of a fund. Each class differs with respect to transfer agent and distribution and service plan fees incurred, as applicable. Certain expense reductions may also differ by class, if applicable. For the reporting period, the allocated portion of income and expenses to each class as a percent of its average net assets may vary due to the timing of recording these transactions in relation to fluctuating net assets of the classes. Expenses directly attributable to a fund are charged to that fund. Expenses attributable to more than one fund are allocated among the respective funds on the basis of relative net assets or other appropriate methods. Expenses included in the accompanying financial statements reflect the expenses of that fund and do not include any expenses associated with any underlying mutual funds or exchange-traded funds. Although not included in a fund's expenses, a fund indirectly bears its proportionate share of these expenses through the net asset value of each underlying mutual fund or exchange-traded fund. Expense estimates are accrued in the period to which they relate and adjustments are made when actual amounts are known.
Income Tax Information and Distributions to Shareholders. Each year, the Fund intends to qualify as a regulated investment company under Subchapter M of the Internal Revenue Code, including distributing substantially all of its taxable income and realized gains. As a result, no provision for U.S. Federal income taxes is required. As of April 30, 2022, the Fund did not have any unrecognized tax benefits in the financial statements; nor is the Fund aware of any tax positions for which it is reasonably possible that the total amounts of unrecognized tax benefits will significantly change in the next twelve months. The Fund files a U.S. federal tax return, in addition to state and local tax returns as required. The Fund's federal income tax returns are subject to examination by the Internal Revenue Service (IRS) for a period of three fiscal years after they are filed. State and local tax returns may be subject to examination for an additional fiscal year depending on the jurisdiction.
Distributions are declared and recorded daily and paid monthly from net investment income. Distributions from realized gains, if any, are declared and recorded on the ex-dividend date. Income and capital gain distributions are declared separately for each class. Income and capital gain distributions are determined in accordance with income tax regulations, which may differ from GAAP.
Capital accounts within the financial statements are adjusted for permanent book-tax differences. These adjustments have no impact on net assets or the results of operations. Capital accounts are not adjusted for temporary book-tax differences which will reverse in a subsequent period.
Book-tax differences are primarily due to market discount, capital loss carryforwards, and losses deferred due to wash sales.
As of period end, the cost and unrealized appreciation (depreciation) in securities, and derivatives if applicable, for federal income tax purposes were as follows:
| Gross unrealized appreciation | $865,441 |
| Gross unrealized depreciation | (6,708,565) |
| Net unrealized appreciation (depreciation) | $(5,843,124) |
| Tax Cost | $132,505,130 |
The tax-based components of distributable earnings as of period end were as follows:
| Undistributed ordinary income | $69,520 |
| Capital loss carryforward | $(8,179,371) |
| Net unrealized appreciation (depreciation) on securities and other investments | $(5,843,124) |
Capital loss carryforwards are only available to offset future capital gains of the Fund to the extent provided by regulations and may be limited. The capital loss carryforward information presented below, including any applicable limitation, is estimated as of fiscal period end and is subject to adjustment.
| No expiration | |
| Short-term | $(3,792,571) |
| Long-term | (4,386,800) |
| Total capital loss carryforward | $(8,179,371) |
The tax character of distributions paid was as follows:
| | April 30, 2022 | April 30,2021 |
| Ordinary Income | $4,340,504 | $ 3,306,762 |
Restricted Securities (including Private Placements). Funds may invest in securities that are subject to legal or contractual restrictions on resale. These securities generally may be resold in transactions exempt from registration or to the public if the securities are registered. Disposal of these securities may involve time-consuming negotiations and expense, and prompt sale at an acceptable price may be difficult. Information regarding restricted securities held at period end is included at the end of the Schedule of Investments, if applicable.
Loans and Other Direct Debt Instruments. Direct debt instruments are interests in amounts owed to lenders by corporate or other borrowers. These instruments may be in the form of loans, trade claims or other receivables and may include standby financing commitments such as revolving credit facilities that obligate a fund to supply additional cash to the borrower on demand. Loans may be acquired through assignment, participation, or may be made directly to a borrower. Such instruments are presented in the Bank Loan Obligations section in the Schedule of Investments. Certain funds may also invest in unfunded loan commitments, which are contractual obligations for future funding. Information regarding unfunded commitments is included at the end of the Schedule of Investments, if applicable.
4. Purchases and Sales of Investments.
Purchases and sales of securities, other than short-term securities and in-kind transactions, as applicable, are noted in the table below.
| | Purchases ($) | Sales ($) |
| Fidelity Short Duration High Income Fund | 71,250,913 | 50,683,956 |
5. Fees and Other Transactions with Affiliates.
Management Fee. Fidelity Management & Research Company LLC (the investment adviser) and its affiliates provide the Fund with investment management related services for which the Fund pays a monthly management fee. The management fee is the sum of an individual fund fee rate that is based on an annual rate of .45% of the Fund's average net assets and an annualized group fee rate that averaged .10% during the period. The group fee rate is based upon the monthly average net assets of a group of registered investment companies with which the investment adviser has management contracts. The group fee rate decreases as assets under management increase and increases as assets under management decrease. For the reporting period, the total annual management fee rate was .55% of the Fund's average net assets.
Distribution and Service Plan Fees. In accordance with Rule 12b-1 of the 1940 Act, the Fund has adopted separate Distribution and Service Plans for each class of shares. Certain classes pay Fidelity Distributors Company LLC (FDC), an affiliate of the investment adviser, separate Distribution and Service Fees, each of which is based on an annual percentage of each class' average net assets. In addition, FDC may pay financial intermediaries for selling shares of the Fund and providing shareholder support services. For the period, the Distribution and Service Fee rates, total fees and amounts retained by FDC were as follows:
| | Distribution Fee | Service Fee | Total Fees | Retained by FDC |
| Class A | -% | .25% | $47,902 | $5,029 |
| Class M | -% | .25% | 6,036 | 25 |
| Class C | .75% | .25% | 39,003 | 11,024 |
| | | | $92,941 | $16,078 |
Sales Load. FDC may receive a front-end sales charge of up to 4.00% for selling Class A shares and Class M shares, some of which is paid to financial intermediaries for selling shares of the Fund. Depending on the holding period, FDC may receive contingent deferred sales charges levied on Class A, Class M and Class C redemptions. The deferred sales charges are 1.00% for Class C shares, 1.00% for certain purchases of Class A shares and .25% for certain purchases of Class M shares.
For the period, sales charge amounts retained by FDC were as follows:
| | Retained by FDC |
| Class A | $3,415 |
| Class M | 82 |
| Class C(a) | 135 |
| | $3,632 |
(a) When Class C shares are initially sold, FDC pays commissions from its own resources to financial intermediaries through which the sales are made.
Transfer Agent Fees. Fidelity Investments Institutional Operations Company LLC (FIIOC), an affiliate of the investment adviser, is the transfer, dividend disbursing and shareholder servicing agent for each class of the Fund. FIIOC receives account fees and asset-based fees that vary according to the account size and type of account of the shareholders of the respective classes of the Fund, except for Class Z. FIIOC receives an asset-based fee of Class Z's average net assets. FIIOC pays for typesetting, printing and mailing of shareholder reports, except proxy statements.
For the period, transfer agent fees for each class were as follows:
| | Amount | % of Class-Level Average Net Assets |
| Class A | $28,045 | .15 |
| Class M | 3,501 | .15 |
| Class C | 7,042 | .18 |
| Short Duration High Income | 91,175 | .10 |
| Class I | 7,849 | .15 |
| Class Z | 2,193 | .05 |
| | $139,805 | |
Accounting Fees. Fidelity Service Company, Inc. (FSC), an affiliate of the investment adviser, maintains the Fund's accounting records. The accounting fee is based on the level of average net assets for each month. For the period, the fees were equivalent to the following annual rates:
| | % of Average Net Assets |
| Fidelity Short Duration High Income Fund | .04 |
Interfund Trades. Funds may purchase from or sell securities to other Fidelity Funds under procedures adopted by the Board. The procedures have been designed to ensure these interfund trades are executed in accordance with Rule 17a-7 of the 1940 Act. Any interfund trades are included within the respective purchases and sales amounts shown in the Purchases and Sales of Investments note. During the period there were no interfund trades.
6. Committed Line of Credit.
Certain Funds participate with other funds managed by the investment adviser or an affiliate in a $4.25 billion credit facility (the "line of credit") to be utilized for temporary or emergency purposes to fund shareholder redemptions or for other short-term liquidity purposes. The participating funds have agreed to pay commitment fees on their pro-rata portion of the line of credit, which are reflected in Miscellaneous expenses on the Statement of Operations, and are listed below. During the period, there were no borrowings on this line of credit.
| | Amount |
| Fidelity Short Duration High Income Fund | $208 |
7. Expense Reductions.
The investment adviser contractually agreed to reimburse expenses of each class to the extent annual operating expenses exceeded certain levels of class-level average net assets as noted in the table below. This reimbursement will remain in place through August 31, 2023. Some expenses, for example the compensation of the independent Trustees, and certain miscellaneous expenses such as proxy and shareholder meeting expenses, are excluded from this reimbursement.
The following classes were in reimbursement during the period:
| | Expense Limitations | Reimbursement |
| Class A | 1.05%/1.00%(a) | $22,756 |
| Class M | 1.05%/1.00%(a) | 2,847 |
| Class C | 1.80%/1.75%(a) | 5,971 |
| Short Duration High Income | .80%/.75%(a) | 67,835 |
| Class I | .80%/.75%(a) | 6,373 |
| Class Z | .71%/.66%(a) | 5,028 |
| | | $110,810 |
(a) Expense limitation effective June 1, 2021.
Through arrangements with the Fund's custodian, credits realized as a result of certain uninvested cash balances were used to reduce the Fund's expenses. During the period, custodian credits reduced the Fund's expenses by $113.
In addition, during the period the investment adviser or an affiliate reimbursed and/or waived a portion of fund-level operating expenses in the amount of $2,028.
8. Distributions to Shareholders.
Distributions to shareholders of each class were as follows:
| | Year ended
April 30, 2022 | Year ended
April 30, 2021 |
| Fidelity Short Duration High Income Fund | | |
| Distributions to shareholders | | |
| Class A | $614,597 | $454,814 |
| Class M | 77,641 | 70,564 |
| Class C | 95,717 | 89,941 |
| Short Duration High Income | 3,213,389 | 2,434,521 |
| Class I | 183,793 | 163,096 |
| Class Z | 155,367 | 93,826 |
| Total | $4,340,504 | $3,306,762 |
9. Share Transactions.
Share transactions for each class were as follows and may contain in-kind transactions, automatic conversions between classes or exchanges between affiliated funds:
| | Shares | Shares | Dollars | Dollars |
| | Year ended April 30, 2022 | Year ended April 30, 2021 | Year ended April 30, 2022 | Year ended April 30, 2021 |
| Fidelity Short Duration High Income Fund | | | | |
| Class A | | | | |
| Shares sold | 1,205,485 | 664,200 | $11,197,038 | $6,244,935 |
| Reinvestment of distributions | 64,152 | 47,323 | 601,003 | 442,759 |
| Shares redeemed | (557,369) | (333,417) | (5,198,452) | (3,125,931) |
| Net increase (decrease) | 712,268 | 378,106 | $6,599,589 | $3,561,763 |
| Class M | | | | |
| Shares sold | 108,902 | 62,595 | $1,014,540 | $585,482 |
| Reinvestment of distributions | 8,107 | 7,346 | 75,921 | 68,665 |
| Shares redeemed | (44,415) | (66,967) | (417,836) | (626,604) |
| Net increase (decrease) | 72,594 | 2,974 | $672,625 | $27,543 |
| Class C | | | | |
| Shares sold | 163,595 | 188,894 | $1,533,455 | $1,779,685 |
| Reinvestment of distributions | 10,112 | 9,530 | 94,817 | 89,087 |
| Shares redeemed | (163,460) | (229,370) | (1,537,583) | (2,129,868) |
| Net increase (decrease) | 10,247 | (30,946) | $90,689 | $(261,096) |
| Short Duration High Income | | | | |
| Shares sold | 6,342,757 | 5,433,537 | $59,798,674 | $50,972,991 |
| Reinvestment of distributions | 287,476 | 216,286 | 2,695,908 | 2,023,447 |
| Shares redeemed | (5,563,233) | (4,106,242) | (52,159,083) | (38,304,188) |
| Net increase (decrease) | 1,067,000 | 1,543,581 | $10,335,499 | $14,692,250 |
| Class I | | | | |
| Shares sold | 206,284 | 316,249 | $1,943,410 | $2,952,746 |
| Reinvestment of distributions | 18,034 | 15,983 | 169,177 | 149,609 |
| Shares redeemed | (189,184) | (250,054) | (1,770,381) | (2,334,522) |
| Net increase (decrease) | 35,134 | 82,178 | $342,206 | $767,833 |
| Class Z | | | | |
| Shares sold | 448,784 | 354,223 | $4,184,309 | $3,332,491 |
| Reinvestment of distributions | 14,784 | 9,701 | 138,688 | 90,878 |
| Shares redeemed | (280,177) | (192,066) | (2,630,889) | (1,802,908) |
| Net increase (decrease) | 183,391 | 171,858 | $1,692,108 | $1,620,461 |
10. Other.
A fund's organizational documents provide former and current trustees and officers with a limited indemnification against liabilities arising in connection with the performance of their duties to the fund. In the normal course of business, a fund may also enter into contracts that provide general indemnifications. A fund's maximum exposure under these arrangements is unknown as this would be dependent on future claims that may be made against a fund. The risk of material loss from such claims is considered remote.
11. Coronavirus (COVID-19) Pandemic.
An outbreak of COVID-19 first detected in China during December 2019 has since spread globally and was declared a pandemic by the World Health Organization during March 2020. Developments that disrupt global economies and financial markets, such as the COVID-19 pandemic, may magnify factors that affect the Fund's performance.
Report of Independent Registered Public Accounting Firm
To the Board of Trustees of Fidelity Summer Street Trust and Shareholders of Fidelity Short Duration High Income Fund
Opinion on the Financial Statements and Financial Highlights
We have audited the accompanying statement of assets and liabilities of Fidelity Short Duration High Income Fund (the "Fund"), a fund of Fidelity Summer Street Trust, including the schedule of investments, as of April 30, 2022, the related statement of operations for the year then ended, the statement of changes in net assets for each of the two years in the period then ended, the financial highlights for each of the five years in the period then ended, and the related notes. In our opinion, the financial statements and financial highlights present fairly, in all material respects, the financial position of the Fund as of April 30, 2022, and the results of its operations for the year then ended, the changes in its net assets for each of the two years in the period then ended, and the financial highlights for each of the five years in the period then ended in conformity with accounting principles generally accepted in the United States of America.
Basis for Opinion
These financial statements and financial highlights are the responsibility of the Fund's management. Our responsibility is to express an opinion on the Fund's financial statements and financial highlights based on our audits. We are a public accounting firm registered with the Public Company Accounting Oversight Board (United States) (PCAOB) and are required to be independent with respect to the Fund in accordance with the U.S. federal securities laws and the applicable rules and regulations of the Securities and Exchange Commission and the PCAOB.
We conducted our audits in accordance with the standards of the PCAOB. Those standards require that we plan and perform the audit to obtain reasonable assurance about whether the financial statements and financial highlights are free of material misstatement, whether due to error or fraud. The Fund is not required to have, nor were we engaged to perform, an audit of its internal control over financial reporting. As part of our audits we are required to obtain an understanding of internal control over financial reporting but not for the purpose of expressing an opinion on the effectiveness of the Fund’s internal control over financial reporting. Accordingly, we express no such opinion.
Our audits included performing procedures to assess the risks of material misstatement of the financial statements and financial highlights, whether due to error or fraud, and performing procedures that respond to those risks. Such procedures included examining, on a test basis, evidence regarding the amounts and disclosures in the financial statements and financial highlights. Our audits also included evaluating the accounting principles used and significant estimates made by management, as well as evaluating the overall presentation of the financial statements and financial highlights. Our procedures included confirmation of securities owned as of April 30, 2022, by correspondence with the custodian, brokers and agent banks; when replies were not received from brokers or agent banks, we performed other auditing procedures. We believe that our audits provide a reasonable basis for our opinion.
/s/ Deloitte & Touche LLP
Boston, Massachusetts
June 15, 2022
We have served as the auditor of one or more of the Fidelity investment companies since 1999.
Trustees and Officers
The Trustees, Members of the Advisory Board (if any), and officers of the trust and fund, as applicable, are listed below. The Board of Trustees governs the fund and is responsible for protecting the interests of shareholders. The Trustees are experienced executives who meet periodically throughout the year to oversee the fund's activities, review contractual arrangements with companies that provide services to the fund, oversee management of the risks associated with such activities and contractual arrangements, and review the fund's performance. Each of the Trustees oversees 324 funds.
The Trustees hold office without limit in time except that (a) any Trustee may resign; (b) any Trustee may be removed by written instrument, signed by at least two-thirds of the number of Trustees prior to such removal; (c) any Trustee who requests to be retired or who has become incapacitated by illness or injury may be retired by written instrument signed by a majority of the other Trustees; and (d) any Trustee may be removed at any special meeting of shareholders by a two-thirds vote of the outstanding voting securities of the trust. Each Trustee who is not an interested person (as defined in the 1940 Act) of the trust and the fund is referred to herein as an Independent Trustee. Each Independent Trustee shall retire not later than the last day of the calendar year in which his or her 75th birthday occurs. The Independent Trustees may waive this mandatory retirement age policy with respect to individual Trustees. Officers and Advisory Board Members hold office without limit in time, except that any officer or Advisory Board Member may resign or may be removed by a vote of a majority of the Trustees at any regular meeting or any special meeting of the Trustees. Except as indicated, each individual has held the office shown or other offices in the same company for the past five years.
The fund's Statement of Additional Information (SAI) includes more information about the Trustees. To request a free copy, call Fidelity at 1-800-544-8544 if you’re an individual investing directly with Fidelity, call 1-800-835-5092 if you’re a plan sponsor or participant with Fidelity as your recordkeeper or call 1-877-208-0098 on institutional accounts or if you’re an advisor or invest through one.
Experience, Skills, Attributes, and Qualifications of the Trustees. The Governance and Nominating Committee has adopted a statement of policy that describes the experience, qualifications, attributes, and skills that are necessary and desirable for potential Independent Trustee candidates (Statement of Policy). The Board believes that each Trustee satisfied at the time he or she was initially elected or appointed a Trustee, and continues to satisfy, the standards contemplated by the Statement of Policy. The Governance and Nominating Committee also engages professional search firms to help identify potential Independent Trustee candidates who have the experience, qualifications, attributes, and skills consistent with the Statement of Policy. From time to time, additional criteria based on the composition and skills of the current Independent Trustees, as well as experience or skills that may be appropriate in light of future changes to board composition, business conditions, and regulatory or other developments, have also been considered by the professional search firms and the Governance and Nominating Committee. In addition, the Board takes into account the Trustees' commitment and participation in Board and committee meetings, as well as their leadership of standing and ad hoc committees throughout their tenure.
In determining that a particular Trustee was and continues to be qualified to serve as a Trustee, the Board has considered a variety of criteria, none of which, in isolation, was controlling. The Board believes that, collectively, the Trustees have balanced and diverse experience, qualifications, attributes, and skills, which allow the Board to operate effectively in governing the fund and protecting the interests of shareholders. Information about the specific experience, skills, attributes, and qualifications of each Trustee, which in each case led to the Board's conclusion that the Trustee should serve (or continue to serve) as a trustee of the fund, is provided below.
Board Structure and Oversight Function. Robert A. Lawrence is an interested person and currently serves as Chair. The Trustees have determined that an interested Chair is appropriate and benefits shareholders because an interested Chair has a personal and professional stake in the quality and continuity of services provided to the fund. Independent Trustees exercise their informed business judgment to appoint an individual of their choosing to serve as Chair, regardless of whether the Trustee happens to be independent or a member of management. The Independent Trustees have determined that they can act independently and effectively without having an Independent Trustee serve as Chair and that a key structural component for assuring that they are in a position to do so is for the Independent Trustees to constitute a substantial majority for the Board. The Independent Trustees also regularly meet in executive session. David M. Thomas serves as Lead Independent Trustee and as such (i) acts as a liaison between the Independent Trustees and management with respect to matters important to the Independent Trustees and (ii) with management prepares agendas for Board meetings.
Fidelity® funds are overseen by different Boards of Trustees. The fund's Board oversees Fidelity's high income and certain equity funds, and other Boards oversee Fidelity's investment-grade bond, money market, asset allocation, and other equity funds. The asset allocation funds may invest in Fidelity® funds overseen by the fund's Board. The use of separate Boards, each with its own committee structure, allows the Trustees of each group of Fidelity® funds to focus on the unique issues of the funds they oversee, including common research, investment, and operational issues. On occasion, the separate Boards establish joint committees to address issues of overlapping consequences for the Fidelity® funds overseen by each Board.
The Trustees operate using a system of committees to facilitate the timely and efficient consideration of all matters of importance to the Trustees, the fund, and fund shareholders and to facilitate compliance with legal and regulatory requirements and oversight of the fund's activities and associated risks. The Board, acting through its committees, has charged FMR and its affiliates with (i) identifying events or circumstances the occurrence of which could have demonstrably adverse effects on the fund's business and/or reputation; (ii) implementing processes and controls to lessen the possibility that such events or circumstances occur or to mitigate the effects of such events or circumstances if they do occur; and (iii) creating and maintaining a system designed to evaluate continuously business and market conditions in order to facilitate the identification and implementation processes described in (i) and (ii) above. Because the day-to-day operations and activities of the fund are carried out by or through FMR, its affiliates, and other service providers, the fund's exposure to risks is mitigated but not eliminated by the processes overseen by the Trustees. While each of the Board's committees has responsibility for overseeing different aspects of the fund's activities, oversight is exercised primarily through the Operations, Audit, and Compliance Committees. Appropriate personnel, including but not limited to the fund's Chief Compliance Officer (CCO), FMR's internal auditor, the independent accountants, the fund's Treasurer and portfolio management personnel, make periodic reports to the Board's committees, as appropriate, including an annual review of Fidelity's risk management program for the Fidelity® funds. The responsibilities of each standing committee, including their oversight responsibilities, are described further under "Standing Committees of the Trustees."
Interested Trustees*:
Correspondence intended for a Trustee who is an interested person may be sent to Fidelity Investments, 245 Summer Street, Boston, Massachusetts 02210.
Name, Year of Birth; Principal Occupations and Other Relevant Experience+
Bettina Doulton (1964)
Year of Election or Appointment: 2020
Trustee
Ms. Doulton also serves as Trustee of other Fidelity® funds. Prior to her retirement, Ms. Doulton served in a variety of positions at Fidelity Investments, including as a managing director of research (2006-2007), portfolio manager to certain Fidelity® funds (1993-2005), equity analyst and portfolio assistant (1990-1993), and research assistant (1987-1990). Ms. Doulton currently owns and operates Phi Builders + Architects and Cellardoor Winery. Previously, Ms. Doulton served as a member of the Board of Brown Capital Management, LLC (2014-2018).
Robert A. Lawrence (1952)
Year of Election or Appointment: 2020
Trustee
Chair of the Board of Trustees
Mr. Lawrence also serves as Trustee of other funds. Previously, Mr. Lawrence served as a Member of the Advisory Board of certain funds. Prior to his retirement in 2008, Mr. Lawrence served as Vice President of certain Fidelity® funds (2006-2008), Senior Vice President, Head of High Income Division of Fidelity Management & Research Company (investment adviser firm, 2006-2008), and President of Fidelity Strategic Investments (investment adviser firm, 2002-2005).
* Determined to be an “Interested Trustee” by virtue of, among other things, his or her affiliation with the trust or various entities under common control with FMR.
+ The information includes the Trustee's principal occupation during the last five years and other information relating to the experience, attributes, and skills relevant to the Trustee's qualifications to serve as a Trustee, which led to the conclusion that the Trustee should serve as a Trustee for the fund.
Independent Trustees:
Correspondence intended for an Independent Trustee may be sent to Fidelity Investments, P.O. Box 55235, Boston, Massachusetts 02205-5235.
Name, Year of Birth; Principal Occupations and Other Relevant Experience+
Thomas P. Bostick (1956)
Year of Election or Appointment: 2021
Trustee
Lieutenant General Bostick also serves as Trustee of other Fidelity® funds. Prior to his retirement, General Bostick (United States Army, Retired) held a variety of positions within the U.S. Army, including Commanding General and Chief of Engineers, U.S. Army Corps of Engineers (2012-2016) and Deputy Chief of Staff and Director of Human Resources, U.S. Army (2009-2012). General Bostick currently serves as a member of the Board and Finance and Governance Committees of CSX Corporation (transportation, 2020-present) and a member of the Board and Corporate Governance and Nominating Committee of Perma-Fix Environmental Services, Inc. (nuclear waste management, 2020-present). General Bostick serves as Chief Executive Officer of Bostick Global Strategies, LLC (consulting, 2016-present) and as a member of the Board of HireVue, Inc. (video interview and assessment, 2020-present). Previously, General Bostick served as a Member of the Advisory Board of certain Fidelity® funds (2021), President, Intrexon Bioengineering (2018-2020) and Chief Operating Officer (2017-2020) and Senior Vice President of the Environment Sector (2016-2017) of Intrexon Corporation (biopharmaceutical company).
Dennis J. Dirks (1948)
Year of Election or Appointment: 2005
Trustee
Mr. Dirks also serves as Trustee of other Fidelity® funds. Prior to his retirement in May 2003, Mr. Dirks served as Chief Operating Officer and as a member of the Board of The Depository Trust & Clearing Corporation (financial markets infrastructure), President, Chief Operating Officer and a member of the Board of The Depository Trust Company (DTC), President and a member of the Board of the National Securities Clearing Corporation (NSCC), Chief Executive Officer and a member of the Board of the Government Securities Clearing Corporation and Chief Executive Officer and a member of the Board of the Mortgage-Backed Securities Clearing Corporation. Mr. Dirks currently serves as a member of the Finance Committee (2016-present) and Board (2017-present) and is Treasurer (2018-present) of the Asolo Repertory Theatre.
Donald F. Donahue (1950)
Year of Election or Appointment: 2018
Trustee
Mr. Donahue also serves as Trustee of other Fidelity® funds. Mr. Donahue serves as President and Chief Executive Officer of Miranda Partners, LLC (risk consulting for the financial services industry, 2012-present). Previously, Mr. Donahue served as Chief Executive Officer (2006-2012), Chief Operating Officer (2003-2006) and Managing Director, Customer Marketing and Development (1999-2003) of The Depository Trust & Clearing Corporation (financial markets infrastructure). Mr. Donahue currently serves as a member (2007-present) and Co-Chairman (2016-present) of the Board of United Way of New York and a member of the Board of The Leadership Academy (previously NYC Leadership Academy) (2012-present). Mr. Donahue previously served as a member of the Advisory Board of certain Fidelity® funds (2015-2018).
Vicki L. Fuller (1957)
Year of Election or Appointment: 2020
Trustee
Ms. Fuller also serves as Trustee of other Fidelity® funds. Previously, Ms. Fuller served as a member of the Advisory Board of certain Fidelity® funds (2018-2020), Chief Investment Officer of the New York State Common Retirement Fund (2012-2018) and held a variety of positions at AllianceBernstein L.P. (global asset management, 1985-2012), including Managing Director (2006-2012) and Senior Vice President and Senior Portfolio Manager (2001-2006). Ms. Fuller currently serves as a member of the Board, Audit Committee and Nominating and Governance Committee of two Blackstone business development companies (2020-present), as a member of the Board of Treliant, LLC (consulting, 2019-present), as a member of the Advisory Board of Ariel Alternatives, LLC (private equity, 2021-present) and as a member of the Board and Chair of the Audit Committee of Gusto, Inc. (software, 2021-present). In addition, Ms. Fuller currently serves as a member of the Board of Roosevelt University (2019-present) and as a member of the Executive Board of New York University’s Stern School of Business. Ms. Fuller previously served as a member of the Board, Audit Committee and Nominating and Governance Committee of The Williams Companies, Inc. (natural gas infrastructure, 2018-2021).
Patricia L. Kampling (1959)
Year of Election or Appointment: 2020
Trustee
Ms. Kampling also serves as Trustee of other Fidelity® funds. Prior to her retirement, Ms. Kampling served as Chairman of the Board and Chief Executive Officer (2012-2019), President and Chief Operating Officer (2011-2012) and Executive Vice President and Chief Financial Officer (2010-2011) of Alliant Energy Corporation. Ms. Kampling currently serves as a member of the Board, Finance Committee and Governance, Compensation and Nominating Committee of Xcel Energy Inc. (utilities company, 2020-present) and as a member of the Board, Audit, Finance and Risk Committee and Safety, Environmental, Technology and Operations Committee and Chair of the Executive Development and Compensation Committee of American Water Works Company, Inc. (utilities company, 2019-present). In addition, Ms. Kampling currently serves as a member of the Board of the Nature Conservancy, Wisconsin Chapter (2019-present). Previously, Ms. Kampling served as a Member of the Advisory Board of certain Fidelity® funds (2020), a member of the Board, Compensation Committee and Executive Committee and Chair of the Audit Committee of Briggs & Stratton Corporation (manufacturing, 2011-2021), a member of the Board of Interstate Power and Light Company (2012-2019) and Wisconsin Power and Light Company (2012-2019) (each a subsidiary of Alliant Energy Corporation) and as a member of the Board and Workforce Development Committee of the Business Roundtable (2018-2019).
Thomas A. Kennedy (1955)
Year of Election or Appointment: 2021
Trustee
Mr. Kennedy also serves as Trustee of other Fidelity® funds. Previously, Mr. Kennedy served as a Member of the Advisory Board of certain Fidelity® funds (2020) and held a variety of positions at Raytheon Company (aerospace and defense, 1983-2020), including Chairman and Chief Executive Officer (2014-2020) and Executive Vice President and Chief Operating Officer (2013-2014). Mr. Kennedy currently serves as Executive Chairman of the Board of Directors of Raytheon Technologies Corporation (aerospace and defense, 2020-present). He is also a member of the Rutgers School of Engineering Industry Advisory Board (2011-present) and a member of the UCLA Engineering Dean’s Executive Board (2016-present).
Oscar Munoz (1959)
Year of Election or Appointment: 2021
Trustee
Mr. Munoz also serves as Trustee of other Fidelity® funds. Prior to his retirement, Mr. Munoz served as Executive Chairman (2020-2021), Chief Executive Officer (2015-2020), President (2015-2016) and a member of the Board (2010-2021) of United Airlines Holdings, Inc. Mr. Munoz currently serves as a member of the Board of CBRE Group, Inc. (commercial real estate, 2020-present), a member of the Board of Univision Communications, Inc. (Hispanic media, 2020-present) and a member of the Advisory Board of Salesforce.com, Inc. (cloud-based software, 2020-present). Previously, Mr. Munoz served as a Member of the Advisory Board of certain Fidelity® funds (2021).
Garnett A. Smith (1947)
Year of Election or Appointment: 2018
Trustee
Mr. Smith also serves as Trustee of other Fidelity® funds. Prior to his retirement, Mr. Smith served as Chairman and Chief Executive Officer (1990-1997) and President (1986-1990) of Inbrand Corp. (manufacturer of personal absorbent products). Prior to his employment with Inbrand Corp., he was employed by a retail fabric chain and North Carolina National Bank (now Bank of America). Mr. Smith previously served as a member of the Advisory Board of certain Fidelity® funds (2012-2013).
David M. Thomas (1949)
Year of Election or Appointment: 2008
Trustee
Lead Independent Trustee
Mr. Thomas also serves as Trustee of other Fidelity® funds. Previously, Mr. Thomas served as Executive Chairman (2005-2006) and Chairman and Chief Executive Officer (2000-2005) of IMS Health, Inc. (pharmaceutical and healthcare information solutions). Mr. Thomas currently serves as a member of the Board of Fortune Brands Home and Security (home and security products, 2004-present) and as Director (2013-present) and Non-Executive Chairman of the Board (2022-present) of Interpublic Group of Companies, Inc. (marketing communication).
Susan Tomasky (1953)
Year of Election or Appointment: 2020
Trustee
Ms. Tomasky also serves as Trustee of other Fidelity® funds. Prior to her retirement, Ms. Tomasky served in various executive officer positions at American Electric Power Company, Inc. (1998-2011), including most recently as President of AEP Transmission (2007-2011). Ms. Tomasky currently serves as a member of the Board and Sustainability Committee and as Chair of the Audit Committee of Marathon Petroleum Corporation (2018-present) and as a member of the Board, Executive Committee, Corporate Governance Committee and Organization and Compensation Committee and as Chair of the Audit Committee of Public Service Enterprise Group, Inc. (utilities company, 2012-present) and as a member of the Board of its subsidiary company, Public Service Electric and Gas Co. (2021-present). In addition, Ms. Tomasky currently serves as a member (2009-present) and President (2020-present) of the Board of the Royal Shakespeare Company – America (2009-present), as a member of the Board of the Columbus Association for the Performing Arts (2011-present) and as a member of the Board and Kenyon in the World Committee of Kenyon College (2016-present). Previously, Ms. Tomasky served as a Member of the Advisory Board of certain Fidelity® funds (2020), as a member of the Board of the Columbus Regional Airport Authority (2007-2020), as a member of the Board (2011-2018) and Lead Independent Director (2015-2018) of Andeavor Corporation (previously Tesoro Corporation) (independent oil refiner and marketer) and as a member of the Board of Summit Midstream Partners LP (energy, 2012-2018).
Michael E. Wiley (1950)
Year of Election or Appointment: 2018
Trustee
Mr. Wiley also serves as Trustee of other Fidelity® funds. Previously, Mr. Wiley served as a member of the Advisory Board of certain Fidelity® funds (2018-2020), Chairman, President and CEO of Baker Hughes, Inc. (oilfield services, 2000-2004). Mr. Wiley also previously served as a member of the Board of Andeavor Corporation (independent oil refiner and marketer, 2005-2018), a member of the Board of Andeavor Logistics LP (natural resources logistics, 2015-2018) and a member of the Board of High Point Resources (exploration and production, 2005-2020).
+ The information includes the Trustee's principal occupation during the last five years and other information relating to the experience, attributes, and skills relevant to the Trustee's qualifications to serve as a Trustee, which led to the conclusion that the Trustee should serve as a Trustee for the fund.
Advisory Board Members and Officers:
Correspondence intended for a Member of the Advisory Board (if any) may be sent to Fidelity Investments, P.O. Box 55235, Boston, Massachusetts 02205-5235. Correspondence intended for an officer or Peter S. Lynch may be sent to Fidelity Investments, 245 Summer Street, Boston, Massachusetts 02210. Officers appear below in alphabetical order.
Name, Year of Birth; Principal Occupation
Peter S. Lynch (1944)
Year of Election or Appointment: 2003
Member of the Advisory Board
Mr. Lynch also serves as a Member of the Advisory Board of other Fidelity® funds. Mr. Lynch is Vice Chairman and a Director of Fidelity Management & Research Company LLC (investment adviser firm). In addition, Mr. Lynch serves as a Trustee of Boston College and as the Chairman of the Inner-City Scholarship Fund. Previously, Mr. Lynch served as Vice Chairman and a Director of FMR Co., Inc. (investment adviser firm) and on the Special Olympics International Board of Directors (1997-2006).
Craig S. Brown (1977)
Year of Election or Appointment: 2019
Assistant Treasurer
Mr. Brown also serves as an officer of other funds. Mr. Brown serves as Assistant Treasurer of FIMM, LLC (2021-present) and is an employee of Fidelity Investments (2013-present).
John J. Burke III (1964)
Year of Election or Appointment: 2018
Chief Financial Officer
Mr. Burke also serves as Chief Financial Officer of other funds. Mr. Burke serves as Head of Investment Operations for Fidelity Fund and Investment Operations (2018-present) and is an employee of Fidelity Investments (1998-present). Previously Mr. Burke served as head of Asset Management Investment Operations (2012-2018).
William C. Coffey (1969)
Year of Election or Appointment: 2019
Assistant Secretary
Mr. Coffey also serves as Assistant Secretary of other funds. He is Senior Vice President and Deputy General Counsel of FMR LLC (diversified financial services company, 2010-present), and is an employee of Fidelity Investments. Previously, Mr. Coffey served as Secretary and CLO of certain funds (2018-2019); CLO, Secretary, and Senior Vice President of Fidelity Management & Research Company and FMR Co., Inc. (investment adviser firms, 2018-2019); Secretary of Fidelity SelectCo, LLC and Fidelity Investments Money Management, Inc. (investment adviser firms, 2018-2019); CLO of Fidelity Management & Research (Hong Kong) Limited, FMR Investment Management (UK) Limited, and Fidelity Management & Research (Japan) Limited (investment adviser firms, 2018-2019); and Assistant Secretary of certain funds (2009-2018).
Timothy M. Cohen (1969)
Year of Election or Appointment: 2018
Vice President
Mr. Cohen also serves as Vice President of other funds. Mr. Cohen serves as Co-Head of Equity (2018-present), a Director of Fidelity Management & Research (Japan) Limited (investment adviser firm, 2016-present), and is an employee of Fidelity Investments. Previously, Mr. Cohen served as Executive Vice President of Fidelity SelectCo, LLC (2019), Head of Global Equity Research (2016-2018), Chief Investment Officer - Equity and a Director of Fidelity Management & Research (U.K.) Inc. (investment adviser firm, 2013-2015) and as a Director of Fidelity Management & Research (Hong Kong) Limited (investment adviser firm, 2017).
Jonathan Davis (1968)
Year of Election or Appointment: 2010
Assistant Treasurer
Mr. Davis also serves as an officer of other funds. Mr. Davis serves as Assistant Treasurer of FIMM, LLC (2021-present), FMR Capital, Inc. (2017-present), FD Funds GP LLC (2021-present), FD Funds Holding LLC (2021-present), and FD Funds Management LLC (2021-present); and is an employee of Fidelity Investments. Previously, Mr. Davis served as Vice President and Associate General Counsel of FMR LLC (diversified financial services company, 2003-2010).
Laura M. Del Prato (1964)
Year of Election or Appointment: 2018
Assistant Treasurer
Ms. Del Prato also serves as an officer of other funds. Ms. Del Prato serves as Assistant Treasurer of FIMM, LLC (2021-present) and is an employee of Fidelity Investments (2017-present). Previously, Ms. Del Prato served as President and Treasurer of The North Carolina Capital Management Trust: Cash Portfolio and Term Portfolio (2018-2020). Prior to joining Fidelity Investments, Ms. Del Prato served as a Managing Director and Treasurer of the JPMorgan Mutual Funds (2014-2017). Prior to JPMorgan, Ms. Del Prato served as a partner at Cohen Fund Audit Services (accounting firm, 2012-2013) and KPMG LLP (accounting firm, 2004-2012).
Colm A. Hogan (1973)
Year of Election or Appointment: 2020
Assistant Treasurer
Mr. Hogan also serves as an officer of other funds. Mr. Hogan serves as Assistant Treasurer of FIMM, LLC (2021-present) and FMR Capital, Inc. (2017-present) and is an employee of Fidelity Investments (2005-present). Previously, Mr. Hogan served as Deputy Treasurer of certain Fidelity® funds (2016-2020) and Assistant Treasurer of certain Fidelity® funds (2016-2018).
Pamela R. Holding (1964)
Year of Election or Appointment: 2018
Vice President
Ms. Holding also serves as Vice President of other funds. Ms. Holding serves as Co-Head of Equity (2018-present) and is an employee of Fidelity Investments (2013-present). Previously, Ms. Holding served as Executive Vice President of Fidelity SelectCo, LLC (2019) and as Chief Investment Officer of Fidelity Institutional Asset Management (2013-2018).
Cynthia Lo Bessette (1969)
Year of Election or Appointment: 2019
Secretary and Chief Legal Officer (CLO)
Ms. Lo Bessette also serves as an officer of other funds. Ms. Lo Bessette serves as CLO, Secretary, and Senior Vice President of Fidelity Management & Research Company LLC (investment adviser firm, 2019-present); CLO of Fidelity Management & Research (Hong Kong) Limited, FMR Investment Management (UK) Limited, and Fidelity Management & Research (Japan) Limited (investment adviser firms, 2019-present); Secretary of FD Funds GP LLC (2021-present), FD Funds Holding LLC (2021-present), and FD Funds Management LLC (2021-present); and Assistant Secretary of FIMM, LLC (2019-present). She is a Senior Vice President and Deputy General Counsel of FMR LLC (diversified financial services company, 2019-present), and is an employee of Fidelity Investments. Previously, Ms. Lo Bessette served as CLO, Secretary, and Senior Vice President of FMR Co., Inc. (investment adviser firm, 2019); Secretary of Fidelity SelectCo, LLC and Fidelity Investments Money Management, Inc. (investment adviser firms, 2019). Prior to joining Fidelity Investments, Ms. Lo Bessette was Executive Vice President, General Counsel (2016-2019) and Senior Vice President, Deputy General Counsel (2015-2016) of OppenheimerFunds (investment management company) and Deputy Chief Legal Officer (2013-2015) of Jennison Associates LLC (investment adviser firm).
Chris Maher (1972)
Year of Election or Appointment: 2020
Deputy Treasurer
Mr. Maher also serves as an officer of other funds. Mr. Maher serves as Assistant Treasurer of FIMM, LLC (2021-present) and FMR Capital, Inc. (2017-present), and is an employee of Fidelity Investments (2008-present). Previously, Mr. Maher served as Assistant Treasurer of certain funds (2013-2020); Vice President of Asset Management Compliance (2013), Vice President of the Program Management Group of FMR (investment adviser firm, 2010-2013), and Vice President of Valuation Oversight (2008-2010).
Jason P. Pogorelec (1975)
Year of Election or Appointment: 2020
Chief Compliance Officer
Mr. Pogorelec also serves as Chief Compliance Officer of other funds. Mr. Pogorelec is a senior Vice President of Asset Management Compliance for Fidelity Investments and is an employee of Fidelity Investments (2006-present). Previously, Mr. Pogorelec served as Vice President, Associate General Counsel for Fidelity Investments (2010-2020) and Assistant Secretary of certain Fidelity funds (2015-2020).
Brett Segaloff (1972)
Year of Election or Appointment: 2021
Anti-Money Laundering (AML) Officer
Mr. Segaloff also serves as an AML Officer of other funds and other related entities. He is Director, Anti-Money Laundering (2007-present) of FMR LLC (diversified financial services company) and is an employee of Fidelity Investments (1996-present).
Stacie M. Smith (1974)
Year of Election or Appointment: 2016
President and Treasurer
Ms. Smith also serves as an officer of other funds. Ms. Smith serves as Assistant Treasurer of FIMM, LLC (2021-present) and FMR Capital, Inc. (2017-present), is an employee of Fidelity Investments (2009-present), and has served in other fund officer roles. Prior to joining Fidelity Investments, Ms. Smith served as Senior Audit Manager of Ernst & Young LLP (accounting firm, 1996-2009). Previously, Ms. Smith served as Assistant Treasurer (2013-2019) and Deputy Treasurer (2013-2016) of certain Fidelity® funds.
Jim Wegmann (1979)
Year of Election or Appointment: 2019
Assistant Treasurer
Mr. Wegmann also serves as an officer of other funds. Mr. Wegmann serves as Assistant Treasurer of FIMM, LLC (2021-present) and is an employee of Fidelity Investments (2011-present). Previously, Mr. Wegmann served as Assistant Treasurer of certain Fidelity® funds (2019-2021).
Shareholder Expense Example
As a shareholder, you incur two types of costs: (1) transaction costs, which may include sales charges (loads) on purchase payments or redemption proceeds, as applicable and (2) ongoing costs, which generally include management fees, distribution and/or service (12b-1) fees and other Fund expenses. This Example is intended to help you understand your ongoing costs (in dollars) of investing in a fund and to compare these costs with the ongoing costs of investing in other mutual funds.
The Example is based on an investment of $1,000 invested at the beginning of the period and held for the entire period (November 1, 2021 to April 30, 2022).
Actual Expenses
The first line of the accompanying table provides information about actual account values and actual expenses. You may use the information in this line, together with the amount you invested, to estimate the expenses that you paid over the period. Simply divide your account value by $1,000.00 (for example, an $8,600 account value divided by $1,000.00 = 8.6), then multiply the result by the number in the first line for a class/Fund under the heading entitled "Expenses Paid During Period" to estimate the expenses you paid on your account during this period. If any fund is a shareholder of any underlying mutual funds or exchange-traded funds (ETFs) (the Underlying Funds), such fund indirectly bears its proportional share of the expenses of the Underlying Funds in addition to the direct expenses incurred presented in the table. These fees and expenses are not included in the annualized expense ratio used to calculate the expense estimate in the table below.
Hypothetical Example for Comparison Purposes
The second line of the accompanying table provides information about hypothetical account values and hypothetical expenses based on the actual expense ratio and an assumed rate of return of 5% per year before expenses, which is not the actual return. The hypothetical account values and expenses may not be used to estimate the actual ending account balance or expenses you paid for the period. You may use this information to compare the ongoing costs of investing in the Fund and other funds. To do so, compare this 5% hypothetical example with the 5% hypothetical examples that appear in the shareholder reports of the other funds. If any fund is a shareholder of any Underlying Funds, such fund indirectly bears its proportional share of the expenses of the Underlying Funds in addition to the direct expenses as presented in the table. These fees and expenses are not included in the annualized expense ratio used to calculate the expense estimate in the table below.
Please note that the expenses shown in the table are meant to highlight your ongoing costs only and do not reflect any transaction costs. Therefore, the second line of the table is useful in comparing ongoing costs only, and will not help you determine the relative total costs of owning different funds. In addition, if these transactional costs were included, your costs would have been higher.
| | Annualized Expense Ratio-A | Beginning
Account Value
November 1, 2021 | Ending
Account Value
April 30, 2022 | Expenses Paid
During Period-B
November 1, 2021
to April 30, 2022 |
| Fidelity Short Duration High Income Fund | | | | |
| Class A | 1.00% | | | |
| Actual | | $1,000.00 | $963.10 | $4.87 |
| Hypothetical-C | | $1,000.00 | $1,019.84 | $5.01 |
| Class M | 1.00% | | | |
| Actual | | $1,000.00 | $963.10 | $4.87 |
| Hypothetical-C | | $1,000.00 | $1,019.84 | $5.01 |
| Class C | 1.75% | | | |
| Actual | | $1,000.00 | $959.50 | $8.50 |
| Hypothetical-C | | $1,000.00 | $1,016.12 | $8.75 |
| Short Duration High Income | .75% | | | |
| Actual | | $1,000.00 | $964.30 | $3.65 |
| Hypothetical-C | | $1,000.00 | $1,021.08 | $3.76 |
| Class I | .75% | | | |
| Actual | | $1,000.00 | $964.30 | $3.65 |
| Hypothetical-C | | $1,000.00 | $1,021.08 | $3.76 |
| Class Z | .66% | | | |
| Actual | | $1,000.00 | $964.70 | $3.22 |
| Hypothetical-C | | $1,000.00 | $1,021.52 | $3.31 |
A Annualized expense ratio reflects expenses net of applicable fee waivers.
B Expenses are equal to the annualized expense ratio, multiplied by the average account value over the period, multiplied by 181/ 365 (to reflect the one-half year period). The fees and expenses of any Underlying Funds are not included in each annualized expense ratio.
C 5% return per year before expenses
Distributions (Unaudited)
The dividend and capital gains distributions for the fund(s) are available on Fidelity.com or Institutional.Fidelity.com.
A total of 0.01% of the dividends distributed during the fiscal year was derived from interest on U.S. Government securities which is generally exempt from state income tax.
The fund designates $3,130,629 of distributions paid in the calendar year 2021 as qualifying to be taxed as interest-related dividends for nonresident alien shareholders.
The fund designates $3,952,187 of distributions paid in the calendar year 2021 as qualifying to be taxed as section 163(j) interest dividends.
The fund will notify shareholders in January 2023 of amounts for use in preparing 2022 income tax returns.
Liquidity Risk Management Program
The Securities and Exchange Commission adopted Rule 22e-4 under the Investment Company Act of 1940 (the Liquidity Rule) to promote effective liquidity risk management throughout the open-end investment company industry, thereby reducing the risk that funds will be unable to meet their redemption obligations and mitigating dilution of the interests of fund shareholders.
The Fund has adopted and implemented a liquidity risk management program pursuant to the Liquidity Rule (the Program) effective December 1, 2018. The Program is reasonably designed to assess and manage the Fund’s liquidity risk and to comply with the requirements of the Liquidity Rule. The Fund’s Board of Trustees (the Board) has designated the Fund’s investment adviser as administrator of the Program. The Fidelity advisers have established a Liquidity Risk Management Committee (the LRM Committee) to manage the Program for each of the Fidelity Funds. The LRM Committee monitors the adequacy and effectiveness of implementation of the Program and on a periodic basis assesses each Fund’s liquidity risk based on a variety of factors including (1) the Fund’s investment strategy, (2) portfolio liquidity and cash flow projections during normal and reasonably foreseeable stressed conditions, (3) shareholder redemptions, (4) borrowings and other funding sources and (5) in the case of exchange-traded funds, certain additional factors including the effect of the Fund’s prices and spreads, market participants, and basket compositions on the overall liquidity of the Fund’s portfolio, as applicable.
In accordance with the Program, each of the Fund’s portfolio investments is classified into one of four liquidity categories described below based on a determination of a reasonable expectation for how long it would take to convert the investment to cash (or sell or dispose of the investment) without significantly changing its market value.
- Highly liquid investments – cash or convertible to cash within three business days or less
- Moderately liquid investments – convertible to cash in three to seven calendar days
- Less liquid investments – can be sold or disposed of, but not settled, within seven calendar days
- Illiquid investments – cannot be sold or disposed of within seven calendar days
Liquidity classification determinations take into account a variety of factors including various market, trading and investment-specific considerations, as well as market depth, and generally utilize analysis from a third-party liquidity metrics service.
The Liquidity Rule places a 15% limit on a fund’s illiquid investments and requires funds that do not primarily hold assets that are highly liquid investments to determine and maintain a minimum percentage of the fund’s net assets to be invested in highly liquid investments (highly liquid investment minimum or HLIM). The Program includes provisions reasonably designed to comply with the 15% limit on illiquid investments and for determining, periodically reviewing and complying with the HLIM requirement as applicable.
At a recent meeting of the Fund’s Board of Trustees, the LRM Committee provided a written report to the Board pertaining to the operation, adequacy, and effectiveness of implementation of the Program for the annual period from December 1, 2020 through November 30, 2021. The report concluded that the Program has been implemented and is operating effectively and is reasonably designed to assess and manage the Fund’s liquidity risk.
SDH-ANN-0622
1.969434.108
Fidelity® Women's Leadership Fund
Annual Report
April 30, 2022
Includes Fidelity and Fidelity Advisor share classes
Contents
To view a fund's proxy voting guidelines and proxy voting record for the 12-month period ended June 30, visit http://www.fidelity.com/proxyvotingresults or visit the Securities and Exchange Commission's (SEC) web site at http://www.sec.gov.
You may also call 1-800-544-8544 if you’re an individual investing directly with Fidelity, call 1-800-835-5092 if you’re a plan sponsor or participant with Fidelity as your recordkeeper or call 1-877-208-0098 on institutional accounts or if you’re an advisor or invest through one to request a free copy of the proxy voting guidelines.
Standard & Poor's, S&P and S&P 500 are registered service marks of The McGraw-Hill Companies, Inc. and have been licensed for use by Fidelity Distributors Corporation.
Other third-party marks appearing herein are the property of their respective owners.
All other marks appearing herein are registered or unregistered trademarks or service marks of FMR LLC or an affiliated company. © 2022 FMR LLC. All rights reserved.
This report and the financial statements contained herein are submitted for the general information of the shareholders of the Fund. This report is not authorized for distribution to prospective investors in the Fund unless preceded or accompanied by an effective prospectus.
A fund files its complete schedule of portfolio holdings with the SEC for the first and third quarters of each fiscal year on Form N-PORT. Forms N-PORT are available on the SEC’s web site at http://www.sec.gov. A fund's Forms N-PORT may be reviewed and copied at the SEC’s Public Reference Room in Washington, DC. Information regarding the operation of the SEC's Public Reference Room may be obtained by calling 1-800-SEC-0330.
For a complete list of a fund's portfolio holdings, view the most recent holdings listing, semiannual report, or annual report on Fidelity's web site at http://www.fidelity.com, http://www.institutional.fidelity.com, or http://www.401k.com, as applicable.
NOT FDIC INSURED •MAY LOSE VALUE •NO BANK GUARANTEE
Neither the Fund nor Fidelity Distributors Corporation is a bank.
Note to Shareholders:
Early in 2020, the outbreak and spread of COVID-19 emerged as a public health emergency that had a major influence on financial markets, primarily based on its impact on the global economy and corporate earnings. On March 11, 2020, the World Health Organization declared the COVID-19 outbreak a pandemic, citing sustained risk of further global spread. The pandemic prompted a number of measures to limit the spread of COVID-19, including travel and border restrictions, quarantines, and restrictions on large gatherings. In turn, these resulted in lower consumer activity, diminished demand for a wide range of products and services, disruption in manufacturing and supply chains, and – given the wide variability in outcomes regarding the outbreak – significant market uncertainty and volatility. To help stem the turmoil, the U.S. government took unprecedented action – in concert with the U.S. Federal Reserve and central banks around the world – to help support consumers, businesses, and the broader economy, and to limit disruption to the financial system.
In general, the overall impact of the pandemic lessened in 2021, amid a resilient economy and widespread distribution of three COVID-19 vaccines granted emergency use authorization from the U.S. Food and Drug Administration (FDA) early in the year. Still, the situation remains dynamic, and the extent and duration of its influence on financial markets and the economy is highly uncertain, due in part to a recent spike in cases based on highly contagious variants of the coronavirus.
Extreme events such as the COVID-19 crisis are exogenous shocks that can have significant adverse effects on mutual funds and their investments. Although multiple asset classes may be affected by market disruption, the duration and impact may not be the same for all types of assets. Fidelity is committed to helping you stay informed amid news about COVID-19 and during increased market volatility, and we continue to take extra steps to be responsive to customer needs. We encourage you to visit us online, where we offer ongoing updates, commentary, and analysis on the markets and our funds.
Performance: The Bottom Line
Average annual total return reflects the change in the value of an investment, assuming reinvestment of distributions from dividend income and capital gains (the profits earned upon the sale of securities that have grown in value, if any) and assuming a constant rate of performance each year. The hypothetical investment and the average annual total returns do not reflect the deduction of taxes that a shareholder would pay on fund distributions or the redemption of fund shares. During periods of reimbursement by Fidelity, a fund’s total return will be greater than it would be had the reimbursement not occurred. How a fund did yesterday is no guarantee of how it will do tomorrow.
Average Annual Total Returns
| For the periods ended April 30, 2022 | Past 1 year | Life of fundA |
| Class A (incl. 5.75% sales charge) | (16.55)% | 8.53% |
| Class M (incl. 3.50% sales charge) | (14.76)% | 9.10% |
| Class C (incl. contingent deferred sales charge) | (12.98)% | 9.87% |
| Fidelity® Women's Leadership Fund | (11.25)% | 10.95% |
| Class I | (11.20)% | 10.99% |
| Class Z | (11.13)% | 11.12% |
A From May 1, 2019
Class C shares' contingent deferred sales charges included in the past one year and life of fund total return figures are 1% and 0%, respectively.
$10,000 Over Life of Fund
Let's say hypothetically that $10,000 was invested in Fidelity® Women's Leadership Fund, a class of the fund, on May 1, 2019, when the fund started.
The chart shows how the value of your investment would have changed, and also shows how the Russell 3000® Index performed over the same period.
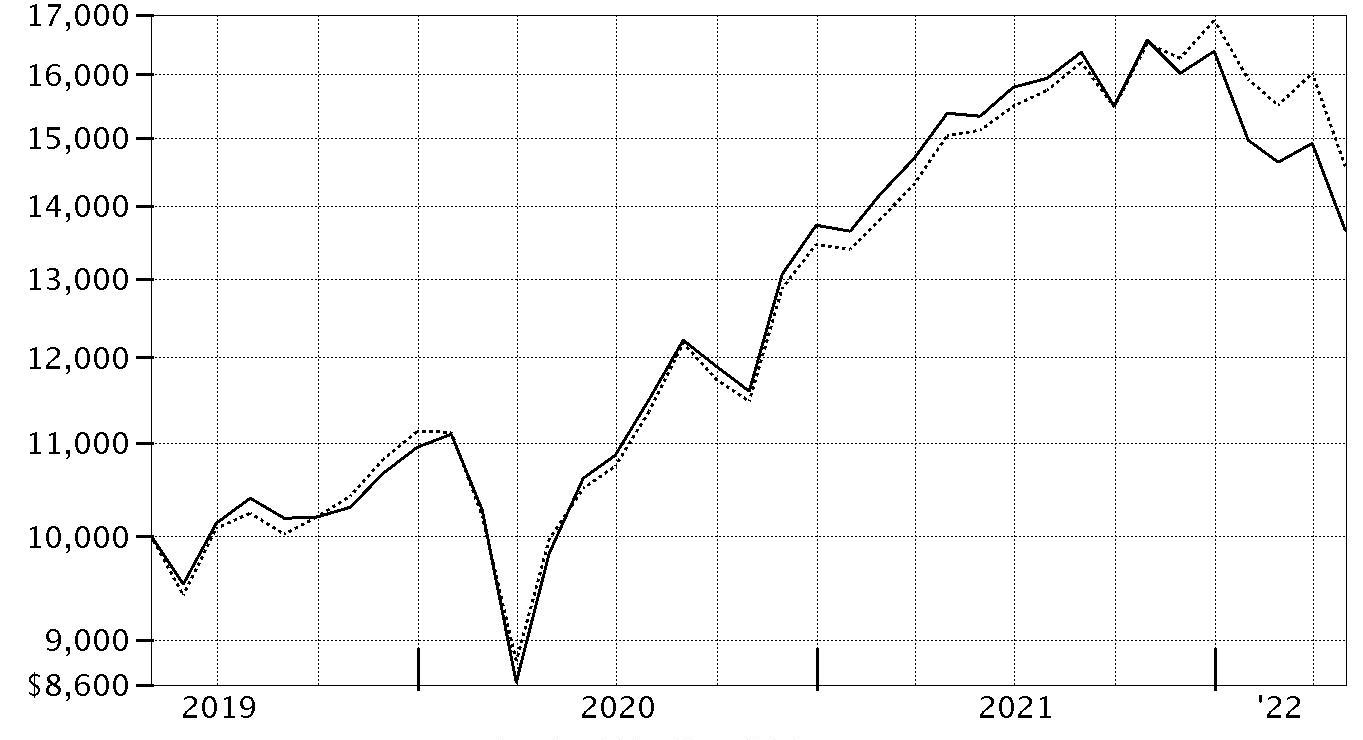
| Period Ending Values |
| $13,657 | Fidelity® Women's Leadership Fund |
| $14,582 | Russell 3000® Index |
Management's Discussion of Fund Performance
Market Recap: The S&P 500
® index gained 0.21% for the 12 months ending April 30, 2022. After posting a strong result in 2021, large-cap stocks retreated to begin the new year amid several notable headwinds that stoked volatility, uncertainty and investor anxiety. Chief among these was the U.S. Federal Reserve’s accelerated plan to hike interest rates and aggressively wind down its balance sheet in an attempt to rein in historically high inflation. In addition, geopolitical unrest rose as Russia invaded Ukraine in late February and escalated its attack through period end. Other factors influencing stocks included surging commodity prices, rising bond yields, supply constraint and disruption, and the potential for variants of the coronavirus to upend the economy. Against this backdrop, the S&P 500
® index returned -5.17% in January and -2.99% in February, falling on mixed corporate earnings, particularly among some highflying tech firms. Volatility eased in March and the index gained 3.71% for the month. April saw a sharp reversal, with the index returning -8.72% amid clearer signals of the Fed’s intension to tighten monetary policy and angst about the economic toll of “zero-COVID” lockdowns in China. It was the largest monthly decline for the S&P 500
® since March 2020. For the full 12 months, the growth-oriented communication services (-22%) and consumer discretionary (-11%) sectors lagged most. In contrast, energy (+61%) rode a surge in commodity prices and led the market by a wide margin, followed by the defensive consumer staples (+17%) sector.
Comments from Portfolio Manager Nicole Connolly: For the fiscal year ending April 30, 2022, the fund's share classes (excluding sales charges, if applicable) returned about -12% to -11%, trailing the -7.44% result of the MSCI USA Women's Leadership Index, as well as the broad-based Russell 3000
® Index. Versus the MSCI index, security selection was the primary detractor. The retailing area of the consumer discretionary sector notably held back the fund’s relative result. Security selection and an underweighting in consumer staples and an underweighting in energy also detracted. Our non-index stake in Gap was the fund's biggest individual relative detractor, due to its roughly -62% result. Also holding back performance was our outsized stake in PayPal Holdings, which returned approximately -66%. The fund's non-index stake in Innovage Holding, a position not held at period end, returned -69%. In contrast, an underweighting in the communication services sector contributed significantly to performance versus the index, due primarily to underexposure in the media & entertainment industry. Strong picks in the financials sector, especially within diversified financials, also helped. Also boosting the fund's relative performance was an underweighting and stock selection in real estate. Not owning Zillow Group, an index component that returned -70%, was the fund’s biggest individual relative contributor. Also adding value was our overweighting in Anthem, which gained 34%. Anthem was among the fund's largest holdings. In the media & entertainment group, avoiding Roku, an index component that returned -73%, also helped relative performance. Lastly, the fund's foreign holdings modestly contributed overall despite the headwind of broad U.S.-dollar strength. Notable changes in positioning include a lower allocation to the communication services and consumer discretionary sectors.
The views expressed above reflect those of the portfolio manager(s) only through the end of the period as stated on the cover of this report and do not necessarily represent the views of Fidelity or any other person in the Fidelity organization. Any such views are subject to change at any time based upon market or other conditions and Fidelity disclaims any responsibility to update such views. These views may not be relied on as investment advice and, because investment decisions for a Fidelity fund are based on numerous factors, may not be relied on as an indication of trading intent on behalf of any Fidelity fund.
Investment Summary (Unaudited)
Top Ten Stocks as of April 30, 2022
| | % of fund's net assets |
| Anthem, Inc. | 3.3 |
| Microsoft Corp. | 3.2 |
| Apple, Inc. | 2.3 |
| Progressive Corp. | 1.9 |
| CDW Corp. | 1.9 |
| Cigna Corp. | 1.8 |
| Accenture PLC Class A | 1.7 |
| AMETEK, Inc. | 1.7 |
| Hologic, Inc. | 1.6 |
| Capgemini SA | 1.6 |
| | 21.0 |
Market Sectors as of April 30, 2022
| | % of fund's net assets |
| Information Technology | 24.2 |
| Health Care | 16.1 |
| Financials | 12.1 |
| Consumer Discretionary | 11.5 |
| Industrials | 11.5 |
| Communication Services | 5.5 |
| Consumer Staples | 4.7 |
| Utilities | 3.8 |
| Materials | 3.7 |
| Real Estate | 3.2 |
| Energy | 2.5 |
Asset Allocation (% of fund's net assets)
| As of April 30, 2022 * |
| | Stocks | 98.5% |
| | Convertible Securities | 0.3% |
| | Short-Term Investments and Net Other Assets (Liabilities) | 1.2% |

* Foreign investments – 14.8%
Geographic Diversification (% of fund's net assets)
| As of April 30, 2022 |
| | United States of America* | 85.2% |
| | Ireland | 3.3% |
| | United Kingdom | 2.5% |
| | France | 2.2% |
| | Denmark | 1.1% |
| | Belgium | 1.0% |
| | Australia | 1.0% |
| | Germany | 1.0% |
| | Norway | 1.0% |
| | Other | 1.7% |

* Includes Short-Term investments and Net Other Assets (Liabilities).
Percentages are based on country or territory of incorporation and include the effect of futures, if applicable.
Schedule of Investments April 30, 2022
Showing Percentage of Net Assets
| Common Stocks - 98.5% | | | |
| | | Shares | Value |
| COMMUNICATION SERVICES - 5.5% | | | |
| Diversified Telecommunication Services - 0.7% | | | |
| Verizon Communications, Inc. | | 21,053 | $974,754 |
| Entertainment - 0.9% | | | |
| The Walt Disney Co. (a) | | 10,081 | 1,125,342 |
| Interactive Media & Services - 1.7% | | | |
| Alphabet, Inc. Class A (a) | | 324 | 739,430 |
| Bumble, Inc. (a) | | 36,077 | 865,487 |
| Snap, Inc. Class A (a) | | 21,382 | 608,532 |
| | | | 2,213,449 |
| Media - 2.2% | | | |
| Cable One, Inc. | | 498 | 580,768 |
| Future PLC | | 17,114 | 468,722 |
| Interpublic Group of Companies, Inc. | | 54,106 | 1,764,938 |
| | | | 2,814,428 |
|
| TOTAL COMMUNICATION SERVICES | | | 7,127,973 |
|
| CONSUMER DISCRETIONARY - 11.5% | | | |
| Automobiles - 0.7% | | | |
| General Motors Co. (a) | | 23,874 | 905,063 |
| Diversified Consumer Services - 1.1% | | | |
| Adtalem Global Education, Inc. (a) | | 25,208 | 738,846 |
| Bright Horizons Family Solutions, Inc. (a) | | 5,799 | 662,478 |
| | | | 1,401,324 |
| Hotels, Restaurants & Leisure - 2.1% | | | |
| Marriott International, Inc. Class A | | 11,090 | 1,968,697 |
| Vail Resorts, Inc. | | 3,069 | 780,017 |
| | | | 2,748,714 |
| Household Durables - 0.5% | | | |
| Taylor Morrison Home Corp. (a) | | 24,928 | 652,864 |
| Internet & Direct Marketing Retail - 1.9% | | | |
| Amazon.com, Inc. (a) | | 627 | 1,558,490 |
| Etsy, Inc. (a) | | 6,478 | 603,685 |
| FSN E-Commerce Ventures Private Ltd. | | 459 | 10,038 |
| The RealReal, Inc. (a) | | 42,413 | 229,878 |
| | | | 2,402,091 |
| Multiline Retail - 0.3% | | | |
| Kohl's Corp. | | 6,699 | 387,738 |
| Specialty Retail - 3.3% | | | |
| Best Buy Co., Inc. | | 8,551 | 768,991 |
| Gap, Inc. | | 51,992 | 645,741 |
| Lowe's Companies, Inc. | | 6,289 | 1,243,524 |
| Ross Stores, Inc. | | 2,629 | 262,295 |
| Torrid Holdings, Inc. (b) | | 53,046 | 310,850 |
| Williams-Sonoma, Inc. (b) | | 7,735 | 1,009,263 |
| | | | 4,240,664 |
| Textiles, Apparel & Luxury Goods - 1.6% | | | |
| LVMH Moet Hennessy Louis Vuitton SE | | 1,111 | 718,967 |
| PVH Corp. | | 6,855 | 498,907 |
| Tapestry, Inc. | | 23,702 | 780,270 |
| | | | 1,998,144 |
|
| TOTAL CONSUMER DISCRETIONARY | | | 14,736,602 |
|
| CONSUMER STAPLES - 4.7% | | | |
| Beverages - 1.0% | | | |
| The Coca-Cola Co. | | 20,060 | 1,296,077 |
| Food & Staples Retailing - 0.7% | | | |
| Albertsons Companies, Inc. | | 28,880 | 903,366 |
| Food Products - 1.2% | | | |
| The Hershey Co. | | 6,892 | 1,556,007 |
| Household Products - 0.7% | | | |
| The Clorox Co. | | 6,091 | 873,876 |
| Personal Products - 1.1% | | | |
| Estee Lauder Companies, Inc. Class A | | 3,065 | 809,344 |
| Olaplex Holdings, Inc. | | 2,700 | 39,690 |
| Shiseido Co. Ltd. | | 12,097 | 571,843 |
| | | | 1,420,877 |
|
| TOTAL CONSUMER STAPLES | | | 6,050,203 |
|
| ENERGY - 2.5% | | | |
| Energy Equipment & Services - 0.3% | | | |
| Tenaris SA | | 26,152 | 399,660 |
| Oil, Gas & Consumable Fuels - 2.2% | | | |
| Equinor ASA | | 22,955 | 775,869 |
| Occidental Petroleum Corp. | | 11,428 | 629,569 |
| Phillips 66 Co. | | 16,916 | 1,467,632 |
| | | | 2,873,070 |
|
| TOTAL ENERGY | | | 3,272,730 |
|
| FINANCIALS - 12.1% | | | |
| Banks - 3.5% | | | |
| Bank of America Corp. | | 56,147 | 2,003,325 |
| Citigroup, Inc. | | 15,881 | 765,623 |
| First Horizon National Corp. | | 29,136 | 652,064 |
| First United Corp. (b) | | 19,718 | 441,880 |
| JPMorgan Chase & Co. | | 4,922 | 587,490 |
| Starling Bank Ltd. Series D (a)(c)(d) | | 34,700 | 102,888 |
| | | | 4,553,270 |
| Capital Markets - 4.4% | | | |
| Coinbase Global, Inc. (a)(b) | | 2,152 | 242,552 |
| Franklin Resources, Inc. | | 24,500 | 602,455 |
| Macquarie Group Ltd. | | 8,765 | 1,261,836 |
| Morningstar, Inc. | | 5,165 | 1,307,933 |
| MSCI, Inc. | | 1,076 | 453,265 |
| NASDAQ, Inc. | | 11,589 | 1,823,761 |
| | | | 5,691,802 |
| Insurance - 4.2% | | | |
| Hartford Financial Services Group, Inc. | | 28,946 | 2,024,194 |
| Marsh & McLennan Companies, Inc. | | 5,587 | 903,418 |
| Progressive Corp. | | 22,834 | 2,451,458 |
| | | | 5,379,070 |
|
| TOTAL FINANCIALS | | | 15,624,142 |
|
| HEALTH CARE - 15.8% | | | |
| Biotechnology - 2.0% | | | |
| Alnylam Pharmaceuticals, Inc. (a) | | 4,731 | 631,257 |
| Vertex Pharmaceuticals, Inc. (a) | | 6,484 | 1,771,558 |
| Zai Lab Ltd. ADR (a) | | 5,558 | 222,098 |
| | | | 2,624,913 |
| Health Care Equipment & Supplies - 2.4% | | | |
| Figs, Inc. Class A (a) | | 32,958 | 516,122 |
| Hologic, Inc. (a) | | 29,213 | 2,103,044 |
| Insulet Corp. (a) | | 1,131 | 270,298 |
| Outset Medical, Inc. (a) | | 5,606 | 195,537 |
| | | | 3,085,001 |
| Health Care Providers & Services - 5.5% | | | |
| Anthem, Inc. | | 8,390 | 4,211,193 |
| Cigna Corp. | | 9,484 | 2,340,462 |
| Guardant Health, Inc. (a) | | 7,473 | 461,084 |
| | | | 7,012,739 |
| Life Sciences Tools & Services - 0.5% | | | |
| ICON PLC (a) | | 2,762 | 624,792 |
| Pharmaceuticals - 5.4% | | | |
| Eli Lilly & Co. | | 5,515 | 1,611,097 |
| GlaxoSmithKline PLC | | 53,471 | 1,205,374 |
| Merck KGaA | | 6,613 | 1,226,893 |
| UCB SA | | 11,794 | 1,340,656 |
| Zoetis, Inc. Class A | | 8,763 | 1,553,242 |
| | | | 6,937,262 |
|
| TOTAL HEALTH CARE | | | 20,284,707 |
|
| INDUSTRIALS - 11.5% | | | |
| Air Freight & Logistics - 1.1% | | | |
| United Parcel Service, Inc. Class B | | 8,134 | 1,463,957 |
| Airlines - 0.3% | | | |
| JetBlue Airways Corp. (a) | | 39,221 | 431,823 |
| Commercial Services & Supplies - 0.5% | | | |
| Stericycle, Inc. (a) | | 3,071 | 154,133 |
| Tomra Systems ASA | | 11,060 | 434,939 |
| | | | 589,072 |
| Electrical Equipment - 3.1% | | | |
| AMETEK, Inc. | | 17,708 | 2,235,812 |
| nVent Electric PLC | | 42,248 | 1,427,137 |
| Sunrun, Inc. (a) | | 15,194 | 303,576 |
| | | | 3,966,525 |
| Machinery - 3.5% | | | |
| Deere & Co. | | 3,226 | 1,217,976 |
| Federal Signal Corp. | | 51,293 | 1,745,501 |
| Otis Worldwide Corp. | | 20,170 | 1,469,183 |
| | | | 4,432,660 |
| Professional Services - 3.0% | | | |
| Leidos Holdings, Inc. | | 13,259 | 1,372,439 |
| Manpower, Inc. | | 14,376 | 1,296,715 |
| Science Applications International Corp. | | 14,201 | 1,181,949 |
| | | | 3,851,103 |
|
| TOTAL INDUSTRIALS | | | 14,735,140 |
|
| INFORMATION TECHNOLOGY - 24.2% | | | |
| Communications Equipment - 0.7% | | | |
| Arista Networks, Inc. (a) | | 7,490 | 865,619 |
| Electronic Equipment & Components - 2.7% | | | |
| CDW Corp. | | 14,741 | 2,405,436 |
| Insight Enterprises, Inc. (a) | | 10,520 | 1,045,372 |
| | | | 3,450,808 |
| IT Services - 8.4% | | | |
| Accenture PLC Class A | | 7,475 | 2,245,191 |
| Capgemini SA | | 10,176 | 2,071,620 |
| Concentrix Corp. | | 4,533 | 713,857 |
| Genpact Ltd. | | 19,988 | 804,917 |
| MasterCard, Inc. Class A | | 5,492 | 1,995,683 |
| PayPal Holdings, Inc. (a) | | 8,760 | 770,267 |
| Twilio, Inc. Class A (a) | | 4,935 | 551,832 |
| WEX, Inc. (a) | | 10,410 | 1,730,558 |
| | | | 10,883,925 |
| Semiconductors & Semiconductor Equipment - 1.7% | | | |
| Advanced Micro Devices, Inc. (a) | | 9,096 | 777,890 |
| NVIDIA Corp. | | 7,717 | 1,431,272 |
| | | | 2,209,162 |
| Software - 8.4% | | | |
| Adobe, Inc. (a) | | 4,247 | 1,681,600 |
| Copperleaf Technologies, Inc. | | 32,733 | 261,935 |
| HubSpot, Inc. (a) | | 2,171 | 823,743 |
| Intuit, Inc. | | 3,812 | 1,596,275 |
| Microsoft Corp. | | 14,743 | 4,091,477 |
| Pagerduty, Inc. (a)(b) | | 16,683 | 476,633 |
| Salesforce.com, Inc. (a) | | 10,716 | 1,885,373 |
| | | | 10,817,036 |
| Technology Hardware, Storage & Peripherals - 2.3% | | | |
| Apple, Inc. | | 18,984 | 2,992,828 |
|
| TOTAL INFORMATION TECHNOLOGY | | | 31,219,378 |
|
| MATERIALS - 3.7% | | | |
| Chemicals - 1.5% | | | |
| Cabot Corp. | | 10,509 | 692,018 |
| Eastman Chemical Co. | | 6,488 | 666,123 |
| Valvoline, Inc. | | 21,563 | 651,849 |
| | | | 2,009,990 |
| Construction Materials - 0.5% | | | |
| Summit Materials, Inc. (a) | | 21,792 | 605,818 |
| Metals & Mining - 1.7% | | | |
| Commercial Metals Co. | | 31,282 | 1,282,562 |
| Schnitzer Steel Industries, Inc. Class A | | 19,938 | 909,771 |
| | | | 2,192,333 |
|
| TOTAL MATERIALS | | | 4,808,141 |
|
| REAL ESTATE - 3.2% | | | |
| Equity Real Estate Investment Trusts (REITs) - 3.2% | | | |
| Equity Lifestyle Properties, Inc. | | 20,737 | 1,602,555 |
| Store Capital Corp. | | 52,627 | 1,496,186 |
| Ventas, Inc. | | 19,289 | 1,071,504 |
| | | | 4,170,245 |
| UTILITIES - 3.8% | | | |
| Electric Utilities - 2.8% | | | |
| NextEra Energy, Inc. | | 11,166 | 793,009 |
| ORSTED A/S (e) | | 12,530 | 1,386,200 |
| SSE PLC | | 58,116 | 1,349,792 |
| | | | 3,529,001 |
| Water Utilities - 1.0% | | | |
| American Water Works Co., Inc. | | 8,599 | 1,324,934 |
|
| TOTAL UTILITIES | | | 4,853,935 |
|
| TOTAL COMMON STOCKS | | | |
| (Cost $123,428,137) | | | 126,883,196 |
|
| Convertible Preferred Stocks - 0.3% | | | |
| HEALTH CARE - 0.3% | | | |
| Health Care Providers & Services - 0.3% | | | |
| Somatus, Inc. Series E (c)(d) | | | |
| (Cost $350,799) | | 402 | 350,799 |
|
| Money Market Funds - 2.6% | | | |
| Fidelity Cash Central Fund 0.32% (f) | | 1,590,390 | 1,590,708 |
| Fidelity Securities Lending Cash Central Fund 0.32% (f)(g) | | 1,804,545 | 1,804,725 |
| TOTAL MONEY MARKET FUNDS | | | |
| (Cost $3,395,433) | | | 3,395,433 |
| TOTAL INVESTMENT IN SECURITIES - 101.4% | | | |
| (Cost $127,174,369) | | | 130,629,428 |
| NET OTHER ASSETS (LIABILITIES) - (1.4)% | | | (1,841,319) |
| NET ASSETS - 100% | | | $128,788,109 |
Legend
(a) Non-income producing
(b) Security or a portion of the security is on loan at period end.
(c) Restricted securities (including private placements) - Investment in securities not registered under the Securities Act of 1933 (excluding 144A issues). At the end of the period, the value of restricted securities (excluding 144A issues) amounted to $453,687 or 0.4% of net assets.
(d) Level 3 security
(e) Security exempt from registration under Rule 144A of the Securities Act of 1933. These securities may be resold in transactions exempt from registration, normally to qualified institutional buyers. At the end of the period, the value of these securities amounted to $1,386,200 or 1.1% of net assets.
(f) Affiliated fund that is generally available only to investment companies and other accounts managed by Fidelity Investments. The rate quoted is the annualized seven-day yield of the fund at period end. A complete unaudited listing of the fund's holdings as of its most recent quarter end is available upon request. In addition, each Fidelity Central Fund's financial statements, which are not covered by the Fund's Report of Independent Registered Public Accounting Firm, are available on the SEC's website or upon request.
(g) Investment made with cash collateral received from securities on loan.
Additional information on each restricted holding is as follows:
| Security | Acquisition Date | Acquisition Cost |
| Somatus, Inc. Series E | 1/31/22 | $350,799 |
| Starling Bank Ltd. Series D | 6/18/21 - 4/5/22 | $68,001 |
Affiliated Central Funds
Fiscal year to date information regarding the Fund's investments in Fidelity Central Funds, including the ownership percentage, is presented below.
| Fund | Value, beginning of period | Purchases | Sales Proceeds | Dividend Income | Realized Gain/Loss | Change in Unrealized appreciation (depreciation) | Value, end of period | % ownership, end of period |
| Fidelity Cash Central Fund 0.32% | $2,784,468 | $54,748,104 | $55,941,864 | $2,954 | $-- | $-- | $1,590,708 | 0.0% |
| Fidelity Securities Lending Cash Central Fund 0.32% | 2,443,525 | 30,061,972 | 30,700,772 | 19,189 | -- | -- | 1,804,725 | 0.0% |
| Total | $5,227,993 | $84,810,076 | $86,642,636 | $22,143 | $-- | $-- | $3,395,433 | |
Amounts in the income column in the above table include any capital gain distributions from underlying funds, which are presented in the corresponding line-item in the Statement of Operations, if applicable. Amount for Fidelity Securities Lending Cash Central Fund represents the income earned on investing cash collateral, less rebates paid to borrowers and any lending agent fees associated with the loan, plus any premium payments received for lending certain types of securities.
Investment Valuation
The following is a summary of the inputs used, as of April 30, 2022, involving the Fund's assets and liabilities carried at fair value. The inputs or methodology used for valuing securities may not be an indication of the risk associated with investing in those securities. For more information on valuation inputs, and their aggregation into the levels used below, please refer to the Investment Valuation section in the accompanying Notes to Financial Statements.
| | Valuation Inputs at Reporting Date: |
| Description | Total | Level 1 | Level 2 | Level 3 |
| Investments in Securities: | | | | |
| Equities:�� | | | | |
| Communication Services | $7,127,973 | $6,659,251 | $468,722 | $-- |
| Consumer Discretionary | 14,736,602 | 14,007,597 | 729,005 | -- |
| Consumer Staples | 6,050,203 | 5,478,360 | 571,843 | -- |
| Energy | 3,272,730 | 2,097,201 | 1,175,529 | -- |
| Financials | 15,624,142 | 14,259,418 | 1,261,836 | 102,888 |
| Health Care | 20,635,506 | 16,511,784 | 3,772,923 | 350,799 |
| Industrials | 14,735,140 | 14,300,201 | 434,939 | -- |
| Information Technology | 31,219,378 | 29,147,758 | 2,071,620 | -- |
| Materials | 4,808,141 | 4,808,141 | -- | -- |
| Real Estate | 4,170,245 | 4,170,245 | -- | -- |
| Utilities | 4,853,935 | 2,117,943 | 2,735,992 | -- |
| Money Market Funds | 3,395,433 | 3,395,433 | -- | -- |
| Total Investments in Securities: | $130,629,428 | $116,953,332 | $13,222,409 | $453,687 |
See accompanying notes which are an integral part of the financial statements.
Financial Statements
Statement of Assets and Liabilities
| | | April 30, 2022 |
| Assets | | |
Investment in securities, at value (including securities loaned of $1,665,686) — See accompanying schedule:
Unaffiliated issuers (cost $123,778,936) | $127,233,995 | |
| Fidelity Central Funds (cost $3,395,433) | 3,395,433 | |
| Total Investment in Securities (cost $127,174,369) | | $130,629,428 |
| Foreign currency held at value (cost $409,785) | | 410,258 |
| Receivable for fund shares sold | | 188,628 |
| Dividends receivable | | 97,071 |
| Distributions receivable from Fidelity Central Funds | | 1,201 |
| Prepaid expenses | | 41 |
| Receivable from investment adviser for expense reductions | | 21,773 |
| Other receivables | | 48 |
| Total assets | | 131,348,448 |
| Liabilities | | |
| Payable for investments purchased | $404,147 | |
| Payable for fund shares redeemed | 251,194 | |
| Accrued management fee | 54,125 | |
| Distribution and service plan fees payable | 2,974 | |
| Other affiliated payables | 32,291 | |
| Other payables and accrued expenses | 10,883 | |
| Collateral on securities loaned | 1,804,725 | |
| Total liabilities | | 2,560,339 |
| Net Assets | | $128,788,109 |
| Net Assets consist of: | | |
| Paid in capital | | $126,408,868 |
| Total accumulated earnings (loss) | | 2,379,241 |
| Net Assets | | $128,788,109 |
| Net Asset Value and Maximum Offering Price | | |
| Class A: | | |
| Net Asset Value and redemption price per share ($5,171,388 ÷ 392,489 shares)(a) | | $13.18 |
| Maximum offering price per share (100/94.25 of $13.18) | | $13.98 |
| Class M: | | |
| Net Asset Value and redemption price per share ($1,054,216 ÷ 80,253 shares)(a) | | $13.14 |
| Maximum offering price per share (100/96.50 of $13.14) | | $13.62 |
| Class C: | | |
| Net Asset Value and offering price per share ($1,539,856 ÷ 118,481 shares)(a) | | $13.00 |
| Fidelity Women's Leadership Fund: | | |
| Net Asset Value, offering price and redemption price per share ($101,533,441 ÷ 7,682,817 shares) | | $13.22 |
| Class I: | | |
| Net Asset Value, offering price and redemption price per share ($11,273,185 ÷ 853,542 shares) | | $13.21 |
| Class Z: | | |
| Net Asset Value, offering price and redemption price per share ($8,216,023 ÷ 620,045 shares) | | $13.25 |
(a) Redemption price per share is equal to net asset value less any applicable contingent deferred sales charge.
See accompanying notes which are an integral part of the financial statements.
Statement of Operations
| | | Year ended April 30, 2022 |
| Investment Income | | |
| Dividends | | $1,489,544 |
| Income from Fidelity Central Funds (including $19,189 from security lending) | | 22,143 |
| Total income | | 1,511,687 |
| Expenses | | |
| Management fee | | |
| Basic fee | $730,443 | |
| Performance adjustment | (31,550) | |
| Transfer agent fees | 340,633 | |
| Distribution and service plan fees | 31,881 | |
| Accounting fees | 54,177 | |
| Custodian fees and expenses | 10,641 | |
| Independent trustees' fees and expenses | 461 | |
| Registration fees | 90,109 | |
| Audit | 52,585 | |
| Legal | 102 | |
| Miscellaneous | 531 | |
| Total expenses before reductions | 1,280,013 | |
| Expense reductions | (25,762) | |
| Total expenses after reductions | | 1,254,251 |
| Net investment income (loss) | | 257,436 |
| Realized and Unrealized Gain (Loss) | | |
| Net realized gain (loss) on: | | |
| Investment securities: | | |
| Unaffiliated issuers | 1,453,728 | |
| Foreign currency transactions | (3,445) | |
| Total net realized gain (loss) | | 1,450,283 |
| Change in net unrealized appreciation (depreciation) on: | | |
| Investment securities: | | |
| Unaffiliated issuers (net of increase in deferred foreign taxes of $612) | (19,544,954) | |
| Unfunded commitments | 6,334 | |
| Assets and liabilities in foreign currencies | (1,093) | |
| Total change in net unrealized appreciation (depreciation) | | (19,539,713) |
| Net gain (loss) | | (18,089,430) |
| Net increase (decrease) in net assets resulting from operations | | $(17,831,994) |
See accompanying notes which are an integral part of the financial statements.
Statement of Changes in Net Assets
| | Year ended April 30, 2022 | Year ended April 30, 2021 |
| Increase (Decrease) in Net Assets | | |
| Operations | | |
| Net investment income (loss) | $257,436 | $129,944 |
| Net realized gain (loss) | 1,450,283 | 2,647,993 |
| Change in net unrealized appreciation (depreciation) | (19,539,713) | 23,240,710 |
| Net increase (decrease) in net assets resulting from operations | (17,831,994) | 26,018,647 |
| Distributions to shareholders | (3,850,676) | (112,730) |
| Share transactions - net increase (decrease) | 33,890,981 | 63,644,346 |
| Total increase (decrease) in net assets | 12,208,311 | 89,550,263 |
| Net Assets | | |
| Beginning of period | 116,579,798 | 27,029,535 |
| End of period | $128,788,109 | $116,579,798 |
See accompanying notes which are an integral part of the financial statements.
Financial Highlights
Fidelity Women's Leadership Fund Class A
| Years ended April 30, | 2022 | 2021 | 2020 A |
| Selected Per–Share Data | | | |
| Net asset value, beginning of period | $15.28 | $9.80 | $10.00 |
| Income from Investment Operations | | | |
| Net investment income (loss)B,C | –D | –D | .04 |
| Net realized and unrealized gain (loss) | (1.70) | 5.49 | (.22) |
| Total from investment operations | (1.70) | 5.49 | (.18) |
| Distributions from net investment income | –D | (.01) | (.02) |
| Distributions from net realized gain | (.40) | – | – |
| Total distributions | (.40) | (.01) | (.02) |
| Net asset value, end of period | $13.18 | $15.28 | $9.80 |
| Total ReturnE,F | (11.46)% | 56.03% | (1.84)% |
| Ratios to Average Net AssetsC,G,H | | | |
| Expenses before reductions | 1.10% | 1.28% | 2.50% |
| Expenses net of fee waivers, if any | 1.10% | 1.25% | 1.25% |
| Expenses net of all reductions | 1.10% | 1.24% | 1.25% |
| Net investment income (loss) | (.01)% | (.03)% | .37% |
| Supplemental Data | | | |
| Net assets, end of period (000 omitted) | $5,171 | $2,865 | $769 |
| Portfolio turnover rateI | 48% | 35% | 52% |
A For the period May 1, 2019 (commencement of operations) through April 30, 2020.
B Calculated based on average shares outstanding during the period.
C Net investment income (loss) is affected by the timing of the declaration of dividends by any underlying mutual funds or exchange-traded funds (ETFs). Net investment income (loss) of any such underlying funds is not included in the Fund's net investment income (loss) ratio.
D Amount represents less than $.005 per share.
E Total returns would have been lower if certain expenses had not been reduced during the applicable periods shown.
F Total returns do not include the effect of the sales charges.
G Fees and expenses of any underlying mutual funds or exchange-traded funds (ETFs) are not included in the Fund's expense ratio. The Fund indirectly bears its proportionate share of these expenses. For additional expense information related to investments in Fidelity Central Funds, please refer to the "Investments in Fidelity Central Funds" note found in the Notes to Financial Statements section of the most recent Annual or Semi-Annual report.
H Expense ratios reflect operating expenses of the class. Expenses before reductions do not reflect amounts reimbursed, waived, or reduced through arrangements with the investment adviser, brokerage services, or other offset arrangements, if applicable, and do not represent the amount paid by the class during periods when reimbursements, waivers or reductions occur.
I Amount does not include the portfolio activity of any underlying mutual funds or exchange-traded funds (ETFs).
See accompanying notes which are an integral part of the financial statements.
Fidelity Women's Leadership Fund Class M
| Years ended April 30, | 2022 | 2021 | 2020 A |
| Selected Per–Share Data | | | |
| Net asset value, beginning of period | $15.22 | $9.78 | $10.00 |
| Income from Investment Operations | | | |
| Net investment income (loss)B,C | (.04) | (.04) | .01 |
| Net realized and unrealized gain (loss) | (1.69) | 5.48 | (.22) |
| Total from investment operations | (1.73) | 5.44 | (.21) |
| Distributions from net investment income | – | –D | (.01) |
| Distributions from net realized gain | (.35) | – | – |
| Total distributions | (.35) | –D | (.01) |
| Net asset value, end of period | $13.14 | $15.22 | $9.78 |
| Total ReturnE,F | (11.66)% | 55.65% | (2.12)% |
| Ratios to Average Net AssetsC,G,H | | | |
| Expenses before reductions | 1.35% | 1.52% | 2.86% |
| Expenses net of fee waivers, if any | 1.35% | 1.50% | 1.50% |
| Expenses net of all reductions | 1.35% | 1.49% | 1.50% |
| Net investment income (loss) | (.27)% | (.28)% | .12% |
| Supplemental Data | | | |
| Net assets, end of period (000 omitted) | $1,054 | $974 | $443 |
| Portfolio turnover rateI | 48% | 35% | 52% |
A For the period May 1, 2019 (commencement of operations) through April 30, 2020.
B Calculated based on average shares outstanding during the period.
C Net investment income (loss) is affected by the timing of the declaration of dividends by any underlying mutual funds or exchange-traded funds (ETFs). Net investment income (loss) of any such underlying funds is not included in the Fund's net investment income (loss) ratio.
D Amount represents less than $.005 per share.
E Total returns would have been lower if certain expenses had not been reduced during the applicable periods shown.
F Total returns do not include the effect of the sales charges.
G Fees and expenses of any underlying mutual funds or exchange-traded funds (ETFs) are not included in the Fund's expense ratio. The Fund indirectly bears its proportionate share of these expenses. For additional expense information related to investments in Fidelity Central Funds, please refer to the "Investments in Fidelity Central Funds" note found in the Notes to Financial Statements section of the most recent Annual or Semi-Annual report.
H Expense ratios reflect operating expenses of the class. Expenses before reductions do not reflect amounts reimbursed, waived, or reduced through arrangements with the investment adviser, brokerage services, or other offset arrangements, if applicable, and do not represent the amount paid by the class during periods when reimbursements, waivers or reductions occur.
I Amount does not include the portfolio activity of any underlying mutual funds or exchange-traded funds (ETFs).
See accompanying notes which are an integral part of the financial statements.
Fidelity Women's Leadership Fund Class C
| Years ended April 30, | 2022 | 2021 | 2020 A |
| Selected Per–Share Data | | | |
| Net asset value, beginning of period | $15.09 | $9.74 | $10.00 |
| Income from Investment Operations | | | |
| Net investment income (loss)B,C | (.11) | (.10) | (.04) |
| Net realized and unrealized gain (loss) | (1.68) | 5.45 | (.22) |
| Total from investment operations | (1.79) | 5.35 | (.26) |
| Distributions from net investment income | – | – | – |
| Distributions from net realized gain | (.30) | – | – |
| Total distributions | (.30) | – | – |
| Net asset value, end of period | $13.00 | $15.09 | $9.74 |
| Total ReturnD,E | (12.12)% | 54.93% | (2.60)% |
| Ratios to Average Net AssetsC,F,G | | | |
| Expenses before reductions | 1.84% | 1.99% | 3.36% |
| Expenses net of fee waivers, if any | 1.84% | 1.99% | 2.00% |
| Expenses net of all reductions | 1.84% | 1.98% | 2.00% |
| Net investment income (loss) | (.75)% | (.77)% | (.38)% |
| Supplemental Data | | | |
| Net assets, end of period (000 omitted) | $1,540 | $937 | $468 |
| Portfolio turnover rateH | 48% | 35% | 52% |
A For the period May 1, 2019 (commencement of operations) through April 30, 2020.
B Calculated based on average shares outstanding during the period.
C Net investment income (loss) is affected by the timing of the declaration of dividends by any underlying mutual funds or exchange-traded funds (ETFs). Net investment income (loss) of any such underlying funds is not included in the Fund's net investment income (loss) ratio.
D Total returns would have been lower if certain expenses had not been reduced during the applicable periods shown.
E Total returns do not include the effect of the contingent deferred sales charge.
F Fees and expenses of any underlying mutual funds or exchange-traded funds (ETFs) are not included in the Fund's expense ratio. The Fund indirectly bears its proportionate share of these expenses. For additional expense information related to investments in Fidelity Central Funds, please refer to the "Investments in Fidelity Central Funds" note found in the Notes to Financial Statements section of the most recent Annual or Semi-Annual report.
G Expense ratios reflect operating expenses of the class. Expenses before reductions do not reflect amounts reimbursed, waived, or reduced through arrangements with the investment adviser, brokerage services, or other offset arrangements, if applicable, and do not represent the amount paid by the class during periods when reimbursements, waivers or reductions occur.
H Amount does not include the portfolio activity of any underlying mutual funds or exchange-traded funds (ETFs).
See accompanying notes which are an integral part of the financial statements.
Fidelity Women's Leadership Fund
| Years ended April 30, | 2022 | 2021 | 2020 A |
| Selected Per–Share Data | | | |
| Net asset value, beginning of period | $15.31 | $9.81 | $10.00 |
| Income from Investment Operations | | | |
| Net investment income (loss)B,C | .03 | .03 | .06 |
| Net realized and unrealized gain (loss) | (1.70) | 5.50 | (.22) |
| Total from investment operations | (1.67) | 5.53 | (.16) |
| Distributions from net investment income | (.02) | (.03) | (.03) |
| Distributions from net realized gain | (.40) | – | – |
| Total distributions | (.42) | (.03) | (.03) |
| Net asset value, end of period | $13.22 | $15.31 | $9.81 |
| Total ReturnD | (11.25)% | 56.44% | (1.63)% |
| Ratios to Average Net AssetsC,E,F | | | |
| Expenses before reductions | .92% | 1.10% | 2.19% |
| Expenses net of fee waivers, if any | .90% | 1.00% | 1.00% |
| Expenses net of all reductions | .90% | .99% | 1.00% |
| Net investment income (loss) | .18% | .22% | .62% |
| Supplemental Data | | | |
| Net assets, end of period (000 omitted) | $101,533 | $98,888 | $22,272 |
| Portfolio turnover rateG | 48% | 35% | 52% |
A For the period May 1, 2019 (commencement of operations) through April 30, 2020.
B Calculated based on average shares outstanding during the period.
C Net investment income (loss) is affected by the timing of the declaration of dividends by any underlying mutual funds or exchange-traded funds (ETFs). Net investment income (loss) of any such underlying funds is not included in the Fund's net investment income (loss) ratio.
D Total returns would have been lower if certain expenses had not been reduced during the applicable periods shown.
E Fees and expenses of any underlying mutual funds or exchange-traded funds (ETFs) are not included in the Fund's expense ratio. The Fund indirectly bears its proportionate share of these expenses. For additional expense information related to investments in Fidelity Central Funds, please refer to the "Investments in Fidelity Central Funds" note found in the Notes to Financial Statements section of the most recent Annual or Semi-Annual report.
F Expense ratios reflect operating expenses of the class. Expenses before reductions do not reflect amounts reimbursed, waived, or reduced through arrangements with the investment adviser, brokerage services, or other offset arrangements, if applicable, and do not represent the amount paid by the class during periods when reimbursements, waivers or reductions occur.
G Amount does not include the portfolio activity of any underlying mutual funds or exchange-traded funds (ETFs).
See accompanying notes which are an integral part of the financial statements.
Fidelity Women's Leadership Fund Class I
| Years ended April 30, | 2022 | 2021 | 2020 A |
| Selected Per–Share Data | | | |
| Net asset value, beginning of period | $15.31 | $9.81 | $10.00 |
| Income from Investment Operations | | | |
| Net investment income (loss)B,C | .04 | .03 | .06 |
| Net realized and unrealized gain (loss) | (1.70) | 5.51 | (.22) |
| Total from investment operations | (1.66) | 5.54 | (.16) |
| Distributions from net investment income | (.04) | (.04) | (.03) |
| Distributions from net realized gain | (.40) | – | – |
| Total distributions | (.44) | (.04) | (.03) |
| Net asset value, end of period | $13.21 | $15.31 | $9.81 |
| Total ReturnD | (11.20)% | 56.52% | (1.63)% |
| Ratios to Average Net AssetsC,E,F | | | |
| Expenses before reductions | .81% | .98% | 2.22% |
| Expenses net of fee waivers, if any | .81% | .98% | 1.00% |
| Expenses net of all reductions | .81% | .97% | 1.00% |
| Net investment income (loss) | .28% | .24% | .62% |
| Supplemental Data | | | |
| Net assets, end of period (000 omitted) | $11,273 | $3,874 | $702 |
| Portfolio turnover rateG | 48% | 35% | 52% |
A For the period May 1, 2019 (commencement of operations) through April 30, 2020.
B Calculated based on average shares outstanding during the period.
C Net investment income (loss) is affected by the timing of the declaration of dividends by any underlying mutual funds or exchange-traded funds (ETFs). Net investment income (loss) of any such underlying funds is not included in the Fund's net investment income (loss) ratio.
D Total returns would have been lower if certain expenses had not been reduced during the applicable periods shown.
E Fees and expenses of any underlying mutual funds or exchange-traded funds (ETFs) are not included in the Fund's expense ratio. The Fund indirectly bears its proportionate share of these expenses. For additional expense information related to investments in Fidelity Central Funds, please refer to the "Investments in Fidelity Central Funds" note found in the Notes to Financial Statements section of the most recent Annual or Semi-Annual report.
F Expense ratios reflect operating expenses of the class. Expenses before reductions do not reflect amounts reimbursed, waived, or reduced through arrangements with the investment adviser, brokerage services, or other offset arrangements, if applicable, and do not represent the amount paid by the class during periods when reimbursements, waivers or reductions occur.
G Amount does not include the portfolio activity of any underlying mutual funds or exchange-traded funds (ETFs).
See accompanying notes which are an integral part of the financial statements.
Fidelity Women's Leadership Fund Class Z
| Years ended April 30, | 2022 | 2021 | 2020 A |
| Selected Per–Share Data | | | |
| Net asset value, beginning of period | $15.35 | $9.83 | $10.00 |
| Income from Investment Operations | | | |
| Net investment income (loss)B,C | .06 | .05 | .08 |
| Net realized and unrealized gain (loss) | (1.71) | 5.51 | (.22) |
| Total from investment operations | (1.65) | 5.56 | (.14) |
| Distributions from net investment income | (.05) | (.04) | (.03) |
| Distributions from net realized gain | (.40) | – | – |
| Total distributions | (.45) | (.04) | (.03) |
| Net asset value, end of period | $13.25 | $15.35 | $9.83 |
| Total ReturnD | (11.13)% | 56.63% | (1.43)% |
| Ratios to Average Net AssetsC,E,F | | | |
| Expenses before reductions | .69% | .87% | 1.88% |
| Expenses net of fee waivers, if any | .69% | .85% | .85% |
| Expenses net of all reductions | .69% | .84% | .85% |
| Net investment income (loss) | .40% | .37% | .76% |
| Supplemental Data | | | |
| Net assets, end of period (000 omitted) | $8,216 | $9,043 | $2,376 |
| Portfolio turnover rateG | 48% | 35% | 52% |
A For the period May 1, 2019 (commencement of operations) through April 30, 2020.
B Calculated based on average shares outstanding during the period.
C Net investment income (loss) is affected by the timing of the declaration of dividends by any underlying mutual funds or exchange-traded funds (ETFs). Net investment income (loss) of any such underlying funds is not included in the Fund's net investment income (loss) ratio.
D Total returns would have been lower if certain expenses had not been reduced during the applicable periods shown.
E Fees and expenses of any underlying mutual funds or exchange-traded funds (ETFs) are not included in the Fund's expense ratio. The Fund indirectly bears its proportionate share of these expenses. For additional expense information related to investments in Fidelity Central Funds, please refer to the "Investments in Fidelity Central Funds" note found in the Notes to Financial Statements section of the most recent Annual or Semi-Annual report.
F Expense ratios reflect operating expenses of the class. Expenses before reductions do not reflect amounts reimbursed, waived, or reduced through arrangements with the investment adviser, brokerage services, or other offset arrangements, if applicable, and do not represent the amount paid by the class during periods when reimbursements, waivers or reductions occur.
G Amount does not include the portfolio activity of any underlying mutual funds or exchange-traded funds (ETFs).
See accompanying notes which are an integral part of the financial statements.
Notes to Financial Statements
For the period ended April 30, 2022
1. Organization.
Fidelity Women's Leadership Fund (the Fund) is a fund of Fidelity Summer Street Trust (the Trust) and is authorized to issue an unlimited number of shares. The Trust is registered under the Investment Company Act of 1940, as amended (the 1940 Act), as an open-end management investment company organized as a Massachusetts business trust. The Fund offers Class A, Class M, Class C, Fidelity Women's Leadership Fund, Class I and Class Z shares, each of which has equal rights as to assets and voting privileges. Each class has exclusive voting rights with respect to matters that affect that class. Effective June 21, 2021, Class C shares will automatically convert to Class A shares after a holding period of eight years from the initial date of purchase, with certain exceptions. Prior to June 21, 2021, Class C shares automatically converted to Class A shares after a holding period of ten years from the initial date of purchase, with certain exceptions. Application of FMR's environmental, social, and governance (ESG) ratings process and/or its sustainable investing exclusion criteria may affect the Fund's exposure to certain issuers, sectors, regions, and countries and may affect the Fund's performance depending on whether certain investments are in or out of favor. The criteria related to the Fund's ESG ratings process and/or adherence to its sustainable investing exclusion criteria may result in the Fund forgoing opportunities to buy certain securities when it might otherwise be advantageous to do so, or selling securities for ESG reasons when it might be otherwise disadvantageous for it to do so. As a result, the Fund's performance may at times be better or worse than the performance of funds that do not use ESG or sustainability criteria. There are significant differences in interpretations of what it means for an issuer to have positive ESG factors. While the investment adviser believes its definitions are reasonable, the portfolio decisions it makes may differ with other investors' or advisers' views.
2. Investments in Fidelity Central Funds.
Funds may invest in Fidelity Central Funds, which are open-end investment companies generally available only to other investment companies and accounts managed by the investment adviser and its affiliates. The Schedule of Investments lists any Fidelity Central Funds held as an investment as of period end, but does not include the underlying holdings of each Fidelity Central Fund. An investing fund indirectly bears its proportionate share of the expenses of the underlying Fidelity Central Funds.
Based on its investment objective, each Fidelity Central Fund may invest or participate in various investment vehicles or strategies that are similar to those of the investing fund. These strategies are consistent with the investment objectives of the investing fund and may involve certain economic risks which may cause a decline in value of each of the Fidelity Central Funds and thus a decline in the value of the investing fund.
| Fidelity Central Fund | Investment Manager | Investment Objective | Investment Practices | Expense Ratio(a) |
| Fidelity Money Market Central Funds | Fidelity Management & Research Company LLC (FMR) | Each fund seeks to obtain a high level of current income consistent with the preservation of capital and liquidity. | Short-term Investments | Less than .005% |
(a) Expenses expressed as a percentage of average net assets and are as of each underlying Central Fund's most recent annual or semi-annual shareholder report.
A complete unaudited list of holdings for each Fidelity Central Fund is available upon request or at the Securities and Exchange Commission website at www.sec.gov. In addition, the financial statements of the Fidelity Central Funds which contain the significant accounting policies (including investment valuation policies) of those funds, and are not covered by the Report of Independent Registered Public Accounting Firm, are available on the Securities and Exchange Commission website or upon request.
3. Significant Accounting Policies.
The Fund is an investment company and applies the accounting and reporting guidance of the Financial Accounting Standards Board (FASB) Accounting Standards Codification Topic 946 Financial Services - Investment Companies. The financial statements have been prepared in conformity with accounting principles generally accepted in the United States of America (GAAP), which require management to make certain estimates and assumptions at the date of the financial statements. Actual results could differ from those estimates. Subsequent events, if any, through the date that the financial statements were issued have been evaluated in the preparation of the financial statements. The Fund's Schedule of Investments lists any underlying mutual funds or exchange-traded funds (ETFs) but does not include the underlying holdings of these funds. The following summarizes the significant accounting policies of the Fund:
Investment Valuation. Investments are valued as of 4:00 p.m. Eastern time on the last calendar day of the period. The Board of Trustees (the Board) has delegated the day to day responsibility for the valuation of the Fund's investments to the Fair Value Committee (the Committee) established by the Fund's investment adviser. In accordance with valuation policies and procedures approved by the Board, the Fund attempts to obtain prices from one or more third party pricing vendors or brokers to value its investments. When current market prices, quotations or currency exchange rates are not readily available or reliable, investments will be fair valued in good faith by the Committee, in accordance with procedures adopted by the Board. Factors used in determining fair value vary by investment type and may include market or investment specific events. The frequency with which these procedures are used cannot be predicted and they may be utilized to a significant extent. The Committee oversees the Fund's valuation policies and procedures and reports to the Board on the Committee's activities and fair value determinations. The Board monitors the appropriateness of the procedures used in valuing the Fund's investments and ratifies the fair value determinations of the Committee.
The Fund categorizes the inputs to valuation techniques used to value its investments into a disclosure hierarchy consisting of three levels as shown below:
- Level 1 – unadjusted quoted prices in active markets for identical investments
- Level 2 – other significant observable inputs (including quoted prices for similar investments, interest rates, prepayment speeds, etc.)
- Level 3 – unobservable inputs (including the Fund's own assumptions based on the best information available)
Valuation techniques used to value the Fund's investments by major category are as follows:
Equity securities, including restricted securities, for which market quotations are readily available, are valued at the last reported sale price or official closing price as reported by a third party pricing vendor on the primary market or exchange on which they are traded and are categorized as Level 1 in the hierarchy. In the event there were no sales during the day or closing prices are not available, securities are valued at the last quoted bid price or may be valued using the last available price and are generally categorized as Level 2 in the hierarchy. For foreign equity securities, when market or security specific events arise, comparisons to the valuation of American Depositary Receipts (ADRs), futures contracts, Exchange-Traded Funds (ETFs) and certain indexes as well as quoted prices for similar securities may be used and would be categorized as Level 2 in the hierarchy. For equity securities, including restricted securities, where observable inputs are limited, assumptions about market activity and risk are used and these securities may be categorized as Level 3 in the hierarchy.
Investments in open-end mutual funds, including the Fidelity Central Funds, are valued at their closing net asset value (NAV) each business day and are categorized as Level 1 in the hierarchy.
Changes in valuation techniques may result in transfers in or out of an assigned level within the disclosure hierarchy. The aggregate value of investments by input level as of April 30, 2022 is included at the end of the Fund's Schedule of Investments.
Foreign Currency. Certain Funds may use foreign currency contracts to facilitate transactions in foreign-denominated securities. Gains and losses from these transactions may arise from changes in the value of the foreign currency or if the counterparties do not perform under the contracts' terms.
Foreign-denominated assets, including investment securities, and liabilities are translated into U.S. dollars at the exchange rates at period end. Purchases and sales of investment securities, income and dividends received, and expenses denominated in foreign currencies are translated into U.S. dollars at the exchange rate in effect on the transaction date.
The effects of exchange rate fluctuations on investments are included with the net realized and unrealized gain (loss) on investment securities. Other foreign currency transactions resulting in realized and unrealized gain (loss) are disclosed separately.
Investment Transactions and Income. For financial reporting purposes, the Fund's investment holdings and NAV include trades executed through the end of the last business day of the period. The NAV per share for processing shareholder transactions is calculated as of the close of business of the New York Stock Exchange (NYSE), normally 4:00 p.m. Eastern time and includes trades executed through the end of the prior business day. Gains and losses on securities sold are determined on the basis of identified cost. Commissions paid to certain brokers with whom the investment adviser, or its affiliates, places trades on behalf of a fund include an amount in addition to trade execution, which may be rebated back to a fund. Any such rebates are included in net realized gain (loss) on investments in the Statement of Operations. Dividend income is recorded on the ex-dividend date, except for certain dividends from foreign securities where the ex-dividend date may have passed, which are recorded as soon as the Fund is informed of the ex-dividend date. Non-cash dividends included in dividend income, if any, are recorded at the fair market value of the securities received. Income and capital gain distributions from Fidelity Central Funds, if any, are recorded on the ex-dividend date. Certain distributions received by the Fund represent a return of capital or capital gain. The Fund determines the components of these distributions subsequent to the ex-dividend date, based upon receipt of tax filings or other correspondence relating to the underlying investment. These distributions are recorded as a reduction of cost of investments and/or as a realized gain. Investment income is recorded net of foreign taxes withheld where recovery of such taxes is uncertain. Funds may file withholding tax reclaims in certain jurisdictions to recover a portion of amounts previously withheld. Any withholding tax reclaims income is included in the Statement of Operations in dividends. Any receivables for withholding tax reclaims are included in the Statement of Assets and Liabilities in dividends receivable.
Class Allocations and Expenses. Investment income, realized and unrealized capital gains and losses, common expenses of a fund, and certain fund-level expense reductions, if any, are allocated daily on a pro-rata basis to each class based on the relative net assets of each class to the total net assets of a fund. Each class differs with respect to transfer agent and distribution and service plan fees incurred, as applicable. Certain expense reductions may also differ by class, if applicable. For the reporting period, the allocated portion of income and expenses to each class as a percent of its average net assets may vary due to the timing of recording these transactions in relation to fluctuating net assets of the classes. Expenses directly attributable to a fund are charged to that fund. Expenses attributable to more than one fund are allocated among the respective funds on the basis of relative net assets or other appropriate methods. Expenses included in the accompanying financial statements reflect the expenses of that fund and do not include any expenses associated with any underlying mutual funds or exchange-traded funds. Although not included in a fund's expenses, a fund indirectly bears its proportionate share of these expenses through the net asset value of each underlying mutual fund or exchange-traded fund. Expense estimates are accrued in the period to which they relate and adjustments are made when actual amounts are known.
Income Tax Information and Distributions to Shareholders. Each year, the Fund intends to qualify as a regulated investment company under Subchapter M of the Internal Revenue Code, including distributing substantially all of its taxable income and realized gains. As a result, no provision for U.S. Federal income taxes is required. As of April 30, 2022, the Fund did not have any unrecognized tax benefits in the financial statements; nor is the Fund aware of any tax positions for which it is reasonably possible that the total amounts of unrecognized tax benefits will significantly change in the next twelve months. The Fund files a U.S. federal tax return, in addition to state and local tax returns as required. The Fund's federal income tax returns are subject to examination by the Internal Revenue Service (IRS) for a period of three fiscal years after they are filed. State and local tax returns may be subject to examination for an additional fiscal year depending on the jurisdiction. Foreign taxes are provided for based on the Fund's understanding of the tax rules and rates that exist in the foreign markets in which it invests. The Fund is subject to a tax imposed on capital gains by certain countries in which it invests. An estimated deferred tax liability for net unrealized appreciation on the applicable securities is included in Other payables and accrued expenses on the Statement of Assets & Liabilities.
Distributions are declared and recorded on the ex-dividend date. Income and capital gain distributions are declared separately for each class. Income and capital gain distributions are determined in accordance with income tax regulations, which may differ from GAAP. In addition, the Fund claimed a portion of the payment made to redeeming shareholders as a distribution for income tax purposes.
Capital accounts within the financial statements are adjusted for permanent book-tax differences. These adjustments have no impact on net assets or the results of operations. Capital accounts are not adjusted for temporary book-tax differences which will reverse in a subsequent period.
Book-tax differences are primarily due to foreign currency transactions and losses deferred due to wash sales and excise tax regulations.
As of period end, the cost and unrealized appreciation (depreciation) in securities, and derivatives if applicable, for federal income tax purposes were as follows:
| Gross unrealized appreciation | $18,070,403 |
| Gross unrealized depreciation | (15,191,032) |
| Net unrealized appreciation (depreciation) | $2,879,371 |
| Tax Cost | $127,750,057 |
The tax-based components of distributable earnings as of period end were as follows:
| Net unrealized appreciation (depreciation) on securities and other investments | $2,878,405 |
The Fund intends to elect to defer to its next fiscal year $498,552 of capital losses recognized during the period November 1, 2021 to April 30, 2022.
The tax character of distributions paid was as follows:
| | April 30, 2022 | April 30, 2021 |
| Ordinary Income | $2,206,934 | $ 112,731 |
| Long-term Capital Gains | 1,643,743 | – |
| Total | $3,850,677 | $ 112,731 |
Restricted Securities (including Private Placements). Funds may invest in securities that are subject to legal or contractual restrictions on resale. These securities generally may be resold in transactions exempt from registration or to the public if the securities are registered. Disposal of these securities may involve time-consuming negotiations and expense, and prompt sale at an acceptable price may be difficult. Information regarding restricted securities held at period end is included at the end of the Schedule of Investments, if applicable.
Special Purpose Acquisition Companies. Funds may invest in stock, warrants, and other securities of special purpose acquisition companies (SPACs) or similar special purpose entities. A SPAC is a publicly traded company that raises investment capital via an initial public offering (IPO) for the purpose of acquiring the equity securities of one or more existing companies via merger, business combination, acquisition or other similar transactions within a designated time frame.
Private Investment in Public Equity. Funds may acquire equity securities of an issuer through a private investment in a public equity (PIPE) transaction, including through commitments to purchase securities on a when-issued basis. A PIPE typically involves the purchase of securities directly from a publicly traded company in a private placement transaction. Securities purchased through PIPE transactions will be restricted from trading and considered illiquid until a resale registration statement for the shares is filed and declared effective.
At the current and/or prior period end, the Fund had commitments to purchase when-issued securities through PIPE transactions with SPACs. The commitments are contingent upon the SPACs acquiring the securities of target companies. Unrealized appreciation (depreciation) on any commitments outstanding at period end is separately presented in the Statements of Assets and Liabilities as Unrealized appreciation (depreciation) on unfunded commitments, and any change in unrealized appreciation (depreciation) on unfunded commitments during the period is separately presented in the Statement of Operations, as applicable.
4. Purchases and Sales of Investments.
Purchases and sales of securities, other than short-term securities and in-kind transactions, as applicable, are noted in the table below.
| | Purchases ($) | Sales ($) |
| Fidelity Women's Leadership Fund | 96,484,295 | 65,464,091 |
5. Fees and Other Transactions with Affiliates.
Management Fee. Fidelity Management & Research Company LLC (the investment adviser) and its affiliates provide the Fund with investment management related services for which the Fund pays a monthly management fee. The management fee is the sum of an individual fund fee rate that is based on an annual rate of .30% of the Fund's average net assets and an annualized group fee rate that averaged .22% during the period. The group fee rate is based upon the monthly average net assets of a group of registered investment companies with which the investment adviser has management contracts. The group fee rate decreases as assets under management increase and increases as assets under management decrease. In addition, the management fee is subject to a performance adjustment (up to a maximum of +/- .10% of the Fund's average net assets over a 36 month performance period). The upward or downward adjustment to the management fee is based on the relative investment performance of Fidelity Women's Leadership Fund as compared to its benchmark index, the Russell 3000 Index, over the same 36 month performance period. For the reporting period, the total annual management fee rate, including the performance adjustment, was .50% of the Fund's average net assets. The performance adjustment included in the management fee rate may be higher or lower than the maximum performance adjustment rate due to the difference between the average net assets for the reporting and performance periods.
Distribution and Service Plan Fees. In accordance with Rule 12b-1 of the 1940 Act, the Fund has adopted separate Distribution and Service Plans for each class of shares. Certain classes pay Fidelity Distributors Company LLC (FDC), an affiliate of the investment adviser, separate Distribution and Service Fees, each of which is based on an annual percentage of each class' average net assets. In addition, FDC may pay financial intermediaries for selling shares of the Fund and providing shareholder support services. For the period, the Distribution and Service Fee rates, total fees and amounts retained by FDC were as follows:
| | Distribution Fee | Service Fee | Total Fees | Retained by FDC |
| Class A | -% | .25% | $11,446 | $764 |
| Class M | .25% | .25% | 5,596 | 84 |
| Class C | .75% | .25% | 14,839 | 9,563 |
| | | | $31,881 | $10,411 |
Sales Load. FDC may receive a front-end sales charge of up to 5.75% for selling Class A shares and 3.50% for selling Class M shares, some of which is paid to financial intermediaries for selling shares of the Fund. Depending on the holding period, FDC may receive contingent deferred sales charges levied on Class A, Class M and Class C redemptions. The deferred sales charges are 1.00% for Class C shares, 1.00% for certain purchases of Class A shares and .25% for certain purchases of Class M shares.
For the period, sales charge amounts retained by FDC were as follows:
| | Retained by FDC |
| Class A | $12,487 |
| Class M | 765 |
| Class C(a) | 18 |
| | $13,270 |
(a) When Class C shares are initially sold, FDC pays commissions from its own resources to financial intermediaries through which the sales are made.
Transfer Agent Fees. Fidelity Investments Institutional Operations Company LLC (FIIOC), an affiliate of the investment adviser, is the transfer, dividend disbursing and shareholder servicing agent for each class of the Fund. FIIOC receives account fees and asset-based fees that vary according to the account size and type of account of the shareholders of the respective classes of the Fund, except for Class Z. FIIOC receives an asset-based fee of Class Z's average net assets. FIIOC pays for typesetting, printing and mailing of shareholder reports, except proxy statements.
For the period, transfer agent fees for each class were as follows:
| | Amount | % of Class-Level Average Net Assets |
| Class A | $9,194 | .20 |
| Class M | 2,261 | .20 |
| Class C | 2,802 | .19 |
| Fidelity Women's Leadership Fund | 307,369 | .27 |
| Class I | 15,034 | .16 |
| Class Z | 3,973 | .04 |
| | $340,633 | |
Accounting Fees. Fidelity Service Company, Inc. (FSC), an affiliate of the investment adviser, maintains the Fund's accounting records. The accounting fee is based on the level of average net assets for each month. For the period, the fees were equivalent to the following annual rates:
| | % of Average Net Assets |
| Fidelity Women's Leadership Fund | .04 |
Brokerage Commissions. A portion of portfolio transactions were placed with brokerage firms which are affiliates of the investment adviser. Brokerage commissions are included in net realized gain (loss) and change in net unrealized appreciation (depreciation) in the Statement of Operations. The commissions paid to these affiliated firms were as follows:
| | Amount |
| Fidelity Women's Leadership Fund | $1,626 |
Interfund Trades. Funds may purchase from or sell securities to other Fidelity Funds under procedures adopted by the Board. The procedures have been designed to ensure these interfund trades are executed in accordance with Rule 17a-7 of the 1940 Act. Any interfund trades are included within the respective purchases and sales amounts shown in the Purchases and Sales of Investments note. Interfund trades during the period are noted in the table below.
| | Purchases ($) | Sales ($) | Realized Gain (Loss) ($) |
| Fidelity Women's Leadership Fund | 1,726,255 | 2,612,721 | (1,584,546) |
6. Committed Line of Credit.
Certain Funds participate with other funds managed by the investment adviser or an affiliate in a $4.25 billion credit facility (the "line of credit") to be utilized for temporary or emergency purposes to fund shareholder redemptions or for other short-term liquidity purposes. The participating funds have agreed to pay commitment fees on their pro-rata portion of the line of credit, which are reflected in Miscellaneous expenses on the Statement of Operations, and are listed below. During the period, there were no borrowings on this line of credit.
| | Amount |
| Fidelity Women's Leadership Fund | $222 |
7. Security Lending.
Funds lend portfolio securities from time to time in order to earn additional income. Lending agents are used, including National Financial Services (NFS), an affiliate of the investment adviser. Pursuant to a securities lending agreement, NFS will receive a fee, which is capped at 9.9% of a fund's daily lending revenue, for its services as lending agent. A fund may lend securities to certain qualified borrowers, including NFS. On the settlement date of the loan, a fund receives collateral (in the form of U.S. Treasury obligations, letters of credit and/or cash) against the loaned securities and maintains collateral in an amount not less than 100% of the market value of the loaned securities during the period of the loan. The market value of the loaned securities is determined at the close of business of a fund and any additional required collateral is delivered to a fund on the next business day. A fund or borrower may terminate the loan at any time, and if the borrower defaults on its obligation to return the securities loaned because of insolvency or other reasons, a fund may apply collateral received from the borrower against the obligation. A fund may experience delays and costs in recovering the securities loaned. Any cash collateral received is invested in the Fidelity Securities Lending Cash Central Fund. Any loaned securities are identified as such in the Schedule of Investments, and the value of loaned securities and cash collateral at period end, as applicable, are presented in the Statement of Assets and Liabilities. Security lending income represents the income earned on investing cash collateral, less rebates paid to borrowers and any lending agent fees associated with the loan, plus any premium payments received for lending certain types of securities. Security lending income is presented in the Statement of Operations as a component of income from Fidelity Central Funds. Affiliated security lending activity, if any, was as follows:
| | Total Security Lending Fees Paid to NFS | Security Lending Income From Securities Loaned to NFS | Value of Securities Loaned to NFS at Period End |
| Fidelity Women's Leadership Fund | $1,725 | $255 | $– |
8. Expense Reductions.
The investment adviser contractually agreed to reimburse expenses of each class to the extent annual operating expenses exceeded certain levels of class-level average net assets as noted in the table below. This reimbursement will remain in place through August 31, 2023. Some expenses, for example the compensation of the independent Trustees are excluded from this reimbursement.
The following classes were in reimbursement during the period:
| | Expense Limitations | Reimbursement |
| Class A | 1.25%/1.15%(a) | $– |
| Class M | 1.50%/1.40%(a) | – |
| Class C | 2.00%/1.90%(a) | – |
| Fidelity Women's Leadership Fund | 1.00%/.90%(a) | 21,773 |
| Class I | 1.00%/.90%(a) | – |
| Class Z | .85%/.75%(a) | – |
| | | $21,773 |
(a) Expense limitation effective June 1, 2021.
In addition, during the period the investment adviser or an affiliate reimbursed and/or waived a portion of fund-level operating expenses in the amount of $3,989.
9. Distributions to Shareholders.
Distributions to shareholders of each class were as follows:
| | Year ended
April 30, 2022 | Year ended
April 30, 2021 |
| Fidelity Women's Leadership Fund | | |
| Distributions to shareholders | | |
| Class A | $111,894 | $624 |
| Class M | 24,841 | 105 |
| Class C | 28,323 | – |
| Fidelity Women's Leadership Fund | 3,101,859 | 93,607 |
| Class I | 293,915 | 3,961 |
| Class Z | 289,844 | 14,433 |
| Total | $3,850,676 | $112,730 |
10. Share Transactions.
Share transactions for each class were as follows and may contain in-kind transactions, automatic conversions between classes or exchanges between affiliated funds:
| | Shares | Shares | Dollars | Dollars |
| | Year ended April 30, 2022 | Year ended April 30, 2021 | Year ended April 30, 2022 | Year ended April 30, 2021 |
| Fidelity Women's Leadership Fund | | | | |
| Class A | | | | |
| Shares sold | 214,342 | 130,547 | $3,271,433 | $1,741,533 |
| Reinvestment of distributions | 7,212 | 56 | 109,985 | 624 |
| Shares redeemed | (16,599) | (21,509) | (254,825) | (292,612) |
| Net increase (decrease) | 204,955 | 109,094 | $3,126,593 | $1,449,545 |
| Class M | | | | |
| Shares sold | 17,367 | 40,717 | $265,289 | $526,821 |
| Reinvestment of distributions | 1,635 | 10 | 24,841 | 105 |
| Shares redeemed | (2,733) | (22,046) | (41,893) | (306,908) |
| Net increase (decrease) | 16,269 | 18,681 | $248,237 | $220,018 |
| Class C | | | | |
| Shares sold | 72,426 | 46,841 | $1,099,839 | $620,306 |
| Reinvestment of distributions | 1,841 | – | 27,774 | – |
| Shares redeemed | (17,878) | (32,790) | (249,596) | (472,777) |
| Net increase (decrease) | 56,389 | 14,051 | $878,017 | $147,529 |
| Fidelity Women's Leadership Fund | | | | |
| Shares sold | 2,939,308 | 5,053,221 | $45,268,708 | $65,814,179 |
| Reinvestment of distributions | 191,234 | 7,216 | 2,919,250 | 89,644 |
| Shares redeemed | (1,906,544) | (870,966)�� | (28,945,460) | (11,068,699) |
| Net increase (decrease) | 1,223,998 | 4,189,471 | $19,242,498 | $54,835,124 |
| Class I | | | | |
| Shares sold | 850,923 | 210,365 | $13,354,621 | $2,876,586 |
| Reinvestment of distributions | 19,138 | 306 | 292,838 | 3,907 |
| Shares redeemed | (269,624) | (29,107) | (3,716,366) | (387,271) |
| Net increase (decrease) | 600,437 | 181,564 | $9,931,093 | $2,493,222 |
| Class Z | | | | |
| Shares sold | 298,679 | 448,196 | $4,535,147 | $5,772,349 |
| Reinvestment of distributions | 16,552 | 1,011 | 253,122 | 12,846 |
| Shares redeemed | (284,436) | (101,683) | (4,323,726) | (1,286,287) |
| Net increase (decrease) | 30,795 | 347,524 | $464,543 | $4,498,908 |
11. Other.
A fund's organizational documents provide former and current trustees and officers with a limited indemnification against liabilities arising in connection with the performance of their duties to the fund. In the normal course of business, a fund may also enter into contracts that provide general indemnifications. A fund's maximum exposure under these arrangements is unknown as this would be dependent on future claims that may be made against a fund. The risk of material loss from such claims is considered remote.
12. Coronavirus (COVID-19) Pandemic.
An outbreak of COVID-19 first detected in China during December 2019 has since spread globally and was declared a pandemic by the World Health Organization during March 2020. Developments that disrupt global economies and financial markets, such as the COVID-19 pandemic, may magnify factors that affect the Fund's performance.
Report of Independent Registered Public Accounting Firm
To the Board of Trustees of Fidelity Summer Street Trust and Shareholders of Fidelity Women's Leadership Fund
Opinion on the Financial Statements and Financial Highlights
We have audited the accompanying statement of assets and liabilities of Fidelity Women's Leadership Fund (the "Fund"), a fund of Fidelity Summer Street Trust, including the schedule of investments, as of April 30, 2022, the related statement of operations for the year then ended, the statement of changes in net assets for each of the two years in the period then ended, the financial highlights for each of the two years in the period then ended and for the period from May 1, 2019 (commencement of operations) through April 30, 2020, and the related notes. In our opinion, the financial statements and financial highlights present fairly, in all material respects, the financial position of the Fund as of April 30, 2022, the results of its operations for the year then ended, the changes in its net assets for each of the two years in the period then ended, and the financial highlights for each of the two years in the period then ended and for the period from May 1, 2019 (commencement of operations) through April 30, 2020, in conformity with accounting principles generally accepted in the United States of America.
Basis for Opinion
These financial statements and financial highlights are the responsibility of the Fund's management. Our responsibility is to express an opinion on the Fund's financial statements and financial highlights based on our audits. We are a public accounting firm registered with the Public Company Accounting Oversight Board (United States) (PCAOB) and are required to be independent with respect to the Fund in accordance with the U.S. federal securities laws and the applicable rules and regulations of the Securities and Exchange Commission and the PCAOB.
We conducted our audits in accordance with the standards of the PCAOB. Those standards require that we plan and perform the audit to obtain reasonable assurance about whether the financial statements and financial highlights are free of material misstatement, whether due to error or fraud. The Fund is not required to have, nor were we engaged to perform, an audit of its internal control over financial reporting. As part of our audits we are required to obtain an understanding of internal control over financial reporting but not for the purpose of expressing an opinion on the effectiveness of the Fund’s internal control over financial reporting. Accordingly, we express no such opinion.
Our audits included performing procedures to assess the risks of material misstatement of the financial statements and financial highlights, whether due to error or fraud, and performing procedures that respond to those risks. Such procedures included examining, on a test basis, evidence regarding the amounts and disclosures in the financial statements and financial highlights. Our audits also included evaluating the accounting principles used and significant estimates made by management, as well as evaluating the overall presentation of the financial statements and financial highlights. Our procedures included confirmation of securities owned as of April 30, 2022, by correspondence with the custodian and brokers; when replies were not received from brokers, we performed other auditing procedures. We believe that our audits provide a reasonable basis for our opinion.
/s/ Deloitte & Touche LLP
Boston, Massachusetts
June 14, 2022
We have served as the auditor of one or more of the Fidelity investment companies since 1999.
Trustees and Officers
The Trustees, Members of the Advisory Board (if any), and officers of the trust and fund, as applicable, are listed below. The Board of Trustees governs the fund and is responsible for protecting the interests of shareholders. The Trustees are experienced executives who meet periodically throughout the year to oversee the fund's activities, review contractual arrangements with companies that provide services to the fund, oversee management of the risks associated with such activities and contractual arrangements, and review the fund's performance. Each of the Trustees oversees 324 funds.
The Trustees hold office without limit in time except that (a) any Trustee may resign; (b) any Trustee may be removed by written instrument, signed by at least two-thirds of the number of Trustees prior to such removal; (c) any Trustee who requests to be retired or who has become incapacitated by illness or injury may be retired by written instrument signed by a majority of the other Trustees; and (d) any Trustee may be removed at any special meeting of shareholders by a two-thirds vote of the outstanding voting securities of the trust. Each Trustee who is not an interested person (as defined in the 1940 Act) of the trust and the fund is referred to herein as an Independent Trustee. Each Independent Trustee shall retire not later than the last day of the calendar year in which his or her 75th birthday occurs. The Independent Trustees may waive this mandatory retirement age policy with respect to individual Trustees. Officers and Advisory Board Members hold office without limit in time, except that any officer or Advisory Board Member may resign or may be removed by a vote of a majority of the Trustees at any regular meeting or any special meeting of the Trustees. Except as indicated, each individual has held the office shown or other offices in the same company for the past five years.
The fund's Statement of Additional Information (SAI) includes more information about the Trustees. To request a free copy, call Fidelity at 1-800-544-8544 if you’re an individual investing directly with Fidelity, call 1-800-835-5092 if you’re a plan sponsor or participant with Fidelity as your recordkeeper or call 1-877-208-0098 on institutional accounts or if you’re an advisor or invest through one.
Experience, Skills, Attributes, and Qualifications of the Trustees. The Governance and Nominating Committee has adopted a statement of policy that describes the experience, qualifications, attributes, and skills that are necessary and desirable for potential Independent Trustee candidates (Statement of Policy). The Board believes that each Trustee satisfied at the time he or she was initially elected or appointed a Trustee, and continues to satisfy, the standards contemplated by the Statement of Policy. The Governance and Nominating Committee also engages professional search firms to help identify potential Independent Trustee candidates who have the experience, qualifications, attributes, and skills consistent with the Statement of Policy. From time to time, additional criteria based on the composition and skills of the current Independent Trustees, as well as experience or skills that may be appropriate in light of future changes to board composition, business conditions, and regulatory or other developments, have also been considered by the professional search firms and the Governance and Nominating Committee. In addition, the Board takes into account the Trustees' commitment and participation in Board and committee meetings, as well as their leadership of standing and ad hoc committees throughout their tenure.
In determining that a particular Trustee was and continues to be qualified to serve as a Trustee, the Board has considered a variety of criteria, none of which, in isolation, was controlling. The Board believes that, collectively, the Trustees have balanced and diverse experience, qualifications, attributes, and skills, which allow the Board to operate effectively in governing the fund and protecting the interests of shareholders. Information about the specific experience, skills, attributes, and qualifications of each Trustee, which in each case led to the Board's conclusion that the Trustee should serve (or continue to serve) as a trustee of the fund, is provided below.
Board Structure and Oversight Function. Robert A. Lawrence is an interested person and currently serves as Chair. The Trustees have determined that an interested Chair is appropriate and benefits shareholders because an interested Chair has a personal and professional stake in the quality and continuity of services provided to the fund. Independent Trustees exercise their informed business judgment to appoint an individual of their choosing to serve as Chair, regardless of whether the Trustee happens to be independent or a member of management. The Independent Trustees have determined that they can act independently and effectively without having an Independent Trustee serve as Chair and that a key structural component for assuring that they are in a position to do so is for the Independent Trustees to constitute a substantial majority for the Board. The Independent Trustees also regularly meet in executive session. David M. Thomas serves as Lead Independent Trustee and as such (i) acts as a liaison between the Independent Trustees and management with respect to matters important to the Independent Trustees and (ii) with management prepares agendas for Board meetings.
Fidelity® funds are overseen by different Boards of Trustees. The fund's Board oversees Fidelity's high income and certain equity funds, and other Boards oversee Fidelity's investment-grade bond, money market, asset allocation, and other equity funds. The asset allocation funds may invest in Fidelity® funds overseen by the fund's Board. The use of separate Boards, each with its own committee structure, allows the Trustees of each group of Fidelity® funds to focus on the unique issues of the funds they oversee, including common research, investment, and operational issues. On occasion, the separate Boards establish joint committees to address issues of overlapping consequences for the Fidelity® funds overseen by each Board.
The Trustees operate using a system of committees to facilitate the timely and efficient consideration of all matters of importance to the Trustees, the fund, and fund shareholders and to facilitate compliance with legal and regulatory requirements and oversight of the fund's activities and associated risks. The Board, acting through its committees, has charged FMR and its affiliates with (i) identifying events or circumstances the occurrence of which could have demonstrably adverse effects on the fund's business and/or reputation; (ii) implementing processes and controls to lessen the possibility that such events or circumstances occur or to mitigate the effects of such events or circumstances if they do occur; and (iii) creating and maintaining a system designed to evaluate continuously business and market conditions in order to facilitate the identification and implementation processes described in (i) and (ii) above. Because the day-to-day operations and activities of the fund are carried out by or through FMR, its affiliates, and other service providers, the fund's exposure to risks is mitigated but not eliminated by the processes overseen by the Trustees. While each of the Board's committees has responsibility for overseeing different aspects of the fund's activities, oversight is exercised primarily through the Operations, Audit, and Compliance Committees. Appropriate personnel, including but not limited to the fund's Chief Compliance Officer (CCO), FMR's internal auditor, the independent accountants, the fund's Treasurer and portfolio management personnel, make periodic reports to the Board's committees, as appropriate, including an annual review of Fidelity's risk management program for the Fidelity® funds. The responsibilities of each standing committee, including their oversight responsibilities, are described further under "Standing Committees of the Trustees."
Interested Trustees*:
Correspondence intended for a Trustee who is an interested person may be sent to Fidelity Investments, 245 Summer Street, Boston, Massachusetts 02210.
Name, Year of Birth; Principal Occupations and Other Relevant Experience+
Bettina Doulton (1964)
Year of Election or Appointment: 2020
Trustee
Ms. Doulton also serves as Trustee of other Fidelity® funds. Prior to her retirement, Ms. Doulton served in a variety of positions at Fidelity Investments, including as a managing director of research (2006-2007), portfolio manager to certain Fidelity® funds (1993-2005), equity analyst and portfolio assistant (1990-1993), and research assistant (1987-1990). Ms. Doulton currently owns and operates Phi Builders + Architects and Cellardoor Winery. Previously, Ms. Doulton served as a member of the Board of Brown Capital Management, LLC (2014-2018).
Robert A. Lawrence (1952)
Year of Election or Appointment: 2020
Trustee
Chair of the Board of Trustees
Mr. Lawrence also serves as Trustee of other funds. Previously, Mr. Lawrence served as a Member of the Advisory Board of certain funds. Prior to his retirement in 2008, Mr. Lawrence served as Vice President of certain Fidelity® funds (2006-2008), Senior Vice President, Head of High Income Division of Fidelity Management & Research Company (investment adviser firm, 2006-2008), and President of Fidelity Strategic Investments (investment adviser firm, 2002-2005).
* Determined to be an “Interested Trustee” by virtue of, among other things, his or her affiliation with the trust or various entities under common control with FMR.
+ The information includes the Trustee's principal occupation during the last five years and other information relating to the experience, attributes, and skills relevant to the Trustee's qualifications to serve as a Trustee, which led to the conclusion that the Trustee should serve as a Trustee for the fund.
Independent Trustees:
Correspondence intended for an Independent Trustee may be sent to Fidelity Investments, P.O. Box 55235, Boston, Massachusetts 02205-5235.
Name, Year of Birth; Principal Occupations and Other Relevant Experience+
Thomas P. Bostick (1956)
Year of Election or Appointment: 2021
Trustee
Lieutenant General Bostick also serves as Trustee of other Fidelity® funds. Prior to his retirement, General Bostick (United States Army, Retired) held a variety of positions within the U.S. Army, including Commanding General and Chief of Engineers, U.S. Army Corps of Engineers (2012-2016) and Deputy Chief of Staff and Director of Human Resources, U.S. Army (2009-2012). General Bostick currently serves as a member of the Board and Finance and Governance Committees of CSX Corporation (transportation, 2020-present) and a member of the Board and Corporate Governance and Nominating Committee of Perma-Fix Environmental Services, Inc. (nuclear waste management, 2020-present). General Bostick serves as Chief Executive Officer of Bostick Global Strategies, LLC (consulting, 2016-present) and as a member of the Board of HireVue, Inc. (video interview and assessment, 2020-present). Previously, General Bostick served as a Member of the Advisory Board of certain Fidelity® funds (2021), President, Intrexon Bioengineering (2018-2020) and Chief Operating Officer (2017-2020) and Senior Vice President of the Environment Sector (2016-2017) of Intrexon Corporation (biopharmaceutical company).
Dennis J. Dirks (1948)
Year of Election or Appointment: 2005
Trustee
Mr. Dirks also serves as Trustee of other Fidelity® funds. Prior to his retirement in May 2003, Mr. Dirks served as Chief Operating Officer and as a member of the Board of The Depository Trust & Clearing Corporation (financial markets infrastructure), President, Chief Operating Officer and a member of the Board of The Depository Trust Company (DTC), President and a member of the Board of the National Securities Clearing Corporation (NSCC), Chief Executive Officer and a member of the Board of the Government Securities Clearing Corporation and Chief Executive Officer and a member of the Board of the Mortgage-Backed Securities Clearing Corporation. Mr. Dirks currently serves as a member of the Finance Committee (2016-present) and Board (2017-present) and is Treasurer (2018-present) of the Asolo Repertory Theatre.
Donald F. Donahue (1950)
Year of Election or Appointment: 2018
Trustee
Mr. Donahue also serves as Trustee of other Fidelity® funds. Mr. Donahue serves as President and Chief Executive Officer of Miranda Partners, LLC (risk consulting for the financial services industry, 2012-present). Previously, Mr. Donahue served as Chief Executive Officer (2006-2012), Chief Operating Officer (2003-2006) and Managing Director, Customer Marketing and Development (1999-2003) of The Depository Trust & Clearing Corporation (financial markets infrastructure). Mr. Donahue currently serves as a member (2007-present) and Co-Chairman (2016-present) of the Board of United Way of New York and a member of the Board of The Leadership Academy (previously NYC Leadership Academy) (2012-present). Mr. Donahue previously served as a member of the Advisory Board of certain Fidelity® funds (2015-2018).
Vicki L. Fuller (1957)
Year of Election or Appointment: 2020
Trustee
Ms. Fuller also serves as Trustee of other Fidelity® funds. Previously, Ms. Fuller served as a member of the Advisory Board of certain Fidelity® funds (2018-2020), Chief Investment Officer of the New York State Common Retirement Fund (2012-2018) and held a variety of positions at AllianceBernstein L.P. (global asset management, 1985-2012), including Managing Director (2006-2012) and Senior Vice President and Senior Portfolio Manager (2001-2006). Ms. Fuller currently serves as a member of the Board, Audit Committee and Nominating and Governance Committee of two Blackstone business development companies (2020-present), as a member of the Board of Treliant, LLC (consulting, 2019-present), as a member of the Advisory Board of Ariel Alternatives, LLC (private equity, 2021-present) and as a member of the Board and Chair of the Audit Committee of Gusto, Inc. (software, 2021-present). In addition, Ms. Fuller currently serves as a member of the Board of Roosevelt University (2019-present) and as a member of the Executive Board of New York University’s Stern School of Business. Ms. Fuller previously served as a member of the Board, Audit Committee and Nominating and Governance Committee of The Williams Companies, Inc. (natural gas infrastructure, 2018-2021).
Patricia L. Kampling (1959)
Year of Election or Appointment: 2020
Trustee
Ms. Kampling also serves as Trustee of other Fidelity® funds. Prior to her retirement, Ms. Kampling served as Chairman of the Board and Chief Executive Officer (2012-2019), President and Chief Operating Officer (2011-2012) and Executive Vice President and Chief Financial Officer (2010-2011) of Alliant Energy Corporation. Ms. Kampling currently serves as a member of the Board, Finance Committee and Governance, Compensation and Nominating Committee of Xcel Energy Inc. (utilities company, 2020-present) and as a member of the Board, Audit, Finance and Risk Committee and Safety, Environmental, Technology and Operations Committee and Chair of the Executive Development and Compensation Committee of American Water Works Company, Inc. (utilities company, 2019-present). In addition, Ms. Kampling currently serves as a member of the Board of the Nature Conservancy, Wisconsin Chapter (2019-present). Previously, Ms. Kampling served as a Member of the Advisory Board of certain Fidelity® funds (2020), a member of the Board, Compensation Committee and Executive Committee and Chair of the Audit Committee of Briggs & Stratton Corporation (manufacturing, 2011-2021), a member of the Board of Interstate Power and Light Company (2012-2019) and Wisconsin Power and Light Company (2012-2019) (each a subsidiary of Alliant Energy Corporation) and as a member of the Board and Workforce Development Committee of the Business Roundtable (2018-2019).
Thomas A. Kennedy (1955)
Year of Election or Appointment: 2021
Trustee
Mr. Kennedy also serves as Trustee of other Fidelity® funds. Previously, Mr. Kennedy served as a Member of the Advisory Board of certain Fidelity® funds (2020) and held a variety of positions at Raytheon Company (aerospace and defense, 1983-2020), including Chairman and Chief Executive Officer (2014-2020) and Executive Vice President and Chief Operating Officer (2013-2014). Mr. Kennedy currently serves as Executive Chairman of the Board of Directors of Raytheon Technologies Corporation (aerospace and defense, 2020-present). He is also a member of the Rutgers School of Engineering Industry Advisory Board (2011-present) and a member of the UCLA Engineering Dean’s Executive Board (2016-present).
Oscar Munoz (1959)
Year of Election or Appointment: 2021
Trustee
Mr. Munoz also serves as Trustee of other Fidelity® funds. Prior to his retirement, Mr. Munoz served as Executive Chairman (2020-2021), Chief Executive Officer (2015-2020), President (2015-2016) and a member of the Board (2010-2021) of United Airlines Holdings, Inc. Mr. Munoz currently serves as a member of the Board of CBRE Group, Inc. (commercial real estate, 2020-present), a member of the Board of Univision Communications, Inc. (Hispanic media, 2020-present) and a member of the Advisory Board of Salesforce.com, Inc. (cloud-based software, 2020-present). Previously, Mr. Munoz served as a Member of the Advisory Board of certain Fidelity® funds (2021).
Garnett A. Smith (1947)
Year of Election or Appointment: 2018
Trustee
Mr. Smith also serves as Trustee of other Fidelity® funds. Prior to his retirement, Mr. Smith served as Chairman and Chief Executive Officer (1990-1997) and President (1986-1990) of Inbrand Corp. (manufacturer of personal absorbent products). Prior to his employment with Inbrand Corp., he was employed by a retail fabric chain and North Carolina National Bank (now Bank of America). Mr. Smith previously served as a member of the Advisory Board of certain Fidelity® funds (2012-2013).
David M. Thomas (1949)
Year of Election or Appointment: 2008
Trustee
Lead Independent Trustee
Mr. Thomas also serves as Trustee of other Fidelity® funds. Previously, Mr. Thomas served as Executive Chairman (2005-2006) and Chairman and Chief Executive Officer (2000-2005) of IMS Health, Inc. (pharmaceutical and healthcare information solutions). Mr. Thomas currently serves as a member of the Board of Fortune Brands Home and Security (home and security products, 2004-present) and as Director (2013-present) and Non-Executive Chairman of the Board (2022-present) of Interpublic Group of Companies, Inc. (marketing communication).
Susan Tomasky (1953)
Year of Election or Appointment: 2020
Trustee
Ms. Tomasky also serves as Trustee of other Fidelity® funds. Prior to her retirement, Ms. Tomasky served in various executive officer positions at American Electric Power Company, Inc. (1998-2011), including most recently as President of AEP Transmission (2007-2011). Ms. Tomasky currently serves as a member of the Board and Sustainability Committee and as Chair of the Audit Committee of Marathon Petroleum Corporation (2018-present) and as a member of the Board, Executive Committee, Corporate Governance Committee and Organization and Compensation Committee and as Chair of the Audit Committee of Public Service Enterprise Group, Inc. (utilities company, 2012-present) and as a member of the Board of its subsidiary company, Public Service Electric and Gas Co. (2021-present). In addition, Ms. Tomasky currently serves as a member (2009-present) and President (2020-present) of the Board of the Royal Shakespeare Company – America (2009-present), as a member of the Board of the Columbus Association for the Performing Arts (2011-present) and as a member of the Board and Kenyon in the World Committee of Kenyon College (2016-present). Previously, Ms. Tomasky served as a Member of the Advisory Board of certain Fidelity® funds (2020), as a member of the Board of the Columbus Regional Airport Authority (2007-2020), as a member of the Board (2011-2018) and Lead Independent Director (2015-2018) of Andeavor Corporation (previously Tesoro Corporation) (independent oil refiner and marketer) and as a member of the Board of Summit Midstream Partners LP (energy, 2012-2018).
Michael E. Wiley (1950)
Year of Election or Appointment: 2018
Trustee
Mr. Wiley also serves as Trustee of other Fidelity® funds. Previously, Mr. Wiley served as a member of the Advisory Board of certain Fidelity® funds (2018-2020), Chairman, President and CEO of Baker Hughes, Inc. (oilfield services, 2000-2004). Mr. Wiley also previously served as a member of the Board of Andeavor Corporation (independent oil refiner and marketer, 2005-2018), a member of the Board of Andeavor Logistics LP (natural resources logistics, 2015-2018) and a member of the Board of High Point Resources (exploration and production, 2005-2020).
+ The information includes the Trustee's principal occupation during the last five years and other information relating to the experience, attributes, and skills relevant to the Trustee's qualifications to serve as a Trustee, which led to the conclusion that the Trustee should serve as a Trustee for the fund.
Advisory Board Members and Officers:
Correspondence intended for a Member of the Advisory Board (if any) may be sent to Fidelity Investments, P.O. Box 55235, Boston, Massachusetts 02205-5235. Correspondence intended for an officer or Peter S. Lynch may be sent to Fidelity Investments, 245 Summer Street, Boston, Massachusetts 02210. Officers appear below in alphabetical order.
Name, Year of Birth; Principal Occupation
Peter S. Lynch (1944)
Year of Election or Appointment: 2003
Member of the Advisory Board
Mr. Lynch also serves as a Member of the Advisory Board of other Fidelity® funds. Mr. Lynch is Vice Chairman and a Director of Fidelity Management & Research Company LLC (investment adviser firm). In addition, Mr. Lynch serves as a Trustee of Boston College and as the Chairman of the Inner-City Scholarship Fund. Previously, Mr. Lynch served as Vice Chairman and a Director of FMR Co., Inc. (investment adviser firm) and on the Special Olympics International Board of Directors (1997-2006).
Craig S. Brown (1977)
Year of Election or Appointment: 2019
Assistant Treasurer
Mr. Brown also serves as an officer of other funds. Mr. Brown serves as Assistant Treasurer of FIMM, LLC (2021-present) and is an employee of Fidelity Investments (2013-present).
John J. Burke III (1964)
Year of Election or Appointment: 2018
Chief Financial Officer
Mr. Burke also serves as Chief Financial Officer of other funds. Mr. Burke serves as Head of Investment Operations for Fidelity Fund and Investment Operations (2018-present) and is an employee of Fidelity Investments (1998-present). Previously Mr. Burke served as head of Asset Management Investment Operations (2012-2018).
William C. Coffey (1969)
Year of Election or Appointment: 2019
Assistant Secretary
Mr. Coffey also serves as Assistant Secretary of other funds. He is Senior Vice President and Deputy General Counsel of FMR LLC (diversified financial services company, 2010-present), and is an employee of Fidelity Investments. Previously, Mr. Coffey served as Secretary and CLO of certain funds (2018-2019); CLO, Secretary, and Senior Vice President of Fidelity Management & Research Company and FMR Co., Inc. (investment adviser firms, 2018-2019); Secretary of Fidelity SelectCo, LLC and Fidelity Investments Money Management, Inc. (investment adviser firms, 2018-2019); CLO of Fidelity Management & Research (Hong Kong) Limited, FMR Investment Management (UK) Limited, and Fidelity Management & Research (Japan) Limited (investment adviser firms, 2018-2019); and Assistant Secretary of certain funds (2009-2018).
Timothy M. Cohen (1969)
Year of Election or Appointment: 2018
Vice President
Mr. Cohen also serves as Vice President of other funds. Mr. Cohen serves as Co-Head of Equity (2018-present), a Director of Fidelity Management & Research (Japan) Limited (investment adviser firm, 2016-present), and is an employee of Fidelity Investments. Previously, Mr. Cohen served as Executive Vice President of Fidelity SelectCo, LLC (2019), Head of Global Equity Research (2016-2018), Chief Investment Officer - Equity and a Director of Fidelity Management & Research (U.K.) Inc. (investment adviser firm, 2013-2015) and as a Director of Fidelity Management & Research (Hong Kong) Limited (investment adviser firm, 2017).
Jonathan Davis (1968)
Year of Election or Appointment: 2010
Assistant Treasurer
Mr. Davis also serves as an officer of other funds. Mr. Davis serves as Assistant Treasurer of FIMM, LLC (2021-present), FMR Capital, Inc. (2017-present), FD Funds GP LLC (2021-present), FD Funds Holding LLC (2021-present), and FD Funds Management LLC (2021-present); and is an employee of Fidelity Investments. Previously, Mr. Davis served as Vice President and Associate General Counsel of FMR LLC (diversified financial services company, 2003-2010).
Laura M. Del Prato (1964)
Year of Election or Appointment: 2018
Assistant Treasurer
Ms. Del Prato also serves as an officer of other funds. Ms. Del Prato serves as Assistant Treasurer of FIMM, LLC (2021-present) and is an employee of Fidelity Investments (2017-present). Previously, Ms. Del Prato served as President and Treasurer of The North Carolina Capital Management Trust: Cash Portfolio and Term Portfolio (2018-2020). Prior to joining Fidelity Investments, Ms. Del Prato served as a Managing Director and Treasurer of the JPMorgan Mutual Funds (2014-2017). Prior to JPMorgan, Ms. Del Prato served as a partner at Cohen Fund Audit Services (accounting firm, 2012-2013) and KPMG LLP (accounting firm, 2004-2012).
Colm A. Hogan (1973)
Year of Election or Appointment: 2020
Assistant Treasurer
Mr. Hogan also serves as an officer of other funds. Mr. Hogan serves as Assistant Treasurer of FIMM, LLC (2021-present) and FMR Capital, Inc. (2017-present) and is an employee of Fidelity Investments (2005-present). Previously, Mr. Hogan served as Deputy Treasurer of certain Fidelity® funds (2016-2020) and Assistant Treasurer of certain Fidelity® funds (2016-2018).
Pamela R. Holding (1964)
Year of Election or Appointment: 2018
Vice President
Ms. Holding also serves as Vice President of other funds. Ms. Holding serves as Co-Head of Equity (2018-present) and is an employee of Fidelity Investments (2013-present). Previously, Ms. Holding served as Executive Vice President of Fidelity SelectCo, LLC (2019) and as Chief Investment Officer of Fidelity Institutional Asset Management (2013-2018).
Cynthia Lo Bessette (1969)
Year of Election or Appointment: 2019
Secretary and Chief Legal Officer (CLO)
Ms. Lo Bessette also serves as an officer of other funds. Ms. Lo Bessette serves as CLO, Secretary, and Senior Vice President of Fidelity Management & Research Company LLC (investment adviser firm, 2019-present); CLO of Fidelity Management & Research (Hong Kong) Limited, FMR Investment Management (UK) Limited, and Fidelity Management & Research (Japan) Limited (investment adviser firms, 2019-present); Secretary of FD Funds GP LLC (2021-present), FD Funds Holding LLC (2021-present), and FD Funds Management LLC (2021-present); and Assistant Secretary of FIMM, LLC (2019-present). She is a Senior Vice President and Deputy General Counsel of FMR LLC (diversified financial services company, 2019-present), and is an employee of Fidelity Investments. Previously, Ms. Lo Bessette served as CLO, Secretary, and Senior Vice President of FMR Co., Inc. (investment adviser firm, 2019); Secretary of Fidelity SelectCo, LLC and Fidelity Investments Money Management, Inc. (investment adviser firms, 2019). Prior to joining Fidelity Investments, Ms. Lo Bessette was Executive Vice President, General Counsel (2016-2019) and Senior Vice President, Deputy General Counsel (2015-2016) of OppenheimerFunds (investment management company) and Deputy Chief Legal Officer (2013-2015) of Jennison Associates LLC (investment adviser firm).
Chris Maher (1972)
Year of Election or Appointment: 2020
Deputy Treasurer
Mr. Maher also serves as an officer of other funds. Mr. Maher serves as Assistant Treasurer of FIMM, LLC (2021-present) and FMR Capital, Inc. (2017-present), and is an employee of Fidelity Investments (2008-present). Previously, Mr. Maher served as Assistant Treasurer of certain funds (2013-2020); Vice President of Asset Management Compliance (2013), Vice President of the Program Management Group of FMR (investment adviser firm, 2010-2013), and Vice President of Valuation Oversight (2008-2010).
Jason P. Pogorelec (1975)
Year of Election or Appointment: 2020
Chief Compliance Officer
Mr. Pogorelec also serves as Chief Compliance Officer of other funds. Mr. Pogorelec is a senior Vice President of Asset Management Compliance for Fidelity Investments and is an employee of Fidelity Investments (2006-present). Previously, Mr. Pogorelec served as Vice President, Associate General Counsel for Fidelity Investments (2010-2020) and Assistant Secretary of certain Fidelity funds (2015-2020).
Brett Segaloff (1972)
Year of Election or Appointment: 2021
Anti-Money Laundering (AML) Officer
Mr. Segaloff also serves as an AML Officer of other funds and other related entities. He is Director, Anti-Money Laundering (2007-present) of FMR LLC (diversified financial services company) and is an employee of Fidelity Investments (1996-present).
Stacie M. Smith (1974)
Year of Election or Appointment: 2016
President and Treasurer
Ms. Smith also serves as an officer of other funds. Ms. Smith serves as Assistant Treasurer of FIMM, LLC (2021-present) and FMR Capital, Inc. (2017-present), is an employee of Fidelity Investments (2009-present), and has served in other fund officer roles. Prior to joining Fidelity Investments, Ms. Smith served as Senior Audit Manager of Ernst & Young LLP (accounting firm, 1996-2009). Previously, Ms. Smith served as Assistant Treasurer (2013-2019) and Deputy Treasurer (2013-2016) of certain Fidelity® funds.
Jim Wegmann (1979)
Year of Election or Appointment: 2019
Assistant Treasurer
Mr. Wegmann also serves as an officer of other funds. Mr. Wegmann serves as Assistant Treasurer of FIMM, LLC (2021-present) and is an employee of Fidelity Investments (2011-present). Previously, Mr. Wegmann served as Assistant Treasurer of certain Fidelity® funds (2019-2021).
Shareholder Expense Example
As a shareholder, you incur two types of costs: (1) transaction costs, which may include sales charges (loads) on purchase payments or redemption proceeds, as applicable and (2) ongoing costs, which generally include management fees, distribution and/or service (12b-1) fees and other Fund expenses. This Example is intended to help you understand your ongoing costs (in dollars) of investing in a fund and to compare these costs with the ongoing costs of investing in other mutual funds.
The Example is based on an investment of $1,000 invested at the beginning of the period and held for the entire period (November 1, 2021 to April 30, 2022).
Actual Expenses
The first line of the accompanying table provides information about actual account values and actual expenses. You may use the information in this line, together with the amount you invested, to estimate the expenses that you paid over the period. Simply divide your account value by $1,000.00 (for example, an $8,600 account value divided by $1,000.00 = 8.6), then multiply the result by the number in the first line for a class/Fund under the heading entitled "Expenses Paid During Period" to estimate the expenses you paid on your account during this period. If any fund is a shareholder of any underlying mutual funds or exchange-traded funds (ETFs) (the Underlying Funds), such fund indirectly bears its proportional share of the expenses of the Underlying Funds in addition to the direct expenses incurred presented in the table. These fees and expenses are not included in the annualized expense ratio used to calculate the expense estimate in the table below.
Hypothetical Example for Comparison Purposes
The second line of the accompanying table provides information about hypothetical account values and hypothetical expenses based on the actual expense ratio and an assumed rate of return of 5% per year before expenses, which is not the actual return. The hypothetical account values and expenses may not be used to estimate the actual ending account balance or expenses you paid for the period. You may use this information to compare the ongoing costs of investing in the Fund and other funds. To do so, compare this 5% hypothetical example with the 5% hypothetical examples that appear in the shareholder reports of the other funds. If any fund is a shareholder of any Underlying Funds, such fund indirectly bears its proportional share of the expenses of the Underlying Funds in addition to the direct expenses as presented in the table. These fees and expenses are not included in the annualized expense ratio used to calculate the expense estimate in the table below.
Please note that the expenses shown in the table are meant to highlight your ongoing costs only and do not reflect any transaction costs. Therefore, the second line of the table is useful in comparing ongoing costs only, and will not help you determine the relative total costs of owning different funds. In addition, if these transactional costs were included, your costs would have been higher.
| | Annualized Expense Ratio-A | Beginning
Account Value
November 1, 2021 | Ending
Account Value
April 30, 2022 | Expenses Paid
During Period-B
November 1, 2021
to April 30, 2022 |
| Fidelity Women's Leadership Fund | | | | |
| Class A | 1.10% | | | |
| Actual | | $1,000.00 | $824.00 | $4.97 |
| Hypothetical-C | | $1,000.00 | $1,019.34 | $5.51 |
| Class M | 1.35% | | | |
| Actual | | $1,000.00 | $822.80 | $6.10 |
| Hypothetical-C | | $1,000.00 | $1,018.10 | $6.76 |
| Class C | 1.83% | | | |
| Actual | | $1,000.00 | $820.70 | $8.26 |
| Hypothetical-C | | $1,000.00 | $1,015.72 | $9.15 |
| Fidelity Women's Leadership Fund | .90% | | | |
| Actual | | $1,000.00 | $824.40 | $4.07 |
| Hypothetical-C | | $1,000.00 | $1,020.33 | $4.51 |
| Class I | .80% | | | |
| Actual | | $1,000.00 | $824.80 | $3.62 |
| Hypothetical-C | | $1,000.00 | $1,020.83 | $4.01 |
| Class Z | .68% | | | |
| Actual | | $1,000.00 | $825.40 | $3.08 |
| Hypothetical-C | | $1,000.00 | $1,021.42 | $3.41 |
A Annualized expense ratio reflects expenses net of applicable fee waivers.
B Expenses are equal to the annualized expense ratio, multiplied by the average account value over the period, multiplied by 181/ 365 (to reflect the one-half year period). The fees and expenses of any Underlying Funds are not included in each annualized expense ratio.
C 5% return per year before expenses
Distributions (Unaudited)
The dividend and capital gains distributions for the fund(s) are available on Fidelity.com or Institutional.Fidelity.com.
The fund hereby designates as a capital gain dividend with respect to the taxable year ended April 30,2022, $1,135,633, or, if subsequently determined to be different, the net capital gain of such year.
The fund designates 100% of the short-term capital gain dividends distributed in June and December, respectively during the fiscal year as qualifying to be taxed as short-term capital gain dividends for nonresident alien shareholders.
Class A designates 57%, and 58%; Class M designates 69%, and 80%; Class C designates 91%, and 100%; Fidelity Women's Leadership Fund designates 52%, and 54%; Class I designates 52%, and 47%; and Class Z designates 50%, and 46%; of the dividends distributed in June and December, respectively during the fiscal year as qualifying for the dividends–received deduction for corporate shareholders.
Class A designates 75%, and 65%; Class M designates 91%, and 90%; Class C designates 100% and 100%; Fidelity Women's Leadership Fund designates 68%, and 60%; Class I designates 68%, and 53%; and Class Z designates 65%, and 52%; of the dividends distributed in June and December, respectively during the fiscal year as amounts which may be taken into account as a dividend for purposes of the maximum rate under section 1(h)(11) of the Internal Revenue Code.
Class A designates 3%, and 5%; Class M designates 4%, and 6%; Fidelity Women's Leadership Fund designates 3%, and 4%; Class I designates 3%, and 4%; and Class Z designates 3%, and 4%; of the dividends distributed in June and December, respectively during the fiscal year as a section 199A dividend.
The fund will notify shareholders in January 2023 of amounts for use in preparing 2022 income tax returns.
Liquidity Risk Management Program
The Securities and Exchange Commission adopted Rule 22e-4 under the Investment Company Act of 1940 (the Liquidity Rule) to promote effective liquidity risk management throughout the open-end investment company industry, thereby reducing the risk that funds will be unable to meet their redemption obligations and mitigating dilution of the interests of fund shareholders.
The Fund has adopted and implemented a liquidity risk management program pursuant to the Liquidity Rule (the Program) effective December 1, 2018. The Program is reasonably designed to assess and manage the Fund’s liquidity risk and to comply with the requirements of the Liquidity Rule. The Fund’s Board of Trustees (the Board) has designated the Fund’s investment adviser as administrator of the Program. The Fidelity advisers have established a Liquidity Risk Management Committee (the LRM Committee) to manage the Program for each of the Fidelity Funds. The LRM Committee monitors the adequacy and effectiveness of implementation of the Program and on a periodic basis assesses each Fund’s liquidity risk based on a variety of factors including (1) the Fund’s investment strategy, (2) portfolio liquidity and cash flow projections during normal and reasonably foreseeable stressed conditions, (3) shareholder redemptions, (4) borrowings and other funding sources and (5) in the case of exchange-traded funds, certain additional factors including the effect of the Fund’s prices and spreads, market participants, and basket compositions on the overall liquidity of the Fund’s portfolio, as applicable.
In accordance with the Program, each of the Fund’s portfolio investments is classified into one of four liquidity categories described below based on a determination of a reasonable expectation for how long it would take to convert the investment to cash (or sell or dispose of the investment) without significantly changing its market value.
- Highly liquid investments – cash or convertible to cash within three business days or less
- Moderately liquid investments – convertible to cash in three to seven calendar days
- Less liquid investments – can be sold or disposed of, but not settled, within seven calendar days
- Illiquid investments – cannot be sold or disposed of within seven calendar days
Liquidity classification determinations take into account a variety of factors including various market, trading and investment-specific considerations, as well as market depth, and generally utilize analysis from a third-party liquidity metrics service.
The Liquidity Rule places a 15% limit on a fund’s illiquid investments and requires funds that do not primarily hold assets that are highly liquid investments to determine and maintain a minimum percentage of the fund’s net assets to be invested in highly liquid investments (highly liquid investment minimum or HLIM). The Program includes provisions reasonably designed to comply with the 15% limit on illiquid investments and for determining, periodically reviewing and complying with the HLIM requirement as applicable.
At a recent meeting of the Fund’s Board of Trustees, the LRM Committee provided a written report to the Board pertaining to the operation, adequacy, and effectiveness of implementation of the Program for the annual period from December 1, 2020 through November 30, 2021. The report concluded that the Program has been implemented and is operating effectively and is reasonably designed to assess and manage the Fund’s liquidity risk.
WLF-ANN-0622
1.9893105.102
Fidelity® U.S. Low Volatility Equity Fund
Annual Report
April 30, 2022
Contents
To view a fund's proxy voting guidelines and proxy voting record for the 12-month period ended June 30, visit http://www.fidelity.com/proxyvotingresults or visit the Securities and Exchange Commission's (SEC) web site at http://www.sec.gov.
You may also call 1-800-544-8544 to request a free copy of the proxy voting guidelines.
Standard & Poor's, S&P and S&P 500 are registered service marks of The McGraw-Hill Companies, Inc. and have been licensed for use by Fidelity Distributors Corporation.
Other third-party marks appearing herein are the property of their respective owners.
All other marks appearing herein are registered or unregistered trademarks or service marks of FMR LLC or an affiliated company. © 2022 FMR LLC. All rights reserved.
This report and the financial statements contained herein are submitted for the general information of the shareholders of the Fund. This report is not authorized for distribution to prospective investors in the Fund unless preceded or accompanied by an effective prospectus.
A fund files its complete schedule of portfolio holdings with the SEC for the first and third quarters of each fiscal year on Form N-PORT. Forms N-PORT are available on the SEC’s web site at http://www.sec.gov. A fund's Forms N-PORT may be reviewed and copied at the SEC’s Public Reference Room in Washington, DC. Information regarding the operation of the SEC's Public Reference Room may be obtained by calling 1-800-SEC-0330.
For a complete list of a fund's portfolio holdings, view the most recent holdings listing, semiannual report, or annual report on Fidelity's web site at http://www.fidelity.com, http://www.institutional.fidelity.com, or http://www.401k.com, as applicable.
NOT FDIC INSURED •MAY LOSE VALUE •NO BANK GUARANTEE
Neither the Fund nor Fidelity Distributors Corporation is a bank.
Note to Shareholders:
Early in 2020, the outbreak and spread of COVID-19 emerged as a public health emergency that had a major influence on financial markets, primarily based on its impact on the global economy and corporate earnings. On March 11, 2020, the World Health Organization declared the COVID-19 outbreak a pandemic, citing sustained risk of further global spread. The pandemic prompted a number of measures to limit the spread of COVID-19, including travel and border restrictions, quarantines, and restrictions on large gatherings. In turn, these resulted in lower consumer activity, diminished demand for a wide range of products and services, disruption in manufacturing and supply chains, and – given the wide variability in outcomes regarding the outbreak – significant market uncertainty and volatility. To help stem the turmoil, the U.S. government took unprecedented action – in concert with the U.S. Federal Reserve and central banks around the world – to help support consumers, businesses, and the broader economy, and to limit disruption to the financial system.
In general, the overall impact of the pandemic lessened in 2021, amid a resilient economy and widespread distribution of three COVID-19 vaccines granted emergency use authorization from the U.S. Food and Drug Administration (FDA) early in the year. Still, the situation remains dynamic, and the extent and duration of its influence on financial markets and the economy is highly uncertain, due in part to a recent spike in cases based on highly contagious variants of the coronavirus.
Extreme events such as the COVID-19 crisis are exogenous shocks that can have significant adverse effects on mutual funds and their investments. Although multiple asset classes may be affected by market disruption, the duration and impact may not be the same for all types of assets. Fidelity is committed to helping you stay informed amid news about COVID-19 and during increased market volatility, and we continue to take extra steps to be responsive to customer needs. We encourage you to visit us online, where we offer ongoing updates, commentary, and analysis on the markets and our funds.
Performance: The Bottom Line
Average annual total return reflects the change in the value of an investment, assuming reinvestment of distributions from dividend income and capital gains (the profits earned upon the sale of securities that have grown in value, if any) and assuming a constant rate of performance each year. The hypothetical investment and the average annual total returns do not reflect the deduction of taxes that a shareholder would pay on fund distributions or the redemption of fund shares. During periods of reimbursement by Fidelity, a fund’s total return will be greater than it would be had the reimbursement not occurred. How a fund did yesterday is no guarantee of how it will do tomorrow.
Average Annual Total Returns
| For the periods ended April 30, 2022 | Past 1 year | Life of fundA |
| Fidelity® U.S. Low Volatility Equity Fund | 0.12% | 6.19% |
A From November 5, 2019
$10,000 Over Life of Fund
Let's say hypothetically that $10,000 was invested in Fidelity® U.S. Low Volatility Equity Fund on November 5, 2019, when the fund started.
The chart shows how the value of your investment would have changed, and also shows how the Russell 3000® Index performed over the same period.
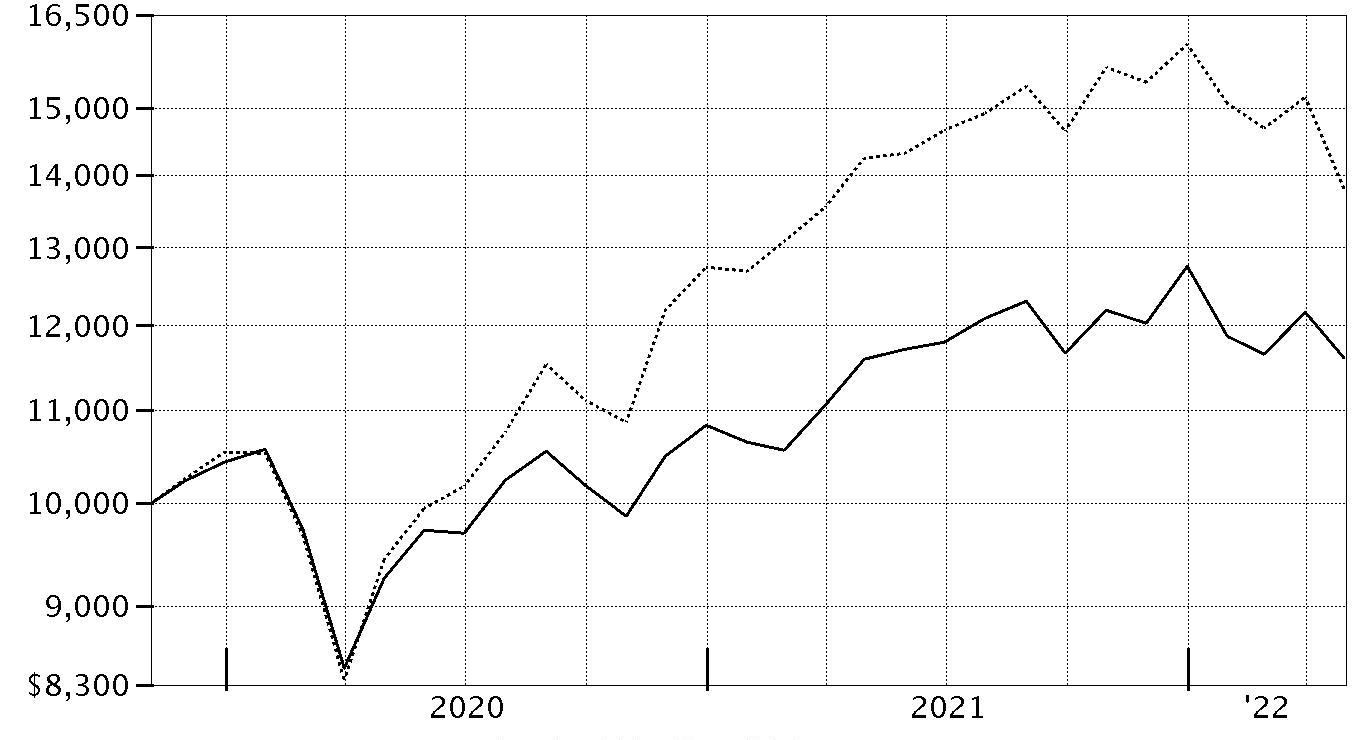
| Period Ending Values |
| $11,609 | Fidelity® U.S. Low Volatility Equity Fund |
| $13,806 | Russell 3000® Index |
Management's Discussion of Fund Performance
Market Recap: The S&P 500
® index gained 0.21% for the 12 months ending April 30, 2022. After posting a strong result in 2021, large-cap stocks retreated to begin the new year amid several notable headwinds that stoked volatility, uncertainty and investor anxiety. Chief among these was the U.S. Federal Reserve’s accelerated plan to hike interest rates and aggressively wind down its balance sheet in an attempt to rein in historically high inflation. In addition, geopolitical unrest rose as Russia invaded Ukraine in late February and escalated its attack through period end. Other factors influencing stocks included surging commodity prices, rising bond yields, supply constraint and disruption, and the potential for variants of the coronavirus to upend the economy. Against this backdrop, the S&P 500
® index returned -5.17% in January and -2.99% in February, falling on mixed corporate earnings, particularly among some highflying tech firms. Volatility eased in March and the index gained 3.71% for the month. April saw a sharp reversal, with the index returning -8.72% amid clearer signals of the Fed’s intension to tighten monetary policy and angst about the economic toll of “zero-COVID” lockdowns in China. It was the largest monthly decline for the S&P 500
® since March 2020. For the full 12 months, the growth-oriented communication services (-22%) and consumer discretionary (-11%) sectors lagged most. In contrast, energy (+61%) rode a surge in commodity prices and led the market by a wide margin, followed by the defensive consumer staples (+17%) sector.
Comments from Portfolio Manager Zach Dewhirst: For the fiscal year ending April 30, 2022, the fund gained 0.12%, outperforming the -3.11% result of the benchmark, the Russell 3000
® Index. The top contributor to performance versus the benchmark was an overweighting in consumer staples. Stock picks and an underweighting in consumer discretionary and security selection in health care also helped. The fund's biggest individual relative contributor was an underweighting in Amazon.com, which returned about -28% the past year. Our second-largest relative contributor this period was avoiding digital payments services company PayPal, a benchmark component that returned roughly -66%. In contrast, the biggest detractor from performance versus the benchmark was stock selection in information technology. An underweighting in energy and stock picks in consumer staples also hurt the fund’s relative performance. An underweighting in consumer electronics company Apple, a stake we established this period, detracted more than any other individual stock. It also hurt to hold a lighter-than-benchmark stake in Microsoft (+11%) in the fund. Lastly, it hurt to overweight software & services company Zoom Video Communications, which returned -63% for the fund. Zoom Video Communications was not held in the fund at period end. Notable changes in fund positioning for the 12 months included increased exposure to the utilities sector and a lower allocation to consumer discretionary.
The views expressed above reflect those of the portfolio manager(s) only through the end of the period as stated on the cover of this report and do not necessarily represent the views of Fidelity or any other person in the Fidelity organization. Any such views are subject to change at any time based upon market or other conditions and Fidelity disclaims any responsibility to update such views. These views may not be relied on as investment advice and, because investment decisions for a Fidelity fund are based on numerous factors, may not be relied on as an indication of trading intent on behalf of any Fidelity fund.
Investment Summary (Unaudited)
Top Ten Stocks as of April 30, 2022
| | % of fund's net assets |
| Vertex Pharmaceuticals, Inc. | 1.2 |
| BJ's Wholesale Club Holdings, Inc. | 1.2 |
| UnitedHealth Group, Inc. | 1.1 |
| Newmont Corp. | 1.1 |
| Dollar Tree, Inc. | 1.1 |
| Dollar General Corp. | 1.1 |
| Eli Lilly & Co. | 1.0 |
| Target Corp. | 1.0 |
| Thermo Fisher Scientific, Inc. | 1.0 |
| T-Mobile U.S., Inc. | 1.0 |
| | 10.8 |
Market Sectors as of April 30, 2022
| | % of fund's net assets |
| Information Technology | 16.1 |
| Consumer Staples | 15.4 |
| Health Care | 15.3 |
| Industrials | 11.5 |
| Utilities | 11.1 |
| Financials | 8.4 |
| Communication Services | 7.2 |
| Consumer Discretionary | 5.4 |
| Materials | 4.5 |
| Real Estate | 3.4 |
| Energy | 0.8 |
| Investment Companies | 0.5 |
Asset Allocation (% of fund's net assets)
| As of April 30, 2022 * |
| | Stocks | 99.6% |
| | Short-Term Investments and Net Other Assets (Liabilities) | 0.4% |

Foreign investments - 12.8%
Geographic Diversification (% of fund's net assets)
| As of April 30, 2022 |
| | United States of America* | 87.2% |
| | Canada | 3.0% |
| | Ireland | 1.7% |
| | Bermuda | 1.6% |
| | Japan | 1.6% |
| | United Kingdom | 1.5% |
| | Switzerland | 1.4% |
| | Israel | 0.7% |
| | France | 0.7% |
| | Other | 0.6% |

* Includes Short-Term investments and Net Other Assets (Liabilities)
Percentages are based on country or territory of incorporation and include the effect of futures, if applicable.
Schedule of Investments April 30, 2022
Showing Percentage of Net Assets
| Common Stocks - 99.1% | | | |
| | | Shares | Value |
| COMMUNICATION SERVICES - 7.2% | | | |
| Diversified Telecommunication Services - 2.2% | | | |
| AT&T, Inc. | | 103,500 | $1,952,010 |
| HKT Trust/HKT Ltd. unit | | 745,626 | 1,067,962 |
| Liberty Global PLC Class C (a) | | 106,800 | 2,531,160 |
| Verizon Communications, Inc. | | 50,600 | 2,342,780 |
| | | | 7,893,912 |
| Entertainment - 1.5% | | | |
| Activision Blizzard, Inc. | | 33,497 | 2,532,373 |
| Electronic Arts, Inc. | | 19,454 | 2,296,545 |
| Warner Bros Discovery, Inc. (a) | | 25,038 | 454,440 |
| | | | 5,283,358 |
| Interactive Media & Services - 0.9% | | | |
| Alphabet, Inc. Class A (a) | | 1,531 | 3,494,033 |
| Media - 1.6% | | | |
| Charter Communications, Inc. Class A (a) | | 4,300 | 1,842,507 |
| Comcast Corp. Class A | | 49,700 | 1,976,072 |
| Liberty Broadband Corp. Class C (a) | | 16,500 | 1,845,030 |
| | | | 5,663,609 |
| Wireless Telecommunication Services - 1.0% | | | |
| T-Mobile U.S., Inc. (a) | | 28,676 | 3,531,163 |
|
| TOTAL COMMUNICATION SERVICES | | | 25,866,075 |
|
| CONSUMER DISCRETIONARY - 5.4% | | | |
| Hotels, Restaurants & Leisure - 0.6% | | | |
| Domino's Pizza, Inc. | | 6,700 | 2,264,600 |
| Internet & Direct Marketing Retail - 0.7% | | | |
| Amazon.com, Inc. (a) | | 950 | 2,361,349 |
| Multiline Retail - 3.2% | | | |
| Dollar General Corp. | | 15,807 | 3,754,637 |
| Dollar Tree, Inc. (a) | | 23,620 | 3,837,069 |
| Target Corp. | | 16,200 | 3,704,130 |
| | | | 11,295,836 |
| Specialty Retail - 0.9% | | | |
| Murphy U.S.A., Inc. | | 14,300 | 3,340,480 |
|
| TOTAL CONSUMER DISCRETIONARY | | | 19,262,265 |
|
| CONSUMER STAPLES - 15.4% | | | |
| Beverages - 2.4% | | | |
| Keurig Dr. Pepper, Inc. | | 72,950 | 2,728,330 |
| Monster Beverage Corp. (a) | | 35,962 | 3,081,224 |
| The Coca-Cola Co. | | 43,253 | 2,794,576 |
| | | | 8,604,130 |
| Food & Staples Retailing - 3.8% | | | |
| Albertsons Companies, Inc. | | 93,700 | 2,930,936 |
| BJ's Wholesale Club Holdings, Inc. (a) | | 63,842 | 4,108,233 |
| Grocery Outlet Holding Corp. (a)(b) | | 103,615 | 3,488,717 |
| Walmart, Inc. | | 18,700 | 2,860,913 |
| | | | 13,388,799 |
| Food Products - 3.8% | | | |
| Bunge Ltd. | | 28,700 | 3,246,544 |
| McCormick & Co., Inc. (non-vtg.) | | 28,100 | 2,826,017 |
| Mondelez International, Inc. | | 45,013 | 2,902,438 |
| Nestle SA (Reg. S) | | 18,335 | 2,366,940 |
| TreeHouse Foods, Inc. (a) | | 72,100 | 2,271,150 |
| | | | 13,613,089 |
| Household Products - 3.3% | | | |
| Kimberly-Clark Corp. | | 21,651 | 3,005,808 |
| Procter & Gamble Co. | | 19,286 | 3,096,367 |
| Reynolds Consumer Products, Inc. | | 99,700 | 2,950,123 |
| The Clorox Co. | | 19,400 | 2,783,318 |
| | | | 11,835,616 |
| Personal Products - 0.4% | | | |
| Estee Lauder Companies, Inc. Class A | | 5,300 | 1,399,518 |
| Tobacco - 1.7% | | | |
| Altria Group, Inc. | | 53,300 | 2,961,881 |
| Philip Morris International, Inc. | | 30,100 | 3,010,000 |
| | | | 5,971,881 |
|
| TOTAL CONSUMER STAPLES | | | 54,813,033 |
|
| ENERGY - 0.8% | | | |
| Oil, Gas & Consumable Fuels - 0.8% | | | |
| Coterra Energy, Inc. | | 95,700 | 2,755,203 |
| FINANCIALS - 8.4% | | | |
| Capital Markets - 3.6% | | | |
| Cboe Global Markets, Inc. | | 26,100 | 2,948,778 |
| Intercontinental Exchange, Inc. | | 24,301 | 2,814,299 |
| Morningstar, Inc. | | 5,500 | 1,392,765 |
| NASDAQ, Inc. | | 17,160 | 2,700,469 |
| Virtu Financial, Inc. Class A | | 102,900 | 2,971,752 |
| | | | 12,828,063 |
| Diversified Financial Services - 0.9% | | | |
| Berkshire Hathaway, Inc. Class B (a) | | 10,348 | 3,340,645 |
| Insurance - 3.9% | | | |
| Arthur J. Gallagher & Co. | | 10,100 | 1,701,749 |
| Assurant, Inc. | | 16,626 | 3,023,937 |
| Brown & Brown, Inc. | | 52,734 | 3,268,453 |
| Marsh & McLennan Companies, Inc. | | 18,716 | 3,026,377 |
| The Travelers Companies, Inc. | | 16,761 | 2,867,137 |
| | | | 13,887,653 |
|
| TOTAL FINANCIALS | | | 30,056,361 |
|
| HEALTH CARE - 15.3% | | | |
| Biotechnology - 4.9% | | | |
| Amgen, Inc. | | 12,817 | 2,988,796 |
| Horizon Therapeutics PLC (a) | | 24,000 | 2,365,440 |
| Incyte Corp. (a) | | 35,400 | 2,653,584 |
| Regeneron Pharmaceuticals, Inc. (a) | | 5,354 | 3,528,875 |
| Seagen, Inc. (a) | | 12,300 | 1,611,423 |
| Vertex Pharmaceuticals, Inc. (a) | | 15,472 | 4,227,263 |
| | | | 17,375,381 |
| Health Care Equipment & Supplies - 0.7% | | | |
| Abbott Laboratories | | 21,000 | 2,383,500 |
| Health Care Providers & Services - 1.9% | | | |
| Humana, Inc. | | 6,376 | 2,834,515 |
| UnitedHealth Group, Inc. | | 7,591 | 3,860,403 |
| | | | 6,694,918 |
| Life Sciences Tools & Services - 2.3% | | | |
| Danaher Corp. | | 11,346 | 2,849,321 |
| Thermo Fisher Scientific, Inc. | | 6,412 | 3,545,323 |
| West Pharmaceutical Services, Inc. | | 6,500 | 2,047,890 |
| | | | 8,442,534 |
| Pharmaceuticals - 5.5% | | | |
| AstraZeneca PLC (United Kingdom) | | 21,231 | 2,833,091 |
| Bristol-Myers Squibb Co. | | 39,698 | 2,988,068 |
| Eli Lilly & Co. | | 12,756 | 3,726,410 |
| Merck & Co., Inc. | | 35,300 | 3,130,757 |
| Roche Holding AG (participation certificate) | | 6,768 | 2,509,669 |
| Sanofi SA sponsored ADR | | 45,300 | 2,366,925 |
| Zoetis, Inc. Class A | | 11,900 | 2,109,275 |
| | | | 19,664,195 |
|
| TOTAL HEALTH CARE | | | 54,560,528 |
|
| INDUSTRIALS - 11.5% | | | |
| Aerospace & Defense - 1.5% | | | |
| Lockheed Martin Corp. | | 5,861 | 2,532,655 |
| Northrop Grumman Corp. | | 6,378 | 2,802,493 |
| | | | 5,335,148 |
| Air Freight & Logistics - 1.4% | | | |
| C.H. Robinson Worldwide, Inc. (b) | | 26,100 | 2,770,515 |
| United Parcel Service, Inc. Class B | | 13,200 | 2,375,736 |
| | | | 5,146,251 |
| Commercial Services & Supplies - 1.8% | | | |
| Republic Services, Inc. | | 21,300 | 2,859,951 |
| Waste Connections, Inc. (United States) | | 25,450 | 3,511,337 |
| | | | 6,371,288 |
| Industrial Conglomerates - 0.9% | | | |
| Roper Technologies, Inc. | | 6,700 | 3,148,464 |
| Machinery - 0.7% | | | |
| IDEX Corp. | | 13,797 | 2,618,947 |
| Professional Services - 2.5% | | | |
| Booz Allen Hamilton Holding Corp. Class A | | 31,288 | 2,554,039 |
| FTI Consulting, Inc. (a) | | 21,900 | 3,453,849 |
| Verisk Analytics, Inc. | | 14,364 | 2,930,974 |
| | | | 8,938,862 |
| Road & Rail - 2.7% | | | |
| J.B. Hunt Transport Services, Inc. | | 10,900 | 1,862,265 |
| Knight-Swift Transportation Holdings, Inc. Class A | | 51,800 | 2,480,702 |
| Landstar System, Inc. | | 20,168 | 3,124,023 |
| Old Dominion Freight Lines, Inc. | | 7,100 | 1,988,852 |
| | | | 9,455,842 |
|
| TOTAL INDUSTRIALS | | | 41,014,802 |
|
| INFORMATION TECHNOLOGY - 16.1% | | | |
| Communications Equipment - 1.4% | | | |
| Cisco Systems, Inc. | | 54,600 | 2,674,308 |
| Motorola Solutions, Inc. | | 10,800 | 2,307,852 |
| | | | 4,982,160 |
| Electronic Equipment & Components - 0.6% | | | |
| Keyence Corp. | | 5,167 | 2,071,967 |
| IT Services - 7.0% | | | |
| Accenture PLC Class A | | 11,637 | 3,495,289 |
| Akamai Technologies, Inc. (a) | | 25,811 | 2,898,059 |
| Cognizant Technology Solutions Corp. Class A | | 32,500 | 2,629,250 |
| Fidelity National Information Services, Inc. | | 15,968 | 1,583,227 |
| Genpact Ltd. | | 63,800 | 2,569,226 |
| MasterCard, Inc. Class A | | 7,531 | 2,736,615 |
| Maximus, Inc. | | 29,957 | 2,183,266 |
| OBIC Co. Ltd. | | 14,700 | 2,171,768 |
| VeriSign, Inc. (a) | | 12,600 | 2,251,494 |
| Visa, Inc. Class A | | 12,194 | 2,598,907 |
| | | | 25,117,101 |
| Software - 5.9% | | | |
| Adobe, Inc. (a) | | 4,408 | 1,745,348 |
| Black Knight, Inc. (a) | | 35,293 | 2,321,926 |
| Check Point Software Technologies Ltd. (a) | | 19,700 | 2,487,913 |
| Citrix Systems, Inc. | | 23,300 | 2,332,330 |
| Intuit, Inc. | | 4,500 | 1,884,375 |
| Microsoft Corp. | | 12,495 | 3,467,612 |
| NortonLifeLock, Inc. | | 107,200 | 2,684,288 |
| Salesforce.com, Inc. (a) | | 8,943 | 1,573,431 |
| SAP SE sponsored ADR | | 12,100 | 1,219,680 |
| VMware, Inc. Class A | | 11,900 | 1,285,676 |
| | | | 21,002,579 |
| Technology Hardware, Storage & Peripherals - 1.2% | | | |
| Apple, Inc. | | 19,200 | 3,026,880 |
| FUJIFILM Holdings Corp. ADR (b) | | 24,200 | 1,341,164 |
| | | | 4,368,044 |
|
| TOTAL INFORMATION TECHNOLOGY | | | 57,541,851 |
|
| MATERIALS - 4.5% | | | |
| Containers & Packaging - 0.7% | | | |
| Ball Corp. | | 31,500 | 2,556,540 |
| Metals & Mining - 3.8% | | | |
| Agnico Eagle Mines Ltd. (United States) (b) | | 45,000 | 2,620,350 |
| Barrick Gold Corp. (Canada) | | 119,776 | 2,671,220 |
| Newmont Corp. | | 52,872 | 3,851,725 |
| Royal Gold, Inc. | | 19,900 | 2,596,552 |
| Wheaton Precious Metals Corp. (b) | | 36,100 | 1,619,446 |
| | | | 13,359,293 |
|
| TOTAL MATERIALS | | | 15,915,833 |
|
| REAL ESTATE - 3.4% | | | |
| Equity Real Estate Investment Trusts (REITs) - 3.4% | | | |
| Alexandria Real Estate Equities, Inc. | | 14,033 | 2,556,251 |
| American Tower Corp. | | 10,884 | 2,623,262 |
| CubeSmart | | 67,444 | 3,204,264 |
| Digital Realty Trust, Inc. | | 17,600 | 2,571,712 |
| SBA Communications Corp. Class A | | 3,900 | 1,353,729 |
| | | | 12,309,218 |
| UTILITIES - 11.1% | | | |
| Electric Utilities - 6.3% | | | |
| Entergy Corp. | | 24,200 | 2,876,170 |
| Evergy, Inc. | | 35,581 | 2,414,171 |
| FirstEnergy Corp. | | 74,500 | 3,226,595 |
| IDACORP, Inc. | | 24,600 | 2,587,428 |
| NextEra Energy, Inc. | | 37,088 | 2,633,990 |
| PNM Resources, Inc. | | 59,900 | 2,794,934 |
| Southern Co. | | 43,100 | 3,163,109 |
| Xcel Energy, Inc. | | 39,400 | 2,886,444 |
| | | | 22,582,841 |
| Multi-Utilities - 3.4% | | | |
| Dominion Energy, Inc. | | 37,389 | 3,052,438 |
| NiSource, Inc. | | 110,500 | 3,217,760 |
| Public Service Enterprise Group, Inc. | | 44,400 | 3,092,904 |
| Sempra Energy | | 17,200 | 2,775,392 |
| | | | 12,138,494 |
| Water Utilities - 1.4% | | | |
| American States Water Co. (b) | | 31,100 | 2,446,326 |
| American Water Works Co., Inc. | | 16,000 | 2,465,280 |
| | | | 4,911,606 |
|
| TOTAL UTILITIES | | | 39,632,941 |
|
| TOTAL COMMON STOCKS | | | |
| (Cost $319,842,547) | | | 353,728,110 |
|
| Money Market Funds - 2.8% | | | |
| Fidelity Cash Central Fund 0.32% (c) | | 1,011,078 | 1,011,280 |
| Fidelity Securities Lending Cash Central Fund 0.32% (c)(d) | | 8,839,773 | 8,840,657 |
| TOTAL MONEY MARKET FUNDS | | | |
| (Cost $9,851,937) | | | 9,851,937 |
|
| Equity Funds - 0.5% | | | |
| Domestic Equity Funds - 0.5% | | | |
| iShares MSCI USA Minimum Volatility ETF | | | |
| (Cost $1,989,506) | | 24,900 | 1,828,407 |
| TOTAL INVESTMENT IN SECURITIES - 102.4% | | | |
| (Cost $331,683,990) | | | 365,408,454 |
| NET OTHER ASSETS (LIABILITIES) - (2.4)% | | | (8,577,200) |
| NET ASSETS - 100% | | | $356,831,254 |
Security Type Abbreviations
ETF – Exchange-Traded Fund
Legend
(a) Non-income producing
(b) Security or a portion of the security is on loan at period end.
(c) Affiliated fund that is generally available only to investment companies and other accounts managed by Fidelity Investments. The rate quoted is the annualized seven-day yield of the fund at period end. A complete unaudited listing of the fund's holdings as of its most recent quarter end is available upon request. In addition, each Fidelity Central Fund's financial statements, which are not covered by the Fund's Report of Independent Registered Public Accounting Firm, are available on the SEC's website or upon request.
(d) Investment made with cash collateral received from securities on loan.
Affiliated Central Funds
Fiscal year to date information regarding the Fund's investments in Fidelity Central Funds, including the ownership percentage, is presented below.
| Fund | Value, beginning of period | Purchases | Sales Proceeds | Dividend Income | Realized Gain/Loss | Change in Unrealized appreciation (depreciation) | Value, end of period | % ownership, end of period |
| Fidelity Cash Central Fund 0.32% | $854,004 | $32,218,913 | $32,061,637 | $829 | $-- | $-- | $1,011,280 | 0.0% |
| Fidelity Securities Lending Cash Central Fund 0.32% | 1,665,825 | 70,667,447 | 63,492,615 | 3,727 | -- | -- | 8,840,657 | 0.0% |
| Total | $2,519,829 | $102,886,360 | $95,554,252 | $4,556 | $-- | $-- | $9,851,937 | |
Amounts in the income column in the above table include any capital gain distributions from underlying funds, which are presented in the corresponding line-item in the Statement of Operations, if applicable. Amount for Fidelity Securities Lending Cash Central Fund represents the income earned on investing cash collateral, less rebates paid to borrowers and any lending agent fees associated with the loan, plus any premium payments received for lending certain types of securities.
Investment Valuation
The following is a summary of the inputs used, as of April 30, 2022, involving the Fund's assets and liabilities carried at fair value. The inputs or methodology used for valuing securities may not be an indication of the risk associated with investing in those securities. For more information on valuation inputs, and their aggregation into the levels used below, please refer to the Investment Valuation section in the accompanying Notes to Financial Statements.
| | Valuation Inputs at Reporting Date: |
| Description | Total | Level 1 | Level 2 | Level 3 |
| Investments in Securities: | | | | |
| Equities: | | | | |
| Communication Services | $25,866,075 | $24,798,113 | $1,067,962 | $-- |
| Consumer Discretionary | 19,262,265 | 19,262,265 | -- | -- |
| Consumer Staples | 54,813,033 | 52,446,093 | 2,366,940 | -- |
| Energy | 2,755,203 | 2,755,203 | -- | -- |
| Financials | 30,056,361 | 30,056,361 | -- | -- |
| Health Care | 54,560,528 | 49,217,768 | 5,342,760 | -- |
| Industrials | 41,014,802 | 41,014,802 | -- | -- |
| Information Technology | 57,541,851 | 55,370,083 | 2,171,768 | -- |
| Materials | 15,915,833 | 15,915,833 | -- | -- |
| Real Estate | 12,309,218 | 12,309,218 | -- | -- |
| Utilities | 39,632,941 | 39,632,941 | -- | -- |
| Money Market Funds | 9,851,937 | 9,851,937 | -- | -- |
| Equity Funds | 1,828,407 | 1,828,407 | -- | -- |
| Total Investments in Securities: | $365,408,454 | $354,459,024 | $10,949,430 | $-- |
See accompanying notes which are an integral part of the financial statements.
Financial Statements
Statement of Assets and Liabilities
| | | April 30, 2022 |
| Assets | | |
Investment in securities, at value (including securities loaned of $8,598,465) — See accompanying schedule:
Unaffiliated issuers (cost $321,832,053) | $355,556,517 | |
| Fidelity Central Funds (cost $9,851,937) | 9,851,937 | |
| Total Investment in Securities (cost $331,683,990) | | $365,408,454 |
| Receivable for fund shares sold | | 228,346 |
| Dividends receivable | | 313,658 |
| Distributions receivable from Fidelity Central Funds | | 818 |
| Prepaid expenses | | 119 |
| Total assets | | 365,951,395 |
| Liabilities | | |
| Payable for fund shares redeemed | $54,010 | |
| Accrued management fee | 132,717 | |
| Other affiliated payables | 62,816 | |
| Other payables and accrued expenses | 29,941 | |
| Collateral on securities loaned | 8,840,657 | |
| Total liabilities | | 9,120,141 |
| Net Assets | | $356,831,254 |
| Net Assets consist of: | | |
| Paid in capital | | $310,416,654 |
| Total accumulated earnings (loss) | | 46,414,600 |
| Net Assets | | $356,831,254 |
| Net Asset Value, offering price and redemption price per share ($356,831,254 ÷ 32,746,290 shares) | | $10.90 |
See accompanying notes which are an integral part of the financial statements.
Statement of Operations
| | | Year ended April 30, 2022 |
| Investment Income | | |
| Dividends | | $5,315,254 |
| Income from Fidelity Central Funds (including $3,727 from security lending) | | 4,556 |
| Total income | | 5,319,810 |
| Expenses | | |
| Management fee | $1,852,633 | |
| Transfer agent fees | 620,188 | |
| Accounting fees | 144,195 | |
| Custodian fees and expenses | 9,440 | |
| Independent trustees' fees and expenses | 1,277 | |
| Registration fees | 26,816 | |
| Audit | 40,471 | |
| Legal | 727 | |
| Interest | 67 | |
| Miscellaneous | 1,393 | |
| Total expenses before reductions | 2,697,207 | |
| Expense reductions | (10,786) | |
| Total expenses after reductions | | 2,686,421 |
| Net investment income (loss) | | 2,633,389 |
| Realized and Unrealized Gain (Loss) | | |
| Net realized gain (loss) on: | | |
| Investment securities: | | |
| Unaffiliated issuers | 28,999,984 | |
| Foreign currency transactions | 2,530 | |
| Total net realized gain (loss) | | 29,002,514 |
| Change in net unrealized appreciation (depreciation) on: | | |
| Investment securities: | | |
| Unaffiliated issuers | (31,323,412) | |
| Assets and liabilities in foreign currencies | (3,937) | |
| Total change in net unrealized appreciation (depreciation) | | (31,327,349) |
| Net gain (loss) | | (2,324,835) |
| Net increase (decrease) in net assets resulting from operations | | $308,554 |
See accompanying notes which are an integral part of the financial statements.
Statement of Changes in Net Assets
| | Year ended April 30, 2022 | Year ended April 30, 2021 |
| Increase (Decrease) in Net Assets | | |
| Operations | | |
| Net investment income (loss) | $2,633,389 | $2,538,894 |
| Net realized gain (loss) | 29,002,514 | 1,889,556 |
| Change in net unrealized appreciation (depreciation) | (31,327,349) | 68,104,868 |
| Net increase (decrease) in net assets resulting from operations | 308,554 | 72,533,318 |
| Distributions to shareholders | (19,895,445) | (2,028,140) |
| Share transactions | | |
| Proceeds from sales of shares | 30,830,702 | 35,089,962 |
| Reinvestment of distributions | 19,794,049 | 2,019,281 |
| Cost of shares redeemed | (35,905,930) | (40,605,178) |
| Net increase (decrease) in net assets resulting from share transactions | 14,718,821 | (3,495,935) |
| Total increase (decrease) in net assets | (4,868,070) | 67,009,243 |
| Net Assets | | |
| Beginning of period | 361,699,324 | 294,690,081 |
| End of period | $356,831,254 | $361,699,324 |
| Other Information | | |
| Shares | | |
| Sold | 2,648,227 | 3,335,657 |
| Issued in reinvestment of distributions | 1,709,270 | 193,786 |
| Redeemed | (3,086,354) | (3,985,178) |
| Net increase (decrease) | 1,271,143 | (455,735) |
See accompanying notes which are an integral part of the financial statements.
Financial Highlights
Fidelity U.S. Low Volatility Equity Fund
| | | | |
| Years ended April 30, | 2022 | 2021 | 2020 A |
| Selected Per–Share Data | | | |
| Net asset value, beginning of period | $11.49 | $9.23 | $10.00 |
| Income from Investment Operations | | | |
| Net investment income (loss)B,C | .08 | .08 | .05 |
| Net realized and unrealized gain (loss) | (.03) | 2.25 | (.79) |
| Total from investment operations | .05 | 2.33 | (.74) |
| Distributions from net investment income | (.08) | (.07) | (.03) |
| Distributions from net realized gain | (.56) | – | – |
| Total distributions | (.64) | (.07) | (.03) |
| Net asset value, end of period | $10.90 | $11.49 | $9.23 |
| Total ReturnD,E | .12% | 25.27% | (7.44)% |
| Ratios to Average Net AssetsC,F,G | | | |
| Expenses before reductions | .73% | .77% | 2.28%H |
| Expenses net of fee waivers, if any | .72% | .77% | .95%H |
| Expenses net of all reductions | .72% | .77% | .95%H |
| Net investment income (loss) | .71% | .79% | 1.46%H |
| Supplemental Data | | | |
| Net assets, end of period (000 omitted) | $356,831 | $361,699 | $294,690 |
| Portfolio turnover rateI | 46% | 39% | 101%J,K |
A For the period November 5, 2019 (commencement of operations) through April 30, 2020.
B Calculated based on average shares outstanding during the period.
C Net investment income (loss) is affected by the timing of the declaration of dividends by any underlying mutual funds or exchange-traded funds (ETFs). Net investment income (loss) of any such underlying funds is not included in the Fund's net investment income (loss) ratio.
D Total returns for periods of less than one year are not annualized.
E Total returns would have been lower if certain expenses had not been reduced during the applicable periods shown.
F Fees and expenses of any underlying mutual funds or exchange-traded funds (ETFs) are not included in the Fund's expense ratio. The Fund indirectly bears its proportionate share of these expenses. For additional expense information related to investments in Fidelity Central Funds, please refer to the "Investments in Fidelity Central Funds" note found in the Notes to Financial Statements section of the most recent Annual or Semi-Annual report.
G Expense ratios reflect operating expenses of the class. Expenses before reductions do not reflect amounts reimbursed, waived, or reduced through arrangements with the investment adviser, brokerage services, or other offset arrangements, if applicable, and do not represent the amount paid by the class during periods when reimbursements, waivers or reductions occur.
H Annualized
I Amount does not include the portfolio activity of any underlying mutual funds or exchange-traded funds (ETFs).
J Portfolio turnover rate excludes securities received or delivered in-kind.
K Amount not annualized.
See accompanying notes which are an integral part of the financial statements.
Notes to Financial Statements
For the period ended April 30, 2022
1. Organization.
Fidelity U.S. Low Volatility Equity Fund (the Fund) is a fund of Fidelity Summer Street Trust (the Trust) and is authorized to issue an unlimited number of shares. Share transactions on the Statement of Changes in Net Assets may contain exchanges between affiliated funds. The Trust is registered under the Investment Company Act of 1940, as amended (the 1940 Act), as an open-end management investment company organized as a Massachusetts business trust.
2. Investments in Fidelity Central Funds.
Funds may invest in Fidelity Central Funds, which are open-end investment companies generally available only to other investment companies and accounts managed by the investment adviser and its affiliates. The Schedule of Investments lists any Fidelity Central Funds held as an investment as of period end, but does not include the underlying holdings of each Fidelity Central Fund. An investing fund indirectly bears its proportionate share of the expenses of the underlying Fidelity Central Funds.
Based on its investment objective, each Fidelity Central Fund may invest or participate in various investment vehicles or strategies that are similar to those of the investing fund. These strategies are consistent with the investment objectives of the investing fund and may involve certain economic risks which may cause a decline in value of each of the Fidelity Central Funds and thus a decline in the value of the investing fund.
| Fidelity Central Fund | Investment Manager | Investment Objective | Investment Practices | Expense Ratio(a) |
| Fidelity Money Market Central Funds | Fidelity Management & Research Company LLC (FMR) | Each fund seeks to obtain a high level of current income consistent with the preservation of capital and liquidity. | Short-term Investments | Less than .005% |
(a) Expenses expressed as a percentage of average net assets and are as of each underlying Central Fund's most recent annual or semi-annual shareholder report.
A complete unaudited list of holdings for each Fidelity Central Fund is available upon request or at the Securities and Exchange Commission website at www.sec.gov. In addition, the financial statements of the Fidelity Central Funds which contain the significant accounting policies (including investment valuation policies) of those funds, and are not covered by the Report of Independent Registered Public Accounting Firm, are available on the Securities and Exchange Commission website or upon request.
3. Significant Accounting Policies.
The Fund is an investment company and applies the accounting and reporting guidance of the Financial Accounting Standards Board (FASB) Accounting Standards Codification Topic 946 Financial Services - Investment Companies. The financial statements have been prepared in conformity with accounting principles generally accepted in the United States of America (GAAP), which require management to make certain estimates and assumptions at the date of the financial statements. Actual results could differ from those estimates. Subsequent events, if any, through the date that the financial statements were issued have been evaluated in the preparation of the financial statements. The Fund's Schedule of Investments lists any underlying mutual funds or exchange-traded funds (ETFs) but does not include the underlying holdings of these funds. The following summarizes the significant accounting policies of the Fund:
Investment Valuation. Investments are valued as of 4:00 p.m. Eastern time on the last calendar day of the period. The Board of Trustees (the Board) has delegated the day to day responsibility for the valuation of the Fund's investments to the Fair Value Committee (the Committee) established by the Fund's investment adviser. In accordance with valuation policies and procedures approved by the Board, the Fund attempts to obtain prices from one or more third party pricing vendors or brokers to value its investments. When current market prices, quotations or currency exchange rates are not readily available or reliable, investments will be fair valued in good faith by the Committee, in accordance with procedures adopted by the Board. Factors used in determining fair value vary by investment type and may include market or investment specific events. The frequency with which these procedures are used cannot be predicted and they may be utilized to a significant extent. The Committee oversees the Fund's valuation policies and procedures and reports to the Board on the Committee's activities and fair value determinations. The Board monitors the appropriateness of the procedures used in valuing the Fund's investments and ratifies the fair value determinations of the Committee.
The Fund categorizes the inputs to valuation techniques used to value its investments into a disclosure hierarchy consisting of three levels as shown below:
- Level 1 – unadjusted quoted prices in active markets for identical investments
- Level 2 – other significant observable inputs (including quoted prices for similar investments, interest rates, prepayment speeds, etc.)
- Level 3 – unobservable inputs (including the Fund's own assumptions based on the best information available)
Valuation techniques used to value the Fund's investments by major category are as follows:
Equity securities, including restricted securities, for which market quotations are readily available, are valued at the last reported sale price or official closing price as reported by a third party pricing vendor on the primary market or exchange on which they are traded and are categorized as Level 1 in the hierarchy. In the event there were no sales during the day or closing prices are not available, securities are valued at the last quoted bid price or may be valued using the last available price and are generally categorized as Level 2 in the hierarchy. For foreign equity securities, when market or security specific events arise, comparisons to the valuation of American Depositary Receipts (ADRs), futures contracts, ETFs and certain indexes as well as quoted prices for similar securities may be used and would be categorized as Level 2 in the hierarchy. For equity securities, including restricted securities, where observable inputs are limited, assumptions about market activity and risk are used and these securities may be categorized as Level 3 in the hierarchy.
ETFs are valued at their last sale price or official closing price as reported by a third party pricing vendor on the primary market or exchange on which they are traded and are categorized as Level 1 in the hierarchy. In the event there were no sales during the day but the exchange reports a closing bid level, ETFs are valued at the closing bid and would be categorized as Level 1 in the hierarchy. In the event there was no closing bid, ETFs may be valued by another method that the Board believes reflects fair value in accordance with the Board's fair value pricing policies and may be categorized as Level 2 in the hierarchy.
Investments in open-end mutual funds, including the Fidelity Central Funds, are valued at their closing net asset value (NAV) each business day and are categorized as Level 1 in the hierarchy.
Changes in valuation techniques may result in transfers in or out of an assigned level within the disclosure hierarchy. The aggregate value of investments by input level as of April 30, 2022 is included at the end of the Fund's Schedule of Investments.
Foreign Currency. Certain Funds may use foreign currency contracts to facilitate transactions in foreign-denominated securities. Gains and losses from these transactions may arise from changes in the value of the foreign currency or if the counterparties do not perform under the contracts' terms.
Foreign-denominated assets, including investment securities, and liabilities are translated into U.S. dollars at the exchange rates at period end. Purchases and sales of investment securities, income and dividends received, and expenses denominated in foreign currencies are translated into U.S. dollars at the exchange rate in effect on the transaction date.
The effects of exchange rate fluctuations on investments are included with the net realized and unrealized gain (loss) on investment securities. Other foreign currency transactions resulting in realized and unrealized gain (loss) are disclosed separately.
Investment Transactions and Income. For financial reporting purposes, the Fund's investment holdings and NAV include trades executed through the end of the last business day of the period. The NAV per share for processing shareholder transactions is calculated as of the close of business of the New York Stock Exchange (NYSE), normally 4:00 p.m. Eastern time and includes trades executed through the end of the prior business day. Gains and losses on securities sold are determined on the basis of identified cost. Commissions paid to certain brokers with whom the investment adviser, or its affiliates, places trades on behalf of a fund include an amount in addition to trade execution, which may be rebated back to a fund. Any such rebates are included in net realized gain (loss) on investments in the Statement of Operations. Dividend income is recorded on the ex-dividend date, except for certain dividends from foreign securities where the ex-dividend date may have passed, which are recorded as soon as the Fund is informed of the ex-dividend date. Non-cash dividends included in dividend income, if any, are recorded at the fair market value of the securities received. Income and capital gain distributions from Fidelity Central Funds, if any, are recorded on the ex-dividend date. Certain distributions received by the Fund represent a return of capital or capital gain. The Fund determines the components of these distributions subsequent to the ex-dividend date, based upon receipt of tax filings or other correspondence relating to the underlying investment. These distributions are recorded as a reduction of cost of investments and/or as a realized gain. Investment income is recorded net of foreign taxes withheld where recovery of such taxes is uncertain. Funds may file withholding tax reclaims in certain jurisdictions to recover a portion of amounts previously withheld. Any withholding tax reclaims income is included in the Statement of Operations in dividends. Any receivables for withholding tax reclaims are included in the Statement of Assets and Liabilities in dividends receivable.
Expenses. Expenses directly attributable to a fund are charged to that fund. Expenses attributable to more than one fund are allocated among the respective funds on the basis of relative net assets or other appropriate methods. Expenses included in the accompanying financial statements reflect the expenses of that fund and do not include any expenses associated with any underlying mutual funds or exchange-traded funds. Although not included in a fund's expenses, a fund indirectly bears its proportionate share of these expenses through the net asset value of each underlying mutual fund or exchange-traded fund. Expense estimates are accrued in the period to which they relate and adjustments are made when actual amounts are known.
Income Tax Information and Distributions to Shareholders. Each year, the Fund intends to qualify as a regulated investment company under Subchapter M of the Internal Revenue Code, including distributing substantially all of its taxable income and realized gains. As a result, no provision for U.S. Federal income taxes is required. As of April 30, 2022, the Fund did not have any unrecognized tax benefits in the financial statements; nor is the Fund aware of any tax positions for which it is reasonably possible that the total amounts of unrecognized tax benefits will significantly change in the next twelve months. The Fund files a U.S. federal tax return, in addition to state and local tax returns as required. The Fund's federal income tax returns are subject to examination by the Internal Revenue Service (IRS) for a period of three fiscal years after they are filed. State and local tax returns may be subject to examination for an additional fiscal year depending on the jurisdiction. Foreign taxes are provided for based on the Fund's understanding of the tax rules and rates that exist in the foreign markets in which it invests.
Distributions are declared and recorded on the ex-dividend date. Income and capital gain distributions are determined in accordance with income tax regulations, which may differ from GAAP. In addition, the Fund claimed a portion of the payment made to redeeming shareholders as a distribution for income tax purposes.
Capital accounts within the financial statements are adjusted for permanent book-tax differences. These adjustments have no impact on net assets or the results of operations. Capital accounts are not adjusted for temporary book-tax differences which will reverse in a subsequent period.
Book-tax differences are primarily due to foreign currency transactions, capital loss carryforwards and losses deferred due to wash sales.
As of period end, the cost and unrealized appreciation (depreciation) in securities, and derivatives if applicable, for federal income tax purposes were as follows:
| Gross unrealized appreciation | $52,108,605 |
| Gross unrealized depreciation | (18,763,826) |
| Net unrealized appreciation (depreciation) | $33,344,779 |
| Tax Cost | $332,063,675 |
The tax-based components of distributable earnings as of period end were as follows:
| Undistributed ordinary income | $959,494 |
| Undistributed long-term capital gain | $12,254,206 |
| Net unrealized appreciation (depreciation) on securities and other investments | $33,341,358 |
Capital loss carryforwards are only available to offset future capital gains of the Fund to the extent provided by regulations and may be limited. The capital loss carryforward information presented below, including any applicable limitation, is estimated as of fiscal period end and is subject to adjustment.
| No expiration | |
| Short-term | $(140,458) |
The tax character of distributions paid was as follows:
| | April 30, 2022 | April 30, 2021 |
| Ordinary Income | $5,227,274 | $ 2,028,140 |
| Long-term Capital Gains | 14,668,171 | – |
| Total | $19,895,445 | $ 2,028,140 |
4. Purchases and Sales of Investments.
Purchases and sales of securities, other than short-term securities and in-kind transactions, as applicable, are noted in the table below.
| | Purchases ($) | Sales ($) |
| Fidelity U.S. Low Volatility Equity Fund | 170,203,913 | 169,235,876 |
5. Fees and Other Transactions with Affiliates.
Management Fee. Fidelity Management & Research Company LLC (the investment adviser) and its affiliates provide the Fund with investment management related services for which the Fund pays a monthly management fee. The management fee is the sum of an individual fund fee rate that is based on an annual rate of .20% of the Fund's average net assets and an annualized group fee rate that averaged .22% during the period. The group fee rate is based upon the monthly average net assets of a group of registered investment companies with which the investment adviser has management contracts. The group fee rate decreases as assets under management increase and increases as assets under management decrease. During January 2022 the Board approved a change in the individual fund fee rate from .30% to .20% effective February 1, 2022. For the reporting period, the total annual management fee rate was .50% of the Fund's average net assets.
Transfer Agent Fees. Fidelity Investments Institutional Operations Company LLC (FIIOC), an affiliate of the investment adviser, is the Fund's transfer, dividend disbursing and shareholder servicing agent. FIIOC receives account fees and asset-based fees that vary according to account size and type of account. FIIOC pays for typesetting, printing and mailing of shareholder reports, except proxy statements. For the period, the transfer agent fees were equivalent to an annual rate of .17% of average net assets.
Accounting Fees. Fidelity Service Company, Inc. (FSC), an affiliate of the investment adviser, maintains the Fund's accounting records. The accounting fee is based on the level of average net assets for each month. For the period, the fees were equivalent to the following annual rates:
| | % of Average Net Assets |
| Fidelity U.S. Low Volatility Equity Fund | .04 |
Brokerage Commissions. A portion of portfolio transactions were placed with brokerage firms which are affiliates of the investment adviser. Brokerage commissions are included in net realized gain (loss) and change in net unrealized appreciation (depreciation) in the Statement of Operations. The commissions paid to these affiliated firms were as follows:
| | Amount |
| Fidelity U.S. Low Volatility Equity Fund | $1,652 |
Interfund Lending Program. Pursuant to an Exemptive Order issued by the Securities and Exchange Commission (the SEC), the Fund, along with other registered investment companies having management contracts with Fidelity Management & Research Company LLC (FMR), or other affiliated entities of FMR, may participate in an interfund lending program. This program provides an alternative credit facility allowing the Fund to borrow from, or lend money to, other participating affiliated funds. At period end, there were no interfund loans outstanding. Activity in this program during the period for which loans were outstanding was as follows:
| | Borrower or Lender | Average Loan Balance | Weighted Average Interest Rate | Interest Expense |
| Fidelity U.S. Low Volatility Equity Fund | Borrower | $3,727,000 | .32% | $67 |
Interfund Trades. Funds may purchase from or sell securities to other Fidelity Funds under procedures adopted by the Board. The procedures have been designed to ensure these interfund trades are executed in accordance with Rule 17a-7 of the 1940 Act. Any interfund trades are included within the respective purchases and sales amounts shown in the Purchases and Sales of Investments note. Interfund trades during the period are noted in the table below.
| | Purchases ($) | Sales ($) | Realized Gain (Loss) ($) |
| Fidelity U.S. Low Volatility Equity Fund | 9,737,628 | 8,842,003 | (766,516) |
6. Committed Line of Credit.
Certain Funds participate with other funds managed by the investment adviser or an affiliate in a $4.25 billion credit facility (the "line of credit") to be utilized for temporary or emergency purposes to fund shareholder redemptions or for other short-term liquidity purposes. The participating funds have agreed to pay commitment fees on their pro-rata portion of the line of credit, which are reflected in Miscellaneous expenses on the Statement of Operations, and are listed below. During the period, there were no borrowings on this line of credit.
| | Amount |
| Fidelity U.S. Low Volatility Equity Fund | $603 |
7. Security Lending.
Funds lend portfolio securities from time to time in order to earn additional income. Lending agents are used, including National Financial Services (NFS), an affiliate of the investment adviser. Pursuant to a securities lending agreement, NFS will receive a fee, which is capped at 9.9% of a fund's daily lending revenue, for its services as lending agent. A fund may lend securities to certain qualified borrowers, including NFS. On the settlement date of the loan, a fund receives collateral (in the form of U.S. Treasury obligations, letters of credit and/or cash) against the loaned securities and maintains collateral in an amount not less than 100% of the market value of the loaned securities during the period of the loan. The market value of the loaned securities is determined at the close of business of a fund and any additional required collateral is delivered to a fund on the next business day. A fund or borrower may terminate the loan at any time, and if the borrower defaults on its obligation to return the securities loaned because of insolvency or other reasons, a fund may apply collateral received from the borrower against the obligation. A fund may experience delays and costs in recovering the securities loaned. Any cash collateral received is invested in the Fidelity Securities Lending Cash Central Fund. Any loaned securities are identified as such in the Schedule of Investments, and the value of loaned securities and cash collateral at period end, as applicable, are presented in the Statement of Assets and Liabilities. Security lending income represents the income earned on investing cash collateral, less rebates paid to borrowers and any lending agent fees associated with the loan, plus any premium payments received for lending certain types of securities. Security lending income is presented in the Statement of Operations as a component of income from Fidelity Central Funds. Affiliated security lending activity, if any, was as follows:
| | Total Security Lending Fees Paid to NFS | Security Lending Income From Securities Loaned to NFS | Value of Securities Loaned to NFS at Period End |
| Fidelity U.S. Low Volatility Equity Fund | $383 | $– | $– |
8. Expense Reductions.
Through arrangements with the Fund's custodian, credits realized as a result of certain uninvested cash balances were used to reduce the Fund's expenses by $86.
In addition, during the period the investment adviser or an affiliate reimbursed and/or waived a portion of operating expenses in the amount of $10,700.
9. Other.
A fund's organizational documents provide former and current trustees and officers with a limited indemnification against liabilities arising in connection with the performance of their duties to the fund. In the normal course of business, a fund may also enter into contracts that provide general indemnifications. A fund's maximum exposure under these arrangements is unknown as this would be dependent on future claims that may be made against a fund. The risk of material loss from such claims is considered remote.
At the end of the period, the following mutual funds managed by the investment adviser or its affiliates were the owners of record of 10% or more of the total outstanding shares.
| | VIP FundsManager 50% Portfolio | VIP FundsManager 60% Portfolio | VIP FundsManager 70% Portfolio |
| Fidelity U.S. Low Volatility Equity Fund | 29% | 42% | 14% |
Mutual funds managed by the investment adviser or its affiliates, in aggregate, were the owners of record of more than 20% of the total outstanding shares.
| Fund | % of shares held |
| Fidelity U.S. Low Volatility Equity Fund | 94% |
10. Coronavirus (COVID-19) Pandemic.
An outbreak of COVID-19 first detected in China during December 2019 has since spread globally and was declared a pandemic by the World Health Organization during March 2020. Developments that disrupt global economies and financial markets, such as the COVID-19 pandemic, may magnify factors that affect the Fund's performance.
Report of Independent Registered Public Accounting Firm
To the Board of Trustees of Fidelity Summer Street Trust and Shareholders of Fidelity U.S. Low Volatility Equity Fund
Opinion on the Financial Statements
We have audited the accompanying statement of assets and liabilities, including the schedule of investments, of Fidelity U.S. Low Volatility Equity Fund (one of the funds constituting Fidelity Summer Street Trust, referred to hereafter as the “Fund”) as of April 30, 2022, the related statement of operations for the year ended April 30, 2022, the statement of changes in net assets for each of the two years in the period ended April 30, 2022, including the related notes, and the financial highlights for each of the two years in the period ended April 30, 2022 and for the period November 5, 2019 (commencement of operations) through April 30, 2020 (collectively referred to as the “financial statements”). In our opinion, the financial statements present fairly, in all material respects, the financial position of the Fund as of April 30, 2022, the results of its operations for the year then ended, the changes in its net assets for each of the two years in the period ended April 30, 2022 and the financial highlights for each of the two years in the period ended April 30, 2022 and for the period November 5, 2019 (commencement of operations) through April 30, 2020 in conformity with accounting principles generally accepted in the United States of America.
Basis for Opinion
These financial statements are the responsibility of the Fund’s management. Our responsibility is to express an opinion on the Fund’s financial statements based on our audits. We are a public accounting firm registered with the Public Company Accounting Oversight Board (United States) (PCAOB) and are required to be independent with respect to the Fund in accordance with the U.S. federal securities laws and the applicable rules and regulations of the Securities and Exchange Commission and the PCAOB.
We conducted our audits of these financial statements in accordance with the standards of the PCAOB. Those standards require that we plan and perform the audit to obtain reasonable assurance about whether the financial statements are free of material misstatement, whether due to error or fraud.
Our audits included performing procedures to assess the risks of material misstatement of the financial statements, whether due to error or fraud, and performing procedures that respond to those risks. Such procedures included examining, on a test basis, evidence regarding the amounts and disclosures in the financial statements. Our audits also included evaluating the accounting principles used and significant estimates made by management, as well as evaluating the overall presentation of the financial statements. Our procedures included confirmation of securities owned as of April 30, 2022 by correspondence with the custodian and brokers. We believe that our audits provide a reasonable basis for our opinion.
/s/ PricewaterhouseCoopers LLP
Boston, Massachusetts
June 14, 2022
We have served as the auditor of one or more investment companies in the Fidelity group of funds since 1932.
Trustees and Officers
The Trustees, Members of the Advisory Board (if any), and officers of the trust and fund, as applicable, are listed below. The Board of Trustees governs the fund and is responsible for protecting the interests of shareholders. The Trustees are experienced executives who meet periodically throughout the year to oversee the fund's activities, review contractual arrangements with companies that provide services to the fund, oversee management of the risks associated with such activities and contractual arrangements, and review the fund's performance. Each of the Trustees oversees 324 funds.
The Trustees hold office without limit in time except that (a) any Trustee may resign; (b) any Trustee may be removed by written instrument, signed by at least two-thirds of the number of Trustees prior to such removal; (c) any Trustee who requests to be retired or who has become incapacitated by illness or injury may be retired by written instrument signed by a majority of the other Trustees; and (d) any Trustee may be removed at any special meeting of shareholders by a two-thirds vote of the outstanding voting securities of the trust. Each Trustee who is not an interested person (as defined in the 1940 Act) of the trust and the fund is referred to herein as an Independent Trustee. Each Independent Trustee shall retire not later than the last day of the calendar year in which his or her 75th birthday occurs. The Independent Trustees may waive this mandatory retirement age policy with respect to individual Trustees. Officers and Advisory Board Members hold office without limit in time, except that any officer or Advisory Board Member may resign or may be removed by a vote of a majority of the Trustees at any regular meeting or any special meeting of the Trustees. Except as indicated, each individual has held the office shown or other offices in the same company for the past five years.
The fund’s Statement of Additional Information (SAI) includes more information about the Trustees. To request a free copy, call Fidelity at 1-800-544-8544.
Experience, Skills, Attributes, and Qualifications of the Trustees. The Governance and Nominating Committee has adopted a statement of policy that describes the experience, qualifications, attributes, and skills that are necessary and desirable for potential Independent Trustee candidates (Statement of Policy). The Board believes that each Trustee satisfied at the time he or she was initially elected or appointed a Trustee, and continues to satisfy, the standards contemplated by the Statement of Policy. The Governance and Nominating Committee also engages professional search firms to help identify potential Independent Trustee candidates who have the experience, qualifications, attributes, and skills consistent with the Statement of Policy. From time to time, additional criteria based on the composition and skills of the current Independent Trustees, as well as experience or skills that may be appropriate in light of future changes to board composition, business conditions, and regulatory or other developments, have also been considered by the professional search firms and the Governance and Nominating Committee. In addition, the Board takes into account the Trustees' commitment and participation in Board and committee meetings, as well as their leadership of standing and ad hoc committees throughout their tenure.
In determining that a particular Trustee was and continues to be qualified to serve as a Trustee, the Board has considered a variety of criteria, none of which, in isolation, was controlling. The Board believes that, collectively, the Trustees have balanced and diverse experience, qualifications, attributes, and skills, which allow the Board to operate effectively in governing the fund and protecting the interests of shareholders. Information about the specific experience, skills, attributes, and qualifications of each Trustee, which in each case led to the Board's conclusion that the Trustee should serve (or continue to serve) as a trustee of the fund, is provided below.
Board Structure and Oversight Function. Robert A. Lawrence is an interested person and currently serves as Chair. The Trustees have determined that an interested Chair is appropriate and benefits shareholders because an interested Chair has a personal and professional stake in the quality and continuity of services provided to the fund. Independent Trustees exercise their informed business judgment to appoint an individual of their choosing to serve as Chair, regardless of whether the Trustee happens to be independent or a member of management. The Independent Trustees have determined that they can act independently and effectively without having an Independent Trustee serve as Chair and that a key structural component for assuring that they are in a position to do so is for the Independent Trustees to constitute a substantial majority for the Board. The Independent Trustees also regularly meet in executive session. David M. Thomas serves as Lead Independent Trustee and as such (i) acts as a liaison between the Independent Trustees and management with respect to matters important to the Independent Trustees and (ii) with management prepares agendas for Board meetings.
Fidelity® funds are overseen by different Boards of Trustees. The fund's Board oversees Fidelity's high income and certain equity funds, and other Boards oversee Fidelity's investment-grade bond, money market, asset allocation, and other equity funds. The asset allocation funds may invest in Fidelity® funds overseen by the fund's Board. The use of separate Boards, each with its own committee structure, allows the Trustees of each group of Fidelity® funds to focus on the unique issues of the funds they oversee, including common research, investment, and operational issues. On occasion, the separate Boards establish joint committees to address issues of overlapping consequences for the Fidelity® funds overseen by each Board.
The Trustees operate using a system of committees to facilitate the timely and efficient consideration of all matters of importance to the Trustees, the fund, and fund shareholders and to facilitate compliance with legal and regulatory requirements and oversight of the fund's activities and associated risks. The Board, acting through its committees, has charged FMR and its affiliates with (i) identifying events or circumstances the occurrence of which could have demonstrably adverse effects on the fund's business and/or reputation; (ii) implementing processes and controls to lessen the possibility that such events or circumstances occur or to mitigate the effects of such events or circumstances if they do occur; and (iii) creating and maintaining a system designed to evaluate continuously business and market conditions in order to facilitate the identification and implementation processes described in (i) and (ii) above. Because the day-to-day operations and activities of the fund are carried out by or through FMR, its affiliates, and other service providers, the fund's exposure to risks is mitigated but not eliminated by the processes overseen by the Trustees. While each of the Board's committees has responsibility for overseeing different aspects of the fund's activities, oversight is exercised primarily through the Operations, Audit, and Compliance Committees. Appropriate personnel, including but not limited to the fund's Chief Compliance Officer (CCO), FMR's internal auditor, the independent accountants, the fund's Treasurer and portfolio management personnel, make periodic reports to the Board's committees, as appropriate, including an annual review of Fidelity's risk management program for the Fidelity® funds. The responsibilities of each standing committee, including their oversight responsibilities, are described further under "Standing Committees of the Trustees."
Interested Trustees*:
Correspondence intended for a Trustee who is an interested person may be sent to Fidelity Investments, 245 Summer Street, Boston, Massachusetts 02210.
Name, Year of Birth; Principal Occupations and Other Relevant Experience+
Bettina Doulton (1964)
Year of Election or Appointment: 2020
Trustee
Ms. Doulton also serves as Trustee of other Fidelity® funds. Prior to her retirement, Ms. Doulton served in a variety of positions at Fidelity Investments, including as a managing director of research (2006-2007), portfolio manager to certain Fidelity® funds (1993-2005), equity analyst and portfolio assistant (1990-1993), and research assistant (1987-1990). Ms. Doulton currently owns and operates Phi Builders + Architects and Cellardoor Winery. Previously, Ms. Doulton served as a member of the Board of Brown Capital Management, LLC (2014-2018).
Robert A. Lawrence (1952)
Year of Election or Appointment: 2020
Trustee
Chair of the Board of Trustees
Mr. Lawrence also serves as Trustee of other funds. Previously, Mr. Lawrence served as a Member of the Advisory Board of certain funds. Prior to his retirement in 2008, Mr. Lawrence served as Vice President of certain Fidelity® funds (2006-2008), Senior Vice President, Head of High Income Division of Fidelity Management & Research Company (investment adviser firm, 2006-2008), and President of Fidelity Strategic Investments (investment adviser firm, 2002-2005).
* Determined to be an “Interested Trustee” by virtue of, among other things, his or her affiliation with the trust or various entities under common control with FMR.
+ The information includes the Trustee's principal occupation during the last five years and other information relating to the experience, attributes, and skills relevant to the Trustee's qualifications to serve as a Trustee, which led to the conclusion that the Trustee should serve as a Trustee for the fund.
Independent Trustees:
Correspondence intended for an Independent Trustee may be sent to Fidelity Investments, P.O. Box 55235, Boston, Massachusetts 02205-5235.
Name, Year of Birth; Principal Occupations and Other Relevant Experience+
Thomas P. Bostick (1956)
Year of Election or Appointment: 2021
Trustee
Lieutenant General Bostick also serves as Trustee of other Fidelity® funds. Prior to his retirement, General Bostick (United States Army, Retired) held a variety of positions within the U.S. Army, including Commanding General and Chief of Engineers, U.S. Army Corps of Engineers (2012-2016) and Deputy Chief of Staff and Director of Human Resources, U.S. Army (2009-2012). General Bostick currently serves as a member of the Board and Finance and Governance Committees of CSX Corporation (transportation, 2020-present) and a member of the Board and Corporate Governance and Nominating Committee of Perma-Fix Environmental Services, Inc. (nuclear waste management, 2020-present). General Bostick serves as Chief Executive Officer of Bostick Global Strategies, LLC (consulting, 2016-present) and as a member of the Board of HireVue, Inc. (video interview and assessment, 2020-present). Previously, General Bostick served as a Member of the Advisory Board of certain Fidelity® funds (2021), President, Intrexon Bioengineering (2018-2020) and Chief Operating Officer (2017-2020) and Senior Vice President of the Environment Sector (2016-2017) of Intrexon Corporation (biopharmaceutical company).
Dennis J. Dirks (1948)
Year of Election or Appointment: 2005
Trustee
Mr. Dirks also serves as Trustee of other Fidelity® funds. Prior to his retirement in May 2003, Mr. Dirks served as Chief Operating Officer and as a member of the Board of The Depository Trust & Clearing Corporation (financial markets infrastructure), President, Chief Operating Officer and a member of the Board of The Depository Trust Company (DTC), President and a member of the Board of the National Securities Clearing Corporation (NSCC), Chief Executive Officer and a member of the Board of the Government Securities Clearing Corporation and Chief Executive Officer and a member of the Board of the Mortgage-Backed Securities Clearing Corporation. Mr. Dirks currently serves as a member of the Finance Committee (2016-present) and Board (2017-present) and is Treasurer (2018-present) of the Asolo Repertory Theatre.
Donald F. Donahue (1950)
Year of Election or Appointment: 2018
Trustee
Mr. Donahue also serves as Trustee of other Fidelity® funds. Mr. Donahue serves as President and Chief Executive Officer of Miranda Partners, LLC (risk consulting for the financial services industry, 2012-present). Previously, Mr. Donahue served as Chief Executive Officer (2006-2012), Chief Operating Officer (2003-2006) and Managing Director, Customer Marketing and Development (1999-2003) of The Depository Trust & Clearing Corporation (financial markets infrastructure). Mr. Donahue currently serves as a member (2007-present) and Co-Chairman (2016-present) of the Board of United Way of New York and a member of the Board of The Leadership Academy (previously NYC Leadership Academy) (2012-present). Mr. Donahue previously served as a member of the Advisory Board of certain Fidelity® funds (2015-2018).
Vicki L. Fuller (1957)
Year of Election or Appointment: 2020
Trustee
Ms. Fuller also serves as Trustee of other Fidelity® funds. Previously, Ms. Fuller served as a member of the Advisory Board of certain Fidelity® funds (2018-2020), Chief Investment Officer of the New York State Common Retirement Fund (2012-2018) and held a variety of positions at AllianceBernstein L.P. (global asset management, 1985-2012), including Managing Director (2006-2012) and Senior Vice President and Senior Portfolio Manager (2001-2006). Ms. Fuller currently serves as a member of the Board, Audit Committee and Nominating and Governance Committee of two Blackstone business development companies (2020-present), as a member of the Board of Treliant, LLC (consulting, 2019-present), as a member of the Advisory Board of Ariel Alternatives, LLC (private equity, 2021-present) and as a member of the Board and Chair of the Audit Committee of Gusto, Inc. (software, 2021-present). In addition, Ms. Fuller currently serves as a member of the Board of Roosevelt University (2019-present) and as a member of the Executive Board of New York University’s Stern School of Business. Ms. Fuller previously served as a member of the Board, Audit Committee and Nominating and Governance Committee of The Williams Companies, Inc. (natural gas infrastructure, 2018-2021).
Patricia L. Kampling (1959)
Year of Election or Appointment: 2020
Trustee
Ms. Kampling also serves as Trustee of other Fidelity® funds. Prior to her retirement, Ms. Kampling served as Chairman of the Board and Chief Executive Officer (2012-2019), President and Chief Operating Officer (2011-2012) and Executive Vice President and Chief Financial Officer (2010-2011) of Alliant Energy Corporation. Ms. Kampling currently serves as a member of the Board, Finance Committee and Governance, Compensation and Nominating Committee of Xcel Energy Inc. (utilities company, 2020-present) and as a member of the Board, Audit, Finance and Risk Committee and Safety, Environmental, Technology and Operations Committee and Chair of the Executive Development and Compensation Committee of American Water Works Company, Inc. (utilities company, 2019-present). In addition, Ms. Kampling currently serves as a member of the Board of the Nature Conservancy, Wisconsin Chapter (2019-present). Previously, Ms. Kampling served as a Member of the Advisory Board of certain Fidelity® funds (2020), a member of the Board, Compensation Committee and Executive Committee and Chair of the Audit Committee of Briggs & Stratton Corporation (manufacturing, 2011-2021), a member of the Board of Interstate Power and Light Company (2012-2019) and Wisconsin Power and Light Company (2012-2019) (each a subsidiary of Alliant Energy Corporation) and as a member of the Board and Workforce Development Committee of the Business Roundtable (2018-2019).
Thomas A. Kennedy (1955)
Year of Election or Appointment: 2021
Trustee
Mr. Kennedy also serves as Trustee of other Fidelity® funds. Previously, Mr. Kennedy served as a Member of the Advisory Board of certain Fidelity® funds (2020) and held a variety of positions at Raytheon Company (aerospace and defense, 1983-2020), including Chairman and Chief Executive Officer (2014-2020) and Executive Vice President and Chief Operating Officer (2013-2014). Mr. Kennedy currently serves as Executive Chairman of the Board of Directors of Raytheon Technologies Corporation (aerospace and defense, 2020-present). He is also a member of the Rutgers School of Engineering Industry Advisory Board (2011-present) and a member of the UCLA Engineering Dean’s Executive Board (2016-present).
Oscar Munoz (1959)
Year of Election or Appointment: 2021
Trustee
Mr. Munoz also serves as Trustee of other Fidelity® funds. Prior to his retirement, Mr. Munoz served as Executive Chairman (2020-2021), Chief Executive Officer (2015-2020), President (2015-2016) and a member of the Board (2010-2021) of United Airlines Holdings, Inc. Mr. Munoz currently serves as a member of the Board of CBRE Group, Inc. (commercial real estate, 2020-present), a member of the Board of Univision Communications, Inc. (Hispanic media, 2020-present) and a member of the Advisory Board of Salesforce.com, Inc. (cloud-based software, 2020-present). Previously, Mr. Munoz served as a Member of the Advisory Board of certain Fidelity® funds (2021).
Garnett A. Smith (1947)
Year of Election or Appointment: 2018
Trustee
Mr. Smith also serves as Trustee of other Fidelity® funds. Prior to his retirement, Mr. Smith served as Chairman and Chief Executive Officer (1990-1997) and President (1986-1990) of Inbrand Corp. (manufacturer of personal absorbent products). Prior to his employment with Inbrand Corp., he was employed by a retail fabric chain and North Carolina National Bank (now Bank of America). Mr. Smith previously served as a member of the Advisory Board of certain Fidelity® funds (2012-2013).
David M. Thomas (1949)
Year of Election or Appointment: 2008
Trustee
Lead Independent Trustee
Mr. Thomas also serves as Trustee of other Fidelity® funds. Previously, Mr. Thomas served as Executive Chairman (2005-2006) and Chairman and Chief Executive Officer (2000-2005) of IMS Health, Inc. (pharmaceutical and healthcare information solutions). Mr. Thomas currently serves as a member of the Board of Fortune Brands Home and Security (home and security products, 2004-present) and as Director (2013-present) and Non-Executive Chairman of the Board (2022-present) of Interpublic Group of Companies, Inc. (marketing communication).
Susan Tomasky (1953)
Year of Election or Appointment: 2020
Trustee
Ms. Tomasky also serves as Trustee of other Fidelity® funds. Prior to her retirement, Ms. Tomasky served in various executive officer positions at American Electric Power Company, Inc. (1998-2011), including most recently as President of AEP Transmission (2007-2011). Ms. Tomasky currently serves as a member of the Board and Sustainability Committee and as Chair of the Audit Committee of Marathon Petroleum Corporation (2018-present) and as a member of the Board, Executive Committee, Corporate Governance Committee and Organization and Compensation Committee and as Chair of the Audit Committee of Public Service Enterprise Group, Inc. (utilities company, 2012-present) and as a member of the Board of its subsidiary company, Public Service Electric and Gas Co. (2021-present). In addition, Ms. Tomasky currently serves as a member (2009-present) and President (2020-present) of the Board of the Royal Shakespeare Company – America (2009-present), as a member of the Board of the Columbus Association for the Performing Arts (2011-present) and as a member of the Board and Kenyon in the World Committee of Kenyon College (2016-present). Previously, Ms. Tomasky served as a Member of the Advisory Board of certain Fidelity® funds (2020), as a member of the Board of the Columbus Regional Airport Authority (2007-2020), as a member of the Board (2011-2018) and Lead Independent Director (2015-2018) of Andeavor Corporation (previously Tesoro Corporation) (independent oil refiner and marketer) and as a member of the Board of Summit Midstream Partners LP (energy, 2012-2018).
Michael E. Wiley (1950)
Year of Election or Appointment: 2018
Trustee
Mr. Wiley also serves as Trustee of other Fidelity® funds. Previously, Mr. Wiley served as a member of the Advisory Board of certain Fidelity® funds (2018-2020), Chairman, President and CEO of Baker Hughes, Inc. (oilfield services, 2000-2004). Mr. Wiley also previously served as a member of the Board of Andeavor Corporation (independent oil refiner and marketer, 2005-2018), a member of the Board of Andeavor Logistics LP (natural resources logistics, 2015-2018) and a member of the Board of High Point Resources (exploration and production, 2005-2020).
+ The information includes the Trustee's principal occupation during the last five years and other information relating to the experience, attributes, and skills relevant to the Trustee's qualifications to serve as a Trustee, which led to the conclusion that the Trustee should serve as a Trustee for the fund.
Advisory Board Members and Officers:
Correspondence intended for a Member of the Advisory Board (if any) may be sent to Fidelity Investments, P.O. Box 55235, Boston, Massachusetts 02205-5235. Correspondence intended for an officer or Peter S. Lynch may be sent to Fidelity Investments, 245 Summer Street, Boston, Massachusetts 02210. Officers appear below in alphabetical order.
Name, Year of Birth; Principal Occupation
Peter S. Lynch (1944)
Year of Election or Appointment: 2003
Member of the Advisory Board
Mr. Lynch also serves as a Member of the Advisory Board of other Fidelity® funds. Mr. Lynch is Vice Chairman and a Director of Fidelity Management & Research Company LLC (investment adviser firm). In addition, Mr. Lynch serves as a Trustee of Boston College and as the Chairman of the Inner-City Scholarship Fund. Previously, Mr. Lynch served as Vice Chairman and a Director of FMR Co., Inc. (investment adviser firm) and on the Special Olympics International Board of Directors (1997-2006).
Craig S. Brown (1977)
Year of Election or Appointment: 2019
Assistant Treasurer
Mr. Brown also serves as an officer of other funds. Mr. Brown serves as Assistant Treasurer of FIMM, LLC (2021-present) and is an employee of Fidelity Investments (2013-present).
John J. Burke III (1964)
Year of Election or Appointment: 2018
Chief Financial Officer
Mr. Burke also serves as Chief Financial Officer of other funds. Mr. Burke serves as Head of Investment Operations for Fidelity Fund and Investment Operations (2018-present) and is an employee of Fidelity Investments (1998-present). Previously Mr. Burke served as head of Asset Management Investment Operations (2012-2018).
William C. Coffey (1969)
Year of Election or Appointment: 2019
Assistant Secretary
Mr. Coffey also serves as Assistant Secretary of other funds. He is Senior Vice President and Deputy General Counsel of FMR LLC (diversified financial services company, 2010-present), and is an employee of Fidelity Investments. Previously, Mr. Coffey served as Secretary and CLO of certain funds (2018-2019); CLO, Secretary, and Senior Vice President of Fidelity Management & Research Company and FMR Co., Inc. (investment adviser firms, 2018-2019); Secretary of Fidelity SelectCo, LLC and Fidelity Investments Money Management, Inc. (investment adviser firms, 2018-2019); CLO of Fidelity Management & Research (Hong Kong) Limited, FMR Investment Management (UK) Limited, and Fidelity Management & Research (Japan) Limited (investment adviser firms, 2018-2019); and Assistant Secretary of certain funds (2009-2018).
Timothy M. Cohen (1969)
Year of Election or Appointment: 2018
Vice President
Mr. Cohen also serves as Vice President of other funds. Mr. Cohen serves as Co-Head of Equity (2018-present), a Director of Fidelity Management & Research (Japan) Limited (investment adviser firm, 2016-present), and is an employee of Fidelity Investments. Previously, Mr. Cohen served as Executive Vice President of Fidelity SelectCo, LLC (2019), Head of Global Equity Research (2016-2018), Chief Investment Officer - Equity and a Director of Fidelity Management & Research (U.K.) Inc. (investment adviser firm, 2013-2015) and as a Director of Fidelity Management & Research (Hong Kong) Limited (investment adviser firm, 2017).
Jonathan Davis (1968)
Year of Election or Appointment: 2010
Assistant Treasurer
Mr. Davis also serves as an officer of other funds. Mr. Davis serves as Assistant Treasurer of FIMM, LLC (2021-present), FMR Capital, Inc. (2017-present), FD Funds GP LLC (2021-present), FD Funds Holding LLC (2021-present), and FD Funds Management LLC (2021-present); and is an employee of Fidelity Investments. Previously, Mr. Davis served as Vice President and Associate General Counsel of FMR LLC (diversified financial services company, 2003-2010).
Laura M. Del Prato (1964)
Year of Election or Appointment: 2018
Assistant Treasurer
Ms. Del Prato also serves as an officer of other funds. Ms. Del Prato serves as Assistant Treasurer of FIMM, LLC (2021-present) and is an employee of Fidelity Investments (2017-present). Previously, Ms. Del Prato served as President and Treasurer of The North Carolina Capital Management Trust: Cash Portfolio and Term Portfolio (2018-2020). Prior to joining Fidelity Investments, Ms. Del Prato served as a Managing Director and Treasurer of the JPMorgan Mutual Funds (2014-2017). Prior to JPMorgan, Ms. Del Prato served as a partner at Cohen Fund Audit Services (accounting firm, 2012-2013) and KPMG LLP (accounting firm, 2004-2012).
Colm A. Hogan (1973)
Year of Election or Appointment: 2020
Assistant Treasurer
Mr. Hogan also serves as an officer of other funds. Mr. Hogan serves as Assistant Treasurer of FIMM, LLC (2021-present) and FMR Capital, Inc. (2017-present) and is an employee of Fidelity Investments (2005-present). Previously, Mr. Hogan served as Deputy Treasurer of certain Fidelity® funds (2016-2020) and Assistant Treasurer of certain Fidelity® funds (2016-2018).
Pamela R. Holding (1964)
Year of Election or Appointment: 2018
Vice President
Ms. Holding also serves as Vice President of other funds. Ms. Holding serves as Co-Head of Equity (2018-present) and is an employee of Fidelity Investments (2013-present). Previously, Ms. Holding served as Executive Vice President of Fidelity SelectCo, LLC (2019) and as Chief Investment Officer of Fidelity Institutional Asset Management (2013-2018).
Cynthia Lo Bessette (1969)
Year of Election or Appointment: 2019
Secretary and Chief Legal Officer (CLO)
Ms. Lo Bessette also serves as an officer of other funds. Ms. Lo Bessette serves as CLO, Secretary, and Senior Vice President of Fidelity Management & Research Company LLC (investment adviser firm, 2019-present); CLO of Fidelity Management & Research (Hong Kong) Limited, FMR Investment Management (UK) Limited, and Fidelity Management & Research (Japan) Limited (investment adviser firms, 2019-present); Secretary of FD Funds GP LLC (2021-present), FD Funds Holding LLC (2021-present), and FD Funds Management LLC (2021-present); and Assistant Secretary of FIMM, LLC (2019-present). She is a Senior Vice President and Deputy General Counsel of FMR LLC (diversified financial services company, 2019-present), and is an employee of Fidelity Investments. Previously, Ms. Lo Bessette served as CLO, Secretary, and Senior Vice President of FMR Co., Inc. (investment adviser firm, 2019); Secretary of Fidelity SelectCo, LLC and Fidelity Investments Money Management, Inc. (investment adviser firms, 2019). Prior to joining Fidelity Investments, Ms. Lo Bessette was Executive Vice President, General Counsel (2016-2019) and Senior Vice President, Deputy General Counsel (2015-2016) of OppenheimerFunds (investment management company) and Deputy Chief Legal Officer (2013-2015) of Jennison Associates LLC (investment adviser firm).
Chris Maher (1972)
Year of Election or Appointment: 2020
Deputy Treasurer
Mr. Maher also serves as an officer of other funds. Mr. Maher serves as Assistant Treasurer of FIMM, LLC (2021-present) and FMR Capital, Inc. (2017-present), and is an employee of Fidelity Investments (2008-present). Previously, Mr. Maher served as Assistant Treasurer of certain funds (2013-2020); Vice President of Asset Management Compliance (2013), Vice President of the Program Management Group of FMR (investment adviser firm, 2010-2013), and Vice President of Valuation Oversight (2008-2010).
Jason P. Pogorelec (1975)
Year of Election or Appointment: 2020
Chief Compliance Officer
Mr. Pogorelec also serves as Chief Compliance Officer of other funds. Mr. Pogorelec is a senior Vice President of Asset Management Compliance for Fidelity Investments and is an employee of Fidelity Investments (2006-present). Previously, Mr. Pogorelec served as Vice President, Associate General Counsel for Fidelity Investments (2010-2020) and Assistant Secretary of certain Fidelity funds (2015-2020).
Brett Segaloff (1972)
Year of Election or Appointment: 2021
Anti-Money Laundering (AML) Officer
Mr. Segaloff also serves as an AML Officer of other funds and other related entities. He is Director, Anti-Money Laundering (2007-present) of FMR LLC (diversified financial services company) and is an employee of Fidelity Investments (1996-present).
Stacie M. Smith (1974)
Year of Election or Appointment: 2016
President and Treasurer
Ms. Smith also serves as an officer of other funds. Ms. Smith serves as Assistant Treasurer of FIMM, LLC (2021-present) and FMR Capital, Inc. (2017-present), is an employee of Fidelity Investments (2009-present), and has served in other fund officer roles. Prior to joining Fidelity Investments, Ms. Smith served as Senior Audit Manager of Ernst & Young LLP (accounting firm, 1996-2009). Previously, Ms. Smith served as Assistant Treasurer (2013-2019) and Deputy Treasurer (2013-2016) of certain Fidelity® funds.
Jim Wegmann (1979)
Year of Election or Appointment: 2019
Assistant Treasurer
Mr. Wegmann also serves as an officer of other funds. Mr. Wegmann serves as Assistant Treasurer of FIMM, LLC (2021-present) and is an employee of Fidelity Investments (2011-present). Previously, Mr. Wegmann served as Assistant Treasurer of certain Fidelity® funds (2019-2021).
Shareholder Expense Example
As a shareholder, you incur two types of costs: (1) transaction costs, which may include sales charges (loads) on purchase payments or redemption proceeds, as applicable and (2) ongoing costs, which generally include management fees, distribution and/or service (12b-1) fees and other Fund expenses. This Example is intended to help you understand your ongoing costs (in dollars) of investing in a fund and to compare these costs with the ongoing costs of investing in other mutual funds.
The Example is based on an investment of $1,000 invested at the beginning of the period and held for the entire period (November 1, 2021 to April 30, 2022).
Actual Expenses
The first line of the accompanying table provides information about actual account values and actual expenses. You may use the information in this line, together with the amount you invested, to estimate the expenses that you paid over the period. Simply divide your account value by $1,000.00 (for example, an $8,600 account value divided by $1,000.00 = 8.6), then multiply the result by the number in the first line for a class/Fund under the heading entitled "Expenses Paid During Period" to estimate the expenses you paid on your account during this period. If any fund is a shareholder of any underlying mutual funds or exchange-traded funds (ETFs) (the Underlying Funds), such fund indirectly bears its proportional share of the expenses of the Underlying Funds in addition to the direct expenses incurred presented in the table. These fees and expenses are not included in the annualized expense ratio used to calculate the expense estimate in the table below.
Hypothetical Example for Comparison Purposes
The second line of the accompanying table provides information about hypothetical account values and hypothetical expenses based on the actual expense ratio and an assumed rate of return of 5% per year before expenses, which is not the actual return. The hypothetical account values and expenses may not be used to estimate the actual ending account balance or expenses you paid for the period. You may use this information to compare the ongoing costs of investing in the Fund and other funds. To do so, compare this 5% hypothetical example with the 5% hypothetical examples that appear in the shareholder reports of the other funds. If any fund is a shareholder of any Underlying Funds, such fund indirectly bears its proportional share of the expenses of the Underlying Funds in addition to the direct expenses as presented in the table. These fees and expenses are not included in the annualized expense ratio used to calculate the expense estimate in the table below.
Please note that the expenses shown in the table are meant to highlight your ongoing costs only and do not reflect any transaction costs. Therefore, the second line of the table is useful in comparing ongoing costs only, and will not help you determine the relative total costs of owning different funds. In addition, if these transactional costs were included, your costs would have been higher.
| | Annualized Expense Ratio-A | Beginning
Account Value
November 1, 2021 | Ending
Account Value
April 30, 2022 | Expenses Paid
During Period-B
November 1, 2021
to April 30, 2022 |
| Fidelity U.S. Low Volatility Equity Fund | .69% | | | |
| Actual | | $1,000.00 | $952.50 | $3.34 |
| Hypothetical-C | | $1,000.00 | $1,021.37 | $3.46 |
A Annualized expense ratio reflects expenses net of applicable fee waivers.
B Expenses are equal to the annualized expense ratio, multiplied by the average account value over the period, multiplied by 181/ 365 (to reflect the one-half year period). The fees and expenses of any Underlying Funds are not included in each annualized expense ratio.
C 5% return per year before expenses
Distributions (Unaudited)
The dividend and capital gains distributions for the fund(s) are available on Fidelity.com or Institutional.Fidelity.com.
The fund hereby designates as a capital gain dividend with respect to the taxable year ended April 30th, 2022, $26,820,776, or, if subsequently determined to be different, the net capital gain of such year.
The fund designates 95.13%, and 100% of the short-term capital gain dividends distributed in June and December, respectively during the fiscal year as qualifying to be taxed as short-term capital gain dividends for nonresident alien shareholders.
The fund designates 99% and 59% of the dividends distributed in June and December, respectively during the fiscal year as qualifying for the dividends–received deduction for corporate shareholders.
The fund designates 100% and 71% of the dividends distributed in June and December, respectively during the fiscal year as amounts which may be taken into account as a dividend for the purposes of the maximum rate under section 1(h)(11) of the Internal Revenue Code.
The fund designates 1%, and 5% of the dividends distributed in June and December, respectively during the fiscal year as a section 199A dividend.
The fund will notify shareholders in January 2023 of amounts for use in preparing 2022 income tax returns.
Board Approval of Investment Advisory Contracts and Management Fees
Fidelity U.S. Low Volatility Equity Fund
At its January 2022 meeting, the Board of Trustees, including the Independent Trustees (together, the Board), approved an amended and restated management contract with Fidelity Management & Research Company LLC (FMR) for the fund to take effect February 1, 2022 (the Amended Contract) that lowered the management fee rate to be paid. The Board, assisted by the advice of fund counsel and Independent Trustees' counsel, considered a broad range of information.
Nature, Extent, and Quality of Services Provided. The Board noted that it previously received and
considered materials relating to the nature, extent and quality of services provided by FMR and the fund's sub-advisers to the fund, including the resources dedicated to investment management and support services, shareholder and administrative services, the benefits to shareholders of investment in a large fund family, and the investment performance of the fund in connection with the annual renewal of the fund's current management contract and sub-advisory agreements (Advisory Contracts). At its January 2022 meeting, the Board concluded that the nature, extent and quality of the services provided to the fund under the existing Advisory Contracts should benefit the fund's shareholders. The Board noted that approval of the Amended Contract would not change the fund's portfolio manager, the investment processes, the level or nature of services provided, the resources and personnel allocated or trading and compliance operations. The Board concluded that the nature, extent, and quality of services to be provided to the fund under the Amended Contract will continue to benefit the fund's shareholders.
Competitiveness of Management Fee and Total Expense Ratio. The Board considered that it received and reviewed information regarding the fund's current management fee and total expense ratio compared to "mapped groups" of competitive funds and classes in connection with the annual renewal of the Advisory Contracts. Based on its review, the Board concluded at its January 2022 meeting that the fund's current management fee and total expenses are fair and reasonable in light of the services that the fund receives and the other factors considered. In its review of the proposed management fee rate under the Amended Contract, the Board considered that the proposed management fee rate would be lower than the current management fee rate. The Board also considered that the proposed management fee rate would not result in any changes in the relationships of the fund's management fee rate and total expense ratio to the competitive medians of its total mapped groups of competitor funds provided to the Board in connection with the annual renewal of the existing Advisory Contracts.The Board also noted that, in conjunction with the approval of the lower management fee rate under the Amended Contract, the fund's existing expense cap would also be lowered by the same amount as the management fee reduction.
Based on its review, the Board concluded that the management fee and the total expenses continue to be fair and reasonable in light of the services that the fund receives and the other factors considered.
Costs of the Services and Profitability. The Board considered that it previously reviewed information regarding the revenues earned and the expenses incurred by FMR in providing services to the fund and the level of FMR's profitability. At its January 2022 meeting, the Board concluded that it was satisfied that FMR's profitability in connection with the operation of the fund was not excessive under the circumstances. Because the Board was approving an arrangement that would reduce the management fee rate, the Board did not consider the costs of the services provided by and the profits realized by FMR to be significant factors in its decision to approve the Amended Contract.
Economies of Scale. The Board considered that it previously received and reviewed information regarding whether there have been economies of scale in respect of the management of the Fidelity funds, whether the Fidelity funds (including the fund) have appropriately benefited from any such economies of scale, and whether there is potential for realization of any further economies of scale and that it concluded, at its January 2022 meeting, that economies of scale, if any, are being appropriately shared between fund shareholders and Fidelity. The Board did not consider economies of scale to be a significant factor in its decision to approve the Amended Contract because the proposed management fee rate is lower than the current management fee rate.
Based on its evaluation of all of the conclusions noted above, and after considering all factors it believed relevant, the Board ultimately concluded that the fund's advisory fee structures are fair and reasonable, and that the Amended Contract should be approved.
Liquidity Risk Management Program
The Securities and Exchange Commission adopted Rule 22e-4 under the Investment Company Act of 1940 (the Liquidity Rule) to promote effective liquidity risk management throughout the open-end investment company industry, thereby reducing the risk that funds will be unable to meet their redemption obligations and mitigating dilution of the interests of fund shareholders.
The Fund has adopted and implemented a liquidity risk management program pursuant to the Liquidity Rule (the Program) effective December 1, 2018. The Program is reasonably designed to assess and manage the Fund’s liquidity risk and to comply with the requirements of the Liquidity Rule. The Fund’s Board of Trustees (the Board) has designated the Fund’s investment adviser as administrator of the Program. The Fidelity advisers have established a Liquidity Risk Management Committee (the LRM Committee) to manage the Program for each of the Fidelity Funds. The LRM Committee monitors the adequacy and effectiveness of implementation of the Program and on a periodic basis assesses each Fund’s liquidity risk based on a variety of factors including (1) the Fund’s investment strategy, (2) portfolio liquidity and cash flow projections during normal and reasonably foreseeable stressed conditions, (3) shareholder redemptions, (4) borrowings and other funding sources and (5) in the case of exchange-traded funds, certain additional factors including the effect of the Fund’s prices and spreads, market participants, and basket compositions on the overall liquidity of the Fund’s portfolio, as applicable.
In accordance with the Program, each of the Fund’s portfolio investments is classified into one of four liquidity categories described below based on a determination of a reasonable expectation for how long it would take to convert the investment to cash (or sell or dispose of the investment) without significantly changing its market value.
- Highly liquid investments – cash or convertible to cash within three business days or less
- Moderately liquid investments – convertible to cash in three to seven calendar days
- Less liquid investments – can be sold or disposed of, but not settled, within seven calendar days
- Illiquid investments – cannot be sold or disposed of within seven calendar days
Liquidity classification determinations take into account a variety of factors including various market, trading and investment-specific considerations, as well as market depth, and generally utilize analysis from a third-party liquidity metrics service.
The Liquidity Rule places a 15% limit on a fund’s illiquid investments and requires funds that do not primarily hold assets that are highly liquid investments to determine and maintain a minimum percentage of the fund’s net assets to be invested in highly liquid investments (highly liquid investment minimum or HLIM). The Program includes provisions reasonably designed to comply with the 15% limit on illiquid investments and for determining, periodically reviewing and complying with the HLIM requirement as applicable.
At a recent meeting of the Fund’s Board of Trustees, the LRM Committee provided a written report to the Board pertaining to the operation, adequacy, and effectiveness of implementation of the Program for the annual period from December 1, 2020 through November 30, 2021. The report concluded that the Program has been implemented and is operating effectively and is reasonably designed to assess and manage the Fund’s liquidity risk.
USL-ANN-0622
1.9896228.102
Fidelity® SAI High Income Fund
Offered exclusively to certain clients of the Adviser, or its affiliates, including Strategic Advisers LLC (SAI) - not available for sale to the general public. Fidelity SAI is a product name of Fidelity® funds dedicated to certain programs affiliated with SAI.
Annual Report
April 30, 2022
Contents
To view a fund's proxy voting guidelines and proxy voting record for the 12-month period ended June 30, visit http://www.fidelity.com/proxyvotingresults or visit the Securities and Exchange Commission's (SEC) web site at http://www.sec.gov.
You may also call 1-800-544-3455 to request a free copy of the proxy voting guidelines.
Standard & Poor's, S&P and S&P 500 are registered service marks of The McGraw-Hill Companies, Inc. and have been licensed for use by Fidelity Distributors Corporation.
Other third-party marks appearing herein are the property of their respective owners.
All other marks appearing herein are registered or unregistered trademarks or service marks of FMR LLC or an affiliated company. © 2022 FMR LLC. All rights reserved.
This report and the financial statements contained herein are submitted for the general information of the shareholders of the Fund. This report is not authorized for distribution to prospective investors in the Fund unless preceded or accompanied by an effective prospectus.
A fund files its complete schedule of portfolio holdings with the SEC for the first and third quarters of each fiscal year on Form N-PORT. Forms N-PORT are available on the SEC’s web site at http://www.sec.gov. A fund's Forms N-PORT may be reviewed and copied at the SEC’s Public Reference Room in Washington, DC. Information regarding the operation of the SEC's Public Reference Room may be obtained by calling 1-800-SEC-0330.
For a complete list of a fund's portfolio holdings, view the most recent holdings listing, semiannual report, or annual report on Fidelity's web site at http://www.fidelity.com, http://www.institutional.fidelity.com, or http://www.401k.com, as applicable.
NOT FDIC INSURED •MAY LOSE VALUE •NO BANK GUARANTEE
Neither the Fund nor Fidelity Distributors Corporation is a bank.
Note to Shareholders:
Early in 2020, the outbreak and spread of COVID-19 emerged as a public health emergency that had a major influence on financial markets, primarily based on its impact on the global economy and corporate earnings. On March 11, 2020, the World Health Organization declared the COVID-19 outbreak a pandemic, citing sustained risk of further global spread. The pandemic prompted a number of measures to limit the spread of COVID-19, including travel and border restrictions, quarantines, and restrictions on large gatherings. In turn, these resulted in lower consumer activity, diminished demand for a wide range of products and services, disruption in manufacturing and supply chains, and – given the wide variability in outcomes regarding the outbreak – significant market uncertainty and volatility. To help stem the turmoil, the U.S. government took unprecedented action – in concert with the U.S. Federal Reserve and central banks around the world – to help support consumers, businesses, and the broader economy, and to limit disruption to the financial system.
In general, the overall impact of the pandemic lessened in 2021, amid a resilient economy and widespread distribution of three COVID-19 vaccines granted emergency use authorization from the U.S. Food and Drug Administration (FDA) early in the year. Still, the situation remains dynamic, and the extent and duration of its influence on financial markets and the economy is highly uncertain, due in part to a recent spike in cases based on highly contagious variants of the coronavirus.
Extreme events such as the COVID-19 crisis are exogenous shocks that can have significant adverse effects on mutual funds and their investments. Although multiple asset classes may be affected by market disruption, the duration and impact may not be the same for all types of assets. Fidelity is committed to helping you stay informed amid news about COVID-19 and during increased market volatility, and we continue to take extra steps to be responsive to customer needs. We encourage you to visit us online, where we offer ongoing updates, commentary, and analysis on the markets and our funds.
Performance: The Bottom Line
Average annual total return reflects the change in the value of an investment, assuming reinvestment of distributions from dividend income and capital gains (the profits earned upon the sale of securities that have grown in value, if any) and assuming a constant rate of performance each year. The hypothetical investment and the average annual total returns do not reflect the deduction of taxes that a shareholder would pay on fund distributions or the redemption of fund shares. During periods of reimbursement by Fidelity, a fund’s total return will be greater than it would be had the reimbursement not occurred. How a fund did yesterday is no guarantee of how it will do tomorrow.
Average annual total returns for Fidelity SAI High Income Fund will be reported once the fund is a year old.
$10,000 Over Life of Fund
Let's say hypothetically that $10,000 was invested in Fidelity® SAI High Income Fund on May 13, 2021, when the fund started.
The chart shows how the value of your investment would have changed, and also shows how the ICE® BofA® US High Yield Constrained Index performed over the same period.

| Period Ending Values |
| $9,490 | Fidelity® SAI High Income Fund |
| $9,513 | ICE® BofA® US High Yield Constrained Index |
Management's Discussion of Fund Performance
Market Recap: The ICE BofA
® US High Yield Constrained Index returned -4.96% for the 12 months ending April 30, 2022. After posting a solid gain in 2021, high-yield bonds retreated to begin the new year amid several major headwinds that stoked volatility, uncertainty and investor anxiety. Chief among these was the U.S. Federal Reserve’s accelerated plan to hike interest rates and aggressively wind down its balance sheet in an attempt to rein in historically high inflation. In addition, geopolitical unrest rose as Russia invaded Ukraine in late February and escalated its attack through period end. Other factors influencing high yield included surging commodity prices, rising bond yields, supply constraint and disruption, and the potential for variants of the coronavirus to upend the economy. Against this dynamic backdrop, the index returned -2.74% in January and -0.90% in February amid an intensifying flight from risk. Volatility eased in March and credit fundamentals remained healthy, but high yield still lost ground (-0.92%) for the month. April saw the downtrend continue, with the index returning -3.63% amid clearer signals of the Fed’s intension to tighten monetary policy and angst about the economic toll of “zero-COVID” lockdowns in China. For the full 12 months, higher-duration BB-rated bonds slightly trailed lower-quality credits. By sector, energy rode a surge in commodity prices and led the way with a modest gain. All other groups declined. Notable laggards included cable/satellite TV, telecommunications, health care, utilities and food/beverage/tobacco.
Comments from Co-Managers Benjamin Harrison, Alexandre Karam, and Michael Weaver: From its inception on May 13, 2021, through April 30, 2022, the fund returned -5.10%, lagging the -4.87% result of the benchmark ICE BofA
® US High Yield/US High Yield Constrained Blend Index. The fund's core allocation to high-yield bonds returned -5.61% and detracted from performance versus the benchmark. By industry, the primary contributors to performance versus the benchmark were security selection and an overweighting in energy. Security selection in the food & drug retail and services industries also bolstered the fund's relative result. Our top individual relative contributor was a non-benchmark stake in Mesquite Energy (+53%). Also lifting performance was our overweighting in Bi-Lo, which gained about 46%. Another key contributor was our non-benchmark position in Jonah Energy (+44%). Conversely, the biggest detractor from performance versus the benchmark was security selection in technology. Security selection in gaming and homebuilders/real estate also hurt the fund's relative result. The biggest individual relative detractor was an overweight position in Rackspace Hosting (-14%). Also holding back performance was our outsized stake in Altice Financial, which returned -10%. Overweighting CenturyLink Group (-12%), another large holding in the fund, also hurt performance. By quality, positioning and picks among bonds rated BB added the most value versus the benchmark, whereas security choices among CCC-rated bonds hurt the most.
The views expressed above reflect those of the portfolio manager(s) only through the end of the period as stated on the cover of this report and do not necessarily represent the views of Fidelity or any other person in the Fidelity organization. Any such views are subject to change at any time based upon market or other conditions and Fidelity disclaims any responsibility to update such views. These views may not be relied on as investment advice and, because investment decisions for a Fidelity fund are based on numerous factors, may not be relied on as an indication of trading intent on behalf of any Fidelity fund.
Note to shareholders: On January 3, 2022, Benjamin Harrison assumed co-management responsibilities for the fund.
Investment Summary (Unaudited)
Top Bond Issuers as of April 30, 2022
| (by issuer, excluding cash equivalents) | % of fund's net assets |
| Ishares Broad Usd High Yield C | 2.5 |
| Uniti Group LP / Uniti Group Finance, Inc. | 2.1 |
| New Fortress Energy, Inc. | 2.1 |
| Community Health Systems, Inc. | 1.6 |
| Bombardier, Inc. | 1.6 |
| Icahn Enterprises LP/Icahn Enterprises Finance Corp. | 1.6 |
| Tallgrass Energy Partners LP / Tallgrass Energy Finance Corp. | 1.5 |
| Crestwood Midstream Partners LP/Crestwood Midstream Finance Corp. | 1.4 |
| Carnival Corp. | 1.4 |
| Tenet Healthcare Corp. | 1.3 |
| | 17.1 |
Top Five Market Sectors as of April 30, 2022
| | % of fund's net assets |
| Energy | 16.5 |
| Telecommunications | 9.5 |
| Healthcare | 8.0 |
| Technology | 6.0 |
| Services | 5.2 |
Quality Diversification (% of fund's net assets)
| As of April 30, 2022 |
| | BBB | 0.8% |
| | BB | 25.9% |
| | B | 45.7% |
| | CCC,CC,C | 14.7% |
| | Not Rated | 2.0% |
| | Equities | 5.4% |
| | Short-Term Investments and Net Other Assets | 5.5% |
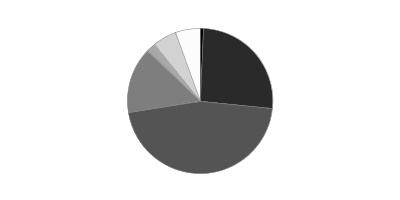
Asset Allocation (% of fund's net assets)
| As of April 30, 2022 * |
| | Nonconvertible Bonds | 83.8% |
| | Convertible Bonds, Preferred Stocks | 1.6% |
| | Common Stocks and Investment Companies | 5.2% |
| | Bank Loan Obligations | 3.7% |
| | Other | 0.2% |
| | Short-Term Investments and Net Other Assets (Liabilities) | 5.5% |

* Foreign investments - 19.2%
Geographic Diversification (% of fund's net assets)
| As of April 30, 2022 |
| | United States of America* | 80.8% |
| | Canada | 4.1% |
| | Luxembourg | 2.5% |
| | Netherlands | 1.9% |
| | Ireland | 1.8% |
| | United Kingdom | 1.8% |
| | Panama | 1.4% |
| | France | 1.1% |
| | Cayman Islands | 0.9% |
| | Other | 3.7% |

* Includes Short-Term investments and Net Other Assets (Liabilities).
Percentages are based on country or territory of incorporation and are adjusted for the effect of futures contracts, if applicable.
Schedule of Investments April 30, 2022
Showing Percentage of Net Assets
| Corporate Bonds - 85.4% | | | |
| | | Principal Amount | Value |
| Convertible Bonds - 1.6% | | | |
| Broadcasting - 0.7% | | | |
| DISH Network Corp.: | | | |
| 2.375% 3/15/24 | | $7,442,000 | $6,917,339 |
| 3.375% 8/15/26 | | 11,663,000 | 10,001,023 |
| | | | 16,918,362 |
| Energy - 0.9% | | | |
| Mesquite Energy, Inc. 15% 7/15/23 (a)(b) | | 1,610,553 | 8,310,453 |
| Mesquite Energy, Inc. 15% 7/15/23 (a)(b) | | 2,784,113 | 12,946,125 |
| | | | 21,256,578 |
|
| TOTAL CONVERTIBLE BONDS | | | 38,174,940 |
|
| Nonconvertible Bonds - 83.8% | | | |
| Aerospace - 4.2% | | | |
| Allegheny Technologies, Inc.: | | | |
| 4.875% 10/1/29 | | 4,780,000 | 4,349,370 |
| 5.875% 12/1/27 | | 11,783,000 | 11,370,595 |
| Bombardier, Inc.: | | | |
| 6% 2/15/28 (c) | | 6,625,000 | 5,730,625 |
| 7.125% 6/15/26 (c) | | 9,910,000 | 9,117,200 |
| 7.5% 3/15/25 (c) | | 10,262,000 | 9,954,140 |
| 7.875% 4/15/27 (c) | | 15,635,000 | 14,565,097 |
| BWX Technologies, Inc. 4.125% 6/30/28 (c) | | 8,790,000 | 8,152,725 |
| Kaiser Aluminum Corp.: | | | |
| 4.5% 6/1/31 (c) | | 3,870,000 | 3,337,875 |
| 4.625% 3/1/28 (c) | | 6,820,000 | 6,257,350 |
| Moog, Inc. 4.25% 12/15/27 (c) | | 3,530,000 | 3,287,313 |
| Science Applications International Corp. 4.875% 4/1/28 (c) | | 875,000 | 835,625 |
| TransDigm, Inc.: | | | |
| 4.625% 1/15/29 | | 4,390,000 | 3,820,090 |
| 5.5% 11/15/27 | | 21,520,000 | 19,690,800 |
| 7.5% 3/15/27 | | 2,425,000 | 2,443,188 |
| | | | 102,911,993 |
| Automotive & Auto Parts - 0.3% | | | |
| Ford Motor Credit Co. LLC: | | | |
| 2.9% 2/10/29 | | 5,810,000 | 4,836,825 |
| 3.815% 11/2/27 | | 3,500,000 | 3,185,000 |
| | | | 8,021,825 |
| Banks & Thrifts - 0.1% | | | |
| Jane Street Group LLC/JSG Finance, Inc. 4.5% 11/15/29 (c) | | 2,015,000 | 1,865,930 |
| Broadcasting - 1.5% | | | |
| Diamond Sports Group LLC/Diamond Sports Finance Co. 5.375% 8/15/26 (c) | | 20,590,000 | 7,618,300 |
| Sinclair Television Group, Inc.: | | | |
| 5.125% 2/15/27 (c) | | 6,080,000 | 5,326,262 |
| 5.5% 3/1/30 (c) | | 335,000 | 273,919 |
| Sirius XM Radio, Inc.: | | | |
| 4% 7/15/28 (c) | | 6,990,000 | 6,317,213 |
| 4.125% 7/1/30 (c) | | 1,555,000 | 1,365,430 |
| 5.5% 7/1/29 (c) | | 5,120,000 | 4,923,699 |
| TEGNA, Inc.: | | | |
| 4.625% 3/15/28 | | 3,285,000 | 3,160,827 |
| 5% 9/15/29 | | 1,395,000 | 1,353,150 |
| Univision Communications, Inc.: | | | |
| 4.5% 5/1/29 (c) | | 3,735,000 | 3,352,163 |
| 6.625% 6/1/27 (c) | | 4,685,000 | 4,696,713 |
| | | | 38,387,676 |
| Building Materials - 0.6% | | | |
| Advanced Drain Systems, Inc. 5% 9/30/27 (c) | | 6,730,000 | 6,502,863 |
| Builders FirstSource, Inc. 4.25% 2/1/32 (c) | | 3,750,000 | 3,201,563 |
| SRS Distribution, Inc.: | | | |
| 4.625% 7/1/28 (c) | | 2,715,000 | 2,485,610 |
| 6% 12/1/29 (c) | | 2,595,000 | 2,277,113 |
| | | | 14,467,149 |
| Cable/Satellite TV - 3.2% | | | |
| CCO Holdings LLC/CCO Holdings Capital Corp.: | | | |
| 4.25% 2/1/31 (c) | | 6,760,000 | 5,697,328 |
| 4.5% 8/15/30 (c) | | 5,705,000 | 4,977,613 |
| 4.5% 5/1/32 | | 6,844,000 | 5,756,865 |
| 4.5% 6/1/33 (c) | | 6,515,000 | 5,330,052 |
| 4.75% 3/1/30 (c) | | 4,700,000 | 4,200,625 |
| CSC Holdings LLC: | | | |
| 4.125% 12/1/30 (c) | | 3,395,000 | 2,800,875 |
| 4.625% 12/1/30 (c) | | 10,030,000 | 7,672,950 |
| 5.375% 2/1/28 (c) | | 6,840,000 | 6,280,043 |
| 5.75% 1/15/30 (c) | | 2,120,000 | 1,759,600 |
| 7.5% 4/1/28 (c) | | 2,580,000 | 2,378,373 |
| Dolya Holdco 18 DAC 5% 7/15/28 (c) | | 3,585,000 | 3,256,829 |
| Radiate Holdco LLC/Radiate Financial Service Ltd.: | | | |
| 4.5% 9/15/26 (c) | | 6,520,000 | 6,004,203 |
| 6.5% 9/15/28 (c) | | 9,930,000 | 8,738,400 |
| Telenet Finance Luxembourg Notes SARL 5.5% 3/1/28 (c) | | 6,000,000 | 5,730,000 |
| Ziggo Bond Co. BV 5.125% 2/28/30 (c) | | 3,720,000 | 3,227,100 |
| Ziggo BV 4.875% 1/15/30 (c) | | 5,980,000 | 5,299,775 |
| | | | 79,110,631 |
| Capital Goods - 0.5% | | | |
| Mueller Water Products, Inc. 4% 6/15/29 (c) | | 3,785,000 | 3,387,575 |
| Vertical Holdco GmbH 7.625% 7/15/28 (c) | | 1,870,000 | 1,799,875 |
| Vertical U.S. Newco, Inc. 5.25% 7/15/27 (c) | | 8,595,000 | 8,051,968 |
| | | | 13,239,418 |
| Chemicals - 3.7% | | | |
| Axalta Coating Systems LLC 3.375% 2/15/29 (c) | | 2,325,000 | 2,011,660 |
| Axalta Coating Systems/Dutch Holding BV 4.75% 6/15/27 (c) | | 1,900,000 | 1,805,000 |
| CVR Partners LP 6.125% 6/15/28 (c) | | 4,955,000 | 4,855,900 |
| Element Solutions, Inc. 3.875% 9/1/28 (c) | | 5,615,000 | 5,018,406 |
| Kronos Acquisition Holdings, Inc. / KIK Custom Products, Inc.: | | | |
| 5% 12/31/26 (c) | | 7,050,000 | 6,239,250 |
| 7% 12/31/27 (c) | | 1,040,000 | 821,600 |
| LSB Industries, Inc. 6.25% 10/15/28 (c) | | 7,090,000 | 6,947,775 |
| Methanex Corp.: | | | |
| 5.125% 10/15/27 | | 5,455,000 | 5,236,800 |
| 5.65% 12/1/44 | | 4,010,000 | 3,508,750 |
| NOVA Chemicals Corp.: | | | |
| 4.25% 5/15/29 (c) | | 3,365,000 | 2,910,725 |
| 5% 5/1/25 (c) | | 1,250,000 | 1,237,500 |
| 5.25% 6/1/27 (c) | | 6,930,000 | 6,566,175 |
| Nufarm Australia Ltd. 5% 1/27/30 (c) | | 5,245,000 | 4,956,525 |
| Olympus Water U.S. Holding Corp.: | | | |
| 4.25% 10/1/28 (c) | | 4,620,000 | 4,082,509 |
| 6.25% 10/1/29 (c) | | 4,505,000 | 3,739,150 |
| SCIL IV LLC / SCIL U.S.A. Holdings LLC 5.375% 11/1/26 (c) | | 3,235,000 | 2,951,938 |
| The Chemours Co. LLC: | | | |
| 4.625% 11/15/29 (c) | | 6,160,000 | 5,336,100 |
| 5.375% 5/15/27 | | 1,415,000 | 1,365,475 |
| 5.75% 11/15/28 (c) | | 14,725,000 | 13,804,688 |
| Valvoline, Inc. 4.25% 2/15/30 (c) | | 3,515,000 | 3,049,263 |
| W.R. Grace Holding LLC 5.625% 8/15/29 (c) | | 6,430,000 | 5,477,717 |
| | | | 91,922,906 |
| Consumer Products - 0.6% | | | |
| Central Garden & Pet Co. 4.125% 10/15/30 | | 175,000 | 151,275 |
| Diamond BC BV 4.625% 10/1/29 (c) | | 6,280,000 | 5,402,244 |
| Michaels Companies, Inc.: | | | |
| 5.25% 5/1/28 (c) | | 3,010,000 | 2,586,854 |
| 7.875% 5/1/29 (c) | | 2,315,000 | 1,823,063 |
| Nordstrom, Inc.: | | | |
| 4.25% 8/1/31 | | 3,440,000 | 2,915,697 |
| 4.375% 4/1/30 | | 2,295,000 | 1,997,270 |
| | | | 14,876,403 |
| Containers - 0.8% | | | |
| Graphic Packaging International, Inc. 3.75% 2/1/30 (c) | | 1,825,000 | 1,600,032 |
| OI European Group BV 4.75% 2/15/30 (c) | | 1,580,000 | 1,390,400 |
| Sealed Air Corp. 5% 4/15/29 (c) | | 3,940,000 | 3,910,450 |
| Trivium Packaging Finance BV: | | | |
| 5.5% 8/15/26 (c) | | 5,900,000 | 5,700,875 |
| 8.5% 8/15/27 (c) | | 6,345,000 | 6,265,688 |
| | | | 18,867,445 |
| Diversified Financial Services - 3.1% | | | |
| Coinbase Global, Inc. 3.375% 10/1/28 (c) | | 7,405,000 | 5,749,464 |
| Hightower Holding LLC 6.75% 4/15/29 (c) | | 4,525,000 | 4,168,883 |
| Icahn Enterprises LP/Icahn Enterprises Finance Corp.: | | | |
| 4.375% 2/1/29 | | 5,640,000 | 4,865,797 |
| 5.25% 5/15/27 | | 29,865,000 | 27,774,450 |
| 6.25% 5/15/26 | | 6,530,000 | 6,473,973 |
| Ladder Capital Finance Holdings LLLP/Ladder Capital Finance Corp.: | | | |
| 4.25% 2/1/27 (c) | | 1,160,000 | 1,066,272 |
| 4.75% 6/15/29 (c) | | 5,290,000 | 4,745,553 |
| OneMain Finance Corp.: | | | |
| 3.5% 1/15/27 | | 5,870,000 | 5,156,912 |
| 3.875% 9/15/28 | | 8,468,000 | 7,197,800 |
| 7.125% 3/15/26 | | 8,425,000 | 8,530,313 |
| | | | 75,729,417 |
| Diversified Media - 0.8% | | | |
| Advantage Sales & Marketing, Inc. 6.5% 11/15/28 (c) | | 10,015,000 | 9,101,131 |
| Nielsen Finance LLC/Nielsen Finance Co.: | | | |
| 4.5% 7/15/29 (c) | | 2,095,000 | 1,979,880 |
| 5.625% 10/1/28 (c) | | 4,408,000 | 4,271,484 |
| 5.875% 10/1/30 (c) | | 330,000 | 316,483 |
| Terrier Media Buyer, Inc. 8.875% 12/15/27 (c) | | 5,475,000 | 5,351,210 |
| | | | 21,020,188 |
| Energy - 13.9% | | | |
| Apache Corp. 4.25% 1/15/30 | | 1,575,000 | 1,463,270 |
| Atlantica Sustainable Infrastructure PLC 4.125% 6/15/28 (c) | | 5,700,000 | 5,187,000 |
| Cheniere Energy, Inc. 4.625% 10/15/28 | | 5,635,000 | 5,451,863 |
| Citgo Petroleum Corp.: | | | |
| 6.375% 6/15/26 (c) | | 9,630,000 | 9,570,294 |
| 7% 6/15/25 (c) | | 10,535,000 | 10,462,625 |
| Colgate Energy Partners III LLC 5.875% 7/1/29 (c) | | 5,775,000 | 5,717,250 |
| Comstock Resources, Inc.: | | | |
| 5.875% 1/15/30 (c) | | 5,625,000 | 5,412,994 |
| 6.75% 3/1/29 (c) | | 5,765,000 | 5,829,453 |
| 7.5% 5/15/25 (c) | | 1,530,000 | 1,561,365 |
| Crestwood Midstream Partners LP/Crestwood Midstream Finance Corp.: | | | |
| 5.625% 5/1/27 (c) | | 16,735,000 | 16,295,706 |
| 5.75% 4/1/25 | | 6,230,000 | 6,155,676 |
| 6% 2/1/29 (c) | | 12,745,000 | 12,396,552 |
| CrownRock LP/CrownRock Finance, Inc.: | | | |
| 5% 5/1/29 (c) | | 2,495,000 | 2,441,633 |
| 5.625% 10/15/25 (c) | | 395,000 | 395,000 |
| CVR Energy, Inc.: | | | |
| 5.25% 2/15/25 (c) | | 7,615,000 | 7,366,751 |
| 5.75% 2/15/28 (c) | | 9,980,000 | 9,354,054 |
| Delek Logistics Partners LP 7.125% 6/1/28 (c) | | 6,695,000 | 6,399,483 |
| DT Midstream, Inc. 4.125% 6/15/29 (c) | | 3,490,000 | 3,175,900 |
| Endeavor Energy Resources LP/EER Finance, Inc. 5.75% 1/30/28 (c) | | 95,000 | 95,245 |
| EnLink Midstream LLC 5.625% 1/15/28 (c) | | 1,365,000 | 1,352,578 |
| EQM Midstream Partners LP 6.5% 7/1/27 (c) | | 3,000,000 | 3,030,000 |
| Global Partners LP/GLP Finance Corp. 6.875% 1/15/29 | | 3,605,000 | 3,515,100 |
| Harvest Midstream I LP 7.5% 9/1/28 (c) | | 6,200,000 | 6,290,892 |
| Hess Midstream Partners LP: | | | |
| 4.25% 2/15/30 (c) | | 1,330,000 | 1,219,996 |
| 5.125% 6/15/28 (c) | | 3,150,000 | 3,047,625 |
| Hilcorp Energy I LP/Hilcorp Finance Co.: | | | |
| 5.75% 2/1/29 (c) | | 1,575,000 | 1,543,500 |
| 6.25% 11/1/28 (c) | | 1,575,000 | 1,568,149 |
| Holly Energy Partners LP/Holly Energy Finance Corp.: | | | |
| 5% 2/1/28 (c) | | 5,170,000 | 4,918,790 |
| 6.375% 4/15/27 (c) | | 2,290,000 | 2,335,800 |
| MEG Energy Corp.: | | | |
| 5.875% 2/1/29 (c) | | 1,730,000 | 1,693,445 |
| 7.125% 2/1/27 (c) | | 2,115,000 | 2,147,783 |
| New Fortress Energy, Inc.: | | | |
| 6.5% 9/30/26 (c) | | 27,595,000 | 26,706,993 |
| 6.75% 9/15/25 (c) | | 21,725,000 | 21,358,717 |
| NGL Energy Operating LLC/NGL Energy Finance Corp. 7.5% 2/1/26 (c) | | 12,845,000 | 12,101,082 |
| NGL Energy Partners LP/NGL Energy Finance Corp. 7.5% 11/1/23 | | 4,635,000 | 4,298,963 |
| Occidental Petroleum Corp.: | | | |
| 6.125% 1/1/31 | | 6,450,000 | 6,779,337 |
| 6.45% 9/15/36 | | 2,805,000 | 3,043,425 |
| 6.625% 9/1/30 | | 4,400,000 | 4,768,500 |
| 7.5% 5/1/31 | | 8,755,000 | 9,980,700 |
| 7.875% 9/15/31 | | 945,000 | 1,104,875 |
| 8.875% 7/15/30 | | 3,970,000 | 4,768,327 |
| PBF Holding Co. LLC/PBF Finance Corp. 9.25% 5/15/25 (c) | | 17,900,000 | 18,526,500 |
| Rockies Express Pipeline LLC: | | | |
| 4.8% 5/15/30 (c) | | 2,185,000 | 2,001,340 |
| 4.95% 7/15/29 (c) | | 3,620,000 | 3,388,429 |
| 6.875% 4/15/40 (c) | | 1,330,000 | 1,263,500 |
| SM Energy Co.: | | | |
| 5.625% 6/1/25 | | 4,245,000 | 4,149,488 |
| 6.5% 7/15/28 | | 4,095,000 | 4,037,056 |
| 6.75% 9/15/26 | | 1,235,000 | 1,228,776 |
| Southwestern Energy Co. 4.75% 2/1/32 | | 3,505,000 | 3,314,433 |
| Sunoco LP/Sunoco Finance Corp.: | | | |
| 4.5% 5/15/29 | | 2,835,000 | 2,549,317 |
| 5.875% 3/15/28 | | 2,780,000 | 2,738,300 |
| Superior Plus LP / Superior General Partner, Inc. 4.5% 3/15/29 (c) | | 2,010,000 | 1,836,638 |
| Tallgrass Energy Partners LP / Tallgrass Energy Finance Corp.: | | | |
| 5.5% 1/15/28 (c) | | 6,980,000 | 6,506,477 |
| 6% 3/1/27 (c) | | 17,974,000 | 17,255,040 |
| 6% 12/31/30 (c) | | 7,565,000 | 6,997,625 |
| 6% 9/1/31 (c) | | 5,465,000 | 4,986,813 |
| 7.5% 10/1/25 (c) | | 905,000 | 923,571 |
| Transocean Guardian Ltd. 5.875% 1/15/24 (c) | | 2,874,323 | 2,751,187 |
| Transocean Phoenix 2 Ltd. 7.75% 10/15/24 (c) | | 530,999 | 534,982 |
| Transocean Pontus Ltd. 6.125% 8/1/25 (c) | | 1,457,550 | 1,431,970 |
| Transocean Poseidon Ltd. 6.875% 2/1/27 (c) | | 2,221,875 | 2,137,933 |
| Transocean Proteus Ltd. 6.25% 12/1/24 (c) | | 655,000 | 643,538 |
| Transocean Sentry Ltd. 5.375% 5/15/23 (c) | | 3,411,785 | 3,309,432 |
| Venture Global Calcasieu Pass LLC: | | | |
| 3.875% 8/15/29 (c) | | 5,495,000 | 5,014,188 |
| 4.125% 8/15/31 (c) | | 5,440,000 | 4,936,800 |
| | | | 344,770,024 |
| Environmental - 0.8% | | | |
| Madison IAQ LLC: | | | |
| 4.125% 6/30/28 (c) | | 6,950,000 | 6,098,625 |
| 5.875% 6/30/29 (c) | | 12,150,000 | 9,902,250 |
| Stericycle, Inc.: | | | |
| 3.875% 1/15/29 (c) | | 4,405,000 | 3,884,549 |
| 5.375% 7/15/24 (c) | | 990,000 | 986,594 |
| | | | 20,872,018 |
| Food & Drug Retail - 0.9% | | | |
| Albertsons Companies LLC/Safeway, Inc./New Albertson's, Inc./Albertson's LLC: | | | |
| 3.5% 3/15/29 (c) | | 13,250,000 | 11,161,800 |
| 4.875% 2/15/30 (c) | | 5,310,000 | 4,805,842 |
| Emergent BioSolutions, Inc. 3.875% 8/15/28 (c) | | 5,975,000 | 5,071,281 |
| Murphy Oil U.S.A., Inc. 3.75% 2/15/31 (c) | | 1,170,000 | 1,027,693 |
| | | | 22,066,616 |
| Food/Beverage/Tobacco - 2.2% | | | |
| C&S Group Enterprises LLC 5% 12/15/28 (c) | | 9,850,000 | 8,384,813 |
| JBS U.S.A. Lux SA / JBS Food Co.: | | | |
| 5.5% 1/15/30 (c) | | 3,255,000 | 3,214,313 |
| 6.5% 4/15/29 (c) | | 2,260,000 | 2,339,100 |
| Lamb Weston Holdings, Inc. 4.125% 1/31/30 (c) | | 6,895,000 | 6,152,960 |
| Performance Food Group, Inc. 5.5% 10/15/27 (c) | | 4,540,000 | 4,405,730 |
| Post Holdings, Inc.: | | | |
| 4.625% 4/15/30 (c) | | 3,035,000 | 2,594,925 |
| 5.5% 12/15/29 (c) | | 4,555,000 | 4,145,050 |
| Primo Water Holdings, Inc. 4.375% 4/30/29 (c) | | 6,145,000 | 5,348,700 |
| TreeHouse Foods, Inc. 4% 9/1/28 | | 3,405,000 | 2,774,462 |
| Triton Water Holdings, Inc. 6.25% 4/1/29 (c) | | 12,745,000 | 10,549,546 |
| U.S. Foods, Inc.: | | | |
| 4.625% 6/1/30 (c) | | 1,725,000 | 1,543,875 |
| 4.75% 2/15/29 (c) | | 3,695,000 | 3,413,072 |
| | | | 54,866,546 |
| Gaming - 2.6% | | | |
| Affinity Gaming LLC 6.875% 12/15/27 (c) | | 6,430,000 | 6,022,595 |
| Caesars Entertainment, Inc.: | | | |
| 4.625% 10/15/29 (c) | | 4,920,000 | 4,218,900 |
| 8.125% 7/1/27 (c) | | 14,480,000 | 15,131,600 |
| Fertitta Entertainment LLC / Fertitta Entertainment Finance Co., Inc. 6.75% 1/15/30 (c) | | 6,725,000 | 5,817,932 |
| Golden Entertainment, Inc. 7.625% 4/15/26 (c) | | 6,865,000 | 7,019,463 |
| Jacobs Entertainment, Inc. 6.75% 2/15/29 (c) | | 2,000,000 | 1,959,400 |
| Melco Resorts Finance Ltd.: | | | |
| 5.375% 12/4/29 (c) | | 2,645,000 | 2,116,555 |
| 5.75% 7/21/28 (c) | | 4,030,000 | 3,346,915 |
| MGM Resorts International: | | | |
| 4.75% 10/15/28 | | 175,000 | 160,746 |
| 5.5% 4/15/27 | | 175,000 | 169,157 |
| Premier Entertainment Sub LLC: | | | |
| 5.625% 9/1/29 (c) | | 5,710,000 | 4,568,000 |
| 5.875% 9/1/31 (c) | | 2,720,000 | 2,142,000 |
| Station Casinos LLC 4.5% 2/15/28 (c) | | 390,000 | 353,993 |
| Wynn Las Vegas LLC/Wynn Las Vegas Capital Corp. 5.25% 5/15/27 (c) | | 4,020,000 | 3,697,073 |
| Wynn Macau Ltd.: | | | |
| 4.875% 10/1/24 (c) | | 3,890,000 | 3,476,688 |
| 5.5% 10/1/27 (c) | | 3,425,000 | 2,791,375 |
| 5.625% 8/26/28 (c) | | 2,425,000 | 1,949,094 |
| | | | 64,941,486 |
| Healthcare - 7.9% | | | |
| 180 Medical, Inc. 3.875% 10/15/29 (c) | | 5,380,000 | 4,788,200 |
| AMN Healthcare 4% 4/15/29 (c) | | 6,270,000 | 5,674,350 |
| Avantor Funding, Inc.: | | | |
| 3.875% 11/1/29 (c) | | 6,810,000 | 6,110,136 |
| 4.625% 7/15/28 (c) | | 775,000 | 737,250 |
| Bausch Health Companies, Inc.: | | | |
| 5% 1/30/28 (c) | | 6,840,000 | 5,045,663 |
| 7% 1/15/28 (c) | | 6,510,000 | 5,370,750 |
| Cano Health, Inc. 6.25% 10/1/28 (c) | | 5,760,000 | 5,313,600 |
| Catalent Pharma Solutions 3.5% 4/1/30 (c) | | 6,945,000 | 6,040,830 |
| Charles River Laboratories International, Inc.: | | | |
| 3.75% 3/15/29 (c) | | 2,300,000 | 2,081,500 |
| 4.25% 5/1/28 (c) | | 635,000 | 606,127 |
| Community Health Systems, Inc.: | | | |
| 4.75% 2/15/31 (c) | | 5,180,000 | 4,390,050 |
| 5.25% 5/15/30 (c) | | 6,585,000 | 5,772,740 |
| 5.625% 3/15/27 (c) | | 10,440,000 | 9,951,852 |
| 6% 1/15/29 (c) | | 5,620,000 | 5,311,968 |
| 6.125% 4/1/30 (c) | | 5,790,000 | 4,762,275 |
| 6.875% 4/15/29 (c) | | 5,670,000 | 4,972,703 |
| 8% 3/15/26 (c) | | 5,185,000 | 5,360,253 |
| CTR Partnership LP/CareTrust Capital Corp. 3.875% 6/30/28 (c) | | 3,610,000 | 3,267,050 |
| DaVita HealthCare Partners, Inc. 4.625% 6/1/30 (c) | | 6,520,000 | 5,672,400 |
| Embecta Corp. 5% 2/15/30 (c) | | 2,280,000 | 2,057,700 |
| Grifols Escrow Issuer SA 4.75% 10/15/28 (c) | | 6,530,000 | 5,958,625 |
| HealthEquity, Inc. 4.5% 10/1/29 (c) | | 2,200,000 | 2,010,250 |
| Hologic, Inc.: | | | |
| 3.25% 2/15/29 (c) | | 3,095,000 | 2,757,227 |
| 4.625% 2/1/28 (c) | | 125,000 | 122,265 |
| Jazz Securities DAC 4.375% 1/15/29 (c) | | 9,310,000 | 8,576,838 |
| MEDNAX, Inc. 5.375% 2/15/30 (c) | | 3,755,000 | 3,498,721 |
| Minerva Merger Sub, Inc. 6.5% 2/15/30 (c) | | 9,645,000 | 8,877,644 |
| ModivCare Escrow Issuer, Inc. 5% 10/1/29 (c) | | 1,910,000 | 1,671,250 |
| Molina Healthcare, Inc. 3.875% 11/15/30 (c) | | 2,385,000 | 2,151,246 |
| Option Care Health, Inc. 4.375% 10/31/29 (c) | | 5,750,000 | 5,169,078 |
| Organon & Co. / Organon Foreign Debt Co-Issuer BV: | | | |
| 4.125% 4/30/28 (c) | | 10,940,000 | 10,177,482 |
| 5.125% 4/30/31 (c) | | 795,000 | 718,481 |
| Owens & Minor, Inc. 4.5% 3/31/29 (c) | | 215,000 | 193,408 |
| Radiology Partners, Inc. 9.25% 2/1/28 (c) | | 5,510,000 | 5,234,500 |
| RP Escrow Issuer LLC 5.25% 12/15/25 (c) | | 6,140,000 | 5,710,200 |
| Teleflex, Inc. 4.25% 6/1/28 (c) | | 1,275,000 | 1,201,688 |
| Tenet Healthcare Corp.: | | | |
| 4.25% 6/1/29 (c) | | 6,525,000 | 5,895,272 |
| 4.375% 1/15/30 (c) | | 3,835,000 | 3,489,351 |
| 4.625% 6/15/28 (c) | | 13,120,000 | 12,365,600 |
| 6.125% 10/1/28 (c) | | 10,070,000 | 9,666,697 |
| 6.25% 2/1/27 (c) | | 2,405,000 | 2,386,963 |
| Valeant Pharmaceuticals International, Inc. 8.5% 1/31/27 (c) | | 4,940,000 | 4,674,574 |
| Vizient, Inc. 6.25% 5/15/27 (c) | | 665,000 | 686,613 |
| | | | 196,481,370 |
| Homebuilders/Real Estate - 3.7% | | | |
| Ashton Woods U.S.A. LLC/Ashton Woods Finance Co. 4.625% 8/1/29 (c) | | 2,060,000 | 1,733,377 |
| Howard Hughes Corp.: | | | |
| 4.125% 2/1/29 (c) | | 2,570,000 | 2,313,986 |
| 4.375% 2/1/31 (c) | | 2,570,000 | 2,285,809 |
| Kennedy-Wilson, Inc. 4.75% 2/1/30 | | 6,055,000 | 5,464,638 |
| MPT Operating Partnership LP/MPT Finance Corp. 5% 10/15/27 | | 9,640,000 | 9,249,676 |
| Railworks Holdings LP 8.25% 11/15/28 (c) | | 6,020,000 | 5,974,850 |
| Realogy Group LLC/Realogy Co-Issuer Corp. 5.75% 1/15/29 (c) | | 7,635,000 | 6,384,769 |
| TopBuild Corp. 4.125% 2/15/32 (c) | | 5,805,000 | 5,001,336 |
| Uniti Group LP / Uniti Group Finance, Inc.: | | | |
| 4.75% 4/15/28 (c) | | 15,260,000 | 13,619,550 |
| 6.5% 2/15/29 (c) | | 45,165,000 | 38,973,330 |
| | | | 91,001,321 |
| Hotels - 0.5% | | | |
| Hilton Domestic Operating Co., Inc.: | | | |
| 3.625% 2/15/32 (c) | | 5,720,000 | 4,844,096 |
| 3.75% 5/1/29 (c) | | 1,010,000 | 915,080 |
| 4% 5/1/31 (c) | | 3,390,000 | 3,031,847 |
| Wyndham Hotels & Resorts, Inc. 4.375% 8/15/28 (c) | | 2,965,000 | 2,763,499 |
| | | | 11,554,522 |
| Insurance - 1.1% | | | |
| Alliant Holdings Intermediate LLC: | | | |
| 4.25% 10/15/27 (c) | | 6,690,000 | 6,178,550 |
| 6.75% 10/15/27 (c) | | 14,510,000 | 13,721,091 |
| AmWINS Group, Inc. 4.875% 6/30/29 (c) | | 6,035,000 | 5,524,017 |
| AssuredPartners, Inc. 5.625% 1/15/29 (c) | | 2,915,000 | 2,563,626 |
| | | | 27,987,284 |
| Leisure - 2.9% | | | |
| Carnival Corp.: | | | |
| 4% 8/1/28 (c) | | 6,005,000 | 5,412,006 |
| 5.75% 3/1/27 (c) | | 10,035,000 | 9,086,843 |
| 6% 5/1/29 (c) | | 7,340,000 | 6,587,650 |
| 6.65% 1/15/28 | | 720,000 | 666,000 |
| 7.625% 3/1/26 (c) | | 12,780,000 | 12,524,400 |
| MajorDrive Holdings IV LLC 6.375% 6/1/29 (c) | | 295,000 | 233,788 |
| NCL Corp. Ltd.: | | | |
| 3.625% 12/15/24 (c) | | 6,645,000 | 6,179,850 |
| 5.875% 3/15/26 (c) | | 1,585,000 | 1,464,239 |
| 7.75% 2/15/29 (c) | | 4,040,000 | 3,918,800 |
| NCL Finance Ltd. 6.125% 3/15/28 (c) | | 1,390,000 | 1,251,000 |
| Royal Caribbean Cruises Ltd.: | | | |
| 4.25% 7/1/26 (c) | | 5,935,000 | 5,363,756 |
| 5.375% 7/15/27 (c) | | 2,775,000 | 2,550,072 |
| 5.5% 8/31/26 (c) | | 6,970,000 | 6,494,611 |
| 5.5% 4/1/28 (c) | | 7,685,000 | 7,012,563 |
| Viking Ocean Cruises Ship VII Ltd. 5.625% 2/15/29 (c) | | 1,545,000 | 1,363,463 |
| Voc Escrow Ltd. 5% 2/15/28 (c) | | 3,205,000 | 2,892,513 |
| | | | 73,001,554 |
| Metals/Mining - 0.9% | | | |
| Eldorado Gold Corp. 6.25% 9/1/29 (c) | | 125,000 | 120,000 |
| ERO Copper Corp. 6.5% 2/15/30 (c) | | 9,020,000 | 8,093,736 |
| First Quantum Minerals Ltd. 6.875% 10/15/27 (c) | | 5,885,000 | 5,860,357 |
| HudBay Minerals, Inc. 4.5% 4/1/26 (c) | | 1,485,000 | 1,372,964 |
| Mineral Resources Ltd. 8.5% 5/1/30 (c) | | 2,310,000 | 2,281,125 |
| PMHC II, Inc. 9% 2/15/30 (c) | | 4,255,000 | 3,425,275 |
| | | | 21,153,457 |
| Paper - 0.7% | | | |
| Ardagh Metal Packaging Finance U.S.A. LLC/Ardagh Metal Packaging Finance PLC 4% 9/1/29 (c) | | 2,040,000 | 1,748,341 |
| Clydesdale Acquisition Holdings, Inc. 6.625% 4/15/29 (c) | | 1,405,000 | 1,401,488 |
| Glatfelter Corp. 4.75% 11/15/29 (c) | | 2,885,000 | 2,308,000 |
| Intertape Polymer Group, Inc. 4.375% 6/15/29 (c) | | 5,980,000 | 6,152,702 |
| SPA Holdings 3 OY 4.875% 2/4/28 (c) | | 7,020,000 | 6,192,334 |
| | | | 17,802,865 |
| Publishing/Printing - 0.1% | | | |
| News Corp. 5.125% 2/15/32 (c) | | 3,130,000 | 2,989,150 |
| Railroad - 0.3% | | | |
| First Student Bidco, Inc./First Transit Parent, Inc. 4% 7/31/29 (c) | | 8,360,000 | 7,482,200 |
| Restaurants - 0.4% | | | |
| 1011778 BC Unlimited Liability Co./New Red Finance, Inc. 4% 10/15/30 (c) | | 4,170,000 | 3,564,725 |
| Yum! Brands, Inc. 4.625% 1/31/32 | | 6,005,000 | 5,457,044 |
| | | | 9,021,769 |
| Services - 4.9% | | | |
| ADT Corp. 4.125% 8/1/29 (c) | | 865,000 | 734,411 |
| Adtalem Global Education, Inc. 5.5% 3/1/28 (c) | | 8,649,000 | 7,940,863 |
| Allied Universal Holdco LLC / Allied Universal Finance Corp. 6% 6/1/29 (c) | | 4,135,000 | 3,421,713 |
| APX Group, Inc. 6.75% 2/15/27 (c) | | 2,660,000 | 2,636,725 |
| Aramark Services, Inc. 5% 2/1/28 (c) | | 760,000 | 708,738 |
| ASGN, Inc. 4.625% 5/15/28 (c) | | 3,260,000 | 3,028,540 |
| Atlas Luxco 4 SARL / Allied Universal Holdco LLC / Allied Universal Finance Corp. 4.625% 6/1/28 (c) | | 4,860,000 | 4,264,650 |
| Booz Allen Hamilton, Inc. 3.875% 9/1/28 (c) | | 6,105,000 | 5,623,682 |
| Brand Energy & Infrastructure Services, Inc. 8.5% 7/15/25 (c) | | 12,680,000 | 11,316,900 |
| CoreCivic, Inc.: | | | |
| 4.75% 10/15/27 | | 5,490,000 | 4,884,813 |
| 8.25% 4/15/26 | | 19,598,000 | 20,131,458 |
| Fair Isaac Corp. 4% 6/15/28 (c) | | 4,295,000 | 3,923,998 |
| Gartner, Inc.: | | | |
| 3.625% 6/15/29 (c) | | 2,145,000 | 1,919,775 |
| 3.75% 10/1/30 (c) | | 2,845,000 | 2,537,171 |
| GEMS MENASA Cayman Ltd. 7.125% 7/31/26 (c) | | 9,310,000 | 9,284,863 |
| Legends Hospitality Holding Co. LLC/Legends Hospitality Co-Issuer, Inc. 5% 2/1/26 (c) | | 6,135,000 | 5,757,391 |
| PowerTeam Services LLC 9.033% 12/4/25 (c) | | 1,215,000 | 1,149,931 |
| Prime Securities Services Borrower LLC/Prime Finance, Inc.: | | | |
| 3.375% 8/31/27 (c) | | 175,000 | 149,361 |
| 5.75% 4/15/26 (c) | | 175,000 | 167,781 |
| Service Corp. International: | | | |
| 4% 5/15/31 | | 4,375,000 | 3,937,500 |
| 5.125% 6/1/29 | | 4,160,000 | 4,103,540 |
| Sotheby's 7.375% 10/15/27 (c) | | 8,105,000 | 7,991,935 |
| The GEO Group, Inc. 6% 4/15/26 | | 3,300,000 | 2,663,100 |
| TriNet Group, Inc. 3.5% 3/1/29 (c) | | 6,635,000 | 6,012,969 |
| WASH Multifamily Acquisition, Inc. 5.75% 4/15/26 (c) | | 8,220,000 | 7,993,950 |
| | | | 122,285,758 |
| Steel - 0.4% | | | |
| Commercial Metals Co. 4.125% 1/15/30 | | 3,495,000 | 3,180,450 |
| Roller Bearing Co. of America, Inc. 4.375% 10/15/29 (c) | | 6,370,000 | 5,733,000 |
| | | | 8,913,450 |
| Super Retail - 1.6% | | | |
| Bath & Body Works, Inc.: | | | |
| 5.25% 2/1/28 | | 825,000 | 792,000 |
| 6.625% 10/1/30 (c) | | 475,000 | 472,437 |
| 6.694% 1/15/27 | | 2,550,000 | 2,626,704 |
| Carvana Co.: | | | |
| 4.875% 9/1/29 (c) | | 2,755,000 | 2,010,599 |
| 5.5% 4/15/27 (c) | | 4,650,000 | 3,721,163 |
| 5.625% 10/1/25 (c) | | 5,105,000 | 4,421,236 |
| 5.875% 10/1/28 (c) | | 1,165,000 | 925,925 |
| EG Global Finance PLC: | | | |
| 6.75% 2/7/25 (c) | | 5,980,000 | 5,812,261 |
| 8.5% 10/30/25 (c) | | 5,425,000 | 5,425,000 |
| LBM Acquisition LLC 6.25% 1/15/29 (c) | | 2,405,000 | 1,957,069 |
| Levi Strauss & Co. 3.5% 3/1/31 (c) | | 4,995,000 | 4,320,675 |
| The William Carter Co. 5.625% 3/15/27 (c) | | 2,315,000 | 2,306,782 |
| Wolverine World Wide, Inc. 4% 8/15/29 (c) | | 6,606,000 | 5,614,043 |
| | | | 40,405,894 |
| Technology - 5.9% | | | |
| Acuris Finance U.S. 5% 5/1/28 (c) | | 10,565,000 | 9,666,975 |
| Arches Buyer, Inc.: | | | |
| 4.25% 6/1/28 (c) | | 6,120,000 | 5,439,028 |
| 6.125% 12/1/28 (c) | | 6,360,000 | 5,533,200 |
| Black Knight InfoServ LLC 3.625% 9/1/28 (c) | | 5,665,000 | 5,254,004 |
| Clarivate Science Holdings Corp.: | | | |
| 3.875% 7/1/28 (c) | | 3,040,000 | 2,705,600 |
| 4.875% 7/1/29 (c) | | 2,880,000 | 2,538,086 |
| CommScope, Inc.: | | | |
| 4.75% 9/1/29 (c) | | 2,985,000 | 2,495,729 |
| 6% 3/1/26 (c) | | 6,745,000 | 6,361,884 |
| 7.125% 7/1/28 (c) | | 5,270,000 | 4,202,825 |
| 8.25% 3/1/27 (c) | | 1,610,000 | 1,368,500 |
| Elastic NV 4.125% 7/15/29 (c) | | 6,818,000 | 6,102,110 |
| Entegris Escrow Corp. 4.75% 4/15/29 (c) | | 4,020,000 | 3,874,315 |
| Gartner, Inc. 4.5% 7/1/28 (c) | | 3,750,000 | 3,594,058 |
| II-VI, Inc. 5% 12/15/29 (c) | | 7,865,000 | 7,373,438 |
| ION Trading Technologies Ltd. 5.75% 5/15/28 (c) | | 6,795,000 | 6,361,819 |
| MicroStrategy, Inc. 6.125% 6/15/28 (c) | | 4,965,000 | 4,548,784 |
| Northwest Fiber LLC/Northwest Fiber Finance Sub, Inc. 10.75% 6/1/28 (c) | | 6,515,000 | 6,677,875 |
| onsemi 3.875% 9/1/28 (c) | | 305,000 | 282,950 |
| Open Text Corp.: | | | |
| 3.875% 2/15/28 (c) | | 3,350,000 | 3,051,125 |
| 3.875% 12/1/29 (c) | | 905,000 | 804,237 |
| Rackspace Hosting, Inc.: | | | |
| 3.5% 2/15/28 (c) | | 5,935,000 | 5,133,003 |
| 5.375% 12/1/28 (c) | | 32,245,000 | 26,270,969 |
| Roblox Corp. 3.875% 5/1/30 (c) | | 3,335,000 | 2,868,100 |
| Sensata Technologies BV 4% 4/15/29 (c) | | 3,060,000 | 2,727,883 |
| TTM Technologies, Inc. 4% 3/1/29 (c) | | 11,365,000 | 9,944,375 |
| Twilio, Inc. 3.875% 3/15/31 | | 2,550,000 | 2,191,649 |
| Uber Technologies, Inc. 8% 11/1/26 (c) | | 7,615,000 | 7,976,713 |
| | | | 145,349,234 |
| Telecommunications - 8.9% | | | |
| Altice Financing SA: | | | |
| 5% 1/15/28 (c) | | 11,615,000 | 9,695,389 |
| 5.75% 8/15/29 (c) | | 16,870,000 | 14,213,144 |
| Altice France Holding SA 6% 2/15/28 (c) | | 10,695,000 | 8,836,744 |
| Altice France SA: | | | |
| 5.125% 1/15/29 (c) | | 10,120,000 | 8,587,680 |
| 5.125% 7/15/29 (c) | | 8,025,000 | 6,793,644 |
| 5.5% 1/15/28 (c) | | 7,575,000 | 6,675,469 |
| 5.5% 10/15/29 (c) | | 6,650,000 | 5,669,125 |
| C&W Senior Financing Designated Activity Co. 6.875% 9/15/27 (c) | | 34,547,000 | 33,424,223 |
| Cablevision Lightpath LLC: | | | |
| 3.875% 9/15/27 (c) | | 2,555,000 | 2,246,816 |
| 5.625% 9/15/28 (c) | | 5,730,000 | 4,909,922 |
| Consolidated Communications, Inc. 5% 10/1/28 (c) | | 2,005,000 | 1,638,486 |
| Frontier Communications Holdings LLC: | | | |
| 5% 5/1/28 (c) | | 8,745,000 | 7,980,206 |
| 5.875% 10/15/27 (c) | | 8,250,000 | 7,899,375 |
| 5.875% 11/1/29 | | 6,275,000 | 5,447,484 |
| 6% 1/15/30 (c) | | 4,935,000 | 4,293,894 |
| 6.75% 5/1/29 (c) | | 6,110,000 | 5,505,721 |
| Intelsat Jackson Holdings SA 6.5% 3/15/30 (c) | | 5,565,000 | 5,239,392 |
| Level 3 Financing, Inc.: | | | |
| 3.625% 1/15/29 (c) | | 4,705,000 | 3,818,390 |
| 4.25% 7/1/28 (c) | | 7,640,000 | 6,455,800 |
| 4.625% 9/15/27 (c) | | 5,620,000 | 5,050,975 |
| Lumen Technologies, Inc.: | | | |
| 4.5% 1/15/29 (c) | | 12,120,000 | 9,576,618 |
| 5.125% 12/15/26 (c) | | 6,460,000 | 5,814,000 |
| Millicom International Cellular SA: | | | |
| 4.5% 4/27/31 (c) | | 455,000 | 392,153 |
| 5.125% 1/15/28 (c) | | 247,500 | 234,011 |
| Northwest Fiber LLC/Northwest Fiber Finance Sub, Inc. 6% 2/15/28 (c) | | 1,235,000 | 1,033,325 |
| Sable International Finance Ltd. 5.75% 9/7/27 (c) | | 130,000 | 128,010 |
| SBA Communications Corp. 3.125% 2/1/29 | | 3,520,000 | 3,019,280 |
| Telecom Italia Capital SA: | | | |
| 6% 9/30/34 | | 2,740,000 | 2,393,280 |
| 7.2% 7/18/36 | | 3,910,000 | 3,527,070 |
| 7.721% 6/4/38 | | 850,000 | 797,938 |
| Uniti Group, Inc. 6% 1/15/30 (c) | | 9,245,000 | 7,709,822 |
| Virgin Media Secured Finance PLC 4.5% 8/15/30 (c) | | 7,435,000 | 6,452,539 |
| VMED O2 UK Financing I PLC 4.25% 1/31/31 (c) | | 6,595,000 | 5,572,313 |
| Windstream Escrow LLC 7.75% 8/15/28 (c) | | 14,415,000 | 13,730,288 |
| Zayo Group Holdings, Inc.: | | | |
| 4% 3/1/27 (c) | | 3,320,000 | 2,888,400 |
| 6.125% 3/1/28 (c) | | 3,695,000 | 3,094,563 |
| | | | 220,745,489 |
| Textiles/Apparel - 0.3% | | | |
| Foot Locker, Inc. 4% 10/1/29 (c) | | 8,585,000 | 7,147,013 |
| Kontoor Brands, Inc. 4.125% 11/15/29 (c) | | 1,230,000 | 1,067,025 |
| | | | 8,214,038 |
| Transportation Ex Air/Rail - 0.5% | | | |
| Golar LNG Ltd. 7% 10/20/25 (c) | | 2,910,000 | 2,906,908 |
| Great Lakes Dredge & Dock Corp. 5.25% 6/1/29 (c) | | 2,085,000 | 1,949,475 |
| Seaspan Corp. 5.5% 8/1/29 (c) | | 8,800,000 | 7,766,000 |
| | | | 12,622,383 |
| Utilities - 3.0% | | | |
| Clearway Energy Operating LLC: | | | |
| 3.75% 2/15/31 (c) | | 2,655,000 | 2,283,300 |
| 4.75% 3/15/28 (c) | | 1,280,000 | 1,209,600 |
| Global Partners LP/GLP Finance Corp. 7% 8/1/27 | | 3,770,000 | 3,685,175 |
| InterGen NV 7% 6/30/23 (c) | | 13,335,000 | 13,001,625 |
| NRG Energy, Inc.: | | | |
| 3.375% 2/15/29 (c) | | 2,565,000 | 2,173,838 |
| 3.625% 2/15/31 (c) | | 120,000 | 99,900 |
| 5.25% 6/15/29 (c) | | 2,640,000 | 2,486,537 |
| NSG Holdings II LLC/NSG Holdings, Inc. 7.75% 12/15/25 (c) | | 4,806,382 | 4,914,525 |
| PG&E Corp.: | | | |
| 5% 7/1/28 | | 8,410,000 | 7,738,798 |
| 5.25% 7/1/30 | | 11,955,000 | 10,864,584 |
| Pike Corp. 5.5% 9/1/28 (c) | | 18,085,000 | 16,412,138 |
| Vistra Operations Co. LLC: | | | |
| 5% 7/31/27 (c) | | 5,895,000 | 5,614,988 |
| 5.625% 2/15/27 (c) | | 4,450,000 | 4,383,250 |
| | | | 74,868,258 |
|
| TOTAL NONCONVERTIBLE BONDS | | | 2,079,817,667 |
|
| TOTAL CORPORATE BONDS | | | |
| (Cost $2,333,580,420) | | | 2,117,992,607 |
| | | Shares | Value |
|
| Common Stocks - 2.7% | | | |
| Cable/Satellite TV - 0.1% | | | |
| Altice U.S.A., Inc. Class A (d) | | 224,406 | 2,082,488 |
| Energy - 1.3% | | | |
| California Resources Corp. warrants 10/27/24 (d) | | 4,491 | 53,780 |
| Jonah Energy Parent LLC (b)(d) | | 203,925 | 13,750,663 |
| Mesquite Energy, Inc. (b)(d) | | 204,784 | 11,418,756 |
| New Fortress Energy, Inc. | | 107,605 | 4,172,922 |
| Pioneer Natural Resources Co. | | 9,600 | 2,231,712 |
|
| TOTAL ENERGY | | | 31,627,833 |
|
| Food & Drug Retail - 1.1% | | | |
| Southeastern Grocers, Inc. (a)(b)(d) | | 1,184,833 | 27,867,272 |
| Gaming - 0.1% | | | |
| Caesars Entertainment, Inc. (d) | | 45,314 | 3,003,412 |
| Telecommunications - 0.0% | | | |
| GTT Communications, Inc. rights (b)(d) | | 366,387 | 366,387 |
| Utilities - 0.1% | | | |
| EQT Corp. | | 67,100 | 2,667,225 |
| TOTAL COMMON STOCKS | | | |
| (Cost $55,981,755) | | | 67,614,617 |
|
| Investment Companies - 2.5% | | | |
| iShares Broad USD High Yield Corporate Bond ETF (e) | | | |
| (Cost $62,803,711) | | 1,651,000 | 61,153,012 |
| | | Principal Amount | Value |
|
| Bank Loan Obligations - 3.7% | | | |
| Broadcasting - 0.3% | | | |
| Diamond Sports Group LLC: | | | |
| 1LN, term loan U.S. Secured Overnight Fin. Rate (SOFR) Indx + 8.000% 9% 5/25/26 (f)(g)(h) | | 4,625,350 | 4,693,991 |
| 2LN, term loan 3 month U.S. LIBOR + 3.250% 3.6555% 8/24/26 (f)(g)(h) | | 11,003,290 | 3,644,840 |
|
| TOTAL BROADCASTING | | | 8,338,831 |
|
| Building Materials - 0.2% | | | |
| Acproducts Holdings, Inc. Tranche B 1LN, term loan 1 month U.S. LIBOR + 4.250% 4.75% 5/17/28 (f)(g)(h) | | 4,658,822 | 3,866,822 |
| Chemicals - 0.4% | | | |
| Consolidated Energy Finance SA Tranche B 1LN, term loan 3 month U.S. LIBOR + 3.500% 4.0287% 5/7/25 (b)(f)(g)(h) | | 5,481,167 | 5,357,841 |
| Olympus Water U.S. Holding Corp. Tranche B 1LN, term loan 1 month U.S. LIBOR + 3.750% 4.8125% 11/9/28 (f)(g)(h) | | 4,719,263 | 4,621,338 |
|
| TOTAL CHEMICALS | | | 9,979,179 |
|
| Consumer Products - 0.1% | | | |
| Michaels Companies, Inc. 1LN, term loan 3 month U.S. LIBOR + 4.250% 5.256% 4/15/28 (f)(g)(h) | | 3,454,286 | 3,142,329 |
| Energy - 0.4% | | | |
| EG America LLC Tranche B 1LN, term loan 3 month U.S. LIBOR + 4.000% 5.006% 2/6/25 (f)(g)(h) | | 5,794,879 | 5,664,494 |
| EG Finco Ltd. Tranche B, term loan 3 month U.S. LIBOR + 4.000% 5.006% 2/6/25 (f)(g)(h) | | 3,977,165 | 3,887,679 |
| Mesquite Energy, Inc.: | | | |
| 1LN, term loan 3 month U.S. LIBOR + 8.000% 0% (b)(g)(h)(i) | | 3,800,000 | 0 |
| term loan 3 month U.S. LIBOR + 0.000% 0% (b)(g)(h)(i) | | 1,620,000 | 0 |
|
| TOTAL ENERGY | | | 9,552,173 |
|
| Gaming - 0.0% | | | |
| Fertitta Entertainment LLC NV Tranche B 1LN, term loan U.S. Secured Overnight Fin. Rate (SOFR) Indx + 4.000% 4.7004% 1/27/29 (f)(g)(h) | | 630,000 | 626,667 |
| Healthcare - 0.1% | | | |
| Da Vinci Purchaser Corp. Tranche B 1LN, term loan 3 month U.S. LIBOR + 4.000% 5.006% 12/13/26 (f)(g)(h) | | 243,759 | 242,999 |
| Gainwell Acquisition Corp. Tranche B 1LN, term loan 3 month U.S. LIBOR + 4.000% 5.006% 10/1/27 (f)(g)(h) | | 715,000 | 711,875 |
| U.S. Renal Care, Inc. Tranche B 1LN, term loan 3 month U.S. LIBOR + 5.000% 5.5% 6/13/26 (f)(g)(h) | | 3,257,586 | 2,874,820 |
|
| TOTAL HEALTHCARE | | | 3,829,694 |
|
| Insurance - 0.3% | | | |
| HUB International Ltd. Tranche B, term loan 3 month U.S. LIBOR + 3.000% 4.2132% 4/25/25 (f)(g)(h) | | 7,045,941 | 6,949,059 |
| Leisure - 0.5% | | | |
| City Football Group Ltd. Tranche B 1LN, term loan 1 month U.S. LIBOR + 3.500% 4.5983% 7/21/28 (f)(g)(h) | | 13,229,588 | 12,857,572 |
| Paper - 0.1% | | | |
| Clydesdale Acquisition Holdings, Inc. 1LN, term loan CME TERM SOFR 1 MONTH INDEX + 4.250% 4.7834% 3/30/29 (f)(g)(h) | | 1,770,000 | 1,745,450 |
| Services - 0.3% | | | |
| Ascend Learning LLC: | | | |
| 2LN, term loan 1 month U.S. LIBOR + 5.750% 6.25% 12/10/29 (f)(g)(h) | | 425,000 | 419,156 |
| Tranche B 1LN, term loan 1 month U.S. LIBOR + 3.500% 4.2637% 12/10/28 (f)(g)(h) | | 4,749,263 | 4,687,332 |
| Brand Energy & Infrastructure Services, Inc. Tranche B, term loan 3 month U.S. LIBOR + 4.250% 5.3964% 6/21/24 (f)(g)(h) | | 1,632,693 | 1,548,087 |
| CoreCivic, Inc. Tranche B 1LN, term loan 3 month U.S. LIBOR + 4.500% 5.5% 12/18/24 (f)(g)(h) | | 551,537 | 546,479 |
|
| TOTAL SERVICES | | | 7,201,054 |
|
| Super Retail - 0.2% | | | |
| LBM Acquisition LLC Tranche B 1LN, term loan 3 month U.S. LIBOR + 3.750% 4.5% 12/18/27 (f)(g)(h) | | 5,240,109 | 4,934,453 |
| Technology - 0.1% | | | |
| CommScope, Inc. Tranche B 1LN, term loan 3 month U.S. LIBOR + 3.250% 4.0137% 4/4/26 (f)(g)(h) | | 3,419,209 | 3,283,296 |
| Telecommunications - 0.6% | | | |
| GTT Communications, Inc. Tranche B, term loan 3 month U.S. LIBOR + 4.750% 7.25% 5/31/25 (f)(g)(h) | | 13,526,933 | 10,967,232 |
| Northwest Fiber LLC Tranche B 1LN, term loan 3 month U.S. LIBOR + 3.750% 4.3013% 4/30/27 (f)(g)(h) | | 3,393,750 | 3,335,785 |
|
| TOTAL TELECOMMUNICATIONS | | | 14,303,017 |
|
| Utilities - 0.1% | | | |
| PG&E Corp. Tranche B 1LN, term loan 3 month U.S. LIBOR + 3.000% 3.8125% 6/23/25 (f)(g)(h) | | 1,708,213 | 1,683,666 |
| TOTAL BANK LOAN OBLIGATIONS | | | |
| (Cost $97,644,247) | | | 92,293,262 |
| | | Shares | Value |
|
| Other - 0.2% | | | |
| Other - 0.2% | | | |
| Fidelity Direct Lending Fund, LP (a)(j) | | | |
| (Cost $5,432,650) | | 543,233 | 5,437,758 |
|
| Money Market Funds - 7.3% | | | |
| Fidelity Cash Central Fund 0.32%(k) | | 119,241,557 | 119,265,405 |
| Fidelity Securities Lending Cash Central Fund 0.32% (k)(l) | | 63,222,228 | 63,228,550 |
| TOTAL MONEY MARKET FUNDS | | | |
| (Cost $182,493,955) | | | 182,493,955 |
| TOTAL INVESTMENT IN SECURITIES - 101.8% | | | |
| (Cost $2,737,936,738) | | | 2,526,985,211 |
| NET OTHER ASSETS (LIABILITIES) - (1.8)% | | | (45,619,802) |
| NET ASSETS - 100% | | | $2,481,365,409 |
Security Type Abbreviations
ETF – Exchange-Traded Fund
Legend
(a) Restricted securities (including private placements) - Investment in securities not registered under the Securities Act of 1933 (excluding 144A issues). At the end of the period, the value of restricted securities (excluding 144A issues) amounted to $54,561,608 or 2.2% of net assets.
(b) Level 3 security
(c) Security exempt from registration under Rule 144A of the Securities Act of 1933. These securities may be resold in transactions exempt from registration, normally to qualified institutional buyers. At the end of the period, the value of these securities amounted to $1,769,402,493 or 71.3% of net assets.
(d) Non-income producing
(e) Security or a portion of the security is on loan at period end.
(f) Coupon rates for floating and adjustable rate securities reflect the rates in effect at period end.
(g) Coupon is indexed to a floating interest rate which may be multiplied by a specified factor and/or subject to caps or floors.
(h) Remaining maturities of bank loan obligations may be less than the stated maturities shown as a result of contractual or optional prepayments by the borrower. Such prepayments cannot be predicted with certainty.
(i) Non-income producing - Security is in default.
(j) Affiliated Fund
(k) Affiliated fund that is generally available only to investment companies and other accounts managed by Fidelity Investments. The rate quoted is the annualized seven-day yield of the fund at period end. A complete unaudited listing of the fund's holdings as of its most recent quarter end is available upon request. In addition, each Fidelity Central Fund's financial statements, which are not covered by the Fund's Report of Independent Registered Public Accounting Firm, are available on the SEC's website or upon request.
(l) Investment made with cash collateral received from securities on loan.
Additional information on each restricted holding is as follows:
| Security | Acquisition Date | Acquisition Cost |
| Fidelity Direct Lending Fund, LP | 12/9/21 - 4/29/22 | $5,432,650 |
| Mesquite Energy, Inc. 15% 7/15/23 | 6/25/21 - 4/1/22 | $6,243,973 |
| Mesquite Energy, Inc. 15% 7/15/23 | 6/25/21 - 4/1/22 | $9,777,984 |
| Southeastern Grocers, Inc. | 6/25/21 - 4/1/22 | $22,540,546 |
Affiliated Central Funds
Fiscal year to date information regarding the Fund's investments in Fidelity Central Funds, including the ownership percentage, is presented below.
| Fund | Value, beginning of period | Purchases | Sales Proceeds | Dividend Income | Realized Gain/Loss | Change in Unrealized appreciation (depreciation) | Value, end of period | % ownership, end of period |
| Fidelity Cash Central Fund 0.32% | $-- | $2,269,924,883 | $2,150,659,478 | $91,620 | $-- | $-- | $119,265,405 | 0.2% |
| Fidelity Securities Lending Cash Central Fund 0.32% | -- | 249,964,016 | 186,735,466 | 107,372 | -- | -- | 63,228,550 | 0.2% |
| Total | $-- | $2,519,888,899 | $2,337,394,944 | $198,992 | $-- | $-- | $182,493,955 | |
Amounts in the income column in the above table include any capital gain distributions from underlying funds, which are presented in the corresponding line-item in the Statement of Operations, if applicable. Amount for Fidelity Securities Lending Cash Central Fund represents the income earned on investing cash collateral, less rebates paid to borrowers and any lending agent fees associated with the loan, plus any premium payments received for lending certain types of securities.
Affiliated Underlying Funds
Fiscal year to date information regarding the Fund's investments in affiliated Underlying Funds is presented below. Exchanges between classes of the same affiliated Underlying Funds may occur, and are excluded from purchases and sales below if applicable. If an underlying Fund changes its name, the name presented below is the name in effect at period end.
| Affiliate | Value, beginning of period | Purchases | Sales Proceeds | Dividend Income | Realized Gain (loss) | Change in Unrealized appreciation (depreciation) | Value, end of period |
| Fidelity Direct Lending Fund, LP | $-- | $5,432,650 | $-- | $90,984 | $-- | $5,108 | $5,437,758 |
| Total | $-- | $5,432,650 | $-- | $90,984 | $-- | $5,108 | $5,437,758 |
Amounts in the income column in the above table include any capital gain distributions from underlying funds, which are presented in the corresponding line-item in the Statement of Operations, if applicable.
Investment Valuation
The following is a summary of the inputs used, as of April 30, 2022, involving the Fund's assets and liabilities carried at fair value. The inputs or methodology used for valuing securities may not be an indication of the risk associated with investing in those securities. For more information on valuation inputs, and their aggregation into the levels used below, please refer to the Investment Valuation section in the accompanying Notes to Financial Statements.
Amounts in this Investment Valuation section exclude the value of Fidelity Direct Lending Fund, LP as presented in the Schedule of Investments. Fidelity Direct Lending Fund, LP is valued using NAV as a practical expedient.
| | Valuation Inputs at Reporting Date: |
| Description | Total | Level 1 | Level 2 | Level 3 |
| Investments in Securities: | | | | |
| Equities: | | | | |
| Communication Services | $2,082,488 | $2,082,488 | $-- | $-- |
| Consumer Discretionary | 3,003,412 | 3,003,412 | -- | -- |
| Consumer Staples | 27,867,272 | -- | -- | 27,867,272 |
| Energy | 34,295,058 | 9,125,639 | -- | 25,169,419 |
| Information Technology | 366,387 | -- | -- | 366,387 |
| Corporate Bonds | 2,117,992,607 | -- | 2,096,736,029 | 21,256,578 |
| Investment Companies | 61,153,012 | 61,153,012 | -- | -- |
| Bank Loan Obligations | 92,293,262 | -- | 86,935,421 | 5,357,841 |
| Money Market Funds | 182,493,955 | 182,493,955 | -- | -- |
| Total Investments in Securities: | $2,521,547,453 | $257,858,506 | $2,183,671,450 | $80,017,497 |
The following is a reconciliation of Investments in Securities for which Level 3 inputs were used in determining value:
| Investments in Securities: | |
| Equities - Consumer Staples | |
| Beginning Balance | $-- |
| Net Realized Gain (Loss) on Investment Securities | -- |
| Net Unrealized Gain (Loss) on Investment Securities | 5,326,726 |
| Cost of Purchases | 22,540,546 |
| Proceeds of Sales | -- |
| Amortization/Accretion | -- |
| Transfers into Level 3 | -- |
| Transfers out of Level 3 | -- |
| Ending Balance | $27,867,272 |
| The change in unrealized gain (loss) for the period attributable to Level 3 securities held at April 30, 2022 | $5,326,726 |
| Equities - Energy | |
| Beginning Balance | $-- |
| Net Realized Gain (Loss) on Investment Securities | -- |
| Net Unrealized Gain (Loss) on Investment Securities | 7,712,099 |
| Cost of Purchases | 17,457,320 |
| Proceeds of Sales | -- |
| Amortization/Accretion | -- |
| Transfers into Level 3 | -- |
| Transfers out of Level 3 | -- |
| Ending Balance | $25,169,419 |
| The change in unrealized gain (loss) for the period attributable to Level 3 securities held at April 30, 2022 | $7,712,099 |
| Other Investments in Securities | |
| Beginning Balance | $-- |
| Net Realized Gain (Loss) on Investment Securities | 27,252 |
| Net Unrealized Gain (Loss) on Investment Securities | 5,241,489 |
| Cost of Purchases | 25,978,740 |
| Proceeds of Sales | (4,316,933) |
| Amortization/Accretion | 50,258 |
| Transfers into Level 3 | -- |
| Transfers out of Level 3 | -- |
| Ending Balance | $26,980,806 |
| The change in unrealized gain (loss) for the period attributable to Level 3 securities held at April 30, 2022 | $5,241,489 |
The information used in the above reconciliations represents fiscal year to date activity for any Investments in Securities identified as using Level 3 inputs at either the beginning or the end of the current fiscal period. Cost of purchases and proceeds of sales may include securities received and/or delivered through in-kind transactions. Transfers in or out of Level 3 represent the beginning value of any Security or Instrument where a change in the pricing level occurred from the beginning to the end of the period. The cost of purchases and the proceeds of sales may include securities received or delivered through corporate actions or exchanges. Realized and unrealized gains (losses) disclosed in the reconciliations are included in Net Gain (Loss) on the Fund's Statement of Operations.
See accompanying notes which are an integral part of the financial statements.
Financial Statements
Statement of Assets and Liabilities
| | | April 30, 2022 |
| Assets | | |
Investment in securities, at value (including securities loaned of $60,830,792) — See accompanying schedule:
Unaffiliated issuers (cost $2,550,010,133) | $2,339,053,498 | |
| Fidelity Central Funds (cost $182,493,955) | 182,493,955 | |
| Other affiliated issuers (cost $5,432,650) | 5,437,758 | |
| Total Investment in Securities (cost $2,737,936,738) | | $2,526,985,211 |
| Cash | | 4,583 |
| Receivable for investments sold | | 3,358,885 |
| Receivable for fund shares sold | | 2,162,518 |
| Dividends receivable | | 22,304 |
| Interest receivable | | 34,135,720 |
| Distributions receivable from Fidelity Central Funds | | 42,107 |
| Prepaid expenses | | 180 |
| Total assets | | 2,566,711,508 |
| Liabilities | | |
| Payable for investments purchased | $19,546,328 | |
| Payable for fund shares redeemed | 1,322,612 | |
| Distributions payable | 16,456 | |
| Accrued management fee | 1,159,988 | |
| Other payables and accrued expenses | 72,165 | |
| Collateral on securities loaned | 63,228,550 | |
| Total liabilities | | 85,346,099 |
| Net Assets | | $2,481,365,409 |
| Net Assets consist of: | | |
| Paid in capital | | $2,750,608,609 |
| Total accumulated earnings (loss) | | (269,243,200) |
| Net Assets | | $2,481,365,409 |
| Net Asset Value, offering price and redemption price per share ($2,481,365,409 ÷ 271,079,229 shares) | | $9.15 |
See accompanying notes which are an integral part of the financial statements.
Statement of Operations
| | | For the period
May 13, 2021 (commencement of operations) through
April 30, 2022 |
| Investment Income | | |
| Dividends (including $90,984 earned from other affiliated issuers) | | $3,348,162 |
| Interest | | 124,433,189 |
| Income from Fidelity Central Funds (including $107,372 from security lending) | | 198,992 |
| Total income | | 127,980,343 |
| Expenses | | |
| Management fee | $14,994,993 | |
| Custodian fees and expenses | 20,622 | |
| Independent trustees' fees and expenses | 7,909 | |
| Registration fees | 952,059 | |
| Audit | 82,421 | |
| Legal | 413,705 | |
| Interest | 829 | |
| Miscellaneous | 4,971 | |
| Total expenses before reductions | 16,477,509 | |
| Expense reductions | (28,415) | |
| Total expenses after reductions | | 16,449,094 |
| Net investment income (loss) | | 111,531,249 |
| Realized and Unrealized Gain (Loss) | | |
| Net realized gain (loss) on: | | |
| Investment securities: | | |
| Unaffiliated issuers | (57,116,764) | |
| Total net realized gain (loss) | | (57,116,764) |
| Change in net unrealized appreciation (depreciation) on: | | |
| Investment securities: | | |
| Unaffiliated issuers | (210,956,635) | |
| Affiliated issuers | 5,108 | |
| Total change in net unrealized appreciation (depreciation) | | (210,951,527) |
| Net gain (loss) | | (268,068,291) |
| Net increase (decrease) in net assets resulting from operations | | $(156,537,042) |
See accompanying notes which are an integral part of the financial statements.
Statement of Changes in Net Assets
| | For the period
May 13, 2021 (commencement of operations) through
April 30, 2022 |
| Increase (Decrease) in Net Assets | |
| Operations | |
| Net investment income (loss) | $111,531,249 |
| Net realized gain (loss) | (57,116,764) |
| Change in net unrealized appreciation (depreciation) | (210,951,527) |
| Net increase (decrease) in net assets resulting from operations | (156,537,042) |
| Distributions to shareholders | (112,706,158) |
| Share transactions | |
| Proceeds from sales of shares | 5,413,238,176 |
| Reinvestment of distributions | 112,444,143 |
| Cost of shares redeemed | (2,775,073,710) |
| Net increase (decrease) in net assets resulting from share transactions | 2,750,608,609 |
| Total increase (decrease) in net assets | 2,481,365,409 |
| Net Assets | |
| Beginning of period | – |
| End of period | $2,481,365,409 |
| Other Information | |
| Shares | |
| Sold | 543,016,881 |
| Issued in reinvestment of distributions | 11,438,350 |
| Redeemed | (283,376,002) |
| Net increase (decrease) | 271,079,229 |
See accompanying notes which are an integral part of the financial statements.
Financial Highlights
Fidelity SAI High Income Fund
| | |
| Years ended April 30, | 2022 A |
| Selected Per–Share Data | |
| Net asset value, beginning of period | $10.00 |
| Income from Investment Operations | |
| Net investment income (loss)B,C | .388 |
| Net realized and unrealized gain (loss) | (.879) |
| Total from investment operations | (.491) |
| Distributions from net investment income | (.345) |
| Distributions from net realized gain | (.014) |
| Total distributions | (.359) |
| Net asset value, end of period | $9.15 |
| Total ReturnD,E | (5.10)% |
| Ratios to Average Net AssetsC,F,G | |
| Expenses before reductions | .60%H |
| Expenses net of fee waivers, if any | .60%H |
| Expenses net of all reductions | .60%H |
| Net investment income (loss) | 4.06%H |
| Supplemental Data | |
| Net assets, end of period (000 omitted) | $2,481,365 |
| Portfolio turnover rateI | 59%H,J |
A For the period May 13, 2021 (commencement of operations) through April 30, 2022.
B Calculated based on average shares outstanding during the period.
C Net investment income (loss) is affected by the timing of the declaration of dividends by any underlying mutual funds or exchange-traded funds (ETFs). Net investment income (loss) of any such underlying funds is not included in the Fund's net investment income (loss) ratio.
D Total returns for periods of less than one year are not annualized.
E Total returns would have been lower if certain expenses had not been reduced during the applicable periods shown.
F Fees and expenses of any underlying mutual funds or exchange-traded funds (ETFs) are not included in the Fund's expense ratio. The Fund indirectly bears its proportionate share of these expenses. For additional expense information related to investments in Fidelity Central Funds, please refer to the "Investments in Fidelity Central Funds" note found in the Notes to Financial Statements section of the most recent Annual or Semi-Annual report. For additional expense information related to investments in Fidelity Direct Lending Fund, LP, please refer to the Investment in Fidelity Direct Lending Fund, LP note found in the Notes to Financial Statements section of the most recent Annual or Semi-Annual report.
G Expense ratios reflect operating expenses of the class. Expenses before reductions do not reflect amounts reimbursed, waived, or reduced through arrangements with the investment adviser, brokerage services, or other offset arrangements, if applicable, and do not represent the amount paid by the class during periods when reimbursements, waivers or reductions occur.
H Annualized
I Amount does not include the portfolio activity of any underlying mutual funds or exchange-traded funds (ETFs).
J Portfolio turnover rate excludes securities received or delivered in-kind.
See accompanying notes which are an integral part of the financial statements.
Notes to Financial Statements
For the period ended April 30, 2022
1. Organization.
Fidelity SAI High Income Fund (the Fund) is a fund of Fidelity Summer Street Trust (the Trust) and is authorized to issue an unlimited number of shares. Shares are offered exclusively to certain clients of Fidelity Management & Research Company LLC (FMR) or its affiliates. The Trust is registered under the Investment Company Act of 1940, as amended (the 1940 Act), as an open-end management investment company organized as a Massachusetts business trust.
2. Investments in Fidelity Central Funds.
Funds may invest in Fidelity Central Funds, which are open-end investment companies generally available only to other investment companies and accounts managed by the investment adviser and its affiliates. The Schedule of Investments lists any Fidelity Central Funds held as an investment as of period end, but does not include the underlying holdings of each Fidelity Central Fund. An investing fund indirectly bears its proportionate share of the expenses of the underlying Fidelity Central Funds.
Based on its investment objective, each Fidelity Central Fund may invest or participate in various investment vehicles or strategies that are similar to those of the investing fund. These strategies are consistent with the investment objectives of the investing fund and may involve certain economic risks which may cause a decline in value of each of the Fidelity Central Funds and thus a decline in the value of the investing fund.
| Fidelity Central Fund | Investment Manager | Investment Objective | Investment Practices | Expense Ratio(a) |
| Fidelity Money Market Central Funds | Fidelity Management & Research Company LLC (FMR) | Each fund seeks to obtain a high level of current income consistent with the preservation of capital and liquidity. | Short-term Investments | Less than .005% |
(a) Expenses expressed as a percentage of average net assets and are as of each underlying Central Fund's most recent annual or semi-annual shareholder report.
A complete unaudited list of holdings for each Fidelity Central Fund is available upon request or at the Securities and Exchange Commission website at www.sec.gov. In addition, the financial statements of the Fidelity Central Funds which contain the significant accounting policies (including investment valuation policies) of those funds, and are not covered by the Report of Independent Registered Public Accounting Firm, are available on the Securities and Exchange Commission website or upon request.
3. Investment in Fidelity Direct Lending Fund, LP.
The Fund invests in Fidelity Direct Lending Fund, LP, which is a limited partnership available only to certain investment companies managed by the investment adviser and its affiliates. The Fund's limited partnership interest is not registered under the Securities Act of 1933, and is subject to substantial restrictions on transfer. The Fund has no redemption rights under the partnership agreement. There will be no trading market for the partnership interest, and the Fund most likely will hold its shares until Fidelity Direct Lending Fund, LP converts by operation of law to a Delaware corporation, trust, or other limited liability entity and (i) registers as a closed-end management investment company under the 1940 Act or (ii) elects to be treated as a business development company under the 1940 Act.
Based on its investment objective, Fidelity Direct Lending Fund, LP may invest or participate in various investments or strategies that are similar to those in which the Fund may invest or participate. These strategies are consistent with the investment objectives of the Fund and may involve certain economic risks which may cause a decline in value of Fidelity Direct Lending Fund, LP and thus a decline in the value of the Fund. The Fidelity Direct Lending Fund, LP intends to invest primarily in direct loans made to private U.S. companies, specifically small- and middle-market companies.
The Schedule of Investments lists Fidelity Direct Lending Fund, LP as an investment as of period end, but does not include the underlying holdings of Fidelity Direct Lending Fund, LP. Fidelity Direct Lending Fund, LP represented less than 5% of the Fund's net assets at period end. The Fund indirectly bears its proportionate share of the expenses of Fidelity Direct Lending Fund, LP, which commenced operations on December 8, 2021. The annual expense ratio for Fidelity Direct Lending Fund, LP is estimated to be a maximum of .20%.
4. Significant Accounting Policies.
The Fund is an investment company and applies the accounting and reporting guidance of the Financial Accounting Standards Board (FASB) Accounting Standards Codification Topic 946 Financial Services - Investment Companies. The financial statements have been prepared in conformity with accounting principles generally accepted in the United States of America (GAAP), which require management to make certain estimates and assumptions at the date of the financial statements. Actual results could differ from those estimates. Subsequent events, if any, through the date that the financial statements were issued have been evaluated in the preparation of the financial statements. The Fund's Schedule of Investments lists any underlying mutual funds or exchange-traded funds (ETFs) but does not include the underlying holdings of these funds. The following summarizes the significant accounting policies of the Fund:
Investment Valuation. Investments are valued as of 4:00 p.m. Eastern time on the last calendar day of the period. The Board of Trustees (the Board) has delegated the day to day responsibility for the valuation of the Fund's investments to the Fair Value Committee (the Committee) established by the Fund's investment adviser. In accordance with valuation policies and procedures approved by the Board, the Fund attempts to obtain prices from one or more third party pricing vendors or brokers to value its investments. When current market prices, quotations or currency exchange rates are not readily available or reliable, investments will be fair valued in good faith by the Committee, in accordance with procedures adopted by the Board. Factors used in determining fair value vary by investment type and may include market or investment specific events, changes in interest rates and credit quality. The frequency with which these procedures are used cannot be predicted and they may be utilized to a significant extent. The Committee oversees the Fund's valuation policies and procedures and reports to the Board on the Committee's activities and fair value determinations. The Board monitors the appropriateness of the procedures used in valuing the Fund's investments and ratifies the fair value determinations of the Committee.
The Fund categorizes the inputs to valuation techniques used to value its investments into a disclosure hierarchy consisting of three levels as shown below:
- Level 1 – unadjusted quoted prices in active markets for identical investments
- Level 2 – other significant observable inputs (including quoted prices for similar investments, interest rates, prepayment speeds, etc.)
- Level 3 – unobservable inputs (including the Fund's own assumptions based on the best information available)
Valuation techniques used to value the Fund's investments by major category are as follows:
Debt securities, including restricted securities, are valued based on evaluated prices received from third party pricing vendors or from brokers who make markets in such securities. Corporate bonds and bank loan obligations are valued by pricing vendors who utilize matrix pricing which considers yield or price of bonds of comparable quality, coupon, maturity and type or by broker-supplied prices. When independent prices are unavailable or unreliable, debt securities may be valued utilizing pricing methodologies which consider similar factors that would be used by third party pricing vendors. Debt securities are generally categorized as Level 2 in the hierarchy but may be Level 3 depending on the circumstances. The Fund invests a significant portion of its assets in below investment grade securities. The value of these securities can be more volatile due to changes in the credit quality of the issuer and is sensitive to changes in economic, market and regulatory conditions.
Equity securities, including restricted securities, for which market quotations are readily available, are valued at the last reported sale price or official closing price as reported by a third party pricing vendor on the primary market or exchange on which they are traded and are categorized as Level 1 in the hierarchy. In the event there were no sales during the day or closing prices are not available, securities are valued at the last quoted bid price or may be valued using the last available price and are generally categorized as Level 2 in the hierarchy. For equity securities, including restricted securities, where observable inputs are limited, assumptions about market activity and risk are used and these securities may be categorized as Level 3 in the hierarchy. Securities, including private placements or other restricted securities, for which observable inputs are not available are valued using alternate valuation approaches, including the market approach, the income approach and cost approach, and are categorized as Level 3 in the hierarchy. The market approach considers factors including the price of recent investments in the same or a similar security or financial metrics of comparable securities. The income approach considers factors including expected future cash flows, security specific risks and corresponding discount rates. The cost approach considers factors including the value of the security's underlying assets and liabilities.
ETFs are valued at their last sale price or official closing price as reported by a third party pricing vendor on the primary market or exchange on which they are traded and are categorized as Level 1 in the hierarchy. In the event there were no sales during the day but the exchange reports a closing bid level, ETFs are valued at the closing bid and would be categorized as Level 1 in the hierarchy. In the event there was no closing bid, ETFs may be valued by another method that the Board believes reflects fair value in accordance with the Board's fair value pricing policies and may be categorized as Level 2 in the hierarchy.
Investments in open-end mutual funds, including the Fidelity Central Funds, are valued at their closing net asset value (NAV) each business day and are categorized as Level 1 in the hierarchy.
Fidelity Direct Lending Fund, LP is valued using NAV as a practical expedient in accordance with the specialized accounting guidance for investment companies.
The following provides information on Level 3 securities held by the Fund that were valued at period end based on unobservable inputs. These amounts exclude valuations provided by a broker and valuations using NAV as a practical expedient.
| Asset Type | Fair Value | Valuation Technique(s) | Unobservable Input | Amount or Range/Weighted Average | Impact to Valuation from an Increase in Input(a) |
| Equities | $53,403,078 | Market approach | Liquidation preference | $1.00 | Increase |
| | | Market comparable | Enterprise value/EBITDA multiple (EV/EBITDA) | 2.6 - 3.8 / 3.2 | Increase |
| | | | Book value multiple | 1.0 | Increase |
| | | | Discount rate | 10.0% | Decrease |
| | | | Discount for lack of marketability | 10.0% | Decrease |
| | | | Comparable sales - land ($/Acre) | $5,500.00 - $6,000.00 / $5,773.16 | Increase |
| | | | Daily production multiple ($/Million cubic feet per day) | $2,500.00 | Increase |
| | | | Daily production multiple ($/Barrels of oil equivalent per day) | $17,500.00 | Increase |
| | | Discounted cash flow | Weighted average cost of capital (WACC) | 8.9% | Decrease |
| | | | Discount for lack of marketability | 10.0% | Decrease |
| | | | Growth rate | 1.5% | Increase |
| Corporate Bonds | $21,256,578 | Market comparable | Enterprise value/EBITDA multiple (EV/EBITDA) | 2.6 | Increase |
| | | | Book value multiple | 1.0 | Increase |
| | | | Discount rate | 10.0% | Decrease |
| | | | Discount for lack of marketability | 10.0% | Decrease |
| | | | Comparable sales - land ($/Acre) | $5,500.00 | Increase |
| | | | Daily production multiple ($/Barrels of oil equivalent per day) | $17,500.00 | Increase |
| Bank Loan Obligations | $5,357,841 | Indicative market price | Evaluated bid | $97.75 | Increase |
| | | Recovery value | Recovery value | $0.00 | Increase |
(a) Represents the directional change in the fair value of the Level 3 investments that could have resulted from an increase in the corresponding input as of period end. A decrease to the unobservable input would have had the opposite effect. Significant changes in these inputs may have resulted in a significantly higher or lower fair value measurement at period end.
Changes in valuation techniques may result in transfers in or out of an assigned level within the disclosure hierarchy. The aggregate value of investments by input level as of April 30, 2022, as well as a roll forward of Level 3 investments, is included at the end of the Fund's Schedule of Investments.
Investment Transactions and Income. For financial reporting purposes, the Fund's investment holdings and NAV include trades executed through the end of the last business day of the period. The NAV per share for processing shareholder transactions is calculated as of the close of business of the New York Stock Exchange (NYSE), normally 4:00 p.m. Eastern time and includes trades executed through the end of the prior business day. Gains and losses on securities sold are determined on the basis of identified cost. Commissions paid to certain brokers with whom the investment adviser, or its affiliates, places trades on behalf of a fund include an amount in addition to trade execution, which may be rebated back to a fund. Any such rebates are included in net realized gain (loss) on investments in the Statement of Operations. Dividend income is recorded on the ex-dividend date, except for certain dividends from foreign securities where the ex-dividend date may have passed, which are recorded as soon as the Fund is informed of the ex-dividend date. Non-cash dividends included in dividend income, if any, are recorded at the fair market value of the securities received. Income and capital gain distributions from Fidelity Central Funds, if any, are recorded on the ex-dividend date. Interest income is accrued as earned and includes coupon interest and amortization of premium and accretion of discount on debt securities as applicable. Debt obligations may be placed on non-accrual status and related interest income may be reduced by ceasing current accruals and writing off interest receivables when the collection of all or a portion of interest has become doubtful based on consistently applied procedures. A debt obligation is removed from non-accrual status when the issuer resumes interest payments or when collectability of interest is reasonably assured.
Expenses. Expenses directly attributable to a fund are charged to that fund. Expenses attributable to more than one fund are allocated among the respective funds on the basis of relative net assets or other appropriate methods. Expenses included in the accompanying financial statements reflect the expenses of that fund and do not include any expenses associated with any underlying mutual funds or exchange-traded funds. Although not included in a fund's expenses, a fund indirectly bears its proportionate share of these expenses through the net asset value of each underlying mutual fund or exchange-traded fund. Expense estimates are accrued in the period to which they relate and adjustments are made when actual amounts are known.
Income Tax Information and Distributions to Shareholders. Each year, the Fund intends to qualify as a regulated investment company under Subchapter M of the Internal Revenue Code, including distributing substantially all of its taxable income and realized gains. As a result, no provision for U.S. Federal income taxes is required. As of April 30, 2022, the Fund did not have any unrecognized tax benefits in the financial statements; nor is the Fund aware of any tax positions for which it is reasonably possible that the total amounts of unrecognized tax benefits will significantly change in the next twelve months. The Fund files a U.S. federal tax return, in addition to state and local tax returns as required. The Fund's federal income tax returns are subject to examination by the Internal Revenue Service (IRS) for a period of three fiscal years after they are filed. State and local tax returns may be subject to examination for an additional fiscal year depending on the jurisdiction.
Distributions are declared and recorded daily and paid monthly from net investment income. Distributions from realized gains, if any, are declared and recorded on the ex-dividend date. Income and capital gain distributions are determined in accordance with income tax regulations, which may differ from GAAP.
Capital accounts within the financial statements are adjusted for permanent book-tax differences. These adjustments have no impact on net assets or the results of operations. Capital accounts are not adjusted for temporary book-tax differences which will reverse in a subsequent period.
Book-tax differences are primarily due to market discount and losses deferred due to wash sales and excise tax regulations.
As of period end, the cost and unrealized appreciation (depreciation) in securities, and derivatives if applicable, for federal income tax purposes were as follows:
| Gross unrealized appreciation | $20,962,279 |
| Gross unrealized depreciation | (229,578,129) |
| Net unrealized appreciation (depreciation) | $(208,615,850) |
| Tax Cost | $2,735,601,061 |
The tax-based components of distributable earnings as of period end were as follows:
| Undistributed ordinary income | $1,003,231 |
| Net unrealized appreciation (depreciation) on securities and other investments | $(208,615,850) |
The Fund intends to elect to defer to its next fiscal year $61,630,581 of capital losses recognized during the period November 1, 2021 to April 30, 2022.
The tax character of distributions paid was as follows:
| | April 30, 2022(a) |
| Ordinary Income | $112,706,158 |
(a) For the period May 13, 2021 (commencement of operations) through April 30th, 2022.
Restricted Securities (including Private Placements). Funds may invest in securities that are subject to legal or contractual restrictions on resale. These securities generally may be resold in transactions exempt from registration or to the public if the securities are registered. Disposal of these securities may involve time-consuming negotiations and expense, and prompt sale at an acceptable price may be difficult. Information regarding restricted securities held at period end is included at the end of the Schedule of Investments, if applicable.
Loans and Other Direct Debt Instruments. Direct debt instruments are interests in amounts owed to lenders by corporate or other borrowers. These instruments may be in the form of loans, trade claims or other receivables and may include standby financing commitments such as revolving credit facilities that obligate a fund to supply additional cash to the borrower on demand. Loans may be acquired through assignment, participation, or may be made directly to a borrower. Such instruments are presented in the Bank Loan Obligations section in the Schedule of Investments. Certain funds may also invest in unfunded loan commitments, which are contractual obligations for future funding. Information regarding unfunded commitments is included at the end of the Schedule of Investments, if applicable.
Commitments. A commitment is an agreement to acquire an investment at a future date (subject to conditions) in connection with a potential public or non-public offering. The amount of commitments outstanding at period end are presented in the table below. These commitments are not included in the net assets of the Fund at period end.
| | Investment to be Acquired | Commitment Amount |
| Fidelity SAI High Income Fund | Fidelity Direct Lending Fund, LP | $14,567,350 |
5. Purchases and Sales of Investments.
Purchases and sales of securities, other than short-term securities and in-kind transactions, as applicable, are noted in the table below.
| | Purchases ($) | Sales ($) |
| Fidelity SAI High Income Fund | 1,419,607,739 | 2,845,432,631 |
6. Fees and Other Transactions with Affiliates.
Management Fee. Fidelity Management & Research Company LLC (the investment adviser) and its affiliates provide the Fund with investment management related services for which the Fund pays a monthly management fee. The management fee is the sum of an individual fund fee rate that is based on an annual rate of .45% of the Fund's average net assets and an annualized group fee rate that averaged .10% during the period. The group fee rate is based upon the monthly average net assets of a group of registered investment companies with which the investment adviser has management contracts. The group fee rate decreases as assets under management increase and increases as assets under management decrease. For the reporting period, the total annualized management fee rate was .55% of the Fund's average net assets.
Brokerage Commissions. A portion of portfolio transactions were placed with brokerage firms which are affiliates of the investment adviser. Brokerage commissions are included in net realized gain (loss) and change in net unrealized appreciation (depreciation) in the Statement of Operations. The commissions paid to these affiliated firms were as follows:
| | Amount |
| Fidelity SAI High Income Fund | $103 |
Interfund Lending Program. Pursuant to an Exemptive Order issued by the Securities and Exchange Commission (the SEC), the Fund, along with other registered investment companies having management contracts with Fidelity Management & Research Company LLC (FMR), or other affiliated entities of FMR, may participate in an interfund lending program. This program provides an alternative credit facility allowing the Fund to borrow from, or lend money to, other participating affiliated funds. At period end, there were no interfund loans outstanding. Activity in this program during the period for which loans were outstanding was as follows:
| | Borrower or Lender | Average Loan Balance | Weighted Average Interest Rate | Interest Expense |
| Fidelity SAI High Income Fund | Borrower | $6,702,929 | .32% | $829 |
Interfund Trades. Funds may purchase from or sell securities to other Fidelity Funds under procedures adopted by the Board. The procedures have been designed to ensure these interfund trades are executed in accordance with Rule 17a-7 of the 1940 Act. Any interfund trades are included within the respective purchases and sales amounts shown in the Purchases and Sales of Investments note. Interfund trades during the period are noted in the table below.
| | Purchases ($) | Sales ($) | Realized Gain (Loss) ($) |
| Fidelity SAI High Income Fund | 7,495 | – | – |
Affiliated Exchanges In-Kind. Shares that were exchanged for investments, including accrued interest and cash, if any, are shown in the table below. The amount of in-kind exchanges is included in share transactions in the accompanying Statement of Changes in Net Assets.
| | Shares | Total Proceeds
($) |
| Fidelity SAI High Income Fund | 418,596,053 | 4,188,784,329 |
7. Committed Line of Credit.
Certain Funds participate with other funds managed by the investment adviser or an affiliate in a $4.25 billion credit facility (the "line of credit") to be utilized for temporary or emergency purposes to fund shareholder redemptions or for other short-term liquidity purposes. The participating funds have agreed to pay commitment fees on their pro-rata portion of the line of credit, which are reflected in Miscellaneous expenses on the Statement of Operations, and are listed below. During the period, there were no borrowings on this line of credit.
| | Amount |
| Fidelity SAI High Income Fund | $151 |
8. Security Lending.
Funds lend portfolio securities from time to time in order to earn additional income. Lending agents are used, including National Financial Services (NFS), an affiliate of the investment adviser. Pursuant to a securities lending agreement, NFS will receive a fee, which is capped at 9.9% of a fund's daily lending revenue, for its services as lending agent. A fund may lend securities to certain qualified borrowers, including NFS. On the settlement date of the loan, a fund receives collateral (in the form of U.S. Treasury obligations, letters of credit and/or cash) against the loaned securities and maintains collateral in an amount not less than 100% of the market value of the loaned securities during the period of the loan. The market value of the loaned securities is determined at the close of business of a fund and any additional required collateral is delivered to a fund on the next business day. A fund or borrower may terminate the loan at any time, and if the borrower defaults on its obligation to return the securities loaned because of insolvency or other reasons, a fund may apply collateral received from the borrower against the obligation. A fund may experience delays and costs in recovering the securities loaned. Any cash collateral received is invested in the Fidelity Securities Lending Cash Central Fund. Any loaned securities are identified as such in the Schedule of Investments, and the value of loaned securities and cash collateral at period end, as applicable, are presented in the Statement of Assets and Liabilities. Security lending income represents the income earned on investing cash collateral, less rebates paid to borrowers and any lending agent fees associated with the loan, plus any premium payments received for lending certain types of securities. Security lending income is presented in the Statement of Operations as a component of income from Fidelity Central Funds. Affiliated security lending activity, if any, was as follows:
| | Total Security Lending Fees Paid to NFS | Security Lending Income From Securities Loaned to NFS | Value of Securities Loaned to NFS at Period End |
| Fidelity SAI High Income Fund | $11,735 | $– | $– |
9. Expense Reductions.
Through arrangements with the Fund's custodian, credits realized as a result of certain uninvested cash balances were used to reduce the Fund's expenses by $443.
In addition, during the period the investment adviser or an affiliate reimbursed and/or waived a portion of operating expenses in the amount of $27,972.
10. Other.
A fund's organizational documents provide former and current trustees and officers with a limited indemnification against liabilities arising in connection with the performance of their duties to the fund. In the normal course of business, a fund may also enter into contracts that provide general indemnifications. A fund's maximum exposure under these arrangements is unknown as this would be dependent on future claims that may be made against a fund. The risk of material loss from such claims is considered remote.
At the end of the period, the following mutual funds managed by the investment adviser or its affiliates were the owners of record of 10% or more of the total outstanding shares.
| | Strategic Advisers Fidelity Core Income Fund |
| Fidelity SAI High Income Fund | 18% |
11. Coronavirus (COVID-19) Pandemic.
An outbreak of COVID-19 first detected in China during December 2019 has since spread globally and was declared a pandemic by the World Health Organization during March 2020. Developments that disrupt global economies and financial markets, such as the COVID-19 pandemic, may magnify factors that affect the Fund's performance.
Report of Independent Registered Public Accounting Firm
To the Board of Trustees of Fidelity Summer Street Trust and Shareholders of Fidelity SAI High Income Fund
Opinion on the Financial Statement
We have audited the accompanying statement of assets and liabilities, including the schedule of investments, of Fidelity SAI High Income Fund (one of the funds constituting Fidelity Summer Street Trust, referred to hereafter as the “Fund”) as of April 30, 2022, and the related statements of operations and changes in net assets, including the related notes, and the financial highlights for the period May 13, 2021 (commencement of operations) through April 30, 2022 (collectively referred to as the “financial statements”). In our opinion, the financial statements present fairly, in all material respects, the financial position of the Fund as of April 30, 2022, and the results of its operations, changes in its net assets, and the financial highlights for the period May 13, 2021 (commencement of operations) through April 30, 2022 in conformity with accounting principles generally accepted in the United States of America.
Basis for Opinion
These financial statements are the responsibility of the Fund’s management. Our responsibility is to express an opinion on the Fund’s financial statements based on our audit. We are a public accounting firm registered with the Public Company Accounting Oversight Board (United States) (PCAOB) and are required to be independent with respect to the Fund in accordance with the U.S. federal securities laws and the applicable rules and regulations of the Securities and Exchange Commission and the PCAOB.
We conducted our audit of these financial statements in accordance with the standards of the PCAOB. Those standards require that we plan and perform the audit to obtain reasonable assurance about whether the financial statements are free of material misstatement, whether due to error or fraud.
Our audit included performing procedures to assess the risks of material misstatement of the financial statements, whether due to error or fraud, and performing procedures that respond to those risks. Such procedures included examining, on a test basis, evidence regarding the amounts and disclosures in the financial statements. Our audit also included evaluating the accounting principles used and significant estimates made by management, as well as evaluating the overall presentation of the financial statements. Our procedures included confirmation of securities owned as of April 30, 2022 by correspondence with the custodian, issuers of privately offered securities, agent banks and brokers; when replies were not received from agent banks and brokers, we performed other auditing procedures. We believe that our audit provides a reasonable basis for our opinion.
/s/ PricewaterhouseCoopers LLP
Boston, Massachusetts
June 14, 2022
We have served as the auditor of one or more investment companies in the Fidelity group of funds since 1932.
Trustees and Officers
The Trustees, Members of the Advisory Board (if any), and officers of the trust and fund, as applicable, are listed below. The Board of Trustees governs the fund and is responsible for protecting the interests of shareholders. The Trustees are experienced executives who meet periodically throughout the year to oversee the fund's activities, review contractual arrangements with companies that provide services to the fund, oversee management of the risks associated with such activities and contractual arrangements, and review the fund's performance. Each of the Trustees oversees 324 funds.
The Trustees hold office without limit in time except that (a) any Trustee may resign; (b) any Trustee may be removed by written instrument, signed by at least two-thirds of the number of Trustees prior to such removal; (c) any Trustee who requests to be retired or who has become incapacitated by illness or injury may be retired by written instrument signed by a majority of the other Trustees; and (d) any Trustee may be removed at any special meeting of shareholders by a two-thirds vote of the outstanding voting securities of the trust. Each Trustee who is not an interested person (as defined in the 1940 Act) of the trust and the fund is referred to herein as an Independent Trustee. Each Independent Trustee shall retire not later than the last day of the calendar year in which his or her 75th birthday occurs. The Independent Trustees may waive this mandatory retirement age policy with respect to individual Trustees. Officers and Advisory Board Members hold office without limit in time, except that any officer or Advisory Board Member may resign or may be removed by a vote of a majority of the Trustees at any regular meeting or any special meeting of the Trustees. Except as indicated, each individual has held the office shown or other offices in the same company for the past five years.
The fund’s Statement of Additional Information (SAI) includes more information about the Trustees. To request a free copy, call Fidelity at 1-800-544-3455.
Experience, Skills, Attributes, and Qualifications of the Trustees. The Governance and Nominating Committee has adopted a statement of policy that describes the experience, qualifications, attributes, and skills that are necessary and desirable for potential Independent Trustee candidates (Statement of Policy). The Board believes that each Trustee satisfied at the time he or she was initially elected or appointed a Trustee, and continues to satisfy, the standards contemplated by the Statement of Policy. The Governance and Nominating Committee also engages professional search firms to help identify potential Independent Trustee candidates who have the experience, qualifications, attributes, and skills consistent with the Statement of Policy. From time to time, additional criteria based on the composition and skills of the current Independent Trustees, as well as experience or skills that may be appropriate in light of future changes to board composition, business conditions, and regulatory or other developments, have also been considered by the professional search firms and the Governance and Nominating Committee. In addition, the Board takes into account the Trustees' commitment and participation in Board and committee meetings, as well as their leadership of standing and ad hoc committees throughout their tenure.
In determining that a particular Trustee was and continues to be qualified to serve as a Trustee, the Board has considered a variety of criteria, none of which, in isolation, was controlling. The Board believes that, collectively, the Trustees have balanced and diverse experience, qualifications, attributes, and skills, which allow the Board to operate effectively in governing the fund and protecting the interests of shareholders. Information about the specific experience, skills, attributes, and qualifications of each Trustee, which in each case led to the Board's conclusion that the Trustee should serve (or continue to serve) as a trustee of the fund, is provided below.
Board Structure and Oversight Function. Robert A. Lawrence is an interested person and currently serves as Chair. The Trustees have determined that an interested Chair is appropriate and benefits shareholders because an interested Chair has a personal and professional stake in the quality and continuity of services provided to the fund. Independent Trustees exercise their informed business judgment to appoint an individual of their choosing to serve as Chair, regardless of whether the Trustee happens to be independent or a member of management. The Independent Trustees have determined that they can act independently and effectively without having an Independent Trustee serve as Chair and that a key structural component for assuring that they are in a position to do so is for the Independent Trustees to constitute a substantial majority for the Board. The Independent Trustees also regularly meet in executive session. David M. Thomas serves as Lead Independent Trustee and as such (i) acts as a liaison between the Independent Trustees and management with respect to matters important to the Independent Trustees and (ii) with management prepares agendas for Board meetings.
Fidelity® funds are overseen by different Boards of Trustees. The fund's Board oversees Fidelity's high income and certain equity funds, and other Boards oversee Fidelity's investment-grade bond, money market, asset allocation, and other equity funds. The asset allocation funds may invest in Fidelity® funds overseen by the fund's Board. The use of separate Boards, each with its own committee structure, allows the Trustees of each group of Fidelity® funds to focus on the unique issues of the funds they oversee, including common research, investment, and operational issues. On occasion, the separate Boards establish joint committees to address issues of overlapping consequences for the Fidelity® funds overseen by each Board.
The Trustees operate using a system of committees to facilitate the timely and efficient consideration of all matters of importance to the Trustees, the fund, and fund shareholders and to facilitate compliance with legal and regulatory requirements and oversight of the fund's activities and associated risks. The Board, acting through its committees, has charged FMR and its affiliates with (i) identifying events or circumstances the occurrence of which could have demonstrably adverse effects on the fund's business and/or reputation; (ii) implementing processes and controls to lessen the possibility that such events or circumstances occur or to mitigate the effects of such events or circumstances if they do occur; and (iii) creating and maintaining a system designed to evaluate continuously business and market conditions in order to facilitate the identification and implementation processes described in (i) and (ii) above. Because the day-to-day operations and activities of the fund are carried out by or through FMR, its affiliates, and other service providers, the fund's exposure to risks is mitigated but not eliminated by the processes overseen by the Trustees. While each of the Board's committees has responsibility for overseeing different aspects of the fund's activities, oversight is exercised primarily through the Operations, Audit, and Compliance Committees. Appropriate personnel, including but not limited to the fund's Chief Compliance Officer (CCO), FMR's internal auditor, the independent accountants, the fund's Treasurer and portfolio management personnel, make periodic reports to the Board's committees, as appropriate, including an annual review of Fidelity's risk management program for the Fidelity® funds. The responsibilities of each standing committee, including their oversight responsibilities, are described further under "Standing Committees of the Trustees."
Interested Trustees*:
Correspondence intended for a Trustee who is an interested person may be sent to Fidelity Investments, 245 Summer Street, Boston, Massachusetts 02210.
Name, Year of Birth; Principal Occupations and Other Relevant Experience+
Bettina Doulton (1964)
Year of Election or Appointment: 2020
Trustee
Ms. Doulton also serves as Trustee of other Fidelity® funds. Prior to her retirement, Ms. Doulton served in a variety of positions at Fidelity Investments, including as a managing director of research (2006-2007), portfolio manager to certain Fidelity® funds (1993-2005), equity analyst and portfolio assistant (1990-1993), and research assistant (1987-1990). Ms. Doulton currently owns and operates Phi Builders + Architects and Cellardoor Winery. Previously, Ms. Doulton served as a member of the Board of Brown Capital Management, LLC (2014-2018).
Robert A. Lawrence (1952)
Year of Election or Appointment: 2020
Trustee
Chair of the Board of Trustees
Mr. Lawrence also serves as Trustee of other funds. Previously, Mr. Lawrence served as a Member of the Advisory Board of certain funds. Prior to his retirement in 2008, Mr. Lawrence served as Vice President of certain Fidelity® funds (2006-2008), Senior Vice President, Head of High Income Division of Fidelity Management & Research Company (investment adviser firm, 2006-2008), and President of Fidelity Strategic Investments (investment adviser firm, 2002-2005).
* Determined to be an “Interested Trustee” by virtue of, among other things, his or her affiliation with the trust or various entities under common control with FMR.
+ The information includes the Trustee's principal occupation during the last five years and other information relating to the experience, attributes, and skills relevant to the Trustee's qualifications to serve as a Trustee, which led to the conclusion that the Trustee should serve as a Trustee for the fund.
Independent Trustees:
Correspondence intended for an Independent Trustee may be sent to Fidelity Investments, P.O. Box 55235, Boston, Massachusetts 02205-5235.
Name, Year of Birth; Principal Occupations and Other Relevant Experience+
Thomas P. Bostick (1956)
Year of Election or Appointment: 2021
Trustee
Lieutenant General Bostick also serves as Trustee of other Fidelity® funds. Prior to his retirement, General Bostick (United States Army, Retired) held a variety of positions within the U.S. Army, including Commanding General and Chief of Engineers, U.S. Army Corps of Engineers (2012-2016) and Deputy Chief of Staff and Director of Human Resources, U.S. Army (2009-2012). General Bostick currently serves as a member of the Board and Finance and Governance Committees of CSX Corporation (transportation, 2020-present) and a member of the Board and Corporate Governance and Nominating Committee of Perma-Fix Environmental Services, Inc. (nuclear waste management, 2020-present). General Bostick serves as Chief Executive Officer of Bostick Global Strategies, LLC (consulting, 2016-present) and as a member of the Board of HireVue, Inc. (video interview and assessment, 2020-present). Previously, General Bostick served as a Member of the Advisory Board of certain Fidelity® funds (2021), President, Intrexon Bioengineering (2018-2020) and Chief Operating Officer (2017-2020) and Senior Vice President of the Environment Sector (2016-2017) of Intrexon Corporation (biopharmaceutical company).
Dennis J. Dirks (1948)
Year of Election or Appointment: 2005
Trustee
Mr. Dirks also serves as Trustee of other Fidelity® funds. Prior to his retirement in May 2003, Mr. Dirks served as Chief Operating Officer and as a member of the Board of The Depository Trust & Clearing Corporation (financial markets infrastructure), President, Chief Operating Officer and a member of the Board of The Depository Trust Company (DTC), President and a member of the Board of the National Securities Clearing Corporation (NSCC), Chief Executive Officer and a member of the Board of the Government Securities Clearing Corporation and Chief Executive Officer and a member of the Board of the Mortgage-Backed Securities Clearing Corporation. Mr. Dirks currently serves as a member of the Finance Committee (2016-present) and Board (2017-present) and is Treasurer (2018-present) of the Asolo Repertory Theatre.
Donald F. Donahue (1950)
Year of Election or Appointment: 2018
Trustee
Mr. Donahue also serves as Trustee of other Fidelity® funds. Mr. Donahue serves as President and Chief Executive Officer of Miranda Partners, LLC (risk consulting for the financial services industry, 2012-present). Previously, Mr. Donahue served as Chief Executive Officer (2006-2012), Chief Operating Officer (2003-2006) and Managing Director, Customer Marketing and Development (1999-2003) of The Depository Trust & Clearing Corporation (financial markets infrastructure). Mr. Donahue currently serves as a member (2007-present) and Co-Chairman (2016-present) of the Board of United Way of New York and a member of the Board of The Leadership Academy (previously NYC Leadership Academy) (2012-present). Mr. Donahue previously served as a member of the Advisory Board of certain Fidelity® funds (2015-2018).
Vicki L. Fuller (1957)
Year of Election or Appointment: 2020
Trustee
Ms. Fuller also serves as Trustee of other Fidelity® funds. Previously, Ms. Fuller served as a member of the Advisory Board of certain Fidelity® funds (2018-2020), Chief Investment Officer of the New York State Common Retirement Fund (2012-2018) and held a variety of positions at AllianceBernstein L.P. (global asset management, 1985-2012), including Managing Director (2006-2012) and Senior Vice President and Senior Portfolio Manager (2001-2006). Ms. Fuller currently serves as a member of the Board, Audit Committee and Nominating and Governance Committee of two Blackstone business development companies (2020-present), as a member of the Board of Treliant, LLC (consulting, 2019-present), as a member of the Advisory Board of Ariel Alternatives, LLC (private equity, 2021-present) and as a member of the Board and Chair of the Audit Committee of Gusto, Inc. (software, 2021-present). In addition, Ms. Fuller currently serves as a member of the Board of Roosevelt University (2019-present) and as a member of the Executive Board of New York University’s Stern School of Business. Ms. Fuller previously served as a member of the Board, Audit Committee and Nominating and Governance Committee of The Williams Companies, Inc. (natural gas infrastructure, 2018-2021).
Patricia L. Kampling (1959)
Year of Election or Appointment: 2020
Trustee
Ms. Kampling also serves as Trustee of other Fidelity® funds. Prior to her retirement, Ms. Kampling served as Chairman of the Board and Chief Executive Officer (2012-2019), President and Chief Operating Officer (2011-2012) and Executive Vice President and Chief Financial Officer (2010-2011) of Alliant Energy Corporation. Ms. Kampling currently serves as a member of the Board, Finance Committee and Governance, Compensation and Nominating Committee of Xcel Energy Inc. (utilities company, 2020-present) and as a member of the Board, Audit, Finance and Risk Committee and Safety, Environmental, Technology and Operations Committee and Chair of the Executive Development and Compensation Committee of American Water Works Company, Inc. (utilities company, 2019-present). In addition, Ms. Kampling currently serves as a member of the Board of the Nature Conservancy, Wisconsin Chapter (2019-present). Previously, Ms. Kampling served as a Member of the Advisory Board of certain Fidelity® funds (2020), a member of the Board, Compensation Committee and Executive Committee and Chair of the Audit Committee of Briggs & Stratton Corporation (manufacturing, 2011-2021), a member of the Board of Interstate Power and Light Company (2012-2019) and Wisconsin Power and Light Company (2012-2019) (each a subsidiary of Alliant Energy Corporation) and as a member of the Board and Workforce Development Committee of the Business Roundtable (2018-2019).
Thomas A. Kennedy (1955)
Year of Election or Appointment: 2021
Trustee
Mr. Kennedy also serves as Trustee of other Fidelity® funds. Previously, Mr. Kennedy served as a Member of the Advisory Board of certain Fidelity® funds (2020) and held a variety of positions at Raytheon Company (aerospace and defense, 1983-2020), including Chairman and Chief Executive Officer (2014-2020) and Executive Vice President and Chief Operating Officer (2013-2014). Mr. Kennedy currently serves as Executive Chairman of the Board of Directors of Raytheon Technologies Corporation (aerospace and defense, 2020-present). He is also a member of the Rutgers School of Engineering Industry Advisory Board (2011-present) and a member of the UCLA Engineering Dean’s Executive Board (2016-present).
Oscar Munoz (1959)
Year of Election or Appointment: 2021
Trustee
Mr. Munoz also serves as Trustee of other Fidelity® funds. Prior to his retirement, Mr. Munoz served as Executive Chairman (2020-2021), Chief Executive Officer (2015-2020), President (2015-2016) and a member of the Board (2010-2021) of United Airlines Holdings, Inc. Mr. Munoz currently serves as a member of the Board of CBRE Group, Inc. (commercial real estate, 2020-present), a member of the Board of Univision Communications, Inc. (Hispanic media, 2020-present) and a member of the Advisory Board of Salesforce.com, Inc. (cloud-based software, 2020-present). Previously, Mr. Munoz served as a Member of the Advisory Board of certain Fidelity® funds (2021).
Garnett A. Smith (1947)
Year of Election or Appointment: 2018
Trustee
Mr. Smith also serves as Trustee of other Fidelity® funds. Prior to his retirement, Mr. Smith served as Chairman and Chief Executive Officer (1990-1997) and President (1986-1990) of Inbrand Corp. (manufacturer of personal absorbent products). Prior to his employment with Inbrand Corp., he was employed by a retail fabric chain and North Carolina National Bank (now Bank of America). Mr. Smith previously served as a member of the Advisory Board of certain Fidelity® funds (2012-2013).
David M. Thomas (1949)
Year of Election or Appointment: 2008
Trustee
Lead Independent Trustee
Mr. Thomas also serves as Trustee of other Fidelity® funds. Previously, Mr. Thomas served as Executive Chairman (2005-2006) and Chairman and Chief Executive Officer (2000-2005) of IMS Health, Inc. (pharmaceutical and healthcare information solutions). Mr. Thomas currently serves as a member of the Board of Fortune Brands Home and Security (home and security products, 2004-present) and as Director (2013-present) and Non-Executive Chairman of the Board (2022-present) of Interpublic Group of Companies, Inc. (marketing communication).
Susan Tomasky (1953)
Year of Election or Appointment: 2020
Trustee
Ms. Tomasky also serves as Trustee of other Fidelity® funds. Prior to her retirement, Ms. Tomasky served in various executive officer positions at American Electric Power Company, Inc. (1998-2011), including most recently as President of AEP Transmission (2007-2011). Ms. Tomasky currently serves as a member of the Board and Sustainability Committee and as Chair of the Audit Committee of Marathon Petroleum Corporation (2018-present) and as a member of the Board, Executive Committee, Corporate Governance Committee and Organization and Compensation Committee and as Chair of the Audit Committee of Public Service Enterprise Group, Inc. (utilities company, 2012-present) and as a member of the Board of its subsidiary company, Public Service Electric and Gas Co. (2021-present). In addition, Ms. Tomasky currently serves as a member (2009-present) and President (2020-present) of the Board of the Royal Shakespeare Company – America (2009-present), as a member of the Board of the Columbus Association for the Performing Arts (2011-present) and as a member of the Board and Kenyon in the World Committee of Kenyon College (2016-present). Previously, Ms. Tomasky served as a Member of the Advisory Board of certain Fidelity® funds (2020), as a member of the Board of the Columbus Regional Airport Authority (2007-2020), as a member of the Board (2011-2018) and Lead Independent Director (2015-2018) of Andeavor Corporation (previously Tesoro Corporation) (independent oil refiner and marketer) and as a member of the Board of Summit Midstream Partners LP (energy, 2012-2018).
Michael E. Wiley (1950)
Year of Election or Appointment: 2018
Trustee
Mr. Wiley also serves as Trustee of other Fidelity® funds. Previously, Mr. Wiley served as a member of the Advisory Board of certain Fidelity® funds (2018-2020), Chairman, President and CEO of Baker Hughes, Inc. (oilfield services, 2000-2004). Mr. Wiley also previously served as a member of the Board of Andeavor Corporation (independent oil refiner and marketer, 2005-2018), a member of the Board of Andeavor Logistics LP (natural resources logistics, 2015-2018) and a member of the Board of High Point Resources (exploration and production, 2005-2020).
+ The information includes the Trustee's principal occupation during the last five years and other information relating to the experience, attributes, and skills relevant to the Trustee's qualifications to serve as a Trustee, which led to the conclusion that the Trustee should serve as a Trustee for the fund.
Advisory Board Members and Officers:
Correspondence intended for a Member of the Advisory Board (if any) may be sent to Fidelity Investments, P.O. Box 55235, Boston, Massachusetts 02205-5235. Correspondence intended for an officer or Peter S. Lynch may be sent to Fidelity Investments, 245 Summer Street, Boston, Massachusetts 02210. Officers appear below in alphabetical order.
Name, Year of Birth; Principal Occupation
Peter S. Lynch (1944)
Year of Election or Appointment: 2003
Member of the Advisory Board
Mr. Lynch also serves as a Member of the Advisory Board of other Fidelity® funds. Mr. Lynch is Vice Chairman and a Director of Fidelity Management & Research Company LLC (investment adviser firm). In addition, Mr. Lynch serves as a Trustee of Boston College and as the Chairman of the Inner-City Scholarship Fund. Previously, Mr. Lynch served as Vice Chairman and a Director of FMR Co., Inc. (investment adviser firm) and on the Special Olympics International Board of Directors (1997-2006).
Craig S. Brown (1977)
Year of Election or Appointment: 2019
Assistant Treasurer
Mr. Brown also serves as an officer of other funds. Mr. Brown serves as Assistant Treasurer of FIMM, LLC (2021-present) and is an employee of Fidelity Investments (2013-present).
John J. Burke III (1964)
Year of Election or Appointment: 2018
Chief Financial Officer
Mr. Burke also serves as Chief Financial Officer of other funds. Mr. Burke serves as Head of Investment Operations for Fidelity Fund and Investment Operations (2018-present) and is an employee of Fidelity Investments (1998-present). Previously Mr. Burke served as head of Asset Management Investment Operations (2012-2018).
William C. Coffey (1969)
Year of Election or Appointment: 2019
Assistant Secretary
Mr. Coffey also serves as Assistant Secretary of other funds. He is Senior Vice President and Deputy General Counsel of FMR LLC (diversified financial services company, 2010-present), and is an employee of Fidelity Investments. Previously, Mr. Coffey served as Secretary and CLO of certain funds (2018-2019); CLO, Secretary, and Senior Vice President of Fidelity Management & Research Company and FMR Co., Inc. (investment adviser firms, 2018-2019); Secretary of Fidelity SelectCo, LLC and Fidelity Investments Money Management, Inc. (investment adviser firms, 2018-2019); CLO of Fidelity Management & Research (Hong Kong) Limited, FMR Investment Management (UK) Limited, and Fidelity Management & Research (Japan) Limited (investment adviser firms, 2018-2019); and Assistant Secretary of certain funds (2009-2018).
Timothy M. Cohen (1969)
Year of Election or Appointment: 2018
Vice President
Mr. Cohen also serves as Vice President of other funds. Mr. Cohen serves as Co-Head of Equity (2018-present), a Director of Fidelity Management & Research (Japan) Limited (investment adviser firm, 2016-present), and is an employee of Fidelity Investments. Previously, Mr. Cohen served as Executive Vice President of Fidelity SelectCo, LLC (2019), Head of Global Equity Research (2016-2018), Chief Investment Officer - Equity and a Director of Fidelity Management & Research (U.K.) Inc. (investment adviser firm, 2013-2015) and as a Director of Fidelity Management & Research (Hong Kong) Limited (investment adviser firm, 2017).
Jonathan Davis (1968)
Year of Election or Appointment: 2010
Assistant Treasurer
Mr. Davis also serves as an officer of other funds. Mr. Davis serves as Assistant Treasurer of FIMM, LLC (2021-present), FMR Capital, Inc. (2017-present), FD Funds GP LLC (2021-present), FD Funds Holding LLC (2021-present), and FD Funds Management LLC (2021-present); and is an employee of Fidelity Investments. Previously, Mr. Davis served as Vice President and Associate General Counsel of FMR LLC (diversified financial services company, 2003-2010).
Laura M. Del Prato (1964)
Year of Election or Appointment: 2018
Assistant Treasurer
Ms. Del Prato also serves as an officer of other funds. Ms. Del Prato serves as Assistant Treasurer of FIMM, LLC (2021-present) and is an employee of Fidelity Investments (2017-present). Previously, Ms. Del Prato served as President and Treasurer of The North Carolina Capital Management Trust: Cash Portfolio and Term Portfolio (2018-2020). Prior to joining Fidelity Investments, Ms. Del Prato served as a Managing Director and Treasurer of the JPMorgan Mutual Funds (2014-2017). Prior to JPMorgan, Ms. Del Prato served as a partner at Cohen Fund Audit Services (accounting firm, 2012-2013) and KPMG LLP (accounting firm, 2004-2012).
Colm A. Hogan (1973)
Year of Election or Appointment: 2020
Assistant Treasurer
Mr. Hogan also serves as an officer of other funds. Mr. Hogan serves as Assistant Treasurer of FIMM, LLC (2021-present) and FMR Capital, Inc. (2017-present) and is an employee of Fidelity Investments (2005-present). Previously, Mr. Hogan served as Deputy Treasurer of certain Fidelity® funds (2016-2020) and Assistant Treasurer of certain Fidelity® funds (2016-2018).
Pamela R. Holding (1964)
Year of Election or Appointment: 2018
Vice President
Ms. Holding also serves as Vice President of other funds. Ms. Holding serves as Co-Head of Equity (2018-present) and is an employee of Fidelity Investments (2013-present). Previously, Ms. Holding served as Executive Vice President of Fidelity SelectCo, LLC (2019) and as Chief Investment Officer of Fidelity Institutional Asset Management (2013-2018).
Cynthia Lo Bessette (1969)
Year of Election or Appointment: 2019
Secretary and Chief Legal Officer (CLO)
Ms. Lo Bessette also serves as an officer of other funds. Ms. Lo Bessette serves as CLO, Secretary, and Senior Vice President of Fidelity Management & Research Company LLC (investment adviser firm, 2019-present); CLO of Fidelity Management & Research (Hong Kong) Limited, FMR Investment Management (UK) Limited, and Fidelity Management & Research (Japan) Limited (investment adviser firms, 2019-present); Secretary of FD Funds GP LLC (2021-present), FD Funds Holding LLC (2021-present), and FD Funds Management LLC (2021-present); and Assistant Secretary of FIMM, LLC (2019-present). She is a Senior Vice President and Deputy General Counsel of FMR LLC (diversified financial services company, 2019-present), and is an employee of Fidelity Investments. Previously, Ms. Lo Bessette served as CLO, Secretary, and Senior Vice President of FMR Co., Inc. (investment adviser firm, 2019); Secretary of Fidelity SelectCo, LLC and Fidelity Investments Money Management, Inc. (investment adviser firms, 2019). Prior to joining Fidelity Investments, Ms. Lo Bessette was Executive Vice President, General Counsel (2016-2019) and Senior Vice President, Deputy General Counsel (2015-2016) of OppenheimerFunds (investment management company) and Deputy Chief Legal Officer (2013-2015) of Jennison Associates LLC (investment adviser firm).
Chris Maher (1972)
Year of Election or Appointment: 2020
Deputy Treasurer
Mr. Maher also serves as an officer of other funds. Mr. Maher serves as Assistant Treasurer of FIMM, LLC (2021-present) and FMR Capital, Inc. (2017-present), and is an employee of Fidelity Investments (2008-present). Previously, Mr. Maher served as Assistant Treasurer of certain funds (2013-2020); Vice President of Asset Management Compliance (2013), Vice President of the Program Management Group of FMR (investment adviser firm, 2010-2013), and Vice President of Valuation Oversight (2008-2010).
Jason P. Pogorelec (1975)
Year of Election or Appointment: 2020
Chief Compliance Officer
Mr. Pogorelec also serves as Chief Compliance Officer of other funds. Mr. Pogorelec is a senior Vice President of Asset Management Compliance for Fidelity Investments and is an employee of Fidelity Investments (2006-present). Previously, Mr. Pogorelec served as Vice President, Associate General Counsel for Fidelity Investments (2010-2020) and Assistant Secretary of certain Fidelity funds (2015-2020).
Brett Segaloff (1972)
Year of Election or Appointment: 2021
Anti-Money Laundering (AML) Officer
Mr. Segaloff also serves as an AML Officer of other funds and other related entities. He is Director, Anti-Money Laundering (2007-present) of FMR LLC (diversified financial services company) and is an employee of Fidelity Investments (1996-present).
Stacie M. Smith (1974)
Year of Election or Appointment: 2016
President and Treasurer
Ms. Smith also serves as an officer of other funds. Ms. Smith serves as Assistant Treasurer of FIMM, LLC (2021-present) and FMR Capital, Inc. (2017-present), is an employee of Fidelity Investments (2009-present), and has served in other fund officer roles. Prior to joining Fidelity Investments, Ms. Smith served as Senior Audit Manager of Ernst & Young LLP (accounting firm, 1996-2009). Previously, Ms. Smith served as Assistant Treasurer (2013-2019) and Deputy Treasurer (2013-2016) of certain Fidelity® funds.
Jim Wegmann (1979)
Year of Election or Appointment: 2019
Assistant Treasurer
Mr. Wegmann also serves as an officer of other funds. Mr. Wegmann serves as Assistant Treasurer of FIMM, LLC (2021-present) and is an employee of Fidelity Investments (2011-present). Previously, Mr. Wegmann served as Assistant Treasurer of certain Fidelity® funds (2019-2021).
Shareholder Expense Example
As a shareholder, you incur two types of costs: (1) transaction costs, which may include sales charges (loads) on purchase payments or redemption proceeds, as applicable and (2) ongoing costs, which generally include management fees, distribution and/or service (12b-1) fees and other Fund expenses. This Example is intended to help you understand your ongoing costs (in dollars) of investing in a fund and to compare these costs with the ongoing costs of investing in other mutual funds.
The Example is based on an investment of $1,000 invested at the beginning of the period and held for the entire period (November 1, 2021 to April 30, 2022).
Actual Expenses
The first line of the accompanying table provides information about actual account values and actual expenses. You may use the information in this line, together with the amount you invested, to estimate the expenses that you paid over the period. Simply divide your account value by $1,000.00 (for example, an $8,600 account value divided by $1,000.00 = 8.6), then multiply the result by the number in the first line for a class/Fund under the heading entitled "Expenses Paid During Period" to estimate the expenses you paid on your account during this period. If any fund is a shareholder of any underlying mutual funds or exchange-traded funds (ETFs) (the Underlying Funds), such fund indirectly bears its proportional share of the expenses of the Underlying Funds in addition to the direct expenses incurred presented in the table. These fees and expenses are not included in the annualized expense ratio used to calculate the expense estimate in the table below.
Hypothetical Example for Comparison Purposes
The second line of the accompanying table provides information about hypothetical account values and hypothetical expenses based on the actual expense ratio and an assumed rate of return of 5% per year before expenses, which is not the actual return. The hypothetical account values and expenses may not be used to estimate the actual ending account balance or expenses you paid for the period. You may use this information to compare the ongoing costs of investing in the Fund and other funds. To do so, compare this 5% hypothetical example with the 5% hypothetical examples that appear in the shareholder reports of the other funds. If any fund is a shareholder of any Underlying Funds, such fund indirectly bears its proportional share of the expenses of the Underlying Funds in addition to the direct expenses as presented in the table. These fees and expenses are not included in the annualized expense ratio used to calculate the expense estimate in the table below.
Please note that the expenses shown in the table are meant to highlight your ongoing costs only and do not reflect any transaction costs. Therefore, the second line of the table is useful in comparing ongoing costs only, and will not help you determine the relative total costs of owning different funds. In addition, if these transactional costs were included, your costs would have been higher.
| | Annualized Expense Ratio-A | Beginning
Account Value
November 1, 2021 | Ending
Account Value
April 30, 2022 | Expenses Paid
During Period-B
November 1, 2021
to April 30, 2022 |
| Fidelity SAI High Income Fund | .58% | | | |
| Actual | | $1,000.00 | $935.10 | $2.78 |
| Hypothetical-C | | $1,000.00 | $1,021.92 | $2.91 |
A Annualized expense ratio reflects expenses net of applicable fee waivers.
B Expenses are equal to the annualized expense ratio, multiplied by the average account value over the period, multiplied by 181/ 365 (to reflect the one-half year period). The fees and expenses of any Underlying Funds are not included in each annualized expense ratio.
C 5% return per year before expenses
Distributions (Unaudited)
The dividend and capital gains distributions for the fund(s) are available on Fidelity.com or Institutional.Fidelity.com.
The fund designates $67,660,356 of distributions paid in the calendar year 2021 as qualifying to be taxed as section 163(j) interest dividends.
The fund will notify shareholders in January 2023 of amounts for use in preparing 2022 income tax returns.
Liquidity Risk Management Program
The Securities and Exchange Commission adopted Rule 22e-4 under the Investment Company Act of 1940 (the Liquidity Rule) to promote effective liquidity risk management throughout the open-end investment company industry, thereby reducing the risk that funds will be unable to meet their redemption obligations and mitigating dilution of the interests of fund shareholders.
The Fund has adopted and implemented a liquidity risk management program pursuant to the Liquidity Rule (the Program) effective December 1, 2018. The Program is reasonably designed to assess and manage the Fund’s liquidity risk and to comply with the requirements of the Liquidity Rule. The Fund’s Board of Trustees (the Board) has designated the Fund’s investment adviser as administrator of the Program. The Fidelity advisers have established a Liquidity Risk Management Committee (the LRM Committee) to manage the Program for each of the Fidelity Funds. The LRM Committee monitors the adequacy and effectiveness of implementation of the Program and on a periodic basis assesses each Fund’s liquidity risk based on a variety of factors including (1) the Fund’s investment strategy, (2) portfolio liquidity and cash flow projections during normal and reasonably foreseeable stressed conditions, (3) shareholder redemptions, (4) borrowings and other funding sources and (5) in the case of exchange-traded funds, certain additional factors including the effect of the Fund’s prices and spreads, market participants, and basket compositions on the overall liquidity of the Fund’s portfolio, as applicable.
In accordance with the Program, each of the Fund’s portfolio investments is classified into one of four liquidity categories described below based on a determination of a reasonable expectation for how long it would take to convert the investment to cash (or sell or dispose of the investment) without significantly changing its market value.
- Highly liquid investments – cash or convertible to cash within three business days or less
- Moderately liquid investments – convertible to cash in three to seven calendar days
- Less liquid investments – can be sold or disposed of, but not settled, within seven calendar days
- Illiquid investments – cannot be sold or disposed of within seven calendar days
Liquidity classification determinations take into account a variety of factors including various market, trading and investment-specific considerations, as well as market depth, and generally utilize analysis from a third-party liquidity metrics service.
The Liquidity Rule places a 15% limit on a fund’s illiquid investments and requires funds that do not primarily hold assets that are highly liquid investments to determine and maintain a minimum percentage of the fund’s net assets to be invested in highly liquid investments (highly liquid investment minimum or HLIM). The Program includes provisions reasonably designed to comply with the 15% limit on illiquid investments and for determining, periodically reviewing and complying with the HLIM requirement as applicable.
At a recent meeting of the Fund’s Board of Trustees, the LRM Committee provided a written report to the Board pertaining to the operation, adequacy, and effectiveness of implementation of the Program for the annual period from December 1, 2020 through November 30, 2021. The report concluded that the Program has been implemented and is operating effectively and is reasonably designed to assess and manage the Fund’s liquidity risk.
SAH-ANN-0622
1.9901441.100
Item 2.
Code of Ethics
As of the end of the period, April 30, 2022, Fidelity Summer Street Trust (the trust) has adopted a code of ethics, as defined in Item 2 of Form N-CSR, that applies to its President and Treasurer and its Chief Financial Officer. A copy of the code of ethics is filed as an exhibit to this Form N-CSR.
Item 3.
Audit Committee Financial Expert
The Board of Trustees of the trust has determined that Donald F. Donahue is an audit committee financial expert, as defined in Item 3 of Form N-CSR. Mr. Donahue is independent for purposes of Item 3 of Form N-CSR.
Item 4.
Principal Accountant Fees and Services
Fees and Services
The following table presents fees billed by Deloitte & Touche LLP, the member firms of Deloitte Touche Tohmatsu, and their respective affiliates (collectively, “Deloitte Entities”) in each of the last two fiscal years for services rendered to Fidelity Series High Income Fund, Fidelity Short Duration High Income Fund and Fidelity Women’s Leadership Fund (the “Funds”):
Services Billed by Deloitte Entities
April 30, 2022 FeesA
| | | | |
| Audit Fees | Audit-Related Fees | Tax Fees | All Other Fees |
Fidelity Series High Income Fund | $52,300 | $- | $9,300 | $1,200 |
Fidelity Short Duration High Income Fund | $54,900 | $- | $9,300 | $1,300 |
Fidelity Women’s Leadership Fund | $39,200 | $- | $7,100 | $900 |
| | | | |
| Audit Fees | Audit-Related Fees | Tax Fees | All Other Fees |
Fidelity Series High Income Fund | $51,000 | $- | $10,500 | $1,300 |
Fidelity Short Duration High Income Fund | $53,400 | $- | $8,800 | $1,300 |
Fidelity Women’s Leadership Fund | $38,200 | $- | $6,900 | $900 |
A Amounts may reflect rounding.
The following table presents fees billed by PricewaterhouseCoopers LLP (“PwC”) in each of the last two fiscal years for services rendered to Fidelity Capital & Income Fund, Fidelity Focused High Income Fund, Fidelity Global High Income Fund, Fidelity High Income Fund, Fidelity SAI High Income Fund and Fidelity U.S. Low Volatility Equity Fund (the “Funds”):
Services Billed by PwC
April 30, 2022 FeesA,B
| | | | |
| Audit Fees | Audit-Related Fees | Tax Fees | All Other Fees |
Fidelity Capital & Income Fund | $96,000 | $8,800 | $12,100 | $2,900 |
Fidelity Focused High Income Fund | $60,400 | $5,700 | $8,300 | $1,900 |
Fidelity Global High Income Fund | $77,900 | $5,800 | $9,600 | $1,900 |
Fidelity High Income Fund | $76,500 | $8,000 | $15,500 | $2,600 |
Fidelity SAI High Income Fund | $62,400 | $5,400 | $11,600 | $1,800 |
Fidelity U.S. Low Volatility Equity Fund | $24,400 | $2,600 | $12,100 | $900 |
| | | | |
| Audit Fees | Audit-Related Fees | Tax Fees | All Other Fees |
Fidelity Capital & Income Fund | $100,600 | $8,800 | $11,200 | $3,300 |
Fidelity Focused High Income Fund | $63,300 | $5,700 | $8,100 | $2,200 |
Fidelity Global High Income Fund | $59,000 | $5,400 | $8,700 | $2,000 |
Fidelity High Income Fund | $93,200 | $8,300 | $13,900 | $3,100 |
Fidelity SAI High Income Fund | $- | $- | $- | $- |
Fidelity U.S. Low Volatility Equity Fund | $28,000 | $2,700 | $10,800 | $1,000 |
A Amounts may reflect rounding.
B Fidelity SAI High Income Fund commenced operations on May 13, 2021.
The following table(s) present(s) fees billed by Deloitte Entities and PwC that were required to be approved by the Audit Committee for services that relate directly to the operations and financial reporting of the Fund(s) and that are rendered on behalf of Fidelity Management & Research Company LLC ("FMR") and entities controlling, controlled by, or under common control with FMR (not including any sub-adviser whose role is primarily portfolio management and is subcontracted with or overseen by another investment adviser) that provide ongoing services to the Fund(s) (“Fund Service Providers”):
Services Billed by Deloitte Entities
| | |
| April 30, 2022A | April 30, 2021A
|
Audit-Related Fees | $- | $- |
Tax Fees | $- | $- |
All Other Fees | $- | $- |
A Amounts may reflect rounding.
Services Billed by PwC
| | |
| April 30, 2022A,B | April 30, 2021A,B |
Audit-Related Fees | $7,914,600 | $9,015,700 |
Tax Fees | $353,200 | $14,300 |
All Other Fees | $- | $- |
A Amounts may reflect rounding.
B May include amounts billed prior to the Fidelity SAI High Income Fund’s commencement of operations.
“Audit-Related Fees” represent fees billed for assurance and related services that are reasonably related to the performance of the fund audit or the review of the fund's financial statements and that are not reported under Audit Fees.
“Tax Fees” represent fees billed for tax compliance, tax advice or tax planning that relate directly to the operations and financial reporting of the fund.
“All Other Fees” represent fees billed for services provided to the fund or Fund Service Provider, a significant portion of which are assurance related, that relate directly to the operations and financial reporting of the fund, excluding those services that are reported under Audit Fees, Audit-Related Fees or Tax Fees.
Assurance services must be performed by an independent public accountant.
* * *
The aggregate non-audit fees billed by Deloitte Entities and PwC for services rendered to the Fund(s), FMR (not including any sub-adviser whose role is primarily portfolio management and is subcontracted with or overseen by another investment adviser), and any Fund Service Provider for each of the last two fiscal years of the Fund(s) are as follows:
| | |
Billed By | April 30, 2022A,B | April 30, 2021A,B |
Deloitte Entities | $$486,700 | $551,300 |
PwC | $13,534,700 | $14,245,900 |
|
|
|
A Amounts may reflect rounding.
B May include amounts billed prior to the Fidelity SAI High Income Fund’s commencement of operations.
The trust's Audit Committee has considered non-audit services that were not pre-approved that were provided by Deloitte Entities and PwC to Fund Service Providers to be compatible with maintaining the independence of Deloitte Entities and PwC in its(their) audit of the Fund(s), taking into account representations from Deloitte Entities and PwC, in accordance with Public Company Accounting Oversight Board rules, regarding its independence from the Fund(s) and its(their) related entities and FMR’s
review of the appropriateness and permissibility under applicable law of such non-audit services prior to their provision to the Fund(s) Service Providers.
Audit Committee Pre-Approval Policies and Procedures
The trust’s Audit Committee must pre-approve all audit and non-audit services provided by a fund’s independent registered public accounting firm relating to the operations or financial reporting of the fund. Prior to the commencement of any audit or non-audit services to a fund, the Audit Committee reviews the services to determine whether they are appropriate and permissible under applicable law.
The Audit Committee has adopted policies and procedures to, among other purposes, provide a framework for the Committee’s consideration of non-audit services by the audit firms that audit the Fidelity funds. The policies and procedures require that any non-audit service provided by a fund audit firm to a Fidelity fund and any non-audit service provided by a fund auditor to a Fund Service Provider that relates directly to the operations and financial reporting of a Fidelity fund (“Covered Service”) are subject to approval by the Audit Committee before such service is provided.
All Covered Services must be approved in advance of provision of the service either: (i) by formal resolution of the Audit Committee, or (ii) by oral or written approval of the service by the Chair of the Audit Committee (or if the Chair is unavailable, such other member of the Audit Committee as may be designated by the Chair to act in the Chair’s absence). The approval contemplated by (ii) above is permitted where the Treasurer determines that action on such an engagement is necessary before the next meeting of the Audit Committee.
Non-audit services provided by a fund audit firm to a Fund Service Provider that do not relate directly to the operations and financial reporting of a Fidelity fund are reported to the Audit Committee periodically.
Non-Audit Services Approved Pursuant to Rule 2-01(c)(7)(i)(C) and (ii) of Regulation S-X (“De Minimis Exception”)
There were no non-audit services approved or required to be approved by the Audit Committee pursuant to the De Minimis Exception during the Fund’s(s’) last two fiscal years relating to services provided to (i) the Fund(s) or (ii) any Fund Service Provider that relate directly to the operations and financial reporting of the Fund(s).
Item 5.
Audit Committee of Listed Registrants
Not applicable.
Item 6.
Investments
(a)
Not applicable.
(b)
Not applicable.
Item 7.
Disclosure of Proxy Voting Policies and Procedures for Closed-End Management Investment Companies
Not applicable.
Item 8.
Portfolio Managers of Closed-End Management Investment Companies
Not applicable.
Item 9.
Purchase of Equity Securities by Closed-End Management Investment Company and Affiliated Purchasers
Not applicable.
Item 10.
Submission of Matters to a Vote of Security Holders
There were no material changes to the procedures by which shareholders may recommend nominees to the trust’s Board of Trustees.
Item 11.
Controls and Procedures
(a)(i) The President and Treasurer and the Chief Financial Officer have concluded that the trust’s disclosure controls and procedures (as defined in Rule 30a-3(c) under the Investment Company Act) provide reasonable assurances that material information relating to the trust is made known to them by the appropriate persons, based on their evaluation of these controls and procedures as of a date within 90 days of the filing date of this report.
(a)(ii) There was no change in the trust’s internal control over financial reporting (as defined in Rule 30a-3(d) under the Investment Company Act) that occurred during the period covered by this report that has materially affected, or is reasonably likely to materially affect, the trust’s internal control over financial reporting.
Item 12.
Disclosure of Securities Lending Activities for Closed-End Management
Investment Companies
Not applicable.
Item 13.
Exhibits
SIGNATURES
Pursuant to the requirements of the Securities Exchange Act of 1934 and the Investment Company Act of 1940, the registrant has duly caused this report to be signed on its behalf by the undersigned, thereunto duly authorized.
Fidelity Summer Street Trust
| |
By: | /s/Stacie M. Smith |
| Stacie M. Smith |
| President and Treasurer |
|
|
Date: | June 21, 2022 |
Pursuant to the requirements of the Securities Exchange Act of 1934 and the Investment Company Act of 1940, this report has been signed below by the following persons on behalf of the registrant and in the capacities and on the dates indicated.
| |
By: | /s/Stacie M. Smith |
| Stacie M. Smith |
| President and Treasurer |
|
|
Date: | June 21, 2022 |
| |
By: | /s/John J. Burke III |
| John J. Burke III |
| Chief Financial Officer |
|
|
Date: | June 21, 2022 |