UNITED STATES
SECURITIES AND EXCHANGE COMMISSION
Washington, D.C. 20549
FORM N-CSR
CERTIFIED SHAREHOLDER REPORT OF REGISTERED
MANAGEMENT INVESTMENT COMPANIES
Investment Company Act file number 811-02741
Fidelity Court Street Trust
(Exact name of registrant as specified in charter)
245 Summer St., Boston, MA 02210
(Address of principal executive offices) (Zip code)
Margaret Carey, Secretary
245 Summer St.
Boston, Massachusetts 02210
(Name and address of agent for service)
Registrant's telephone number, including area code:
617-563-7000
| |
Date of fiscal year end: | November 30 |
|
|
Date of reporting period: | May 31, 2024 |
Item 1.
Reports to Stockholders
| |
| | SEMI-ANNUAL SHAREHOLDER REPORT | AS OF MAY 31, 2024 | |
| | Fidelity® New Jersey Municipal Income Fund Fidelity® New Jersey Municipal Income Fund : FNJHX |
| | | |
This semi-annual shareholder report contains information about Fidelity® New Jersey Municipal Income Fund for the period December 1, 2023 to May 31, 2024. You can find additional information about the Fund at fundresearch.fidelity.com/prospectus/sec. You can also request this information by contacting us at 1-800-544-8544 or by sending an e-mail to fidfunddocuments@fidelity.com.
What were your Fund costs for the last six months?(based on hypothetical $10,000 investment)
| | Costs of a $10,000 investment | Costs paid as a percentage of a $10,000 investment | |
| Fidelity® New Jersey Municipal Income Fund | $ 23 | 0.46% | |
Key Fund Statistics (as of May 31, 2024)
KEY FACTS | | |
| Fund Size | $522,425,502 | |
| Number of Holdings | 242 | |
| Portfolio Turnover | 16% | |
What did the Fund invest in?
(as of May 31, 2024)
REVENUE SOURCES (% of Fund's net assets) |
| General Obligations | 33.1 | |
| Transportation | 20.2 | |
| Education | 18.0 | |
| Health Care | 13.1 | |
| Others(Individually Less Than 5%) | 15.6 | |
| 100.0 | |
| |
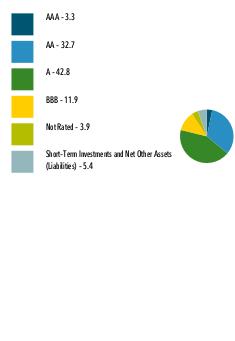
| AAA | 3.3 |
| AA | 32.7 |
| A | 42.8 |
| BBB | 11.9 |
| Not Rated | 3.9 |
| Short-Term Investments and Net Other Assets (Liabilities) | 5.4 |
QUALITY DIVERSIFICATION (% of Fund's net assets) |
|
| |
| We have used ratings from Moody's Investors Service, Inc. Where Moody's® ratings are not available, we have used S&P® ratings. All ratings are as of the date indicated and do not reflect subsequent changes. |
| Fidelity, the Fidelity Investments Logo and all other Fidelity trademarks or service marks used herein are trademarks or service marks of FMR LLC. Any third-party marks that are used herein are trademarks or service marks of their respective owners. © 2024 FMR LLC. All rights reserved. |
1.9915887.100 416-TSRS-0724 | | For additional information about the Fund; including its prospectus, financial information, holdings and proxy information, scan the QR code or visit fundresearch.fidelity.com/prospectus/sec |
| |
| | SEMI-ANNUAL SHAREHOLDER REPORT | AS OF MAY 31, 2024 | |
| | Fidelity® Connecticut Municipal Income Fund Fidelity® Connecticut Municipal Income Fund : FICNX |
| | | |
This semi-annual shareholder report contains information about Fidelity® Connecticut Municipal Income Fund for the period December 1, 2023 to May 31, 2024. You can find additional information about the Fund at fundresearch.fidelity.com/prospectus/sec. You can also request this information by contacting us at 1-800-544-8544 or by sending an e-mail to fidfunddocuments@fidelity.com.
What were your Fund costs for the last six months?(based on hypothetical $10,000 investment)
| | Costs of a $10,000 investment | Costs paid as a percentage of a $10,000 investment | |
| Fidelity® Connecticut Municipal Income Fund | $ 24 | 0.49% | |
Key Fund Statistics (as of May 31, 2024)
KEY FACTS | | |
| Fund Size | $288,487,062 | |
| Number of Holdings | 212 | |
| Portfolio Turnover | 19% | |
What did the Fund invest in?
(as of May 31, 2024)
REVENUE SOURCES (% of Fund's net assets) |
| General Obligations | 45.8 | |
| Education | 16.8 | |
| Health Care | 16.7 | |
| Housing | 7.8 | |
| Special Tax | 7.4 | |
| Others(Individually Less Than 5%) | 5.5 | |
| 100.0 | |
| |
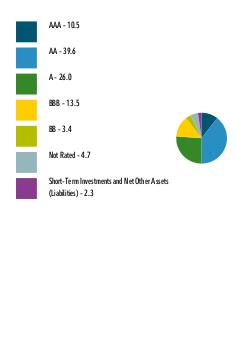
| AAA | 10.5 |
| AA | 39.6 |
| A | 26.0 |
| BBB | 13.5 |
| BB | 3.4 |
| Not Rated | 4.7 |
| Short-Term Investments and Net Other Assets (Liabilities) | 2.3 |
QUALITY DIVERSIFICATION (% of Fund's net assets) |
|
| |
| We have used ratings from Moody's Investors Service, Inc. Where Moody's® ratings are not available, we have used S&P® ratings. All ratings are as of the date indicated and do not reflect subsequent changes. |
| Fidelity, the Fidelity Investments Logo and all other Fidelity trademarks or service marks used herein are trademarks or service marks of FMR LLC. Any third-party marks that are used herein are trademarks or service marks of their respective owners. © 2024 FMR LLC. All rights reserved. |
1.9915886.100 407-TSRS-0724 | | For additional information about the Fund; including its prospectus, financial information, holdings and proxy information, scan the QR code or visit fundresearch.fidelity.com/prospectus/sec |
Item 2.
Code of Ethics
Not applicable.
Item 3.
Audit Committee Financial Expert
Not applicable.
Item 4.
Principal Accountant Fees and Services
Not applicable.
Item 5.
Audit Committee of Listed Registrants
Not applicable.
Item 6.
Investments
(a)
Not applicable.
(b)
Not applicable
Item 7.
Financial Statements and Financial Highlights for Open-End Management Investment Companies
Fidelity® New Jersey Municipal Income Fund
Semi-Annual Report
May 31, 2024
Contents
To view a fund's proxy voting guidelines and proxy voting record for the 12-month period ended June 30, visit http://www.fidelity.com/proxyvotingresults or visit the Securities and Exchange Commission's (SEC) web site at http://www.sec.gov.
You may also call 1-800-544-8544 to request a free copy of the proxy voting guidelines.
Standard & Poor's, S&P and S&P 500 are registered service marks of The McGraw-Hill Companies, Inc. and have been licensed for use by Fidelity Distributors Corporation.
Other third-party marks appearing herein are the property of their respective owners.
All other marks appearing herein are registered or unregistered trademarks or service marks of FMR LLC or an affiliated company. © 2024 FMR LLC. All rights reserved.
This report and the financial statements contained herein are submitted for the general information of the shareholders of the Fund. This report is not authorized for distribution to prospective investors in the Fund unless preceded or accompanied by an effective prospectus.
A fund files its complete schedule of portfolio holdings with the SEC for the first and third quarters of each fiscal year on Form N-PORT. Forms N-PORT are available on the SEC's web site at http://www.sec.gov. A fund's Forms N-PORT may be reviewed and copied at the SEC's Public Reference Room in Washington, DC. Information regarding the operation of the SEC's Public Reference Room may be obtained by calling 1-800-SEC-0330.
For a complete list of a fund's portfolio holdings, view the most recent holdings listing, semiannual report, or annual report on Fidelity's web site at http://www.fidelity.com, http://www.institutional.fidelity.com, or http://www.401k.com, as applicable.
NOT FDIC INSURED •MAY LOSE VALUE •NO BANK GUARANTEE
Neither the Fund nor Fidelity Distributors Corporation is a bank.
Item 7: Financial Statements and Financial Highlights for Open-End Management Investment Companies (Semi-Annual Report)
Fidelity® New Jersey Municipal Income Fund
Schedule of Investments May 31, 2024 (Unaudited)
Showing Percentage of Net Assets
| Municipal Bonds - 92.5% |
| | | Principal Amount (a) | Value ($) |
| Delaware - 0.5% | | | |
| Delaware River & Bay Auth. Rev. Series 2024 B: | | | |
| 5% 1/1/41 | | 500,000 | 544,901 |
| 5% 1/1/42 | | 800,000 | 868,519 |
| 5% 1/1/43 | | 600,000 | 648,816 |
| 5% 1/1/44 | | 425,000 | 457,936 |
TOTAL DELAWARE | | | 2,520,172 |
| Delaware, New Jersey - 0.4% | | | |
| Delaware River & Bay Auth. Rev. Series 2022, 5% 1/1/42 | | 2,075,000 | 2,222,253 |
| New Jersey - 73.7% | | | |
| Audubon Scd Series 2022, 2.75% 8/15/33 (Assured Guaranty Muni. Corp. Insured) | | 1,160,000 | 1,000,704 |
| Bergen County Gen. Oblig. Series 2021 ABC, 2% 6/1/28 | | 285,000 | 257,794 |
| Berkely Township Series 2023, 3.25% 8/15/35 | | 1,255,000 | 1,134,170 |
| Englewood Gen. Oblig. Series 2021, 2% 2/1/29 | | 560,000 | 491,080 |
| Essex County Gen. Oblig. Series 2020, 2% 9/1/31 | | 995,000 | 832,677 |
| Gloucester County Impt. Auth. Rev. (Rowan Univ. Projs.) Series 2024, 5% 7/1/54 (Build America Mutual Assurance Insured) | | 4,650,000 | 4,879,368 |
| Hanover Park Reg'l. High School Series 2023, 3.5% 3/15/31 | | 1,120,000 | 1,073,233 |
| Hillsborough Township Scd Series 2020, 2% 7/15/40 | | 1,240,000 | 826,216 |
| Howell Township Gen. Oblig. Series 2020, 2% 10/1/31 | | 1,000,000 | 826,421 |
| Hudson County Gen. Oblig. Series 2020, 3% 11/15/32 | | 485,000 | 441,126 |
| Hudson County Impt. Auth. (Hudson County Courthouse Proj.) Series 2020, 3% 10/1/36 | | 2,950,000 | 2,591,466 |
| Jersey City Gen. Oblig. Series 2022 A, 3% 2/15/37 | | 1,000,000 | 888,104 |
| Mercer County Gen. Oblig. Series 2021, 2.375% 2/15/30 | | 2,280,000 | 2,044,227 |
| Millburn Township Board of Ed. Series 2023: | | | |
| 1% 8/15/27 | | 1,430,000 | 1,285,896 |
| 1% 8/15/28 | | 1,100,000 | 960,060 |
| Monmouth County Impt. Auth. Rev. Series 2021 A, 3% 3/1/33 | | 385,000 | 355,625 |
| Montclair Township N J Board Ed. Series 2023, 3.25% 1/15/38 (Build America Mutual Assurance Insured) | | 1,825,000 | 1,612,127 |
| Morris County Gen. Oblig. Series 2021, 2% 2/1/29 | | 1,085,000 | 969,250 |
| New Jersey Econ. Dev. Auth.: | | | |
| (White Horse HMT Urban Renewal LLC Proj.) Series 2020, 5% 1/1/40 (b) | | 1,000,000 | 682,641 |
| Series 2015, 5.25% 6/15/27 | | 1,395,000 | 1,411,604 |
| Series 2024 SSS: | | | |
5% 6/15/33 | | 1,725,000 | 1,916,892 |
5.25% 6/15/37 | | 1,570,000 | 1,776,668 |
5.25% 6/15/38 | | 2,000,000 | 2,248,396 |
5.25% 6/15/39 | | 3,000,000 | 3,355,297 |
| Series A, 5% 11/1/35 | | 5,000,000 | 5,333,273 |
| Series QQQ: | | | |
4% 6/15/46 | | 1,250,000 | 1,190,593 |
4% 6/15/50 | | 1,000,000 | 925,075 |
| Series WW, 5.25% 6/15/40 (Pre-Refunded to 6/15/25 @ 100) | | 105,000 | 106,871 |
| New Jersey Econ. Dev. Auth. Lease Rev. (Health Dept. and Taxation Division Office Proj.) Series 2018 A, 5% 6/15/31 | | 2,555,000 | 2,660,972 |
| New Jersey Econ. Dev. Auth. Motor Vehicle Rev.: | | | |
| Series 2017 A, 3.375% 7/1/30 | | 3,705,000 | 3,491,464 |
| Series 2017 B, 3.125% 7/1/29 | | 1,335,000 | 1,257,887 |
| New Jersey Econ. Dev. Auth. Rev.: | | | |
| (Black Horse EHT Urban Renewal LLC Proj.) Series 2019 A, 5% 10/1/39 (b) | | 1,250,000 | 796,087 |
| (Goethals Bridge Replacement Proj.) Series 2013, 5.125% 1/1/34 (c) | | 1,500,000 | 1,500,661 |
| (Provident Montclair Proj.) Series 2017: | | | |
5% 6/1/30 (Assured Guaranty Muni. Corp. Insured) | | 1,500,000 | 1,546,923 |
5% 6/1/31 (Assured Guaranty Muni. Corp. Insured) | | 1,500,000 | 1,547,425 |
5% 6/1/37 (Assured Guaranty Muni. Corp. Insured) | | 4,000,000 | 4,109,475 |
| New Jersey Econ. Dev. Auth. Spl. Facilities Rev. (Port Newark Container Term. LLC. Proj.) Series 2017, 5% 10/1/37 (c) | | 1,000,000 | 1,024,286 |
| New Jersey Econ. Dev. Auth. Wtr. Facilities Rev.: | | | |
| (Middlesex Wtr. Co. Proj.) Series 2019: | | | |
4% 8/1/59 (c) | | 1,000,000 | 881,519 |
5% 8/1/59 (c) | | 1,000,000 | 1,017,235 |
| Bonds (New Jersey- American Wtr. Co., INC. Proj.) Series 2020 B, 3.75%, tender 6/1/28 (c)(d) | | 5,000,000 | 4,890,860 |
| New Jersey Edl. Facilities Auth. Rev. Series 2024 A: | | | |
| 5% 7/1/26 (Assured Guaranty Muni. Corp. Insured) | | 1,200,000 | 1,235,886 |
| 5% 7/1/27 (Assured Guaranty Muni. Corp. Insured) | | 1,445,000 | 1,510,712 |
| 5% 7/1/44 (Assured Guaranty Muni. Corp. Insured) | | 1,400,000 | 1,523,963 |
| New Jersey Edl. Facility: | | | |
| (Stevens Institute of Techonolgy Proj.) Series 2017 A: | | | |
5% 7/1/24 | | 690,000 | 690,269 |
5% 7/1/25 | | 600,000 | 606,089 |
5% 7/1/26 | | 945,000 | 962,926 |
5% 7/1/29 | | 865,000 | 891,823 |
| Series 2015 B, 5% 7/1/31 | | 3,000,000 | 3,031,432 |
| Series 2016 A: | | | |
5% 7/1/27 | | 2,875,000 | 2,933,842 |
5% 7/1/29 | | 1,000,000 | 1,018,765 |
5% 7/1/32 | | 600,000 | 611,741 |
| Series 2016 E, 5% 7/1/32 (Build America Mutual Assurance Insured) | | 3,335,000 | 3,414,248 |
| Series A: | | | |
4% 7/1/50 | | 3,000,000 | 2,588,942 |
5% 7/1/32 | | 420,000 | 440,721 |
5% 7/1/33 | | 675,000 | 707,866 |
5% 7/1/34 | | 540,000 | 565,323 |
5% 7/1/35 | | 570,000 | 595,950 |
5% 7/1/36 | | 1,095,000 | 1,141,844 |
5% 7/1/37 | | 1,095,000 | 1,137,393 |
5% 7/1/38 | | 985,000 | 1,015,488 |
5% 7/1/39 | | 1,040,000 | 1,066,018 |
5% 7/1/40 | | 1,035,000 | 1,057,521 |
5% 7/1/45 | | 3,500,000 | 3,536,245 |
| New Jersey Gen. Oblig.: | | | |
| Series 2020 A, 3% 6/1/32 | | 4,240,000 | 3,956,121 |
| Series 2021: | | | |
2% 6/1/26 | | 6,300,000 | 5,981,348 |
2% 6/1/27 | | 2,000,000 | 1,852,148 |
2% 6/1/29 | | 3,110,000 | 2,744,066 |
| New Jersey Health Care Facilities Fing. Auth. Rev.: | | | |
| (Inspira Health Proj.) Series 2017 A, 5% 7/1/42 | | 5,325,000 | 5,406,564 |
| (St Joseph Hosp. & Med. Ctr., Proj.) Series 2016, 5% 7/1/25 | | 700,000 | 701,971 |
| Series 2014 A, 4% 7/1/45 | | 1,300,000 | 1,169,199 |
| Series 2015 A, 4.125% 7/1/38 (Assured Guaranty Muni. Corp. Insured) | | 1,000,000 | 975,897 |
| Series 2016 A: | | | |
5% 7/1/27 | | 100,000 | 102,525 |
5% 7/1/39 | | 11,000,000 | 11,184,095 |
5% 7/1/43 | | 2,500,000 | 2,529,707 |
| Series 2016: | | | |
4% 7/1/48 | | 425,000 | 370,091 |
5% 7/1/26 | | 800,000 | 805,199 |
5% 7/1/31 | | 400,000 | 413,227 |
5% 7/1/35 | | 950,000 | 956,792 |
5% 7/1/36 | | 565,000 | 568,258 |
5% 7/1/41 | | 6,085,000 | 6,021,053 |
| Series 2017 A, 5% 7/1/25 | | 110,000 | 111,642 |
| Series 2019: | | | |
3% 7/1/49 | | 9,640,000 | 7,447,616 |
5% 7/1/34 | | 960,000 | 1,019,044 |
| Series 2021 A, 5% 7/1/25 | | 3,000,000 | 3,048,283 |
| Series 2021: | | | |
3% 7/1/46 | | 7,140,000 | 5,379,672 |
4% 7/1/35 | | 750,000 | 760,715 |
4% 7/1/37 | | 700,000 | 704,649 |
5% 7/1/33 | | 1,420,000 | 1,534,304 |
5% 7/1/34 | | 1,250,000 | 1,352,893 |
| Series 2024 A: | | | |
5% 7/1/27 | | 735,000 | 768,780 |
5% 7/1/28 | | 1,000,000 | 1,060,520 |
5% 7/1/29 | | 455,000 | 489,346 |
| New Jersey Higher Ed. Student Assistance Auth. Student Ln. Rev.: | | | |
| Series 2016 1A, 5% 12/1/25 (c) | | 1,400,000 | 1,418,461 |
| Series 2017 1A: | | | |
5% 12/1/25 (c) | | 3,000,000 | 3,039,558 |
5% 12/1/27 (c) | | 2,500,000 | 2,537,987 |
| Series 2018 B: | | | |
5% 12/1/26 (c) | | 255,000 | 259,476 |
5% 12/1/28 (c) | | 950,000 | 971,304 |
| Series 2019 A: | | | |
5% 12/1/27 | | 2,000,000 | 2,084,862 |
5% 12/1/28 | | 700,000 | 730,283 |
| Series 2021 A: | | | |
5% 12/1/26 (c) | | 325,000 | 330,704 |
5% 12/1/27 (c) | | 325,000 | 330,889 |
5% 12/1/28 (c) | | 400,000 | 409,010 |
5% 12/1/29 (c) | | 1,050,000 | 1,084,238 |
| Series 2021 B: | | | |
5% 12/1/27 (c) | | 1,325,000 | 1,349,008 |
5% 12/1/28 (c) | | 1,450,000 | 1,482,663 |
5% 12/1/29 (c) | | 1,415,000 | 1,459,743 |
| Series 2023 A: | | | |
5% 12/1/25 (c) | | 575,000 | 582,582 |
5% 12/1/26 (c) | | 1,275,000 | 1,297,379 |
| Series 2023 B: | | | |
5% 12/1/25 (c) | | 1,850,000 | 1,874,394 |
5% 12/1/26 (c) | | 7,000,000 | 7,122,865 |
| Series 2024 A: | | | |
5% 12/1/29 (c) | | 1,900,000 | 1,972,303 |
5% 12/1/30 (c) | | 1,875,000 | 1,955,551 |
5% 12/1/31 (c) | | 1,270,000 | 1,331,271 |
| Series 2024 B, 5% 12/1/28 (c) | | 1,900,000 | 1,959,189 |
| Series 2024 C, 5.25% 12/1/54 (c) | | 2,225,000 | 2,196,909 |
| New Jersey Hsg. & Mtg. Fin. Agcy. Multi-family Rev. Series 2023 C: | | | |
| 5% 11/1/28 (c) | | 1,875,000 | 1,882,360 |
| 5% 5/1/29 (c) | | 1,885,000 | 1,891,575 |
| 5% 11/1/29 (c) | | 1,950,000 | 1,958,958 |
| 5% 5/1/30 (c) | | 2,000,000 | 2,008,375 |
| 5% 11/1/30 (c) | | 2,045,000 | 2,053,869 |
| New Jersey Hsg. & Mtg. Fin. Agcy. Rev.: | | | |
| Series 2019 D, 4% 10/1/24 (c) | | 2,370,000 | 2,364,219 |
| Series 2020 E, 1.75% 4/1/30 | | 900,000 | 750,942 |
| Series 2021 H: | | | |
5% 4/1/28 | | 300,000 | 312,379 |
5% 10/1/28 | | 480,000 | 502,730 |
5% 4/1/29 | | 500,000 | 528,223 |
| Series 2022 I, 5% 10/1/53 | | 3,335,000 | 3,396,806 |
| New Jersey Institute of Technology Series A: | | | |
| 5% 7/1/31 | | 375,000 | 400,966 |
| 5% 7/1/32 | | 375,000 | 401,433 |
| 5% 7/1/33 | | 170,000 | 181,902 |
| New Jersey Tobacco Settlement Fing. Corp.: | | | |
| Series 2018 A: | | | |
5% 6/1/26 | | 5,000,000 | 5,112,260 |
5% 6/1/27 | | 1,000,000 | 1,037,677 |
5% 6/1/28 | | 2,000,000 | 2,101,788 |
| Series 2018 B, 5% 6/1/46 | | 5,965,000 | 6,003,508 |
| New Jersey Tpk. Auth. Tpk. Rev. Series 2024, 5% 1/1/30 (e) | | 6,345,000 | 6,871,754 |
| New Jersey Trans. Trust Fund Auth.: | | | |
| (Trans. Prog.) Series 2019 AA, 5.25% 6/15/43 | | 520,000 | 540,081 |
| Series 2006 C: | | | |
0% 12/15/26 (AMBAC Insured) | | 10,000,000 | 9,072,993 |
0% 12/15/34 | | 4,000,000 | 2,627,414 |
| Series 2008 A, 0% 12/15/36 | | 25,000,000 | 14,797,343 |
| Series 2009 A: | | | |
0% 12/15/33 | | 1,135,000 | 770,991 |
0% 12/15/38 | | 13,900,000 | 7,401,619 |
| Series 2010 A: | | | |
0% 12/15/27 | | 3,000,000 | 2,616,114 |
0% 12/15/28 | | 9,800,000 | 8,204,068 |
0% 12/15/30 | | 14,795,000 | 11,445,840 |
0% 12/15/32 | | 355,000 | 252,230 |
| Series 2010 A3, 0% 12/15/34 | | 10,775,000 | 7,004,910 |
| Series 2014 AA: | | | |
5% 6/15/38 | | 770,000 | 770,121 |
5% 6/15/44 | | 555,000 | 555,072 |
| Series 2016 A, 5% 6/15/29 | | 750,000 | 766,319 |
| Series 2019 BB, 4% 6/15/38 | | 1,035,000 | 1,018,286 |
| Series 2020 AA, 3% 6/15/50 | | 7,500,000 | 5,433,318 |
| Series 2022 AA, 5% 6/15/38 | | 6,440,000 | 6,992,495 |
| Series 2023 BB, 5.25% 6/15/50 | | 10,000,000 | 10,710,805 |
| Series A: | | | |
0% 12/15/31 | | 365,000 | 270,973 |
5% 12/15/33 | | 2,850,000 | 3,048,388 |
| Series AA: | | | |
4% 6/15/50 | | 4,300,000 | 3,977,821 |
5% 6/15/50 | | 1,000,000 | 1,042,328 |
| Newark Port Auth. Hsg. Auth. Rev. Series 2007, 5.25% 1/1/25 (Nat'l. Pub. Fin. Guarantee Corp. Insured) | | 200,000 | 200,747 |
| Ocean City Gen. Oblig. Series 2019, 2.25% 9/15/32 | | 455,000 | 379,568 |
| Passaic County Gen. Oblig.: | | | |
| Series 2020 C, 2% 11/1/33 | | 685,000 | 539,061 |
| Series 2021 AB: | | | |
2% 11/1/34 | | 1,840,000 | 1,414,040 |
2% 11/1/36 | | 1,230,000 | 905,697 |
| Passaic County N J Impt. Auth. Cha: | | | |
| (Paterson Arts & Science Charter School Proj.) Series 2023, 4.25% 7/1/33 | | 620,000 | 618,293 |
| (Paterson Arts and Science Charter School Proj.) Series 2023: | | | |
5.25% 7/1/43 | | 670,000 | 685,428 |
5.375% 7/1/53 | | 1,000,000 | 1,013,510 |
5.5% 7/1/58 | | 635,000 | 646,483 |
| Princeton Borough Gen. Oblig. Series 2021, 2.5% 9/15/32 | | 835,000 | 720,887 |
| Rahway Board of Ed. Series 2021: | | | |
| 2.125% 7/15/32 | | 2,400,000 | 1,981,332 |
| 2.125% 7/15/37 (Build America Mutual Assurance Insured) | | 1,110,000 | 815,997 |
| 2.125% 7/15/38 (Build America Mutual Assurance Insured) | | 1,400,000 | 1,001,675 |
| River Vale Township School District Series 2021, 2% 6/15/30 | | 1,020,000 | 863,781 |
| Salem County Indl. Poll. Cont. Fing. Auth. Poll. Cont. Rev. Bonds (Philadelphia Elec. Co. Proj.) Series 1993 A, 4.45%, tender 3/1/25 (c)(d) | | 3,200,000 | 3,200,956 |
| South Jersey Port Corp. Rev. (New Jersey Gen. Oblig. Proj.) Series 2017 B: | | | |
| 5% 1/1/29 (c) | | 955,000 | 990,782 |
| 5% 1/1/31 (c) | | 1,950,000 | 2,023,745 |
| 5% 1/1/33 (c) | | 750,000 | 778,076 |
| 5% 1/1/35 (c) | | 2,000,000 | 2,073,806 |
| South Jersey Trans. Auth. Trans. Sys. Rev.: | | | |
| Series 2019 A: | | | |
5% 11/1/28 (Assured Guaranty Muni. Corp. Insured) | | 200,000 | 210,843 |
5% 11/1/31 (Assured Guaranty Muni. Corp. Insured) | | 1,500,000 | 1,602,890 |
5% 11/1/32 (Assured Guaranty Muni. Corp. Insured) | | 1,230,000 | 1,314,233 |
5% 11/1/33 (Assured Guaranty Muni. Corp. Insured) | | 750,000 | 801,281 |
| Series 2020 A: | | | |
5% 11/1/45 | | 7,000,000 | 7,196,391 |
5% 11/1/45 (Build America Mutual Assurance Insured) | | 2,000,000 | 2,088,951 |
| The Board of Ed. of Newark Series 2021: | | | |
| 4% 7/15/36 (Build America Mutual Assurance Insured) | | 775,000 | 777,243 |
| 4% 7/15/37 (Build America Mutual Assurance Insured) | | 725,000 | 725,072 |
| 5% 7/15/24 | | 400,000 | 400,360 |
| 5% 7/15/28 (Build America Mutual Assurance Insured) | | 300,000 | 315,127 |
| 5% 7/15/29 (Build America Mutual Assurance Insured) | | 300,000 | 318,570 |
| 5% 7/15/30 (Build America Mutual Assurance Insured) | | 300,000 | 321,751 |
| 5% 7/15/31 (Build America Mutual Assurance Insured) | | 375,000 | 405,840 |
| 5% 7/15/32 (Build America Mutual Assurance Insured) | | 400,000 | 431,500 |
| 5% 7/15/33 (Build America Mutual Assurance Insured) | | 500,000 | 538,739 |
| Washington Township Gloucester County Series 2021, 2% 5/15/33 | | 1,000,000 | 800,296 |
| Washington Township N J Board Ed. Morr Series 2023, 3.125% 8/15/35 | | 1,515,000 | 1,361,776 |
TOTAL NEW JERSEY | | | 385,168,989 |
| New York And New Jersey - 15.7% | | | |
| New Jersey Edl. Facilities Auth. Rev. Series 2024 B, 5.25% 3/1/54 | | 6,185,000 | 6,797,244 |
| Port Auth. of New York & New Jersey: | | | |
| Series 2014 185, 5% 9/1/30 (c) | | 1,105,000 | 1,106,654 |
| Series 2015 189, 3.25% 5/1/33 | | 500,000 | 454,488 |
| Series 2016, 5% 11/15/32 (c) | | 5,000,000 | 5,078,382 |
| Series 2018: | | | |
5% 9/15/28 (c) | | 4,000,000 | 4,130,572 |
5% 9/15/34 (c) | | 5,000,000 | 5,159,310 |
| Series 2020 221, 4% 7/15/50 (c) | | 1,215,000 | 1,102,701 |
| Series 2021 227, 2% 10/1/31 (c) | | 2,685,000 | 2,171,443 |
| Series 2022 236, 5% 1/15/47 (c) | | 6,000,000 | 6,227,129 |
| Series 2023 238: | | | |
5% 7/15/35 (c) | | 3,525,000 | 3,809,569 |
5% 7/15/36 (c) | | 2,940,000 | 3,169,914 |
5% 7/15/37 (c) | | 1,765,000 | 1,892,523 |
5% 7/15/38 (c) | | 1,770,000 | 1,889,120 |
5% 7/15/39 (c) | | 1,685,000 | 1,794,709 |
| Series 207, 5% 9/15/29 (c) | | 1,750,000 | 1,807,341 |
| Series 214: | | | |
5% 9/1/30 (c) | | 250,000 | 262,283 |
5% 9/1/36 (c) | | 6,785,000 | 7,074,007 |
| Series 218, 5% 11/1/44 (c) | | 1,420,000 | 1,448,085 |
| Series 221: | | | |
4% 7/15/37 (c) | | 1,000,000 | 986,233 |
4% 7/15/45 (c) | | 1,500,000 | 1,401,857 |
5% 7/15/35 (c) | | 2,500,000 | 2,643,118 |
| Series 223: | | | |
4% 7/15/34 (c) | | 2,000,000 | 2,004,322 |
4% 7/15/35 (c) | | 2,250,000 | 2,249,523 |
4% 7/15/36 (c) | | 1,350,000 | 1,339,545 |
4% 7/15/37 (c) | | 2,750,000 | 2,698,483 |
4% 7/15/38 (c) | | 6,000,000 | 5,817,188 |
4% 7/15/39 (c) | | 4,000,000 | 3,847,966 |
5% 7/15/56 (c) | | 3,500,000 | 3,571,061 |
TOTAL NEW YORK AND NEW JERSEY | | | 81,934,770 |
| Pennsylvania, New Jersey - 0.4% | | | |
| Delaware River Joint Toll Bridge Commission Pennsylvania-New Jersey Bridge Rev. Series 2019 A, 5% 7/1/44 | | 700,000 | 726,016 |
| Delaware River Port Auth. Pennsylvania & New Jersey Rev. Series 2018 A, 5% 1/1/37 | | 1,200,000 | 1,277,500 |
TOTAL PENNSYLVANIA, NEW JERSEY | | | 2,003,516 |
| Puerto Rico - 1.8% | | | |
| Puerto Rico Commonwealth Aqueduct & Swr. Auth. Series 2021 B, 5% 7/1/37 (b) | | 1,395,000 | 1,449,683 |
| Puerto Rico Commonwealth Pub. Impt. Gen. Oblig. Series 2021 A1: | | | |
| 0% 7/1/33 | | 1,552,650 | 1,029,020 |
| 5.625% 7/1/27 | | 175,000 | 182,843 |
| 5.625% 7/1/29 | | 545,000 | 585,833 |
| 5.75% 7/1/31 | | 1,300,000 | 1,446,606 |
| Puerto Rico Indl., Tourist, Edl., Med. And Envir. Cont. Facilities Fing. Auth. Series 2021: | | | |
| 4% 7/1/41 | | 195,000 | 171,698 |
| 5% 7/1/30 | | 860,000 | 892,331 |
| 5% 7/1/32 | | 125,000 | 130,425 |
| 5% 7/1/34 | | 110,000 | 114,744 |
| 5% 7/1/35 | | 480,000 | 500,550 |
| Puerto Rico Sales Tax Fing. Corp. Sales Tax Rev.: | | | |
| Series 2018 A1, 0% 7/1/31 | | 1,465,000 | 1,114,048 |
| Series 2019 A2: | | | |
4.329% 7/1/40 | | 914,000 | 908,007 |
4.55% 7/1/40 | | 1,050,000 | 1,056,332 |
TOTAL PUERTO RICO | | | 9,582,120 |
| TOTAL MUNICIPAL BONDS (Cost $490,828,634) | | | 483,431,820 |
| | | | |
| Municipal Notes - 2.1% |
| | | Principal Amount (a) | Value ($) |
| New Jersey - 2.1% | | | |
New Jersey Health Care Facilities Fing. Auth. Rev. (Virtua Health Proj.) Series 2009 C, 3.3% 6/3/24, LOC JPMorgan Chase Bank, VRDN (d) (Cost $11,000,000) | | 11,000,000 | 11,000,000 |
| | | | |
| Money Market Funds - 5.7% |
| | | Shares | Value ($) |
Fidelity Municipal Cash Central Fund 3.58% (f)(g) (Cost $29,809,454) | | 29,803,491 | 29,809,444 |
| | | | |
| TOTAL INVESTMENT IN SECURITIES - 100.3% (Cost $531,638,088) | 524,241,264 |
NET OTHER ASSETS (LIABILITIES) - (0.3)% | (1,815,762) |
| NET ASSETS - 100.0% | 522,425,502 |
| | |
Security Type Abbreviations
| VRDN | - | VARIABLE RATE DEMAND NOTE (A debt instrument that is payable upon demand, either daily, weekly or monthly) |
Legend
| (a) | Amount is stated in United States dollars unless otherwise noted. |
| (b) | Security exempt from registration under Rule 144A of the Securities Act of 1933. These securities may be resold in transactions exempt from registration, normally to qualified institutional buyers. At the end of the period, the value of these securities amounted to $2,928,411 or 0.6% of net assets. |
| (c) | Private activity obligations whose interest is subject to the federal alternative minimum tax for individuals. |
| (d) | Coupon rates for floating and adjustable rate securities reflect the rates in effect at period end. |
| (e) | Security or a portion of the security purchased on a delayed delivery or when-issued basis. |
| (f) | Information in this report regarding holdings by state and security types does not reflect the holdings of the Fidelity Municipal Cash Central Fund. |
| (g) | Affiliated fund that is generally available only to investment companies and other accounts managed by Fidelity Investments. The rate quoted is the annualized seven-day yield of the fund at period end. A complete unaudited listing of the fund's holdings as of its most recent quarter end is available upon request. In addition, each Fidelity Central Fund's financial statements are available on the SEC's website or upon request. |
Affiliated Central Funds
Fiscal year to date information regarding the Fund's investments in Fidelity Central Funds, including the ownership percentage, is presented below.
| Affiliate | Value, beginning of period ($) | Purchases ($) | Sales Proceeds ($) | Dividend Income ($) | Realized Gain (loss) ($) | Change in Unrealized appreciation (depreciation) ($) | Value, end of period ($) | % ownership, end of period |
| Fidelity Municipal Cash Central Fund 3.58% | 31,014,001 | 36,029,563 | 37,233,894 | 683,775 | (212) | (14) | 29,809,444 | 1.5% |
| Total | 31,014,001 | 36,029,563 | 37,233,894 | 683,775 | (212) | (14) | 29,809,444 | |
| | | | | | | | | |
Amounts in the dividend income column in the above table include any capital gain distributions from underlying funds, which are presented in the corresponding line item in the Statement of Operations, if applicable.
Amounts included in the purchases and sales proceeds columns may include in-kind transactions, if applicable.
Investment Valuation
The following is a summary of the inputs used, as of May 31, 2024, involving the Fund's assets and liabilities carried at fair value. The inputs or methodology used for valuing securities may not be an indication of the risk associated with investing in those securities. For more information on valuation inputs, and their aggregation into the levels used below, please refer to the Investment Valuation section in the accompanying Notes to Financial Statements.
| Valuation Inputs at Reporting Date: |
| Description | Total ($) | Level 1 ($) | Level 2 ($) | Level 3 ($) |
Investments in Securities: | | | | |
|
| Municipal Securities | 494,431,820 | - | 494,431,820 | - |
|
| Money Market Funds | 29,809,444 | 29,809,444 | - | - |
| Total Investments in Securities: | 524,241,264 | 29,809,444 | 494,431,820 | - |
Financial Statements (Unaudited)
| Statement of Assets and Liabilities |
| | | | May 31, 2024 (Unaudited) |
| | | | | |
| Assets | | | | |
| Investment in securities, at value - See accompanying schedule: | | | | |
Unaffiliated issuers (cost $501,828,634) | $ | 494,431,820 | | |
Fidelity Central Funds (cost $29,809,454) | | 29,809,444 | | |
| | | | | |
| | | | | |
| Total Investment in Securities (cost $531,638,088) | | | $ | 524,241,264 |
| Receivable for fund shares sold | | | | 215,847 |
| Interest receivable | | | | 6,429,406 |
| Distributions receivable from Fidelity Central Funds | | | | 113,798 |
| Prepaid expenses | | | | 77 |
| Other receivables | | | | 2,052 |
Total assets | | | | 531,002,444 |
| Liabilities | | | | |
| Payable to custodian bank | $ | 92,916 | | |
| Payable for investments purchased on a delayed delivery basis | | 7,000,565 | | |
| Payable for fund shares redeemed | | 748,236 | | |
| Distributions payable | | 513,854 | | |
| Accrued management fee | | 188,612 | | |
| Other payables and accrued expenses | | 32,759 | | |
| Total liabilities | | | | 8,576,942 |
| Net Assets | | | $ | 522,425,502 |
| Net Assets consist of: | | | | |
| Paid in capital | | | $ | 536,391,056 |
| Total accumulated earnings (loss) | | | | (13,965,554) |
| Net Assets | | | $ | 522,425,502 |
Net Asset Value, offering price and redemption price per share ($522,425,502 ÷ 46,086,806 shares) | | | $ | 11.34 |
| Statement of Operations |
| | | | Six months ended May 31, 2024 (Unaudited) |
| Investment Income | | | | |
| Interest | | | $ | 8,435,611 |
| Income from Fidelity Central Funds | | | | 683,775 |
| Total income | | | | 9,119,386 |
| Expenses | | | | |
| Management fee | $ | 1,017,652 | | |
| Transfer agent fees | | 113,592 | | |
| Accounting fees and expenses | | 33,604 | | |
| Custodian fees and expenses | | 6,455 | | |
| Independent trustees' fees and expenses | | 739 | | |
| Registration fees | | 26,259 | | |
| Audit | | 25,170 | | |
| Legal | | 5,476 | | |
| Miscellaneous | | 1,319 | | |
| Total expenses before reductions | | 1,230,266 | | |
| Expense reductions | | (13,595) | | |
| Total expenses after reductions | | | | 1,216,671 |
| Net Investment income (loss) | | | | 7,902,715 |
| Realized and Unrealized Gain (Loss) | | | | |
| Net realized gain (loss) on: | | | | |
| Investment Securities: | | | | |
| Unaffiliated issuers | | 332,058 | | |
| Fidelity Central Funds | | (212) | | |
| Total net realized gain (loss) | | | | 331,846 |
| Change in net unrealized appreciation (depreciation) on: | | | | |
| Investment Securities: | | | | |
| Unaffiliated issuers | | (4,358,293) | | |
| Fidelity Central Funds | | (14) | | |
| Total change in net unrealized appreciation (depreciation) | | | | (4,358,307) |
| Net gain (loss) | | | | (4,026,461) |
| Net increase (decrease) in net assets resulting from operations | | | $ | 3,876,254 |
| Statement of Changes in Net Assets |
| |
| | Six months ended May 31, 2024 (Unaudited) | | Year ended November 30, 2023 |
| Increase (Decrease) in Net Assets | | | | |
| Operations | | | | |
| Net investment income (loss) | $ | 7,902,715 | $ | 14,114,200 |
| Net realized gain (loss) | | 331,846 | | (1,645,447) |
| Change in net unrealized appreciation (depreciation) | | (4,358,307) | | 13,728,605 |
| Net increase (decrease) in net assets resulting from operations | | 3,876,254 | | 26,197,358 |
| Distributions to shareholders | | (7,587,347) | | (13,704,010) |
| | | | | |
| Share transactions | | | | |
| Proceeds from sales of shares | | 54,895,376 | | 123,066,423 |
| Reinvestment of distributions | | 4,711,684 | | 8,787,843 |
| Cost of shares redeemed | | (50,995,339) | | (134,151,204) |
| | | | | |
Net increase (decrease) in net assets resulting from share transactions | | 8,611,721 | | (2,296,938) |
| Total increase (decrease) in net assets | | 4,900,628 | | 10,196,410 |
| | | | | |
| Net Assets | | | | |
| Beginning of period | | 517,524,874 | | 507,328,464 |
| End of period | $ | 522,425,502 | $ | 517,524,874 |
| | | | | |
| Other Information | | | | |
| Shares | | | | |
| Sold | | 4,747,563 | | 11,026,048 |
| Issued in reinvestment of distributions | | 407,871 | | 781,524 |
| Redeemed | | (4,409,665) | | (12,023,702) |
| Net increase (decrease) | | 745,769 | | (216,130) |
| | | | | |
Financial Highlights
Fidelity® New Jersey Municipal Income Fund |
| |
| | Six months ended (Unaudited) May 31, 2024 | | Years ended November 30, 2023 | | 2022 | | 2021 | | 2020 | | 2019 |
Selected Per-Share Data | | | | | | | | | | | | |
| Net asset value, beginning of period | $ | 11.41 | $ | 11.14 | $ | 12.62 | $ | 12.48 | $ | 12.33 | $ | 11.56 |
| Income from Investment Operations | | | | | | | | | | | | |
Net investment income (loss) A,B | | .174 | | .316 | | .263 | | .249 | | .299 | | .333 |
| Net realized and unrealized gain (loss) | | (.050) | | .261 | | (1.417) | | .194 | | .216 | | .773 |
| Total from investment operations | | .124 | | .577 | | (1.154) | | .443 | | .515 | | 1.106 |
| Distributions from net investment income | | (.193) | | (.307) | | (.263) | | (.249) | | (.299) | | (.333) |
| Distributions from net realized gain | | (.001) | | - | | (.063) | | (.054) | | (.066) | | (.003) |
| Total distributions | | (.194) | | (.307) | | (.326) | | (.303) | | (.365) | | (.336) |
| Net asset value, end of period | $ | 11.34 | $ | 11.41 | $ | 11.14 | $ | 12.62 | $ | 12.48 | $ | 12.33 |
Total Return C,D | | | | 5.25% | | (9.22)% | | 3.58% | | 4.28% | | 9.66% |
Ratios to Average Net Assets B,E,F | | | | | | | | | | | | |
| Expenses before reductions | | .47% G | | .48% | | .48% | | .47% | | .47% | | .47% |
| Expenses net of fee waivers, if any | | | | .48% | | .47% | | .47% | | .47% | | .47% |
| Expenses net of all reductions | | .46% G | | .48% | | .47% | | .47% | | .47% | | .47% |
| Net investment income (loss) | | 3.01% G | | 2.81% | | 2.28% | | 1.97% | | 2.45% | | 2.75% |
| Supplemental Data | | | | | | | | | | | | |
| Net assets, end of period (000 omitted) | $ | 522,426 | $ | 517,525 | $ | 507,328 | $ | 717,965 | $ | 616,308 | $ | 585,664 |
Portfolio turnover rate H | | | | 29% | | 14% | | 12% | | 15% | | 12% |
ACalculated based on average shares outstanding during the period.
BNet investment income (loss) is affected by the timing of the declaration of dividends by any underlying mutual funds or exchange-traded funds (ETFs). Net investment income (loss) of any mutual funds or ETFs is not included in the Fund's net investment income (loss) ratio.
CTotal returns would have been lower if certain expenses had not been reduced during the applicable periods shown.
DTotal returns for periods of less than one year are not annualized.
EFees and expenses of any underlying mutual funds or exchange-traded funds (ETFs) are not included in the Fund's expense ratio. The Fund indirectly bears its proportionate share of these expenses. For additional expense information related to investments in Fidelity Central Funds, please refer to the "Investments in Fidelity Central Funds" note found in the Notes to Financial Statements section of the most recent Annual or Semi-Annual report.
FExpense ratios reflect operating expenses of the class. Expenses before reductions do not reflect amounts reimbursed, waived, or reduced through arrangements with the investment adviser, brokerage services, or other offset arrangements, if applicable, and do not represent the amount paid by the class during periods when reimbursements, waivers or reductions occur.
GAnnualized.
HAmount does not include the portfolio activity of any underlying mutual funds or exchange-traded funds (ETFs).
Notes to Financial Statements
(Unaudited)For the period ended May 31, 2024
1. Organization.
Fidelity New Jersey Municipal Income Fund (the Fund) is a non-diversified fund of Fidelity Court Street Trust (the Trust) and is authorized to issue an unlimited number of shares. Share transactions on the Statement of Changes in Net Assets may contain exchanges between affiliated funds. The Trust is registered under the Investment Company Act of 1940, as amended (the 1940 Act), as an open-end management investment company organized as a Massachusetts business trust. The Fund may be affected by economic and political developments in the state of New Jersey.
2. Investments in Fidelity Central Funds.
Funds may invest in Fidelity Central Funds, which are open-end investment companies generally available only to other investment companies and accounts managed by the investment adviser and its affiliates. The Schedule of Investments lists any Fidelity Central Funds held as an investment as of period end, but does not include the underlying holdings of each Fidelity Central Fund. An investing fund indirectly bears its proportionate share of the expenses of the underlying Fidelity Central Funds.
Based on its investment objective, each Fidelity Central Fund may invest or participate in various investment vehicles or strategies that are similar to those of the investing fund. These strategies are consistent with the investment objectives of the investing fund and may involve certain economic risks which may cause a decline in value of each of the Fidelity Central Funds and thus a decline in the value of the investing fund.
| Fidelity Central Fund | Investment Manager | Investment Objective | Investment Practices | Expense RatioA |
| Fidelity Money Market Central Funds | Fidelity Management & Research Company LLC (FMR) | Each fund seeks to obtain a high level of current income consistent with the preservation of capital and liquidity. | Short-term Investments | Less than .005% |
A Expenses expressed as a percentage of average net assets and are as of each underlying Central Fund's most recent annual or semi-annual shareholder report.
A complete unaudited list of holdings for each Fidelity Central Fund is available upon request or at the Securities and Exchange Commission website at www.sec.gov. In addition, the financial statements of the Fidelity Central Funds which contain the significant accounting policies (including investment valuation policies) of those funds, and are not covered by the Report of Independent Registered Public Accounting Firm, are available on the Securities and Exchange Commission website or upon request.
3. Significant Accounting Policies.
The Fund is an investment company and applies the accounting and reporting guidance of the Financial Accounting Standards Board (FASB) Accounting Standards Codification Topic 946 Financial Services - Investment Companies. The financial statements have been prepared in conformity with accounting principles generally accepted in the United States of America (GAAP), which require management to make certain estimates and assumptions at the date of the financial statements. Actual results could differ from those estimates. Subsequent events, if any, through the date that the financial statements were issued have been evaluated in the preparation of the financial statements. The Fund's Schedule of Investments lists any underlying mutual funds or exchange-traded funds (ETFs) but does not include the underlying holdings of these funds. The following summarizes the significant accounting policies of the Fund:
Investment Valuation. Investments are valued as of 4:00 p.m. Eastern time on the last calendar day of the period. The Board of Trustees (the Board) has designated the Fund's investment adviser as the valuation designee responsible for the fair valuation function and performing fair value determinations as needed. The investment adviser has established a Fair Value Committee (the Committee) to carry out the day-to-day fair valuation responsibilities and has adopted policies and procedures to govern the fair valuation process and the activities of the Committee. In accordance with these fair valuation policies and procedures, which have been approved by the Board, the Fund attempts to obtain prices from one or more third party pricing services or brokers to value its investments. When current market prices, quotations or currency exchange rates are not readily available or reliable, investments will be fair valued in good faith by the Committee, in accordance with the policies and procedures. Factors used in determining fair value vary by investment type and may include market or investment specific events, transaction data, estimated cash flows, and market observations of comparable investments. The frequency that the fair valuation procedures are used cannot be predicted and they may be utilized to a significant extent. The Committee manages the Fund's fair valuation practices and maintains the fair valuation policies and procedures. The Fund's investment adviser reports to the Board information regarding the fair valuation process and related material matters.
The Fund categorizes the inputs to valuation techniques used to value its investments into a disclosure hierarchy consisting of three levels as shown below:
Level 1 - unadjusted quoted prices in active markets for identical investments
Level 2 - other significant observable inputs (including quoted prices for similar investments, interest rates, prepayment speeds, etc.)
Level 3 - unobservable inputs (including the Fund's own assumptions based on the best information available)
Valuation techniques used to value the Fund's investments by major category are as follows:
Debt securities, including restricted securities, are valued based on evaluated prices received from third party pricing services or from brokers who make markets in such securities. Municipal securities are valued by pricing services who utilize matrix pricing which considers yield or price of bonds of comparable quality, coupon, maturity and type or by broker-supplied prices. When independent prices are unavailable or unreliable, debt securities may be valued utilizing pricing methodologies which consider similar factors that would be used by third party pricing services. Debt securities are generally categorized as Level 2 in the hierarchy but may be Level 3 depending on the circumstances
Investments in open-end mutual funds, including the Fidelity Central Funds, are valued at their closing net asset value (NAV) each business day and are categorized as Level 1 in the hierarchy
Changes in valuation techniques may result in transfers in or out of an assigned level within the disclosure hierarchy. The aggregate value of investments by input level as of May 31, 2024 is included at the end of the Fund's Schedule of Investments.
Investment Transactions and Income. For financial reporting purposes, the Fund's investment holdings and NAV include trades executed through the end of the last business day of the period. The NAV per share for processing shareholder transactions is calculated as of the close of business of the New York Stock Exchange (NYSE) , normally 4:00 p.m. Eastern time and includes trades executed through the end of the prior business day. Gains and losses on securities sold are determined on the basis of identified cost. Income and capital gain distributions from Fidelity Central Funds, if any, are recorded on the ex-dividend date. Interest income is accrued as earned and includes coupon interest and amortization of premium and accretion of discount on debt securities as applicable.
Expenses. Expenses directly attributable to a fund are charged to that fund. Expenses attributable to more than one fund are allocated among the respective funds on the basis of relative net assets or other appropriate methods. Expenses included in the accompanying financial statements reflect the expenses of that fund and do not include any expenses associated with any underlying mutual funds or exchange-traded funds. Although not included in a fund's expenses, a fund indirectly bears its proportionate share of these expenses through the net asset value of each underlying mutual fund or exchange-traded fund. Expense estimates are accrued in the period to which they relate and adjustments are made when actual amounts are known.
Income Tax Information and Distributions to Shareholders. Each year, the Fund intends to qualify as a regulated investment company under Subchapter M of the Internal Revenue Code, including distributing substantially all of its taxable income and realized gains. As a result, no provision for U.S. Federal income taxes is required. The Fund files a U.S. federal tax return, in addition to state and local tax returns as required. The Fund's federal income tax returns are subject to examination by the Internal Revenue Service (IRS) for a period of three fiscal years after they are filed. State and local tax returns may be subject to examination for an additional fiscal year depending on the jurisdiction.
Distributions are declared and recorded daily and paid monthly from net investment income. Distributions from realized gains, if any, are declared and recorded on the ex-dividend date. Income and capital gain distributions are determined in accordance with income tax regulations, which may differ from GAAP.
Capital accounts within the financial statements are adjusted for permanent book-tax differences. These adjustments have no impact on net assets or the results of operations. Capital accounts are not adjusted for temporary book-tax differences which will reverse in a subsequent period.
Book-tax differences are primarily due to market discount and capital loss carryforwards.
The Fund purchases municipal securities whose interest, in the opinion of the issuer, is free from federal income tax. There is no assurance that the IRS will agree with this opinion. In the event the IRS determines that the issuer does not comply with relevant tax requirements, interest payments from a security could become federally taxable, possibly retroactively to the date the security was issued.
As of period end, the cost and unrealized appreciation (depreciation) in securities, and derivatives if applicable, for federal income tax purposes were as follows:
| Gross unrealized appreciation | $12,783,970 |
| Gross unrealized depreciation | (19,375,633) |
| Net unrealized appreciation (depreciation) | $(6,591,663) |
| Tax cost | $530,832,927 |
Capital loss carryforwards are only available to offset future capital gains of the Fund to the extent provided by regulations and may be limited. The capital loss carryforward information presented below, including any applicable limitation, is estimated as of prior fiscal period end and is subject to adjustment.
Short-term | $(279,879) |
Long-term | (7,421,461) |
| Total capital loss carryforward | $(7,701,340) |
Delayed Delivery Transactions and When-Issued Securities. During the period, certain Funds transacted in securities on a delayed delivery or when-issued basis. Payment and delivery may take place after the customary settlement period for that security. The price of the underlying securities and the date when the securities will be delivered and paid for are fixed at the time the transaction is negotiated. Securities purchased on a delayed delivery or when-issued basis are identified as such in the Schedule of Investments. Compensation for interest forgone in the purchase of a delayed delivery or when-issued debt security may be received. With respect to purchase commitments, each applicable Fund identifies securities as segregated in its records with a value at least equal to the amount of the commitment. Payables and receivables associated with the purchases and sales of delayed delivery securities having the same coupon, settlement date and broker are offset. Delayed delivery or when-issued securities that have been purchased from and sold to different brokers are reflected as both payables and receivables in the Statement of Assets and Liabilities under the caption "Delayed delivery", as applicable. Losses may arise due to changes in the value of the underlying securities or if the counterparty does not perform under the contract's terms, or if the issuer does not issue the securities due to political, economic, or other factors.
Restricted Securities (including Private Placements). Funds may invest in securities that are subject to legal or contractual restrictions on resale. These securities generally may be resold in transactions exempt from registration or to the public if the securities are registered. Disposal of these securities may involve time-consuming negotiations and expense, and prompt sale at an acceptable price may be difficult. Information regarding restricted securities held at period end is included at the end of the Schedule of Investments, if applicable.
4. Purchases and Sales of Investments.
Purchases and sales of securities, other than short-term securities and in-kind transactions, as applicable, are noted in the table below.
| | Purchases ($) | Sales ($) |
| Fidelity New Jersey Municipal Income Fund | 60,947,907 | 36,950,293 |
5. Fees and Other Transactions with Affiliates.
Management Fee. Fidelity Management & Research Company LLC (the investment adviser) and its affiliates provide the Fund with investment management related services for which the Fund pays a monthly management fee.
Effective March 1, 2024, the Fund's management contract was amended to incorporate administrative services previously covered under separate services agreements (Transfer Agent and Accounting agreements). Any reference to "class" in this note shall mean "the Fund" as the Fund currently offers only one class of shares. The amended contract incorporates a management fee rate that may vary by class. The investment adviser or an affiliate pays certain expenses of managing and operating the Fund out of each class's management fee. Each class of the Fund pays a management fee to the investment adviser. The management fee is calculated and paid to the investment adviser every month. When determining a class's management fee, a mandate rate is calculated based on the monthly average net assets of a group of funds advised by FMR within a designated asset class. A discount rate is subtracted from the mandate rate once the Fund's monthly average net assets reach a certain level. The mandate rate and discount rate may vary by class. The annual management fee rate for a class of shares of the Fund is the lesser of (1) the class's mandate rate reduced by the class's discount rate (if applicable) or (2) the amount set forth in the following table.
| | Maximum Management Fee Rate % |
| Fidelity New Jersey Municipal Income Fund | .43 |
One-twelfth of the management fee rate for a class is applied to the average net assets of the class for the month, giving a dollar amount which is the management fee for the class for that month. A different management fee rate may be applicable to each class of the Fund. The difference between classes is the result of separate arrangements for class-level services and/or waivers of certain expenses. It is not the result of any difference in advisory or custodial fees or other expenses related to the management of the Fund's assets, which do not vary by class. For the portion of the reporting period on or after March 1, 2024, the total annualized management fee rates were as follows:
| | Total Management Fee Rate % |
| Fidelity New Jersey Municipal Income Fund | .43 |
Prior to March 1, 2024, the management fee was the sum of an individual fund fee rate that was based on an annual rate of .25% of the Fund's average net assets and an annualized group fee rate that averaged .10% during the period. The group fee rate was based upon the monthly average net assets of a group of registered investment companies with which the investment adviser has management contracts. The group fee rate decreased as assets under management increased and increased as assets under management decreased. For the portion of the reporting period prior to March 1, 2024, the total annualized management fee rate was .35%.
Effective March 1, 2024, the Fund's sub-advisory agreements with FMR Investment Management (UK) Limited, Fidelity Management & Research (Hong Kong) Limited, and Fidelity Management & Research (Japan) Limited were amended to provide that the investment adviser pays each sub-adviser monthly fees equal to 110% of the sub-adviser's costs for providing sub-advisory services.
Transfer Agent Fees. Fidelity Investments Institutional Operations Company LLC (FIIOC), an affiliate of the investment adviser, is the transfer, dividend disbursing and shareholder servicing agent for the Fund. Effective March 1, 2024, each Fund's management contract was amended to incorporate transfer agent services and associated fees previously covered under a separate services agreement. FIIOC pays for typesetting, printing and mailing of shareholder reports, except proxy statements.
During November 2023, the Board approved a change in the transfer agent fees effective December 1, 2023 to a fixed annual rate of .0857% average net assets.
Prior to December 1, 2023, FIIOC received account fees and asset-based fees that varied according to account size and type of account. For the portion of the reporting period prior to March 1, 2024, the fees were equivalent to the annualized rate of .09% of average net assets.
Accounting Fees. Fidelity Service Company, Inc. (FSC), an affiliate of the investment adviser, maintains the Fund's accounting records. Effective March 1, 2024, the Fund's management contract was amended to incorporate accounting services and associated fees previously covered under a separate services agreement.
During November 2023, the Board approved a change in the accounting fees effective December 1, 2023 to a fixed annual rate of average net assets as follows:
| | % of Average Net Assets |
| Fidelity New Jersey Municipal Income Fund | .0256 |
Prior to December 1, 2023, the accounting fee was based on the level of average net assets for each month. For the portion of the reporting period prior to March 1, 2024, the fees were equivalent to the following annualized rates:
| | % of Average Net Assets |
| Fidelity New Jersey Municipal Income Fund | .03 |
Interfund Trades. Funds may purchase from or sell securities to other Fidelity Funds under procedures adopted by the Board. The procedures have been designed to ensure these interfund trades are executed in accordance with Rule 17a-7 of the 1940 Act. Any interfund trades are included within the respective purchases and sales amounts shown in the Purchases and Sales of Investments note. Interfund trades during the period are noted in the table below.
| | Purchases ($) | Sales ($) | Realized Gain (Loss)($) |
| Fidelity New Jersey Municipal Income Fund | 523,419 | - | - |
6. Committed Line of Credit.
Certain Funds participate with other funds managed by the investment adviser or an affiliate in a $4.25 billion credit facility (the "line of credit") to be utilized for temporary or emergency purposes to fund shareholder redemptions or for other short-term liquidity purposes. The participating funds have agreed to pay commitment fees on their pro-rata portion of the line of credit, which are reflected in Miscellaneous expenses on the Statement of Operations, and are listed below. During the period, there were no borrowings on this line of credit.
| | Amount ($) |
| Fidelity New Jersey Municipal Income Fund | 484 |
7. Expense Reductions.
Through arrangements with the Fund's custodian, credits realized as a result of certain uninvested cash balances were used to reduce the Fund's expenses by $1,179.
In addition, during the period the investment adviser or an affiliate reimbursed and/or waived a portion of operating expenses in the amount of $12,416.
8. Other.
A fund's organizational documents provide former and current trustees and officers with a limited indemnification against liabilities arising in connection with the performance of their duties to the fund. In the normal course of business, a fund may also enter into contracts that provide general indemnifications. A fund's maximum exposure under these arrangements is unknown as this would be dependent on future claims that may be made against a fund. The risk of material loss from such claims is considered remote.
9. Risk and Uncertainties.
Many factors affect a fund's performance. Developments that disrupt global economies and financial markets, such as pandemics, epidemics, outbreaks of infectious diseases, war, terrorism, and environmental disasters, may significantly affect a fund's investment performance. The effects of these developments to a fund will be impacted by the types of securities in which a fund invests, the financial condition, industry, economic sector, and geographic location of an issuer, and a fund's level of investment in the securities of that issuer. Significant concentrations in security types, issuers, industries, sectors, and geographic locations may magnify the factors that affect a fund's performance.
Item 8: Changes in and Disagreements with Accountants for Open-End Management Investment Companies
Note: This is not applicable for any fund included in this document.
Item 9: Proxy Disclosures for Open-End Management Investment Companies
Note: This is not applicable for any fund included in this document.
Item 10: Renumeration Paid to Directors, Officers, and others of Open-End Management Investment Companies
Note: This information is disclosed as part of the financial statements for each Fund as part of Item 7: Financial Statements and Financial Highlights for Open-End Management Investment companies.
Item 11: Statement Regarding Basis for Approval of Investment Advisory Contract
Board Approval of Investment Advisory Contracts
Fidelity New Jersey Municipal Income Fund
At its January 2024 meeting, the Board of Trustees, including the Independent Trustees (together, the Board), approved an amended and restated management contract with Fidelity Management & Research Company LLC (FMR) (the Management Contract), and amended and restated sub-advisory agreements (the Sub-Advisory Contracts, and together with the Management Contract, the Advisory Contracts) for the fund, including the fund's sub-advisory agreements with FMR Investment Management (UK) Limited (FMR UK), Fidelity Management & Research (Hong Kong) Limited (FMR H.K.), and Fidelity Management & Research (Japan) Limited (FMR Japan). The Advisory Contracts will be effective March 1, 2024. The Board will consider the annual renewal of the fund's Advisory Contracts in September 2024, following its review of additional materials provided by FMR.
Management Contract. The Board approved the Management Contract, which implements a new fee structure combining the management fee, transfer agent fee (TA Fee), and pricing and bookkeeping fee (P&B Fee) of the fund into a single fee based on tiered schedules and subject to a maximum rate (the Unified Fee). In exchange for the Unified Fee, the fund will receive investment advisory, management, administrative, transfer agent, pricing and bookkeeping services under a single agreement - the Management Contract.
In its consideration of the Management Contract over several meetings, the Board received, reviewed and discussed a comprehensive set of analyses regarding the Unified Fee including (i) the legal framework, (ii) design goals for the Unified Fee, (iii) calculation methodology for the Unified Fee and illustrative examples, (iv) annual and cumulative projected impacts under various scenarios, both in the aggregate and at the fund/class level, (v) explanations of schedules, rate levers and maximum rates and (vi) shareholder benefits and projected savings.
The Board considered that the maximum Unified Fee for the fund would be no higher than the sum of (i) the lowest contractual management fee under the fund's existing management contract, which is the individual fund fee, if any, plus the lowest contractual marginal group fee rate and (ii) the TA and P&B Fee rates, which are fixed fee rates since December 1, 2023 (together, the "Unified Fee Cap"). The Board noted that, as a result of this Unified Fee Cap, the Unified Fee would be no greater than the fees previously authorized to be charged for the same services. The Board noted that certain expenses such as third-party expenses and certain other miscellaneous expenses would be outside the scope of the Unified Fee and the calculation of such fees would not change as a result of the Unified Fee.
The Board considered that implementation of the Unified Fee, which includes the Unified Fee Cap, would cause all funds subject to a Unified Fee, including the fund, to experience an immediate reduction on contractual fee rates for services provided under the current management contracts. The Board considered that some funds would not experience lower fees as a result of existing fee caps. The Board further considered that, in addition to the contractual fee savings, the Unified Fee offers funds and their shareholders greater protection from future rate increases for services previously offered under separate agreements that are now covered by the Management Contract because such rate increases would require shareholder, as well as Board, approval.
Sub-Advisory Contracts. In connection with the Unified Fee changes, the Board considered the Sub-Advisory Contracts, which changed the arrangements for fees paid by FMR to the sub-advisers under the agreements. The Board noted that the agreements with FMR UK, FMR H.K., and FMR Japan were amended to provide that FMR will compensate each sub-adviser at a fee equal to 110% of the sub-adviser's costs incurred in providing services under the agreement. The Board considered that, under the Sub-Advisory Contracts, FMR, and not the fund, will continue to pay the sub-advisory fees to each applicable sub-adviser.
The Board considered that the approval of the fund's Advisory Contracts will not result in any changes in the investment process or strategies employed in the management of the fund's assets or the day-to-day management of the fund or the persons primarily responsible for such management. Further, the Board considered that the Management Contract would not change the obligations and services of FMR and its affiliates on behalf of the fund, and, in particular, there would be no change in the nature and level of advisory, management, administration, transfer agent, and pricing and bookkeeping services provided to the fund by FMR and its affiliates.
In connection with its consideration of future renewals of the fund's Advisory Contracts, the Board will consider: (i) the nature, extent and quality of services provided to the funds, including shareholder and administrative services and investment performance; (ii) the competitiveness of the management fee and total expenses for the fund; (iii) the costs of the services and profitability, including the revenues earned and the expenses incurred in conducting the business of developing, marketing, distributing, managing, administering, and servicing the fund and its shareholders, to the extent applicable; and (iv) whether there have been economies of scale in respect of the Fidelity funds, whether the Fidelity funds (including the fund) have appropriately benefited from any such economies of scale, and whether there is the potential for realization of any further economies.
Based on its evaluation of all of the conclusions noted above, and after considering all factors it believed relevant, the Board concluded that the fund's management fee structure is fair and reasonable, and that the fund's Advisory Contracts should be approved.
1.704871.126
NJN-SANN-0724
Fidelity® Connecticut Municipal Income Fund
Semi-Annual Report
May 31, 2024
Contents
To view a fund's proxy voting guidelines and proxy voting record for the 12-month period ended June 30, visit http://www.fidelity.com/proxyvotingresults or visit the Securities and Exchange Commission's (SEC) web site at http://www.sec.gov.
You may also call 1-800-544-8544 to request a free copy of the proxy voting guidelines.
Standard & Poor's, S&P and S&P 500 are registered service marks of The McGraw-Hill Companies, Inc. and have been licensed for use by Fidelity Distributors Corporation.
Other third-party marks appearing herein are the property of their respective owners.
All other marks appearing herein are registered or unregistered trademarks or service marks of FMR LLC or an affiliated company. © 2024 FMR LLC. All rights reserved.
This report and the financial statements contained herein are submitted for the general information of the shareholders of the Fund. This report is not authorized for distribution to prospective investors in the Fund unless preceded or accompanied by an effective prospectus.
A fund files its complete schedule of portfolio holdings with the SEC for the first and third quarters of each fiscal year on Form N-PORT. Forms N-PORT are available on the SEC's web site at http://www.sec.gov. A fund's Forms N-PORT may be reviewed and copied at the SEC's Public Reference Room in Washington, DC. Information regarding the operation of the SEC's Public Reference Room may be obtained by calling 1-800-SEC-0330.
For a complete list of a fund's portfolio holdings, view the most recent holdings listing, semiannual report, or annual report on Fidelity's web site at http://www.fidelity.com, http://www.institutional.fidelity.com, or http://www.401k.com, as applicable.
NOT FDIC INSURED •MAY LOSE VALUE •NO BANK GUARANTEE
Neither the Fund nor Fidelity Distributors Corporation is a bank.
Item 7: Financial Statements and Financial Highlights for Open-End Management Investment Companies (Semi-Annual Report)
Fidelity® Connecticut Municipal Income Fund
Schedule of Investments May 31, 2024 (Unaudited)
Showing Percentage of Net Assets
| Municipal Bonds - 97.7% |
| | | Principal Amount (a) | Value ($) |
| Connecticut - 96.1% | | | |
| Bridgeport Gen. Oblig.: | | | |
| Series 2016 D: | | | |
5% 8/15/31 (Assured Guaranty Muni. Corp. Insured) | | 1,000,000 | 1,027,049 |
5% 8/15/32 (Assured Guaranty Muni. Corp. Insured) | | 3,090,000 | 3,173,669 |
| Series 2019 A: | | | |
5% 2/1/32 (Build America Mutual Assurance Insured) | | 1,000,000 | 1,064,473 |
5% 2/1/37 (Build America Mutual Assurance Insured) | | 1,000,000 | 1,054,645 |
5% 2/1/39 (Build America Mutual Assurance Insured) | | 1,000,000 | 1,047,922 |
| Series 2021 A: | | | |
4% 8/1/38 | | 800,000 | 798,333 |
4% 8/1/41 | | 1,050,000 | 1,023,715 |
4% 8/1/46 | | 375,000 | 349,247 |
4% 8/1/51 | | 575,000 | 523,506 |
5% 8/1/35 | | 450,000 | 488,029 |
| Brookfield Gen. Oblig. Series 2020, 2% 8/15/35 | | 365,000 | 282,977 |
| Connecticut Arpt. Auth. Customer Facility Charge Rev. (Ground Trans. Ctr. Proj.) Series 2019 A: | | | |
| 4% 7/1/49 (b) | | 2,000,000 | 1,757,436 |
| 5% 7/1/49 (b) | | 2,925,000 | 2,941,803 |
| Connecticut Gen. Oblig.: | | | |
| Series 2015 B: | | | |
5% 6/15/27 | | 4,825,000 | 4,881,940 |
5% 6/15/30 | | 1,290,000 | 1,304,652 |
| Series 2015 F, 5% 11/15/31 | | 4,000,000 | 4,060,297 |
| Series 2018 A, 5% 4/15/30 | | 2,500,000 | 2,638,485 |
| Series 2018 C, 5% 6/15/31 | | 725,000 | 764,338 |
| Series 2019 A: | | | |
5% 4/15/35 | | 2,000,000 | 2,141,313 |
5% 4/15/36 | | 2,300,000 | 2,458,207 |
5% 4/15/39 | | 2,450,000 | 2,591,997 |
| Series 2020 A, 3% 1/15/39 | | 5,500,000 | 4,701,149 |
| Series 2020 C, 3% 6/1/40 | | 3,380,000 | 2,799,495 |
| Series 2021 A: | | | |
3% 1/15/32 | | 335,000 | 308,812 |
3% 1/15/35 | | 1,850,000 | 1,656,965 |
3% 1/15/36 | | 9,130,000 | 8,103,726 |
3% 1/15/37 | | 2,875,000 | 2,513,014 |
3% 1/15/38 | | 1,000,000 | 857,989 |
| Series 2021 B, 3% 6/1/39 | | 1,400,000 | 1,178,239 |
| Series 2022 A, 4% 1/15/34 | | 400,000 | 411,550 |
| Series 2022 B, 2% 1/15/38 | | 320,000 | 228,024 |
| Series 2023 A, 5% 5/15/27 | | 900,000 | 939,495 |
| Series 2023 B: | | | |
5% 8/1/26 | | 3,000,000 | 3,093,245 |
5% 8/1/27 | | 1,835,000 | 1,921,562 |
| Series 2024: | | | |
5% 3/1/28 | | 2,000,000 | 2,112,625 |
5% 1/15/29 | | 2,000,000 | 2,141,267 |
5% 3/1/29 | | 1,855,000 | 1,989,994 |
5% 1/15/30 | | 1,335,000 | 1,450,781 |
5% 3/1/30 | | 2,500,000 | 2,721,757 |
| Connecticut Health & Edl. Facilities Auth. Rev.: | | | |
| (Fairfield Univ.): | | | |
Series 2017 R: | | | |
5% 7/1/31 | | 1,825,000 | 1,880,285 |
5% 7/1/32 | | 1,000,000 | 1,030,170 |
Series 2017, 5% 7/1/30 | | 2,400,000 | 2,473,854 |
| (Sacred Heart Univ., CT. Proj.) Series 2017 I-1: | | | |
5% 7/1/27 | | 80,000 | 82,730 |
5% 7/1/28 | | 1,150,000 | 1,187,462 |
5% 7/1/29 | | 350,000 | 362,047 |
5% 7/1/30 | | 1,100,000 | 1,137,398 |
5% 7/1/31 | | 1,300,000 | 1,342,809 |
5% 7/1/32 | | 1,050,000 | 1,084,446 |
5% 7/1/33 | | 700,000 | 722,348 |
5% 7/1/34 | | 750,000 | 773,225 |
| Bonds Series 2017 B2, 3.2%, tender 7/1/26 (c) | | 7,000,000 | 6,932,230 |
| Series 2013 N, 5% 7/1/25 | | 300,000 | 300,179 |
| Series 2014 E: | | | |
5% 7/1/28 | | 3,260,000 | 3,261,598 |
5% 7/1/29 | | 3,840,000 | 3,841,937 |
| Series 2015 L, 5% 7/1/29 | | 1,500,000 | 1,515,818 |
| Series 2015, 5% 7/1/32 | | 205,000 | 207,270 |
| Series 2016 K, 4% 7/1/46 | | 7,000,000 | 6,063,618 |
| Series 2018 K3, 5% 7/1/38 | | 985,000 | 971,928 |
| Series 2019 A: | | | |
4% 7/1/49 | | 1,365,000 | 1,164,397 |
5% 7/1/26 | | 310,000 | 310,010 |
5% 7/1/29 | | 1,290,000 | 1,301,023 |
5% 7/1/49 (d) | | 6,000,000 | 4,888,108 |
| Series 2019 Q1, 3% 11/1/33 | | 1,000,000 | 908,600 |
| Series 2020 A, 4% 7/1/40 | | 1,250,000 | 1,175,160 |
| Series 2020 C, 4% 7/1/45 | | 1,800,000 | 1,657,027 |
| Series 2020 K: | | | |
5% 7/1/36 | | 1,000,000 | 1,062,011 |
5% 7/1/37 | | 1,750,000 | 1,848,409 |
5% 7/1/39 | | 2,830,000 | 2,961,168 |
| Series 2021 A, 3% 7/1/39 | | 5,000,000 | 3,929,529 |
| Series 2021 L, 3% 7/1/41 | | 1,340,000 | 1,085,008 |
| Series 2022 M: | | | |
4% 7/1/36 | | 250,000 | 252,293 |
4% 7/1/37 | | 260,000 | 261,071 |
4% 7/1/39 | | 2,600,000 | 2,477,937 |
4% 7/1/40 | | 3,300,000 | 3,091,432 |
4% 7/1/41 | | 1,195,000 | 1,157,118 |
4% 7/1/42 | | 1,750,000 | 1,590,019 |
| Series 2023 E: | | | |
5% 7/15/38 | | 900,000 | 951,748 |
5% 7/15/39 | | 1,060,000 | 1,116,379 |
5% 7/15/40 | | 1,300,000 | 1,356,971 |
| Series E, 5% 7/1/28 | | 1,250,000 | 1,250,148 |
| Series G: | | | |
5% 7/1/29 (d) | | 1,055,000 | 1,017,201 |
5% 7/1/30 (d) | | 275,000 | 264,221 |
5% 7/1/34 (d) | | 695,000 | 664,416 |
5% 7/1/39 (d) | | 2,600,000 | 2,444,997 |
5% 7/1/50 (d) | | 1,000,000 | 878,149 |
| Series K1: | | | |
5% 7/1/24 | | 600,000 | 599,854 |
5% 7/1/25 | | 1,240,000 | 1,242,613 |
5% 7/1/27 | | 250,000 | 251,524 |
| Series K3, 5% 7/1/48 | | 3,695,000 | 3,399,677 |
| Series L: | | | |
5% 7/1/26 | | 1,000,000 | 1,010,649 |
5% 7/1/27 | | 2,000,000 | 2,019,302 |
| Series L1: | | | |
4% 7/1/24 | | 650,000 | 649,284 |
4% 7/1/25 | | 600,000 | 595,599 |
4% 7/1/26 | | 1,175,000 | 1,170,426 |
4% 7/1/27 | | 700,000 | 697,740 |
| Series N: | | | |
4% 7/1/39 | | 1,850,000 | 1,518,568 |
5% 7/1/24 | | 375,000 | 374,732 |
5% 7/1/25 | | 340,000 | 338,364 |
5% 7/1/27 | | 430,000 | 428,036 |
5% 7/1/31 | | 500,000 | 498,230 |
5% 7/1/32 | | 550,000 | 546,759 |
5% 7/1/33 | | 720,000 | 713,292 |
5% 7/1/34 | | 675,000 | 666,103 |
| Series R: | | | |
5% 6/1/37 | | 1,000,000 | 1,068,070 |
5% 6/1/38 | | 1,045,000 | 1,107,192 |
5% 6/1/39 | | 1,595,000 | 1,682,379 |
5% 6/1/40 | | 1,125,000 | 1,176,793 |
| Connecticut Higher Ed. Supplemental Ln. Auth. Rev. (Chesla Ln. Prog.): | | | |
| Series 2024 B: | | | |
5% 11/15/26 (b) | | 400,000 | 407,606 |
5% 11/15/27 (b) | | 665,000 | 683,060 |
5% 11/15/28 (b) | | 1,020,000 | 1,055,545 |
5% 11/15/29 (b) | | 1,080,000 | 1,124,987 |
5% 11/15/30 (b) | | 1,075,000 | 1,125,798 |
5% 11/15/31 (b) | | 750,000 | 790,399 |
5% 11/15/32 (b) | | 725,000 | 767,809 |
5% 11/15/33 (b) | | 540,000 | 573,155 |
| Series B: | | | |
5% 11/15/24 (b) | | 300,000 | 300,818 |
5% 11/15/25 (b) | | 400,000 | 403,638 |
5% 11/15/26 (b) | | 600,000 | 610,010 |
5% 11/15/27 (b) | | 610,000 | 620,873 |
5% 11/15/28 (b) | | 525,000 | 542,003 |
5% 11/15/29 (b) | | 495,000 | 514,150 |
| Series D: | | | |
5% 11/15/24 (Escrowed to Maturity) | | 425,000 | 427,354 |
5% 11/15/25 (Escrowed to Maturity) | | 250,000 | 255,260 |
5% 11/15/26 (Escrowed to Maturity) | | 180,000 | 186,631 |
| Connecticut Hsg. Fin. Auth.: | | | |
| Series 2016 F, 3.5% 5/15/39 (b) | | 340,000 | 334,426 |
| Series 2018 E1, 4.25% 5/15/42 | | 990,000 | 984,542 |
| Series 2019 B1, 4% 5/15/49 | | 2,120,000 | 2,084,671 |
| Series 2019 F, 3.5% 11/15/43 | | 2,005,000 | 1,961,303 |
| Series 2020 A2, 2.2% 5/15/31 (b) | | 1,350,000 | 1,106,193 |
| Series 2021 A1: | | | |
1.3% 5/15/30 | | 2,000,000 | 1,592,379 |
1.6% 5/15/32 | | 1,500,000 | 1,154,352 |
| Series 2021 A3, 1.6% 5/15/32 | | 2,240,000 | 1,828,303 |
| Series 2021 B1, 3% 11/15/49 | | 2,095,000 | 2,000,123 |
| Series 2022 A1, 3.5% 11/15/51 | | 920,000 | 886,156 |
| Series A2: | | | |
5% 11/15/26 (b) | | 840,000 | 852,257 |
5% 5/15/27 (b) | | 1,890,000 | 1,922,556 |
5% 11/15/27 (b) | | 860,000 | 877,811 |
5% 5/15/28 (b) | | 615,000 | 627,700 |
5% 11/15/28 (b) | | 225,000 | 230,451 |
| Series C: | | | |
5% 5/15/26 (b) | | 1,820,000 | 1,848,383 |
5% 5/15/27 (b) | | 800,000 | 817,111 |
5% 11/15/28 (b) | | 580,000 | 594,523 |
5% 5/15/29 (b) | | 1,115,000 | 1,153,788 |
| Connecticut Spl. Tax Oblig. Trans. Infrastructure Rev.: | | | |
| Series 2021 A, 5% 5/1/35 | | 1,000,000 | 1,102,184 |
| Series 2021 C: | | | |
5% 1/1/28 | | 1,600,000 | 1,685,953 |
5% 1/1/30 | | 3,500,000 | 3,801,450 |
5% 1/1/31 | | 3,410,000 | 3,752,740 |
5% 1/1/32 | | 2,500,000 | 2,780,245 |
| Series A: | | | |
5% 5/1/28 | | 1,000,000 | 1,058,961 |
5% 9/1/33 | | 1,000,000 | 1,001,862 |
| East Lyme Gen. Oblig. Series 2020, 3% 7/15/38 | | 530,000 | 437,838 |
| Greater New Haven Wtr. Poll. Cont. Auth. Reg'l. Wastewtr. Sys. Rev. Series 2005 A, 5% 8/15/35 (Nat'l. Pub. Fin. Guarantee Corp. Insured) | | 10,000 | 10,000 |
| Hartford County Metropolitan District Gen. Oblig. Series 2018: | | | |
| 5% 7/15/31 | | 1,000,000 | 1,063,479 |
| 5% 7/15/32 | | 1,250,000 | 1,326,817 |
| 5% 7/15/33 | | 1,000,000 | 1,060,231 |
| 5% 7/15/34 | | 1,000,000 | 1,058,990 |
| Hbr. Point Infrastructure Impt. District Series 2017, 5% 4/1/39 (d) | | 2,000,000 | 1,971,154 |
| Meriden Gen. Oblig.: | | | |
| Series 2020 B, 2% 7/1/36 | | 680,000 | 511,571 |
| Series 2023: | | | |
3% 6/15/35 | | 1,165,000 | 1,021,849 |
3.25% 6/15/36 | | 565,000 | 505,073 |
| Milford Gen. Oblig. Series 2021 A: | | | |
| 2% 11/1/33 | | 330,000 | 266,639 |
| 2% 11/1/35 | | 1,285,000 | 1,000,495 |
| Naugatuck Ctfs. of Prtn. (Naugatuck Incineration Facilities Proj.) Series 2021 A, 4% 8/15/38 (b) | | 3,330,000 | 3,089,420 |
| New Britain Gen. Oblig.: | | | |
| Series 2015 A: | | | |
5% 3/1/30 | | 600,000 | 604,691 |
5% 3/1/30 (Pre-Refunded to 3/1/25 @ 100) | | 1,260,000 | 1,272,197 |
5% 3/1/31 (Pre-Refunded to 3/1/25 @ 100) | | 1,955,000 | 1,973,925 |
| Series 2017 C: | | | |
5% 3/1/32 (Assured Guaranty Muni. Corp. Insured) | | 1,635,000 | 1,691,619 |
5% 3/1/33 (Assured Guaranty Muni. Corp. Insured) | | 1,900,000 | 1,966,624 |
| Series 2020, 3% 9/1/44 (Assured Guaranty Muni. Corp. Insured) | | 1,190,000 | 919,064 |
| New Haven Gen. Oblig.: | | | |
| Series 2015 B: | | | |
5% 8/15/26 (Build America Mutual Assurance Insured) | | 615,000 | 622,980 |
5% 8/15/27 (Build America Mutual Assurance Insured) | | 765,000 | 774,943 |
| Series 2015: | | | |
5% 9/1/29 (Assured Guaranty Muni. Corp. Insured) | | 2,655,000 | 2,692,741 |
5% 9/1/31 (Assured Guaranty Muni. Corp. Insured) | | 1,430,000 | 1,448,559 |
| Series 2016 A: | | | |
5% 8/15/27 (Pre-Refunded to 8/15/26 @ 100) | | 35,000 | 36,182 |
5% 8/15/28 (Assured Guaranty Muni. Corp. Insured) | | 1,500,000 | 1,538,536 |
5% 8/15/30 (Assured Guaranty Muni. Corp. Insured) | | 1,000,000 | 1,024,878 |
5% 8/15/34 (Assured Guaranty Muni. Corp. Insured) | | 1,000,000 | 1,021,018 |
5% 8/15/35 (Assured Guaranty Muni. Corp. Insured) | | 1,000,000 | 1,021,032 |
| Series 2017 B, 5% 8/1/25 | | 500,000 | 506,080 |
| Series 2021 A, 4% 8/1/32 | | 950,000 | 941,618 |
| Series 2023: | | | |
5% 8/1/36 (Build America Mutual Assurance Insured) | | 400,000 | 437,439 |
5% 8/1/37 (Build America Mutual Assurance Insured) | | 550,000 | 598,114 |
5% 8/1/38 (Build America Mutual Assurance Insured) | | 300,000 | 323,310 |
5.25% 8/1/43 (Build America Mutual Assurance Insured) | | 1,900,000 | 2,051,823 |
| South Windsor Gen. Oblig. Series 2023, 3% 2/1/36 | | 765,000 | 675,677 |
| Steelpointe Hbr. Infrastructure Impt. District (Steelpointe Hbr. Proj.) Series 2021: | | | |
| 4% 4/1/31 (d) | | 390,000 | 369,158 |
| 4% 4/1/36 (d) | | 485,000 | 436,452 |
| 4% 4/1/41 (d) | | 660,000 | 562,324 |
| 4% 4/1/51 (d) | | 1,225,000 | 984,725 |
| Stratford Gen. Oblig. Series 2019, 5% 1/1/27 | | 1,990,000 | 2,067,624 |
| Univ. of Connecticut Gen. Oblig.: | | | |
| Series 2018 A, 5% 4/15/28 | | 4,400,000 | 4,657,143 |
| Series 2023 A: | | | |
5% 8/15/29 | | 1,500,000 | 1,624,460 |
5% 8/15/30 | | 1,325,000 | 1,454,470 |
| West Haven Gen. Oblig.: | | | |
| Series 2017 A: | | | |
5% 11/1/25 | | 635,000 | 645,390 |
5% 11/1/26 | | 635,000 | 650,315 |
| Series 2017 B, 5% 11/1/32 | | 400,000 | 411,202 |
| Series 2021, 4% 9/15/41 | | 1,125,000 | 1,026,687 |
| Series 2024: | | | |
4% 2/15/44 (Build America Mutual Assurance Insured) | | 300,000 | 281,613 |
5% 2/15/25 (Build America Mutual Assurance Insured) | | 500,000 | 503,236 |
5% 2/15/27 (Build America Mutual Assurance Insured) | | 400,000 | 412,245 |
5% 2/15/29 (Build America Mutual Assurance Insured) | | 500,000 | 528,214 |
5% 2/15/31 (Build America Mutual Assurance Insured) | | 450,000 | 480,929 |
5% 2/15/33 (Build America Mutual Assurance Insured) | | 450,000 | 482,558 |
5% 2/15/35 (Build America Mutual Assurance Insured) | | 300,000 | 322,139 |
TOTAL CONNECTICUT | | | 277,291,819 |
| Puerto Rico - 1.6% | | | |
| Puerto Rico Commonwealth Aqueduct & Swr. Auth. Series 2021 B, 5% 7/1/37 (d) | | 835,000 | 867,731 |
| Puerto Rico Commonwealth Pub. Impt. Gen. Oblig. Series 2021 A1: | | | |
| 0% 7/1/33 | | 863,283 | 572,141 |
| 5.625% 7/1/27 | | 100,000 | 104,482 |
| 5.625% 7/1/29 | | 310,000 | 333,226 |
| 5.75% 7/1/31 | | 735,000 | 817,889 |
| Puerto Rico Sales Tax Fing. Corp. Sales Tax Rev.: | | | |
| Series 2018 A1, 0% 7/1/31 | | 855,000 | 650,178 |
| Series 2019 A2, 4.329% 7/1/40 | | 1,105,000 | 1,097,754 |
TOTAL PUERTO RICO | | | 4,443,401 |
| TOTAL MUNICIPAL BONDS (Cost $296,775,438) | | | 281,735,220 |
| | | | |
| Money Market Funds - 1.0% |
| | | Shares | Value ($) |
Fidelity Municipal Cash Central Fund 3.58% (e)(f) (Cost $2,955,762) | | 2,955,171 | 2,955,762 |
| | | | |
| TOTAL INVESTMENT IN SECURITIES - 98.7% (Cost $299,731,200) | 284,690,982 |
NET OTHER ASSETS (LIABILITIES) - 1.3% | 3,796,080 |
| NET ASSETS - 100.0% | 288,487,062 |
| | |
Legend
| (a) | Amount is stated in United States dollars unless otherwise noted. |
| (b) | Private activity obligations whose interest is subject to the federal alternative minimum tax for individuals. |
| (c) | Coupon rates for floating and adjustable rate securities reflect the rates in effect at period end. |
| (d) | Security exempt from registration under Rule 144A of the Securities Act of 1933. These securities may be resold in transactions exempt from registration, normally to qualified institutional buyers. At the end of the period, the value of these securities amounted to $15,348,636 or 5.3% of net assets. |
| (e) | Information in this report regarding holdings by state and security types does not reflect the holdings of the Fidelity Municipal Cash Central Fund. |
| (f) | Affiliated fund that is generally available only to investment companies and other accounts managed by Fidelity Investments. The rate quoted is the annualized seven-day yield of the fund at period end. A complete unaudited listing of the fund's holdings as of its most recent quarter end is available upon request. In addition, each Fidelity Central Fund's financial statements are available on the SEC's website or upon request. |
Affiliated Central Funds
Fiscal year to date information regarding the Fund's investments in Fidelity Central Funds, including the ownership percentage, is presented below.
| Affiliate | Value, beginning of period ($) | Purchases ($) | Sales Proceeds ($) | Dividend Income ($) | Realized Gain (loss) ($) | Change in Unrealized appreciation (depreciation) ($) | Value, end of period ($) | % ownership, end of period |
| Fidelity Municipal Cash Central Fund 3.58% | 9,227,996 | 34,678,860 | 40,949,928 | 81,337 | (1,166) | - | 2,955,762 | 0.1% |
| Total | 9,227,996 | 34,678,860 | 40,949,928 | 81,337 | (1,166) | - | 2,955,762 | |
| | | | | | | | | |
Amounts in the dividend income column in the above table include any capital gain distributions from underlying funds, which are presented in the corresponding line item in the Statement of Operations, if applicable.
Amounts included in the purchases and sales proceeds columns may include in-kind transactions, if applicable.
Investment Valuation
The following is a summary of the inputs used, as of May 31, 2024, involving the Fund's assets and liabilities carried at fair value. The inputs or methodology used for valuing securities may not be an indication of the risk associated with investing in those securities. For more information on valuation inputs, and their aggregation into the levels used below, please refer to the Investment Valuation section in the accompanying Notes to Financial Statements.
| Valuation Inputs at Reporting Date: |
| Description | Total ($) | Level 1 ($) | Level 2 ($) | Level 3 ($) |
Investments in Securities: | | | | |
|
| Municipal Securities | 281,735,220 | - | 281,735,220 | - |
|
| Money Market Funds | 2,955,762 | 2,955,762 | - | - |
| Total Investments in Securities: | 284,690,982 | 2,955,762 | 281,735,220 | - |
Financial Statements (Unaudited)
| Statement of Assets and Liabilities |
| | | | May 31, 2024 (Unaudited) |
| | | | | |
| Assets | | | | |
| Investment in securities, at value - See accompanying schedule: | | | | |
Unaffiliated issuers (cost $296,775,438) | $ | 281,735,220 | | |
Fidelity Central Funds (cost $2,955,762) | | 2,955,762 | | |
| | | | | |
| | | | | |
| Total Investment in Securities (cost $299,731,200) | | | $ | 284,690,982 |
| Cash | | | | 100,000 |
| Receivable for fund shares sold | | | | 8,076 |
| Interest receivable | | | | 4,033,635 |
| Distributions receivable from Fidelity Central Funds | | | | 24,731 |
| Prepaid expenses | | | | 47 |
| Other receivables | | | | 352 |
Total assets | | | | 288,857,823 |
| Liabilities | | | | |
| Payable for fund shares redeemed | $ | 81,885 | | |
| Distributions payable | | 151,057 | | |
| Accrued management fee | | 104,497 | | |
| Audit fee payable | | 27,211 | | |
| Other payables and accrued expenses | | 6,111 | | |
| Total liabilities | | | | 370,761 |
| Net Assets | | | $ | 288,487,062 |
| Net Assets consist of: | | | | |
| Paid in capital | | | $ | 305,557,283 |
| Total accumulated earnings (loss) | | | | (17,070,221) |
| Net Assets | | | $ | 288,487,062 |
Net Asset Value, offering price and redemption price per share ($288,487,062 ÷ 26,981,609 shares) | | | $ | 10.69 |
| Statement of Operations |
| | | | Six months ended May 31, 2024 (Unaudited) |
| Investment Income | | | | |
| Interest | | | $ | 4,625,769 |
| Income from Fidelity Central Funds | | | | 81,337 |
| Total income | | | | 4,707,106 |
| Expenses | | | | |
| Management fee | $ | 572,809 | | |
| Transfer agent fees | | 67,252 | | |
| Accounting fees and expenses | | 19,348 | | |
| Custodian fees and expenses | | 5,569 | | |
| Independent trustees' fees and expenses | | 424 | | |
| Registration fees | | 22,038 | | |
| Audit | | 27,092 | | |
| Legal | | 12,073 | | |
| Miscellaneous | | 908 | | |
| Total expenses before reductions | | 727,513 | | |
| Expense reductions | | (7,167) | | |
| Total expenses after reductions | | | | 720,346 |
| Net Investment income (loss) | | | | 3,986,760 |
| Realized and Unrealized Gain (Loss) | | | | |
| Net realized gain (loss) on: | | | | |
| Investment Securities: | | | | |
| Unaffiliated issuers | | (229,346) | | |
| Fidelity Central Funds | | (1,166) | | |
| Total net realized gain (loss) | | | | (230,512) |
| Change in net unrealized appreciation (depreciation) on investment securities | | | | (2,722,065) |
| Net gain (loss) | | | | (2,952,577) |
| Net increase (decrease) in net assets resulting from operations | | | $ | 1,034,183 |
| Statement of Changes in Net Assets |
| |
| | Six months ended May 31, 2024 (Unaudited) | | Year ended November 30, 2023 |
| Increase (Decrease) in Net Assets | | | | |
| Operations | | | | |
| Net investment income (loss) | $ | 3,986,760 | $ | 7,774,339 |
| Net realized gain (loss) | | (230,512) | | (1,581,508) |
| Change in net unrealized appreciation (depreciation) | | (2,722,065) | | 4,266,298 |
| Net increase (decrease) in net assets resulting from operations | | 1,034,183 | | 10,459,129 |
| Distributions to shareholders | | (3,795,116) | | (7,563,399) |
| | | | | |
| Share transactions | | | | |
| Proceeds from sales of shares | | 26,973,337 | | 57,343,626 |
| Reinvestment of distributions | | 2,922,595 | | 5,784,378 |
| Cost of shares redeemed | | (37,406,021) | | (73,627,936) |
| | | | | |
Net increase (decrease) in net assets resulting from share transactions | | (7,510,089) | | (10,499,932) |
| Total increase (decrease) in net assets | | (10,271,022) | | (7,604,202) |
| | | | | |
| Net Assets | | | | |
| Beginning of period | | 298,758,084 | | 306,362,286 |
| End of period | $ | 288,487,062 | $ | 298,758,084 |
| | | | | |
| Other Information | | | | |
| Shares | | | | |
| Sold | | 2,467,188 | | 5,340,689 |
| Issued in reinvestment of distributions | | 268,080 | | 541,660 |
| Redeemed | | (3,413,953) | | (6,916,326) |
| Net increase (decrease) | | (678,685) | | (1,033,977) |
| | | | | |
Financial Highlights
Fidelity® Connecticut Municipal Income Fund |
| |
| | Six months ended (Unaudited) May 31, 2024 | | Years ended November 30, 2023 | | 2022 | | 2021 | | 2020 | | 2019 |
Selected Per-Share Data | | | | | | | | | | | | |
| Net asset value, beginning of period | $ | 10.80 | $ | 10.68 | $ | 11.94 | $ | 11.96 | $ | 11.78 | $ | 11.10 |
| Income from Investment Operations | | | | | | | | | | | | |
Net investment income (loss) A,B | | .147 | | .274 | | .246 | | .247 | | .279 | | .292 |
| Net realized and unrealized gain (loss) | | (.094) | | .112 | | (1.232) | | .035 | | .190 | | .680 |
| Total from investment operations | | .053 | | .386 | | (.986) | | .282 | | .469 | | .972 |
| Distributions from net investment income | | (.163) | | (.266) | | (.244) | | (.247) | | (.279) | | (.292) |
| Distributions from net realized gain | | - | | - | | (.030) | | (.055) | | (.010) | | - |
| Total distributions | | (.163) | | (.266) | | (.274) | | (.302) | | (.289) | | (.292) |
| Net asset value, end of period | $ | 10.69 | $ | 10.80 | $ | 10.68 | $ | 11.94 | $ | 11.96 | $ | 11.78 |
Total Return C,D | | | | 3.67% | | (8.31)% | | 2.39% | | 4.04% | | 8.83% |
Ratios to Average Net Assets B,E,F | | | | | | | | | | | | |
| Expenses before reductions | | .49% G | | .49% | | .49% | | .48% | | .49% | | .48% |
| Expenses net of fee waivers, if any | | | | .49% | | .49% | | .48% | | .49% | | .48% |
| Expenses net of all reductions | | .49% G | | .49% | | .49% | | .48% | | .49% | | .48% |
| Net investment income (loss) | | 2.69% G | | 2.56% | | 2.23% | | 2.07% | | 2.37% | | 2.53% |
| Supplemental Data | | | | | | | | | | | | |
| Net assets, end of period (000 omitted) | $ | 288,487 | $ | 298,758 | $ | 306,362 | $ | 358,584 | $ | 354,094 | $ | 352,073 |
Portfolio turnover rate H | | | | 15% | | 13% | | 13% | | 16% | | 20% |
ACalculated based on average shares outstanding during the period.
BNet investment income (loss) is affected by the timing of the declaration of dividends by any underlying mutual funds or exchange-traded funds (ETFs). Net investment income (loss) of any mutual funds or ETFs is not included in the Fund's net investment income (loss) ratio.
CTotal returns for periods of less than one year are not annualized.
DTotal returns would have been lower if certain expenses had not been reduced during the applicable periods shown.
EFees and expenses of any underlying mutual funds or exchange-traded funds (ETFs) are not included in the Fund's expense ratio. The Fund indirectly bears its proportionate share of these expenses. For additional expense information related to investments in Fidelity Central Funds, please refer to the "Investments in Fidelity Central Funds" note found in the Notes to Financial Statements section of the most recent Annual or Semi-Annual report.
FExpense ratios reflect operating expenses of the class. Expenses before reductions do not reflect amounts reimbursed, waived, or reduced through arrangements with the investment adviser, brokerage services, or other offset arrangements, if applicable, and do not represent the amount paid by the class during periods when reimbursements, waivers or reductions occur.
GAnnualized.
HAmount does not include the portfolio activity of any underlying mutual funds or exchange-traded funds (ETFs).
Notes to Financial Statements
(Unaudited)For the period ended May 31, 2024
1. Organization.
Fidelity Connecticut Municipal Income Fund (the Fund) is a non-diversified fund of Fidelity Court Street Trust (the Trust) and is authorized to issue an unlimited number of shares. Share transactions on the Statement of Changes in Net Assets may contain exchanges between affiliated funds. The Trust is registered under the Investment Company Act of 1940, as amended (the 1940 Act), as an open-end management investment company organized as a Massachusetts business trust. The Fund may be affected by economic and political developments in the state of Connecticut.
2. Investments in Fidelity Central Funds.
Funds may invest in Fidelity Central Funds, which are open-end investment companies generally available only to other investment companies and accounts managed by the investment adviser and its affiliates. The Schedule of Investments lists any Fidelity Central Funds held as an investment as of period end, but does not include the underlying holdings of each Fidelity Central Fund. An investing fund indirectly bears its proportionate share of the expenses of the underlying Fidelity Central Funds.
Based on its investment objective, each Fidelity Central Fund may invest or participate in various investment vehicles or strategies that are similar to those of the investing fund. These strategies are consistent with the investment objectives of the investing fund and may involve certain economic risks which may cause a decline in value of each of the Fidelity Central Funds and thus a decline in the value of the investing fund.
| Fidelity Central Fund | Investment Manager | Investment Objective | Investment Practices | Expense RatioA |
| Fidelity Money Market Central Funds | Fidelity Management & Research Company LLC (FMR) | Each fund seeks to obtain a high level of current income consistent with the preservation of capital and liquidity. | Short-term Investments | Less than .005% |
A Expenses expressed as a percentage of average net assets and are as of each underlying Central Fund's most recent annual or semi-annual shareholder report.
A complete unaudited list of holdings for each Fidelity Central Fund is available upon request or at the Securities and Exchange Commission website at www.sec.gov. In addition, the financial statements of the Fidelity Central Funds which contain the significant accounting policies (including investment valuation policies) of those funds, and are not covered by the Report of Independent Registered Public Accounting Firm, are available on the Securities and Exchange Commission website or upon request.
3. Significant Accounting Policies.
The Fund is an investment company and applies the accounting and reporting guidance of the Financial Accounting Standards Board (FASB) Accounting Standards Codification Topic 946 Financial Services - Investment Companies. The financial statements have been prepared in conformity with accounting principles generally accepted in the United States of America (GAAP), which require management to make certain estimates and assumptions at the date of the financial statements. Actual results could differ from those estimates. Subsequent events, if any, through the date that the financial statements were issued have been evaluated in the preparation of the financial statements. The Fund's Schedule of Investments lists any underlying mutual funds or exchange-traded funds (ETFs) but does not include the underlying holdings of these funds. The following summarizes the significant accounting policies of the Fund:
Investment Valuation. Investments are valued as of 4:00 p.m. Eastern time on the last calendar day of the period. The Board of Trustees (the Board) has designated the Fund's investment adviser as the valuation designee responsible for the fair valuation function and performing fair value determinations as needed. The investment adviser has established a Fair Value Committee (the Committee) to carry out the day-to-day fair valuation responsibilities and has adopted policies and procedures to govern the fair valuation process and the activities of the Committee. In accordance with these fair valuation policies and procedures, which have been approved by the Board, the Fund attempts to obtain prices from one or more third party pricing services or brokers to value its investments. When current market prices, quotations or currency exchange rates are not readily available or reliable, investments will be fair valued in good faith by the Committee, in accordance with the policies and procedures. Factors used in determining fair value vary by investment type and may include market or investment specific events, transaction data, estimated cash flows, and market observations of comparable investments. The frequency that the fair valuation procedures are used cannot be predicted and they may be utilized to a significant extent. The Committee manages the Fund's fair valuation practices and maintains the fair valuation policies and procedures. The Fund's investment adviser reports to the Board information regarding the fair valuation process and related material matters.
The Fund categorizes the inputs to valuation techniques used to value its investments into a disclosure hierarchy consisting of three levels as shown below:
Level 1 - unadjusted quoted prices in active markets for identical investments
Level 2 - other significant observable inputs (including quoted prices for similar investments, interest rates, prepayment speeds, etc.)
Level 3 - unobservable inputs (including the Fund's own assumptions based on the best information available)
Valuation techniques used to value the Fund's investments by major category are as follows:
Debt securities, including restricted securities, are valued based on evaluated prices received from third party pricing services or from brokers who make markets in such securities. Municipal securities, are valued by pricing services who utilize matrix pricing which considers yield or price of bonds of comparable quality, coupon, maturity and type or by broker-supplied prices. When independent prices are unavailable or unreliable, debt securities may be valued utilizing pricing methodologies which consider similar factors that would be used by third party pricing services. Debt securities are generally categorized as Level 2 in the hierarchy but may be Level 3 depending on the circumstances.
Investments in open-end mutual funds, including the Fidelity Central Funds, are valued at their closing net asset value (NAV) each business day and are categorized as Level 1 in the hierarchy.
Changes in valuation techniques may result in transfers in or out of an assigned level within the disclosure hierarchy. The aggregate value of investments by input level as of May 31, 2024 is included at the end of the Fund's Schedule of Investments.
Investment Transactions and Income. For financial reporting purposes, the Fund's investment holdings and NAV include trades executed through the end of the last business day of the period. The NAV per share for processing shareholder transactions is calculated as of the close of business of the New York Stock Exchange (NYSE), normally 4:00 p.m. Eastern time and includes trades executed through the end of the prior business day. Gains and losses on securities sold are determined on the basis of identified cost. Income and capital gain distributions from Fidelity Central Funds, if any, are recorded on the ex-dividend date. Interest income is accrued as earned and includes coupon interest and amortization of premium and accretion of discount on debt securities as applicable. Debt obligations may be placed on non-accrual status and related interest income may be reduced by ceasing current accruals and writing off interest receivables when the collection of all or a portion of interest has become doubtful based on consistently applied procedures. A debt obligation is removed from non-accrual status when the issuer resumes interest payments or when collectability of interest is reasonably assured.
Expenses. Expenses directly attributable to a fund are charged to that fund. Expenses attributable to more than one fund are allocated among the respective funds on the basis of relative net assets or other appropriate methods. Expenses included in the accompanying financial statements reflect the expenses of that fund and do not include any expenses associated with any underlying mutual funds or exchange-traded funds. Although not included in a fund's expenses, a fund indirectly bears its proportionate share of these expenses through the net asset value of each underlying mutual fund or exchange-traded fund. Expense estimates are accrued in the period to which they relate and adjustments are made when actual amounts are known.
Income Tax Information and Distributions to Shareholders. Each year, the Fund intends to qualify as a regulated investment company under Subchapter M of the Internal Revenue Code, including distributing substantially all of its taxable income and realized gains. As a result, no provision for U.S. Federal income taxes is required. The Fund files a U.S. federal tax return, in addition to state and local tax returns as required. The Fund's federal income tax returns are subject to examination by the Internal Revenue Service (IRS) for a period of three fiscal years after they are filed. State and local tax returns may be subject to examination for an additional fiscal year depending on the jurisdiction.
Distributions are declared and recorded daily and paid monthly from net investment income. Distributions from realized gains, if any, are declared and recorded on the ex-dividend date. Income and capital gain distributions are determined in accordance with income tax regulations, which may differ from GAAP.
Capital accounts within the financial statements are adjusted for permanent book-tax differences. These adjustments have no impact on net assets or the results of operations. Capital accounts are not adjusted for temporary book-tax differences which will reverse in a subsequent period.
Book-tax differences are primarily due to market discount and capital loss carryforwards.
The Fund purchases municipal securities whose interest, in the opinion of the issuer, is free from federal income tax. There is no assurance that the IRS will agree with this opinion. In the event the IRS determines that the issuer does not comply with relevant tax requirements, interest payments from a security could become federally taxable, possibly retroactively to the date the security was issued.
As of period end, the cost and unrealized appreciation (depreciation) in securities, and derivatives if applicable, for federal income tax purposes were as follows:
| Gross unrealized appreciation | $1,001,184 |
| Gross unrealized depreciation | (15,598,331) |
| Net unrealized appreciation (depreciation) | $(14,597,147) |
| Tax cost | $299,288,129 |
Capital loss carryforwards are only available to offset future capital gains of the Fund to the extent provided by regulations and may be limited. The capital loss carryforward information presented below, including any applicable limitation, is estimated as of prior fiscal period end and is subject to adjustment.
| Short-term | $(384,655) |
| Long-term | (1,886,181) |
| Total capital loss carryforward | $(2,270,836) |
Restricted Securities (including Private Placements). Funds may invest in securities that are subject to legal or contractual restrictions on resale. These securities generally may be resold in transactions exempt from registration or to the public if the securities are registered. Disposal of these securities may involve time-consuming negotiations and expense, and prompt sale at an acceptable price may be difficult. Information regarding restricted securities held at period end is included at the end of the Schedule of Investments, if applicable.
4. Purchases and Sales of Investments.
Purchases and sales of securities, other than short-term securities and in-kind transactions, as applicable, are noted in the table below.
| | Purchases ($) | Sales ($) |
| Fidelity Connecticut Municipal Income Fund | 27,531,788 | 27,485,190 |
5. Fees and Other Transactions with Affiliates.
Management Fee. Fidelity Management & Research Company LLC (the investment adviser) and its affiliates provide the Fund with investment management related services for which the Fund pays a monthly management fee.
Effective March 1, 2024, the Fund's management contract was amended to incorporate administrative services previously covered under separate services agreements (Transfer Agent and Accounting agreements). Any reference to "class" in this note shall mean "the Fund" as the Fund currently offers only one class of shares. The amended contract incorporates a management fee rate that may vary by class. The investment adviser or an affiliate pays certain expenses of managing and operating the Fund out of each class's management fee. Each class of the Fund pays a management fee to the investment adviser. The management fee is calculated and paid to the investment adviser every month. When determining a class's management fee, a mandate rate is calculated based on the monthly average net assets of a group of funds advised by FMR within a designated asset class. A discount rate is subtracted from the mandate rate once the Fund's monthly average net assets reach a certain level. The mandate rate and discount rate may vary by class. The annual management fee rate for a class of shares of the Fund is the lesser of (1) the class's mandate rate reduced by the class's discount rate (if applicable) or (2) the amount set forth in the following table.
| | Maximum Management Fee Rate % |
| Fidelity Connecticut Municipal Income Fund | .43 |
One-twelfth of the management fee rate for a class is applied to the average net assets of the class for the month, giving a dollar amount which is the management fee for the class for that month. A different management fee rate may be applicable to each class of the Fund. The difference between classes is the result of separate arrangements for class-level services and/or waivers of certain expenses. It is not the result of any difference in advisory or custodial fees or other expenses related to the management of the Fund's assets, which do not vary by class. For the portion of the reporting period on or after March 1, 2024, the total annualized management fee rates were as follows:
| | Total Management Fee Rate % |
| Fidelity Connecticut Municipal Income Fund | .43 |
Prior to March 1, 2024, the management fee was the sum of an individual fund fee rate that was based on an annual rate of .25% of the Fund's average net assets and an annualized group fee rate that averaged .10% during the period. The group fee rate was based upon the monthly average net assets of a group of registered investment companies with which the investment adviser has management contracts. The group fee rate decreased as assets under management increased and increased as assets under management decreased. For the portion of the reporting period prior to March 1, 2024, the total annualized management fee rate was .35%.
Effective March 1, 2024, the Fund's sub-advisory agreements with FMR Investment Management (UK) Limited, Fidelity Management & Research (Hong Kong) Limited, and Fidelity Management & Research (Japan) Limited were amended to provide that the investment adviser pays each sub-adviser monthly fees equal to 110% of the sub-adviser's costs for providing sub-advisory services.
Transfer Agent Fees. Fidelity Investments Institutional Operations Company LLC (FIIOC), an affiliate of the investment adviser, is the transfer, dividend disbursing and shareholder servicing agent for the Fund. Effective March 1, 2024, each Fund's management contract was amended to incorporate transfer agent services and associated fees previously covered under a separate services agreement. FIIOC pays for typesetting, printing and mailing of shareholder reports, except proxy statements.
During November 2023, the Board approved a change in the transfer agent fees effective December 1, 2023 to a fixed annual rate of 0.0900% of average net assets.
Prior to December 1, 2023, FIIOC received account fees and asset-based fees that varied according to account size and type of account. For the portion of the reporting period prior to March 1, 2024, the fees were equivalent to the annualized rate of .09% of average net assets.
Accounting Fees. Fidelity Service Company, Inc. (FSC), an affiliate of the investment adviser, maintains the Fund's accounting records. Effective March 1, 2024, the Fund's management contract was amended to incorporate accounting services and associated fees previously covered under a separate services agreement.
During November 2023, the Board approved a change in the accounting fees effective December 1, 2023 to a fixed annual rate of average net assets as follows:
| | % of Average Net Assets |
| Fidelity Connecticut Municipal Income Fund | 0.0259 |
Prior to December 1, 2023, the accounting fee was based on the level of average net assets for each month. For the portion of the reporting period prior to March 1, 2024, the fees were equivalent to the following annualized rates:
| | % of Average Net Assets |
| Fidelity Connecticut Municipal Income Fund | .03 |
Interfund Trades. Funds may purchase from or sell securities to other Fidelity Funds under procedures adopted by the Board. The procedures have been designed to ensure these interfund trades are executed in accordance with Rule 17a-7 of the 1940 Act. Any interfund trades are included within the respective purchases and sales amounts shown in the Purchases and Sales of Investments note. During the period, there were no interfund trades.
6. Committed Line of Credit.
Certain Funds participate with other funds managed by the investment adviser or an affiliate in a $4.25 billion credit facility (the "line of credit") to be utilized for temporary or emergency purposes to fund shareholder redemptions or for other short-term liquidity purposes. The participating funds have agreed to pay commitment fees on their pro-rata portion of the line of credit, which are reflected in Miscellaneous expenses on the Statement of Operations, and are listed below. During the period, there were no borrowings on this line of credit.
| | Amount ($) |
| Fidelity Connecticut Municipal Income Fund | 278 |
7. Expense Reductions.
Through arrangements with the Fund's custodian, credits realized as a result of certain uninvested cash balances were used to reduce the Fund's expenses by $77.
In addition, during the period the investment adviser or an affiliate reimbursed and/or waived a portion of operating expenses in the amount of $7,090.
8. Other.
A fund's organizational documents provide former and current trustees and officers with a limited indemnification against liabilities arising in connection with the performance of their duties to the fund. In the normal course of business, a fund may also enter into contracts that provide general indemnifications. A fund's maximum exposure under these arrangements is unknown as this would be dependent on future claims that may be made against a fund. The risk of material loss from such claims is considered remote.
9. Risk and Uncertainties.
Many factors affect a fund's performance. Developments that disrupt global economies and financial markets, such as pandemics, epidemics, outbreaks of infectious diseases, war, terrorism, and environmental disasters, may significantly affect a fund's investment performance. The effects of these developments to a fund will be impacted by the types of securities in which a fund invests, the financial condition, industry, economic sector, and geographic location of an issuer, and a fund's level of investment in the securities of that issuer. Significant concentrations in security types, issuers, industries, sectors, and geographic locations may magnify the factors that affect a fund's performance.
Item 8: Changes in and Disagreements with Accountants for Open-End Management Investment Companies
Note: This is not applicable for any fund included in this document.
Item 9: Proxy Disclosures for Open-End Management Investment Companies
Note: This is not applicable for any fund included in this document.
Item 10: Renumeration Paid to Directors, Officers, and others of Open-End Management Investment Companies
Note: This information is disclosed as part of the financial statements for each Fund as part of Item 7: Financial Statements and Financial Highlights for Open-End Management Investment companies.
Item 11: Statement Regarding Basis for Approval of Investment Advisory Contract
Board Approval of Investment Advisory Contracts
Fidelity Connecticut Municipal Income Fund
At its January 2024 meeting, the Board of Trustees, including the Independent Trustees (together, the Board), approved an amended and restated management contract with Fidelity Management & Research Company LLC (FMR) (the Management Contract), and amended and restated sub-advisory agreements (the Sub-Advisory Contracts, and together with the Management Contract, the Advisory Contracts) for the fund, including the fund's sub-advisory agreements with FMR Investment Management (UK) Limited (FMR UK), Fidelity Management & Research (Hong Kong) Limited (FMR H.K.), and Fidelity Management & Research (Japan) Limited (FMR Japan). The Advisory Contracts will be effective March 1, 2024. The Board will consider the annual renewal of the fund's Advisory Contracts in September 2024, following its review of additional materials provided by FMR.
Management Contract. The Board approved the Management Contract, which implements a new fee structure combining the management fee, transfer agent fee (TA Fee), and pricing and bookkeeping fee (P&B Fee) of the fund into a single fee based on tiered schedules and subject to a maximum rate (the Unified Fee). In exchange for the Unified Fee, the fund will receive investment advisory, management, administrative, transfer agent, pricing and bookkeeping services under a single agreement - the Management Contract.
In its consideration of the Management Contract over several meetings, the Board received, reviewed and discussed a comprehensive set of analyses regarding the Unified Fee including (i) the legal framework, (ii) design goals for the Unified Fee, (iii) calculation methodology for the Unified Fee and illustrative examples, (iv) annual and cumulative projected impacts under various scenarios, both in the aggregate and at the fund/class level, (v) explanations of schedules, rate levers and maximum rates and (vi) shareholder benefits and projected savings.
The Board considered that the maximum Unified Fee for the fund would be no higher than the sum of (i) the lowest contractual management fee under the fund's existing management contract, which is the individual fund fee, if any, plus the lowest contractual marginal group fee rate and (ii) the TA and P&B Fee rates, which are fixed fee rates since December 1, 2023 (together, the "Unified Fee Cap"). The Board noted that, as a result of this Unified Fee Cap, the Unified Fee would be no greater than the fees previously authorized to be charged for the same services. The Board noted that certain expenses such as third-party expenses and certain other miscellaneous expenses would be outside the scope of the Unified Fee and the calculation of such fees would not change as a result of the Unified Fee.
The Board considered that implementation of the Unified Fee, which includes the Unified Fee Cap, would cause all funds subject to a Unified Fee, including the fund, to experience an immediate reduction on contractual fee rates for services provided under the current management contracts. The Board considered that some funds would not experience lower fees as a result of existing fee caps. The Board further considered that, in addition to the contractual fee savings, the Unified Fee offers funds and their shareholders greater protection from future rate increases for services previously offered under separate agreements that are now covered by the Management Contract because such rate increases would require shareholder, as well as Board, approval.
Sub-Advisory Contracts. In connection with the Unified Fee changes, the Board considered the Sub-Advisory Contracts, which changed the arrangements for fees paid by FMR to the sub-advisers under the agreements. The Board noted that the agreements with FMR UK, FMR H.K., and FMR Japan were amended to provide that FMR will compensate each sub-adviser at a fee equal to 110% of the sub-adviser's costs incurred in providing services under the agreement. The Board considered that, under the Sub-Advisory Contracts, FMR, and not the fund, will continue to pay the sub-advisory fees to each applicable sub-adviser.
The Board considered that the approval of the fund's Advisory Contracts will not result in any changes in the investment process or strategies employed in the management of the fund's assets or the day-to-day management of the fund or the persons primarily responsible for such management. Further, the Board considered that the Management Contract would not change the obligations and services of FMR and its affiliates on behalf of the fund, and, in particular, there would be no change in the nature and level of advisory, management, administration, transfer agent, and pricing and bookkeeping services provided to the fund by FMR and its affiliates.
In connection with its consideration of future renewals of the fund's Advisory Contracts, the Board will consider: (i) the nature, extent and quality of services provided to the funds, including shareholder and administrative services and investment performance; (ii) the competitiveness of the management fee and total expenses for the fund; (iii) the costs of the services and profitability, including the revenues earned and the expenses incurred in conducting the business of developing, marketing, distributing, managing, administering, and servicing the fund and its shareholders, to the extent applicable; and (iv) whether there have been economies of scale in respect of the Fidelity funds, whether the Fidelity funds (including the fund) have appropriately benefited from any such economies of scale, and whether there is the potential for realization of any further economies.
Based on its evaluation of all of the conclusions noted above, and after considering all factors it believed relevant, the Board concluded that the fund's management fee structure is fair and reasonable, and that the fund's Advisory Contracts should be approved.
1.704902.126
CTF-SANN-0724
Item 8.
Changes in and Disagreements with Accountants for Open-End Management Investment Companies
See Item 7.
Item 9.
Proxy Disclosures for Open-End Management Investment Companies
See Item 7.
Item 10.
Remuneration Paid to Directors, Officers, and Others of Open-End Management Investment Companies
See Item 7.
Item 11.
Statement Regarding Basis for Approval of Investment Advisory Contract
See Item 7.
Item 12.
Disclosure of Proxy Voting Policies and Procedures for Closed-End Management Investment Companies
Not applicable.
Item 13.
Portfolio Managers of Closed-End Management Investment Companies
Not applicable.
Item 14.
Purchases of Equity Securities by Closed-End Management Investment Company and Affiliated Purchasers
Not applicable.
Item 15.
Submission of Matters to a Vote of Security Holders
There were no material changes to the procedures by which shareholders may recommend nominees to the Fidelity Court Street Trust’s Board of Trustees.
Item 16.
Controls and Procedures
(a)(i) The President and Treasurer and the Chief Financial Officer have concluded that the Fidelity Court Street Trust’s (the “Trust”) disclosure controls and procedures (as defined in Rule 30a-3(c) under the Investment Company Act) provide reasonable assurances that material information relating to the Trust is made known to them by the appropriate persons, based on their evaluation of these controls and procedures as of a date within 90 days of the filing date of this report.
(a)(ii) There was no change in the Trust’s internal control over financial reporting (as defined in Rule 30a-3(d) under the Investment Company Act) that occurred during the period covered by this report that has materially affected, or is reasonably likely to materially affect, the Trust’s internal control over financial reporting.
Item 17.
Disclosure of Securities Lending Activities for Closed-End Management Investment Companies
Not applicable.
Item 18.
Recovery of Erroneously Awarded Compensation
(a)
Not applicable.
(b)
Not applicable.
Item 19.
Exhibits
SIGNATURES
Pursuant to the requirements of the Securities Exchange Act of 1934 and the Investment Company Act of 1940, the registrant has duly caused this report to be signed on its behalf by the undersigned, thereunto duly authorized.
Fidelity Court Street Trust
|
By: | /s/Laura M. Del Prato |
| Laura M. Del Prato |
| President and Treasurer (Principal Executive Officer) |
|
|
Date: | July 23, 2024 |
Pursuant to the requirements of the Securities Exchange Act of 1934 and the Investment Company Act of 1940, this report has been signed below by the following persons on behalf of the registrant and in the capacities and on the dates indicated.
|
By: | /s/Laura M. Del Prato |
| Laura M. Del Prato |
| President and Treasurer (Principal Executive Officer) |
|
|
Date: | July 23, 2024 |
|
By: | /s/John J. Burke III |
| John J. Burke III |
| Chief Financial Officer (Principal Financial Officer) |
|
|
Date: | July 23, 2024 |