UNITED STATES
SECURITIES AND EXCHANGE COMMISSION
Washington, D.C. 20549
FORM N-CSR
CERTIFIED SHAREHOLDER REPORT OF REGISTERED
MANAGEMENT INVESTMENT COMPANIES
Investment Company Act file number 811-02741
Fidelity Court Street Trust
(Exact name of registrant as specified in charter)
245 Summer St., Boston, MA 02210
(Address of principal executive offices) (Zip code)
Cynthia Lo Bessette, Secretary
245 Summer St.
Boston, Massachusetts 02210
(Name and address of agent for service)
Registrant's telephone number, including area code:
617-563-7000
| |
Date of fiscal year end: | November 30 |
|
|
Date of reporting period: | May 31, 2022 |
Item 1.
Reports to Stockholders
Fidelity® Connecticut Municipal Income Fund
Fidelity® Connecticut Municipal Money Market Fund
Semi-Annual Report
May 31, 2022


Contents
To view a fund's proxy voting guidelines and proxy voting record for the 12-month period ended June 30, visit http://www.fidelity.com/proxyvotingresults or visit the Securities and Exchange Commission's (SEC) web site at http://www.sec.gov.
You may also call 1-800-544-8544 to request a free copy of the proxy voting guidelines.
Standard & Poor's, S&P and S&P 500 are registered service marks of The McGraw-Hill Companies, Inc. and have been licensed for use by Fidelity Distributors Corporation.
Other third-party marks appearing herein are the property of their respective owners.
All other marks appearing herein are registered or unregistered trademarks or service marks of FMR LLC or an affiliated company. © 2022 FMR LLC. All rights reserved.
This report and the financial statements contained herein are submitted for the general information of the shareholders of the Funds. This report is not authorized for distribution to prospective investors in the Funds unless preceded or accompanied by an effective prospectus.
A fund files its complete schedule of portfolio holdings with the SEC for the first and third quarters of each fiscal year on Form N-PORT. Forms N-PORT are available on the SEC’s web site at http://www.sec.gov. A fund's Forms N-PORT may be reviewed and copied at the SEC’s Public Reference Room in Washington, DC. Information regarding the operation of the SEC's Public Reference Room may be obtained by calling 1-800-SEC-0330.
For a complete list of a fund's portfolio holdings, view the most recent holdings listing, semiannual report, or annual report on Fidelity's web site at http://www.fidelity.com, http://www.institutional.fidelity.com, or http://www.401k.com, as applicable.
NOT FDIC INSURED •MAY LOSE VALUE •NO BANK GUARANTEE
Neither the Funds nor Fidelity Distributors Corporation is a bank.
Note to Shareholders:
Early in 2020, the outbreak and spread of COVID-19 emerged as a public health emergency that had a major influence on financial markets, primarily based on its impact on the global economy and corporate earnings. On March 11, 2020, the World Health Organization declared the COVID-19 outbreak a pandemic, citing sustained risk of further global spread. The pandemic prompted a number of measures to limit the spread of COVID-19, including travel and border restrictions, quarantines, and restrictions on large gatherings. In turn, these resulted in lower consumer activity, diminished demand for a wide range of products and services, disruption in manufacturing and supply chains, and – given the wide variability in outcomes regarding the outbreak – significant market uncertainty and volatility. To help stem the turmoil, the U.S. government took unprecedented action – in concert with the U.S. Federal Reserve and central banks around the world – to help support consumers, businesses, and the broader economy, and to limit disruption to the financial system.
In general, the overall impact of the pandemic lessened in 2021, amid a resilient economy and widespread distribution of three COVID-19 vaccines granted emergency use authorization from the U.S. Food and Drug Administration (FDA) early in the year. Still, the situation remains dynamic, and the extent and duration of its influence on financial markets and the economy is highly uncertain, due in part to a recent spike in cases based on highly contagious variants of the coronavirus.
Extreme events such as the COVID-19 crisis are exogenous shocks that can have significant adverse effects on mutual funds and their investments. Although multiple asset classes may be affected by market disruption, the duration and impact may not be the same for all types of assets. Fidelity is committed to helping you stay informed amid news about COVID-19 and during increased market volatility, and we continue to take extra steps to be responsive to customer needs. We encourage you to visit us online, where we offer ongoing updates, commentary, and analysis on the markets and our funds.
Fidelity® Connecticut Municipal Income Fund
Investment Summary (Unaudited)
Top Five Sectors as of May 31, 2022
| | % of fund's net assets |
| General Obligations | 42.1 |
| Health Care | 15.9 |
| Education | 13.8 |
| Special Tax | 13.6 |
| Housing | 6.5 |
Quality Diversification (% of fund's net assets)
| As of May 31, 2022 |
| | AAA | 6.4% |
| | AA,A | 68.2% |
| | BBB | 16.9% |
| | BB and Below | 1.9% |
| | Not Rated | 3.6% |
| | Short-Term Investments and Net Other Assets | 3.0% |
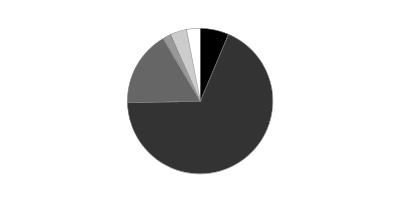
We have used ratings from Moody's Investors Service, Inc. Where Moody's® ratings are not available, we have used S&P® ratings. All ratings are as of the date indicated and do not reflect subsequent changes.
Fidelity® Connecticut Municipal Income Fund
Schedule of Investments May 31, 2022 (Unaudited)
Showing Percentage of Net Assets
| Municipal Bonds - 97.0% | | | |
| | | Principal Amount | Value |
| Connecticut - 96.5% | | | |
| Bridgeport Gen. Oblig.: | | | |
| Series 2016 D: | | $ | $ |
| 5% 8/15/31 (Assured Guaranty Muni. Corp. Insured) | | 1,000,000 | 1,086,970 |
| 5% 8/15/32 (Assured Guaranty Muni. Corp. Insured) | | 3,090,000 | 3,354,397 |
| Series 2019 A: | | | |
| 5% 2/1/32 (Build America Mutual Assurance Insured) | | 1,000,000 | 1,138,249 |
| 5% 2/1/37 (Build America Mutual Assurance Insured) | | 1,000,000 | 1,128,461 |
| 5% 2/1/39 (Build America Mutual Assurance Insured) | | 1,000,000 | 1,125,209 |
| 5% 2/1/49 (Build America Mutual Assurance Insured) | | 1,285,000 | 1,432,704 |
| Series 2021 A: | | | |
| 4% 8/1/38 | | 800,000 | 832,189 |
| 4% 8/1/41 | | 1,050,000 | 1,078,265 |
| 4% 8/1/46 | | 375,000 | 382,468 |
| 4% 8/1/51 | | 575,000 | 583,634 |
| 5% 8/1/35 | | 450,000 | 519,504 |
| Connecticut Arpt. Auth. Customer Facility Charge Rev. (Ground Trans. Ctr. Proj.) Series 2019 A: | | | |
| 4% 7/1/49 (a) | | 2,000,000 | 1,850,724 |
| 5% 7/1/49 (a) | | 2,925,000 | 3,034,592 |
| Connecticut Gen. Oblig.: | | | |
| Series 2013 A: | | | |
| 5% 3/1/27 | | 5,480,000 | 5,606,706 |
| 5% 10/15/27 | | 1,000,000 | 1,041,349 |
| Series 2014 G, 5% 11/15/28 | | 7,000,000 | 7,422,948 |
| Series 2015 B: | | | |
| 5% 6/15/27 | | 4,825,000 | 5,196,535 |
| 5% 6/15/30 | | 1,290,000 | 1,379,708 |
| 5% 6/15/32 | | 5,500,000 | 5,867,962 |
| Series 2015 F, 5% 11/15/31 | | 4,000,000 | 4,305,399 |
| Series 2016 A, 5% 3/15/31 | | 6,950,000 | 7,510,156 |
| Series 2018 A: | | | |
| 5% 4/15/30 | | 2,500,000 | 2,814,151 |
| 5% 4/15/38 | | 1,700,000 | 1,876,584 |
| Series 2018 C, 5% 6/15/31 | | 725,000 | 813,617 |
| Series 2019 A: | | | |
| 4% 4/15/37 | | 1,825,000 | 1,868,142 |
| 5% 4/15/25 | | 1,140,000 | 1,227,714 |
| 5% 4/15/35 | | 2,000,000 | 2,236,168 |
| 5% 4/15/36 | | 2,300,000 | 2,568,998 |
| 5% 4/15/39 | | 2,450,000 | 2,725,019 |
| Series 2020 A, 4% 1/15/38 | | 4,000,000 | 4,083,481 |
| Series 2021 B, 5% 6/1/41 | | 1,000,000 | 1,134,638 |
| Connecticut Health & Edl. Facilities Auth. Rev.: | | | |
| (Fairfield Univ.): | | | |
| Series 2017 R: | | | |
| 5% 7/1/31 | | 1,825,000 | 1,995,123 |
| 5% 7/1/32 | | 1,000,000 | 1,091,532 |
| Series 2017, 5% 7/1/30 | | 2,400,000 | 2,629,925 |
| (Sacred Heart Univ., CT. Proj.) Series 2017 I-1: | | | |
| 5% 7/1/27 | | 80,000 | 88,633 |
| 5% 7/1/28 | | 1,150,000 | 1,267,811 |
| 5% 7/1/29 | | 350,000 | 384,678 |
| 5% 7/1/30 | | 1,100,000 | 1,205,382 |
| 5% 7/1/31 | | 1,300,000 | 1,421,184 |
| 5% 7/1/32 | | 1,050,000 | 1,146,109 |
| 5% 7/1/33 | | 700,000 | 761,253 |
| 5% 7/1/34 | | 750,000 | 810,882 |
| 5% 7/1/42 | | 2,000,000 | 2,116,647 |
| Series 2013 N: | | | |
| 5% 7/1/24 | | 400,000 | 414,439 |
| 5% 7/1/25 | | 300,000 | 310,763 |
| Series 2014 E: | | | |
| 5% 7/1/28 | | 3,260,000 | 3,424,775 |
| 5% 7/1/29 | | 3,840,000 | 4,028,687 |
| Series 2015 L, 5% 7/1/29 | | 1,500,000 | 1,594,949 |
| Series 2016 K, 4% 7/1/46 | | 7,000,000 | 6,595,723 |
| Series 2018 K3, 5% 7/1/38 | | 985,000 | 1,020,295 |
| Series 2019 A, 5% 7/1/49 (b) | | 6,000,000 | 5,463,464 |
| Series 2020 A, 4% 7/1/40 | | 1,250,000 | 1,265,434 |
| Series 2020 C, 4% 7/1/45 | | 1,800,000 | 1,813,460 |
| Series 2021 G, 4% 3/1/51 | | 3,000,000 | 3,043,297 |
| Series 2022 M: | | | |
| 4% 7/1/36 | | 250,000 | 255,411 |
| 4% 7/1/37 | | 260,000 | 265,237 |
| 4% 7/1/39 | | 2,600,000 | 2,534,459 |
| 4% 7/1/40 | | 3,300,000 | 3,192,269 |
| 4% 7/1/41 | | 1,195,000 | 1,209,709 |
| 4% 7/1/42 | | 1,750,000 | 1,671,069 |
| Series E: | | | |
| 5% 7/1/28 | | 1,250,000 | 1,300,774 |
| 5% 7/1/42 | | 3,000,000 | 3,078,617 |
| Series F, 5% 7/1/45 | | 4,890,000 | 5,063,994 |
| Series G: | | | |
| 5% 7/1/29 (b) | | 1,055,000 | 1,168,188 |
| 5% 7/1/30 (b) | | 275,000 | 297,174 |
| 5% 7/1/34 (b) | | 695,000 | 739,977 |
| 5% 7/1/39 (b) | | 2,600,000 | 2,750,946 |
| 5% 7/1/50 (b) | | 1,000,000 | 1,042,844 |
| Series K1: | | | |
| 5% 7/1/24 | | 600,000 | 618,779 |
| 5% 7/1/25 | | 1,240,000 | 1,292,904 |
| 5% 7/1/27 | | 250,000 | 264,784 |
| Series K3, 5% 7/1/48 | | 3,695,000 | 3,783,158 |
| Series L: | | | |
| 5% 7/1/26 | | 1,000,000 | 1,070,815 |
| 5% 7/1/27 | | 2,000,000 | 2,137,411 |
| Series L1: | | | |
| 4% 7/1/22 | | 500,000 | 500,998 |
| 4% 7/1/23 | | 550,000 | 561,602 |
| 4% 7/1/24 | | 650,000 | 665,684 |
| 4% 7/1/25 | | 600,000 | 618,137 |
| 4% 7/1/26 | | 700,000 | 723,889 |
| 4% 7/1/27 | | 700,000 | 724,010 |
| Series N: | | | |
| 4% 7/1/39 | | 1,850,000 | 1,724,143 |
| 5% 7/1/22 | | 400,000 | 400,920 |
| 5% 7/1/23 | | 415,000 | 425,243 |
| 5% 7/1/24 | | 375,000 | 387,271 |
| 5% 7/1/25 | | 340,000 | 355,112 |
| 5% 7/1/27 | | 430,000 | 455,632 |
| 5% 7/1/31 | | 500,000 | 527,484 |
| 5% 7/1/32 | | 550,000 | 578,705 |
| 5% 7/1/33 | | 720,000 | 756,133 |
| 5% 7/1/34 | | 675,000 | 707,206 |
| Series O, 5% 7/1/23 | | 235,000 | 243,097 |
| Series R: | | | |
| 5% 6/1/37 | | 1,000,000 | 1,121,788 |
| 5% 6/1/38 | | 1,045,000 | 1,170,313 |
| 5% 6/1/39 | | 1,595,000 | 1,783,257 |
| 5% 6/1/40 | | 1,125,000 | 1,255,910 |
| Connecticut Higher Ed. Supplemental Ln. Auth. Rev.: | | | |
| (Chesla Ln. Prog.): | | | |
| Series 2017 A, 5% 11/15/23 (a) | | 1,100,000 | 1,148,696 |
| Series 2017 B: | | | |
| 5% 11/15/22 (a) | | 975,000 | 990,446 |
| 5% 11/15/24 (a) | | 1,065,000 | 1,137,531 |
| Series B: | | | |
| 5% 11/15/24 (a) | | 300,000 | 316,489 |
| 5% 11/15/25 (a) | | 400,000 | 427,315 |
| 5% 11/15/26 (a) | | 600,000 | 647,924 |
| 5% 11/15/27 (a) | | 610,000 | 665,998 |
| 5% 11/15/28 (a) | | 525,000 | 578,201 |
| 5% 11/15/29 (a) | | 550,000 | 610,786 |
| (Chesla Loan Prog.): | | | |
| Series C: | | | |
| 5% 11/15/24 | | 225,000 | 240,881 |
| 5% 11/15/25 | | 240,000 | 262,775 |
| 5% 11/15/26 | | 200,000 | 223,680 |
| 5% 11/15/27 (Pre-Refunded to 11/15/26 @ 100) | | 125,000 | 139,800 |
| Series D: | | | |
| 5% 11/15/22 | | 450,000 | 457,335 |
| 5% 11/15/23 | | 450,000 | 470,583 |
| 5% 11/15/24 | | 425,000 | 454,998 |
| 5% 11/15/25 | | 250,000 | 273,724 |
| 5% 11/15/26 | | 180,000 | 201,312 |
| Connecticut Hsg. Fin. Auth.: | | | |
| Series 2014 C, 4% 11/15/44 | | 160,000 | 162,528 |
| Series 2016 F, 3.5% 5/15/39 (a) | | 860,000 | 868,054 |
| Series 2019 B1, 4% 5/15/49 | | 3,095,000 | 3,182,902 |
| Series 2019 F, 3.5% 11/15/43 | | 3,275,000 | 3,314,460 |
| Series 2021 B1, 3% 11/15/49 | | 2,870,000 | 2,842,857 |
| Series A2: | | | |
| 5% 11/15/26 (a) | | 840,000 | 921,761 |
| 5% 5/15/27 (a) | | 1,890,000 | 2,085,701 |
| 5% 11/15/27 (a) | | 860,000 | 954,865 |
| 5% 5/15/28 (a) | | 615,000 | 680,157 |
| 5% 11/15/28 (a) | | 225,000 | 250,153 |
| Series C: | | | |
| 5% 5/15/26 (a) | | 1,820,000 | 1,982,712 |
| 5% 5/15/27 (a) | | 800,000 | 882,836 |
| 5% 11/15/28 (a) | | 580,000 | 641,263 |
| 5% 5/15/29 (a) | | 1,115,000 | 1,238,458 |
| Connecticut Muni. Elec. Energy Coop. Pwr. Supply Sys. Rev. Series 2013 A, 5% 1/1/28 | | 1,000,000 | 1,015,357 |
| Connecticut Spl. Tax Oblig. Trans. Infrastructure Rev.: | | | |
| Series 2012 A: | | | |
| 5% 1/1/26 | | 5,000,000 | 5,090,642 |
| 5% 1/1/28 | | 1,000,000 | 1,017,809 |
| 5% 1/1/31 | | 5,000,000 | 5,082,801 |
| Series 2015 A, 5% 8/1/34 | | 6,000,000 | 6,401,532 |
| Series 2021 A: | | | |
| 5% 5/1/35 | | 1,000,000 | 1,160,487 |
| 5% 5/1/41 | | 4,085,000 | 4,667,841 |
| Series 2021 C: | | | |
| 5% 1/1/28 | | 1,600,000 | 1,815,302 |
| 5% 1/1/30 | | 3,500,000 | 4,068,651 |
| 5% 1/1/31 | | 3,410,000 | 4,003,667 |
| 5% 1/1/32 | | 2,500,000 | 2,962,917 |
| Series A: | | | |
| 5% 5/1/28 | | 1,000,000 | 1,139,809 |
| 5% 9/1/33 | | 1,000,000 | 1,050,262 |
| Greater New Haven Wtr. Poll. Cont. Auth. Reg'l. Wastewtr. Sys. Rev.: | | | |
| Series 2005 A, 5% 8/15/35 (Nat'l. Pub. Fin. Guarantee Corp. Insured) | | 10,000 | 10,019 |
| Series 2014 B: | | | |
| 5% 8/15/25 | | 450,000 | 477,011 |
| 5% 8/15/26 | | 700,000 | 741,112 |
| 5% 8/15/27 | | 750,000 | 792,804 |
| 5% 8/15/28 | | 385,000 | 406,089 |
| Hartford County Metropolitan District (Connecticut Clean Wtr. Proj.) Series 2014 A, 5% 11/1/28 (Pre-Refunded to 11/1/24 @ 100) | | 1,000,000 | 1,071,933 |
| Hartford County Metropolitan District Gen. Oblig. Series 2018: | | | |
| 5% 7/15/31 | | 1,000,000 | 1,136,240 |
| 5% 7/15/32 | | 1,250,000 | 1,418,472 |
| 5% 7/15/33 | | 1,000,000 | 1,130,430 |
| 5% 7/15/34 | | 1,000,000 | 1,128,072 |
| Hartford Gen. Oblig.: | | | |
| Series 2014 C, 5% 8/15/24 (Build America Mutual Assurance Insured) | | 1,835,000 | 1,946,824 |
| Series 2015 A: | | | |
| 5% 7/1/28 (Assured Guaranty Muni. Corp. Insured) | | 1,000,000 | 1,069,945 |
| 5% 7/1/29 (Assured Guaranty Muni. Corp. Insured) | | 1,000,000 | 1,066,956 |
| Hbr. Point Infrastructure Impt. District Series 2017, 5% 4/1/39 (b) | | 2,000,000 | 2,111,230 |
| Naugatuck Ctfs. of Prtn. (Naugatuck Incineration Facilities Proj.) Series 2021 A, 4% 8/15/38 (a) | | 3,330,000 | 3,364,590 |
| New Britain Gen. Oblig.: | | | |
| Series 2015 A: | | | |
| 5% 3/1/27 (Build America Mutual Assurance Insured) | | 1,605,000 | 1,713,226 |
| 5% 3/1/29 (Build America Mutual Assurance Insured) | | 1,770,000 | 1,881,077 |
| 5% 3/1/30 (Build America Mutual Assurance Insured) | | 1,860,000 | 1,973,299 |
| 5% 3/1/31 (Build America Mutual Assurance Insured) | | 1,955,000 | 2,071,563 |
| Series 2017 C: | | | |
| 5% 3/1/32 (Assured Guaranty Muni. Corp. Insured) | | 1,635,000 | 1,804,491 |
| 5% 3/1/33 (Assured Guaranty Muni. Corp. Insured) | | 1,900,000 | 2,092,261 |
| New Haven Gen. Oblig.: | | | |
| Series 2015 B: | | | |
| 5% 8/15/26 (Build America Mutual Assurance Insured) | | 615,000 | 664,768 |
| 5% 8/15/27 (Build America Mutual Assurance Insured) | | 765,000 | 823,596 |
| Series 2015: | | | |
| 5% 9/1/29 (Assured Guaranty Muni. Corp. Insured) | | 2,655,000 | 2,846,950 |
| 5% 9/1/31 (Assured Guaranty Muni. Corp. Insured) | | 1,430,000 | 1,528,644 |
| Series 2016 A: | | | |
| 5% 8/15/27 (Pre-Refunded to 8/15/26 @ 100) | | 35,000 | 39,020 |
| 5% 8/15/28 (Assured Guaranty Muni. Corp. Insured) | | 1,500,000 | 1,639,930 |
| 5% 8/15/30 (Assured Guaranty Muni. Corp. Insured) | | 1,000,000 | 1,088,209 |
| 5% 8/15/34 (Assured Guaranty Muni. Corp. Insured) | | 1,000,000 | 1,082,259 |
| 5% 8/15/35 (Assured Guaranty Muni. Corp. Insured) | | 1,000,000 | 1,079,400 |
| South Central Reg'l. Wtr. Auth. Wtr. Sys. Rev. Series 32 B: | | | |
| 5% 8/1/32 | | 1,000,000 | 1,084,875 |
| 5% 8/1/33 | | 1,150,000 | 1,246,106 |
| 5% 8/1/37 | | 3,000,000 | 3,238,245 |
| 5% 8/1/38 | | 1,000,000 | 1,078,396 |
| Steelpointe Hbr. Infrastructure Impt. District (Steelpointe Hbr. Proj.) Series 2021: | | | |
| 4% 4/1/31 (b) | | 390,000 | 377,004 |
| 4% 4/1/36 (b) | | 485,000 | 456,864 |
| 4% 4/1/41 (b) | | 660,000 | 601,111 |
| 4% 4/1/51 (b) | | 1,225,000 | 1,060,753 |
| Stratford Gen. Oblig.: | | | |
| Series 2017, 5% 7/1/30 (Assured Guaranty Muni. Corp. Insured) | | 1,000,000 | 1,062,808 |
| Series 2019, 5% 1/1/27 | | 1,990,000 | 2,201,752 |
| Univ. of Connecticut Gen. Oblig.: | | | |
| Series 2018 A, 5% 4/15/28 | | 4,400,000 | 4,986,307 |
| Series A, 5% 8/15/27 | | 1,335,000 | 1,379,309 |
| West Haven Gen. Oblig.: | | | |
| Series 2017 A: | | | |
| 5% 11/1/22 | | 800,000 | 811,583 |
| 5% 11/1/25 | | 635,000 | 689,790 |
| 5% 11/1/26 | | 635,000 | 701,383 |
| Series 2017 B, 5% 11/1/32 | | 400,000 | 440,698 |
| Series 2021, 4% 9/15/41 | | 1,125,000 | 1,144,726 |
|
| TOTAL CONNECTICUT | | | 302,042,527 |
|
| Guam - 0.1% | | | |
| Guam Int'l. Arpt. Auth. Rev. Series 2013 C, 6.375% 10/1/43 (a) | | 385,000 | 401,234 |
| Puerto Rico - 0.4% | | | |
| Puerto Rico Commonwealth Pub. Impt. Gen. Oblig. Series 2021 A1: | | | |
| 5.625% 7/1/27 | | 100,000 | 109,070 |
| 5.625% 7/1/29 | | 310,000 | 342,414 |
| 5.75% 7/1/31 | | 735,000 | 830,911 |
|
| TOTAL PUERTO RICO | | | 1,282,395 |
|
| TOTAL MUNICIPAL BONDS | | | |
| (Cost $312,956,594) | | | 303,726,156 |
| TOTAL INVESTMENT IN SECURITIES - 97.0% | | | |
| (Cost $312,956,594) | | | 303,726,156 |
| NET OTHER ASSETS (LIABILITIES) - 3.0% | | | 9,407,828 |
| NET ASSETS - 100% | | | $313,133,984 |
Legend
(a) Private activity obligations whose interest is subject to the federal alternative minimum tax for individuals.
(b) Security exempt from registration under Rule 144A of the Securities Act of 1933. These securities may be resold in transactions exempt from registration, normally to qualified institutional buyers. At the end of the period, the value of these securities amounted to $16,069,555 or 5.1% of net assets.
Investment Valuation
The following is a summary of the inputs used, as of May 31, 2022, involving the Fund's assets and liabilities carried at fair value. The inputs or methodology used for valuing securities may not be an indication of the risk associated with investing in those securities. For more information on valuation inputs, and their aggregation into the levels used below, please refer to the Investment Valuation section in the accompanying Notes to Financial Statements.
| | Valuation Inputs at Reporting Date: |
| Description | Total | Level 1 | Level 2 | Level 3 |
| Investments in Securities: | | | | |
| Municipal Securities | $303,726,156 | $-- | $303,726,156 | $-- |
| Total Investments in Securities: | $303,726,156 | $-- | $303,726,156 | $-- |
Other Information
The distribution of municipal securities by revenue source, as a percentage of total Net Assets, is as follows (Unaudited):
| General Obligations | 42.1% |
| Health Care | 15.9% |
| Education | 13.8% |
| Special Tax | 13.6% |
| Housing | 6.5% |
| Others* (Individually Less Than 5%) | 8.1% |
| | 100.0% |
* Includes net other assets
See accompanying notes which are an integral part of the financial statements.
Fidelity® Connecticut Municipal Income Fund
Financial Statements
Statement of Assets and Liabilities
| | | May 31, 2022 (Unaudited) |
| Assets | | |
Investment in securities, at value — See accompanying schedule:
Unaffiliated issuers (cost $312,956,594) | | $303,726,156 |
| Cash | | 5,091,672 |
| Receivable for fund shares sold | | 499,486 |
| Interest receivable | | 4,256,756 |
| Prepaid expenses | | 59 |
| Other receivables | | 731 |
| Total assets | | 313,574,860 |
| Liabilities | | |
| Payable for fund shares redeemed | $121,635 | |
| Distributions payable | 174,933 | |
| Accrued management fee | 88,614 | |
| Transfer agent fee payable | 23,039 | |
| Other affiliated payables | 6,610 | |
| Other payables and accrued expenses | 26,045 | |
| Total liabilities | | 440,876 |
| Net Assets | | $313,133,984 |
| Net Assets consist of: | | |
| Paid in capital | | $322,424,312 |
| Total accumulated earnings (loss) | | (9,290,328) |
| Net Assets | | $313,133,984 |
| Net Asset Value, offering price and redemption price per share ($313,133,984 ÷ 28,603,776 shares) | | $10.95 |
See accompanying notes which are an integral part of the financial statements.
Statement of Operations
| | | Six months ended May 31, 2022 (Unaudited) |
| Investment Income | | |
| Interest | | $4,372,726 |
| Expenses | | |
| Management fee | $578,500 | |
| Transfer agent fees | 143,924 | |
| Accounting fees and expenses | 43,202 | |
| Custodian fees and expenses | 3,491 | |
| Independent trustees' fees and expenses | 531 | |
| Registration fees | 23,571 | |
| Audit | 28,742 | |
| Legal | 5,155 | |
| Miscellaneous | 645 | |
| Total expenses before reductions | 827,761 | |
| Expense reductions | (6,256) | |
| Total expenses after reductions | | 821,505 |
| Net investment income (loss) | | 3,551,221 |
| Realized and Unrealized Gain (Loss) | | |
| Net realized gain (loss) on: | | |
| Investment securities: | | |
| Unaffiliated issuers | | (86,173) |
| Total net realized gain (loss) | | (86,173) |
| Change in net unrealized appreciation (depreciation) on investment securities | | (28,173,047) |
| Net gain (loss) | | (28,259,220) |
| Net increase (decrease) in net assets resulting from operations | | $(24,707,999) |
See accompanying notes which are an integral part of the financial statements.
Statement of Changes in Net Assets
| | Six months ended May 31, 2022 (Unaudited) | Year ended November 30, 2021 |
| Increase (Decrease) in Net Assets | | |
| Operations | | |
| Net investment income (loss) | $3,551,221 | $7,386,442 |
| Net realized gain (loss) | (86,173) | 935,171 |
| Change in net unrealized appreciation (depreciation) | (28,173,047) | 119,528 |
| Net increase (decrease) in net assets resulting from operations | (24,707,999) | 8,441,141 |
| Distributions to shareholders | (4,448,763) | (9,020,908) |
| Share transactions | | |
| Proceeds from sales of shares | 18,174,938 | 44,628,431 |
| Reinvestment of distributions | 3,170,922 | 6,313,938 |
| Cost of shares redeemed | (37,638,810) | (45,873,267) |
| Net increase (decrease) in net assets resulting from share transactions | (16,292,950) | 5,069,102 |
| Total increase (decrease) in net assets | (45,449,712) | 4,489,335 |
| Net Assets | | |
| Beginning of period | 358,583,696 | 354,094,361 |
| End of period | $313,133,984 | $358,583,696 |
| Other Information | | |
| Shares | | |
| Sold | 1,623,409 | 3,730,416 |
| Issued in reinvestment of distributions | 277,302 | 528,527 |
| Redeemed | (3,328,635) | (3,841,196) |
| Net increase (decrease) | (1,427,924) | 417,747 |
See accompanying notes which are an integral part of the financial statements.
Financial Highlights
Fidelity Connecticut Municipal Income Fund
| | Six months ended (Unaudited) May 31, | Years endedNovember 30, | | | | |
| | 2022 | 2021 | 2020 | 2019 | 2018 | 2017 |
| Selected Per–Share Data | | | | | | |
| Net asset value, beginning of period | $11.94 | $11.96 | $11.78 | $11.10 | $11.35 | $11.30 |
| Income from Investment Operations | | | | | | |
| Net investment income (loss)A,B | .121 | .247 | .279 | .292 | .282 | .289 |
| Net realized and unrealized gain (loss) | (.960) | .035 | .190 | .680 | (.191) | .185 |
| Total from investment operations | (.839) | .282 | .469 | .972 | .091 | .474 |
| Distributions from net investment income | (.121) | (.247) | (.279) | (.292) | (.282) | (.289) |
| Distributions from net realized gain | (.030) | (.055) | (.010) | – | (.059) | (.135) |
| Total distributions | (.151) | (.302) | (.289) | (.292) | (.341) | (.424) |
| Redemption fees added to paid in capitalA | – | – | – | – | – | –C |
| Net asset value, end of period | $10.95 | $11.94 | $11.96 | $11.78 | $11.10 | $11.35 |
| Total ReturnD,E | (7.07)% | 2.39% | 4.04% | 8.83% | .82% | 4.26% |
| Ratios to Average Net AssetsB,F,G | | | | | | |
| Expenses before reductions | .50%H | .48% | .49% | .48% | .48% | .48% |
| Expenses net of fee waivers, if any | .50%H | .48% | .49% | .48% | .48% | .48% |
| Expenses net of all reductions | .49%H | .48% | .49% | .48% | .48% | .48% |
| Net investment income (loss) | 2.13%H | 2.07% | 2.37% | 2.53% | 2.52% | 2.53% |
| Supplemental Data | | | | | | |
| Net assets, end of period (000 omitted) | $313,134 | $358,584 | $354,094 | $352,073 | $326,476 | $380,497 |
| Portfolio turnover rateI | 3%H | 13% | 16% | 20% | 12% | 8% |
A Calculated based on average shares outstanding during the period.
B Net investment income (loss) is affected by the timing of the declaration of dividends by any underlying mutual funds or exchange-traded funds (ETFs). Net investment income (loss) of any such underlying funds is not included in the Fund's net investment income (loss) ratio.
C Amount represents less than $.0005 per share.
D Total returns for periods of less than one year are not annualized.
E Total returns would have been lower if certain expenses had not been reduced during the applicable periods shown.
F Fees and expenses of any underlying mutual funds or exchange-traded funds (ETFs) are not included in the Fund's expense ratio. The Fund indirectly bears its proportionate share of these expenses.
G Expense ratios reflect operating expenses of the class. Expenses before reductions do not reflect amounts reimbursed, waived, or reduced through arrangements with the investment adviser, brokerage services, or other offset arrangements, if applicable, and do not represent the amount paid by the class during periods when reimbursements, waivers or reductions occur.
H Annualized
I Amount does not include the portfolio activity of any underlying mutual funds or exchange-traded funds (ETFs).
See accompanying notes which are an integral part of the financial statements.
Fidelity® Connecticut Municipal Money Market Fund
Investment Summary/Performance (Unaudited)
Effective Maturity Diversification as of May 31, 2022
| Days | % of fund's investments 5/31/22 |
| 1 - 7 | 72.4 |
| 8 - 30 | 0.9 |
| 31 - 60 | 15.4 |
| 61 - 90 | 4.1 |
| 91 - 180 | 3.1 |
| > 180 | 4.1 |
Effective maturity is determined in accordance with the requirements of Rule 2a-7 under the Investment Company Act of 1940.
Asset Allocation (% of fund's net assets)
| As of May 31, 2022 |
| | Variable Rate Demand Notes (VRDNs) | 35.2% |
| | Tender Option Bond | 32.0% |
| | Other Municipal Security | 17.5% |
| | Investment Companies | 14.7% |
| | Net Other Assets (Liabilities) | 0.6% |

Current 7-Day Yields
| | 5/31/22 |
| Fidelity® Connecticut Municipal Money Market Fund | 0.32% |
Yield refers to the income paid by the Fund over a given period. Yield for money market funds is usually for seven-day periods, as it is here, though it is expressed as an annual percentage rate. Past performance is no guarantee of future results. Yield will vary and it's possible to lose money investing in the Fund.
Fidelity® Connecticut Municipal Money Market Fund
Schedule of Investments May 31, 2022 (Unaudited)
Showing Percentage of Net Assets
| Variable Rate Demand Note - 35.2% | | | |
| | | Principal Amount | Value |
| Alabama - 0.7% | | | |
| Decatur Indl. Dev. Board Exempt Facilities Rev. (Nucor Steel Decatur LLC Proj.) Series 2003 A, 1.03% 6/7/22, VRDN (a)(b) | | $1,900,000 | $1,900,000 |
| Arkansas - 0.5% | | | |
| Blytheville Indl. Dev. Rev. (Nucor Corp. Proj.): | | | |
| Series 1998, 1.03% 6/7/22, VRDN (a)(b) | | 200,000 | 200,000 |
| Series 2002, 0.98% 6/7/22, VRDN (a)(b) | | 1,100,000 | 1,100,000 |
| | | | 1,300,000 |
| Connecticut - 32.4% | | | |
| Connecticut Dev. Auth. Wtr. Facilities Rev. (Connecticut Wtr. Co. Proj.): | | | |
| Series 2004 A, 0.93% 6/7/22, LOC Citizens Bank NA, VRDN (a)(b) | | 5,000,000 | 5,000,000 |
| Series 2004 B, 0.93% 6/7/22, LOC Citizens Bank NA, VRDN (b) | | 4,550,000 | 4,550,000 |
| Connecticut Health & Edl. Facilities Auth. Rev.: | | | |
| (Gaylord Hosp. Proj.) Series B, 0.79% 6/7/22, LOC Bank of America NA, VRDN (b) | | 11,470,000 | 11,470,000 |
| (Greenwich Hosp. Proj.) Series C, 0.78% 6/7/22, VRDN (b) | | 2,730,000 | 2,730,000 |
| (Trinity College Proj.) Series L, 0.79% 6/7/22, LOC JPMorgan Chase Bank, VRDN (b) | | 6,730,000 | 6,730,000 |
| (Wesleyan Univ. Proj.) Series H, 0.77% 6/7/22, VRDN (b) | | 14,455,000 | 14,455,000 |
| (Yale Univ. Proj.): | | | |
| Series V1, 0.3% 6/1/22, VRDN (b) | | 900,000 | 900,000 |
| Series V2, 0.3% 6/1/22, VRDN (b) | | 8,740,000 | 8,740,000 |
| Series 2013 O, 0.8% 6/7/22, VRDN (b) | | 2,100,000 | 2,100,000 |
| Series 2014 C, 0.8% 6/7/22, VRDN (b) | | 5,500,000 | 5,500,000 |
| Series 2014 D, 0.78% 6/7/22, VRDN (b) | | 4,100,000 | 4,100,000 |
| Connecticut Hsg. Fin. Auth.: | | | |
| (Hsg. Mtg. Fin. Prog.) Series 2018 C, 0.83% 6/7/22 (Liquidity Facility TD Banknorth, NA), VRDN (a)(b) | | 2,100,000 | 2,100,000 |
| (Mtg. Fin. Prog.) Series C3, 0.79% 6/7/22 (Liquidity Facility Royal Bank of Canada), VRDN (b) | | 3,000,000 | 3,000,000 |
| Series 2012 C2, 0.82% 6/7/22 (Liquidity Facility Sumitomo Mitsui Banking Corp.), VRDN (b) | | 2,195,000 | 2,195,000 |
| Series 2016 A, 0.79% 6/7/22 (Liquidity Facility Royal Bank of Canada), VRDN (b) | | 1,100,000 | 1,100,000 |
| Series 2016 F, 0.79% 6/7/22 (Liquidity Facility U.S. Bank NA, Cincinnati), VRDN (b) | | 1,500,000 | 1,500,000 |
| Series 2019 A3, 0.79% 6/7/22 (Liquidity Facility U.S. Bank NA, Cincinnati), VRDN (b) | | 1,500,000 | 1,500,000 |
| Series 2019 B2, 0.84% 6/7/22 (Liquidity Facility Bank of America NA), VRDN (a)(b) | | 330,000 | 330,000 |
| Series 2020 E3, 0.72% 6/7/22 (Liquidity Facility State Street Bank & Trust Co., Boston), VRDN (b) | | 2,100,000 | 2,100,000 |
| Connecticut Innovations, Inc. Rev. (ISO New England, Inc. Proj.) Series 2012, 0.78% 6/7/22, LOC TD Banknorth, NA, VRDN (b) | | 14,525,000 | 14,525,000 |
| | | | 94,625,000 |
| Kansas - 0.4% | | | |
| St. Mary's Kansas Poll. Cont. Rev. (Kansas Gas and Elec. Co. Proj.) Series 1994, 0.96% 6/7/22, VRDN (b) | | 1,100,000 | 1,100,000 |
| Wamego Kansas Poll. Cont. Rfdg. Rev. (Western Resources, Inc. Proj.) Series 1994, 0.96% 6/7/22, VRDN (b) | | 200,000 | 200,000 |
| | | | 1,300,000 |
| Nebraska - 0.4% | | | |
| Stanton County Indl. Dev. Rev.: | | | |
| (Nucor Corp. Proj.) Series 1996, 1.03% 6/7/22, VRDN (a)(b) | | 1,200,000 | 1,200,000 |
| Series 1998, 1.03% 6/7/22, VRDN (a)(b) | | 100,000 | 100,000 |
| | | | 1,300,000 |
| North Carolina - 0.1% | | | |
| Hertford County Indl. Facilities Poll. Cont. Fing. Auth. (Nucor Corp. Proj.) Series 2000 A, 0.98% 6/7/22, VRDN (a)(b) | | 300,000 | 300,000 |
| South Carolina - 0.0% | | | |
| Berkeley County Indl. Dev. Rev. (Nucor Corp. Proj.) Series 1995, 1.03% 6/7/22, VRDN (a)(b) | | 100,000 | 100,000 |
| West Virginia - 0.7% | | | |
| West Virginia Econ. Dev. Auth. Solid Waste Disp. Facilities Rev.: | | | |
| (Appalachian Pwr. Co. Amos Proj.) Series 2008 B, 0.92% 6/7/22, VRDN (a)(b) | | 700,000 | 700,000 |
| (Appalachian Pwr. Co.- Mountaineer Proj.) Series 2008 A, 0.87% 6/7/22, VRDN (a)(b) | | 1,400,000 | 1,400,000 |
| | | | 2,100,000 |
| TOTAL VARIABLE RATE DEMAND NOTE | | | |
| (Cost $102,925,000) | | | 102,925,000 |
|
| Tender Option Bond - 32.0% | | | |
| Colorado - 0.0% | | | |
| Denver City & County Arpt. Rev. Bonds Series G-114, 1.04%, tender 12/1/22 (Liquidity Facility Royal Bank of Canada) (a)(b)(c)(d)(e) | | 100,000 | 100,000 |
| Connecticut - 31.1% | | | |
| Connecticut Gen. Oblig. Participating VRDN: | | | |
| Series 15 XF0222, 0.83% 6/7/22 (Liquidity Facility Toronto-Dominion Bank) (b)(c)(e) | | 8,000,000 | 8,000,000 |
| Series 2017, 0.83% 6/7/22 (Liquidity Facility Barclays Bank PLC) (b)(c)(e) | | 3,200,000 | 3,200,000 |
| Series Floaters 014, 0.91% 7/12/22 (Liquidity Facility Barclays Bank PLC) (b)(c)(e) | | 22,250,000 | 22,250,000 |
| Series Floaters 016, 0.91% 7/12/22 (Liquidity Facility Barclays Bank PLC) (b)(c)(e) | | 5,300,000 | 5,300,000 |
| Series Floaters G66, 0.82% 6/7/22 (Liquidity Facility Royal Bank of Canada) (b)(c)(e) | | 2,300,000 | 2,300,000 |
| Series XL 01 42, 0.85% 6/7/22 (Liquidity Facility Morgan Stanley Bank, West Valley City Utah) (b)(c)(e) | | 2,700,000 | 2,700,000 |
| Series XM 07 62, 0.82% 6/7/22 (Liquidity Facility JPMorgan Chase Bank) (b)(c)(e) | | 1,680,000 | 1,680,000 |
| Series XM 08 57, 0.82% 6/7/22 (Liquidity Facility JPMorgan Chase Bank) (b)(c)(e) | | 5,300,000 | 5,300,000 |
| Series XM 08 58, 0.82% 6/7/22 (Liquidity Facility JPMorgan Chase Bank) (b)(c)(e) | | 5,000,000 | 5,000,000 |
| Series YX 11 07, 0.83% 6/7/22 (Liquidity Facility Barclays Bank PLC) (b)(c)(e) | | 6,005,000 | 6,005,000 |
| Connecticut Health & Edl. Facilities Auth. Rev. Participating VRDN: | | | |
| Series 16 ZF0378, 0.83% 6/7/22 (Liquidity Facility Toronto-Dominion Bank) (b)(c)(e) | | 3,750,000 | 3,750,000 |
| Series Floaters XG 02 04, 0.82% 6/7/22 (Liquidity Facility Barclays Bank PLC) (b)(c)(e) | | 400,000 | 400,000 |
| Series RBC 2016 ZM0134, 0.82% 6/7/22 (Liquidity Facility Royal Bank of Canada) (b)(c)(e) | | 7,410,000 | 7,410,000 |
| Connecticut Muni. Elec. Energy Coop. Pwr. Supply Sys. Rev. Participating VRDN Series XG 00 59, 0.85% 6/7/22 (Liquidity Facility Deutsche Bank AG New York Branch) (b)(c)(e) | | 3,585,000 | 3,585,000 |
| Connecticut Spl. Tax Oblig. Trans. Infrastructure Rev.: | | | |
| Bonds Series Floaters G 110, 0.97%, tender 10/3/22 (Liquidity Facility Royal Bank of Canada) (b)(c)(d)(e) | | 3,400,000 | 3,400,000 |
| Participating VRDN: | | | |
| Series Floaters YX 10 77, 0.83% 6/7/22 (Liquidity Facility Barclays Bank PLC) (b)(c)(e) | | 2,900,000 | 2,900,000 |
| Series ROC II R 14073, 0.85% 6/7/22 (Liquidity Facility Citibank NA) (b)(c)(e) | | 6,300,000 | 6,299,990 |
| Series YX 11 37, 0.83% 6/7/22 (Liquidity Facility Barclays Bank PLC) (b)(c)(e) | | 1,485,000 | 1,485,000 |
| | | | 90,964,990 |
| District Of Columbia - 0.0% | | | |
| Metropolitan Washington DC Arpts. Auth. Sys. Rev. Participating VRDN Series Floaters XF 06 94, 0.91% 6/7/22 (Liquidity Facility Bank of America NA) (a)(b)(c)(e) | | 60,000 | 60,000 |
| Florida - 0.1% | | | |
| Lee County Arpt. Rev. Participating VRDN Series XF 11 26, 0.86% 6/7/22 (Liquidity Facility Deutsche Bank AG New York Branch) (a)(b)(c)(e) | | 200,000 | 200,000 |
| Tampa-Hillsborough County Expressway Auth. Rev. Bonds Series G-113, 0.99%, tender 7/1/22 (Liquidity Facility Royal Bank of Canada) (b)(c)(d)(e) | | 200,000 | 200,000 |
| | | | 400,000 |
| Indiana - 0.3% | | | |
| Hamilton County Healthcare Facilities Rev. Participating VRDN Series XF 10 26, 0.85% 6/7/22 (Liquidity Facility Deutsche Bank AG New York Branch) (b)(c)(e) | | 800,000 | 800,000 |
| Kentucky - 0.1% | | | |
| CommonSpirit Health Participating VRDN Series MIZ 90 21, 0.91% 6/7/22 (Liquidity Facility Mizuho Cap. Markets LLC) (b)(c)(e) | | 200,000 | 200,000 |
| New York - 0.0% | | | |
| New York City Gen. Oblig. Participating VRDN Series 2020 003, 0.94% 7/12/22 (Liquidity Facility Wells Fargo Bank NA) (b)(c)(e) | | 100,000 | 100,000 |
| Ohio - 0.2% | | | |
| Ohio Hosp. Rev. Participating VRDN Series 002, 0.91% 7/12/22 (Liquidity Facility Barclays Bank PLC) (b)(c)(e) | | 300,000 | 300,000 |
| Ohio Univ. Gen. Receipts Athens Bonds Series Floaters G 27, 0.99%, tender 12/1/22 (Liquidity Facility Royal Bank of Canada) (b)(c)(d)(e) | | 200,000 | 200,000 |
| | | | 500,000 |
| Tennessee - 0.0% | | | |
| Metropolitan Nashville Arpt. Auth. Rev. Participating VRDN Series 2021 XL 01 89, 0.86% 6/7/22 (Liquidity Facility Deutsche Bank AG New York Branch) (a)(b)(c)(e) | | 100,000 | 100,000 |
| Texas - 0.1% | | | |
| Alamo Cmnty. College District Rev. Bonds Series G-111, 0.99%, tender 11/1/22 (Liquidity Facility Royal Bank of Canada) (b)(c)(d)(e) | | 200,000 | 200,000 |
| Virginia - 0.1% | | | |
| Suffolk Econ. Dev. Auth. Hosp. Facilities Rev. Participating VRDN Series MIZ 90 25, 0.88% 6/7/22 (Liquidity Facility Mizuho Cap. Markets LLC) (b)(c)(e) | | 100,000 | 100,000 |
| Virginia Pub. Bldg. Auth. Pub. Facilities Rev. Bonds Series Floaters G 40, 0.99%, tender 8/1/22 (Liquidity Facility Royal Bank of Canada) (b)(c)(d)(e) | | 100,000 | 100,000 |
| | | | 200,000 |
| TOTAL TENDER OPTION BOND | | | |
| (Cost $93,624,990) | | | 93,624,990 |
|
| Other Municipal Security - 17.5% | | | |
| Connecticut - 17.5% | | | |
| Connecticut Gen. Oblig. Bonds: | | | |
| Series 2012 C, 5% 6/1/22 | | 415,000 | 415,000 |
| Series 2012 E, 5% 9/15/22 | | 1,115,000 | 1,128,110 |
| Series 2013 A, 1.69% 3/1/23 (b)(f) | | 2,015,000 | 2,017,990 |
| Series 2021 B, 3% 6/1/22 | | 690,000 | 690,000 |
| Series 2022, 4% 9/15/22 (g) | | 2,900,000 | 2,914,181 |
| Connecticut Health & Edl. Facilities Auth. Rev. Bonds: | | | |
| Series 2017 A2, 5%, tender 7/1/22(b) | | 2,450,000 | 2,459,391 |
| Series 2017 C2, 5%, tender 2/1/23 (b) | | 2,450,000 | 2,498,907 |
| Connecticut Hsg. Fin. Auth. Bonds Series 2017 F2, 2.1% 11/15/22 (a) | | 760,000 | 760,014 |
| Connecticut Spl. Tax Oblig. Trans. Infrastructure Rev. Bonds Series 2015 A, 5% 8/1/22 | | 500,000 | 503,787 |
| Danbury Gen. Oblig. BAN Series 2021, 1% 7/14/22 | | 1,625,000 | 1,626,378 |
| Enfield Gen. Oblig. BAN Series 2021, 2% 8/4/22 | | 2,620,000 | 2,625,763 |
| Fairfield Gen. Oblig.: | | | |
| BAN Series 2021, 2% 7/8/22 | | 3,100,000 | 3,105,836 |
| Bonds Series 2021, 5% 7/1/22 | | 710,000 | 712,826 |
| Greater New Haven Wtr. Poll. Cont. Auth. Reg'l. Wastewtr. Sys. Rev. Bonds Series 2012 B, 5% 7/1/22 (Pre-Refunded to 7/1/22 @ 100) | | 1,325,000 | 1,329,777 |
| Greenwich Gen. Oblig. BAN Series 2022, 2% 2/9/23 | | 2,000,000 | 2,023,467 |
| Hartford County Metropolitan District Gen. Oblig. Bonds Series 2021 A, 4% 9/1/22 | | 745,000 | 751,472 |
| Reg'l. School District # 14 Woodbury & Bethlehem BAN Series 2022, 2% 7/21/22 | | 5,000,000 | 5,004,093 |
| Rocky Hill Gen. Oblig. BAN Series 2021, 2% 7/27/22 | | 2,250,000 | 2,256,376 |
| South Central Reg'l. Wtr. Auth. Wtr. Sys. Rev. Bonds: | | | |
| Eighth Series A, 5% 8/1/22 (Pre-Refunded to 8/1/22 @ 100) | | 200,000 | 201,429 |
| Series 2012 27: | | | |
| 5% 8/1/22 (Pre-Refunded to 8/1/22 @ 100) | | 1,800,000 | 1,810,765 |
| 5% 8/1/22 (Pre-Refunded to 8/1/22 @ 100) | | 1,945,000 | 1,960,585 |
| 5% 8/1/22 (Pre-Refunded to 8/1/22 @ 100) | | 1,000,000 | 1,005,951 |
| 5% 8/1/22 (Pre-Refunded to 8/1/22 @ 100) | | 665,000 | 669,216 |
| Twenty-Seventh Series, 5% 8/1/22 (Pre-Refunded to 8/1/22 @ 100) | | 200,000 | 201,317 |
| South Windsor Gen. Oblig. BAN Series 2022, 2.25% 2/10/23 | | 3,000,000 | 3,032,113 |
| Univ. of Connecticut Gen. Oblig. Bonds Series 2020 A, 5% 2/15/23 | | 3,835,000 | 3,917,977 |
| Windsor Gen. Oblig. BAN Series 2021, 2% 6/23/22 | | 2,610,000 | 2,612,906 |
| Wolcott Gen. Oblig. BAN Series 2021, 1.25% 8/23/22 | | 2,840,000 | 2,840,661 |
| TOTAL OTHER MUNICIPAL SECURITY | | | |
| (Cost $51,076,288) | | | 51,076,288 |
| | | Shares | Value |
|
| Investment Company - 14.7% | | | |
| Fidelity Municipal Cash Central Fund 0.75% (h)(i) | | | |
| (Cost $43,024,492) | | 43,016,895 | 43,024,492 |
| TOTAL INVESTMENT IN SECURITIES - 99.4% | | | |
| (Cost $290,650,770) | | | 290,650,770 |
| NET OTHER ASSETS (LIABILITIES) - 0.6% | | | 1,817,137 |
| NET ASSETS - 100% | | | $292,467,907 |
Security Type Abbreviations
BAN – BOND ANTICIPATION NOTE
VRDN – VARIABLE RATE DEMAND NOTE (A debt instrument that is payable upon demand, either daily, weekly or monthly)
The date shown for securities represents the date when principal payments must be paid, taking into account any call options exercised by the issuer and any permissible maturity shortening features other than interest rate resets.
Legend
(a) Private activity obligations whose interest is subject to the federal alternative minimum tax for individuals.
(b) Coupon rates for floating and adjustable rate securities reflect the rates in effect at period end.
(c) Provides evidence of ownership in one or more underlying municipal bonds.
(d) Restricted securities (including private placements) - Investment in securities not registered under the Securities Act of 1933 (excluding 144A issues). At the end of the period, the value of restricted securities (excluding 144A issues) amounted to $4,200,000 or 1.4% of net assets.
(e) Coupon rates are determined by re-marketing agents based on current market conditions.
(f) Coupon is indexed to a floating interest rate which may be multiplied by a specified factor and/or subject to caps or floors.
(g) Security or a portion of the security purchased on a delayed delivery or when-issued basis.
(h) Information in this report regarding holdings by state and security types does not reflect the holdings of the Fidelity Municipal Cash Central Fund.
(i) Affiliated fund that is generally available only to investment companies and other accounts managed by Fidelity Investments. The rate quoted is the annualized seven-day yield of the fund at period end. A complete unaudited listing of the fund's holdings as of its most recent quarter end is available upon request. In addition, each Fidelity Central Fund's financial statements are available on the SEC's website or upon request.
Additional information on each restricted holding is as follows:
| Security | Acquisition Date | Cost |
| Alamo Cmnty. College District Rev. Bonds Series G-111, 0.99%, tender 11/1/22 (Liquidity Facility Royal Bank of Canada) | 5/3/21 | $200,000 |
| Connecticut Spl. Tax Oblig. Trans. Infrastructure Rev. Bonds Series Floaters G 110, 0.97%, tender 10/3/22 (Liquidity Facility Royal Bank of Canada) | 4/1/21 | $3,400,000 |
| Denver City & County Arpt. Rev. Bonds Series G-114, 1.04%, tender 12/1/22 (Liquidity Facility Royal Bank of Canada) | 6/1/21 | $100,000 |
| Ohio Univ. Gen. Receipts Athens Bonds Series Floaters G 27, 0.99%, tender 12/1/22 (Liquidity Facility Royal Bank of Canada) | 6/1/21 | $200,000 |
| Tampa-Hillsborough County Expressway Auth. Rev. Bonds Series G-113, 0.99%, tender 7/1/22 (Liquidity Facility Royal Bank of Canada) | 7/1/21 | $200,000 |
| Virginia Pub. Bldg. Auth. Pub. Facilities Rev. Bonds Series Floaters G 40, 0.99%, tender 8/1/22 (Liquidity Facility Royal Bank of Canada) | 2/1/21 | $100,000 |
Affiliated Central Funds
Fiscal year to date information regarding the Fund's investments in Fidelity Central Funds, including the ownership percentage, is presented below.
| Fund | Value, beginning of period | Purchases | Sales Proceeds | Dividend Income | Realized Gain/Loss | Change in Unrealized appreciation (depreciation) | Value, end of period | % ownership, end of period |
| Fidelity Municipal Cash Central Fund 0.75% | $29,199,492 | $65,761,000 | $51,936,000 | $54,468 | $-- | $-- | $43,024,492 | 2.3% |
| Total | $29,199,492 | $65,761,000 | $51,936,000 | $54,468 | $-- | $-- | $43,024,492 | |
Amounts in the income column in the above table include any capital gain distributions from underlying funds, which are presented in the corresponding line-item in the Statement of Operations, if applicable.
Investment Valuation
All investments are categorized as Level 2 under the Fair Value Hierarchy. The inputs or methodology used for valuing securities may not be an indication of the risk associated with investing in those securities. For more information on valuation inputs please refer to the Investment Valuation section in the accompanying Notes to Financial Statements.
See accompanying notes which are an integral part of the financial statements.
Fidelity® Connecticut Municipal Money Market Fund
Financial Statements
Statement of Assets and Liabilities
| | | May 31, 2022 (Unaudited) |
| Assets | | |
Investment in securities, at value — See accompanying schedule:
Unaffiliated issuers (cost $247,626,278) | $247,626,278 | |
| Fidelity Central Funds (cost $43,024,492) | 43,024,492 | |
| Total Investment in Securities (cost $290,650,770) | | $290,650,770 |
| Cash | | 610,273 |
| Receivable for securities sold on a delayed delivery basis | | 3,120,000 |
| Receivable for fund shares sold | | 592,270 |
| Interest receivable | | 777,043 |
| Distributions receivable from Fidelity Central Funds | | 23,232 |
| Prepaid expenses | | 51 |
| Other receivables | | 4 |
| Total assets | | 295,773,643 |
| Liabilities | | |
| Payable for investments purchased on a delayed delivery basis | $2,914,181 | |
| Payable for fund shares redeemed | 255,353 | |
| Distributions payable | 1,818 | |
| Accrued management fee | 85,455 | |
| Other affiliated payables | 29,206 | |
| Other payables and accrued expenses | 19,723 | |
| Total liabilities | | 3,305,736 |
| Net Assets | | $292,467,907 |
| Net Assets consist of: | | |
| Paid in capital | | $292,414,715 |
| Total accumulated earnings (loss) | | 53,192 |
| Net Assets | | $292,467,907 |
| Net Asset Value, offering price and redemption price per share ($292,467,907 ÷ 291,859,907 shares) | | $1.00 |
See accompanying notes which are an integral part of the financial statements.
Statement of Operations
| | | Six months ended May 31, 2022 (Unaudited) |
| Investment Income | | |
| Interest | | $436,600 |
| Income from Fidelity Central Funds | | 54,468 |
| Total income | | 491,068 |
| Expenses | | |
| Management fee | $505,905 | |
| Transfer agent fees | 153,956 | |
| Accounting fees and expenses | 22,755 | |
| Custodian fees and expenses | 1,723 | |
| Independent trustees' fees and expenses | 452 | |
| Registration fees | 18,571 | |
| Audit | 18,668 | |
| Legal | 4,193 | |
| Miscellaneous | 310 | |
| Total expenses before reductions | 726,533 | |
| Expense reductions | (318,399) | |
| Total expenses after reductions | | 408,134 |
| Net investment income (loss) | | 82,934 |
| Realized and Unrealized Gain (Loss) | | |
| Net realized gain (loss) on: | | |
| Investment securities: | | |
| Unaffiliated issuers | 141,146 | |
| Total net realized gain (loss) | | 141,146 |
| Net increase in net assets resulting from operations | | $224,080 |
See accompanying notes which are an integral part of the financial statements.
Statement of Changes in Net Assets
| | Six months ended May 31, 2022 (Unaudited) | Year ended November 30, 2021 |
| Increase (Decrease) in Net Assets | | |
| Operations | | |
| Net investment income (loss) | $82,934 | $31,969 |
| Net realized gain (loss) | 141,146 | 48,619 |
| Net increase in net assets resulting from operations | 224,080 | 80,588 |
| Distributions to shareholders | (82,399) | (31,933) |
| Share transactions | | |
| Proceeds from sales of shares | 26,408,070 | 44,317,665 |
| Reinvestment of distributions | 80,061 | 31,212 |
| Cost of shares redeemed | (27,945,962) | (99,795,622) |
| Net increase (decrease) in net assets and shares resulting from share transactions | (1,457,831) | (55,446,745) |
| Total increase (decrease) in net assets | (1,316,150) | (55,398,090) |
| Net Assets | | |
| Beginning of period | 293,784,057 | 349,182,147 |
| End of period | $292,467,907 | $293,784,057 |
| Other Information | | |
| Shares | | |
| Sold | 26,408,070 | 44,317,665 |
| Issued in reinvestment of distributions | 80,061 | 31,212 |
| Redeemed | (27,945,962) | (99,795,622) |
| Net increase (decrease) | (1,457,831) | (55,446,745) |
See accompanying notes which are an integral part of the financial statements.
Financial Highlights
Fidelity Connecticut Municipal Money Market Fund
| | Six months ended (Unaudited) May 31, | Years endedNovember 30, | | | | |
| | 2022 | 2021 | 2020 | 2019 | 2018 | 2017 |
| Selected Per–Share Data | | | | | | |
| Net asset value, beginning of period | $1.00 | $1.00 | $1.00 | $1.00 | $1.00 | $1.00 |
| Income from Investment Operations | | | | | | |
| Net investment income (loss)A | –B | –B | .004 | .011 | .010 | .004 |
| Net realized and unrealized gain (loss) | –B | –B | –B | .001 | –B | –B |
| Total from investment operations | –B | –B | .004 | .012 | .010 | .004 |
| Distributions from net investment income | –B | –B | (.004) | (.011) | (.010) | (.004) |
| Distributions from net realized gain | – | – | – | (.001) | –B | – |
| Total distributions | –B | –B | (.004) | (.012) | (.010) | (.004) |
| Net asset value, end of period | $1.00 | $1.00 | $1.00 | $1.00 | $1.00 | $1.00 |
| Total ReturnC,D | .03% | .01% | .40% | 1.20% | .98% | .38% |
| Ratios to Average Net AssetsA,E,F | | | | | | |
| Expenses before reductions | .50%G | .49% | .49% | .49% | .49% | .48% |
| Expenses net of fee waivers, if any | .28%G | .10% | .39% | .48% | .48% | .48% |
| Expenses net of all reductions | .28%G | .10% | .39% | .48% | .48% | .48% |
| Net investment income (loss) | .06%G | .01% | .42% | 1.13% | .96% | .37% |
| Supplemental Data | | | | | | |
| Net assets, end of period (000 omitted) | $292,468 | $293,784 | $349,182 | $419,015 | $507,690 | $695,621 |
A Net investment income (loss) is affected by the timing of the declaration of dividends by any underlying mutual funds or exchange-traded funds (ETFs). Net investment income (loss) of any such underlying funds is not included in the Fund's net investment income (loss) ratio.
B Amount represents less than $.0005 per share.
C Total returns for periods of less than one year are not annualized.
D Total returns would have been lower if certain expenses had not been reduced during the applicable periods shown.
E Fees and expenses of any underlying mutual funds or exchange-traded funds (ETFs) are not included in the Fund's expense ratio. The Fund indirectly bears its proportionate share of these expenses. For additional expense information related to investments in Fidelity Central Funds, please refer to the "Investments in Fidelity Central Funds" note found in the Notes to Financial Statements section of the most recent Annual or Semi-Annual report.
F Expense ratios reflect operating expenses of the class. Expenses before reductions do not reflect amounts reimbursed, waived, or reduced through arrangements with the investment adviser, brokerage services, or other offset arrangements, if applicable, and do not represent the amount paid by the class during periods when reimbursements, waivers or reductions occur.
G Annualized
See accompanying notes which are an integral part of the financial statements.
Notes to Financial Statements (Unaudited)
For the period ended May 31, 2022
1. Organization.
Fidelity Connecticut Municipal Income Fund (the Income Fund) is a fund of Fidelity Court Street Trust. Fidelity Connecticut Municipal Money Market Fund (the Money Market Fund) is a fund of Fidelity Court Street Trust II. Each Trust is registered under the Investment Company Act of 1940, as amended (the 1940 Act), as an open-end management investment company. Fidelity Court Street Trust and Fidelity Court Street Trust II (the Trusts) are organized as a Massachusetts business trust and a Delaware statutory trust, respectively. The Income Fund is a non-diversified fund. Each Fund is authorized to issue an unlimited number of shares. Shares of the Money Market Fund are only available for purchase by retail shareholders. Share transactions on the Statement of Changes in Net Assets may contain exchanges between affiliated funds. Each Fund may be affected by economic and political developments in the state of Connecticut.
Effective after the close of business on July 15, 2022, Fidelity Connecticut Municipal Money Market Fund was closed to new accounts with certain exceptions.
2. Investments in Fidelity Central Funds.
Funds may invest in Fidelity Central Funds, which are open-end investment companies generally available only to other investment companies and accounts managed by the investment adviser and its affiliates. The Schedule of Investments lists any Fidelity Central Funds held as an investment as of period end, but does not include the underlying holdings of each Fidelity Central Fund. An investing fund indirectly bears its proportionate share of the expenses of the underlying Fidelity Central Funds.
Based on its investment objective, each Fidelity Central Fund may invest or participate in various investment vehicles or strategies that are similar to those of the investing fund. These strategies are consistent with the investment objectives of the investing fund and may involve certain economic risks which may cause a decline in value of each of the Fidelity Central Funds and thus a decline in the value of the investing fund.
| Fidelity Central Fund | Investment Manager | Investment Objective | Investment Practices | Expense Ratio(a) |
| Fidelity Money Market Central Funds | Fidelity Management & Research Company LLC (FMR) | Each fund seeks to obtain a high level of current income consistent with the preservation of capital and liquidity. | Short-term Investments | Less than .005% |
(a) Expenses expressed as a percentage of average net assets and are as of each underlying Central Fund's most recent annual or semi-annual shareholder report.
A complete unaudited list of holdings for each Fidelity Central Fund is available upon request or at the Securities and Exchange Commission website at www.sec.gov. In addition, the financial statements of the Fidelity Central Funds which contain the significant accounting policies (including investment valuation policies) of those funds, and are not covered by the Report of Independent Registered Public Accounting Firm, are available on the Securities and Exchange Commission website or upon request.
3. Significant Accounting Policies.
Each Fund is an investment company and applies the accounting and reporting guidance of the Financial Accounting Standards Board (FASB) Accounting Standards Codification Topic 946 Financial Services - Investment Companies. The financial statements have been prepared in conformity with accounting principles generally accepted in the United States of America (GAAP), which require management to make certain estimates and assumptions at the date of the financial statements. Actual results could differ from those estimates. Subsequent events, if any, through the date that the financial statements were issued have been evaluated in the preparation of the financial statements. Each Fund's Schedule of Investments lists any underlying mutual funds or exchange-traded funds (ETFs) but does not include the underlying holdings of these funds. The following summarizes the significant accounting policies of each Fund:
Investment Valuation. Investments are valued as of 4:00 p.m. Eastern time on the last calendar day of the period. The Board of Trustees (the Board) has delegated the day to day responsibility for the valuation of the Income Fund's investments to the Fair Value Committee (the Committee) established by the Income Fund's investment adviser. In accordance with valuation policies and procedures approved by the Board, the Income Fund attempts to obtain prices from one or more third party pricing vendors or brokers to value its investments. When current market prices, quotations or currency exchange rates are not readily available or reliable, investments will be fair valued in good faith by the Committee, in accordance with procedures adopted by the Board. Factors used in determining fair value vary by investment type and may include market or investment specific events, changes in interest rates and credit quality. The frequency with which these procedures are used cannot be predicted and they may be utilized to a significant extent. The Committee oversees the Income Fund's valuation policies and procedures and reports to the Board on the Committee's activities and fair value determinations. The Board monitors the appropriateness of the procedures used in valuing the Income Fund's investments and ratifies the fair value determinations of the Committee.
Each Fund categorizes the inputs to valuation techniques used to value its investments into a disclosure hierarchy consisting of three levels as shown below:
- Level 1 – unadjusted quoted prices in active markets for identical investments
- Level 2 – other significant observable inputs (including quoted prices for similar investments, interest rates, prepayment speeds, etc.)
- Level 3 – unobservable inputs (including the Fund's own assumptions based on the best information available)
Valuation techniques used to value each Fund's investments by major category are as follows:
For the Income Fund, debt securities, including restricted securities, are valued based on evaluated prices received from third party pricing vendors or from brokers who make markets in such securities. Municipal securities are valued by pricing vendors who utilize matrix pricing which considers yield or price of bonds of comparable quality, coupon, maturity and type or by broker-supplied prices. When independent prices are unavailable or unreliable, debt securities may be valued utilizing pricing methodologies which consider similar factors that would be used by third party pricing vendors. Debt securities are generally categorized as Level 2 in the hierarchy but may be Level 3 depending on the circumstances.
For the Money Market Fund, as permitted by compliance with certain conditions under Rule 2a-7 of the 1940 Act, securities are valued at amortized cost, which approximates fair value. The amortized cost of an instrument is determined by valuing it at its original cost and thereafter amortizing any discount or premium from its face value at a constant rate until maturity. Securities held by a money market fund are generally high quality and liquid; however, they are reflected as Level 2 because the inputs used to determine fair value are not quoted prices in an active market.
For the Income Fund, changes in valuation techniques may result in transfers in or out of an assigned level within the disclosure hierarchy. The aggregate value of investments by input level as of May 31, 2022 is included at the end of the Fund's Schedule of Investments.
Investment Transactions and Income. For financial reporting purposes, the Funds' investment holdings and NAV include trades executed through the end of the last business day of the period. The NAV per share for processing shareholder transactions is calculated as of the close of business of the New York Stock Exchange (NYSE), normally 4:00 p.m. Eastern time and includes trades executed through the end of the prior business day for the Income Fund and trades executed through the end of the current business day for the Money Market Fund. Gains and losses on securities sold are determined on the basis of identified cost. Income and capital gain distributions from Fidelity Central Funds, if any, are recorded on the ex-dividend date. Interest income is accrued as earned and includes coupon interest and amortization of premium and accretion of discount on debt securities as applicable. Debt obligations may be placed on non-accrual status and related interest income may be reduced by ceasing current accruals and writing off interest receivables when the collection of all or a portion of interest has become doubtful based on consistently applied procedures. A debt obligation is removed from non-accrual status when the issuer resumes interest payments or when collectability of interest is reasonably assured.
Expenses. Expenses directly attributable to a fund are charged to that fund. Expenses attributable to more than one fund are allocated among the respective funds on the basis of relative net assets or other appropriate methods. Expenses included in the accompanying financial statements reflect the expenses of that fund and do not include any expenses associated with any underlying mutual funds or exchange-traded funds. Although not included in a fund's expenses, a fund indirectly bears its proportionate share of these expenses through the net asset value of each underlying mutual fund or exchange-traded fund. Expense estimates are accrued in the period to which they relate and adjustments are made when actual amounts are known.
Income Tax Information and Distributions to Shareholders. Each year, each Fund intends to qualify as a regulated investment company under Subchapter M of the Internal Revenue Code, including distributing substantially all of its taxable income and realized gains. As a result, no provision for U.S. Federal income taxes is required. Each Fund files a U.S. federal tax return, in addition to state and local tax returns as required. Each Fund's federal income tax returns are subject to examination by the Internal Revenue Service (IRS) for a period of three fiscal years after they are filed. State and local tax returns may be subject to examination for an additional fiscal year depending on the jurisdiction.
Distributions are declared and recorded daily and paid monthly from net investment income. Distributions from realized gains, if any, are declared and recorded on the ex-dividend date. Income and capital gain distributions are determined in accordance with income tax regulations, which may differ from GAAP.
Capital accounts within the financial statements are adjusted for permanent book-tax differences. These adjustments have no impact on net assets or the results of operations. Capital accounts are not adjusted for temporary book-tax differences which will reverse in a subsequent period.
Book-tax differences are primarily due to capital loss carryforwards.
The Funds purchase municipal securities whose interest, in the opinion of the issuer, is free from federal income tax. There is no assurance that the Internal Revenue Service (IRS) will agree with this opinion. In the event the IRS determines that the issuer does not comply with relevant tax requirements, interest payments from a security could become federally taxable, possibly retroactively to the date the security was issued.
As of period end, the cost and unrealized appreciation (depreciation) in securities, and derivatives if applicable, for federal income tax purposes were as follows for each Fund:
| | Tax cost | Gross unrealized appreciation | Gross unrealized depreciation | Net unrealized appreciation (depreciation) |
| Fidelity Connecticut Municipal Income Fund | $312,956,594 | $2,258,629 | $(11,489,067) | $(9,230,438) |
| Fidelity Connecticut Municipal Money Market Fund | 290,650,770 | – | – | – |
Capital loss carryforwards are only available to offset future capital gains of the Funds to the extent provided by regulations and may be limited. The capital loss carryforward information presented below, including any applicable limitation, is estimated as of prior fiscal period end and is subject to adjustment.
| | No expiration | | |
| | Short-term | Long-term | Total capital loss carryforward |
| Fidelity Connecticut Municipal Money Market Fund | (86,079) | (–) | (86,079) |
Delayed Delivery Transactions and When-Issued Securities. During the period, certain Funds transacted in securities on a delayed delivery or when-issued basis. Payment and delivery may take place after the customary settlement period for that security. The price of the underlying securities and the date when the securities will be delivered and paid for are fixed at the time the transaction is negotiated. Securities purchased on a delayed delivery or when-issued basis are identified as such in the Schedule of Investments. Compensation for interest forgone in the purchase of a delayed delivery or when-issued debt security may be received. With respect to purchase commitments, each applicable Fund identifies securities as segregated in its records with a value at least equal to the amount of the commitment. Payables and receivables associated with the purchases and sales of delayed delivery securities having the same coupon, settlement date and broker are offset. Delayed delivery or when-issued securities that have been purchased from and sold to different brokers are reflected as both payables and receivables in the Statement of Assets and Liabilities under the caption "Delayed delivery", as applicable. Losses may arise due to changes in the value of the underlying securities or if the counterparty does not perform under the contract's terms, or if the issuer does not issue the securities due to political, economic, or other factors.
Restricted Securities (including Private Placements). Funds may invest in securities that are subject to legal or contractual restrictions on resale. These securities generally may be resold in transactions exempt from registration or to the public if the securities are registered. Disposal of these securities may involve time-consuming negotiations and expense, and prompt sale at an acceptable price may be difficult. Information regarding restricted securities held at period end is included at the end of the Schedule of Investments, if applicable.
4. Purchases and Sales of Investments.
Purchases and sales of securities, other than short-term securities and in-kind transactions, as applicable, are noted in the table below.
| | Purchases ($) | Sales ($) |
| Fidelity Connecticut Municipal Income Fund | 4,251,429 | 20,793,649 |
5. Fees and Other Transactions with Affiliates.
Management Fee. Fidelity Management & Research Company LLC (the investment adviser) and its affiliates provide the Funds with investment management related services for which the Funds pay a monthly management fee. The management fee is the sum of an individual fund fee rate and an annualized group fee rate. The individual fund fee rate is applied to each Fund's average net assets. The group fee rate is based upon the monthly average net assets of a group of registered investment companies with which the investment adviser has management contracts. The group fee rate decreases as assets under management increase and increases as assets under management decrease. For the reporting period, each Fund's annualized management fee rate expressed as a percentage of each Fund's average net assets was as follows:
| | Individual Rate | Group Rate | Total |
| Fidelity Connecticut Municipal Income Fund | .25% | .10% | .35% |
| Fidelity Connecticut Municipal Money Market Fund | .25% | .10% | .35% |
Transfer Agent Fees. Fidelity Investments Institutional Operations Company LLC (FIIOC), an affiliate of the investment adviser, is the transfer, dividend disbursing and shareholder servicing agent for the Funds. FIIOC receives account fees and asset-based fees that vary according to account size and type of account. FIIOC pays for typesetting, printing and mailing of shareholder reports, except proxy statements. For the period, the transfer agent fees were equivalent to the following annualized rates expressed as a percentage of average net assets:
| Fidelity Connecticut Municipal Income Fund | .09% |
| Fidelity Connecticut Municipal Money Market Fund | .11% |
Accounting Fees. Fidelity Service Company, Inc. (FSC), an affiliate of the investment adviser, maintains each Fund's accounting records. The accounting fee is based on the level of average net assets for each month. For the period, the fees were equivalent to the following annualized rates:
| | % of Average Net Assets |
| Fidelity Connecticut Municipal Income Fund | .03 |
| Fidelity Connecticut Municipal Money Market Fund | .02 |
Interfund Trades. Funds may purchase from or sell securities to other Fidelity Funds under procedures adopted by the Board. The procedures have been designed to ensure these interfund trades are executed in accordance with Rule 17a-7 of the 1940 Act. For the Income Fund, any interfund trades are included within the respective purchases and sales amounts shown in the Purchases and Sales of Investments note.
| | Purchases ($) | Sales ($) | Realized Gain (Loss) ($) |
| Fidelity Connecticut Municipal Income Fund | – | – | – |
| Fidelity Connecticut Municipal Money Market Fund | 1,600,000 | 7,905,000 | – |
6. Committed Line of Credit.
Certain Funds participate with other funds managed by the investment adviser or an affiliate in a $4.25 billion credit facility (the "line of credit") to be utilized for temporary or emergency purposes to fund shareholder redemptions or for other short-term liquidity purposes. The participating funds have agreed to pay commitment fees on their pro-rata portion of the line of credit, which are reflected in Miscellaneous expenses on the Statement of Operations, and are listed below. During the period, there were no borrowings on this line of credit.
| | Amount |
| Fidelity Connecticut Municipal Income Fund | $289 |
7. Expense Reductions.
The investment adviser voluntarily agreed to reimburse expenses of the Money Market Fund to the extent annual operating expenses exceeded certain levels of average net assets as noted in the table below. Some expenses, for example the compensation of the independent Trustees, and certain miscellaneous expenses such as proxy and shareholder meeting expenses, are excluded from this reimbursement.
The Money Market Fund in reimbursement during the period:
| | Expense Limitations | Reimbursement |
| Fidelity Connecticut Municipal Money Market Fund | .48% | $28,041 |
Additionally, the investment adviser or its affiliates voluntarily agreed to waive certain fees for the Money Market Fund in order to avoid a negative yield. Such arrangements may be discontinued by the investment adviser at any time. For the period, the amount of the waiver was $287,899.
Through arrangements with each applicable Fund's custodian, credits realized as a result of certain uninvested cash balances were used to reduce each applicable Fund's expenses. All of the applicable expense reductions are noted in the table below.
| | Custodian credits |
| Fidelity Connecticut Municipal Income Fund | $3,491 |
| Fidelity Connecticut Municipal Money Market Fund | 130 |
In addition, during the period the investment adviser or an affiliate reimbursed and/or waived a portion of operating expenses as follows:
| | Amount |
| Fidelity Connecticut Municipal Income Fund | $2,765 |
| Fidelity Connecticut Municipal Money Market Fund | 2,329 |
8. Other.
A fund's organizational documents provide former and current trustees and officers with a limited indemnification against liabilities arising in connection with the performance of their duties to the fund. In the normal course of business, a fund may also enter into contracts that provide general indemnifications. A fund's maximum exposure under these arrangements is unknown as this would be dependent on future claims that may be made against a fund. The risk of material loss from such claims is considered remote.
9. Coronavirus (COVID-19) Pandemic.
An outbreak of COVID-19 first detected in China during December 2019 has since spread globally and was declared a pandemic by the World Health Organization during March 2020. Developments that disrupt global economies and financial markets, such as the COVID-19 pandemic, may magnify factors that affect the Funds' performance.
10. Proposed Reorganization.
The Board of Trustees of Fidelity Connecticut Municipal Money Market Fund approved an Agreement and Plan of Reorganization (the Agreement) between Fidelity Connecticut Municipal Money Market Fund and Fidelity Municipal Money Market Fund. The Agreement provides for the transfer of all the assets and the assumption of all the liabilities of Fidelity Connecticut Municipal Money Market Fund in exchange for shares of Fidelity Municipal Money Market Fund equal in value to the net assets of Fidelity Connecticut Municipal Money Market Fund on the day the reorganization is effective.
A meeting of shareholders of Fidelity Connecticut Municipal Money Market Fund is expected to be held during the fourth quarter of 2022 to vote on the reorganization. If approved by shareholders, the reorganization is expected to become effective on December 2, 2022. The reorganization is expected to qualify as a tax-free transaction for federal income tax purposes with no gain or loss recognized by the funds or their shareholders.
Shareholder Expense Example
As a shareholder, you incur two types of costs: (1) transaction costs, which may include sales charges (loads) on purchase payments or redemption proceeds, as applicable and (2) ongoing costs, which generally include management fees, distribution and/or service (12b-1) fees and other Fund expenses. This Example is intended to help you understand your ongoing costs (in dollars) of investing in a fund and to compare these costs with the ongoing costs of investing in other mutual funds.
The Example is based on an investment of $1,000 invested at the beginning of the period and held for the entire period (December 1, 2021 to May 31, 2022).
Actual Expenses
The first line of the accompanying table provides information about actual account values and actual expenses. You may use the information in this line, together with the amount you invested, to estimate the expenses that you paid over the period. Simply divide your account value by $1,000.00 (for example, an $8,600 account value divided by $1,000.00 = 8.6), then multiply the result by the number in the first line for a class/Fund under the heading entitled "Expenses Paid During Period" to estimate the expenses you paid on your account during this period. If any fund is a shareholder of any underlying mutual funds or exchange-traded funds (ETFs) (the Underlying Funds), such fund indirectly bears its proportional share of the expenses of the Underlying Funds in addition to the direct expenses incurred presented in the table. These fees and expenses are not included in the annualized expense ratio used to calculate the expense estimate in the table below.
Hypothetical Example for Comparison Purposes
The second line of the accompanying table provides information about hypothetical account values and hypothetical expenses based on the actual expense ratio and an assumed rate of return of 5% per year before expenses, which is not the actual return. The hypothetical account values and expenses may not be used to estimate the actual ending account balance or expenses you paid for the period. You may use this information to compare the ongoing costs of investing in the Fund and other funds. To do so, compare this 5% hypothetical example with the 5% hypothetical examples that appear in the shareholder reports of the other funds. If any fund is a shareholder of any Underlying Funds, such fund indirectly bears its proportional share of the expenses of the Underlying Funds in addition to the direct expenses as presented in the table. These fees and expenses are not included in the annualized expense ratio used to calculate the expense estimate in the table below.
Please note that the expenses shown in the table are meant to highlight your ongoing costs only and do not reflect any transaction costs. Therefore, the second line of the table is useful in comparing ongoing costs only, and will not help you determine the relative total costs of owning different funds. In addition, if these transactional costs were included, your costs would have been higher.
| | Annualized Expense Ratio-A | Beginning
Account Value
December 1, 2021 | Ending
Account Value
May 31, 2022 | Expenses Paid
During Period-B
December 1, 2021
to May 31, 2022 |
| Fidelity Connecticut Municipal Income Fund | .50% | | | |
| Actual | | $1,000.00 | $929.30 | $2.41 |
| Hypothetical-C | | $1,000.00 | $1,022.44 | $2.52 |
| Fidelity Connecticut Municipal Money Market Fund | .28% | | | |
| Actual | | $1,000.00 | $1,000.30 | $1.40 ** |
| Hypothetical-C | | $1,000.00 | $1,023.54 | $1.41 ** |
A Annualized expense ratio reflects expenses net of applicable fee waivers.
B Expenses are equal to the annualized expense ratio, multiplied by the average account value over the period, multiplied by 182/ 365 (to reflect the one-half year period). The fees and expenses of any Underlying Funds are not included in each annualized expense ratio.
C 5% return per year before expenses
** If certain fees were not voluntarily waived by the investment adviser or its affiliates during the period, the annualized expense ratios and the expenses paid in the actual and hypothetical examples above would have been as follows:
| | Annualized Expense Ratio-(a)
| Expenses Paid
|
| Fidelity Connecticut Municipal Money Market Fund | .48% | |
| Actual | | $2.39 |
| Hypothetical-(b) | | $2.42 |
| | | |
(a) Annualized expense ratio reflects expenses net of applicable fee waivers.
(b) 5% return per year before expenses
Liquidity Risk Management Program
The Securities and Exchange Commission adopted Rule 22e-4 under the Investment Company Act of 1940 (the Liquidity Rule) to promote effective liquidity risk management throughout the open-end investment company industry, thereby reducing the risk that funds will be unable to meet their redemption obligations and mitigating dilution of the interests of fund shareholders.
The Connecticut Municipal Income Fund (the Income Fund) has adopted and implemented a liquidity risk management program pursuant to the Liquidity Rule (the Program) effective December 1, 2018. The Program is reasonably designed to assess and manage the Income Fund’s liquidity risk and to comply with the requirements of the Liquidity Rule. The Income Fund’s Board of Trustees (the Board) has designated the Income Fund’s investment adviser as administrator of the Program. The Fidelity advisers have established a Liquidity Risk Management Committee (the LRM Committee) to manage the Program for each of the Fidelity Funds. The LRM Committee monitors the adequacy and effectiveness of implementation of the Program and on a periodic basis assesses each Fund’s liquidity risk based on a variety of factors including (1) the Fund’s investment strategy, (2) portfolio liquidity and cash flow projections during normal and reasonably foreseeable stressed conditions, (3) shareholder redemptions, (4) borrowings and other funding sources and (5) in the case of exchange-traded funds, certain additional factors including the effect of the Fund’s prices and spreads, market participants, and basket compositions on the overall liquidity of the Fund’s portfolio, as applicable.
In accordance with the Program, each of the Fund’s portfolio investments is classified into one of four liquidity categories described below based on a determination of a reasonable expectation for how long it would take to convert the investment to cash (or sell or dispose of the investment) without significantly changing its market value.
- Highly liquid investments – cash or convertible to cash within three business days or less
- Moderately liquid investments – convertible to cash in three to seven calendar days
- Less liquid investments – can be sold or disposed of, but not settled, within seven calendar days
- Illiquid investments – cannot be sold or disposed of within seven calendar days
Liquidity classification determinations take into account a variety of factors including various market, trading and investment-specific considerations, as well as market depth, and generally utilize analysis from a third-party liquidity metrics service.
The Liquidity Rule places a 15% limit on a fund’s illiquid investments and requires funds that do not primarily hold assets that are highly liquid investments to determine and maintain a minimum percentage of the fund’s net assets to be invested in highly liquid investments (highly liquid investment minimum or HLIM). The Program includes provisions reasonably designed to comply with the 15% limit on illiquid investments and for determining, periodically reviewing and complying with the HLIM requirement as applicable.
At a recent meeting of the Fund’s Board of Trustees, the LRM Committee provided a written report to the Board pertaining to the operation, adequacy, and effectiveness of implementation of the Program for the annual period from December 1, 2020 through November 30, 2021. The report concluded that the Program has been implemented and is operating effectively and is reasonably designed to assess and manage the Fund’s liquidity risk.

CTF-SANN-0722
1.704902.124
Fidelity® New Jersey Municipal Income Fund
Fidelity® New Jersey Municipal Money Market Fund
Semi-Annual Report
May 31, 2022
Contents
To view a fund's proxy voting guidelines and proxy voting record for the 12-month period ended June 30, visit http://www.fidelity.com/proxyvotingresults or visit the Securities and Exchange Commission's (SEC) web site at http://www.sec.gov.
You may also call 1-800-544-8544 to request a free copy of the proxy voting guidelines.
Standard & Poor's, S&P and S&P 500 are registered service marks of The McGraw-Hill Companies, Inc. and have been licensed for use by Fidelity Distributors Corporation.
Other third-party marks appearing herein are the property of their respective owners.
All other marks appearing herein are registered or unregistered trademarks or service marks of FMR LLC or an affiliated company. © 2022 FMR LLC. All rights reserved.
This report and the financial statements contained herein are submitted for the general information of the shareholders of the Funds. This report is not authorized for distribution to prospective investors in the Funds unless preceded or accompanied by an effective prospectus.
A fund files its complete schedule of portfolio holdings with the SEC for the first and third quarters of each fiscal year on Form N-PORT. Forms N-PORT are available on the SEC’s web site at http://www.sec.gov. A fund's Forms N-PORT may be reviewed and copied at the SEC’s Public Reference Room in Washington, DC. Information regarding the operation of the SEC's Public Reference Room may be obtained by calling 1-800-SEC-0330.
For a complete list of a fund's portfolio holdings, view the most recent holdings listing, semiannual report, or annual report on Fidelity's web site at http://www.fidelity.com, http://www.institutional.fidelity.com, or http://www.401k.com, as applicable.
NOT FDIC INSURED •MAY LOSE VALUE •NO BANK GUARANTEE
Neither the Funds nor Fidelity Distributors Corporation is a bank.
Note to Shareholders:
Early in 2020, the outbreak and spread of COVID-19 emerged as a public health emergency that had a major influence on financial markets, primarily based on its impact on the global economy and corporate earnings. On March 11, 2020, the World Health Organization declared the COVID-19 outbreak a pandemic, citing sustained risk of further global spread. The pandemic prompted a number of measures to limit the spread of COVID-19, including travel and border restrictions, quarantines, and restrictions on large gatherings. In turn, these resulted in lower consumer activity, diminished demand for a wide range of products and services, disruption in manufacturing and supply chains, and – given the wide variability in outcomes regarding the outbreak – significant market uncertainty and volatility. To help stem the turmoil, the U.S. government took unprecedented action – in concert with the U.S. Federal Reserve and central banks around the world – to help support consumers, businesses, and the broader economy, and to limit disruption to the financial system.
In general, the overall impact of the pandemic lessened in 2021, amid a resilient economy and widespread distribution of three COVID-19 vaccines granted emergency use authorization from the U.S. Food and Drug Administration (FDA) early in the year. Still, the situation remains dynamic, and the extent and duration of its influence on financial markets and the economy is highly uncertain, due in part to a recent spike in cases based on highly contagious variants of the coronavirus.
Extreme events such as the COVID-19 crisis are exogenous shocks that can have significant adverse effects on mutual funds and their investments. Although multiple asset classes may be affected by market disruption, the duration and impact may not be the same for all types of assets. Fidelity is committed to helping you stay informed amid news about COVID-19 and during increased market volatility, and we continue to take extra steps to be responsive to customer needs. We encourage you to visit us online, where we offer ongoing updates, commentary, and analysis on the markets and our funds.
Fidelity® New Jersey Municipal Income Fund
Investment Summary (Unaudited)
Top Five Sectors as of May 31, 2022
| | % of fund's net assets |
| General Obligations | 30.2 |
| Transportation | 27.2 |
| Health Care | 19.8 |
| Education | 14.7 |
| Escrowed/Pre-Refunded | 2.5 |
Quality Diversification (% of fund's net assets)
| As of May 31, 2022 |
| | AAA | 2.1% |
| | AA,A | 79.5% |
| | BBB | 12.5% |
| | Not Rated | 2.7% |
| | Short-Term Investments and Net Other Assets | 3.2% |
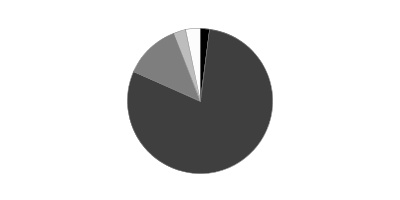
We have used ratings from Moody's Investors Service, Inc. Where Moody's® ratings are not available, we have used S&P® ratings. All ratings are as of the date indicated and do not reflect subsequent changes.
Fidelity® New Jersey Municipal Income Fund
Schedule of Investments May 31, 2022 (Unaudited)
Showing Percentage of Net Assets
| Municipal Bonds - 98.4% | | | |
| | | Principal Amount | Value |
| Delaware, New Jersey - 4.2% | | | |
| Delaware River & Bay Auth. Rev.: | | | |
| Series 2014 A, 5% 1/1/44 | | $3,000,000 | $3,114,010 |
| Series 2014 B, 5% 1/1/23 | | 700,000 | 713,608 |
| Series 2019, 5% 1/1/32 | | 5,000,000 | 5,811,867 |
| Series 2022: | | | |
| 5% 1/1/25 (a) | | 1,000,000 | 1,058,925 |
| 5% 1/1/26 (a) | | 1,400,000 | 1,511,202 |
| 5% 1/1/29 (a) | | 1,525,000 | 1,712,529 |
| 5% 1/1/30 (a) | | 825,000 | 937,221 |
| 5% 1/1/31 (a) | | 1,000,000 | 1,152,728 |
| 5% 1/1/32 (a) | | 1,250,000 | 1,453,172 |
| 5% 1/1/33 (a) | | 1,250,000 | 1,448,452 |
| 5% 1/1/36 (a) | | 1,490,000 | 1,706,653 |
| 5% 1/1/38 (a) | | 410,000 | 467,449 |
| 5% 1/1/42 (a) | | 2,075,000 | 2,347,034 |
|
| TOTAL DELAWARE, NEW JERSEY | | | 23,434,850 |
|
| Guam - 0.1% | | | |
| Guam Int'l. Arpt. Auth. Rev. Series 2013 C, 6.375% 10/1/43 (b) | | 480,000 | 500,240 |
| New Jersey - 77.9% | | | |
| Camden County Impt. Auth. Health Care Redev. Rev. Series 2014 A: | | | |
| 5% 2/15/25 | | 1,020,000 | 1,061,378 |
| 5% 2/15/26 | | 1,500,000 | 1,556,450 |
| 5% 2/15/27 | | 1,000,000 | 1,034,886 |
| 5% 2/15/28 | | 1,000,000 | 1,031,526 |
| 5% 2/15/29 | | 1,000,000 | 1,029,325 |
| 5% 2/15/32 | | 1,000,000 | 1,024,056 |
| 5% 2/15/33 | | 1,000,000 | 1,023,508 |
| 5% 2/15/34 | | 1,200,000 | 1,227,592 |
| 5% 2/15/35 | | 1,000,000 | 1,022,608 |
| Camden County Impt. Auth. Rev. (County Cap. Prog.) Series 2016, 5% 1/15/32 | | 3,000,000 | 3,255,112 |
| Cumberland County Impt. Auth.: | | | |
| (County Correctional Facility Proj.) Series 2018, 5% 10/1/58 | | 5,000,000 | 5,387,960 |
| (Technical High School Proj.) Series 2014: | | | |
| 5% 9/1/23 (Assured Guaranty Muni. Corp. Insured) | | 600,000 | 623,782 |
| 5% 9/1/24 (Assured Guaranty Muni. Corp. Insured) | | 1,640,000 | 1,740,612 |
| 5% 9/1/25 (Assured Guaranty Muni. Corp. Insured) | | 1,375,000 | 1,457,836 |
| Gloucester County Impt. Auth. Rev. (Rowan Univ. Proj.): | | | |
| Series 2017 A: | | | |
| 5% 11/1/28 (Assured Guaranty Muni. Corp. Insured) | | 2,500,000 | 2,745,978 |
| 5% 11/1/29 (Assured Guaranty Muni. Corp. Insured) | | 750,000 | 821,826 |
| 5% 11/1/30 (Assured Guaranty Muni. Corp. Insured) | | 605,000 | 661,621 |
| Series 2019: | | | |
| 4% 7/1/48 | | 1,000,000 | 1,025,048 |
| 5% 7/1/44 | | 2,375,000 | 2,661,935 |
| Hudson Co. Impt. Auth. Swsr Series 2019: | | | |
| 4% 1/1/35 | | 1,000,000 | 1,046,315 |
| 4% 1/1/37 | | 395,000 | 408,676 |
| 4% 1/1/38 | | 1,000,000 | 1,030,156 |
| 4% 1/1/39 | | 835,000 | 858,926 |
| Jersey City Gen. Oblig. Series 2017 A: | | | |
| 5% 11/1/24 | | 1,000,000 | 1,068,752 |
| 5% 11/1/28 | | 1,050,000 | 1,186,463 |
| 5% 11/1/29 | | 1,035,000 | 1,166,290 |
| 5% 11/1/30 | | 800,000 | 900,111 |
| 5% 11/1/31 | | 500,000 | 562,144 |
| New Brunswick Parking Auth. Rev. Series 2012: | | | |
| 5% 9/1/23 | | 1,450,000 | 1,461,301 |
| 5% 9/1/26 | | 600,000 | 603,965 |
| 5% 9/1/27 | | 440,000 | 442,833 |
| New Jersey Econ. Dev. Auth.: | | | |
| (White Horse HMT Urban Renewal LLC Proj.) Series 2020, 5% 1/1/40 (c) | | 1,000,000 | 844,129 |
| Series 2013, 5% 3/1/27 | | 335,000 | 340,942 |
| Series A, 5% 11/1/35 | | 5,000,000 | 5,464,363 |
| Series QQQ: | | | |
| 4% 6/15/46 | | 1,250,000 | 1,236,503 |
| 4% 6/15/50 | | 1,000,000 | 979,929 |
| Series WW: | | | |
| 5.25% 6/15/40 | | 1,895,000 | 1,980,681 |
| 5.25% 6/15/40 (Pre-Refunded to 6/15/25 @ 100) | | 105,000 | 114,806 |
| New Jersey Econ. Dev. Auth. Lease Rev. (Health Dept. and Taxation Division Office Proj.) Series 2018 A, 5% 6/15/31 | | 2,555,000 | 2,758,669 |
| New Jersey Econ. Dev. Auth. Motor Vehicle Rev. Series 2017 B, 3.125% 7/1/29 | | 1,335,000 | 1,306,039 |
| New Jersey Econ. Dev. Auth. Rev.: | | | |
| (Black Horse EHT Urban Renewal LLC Proj.) Series 2019 A, 5% 10/1/39 (c) | | 1,250,000 | 1,099,180 |
| (Goethals Bridge Replacement Proj.) Series 2013, 5.125% 1/1/34 (b) | | 1,500,000 | 1,532,632 |
| (Provident Montclair Proj.) Series 2017: | | | |
| 5% 6/1/30 (Assured Guaranty Muni. Corp. Insured) | | 1,500,000 | 1,663,945 |
| 5% 6/1/31 (Assured Guaranty Muni. Corp. Insured) | | 1,500,000 | 1,659,950 |
| 5% 6/1/37 (Assured Guaranty Muni. Corp. Insured) | | 4,000,000 | 4,386,629 |
| Series 2005 N1, 5.5% 9/1/24 (AMBAC Insured) | | 5,000,000 | 5,324,189 |
| Series 2013 NN, 5% 3/1/26 | | 4,130,000 | 4,203,630 |
| Series 2013, 5% 3/1/25 | | 1,295,000 | 1,318,349 |
| Series 2015 XX: | | | |
| 4.25% 6/15/26 | | 4,220,000 | 4,389,447 |
| 5.25% 6/15/27 | | 3,000,000 | 3,205,636 |
| Series 2016 BBB, 5.5% 6/15/30 (Pre-Refunded to 12/15/26 @ 100) | | 2,165,000 | 2,476,891 |
| New Jersey Econ. Dev. Auth. Wtr. Facilities Rev.: | | | |
| (Middlesex Wtr. Co. Proj.) Series 2019, 5% 8/1/59 (b) | | 1,000,000 | 1,089,857 |
| (New Jersey-American Wtr. Co., Inc. Proj.): | | | |
| Series 2020 A, 1% 6/1/23 | | 1,300,000 | 1,286,654 |
| Series 2020 C, 1.15% 6/1/23 (b) | | 2,500,000 | 2,474,383 |
| Bonds (New Jersey-American Wtr. Co., Inc.) Series 2020, 1.2%, tender 6/1/23 (b)(d) | | 1,000,000 | 989,140 |
| New Jersey Edl. Facility: | | | |
| (Stevens Institute of Techonolgy Proj.) Series 2017 A: | | | |
| 5% 7/1/23 | | 635,000 | 653,421 |
| 5% 7/1/24 | | 690,000 | 722,067 |
| 5% 7/1/25 | | 600,000 | 638,407 |
| 5% 7/1/26 | | 945,000 | 1,020,355 |
| 5% 7/1/29 | | 665,000 | 718,475 |
| Series 2015 B, 5% 7/1/31 | | 3,000,000 | 3,179,109 |
| Series 2016 A: | | | |
| 5% 7/1/27 | | 2,875,000 | 3,127,482 |
| 5% 7/1/29 | | 1,000,000 | 1,080,697 |
| 5% 7/1/32 | | 600,000 | 644,762 |
| Series 2016 E: | | | |
| 5% 7/1/32 (Build America Mutual Assurance Insured) | | 3,335,000 | 3,603,760 |
| 5% 7/1/33 (Build America Mutual Assurance Insured) | | 1,000,000 | 1,079,306 |
| 5% 7/1/34 (Build America Mutual Assurance Insured) | | 1,000,000 | 1,078,125 |
| Series A: | | | |
| 4% 7/1/50 | | 3,000,000 | 2,811,520 |
| 5% 7/1/32 | | 420,000 | 460,237 |
| 5% 7/1/33 | | 675,000 | 737,588 |
| 5% 7/1/34 | | 540,000 | 588,904 |
| 5% 7/1/35 | | 570,000 | 620,791 |
| 5% 7/1/36 | | 1,095,000 | 1,191,217 |
| 5% 7/1/37 | | 1,095,000 | 1,189,798 |
| 5% 7/1/38 | | 985,000 | 1,067,058 |
| 5% 7/1/39 | | 1,040,000 | 1,124,736 |
| 5% 7/1/40 | | 1,035,000 | 1,117,658 |
| 5% 7/1/45 | | 3,500,000 | 3,748,315 |
| New Jersey Envir. Infrastructure Trust Series 2015 AR1, 5% 9/1/26 | | 200,000 | 223,500 |
| New Jersey Gen. Oblig. Series 2020 A, 5% 6/1/29 | | 2,000,000 | 2,285,606 |
| New Jersey Health Care Facilities Fing. Auth. Rev.: | | | |
| (Inspira Health Proj.) Series 2017 A, 5% 7/1/42 | | 5,325,000 | 5,648,225 |
| (St Joseph Hosp. & Med. Ctr., Proj.) Series 2016, 5% 7/1/25 | | 700,000 | 746,301 |
| Bonds: | | | |
| Series 2019 B2, 5%, tender 7/1/25 (d) | | 2,000,000 | 2,143,306 |
| Series 2019 B3, 5%, tender 7/1/26 (d) | | 5,000,000 | 5,457,060 |
| Series 2011: | | | |
| 5% 7/1/24 | | 2,100,000 | 2,106,181 |
| 5% 7/1/25 | | 2,265,000 | 2,271,611 |
| Series 2013 A: | | | |
| 5% 7/1/28 | | 1,080,000 | 1,113,912 |
| 5% 7/1/32 | | 1,600,000 | 1,648,152 |
| 5.25% 7/1/28 | | 3,250,000 | 3,352,548 |
| Series 2013, 5% 7/1/26 | | 1,335,000 | 1,377,792 |
| Series 2014 A: | | | |
| 4% 7/1/45 | | 1,300,000 | 1,266,511 |
| 5% 7/1/30 (Pre-Refunded to 7/1/24 @ 100) | | 700,000 | 742,617 |
| 5% 7/1/31 (Pre-Refunded to 7/1/24 @ 100) | | 455,000 | 482,701 |
| 5% 7/1/44 | | 3,635,000 | 3,764,333 |
| 5% 7/1/45 (Pre-Refunded to 7/1/24 @ 100) | | 2,225,000 | 2,360,463 |
| Series 2016 A: | | | |
| 5% 7/1/26 (Escrowed to Maturity) | | 1,575,000 | 1,731,789 |
| 5% 7/1/27 | | 100,000 | 109,389 |
| 5% 7/1/27 (Pre-Refunded to 7/1/26 @ 100) | | 1,700,000 | 1,869,232 |
| 5% 7/1/28 | | 2,000,000 | 2,178,100 |
| 5% 7/1/28 (Pre-Refunded to 7/1/26 @ 100) | | 2,040,000 | 2,243,079 |
| 5% 7/1/29 (Pre-Refunded to 7/1/26 @ 100) | | 1,550,000 | 1,704,300 |
| 5% 7/1/30 | | 1,200,000 | 1,300,389 |
| 5% 7/1/30 (Pre-Refunded to 7/1/26 @ 100) | | 2,000,000 | 2,199,097 |
| 5% 7/1/31 | | 5,100,000 | 5,426,891 |
| 5% 7/1/31 | | 10,195,000 | 10,928,955 |
| 5% 7/1/33 | | 1,000,000 | 1,059,538 |
| 5% 7/1/33 | | 7,000,000 | 7,485,576 |
| 5% 7/1/39 | | 11,000,000 | 11,769,698 |
| 5% 7/1/43 | | 2,500,000 | 2,644,202 |
| Series 2016: | | | |
| 4% 7/1/48 | | 425,000 | 413,847 |
| 5% 7/1/23 | | 1,240,000 | 1,281,776 |
| 5% 7/1/24 | | 835,000 | 883,554 |
| 5% 7/1/24 | | 1,000,000 | 1,047,510 |
| 5% 7/1/26 | | 800,000 | 867,320 |
| 5% 7/1/29 | | 1,050,000 | 1,142,100 |
| 5% 7/1/30 | | 605,000 | 654,933 |
| 5% 7/1/31 | | 400,000 | 430,313 |
| 5% 7/1/35 | | 950,000 | 999,180 |
| 5% 7/1/36 | | 565,000 | 593,877 |
| 5% 7/1/41 | | 5,085,000 | 5,264,619 |
| Series 2017 A: | | | |
| 5% 7/1/25 | | 110,000 | 118,594 |
| 5% 7/1/52 | | 4,265,000 | 4,485,875 |
| Series 2021: | | | |
| 4% 7/1/35 | | 750,000 | 774,042 |
| 4% 7/1/37 | | 700,000 | 722,724 |
| 5% 7/1/33 | | 1,420,000 | 1,593,420 |
| 5% 7/1/34 | | 1,250,000 | 1,394,434 |
| New Jersey Higher Ed. Student Assistance Auth. Student Ln. Rev.: | | | |
| Series 2013, 5% 12/1/22 (b) | | 2,250,000 | 2,287,702 |
| Series 2016 1A, 5% 12/1/25 (b) | | 1,400,000 | 1,507,795 |
| Series 2017 1A: | | | |
| 5% 12/1/22 (b) | | 500,000 | 508,629 |
| 5% 12/1/25 (b) | | 3,000,000 | 3,233,071 |
| 5% 12/1/27 (b) | | 2,500,000 | 2,719,916 |
| Series 2018 B, 5% 12/1/28 (b) | | 950,000 | 1,046,707 |
| Series 2019 A: | | | |
| 5% 12/1/26 | | 2,525,000 | 2,789,723 |
| 5% 12/1/27 | | 2,000,000 | 2,235,844 |
| 5% 12/1/28 | | 700,000 | 781,801 |
| Series 2020 A, 5% 12/1/23 (b) | | 1,500,000 | 1,560,328 |
| Series 2020, 5% 12/1/23 (b) | | 2,375,000 | 2,470,519 |
| Series 2021 A: | | | |
| 5% 12/1/26 (b) | | 325,000 | 354,162 |
| 5% 12/1/27 (b) | | 325,000 | 361,218 |
| 5% 12/1/28 (b) | | 400,000 | 443,688 |
| 5% 12/1/29 (b) | | 550,000 | 613,325 |
| Series 2021 B: | | | |
| 5% 12/1/27 (b) | | 1,325,000 | 1,459,879 |
| 5% 12/1/28 (b) | | 1,450,000 | 1,608,368 |
| 5% 12/1/29 (b) | | 1,415,000 | 1,577,919 |
| New Jersey Hsg. & Mtg. Fin. Agcy. Rev.: | | | |
| Series 2019 D: | | | |
| 4% 4/1/24 (b) | | 2,320,000 | 2,385,473 |
| 4% 10/1/24 (b) | | 2,370,000 | 2,446,919 |
| Series 2021 H: | | | |
| 5% 4/1/28 | | 300,000 | 334,470 |
| 5% 10/1/28 | | 480,000 | 538,252 |
| 5% 4/1/29 | | 500,000 | 563,901 |
| New Jersey Institute of Technology Series A: | | | |
| 5% 7/1/27 | | 170,000 | 190,834 |
| 5% 7/1/28 | | 225,000 | 256,122 |
| 5% 7/1/29 | | 270,000 | 311,679 |
| 5% 7/1/30 | | 260,000 | 298,393 |
| 5% 7/1/31 | | 375,000 | 427,720 |
| 5% 7/1/32 | | 375,000 | 426,836 |
| 5% 7/1/33 | | 170,000 | 193,125 |
| New Jersey Tobacco Settlement Fing. Corp.: | | | |
| Series 2018 A: | | | |
| 5% 6/1/23 | | 800,000 | 819,866 |
| 5% 6/1/26 | | 3,000,000 | 3,211,577 |
| 5% 6/1/27 | | 1,000,000 | 1,083,731 |
| 5% 6/1/28 | | 2,000,000 | 2,185,695 |
| Series 2018 B, 3.2% 6/1/27 | | 1,390,000 | 1,390,541 |
| New Jersey Tpk. Auth. Tpk. Rev.: | | | |
| Series 2014 A, 5% 1/1/32 | | 5,000,000 | 5,228,517 |
| Series 2017 B: | | | |
| 5% 1/1/33 | | 5,000,000 | 5,540,692 |
| 5% 1/1/34 | | 2,500,000 | 2,767,470 |
| Series 2019 A, 5% 1/1/48 | | 2,000,000 | 2,203,843 |
| New Jersey Trans. Trust Fund Auth.: | | | |
| (Trans. Prog.) Series 2019 AA, 5.25% 6/15/43 | | 520,000 | 565,086 |
| Series 2005 B, 5.25% 12/15/22 (AMBAC Insured) | | 1,200,000 | 1,223,504 |
| Series 2006 A, 5.25% 12/15/22 | | 125,000 | 127,448 |
| Series 2006 C: | | | |
| 0% 12/15/26 (AMBAC Insured) | | 10,000,000 | 8,861,611 |
| 0% 12/15/34 | | 4,000,000 | 2,582,037 |
| Series 2008 A, 0% 12/15/36 | | 25,000,000 | 14,445,945 |
| Series 2009 A, 0% 12/15/38 | | 13,900,000 | 7,288,051 |
| Series 2010 A: | | | |
| 0% 12/15/27 | | 3,000,000 | 2,553,335 |
| 0% 12/15/30 | | 14,795,000 | 11,198,439 |
| Series 2010 A3, 0% 12/15/34 | | 10,775,000 | 6,828,063 |
| Series 2013 AA, 5% 6/15/29 | | 510,000 | 522,323 |
| Series 2014 AA: | | | |
| 5% 6/15/38 | | 770,000 | 790,734 |
| 5% 6/15/44 | | 555,000 | 568,274 |
| Series 2016 A: | | | |
| 5% 6/15/29 | | 750,000 | 809,399 |
| 5% 6/15/30 | | 5,000,000 | 5,370,994 |
| Series 2018 A, 5% 6/15/31 | | 3,000,000 | 3,216,329 |
| Series 2019 BB, 4% 6/15/38 | | 1,035,000 | 1,041,173 |
| Series 2022 AA: | | | |
| 5% 6/15/37 | | 10,000,000 | 11,178,347 |
| 5% 6/15/38 | | 5,440,000 | 6,069,129 |
| Series A: | | | |
| 0% 12/15/31 | | 365,000 | 264,822 |
| 5% 12/15/32 | | 2,600,000 | 2,857,587 |
| 5% 12/15/33 | | 2,850,000 | 3,126,356 |
| Series AA, 5% 6/15/45 | | 9,635,000 | 10,415,746 |
| Newark Port Auth. Hsg. Auth. Rev. Series 2007, 5.25% 1/1/25 (Nat'l. Pub. Fin. Guarantee Corp. Insured) | | 200,000 | 211,837 |
| Rutgers State Univ. Rev. Series Q: | | | |
| 5% 5/1/24 | | 1,360,000 | 1,435,141 |
| 5% 5/1/25 | | 750,000 | 809,135 |
| 5% 5/1/26 | | 700,000 | 770,548 |
| 5% 5/1/27 | | 750,000 | 839,993 |
| South Jersey Port Corp. Rev. (New Jersey Gen. Oblig. Proj.) Series 2017 B: | | | |
| 5% 1/1/29 (b) | | 955,000 | 1,025,869 |
| 5% 1/1/31 (b) | | 1,950,000 | 2,079,179 |
| 5% 1/1/33 (b) | | 750,000 | 794,900 |
| 5% 1/1/35 (b) | | 2,000,000 | 2,107,112 |
| South Jersey Trans. Auth. Trans. Sys. Rev.: | | | |
| Series 2019 A: | | | |
| 5% 11/1/28 (Assured Guaranty Muni. Corp. Insured) | | 200,000 | 225,744 |
| 5% 11/1/31 (Assured Guaranty Muni. Corp. Insured) | | 1,500,000 | 1,680,201 |
| 5% 11/1/32 (Assured Guaranty Muni. Corp. Insured) | | 1,230,000 | 1,374,879 |
| 5% 11/1/33 (Assured Guaranty Muni. Corp. Insured) | | 750,000 | 836,692 |
| Series 2020 A: | | | |
| 4% 11/1/50 (Build America Mutual Assurance Insured) | | 2,000,000 | 2,001,174 |
| 5% 11/1/45 | | 7,000,000 | 7,493,235 |
| 5% 11/1/45 (Build America Mutual Assurance Insured) | | 2,000,000 | 2,214,685 |
| The Board of Ed. of Newark Series 2021: | | | |
| 4% 7/15/36 (Build America Mutual Assurance Insured) | | 775,000 | 790,375 |
| 4% 7/15/37 (Build America Mutual Assurance Insured) | | 725,000 | 738,426 |
| 5% 7/15/22 | | 125,000 | 125,572 |
| 5% 7/15/23 | | 265,000 | 274,625 |
| 5% 7/15/24 | | 400,000 | 422,618 |
| 5% 7/15/25 (Build America Mutual Assurance Insured) | | 230,000 | 248,891 |
| 5% 7/15/26 (Build America Mutual Assurance Insured) | | 275,000 | 303,274 |
| 5% 7/15/27 (Build America Mutual Assurance Insured) | | 325,000 | 363,873 |
| 5% 7/15/28 (Build America Mutual Assurance Insured) | | 300,000 | 340,233 |
| 5% 7/15/29 (Build America Mutual Assurance Insured) | | 300,000 | 344,800 |
| 5% 7/15/30 (Build America Mutual Assurance Insured) | | 300,000 | 348,881 |
| 5% 7/15/31 (Build America Mutual Assurance Insured) | | 375,000 | 440,039 |
| 5% 7/15/32 (Build America Mutual Assurance Insured) | | 400,000 | 466,780 |
| 5% 7/15/33 (Build America Mutual Assurance Insured) | | 500,000 | 580,347 |
|
| TOTAL NEW JERSEY | | | 431,728,544 |
|
| New York - 0.7% | | | |
| Port Auth. of New York & New Jersey Series 221: | | | |
| 4% 7/15/37 (b) | | 1,000,000 | 1,013,280 |
| 5% 7/15/35 (b) | | 2,500,000 | 2,794,106 |
|
| TOTAL NEW YORK | | | 3,807,386 |
|
| New York And New Jersey - 12.2% | | | |
| Port Auth. of New York & New Jersey: | | | |
| Series 194, 5.25% 10/15/55 | | 10,000,000 | 10,570,235 |
| Series 2014 185, 5% 9/1/30 (b) | | 1,105,000 | 1,155,920 |
| Series 2016, 5% 11/15/32 (b) | | 5,000,000 | 5,330,704 |
| Series 2018, 5% 9/15/34 (b) | | 5,000,000 | 5,368,571 |
| Series 207, 5% 9/15/29 (b) | | 1,750,000 | 1,913,869 |
| Series 209, 5% 7/15/35 | | 3,970,000 | 4,471,334 |
| Series 213, 5% 9/1/39 | | 5,390,000 | 5,936,585 |
| Series 214: | | | |
| 5% 9/1/30 (b) | | 250,000 | 277,799 |
| 5% 9/1/36 (b) | | 6,785,000 | 7,312,558 |
| Series 218, 5% 11/1/44 (b) | | 1,420,000 | 1,511,501 |
| Series 221, 4% 7/15/45 (b) | | 1,500,000 | 1,496,628 |
| Series 223: | | | |
| 4% 7/15/34 (b) | | 2,000,000 | 2,050,094 |
| 4% 7/15/35 (b) | | 2,250,000 | 2,299,376 |
| 4% 7/15/36 (b) | | 1,350,000 | 1,373,646 |
| 4% 7/15/37 (b) | | 2,750,000 | 2,790,302 |
| 4% 7/15/38 (b) | | 6,000,000 | 6,071,746 |
| 4% 7/15/39 (b) | | 4,000,000 | 4,040,058 |
| 5% 7/15/56 (b) | | 3,500,000 | 3,757,686 |
|
| TOTAL NEW YORK AND NEW JERSEY | | | 67,728,612 |
|
| Non-State Specific - 0.2% | | | |
| Port Auth. of New York & New Jersey Series 217, 5% 11/1/44 | | 1,000,000 | 1,093,969 |
| Pennsylvania, New Jersey - 2.3% | | | |
| Delaware River Joint Toll Bridge Commission Pennsylvania-New Jersey Bridge Rev.: | | | |
| Series 2015: | | | |
| 3% 7/1/27 (Build America Mutual Assurance Insured) | | 1,000,000 | 1,018,476 |
| 5% 7/1/26 | | 650,000 | 704,814 |
| 5% 7/1/29 (Pre-Refunded to 7/1/25 @ 100) | | 300,000 | 326,141 |
| 5% 7/1/30 (Pre-Refunded to 7/1/25 @ 100) | | 350,000 | 380,498 |
| Series 2019 A, 5% 7/1/44 | | 700,000 | 788,363 |
| Series 2019 B, 5% 7/1/32 | | 1,000,000 | 1,152,081 |
| Delaware River Port Auth. Pennsylvania & New Jersey Rev.: | | | |
| (Port District Proj.) Series 2012, 5% 1/1/24 | | 3,000,000 | 3,057,426 |
| Series 2018 A: | | | |
| 5% 1/1/37 | | 1,200,000 | 1,315,452 |
| 5% 1/1/38 | | 1,450,000 | 1,587,261 |
| 5% 1/1/39 | | 1,190,000 | 1,294,208 |
| 5% 1/1/40 | | 1,250,000 | 1,350,127 |
|
| TOTAL PENNSYLVANIA, NEW JERSEY | | | 12,974,847 |
|
| Puerto Rico - 0.8% | | | |
| Puerto Rico Commonwealth Pub. Impt. Gen. Oblig. Series 2021 A1: | | | |
| 5.625% 7/1/27 | | 175,000 | 190,873 |
| 5.625% 7/1/29 | | 545,000 | 601,985 |
| 5.75% 7/1/31 | | 1,300,000 | 1,469,639 |
| Puerto Rico Indl., Tourist, Edl., Med. And Envir. Cont. Facilities Fing. Auth. Series 2021: | | | |
| 4% 7/1/41 | | 195,000 | 194,705 |
| 5% 7/1/30 | | 475,000 | 539,249 |
| 5% 7/1/32 | | 125,000 | 141,958 |
| 5% 7/1/34 | | 110,000 | 123,987 |
| 5% 7/1/35 | | 120,000 | 134,859 |
| Puerto Rico Sales Tax Fing. Corp. Sales Tax Rev. Series 2019 A2, 4.55% 7/1/40 | | 1,050,000 | 1,060,975 |
|
| TOTAL PUERTO RICO | | | 4,458,230 |
|
| TOTAL MUNICIPAL BONDS | | | |
| (Cost $550,861,663) | | | 545,726,678 |
| TOTAL INVESTMENT IN SECURITIES - 98.4% | | | |
| (Cost $550,861,663) | | | 545,726,678 |
| NET OTHER ASSETS (LIABILITIES) - 1.6% | | | 8,883,425 |
| NET ASSETS - 100% | | | $554,610,103 |
Legend
(a) Security or a portion of the security purchased on a delayed delivery or when-issued basis.
(b) Private activity obligations whose interest is subject to the federal alternative minimum tax for individuals.
(c) Security exempt from registration under Rule 144A of the Securities Act of 1933. These securities may be resold in transactions exempt from registration, normally to qualified institutional buyers. At the end of the period, the value of these securities amounted to $1,943,309 or 0.4% of net assets.
(d) Coupon rates for floating and adjustable rate securities reflect the rates in effect at period end.
Investment Valuation
The following is a summary of the inputs used, as of May 31, 2022, involving the Fund's assets and liabilities carried at fair value. The inputs or methodology used for valuing securities may not be an indication of the risk associated with investing in those securities. For more information on valuation inputs, and their aggregation into the levels used below, please refer to the Investment Valuation section in the accompanying Notes to Financial Statements.
| | Valuation Inputs at Reporting Date: |
| Description | Total | Level 1 | Level 2 | Level 3 |
| Investments in Securities: | | | | |
| Municipal Securities | $545,726,678 | $-- | $545,726,678 | $-- |
| Total Investments in Securities: | $545,726,678 | $-- | $545,726,678 | $-- |
Other Information
The distribution of municipal securities by revenue source, as a percentage of total Net Assets, is as follows (Unaudited):
| General Obligations | 30.2% |
| Transportation | 27.2% |
| Health Care | 19.8% |
| Education | 14.7% |
| Others* (Individually Less Than 5%) | 8.1% |
| | 100.0% |
* Includes net other assets
See accompanying notes which are an integral part of the financial statements.
Fidelity® New Jersey Municipal Income Fund
Financial Statements
Statement of Assets and Liabilities
| | | May 31, 2022 (Unaudited) |
| Assets | | |
Investment in securities, at value — See accompanying schedule:
Unaffiliated issuers (cost $550,861,663) | | $545,726,678 |
| Cash | | 17,222,451 |
| Receivable for fund shares sold | | 2,083,393 |
| Interest receivable | | 7,695,828 |
| Prepaid expenses | | 116 |
| Other receivables | | 1,315 |
| Total assets | | 572,729,781 |
| Liabilities | | |
| Payable for investments purchased on a delayed delivery basis | $14,911,980 | |
| Payable for fund shares redeemed | 2,588,851 | |
| Distributions payable | 382,532 | |
| Accrued management fee | 158,885 | |
| Other affiliated payables | 52,483 | |
| Other payables and accrued expenses | 24,947 | |
| Total liabilities | | 18,119,678 |
| Net Assets | | $554,610,103 |
| Net Assets consist of: | | |
| Paid in capital | | $560,904,357 |
| Total accumulated earnings (loss) | | (6,294,254) |
| Net Assets | | $554,610,103 |
| Net Asset Value, offering price and redemption price per share ($554,610,103 ÷ 48,523,670 shares) | | $11.43 |
See accompanying notes which are an integral part of the financial statements.
Statement of Operations
| | | Six months ended May 31, 2022 (Unaudited) |
| Investment Income | | |
| Interest | | $8,119,857 |
| Expenses | | |
| Management fee | $1,094,785 | |
| Transfer agent fees | 275,436 | |
| Accounting fees and expenses | 74,997 | |
| Custodian fees and expenses | 4,806 | |
| Independent trustees' fees and expenses | 1,027 | |
| Registration fees | 26,842 | |
| Audit | 26,886 | |
| Legal | 5,726 | |
| Miscellaneous | 1,263 | |
| Total expenses before reductions | 1,511,768 | |
| Expense reductions | (10,121) | |
| Total expenses after reductions | | 1,501,647 |
| Net investment income (loss) | | 6,618,210 |
| Realized and Unrealized Gain (Loss) | | |
| Net realized gain (loss) on: | | |
| Investment securities: | | |
| Unaffiliated issuers | | (1,152,090) |
| Total net realized gain (loss) | | (1,152,090) |
| Change in net unrealized appreciation (depreciation) on investment securities | | (58,747,981) |
| Net gain (loss) | | (59,900,071) |
| Net increase (decrease) in net assets resulting from operations | | $(53,281,861) |
See accompanying notes which are an integral part of the financial statements.
Statement of Changes in Net Assets
| | Six months ended May 31, 2022 (Unaudited) | Year ended November 30, 2021 |
| Increase (Decrease) in Net Assets | | |
| Operations | | |
| Net investment income (loss) | $6,618,210 | $13,602,994 |
| Net realized gain (loss) | (1,152,090) | 3,985,933 |
| Change in net unrealized appreciation (depreciation) | (58,747,981) | 5,736,100 |
| Net increase (decrease) in net assets resulting from operations | (53,281,861) | 23,325,027 |
| Distributions to shareholders | (10,189,988) | (16,312,712) |
| Share transactions | | |
| Proceeds from sales of shares | 169,003,535 | 182,166,528 |
| Reinvestment of distributions | 6,151,735 | 9,868,775 |
| Cost of shares redeemed | (275,038,606) | (97,390,245) |
| Net increase (decrease) in net assets resulting from share transactions | (99,883,336) | 94,645,058 |
| Total increase (decrease) in net assets | (163,355,185) | 101,657,373 |
| Net Assets | | |
| Beginning of period | 717,965,288 | 616,307,915 |
| End of period | $554,610,103 | $717,965,288 |
| Other Information | | |
| Shares | | |
| Sold | 14,579,324 | 14,441,831 |
| Issued in reinvestment of distributions | 509,921 | 783,148 |
| Redeemed | (23,456,636) | (7,723,607) |
| Net increase (decrease) | (8,367,391) | 7,501,372 |
See accompanying notes which are an integral part of the financial statements.
Financial Highlights
Fidelity New Jersey Municipal Income Fund
| | Six months ended (Unaudited) May 31, | Years endedNovember 30, | | | | |
| | 2022 | 2021 | 2020 | 2019 | 2018 | 2017 |
| Selected Per–Share Data | | | | | | |
| Net asset value, beginning of period | $12.62 | $12.48 | $12.33 | $11.56 | $11.84 | $11.55 |
| Income from Investment Operations | | | | | | |
| Net investment income (loss)A,B | .126 | .249 | .299 | .333 | .343 | .350 |
| Net realized and unrealized gain (loss) | (1.127) | .194 | .216 | .773 | (.216) | .379 |
| Total from investment operations | (1.001) | .443 | .515 | 1.106 | .127 | .729 |
| Distributions from net investment income | (.126) | (.249) | (.299) | (.333) | (.343) | (.349) |
| Distributions from net realized gain | (.063) | (.054) | (.066) | (.003) | (.064) | (.090) |
| Total distributions | (.189) | (.303) | (.365) | (.336) | (.407) | (.439) |
| Redemption fees added to paid in capitalA | – | – | – | – | – | –C |
| Net asset value, end of period | $11.43 | $12.62 | $12.48 | $12.33 | $11.56 | $11.84 |
| Total ReturnD,E | (8.00)% | 3.58% | 4.28% | 9.66% | 1.10% | 6.44% |
| Ratios to Average Net AssetsB,F,G | | | | | | |
| Expenses before reductions | .48%H | .47% | .47% | .47% | .47% | .47% |
| Expenses net of fee waivers, if any | .48%H | .47% | .47% | .47% | .47% | .47% |
| Expenses net of all reductions | .48%H | .47% | .47% | .47% | .47% | .47% |
| Net investment income (loss) | 2.10%H | 1.97% | 2.45% | 2.75% | 2.95% | 2.99% |
| Supplemental Data | | | | | | |
| Net assets, end of period (000 omitted) | $554,610 | $717,965 | $616,308 | $585,664 | $510,645 | $522,402 |
| Portfolio turnover rateI | 6%H | 12% | 15% | 12% | 18% | 17% |
A Calculated based on average shares outstanding during the period.
B Net investment income (loss) is affected by the timing of the declaration of dividends by any underlying mutual funds or exchange-traded funds (ETFs). Net investment income (loss) of any such underlying funds is not included in the Fund's net investment income (loss) ratio.
C Amount represents less than $.0005 per share.
D Total returns for periods of less than one year are not annualized.
E Total returns would have been lower if certain expenses had not been reduced during the applicable periods shown.
F Fees and expenses of any underlying mutual funds or exchange-traded funds (ETFs) are not included in the Fund's expense ratio. The Fund indirectly bears its proportionate share of these expenses.
G Expense ratios reflect operating expenses of the class. Expenses before reductions do not reflect amounts reimbursed, waived, or reduced through arrangements with the investment adviser, brokerage services, or other offset arrangements, if applicable, and do not represent the amount paid by the class during periods when reimbursements, waivers or reductions occur.
H Annualized
I Amount does not include the portfolio activity of any underlying mutual funds or exchange-traded funds (ETFs).
See accompanying notes which are an integral part of the financial statements.
Fidelity® New Jersey Municipal Money Market Fund
Investment Summary/Performance (Unaudited)
Effective Maturity Diversification as of May 31, 2022
| Days | % of fund's investments 5/31/22 |
| 1 - 7 | 74.4 |
| 8 - 30 | 7.9 |
| 31 - 60 | 4.5 |
| 61 - 90 | 0.9 |
| 91 - 180 | 8.5 |
| > 180 | 3.8 |
Effective maturity is determined in accordance with the requirements of Rule 2a-7 under the Investment Company Act of 1940.
Asset Allocation (% of fund's net assets)
| As of May 31, 2022 |
| | Variable Rate Demand Notes (VRDNs) | 26.7% |
| | Tender Option Bond | 42.6% |
| | Other Municipal Security | 24.1% |
| | Investment Companies | 6.4% |
| | Net Other Assets (Liabilities) | 0.2% |

Current 7-Day Yields
| | 5/31/22 |
| Fidelity® New Jersey Municipal Money Market Fund | 0.30% |
Yield refers to the income paid by the Fund over a given period. Yields for money market funds are usually for seven-day periods, as they are here, though they are expressed as annual percentage rates. Past performance is no guarantee of future results. Yield will vary and it's possible to lose money investing in the Fund.
Fidelity® New Jersey Municipal Money Market Fund
Schedule of Investments May 31, 2022 (Unaudited)
Showing Percentage of Net Assets
| Variable Rate Demand Note - 26.7% | | | |
| | | Principal Amount | Value |
| Alabama - 0.2% | | | |
| Decatur Indl. Dev. Board Exempt Facilities Rev. (Nucor Steel Decatur LLC Proj.) Series 2003 A, 1.03% 6/7/22, VRDN (a)(b) | | $900,000 | $900,000 |
| Arkansas - 0.1% | | | |
| Blytheville Indl. Dev. Rev. (Nucor Corp. Proj.) Series 1998, 1.03% 6/7/22, VRDN (a)(b) | | 300,000 | 300,000 |
| Kansas - 0.7% | | | |
| Burlington Envir. Impt. Rev. (Kansas City Pwr. and Lt. Co. Proj.): | | | |
| Series 2007 A, 1.02% 6/7/22, VRDN (b) | | 800,000 | 800,000 |
| Series 2007 B, 1.02% 6/7/22, VRDN (b) | | 400,000 | 400,000 |
| St. Mary's Kansas Poll. Cont. Rev. (Kansas Gas and Elec. Co. Proj.) Series 1994, 0.96% 6/7/22, VRDN (b) | | 1,600,000 | 1,600,000 |
| | | | 2,800,000 |
| Louisiana - 1.0% | | | |
| Saint James Parish Gen. Oblig. (Nucor Steel Louisiana LLC Proj.) Series 2010 B1, 0.97% 6/7/22, VRDN (b) | | 3,900,000 | 3,900,000 |
| Nebraska - 0.0% | | | |
| Stanton County Indl. Dev. Rev. Series 1998, 1.03% 6/7/22, VRDN (a)(b) | | 100,000 | 100,000 |
| New Jersey - 21.0% | | | |
| New Jersey Econ. Dev. Auth. Natural Gas Facilities Rev. (South Jersey Gas Co. Proj.) Series 2006-1, 0.72% 6/7/22, LOC JPMorgan Chase Bank, VRDN (a)(b) | | 19,900,000 | 19,900,000 |
| New Jersey Econ. Dev. Auth. Rev. (Cooper Health Sys. Proj.) Series 2008 A, 0.75% 6/7/22, LOC TD Banknorth, NA, VRDN (b) | | 15,500,000 | 15,500,000 |
| New Jersey Health Care Facilities Fing. Auth. Rev.: | | | |
| (AHS Hosp. Corp. Proj.): | | | |
| Series 2008 B, 0.79% 6/7/22, LOC Bank of America NA, VRDN (b) | | 9,510,000 | 9,510,000 |
| Series 2008 C, 0.79% 6/7/22, LOC JPMorgan Chase Bank, VRDN (b) | | 3,720,000 | 3,720,000 |
| (Virtua Health Proj.) Series 2009 E, 0.6% 6/7/22, LOC TD Banknorth, NA, VRDN (b) | | 7,000,000 | 7,000,000 |
| New Jersey Hsg. & Mtg. Fin. Agcy. Multi-family Rev. Series 2013 5, 0.82% 6/7/22, LOC Citibank NA, VRDN (a)(b) | | 20,030,000 | 20,030,000 |
| FHLMC Essex County Impt. Auth. Multi-family Hsg. Rev. (Fern Sr. Hsg. Proj.) Series 2010, 0.79% 6/7/22, LOC Freddie Mac, VRDN (b) | | 8,000,000 | 8,000,000 |
| | | | 83,660,000 |
| New York And New Jersey - 2.9% | | | |
| Port Auth. of New York & New Jersey: | | | |
| Series 1995 3, 0.87% 6/30/22, VRDN (a)(b)(c) | | 4,800,000 | 4,800,000 |
| Series 1995 4, 0.87% 6/30/22, VRDN (a)(b)(c) | | 6,600,000 | 6,600,000 |
| | | | 11,400,000 |
| Pennsylvania - 0.0% | | | |
| Beaver County Indl. Dev. Auth. Series 2018 A, 0.87% 6/7/22, LOC Truist Bank, VRDN (b) | | 100,000 | 100,000 |
| South Carolina - 0.6% | | | |
| Berkeley County Indl. Dev. Rev. (Nucor Corp. Proj.): | | | |
| Series 1995, 1.03% 6/7/22, VRDN (a)(b) | | 100,000 | 100,000 |
| Series 1997, 1.03% 6/7/22, VRDN (a)(b) | | 2,100,000 | 2,100,000 |
| | | | 2,200,000 |
| Tennessee - 0.0% | | | |
| Memphis-Shelby County Indl. Dev. Board Facilities Rev. Series 2007, 1.03% 6/7/22, VRDN (a)(b) | | 50,000 | 50,000 |
| West Virginia - 0.2% | | | |
| West Virginia Econ. Dev. Auth. Solid Waste Disp. Facilities Rev.: | | | |
| (Appalachian Pwr. Co. Amos Proj.) Series 2008 B, 0.92% 6/7/22, VRDN (a)(b) | | 400,000 | 400,000 |
| (Appalachian Pwr. Co.- Mountaineer Proj.) Series 2008 A, 0.87% 6/7/22, VRDN (a)(b) | | 600,000 | 600,000 |
| | | | 1,000,000 |
| TOTAL VARIABLE RATE DEMAND NOTE | | | |
| (Cost $106,410,000) | | | 106,410,000 |
|
| Tender Option Bond - 42.6% | | | |
| California - 0.8% | | | |
| California Health Facilities Fing. Auth. Rev. Participating VRDN Series DBE 80 11, 0.93% 6/7/22 (Liquidity Facility Deutsche Bank AG New York Branch) (b)(d)(e) | | 3,200,000 | 3,200,000 |
| Colorado - 0.0% | | | |
| Denver City & County Arpt. Rev. Bonds Series G-114, 1.04%, tender 12/1/22 (Liquidity Facility Royal Bank of Canada) (a)(b)(c)(d)(e) | | 100,000 | 100,000 |
| Connecticut - 0.2% | | | |
| Connecticut Gen. Oblig. Participating VRDN Series Floaters 016, 0.91% 7/12/22 (Liquidity Facility Barclays Bank PLC) (b)(d)(e) | | 200,000 | 200,000 |
| Connecticut Spl. Tax Oblig. Trans. Infrastructure Rev. Bonds Series Floaters G 110, 0.97%, tender 10/3/22 (Liquidity Facility Royal Bank of Canada) (b)(c)(d)(e) | | 500,000 | 500,000 |
| | | | 700,000 |
| District Of Columbia - 0.0% | | | |
| Metropolitan Washington DC Arpts. Auth. Sys. Rev. Participating VRDN Series Floaters XF 06 94, 0.91% 6/7/22 (Liquidity Facility Bank of America NA) (a)(b)(d)(e) | | 55,000 | 55,000 |
| Florida - 0.2% | | | |
| Greater Orlando Aviation Auth. Arpt. Facilities Rev. Bonds Series Floaters G 25, 1.04%, tender 10/3/22 (Liquidity Facility Royal Bank of Canada) (a)(b)(c)(d)(e) | | 200,000 | 200,000 |
| Lee County Arpt. Rev. Participating VRDN Series XF 11 26, 0.86% 6/7/22 (Liquidity Facility Deutsche Bank AG New York Branch) (a)(b)(d)(e) | | 100,000 | 100,000 |
| Tampa-Hillsborough County Expressway Auth. Rev. Bonds Series G-113, 0.99%, tender 7/1/22 (Liquidity Facility Royal Bank of Canada) (b)(c)(d)(e) | | 300,000 | 300,000 |
| | | | 600,000 |
| Illinois - 0.2% | | | |
| Chicago Gen. Oblig. Participating VRDN Series XM 10 05, 0.94% 6/7/22 (Liquidity Facility Deutsche Bank AG New York Branch) (b)(d)(e) | | 600,000 | 600,000 |
| Kentucky - 0.0% | | | |
| CommonSpirit Health Participating VRDN Series MIZ 90 21, 0.91% 6/7/22 (Liquidity Facility Mizuho Cap. Markets LLC) (b)(d)(e) | | 100,000 | 100,000 |
| New Jersey - 32.9% | | | |
| Hudson County Impt. Auth. Participating VRDN: | | | |
| Series 16 ZF0450, 0.84% 6/7/22 (Liquidity Facility Toronto-Dominion Bank) (b)(d)(e) | | 3,970,000 | 3,970,000 |
| Series Floaters XG 02 22, 0.84% 6/7/22 (Liquidity Facility Bank of America NA) (b)(d)(e) | | 2,460,000 | 2,460,000 |
| New Jersey Econ. Dev. Auth. Participating VRDN Series XF 28 65, 0.83% 6/7/22 (Liquidity Facility Barclays Bank PLC) (b)(d)(e) | | 4,500,000 | 4,500,000 |
| New Jersey Econ. Dev. Auth. Natural Gas Facilities Rev. Participating VRDN: | | | |
| Series XF 08 82, 0.83% 6/7/22 (Liquidity Facility Toronto-Dominion Bank) (a)(b)(d)(e) | | 4,460,000 | 4,460,000 |
| Series ZF 08 12, 0.86% 6/7/22 (Liquidity Facility Bank of America NA) (a)(b)(d)(e) | | 13,550,000 | 13,550,000 |
| New Jersey Econ. Dev. Auth. Rev. Participating VRDN: | | | |
| Series Floaters XF 10 48, 0.83% 6/7/22 (Liquidity Facility Barclays Bank PLC) (b)(d)(e) | | 11,885,000 | 11,885,000 |
| Series Floaters XX 10 91, 0.83% 6/7/22 (Liquidity Facility Barclays Bank PLC) (b)(d)(e) | | 9,600,000 | 9,600,000 |
| Series XG 02 60, 0.82% 6/7/22 (Liquidity Facility Bank of America NA) (b)(d)(e) | | 3,000,000 | 3,000,000 |
| Series XG 02 61, 0.82% 6/7/22 (Liquidity Facility Bank of America NA) (b)(d)(e) | | 3,000,000 | 3,000,000 |
| New Jersey Gen. Oblig. Participating VRDN Series ZF 12 07, 0.82% 6/7/22 (Liquidity Facility JPMorgan Chase Bank) (b)(d)(e) | | 6,050,000 | 6,050,000 |
| New Jersey Health Care Facilities Fing. Auth. Rev. Participating VRDN: | | | |
| Series 2022 ZF 12 74, 0.82% 6/7/22 (Liquidity Facility Royal Bank of Canada) (b)(d)(e) | | 4,100,000 | 4,100,000 |
| Series XF 09 71, 0.83% 6/7/22 (Liquidity Facility Toronto-Dominion Bank) (b)(d)(e) | | 1,915,000 | 1,915,000 |
| Series XF 27 02, 0.82% 6/7/22 (Liquidity Facility Barclays Bank PLC) (b)(d)(e) | | 2,200,000 | 2,200,000 |
| New Jersey Higher Ed. Student Assistance Auth. Student Ln. Rev. Participating VRDN Series Floaters XG 01 78, 0.87% 6/7/22 (Liquidity Facility Bank of America NA) (a)(b)(d)(e) | | 4,460,000 | 4,460,000 |
| New Jersey Hsg. & Mtg. Fin. Agcy. Rev. Participating VRDN: | | | |
| Series 20 XF 28 96, 0.82% 6/7/22 (Liquidity Facility Morgan Stanley Bank, West Valley City Utah) (b)(d)(e) | | 2,705,000 | 2,705,000 |
| Series Floaters XF 27 97, 0.82% 6/7/22 (Liquidity Facility Morgan Stanley Bank, West Valley City Utah) (b)(d)(e) | | 2,520,000 | 2,520,000 |
| Series Floaters XG 02 28, 0.82% 6/7/22 (Liquidity Facility Royal Bank of Canada) (b)(d)(e) | | 1,865,000 | 1,865,000 |
| New Jersey Tpk. Auth. Tpk. Rev. Bonds Series G 119, 0.94%, tender 1/3/23 (Liquidity Facility Royal Bank of Canada) (b)(c)(d)(e) | | 1,100,000 | 1,100,000 |
| New Jersey Trans. Trust Fund Auth. Participating VRDN: | | | |
| Series Floaters XF 23 70, 0.83% 6/7/22 (Liquidity Facility Barclays Bank PLC) (b)(d)(e) | | 3,415,000 | 3,415,000 |
| Series Floaters XG 02 24, 0.82% 6/7/22 (Liquidity Facility Bank of America NA) (b)(d)(e) | | 8,435,000 | 8,435,000 |
| Series Floaters XX 10 93, 0.83% 6/7/22 (Liquidity Facility Barclays Bank PLC) (b)(d)(e) | | 3,700,000 | 3,700,000 |
| Series YX 11 38, 0.83% 6/7/22 (Liquidity Facility Barclays Bank PLC) (b)(d)(e)(f) | | 1,300,000 | 1,300,000 |
| Rutgers State Univ. Rev. Participating VRDN: | | | |
| Series XF 22 95, 0.79% 6/7/22 (Liquidity Facility Citibank NA) (b)(d)(e) | | 3,900,000 | 3,900,000 |
| Series ZF 24 76, 0.79% 6/7/22 (Liquidity Facility Citibank NA) (b)(d)(e) | | 3,315,000 | 3,315,000 |
| Series ZF 24 77, 0.79% 6/7/22 (Liquidity Facility Citibank NA) (b)(d)(e) | | 4,000,000 | 4,000,000 |
| Union County Impt. Auth. Participating VRDN Series XF 10 19, 0.82% 6/7/22 (Liquidity Facility Barclays Bank PLC) (b)(d)(e) | | 600,000 | 600,000 |
| Union County Impt. Auth. Rev. Participating VRDN Series XG 00 57, 0.85% 6/7/22 (Liquidity Facility Deutsche Bank AG New York Branch) (b)(d)(e) | | 5,960,000 | 5,960,000 |
| Union County Utils. Resources Auth. Participating VRDN Series 16 ZM0165, 0.87% 6/7/22 (Liquidity Facility Royal Bank of Canada) (a)(b)(d)(e) | | 13,050,000 | 13,050,000 |
| | | | 131,015,000 |
| Pennsylvania, New Jersey - 0.8% | | | |
| Delaware River Port Auth. Pennsylvania & New Jersey Rev. Participating VRDN Series YX 12 14, 0.83% 6/7/22 (Liquidity Facility Barclays Bank PLC) (b)(d)(e) | | 3,000,000 | 3,000,000 |
| New York - 0.0% | | | |
| New York City Gen. Oblig. Participating VRDN Series 2020 003, 0.94% 7/12/22 (Liquidity Facility Wells Fargo Bank NA) (b)(d)(e) | | 100,000 | 100,000 |
| New York And New Jersey - 7.1% | | | |
| Port Auth. of New York & New Jersey Participating VRDN: | | | |
| Series 15 ZF0203, 0.86% 6/7/22 (Liquidity Facility JPMorgan Chase Bank) (a)(b)(d)(e) | | 1,675,000 | 1,675,000 |
| Series MS 3321, 0.86% 6/7/22 (Liquidity Facility Toronto-Dominion Bank) (a)(b)(d)(e) | | 4,970,000 | 4,970,000 |
| Series X3 03 37, 0.89% 6/7/22 (Liquidity Facility Bank of America NA) (a)(b)(d)(e) | | 2,800,000 | 2,800,000 |
| Series XF 09 38, 0.86% 6/7/22 (Liquidity Facility JPMorgan Chase Bank) (a)(b)(d)(e)(f) | | 3,000,000 | 3,000,000 |
| Series XG 02 65 0.89% 6/7/22 (Liquidity Facility Bank of America NA) (a)(b)(d)(e) | | 10,375,000 | 10,375,000 |
| Series XL 01 10, 0.89% 6/7/22 (Liquidity Facility Royal Bank of Canada) (a)(b)(d)(e) | | 3,325,000 | 3,325,000 |
| Series ZL 02 55, 0.89% 6/7/22 (Liquidity Facility Bank of America NA) (a)(b)(d)(e) | | 2,000,000 | 2,000,000 |
| | | | 28,145,000 |
| Ohio - 0.2% | | | |
| Ohio Hosp. Rev. Participating VRDN Series 002, 0.91% 7/12/22 (Liquidity Facility Barclays Bank PLC) (b)(d)(e) | | 400,000 | 400,000 |
| Ohio Univ. Gen. Receipts Athens Bonds Series Floaters G 27, 0.99%, tender 12/1/22 (Liquidity Facility Royal Bank of Canada) (b)(c)(d)(e) | | 200,000 | 200,000 |
| | | | 600,000 |
| South Carolina - 0.0% | | | |
| South Carolina Trans. Infrastructure Bank Rev. Bonds Series Floaters G 109, 0.99%, tender 10/3/22 (Liquidity Facility Royal Bank of Canada) (b)(c)(d)(e) | | 100,000 | 100,000 |
| Tennessee - 0.0% | | | |
| Metropolitan Nashville Arpt. Auth. Rev. Participating VRDN Series 2021 XL 01 89, 0.86% 6/7/22 (Liquidity Facility Deutsche Bank AG New York Branch) (a)(b)(d)(e) | | 100,000 | 100,000 |
| Texas - 0.0% | | | |
| Alamo Cmnty. College District Rev. Bonds Series G-111, 0.99%, tender 11/1/22 (Liquidity Facility Royal Bank of Canada) (b)(c)(d)(e) | | 200,000 | 200,000 |
| Virginia - 0.2% | | | |
| Suffolk Econ. Dev. Auth. Hosp. Facilities Rev. Participating VRDN Series MIZ 90 25, 0.88% 6/7/22 (Liquidity Facility Mizuho Cap. Markets LLC) (b)(d)(e) | | 750,000 | 750,000 |
| Virginia Pub. Bldg. Auth. Pub. Facilities Rev. Bonds Series Floaters G 40, 0.99%, tender 8/1/22 (Liquidity Facility Royal Bank of Canada) (b)(c)(d)(e) | | 100,000 | 100,000 |
| | | | 850,000 |
| TOTAL TENDER OPTION BOND | | | |
| (Cost $169,465,000) | | | 169,465,000 |
|
| Other Municipal Security - 24.1% | | | |
| Michigan - 0.0% | | | |
| Kent Hosp. Fin. Auth. Hosp. Facilities Rev. Bonds (Spectrum Health Sys. Proj.) Series 2015 A, SIFMA Municipal Swap Index + 0.250% 1.04%, tender 12/27/22 (b)(g) | | 100,000 | 100,000 |
| New Jersey - 18.8% | | | |
| Bergen County Gen. Oblig. BAN Series 2021 A, 1% 6/9/22 | | 2,800,000 | 2,800,515 |
| Burlington County Bridge Commission Lease Rev. BAN (Govt. Leasing Prog.) Series 2021 C, 2% 11/10/22 | | 5,700,000 | 5,718,448 |
| Cherry Hill Township Gen. Oblig. BAN Series 2021, 2% 10/25/22 | | 5,600,000 | 5,640,017 |
| Closter Gen. Oblig. BAN Series 2022, 3% 6/1/23 (h) | | 1,000,000 | 1,006,820 |
| Little Ferry BAN Series 2022 A, 2% 8/19/22 | | 3,085,000 | 3,088,975 |
| Mercer County Gen. Oblig.: | | | |
| BAN Series 2021 A, 1% 6/8/22 | | 3,110,000 | 3,110,397 |
| Bonds: | | | |
| Series 2021, 2% 2/15/23 | | 1,890,000 | 1,901,340 |
| Series 2022, 4% 2/1/23 (h) | | 1,565,000 | 1,585,674 |
| Monmouth County Bonds Series 2021 B, 5% 1/15/23 | | 1,525,000 | 1,560,963 |
| Monroe Township Middlesex County Gen. Oblig. BAN Series 2021, 2% 6/7/22 | | 4,400,000 | 4,401,321 |
| New Jersey Econ. Dev. Auth. Rev. Bonds: | | | |
| Series 2012: | | | |
| 5% 6/15/22 (Pre-Refunded to 6/15/22 @ 100) | | 3,345,000 | 3,350,318 |
| 5% 6/15/22 (Pre-Refunded to 6/15/22 @ 100) | | 2,200,000 | 2,203,452 |
| Series 2022, 0.48% tender 6/15/22, CP mode | | 2,030,000 | 2,030,000 |
| New Jersey Edl. Facility Bonds Series 2015 A, 5% 7/1/22 | | 375,000 | 376,418 |
| New Jersey Health Care Facilities Fing. Auth. Rev. Bonds Series 2016 A, 5% 7/1/22 | | 785,000 | 788,080 |
| New Jersey Tpk. Auth. Tpk. Rev. Bonds Series 2013 A: | | | |
| 5% 7/1/22 (Pre-Refunded to 7/1/22 @ 100) | | 2,345,000 | 2,353,193 |
| 5% 7/1/22 (Pre-Refunded to 7/1/22 @ 100) | | 100,000 | 100,389 |
| 5% 7/1/22 (Pre-Refunded to 7/1/22 @ 100) | | 5,500,000 | 5,521,182 |
| 5% 7/1/22 (Pre-Refunded to 7/1/22 @ 100) | | 1,510,000 | 1,515,706 |
| 5% 7/1/22 (Pre-Refunded to 7/1/22 @ 100) | | 1,390,000 | 1,395,050 |
| North Hudson Swr. Auth. Bonds Series 2012 A, 5% | | 500,000 | 500,000 |
| Ship Bottom Gen. Impt. Wtr. Swr. Util. BAN Series 2021, 1.5% 10/20/22 | | 2,200,000 | 2,210,419 |
| South Jersey Trans. Auth. Trans. Sys. Rev. Bonds Series 2012 A, 5% 11/1/22 (Pre-Refunded to 11/1/22 @ 100) | | 1,200,000 | 1,216,809 |
| Summit Gen. Oblig. BAN Series 2021, 2% 10/21/22 | | 4,500,000 | 4,531,442 |
| Tenafly BAN Series 2022: | | | |
| 4% 9/30/22 | | 4,300,000 | 4,330,276 |
| 4% 5/26/23 | | 2,500,000 | 2,536,220 |
| Verona Township Gen. Oblig. BAN Series 2022, 4% 3/3/23 (h) | | 4,786,000 | 4,851,905 |
| Wildwood Crest BAN Series 2022, 2% 9/30/22 | | 4,100,000 | 4,114,908 |
| | | | 74,740,237 |
| Pennsylvania, New Jersey - 0.2% | | | |
| Delaware River Joint Toll Bridge Commission Pennsylvania-New Jersey Bridge Rev. Bonds Series 2012 A, 3% 7/1/22 (Pre-Refunded to 7/1/22 @ 100) | | 1,000,000 | 1,002,340 |
| New York And New Jersey - 5.1% | | | |
| Port Auth. of New York & New Jersey: | | | |
| Bonds: | | | |
| Series 172, 5% 6/20/22 (a) | | 110,000 | 110,139 |
| Series 2013 177, 5% 7/15/22 (a) | | 2,825,000 | 2,838,553 |
| Series 2013, 5% 12/1/22 (a) | | 205,000 | 209,717 |
| Series 2014 186, 5% 10/15/22 (a) | | 3,100,000 | 3,149,126 |
| Series 2015 194, 5% 10/15/22 | | 1,000,000 | 1,012,935 |
| Series 2018, 5% 9/15/22 (a) | | 825,000 | 834,864 |
| Series 2020 221, 5% 7/15/22 (a) | | 100,000 | 100,474 |
| Series 2022 231, 5% 8/1/22 (a) | | 500,000 | 502,386 |
| Series 223, 5% 7/15/22 (a) | | 800,000 | 804,179 |
| Series 2021 A, 0.18% 6/1/22, CP (a) | | 4,300,000 | 4,300,000 |
| Series 2022 A: | | | |
| 0.25% 6/16/22, CP (a) | | 2,000,000 | 2,000,000 |
| 0.95% 6/22/22, CP (a) | | 3,000,000 | 3,000,000 |
| Series 2022 B: | | | |
| 1.1% 6/21/22, CP | | 900,000 | 900,000 |
| 1.3% 6/21/22, CP | | 500,000 | 500,000 |
| | | | 20,262,373 |
| TOTAL OTHER MUNICIPAL SECURITY | | | |
| (Cost $96,104,950) | | | 96,104,950 |
| | | Shares | Value |
|
| Investment Company - 6.4% | | | |
| Fidelity Municipal Cash Central Fund 0.75% (i)(j) | | | |
| (Cost $25,432,421) | | 25,428,504 | 25,432,421 |
| TOTAL INVESTMENT IN SECURITIES - 99.8% | | | |
| (Cost $397,412,371) | | | 397,412,371 |
| NET OTHER ASSETS (LIABILITIES) - 0.2% | | | 701,046 |
| NET ASSETS - 100% | | | $398,113,417 |
Legend
(a) Private activity obligations whose interest is subject to the federal alternative minimum tax for individuals.
(b) Coupon rates for floating and adjustable rate securities reflect the rates in effect at period end.
(c) Restricted securities (including private placements) - Investment in securities not registered under the Securities Act of 1933 (excluding 144A issues). At the end of the period, the value of restricted securities (excluding 144A issues) amounted to $14,200,000 or 3.6% of net assets.
(d) Provides evidence of ownership in one or more underlying municipal bonds.
(e) Coupon rates are determined by re-marketing agents based on current market conditions.
(f) A portion of the security sold on a delayed delivery basis.
(g) Coupon is indexed to a floating interest rate which may be multiplied by a specified factor and/or subject to caps or floors.
(h) Security or a portion of the security purchased on a delayed delivery or when-issued basis.
(i) Information in this report regarding holdings by state and security types does not reflect the holdings of the Fidelity Municipal Cash Central Fund.
(j) Affiliated fund that is generally available only to investment companies and other accounts managed by Fidelity Investments. The rate quoted is the annualized seven-day yield of the fund at period end. A complete unaudited listing of the fund's holdings as of its most recent quarter end is available upon request. In addition, each Fidelity Central Fund's financial statements are available on the SEC's website or upon request.
Affiliated Central Funds
Fiscal year to date information regarding the Fund's investments in Fidelity Central Funds, including the ownership percentage, is presented below.
| Fund | Value, beginning of period | Purchases | Sales Proceeds | Dividend Income | Realized Gain/Loss | Change in Unrealized appreciation (depreciation) | Value, end of period | % ownership, end of period |
| Fidelity Municipal Cash Central Fund 0.75% | $32,404,904 | $90,868,000 | $97,841,000 | $45,819 | $517 | $- | $25,432,421 | 1.4% |
| Total | $32,404,904 | $90,868,000 | $97,841,000 | $45,819 | $517 | $- | $25,432,421 | 1.4% |
Amounts in the income column in the above table include any capital gain distributions from underlying funds, which are presented in the corresponding line-item in the Statement of Operations, if applicable.
Investment Valuation
All investments are categorized as Level 2 under the Fair Value Hierarchy. The inputs or methodology used for valuing securities may not be an indication of the risk associated with investing in those securities. For more information on valuation inputs please refer to the Investment Valuation section in the accompanying Notes to Financial Statements.
See accompanying notes which are an integral part of the financial statements.
Fidelity® New Jersey Municipal Money Market Fund
Financial Statements
Statement of Assets and Liabilities
| | | May 31, 2022 (Unaudited) |
| Assets | | |
Investment in securities, at value — See accompanying schedule:
Unaffiliated issuers (cost $371,979,950) | $371,979,950 | |
| Fidelity Central Funds (cost $25,432,421) | 25,432,421 | |
| Total Investment in Securities (cost $397,412,371) | | $397,412,371 |
| Cash | | 2,690 |
| Receivable for securities sold on a delayed delivery basis | | 7,800,000 |
| Receivable for fund shares sold | | 11,435 |
| Interest receivable | | 1,246,517 |
| Distributions receivable from Fidelity Central Funds | | 21,829 |
| Prepaid expenses | | 74 |
| Other receivables | | 75 |
| Total assets | | 406,494,991 |
| Liabilities | | |
| Payable for investments purchased on a delayed delivery basis | $7,444,397 | |
| Payable for fund shares redeemed | 750,742 | |
| Distributions payable | 3,661 | |
| Accrued management fee | 116,196 | |
| Other affiliated payables | 46,980 | |
| Other payables and accrued expenses | 19,598 | |
| Total liabilities | | 8,381,574 |
| Net Assets | | $398,113,417 |
| Net Assets consist of: | | |
| Paid in capital | | $398,375,042 |
| Total accumulated earnings (loss) | | (261,625) |
| Net Assets | | $398,113,417 |
| Net Asset Value, offering price and redemption price per share ($398,113,417 ÷ 397,527,420 shares) | | $1.00 |
See accompanying notes which are an integral part of the financial statements.
Statement of Operations
| | | Six months ended May 31, 2022 (Unaudited) |
| Investment Income | | |
| Interest | | $634,480 |
| Income from Fidelity Central Funds | | 45,819 |
| Total income | | 680,299 |
| Expenses | | |
| Management fee | $715,317 | |
| Transfer agent fees | 264,709 | |
| Accounting fees and expenses | 32,175 | |
| Custodian fees and expenses | 2,203 | |
| Independent trustees' fees and expenses | 646 | |
| Registration fees | 18,877 | |
| Audit | 18,218 | |
| Legal | 3,386 | |
| Miscellaneous | 444 | |
| Total expenses before reductions | 1,055,975 | |
| Expense reductions | (468,657) | |
| Total expenses after reductions | | 587,318 |
| Net investment income (loss) | | 92,981 |
| Realized and Unrealized Gain (Loss) | | |
| Net realized gain (loss) on: | | |
| Investment securities: | | |
| Unaffiliated issuers | (2,992) | |
| Fidelity Central Funds | 517 | |
| Total net realized gain (loss) | | (2,475) |
| Net increase in net assets resulting from operations | | $90,506 |
See accompanying notes which are an integral part of the financial statements.
Statement of Changes in Net Assets
| | Six months ended May 31, 2022 (Unaudited) | Year ended November 30, 2021 |
| Increase (Decrease) in Net Assets | | |
| Operations | | |
| Net investment income (loss) | $92,981 | $44,749 |
| Net realized gain (loss) | (2,475) | 84,461 |
| Net increase in net assets resulting from operations | 90,506 | 129,210 |
| Distributions to shareholders | (339,860) | (44,659) |
| Share transactions | | |
| Proceeds from sales of shares | 19,702,410 | 36,561,916 |
| Reinvestment of distributions | 324,928 | 42,790 |
| Cost of shares redeemed | (50,625,980) | (81,181,381) |
| Net increase (decrease) in net assets and shares resulting from share transactions | (30,598,642) | (44,576,675) |
| Total increase (decrease) in net assets | (30,847,996) | (44,492,124) |
| Net Assets | | |
| Beginning of period | 428,961,413 | 473,453,537 |
| End of period | $398,113,417 | $428,961,413 |
| Other Information | | |
| Shares | | |
| Sold | 19,702,411 | 36,561,916 |
| Issued in reinvestment of distributions | 324,928 | 42,790 |
| Redeemed | (50,625,981) | (81,181,381) |
| Net increase (decrease) | (30,598,642) | (44,576,675) |
See accompanying notes which are an integral part of the financial statements.
Financial Highlights
Fidelity New Jersey Municipal Money Market Fund
| | Six months ended (Unaudited) May 31, | Years endedNovember 30, | | | | |
| | 2022 | 2021 | 2020 | 2019 | 2018 | 2017 |
| Selected Per–Share Data | | | | | | |
| Net asset value, beginning of period | $1.00 | $1.00 | $1.00 | $1.00 | $1.00 | $1.00 |
| Income from Investment Operations | | | | | | |
| Net investment income (loss)A | –B | –B | .004 | .011 | .009 | .004 |
| Net realized and unrealized gain (loss) | .001C | –B | –B | –B | .001 | –B |
| Total from investment operations | .001 | –B | .004 | .011 | .010 | .004 |
| Distributions from net investment income | –B | –B | (.004) | (.011) | (.009) | (.004) |
| Distributions from net realized gain | (.001) | – | – | –B | (.001) | – |
| Total distributions | (.001) | –B | (.004) | (.011) | (.010) | (.004) |
| Net asset value, end of period | $1.00 | $1.00 | $1.00 | $1.00 | $1.00 | $1.00 |
| Total ReturnD,E | .08% | .01% | .39% | 1.13% | 1.02% | .37% |
| Ratios to Average Net AssetsA,F,G | | | | | | |
| Expenses before reductions | .51%H | .51% | .51% | .51% | .51% | .50% |
| Expenses net of fee waivers, if any | .29%H | .11% | .40% | .51% | .51% | .50% |
| Expenses net of all reductions | .29%H | .11% | .40% | .51% | .51% | .50% |
| Net investment income (loss) | .05%H | .01% | .41% | 1.09% | .91% | .36% |
| Supplemental Data | | | | | | |
| Net assets, end of period (000 omitted) | $398,113 | $428,961 | $473,454 | $570,800 | $716,063 | $983,578 |
A Net investment income (loss) is affected by the timing of the declaration of dividends by any underlying mutual funds or exchange-traded funds (ETFs). Net investment income (loss) of any such underlying funds is not included in the Fund's net investment income (loss) ratio.
B Amount represents less than $.0005 per share.
C The amount shown for a share outstanding does not correspond with the aggregate net gain (loss) on investments for the period due to the timing of sales and repurchases of shares in relation to fluctuating market values of the investments of the Fund.
D Total returns for periods of less than one year are not annualized.
E Total returns would have been lower if certain expenses had not been reduced during the applicable periods shown.
F Fees and expenses of any underlying mutual funds or exchange-traded funds (ETFs) are not included in the Fund's expense ratio. The Fund indirectly bears its proportionate share of these expenses. For additional expense information related to investments in Fidelity Central Funds, please refer to the "Investments in Fidelity Central Funds" note found in the Notes to Financial Statements section of the most recent Annual or Semi-Annual report.
G Expense ratios reflect operating expenses of the class. Expenses before reductions do not reflect amounts reimbursed, waived, or reduced through arrangements with the investment adviser, brokerage services, or other offset arrangements, if applicable, and do not represent the amount paid by the class during periods when reimbursements, waivers or reductions occur.
H Annualized
See accompanying notes which are an integral part of the financial statements.
Notes to Financial Statements (Unaudited)
For the period ended May 31, 2022
1. Organization.
Fidelity New Jersey Municipal Income Fund (the Income Fund) is a fund of Fidelity Court Street Trust. Fidelity New Jersey Municipal Money Market Fund (the Money Market Fund) is a fund of Fidelity Court Street Trust II. Each Trust is registered under the Investment Company Act of 1940, as amended (the 1940 Act), as an open-end management investment company. Fidelity Court Street Trust and Fidelity Court Street Trust II (the Trusts) are organized as a Massachusetts business trust and a Delaware statutory trust, respectively. The Income Fund is a non-diversified fund. Each Fund is authorized to issue an unlimited number of shares. Shares of the Money Market Fund are only available for purchase by retail shareholders. Share transactions on the Statement of Changes in Net Assets may contain exchanges between affiliated funds. Each Fund may be affected by economic and political developments in the state of New Jersey.
Effective after the close of business on September 9, 2022, Fidelity New Jersey Municipal Money Market Fund will be closed to new accounts with certain exceptions.
2. Investments in Fidelity Central Funds.
Funds may invest in Fidelity Central Funds, which are open-end investment companies generally available only to other investment companies and accounts managed by the investment adviser and its affiliates. The Schedule of Investments lists any Fidelity Central Funds held as an investment as of period end, but does not include the underlying holdings of each Fidelity Central Fund. An investing fund indirectly bears its proportionate share of the expenses of the underlying Fidelity Central Funds.
Based on its investment objective, each Fidelity Central Fund may invest or participate in various investment vehicles or strategies that are similar to those of the investing fund. These strategies are consistent with the investment objectives of the investing fund and may involve certain economic risks which may cause a decline in value of each of the Fidelity Central Funds and thus a decline in the value of the investing fund.
| Fidelity Central Fund | Investment Manager | Investment Objective | Investment Practices | Expense Ratio(a) |
| Fidelity Money Market Central Funds | Fidelity Management & Research Company LLC (FMR) | Each fund seeks to obtain a high level of current income consistent with the preservation of capital and liquidity. | Short-term Investments | Less than .005% |
(a) Expenses expressed as a percentage of average net assets and are as of each underlying Central Fund's most recent annual or semi-annual shareholder report.
A complete unaudited list of holdings for each Fidelity Central Fund is available upon request or at the Securities and Exchange Commission website at www.sec.gov. In addition, the financial statements of the Fidelity Central Funds which contain the significant accounting policies (including investment valuation policies) of those funds, and are not covered by the Report of Independent Registered Public Accounting Firm, are available on the Securities and Exchange Commission website or upon request.
3. Significant Accounting Policies.
Each Fund is an investment company and applies the accounting and reporting guidance of the Financial Accounting Standards Board (FASB) Accounting Standards Codification Topic 946 Financial Services - Investment Companies. The financial statements have been prepared in conformity with accounting principles generally accepted in the United States of America (GAAP), which require management to make certain estimates and assumptions at the date of the financial statements. Actual results could differ from those estimates. Subsequent events, if any, through the date that the financial statements were issued have been evaluated in the preparation of the financial statements. Each Fund's Schedule of Investments lists any underlying mutual funds or exchange-traded funds (ETFs) but does not include the underlying holdings of these funds. The following summarizes the significant accounting policies of each Fund:
Investment Valuation. Investments are valued as of 4:00 p.m. Eastern time on the last calendar day of the period. The Board of Trustees (the Board) has delegated the day to day responsibility for the valuation of the Income Fund's investments to the Fair Value Committee (the Committee) established by the Income Fund's investment adviser. In accordance with valuation policies and procedures approved by the Board, the Income Fund attempts to obtain prices from one or more third party pricing vendors or brokers to value its investments. When current market prices, quotations or currency exchange rates are not readily available or reliable, investments will be fair valued in good faith by the Committee, in accordance with procedures adopted by the Board. Factors used in determining fair value vary by investment type and may include market or investment specific events, changes in interest rates and credit quality. The frequency with which these procedures are used cannot be predicted and they may be utilized to a significant extent. The Committee oversees the Income Fund's valuation policies and procedures and reports to the Board on the Committee's activities and fair value determinations. The Board monitors the appropriateness of the procedures used in valuing the Income Fund's investments and ratifies the fair value determinations of the Committee.
Each Fund categorizes the inputs to valuation techniques used to value its investments into a disclosure hierarchy consisting of three levels as shown below:
- Level 1 – unadjusted quoted prices in active markets for identical investments
- Level 2 – other significant observable inputs (including quoted prices for similar investments, interest rates, prepayment speeds, etc.)
- Level 3 – unobservable inputs (including the Fund's own assumptions based on the best information available)
Valuation techniques used to value each Fund's investments by major category are as follows:
For the Income Fund, debt securities, including restricted securities, are valued based on evaluated prices received from third party pricing vendors or from brokers who make markets in such securities. Municipal securities are valued by pricing vendors who utilize matrix pricing which considers yield or price of bonds of comparable quality, coupon, maturity and type or by broker-supplied prices. When independent prices are unavailable or unreliable, debt securities may be valued utilizing pricing methodologies which consider similar factors that would be used by third party pricing vendors. Debt securities are generally categorized as Level 2 in the hierarchy but may be Level 3 depending on the circumstances.
Investments in open-end mutual funds, including the Fidelity Central Funds, are valued at their closing net asset value (NAV) each business day and are categorized as Level 1 in the hierarchy.
For the Money Market Fund, as permitted by compliance with certain conditions under Rule 2a-7 of the 1940 Act, securities are valued at amortized cost, which approximates fair value. The amortized cost of an instrument is determined by valuing it at its original cost and thereafter amortizing any discount or premium from its face value at a constant rate until maturity. Securities held by a money market fund are generally high quality and liquid; however, they are reflected as Level 2 because the inputs used to determine fair value are not quoted prices in an active market.
For the Income Fund, changes in valuation techniques may result in transfers in or out of an assigned level within the disclosure hierarchy. The aggregate value of investments by input level as of May 31, 2022 is included at the end of the Fund's Schedule of Investments.
Investment Transactions and Income. For financial reporting purposes, the Funds' investment holdings and NAV include trades executed through the end of the last business day of the period. The NAV per share for processing shareholder transactions is calculated as of the close of business of the New York Stock Exchange (NYSE), normally 4:00 p.m. Eastern time and includes trades executed through the end of the prior business day for the Income Fund and trades executed through the end of the current business day for the Money Market Fund. Gains and losses on securities sold are determined on the basis of identified cost. Income and capital gain distributions from Fidelity Central Funds, if any, are recorded on the ex-dividend date. Interest income is accrued as earned and includes coupon interest and amortization of premium and accretion of discount on debt securities as applicable.
Expenses. Expenses directly attributable to a fund are charged to that fund. Expenses attributable to more than one fund are allocated among the respective funds on the basis of relative net assets or other appropriate methods. Expenses included in the accompanying financial statements reflect the expenses of that fund and do not include any expenses associated with any underlying mutual funds or exchange-traded funds. Although not included in a fund's expenses, a fund indirectly bears its proportionate share of these expenses through the net asset value of each underlying mutual fund or exchange-traded fund. Expense estimates are accrued in the period to which they relate and adjustments are made when actual amounts are known.
Income Tax Information and Distributions to Shareholders. Each year, each Fund intends to qualify as a regulated investment company under Subchapter M of the Internal Revenue Code, including distributing substantially all of its taxable income and realized gains. As a result, no provision for U.S. Federal income taxes is required. Each Fund files a U.S. federal tax return, in addition to state and local tax returns as required. Each Fund's federal income tax returns are subject to examination by the Internal Revenue Service (IRS) for a period of three fiscal years after they are filed. State and local tax returns may be subject to examination for an additional fiscal year depending on the jurisdiction.
Distributions are declared and recorded daily and paid monthly from net investment income. Distributions from realized gains, if any, are declared and recorded on the ex-dividend date. Income and capital gain distributions are determined in accordance with income tax regulations, which may differ from GAAP.
Capital accounts within the financial statements are adjusted for permanent book-tax differences. These adjustments have no impact on net assets or the results of operations. Capital accounts are not adjusted for temporary book-tax differences which will reverse in a subsequent period.
Book-tax differences are primarily due to market discount and capital loss carryforwards.
The Funds purchase municipal securities whose interest, in the opinion of the issuer, is free from federal income tax. There is no assurance that the Internal Revenue Service (IRS) will agree with this opinion. In the event the IRS determines that the issuer does not comply with relevant tax requirements, interest payments from a security could become federally taxable, possibly retroactively to the date the security was issued.
As of period end, the cost and unrealized appreciation (depreciation) in securities, and derivatives if applicable, for federal income tax purposes were as follows for each Fund:
| | Tax cost | Gross unrealized appreciation | Gross unrealized depreciation | Net unrealized appreciation (depreciation) |
| Fidelity New Jersey Municipal Income Fund | $550,851,038 | $15,444,703 | $(20,569,063) | $(5,124,360) |
| Fidelity New Jersey Municipal Money Market Fund | 397,412,371 | – | – | – |
Capital loss carryforwards are only available to offset future capital gains of the Funds to the extent provided by regulations and may be limited. The capital loss carryforward information presented below, including any applicable limitation, is estimated as of prior fiscal period end and is subject to adjustment.
| | No expiration | | |
| | Short-term | Long-term | Total capital loss carryforward |
| Fidelity New Jersey Municipal Money Market Fund | (12,321) | (–) | (12,321) |
Delayed Delivery Transactions and When-Issued Securities. During the period, certain Funds transacted in securities on a delayed delivery or when-issued basis. Payment and delivery may take place after the customary settlement period for that security. The price of the underlying securities and the date when the securities will be delivered and paid for are fixed at the time the transaction is negotiated. Securities purchased on a delayed delivery or when-issued basis are identified as such in the Schedule of Investments. Compensation for interest forgone in the purchase of a delayed delivery or when-issued debt security may be received. With respect to purchase commitments, each applicable Fund identifies securities as segregated in its records with a value at least equal to the amount of the commitment. Payables and receivables associated with the purchases and sales of delayed delivery securities having the same coupon, settlement date and broker are offset. Delayed delivery or when-issued securities that have been purchased from and sold to different brokers are reflected as both payables and receivables in the Statement of Assets and Liabilities under the caption "Delayed delivery", as applicable. Losses may arise due to changes in the value of the underlying securities or if the counterparty does not perform under the contract's terms, or if the issuer does not issue the securities due to political, economic, or other factors.
Restricted Securities (including Private Placements). Funds may invest in securities that are subject to legal or contractual restrictions on resale. These securities generally may be resold in transactions exempt from registration or to the public if the securities are registered. Disposal of these securities may involve time-consuming negotiations and expense, and prompt sale at an acceptable price may be difficult. Information regarding restricted securities held at period end is included at the end of the Schedule of Investments, if applicable.
4. Purchases and Sales of Investments.
Purchases and sales of securities, other than short-term securities and in-kind transactions, as applicable, are noted in the table below.
| | Purchases ($) | Sales ($) |
| Fidelity New Jersey Municipal Income Fund | 18,238,964 | 74,989,087 |
5. Fees and Other Transactions with Affiliates.
Management Fee. Fidelity Management & Research Company LLC (the investment adviser) and its affiliates provide the Funds with investment management related services for which the Funds pay a monthly management fee. The management fee is the sum of an individual fund fee rate and an annualized group fee rate. The individual fund fee rate is applied to each Fund's average net assets. The group fee rate is based upon the monthly average net assets of a group of registered investment companies with which the investment adviser has management contracts. The group fee rate decreases as assets under management increase and increases as assets under management decrease. For the reporting period, each Fund's annualized management fee rate expressed as a percentage of each Fund's average net assets was as follows:
| | Individual Rate | Group Rate | Total |
| Fidelity New Jersey Municipal Income Fund | .25% | .10% | .35% |
| Fidelity New Jersey Municipal Money Market Fund | .25% | .10% | .35% |
Transfer Agent Fees. Fidelity Investments Institutional Operations Company LLC (FIIOC), an affiliate of the investment adviser, is the transfer, dividend disbursing and shareholder servicing agent for the Funds. FIIOC receives account fees and asset-based fees that vary according to account size and type of account. FIIOC pays for typesetting, printing and mailing of shareholder reports, except proxy statements. For the period, the transfer agent fees were equivalent to the following annualized rates expressed as a percentage of average net assets:
| Fidelity New Jersey Municipal Income Fund | .09% |
| Fidelity New Jersey Municipal Money Market Fund | .13% |
During the period, the investment advisor or its affiliates waived a portion of these fees for the Fidelity New Jersey Municipal Money Market Fund.
Accounting Fees. Fidelity Service Company, Inc. (FSC), an affiliate of the investment adviser, maintains each Fund's accounting records. The accounting fee is based on the level of average net assets for each month. For the period, the fees were equivalent to the following annualized rates:
| | % of Average Net Assets |
| Fidelity New Jersey Municipal Income Fund | .02 |
| Fidelity New Jersey Municipal Money Market Fund | .02 |
Interfund Trades. Funds may purchase from or sell securities to other Fidelity Funds under procedures adopted by the Board. The procedures have been designed to ensure these interfund trades are executed in accordance with Rule 17a-7 of the 1940 Act. For the Income Fund, any interfund trades are included within the respective purchases and sales amounts shown in the Purchases and Sales of Investments note. Interfund trades during the period are noted in the table below.
| | Purchases ($) | Sales ($) | Realized Gain (Loss) ($) |
| Fidelity New Jersey Municipal Income Fund | – | – | – |
| Fidelity New Jersey Municipal Money Market Fund | – | 19,100,000 | – |
6. Committed Line of Credit.
Certain Funds participate with other funds managed by the investment adviser or an affiliate in a $4.25 billion credit facility (the "line of credit") to be utilized for temporary or emergency purposes to fund shareholder redemptions or for other short-term liquidity purposes. The participating funds have agreed to pay commitment fees on their pro-rata portion of the line of credit, which are reflected in Miscellaneous expenses on the Statement of Operations, and are listed below. During the period, there were no borrowings on this line of credit.
| | Amount |
| Fidelity New Jersey Municipal Income Fund | $565 |
7. Expense Reductions.
The investment adviser or its affiliates voluntarily agreed to waive certain fees for the Money Market Fund in order to avoid a negative yield. Such arrangements may be discontinued by the investment adviser at any time. For the period, the amount of the waiver was $465,284.
Through arrangements with each applicable Fund's custodian, credits realized as a result of certain uninvested cash balances were used to reduce each applicable Fund's expenses. All of the applicable expense reductions are noted in the table below.
| | Custodian credits |
| Fidelity New Jersey Municipal Income Fund | $4,806 |
| Fidelity New Jersey Municipal Money Market Fund | 39 |
In addition, during the period the investment adviser or an affiliate reimbursed and/or waived a portion of operating expenses as follows:
| | Amount |
| Fidelity New Jersey Municipal Income Fund | $5,315 |
| Fidelity New Jersey Municipal Money Market Fund | 3,334 |
8. Other.
A fund's organizational documents provide former and current trustees and officers with a limited indemnification against liabilities arising in connection with the performance of their duties to the fund. In the normal course of business, a fund may also enter into contracts that provide general indemnifications. A fund's maximum exposure under these arrangements is unknown as this would be dependent on future claims that may be made against a fund. The risk of material loss from such claims is considered remote.
9. Coronavirus (COVID-19) Pandemic.
An outbreak of COVID-19 first detected in China during December 2019 has since spread globally and was declared a pandemic by the World Health Organization during March 2020. Developments that disrupt global economies and financial markets, such as the COVID-19 pandemic, may magnify factors that affect the Funds' performance.
10. Proposed Reorganization.
The Board of Trustees of Fidelity New Jersey Municipal Money Market Fund approved an Agreement and Plan of Reorganization (the Agreement) between Fidelity New Jersey Municipal Money Market Fund and Fidelity New Jersey AMT Tax-Free Money Market Fund. The Agreement provides for the transfer of all the assets and the assumption of all the liabilities of Fidelity New Jersey Municipal Money Market Fund in exchange for corresponding shares of Fidelity New Jersey AMT Tax-Free Money Market Fund equal in value to the net assets of Fidelity New Jersey Municipal Money Market Fund on the day the reorganization is effective. The reorganization does not require shareholder approval and is expected to become effective on September 16, 2022. The reorganization is expected to qualify as a tax-free transaction for federal income tax purposes with no gain or loss recognized by the funds or their shareholders.
Shareholder Expense Example
As a shareholder, you incur two types of costs: (1) transaction costs, which may include sales charges (loads) on purchase payments or redemption proceeds, as applicable and (2) ongoing costs, which generally include management fees, distribution and/or service (12b-1) fees and other Fund expenses. This Example is intended to help you understand your ongoing costs (in dollars) of investing in a fund and to compare these costs with the ongoing costs of investing in other mutual funds.
The Example is based on an investment of $1,000 invested at the beginning of the period and held for the entire period (December 1, 2021 to May 31, 2022).
Actual Expenses
The first line of the accompanying table provides information about actual account values and actual expenses. You may use the information in this line, together with the amount you invested, to estimate the expenses that you paid over the period. Simply divide your account value by $1,000.00 (for example, an $8,600 account value divided by $1,000.00 = 8.6), then multiply the result by the number in the first line for a class/Fund under the heading entitled "Expenses Paid During Period" to estimate the expenses you paid on your account during this period. If any fund is a shareholder of any underlying mutual funds or exchange-traded funds (ETFs) (the Underlying Funds), such fund indirectly bears its proportional share of the expenses of the Underlying Funds in addition to the direct expenses incurred presented in the table. These fees and expenses are not included in the annualized expense ratio used to calculate the expense estimate in the table below.
Hypothetical Example for Comparison Purposes
The second line of the accompanying table provides information about hypothetical account values and hypothetical expenses based on the actual expense ratio and an assumed rate of return of 5% per year before expenses, which is not the actual return. The hypothetical account values and expenses may not be used to estimate the actual ending account balance or expenses you paid for the period. You may use this information to compare the ongoing costs of investing in the Fund and other funds. To do so, compare this 5% hypothetical example with the 5% hypothetical examples that appear in the shareholder reports of the other funds. If any fund is a shareholder of any Underlying Funds, such fund indirectly bears its proportional share of the expenses of the Underlying Funds in addition to the direct expenses as presented in the table. These fees and expenses are not included in the annualized expense ratio used to calculate the expense estimate in the table below.
Please note that the expenses shown in the table are meant to highlight your ongoing costs only and do not reflect any transaction costs. Therefore, the second line of the table is useful in comparing ongoing costs only, and will not help you determine the relative total costs of owning different funds. In addition, if these transactional costs were included, your costs would have been higher.
| | Annualized Expense Ratio-A | Beginning
Account Value
December 1, 2021 | Ending
Account Value
May 31, 2022 | Expenses Paid
During Period-B
December 1, 2021
to May 31, 2022 |
| Fidelity New Jersey Municipal Income Fund | .48% | | | |
| Actual | | $1,000.00 | $920.00 | $2.30 |
| Hypothetical-C | | $1,000.00 | $1,022.54 | $2.42 |
| Fidelity New Jersey Municipal Money Market Fund | .29% | | | |
| Actual | | $1,000.00 | $1,000.80 | $1.45 ** |
| Hypothetical-C | | $1,000.00 | $1,023.49 | $1.46 ** |
A Annualized expense ratio reflects expenses net of applicable fee waivers.
B Expenses are equal to the annualized expense ratio, multiplied by the average account value over the period, multiplied by 182/ 365 (to reflect the one-half year period). The fees and expenses of any Underlying Funds are not included in each annualized expense ratio.
C 5% return per year before expenses
** If certain fees were not voluntarily waived by the investment adviser or its affiliates during the period, the annualized expense ratios and the expenses paid in the actual and hypothetical examples above would have been as follows:
| | Annualized Expense Ratio-(a)
| Expenses Paid
|
| Fidelity New Jersey Municipal Money Market Fund | .51% | |
| Actual | | $2.54 |
| Hypothetical-(b) | | $2.57 |
| | | |
(a) Annualized expense ratio reflects expenses net of applicable fee waivers.
(b) 5% return per year before expenses
Liquidity Risk Management Program
The Securities and Exchange Commission adopted Rule 22e-4 under the Investment Company Act of 1940 (the Liquidity Rule) to promote effective liquidity risk management throughout the open-end investment company industry, thereby reducing the risk that funds will be unable to meet their redemption obligations and mitigating dilution of the interests of fund shareholders.
The New Jersey Municipal Income Fund (the Income Fund) has adopted and implemented a liquidity risk management program pursuant to the Liquidity Rule (the Program) effective December 1, 2018. The Program is reasonably designed to assess and manage the Income Fund’s liquidity risk and to comply with the requirements of the Liquidity Rule. The Income Fund’s Board of Trustees (the Board) has designated the Income Fund’s investment adviser as administrator of the Program. The Fidelity advisers have established a Liquidity Risk Management Committee (the LRM Committee) to manage the Program for each of the Fidelity Funds. The LRM Committee monitors the adequacy and effectiveness of implementation of the Program and on a periodic basis assesses each Fund’s liquidity risk based on a variety of factors including (1) the Fund’s investment strategy, (2) portfolio liquidity and cash flow projections during normal and reasonably foreseeable stressed conditions, (3) shareholder redemptions, (4) borrowings and other funding sources and (5) in the case of exchange-traded funds, certain additional factors including the effect of the Fund’s prices and spreads, market participants, and basket compositions on the overall liquidity of the Fund’s portfolio, as applicable.
In accordance with the Program, each of the Fund’s portfolio investments is classified into one of four liquidity categories described below based on a determination of a reasonable expectation for how long it would take to convert the investment to cash (or sell or dispose of the investment) without significantly changing its market value.
- Highly liquid investments – cash or convertible to cash within three business days or less
- Moderately liquid investments – convertible to cash in three to seven calendar days
- Less liquid investments – can be sold or disposed of, but not settled, within seven calendar days
- Illiquid investments – cannot be sold or disposed of within seven calendar days
Liquidity classification determinations take into account a variety of factors including various market, trading and investment-specific considerations, as well as market depth, and generally utilize analysis from a third-party liquidity metrics service.
The Liquidity Rule places a 15% limit on a fund’s illiquid investments and requires funds that do not primarily hold assets that are highly liquid investments to determine and maintain a minimum percentage of the fund’s net assets to be invested in highly liquid investments (highly liquid investment minimum or HLIM). The Program includes provisions reasonably designed to comply with the 15% limit on illiquid investments and for determining, periodically reviewing and complying with the HLIM requirement as applicable.
At a recent meeting of the Fund’s Board of Trustees, the LRM Committee provided a written report to the Board pertaining to the operation, adequacy, and effectiveness of implementation of the Program for the annual period from December 1, 2020 through November 30, 2021. The report concluded that the Program has been implemented and is operating effectively and is reasonably designed to assess and manage the Fund’s liquidity risk.
NJN-SANN-0722
1.704871.124
Item 2.
Code of Ethics
Not applicable.
Item 3.
Audit Committee Financial Expert
Not applicable.
Item 4.
Principal Accountant Fees and Services
Not applicable.
Item 5.
Audit Committee of Listed Registrants
Not applicable.
Item 6.
Investments
(a)
Not applicable.
(b)
Not applicable
Item 7.
Disclosure of Proxy Voting Policies and Procedures for Closed-End Management Investment Companies
Not applicable.
Item 8.
Portfolio Managers of Closed-End Management Investment Companies
Not applicable.
Item 9.
Purchase of Equity Securities by Closed-End Management Investment Company and Affiliated Purchasers
Not applicable.
Item 10.
Submission of Matters to a Vote of Security Holders
There were no material changes to the procedures by which shareholders may recommend nominees to the Fidelity Court Street Trust’s Board of Trustees.
Item 11.
Controls and Procedures
(a)(i) The President and Treasurer and the Chief Financial Officer have concluded that the Fidelity Court Street Trust’s (the “Trust”) disclosure controls and procedures (as defined in Rule 30a-3(c) under the Investment Company Act) provide reasonable assurances that material information relating to the Trust is made known to them by the appropriate persons, based on their evaluation of these controls and procedures as of a date within 90 days of the filing date of this report.
(a)(ii) There was no change in the Trust’s internal control over financial reporting (as defined in Rule 30a-3(d) under the Investment Company Act) that occurred during the period covered by this report that has materially affected, or is reasonably likely to materially affect, the Trust’s internal control over financial reporting.
Item 12.
Disclosure of Securities Lending Activities for Closed-End Management
Investment Companies
Not applicable.
Item 13.
Exhibits
SIGNATURES
Pursuant to the requirements of the Securities Exchange Act of 1934 and the Investment Company Act of 1940, the registrant has duly caused this report to be signed on its behalf by the undersigned, thereunto duly authorized.
Fidelity Court Street Trust
| |
By: | /s/Laura M. Del Prato |
| Laura M. Del Prato |
| President and Treasurer |
|
|
Date: | July 21, 2022 |
Pursuant to the requirements of the Securities Exchange Act of 1934 and the Investment Company Act of 1940, this report has been signed below by the following persons on behalf of the registrant and in the capacities and on the dates indicated.
| |
By: | /s/Laura M. Del Prato |
| Laura M. Del Prato |
| President and Treasurer |
|
|
Date: | July 21, 2022 |
| |
By: | /s/John J. Burke III |
| John J. Burke III |
| Chief Financial Officer |
|
|
Date: | July 21, 2022 |