UNITED STATES
SECURITIES AND EXCHANGE COMMISSION
Washington, D.C. 20549
FORM N-CSRS
CERTIFIED SHAREHOLDER REPORT OF REGISTERED MANAGEMENT INVESTMENT COMPANIES
Investment Company Act file number 811-02790
Franklin California Tax-Free Income Fund
(Exact name of registrant as specified in charter)
_One Franklin Parkway, San Mateo, CA 94403-1906
(Address of principal executive offices) (Zip code)
_Craig S. Tyle, One Franklin Parkway, San Mateo, CA 94403-1906
(Name and address of agent for service)
Registrant's telephone number, including area code: 650 312-2000
Date of fiscal year end:_3/31
Date of reporting period:_9/30/10
Item 1. Reports to Stockholders.
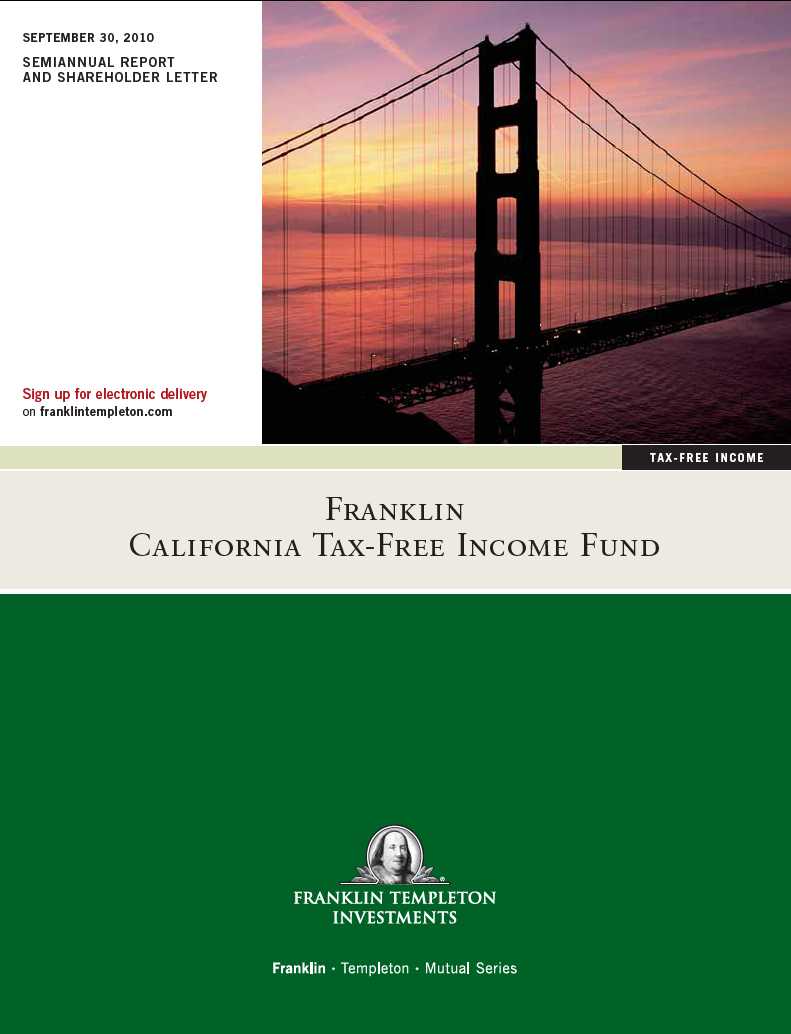
Semiannual Report
Franklin California
Tax-Free Income Fund
Your Fund’s Goal and Main Investments: Franklin California Tax-Free Income Fund seeks to provide as high a level of income exempt from federal and California personal income taxes (for California residents) as is consistent with prudent investment management and preservation of capital by investing at least 80% of its total assets in securities that pay interest free from such taxes.1
Credit Quality Breakdown*
Based on Total Long-Term Investments as of 9/30/10**
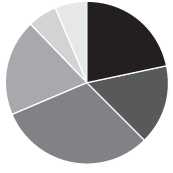

*Standard & Poor’s (S&P) is the primary independent rating agency, Moody’s is the secondary rating agency and Fitch is the tertiary rating agency. Securities not rated by an independent rating agency are assigned comparable internal ratings. Ratings for securities not rated by S&P are in the table below. The letter ratings are provided to indicate the creditworthiness of the Fund’s bond holdings and generally can range from AAA or Aaa (highest) to Below Investment Grade (lowest).
**Does not include short-term investments and other net assets.
| | | | | | |
| Ratings | Moody’s | | Fitch | | Internal | |
| AAA or Aaa | 0.1 | % | — | | 1.1 | % |
| AA or Aa | 0.4 | % | 0.2 | % | — | |
| A | 0.9 | % | — | | 0.6 | % |
| BBB or Baa | 1.9 | % | 0.1 | % | 0.6 | % |
| Below Investment Grade | — | | 0.2 | % | 0.1 | % |
| Total | 3.3 | % | 0.5 | % | 2.4 | % |
We are pleased to bring you Franklin California Tax-Free Income Fund’s semiannual report for the period ended September 30, 2010.
1. For investors subject to alternative minimum tax, a small portion of Fund dividends may be taxable. Distributions of capital gains are generally taxable. To avoid imposition of 28% backup withholding on all Fund distributions and redemption proceeds, U.S. investors must be properly certified on Form W-9 and non-U.S. investors on Form W-8BEN.
4 | Semiannual Report
The dollar value, number of shares or principal amount, and names of all portfolio holdings are listed in the Fund’s Statement of Investments (SOI). The SOI begins on page 19.
| | | | |
| Dividend Distributions2 | | | | |
| | | Dividend per Share | |
| Month | Class A | Class B | Class C | Advisor Class |
| April | 2.70 cents | 2.34 cents | 2.36 cents | 2.75 cents |
| May | 2.70 cents | 2.34 cents | 2.36 cents | 2.75 cents |
| June | 2.70 cents | 2.38 cents | 2.39 cents | 2.75 cents |
| July | 2.70 cents | 2.38 cents | 2.39 cents | 2.75 cents |
| August | 2.70 cents | 2.38 cents | 2.39 cents | 2.75 cents |
| September | 2.70 cents | 2.38 cents | 2.39 cents | 2.76 cents |
Performance Overview
The Fund’s Class A share price, as measured by net asset value, increased from $6.99 on March 31, 2010, to $7.22 on September 30, 2010. The Fund’s Class A shares paid dividends totaling 16.20 cents per share for the reporting period.2 The Performance Summary beginning on page 10 shows that at the end of this reporting period the Fund’s Class A shares’ distribution rate was 4.30% based on an annualization of the 2.70 cent per share September dividend and the maximum offering price of $7.54 on September 30, 2010. An investor in the 2010 maximum combined effective federal and California personal income tax bracket of 41.21% would need to earn a distribution rate of 7.31% from a taxable investment to match the Fund’s Class A ta x-free distribution rate. For the Fund’s Class B, C and Advisor shares’ performance, please see the Performance Summary.
State Update
California’s historically robust economy, the eighth largest in the world, faced severe headwinds during the reporting period. The state weathered tax revenue declines, more than half of which were from personal income taxes. In addition, state lawmakers struggled to pass a budget, setting a record for the longest budget impasse in California history. High unemployment compounded state budget problems as well and placed pressure on California’s weak housing market. Correspondingly, construction suffered the greatest job losses during the reporting period as the supply of distressed homes increased and demand slowed with the expiration of a first-time home buyer tax credit. State government also shed a number of jobs and by September, unemployment stood at 12.4%, nearly three percentage points above the 9.6% national median.3
2. All Fund distributions will vary depending upon current market conditions, and past distributions are not indicative of future trends.
3. Source: Bureau of Labor Statistics.
Performance data represent past performance, which does not guarantee future results. Investment return and principal value will fluctuate, and you may have a gain or loss when you sell your shares. Current performance may differ from figures shown. Please visit franklintempleton.com or call (800) 342-5236 for most recent month-end performance.
Semiannual Report | 5
Governor Schwarzenegger announced a financial state of emergency late in the period and furloughed state workers for three days a month, affecting 150,000 workers.
In contrast, several sectors added jobs over the period, and California continued to benefit from some long-term positive trends. Mining and logging and professional and business services experienced job growth during the reporting period. In addition, California’s world-class universities and strong business links to the global economy helped offset job losses. With more than 50 Fortune 500 companies and many technology leaders, the state experienced international demand for its technology exports, supporting jobs in that sector as well.
California’s budget impasse was a major challenge for the state as local governments and school districts prepared for anticipated cuts to bridge a $19 billion budget shortfall for 2011.4 The governor pledged not to sign a budget without reforms to public pension, a cost that grew three times faster than state revenues over the past decade. Republicans along with the governor proposed cutting $12 billion in spending, including dismantling the state’s welfare program and eliminating most state-funded child care.5 Democrats countered with $5.9 billion in higher taxes and fees combined with a proposed $8 billion in spending cuts.5 State finance experts also predicted $6 billion in bond debt would be needed through November.5
Given the size of California’s budget, the state’s tax-supported debt was moderate at $2,362 per capita or 5.6% of personal income, compared with the $936 and 2.5% national medians.6 However, because California is implementing a long-term strategic plan with voter-authorized projects geared toward supporting ongoing economic growth, its debt burden is likely to increase in the next few years.
During the period, independent credit rating agency Moody’s Investors Service maintained its A rating of California’s general obligation bonds with a stable outlook.7 The rating and outlook reflected the budgetary shortfalls the state faced, as well as possible liquidity strains resulting from such shortfalls, particularly if the legislature fails to enact timely solutions.
Municipal Bond Market Overview
For the six months ended September 30, 2010, the municipal bond market posted strong results with a +5.51% total return as measured by the Barclays
4. Source: Moody’s Investors Service, “Moody’s Analytics, Precis U.S. State,” August 2010.
5. Source: www.businessweek.com, “California Budget ‘Framework’ Is Reached, Schwarzenegger Says,” 9/24/10. 6. Source: Moody’s Investors Service, “Special Comment: 2010 State Debt Medians Report,” May 2010.
7. This does not indicate Moody’s rating of the Fund.
6 | Semiannual Report
Capital (BC) Municipal Bond Index.8 Coupon payments generated 2.38% of the total return, and 3.13% came from bond price appreciation. This was historically strong six-month performance for municipal bonds. Fixed income investments generally produced robust results during the same six-month period, and the Treasury bond market returned +7.54% according to the BC U.S. Treasury Bond Index.9
Despite municipal bonds’ strength, many tax-free bonds retained their pre-tax yield advantage over Treasuries. As of period-end, the 4.59% yield of the BC Municipal Bond Index: Long Component exceeded the 3.37% yield of the BC U.S. Treasury Index: Long Component.10 Investors continued to purchase municipal bond mutual fund shares even though budgetary pressures at state and local levels and concerns regarding some issuers’ abilities to repay debt were well publicized. Many municipal bonds were re-rated during the period due to a changing economic landscape and reconciliation between corporate and municipal rating scales. Moody’s Investors Service and Fitch recalibrated ratings for many state and local government issuers to bring them in line wit h corporate and sovereign ratings. In some cases, these changes resulted in as much as a three-notch rating increase. Investor interest also increased for lower investment-grade and speculative-grade issues during the reporting period, which contributed to the BC Baa Municipal Bond Index’s +7.15% return and the BC Municipal Bond High Yield Index’s +7.78% return, compared with the BC Aaa Municipal Bond Index’s +4.41% total return.11
The American Recovery and Reinvestment Act of February 2009 allowed municipalities to issue taxable bonds and receive a 35% federal government subsidy for all coupon payments distributed to investors for the life of the bonds. Such bonds, however, are not part of the Fund’s tax-free portfolio. The subsidy enabled municipalities to borrow significantly below their after-tax cost in the
8. Source: © 2010 Morningstar. All Rights Reserved. The information contained herein: (1) is proprietary to Morningstar and/or its content providers; (2) may not be copied or distributed; and (3) is not warranted to be accurate, complete or timely. Neither Morningstar nor its content providers are responsible for any damages or losses arising from any use of this information. The BC Municipal Bond Index is a market value-weighted index engineered for the long-term tax-exempt bond market. To be included in the index, bonds must be fixed rate, have at least one year to final maturity and be rated investment grade (Baa3/BBB- or higher) by at least two of the following agencies: Moody’s, Standard & Poor’s and Fitch.
9. Source: © 2010 Morningstar. The BC U.S. Treasury Index is the U.S. Treasury component of the U.S. Government Index and covers public obligations of the U.S. Treasury with a remaining maturity of one year or more.
10. Source: © 2010 Morningstar. The BC Municipal Bond Index: Long Component is the long (22+ years) component of the BC Municipal Bond Index. The BC U.S. Treasury Index: Long Component is the long component of the BC U.S. Treasury Index and covers public obligations of the U.S. Treasury with a remaining maturity of 10 years or more.
11. Source: © 2010 Morningstar. The BC Baa Municipal Bond Index is the Baa credit quality component of the BC Municipal Bond Index. The BC Municipal Bond High Yield Index consists of bonds that must be nonrated or rated Ba1 or below. They must have an outstanding par value of at least $3 million and be issued as part of a transaction of at least $20 million. The bonds must be dated after 12/31/90 and must be at least one year from their maturity date. The BC Aaa Municipal Bond Index is the Aaa credit quality component of the BC Municipal Bond Index.
Semiannual Report | 7
|
| Portfolio Breakdown |
| 9/30/10 |
| |
| % of Total |
| Long-Term Investments* |
| | |
| Prerefunded | 19.9 | % |
| Transportation | 18.1 | % |
| Hospital & Health Care | 17.8 | % |
| General Obligation | 14.4 | % |
| Utilities | 11.9 | % |
| Subject to Government Appropriations | 6.9 | % |
| Tax-Supported | 5.4 | % |
| Higher Education | 2.3 | % |
| Other Revenue | 1.8 | % |
| Housing | 1.5 | % |
*Does not include short-term investments and other net assets.
traditional tax-exempt municipal bond market. In May 2010, the House of Representatives modified and approved certain provisions of the Act. If these modifications become law, municipalities would continue to receive a subsidy for their taxable borrowing at 32% starting in 2011 and 30% in 2012. Municipal bond new-issue supply rose 3.9% in the first half of 2010 compared with the first half of 2009.12 Notably, issuance of taxable municipals surged 157.8% while tax-free issuance fell 19.8% for the same period.12 This comparative shortage of tax-free supply, at a time when many observers b elieved taxes are likely to rise in the future, supported the municipal bond market’s performance. We continued to believe these new, subsidized, taxable municipal bonds, known as Build America Bonds, may suppress future supply of tax-exempt municipal bonds as long as the government permits their use.
Given the various ratings changes, the relatively steep yield curve, and the reduced tax-exempt supply during the reporting period, we looked for opportunities to keep the portfolio fully invested in longer term bonds.
Investment Strategy
We use a consistent, disciplined strategy in an effort to maximize tax-exempt income for our shareholders by seeking to maintain exposure to higher coupon securities. We generally employ a buy-and-hold approach and invest in securities we believe should provide the most relative value in the market. As we invest during different interest rate environments, the Fund’s portfolio becomes progressively more diversified with a broad range of securities. This broad diversification may help mitigate interest rate risk. We do not use leverage or exotic derivatives, nor do we use hedging techniques that could add volatility and contribute to underperformance in adverse markets. We generally stay fully invested to help maximize income distribution.
Manager’s Discussion
The mixture of our value-oriented philosophy of investing primarily for income and a positively sloping municipal yield curve favored the use of longer term bonds. Consequently, we sought to remain fully invested in bonds that ranged from 15 to 30 years in maturity with good call features. We intend to maintain our conservative, buy-and-hold investment strategy as we attempt to provide shareholders with high, current, tax-free income.
12. Source: Thomson Reuters.
8 | Semiannual Report
Thank you for your participation in Franklin California Tax-Free Income Fund. We look forward to serving your future investment needs.
The foregoing information reflects our analysis, opinions and portfolio holdings as of September 30, 2010, the end of the reporting period. The way we implement our main investment strategies and the resulting portfolio holdings may change depending on factors such as market and economic conditions. These opinions may not be relied upon as investment advice or an offer for a particular security. The information is not a complete analysis of every aspect of any market, state, industry, security or the Fund. Statements of fact are from sources considered reliable, but the investment manager makes no representation or warranty as to their completeness or accuracy. Although historical performance is no guarantee of future results, these insights may help you understand our investment management philosophy.
Semiannual Report | 9
Performance Summary as of 9/30/10
Your dividend income will vary depending on dividends or interest paid by securities in the Fund’s portfolio, adjusted for operating expenses of each class. Capital gain distributions are net profits realized from the sale of portfolio securities. The performance table does not reflect any taxes that a shareholder would pay on Fund dividends, capital gain distributions, if any, or any realized gains on the sale of Fund shares. Total return reflects reinvestment of the Fund’s dividends and capital gain distributions, if any, and any unrealized gains or losses.
| | | | | | | | |
| Price and Distribution Information | | | | | | |
| Class A (Symbol: FKTFX) | | | | Change | | 9/30/10 | | 3/31/10 |
| Net Asset Value (NAV) | | | +$ | 0.23 | $ | 7.22 | $ | 6.99 |
| Distributions (4/1/10–9/30/10) | | | | | | | | |
| Dividend Income | $ | 0.1620 | | | | | | |
| Class B (Symbol: FCABX) | | | | Change | | 9/30/10 | | 3/31/10 |
| Net Asset Value (NAV) | | | +$ | 0.23 | $ | 7.22 | $ | 6.99 |
| Distributions (4/1/10–9/30/10) | | | | | | | | |
| Dividend Income | $ | 0.1420 | | | | | | |
| Class C (Symbol: FRCTX) | | | | Change | | 9/30/10 | | 3/31/10 |
| Net Asset Value (NAV) | | | +$ | 0.23 | $ | 7.21 | $ | 6.98 |
| Distributions (4/1/10–9/30/10) | | | | | | | | |
| Dividend Income | $ | 0.1428 | | | | | | |
| Advisor Class (Symbol: FCAVX) | | | | Change | | 9/30/10 | | 3/31/10 |
| Net Asset Value (NAV) | | | +$ | 0.23 | $ | 7.21 | $ | 6.98 |
| Distributions (4/1/10–9/30/10) | | | | | | | | |
| Dividend Income | $ | 0.1651 | | | | | | |
10 | Semiannual Report
Performance Summary (continued)
Performance
Cumulative total return excludes sales charges. Average annual total return includes maximum sales charges. Class A: 4.25% maximum initial sales charge; Class B: contingent deferred sales charge (CDSC) declining from 4% to 1% over six years, and eliminated thereafter; Class C: 1% CDSC in first year only; Advisor Class: no sales charges.
| | | | | | | | | | | | | | |
| Class A | | 6-Month | | | | | 1-Year | | | 5-Year | | | 10-Year | |
| Cumulative Total Return1 | + | 5.68 | % | | | + | 5.18 | % | + | 24.46 | % | + | 67.36 | % |
| Average Annual Total Return2 | + | 1.19 | % | | | + | 0.70 | % | + | 3.56 | % | + | 4.83 | % |
| Distribution Rate3 | | | | 4.30 | % | | | | | | | | | |
| Taxable Equivalent Distribution Rate4 | | | | 7.31 | % | | | | | | | | | |
| 30-Day Standardized Yield5 | | | | 3.39 | % | | | | | | | | | |
| Taxable Equivalent Yield4 | | | | 5.77 | % | | | | | | | | | |
| Total Annual Operating Expenses6 | | | | 0.57 | % | | | | | | | | | |
| Class B | | 6-Month | | | | | 1-Year | | | 5-Year | | | 10-Year | |
| Cumulative Total Return1 | + | 5.38 | % | | | + | 4.72 | % | + | 21.15 | % | + | 59.79 | % |
| Average Annual Total Return2 | + | 1.38 | % | | | + | 0.72 | % | + | 3.57 | % | + | 4.80 | % |
| Distribution Rate3 | | | | 3.96 | % | | | | | | | | | |
| Taxable Equivalent Distribution Rate4 | | | | 6.74 | % | | | | | | | | | |
| 30-Day Standardized Yield5 | | | | 2.99 | % | | | | | | | | | |
| Taxable Equivalent Yield4 | | | | 5.09 | % | | | | | | | | | |
| Total Annual Operating Expenses6 | | | | 1.13 | % | | | | | | | | | |
| Class C | | 6-Month | | | | | 1-Year | | | 5-Year | | | 10-Year | |
| Cumulative Total Return1 | + | 5.40 | % | | | + | 4.61 | % | + | 21.07 | % | + | 58.33 | % |
| Average Annual Total Return2 | + | 4.40 | % | | | + | 3.61 | % | + | 3.90 | % | + | 4.70 | % |
| Distribution Rate3 | | | | 3.98 | % | | | | | | | | | |
| Taxable Equivalent Distribution Rate4 | | | | 6.77 | % | | | | | | | | | |
| 30-Day Standardized Yield5 | | | | 2.99 | % | | | | | | | | | |
| Taxable Equivalent Yield4 | | | | 5.09 | % | | | | | | | | | |
| Total Annual Operating Expenses6 | | | | 1.13 | % | | | | | | | | | |
| Advisor Class7 | | 6-Month | | | | | 1-Year | | | 5-Year | | | 10-Year | |
| Cumulative Total Return1 | + | 5.74 | % | | | + | 5.28 | % | + | 25.03 | % | + | 68.50 | % |
| Average Annual Total Return2 | + | 5.74 | % | | | + | 5.28 | % | + | 4.57 | % | + | 5.36 | % |
| Distribution Rate3 | | | | 4.59 | % | | | | | | | | | |
| Taxable Equivalent Distribution Rate4 | | | | 7.81 | % | | | | | | | | | |
| 30-Day Standardized Yield5 | | | | 3.63 | % | | | | | | | | | |
| Taxable Equivalent Yield4 | | | | 6.17 | % | | | | | | | | | |
| Total Annual Operating Expenses6 | | | | 0.48 | % | | | | | | | | | |
Performance data represent past performance, which does not guarantee future results. Investment return and principal value will fluctuate, and you may have a gain or loss when you sell your shares. Current performance may differ from figures shown. For most recent month-end performance, go to franklintempleton.com or call (800) 342-5236.
Semiannual Report | 11
Performance Summary (continued)
Endnotes
Because municipal bonds are sensitive to interest rate movements, the Fund’s yield and share price will fluctuate with market conditions. Bond prices generally move in the opposite direction of interest rates. Thus, as prices of bonds in the Fund adjust to a rise in interest rates, the Fund’s share price may decline. Since the Fund concentrates its investments in a single state, it is subject to greater risk of adverse economic and regulatory changes in that state than a geographically diversified fund. The Fund’s prospectus also includes a description of the main investment risks.
| |
Class B: Class C: | These shares have higher annual fees and expenses than Class A shares. Prior to 1/1/04, these shares were offered with an initial sales charge; thus actual total returns would have differed. These shares have higher annual fees and expenses than Class A shares. |
Advisor Class: | Shares are available to certain eligible investors as described in the prospectus. |
1. Cumulative total return represents the change in value of an investment over the periods indicated.
2. Average annual total return represents the average annual change in value of an investment over the periods indicated. Six-month return has not been annualized.
3. Distribution rate is based on an annualization of the respective class’s September dividend and the maximum offering price (NAV for Classes B, C and Advisor) per share on 9/30/10.
4. Taxable equivalent distribution rate and yield assume the published rates as of 6/28/10 for the maximum combined effective federal and California personal income tax rate of 41.21%, based on the federal income tax rate of 35.00%.
5. The 30-day standardized yield for the 30 days ended 9/30/10 reflects an estimated yield to maturity (assuming all portfolio securities are held to maturity). It should be regarded as an estimate of the Fund’s rate of investment income, and it may not equal the Fund’s actual income distribution rate (which reflects the Fund’s past dividends paid to shareholders) or the income reported in the Fund’s financial statements.
6. Figures are as stated in the Fund’s prospectus current as of the date of this report. In periods of market volatility, assets may decline significantly, causing total annual Fund operating expenses to become higher than the figures shown.
7. Effective 10/1/01, the Fund began offering Advisor Class shares, which do not have sales charges or a Rule 12b-1 plan. Performance quotations for this class reflect the following methods of calculation: (a) For periods prior to 10/1/01, a restated figure is used based upon the Fund’s Class A performance, excluding the effect of Class A’s maximum initial sales charge, but reflecting the effect of the Class A Rule 12b-1 fees; and (b) for periods after 9/30/01, actual Advisor Class performance is used reflecting all charges and fees applicable to that class. Since 10/1/01 (commencement of sales), the cumulative and average annual total returns of Advisor Class shares were +53.22% and +4.86%.
12 | Semiannual Report
Your Fund’s Expenses
As a Fund shareholder, you can incur two types of costs:
- Transaction costs, including sales charges (loads) on Fund purchases; and
- Ongoing Fund costs, including management fees, distribution and service (12b-1) fees, and other Fund expenses. All mutual funds have ongoing costs, sometimes referred to as operating expenses.
The following table shows ongoing costs of investing in the Fund and can help you understand these costs and compare them with those of other mutual funds. The table assumes a $1,000 investment held for the six months indicated.
Actual Fund Expenses
The first line (Actual) for each share class listed in the table provides actual account values and expenses. The “Ending Account Value” is derived from the Fund’s actual return, which includes the effect of Fund expenses.
You can estimate the expenses you paid during the period by following these steps. Of course, your account value and expenses will differ from those in this illustration:
| 1. | Divide your account value by $1,000. |
| | If an account had an $8,600 value, then $8,600 ÷ $1,000 = 8.6. |
| 2. | Multiply the result by the number under the heading “Expenses Paid During Period.” |
| | If Expenses Paid During Period were $7.50, then 8.6 x $7.50 = $64.50. |
In this illustration, the estimated expenses paid this period are $64.50.
Hypothetical Example for Comparison with Other Funds
Information in the second line (Hypothetical) for each class in the table can help you compare ongoing costs of investing in the Fund with those of other mutual funds. This information may not be used to estimate the actual ending account balance or expenses you paid during the period. The hypothetical “Ending Account Value” is based on the actual expense ratio for each class and an assumed 5% annual rate of return before expenses, which does not represent the Fund’s actual return. The figure under the heading “Expenses Paid During Period” shows the hypothetical expenses your account would have incurred under this scenario. You can compare this figure with the 5% hypothetical examples that appear in shareholder reports of other funds.
Semiannual Report | 13
Your Fund’s Expenses (continued)
Please note that expenses shown in the table are meant to highlight ongoing costs and do not reflect any transaction costs, such as sales charges. Therefore, the second line for each class is useful in comparing ongoing costs only, and will not help you compare total costs of owning different funds. In addition, if transaction costs were included, your total costs would have been higher. Please refer to the Fund prospectus for additional information on operating expenses.
| | | | | | |
| | | Beginning Account | | Ending Account | | Expenses Paid During |
| Class A | | Value 4/1/10 | | Value 9/30/10 | | Period* 4/1/10–9/30/10 |
| Actual | $ | 1,000 | $ | 1,056.80 | $ | 2.99 |
| Hypothetical (5% return before expenses) | $ | 1,000 | $ | 1,022.16 | $ | 2.94 |
| Class B | | | | | | |
| Actual | $ | 1,000 | $ | 1,053.80 | $ | 5.82 |
| Hypothetical (5% return before expenses) | $ | 1,000 | $ | 1,019.40 | $ | 5.72 |
| Class C | | | | | | |
| Actual | $ | 1,000 | $ | 1,054.00 | $ | 5.87 |
| Hypothetical (5% return before expenses) | $ | 1,000 | $ | 1,019.35 | $ | 5.77 |
| Advisor Class | | | | | | |
| Actual | $ | 1,000 | $ | 1,057.40 | $ | 2.53 |
| Hypothetical (5% return before expenses) | $ | 1,000 | $ | 1,022.61 | $ | 2.48 |
*Expenses are calculated using the most recent six-month expense ratio, annualized for each class (A: 0.58%; B: 1.13%; C: 1.14%; and Advisor: 0.49%), multiplied by the average account value over the period, multiplied by 183/365 to reflect the one-half year period.
14 | Semiannual Report
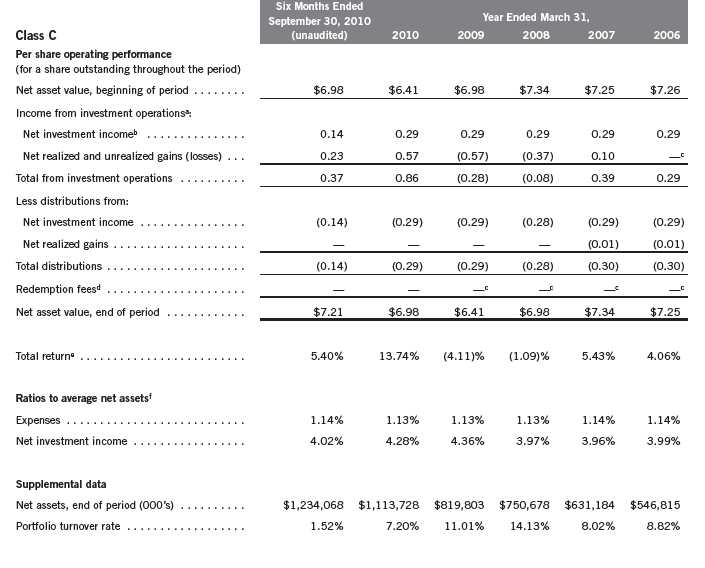
Franklin California Tax-Free Income Fund
Financial Highlights

Semiannual Report | The accompanying notes are an integral part of these financial statements. | 15
Franklin California Tax-Free Income Fund
Financial Highlights (continued)

16 | The accompanying notes are an integral part of these financial statements. | Semiannual Report
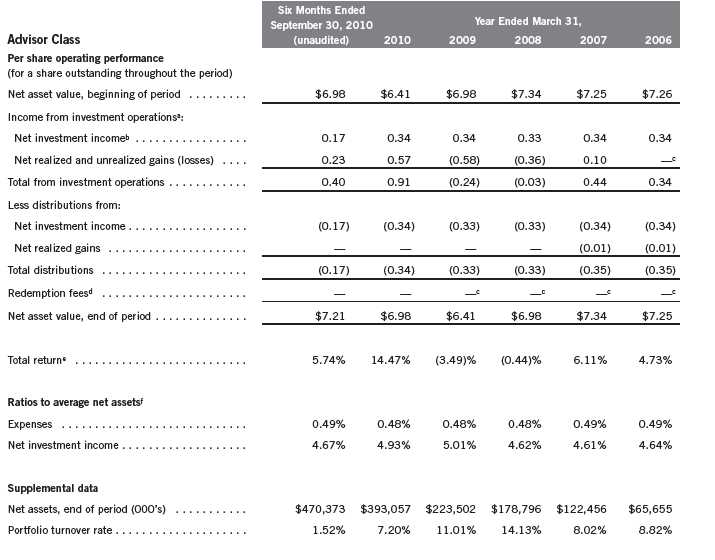
Franklin California Tax-Free Income Fund
Financial Highlights (continued)
Semiannual Report | The accompanying notes are an integral part of these financial statements. | 17
Franklin California Tax-Free Income Fund
Financial Highlights (continued)
18 | The accompanying notes are an integral part of these financial statements. | Semiannual Report
Franklin California Tax-Free Income Fund
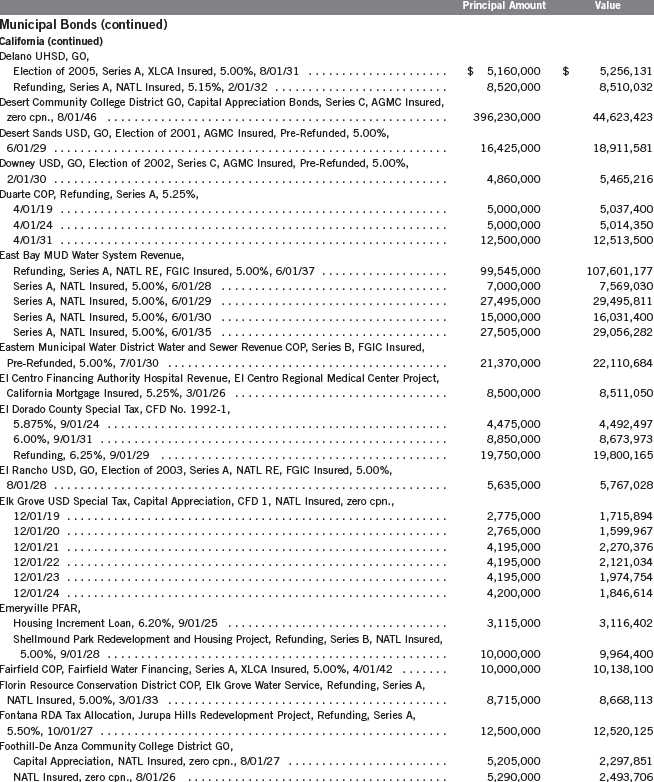
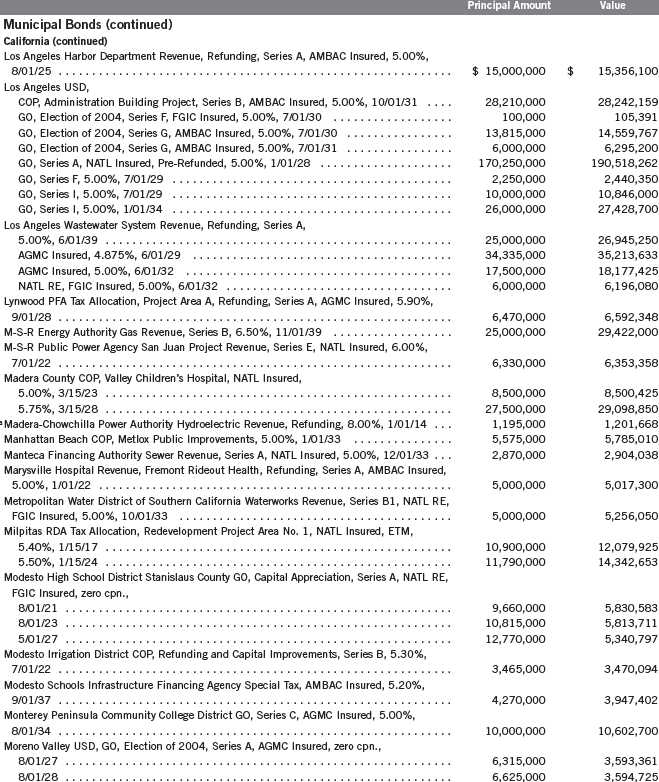
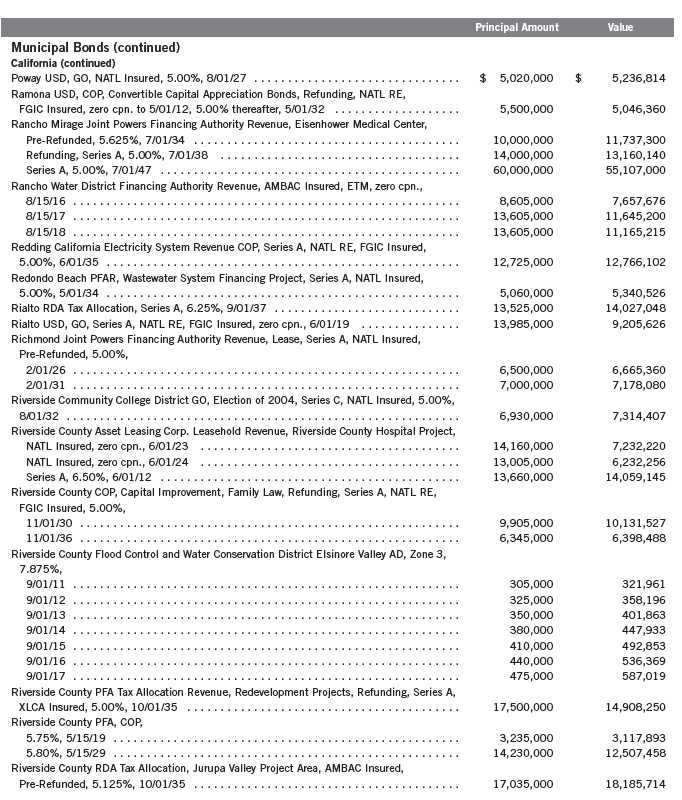
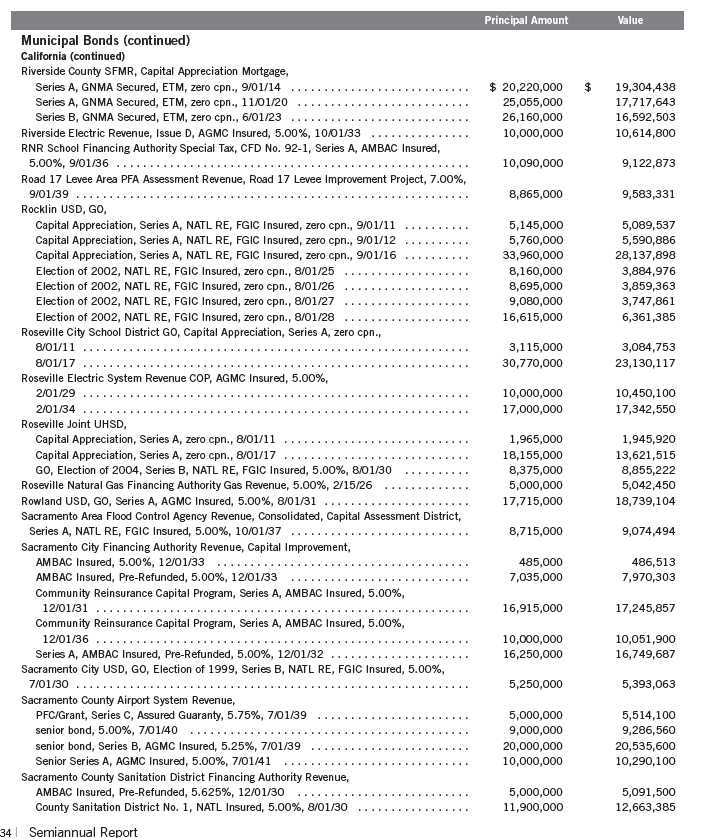
Statement of Investments, September 30, 2010 (unaudited)
| | | | |
| | | Principal Amount | | Value |
| Municipal Bonds 95.4% | | | | |
| California 87.1% | | | | |
| ABAG Finance Authority for Nonprofit Corps. COP, | | | | |
| Butte Valley-Tulelake Rural Health, California Mortgage Insured, 6.65%, 10/01/22 | $ | 670,000 | $ | 671,501 |
| California Mortgage Insured, 6.125%, 3/01/21 | | 3,455,000 | | 3,467,645 |
| Episcopal Home Foundation, Refunding, 5.125%, 7/01/13 | | 6,000,000 | | 6,026,940 |
| Episcopal Home Foundation, Refunding, 5.125%, 7/01/18 | | 20,625,000 | | 20,671,819 |
| Home for Jewish Parents, California Mortgage Insured, 5.625%, 5/15/22 | | 4,675,000 | | 4,677,244 |
| Lytton Gardens Inc., Refunding, California Mortgage Insured, 6.00%, 2/15/30 | | 4,225,000 | | 4,226,606 |
| Odd Fellows Home, California Mortgage Insured, 6.00%, 8/15/24 | | 5,525,000 | | 5,542,735 |
| Rhoda Haas Goldman Plaza, California Mortgage Insured, 5.125%, 5/15/23 | | 5,000,000 | | 5,003,300 |
| ABAG Finance Authority for Nonprofit Corps. MFHR, Palo Alto Gardens Apartments, Series A, | | | | |
| 5.45%, 4/01/39 | | 5,500,000 | | 5,218,510 |
| ABAG Finance Authority for Nonprofit Corps. Revenue, | | | | |
| Channing House, California Mortgage Insured, 6.125%, 5/15/40 | | 17,635,000 | | 18,169,340 |
| San Diego Hospital Assn., Series A, 6.125%, 8/15/20 | | 21,960,000 | | 22,292,694 |
| San Diego Hospital Assn., Series C, 5.375%, 3/01/21 | | 5,000,000 | | 5,109,550 |
| San Diego Hospital Assn., Sharp Healthcare, 6.25%, 8/01/39 | | 17,500,000 | | 19,627,125 |
| St. Rose Hospital, Series A, California Mortgage Insured, 6.00%, 5/15/29 | | 8,620,000 | | 9,154,699 |
| ABAG Revenue Tax Allocation, RDA Pool, Series A6, AGMC Insured, 5.375%, 12/15/25 | | 1,075,000 | | 1,075,839 |
| ABAG Water and Wastewater Revenue, Pooled Financing Program, Refunding, Series A, | | | | |
| AGMC Insured, 5.30%, 10/01/21 | | 5,450,000 | | 5,455,014 |
| Alameda Corridor Transportation Authority Revenue, | | | | |
| Capital Appreciation, sub. lien, Refunding, Series A, AMBAC Insured, zero cpn., | | | | |
| 10/01/29 | | 20,000,000 | | 5,958,200 |
| Capital Appreciation, sub. lien, Refunding, Series A, AMBAC Insured, zero cpn., | | | | |
| 10/01/30 | | 41,665,000 | | 11,488,707 |
| Capital Appreciation, sub. lien, Refunding, Series A, AMBAC Insured, zero cpn. to | | | | |
| 10/01/12, 5.30% thereafter, 10/01/22 | | 81,685,000 | | 71,363,283 |
| Capital Appreciation, sub. lien, Refunding, Series A, AMBAC Insured, zero cpn. to | | | | |
| 10/01/12, 5.30% thereafter, 10/01/23 | | 70,015,000 | | 60,423,645 |
| Capital Appreciation, sub. lien, Refunding, Series A, AMBAC Insured, zero cpn. to | | | | |
| 10/01/12, 5.40% thereafter, 10/01/24 | | 43,770,000 | | 37,651,829 |
| Capital Appreciation, sub. lien, Refunding, Series A, AMBAC Insured, zero cpn. to | | | | |
| 10/01/12, 5.45% thereafter, 10/01/25 | | 32,960,000 | | 28,214,090 |
| senior lien, Series A, NATL Insured, 5.00%, 10/01/29 | | 24,490,000 | | 24,489,755 |
| Alameda County COP, Alameda County Medical Center Project, NATL Insured, ETM, | | | | |
| 5.00%, 6/01/23 | | 19,195,000 | | 19,249,898 |
| 5.30%, 6/01/26 | | 7,000,000 | | 7,021,000 |
| 5.00%, 6/01/28 | | 8,925,000 | | 8,949,811 |
| Alhambra USD, GO, Election of 2004, Series A, NATL RE, FGIC Insured, 5.00%, | | | | |
| 8/01/29 | | 13,025,000 | | 13,677,813 |
| Alvord USD, GO, Election of 2007, Series A, AGMC Insured, 5.00%, 8/01/32 | | 11,625,000 | | 12,112,901 |
| Anaheim PFA Lease Revenue, Capital Appreciation, Public Improvements Project, Series C, | | | | |
| AGMC Insured, zero cpn., | | | | |
| 9/01/24 | | 26,855,000 | | 12,560,621 |
| 9/01/26 | | 29,430,000 | | 12,075,423 |
| 9/01/27 | | 22,860,000 | | 8,667,140 |
| 9/01/28 | | 14,425,000 | | 5,101,546 |
| 9/01/29 | | 24,810,000 | | 8,158,768 |
Semiannual Report | 19
Franklin California Tax-Free Income Fund
Statement of Investments, September 30, 2010 (unaudited) (continued)
20 | Semiannual Report
Franklin California Tax-Free Income Fund
Statement of Investments, September 30, 2010 (unaudited) (continued)
| | | | |
| | | Principal Amount | | Value |
| Municipal Bonds (continued) | | | | |
| California (continued) | | | | |
| California Educational Facilities Authority Revenue, (continued) | | | | |
| Occidental College, Refunding, Series A, NATL Insured, 5.00%, 10/01/36 | $ | 7,275,000 | $ | 7,551,013 |
| Pepperdine University, Refunding, Series A, AMBAC Insured, 5.00%, 12/01/35 | | 7,720,000 | | 8,032,274 |
| Santa Clara University, Refunding, AMBAC Insured, zero cpn., 9/01/26 | | 5,800,000 | | 2,390,876 |
| Stanford University, Refunding, Series O, 5.125%, 1/01/31 | | 15,750,000 | | 15,767,325 |
| California Health Facilities Financing Authority Revenue, | | | | |
| Adventist Health System West, Series A, 5.75%, 9/01/39 | | 18,000,000 | | 18,828,180 |
| Capital Appreciation, Kaiser Permanente, Series A, zero cpn, 10/01/11 | | 13,970,000 | | 13,883,386 |
| Casa Colina, 6.125%, 4/01/32 | | 10,300,000 | | 10,358,607 |
| Catholic Healthcare West, Refunding, Series A, 5.00%, 7/01/18 | | 23,435,000 | | 23,457,029 |
| Catholic Healthcare West, Refunding, Series A, 5.00%, 7/01/28 | | 117,175,000 | | 117,191,404 |
| Catholic Healthcare West, Refunding, Series A, 6.00%, 7/01/34 | | 10,000,000 | | 10,419,300 |
| Catholic Healthcare West, Refunding, Series A, NATL Insured, 5.75%, 7/01/15 | | 12,500,000 | | 12,538,250 |
| Catholic Healthcare West, Refunding, Series A, NATL Insured, 5.00%, 7/01/17 | | 3,390,000 | | 3,400,272 |
| Catholic Healthcare West, Refunding, Series A, NATL Insured, 5.125%, 7/01/24 | | 7,825,000 | | 7,845,267 |
| Catholic Healthcare West, Series G, 5.25%, 7/01/23 | | 3,000,000 | | 3,111,960 |
| Cedars-Sinai Medical Center, 5.00%, 8/15/39 | | 30,000,000 | | 30,405,600 |
| Cedars-Sinai Medical Center, Series A, NATL Insured, 5.125%, 8/01/17 | | 8,355,000 | | 8,381,820 |
| Cedars-Sinai Medical Center, Series B, NATL Insured, 5.25%, 8/01/27 | | 52,500,000 | | 52,641,750 |
| Children’s Hospital Los Angeles, Refunding, Series A, AGMC Insured, 5.25%, | | | | |
| 7/01/38 | | 10,000,000 | | 10,252,100 |
| Children’s Hospital of Orange County, Series A, 6.50%, 11/01/24 | | 10,500,000 | | 12,015,990 |
| Children’s Hospital of Orange County, Series A, 6.25%, 11/01/29 | | 13,870,000 | | 15,206,236 |
| Families First, Refunding, Series A, California Mortgage Insured, 6.00%, 12/01/25 | | 9,500,000 | | 9,530,875 |
| Feedback Foundation Inc., Series A, California Mortgage Insured, 6.50%, 12/01/22 | | 1,275,000 | | 1,277,627 |
| Health Facility, Valleycare, Series A, California Mortgage Insured, Pre-Refunded, 5.25%, | | | | |
| 5/01/22 | | 5,000,000 | | 5,364,900 |
| Hospital of the Good Samaritan, Refunding, 7.00%, 9/01/21 | | 60,930,000 | | 58,072,992 |
| Insured Health Facility, Help Group, Series A, California Mortgage Insured, 6.10%, | | | | |
| 8/01/25 | | 12,905,000 | | 12,997,013 |
| Kaiser Permanente, Series A, AGMC Insured, ETM, 5.00%, 6/01/20 | | 32,295,000 | | 32,384,457 |
| Kaiser Permanente, Series A, AGMC Insured, ETM, 5.00%, 6/01/24 | | 136,775,000 | | 137,133,350 |
| Kaiser Permanente, Series A, ETM, 5.40%, 5/01/28 | | 46,000,000 | | 46,040,940 |
| Kaiser Permanente, Series B, ETM, 5.40%, 5/01/28 | | 80,000,000 | | 80,071,200 |
| Lucile Salter Packard Hospital, Series C, AMBAC Insured, 5.00%, 8/15/26 | | 6,000,000 | | 6,267,720 |
| Marshall Hospital, Refunding, Series A, California Mortgage Insured, 5.30%, | | | | |
| 11/01/28 | | 4,860,000 | | 4,875,989 |
| Northern California Presbyterian, Refunding, 5.40%, 7/01/28 | | 6,340,000 | | 6,232,981 |
| Paradise Valley Estates, Refunding, California Mortgage Insured, 5.125%, 1/01/22 | | 6,610,000 | | 6,797,327 |
| Paradise Valley Estates, Refunding, California Mortgage Insured, 5.25%, 1/01/26 | | 5,000,000 | | 5,116,100 |
| Pomona Valley Hospital, Refunding, Series A, NATL Insured, 5.625%, 7/01/19 | | 8,500,000 | | 8,525,245 |
| Providence Health and Services, Series C, 6.25%, 10/01/28 | | 4,000,000 | | 4,531,320 |
| Providence Health and Services, Series C, 6.50%, 10/01/38 | | 6,500,000 | | 7,378,280 |
| Small Facilities Program, Refunding, Series A, NATL RE, FGIC Insured, 5.00%, | | | | |
| 4/01/25 | | 10,915,000 | | 11,037,248 |
| Southern California, Series A, California Mortgage Insured, 5.50%, 12/01/22 | | 2,800,000 | | 2,802,128 |
| Sutter Health, Refunding, Series A, NATL Insured, 5.35%, 8/15/28 | | 6,170,000 | | 6,206,526 |
| Sutter Health, Series A, 5.00%, 8/15/38 | | 30,300,000 | | 30,533,310 |
Semiannual Report | 21
Franklin California Tax-Free Income Fund
Statement of Investments, September 30, 2010 (unaudited) (continued)
22 | Semiannual Report
Franklin California Tax-Free Income Fund
Statement of Investments, September 30, 2010 (unaudited) (continued)
Franklin California Tax-Free Income Fund
Statement of Investments, September 30, 2010 (unaudited) (continued)
| | | | |
| | | Principal Amount | | Value |
| Municipal Bonds (continued) | | | | |
| California (continued) | | | | |
| California State Public Works Board Lease Revenue, (continued) | | | | |
| Various California Community Colleges Projects, Refunding, Series A, 5.90%, | | | | |
| 4/01/17 | $ | 8,320,000 | $ | 8,344,378 |
| Various Capital Projects, Series G-1, 5.75%, 10/01/30 | | 100,000,000 | | 107,322,000 |
| Various Capital Projects, Series I, 6.375%, 11/01/34 | | 50,000,000 | | 55,116,500 |
| Various Capital Projects, Sub-Series A-1, 6.00%, 3/01/35 | | 10,000,000 | | 10,719,300 |
| California State University Revenue, Systemwide, | | | | |
| Refunding, Series A, AGMC Insured, 5.00%, 11/01/34 | | 5,000,000 | | 5,141,250 |
| Refunding, Series C, NATL Insured, 5.00%, 11/01/30 | | 15,490,000 | | 16,383,773 |
| Series A, AGMC Insured, 5.00%, 11/01/29 | | 10,000,000 | | 10,448,000 |
| Series A, AMBAC Insured, 5.00%, 11/01/35 | | 15,925,000 | | 16,402,750 |
| California Statewide CDA, | | | | |
| Assisted Living Facilities Revenue, Hollenbeck Palms/Magnolia Court, Series A, | | | | |
| Radian Insured, 4.60%, 2/01/37 | | 5,010,000 | | 4,501,836 |
| COP, Children’s Hospital Los Angeles, 5.25%, 8/15/29 | | 37,685,000 | | 35,946,968 |
| COP, NATL Insured, 5.00%, 4/01/18 | | 7,000,000 | | 6,729,380 |
| COP, NATL Insured, 5.125%, 4/01/23 | | 6,000,000 | | 5,513,460 |
| COP, Refunding, AGMC Insured, 5.50%, 8/15/31 | | 9,000,000 | | 9,008,640 |
| COP, The Internext Group, 5.375%, 4/01/17 | | 7,100,000 | | 7,126,909 |
| COP, The Internext Group, 5.375%, 4/01/30 | | 67,480,000 | | 65,770,057 |
| MFHR, Borregas Court Project, Series J, GNMA Secured, 6.30%, 3/20/39 | | 6,967,000 | | 7,201,509 |
| California Statewide CDA Revenue, | | | | |
| Catholic Healthcare West, Refunding, Series L, Assured Guaranty, 5.25%, 7/01/41 | | 13,000,000 | | 13,473,330 |
| Catholic Healthcare West, Series A, 5.50%, 7/01/30 | | 10,000,000 | | 10,450,900 |
| Catholic Healthcare West, Series E, 5.50%, 7/01/31 | | 15,000,000 | | 15,667,500 |
| CHF-Irvine LLC, UCI East Campus Apartments, Phase II, 5.50%, 5/15/26 | | 9,500,000 | | 10,030,860 |
| CHF-Irvine LLC, UCI East Campus Apartments, Phase II, 6.00%, 5/15/40 | | 59,000,000 | | 61,092,140 |
| Daughters of Charity Health, Refunding, Series A, 5.25%, 7/01/24 | | 6,000,000 | | 5,861,820 |
| Daughters of Charity Health, Refunding, Series A, 5.25%, 7/01/30 | | 5,000,000 | | 4,640,000 |
| Daughters of Charity Health, Refunding, Series A, 5.25%, 7/01/35 | | 13,900,000 | | 12,547,113 |
| Daughters of Charity Health, Refunding, Series A, 5.00%, 7/01/39 | | 29,980,000 | | 25,460,815 |
| Daughters of Charity Health, Refunding, Series H, 5.25%, 7/01/25 | | 3,545,000 | | 3,428,192 |
| East Campus Apartments LLC, Series A, ACA Insured, 5.50%, 8/01/22 | | 11,000,000 | | 11,093,830 |
| East Campus Apartments LLC, Series A, ACA Insured, 5.625%, 8/01/34 | | 25,000,000 | | 25,064,250 |
| Enloe Medical Center, California Mortgage Insured, 6.25%, 8/15/33 | | 20,000,000 | | 21,620,600 |
| Enloe Medical Center, California Mortgage Insured, 5.75%, 8/15/38 | | 36,500,000 | | 37,850,865 |
| Health Facility, Adventist Health, Series A, 5.00%, 3/01/30 | | 6,300,000 | | 6,304,662 |
| Health Facility, Los Angeles Jewish Home for the Aging, California Mortgage Insured, | | | | |
| 5.50%, 11/15/33 | | 19,400,000 | | 19,459,170 |
| Health Facility, Memorial Health Services, Series A, 5.50%, 10/01/33 | | 45,465,000 | | 46,847,591 |
| Henry Mayo Newhall Memorial Hospital, Series A, California Mortgage Insured, 5.00%, | | | | |
| 10/01/37 | | 5,000,000 | | 4,884,150 |
| Huntington Memorial Hospital, Refunding, 5.00%, 7/01/27 | | 22,000,000 | | 22,294,580 |
| Huntington Memorial Hospital, Refunding, 5.00%, 7/01/35 | | 50,000,000 | | 49,715,000 |
| Kaiser Permanente, Refunding, Series A, 4.75%, 4/01/33 | | 24,590,000 | | 24,123,282 |
| Kaiser Permanente, Refunding, Series A, BHAC Insured, 5.00%, 4/01/31 | | 10,000,000 | | 10,346,900 |
| Kaiser Permanente, Series A, 5.50%, 11/01/32 | | 27,000,000 | | 27,367,470 |
24 | Semiannual Report
Franklin California Tax-Free Income Fund
Statement of Investments, September 30, 2010 (unaudited) (continued)
| | | | |
| | | Principal Amount | | Value |
| Municipal Bonds (continued) | | | | |
| California (continued) | | | | |
| California Statewide CDA Revenue, (continued) | | | | |
| Kaiser Permanente, Series B, 5.00%, 3/01/41 | $ | 39,980,000 | $ | 39,546,617 |
| Kaiser Permanente, Series B, 5.25%, 3/01/45 | | 177,235,000 | | 178,385,255 |
| Lodi Memorial Hospital, Series A, California Mortgage Insured, 5.00%, 12/01/37 | | 20,000,000 | | 19,534,000 |
| Los Angeles Orthopedic Hospital Foundation, AMBAC Insured, 5.75%, 6/01/30 | | 8,375,000 | | 8,375,586 |
| Methodist Hospital of Southern California Project, FHA Insured, 6.25%, 8/01/24 | | 14,270,000 | | 16,963,177 |
| Methodist Hospital of Southern California Project, FHA Insured, 6.625%, 8/01/29 | | 22,500,000 | | 26,323,425 |
| Methodist Hospital of Southern California Project, FHA Insured, 6.75%, 2/01/38 | | 22,000,000 | | 25,604,700 |
| Mission Community, California Mortgage Insured, 5.375%, 11/01/21 | | 7,670,000 | | 7,848,941 |
| Mission Community, California Mortgage Insured, 5.375%, 11/01/26 | | 9,755,000 | | 9,868,548 |
| Refunding, California Mortgage Insured, 5.50%, 1/01/28 | | 3,615,000 | | 3,690,120 |
| Series B, 5.625%, 8/15/42 | | 51,000,000 | | 51,628,320 |
| St. Joseph Health System, Series B, FGIC Insured, 5.75%, 7/01/47 | | 30,275,000 | | 31,498,110 |
| St. Joseph Health System, Series E, AGMC Insured, 5.25%, 7/01/47 | | 15,300,000 | | 15,899,913 |
| Stovehaven Apartments Project, Series A, ACA Insured, 5.875%, 7/01/32 | | 4,945,000 | | 3,886,374 |
| Sutter Health, Refunding, Series A, 5.00%, 11/15/43 | | 103,300,000 | | 103,618,164 |
| Sutter Health, Series B, 5.25%, 11/15/48 | | 15,000,000 | | 15,253,200 |
| Sutter Health, Series C, 5.00%, 11/15/38 | | 23,925,000 | | 24,104,437 |
| California Statewide CDA Revenue COP, | | | | |
| Capital Appreciation, Hospital, Triad Health Care, California Mortgage Insured, ETM, | | | | |
| zero cpn., 8/01/11 | | 3,115,000 | | 3,093,351 |
| CHFCLP Insured Health Facilities, Unihealth, Series A, AMBAC Insured, Pre-Refunded, | | | | |
| 5.75%, 10/01/25 | | 24,545,000 | | 29,568,134 |
| Southern California Development Corp., California Mortgage Insured, 6.10%, | | | | |
| 12/01/15 | | 1,495,000 | | 1,500,771 |
| California Statewide CDA Water and Wastewater Revenue, Pooled Financing Program, | | | | |
| Series A, AGMC Insured, | | | | |
| 5.25%, 10/01/24 | | 3,925,000 | | 4,289,476 |
| 5.00%, 10/01/29 | | 1,095,000 | | 1,160,711 |
| Pre-Refunded, 5.25%, 10/01/24 | | 1,075,000 | | 1,234,799 |
| Pre-Refunded, 5.00%, 10/01/29 | | 1,905,000 | | 2,174,081 |
| California Valley HFAR, Home Mortgage, NATL Insured, 5.65%, 2/01/27 | | 3,285,000 | | 3,292,950 |
| Camarillo Community Development Commission Tax Allocation, Camarillo Corridor Project, | | | | |
| Refunding, AMBAC Insured, 5.00%, 9/01/36 | | 7,800,000 | | 7,006,818 |
| Campbell RDA Tax Allocation, Central Campbell Redevelopment Project, Series A, 6.00%, | | | | |
| 10/01/33 | | 5,000,000 | | 4,963,000 |
| Campbell USD, | | | | |
| GO, Series A, NATL RE, FGIC Insured, 5.00%, 8/01/28 | | 5,205,000 | | 5,666,111 |
| GO, Series E, AGMC Insured, 5.00%, 8/01/29 | | 6,260,000 | | 6,749,908 |
| Series B, NATL RE, FGIC Insured, zero cpn., 8/01/20 | | 5,000,000 | | 3,223,350 |
| Series B, NATL RE, FGIC Insured, zero cpn., 8/01/21 | | 6,280,000 | | 3,790,482 |
| Capistrano University School CFD Special Tax, Number 90-2 Talega, | | | | |
| 5.875%, 9/01/33 | | 5,730,000 | | 5,769,824 |
| 6.00%, 9/01/33 | | 7,100,000 | | 7,172,846 |
| Carlsbad USD, GO, zero cpn. to 5/01/19, 6.00% thereafter, 5/01/34 | | 14,000,000 | | 8,994,300 |
| Centinela Valley UHSD, GO, Refunding, Series A, NATL Insured, 5.50%, 8/01/33 | | 15,630,000 | | 16,487,931 |
Semiannual Report | 25
Franklin California Tax-Free Income Fund
Statement of Investments, September 30, 2010 (unaudited) (continued)
Franklin California Tax-Free Income Fund
Statement of Investments, September 30, 2010 (unaudited) (continued)
Semiannual Report | 27
Franklin California Tax-Free Income Fund
Statement of Investments, September 30, 2010 (unaudited) (continued)
| | | | |
| | | Principal Amount | | Value |
| Municipal Bonds (continued) | | | | |
| California (continued) | | | | |
| Foothill/Eastern Corridor Agency Toll Road Revenue, | | | | |
| Capital Appreciation, Refunding, 5.80%, 1/15/20 | $ | 49,500,000 | $ | 50,858,775 |
| Capital Appreciation, Refunding, 5.85%, 1/15/23 | | 10,000,000 | | 10,271,100 |
| Capital Appreciation, Refunding, 5.875%, 1/15/26 | | 30,000,000 | | 30,963,600 |
| Capital Appreciation, Refunding, 5.875%, 1/15/27 | | 80,835,000 | | 81,904,447 |
| Capital Appreciation, Refunding, 5.875%, 1/15/28 | | 80,500,000 | | 81,784,780 |
| Capital Appreciation, Refunding, 5.875%, 1/15/29 | | 112,230,000 | | 113,561,048 |
| Capital Appreciation, Refunding, zero cpn., 1/15/21 | | 51,180,000 | | 26,946,270 |
| Capital Appreciation, Refunding, zero cpn., 1/15/25 | | 57,000,000 | | 22,399,290 |
| Capital Appreciation, Refunding, zero cpn., 1/15/30 | | 98,460,000 | | 25,893,011 |
| Capital Appreciation, Refunding, zero cpn., 1/15/31 | | 14,635,000 | | 3,542,255 |
| Capital Appreciation, Refunding, zero cpn., 1/15/32 | | 100,000,000 | | 22,337,000 |
| Capital Appreciation, Refunding, zero cpn., 1/15/33 | | 132,460,000 | | 28,114,635 |
| Capital Appreciation, Refunding, zero cpn., 1/15/34 | | 100,000,000 | | 19,185,000 |
| Capital Appreciation, Refunding, zero cpn., 1/15/35 | | 20,000,000 | | 3,549,200 |
| Capital Appreciation, Refunding, zero cpn., 1/15/36 | | 182,160,000 | | 29,958,034 |
| Capital Appreciation, Refunding, zero cpn., 1/15/37 | | 170,615,000 | | 25,993,195 |
| Capital Appreciation, Refunding, zero cpn., 1/15/38 | | 160,560,000 | | 22,592,398 |
| Capital Appreciation, senior lien, Series A, ETM, zero cpn., 1/01/22 | | 30,835,000 | | 21,918,751 |
| Capital Appreciation, senior lien, Series A, ETM, zero cpn., 1/01/23 | | 5,765,000 | | 3,937,264 |
| Capital Appreciation, senior lien, Series A, ETM, zero cpn., 1/01/24 | | 72,045,000 | | 46,954,608 |
| Capital Appreciation, senior lien, Series A, ETM, zero cpn., 1/01/28 | | 2,000,000 | | 1,077,540 |
| Refunding, 5.75%, 1/15/40 | | 395,510,000 | | 386,168,054 |
| senior lien, Series A, 5.00%, 1/01/35 | | 15,955,000 | | 14,151,766 |
| senior lien, Series A, ETM, zero cpn., 1/01/25 | | 20,660,000 | | 12,873,246 |
| senior lien, Series A, ETM, zero cpn., 1/01/26 | | 23,475,000 | | 13,980,536 |
| senior lien, Series A, ETM, zero cpn., 1/01/27 | | 15,000,000 | | 8,525,100 |
| senior lien, Series A, ETM, zero cpn., 1/01/29 | | 35,310,000 | | 18,060,006 |
| Fremont GO, Election of 2002, Fire Safety Project, Series B, NATL RE, FGIC Insured, 5.00%, | | | | |
| 8/01/34 | | 7,235,000 | | 7,551,676 |
| Fremont USD Alameda County GO, Election of 2002, Series B, AGMC Insured, 5.00%, | | | | |
| 8/01/28 | | 10,000,000 | | 10,655,200 |
| Fresno Joint Powers Financing Authority Lease Revenue, Master Lease Projects, Series A, | | | | |
| 6.375%, 4/01/39 | | 25,415,000 | | 27,389,237 |
| Glendale Community College District GO, NATL RE, FGIC Insured, zero cpn., 8/01/28 | | 15,000,000 | | 6,204,000 |
| Golden State Tobacco Securitization Corp. Tobacco Settlement Revenue, | | | | |
| Asset-Backed, Refunding, Series A, FGIC Insured, 5.00%, 6/01/45 | | 20,000,000 | | 18,840,200 |
| Asset-Backed, Senior Series A-1, 5.125%, 6/01/47 | | 5,000,000 | | 3,423,400 |
| Asset-Backed, Senior Series A-1, 5.75%, 6/01/47 | | 77,500,000 | | 58,722,525 |
| Enhanced, Asset-Backed, Refunding, Series A, 5.00%, 6/01/45 | | 34,000,000 | | 32,028,340 |
| Enhanced, Asset-Backed, Refunding, Series A, Radian Insured, 5.00%, 6/01/45 | | 30,000,000 | | 28,260,300 |
| Enhanced, Asset-Backed, Series A, AGMC Insured, 5.00%, 6/01/35 | | 50,000,000 | | 50,555,000 |
| Enhanced, Asset-Backed, Series B, Pre-Refunded, 5.50%, 6/01/33 | | 15,000,000 | | 16,886,700 |
| Enhanced, Asset-Backed, Series B, Pre-Refunded, 5.625%, 6/01/38 | | 138,000,000 | | 155,810,280 |
| Enhanced, Asset-Backed, Series B, Pre-Refunded, 5.50%, 6/01/43 | | 57,000,000 | | 64,169,460 |
| Enhanced, Series A, AMBAC Insured, 5.00%, 6/01/45 | | 14,085,000 | | 13,268,211 |
| Refunding, AGMC Insured, 5.00%, 6/01/45 | | 30,000,000 | | 29,608,500 |
| Series A-1, Pre-Refunded, 6.75%, 6/01/39 | | 5,290,000 | | 6,128,994 |
28 | Semiannual Report
Franklin California Tax-Free Income Fund
Statement of Investments, September 30, 2010 (unaudited) (continued)
| | | | |
| | | Principal Amount | | Value |
| Municipal Bonds (continued) | | | | |
| California (continued) | | | | |
| Hartnell Community College District GO, | | | | |
| Capital Appreciation, Election of 2002, zero cpn. to 8/01/22, 6.125% thereafter, | | | | |
| 8/01/33 | $ | 20,000,000 | $ | 10,061,200 |
| Election of 2002, Series A, NATL Insured, Pre-Refunded, 5.00%, 8/01/27 | | 5,020,000 | | 5,635,653 |
| Hawaiian Gardens RDA Tax Allocation, Project No. 1, ETM, 8.00%, 12/01/10 | | 845,000 | | 854,861 |
| Hawthorne School District GO, Capital Appreciation, Election of 2004, Series C, | | | | |
| Assured Guaranty, zero cpn., 8/01/48 | | 37,665,000 | | 3,489,286 |
| Huntington Beach City and School District, Capital Appreciation, Election of 2002, Series A, | | | | |
| NATL RE, FGIC Insured, zero cpn., 8/01/28 | | 10,005,000 | | 3,830,614 |
| Huntington Beach UHSD, GO, Election of 2004, AGMC Insured, 5.00%, 8/01/29 | | 11,000,000 | | 11,726,990 |
| Imperial Irrigation District Electric Revenue, System, Refunding, BHAC Insured, 5.125%, | | | | |
| 11/01/38 | | 4,800,000 | | 5,145,312 |
| Indio Water Authority Water Revenue, AMBAC Insured, 5.00%, 4/01/36 | | 15,520,000 | | 15,893,566 |
| Inland Empire Solid Waste Financing Authority Revenue, Landfill Improvement Financing | | | | |
| Project, Series B, AGMC Insured, ETM, 6.25%, 8/01/11 | | 1,100,000 | | 1,119,536 |
| Inland Empire Tobacco Securitization Authority Tobacco Settlement Revenue, | | | | |
| Capital Appreciation, Series B, zero cpn. to 12/01/11, 5.75% thereafter, 6/01/26 | | 35,000,000 | | 26,151,650 |
| Intercommunity Hospital Financing Authority COP, Northbay Healthcare System, Refunding, | | | | |
| ACA Insured, 5.25%, 11/01/19 | | 10,550,000 | | 10,549,894 |
| Irvine 1915 Act Special Assessment, Limited Obligation, | | | | |
| AD No. 00-18, Group 4, 5.375%, 9/02/26 | | 2,500,000 | | 2,490,600 |
| AD No. 03-19, Group 2, Refunding, 5.45%, 9/02/23 | | 2,000,000 | | 2,024,420 |
| AD No. 03-19, Group 2, Refunding, 5.50%, 9/02/29 | | 4,295,000 | | 4,254,928 |
| Irvine USD Financing Authority Special Tax, Series A, | | | | |
| 5.00%, 9/01/26 | | 2,865,000 | | 2,749,483 |
| 5.125%, 9/01/36 | | 10,585,000 | | 9,528,194 |
| Kaweah Delta Health Care District GO, Election of 2003, NATL Insured, 5.00%, 8/01/34 | | 16,500,000 | | 16,183,530 |
| Kern Community College District COP, AMBAC Insured, 5.00%, 3/01/34 | | 15,000,000 | | 15,334,500 |
| Kern County Board of Education COP, Refunding, Series A, NATL Insured, 5.20%, | | | | |
| 5/01/28 | | 3,150,000 | | 3,154,316 |
| Kern High School District GO, Election of 1990, Series E, NATL RE, FGIC Insured, 5.125%, | | | | |
| 8/01/33 | | 5,275,000 | | 5,419,060 |
| La Mirada SFMR, MBS, Series A, GNMA Secured, 7.65%, 4/01/24 | | 45,000 | | 47,867 |
| La Palma Community Development Commission Tax Allocation, La Palma Community | | | | |
| Development Project No. 1, Refunding, 6.10%, 6/01/22 | | 1,915,000 | | 1,919,749 |
| La Quinta RDA Tax Allocation, Redevelopment Project Area No. 1, AMBAC Insured, 5.125%, | | | | |
| 9/01/32 | | 10,825,000 | | 10,875,769 |
| Laguna Beach USD, CFD Special Tax No. 98-1, 5.375%, 9/01/34 | | 5,375,000 | | 4,825,621 |
| Lake Elsinore PFA Tax Allocation Revenue, Series A, | | | | |
| 5.50%, 9/01/30 | | 15,550,000 | | 15,550,466 |
| Assured Guaranty, 5.25%, 9/01/33 | | 10,065,000 | | 10,545,704 |
| Lancaster RDA, RMR, Los Angeles County, Series A, ETM, 10.125%, 9/01/16 | | 5,000 | | 7,411 |
| Lawndale RDA Tax Allocation, Economic Revitalization Project, Assured Guaranty, 5.50%, | | | | |
| 8/01/39 | | 10,280,000 | | 10,806,953 |
| Lemon Grove CDA Tax Allocation, Refunding, 5.75%, 8/01/28 | | 7,650,000 | | 7,665,223 |
| Local Medical Facilities Financing Authority COP, California Mortgage Insured, 7.55%, | | | | |
| 3/01/20 | | 735,000 | | 736,867 |
Semiannual Report | 29
Franklin California Tax-Free Income Fund
Statement of Investments, September 30, 2010 (unaudited) (continued)
| | | | | |
| | | | Principal Amount | | Value |
| | Municipal Bonds (continued) | | | | |
| | California (continued) | | | | |
| | Loma Linda Hospital Revenue, Loma Linda University Medical Center, Series A, | | | | |
| | 5.00%, 12/01/23 | $ | 9,200,000 | $ | 8,881,128 |
| | 8.25%, 12/01/38 | | 35,000,000 | | 40,456,150 |
| | Long Beach Bond Finance Authority Lease Revenue, Aquarium of the Pacific Project, | | | | |
| | Refunding, AMBAC Insured, 5.00%, 11/01/26 | | 20,000,000 | | 19,781,600 |
| | Long Beach Bond Finance Authority Natural Gas Purchase Revenue, Series A, | | | | |
| | 5.50%, 11/15/28 | | 8,000,000 | | 8,347,920 |
| | 5.00%, 11/15/29 | | 17,465,000 | | 17,189,577 |
| | 5.50%, 11/15/30 | | 5,000,000 | | 5,141,250 |
| | 5.00%, 11/15/35 | | 69,800,000 | | 66,721,122 |
| | 5.50%, 11/15/37 | | 35,000,000 | | 35,593,250 |
| | Long Beach California Board Finance Authority Lease Revenue, Temple and Willow Facility, | | | | |
| | Refunding, Series B, NATL Insured, 5.00%, 10/01/27 | | 14,935,000 | | 14,939,929 |
| | Los Angeles Community College District GO, | | | | |
| | Election of 2001, Series A, NATL RE, FGIC Insured, 5.00%, 8/01/32 | | 21,500,000 | | 22,758,180 |
| | Series A, NATL Insured, Pre-Refunded, 5.00%, 6/01/26 | | 59,275,000 | | 61,560,644 |
| | Los Angeles COP, Department of Public Social Services, Series A, AMBAC Insured, 5.50%, | | | | |
| | 8/01/24 | | 4,000,000 | | 4,022,920 |
| | 8/01/31 | | 5,000,000 | | 5,025,900 |
| | Los Angeles County COP, Series 1992, California Mortgage Insured, 6.625%, 7/01/22 | | 795,000 | | 796,208 |
| | Los Angeles County Infrastructure and Economic Development Bank Revenue, County | | | | |
| | Department of Public Social Services, AMBAC Insured, 5.00%, 9/01/35 | | 7,765,000 | | 6,827,143 |
| | Los Angeles County MTA Sales Tax Revenue, Proposition A, Senior Series A, AGMC Insured, | | | | |
| Pre | -Refunded, 5.00%, 7/01/24 | | 5,000,000 | | 5,225,100 |
| | Los Angeles County Sanitation Districts Financing Authority Revenue, Capital Projects, | | | | |
| | District No. 14, Series B, NATL RE, FGIC Insured, 5.00%, 10/01/30 | | 7,000,000 | | 7,284,830 |
| | District No. 14, Series B, NATL RE, FGIC Insured, 5.00%, 10/01/34 | | 25,820,000 | | 26,518,689 |
| | Series A, NATL Insured, 5.00%, 10/01/34 | | 7,110,000 | | 7,206,980 |
| | Los Angeles CRDA, Financing Authority Revenue, Pooled Financing, Beacon Normandie, | | | | |
| | Series B, 6.625%, 9/01/14 | | 360,000 | | 361,062 |
| | Los Angeles Department of Airports Airport Revenue, | | | | |
| | Los Angeles International Airport, Subordinated, Refunding, Series C, 5.125%, | | | | |
| | 5/15/33 | | 16,000,000 | | 16,805,920 |
| | Series A, 5.00%, 5/15/34 | | 18,500,000 | | 19,368,760 |
| | Series A, 5.25%, 5/15/39 | | 14,000,000 | | 14,803,460 |
| | Los Angeles Department of Water and Power Revenue, | | | | |
| | Power System, Series A, Sub Series A-1, 5.25%, 7/01/38 | | 10,000,000 | | 10,741,700 |
| | Power System, Series A, Sub Series A-1, AGMC Insured, 5.00%, 7/01/31 | | 10,000,000 | | 10,524,200 |
| | Power System, Series A, Sub Series A-1, AGMC Insured, 5.00%, 7/01/35 | | 63,435,000 | | 66,228,677 |
| | Power System, Series A, Sub Series A-1, AMBAC Insured, 5.00%, 7/01/37 | | 12,345,000 | | 12,985,212 |
| | Power System, Series B, AGMC Insured, 5.00%, 7/01/28 | | 10,575,000 | | 11,296,321 |
| | Refunding, Series A, Sub Series A-2, 5.00%, 7/01/30 | | 7,000,000 | | 7,443,030 |
| | Series A, Sub Series A-2, NATL Insured, 5.00%, 7/01/23 | | 6,550,000 | | 7,133,212 |
| | Los Angeles Department of Water and Power Waterworks Revenue, System, Series A, | | | | |
| | Sub Series A-1, AMBAC Insured, 5.00%, 7/01/36 | | 14,385,000 | | 15,115,326 |
| | Sub Series A-1, AMBAC Insured, 5.00%, 7/01/38 | | 18,000,000 | | 19,031,220 |
| | Sub Series A-2, AMBAC Insured, 5.00%, 7/01/44 | | 38,000,000 | | 39,629,820 |
30 | Semiannual Report
Franklin California Tax-Free Income Fund
Statement of Investments, September 30, 2010 (unaudited) (continued)
Semiannual Report | 31
Franklin California Tax-Free Income Fund
Statement of Investments, September 30, 2010 (unaudited) (continued)
| | | | | | |
| | | | | Principal Amount | | Value |
| | | Municipal Bonds (continued) | | | | |
| | | California (continued) | | | | |
| | | Murrieta Valley USD, | | | | |
| | | GO, AGMC Insured, 4.50%, 9/01/28 | $ | 5,300,000 | $ | 5,375,207 |
| | | PFA, Special Tax Revenue, Series A, NATL RE, FGIC Insured, 5.00%, 9/01/37 | | 6,975,000 | | 6,996,762 |
| | | Natomas USD, GO, Election of 2006, BHAC Insured, 5.00%, 8/01/32 | | 16,450,000 | | 17,463,155 |
| | | Needles PFAR Tax Allocation, Redevelopment Project, Series A, 7.50%, 8/15/22 | | 1,260,000 | | 1,261,462 |
| | | New Haven USD, GO, Capital Appreciation, Series C, NATL RE, FGIC Insured, zero cpn., | | | | |
| | | 8/01/23 | | 14,700,000 | | 7,535,367 |
| | | Norco RDA Tax Allocation, Area No. 1, Refunding, NATL Insured, 5.125%, 3/01/30 | | 8,515,000 | | 8,437,088 |
| | | Northern California Power Agency Public Power Revenue, Hydroelectric Project No. 1, | | | | |
| | | Refunding, Series A, NATL Insured, | | | | |
| | | 5.00%, 7/01/28 | | 12,510,000 | | 12,515,629 |
| | | 5.20%, 7/01/32 | | 12,930,000 | | 12,931,293 |
| | | Oakland GO, Series B, 6.25%, 1/15/39 | | 10,045,000 | | 11,225,790 |
| | | Oakland USD Alameda County GO, 6.125%, 8/01/29 | | 7,225,000 | | 7,982,975 |
| | | Oceanside USD, GO, Election of 2000, Series D, NATL RE, FGIC Insured, 5.00%, | | | | |
| | | 8/01/29 | | 5,755,000 | | 5,936,167 |
| | | 8/01/33 | | 5,590,000 | | 5,639,919 |
| | | Orange County CFD No. 2003-1 Special Tax, Ladera Ranch, Series A, | | | | |
| | | 5.50%, 8/15/24 | | 1,100,000 | | 1,101,067 |
| | | 5.60%, 8/15/28 | | 3,250,000 | | 3,255,688 |
| | | 5.625%, 8/15/34 | | 5,000,000 | | 4,906,300 |
| | | Orange County CFD No. 2004-1 Special Tax, Ladera Ranch, Series A, | | | | |
| | | 5.15%, 8/15/29 | | 6,405,000 | | 6,121,707 |
| | | 5.20%, 8/15/34 | | 11,000,000 | | 10,313,930 |
| | | Orange County Water District Revenue COP, Series B, NATL Insured, | | | | |
| | | 5.00%, 8/15/28 | | 22,950,000 | | 24,224,413 |
| | | 5.00%, 8/15/34 | | 19,435,000 | | 20,172,947 |
| | | ETM, 5.00%, 8/15/34 | | 4,140,000 | | 4,962,701 |
| | | Oxnard Harbor District Revenue, ACA Insured, 5.60%, 8/01/19 | | 10,820,000 | | 10,943,997 |
| | | Palmdale CRDA Tax Allocation, Merged Redevelopment Project Areas, | | | | |
| | | Refunding, NATL Insured, 5.00%, 9/01/34 | | 6,980,000 | | 6,527,347 |
| | | sub. lien, AMBAC Insured, 5.50%, 12/01/29 | | 2,900,000 | | 2,946,632 |
| | | Palo Verde Community College District COP, AMBAC Insured, 5.50%, 1/01/37 | | 21,000,000 | | 22,203,930 |
| | | Palomar Pomerado Health Care District COP, 6.75%, 11/01/39 | | 30,000,000 | | 33,167,700 |
| | | Palomar Pomerado Health GO, Convertible Capital Appreciation, Election of 2004, Series A, | | | | |
| | | Assured Guaranty, zero cpn. to 8/01/19, 7.00% thereafter, 8/01/38 | | 36,000,000 | | 24,383,880 |
| | | Peralta Community College District GO, Election of 2000, Series C, NATL Insured, 5.00%, | | | | |
| | | 8/01/31 | | 4,105,000 | | 4,268,872 |
| | | 8/01/34 | | 6,920,000 | | 7,176,317 |
| | | Perris PFAR Tax Allocation, Series A, 5.75%, 10/01/31 | | 5,000,000 | | 5,084,850 |
| | | Perris SFMR, Series A, GNMA Secured, ETM, zero cpn., 6/01/23 | | 19,095,000 | | 12,111,386 |
| | | Perris Special Tax, CFD No. 91-1, 8.75%, 9/01/21 | | 4,545,000 | | 4,589,177 |
| | | Port Hueneme RDA Tax Allocation, R-76 Project, Refunding, 6.50%, 5/01/23 | | 2,185,000 | | 2,189,698 |
| | | Port of Oakland Revenue, | | | | |
| | | Refunding, Series L, NATL RE, FGIC Insured, 5.375%, 11/01/27 | | 4,440,000 | | 4,507,088 |
| | | Series L, NATL RE, FGIC Insured, Pre-Refunded, 5.375%, 11/01/27 | | 560,000 | | 611,570 |
| | | Porterville COP, Infrastructure Financing Project, Refunding, AMBAC Insured, 5.00%, | | | | |
| | | 7/01/30 | | 7,420,000 | | 7,336,896 |
| | | 7/01/36 | | 6,535,000 | | 6,130,091 |
| |
| 32 | | | Semiannual Report | | | | |
Franklin California Tax-Free Income Fund
Statement of Investments, September 30, 2010 (unaudited) (continued)
Semiannual Report | 33
Franklin California Tax-Free Income Fund
Statement of Investments, September 30, 2010 (unaudited) (continued)
Franklin California Tax-Free Income Fund
Statement of Investments, September 30, 2010 (unaudited) (continued)
| | | | |
| | | Principal Amount | | Value |
| Municipal Bonds (continued) | | | | |
| California (continued) | | | | |
| Sacramento County Sanitation District Financing Authority Revenue, (continued) | | | | |
| Sacramento Regional County Sanitation District, NATL RE, FGIC Insured, 5.00%, | | | | |
| 12/01/30 | $ | 10,000,000 | $ | 10,662,700 |
| Sacramento Regional County Sanitation District, NATL RE, FGIC Insured, 5.00%, | | | | |
| 12/01/36 | | 61,095,000 | | 63,904,759 |
| Sacramento Regional County Sanitation District, Series A, AMBAC Insured, Pre-Refunded, | | | | |
| 5.00%, 12/01/35 | | 40,000,000 | | 46,709,600 |
| Sacramento MUD Electric Revenue, | | | | |
| Refunding, Series T, NATL RE, FGIC Insured, 5.00%, 5/15/30 | | 9,095,000 | | 9,416,144 |
| Series N, NATL Insured, 5.00%, 8/15/28 | | 63,500,000 | | 64,319,785 |
| sub. lien, Refunding, 8.00%, 11/15/10 | | 6,355,000 | | 6,387,029 |
| Sacramento USD, COP, Refunding, NATL Insured, 5.00%, 3/01/31 | | 6,000,000 | | 6,008,340 |
| Saddleback Valley USD, GO, | | | | |
| AGMC Insured, 5.00%, 8/01/27 | | 4,680,000 | | 4,992,764 |
| AGMC Insured, 5.00%, 8/01/29 | | 4,335,000 | | 4,565,535 |
| Election of 2004, Series A, NATL Insured, 4.50%, 8/01/30 | | 5,250,000 | | 5,314,313 |
| Salida Area Public Facilities Financing Agency CFD No. 1988-1 Special Tax, Refunding, | | | | |
| AGMC Insured, 5.25%, 9/01/28 | | 6,800,000 | | 6,802,992 |
| San Bernardino Community College District GO, Election of 2008, Series B, zero cpn., | | | | |
| 8/01/48 | | 47,640,000 | | 4,890,722 |
| San Bernardino County COP, Medical Center Financing Project, Refunding, 5.00%, | | | | |
| 8/01/26 | | 13,045,000 | | 13,045,000 |
| San Bernardino County Housing Authority MFMR, | | | | |
| Sequoia Plaza Mobil Home, GNMA Secured, 6.75%, 4/20/41 | | 6,920,000 | | 7,316,032 |
| Series A, GNMA Secured, 6.70%, 3/20/43 | | 3,345,000 | | 3,619,926 |
| San Bernardino Joint Powers Financing Authority Lease Revenue, City Hall Project, | | | | |
| Refunding, NATL Insured, 5.70%, 1/01/23 | | 6,315,000 | | 6,323,146 |
| San Carlos School District GO, Election of 2005, Series A, NATL Insured, 5.00%, | | | | |
| 10/01/26 | | 5,070,000 | | 5,549,318 |
| 10/01/30 | | 9,820,000 | | 10,505,534 |
| San Diego Community College District GO, Election of 2002, Capital Appreciation, zero cpn. | | | | |
| to 8/01/19, 6.00% thereafter, 8/01/33 | | 26,880,000 | | 17,213,952 |
| San Diego County COP, | | | | |
| 5.125%, 7/01/40 | | 15,000,000 | | 15,269,400 |
| NATL Insured, 5.00%, 8/15/28 | | 24,000,000 | | 23,998,560 |
| San Diego County Water Authority Water Revenue COP, Series A, | | | | |
| AGMC Insured, 5.00%, 5/01/34 | | 106,705,000 | | 111,392,551 |
| NATL Insured, 5.00%, 5/01/25 | | 12,440,000 | | 13,051,799 |
| San Diego Public Facilities Financing Authority Water Revenue, | | | | |
| NATL Insured, 5.00%, 8/01/26 | | 12,210,000 | | 12,650,415 |
| Subordinated, Refunding, NATL Insured, 5.00%, 8/01/32 | | 20,000,000 | | 20,431,800 |
| San Diego RDA Tax Allocation, Horton Project, Refunding, Series A, AGMC Insured, 6.00%, | | | | |
| 11/01/15 | | 4,405,000 | | 4,419,933 |
| San Diego USD, GO, | | | | |
| Capital Appreciation Bond, Series A, NATL RE, FGIC Insured, zero cpn., 7/01/21 | | 12,160,000 | | 7,492,870 |
| Capital Appreciation Bond, Series A, NATL RE, FGIC Insured, zero cpn., 7/01/22 | | 8,440,000 | | 4,903,387 |
| Capital Appreciation Bond, Series A, NATL RE, FGIC Insured, zero cpn., 7/01/23 | | 11,120,000 | | 6,122,450 |
| Capital Appreciation, Election of 2008, Series A, zero cpn. to 7/01/19, 6.00% thereafter, | | | | |
| 7/01/33 | | 104,505,000 | | 67,392,139 |
| |
| | | Semiannual Report | 35 |
Franklin California Tax-Free Income Fund
Statement of Investments, September 30, 2010 (unaudited) (continued)
| | | | | | |
| | | | | Principal Amount | | Value |
| | | Municipal Bonds (continued) | | | | |
| | | California (continued) | | | | |
| | | San Diego USD, GO, (continued) | | | | |
| | | Election of 1998, Series D, FGIC Insured, 5.00%, 7/01/27 | $ | 16,000,000 | $ | 17,143,520 |
| | | Election of 1998, Series E, AGMC Insured, 5.00%, 7/01/28 | | 10,000,000 | | 11,069,300 |
| | | Series C, AGMC Insured, 5.00%, 7/01/26 | | 6,490,000 | | 6,822,353 |
| | | Series C, zero cpn. to 6/30/30, 6.625% thereafter, 7/01/49 | | 79,500,000 | | 25,832,730 |
| | | San Francisco BART District GO, Election of 2004, Series B, 5.00%, 8/01/32 | | 28,000,000 | | 30,598,960 |
| | | San Francisco BART District Sales Tax Revenue, AGMC Insured, 5.00%, | | | | |
| | | 7/01/31 | | 10,000,000 | | 10,564,000 |
| | | 7/01/36 | | 6,760,000 | | 7,087,928 |
| | | San Francisco City and County Airports Commission International Airport Revenue, | | | | |
| | | Issue 32G, Refunding, Second Series, NATL RE, FGIC Insured, 4.50%, 5/01/28 | | 7,500,000 | | 7,532,775 |
| | | Issue 32G, Refunding, Second Series, NATL RE, FGIC Insured, 4.50%, 5/01/32 | | 5,260,000 | | 5,252,636 |
| | | Refunding, Second Series 28A, NATL Insured, 5.125%, 5/01/32 | | 26,290,000 | | 26,353,885 |
| | | Refunding, Second Series 28B, NATL Insured, 5.00%, 5/01/27 | | 5,050,000 | | 5,166,302 |
| | | San Francisco City and County COP, 30 Van Ness Avenue Property, Series A, NATL Insured, | | | | |
| | | 5.00%, 9/01/31 | | 5,805,000 | | 5,837,218 |
| | | San Francisco City and County RDA, Hotel Tax Revenue, AGMC Insured, 6.75%, 7/01/25 | | 315,000 | | 316,030 |
| | | San Jacinto USD, COP, Refunding, AGMC Insured, 5.375%, 9/01/40 | | 12,000,000 | | 12,499,920 |
| | | San Joaquin Hills Transportation Corridor Agency Toll Road Revenue, | | | | |
| | | Capital Appreciation, Refunding, Series A, 5.60%, 1/15/16 | | 19,500,000 | | 20,209,020 |
| | | Capital Appreciation, Refunding, Series A, 5.65%, 1/15/17 | | 17,000,000 | | 17,457,980 |
| | | Capital Appreciation, Refunding, Series A, 5.70%, 1/15/19 | | 57,000,000 | | 57,796,860 |
| | | Capital Appreciation, Refunding, Series A, 5.75%, 1/15/23 | | 80,000,000 | | 80,064,000 |
| | | Capital Appreciation, Refunding, Series A, 5.75%, 1/15/24 | | 80,000,000 | | 79,844,800 |
| | | Refunding, Series A, 5.50%, 1/15/28 | | 247,300,000 | | 231,564,301 |
| | | Refunding, Series A, NATL Insured, 5.375%, 1/15/29 | | 85,500,000 | | 79,787,745 |
| | | Refunding, Series A, NATL Insured, 5.25%, 1/15/30 | | 21,000,000 | | 19,190,430 |
| | | senior lien, 5.00%, 1/01/33 | | 82,040,000 | | 69,277,858 |
| | | senior lien, ETM, zero cpn., 1/01/25 | | 5,700,000 | | 3,551,670 |
| | | senior lien, ETM, zero cpn., 1/01/28 | | 33,545,000 | | 18,073,040 |
| | | senior lien, ETM, zero cpn., 1/01/29 | | 37,050,000 | | 18,949,963 |
| | | senior lien, Refunding, Series A, 5.65%, 1/15/18 | | 60,000,000 | | 61,116,000 |
| | | senior lien, Refunding, Series A, 5.70%, 1/15/20 | | 80,000,000 | | 80,644,000 |
| | | senior lien, Refunding, Series A, 5.75%, 1/15/22 | | 90,000,000 | | 90,072,000 |
| | | San Jose Airport Revenue, | | | | |
| | | Refunding, Series A, NATL RE, FGIC Insured, 5.00%, 3/01/31 | | 11,000,000 | | 11,026,290 |
| | | Refunding, Series B, AMBAC Insured, 5.00%, 3/01/37 | | 65,000,000 | | 66,389,700 |
| | | Series D, NATL Insured, 5.00%, 3/01/28 | | 10,000,000 | | 10,295,800 |
| | | San Jose Financing Authority Lease Revenue, | | | | |
| | | Civic Center Project, Refunding, Series A, AMBAC Insured, 5.00%, 6/01/39 | | 20,885,000 | | 21,632,056 |
| | | Civic Center Project, Series B, AMBAC Insured, 5.00%, 6/01/27 | | 46,400,000 | | 48,015,648 |
| | | Refunding, Series F, NATL Insured, 5.00%, 9/01/21 | | 14,045,000 | | 14,533,204 |
| | | Refunding, Series F, NATL Insured, 5.00%, 9/01/22 | | 14,730,000 | | 15,226,990 |
| | | San Jose Financing Authority Revenue, Fourth a nd San Fernando Parking Facility, Series A, | | | | |
| | | AMBAC Insured, 5.00%, 9/01/24 | | 5,000,000 | | 5,102,500 |
| | | San Jose GO, | | | | |
| | | Libraries, Parks and Public Safety Projects, 5.00%, 9/01/28 | | 11,600,000 | | 12,178,144 |
| | | Libraries, Parks and Public Safety Projects, NATL Insured, 5.00%, 9/01/34 | | 15,820,000 | | 16,429,703 |
| | | Libraries and Parks Projects, NATL Insured, 5.00%, 9/01/36 | | 35,150,000 | | 37,456,894 |
| |
| 36 | | | Semiannual Report | | | | |
Franklin California Tax-Free Income Fund
Statement of Investments, September 30, 2010 (unaudited) (continued)
| | | | |
| | | Principal Amount | | Value |
| Municipal Bonds (continued) | | | | |
| California (continued) | | | | |
| San Jose RDA, MFHR, Miraido Village, Series A, GNMA Secured, 5.75%, 7/20/38 | $ | 7,110,000 | $ | 7,101,468 |
| San Jose RDA Tax Allocation, | | | | |
| Housing Set-Aside Merged Area, Series E, NATL Insured, 5.85%, 8/01/27 | | 7,325,000 | | 7,330,787 |
| Merged Area Redevelopment Project, Refunding, NATL Insured, 5.625%, 8/01/28 | | 2,030,000 | | 2,031,137 |
| Merged Area Redevelopment Project, Series B, XLCA Insured, 5.00%, 8/01/32 | | 13,395,000 | | 13,341,152 |
| Series A, 6.50%, 8/01/18 | | 10,000,000 | | 11,649,700 |
| Series B, 7.00%, 8/01/35 | | 28,565,000 | | 32,821,471 |
| San Jose USD, COP, Refunding, AGMC Insured, zero cpn., | | | | |
| 1/01/27 | | 7,105,000 | | 2,953,193 |
| 1/01/29 | | 7,105,000 | | 2,571,726 |
| San Jose USD Santa Clara County GO, Series A, AGMC Insured, 5.00%, | | | | |
| 8/01/24 | | 9,200,000 | | 9,517,308 |
| 8/01/27 | | 9,150,000 | | 9,366,855 |
| San Juan Basin Authority Lease Revenue, AMBAC Insured, 5.00%, 12/01/34 | | 4,000,000 | | 3,790,360 |
| San Juan Bautista Water and Wastewater Revenue COP, Refunding, 6.25%, 10/01/43 | | 7,330,000 | | 7,902,326 |
| San Juan USD, GO, Election of 1998, Series B, NATL Insured, zero cpn., | | | | |
| 8/01/26 | | 15,825,000 | | 7,060,166 |
| 8/01/27 | | 18,605,000 | | 7,730,005 |
| 8/01/28 | | 19,470,000 | | 7,611,407 |
| San Luis Obispo County Financing Authority Revenue, Nacimiento Water Project, Series A, | | | | |
| NATL Insured, 5.00%, 9/01/32 | | 12,500,000 | | 12,822,125 |
| San Marcos PFAR, Series A, ETM, 6.25%, 9/02/22 | | 15,000,000 | | 20,503,650 |
| San Marcos Public Facilities Authority Revenue, | | | | |
| Refunding, 5.80%, 9/01/18 | | 4,745,000 | | 4,777,883 |
| Senior Tax Increment Project Area 3, Series A, NATL Insured, Pre-Refunded, 5.80%, | | | | |
| 10/01/30 | | 8,035,000 | | 8,196,905 |
| San Mateo County Joint Powers Authority Lease Revenue, Capital Projects, Refunding, | | | | |
| Series A, AGMC Insured, 5.00%, 7/15/29 | | 4,545,000 | | 4,563,589 |
| San Mateo Flood Control District COP, Colma Creek Flood Control Zone, AMBAC Insured, | | | | |
| 5.00%, 8/01/39 | | 6,555,000 | | 6,146,230 |
| San Mateo RDA Tax Allocation, Pre-Refunded, 5.60%, 8/01/25 | | 10,185,000 | | 10,623,566 |
| San Mateo UHSD, | | | | |
| COP, Phase I Projects, Capital Appreciation, Series B, AMBAC Insured, zero cpn. to | | | | |
| 12/15/19, 5.00% thereafter, 12/15/43 | | 11,535,000 | | 6,089,673 |
| GO, Capital Appreciation, Election of 2000, Series B, NATL RE, FGIC Insured, zero cpn., | | | | |
| 9/01/22 | | 5,000,000 | | 2,981,550 |
| GO, Election of 2000, Series A, FGIC Insured, Pre-Refunded, 5.00%, 9/01/25 | | 13,865,000 | | 14,460,363 |
| San Ramon PFA Tax Allocation Revenue, NATL Insured, 5.30%, 2/01/28 | | 18,360,000 | | 18,380,012 |
| San Ramon Valley Fire Protection District COP, XLCA Insured, 5.00%, 8/01/36 | | 5,655,000 | | 5,915,922 |
| San Ramon Valley USD, GO, Election of 2002, | | | | |
| AGMC Insured, 5.40%, 3/01/28 | | 27,410,000 | | 29,624,454 |
| NATL Insured, 5.00%, 8/01/25 | | 9,215,000 | | 10,208,008 |
| NATL Insured, 5.00%, 8/01/28 | | 14,770,000 | | 16,172,411 |
| Sanger USD, GO, Election of 2006, Series A, AGMC Insured, 5.00%, 8/01/27 | | 6,000,000 | | 6,459,180 |
| aSanta Barbara Housing Authority Revenue, Refunding and Acquisition, 6.25%, 11/15/20 | | 4,160,000 | | 3,806,608 |
| Santa Clara County Financing Authority Revenue, El Camino Hospital, Series B, | | | | |
| AMBAC Insured, 5.125%, 2/01/41 | | 20,000,000 | | 20,061,400 |
| Santa Clara Housing Authority MFHR, Elena Gardens Apartments Project, Series A, | | | | |
| GNMA Secured, 6.40%, 6/20/35 | | 5,265,000 | | 5,271,423 |
| |
| | | Semiannual Report | 37 |
Franklin California Tax-Free Income Fund
Statement of Investments, September 30, 2010 (unaudited) (continued)
| | | | |
| | | Principal Amount | | Value |
| Municipal Bonds (continued) | | | | |
| California (continued) | | | | |
| Santa Clara USD, COP, 5.375%, 7/01/31 | $ | 7,575,000 | $ | 7,797,326 |
| Santa Clarita Community College District GO, Election of 2006, NATL Insured, 5.00%, | | | | |
| 8/01/32 | | 9,765,000 | | 10,306,665 |
| Santa Cruz City High School District GO, NATL Insured, 5.00%, 8/01/29 | | 10,885,000 | | 11,023,675 |
| Santa Cruz County RDA Tax Allocation, 7.00%, 9/01/36 | | 5,000,000 | | 5,680,550 |
| Santa Margarita Water District Special Tax, CFD No. 99-1, Pre-Refunded, 6.00%, | | | | |
| 9/01/30 | | 9,000,000 | | 10,352,610 |
| Santa Maria Bonita School District COP, NATL Insured, 7.00%, 3/01/16 | | 325,000 | | 332,937 |
| Santa Maria Water and Wastewater Revenue, COP, Series A, AMBAC Insured, 5.55%, | | | | |
| 8/01/27 | | 21,000,000 | | 22,052,520 |
| Santee School District COP, Capital Improvement Project, Assured Guaranty, 5.50%, | | | | |
| 10/01/48 | | 15,460,000 | | 16,434,444 |
| Saugus USD, GO, Series B, AGMC Insured, Pre-Refunded, 5.00%, 8/01/29 | | 5,000,000 | | 5,908,150 |
| School Facilities Financing Authority Revenue, Capital Appreciation, Grant Joint UHSD, | | | | |
| Series A, AGMC Insured, zero cpn., 8/01/42 | | 49,000,000 | | 7,019,740 |
| Shafter Joint Powers Financing Authority Lease Revenue, Community Correctional Facility | | | | |
| Project, Series A, | | | | |
| 5.95%, 1/01/11 | | 425,000 | | 426,513 |
| 6.05%, 1/01/17 | | 5,135,000 | | 5,153,640 |
| Simi Valley USD, GO, Election of 2004, Series A, NATL Insured, Pre-Refunded, 5.00%, | | | | |
| 8/01/26 | | 6,000,000 | | 6,936,840 |
| Snowline Joint USD, CFD Special Tax, No. 2002-1, Series A, | | | | |
| 5.30%, 9/01/29 | | 1,615,000 | | 1,477,870 |
| 5.40%, 9/01/34 | | 2,000,000 | | 1,794,900 |
| Solano County COP, GO, NATL Insured, Pre-Refunded, 5.00%, 11/01/32 | | 14,665,000 | | 15,998,195 |
| South Gate Utility Authority Revenue, Water and Sewer Systems Project, NATL RE, | | | | |
| FGIC Insured, 5.00%, 10/01/32 | | 6,475,000 | | 6,381,501 |
| Southern California Public Power Authority Natural Gas Project Revenue, Project No. 1, | | | | |
| Series A, 5.00%, 11/01/33 | | 17,500,000 | | 16,986,375 |
| Southern California Public Power Authority Power Project Revenue, | | | | |
| 6.75%, 7/01/13 | | 10,000,000 | | 11,564,200 |
| Series A, AMBAC Insured, ETM, zero cpn., 7/01/11 | | 12,000,000 | | 11,938,200 |
| Series A, AMBAC Insured, ETM, zero cpn., 7/01/12 | | 16,890,000 | | 16,648,473 |
| Series A, AMBAC Insured, ETM, zero cpn., 7/01/13 | | 16,000,000 | | 15,564,480 |
| Southern California Public Power Authority Project Revenue, Magnolia Power Project, | | | | |
| Series A, AMBAC Insured, Pre-Refunded, 5.00%, 7/01/36 | | 15,800,000 | | 17,680,990 |
| Southern California Public Power Authority Transmission Project Revenue, Southern | | | | |
| Transmission Project, 6.125%, 7/01/18 | | 1,135,000 | | 1,139,268 |
| Stockton East Water District COP, Capital Appreciation, 1990 Project, Series B, zero cpn., | | | | |
| 4/01/16 | | 103,885,000 | | 83,139,165 |
| Stockton Revenue, O’Connor Woods Housing Corp., Series A, 6.35%, 11/01/31 | | 9,110,000 | | 9,122,025 |
| Stockton Revenue COP, Wastewater System Project, Refunding, Series A, NATL Insured, | | | | |
| 5.20%, 9/01/29 | | 19,160,000 | | 19,175,136 |
| Stockton USD, GO, | | | | |
| Election of 2000, NATL Insured, 5.00%, 1/01/27 | | 5,030,000 | | 5,116,969 |
| NATL Insured, 5.00%, 1/01/28 | | 5,335,000 | | 5,418,119 |
| Suisun City PFA Tax Allocation Revenue, Capital Appreciation Redevelopment Project, | | | | |
| Series A, zero cpn., 10/01/28 | | 17,855,000 | | 7,000,231 |
38 | Semiannual Report
Franklin California Tax-Free Income Fund
Statement of Investments, September 30, 2010 (unaudited) (continued)
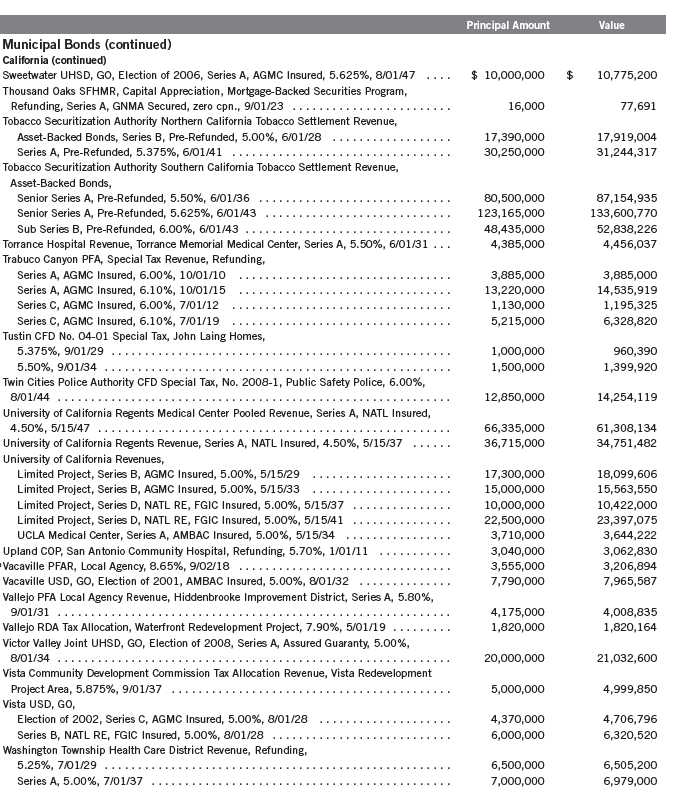
Semiannual Report | 39
Franklin California Tax-Free Income Fund
Statement of Investments, September 30, 2010 (unaudited) (continued)
| | | | |
| | | Principal Amount | | Value |
| Municipal Bonds (continued) | | | | |
| California (continued) | | | | |
| West Contra Costa USD, GO, | | | | |
| Election of 2002, Series C, NATL RE, FGIC Insured, 5.00%, 8/01/34 | $ | 11,605,000 | $ | 11,460,982 |
| Series A, AGMC Insured, 5.00%, 8/01/35 | | 12,000,000 | | 12,403,800 |
| West Covina PFA Lease Revenue, Big League Dreams Project, Series A, 5.00%, | | | | |
| 6/01/30 | | 4,200,000 | | 4,369,512 |
| 6/01/36 | | 5,045,000 | | 5,182,123 |
| West Kern Community College District COP, AMBAC Insured, 5.625%, 11/01/34 | | 11,035,000 | | 11,923,649 |
| West Sacramento Financing Authority Special Tax Revenue, Series A, XLCA Insured, 5.00%, | | | | |
| 9/01/34 | | 5,000,000 | | 4,409,500 |
| Western Placer Unified School COP, Refinancing Project, Series B, Assured Guaranty, | | | | |
| 5.125%, 8/01/47 | | 10,275,000 | | 10,463,135 |
| Westlands Water District Revenue COP, | | | | |
| NATL Insured, 5.00%, 9/01/26 | | 13,150,000 | | 13,883,112 |
| NATL Insured, 5.00%, 9/01/34 | | 13,500,000 | | 13,758,660 |
| Series A, NATL Insured, 5.00%, 9/01/30 | | 6,250,000 | | 6,489,688 |
| Series A, NATL Insured, 5.00%, 9/01/31 | | 7,490,000 | | 7,828,099 |
| Series A, NATL Insured, 5.00%, 9/01/35 | | 6,910,000 | | 6,999,554 |
| Westminster School District GO, Election of 2008, Series A-1, Assured Guaranty, 5.00%, | | | | |
| 8/01/34 | | 18,980,000 | | 19,468,925 |
| Whittier Health Facility Revenue, Presbyterian Intercommunity Hospital, Pre-Refunded, | | | | |
| 5.60%, 6/01/22 | | 14,285,000 | | 15,593,649 |
| 5.75%, 6/01/31 | | 28,000,000 | | 30,634,240 |
| William S. Hart UHSD, GO, Series A, NATL Insured, 5.00%, 9/01/27 | | 8,685,000 | | 9,040,130 |
| Yuba Community College District GO, | | | | |
| Capital Appreciation, Election of 2006, Series B, AMBAC Insured, zero cpn., 8/01/39 | | 7,075,000 | | 1,187,185 |
| Election of 2006, Series A, AMBAC Insured, 5.00%, 8/01/46 | | 24,080,000 | | 24,594,590 |
| Yucaipa Valley Water District Water System Revenue COP, Series A, NATL Insured, 5.00%, | | | | |
| 9/01/29 | | 10,100,000 | | 10,461,479 |
| 9/01/34 | | 12,765,000 | | 12,949,582 |
| | | | | 13,049,595,346 |
| U.S. Territories 8.3% | | | | |
| Puerto Rico 8.2% | | | | |
| Children’s Trust Fund Puerto Rico Tobacco Settlement Revenue, Asset-Backed Bonds, | | | | |
| Refunding, | | | | |
| 5.50%, 5/15/39 | | 7,210,000 | | 6,700,830 |
| 5.625%, 5/15/43 | | 25,500,000 | | 23,623,200 |
| Puerto Rico Commonwealth Aqueduct and Sewer Authority Revenue, senior lien, Series A, | | | | |
| 6.00%, 7/01/44 | | 10,500,000 | | 11,312,595 |
| Puerto Rico Commonwealth GO, | | | | |
| Public Improvement, Refunding, Series A, 5.50%, 7/01/32 | | 30,000,000 | | 31,500,000 |
| Public Improvement, Refunding, Series A, NATL Insured, 5.50%, 7/01/20 | | 10,000,000 | | 11,088,700 |
| Public Improvement, Series A, 5.125%, 7/01/28 | | 10,000,000 | | 10,194,300 |
| Public Improvement, Series A, 5.125%, 7/01/31 | | 95,185,000 | | 95,543,847 |
| Public Improvement, Series A, 6.00%, 7/01/38 | | 10,000,000 | | 10,780,600 |
| Public Improvement, Series A, Pre-Refunded, 5.00%, 7/01/27 | | 14,525,000 | | 15,686,855 |
40 | Semiannual Report
Franklin California Tax-Free Income Fund
Statement of Investments, September 30, 2010 (unaudited) (continued)
| | | | |
| | | Principal Amount | | Value |
| Municipal Bonds (continued) | | | | |
| U.S. Territories (continued) | | | | |
| Puerto Rico (continued) | | | | |
| Puerto Rico Commonwealth GO, (continued) | | | | |
| Public Improvement, Series A, Pre-Refunded, 5.125%, 7/01/31 | $ | 37,740,000 | $ | 39,097,130 |
| Public Improvement, Series B, Pre-Refunded, 5.25%, 7/01/32 | | 12,495,000 | | 15,177,052 |
| Public Improvement, Series B, Pre-Refunded, 5.00%, 7/01/35 | | 21,200,000 | | 25,458,868 |
| Refunding, Series C, Sub Series C-7, NATL Insured, 6.00%, 7/01/27 | | 21,000,000 | | 22,951,530 |
| Series A, 5.25%, 7/01/32 | | 10,000,000 | | 10,331,300 |
| Series A, 5.25%, 7/01/33 | | 8,800,000 | | 9,065,848 |
| Puerto Rico Commonwealth Highway and Transportation Authority Highway Revenue, | | | | |
| Series Y, Pre-Refunded, 5.00%, 7/01/36 | | 63,000,000 | | 75,656,070 |
| Puerto Rico Commonwealth Highway and Transportation Authority Transportation Revenue, | | | | |
| Refunding, Series A, NATL Insured, 5.00%, 7/01/38 | | 5,800,000 | | 5,800,464 |
| Refunding, Series N, FGIC Insured, 5.25%, 7/01/39 | | 7,000,000 | | 7,275,660 |
| Series D, Pre-Refunded, 5.375%, 7/01/36 | | 45,000,000 | | 48,686,400 |
| Series D, Pre-Refunded, 5.75%, 7/01/41 | | 20,000,000 | | 21,768,000 |
| Series K, Pre-Refunded, 5.00%, 7/01/40 | | 30,000,000 | | 35,433,300 |
| Series K, Pre-Refunded, 5.00%, 7/01/45 | | 30,000,000 | | 35,433,300 |
| Puerto Rico Commonwealth Infrastructure Financing Authority Special Tax Revenue, 5.00%, | | | | |
| 7/01/46 | | 20,000,000 | | 20,004,400 |
| Puerto Rico Convention Center District Authority Hotel Occupancy Tax Revenue, Series A, | | | | |
| AMBAC Insured, 5.00%, 7/01/31 | | 8,000,000 | | 8,023,120 |
| Puerto Rico Electric Power Authority Power Revenue, | | | | |
| Series II, Pre-Refunded, 5.25%, 7/01/31 | | 48,000,000 | | 52,479,840 |
| Series WW, 5.00%, 7/01/28 | | 12,030,000 | | 12,610,929 |
| Series WW, 5.25%, 7/01/33 | | 32,250,000 | | 33,663,518 |
| Series XX, 5.25%, 7/01/40 | | 14,000,000 | | 14,662,060 |
| Puerto Rico Industrial Tourist Educational Medical and Environmental Control Facilities | | | | |
| Revenue, Cogeneration Facility, AES Puerto Rico Project, 6.625%, 6/01/26 | | 6,800,000 | | 6,855,624 |
| Puerto Rico PBA Guaranteed Revenue, Government Facilities, | | | | |
| Refunding, Series D, 5.375%, 7/01/33 | | 26,510,000 | | 26,860,727 |
| Refunding, Series M-3, NATL Insured, 6.00%, 7/01/24 | | 21,535,000 | | 23,832,138 |
| Refunding, Series M-3, NATL Insured, 6.00%, 7/01/27 | | 15,000,000 | | 16,393,950 |
| Refunding, Series M-3, NATL Insured, 6.00%, 7/01/28 | | 10,000,000 | | 10,888,500 |
| Refunding, Series N, 5.00%, 7/01/37 | | 50,000,000 | | 49,923,000 |
| Series D, Pre-Refunded, 5.375%, 7/01/33 | | 73,490,000 | | 79,510,301 |
| Puerto Rico Public Finance Corp. Revenue, Commonwealth Appropriation, Series E, | | | | |
| Pre-Refunded, 5.50%, 8/01/29 | | 129,995,000 | | 138,315,980 |
| Puerto Rico Sales Tax Financing Corp. Sales Tax Revenue, | | | | |
| Capital Appreciation, first sub., Series A, zero cpn. to 8/01/16, 6.75% thereafter, | | | | |
| 8/01/32 | | 80,000,000 | | 68,913,600 |
| first sub., Series A, 5.75%, 8/01/37 | | 10,000,000 | | 10,893,600 |
| first sub., Series A, 5.375%, 8/01/39 | | 10,000,000 | | 10,581,500 |
| first sub., Series A, 5.50%, 8/01/42 | | 10,000,000 | | 10,636,400 |
| first sub., Series A, 6.00%, 8/01/42 | | 8,000,000 | | 8,840,720 |
| first sub., Series C, 5.50%, 8/01/40 | | 50,000,000 | | 53,521,000 |
| Series A, 5.25%, 8/01/57 | | 10,000,000 | | 10,513,700 |
| | | | | 1,236,490,456 |
Semiannual Report | 41
Franklin California Tax-Free Income Fund
Statement of Investments, September 30, 2010 (unaudited) (continued)
| | | | |
| | | Principal Amount | | Value |
| Municipal Bonds (continued) | | | | |
| U.S. Territories (continued) | | | | |
| U.S. Virgin Islands 0.1% | | | | |
| Virgin Islands PFAR, Virgin Islands Matching Fund Loan Note, Diageo Project, Series A, | | | | |
| 6.75%, 10/01/37 | $ | 10,000,000 | $ | 11,441,500 |
| Total U.S. Territories (Cost $1,138,311,604) | | | | 1,247,931,956 |
| Total Municipal Bonds before Short Term Investments | | | | |
| (Cost $13,694,461,253) | | | | 14,297,527,302 |
| Short Term Investments 3.5% | | | | |
| Municipal Bonds 3.5% | | | | |
| California 3.5% | | | | |
| bCalifornia Educational Facilities Authority Revenue, Chapman University, Refunding, Series A, | | | | |
| Daily VRDN and Put, 0.30%, 10/01/36 | | 16,565,000 | | 16,565,000 |
| bCalifornia Health Facilities Financing Authority Revenue, | | | | |
| Adventist Health System West, Series B, Daily VRDN and Put, 0.25%, 9/01/38 | | 14,215,000 | | 14,215,000 |
| Children’s Hospital Los Angeles, Series B, Daily VRDN and Put, 0.30%, 7/01/42 | | 42,300,000 | | 42,300,000 |
| bCalifornia Infrastructure and Economic Development Bank Revenue, | | | | |
| Asian Art Museum Foundation, NATL Insured, Daily VRDN and Put, 0.34%, 6/01/34 | | 39,810,000 | | 39,810,000 |
| Contemporary Jewish Museum, Daily VRDN and Put, 0.30%, 12/01/36 | | 23,500,000 | | 23,500,000 |
| Pacific Gas and Electric Co., Refunding, Series A, Daily VRDN and Put, 0.27%, | | | | |
| 11/01/26 | | 24,800,000 | | 24,800,000 |
| Pacific Gas and Electric Co., Refunding, Series D, Daily VRDN and Put, 0.20%, | | | | |
| 12/01/16 | | 1,000,000 | | 1,000,000 |
| bCalifornia PCFA, PCR, Pacific Gas and Electric Co., Refunding, Series C, Daily VRDN and | | | | |
| Put, 0.29%, 11/01/26 | | 3,604,000 | | 3,604,000 |
| bCalifornia State Department of Water Resources Power Supply Revenue, Series B, | | | | |
| Sub Series B-1, Daily VRDN and Put, 0.25%, 5/01/22 | | 180,000 | | 180,000 |
| bCalifornia State Economic Recovery GO, | | | | |
| Refunding, Series C-1, Daily VRDN and Put, 0.26%, 7/01/23 | | 27,100,000 | | 27,100,000 |
| Series C-3, Daily VRDN and Put, 0.24%, 7/01/23 | | 71,855,000 | | 71,855,000 |
| Series C-4, Daily VRDN and Put, 0.25%, 7/01/23 | | 9,800,000 | | 9,800,000 |
| bCalifornia State GO, Kindergarten, | | | | |
| Series A5, Daily VRDN and Put, 0.28%, 5/01/34 | | 10,000,000 | | 10,000,000 |
| Series B1, Daily VRDN and Put, 0.26%, 5/01/34 | | 19,000,000 | | 19,000,000 |
| Series B3, Daily VRDN and Put, 0.24%, 5/01/34 | | 6,520,000 | | 6,520,000 |
| bCalifornia Statewide CDA Revenue, | | | | |
| Los Angeles County Museum Art Project, Refunding, Series D, Daily VRDN and Put, | | | | |
| 0.25%, 12/01/34 | | 1,900,000 | | 1,900,000 |
| North Peninsula Jewish Campus, Daily VRDN and Put, 0.30%, 7/01/34 | | 15,175,000 | | 15,175,000 |
| University Retirement Community Project, Daily VRDN and Put, 0.25%, 11/15/38 | | 6,300,000 | | 6,300,000 |
| bIrvine 1915 Act Special Assessment, Limited Obligation, AD No. 93-14, Daily VRDN and | | | | |
| Put, 0.24%, 9/02/25 | | 19,775,000 | | 19,775,000 |
| bIrvine Ranch Water District Revenue, ID, Consolidated, Series B, Daily VRDN and Put, | | | | |
| 0.25%, 10/01/41 | | 13,300,000 | | 13,300,000 |
| bLos Angeles Department of Water and Power Revenue, Refunding, Series B-3, Daily VRDN | | | | |
| and Put, 0.29%, 7/01/34 | | 22,700,000 | | 22,700,000 |
| bLos Angeles Department of Water and Power Waterworks Revenue, Series B, Sub Series B-2, | | | | |
| Daily VRDN and Put, 0.23%, 7/01/35 | | 5,500,000 | | 5,500,000 |
42 | Semiannual Report
Franklin California Tax-Free Income Fund
Statement of Investments, September 30, 2010 (unaudited) (continued)
| | | | |
| | | Principal Amount | | Value |
| Short Term Investments (continued) | | | | |
| Municipal Bonds (continued) | | | | |
| California (continued) | | | | |
| bMetropolitan Water District of Southern California Waterworks Revenue, | | | | |
| Series B, Weekly VRDN and Put, 0.26%, 7/01/27 | $ | 2,800,000 | $ | 2,800,000 |
| Series C-2, Daily VRDN and Put, 0.29%, 7/01/36 | | 15,280,000 | | 15,280,000 |
| bSacramento County Sanitation District Financing Authority Revenue, sub. lien, Sanitation | | | | |
| District, Refunding, | | | | |
| Series A, Daily VRDN and Put, 0.30%, 12/01/36 | | 12,000,000 | | 12,000,000 |
| Series C, Daily VRDN and Put, 0.30%, 12/01/38 | | 12,300,000 | | 12,300,000 |
| bSanta Clara Electric Revenue, sub. bond, Refunding, Series A, Daily VRDN and Put, 0.30%, | | | | |
| 7/01/34 | | 17,735,000 | | 17,735,000 |
| bSouthern California Public Power Authority Power Project Revenue, | | | | |
| Mead-Adelanto Project, Refunding, Series A, Daily VRDN and Put, 0.25%, 7/01/20 | | 46,740,000 | | 46,740,000 |
| Mead-Phoenix Project, Refunding, Series A, Daily VRDN and Put, 0.25%, 7/01/20 | | 15,500,000 | | 15,500,000 |
| Total Short Term Investments (Cost $517,254,000) | | | | 517,254,000 |
| Total Investments (Cost $14,211,715,253) 98.9% | | | | 14,814,781,302 |
| Other Assets, less Liabilities 1.1% | | | | 169,902,474 |
| Net Assets 100.0% | | | $ | 14,984,683,776 |
See Abbreviations on page 55.
aSecurity has been deemed illiquid because it may not be able to be sold within seven days. At September 30, 2010, the aggregate value of these securities was $8,215,170, representing 0.05% of net assets. bVariable rate demand notes (VRDNs) are tax-exempt obligations which contain a floating or variable interest rate adjustment formula and an unconditional right of demand to receive payment of the principal balance plus accrued interest at specified dates. The coupon rate shown represents the rate at period end.
Semiannual Report | The accompanying notes are an integral part of these financial statements. | 43
Franklin California Tax-Free Income Fund
Financial Statements
Statement of Assets and Liabilities
September 30, 2010 (unaudited)
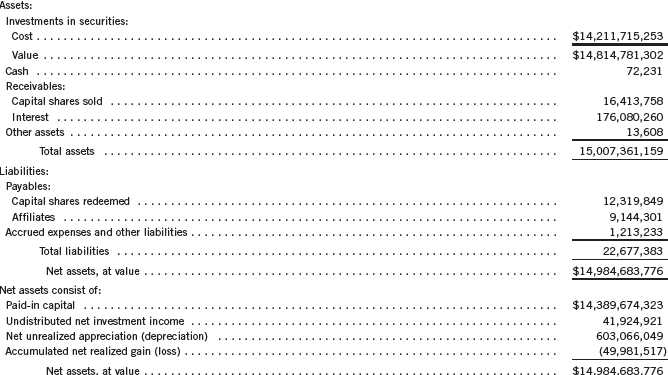
44 | The accompanying notes are an integral part of these financial statements. | Semiannual Report
Franklin California Tax-Free Income Fund
Financial Statements (continued)
Statement of Assets and Liabilities (continued)
September 30, 2010 (unaudited)
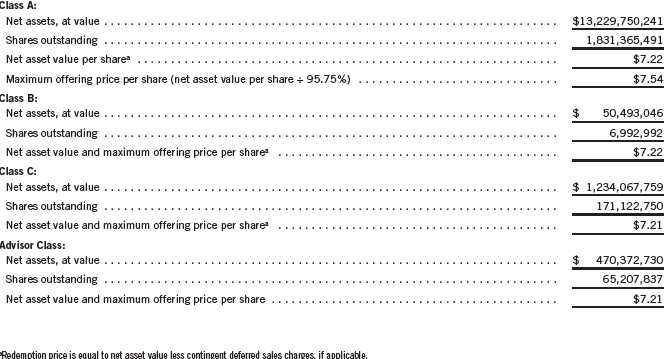
Semiannual Report | The accompanying notes are an integral part of these financial statements. | 45
Franklin California Tax-Free Income Fund
Financial Statements (continued)
Statement of Operations
for the six months ended September 30, 2010 (unaudited)
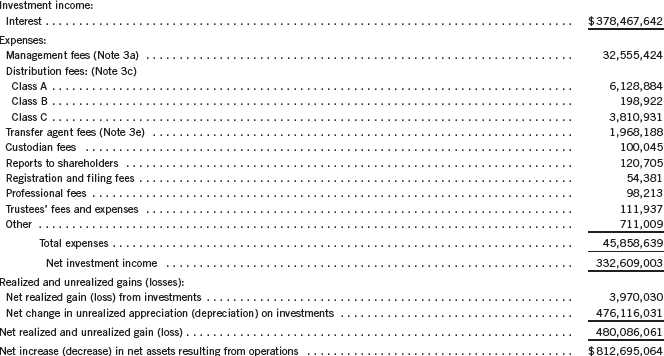
46 | The accompanying notes are an integral part of these financial statements. | Semiannual Report
Franklin California Tax-Free Income Fund
Financial Statements (continued)
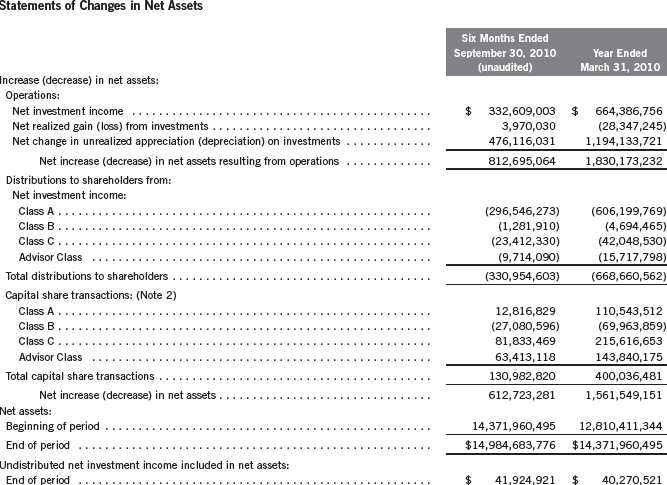
Semiannual Report | The accompanying notes are an integral part of these financial statements. | 47
Franklin California Tax-Free Income Fund
Notes to Financial Statements (unaudited)
1. ORGANIZATION AND SIGNIFICANT ACCOUNTING POLICIES
Franklin California Tax-Free Income Fund (Fund) is registered under the Investment Company Act of 1940, as amended, (1940 Act) as an open-end investment company. The Fund offers four classes of shares: Class A, Class B, Class C, and Advisor Class. Each class of shares differs by its initial sales load, contingent deferred sales charges, distribution fees, voting rights on matters affecting a single class and its exchange privilege.
The following summarizes the Fund’s significant accounting policies.
a. Financial Instrument Valuation
The Fund values its investments in securities and other assets and liabilities carried at fair value daily. Fair value is the price that would be received to sell an asset or paid to transfer a liability in an orderly transaction between market participants on the measurement date. Under procedures approved by the Fund’s Board of Trustees, the Fund may utilize independent pricing services, quotations from securities and financial instrument dealers, and other market sources to determine fair value.
Debt securities generally trade in the over-the-counter market rather than on a securities exchange. The Fund’s pricing services use multiple valuation techniques to determine fair value. In instances where sufficient market activity exists, the pricing services may utilize a market-based approach through which quotes from market makers are used to determine fair value. In instances where sufficient market activity may not exist or is limited, the pricing services also utilize proprietary valuation models which may consider market characteristics such as benchmark yield curves, option-adjusted spreads, credit spreads, estimated default rates, coupon rates, anticipated timing of principal repayments, underlying collateral, and other unique security features in order to estimate the relevant cash flows, which are then discounted to calculate the fair value.
The Fund has procedures to determine the fair value of securities and other financial instruments for which market prices are not readily available or which may not be reliably priced. Under these procedures, the Fund primarily employs a market-based approach which may use related or comparable assets or liabilities, recent transactions, market multiples, book values, and other relevant information for the investment to determine the fair value of the investment. The Fund may also use an income-based valuation approach in which the anticipated future cash flows of the investment are discounted to calculate fair value. Discounts may also be applied due to the nature or duration of any restrictions on the disposition of the investments. Due to the inherent uncertainty of valuations of such investments, the fair values may differ significantly from the values that would have been used had an active market existed.
b. Income Taxes
It is the Fund’s policy to qualify as a regulated investment company under the Internal Revenue Code and to distribute to shareholders substantially all of its income and net realized gains. As
48 | Semiannual Report
Franklin California Tax-Free Income Fund
Notes to Financial Statements (unaudited) (continued)
1. ORGANIZATION AND SIGNIFICANT ACCOUNTING POLICIES (continued) b. Income Taxes (continued)
a result, no provision for U.S. federal income taxes is required. The Fund files U.S. income tax returns as well as tax returns in certain other jurisdictions. The Fund recognizes in its financial statements the effects including penalties and interest, if any, of a tax position taken on tax return (or expected to be taken) when it’s more likely than not (a greater than 50% probability), based on the technical merits, that the tax position will be sustained upon examination by the tax authorities. As of September 30, 2010, and for all open tax years, the Fund has determined that no provision for income tax is required in the Fund’s financial statements. Open tax years are those that remain subject to examination and are based on each tax jurisdiction statute of limitation. The Fund is not aware of any tax position for which it is reasonably possible that the total amounts of unrecognized tax effects will significantly chang e in the next twelve months.
c. Security Transactions, Investment Income, Expenses and Distributions
Security transactions are accounted for on trade date. Realized gains and losses on security transactions are determined on a specific identification basis. Interest income and estimated expenses are accrued daily. Amortization of premium and accretion of discount on debt securities are included in interest income. Distributions to shareholders are recorded on the ex-dividend date and are determined according to income tax regulations (tax basis). Distributable earnings determined on a tax basis may differ from earnings recorded in accordance with accounting principles generally accepted in the United States of America. These differences may be permanent or temporary. Permanent differences are reclassified among capital accounts to reflect their tax character. These reclassifications have no impact on net assets or the results of operations. Temporary differences are not reclassified, as they may reverse in subsequent periods.
Realized and unrealized gains and losses and net investment income, not including class specific expenses, are allocated daily to each class of shares based upon the relative proportion of net assets of each class. Differences in per share distributions, by class, are generally due to differences in class specific expenses.
d. Insurance
The scheduled payments of interest and principal for each insured municipal security in the Fund are insured by either a new issue insurance policy or a secondary insurance policy. Some municipal securities in the Fund are secured by collateral guaranteed by an agency of the U.S. government. Insurance companies typically insure municipal bonds that tend to be of very high quality, with the majority of underlying municipal bonds rated A or better. However, there is a risk that in the event of an issuer default, the insurer may not be able to fulfill its obligations under the terms of the policy.
Depending on the type of coverage, premiums for insurance are either added to the cost basis of the security or paid by a third party.
Semiannual Report | 49
Franklin California Tax-Free Income Fund
Notes to Financial Statements (unaudited) (continued)
| 1. | ORGANIZATION AND SIGNIFICANT ACCOUNTING POLICIES (continued) |
| e. | Accounting Estimates |
The preparation of financial statements in accordance with accounting principles generally accepted in the United States of America requires management to make estimates and assumptions that affect the reported amounts of assets and liabilities at the date of the financial statements and the amounts of income and expenses during the reporting period. Actual results could differ from those estimates.
f. Guarantees and Indemnifications
Under the Fund’s organizational documents, its officers and trustees are indemnified by the Fund against certain liabilities arising out of the performance of their duties to the Fund. Additionally, in the normal course of business, the Fund enters into contracts with service providers that contain general indemnification clauses. The Fund’s maximum exposure under these arrangements is unknown as this would involve future claims that may be made against the Fund that have not yet occurred. Currently, the Fund expects the risk of loss to be remote.
2. CAPITAL STOCK
At September 30, 2010, there were an unlimited number of shares authorized (without par value).
Transactions in the Fund’s shares were as follows:
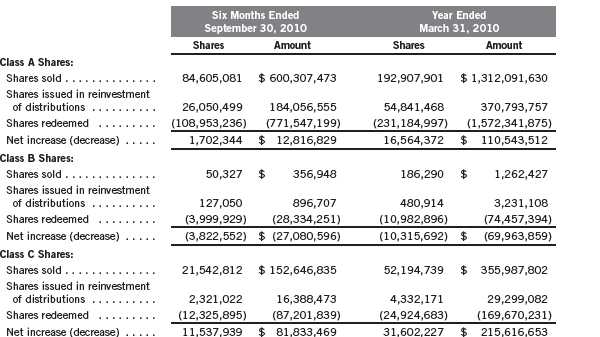
50 | Semiannual Report
Franklin California Tax-Free Income Fund
Notes to Financial Statements (unaudited) (continued)
| | | | | | | | | | |
| 2. CAPITAL STOCK (continued) | | | | | | | | | | |
| |
| | Six Months Ended | | Year Ended | |
| | September 30, 2010 | | March 31, 2010 | |
| | Shares | | | Amount | | Shares | | | Amount | |
| Advisor Class Shares: | | | | | | | | | | |
| Shares sold | 14,551,897 | | $ | 103,393,514 | | 29,620,760 | | $ | 199,953,550 | |
| Shares issued in reinvestment | | | | | | | | | | |
| of distributions | 783,136 | | | 5,525,569 | | 1,376,443 | | | 9,322,400 | |
| Shares redeemed | (6,437,807 | ) | | (45,505,965 | ) | (9,571,362 | ) | | (65,435,775 | ) |
| Net increase (decrease) | 8,897,226 | | $ | 63,413,118 | | 21,425,841 | | $ | 143,840,175 | |
3. TRANSACTIONS WITH AFFILIATES
Franklin Resources, Inc. is the holding company for various subsidiaries that together are referred to as Franklin Templeton Investments. Certain officers and trustees of the Fund are also officers and/or directors of the following subsidiaries:

a. Management Fees
The Fund pays an investment management fee to Advisers based on the month-end net assets of the Fund as follows:
| | |
| Annualized Fee Rate | | Net Assets |
| 0.625 | % | Up to and including $100 million |
| 0.500 | % | Over $100 million, up to and including $250 million |
| 0.450 | % | Over $250 million, up to and including $7.5 billion |
| 0.440 | % | Over $7.5 billion, up to and including $10 billion |
| 0.430 | % | Over $10 billion, up to and including $12.5 billion |
| 0.420 | % | Over $12.5 billion, up to and including $15 billion |
| 0.400 | % | Over $15 billion, up to and including $17.5 billion |
| 0.380 | % | Over $17.5 billion, up to and including $20 billion |
| 0.360 | % | In excess of $20 billion |
b. Administrative Fees
Under an agreement with Advisers, FT Services provides administrative services to the Fund. The fee is paid by Advisers based on average daily net assets, and is not an additional expense of the Fund.
Semiannual Report | 51
Franklin California Tax-Free Income Fund
Notes to Financial Statements (unaudited) (continued)
| 3. | TRANSACTIONS WITH AFFILIATES (continued) |
| c. | Distribution Fees |
The Fund’s Board of Trustees has adopted distribution plans for each share class, with the exception of Advisor Class shares, pursuant to Rule 12b-1 under the 1940 Act. Under the Fund’s Class A reimbursement distribution plan, the Fund reimburses Distributors for costs incurred in connection with the servicing, sale and distribution of the Fund’s shares up to the maximum annual plan rate. Under the Class A reimbursement distribution plan, costs exceeding the maximum for the current plan year cannot be reimbursed in subsequent periods.
In addition, under the Fund’s Class B and C compensation distribution plans, the Fund pays Distributors for costs incurred in connection with the servicing, sale and distribution of the Fund’s shares up to the maximum annual plan rate for each class.
The maximum annual plan rates, based on the average daily net assets, for each class, are as follows:
| | |
| Reimbursement plans | | |
| Class A | 0.10 | % |
| Compensation plans | | |
| Class B | 0.65 | % |
| Class C | 0.65 | % |
d. Sales Charges/Underwriting Agreements
Distributors has advised the Fund of the following commission transactions related to the sales and redemptions of the Fund’s shares for the period:
| | |
| Sales charges retained net of commissions paid to unaffiliated | | |
| broker/dealers | $ | 1,333,155 |
| Contingent deferred sales charges retained | $ | 141,203 |
e. Transfer Agent Fees
For the period ended September 30, 2010, the Fund paid transfer agent fees of $1,968,188, of which $1,118,575 was retained by Investor Services.
4. INCOME TAXES
For tax purposes, capital losses may be carried over to offset future capital gains, if any. At March 31, 2010, the capital loss carryforwards were as follows:
| | |
| Capital loss carryforwards expiring in: | | |
| 2016 | $ | 18,263,066 |
| 2017 | | 5,213,307 |
| 2018 | | 19,023,015 |
| | $ | 42,499,388 |
52 | Semiannual Report
Franklin California Tax-Free Income Fund
Notes to Financial Statements (unaudited) (continued)
4. INCOME TAXES (continued)
For tax purposes, realized capital losses occurring subsequent to October 31, may be deferred and treated as occurring on the first day of the following fiscal year. At March 31, 2010, the Fund deferred realized capital losses of $8,598,324.
At September 30, 2010, the cost of investments and net unrealized appreciation (depreciation) for income tax purposes were as follows:
| | | |
| Cost of investments | $ | 14,204,887,323 | |
| |
| Unrealized appreciation | $ | 800,613,025 | |
| Unrealized depreciation | | (190,719,046 | ) |
| Net unrealized appreciation (depreciation) | $ | 609,893,979 | |
Net investment income differs for financial statement and tax purposes primarily due to differing treatments of bond discounts.
Net realized gains (losses) differ for financial statement and tax purposes primarily due to differing treatments of wash sales and bond discounts.
5. INVESTMENT TRANSACTIONS
Purchases and sales of investments (excluding short term securities) for the period ended September 30, 2010, aggregated $215,086,475 and $316,965,815, respectively.
6. CREDIT RISK
At September 30, 2010, the Fund had 6.3% of its portfolio invested in high yield or other securities rated below investment grade. These securities may be more sensitive to economic conditions causing greater price volatility and are potentially subject to a greater risk of loss due to default than higher rated securities.
7. CONCENTRATION OF RISK
The Fund invests a large percentage of its total assets in obligations of issuers within California. Such concentration may subject the Fund to risks associated with industrial or regional matters, and economic, political or legal developments occurring within California. In addition, investments in these securities are sensitive to interest rate changes and credit risk of the issuer and may subject the funds to increased market volatility. The market for these investments may be limited, which may make them difficult to buy or sell.
Semiannual Report | 53
Franklin California Tax-Free Income Fund
Notes to Financial Statements (unaudited) (continued)
8. CREDIT FACILITY
The Fund, together with other U.S. registered and foreign investment funds (collectively “Borrowers”), managed by Franklin Templeton Investments, are borrowers in a joint syndicated senior unsecured credit facility totaling $750 million (Global Credit Facility) which matures on January 21, 2011. This Global Credit Facility provides a source of funds to the Borrowers for temporary and emergency purposes, including the ability to meet future unanticipated or unusually large redemption requests.
Under the terms of the Global Credit Facility, the Fund shall, in addition to interest charged on any borrowings made by the Fund and other costs incurred by the Fund, pay its share of fees and expenses incurred in connection with the implementation and maintenance of the Global Credit Facility, based upon its relative share of the aggregate net assets of all of the Borrowers, including an annual commitment fee of 0.10% based upon the unused portion of the Global Credit Facility, which is reflected in other expenses on the Statement of Operations. During the period ended September 30, 2010, the Fund did not use the Global Credit Facility.
9. REGULATORY AND LITIGATION MATTERS
During the period ended September 30, 2010, the Fund received $1,091,030 resulting from a settlement between the SEC and Advisers relating to market-timing activities, as previously reported in the Fund’s financial statements during the years ended March 31, 2005 through March 31, 2008. This payment is included in capital shares transactions on the Statements of Changes in Net Assets.
10. FAIR VALUE MEASUREMENTS
The Fund follows a fair value hierarchy that distinguishes between market data obtained from independent sources (observable inputs) and the Fund’s own market assumptions (unobservable inputs). These inputs are used in determining the value of the Fund’s investments and are summarized in the following fair value hierarchy:
- Level 1 – quoted prices in active markets for identical securities
- Level 2 – other significant observable inputs (including quoted prices for similar securities, interest rates, prepayment speed, credit risk, etc.)
- Level 3 – significant unobservable inputs (including the Fund’s own assumptions in determining the fair value of investments)
The inputs or methodology used for valuing securities are not an indication of the risk associated with investing in those securities.
For movements between the levels within the fair value hierarchy, the Fund has adopted a policy of recognizing the transfers as of the date of the underlying event which caused the movement.
54 | Semiannual Report
Franklin California Tax-Free Income Fund
Notes to Financial Statements (unaudited) (continued)
10. FAIR VALUE MEASUREMENTS (continued)
At September 30, 2010, all of the Fund’s investments in securities carried at fair value were in Level 2 inputs.
11. SUBSEQUENT EVENTS
The Fund has evaluated subsequent events through the issuance of the financial statements and determined that no events have occurred that require disclosure.
Semiannual Report | 55
Franklin California Tax-Free Income Fund
Shareholder Information
Proxy Voting Policies and Procedures
The Fund’s investment manager has established Proxy Voting Policies and Procedures (Policies) that the Fund uses to determine how to vote proxies relating to portfolio securities. Shareholders may view the Fund’s complete Policies online at franklintempleton.com. Alternatively, shareholders may request copies of the Policies free of charge by calling the Proxy Group collect at (954) 527-7678 or by sending a written request to: Franklin Templeton Companies, LLC, 500 East Broward Boulevard, Suite 1500, Fort Lauderdale, FL 33394, Attention: Proxy Group. Copies of the Fund’s proxy voting records are also made available online at franklintempleton.com and posted on the U.S. Securities and Exchange Commission’s website at sec.gov and reflect the most recent 12-month period ended June 30.
Quarterly Statement of Investments
The Fund files a complete statement of investments with the U.S. Securities and Exchange Commission for the first and third quarters for each fiscal year on Form N-Q. Shareholders may view the filed Form N-Q by visiting the Commission’s website at sec.gov. The filed form may also be viewed and copied at the Commission’s Public Reference Room in Washington, DC. Information regarding the operations of the Public Reference Room may be obtained by calling (800) SEC-0330.
56 | Semiannual Report

Sign up for electronic delivery
on franklintempleton. com
Semiannual Report and Shareholder Letter
FRANKLIN CALIFORNIA
TAX-FREE INCOME FUND
Investment Manager
Franklin Advisers, Inc.
Distributor
Franklin Templeton Distributors, Inc.
(800) DIAL BEN®
franklintempleton. com
Shareholder Services
(800) 632-2301
Authorized for distribution only when accompanied or preceded by a summary prospectus and/or prospectus. Investors should carefully consider a fund’s investment goals, risks, charges and expenses before investing. A prospectus contains this and other information; please read it carefully before investing.
To ensure the highest quality of service, telephone calls to or from our service departments may be monitored, recorded and accessed. These calls can be identified by the presence of a regular beeping tone.

Item 2. Code of Ethics.
(a) The Registrant has adopted a code of ethics that applies to its principal executive officers and principal financial and accounting officer.
(c) N/A
(d) N/A
(f) Pursuant to Item 12(a)(1), the Registrant is attaching as an exhibit a copy of its code of ethics that applies to its principal executive officers and principal financial and accounting officer.
Item 3. Audit Committee Financial Expert.
(a)(1) The Registrant has an audit committee financial expert serving on its audit committee.
(2) The audit committee financial expert is John B. Wilson and he is "independent" as defined under the relevant Securities and Exchange Commission Rules and Releases.
Item 4. Principal Accountant Fees and Services. N/A
Item 5. Audit Committee of Listed Registrants. N/A
Item 6. Schedule of Investments. N/A
Item 7. Disclosure of Proxy Voting Policies and Procedures for Closed-End Management Investment Companies. N/A
Item 8. Portfolio Managers of Closed-End Management Investment Companies. N/A
Item 9. Purchases of Equity Securities by Closed-End Management Investment Company and Affiliated Purchasers. N/A
Item 10. Submission of Matters to a Vote of Security Holders.
There have been no changes to the procedures by which shareholders may recommend nominees to the Registrant's Board of Trustees that would require disclosure herein.
Item 11. Controls and Procedures.
(a) Evaluation of Disclosure Controls and Procedures. The Registrant maintains disclosure controls and procedures that are designed to ensure that information required to be disclosed in the Registrant’s filings under the Securities Exchange Act of 1934 and the Investment Company Act of 1940 is recorded, processed, summarized and reported within the periods specified in the rules and forms of the Securities and Exchange Commission. Such information is accumulated and communicated to the Registrant’s management, including its principal executive officer and principal financial officer, as appropriate, to allow timely decisions regarding required disclosure. The Registrant’s management, including the principal executive officer and the principal financial officer, recognizes that any set of controls and procedures, no matter how well designed and operated, can provide only reasonable assurance of achieving the desired control objectives.
Within 90 days prior to the filing date of this Shareholder Report on Form N-CSR, the Registrant had carried out an evaluation, under the supervision and with the participation of the Registrant’s management, including the Registrant’s principal executive officer and the Registrant’s principal financial officer, of the effectiveness of the design and operation of the Registrant’s disclosure controls and procedures. Based on such evaluation, the Registrant’s principal executive officer and principal financial officer concluded that the Registrant’s disclosure controls and procedures are effective.
(b) Changes in Internal Controls. There have been no significant changes in the Registrant’s internal controls or in other factors that could significantly affect the internal controls subsequent to the date of their evaluation in connection with the preparation of this Shareholder Report on Form N-CSR.
Item 12. Exhibits.
(a) (1) Code of Ethics
(a) (2) Certifications pursuant to Section 302 of the Sarbanes-Oxley Act of 2002 of Laura F. Fergerson, Chief Executive Officer - Finance and Administration, and Gaston Gardey, Chief Financial Officer and Chief Accounting Officer
(b) Certifications pursuant to Section 906 of the Sarbanes-Oxley Act of 2002 of Laura F. Fergerson, Chief Executive Officer - Finance and Administration, and Gaston Gardey, Chief Financial Officer and Chief Accounting Officer
SIGNATURES
Pursuant to the requirements of the Securities Exchange Act of 1934 and the Investment Company Act of 1940, the registrant has duly caused this report to be signed on its behalf by the undersigned, thereunto duly authorized.
FRANKLIN CALIFORNIA TAX-FREE INCOME FUND
By s/LAURA F. FERGERSON
Laura F. Fergerson
Chief Executive Officer - Finance and Administration
Date November 24, 2010
Pursuant to the requirements of the Securities Exchange Act of 1934 and the Investment Company Act of 1940, this report has been signed below by the following persons on behalf of the registrant and in the capacities and on the dates indicated.
By /s/LAURA F. FERGERSON
Laura F. Fergerson
Chief Executive Officer - Finance and Administration
Date November 24, 2010
By /s/GASTON GARDEY
Gaston Gardey
Chief Financial Officer and Chief Accounting Officer
Date November 24, 2010