| 1
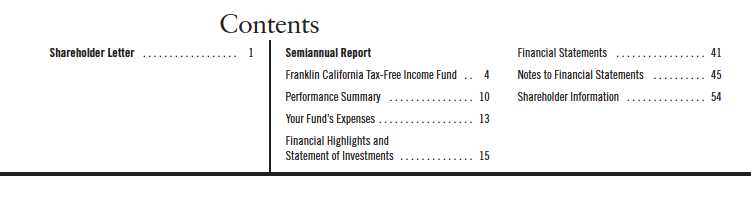
Semiannual Report
Franklin California
Tax-Free Income Fund
Your Fund’s Goal and Main Investments: Franklin California Tax-Free Income Fund seeks to provide as high a level of income exempt from federal and California personal income taxes (for California residents) as is consistent with prudent investment management and preservation of capital by investing at least 80% of its total assets in securities that pay interest free from such taxes.1

4 | Semiannual Report
Performance Overview
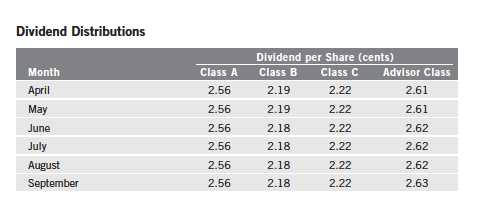
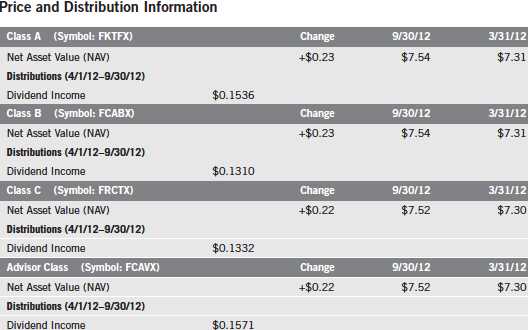
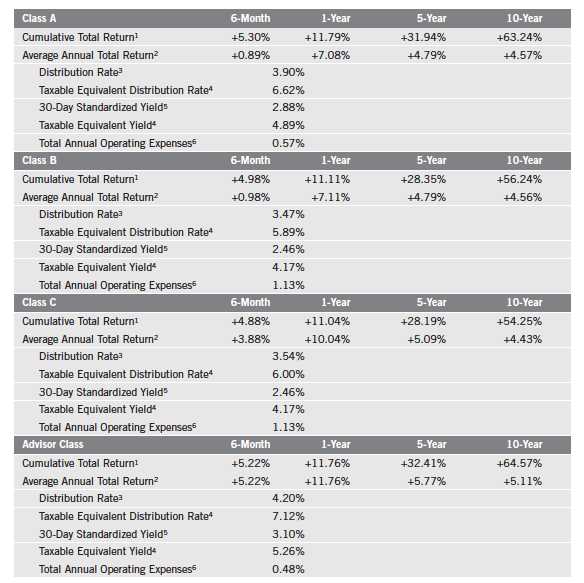
The Fund’s Class A share price, as measured by net asset value, increased from $7.31 on March 31, 2012, to $7.54 on September 30, 2012. The Fund’s Class A shares paid dividends totaling 15.36 cents per share for the reporting period.2 The Performance Summary beginning on page 10 shows that at the end of this reporting period the Fund’s Class A shares’ distribution rate was 3.90% based on an annualization of the 2.56 cent per share September dividend and the maximum offering price of $7.87 on September 30, 2012. An investor in the 2012 maximum combined effective federal and California personal income tax bracket of 41.05% would need to earn a distribution rate of 6.62% from a taxable investment to match the Fund’s Class A tax-free distribution rate. For the Fund’s Class B, C and Advisor shares’ performance, please see the Performance Summary.
State Update
California’s post-recession economic recovery continued over the six-month period, although at a slower pace than the nation’s. Although the state’s real estate market appeared to have reached a bottom and showed signs of recovery, with default notices declining significantly from 2009 highs, the median sale price of existing homes rising from 2009 lows, and home sales increasing on a year-over-year basis, the housing market remained historically weak. California benefited from strong export growth and venture capital investments largely in the software and biotechnology industries. A state economic activity
2. All Fund distributions will vary depending upon current market conditions, and past distributions are not indicative of future trends.
Performance data represent past performance, which does not guarantee future results. Investment return and principal value will fluctuate, and you may have a gain or loss when you sell your shares. Current performance may differ from figures shown. Please visit franklintempleton.com or call (800) 342-5236 for most recent month-end performance.
Semiannual Report | 5

index measuring nonfarm payrolls, exports, sales tax revenues, hotel occupancy rates, continuing claims for unemployment insurance, building permits and other statistics reached its highest level since June 2008.3 California’s unemployment rate declined from 11.7% in September 2011 to 10.2% at period-end, but it remained significantly higher than the 7.8% national rate.4 The leisure and hospitality, information, and professional and business services sectors posted the strongest growth rates, while the government, manufacturing and other services sectors had declines. In the economic forecast included with the governor’s revised fiscal year 2013 (ending June 30, 2013) budget proposal, the state projected nonfarm jobs lost during the Great Recession to be recovered fully by the fourth quarter of 2015, rather than the previous forecast of 2016.
California enacted an on-time fiscal year 2013 budget that closed a $15.7 billion gap through recurring and one-time spending cuts, temporary taxes and other actions while rebuilding a nearly $1 billion reserve.5 The enacted budget reforms the state’s welfare program and overhauls the correctional system while increasing school and university funding, pending voter approval of the governor’s tax initiative in the November general election. In addition, the timely budget passage avoided short-term liquidity shortfalls. Should voters reject the measure, an offsetting automatic trigger would cut $6 billion from education and public safety funding.5 Independent credit rating agency Standard & Poor’s (S&P) considered California’s budgetary solutions realistic and believed the enacted budget positions the state to finance intra-year cash flow deficits in a timely manner.
The state’s net tax-supported debt was $2,559 per capita and 6.0% of personal income, compared with the $1,117 and 2.8% national medians.6 Although California’s debt levels ranked among the nation’s highest, S&P considered them moderate given the state’s large population and budget. In April 2012, S&P affirmed California’s general obligation bond rating of A- (a low rating for states) with a positive outlook.7 S&P’s rating and outlook reflected the state’s economic depth and diversity, capacity to attract venture capital, significant presence of the growing biotechnology and alternative energy industries, prominent higher education institutions, innovative businesses and sectors, as well as improved budgeting flexibility and cash performance.
3. Source: Comerica Bank’s California Economic Activity Index. 4. Source: Bureau of Labor Statistics.
5. Source: Edmund G. Brown, Jr., Governor, State of California, “California State Budget 2012-13: Enacted Budget Summary,” 6/28/12.
6. Moody’s Investors Service, “Median Report: 2012 State Debt Medians Report,” 5/22/12.
7. This does not indicate S&P’s rating of the Fund.
6 | Semiannual Report
These positives were counterbalanced by California’s volatile revenue base and large debt, uncertainty about the upcoming November vote on a constitutional budget amendment, savings assumptions from the resolution of redevelopment agencies, cuts to health care and human services requiring federal approval, retirement benefit and budgetary liabilities, other revenue assumptions and governance rules that have sometimes contributed to delayed fiscal decision making. However, S&P added it believed the current risks were smaller than the ones it identified for the fiscal 2011-2012 budget. Although a few California municipalities pursued protection through the bankruptcy courts, the Fund does not hold specific bonds affected by these filings.
Municipal Bond Market Overview
For the six-month period ended September 30, 2012, the municipal bond market produced solid returns. During this period, the Barclays Municipal Bond Index, which tracks investment-grade municipal securities, returned +4.24%.8 In comparison, the Barclays U.S. Treasury Index returned +3.42%.8 The tax-exempt nature of most municipal bond coupon payments included in the Barclays Municipal Bond Index further enhanced the relative strength of municipal bond performance for the six months under review.
In a September 13, 2012, news release, the Federal Open Market Committee (FOMC) cited continued elevated unemployment levels, slowing increases to business spending and sluggish home prices as reasons to augment its highly accommodative monetary policy. Beyond keeping the federal funds target rate extremely low, the FOMC stated its intention to buy $40 billion a month in mortgages for the foreseeable future. The FOMC also intended to continue its current program of buying long-term Treasury bonds and selling short-term Treasury bills and notes, commonly called “Operation Twist,” through the remainder of 2012. The Fed’s actions during the period under review benefited the U.S. Treasury market and the municipal bond market.
Federal Reserve Board Chairman Ben Bernanke spoke on August 31, 2012, about state and local government austerity measures as a headwind to the pace of economic growth, adding that state and local governments had made real cuts to spending and employment. Spending cuts included reducing borrowing costs by issuing new debt at a lower rate and refinancing outstanding debt. New issuance increased during the first nine months of 2012 compared with the
8. Source: © 2012 Morningstar. All Rights Reserved. The information contained herein: (1) is proprietary to Morningstar and/or its content providers; (2) may not be copied or distributed; and (3) is not warranted to be accurate, complete or timely. Neither Morningstar nor its content providers are responsible for any damages or losses arising from any use of this information.
Semiannual Report | 7
same period in 2011, albeit from levels that were the lowest for new municipal bond issuance in a decade. Almost half of municipalities’ primary market issuance was for the purpose of refinancing outstanding debt. Year-to-date in 2012, the dollar amount of bonds issued for refinancing nearly doubled from the same period in 2011, but such bonds generally do not affect the total amount of outstanding municipal bonds. In contrast, bonds issued for new projects were more limited, resulting in low net supply of investment opportunities for municipal bond buyers. The scarcity of new bonds drove prices higher during the period.
The credit quality of outstanding municipal bonds, as assessed by independent credit rating agency S&P, increased slightly during the first six months of 2012, as S&P upgrades exceeded downgrades. For the same period, another independent credit rating agency, Moody’s Investors Service, announced more downgrades than upgrades. Many of the downgrades came on the heels of Moody’s massive upgrades in 2010, when it effected a wholesale shift in its municipal rating scale to fit its new global rating scale, which included corporate debt ratings. Subsequently, some of the issues that benefited from the 2010 rating upgrades were adjusted downward as Moody’s reviewed them using the new global rating scale criteria. In addition, the number of defaulted municipal issuers declined in the first half of 2012 compared with the same period in 2011. Despite general economic headwinds, the municipal bond market continued to provide investors with high-quality sources of fixed income opportunities.
At period-end, we maintained our positive view of the municipal bond market. We believe municipal bonds continue to be an attractive asset class among fixed income securities, and we intend to follow our solid discipline of investing to maximize income while seeking value in the municipal bond market.
Investment Strategy
We use a consistent, disciplined strategy in an effort to maximize tax-exempt income for our shareholders while balancing risk and return within the Fund’s range of allowable investments. We generally employ a buy-and-hold approach and invest in securities we believe should provide the most relative value in the market. We do not use leverage or exotic derivatives, nor do we use hedging techniques that could add volatility and contribute to underperformance in adverse markets. We generally seek to stay close to fully invested to help maximize income distribution.
8 | Semiannual Report
Manager’s Discussion
Based on the combination of our value-oriented philosophy of investing primarily for income and a positive-sloping municipal yield curve, we favored the use of longer term bonds. Consistent with our strategy, we sought to purchase bonds that ranged from 15 to 30 years in maturity with good call features. We believe our conservative, buy-and-hold investment strategy can help us achieve relatively high, current, tax-free income for shareholders.
Thank you for your participation in Franklin California Tax-Free Income Fund. We look forward to serving your future investment needs.
The foregoing information reflects our analysis, opinions and portfolio holdings as of September 30, 2012, the end of the reporting period. The way we implement our main investment strategies and the resulting portfolio holdings may change depending on factors such as market and economic conditions. These opinions may not be relied upon as investment advice or an offer for a particular security. The information is not a complete analysis of every aspect of any market, state, industry, security or the Fund. Statements of fact are from sources considered reliable, but the investment manager makes no representation or warranty as to their completeness or accuracy. Although historical performance is no guarantee of future results, these insights may help you understand our investment management philosophy.
Semiannual Report | 9
Performance Summary as of 9/30/12
Your dividend income will vary depending on dividends or interest paid by securities in the Fund’s portfolio, adjusted for operating expenses of each class. Capital gain distributions are net profits realized from the sale of portfolio securities. The performance table does not reflect any taxes that a shareholder would pay on Fund dividends, capital gain distributions, if any, or any realized gains on the sale of Fund shares. Total return reflects reinvestment of the Fund’s dividends and capital gain distributions, if any, and any unrealized gains or losses.
10 | Semiannual Report
Performance Summary (continued)
Performance
Cumulative total return excludes sales charges. Average annual total return includes maximum sales charges. Class A: 4.25% maximum initial sales charge; Class B: contingent deferred sales charge (CDSC) declining from 4% to 1% over six years, and eliminated thereafter; Class C: 1% CDSC in first year only; Advisor Class: no sales charges.
Performance data represent past performance, which does not guarantee future results. Investment return and principal value will fluctuate, and you may have a gain or loss when you sell your shares. Current performance may differ from figures shown. For most recent month-end performance, go to franklintempleton.com or call (800) 342-5236.
Semiannual Report | 11
Performance Summary (continued)
Endnotes
All investments involve risks, including possible loss of principal. The Fund is likely to be affected by events in California, including economic or political policy changes, tax base erosion, constitutional limits on tax increases, budget deficits, other financial difficulties, and changes in the credit ratings assigned to California issuers. The Fund may be affected by the same types of events in any of the territories in which it invests. When interest rates rise, debt security prices generally fall, and debt security prices generally rise when interest rates fall. Securities with longer maturities are generally more sensitive to interest rate changes. A debt security issuer may fail to make interest payments and/or to repay principal when due. Changes in an issuer’s financial strength or in a security’s credit rating may affect a security’s value. A change in the credit rating of any insurers of securities in the Fund’s portfolio, or the inability of an insurer to meet its insurance obligations, may affect the Fund. The Fund is actively managed but there is no guarantee that the manager’s investment decisions will produce the desired results. The Fund’s prospectus also includes a description of the main investment risks.
| |
Class B: Class C: | These shares have higher annual fees and expenses than Class A shares. Prior to 1/1/04, these shares were offered with an initial sales charge; thus actual total returns would have differed. These shares have higher annual fees and expenses than Class A shares. |
Advisor Class: | Shares are available to certain eligible investors as described in the prospectus. |
1. Cumulative total return represents the change in value of an investment over the periods indicated.
2. Average annual total return represents the average annual change in value of an investment over the periods indicated. Six-month return has not been annualized.
3. Distribution rate is based on an annualization of the respective class’s September dividend and the maximum offering price (NAV for Classes B, C and Advisor) per share on 9/30/12.
4. Taxable equivalent distribution rate and yield assume the published rates as of 6/27/12 for the maximum combined effective federal and California personal income tax rate of 41.05%, based on the federal income tax rate of 35.00%.
5. The 30-day standardized yield for the 30 days ended 9/30/12 reflects an estimated yield to maturity (assuming all portfolio securities are held to maturity). It should be regarded as an estimate of the Fund’s rate of investment income, and it may not equal the Fund’s actual income distribution rate (which reflects the Fund’s past dividends paid to shareholders) or the income reported in the Fund’s financial statements.
6. Figures are as stated in the Fund’s prospectus current as of the date of this report. In periods of market volatility, assets may decline significantly, causing total annual Fund operating expenses to become higher than the figures shown.
12 | Semiannual Report
Your Fund’s Expenses
As a Fund shareholder, you can incur two types of costs:
- Transaction costs, including sales charges (loads) on Fund purchases; and
- Ongoing Fund costs, including management fees, distribution and service (12b-1) fees, and other Fund expenses. All mutual funds have ongoing costs, sometimes referred to as operating expenses.
The following table shows ongoing costs of investing in the Fund and can help you understand these costs and compare them with those of other mutual funds. The table assumes a $1,000 investment held for the six months indicated.
Actual Fund Expenses
The first line (Actual) for each share class of the table provides actual account values and expenses. The “Ending Account Value” is derived from the Fund’s actual return, which includes the effect of Fund expenses.
You can estimate the expenses you paid during the period by following these steps. Of course, your account value and expenses will differ from those in this illustration:
| 1. | Divide your account value by $1,000. |
| | If an account had an $8,600 value, then $8,600 ÷ $1,000 = 8.6. |
| 2. | Multiply the result by the number under the heading “Expenses Paid During Period.” |
| | If Expenses Paid During Period were $7.50, then 8.6 x $7.50 = $64.50. |
In this illustration, the estimated expenses paid this period are $64.50.
Hypothetical Example for Comparison with Other Funds
Information in the second line (Hypothetical) for each class in the table can help you compare ongoing costs of investing in the Fund with those of other mutual funds. This information may not be used to estimate the actual ending account balance or expenses you paid during the period. The hypothetical “Ending Account Value” is based on the actual expense ratio for each class and an assumed 5% annual rate of return before expenses, which does not represent the Fund’s actual return. The figure under the heading “Expenses Paid During Period” shows the hypothetical expenses your account would have incurred under this scenario. You can compare this figure with the 5% hypothetical examples that appear in shareholder reports of other funds.
Semiannual Report | 13
Your Fund’s Expenses (continued)
Please note that expenses shown in the table are meant to highlight ongoing costs and do not reflect any transaction costs, such as sales charges. Therefore, the second line for each class is useful in comparing ongoing costs only, and will not help you compare total costs of owning different funds. In addition, if transaction costs were included, your total costs would have been higher. Please refer to the Fund prospectus for additional information on operating expenses.

*Expenses are calculated using the most recent six-month expense ratio, annualized for each class (A: 0.57%; B: 1.12%; C: 1.13%; and Advisor: 0.48%), multiplied by the average account value over the period, multiplied by 183/365 to reflect the one-half year period.
14 | Semiannual Report
Franklin California Tax-Free Income Fund
Financial Highlights

Semiannual Report | The accompanying notes are an integral part of these financial statements. | 15
Franklin California Tax-Free Income Fund
Financial Highlights (continued)
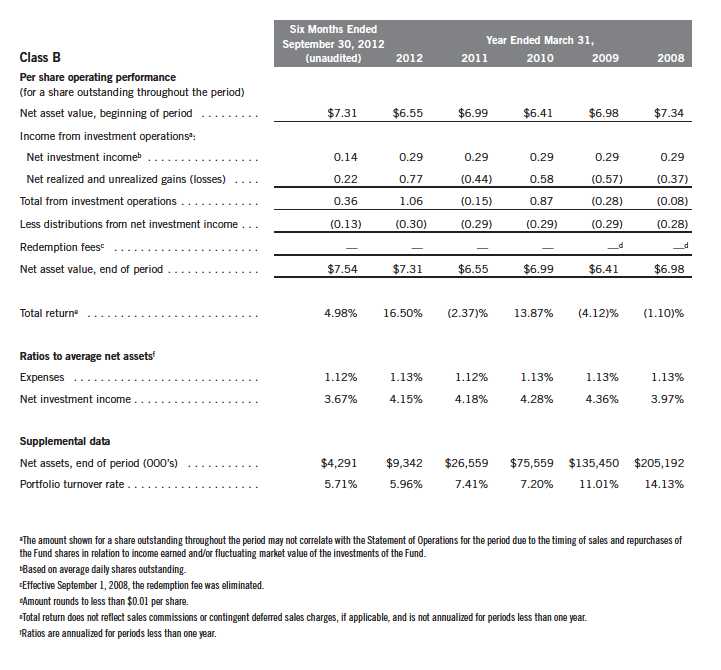
16 | The accompanying notes are an integral part of these financial statements. | Semiannual Report
Franklin California Tax-Free Income Fund
Financial Highlights (continued)
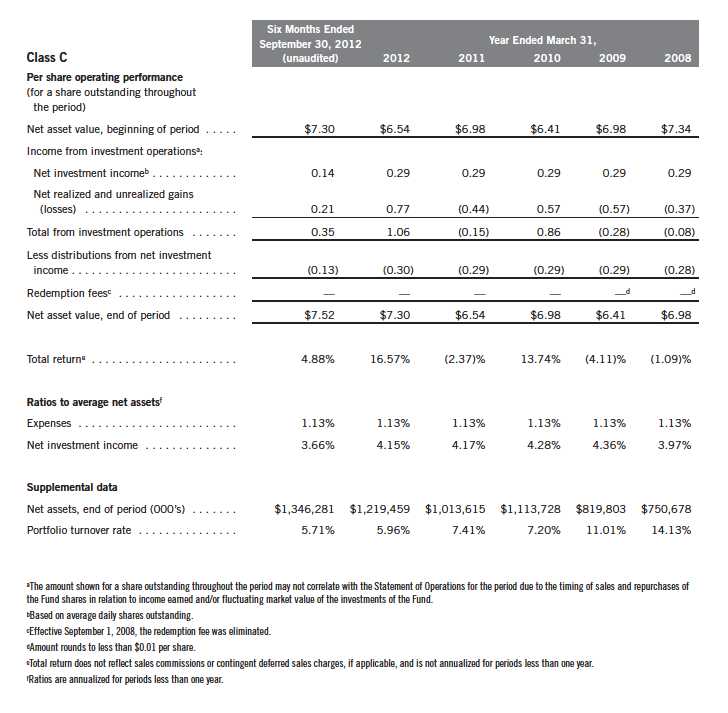
Semiannual Report | The accompanying notes are an integral part of these financial statements. | 17
Franklin California Tax-Free Income Fund
Financial Highlights (continued)
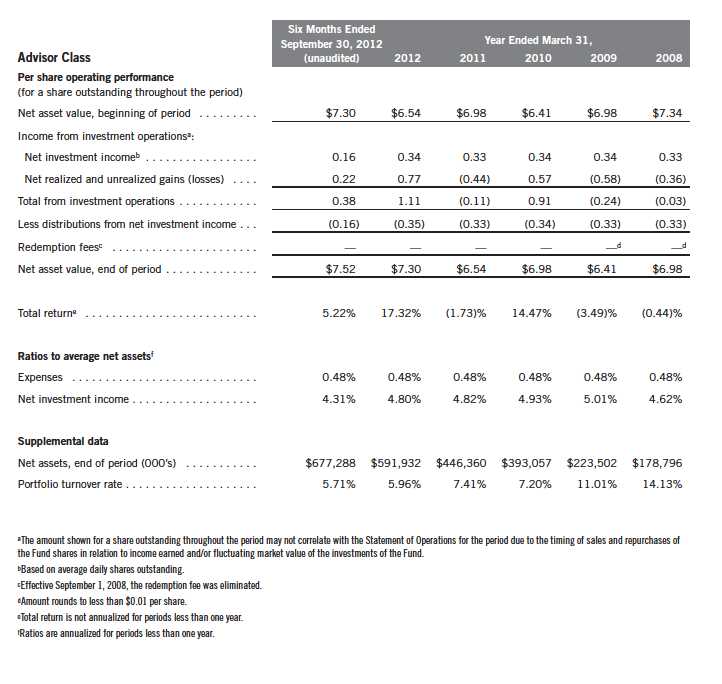
18 | The accompanying notes are an integral part of these financial statements. | Semiannual Report
Franklin California Tax-Free Income Fund
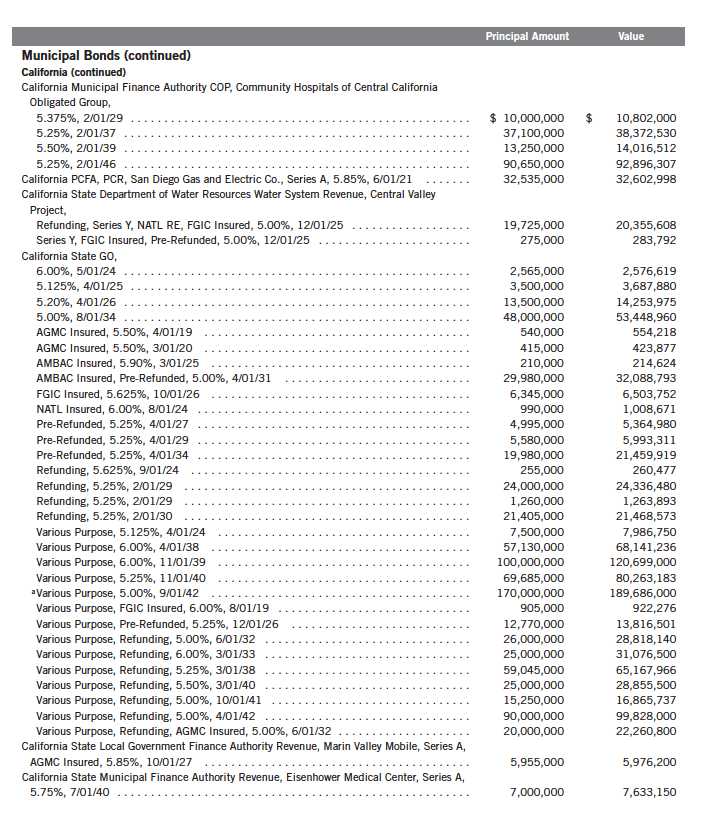
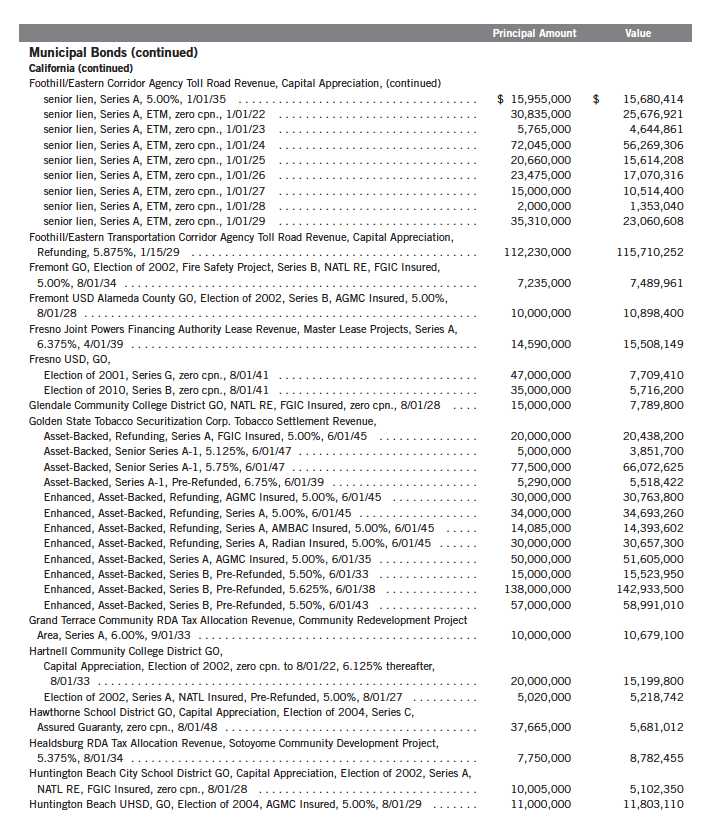
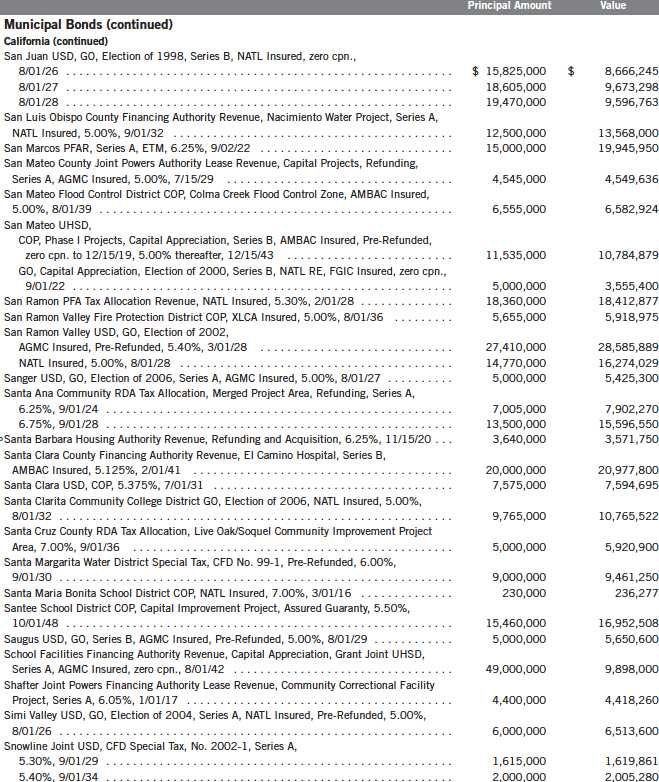
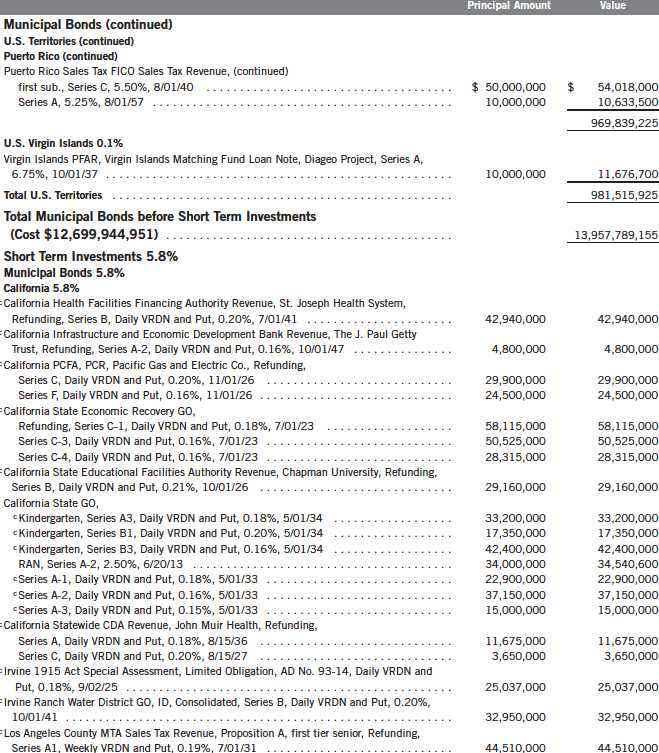
Statement of Investments, September 30, 2012 (unaudited)
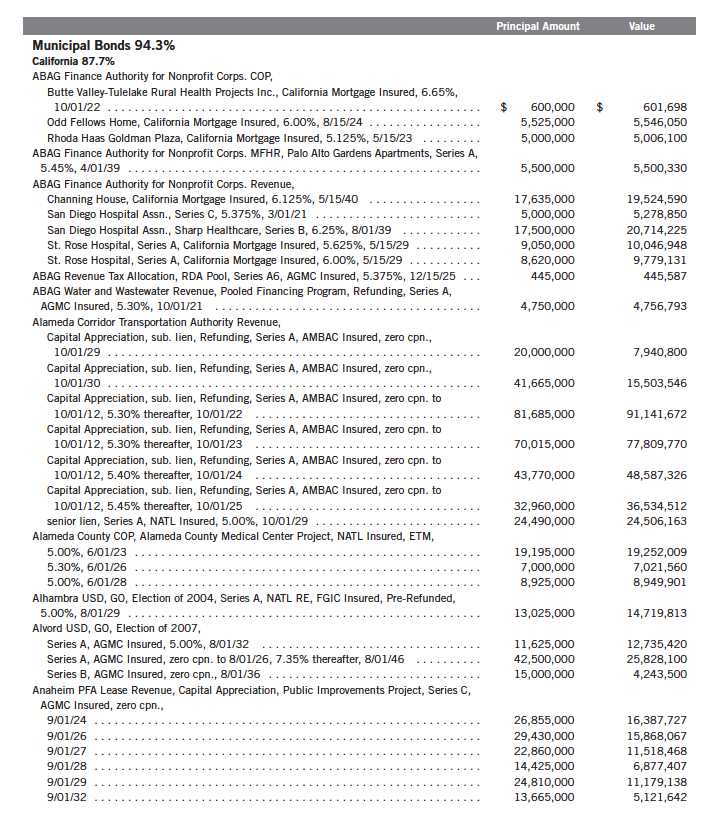
Semiannual Report | 19
Franklin California Tax-Free Income Fund
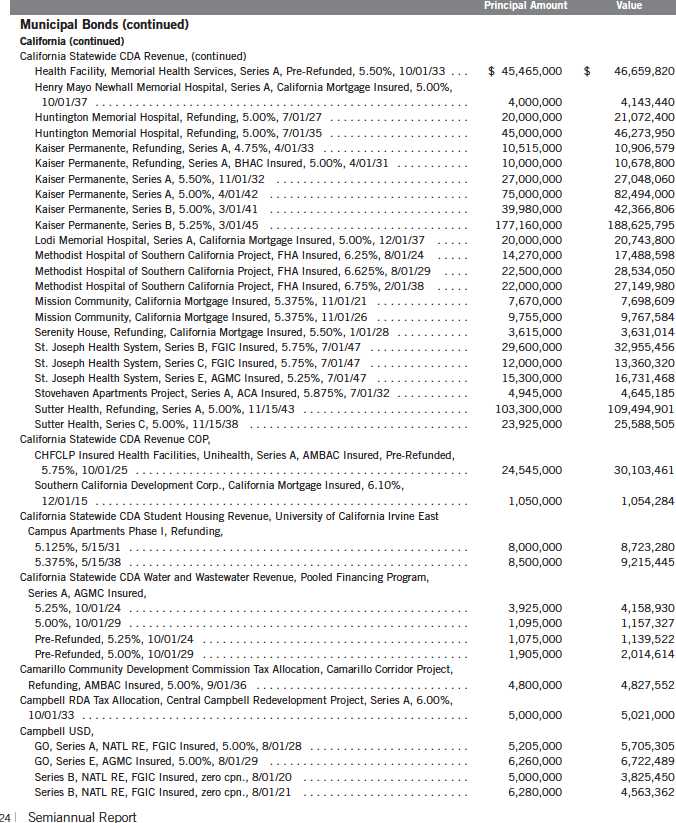
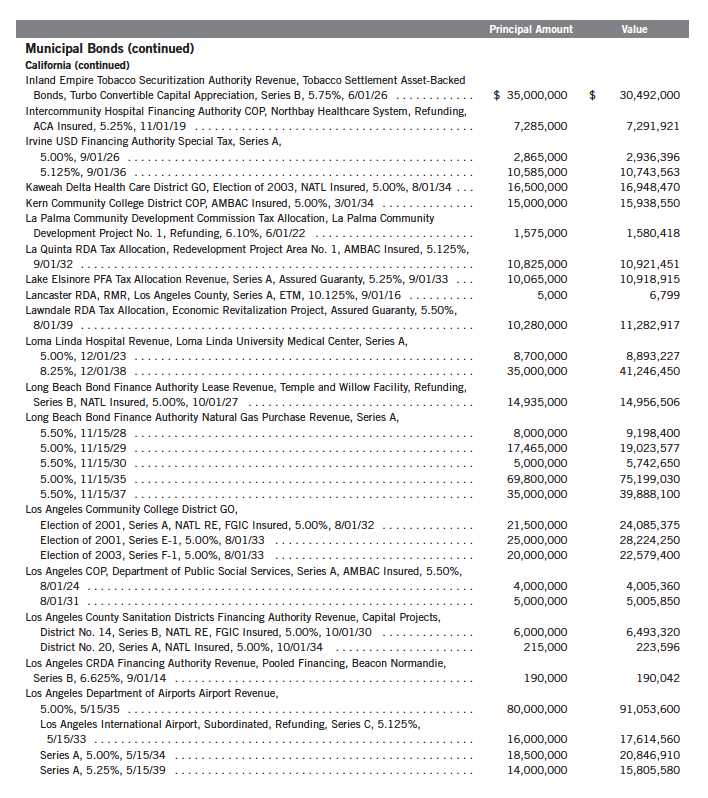
Statement of Investments, September 30, 2012 (unaudited) (continued)

20 | Semiannual Report
Franklin California Tax-Free Income Fund
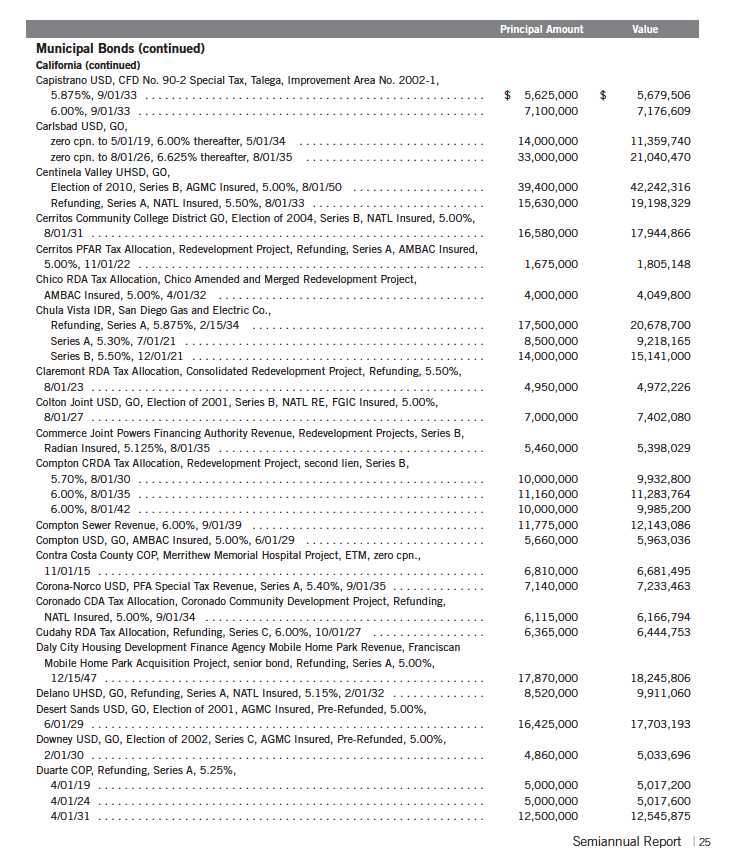
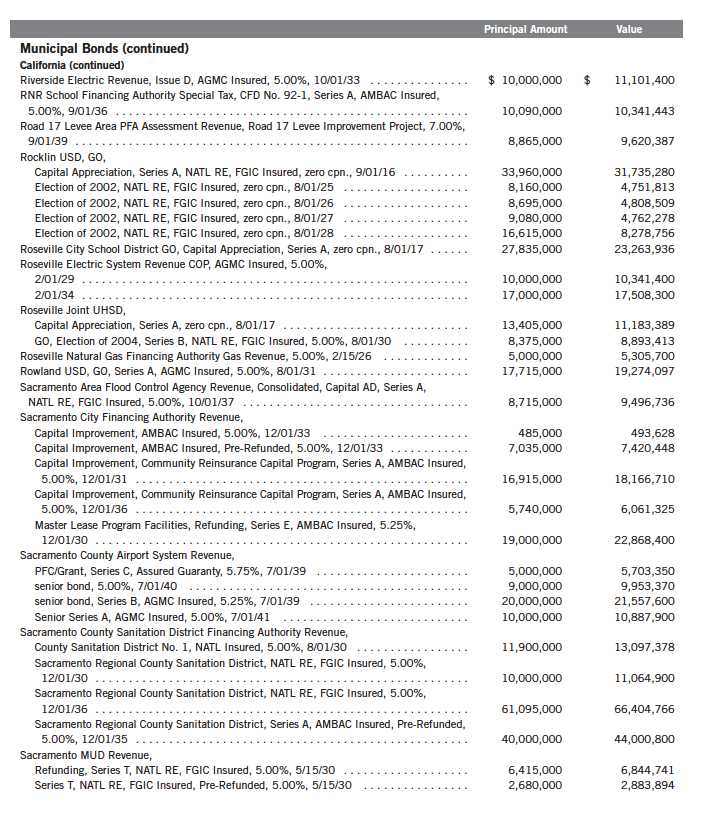
Statement of Investments, September 30, 2012 (unaudited) (continued)

Semiannual Report | 21
Franklin California Tax-Free Income Fund
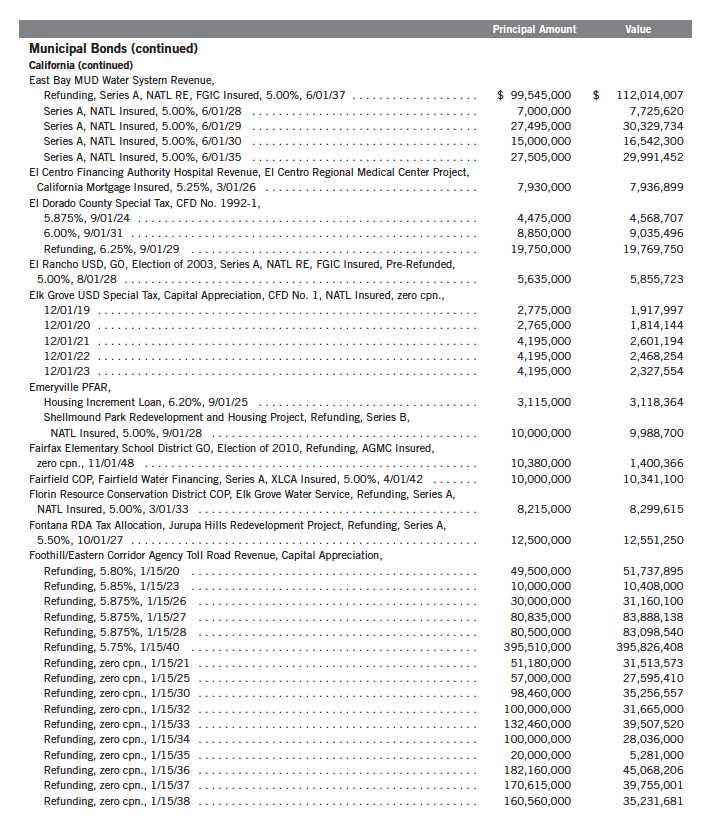
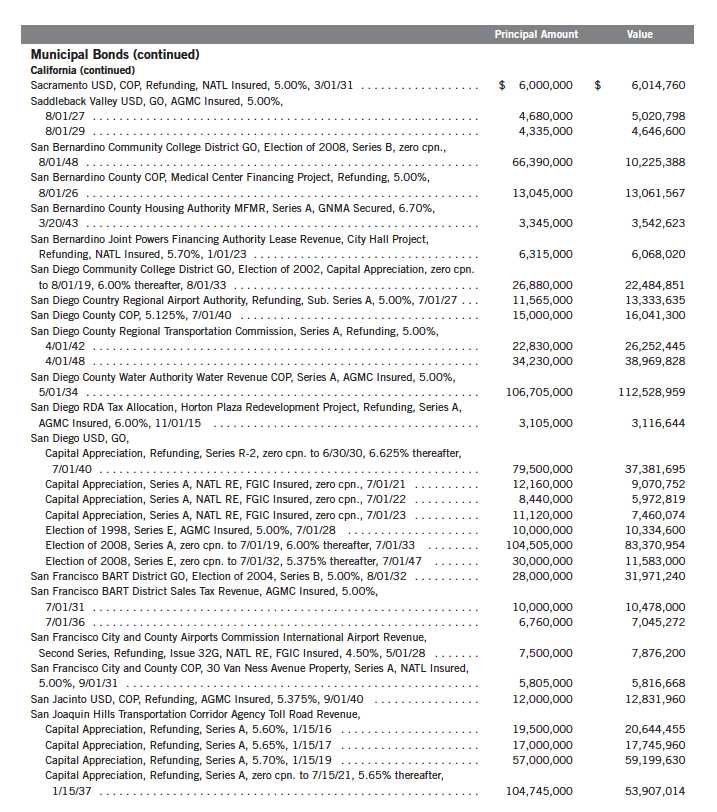
Statement of Investments, September 30, 2012 (unaudited) (continued)
22 | Semiannual Report
Franklin California Tax-Free Income Fund
Statement of Investments, September 30, 2012 (unaudited) (continued)

Semiannual Report | 23
Franklin California Tax-Free Income Fund
Statement of Investments, September 30, 2012 (unaudited) (continued)
Franklin California Tax-Free Income Fund
Statement of Investments, September 30, 2012 (unaudited) (continued)
Franklin California Tax-Free Income Fund
Statement of Investments, September 30, 2012 (unaudited) (continued)
26 | Semiannual Report
Franklin California Tax-Free Income Fund
Statement of Investments, September 30, 2012 (unaudited) (continued)
Semiannual Report | 27
Franklin California Tax-Free Income Fund
Statement of Investments, September 30, 2012 (unaudited) (continued)
28 | Semiannual Report
Franklin California Tax-Free Income Fund
Statement of Investments, September 30, 2012 (unaudited) (continued)

Semiannual Report | 29
Franklin California Tax-Free Income Fund
Statement of Investments, September 30, 2012 (unaudited) (continued)

30 | Semiannual Report
Franklin California Tax-Free Income Fund
Statement of Investments, September 30, 2012 (unaudited) (continued)

Semiannual Report | 31
Franklin California Tax-Free Income Fund
Statement of Investments, September 30, 2012 (unaudited) (continued)
32 | Semiannual Report
Franklin California Tax-Free Income Fund
Statement of Investments, September 30, 2012 (unaudited) (continued)
Semiannual Report | 33
Franklin California Tax-Free Income Fund
Statement of Investments, September 30, 2012 (unaudited) (continued)

34 | Semiannual Report
Franklin California Tax-Free Income Fund
Statement of Investments, September 30, 2012 (unaudited) (continued)
Semiannual Report | 35
Franklin California Tax-Free Income Fund
Statement of Investments, September 30, 2012 (unaudited) (continued)

36 | Semiannual Report
Franklin California Tax-Free Income Fund
Statement of Investments, September 30, 2012 (unaudited) (continued)

Semiannual Report | 37
Franklin California Tax-Free Income Fund
Statement of Investments, September 30, 2012 (unaudited) (continued)

38 | Semiannual Report
Franklin California Tax-Free Income Fund
Statement of Investments, September 30, 2012 (unaudited) (continued)
Semiannual Report | 39
Franklin California Tax-Free Income Fund
Statement of Investments, September 30, 2012 (unaudited) (continued)

40 | The accompanying notes are an integral part of these financial statements. | Semiannual Report
Franklin California Tax-Free Income Fund
Financial Statements
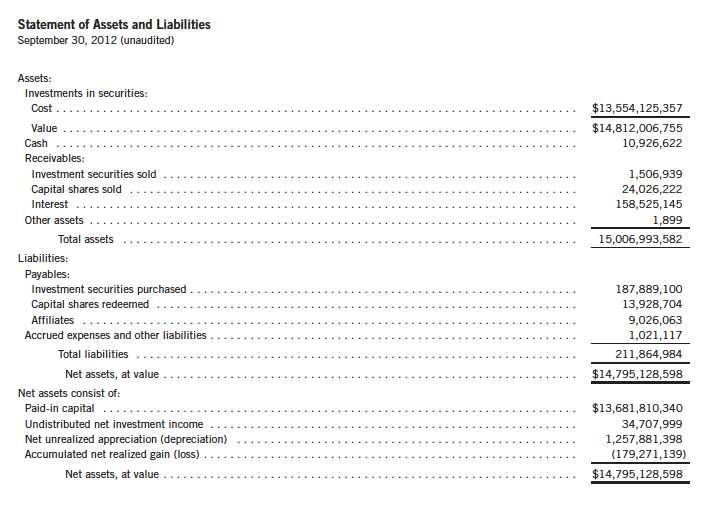
Semiannual Report | The accompanying notes are an integral part of these financial statements. | 41
Franklin California Tax-Free Income Fund
Financial Statements (continued)
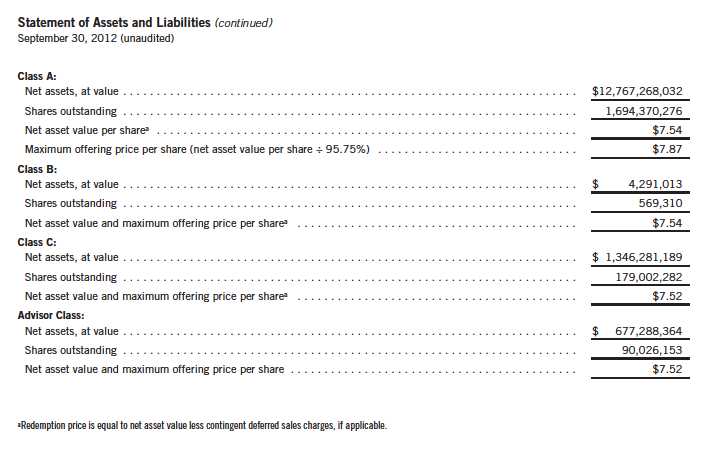
42 | The accompanying notes are an integral part of these financial statements. | Semiannual Report
Franklin California Tax-Free Income Fund
Financial Statements (continued)

Semiannual Report | The accompanying notes are an integral part of these financial statements. | 43
Franklin California Tax-Free Income Fund
Financial Statements (continued)
44 | The accompanying notes are an integral part of these financial statements. | Semiannual Report
Franklin California Tax-Free Income Fund
Notes to Financial Statements (unaudited)
1. ORGANIZATION AND SIGNIFICANT ACCOUNTING POLICIES
Franklin California Tax-Free Income Fund (Fund) is registered under the Investment Company Act of 1940, as amended, (1940 Act) as an open-end investment company. The Fund offers four classes of shares: Class A, Class B, Class C, and Advisor Class. Each class of shares differs by its initial sales load, contingent deferred sales charges, distribution fees, voting rights on matters affecting a single class and its exchange privilege.
The following summarizes the Fund’s significant accounting policies.
a. Financial Instrument Valuation
The Fund’s investments in financial instruments are carried at fair value daily. Fair value is the price that would be received to sell an asset or paid to transfer a liability in an orderly transaction between market participants on the measurement date. Under procedures approved by the Fund’s Board of Trustees (the Board), the Fund’s administrator, investment manager and other affiliates have formed the Valuation and Liquidity Oversight Committee (VLOC). The VLOC provides administration and oversight of the Fund’s valuation policies and procedures, which are approved annually by the Board. Among other things, these procedures allow the Fund to utilize independent pricing services, quotations from securities and financial instrument dealers, and other market sources to determine fair value.
Debt securities generally trade in the over-the-counter market rather than on a securities exchange. The Fund’s pricing services use multiple valuation techniques to determine fair value. In instances where sufficient market activity exists, the pricing services may utilize a market-based approach through which quotes from market makers are used to determine fair value. In instances where sufficient market activity may not exist or is limited, the pricing services also utilize proprietary valuation models which may consider market characteristics such as benchmark yield curves, credit spreads, estimated default rates, anticipated market interest rate volatility, coupon rates, anticipated timing of principal repayments, underlying collateral, and other unique security features in order to estimate the relevant cash flows, which are then discounted to calculate the fair value.
The Fund has procedures to determine the fair value of financial instruments for which market prices are not reliable or readily available. Under these procedures, the VLOC convenes on a regular basis to review such financial instruments and considers a number of factors, including significant unobservable valuation inputs, when arriving at fair value. The VLOC primarily employs a market-based approach which may use related or comparable assets or liabilities, recent transactions, market multiples, book values, and other relevant information for the investment to determine the fair value of the investment. An income-based valuation approach may also be
Semiannual Report | 45
Franklin California Tax-Free Income Fund
Notes to Financial Statements (unaudited) (continued)
| 1. | ORGANIZATION AND SIGNIFICANT ACCOUNTING POLICIES (continued) |
| a. | Financial Instrument Valuation (continued) |
used in which the anticipated future cash flows of the investment are discounted to calculate fair value. Discounts may also be applied due to the nature or duration of any restrictions on the disposition of the investments. Due to the inherent uncertainty of valuations of such investments, the fair values may differ significantly from the values that would have been used had an active market existed. The VLOC employs various methods for calibrating these valuation approaches including a regular review of key inputs and assumptions, transactional back-testing or disposition analysis, and reviews of any related market activity.
b. Securities Purchased on a When-Issued Basis
The Fund purchases securities on a when-issued basis, with payment and delivery scheduled for a future date. These transactions are subject to market fluctuations and are subject to the risk that the value at delivery may be more or less than the trade date purchase price. Although the Fund will generally purchase these securities with the intention of holding the securities, it may sell the securities before the settlement date. Sufficient assets have been segregated for these securities.
c. Income Taxes
It is the Fund’s policy to qualify as a regulated investment company under the Internal Revenue Code. The Fund intends to distribute to shareholders substantially all of its income and net realized gains to relieve it from federal income and excise taxes. As a result, no provision for U.S. federal income taxes is required.
The Fund recognizes the tax benefits of uncertain tax positions only when the position is “more likely than not” to be sustained upon examination by the tax authorities based on the technical merits of the tax position. As of September 30, 2012, and for all open tax years, the Fund has determined that no liability for unrecognized tax benefits is required in the Fund’s financial statements related to uncertain tax positions taken on a tax return (or expected to be taken on future tax returns). Open tax years are those that remain subject to examination and are based on each tax jurisdiction statute of limitation.
d. Security Transactions, Investment Income, Expenses and Distributions
Security transactions are accounted for on trade date. Realized gains and losses on security transactions are determined on a specific identification basis. Interest income and estimated expenses are accrued daily. Amortization of premium and accretion of discount on debt securities are included in interest income. Distributions to shareholders are recorded on the ex-dividend date and are determined according to income tax regulations (tax basis). Distributable earnings determined on a tax basis may differ from earnings recorded in accordance with accounting principles
46 | Semiannual Report
Franklin California Tax-Free Income Fund
Notes to Financial Statements (unaudited) (continued)
| 1. | ORGANIZATION AND SIGNIFICANT ACCOUNTING POLICIES (continued) |
| d. | Security Transactions, Investment Income, Expenses and Distributions (continued) |
generally accepted in the United States of America. These differences may be permanent or temporary. Permanent differences are reclassified among capital accounts to reflect their tax character. These reclassifications have no impact on net assets or the results of operations. Temporary differences are not reclassified, as they may reverse in subsequent periods.
Realized and unrealized gains and losses and net investment income, not including class specific expenses, are allocated daily to each class of shares based upon the relative proportion of net assets of each class. Differences in per share distributions, by class, are generally due to differences in class specific expenses.
e. Insurance
The scheduled payments of interest and principal for each insured municipal security in the Fund are insured by either a new issue insurance policy or a secondary insurance policy. Some municipal securities in the Fund are secured by collateral guaranteed by an agency of the U.S. government. Depending on the type of coverage, premiums for insurance are either added to the cost basis of the security or paid by a third party.
Insurance companies typically insure municipal bonds that tend to be of very high quality, with the majority of underlying municipal bonds rated A or better. However, an event involving an insurer could have an adverse effect on the value of the securities insured by that insurance company. There is no guarantee the insurer will be able to fulfill its obligations under the terms of the policy.
f. Accounting Estimates
The preparation of financial statements in accordance with accounting principles generally accepted in the United States of America requires management to make estimates and assumptions that affect the reported amounts of assets and liabilities at the date of the financial statements and the amounts of income and expenses during the reporting period. Actual results could differ from those estimates.
g. Guarantees and Indemnifications
Under the Fund’s organizational documents, its officers and trustees are indemnified by the Fund against certain liabilities arising out of the performance of their duties to the Fund. Additionally, in the normal course of business, the Fund enters into contracts with service providers that contain general indemnification clauses. The Fund’s maximum exposure under these arrangements is unknown as this would involve future claims that may be made against the Fund that have not yet occurred. Currently, the Fund expects the risk of loss to be remote.
Semiannual Report | 47
Franklin California Tax-Free Income Fund
Notes to Financial Statements (unaudited) (continued)
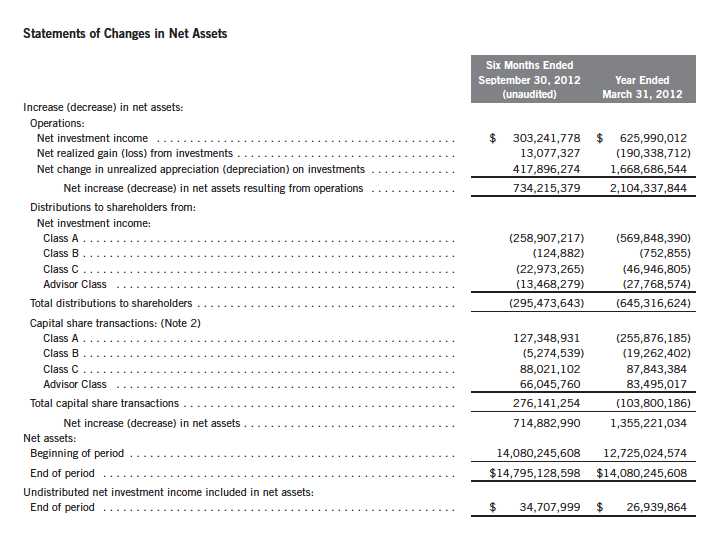
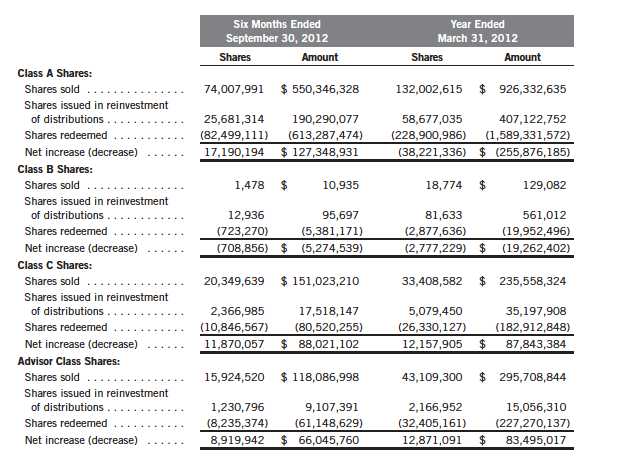
2. SHARES OF BENEFICIAL INTEREST
At September 30, 2012, there were an unlimited number of shares authorized (without par value). Transactions in the Fund’s shares were as follows:
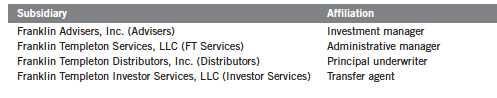
3. TRANSACTIONS WITH AFFILIATES
Franklin Resources, Inc. is the holding company for various subsidiaries that together are referred to as Franklin Templeton Investments. Certain officers and trustees of the Fund are also officers and/or directors of the following subsidiaries:
48 | Semiannual Report
Franklin California Tax-Free Income Fund
Notes to Financial Statements (unaudited) (continued)
| 3. | TRANSACTIONS WITH AFFILIATES (continued) |
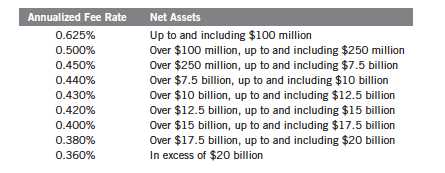
| a. | Management Fees |
The Fund pays an investment management fee to Advisers based on the month-end net assets of the Fund as follows:
b. Administrative Fees
Under an agreement with Advisers, FT Services provides administrative services to the Fund. The fee is paid by Advisers based on average daily net assets, and is not an additional expense of the Fund.
c. Distribution Fees
The Board has adopted distribution plans for each share class, with the exception of Advisor Class shares, pursuant to Rule 12b-1 under the 1940 Act. Distribution fees are not charged on shares held by affiliates. Under the Fund’s Class A reimbursement distribution plan, the Fund reimburses Distributors for costs incurred in connection with the servicing, sale and distribution of the Fund’s shares up to the maximum annual plan rate. Under the Class A reimbursement distribution plan, costs exceeding the maximum for the current plan year cannot be reimbursed in subsequent periods. In addition, under the Fund’s Class B and C compensation distribution plans, the Fund pays Distributors for costs incurred in connection with the servicing, sale and distribution of the Fund’s shares up to the maximum annual plan rate for each class.
The maximum annual plan rates, based on the average daily net assets, for each class, are as follows:

Semiannual Report | 49
Franklin California Tax-Free Income Fund
Notes to Financial Statements (unaudited) (continued)
| 3. | TRANSACTIONS WITH AFFILIATES (continued) |
| d. | Sales Charges/Underwriting Agreements |
Front-end sales charges and contingent deferred sales charges (CDSC) do not represent expenses of the Fund. These charges are deducted from the proceeds of sales of Fund shares prior to investment or from redemption proceeds prior to remittance, as applicable. Distributors has advised the Fund of the following commission transactions related to the sales and redemptions of the Fund’s shares for the period:

e. Transfer Agent Fees
For the period ended September 30, 2012, the Fund paid transfer agent fees of $1,884,796, of which $920,659 was retained by Investor Services.
4. INCOME TAXES
For tax purposes, capital losses may be carried over to offset future capital gains, if any. Capital loss carryforwards with no expiration, if any, must be fully utilized before those losses with expiration dates.
At March 31, 2012, the Fund had capital loss carryforwards of $108,014 expiring in 2018 and capital loss carryforwards of $190,246,080 not subject to expiration.
At September 30, 2012, the cost of investments and net unrealized appreciation (depreciation) for income tax purposes were as follows:
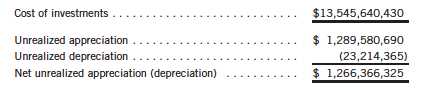
Differences between income and/or capital gains as determined on a book basis and a tax basis are primarily due to differing treatments of bond discounts and premiums, and wash sales.
50 | Semiannual Report
Franklin California Tax-Free Income Fund
Notes to Financial Statements (unaudited) (continued)
5. INVESTMENT TRANSACTIONS
Purchases and sales of investments (excluding short term securities) for the period ended September 30, 2012, aggregated $995,872,863 and $785,904,067, respectively.
6. CREDIT RISK
At September 30, 2012, the Fund had 7.2% of its portfolio invested in high yield or other securities rated below investment grade. These securities may be more sensitive to economic conditions causing greater price volatility and are potentially subject to a greater risk of loss due to default than higher rated securities.
7. CONCENTRATION OF RISK
The Fund invests a large percentage of its total assets in obligations of issuers within California and U.S. territories. Such concentration may subject the Fund to risks associated with industrial or regional matters, and economic, political or legal developments occurring within California and U.S. territories. In addition, investments in these securities are sensitive to interest rate changes and credit risk of the issuer and may subject the funds to increased market volatility. The market for these investments may be limited, which may make them difficult to buy or sell.
8. CREDIT FACILITY
The Fund, together with other U.S. registered and foreign investment funds (collectively, Borrowers), managed by Franklin Templeton Investments, are borrowers in a joint syndicated senior unsecured credit facility totaling $1.5 billion (Global Credit Facility) which matures on January 18, 2013. This Global Credit Facility provides a source of funds to the Borrowers for temporary and emergency purposes, including the ability to meet future unanticipated or unusually large redemption requests.
Under the terms of the Global Credit Facility, the Fund shall, in addition to interest charged on any borrowings made by the Fund and other costs incurred by the Fund, pay its share of fees and expenses incurred in connection with the implementation and maintenance of the Global Credit Facility, based upon its relative share of the aggregate net assets of all of the Borrowers, including an annual commitment fee of 0.08% based upon the unused portion of the Global Credit Facility, which is reflected in other expenses on the Statement of Operations. During the period ended September 30, 2012, the Fund did not use the Global Credit Facility.
Semiannual Report | 51
Franklin California Tax-Free Income Fund
Notes to Financial Statements (unaudited) (continued)
9. FAIR VALUE MEASUREMENTS
The Fund follows a fair value hierarchy that distinguishes between market data obtained from independent sources (observable inputs) and the Fund’s own market assumptions (unobservable inputs). These inputs are used in determining the value of the Fund’s financial instruments and are summarized in the following fair value hierarchy:
- Level 1 – quoted prices in active markets for identical financial instruments
- Level 2 – other significant observable inputs (including quoted prices for similar financial instruments, interest rates, prepayment speed, credit risk, etc.)
- Level 3 – significant unobservable inputs (including the Fund’s own assumptions in determining the fair value of financial instruments)
The inputs or methodology used for valuing financial instruments are not an indication of the risk associated with investing in those financial instruments.
For movements between the levels within the fair value hierarchy, the Fund has adopted a policy of recognizing the transfers as of the date of the underlying event which caused the movement.
At September 30, 2012, all of the Fund’s investments in financial instruments carried at fair value were valued using Level 2 inputs.
10. SUBSEQUENT EVENTS
The Fund has evaluated subsequent events through the issuance of the financial statements and determined that no events have occurred that require disclosure.
52 | Semiannual Report
Franklin California Tax-Free Income Fund
Notes to Financial Statements (unaudited) (continued)
Semiannual Report | 53
Franklin California Tax-Free Income Fund
Shareholder Information
Proxy Voting Policies and Procedures
The Fund’s investment manager has established Proxy Voting Policies and Procedures (Policies) that the Fund uses to determine how to vote proxies relating to portfolio securities. Shareholders may view the Fund’s complete Policies online at franklintempleton.com. Alternatively, shareholders may request copies of the Policies free of charge by calling the Proxy Group collect at (954) 527-7678 or by sending a written request to: Franklin Templeton Companies, LLC, 300 S.E. 2nd Street, Fort Lauderdale, FL 33301, Attention: Proxy Group. Copies of the Fund’s proxy voting records are also made available online at franklintempleton.com and posted on the U.S. Securities and Exchange Commission’s website at sec.gov and reflect the most recent 12-month period ended June 30.
Quarterly Statement of Investments
The Fund files a complete statement of investments with the U.S. Securities and Exchange Commission for the first and third quarters for each fiscal year on Form N-Q. Shareholders may view the filed Form N-Q by visiting the Commission’s website at sec.gov. The filed form may also be viewed and copied at the Commission’s Public Reference Room in Washington, DC. Information regarding the operations of the Public Reference Room may be obtained by calling (800) SEC-0330.
54 | Semiannual Report
This page intentionally left blank.
This page intentionally left blank.
Item 2. Code of Ethics.
(a) The Registrant has adopted a code of ethics that applies to its principal executive officers and principal financial and accounting officer.
| (c) | N/A |
| (d) | N/A |
| (f) | Pursuant to Item 12(a)(1), the Registrant is attaching as an exhibit a copy of its code of ethics that applies to its principal executive officers and principal financial and accounting officer. |
Item 3. Audit Committee Financial Expert.
(a)(1) The Registrant has an audit committee financial expert serving on its audit committee.
(2) The audit committee financial expert is John B. Wilson and he is "independent" as defined under the relevant Securities and Exchange Commission Rules and Releases.
Item 4. Principal Accountant Fees and Services. N/A
Item 5. Audit Committee of Listed Registrants. N/A
Item 6. Schedule of Investments. N/A
Item 7. Disclosure of Proxy Voting Policies and Procedures for Closed-End Management Investment Companies. N/A
Item 8. Portfolio Managers of Closed-End Management Investment Companies. N/A
Item 9. Purchases of Equity Securities by Closed-End Management Investment Company and Affiliated Purchasers. N/A
Item 10. Submission of Matters to a Vote of Security Holders.
There have been no changes to the procedures by which shareholders may recommend nominees to the Registrant's Board of Trustees that would require disclosure herein.
Item 11. Controls and Procedures.
(a) Evaluation of Disclosure Controls and Procedures. The Registrant maintains disclosure controls and procedures that are designed to ensure that information required to be disclosed in the Registrant’s filings under the Securities Exchange Act of 1934 and the Investment Company Act of 1940 is recorded, processed, summarized and reported within the periods specified in the rules and forms of the Securities and Exchange Commission. Such information is accumulated and communicated to the Registrant’s management, including its principal executive officer and principal financial officer, as appropriate, to allow timely decisions regarding required disclosure. The Registrant’s management, including the principal executive officer and the principal financial officer, recognizes that any set of controls and procedures, no matter how well designed and operated, can provide only reasonable assurance of achieving the desired control objectives.
Within 90 days prior to the filing date of this Shareholder Report on Form N-CSR, the Registrant had carried out an evaluation, under the supervision and with the participation of the Registrant’s management, including the Registrant’s principal executive officer and the Registrant’s principal financial officer, of the effectiveness of the design and operation of the Registrant’s disclosure controls and procedures. Based on such evaluation, the Registrant’s principal executive officer and principal financial officer concluded that the Registrant’s disclosure controls and procedures are effective.
(b) Changes in Internal Controls.
There have been no changes in the Registrant’s internal controls or in other factors that could materially affect the internal controls over financial reporting subsequent to the date of their evaluation in connection with the preparation of this Shareholder Report on Form N-CSR.
Item 12. Exhibits.
| (a) | (1) Code of Ethics |
| (a) | (2) Certifications pursuant to Section 302 of the Sarbanes-Oxley Act of 2002 of Laura F. Fergerson, Chief Executive Officer - Finance and Administration, and Gaston Gardey, Chief Financial Officer and Chief Accounting Officer |
| (b) | Certifications pursuant to Section 906 of the Sarbanes-Oxley Act of 2002 of Laura F. Fergerson, Chief Executive Officer - Finance and Administration, and Gaston Gardey, Chief Financial Officer and Chief Accounting Officer |
SIGNATURES
Pursuant to the requirements of the Securities Exchange Act of 1934 and the Investment Company Act of 1940, the registrant has duly caused this report to be signed on its behalf by the undersigned, thereunto duly authorized.
FRANKLIN CALIFORNIA TAX-FREE INCOME FUND
By /s/ Laura F. Fergerson
Laura F. Fergerson
Chief Executive Officer - Finance and Administration
Date November 27, 2012
Pursuant to the requirements of the Securities Exchange Act of 1934 and
the Investment Company Act of 1940, this report has been signed below
by the following persons on behalf of the registrant and in the
capacities and on the dates indicated.
By /s/ Laura F. Fergerson
Laura F. Fergerson
Chief Executive Officer - Finance and Administration
Date November 27, 2012
By /s/ Gaston Gardey
Gaston Gardey
Chief Financial Officer and Chief Accounting Officer
Date November 27, 2012