(Exact name of registrant as specified in charter)
500 Boylston Street, Boston, Massachusetts 02116
(Address of principal executive offices) (Zip code)
Susan S. Newton
Massachusetts Financial Services Company
500 Boylston Street
Boston, Massachusetts 02116
(Name and address of agents for service)
Registrant’s telephone number, including area code: (617) 954-5000
Date of fiscal year end: January 31
Date of reporting period: January 31, 2006
ITEM 1. REPORTS TO STOCKHOLDERS.
LETTER FROM THE CEO
Dear Shareholders,
It has been said that change is the only constant in life. As investors have seen, that theme is still accurate today as we recently have experienced shifting economic cycles because of natural disasters and political instability around the globe. Markets worldwide have fluctuated in the past year as devastating hurricanes had a dramatic effect on the international economy, particularly on oil prices. We witnessed political unrest in the Middle East, highlighted by instability in Iraq, and in Africa, the usually stable Nigeria also experienced violence. As a result, energy prices have bounced up and down, with crude oil prices at one point topping a record $70 per barrel.
Such cycles are not uncommon and in fact have almost become the norm in our everyday lives. What does all of this mean to you as an investor? In times like these, it helps to know that you’re working with a seasoned investment professional who has experience to guide you through difficult times. At MFS®, we believe our investment management team has the knowledge and confidence to navigate through difficult cycles and at the same time see through adversity to find investment opportunities for our clients and shareholders.
Our investment management process, honed over 80 years, combines a unique concept of teamwork with our unwavering focus on the long term. We firmly believe that the best way to realize long-term financial goals – be it a college education, a comfortable retirement, or a secure family legacy – is to follow a three-pronged approach that focuses on longer time horizons. Allocate holdings across the major asset classes – including stocks, bonds, and cash. Diversify within each class to take advantage of different market segments and investing styles. Rebalance assets regularly to maintain a desired asset allocation. Of course, these strategies cannot guarantee a profit or protect against a loss. This long-term approach requires diligence and patience, two traits that in our experience are essential to capitalizing on the many opportunities the financial markets can offer – through both up and down economic cycles.
Respectfully,
Robert J. Manning
Chief Executive Officer and Chief Investment Officer MFS Investment Management® March 15, 2006
The opinions expressed in this letter are those of MFS, and no forecasts can be guaranteed.
ANNUAL REPORT 1
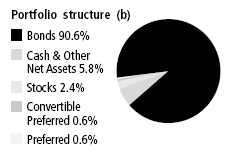
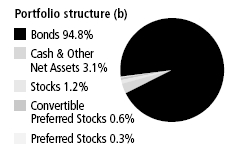
PORTFOLIO COMPOSITION
Top five bond industries (b)
Healthcare Revenue – Hospitals
21.7%
Healthcare Revenue – Long Term Care
9.9%
Tobacco
5.1%
General Obligation – General Purpose
4.6%
Tax Assessment
4.5%
Credit quality of bonds (r)
AAA
23.7%
AA
2.9%
A
7.1%
BBB
27.3%
BB
8.9%
B
5.1%
CCC
3.2%
Not Rated
21.8%
Portfolio facts
Average Duration (d)
6.2
Average Life (m)
16.4 yrs.
Average Maturity (m)
19.1 yrs.
Average Credit Quality of
Rated Securities (a)
A-
Average Short Term Credit Quality
A-1
(b)
For purposes of this graphical presentation, the bond component includes both accrued interest amounts
and the equivalent exposure from any derivative holdings, if applicable.
(r)
Each security is assigned a rating from Moody’s Investors Service. If not rated by Moody’s, the rating will
be that assigned by Standard & Poor’s. Likewise, if not assigned a rating by Standard & Poor’s, it will be
based on the rating assigned by Fitch, Inc. For those portfolios that hold a security which is not rated by
any of the three agencies, the security is considered Not Rated. Holdings in U.S. Treasuries and
government agency mortgage-backed securities, if any, are included in the ’’AAA’’-rating category.
Percentages are based on the total market value of investments as of 1/31/06.
(m)
The average maturity shown is calculated using the final stated maturity on the portfolio’s holdings
without taking into account any holdings which have been pre-refunded to an earlier date or which
have a mandatory put date prior to the stated maturity. The average life shown takes into account these
earlier dates.
(a)
The average credit quality of rated securities is based upon a market weighted average of portfolio
holdings that are rated by public rating agencies.
(d)
Duration is a measure of how much a bond’s price is likely to fluctuate with general changes in interest
rates, e.g., if rates rise 1.00%, a bond with a 5-year duration is likely to lose about 5.00% of
its value.
Percentages are based on net assets as of 1/31/06, unless otherwise noted. The portfolio is actively managed, and current holdings may be different.
2 ANNUAL REPORT
MANAGEMENT REVIEW
Summary of Results
For the twelve months ended January 31, 2006, Class A shares of the MFS Municipal High Income Fund provided a total return of 5.81%, at net asset value. In comparison, the fund’s benchmark, the Lehman Brothers Municipal Bond Index, returned 2.83% ..
Contributors to performance
The fund benefited from holding lower-quality ‘‘BBB’’-rated1 securities and below-investment-grade debt. During the period, spreads in these credit sectors narrowed due to strong demands for higher-yielding securities, causing prices on these securities to appreciate. (The Lehman Brothers Municipal Bond Index is composed primarily of higher-grade securities with no bonds rated lower than ‘‘BBB’’).
Strong security selection in the transportation, industrial, housing, and utilities sectors bolstered relative returns. A combination of security selection and overweighted positions in the health care and tobacco sectors also helped. The portfolio’s shorter duration2 stance contributed to relative performance over the period as short-term rates rose.
Detractors from performance
Yield curve3 positioning negatively affected relative results. Underweighting the intermediate area of the curve (represented by bonds with durations of 11- to 14-years) detracted as this area outperformed the index. Additionally, our overweight on the front portion of the curve (represented by bonds with durations of 0- to 4-years) hindered relative results as rates in that area increased considerably over the reporting period.
1 Bonds rated ‘‘BBB’’ or higher are considered investment grade; bonds rated ‘‘BB’’ or lower are considered
non-investment grade.
2 Duration is a measure of a portfolio’s sensitivity to changes in interest rates.
3 A yield curve graphically depicts the yields of different maturity bonds of the same credit quality and type. A
normal yield curve is upward sloping, with short-term rates lower than long-term rates.
The views expressed in this report are those of the portfolio manager only through the end of the period of the report as stated on the cover and do not necessarily reflect the views of MFS or any other person in the MFS organization. These views are subject to change at any time based on market and other conditions, and MFS disclaims any responsibility to update such views. These views may not be relied upon as investment advice or an indication of trading intent on behalf of any MFS Fund. References to specific securities are not recommendations of such securities, and may not be representative of any MFS Fund’s current or future investments.
ANNUAL REPORT 3
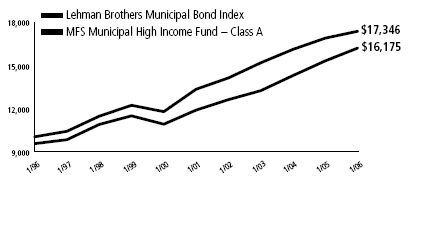
PERFORMANCE SUMMARY THROUGH 1/31/06
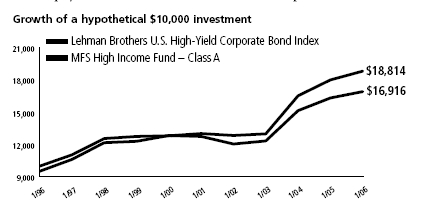
The following chart illustrates the historical performance of the fund’s Class A shares in comparison to its benchmark. Performance results include the deduction of the maximum applicable sales charge and reflect the percentage change in net asset value, including reinvestment of dividends and capital gains distributions. The performance of other share classes will be greater than or less than that of the class depicted below. Benchmark comparisons are unmanaged; do not reflect sales charges, commissions and expenses; and cannot be invested in directly. (See Notes to Performance Summary.)
Performance data shown represents past performance and is no guarantee of future results. Investment return and principal value fluctuate so your shares, when sold, may be worth more or less than the original cost; current performance may be lower or higher than quoted. For most recent month-end performance, please visit mfs.com. The performance shown does not reflect the deduction of taxes, if any, that a shareholder would pay on fund distributions or the redemption of fund shares.
Growth of a hypothetical $10,000 investment
4 ANNUAL REPORT
Performance summary – continued
Total returns through 1/31/06
Average annual without sales charge
Share class
Class inception date
1-yr
5-yr
10-yr
A
2/24/84
5.81%
6.40%
5.44%
B
9/07/93
4.88%
5.55%
4.57%
C
9/25/98
4.76%
5.35%
4.42%
Average annual
Comparative benchmarks
Average high-yield municipal debt fund (l)
5.63%
6.07%
5.13%
Lehman Brothers Municipal Bond Index (s)
2.83%
5.44%
5.66%
Average annual with sales charge
Share class
A
0.78%
5.37%
4.93%
With Initial Sales Charge (4.75%)
B
0.88%
5.23%
4.57%
With CDSC (Declining over six years from 4% to 0%)
C
3.76%
5.35%
4.42%
With CDSC (1% for 12 months) (z)
CDSC – Contingent Deferred Sales Charge. (z) Assuming redemption within one year from the end of the prior month of purchase. (l) Source: Lipper Inc., an independent firm that reports mutual fund performance. (s) Source: Standard & Poor’s Micropal, Inc.
Index Definition
Lehman Brothers Municipal Bond Index – a market-value-weighted index representative of the tax-exempt bond market.
It is not possible to invest directly in an index.
Notes to Performance Summary
Performance for Class C shares includes the performance of the fund’s Class B shares prior to their offering. This blended class performance has been adjusted to take into account differences in sales loads, if any, applicable to these share classes, but has not been adjusted to take into account differences in class specific operating expenses (such as Rule 12b-1 fees). Compared to performance these share classes would have experienced had they been offered for the entire period, the use of blended performance generally results in higher performance for share classes with higher operating expenses than the share class to which it is blended, and lower performance for share classes with lower operating expenses than the share class to which it is blended.
ANNUAL REPORT 5
Performance summary – continued
Performance results reflect any applicable expense subsidies and waivers in effect during the periods shown. Without such subsidies and waivers the fund’s performance results would be less favorable. Please see the prospectus and financial statements for complete details.
A portion of income may be subject to state, federal, and/or alternative minimum tax. Capital gains, if any, are subject to a capital gains tax. From time to time the fund may receive proceeds from litigation settlements, without which performance would be lower.
6 ANNUAL REPORT
EXPENSE TABLE
Fund Expenses Borne by the Shareholders During the Period, August 1, 2005 through January 31, 2006.
As a shareholder of the fund, you incur two types of costs: (1) transaction costs, including sales charges (loads) on certain purchase or redemption payments and redemption fees on certain exchanges and redemptions, and (2) ongoing costs, including management fees; distribution and service (12b-1) fees; and other fund expenses. This example is intended to help you understand your ongoing costs (in dollars) of investing in the fund and to compare these costs with the ongoing costs of investing in other mutual funds. The example is based on an investment of $1,000 invested at the beginning of the period and held for the entire period August 1, 2005 through January 31, 2006.
Actual Expenses
The first line for each share class in the following table provides information about actual account values and actual expenses. You may use the information in this line, together with the amount you invested, to estimate the expenses that you paid over the period. Simply divide your account value by $1,000 (for example, an $8,600 account value divided by $1,000 - 8.6), then multiply the result by the number in the first line under the heading entitled ‘‘Expenses Paid During Period’’ to estimate the expenses you paid on your account during this period.
Hypothetical Example for Comparison Purposes
The second line for each share class in the following table provides information about hypothetical account values and hypothetical expenses based on the fund’s actual expense ratio and an assumed rate of return of 5% per year before expenses, which is not the fund’s actual return. The hypothetical account values and expenses may not be used to estimate the actual ending account balance or expenses you paid for the period. You may use this information to compare the ongoing costs of investing in the fund and other funds. To do so, compare this 5% hypothetical example with the 5% hypothetical examples that appear in the shareholder reports of the other funds. Please note that the expenses shown in the table are meant to highlight your ongoing costs only and do not reflect any transactional costs, such as sales charges (loads) or redemption fees. Therefore, the second line for each share class in the table is useful in comparing ongoing costs only, and will not help you determine the relative total costs of owning different funds. In addition, if these transactional costs were included, your costs would have been higher.
ANNUAL REPORT 7
Expense table – continued
Share Class
Annualized Expense Ratio
Beginning Account Value 8/01/05
Ending Account Value 1/31/06
Expenses Paid During Period (p) 8/01/05-1/31/06
A
Actual
0.72%
$1,000.00
$1,023.50
$3.67
Hypothetical (h)
0.72%
$1,000.00
$1,021.58
$3.67
B
Actual
1.49%
$1,000.00
$1,018.40
$7.58
Hypothetical (h)
1.49%
$1,000.00
$1,017.69
$7.58
C
Actual
1.73%
$1,000.00
$1,018.40
$8.80
Hypothetical (h)
1.73%
$1,000.00
$1,016.48
$8.79
(h)
5% class return per year before expenses.
(p)
Expenses paid is equal to each class’ annualized expense ratio, as shown above, multiplied by the average
account value over the period, multiplied by the number of days in the period, divided by the number of
days in the year. Expenses paid do not include any applicable sales charges (loads) or redemption fees. If
these transaction costs had been included, your costs would have been higher.
8 ANNUAL REPORT
PORTFOLIO OF INVESTMENTS – 1/31/06
The Portfolio of Investments is a complete list of all securities owned by your fund.
It is categorized by broad-based asset classes.
Municipal Bonds - 97.1%
Issuer
Shares/Par
Value ($)
Airport & Port Revenue - 1.3%
Chicago, IL, O’Hare International Airport Rev., ‘‘A’’, RITES, FSA,
7.634%, 2022(r)(v)
$
6,250,000
$
7,454,128
Chicago, IL, O’Hare International Airport Rev., Third Lien, ‘‘A’’,
FGIC, 5%, 2033
1,070,000
1,105,438
Chicago, IL, O’Hare International Airport Rev., Third Lien, ‘‘A’’,
MBIA, 5%, 2029
4,270,000
4,442,508
Denver, CO, City & County Airport Rev., RITES, AMBAC, 8.67%,
2017(r)(v)
2,500,000
2,969,800
Miami-Dade County, FL, Aviation Revenue, ‘‘A’’, CIFG, 5%, 2038
2,195,000
2,225,093
New York City, NY, City Industrial Development Agency, Special
Facilities Rev. (Terminal One Group), 5.5%, 2024
850,000
899,895
$
19,096,862
Chemicals - 0.4%
Red River Authority, TX, Pollution Control Rev. (Celanese Project),
6.7%, 2030
$
5,380,000
$
5,703,522
General Obligations - General Purpose - 4.5%
Cranston, RI, FGIC, 6.375%, 2009(c)
$
855,000
$
952,385
Delaware County, OH, 6.25%, 2010(c)
1,000,000
1,131,480
Huntsville, AL, Capital Improvement Water, ‘‘C’’, MBIA, 5%, 2024
845,000
887,901
Kane Kendall County, IL, Capital Appreciation, ‘‘E’’, FGIC, 0%, 2023
5,945,000
2,481,859
Kane Kendall County, IL, Capital Appreciation, ‘‘E’’, FGIC, 0%, 2025
6,000,000
2,230,020
Little Rock, AR, Capital Improvement Rev., 5.7%, 2018
765,000
788,149
Los Angeles, CA, RITES, FGIC, 6.703%, 2015(r)(v)
5,310,000
6,527,264
Massachusetts State Consolidated Loan, ‘‘C’’, 5%, 2025
6,110,000
6,437,740
New York City, NY, ‘‘F’’, FGIC, 5.875%, 2006(c)
3,390,000
3,486,717
New York City, NY, ‘‘F’’, FGIC, 5.875%, 2024
3,610,000
3,708,481
New York City, NY, ‘‘H’’, FGIC, 6.125%, 2007(c)
1,210,000
1,273,331
New York City, NY, ‘‘H’’, FGIC, 6.125%, 2025
6,790,000
7,124,000
New York City, NY, ‘‘M’’, 5%, 2035
11,200,000
11,514,272
State of Florida, Department of Transportation, RITES,
6.203%, 2017(r)(v)
2,300,000
2,562,292
State of Massachusetts, ROLS, 7.609%, 2011(r)(c)(v)
2,000,000
2,345,960
Washington State Motor Vehicle Fuel Tax, ‘‘B’’, FSA, 5%, 2024
9,850,000
10,378,650
West Warwick, RI, 7.45%, 2013
455,000
467,367
$
64,297,868
General Obligations - Improvement - 0.5%
Bergen County, NJ, Improvement Authority School District Rev.
(Township of Wyckoff Board of Education), 5%, 2032
$
540,000
$
565,013
Birmingham, AL, ‘‘B’’, 5.75%, 2009(c)
910,000
986,031
ANNUAL REPORT 9
Portfolio of Investments – continued
Issuer
Shares/Par
Value ($)
Municipal Bonds - continued
General Obligations - Improvement - continued
Birmingham, AL, ‘‘B’’, 5.75%, 2019
$
90,000
$
96,959
District of Columbia, ‘‘A’’, 6%, 2007(c)
5,000,000
5,274,850
$
6,922,853
General Obligations - Schools - 3.8%
Aledo, TX, Independent School District, School Building, ‘‘A’’, PSF,
5.125%, 2033
$
2,815,000
$
2,933,765
Chicago, IL, Board of Education, RITES, FGIC, 6.68%, 2020(r)(v)
7,910,000
9,896,676
De Soto, TX, Independent School District, School Building, PSF,
0%, 2031
1,700,000
447,083
De Soto, TX, Independent School District, School Building, PSF,
0%, 2034
1,285,000
284,872
De Soto, TX, Independent School District, School Building, PSF,
0%, 2036
1,715,000
342,091
Forsyth County, GA, School District, 6%, 2010(c)
1,700,000
1,888,105
Fort Bend, TX, Independent School District, ‘‘A’’, PSF, 5.25%, 2027
2,825,000
3,021,196
Houston, TX, Independent School District, RITES, PSF,
6.691%, 2017(r)(v)
5,000,000
5,540,600
Kane Cook & Dupage Counties, IL, FSA, 6.375%, 2011(c)
1,255,000
1,415,251
Kane Cook & Dupage Counties, IL, FSA, 6.5%, 2011(c)
1,355,000
1,535,608
Lake County, IL, FGIC, 6%, 2008(c)
2,500,000
2,681,375
Leander, TX, Independent School District, Capital Appreciation,
Refunding, School Building, FGIC, 0%, 2026
3,780,000
1,306,670
Leander, TX, Independent School District, Capital Appreciation,
Refunding, School Building, FGIC, 0%, 2031
3,820,000
973,756
Leander, TX, Independent School District, PSF, 0%, 2029
7,310,000
2,013,247
Leander, TX, Independent School District, PSF, 0%, 2030
6,480,000
1,678,514
McHenry & Lake County, IL, FSA, 6.125%, 2010(c)
1,700,000
1,869,660
Royse City, TX, Independent School District, School Building, PSF,
0%, 2027
2,960,000
986,154
Royse City, TX, Independent School District, School Building, PSF,
0%, 2028
2,975,000
933,585
Royse City, TX, Independent School District, School Building, PSF,
0%, 2029
2,995,000
886,640
San Jose Evergreen, CA, Community College District, Election 2004,
‘‘A’’, MBIA, 0%, 2028
3,260,000
1,023,281
Snyder, TX, Independent School District, School Building, AMBAC,
5.25%, 2030
2,150,000
2,281,688
State of Florida, Board of Education, RITES, FGIC,
6.726%, 2012(r)(v)
1,500,000
1,770,630
State of Florida, Board of Education, RITES, FGIC,
6.726%, 2013(r)(v)
5,000,000
5,972,900
White Settlement, TX, Independent School District, School Building,
PSF, 0%, 2033
8,965,000
2,100,858
$
53,784,205
10 ANNUAL REPORT
Portfolio of Investments – continued
Issuer
Shares/Par
Value ($)
Municipal Bonds - continued
Healthcare Revenue - Hospitals - 21.4%
Allegheny County, PA, Hospital Development Authority Rev. (South
Hills Health Systems), ‘‘B’’, 6.75%, 2025
$ 1,200,000
$
1,266,636
Allegheny County, PA, Hospital Development Authority Rev. (West
Penn Allegheny Health), 9.25%, 2030
6,100,000
7,190,314
Allegheny County, PA, Hospital Development Authority Rev. (West
Penn Allegheny Health), ‘‘B’’, 9.25%, 2022
3,360,000
3,976,594
Arkansas Development Finance Authority Rev. (Washington
Regional Medical Center), 7.25%, 2010
2,500,000
2,843,650
Athens County, OH, Hospital Facilities Rev. (O’Bleness Memorial
Hospital), ‘‘A’’, 7.125%, 2033
2,500,000
2,596,950
Baldwin County, AL, Eastern Shore Health Care Authority Rev.
(Thomas Hospital), 6.75%, 2006
500,000
512,775
Baldwin County, AL, Eastern Shore Health Care Authority Rev.
(Thomas Hospital), 5.75%, 2008
1,600,000
1,707,728
Birmingham, AL, Baptist Medical Center, Special Care Facilities Rev.
(Baptist Health Systems Inc.), ‘‘A’’, 5%, 2030
5,510,000
5,327,233
Brookhaven, NY, Industrial Development Agency Rev. (Memorial
Hospital Medical Center Inc.), ‘‘A’’, 8.25%, 2030
2,500,000
2,682,775
California Valley Health Systems, COP, 6.875%, 2023
2,185,000
2,191,337
Chautauqua County, NY, Industrial Development Agency, Civic
Facilities Rev. (Women’s Christian Assn.), ‘‘A’’, 6.35%, 2017
1,175,000
1,198,676
Chautauqua County, NY, Industrial Development Agency, Civic
Facilities Rev. (Women’s Christian Assn.), ‘‘A’’, 6.4%, 2029
3,430,000
3,428,697
Chemung County, NY, Civic Facilities Rev. (St. Joseph’s Hospital-
Elmira), ‘‘A’’, 6%, 2013
1,810,000
1,817,801
Chemung County, NY, Civic Facilities Rev. (St. Joseph’s Hospital-
Elmira), ‘‘B’’, 6.35%, 2013
1,280,000
1,314,547
Chester County, PA, Health & Educational Facilities Rev. (Chester
County Hospital), ‘‘A’’, 6.75%, 2031
2,500,000
2,729,150
Citrus County, FL, Hospital Development Authority Rev. (Citrus
Memorial Hospital), 6.25%, 2023
960,000
1,027,162
Coffee County, GA, Hospital Authority Rev. (Coffee Regional
Medical Center, Inc.), 5%, 2026
110,000
109,992
Colorado Health Facilities Authority Rev. (Hospital Parkview Medical
Center, Inc.), 5%, 2025
1,000,000
1,019,790
Colorado Health Facilities Authority Rev. (Parkview Medical Center),
6.5%, 2020
770,000
847,978
Colorado Health Facilities Authority Rev. (Portercare Adventist
Health Systems), 6.625%, 2011
2,200,000
2,561,152
Crittenden County, AR, Hospital Rev., Refunding & Improvement,
7.15%, 2025
1,165,000
1,170,778
Cuyahoga County, OH, Hospital Facilities Rev. (Canton, Inc.),
7.5%, 2030
5,020,000
5,574,509
Denver, CO, Health & Hospital Authority Rev., 5.375%, 2018
3,700,000
3,783,694
Denver, CO, Health & Hospital Authority Rev., 5.375%, 2028
950,000
954,323
ANNUAL REPORT 11
Portfolio of Investments – continued
Issuer
Shares/Par
Value ($)
Municipal Bonds - continued
Healthcare Revenue - Hospitals - continued
Denver, CO, Health & Hospital Authority Rev., ‘‘A’’, 6%, 2023
$
750,000
$
798,360
District of Columbia, Health & Hospital Authority Rev. (Medstar
University Hospital), ‘‘D’’, 6.875%, 2007
3,875,000
4,018,104
Gaylord, MI, Hospital Finance Authority Rev. (Otsego Memorial
Hospital), 6.2%, 2025
750,000
742,305
Gaylord, MI, Hospital Finance Authority Rev. (Otsego Memorial
Hospital), 6.5%, 2031
865,000
865,666
Grand Forks, ND, Health Care Authority Rev. (Altru Health Systems
Obligated Group), 7.125%, 2024
2,250,000
2,501,280
Highlands County, FL, Health Facilities Authority Rev. (Adventist/
Sunbelt Hospital), 6%, 2031
3,000,000
3,241,920
Illinois Health Facilities Authority Rev. (Sinai Health), FHA,
5.15%, 2037
2,500,000
2,580,250
Indiana Health Facilities Financing Authority, Hospital Rev. (Clarian
Health), ‘‘A’’, 5%, 2039
3,430,000
3,402,526
Indiana Health Facilities Financing Authority, Hospital Rev.
(Community Hospital), ‘‘A’’, AMBAC, 5%, 2035
5,220,000
5,395,288
Indiana Health Facilities Financing Authority, Hospital Rev. (Munster
Medical Research Foundation, Inc.), 6.375%, 2031
8,950,000
9,455,675
Indiana Health Facilities Financing Authority, Hospital Rev. (Munster
Medical Research Foundation, Inc.), 6.375%, 2021
3,300,000
3,491,796
Indiana Health Facilities Financing Authority, Hospital Rev.
(Riverview Hospital), 6.125%, 2031
3,750,000
3,929,850
Johnson City, TN, Health & Educational Facilities, Hospital Rev.,
‘‘A’’ (Mountain States Health), 5.5%, 2036
870,000
902,782
Joplin, MO, Industrial Development Authority Health Facilities Rev.
(Freeman Health Systems), 5.5%, 2029
1,290,000
1,339,730
Joplin, MO, Industrial Development Authority Health Facilities Rev.
(Freeman Health Systems), 5.75%, 2035
1,395,000
1,487,754
Kentucky Economic Development Finance Authority, Health Systems
Rev. (Norton Healthcare, Inc.), 6.5%, 2020
5,000,000
5,463,150
Kentucky Economic Development Finance Authority, Health Systems
Rev. (Norton Healthcare, Inc.), 6.625%, 2028
2,000,000
2,181,560
Knox County, TN, Health Educational Housing Facilities Board,
Hospital Facilities Rev. (Baptist Health Systems), 6.5%, 2031
5,350,000
5,681,700
Lufkin, TX, Health Facilities Rev. (Memorial Health System of East
Texas), 6.875%, 2006
1,285,000
1,312,242
Lufkin, TX, Health Facilities Rev. (Memorial Health System of East
Texas), 5.7%, 2008
3,305,000
3,508,720
Macomb County, MI, Hospital Finance Authority Rev. (Mount
Clemens General Hospital), 5.75%, 2025
2,000,000
1,969,680
Macomb County, MI, Hospital Finance Authority Rev. (Mount
Clemens General Hospital), 5.875%, 2034
4,345,000
4,271,396
Maryland Health & Higher Educational Facilities Authority Rev.
(University of Maryland Medical System), 6.75%, 2010
1,000,000
1,139,000
Massachusetts Health & Educational Facilities Authority Rev.
(Caritas Christi), 6.5%, 2012
1,500,000
1,635,765
12 ANNUAL REPORT
Portfolio of Investments – continued
Issuer
Shares/Par
Value ($)
Municipal Bonds - continued
Healthcare Revenue - Hospitals - continued
Massachusetts Health & Educational Facilities Authority Rev.
(Caritas Christi), 5.7%, 2015
$ 3,500,000
$
3,622,675
Massachusetts Health & Educational Facilities Authority Rev.
(Jordan Hospital), 5.25%, 2018
4,600,000
4,612,696
Massachusetts Health & Educational Facilities Authority Rev.
(Milford Whitinsville Hospital), 6.35%, 2032
1,450,000
1,540,828
Massachusetts Health & Educational Facilities Authority Rev. (North
Adams Regional Hospital), ‘‘C’’, 6.625%, 2018
1,405,000
1,440,870
Massachusetts Health & Educational Facilities Authority Rev.
(Northern Berkshire Health), ‘‘B’’, 6.375%, 2034
760,000
785,278
Massachusetts Health & Educational Facilities Authority Rev. (Saints
Memorial Medical Center), 6%, 2023
12,530,000
12,559,696
Massachusetts Health & Educational Facilities Authority Rev.
(University of Massachusetts Memorial Hospital), 6.5%, 2021
500,000
534,660
Mecosta County, MI, General Hospital Rev., 6%, 2018
1,200,000
1,200,636
Miami Beach, FL, Health Facilities Rev. (Mount Sinai Medical
Center), 6.75%, 2029
2,490,000
2,747,342
Miami Beach, FL, Health Facilities Rev. (Mount Sinai Medical
Brazos River Authority, TX, Pollution Control Rev. (Texas Utility
Co.), ‘‘B’’, 6.3%, 2032
$
685,000
$
732,039
Brazos River Authority, TX, Pollution Control Rev. (Texas Utility
Co.), ‘‘C’’, 6.75%, 2038
2,505,000
2,753,195
30 ANNUAL REPORT
Portfolio of Investments – continued
Issuer
Shares/Par
Value ($)
Municipal Bonds - continued
Utilities - Investor Owned - continued
Calcasieu Parish, LA, Industrial Development Board, Pollution
Control Rev. (Entergy Gulf States, Inc.), 5.45%, 2010
$
4,800,000
$
4,821,696
Clark County, NV, Industrial Development Authority Rev. (Nevada
Power Co.), FGIC, 6.7%, 2022
4,000,000
4,153,840
Clark County, NV, Industrial Development Rev., (Southwest Gas
Corp.), ‘‘A’’, AMBAC, 4.85%, 2035
3,215,000
3,189,794
Farmington, NM, Pollution Control Rev. (New Mexico Public
Service), ‘‘C’’, 5.8%, 2022
1,390,000
1,406,291
Farmington, NM, Pollution Control Rev. (New Mexico Public
Service), ‘‘A’’, 5.8%, 2022
4,500,000
4,552,740
Farmington, NM, Pollution Control Rev. (New Mexico Public
Service), ‘‘A’’, 6.3%, 2016
3,240,000
3,387,355
Farmington, NM, Pollution Control Rev. (Tucson Electric),
6.95%, 2020
3,000,000
3,125,610
Forsyth, MT, Pollution Control Rev. (Portland General), 5.2%, 2033
770,000
797,759
Forsyth, MT, Pollution Control Rev. (Puget Sound Energy), ‘‘A’’,
AMBAC, 5%, 2031
3,165,000
3,286,283
Matagorda County, TX, Pollution Control Rev. (Reliant Energy),
5.95%, 2030
3,095,000
3,177,265
Mecklenburg County, VA, Industrial Development Authority Rev.
(UAE Mecklenburg LP), 6.5%, 2017
2,800,000
3,093,328
New Hampshire Industrial Development Authority, Pollution Control
Rev. (CT Light & Power), 5.9%, 2018
1,000,000
1,060,220
Pima County, AZ, Industrial Development Authority Rev. (Tucson
Electric Power Co.), ‘‘A’’, 6.1%, 2025
2,000,000
2,000,380
Pittsylvania County, VA, Industrial Development Authority Rev.
(Multi-trade of Pittsylvania), 7.55%, 2019
10,000,000
10,250,000
Pointe Coupee Parish, LA, Pollution Control Rev. (Gulf States
Utilities Co.), 6.7%, 2013
1,000,000
1,007,630
Port Morrow, OR, Pollution Control Rev. (Portland General Electric),
5.2%, 2033
1,900,000
1,975,658
Trinity River Authority, TX, Pollution Control Rev. (TXU Electric Co.),
6.25%, 2028
1,500,000
1,623,180
West Feliciana Parish, LA, Pollution Control Rev. (Entergy Gulf
States), 6.6%, 2028
3,335,000
3,361,713
$
59,755,976
Utilities - Municipal Owned - 0.5%
Corpus Christi, TX, Utility Systems Rev., AMBAC, 5%, 2025
$
2,600,000
$
2,717,442
North Carolina Municipal Power Agency, Catawba Electric Rev.,
6.375%, 2013
2,750,000
3,025,578
San Antonio, TX, Electric & Gas, ‘‘A’’, 5%, 2025
1,505,000
1,578,309
Southern California Public Power Authority (Transmission Project
Rev.), RIBS, 8.167%, 2012(v)
150,000
150,462
$
7,471,791
ANNUAL REPORT 31
Portfolio of Investments – continued
Issuer
Shares/Par
Value ($)
Municipal Bonds - continued
Water & Sewer Utility Revenue - 3.5%
Alabama Drinking Water Finance Authority, ‘‘A’’, AMBAC,
4%, 2028
$
5,000,000
$
4,500,600
Everett, WA, Water & Sewer Rev., MBIA, 5%, 2027
835,000
874,579
Forsyth County, GA, Water & Sewage Authority, 6.25%, 2010(c)
1,000,000
1,115,050
Forsyth County, GA, Water & Sewer Authority Rev., 6.25%, 2010(c)
1,010,000
1,126,201
Louisville & Jefferson, KY, District Sewer & Drain System, ‘‘A’’,
FGIC, 5.25%, 2037
2,635,000
2,822,428
Massachusetts Water Resources Authority, RITES, FGIC,
9.102%, 2019(r)(v)
765,000
1,080,302
Michigan Municipal Bond Authority Rev., RITES,
7.203%, 2009(r)(c)(v)
7,585,000
8,811,798
Mississippi Development Bank Special Obligations, Grenada, MS,
Water & Sewer Systems Project, ‘‘N’’, FSA, 5%, 2030
2,155,000
2,238,011
Narragansett, RI, Bay Commission, ‘‘A’’, MBIA, 5%, 2027
2,450,000
2,565,028
New York City, NY, Municipal Water & Sewer Finance Authority,
Water & Sewer Systems Rev., ‘‘D’’, 5%, 2038
2,240,000
2,310,874
New York City, NY, Municipal Water Finance Authority Rev., ‘‘B’’,
5.75%, 2007(c)
8,590,000
8,966,070
Nueces River Authority, Texas Water Supply Rev. (Corpus Christi
Project), FSA, 5%, 2027
2,000,000
2,084,060
Phoenix, AZ, FGIC, 6.25%, 2010(c)
1,000,000
1,123,100
State of Virginia, Clean Water Rev., 5.75%, 2010(c)
2,500,000
2,744,375
Upland, CA, Public Financing Authority Rev., Water Systems
Improvement, AMBAC, 5%, 2033
2,585,000
2,662,757
Westmoreland County, PA, Municipal Authority Services Rev., FSA,
5.25%, 2025
1,600,000
1,734,768
Westmoreland County, PA, Municipal Authority Services Rev., FSA,
5.25%, 2026
2,075,000
2,244,673
$
49,004,674
Total Municipal Bonds (Identified Cost, $1,326,597,239)
$
1,380,833,462
Floating Rate Demand Notes - 1.7%
Allegheny County, PA, Hospital Development Authority Rev.
(Presbyterian University Hospital), ‘‘A’’, 3.05%, due 2/02/06
$
130,000
$
130,000
Allegheny County, PA, Hospital Development Authority Rev.
(Presbyterian University Hospital), ‘‘D’’, 3.05%, due 2/02/06
200,000
200,000
Bell County, TX, Health Facilities Development Corp. Rev. (Scott &
White Memorial Hospital), 3.07%, due 2/01/06
100,000
100,000
Burke County, GA, Development Authority Pollution Control Rev.
(Oglethorpe Power Corp.), ‘‘A’’, 3.02%, due 2/01/06
350,000
350,000
Chicago, IL, Midway Airport Rev., Second Lien, ‘‘B’’, 3.12%,
due 2/01/06
375,000
375,000
Illinois Development Finance Authority Rev. (Jewish Federation of
Metropolitan Chicago), 3.07%, due 2/01/06
350,000
350,000
Jackson County, MS, Pollution Control Rev. (Chevron USA, Inc.),
3.07%, due 2/01/06
1,100,000
1,100,000
32 ANNUAL REPORT
Portfolio of Investments – continued
Issuer
Shares/Par
Value ($)
Floating Rate Demand Notes - continued
Jefferson County, AL, Sewer Rev., Capital Improvement Warrants,
‘‘A’’, 3.02%, due 2/02/06
$ 2,800,000
$
2,800,000
Jefferson County, AL, Sewer Rev., Warrants, ‘‘B-4’’, 3.02%,
due 2/02/06
1,750,000
1,750,000
Pinellas County, FL, Health Facilities Authority Rev. (Pooled Hospital
Loan Program), 3.1%, due 2/01/06
200,000
200,000
Sevier County, TN, Public Building Authority, 3.04%, due 2/02/06
50,000
50,000
Sevier County, TN, Public Building Authority, ‘‘B-6’’, 3.07%,
due 2/01/06
100,000
100,000
State of California, Department of Water Resources, Power Supply
Rev., ‘‘C-2’’, 2.97%, due 2/02/06
10,700,000
10,700,000
Sublette County, WY, Pollution Control Rev. (Exxon Mobil Corp.),
3%, due 2/01/06
4,300,000
4,300,000
Uinta County, WY, Pollution Control Rev. (Chevron, Inc.), 3.07%,
due 2/01/06
1,000,000
1,000,000
Total Floating Rate Demand Notes, at Identified Cost
$
23,505,000
Total Investments (Identified Cost, $1,350,102,239) (k)
$
1,404,338,462
Other Assets, Less Liabilities - 1.2%
17,272,552
Net Assets - 100.0%
$
1,421,611,014
Swap Agreements
Interest Rate Swaps
Notional
Principal
Cash Flows
Unrealized
Amount of
Cash Flows Paid
Received
Appreciation
Expiration
Currency
Contract
by the Fund
by the Fund
(Depreciation)
12/01/2007
USD
$22,000,000
Fixed - 3 Year
Floating - 7 day
$270,890
BMA Swap Index
BMA Swap Index
(2.795%)
7/13/2016
USD
13,000,000
Fixed - 10 Year
Floating - 7 Day
90,726
BMA Swap Index
BMA Swap Index
(3.742%)
5/16/2018
USD
25,000,000
Fixed - 12 Year
Floating - 7 Day
111,721
BMA Swap Index
BMA Swap Index
(3.838%)
$473,337
At January 31, 2006, the fund had sufficient cash and/or securities to cover any commitments under
these derivative contracts.
(q)
Interest received was less than stated coupon rate.
(a)
SEC Rule 144A restriction.
(k)
As of January 31, 2006, the fund had three securities representing $43,664,312 and 3.1% of net assets
that were fair valued in accordance with the policies adopted by the Board of Trustees.
(d)
Non-income producing security - in default.
(c)
Refunded bond.
(v)
Inverse floating rate security.
(r)
Restricted securities (excluding 144A issues) are not registered under the Securities Act of 1933 and are
subject to legal or contractual restrictions on resale. These securities generally may be resold in
transactions exempt from registration or to the public if the securities are registered. Disposal of these
securities may involve time-consuming negotiations and prompt sale at an acceptable price may be difficult.
The fund holds the following restricted securities:
ANNUAL REPORT 33
Portfolio of Investments – continued
Restricted Securities – continued
Current
Acquisition
Acquisition
Market
Total % of
Security
Date
Cost
Value
Net Assets
Arizona Health Facilities Authority
Rev. (The Terraces Project), 7.75%,
2033
10/17/2003
$2,210,535
$
2,482,538
Bridgeport, CT, Senior Living Facility
Rev. (3030 Park Retirement
Community), 7.25%, 2035
3/24/2005
2,980,000
2,542,745
California Statewide Communities
Development Authority (Prides
Industries), 7.125%, 2009
11/23/1999
1,565,000
1,739,482
Contra Costa County, CA, Residential
Rental Facilities Rev. (Cypress
Meadows), 7%, 2028
9/21/1998
354,958
106,487
Chicago, IL, Board of Education,
RITES, FGIC, 6.68%, 2020
2/09/2000
6,211,881
9,896,676
Chicago, IL, Public Building
Commission Rev., RITES, FGIC,
9.096%, 2017
3/10/1999
4,815,180
5,578,470
Chicago, IL, O’Hare International
Airport Rev., ‘‘A’’, RITES, FSA,
7.634%, 2022
8/21/2003
6,664,625
7,454,128
Denver, CO, City & County Airport
Rev., RITES, AMBAC, 8.67%, 2017
8/28/2000
2,683,700
2,969,800
Essex County, NJ, RITES, FGIC,
7.85%, 2020
3/20/2000
5,968,080
7,173,000
Gallery Certificate Trust, PA, Parking
Rev., FSA, 4.5%, 2013
12/17/2003
2,502,185
2,494,000
Houston, TX, Independent School
District, RITES, PSF, 6.691%, 2017
2/26/1999
5,249,100
5,540,600
Los Angeles, CA, RITES, FGIC,
6.703%, 2015
7/21/1999
5,563,924
6,527,264
Madison County, FL, Rev. (Twin Oaks
Project), ‘‘A’’, 6%, 2025
7/13/2005
1,656,102
1,657,888
Massachusetts Water Resources
Authority, RITES, FGIC, 9.102%, 2019
3/16/2000
904,781
1,080,302
Michigan Municipal Bond Authority
Rev., RITES, 7.203%, 2009
2/23/2000
6,633,841
8,811,798
New Jersey Economic Development
Authority, Economic Development Rev.
(Holt Hauling & Warehousing),
8.4%, 2015
1/30/1997
4,197,120
3,640,000
34 ANNUAL REPORT
Portfolio of Investments – continued
Restricted Securities – continued
Current
Acquisition
Acquisition
Market
Total % of
Security
Date
Cost
Value
Net Assets
New Jersey Economic Development
Authority, Economic Development Rev.
(Holt Hauling & Warehousing),
8.6%, 2017
1/30/1997
$8,415,520
$
7,280,000
New Jersey Turnpike Authority, RITES,
MBIA, 6.976%, 2020
4/19/2000
4,637,900
5,705,900
Pennsylvania Economic Development
Financing Authority Rev., Resources
Recovery Rev. (Colver), ‘‘G’’,
5.125%, 2015
7/15/2005
1,050,000
1,036,529
Philadelphia, PA, Industrial
Development Authority Rev., 6.125%,
2019
3/29/1999
1,239,651
935,800
State of Florida, Board of Education,
RITES, FGIC, 6.726%, 2012
2/25/2002
1,756,860
1,770,630
State of Florida, Board of Education,
RITES, FGIC, 6.726%, 2013
2/25/2002
5,791,400
5,972,900
State of Florida, Department of
Transportation, RITES, 6.203%, 2017
4/09/1999
2,332,844
2,562,292
State of Massachusetts, ROLS,
7.609%, 2011
8/28/2001
2,226,440
2,345,960
Texas Housing & Community Board
(Harbors & Plumtree), 10%, 2026
10/31/1996
1,640,000
1,593,982
Total Restricted Securities
$
98,899,171
7.0%
The following abbreviations are used in the Portfolio of Investments and are defined:
BMA
Bond Market Assn.
COP
Certificate of Participation.
ETM
Escrowed to Maturity.
Insurers:
Inverse Floaters:
AMBAC
AMBAC Indemnity Corp.
RIBS
Residual Interest Bonds
CIFG
CDS IXIS Financial Guaranty
RITES
Residual Interest Tax-Exempt Security
FGIC
Financial Guaranty Insurance Co.
ROLS
Residual Option Longs
FHA
Federal Housing Administration
FNMA
Federal National Mortgage Assn.
FSA
Financial Security Assurance Inc.
GNMA
Government National Mortgage Assn.
MBIA
MBIA Insurance Corp.
PSF
Permanent School Fund
XLCA
XL Capital Insurance Co.
See Notes to Financial Statements
ANNUAL REPORT 35
FINANCIAL STATEMENTS | Statement of Assets and Liabilities
This statement represents your fund’s balance sheet, which details the assets
and liabilities composing the total value of the fund.
At 1/31/06
Assets
Investments, at value (identified cost, $1,350,102,239)
$1,404,338,462
Cash
484,680
Receivable for investments sold
6,852,889
Receivable for fund shares sold
7,326,505
Interest receivable
18,802,189
Unrealized appreciation on interest rate swap agreements
575,820
Other assets
8,794
Total assets
$1,438,389,339
Liabilities
Distributions payable
$3,105,500
Payable for investments purchased
8,118,898
Payable for fund shares reacquired
5,149,504
Unrealized depreciation on interest rate swap agreements
102,483
Payable to affiliates
Management fee
19,466
Shareholder servicing costs
120,748
Distribution and service fees
21,462
Administrative services fee
456
Payable for independent trustees’ compensation
56,029
Accrued expenses and other liabilities
83,779
Total liabilities
$16,778,325
Net assets
$1,421,611,014
Net assets consist of:
Paid-in capital
$1,433,105,284
Unrealized appreciation (depreciation) on investments
54,709,560
Accumulated net realized gain (loss) on investments
(68,167,457)
Undistributed net investment income
1,963,627
Net assets
$1,421,611,014
Shares of beneficial interest outstanding
169,073,681
36 ANNUAL REPORT
Statement of Assets and Liabilities – continued
Class A shares
Net assets
$1,080,804,793
Shares outstanding
128,571,230
Net asset value per share
$8.41
Offering price per share (100¸95.25´$8.41)
$8.83
Class B shares
Net assets
$220,854,153
Shares outstanding
26,249,695
Net asset value and offering price per share
$8.41
Class C shares
Net assets
$119,952,068
Shares outstanding
14,252,756
Net asset value and offering price per share
$8.42
On sales of $100,000 or more, the offering price of Class A shares is reduced. A contingent deferred sales
charge may be imposed on redemptions of Class A, Class B and Class C shares.
See Notes to Financial Statements
ANNUAL REPORT 37
FINANCIAL STATEMENTS | Statement of Operations
This statement describes how much your fund earned in investment income and accrued in
expenses. It also describes any gains and/or losses generated by fund operations.
Year ended 1/31/06
Net investment income
Interest income
$85,173,999
Expenses
Management fee
$8,277,407
Distribution and service fees
2,931,724
Shareholder servicing costs
2,053,007
Administrative services fee
167,174
Independent trustees’ compensation
33,302
Custodian fee
374,570
Shareholder communications
96,399
Auditing fees
63,816
Legal fees
44,619
Miscellaneous
120,171
Total expenses
$14,162,189
Fees paid indirectly
(78,485)
Reduction of expenses by investment adviser
(1,392,179)
Net expenses
$12,691,525
Net investment income
$72,482,474
Realized and unrealized gain (loss) on investments
Realized gain (loss) (identified cost basis)
Investment transactions
$(4,687,009)
Swap transactions
995,024
Net realized gain (loss) on investments
$(3,691,985)
Change in unrealized appreciation (depreciation)
Investments
$4,611,212
Swap transactions
549,694
Net unrealized gain (loss) on investments
$5,160,906
Net realized and unrealized gain (loss) on investments
$1,468,921
Change in net assets from operations
$73,951,395
See Notes to Financial Statements
38 ANNUAL REPORT
FINANCIAL STATEMENTS | Statements of Changes in Net Assets
These statements describe the increases and/or decreases in net assets resulting
from operations, any distributions, and any shareholder transactions.
Years ended 1/31
2006
2005
Change in net assets
From operations
Net investment income
$72,482,474
$75,161,910
Net realized gain (loss) on investments
(3,691,985)
(8,690,832)
Net unrealized gain (loss) on investments
5,160,906
22,889,576
Change in net assets from operations
$73,951,395
$89,360,654
Distributions declared to shareholders
From net investment income
Class A
$(55,605,183)
$(53,974,581)
Class B
(11,731,680)
(14,879,834)
Class C
(4,423,031)
(3,631,704)
Total distributions declared to shareholders
$(71,759,894)
$(72,486,119)
Change in net assets from fund share transactions
$72,920,977
$(89,758,493)
Redemption fees
$8,158
$6,610
Total change in net assets
$75,120,636
$(72,877,348)
Net assets
At beginning of period
1,346,490,378
1,419,367,726
At end of period (including undistributed net investment
income of $1,963,627 and accumulated distributions in
excess of net investment income of $115,523)
$1,421,611,014
$1,346,490,378
See Notes to Financial Statements
ANNUAL REPORT 39
FINANCIAL STATEMENTS | Financial Highlights
The financial highlights table is intended to help you understand the trust’s financial performance for the past
5 years. Certain information reflects financial results for a single trust share. The total returns in the table
represent the rate by which an investor would have earned (or lost) on an investment in the trust share class
(assuming reinvestment of all distributions) held for the entire period. This information has been audited by the
trust’s independent registered public accounting firm, whose report, together with the trust’s financial
statements, are included in this report.
Class A
Years ended 1/31
2006
2005
2004
2003
2002
Net asset value, beginning of period
$8.39
$8.28
$8.12
$8.23
$8.24
Income (loss) from
investment operations
Net investment income (d)
$0.46
$0.48
$0.47
$0.48
$0.51
Net realized and unrealized gain
(loss) on investments
0.02
0.09
0.17
(0.09)
(0.02)
Total from investment operations
$0.48
$0.57
$0.64
$0.39
$0.49
Less distributions declared
to shareholders
From net investment income
$(0.46)
$(0.46)
$(0.48)
$(0.50)
$(0.50)
Redemption fees added to paid-in
capital (d)
$0.00(w)
$0.00(w)
$—
$—
$—
Net asset value, end of period
$8.41
$8.39
$8.28
$8.12
$8.23
Total return (%)(t)(s)(r)
5.81
7.16
7.98
4.96
6.13
Ratios (%) (to average net assets)
and Supplemental data:
Expenses before expense reductions (f)
0.82
0.80
0.81
0.84
0.83
Expenses after expense reductions (f)
0.72
0.71
0.79
0.79
0.76
Net investment income
5.47
5.82
5.80
5.88
6.11
Portfolio turnover
20
13
9
20
17
Net assets at end of period
(000 Omitted)
$1,080,805
$977,416
$1,003,328
$1,050,204
$1,037,925
See Notes to Financial Statements
40 ANNUAL REPORT
Financial Highlights – continued
Class B
Years ended 1/31
2006
2005
2004
2003
2002
Net asset value, beginning of period
$8.40
$8.28
$8.13
$8.24
$8.25
Income (loss) from
investment operations
Net investment income (d)
$0.40
$0.42
$0.41
$0.42
$0.44
Net realized and unrealized gain
(loss) on investments
0.00(w)
0.10
0.16
(0.10)
(0.01)
Total from investment operations
$0.40
$0.52
$0.57
$0.32
$0.43
Less distributions declared
to shareholders
From net investment income
$(0.39)
$(0.40)
$(0.42)
$(0.43)
$(0.44)
Redemption fees added to paid-in
capital (d)
$0.00(w)
$0.00(w)
$—
$—
$—
Net asset value, end of period
$8.41
$8.40
$8.28
$8.13
$8.24
Total return (%)(t)(s)(r)
4.88
6.47
7.15
4.01
5.28
Ratios (%) (to average net assets)
and Supplemental data:
Expenses before expense reductions (f)
1.58
1.57
1.59
1.63
1.63
Expenses after expense reductions (f)
1.48
1.48
1.57
1.58
1.56
Net investment income
4.73
5.05
5.02
5.09
5.29
Portfolio turnover
20
13
9
20
17
Net assets at end of period
(000 Omitted)
$220,854
$283,360
$337,065
$355,602
$382,280
See Notes to Financial Statements
ANNUAL REPORT 41
Financial Highlights – continued
Class C
Years ended 1/31
2006
2005
2004
2003
2002
Net asset value, beginning of period
$8.40
$8.29
$8.13
$8.24
$8.25
Income (loss) from
investment operations
Net investment income (d)
$0.37
$0.39
$0.39
$0.40
$0.43
Net realized and unrealized gain
(loss) on investments
0.02
0.10
0.17
(0.10)
(0.02)
Total from investment operations
$0.39
$0.49
$0.56
$0.30
$0.41
Less distributions declared
to shareholders
From net investment income
$(0.37)
$(0.38)
$(0.40)
$(0.41)
$(0.42)
Redemption fees added to paid-in capital (d)
$0.00(w)
$0.00(w)
$—
$—
$—
Net asset value, end of period
$8.42
$8.40
$8.29
$8.13
$8.24
Total return (%)(t)(s)(r)
4.76
6.10
6.91
3.92
5.07
Ratios (%) (to average net assets)
and Supplemental data:
Expenses before expense reductions (f)
1.82
1.80
1.81
1.84
1.83
Expenses after expense reductions (f)
1.72
1.71
1.79
1.79
1.76
Net investment income
4.44
4.80
4.78
4.86
5.07
Portfolio turnover
20
13
9
20
17
Net assets at end of period
(000 Omitted)
$119,952
$85,715
$78,975
$71,519
$59,799
(r)
Certain expenses have been reduced without which performance would have been lower.
(f)
Ratios do not reflect reductions from fees paid indirectly.
(d)
Per share data are based on average shares outstanding.
(t)
Total returns do not include any applicable sales charges.
(s)
From time to time the fund may receive proceeds from litigation settlements, without which performance
would be lower.
(w) Per share amount was less than $0.01.
See Notes to Financial Statements
42 ANNUAL REPORT
NOTES TO FINANCIAL STATEMENTS
(1) Business and Organization
MFS Municipal High Income Fund (the fund) is a series of MFS Series Trust III (the trust). The trust is organized as a Massachusetts business trust and is registered under the Investment Company Act of 1940, as amended, as an open-end management investment company.
(2) Significant Accounting Policies
General – The preparation of financial statements in conformity with U.S. generally accepted accounting principles requires management to make estimates and assumptions that affect the reported amounts of assets and liabilities, and disclosure of contingent assets and liabilities at the date of the financial statements and the reported amounts of revenues and expenses during the reporting period. Actual results could differ from those estimates. The fund can invest up to 100% of its portfolio in high-yield securities rated below investment grade. Investments in high-yield securities involve greater degrees of credit and market risk than investments in higher-rated securities and tend to be more sensitive to economic conditions. Municipal securities backed by current or anticipated revenues from a specific project or specific assets can be negatively affected by the discontinuance of the taxation supporting the projects or assets or the inability to collect revenues for the project or from the assets. If the Internal Revenue Service determines an issuer of a municipal security has not complied with applicable tax requirements, the security could decline in value, interest from the security could become taxable and the fund may be required to issue Forms 1099-DIV.
Investment Valuations– Debt instruments (other than short-term instruments), including restricted debt instruments, are generally valued at an evaluated bid price as reported by an independent pricing service. Values of debt instruments obtained from pricing services can utilize both dealer-supplied valuations and electronic data processing techniques which take into account factors such as institutional-size trading in similar groups of securities, yield, quality, coupon rate, maturity, type of issue, trading characteristics and other market data. Short-term instruments with a maturity at issuance of 365 days or less are generally valued at amortized cost, which approximates market value. Swaps are generally valued on the basis of quotations from brokers and dealers. Securities and other assets generally valued on the basis of information from an independent pricing service may also be valued on the basis of information from brokers and dealers. When pricing-service information or market quotations are not readily available, securities are priced at fair value as determined under the direction of the Board of Trustees.
Derivative Risk– The fund may invest in derivatives for hedging or non-hedging purposes. While hedging can reduce or eliminate losses, it can also reduce or eliminate gains. When the fund uses derivatives as an investment to gain market exposure, or for hedging purposes, gains and losses from derivative instruments may be substantially greater than the derivative’s original cost. Derivative instruments include swap agreements.
ANNUAL REPORT 43
Notes to Financial Statements – continued
Swap Agreements – The fund may enter into swap agreements. A swap is an exchange of cash payments between the fund and another party. Net cash payments are exchanged at specified intervals and are recorded as a realized gain or loss in the Statement of Operations. The value of the swap is adjusted daily and the change in value is recorded as unrealized appreciation or depreciation in the Statement of Operations. Risks may arise upon entering into these agreements from the potential inability of counterparties to meet the terms of their contract and from unanticipated changes in the value of the financial index on which the swap agreement is based. The fund may use swaps for both hedging and non-hedging purposes. For hedging purposes, the fund may use swaps to reduce its exposure to interest and foreign exchange rate fluctuations. For non-hedging purposes, the fund may use swaps to take a position on anticipated changes in the underlying financial index.
Interest Rate Swap Agreements – Interest rate swap agreements are agreements to exchange cash flows periodically based on a notional principal amount, such as the exchange of fixed rate interest payments for floating rate interest payments, which are based on a specific financial index, or the exchange of two distinct floating rate payments. The net receivable or payable associated with these payments is accrued daily and recorded as an unrealized gain or loss, and any payments received or made are recorded as realized gains or losses, in the Statement of Operations. The primary risk associated with interest rate swap agreements is that unfavorable changes in the fluctuation of interest rates could adversely impact the fund.
Short Term Fees – For purchases made on or after July 1, 2004 and before April 1, 2005, the fund charged a 2% redemption fee (which was retained by the fund) on proceeds from Class A, Class B, and Class C shares redeemed or exchanged within 30 calendar days following their acquisition (either by purchase or exchange). Effective April 1, 2005, the fund charges a 1% redemption fee on proceeds from Class A, Class B, and Class C shares redeemed or exchanged within 30 calendar days following their acquisition. The fund may change the redemption fee period in the future, including in connection with Securities and Exchange Commission rule developments. See the fund’s prospectus for details. Any redemption fees are accounted for as an addition to paid-in capital.
Investment Transactions and Income – Investment transactions are recorded on the trade date. Interest income is recorded on the accrual basis. All premium and discount is amortized or accreted for financial statement purposes in accordance with U.S. generally accepted accounting principles. All premium and original issue discount is amortized or accreted for tax reporting purposes as required by federal income tax regulations. The fund may receive proceeds from litigation settlements involving its portfolio holdings. Any proceeds received are reflected in realized gain/loss in the Statement of Operations, or in unrealized gain/loss if the security is still held by the fund. Legal fees and other related expenses incurred to preserve and protect the value of a security owned are added to the cost of the security; other legal fees
44 ANNUAL REPORT
Notes to Financial Statements – continued
are expensed. Capital infusions made directly to the security issuer, which are generally non-recurring, incurred to protect or enhance the value of high-yield debt securities, are reported as additions to the cost basis of the security. Costs that are incurred to negotiate the terms or conditions of capital infusions or that are expected to result in a plan of reorganization are reported as realized losses. Ongoing costs incurred to protect or enhance an investment, or costs incurred to pursue other claims or legal actions, are expensed.
Fees Paid Indirectly – The fund’s custody fee is reduced according to an arrangement that measures the value of cash deposited with the custodian by the fund. This amount, for the year ended January 31, 2006, is shown as a reduction of total expenses on the Statement of Operations.
Tax Matters and Distributions – The fund intends to continue to qualify as a regulated investment company, as defined under Subchapter M of the Internal Revenue Code, and to distribute all of its taxable and tax-exempt income, including realized capital gains. Accordingly, no provision for federal income tax is required in the financial statements.
Distributions to shareholders are recorded on the ex-dividend date. Income and capital gain distributions are determined in accordance with income tax regulations, which may differ from generally accepted accounting principles. Certain capital accounts in the financial statements are periodically adjusted for permanent differences in order to reflect their tax character. These adjustments have no impact on net assets or net asset value per share.
Temporary differences which arise from recognizing certain items of income, expense, gain or loss in different periods for financial statement and tax purposes will reverse at some time in the future. Distributions in excess of net investment income or net realized gains are temporary overdistributions for financial statement purposes resulting from differences in the recognition or classification of income for financial statement and tax purposes.
Book/tax differences primarily relate to expiration of capital loss carryforwards, amortization and accretion of debt securities and defaulted bonds.
The tax character of distributions declared to shareholders is as follows:
1/31/06
1/31/05
Ordinary income (including any
short-term capital gains)
$273,910
$829,813
Tax-exempt income
71,485,984
71,656,306
Total distributions
$71,759,894
$72,486,119
ANNUAL REPORT 45
Notes to Financial Statements – continued
The federal tax cost and the tax basis components of distributable earnings were as follows:
As of January 31, 2006
Cost of investments
$1,348,983,548
Gross appreciation
$82,024,809
Gross depreciation
(26,669,895)
Net unrealized appreciation (depreciation)
$55,354,914
Undistributed ordinary income
$301,170
Undistributed tax-exempt income
8,406,920
Capital loss carryforwards
(69,273,707)
Other temporary differences
(6,283,567)
As of January 31, 2006, the fund had available capital loss carryforwards to offset future realized gains. Such losses expire as follows:
January
31,
2007
$(6,121,853)
January
31,
2008
(1,353,678)
January
31,
2009
(10,935,605)
January
31,
2010
(2,971,573)
January
31,
2011
(18,364,839)
January
31,
2012
(15,537,212)
January
31,
2013
(3,190,630)
January
31,
2014
(10,798,317)
Total
$(69,273,707)
Multiple Classes of Shares of Beneficial Interest – The fund offers multiple classes of shares, which differ in their respective distribution and service fees. All shareholders bear the common expenses of the fund based on the value of settled shares outstanding of each class, without distinction between share classes. Dividends are declared separately for each class. Differences in per share dividend rates are generally due to differences in separate class expenses. Class B shares will convert to Class A shares approximately eight years after purchase.
(3) Transactions with Affiliates
Investment Adviser – The fund has an investment advisory agreement with Massachusetts Financial Services Company (MFS) to provide overall investment advisory and administrative services, and general office facilities. The management fee is computed daily and paid monthly at the following annual rates:
First $1.4 billion of average daily net assets
0.60%
Average daily net assets in excess of $1.4 billion
0.57%
As part of a settlement agreement with the New York Attorney General concerning market timing and related matters, MFS has agreed to reduce the management fee to 0.50% of the fund’s average daily net assets for the period March 1, 2004 through February 28, 2009. For the year ended January 31, 2006, this waiver amounted to $1,385,471 and is reflected as a reduction of total expenses in the Statement of Operations.
46 ANNUAL REPORT
Notes to Financial Statements – continued
The management fee incurred for the year ended January 31, 2006 was equivalent to an annual effective rate of 0.50% of the fund’s average daily net assets.
Distributor – MFS Fund Distributors, Inc. (MFD), a wholly owned subsidiary of MFS, as distributor, received $459,969 for the year ended January 31, 2006, as its portion of the initial sales charge on sales of Class A shares of the fund. The Board of Trustees has adopted a distribution plan for certain class shares pursuant to Rule 12b-1 of the Investment Company Act of 1940.
The fund’s distribution plan provides that the fund will pay MFD for services provided by MFD and financial intermediaries in connection with the distribution and servicing of certain share classes. One component of the plan is a distribution fee paid to MFD and another component of the plan is a service fee paid to MFD. MFD may subsequently pay all, or a portion, of the distribution and/or service fees to financial intermediaries.
Distribution Fee Plan Table:
Total
Annual
Distribution
Distribution
Service
Distribution
Effective
and Service
Fee Rate
Fee Rate
Plan(1)
Rate(2)
Fee
Class B
0.75%
0.25%
1.00%
0.77%
$1,927,554
Class C
0.75%
0.25%
1.00%
1.00%
1,004,170
Total Distribution and Service Fees
$2,931,724
(1)
In accordance with the distribution plan for certain classes, the fund pays distribution and/or service fees
up to these annual percentage rates of each class’ average daily net assets.
(2)
The annual effective rates represent actual fees incurred under the distribution plan for the year ended
January 31, 2006 based on each class’ average daily net assets. Except in the case of the 0.25% annual
Class B service fee paid by the fund upon the sale of Class B shares in the first year, payment of the Class
B service fee will not be implemented until such date as the fund’s Board of Trustees may determine.
Certain Class A and Class C shares are subject to a contingent deferred sales charge in the event of a shareholder redemption within 12 months of purchase. Class B shares are subject to a contingent deferred sales charge in the event of a shareholder redemption within six years of purchase. All contingent deferred sales charges are paid to MFD and during the year ended January 31, 2006, were as follows:
Amount
Class A
$63,282
Class B
$333,221
Class C
$14,471
Shareholder Servicing Agent – The fund pays a portion of shareholder servicing costs to MFS Service Center, Inc. (MFSC), a wholly-owned subsidiary of MFS. MFSC receives a fee from the fund, for its services as shareholder servicing agent, set periodically under the supervision of the fund’s Board of Trustees. For the year ended January 31, 2006, the fee was $1,460,358, which equated to 0.1060% annually of the fund’s average daily net assets. MFSC also receives payment from the fund for out-of-pocket and sub-accounting expenses paid by MFSC on behalf of the fund. For the year ended January 31, 2006, these costs amounted to $499,169.
ANNUAL REPORT 47
Notes to Financial Statements – continued
Administrator – MFS provides certain financial, legal, shareholder communications, compliance, and other administrative services to certain funds for which MFS acts as investment adviser. Under an administrative services agreement, the funds may partially reimburse MFS the costs incurred to provide these services, subject to review and approval by the Board of Trustees. Each fund is charged a fixed amount plus a fee based on calendar year average net assets. Effective July 1, 2005, the fund’s annual fixed amount is $10,000. The administrative services fee incurred for the year ended January 31, 2006 was equivalent to an annual effective rate of 0.0121% of the fund’s average daily net assets.
Trustees’ and Officers’ Compensation – The fund pays compensation to Independent Trustees in the form of a retainer, attendance fees, and additional compensation to Board and Committee chairpersons. The fund does not pay compensation directly to Trustees who are officers of the investment adviser, or to officers of the fund, all of whom receive remuneration for their services to the fund from MFS. Certain officers and Trustees of the fund are officers or directors of MFS, MFD, and MFSC. The fund has an unfunded, defined benefit plan for retired Independent Trustees which resulted in a pension expense of $7,981. This amount is included in Independent trustees’ compensation for the year ended January 31, 2006. The deferred liability for retirement benefits payable to retired Trustees amounted to $53,239 at January 31, 2006, and is included in payable for independent trustees’ compensation.
Other – This fund and certain other MFS funds (the funds) have entered into a services agreement (the Agreement) which provides for payment of fees by the funds to Tarantino LLC in return for the provision of services of an Independent Chief Compliance Officer (ICCO) for the funds. The ICCO is an officer of the funds and the sole member of Tarantino LLC. The funds can terminate the Agreement with Tarantino LLC at any time under the terms of the Agreement. For the year ended January 31, 2006, the fee paid to Tarantino LLC was $7,591. MFS has agreed to reimburse the fund for a portion of the payments made by the funds to Tarantino LLC in the amount of $6,708, which is shown as a reduction of total expenses in the Statement of Operations. Additionally, MFS has agreed to bear all expenses associated with office space, other administrative support, and supplies provided to the ICCO.
(4) Portfolio Securities
Purchases and sales of investments, other than U.S. government securities, purchased option transactions, and short-term obligations, aggregated $320,933,998 and $265,000,315, respectively.
48 ANNUAL REPORT
Notes to Financial Statements – continued
(5) Shares of Beneficial Interest
The fund’s Declaration of Trust permits the Trustees to issue an unlimited number of full and fractional shares of beneficial interest. Transactions in fund shares were as follows:
Year ended 1/31/06
Year ended 1/31/05
Class A shares
Shares
Amount
Shares
Amount
Shares sold
26,541,560
$223,301,024
14,994,428
$123,833,368
Shares issued to shareholders in
reinvestment of distributions
3,206,817
26,966,277
3,385,200
27,878,249
Shares reacquired
(17,665,426)
(148,419,854)
(23,130,281)
(190,008,514)
Net change
12,082,951
$101,847,447
(4,750,653)
$(38,296,897)
Class B shares
Shares sold
2,188,616
$18,426,446
2,085,133
$17,200,031
Shares issued to shareholders in
reinvestment of distributions
545,639
4,592,022
778,701
6,417,631
Shares reacquired
(10,224,466)
(86,098,379)
(9,814,364)
(80,771,810)
Net change
(7,490,211)
$(63,079,911)
(6,950,530)
$(57,154,148)
Class C shares
Shares sold
5,397,216
$45,484,475
2,512,149
$20,799,666
Shares issued to shareholders in
reinvestment of distributions
253,396
2,133,722
222,096
1,831,569
Shares reacquired
(1,600,899)
(13,464,756)
(2,062,006)
(16,938,683)
Net change
4,049,713
$34,153,441
672,239
$5,692,552
(6) Line of Credit
The fund and other affiliated funds participate in a $1 billion unsecured line of credit provided by a syndication of banks under a credit agreement. Borrowings may be made for temporary financing needs. Interest is charged to each fund, based on its borrowings, at a rate equal to the Federal Reserve funds rate plus 0.35% . In addition, a commitment fee, based on the average daily, unused portion of the line of credit, is allocated among the participating funds at the end of each calendar quarter. The commitment fee allocated to the fund for the year ended January 31, 2006 was $8,931, and is included in miscellaneous expense on the Statement of Operations. The fund had no significant borrowings during the year ended January 31, 2006.
(7) Concentration of Credit Risk
At January 31, 2006, 20.0% of securities in the portfolio of investments are backed by letters of credit or bond insurance of various financial institutions and financial guaranty assurance agencies. The percentage of investments insured by or supported (backed) by a letter of credit from any one institution or agency did not exceed 5.6% of total investments.
ANNUAL REPORT 49
Notes to Financial Statements – continued
(8) Loss Contingency
On February 23, 2003, the Special Care Facilities Financing Authority of the City of Daphne, Alabama received notification that the Internal Revenue Service (IRS) had commenced an audit of two bonds held in the fund’s portfolio, Daphne, Alabama, Special Care Facilities Authority 1st Mortgage Presbyterian, 0%, 2008 and Daphne, Alabama, Special Care Facilities Authority 2nd Mortgage Presbyterian, 0%, 2008 (the ‘‘Daphne Bonds’’). The IRS has asserted that the Daphne Bonds fail to satisfy certain provisions of the Internal Revenue Code, and as a result, interest on the bonds is not excludable from gross income for federal tax purposes. If the IRS issues final determination of taxability, the fund may incur a tax liability for failure to correctly report taxable income on Form 1099-DIV for the last 3 open tax years. An estimate of such tax liability cannot be made at this time.
50 ANNUAL REPORT
REPORT OF INDEPENDENT REGISTERED PUBLIC ACCOUNTING FIRM
To the Board of Trustees and Shareholders of MFS Municipal High Income Fund:
We have audited the accompanying statement of assets and liabilities of MFS Municipal High Income Fund (the Fund), including the portfolio of investments, as of January 31, 2006, and the related statement of operations for the year then ended, the statements of changes in net assets for each of the two years in the period then ended, and the financial highlights for each of the five years in the period then ended. These financial statements and financial highlights are the responsibility of the Fund’s management. Our responsibility is to express an opinion on these financial statements and financial highlights based on our audits.
We conducted our audits in accordance with the standards of the Public Company Accounting Oversight Board (United States). Those standards require that we plan and perform the audit to obtain reasonable assurance about whether the financial statements and financial highlights are free of material misstatement. We were not engaged to perform an audit of the Fund’s internal control over financial reporting. Our audits included consideration of internal control over financial reporting as a basis for designing audit procedures that are appropriate in the circumstances, but not for the purpose of expressing an opinion on the effectiveness of the Fund’s internal control over financial reporting. Accordingly, we express no such opinion. An audit also includes examining, on a test basis, evidence supporting the amounts and disclosures in the financial statements and financial highlights, assessing the accounting principles used and significant estimates made by management, and evaluating the overall financial statement presentation. Our procedures included confirmation of securities owned as of January 31, 2006, by correspondence with the custodian and brokers or by other appropriate auditing procedures where replies from brokers were not received. We believe that our audits provide a reasonable basis for our opinion.
In our opinion, the financial statements and financial highlights referred to above present fairly, in all material respects, the financial position of MFS Municipal High Income Fund at January 31, 2006, the results of its operations for the year then ended, the changes in its net assets for each of the two years in the period then ended, and its financial highlights for each of the five years in the period then ended, in conformity with U.S. generally accepted accounting principles.
Boston, Massachusetts March 10, 2006
ANNUAL REPORT 51
TRUSTEES AND OFFICERS — IDENTIFICATION AND BACKGROUND
The Trustees and officers of the Trust, as of March 1, 2006, are listed below, together with their principal occupations during the past five years. (Their titles may have varied during that period.) The address of each Trustee and officer is 500 Boylston Street, Boston, Massachusetts 02116.
Principal Occupations During
Position(s) Held
Trustee/Officer
the Past Five Years &
Name, Date of Birth
with Fund
Since(1)
Other Directorships(2)
INTERESTED TRUSTEES
Robert J. Manning(3)
Trustee
February 2004
Massachusetts Financial Services
(born 10/20/63)
Company, Chief Executive
Officer, President, Chief
Investment Officer and Director
Robert C. Pozen(3)
Trustee
February 2004
Massachusetts Financial Services
(born 08/08/46)
Company, Chairman (since
February 2004); Secretary of
Economic Affairs, The
Commonwealth of Massachusetts
(January 2002 to December 2002);
Fidelity Investments, Vice
Chairman (June 2000 to
December 2001); Fidelity
Management & Research
Company (investment adviser),
President (March 1997 to July
2001); Bell Canada Enterprises
(telecommunications), Director;
Medtronic, Inc. (medical
technology), Director; Telesat
(satellite communications),
Director
INDEPENDENT TRUSTEES
J. Atwood Ives
Trustee and
February 1992
Private investor; Eastern
(born 05/01/36)
Chair of
Enterprises (diversified services
Trustees
company), Chairman, Trustee and
Chief Executive Officer (until
November 2000)
Robert E. Butler(4)
Trustee
January 2006
Consultant – regulatory and
(born 11/29/41)
compliance matters (since July
2002); PricewaterhouseCoopers
LLP (professional services firm),
Partner (November 2000 until
June 2002)
Lawrence H. Cohn, M.D.
Trustee
August 1993
Brigham and Women’s Hospital,
(born 03/11/37)
Senior Cardiac Surgeon, Chief of
Cardiac Surgery (until 2005);
Harvard Medical School, Professor
of Surgery; Brigham and Women’s
Hospital Physicians’ Organization,
Chair (2000 to 2004)
52 ANNUAL REPORT
Principal Occupations During
Position(s) Held
Trustee/Officer
the Past Five Years &
Name, Date of Birth
with Fund
Since(1)
Other Directorships(2)
David H. Gunning
Trustee
January 2004
Cleveland-Cliffs Inc. (mining
(born 05/30/42)
products and service provider),
Vice Chairman/Director (since
April 2001); Encinitos Ventures
(private investment company),
Principal (1997 to April 2001);
Lincoln Electric Holdings, Inc.
(welding equipment
manufacturer), Director
William R. Gutow
Trustee
December 1993
Private investor and real estate
(born 09/27/41)
consultant; Capitol Entertainment
Management Company (video
franchise), Vice Chairman
Michael Hegarty
Trustee
December 2004
Retired; AXA Financial (financial
(born 12/21/44)
services and insurance), Vice
Chairman and Chief Operating
Officer (until May 2001); The
Equitable Life Assurance Society
(insurance), President and Chief
Operating Officer (until May 2001)
Lawrence T. Perera
Trustee
July 1981
Hemenway & Barnes (attorneys),
(born 06/23/35)
Partner
J. Dale Sherratt
Trustee
August 1993
Insight Resources, Inc.
(born 09/23/38)
(acquisition planning specialists),
President; Wellfleet Investments
(investor in health care
companies), Managing General
Partner (since 1993); Cambridge
Nutraceuticals (professional
nutritional products), Chief
Executive Officer (until May 2001)
Laurie J. Thomsen
Trustee
March 2005
Private investor; Prism Venture
(born 08/05/57)
Partners (venture capital), Co-
founder and General Partner
(until June 2004); St. Paul
Travelers Companies (commercial
property liability insurance),
Director
Robert W. Uek
Trustee
January 2006
Retired (since 1999);
(born 05/18/41)
PricewaterhouseCoopers LLP
(professional services firm),
Partner (until 1999); Consultant
to investment company industry
(since 2000); TT International
Funds (mutual fund complex),
Trustee (2000 until 2005);
Hillview Investment Trust II
Funds (mutual fund complex),
Trustee (2000 until 2005)
ANNUAL REPORT 53
Principal Occupations During
Position(s) Held
Trustee/Officer
the Past Five Years &
Name, Date of Birth
with Fund
Since(1)
Other Directorships(2)
OFFICERS
Maria F. Dwyer(3)
President
November 2005
Massachusetts Financial Services
(born 12/01/58)
Company, Executive Vice
President and Chief Regulatory
Officer (since March 2004);
Fidelity Management & Research
Company, Vice President (prior
to March 2004); Fidelity Group of
Funds, President and Treasurer
(prior to March 2004)
Tracy Atkinson(3)
Treasurer
September 2005
Massachusetts Financial Services
(born 12/30/64)
Company, Senior Vice President
(since September 2004);
PricewaterhouseCoopers LLP,
Partner (prior to September 2004)
Christopher R. Bohane(3)
Assistant
July 2005
Massachusetts Financial Services
(born 1/18/74)
Secretary and
Company, Vice President and
Assistant
Senior Counsel (since April
Clerk
2003); Kirkpatrick & Lockhart
LLP (law firm), Associate (prior
to April 2003); Nvest Services
Company, Assistant Vice
President and Associate Counsel
(prior to January 2001)
Ethan D. Corey(3)
Assistant
July 2005
Massachusetts Financial Services
(born 11/21/63)
Secretary and
Company, Special Counsel (since
Assistant
December 2004); Dechert LLP
Clerk
(law firm), Counsel (prior to
December 2004)
David L. DiLorenzo(3)
Assistant
July 2005
Massachusetts Financial Services
(born 8/10/68)
Treasurer
Company, Vice President (since
June 2005); JP Morgan Investor
Services, Vice President (January
2001 to June 2005); State Street
Bank, Vice President and
Corporate Audit Manager (prior
to January 2001)
Timothy M. Fagan(3)
Assistant
September 2005
Massachusetts Financial Services
(born 7/10/68)
Secretary and
Company, Vice President and
Assistant
Senior Counsel (since September
Clerk
2005); John Hancock Advisers,
LLC, Vice President and Chief
Compliance Officer (September
2004 to August 2005), Senior
Attorney (prior to September
2004); John Hancock Group of
Funds, Vice President and Chief
Compliance Officer (September
2004 to December 2004)
54 ANNUAL REPORT
Principal Occupations During
Position(s) Held
Trustee/Officer
the Past Five Years &
Name, Date of Birth
with Fund
Since(1)
Other Directorships(2)
Mark D. Fischer(3)
Assistant
July 2005
Massachusetts Financial Services
(born 10/27/70)
Treasurer
Company, Vice President (since
May 2005); JP Morgan Investment
Management Company, Vice
President (prior to May 2005)
Brian T. Hourihan(3)
Assistant
September 2004
Massachusetts Financial Services
(born 11/11/64)
Secretary and
Company, Vice President, Senior
Assistant
Counsel and Assistant Secretary
Clerk
(since June 2004); Affiliated
Managers Group, Inc., Chief Legal
Officer/Centralized Compliance
Program (January to April 2004);
Fidelity Research & Management
Company, Assistant General
Counsel (prior to January 2004)
Ellen Moynihan(3)
Assistant
April 1997
Massachusetts Financial Services
(born 11/13/57)
Treasurer
Company, Senior Vice President
Susan S. Newton(3)
Assistant
May 2005
Massachusetts Financial Services
(born 03/07/50)
Secretary and
Company, Senior Vice President
Assistant
and Associate General Counsel
Clerk
(since April 2005); John Hancock
Advisers, LLC, Senior Vice
President, Secretary and Chief
Legal Officer (prior to April
2005); John Hancock Group of
Funds, Senior Vice President,
Secretary and Chief Legal Officer
(prior to April 2005)
Susan A. Pereira(3)
Assistant
July 2005
Massachusetts Financial Services
(born 11/05/70)
Secretary and
Company, Vice President and
Assistant
Senior Counsel (since June 2004);
Clerk
Bingham McCutchen LLP (law
firm), Associate (January 2001 to
June 2004); Preti, Flaherty,
Beliveau, Pachios & Haley, LLC,
Associate (prior to January 2001)
Mark N. Polebaum(3)
Secretary and
January 2006
Massachusetts Financial Services
(born 05/01/52)
Clerk
Company, Executive Vice
President, General Counsel and
Secretary (since January 2006);
Wilmer Cutler Pickering Hale
and Dorr LLP (law firm), Partner
(prior to January 2006)
ANNUAL REPORT 55
Principal Occupations During
Position(s) Held
Trustee/Officer
the Past Five Years &
Name, Date of Birth
with Fund
Since(1)
Other Directorships(2)
Frank L. Tarantino
Independent
June 2004
Tarantino LLC (provider of
(born 03/07/44)
Chief
compliance services), Principal
Compliance
(since June 2004); CRA Business
Officer
Strategies Group (consulting
services), Executive Vice
President (April 2003 to June
2004); David L. Babson & Co.
(investment adviser), Managing
Director, Chief Administrative
Officer and Director (February
1997 to March 2003)
James O. Yost(3)
Assistant
September 1990
Massachusetts Financial Services
(born 06/12/60)
Treasurer
Company, Senior Vice President
1 Date first appointed to serve as Trustee/officer of an MFS fund. Each Trustee has served continuously since
appointment unless indicated otherwise.
2 Directorships or trusteeships of companies required to report to the Securities and Exchange Commission
(i.e., ‘‘public companies’’).
3 ‘‘Interested person’’ of the Trust within the meaning of the Investment Company Act of 1940 (referred to as
the 1940 Act), which is the principal federal law governing investment companies like the fund, as a result of
position with MFS. The address of MFS is 500 Boylston Street, Boston, Massachusetts 02116.
4 In 2004 and 2005, Mr. Butler provided consulting services to the independent compliance consultant retained
by MFS pursuant to its settlement with the SEC concerning market timing and related matters. The terms of
that settlement required that compensation and expenses related to the independent compliance consultant
be borne exclusively by MFS and, therefore, MFS paid Mr. Butler for the services he rendered to the
independent compliance consultant. In 2004 and 2005, MFS paid Mr. Butler a total of $351,119.29.
Each Trustee and officer holds office until his or her successor is chosen and qualified or until his or her earlier death, resignation, retirement or removal. Messrs. Butler, Ives, Sherratt and Uek and Ms. Thomsen are members of the Trust’s Audit Committee.
Each of the Trust’s Trustees and officers holds comparable positions with certain other funds of which MFS or a subsidiary is the investment adviser or distributor, and, in the case of the officers, with certain affiliates of MFS. As of December 31, 2005, each Trustee served as a board member of 98 funds within the MFS Family of Funds.
The Trust held a shareholders’ meeting in 2005, and will hold a shareholders’ meeting at least once every five years thereafter, to elect Trustees.
The Statement of Additional Information contains further information about the Trustees and is available without charge upon request by calling 1-800-225-2606.
Investment Adviser
Custodian
Massachusetts Financial Services Company
State Street Bank and Trust Company
500 Boylston Street, Boston, MA 02116-3741
225 Franklin Street, Boston, MA 02110
Distributor
Independent Registered Public Accounting Firm
MFS Fund Distributors, Inc.
Ernst & Young LLP
500 Boylston Street, Boston, MA 02116-3741
200 Clarendon Street, Boston, MA 02116
Portfolio Manager
Geoffrey L. Schechter
56 ANNUAL REPORT
BOARD REVIEW OF INVESTMENT ADVISORY AGREEMENT
A discussion regarding the Board’s most recent review and renewal of the Fund’s investment advisory agreement is available by clicking on the fund’s name under ‘‘Select a fund’’ on the MFS Web site (mfs.com).
PROXY VOTING POLICIES AND INFORMATION
A general description of the MFS funds’ proxy voting policies and procedures is available without charge, upon request, by calling 1-800-225-2606, by visiting the Proxy Voting section of mfs.com or by visiting the SEC’s Web site at http://www.sec.gov.
Information regarding how the fund voted proxies relating to portfolio securities during the most recent twelve-month period ended June 30 is available without charge by visiting the Proxy Voting section of mfs.com or by visiting the SEC’s Web site at http://www.sec.gov.
QUARTERLY PORTFOLIO DISCLOSURE
The fund will file a complete schedule of portfolio holdings with the Securities and Exchange Commission (the Commission) for the first and third quarters of each fiscal year on Form N-Q. The fund’s Form N-Q may be reviewed and copied at the: Public Reference Room Securities and Exchange Commission Washington, D.C. 20549-0102 Information on the operation of the Public Reference Room may be obtained by calling the Commission at 1-800-SEC-0330. The fund’s Form N-Q is available on the EDGAR database on the Commission’s Internet Web site at http://www.sec.gov, and copies of this information may be obtained, upon payment of a duplicating fee, by electronic request at the following e-mail address: publicinfo@sec.gov or by writing the Public Reference Section at the above address.
A shareholder can also obtain the quarterly portfolio holdings report at mfs.com.
FEDERAL TAX INFORMATION (unaudited)
The fund will notify shareholders of amounts for use in preparing 2006 income tax forms in January 2007. The following information is provided pursuant to provisions of the Internal Revenue Code.
Of the dividends paid from net investment income during the fiscal year, 99.62% is designated as from exempt interest dividends for federal income tax purposes. If the fund has earned income on private activity bonds, a portion of the dividends paid may be considered a tax preference item for purposes of computing a shareholder’s alternative minimum tax.
ANNUAL REPORT 57
d641411_report.pdf -- Converted by SECPublisher 4.0, created by BCL Technologies Inc., for SEC Filing
LETTER FROM THE CEO
Dear Shareholders,
It has been said that change is the only constant in life. As investors have seen, that theme is still accurate today as we recently have experienced shifting economic cycles because of natural disasters and political instability around the globe.
Markets worldwide have fluctuated in the past year as devastating hurricanes had a dramatic effect on the international economy, particularly on oil prices. We witnessed political unrest in the Middle East, highlighted by instability in Iraq, and in Africa, the usually stable Nigeria also experienced violence. As a result, energy prices have bounced up and down, with crude oil prices at one point topping a record $70 per barrel.
Such cycles are not uncommon and in fact have almost become the norm in our everyday lives. What does all of this mean to you as an investor? In times like these, it helps to know that you’re working with a seasoned investment professional who has experience to guide you through difficult times. At MFS®, we believe our investment management team has the knowledge and confidence to navigate through difficult cycles and at the same time see through adversity to find investment opportunities for our clients and shareholders.
Our investment management process, honed over 80 years, combines a unique concept of teamwork with our unwavering focus on the long term. We firmly believe that the best way to realize long-term financial goals – be it a college education, a comfortable retirement, or a secure family legacy – is to follow a three-pronged approach that focuses on longer time horizons. Allocate holdings across the major asset classes – including stocks, bonds, and cash. Diversify within each class to take advantage of different market segments and investing styles. Rebalance assets regularly to maintain a desired asset allocation. Of course, these strategies cannot guarantee a profit or protect against a loss. This long-term approach requires diligence and patience, two traits that in our experience are essential to capitalizing on the many opportunities the financial markets can offer – through both up and down economic cycles.
Respectfully,
Robert J. Manning Chief Executive Officer and Chief Investment Officer MFS Investment Management®
March 15, 2006
The opinions expressed in this letter are those of MFS, and no forecasts can be guaranteed.
ANNUAL REPORT 1
PORTFOLIO COMPOSITION
Top five bond industries (b)
Emerging Market Sovereign
7.3%
Gaming & Lodging
5.9%
Automotive
5.3%
Advertising & Broadcasting
5.3%
Utilities – Electric Power
4.8%
Credit quality of bonds (r)
AAA
0.4%
AA
0.3%
A
0.8%
BBB
6.1%
BB
30.7%
B
39.5%
CCC
18.7%
CC
0.4%
D
0.4%
Not Rated
2.7%
Portfolio facts
Average Duration (d)
4.6
Average Life (m)
9.0 yrs.
Average Maturity (m)
9.5 yrs.
Average Credit Quality of
Rated Securities (a)
B+
Average Short Term Quality
A-1
(b)
For purposes of this graphical presentation, the bond component includes both accrued interest amounts
and the equivalent exposure from any derivative holdings, if applicable.
(r)
Each security is assigned a rating from Moody’s Investors Service. If not rated by Moody’s, the rating will
be that assigned by Standard & Poor’s. Likewise, if not assigned a rating by Standard & Poor’s, it will be
based on the rating assigned by Fitch, Inc. For those portfolios that hold a security which is not rated by
any of the three agencies, the security is considered Not Rated. Holdings in U.S. Treasuries and
government agency mortgage-backed securities, if any, are included in a ‘‘AAA’’-rating category.
Percentages are based on the total market value of investments as of 1/31/06.
(m)
The average maturity shown is calculated using the final stated maturity on the portfolio’s holdings
without taking into account any holdings which have been pre-refunded to an earlier date or which have
a mandatory put date prior to the stated maturity. The average life shown takes into account these
earlier dates.
(a)
The average credit quality of rated securities is based upon a market weighted average of portfolio
holdings that are rated by public rating agencies.
(d)
Duration is a measure of how much a bond’s price is likely to fluctuate with general changes in interest
rates, e.g., if rates rise 1.00%, a bond with a 5-year duration is likely to lose about 5.00% of its value.
Percentages are based on net assets as of 1/31/06, unless otherwise noted.
The portfolio is actively managed, and current holdings may be different.
2 ANNUAL REPORT
MANAGEMENT REVIEW
Summary of Results
For the twelve months ended January 31, 2006, Class A shares of the MFS High Yield Opportunities Fund provided a total return of 5.55%, at net asset value. In comparison, the fund’s benchmark, the Lehman Brothers U.S. High-Yield Corporate Bond Index returned 4.51%.
Contributors to performance
Emerging market debt largely outperformed domestic debt over the period, and, as a result, our investment in this sector benefited relative performance. In particular, our positions in Brazilian sovereign debt boosted results.
Our holdings in several strong-performing securities also contributed to relative performance. These included bond positions in lottery equipment supplier GTECH Holdings, eyewear manufacturer Safilo Group, regional amusement park operator Six Flags, and enhanced equipment trust certificates of air carrier Continental Airlines.
Holding higher-yielding issues relative to the benchmark, which generated a higher level of income for the fund, helped results.
Detractors from performance
Several of our holdings in the more speculative ‘‘CCC’’-rated(r) sectors of the high yield market held back the fund’s relative performance during the period.
Holdings that detracted from relative performance included bonds of independent power producer Calpine*, packaging manufacturer Pliant, and electrical contracting and maintenance company Integrated Electrical Services*.
Respectively,
John F. Addeo
Scott B. Richards
Matthew W. Ryan
Portfolio Manager
Portfolio Manager
Portfolio Manager
* Security was not held in the portfolio at period-end.
(r) Bonds rated ‘‘BBB’’ or higher are considered investment grade; bonds rated ‘‘BB’’ or lower are considered non-investment grade.
The views expressed in this report are those of the portfolio managers only through the end of the period of the report as stated on the cover and do not necessarily reflect the views of MFS or any other person in the MFS organization. These views are subject to change at any time based on market and other conditions, and MFS disclaims any responsibility to update such views. These views may not be relied upon as investment advice or an indication of trading intent on behalf of any MFS portfolio. References to specific securities are not recommendations of such securities, and may not be representative of any MFS portfolio’s current or future investments.
ANNUAL REPORT 3
PERFORMANCE SUMMARY THROUGH 1/31/06
The following chart illustrates the historical performance of the fund’s Class A shares in comparison to its benchmark. Performance results include the deduction of the maximum applicable sales charge and reflect the percentage change in net asset value, including reinvestment of dividends and capital gains distributions. The performance of other share classes will be greater than or less than that of the class depicted below. Benchmark comparisons are unmanaged; do not reflect sales charges, commissions or expenses; and cannot be invested in directly. (See Notes to Performance Summary.)
Performance data shown represents past performance and is no guarantee of future results. Investment return and principal value fluctuate so your shares, when sold, may be worth more or less than the original cost; current performance may be lower or higher than quoted. For most recent month-end performance, please visit mfs.com. (For the most recent month-end performance for Class I shares call 1-888-808-6374.) The performance shown does not reflect the deduction of taxes, if any, that a shareholder would pay on fund distributions or the redemption of fund shares.
Growth of a hypothetical $10,000 investment
For the period from the commencement of the fund’s investment operations, July 1, 1998 through January 31, 2006. Index information is from July 1, 1998.
4 ANNUAL REPORT
Performance summary – continued
Total returns through 1/31/06
Average annual without sales charge
Share class
Class inception date
1-yr
5-yr
Life(t)
A
7/01/98
5.55%
8.27%
6.29%
B
7/01/98
4.87%
7.57%
5.63%
C
7/01/98
4.86%
7.55%
5.58%
I
7/01/98
5.92%
8.47%
6.66%
Average annual
Comparative benchmarks
Average high current yield fund (l)
4.00%
6.21%
3.49%
Lehman Brothers U.S. High-Yield
Corporate Bond Index (s)
4.51%
7.63%
5.11%
Average annual with sales charge
Share class
A
0.53%
7.22%
5.61%
With Initial Sales Charge (4.75%)
B
0.99%
7.29%
5.63%
With CDSC (Declining over six years from 4% to 0%)
C
3.89%
7.55%
5.58%
With CDSC (1% for 12 months) (a)
Class I shares do not have a sales charge. Please see Notes to Performance Summary for more details. CDSC – Contingent Deferred Sales Charge.
(a)
Assuming redemption within one year from the end of the prior month of purchase.
(t)
For the period from the commencement of the fund’s investment operations, July 1, 1998 through January 31, 2006. Index information is from July 1, 1998.
(l)
Source: Lipper Inc., an independent firm that reports mutual fund performance.
(s)
Source: Standard & Poor’s Micropal, Inc.
Index Definition
Lehman Brothers U.S. High-Yield Corporate Bond Index – measures the universe of non-investment grade, fixed rate debt. Eurobonds, and debt issues from countries designated as emerging markets (e.g., Argentina, Brazil, Venezuela, etc.) are excluded.
It is not possible to invest directly in an index.
ANNUAL REPORT 5
Performance summary – continued
Notes to Performance Summary
Class I shares are available only to certain eligible investors.
Performance results reflect any applicable expense subsidies and waivers in effect during the periods shown. Without such subsidies and waivers the fund’s performance results would be less favorable. Please see the prospectus and financial statements for complete details.
From time to time the fund may receive proceeds from litigation settlements, without which performance would be lower.
6 ANNUAL REPORT
EXPENSE TABLE
Fund Expenses Borne by the Shareholders During the Period, August 1, 2005 through January 31, 2006.
As a shareholder of the fund, you incur two types of costs: (1) transaction costs, including sales charges (loads) on certain purchase or redemption payments and redemption fees on certain exchanges and redemptions, and (2) ongoing costs, including management fees; distribution and service (12b-1) fees; and other fund expenses. This example is intended to help you understand your ongoing costs (in dollars) of investing in the fund and to compare these costs with the ongoing costs of investing in other mutual funds.
The example is based on an investment of $1,000 invested at the beginning of the period and held for the entire period August 1, 2005 through January 31, 2006.
Actual Expenses
The first line for each share class in the following table provides information about actual account values and actual expenses. You may use the information in this line, together with the amount you invested, to estimate the expenses that you paid over the period. Simply divide your account value by $1,000 (for example, an $8,600 account value divided by $1,000 = 8.6), then multiply the result by the number in the first line under the heading entitled ‘‘Expenses Paid During Period’’ to estimate the expenses you paid on your account during this period.
Hypothetical Example for Comparison Purposes
The second line for each share class in the following table provides information about hypothetical account values and hypothetical expenses based on the fund’s actual expense ratio and an assumed rate of return of 5% per year before expenses, which is not the fund’s actual return. The hypothetical account values and expenses may not be used to estimate the actual ending account balance or expenses you paid for the period. You may use this information to compare the ongoing costs of investing in the fund and other funds. To do so, compare this 5% hypothetical example with the 5% hypothetical examples that appear in the shareholder reports of the other funds.
Please note that the expenses shown in the table are meant to highlight your ongoing costs only and do not reflect any transactional costs, such as sales charges (loads) or redemption fees. Therefore, the second line for each share class in the table is useful in comparing ongoing costs only, and will not help you determine the relative total costs of owning different funds. In addition, if these transactional costs were included, your costs would have been higher.
ANNUAL REPORT 7
Expense table – continued
Share Class
Annualized Expense Ratio
Beginning Account Value 8/01/05
Ending Account Value 1/31/06
Expenses Paid During Period(p) 8/01/05-1/31/06
A
Actual
0.86%
$1,000.00
$1,022.60
$4.38
Hypothetical(h)
0.86%
$1,000.00
$1,020.87
$4.38
B
Actual
1.52%
$1,000.00
$1,017.90
$7.73
Hypothetical(h)
1.52%
$1,000.00
$1,017.54
$7.73
C
Actual
1.51%
$1,000.00
$1,017.90
$7.68
Hypothetical(h)
1.51%
$1,000.00
$1,017.59
$7.68
I
Actual
0.51%
$1,000.00
$1,023.00
$2.60
Hypothetical(h)
0.51%
$1,000.00
$1,022.63
$2.60
(h)
5% class return per year before expenses.
(p)
Expenses paid is equal to each class’ annualized expense ratio, as shown above, multiplied by the average
account value over the period, multiplied by the number of days in the period, divided by the number of
days in the year. Expenses paid do not include any applicable sales charges (loads) or redemption fees. If
these transaction costs had been included, your costs would have been higher.
8 ANNUAL REPORT
PORTFOLIO OF INVESTMENTS – 1/31/06
The Portfolio of Investments is a complete list of all securities owned by your fund.
It is categorized by broad-based asset classes.
Bonds - 89.1%
Issuer
Shares/Par
Value ($)
Advertising & Broadcasting - 5.2%
Allbritton Communications Co., 7.75%, 2012
$
4,037,000
$
4,047,093
DIRECTV Holdings LLC, 8.375%, 2013
703,000
753,968
DIRECTV Holdings LLC, 6.375%, 2015
860,000
842,800
EchoStar DBS Corp., 6.375%, 2011
4,185,000
4,080,375
Granite Broadcasting Corp., 9.75%, 2010
3,365,000
2,902,313
Inmarsat Finance II PLC, 0% to 2008, 10.375% to 2012
3,245,000
2,705,519
Innova S. de R.L., 9.375%, 2013
215,000
238,381
Intelsat Ltd., 8.625%, 2015(a)
1,260,000
1,263,150
Intelsat Ltd., 0% to 2010, 9.25% to 2015(a)
1,745,000
1,151,700
Lamar Media Corp., 6.625%, 2015
790,000
793,950
LBI Media Holdings, Inc., 0% to 2008, 11% to 2013
4,375,000
3,221,094
Panamsat Holding Corp., 0% to 2009, 10.375% to 2014
Empresa Nacional de Electricidad S.A., 8.35%, 2013
145,000
163,472
Enersis S.A., 7.375%, 2014
1,693,000
1,805,481
FirstEnergy Corp., 6.45%, 2011
970,000
1,019,721
Midwest Generation LLC, 8.75%, 2034
2,150,000
2,354,216
Mirant North America LLC, 7.375%, 2013(a)
1,235,000
1,256,613
Mission Energy Holding Co., 13.5%, 2008
1,615,000
1,865,325
NGC Corp. Capital Trust, 8.316%, 2027
1,975,000
1,817,000
NorthWestern Corp., 5.875%, 2014
1,225,000
1,216,289
ANNUAL REPORT 19
Portfolio of Investments – continued
Issuer
Shares/Par
Value ($)
Bonds - continued
Utilities - Electric Power - continued
NRG Energy, Inc., 8%, 2013
$
1,343,000
$
1,497,445
NRG Energy, Inc., 7.375%, 2016
3,390,000
3,449,325
PSEG Energy Holdings LLC, 8.625%, 2008
760,000
799,900
Reliant Energy, Inc., 6.75%, 2014
530,000
455,800
Reliant Resources, Inc., 9.25%, 2010
785,000
775,188
Sierra Pacific Resources, 6.75%, 2017(a)
1,845,000
1,849,613
Texas Genco LLC, 6.875%, 2014(a)
1,105,000
1,196,163
TXU Corp., 5.55%, 2014
1,780,000
1,671,495
$
29,240,847
Total Bonds (Identified Cost, $528,230,598)
$537,884,907
Stocks - 2.4%
Automotive - 0.9%
Magna International, Inc., ‘‘A’’
73,650
$
5,450,100
Broadcast & Cable TV - 0.1%
Sinclair Broadcast Group, Inc., ‘‘A’’
75,683
$
602,437
Business Services - 0.3%
Brink’s Co.
35,500
$
1,888,600
Metals & Mining - 0%
Oxford Automotive, Inc.(n)
29
$
0
Natural Gas - Distribution - 0.5%
Ferrell Gas Partners LP
40,712
$
883,450
Northwestern Corp.
71,764
2,249,084
$
3,132,534
Pharmaceuticals - 0.2%
Merck & Co., Inc.
31,600
$
1,090,200
Specialty Chemicals - 0%
Sterling Chemicals, Inc.(n)
1
$
11
Telecommunications - Wireless - 0.1%
Vodafone Group PLC, ADR
35,960
$
759,116
Telephone Services - 0.3%
NTL, Inc.(n)
12,137
$
767,665
Telewest Global, Inc.(n)
30,109
701,540
$
1,469,205
Total Stocks (Identified Cost, $13,886,722)
$
14,392,203
20 ANNUAL REPORT
Portfolio of Investments – continued
Convertible Preferred Stocks - 0.6%
Issuer
Shares/Par
Value ($)
Automotive - 0.6%
General Motors Corp., 5.25% (Identified Cost, $3,978,005)
244,166
$
4,033,622
Preferred Stocks - 0.6%
Broadcast & Cable TV - 0.6%
Paxson Communications Corp., 14.25%(n)
162
$
1,393,200
Spanish Broadcasting Systems, Inc., ‘‘B’’, 10.75%
1,975
2,133,000
$
3,526,200
Real Estate - 0%
HRPT Properties Trust, ‘‘B’’, 8.75%
1,375
$
35,200
Telephone Services - 0%
PTV, Inc., ‘‘A’’(n)
12
$
25
Total Preferred Stocks (Identified Cost, $3,436,886)
$
3,561,425
Warrants - 0%
Strike
First
Price
Exercise
Cybernet Internet Services (Computer
Software)(n)
$22.28
10/29/99
20
$
0
GT Group Telecom, Inc. (Telephone Services)(n)
0.00
8/01/00
750
0
Metricom (Network & Telecom)(n)
87.00
8/15/00
225
0
Pliant Corp. (Containers)(a)(n)
0.01
5/25/00
815
8
Sirius Satellite Radio, Inc. (Advertising &
Broadcasting)(n)
24.92
8/13/99
300
0
Sterling Chemicals, Inc. (Specialty Chemicals)(n)
52.00
12/31/02
1
0
XM Satellite Radio, Inc. (Broadcast & Cable
TV)(n)
45.24
9/16/00
258
9,288
XO Communications, Inc., ‘‘A’’ (Telephone
Services)(n)
6.25
5/27/03
470
141
XO Communications, Inc., ‘‘B’’ (Telephone
Services)(n)
7.50
5/27/03
352
70
XO Communications, Inc., ‘‘C’’ (Telephone
Services)(n)
10.00
5/27/03
352
56
Total Warrants (Identified Cost, $133,617)
$
9,563
Short-Term Obligations (y) - 5.8%
General Electric Co., 4.48%, due 2/01/06
$
24,056,000
$
24,056,000
Sheffield Receivables Corp., 4.48%, due 2/01/06 (t)
10,825,000
10,825,000
Total Short-Term Obligations, at Amortized Cost
$
34,881,000
Total Investments (Identified Cost, $584,546,828) (k)
$
594,762,720
Other Assets, Less Liabilities - 1.5%
8,956,002
Net Assets - 100.0%
$
603,718,722
ANNUAL REPORT 21
Portfolio of Investments – continued
Forward Foreign Currency Exchange Contracts
Sales and Purchases in the table below are reported by currency.
Net Unrealized
Contracts to
Contracts
Appreciation
Deliver/Receive
Settlement Date
In Exchange For
at Value
(Depreciation)
Sales
EUR
8,139,838
2/21/2006
$ 9,565,083
$ 9,921,565
$(356,482)
MXN
34,667,684
2/27/2006
3,292,434
3,312,180
(19,746)
SEK
313,806
2/13/2006
40,782
41,390
(608)
$12,898,299
$13,275,135
$(376,836)
Purchases
EUR
477,253
3/20/2006
$ 579,834
$ 582,639
$ 2,805
MXN
15,071,903
2/27/2006
1,440,478
1,439,982
(496)
SEK
313,806
2/13/2006
39,506
41,390
1,884
$ 2,059,818
$ 2,064,011
$ 4,193
At January 31, 2006, forward foreign currency purchases and sales under master netting agreements
excluded above amounted to a net receivable of $5,946 with Merrill Lynch.
At January 31, 2006, the fund had sufficient cash and/or securities to cover any commitments under
these derivative contracts.
(t)
Security exempt from registration with the U.S. Securities and Exchange Commission under Section 4(2) of
the Securities Act of 1933.
(n)
Non-income producing security.
(a)
SEC Rule 144A restriction.
(e)
The rate shown represents a current effective yield.
(y)
The rate shown represents an annualized yield at time of purchase.
(k)
As of January 31, 2006 the fund had eight securities representing $0 and 0% of net assets that were fair
valued in accordance with the policies adopted by the Board of Trustees.
(i)
Interest only security for which the fund receives interest on notional principal (Par amount). Par amount
shown is the notional principal and does not reflect the cost of the security.
(d)
Non-income producing security - in default.
(p)
Payment-in-kind security.
(r)
Restricted securities (excluding 144A issues) are not registered under the Securities Act of 1933 and are
subject to legal or contractual restrictions on resale. These securities generally may be resold in
transactions exempt from registration or to the public if the securities are registered. Disposal of these
securities may involve time-consuming negotiations and prompt sale at an acceptable price may be difficult.
The fund holds the following restricted security:
Current
Acquisition
Acquisition
Market
Total % of
Security
Date
Cost
Value
Net Assets
Inter-American Development Bank,
8.044%, 2016
6/21/1996
$1,035,781
$1,844,884
0.31%
The following abbreviations are used in the Portfolio of Investments and are defined:
ADR
American Depository Receipt
FRN
Floating Rate Note. The interest rate is the rate in effect as of period end.
Abbreviations have been used throughout this report to indicate amounts shown in currencies other than
the U.S. dollar. All amounts are stated in U.S. dollars unless otherwise indicated. A list of abbreviations is
shown below:
ARS
Argentine Peso
MXN
Mexican Peso
EUR
Euro
SEK
Swedish Krona
See Notes to Financial Statements
22 ANNUAL REPORT
FINANCIAL STATEMENTS | Statement of Assets and Liabilities
This statement represents your fund’s balance sheet, which details the assets
and liabilities composing the total value of the fund.
At 1/31/06
Assets
Investments, at value (identified cost, $584,546,828)
594,762,720
Cash
413,634
Receivable for forward foreign currency exchange contracts
4,763
Receivable for forward foreign currency exchange contracts
subject to master netting agreements
5,946
Receivable for investments sold
7,743,755
Receivable for fund shares sold
2,532,688
Interest and dividends receivable
9,453,508
Receivable from investment adviser
46,541
Other assets
4,681
Total assets
$614,968,236
Liabilities
Distributions payable
$1,343,898
Payable for forward foreign currency exchange contracts
377,406
Payable for investments purchased
7,788,788
Payable for fund shares reacquired
1,529,382
Payable to affiliates
Management fee
8,363
Shareholder servicing costs
74,405
Distribution and service fees
9,205
Administrative services fee
139
Payable for independent trustees’ compensation
8,119
Accrued expenses and other liabilities
109,809
Total liabilities
$11,249,514
Net assets
$603,718,722
Net assets consist of:
Paid-in capital
$600,848,070
Unrealized appreciation (depreciation) on investments and
translation of assets and liabilities in foreign currencies
9,853,358
Accumulated net realized gain (loss) on investments and
foreign currency transactions
(7,253,135
)
Undistributed net investment income
270,429
Net assets
$603,718,722
Shares of beneficial interest outstanding
81,581,930
ANNUAL REPORT 23
Statement of Assets and Liabilities – continued
Class A shares
Net assets
$338,567,608
Shares outstanding
45,776,706
Net asset value per share
$7.40
Offering price per share (100÷95.25 x $7.40)
$7.77
Class B shares
Net assets
$125,667,241
Shares outstanding
16,939,226
Net asset value and offering price per share
$7.42
Class C shares
Net assets
$92,612,884
Shares outstanding
12,549,159
Net asset value and offering price per share
$7.38
Class I shares
Net assets
$46,870,989
Shares outstanding
6,316,839
Net asset value, offering price, and redemption price per share
$7.42
On sales of $100,000 or more, the offering price of Class A shares is reduced. A contingent deferred sales
charge may be imposed on redemptions of Class A, Class B and Class C shares.
See Notes to Financial Statements
24 ANNUAL REPORT
FINANCIAL STATEMENTS | Statement of Operations
This statement describes how much your fund earned in investment income and accrued in
expenses. It also describes any gains and/or losses generated by fund operations.
Year ended 1/31/06
Net investment income
Income
Interest
$46,559,317
Dividends
799,498
Foreign taxes withheld
(17,234)
Total investment income
$47,341,581
Expenses
Management fee
$3,687,484
Distribution and service fees
3,331,724
Shareholder servicing costs
995,532
Administrative services fee
72,223
Independent trustees’ compensation
16,513
Custodian fee
278,504
Shareholder communications
136,076
Auditing fees
61,146
Legal fees
19,283
Miscellaneous
60,679
Total expenses
$8,659,164
Fees paid indirectly
(65,396)
Reduction of expenses by investment adviser
(2,481,115)
Net expenses
$6,112,653
Net investment income
$41,228,928
Realized and unrealized gain (loss) on investments
Realized gain (loss) (identified cost basis)
Investment transactions
$(2,225,024)
Foreign currency transactions
1,300,947
Net realized gain (loss) on investments and foreign
currency transactions
$(924,077)
Change in unrealized appreciation (depreciation)
Investments
$(11,753,899)
Translation of assets and liabilities in foreign currencies
(299,694)
Net unrealized gain (loss) on investments and foreign
currency translation
$(12,053,593)
Net realized and unrealized gain (loss) on investments and
foreign currency
$(12,977,670)
Change in net assets from operations
$28,251,258
See Notes to Financial Statements
ANNUAL REPORT 25
FINANCIAL STATEMENTS | Statements of Changes in Net Assets
These statements describe the increases and/or decreases in net assets resulting
from operations, any distributions, and any shareholder transactions.
Years ended 1/31
2006
2005
Change in net assets
From operations
Net investment income
$41,228,928
$32,416,329
Net realized gain (loss) on investments and foreign
currency transactions
(924,077)
7,952,314
Net unrealized gain (loss) on investments and foreign
currency translation
(12,053,593)
(1,263,987)
Change in net assets from operations
$28,251,258
$39,104,656
Distributions declared to shareholders
From net investment income
Class A
$(23,525,662)
$(15,729,828)
Class B
(9,717,570)
(10,299,301)
Class C
(6,882,339)
(6,505,024)
Class I
(3,324,412)
(854,209)
From net realized gain on investments and
foreign currency transactions
Class A
$(1,564,390)
$(2,177,440)
Class B
(753,548)
(1,431,789)
Class C
(531,169)
(928,293)
Class I
(217,849)
(119,179)
Total distributions declared to shareholders
$(46,516,939)
$(38,045,063)
Change in net assets from fund share transactions
$56,692,052
$185,426,549
Redemption fees
$26,360
$20,643
Total change in net assets
$38,452,731
$186,506,785
Net assets
At beginning of period
565,265,991
378,759,206
At end of period (including undistributed net investment
income of $270,429 and accumulated distributions in
excess of net investment income of $1,245,190)
$603,718,722
$565,265,991
See Notes to Financial Statements
26 ANNUAL REPORT
FINANCIAL STATEMENTS | Financial Highlights
The financial highlights table is intended to help you understand the fund’s financial performance for the past
5 years. Certain information reflects financial results for a single fund share. The total returns in the table
represent the rate by which an investor would have earned (or lost) on an investment in the fund share class
(assuming reinvestment of all distributions) held for the entire period. This information has been audited by the
fund’s independent registered public accounting firm, whose report, together with the fund’s financial
statements, are included in this report.
Class A
Years ended 1/31
2006
2005
2004
2003
2002
Net asset value, beginning of period
$7.63
$7.65
$6.61
$7.08
$7.96
Income (loss) from
investment operations
Net investment income (d)
$0.56
$0.57
$0.60
$0.62
$0.80
Net realized and unrealized gain
(loss) on investments and foreign
currency
(0.16)
0.08
1.05
(0.43)
(0.85)
Total from investment operations
$0.40
$0.65
$1.65
$0.19
$(0.05)
Less distributions declared
to shareholders
From net investment income
$(0.59)
$(0.59)
$(0.61)
$(0.66)
$(0.83)
From net realized gain on
investments and foreign currency
transactions
(0.04)
(0.08)
—
—
—
Total distributions declared to
shareholders
$(0.63)
$(0.67)
$(0.61)
$(0.66)
$(0.83)
Redemption fees added to paid-in
capital (d)
$0.00
(w)
$0.00
(w)
$—
$—
$—
Net asset value, end of period
$7.40
$7.63
$7.65
$6.61
$7.08
Total return (%)(t)(s)(r)
5.55
8.98
26.04
2.95
(0.30)
Ratios (%) (to average net assets)
and Supplemental data:
Expenses before expense reductions (f)
1.29
1.29
1.34
1.37
1.46
Expenses after expense reductions (f)
0.85
0.87
1.01
1.01
1.01
Net investment income
7.51
7.62
8.21
9.35
11.18
Portfolio turnover
66
69
98
104
133
Net assets at end of period
(000 Omitted)
$338,568
$278,886
$150,334
$70,892
$37,187
See Notes to Financial Statements
ANNUAL REPORT 27
Financial Highlights – continued
Class B
Years ended 1/31
2006
2005
2004
2003
2002
Net asset value, beginning of period
$7.65
$7.67
$6.63
$7.09
$7.98
Income (loss) from
investment operations
Net investment income (d)
$0.51
$0.53
$0.55
$0.58
$0.77
Net realized and unrealized gain
(loss) on investments and foreign
currency
(0.16)
0.07
1.06
(0.43)
(0.87)
Total from investment operations
$0.35
$0.60
$1.61
$0.15
$(0.10)
Less distributions declared
to shareholders
From net investment income
$(0.54)
$(0.54)
$(0.57)
$(0.61)
$(0.79)
From net realized gain on
investments and foreign currency
transactions
(0.04)
(0.08)
—
—
—
Total distributions declared to
shareholders
$(0.58)
$(0.62)
$(0.57)
$(0.61)
$(0.79)
Redemption fees added to paid-in
capital (d)
$0.00
(w)
$0.00
(w)
$—
$—
$—
Net asset value, end of period
$7.42
$7.65
$7.67
$6.63
$7.09
Total return (%)(t)(s)(r)
4.87
8.28
25.19
2.43
(1.07)
Ratios (%) (to average net assets)
and Supplemental data:
Expenses before expense reductions (f)
1.94
1.94
1.99
2.02
2.11
Expenses after expense reductions (f)
1.50
1.52
1.66
1.66
1.66
Net investment income
6.88
7.03
7.61
8.75
10.59
Portfolio turnover
66
69
98
104
133
Net assets at end of period
(000 Omitted)
$125,667
$151,711
$140,348
$72,321
$41,481
See Notes to Financial Statements
28 ANNUAL REPORT
Financial Highlights – continued
Class C
Years ended 1/31
2006
2005
2004
2003
2002
Net asset value, beginning of period
$7.61
$7.63
$6.60
$7.07
$7.95
Income (loss) from
investment operations
Net investment income (d)
$0.51
$0.52
$0.54
$0.57
$0.77
Net realized and unrealized gain (loss) on
investments and foreign currency
(0.16)
0.08
1.06
(0.43)
(0.86)
Total from investment operations
$0.35
$0.60
$1.60
$0.14
$(0.09)
Less distributions declared
to shareholders
From net investment income
$(0.54)
$(0.54)
$(0.57)
$(0.61)
$(0.79)
From net realized gain on investments and
foreign currency transactions
(0.04)
(0.08)
—
—
—
Total distributions declared to shareholders
$(0.58)
$(0.62)
$(0.57)
$(0.61)
$(0.79)
Redemption fees added to paid-in capital (d)
$0.00
(w)
$0.00
(w)
$—
$—
$—
Net asset value, end of period
$7.38
$7.61
$7.63
$6.60
$7.07
Total return (%)(t)(s)(r)
4.86
8.28
25.10
2.29
(0.94)
Ratios (%) (to average net assets)
and Supplemental data:
Expenses before expense reductions (f)
1.94
1.94
1.99
2.02
2.11
Expenses after expense reductions (f)
1.50
1.52
1.66
1.66
1.66
Net investment income
6.88
7.01
7.56
8.67
10.62
Portfolio turnover
66
69
98
104
133
Net assets at end of period
(000 Omitted)
$92,613
$101,113
$84,643
$38,130
$17,518
See Notes to Financial Statements
ANNUAL REPORT 29
Financial Highlights – continued
Class I
Years ended 1/31
2006
2005
2004
2003
2002
Net asset value, beginning of period
$7.65
$7.68
$6.64
$7.10
$8.04
Income (loss) from
investment operations
Net investment income (d)
$0.59
$0.55
$0.63
$0.64
$0.59
Net realized and unrealized gain (loss) on
investments and foreign currency
(0.16)
0.12
1.05
(0.42)
(0.67)
Total from investment operations
$0.43
$0.67
$1.68
$0.22
$(0.08)
Less distributions declared
to shareholders
From net investment income
$(0.62)
$(0.62)
$(0.64)
$(0.68)
$(0.86)
From net realized gain on investments and
foreign currency transactions
(0.04)
(0.08)
—
—
—
Total distributions declared to shareholders
$(0.66)
$(0.70)
$(0.64)
$(0.68)
$(0.86)
Redemption fees added to paid-in capital (d)
$0.00
(w)
$0.00
(w)
$—
$—
$—
Net asset value, end of period
$7.42
$7.65
$7.68
$6.64
$7.10
Total return (%)(s)(r)
5.92
9.23
26.41
3.45
(0.74)
Ratios (%) (to average net assets)
and Supplemental data:
Expenses before expense reductions (f)
0.94
0.93
0.99
1.02
1.11
Expenses after expense reductions (f)
0.50
0.51
0.66
0.66
0.66
Net investment income
7.86
7.75
8.66
9.76
10.25
Portfolio turnover
66
69
98
104
133
Net assets at end of period
(000 Omitted)
$46,871
$33,556
$3,434
$2,508
$155
(r)
Certain expenses have been reduced without which performance would have been lower.
(w)
Per share amount was less than $0.01.
(d)
Per share data are based on average shares outstanding.
(f)
Ratios do not reflect reductions from fees paid indirectly.
(t)
Total returns do not include any applicable sales charges.
(s)
From time to time the fund may receive proceeds from litigation settlements, without which performance
would be lower.
See Notes to Financial Statements
30 ANNUAL REPORT
NOTES TO FINANCIAL STATEMENTS
(1) Business and Organization
MFS High Yield Opportunities Fund (the fund) is a series of MFS Series Trust III (the trust). The trust is organized as a Massachusetts business trust and is registered under the Investment Company Act of 1940, as amended, as an open-end management investment company.
(2) Significant Accounting Policies
General – The preparation of financial statements in conformity with U.S. generally accepted accounting principles requires management to make estimates and assumptions that affect the reported amounts of assets and liabilities, and disclosure of contingent assets and liabilities at the date of the financial statements and the reported amounts of revenues and expenses during the reporting period. Actual results could differ from those estimates. The fund can invest up to 100% of its portfolio in high-yield securities rated below investment grade. Investments in high-yield securities involve greater degrees of credit and market risk than investments in higher-rated securities and tend to be more sensitive to economic conditions. The fund can invest in foreign securities. Investments in foreign securities are vulnerable to the effects of changes in the relative values of the local currency and the U.S. dollar and to the effects of changes in each country’s legal, political, and economic environment. The markets of emerging markets countries are generally more volatile than the markets of developed countries with more mature economies. All of the risks of investing in foreign securities previously described are heightened when investing in emerging markets countries.
Investment Valuations – Equity securities, including restricted equity securities, are generally valued at the last sale or official closing price as reported by an independent pricing service on the market or exchange on which they are primarily traded. For securities for which there were no sales during the day, equity securities are generally valued at the last quoted bid price as reported by an independent pricing service on the market or exchange on which they are primarily traded. Debt instruments (other than short-term instruments), including restricted debt instruments, are generally valued at an evaluated bid price as reported by an independent pricing service. Values of debt instruments obtained from pricing services can utilize both dealer-supplied valuations and electronic data processing techniques which take into account factors such as institutional-size trading in similar groups of securities, yield, quality, coupon rate, maturity, type of issue, trading characteristics and other market data. Short-term instruments with a maturity at issuance of 365 days or less are generally valued at amortized cost, which approximates market value. Forward foreign currency contracts are generally valued at the mean of bid and asked prices based on rates reported by an independent pricing service. Securities and other assets generally valued on the basis of information from an independent pricing service may also be valued on the basis of information from brokers and dealers. The values of foreign securities and other assets and liabilities expressed in foreign currencies are converted to U.S. dollars based upon exchange rates provided by an independent source. When pricing-service information or market quotations are not readily
ANNUAL REPORT 31
Notes to Financial Statements – continued
available, securities are priced at fair value as determined under the direction of the Board of Trustees. For example, in valuing securities that trade principally on foreign markets, events reasonably determined to be significant (such as certain movements in the U.S. securities market, or other regional and local developments) may occur between the time that foreign markets close (where the security is principally traded) and the fund’s valuation time that may impact the value of securities traded in these foreign markets. In these cases, the fund may utilize information from an external vendor or other sources to adjust closing market prices of foreign equity securities to reflect what it believes to be the fair value of the securities as of the fund’s valuation time. Fair valuation of foreign equity securities may occur frequently based on an assessment that events which occur on a fairly regular basis (such as U.S. market movements) are significant.
Repurchase Agreements – The fund may enter into repurchase agreements with institutions that the fund’s investment adviser has determined are creditworthy. Each repurchase agreement is recorded at cost. The fund requires that the securities collateral in a repurchase transaction be transferred to the custodian in a manner sufficient to enable the fund to obtain those securities in the event of a default under the repurchase agreement. The fund monitors, on a daily basis, the value of the collateral to ensure that its value, including accrued interest, is greater than amounts owed to the fund under each such repurchase agreement. The fund, along with other affiliated entities of Massachusetts Financial Services Company (MFS), may utilize a joint trading account for the purpose of entering into one or more repurchase agreements.
Foreign Currency Translation – Purchases and sales of foreign investments, income, and expenses are converted into U.S. dollars based upon currency exchange rates prevailing on the respective dates of such transactions. Gains and losses attributable to foreign currency exchange rates on sales of securities are recorded for financial statement purposes as net realized gains and losses on investments. Gains and losses attributable to foreign exchange rate movements on income and expenses are recorded for financial statement purposes as foreign currency transaction gains and losses. That portion of both realized and unrealized gains and losses on investments that results from fluctuations in foreign currency exchange rates is not separately disclosed.
Derivative Risk – The fund may invest in derivatives for hedging or non-hedging purposes. While hedging can reduce or eliminate losses, it can also reduce or eliminate gains. When the fund uses derivatives as an investment to gain market exposure, or for hedging purposes, gains and losses from derivative instruments may be substantially greater than the derivative’s original cost. Derivative instruments include forward foreign currency exchange contracts.
Forward Foreign Currency Exchange Contracts – The fund may enter into forward foreign currency exchange contracts for the purchase or sale of a specific foreign currency at a fixed price on a future date. Risks may arise upon entering into these contracts from the potential inability of
32 ANNUAL REPORT
Notes to Financial Statements – continued
counterparties to meet the terms of their contracts and from unanticipated movements in the value of the contract. The fund may enter into forward foreign currency exchange contracts for hedging purposes as well as for non-hedging purposes. For hedging purposes, the fund may enter into contracts to deliver or receive foreign currency it will receive from or require for its normal investment activities. The fund may also use contracts in a manner intended to protect foreign currency denominated securities from declines in value due to unfavorable exchange rate movements. For non-hedging purposes, the fund may enter into contracts with the intent of changing the relative exposure of the fund’s portfolio of securities to different currencies to take advantage of anticipated changes. The forward foreign currency exchange contracts are adjusted by the daily exchange rate of the underlying currency and any gains or losses are recorded as unrealized until the contract settlement date. On contract settlement date, the gains or losses are recorded as realized gains or losses on foreign currency transactions.
Short Term Fees – For purchases made on or after July 1, 2004 and before April 1, 2005, the fund charged a 2% redemption fee (which was retained by the fund) on proceeds from Class A, Class B, Class C, and Class I shares redeemed or exchanged within 30 calendar days following their acquisition (either by purchase or exchange). Effective April 1, 2005, the fund charges a 1% redemption fee on proceeds from Class A, Class B, Class C, and Class I shares redeemed or exchanged within 30 calendar days following their acquisition. The fund may change the redemption fee period in the future, including in connection with Securities and Exchange Commission rule developments. See the fund’s prospectus for details. Any redemption fees are accounted for as an addition to paid-in capital.
Investment Transactions and Income – Investment transactions are recorded on the trade date. Interest income is recorded on the accrual basis. All premium and discount is amortized or accreted for financial statement purposes in accordance with U.S. generally accepted accounting principles. All discount is accreted for tax reporting purposes as required by federal income tax regulations. Dividends received in cash are recorded on the ex-dividend date. Certain dividends from foreign securities will be recorded when the fund is informed of the dividend if such information is obtained subsequent to the ex-dividend date. Dividend and interest payments received in additional securities are recorded on the ex-dividend or ex-interest date in an amount equal to the value of the security on such date. The fund may receive proceeds from litigation settlements involving its portfolio holdings. Any proceeds received are reflected in realized gain/loss in the Statement of Operations, or in unrealized gain/loss if the security is still held by the fund. Legal fees and other related expenses incurred to preserve and protect the value of a security owned are added to the cost of the security; other legal fees are expensed. Capital infusions made directly to the security issuer, which are generally non-recurring, incurred to protect or enhance the value of high-yield debt securities, are reported as additions to the cost basis of the security. Costs that are incurred to negotiate the terms or conditions of capital infusions or that
ANNUAL REPORT 33
Notes to Financial Statements – continued
are expected to result in a plan of reorganization are reported as realized losses. Ongoing costs incurred to protect or enhance an investment, or costs incurred to pursue other claims or legal actions, are expensed.
Fees Paid Indirectly – The fund’s custody fee is reduced according to an arrangement that measures the value of cash deposited with the custodian by the fund. During the year ended January 31, 2006, the fund’s custodian fees were reduced by $64,371 under this arrangement. The fund has entered into a commission recapture agreement, under which certain brokers will credit the fund a portion of the commissions generated, to offset certain expenses of the fund. For the year ended January 31, 2006, the fund’s custodian expenses were reduced by $1,025 under this agreement. These amounts are shown as a reduction of total expenses on the Statement of Operations. Effective January 1, 2006, the commission recapture agreement was terminated.
Tax Matters and Distributions – The fund intends to continue to qualify as a regulated investment company, as defined under Subchapter M of the Internal Revenue Code, and to distribute all of its taxable income, including realized capital gains. Accordingly, no provision for federal income tax is required in the financial statements. Foreign taxes, if any, have been accrued by the fund in the accompanying financial statements.
Distributions to shareholders are recorded on the ex-dividend date. Income and capital gain distributions are determined in accordance with income tax regulations, which may differ from generally accepted accounting principles. Certain capital accounts in the financial statements are periodically adjusted for permanent differences in order to reflect their tax character. These adjustments have no impact on net assets or net asset value per share. Temporary differences which arise from recognizing certain items of income, expense, gain or loss in different periods for financial statement and tax purposes will reverse at some time in the future. Distributions in excess of net investment income or net realized gains are temporary overdistributions for financial statement purposes resulting from differences in the recognition or classification of income for financial statement and tax purposes.
Book/tax differences primarily relate to amortization and accretion of debt securities, defaulted bonds, foreign currency transactions, and treating a portion of the proceeds from redemptions as a distribution for tax purposes. The tax character of distributions declared to shareholders is as follows:
1/31/06
1/31/05
Ordinary income (including any
short-term capital gains)
$45,471,541
$36,308,924
Long-term capital gain
1,045,398
1,736,139
Total distributions
$46,516,939
$38,045,063
34 ANNUAL REPORT
Notes to Financial Statements – continued
The federal tax cost and the tax basis components of distributable earnings were as follows:
As of January 31, 2006
Cost of investments
$587,377,164
Gross appreciation
$18,890,453
Gross depreciation
(11,504,897)
Net unrealized appreciation (depreciation)
$7,385,556
Undistributed ordinary income
3,624,169
Post-October capital loss deferral
(4,422,799)
Other temporary differences
(3,716,274)
Multiple Classes of Shares of Beneficial Interest – The fund offers multiple classes of shares, which differ in their respective distribution and service fees. All shareholders bear the common expenses of the fund based on the value of settled shares outstanding of each class, without distinction between share classes. Dividends are declared separately for each class. Differences in per share dividend rates are generally due to differences in separate class expenses. Class B shares will convert to Class A shares approximately eight years after purchase.
(3) Transactions with Affiliates
Investment Adviser – The fund has an investment advisory agreement with Massachusetts Financial Services Company (MFS) to provide overall investment advisory and administrative services, and general office facilities. The management fee is computed daily and paid monthly at an annual rate of 0.65% of the fund’s average daily net assets. As part of a settlement agreement with the New York Attorney General concerning market timing and related matters, MFS has agreed to reduce the management fee to 0.50% of the fund’s average daily net assets for the period March 1, 2004 through February 28, 2009. For the year ended January 31, 2006, this waiver amounted to $854,354 and is reflected as a reduction of total expenses in the Statement of Operations. The management fee incurred for the year ended January 31, 2006 was equivalent to an annual effective rate of 0.50% of the fund’s average daily net assets. The investment adviser has contractually agreed to pay all of the fund’s operating expenses, exclusive of management, distribution and service and certain other fees and expenses. This contractual fee arrangement will continue until June 1, 2006, unless the fund’s Board of Trustees consents to an earlier revision or termination of this agreement. For the year ended January 31, 2006, this reduction amounted to $1,624,137 and is reflected as a reduction of total expenses in the Statement of Operations.
Distributor – MFS Fund Distributors, Inc. (MFD), a wholly owned subsidiary of MFS, as distributor, received $190,907 for the year ended January 31, 2006, as its portion of the initial sales charge on sales of Class A shares of the fund. The Board of Trustees has adopted a distribution plan for certain class shares pursuant to Rule 12b-1 of the Investment Company Act of 1940. The fund’s distribution plan provides that the fund will pay MFD for services provided by
ANNUAL REPORT 35
Notes to Financial Statements – continued
MFD and financial intermediaries in connection with the distribution and servicing of certain share classes. One component of the plan is a distribution fee paid to MFD and another component of the plan is a service fee paid to MFD. MFD may subsequently pay all, or a portion, of the distribution and/or service fees to financial intermediaries.
Distribution Fee Plan Table:
Total
Annual
Distribution
Distribution
Service
Distribution
Effective
and Service
Fee Rate
Fee Rate
Plan(1)
Rate(2)
Fee
Class A
0.10%
0.25%
0.35%
0.35%
$1,040,464
Class B
0.75%
0.25%
1.00%
1.00%
1,341,866
Class C
0.75%
0.25%
1.00%
1.00%
949,394
Total Distribution and Service Fees
$3,331,724
(1)
In accordance with the distribution plan for certain classes, the fund pays distribution and/or service fees up
to these annual percentage rates of each class’ average daily net assets.
(2)
The annual effective rates represent actual fees incurred under the distribution plan for the year ended
January 31, 2006 based on each class’ average daily net assets.
Certain Class A and Class C shares are subject to a contingent deferred sales charge in the event of a shareholder redemption within 12 months of purchase. Class B shares are subject to a contingent deferred sales charge in the event of a shareholder redemption within six years of purchase. All contingent deferred sales charges are paid to MFD and during the year ended January 31, 2006, were as follows:
Amount
Class A
$399
Class B
$364,535
Class C
$20,001
Shareholder Servicing Agent – The fund pays a portion of shareholder servicing costs to MFS Service Center, Inc. (MFSC), a wholly-owned subsidiary of MFS. MFSC receives a fee from the fund, for its services as shareholder servicing agent, set periodically under the supervision of the fund’s Board of Trustees. For the year ended January 31, 2006, the fee was $601,477, which equated to 0.1062% annually of the fund’s average daily net assets. MFSC also receives payment from the fund for out-of-pocket and sub-accounting expenses paid by MFSC on behalf of the fund. For the year ended January 31, 2006, these costs amounted to $310,927.
Administrator – MFS provides certain financial, legal, shareholder communications, compliance, and other administrative services to certain funds for which MFS acts as investment adviser. Under an administrative services agreement, the funds may partially reimburse MFS the costs incurred to provide these services, subject to review and approval by the Board of Trustees. Each fund is charged a fixed amount plus a fee based on calendar year average net assets. Effective July 1, 2005, the fund’s annual fixed amount is $10,000. The administrative services fee incurred for the year ended January 31, 2006 was equivalent to an annual effective rate of 0.0127% of the fund’s average daily net assets.
36 ANNUAL REPORT
Notes to Financial Statements – continued
Trustees’ and Officers’ Compensation – The fund pays compensation to Independent Trustees in the form of a retainer, attendance fees, and additional compensation to Board and Committee chairpersons. The fund does not pay compensation directly to Trustees who are officers of the investment adviser, or to officers of the fund, all of whom receive remuneration for their services to the fund from MFS. Certain officers and Trustees of the fund are officers or directors of MFS, MFD, and MFSC. The fund has an unfunded, defined benefit plan for retired Independent Trustees which resulted in a reduction of pension expense of $299. The fund also has an unfunded retirement benefit deferral plan for certain current Independent Trustees which resulted in a net decrease of $7,655. Both amounts are included in Independent trustees’ compensation for the year ended January 31, 2006. The deferred liability for retirement benefits payable to retired Trustees and certain current Trustees amounted to $0 and $8,049, respectively, at January 31, 2006, and is included in payable for independent trustees’ compensation.
Other – This fund and certain other MFS funds (the funds) have entered into a services agreement (the Agreement) which provides for payment of fees by the funds to Tarantino LLC in return for the provision of services of an Independent Chief Compliance Officer (ICCO) for the funds. The ICCO is an officer of the funds and the sole member of Tarantino LLC. The funds can terminate the Agreement with Tarantino LLC at any time under the terms of the Agreement. For the year ended January 31, 2006, the fee paid to Tarantino LLC was $3,086. MFS has agreed to reimburse the fund for a portion of the payments made by the funds to Tarantino LLC in the amount of $2,624, which is shown as a reduction of total expenses in the Statement of Operations. Additionally, MFS has agreed to bear all expenses associated with office space, other administrative support, and supplies provided to the ICCO.
(4) Portfolio Securities
Purchases and sales of investments, other than U.S. government securities, purchased option transactions, and short-term obligations, aggregated $390,618,905 and $350,897,732, respectively.
(5) Shares of Beneficial Interest
The fund’s Declaration of Trust permits the Trustees to issue an unlimited number of full and fractional shares of beneficial interest. Transactions in fund shares were as follows:
Year ended 1/31/06
Year ended 1/31/05
Class A shares
Shares
Amount
Shares
Amount
Shares sold
23,977,257
$178,646,326
23,742,389
$178,434,555
Shares issued to shareholders in
reinvestment of distributions
2,333,406
17,291,324
1,476,078
11,090,161
Shares reacquired
(17,086,602)
(126,841,975)
(8,322,365)
(62,222,536)
Net change
9,224,061
$69,095,675
16,896,102
$127,302,180
ANNUAL REPORT 37
Notes to Financial Statements – continued
Year ended 1/31/06
Year ended 1/31/05
Class B shares
Shares
Amount
Shares
Amount
Shares sold
3,145,326
$23,481,984
7,090,726
$53,277,877
Shares issued to shareholders in
reinvestment of distributions
769,335
5,723,400
927,114
6,974,876
Shares reacquired
(6,802,691)
(50,722,310)
(6,492,439)
(48,594,938)
Net change
(2,888,030)
$(21,516,926)
1,525,401
$11,657,815
Class C shares
Shares sold
3,023,579
$22,507,817
5,457,312
$40,854,541
Shares issued to shareholders in
reinvestment of distributions
506,375
3,745,237
522,999
3,914,613
Shares reacquired
(4,263,101)
(31,585,150)
(3,789,810)
(28,215,092)
Net change
(733,147)
$(5,332,096)
2,190,501
$16,554,062
Class I shares
Shares sold
2,796,435
$20,868,063
4,179,938
$31,749,708
Shares issued to shareholders in
reinvestment of distributions
40,352
299,617
28,756
217,139
Shares reacquired
(903,916)
(6,722,281)
(271,921)
(2,054,355)
Net change
1,932,871
$14,445,399
3,936,773
$29,912,492
(6) Line of Credit
The fund and other affiliated funds participate in a $1 billion unsecured line of credit provided by a syndication of banks under a credit agreement. Borrowings may be made for temporary financing needs. Interest is charged to each fund, based on its borrowings, at a rate equal to the Federal Reserve funds rate plus 0.35% . In addition, a commitment fee, based on the average daily, unused portion of the line of credit, is allocated among the participating funds at the end of each calendar quarter. The commitment fee allocated to the fund for the year ended January 31, 2006 was $3,923, and is included in miscellaneous expense on the Statement of Operations. The fund had no significant borrowings during the year ended January 31, 2006.
38 ANNUAL REPORT
REPORT OF INDEPENDENT REGISTERED PUBLIC ACCOUNTING FIRM
To the Trustees of MFS Series Trust III and the Shareholders of MFS High Yield Opportunities Fund:
We have audited the accompanying statement of assets and liabilities, including the portfolio of investments, of MFS High Yield Opportunities Fund (one of the portfolios constituting MFS Series Trust III) (the ‘‘Trust’’) as of January 31, 2006, and the related statement of operations for the year then ended, the statements of changes in net assets for each of the two years in the period then ended, and the financial highlights for each of the five years in the period then ended. These financial statements and financial highlights are the responsibility of the Trust’s management. Our responsibility is to express an opinion on these financial statements and financial highlights based on our audit.
We conducted our audits in accordance with the standards of the Public Company Accounting Oversight Board (United States). Those standards require that we plan and perform the audit to obtain reasonable assurance about whether the financial statements and financial highlights are free of material misstatement. The Trust is not required to have, nor were we engaged to perform, an audit of its internal control over financial reporting. Our audit included consideration of internal control over financial reporting as a basis for designing audit procedures that are appropriate in the circumstances, but not for the purpose of expressing an opinion on the effectiveness of the Trust’s internal control over financial reporting. Accordingly, we express no such opinion. An audit also includes examining, on a test basis, evidence supporting the amounts and disclosures in the financial statements, assessing the accounting principles used and significant estimates made by management, as well as evaluating the overall financial statement presentation. Our procedures included confirmation of securities owned as of January 31, 2006, by correspondence with the custodian and brokers; where replies were not received from brokers, we performed other auditing procedures. We believe that our audits provide a reasonable basis for our opinion.
In our opinion, such financial statements and financial highlights present fairly, in all material respects, the financial position of MFS High Yield Opportunities Fund as of January 31, 2006, the results of its operations for the year then ended, the changes in its net assets for each of the two years in the period then ended, and its financial highlights for each of the five years in the period then ended, in conformity with accounting principles generally accepted in the United States of America.
DELOITTE & TOUCHE LLP
Boston, Massachusetts
March 24, 2006
ANNUAL REPORT 39
TRUSTEES AND OFFICERS — IDENTIFICATION AND BACKGROUND
The Trustees and officers of the Trust, as of March 1, 2006, are listed below, together with their principal occupations during the past five years. (Their titles may have varied during that period.) The address of each Trustee and officer is 500 Boylston Street, Boston, Massachusetts 02116.
Name, Date of Birth
Position(s) Held with Fund
Trustee/Officer Since(1)
Principal Occupations During the Past Five Years & Other Directorships(2)
INTERESTED TRUSTEES
Robert J. Manning(3)
Trustee
February 2004
Massachusetts Financial Services
(born 10/20/63)
Company, Chief Executive
Officer, President, Chief
Investment Officer and Director
Robert C. Pozen(3)
Trustee
February 2004
Massachusetts Financial Services
(born 08/08/46)
Company, Chairman (since
February 2004); Secretary of
Economic Affairs, The
Commonwealth of Massachusetts
(January 2002 to December 2002);
Fidelity Investments, Vice
Chairman (June 2000 to
December 2001); Fidelity
Management & Research
Company (investment adviser),
President (March 1997 to July
2001); Bell Canada Enterprises
(telecommunications), Director;
Medtronic, Inc. (medical
technology), Director; Telesat
(satellite communications),
Director
INDEPENDENT TRUSTEES
J. Atwood Ives
Trustee and
February 1992
Private investor; Eastern
(born 05/01/36)
Chair of
Enterprises (diversified services
Trustees
company), Chairman, Trustee and
Chief Executive Officer (until
November 2000)
Robert E. Butler(4)
Trustee
January 2006
Consultant – regulatory and
(born 11/29/41)
compliance matters (since July
2002); PricewaterhouseCoopers
LLP (professional services firm),
Partner (November 2000 until
June 2002)
Lawrence H. Cohn, M.D.
Trustee
August 1993
Brigham and Women’s Hospital,
(born 03/11/37)
Senior Cardiac Surgeon, Chief of
Cardiac Surgery (until 2005);
Harvard Medical School, Professor
of Surgery; Brigham and Women’s
Hospital Physicians’ Organization,
Chair (2000 to 2004)
40 ANNUAL REPORT
Name, Date of Birth
Position(s) Held with Fund
Trustee/Officer Since(1)
Principal Occupations During the Past Five Years & Other Directorships(2)
David H. Gunning
Trustee
January 2004
Cleveland-Cliffs Inc. (mining
(born 05/30/42)
products and service provider),
Vice Chairman/Director (since
April 2001); Encinitos Ventures
(private investment company),
Principal (1997 to April 2001);
Lincoln Electric Holdings, Inc.
(welding equipment
manufacturer), Director
William R. Gutow
Trustee
December 1993
Private investor and real estate
(born 09/27/41)
consultant; Capitol Entertainment
Management Company (video
franchise), Vice Chairman
Michael Hegarty
Trustee
December 2004
Retired; AXA Financial (financial
(born 12/21/44)
services and insurance), Vice
Chairman and Chief Operating
Officer (until May 2001); The
Equitable Life Assurance Society
(insurance), President and Chief
Operating Officer (until May 2001)
Lawrence T. Perera
Trustee
July 1981
Hemenway & Barnes (attorneys),
(born 06/23/35)
Partner
J. Dale Sherratt
Trustee
August 1993
Insight Resources, Inc.
(born 09/23/38)
(acquisition planning specialists),
President; Wellfleet Investments
(investor in health care
companies), Managing General
Partner (since 1993); Cambridge
Nutraceuticals (professional
nutritional products), Chief
Executive Officer (until May 2001)
Laurie J. Thomsen
Trustee
March 2005
Private investor; Prism Venture
(born 08/05/57)
Partners (venture capital), Co-
founder and General Partner
(until June 2004); St. Paul
Travelers Companies (commercial
property liability insurance),
Director
Robert W. Uek
Trustee
January 2006
Retired (since 1999);
(born 05/18/41)
PricewaterhouseCoopers LLP
(professional services firm),
Partner (until 1999); Consultant
to investment company industry
(since 2000); TT International
Funds (mutual fund complex),
Trustee (2000 until 2005);
Hillview Investment Trust II
Funds (mutual fund complex),
Trustee (2000 until 2005)
ANNUAL REPORT 41
Name, Date of Birth
Position(s) Held with Fund
Trustee/Officer Since(1)
Principal Occupations During the Past Five Years & Other Directorships(2)
OFFICERS
Maria F. Dwyer(3)
President
November 2005
Massachusetts Financial Services
(born 12/01/58)
Company, Executive Vice
President and Chief Regulatory
Officer (since March 2004);
Fidelity Management & Research
Company, Vice President (prior
to March 2004); Fidelity Group of
Funds, President and Treasurer
(prior to March 2004)
Tracy Atkinson(3)
Treasurer
September 2005
Massachusetts Financial Services
(born 12/30/64)
Company, Senior Vice President
(since September 2004);
PricewaterhouseCoopers LLP,
Partner (prior to September 2004)
Christopher R. Bohane(3)
Assistant
July 2005
Massachusetts Financial Services
(born 1/18/74)
Secretary and
Company, Vice President and
Assistant
Senior Counsel (since April
Clerk
2003); Kirkpatrick & Lockhart
LLP (law firm), Associate (prior
to April 2003); Nvest Services
Company, Assistant Vice
President and Associate Counsel
(prior to January 2001)
Ethan D. Corey(3)
Assistant
July 2005
Massachusetts Financial Services
(born 11/21/63)
Secretary and
Company, Special Counsel (since
Assistant
December 2004); Dechert LLP
Clerk
(law firm), Counsel (prior to
December 2004)
David L. DiLorenzo(3)
Assistant
July 2005
Massachusetts Financial Services
(born 8/10/68)
Treasurer
Company, Vice President (since
June 2005); JP Morgan Investor
Services, Vice President (January
2001 to June 2005); State Street
Bank, Vice President and
Corporate Audit Manager (prior
to January 2001)
Timothy M. Fagan(3)
Assistant
September 2005
Massachusetts Financial Services
(born 7/10/68)
Secretary and
Company, Vice President and
Assistant
Senior Counsel (since September
Clerk
2005); John Hancock Advisers,
LLC, Vice President and Chief
Compliance Officer (September
2004 to August 2005), Senior
Attorney (prior to September
2004); John Hancock Group of
Funds, Vice President and Chief
Compliance Officer (September
2004 to December 2004)
42 ANNUAL REPORT
Name, Date of Birth
Position(s) Held with Fund
Trustee/Officer Since(1)
Principal Occupations During the Past Five Years & Other Directorships(2)
Mark D. Fischer(3)
Assistant
July 2005
Massachusetts Financial Services
(born 10/27/70)
Treasurer
Company, Vice President (since
May 2005); JP Morgan Investment
Management Company, Vice
President (prior to May 2005)
Brian T. Hourihan(3)
Assistant
September 2004
Massachusetts Financial Services
(born 11/11/64)
Secretary and
Company, Vice President, Senior
Assistant
Counsel and Assistant Secretary
Clerk
(since June 2004); Affiliated
Managers Group, Inc., Chief Legal
Officer/Centralized Compliance
Program (January to April 2004);
Fidelity Research & Management
Company, Assistant General
Counsel (prior to January 2004)
Ellen Moynihan(3)
Assistant
April 1997
Massachusetts Financial Services
(born 11/13/57)
Treasurer
Company, Senior Vice President
Susan S. Newton(3)
Assistant
May 2005
Massachusetts Financial Services
(born 03/07/50)
Secretary and
Company, Senior Vice President
Assistant
and Associate General Counsel
Clerk
(since April 2005); John Hancock
Advisers, LLC, Senior Vice
President, Secretary and Chief
Legal Officer (prior to April
2005); John Hancock Group of
Funds, Senior Vice President,
Secretary and Chief Legal Officer
(prior to April 2005)
Susan A. Pereira(3)
Assistant
July 2005
Massachusetts Financial Services
(born 11/05/70)
Secretary and
Company, Vice President and
Assistant
Senior Counsel (since June 2004);
Clerk
Bingham McCutchen LLP (law
firm), Associate (January 2001 to
June 2004); Preti, Flaherty,
Beliveau, Pachios & Haley, LLC,
Associate (prior to January 2001)
Mark N. Polebaum(3)
Secretary and
January 2006
Massachusetts Financial Services
(born 05/01/52)
Clerk
Company, Executive Vice
President, General Counsel and
Secretary (since January 2006);
Wilmer Cutler Pickering Hale
and Dorr LLP (law firm), Partner
(prior to January 2006)
ANNUAL REPORT 43
Name, Date of Birth
Position(s) Held with Fund
Trustee/Officer Since(1)
Principal Occupations During the Past Five Years & Other Directorships(2)
Frank L. Tarantino
Independent
June 2004
Tarantino LLC (provider of
(born 03/07/44)
Chief
compliance services), Principal
Compliance
(since June 2004); CRA Business
Officer
Strategies Group (consulting
services), Executive Vice
President (April 2003 to June
2004); David L. Babson & Co.
(investment adviser), Managing
Director, Chief Administrative
Officer and Director (February
1997 to March 2003)
James O. Yost(3)
Assistant
September 1990
Massachusetts Financial Services
(born 06/12/60)
Treasurer
Company, Senior Vice President
1
Date first appointed to serve as Trustee/officer of an MFS fund. Each Trustee has served continuously since
appointment unless indicated otherwise.
2
Directorships or trusteeships of companies required to report to the Securities and Exchange Commission
(i.e., ‘‘public companies’’).
3
‘‘Interested person’’ of the Trust within the meaning of the Investment Company Act of 1940 (referred to as
the 1940 Act), which is the principal federal law governing investment companies like the fund, as a result of
position with MFS. The address of MFS is 500 Boylston Street, Boston, Massachusetts 02116.
4
In 2004 and 2005, Mr. Butler provided consulting services to the independent compliance consultant retained
by MFS pursuant to its settlement with the SEC concerning market timing and related matters. The terms of
that settlement required that compensation and expenses related to the independent compliance consultant
be borne exclusively by MFS and, therefore, MFS paid Mr. Butler for the services he rendered to the
independent compliance consultant. In 2004 and 2005, MFS paid Mr. Butler a total of $351,119.29.
Each Trustee and officer holds office until his or her successor is chosen and qualified or until his or her earlier death, resignation, retirement or removal. Messrs. Butler, Ives, Sherratt and Uek and Ms. Thomsen are members of the Trust’s Audit Committee.
Each of the Trust’s Trustees and officers holds comparable positions with certain other funds of which MFS or a subsidiary is the investment adviser or distributor, and, in the case of the officers, with certain affiliates of MFS. As of December 31, 2005, each Trustee served as a board member of 98 funds within the MFS Family of Funds.
The Trust held a shareholders’ meeting in 2005, and will hold a shareholders’ meeting at least once every five years thereafter, to elect Trustees.
The Statement of Additional Information contains further information about the Trustees and is available without charge upon request by calling 1-800-225-2606.
Investment Adviser
Custodian
Massachusetts Financial Services Company
State Street Bank and Trust Company
500 Boylston Street, Boston, MA 02116-3741
225 Franklin Street, Boston, MA 02110
Distributor
Independent Registered Public Accounting Firm
MFS Fund Distributors, Inc.
Deloitte & Touche LLP
500 Boylston Street, Boston, MA 02116-3741
200 Berkeley Street, Boston, MA 02116
Portfolio Managers
John F. Addeo
Scott B. Richards
Matthew W. Ryan
44 ANNUAL REPORT
BOARD REVIEW OF INVESTMENT ADVISORY AGREEMENT
A discussion regarding the Board’s most recent review and renewal of the Fund’s investment advisory agreement is available by clicking on the Fund’s name under ‘‘Select a fund’’ on the MFS Web site (mfs.com).
PROXY VOTING POLICIES AND INFORMATION
A general description of the MFS funds’ proxy voting policies and procedures is available without charge, upon request, by calling 1-800-225-2606, by visiting the Proxy Voting section of mfs.com or by visiting the SEC’s Web site at http://www.sec.gov.
Information regarding how the fund voted proxies relating to portfolio securities during the most recent twelve-month period ended June 30 is available without charge by visiting the Proxy Voting section of mfs.com or by visiting the SEC’s Web site at http://www.sec.gov.
QUARTERLY PORTFOLIO DISCLOSURE
The fund will file a complete schedule of portfolio holdings with the Securities and Exchange Commission (the Commission) for the first and third quarters of each fiscal year on Form N-Q. The fund’s Form N-Q may be reviewed and copied at the:
Public Reference Room Securities and Exchange Commission Washington, D.C. 20549-0102
Information on the operation of the Public Reference Room may be obtained by calling the Commission at 1-800-SEC-0330. The fund’s Form N-Q is available on the EDGAR database on the Commission’s Internet Web site at http://www.sec.gov, and copies of this information may be obtained, upon payment of a duplicating fee, by electronic request at the following e-mail address: publicinfo@sec.gov or by writing the Public Reference Section at the above address.
A shareholder can also obtain the quarterly portfolio holdings report at mfs.com.
FEDERAL TAX INFORMATION (unaudited)
The fund will notify shareholders of amounts for use in preparing 2006 income tax forms in January 2007. The following information is provided pursuant to provisions of the Internal Revenue Code.
The fund designates $1,894,226 as capital gain dividends paid during the fiscal year.
ANNUAL REPORT 45
d641421_report.pdf -- Converted by SECPublisher 4.0, created by BCL Technologies Inc., for SEC Filing
LETTER FROM THE CEO
Dear Shareholders,
It has been said that change is the only constant in life. As investors have seen, that theme is still accurate today as we recently have experienced shifting economic cycles because of natural disasters and political instability around the globe.
Markets worldwide have fluctuated in the past year as devastating hurricanes had a dramatic effect on the international economy, particularly on oil prices. We witnessed political unrest in the Middle East, highlighted by instability in Iraq, and in Africa, the usually stable Nigeria also experienced violence. As a result, energy prices have bounced up and down, with crude oil prices at one point topping a record $70 per barrel.
Such cycles are not uncommon and in fact have almost become the norm in our everyday lives. What does all of this mean to you as an investor? In times like these, it helps to know that you’re working with a seasoned investment professional who has experience to guide you through difficult times. At MFS®, we believe our investment management team has the knowledge and confidence to navigate through difficult cycles and at the same time see through adversity to find investment opportunities for our clients and shareholders.
Our investment management process, honed over 80 years, combines a unique concept of teamwork with our unwavering focus on the long term. We firmly believe that the best way to realize long-term financial goals – be it a college education, a comfortable retirement, or a secure family legacy – is to follow a three-pronged approach that focuses on longer time horizons. Allocate holdings across the major asset classes – including stocks, bonds, and cash. Diversify within each class to take advantage of different market segments and investing styles. Rebalance assets regularly to maintain a desired asset allocation. Of course, these strategies cannot guarantee a profit or protect against a loss. This long-term approach requires diligence and patience, two traits that in our experience are essential to capitalizing on the many opportunities the financial markets can offer – through both up and down economic cycles.
Respectfully,
Robert J. Manning Chief Executive Officer and Chief Investment Officer MFS Investment Management® March 15, 2006
The opinions expressed in this letter are those of MFS, and no forecasts can be guaranteed.
ANNUAL REPORT 1
PORTFOLIO COMPOSITION
Top five bond industries (b)
Utilities – Electric Power
7.8%
Gaming & Lodging
7.1%
Medical & Health Technology &
Services
6.5%
Automotive
5.6%
Chemicals
4.7%
Credit quality of bonds (r)
AAA
0.3%
A
1.1%
BBB
4.4%
BB
39.2%
B
39.6%
CCC
13.7%
CC
0.4%
D
0.2%
Not Rated
1.1%
Portfolio facts
Average Duration (d)
4.5
Average Life (m)
7.6 yrs.
Average Maturity (m)
8.2 yrs.
Average Credit Quality of
Rated Securities (a)
B+
Average Short Term Quality
A-1
(b)
For purposes of this graphical presentation, the bond component includes both accrued interest amounts
and the equivalent exposure from any derivative holdings, if applicable.
(r)
Each security is assigned a rating from Moody’s Investors Service. If not rated by Moody’s, the rating will
be that assigned by Standard & Poor’s. Likewise, if not assigned a rating by Standard & Poor’s, it will be
based on the rating assigned by Fitch, Inc. For those portfolios that hold a security which is not rated by
any of the three agencies, the security is considered Not Rated. Holdings in U.S. Treasuries and
government agency mortgage-backed securities, if any, are included in the ‘‘AAA’’-rating category.
Percentages are based on the total market value of investments as of 1/31/06.
(m)
The average maturity shown is calculated using the final stated maturity on the portfolio’s holdings
without taking into account any holdings which have been pre-refunded to an earlier date or which
have a mandatory put date prior to the stated maturity. The average life shown takes into account these
earlier dates.
(a)
The average credit quality of rated securities is based upon a market weighted average of portfolio
holdings that are rated by public rating agencies.
(d)
Duration is a measure of how much a bond’s price is likely to fluctuate with general changes in interest
rates, e.g., if rates rise 1.00%, a bond with a 5-year duration is likely to lose about 5.00% of
its value.
Percentages are based on net assets as of 1/31/06, unless otherwise noted.
The portfolio is actively managed, and current holdings may be different.
2 ANNUAL REPORT
MANAGEMENT REVIEW
Summary of Results
For the twelve months ended January 31, 2006, Class A shares of the MFS High Income Fund provided a total return of 3.61%, at net asset value. In comparison, the fund’s benchmark, the Lehman Brothers U.S. High-Yield Corporate Bond Index returned 4.51% .
Detractors from performance
Several of our holdings in the more speculative ‘‘CCC’’-ratedr sectors of the high yield market held back the fund’s relative performance during the period. Holding lower-yielding issues relative to the benchmark also held back results as the fund generated a lower level of income than the benchmark.
Holdings that detracted from relative performance included bonds of packaging manufacturer Pliant, electrical contracting and maintenance company Integrated Electrical Services*, and independent power producer Calpine*. Our position in brokerage company Refco* also hurt relative returns as the value of the company’s debt declined due to its alleged involvement in fraudulent business practices.
Contributors to performance
The fund’s holdings in several strong-performing securities boosted relative results. These included bond positions in lottery equipment supplier GTECH Holdings, eyewear manufacturer Safilo Group, and specialty magazine publisher PRIMEDIA.
*Security was not held in the portfolio at period-end.
Respectfully,
John Addeo Scott Richards
Portfolio Manager Portfolio Manager
rBonds rated ‘‘BBB’’ or higher are considered investment grade; bonds rated ‘‘BB’’ or lower are considered non-investment grade.
The views expressed in this report are those of the portfolio managers only through the end of the period of the report as stated on the cover and do not necessarily reflect the views of MFS or any other person in the MFS organization. These views are subject to change at any time based on market and other conditions, and MFS disclaims any responsibility to update such views. These views may not be relied upon as investment advice or an indication of trading intent on behalf of any MFS Fund. References to specific securities are not recommendations of such securities, and may not be representative of any MFS Fund’s current or future investments.
ANNUAL REPORT 3
PERFORMANCE SUMMARY THROUGH 1/31/06
The following chart illustrates the historical performance of the fund’s Class A shares in comparison to its benchmark. Performance results include the deduction of the maximum applicable sales charge and reflect the percentage change in net asset value, including reinvestment of dividends and capital gains distributions. The performance of other share classes will be greater than or less than that of the class depicted below. Benchmark comparisons are unmanaged; do not reflect sales charges, commissions or expenses; and cannot be invested in directly. (See Notes to Performance Summary.)
Performance data shown represents past performance and is no guarantee of future results. Investment return and principal value fluctuate so your shares, when sold, may be worth more or less than the original cost; current performance may be lower or higher than quoted. For most recent month-end performance, please visit mfs.com. (For the most recent month-end performance for Class I shares call 1-888-808-6374.) The performance shown does not reflect the deduction of taxes, if any, that a shareholder would pay on fund distributions or the redemption of fund shares.
4 ANNUAL REPORT
Performance summary – continued
Total returns through 1/31/06 Average annual without sales charge
Share class
Class inception date
1-yr
5-yr
10-yr
A
2/17/78
3.61%
5.81%
5.91%
B
9/27/93
2.90%
5.09%
5.18%
C
1/03/94
2.91%
5.09%
5.18%
I
1/02/97
3.92%
6.14%
6.19%
R
12/31/02
3.68%
5.70%
5.86%
R1
4/01/05
2.76%
5.06%
5.16%
R2
4/01/05
3.04%
5.12%
5.19%
R3
10/31/03
3.45%
5.26%
5.26%
R4
4/01/05
3.53%
5.79%
5.90%
R5
4/01/05
3.78%
5.84%
5.93%
529A
7/31/02
3.30%
5.56%
5.79%
529B
7/31/02
2.89%
4.85%
5.06%
529C
7/31/02
2.64%
4.86%
5.06%
Average annual Comparative benchmarks
Average high current yield bond fund (l)
3.37%
5.06%
4.54%
Lehman Brothers U.S. High-Yield
Corporate Bond Index (s)
4.51%
7.63%
6.52%
Average annual with sales charge Share class
A
-1.31%
4.78%
5.40%
With Initial Sales Charge (4.75%)
B
-0.94%
4.80%
5.18%
With CDSC (Declining over six years from 4% to 0%)
C
1.95%
5.09%
5.18%
With CDSC (1% for 12 months) (c)
529A
-1.60%
4.54%
5.27%
With Initial Sales Charge (4.75%)
529B
-0.96%
4.57%
5.06%
With CDSC (Declining over six years from 4% to 0%)
529C
1.68%
4.86%
5.06%
With CDSC (1% for 12 months) (c)
Class I, R, R1, R2, R3, R4, and R5 shares do not have a sales charge. Please see Notes to Performance Summary for more details.
CDSC – Contingent Deferred Sales Charge.
(c) Assuming redemption within one year from the end of the prior month of purchase.
(l) Source: Lipper Inc., an independent firm that reports mutual fund performance.
(s) Source: Standard & Poor’s Micropal, Inc.
ANNUAL REPORT 5
Performance summary – continued
Index Definition
Lehman Brothers U.S. High-Yield Corporate Bond Index – measures the universe of non-investment grade, fixed rate debt. Eurobonds, and debt issues from countries designated as emerging markets (e.g., Argentina, Brazil, Venezuela, etc.) are excluded.
It is not possible to invest directly in an index.
Notes to Performance Summary
Class R shares are available only to existing Class R shareholders. Class I shares are only available to certain eligible investors, and Class R1, R2, R3, R4, and R5 shares are only available to certain retirement plans. Class 529 shares are only available in conjunction with qualified tuition programs, such as the MFS 529 Savings Plan. There also is an additional annual fee, which is detailed in the program description, on qualified tuition programs. If this fee was reflected, the performance for Class 529 shares would have been lower. This annual fee is waived for Oregon residents and for those accounts with assets of $25,000 or more.
Performance for classes I, R, R4, R5 and 529A shares includes the performance of the fund’s class A shares for periods prior to their offering. Performance for classes R1, R2, R3 and 529B shares includes the performance of the fund’s class B shares for periods prior to their offering. Performance for class 529C shares includes the performance of the fund’s class C shares for periods prior to their offering. This blended class performance has been adjusted to take into account differences in sales loads, if any, applicable to these share classes, but has not been adjusted to take into account differences in class specific operating expenses (such as Rule 12b-1 fees). Compared to performance these share classes would have experienced had they been offered for the entire period, the use of blended performance generally results in higher performance for share classes with higher operating expenses than the share class to which it is blended, and lower performance for share classes with lower operating expenses than the share class to which it is blended.
Performance results reflect any applicable expense subsidies and waivers in effect during the periods shown. Without such subsidies and waivers the fund’s performance results would be less favorable. Please see the prospectus and financial statements for complete details.
From time to time the fund may receive proceeds from litigation settlements, without which performance would be lower.
6 ANNUAL REPORT
EXPENSE TABLE
Fund Expenses Borne by the Shareholders During the Period, August 1, 2005 through January 31, 2006.
As a shareholder of the fund, you incur two types of costs: (1) transaction costs, including sales charges (loads) on certain purchase or redemption payments and redemption fees on certain exchanges and redemptions, and (2) ongoing costs, including management fees; distribution and service (12b-1) fees; and other trust expenses. This example is intended to help you understand your ongoing costs (in dollars) of investing in the fund and to compare these costs with the ongoing costs of investing in other mutual funds.
The example is based on an investment of $1,000 invested at the beginning of the period and held for the entire period August 1, 2005 through January 31, 2006.
Actual Expenses
The first line for each share class in the following table provides information about actual account values and actual expenses. You may use the information in this line, together with the amount you invested, to estimate the expenses that you paid over the period. Simply divide your account value by $1,000 (for example, an $8,600 account value divided by $1,000 = 8.6), then multiply the result by the number in the first line under the heading entitled ‘‘Expenses Paid During Period’’ to estimate the expenses you paid on your account during this period.
Hypothetical Example for Comparison Purposes
The second line for each share class in the following table provides information about hypothetical account values and hypothetical expenses based on the fund’s actual expense ratio and an assumed rate of return of 5% per year before expenses, which is not the fund’s actual return. The hypothetical account values and expenses may not be used to estimate the actual ending account balance or expenses you paid for the period. You may use this information to compare the ongoing costs of investing in the fund and other funds. To do so, compare this 5% hypothetical example with the 5% hypothetical examples that appear in the shareholder reports of the other funds.
Please note that the expenses shown in the table are meant to highlight your ongoing costs only and do not reflect any transactional costs, such as sales charges (loads) or redemption fees. Therefore, the second line for each share class in the table is useful in comparing ongoing costs only, and will not help you determine the relative total costs of owning different funds. In addition, if these transactional costs were included, your costs would have been higher.
ANNUAL REPORT 7
Expense table – continued
Expenses
Annualized
Beginning
Ending
Paid During
Share
Expense
Account Value
Account Value
Period (p)
Class
Ratio
8/01/05
1/31/06
8/01/05-1/31/06
A
Actual
0.98%
$1,000.00
$1,015.40
$4.98
Hypothetical (h)
0.98%
$1,000.00
$1,020.27
$4.99
B
Actual
1.71%
$1,000.00
$1,009.30
$8.66
Hypothetical (h)
1.71%
$1,000.00
$1,016.59
$8.69
C
Actual
1.71%
$1,000.00
$1,011.90
$8.67
Hypothetical (h)
1.71%
$1,000.00
$1,016.59
$8.69
I
Actual
0.71%
$1,000.00
$1,016.90
$3.61
Hypothetical (h)
0.71%
$1,000.00
$1,021.63
$3.62
R
Actual
1.21%
$1,000.00
$1,014.40
$6.14
Hypothetical (h)
1.21%
$1,000.00
$1,019.11
$6.16
R1
Actual
1.84%
$1,000.00
$1,011.20
$9.33
Hypothetical (h)
1.84%
$1,000.00
$1,015.93
$9.35
R2
Actual
1.49%
$1,000.00
$1,012.90
$7.56
Hypothetical (h)
1.49%
$1,000.00
$1,017.69
$7.58
R3
Actual
1.40%
$1,000.00
$1,013.50
$7.11
Hypothetical (h)
1.40%
$1,000.00
$1,018.15
$7.12
R4
Actual
1.16%
$1,000.00
$1,014.80
$5.89
Hypothetical (h)
1.16%
$1,000.00
$1,019.36
$5.90
R5
Actual
0.79%
$1,000.00
$1,016.40
$4.02
Hypothetical (h)
0.79%
$1,000.00
$1,021.22
$4.02
529A
Actual
1.31%
$1,000.00
$1,013.80
$6.65
Hypothetical (h)
1.31%
$1,000.00
$1,018.60
$6.67
529B
Actual
1.96%
$1,000.00
$1,010.50
$9.93
Hypothetical (h)
1.96%
$1,000.00
$1,015.32
$9.96
529C
Actual
1.96%
$1,000.00
$1,008.00
$9.92
Hypothetical (h)
1.96%
$1,000.00
$1,015.32
$9.96
(h)
5% class return per year before expenses.
(p)
Expenses paid is equal to each class’ annualized expense ratio, as shown above, multiplied by the average account value over the period, multiplied by the number of days in the period, divided by the number of days in the year. Expenses paid do not include any applicable sales charges (loads) or redemption fees. If these transaction costs had been included, your costs would have been higher.
Effective October 1, 2005 the fund’s Class R1, Class R2, and Class R3 retirement plan administration and services fee was reduced (as described in Note 3 of the Notes to the Financial Statements). Had this fee reduction been in effect through the entire six month period, the annualized expense ratio would have been 1.80%, 1.44%, and 1.36% for Class R1, Class R2, and Class R3, respectively, and the actual expenses paid during the period would have been approximately $9.13, $7.31, and $6.90 for Class R1, Class R2, and Class R3, respectively.
8 ANNUAL REPORT
PORTFOLIO OF INVESTMENTS – 1/31/06
The Portfolio of Investments is a complete list of all securities owned by your fund.
It is categorized by broad-based asset classes.
Bonds - 93.1%
Issuer
Shares/Par
Value ($)
Advertising & Broadcasting - 4.2%
Allbritton Communications Co., 7.75%, 2012
$
5,515,000
$
5,528,787
DIRECTV Holdings LLC, 8.375%, 2013
1,813,000
1,944,442
DIRECTV Holdings LLC, 6.375%, 2015
2,955,000
2,895,900
EchoStar DBS Corp., 6.375%, 2011
9,325,000
9,091,875
Granite Broadcasting Corp., 9.75%, 2010
4,485,000
3,868,312
Innova S. de R.L., 9.375%, 2013
2,030,000
2,250,763
Intelsat Ltd., 8.625%, 2015(a)
4,005,000
4,015,013
Intelsat Ltd., 0% to 2010, 9.25% to 2015(a)
5,720,000
3,775,200
Lamar Media Corp., 7.25%, 2013
2,700,000
2,787,750
Lamar Media Corp., 6.625%, 2015
1,000,000
1,005,000
Panamsat Holding Corp., 0% to 2009, 10.375% to 2014
Total Preferred Stocks (Identified Cost, $3,318,898)
$
3,584,926
Warrants - 0%
Strike
Issuer
Price
1stExercise
Shares/Par
Value ($)
Cybernet Internet Services (Computer
Software)(n)
$22.28
10/29/99
3,385
$
0
GT Group Telecom, Inc. (Telephone
Services)(n)
0.00
8/01/00
11,650
0
Knology, Inc. (Network & Telecom)(a)(n)
0.10
11/22/97
2,475
0
Loral Space & Communications Ltd.
(Business Services)(n)
0.14
1/28/97
5,000
0
Loral Space & Communications Ltd.
(Business Services)(n)
0.14
1/28/97
11,775
0
Pliant Corp. (Containers)(a)(n)
0.01
5/25/00
6,795
68
Sterling Chemicals, Inc. (Specialty
Chemicals)(n)
52.00
12/31/02
141
7
XM Satellite Radio, Inc. (Broadcast & Cable
TV)(n)
45.24
9/16/00
3,440
123,840
XO Communications, Inc., ‘‘A’’ (Telephone
Services)(n)
6.25
5/27/03
2,640
792
XO Communications, Inc., ‘‘B’’ (Telephone
Services)(n)
7.50
5/27/03
1,980
396
XO Communications, Inc., ‘‘C’’ (Telephone
Services)(n)
10.00
5/27/03
1,980
317
Total Warrants (Identified Cost, $1,308,694)
$
125,420
20 ANNUAL REPORT
Portfolio of Investments – continued
Short-Term Obligations - 3.9% (y)
Issuer
Shares/Par
Value ($)
General Electric Co., 4.48%, due 2/01/06
$ 6,909,000
$
6,909,000
New Center Asset Trust, 4.48%, due 2/01/06
45,011,000
45,011,000
Total Short-Term Obligations, at Amortized Cost
$
51,920,000
Total Investments (Identified Cost, $1,314,964,949) (k)
$
1,315,158,421
Other Assets, Less Liabilities - 0.9%
12,083,039
Net Assets - 100.0%
$
1,327,241,460
(n)
Non-income producing security.
(d)
Non-income producing security - in default.
(a)
SEC Rule 144A restriction.
(y)
The rate shown represents an annualized yield at time of purchase.
(p)
Payment-in-kind security.
(k)
As of January 31, 2006, the fund had 12 securities representing $0 of net assets that were fair valued in
accordance with the policies adopted by the Board of Trustees.
(i)
Interest only security for which the fund receives interest on notional principal (Par amount). Par amount
shown is the notional principal and does not reflect the cost of the security.
(r)
Restricted securities (excluding 144A issues) are not registered under the Securities Act of 1933 and are
subject to legal or contractual restrictions on resale. These securities generally may be resold in
transactions exempt from registration or to the public if the securities are registered. Disposal of these
securities may involve time-consuming negotiations and prompt sale at an acceptable price may be difficult.
The fund holds the following restricted security:
Current
Acquisition
Acquisition
Market
Total % of
Security
Date
Cost
Value
Net Assets
Airplane Pass-Through Trust, ‘‘D’’,
10.875%, 2019
3/13/1996
$5,250,000
$0
0.0%
Forward Foreign Currency Exchange Contracts
Sales and Purchases in the table below are reported by currency.
Net Unrealized
Contracts to
Contracts
Appreciation
Deliver/Receive
Settlement Date
In Exchange For
at Value
(Depreciation)
Sales
EUR
17,206,092
2/21/2006
$20,218,792
$20,972,328
$(753,536)
SEK
5,253,248
2/13/2006
682,701
692,895
(10,194)
$20,901,493
$21,665,223
$(763,730)
Purchases
EUR
3,805,678
2/21/2006 - 3/20/2006
$ 4,614,630
$ 4,641,315
$
26,685
GBP
788,716
3/30/2006
1,407,236
1,407,021
(215)
SEK
5,253,248
2/13/2006
661,352
692,895
31,543
$ 6,683,218
$ 6,741,231
$
58,013
At January 31, 2006, forward foreign currency purchases and sales under master netting agreements excluded above amounted
to a net receivable of $45,304 with Merrill Lynch International.
At January 31, 2006, the fund had sufficient cash and/or securities to cover any commitments under these derivative contracts.
ANNUAL REPORT 21
Portfolio of Investments – continued
The following abbreviations are used in the Portfolio of Investments and are defined:
ADR
American Depository Receipt
FRN
Floating Rate Note. The interest rate is the rate in effect as of period end.
Abbreviations have been used throughout this report to indicate amounts shown in currencies other than the U.S. dollar. All amounts are stated in U.S. dollars unless otherwise indicated. A list of abbreviations is shown below:
EUR
Euro
GBP
British Pound
SEK
Swedish Krona
See Notes to Financial Statements
22 ANNUAL REPORT
FINANCIAL STATEMENTS | Statement of Assets and Liabilities
This statement represents your fund’s balance sheet, which details the assets and liabilities composing the total value of the fund.
At 1/31/06
Assets
Investments, at value (identified cost, $1,314,964,949)
$1,315,158,421
Cash
747,071
Foreign currency, at value (identified cost, $42,039)
42,186
Receivable for forward foreign currency exchange contracts
58,227
Receivable for forward foreign currency exchange contracts
subject to master netting agreements
45,304
Receivable for investments sold
10,813,413
Receivable for fund shares sold
1,848,582
Interest and dividends receivable
22,303,675
Other assets
7,569
Total assets
$1,351,024,448
Liabilities
Distributions payable
$2,143,798
Payable for forward foreign currency exchange contracts
763,944
Payable for investments purchased
18,571,869
Payable for fund shares reacquired
1,747,446
Payable to affiliates
Management fee
11,462
Shareholder servicing costs
196,481
Distribution and service fees
16,529
Administrative services fee
358
Program manager fees
79
Retirement plan administration and services fees
11
Payable for independent trustees’ compensation
138,559
Accrued expenses and other liabilities
192,452
Total liabilities
$23,782,988
Net assets
$1,327,241,460
Net assets consist of:
Paid-in capital
$1,764,633,025
Unrealized appreciation (depreciation) on investments and
translation of assets and liabilities in foreign currencies
(462,839)
Accumulated net realized gain (loss) on investments and
foreign currency transactions
(433,590,704)
Accumulated distributions in excess of net investment income
(3,338,022)
Net assets
$1,327,241,460
Shares of beneficial interest outstanding
346,801,724
ANNUAL REPORT 23
Statement of Assets and Liabilities – continued
Class A shares
Net assets
$703,304,634
Shares outstanding
183,939,392
Net asset value per share
$3.82
Offering price per share (100÷95.25x$3.82 of net asset
value per share)
$4.01
Class B shares
Net assets
$275,363,357
Shares outstanding
71,803,310
Net asset value and offering price per share
$3.83
Class C shares
Net assets
$108,181,494
Shares outstanding
28,151,012
Net asset value and offering price per share
$3.84
Class I shares
Net assets
$231,454,553
Shares outstanding
60,572,942
Net asset value, offering price, and redemption price per share
$3.82
Class R shares
Net assets
$5,421,953
Shares outstanding
1,416,342
Net asset value, offering price, and redemption price per share
$3.83
Class R1 shares
Net assets
$230,637
Shares outstanding
60,182
Net asset value, offering price, and redemption price per share
$3.83
Class R2 shares
Net assets
$276,703
Shares outstanding
72,221
Net asset value, offering price, and redemption price per share
$3.83
Class R3 shares
Net assets
$1,211,505
Shares outstanding
316,625
Net asset value, offering price, and redemption price per share
$3.83
Class R4 shares
Net assets
$393,327
Shares outstanding
102,917
Net asset value, offering price, and redemption price per share
$3.82
24 ANNUAL REPORT
Statement of Assets and Liabilities – continued
Class R5 shares
Net assets
$52,646
Shares outstanding
13,769
Net asset value, offering price, and redemption price per share
$3.82
Class 529A shares
Net assets
$776,201
Shares outstanding
203,052
Net asset value per share
$3.82
Offering price per share (100÷95.25x$3.82 of net asset
value per share)
$4.01
Class 529B shares
Net assets
$157,288
Shares outstanding
41,149
Net asset value and offering price per share
$3.82
Class 529C shares
Net assets
$417,162
Shares outstanding
108,811
Net asset value and offering price per share
$3.83
On sales of $100,000 or more, the offering price of Class A and Class 529A shares are reduced. A contingent deferred sales charge may be imposed on redemptions of Class A, Class B, Class C, Class 529B and Class 529C shares.
See Notes to Financial Statements
ANNUAL REPORT 25
FINANCIAL STATEMENTS | Statement of Operations
This statement describes how much your fund earned in investment income and accrued in expenses. It also describes any gains and/or losses generated by fund operations.
Year ended 1/31/06
Net investment income
Income
Interest
$107,792,679
Dividends
1,552,416
Foreign taxes withheld
(13,634)
Total investment income
$109,331,461
Expenses
Management fee
$6,322,478
Distribution and service fees
6,630,935
Program manager fees
3,202
Shareholder servicing costs
2,397,068
Administrative services fee
168,479
Retirement plan administration and services fees
2,670
Independent trustees’ compensation
48,466
Custodian fee
392,626
Shareholder communications
232,374
Auditing fees
70,305
Legal fees
13,106
Miscellaneous
194,381
Total expenses
$16,476,090
Fees paid indirectly
(120,949)
Reduction of expenses by investment adviser
(7,106)
Net expenses
$16,348,035
Net investment income
$92,983,426
Realized and unrealized gain (loss) on investments
Realized gain (loss) (identified cost basis)
Investment transactions
$(8,241,940)
Foreign currency transactions
2,299,402
Net realized gain (loss) on investments and foreign
currency transactions
$(5,942,538)
Change in unrealized appreciation (depreciation)
Investments
$(39,246,815)
Translation of assets and liabilities in foreign currencies
(457,746)
Net unrealized gain (loss) on investments and foreign
currency translation
$(39,704,561)
Net realized and unrealized gain (loss) on investments and
foreign currency
$(45,647,099)
Change in net assets from operations
$47,336,327
See Notes to Financial Statements
26 ANNUAL REPORT
FINANCIAL STATEMENTS | Statements of Changes in Net Assets
These statements describe the increases and/or decreases in net assets resulting
from operations, any distributions, and any shareholder transactions.
Years ended 1/31
2006
2005
Change in net assets
From operations
Net investment income
$92,983,426
$107,644,176
Net realized gain (loss) on investments and foreign
currency transactions
(5,942,538)
(679,575)
Net unrealized gain (loss) on investments and foreign
currency translation
(39,704,561)
(1,545,302)
Change in net assets from operations
$47,336,327
$105,419,299
Distributions declared to shareholders
From net investment income
Class A
$(55,578,562)
$(63,583,514)
Class B
(22,027,569)
(28,196,919)
Class C
(8,430,256)
(10,895,326)
Class I
(15,874,191)
(10,153,961)
Class R
(371,890)
(193,334)
Class R1
(8,590)
—
Class R2
(10,613)
—
Class R3
(43,025)
(8,204)
Class R4
(4,947)
—
Class R5
(3,390)
—
Class 529A
(55,508)
(35,337)
Class 529B
(10,029)
(8,278)
Class 529C
(25,326)
(19,515)
Total distributions declared to shareholders
$(102,443,896)
$(113,094,388)
Change in net assets from fund share transactions
$(120,835,566)
$(206,558,888)
Redemption fees
$6,191
$17,850
Total change in net assets
$(175,936,944)
$(214,216,127)
Net assets
At beginning of period
1,503,178,404
1,717,394,531
At end of period (including accumulated distributions in
excess of net investment income of $3,338,022 and
$2,882,801, respectively)
$1,327,241,460
$1,503,178,404
See Notes to Financial Statements
ANNUAL REPORT 27
FINANCIAL STATEMENTS | Financial Highlights
The financial highlights table is intended to help you understand the fund’s financial performance for the past 5 years (or life of a particular share class, if shorter). Certain information reflects financial results for a single fund share. The total returns in the table represent the rate by which an investor would have earned (or lost) on an investment in the fund share class (assuming reinvestment of all distributions) held for the entire period. This information has been audited by the fund’s independent registered public accounting firm, whose report, together with the fund’s financial statements, are included in this report.
Class A
Years ended 1/31
2006
2005
2004
2003
2002
Net asset value, beginning of period
$3.98
$3.98
$3.52
$3.78
$4.44
Income (loss) from
investment operations
Net investment income (d)
$0.27
$0.29
$0.30
$0.33
$0.41
Net realized and unrealized gain (loss) on
investments and foreign currency
(0.13)
0.01(g)
0.46
(0.25)
(0.65)
Total from investment operations
$0.14
$0.30
$0.76
$0.08
$(0.24)
Less distributions declared
to shareholders
From net investment income
$(0.30)
$(0.30)
$(0.30)
$(0.34)
$(0.42)
Redemption fees added to paid-in capital (d)
$0.00(w)
$0.00(w)
$—
$—
$—
Net asset value, end of period
$3.82
$3.98
$3.98
$3.52
$3.78
Total return (%) (t)(s)(r)
3.61
7.74
22.83
2.34
(5.50)
Ratios (%) (to average net assets)
and Supplemental data:
Expenses before expense reductions (f)
1.00
0.99
0.99
1.00
1.06
Expenses after expense reductions (f)
1.00
0.99
0.99
1.00
1.06
Net investment income
6.85
7.31
7.87
9.32
10.12
Portfolio turnover
51
68
81
80
72
Net assets at end of period
(000 Omitted)
$703,305
$799,651
$934,958
$769,069
$746,096
See Notes to Financial Statements
28 ANNUAL REPORT
Financial Highlights – continued
Class B
Years ended 1/31
2006
2005
2004
2003
2002
Net asset value, beginning of period
$3.99
$3.99
$3.53
$3.79
$4.44
Income (loss) from
investment operations
Net investment income (d)
$0.24
$0.26
$0.27
$0.31
$0.38
Net realized and unrealized gain (loss) on
investments and foreign currency
(0.13)
0.01(g)
0.47
(0.26)
(0.64)
Total from investment operations
$0.11
$0.27
$0.74
$0.05
$(0.26)
Less distributions declared
to shareholders
From net investment income
$(0.27)
$(0.27)
$(0.28)
$(0.31)
$(0.39)
Redemption fees added to paid-in capital (d)
$0.00(w)
$0.00(w)
$—
$—
$—
Net asset value, end of period
$3.83
$3.99
$3.99
$3.53
$3.79
Total return (%) (t)(s)(r)
2.90
7.10
21.65
1.64
(5.94)
Ratios (%) (to average net assets)
and Supplemental data:
Expenses before expense reductions (f)
1.72
1.69
1.69
1.70
1.76
Expenses after expense reductions (f)
1.72
1.69
1.69
1.70
1.76
Net investment income
6.26
6.63
7.18
8.65
9.45
Portfolio turnover
51
68
81
80
72
Net assets at end of period
(000 Omitted)
$275,363
$379,253
$471,520
$411,533
$439,987
See Notes to Financial Statements
ANNUAL REPORT 29
Financial Highlights – continued
Class C
Years ended 1/31
2006
2005
2004
2003
2002
Net asset value, beginning of period
$4.00
$4.00
$3.54
$3.80
$4.45
Income (loss) from
investment operations
Net investment income (d)
$0.24
$0.26
$0.27
$0.30
$0.38
Net realized and unrealized gain (loss) on
investments and foreign currency
(0.13)
0.01(g)
0.47
(0.25)
(0.64)
Total from investment operations
$0.11
$0.27
$0.74
$0.05
$(0.26)
Less distributions declared
to shareholders
From net investment income
$(0.27)
$(0.27)
$(0.28)
$(0.31)
$(0.39)
Redemption fees added to paid-in capital (d)
$0.00(w)
$0.00(w)
$—
$—
$—
Net asset value, end of period
$3.84
$4.00
$4.00
$3.54
$3.80
Total return (%) (t)(s)(r)
2.91
7.10
21.61
1.64
(5.91)
Ratios (%) (to average net assets)
and Supplemental data:
Expenses before expense reductions (f)
1.72
1.69
1.69
1.70
1.76
Expenses after expense reductions (f)
1.72
1.69
1.69
1.70
1.76
Net investment income
6.26
6.63
7.18
8.59
9.39
Portfolio turnover
51
68
81
80
72
Net assets at end of period
(000 Omitted)
$108,181
$148,073
$214,915
$183,364
$160,798
See Notes to Financial Statements
30 ANNUAL REPORT
Financial Highlights – continued
Class I
Years ended 1/31
2006
2005
2004
2003
2002
Net asset value, beginning of period
$3.98
$3.98
$3.52
$3.78
$4.43
Income (loss) from
investment operations
Net investment income (d)
$0.28
$0.29
$0.30
$0.33
$0.42
Net realized and unrealized gain (loss) on
investments and foreign currency
(0.13)
0.02(g)
0.47
(0.24)
(0.64)
Total from investment operations
$0.15
$0.31
$0.77
$0.09
$(0.22)
Less distributions declared
to shareholders
From net investment income
$(0.31)
$(0.31)
$(0.31)
$(0.35)
$(0.43)
Redemption fees added to paid-in capital (d)
$0.00(w)
$0.00(w)
$—
$—
$—
Net asset value, end of period
$3.82
$3.98
$3.98
$3.52
$3.78
Total return (%) (s)(r)
3.92
8.17
22.88
2.66
(4.99)
Ratios (%) (to average net assets)
and Supplemental data:
Expenses before expense reductions (f)
0.71
0.68
0.69
0.70
0.76
Expenses after expense reductions (f)
0.71
0.68
0.69
0.70
0.76
Net investment income
7.24
7.55
8.03
9.58
10.43
Portfolio turnover
51
68
81
80
72
Net assets at end of period
(000 Omitted)
$231,455
$170,679
$93,887
$26,373
$19,352
See Notes to Financial Statements
ANNUAL REPORT 31
Financial Highlights – continued
Class R
Years ended 1/31
2006
2005
2004
2003(i)
Net asset value, beginning of period
$3.98
$3.98
$3.52
$3.51
Income (loss) from investment operations
Net investment income (d)
$0.26
$0.28
$0.28
$0.02
Net realized and unrealized gain (loss) on investments
and foreign currency
(0.12)
0.01(g)
0.48
0.02
Total from investment operations
$0.14
$0.29
$0.76
$0.04
Less distributions declared to shareholders
From net investment income
$(0.29)
$(0.29)
$(0.30)
$(0.03)
Redemption fees added to paid-in capital (d)
$0.00(w)
$0.00(w)
$—
$—
Net asset value, end of period
$3.83
$3.98
$3.98
$3.52
Total return (%) (s)(r)
3.68
7.63
22.29
1.03(n)
Ratios (%) (to average net assets)
and Supplemental data:
Expenses before expense reductions (f)
1.21
1.18
1.20
1.20(a)
Expenses after expense reductions (f)
1.21
1.18
1.20
1.20(a)
Net investment income
6.76
7.06
7.46
7.97(a)
Portfolio turnover
51
68
81
80
Net assets at end of period (000 Omitted)
$5,422
$4,021
$1,359
$40
Class R1
Class R2
Year ended
Year ended
1/31/06(i)
1/31/06(i)
Net asset value, beginning of period
$3.89
$3.89
Income (loss) from investment operations
Net investment income (d)
$0.19
$0.21
Net realized and unrealized gain (loss) on investments and
foreign currency
(0.03)(g)
(0.04)(g)
Total from investment operations
$0.16
$0.17
Less distributions declared to shareholders
From net investment income
$(0.22)
$(0.23)
Redemption fees added to paid-in capital (d)
$0.00(w)
$0.00(w)
Net asset value, end of period
$3.83
$3.83
Total return (%) (s)(r)
4.28(n)
4.56(n)
Ratios (%) (to average net assets)
and Supplemental data:
Expenses before expense reductions (f)
1.91(a)
1.59(a)
Expenses after expense reductions (f)
1.85(a)
1.51(a)
Net investment income
6.08(a)
6.50(a)
Portfolio turnover
51
51
Net assets at end of period (000 Omitted)
$231
$277
See Notes to Financial Statements
32 ANNUAL REPORT
Financial Highlights – continued
Class R3
Years ended 1/31
2006
2005
2004(i)
Net asset value, beginning of period
$3.98
$3.98
$3.85
Income (loss) from investment operations
Net investment income (d)
$0.24
$0.25
$0.07
Net realized and unrealized gain (loss) on investments and
foreign currency
(0.11)
0.03(g)
0.13(g)
Total from investment operations
$0.13
$0.28
$0.20
Less distributions declared to shareholders
From net investment income
$(0.28)
$(0.28)
$(0.07)
Redemption fees added to paid-in capital (d)
$0.00(w)
$0.00(w)
$—
Net asset value, end of period
$3.83
$3.98
$3.98
Total return (%) (s)(r)
3.45
7.37
5.32(n)
Ratios (%) (to average net assets)
and Supplemental data:
Expenses before expense reductions (f)
1.46
1.49
1.43(a)
Expenses after expense reductions (f)
1.42
1.49
1.43(a)
Net investment income
6.61
6.58
7.07(a)
Portfolio turnover
51
68
81
Net assets at end of period (000 Omitted)
$1,212
$246
$42
Class R4
Class R5
Year ended
Year ended
1/31/06(i)
1/31/06(i)
Net asset value, beginning of period
$3.88
$3.88
Income (loss) from investment operations
Net investment income (d)
$0.21
$0.23
Net realized and unrealized gain (loss) on investments and
foreign currency
(0.02)(g)
(0.03)(g)
Total from investment operations
$0.19
$0.20
Less distributions declared to shareholders
From net investment income
$(0.25)
$(0.26)
Redemption fees added to paid-in capital (d)
$0.00(w)
$0.00(w)
Net asset value, end of period
$3.82
$3.82
Total return (%) (s)(r)
4.94(n)
5.20(n)
Ratios (%) (to average net assets)
and Supplemental data:
Expenses before expense reductions (f)
1.15(a)
0.80(a)
Expenses after expense reductions (f)
1.15(a)
0.80(a)
Net investment income
6.73(a)
7.11(a)
Portfolio turnover
51
51
Net assets at end of period (000 Omitted)
$393
$53
See Notes to Financial Statements
ANNUAL REPORT 33
Financial Highlights – continued
Class 529A
Years ended 1/31
2006
2005
2004
2003(i)
Net asset value, beginning of period
$3.98
$3.98
$3.52
$3.42
Income (loss) from investment operations
Net investment income (d)
$0.26
$0.27
$0.28
$0.13
Net realized and unrealized gain (loss) on investments
and foreign currency
(0.14)
0.02(g)
0.47
0.13(g)
Total from investment operations
$0.12
$0.29
$0.75
$0.26
Less distributions declared to shareholders
From net investment income
$(0.28)
$(0.29)
$(0.29)
$(0.16)
Redemption fees added to paid-in capital (d)
$0.00(w)
$0.00(w)
$—
$—
Net asset value, end of period
$3.82
$3.98
$3.98
$3.52
Total return (%) (t)(s)(r)
3.30
7.53
22.16
7.70(n)
Ratios (%) (to average net assets)
and Supplemental data:
Expenses before expense reductions (f)
1.32
1.29
1.30
1.30(a)
Expenses after expense reductions (f)
1.32
1.29
1.30
1.30(a)
Net investment income
6.65
6.97
7.42
8.66(a)
Portfolio turnover
51
68
81
80
Net assets at end of period (000 Omitted)
$776
$768
$406
$53
Class 529B
Years ended 1/31
2006
2005
2004
2003(i)
Net asset value, beginning of period
$3.97
$3.98
$3.52
$3.42
Income (loss) from investment operations
Net investment income (d)
$0.23
$0.25
$0.25
$0.11
Net realized and unrealized gain (loss) on investments
and foreign currency
(0.12)
0.00(w)(g) 0.48
0.14(g)
Total from investment operations
$0.11
$0.25
$0.73
$0.25
Less distributions declared to shareholders
From net investment income
$(0.26)
$(0.26)
$(0.27)
$(0.15)
Redemption fees added to paid-in capital (d)
$0.00(w)
$0.00(w)
$—
$—
Net asset value, end of period
$3.82
$3.97
$3.98
$3.52
Total return (%) (t)(s)(r)
2.89
6.57
21.39
7.35(n)
Ratios (%) (to average net assets)
and Supplemental data:
Expenses before expense reductions (f)
1.96
2.01
1.95
1.95(a)
Expenses after expense reductions (f)
1.96
2.01
1.95
1.95(a)
Net investment income
6.00
6.29
6.80
8.37(a)
Portfolio turnover
51
68
81
80
Net assets at end of period (000 Omitted)
$157
$139
$119
$31
See Notes to Financial Statements
34 ANNUAL REPORT
Financial Highlights – continued
Class 529C
Years ended 1/31
2006
2005
2004
2003(i)
Net asset value, beginning of period
$3.99
$3.99
$3.53
$3.43
Income (loss) from investment operations
Net investment income (d)
$0.23
$0.25
$0.26
$0.13
Net realized and unrealized gain (loss) on investments
and foreign currency
(0.13)
0.01(g)
0.47
0.12(g)
Total from investment operations
$0.10
$0.26
$0.73
$0.25
Less distributions declared to shareholders
From net investment income
$(0.26)
$(0.26)
$(0.27)
$(0.15)
Redemption fees added to paid-in capital (d)
$0.00(w)
$0.00(w)
$—
$—
Net asset value, end of period
$3.83
$3.99
$3.99
$3.53
Total return (%) (t)(s)(r)
2.64
6.84
21.35
7.33(n)
Ratios (%) (to average net assets)
and Supplemental data:
Expenses before expense reductions (f)
1.96
1.97
1.95
1.95(a)
Expenses after expense reductions (f)
1.96
1.97
1.95
1.95(a)
Net investment income
6.00
6.31
6.79
8.05(a)
Portfolio turnover
51
68
81
80
Net assets at end of period (000 Omitted)
$417
$347
$189
$43
(i)
For the period from the class’ inception, December 31, 2002 (Class R), July 31, 2002 (Classes 529A, 529B, and 529C), October 31, 2003 (Class R3) and April 1, 2005 (Classes R1, R2, R4, and R5) through the stated period end.
(a)
Annualized.
(n)
Not annualized.
(r)
Certain expenses have been reduced without which performance would have been lower.
(w)
Per share amount was less than $0.01.
(d)
Per share data are based on average shares outstanding.
(f)
Ratios do not reflect reductions from fees paid indirectly.
(t)
Total returns do not include any applicable sales charges.
(s)
From time to time the fund may receive proceeds from litigation settlements, without which performance would be lower.
(g)
The per share amount is not in accordance with the net realized and unrealized gain/loss for the period because of the timing of sales of fund shares and the amount of per share realized and unrealized gains and losses at such time.
See Notes to Financial Statements
ANNUAL REPORT 35
NOTES TO FINANCIAL STATEMENTS
(1) Business and Organization
MFS High Income Fund (the fund) is a series of MFS Series Trust III (the trust). The trust is organized as a Massachusetts business trust and is registered under the Investment Company Act of 1940, as amended, as an open-end management investment company.
(2) Significant Accounting Policies
General – The preparation of financial statements in conformity with U.S. generally accepted accounting principles requires management to make estimates and assumptions that affect the reported amounts of assets and liabilities, and disclosure of contingent assets and liabilities at the date of the financial statements and the reported amounts of revenues and expenses during the reporting period. Actual results could differ from those estimates. The fund can invest up to 100% of its portfolio in high-yield securities rated below investment grade. Investments in high-yield securities involve greater degrees of credit and market risk than investments in higher-rated securities and tend to be more sensitive to economic conditions. The fund can invest in foreign securities, including securities of emerging market issuers. Investments in foreign securities are vulnerable to the effects of changes in the relative values of the local currency and the U.S. dollar and to the effects of changes in each country’s legal, political, and economic environment. The markets of emerging markets countries are generally more volatile than the markets of developed countries with more mature economies. All of the risks of investing in foreign securities previously described are heightened when investing in emerging markets countries.
Investment Valuations – Equity securities, including restricted equity securities, are generally valued at the last sale or official closing price as reported by an independent pricing service on the market or exchange on which they are primarily traded. For securities for which there were no sales during the day, equity securities are generally valued at the last quoted bid price as reported by an independent pricing service on the market or exchange on which they are primarily traded. Debt instruments (other than short-term instruments), including restricted debt instruments, are generally valued at an evaluated bid price as reported by an independent pricing service. Values of debt instruments obtained from pricing services can utilize both dealer-supplied valuations and electronic data processing techniques which take into account factors such as institutional-size trading in similar groups of securities, yield, quality, coupon rate, maturity, type of issue, trading characteristics and other market data. Short-term instruments with a maturity at issuance of 365 days or less are generally valued at amortized cost, which approximates market value. Forward foreign currency contracts are generally valued at the mean of bid and asked prices based on rates reported by an independent pricing service. Securities and other assets generally valued on the basis of information from an independent pricing service may also be valued on the basis of information from brokers and dealers. The values of foreign securities and other assets and liabilities expressed in foreign currencies are converted to U.S. dollars based upon exchange rates provided by an independent source.
36 ANNUAL REPORT
Notes to Financial Statements – continued
When pricing-service information or market quotations are not readily available, securities are priced at fair value as determined under the direction of the Board of Trustees. For example, in valuing securities that trade principally on foreign markets, events reasonably determined to be significant (such as certain movements in the U.S. securities market, or other regional and local developments) may occur between the time that foreign markets close (where the security is principally traded) and the fund’s valuation time that may impact the value of securities traded in these foreign markets. In these cases, the fund may utilize information from an external vendor or other sources to adjust closing market prices of foreign equity securities to reflect what it believes to be the fair value of the securities as of the fund’s valuation time. Fair valuation of foreign equity securities may occur frequently based on an assessment that events which occur on a fairly regular basis (such as U.S. market movements) are significant.
Repurchase Agreements – The fund may enter into repurchase agreements with institutions that the fund’s investment adviser has determined are creditworthy. Each repurchase agreement is recorded at cost. The fund requires that the securities collateral in a repurchase transaction be transferred to the custodian in a manner sufficient to enable the fund to obtain those securities in the event of a default under the repurchase agreement. The fund monitors, on a daily basis, the value of the collateral to ensure that its value, including accrued interest, is greater than amounts owed to the fund under each such repurchase agreement. The fund, along with other affiliated entities of Massachusetts Financial Services Company (MFS), may utilize a joint trading account for the purpose of entering into one or more repurchase agreements.
Foreign Currency Translation – Purchases and sales of foreign investments, income, and expenses are converted into U.S. dollars based upon currency exchange rates prevailing on the respective dates of such transactions. Gains and losses attributable to foreign currency exchange rates on sales of securities are recorded for financial statement purposes as net realized gains and losses on investments. Gains and losses attributable to foreign exchange rate movements on income and expenses are recorded for financial statement purposes as foreign currency transaction gains and losses. That portion of both realized and unrealized gains and losses on investments that results from fluctuations in foreign currency exchange rates is not separately disclosed.
Derivative Risk – The fund may invest in derivatives for hedging or non-hedging purposes. While hedging can reduce or eliminate losses, it can also reduce or eliminate gains. When the fund uses derivatives as an investment to gain market exposure, or for hedging purposes, gains and losses from derivative instruments may be substantially greater than the derivative’s original cost. Derivative instruments include forward foreign currency exchange contracts.
Forward Foreign Currency Exchange Contracts – The fund may enter into forward foreign currency exchange contracts for the purchase or sale of a specific foreign currency at a fixed price on a future date. Risks may arise
ANNUAL REPORT 37
Notes to Financial Statements – continued
upon entering into these contracts from the potential inability of counterparties to meet the terms of their contracts and from unanticipated movements in the value of the contract. The fund may enter into forward foreign currency exchange contracts for hedging purposes as well as for non-hedging purposes. For hedging purposes, the fund may enter into contracts to deliver or receive foreign currency it will receive from or require for its normal investment activities. The fund may also use contracts in a manner intended to protect foreign currency denominated securities from declines in value due to unfavorable exchange rate movements. For non-hedging purposes, the fund may enter into contracts with the intent of changing the relative exposure of the fund’s portfolio of securities to different currencies to take advantage of anticipated changes. The forward foreign currency exchange contracts are adjusted by the daily exchange rate of the underlying currency and any gains or losses are recorded as unrealized until the contract settlement date. On contract settlement date, the gains or losses are recorded as realized gains or losses on foreign currency transactions.
Short Term Fees – For purchases made on or after July 1, 2004 and before April 1, 2005, the fund charged a 2% redemption fee (which was retained by the fund) on proceeds from Class A, Class B, Class C, and Class I shares redeemed or exchanged within 30 calendar days following their acquisition (either by purchase or exchange). Effective April 1, 2005, the fund charges a 1% redemption fee on proceeds from Class A, Class B, Class C, and Class I shares redeemed or exchanged within 30 calendar days following their acquisition. The fund may change the redemption fee period in the future, including in connection with Securities and Exchange Commission rule developments. See the fund’s prospectus for details. Any redemption fees are accounted for as an addition to paid-in capital.
Investment Transactions and Income – Investment transactions are recorded on the trade date. Interest income is recorded on the accrual basis. All premium and discount is amortized or accreted for financial statement purposes in accordance with U.S. generally accepted accounting principles. All discount is accreted for tax reporting purposes as required by federal income tax regulations. Dividends received in cash are recorded on the ex-dividend date. Certain dividends from foreign securities will be recorded when the fund is informed of the dividend if such information is obtained subsequent to the ex-dividend date. Dividend and interest payments received in additional securities are recorded on the ex-dividend or ex-interest date in an amount equal to the value of the security on such date.
The fund may receive proceeds from litigation settlements involving its portfolio holdings. Any proceeds received are reflected in realized gain/loss in the Statement of Operations, or in unrealized gain/loss if the security is still held by the fund.
Legal fees and other related expenses incurred to preserve and protect the value of a security owned are added to the cost of the security; other legal fees are expensed. Capital infusions made directly to the security issuer, which are
38 ANNUAL REPORT
Notes to Financial Statements – continued
generally non-recurring, incurred to protect or enhance the value of high-yield debt securities, are reported as additions to the cost basis of the security. Costs that are incurred to negotiate the terms or conditions of capital infusions or that are expected to result in a plan of reorganization are reported as realized losses. Ongoing costs incurred to protect or enhance an investment, or costs incurred to pursue other claims or legal actions, are expensed.
Fees Paid Indirectly – The fund’s custody fee is reduced according to an arrangement that measures the value of cash deposited with the custodian by the fund. During the year ended January 31, 2006, the fund’s custodian fees were reduced by $120,209 under this arrangement. The fund has entered into a commission recapture agreement, under which certain brokers will credit the fund a portion of the commissions generated, to offset certain expenses of the fund. For the year ended January 31, 2006, the fund’s custodian expenses were reduced by $740 under this agreement. These amounts are shown as a reduction of total expenses on the Statement of Operations. Effective January 1, 2006, the commission recapture agreement was terminated.
Tax Matters and Distributions – The fund intends to continue to qualify as a regulated investment company, as defined under Subchapter M of the Internal Revenue Code, and to distribute all of its taxable income, including realized capital gains. Accordingly, no provision for federal income tax is required in the financial statements. Foreign taxes, if any, have been accrued by the fund in the accompanying financial statements.
Distributions to shareholders are recorded on the ex-dividend date. Income and capital gain distributions are determined in accordance with income tax regulations, which may differ from generally accepted accounting principles. Certain capital accounts in the financial statements are periodically adjusted for permanent differences in order to reflect their tax character. These adjustments have no impact on net assets or net asset value per share. Temporary differences which arise from recognizing certain items of income, expense, gain or loss in different periods for financial statement and tax purposes will reverse at some time in the future. Distributions in excess of net investment income or net realized gains are temporary overdistributions for financial statement purposes resulting from differences in the recognition or classification of income for financial statement and tax purposes.
Book/tax differences primarily relate to amortization and accretion of debt securities, defaulted bonds and foreign currency transactions.
The tax character of distributions declared to shareholders is as follows:
1/31/06
1/31/05
Ordinary income (including any short-
term capital gains)
$102,443,896
$113,094,388
ANNUAL REPORT 39
Notes to Financial Statements – continued
The federal tax cost and the tax basis components of distributable earnings were as follows:
As of January 31, 2006
Cost of investments
$1,346,226,948
Gross appreciation
$31,022,801
Gross depreciation
(62,091,328)
Net unrealized appreciation (depreciation)
$(31,068,527)
Undistributed ordinary income
7,790,251
Capital loss carryforwards
(389,086,167)
Post-October capital loss deferral
(13,242,538)
Other temporary differences
(11,784,584)
As of January 31, 2006, the fund had available capital loss carryforwards to offset future realized gains. Such losses expire as follows:
January 31, 2007
$(17,432,351)
January 31, 2008
(10,853,391)
January 31, 2009
(24,778,024)
January 31, 2010
(137,538,425)
January 31, 2011
(159,064,624)
January 31, 2013
(19,406,719)
January 31, 2014
(20,012,633)
Total
$(389,086,167)
Multiple Classes of Shares of Beneficial Interest – The fund offers multiple classes of shares, which differ in their respective distribution and service fees. All shareholders bear the common expenses of the fund based on the value of settled shares outstanding of each class, without distinction between share classes. Dividends are declared separately for each class. Differences in per share dividend rates are generally due to differences in separate class expenses. Class B and Class 529B shares will convert to Class A and Class 529A shares, respectively, approximately eight years after purchase.
(3) Transactions with Affiliates
Investment Adviser – The fund has an investment advisory agreement with MFS to provide overall investment advisory and administrative services, and general office facilities.
The management fee is computed daily and paid monthly at the following annual rates:
First $1.4 billion of average daily net assets
0.46%
Average daily net assets in excess of $1.4 billion
0.44%
As part of a settlement agreement with the New York Attorney General concerning market timing and related matters, MFS has agreed to reduce the management fee to 0.39% of the fund’s average daily net assets in excess of $1.4 billion for the period March 1, 2004 through February 28, 2009. For the year ended January 31, 2006, this waiver amounted to $0.
40 ANNUAL REPORT
Notes to Financial Statements – continued
The management fee incurred for the year ended January 31, 2006 was equivalent to an annual effective rate of 0.46% of the fund’s average daily net assets.
Distributor – MFS Fund Distributors, Inc. (MFD), a wholly owned subsidiary of MFS, as distributor, received $101,331 and $746 for the year ended January 31, 2006, as its portion of the initial sales charge on sales of Class A and Class 529A shares of the fund, respectively.
The Board of Trustees has adopted a distribution plan for certain class shares pursuant to Rule 12b-1 of the Investment Company Act of 1940.
The fund’s distribution plan provides that the fund will pay MFD for services provided by MFD and financial intermediaries in connection with the distribution and servicing of certain share classes. One component of the plan is a distribution fee paid to MFD and another component of the plan is a service fee paid to MFD. MFD may subsequently pay all, or a portion, of the distribution and/or service fees to financial intermediaries.
Distribution Fee Plan Table:
Total
Annual
Distribution
Distribution
Service
Distribution
Effective
and Service
Fee Rate
Fee Rate
Plan(1)
Rate(2)
Fee
Class A
0.10%
0.25%
0.35%
0.30%
$ 2,182,472
Class B
0.75%
0.25%
1.00%
1.00%
3,188,863
Class C
0.75%
0.25%
1.00%
1.00%
1,222,099
Class R
0.25%
0.25%
0.50%
0.50%
24,984
Class R1
0.50%
0.25%
0.75%
0.75%
870
Class R2
0.25%
0.25%
0.50%
0.50%
720
Class R3
0.25%
0.25%
0.50%
0.50%
2,866
Class R4
—
0.25%
0.25%
0.25%
169
Class 529A
0.25%
0.25%
0.50%
0.35%
2,646
Class 529B
0.75%
0.25%
1.00%
1.00%
1,489
Class 529C
0.75%
0.25%
1.00%
1.00%
3,757
Total Distribution and Service Fees
$ 6,630,935
(1)
In accordance with the distribution plan for certain classes, the fund pays distribution and/or service fees up to these annual percentage rates of each class’ average daily net assets.
(2)
The annual effective rates represent actual fees incurred under the distribution plan for the year ended January 31, 2006 based on each class’ average daily net assets. Assets attributable to Class A shares sold prior to March 1, 1991 are subject to a service fee of 0.15% annually. 0.05% of the Class A and 0.10% of the Class 529A distribution fee is currently being paid by the fund. Payment of the remaining 0.05% of the Class A and 0.15% of the Class 529A distribution fee is not yet implemented and will commence on such date as the fund’s Board of Trustees may determine.
Certain Class A, Class C and Class 529C shares are subject to a contingent deferred sales charge in the event of a shareholder redemption within 12 months of purchase. Class B and Class 529B shares are subject to a contingent deferred sales charge in the event of a shareholder redemption within six years of purchase. All contingent deferred sales charges are paid to MFD and during the year ended January 31, 2006, were as follows:
ANNUAL REPORT 41
Notes to Financial Statements – continued
Amount
Class A
$6,423
Class B
$692,477
Class C
$7,976
Class 529B
$—
Class 529C
$—
The fund has entered into and may from time to time enter into contracts with program managers and other parties which administer the tuition programs through which an investment in the fund’s 529 share classes is made. The fund has entered into an agreement with MFD pursuant to which MFD receives an annual fee of up to 0.35% from the fund based solely upon the value of the fund’s 529 share classes attributable to tuition programs to which MFD, or a third party which contracts with MFD, provides administrative services. The current fee has been established at 0.25% annually of average net assets of the fund’s 529 share classes. The fee may only be increased with the approval of the Board of Trustees who oversees the fund. The services provided by MFD, or a third party with which MFD contracts, include recordkeeping and tax reporting and account services, as well as services designed to maintain the program’s compliance with the Internal Revenue Code and other regulatory requirements. Program manager fees for the year ended January 31, 2006, were as follows:
Amount
Class 529A
$1,891
Class 529B
372
Class 529C
939
Total Program Manager Fees
$3,202
Shareholder Servicing Agent – The fund pays a portion of shareholder servicing costs to MFS Service Center, Inc. (MFSC), a wholly-owned subsidiary of MFS. MFSC receives a fee from the fund, for its services as shareholder servicing agent, set periodically under the supervision of the fund’s Board of Trustees. For the year ended January 31, 2006, the fee was $1,458,523, which equated to 0.1053% annually of the fund’s average daily net assets. MFSC also receives payment from the fund for out-of-pocket and sub-accounting expenses paid by MFSC on behalf of the fund. For the year ended January 31, 2006, these costs amounted to $677,604.
Administrator – MFS provides certain financial, legal, shareholder communications, compliance, and other administrative services to certain funds for which MFS acts as investment adviser. Under an administrative services agreement, the funds may partially reimburse MFS the costs incurred to provide these services, subject to review and approval by the Board of Trustees. Each fund is charged a fixed amount plus a fee based on calendar year average net assets. Effective July 1, 2005, the fund’s annual fixed amount is $10,000.
42 ANNUAL REPORT
Notes to Financial Statements – continued
The administrative services fee incurred for the year ended January 31, 2006 was equivalent to an annual effective rate of 0.0122% of the fund average daily net assets.
In addition to the administrative services provided by MFS to the fund as described above, MFS is responsible for providing certain retirement plan administration and services with respect to certain Class R shares. These services include various administrative, recordkeeping, and communication/ educational services with respect to the retirement plans which invest in these shares, and may be provided directly by MFS or by a third party. MFS may subsequently pay all, or a portion, of the retirement plan administration and services fee to affiliated or unaffiliated third parties. For the year ended January 31, 2006, the fund paid MFS an annual retirement plan administration and services fee up to the following annual percentage rates of each class’ average daily net assets:
Annual
Fee
Effective
Total
Rate
Rate(1)
Amount
Class R1
0.45%
0.39%
$521
Class R2
0.40%
0.32%
575
Class R3
0.25%
0.21%
1,430
Class R4
0.15%
0.15%
101
Class R5
0.10%
0.10%
43
Total Retirement Plan Administration and Services Fees
$ 2,670
(1)
Effective October 1, 2005, MFS has contractually agreed to waive a portion of the retirement plan administration and services fee equal to 0.10% for Class R1 shares, 0.15% for Class R2 shares, and 0.10% for Class R3 shares. This agreement will continue until at least September 30, 2007. For the year ended January 31, 2006, this waiver amounted to $442 and is reflected as a reduction of total expenses in the Statement of Operations.
Trustees’ and Officers’ Compensation – The fund pays compensation to Independent Trustees in the form of a retainer, attendance fees, and additional compensation to Board and Committee chairpersons. The fund does not pay compensation directly to Trustees who are officers of the investment adviser, or to officers of the fund, all of whom receive remuneration for their services to the fund from MFS. Certain officers and Trustees of the fund are officers or directors of MFS, MFD, and MFSC.
The fund has an unfunded, defined benefit plan for retired Independent Trustees which resulted in a pension expense of $12,008. The fund also has an unfunded retirement benefit deferral plan for certain current Independent Trustees which resulted in an expense of $2,412. Both amounts are included in Independent trustees’ compensation for the year ended January 31, 2006. The deferred liability for retirement benefits payable to retired Trustees and certain current Trustees amounted to $69,272 and $65,417, respectively, at January 31, 2006, and is included in payable for independent trustees’ compensation.
ANNUAL REPORT 43
Notes to Financial Statements – continued
Other – This fund and certain other MFS funds (the funds) have entered into a services agreement (the Agreement) which provides for payment of fees by the funds to Tarantino LLC in return for the provision of services of an Independent Chief Compliance Officer (ICCO) for the funds. The ICCO is an officer of the funds and the sole member of Tarantino LLC. The funds can terminate the Agreement with Tarantino LLC at any time under the terms of the Agreement. For the year ended January 31, 2006, the fee paid to Tarantino LLC was $7,688. MFS has agreed to reimburse the fund for a portion of the payments made by the funds to Tarantino LLC in the amount of $6,664, which is shown as a reduction of total expenses in the Statement of Operations. Additionally, MFS has agreed to bear all expenses associated with office space, other administrative support, and supplies provided to the ICCO.
(4) Portfolio Securities
Purchases and sales of investments, other than U.S. government securities, purchased option transactions, and short-term obligations, aggregated $665,938,110 and $807,425,153, respectively.
(5) Shares of Beneficial Interest
The fund’s Declaration of Trust permits the Trustees to issue an unlimited number of full and fractional shares of beneficial interest. Transactions in fund shares were as follows:
Year ended 1/31/06
Year ended 1/31/05
Class A shares
Shares
Amount
Shares
Amount
Shares sold
53,094,170
$204,613,715
49,940,117
$195,588,296
Shares issued to shareholders in
reinvestment of distributions
9,501,874
36,674,060
11,800,931
46,380,896
Shares reacquired
(79,701,513)
(308,719,388)
(95,320,762)
(372,376,173)
Net change
(17,105,469)
$(67,431,613)
(33,579,714)
$(130,406,981)
Class B shares
Shares sold
8,512,442
$33,027,271
11,988,099
$47,146,590
Shares issued to shareholders in
reinvestment of distributions
3,232,023
12,513,655
4,485,634
17,644,656
Shares reacquired
(35,002,183)
(135,898,194)
(39,553,420)
(154,823,486)
Net change
(23,257,718)
$(90,357,268)
(23,079,687)
$(90,032,240)
Class C shares
Shares sold
8,349,621
$32,524,744
11,232,803
$44,104,669
Shares issued to shareholders in
reinvestment of distributions
1,319,009
5,121,049
1,858,994
7,333,640
Shares reacquired
(18,557,769)
(72,355,245)
(29,784,248)
(116,926,550)
Net change
(8,889,139)
$(34,709,452)
(16,692,451)
$(65,488,241)
44 ANNUAL REPORT
Notes to Financial Statements – continued
Year ended 1/31/06
Year ended 1/31/05
Class I shares
Shares
Amount
Shares
Amount
Shares sold
14,852,538
$57,233,094
19,961,981
$78,328,710
Shares issued to shareholders in
reinvestment of distributions
4,068,920
15,679,773
2,663,323
10,454,551
Shares reacquired
(1,280,490)
(4,929,805)
(3,298,517)
(12,799,669)
Net change
17,640,968
$67,983,062
19,326,787
$75,983,592
Class R shares
Shares sold
670,594
$2,615,846
923,723
$3,647,261
Shares issued to shareholders in
reinvestment of distributions
95,583
368,742
50,560
198,940
Shares reacquired
(359,289)
(1,398,275)
(305,933)
(1,203,026)
Net change
406,888
$1,586,313
668,350
$2,643,175
Period ended 1/31/06*
Class R1 shares
Shares
Amount
Shares sold
66,771
$258,252
Shares issued to shareholders in
reinvestment of distributions
2,220
8,514
Shares reacquired
(8,809)
(33,691)
Net change
60,182
$233,075
Class R2 shares
Shares sold
93,309
$362,470
Shares issued to shareholders in
reinvestment of distributions
2,707
10,401
Shares reacquired
(23,795)
(90,465)
Net change
72,221
$282,406
Year ended 1/31/06
Year ended 1/31/05
Class R3 shares
Shares
Amount
Shares
Amount
Shares sold
397,413
$1,536,498
51,117
$199,781
Shares issued to shareholders in
reinvestment of distributions
11,099
42,667
2,130
8,424
Shares reacquired
(153,808)
(591,663)
(1,855)
(7,376)
Net change
254,704
$987,502
51,392
$200,829
Period ended 1/31/06*
Class R4 shares
Shares
Amount
Shares sold
102,258
$389,569
Shares issued to shareholders in
reinvestment of distributions
1,289
4,943
Shares reacquired
(630)
(2,404)
Net change
102,917
$392,108
ANNUAL REPORT 45
Notes to Financial Statements – continued
Period ended 1/31/06*
Class R5 shares
Shares
Amount
Shares sold
12,886
$49,903
Shares issued to shareholders in
reinvestment of distributions
883
3,390
Net change
13,769
$53,293
Year ended 1/31/06
Year ended 1/31/05
Class 529A shares
Shares
Amount
Shares
Amount
Shares sold
46,995
$181,253
103,438
$412,576
Shares issued to shareholders in
reinvestment of distributions
14,295
55,143
9,573
37,541
Shares reacquired
(51,419)
(199,388)
(21,958)
(84,833)
Net change
9,871
$37,008
91,053
$365,284
Class 529B shares
Shares sold
7,237
$27,829
7,162
$28,051
Shares issued to shareholders in
reinvestment of distributions
2,593
9,994
2,268
8,894
Shares reacquired
(3,676)
(14,149)
(4,340)
(16,951)
Net change
6,154
$23,674
5,090
$19,994
Class 529C shares
Shares sold
41,648
$162,287
42,089
$165,359
Shares issued to shareholders in
reinvestment of distributions
6,512
25,170
5,205
20,480
Shares reacquired
(26,433)
(103,131)
(7,613)
(30,139)
Net change
21,727
$84,326
39,681
$155,700
* For the period from the inception of Class R1, R2, R4 and R5, April 1, 2005, through January 31, 2006.
The fund is one of several mutual funds in which the MFS funds-of-funds may invest. The MFS funds-of-funds do not invest in the underlying MFS funds for the purpose of exercising management or control. At the end of the period, the MFS Moderate Allocation Fund and MFS Growth Allocation Fund were the owners of record of approximately 7% and 8%, respectively, of the value of outstanding voting shares.
(6) Line of Credit
The fund and other affiliated funds participate in a $1 billion unsecured line of credit provided by a syndication of banks under a credit agreement. Borrowings may be made for temporary financing needs. Interest is charged to each fund, based on its borrowings, at a rate equal to the Federal Reserve funds rate plus 0.35% . In addition, a commitment fee, based on the average daily, unused portion of the line of credit, is allocated among the participating funds at the end of each calendar quarter. The commitment fee allocated to the fund for the year ended January 31, 2006 was $8,661, and is included in miscellaneous expense on the Statement of Operations. The fund had no significant borrowings during the year ended January 31, 2006.
46 ANNUAL REPORT
REPORT OF INDEPENDENT REGISTERED PUBLIC ACCOUNTING FIRM
To the Trustees of MFS Series Trust III and the Shareholders of MFS High Income Fund:
We have audited the accompanying statement of assets and liabilities, including the portfolio of investments, of MFS High Income Fund (one of the portfolios constituting MFS Series Trust III) (the ‘‘Trust’’) as of January 31, 2006, and the related statement of operations for the year then ended, the statements of changes in net assets for each of the two years in the period then ended, and the financial highlights for each of the five years in the period then ended. These financial statements and financial highlights are the responsibility of the Trust’s management. Our responsibility is to express an opinion on these financial statements and financial highlights based on our audit.
We conducted our audits in accordance with the standards of the Public Company Accounting Oversight Board (United States). Those standards require that we plan and perform the audit to obtain reasonable assurance about whether the financial statements and financial highlights are free of material misstatement. The Trust is not required to have, nor were we engaged to perform, an audit of its internal control over financial reporting. Our audit included consideration of internal control over financial reporting as a basis for designing audit procedures that are appropriate in the circumstances, but not for the purpose of expressing an opinion on the effectiveness of the Trust’s internal control over financial reporting. Accordingly, we express no such opinion. An audit also includes examining, on a test basis, evidence supporting the amounts and disclosures in the financial statements, assessing the accounting principles used and significant estimates made by management, as well as evaluating the overall financial statement presentation. Our procedures included confirmation of securities owned as of January 31, 2006, by correspondence with the custodian and brokers; where replies were not received from brokers, we performed other auditing procedures. We believe that our audits provide a reasonable basis for our opinion.
In our opinion, such financial statements and financial highlights present fairly, in all material respects, the financial position of MFS High Income Fund as of January 31, 2006, the results of its operations for the year then ended, the changes in its net assets for each of the two years in the period then ended, and its financial highlights for each of the five years in the period then ended, in conformity with accounting principles generally accepted in the United States of America.
DELOITTE & TOUCHE LLP
Boston, Massachusetts
March 24, 2006
ANNUAL REPORT 47
TRUSTEES AND OFFICERS — IDENTIFICATION AND BACKGROUND
The Trustees and officers of the Trust, as of March 1, 2006, are listed below, together with their principal occupations during the past five years. (Their titles may have varied during that period.) The address of each Trustee and officer is 500 Boylston Street, Boston, Massachusetts 02116.
Principal Occupations During
Position(s) Held
Trustee/Officer
the Past Five Years &
Name, Date of Birth
with Fund
Since(1)
Other Directorships(2)
INTERESTED TRUSTEES
Robert J. Manning(3)
Trustee
February 2004
Massachusetts Financial Services
(born 10/20/63)
Company, Chief Executive
Officer, President, Chief
Investment Officer and Director
Robert C. Pozen(3)
Trustee
February 2004
Massachusetts Financial Services
(born 08/08/46)
Company, Chairman (since
February 2004); Secretary of
Economic Affairs, The
Commonwealth of Massachusetts
(January 2002 to December 2002);
Fidelity Investments, Vice
Chairman (June 2000 to
December 2001); Fidelity
Management & Research
Company (investment adviser),
President (March 1997 to July
2001); Bell Canada Enterprises
(telecommunications), Director;
Medtronic, Inc. (medical
technology), Director; Telesat
(satellite communications),
Director
INDEPENDENT TRUSTEES
J. Atwood Ives
Trustee and
February 1992
Private investor; Eastern
(born 05/01/36)
Chair of
Enterprises (diversified services
Trustees
company), Chairman, Trustee and
Chief Executive Officer (until
November 2000)
Robert E. Butler(4)
Trustee
January 2006
Consultant – regulatory and
(born 11/29/41)
compliance matters (since July
2002); PricewaterhouseCoopers
LLP (professional services firm),
Partner (November 2000 until
June 2002)
Lawrence H. Cohn, M.D.
Trustee
August 1993
Brigham and Women’s Hospital,
(born 03/11/37)
Senior Cardiac Surgeon, Chief of
Cardiac Surgery (until 2005);
Harvard Medical School, Professor
of Surgery; Brigham and Women’s
Hospital Physicians’ Organization,
Chair (2000 to 2004)
48 ANNUAL REPORT
Principal Occupations During
Position(s) Held
Trustee/Officer
the Past Five Years &
Name, Date of Birth
with Fund
Since(1)
Other Directorships(2)
David H. Gunning
Trustee
January 2004
Cleveland-Cliffs Inc. (mining
(born 05/30/42)
products and service provider),
Vice Chairman/Director (since
April 2001); Encinitos Ventures
(private investment company),
Principal (1997 to April 2001);
Lincoln Electric Holdings, Inc.
(welding equipment
manufacturer), Director
William R. Gutow
Trustee
December 1993
Private investor and real estate
(born 09/27/41)
consultant; Capitol Entertainment
Management Company (video
franchise), Vice Chairman
Michael Hegarty
Trustee
December 2004
Retired; AXA Financial (financial
(born 12/21/44)
services and insurance), Vice
Chairman and Chief Operating
Officer (until May 2001); The
Equitable Life Assurance Society
(insurance), President and Chief
Operating Officer (until May 2001)
Lawrence T. Perera
Trustee
July 1981
Hemenway & Barnes (attorneys),
(born 06/23/35)
Partner
J. Dale Sherratt
Trustee
August 1993
Insight Resources, Inc.
(born 09/23/38)
(acquisition planning specialists),
President; Wellfleet Investments
(investor in health care
companies), Managing General
Partner (since 1993); Cambridge
Nutraceuticals (professional
nutritional products), Chief
Executive Officer (until May 2001)
Laurie J. Thomsen
Trustee
March 2005
Private investor; Prism Venture
(born 08/05/57)
Partners (venture capital), Co-
founder and General Partner
(until June 2004); St. Paul
Travelers Companies (commercial
property liability insurance),
Director
Robert W. Uek
Trustee
January 2006
Retired (since 1999);
(born 05/18/41)
PricewaterhouseCoopers LLP
(professional services firm),
Partner (until 1999); Consultant
to investment company industry
(since 2000); TT International
Funds (mutual fund complex),
Trustee (2000 until 2005);
Hillview Investment Trust II
Funds (mutual fund complex),
Trustee (2000 until 2005)
ANNUAL REPORT 49
Principal Occupations During
Position(s) Held
Trustee/Officer
the Past Five Years &
Name, Date of Birth
with Fund
Since(1)
Other Directorships(2)
OFFICERS
Maria F. Dwyer(3)
President
November 2005
Massachusetts Financial Services
(born 12/01/58)
Company, Executive Vice
President and Chief Regulatory
Officer (since March 2004);
Fidelity Management & Research
Company, Vice President (prior
to March 2004); Fidelity Group of
Funds, President and Treasurer
(prior to March 2004)
Tracy Atkinson(3)
Treasurer
September 2005
Massachusetts Financial Services
(born 12/30/64)
Company, Senior Vice President
(since September 2004);
PricewaterhouseCoopers LLP,
Partner (prior to September 2004)
Christopher R. Bohane(3)
Assistant
July 2005
Massachusetts Financial Services
(born 1/18/74)
Secretary and
Company, Vice President and
Assistant
Senior Counsel (since April
Clerk
2003); Kirkpatrick & Lockhart
LLP (law firm), Associate (prior
to April 2003); Nvest Services
Company, Assistant Vice
President and Associate Counsel
(prior to January 2001)
Ethan D. Corey(3)
Assistant
July 2005
Massachusetts Financial Services
(born 11/21/63)
Secretary and
Company, Special Counsel (since
Assistant
December 2004); Dechert LLP
Clerk
(law firm), Counsel (prior to
December 2004)
David L. DiLorenzo(3)
Assistant
July 2005
Massachusetts Financial Services
(born 8/10/68)
Treasurer
Company, Vice President (since
June 2005); JP Morgan Investor
Services, Vice President (January
2001 to June 2005); State Street
Bank, Vice President and
Corporate Audit Manager (prior
to January 2001)
Timothy M. Fagan(3)
Assistant
September 2005
Massachusetts Financial Services
(born 7/10/68)
Secretary and
Company, Vice President and
Assistant
Senior Counsel (since September
Clerk
2005); John Hancock Advisers,
LLC, Vice President and Chief
Compliance Officer (September
2004 to August 2005), Senior
Attorney (prior to September
2004); John Hancock Group of
Funds, Vice President and Chief
Compliance Officer (September
2004 to December 2004)
50 ANNUAL REPORT
Principal Occupations During
Position(s) Held
Trustee/Officer
the Past Five Years &
Name, Date of Birth
with Fund
Since(1)
Other Directorships(2)
Mark D. Fischer(3)
Assistant
July 2005
Massachusetts Financial Services
(born 10/27/70)
Treasurer
Company, Vice President (since
May 2005); JP Morgan Investment
Management Company, Vice
President (prior to May 2005)
Brian T. Hourihan(3)
Assistant
September 2004
Massachusetts Financial Services
(born 11/11/64)
Secretary and
Company, Vice President, Senior
Assistant
Counsel and Assistant Secretary
Clerk
(since June 2004); Affiliated
Managers Group, Inc., Chief Legal
Officer/Centralized Compliance
Program (January to April 2004);
Fidelity Research & Management
Company, Assistant General
Counsel (prior to January 2004)
Ellen Moynihan(3)
Assistant
April 1997
Massachusetts Financial Services
(born 11/13/57)
Treasurer
Company, Senior Vice President
Susan S. Newton(3)
Assistant
May 2005
Massachusetts Financial Services
(born 03/07/50)
Secretary and
Company, Senior Vice President
Assistant
and Associate General Counsel
Clerk
(since April 2005); John Hancock
Advisers, LLC, Senior Vice
President, Secretary and Chief
Legal Officer (prior to April
2005); John Hancock Group of
Funds, Senior Vice President,
Secretary and Chief Legal Officer
(prior to April 2005)
Susan A. Pereira(3)
Assistant
July 2005
Massachusetts Financial Services
(born 11/05/70)
Secretary and
Company, Vice President and
Assistant
Senior Counsel (since June 2004);
Clerk
Bingham McCutchen LLP (law
firm), Associate (January 2001 to
June 2004); Preti, Flaherty,
Beliveau, Pachios & Haley, LLC,
Associate (prior to January 2001)
Mark N. Polebaum(3)
Secretary and
January 2006
Massachusetts Financial Services
(born 05/01/52)
Clerk
Company, Executive Vice
President, General Counsel and
Secretary (since January 2006);
Wilmer Cutler Pickering Hale
and Dorr LLP (law firm), Partner
(prior to January 2006)
ANNUAL REPORT 51
Principal Occupations During
Position(s) Held
Trustee/Officer
the Past Five Years &
Name, Date of Birth
with Fund
Since(1)
Other Directorships(2)
Frank L. Tarantino
Independent
June 2004
Tarantino LLC (provider of
(born 03/07/44)
Chief
compliance services), Principal
Compliance
(since June 2004); CRA Business
Officer
Strategies Group (consulting
services), Executive Vice
President (April 2003 to June
2004); David L. Babson & Co.
(investment adviser), Managing
Director, Chief Administrative
Officer and Director (February
1997 to March 2003)
James O. Yost(3)
Assistant
September 1990
Massachusetts Financial Services
(born 06/12/60)
Treasurer
Company, Senior Vice President
1
Date first appointed to serve as Trustee/officer of an MFS fund. Each Trustee has served continuously since appointment unless indicated otherwise.
2
Directorships or trusteeships of companies required to report to the Securities and Exchange Commission (i.e., ‘‘public companies’’).
3
‘‘Interested person’’ of the Trust within the meaning of the Investment Company Act of 1940 (referred to as the 1940 Act), which is the principal federal law governing investment companies like the fund, as a result of position with MFS. The address of MFS is 500 Boylston Street, Boston, Massachusetts 02116.
4
In 2004 and 2005, Mr. Butler provided consulting services to the independent compliance consultant retained by MFS pursuant to its settlement with the SEC concerning market timing and related matters. The terms of that settlement required that compensation and expenses related to the independent compliance consultant be borne exclusively by MFS and, therefore, MFS paid Mr. Butler for the services he rendered to the independent compliance consultant. In 2004 and 2005, MFS paid Mr. Butler a total of $351,119.29.
Each Trustee and officer holds office until his or her successor is chosen and qualified or until his or her earlier death, resignation, retirement or removal. Messrs. Butler, Ives, Sherratt and Uek and Ms. Thomsen are members of the Trust’s Audit Committee.
Each of the Trust’s Trustees and officers holds comparable positions with certain other funds of which MFS or a subsidiary is the investment adviser or distributor, and, in the case of the officers, with certain affiliates of MFS. As of December 31, 2005, each Trustee served as a board member of 98 funds within the MFS Family of Funds.
The Trust held a shareholders’ meeting in 2005, and will hold a shareholders’ meeting at least once every five years thereafter, to elect Trustees.
The Statement of Additional Information contains further information about the Trustees and is available without charge upon request by calling 1-800-225-2606.
Investment Adviser
Custodians
Massachusetts Financial Services Company
State Street Bank and Trust Company
500 Boylston Street, Boston, MA 02116-3741
225 Franklin Street, Boston, MA 02110
Distributor
J.P. Morgan Chase Bank
MFS Fund Distributors, Inc.
One Chase Manhattan Plaza
500 Boylston Street, Boston, MA 02116-3741
New York, NY 10081
Portfolio Managers
Independent Registered Public Accounting Firm
John Addeo
Deloitte & Touche LLP
Scott Richards
200 Berkeley Street, Boston, MA 02116
52 ANNUAL REPORT
BOARD REVIEW OF INVESTMENT ADVISORY AGREEMENT
A discussion regarding the Board’s most recent review and renewal of the Fund’s investment advisory agreement is available by clicking on the fund’s name under ‘‘Select a fund’’ on the MFS Web site (mfs.com).
PROXY VOTING POLICIES AND INFORMATION
A general description of the MFS funds’ proxy voting policies and procedures is available without charge, upon request, by calling 1-800-225-2606, by visiting the Proxy Voting section of mfs.com or by visiting the SEC’s Web site at http://www.sec.gov.
Information regarding how the fund voted proxies relating to portfolio securities during the most recent twelve-month period ended June 30 is available without charge by visiting the Proxy Voting section of mfs.com or by visiting the SEC’s Web site at http://www.sec.gov.
QUARTERLY PORTFOLIO DISCLOSURE
The fund will file a complete schedule of portfolio holdings with the Securities and Exchange Commission (the Commission) for the first and third quarters of each fiscal year on Form N-Q. The fund’s Form N-Q may be reviewed and copied at the:
Public Reference Room Securities and Exchange Commission Washington, D.C. 20549-0102
Information on the operation of the Public Reference Room may be obtained by calling the Commission at 1-800-SEC-0330. The fund’s Form N-Q is available on the EDGAR database on the Commission’s Internet Web site at http://www.sec.gov, and copies of this information may be obtained, upon payment of a duplicating fee, by electronic request at the following e-mail address: publicinfo@sec.gov or by writing the Public Reference Section at the above address.
A shareholder can also obtain the quarterly portfolio holdings report at mfs.com.
FEDERAL TAX INFORMATION (unaudited)
The fund will notify shareholders of amounts for use in preparing 2006 income tax forms in January 2007.
ANNUAL REPORT 53
ITEM 2. CODE OF ETHICS.
The Registrant has adopted a Code of Ethics pursuant to Section 406 of the Sarbanes-Oxley Act and as defined in Form N-CSR that applies to the Registrant’s principal executive officer and principal financial and accounting officer. The Registrant has amended its Code of Ethics to reflect that the Registrant’s Principal Financial Officer and Principal Executive Officer have changed.
ITEM 3. AUDIT COMMITTEE FINANCIAL EXPERT.
Messrs. Robert E. Butler, J. Atwood Ives and Robert W. Uek and Ms. Laurie J. Thomsen, members of the Audit Committee, have been determined by the Board of Trustees in their reasonable business judgment to meet the definition of “audit committee financial expert” as such term is defined in Form N-CSR. In addition, Messrs. Butler, Ives and Uek and Ms. Thomsen are “independent” members of the Audit Committee (as such term has been defined by the Securities and Exchange Commission in regulations implementing Section 407 of the Sarbanes-Oxley Act of 2002). The Securities and Exchange Commission has stated that the designation of a person as an audit committee financial expert pursuant to this Item 3 on the Form N-CSR does not impose on such a person any duties, obligations or liability that are greater than the duties, obligations or liability imposed on such person as a member of the Audit Committee and the Board of Trustees in the absence of such designation or identification.
ITEM 4. PRINCIPAL ACCOUNTANT FEES AND SERVICES.
Items 4(a) through 4(d) and 4(g):
The Board of Trustees has appointed Deloitte & Touche LLP (“Deloitte”) to serve as independent accountants to certain series of the Registrant and Ernst & Young LLP (“E&Y”) to serve in the same capacity to certain other series of the Registrant (the series referred to collectively as the “Funds” and singularly as a “Fund”). The tables below set forth the audit fees billed to the Funds as well as fees for non-audit services provided to the Funds and/or to the Funds’ investment adviser, Massachusetts Financial Services Company (“MFS”) and to various entities either controlling, controlled by, or under common control with MFS that provide ongoing services to the Funds (“MFS Related Entities”).
For the fiscal years ended January 31, 2006 and 2005, audit fees billed to the Funds by Deloitte and E&Y were as follows:
Audit Fees
Fees billed by Deloitte:
2006
2005
MFS High Income Fund
$47,875
$46,675
MFS High Yield Opportunities Fund
46,825
47,625
Total
$94,700
$94,30
Audit Fees
Fees billed by E&Y:
2006
2005
MFS Municipal High Income Fund
$38,420
$38,420
For the fiscal years ended January 31, 2006 and 2005, fees billed by Deloitte and E&Y for audit-related, tax and other services provided to the Funds and for audit-related, tax and other services provided to MFS and MFS Related Entities were as follows:
Audit-Related Fees1
Tax Fees2
All Other Fees3
Fees billed by Deloitte:
2006
2005
2006
2005
2006
2005
To MFS High Income
$0
$0
$11,600
$11,600
$0
$0
Fund
To MFS High Yield
0
0
10,100
10,100
0
0
Opportunities Fund
Total fees billed by Deloitte
$0
$0
$21,700
$21,700
$0
$0
To above Funds:
To MFS and MFS Related
$741,371
$1,146,170
$0
$62,000
$373,825
$602,500
Entities of MFS High
Income Fund*
To MFS and MFS Related
741,371
1,146,170
0
62,000
373,825
602,500
Entities of MFS High
Yield Opportunities Fund*
Aggregate fees for non-audit
services:
2006
2005
To MFS High Income
$1,146,002
$1,857,960
Fund, MFS and MFS
Related Entities#
To MFS High Yield
1,144,502
1,856,460
Opportunities Fund,
MFS and MFS
Related Entities#
Audit-Related Fees1
Tax Fees2
All Other Fees4
Fees billed by E&Y:
2006
2005
2006
2005
2006
2005
To MFS Municipal High
$0
$0
$11,715
$11,715
$0
$0
Income Fund
To MFS and MFS Related
$0
$0
$15,500
$0
$667,899
$37,500
Entities of MFS
Municipal High Income
Fund*
Aggregate fees for non-audit
services:
2006
2005
To MFS Municipal High
$727,114
$56,686
Income Fund, MFS and
MFS Related Entities#
* This amount reflects the fees billed to MFS and MFS Related Entities for non-audit services relating directly to the operations and financial reporting of the Funds (portions of which services also related to the operations and financial reporting of other funds within the MFS Funds complex).
# This amount reflects the aggregate fees billed by E&Y or D&T, as the case may be, for non-audit services rendered to the Funds and for non-audit services rendered to MFS and the MFS Related Entities.
1 The fees included under “Audit-Related Fees” are fees related to assurance and related services that are reasonably related to the performance of the audit or review of financial statements, but not reported under ‘‘Audit Fees,’’ including accounting consultations, agreed-upon procedure reports, attestation reports, comfort letters and internal control reviews.
2 The fees included under “Tax Fees” are fees associated with tax compliance, tax advice and tax planning, including services relating to the filing or amendment of federal, state or local income tax returns, regulated investment company qualification reviews and tax distribution and analysis.
3 The fees included under “All Other Fees” are fees for products and services provided by D&T other than those reported under “Audit Fees,” “Audit-Related Fees” and “Tax Fees,” including fees for services related to sales tax refunds, consultation on internal cost allocations, consultation on allocation of monies pursuant to an administrative proceeding regarding disclosure of brokerage allocation practices in connection with fund sales, and analysis of certain portfolio holdings versus investment styles.
4 The fees included under “All Other Fees” are fees for products and services provided by E&Y other than those reported under “Audit Fees,” “Audit-Related Fees” and “Tax Fees,” including fees for services related to analysis of fund administrative expenses, compliance program and records management projects.
Item 4(e)(1):
Set forth below are the policies and procedures established by the Audit Committee of the Board of Trustees relating to the pre-approval of audit and non-audit related services: To the extent required by applicable law, pre-approval by the Audit Committee of the Board is needed for all audit and permissible non-audit services rendered to the Funds and
all permissible non-audit services rendered to MFS or MFS Related Entities if the services relate directly to the operations and financial reporting of the Registrant. Pre-approval is currently on an engagement-by-engagement basis. In the event pre-approval of such services is necessary between regular meetings of the Audit Committee and it is not practical to wait to seek pre-approval at the next regular meeting of the Audit Committee, pre-approval of such services may be referred to the Chair of the Audit Committee for approval; provided that the Chair may not pre-approve any individual engagement for such services exceeding $50,000 or multiple engagements for such services in the aggregate exceeding $100,000 between such regular meetings of the Audit Committee. Any engagement pre-approved by the Chair between regular meetings of the Audit Committee shall be presented for ratification by the entire Audit Committee at its next regularly scheduled meeting.
Item 4(e)(2):
None, or 0%, of the services relating to the Audit-Related Fees, Tax Fees and All Other Fees paid by the Fund and MFS and MFS Related Entities relating directly to the operations and financial reporting of the Registrant disclosed above were approved by the audit committee pursuant to paragraphs (c)(7)(i)(C) of Rule 2-01 of Regulation S-X (which permits audit committee approval after the start of the engagement with respect to services other than audit, review or attest services, if certain conditions are satisfied).
Item 4(f): Not applicable.
Item 4(h): The Registrant’s Audit Committee has considered whether the provision by a Registrant’s independent registered public accounting firm of non-audit services to MFS and MFS Related Entities that were not pre-approved by the Committee (because such services did not relate directly to the operations and financial reporting of the Registrant) was compatible with maintaining the independence of the independent registered public accounting firm as the Registrant’s principal auditors.
ITEM 5. AUDIT COMMITTEE OF LISTED REGISTRANTS.
Not applicable to the Registrant.
ITEM 6. SCHEDULE OF INVESTMENTS
A schedule of investments of the Registrant is included as part of the report to shareholders of such series under Item 1 of this Form N-CSR.
ITEM 7. DISCLOSURE OF PROXY VOTING POLICIES AND PROCEDURES FOR CLOSED-END MANAGEMENT INVESTMENT COMPANIES.
Not applicable to the Registrant.
ITEM 8. PORTFOLIO MANAGERS OF CLOSED-END MANAGEMENT INVESTMENT COMPANIES.
Not applicable to the Registrant.
ITEM 9.PURCHASES OF EQUITY SECURITIES BY CLOSED-END
MANAGEMENT INVESTMENT COMPANY AND AFFILIATED PURCHASERS .
Not applicable to the Registrant.
ITEM 10. SUBMISSION OF MATTERS TO A VOTE OF SECURITY HOLDERS.
There were no material changes to the procedures by which shareholders may send
recommendations to the Board for nominees to the Registrant’s Board since the Registrant
last provided disclosure as to such procedures in response to the requirements of Item
7(d)(2)(ii)(G) of Schedule 14A or this Item.
ITEM 11. CONTROLS AND PROCEDURES.
(a)
Based upon their evaluation of the registrant’s disclosure controls and procedures (as
defined in Rule 30a-3(c) under the Investment Company Act of 1940 (the “Act”)) as
conducted within 90 days of the filing date of this Form N-CSR, the registrant’s
principal financial officer and principal executive officer have concluded that those
disclosure controls and procedures provide reasonable assurance that the material
information required to be disclosed by the registrant on this report is recorded,
processed, summarized and reported within the time periods specified in the Securities
and Exchange Commission’s rules and forms.
(b)
There were no changes in the registrant’s internal controls over financial reporting (as
defined in Rule 30a-3(d) under the Act) that occurred during the second fiscal quarter
of the period covered by the report that have materially affected, or are reasonably
likely to materially affect, the registrant’s internal control over financial reporting.
ITEM 12. EXHIBITS.
(a)
File the exhibits listed below as part of this Form. Letter or number the exhibits in the
sequence indicated.
(1) Any code of ethics, or amendment thereto, that is the subject of the disclosure
required by Item 2, to the extent that the registrant intends to satisfy the Item 2
requirements through filing of an exhibit: Code of Ethics attached hereto.
(2) A separate certification for each principal executive officer and principal financial
officer of the registrant as required by Rule 30a-2 under the Act (17 CFR
270.30a-2): Attached hereto.
(b) If the report is filed under Section 13(a) or 15(d) of the Exchange Act, provide the
certifications required by Rule 30a-2(b) under the Act (17 CFR 270.30a-2(b)), Rule
13a-14(b) or Rule 15d-14(b) under the Exchange Act (17 CFR 240.13a-14(b) or
240.15d-14(b)) and Section 1350 of Chapter 63 of Title 18 of the United States Code
(18 U.S.C. 1350) as an exhibit. A certification furnished pursuant to this paragraph
will not be deemed “filed” for the purposes of Section 18 of the Exchange Act (15
U.S.C. 78r), or otherwise subject to the liability of that section. Such certification will
not be deemed to be incorporated by reference into any filing under the Securities Act
of 1933 or the Exchange Act, except to the extent that the registrant specifically
incorporates it by reference: Attached hereto.
Notice
A copy of the Amended and Restated Declaration of Trust of the Registrant is on file with
the Secretary of State of the Commonwealth of Massachusetts and notice is hereby given
that this instrument is executed on behalf of the Registrant by an officer of the Registrant as
an officer and not individually and the obligations of or arising out of this instrument are
not binding upon any of the Trustees or shareholders individually, but are binding only
upon the assets and property of the respective constituent series of the Registrant.
SIGNATURES
Pursuant to the requirements of the Securities Exchange Act of 1934 and the Investment
Company Act of 1940, the registrant has duly caused this report to be signed on its behalf
by the undersigned, thereunto duly authorized.
(Registrant) MFS SERIES TRUST III
By (Signature and Title)*
MARIA F. DWYER
Maria F. Dwyer, President
Date: March 24, 2006
Pursuant to the requirements of the Securities Exchange Act of 1934 and the Investment
Company Act of 1940, this report has been signed below by the following persons on
behalf of the registrant and in the capacities and on the dates indicated.
By (Signature and Title)*
MARIA F. DWYER
Maria F. Dwyer, President (Principal Executive Officer)
Date: March 24, 2006
By (Signature and Title)*
TRACY ATKINSON
Tracy Atkinson, Treasurer (Principal Financial Officer and
Accounting Officer)
Date: March 24, 2006
* Print name and title of each signing officer under his or her signature.
We use cookies on this site to provide a more responsive and personalized service. Continuing to browse, clicking I Agree, or closing this banner indicates agreement. See our Cookie Policy for more information.