UNITED STATES
SECURITIES AND EXCHANGE COMMISSION
Washington, D.C. 20549
FORM N-CSR
CERTIFIED SHAREHOLDER REPORT OF
REGISTERED MANAGEMENT INVESTMENT COMPANIES
| | |
Investment Company Act file number | | 811-2794 |
MFS SERIES TRUST III
|
| (Exact name of registrant as specified in charter) |
| | |
| 500 Boylston Street, Boston, Massachusetts | | 02116 |
| (Address of principal executive offices) | | (Zip code) |
Susan S. Newton
Massachusetts Financial Services Company
500 Boylston Street
Boston, Massachusetts 02116
|
| (Name and address of agents for service) |
Registrant’s telephone number, including area code: (617) 954-5000
Date of fiscal year end: January 31
Date of reporting period: January 31, 2008
ITEM 1. REPORTS TO STOCKHOLDERS.

MFS® High Income Fund
| | |
| CONTACT INFORMATION | | BACK COVER |
SIPC Contact Information:
You may obtain information about the Securities Investor Protection Corporation (“SIPC”), including the SIPC Brochure, by contacting SIPC either by telephone (202-371-8300) or by accessing SIPC’s website address (www.sipc.org).
The report is prepared for the general information of shareholders. It is authorized for distribution to prospective investors only when preceded or accompanied by a current prospectus.
NOT FDIC INSURED Ÿ MAY LOSE VALUE Ÿ NO BANK OR CREDIT UNION GUARANTEE Ÿ NOT A DEPOSIT Ÿ NOT INSURED BY ANY FEDERAL GOVERNMENT AGENCY OR NCUA/NCUSIF
1/31/08
MFH-ANN

LETTER FROM THE CEO
Dear Shareholders:
Many of our MFS® fund shareholders have been justifiably concerned, as have most investors around the world, about the state of the global economy. As we enter 2008 we see the market volatility that began in the third quarter of 2007 has intensified.
We here at MFS, and those before us who guided the firm with the same disciplined investment process, have weathered many major economic disruptions over our eight-plus decades of managing clients’ investments. We have managed money through the Great Depression, 14 recessions, as well as numerous market crises caused by wars, political upheavals, and terrorist attacks. MFS remains in business because our investors believe in the integrity of our long-term investment strategy and its proven results.
Worries over market volatility are valid, and investors cannot always expect to see the kind of returns stocks have delivered in the bull markets of past years. Yet we believe our strategy of ADR — allocating across the major asset classes, diversifying within each class, and regularly rebalancing your portfolio to maintain your desired allocation — can help you pursue the highest investment returns while minimizing the effects of market fluctuations.
MFS is a world leader in domestic and global investing. Our team approach is research driven, globally integrated, and balanced. We have 176 investment management professionals located in the Americas, Europe, and Asia who focus on the fundamentals of each security and then integrate our sophisticated quantitative approach.* This collaborative process allows us to find opportunities in any market environment.
I personally would like to thank you for your continued business. We want you to be confident that we are constantly managing our fund offerings with you in mind, while adding new products that can help you to choose what fits your unique financial goals.
Respectfully,

Robert J. Manning
Chief Executive Officer and Chief Investment Officer
MFS Investment Management®
March 14, 2008
* as of 12/31/07
The opinions expressed in this letter are subject to change, may not be relied upon for investment advice, and no forecasts can be guaranteed.
1
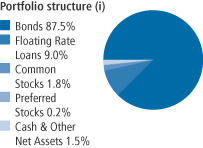
PORTFOLIO COMPOSITION
| | |
| Top five industries (i) | | |
| Medical & Health Technology & Services | | 9.5% |
| Broadcasting | | 8.4% |
| Gaming & Lodging | | 6.4% |
| Utilities – Electric Power | | 6.3% |
| Energy – Independent | | 5.3% |
| | |
| Credit quality of bonds (r) | | |
| AAA | | 0.6% |
| AA | | 0.4% |
| A | | 0.1% |
| BBB | | 1.9% |
| BB | | 30.5% |
| B | | 49.7% |
| CCC | | 16.0% |
| CC | | 0.1% |
| Not Rated | | 0.7% |
| |
| Portfolio facts | | |
| Average Duration (d)(i) | | 4.3 |
| Average Life (i)(m) | | 6.8 yrs. |
| Average Maturity (i)(m) | | 7.4 yrs. |
| Average Credit Quality of Rated Securities (long-term) (a) | | B+ |
| Average Credit Quality of Rated Securities (short-term) (a) | | A-1 |
| (a) | The average credit quality of rated securities is based upon a market weighted average of portfolio holdings that are rated by public rating agencies. |
| (d) | Duration is a measure of how much a bond’s price is likely to fluctuate with general changes in interest rates, e.g., if rates rise 1.00%, a bond with a 5-year duration is likely to lose about 5.00% of its value. |
| (i) | For purposes of this presentation, the bond component includes accrued interest amounts and may be positively or negatively impacted by the equivalent exposure from any derivative holdings, if applicable. |
| (m) | The average maturity shown is calculated using the final stated maturity on the portfolio’s holdings without taking into account any holdings which have been pre-refunded or pre-paid to an earlier date or which have a mandatory put date prior to the stated maturity. The average life shown takes into account these earlier dates. |
| (r) | Each security is assigned a rating from Moody’s Investors Service. If not rated by Moody’s, the rating will be that assigned by Standard & Poor’s. Likewise, if not assigned a rating by Standard & Poor’s, it will be based on the rating assigned by Fitch, Inc. For those portfolios that hold a security which is not rated by any of the three agencies, the security is considered Not Rated. Holdings in U.S. Treasuries and government agency mortgage-backed securities, if any, are included in the “AAA”-rating category. Percentages are based on the total market value of investments as of 1/31/08. |
Percentages are based on net assets as of 1/31/08, unless otherwise noted.
The portfolio is actively managed and current holdings may be different.
2
MANAGEMENT REVIEW
Summary of Results
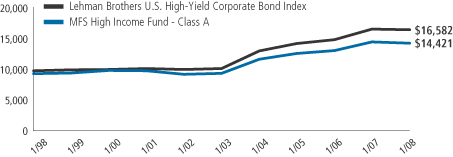
For the twelve months ended January 31, 2008, Class A shares of the MFS High Income Fund provided a total return of -1.20%. This compares with a return of -0.60% for the fund’s benchmark, the Lehman Brothers U.S. High-Yield Corporate Bond Index.
Market environment
Despite seemingly robust growth rates during the second and third quarters of 2007, underlying economic activity in the U.S. remained muted relative to other major economies. Overall, global economies witnessed moderate to strong growth during the reporting period as domestic demand improved and world trade accelerated.
With the strong global growth, however, concerns emerged about rising global inflation, especially as capacity became more constrained, wages rose, and energy and food prices advanced. During the reporting period, global central banks (with the exception of the U.S. Federal Reserve Board) tightened monetary conditions, which in turn pushed global bond yields to their highest levels during this economic expansion.
However, financial markets – particularly in the mortgage and structured-products areas – experienced substantial volatility in recent months. Beginning in late July, heightened uncertainty and distress concerning the subprime mortgage market caused several global credit markets to tighten up, forcing central banks to inject liquidity and to reassess their tightening biases as sovereign bond yields declined and credit spreads widened. While credit conditions improved somewhat by late October as the Federal Reserve Board cut interest rates, the level of market turbulence remained significant through year end. Increased market turmoil was also exacerbated by U.S. home foreclosures and uncertainties surrounding falling housing prices. Despite increased volatility across all asset classes and the widening in credit spreads, U.S. labor markets were resilient and wages rose modestly. More broadly, global equity markets rebounded following summer losses and generally held those gains through the end of the reporting period.
Detractors from performance
The fund’s exposure to finance-related debt held back results relative to the Lehman Brothers U.S. High-Yield Corporate Bond Index. In addition, our greater relative exposure to “B” and “CCC” rated(s) securities had a negative impact on relative returns. Security selection was also an overall negative for the fund’s relative performance. Top detractors included Harrah’s Operating Co., Univision Communications, Inc., Tropicana Entertainment(g), and Station Casinos.
3
Management review – continued
Contributors to performance
Over the reporting period, yield was a positive factor that boosted relative performance. The fund’s lower relative exposure to “BB” rated bonds also helped results. Holdings that contributed to the fund’s relative returns included Hospital Corporation of America (HCA), Freeport-McMoRan Copper & Gold, and FMG Finance.
Respectfully,
| | | | |
| John Addeo | | | | David Cole |
| Portfolio Manager | | | | Portfolio Manager |
| (g) | Security was not held in the portfolio at period end. |
| (s) | Bonds rated “BBB”, “Baa”, or higher are considered investment grade; bonds rated “BB”, “Ba,” or below are considered non-investment grade. The primary source for bond quality ratings is Moody’s Investors Service. If not available, ratings by Standard & Poor’s are used, else ratings by Fitch, Inc. For securities which are not rated by any of the three agencies, the security is considered Not Rated. |
The views expressed in this report are those of the portfolio managers only through the end of the period of the report as stated on the cover and do not necessarily reflect the views of MFS or any other person in the MFS organization. These views are subject to change at any time based on market or other conditions, and MFS disclaims any responsibility to update such views. These views may not be relied upon as investment advice or an indication of trading intent on behalf of any MFS portfolio. References to specific securities are not recommendations of such securities, and may not be representative of any MFS portfolio’s current or future investments.
4
PERFORMANCE SUMMARY THROUGH 1/31/08
The following chart illustrates a representative class of the fund’s historical performance in comparison to its benchmark. Performance results include the deduction of the maximum applicable sales charge and reflect the percentage change in net asset value, including reinvestment of dividends and capital gains distributions. The performance of other share classes will be greater than or less than that of the class depicted below. Benchmark comparisons are unmanaged; do not reflect sales charges, commissions or expenses; and cannot be invested in directly. (See Notes to Performance Summary.)
Performance data shown represents past performance and is no guarantee of future results. Investment return and principal value fluctuate so your shares, when sold, may be worth more or less than the original cost; current performance may be lower or higher than quoted. The performance shown does not reflect the deduction of taxes, if any, that a shareholder would pay on fund distributions or the redemption of fund shares.
Growth of a hypothetical $10,000 investment
5
Performance summary – continued
Total returns through 1/31/08
Average annual without sales charge
| | | | | | | | | | | | |
| | | Share class | | Class inception date | | 1-yr | | 5-yr | | 10-yr | | |
| | | A | | 2/17/78 | | (1.20)% | | 8.36% | | 4.23% | | |
| | | B | | 9/27/93 | | (1.87)% | | 7.58% | | 3.52% | | |
| | | C | | 1/03/94 | | (1.84)% | | 7.58% | | 3.52% | | |
| | | I | | 1/02/97 | | (0.90)% | | 8.65% | | 4.56% | | |
| | | R | | 12/31/02 | | (1.65)% | | 8.12% | | 4.11% | | |
| | | R1 | | 4/01/05 | | (1.96)% | | 7.51% | | 3.48% | | |
| | | R2 | | 4/01/05 | | (1.87)% | | 7.66% | | 3.56% | | |
| | | R3 | | 10/31/03 | | (1.79)% | | 7.85% | | 3.65% | | |
| | | R4 | | 4/01/05 | | (1.28)% | | 8.31% | | 4.21% | | |
| | | R5 | | 4/01/05 | | (0.99)% | | 8.49% | | 4.29% | | |
| | | 529A | | 7/31/02 | | (1.49)% | | 8.01% | | 4.05% | | |
| | | 529B | | 7/31/02 | | (2.13)% | | 7.31% | | 3.35% | | |
| | | 529C | | 7/31/02 | | (2.11)% | | 7.31% | | 3.35% | | |
Average annual
Comparative benchmarks
| | | | | | | | | | | | |
| | | Lehman Brothers U.S. High-Yield Corporate Bond
Index (f) | | (0.60)% | | 9.89% | | 5.19% | | |
Average annual with sales charge
| | | | | | | | | | | | |
| | | A With Initial Sales Charge (4.75%) | | (5.89)% | | 7.31% | | 3.73% | | |
| | | B With CDSC (Declining over six years from 4% to 0%) (x) | | (5.52)% | | 7.28% | | 3.52% | | |
| | | C With CDSC (1% for 12 months) (x) | | (2.76)% | | 7.58% | | 3.52% | | |
| | | 529A With Initial Sales Charge (4.75%) | | (6.17)% | | 6.96% | | 3.54% | | |
| | | 529B With CDSC (Declining over six years from 4% to 0%) (x) | | (5.79)% | | 7.01% | | 3.35% | | |
| | | 529C With CDSC (1% for 12 months) (x) | | (3.03)% | | 7.31% | | 3.35% | | |
Class I, R, R1, R2, R3, R4, and R5 shares do not have a sales charge. Please see Notes to Performance Summary for more details.
CDSC – Contingent Deferred Sales Charge.
| (f) | Source: FactSet Research Systems Inc. |
| (x) | Assuming redemption at the end of the applicable period. |
6
Performance summary – continued
Index Definition
Lehman Brothers U.S. High-Yield Corporate Bond Index – a market capitalization-weighted index that measures the performance of non-investment grade, fixed rate debt. Eurobonds and debt issues from countries designated as emerging markets (e.g., Argentina, Brazil, Venezuela, etc.) are excluded.
It is not possible to invest directly in an index.
Notes to Performance Summary
Class 529 shares are only available in conjunction with qualified tuition programs, such as the MFS 529 Savings Plan. There also is an additional fee, which is detailed in the program description, on qualified tuition programs. If this fee was reflected, the performance for Class 529 shares would have been lower. This annual fee is waived for Oregon residents and for those accounts with assets of $25,000 or more.
Performance for classes R, R4, R5 and 529A shares includes the performance of the fund’s class A shares for periods prior to their offering. Performance for classes R1, R2, R3 and 529B shares includes the performance of the fund’s class B shares for periods prior to their offering. Performance for class 529C shares includes the performance of the fund’s class C shares for periods prior to their offering.
This blended class performance has been adjusted to take into account differences in sales loads, if any, applicable to these share classes, but has not been adjusted to take into account differences in class specific operating expenses (such as Rule 12b-1 fees). Compared to performance these share classes would have experienced had they been offered for the entire period, the use of blended performance generally results in higher performance for share classes with higher operating expenses than the share class to which it is blended, and lower performance for share classes with lower operating expenses than the share class to which it is blended.
Performance results reflect any applicable expense subsidies and waivers in effect during the periods shown. Without such subsidies and waivers the fund’s performance results would be less favorable. Please see the prospectus and financial statements for complete details.
From time to time the fund may receive proceeds from litigation settlements, without which performance would be lower.
7
EXPENSE TABLE
Fund expenses borne by the shareholders during the period,
August 1, 2007 through January 31, 2008
As a shareholder of the fund, you incur two types of costs: (1) transaction costs, including sales charges (loads) on certain purchase or redemption payments and (2) ongoing costs, including management fees; distribution and service (12b-1) fees; and other fund expenses. This example is intended to help you understand your ongoing costs (in dollars) of investing in the fund and to compare these costs with the ongoing costs of investing in other mutual funds.
The example is based on an investment of $1,000 invested at the beginning of the period and held for the entire period August 1, 2007 through January 31, 2008.
Actual expenses
The first line for each share class in the following table provides information about actual account values and actual expenses. You may use the information in this line, together with the amount you invested, to estimate the expenses that you paid over the period. Simply divide your account value by $1,000 (for example, an $8,600 account value divided by $1,000 = 8.6), then multiply the result by the number in the first line under the heading entitled “Expenses Paid During Period” to estimate the expenses you paid on your account during this period.
The actual expenses include the payment of a portion of the transfer-agent-related expenses of MFS funds that invest in the fund. For further information, please see the Notes to the Financial Statements.
Hypothetical example for comparison purposes
The second line for each share class in the following table provides information about hypothetical account values and hypothetical expenses based on the fund’s actual expense ratio and an assumed rate of return of 5% per year before expenses, which is not the fund’s actual return. The hypothetical account values and expenses may not be used to estimate the actual ending account balance or expenses you paid for the period. You may use this information to compare the ongoing costs of investing in the fund and other funds. To do so, compare this 5% hypothetical example with the 5% hypothetical examples that appear in the shareholder reports of the other funds.
Please note that the expenses shown in the table are meant to highlight your ongoing costs only and do not reflect any transactional costs, such as sales charges (loads). Therefore, the second line for each share class in the table is useful in comparing ongoing costs only, and will not help you determine the relative total costs of owning different funds. In addition, if these transactional costs were included, your costs would have been higher.
8
Expense table – continued
| | | | | | | | | | |
Share
Class | | | | Annualized
Expense
Ratio | | Beginning
Account Value
8/01/07 | | Ending
Account Value
1/31/08 | | Expenses
Paid During
Period (p)
8/01/07-1/31/08 |
| A | | Actual | | 0.97% | | $1,000.00 | | $1,009.22 | | $4.91 |
| | Hypothetical (h) | | 0.97% | | $1,000.00 | | $1,020.32 | | $4.94 |
| B | | Actual | | 1.67% | | $1,000.00 | | $1,005.78 | | $8.44 |
| | Hypothetical (h) | | 1.67% | | $1,000.00 | | $1,016.79 | | $8.49 |
| C | | Actual | | 1.67% | | $1,000.00 | | $1,005.87 | | $8.44 |
| | Hypothetical (h) | | 1.67% | | $1,000.00 | | $1,016.79 | | $8.49 |
| I | | Actual | | 0.67% | | $1,000.00 | | $1,010.75 | | $3.40 |
| | Hypothetical (h) | | 0.67% | | $1,000.00 | | $1,021.83 | | $3.41 |
| R | | Actual | | 1.18% | | $1,000.00 | | $1,005.49 | | $5.96 |
| | Hypothetical (h) | | 1.18% | | $1,000.00 | | $1,019.26 | | $6.01 |
| R1 | | Actual | | 1.76% | | $1,000.00 | | $1,005.27 | | $8.90 |
| | Hypothetical (h) | | 1.76% | | $1,000.00 | | $1,016.33 | | $8.94 |
| R2 | | Actual | | 1.37% | | $1,000.00 | | $1,004.46 | | $6.92 |
| | Hypothetical (h) | | 1.37% | | $1,000.00 | | $1,018.30 | | $6.97 |
| R3 | | Actual | | 1.28% | | $1,000.00 | | $1,004.85 | | $6.47 |
| | Hypothetical (h) | | 1.28% | | $1,000.00 | | $1,018.75 | | $6.51 |
| R4 | | Actual | | 1.04% | | $1,000.00 | | $1,008.84 | | $5.27 |
| | Hypothetical (h) | | 1.04% | | $1,000.00 | | $1,019.96 | | $5.30 |
| R5 | | Actual | | 0.75% | | $1,000.00 | | $1,010.32 | | $3.80 |
| | Hypothetical (h) | | 0.75% | | $1,000.00 | | $1,021.42 | | $3.82 |
| 529A | | Actual | | 1.27% | | $1,000.00 | | $1,007.70 | | $6.43 |
| | Hypothetical (h) | | 1.27% | | $1,000.00 | | $1,018.80 | | $6.46 |
| 529B | | Actual | | 1.92% | | $1,000.00 | | $1,004.42 | | $9.70 |
| | Hypothetical (h) | | 1.92% | | $1,000.00 | | $1,015.53 | | $9.75 |
| 529C | | Actual | | 1.92% | | $1,000.00 | | $1,004.51 | | $9.70 |
| | Hypothetical (h) | | 1.92% | | $1,000.00 | | $1,015.53 | | $9.75 |
| (h) | 5% class return per year before expenses. |
| (p) | Expenses paid is equal to each class’ annualized expense ratio, as shown above, multiplied by the average account value over the period, multiplied by the number of days in the period, divided by the number of days in the year. Expenses paid do not include any applicable sales charges (loads). If these transaction costs had been included, your costs would have been higher. |
Effective January 1, 2008 the fund’s Class R2, Class R3, Class R4, and Class R5 retirement plan administration and service fee were terminated (as described in Note 3 of the Notes to the Financial Statements). Had this fee not been in effect throughout the entire six month period, the annualized expense ratios would have been 1.16%, 1.15%, 0.92% and 0.67% for Class R2, Class R3, Class R4 and Class R5 shares respectively. The actual expenses paid during the period would have been approximately $5.87, $5.81, $4.66, and $3.40 and
9
Expense table – continued
the hypothetical expenses paid during the period would have been approximately $5.90, $5.85, $4.69 and $3.41 for Class R2, Class R3, Class R4 and Class R5 shares, respectively.
Effective March 1, 2008 the fund’s Class R1 retirement plan administration and service fee were terminated and the Class R1 distribution fee was increased (as described in Note 3 of the Notes to the Financial Statements). Had these fees been in effect throughout the entire six month period, the annualized expense ratio would have been 1.66%. The actual expenses paid during the period would have been approximately $8.39 and the hypothetical expenses paid during the period would have been approximately $8.44.
Effective April 1, 2008 the fund’s Class 529A, 529B, and 529C shares program manager fee was reduced (as described in Note 3 of the Notes to Financial Statements). Had this fee been in effect throughout the entire six month period, the annualized expense ratio would have been 1.12%, 1.77% and 1.77% for Class 529A, 529B and 529C shares, respectively. The actual expenses paid during the period would have been approximately $5.67, $8.95 and $8.95 and the hypothetical expenses paid during the period would have been approximately $5.70, $9.00 and $9.00 for Class 529A, Class 529B and Class 529C shares, respectively.
10
PORTFOLIO OF INVESTMENTS
1/31/08
The Portfolio of Investments is a complete list of all securities owned by your fund. It is categorized by broad-based asset classes.
| | | | | | |
| Bonds - 83.5% | | | | | | |
| | | | | | |
| Issuer | | Shares/Par | | Value ($) |
| Aerospace - 1.8% | | | | | | |
| Bombardier, Inc., 8%, 2014 (n) | | $ | 4,888,000 | | $ | 5,107,947 |
| Hawker Beechcraft Acquisition Co., 9.75%, 2017 (n) | | | 3,650,000 | | | 3,476,625 |
| TransDigm Group, Inc., 7.75%, 2014 | | | 2,940,000 | | | 2,954,700 |
| Vought Aircraft Industries, Inc., 8%, 2011 | | | 6,690,000 | | | 6,171,525 |
| | | | | | |
| | | | | | $ | 17,710,797 |
| Airlines - 0.8% | | | | | | |
| Continental Airlines, Inc., 6.9%, 2017 | | $ | 991,856 | | $ | 927,385 |
| Continental Airlines, Inc., 6.748%, 2017 | | | 2,009,490 | | | 1,898,968 |
| Continental Airlines, Inc., 6.795%, 2018 | | | 5,493,299 | | | 5,149,968 |
| | | | | | |
| | | | | | $ | 7,976,321 |
| Asset Backed & Securitized - 2.5% | | | | | | |
| Airlie LCDO Ltd., CDO, FRN, 6.784%, 2011 (z) | | $ | 2,326,000 | | $ | 2,052,230 |
| Anthracite Ltd., CDO, 6%, 2037 (z) | | | 5,148,000 | | | 3,441,116 |
| Asset Securitization Corp., FRN, 8.825%, 2029 (z) | | | 2,000,000 | | | 2,296,250 |
| Babson Ltd., CLO, “D”, FRN, 5.758%, 2018 (n) | | | 2,385,000 | | | 1,764,900 |
| CWCapital Cobalt Ltd., CDO, “E2”, 6%, 2045 (z) | | | 1,000,000 | | | 710,370 |
| CWCapital Cobalt Ltd., CDO, “F”, FRN, 4.544%, 2050 (z) | | | 610,000 | | | 378,139 |
| CWCapital Cobalt Ltd., CDO, “G”, FRN, 4.744%, 2050 (z) | | | 1,890,000 | | | 1,119,296 |
| Falcon Franchise Loan LLC, FRN, 3.933%, 2025 (i)(z) | | | 13,882,980 | | | 1,803,788 |
| First Union National Bank Commercial Mortgage Trust, 6.75%, 2032 | | | 2,000,000 | | | 1,891,289 |
| JPMorgan Chase Commercial Mortgage Securities Corp., FRN, 6.261%, 2051 | | | 2,285,000 | | | 1,929,103 |
| Lehman Brothers Commercial Conduit Mortgage Trust, FRN, 0.093%, 2030 (i) | | | 14,053,361 | | | 554,433 |
| Merrill Lynch Mortgage Trust, FRN, 6.023%, 2050 | | | 2,285,000 | | | 1,903,736 |
| Morgan Stanley Capital I, Inc., 1.46%, 2039 (i)(n) | | | 23,489,233 | | | 810,195 |
| TIERS Beach Street Synthetic, CLO, FRN, 8.646%, 2011 (z) | | | 2,750,000 | | | 2,367,475 |
| Wachovia Credit, CDO, FRN, 6.234%, 2026 (z) | | | 1,320,000 | | | 984,060 |
| | | | | | |
| | | | | | $ | 24,006,380 |
| Automotive - 2.4% | | | | | | |
| Allison Transmission, Inc., 11%, 2015 (n) | | $ | 6,355,000 | | $ | 5,338,200 |
| Ford Motor Credit Co. LLC, 9.75%, 2010 | | | 5,455,000 | | | 5,268,892 |
| Ford Motor Credit Co. LLC, 8.625%, 2010 | | | 3,855,000 | | | 3,622,821 |
| Ford Motor Credit Co. LLC, 8%, 2016 | | | 2,655,000 | | | 2,229,159 |
11
Portfolio of Investments – continued
| | | | | | |
| Issuer | | Shares/Par | | Value ($) |
| | | | | | |
| Bonds - continued | | | | | | |
| Automotive - continued | | | | | | |
| General Motors Acceptance Corp., 8.375%, 2033 | | $ | 5,225,000 | | $ | 4,245,313 |
| TRW Automotive, Inc., 7%, 2014 (n) | | | 2,340,000 | | | 2,146,950 |
| | | | | | |
| | | | | | $ | 22,851,335 |
| Broadcasting - 7.3% | | | | | | |
| Allbritton Communications Co., 7.75%, 2012 | | $ | 7,570,000 | | $ | 7,551,075 |
| Bonten Media Acquisition Co., 9%, 2015 (n)(p) | | | 4,420,000 | | | 3,668,600 |
| CanWest MediaWorks LP, 9.25%, 2015 (n) | | | 4,700,000 | | | 4,441,500 |
| Clear Channel Communications, Inc., 5.5%, 2014 | | | 5,900,000 | | | 4,495,570 |
| Intelsat Ltd., 8.625%, 2015 | | | 2,330,000 | | | 2,321,263 |
| Intelsat Ltd., 0% to 2010, 9.25% to 2015 | | | 4,765,000 | | | 3,907,300 |
| Intelsat Ltd., 11.25%, 2016 | | | 4,270,000 | | | 4,270,000 |
| Intelsat Ltd., FRN, 10.829%, 2013 | | | 1,935,000 | | | 1,978,538 |
| ION Media Networks, Inc., FRN, 10.508%, 2013 (n) | | | 5,400,000 | | | 4,671,000 |
| Lamar Media Corp., 6.625%, 2015 | | | 4,660,000 | | | 4,415,350 |
| Lamar Media Corp., 6.625%, 2015 | | | 2,950,000 | | | 2,795,125 |
| LBI Media, Inc., 8.5%, 2017 (n) | | | 3,205,000 | | | 2,844,438 |
| LIN TV Corp., 6.5%, 2013 | | | 6,610,000 | | | 6,229,925 |
| Local TV Finance LLC, 9.25%, 2015 (n)(p) | | | 4,820,000 | | | 4,217,500 |
| Nexstar Broadcasting Group, Inc., 7%, 2014 | | | 3,400,000 | | | 3,111,000 |
| Univision Communications, Inc., 9.75%, 2015 (n)(p) | | | 12,690,000 | | | 9,485,775 |
| | | | | | |
| | | | | | $ | 70,403,959 |
| Brokerage & Asset Managers - 0.3% | | | | | | |
| Nuveen Investments, Inc., 10.5%, 2015 (n) | | $ | 2,985,000 | | $ | 2,895,450 |
| | |
| Building - 0.5% | | | | | | |
| Building Materials Corp. of America, 7.75%, 2014 | | $ | 1,475,000 | | $ | 1,091,500 |
| Interface, Inc., 9.5%, 2014 | | | 600,000 | | | 613,500 |
| Ply Gem Industries, Inc., 9%, 2012 | | | 3,810,000 | | | 2,838,450 |
| | | | | | |
| | | | | | $ | 4,543,450 |
| Business Services - 0.8% | | | | | | |
| SunGard Data Systems, Inc., 10.25%, 2015 | | $ | 7,558,000 | | $ | 7,558,000 |
| | |
| Cable TV - 2.8% | | | | | | |
| CCH I Holdings LLC, 11%, 2015 | | $ | 3,680,000 | | $ | 2,635,800 |
| CCH II Holdings LLC, 10.25%, 2010 | | | 2,915,000 | | | 2,761,963 |
| CCO Holdings LLC, 8.75%, 2013 | | | 6,870,000 | | | 6,389,100 |
| CSC Holdings, Inc., 6.75%, 2012 | | | 6,715,000 | | | 6,362,463 |
| Mediacom LLC, 9.5%, 2013 | | | 3,070,000 | | | 2,739,975 |
| NTL Cable PLC, 9.125%, 2016 | | | 4,173,000 | | | 3,776,565 |
12
Portfolio of Investments – continued
| | | | | | |
| Issuer | | Shares/Par | | Value ($) |
| | | | | | |
| Bonds - continued | | | | | | |
| Cable TV - continued | | | | | | |
| Videotron LTEE, 6.875%, 2014 | | $ | 2,820,000 | | $ | 2,728,350 |
| | | | | | |
| | | | | | $ | 27,394,216 |
| Chemicals - 3.5% | | | | | | |
| Innophos, Inc., 8.875%, 2014 | | $ | 5,530,000 | | $ | 5,433,225 |
| Koppers Holdings, Inc., 9.875%, 2013 | | | 4,665,000 | | | 4,968,225 |
| Koppers Holdings, Inc., 0% to 2009, 9.875% to 2014 | | | 7,030,000 | | | 5,940,350 |
| Momentive Performance Materials, Inc., 9.75%, 2014 | | | 5,080,000 | | | 4,597,400 |
| Mosaic Co., 7.875%, 2016 (n) | | | 4,870,000 | | | 5,259,600 |
| Nalco Co., 7.75%, 2011 | | | 1,485,000 | | | 1,485,000 |
| Nalco Co., 8.875%, 2013 | | | 6,215,000 | | | 6,308,225 |
| | | | | | |
| | | | | | $ | 33,992,025 |
| Computer Software - 0.4% | | | | | | |
| First Data Corp., 9.875%, 2015 (n) | | $ | 4,520,000 | | $ | 4,000,200 |
| | |
| Consumer Goods & Services - 2.5% | | | | | | |
| Corrections Corp. of America, 6.25%, 2013 | | $ | 3,710,000 | | $ | 3,691,450 |
| GEO Group, Inc., 8.25%, 2013 | | | 4,290,000 | | | 4,322,175 |
| KAR Holdings, Inc., 10%, 2015 (n) | | | 3,440,000 | | | 2,872,400 |
| Service Corp. International, 7.375%, 2014 | | | 2,385,000 | | | 2,432,700 |
| Service Corp. International, 6.75%, 2015 | | | 1,410,000 | | | 1,395,900 |
| Service Corp. International, 7%, 2017 | | | 7,550,000 | | | 7,399,000 |
| Visant Holding Corp., 8.75%, 2013 | | | 1,557,000 | | | 1,506,398 |
| | | | | | |
| | | | | | $ | 23,620,023 |
| Containers - 1.5% | | | | | | |
| Crown Americas LLC, 7.625%, 2013 | | $ | 3,075,000 | | $ | 3,098,063 |
| Graham Packaging Co. LP, 9.875%, 2014 | | | 3,335,000 | | | 2,818,075 |
| Greif, Inc., 6.75%, 2017 | | | 3,415,000 | | | 3,252,788 |
| Owens-Brockway Glass Container, Inc., 8.25%, 2013 | | | 5,470,000 | | | 5,661,450 |
| | | | | | |
| | | | | | $ | 14,830,376 |
| Defense Electronics - 0.9% | | | | | | |
| L-3 Communications Corp., 6.125%, 2014 | | $ | 4,750,000 | | $ | 4,678,750 |
| L-3 Communications Corp., 5.875%, 2015 | | | 4,475,000 | | | 4,351,938 |
| | | | | | |
| | | | | | $ | 9,030,688 |
| Electronics - 0.9% | | | | | | |
| Avago Technologies Finance, 11.875%, 2015 | | $ | 2,340,000 | | $ | 2,445,300 |
| Flextronics International Ltd., 6.25%, 2014 | | | 3,535,000 | | | 3,322,900 |
| Spansion LLC, 11.25%, 2016 (n) | | | 3,855,000 | | | 2,698,500 |
| | | | | | |
| | | | | | $ | 8,466,700 |
13
Portfolio of Investments – continued
| | | | | | |
| Issuer | | Shares/Par | | Value ($) |
| | | | | | |
| Bonds - continued | | | | | | |
| Emerging Market Sovereign - 0.6% | | | | | | |
| Republic of Argentina, FRN, 5.374%, 2012 | | $ | 6,474,375 | | $ | 5,681,347 |
| | |
| Energy - Independent - 5.2% | | | | | | |
| Chaparral Energy, Inc., 8.875%, 2017 (n) | | $ | 4,310,000 | | $ | 3,598,850 |
| Chesapeake Energy Corp., 7%, 2014 | | | 2,147,000 | | | 2,147,000 |
| Chesapeake Energy Corp., 6.375%, 2015 | | | 5,900,000 | | | 5,723,000 |
| Forest Oil Corp., 7.25%, 2019 (n) | | | 3,155,000 | | | 3,155,000 |
| Hilcorp Energy I LP, 7.75%, 2015 (n) | | | 1,940,000 | | | 1,857,550 |
| Hilcorp Energy I LP, 9%, 2016 (n) | | | 3,420,000 | | | 3,420,000 |
| Mariner Energy, Inc., 8%, 2017 | | | 3,910,000 | | | 3,734,050 |
| Newfield Exploration Co., 6.625%, 2014 | | | 5,085,000 | | | 5,008,725 |
| OPTI Canada, Inc., 8.25%, 2014 (n) | | | 5,985,000 | | | 5,865,300 |
| Plains Exploration & Production Co., 7%, 2017 | | | 7,440,000 | | | 7,068,000 |
| Quicksilver Resources, Inc., 7.125%, 2016 | | | 5,370,000 | | | 5,208,900 |
| Southwestern Energy Co., 7.5%, 2018 (z) | | | 2,855,000 | | | 2,933,513 |
| | | | | | |
| | | | | | $ | 49,719,888 |
| Entertainment - 0.2% | | | | | | |
| AMC Entertainment, Inc., 11%, 2016 | | $ | 1,480,000 | | $ | 1,465,200 |
| | |
| Financial Institutions - 1.5% | | | | | | |
| General Motors Acceptance Corp., 6.875%, 2011 | | $ | 12,054,000 | | $ | 10,538,523 |
| Residential Capital LLC, 7.625%, 2008 | | | 4,329,000 | | | 3,333,330 |
| Residential Capital LLC, 8% to 2008, 8.5% to 2012 | | | 598,000 | | | 373,750 |
| | | | | | |
| | | | | | $ | 14,245,603 |
| Food & Beverages - 1.7% | | | | | | |
| ARAMARK Corp., 8.5%, 2015 | | $ | 6,550,000 | | $ | 6,517,250 |
| B&G Foods, Inc., 8%, 2011 | | | 3,570,000 | | | 3,462,900 |
| Del Monte Corp., 6.75%, 2015 | | | 3,920,000 | | | 3,645,600 |
| Michael Foods, Inc., 8%, 2013 | | | 3,105,000 | | | 3,058,425 |
| | | | | | |
| | | | | | $ | 16,684,175 |
| Forest & Paper Products - 2.3% | | | | | | |
| Buckeye Technologies, Inc., 8%, 2010 | | $ | 1,122,000 | | $ | 1,110,780 |
| Buckeye Technologies, Inc., 8.5%, 2013 | | | 7,725,000 | | | 7,802,250 |
| Catalyst Paper Corp., 8.625%, 2011 | | | 1,515,000 | | | 1,280,175 |
| Jefferson Smurfit Corp., 8.25%, 2012 | | | 4,872,000 | | | 4,677,120 |
| JSG Funding PLC, 7.75%, 2015 | | | 525,000 | | | 483,000 |
| Millar Western Forest Products Ltd., 7.75%, 2013 | | | 4,885,000 | | | 3,590,475 |
| NewPage Holding Corp., 10%, 2012 (n) | | | 3,115,000 | | | 3,099,425 |
| | | | | | |
| | | | | | $ | 22,043,225 |
14
Portfolio of Investments – continued
| | | | | | |
| Issuer | | Shares/Par | | Value ($) |
| | | | | | |
| Bonds - continued | | | | | | |
| Gaming & Lodging - 6.0% | | | | | | |
| Fontainebleau Las Vegas Holdings LLC, 10.25%, 2015 (n) | | $ | 4,290,000 | | $ | 3,217,500 |
| Harrah’s Operating Co., Inc., 5.375%, 2013 | | | 660,000 | | | 448,800 |
| Harrah’s Operating Co., Inc., 10.75%, 2016 (z) | | | 2,920,000 | | | 2,642,600 |
| Harrah’s Operating Co., Inc., 5.75%, 2017 | | | 13,670,000 | | | 8,202,000 |
| Isle of Capri Casinos, Inc., 7%, 2014 | | | 3,620,000 | | | 2,787,400 |
| Mandalay Resort Group, 9.375%, 2010 | | | 3,525,000 | | | 3,635,156 |
| MGM Mirage, 8.5%, 2010 | | | 3,075,000 | | | 3,198,000 |
| MGM Mirage, 8.375%, 2011 | | | 2,895,000 | | | 2,960,138 |
| MGM Mirage, 6.75%, 2013 | | | 4,020,000 | | | 3,829,050 |
| MGM Mirage, 5.875%, 2014 | | | 3,010,000 | | | 2,724,050 |
| MGM Mirage, 7.5%, 2016 | | | 7,760,000 | | | 7,449,600 |
| Station Casinos, Inc., 6.5%, 2014 | | | 9,025,000 | | | 6,227,250 |
| Station Casinos, Inc., 6.875%, 2016 | | | 1,600,000 | | | 1,088,000 |
| Trump Entertainment Resorts Holdings, Inc., 8.5%, 2015 | | | 4,275,000 | | | 3,078,000 |
| Wynn Las Vegas LLC, 6.625%, 2014 | | | 6,740,000 | | | 6,495,675 |
| | | | | | |
| | | | | | $ | 57,983,219 |
| Industrial - 1.4% | | | | | | |
| Blount, Inc., 8.875%, 2012 | | $ | 3,955,000 | | $ | 3,885,788 |
| Cii Carbon LLC, 11.125%, 2015 (n) | | | 1,775,000 | | | 1,695,125 |
| JohnsonDiversey Holdings, Inc., “B”, 9.625%, 2012 | | | 7,525,000 | | | 7,637,875 |
| | | | | | |
| | | | | | $ | 13,218,788 |
| Insurance - Health - 0.4% | | | | | | |
| Centene Corp., 7.25%, 2014 | | $ | 3,760,000 | | $ | 3,684,800 |
| | |
| Insurance - Property & Casualty - 0.4% | | | | | | |
| USI Holdings Corp., 9.75%, 2015 (n) | | $ | 4,620,000 | | $ | 3,603,600 |
| | |
| Machinery & Tools - 0.7% | | | | | | |
| Case New Holland, Inc., 7.125%, 2014 | | $ | 7,175,000 | | $ | 7,157,063 |
| | |
| Medical & Health Technology & Services - 8.1% | | | | | | |
| Community Health Systems, Inc., 8.875%, 2015 | | $ | 8,805,000 | | $ | 8,860,031 |
| Cooper Cos., Inc., 7.125%, 2015 | | | 5,600,000 | | | 5,320,000 |
| DaVita, Inc., 6.625%, 2013 | | | 2,665,000 | | | 2,625,025 |
| DaVita, Inc., 7.25%, 2015 | | | 9,005,000 | | | 8,959,975 |
| HCA, Inc., 6.375%, 2015 | | | 8,905,000 | | | 7,591,513 |
| HCA, Inc., 9.25%, 2016 | | | 16,355,000 | | | 17,152,306 |
| HealthSouth Corp., 10.75%, 2016 | | | 1,055,000 | | | 1,099,838 |
| LVB Acquisition Merger Sub, Inc., 10%, 2017 (n) | | | 4,110,000 | | | 4,233,300 |
| LVB Acquisition Merger Sub, Inc., 11.625%, 2017 (n) | | | 3,125,000 | | | 3,050,781 |
15
Portfolio of Investments – continued
| | | | | | |
| Issuer | | Shares/Par | | Value ($) |
| | | | | | |
| Bonds - continued | | | | | | |
| Medical & Health Technology & Services - continued | | | | | | |
| Psychiatric Solutions, Inc., 7.75%, 2015 | | $ | 5,500,000 | | $ | 5,417,500 |
| U.S. Oncology, Inc., 10.75%, 2014 | | | 6,330,000 | | | 6,171,750 |
| Universal Hospital Services, Inc., 8.5%, 2015 (p) | | | 3,330,000 | | | 3,363,300 |
| Universal Hospital Services, Inc., FRN, 8.287%, 2015 | | | 1,015,000 | | | 964,250 |
| VWR Funding, Inc., 10.25%, 2015 (n)(p) | | | 2,835,000 | | | 2,650,725 |
| | | | | | |
| | | | | | $ | 77,460,294 |
| Metals & Mining - 4.5% | | | | | | |
| Arch Western Finance LLC, 6.75%, 2013 | | $ | 3,570,000 | | $ | 3,453,975 |
| FMG Finance Ltd., 10.625%, 2016 (n) | | | 7,395,000 | | | 8,393,325 |
| Foundation PA Coal Co., 7.25%, 2014 | | | 1,645,000 | | | 1,620,325 |
| Freeport-McMoRan Copper & Gold, Inc., 8.375%, 2017 | | | 10,615,000 | | | 11,278,438 |
| Freeport-McMoRan Copper & Gold, Inc., FRN, 8.394%, 2015 | | | 4,988,000 | | | 4,894,475 |
| Peabody Energy Corp., 5.875%, 2016 | | | 4,440,000 | | | 4,151,400 |
| Peabody Energy Corp., 7.375%, 2016 | | | 3,600,000 | | | 3,681,000 |
| PNA Group, Inc., 10.75%, 2016 | | | 4,055,000 | | | 3,649,500 |
| Ryerson, Inc., 12%, 2015 (n) | | | 2,030,000 | | | 1,908,200 |
| | | | | | |
| | | | | | $ | 43,030,638 |
| Natural Gas - Distribution - 0.9% | | | | | | |
| AmeriGas Partners LP, 7.125%, 2016 | | $ | 5,550,000 | | $ | 5,397,375 |
| Inergy LP, 6.875%, 2014 | | | 3,625,000 | | | 3,507,188 |
| | | | | | |
| | | | | | $ | 8,904,563 |
| Natural Gas - Pipeline - 3.0% | | | | | | |
| Atlas Pipeline Partners LP, 8.125%, 2015 | | $ | 5,495,000 | | $ | 5,275,200 |
| Deutsche Bank (El Paso Performance-Linked Trust, CLN), 7.75%, 2011 (n) | | | 7,655,000 | | | 7,872,877 |
| El Paso Corp., 7.75%, 2032 | | | 2,830,000 | | | 2,813,951 |
| Knight, Inc., 7.25%, 2028 | | | 4,105,000 | | | 3,723,075 |
| Transcontinental Gas Pipe Line Corp., 7%, 2011 | | | 1,094,000 | | | 1,148,700 |
| Williams Cos., Inc., 8.75%, 2032 | | | 3,352,000 | | | 4,005,640 |
| Williams Partners LP, 7.25%, 2017 | | | 4,285,000 | | | 4,434,975 |
| | | | | | |
| | | | | | $ | 29,274,418 |
| Network & Telecom - 3.0% | | | | | | |
| Cincinnati Bell, Inc., 8.375%, 2014 | | $ | 5,965,000 | | $ | 5,696,575 |
| Citizens Communications Co., 9.25%, 2011 | | | 4,461,000 | | | 4,750,965 |
| Nordic Telephone Co. Holdings, 8.875%, 2016 (n) | | | 3,965,000 | | | 4,024,475 |
| Qwest Capital Funding, Inc., 7.25%, 2011 | | | 3,620,000 | | | 3,556,650 |
| Qwest Corp., 7.875%, 2011 | | | 715,000 | | | 737,344 |
| Qwest Corp., 8.875%, 2012 | | | 5,210,000 | | | 5,503,063 |
16
Portfolio of Investments – continued
| | | | | | |
| Issuer | | Shares/Par | | Value ($) |
| | | | | | |
| Bonds - continued | | | | | | |
| Network & Telecom - continued | | | | | | |
| Windstream Corp., 8.625%, 2016 | | $ | 4,540,000 | | $ | 4,698,900 |
| | | | | | |
| | | | | | $ | 28,967,972 |
| Oil Services - 0.8% | | | | | | |
| Basic Energy Services, Inc., 7.125%, 2016 | | $ | 5,755,000 | | $ | 5,409,700 |
| Compagnie Generale de Geophysique - Veritas, 7.75%, 2017 | | | 535,000 | | | 529,650 |
| GulfMark Offshore, Inc., 7.75%, 2014 | | | 1,340,000 | | | 1,360,100 |
| | | | | | |
| | | | | | $ | 7,299,450 |
| Other Banks & Diversified Financials - 0.1% | | | | | | |
| VTB Capital S.A., 6.609%, 2012 (n) | | $ | 1,128,000 | | $ | 1,116,720 |
| | |
| Printing & Publishing - 4.3% | | | | | | |
| American Media Operations, Inc., 10.25%, 2009 | | $ | 4,618,000 | | $ | 3,440,410 |
| American Media Operations, Inc., 10.25%, 2009 | | | 167,910 | | | 125,093 |
| Dex Media, Inc., 0% to 2008, 9% to 2013 | | | 9,895,000 | | | 8,781,813 |
| Dex Media, Inc., 0% to 2008, 9% to 2013 | | | 6,115,000 | | | 5,427,063 |
| Idearc, Inc., 8%, 2016 | | | 13,665,000 | | | 12,230,175 |
| Nielsen Finance LLC, 10%, 2014 | | | 3,035,000 | | | 3,065,350 |
| Nielsen Finance LLC, 0% to 2011, 12.5% to 2016 | | | 3,200,000 | | | 2,240,000 |
| Quebecor World, Inc., 6.125%, 2013 (d) | | | 2,190,000 | | | 941,700 |
| R.H. Donnelley Corp., 8.875%, 2016 | | | 6,230,000 | | | 5,342,225 |
| | | | | | |
| | | | | | $ | 41,593,829 |
| Retailers - 0.4% | | | | | | |
| Buhrmann U.S., Inc., 7.875%, 2015 | | $ | 2,075,000 | | $ | 1,919,375 |
| Couche-Tard, Inc., 7.5%, 2013 | | | 2,390,000 | | | 2,375,063 |
| | | | | | |
| | | | | | $ | 4,294,438 |
| Specialty Stores - 0.3% | | | | | | |
| Payless ShoeSource, Inc., 8.25%, 2013 | | $ | 3,290,000 | | $ | 3,026,800 |
| | |
| Supermarkets - 0.7% | | | | | | |
| Stater Brothers Holdings, Inc., 7.75%, 2015 | | $ | 3,545,000 | | $ | 3,332,300 |
| SUPERVALU, Inc., 7.5%, 2014 | | | 3,015,000 | | | 3,056,456 |
| | | | | | |
| | | | | | $ | 6,388,756 |
| Telecommunications - Wireless - 1.7% | | | | | | |
| Alltel Corp., 7%, 2012 | | $ | 4,894,000 | | $ | 4,159,900 |
| American Tower Corp., 7%, 2017 (n) | | | 1,215,000 | | | 1,202,850 |
| Centennial Communications Corp., 10.125%, 2013 | | | 1,830,000 | | | 1,871,175 |
| MetroPCS Wireless, Inc., 9.25%, 2014 | | | 4,285,000 | | | 3,942,200 |
17
Portfolio of Investments – continued
| | | | | | |
| Issuer | | Shares/Par | | Value ($) |
| | | | | | |
| Bonds - continued | | | | | | |
| Telecommunications - Wireless - continued | | | | | | |
| Wind Acquisition Finance S.A., 10.75%, 2015 (n) | | $ | 4,720,000 | | $ | 5,003,200 |
| | | | | | |
| | | | | | $ | 16,179,325 |
| Transportation - Services - 0.5% | | | | | | |
| Hertz Corp., 8.875%, 2014 | | $ | 5,125,000 | | $ | 4,945,625 |
| | |
| Utilities - Electric Power - 5.9% | | | | | | |
| AES Corp., 9.375%, 2010 | | $ | 5,130,000 | | $ | 5,360,850 |
| Dynegy Holdings, Inc., 7.5%, 2015 | | | 4,140,000 | | | 3,860,550 |
| Edison Mission Energy, 7%, 2017 | | | 11,270,000 | | | 10,960,075 |
| Intergen N.V., 9%, 2017 (n) | | | 2,730,000 | | | 2,846,025 |
| Mirant Americas Generation LLC, 8.3%, 2011 | | | 2,900,000 | | | 2,929,000 |
| Mirant North America LLC, 7.375%, 2013 | | | 4,870,000 | | | 4,870,000 |
| NRG Energy, Inc., 7.375%, 2016 | | | 14,830,000 | | | 14,329,488 |
| Reliant Energy, Inc., 6.75%, 2014 | | | 1,555,000 | | | 1,568,606 |
| Reliant Energy, Inc., 7.875%, 2017 | | | 7,475,000 | | | 7,288,125 |
| Sierra Pacific Resources, 8.625%, 2014 | | | 2,375,000 | | | 2,546,081 |
| | | | | | |
| | | | | | $ | 56,558,800 |
| Total Bonds (Identified Cost, $848,228,840) | | | | | $ | 803,808,456 |
| | |
| Floating Rate Loans - 9.0% (g)(r) | | | | | | |
| Aerospace - 0.3% | | | | | | |
| Hawker Beechcraft Acquisition Co., Letter of Credit, 4.73%, 2014 | | $ | 127,224 | | $ | 116,198 |
| Hawker Beechcraft Acquisition Co., Term Loan B, 6.83%, 2014 | | | 3,086,964 | | | 2,819,427 |
| | | | | | |
| | | | | | $ | 2,935,625 |
| Automotive - 1.5% | | | | | | |
| Allison Transmission, Inc., Term Loan B, 7.43%, 2014 | | $ | 749,593 | | $ | 654,582 |
| Ford Motor Co., Term Loan B, 8%, 2013 | | | 6,350,703 | | | 5,546,279 |
| Goodyear Tire & Rubber Co., Second Lien Term Loan, 6.35%, 2014 | | | 6,606,938 | | | 6,012,314 |
| Mark IV Industries, Inc., Second Lien Term Loan, 11%, 2011 | | | 3,476,611 | | | 2,120,733 |
| | | | | | |
| | | | | | $ | 14,333,908 |
| Broadcasting - 0.6% | | | | | | |
| Gray Television, Inc., Term Loan B, 6.73%, 2014 | | $ | 2,672,254 | | $ | 2,388,327 |
| Univision Communications, Inc., Term Loan B, 5.49%, 2014 | | | 3,974,730 | | | 3,263,253 |
| | | | | | |
| | | | | | $ | 5,651,580 |
| Building - 0.2% | | | | | | |
| Building Materials Holding Corp., Second Lien Term Loan, 9.56%, 2014 | | $ | 3,469,598 | | $ | 2,333,305 |
18
Portfolio of Investments - continued
| | | | | | |
| Issuer | | Shares/Par | | Value ($) |
| | | | | | |
| Floating Rate Loans - continued | | | | | | |
| Cable TV - 1.2% | | | | | | |
| Charter Communications, Inc., Term Loan, 5.26%, 2013 | | $ | 5,433,760 | | $ | 4,726,134 |
| CSC Holdings, Inc., Term Loan B, 6.9%, 2013 | | | 4,050,157 | | | 3,715,598 |
| MCC Iowa Mediacom Broadband LLC, Term Loan A, 5.55%, 2011 | | | 3,664,936 | | | 3,304,551 |
| | | | | | |
| | | | | | $ | 11,746,283 |
| Chemicals - 0.6% | | | | | | |
| Celanese AG, Term Loan, 6.98%, 2014 | | $ | 5,774,552 | | $ | 5,409,517 |
| | |
| Computer Software - 0.5% | | | | | | |
| First Data Corp., Term Loan B-2, 7.63%, 2014 (o) | | $ | 4,961,327 | | $ | 4,461,472 |
| | |
| Food & Beverages - 0.4% | | | | | | |
| Dole Food Co., Inc., Letter of Credit, 4.25%, 2013 | | $ | 378,107 | | $ | 341,832 |
| Dole Food Co., Inc., Term Loan B, 6.68%, 2013 | | | 835,852 | | | 755,663 |
| Dole Food Co., Inc., Term Loan C, 6.56%, 2013 | | | 2,786,175 | | | 2,518,876 |
| | | | | | |
| | | | | | $ | 3,616,371 |
| Gaming & Lodging - 0.2% | | | | | | |
| Harrahs Entertainment, Inc., Term Loan B-2, 2015 (o) | | $ | 2,312,200 | | $ | 2,122,408 |
| | |
| Medical & Health Technology & Services - 1.3% | | | | | | |
| Advanced Medical Optics, Inc., Term Loan B, 6.77%, 2014 | | $ | 2,031,153 | | $ | 1,883,894 |
| Community Health Systems, Inc., Term Loan, 7.33%, 2014 | | | 3,252,937 | | | 2,993,443 |
| HCA, Inc., Term Loan B, 7.45%, 2013 | | | 7,776,773 | | | 7,173,378 |
| | | | | | |
| | | | | | $ | 12,050,715 |
| Pollution Control - 0.4% | | | | | | |
| Allied Waste North America, Inc., Letter of Credit, 5%, 2012 | | $ | 1,610,231 | | $ | 1,503,553 |
| Allied Waste North America, Inc., Term Loan B, 5.89%, 2012 | | | 2,542,254 | | | 2,373,828 |
| | | | | | |
| | | | | | $ | 3,877,381 |
| Printing & Publishing - 0.5% | | | | | | |
| Nielsen Finance LLC, Term Loan B, 6.81%, 2013 | | $ | 4,996,160 | | $ | 4,594,681 |
| | |
| Retailers - 0.3% | | | | | | |
| Neiman Marcus, Term Loan B, 6.69%, 2013 | | $ | 3,342,337 | | $ | 3,064,021 |
| | |
| Specialty Stores - 0.7% | | | | | | |
| Michaels Stores, Inc., Term Loan B, 7.58%, 2013 (o) | | $ | 8,482,031 | | $ | 7,219,150 |
| | |
| Utilities - Electric Power - 0.3% | | | | | | |
| TXU Corp. Term Loan B-3, 2014 (o) | | $ | 2,852,624 | | $ | 2,629,960 |
| Total Floating Rate Loans (Identified Cost, $95,165,615) | | | | | $ | 86,046,377 |
19
Portfolio of Investments – continued
| | | | | |
| Issuer | | Shares/Par | | Value ($) |
| | | | | |
| Common Stocks - 1.8% | | | | | |
| Automotive - 0.0% | | | | | |
| Oxford Automotive, Inc. (a) | | 1,087 | | $ | 0 |
| | |
| Broadcasting - 0.1% | | | | | |
| Clear Channel Communications, Inc. | | 24,700 | | $ | 758,537 |
| | |
| Cable TV - 0.6% | | | | | |
| Comcast Corp., “A” (a) | | 228,100 | | $ | 4,142,296 |
| Time Warner Cable, Inc. (a) | | 59,500 | | | 1,497,020 |
| | | | | |
| | | | | $ | 5,639,316 |
| Consumer Goods & Services - 0.0% | | | | | |
| Central Garden & Pet Co. (a) | | 47,600 | | $ | 261,324 |
| | |
| Electronics - 0.1% | | | | | |
| Intel Corp. | | 48,900 | | $ | 1,036,680 |
| | |
| Energy - Integrated - 0.2% | | | | | |
| Chevron Corp. | | 20,100 | | $ | 1,698,450 |
| | |
| Forest & Paper Products - 0.1% | | | | | |
| Louisiana-Pacific Corp. | | 52,900 | | $ | 807,783 |
| | |
| Major Banks - 0.1% | | | | | |
| Bank of America Corp. | | 11,900 | | $ | 527,765 |
| JPMorgan Chase & Co. | | 12,000 | | | 570,600 |
| | | | | |
| | | | | $ | 1,098,365 |
| Pharmaceuticals - 0.1% | | | | | |
| Johnson & Johnson | | 19,300 | | $ | 1,220,918 |
| | |
| Printing & Publishing - 0.0% | | | | | |
| Golden Books Family Entertainment, Inc. (a) | | 206,408 | | $ | 0 |
| | |
| Real Estate - 0.2% | | | | | |
| Host Hotels & Resorts, Inc., REIT | | 102,500 | | $ | 1,715,850 |
| | |
| Telephone Services - 0.3% | | | | | |
| Windstream Corp. | | 242,000 | | $ | 2,809,620 |
| Total Common Stocks (Identified Cost, $21,575,558) | | | | $ | 17,046,843 |
20
Portfolio of Investments – continued
| | | | | |
| Issuer | | Shares/Par | | Value ($) |
| | | | | |
| Preferred Stocks - 0.2% | | | | | |
| Broadcasting - 0.2% | | | | | |
Spanish Broadcasting Systems, Inc., “B”, 10.75% (p)
(Identified Cost, $2,000,756) | | 2,034 | | $ | 1,830,600 |
| | |
| Money Market Funds (v) - 3.2% | | | | | |
MFS Institutional Money Market Portfolio, 4.34%,
at Cost and Net Asset Value | | 31,031,601 | | $ | 31,031,601 |
| Total Investments (Identified Cost, $998,002,370) (k) | | | | $ | 939,763,877 |
| | |
| Other Assets, Less Liabilities - 2.3% | | | | | 22,508,133 |
| Net Assets - 100.0% | | | | $ | 962,272,010 |
| (a) | Non-income producing security. |
| (d) | Non-income producing security – in default. |
| (g) | The rate shown represents a weighted average coupon rate on settled positions at period end. |
| (i) | Interest only security for which the fund receives interest on notional principal (Par amount). Par amount shown is the notional principal and does not reflect the cost of the security. |
| (k) | As of January 31, 2008, the fund held securities fair valued in accordance with the policies adopted by the Board of Trustees, aggregating $775,534,087 and 82.52% of market value. An independent pricing service provided an evaluated bid for 82.23% of the market value. |
| (n) | Securities exempt from registration under Rule 144A of the Securities Act of 1933. These securities may be sold in the ordinary course of business in transactions exempt from registration, normally to qualified institutional buyers. At period end, the aggregate value of these securities was $137,514,608, representing 14.3% of net assets. |
| (o) | All or a portion of this position has not settled. Upon settlement date, interest rates will be determined. |
| (p) | Payment-in-kind security. |
| (r) | Remaining maturities of floating rate loans may be less than stated maturities shown as a result of contractual or optional prepayments by the borrower. Such prepayments cannot be predicted with certainty. These loans may be subject to restrictions on resale. Floating rate loans generally have rates of interest which are determined periodically by reference to a base lending rate plus a premium. |
| (v) | Underlying fund that is available only to investment companies managed by MFS. The rate quoted is the annualized seven-day yield of the fund at period end. |
| (z) | Restricted securities are not registered under the Securities Act of 1933 and are subject to legal restrictions on resale. These securities generally may be resold in transactions exempt from registration or to the public if the securities are subsequently registered. Disposal of these securities may involve time-consuming negotiations and prompt sale at an acceptable price may be difficult. The fund holds the following restricted securities: |
21
Portfolio of Investments – continued
| | | | | | |
| Restricted Securities | | Acquisition
Date | | Acquisition
Cost | | Current
Market
Value |
| Airlie LCDO Ltd., CDO, FRN, 6.784%, 2011 | | 10/13/06 | | $2,326,000 | | $2,052,230 |
| Anthracite Ltd., CDO, 6%, 2037 | | 5/14/02 | | 3,503,209 | | 3,441,116 |
| Asset Securitization Corp., FRN, 8.825%, 2029 | | 1/25/05 | | 1,726,172 | | 2,296,250 |
| CWCapital Cobalt Ltd., CDO, “E2”, 6%, 2045 | | 3/20/06 | | 957,539 | | 710,370 |
CWCapital Cobalt Ltd., CDO, “F”, FRN,
4.544%, 2050 | | 4/12/06 | | 610,000 | | 378,139 |
CWCapital Cobalt Ltd., CDO, “G”, FRN,
4.744%, 2050 | | 4/12/06 | | 1,890,000 | | 1,119,296 |
Falcon Franchise Loan LLC, FRN,
3.933%, 2025 | | 1/29/03 | | 2,637,254 | | 1,803,788 |
| Harrah’s Operating Co., Inc., 10.75%, 2016 | | 1/30/08 | | 2,659,031 | | 2,642,600 |
| Southwestern Energy Co., 7.5%, 2018 | | 1/11/08-1/16/08 | | 2,882,656 | | 2,933,513 |
TIERS Beach Street Synthetic, CLO, FRN,
8.646%, 2011 | | 5/17/06 | | 2,750,000 | | 2,367,475 |
| Wachovia Credit, CDO, FRN, 6.234%, 2026 | | 6/08/06 | | 1,320,000 | | 984,060 |
| Total Restricted Securities | | | | | | $20,728,837 |
| % of Net Assets | | | | | | 2.2% |
Unfunded Loan Commitments
As of January 31, 2008, the portfolio had the following unfunded loan commitments of $301,612 which could be extended at the option of the borrower:
| | | | | |
| Borrower | | Unfunded
Loan
Commitment | | Unrealized
Appreciation
(Depreciation) | |
| Community Health Systems, Inc., Delayed Draw Term Loan B, 2014 | | $163,601 | | $(13,051 | ) |
| Univision Communications, Inc., Delayed Draw Term Loan B, 2014 | | 138,011 | | (21,401 | ) |
| | | | | |
| | $301,612 | | $(34,452 | ) |
| | | | | |
At January 31, 2008, the fund had sufficient cash and/or other liquid securities to cover any commitments under these contracts.
Forward Foreign Currency Exchange Contracts at 1/31/08
| | | | | | | | | | | | | |
| Type | | Currency | | Contracts to
Deliver/ Receive | | Settlement
Date Range | | In Exchange
for | | Contracts
at Value | | Net
Unrealized
Appreciation
(Depreciation) | |
| Depreciation | | | | | | | | | | | | | |
| BUY | | GBP | | 788,716 | | 2/14/08 | | $1,586,148 | | $1,568,691 | | $(17,457 | ) |
| | | | | | | | | | | | | |
Futures contracts outstanding at 1/31/08
| | | | | | | | |
| Description | | Contracts | | Value | | Expiration
Date | | Unrealized
Appreciation/
(Depreciation) |
| U.S. Treasury Bond (Long) | | 116 | | $13,840,250 | | Mar-08 | | $270,563 |
| | | | | | | | |
22
Portfolio of Investments – continued
Swap Agreements at 1/31/08
| | | | | | | | | | | | | |
| Expiration | | | | Notional
Amount | | Counterparty | | Cash Flows to Receive | | Cash Flows
to Pay | | Value | |
| Credit Default Swaps | | | | | | | | | |
| 6/20/09 | | USD | | 4,200,000 | | JPMorgan Chase Bank | | 4.1% (fixed rate) | | (1) | | $ (416,990 | ) |
| 6/20/09 | | USD | | 2,100,000 | | JPMorgan Chase Bank | | 4.8% (fixed rate) | | (1) | | (189,152 | ) |
| 6/20/12 | | USD | | 9,500,000 | | JPMorgan Chase Bank (a) | | (2) | | 4.065% (fixed rate) | | 813,368 | |
| 6/20/12 | | USD | | 4,200,000 | | Morgan Stanley Capital Services, Inc. | | 3.76% (fixed rate) | | (3) | | (930,543 | ) |
| 6/20/12 | | USD | | 2,100,000 | | Morgan Stanley Capital Services, Inc. | | 4.15% (fixed rate) | | (3) | | (441,285 | ) |
| 9/20/12 | | USD | | 4,200,000 | | Goldman Sachs International | | 3.75% (fixed rate) | | (4) | | 4,978 | |
| | | | | | | | | | | | | |
| | | | | | | | | | | | $(1,159,624 | ) |
| | | | | | | | | | | | | |
| (1) | Fund to pay notional amount upon a defined credit event by Abitibi-Consolidated, Inc., 8.375%, 4/01/15. |
| (2) | Fund to receive notional amount upon a defined credit event by a reference obligation specified in the CDX High Yield Index. |
| (3) | Fund to pay notional amount upon a defined credit event by Bowater, Inc. 6.5%, 6/15/13. |
| (4) | Fund to pay notional amount upon a defined credit event by Allied Waste Industries, Inc., 7.375%, 4/15/14. |
| (a) | Premiums paid by the fund amounted to $469,043. |
At January 31, 2008, the fund had sufficient cash and/or other liquid securities to cover any commitments under these derivative contracts.
The following abbreviations are used in this report and are defined:
| CDO | | Collateralized Debt Obligation |
| CLO | | Collateralized Loan Obligation |
| FRN | | Floating Rate Note. Interest rate resets periodically and may not be the rate reported at period end. |
| REIT | | Real Estate Investment Trust |
Abbreviations indicate amounts shown in currencies other than the U.S. dollar. All amounts are stated in U.S. dollars unless otherwise indicated. A list of abbreviations is shown below:
See Notes to Financial Statements
23
Financial Statements
STATEMENT OF ASSETS AND LIABILITIES
At 1/31/08
This statement represents your fund’s balance sheet, which details the assets and liabilities comprising the total value of the fund.
| | | | | |
| Assets | | | | | |
| Investments – | | | | | |
| Non-affiliated issuers, at value (identified cost, $966,970,769) | | $908,732,276 | | | |
| Underlying funds, at cost and value | | $31,031,601 | | | |
| Total investments, at value (identified cost, $998,002,370) | | | | | $939,763,877 |
| Cash | | 83,617 | | | |
| Restricted cash | | 1,672,780 | | | |
| Receivable for daily variation margin on open futures contracts | | 116,000 | | | |
| Receivable for investments sold | | 26,770,519 | | | |
| Receivable for fund shares sold | | 634,143 | | | |
| Interest and dividends receivable | | 18,496,571 | | | |
| Swaps, at value (net unamortized premiums paid $469,043) | | 818,346 | | | |
| Other assets | | 13,578 | | | |
| Total assets | | | | | $988,369,431 |
| Liabilities | | | | | |
| Distributions payable | | $1,381,818 | | | |
| Payable for forward foreign currency exchange contracts | | 17,457 | | | |
| Payable for investments purchased | | 18,554,445 | | | |
| Payable for fund shares reacquired | | 3,369,191 | | | |
| Swaps, at value | | 1,977,970 | | | |
| Unrealized depreciation on unfunded loan commitments | | 34,452 | | | |
| Payable to affiliates | | | | | |
Management fee | | 24,183 | | | |
Shareholder servicing costs | | 418,182 | | | |
Distribution and service fees | | 18,650 | | | |
Administrative services fee | | 699 | | | |
Program manager fees | | 19 | | | |
Retirement plan administration and services fees | | 24 | | | |
| Payable for independent trustees’ compensation | | 129,220 | | | |
| Accrued expenses and other liabilities | | 171,111 | | | |
| Total liabilities | | | | | $26,097,421 |
| Net assets | | | | | $962,272,010 |
| Net assets consist of: | | | | | |
| Paid-in capital | | $1,444,381,526 | | | |
| Unrealized appreciation (depreciation) on investments and translation of assets and liabilities in foreign currencies | | (59,648,506 | ) | | |
| Accumulated net realized gain (loss) on investments and foreign currency transactions | | (420,173,569 | ) | | |
| Accumulated distributions in excess of net investment income | | (2,287,441 | ) | | |
| Net assets | | | | | $962,272,010 |
| Shares of beneficial interest outstanding | | | | | 268,711,885 |
24
Statement of Assets and Liabilities – continued
| | | | |
| Class A shares: | | | | |
Net assets | | $504,159,011 | | |
Shares outstanding | | 140,863,684 | | |
Net asset value per share | | | | $3.58 |
Offering price per share (100 / 95.25 x net asset value per share) | | | | $3.76 |
| Class B shares: | | | | |
Net assets | | $113,331,134 | | |
Shares outstanding | | 31,569,581 | | |
Net asset value and offering price per share | | | | $3.59 |
| Class C shares: | | | | |
Net assets | | $69,505,091 | | |
Shares outstanding | | 19,323,365 | | |
Net asset value and offering price per share | | | | $3.60 |
| Class I shares | | | | |
Net assets | | $257,571,873 | | |
Shares outstanding | | 72,010,111 | | |
Net asset value, offering price, and redemption price per share | | | | $3.58 |
| Class R shares: | | | | |
Net assets | | $737,104 | | |
Shares outstanding | | 205,787 | | |
Net asset value, offering price, and redemption price per share | | | | $3.58 |
| Class R1 shares: | | | | |
Net assets | | $1,273,323 | | |
Shares outstanding | | 355,119 | | |
Net asset value, offering price, and redemption price per share | | | | $3.59 |
| Class R2 shares | | | | |
Net assets | | $663,581 | | |
Shares outstanding | | 185,169 | | |
Net asset value, offering price, and redemption price per share | | | | $3.58 |
| Class R3 shares | | | | |
Net assets | | $5,524,576 | | |
Shares outstanding | | 1,542,012 | | |
Net asset value, offering price, and redemption price per share | | | | $3.58 |
| Class R4 shares | | | | |
Net assets | | $8,064,797 | | |
Shares outstanding | | 2,254,433 | | |
Net asset value, offering price, and redemption price per share | | | | $3.58 |
25
Statement of Assets and Liabilities – continued
| | | | |
| Class R5 shares | | | | |
Net assets | | $57,537 | | |
Shares outstanding | | 16,077 | | |
Net asset value, offering price, and redemption price per share | | | | $3.58 |
| Class 529A shares | | | | |
Net assets | | $848,688 | | |
Shares outstanding | | 237,203 | | |
Net asset value per share | | | | $3.58 |
Offering price per share (100 / 95.25 x net asset value per share) | | | | $3.76 |
| Class 529B shares | | | | |
Net assets | | $213,453 | | |
Shares outstanding | | 59,659 | | |
Net asset value and offering price per share | | | | $3.58 |
| Class 529C shares | | | | |
Net assets | | $321,842 | | |
Shares outstanding | | 89,685 | | |
Net asset value and offering price per share | | | | $3.59 |
On sales of $50,000 or more, the offering prices of Class A and Class 529A shares are reduced. A contingent deferred sales charge may be imposed on redemptions of Class A, Class B, Class C, Class 529B, and Class 529C shares.
See Notes to Financial Statements
26
Financial Statements
STATEMENT OF OPERATIONS
Year ended 1/31/08
This statement describes how much your fund earned in investment income and accrued in expenses.
It also describes any gains and/or losses generated by fund operations.
| | | | | | |
| Net investment income | | | | | | |
| Income | | | | | | |
Interest | | $89,372,663 | | | | |
Dividends | | 726,680 | | | | |
Dividends from underlying funds | | 1,660,700 | | | | |
| Total investment income | | | | | $91,760,043 | |
| Expenses | | | | | | |
Management fee | | $5,188,578 | | | | |
Distribution and service fees | | 4,284,624 | | | | |
Program manager fees | | 3,799 | | | | |
Shareholder servicing costs | | 1,554,051 | | | | |
Administrative services fee | | 189,047 | | | | |
Retirement plan administration and services fees | | 19,149 | | | | |
Independent trustees’ compensation | | 36,385 | | | | |
Custodian fee | | 133,797 | | | | |
Shareholder communications | | 126,523 | | | | |
Auditing fees | | 75,024 | | | | |
Legal fees | | 26,776 | | | | |
Miscellaneous | | 188,212 | | | | |
| Total expenses | | | | | $11,825,965 | |
Reduction of expenses by investment adviser | | (5,839 | ) | | | |
| Net expenses | | | | | $11,820,126 | |
| Net investment income | | | | | $79,939,917 | |
| Realized and unrealized gain (loss) on investments | | | | | | |
| Realized gain (loss) (identified cost basis) | | | | | | |
Investment transactions: | | | | | | |
Non-affiliated issuers | | $(2,246,110 | ) | | | |
Futures contracts | | (350,761 | ) | | | |
Swap transactions | | 690,142 | | | | |
Foreign currency transactions | | 97,551 | | | | |
Net realized gain (loss) on investments
and foreign currency transactions | | | | | $(1,809,178 | ) |
| Change in unrealized appreciation (depreciation) | | | | | | |
Investments | | $(90,090,550 | ) | | | |
Futures contracts | | 1,496,503 | | | | |
Swap transactions | | (1,681,579 | ) | | | |
Translation of assets and liabilities in foreign currencies | | (68,796 | ) | | | |
Unfunded loan commitments | | (34,452 | ) | | | |
Net unrealized gain (loss) on investments
and foreign currency translation | | | | | $(90,378,874 | ) |
Net realized and unrealized gain (loss) on investments
and foreign currency | | | | | $(92,188,052 | ) |
| Change in net assets from operations | | | | | $(12,248,135 | ) |
See Notes to Financial Statements
27
Financial Statements
STATEMENTS OF CHANGES IN NET ASSETS
These statements describe the increases and/or decreases in net assets resulting from operations, any distributions, and any shareholder transactions.
| | | | | | |
| | | Year ended 1/31 | |
| | | 2008 | | | 2007 | |
| Change in net assets | | | | | | |
| From operations | | | | | | |
| Net investment income | | $79,939,917 | | | $86,619,309 | |
Net realized gain (loss) on investments and
foreign currency transactions | | (1,809,178 | ) | | 1,111,730 | |
Net unrealized gain (loss) on investments and
foreign currency translation | | (90,378,874 | ) | | 31,193,207 | |
| Change in net assets from operations | | $(12,248,135 | ) | | $118,924,246 | |
| Distributions declared to shareholders | | | | | | |
| From net investment income | | | | | | |
Class A | | $(48,029,574 | ) | | $(47,667,939 | ) |
Class B | | (11,005,810 | ) | | (14,939,675 | ) |
Class C | | (5,876,268 | ) | | (6,203,739 | ) |
Class I | | (21,291,854 | ) | | (18,929,135 | ) |
Class R | | (243,806 | ) | | (363,983 | ) |
Class R1 | | (56,111 | ) | | (17,366 | ) |
Class R2 | | (38,427 | ) | | (23,859 | ) |
Class R3 | | (261,511 | ) | | (123,244 | ) |
Class R4 | | (587,093 | ) | | (187,948 | ) |
Class R5 | | (4,732 | ) | | (4,063 | ) |
Class 529A | | (66,936 | ) | | (55,195 | ) |
Class 529B | | (15,465 | ) | | (11,049 | ) |
Class 529C | | (28,036 | ) | | (28,602 | ) |
| Total distributions declared to shareholders | | $(87,505,623 | ) | | $(88,555,797 | ) |
| Change in net assets from fund share transactions | | $(157,432,891 | ) | | $(138,159,915 | ) |
| Redemption fees | | $— | | | $8,665 | |
| Total change in net assets | | $(257,186,649 | ) | | $(107,782,801 | ) |
| Net assets | | | | | | |
| At beginning of period | | 1,219,458,659 | | | 1,327,241,460 | |
At end of period (including accumulated distributions
in excess of net investment income of $2,287,441 and undistributed net investment income of $677,936) | | $962,272,010 | | | $1,219,458,659 | |
See Notes to Financial Statements
28
Financial Statements
FINANCIAL HIGHLIGHTS
The financial highlights table is intended to help you understand the fund’s financial performance for the past 5 years (or life of a particular share class, if shorter). Certain information reflects financial results for a single fund share. The total returns in the table represent the rate by which an investor would have earned (or lost) on an investment in the fund share class (assuming reinvestment of all distributions) held for the entire period.
| | | | | | | | | | | | | | | |
| Class A | | Years ended 1/31 | |
| | | 2008 | | | 2007 | | | 2006 | | | 2005 | | | 2004 | |
| Net asset value, beginning of period | | $3.92 | | | $3.82 | | | $3.98 | | | $3.98 | | | $3.52 | |
| Income (loss) from investment operations | | | | | | | | | | | | | | | |
Net investment income (d) | | $0.27 | | | $0.27 | | | $0.27 | | | $0.29 | | | $0.30 | |
Net realized and unrealized gain (loss)
on investments and foreign currency | | (0.31 | ) | | 0.11 | | | (0.13 | ) | | 0.01 | (g) | | 0.46 | |
| Total from investment operations | | $(0.04 | ) | | $0.38 | | | $0.14 | | | $0.30 | | | $0.76 | |
| Less distributions declared to shareholders | | | | | | | | | | | | | | | |
From net investment income | | $(0.30 | ) | | $(0.28 | ) | | $(0.30 | ) | | $(0.30 | ) | | $(0.30 | ) |
| Redemption fees added to paid-in capital (d) | | $— | | | $0.00 | (w) | | $0.00 | (w) | | $0.00 | (w) | | $— | |
| Net asset value, end of period | | $3.58 | | | $3.92 | | | $3.82 | | | $3.98 | | | $3.98 | |
| Total return (%) (r)(s)(t) | | (1.20 | ) | | 10.30 | | | 3.61 | | | 7.74 | | | 22.83 | |
Ratios (%) (to average net assets)
and Supplemental data: | | | | | | | | | | | | | | | |
| Expenses before expense reductions (f) | | 0.97 | | | 1.00 | | | 1.00 | | | 0.99 | | | 0.99 | |
| Expenses after expense reductions (f) | | 0.97 | | | 1.00 | | | 1.00 | | | 0.99 | | | N/A | |
| Net investment income | | 7.17 | | | 7.09 | | | 6.85 | | | 7.31 | | | 7.87 | |
| Portfolio turnover | | 66 | | | 89 | | | 51 | | | 68 | | | 81 | |
| Net assets at end of period (000 Omitted) | | $504,159 | | | $671,019 | | | $703,305 | | | $799,651 | | | $934,958 | |
See Notes to Financial Statements
29
Financial Highlights – continued
| | | | | | | | | | | | | | | |
| Class B | | Years ended 1/31 | |
| | | 2008 | | | 2007 | | | 2006 | | | 2005 | | | 2004 | |
| Net asset value, beginning of period | | $3.93 | | | $3.83 | | | $3.99 | | | $3.99 | | | $3.53 | |
| Income (loss) from investment operations | | | | | | | | | | | | | | | |
Net investment income (d) | | $0.25 | | | $0.25 | | | $0.24 | | | $0.26 | | | $0.27 | |
Net realized and unrealized gain (loss)
on investments and foreign currency | | (0.32 | ) | | 0.10 | | | (0.13 | ) | | 0.01 | (g) | | 0.47 | |
| Total from investment operations | | $(0.07 | ) | | $0.35 | | | $0.11 | | | $0.27 | | | $0.74 | |
| Less distributions declared to shareholders | | | | | | | | | | | | | | | |
From net investment income | | $(0.27 | ) | | $(0.25 | ) | | $(0.27 | ) | | $(0.27 | ) | | $(0.28 | ) |
| Redemption fees added to paid-in capital (d) | | $— | | | $0.00 | (w) | | $0.00 | (w) | | $0.00 | (w) | | $— | |
| Net asset value, end of period | | $3.59 | | | $3.93 | | | $3.83 | | | $3.99 | | | $3.99 | |
| Total return (%) (r)(s)(t) | | (1.87 | ) | | 9.53 | | | 2.90 | | | 7.10 | | | 21.65 | |
Ratios (%) (to average net assets)
and Supplemental data: | | | | | | | | | | | | | | | |
| Expenses before expense reductions (f) | | 1.67 | | | 1.71 | | | 1.72 | | | 1.69 | | | 1.69 | |
| Expenses after expense reductions (f) | | 1.67 | | | 1.71 | | | 1.72 | | | 1.69 | | | N/A | |
| Net investment income | | 6.47 | | | 6.40 | | | 6.26 | | | 6.63 | | | 7.18 | |
| Portfolio turnover | | 66 | | | 89 | | | 51 | | | 68 | | | 81 | |
| Net assets at end of period (000 Omitted) | | $113,331 | | | $195,028 | | | $275,363 | | | $379,253 | | | $471,520 | |
See Notes to Financial Statements
30
Financial Highlights – continued
| | | | | | | | | | | | | | | |
| Class C | | Years ended 1/31 | |
| | | 2008 | | | 2007 | | | 2006 | | | 2005 | | | 2004 | |
| Net asset value, beginning of period | | $3.94 | | | $3.84 | | | $4.00 | | | $4.00 | | | $3.54 | |
| Income (loss) from investment operations | | | | | | | | | | | | | | | |
Net investment income (d) | | $0.25 | | | $0.24 | | | $0.24 | | | $0.26 | | | $0.27 | |
Net realized and unrealized gain (loss)
on investments and foreign currency | | (0.32 | ) | | 0.11 | | | (0.13 | ) | | 0.01 | (g) | | 0.47 | |
| Total from investment operations | | $(0.07 | ) | | $0.35 | | | $0.11 | | | $0.27 | | | $0.74 | |
| Less distributions declared to shareholders | | | | | | | | | | | | | | | |
From net investment income | | $(0.27 | ) | | $(0.25 | ) | | $(0.27 | ) | | $(0.27 | ) | | $(0.28 | ) |
| Redemption fees added to paid-in capital (d) | | $— | | | $0.00 | (w) | | $0.00 | (w) | | $0.00 | (w) | | $— | |
| Net asset value, end of period | | $3.60 | | | $3.94 | | | $3.84 | | | $4.00 | | | $4.00 | |
| Total return (%) (r)(s)(t) | | (1.84 | ) | | 9.52 | | | 2.91 | | | 7.10 | | | 21.61 | |
Ratios (%) (to average net assets)
and Supplemental data: | | | | | | | | | | | | | | | |
| Expenses before expense reductions (f) | | 1.67 | | | 1.70 | | | 1.72 | | | 1.69 | | | 1.69 | |
| Expenses after expense reductions (f) | | 1.67 | | | 1.70 | | | 1.72 | | | 1.69 | | | N/A | |
| Net investment income | | 6.46 | | | 6.39 | | | 6.26 | | | 6.63 | | | 7.18 | |
| Portfolio turnover | | 66 | | | 89 | | | 51 | | | 68 | | | 81 | |
| Net assets at end of period (000 Omitted) | | $69,505 | | | $92,050 | | | $108,181 | | | $148,073 | | | $214,915 | |
See Notes to Financial Statements
31
Financial Highlights – continued
| | | | | | | | | | | | | | | |
| Class I | | Years ended 1/31 | |
| | | 2008 | | | 2007 | | | 2006 | | | 2005 | | | 2004 | |
| Net asset value, beginning of period | | $3.92 | | | $3.82 | | | $3.98 | | | $3.98 | | | $3.52 | |
| Income (loss) from investment operations | | | | | | | | | | | | | | | |
Net investment income (d) | | $0.29 | | | $0.28 | | | $0.28 | | | $0.29 | | | $0.30 | |
Net realized and unrealized gain (loss)
on investments and foreign currency | | (0.32 | ) | | 0.11 | | | (0.13 | ) | | 0.02 | (g) | | 0.47 | |
| Total from investment operations | | $(0.03 | ) | | $0.39 | | | $0.15 | | | $0.31 | | | $0.77 | |
| Less distributions declared to shareholders | | | | | | | | | | | | | | | |
From net investment income | | $(0.31 | ) | | $(0.29 | ) | | $(0.31 | ) | | $(0.31 | ) | | $(0.31 | ) |
| Redemption fees added to paid-in capital (d) | | $— | | | $0.00 | (w) | | $0.00 | (w) | | $0.00 | (w) | | $— | |
| Net asset value, end of period | | $3.58 | | | $3.92 | | | $3.82 | | | $3.98 | | | $3.98 | |
| Total return (%) (r)(s) | | (0.90 | ) | | 10.62 | | | 3.92 | | | 8.17 | | | 22.88 | |
Ratios (%) (to average net assets)
and Supplemental data: | | | | | | | | | | | | | | | |
| Expenses before expense reductions (f) | | 0.67 | | | 0.70 | | | 0.71 | | | 0.68 | | | 0.69 | |
| Expenses after expense reductions (f) | | 0.67 | | | 0.70 | | | 0.71 | | | 0.68 | | | N/A | |
| Net investment income | | 7.47 | | | 7.38 | | | 7.24 | | | 7.55 | | | 8.03 | |
| Portfolio turnover | | 66 | | | 89 | | | 51 | | | 68 | | | 81 | |
| Net assets at end of period (000 Omitted) | | $257,572 | | | $246,306 | | | $231,455 | | | $170,679 | | | $93,887 | |
See Notes to Financial Statements
32
Financial Highlights – continued
| | | | | | | | | | | | | | | |
| Class R | | Years ended 1/31 | |
| | | 2008 | | | 2007 | | | 2006 | | | 2005 | | | 2004 | |
| Net asset value, beginning of period | | $3.93 | | | $3.83 | | | $3.98 | | | $3.98 | | | $3.52 | |
| Income (loss) from investment operations | | | | | | | | | | | | | | | |
Net investment income (d) | | $0.27 | | | $0.26 | | | $0.26 | | | $0.28 | | | $0.28 | |
Net realized and unrealized gain (loss)
on investments and foreign currency | | (0.33 | ) | | 0.11 | | | (0.12 | ) | | 0.01 | (g) | | 0.48 | |
| Total from investment operations | | $(0.06 | ) | | $0.37 | | | $0.14 | | | $0.29 | | | $0.76 | |
| Less distributions declared to shareholders | | | | | | | | | | | | | | | |
From net investment income | | $(0.29 | ) | | $(0.27 | ) | | $(0.29 | ) | | $(0.29 | ) | | $(0.30 | ) |
| Redemption fees added to paid-in capital (d) | | $— | | | $0.00 | (w) | | $0.00 | (w) | | $0.00 | (w) | | $— | |
| Net asset value, end of period | | $3.58 | | | $3.93 | | | $3.83 | | | $3.98 | | | $3.98 | |
| Total return (%) (r)(s) | | (1.65 | ) | | 10.07 | | | 3.68 | | | 7.63 | | | 22.29 | |
Ratios (%) (to average net assets)
and Supplemental data: | | | | | | | | | | | | | | | |
| Expenses before expense reductions (f) | | 1.17 | | | 1.20 | | | 1.21 | | | 1.18 | | | 1.20 | |
| Expenses after expense reductions (f) | | 1.17 | | | 1.20 | | | 1.21 | | | 1.18 | | | N/A | |
| Net investment income | | 6.98 | | | 6.88 | | | 6.76 | | | 7.06 | | | 7.46 | |
| Portfolio turnover | | 66 | | | 89 | | | 51 | | | 68 | | | 81 | |
| Net assets at end of period (000 Omitted) | | $737 | | | $5,072 | | | $5,422 | | | $4,021 | | | $1,359 | |
See Notes to Financial Statements
33
Financial Highlights – continued
| | | | | | | | | |
| Class R1 | | Years ended 1/31 | |
| | | 2008 | | | 2007 | | | 2006(i) | |
| Net asset value, beginning of period | | $3.93 | | | $3.83 | | | $3.89 | |
| Income (loss) from investment operations | | | | | | | | | |
Net investment income (d) | | $0.24 | | | $0.24 | | | $0.19 | |
Net realized and unrealized gain (loss)
on investments and foreign currency | | (0.31 | ) | | 0.11 | | | (0.03 | )(g) |
| Total from investment operations | | $(0.07 | ) | | $0.35 | | | $0.16 | |
| Less distributions declared to shareholders | | | | | | | | | |
From net investment income | | $(0.27 | ) | | $(0.25 | ) | | $(0.22 | ) |
| Redemption fees added to paid-in capital (d) | | $— | | | $0.00 | (w) | | $0.00 | (w) |
| Net asset value, end of period | | $3.59 | | | $3.93 | | | $3.83 | |
| Total return (%) (r)(s) | | (1.96 | ) | | 9.41 | | | 4.28 | (n) |
Ratios (%) (to average net assets)
and Supplemental data: | | | | | | | | | |
| Expenses before expense reductions (f) | | 1.77 | | | 1.89 | | | 1.91 | (a) |
| Expenses after expense reductions (f) | | 1.76 | | | 1.79 | | | 1.85 | (a) |
| Net investment income | | 6.35 | | | 6.27 | | | 6.08 | (a) |
| Portfolio turnover | | 66 | | | 89 | | | 51 | |
| Net assets at end of period (000 Omitted) | | $1,273 | | | $361 | | | $231 | |
See Notes to Financial Statements
34
Financial Highlights – continued
| | | | | | | | | |
| Class R2 | | Years ended 1/31 | |
| | | 2008 | | | 2007 | | | 2006(i) | |
| Net asset value, beginning of period | | $3.93 | | | $3.83 | | | $3.89 | |
| Income (loss) from investment operations | | | | | | | | | |
Net investment income (d) | | $0.25 | | | $0.26 | | | $0.21 | |
Net realized and unrealized gain (loss)
on investments and foreign currency | | (0.32 | ) | | 0.10 | | | (0.04 | )(g) |
| Total from investment operations | | $(0.07 | ) | | $0.36 | | | $0.17 | |
| Less distributions declared to shareholders | | | | | | | | | |
From net investment income | | $(0.28 | ) | | $(0.26 | ) | | $(0.23 | ) |
| Redemption fees added to paid-in capital (d) | | $— | | | $0.00 | (w) | | $0.00 | (w) |
| Net asset value, end of period | | $3.58 | | | $3.93 | | | $3.83 | |
| Total return (%) (r)(s) | | (1.87 | ) | | 9.80 | | | 4.56 | (n) |
Ratios (%) (to average net assets)
and Supplemental data: | | | | | | | | | |
| Expenses before expense reductions (f) | | 1.41 | | | 1.59 | | | 1.59 | (a) |
| Expenses after expense reductions (f) | | 1.39 | | | 1.44 | | | 1.51 | (a) |
| Net investment income | | 6.74 | | | 6.63 | | | 6.50 | (a) |
| Portfolio turnover | | 66 | | | 89 | | | 51 | |
| Net assets at end of period (000 Omitted) | | $664 | | | $460 | | | $277 | |
See Notes to Financial Statements
35
Financial Highlights – continued
| | | | | | | | | | | | | | | |
| Class R3 | | Years ended 1/31 | |
| | | 2008 | | | 2007 | | | 2006 | | | 2005 | | | 2004(i) | |
| Net asset value, beginning of period | | $3.93 | | | $3.83 | | | $3.98 | | | $3.98 | | | $3.85 | |
| Income (loss) from investment operations | | | | | | | | | | |
Net investment income (d) | | $0.26 | | | $0.26 | | | $0.24 | | | $0.25 | | | $0.07 | |
Net realized and unrealized gain (loss)
on investments and foreign currency | | (0.32 | ) | | 0.10 | | | (0.11 | ) | | 0.03 | (g) | | 0.13 | (g) |
| Total from investment operations | | $(0.06 | ) | | $0.36 | | | $0.13 | | | $0.28 | | | $0.20 | |
| Less distributions declared to shareholders | | | | | | | | | | |
From net investment income | | $(0.29 | ) | | $(0.26 | ) | | $(0.28 | ) | | $(0.28 | ) | | $(0.07 | ) |
| Redemption fees added to paid-in capital (d) | | $— | | | $0.00 | (w) | | $0.00 | (w) | | $0.00 | (w) | | $— | |
| Net asset value, end of period | | $3.58 | | | $3.93 | | | $3.83 | | | $3.98 | | | $3.98 | |
| Total return (%) (r)(s) | | (1.79 | ) | | 9.91 | | | 3.45 | | | 7.37 | | | 5.32 | (n) |
Ratios (%) (to average net assets)
and Supplemental data: | | | | | | | | | | | | | |
| Expenses before expense reductions (f) | | 1.30 | | | 1.44 | | | 1.46 | | | 1.49 | | | 1.43 | (a) |
| Expenses after expense reductions (f) | | 1.29 | | | 1.34 | | | 1.42 | | | 1.49 | | | N/A | |
| Net investment income | | 6.83 | | | 6.71 | | | 6.61 | | | 6.58 | | | 7.07 | (a) |
| Portfolio turnover | | 66 | | | 89 | | | 51 | | | 68 | | | 81 | |
| Net assets at end of period (000 Omitted) | | $5,525 | | | $2,406 | | | $1,212 | | | $246 | | | $42 | |
See Notes to Financial Statements
36
Financial Highlights – continued
| | | | | | | | | |
| Class R4 | | Years ended 1/31 | |
| | | 2008 | | | 2007 | | | 2006(i) | |
| Net asset value, beginning of period | | $3.92 | | | $3.82 | | | $3.88 | |
| Income (loss) from investment operations | | | | |
Net investment income (d) | | $0.27 | | | $0.27 | | | $0.21 | |
Net realized and unrealized gain (loss)
on investments and foreign currency | | (0.31 | ) | | 0.10 | | | (0.02 | )(g) |
| Total from investment operations | | $(0.04 | ) | | $0.37 | | | $0.19 | |
| Less distributions declared to shareholders | | | | |
From net investment income | | $(0.30 | ) | | $(0.27 | ) | | $(0.25 | ) |
| Redemption fees added to paid-in capital (d) | | $— | | | $0.00 | (w) | | $0.00 | (w) |
| Net asset value, end of period | | $3.58 | | | $3.92 | | | $3.82 | |
| Total return (%) (r)(s) | | (1.28 | ) | | 10.18 | | | 4.94 | (n) |
Ratios (%) (to average net assets)
and Supplemental data: | | | | | | | |
| Expenses before expense reductions (f) | | 1.05 | | | 1.07 | | | 1.15 | (a) |
| Expenses after expense reductions (f) | | 1.05 | | | 1.07 | | | 1.15 | (a) |
| Net investment income | | 7.08 | | | 6.90 | | | 6.73 | (a) |
| Portfolio turnover | | 66 | | | 89 | | | 51 | |
| Net assets at end of period (000 Omitted) | | $8,065 | | | $5,143 | | | $393 | |
See Notes to Financial Statements
37
Financial Highlights – continued
| | | | | | | | | |
| Class R5 | | Years ended 1/31 | |
| | | 2008 | | | 2007 | | | 2006(i) | |
| Net asset value, beginning of period | | $3.92 | | | $3.82 | | | $3.88 | |
| Income (loss) from investment operations | | | | |
Net investment income (d) | | $0.28 | | | $0.28 | | | $0.23 | |
Net realized and unrealized gain (loss)
on investments and foreign currency | | (0.31 | ) | | 0.11 | | | (0.03 | )(g) |
| Total from investment operations | | $(0.03 | ) | | $0.39 | | | $0.20 | |
| Less distributions declared to shareholders | | | | |
From net investment income | | $(0.31 | ) | | $(0.29 | ) | | $(0.26 | ) |
| Redemption fees added to paid-in capital (d) | | $— | | | $0.00 | (w) | | $0.00 | (w) |
| Net asset value, end of period | | $3.58 | | | $3.92 | | | $3.82 | |
| Total return (%) (r)(s) | | (0.99 | ) | | 10.52 | | | 5.2 | 0(n) |
Ratios (%) (to average net assets)
and Supplemental data: | | | | | | | |
| Expenses before expense reductions (f) | | 0.76 | | | 0.80 | | | 0.80 | (a) |
| Expenses after expense reductions (f) | | 0.76 | | | 0.80 | | | 0.80 | (a) |
| Net investment income | | 7.38 | | | 7.29 | | | 7.11 | (a) |
| Portfolio turnover | | 66 | | | 89 | | | 51 | |
| Net assets at end of period (000 Omitted) | | $58 | | | $58 | | | $53 | |
See Notes to Financial Statements
38
Financial Highlights – continued
| | | | | | | | | | | | | | | |
| Class 529A | | Years ended 1/31 | |
| | | 2008 | | | 2007 | | | 2006 | | | 2005 | | | 2004 | |
| Net asset value, beginning of period | | $3.92 | | | $3.82 | | | $3.98 | | | $3.98 | | | $3.52 | |
| Income (loss) from investment operations | | | | | | | | | | |
Net investment income (d) | | $0.26 | | | $0.26 | | | $0.26 | | | $0.27 | | | $0.28 | |
Net realized and unrealized gain (loss)
on investments and foreign currency | | (0.31 | ) | | 0.11 | | | (0.14 | ) | | 0.02 | (g) | | 0.47 | |
| Total from investment operations | | $(0.05 | ) | | $0.37 | | | $0.12 | | | $0.29 | | | $0.75 | |
| Less distributions declared to shareholders | | | | | | | | | | |
From net investment income | | $(0.29 | ) | | $(0.27 | ) | | $(0.28 | ) | | $(0.29 | ) | | $(0.29 | ) |
| Redemption fees added to paid-in capital (d) | | $— | | | $0.00 | (w) | | $0.00 | (w) | | $0.00 | (w) | | $— | |
| Net asset value, end of period | | $3.58 | | | $3.92 | | | $3.82 | | | $3.98 | | | $3.98 | |
| Total return (%) (r)(s)(t) | | (1.49 | ) | | 9.97 | | | 3.30 | | | 7.53 | | | 22.16 | |
Ratios (%) (to average net assets)
and Supplemental data: | | | | | | | | | | | | | |
| Expenses before expense reductions (f) | | 1.27 | | | 1.30 | | | 1.32 | | | 1.29 | | | 1.30 | |
| Expenses after expense reductions (f) | | 1.27 | | | 1.30 | | | 1.32 | | | 1.29 | | | N/A | |
| Net investment income | | 6.87 | | | 6.78 | | | 6.65 | | | 6.97 | | | 7.42 | |
| Portfolio turnover | | 66 | | | 89 | | | 51 | | | 68 | | | 81 | |
| Net assets at end of period (000 Omitted) | | $849 | | | $854 | | | $776 | | | $768 | | | $406 | |
See Notes to Financial Statements
39
Financial Highlights – continued
| | | | | | | | | | | | | | | |
| Class 529B | | Years ended 1/31 | |
| | | 2008 | | | 2007 | | | 2006 | | | 2005 | | | 2004 | |
| Net asset value, beginning of period | | $3.92 | | | $3.82 | | | $3.97 | | | $3.98 | | | $3.52 | |
| Income (loss) from investment operations | | | | | | | | | | |
Net investment income (d) | | $0.24 | | | $0.23 | | | $0.23 | | | $0.25 | | | $0.25 | |
Net realized and unrealized gain (loss)
on investments and foreign currency | | (0.32 | ) | | 0.11 | | | (0.12 | ) | | 0.00 | (g)(w) | | 0.48 | |
| Total from investment operations | | $(0.08 | ) | | $0.34 | | | $0.11 | | | $0.25 | | | $0.73 | |
| Less distributions declared to shareholders | | | | | | | | | | |
From net investment income | | $(0.26 | ) | | $(0.24 | ) | | $(0.26 | ) | | $(0.26 | ) | | $(0.27 | ) |
| Redemption fees added to paid-in capital (d) | | $— | | | $0.00 | (w) | | $0.00 | (w) | | $0.00 | (w) | | $— | |
| Net asset value, end of period | | $3.58 | | | $3.92 | | | $3.82 | | | $3.97 | | | $3.98 | |
| Total return (%) (r)(s)(t) | | (2.13 | ) | | 9.26 | | | 2.89 | | | 6.57 | | | 21.39 | |
Ratios (%) (to average net assets)
and Supplemental data: | | | | | | | | | | | | | |
| Expenses before expense reductions (f) | | 1.92 | | | 1.95 | | | 1.96 | | | 2.01 | | | 1.95 | |
| Expenses after expense reductions (f) | | 1.92 | | | 1.95 | | | 1.96 | | | 2.01 | | | N/A | |
| Net investment income | | 6.22 | | | 6.13 | | | 6.00 | | | 6.29 | | | 6.80 | |
| Portfolio turnover | | 66 | | | 89 | | | 51 | | | 68 | | | 81 | |
| Net assets at end of period (000 Omitted) | | $213 | | | $202 | | | $157 | | | $139 | | | $119 | |
See Notes to Financial Statements
40
Financial Highlights – continued
| | | | | | | | | | | | | | | |
| Class 529C | | Years ended 1/31 | |
| | | 2008 | | | 2007 | | | 2006 | | | 2005 | | | 2004 | |
| Net asset value, beginning of period | | $3.93 | | | $3.83 | | | $3.99 | | | $3.99 | | | $3.53 | |
| Income (loss) from investment operations | | | | | | | | | | |
Net investment income (d) | | $0.24 | | | $0.23 | | | $0.23 | | | $0.25 | | | $0.26 | |
Net realized and unrealized gain (loss)
on investments and foreign currency | | (0.32 | ) | | 0.11 | | | (0.13 | ) | | 0.01 | (g) | | 0.47 | |
| Total from investment operations | | $(0.08 | ) | | $0.34 | | | $0.10 | | | $0.26 | | | $0.73 | |
| Less distributions declared to shareholders | | | | | | | | | | |
From net investment income | | $(0.26 | ) | | $(0.24 | ) | | $(0.26 | ) | | $(0.26 | ) | | $(0.27 | ) |
| Redemption fees added to paid-in capital (d) | | $— | | | $0.00 | (w) | | $0.00 | (w) | | $0.00 | (w) | | $— | |
| Net asset value, end of period | | $3.59 | | | $3.93 | | | $3.83 | | | $3.99 | | | $3.99 | |
| Total return (%) (r)(s)(t) | | (2.11 | ) | | 9.26 | | | 2.64 | | | 6.84 | | | 21.35 | |
Ratios (%) (to average net assets)
and Supplemental data: | | | | | | | | | | | | | |
| Expenses before expense reductions (f) | | 1.92 | | | 1.95 | | | 1.96 | | | 1.97 | | | 1.95 | |
| Expenses after expense reductions (f) | | 1.91 | | | 1.95 | | | 1.96 | | | 1.97 | | | N/A | |
| Net investment income | | 6.21 | | | 6.13 | | | 6.00 | | | 6.31 | | | 6.79 | |
| Portfolio turnover | | 66 | | | 89 | | | 51 | | | 68 | | | 81 | |
| Net assets at end of period (000 Omitted) | | $322 | | | $500 | | | $417 | | | $347 | | | $189 | |
| (d) | Per share data are based on average shares outstanding. |
| (f) | Ratios do not reflect reductions from fees paid indirectly, if applicable. |
| (g) | The per share amount is not in accordance with the net realized and unrealized gain/loss for the period because of the timing of sales of fund shares and the per share amount of realized and unrealized gains and losses at such time. |
| (i) | For the period from the class’ inception, October 31, 2003 (Class R3) and April 1, 2005 (Classes R1, R2, R4, and R5) through the stated period end. |
| (r) | Certain expenses have been reduced without which performance would have been lower. |
| (s) | From time to time the fund may receive proceeds from litigation settlements, without which performance would be lower. |
| (t) | Total returns do not include any applicable sales charges. |
| (w) | Per share amount was less than $0.01 |
See Notes to Financial Statements
41
NOTES TO FINANCIAL STATEMENTS
| (1) | Business and Organization |
MFS High Income Fund (the fund) is a series of MFS Series Trust III (the trust). The trust is organized as a Massachusetts business trust and is registered under the Investment Company Act of 1940, as amended, as an open-end management investment company.
| (2) | Significant Accounting Policies |
General – The preparation of financial statements in conformity with U.S. generally accepted accounting principles requires management to make estimates and assumptions that affect the reported amounts of assets and liabilities, and disclosure of contingent assets and liabilities at the date of the financial statements and the reported amounts of revenues and expenses during the reporting period. Actual results could differ from those estimates. The fund can invest up to 100% of its portfolio in high-yield securities rated below investment grade. Investments in high-yield securities involve greater degrees of credit and market risk than investments in higher-rated securities and tend to be more sensitive to economic conditions. The fund can invest in foreign securities, including securities of emerging market issuers. Investments in foreign securities are vulnerable to the effects of changes in the relative values of the local currency and the U.S. dollar and to the effects of changes in each country’s legal, political, and economic environment. The markets of emerging markets countries are generally more volatile than the markets of developed countries with more mature economies. All of the risks of investing in foreign securities previously described are heightened when investing in emerging markets countries.
Investment Valuations – Equity securities, including restricted equity securities, are generally valued at the last sale or official closing price as reported by an independent pricing service on the market or exchange on which they are primarily traded. For securities for which there were no sales reported that day, equity securities are generally valued at the last quoted daily bid quotation as reported by an independent pricing service on the market or exchange on which they are primarily traded. For securities held short for which there were no sales reported for the day, the position is generally valued at the last quoted daily ask quotation as reported by an independent pricing service on the market or exchange on which such securities are primarily traded. Debt instruments (other than short-term instruments), including restricted debt instruments, are generally valued at an evaluated or composite bid as reported by an independent pricing service. Short-term instruments with a maturity at issuance of 60 days or less may be valued at amortized cost, which approximates market value. Futures contracts are generally valued at
42
Notes to Financial Statements – continued
last posted settlement price as reported by an independent pricing service on the market on which they are primarily traded. Futures contracts for which there were no trades that day for a particular position are generally valued at the closing bid quotation as reported by an independent pricing service on the market on which such futures contracts are primarily traded. Forward foreign currency contracts are generally valued at the mean of bid and asked prices for the time period interpolated from rates reported by an independent pricing service for proximate time periods. Swaps are generally valued at an evaluated bid as reported by an independent pricing service. Securities and other assets generally valued on the basis of information from an independent pricing service may also be valued at a broker-dealer bid quotation. Values obtained from pricing services can utilize both dealer-supplied valuations and electronic data processing techniques, which take into account factors such as institutional-size trading in similar groups of securities, yield, quality, coupon rate, maturity, type of issue, trading characteristics, and other market data. The values of foreign securities and other assets and liabilities expressed in foreign currencies are converted to U.S. dollars using the mean of bid and asked prices for rates reported by an independent pricing service.
The Board of Trustees has delegated primary responsibility for determining or causing to be determined the value of the fund’s investments (including any fair valuation) to the adviser pursuant to valuation policies and procedures approved by the Board. If the adviser determines that reliable market quotations are not readily available, investments are valued at fair value as determined in good faith by the adviser in accordance with such procedures under the oversight of the Board of Trustees. Under the fund’s valuation policies and procedures, market quotations are not considered to be readily available for many types of debt instruments and certain types of derivatives. These investments are generally valued at fair value based on information from independent pricing services. In addition, investments may be valued at fair value if the adviser determines that an investment’s value has been materially affected by events occurring after the close of the exchange or market on which the investment is principally traded (such as foreign exchange or market) and prior to the determination of the fund’s net asset value, or after the halting of trading of a specific security where trading does not resume prior to the close of the exchange or market on which the security is principally traded. The adviser may rely on independent pricing services or other information (such as the correlation with price movements of similar securities in the same or other markets; the type, cost and investment characteristics of the security; the business and financial condition of the issuer; and trading and other market data) to assist in determining whether to fair value and at what value to fair value an investment. The value of an investment for purposes of calculating the fund’s net asset value can differ depending on the source and method used to
43
Notes to Financial Statements – continued
determine value. When fair valuation is used, the value of investments used to determine the fund’s net asset value may differ from quoted or published prices for the same investments.
In September 2006, FASB Statement No. 157, Fair Value Measurements (the “Statement”) was issued, and is effective for fiscal years beginning after November 15, 2007 and for all interim periods within those fiscal years. This Statement provides a single definition of fair value, a hierarchy for measuring fair value and expanded disclosures about fair value measurements. Management is evaluating the application of the Statement to the fund, and believes the impact will be limited to expanded disclosures resulting from the adoption of this Statement in the fund’s financial statements.
Repurchase Agreements – The fund may enter into repurchase agreements with institutions that the fund’s investment adviser has determined are creditworthy. Each repurchase agreement is recorded at cost. The fund requires that the securities collateral in a repurchase transaction be transferred to the custodian in a manner sufficient to enable the fund to obtain those securities in the event of a default under the repurchase agreement. The fund monitors, on a daily basis, the value of the collateral to ensure that its value, including accrued interest, is greater than amounts owed to the fund under each such repurchase agreement.
Foreign Currency Translation – Purchases and sales of foreign investments, income, and expenses are converted into U.S. dollars based upon currency exchange rates prevailing on the respective dates of such transactions. Gains and losses attributable to foreign currency exchange rates on sales of securities are recorded for financial statement purposes as net realized gains and losses on investments. Gains and losses attributable to foreign exchange rate movements on income and expenses are recorded for financial statement purposes as foreign currency transaction gains and losses. That portion of both realized and unrealized gains and losses on investments that results from fluctuations in foreign currency exchange rates is not separately disclosed.
Derivative Risk – The fund may invest in derivatives for hedging or non-hedging purposes. While hedging can reduce or eliminate losses, it can also reduce or eliminate gains. When the fund uses derivatives as an investment to gain market exposure, or for hedging purposes, gains and losses from derivative instruments may be substantially greater than the derivative’s original cost. Cash that has been segregated on behalf of certain derivative contracts will be reported separately on the Statement of Assets and Liabilities as restricted cash. Derivative instruments include futures contracts, forward foreign currency exchange contracts, and swap agreements.
Futures Contracts – The fund may enter into futures contracts for the delayed delivery of securities or currency, or contracts based on financial indices at a
44
Notes to Financial Statements – continued
fixed price on a future date. In entering such contracts, the fund is required to deposit with the broker either in cash or securities an amount equal to a certain percentage of the contract amount. Subsequent payments are made or received by the fund each day, depending on the daily fluctuations in the value of the contract, and are recorded for financial statement purposes as unrealized gains or losses by the fund. Upon entering into such contracts, the fund bears the risk of interest or exchange rates or securities prices moving unexpectedly, in which case, the fund may not achieve the anticipated benefits of the futures contracts and may realize a loss.
Forward Foreign Currency Exchange Contracts – The fund may enter into forward foreign currency exchange contracts for the purchase or sale of a specific foreign currency at a fixed price on a future date. Risks may arise upon entering into these contracts from the potential inability of counterparties to meet the terms of their contracts and from unanticipated movements in the value of the contract. The fund may enter into forward foreign currency exchange contracts for hedging purposes as well as for non-hedging purposes. For hedging purposes, the fund may enter into contracts to deliver or receive foreign currency it will receive from or require for its normal investment activities. The fund may also use contracts in a manner intended to protect foreign currency denominated securities from declines in value due to unfavorable exchange rate movements. For non-hedging purposes, the fund may enter into contracts with the intent of changing the relative exposure of the fund’s portfolio of securities to different currencies to take advantage of anticipated changes. The forward foreign currency exchange contracts are adjusted by the daily exchange rate of the underlying currency and any gains or losses are recorded as unrealized until the contract settlement date. On contract settlement date, the gains or losses are recorded as realized gains or losses on foreign currency transactions.
Swap Agreements – The fund may enter into swap agreements. A swap is an exchange of cash payments between the fund and another party. Net cash payments are exchanged at specified intervals and are recorded as a realized gain or loss in the Statement of Operations. The value of the swap is adjusted daily and the change in value, including accruals of periodic amounts of interest to be paid or received, is recorded as unrealized appreciation or depreciation in the Statement of Operations. Amounts paid or received at the inception of the swap are reflected as premiums paid or received on the Statement of Assets and Liabilities and are amortized using the effective interest method over the term of the agreement. A liquidation payment received or made upon early termination is recorded as a realized gain or loss in the Statement of Operations. Collateral, in the form of cash or securities, may be required to be held in segregated accounts with the fund’s custodian in connection with these agreements. Risk of loss may exceed amounts
45
Notes to Financial Statements – continued
recognized on the Statement of Assets and Liabilities. These risks include the possible lack of a liquid market, failure of the counterparty to perform under the terms of the agreements, and unfavorable market movement of the underlying instrument. All swap agreements entered into by the fund with the same counterparty are generally governed by a single master agreement, which provides for the netting of all amounts owed by the parties under the agreement upon the occurrence of an event of default, thereby reducing the credit risk to which such party is exposed.
The fund holds credit default swaps in which one party makes a stream of payments based on a fixed percentage applied to the notional amount to another party in exchange for the right to receive a specified return in the event of a default by a third party, such as a corporate issuer or foreign issuer, on its obligation. The fund may enter into credit default swaps to limit or to reduce its risk exposure to defaults of corporate and sovereign issuers or to create direct or synthetic short or long exposure to corporate debt securities or certain sovereign debt securities to which it is not otherwise exposed.
Hybrid Instruments – The fund may invest in indexed or hybrid securities on which any combination of interest payments, the principal or stated amount payable at maturity is determined by reference to prices of other securities, currencies, indexes, economic factors or other measures, including interest rates, currency exchange rates, or securities indices. The risks of investing in hybrid instruments reflect a combination of the risks of investing in securities, swaps, options, futures and currencies. Hybrid instruments are potentially more volatile and carry greater market risks than traditional debt instruments. Depending on the structure of the particular hybrid instrument, changes in a benchmark, underlying assets or economic indicator may be magnified by the terms of the hybrid instrument and have an even more dramatic and substantial effect upon the value of the hybrid instrument. Also, the prices of the hybrid instrument and the benchmark, underlying asset or economic indicator may not move in the same direction or at the same time.
Loans and Other Direct Debt Instruments – The fund may invest in loans and loan participations or other receivables. These investments may include standby financing commitments, including revolving credit facilities, which obligate the fund to supply additional cash to the borrower on demand. At January 31, 2008, the portfolio had unfunded loan commitments of $301,612, which could be extended at the option of the borrower and which are covered by sufficient cash and/or liquid securities held by the fund. Loan participations involve a risk of insolvency of the lending bank or other financial intermediary.
Indemnifications – Under the fund’s organizational documents, its officers and trustees may be indemnified against certain liabilities and expenses arising out of the performance of their duties to the fund. Additionally, in the normal
46
Notes to Financial Statements – continued
course of business, the fund enters into agreements with service providers that may contain indemnification clauses. The fund’s maximum exposure under these agreements is unknown as this would involve future claims that may be made against the fund that have not yet occurred.
Short Term Fees – The fund charged a 1% redemption fee on proceeds from Class A, Class B, Class C, and Class I shares redeemed or exchanged within 30 calendar days following their acquisition. Effective December 1, 2006, the fund no longer charges a redemption fee. Any redemption fees charged are accounted for as an addition to paid-in-capital.
Investment Transactions and Income – Investment transactions are recorded on the trade date. Interest income is recorded on the accrual basis. All premium and discount is amortized or accreted for financial statement purposes in accordance with U.S. generally accepted accounting principles. All discount is accreted for tax reporting purposes as required by federal income tax regulations. The fund earns certain fees in connection with its floating rate loan purchasing activities. These fees are in addition to interest payments earned and may include amendment fees, commitment fees, facility fees, consent fees, and prepayment fees. Commitment fees are recorded on an accrual basis as income in the accompanying financial statements. Dividends received in cash are recorded on the ex-dividend date. Certain dividends from foreign securities will be recorded when the fund is informed of the dividend if such information is obtained subsequent to the ex-dividend date. Dividend and interest payments received in additional securities are recorded on the ex-dividend or ex-interest date in an amount equal to the value of the security on such date. The fund may receive proceeds from litigation settlements. Any proceeds received from litigation involving portfolio holdings are reflected in the Statement of Operations in realized gain/loss if the security has been disposed of by the fund or in unrealized gain/loss if the security is still held by the fund. Any other proceeds from litigation not related to portfolio holdings are reflected as other income in the Statement of Operations.
Fees Paid Indirectly – The fund’s custody fee may be reduced according to an arrangement that measures the value of cash deposited with the custodian by the fund. For the year ended January 31, 2008, custody fees were not reduced.
Tax Matters and Distributions – The fund intends to qualify as a regulated investment company, as defined under Subchapter M of the Internal Revenue Code, and to distribute all of its taxable income, including realized capital gains. As a result, no provision for federal income tax is required. The fund adopted the provisions of FASB Interpretation No. 48, Accounting for Uncertainty in Income Taxes (“the Interpretation”) on January 1, 2007. The Interpretation prescribes a minimum threshold for financial statement recognition of the benefit of a tax position taken or expected to be taken in a
47
Notes to Financial Statements – continued
tax return. There was no impact resulting from the adoption of this Interpretation on the fund’s financial statements. Each of the fund’s federal tax returns for the prior three fiscal years remains subject to examination by the Internal Revenue Service. It is the fund’s policy to record interest and penalty charges on underpaid taxes associated with its tax positions as interest expense and miscellaneous expense, respectively. No such charges were recorded in the current financial statements. Foreign taxes, if any, have been accrued by the fund in the accompanying financial statements.
Distributions to shareholders are recorded on the ex-dividend date. Income and capital gain distributions are determined in accordance with income tax regulations, which may differ from U.S. generally accepted accounting principles. Certain capital accounts in the financial statements are periodically adjusted for permanent differences in order to reflect their tax character. These adjustments have no impact on net assets or net asset value per share. Temporary differences which arise from recognizing certain items of income, expense, gain or loss in different periods for financial statement and tax purposes will reverse at some time in the future. Distributions in excess of net investment income or net realized gains are temporary overdistributions for financial statement purposes resulting from differences in the recognition or classification of income or distributions for financial statement and tax purposes.
Book/tax differences primarily relate to expiration of capital loss carryforwards and amortization and accretion of debt securities.
The tax character of distributions declared to shareholders is as follows:
| | | | |
| | | 1/31/08 | | 1/31/07 |
| Ordinary income (including any short-term capital gains) | | $87,505,623 | | $88,555,797 |
The federal tax cost and the tax basis components of distributable earnings were as follows:
| | | |
| As of 1/31/08 | | | |
| Cost of investments | | $1,001,243,417 | |
| Gross appreciation | | 4,540,124 | |
| Gross depreciation | | (66,019,664 | ) |
| Net unrealized appreciation (depreciation) | | $(61,479,540 | ) |
| Undistributed ordinary income | | $2,305,483 | |
| Capital loss carryforwards | | (403,838,082 | ) |
| Post-October capital loss deferral | | (12,726,203 | ) |
| Other temporary differences | | (6,371,174 | ) |
48
Notes to Financial Statements – continued
As of January 31, 2008, the fund had capital loss carryforwards available to offset future realized gains. Such losses expire as follows:
| | | |
| 1/31/09 | | $(24,778,024 | ) |
| 1/31/10 | | (137,538,425 | ) |
| 1/31/11 | | (159,064,624 | ) |
| 1/31/13 | | (19,406,719 | ) |
| 1/31/14 | | (20,012,633 | ) |
| 1/31/15 | | (43,037,657 | ) |
| | $(403,838,082 | ) |
Multiple Classes of Shares of Beneficial Interest – The fund offers multiple classes of shares, which differ in their respective distribution and service fees. All shareholders bear the common expenses of the fund based on the value of settled shares outstanding of each class, without distinction between share classes. Dividends are declared separately for each class. Differences in per share dividend rates are generally due to differences in separate class expenses. Class B and Class 529B shares will convert to Class A and Class 529A shares, respectively, approximately eight years after purchase.
| (3) | | Transactions with Affiliates |
Investment Adviser – The fund has an investment advisory agreement with Massachusetts Financial Services Company (MFS) to provide overall investment management and related administrative services and facilities to the fund.
The management fee is computed daily and paid monthly at the following annual rates:
| | | |
| First $1.4 billion of average daily net assets | | 0.46 | % |
| Average daily net assets in excess of $1.4 billion | | 0.44 | % |
As part of a settlement agreement with the New York Attorney General concerning market timing and related matters, MFS has agreed to reduce the management fee to 0.39% of the fund’s average daily net assets in excess of $1.4 billion for the period March 1, 2004 through February 28, 2009. For the year ended January 31, 2008, the fund’s average daily net assets did not exceed $1.4 billion and therefore, the management fee was not reduced.
The management fee incurred for the year ended January 31, 2008 was equivalent to an annual effective rate of 0.46% of the fund’s average daily net assets.
Distributor – MFS Fund Distributors, Inc. (MFD), a wholly-owned subsidiary of MFS, as distributor, received $67,089 and $1,020 for the year ended January 31, 2008, as its portion of the initial sales charge on sales of Class A and Class 529A shares of the fund, respectively.
The Board of Trustees has adopted a distribution plan for certain class shares pursuant to Rule 12b-1 of the Investment Company Act of 1940.
49
Notes to Financial Statements – continued
The fund’s distribution plan provides that the fund will pay MFD for services provided by MFD and financial intermediaries in connection with the distribution and servicing of certain share classes. One component of the plan is a distribution fee paid to MFD and another component of the plan is a service fee paid to MFD. MFD may subsequently pay all, or a portion, of the distribution and/or service fees to financial intermediaries.
Distribution Plan Fee Table:
| | | | | | | | | | |
| | | Distribution Fee Rate | | Service
Fee Rate | | Total
Distribution
Plan (d) | | Annual
Effective
Rate (e) | | Distribution
and Service
Fee |
| Class A | | 0.10% | | 0.25% | | 0.35% | | 0.30% | | $1,839,514 |
| Class B | | 0.75% | | 0.25% | | 1.00% | | 1.00% | | 1,551,031 |
| Class C | | 0.75% | | 0.25% | | 1.00% | | 1.00% | | 824,092 |
| Class R | | 0.25% | | 0.25% | | 0.50% | | 0.50% | | 16,294 |
| Class R1 (c) | | 0.50% | | 0.25% | | 0.75% | | 0.75% | | 5,827 |
| Class R2 | | 0.25% | | 0.25% | | 0.50% | | 0.50% | | 2,564 |
| Class R3 | | 0.25% | | 0.25% | | 0.50% | | 0.50% | | 17,186 |
| Class R4 | | — | | 0.25% | | 0.25% | | 0.25% | | 18,665 |
| Class 529A | | 0.25% | | 0.25% | | 0.50% | | 0.35% | | 3,093 |
| Class 529B | | 0.75% | | 0.25% | | 1.00% | | 1.00% | | 2,241 |
| Class 529C | | 0.75% | | 0.25% | | 1.00% | | 1.00% | | 4,117 |
| Total Distribution and Service Fees | | | | | | | | $4,284,624 |
| (c) | Effective March 1, 2008, the distribution fee rate for Class R1 shares will be 0.75%. |
| (d) | In accordance with the distribution plan for certain classes, the fund pays distribution and/or service fees up to these annual percentage rates of each class’ average daily net assets. |
| (e) | The annual effective rates represent actual fees incurred under the distribution plan for the year ended January 31, 2008 based on each class’ average daily net assets. Assets attributable to Class A shares sold prior to March 1, 1991 are subject to a service fee of 0.15% annually. 0.05% of the Class A and 0.10% of the Class 529A distribution fee is currently being paid by the fund. Payment of the remaining 0.05% of the Class A and 0.15% of the Class 529A distribution fee is not yet in effect and will be implemented on such date as the fund’s Board of Trustees may determine. |
Certain Class A, Class C and Class 529C shares are subject to a contingent deferred sales charge in the event of a shareholder redemption within 12 months of purchase. Class B and Class 529B shares are subject to a contingent deferred sales charge in the event of a shareholder redemption within six years of purchase. All contingent deferred sales charges are paid to MFD and during the year ended January 31, 2008, were as follows:
| | |
| | | Amount |
| Class A | | $7,643 |
| Class B | | $252,935 |
| Class C | | $5,198 |
| Class 529B | | $39 |
| Class 529C | | $— |
The fund has entered into and may from time to time enter into contracts with program managers and other parties which administer the tuition programs
50
Notes to Financial Statements – continued
through which an investment in the fund’s 529 share classes is made. The fund has entered into an agreement with MFD pursuant to which MFD receives an annual fee of up to 0.35% of the average daily net assets attributable to each 529 share class. The fee is based on average daily net assets and is currently established at 0.25% annually of average daily net assets of the fund’s 529 share classes. Effective April 1, 2008, the fee will be 0.10%. The fee may only be increased with the approval of the Board of Trustees who oversees the fund. The services provided by MFD, or a third party with which MFD contracts, include recordkeeping and tax reporting and account services, as well as services designed to maintain the program’s compliance with the Internal Revenue Code and other regulatory requirements. Program manager fees for the year ended January 31, 2008, were as follows:
| | |
| | | Amount |
| Class 529A | | $2,210 |
| Class 529B | | 560 |
| Class 529C | | 1,029 |
| Total Program Manager Fees | | $3,799 |
Shareholder Servicing Agent – MFS Service Center, Inc. (MFSC), a wholly-owned subsidiary of MFS, receives a fee from the fund for its services as shareholder servicing agent calculated as a percentage of the average daily net assets of the fund as determined periodically under the supervision of the fund’s Board of Trustees. For the year ended January 31, 2008, the fee was $530,123, which equated to 0.0470% annually of the fund’s average daily net assets. MFSC also receives payment from the fund for out-of-pocket expenses, sub-accounting and other shareholder servicing costs which may be paid to affiliated and unaffiliated service providers. For the year ended January 31, 2008, these out-of-pocket expenses, sub-accounting and other shareholder servicing costs amounted to $679,311. The fund may also pay shareholder servicing related costs directly to non-related parties.
Effective May 1, 2007, under a Special Servicing Agreement among MFS, each MFS fund which invests in other MFS funds (“MFS fund-of-funds”) and each underlying fund in which a MFS fund-of-funds invests (“underlying funds”), each underlying fund may pay a portion of each MFS fund-of-fund’s transfer agent-related expenses, including sub-accounting fees payable to financial intermediaries, to the extent such payments do not exceed the benefits realized or expected to be realized by the underlying fund from the investment in the underlying fund by the MFS fund-of-fund. For the year ended January 31, 2008, these costs for the fund amounted to $309,685 and are reflected in the shareholder servicing costs on the Statement of Operations.
Administrator – MFS provides certain financial, legal, shareholder communications, compliance, and other administrative services to the fund.
51
Notes to Financial Statements – continued
Under an administrative services agreement, the fund partially reimburses MFS the costs incurred to provide these services. The fund is charged a fixed amount plus a fee based on average daily net assets. The fund’s annual fixed amount is $17,500.
The administrative services fee incurred for the year ended January 31, 2008 was equivalent to an annual effective rate of 0.0168% of the funds average daily net assets.
In addition to the administrative services provided by MFS to the fund as described above, MFS is responsible for providing certain retirement plan administration and services with respect to certain shares. These services include various administrative, recordkeeping, and communication/educational services with respect to the retirement plans which invest in these shares, and may be provided directly by MFS or by a third party. MFS may subsequently pay all, or a portion, of the retirement plan administration and services fee to affiliated or unaffiliated third parties. For the year ended January 31, 2008, the fund paid MFS an annual retirement plan administration and services fee up to the following annual percentage rates of each class’ average daily net assets:
| | | | | | | | |
| | | Beginning
of period
through
3/31/07 | | Effective
4/1/07 | | Annual
Effective
Rate (g) | | Total
Amount |
Class R1 | | 0.45% | | 0.35% | | 0.35% | | $2,786 |
Class R2 | | 0.40% | | 0.25% | | 0.22% | | 1,253 |
Class R3 | | 0.25% | | 0.15% | | 0.13% | | 4,858 |
Class R4 | | 0.15% | | 0.15% | | 0.14% | | 10,199 |
Class R5 | | 0.10% | | 0.10% | | 0.09% | | 53 |
| Total Retirement Plan Administration and Services Fees | | | | | | $19,149 |
| (g) | Prior to April 1, 2007, MFS had agreed in writing to waive a portion of the retirement plan administration and services fee equal to 0.10% for Class R1, 0.15% for Class R2, and 0.10% for Class R3 shares. This agreement was discontinued on March 31, 2007. On April 1, 2007, the annual retirement plan administration and services fee for Class R1, Class R2, and Class R3 shares was lowered to 0.35%, 0.25%, and 0.15%, respectively. Effective January 1, 2008, the annual retirement plan administration and services fee was eliminated for Class R2, Class R3, Class R4 and Class R5 shares. Effective March 1, 2008, the annual retirement plan administration and services fee will be eliminated for Class R1 shares. For the year ended January 31, 2008, the waiver amounted to $592 and is reflected as a reduction of total expenses in the Statement of Operations. |
Trustees’ and Officers’ Compensation – The fund pays compensation to independent trustees in the form of a retainer, attendance fees, and additional compensation to Board and Committee chairpersons. The fund does not pay compensation directly to trustees or officers of the fund who are also officers of the investment adviser, all of whom receive remuneration for their services to the fund from MFS. Certain officers and trustees of the fund are officers or directors of MFS, MFD, and MFSC.
52
Notes to Financial Statements – continued
The fund has an unfunded, defined benefit plan for certain retired independent trustees which resulted in a pension expense of $7,630. The fund also has an unfunded retirement benefit deferral plan for certain independent trustees which resulted in an expense of $1,226. Both amounts are included in independent trustees’ compensation for the year ended January 31, 2008. The liability for deferred retirement benefits payable to certain independent trustees under both plans amounted to $129,220 at January��31, 2008, and is included in payable for independent trustees’ compensation.
Other – This fund and certain other MFS funds (the funds) have entered into a services agreement (the Agreement) which provides for payment of fees by the funds to Tarantino LLC in return for the provision of services of an Independent Chief Compliance Officer (ICCO) for the funds. The ICCO is an officer of the funds and the sole member of Tarantino LLC. The funds can terminate the Agreement with Tarantino LLC at any time under the terms of the Agreement. For the year ended January 31, 2008, the fee paid by the fund to Tarantino LLC was $8,597 and is included in miscellaneous expense on the Statement of Operations. MFS has agreed to reimburse the fund for a portion of the payments made by the fund to Tarantino LLC in the amount of $5,247, which is shown as a reduction of total expenses in the Statement of Operations. Additionally, MFS has agreed to bear all expenses associated with office space, other administrative support, and supplies provided to the ICCO.
The fund may invest in a money market fund managed by MFS which seeks preservation of capital and current income. Income earned on this investment is included in dividends from underlying funds on the Statement of Operations. This money market fund does not pay a management fee to MFS.
Purchases and sales of investments, other than U.S. government securities, purchased option transactions, and short-term obligations, aggregated $712,605,449 and $868,065,393, respectively.
53
Notes to Financial Statements – continued
| (5) | Shares of Beneficial Interest |
The fund’s Declaration of Trust permits the Trustees to issue an unlimited number of full and fractional shares of beneficial interest. Transactions in fund shares were as follows:
| | | | | | | | |
| | | Year ended
1/31/08 | | Year ended
1/31/07 |
| | | Shares | | Amount | | Shares | | Amount |
| Shares sold | | | | | | | | |
Class A | | 38,562,900 | | $147,292,626 | | 30,193,322 | | $115,720,298 |
Class B | | 2,941,333 | | 11,228,161 | | 3,834,252 | | 14,694,024 |
Class C | | 2,894,221 | | 11,072,220 | | 3,267,356 | | 12,574,521 |
Class I | | 9,490,396 | | 36,056,785 | | 10,406,564 | | 39,870,984 |
Class R | | 383,937 | | 1,463,524 | | 404,231 | | 1,551,092 |
Class R1 | | 353,078 | | 1,348,795 | | 55,801 | | 217,031 |
Class R2 | | 185,128 | | 705,976 | | 80,563 | | 309,260 |
Class R3 | | 1,480,388 | | 5,623,215 | | 655,237 | | 2,547,647 |
Class R4 | | 2,343,338 | | 9,094,750 | | 1,650,795 | | 6,370,935 |
Class R5 | | 23 | | 52 | | — | | — |
Class 529A | | 46,353 | | 174,605 | | 37,684 | | 144,149 |
Class 529B | | 12,877 | | 49,690 | | 7,907 | | 30,301 |
Class 529C | | 18,772 | | 71,221 | | 24,449 | | 94,085 |
| | 58,712,744 | | $224,181,620 | | 50,618,161 | | $194,124,327 |
| Shares issued to shareholders in reinvestment of distributions | | | | | | | | |
Class A | | 8,482,288 | | $32,465,531 | | 8,226,268 | | $31,535,651 |
Class B | | 1,698,112 | | 6,531,925 | | 2,239,856 | | 8,607,206 |
Class C | | 932,899 | | 3,589,999 | | 987,760 | | 3,805,122 |
Class I | | 5,475,289 | | 20,903,372 | | 4,892,417 | | 18,744,576 |
Class R | | 66,020 | | 243,806 | | 93,359 | | 358,400 |
Class R1 | | 13,210 | | 50,105 | | 4,498 | | 17,306 |
Class R2 | | 9,428 | | 35,936 | | 6,105 | | 23,481 |
Class R3 | | 61,597 | | 234,304 | | 32,016 | | 122,910 |
Class R4 | | 145,329 | | 553,004 | | 48,637 | | 187,177 |
Class R5 | | 1,225 | | 4,682 | | 1,060 | | 4,063 |
Class 529A | | 17,200 | | 65,701 | | 14,324 | | 54,911 |
Class 529B | | 3,979 | | 15,198 | | 2,879 | | 11,044 |
Class 529C | | 7,367 | | 28,036 | | 7,434 | | 28,580 |
| | 16,913,943 | | $64,721,599 | | 16,556,613 | | $63,500,427 |
54
Notes to Financial Statements – continued
| | | | | | | | | | | | |
| | | Year ended
1/31/08 | | | Year ended
1/31/07 | |
| | | Shares | | | Amount | | | Shares | | | Amount | |
| Shares reacquired | | | | | | | | | | | | |
Class A | | (77,224,190 | ) | | $(292,987,315 | ) | | (51,316,296 | ) | | $(195,796,223 | ) |
Class B | | (22,633,463 | ) | | (86,567,467 | ) | | (28,313,819 | ) | | (108,462,463 | ) |
Class C | | (7,848,898 | ) | | (29,930,027 | ) | | (9,060,985 | ) | | (34,733,775 | ) |
Class I | | (5,776,262 | ) | | (21,370,102 | ) | | (13,051,235 | ) | | (50,482,839 | ) |
Class R | | (1,535,470 | ) | | (5,830,580 | ) | | (622,632 | ) | | (2,390,931 | ) |
Class R1 | | (102,945 | ) | | (397,221 | ) | | (28,705 | ) | | (111,903 | ) |
Class R2 | | (126,552 | ) | | (488,613 | ) | | (41,724 | ) | | (161,038 | ) |
Class R3 | | (612,741 | ) | | (2,355,230 | ) | | (391,110 | ) | | (1,531,661 | ) |
Class R4 | | (1,545,791 | ) | | (5,968,505 | ) | | (490,792 | ) | | (1,916,957 | ) |
Class 529A | | (44,221 | ) | | (164,872 | ) | | (37,189 | ) | | (142,863 | ) |
Class 529B | | (8,721 | ) | | (32,828 | ) | | (411 | ) | | (1,578 | ) |
Class 529C | | (63,456 | ) | | (243,350 | ) | | (13,692 | ) | | (52,438 | ) |
| | (117,522,710 | ) | | $(446,336,110 | ) | | (103,368,590 | ) | | $(395,784,669 | ) |
| Net change | | | | | | | | | | | | |
Class A | | (30,179,002 | ) | | $(113,229,158 | ) | | (12,896,706 | ) | | $(48,540,274 | ) |
Class B | | (17,994,018 | ) | | (68,807,381 | ) | | (22,239,711 | ) | | (85,161,233 | ) |
Class C | | (4,021,778 | ) | | (15,267,808 | ) | | (4,805,869 | ) | | (18,354,132 | ) |
Class I | | 9,189,423 | | | 35,590,055 | | | 2,247,746 | | | 8,132,721 | |
Class R | | (1,085,513 | ) | | (4,123,250 | ) | | (125,042 | ) | | (481,439 | ) |
Class R1 | | 263,343 | | | 1,001,679 | | | 31,594 | | | 122,434 | |
Class R2 | | 68,004 | | | 253,299 | | | 44,944 | | | 171,703 | |
Class R3 | | 929,244 | | | 3,502,289 | | | 296,143 | | | 1,138,896 | |
Class R4 | | 942,876 | | | 3,679,249 | | | 1,208,640 | | | 4,641,155 | |
Class R5 | | 1,248 | | | 4,734 | | | 1,060 | | | 4,063 | |
Class 529A | | 19,332 | | | 75,434 | | | 14,819 | | | 56,197 | |
Class 529B | | 8,135 | | | 32,060 | | | 10,375 | | | 39,767 | |
Class 529C | | (37,317 | ) | | (144,093 | ) | | 18,191 | | | 70,227 | |
| | (41,896,023 | ) | | $(157,432,891 | ) | | (36,193,816 | ) | | $(138,159,915 | ) |
The fund is one of several mutual funds in which the MFS funds-of-funds may invest. The MFS funds-of-funds do not invest in the underlying MFS funds for the purpose of exercising management or control. At the end of the period, the MFS Moderate Allocation Fund and MFS Growth Allocation Fund were the owners of record of approximately 12% and 14%, respectively, of the value of outstanding voting shares. In addition, the MFS Lifetime 2020 Fund and the MFS Lifetime 2030 Fund were each the owners of record of less than 1% of the value of outstanding voting shares.
The fund and other funds managed by MFS participate in a $1 billion unsecured committed line of credit provided by a syndication of banks under a
55
Notes to Financial Statements – continued
credit agreement. In addition, the fund and other funds managed by MFS have established uncommitted borrowing arrangements with certain banks. Borrowings may be made for temporary financing needs. Interest is charged to each fund, based on its borrowings, generally at a rate equal to the Federal Reserve funds rate plus 0.30%. In addition, a commitment fee, based on the average daily, unused portion of the committed line of credit, is allocated among the participating funds at the end of each calendar quarter. For the year ended January 31, 2008, the fund’s commitment fee and interest expense were $6,155 and $0, respectively, and are included in miscellaneous expense on the Statement of Operations.
| (7) | Transactions in Underlying Funds – Affiliated Issuers |
An affiliated issuer may be considered one in which the fund owns 5% or more of the outstanding voting securities, or a company which is under common control. For the purposes of this report, the fund assumes the following to be affiliated issuers:
| | | | | | | | | |
| Underlying Fund | | Beginning
Shares
Amount | | Acquisitions
Shares
Amount | | Dispositions
Shares
Amount | | | Ending
Shares
Amount |
| MFS Institutional Money | | — | | 436,699,524 | | (405,667,923 | ) | | 31,031,601 |
| Market Portfolio | | | | | | | | | |
| Underlying Fund | | Realized
Gain
(Loss) | | Capital Gain
Distributions | | Dividend
Income | | | Ending
Value |
| MFS Institutional Money | | | | | | | | | |
| Market Portfolio | | $— | | $— | | $1,660,700 | | | $31,031,601 |
56
REPORT OF INDEPENDENT REGISTERED PUBLIC ACCOUNTING FIRM
To the Board of Trustees of MFS Series Trust III and the Shareholders of MFS High Income Fund:
We have audited the accompanying statement of assets and liabilities, including the portfolio of investments, of MFS High Income Fund (one of the portfolios comprising MFS Series Trust III) (the “Trust”) as of January 31, 2008, and the related statement of operations for the year then ended, the statements of changes in net assets for each of the two years in the period then ended, and the financial highlights for each of the five years in the period then ended. These financial statements and financial highlights are the responsibility of the Trust’s management. Our responsibility is to express an opinion on these financial statements and financial highlights based on our audits.
We conducted our audits in accordance with the standards of the Public Company Accounting Oversight Board (United States). Those standards require that we plan and perform the audit to obtain reasonable assurance about whether the financial statements and financial highlights are free of material misstatement. The Trust is not required to have, nor were we engaged to perform, an audit of its internal control over financial reporting. Our audits included consideration of internal control over financial reporting as a basis for designing audit procedures that are appropriate in the circumstances, but not for the purpose of expressing an opinion on the effectiveness of the Trust’s internal control over financial reporting. Accordingly, we express no such opinion. An audit also includes examining, on a test basis, evidence supporting the amounts and disclosures in the financial statements, assessing the accounting principles used and significant estimates made by management, as well as evaluating the overall financial statement presentation. Our procedures included confirmation of securities owned as of January 31, 2008, by correspondence with the custodian and brokers; where replies were not received from brokers, we performed other auditing procedures. We believe that our audits provide a reasonable basis for our opinion.
In our opinion, such financial statements and financial highlights present fairly, in all material respects, the financial position of MFS High Income Fund as of January 31, 2008, the results of its operations for the year then ended, the changes in its net assets for each of the two years in the period then ended, and its financial highlights for each of the five years in the period then ended, in conformity with accounting principles generally accepted in the United States of America.
DELOITTE & TOUCHE LLP
Boston, Massachusetts
March 17, 2008
57
TRUSTEES AND OFFICERS — IDENTIFICATION AND BACKGROUND
The Trustees and officers of the Trust, as of March 1, 2008, are listed below, together with their principal occupations during the past five years. (Their titles may have varied during that period.) The address of each Trustee and officer is 500 Boylston Street, Boston, Massachusetts 02116.
| | | | | | |
Name, Date of Birth | | Position(s) Held
with Fund | | Trustee/Officer
Since(h) | | Principal Occupations During
the Past Five Years & Other
Directorships(j) |
| INTERESTED TRUSTEES | | | | |
Robert J. Manning(k)
(born 10/20/63) | | Trustee | | February 2004 | | Massachusetts Financial Services Company, Chief Executive Officer, President, Chief Investment Officer and Director |
Robert C. Pozen(k)
(born 8/08/46) | | Trustee | | February 2004 | | Massachusetts Financial Services Company, Chairman (since February 2004); MIT Sloan School (education), Senior Lecturer (since 2006); Secretary of Economic Affairs, The Commonwealth of Massachusetts (January 2002 to December 2002); Fidelity Investments, Vice Chairman (June 2000 to December 2001); Fidelity Management & Research Company (investment adviser), President (March 1997 to July 2001); Bell Canada Enterprises (telecommunications), Director; Medtronic, Inc. (medical technology), Director; Telesat (satellite communications), Director (until 2007) |
| INDEPENDENT TRUSTEES | | | | |
J. Atwood Ives
(born 5/01/36) | | Trustee and Chair of Trustees | | February 1992 | | Private investor; KeySpan Corporation (energy related services), Director until 2004; Woodstock Corporation (investment advisory firm), Director until 2003 |
Robert E. Butler(n)
(born 11/29/41) | | Trustee | | January 2006 | | Consultant – regulatory and compliance matters (since July 2002); PricewaterhouseCoopers LLP (professional services firm), Partner (until 2002) |
58
Trustees and Officers – continued
| | | | | | |
Name, Date of Birth | | Position(s) Held
with Fund | | Trustee/Officer
Since(h) | | Principal Occupations During
the Past Five Years & Other
Directorships(j) |
Lawrence H. Cohn, M.D.
(born 3/11/37) | | Trustee | | August 1993 | | Brigham and Women’s Hospital, Chief of Cardiac Surgery (2005); Harvard Medical School, Professor of Cardiac Surgery; Physician Director of Medical Device Technology for Partners HealthCare |
David H. Gunning
(born 5/30/42) | | Trustee | | January 2004 | | Retired; Cleveland-Cliffs Inc. (mining products and service provider), Vice Chairman/Director (until May 2007); Portman Limited (mining), Director (since 2005); Encinitos Ventures (private investment company), Principal (1997 to April 2001); Lincoln Electric Holdings, Inc. (welding equipment manufacturer), Director |
William R. Gutow
(born 9/27/41) | | Trustee | | December 1993 | | Private investor and real estate consultant (since 1998); Capital Entertainment Management Company (video franchise), Vice Chairman (since 1998); Texas Donuts (donut franchise), Vice Chairman (since 2007); Atlantic Coast Tan (tanning salons), Vice Chairman (until 2007) |
Michael Hegarty
(born 12/21/44) | | Trustee | | December 2004 | | Retired; AXA Financial (financial services and insurance), Vice Chairman and Chief Operating Officer (until May 2001); The Equitable Life Assurance Society (insurance), President and Chief Operating Officer
(until May 2001) |
Lawrence T. Perera
(born 6/23/35) | | Trustee | | July 1981 | | Hemenway & Barnes (attorneys), Partner |
J. Dale Sherratt
(born 9/23/38) | | Trustee | | August 1993 | | Insight Resources, Inc. (acquisition planning specialists), President; Wellfleet Investments (investor in health care companies), Managing General Partner (since 1993); Cambridge Nutraceuticals (professional nutritional products), Chief Executive Officer (until May 2001) |
59
Trustees and Officers – continued
| | | | | | |
Name, Date of Birth | | Position(s) Held
with Fund | | Trustee/Officer
Since(h) | | Principal Occupations During
the Past Five Years & Other
Directorships(j) |
Laurie J. Thomsen
(born 8/05/57) | | Trustee | | March 2005 | | New Profit, Inc. (venture philanthropy), Partner (since 2006); Private investor; Prism Venture Partners (venture capital), Co-founder and General Partner (until June 2004); The Travelers Companies (commercial property liability insurance), Director |
Robert W. Uek
(born 5/18/41) | | Trustee | | January 2006 | | Retired (since 1999); PricewaterhouseCoopers LLP (professional services firm), Partner (until 1999); Consultant to investment company industry (since 2000); TT International Funds (mutual fund complex), Trustee (2000 until 2005); Hillview Investment Trust II Funds (mutual fund complex), Trustee (2000 until 2005) |
| OFFICERS | | | | | | |
Maria F. Dwyer(k)
(born 12/01/58) | | President | | November 2005 | | Massachusetts Financial Services Company, Executive Vice President and Chief Regulatory Officer (since March 2004) Chief Compliance Officer (since December 2006); Fidelity Management & Research Company, Vice President (prior to March 2004); Fidelity Group of Funds, President and Treasurer (prior to March 2004) |
Tracy Atkinson(k)
(born 12/30/64) | | Treasurer | | September 2005 | | Massachusetts Financial Services Company, Senior Vice President (since September 2004); PricewaterhouseCoopers LLP, Partner (prior to September 2004) |
Christopher R. Bohane(k)
(born 1/18/74) | | Assistant Secretary and Assistant Clerk | | July 2005 | | Massachusetts Financial Services Company, Vice President and Senior Counsel (since April 2003); Kirkpatrick & Lockhart LLP (law firm), Associate (prior to April 2003) |
Ethan D. Corey(k)
(born 11/21/63) | | Assistant Secretary and Assistant Clerk | | July 2005 | | Massachusetts Financial Services Company, Senior Vice President and Associate General Counsel (since April 2006); Special Counsel (prior to April 2006); Dechert LLP (law firm), Counsel (prior to December 2004) |
60
Trustees and Officers – continued
| | | | | | |
Name, Date of Birth | | Position(s) Held
with Fund | | Trustee/Officer
Since(h) | | Principal Occupations During
the Past Five Years & Other
Directorships(j) |
David L. DiLorenzo(k)
(born 8/10/68) | | Assistant Treasurer | | July 2005 | | Massachusetts Financial Services Company, Vice President (since June 2005); JP Morgan Investor Services, Vice President (prior to June 2005) |
Timothy M. Fagan(k)
(born 7/10/68) | | Assistant Secretary and Assistant Clerk | | September 2005 | | Massachusetts Financial Services Company, Vice President and Senior Counsel (since September 2005); John Hancock Advisers, LLC, Vice President and Chief Compliance Officer (September 2004 to August 2005), Senior Attorney (prior to September 2004); John Hancock Group of Funds, Vice President and Chief Compliance Officer (September 2004 to December 2004) |
Mark D. Fischer(k)
(born 10/27/70) | | Assistant Treasurer | | July 2005 | | Massachusetts Financial Services Company, Vice President (since May 2005); JP Morgan Investment Management Company, Vice President (prior to May 2005) |
Brian E. Langenfeld(k) (born 3/07/73) | | Assistant Secretary and Assistant Clerk | | June 2006 | | Massachusetts Financial Services Company, Assistant Vice President and Counsel (since May 2006); John Hancock Advisers, LLC, Assistant Vice President and Counsel (May 2005 to April 2006); John Hancock Advisers, LLC, Attorney and Assistant Secretary (prior to May 2005) |
Ellen Moynihan(k)
(born 11/13/57) | | Assistant Treasurer | | April 1997 | | Massachusetts Financial Services Company, Senior Vice President |
| | | |
Susan S. Newton(k) (born 3/07/50) | | Assistant Secretary and Assistant Clerk | | May 2005 | | Massachusetts Financial Services Company, Senior Vice President and Associate General Counsel (since April 2005); John Hancock Advisers, LLC, Senior Vice President, Secretary and Chief Legal Officer (prior to April 2005); John Hancock Group of Funds, Senior Vice President, Secretary and Chief Legal Officer (prior to April 2005) |
61
Trustees and Officers – continued
| | | | | | |
Name, Date of Birth | | Position(s) Held
with Fund | | Trustee/Officer
Since(h) | | Principal Occupations During
the Past Five Years & Other
Directorships(j) |
Susan A. Pereira(k)
(born 11/05/70) | | Assistant Secretary and Assistant Clerk | | July 2005 | | Massachusetts Financial Services Company, Vice President and Senior Counsel (since June 2004); Bingham McCutchen LLP (law firm), Associate (prior to June 2004) |
Mark N. Polebaum(k)
(born 5/01/52) | | Secretary and Clerk | | January 2006 | | Massachusetts Financial Services Company, Executive Vice President, General Counsel and Secretary (since January 2006); Wilmer Cutler Pickering Hale and Dorr LLP (law firm), Partner (prior to January 2006) |
Frank L. Tarantino
(born 3/07/44) | | Independent Chief Compliance Officer | | June 2004 | | Tarantino LLC (provider of compliance services), Principal (since June 2004); CRA Business Strategies Group (consulting services), Executive Vice President (April 2003 to June 2004); David L. Babson & Co. (investment adviser), Managing Director, Chief Administrative Officer and Director (prior to March 2003) |
Richard S. Weiztel(k)
(born 7/16/70) | | Assistant Secretary and Assistant Clerk | | October 2007 | | Massachusetts Financial Services Company, Vice President and Assistant General Counsel (since 2007); Vice President and Senior Counsel (since May 2004); Massachusetts Department of Business and Technology, General Counsel (February 2003 to April 2004); Massachusetts Office of the Attorney General, Assistant Attorney General (April 2001 to February 2003); Ropes and Gray, Associate (prior to April 2001) |
James O. Yost(k)
(born 6/12/60) | | Assistant Treasurer | | September 1990 | | Massachusetts Financial Services Company, Senior Vice President |
| (h) | Date first appointed to serve as Trustee/officer of an MFS fund. Each Trustee has served continuously since appointment unless indicated otherwise. |
| (j) | Directorships or trusteeships of companies required to report to the Securities and Exchange Commission (i.e., “public companies”). |
| (k) | “Interested person” of the Trust within the meaning of the Investment Company Act of 1940 (referred to as the 1940 Act), which is the principal federal law governing investment companies like the fund, as a result of position with MFS. The address of MFS is 500 Boylston Street, Boston, Massachusetts 02116. |
62
Trustees and Officers – continued
| (n) | In 2004 and 2005, Mr. Butler provided consulting services to the independent compliance consultant retained by MFS pursuant to its settlement with the SEC concerning market timing and related matters. The terms of that settlement required that compensation and expenses related to the independent compliance consultant be borne exclusively by MFS and, therefore, MFS paid Mr. Butler for the services he rendered to the independent compliance consultant. In 2004 and 2005, MFS paid Mr. Butler a total of $351,119.29. |
The Trust held a shareholders’ meeting in 2005 to elect Trustees, and will hold a shareholders’ meeting at least once every five years thereafter, to elect Trustees.
Each Trustee (except Mr. Butler and Mr. Uek) has been elected by shareholders and each Trustee and officer holds office until his or her successor is chosen and qualified or until his or her earlier death, resignation, retirement or removal. Messrs. Butler, Gutow, Sherratt and Uek and Ms. Thomsen are members of the Trust’s Audit Committee.
Each of the Trust’s Trustees and officers holds comparable positions with certain other funds of which MFS or a subsidiary is the investment adviser or distributor, and, in the case of the officers, with certain affiliates of MFS. As of January 1, 2008, the Trustees served as board members of 100 funds within the MFS Family of Funds.
The Statement of Additional Information contains further information about the Trustees and is available without charge upon request by calling 1-800-225-2606.
| | |
| Investment Adviser | | Custodian |
Massachusetts Financial Services Company
500 Boylston Street, Boston, MA 02116-3741 | | JPMorgan Chase Bank
One Chase Manhattan Plaza
New York, NY 10081 |
| Distributor | | Independent Registered Public Accounting Firm |
MFS Fund Distributors, Inc.
500 Boylston Street, Boston, MA 02116-3741 | | Deloitte & Touche LLP
200 Berkeley Street, Boston, MA 02116 |
| Portfolio Managers | | |
| John Addeo | | |
| David Cole | | |
63
BOARD REVIEW OF INVESTMENT ADVISORY AGREEMENT
A discussion regarding the Board’s most recent review and renewal of the Fund’s investment advisory agreement is available by clicking on the fund’s name under “Select a fund” on the MFS Web site (mfs.com).
PROXY VOTING POLICIES AND INFORMATION
A general description of the MFS funds’ proxy voting policies and procedures is available without charge, upon request, by calling 1-800-225-2606, by visiting the Proxy Voting section of mfs.com or by visiting the SEC’s Web site at http://www.sec.gov.
Information regarding how the fund voted proxies relating to portfolio securities during the most recent twelve-month period ended June 30 is available without charge by visiting the Proxy Voting section of mfs.com or by visiting the SEC’s Web site at http://www.sec.gov.
QUARTERLY PORTFOLIO DISCLOSURE
The fund will file a complete schedule of portfolio holdings with the Securities and Exchange Commission (the Commission) for the first and third quarters of each fiscal year on Form N-Q. The fund’s Form N-Q may be reviewed and copied at the:
Public Reference Room
Securities and Exchange Commission
100 F Street, NE, Room 1580
Washington, D.C. 20549
Information on the operation of the Public Reference Room may be obtained by calling the Commission at 1-800-SEC-0330. The fund’s Form N-Q is available on the EDGAR database on the Commission’s Internet Web site at http://www.sec.gov, and copies of this information may be obtained, upon payment of a duplicating fee, by electronic request at the following e-mail address: publicinfo@sec.gov or by writing the Public Reference Section at the above address.
A shareholder can also obtain the quarterly portfolio holdings report at mfs.com.
FEDERAL TAX INFORMATION (unaudited)
The fund will notify shareholders of amounts for use in preparing 2008 income tax forms in January 2009.
64
MFS® PRIVACY NOTICE
Privacy is a concern for every investor today. At MFS Investment Management® and the MFS funds, we take this concern very seriously. We want you to understand our policies about the investment products and services that we offer, and how we protect the nonpublic personal information of investors who have a direct relationship with us and our wholly owned subsidiaries.
Throughout our business relationship, you provide us with personal information. We maintain information and records about you, your investments, and the services you use. Examples of the nonpublic personal information we maintain include
| | Ÿ | | data from investment applications and other forms |
| | Ÿ | | share balances and transactional history with us, our affiliates, or others |
| | Ÿ | | facts from a consumer reporting agency |
We do not disclose any nonpublic personal information about our customers or former customers to anyone, except as permitted by law. We may share nonpublic personal information with third parties or certain of our affiliates in connection with servicing your account or processing your transactions. We may share information with companies or financial institutions that perform marketing services on our behalf or with other financial institutions with which we have joint marketing arrangements, subject to any legal requirements.
Authorization to access your nonpublic personal information is limited to appropriate personnel who provide products, services, or information to you. We maintain physical, electronic, and procedural safeguards to help protect the personal information we collect about you.
If you have any questions about the MFS privacy policy, please call 1-800-225-2606 any business day between 8 a.m. and 8 p.m. Eastern time.
Note: If you own MFS products or receive MFS services in the name of a third party such as a bank or broker-dealer, their privacy policy may apply to you instead of ours.
65


MFS® Municipal High Income Fund
| | |
| CONTACT INFORMATION | | BACK COVER |
SIPC Contact Information:
You may obtain information about the Securities Investor Protection Corporation (“SIPC”), including the SIPC Brochure, by contacting SIPC either by telephone (202-371-8300) or by accessing SIPC’s website address (www.sipc.org).
The report is prepared for the general information of shareholders. It is authorized for distribution to prospective investors only when preceded or accompanied by a current prospectus.
NOT FDIC INSURED Ÿ MAY LOSE VALUE Ÿ NO BANK OR CREDIT UNION GUARANTEE Ÿ NOT A DEPOSIT Ÿ NOT INSURED BY ANY FEDERAL GOVERNMENT AGENCY OR NCUA/NCUSIF
1/31/08
MMH-ANN

LETTER FROM THE CEO
Dear Shareholders:
Many of our MFS® fund shareholders have been justifiably concerned, as have most investors around the world, about the state of the global economy. As we enter 2008 we see the market volatility that began in the third quarter of 2007 has intensified.
We here at MFS, and those before us who guided the firm with the same disciplined investment process, have weathered many major economic disruptions over our eight-plus decades of managing clients’ investments. We have managed money through the Great Depression, 14 recessions, as well as numerous market crises caused by wars, political upheavals, and terrorist attacks. MFS remains in business because our investors believe in the integrity of our long-term investment strategy and its proven results.
Worries over market volatility are valid, and investors cannot always expect to see the kind of returns stocks have delivered in the bull markets of past years. Yet we believe our strategy of ADR — allocating across the major asset classes, diversifying within each class, and regularly rebalancing your portfolio to maintain your desired allocation — can help you pursue the highest investment returns while minimizing the effects of market fluctuations.
MFS is a world leader in domestic and global investing. Our team approach is research driven, globally integrated, and balanced. We have 176 investment management professionals located in the Americas, Europe, and Asia who focus on the fundamentals of each security and then integrate our sophisticated quantitative approach.* This collaborative process allows us to find opportunities in any market environment.
I personally would like to thank you for your continued business. We want you to be confident that we are constantly managing our fund offerings with you in mind, while adding new products that can help you to choose what fits your unique financial goals.
Respectfully,

Robert J. Manning
Chief Executive Officer and Chief Investment Officer
MFS Investment Management®
March 14, 2008
* as of 12/31/07
The opinions expressed in this letter are subject to change, may not be relied upon for investment advice, and no forecasts can be guaranteed.
1
PORTFOLIO COMPOSITION
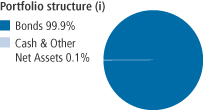
| | |
| Top five industries (i) | | |
| Healthcare Revenue – Hospitals | | 23.0% |
| Healthcare Revenue – Long Term Care | | 13.0% |
| Tax Assessment | | 8.1% |
| Tobacco | | 7.1% |
| Industrial Revenue – Airlines | | 6.0% |
| | |
| Credit quality of bonds (r) | | |
| AAA | | 15.5% |
| AA | | 3.1% |
| A | | 3.3% |
| BBB | | 24.7% |
| BB | | 7.3% |
| B | | 7.6% |
| CCC | | 1.9% |
| CC (o) | | 0.0% |
| C | | 0.1% |
| Not Rated | | 36.5% |
| | |
| Portfolio facts | | |
| Average Duration (d)(i) | | 8.4 |
| Average Life (i)(m) | | 17.1 yrs. |
| Average Maturity (i)(m) | | 19.4 yrs. |
| Average Credit Quality of Rated Securities (long-term) (a) | | BBB+ |
| (a) | The average credit quality of rated securities is based upon a market weighted average of portfolio holdings that are rated by public rating agencies. |
| (d) | Duration is a measure of how much a bond’s price is likely to fluctuate with general changes in interest rates, e.g., if rates rise 1.00%, a bond with a 5-year duration is likely to lose about 5.00% of its value. |
| (i) | For purposes of this presentation, the bond component includes accrued interest amounts and may be positively or negatively impacted by the equivalent exposure from any derivative holdings, if applicable. |
| (m) | The average maturity shown is calculated using the final stated maturity on the portfolio’s holdings without taking into account any holdings which have been pre-refunded or pre-paid to an earlier date or which have a mandatory put date prior to the stated maturity. The average life shown takes into account these earlier dates. |
| (r) | Each security is assigned a rating from Moody’s Investors Service. If not rated by Moody’s, the rating will be that assigned by Standard & Poor’s. Likewise, if not assigned a rating by Standard & Poor’s, it will be based on the rating assigned by Fitch, Inc. For those portfolios that hold a security which is not rated by any of the three agencies, the security is considered Not Rated. Holdings in U.S. Treasuries and government agency mortgage-backed securities, if any, are included in the “AAA”-rating category. Percentages are based on the total market value of investments as of 01/31/08. |
Percentages are based on net assets as of 01/31/08, unless otherwise noted.
The portfolio is actively managed and current holdings may be different.
2
MANAGEMENT REVIEW
Summary of Results
For the twelve months ended January 31, 2008, Class A shares of the MFS Municipal High Income Fund provided a total return of 0.04%, at net asset value. This compares with a return of 4.93% for the fund’s benchmark, the Lehman Brothers Municipal Bond Index.
Market environment
The U.S. economy and financial markets experienced deterioration and heightened volatility over the reporting period. U.S. economic growth slowed significantly in the fourth quarter of 2007 and the domestic economy continued to be buffeted by headwinds as we entered 2008. These challenges included continued weakness in the housing market, subdued corporate investment, signs of a weaker job market, and a tighter credit environment as banks sought to repair balance sheets. While reasonably resilient, parts of the global economy and financial system experienced some spillover from the U.S. slowdown. Japanese growth slowed over the reporting period and European financial markets were adversely affected by U.S. mortgage and structured product losses.
In the face of this financial and economic turmoil, most global central banks were forced to inject liquidity and to reassess their tightening biases as government bond yields declined and credit spreads widened. Late in the reporting period, the U.S. Federal Reserve Board began an aggressive rate cutting campaign, while the U.S. federal government moved quickly to design a modest fiscal stimulus package. Though the Bank of England and the Bank of Canada also cut rates, the dilemma of rising energy and food prices heightened concerns among central bankers that inflationary expectations might become unhinged.
By the end of the reporting period, bond yields and credit spreads implied market expectations of further financial and economic weakening, as well as continued rate cuts by many global central banks. However, global equity markets recorded only a modest decline from third quarter highs.
Factors affecting performance
While the fund’s relative performance suffered across the quality spectrum, the principal negative impacts occurred among “BBB” and lower-rated securities. During the period, spreads in these credit sectors widened, causing prices of these securities to depreciate. (The Lehman Brothers Municipal Bond Index is composed primarily of higher-grade securities with no bonds rated below “BBB”.)
Our positioning along the yield curve(y) was another area of relative weakness. The fund was overweight in its holdings of bonds with longer maturities over the investment period. As the municipal yield curve steepened, the value of longer maturity bonds decreased in value.
3
Management review – continued
Security selection in the general obligation, health care, and tobacco sectors also held back relative returns. Additionally, during this period, concerns surrounding insurance companies who guarantee municipal debt came into question which further dampened relative results.
Respectfully,
| | |
| Gary Lasman | | Geoffrey Schechter |
| Portfolio Manager | | Portfolio Manager |
| (s) | Bonds rated “BBB”, “Baa”, or higher are considered investment grade; bonds rated “BB”, “Ba”, or below are considered non-investment grade. The primary source for bond quality ratings is Moody’s Investors Service. If not available, ratings by Standard & Poor’s are used, else ratings by Fitch, Inc. For securities which are not rated by any of the three agencies, the security is considered Not Rated. |
| (y) | A yield curve graphically depicts the yields of different maturity bonds of the same credit quality and type; a normal yield curve is upward sloping, with short-term rates lower than long-term rates. |
The views expressed in this report are those of the portfolio managers only through the end of the period of the report as stated on the cover and do not necessarily reflect the views of MFS or any other person in the MFS organization. These views are subject to change at any time based on market or other conditions, and MFS disclaims any responsibility to update such views. These views may not be relied upon as investment advice or an indication of trading intent on behalf of any MFS portfolio. References to specific securities are not recommendations of such securities, and may not be representative of any MFS portfolio’s current or future investments.
4
PERFORMANCE SUMMARY THROUGH 1/31/08
The following chart illustrates a representative class of the fund’s historical performance in comparison to its benchmark. Performance results include the deduction of the maximum applicable sales charge and reflect the percentage change in net asset value, including reinvestment of dividends and capital gains distributions. The performance of other share classes will be greater than or less than that of the class depicted below. Benchmark comparisons are unmanaged; do not reflect sales charges, commissions or expenses; and cannot be invested in directly. (See Notes to Performance Summary.)
Performance data shown represents past performance and is no guarantee of future results. Investment return and principal value fluctuate so your shares, when sold, may be worth more or less than the original cost; current performance may be lower or higher than quoted. The performance shown does not reflect the deduction of taxes, if any, that a shareholder would pay on fund distributions or the redemption of fund shares.
Growth of a hypothetical $10,000 investment
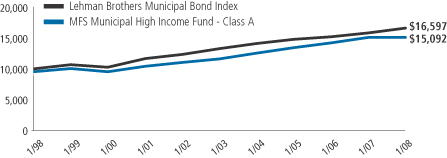
5
Performance summary – continued
Total returns through 1/31/2008
Average annual without sales charge
| | | | | | | | | | | | |
| | | Share class | | Class inception date | | 1-yr | | 5-yr | | 10-yr | | |
| | | A | | 2/24/84 | | 0.04% | | 5.42% | | 4.71% | | |
| | | B | | 9/07/93 | | (0.85)% | | 4.62% | | 3.87% | | |
| | | C | | 9/25/98 | | (1.08)% | | 4.35% | | 3.66% | | |
Average Annual
Comparative benchmarks
| | | | | | | | | | |
| | | Lehman Brothers Municipal Bond Index (f) | | 4.93% | | 4.62% | | 5.20% | | |
Average annual with sales charge
| | | | | | | | | | |
| | | A With Initial Sales Charge (4.75%) | | (4.71)% | | 4.40% | | 4.20% | | |
| | | B With CDSC (Declining over six years from 4% to 0%) (x) | | (4.64)% | | 4.28% | | 3.87% | | |
| | | C With CDSC (1% for 12 months) (x) | | (2.02)% | | 4.35% | | 3.66% | | |
CDSC – Contingent Deferred Sales Charge.
| (f) | Source: FactSet Research Systems Inc. |
| (x) | Assuming redemption at the end of the applicable period. |
Index Definition
Lehman Brothers Municipal Bond Index – a market capitalization-weighted index that measures the performance of the tax-exempt bond market.
It is not possible to invest directly in an index.
Notes to Performance Summary
Performance for class C shares includes the performance of the fund’s class B shares for periods prior to their offering. This blended class performance has been adjusted to take into account differences in sales loads, if any, applicable to these share classes, but has not been adjusted to take into account differences in class specific operating expenses (such as Rule 12b-1 fees). Compared to performance these share classes would have experienced had they been offered for the entire period, the use of blended performance generally results in higher performance for share classes with higher operating expenses than the share class to which it is blended, and lower performance for share classes with lower operating expenses than the share class to which it is Blended.
Performance results reflect any applicable expense subsidies and waivers in effect during the periods shown. Without such subsidies and waivers the fund’s performance results would be less favorable. Please see the prospectus and financial statements for complete details.
6
Performance summary – continued
A portion of income may be subject to state, federal, and/or alternative minimum tax. Capital gains, if any, are subject to a capital gains tax.
From time to time the fund may receive proceeds from litigation settlements, without which performance would be lower.
7
EXPENSE TABLE
Fund expenses borne by the shareholders during the period,
August 1, 2007 through January 31, 2008
As a shareholder of the fund, you incur two types of costs: (1) transaction costs, including sales charges (loads) on certain purchase or redemption payments and (2) ongoing costs, including management fees; distribution and service (12b-1) fees; and other fund expenses. This example is intended to help you understand your ongoing costs (in dollars) of investing in the fund and to compare these costs with the ongoing costs of investing in other mutual funds.
The example is based on an investment of $1,000 invested at the beginning of the period and held for the entire period August 1, 2007 through January 31, 2008.
Actual expenses
The first line for each share class in the following table provides information about actual account values and actual expenses. You may use the information in this line, together with the amount you invested, to estimate the expenses that you paid over the period. Simply divide your account value by $1,000 (for example, an $8,600 account value divided by $1,000 = 8.6), then multiply the result by the number in the first line under the heading entitled “Expenses Paid During Period” to estimate the expenses you paid on your account during this period.
Hypothetical example for comparison purposes
The second line for each share class in the following table provides information about hypothetical account values and hypothetical expenses based on the fund’s actual expense ratio and an assumed rate of return of 5% per year before expenses, which is not the fund’s actual return. The hypothetical account values and expenses may not be used to estimate the actual ending account balance or expenses you paid for the period. You may use this information to compare the ongoing costs of investing in the fund and other funds. To do so, compare this 5% hypothetical example with the 5% hypothetical examples that appear in the shareholder reports of the other funds.
Please note that the expenses shown in the table are meant to highlight your ongoing costs only and do not reflect any transactional costs, such as sales charges (loads). Therefore, the second line for each share class in the table is useful in comparing ongoing costs only, and will not help you determine the relative total costs of owning different funds. In addition, if these transactional costs were included, your costs would have been higher.
8
Expense table – continued
| | | | | | | | | | |
Share
Class | | | | Annualized
Expense
Ratio | | Beginning
Account Value
8/1/07 | | Ending
Account Value
1/31/08 | | Expenses
Paid During
Period (p)
8/1/07-1/31/08 |
| A | | Actual | | 0.75% | | $1,000.00 | | $990.35 | | $3.76 |
| | Hypothetical (h) | | 0.75% | | $1,000.00 | | $1,021.42 | | $3.82 |
| B | | Actual | | 1.52% | | $1,000.00 | | $986.52 | | $7.61 |
| | Hypothetical (h) | | 1.52% | | $1,000.00 | | $1,017.54 | | $7.73 |
| C | | Actual | | 1.75% | | $1,000.00 | | $984.22 | | $8.75 |
| | Hypothetical (h) | | 1.75% | | $1,000.00 | | $1,016.38 | | $8.89 |
| (h) | 5% class return per year before expenses. |
| (p) | Expenses paid is equal to each class’ annualized expense ratio, as shown above, multiplied by the average account value over the period, multiplied by the number of days in the period, divided by the number of days in the year. Expenses paid do not include any applicable sales charges (loads). If these transaction costs had been included, your costs would have been higher. |
9
PORTFOLIO OF INVESTMENTS
1/31/08
The Portfolio of Investments is a complete list of all securities owned by your fund. It is categorized by broad-based asset classes.
| | | | | | |
| Municipal Bonds - 98.5% | | | | | | |
| Issuer | | Shares/Par | | Value ($) |
| | | | | | |
| Airport & Port Revenue - 1.4% | | | | | | |
| Branson, MO, Regional Airport Transportation Development District Airport Rev., “B”, 6%, 2025 | | $ | 1,200,000 | | $ | 1,145,085 |
| Branson, MO, Regional Airport Transportation Development District Airport Rev., “B”, 6%, 2037 | | | 300,000 | | | 282,660 |
| Branson, MO, Regional Airport Transportation Development District Airport Rev., “B”, 6%, 2037 | | | 2,480,000 | | | 2,305,904 |
| Chicago, IL, O’Hare International Airport Rev. (Third Lien Passenger Facility), “B”, FSA, 5.75%, 2022 (u) | | | 12,500,000 | | | 13,368,625 |
| Denver, CO, City & County Airport Rev., AMBAC, 6%, 2017 (u) | | | 5,000,000 | | | 5,250,700 |
| | | | | | |
| | | | | | $ | 22,352,974 |
| General Obligations - General Purpose - 2.2% | | | | | | |
| Commonwealth of Massachusetts, 5.375%, 2011 (c)(u) | | $ | 4,000,000 | | $ | 4,410,440 |
| Commonwealth of Puerto Rico, “A”, 5.25%, 2027 | | | 665,000 | | | 678,094 |
| Cranston, RI, FGIC, 6.375%, 2009 (c) | | | 855,000 | | | 926,504 |
Kane Kendall County, IL, Capital Appreciation, “E”, FGIC,
0%, 2023 | | | 5,945,000 | | | 2,759,431 |
Kane Kendall County, IL, Capital Appreciation, “E”, FGIC,
0%, 2025 | | | 6,000,000 | | | 2,478,600 |
| Little Rock, AR, Capital Improvement Rev., 5.7%, 2018 | | | 670,000 | | | 676,573 |
| Los Angeles, CA, FGIC, 5.25%, 2015 (u) | | | 10,620,000 | | | 12,058,160 |
| Texas Department of Transportation, 7%, 2012 | | | 119,167 | | | 121,841 |
| Texas Transportation Commission Mobility Fund, 5%, 2037 | | | 9,130,000 | | | 9,427,364 |
| West Warwick, RI, 7.45%, 2013 | | | 365,000 | | | 373,669 |
| | | | | | |
| | | | | | $ | 33,910,676 |
| General Obligations - Improvement - 0.4% | | | | | | |
Massachusetts Bay Transportation Authority Sales Tax Rev.,
5%, 2031 | | $ | 4,000,000 | | $ | 4,317,720 |
| Mississippi Development Bank Special Obligation (Greenville, MS Project), 5%, 2027 | | | 1,750,000 | | | 1,613,938 |
| | | | | | |
| | | | | | $ | 5,931,658 |
| General Obligations - Schools - 3.3% | | | | | | |
| Chicago, IL, Board of Education, FGIC, 5.25%, 2020 (u) | | $ | 15,820,000 | | $ | 17,804,619 |
DeSoto, TX, Independent School District, School Building, PSF,
0%, 2031 | | | 1,700,000 | | | 491,997 |
10
Portfolio of Investments – continued
| | | | | | |
| Issuer | | Shares/Par | | Value ($) |
| | | | | | |
| Municipal Bonds - continued | | | | | | |
| General Obligations - Schools - continued | | | | | | |
DeSoto, TX, Independent School District, School Building, PSF,
0%, 2034 | | $ | 1,285,000 | | $ | 315,056 |
DeSoto, TX, Independent School District, School Building, PSF,
0%, 2036 | | | 1,715,000 | | | 378,209 |
| Florida Board of Education, FGIC, 5.25%, 2012 (u) | | | 3,000,000 | | | 3,285,600 |
| Florida Board of Education, FGIC, 5.25%, 2013 (u) | | | 10,000,000 | | | 11,062,500 |
Irving, TX, Independent School District, Capital Appreciation, PSF,
0%, 2026 | | | 3,495,000 | | | 1,366,440 |
| Kane, Cook & DuPage Counties, IL, FSA, 6.375%, 2011 (c) | | | 1,255,000 | | | 1,394,543 |
| Kane, Cook & DuPage Counties, IL, FSA, 6.5%, 2011 (c) | | | 1,355,000 | | | 1,510,391 |
| Leander, TX, Independent School District, PSF, 0%, 2029 | | | 7,310,000 | | | 2,232,401 |
| Leander, TX, Independent School District, PSF, 0%, 2030 | | | 6,480,000 | | | 1,863,130 |
| Prosper, TX, Independent School District, Capital Appreciation, School Building, “N”, PSF, 0%, 2031 | | | 2,595,000 | | | 751,019 |
Royse City, TX, Independent School District, School Building, PSF,
0%, 2027 | | | 2,960,000 | | | 1,084,159 |
Royse City, TX, Independent School District, School Building, PSF,
0%, 2029 | | | 2,995,000 | | | 971,249 |
| San Jose Evergreen, CA, Community College District, Election 2004, “A”, MBIA, 0%, 2028 | | | 3,260,000 | | | 1,105,531 |
| Santa Clarita Community College District, CA, Election 2006, MBIA, 0%, 2030 | | | 2,205,000 | | | 675,546 |
| State Public School Building Authority, PA, School Rev. (Haverford Township Project), XLCA, 5%, 2027 | | | 2,670,000 | | | 2,768,950 |
| White Settlement, TX, Independent School District, School Building, PSF, 0%, 2033 | | | 8,965,000 | | | 2,323,459 |
| | | | | | |
| | | | | | $ | 51,384,799 |
| Healthcare Revenue - Hospitals - 22.6% | | | | | | |
| Alexander City, AL, Special Care Facilities Financing Authority Medical Facilities Rev., “A” (Russell Hospital Corp.), 5.75%, 2036 | | $ | 1,900,000 | | $ | 1,903,724 |
| Allegheny County, PA, Hospital Development Authority Rev. (South Hills Health Systems), “B”, 6.75%, 2010 (c) | | | 1,200,000 | | | 1,314,996 |
| Allegheny County, PA, Hospital Development Authority Rev. (West Penn Allegheny Health), 9.25%, 2010 (c) | | | 6,100,000 | | | 7,278,825 |
| Allegheny County, PA, Hospital Development Authority Rev. (West Penn Allegheny Health), “A”, 5%, 2028 | | | 3,465,000 | | | 2,971,792 |
| Allegheny County, PA, Hospital Development Authority Rev. (West Penn Allegheny Health), “A”, 5.375%, 2040 | | | 5,785,000 | | | 5,039,082 |
| Allegheny County, PA, Hospital Development Authority Rev. (West Penn Allegheny Health), “B”, 9.25%, 2010 (c) | | | 3,360,000 | | | 4,009,320 |
11
Portfolio of Investments – continued
| | | | | | |
| Issuer | | Shares/Par | | Value ($) |
| | | | | | |
| Municipal Bonds - continued | | | | | | |
| Healthcare Revenue - Hospitals - continued | | | | | | |
| Arkansas Development Finance Authority Rev. (Washington Regional Medical Center), 7.25%, 2010 (c) | | $ | 2,500,000 | | $ | 2,732,575 |
| Athens County, OH, Hospital Facilities Rev. (O’Bleness Memorial Hospital), “A”, 7.125%, 2033 | | | 2,500,000 | | | 2,599,500 |
| Brookhaven, NY, Industrial Development Agency Rev. (Memorial Hospital Medical Center, Inc.), “A”, 8.25%, 2010 (c) | | | 2,500,000 | | | 2,911,775 |
| California Statewide Communities Development Authority Rev. (Valleycare Health Systems), “A”, 5%, 2022 | | | 600,000 | | | 556,782 |
| California Statewide Communities Development Authority Rev. (Valleycare Health Systems), “A”, 5.125%, 2031 | | | 300,000 | | | 264,780 |
| Cass County, MO, Hospital Rev., 5.625%, 2038 | | | 1,215,000 | | | 1,191,514 |
| Chautauqua County, NY, Industrial Development Agency, Civic Facilities Rev. (Women’s Christian Assn.), “A”, 6.35%, 2017 | | | 1,000,000 | | | 1,011,220 |
| Chautauqua County, NY, Industrial Development Agency, Civic Facilities Rev. (Women’s Christian Assn.), “A”, 6.4%, 2029 | | | 3,350,000 | | | 3,358,476 |
| Chemung County, NY, Civic Facilities Rev. (St. Joseph’s Hospital-Elmira), “A”, 6%, 2013 | | | 1,330,000 | | | 1,350,322 |
| Chemung County, NY, Civic Facilities Rev. (St. Joseph’s Hospital-Elmira), “B”, 6.35%, 2013 | | | 995,000 | | | 1,015,447 |
| Chester County, PA, Health & Educational Facilities Rev. (Chester County Hospital), “A”, 6.75%, 2031 | | | 2,500,000 | | | 2,595,900 |
| Citrus County, FL, Hospital Development Authority Rev. (Citrus Memorial Hospital), 6.25%, 2023 | | | 900,000 | | | 923,598 |
| Clinton County, MO, Industrial Development Agency, Health Facilities Rev. (Cameron Regional Medical Center), 5%, 2032 | | | 2,000,000 | | | 1,771,540 |
| Coffee County, GA, Hospital Authority Rev. (Coffee Regional Medical Center, Inc.), 5%, 2026 | | | 110,000 | | | 104,334 |
| Colorado Health Facilities Authority Rev. (Portercare Adventist Health Systems), 6.625%, 2011 (c) | | | 2,200,000 | | | 2,528,768 |
| Crittenden County, AR, Hospital Rev., Refunding & Improvement, 7.15%, 2010 (c) | | | 1,165,000 | | | 1,305,150 |
Cuyahoga County, OH, Hospital Facilities Rev. (Canton, Inc.),
7.5%, 2030 | | | 5,020,000 | | | 5,280,086 |
| Denver, CO, Health & Hospital Authority Rev., “A”, 6%, 2011 (c) | | | 750,000 | | | 841,013 |
| Garden City, MI, Hospital Finance Authority Rev. (Garden City Hospital), “A”, 4.875%, 2027 | | | 4,725,000 | | | 3,937,248 |
| Gaylord, MI, Hospital Finance Authority Rev. (Otsego Memorial Hospital), 6.2%, 2025 | | | 750,000 | | | 756,938 |
| Gaylord, MI, Hospital Finance Authority Rev. (Otsego Memorial Hospital), 6.5%, 2031 | | | 865,000 | | | 869,697 |
12
Portfolio of Investments – continued
| | | | | | |
| Issuer | | Shares/Par | | Value ($) |
| | | | | | |
| Municipal Bonds - continued | | | | | | |
| Healthcare Revenue - Hospitals - continued | | | | | | |
| Genesee County, NY, Industrial Development Agency Civic Facility Rev. (United Memorial Medical Center), 5%, 2027 | | $ | 1,320,000 | | $ | 1,169,441 |
| Glendale, AZ, Industrial Development Authority (John C. Lincoln Health), 5%, 2042 | | | 910,000 | | | 834,461 |
| Grand Forks, ND, Health Care Authority Rev. (Altru Health Systems Obligated Group), 7.125%, 2010 (c) | | | 2,250,000 | | | 2,531,588 |
| Hermann, MO, Hospital Rev., 5.15%, 2036 | | | 3,920,000 | | | 3,442,897 |
| Illinois Finance Authority Rev. (Kewanee Hospital), 5.1%, 2031 | | | 2,090,000 | | | 1,784,379 |
| Indiana Health & Educational Facilities Authority, Hospital Rev. (Community Foundation of Northwest Indiana), 5.5%, 2037 | | | 8,150,000 | | | 7,602,809 |
Indiana Health & Educational Facilities Authority, Hospital Rev. (Community Foundation of Northwest Indiana), “A”,
6.375%, 2011 (c) | | | 360,000 | | | 409,111 |
Indiana Health & Educational Facilities Authority, Hospital Rev. (Community Foundation of Northwest Indiana), “A”,
6.375%, 2011 (c) | | | 6,785,000 | | | 7,710,610 |
| Indiana Health & Educational Facilities Authority, Hospital Rev. (Community Foundation of Northwest Indiana), “A”, 6.375%, 2021 | | | 2,940,000 | | | 3,042,253 |
| Indiana Health & Educational Facilities Authority, Hospital Rev. (Community Foundation of Northwest Indiana), “A”, 6.375%, 2031 | | | 2,165,000 | | | 2,202,455 |
| Indiana Health & Educational Facilities Authority, Hospital Rev. (Riverview Hospital), 6.125%, 2031 | | | 3,750,000 | | | 3,903,975 |
| Jefferson County, IA, Hospital Authority Rev. (Jefferson County Hospital), “C”, 5.8%, 2032 | | | 5,135,000 | | | 4,896,531 |
| Joplin, MO, Industrial Development Authority Health Facilities Rev. (Freeman Health Systems), 5.5%, 2029 | | | 1,290,000 | | | 1,277,294 |
| Joplin, MO, Industrial Development Authority Health Facilities Rev. (Freeman Health Systems), 5.75%, 2035 | | | 1,395,000 | | | 1,405,714 |
| Kentucky Economic Development Finance Authority (Norton Healthcare), “A”, 6.5%, 2010 (c) | | | 1,965,000 | | | 2,185,119 |
| Kentucky Economic Development Finance Authority (Norton Healthcare), “A”, 6.625%, 2010 (c) | | | 1,565,000 | | | 1,745,319 |
| Kentucky Economic Development Finance Authority, Unrefunded (Norton Healthcare), “A”, 6.5%, 2020 | | | 3,035,000 | | | 3,172,486 |
| Kentucky Economic Development Finance Authority, Unrefunded (Norton Healthcare), “A”, 6.625%, 2028 | | | 435,000 | | | 450,556 |
| Knox County, TN, Health, Educational & Housing Facilities Board Rev. (Covenant Health), “A”, 0%, 2039 | | | 5,000,000 | | | 896,250 |
| Knox County, TN, Health, Educational & Housing Facilities Board Rev. (University Health Systems, Inc.), 5.25%, 2027 | | | 1,000,000 | | | 997,530 |
| Knox County, TN, Health, Educational, Hospital & Housing Facilities Board Rev. (Baptist Health Systems), 6.5%, 2031 | | | 7,100,000 | | | 7,351,553 |
13
Portfolio of Investments – continued
| | | | | | |
| Issuer | | Shares/Par | | Value ($) |
| | | | | | |
| Municipal Bonds - continued | | | | | | |
| Healthcare Revenue - Hospitals - continued | | | | | | |
| Knox County, TN, Health, Educational, Hospital & Housing Facilities Board Rev. (Covenant Health), “A”, 0%, 2035 | | $ | 3,795,000 | | $ | 856,456 |
| Knox County, TN, Health, Educational, Hospital & Housing Facilities Board Rev. (Covenant Health), “A”, 0%, 2036 | | | 2,490,000 | | | 531,715 |
| Knox County, TN, Health, Educational, Hospital & Housing Facilities Board Rev. (Covenant Health), “A”, 0%, 2037 | | | 1,625,000 | | | 327,405 |
| Louisiana Public Facilities Authority Hospital Rev. (Lake Charles Memorial Hospital), 6.375%, 2034 | | | 5,575,000 | | | 5,605,440 |
| Lufkin, TX, Health Facilities Development Corp. Rev. (Memorial Health System), 5.5%, 2032 | | | 410,000 | | | 399,857 |
| Lufkin, TX, Health Facilities Development Corp. Rev. (Memorial Health System), 5.5%, 2037 | | | 400,000 | | | 387,600 |
| Macomb County, MI, Hospital Finance Authority Rev. (Mount Clemens General Hospital), 5.75%, 2025 | | | 2,050,000 | | | 1,998,607 |
| Macomb County, MI, Hospital Finance Authority Rev. (Mount Clemens General Hospital), 5.875%, 2034 | | | 4,345,000 | | | 4,183,105 |
| Madison County, ID, Hospital Rev., COP, 5.25%, 2026 | | | 780,000 | | | 728,216 |
| Madison County, ID, Hospital Rev., COP, 5.25%, 2037 | | | 2,640,000 | | | 2,347,382 |
| Maryland Health & Higher Educational Facilities Authority Rev. (Mercy Medical Center), “A”, 5.5%, 2042 | | | 3,895,000 | | | 3,835,640 |
| Maryland Health & Higher Educational Facilities Authority Rev. (University of Maryland Medical System), 6.75%, 2010 (c) | | | 1,000,000 | | | 1,112,250 |
| Massachusetts Health & Educational Facilities Authority Rev. (Caritas Christi), “A”, 5.7%, 2015 | | | 3,500,000 | | | 3,566,255 |
| Massachusetts Health & Educational Facilities Authority Rev. (Caritas Christi), “B”, 6.5%, 2012 | | | 1,500,000 | | | 1,592,010 |
| Massachusetts Health & Educational Facilities Authority Rev. (Jordan Hospital), “D”, 5.25%, 2018 | | | 4,600,000 | | | 4,634,776 |
| Massachusetts Health & Educational Facilities Authority Rev. (Milford-Whitinsville Hospital), “D”, 6.35%, 2012 (c) | | | 1,450,000 | | | 1,674,518 |
Massachusetts Health & Educational Facilities Authority Rev.
(North Adams Regional Hospital), “C”, 6.625%, 2018 | | | 1,405,000 | | | 1,411,365 |
| Massachusetts Health & Educational Facilities Authority Rev. (Northern Berkshire Health), “B”, 6.375%, 2034 | | | 760,000 | | | 778,156 |
Massachusetts Health & Educational Facilities Authority Rev.
(Saints Memorial Medical Center), “A”, 6%, 2023 | | | 12,090,000 | | | 12,095,078 |
| Massachusetts Health & Educational Facilities Authority Rev. (University of Massachusetts Memorial Hospital), “C”, 6.5%, 2021 | | | 500,000 | | | 520,810 |
| Mecosta County, MI, General Hospital Rev., 6%, 2018 | | | 1,200,000 | | | 1,209,792 |
| Meeker County, MN, Gross Rev., Hospital Facilities (Memorial Hospital), 5.75%, 2027 | | | 655,000 | | | 648,077 |
14
Portfolio of Investments – continued
| | | | | | |
| Issuer | | Shares/Par | | Value ($) |
| | | | | | |
| Municipal Bonds - continued | | | | | | |
| Healthcare Revenue - Hospitals - continued | | | | | | |
| Meeker County, MN, Gross Rev., Hospital Facilities (Memorial Hospital), 5.75%, 2037 | | $ | 1,365,000 | | $ | 1,321,457 |
| Miami Beach, FL, Health Facilities Authority Rev. (Mount Sinai Medical Center), 6.75%, 2029 | | | 2,490,000 | | | 2,541,095 |
| Miami Beach, FL, Health Facilities Authority Rev. (Mount Sinai Medical Center), “A”, 6.7%, 2019 | | | 3,505,000 | | | 3,637,559 |
| Michigan Hospital Finance Authority Rev. (Memorial Healthcare Center), 5.875%, 2021 | | | 1,000,000 | | | 1,021,900 |
| Monroe County, MI, Hospital Finance Authority, Hospital Rev. (Mercy Memorial Hospital Corp.), 5.375%, 2026 | | | 1,720,000 | | | 1,555,276 |
| Monroe County, MI, Hospital Finance Authority, Hospital Rev. (Mercy Memorial Hospital Corp.), 5.5%, 2035 | | | 3,225,000 | | | 2,882,699 |
| Monroe County, NY, Industrial Development Agency, Civic Facilities Rev. (Highland Hospital of Rochester), 5%, 2025 | | | 185,000 | | | 180,368 |
| Montgomery, AL, Medical Clinic Board Health Care Facility Rev. (Jackson Hospital & Clinic), 5.25%, 2031 | | | 2,745,000 | | | 2,607,668 |
| Montgomery, AL, Medical Clinic Board Health Care Facility Rev. (Jackson Hospital & Clinic), 5.25%, 2036 | | | 1,100,000 | | | 1,035,430 |
| Neosho County, KS, Hospital Authority Rev., “A”, 5.05%, 2026 | | | 570,000 | | | 522,365 |
| Neosho County, KS, Hospital Authority Rev., “A”, 5.15%, 2031 | | | 770,000 | | | 692,423 |
| New Hampshire Health & Education Facilities Authority Rev. (Covenant Health System), 6.5%, 2017 | | | 1,570,000 | | | 1,716,246 |
| New Hampshire Health & Educational Facilities Authority Rev. (Catholic Medical Center), “A”, 6.125%, 2012 (c) | | | 1,320,000 | | | 1,516,508 |
| New Hampshire Health & Educational Facilities Authority Rev. (Catholic Medical Center), “A”, 6.125%, 2032 | | | 180,000 | | | 186,111 |
| New Hampshire Higher Educational & Health Facilities Authority Rev. (Littleton Regional Hospital), “A”, 5.9%, 2008 (c) | | | 1,750,000 | | | 1,800,680 |
| New Jersey Health Care Facilities, Financing Authority Rev. (Palisades Medical Center), 6.625%, 2031 | | | 1,115,000 | | | 1,141,013 |
| New Jersey Health Care Facilities, Financing Authority Rev. (St. Barnabas Health) Capital Appreciation, “B”, 0%, 2036 | | | 4,305,000 | | | 725,091 |
| New Jersey Health Care Facilities, Financing Authority Rev. (St. Barnabas Health) Capital Appreciation, “B”, 0%, 2038 | | | 22,690,000 | | | 3,351,540 |
| New Jersey Health Care Facilities, Financing Authority Rev. (St. Peter’s University Hospital), “A”, 6.875%, 2030 | | | 4,000,000 | | | 4,107,600 |
| New Mexico State Hospital Equipment Loan Council, Hospital Rev. (Rehoboth McKinley Christian Hospital), “A”, 5%, 2017 | | | 500,000 | | | 476,650 |
| New Mexico State Hospital Equipment Loan Council, Hospital Rev. (Rehoboth McKinley Christian Hospital), “A”, 5.25%, 2026 | | | 1,580,000 | | | 1,422,411 |
| New York, NY, Industrial Development Agency, Civic Facilities Rev. (Staten Island University Hospital), “A”, 6.375%, 2031 | | | 490,000 | | | 495,478 |
15
Portfolio of Investments – continued
| | | | | | |
| Issuer | | Shares/Par | | Value ($) |
| | | | | | |
| Municipal Bonds - continued | | | | | | |
| Healthcare Revenue - Hospitals - continued | | | | | | |
| New York, NY, Industrial Development Agency, Civic Facilities Rev. (Staten Island University Hospital), “B”, 6.375%, 2031 | | $ | 1,450,000 | | $ | 1,466,211 |
| New York, NY, Industrial Development Agency, Civic Facilities Rev. (Staten Island University Hospital), “C”, 6.45%, 2032 | | | 920,000 | | | 936,744 |
| Norman, OK, Regional Hospital Authority Rev., 5.375%, 2036 | | | 4,455,000 | | | 4,197,991 |
Ohio County, WV, County Commission Health System Rev.
(Ohio Valley Medical Center), 5.75%, 2013 | | | 5,000,000 | | | 4,903,650 |
| Oklahoma Development Finance Authority Rev. (Comanche County Hospital), “B”, 6%, 2014 | | | 2,400,000 | | | 2,586,768 |
| Oklahoma Development Finance Authority Rev. (Comanche County Hospital), “B”, 6.6%, 2031 | | | 4,080,000 | | | 4,296,811 |
| Peninsula Ports Authority, VA, Hospital Facility Rev. (Whittaker Memorial), FHA, 8.7%, 2023 | | | 475,000 | | | 523,531 |
| Philadelphia, PA, Hospitals & Higher Education Facilities Authority Rev. (Temple University Hospital), “A”, 5.5%, 2030 | | | 4,110,000 | | | 3,971,205 |
| Rhode Island Health & Education Building Corp. Rev., Hospital Financing (Lifespan Obligated Group), 6.5%, 2012 (c) | | | 4,000,000 | | | 4,619,720 |
| Royston, GA, Hospital Authority Rev. (Ty Cobb Healthcare Systems, Inc.), 6.375%, 2014 | | | 1,395,000 | | | 1,422,384 |
| Royston, GA, Hospital Authority Rev. (Ty Cobb Healthcare Systems, Inc.), 6.5%, 2027 | | | 1,855,000 | | | 1,867,484 |
| Salida, CO, Hospital District Rev., 5.25%, 2036 | | | 6,045,000 | | | 5,330,481 |
| Shelby County, TN, Educational & Housing Facilities Board Hospital Rev. (Methodist Healthcare), 6%, 2012 (c) | | | 450,000 | | | 511,799 |
| Shelby County, TN, Educational & Housing Facilities Board Hospital Rev. (Methodist Healthcare), 6%, 2012 (c) | | | 750,000 | | | 852,998 |
| Shelby County, TN, Educational & Housing Facilities Board Hospital Rev. (Methodist Healthcare), 6%, 2012 (c) | | | 745,000 | | | 847,311 |
| Shelby County, TN, Educational & Housing Facilities Board Hospital Rev. (Methodist Healthcare), 6%, 2012 (c) | | | 1,255,000 | | | 1,427,349 |
| Shelby County, TN, Educational & Housing Facilities Board Hospital Rev. (Methodist Healthcare), 6.25%, 2012 (c) | | | 750,000 | | | 861,000 |
| Shelby County, TN, Educational & Housing Facilities Board Hospital Rev. (Methodist Healthcare), 6.25%, 2012 (c) | | | 1,250,000 | | | 1,435,000 |
| Skagit County, WA, Public Hospital District No. 001, 5.75%, 2032 | | | 615,000 | | | 611,722 |
| South Carolina Jobs & Economic Development Authority, Hospital Facilities Rev. (Palmetto Health Alliance), 6.25%, 2031 | | | 2,725,000 | | | 2,806,123 |
| Southwestern, IL, Development Authority Rev. (Anderson Hospital), 5.375%, 2015 | | | 885,000 | | | 901,806 |
| Southwestern, IL, Development Authority Rev. (Anderson Hospital), 5.5%, 2020 | | | 1,805,000 | | | 1,822,797 |
16
Portfolio of Investments – continued
| | | | | | |
| Issuer | | Shares/Par | | Value ($) |
| | | | | | |
| Municipal Bonds - continued | | | | | | |
| Healthcare Revenue - Hospitals - continued | | | | | | |
| Southwestern, IL, Development Authority Rev. (Anderson Hospital), 5.625%, 2029 | | $ | 1,330,000 | | $ | 1,324,228 |
| Southwestern, IL, Development Authority Rev. (Anderson Hospital), 5.125%, 2036 | | | 2,580,000 | | | 2,351,825 |
| Springfield, TN, Health & Educational Facilities Rev. (Northcrest Medical Center), 5.25%, 2018 | | | 3,500,000 | | | 3,508,050 |
| Springfield, TN, Health & Educational Facilities Rev. (Northcrest Medical Center), 5.375%, 2024 | | | 4,000,000 | | | 3,925,000 |
| St. Genevieve County, MO, Hospital Rev., “B”, 5%, 2026 | | | 1,000,000 | | | 894,610 |
| St. Louis County, MO, Industrial Development Authority, Health Facilities Rev. (Ranken Jordan Project), 5%, 2027 | | | 1,350,000 | | | 1,225,247 |
| St. Louis County, MO, Industrial Development Authority, Health Facilities Rev. (Ranken Jordan Project), 5%, 2035 | | | 1,300,000 | | | 1,133,041 |
| St. Paul, MN, Housing & Redevelopment Hospital (Healtheast Project), 6%, 2035 | | | 2,000,000 | | | 2,004,700 |
| Sullivan County, TN, Health Educational & Housing Facilities Board Hospital Rev. (Wellmont Health Systems Project), “C”, 5.25%, 2036 | | | 3,320,000 | | | 3,211,170 |
| Sumner County, TN, Health, Educational & Housing Facilities Board Rev. (Sumner Regional Health), “A”, 5.5%, 2046 | | | 4,000,000 | | | 3,833,080 |
| Tallahassee, FL, Health Facilities Rev. (Tallahassee Memorial Healthcare), 6.25%, 2020 | | | 4,500,000 | | | 4,620,960 |
Texas Metro Health Facilities Development Corp., Metro Health Facilities Development Rev. (Wilson N. Jones Memorial Hospital),
7.2%, 2021 | | | 4,300,000 | | | 4,371,380 |
| Texas Metro Health Facilities Development Corp., Metro Health Facilities Development Rev. (Wilson N. Jones Memorial Hospital), 7.25%, 2031 | | | 2,000,000 | | | 2,030,540 |
| Tom Green County, TX, Health Facilities Rev. (Shannon Health System), 6.75%, 2021 | | | 3,150,000 | | | 3,305,201 |
Turlock, CA, Health Facilities Rev. (Emanuel Medical Center),
5.5%, 2037 | | | 4,725,000 | | | 4,417,403 |
| Tyler, TX, Health Facilities Development Corp. (East Texas Medical Center), “A”, 5.25%, 2032 | | | 3,515,000 | | | 3,227,860 |
| Tyler, TX, Health Facilities Development Corp. (East Texas Medical Center), “A”, 5.375%, 2037 | | | 2,885,000 | | | 2,669,750 |
| Upper Illinois River Valley Development, Health Facilities Rev. (Morris Hospital), 6.625%, 2031 | | | 1,900,000 | | | 1,982,042 |
Valley Health Systems, CA, Partners Refunding Project,
6.875%, 2023 (d) | | | 2,050,000 | | | 1,230,000 |
Valley, AL, Financing Authority Rev. (Lanier Memorial Hospital),
5.45%, 2011 | | | 1,175,000 | | | 1,200,486 |
| Vigo County Hospital Authority Rev. (Union Hospital), 5.75%, 2042 | | | 780,000 | | | 728,107 |
17
Portfolio of Investments – continued
| | | | | | |
| Issuer | | Shares/Par | | Value ($) |
| | | | | | |
| Municipal Bonds - continued | | | | | | |
| Healthcare Revenue - Hospitals - continued | | | | | | |
Vigo County, IN, Hospital Authority Rev. (Union Hospital),
5.8%, 2047 | | $ | 3,750,000 | | $ | 3,493,125 |
| Wapello County, IA, Hospital Authority Rev. (Ottumwa Regional Health Center), 6.25%, 2012 (c) | | | 2,000,000 | | | 2,301,020 |
| Wapello County, IA, Hospital Authority Rev. (Ottumwa Regional Health Center), 6.375%, 2012 (c) | | | 2,595,000 | | | 2,999,638 |
| Washington Health Care Facilities Authority Rev. (Mason Medical), “A”, 6.25%, 2042 | | | 5,075,000 | | | 4,911,281 |
| Weirton, WV, Municipal Hospital Building, Commission Rev. (Weirton Hospital Medical Center), 6.375%, 2031 | | | 3,885,000 | | | 3,948,248 |
Weslaco, TX, Health Facilities Rev. (Knapp Medical Center),
6.25%, 2032 | | | 4,000,000 | | | 4,107,440 |
| West Plains, MO, Industrial Development Authority Rev. (Ozarks Medical Center), 6.75%, 2024 | | | 810,000 | | | 819,671 |
West Shore, PA, Hospital Authority Rev. (Holy Spirit Hospital),
6.2%, 2026 | | | 4,500,000 | | | 4,605,930 |
Wichita, KS, Hospital Authority Rev. (Via Christi Health System),
6.25%, 2020 | | | 2,500,000 | | | 2,712,175 |
| Wisconsin Health & Educational Facilities Authority Rev. (Aurora Health Care, Inc.), 6.875%, 2030 | | | 2,250,000 | | | 2,358,945 |
| Wisconsin Health & Educational Facilities Authority Rev. (Aurora Health Care, Inc.), “B”, 5.625%, 2029 | | | 1,100,000 | | | 1,085,964 |
| Wisconsin Health & Educational Facilities Authority Rev. (Wheaton Franciscan Healthcare), 5.25%, 2031 | | | 5,625,000 | | | 5,176,744 |
| Wisconsin Health & Educational Facilities Authority Rev. (Wheaton Franciscan Healthcare), “B”, 5.125%, 2030 | | | 4,085,000 | | | 3,699,131 |
| Yonkers, NY, Industrial Development Agency, Civic Facilities Rev. (St. John’s Riverside Hospital), “B”, 6.8%, 2016 | | | 1,365,000 | | | 1,401,323 |
| Yonkers, NY, Industrial Development Agency, Civic Facilities Rev. (St. John’s Riverside Hospital), “B”, 7.125%, 2031 | | | 2,000,000 | | | 2,023,460 |
| Yonkers, NY, Industrial Development Agency, Civic Facilities Rev. (St. Joseph’s Hospital), “A”, 6.15%, 2015 | | | 2,000,000 | | | 1,996,720 |
| Yonkers, NY, Industrial Development Agency, Civic Facilities Rev. (St. Joseph’s Hospital), “C”, 6.2%, 2020 | | | 250,000 | | | 244,635 |
| | | | | | |
| | | | | | $ | 354,099,826 |
| Healthcare Revenue - Long Term Care - 12.9% | | | | | | |
| Abilene, TX, Health Facilities Development Corp., Retirement Facilities Rev. (Sears Methodist Retirement), “A”, 7%, 2033 | | $ | 1,155,000 | | $ | 1,197,608 |
Arizona Health Facilities Authority Rev. (The Terraces Project),
7.75%, 2013 (c) | | | 2,250,000 | | | 2,851,088 |
| Bell County, TX, Health Facilities Development Rev. (Advanced Living Technology), 8.125%, 2016 (d) | | | 1,415,000 | | | 990,500 |
18
Portfolio of Investments – continued
| | | | | | |
| Issuer | | Shares/Par | | Value ($) |
| | | | | | |
| Municipal Bonds - continued | | | | | | |
| Healthcare Revenue - Long Term Care - continued | | | | | | |
| Bell County, TX, Health Facilities Development Rev. (Advanced Living Technology), 8.5%, 2026 (d) | | $ | 3,345,000 | | $ | 2,341,500 |
| Bucks County, PA, Industrial Development Authority Rev. (Lutheran Community Telford Center), 5.75%, 2027 | | | 620,000 | | | 585,850 |
| Bucks County, PA, Industrial Development Authority Rev. (Lutheran Community Telford Center), 5.75%, 2037 | | | 800,000 | | | 736,760 |
| Bucks County, PA, Industrial Development Authority, Retirement Community Rev. (Ann’s Choice, Inc.), 6.125%, 2025 | | | 1,320,000 | | | 1,310,984 |
| Cambria County, PA, Industrial Development Authority Rev. (Beverly Enterprises, Inc.) ETM, 10%, 2012 (c) | | | 480,000 | | | 565,200 |
| Chartiers Valley, PA, Industrial & Commercial Development Authority (Asbury Health Center Project), 5.75%, 2022 | | | 500,000 | | | 496,510 |
| Chester County, PA, Industrial Development Authority Rev. (RHA Nursing Home), 8.5%, 2032 | | | 1,090,000 | | | 1,114,492 |
| Colorado Health Facilities Authority Rev. (American Baptist Homes), “A”, 5.9%, 2037 | | | 2,730,000 | | | 2,529,618 |
| Colorado Health Facilities Authority Rev. (Christian Living Communities Project), “A”, 5.75%, 2037 | | | 3,355,000 | | | 3,102,268 |
| Colorado Health Facilities Authority Rev. (Covenant Retirement Communities, Inc.), “B”, 6.125%, 2033 | | | 1,500,000 | | | 1,529,580 |
| Cumberland County, PA, Municipal Authority Rev. (Wesley), “A”, 7.25%, 2013 (c) | | | 760,000 | | | 916,340 |
| Cumberland County, PA, Municipal Authority, Retirement Community Rev. (Wesley), “A”, 7.25%, 2035 | | | 1,965,000 | | | 2,369,220 |
| Daphne, AL, Special Care Facilities Financing Authority (1st Mortgage Presbyterian), 0%, 2008 (c) | | | 29,975,000 | | | 29,637,182 |
| Daphne, AL, Special Care Facilities Financing Authority (2nd Mortgage Presbyterian), 0%, 2008 (c) | | | 48,475,000 | | | 13,608,872 |
| Daphne, AL, Special Care Facilities Financing Authority (2nd Mortgage Presbyterian), 0%, 2008 (c) | | | 4,500,000 | | | 4,448,115 |
| Duluth, MN, Housing & Redevelopment Authority (Benedictine Health Center), 5.875%, 2033 | | | 585,000 | | | 556,317 |
| East Rochester, NY, Housing Authority Rev. (Woodland Village Project), 5.5%, 2033 | | | 600,000 | | | 540,882 |
| Fulton County, GA, Residential Care Facilities (Canterbury Court), “A”, 6.125%, 2034 | | | 1,020,000 | | | 999,835 |
| Fulton County, GA, Residential Care Facilities, First Mortgage (Lenbrook Project), “A”, 5%, 2027 | | | 2,500,000 | | | 2,158,875 |
| Fulton County, GA, Residential Care Facilities, First Mortgage (Lenbrook Square Foundation, Inc.), “A”, 5.125%, 2042 | | | 2,500,000 | | | 2,061,775 |
| Georgia Medical Center Hospital Authority Rev. (Spring Harbor Green Island Project), 5.25%, 2037 | | | 3,725,000 | | | 3,217,432 |
19
Portfolio of Investments – continued
| | | | | | |
| Issuer | | Shares/Par | | Value ($) |
| | | | | | |
| Municipal Bonds - continued | | | | | | |
| Healthcare Revenue - Long Term Care - continued | | | | | | |
| Hawaii Department of Budget & Finance, Special Purpose Rev. (Kahala Nui Senior Living Community), 8%, 2033 | | $ | 1,500,000 | | $ | 1,644,180 |
| HFDC of Central Texas, Inc., Retirement Facilities Rev. (Legacy at Willow Bend), “A”, 5.625%, 2026 | | | 1,500,000 | | | 1,366,365 |
| HFDC of Central Texas, Inc., Retirement Facilities Rev. (Legacy at Willow Bend), “A”, 5.75%, 2036 | | | 1,500,000 | | | 1,333,020 |
| HFDC of Central Texas, Inc., Retirement Facilities Rev. (Village at Gleannloch Farms), “A”, 5.5%, 2037 | | | 3,050,000 | | | 2,608,360 |
| Huntsville-Redstone Village, AL, Special Care Facilities Financing Authority (Redstone Village Project), 5.5%, 2028 | | | 2,265,000 | | | 2,077,707 |
| Huntsville-Redstone Village, AL, Special Care Facilities Financing Authority (Redstone Village Project), 5.5%, 2043 | | | 1,960,000 | | | 1,724,643 |
Illinois Finance Authority Rev. (Clare at Water Tower), “A”,
6%, 2025 | | | 1,510,000 | | | 1,473,398 |
| Illinois Finance Authority Rev. (Franciscan Communities, Inc.), “A”, 5.5%, 2027 | | | 1,600,000 | | | 1,517,904 |
| Illinois Finance Authority Rev. (Franciscan Communities, Inc.), “A”, 5.5%, 2037 | | | 3,000,000 | | | 2,755,410 |
Illinois Finance Authority Rev. (Friendship Village), “A”,
5.375%, 2025 | | | 4,630,000 | | | 4,199,966 |
Illinois Finance Authority Rev. (Landing at Plymouth Place), “A”,
6%, 2037 | | | 1,510,000 | | | 1,419,007 |
Illinois Finance Authority Rev. (Montgomery Place), “A”,
5.75%, 2038 | | | 1,730,000 | | | 1,575,909 |
Illinois Finance Authority Rev., Bond Anticipation Notes (Tallgrass),
13%, 2012 | | | 790,000 | | | 790,213 |
| Iowa Finance Authority Senior Housing Authority Rev. (Bethany Life Communities), “A”, 5.55%, 2041 | | | 770,000 | | | 677,947 |
| Iowa Finance Authority, Health Care Facilities Rev. (Care Initiatives), 9.25%, 2011 (c) | | | 3,900,000 | | | 4,763,343 |
| Iowa Finance Authority, Health Care Facilities Rev. (Care Initiatives), “A”, 5.5%, 2025 | | | 2,495,000 | | | 2,448,319 |
| Iowa Finance Authority, Health Care Facilities Rev. (Care Initiatives), “B”, 5.75%, 2018 | | | 2,520,000 | | | 2,553,088 |
| James City County, VA, Economic Development (Virginia United Methodist Homes, Inc.), “A”, 5.4%, 2027 | | | 2,180,000 | | | 2,003,006 |
| James City County, VA, Economic Development (Virginia United Methodist Homes, Inc.), “A”, 5.5%, 2037 | | | 3,375,000 | | | 3,031,931 |
| Kalamazoo, MI, Economic Development Corp. Rev. (Heritage Community), 5.375%, 2027 | | | 750,000 | | | 676,980 |
| Kalamazoo, MI, Economic Development Corp. Rev. (Heritage Community), 5.5%, 2036 | | | 2,200,000 | | | 1,951,620 |
Lancaster County, PA, Hospital Authority Rev. (Brethren),
6.5%, 2040 | | | 2,135,000 | | | 2,112,049 |
20
Portfolio of Investments – continued
| | | | | | |
| Issuer | | Shares/Par | | Value ($) |
| | | | | | |
| Municipal Bonds - continued | | | | | | |
| Healthcare Revenue - Long Term Care - continued | | | | | | |
| Lenexa, KS, Health Care Facilities Rev. (Lakeview Village, Inc.), “C”, 6.875%, 2012 (c) | | $ | 1,250,000 | | $ | 1,471,688 |
| Lenexa, KS, Health Care Facilities Rev. (Lakeview Village, Inc.), 5.375%, 2027 | | | 1,580,000 | | | 1,466,208 |
| Lenexa, KS, Health Care Facilities Rev. (Lakeview Village, Inc.), 5.5%, 2039 | | | 2,605,000 | | | 2,370,811 |
| Loves Park, IL (Hoosier Care), 7.125%, 2034 | | | 1,860,000 | | | 1,867,068 |
Maine Health & Higher Educational Facilities Rev. (Piper Shores),
7.5%, 2009 (c) | | | 1,320,000 | | | 1,380,997 |
| Massachusetts Development Finance Agency Rev. (Adventcare), “A”, 6.75%, 2037 | | | 4,640,000 | | | 4,417,466 |
| Massachusetts Development Finance Agency Rev. (Linden Ponds, Inc.), “A”, 5.5%, 2027 | | | 1,235,000 | | | 1,135,792 |
| Massachusetts Development Finance Agency Rev. (Linden Ponds, Inc.), “A”, 5.75%, 2035 | | | 310,000 | | | 284,704 |
| Massachusetts Industrial Finance Agency Rev. (GF/Revere, Inc.), 6.6%, 2025 | | | 6,430,000 | | | 6,314,196 |
| Millbrae, CA, Residential Facilities Rev. (Magnolia of Millbrae), “A”, 7.375%, 2027 | | | 6,670,000 | | | 6,805,735 |
| Montgomery County, PA, Higher Education & Health Authority Rev. (AHF/Montgomery), 6.875%, 2036 | | | 3,805,000 | | | 3,769,461 |
| Montgomery County, PA, Industrial Development Authority Rev. (Whitemarsh Continuing Care), 6.125%, 2028 | | | 750,000 | | | 738,533 |
| Montgomery County, PA, Industrial Development Authority Rev. (Whitemarsh Continuing Care), 6.25%, 2035 | | | 1,490,000 | | | 1,461,437 |
| New Jersey Economic Development Authority Rev. (Courthouse Convalescent Center), “A”, 8.7%, 2014 | | | 1,220,000 | | | 1,225,112 |
| New Jersey Economic Development Authority Rev. (Lions Gate), “A”, 5.875%, 2037 | | | 920,000 | | | 861,258 |
| New Jersey Economic Development Authority Rev. (Seabrook Village, Inc.), 5.25%, 2036 | | | 2,735,000 | | | 2,366,705 |
| New Jersey Economic Development Authority Rev. (Seashore Gardens), 5.375%, 2036 | | | 300,000 | | | 261,900 |
| New Jersey Health Care Facilities Financing Authority Rev. (Cherry Hill), 8%, 2027 | | | 4,000,000 | | | 4,041,640 |
| Norfolk, VA, Redevelopment & Housing Authority Rev. (Fort Norfolk Retirement Community), “A”, 6%, 2025 | | | 375,000 | | | 369,889 |
| Norfolk, VA, Redevelopment & Housing Authority Rev. (Fort Norfolk Retirement Community), “A”, 6.125%, 2035 | | | 340,000 | | | 331,024 |
| Olathe, KS, Senior Living Facilities Rev. (Catholic Care Campus, Inc.), “A”, 6%, 2038 | | | 1,700,000 | | | 1,593,699 |
21
Portfolio of Investments – continued
| | | | | | |
| Issuer | | Shares/Par | | Value ($) |
| | | | | | |
| Municipal Bonds - continued | | | | | | |
| Healthcare Revenue - Long Term Care - continued | | | | | | |
| Orange County, FL, Health Facilities Authority Rev. (Orlando Lutheran Tower), 5.5%, 2038 | | $ | 1,180,000 | | $ | 1,022,954 |
| Rochester, MN, Housing & Healthcare Rev. (Madonna Towers of Rochester, Inc.), 5.875%, 2028 | | | 855,000 | | | 822,715 |
| Sarasota County, FL, Health Facility Authority Rev. (Sarasota Manatee), 5.75%, 2037 | | | 1,790,000 | | | 1,645,440 |
| Sarasota County, FL, Health Facility Authority Rev. (Sarasota Manatee), 5.75%, 2045 | | | 395,000 | | | 356,602 |
| Scott County, IA, Rev. (Ridgecrest Village), 5.25%, 2027 | | | 2,950,000 | | | 2,638,687 |
| Shelby County, TN, Health, Educational & Housing Facilities Board Rev. (Germantown Village), “A”, 7.25%, 2034 | | | 2,470,000 | | | 2,470,790 |
| South Carolina Jobs & Economic Development Authority Rev. (Woodlands at Furman), “A”, 6%, 2027 | | | 1,840,000 | | | 1,790,007 |
| South Carolina Jobs & Economic Development Authority Rev. (Woodlands at Furman), “A”, 6%, 2042 | | | 1,690,000 | | | 1,582,651 |
| South Carolina Jobs & Economic Development Authority Rev., First Mortgage (Lutheran Homes of South Carolina), 5.5%, 2028 | | | 870,000 | | | 796,485 |
| South Carolina Jobs & Economic Development Authority Rev., First Mortgage (Lutheran Homes of South Carolina), 5.625%, 2042 | | | 550,000 | | | 489,660 |
| St. Johns County, FL Industrial Development Authority (Bayview Project), “A”, 5.25%, 2041 | | | 2,800,000 | | | 2,259,712 |
| St. Joseph County, IN, Economic Development Rev. (Holy Cross Village at Notre Dame), “A”, 6%, 2038 | | | 475,000 | | | 445,455 |
| Stark County, ND, Healthcare Housing Rev. (Benedictine Living Communities, Inc.), 6.75%, 2033 | | | 1,175,000 | | | 1,179,759 |
| Sterling, IL (Hoosier Care), 7.125%, 2034 | | | 1,300,000 | | | 1,303,796 |
| Suffolk County, NY, Industrial Development Agency (Medford Hamlet Assisted Living), 6.375%, 2039 | | | 1,500,000 | | | 1,455,615 |
| Travis County, TX, Health Facilities Development Corp., Retirement Facilities Rev. (Querencia Barton Creek), 5.5%, 2025 | | | 1,440,000 | | | 1,349,856 |
| Ulster County, NY, Industrial Development Agency (Woodland Pond), “A”, 6%, 2037 | | | 3,925,000 | | | 3,747,355 |
| Washington Housing Finance Commission Non-profit Rev. (Skyline at First Hill), “A”, 5.625%, 2027 | | | 785,000 | | | 737,594 |
| Washington Housing Finance Commission Non-profit Rev. (Skyline at First Hill), “A”, 5.625%, 2038 | | | 3,980,000 | | | 3,610,139 |
| Washington, IA, Senior Housing Rev. (United Presbyterian Home of Washington), “A”, 5.6%, 2036 | | | 1,615,000 | | | 1,440,015 |
| Wisconsin Health & Educational Facilities Board Rev. (All Saints Assisted Living Project), 5.9%, 2027 | | | 615,000 | | | 594,822 |
| Wisconsin Health & Educational Facilities Board Rev. (All Saints Assisted Living Project), 6%, 2037 | | | 1,230,000 | | | 1,171,132 |
| | | | | | |
| | | | | | $ | 202,017,732 |
22
Portfolio of Investments – continued
| | | | | | |
| Issuer | | Shares/Par | | Value ($) |
| | | | | | |
| Municipal Bonds - continued | | | | | | |
| Human Services - 1.8% | | | | | | |
| Alaska Industrial Development & Export Authority Community Provider Rev. (Boys & Girls Home of Alaska, Inc.), 5.875%, 2027 | | $ | 3,790,000 | | $ | 3,608,686 |
| Alaska Industrial Development & Export Authority Community Provider Rev. (Boys & Girls Home of Alaska, Inc.), 6%, 2036 | | | 1,175,000 | | | 1,098,790 |
| California Statewide Communities Development Authority (Prides Industries), 7.125%, 2009 (c) | | | 1,315,000 | | | 1,439,123 |
| Colorado Educational & Cultural Facilities Authority (Cerebral Palsy Project), “A”, 6.25%, 2036 | | | 775,000 | | | 772,869 |
| Lehigh County, PA, General Purpose Authority (Kidspeace Obligated Group), 6%, 2018 | | | 3,550,000 | | | 3,575,383 |
| Louisiana Local Government, Environmental Facilities & Community Development Authority Rev. (CDF Healthcare), “A”, 7%, 2036 | | | 1,600,000 | | | 1,545,232 |
| Louisiana Local Government, Environmental Facilities & Community Development Authority Rev. (CDF Healthcare), “C”, 7%, 2036 | | | 1,270,000 | | | 1,162,520 |
| Louisiana Local Government, Environmental Facilities & Community Development Authority Rev. (Westside Rehab Center Project), “A”, 6.85%, 2036 | | | 3,415,000 | | | 3,583,120 |
| Louisiana Local Government, Environmental Facilities & Community Development Authority Rev. (Westside Rehab Center Project), “B”, 6.5%, 2013 | | | 270,000 | | | 275,138 |
| Montgomery County, PA, Industrial Development Authority (Wordsworth Academy), 8%, 2024 | | | 2,850,000 | | | 2,851,055 |
| New Hampshire Higher Educational & Health Facilities Authority Rev. (Child & Family Services), 6.125%, 2009 (c) | | | 1,030,000 | | | 1,088,051 |
| New York, NY, Industrial Development Agency Rev. (Special Needs Facilities Pooled Program), 6.1%, 2012 | | | 1,005,000 | | | 1,020,789 |
| Orange County, FL, Health Facilities Authority Rev. (GF/Orlando Healthcare Facilities), 8.875%, 2021 | | | 1,925,000 | | | 2,106,412 |
| Orange County, FL, Health Facilities Authority Rev. (GF/Orlando Healthcare Facilities), 9%, 2031 | | | 2,185,000 | | | 2,393,536 |
| Osceola County, FL, Industrial Development Authority Rev. (Community Provider), 7.75%, 2017 | | | 608,000 | | | 611,277 |
Philadelphia, PA, Industrial Development Authority Rev.,
6.125%, 2019 | | | 1,250,000 | | | 944,363 |
| | | | | | |
| | | | | | $ | 28,076,344 |
| Industrial Revenue - Airlines - 5.8% | | | | | | |
Alliance Airport Authority, TX (American Airlines, Inc.),
5.25%, 2029 | | $ | 3,045,000 | | $ | 2,349,309 |
| Chicago, IL, O’Hare International Airport Special Facilities Rev. (American Airlines, Inc.), 5.5%, 2030 | | | 10,700,000 | | | 8,798,931 |
| Dallas Fort Worth, TX, International Airport Facility Improvement Corp. (American Airlines, Inc.), 5.5%, 2030 | | | 4,325,000 | | | 3,470,942 |
23
Portfolio of Investments – continued
| | | | | | |
| Issuer | | Shares/Par | | Value ($) |
| | | | | | |
| Municipal Bonds - continued | | | | | | |
| Industrial Revenue - Airlines - continued | | | | | | |
Denver, CO, City & County Airport Rev. (United Airlines),
5.25%, 2032 | | $ | 11,960,000 | | $ | 10,212,046 |
Denver, CO, City & County Airport Rev. (United Airlines),
5.75%, 2032 | | | 3,460,000 | | | 3,206,797 |
| Houston, TX, Airport Systems Rev., Special Facilities (Continental, Inc.), “E”, 6.75%, 2029 | | | 5,045,000 | | | 5,075,018 |
| Los Angeles, CA, Regional Airport Lease Rev. (AMR Corp.), “C”, 7%, 2012 | | | 1,700,000 | | | 1,747,192 |
| Los Angeles, CA, Regional Airport Lease Rev. (AMR Corp.), “C”, 7.5%, 2024 | | | 5,450,000 | | | 5,562,543 |
| New Jersey Economic Development Authority Special Facilities Rev. (Continental Airlines, Inc.), 6.25%, 2019 | | | 3,205,000 | | | 3,082,120 |
| New Jersey Economic Development Authority, Special Facilities Rev. (Continental Airlines, Inc.), 6.25%, 2029 | | | 3,880,000 | | | 3,677,542 |
| New York, NY, City Industrial Development Agencies Rev. (American Airlines, Inc.), 7.625%, 2025 | | | 29,945,000 | | | 32,007,312 |
| New York, NY, City Industrial Development Agencies Rev. (American Airlines, Inc.), 7.75%, 2031 | | | 3,935,000 | | | 4,264,163 |
| New York, NY, City Industrial Development Agency, Special Facilities Rev. (American Airlines, Inc.), 5.4%, 2020 | | | 1,250,000 | | | 1,091,525 |
| New York, NY, Industrial Development Agencies Rev. (American Airlines, Inc.), 7.125%, 2011 | | | 5,845,000 | | | 5,932,383 |
| New York, NY, Industrial Development Agencies Rev. (Continental Airlines, Inc.), 7.25%, 2008 | | | 155,000 | | | 155,426 |
| New York, NY, Industrial Development Agencies Rev. (Continental Airlines, Inc.), 8%, 2012 | | | 950,000 | | | 982,215 |
| Tulsa, OK, Municipal Airport Trust Rev. (American Airlines, Inc.), “B”, 5.65%, 2035 (a) | | | 120,000 | | | 119,464 |
| | | | | | |
| | | | | | $ | 91,734,928 |
| Industrial Revenue - Chemicals - 0.5% | | | | | | |
| Louisiana, Environmental Facilities & Community Development Authority Rev. (Westlake Chemical), 6.75%, 2032 | | $ | 3,100,000 | | $ | 3,169,440 |
| Red River Authority, TX, Pollution Control Rev. (Celanese Project) “B”, 6.7%, 2030 | | | 5,380,000 | | | 5,274,767 |
| York County, SC, Industrial Rev. (Hoechst Celanese), 5.7%, 2024 | | | 130,000 | | | 118,694 |
| | | | | | |
| | | | | | $ | 8,562,901 |
| Industrial Revenue - Environmental Services - 1.6% | | | | | | |
| California Pollution Control Financing Authority, Solid Waste Disposal Rev. (Browning Ferris, Inc.), “A”, 5.8%, 2016 | | $ | 5,000,000 | | $ | 4,886,700 |
| Cobb County, GA, Development Authority, Solid Waste Disposal Rev. (Waste Management, Inc.), “A”, 5%, 2033 | | | 2,780,000 | | | 2,440,757 |
24
Portfolio of Investments – continued
| | | | | | |
| Issuer | | Shares/Par | | Value ($) |
| | | | | | |
| Municipal Bonds - continued | | | | | | |
| Industrial Revenue - Environmental Services - continued | | | |
| Colorado Housing & Finance Authority, Solid Waste Rev. (Waste Management, Inc.), 5.7%, 2018 | | $ | 540,000 | | $ | 571,250 |
| Gulf Coast Waste Disposal Authority (Waste Management, Inc.), 5.2%, 2028 | | | 3,260,000 | | | 3,021,172 |
| Henrico County, VA, Industrial Development Authority Rev. (Browning Ferris, Inc.), 5.45%, 2014 | | | 2,000,000 | | | 1,960,420 |
| Mission, TX, Economic Development Corp., Solid Waste Disposal Rev. (Allied Waste N.A., Inc.), “A”, 5.2%, 2018 | | | 1,500,000 | | | 1,379,580 |
| Nevada Department of Business & Industry Rev. (Republic Services, Inc.), 5.625%, 2026 (a) | | | 2,000,000 | | | 2,132,920 |
| New Hampshire Business Finance Authority, Solid Waste Disposal Rev. (Waste Management, Inc.), 5.2%, 2027 | | | 2,890,000 | | | 2,706,196 |
| New Morgan, PA, Industrial Development Authority, Solid Waste Disposal Rev. (New Morgan Landfill Co., Inc./Browning Ferris, Inc.), 6.5%, 2019 | | | 2,500,000 | | | 2,501,875 |
| Yavapai County, AZ, Industrial Development Authority Rev. (Waste Management, Inc.), 4.9%, 2028 | | | 4,615,000 | | | 4,054,416 |
| | | | | | |
| | | | | | $ | 25,655,286 |
| Industrial Revenue - Metals - 0.2% | | | | | | |
| Burns Harbor, IN, Solid Waste Disposal Facilities Rev. (Bethlehem Steel), 8%, 2024 (d) | | $ | 10,455,000 | | $ | 1,046 |
| Cambria County, PA, Industrial Development Authority Rev. (Bethlehem Steel), 7.5%, 2015 (d) | | | 3,890,000 | | | 389 |
| Mobile County, AL, Industrial Development Authority Rev. (Ipsco, Inc.), 6.875%, 2030 (a) | | | 2,850,000 | | | 2,961,578 |
| | | | | | |
| | | | | | $ | 2,963,013 |
| Industrial Revenue - Other - 2.6% | | | | | | |
Aztalan, WI, Exempt Facility Rev. (Renew Energy LLC Project),
7.5%, 2018 | | $ | 3,160,000 | | $ | 3,018,622 |
| Bayonne, NJ, Redevelopment Agency (Royal Caribbean Project), “A”, 5.375%, 2035 | | | 1,500,000 | | | 1,387,215 |
| Gulf Coast, TX, Industrial Development Authority Rev. (Microgy Holdings LLC Project), 7%, 2036 | | | 2,060,000 | | | 2,012,373 |
Gulf Coast, TX, Waste Disposal Rev. (Valero Energy Corp.),
6.65%, 2032 | | | 1,500,000 | | | 1,549,680 |
| Janesville, WI, Industrial Development Rev. (Simmons Manufacturing Co.), 7%, 2017 | | | 3,900,000 | | | 3,913,806 |
| Liberty, NY, Development Corp. Rev. (Goldman Sachs Headquarters), 5.25%, 2035 | | | 2,640,000 | | | 2,750,299 |
25
Portfolio of Investments – continued
| | | | | | |
| Issuer | | Shares/Par | | Value ($) |
| | | | | | |
| Municipal Bonds - continued | | | | | | |
| Industrial Revenue - Other - continued | | | |
| New Jersey Economic Development Authority Rev. (Gloucester Marine), “C”, 6.5%, 2015 | | $ | 2,300,000 | | $ | 2,421,854 |
| New Jersey Economic Development Authority Rev. (GMT Realty LLC), “B”, 6.875%, 2037 | | | 1,570,000 | | | 1,633,240 |
| New York, NY, City Industrial Development Agency Rev., Liberty Bonds (IAC/InterActiveCorp), 5%, 2035 | | | 1,880,000 | | | 1,737,289 |
| Park Creek Metropolitan District, CO, Rev. (Custodial Receipts), “CR-1”, 7.875%, 2032 (a)(n) | | | 4,220,000 | | | 4,537,724 |
| Park Creek Metropolitan District, CO, Rev. (Custodial Receipts), “CR-2”, 7.875%, 2032 (a)(n) | | | 1,860,000 | | | 2,000,039 |
| Philadelphia, PA, Industrial Development Authority Rev. (Host Marriott LP), 7.75%, 2017 | | | 2,000,000 | | | 2,006,660 |
Spirit Lake, IA, Industrial Development Rev. (Crystal Tips Inc.),
0%, 2008 (c) | | | 11,322,252 | | | 11,570,323 |
| | | | | | |
| | | | | | $ | 40,539,124 |
| Industrial Revenue - Paper - 2.0% | | | | | | |
| Arkansas Development Finance Authority, Industrial Facilities Rev. (Potlatch Corp.), “A”, 7.75%, 2025 | | $ | 1,200,000 | | $ | 1,307,868 |
| Butler, AL, Industrial Development Board, Solid Waste Disposal Rev. (Georgia Pacific Corp.), 5.75%, 2028 | | | 1,510,000 | | | 1,332,620 |
| Cass County, TX, Industrial Development Corp. (International Paper Co.), “A”, 4.625%, 2027 | | | 3,750,000 | | | 3,115,500 |
| De Soto Parish, LA, Environmental Improvement Rev. (International Paper Co.), 6.35%, 2025 | | | 1,650,000 | | | 1,686,663 |
Delta County, MI, Economic Development Corp., Environmental Improvement Rev. (Mead Westvaco Escanaba), “A”,
6.25%, 2012 (c) | | | 3,100,000 | | | 3,536,139 |
Delta County, MI, Economic Development Corp., Environmental Improvement Rev. (Mead Westvaco Escanaba), “B”,
6.45%, 2012 (c) | | | 1,100,000 | | | 1,240,140 |
| Escambia County, FL, Environmental Improvement Rev. (International Paper Co.), “A”, 4.75%, 2030 | | | 1,940,000 | | | 1,625,739 |
| Hodge, LA, Utilities Rev. (Stone Container Corp.), 7.45%, 2024 | | | 3,000,000 | | | 3,222,240 |
| Hopewell, VA, Industrial Development Authority, Environmental Improvement Rev. (Smurfit-Stone Container), 5.25%, 2015 | | | 2,700,000 | | | 2,591,973 |
| Rockdale County, GA, Development Authority Project Rev. (Visy Paper Project), “A”, 6.125%, 2034 | | | 2,835,000 | | | 2,705,837 |
| Sabine River Authority Rev., Louisiana Water Facilities (International Paper Co.), 6.2%, 2025 | | | 2,250,000 | | | 2,306,993 |
26
Portfolio of Investments – continued
| | | | | | |
| Issuer | | Shares/Par | | Value ($) |
| | | | | | |
| Municipal Bonds - continued | | | | | | |
| Industrial Revenue - Paper - continued | | | |
| West Point, VA, Industrial Development Authority, Solid Waste Disposal Rev. (Chesapeake Corp.), 6.25%, 2019 | | $ | 6,830,000 | | $ | 5,858,159 |
| West Point, VA, Industrial Development Authority, Solid Waste Disposal Rev. (Chesapeake Corp.), “A”, 6.375%, 2019 | | | 800,000 | | | 686,168 |
| | | | | | |
| | | | | | $ | 31,216,039 |
| Miscellaneous Revenue - Entertainment & Tourism - 0.5% | | | |
| Mashantucket, CT, Western Pequot Tribe, 5.5%, 2036 (z) | | $ | 1,750,000 | | $ | 1,608,705 |
| Mississippi Development Bank, Special Obligation (Diamond Lakes Utilities), 6.25%, 2017 | | | 2,800,000 | | | 2,839,536 |
| New York Liberty Development Corp. Rev. (National Sports Museum), “A”, 6.125%, 2019 | | | 1,315,000 | | | 1,341,326 |
| Seminole Tribe, FL, Special Obligation, “A”, 5.25%, 2027 (n) | | | 1,840,000 | | | 1,734,421 |
| Seneca Nation Indians, NY, Capital Improvements Authority Special Obligation, 5%, 2023 (n) | | | 1,040,000 | | | 943,311 |
| | | | | | |
| | | | | | $ | 8,467,299 |
| Miscellaneous Revenue - Other - 2.0% | | | | | | |
| Austin, TX, Convention Center (Convention Enterprises, Inc.), “A”, 6.6%, 2011 (c) | | $ | 1,300,000 | | $ | 1,448,824 |
| Austin, TX, Convention Center (Convention Enterprises, Inc.), “A”, 6.7%, 2011 (c) | | | 2,000,000 | | | 2,234,540 |
| Austin, TX, Convention Center (Convention Enterprises, Inc.), “B”, 5.75%, 2034 | | | 2,705,000 | | | 2,464,769 |
| Cleveland-Cuyahoga County, OH, Port Authority Rev. (Fairmount), “B”, 5.125%, 2025 | | | 540,000 | | | 529,346 |
| Cleveland-Cuyahoga County, OH, Port Authority Rev. (Myers University), “E”, 5.6%, 2025 | | | 395,000 | | | 397,173 |
| Cleveland-Cuyahoga County, OH, Port Authority Rev. (Perrysburg Project), 4.8%, 2035 | | | 795,000 | | | 697,573 |
| Hardeman County, TN, Correctional Facilities Rev., 7.75%, 2017 | | | 5,780,000 | | | 5,908,778 |
| Madison County, FL, Rev. (Twin Oaks Project), “A”, 6%, 2025 | | | 1,590,000 | | | 1,597,060 |
Maryland Economic Development Corp. (Chesapeake Bay), “A”,
5%, 2031 | | | 1,295,000 | | | 1,127,414 |
| New Jersey Economic Development Authority Rev. (Kapkowski Project), “B”, 6.8%, 2018 | | | 3,785,000 | | | 4,096,354 |
| Riversouth, OH, Authority Rev. (Lazarus Building) “A”, 5.75%, 2027 | | | 3,975,000 | | | 3,900,946 |
| Southwestern Illinois Development Authority Rev., Solid Waste Disposal Rev., 5.9%, 2014 | | | 1,525,000 | | | 1,532,991 |
| Summit County, OH, Port Authority Building Rev. (Seville Project), “A”, 5.1%, 2025 | | | 600,000 | | | 586,482 |
27
Portfolio of Investments – continued
| | | | | | |
| Issuer | | Shares/Par | | Value ($) |
| | | | | | |
| Municipal Bonds - continued | | | | | | |
| Miscellaneous Revenue - Other - continued | | | |
| Summit County, OH, Port Authority Building Rev. (Twinsburg Township), “D”, 5.125%, 2025 | | $ | 460,000 | | $ | 448,385 |
| Summit County, OH, Port Authority Building Rev. (Workforce Policy Board), “F”, 4.875%, 2025 | | | 2,810,000 | | | 2,651,938 |
| Toledo Lucas County, OH, Port Authority Development Rev. (Northwest Ohio Bond Fund), “B”, 4.8%, 2035 | | | 910,000 | | | 798,480 |
| Toledo Lucas County, OH, Port Authority Development Rev. (Northwest Ohio Bond Fund), “C”, 5.125%, 2025 | | | 275,000 | | | 258,225 |
| | | | | | |
| | | | | | $ | 30,679,278 |
| Multi-Family Housing Revenue - 2.4% | | | | | | |
| Alexandria, VA, Redevelopment & Housing Finance Authority Rev. (Jefferson Village Apartments), “B”, 9%, 2018 | | $ | 1,720,000 | | $ | 1,731,094 |
| Bay County, FL, Housing Finance Authority, Multi-Family Rev. (Andrews Place II Apartments), FSA, 5%, 2035 | | | 635,000 | | | 613,778 |
| Bay County, FL, Housing Finance Authority, Multi-Family Rev. (Andrews Place II Apartments), FSA, 5.1%, 2046 | | | 1,155,000 | | | 1,111,664 |
| Charter Mac Equity Issuer Trust, FRN, 6.625%, 2009 (a)(n) | | | 8,000,000 | | | 8,385,040 |
| Fairfax County, VA, Economic Development Authority, Senior Living (Lewinsville Retirement Village), “A”, 5.25%, 2032 | | | 1,215,000 | | | 1,059,286 |
| GMAC Municipal Mortgage Trust, “B-1”, 5.6%, 2039 (a)(n) | | | 4,000,000 | | | 4,243,720 |
| GMAC Municipal Mortgage Trust, “C-1”, 5.7%, 2040 (a)(n) | | | 2,000,000 | | | 2,012,760 |
Indianapolis, IN, Multi-Family Rev. (Cambridge Station
Apartments II), FNMA, 5.25%, 2039 (a) | | | 1,430,000 | | | 1,404,189 |
| Mississippi Home Corp., Rev. (Kirkwood Apartments), 6.8%, 2037 | | | 3,850,000 | | | 3,799,642 |
| MuniMae TE Bond Subsidiary LLC, 6.875%, 2049 (a)(n) | | | 6,000,000 | | | 6,277,080 |
| MuniMae TE Bond Subsidiary LLC, 5.4%, 2049 (n) | | | 2,000,000 | | | 2,088,340 |
| MuniMae TE Bond Subsidiary LLC, 5.9%, 2049 (n) | | | 2,000,000 | | | 2,071,340 |
| North Charleston, SC, Housing Authority Rev. (Horizon Village), “A”, FHA, 5.15%, 2048 | | | 1,380,000 | | | 1,332,404 |
| Seattle, WA, Housing Authority Rev., Capped Fund Program (High Rise Rehab), “I”, FSA, 5%, 2025 | | | 2,050,000 | | | 2,021,382 |
| | | | | | |
| | | | | | $ | 38,151,719 |
| Parking - 0.1% | | | | | | |
| Rail Connections, Inc., MA, Rev., “B”, 0%, 2009 (c) | | $ | 375,000 | | $ | 254,501 |
| Rail Connections, Inc., MA, Rev., “B”, 0%, 2009 (c) | | | 450,000 | | | 285,759 |
| Rail Connections, Inc., MA, Rev., “B”, 0%, 2009 (c) | | | 975,000 | | | 578,926 |
| Rail Connections, Inc., MA, Rev., “B”, 0%, 2009 (c) | | | 1,235,000 | | | 686,796 |
| | | | | | |
| | | | | | $ | 1,805,982 |
28
Portfolio of Investments – continued
| | | | | | |
| Issuer | | Shares/Par | | Value ($) |
| | | | | | |
| Municipal Bonds - continued | | | | | | |
| Sales & Excise Tax Revenue - 0.1% | | | | | | |
| Desloge, MO, Tax Increment Rev. (U.S. Highway 67 Street Redevelopment), 5.2%, 2020 | | $ | 1,225,000 | | $ | 1,219,439 |
| Single Family Housing - Local - 1.2% | | | | | | |
| California Rural Home Mortgage Finance Authority Rev., GNMA, 6.55%, 2030 | | $ | 290,000 | | $ | 298,720 |
Chicago, IL, Single Family Mortgage Rev., “C”, GNMA,
7.05%, 2030 | | | 25,000 | | | 25,400 |
| Cook County, IL, Single Family Mortgage Rev., “A”, 0%, 2015 | | | 100,000 | | | 28,427 |
| Corpus Christi, TX, Housing Finance Authority Rev., “B”, 0%, 2011 | | | 1,615,000 | | | 758,856 |
Escambia County, FL, Single Family Housing Rev., GNMA,
6.95%, 2024 | | | 205,000 | | | 211,507 |
| Jefferson County, TX, Housing Finance Corp., MBIA, 0%, 2015 | | | 525,000 | | | 230,260 |
| Jefferson Parish, LA, Single Family Mortgage Rev., “B-1”, GNMA, 6.625%, 2023 | | | 385,000 | | | 401,636 |
| Jefferson Parish, LA, Single Family Mortgage Rev., “B-1”, GNMA, 6.75%, 2030 | | | 1,195,000 | | | 1,235,511 |
Jefferson Parish, LA, Single Family Mortgage Rev., “D”, GNMA,
5%, 2038 | | | 2,105,000 | | | 2,135,944 |
| Jefferson Parish, LA, Single Family Mortgage Rev., “D-1”, GNMA, 7.5%, 2026 | | | 95,000 | | | 96,914 |
| Nortex, TX, Housing Finance Corp., Single Family Mortgage Rev., “B”, 5.5%, 2038 | | | 440,000 | | | 429,321 |
| Pima County, AZ, Industrial Development Authority Rev., “B-1”, GNMA, 7.05%, 2030 | | | 195,000 | | | 201,166 |
| Pinellas County, FL, Housing Finance Authority Rev. (Multi-County Program), “B-1”, GNMA, 6.2%, 2031 | | | 345,000 | | | 345,535 |
| Sedgwick & Shawnee Counties, KS, Single Family Housing Rev., “A”, GNMA, 6.45%, 2029 | | | 260,000 | | | 262,278 |
| Sedgwick & Shawnee Counties, KS, Single Family Housing Rev., “A”, GNMA, 5.9%, 2035 | | | 1,000,000 | | | 1,078,830 |
| Sedgwick & Shawnee Counties, KS, Single Family Housing Rev., “A”, GNMA, 6.25%, 2035 | | | 450,000 | | | 479,295 |
| Sedgwick & Shawnee Counties, KS, Single Family Housing Rev., “A”, GNMA, 5.4%, 2037 | | | 2,295,000 | | | 2,441,765 |
| Sedgwick & Shawnee Counties, KS, Single Family Housing Rev., “A-1”, GNMA, 6.875%, 2026 | | | 35,000 | | | 35,224 |
| Sedgwick & Shawnee Counties, KS, Single Family Housing Rev., “A-1”, GNMA, 5.75%, 2037 | | | 840,000 | | | 888,661 |
| Sedgwick & Shawnee Counties, KS, Single Family Housing Rev., “A-2”, GNMA, 5.75%, 2037 | | | 1,560,000 | | | 1,638,562 |
| Sedgwick & Shawnee Counties, KS, Single Family Housing Rev., “A-3”, GNMA, 6%, 2035 | | | 915,000 | | | 981,191 |
29
Portfolio of Investments – continued
| | | | | | |
| Issuer | | Shares/Par | | Value ($) |
| | | | | | |
| Municipal Bonds - continued | | | | | | |
| Single Family Housing - Local - continued | | | | | | |
| Sedgwick & Shawnee Counties, KS, Single Family Housing Rev., “A-4”, GNMA, 5.625%, 2036 | | $ | 925,000 | | $ | 969,039 |
| Sedgwick & Shawnee Counties, KS, Single Family Housing Rev., “A-4”, GNMA, 5.85%, 2037 | | | 1,500,000 | | | 1,594,920 |
| Sedgwick & Shawnee Counties, KS, Single Family Housing Rev., “A-5”, GNMA, 5.9%, 2037 | | | 600,000 | | | 640,776 |
| Sedgwick & Shawnee Counties, KS, Single Family Housing Rev., “B-2”, GNMA, 6.45%, 2033 | | | 800,000 | | | 853,872 |
| | | | | | |
| | | | | | $ | 18,263,610 |
| Single Family Housing - State - 1.4% | | | | | | |
| Colorado Housing & Finance Authority Rev., “A-1”, 7.4%, 2027 | | $ | 20,000 | | $ | 20,160 |
| Colorado Housing & Finance Authority Rev., “A-2”, 7.15%, 2014 | | | 2,000 | | | 2,023 |
Colorado Housing & Finance Authority Rev., “A-2”, AMBAC,
6.6%, 2028 | | | 895,000 | | | 916,194 |
| Colorado Housing & Finance Authority Rev., “B-2”, 6.1%, 2023 | | | 325,000 | | | 349,924 |
| Colorado Housing & Finance Authority Rev., “B-3”, 6.55%, 2025 | | | 52,000 | | | 53,840 |
| Colorado Housing & Finance Authority Rev., “B-3”, 6.55%, 2033 | | | 305,000 | | | 311,969 |
| Colorado Housing & Finance Authority Rev., “C-2”, 5.9%, 2023 | | | 470,000 | | | 482,464 |
Colorado Housing & Finance Authority Rev., “C-2”, FHA,
6.6%, 2032 | | | 465,000 | | | 493,170 |
| Colorado Housing & Finance Authority Rev., “C-3”, 6.75%, 2021 | | | 140,000 | | | 146,370 |
| Colorado Housing & Finance Authority Rev., “C-3”, 7.15%, 2030 | | | 60,000 | | | 61,002 |
| Louisiana Housing Finance Agency, Single Family Mortgage Rev., “B-2”, GNMA, 7.55%, 2031 | | | 135,000 | | | 139,244 |
Mississippi Home Corp. Rev., Single Family Rev., “A”, GNMA,
6.1%, 2034 | | | 2,160,000 | | | 2,201,191 |
| Mississippi Home Corp. Rev., Single Family Rev., “A-2”, GNMA, 6.5%, 2032 | | | 2,075,000 | | | 2,076,411 |
| Missouri Housing Development Commission, Single Family Mortgage Rev. (Home Loan Program), GNMA, 7.45%, 2031 | | | 100,000 | | | 102,659 |
| Missouri Housing Development Commission, Single Family Mortgage Rev. (Home Loan Program), GNMA, 6.35%, 2032 | | | 380,000 | | | 396,036 |
| Missouri Housing Development Commission, Single Family Mortgage Rev. (Home Loan Program), GNMA, 6.85%, 2032 | | | 295,000 | | | 311,552 |
| Missouri Housing Development Commission, Single Family Mortgage Rev. (Home Loan Program), GNMA, 6.75%, 2034 | | | 305,000 | | | 315,471 |
| Missouri Housing Development Commission, Single Family Mortgage Rev. (Home Loan Program), “B”, GNMA, 6.7%, 2030 | | | 610,000 | | | 641,775 |
| Missouri Housing Development Commission, Single Family Mortgage Rev. (Home Loan Program), “B”, GNMA, 6.05%, 2037 | | | 3,285,000 | | | 3,511,139 |
New Hampshire Housing Finance Authority Rev., “B”,
5.875%, 2030 | | | 295,000 | | | 305,428 |
30
Portfolio of Investments – continued
| | | | | | |
| Issuer | | Shares/Par | | Value ($) |
| | | | | | |
| Municipal Bonds - continued | | | | | | |
| Single Family Housing - State - continued | | | | | | |
| New Hampshire Housing Finance Authority Rev., “B”, 6.3%, 2031 | | $ | 210,000 | | $ | 214,358 |
| New Hampshire Housing Finance Authority Rev., “B”, 6.5%, 2035 | | | 3,075,000 | | | 3,269,033 |
| New Mexico Mortgage Finance Authority Rev., “B-2”, GNMA, 6.35%, 2033 | | | 530,000 | | | 550,129 |
| North Dakota Housing Finance Agency Rev., Housing Finance, “A”, 5%, 2033 | | | 810,000 | | | 819,526 |
| Oklahoma Housing Finance Agency, Single Family, 7.55%, 2028 | | | 260,000 | | | 260,655 |
| Texas Affordable Housing Corp. (Single Family Mortgage), “B”, GNMA, 5.25%, 2039 | | | 2,255,000 | | | 2,187,305 |
| Texas Housing & Community Affairs, Residential Mortgage Rev., GNMA, 7.1%, 2021 | | | 1,645,000 | | | 1,724,766 |
| | | | | | |
| | | | | | $ | 21,863,794 |
| Solid Waste Revenue - 0.7% | | | | | | |
| Delaware County, PA, Industrial Development Authority, Resource Recovery Facilities Rev. (American Ref-Fuel Co.), “A”, 6.2%, 2019 | | $ | 3,900,000 | | $ | 3,936,582 |
| Hudson County, NJ, Solid Waste System Rev., 6%, 2019 | | | 2,000,000 | | | 2,005,200 |
| Massachusetts Industrial Finance Agency, Resource Recovery Rev. (Ogden Haverhill Associates), “A”, 5.6%, 2019 | | | 5,425,000 | | | 5,458,201 |
| | | | | | |
| | | | | | $ | 11,399,983 |
| State & Agency - Other - 0.3% | | | | | | |
| Commonwealth of Puerto Rico (Mepsi Campus), “A”, 6.25%, 2024 | | $ | 900,000 | | $ | 900,549 |
| Commonwealth of Puerto Rico (Mepsi Campus), “A”, 6.5%, 2037 | | | 3,600,000 | | | 3,602,160 |
| | | | | | |
| | | | | | $ | 4,502,709 |
| State & Local Agencies - 2.2% | | | | | | |
| Alabama Building Renovation Authority, AMBAC, 6%, 2018 | | $ | 1,155,000 | | $ | 1,237,271 |
| Delaware Valley, PA, Regional Finance Authority, RITES, AMBAC, 6.722%, 2018 (p) | | | 7,000,000 | | | 8,913,100 |
| Essex County, NJ, FGIC, 5.75%, 2010 (c)(u) | | | 12,000,000 | | | 13,050,480 |
| Golden State, CA, Tobacco Securitization Corp., Tobacco Settlement Rev., “A-1”, AMBAC, 0% to 2010, 4.6% to 2023 | | | 1,185,000 | | | 1,017,761 |
| Golden State, CA, Tobacco Securitization Corp., Tobacco Settlement Rev., Enhanced, “A”, 5%, 2045 | | | 5,000,000 | | | 4,742,750 |
| Harris County, TX, 5.8%, 2014 | | | 1,057,650 | | | 1,078,020 |
| Harris County, TX, 5.625%, 2020 | | | 2,168,960 | | | 2,113,868 |
Northumberland County, PA (Country Careers & Arts Center),
6.65%, 2020 | | | 1,030,000 | | | 1,053,597 |
| Northumberland County, PA (Mountain View Manor), 7%, 2010 (c) | | | 1,000,000 | | | 1,116,800 |
Shawnee County, KS (Community Mental Health Center, Inc.),
5.35%, 2009 (c) | | | 250,000 | | | 260,978 |
| | | | | | |
| | | | | | $ | 34,584,625 |
31
Portfolio of Investments – continued
| | | | | | |
| Issuer | | Shares/Par | | Value ($) |
| | | | | | |
| Municipal Bonds - continued | | | | | | |
| Student Loan Revenue - 0.3% | | | | | | |
Access to Loans for Learning, California Student Loan Rev.,
7.95%, 2030 | | $ | 2,700,000 | | $ | 2,794,500 |
| Arizona Student Loan Acquisition Authority, Student Loan Rev., 6.15%, 2029 | | | 1,500,000 | | | 1,556,040 |
| | | | | | |
| | | | | | $ | 4,350,540 |
| Tax - Other - 0.6% | | | | | | |
| Black Hawk, CO, Device Tax Rev., 5%, 2010 | | $ | 280,000 | | $ | 284,693 |
| Black Hawk, CO, Device Tax Rev., 5%, 2013 | | | 180,000 | | | 181,980 |
| Black Hawk, CO, Device Tax Rev., 5%, 2015 | | | 560,000 | | | 557,810 |
| Harris County-Houston, TX, Sports Authority Rev., MBIA, 0%, 2032 | | | 6,310,000 | | | 1,626,339 |
| New Jersey Economic Development Authority Rev. (Cigarette Tax), 5.5%, 2024 | | | 1,000,000 | | | 963,870 |
| New Jersey Economic Development Authority Rev. (Cigarette Tax), 5.75%, 2029 | | | 1,795,000 | | | 1,775,201 |
| New Jersey Economic Development Authority Rev. (Cigarette Tax), 5.5%, 2031 | | | 800,000 | | | 765,480 |
| New Jersey Economic Development Authority Rev. (Cigarette Tax), 5.75%, 2034 | | | 1,195,000 | | | 1,176,023 |
| Virgin Islands Public Finance Authority Rev., “E”, 5.875%, 2018 | | | 1,500,000 | | | 1,531,365 |
| | | | | | |
| | | | | | $ | 8,862,761 |
| Tax Assessment - 8.0% | | | | | | |
| Arborwood Community Development District, FL, Capital Improvement Rev., 5.25%, 2016 | | $ | 475,000 | | $ | 425,762 |
| Arborwood Community Development District, FL, Capital Improvement Rev. (Centex Homes Project), “A-1”, 5.5%, 2036 | | | 1,480,000 | | | 1,206,585 |
Arborwood Community Development District, FL, Capital Improvement Rev. (Master Infrastructure Projects), “A”,
5.35%, 2036 | | | 1,845,000 | | | 1,470,317 |
| Arborwood Community Development District, FL, Special Assessment (Master Infrastructure Projects), “B”, 5.1%, 2014 | | | 700,000 | | | 633,283 |
| Atlanta, GA, Tax Allocation (Eastside Project), “B”, 5.6%, 2030 | | | 2,450,000 | | | 2,258,484 |
| Atlanta, GA, Tax Allocation (Princeton Lakes Project), 5.5%, 2031 | | | 1,765,000 | | | 1,608,798 |
| Ave Maria, FL, Stewardship Community, “A”, 5.125%, 2038 | | | 2,045,000 | | | 1,575,816 |
| Belmont Community Development District, FL, Capital Improvement Rev., “B”, 5.125%, 2014 | | | 2,995,000 | | | 2,695,530 |
| Capital Region Community Development District, FL, Capital Improvement Rev., “A-2”, 6.85%, 2031 | | | 695,000 | | | 737,451 |
Century Gardens Village Community Development District, FL,
Special Assessment, 5.1%, 2037 | | | 1,020,000 | | | 786,247 |
Concord Station Community Development District, FL,
Special Assessment, 5%, 2015 | | | 825,000 | | | 734,993 |
32
Portfolio of Investments – continued
| | | | | | |
| Issuer | | Shares/Par | | Value ($) |
| | | | | | |
| Municipal Bonds - continued | | | | | | |
| Tax Assessment - continued | | | | | | |
| Concorde Estates Community Development District, FL, Special Assessment, “B”, 5%, 2011 | | $ | 420,000 | | $ | 409,807 |
| Creekside Community Development District, FL, Special Assessment, 5.2%, 2038 | | | 2,700,000 | | | 2,103,192 |
| Dardenne, MO, Town Square Transportation Development District, “A”, 5%, 2026 | | | 2,750,000 | | | 2,386,835 |
| Du Page County, IL, Special Service Area No. 31 Special Tax (Monarch Landing Project), 5.625%, 2036 | | | 945,000 | | | 839,963 |
| Durbin Crossing Community Development District, FL, Special Assessment Rev., “B-1”, 4.875%, 2010 | | | 5,070,000 | | | 4,811,126 |
| East Homestead Community Development District, FL, Special Assessment, “B”, 5%, 2011 | | | 500,000 | | | 471,825 |
| Enclave at Black Point Marina Community Development District, FL, “B”, 5.2%, 2014 | | | 1,785,000 | | | 1,626,296 |
| Fishhawk Community Development District, FL, 5.125%, 2009 | | | 995,000 | | | 990,761 |
| Grand Bay at Doral Community Development, FL, “A”, 6%, 2039 | | | 620,000 | | | 541,675 |
| Grand Bay at Doral Community Development, FL, “B”, 6%, 2017 | | | 3,685,000 | | | 3,446,396 |
| Greyhawk Landing Community Development District, FL, Special Assessment, “B”, 6.25%, 2009 | | | 90,000 | | | 89,883 |
| Hawks Point Community Development District, FL, Special Assessment, “A”, 5.3%, 2039 | | | 1,430,000 | | | 1,130,515 |
Heritage Harbour North Community Development District, FL,
Capital Improvement Rev., 6.375%, 2038 | | | 2,105,000 | | | 1,942,705 |
| Katy, TX, Development Authority Rev., “B”, 5.8%, 2011 | | | 1,985,000 | | | 1,993,079 |
| Katy, TX, Development Authority Rev., “B”, 6%, 2018 | | | 4,600,000 | | | 4,568,122 |
| Killarney Community Development District, FL, Special Assessment, “B”, 5.125%, 2009 | | | 740,000 | | | 724,490 |
| Lakes by the Bay South Community Development District, FL, Rev., “B”, 5.3%, 2009 | | | 1,000,000 | | | 993,780 |
| Lakeshore Villages Master Community Development District, LA, Special Assessment, 5.25%, 2017 | | | 2,961,000 | | | 2,707,272 |
| Lancaster County, SC, Assessment Rev. (Sun City Carolina Lakes), 5.45%, 2037 | | | 340,000 | | | 287,334 |
| Landmark at Doral, FL, Community Development District, Special Assessment, “B”, 5.2%, 2015 | | | 2,000,000 | | | 1,631,360 |
| Legends Bay Community Development District, FL, “A”, 5.5%, 2014 | | | 1,580,000 | | | 1,466,856 |
Legends Bay Community Development District, FL, “A”,
5.875%, 2038 | | | 1,370,000 | | | 1,187,845 |
| Magnolia Park Community Development District, FL, Special Assessment Rev., “A”, 6.15%, 2039 | | | 4,625,000 | | | 4,149,643 |
| Markham, IL, Tax Increment Rev., 9%, 2012 | | | 1,575,000 | | | 1,583,174 |
| Middle Village Community Development District, FL, Special Assessment, “A”, 5.8%, 2022 | | | 840,000 | | | 840,664 |
33
Portfolio of Investments – continued
| | | | | | |
| Issuer | | Shares/Par | | Value ($) |
| | | | | | |
| Municipal Bonds - continued | | | | | | |
| Tax Assessment - continued | | | | | | |
| Morgantown, WV, Tax Increment Rev., Parking Garage Project, “A”, 4.8%, 2026 | | $ | 1,215,000 | | $ | 1,067,681 |
| Morgantown, WV, Tax Increment Rev., Parking Garage Project, “A”, 5%, 2033 | | | 500,000 | | | 428,910 |
| Naturewalk Community Development District, FL, Capital Improvement Rev., “B”, 5.3%, 2016 | | | 2,300,000 | | | 2,051,416 |
| New Port Tampa Bay Community Development District, FL, Special Assessment, “B”, 5.3%, 2012 | | | 1,360,000 | | | 964,254 |
| North Springs Improvement District, FL, Special Assessment (Parkland Golf Country Club), “B-1”, 5.125%, 2015 | | | 540,000 | | | 467,381 |
| North Springs Improvement District, FL, Special Assessment (Parkland Golf Country Club), “B-2”, 5.125%, 2015 | | | 295,000 | | | 255,328 |
| Ohio County, WV, Commission Tax Increment Rev. (Fort Henry Centre), “A”, 5.85%, 2034 | | | 865,000 | | | 803,697 |
| Old Palm Community Development District, FL, Special Assessment (Palm Beach Gardens), “A”, 5.9%, 2035 | | | 725,000 | | | 582,596 |
| Old Palm Community Development District, FL, Special Assessment (Palm Beach Gardens), “B”, 5.375%, 2014 | | | 805,000 | | | 725,353 |
| Osage Beach, MO, Tax Increment Rev. (Prewitts), 4.8%, 2016 | | | 1,675,000 | | | 1,607,665 |
| Osage Beach, MO, Tax Increment Rev. (Prewitts), 5%, 2023 | | | 1,500,000 | | | 1,369,605 |
| OTC Community Development District, FL, Special Assessment, “A”, 5.3%, 2038 | | | 4,000,000 | | | 3,212,520 |
Overland Park, KS, Special Assessment (Tallgrass Creek),
4.85%, 2016 | | | 565,000 | | | 540,886 |
Overland Park, KS, Special Assessment (Tallgrass Creek),
5.125%, 2028 | | | 1,220,000 | | | 1,096,085 |
| Palm Glades Community Development District, FL, Special Assessment, “A”, 5.3%, 2036 | | | 1,110,000 | | | 902,075 |
| Palm River Community Development District, FL, Special Assessment, “A”, 5.375%, 2036 | | | 970,000 | | | 783,013 |
| Palm River Community Development District, FL, Special Assessment, “B”, 5.15%, 2013 | | | 1,000,000 | | | 922,710 |
| Panther Trace II, Community Development District, FL, Special Assessment, 5.125%, 2013 | | | 1,145,000 | | | 1,066,831 |
| Panther Trace II, Community Development District, FL, Special Assessment, “B”, 5%, 2010 | | | 1,535,000 | | | 1,479,034 |
| Parker Road Community Development District, FL, “A”, 5.6%, 2038 | | | 1,260,000 | | | 1,048,849 |
| Parkway Center, Community Development District, FL, Special Assessment, “B”, 5.625%, 2014 | | | 3,185,000 | | | 2,976,797 |
| Paseo, FL, Community Development District, “B”, 4.875%, 2010 | | | 3,145,000 | | | 3,011,495 |
| Preserve at Wilderness Lake, FL, 6.2%, 2008 | | | 30,000 | | | 29,845 |
34
Portfolio of Investments – continued
| | | | | | |
| Issuer | | Shares/Par | | Value ($) |
| | | | | | |
| Municipal Bonds - continued | | | | | | |
| Tax Assessment - continued | | | | | | |
| Prince George’s County, MD, Special Obligation (National Harbor Project), 5.2%, 2034 | | $ | 755,000 | | $ | 670,863 |
| Renaissance Community Development District, FL, Special Assessment, “B”, 6.25%, 2008 | | | 275,000 | | | 274,480 |
| Riverwood Estates Community Development District, FL, Special Assessment, “B”, 5%, 2013 | | | 4,405,000 | | | 4,032,293 |
Rolling Hills Community Development District, FL, “B”,
5.125%, 2013 | | | 2,300,000 | | | 2,104,868 |
| Sarasota National Community Development District, FL, Special Assessment Rev., 5.3%, 2039 | | | 3,215,000 | | | 2,481,948 |
| Six Mile Creek Community Development District, FL, Capital Improvement Rev., 5.875%, 2038 | | | 5,000,000 | | | 3,868,600 |
| Sterling Hill Community Development District, FL, Special Assessment, 5.5%, 2010 | | | 770,000 | | | 768,830 |
| Stone Ridge, CO, Metropolitan District No. 2, 7.25%, 2031 | | | 2,700,000 | | | 2,576,340 |
| Stonebrier Community Development District, FL, Special Assessment, 5.5%, 2037 | | | 1,845,000 | | | 1,498,435 |
| Stoneybrook South Community Development District, FL, Special Assessment, “A”, 5.8%, 2039 | | | 2,000,000 | | | 1,712,460 |
| Stoneybrook South Community Development District, FL, Special Assessment, “B”‘, 5.45%, 2015 | | | 2,000,000 | | | 1,823,520 |
| Sweetwater Creek Community Development District, FL, Capital Improvement Rev., 5.3%, 2017 | | | 2,000,000 | | | 1,760,100 |
| Sweetwater Creek Community Development District, FL, Capital Improvement Rev., 5.5%, 2038 | | | 1,500,000 | | | 1,176,765 |
| Tolomato Community Development District, FL, Special Assessment Rev., 6.65%, 2040 | | | 3,825,000 | | | 3,696,633 |
| Tuscany Reserve Community Development District, FL, Special Assessment Rev., “B”, 5.25%, 2016 | | | 2,645,000 | | | 2,313,370 |
| Two Creeks Community Development District, FL, Capital Improvement Rev., 5.25%, 2037 | | | 2,185,000 | | | 1,709,347 |
| Villa Portofino East Community Development District, FL, Special Assessment, 5.2%, 2037 | | | 2,345,000 | | | 1,836,792 |
| Villa Portofino West Community Development District, FL, Special Assessment, “A”, 5.35%, 2036 | | | 995,000 | | | 800,129 |
Villa Vizcaya Community Development District, FL, “A”,
5.55%, 2039 | | | 790,000 | | | 643,645 |
| Washington County, PA, Redevelopment Authority (Victory Centre Project), “A”, 5.45%, 2035 | | | 630,000 | | | 573,124 |
Watergrass Community Development District, FL, “A”,
5.375%, 2039 | | | 1,580,000 | | | 1,252,466 |
35
Portfolio of Investments – continued
| | | | | | |
| Issuer | | Shares/Par | | Value ($) |
| | | | | | |
| Municipal Bonds - continued | | | | | | |
| Tax Assessment - continued | | | | | | |
| Watergrass Community Development District, FL, Special Assessment, “B”, 4.875%, 2010 | | $ | 2,065,000 | | $ | 1,959,561 |
| Wentworth Estates Community Development District, FL, Special Assessment, “B”, 5.125%, 2012 | | | 1,110,000 | | | 980,818 |
| | | | | | |
| | | | | | $ | 124,967,277 |
| Tobacco - 7.0% | | | | | | |
| Badger, WI, Tobacco Asset Securitization Corp., 6.125%, 2027 | | $ | 10,065,000 | | $ | 10,427,441 |
| Badger, WI, Tobacco Asset Securitization Corp., 6.375%, 2032 | | | 495,000 | | | 510,795 |
| Buckeye Tobacco Settlement Financing Authority, 6%, 2042 | | | 780,000 | | | 762,302 |
Buckeye, OH, Tobacco Settlement Financing Authority Rev.,
5.75%, 2034 | | | 2,500,000 | | | 2,404,850 |
| Buckeye, OH, Tobacco Settlement Rev., Asset Backed, “A-2”, 5.875%, 2030 | | | 19,455,000 | | | 19,038,079 |
| Buckeye, OH, Tobacco Settlement Rev., Asset Backed, “A-2”, 5.875%, 2047 | | | 3,335,000 | | | 3,223,878 |
Buckeye, OH, Tobacco Settlement Rev., Asset Backed, “A-2”,
6.5%, 2047 | | | 8,635,000 | | | 8,878,421 |
| California County, CA, Tobacco Securitization Agency, Capital Appreciation Asset Backed (Gold Country), 0%, 2033 | | | 7,870,000 | | | 1,538,821 |
| California County, CA, Tobacco Securitization Agency, Tobacco Settlement (Los Angeles County), 0% to 2010, 5.65% to 2041 | | | 1,525,000 | | | 1,164,094 |
| California Statewide Financing Authority, Tobacco Settlement, 5.625%, 2029 | | | 4,165,000 | | | 4,151,714 |
| Children’s Trust Fund, Tobacco Settlement Rev., Puerto Rico, “A”, 0%, 2050 | | | 8,000,000 | | | 473,440 |
| Children’s Trust Fund, Tobacco Settlement Rev., Puerto Rico, “B”, 0%, 2055 | | | 14,000,000 | | | 496,860 |
| District of Columbia, Tobacco Settlement, 6.25%, 2024 | | | 3,455,000 | | | 3,532,081 |
| District of Columbia, Tobacco Settlement, 6.75%, 2040 | | | 885,000 | | | 908,842 |
| District of Columbia, Tobacco Settlement, Capital Appreciation, “A”, 0%, 2046 | | | 19,160,000 | | | 1,383,544 |
| Golden State, CA, Tobacco Securitization Corp., Tobacco Settlement Rev., “A-4”, 7.8%, 2013 (c) | | | 3,000,000 | | | 3,698,310 |
| Golden State, CA, Tobacco Securitization Corp., Tobacco Settlement Rev., Asset Backed, “A-1”, 5.125%, 2047 | | | 1,740,000 | | | 1,508,754 |
| Inland Empire, CA, Tobacco Securitization Corp., Tobacco Settlement Rev., Asset Backed, “C-1”, 0%, 2036 | | | 11,775,000 | | | 1,776,848 |
| Iowa Tobacco Settlement Authority, Tobacco Settlement Rev., Asset Backed, “B”, 5.6%, 2034 | | | 4,295,000 | | | 4,025,575 |
| Louisiana Tobacco Settlement Authority Rev., 5.5%, 2030 | | | 4,915,000 | | | 4,797,335 |
36
Portfolio of Investments – continued
| | | | | | |
| Issuer | | Shares/Par | | Value ($) |
| | | | | | |
| Municipal Bonds - continued | | | | | | |
| Tobacco - continued | | | | | | |
Louisiana Tobacco Settlement Authority Rev., “2001B”,
5.875%, 2039 | | $ | 4,325,000 | | $ | 4,225,309 |
| Michigan Tobacco Settlement Finance Authority, Tobacco Settlement Rev., Asset Backed, “A”, 6%, 2048 | | | 11,470,000 | | | 11,283,154 |
| New Jersey Tobacco Settlement Financing Corp., 7%, 2013 (c) | | | 45,000 | | | 54,258 |
| New Jersey Tobacco Settlement Financing Corp., 5.75%, 2032 (c) | | | 2,560,000 | | | 2,811,162 |
Northern Tobacco Securitization Corp., AK, Asset Backed, “A”,
5%, 2046 | | | 1,570,000 | | | 1,312,080 |
| Rhode Island Tobacco Settlement Financing Corp., “A”, 0%, 2052 | | | 41,525,000 | | | 2,045,106 |
| Rockland Tobacco Asset Securitization Corp., NY, Tobacco Asset Backed, “C”, 0%, 2060 | | | 33,955,000 | | | 638,354 |
| Silicon Valley Tobacco Securitization Authority, CA, Tobacco Settlement Rev. (Turbo-Santa Clara), “A”, 0%, 2036 | | | 7,265,000 | | | 1,096,289 |
| Silicon Valley Tobacco Securitization Authority, CA, Tobacco Settlement Rev. (Turbo-Santa Clara), “A”, 0%, 2041 | | | 5,640,000 | | | 584,473 |
South Carolina Tobacco Settlement Authority Rev., “B”,
6%, 2022 | | | 2,500,000 | | | 2,554,200 |
South Carolina Tobacco Settlement Authority Rev., “B”,
6.375%, 2028 | | | 3,725,000 | | | 3,777,523 |
South Carolina Tobacco Settlement Authority Rev., “B”,
6.375%, 2030 | | | 2,435,000 | | | 2,473,887 |
| Virginia Tobacco Settlement Financing Corp., “B-1”, 5%, 2047 | | | 430,000 | | | 361,402 |
| Washington Tobacco Settlement Authority, 6.5%, 2026 | | | 1,025,000 | | | 1,070,838 |
| | | | | | |
| | | | | | $ | 108,990,019 |
| Toll Roads - 2.1% | | | | | | |
| E-470 Public Highway Authority, Colorado Rev., Capital Appreciation, “B”, MBIA, 0%, 2027 | | $ | 12,305,000 | | $ | 4,179,762 |
Foothill/Eastern Corridor Agency, CA, Toll Road Rev., “A”,
7.15%, 2010 (c) | | | 5,000,000 | | | 5,560,200 |
| New Jersey Turnpike Authority Rev., MBIA, 5.375%, 2010 (c)(u) | | | 10,000,000 | | | 10,583,300 |
| San Joaquin Hills, CA, Transportation Corridor Agency, Toll Road Rev., ETM, 0%, 2011 (c) | | | 13,400,000 | | | 12,463,206 |
| | | | | | |
| | | | | | $ | 32,786,468 |
| Transportation - Special Tax - 0.8% | | | | | | |
| Puerto Rico Commonwealth Highway & Transportation Authority Rev., FSA, 5.25%, 2033 | | $ | 5,000,000 | | $ | 5,436,400 |
| Telluride, CO, Real Estate Transfer Assessment Rev. (Gondola Transit Co.), ETM, 11.5%, 2012 (c) | | | 6,000,000 | | | 7,775,820 |
| | | | | | |
| | | | | | $ | 13,212,220 |
37
Portfolio of Investments – continued
| | | | | | |
| Issuer | | Shares/Par | | Value ($) |
| | | | | | |
| Municipal Bonds - continued | | | | | | |
| Universities - Colleges - 2.5% | | | | | | |
| Anderson, IN, Economic Development Rev. (Anderson University Project), 5%, 2028 | | $ | 3,530,000 | | $ | 3,313,470 |
| Anderson, IN, Economic Development Rev. (Anderson University Project), 5%, 2032 | | | 1,025,000 | | | 939,402 |
| California Educational Facilities Authority Rev. (L.A. College of Chiropractic), 5.6%, 2017 | | | 2,000,000 | | | 1,998,320 |
| California Educational Facilities Authority Rev. (University of La Verne), “A”, 5%, 2029 | | | 2,205,000 | | | 2,054,685 |
| California Statewide Communities Development Authority Rev. (California Baptist University), “A”, 5.5%, 2038 | | | 1,580,000 | | | 1,503,970 |
| Chabot Las Positas, CA, Community College, Capital Appreciation, Election of 2004, “B”, AMBAC, 0%, 2027 | | | 3,565,000 | | | 1,305,895 |
| Chabot-Las Positas Community College District, CA, “C”, AMBAC, 0%, 2034 | | | 10,000,000 | | | 2,357,600 |
| Chabot-Las Positas Community College District, CA, “C”, AMBAC, 0%, 2035 | | | 11,250,000 | | | 2,504,813 |
| Foothill-DE Anza Community College District, CA, Capital Appreciation, “B”, AMBAC, 0%, 2032 | | | 4,825,000 | | | 1,321,133 |
| Foothill-DE Anza Community College District, CA, Capital Appreciation, “B”, AMBAC, 0%, 2033 | | | 5,335,000 | | | 1,382,085 |
| Foothill-DE Anza Community College District, CA, Capital Appreciation, “B”, AMBAC, 0%, 2034 | | | 9,580,000 | | | 2,347,675 |
| Harrisburg, PA, University of Science, “A”, 5.4%, 2016 | | | 815,000 | | | 816,068 |
| Houston, TX, Community College Systems, MBIA, 7.875%, 2025 | | | 9,150,000 | | | 10,935,440 |
| Illinois Educational Facilities Authority Rev. (Augustana College), “A”, 5.625%, 2022 | | | 1,300,000 | | | 1,356,290 |
| Indiana Educational Facilities Authority Rev. (Manchester College), 5.75%, 2018 | | | 1,000,000 | | | 1,015,390 |
| Iowa Higher Education Loan Authority Rev. (Waldorf Lutheran Collage), “A”, 5%, 2027 | | | 1,100,000 | | | 1,013,243 |
| Iowa Higher Education Loan Authority Rev. (Waldorf Lutheran Collage), “A”, 5%, 2034 | | | 1,000,000 | | | 887,100 |
| Savannah, GA, Economic Development Authority Rev. (College of Art & Design, Inc.), 6.5%, 2009 (c) | | | 2,000,000 | | | 2,172,060 |
| Savannah, GA, Economic Development Authority Rev. (College of Art & Design, Inc.), ETM, 6.2%, 2009 (c) | | | 450,000 | | | 469,427 |
| | | | | | |
| | | | | | $ | 39,694,066 |
| Universities - Dormitories - 0.3% | | | | | | |
| California Statewide Communities Development Authority Rev. (California Baptist University), “A”, 5.4%, 2027 | | $ | 1,385,000 | | $ | 1,339,198 |
38
Portfolio of Investments – continued
| | | | | | |
| Issuer | | Shares/Par | | Value ($) |
| | | | | | |
| Municipal Bonds - continued | | | | | | |
| Universities - Dormitories - continued | | | | | | |
| California Statewide Communities Development Authority Rev. (Lancer Educational Student Housing Project), 5.625%, 2033 | | $ | 1,380,000 | | $ | 1,316,368 |
| Illinois Educational Facilities Authority, Educational Advancement Fund (University Center), 6.625%, 2012 (c) | | | 1,500,000 | | | 1,752,240 |
| | | | | | |
| | | | | | $ | 4,407,806 |
| Universities - Secondary Schools - 1.9% | | | | | | |
| California Statewide Communities Development Authority Rev. (Escondido Charter High School), 7.5%, 2011 (c) | | $ | 1,780,000 | | $ | 2,051,361 |
| California Statewide Communities Development Authority Rev. (Escondido Charter High School), 7.5%, 2011 (c) | | | 3,485,000 | | | 4,132,792 |
| Colorado Housing Finance Development Rev. (Evergreen Country Day School), 5.875%, 2037 | | | 2,760,000 | | | 2,639,195 |
| Deerfield, IL, Educational Facilities Authority Rev. (Chicagoland Jewish High School Project), 6%, 2041 | | | 2,610,000 | | | 2,509,646 |
| Lee County, FL, Industrial Development Authority Rev. (Lee Charter Foundation), “A”, 5.25%, 2027 | | | 1,570,000 | | | 1,396,594 |
| Lee County, FL, Industrial Development Authority Rev. (Lee Charter Foundation), “A”, 5.375%, 2037 | | | 3,155,000 | | | 2,725,194 |
| Maryland Health & Higher Educational Facilities Authority Rev. (Washington Christian Academy), 5.25%, 2018 | | | 985,000 | | | 945,285 |
| Maryland Health & Higher Educational Facilities Authority Rev. (Washington Christian Academy), 5.5%, 2038 | | | 460,000 | | | 398,236 |
Maryland Industrial Development Financing Authority, Economic Development Authority Rev. (Our Lady of Good Council), “A”,
6%, 2035 | | | 450,000 | | | 447,678 |
| Michigan Municipal Bond Authority Rev. (YMCA Service Learning Academy), 7.625%, 2021 | | | 550,000 | | | 572,028 |
| Michigan Municipal Bond Authority Rev. (YMCA Service Learning Academy), 7.75%, 2031 | | | 2,450,000 | | | 2,546,579 |
| Pima County, AZ, Industrial Development Authority Education Rev. (Arizona Charter Schools), “C”, 6.4%, 2013 | | | 1,055,000 | | | 1,100,998 |
| Pima County, AZ, Industrial Development Authority Education Rev. (Arizona Charter Schools), “C”, 6.75%, 2031 | | | 2,970,000 | | | 3,047,576 |
| Utah County, UT, Charter School Rev. (Lakeview Academy), “A”, 5.625%, 2037 | | | 1,815,000 | | | 1,672,196 |
| Utah County, UT, Charter School Rev. (Renaissance Academy), “A”, 5.625%, 2037 | | | 1,065,000 | | | 977,180 |
| Utah County, UT, Charter School Rev. (Ronald Wilson Reagan Academy), “A”, 6%, 2038 | | | 2,820,000 | | | 2,702,829 |
| | | | | | |
| | | | | | $ | 29,865,367 |
39
Portfolio of Investments – continued
| | | | | | |
| Issuer | | Shares/Par | | Value ($) |
| | | | | | |
| Municipal Bonds - continued | | | | | | |
| Utilities - Cogeneration - 0.5% | | | | | | |
| Alaska Industrial Development & Export Authority, 5.7%, 2012 | | $ | 680,000 | | $ | 684,216 |
| Alaska Industrial Development & Export Authority, 5.875%, 2032 | | | 1,800,000 | | | 1,693,332 |
Ohio Water Development Authority (Bay Shore Power),
5.875%, 2020 | | | 1,700,000 | | | 1,710,965 |
| Pennsylvania Economic Development Financing Authority Rev., Resources Recovery Rev. (Colver), “G”, 5.125%, 2015 | | | 1,050,000 | | | 1,051,691 |
Pennsylvania Economic Development Financing Authority Rev., Resources Recovery Rev. (Northampton Generating), “A”,
6.5%, 2013 | | | 2,300,000 | | | 2,307,958 |
| | | | | | |
| | | | | | $ | 7,448,162 |
| Utilities - Investor Owned - 2.4% | | | | | | |
| Brazos River Authority, TX, Pollution Control Rev. (TXU Electric Co. LLC), “C”, 5.75%, 2036 (a) | | $ | 7,265,000 | | $ | 7,071,824 |
| Brazos River Authority, TX, Pollution Control Rev. (TXU Electric Co. LLC), “D”, 5.4%, 2029 (a) | | | 310,000 | | | 290,827 |
| Farmington, NM, Pollution Control Rev. (Public Service New Mexico), “A”, 6.3%, 2016 | | | 3,240,000 | | | 3,286,040 |
| Farmington, NM, Pollution Control Rev. (Public Service New Mexico), “A”, 5.8%, 2022 | | | 4,500,000 | | | 4,507,155 |
| Farmington, NM, Pollution Control Rev. (Public Service New Mexico), “C”, 5.8%, 2022 | | | 1,390,000 | | | 1,392,210 |
| Farmington, NM, Pollution Control Rev. (Tucson Electric), “A”, 6.95%, 2020 | | | 3,000,000 | | | 3,067,590 |
| Matagorda County, TX, Pollution Control Rev. (Reliant Energy), 5.95%, 2030 | | | 3,095,000 | | | 3,117,284 |
| Mecklenburg County, VA, Industrial Development Authority Rev. (UAE Mecklenburg LP), 6.5%, 2017 | | | 2,800,000 | | | 3,051,664 |
| Pointe Coupee Parish, LA, Pollution Control Rev. (Gulf States Utilities Co.), 6.7%, 2013 | | | 1,000,000 | | | 1,002,860 |
| Red River Authority (AEP Texas Central Co.), MBIA, 4.45%, 2020 | | | 2,925,000 | | | 3,028,838 |
| Sabine River Authority, TX, Pollution Control Rev. (TXU Electric Co. LLC), 5.2%, 2028 | | | 1,255,000 | | | 1,028,724 |
| Sabine River Authority, TX, Pollution Control Rev. (TXU Electric Co. LLC), 5.75%, 2030 (a) | | | 1,060,000 | | | 1,031,815 |
| West Feliciana Parish, LA, Pollution Control Rev. (Entergy Gulf States), 6.6%, 2028 | | | 3,335,000 | | | 3,335,567 |
| Yuma County, AZ, Industrial Development Authority (Far West Water & Sewer, Inc.), 6.375%, 2037 | | | 2,605,000 | | | 2,558,683 |
| | | | | | |
| | | | | | $ | 37,771,081 |
40
Portfolio of Investments – continued
| | | | | | |
| Issuer | | Shares/Par | | Value ($) |
| | | | | | |
| Municipal Bonds - continued | | | | | | |
| Utilities - Other - 0.4% | | | | | | |
| Main Street Natural Gas, Inc., GA, “A”, 5.5%, 2028 | | $ | 2,245,000 | | $ | 2,242,104 |
SA Energy Acquisition Public Facility Corp. (Tex Gas Supply),
5.5%, 2027 | | | 4,000,000 | | | 4,116,120 |
| | | | | | |
| | | | | | $ | 6,358,224 |
| Water & Sewer Utility Revenue - 3.5% | | | | | | |
Alabama Drinking Water Finance Authority, “A”, AMBAC,
4%, 2028 | | $ | 5,000,000 | | $ | 4,585,450 |
| Berkeley County, WV, Public Service Sewer District, “A”, 5%, 2047 | | | 745,000 | | | 700,114 |
Forsyth County, GA, Water & Sewer Authority Rev.,
6.25%, 2010 (c) | | | 1,010,000 | | | 1,103,455 |
Forsyth County, GA, Water & Sewerage Authority Rev.,
6.25%, 2010 (c) | | | 1,000,000 | | | 1,092,530 |
| Los Angeles County, CA, Sanitation Districts Financing Authority Rev., AMBAC, 4.5%, 2038 | | | 9,715,000 | | | 8,999,685 |
| Louisville & Jefferson, KY, District Sewer & Drain System, “A”, FGIC, 5.25%, 2037 | | | 2,635,000 | | | 2,763,245 |
| Magnolia, TX, Water & Sewer System Rev., 5.15%, 2031 | | | 655,000 | | | 638,311 |
| Massachusetts Water Resources Authority (Charlestown Navy Yard), FSA, 5.25%, 2029 | | | 5,185,000 | | | 5,847,850 |
Massachusetts Water Resources Authority, “A”, FSA,
4.375%, 2032 | | | 8,915,000 | | | 8,609,394 |
| Massachusetts Water Resources Authority, RITES, FRN, FGIC, 9.825%, 2019 (n)(v) | | | 765,000 | | | 1,100,567 |
| Miami-Dade County, FL, Stormwater Utility Rev., MBIA, 5%, 2028 | | | 1,685,000 | | | 1,728,692 |
| Michigan Municipal Bond Authority Rev., 5.5%, 2009 (c)(u) | | | 15,170,000 | | | 16,148,465 |
| Mississippi Development Bank Special Obligations, Grenada, MS, Water & Sewer Systems Project, “N”, FSA, 5%, 2030 | | | 2,155,000 | | | 2,237,428 |
| | | | | | |
| | | | | | $ | 55,555,186 |
| Total Investments (Identified Cost, $1,571,442,084) (k) | | | | | $ | 1,543,652,915 |
| | |
| Other Assets, Less Liabilities - 1.5% | | | | | | 23,743,657 |
| Net Assets - 100.0% | | | | | $ | 1,567,396,572 |
| (a) | Mandatory tender date is earlier than stated maturity date. |
| (d) | Non-income producing security - in default. |
| (k) | As of January 31, 2008 the fund held securities fair valued in accordance with the policies adopted by the Board of Trustees, aggregating $1,543,652,915 and 100.00% of market value. All of these security values were provided by an independent pricing service using an evaluated bid. |
| (n) | Securities exempt from registration under Rule 144A of the Securities Act of 1933. These securities may be sold in the ordinary course of business in transactions exempt from registration, normally to qualified institutional buyers. At period end, the aggregate value of these securities was $35,394,342 representing 2.3% of net assets. |
41
Portfolio of Investments – continued
| (p) | Primary inverse floater. |
| (u) | Underlying security deposited into special purpose trust (“the trust”) by investment banker upon creation of self-deposited inverse floaters. |
| (v) | Externally deposited inverse floater. |
| (z) | Restricted securities are not registered under the Securities Act of 1933 and are subject to legal restrictions on resale. These securities generally may be resold in transactions exempt from registration or to the public if the securities are subsequently registered. Disposal of these securities may involve time-consuming negotiations and prompt sale at an acceptable price may be difficult. The fund holds the following restricted securities: |
| | | | | | |
| Restricted Securities | | Acquisition
Date | | Acquisition
Cost | | Current
Market
Value |
| Mashantucket, CT, Western Pequot Tribe, 5.5%, 2036 | | 1/07/08 | | $1,630,843 | | $1,608,705 |
| % of Net Assets | | | | | | 0.1% |
The following abbreviations are used in this report and are defined:
| COP | | Certificate of Participation |
| FRN | | Floating Rate Note. Interest rate resets periodically and may not be the rate reported at period end. |
Insurers
| AMBAC | | AMBAC Indemnity Corp. |
| FGIC | | Financial Guaranty Insurance Co. |
| FHA | | Federal Housing Administration |
| FNMA | | Federal National Mortgage Assn. |
| FSA | | Financial Security Assurance Inc. |
| GNMA | | Government National Mortgage Assn. |
| MBIA | | MBIA Insurance Corp. |
| PSF | | Permanent School Fund |
| XLCA | | XL Capital Insurance Co. |
Inverse Floaters
| RITES | | Residual Interest Tax-Exempt Security |
See Notes to Financial Statements
42
Financial Statements
STATEMENT OF ASSETS AND LIABILITIES
At 1/31/08
This statement represents your fund’s balance sheet, which details the assets and liabilities comprising the total value of the fund.
| | | | | |
| Assets | | | | | |
| Investments, at value (identified cost, $1,571,442,084) | | $1,543,652,915 | | | |
| Cash | | 26,112,873 | | | |
| Receivable for investments sold | | 39,527,443 | | | |
| Receivable for fund shares sold | | 7,290,173 | | | |
| Interest receivable | | 21,585,009 | | | |
| Other assets | | 20,654 | | | |
| Total assets | | | | | $1,638,189,067 |
| Liabilities | | | | | |
| Distributions payable | | $3,448,707 | | | |
| Payable for investments purchased | | 14,680,681 | | | |
| Payable to the holder of the floating rate certificate from trust assets | | 49,337,378 | | | |
| Payable for fund shares reacquired | | 2,471,383 | | | |
| Payable to affiliates | | | | | |
Management fee | | 42,703 | | | |
Shareholder servicing costs | | 176,996 | | | |
Distribution and service fees | | 18,647 | | | |
Administrative services fee | | 1,096 | | | |
| Payable for independent trustees’ compensation | | 42,238 | | | |
| Payable for interest expense and fees | | 394,966 | | | |
| Accrued expenses and other liabilities | | 177,700 | | | |
| Total liabilities | | | | | $70,792,495 |
| Net assets | | | | | $1,567,396,572 |
| Net assets consist of: | | | | | |
| Paid-in capital | | $1,646,046,235 | | | |
| Unrealized appreciation (depreciation) on investments | | (27,789,169 | ) | | |
| Accumulated net realized gain (loss) on investments | | (58,880,347 | ) | | |
| Undistributed net investment income | | 8,019,853 | | | |
| Net assets | | | | | $1,567,396,572 |
| Shares of beneficial interest outstanding | | | | | 194,531,912 |
43
Statement of Assets and Liabilities – continued
| | | | |
| Class A shares: | | | | |
Net assets | | $1,267,514,463 | | |
Shares outstanding | | 157,344,819 | | |
Net asset value per share | | | | $8.06 |
Offering price per share (100 / 95.25 x net asset value per share) | | | | $8.46 |
| Class B shares: | | | | |
Net assets | | $127,598,893 | | |
Shares outstanding | | 15,824,169 | | |
Net asset value and offering price per share | | | | $8.06 |
| Class C shares: | | | | |
Net assets | | $172,283,216 | | |
Shares outstanding | | 21,362,924 | | |
Net asset value and offering price per share | | | | $8.06 |
On sales of $50,000 or more, the offering price of Class A shares is reduced. A contingent deferred sales charge may be imposed on redemptions of Class A, Class B, and Class C shares.
See Notes to Financial Statements
44
Financial Statements
STATEMENT OF OPERATIONS
Year ended 1/31/08
This statement describes how much your fund earned in investment income and accrued in expenses. It also describes any gains and/or losses generated by fund operations.
| | | | | | |
| Net investment income | | | | | | |
| Interest income | | | | | $106,016,581 | |
| Expenses | | | | | | |
Management fee | | $9,914,720 | | | | |
Distribution and service fees | | 2,920,198 | | | | |
Shareholder servicing costs | | 1,279,270 | | | | |
Administrative services fee | | 271,872 | | | | |
Independent trustees’ compensation | | 43,379 | | | | |
Custodian fee | | 140,560 | | | | |
Shareholder communications | | 117,730 | | | | |
Auditing fees | | 58,263 | | | | |
Legal fees | | 35,647 | | | | |
Interest expense and fees | | 2,205,223 | | | | |
Miscellaneous | | 241,721 | | | | |
| Total expenses | | | | | $17,228,583 | |
Reduction of expenses by investment adviser | | (1,593,571 | ) | | | |
| Net expenses | | | | | $15,635,012 | |
| Net investment income | | | | | $90,381,569 | |
| Realized and unrealized gain (loss) on investments | | | | | | |
| Realized gain (loss) (identified cost basis) | | | | | | |
Investment transactions | | $1,168,099 | | | | |
Swap transactions | | 470,959 | | | | |
| Net realized gain (loss) on investments | | | | | $1,639,058 | |
| Change in unrealized appreciation (depreciation) | | | | | | |
Investments | | $(95,709,689 | ) | | | |
Swap transactions | | (327,350 | ) | | | |
| Net unrealized gain (loss) on investments | | | | | $(96,037,039 | ) |
| Net realized and unrealized gain (loss) on investments | | | | | $(94,397,981 | ) |
| Change in net assets from operations | | | | | $(4,016,412 | ) |
See Notes to Financial Statements
45
Financial Statements
STATEMENTS OF CHANGES IN NET ASSETS
These statements describe the increases and/or decreases in net assets resulting from operations, any distributions, and any shareholder transactions.
| | | | | | |
| | | Years ended 1/31 | |
| | | 2008 | | | 2007 | |
| Change in net assets | | | | | | |
| From operations | | | | | | |
| Net investment income | | $90,381,569 | | | $78,097,274 | |
| Net realized gain (loss) on investments | | 1,639,058 | | | (1,089,624 | ) |
| Net unrealized gain (loss) on investments | | (96,037,039 | ) | | 13,538,310 | |
| Change in net assets from operations | | $(4,016,412 | ) | | $90,545,960 | |
| Distributions declared to shareholders | | | | | | |
| From net investment income | | | | | | |
Class A | | $(70,087,274 | ) | | $(61,246,122 | ) |
Class B | | (6,721,508 | ) | | (8,854,231 | ) |
Class C | | (7,442,444 | ) | | (6,023,571 | ) |
| Total distributions declared to shareholders | | $(84,251,226 | ) | | $(76,123,924 | ) |
| Change in net assets from fund share transactions | | $(28,217,675 | ) | | $247,827,107 | |
| Redemption fees | | $— | | | $21,728 | |
| Total change in net assets | | $(116,485,313 | ) | | $262,270,871 | |
| Net assets | | | | | | |
| At beginning of period | | 1,683,881,885 | | | 1,421,611,014 | |
| At end of period (including undistributed net investment income of $8,019,853 and $2,646,054, respectively) | | $1,567,396,572 | | | $1,683,881,885 | |
See Notes to Financial Statements
46
Financial Statements
FINANCIAL HIGHLIGHTS
The financial highlights table is intended to help you understand the fund’s financial performance for the past 5 years. Certain information reflects financial results for a single fund share. The total returns in the table represent the rate by which an investor would have earned (or lost) on an investment in the fund share class (assuming reinvestment of all distributions) held for the entire period.
| | | | | | | | | | | | | | | |
| Class A | | Years ended 1/31 | |
| | | 2008 | | | 2007 | | | 2006 | | | 2005 | | | 2004 | |
| Net asset value, beginning of period | | $8.49 | | | $8.41 | | | $8.39 | | | $8.28 | | | $8.12 | |
| Income (loss) from investment operations | | | | | | | | | | | | | |
Net investment income (d) | | $0.47 | | | $0.45 | | | $0.46 | | | $0.48 | | | $0.47 | |
Net realized and unrealized gain (loss) on investments | | (0.47 | ) | | 0.07 | | | 0.02 | | | 0.09 | | | 0.17 | |
| Total from investment operations | | $(0.00 | )(w) | | $0.52 | | | $0.48 | | | $0.57 | | | $0.64 | |
| Less distributions declared to shareholders | | | | | | | | | | | | | |
From net investment income | | $(0.43 | ) | | $(0.44 | ) | | $(0.46 | ) | | $(0.46 | ) | | $(0.48 | ) |
Redemption fees added to paid-in
capital (d) | | $— | | | $ 0.00 | (w) | | $ 0.00 | (w) | | $0.00 | (w) | | $— | |
| Net asset value, end of period | | $8.06 | | | $8.49 | | | $8.41 | | | $8.39 | | | $8.28 | |
| Total return (%) (r)(s)(t) | | 0.04 | | | 6.32 | | | 5.81 | | | 7.16 | | | 7.98 | |
Ratios (%) (to average net assets)
and Supplemental data: | | | | | | | | | | | | | |
| Expenses before expense reductions (f) | | 0.86 | | | 0.97 | | | 0.94 | (z) | | 0.80 | | | 0.81 | |
| Expenses after expense reductions (f) | | 0.76 | | | 0.87 | | | 0.84 | (z) | | 0.71 | | | 0.79 | |
| Expenses after expense reductions and excluding interest expense and fees (f)(l) | | 0.63 | | | 0.72 | | | 0.72 | | | 0.71 | | | 0.79 | |
| Net investment income | | 5.60 | | | 5.32 | | | 5.47 | | | 5.82 | | | 5.80 | |
| Portfolio turnover | | 38 | | | 13 | | | 20 | | | 13 | | | 9 | |
| Net assets at end of period (000 Omitted) | | $1,267,514 | | | $1,335,269 | | | $1,080,805 | | | $977,416 | | | $1,003,328 | |
See Notes to Financial Statements
47
Financial Highlights – continued
| | | | | | | | | | | | | | | |
| Class B | | Years ended 1/31 | |
| | | 2008 | | | 2007 | | | 2006 | | | 2005 | | | 2004 | |
| Net asset value, beginning of period | | $8.50 | | | $8.41 | | | $8.40 | | | $8.28 | | | $8.13 | |
| Income (loss) from investment operations | | | | | | | | | | | | | |
Net investment income (d) | | $0.40 | | | $0.39 | | | $0.40 | | | $0.42 | | | $0.41 | |
Net realized and unrealized gain (loss) on investments | | (0.47 | ) | | 0.07 | | | 0.00 | (w) | | 0.10 | | | 0.16 | |
| Total from investment operations | | $(0.07 | ) | | $0.46 | | | $0.40 | | | $0.52 | | | $0.57 | |
| Less distributions declared to shareholders | | | | | | | | | | | | | |
From net investment income | | $(0.37 | ) | | $(0.37 | ) | | $(0.39 | ) | | $(0.40 | ) | | $(0.42 | ) |
| Redemption fees added to paid-in capital (d) | | $— | | | $0.00 | (w) | | $0.00 | (w) | | $0.00 | (w) | | $— | |
| Net asset value, end of period | | $8.06 | | | $8.50 | | | $8.41 | | | $8.40 | | | $8.28 | |
| Total return (%) (r)(s)(t) | | (0.85 | ) | | 5.64 | | | 4.88 | | | 6.47 | | | 7.15 | |
Ratios (%) (to average net assets) and Supplemental data: | | | | | | | | | | | | | | | |
| Expenses before expense reductions (f) | | 1.63 | | | 1.74 | | | 1.70 | (z) | | 1.57 | | | 1.59 | |
| Expenses after expense reductions (f) | | 1.53 | | | 1.64 | | | 1.60 | (z) | | 1.48 | | | 1.57 | |
| Expenses after expense reductions and excluding interest expense and fees (f)(l) | | 1.40 | | | 1.50 | | | 1.48 | | | 1.48 | | | 1.57 | |
| Net investment income | | 4.83 | | | 4.60 | | | 4.73 | | | 5.05 | | | 5.02 | |
| Portfolio turnover | | 38 | | | 13 | | | 20 | | | 13 | | | 9 | |
| Net assets at end of period (000 Omitted) | | $127,599 | | | $178,566 | | | $220,854 | | | $283,360 | | | $337,065 | |
See Notes to Financial Statements
48
Financial Highlights – continued
| | | | | | | | | | | | | | | |
| Class C | | Years ended 1/31 | |
| | | 2008 | | | 2007 | | | 2006 | | | 2005 | | | 2004 | |
| Net asset value, beginning of period | | $8.50 | | | $8.42 | | | $8.40 | | | $8.29 | | | $8.13 | |
| Income (loss) from investment operations | | | | | | | | | | | | | |
Net investment income (d) | | $0.38 | | | $0.36 | | | $0.37 | | | $0.39 | | | $0.39 | |
Net realized and unrealized gain (loss) on investments | | (0.47 | ) | | 0.08 | | | 0.02 | | | 0.10 | | | 0.17 | |
| Total from investment operations | | $(0.09 | ) | | $0.44 | | | $0.39 | | | $0.49 | | | $0.56 | |
| Less distributions declared to shareholders | | | | | | | | | | | | | |
From net investment income | | $(0.35 | ) | | $(0.36 | ) | | $(0.37 | ) | | $(0.38 | ) | | $(0.40 | ) |
| Redemption fees added to paid-in capital (d) | | $— | | | $0.00 | (w) | | $0.00 | (w) | | $0.00 | (w) | | $— | |
| Net asset value, end of period | | $8.06 | | | $8.50 | | | $8.42 | | | $8.40 | | | $8.29 | |
| Total return (%) (r)(s)(t) | | (1.08 | ) | | 5.27 | | | 4.76 | | | 6.10 | | | 6.91 | |
Ratios (%) (to average net assets) and Supplemental data: | | | | | | | | | | | | | |
| Expenses before expense reductions (f) | | 1.86 | | | 1.97 | | | 1.94 | (z) | | 1.80 | | | 1.81 | |
| Expenses after expense reductions (f) | | 1.76 | | | 1.87 | | | 1.84 | (z) | | 1.71 | | | 1.79 | |
| Expenses after expense reductions and excluding interest expense and fees (f)(l) | | 1.63 | | | 1.72 | | | 1.72 | | | 1.71 | | | 1.79 | |
| Net investment income | | 4.60 | | | 4.30 | | | 4.44 | | | 4.80 | | | 4.78 | |
| Portfolio turnover | | 38 | | | 13 | | | 20 | | | 13 | | | 9 | |
| Net assets at end of period (000 Omitted) | | $172,283 | | | $170,047 | | | $119,952 | | | $85,715 | | | $78,975 | |
| (d) | Per share data are based on average shares outstanding. |
| (f) | Ratios do not reflect reductions from fees paid indirectly, if applicable. |
| (l) | Interest expense and fees relate to payments made to the holder of the floating rate certificate from trust assets. |
| (r) | Certain expenses have been reduced without which performance would have been lower. |
| (s) | From time to time the fund may receive proceeds from litigation settlements, without which performance would be lower. |
| (t) | Total returns do not include any applicable sales charges. |
| (w) | Per share amount was less than $0.01. |
| (z) | After the fund issued its January 31, 2006 financial statements, the fund determined that the criteria for sale accounting in FASB Statement No. 140 had not been met for certain transfers of municipal bonds during the fiscal year ended January 31, 2006 and that its transfers of municipal bonds in connection with self-deposited inverse floaters should have been accounted for as secured borrowings rather than as sales. Accordingly, the expense ratio has been restated to reflect interest expense and fees related to payments made to the holder of the floating rate certificate from trust assets in connection with self-deposited inverse floater transactions. The impact of the restatement was to increase the expense ratio by 0.12%. |
See Notes to Financial Statements
49
NOTES TO FINANCIAL STATEMENTS
| (1) | | Business and Organization |
MFS Municipal High Income Fund (the fund) is a series of MFS Series Trust III (the trust). The trust is organized as a Massachusetts business trust and is registered under the Investment Company Act of 1940, as amended, as an open-end management investment company.
| (2) | | Significant Accounting Policies |
General – The preparation of financial statements in conformity with U.S. generally accepted accounting principles requires management to make estimates and assumptions that affect the reported amounts of assets and liabilities, and disclosure of contingent assets and liabilities at the date of the financial statements and the reported amounts of revenues and expenses during the reporting period. Actual results could differ from those estimates. The fund can invest up to 100% of its portfolio in high-yield securities rated below investment grade. Investments in high-yield securities involve greater degrees of credit and market risk than investments in higher-rated securities and tend to be more sensitive to economic conditions. Municipal securities backed by current or anticipated revenues from a specific project or specific assets can be negatively affected by the discontinuance of the taxation supporting the projects or assets or the inability to collect revenues for the project or from the assets. If the Internal Revenue Service determines an issuer of a municipal security has not complied with applicable tax requirements, the security could decline in value, interest from the security could become taxable and the fund may be required to issue Forms 1099-DIV.
Investment Valuations – Debt instruments (other than short-term instruments), including restricted debt instruments, are generally valued at an evaluated or composite bid as reported by an independent pricing service. Short-term instruments with a maturity at issuance of 60 days or less may be valued at amortized cost, which approximates market value. Swaps are generally valued at an evaluated bid as reported by an independent pricing service. Securities and other assets generally valued on the basis of information from an independent pricing service may also be valued at a broker-dealer bid quotation. Values obtained from pricing services can utilize both dealer-supplied valuations and electronic data processing techniques, which take into account factors such as institutional-size trading in similar groups of securities, yield, quality, coupon rate, maturity, type of issue, trading characteristics, and other market data.
The Board of Trustees has delegated primary responsibility for determining or causing to be determined the value of the fund’s investments (including any fair valuation) to the adviser pursuant to valuation policies and procedures
50
Notes to Financial Statements – continued
approved by the Board. If the adviser determines that reliable market quotations are not readily available, investments are valued at fair value as determined in good faith by the adviser in accordance with such procedures under the oversight of the Board of Trustees. Under the fund’s valuation policies and procedures, market quotations are not considered to be readily available for many types of debt instruments and certain types of derivatives. These investments are generally valued at fair value based on information from independent pricing services. In addition, investments may be valued at fair value if the adviser determines that an investment’s value has been materially affected by events occurring after the close of the exchange or market on which the investment is principally traded (such as foreign exchange or market) and prior to the determination of the fund’s net asset value, or after the halting of trading of a specific security where trading does not resume prior to the close of the exchange or market on which the security is principally traded. The adviser may rely on independent pricing services or other information (such as the correlation with price movements of similar securities in the same or other markets; the type, cost and investment characteristics of the security; the business and financial condition of the issuer; and trading and other market data) to assist in determining whether to fair value and at what value to fair value an investment. The value of an investment for purposes of calculating the fund’s net asset value can differ depending on the source and method used to determine value. When fair valuation is used, the value of investments used to determine the fund’s net asset value may differ from quoted or published prices for the same investments.
In September 2006, FASB Statement No. 157, Fair Value Measurements (the “Statement”) was issued, and is effective for fiscal years beginning after November 15, 2007 and for all interim periods within those fiscal years. This Statement provides a single definition of fair value, a hierarchy for measuring fair value and expanded disclosures about fair value measurements. Management is evaluating the application of the Statement to the fund, and believes the impact will be limited to expanded disclosures resulting from the adoption of this Statement in the fund’s financial statements.
Derivative Risk – The fund may invest in derivatives for hedging or non-hedging purposes. While hedging can reduce or eliminate losses, it can also reduce or eliminate gains. When the fund uses derivatives as an investment to gain market exposure, or for hedging purposes, gains and losses from derivative instruments may be substantially greater than the derivative’s original cost. Cash that has been segregated on behalf of certain derivative contracts will be reported separately on the Statement of Assets and Liabilities as restricted cash. Derivative instruments include swap agreements.
51
Notes to Financial Statements – continued
Swap Agreements – The fund may enter into swap agreements. A swap is an exchange of cash payments between the fund and another party. Net cash payments are exchanged at specified intervals and are recorded as a realized gain or loss in the Statement of Operations. The value of the swap is adjusted daily and the change in value, including accruals of periodic amounts of interest to be paid or received, is recorded as unrealized appreciation or depreciation in the Statement of Operations. Amounts paid or received at the inception of the swap are reflected as premiums paid or received on the Statement of Assets and Liabilities and are amortized using the effective interest method over the term of the agreement. A liquidation payment received or made upon early termination is recorded as a realized gain or loss in the Statement of Operations. Collateral, in the form of cash or securities, may be required to be held in segregated accounts with the fund’s custodian in connection with these agreements. Risk of loss may exceed amounts recognized on the Statement of Assets and Liabilities. These risks include the possible lack of a liquid market, failure of the counterparty to perform under the terms of the agreements, and unfavorable market movement of the underlying instrument. All swap agreements entered into by the fund with the same counterparty are generally governed by a single master agreement, which provides for the netting of all amounts owed by the parties under the agreement upon the occurrence of an event of default, thereby reducing the credit risk to which such party is exposed.
The fund may hold interest rate swap agreements which involve the periodic exchange of cash flows, such as the exchange of fixed rate interest payments for floating rate interest payments based on a notional principal amount. The interest rates may be based on a specific financial index or the exchange of two distinct floating rate payments. The fund may enter into an interest rate swap in order to manage its exposure to interest rate fluctuations.
Inverse Floaters – The fund invests in municipal inverse floating rate securities which are structured by the issuer (known as primary market inverse floating rate securities) or by an investment banker utilizing municipal bonds which have already been issued (known as secondary market inverse floating rate securities) to have variable rates of interest which typically move in the opposite direction of short term interest rates. A secondary market inverse floating rate security is created when an investment banker transfers a fixed rate municipal bond to a special purpose trust, and causes the trust to (a) issue floating rate certificates to third parties, in an amount equal to a fraction of the par amount of the deposited bonds (these certificates usually pay tax-exempt interest at short-term interest rates that typically reset weekly; and the certificate holders typically, on seven days notice, have the option to tender their certificates to the investment banker or another party for redemption at par plus accrued interest), and (b) issue inverse floating rate certificates
52
Notes to Financial Statements – continued
(sometimes referred to as “inverse floaters”). If the holder of the inverse floater transfers the municipal bonds to an investment banker for the purpose of depositing the municipal bonds into the special purpose trust, the inverse floating rate certificates that are issued by the trust are referred to as “self-deposited inverse floaters.” If the bonds held by the trust are purchased by the investment banker for deposit into the trust from someone other than the purchasers of the inverse floaters, the inverse floating rate certificates that are issued by the trust are referred to as “externally deposited inverse floaters.” Such self-deposited inverse floaters held by the fund are accounted for as secured borrowings, with the municipal bonds reflected in the investments of the fund and amounts owed to the holder of the floating rate certificate under the provisions of the trust, which amounts are paid solely from the assets of the trust, reflected as liabilities of the fund in the Statement of Assets and Liabilities under the caption, “Payable to the holder of the floating rate certificate from trust assets”. At January 31, 2008, the fund’s payable to the holder of the floating rate certificate from trust assets was $49,337,378. The weighted average interest rate on the floating rate certificates issued by the trust was 3.27%. Interest expense and fees relate to payments made to the holder of the floating rate certificate from trust assets in connection with self-deposited inverse floater transactions. Interest expense and fees are recorded as incurred. For the year ended January 31, 2008, interest expense and fees in connection with self-deposited inverse floaters was $2,205,223. Primary and externally deposited inverse floaters held by the fund are not accounted for as secured borrowings.
Indemnifications – Under the fund’s organizational documents, its officers and trustees may be indemnified against certain liabilities and expenses arising out of the performance of their duties to the fund. Additionally, in the normal course of business, the fund enters into agreements with service providers that may contain indemnification clauses. The fund’s maximum exposure under these agreements is unknown as this would involve future claims that may be made against the fund that have not yet occurred.
Investment Transactions and Income – Investment transactions are recorded on the trade date. Interest income is recorded on the accrual basis. All premium and discount is amortized or accreted for financial statement purposes in accordance with U.S. generally accepted accounting principles. All premium and original issue discount is amortized or accreted for tax reporting purposes as required by federal income tax regulations.
The fund may receive proceeds from litigation settlements. Any proceeds received from litigation involving portfolio holdings are reflected in the Statement of Operations in realized gain/loss if the security has been disposed of by the fund or in unrealized gain/loss if the security is still held by the fund.
53
Notes to Financial Statements – continued
Any other proceeds from litigation not related to portfolio holdings are reflected as other income in the Statement of Operations.
Legal fees and other related expenses incurred to preserve and protect the value of a security owned are added to the cost of the security; other legal fees are expensed. Capital infusions made directly to the security issuer, which are generally non-recurring, incurred to protect or enhance the value of high-yield debt securities, are reported as additions to the cost basis of the security. Costs that are incurred to negotiate the terms or conditions of capital infusions or that are expected to result in a plan of reorganization are reported as realized losses. Ongoing costs incurred to protect or enhance an investment, or costs incurred to pursue other claims or legal actions, are expensed.
Fees Paid Indirectly – The fund’s custody fee may be reduced according to an arrangement that measures the value of cash deposited with the custodian by the fund. For the year ended January 31, 2008, custody fees were not reduced.
Tax Matters and Distributions – The fund intends to qualify as a regulated investment company, as defined under Subchapter M of the Internal Revenue Code, and to distribute all of its taxable and tax-exempt income, including realized capital gains. As a result, no provision for federal income taxes is required. The fund adopted the provisions of FASB Interpretation No. 48, Accounting for Uncertainty in Income Taxes (“the Interpretation”) on January 1, 2007. The Interpretation prescribes a minimum threshold for financial statement recognition of the benefit of a tax position taken or expected to be taken in a tax return. There was no impact resulting from the adoption of this Interpretation on the fund’s financial statements. Each of the tax years in the three year period ended January 31, 2008 remains subject to examination by the Internal Revenue Service. It is the fund’s policy to record interest and penalty charges on underpaid taxes associated with its tax positions as interest expense and miscellaneous expense, respectively. No such charges were recorded in the current financial statements.
Distributions to shareholders are recorded on the ex-dividend date. Income and capital gain distributions are determined in accordance with income tax regulations, which may differ from U.S. generally accepted accounting principles. Certain capital accounts in the financial statements are periodically adjusted for permanent differences in order to reflect their tax character. These adjustments have no impact on net assets or net asset value per share. Temporary differences which arise from recognizing certain items of income, expense, gain or loss in different periods for financial statement and tax purposes will reverse at some time in the future. Distributions in excess of net investment income or net realized gains are temporary overdistributions for financial statement purposes resulting from differences in the recognition or classification of income or distributions for financial statement and tax purposes.
54
Notes to Financial Statements – continued
Book/tax differences primarily relate to expiration of capital loss carryforwards, amortization and accretion of debt securities, and secured borrowings.
The tax character of distributions declared to shareholders is as follows:
| | | | |
| | | 1/31/08 | | 1/31/07 |
| Ordinary income (including any short-term capital gains) | | $1,030,222 | | $301,170 |
| Tax-exempt income | | 83,221,004 | | 75,822,754 |
| Total distributions | | $84,251,226 | | $76,123,924 |
The federal tax cost and the tax basis components of distributable earnings were as follows:
| | | |
| As of 1/31/08 | | | |
| Cost of investments | | $1,518,208,039 | |
| Gross appreciation | | 54,348,434 | |
| Gross depreciation | | (78,240,936 | ) |
| Net unrealized appreciation (depreciation) | | $(23,892,502 | ) |
| Undistributed ordinary income | | $1,358,629 | |
| Undistributed tax-exempt income | | 13,892,801 | |
| Capital loss carryforwards | | (62,028,389 | ) |
| Post-October capital loss deferral | | (748,625 | ) |
| Other temporary differences | | (7,231,577 | ) |
As of January 31, 2008, the fund had capital loss carryforwards available to offset future realized gains. Such losses expire as follows:
| | | |
| 1/31/09 | | $(10,935,605 | ) |
| 1/31/10 | | (2,971,573 | ) |
| 1/31/11 | | (18,364,839 | ) |
| 1/31/12 | | (15,537,212 | ) |
| 1/31/13 | | (3,190,630 | ) |
| 1/31/14 | | (10,798,317 | ) |
| 1/31/15 | | (230,213 | ) |
| | $(62,028,389 | ) |
Multiple Classes of Shares of Beneficial Interest – The fund offers multiple classes of shares, which differ in their respective distribution and service fees. All shareholders bear the common expenses of the fund based on daily net assets of each class, without distinction between share classes. Dividends are declared separately for each class. Differences in per share dividend rates are generally due to differences in separate class expenses. Class B shares will convert to Class A shares approximately eight years after purchase.
55
Notes to Financial Statements – continued
| (3) | | Transactions with Affiliates |
Investment Adviser – The fund has an investment advisory agreement with MFS to provide overall investment management and related administrative services and facilities to the fund.
The management fee is computed daily and paid monthly at the following annual rates:
| | | |
| First $1.4 billion of average daily net assets | | 0.60 | % |
| Average daily net assets in excess of $1.4 billion | | 0.57 | % |
As part of a settlement agreement with the New York Attorney General concerning market timing and related matters, MFS has agreed to reduce the management fee to 0.50% of the fund’s average daily net assets for the period March 1, 2004 through February 28, 2009. For the year ended January 31, 2008, this waiver amounted to $1,585,916 and is reflected as a reduction of total expenses in the Statement of Operations.
The management fee incurred for the year ended January 31, 2008 was equivalent to an annual effective rate of 0.50% of the fund’s average daily net assets.
Distributor – MFS Fund Distributors, Inc. (MFD), a wholly-owned subsidiary of MFS, as distributor, received $435,180 for the year ended January 31, 2008, as its portion of the initial sales charge on sales of Class A shares of the fund.
The Board of Trustees has adopted a distribution plan for certain class shares pursuant to Rule 12b-1 of the Investment Company Act of 1940.
The fund’s distribution plan provides that the fund will pay MFD for services provided by MFD and financial intermediaries in connection with the distribution and servicing of certain share classes. One component of the plan is a distribution fee paid to MFD and another component of the plan is a service fee paid to MFD. MFD may subsequently pay all, or a portion, of the distribution and/or service fees to financial intermediaries.
Distribution Plan Fee Table:
| | | | | | | | | | |
| | | Distribution
Fee Rate | | Service
Fee Rate | | Total
Distribution
Plan(d) | | Annual
Effective
Rate(e) | | Distribution
and Service
Fee |
| Class B | | 0.75% | | 0.25% | | 1.00% | | 0.77% | | $1,159,885 |
| Class C | | 0.75% | | 0.25% | | 1.00% | | 1.00% | | 1,760,313 |
| Total Distribution and Service Fees | | | | | | | | $2,920,198 |
| (d) | In accordance with the distribution plan for certain classes, the fund pays distribution and/or service fees up to these annual percentage rates of each class’ average daily net assets. |
| (e) | The annual effective rates represent actual fees incurred under the distribution plan for the year ended January 31, 2008 based on each class’ average daily net assets. For one year from the date of sale of Class B shares, assets attributable to such Class B shares are subject to the 0.25% annual Class B service fee. On assets attributable to all other Class B shares, the service fee is not currently in effect, but may be implemented on such date as the fund’s Board of Trustees may determine. |
56
Notes to Financial Statements – continued
Certain Class A and Class C shares are subject to a contingent deferred sales charge in the event of a shareholder redemption within 12 months of purchase. Class B shares are subject to a contingent deferred sales charge in the event of a shareholder redemption within six years of purchase. All contingent deferred sales charges are paid to MFD and during the year ended January 31, 2008, were as follows:
| | |
| | | Amount |
| Class A | | $86,620 |
| Class B | | 238,266 |
| Class C | | 48,490 |
Shareholder Servicing Agent – MFS Service Center, Inc. (MFSC), a wholly-owned subsidiary of MFS, receives a fee from the fund for its services as shareholder servicing agent calculated as a percentage of the average daily net assets of the fund as determined periodically under the supervision of the fund’s Board of Trustees. For the year ended January 31, 2008, the fee was $735,918, which equated to 0.0442% annually of the fund’s average daily net assets. MFSC also receives payment from the fund for out-of-pocket expenses, sub-accounting and other shareholder servicing costs which may be paid to affiliated and unaffiliated service providers. For the year ended January 31, 2008, these out-of-pocket expenses, sub-accounting and other shareholder servicing costs amounted to $536,678. The fund may also pay shareholder servicing related costs directly to non-related parties.
Administrator – MFS provides certain financial, legal, shareholder communications, compliance, and other administrative services to the fund. Under an administrative services agreement, the fund partially reimburses MFS the costs incurred to provide these services. The fund is charged a fixed amount plus a fee based on average daily net assets. The fund’s annual fixed amount is $17,500.
The administrative services fee incurred for the year ended January 31, 2008 was equivalent to an annual effective rate of 0.0163% of the fund’s average daily net assets.
Trustees’ and Officers’ Compensation – The fund pays compensation to independent trustees in the form of a retainer, attendance fees, and additional compensation to Board and Committee chairpersons. The fund does not pay compensation directly to trustees or officers of the fund who are also officers of the investment adviser, all of whom receive remuneration for their services to the fund from MFS. Certain officers and trustees of the fund are officers or directors of MFS, MFD, and MFSC. The fund has an unfunded, defined benefit plan for certain retired independent trustees which resulted in a pension expense of $4,802. This amount is included in independent trustees’ compensation for the year ended January 31, 2008. The liability for deferred
57
Notes to Financial Statements – continued
retirement benefits payable to certain retired independent trustees amounted to $42,238 at January 31, 2008, and is included in payable for independent trustees’ compensation.
Other – This fund and certain other MFS funds (the funds) have entered into a services agreement (the Agreement) which provides for payment of fees by the funds to Tarantino LLC in return for the provision of services of an Independent Chief Compliance Officer (ICCO) for the funds. The ICCO is an officer of the funds and the sole member of Tarantino LLC. The funds can terminate the Agreement with Tarantino LLC at any time under the terms of the Agreement. For the year ended January 31, 2008, the fee paid by the fund to Tarantino LLC was $12,531 and is included in miscellaneous expense on the Statement of Operations. MFS has agreed to reimburse the fund for a portion of the payments made by the fund to Tarantino LLC in the amount of $7,655, which is shown as a reduction of total expenses in the Statement of Operations. Additionally, MFS has agreed to bear all expenses associated with office space, other administrative support, and supplies provided to the ICCO.
Purchases and sales of investments, other than U.S. government securities, purchased option transactions, and short-term obligations, aggregated $637,814,070 and $727,595,640, respectively.
| (5) | | Shares of Beneficial Interest |
The fund’s Declaration of Trust permits the Trustees to issue an unlimited number of full and fractional shares of beneficial interest. Transactions in fund shares were as follows:
| | | | | | | | |
| | | Year ended
1/31/08 | | Year ended
1/31/07 |
| | | Shares | | Amount | | Shares | | Amount |
| Shares sold | | | | | | | | |
Class A | | 37,728,027 | | $313,421,498 | | 44,330,384 | | $375,734,204 |
Class B | | 1,104,161 | | 9,176,463 | | 2,008,855 | | 16,999,796 |
Class C | | 6,258,233 | | 52,071,400 | | 7,867,910 | | 66,695,786 |
| | 45,090,421 | | $374,669,361 | | 54,207,149 | | $459,429,786 |
| Shares issued to shareholders in reinvestment of distributions | | | | | | | | |
Class A | | 4,265,096 | | $35,513,555 | | 3,592,569 | | $30,420,282 |
Class B | | 339,127 | | 2,830,755 | | 422,131 | | 3,574,609 |
Class C | | 459,163 | | 3,827,345 | | 359,226 | | 3,045,882 |
| | 5,063,386 | | $42,171,655 | | 4,373,926 | | $37,040,773 |
58
Notes to Financial Statements – continued
| | | | | | | | | | | | |
| | | Year ended
1/31/08 | | | Year ended
1/31/07 | |
| | | Shares | | | Amount | | | Shares | | | Amount | |
| Shares reacquired | | | | | | | | | | | | |
Class A | | (41,904,964 | ) | | $(345,483,708 | ) | | (19,237,523 | ) | | $(162,774,354 | ) |
Class B | | (6,630,345 | ) | | (55,278,345 | ) | | (7,669,455 | ) | | (64,903,633 | ) |
Class C | | (5,358,929 | ) | | (44,296,638 | ) | | (2,475,435 | ) | | (20,965,465 | ) |
| | (53,894,238 | ) | | $(445,058,691 | ) | | (29,382,413 | ) | | $(248,643,452 | ) |
| Net change | | | | | | | | | | | | |
Class A | | 88,159 | | | $3,451,345 | | | 28,685,430 | | | $243,380,132 | |
Class B | | (5,187,057 | ) | | (43,271,127 | ) | | (5,238,469 | ) | | (44,329,228 | ) |
Class C | | 1,358,467 | | | 11,602,107 | | | 5,751,701 | | | 48,776,203 | |
| | (3,740,431 | ) | | $(28,217,675 | ) | | 29,198,662 | | | $247,827,107 | |
The fund and other funds managed by MFS participate in a $1 billion unsecured committed line of credit provided by a syndication of banks under a credit agreement. In addition, the fund and other funds managed by MFS have established uncommitted borrowing arrangements with certain banks. Borrowings may be made for temporary financing needs. Interest is charged to each fund, based on its borrowings, generally at a rate equal to the Federal Reserve funds rate plus 0.30%. In addition, a commitment fee, based on the average daily, unused portion of the committed line of credit, is allocated among the participating funds at the end of each calendar quarter. For the year ended January 31, 2008, the fund’s commitment fee and interest expense on the line of credit were $8,804 and $0, respectively, and are included in miscellaneous expense and interest expense and fees, respectively, on the Statement of Operations.
59
REPORT OF INDEPENDENT REGISTERED PUBLIC ACCOUNTING FIRM
To the Trustees and Shareholders of MFS Municipal High Income Fund:
We have audited the accompanying statement of assets and liabilities of MFS Municipal High Income Fund (the Fund), including the portfolio of investments, as of January 31, 2008, and the related statement of operations for the year then ended, the statements of changes in net assets for each of the two years in the period then ended, and the financial highlights for each of the five years in the periods then ended. These financial statements and financial highlights are the responsibility of the Fund’s management. Our responsibility is to express an opinion on these financial statements and financial highlights based on our audits.
We conducted our audits in accordance with the standards of the Public Company Accounting Oversight Board (United States). Those standards require that we plan and perform the audit to obtain reasonable assurance about whether the financial statements and financial highlights are free of material misstatement. We were not engaged to perform an audit of the Fund’s internal control over financial reporting. Our audits included consideration of internal control over financial reporting as a basis for designing audit procedures that are appropriate in the circumstances, but not for the purpose of expressing an opinion on the effectiveness of the Fund’s internal control over financial reporting. Accordingly, we express no such opinion. An audit also includes examining, on a test basis, evidence supporting the amounts and disclosures in the financial statements and financial highlights, assessing the accounting principles used and significant estimates made by management, and evaluating the overall financial statement presentation. Our procedures included confirmation of securities owned as of January 31, 2008, by correspondence with the Fund’s custodian and brokers or by other appropriate auditing procedures where replies from brokers were not received. We believe that our audits provide a reasonable basis for our opinion.
In our opinion, the financial statements and financial highlights referred to above present fairly, in all material respects, the financial position of MFS Municipal High Income Fund at January 31, 2008, the results of its operations for the year then ended, the changes in its net assets for each of the two years in the period then ended, and its financial highlights for each of five years in the period then ended, in conformity with U.S. generally accepted accounting principles.

Boston, Massachusetts
March 17, 2008
60
TRUSTEES AND OFFICERS — IDENTIFICATION AND BACKGROUND
The Trustees and officers of the Trust, as of March 1, 2008, are listed below, together with their principal occupations during the past five years. (Their titles may have varied during that period.) The address of each Trustee and officer is 500 Boylston Street, Boston, Massachusetts 02116.
| | | | | | |
Name, Date of Birth | | Position(s) Held
with Fund | | Trustee/Officer
Since(h) | | Principal Occupations During
the Past Five Years & Other
Directorships(j) |
| INTERESTED TRUSTEES | | | | |
Robert J. Manning(k)
(born 10/20/63) | | Trustee | | February 2004 | | Massachusetts Financial Services Company, Chief Executive Officer, President, Chief Investment Officer and Director |
Robert C. Pozen(k)
(born 8/08/46) | | Trustee | | February 2004 | | Massachusetts Financial Services Company, Chairman (since February 2004); MIT Sloan School (education), Senior Lecturer (since 2006); Secretary of Economic Affairs, The Commonwealth of Massachusetts (January 2002 to December 2002); Fidelity Investments, Vice Chairman (June 2000 to December 2001); Fidelity Management & Research Company (investment adviser), President (March 1997 to July 2001); Bell Canada Enterprises (telecommunications), Director; Medtronic, Inc. (medical technology), Director; Telesat (satellite communications), Director (until 2007) |
| INDEPENDENT TRUSTEES | | | | |
J. Atwood Ives
(born 5/01/36) | | Trustee and Chair of Trustees | | February 1992 | | Private investor; KeySpan Corporation (energy related services), Director until 2004; Woodstock Corporation (investment advisory firm), Director until 2003 |
Robert E. Butler(n)
(born 11/29/41) | | Trustee | | January 2006 | | Consultant – regulatory and compliance matters (since July 2002); PricewaterhouseCoopers LLP (professional services firm), Partner (until 2002) |
61
Trustees and Officers – continued
| | | | | | |
Name, Date of Birth | | Position(s) Held
with Fund | | Trustee/Officer
Since(h) | | Principal Occupations During
the Past Five Years & Other
Directorships(j) |
Lawrence H. Cohn, M.D.
(born 3/11/37) | | Trustee | | August 1993 | | Brigham and Women’s Hospital, Chief of Cardiac Surgery (2005); Harvard Medical School, Professor of Cardiac Surgery; Physician Director of Medical Device Technology for Partners HealthCare |
David H. Gunning
(born 5/30/42) | | Trustee | | January 2004 | | Retired; Cleveland-Cliffs Inc. (mining products and service provider), Vice Chairman/Director (until May 2007); Portman Limited (mining), Director (since 2005); Encinitos Ventures (private investment company), Principal (1997 to April 2001); Lincoln Electric Holdings, Inc. (welding equipment manufacturer), Director |
William R. Gutow
(born 9/27/41) | | Trustee | | December 1993 | | Private investor and real estate consultant (since 1998); Capital Entertainment Management Company (video franchise), Vice Chairman (since 1998); Texas Donuts (donut franchise), Vice Chairman (since 2007); Atlantic Coast Tan (tanning salons), Vice Chairman (until 2007) |
Michael Hegarty
(born 12/21/44) | | Trustee | | December 2004 | | Retired; AXA Financial (financial services and insurance), Vice Chairman and Chief Operating Officer (until May 2001); The Equitable Life Assurance Society (insurance), President and Chief Operating Officer
(until May 2001) |
Lawrence T. Perera
(born 6/23/35) | | Trustee | | July 1981 | | Hemenway & Barnes (attorneys), Partner |
J. Dale Sherratt
(born 9/23/38) | | Trustee | | August 1993 | | Insight Resources, Inc. (acquisition planning specialists), President; Wellfleet Investments (investor in health care companies), Managing General Partner (since 1993); Cambridge Nutraceuticals (professional nutritional products), Chief Executive Officer (until May 2001) |
62
Trustees and Officers – continued
| | | | | | |
Name, Date of Birth | | Position(s) Held
with Fund | | Trustee/Officer
Since(h) | | Principal Occupations During
the Past Five Years & Other
Directorships(j) |
Laurie J. Thomsen
(born 8/05/57) | | Trustee | | March 2005 | | New Profit, Inc. (venture philanthropy), Partner (since 2006); Private investor; Prism Venture Partners (venture capital), Co-founder and General Partner (until June 2004); The Travelers Companies (commercial property liability insurance), Director |
Robert W. Uek
(born 5/18/41) | | Trustee | | January 2006 | | Retired (since 1999); PricewaterhouseCoopers LLP (professional services firm), Partner (until 1999); Consultant to investment company industry (since 2000); TT International Funds (mutual fund complex), Trustee (2000 until 2005); Hillview Investment Trust II Funds (mutual fund complex), Trustee (2000 until 2005) |
| OFFICERS | | | | | | |
Maria F. Dwyer(k)
(born 12/01/58) | | President | | November 2005 | | Massachusetts Financial Services Company, Executive Vice President and Chief Regulatory Officer (since March 2004) Chief Compliance Officer (since December 2006); Fidelity Management & Research Company, Vice President (prior to March 2004); Fidelity Group of Funds, President and Treasurer (prior to March 2004) |
Tracy Atkinson(k)
(born 12/30/64) | | Treasurer | | September 2005 | | Massachusetts Financial Services Company, Senior Vice President (since September 2004); PricewaterhouseCoopers LLP, Partner (prior to September 2004) |
Christopher R. Bohane(k)
(born 1/18/74) | | Assistant Secretary and Assistant Clerk | | July 2005 | | Massachusetts Financial Services Company, Vice President and Senior Counsel (since April 2003); Kirkpatrick & Lockhart LLP (law firm), Associate (prior to April 2003) |
Ethan D. Corey(k)
(born 11/21/63) | | Assistant Secretary and Assistant Clerk | | July 2005 | | Massachusetts Financial Services Company, Senior Vice President and Associate General Counsel (since April 2006); Special Counsel (prior to April 2006); Dechert LLP (law firm), Counsel (prior to December 2004) |
63
Trustees and Officers – continued
| | | | | | |
Name, Date of Birth | | Position(s) Held
with Fund | | Trustee/Officer
Since(h) | | Principal Occupations During
the Past Five Years & Other
Directorships(j) |
David L. DiLorenzo(k)
(born 8/10/68) | | Assistant Treasurer | | July 2005 | | Massachusetts Financial Services Company, Vice President (since June 2005); JP Morgan Investor Services, Vice President (prior to June 2005) |
Timothy M. Fagan(k)
(born 7/10/68) | | Assistant Secretary and Assistant Clerk | | September 2005 | | Massachusetts Financial Services Company, Vice President and Senior Counsel (since September 2005); John Hancock Advisers, LLC, Vice President and Chief Compliance Officer (September 2004 to August 2005), Senior Attorney (prior to September 2004); John Hancock Group of Funds, Vice President and Chief Compliance Officer (September 2004 to December 2004) |
Mark D. Fischer(k)
(born 10/27/70) | | Assistant Treasurer | | July 2005 | | Massachusetts Financial Services Company, Vice President (since May 2005); JP Morgan Investment Management Company, Vice President (prior to May 2005) |
Brian E. Langenfeld(k) (born 3/07/73) | | Assistant Secretary and Assistant Clerk | | June 2006 | | Massachusetts Financial Services Company, Assistant Vice President and Counsel (since May 2006); John Hancock Advisers, LLC, Assistant Vice President and Counsel (May 2005 to April 2006); John Hancock Advisers, LLC, Attorney and Assistant Secretary (prior to May 2005) |
Ellen Moynihan(k)
(born 11/13/57) | | Assistant Treasurer | | April 1997 | | Massachusetts Financial Services Company, Senior Vice President |
| | | |
Susan S. Newton(k) (born 3/07/50) | | Assistant Secretary and Assistant Clerk | | May 2005 | | Massachusetts Financial Services Company, Senior Vice President and Associate General Counsel (since April 2005); John Hancock Advisers, LLC, Senior Vice President, Secretary and Chief Legal Officer (prior to April 2005); John Hancock Group of Funds, Senior Vice President, Secretary and Chief Legal Officer (prior to April 2005) |
64
Trustees and Officers – continued
| | | | | | |
Name, Date of Birth | | Position(s) Held
with Fund | | Trustee/Officer
Since(h) | | Principal Occupations During
the Past Five Years & Other
Directorships(j) |
Susan A. Pereira(k)
(born 11/05/70) | | Assistant Secretary and Assistant Clerk | | July 2005 | | Massachusetts Financial Services Company, Vice President and Senior Counsel (since June 2004); Bingham McCutchen LLP (law firm), Associate (prior to June 2004) |
Mark N. Polebaum(k)
(born 5/01/52) | | Secretary and Clerk | | January 2006 | | Massachusetts Financial Services Company, Executive Vice President, General Counsel and Secretary (since January 2006); Wilmer Cutler Pickering Hale and Dorr LLP (law firm), Partner (prior to January 2006) |
Frank L. Tarantino
(born 3/07/44) | | Independent Chief Compliance Officer | | June 2004 | | Tarantino LLC (provider of compliance services), Principal (since June 2004); CRA Business Strategies Group (consulting services), Executive Vice President (April 2003 to June 2004); David L. Babson & Co. (investment adviser), Managing Director, Chief Administrative Officer and Director (prior to March 2003) |
Richard S. Weiztel(k)
(born 7/16/70) | | Assistant Secretary and Assistant Clerk | | October 2007 | | Massachusetts Financial Services Company, Vice President and Assistant General Counsel (since 2007); Vice President and Senior Counsel (since May 2004); Massachusetts Department of Business and Technology, General Counsel (February 2003 to April 2004); Massachusetts Office of the Attorney General, Assistant Attorney General (April 2001 to February 2003); Ropes and Gray, Associate (prior to April 2001) |
James O. Yost(k)
(born 6/12/60) | | Assistant Treasurer | | September 1990 | | Massachusetts Financial Services Company, Senior Vice President |
| (h) | Date first appointed to serve as Trustee/officer of an MFS fund. Each Trustee has served continuously since appointment unless indicated otherwise. |
| (j) | Directorships or trusteeships of companies required to report to the Securities and Exchange Commission (i.e., “public companies”). |
| (k) | “Interested person” of the Trust within the meaning of the Investment Company Act of 1940 (referred to as the 1940 Act), which is the principal federal law governing investment companies like the fund, as a result of position with MFS. The address of MFS is 500 Boylston Street, Boston, Massachusetts 02116. |
65
Trustees and Officers – continued
| (n) | In 2004 and 2005, Mr. Butler provided consulting services to the independent compliance consultant retained by MFS pursuant to its settlement with the SEC concerning market timing and related matters. The terms of that settlement required that compensation and expenses related to the independent compliance consultant be borne exclusively by MFS and, therefore, MFS paid Mr. Butler for the services he rendered to the independent compliance consultant. In 2004 and 2005, MFS paid Mr. Butler a total of $351,119.29. |
The Trust held a shareholders’ meeting in 2005 to elect Trustees, and will hold a shareholders’ meeting at least once every five years thereafter, to elect Trustees.
Each Trustee (except Mr. Butler and Mr. Uek) has been elected by shareholders and each Trustee and officer holds office until his or her successor is chosen and qualified or until his or her earlier death, resignation, retirement or removal. Messrs. Butler, Gutow, Sherratt and Uek and Ms. Thomsen are members of the Trust’s Audit Committee.
Each of the Trust’s Trustees and officers holds comparable positions with certain other funds of which MFS or a subsidiary is the investment adviser or distributor, and, in the case of the officers, with certain affiliates of MFS. As of January 1, 2008, the Trustees served as board members of 100 funds within the MFS Family of Funds.
The Statement of Additional Information contains further information about the Trustees and is available without charge upon request by calling 1-800-225-2606.
| | |
| Investment Adviser | | Custodian |
Massachusetts Financial Services Company
500 Boylston Street, Boston, MA 02116-3741 | | JPMorgan Chase Bank One Chase Manhattan Plaza, New York, NY 10081 |
| Distributor | | Independent Registered Public Accounting Firm |
MFS Fund Distributors, Inc.
500 Boylston Street, Boston, MA 02116-3741 | | Ernst & Young LLP
200 Clarendon Street, Boston, MA 02116 |
| Portfolio Managers | | |
Gary Lasman
Geoffrey Schechter | | |
66
BOARD REVIEW OF INVESTMENT ADVISORY AGREEMENT
A discussion regarding the Board’s most recent review and renewal of the Fund’s investment advisory agreement is available by clicking on the Fund’s name under “Select a fund” on the MFS Web site (mfs.com).
PROXY VOTING POLICIES AND INFORMATION
A general description of the MFS funds’ proxy voting policies and procedures is available without charge, upon request, by calling 1-800-225-2606, by visiting the Proxy Voting section of mfs.com or by visiting the SEC’s Web site at http://www.sec.gov.
Information regarding how the fund voted proxies relating to portfolio securities during the most recent twelve-month period ended June 30 is available without charge by visiting the Proxy Voting section of mfs.com or by visiting the SEC’s Web site at http://www.sec.gov.
QUARTERLY PORTFOLIO DISCLOSURE
The fund will file a complete schedule of portfolio holdings with the Securities and Exchange Commission (the Commission) for the first and third quarters of each fiscal year on Form N-Q. The fund’s Form N-Q may be reviewed and copied at the:
Public Reference Room
Securities and Exchange Commission
100 F Street, NE, Room 1580
Washington, D.C. 20549
Information on the operation of the Public Reference Room may be obtained by calling the Commission at 1-800-SEC-0330. The fund’s Form N-Q is available on the EDGAR database on the Commission’s Internet Web site at http://www.sec.gov, and copies of this information may be obtained, upon payment of a duplicating fee, by electronic request at the following e-mail address: publicinfo@sec.gov or by writing the Public Reference Section at the above address.
A shareholder can also obtain the quarterly portfolio holdings report at mfs.com.
FEDERAL TAX INFORMATION (unaudited)
The fund will notify shareholders of amounts for use in preparing 2008 income tax forms in January 2009.
The following information is provided pursuant to provisions of the Internal Revenue Code.
Of the dividends paid from net investment income during the fiscal year, 98.78% is designated as exempt interest dividends for federal income tax purposes. If the fund has earned income on private activity bonds, a portion of the dividends paid may be considered a tax preference item for purposes of computing a shareholder’s alternative minimum tax.
67
MFS® PRIVACY NOTICE
Privacy is a concern for every investor today. At MFS Investment Management® and the MFS funds, we take this concern very seriously. We want you to understand our policies about the investment products and services that we offer, and how we protect the nonpublic personal information of investors who have a direct relationship with us and our wholly owned subsidiaries.
Throughout our business relationship, you provide us with personal information. We maintain information and records about you, your investments, and the services you use. Examples of the nonpublic personal information we maintain include
| | Ÿ | | data from investment applications and other forms |
| | Ÿ | | share balances and transactional history with us, our affiliates, or others |
| | Ÿ | | facts from a consumer reporting agency |
We do not disclose any nonpublic personal information about our customers or former customers to anyone, except as permitted by law. We may share nonpublic personal information with third parties or certain of our affiliates in connection with servicing your account or processing your transactions. We may share information with companies or financial institutions that perform marketing services on our behalf or with other financial institutions with which we have joint marketing arrangements, subject to any legal requirements.
Authorization to access your nonpublic personal information is limited to appropriate personnel who provide products, services, or information to you. We maintain physical, electronic, and procedural safeguards to help protect the personal information we collect about you.
If you have any questions about the MFS privacy policy, please call 1-800-225-2606 any business day between 8 a.m. and 8 p.m. Eastern time.
Note: If you own MFS products or receive MFS services in the name of a third party such as a bank or broker-dealer, their privacy policy may apply to you instead of ours.
68


MFS® High Yield Opportunities Fund
| | |
| CONTACT INFORMATION | | BACK COVER |
SIPC Contact Information:
You may obtain information about the Securities Investor Protection Corporation (“SIPC”), including the SIPC Brochure, by contacting SIPC either by telephone (202-371-8300) or by accessing SIPC’s website address (www.sipc.org).
The report is prepared for the general information of shareholders. It is authorized for distribution to prospective investors only when preceded or accompanied by a current prospectus.
NOT FDIC INSURED Ÿ MAY LOSE VALUE Ÿ NO BANK OR CREDIT UNION GUARANTEE Ÿ NOT A DEPOSIT Ÿ NOT INSURED BY ANY FEDERAL GOVERNMENT AGENCY OR NCUA/NCUSIF
1/31/08
HYO-ANN

LETTER FROM THE CEO
Dear Shareholders:
Many of our MFS® fund shareholders have been justifiably concerned, as have most investors around the world, about the state of the global economy. As we enter 2008 we see the market volatility that began in the third quarter of 2007 has intensified.
We here at MFS, and those before us who guided the firm with the same disciplined investment process, have weathered many major economic disruptions over our eight-plus decades of managing clients’ investments. We have managed money through the Great Depression, 14 recessions, as well as numerous market crises caused by wars, political upheavals, and terrorist attacks. MFS remains in business because our investors believe in the integrity of our long-term investment strategy and its proven results.
Worries over market volatility are valid, and investors cannot always expect to see the kind of returns stocks have delivered in the bull markets of past years. Yet we believe our strategy of ADR — allocating across the major asset classes, diversifying within each class, and regularly rebalancing your portfolio to maintain your desired allocation — can help you pursue the highest investment returns while minimizing the effects of market fluctuations.
MFS is a world leader in domestic and global investing. Our team approach is research driven, globally integrated, and balanced. We have 176 investment management professionals located in the Americas, Europe, and Asia who focus on the fundamentals of each security and then integrate our sophisticated quantitative approach.* This collaborative process allows us to find opportunities in any market environment.
I personally would like to thank you for your continued business. We want you to be confident that we are constantly managing our fund offerings with you in mind, while adding new products that can help you to choose what fits your unique financial goals.
Respectfully,

Robert J. Manning
Chief Executive Officer and Chief Investment Officer
MFS Investment Management®
March 14, 2008
* as of 12/31/07
The opinions expressed in this letter are subject to change, may not be relied upon for investment advice, and no forecasts can be guaranteed.
1
PORTFOLIO COMPOSITION
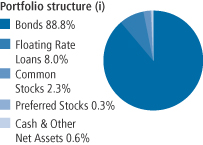
| | |
| Top five industries (i) | | |
| Medical & Health Technology & Services | | 9.1% |
| Broadcasting | | 9.1% |
| Utilities – Electric Power | | 6.6% |
| Emerging Market Sovereign | | 6.2% |
| Gaming & Lodging | | 6.2% |
| | |
| Credit quality of bonds (r) | | |
| AAA | | 0.5% |
| AA | | 0.4% |
| A | | 1.8% |
| BBB | | 3.3% |
| BB | | 25.2% |
| B | | 47.3% |
| CCC | | 18.8% |
| CC | | 0.1% |
| C (o) | | 0.0% |
| D (o) | | 0.0% |
| Not Rated | | 2.6% |
| |
| Portfolio facts | | |
| Average Duration (d)(i) | | 4.7 |
| Average Life (i)(m) | | 7.9 yrs. |
| Average Maturity (i)(m) | | 8.4 yrs. |
| Average Credit Quality of Rated Securities (long-term) (a) | | B+ |
| Average Credit Quality of Rated Securities (short-term) (a) | | A-1 |
| (a) | The average credit quality of rated securities is based upon a market weighted average of portfolio holdings that are rated by public rating agencies. |
| (d) | Duration is a measure of how much a bond’s price is likely to fluctuate with general changes in interest rates, e.g., if rates rise 1.00%, a bond with a 5-year duration is likely to lose about 5.00% of its value. |
| (i) | For purposes of this presentation, the bond component includes accrued interest amounts and may be positively or negatively impacted by the equivalent exposure from any derivative holdings, if applicable. |
| (m) | The average maturity shown is calculated using the final stated maturity on the portfolio’s holdings without taking into account any holdings which have been pre-refunded or pre-paid to an earlier date or which have a mandatory put date prior to the stated maturity. The average life shown takes into account these earlier dates. |
| (r) | Each security is assigned a rating from Moody’s Investors Service. If not rated by Moody’s, the rating will be that assigned by Standard & Poor’s. Likewise, if not assigned a rating by Standard & Poor’s, it will be based on the rating assigned by Fitch, Inc. For those portfolios that hold a security which is not rated by any of the three agencies, the security is considered Not Rated. Holdings in U.S. Treasuries and government agency mortgage-backed securities, if any, are included in the “AAA”-rating category. Percentages are based on the total market value of investments as of 1/31/08. |
Percentages are based on net assets as of 1/31/08, unless otherwise noted.
The portfolio is actively managed and current holdings may be different.
2
MANAGEMENT REVIEW
Summary of Results
For the twelve months ended January 31, 2008, Class A shares of the MFS High Yield Opportunities Fund provided a total return of –1.88%. This compares with a return of –0.60% for the fund’s benchmark, the Lehman Brothers U.S. High-Yield Corporate Bond Index.
Market Environment
Despite seemingly robust growth rates during the second and third quarters of 2007, underlying economic activity in the U.S. remained muted relative to other major economies. Overall, global economies witnessed moderate to strong growth during the reporting period as domestic demand improved and world trade accelerated.
With the strong global growth, however, concerns emerged about rising global inflation, especially as capacity became more constrained, wages rose, and energy and food prices advanced. During the reporting period, global central banks (with the exception of the U.S. Federal Reserve Board) tightened monetary conditions, which in turn pushed global bond yields to their highest levels during this economic expansion.
However, financial markets – particularly in the mortgage and structured-products areas – experienced substantial volatility in recent months. Beginning in late July, heightened uncertainty and distress concerning the subprime mortgage market caused several global credit markets to tighten up, forcing central banks to inject liquidity and to reassess their tightening biases as sovereign bond yields declined and credit spreads widened. While credit conditions improved somewhat by late October as the Federal Reserve Board cut interest rates, the level of market turbulence remained significant through year end. Increased market turmoil was also exacerbated by U.S. home foreclosures and uncertainties surrounding falling housing prices. Despite increased volatility across all asset classes and the widening in credit spreads, U.S. labor markets were resilient and wages rose modestly. More broadly, global equity markets rebounded following summer losses and generally held those gains through the end of the reporting period.
Detractors from performance
Over the reporting period, security selection held back performance relative to the Lehman Brothers U.S. High-Yield Corporate Bond Index. Among the top detractors were debt holdings of Propex Fabrics, Realogy(g), Harrah’s Operating Co., and Univision Communications, Inc.
The fund’s greater relative exposure to “CCC” rated(s) bonds held back relative returns as credit spreads widened over the reporting period. Our relative
3
Management review – continued
exposure to bonds in the financial sector also detracted from results as these securities suffered from the recent turmoil in the subprime mortgage market.
Contributors to performance
The fund generated a higher level of income than the benchmark which had a positive impact on relative performance. Our lower relative exposure to “BB” rated bonds and exposure to emerging markets debt securities also bolstered results. Securities that had a strong showing over the reporting period included the debt of FMG Finance, Del Laboratories(g), and Hospital Corporation of America (HCA).
Respectfully,
| | | | |
| John Addeo | | David Cole | | Matthew Ryan |
| Portfolio Manager | | Portfolio Manager | | Portfolio Manager |
| (g) | Security was not held in the portfolio at period end. |
| (s) | Bonds rated “BBB”, “Baa”, or higher are considered investment grade; bonds rated “BB”, “Ba”, or below are considered non-investment grade. The primary source for bond quality ratings is Moody’s Investors Service. If not available, ratings by Standard & Poor’s are used, else ratings by Fitch, Inc. For securities which are not rated by any of the three agencies, the security is considered Not Rated. |
The views expressed in this report are those of the portfolio managers only through the end of the period of the report as stated on the cover and do not necessarily reflect the views of MFS or any other person in the MFS organization. These views are subject to change at any time based on market or other conditions, and MFS disclaims any responsibility to update such views. These views may not be relied upon as investment advice or an indication of trading intent on behalf of any MFS portfolio. References to specific securities are not recommendations of such securities, and may not be representative of any MFS portfolio’s current or future investments.
4
PERFORMANCE SUMMARY THROUGH 1/31/08
The following chart illustrates a representative class of the fund’s historical performance in comparison to its benchmark. Performance results include the deduction of the maximum applicable sales charge and reflect the percentage change in net asset value, including reinvestment of dividends and capital gains distributions. The performance of other share classes will be greater than or less than that of the class depicted below. Benchmark comparisons are unmanaged; do not reflect sales charges, commissions or expenses; and cannot be invested in directly. (See Notes to Performance Summary.)
Performance data shown represents past performance and is no guarantee of future results. Investment return and principal value fluctuate so your shares, when sold, may be worth more or less than the original cost; current performance may be lower or higher than quoted. The performance shown does not reflect the deduction of taxes, if any, that a shareholder would pay on fund distributions or the redemption of fund shares.
Growth of a hypothetical $10,000 investment
(For the period from the commencement of the fund’s investment operations, July 1, 1998 through the stated period end.)
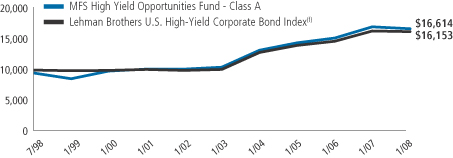
5
Performance summary – continued
Total returns through 1/31/2008
Average annual without sales charge
| | | | | | | | | | | | |
| | | Share class | | Class inception date | | 1-yr | | 5-yr | | Life (t) | | |
| | | A | | 7/01/98 | | (1.88)% | | 9.74% | | 5.97% | | |
| | | B | | 7/01/98 | | (2.49)% | | 9.03% | | 5.31% | | |
| | | C | | 7/01/98 | | (2.40)% | | 9.04% | | 5.29% | | |
| | | I | | 7/01/98 | | (1.51)% | | 10.09% | | 6.35% | | |
Average annual
Comparative Benchmark
| | | | | | | | | | | | |
| | | Lehman Brothers U.S. High-Yield Corporate Bond
Index (f) | | (0.60)% | | 9.89% | | 5.13% | | |
Average annual with sales charge
| | | | | | | | | | | | |
| | | A With Initial Sales Charge (4.75%) | | (6.54)% | | 8.68% | | 5.44% | | |
| | | B With CDSC (Declining over six years from 4% to 0%) (x) | | (6.10)% | | 8.75% | | 5.31% | | |
| | | C With CDSC (1% for 12 months) (x) | | (3.31)% | | 9.04% | | 5.29% | | |
Class I shares do not have a sales charge. Please see Notes to Performance Summary for more
CDSC – Contingent Deferred Sales Charge.
| (f) | Source: FactSet Research Systems Inc. |
| (t) | For the period from the commencement of the fund’s investment operations, July 1, 1998 through the stated period end. |
| (x) | Assuming redemption at the end of the applicable period. |
Index Definition
Lehman Brothers U.S. High-Yield Corporate Bond Index – a market capitalization-weighted index that measures the performance of non-investment grade, fixed rate debt. Eurobonds and debt issues from countries designated as emerging markets (e.g., Argentina, Brazil, Venezuela, etc.) are excluded.
It is not possible to invest directly in an index.
Notes to Performance Summary
Performance results reflect any applicable expense subsidies and waivers in effect during the periods shown. Without such subsidies and waivers the fund’s performance results would be less favorable. Please see the prospectus and financial statements for complete details.
From time to time the fund may receive proceeds from litigation settlements, without which performance would be lower.
6
EXPENSE TABLE
Fund expenses borne by the shareholders during the period,
August 1, 2007 through January 31, 2008
As a shareholder of the fund, you incur two types of costs: (1) transaction costs, including sales charges (loads) on certain purchase or redemption payments and (2) ongoing costs, including management fees; distribution and service (12b-1) fees; and other fund expenses. This example is intended to help you understand your ongoing costs (in dollars) of investing in the fund and to compare these costs with the ongoing costs of investing in other mutual funds.
The example is based on an investment of $1,000 invested at the beginning of the period and held for the entire period August 1, 2007 through January 31, 2008.
Actual expenses
The first line for each share class in the following table provides information about actual account values and actual expenses. You may use the information in this line, together with the amount you invested, to estimate the expenses that you paid over the period. Simply divide your account value by $1,000 (for example, an $8,600 account value divided by $1,000 = 8.6), then multiply the result by the number in the first line under the heading entitled “Expenses Paid During Period” to estimate the expenses you paid on your account during this period.
Hypothetical example for comparison purposes
The second line for each share class in the following table provides information about hypothetical account values and hypothetical expenses based on the fund’s actual expense ratio and an assumed rate of return of 5% per year before expenses, which is not the fund’s actual return. The hypothetical account values and expenses may not be used to estimate the actual ending account balance or expenses you paid for the period. You may use this information to compare the ongoing costs of investing in the fund and other funds. To do so, compare this 5% hypothetical example with the 5% hypothetical examples that appear in the shareholder reports of the other funds.
Please note that the expenses shown in the table are meant to highlight your ongoing costs only and do not reflect any transactional costs, such as sales charges (loads). Therefore, the second line for each share class in the table is useful in comparing ongoing costs only, and will not help you determine the relative total costs of owning different funds. In addition, if these transactional costs were included, your costs would have been higher.
7
Expense table – continued
| | | | | | | | | | |
Share
Class | | | | Annualized
Expense
Ratio | | Beginning
Account Value
8/01/07 | | Ending Account Value
1/31/08 | | Expenses
Paid During
Period (p)
8/01/07-1/31/08 |
| A | | Actual | | 0.85% | | $1,000.00 | | $1,000.74 | | $4.29 |
| | Hypothetical (h) | | 0.85% | | $1,000.00 | | $1,020.92 | | $4.33 |
| B | | Actual | | 1.50% | | $1,000.00 | | $996.22 | | $7.55 |
| | Hypothetical (h) | | 1.50% | | $1,000.00 | | $1,017.64 | | $7.63 |
| C | | Actual | | 1.50% | | $1,000.00 | | $997.43 | | $7.55 |
| | Hypothetical (h) | | 1.50% | | $1,000.00 | | $1,017.64 | | $7.63 |
| I | | Actual | | 0.50% | | $1,000.00 | | $1,001.25 | | $2.52 |
| | Hypothetical (h) | | 0.50% | | $1,000.00 | | $1,022.68 | | $2.55 |
| (h) | 5% class return per year before expenses. |
| (p) | Expenses paid is equal to each class’ annualized expense ratio, as shown above, multiplied by the average account value over the period, multiplied by the number of days in the period, divided by the number of days in the year. Expenses paid do not include any applicable sales charges (loads). If these transaction costs had been included, your costs would have been higher. |
8
PORTFOLIO OF INVESTMENTS
1/31/08
The Portfolio of Investments is a complete list of all securities owned by your fund. It is categorized by broad-based asset classes.
| | | | | | |
| Bonds - 86.7% | | | | | | |
| Issuer | | Shares/Par | | Value ($) |
| | | | | | |
| Aerospace - 2.0% | | | | | | |
| Bombardier, Inc., 8%, 2014 (n) | | $ | 2,638,000 | | $ | 2,756,709 |
| Hawker Beechcraft Acquisition Co., 9.75%, 2017 (n) | | | 3,775,000 | | | 3,595,687 |
| TransDigm Group, Inc., 7.75%, 2014 | | | 1,810,000 | | | 1,819,049 |
| Vought Aircraft Industries, Inc., 8%, 2011 | | | 5,540,000 | | | 5,110,649 |
| | | | | | |
| | | | | | $ | 13,282,094 |
| Airlines - 0.3% | | | | | | |
| Continental Airlines, Inc., 6.9%, 2017 | | $ | 193,381 | | $ | 180,810 |
| Continental Airlines, Inc., 6.748%, 2017 | | | 380,652 | | | 359,715 |
| Continental Airlines, Inc., 6.795%, 2018 | | | 1,451,376 | | | 1,360,664 |
| | | | | | |
| | | | | | $ | 1,901,189 |
| Alcoholic Beverages - 0.1% | | | | | | |
| Cerveceria Nacional Dominicana, 8%, 2014 (n) | | $ | 147,000 | | $ | 148,469 |
| Cerveceria Nacional Dominicana, 8%, 2014 | | | 569,000 | | | 574,689 |
| | | | | | |
| | | | | | $ | 723,158 |
| Apparel Manufacturers - 0.1% | | | | | | |
| Propex Fabrics, Inc., 10%, 2012 (d) | | $ | 3,605,000 | | $ | 342,475 |
| | |
| Asset Backed & Securitized - 2.1% | | | | | | |
| Anthracite Ltd., CDO, 6%, 2037 (z) | | $ | 1,500,000 | | $ | 1,002,655 |
| Arbor Realty Mortgage Securities, CDO, FRN, 6.194%, 2038 (z) | | | 1,354,583 | | | 1,121,621 |
| ARCap REIT, Inc., CDO, “H”, 6.1%, 2045 (n) | | | 1,025,662 | | | 410,264 |
| Asset Securitization Corp., FRN, 8.825%, 2029 (z) | | | 2,300,000 | | | 2,640,687 |
| Babson Ltd., CLO, “D”, FRN, 5.758%, 2018 (n) | | | 1,005,000 | | | 743,699 |
| Crest Ltd., CDO, 7%, 2040 | | | 993,500 | | | 756,082 |
| Falcon Franchise Loan LLC, FRN, 3.933%, 2025 (i)(z) | | | 1,761,204 | | | 228,829 |
JPMorgan Chase Commercial Mortgage Securities Corp., FRN,
6.261%, 2051 | | | 1,390,000 | | | 1,173,500 |
Lehman Brothers Commercial Conduit Mortgage Trust, FRN,
0.093%, 2030 (i) | | | 2,062,666 | | | 81,376 |
| Merrill Lynch Mortgage Trust, FRN, 6.023%, 2017 | | | 1,390,000 | | | 1,158,072 |
| Morgan Stanley Capital I, Inc., 1.46%, 2039 (i)(n) | | | 4,926,790 | | | 169,936 |
| Preferred Term Securities XII Ltd., 9.8%, 2033 (e)(z) | | | 1,775,000 | | | 1,242,500 |
| Preferred Term Securities XVI Ltd., 14%, 2035 (e)(z) | | | 3,250,000 | | | 2,470,000 |
| Preferred Term Securities XVII Ltd., 9.3%, 2035 (e)(z) | | | 1,813,000 | | | 1,269,100 |
| | | | | | |
| | | | | | $ | 14,468,321 |
9
Portfolio of Investments – continued
| | | | | | |
| Issuer | | Shares/Par | | Value ($) |
| | | | | | |
| Bonds - continued | | | | | | |
| Automotive - 2.6% | | | | | | |
| Allison Transmission, Inc., 11%, 2015 (n) | | $ | 7,140,000 | | $ | 5,997,600 |
| Ford Motor Credit Co. LLC, 9.75%, 2010 | | | 4,305,000 | | | 4,158,126 |
| Ford Motor Credit Co. LLC, 8.625%, 2010 | | | 1,255,000 | | | 1,179,414 |
| Ford Motor Credit Co. LLC, 8%, 2016 | | | 1,610,000 | | | 1,351,769 |
| General Motors Acceptance Corp., 8.375%, 2033 | | | 4,102,000 | | | 3,332,875 |
| TRW Automotive, Inc., 7%, 2014 (n) | | | 1,360,000 | | | 1,247,800 |
| | | | | | |
| | | | | | $ | 17,267,584 |
| Broadcasting - 7.8% | | | | | | |
| Allbritton Communications Co., 7.75%, 2012 | | $ | 4,672,000 | | $ | 4,660,320 |
| Bonten Media Acquisition Co., 9%, 2015 (n)(p) | | | 2,560,000 | | | 2,124,800 |
| CanWest MediaWorks LP, 9.25%, 2015 (n) | | | 2,905,000 | | | 2,745,225 |
| Clear Channel Communications, Inc., 5.5%, 2014 | | | 3,125,000 | | | 2,381,128 |
| Grupo Televisa S.A., 8.5%, 2032 | | | 1,368,000 | | | 1,645,704 |
| Inmarsat Finance II PLC, 0% to 2008, 10.375% to 2012 | | | 3,245,000 | | | 3,163,875 |
| Intelsat Ltd., 8.625%, 2015 | | | 1,260,000 | | | 1,255,275 |
| Intelsat Ltd., 0% to 2010, 9.25% to 2015 | | | 1,745,000 | | | 1,430,900 |
| Intelsat Ltd., 11.25%, 2016 | | | 3,510,000 | | | 3,510,000 |
| Intelsat Ltd., FRN, 10.829%, 2013 | | | 1,165,000 | | | 1,191,213 |
| ION Media Networks, Inc., FRN, 10.508%, 2013 (n) | | | 3,370,000 | | | 2,915,050 |
| Lamar Media Corp., 6.625%, 2015 | | | 2,875,000 | | | 2,724,063 |
| Lamar Media Corp., 6.625%, 2015 | | | 1,820,000 | | | 1,724,450 |
| LBI Media Holdings, Inc., 0% to 2008, 11% to 2013 | | | 4,375,000 | | | 3,959,375 |
| LBI Media, Inc., 8.5%, 2017 (n) | | | 1,895,000 | | | 1,681,813 |
| LIN TV Corp., 6.5%, 2013 | | | 4,080,000 | | | 3,845,400 |
| Local TV Finance LLC, 9.25%, 2015 (n)(p) | | | 2,975,000 | | | 2,603,125 |
| Nexstar Broadcasting Group, Inc., 7%, 2014 | | | 2,100,000 | | | 1,921,500 |
| Univision Communications, Inc., 9.75%, 2015 (n)(p) | | | 9,560,000 | | | 7,146,100 |
| | | | | | |
| | | | | | $ | 52,629,316 |
| Brokerage & Asset Managers - 0.6% | | | | | | |
| Nuveen Investments, Inc., 10.5%, 2015 (n) | | $ | 4,260,000 | | $ | 4,132,200 |
| | |
| Building - 0.5% | | | | | | |
| Building Materials Corp. of America, 7.75%, 2014 | | $ | 895,000 | | $ | 662,300 |
| C10 Capital SPV Ltd., 6.722% to 2016, FRN to 2049 (n) | | | 258,000 | | | 225,636 |
| Interface, Inc., 9.5%, 2014 | | | 1,055,000 | | | 1,078,738 |
| Ply Gem Industries, Inc., 9%, 2012 | | | 2,310,000 | | | 1,720,950 |
| | | | | | |
| | | | | | $ | 3,687,624 |
| Business Services - 0.7% | | | | | | |
| SunGard Data Systems, Inc., 10.25%, 2015 | | $ | 4,668,000 | | $ | 4,668,000 |
10
Portfolio of Investments – continued
| | | | | | |
| Issuer | | Shares/Par | | Value ($) |
| | | | | | |
| Bonds - continued | | | | | | |
| Cable TV - 2.2% | | | | | | |
| CCH I Holdings LLC, 11%, 2015 | | $ | 3,972,000 | | $ | 2,844,945 |
| CCH II Holdings LLC, 10.25%, 2010 | | | 1,895,000 | | | 1,795,513 |
| CCO Holdings LLC, 8.75%, 2013 | | | 2,035,000 | | | 1,892,550 |
| CSC Holdings, Inc., 6.75%, 2012 | | | 2,085,000 | | | 1,975,538 |
| Mediacom LLC, 9.5%, 2013 | | | 1,890,000 | | | 1,686,825 |
| NTL Cable PLC, 9.125%, 2016 | | | 2,924,000 | | | 2,646,220 |
| Videotron LTEE, 6.875%, 2014 | | | 1,835,000 | | | 1,775,363 |
| | | | | | |
| | | | | | $ | 14,616,954 |
| Chemicals - 3.0% | | | | | | |
| Innophos, Inc., 8.875%, 2014 | | $ | 3,140,000 | | $ | 3,085,050 |
| Koppers Holdings, Inc., 9.875%, 2013 | | | 2,575,000 | | | 2,742,375 |
| Koppers Holdings, Inc., 0% to 2009, 9.875% to 2014 | | | 4,981,000 | | | 4,208,945 |
| Momentive Performance Materials, Inc., 9.75%, 2014 | | | 3,315,000 | | | 3,000,075 |
| Mosaic Co., 7.875%, 2016 (n) | | | 2,170,000 | | | 2,343,600 |
| Nalco Co., 7.75%, 2011 | | | 960,000 | | | 960,000 |
| Nalco Co., 8.875%, 2013 | | | 3,735,000 | | | 3,791,025 |
| | | | | | |
| | | | | | $ | 20,131,070 |
| Computer Software - 0.6% | | | | | | |
| First Data Corp., 9.875%, 2015 (n) | | $ | 4,270,000 | | $ | 3,778,950 |
| | |
| Construction - 0.0% | | | | | | |
| Urbi Desarrollos Urbanos S.A. de C.V., 8.5%, 2016 (n) | | $ | 10,000 | | $ | 10,050 |
| | |
| Consumer Goods & Services - 2.0% | | | | | | |
| Corrections Corp. of America, 6.25%, 2013 | | $ | 2,400,000 | | $ | 2,388,000 |
| GEO Group, Inc., 8.25%, 2013 | | | 2,465,000 | | | 2,483,488 |
| KAR Holdings, Inc., 10%, 2015 (n) | | | 2,135,000 | | | 1,782,725 |
| Service Corp. International, 7.375%, 2014 | | | 1,485,000 | | | 1,514,700 |
| Service Corp. International, 6.75%, 2015 | | | 86,000 | | | 85,140 |
| Service Corp. International, 7%, 2017 | | | 3,615,000 | | | 3,542,700 |
| Visant Holding Corp., 8.75%, 2013 | | | 1,097,000 | | | 1,061,348 |
| Vitro S.A. de C.V., 8.625%, 2012 | | | 204,000 | | | 193,800 |
| Vitro S.A.B. de C.V., 9.125%, 2017 | | | 907,000 | | | 791,358 |
| | | | | | |
| | | | | | $ | 13,843,259 |
| Containers - 1.6% | | | | | | |
| Crown Americas LLC, 7.625%, 2013 | | $ | 1,975,000 | | $ | 1,989,813 |
| Graham Packaging Co. LP, 9.875%, 2014 | | | 3,720,000 | | | 3,143,400 |
| Greif, Inc., 6.75%, 2017 | | | 2,185,000 | | | 2,081,213 |
| Owens-Brockway Glass Container, Inc., 8.25%, 2013 | | | 3,570,000 | | | 3,694,950 |
| | | | | | |
| | | | | | $ | 10,909,376 |
11
Portfolio of Investments – continued
| | | | | |
| Issuer | | Shares/Par | | Value ($) |
| | | | | |
| Bonds - continued | | | | | |
| Defense Electronics - 0.9% | | | | | |
| L-3 Communications Corp., 6.125%, 2014 | | $1,500,000 | | $ | 1,477,500 |
| L-3 Communications Corp., 5.875%, 2015 | | 4,415,000 | | | 4,293,588 |
| | | | | |
| | | | | $ | 5,771,088 |
| Electronics - 1.3% | | | | | |
| Avago Technologies Finance, 11.875%, 2015 | | $2,285,000 | | $ | 2,387,825 |
| Flextronics International Ltd., 6.25%, 2014 | | 3,460,000 | | | 3,252,400 |
| Spansion LLC, 11.25%, 2016 (n) | | 4,495,000 | | | 3,146,500 |
| | | | | |
| | | | | $ | 8,786,725 |
| Emerging Market Quasi - Sovereign - 2.1% | | | | | |
| Banco do Brasil S.A., 7.95%, 2049 (n) | | $283,000 | | $ | 285,830 |
| Codelco, Inc., 5.625%, 2035 | | 3,362,000 | | | 3,086,097 |
| Gazprom International S.A., 6.212%, 2016 | | 2,538,000 | | | 2,474,550 |
| Gazprom International S.A., 7.201%, 2020 | | 3,402,641 | | | 3,503,699 |
| Gazprom International S.A., 6.51%, 2022 (n) | | 2,020,000 | | | 1,908,900 |
| Majapahit Holding B.V., 7.75%, 2016 (n) | | 309,000 | | | 304,365 |
| Majapahit Holding B.V., 7.25%, 2017 (n) | | 723,000 | | | 685,043 |
| National Power Corp., 6.875%, 2016 (n) | | 317,000 | | | 320,170 |
| OAO Gazprom, 9.625%, 2013 | | 1,340,000 | | | 1,546,092 |
| Pemex Project Funding Master Trust, 6.625%, 2035 (n) | | 191,000 | | | 196,157 |
| | | | | |
| | | | | $ | 14,310,903 |
| Emerging Market Sovereign - 6.1% | | | | | |
| Federative Republic of Brazil, 6%, 2017 | | $3,074,000 | | $ | 3,135,480 |
| Federative Republic of Brazil, 8%, 2018 | | 3,263,000 | | | 3,687,190 |
| Gabonese Republic, 8.2%, 2017 (n) | | 1,510,000 | | | 1,576,063 |
| Republic of Argentina, 7%, 2013 | | 3,000,000 | | | 2,661,667 |
| Republic of Argentina, 7%, 2015 | | 1,561,000 | | | 1,340,899 |
| Republic of Argentina, 8.28%, 2033 | | 1,024,683 | | | 943,733 |
| Republic of Argentina, FRN, 5.374%, 2012 | | 2,040,000 | | | 1,790,126 |
| Republic of Argentina, FRN, 0%, 2033 | | ARS 610,000 | | | 234,816 |
| Republic of Argentina, FRN, 0%, 2035 | | $2,579,000 | | | 331,402 |
| Republic of Colombia, 7.375%, 2017 | | 468,000 | | | 512,928 |
| Republic of Colombia, 7.375%, 2037 | | 1,371,000 | | | 1,463,543 |
| Republic of Ecuador, 10%, 2030 | | 464,000 | | | 448,920 |
| Republic of El Salvador, 8.25%, 2032 | | 1,475,000 | | | 1,755,250 |
| Republic of El Salvador, 7.65%, 2035 (n) | | 386,000 | | | 432,320 |
| Republic of Indonesia, 6.875%, 2018 (z) | | 797,000 | | | 821,906 |
| Republic of Indonesia, 7.75%, 2038 (z) | | 1,371,000 | | | 1,448,119 |
| Republic of Panama, 6.7%, 2036 | | 1,802,000 | | | 1,820,020 |
| Republic of Peru, 6.55%, 2037 | | 947,000 | | | 974,842 |
| Republic of Philippines, 8%, 2016 | | 329,000 | | | 373,415 |
| Republic of Philippines, 7.5%, 2024 | | 930,000 | | | 1,028,813 |
| Republic of Philippines, 9.5%, 2030 | | 234,000 | | | 309,465 |
12
Portfolio of Investments – continued
| | | | | | |
| Issuer | | Shares/Par | | Value ($) |
| | | | | | |
| Bonds - continued | | | | | | |
| Emerging Market Sovereign - continued | | | | | | |
| Republic of Philippines, 7.75%, 2031 | | $ | 1,405,000 | | $ | 1,580,625 |
| Republic of Philippines, 6.375%, 2032 | | | 103,000 | | | 101,455 |
| Republic of Turkey, 6.75%, 2018 | | | 862,000 | | | 890,015 |
| Republic of Turkey, 6.875%, 2036 | | | 2,843,000 | | | 2,793,248 |
| Republic of Uruguay, 9.25%, 2017 | | | 1,349,000 | | | 1,639,035 |
| Republic of Uruguay, 8%, 2022 | | | 2,331,000 | | | 2,573,424 |
| Republic of Uruguay, 7.625%, 2036 | | | 236,000 | | | 248,626 |
| Republic of Venezuela, 7%, 2018 | | | 2,325,000 | | | 2,028,563 |
| Ukraine Ministry of Finance, 6.75%, 2017 (n) | | | 321,000 | | | 322,640 |
| United Mexican States, 8.3%, 2031 | | | 1,218,000 | | | 1,541,988 |
| United Mexican States, 6.05%, 2040 | | | 552,000 | | | 543,168 |
| | | | | | |
| | | | | | $ | 41,353,704 |
| Energy - Independent - 4.7% | | | | | | |
| Chaparral Energy, Inc., 8.875%, 2017 (n) | | $ | 3,475,000 | | $ | 2,901,625 |
| Chesapeake Energy Corp., 6.375%, 2015 | | | 3,450,000 | | | 3,346,500 |
| Chesapeake Energy Corp., 6.875%, 2016 | | | 1,115,000 | | | 1,103,850 |
| Forest Oil Corp., 7.25%, 2019 (n) | | | 1,860,000 | | | 1,860,000 |
| Hilcorp Energy I LP, 7.75%, 2015 (n) | | | 2,295,000 | | | 2,197,463 |
| Hilcorp Energy I LP, 9%, 2016 (n) | | | 1,680,000 | | | 1,680,000 |
| Mariner Energy, Inc., 8%, 2017 | | | 3,455,000 | | | 3,299,525 |
| Newfield Exploration Co., 6.625%, 2014 | | | 2,255,000 | | | 2,221,175 |
| OPTI Canada, Inc., 8.25%, 2014 (n) | | | 3,685,000 | | | 3,611,300 |
| Plains Exploration & Production Co., 7%, 2017 | | | 5,205,000 | | | 4,944,750 |
| Quicksilver Resources, Inc., 7.125%, 2016 | | | 3,125,000 | | | 3,031,250 |
| Southwestern Energy Co., 7.5%, 2018 (z) | | | 1,770,000 | | | 1,818,675 |
| | | | | | |
| | | | | | $ | 32,016,113 |
| Energy - Integrated - 0.2% | | | | | | |
| Petroleum Co. of Trinidad & Tobago Ltd., 6%, 2022 (n) | | $ | 674,000 | | $ | 674,674 |
| TNK-BP Finance S.A., 7.5%, 2013 (n) | | | 131,000 | | | 131,655 |
| TNK-BP Finance S.A., 7.5%, 2016 (n) | | | 896,000 | | | 869,120 |
| | | | | | |
| | | | | | $ | 1,675,449 |
| Entertainment - 0.5% | | | | | | |
| AMC Entertainment, Inc., 11%, 2016 | | $ | 1,615,000 | | $ | 1,598,850 |
| Marquee Holdings, Inc., 0% to 2009, 12% to 2014 | | | 2,585,000 | | | 1,822,425 |
| | | | | | |
| | | | | | $ | 3,421,275 |
| Financial Institutions - 1.3% | | | | | | |
| General Motors Acceptance Corp., 6.875%, 2011 | | $ | 5,779,000 | | $ | 5,052,441 |
| Residential Capital LLC, 7.625%, 2008 | | | 4,152,000 | | | 3,197,040 |
| Residential Capital LLC, 7.5%, 2012 | | | 360,000 | | | 225,000 |
| | | | | | |
| | | | | | $ | 8,474,481 |
13
Portfolio of Investments – continued
| | | | | | |
| Issuer | | Shares/Par | | Value ($) |
| | | | | | |
| Bonds - continued | | | | | | |
| Food & Beverages - 1.7% | | | | | | |
| ARAMARK Corp., 8.5%, 2015 | | $ | 5,565,000 | | $ | 5,537,175 |
| B&G Foods, Inc., 8%, 2011 | | | 1,525,000 | | | 1,479,250 |
| Dean Foods Co., 7%, 2016 | | | 1,000,000 | | | 910,000 |
| Del Monte Corp., 6.75%, 2015 | | | 2,180,000 | | | 2,027,400 |
| Michael Foods, Inc., 8%, 2013 | | | 1,400,000 | | | 1,379,000 |
| | | | | | |
| | | | | | $ | 11,332,825 |
| Forest & Paper Products - 2.0% | | | | | | |
| Abitibi-Consolidated, Inc., 7.4%, 2018 | | $ | 1,870,000 | | $ | 1,187,450 |
| Buckeye Technologies, Inc., 8%, 2010 | | | 2,041,000 | | | 2,020,590 |
| Catalyst Paper Corp., 8.625%, 2011 | | | 985,000 | | | 832,325 |
| Jefferson Smurfit Corp., 8.25%, 2012 | | | 2,949,000 | | | 2,831,040 |
| JSG Funding PLC, 7.75%, 2015 | | | 1,365,000 | | | 1,255,800 |
| Millar Western Forest Products Ltd., 7.75%, 2013 | | | 4,965,000 | | | 3,649,275 |
| NewPage Holding Corp., 10%, 2012 (n) | | | 1,950,000 | | | 1,940,250 |
| | | | | | |
| | | | | | $ | 13,716,730 |
| Gaming & Lodging - 5.8% | | | | | | |
| Fontainebleau Las Vegas Holdings LLC, 10.25%, 2015 (n) | | $ | 3,200,000 | | $ | 2,400,000 |
| Harrah’s Operating Co., Inc., 5.375%, 2013 | | | 2,245,000 | | | 1,526,600 |
| Harrah’s Operating Co., Inc., 10.75%, 2016 (z) | | | 1,740,000 | | | 1,574,700 |
| Harrah’s Operating Co., Inc., 5.75%, 2017 | | | 9,740,000 | | | 5,844,000 |
| Isle of Capri Casinos, Inc., 7%, 2014 | | | 3,570,000 | | | 2,748,900 |
| Mandalay Resort Group, 9.375%, 2010 | | | 1,000,000 | | | 1,031,250 |
| MGM Mirage, 8.375%, 2011 | | | 2,485,000 | | | 2,540,913 |
| MGM Mirage, 5.875%, 2014 | | | 1,975,000 | | | 1,787,375 |
| MGM Mirage, 7.5%, 2016 | | | 6,475,000 | | | 6,216,000 |
| MTR Gaming Group, Inc., 9%, 2012 | | | 970,000 | | | 834,200 |
| Newland International Properties Corp., 9.5%, 2014 (n) | | | 1,948,000 | | | 1,877,385 |
| Station Casinos, Inc., 6.5%, 2014 | | | 6,715,000 | | | 4,633,350 |
| Station Casinos, Inc., 6.875%, 2016 | | | 965,000 | | | 656,200 |
| Trump Entertainment Resorts Holdings, Inc., 8.5%, 2015 | | | 2,580,000 | | | 1,857,600 |
| Wynn Las Vegas LLC, 6.625%, 2014 | | | 4,185,000 | | | 4,033,294 |
| | | | | | |
| | | | | | $ | 39,561,767 |
| Industrial - 1.2% | | | | | | |
| Blount, Inc., 8.875%, 2012 | | $ | 1,880,000 | | $ | 1,847,100 |
| Cii Carbon LLC, 11.125%, 2015 (n) | | | 1,320,000 | | | 1,260,600 |
| JohnsonDiversey Holdings, Inc., “B”, 9.625%, 2012 | | | 4,855,000 | | | 4,927,825 |
| | | | | | |
| | | | | | $ | 8,035,525 |
| Insurance - Property & Casualty - 0.5% | | | | | | |
| USI Holdings Corp., 9.75%, 2015 (n) | | $ | 4,700,000 | | $ | 3,666,000 |
14
Portfolio of Investments – continued
| | | | | | |
| Issuer | | Shares/Par | | Value ($) |
| | | | | | |
| Bonds - continued | | | | | | |
| Machinery & Tools - 0.2% | | | | | | |
| Case New Holland, Inc., 7.125%, 2014 | | $ | 1,160,000 | | $ | 1,157,100 |
| | |
| Medical & Health Technology & Services - 8.3% | | | | | | |
| Accellent, Inc., 10.5%, 2013 | | $ | 4,160,000 | | $ | 3,286,400 |
| Community Health Systems, Inc., 8.875%, 2015 | | | 5,705,000 | | | 5,740,656 |
| Cooper Cos., Inc., 7.125%, 2015 | | | 2,980,000 | | | 2,831,000 |
| DaVita, Inc., 6.625%, 2013 | | | 860,000 | | | 847,100 |
| DaVita, Inc., 7.25%, 2015 | | | 6,270,000 | | | 6,238,650 |
| HCA, Inc., 9%, 2014 | | | 4,680,000 | | | 4,469,433 |
| HCA, Inc., 6.375%, 2015 | | | 3,215,000 | | | 2,740,788 |
| HCA, Inc., 9.25%, 2016 | | | 7,115,000 | | | 7,461,856 |
| HealthSouth Corp., 10.75%, 2016 | | | 2,010,000 | | | 2,095,425 |
| LVB Acquisition Merger Sub, Inc., 10%, 2017 (n) | | | 2,365,000 | | | 2,435,950 |
| LVB Acquisition Merger Sub, Inc., 11.625%, 2017 (n) | | | 3,645,000 | | | 3,558,431 |
| Psychiatric Solutions, Inc., 7.75%, 2015 | | | 3,080,000 | | | 3,033,800 |
| Surgical Care Affiliates, Inc., 10%, 2017 (n) | | | 2,815,000 | | | 2,392,750 |
| U.S. Oncology, Inc., 10.75%, 2014 | | | 3,040,000 | | | 2,964,000 |
| Universal Hospital Services, Inc., 8.5%, 2015 (p) | | | 1,910,000 | | | 1,929,100 |
| Universal Hospital Services, Inc., FRN, 8.287%, 2015 | | | 590,000 | | | 560,500 |
| VWR Funding, Inc., 10.25%, 2015 (n) | | | 3,815,000 | | | 3,567,025 |
| | | | | | |
| | | | | | $ | 56,152,864 |
| Metals & Mining - 3.8% | | | | | | |
| Arch Western Finance LLC, 6.75%, 2013 | | $ | 2,210,000 | | $ | 2,138,175 |
| FMG Finance Ltd., 10.625%, 2016 (n) | | | 6,125,000 | | | 6,951,875 |
| Foundation PA Coal Co., 7.25%, 2014 | | | 980,000 | | | 965,300 |
| Freeport-McMoRan Copper & Gold, Inc., 8.375%, 2017 | | | 4,345,000 | | | 4,616,563 |
| Freeport-McMoRan Copper & Gold, Inc., FRN, 8.394%, 2015 | | | 3,039,000 | | | 2,982,019 |
| Peabody Energy Corp., 5.875%, 2016 | | | 1,675,000 | | | 1,566,125 |
| Peabody Energy Corp., 7.375%, 2016 | | | 1,635,000 | | | 1,671,788 |
| PNA Group, Inc., 10.75%, 2016 | | | 3,475,000 | | | 3,127,500 |
| Ryerson, Inc., 12%, 2015 (n) | | | 1,725,000 | | | 1,621,500 |
| | | | | | |
| | | | | | $ | 25,640,845 |
| Natural Gas - Distribution - 0.4% | | | | | | |
| AmeriGas Partners LP, 7.125%, 2016 | | $ | 3,000,000 | | $ | 2,917,500 |
| | |
| Natural Gas - Pipeline - 2.7% | | | | | | |
| Atlas Pipeline Partners LP, 8.125%, 2015 | | $ | 2,955,000 | | $ | 2,836,800 |
Deutsche Bank (El Paso Performance-Linked Trust, CLN),
7.75%, 2011 (n) | | | 4,640,000 | | | 4,772,064 |
| El Paso Corp., 7.75%, 2032 | | | 2,055,000 | | | 2,043,346 |
| Intergas Finance B.V., 6.875%, 2011 (n) | | | 1,337,000 | | | 1,290,205 |
15
Portfolio of Investments – continued
| | | | | | |
| Issuer | | Shares/Par | | Value ($) |
| | | | | | |
| Bonds - continued | | | | | | |
| Natural Gas - Pipeline - continued | | | | | | |
| Knight, Inc., 7.25%, 2028 | | $ | 2,495,000 | | $ | 2,262,868 |
| Williams Cos., Inc., 8.75%, 2032 | | | 1,993,000 | | | 2,381,635 |
| Williams Partners LP, 7.25%, 2017 | | | 2,750,000 | | | 2,846,250 |
| | | | | | |
| | | | | | $ | 18,433,168 |
| Network & Telecom - 1.6% | | | | | | |
| Cincinnati Bell, Inc., 8.375%, 2014 | | $ | 2,820,000 | | $ | 2,693,100 |
| Nordic Telephone Co. Holdings, 8.875%, 2016 (n) | | | 1,270,000 | | | 1,289,050 |
| Qwest Capital Funding, Inc., 7.25%, 2011 | | | 2,015,000 | | | 1,979,738 |
| Qwest Corp., 7.875%, 2011 | | | 1,400,000 | | | 1,443,750 |
| Qwest Corp., 8.875%, 2012 | | | 465,000 | | | 491,156 |
| Windstream Corp., 8.625%, 2016 | | | 2,610,000 | | | 2,701,350 |
| | | | | | |
| | | | | | $ | 10,598,144 |
| Oil Services - 0.3% | | | | | | |
| Basic Energy Services, Inc., 7.125%, 2016 | | $ | 1,870,000 | | $ | 1,757,800 |
| | |
| Oils - 0.1% | | | | | | |
| Petroleos de Venezuela S.A., 5.25%, 2017 | | $ | 1,327,000 | | $ | 978,663 |
| | |
| Other Banks & Diversified Financials - 0.8% | | | | | | |
| Banco do Estado de Sao Paulo S.A., 8.7%, 2049 (n) | | $ | 682,000 | | $ | 696,493 |
| CenterCredit International B.V., 8.625%, 2014 (n) | | | 1,419,000 | | | 1,273,553 |
| RSHB Capital S.A., 7.175%, 2013 (n) | | | 212,000 | | | 217,300 |
| Russian Standard Finance S.A., 8.125%, 2008 (n) | | | 869,000 | | | 865,785 |
| Russian Standard Finance S.A., 8.625%, 2011 (n) | | | 483,000 | | | 452,813 |
| VTB Capital S.A., 7.5%, 2011 | | | 1,066,000 | | | 1,097,447 |
| VTB Capital S.A., 6.609%, 2012 (n) | | | 1,106,000 | | | 1,094,940 |
| | | | | | |
| | | | | | $ | 5,698,331 |
| Printing & Publishing - 3.9% | | | | | | |
| American Media Operations, Inc., 10.25%, 2009 | | $ | 154,675 | | $ | 115,233 |
| American Media Operations, Inc., 10.25%, 2009 | | | 4,254,000 | | | 3,169,230 |
| Dex Media West LLC, 9.875%, 2013 | | | 610,000 | | | 622,200 |
| Dex Media, Inc., 0% to 2008, 9% to 2013 | | | 3,250,000 | | | 2,884,375 |
| Dex Media, Inc., 0% to 2008, 9% to 2013 | | | 2,465,000 | | | 2,187,688 |
| Idearc, Inc., 8%, 2016 | | | 8,400,000 | | | 7,518,000 |
| Nielsen Finance LLC, 10%, 2014 | | | 1,830,000 | | | 1,848,300 |
| Nielsen Finance LLC, 0% to 2011, 12.5% to 2016 | | | 4,495,000 | | | 3,146,500 |
| Quebecor World, Inc., 6.125%, 2013 (d) | | | 2,060,000 | | | 885,800 |
| R.H. Donnelley Corp., 8.875%, 2016 | | | 5,050,000 | | | 4,330,375 |
| | | | | | |
| | | | | | $ | 26,707,701 |
16
Portfolio of Investments – continued
| | | | | | |
| Issuer | | Shares/Par | | Value ($) |
| | | | | | |
| Bonds - continued | | | | | | |
| Railroad & Shipping - 0.1% | | | | | | |
| TFM S.A. de C.V., 9.375%, 2012 | | $ | 665,000 | | $ | 684,950 |
| | |
| Retailers - 0.5% | | | | | | |
| Buhrmann U.S., Inc., 7.875%, 2015 | | $ | 1,095,000 | | $ | 1,012,875 |
| Couche-Tard, Inc., 7.5%, 2013 | | | 1,450,000 | | | 1,440,938 |
| Eye Care Centers of America, Inc., 10.75%, 2015 | | | 1,105,000 | | | 1,168,538 |
| | | | | | |
| | | | | | $ | 3,622,351 |
| Specialty Stores - 0.3% | | | | | | |
| Payless ShoeSource, Inc., 8.25%, 2013 | | $ | 2,035,000 | | $ | 1,872,200 |
| | |
| Supermarkets - 0.5% | | | | | | |
| Stater Brothers Holdings, Inc., 7.75%, 2015 | | $ | 1,975,000 | | $ | 1,856,500 |
| SUPERVALU, Inc., 7.5%, 2014 | | | 1,663,000 | | | 1,685,866 |
| | | | | | |
| | | | | | $ | 3,542,366 |
| Telecommunications - Wireless - 1.5% | | | | | | |
| Alltel Corp., 7%, 2012 | | $ | 3,015,000 | | $ | 2,562,750 |
| American Tower Corp., 7%, 2017 (n) | | | 715,000 | | | 707,850 |
| Centennial Communications Corp., 10.125%, 2013 | | | 1,305,000 | | | 1,334,363 |
| MetroPCS Wireless, Inc., 9.25%, 2014 | | | 2,540,000 | | | 2,336,800 |
| Wind Acquisition Finance S.A., 10.75%, 2015 (n) | | | 3,270,000 | | | 3,466,200 |
| | | | | | |
| | | | | | $ | 10,407,963 |
| Transportation - 0.4% | | | | | | |
| Autopistas del Sol S.A., 11.5%, 2017 (n) | | $ | 1,326,000 | | $ | 1,088,978 |
| Peru Enhanced Pass-Through Trust, 0%, 2018 (n) | | | 346,000 | | | 236,145 |
| PT Arpeni Pratama Ocean Line Tbk., 8.75%, 2013 (n) | | | 1,419,000 | | | 1,234,530 |
| | | | | | |
| | | | | | $ | 2,559,653 |
| Transportation - Services - 0.4% | | | | | | |
| Hertz Corp., 8.875%, 2014 | | $ | 3,115,000 | | $ | 3,005,975 |
| | |
| Utilities - Electric Power - 6.2% | | | | | | |
| AES Corp., 9.375%, 2010 | | $ | 2,840,000 | | $ | 2,967,800 |
| Dynegy Holdings, Inc., 7.5%, 2015 | | | 2,535,000 | | | 2,363,888 |
| Edison Mission Energy, 7%, 2017 | | | 7,670,000 | | | 7,459,075 |
| EEB International Ltd., 8.75%, 2014 (n) | | | 992,000 | | | 1,019,280 |
| Enersis S.A., 7.375%, 2014 | | | 1,693,000 | | | 1,801,272 |
| Intergen N.V., 9%, 2017 (n) | | | 1,610,000 | | | 1,678,425 |
| ISA Capital do Brasil S.A., 7.875%, 2012 (n) | | | 754,000 | | | 767,195 |
| Mirant Americas Generation LLC, 8.3%, 2011 | | | 1,900,000 | | | 1,919,000 |
| Mirant Americas Generation LLC, 8.5%, 2021 | | | 1,250,000 | | | 1,103,125 |
| Mirant North America LLC, 7.375%, 2013 | | | 3,000,000 | | | 3,000,000 |
| NGC Corp. Capital Trust, 8.316%, 2027 | | | 1,975,000 | | | 1,738,000 |
| NRG Energy, Inc., 7.375%, 2016 | | | 8,995,000 | | | 8,691,419 |
17
Portfolio of Investments – continued
| | | | | | |
| Issuer | | Shares/Par | | Value ($) |
| | | | | | |
| Bonds - continued | | | | | | |
| Utilities - Electric Power - continued | | | | | | |
| Reliant Energy, Inc., 6.75%, 2014 | | $ | 1,000,000 | | $ | 1,008,750 |
| Reliant Energy, Inc., 7.875%, 2017 | | | 4,815,000 | | | 4,694,625 |
| Sierra Pacific Resources, 8.625%, 2014 | | | 1,470,000 | | | 1,575,890 |
| | | | | | |
| | | | | | $ | 41,787,744 |
| Utilities - Gas - 0.2% | | | | | | |
| TGI International Ltd., 9.5%, 2017 (n) | | $ | 1,005,000 | | $ | 1,042,688 |
| Total Bonds (Identified Cost, $621,076,430) | | | | | $ | 587,082,211 |
| | |
| Floating Rate Loans - 7.9% (g)(r) | | | | | | |
| Aerospace - 0.3% | | | | | | |
| Hawker Beechcraft Acquisition Co., Letter of Credit, 4.73%, 2014 | | $ | 79,917 | | $ | 72,991 |
| Hawker Beechcraft Acquisition Co., Term Loan B, 6.83%, 2014 | | | 1,965,700 | | | 1,795,340 |
| | | | | | |
| | | | | | $ | 1,868,331 |
| Automotive - 1.4% | | | | | | |
| Allison Transmission, Inc., Term Loan B, 7.43%, 2014 (o) | | $ | 532,083 | | $ | 464,641 |
| Ford Motor Co., Term Loan B, 8%, 2013 | | | 3,610,889 | | | 3,153,508 |
| Goodyear Tire & Rubber Co., Second Lien Term Loan, 6.35%, 2014 | | | 3,996,657 | | | 3,636,958 |
| Mark IV Industries, Inc., Second Lien Term Loan, 11%, 2011 | | | 3,190,622 | | | 1,946,279 |
| | | | | | |
| | | | | | $ | 9,201,386 |
| Broadcasting - 0.5% | | | | | | |
| Gray Television, Inc., Term Loan B, 6.73%, 2014 | | $ | 1,373,556 | | $ | 1,227,615 |
| Univision Communications, Inc., Term Loan B, 5.49%, 2014 (o) | | | 2,421,560 | | | 1,988,101 |
| | | | | | |
| | | | | | $ | 3,215,716 |
| Building - 0.6% | | | | | | |
Building Materials Holding Corp., Second Lien Term Loan,
9.56%, 2014 | | $ | 3,344,676 | | $ | 2,249,295 |
| Roofing Supply Group, Inc., Term Loan B, 9.71%, 2013 | | | 2,300,085 | | | 2,024,075 |
| | | | | | |
| | | | | | $ | 4,273,370 |
| Cable TV - 1.0% | | | | | | |
| Charter Communications, Inc., Term Loan, 5.26%, 2013 (o) | | $ | 3,138,790 | | $ | 2,730,033 |
| CSC Holdings, Inc., Term Loan B, 6.9%, 2013 (o) | | | 2,478,001 | | | 2,273,308 |
| MCC Iowa Mediacom Broadband LLC, Term Loan A, 5.54%, 2011 | | | 2,002,791 | | | 1,805,850 |
| | | | | | |
| | | | | | $ | 6,809,191 |
| Chemicals - 0.4% | | | | | | |
| Celanese AG, Term Loan, 6.98%, 2014 | | $ | 2,818,836 | | $ | 2,640,645 |
| | |
| Computer Software - 0.6% | | | | | | |
| First Data Corp., Term Loan B-2, 7.63%, 2014 (o) | | $ | 4,263,612 | | $ | 3,834,053 |
18
Portfolio of Investments – continued
| | | | | | |
| Issuer | | Shares/Par | | Value ($) |
| | | | | | |
| Floating Rate Loans - continued | | | | | | |
| Energy - Independent - 0.9% | | | | | | |
| Crimson Exploration, Inc., Second Lien Term Loan, 10.07%, 2012 | | $ | 1,888,867 | | $ | 1,794,423 |
| Sandridge Energy, Inc., Term Loan B, 8.63%, 2015 | | | 4,673,000 | | | 4,614,588 |
| | | | | | |
| | | | | | $ | 6,409,011 |
| Gaming & Lodging - 0.2% | | | | | | |
| Harrahs Entertainment, Inc., Term Loan B-2, 2015 (o) | | $ | 1,380,734 | | $ | 1,267,399 |
| | |
| Medical & Health Technology & Services - 0.6% | | | | | | |
| Advanced Medical Optics, Inc., Term Loan B, 6.77%, 2014 | | $ | 881,078 | | $ | 817,199 |
| HCA, Inc., Term Loan B, 7.45%, 2013 | | | 3,832,422 | | | 3,535,066 |
| | | | | | |
| | | | | | $ | 4,352,265 |
| Pollution Control - 0.4% | | | | | | |
| Allied Waste North America, Inc., Letter of Credit, 5%, 2012 | | $ | 893,901 | | $ | 834,680 |
| Allied Waste North America, Inc., Term Loan B, 5.89%, 2012 | | | 1,788,315 | | | 1,669,839 |
| | | | | | |
| | | | | | $ | 2,504,519 |
| Specialty Stores - 0.7% | | | | | | |
| Michaels Stores, Inc., Term Loan B, 7.58%, 2013 (o) | | $ | 5,810,797 | | $ | 4,945,633 |
| | |
| Utilities - Electric Power - 0.3% | | | | | | |
| TXU Corp. Term Loan B-3, 2014 (o) | | $ | 2,500,000 | | $ | 2,304,860 |
| Total Floating Rate Loans (Identified Cost, $59,347,566) | | | | | $ | 53,626,379 |
| | |
| Common Stocks - 2.3% | | | | | | |
| Automotive - 0.0% | | | | | | |
| Oxford Automotive, Inc. (a) | | | 29 | | $ | 0 |
| | |
| Broadcasting - 0.4% | | | | | | |
| Clear Channel Communications, Inc. | | | 34,400 | | $ | 1,056,424 |
| Idearc, Inc. | | | 92,200 | | | 1,499,172 |
| | | | | | |
| | | | | | $ | 2,555,596 |
| Cable TV - 0.8% | | | | | | |
| Comcast Corp., “A” (a) | | | 236,900 | | $ | 4,302,104 |
| Time Warner Cable, Inc. (a) | | | 33,200 | | | 835,312 |
| | | | | | |
| | | | | | $ | 5,137,416 |
| Consumer Goods & Services - 0.0% | | | | | | |
| Central Garden & Pet Co. (a) | | | 28,000 | | $ | 153,720 |
| | |
| Electronics - 0.1% | | | | | | |
| Intel Corp. | | | 29,000 | | $ | 614,800 |
19
Portfolio of Investments – continued
| | | | | |
| Issuer | | Shares/Par | | Value ($) |
| | | | | |
| Common Stocks - continued | | | | | |
| Energy - Independent - 0.0% | | | | | |
| Sandridge Energy, Inc. (a) | | 490 | | $ | 14,911 |
| | |
| Energy - Integrated - 0.2% | | | | | |
| Chevron Corp. | | 14,100 | | $ | 1,191,450 |
| | |
| Forest & Paper Products - 0.1% | | | | | |
| Louisiana-Pacific Corp. | | 28,000 | | $ | 427,560 |
| | |
| Major Banks - 0.1% | | | | | |
| Bank of America Corp. | | 7,100 | | $ | 314,885 |
| JPMorgan Chase & Co. | | 7,100 | | | 337,605 |
| | | | | |
| | | | | $ | 652,490 |
| Pharmaceuticals - 0.1% | | | | | |
| Johnson & Johnson | | 11,400 | | $ | 721,164 |
| | |
| Real Estate - 0.1% | | | | | |
| Host Hotels & Resorts, Inc., REIT | | 59,400 | | $ | 994,356 |
| | |
| Telephone Services - 0.4% | | | | | |
| Windstream Corp. | | 246,100 | | $ | 2,857,221 |
| Total Common Stocks (Identified Cost, $18,020,444) | | | | $ | 15,320,684 |
| | |
| Preferred Stocks - 0.3% | | | | | |
| Broadcasting - 0.3% | | | | | |
Spanish Broadcasting Systems, Inc., “B”,
10.75% (Identified Cost, $1,942,737) (p) | | 1,975 | | $ | 1,777,500 |
| | |
| Money Market Funds (v) - 1.2% | | | | | |
MFS Institutional Money Market Portfolio, 4.296%,
at Cost and Net Asset Value | | 8,260,181 | | $ | 8,260,181 |
| Total Investments (Identified Cost, $708,647,358) (k) | | | | $ | 666,066,955 |
| | |
| Other Assets, Less Liabilities - 1.6% | | | | | 11,232,729 |
| Net Assets - 100.0% | | | | $ | 677,299,684 |
| (a) | Non-income producing security. |
| (d) | Non-income producing security-in default. |
| (e) | The rate shown represents a current effective yield. |
| (g) | The rate shown represents a weighted average coupon rate on settled positions at period end. |
| (i) | Interest only security for which the fund receives interest no notional principal (Par amount). Par amount shown is the notional principal and does not reflect the cost of the security. |
| (k) | As of January 31, 2008, the fund held securities fair valued in accordance with the policies adopted by the Board of Trustees, aggregating $564,831,779 and 84.80% of market value. An independent pricing service provided an evaluated bid for 83.92% of the market value. |
| (n) | Securities exempt from registration under Rule 144A of the Securities Act of 1933. These securities may be sold in the ordinary course of business in transactions exempt from registration, normally to qualified institutional buyers. At period end, the aggregate value of these securities was $124,528,523, representing 18.4% of net assets. |
20
Portfolio of Investments – continued
| (o) | All or a portion of this position has not settled. Upon settlement date, interest rates will be determined. |
| (p) | Payment-in-kind security. |
| (r) | Remaining maturities of floating rate loans may be less than stated maturities shown as a result of contractual or optional prepayments by the borrower. Such prepayments cannot be predicted with certainty. These loans may be subject to restrictions on resale. Floating rate loans generally have rates of interest which are determined periodically by reference to a base lending rate plus a premium. |
| (v) | Underlying fund that is available only to investment companies managed by MFS. The rate quoted is the annualized seven-day yield of the fund at period end. |
| (z) | Restricted securities are not registered under the Securities Act of 1933 and are subject to legal restrictions on resale. These securities generally may be resold in transactions exempt from registration or to the public if the securities are subsequently registered. Disposal of these securities may involve time-consuming negotiations and prompt sale at an acceptable price may be difficult. The fund holds the following restricted securities: |
| | | | | | | |
| Restricted Securities | | Acquisition
Date | | Acquisition
Cost | | Current
Market
Value | |
| Anthracite Ltd., CDO, 6%, 2037 | | 5/14/02 | | $968,128 | | $1,002,655 | |
Arbor Realty Mortgage Securities, CDO, FRN,
6.194%, 2038 | | 12/20/05 | | 1,354,583 | | 1,121,621 | |
Asset Securitization Corp., FRN,
8.825%, 2029 | | 1/25/05 | | 1,985,098 | | 2,640,687 | |
Falcon Franchise Loan LLC, FRN,
3.933%, 2025 | | 1/29/03 | | 334,564 | | 228,829 | |
Harrah’s Operating Co., Inc.,
10.75%, 2016 | | 1/30/08 | | 1,584,494 | | 1,574,700 | |
Preferred Term Securities XII Ltd.,
9.8%, 2033 | | 1/07/05 | | 1,863,750 | | 1,242,500 | |
Preferred Term Securities XVI Ltd.,
14%, 2035 | | 12/08/04-1/25/05 | | 3,274,750 | | 2,470,000 | |
Preferred Term Securities XVII Ltd.,
9.3%, 2035 | | 3/09/05 | | 1,813,000 | | 1,269,100 | |
Republic of Indonesia,
6.875%, 2018 | | 1/10/08 | | 792,744 | | 821,906 | |
Republic of Indonesia,
7.75%, 2038 | | 1/10/08-1/31/08 | | 1,426,370 | | 1,448,119 | |
Southwestern Energy Co.,
7.5%, 2018 | | 1/11/08-1/16/08 | | 1,786,875 | | 1,818,675 | |
| Total Restricted Securities | | | | | | $15,638,792 | |
| % of Net Assets | | | | | | 2.3 | % |
The following abbreviations are used in this report and are defined:
| CDO | | Collateralized Debt Obligation |
| CLO | | Collateralized Loan Obligation |
| FRN | | Floating Rate Note. Interest rate resets periodically and may not be the rate reported at period end. |
| REIT | | Real Estate Investment Trust |
21
Portfolio of Investments – continued
Unfunded Loan Commitments
As of January 31, 2008, the portfolio had the following unfunded loan commitments of $84,082, which could be extended at the option of the borrower:
| | | | | |
| Borrower | | Unfunded
Loan
Commitment | | Unrealized
Appreciation
(Depreciation) | |
| Univision Communications, Inc., Delay Draw Term Loan B, 2014 | | $84,082 | | $(7,904 | ) |
Swap Agreements at 1/31/08
| | | | | | | | | | | | | |
| Expiration | | Notional
Amount | | Counterparty | | Cash Flows
to Receive | | Cash Flows
to Pay | | Value | |
Credit Default Swaps | | | | | | | | | |
| 6/20/09 | | USD | | 2,300,000 | | JPMorgan Chase Bank | | 4.1% (fixed rate) | | (1) | | $(228,352 | ) |
| 6/20/09 | | USD | | 1,150,000 | | JPMorgan Chase Bank | | 4.8% (fixed rate) | | (1) | | (103,583 | ) |
| 6/20/12 | | USD | | 6,800,000 | | JPMorgan Chase Bank (a) | | (2) | | 4.21% (fixed rate) | | 582,200 | |
| 6/20/12 | | USD | | 2,300,000 | | Morgan Stanley
Capital Services, Inc. | | 3.76% (fixed rate) | | (3) | | (509,583 | ) |
| 6/20/12 | | USD | | 1,150,000 | | Morgan Stanley
Capital Services, Inc. | | 4.15% (fixed rate) | | (3) | | (241,656 | ) |
| 9/20/12 | | USD | | 2,300,000 | | Goldman Sachs
International | | 3.75% (fixed rate) | | (4) | | 2,726 | |
| | | | | | | | | | | | | $(498,248 | ) |
| (1) | Fund to pay notional amount upon a defined credit default event by Abitibi Consolidated, 8.375%, 4/01/15. |
| (2) | Fund to receive notional amount upon a defined credit event by a reference obligation specified in the CDX High Yield Index. |
| (3) | Fund to pay notional amount upon a defined credit default event by Bowater, Inc., 6.5%, 6/15/13. |
| (4) | Fund to pay notional amount upon a defined credit default event by Allied Waste North America, Inc., 7.375%, 4/15/14. |
| (a) | Premiums paid by the fund amounted to $335,736. |
At January 31, 2008, the fund had sufficient cash and/or other liquid securities to cover any commitments under these derivative contracts.
Abbreviations indicate amounts shown in currencies other than the U.S. dollar. All amounts are stated in U.S. dollars unless otherwise indicated. A list of abbreviations is shown below:
See Notes to Financial Statements
22
Financial Statements
STATEMENT OF ASSETS AND LIABILITIES
At 1/31/08
This statement represents your fund’s balance sheet, which details the assets and liabilities comprising the total value of the fund.
| | | | | |
| Assets | | | | | |
| Investments - | | | | | |
| Non-affiliated issuers, at value (identified cost, $700,387,177) | | $657,806,774 | | | |
| Underlying funds, at cost and value | | 8,260,181 | | | |
| Total investments, at value (identified cost, $708,647,358) | | $666,066,955 | | | |
| Cash | | 73,333 | | | |
| Restricted cash | | 840,230 | | | |
| Foreign currency, at value (identified cost, $27,332) | | 27,213 | | | |
| Receivable for investments sold | | 17,256,510 | | | |
| Receivable for fund shares sold | | 2,243,997 | | | |
| Interest and dividends receivable | | 13,126,526 | | | |
| Receivable from investment adviser | | 121,455 | | | |
| Swaps, at value (premiums paid, $335,736) | | 584,926 | | | |
| Other assets | | 10,698 | | | |
| Total assets | | | | | $700,351,843 |
| Liabilities | | | | | |
| Distributions payable | | $1,526,754 | | | |
| Payable for investments purchased | | 17,216,041 | | | |
| Payable for fund shares reacquired | | 2,764,088 | | | |
| Swaps, at value | | 1,083,174 | | | |
| Unrealized depreciation on unfunded loan commitments | | 7,904 | | | |
| Payable to affiliates | | | | | |
Management fee | | 18,491 | | | |
Shareholder servicing costs | | 244,963 | | | |
Distribution and service fees | | 18,785 | | | |
Administrative services fee | | 510 | | | |
| Payable for independent trustees’ compensation | | 10,042 | | | |
| Accrued expenses and other liabilities | | 161,407 | | | |
| Total liabilities | | | | | $23,052,159 |
| Net assets | | | | | $677,299,684 |
| Net assets consist of: | | | | | |
| Paid-in capital | | $733,359,400 | | | |
| Unrealized appreciation (depreciation) on investments and translation of assets and liabilities in foreign currencies | | (43,422,432 | ) | | |
| Accumulated distributions in excess of net realized gain on investments and foreign currency transactions | | (12,494,944 | ) | | |
| Accumulated distributions in excess of net investment income | | (142,340 | ) | | |
| Net assets | | | | | $677,299,684 |
| Shares of beneficial interest outstanding | | | | | 98,101,607 |
23
Statement of Assets and Liabilities – continued
| | | | |
| Class A shares: | | | | |
Net assets | | $458,651,040 | | |
Shares outstanding | | 66,451,765 | | |
Net asset value per share | | | | $6.90 |
Offering price per share (100 / 95.25 x net asset value per share) | | | | $7.24 |
| Class B shares: | | | | |
Net assets | | $90,329,836 | | |
Shares outstanding | | 13,046,221 | | |
Net asset value and offering price per share | | | | $6.92 |
| Class C shares: | | | | |
Net assets | | $92,946,943 | | |
Shares outstanding | | 13,495,031 | | |
Net asset value and offering price per share | | | | $6.89 |
| Class I shares: | | | | |
Net assets | | $35,371,865 | | |
Shares outstanding | | 5,108,590 | | |
Net asset value, offering price, and redemption price per share | | | | $6.92 |
On sales of $50,000 or more, the offering price of Class A shares is reduced. A contingent deferred sales charge may be imposed on redemptions of Class A, Class B, and Class C shares.
See Notes to Financial Statements
24
Financial Statements
STATEMENT OF OPERATIONS
Year ended 1/31/08
This statement describes how much your fund earned in investment income and accrued in expenses.
It also describes any gains and/or losses generated by fund operations.
| | | | | | |
| Net investment income | | | | | | |
| Income | | | | | | |
Interest | | $64,718,184 | | | | |
Dividends | | 596,444 | | | | |
Dividends from underlying funds | | 1,325,948 | | | | |
Foreign taxes withheld | | (9,099 | ) | | | |
| Total investment income | | | | | $66,631,477 | |
| Expenses | | | | | | |
Management fee | | $5,069,181 | | | | |
Distribution and service fees | | 3,941,728 | | | | |
Shareholder servicing costs | | 947,904 | | | | |
Administrative services fee | | 134,651 | | | | |
Independent trustees’ compensation | | 19,334 | | | | |
Custodian fee | | 114,873 | | | | |
Shareholder communications | | 83,893 | | | | |
Auditing fees | | 73,656 | | | | |
Legal fees | | 13,484 | | | | |
Miscellaneous | | 121,208 | | | | |
| Total expenses | | | | | $10,519,912 | |
Reduction of expenses by investment adviser | | (2,675,297 | ) | | | |
| Net expenses | | | | | $7,844,615 | |
| Net investment income | | | | | $58,786,862 | |
| Realized and unrealized gain (loss) on investments | | | | | | |
| Realized gain (loss) (identified cost basis) | | | | | | |
Investment transactions | | $(2,858,790 | ) | | | |
Futures contracts | | (410,649 | ) | | | |
Swap transactions | | 357,279 | | | | |
Foreign currency transactions | | 40,668 | | | | |
Net realized gain (loss) on investments
and foreign currency transactions | | | | | $(2,871,492 | ) |
| Change in unrealized appreciation (depreciation) | | | | | | |
Investments | | $(70,682,010 | ) | | | |
Futures contracts | | 439,740 | | | | |
Swap transactions | | (862,959 | ) | | | |
Translation of assets and liabilities in foreign currencies | | 79 | | | | |
Unfunded loan commitments | | (7,904 | ) | | | |
Net unrealized gain (loss) on investments
and foreign currency translation | | | | | $(71,113,054 | ) |
Net realized and unrealized gain (loss) on investments
and foreign currency | | | | | $(73,984,546 | ) |
| Change in net assets from operations | | | | | $(15,197,684 | ) |
See Notes to Financial Statements
25
Financial Statements
STATEMENTS OF CHANGES IN NET ASSETS
These statements describe the increases and/or decreases in net assets resulting from operations, any distributions, and any shareholder transactions.
| | | | | | |
| | | Years ended 1/31 | |
| | | 2008 | | | 2007 | |
| Change in net assets | | | | | | |
| From operations | | | | | | |
| Net investment income | | $58,786,862 | | | $48,578,791 | |
Net realized gain (loss) on investments and
foreign currency transactions | | (2,871,492 | ) | | 8,650,238 | |
Net unrealized gain (loss) on investments and
foreign currency translation | | (71,113,054 | ) | | 17,837,264 | |
| Change in net assets from operations | | $(15,197,684 | ) | | $75,066,293 | |
| Distributions declared to shareholders | | | | | | |
| From net investment income | | | | | | |
Class A | | $(40,470,416 | ) | | $(30,978,000 | ) |
Class B | | (8,017,465 | ) | | (8,758,040 | ) |
Class C | | (7,548,333 | ) | | (6,910,379 | ) |
Class I | | (4,371,494 | ) | | (4,015,222 | ) |
| From net realized gain on investments | | | | | | |
Class A | | (3,206,632 | ) | | — | |
Class B | | (648,287 | ) | | — | |
Class C | | (645,412 | ) | | — | |
Class I | | (306,690 | ) | | — | |
| Total distributions declared to shareholders | | $(65,214,729 | ) | | $(50,661,641 | ) |
| Change in net assets from fund share transactions | | $(15,470,526 | ) | | $145,046,575 | |
| Redemption fees | | $— | | | $12,674 | |
| Total change in net assets | | $(95,882,939 | ) | | $169,463,901 | |
| Net assets | | | | | | |
| At beginning of period | | 773,182,623 | | | 603,718,722 | |
| At end of period (including accumulated distributions in excess of net investment income of $142,340 and $313,313, respectively) | | $677,299,684 | | | $773,182,623 | |
See Notes to Financial Statements
26
Financial Statements
FINANCIAL HIGHLIGHTS
The financial highlights table is intended to help you understand the fund’s financial performance for the past 5 years. Certain information reflects financial results for a single fund share. The total returns in the table represent the rate by which an investor would have earned (or lost) on an investment in the fund share class (assuming reinvestment of all distributions) held for the entire period.
| | | | | | | | | | | | | | | |
| Class A | | Years ended 1/31 | |
| | | 2008 | | | 2007 | | | 2006 | | | 2005 | | | 2004 | |
| Net asset value, beginning of period | | $7.66 | | | $7.40 | | | $7.63 | | | $7.65 | | | $6.61 | |
| Income (loss) from investment operations | | | | | | | | | | | | | |
Net investment income (d) | | $0.58 | | | $0.56 | | | $0.56 | | | $0.57 | | | $0.60 | |
Net realized and unrealized gain (loss) on investments and foreign currency | | (0.70 | ) | | 0.28 | | | (0.16 | ) | | 0.08 | | | 1.05 | |
| Total from investment operations | | $(0.12 | ) | | $0.84 | | | $0.40 | | | $0.65 | | | $1.65 | |
| Less distributions declared to shareholders | | | | | | | | | | | | | |
From net investment income | | $(0.59 | ) | | $(0.58 | ) | | $(0.59 | ) | | $(0.59 | ) | | $(0.61 | ) |
From net realized gain on investments | | (0.05 | ) | | — | | | (0.04 | ) | | (0.08 | ) | | — | |
| Total distributions declared to shareholders | | $(0.64 | ) | | $(0.58 | ) | | $(0.63 | ) | | $(0.67 | ) | | $(0.61 | ) |
| Redemption fees added to paid-in capital (d) | | $— | | | $0.00 | (w) | | $0.00 | (w) | | $0.00 | (w) | | $— | |
| Net asset value, end of period | | $6.90 | | | $7.66 | | | $7.40 | | | $7.63 | | | $7.65 | |
| Total return (%) (r)(s)(t) | | (1.88 | ) | | 11.89 | | | 5.55 | | | 8.98 | | | 26.04 | |
Ratios (%) (to average net assets)
and Supplemental data: | | | | | | | | | | | | | | | |
| Expenses before expense reductions (f) | | 1.19 | | | 1.27 | | | 1.29 | | | 1.29 | | | 1.34 | |
| Expenses after expense reductions (f) | | 0.85 | | | 0.85 | | | 0.85 | | | 0.87 | | | 1.01 | |
| Net investment income | | 7.70 | | | 7.53 | | | 7.51 | | | 7.62 | | | 8.21 | |
| Portfolio turnover | | 79 | | | 85 | | | 66 | | | 69 | | | 98 | |
| Net assets at end of period (000 Omitted) | | $458,651 | | | $488,673 | | | $338,568 | | | $278,886 | | | $150,334 | |
See Notes to Financial Statements
27
Financial Highlights – continued
| | | | | | | | | | | | | | | |
| Class B | | Years ended 1/31 | |
| | | 2008 | | | 2007 | | | 2006 | | | 2005 | | | 2004 | |
| Net asset value, beginning of period | | $7.68 | | | $7.42 | | | $7.65 | | | $7.67 | | | $6.63 | |
| Income (loss) from investment operations | | | | | | | | | | | | | |
Net investment income (d) | | $0.53 | | | $0.52 | | | $0.51 | | | $0.53 | | | $0.55 | |
Net realized and unrealized gain (loss)
on investments and foreign currency | | (0.70 | ) | | 0.28 | | | (0.16 | ) | | 0.07 | | | 1.06 | |
| Total from investment operations | | $(0.17 | ) | | $0.80 | | | $0.35 | | | $0.60 | | | $1.61 | |
| Less distributions declared to shareholders | | | | | | | | | | | | | |
From net investment income | | $(0.54 | ) | | $(0.54 | ) | | $(0.54 | ) | | $(0.54 | ) | | $(0.57 | ) |
From net realized gain on investments | | (0.05 | ) | | — | | | (0.04 | ) | | (0.08 | ) | | — | |
| Total distributions declared to shareholders | | $(0.59 | ) | | $(0.54 | ) | | $(0.58 | ) | | $(0.62 | ) | | $(0.57 | ) |
| Redemption fees added to paid-in capital (d) | | $— | | | $0.00 | (w) | | $0.00 | (w) | | $0.00 | (w) | | $— | |
| Net asset value, end of period | | $6.92 | | | $7.68 | | | $7.42 | | | $7.65 | | | $7.67 | |
| Total return (%) (r)(s)(t) | | (2.49 | ) | | 11.17 | | | 4.87 | | | 8.28 | | | 25.19 | |
Ratios (%) (to average net assets)
and Supplemental data: | | | | | | | | | | | | | |
| Expenses before expense reductions (f) | | 1.84 | | | 1.92 | | | 1.94 | | | 1.94 | | | 1.99 | |
| Expenses after expense reductions (f) | | 1.50 | | | 1.50 | | | 1.50 | | | 1.52 | | | 1.66 | |
| Net investment income | | 7.03 | | | 6.91 | | | 6.88 | | | 7.03 | | | 7.61 | |
| Portfolio turnover | | 79 | | | 85 | | | 66 | | | 69 | | | 98 | |
| Net assets at end of period (000 Omitted) | | $90,330 | | | $124,393 | | | $125,667 | | | $151,711 | | | $140,348 | |
See Notes to Financial Statements
28
Financial Highlights – continued
| | | | | | | | | | | | | | | |
| Class C | | Years ended 1/31 | |
| | | 2008 | | | 2007 | | | 2006 | | | 2005 | | | 2004 | |
| Net asset value, beginning of period | | $7.64 | | | $7.38 | | | $7.61 | | | $7.63 | | | $6.60 | |
| Income (loss) from investment operations | | | | | | | | | | | | | | | |
Net investment income (d) | | $0.53 | | | $0.51 | | | $0.51 | | | $0.52 | | | $0.54 | |
Net realized and unrealized gain (loss)
on investments and foreign currency | | (0.69 | ) | | 0.28 | | | (0.16 | ) | | 0.08 | | | 1.06 | |
| Total from investment operations | | $(0.16 | ) | | $0.79 | | | $0.35 | | | $0.60 | | | $1.60 | |
| Less distributions declared to shareholders | | | | | | | | | | | | | |
From net investment income | | $(0.54 | ) | | $(0.53 | ) | | $(0.54 | ) | | $(0.54 | ) | | $(0.57 | ) |
From net realized gain on investments | | (0.05 | ) | | — | | | (0.04 | ) | | (0.08 | ) | | — | |
| Total distributions declared to shareholders | | $(0.59 | ) | | $(0.53 | ) | | $(0.58 | ) | | $(0.62 | ) | | $(0.57 | ) |
| Redemption fees added to paid-in capital (d) | | $— | | | $0.00 | (w) | | $0.00 | (w) | | $0.00 | (w) | | $— | |
| Net asset value, end of period | | $6.89 | | | $7.64 | | | $7.38 | | | $7.61 | | | $7.63 | |
| Total return (%) (r)(s)(t) | | (2.40 | ) | | 11.19 | | | 4.86 | | | 8.28 | | | 25.10 | |
Ratios (%) (to average net assets)
and Supplemental data: | | | | | | | | | | | | | | | |
| Expenses before expense reductions (f) | | 1.84 | | | 1.92 | | | 1.94 | | | 1.94 | | | 1.99 | |
| Expenses after expense reductions (f) | | 1.50 | | | 1.50 | | | 1.50 | | | 1.52 | | | 1.66 | |
| Net investment income | | 7.05 | | | 6.90 | | | 6.88 | | | 7.01 | | | 7.56 | |
| Portfolio turnover | | 79 | | | 85 | | | 66 | | | 69 | | | 98 | |
| Net assets at end of period (000 Omitted) | | $92,947 | | | $103,873 | | | $92,613 | | | $101,113 | | | $84,643 | |
See Notes to Financial Statements
29
Financial Highlights – continued
| | | | | | | | | | | | | | | |
| Class I | | Years ended 1/31 | |
| | | 2008 | | | 2007 | | | 2006 | | | 2005 | | | 2004 | |
| Net asset value, beginning of period | | $7.68 | | | $7.42 | | | $7.65 | | | $7.68 | | | $6.64 | |
| Income (loss) from investment operations | | | | | | | | | | | | | | | |
Net investment income (d) | | $0.60 | | | $0.59 | | | $0.59 | | | $0.55 | | | $0.63 | |
Net realized and unrealized gain (loss)
on investments and foreign currency | | (0.69 | ) | | 0.28 | | | (0.16 | ) | | 0.12 | | | 1.05 | |
| Total from investment operations | | $(0.09 | ) | | $0.87 | | | $0.43 | | | $0.67 | | | $1.68 | |
| Less distributions declared to shareholders | | | | | | | | | | | | | | | |
From net investment income | | $(0.62 | ) | | $(0.61 | ) | | $(0.62 | ) | | $(0.62 | ) | | $(0.64 | ) |
From net realized gain on investments | | (0.05 | ) | | — | | | (0.04 | ) | | (0.08 | ) | | — | |
| Total distributions declared to shareholders | | $(0.67 | ) | | $(0.61 | ) | | $(0.66 | ) | | $(0.70 | ) | | $(0.64 | ) |
| Redemption fees added to paid-in capital (d) | | $— | | | $0.00 | (w) | | $0.00 | (w) | | $0.00 | (w) | | $— | |
| Net asset value, end of period | | $6.92 | | | $7.68 | | | $7.42 | | | $7.65 | | | $7.68 | |
| Total return (%) (r)(s) | | (1.51 | ) | | 12.27 | | | 5.92 | | | 9.23 | | | 26.41 | |
Ratios (%) (to average net assets)
and Supplemental data: | | | | | | | | | | | | | | | |
| Expenses before expense reductions (f) | | 0.84 | | | 0.92 | | | 0.94 | | | 0.93 | | | 0.99 | |
| Expenses after expense reductions (f) | | 0.50 | | | 0.50 | | | 0.50 | | | 0.51 | | | 0.66 | |
| Net investment income | | 8.01 | | | 7.89 | | | 7.86 | | | 7.75 | | | 8.66 | |
| Portfolio turnover | | 79 | | | 85 | | | 66 | | | 69 | | | 98 | |
| Net assets at end of period (000 Omitted) | | $35,372 | | | $56,243 | | | $46,871 | | | $33,556 | | | $3,434 | |
| (d) | Per share data are based on average shares outstanding. |
| (f) | Ratios do not reflect reductions from fees paid indirectly, if applicable. |
| (r) | Certain expenses have been reduced without which performance would have been lower. |
| (s) | From time to time the fund may receive proceeds from litigation settlements, without which performance would be lower. |
| (t) | Total returns do not include any applicable sales charges. |
| (w) | Per share amount was less than $0.01. |
See Notes to Financial Statements
30
NOTES TO FINANCIAL STATEMENTS
| (1) | | Business and Organization |
MFS High Yield Opportunities Fund (the fund) is a series of MFS Series Trust III (the trust). The trust is organized as a Massachusetts business trust and is registered under the Investment Company Act of 1940, as amended, as an open-end management investment company.
| (2) | | Significant Accounting Policies |
General – The preparation of financial statements in conformity with U.S. generally accepted accounting principles requires management to make estimates and assumptions that affect the reported amounts of assets and liabilities, and disclosure of contingent assets and liabilities at the date of the financial statements and the reported amounts of revenues and expenses during the reporting period. Actual results could differ from those estimates. The fund can invest up to 100% of its portfolio in high-yield securities rated below investment grade. Investments in high-yield securities involve greater degrees of credit and market risk than investments in higher-rated securities and tend to be more sensitive to economic conditions. The fund can invest in foreign securities, including securities of emerging market issuers. Investments in foreign securities are vulnerable to the effects of changes in the relative values of the local currency and the U.S. dollar and to the effects of changes in each country’s legal, political, and economic environment. The markets of emerging markets countries are generally more volatile than the markets of developed countries with more mature economies. All of the risks of investing in foreign securities previously described are heightened when investing in emerging markets countries.
Investment Valuations – Debt instruments (other than short-term instruments), including restricted debt instruments, are generally valued at an evaluated or composite bid as reported by an independent pricing service. Equity securities, including restricted equity securities, are generally valued at the last sale or official closing price as reported by an independent pricing service on the market or exchange on which they are primarily traded. For securities for which there were no sales reported that day, equity securities are generally valued at the last quoted daily bid quotation as reported by an independent pricing service on the market or exchange on which they are primarily traded. For securities held short for which there were no sales reported for the day, the position is generally valued at the last quoted daily ask quotation as reported by an independent pricing service on the market or exchange on which such securities are primarily traded. Short-term instruments with a maturity at issuance of 60 days or less may be valued at amortized cost, which approximates market value. Futures contracts are
31
Notes to Financial Statements – continued
generally valued at last posted settlement price as reported by an independent pricing service on the market on which they are primarily traded. Futures contracts for which there were no trades that day for a particular position are generally valued at the closing bid quotation as reported by an independent pricing service on the market on which such futures contracts are primarily traded. Swaps are generally valued at an evaluated bid as reported by an independent pricing service. Open-end investment companies are generally valued at net asset value per share. Securities and other assets generally valued on the basis of information from an independent pricing service may also be valued at a broker-dealer bid quotation. Values obtained from pricing services can utilize both dealer-supplied valuations and electronic data processing techniques, which take into account factors such as institutional-size trading in similar groups of securities, yield, quality, coupon rate, maturity, type of issue, trading characteristics, and other market data. The values of foreign securities and other assets and liabilities expressed in foreign currencies are converted to U.S. dollars using the mean of bid and asked prices for rates reported by an independent pricing service.
The Board of Trustees has delegated primary responsibility for determining or causing to be determined the value of the fund’s investments (including any fair valuation) to the adviser pursuant to valuation policies and procedures approved by the Board. If the adviser determines that reliable market quotations are not readily available, investments are valued at fair value as determined in good faith by the adviser in accordance with such procedures under the oversight of the Board of Trustees. Under the fund’s valuation policies and procedures, market quotations are not considered to be readily available for many types of debt instruments and certain types of derivatives. These investments are generally valued at fair value based on information from independent pricing services. In addition, investments may be valued at fair value if the adviser determines that an investment’s value has been materially affected by events occurring after the close of the exchange or market on which the investment is principally traded (such as foreign exchange or market) and prior to the determination of the fund’s net asset value, or after the halting of trading of a specific security where trading does not resume prior to the close of the exchange or market on which the security is principally traded. The adviser may rely on independent pricing services or other information (such as the correlation with price movements of similar securities in the same or other markets; the type, cost and investment characteristics of the security; the business and financial condition of the issuer; and trading and other market data) to assist in determining whether to fair value and at what value to fair value an investment. The value of an investment for purposes of calculating the fund’s net asset value can differ depending on the source and method used to determine value. When fair valuation is used, the value of investments used to determine the fund’s net asset value may differ from quoted or published prices for the same investments.
32
Notes to Financial Statements – continued
In September 2006, FASB Statement No. 157, Fair Value Measurements (the “Statement”) was issued, and is effective for fiscal years beginning after November 15, 2007 and for all interim periods within those fiscal years. This Statement provides a single definition of fair value, a hierarchy for measuring fair value and expanded disclosures about fair value measurements. Management is evaluating the application of the Statement to the fund, and believes the impact will be limited to expanded disclosures resulting from the adoption of this Statement in the fund’s financial statements.
Repurchase Agreements – The fund may enter into repurchase agreements with institutions that the fund’s investment adviser has determined are creditworthy. Each repurchase agreement is recorded at cost. The fund requires that the securities collateral in a repurchase transaction be transferred to the custodian in a manner sufficient to enable the fund to obtain those securities in the event of a default under the repurchase agreement. The fund monitors, on a daily basis, the value of the collateral to ensure that its value, including accrued interest, is greater than amounts owed to the fund under each such repurchase agreement.
Foreign Currency Translation – Purchases and sales of foreign investments, income, and expenses are converted into U.S. dollars based upon currency exchange rates prevailing on the respective dates of such transactions. Gains and losses attributable to foreign currency exchange rates on sales of securities are recorded for financial statement purposes as net realized gains and losses on investments. Gains and losses attributable to foreign exchange rate movements on income and expenses are recorded for financial statement purposes as foreign currency transaction gains and losses. That portion of both realized and unrealized gains and losses on investments that results from fluctuations in foreign currency exchange rates is not separately disclosed.
Derivative Risk – The fund may invest in derivatives for hedging or non-hedging purposes. While hedging can reduce or eliminate losses, it can also reduce or eliminate gains. When the fund uses derivatives as an investment to gain market exposure, or for hedging purposes, gains and losses from derivative instruments may be substantially greater than the derivative’s original cost. Cash that has been segregated on behalf of certain derivative contracts will be reported separately on the Statement of Assets and Liabilities as restricted cash. Derivative instruments include futures contracts and swap agreements.
Futures Contracts – The fund may enter into futures contracts for the delayed delivery of securities or currency, or contracts based on financial indices at a fixed price on a future date. In entering such contracts, the fund is required to deposit with the broker either in cash or securities an amount equal to a certain percentage of the contract amount. Subsequent payments are made or received by the fund each day, depending on the daily fluctuations in the value
33
Notes to Financial Statements – continued
of the contract, and are recorded for financial statement purposes as unrealized gains or losses by the fund. Upon entering into such contracts, the fund bears the risk of interest or exchange rates or securities prices moving unexpectedly, in which case, the fund may not achieve the anticipated benefits of the futures contracts and may realize a loss.
Swap Agreements – The fund may enter into swap agreements. A swap is an exchange of cash payments between the fund and another party. Net cash payments are exchanged at specified intervals and are recorded as a realized gain or loss in the Statement of Operations. The value of the swap is adjusted daily and the change in value, including accruals of periodic amounts of interest to be paid or received, is recorded as unrealized appreciation or depreciation in the Statement of Operations. Amounts paid or received at the inception of the swap are reflected as premiums paid or received on the Statements of Assets and Liabilities and are amortized using the effective interest method over the term of the agreement. A liquidation payment received or made upon early termination is recorded as a realized gain or loss in the Statement of Operations. Collateral, in the form of cash or securities, may be required to be held in segregated accounts with the fund’s custodian in connection with these agreements. Risk of loss may exceed amounts recognized on the Statement of Assets and Liabilities. These risks include the possible lack of a liquid market, failure of the counterparty to perform under the terms of the agreements, and unfavorable market movement of the underlying instrument. All swap agreements entered into by the fund with the same counterparty are generally governed by a single master agreement, which provides for the netting of all amounts owed by the parties under the agreement upon the occurrence of an event of default, thereby reducing the credit risk to which such party is exposed.
The fund holds credit default swaps in which one party makes a stream of payments based on a fixed percentage applied to the notional amount to another party in exchange for the right to receive a specified return in the event of a default by a third party, such as a corporate issuer or foreign issuer, on its obligation. The fund may enter into credit default swaps to limit or to reduce its risk exposure to defaults of corporate and sovereign issuers or to create direct or synthetic short or long exposure to corporate debt securities or certain sovereign debt securities to which it is not otherwise exposed.
Hybrid Instruments – The fund may invest in indexed or hybrid securities on which any combination of interest payments, the principal or stated amount payable at maturity is determined by reference to prices of other securities, currencies, indexes, economic factors or other measures, including interest rates, currency exchange rates, or securities indices. The risks of investing in hybrid instruments reflect a combination of the risks of investing in securities,
34
Notes to Financial Statements – continued
swaps, options, futures and currencies. Hybrid instruments are potentially more volatile and carry greater market risks than traditional debt instruments. Depending on the structure of the particular hybrid instrument, changes in a benchmark, underlying assets or economic indicator may be magnified by the terms of the hybrid instrument and have an even more dramatic and substantial effect upon the value of the hybrid instrument. Also, the prices of the hybrid instrument and the benchmark, underlying asset or economic indicator may not move in the same direction or at the same time.
Loans and Other Direct Debt Instruments – The fund may invest in loans and loan participations or other receivables. These investments may include standby financing commitments, including revolving credit facilities, which obligate the fund to supply additional cash to the borrower on demand. At January 31, 2008, the portfolio had unfunded loan commitments of $84,082, which could be extended at the option of the borrower and which are covered by sufficient cash and/or liquid securities held by the fund. Loan participations involve a risk of insolvency of the lending bank or other financial intermediary.
Indemnifications – Under the fund’s organizational documents, its officers and trustees may be indemnified against certain liabilities and expenses arising out of the performance of their duties to the fund. Additionally, in the normal course of business, the fund enters into agreements with service providers that may contain indemnification clauses. The fund’s maximum exposure under these agreements is unknown as this would involve future claims that may be made against the fund that have not yet occurred.
Short Term Fees – The fund charged a 1% redemption fee on proceeds from Class A, Class B, Class C, and Class I shares redeemed or exchanged within 30 calendar days following their acquisition. Effective December 1, 2006, the fund no longer charges a redemption fee. Any redemption fees charged are accounted for as an addition to paid-in-capital.
Investment Transactions and Income – Investment transactions are recorded on the trade date. Interest income is recorded on the accrual basis. All premium and discount is amortized or accreted for financial statement purposes in accordance with U.S. generally accepted accounting principles. All discount is accreted for tax reporting purposes as required by federal income tax regulations. The fund earns certain fees in connection with its floating rate loan purchasing activities. These fees are in addition to interest payments earned and may include amendment fees, commitment fees, facility fees, consent fees, and prepayment fees. Commitment fees are recorded on an accrual basis as income in the accompanying financial statements. Dividends received in cash are recorded on the ex-dividend date. Certain dividends from foreign securities will be recorded when the fund is informed of the dividend if such information is obtained subsequent to the ex-dividend date. Dividend and
35
Notes to Financial Statements – continued
interest payments received in additional securities are recorded on the ex-dividend or ex-interest date in an amount equal to the value of the security on such date. The fund may receive proceeds from litigation settlements. Any proceeds received from litigation involving portfolio holdings are reflected in the Statement of Operations in realized gain/loss if the security has been disposed of by the fund or in unrealized gain/loss if the security is still held by the fund. Any other proceeds from litigation not related to portfolio holdings are reflected as other income in the Statement of Operations.
Fees Paid Indirectly – The fund’s custody fee may be reduced according to an arrangement that measures the value of cash deposited with the custodian by the fund. For the year ended January 31, 2008, custodian fees were not reduced.
Tax Matters and Distributions – The fund intends to qualify as a regulated investment company, as defined under Subchapter M of the Internal Revenue Code, and to distribute all of its taxable income, including realized capital gains. As a result, no provision for federal income tax is required. The fund adopted the provisions of FASB Interpretation No. 48, Accounting for Uncertainty in Income Taxes (“the Interpretation”) on January 1, 2007. The Interpretation prescribes a minimum threshold for financial statement recognition of the benefit of a tax position taken or expected to be taken in a tax return. There was no impact resulting from the adoption of this Interpretation on the fund’s financial statements. Each of the fund’s federal tax returns for the prior three fiscal years remains subject to examination by the Internal Revenue Service. It is the fund’s policy to record interest and penalty charges on underpaid taxes associated with its tax positions as interest expense and miscellaneous expense, respectively. No such charges were recorded in the current financial statements. Foreign taxes, if any, have been accrued by the fund in the accompanying financial statements.
Distributions to shareholders are recorded on the ex-dividend date. Income and capital gain distributions are determined in accordance with income tax regulations, which may differ from U.S. generally accepted accounting principles. Certain capital accounts in the financial statements are periodically adjusted for permanent differences in order to reflect their tax character. These adjustments have no impact on net assets or net asset value per share. Temporary differences which arise from recognizing certain items of income, expense, gain or loss in different periods for financial statement and tax purposes will reverse at some time in the future. Distributions in excess of net investment income or net realized gains are temporary overdistributions for financial statement purposes resulting from differences in the recognition or classification of income or distributions for financial statement and tax purposes.
Book/tax differences primarily relate to amortization and accretion of debt securities, wash sale loss deferrals, derivative transactions and treating a portion of the proceeds from redemptions as a distribution for tax purposes.
36
Notes to Financial Statements – continued
The tax character of distributions declared to shareholders is as follows:
| | | | |
| | | 1/31/08 | | 1/31/07 |
| Ordinary income (including any short-term capital gains) | | $62,714,558 | | $50,661,641 |
| Long-term capital gain | | 2,500,171 | | — |
| Total distributions | | $65,214,729 | | $50,661,641 |
The federal tax cost and the tax basis components of distributable earnings were as follows:
| | | |
| As of 1/31/08 | | | |
| Cost of investments | | $711,166,068 | |
| Gross appreciation | | $5,952,801 | |
| Gross depreciation | | (51,051,914 | ) |
| Net unrealized appreciation (depreciation) | | $(45,099,113 | ) |
| Undistributed ordinary income | | $3,555,555 | |
| Undistributed long-term capital gain | | 431,261 | |
| Post-October capital loss deferral | | (10,372,527 | ) |
| Other temporary differences | | (4,574,892 | ) |
Multiple Classes of Shares of Beneficial Interest – The fund offers multiple classes of shares, which differ in their respective distribution and service fees. All shareholders bear the common expenses of the fund based on daily net assets of each class, without distinction between share classes. Dividends are declared separately for each class. Differences in per share dividend rates are generally due to differences in separate class expenses. Class B shares will convert to Class A shares approximately eight years after purchase.
| (3) | | Transactions with Affiliates |
Investment Adviser – The fund has an investment advisory agreement with MFS to provide overall investment management and related administrative services and facilities to the fund. The management fee is computed daily and paid monthly at an annual rate of 0.65% of the fund’s average daily net assets.
As part of a settlement agreement with the New York Attorney General concerning market timing and related matters, MFS has agreed to reduce the management fee to 0.50% of the fund’s average daily net assets for the period March 1, 2004 through February 28, 2009. For the year ended January 31, 2008, this waiver amounted to $1,169,816 and is reflected as a reduction of total expenses in the Statement of Operations.
The investment advisor has agreed in writing to pay all of the fund’s operating expenses, exclusive of management, distribution and service, and certain other fees and expenses. This written agreement will continue though May 31, 2008 unless changed or rescinded by the fund’s Board of Trustees. For the year
37
Notes to Financial Statements – continued
ended January 31, 2008, this reduction amounted to $1,501,898 and is reflected as a reduction of total expenses in the Statement of Operations.
Distributor – MFS Fund Distributors, Inc. (MFD), a wholly-owned subsidiary of MFS, as distributor, received $140,797 for the year ended January 31, 2008, as its portion of the initial sales charge on sales of Class A shares of the fund.
The Board of Trustees has adopted a distribution plan for certain class shares pursuant to Rule 12b-1 of the Investment Company Act of 1940.
The fund’s distribution plan provides that the fund will pay MFD for services provided by MFD and financial intermediaries in connection with the distribution and servicing of certain share classes. One component of the plan is a distribution fee paid to MFD and another component of the plan is a service fee paid to MFD. MFD may subsequently pay all, or a portion, of the distribution and/or service fees to financial intermediaries.
| | | | | | | | | | |
| | | Distribution
Fee Rate | | Service
Fee Rate | | Total
Distribution
Plan(d) | | Annual
Effective
Rate(e) | | Distribution
and Service
Fee |
| Class A | | 0.10% | | 0.25% | | 0.35% | | 0.35% | | $1,789,376 |
| Class B | | 0.75% | | 0.25% | | 1.00% | | 1.00% | | 1,109,808 |
| Class C | | 0.75% | | 0.25% | | 1.00% | | 1.00% | | 1,042,544 |
| Total Distribution and Service Fees | | | | | | | | $3,941,728 |
| (d) | In accordance with the distribution plan for certain classes, the fund pays distribution and/or service fees up to these annual percentage rates of each class’ average daily net assets. |
| (e) | The annual effective rates represent actual fees incurred under the distribution plan for the year ended January 31, 2008 based on each class’ average daily net assets. |
Certain Class A and Class C shares are subject to a contingent deferred sales charge in the event of a shareholder redemption within 12 months of purchase. Class B shares are subject to a contingent deferred sales charge in the event of a shareholder redemption within six years of purchase. All contingent deferred sales charges are paid to MFD and during the year ended January 31, 2008, were as follows:
| | |
| | | Amount |
| Class A | | $10,583 |
| Class B | | $242,383 |
| Class C | | $17,695 |
Shareholder Servicing Agent – MFS Service Center, Inc. (MFSC), a wholly-owned subsidiary of MFS, receives a fee from the fund for its services as shareholder servicing agent calculated as a percentage of the average daily net assets of the fund as determined periodically under the supervision of the fund’s Board of Trustees. For the year ended January 31, 2008, the fee was $349,769, which equated to 0.0449% annually of the fund’s average daily net assets. MFSC also receives payment from the fund for out-of-pocket expenses, sub-accounting and other shareholder servicing costs which may be paid to affiliated and
38
Notes to Financial Statements – continued
unaffiliated service providers. For the year ended January 31, 2008, these out-of-pocket expenses, sub-accounting and other shareholder servicing costs amounted to $591,710. The fund may also pay shareholder servicing related costs directly to non-related parties.
Administrator – MFS provides certain financial, legal, shareholder communications, compliance, and other administrative services to the fund. Under an administrative services agreement, the fund partially reimburses MFS the costs incurred to provide these services. The fund is charged a fixed amount plus a fee based on average daily net assets. The fund’s annual fixed amount is $17,500.
The administrative services fee incurred for the year ended January 31, 2008 was equivalent to an annual effective rate of 0.0173% of the fund’s average daily net assets.
Trustees’ and Officers’ Compensation – The fund pays compensation to independent trustees in the form of a retainer, attendance fees, and additional compensation to Board and Committee chairpersons. The fund does not pay compensation directly to trustees or officers of the fund who are also officers of the investment adviser, all of whom receive remuneration for their services to the fund from MFS. Certain officers and trustees of the fund are officers or directors of MFS, MFD, and MFSC.
The fund has an unfunded, defined benefit plan for certain retired independent trustees which resulted in a pension expense of $1,161. This amount is included in independent trustees’ compensation for the year ended January 31, 2008. The liability for deferred retirement benefits payable to certain retired independent trustees amounted to $10,042 at January 31, 2008, and is included in payable for independent trustees’ compensation.
Other – This fund and certain other MFS funds (the funds) have entered into a services agreement (the Agreement) which provides for payment of fees by the funds to Tarantino LLC in return for the provision of services of an Independent Chief Compliance Officer (ICCO) for the funds. The ICCO is an officer of the funds and the sole member of Tarantino LLC. The funds can terminate the Agreement with Tarantino LLC at any time under the terms of the Agreement. For the year ended January 31, 2008, the fee paid by the fund to Tarantino LLC was $5,818 and is included in miscellaneous expenses on the Statement of Operations. MFS has agreed to reimburse the fund for a portion of the payments made by the fund to Tarantino LLC in the amount of $3,583, which is shown as a reduction of total expenses in the Statement of Operations. Additionally, MFS has agreed to bear all expenses associated with office space, other administrative support, and supplies provided to the ICCO.
The fund may invest in a money market fund managed by MFS which seeks preservation of capital and current income. Income earned on this investment
39
Notes to Financial Statements – continued
is included in dividends from underlying funds on the Statement of Operations. This money market fund does not pay a management fee to MFS.
Purchases and sales of investments, other than U.S. government securities, purchased option transactions, and short-term obligations, aggregated $601,972,806 and $578,199,346, respectively.
| (5) | | Shares of Beneficial Interest |
The fund’s Declaration of Trust permits the Trustees to issue an unlimited number of full and fractional shares of beneficial interest. Transactions in fund shares were as follows:
| | | | | | | | | | | | |
| | | Year ended
1/31/08 | | | Year ended
1/31/07 | |
| | | Shares | | | Amount | | | Shares | | | Amount | |
| Shares sold | | | | | | | | | | | | |
Class A | | 34,726,687 | | | $258,890,967 | | | 30,524,426 | | | $228,027,783 | |
Class B | | 1,926,284 | | | 14,510,416 | | | 3,406,685 | | | 25,477,273 | |
Class C | | 3,428,590 | | | 25,697,373 | | | 4,014,845 | | | 29,944,983 | |
Class I | | 3,985,286 | | | 30,184,626 | | | 2,522,708 | | | 18,976,883 | |
| | 44,066,847 | | | $329,283,382 | | | 40,468,664 | | | $302,426,922 | |
Shares issued to shareholders
in reinvestment of distributions | | | | | | | | | | | | |
Class A | | 4,334,643 | | | $32,205,504 | | | 2,967,916 | | | $22,199,143 | |
Class B | | 668,681 | | | 4,994,984 | | | 638,792 | | | 4,787,667 | |
Class C | | 570,046 | | | 4,227,582 | | | 486,261 | | | 3,625,246 | |
Class I | | 168,161 | | | 1,249,472 | | | 44,043 | | | 330,585 | |
| | 5,741,531 | | | $42,677,542 | | | 4,137,012 | | | $30,942,641 | |
| Shares reacquired | | | | | | | | | | | | |
Class A | | (36,416,984 | ) | | $(267,550,156 | ) | | (15,461,629 | ) | | $(115,162,433 | ) |
Class B | | (5,739,608 | ) | | (42,674,279 | ) | | (4,793,839 | ) | | (35,756,027 | ) |
Class C | | (4,095,833 | ) | | (30,069,410 | ) | | (3,458,037 | ) | | (25,737,214 | ) |
Class I | | (6,364,579 | ) | | (47,137,605 | ) | | (1,563,868 | ) | | (11,667,314 | ) |
| | (52,617,004 | ) | | $(387,431,450 | ) | | (25,277,373 | ) | | $(188,322,988 | ) |
| Net change | | | | | | | | | | | | |
Class A | | 2,644,346 | | | $23,546,315 | | | 18,030,713 | | | $135,064,493 | |
Class B | | (3,144,643 | ) | | (23,168,879 | ) | | (748,362 | ) | | (5,491,087 | ) |
Class C | | (97,197 | ) | | (144,455 | ) | | 1,043,069 | | | 7,833,015 | |
Class I | | (2,211,132 | ) | | (15,703,507 | ) | | 1,002,883 | | | 7,640,154 | |
| | (2,808,626 | ) | | $(15,470,526 | ) | | 19,328,303 | | | $145,046,575 | |
The fund and other funds managed by MFS participate in a $1 billion unsecured committed line of credit provided by a syndication of banks under a
40
Notes to Financial Statements – continued
credit agreement. In addition, the fund and other funds managed by MFS have established uncommitted borrowing arrangements with certain banks. Borrowings may be made for temporary financing needs. Interest is charged to each fund, based on its borrowings, generally at a rate equal to the Federal Reserve funds rate plus 0.30%. In addition, a commitment fee, based on the average daily, unused portion of the committed line of credit, is allocated among the participating funds at the end of each calendar quarter. For the year ended January 31, 2008, the fund’s commitment fee and interest expense were $4,136 and $0, respectively, and are included in miscellaneous expense on the Statement of Operations.
| (7) | | Transactions in Underlying Funds-Affiliated Issuers |
An affiliated issuer may be considered one in which the fund owns 5% or more of the outstanding voting securities, or a company which is under common control. For the purposes of this report, the fund assumes the following to be affiliated issuers:
| | | | | | | | | |
| Underlying Funds | | Beginning
Shares/Par
Amount | | Acquisitions
Shares/Par
Amount | | Dispositions
Shares/Par
Amount | | | Ending
Shares/Par
Amount |
| MFS Institutional Money | | | | | | | | | |
| Market Portfolio | | — | | 324,842,683 | | (316,582,502 | ) | | 8,260,181 |
| | | | |
| Underlying Funds | | Realized
Gain
(Loss) | | Capital Gain
Distributions | | Dividend
Income | | | Ending
Value |
| MFS Institutional Money | | | | | | | | | |
| Market Portfolio | | $— | | $— | | $1,325,948 | | | $8,260,181 |
41
REPORT OF INDEPENDENT REGISTERED PUBLIC ACCOUNTING FIRM
To the Board of Trustees of MFS Series Trust III and the Shareholders of MFS High Yield Opportunities Fund:
We have audited the accompanying statement of assets and liabilities, including the portfolio of investments, of MFS High Yield Opportunities Fund (one of the portfolios comprising MFS Series Trust III) (the “Trust”) as of January 31, 2008, and the related statement of operations for the year then ended, the statements of changes in net assets for each of the two years in the period then ended, and the financial highlights for each of the five years in the period then ended. These financial statements and financial highlights are the responsibility of the Trust’s management. Our responsibility is to express an opinion on these financial statements and financial highlights based on our audits.
We conducted our audits in accordance with the standards of the Public Company Accounting Oversight Board (United States). Those standards require that we plan and perform the audit to obtain reasonable assurance about whether the financial statements and financial highlights are free of material misstatement. The Trust is not required to have, nor were we engaged to perform, an audit of its internal control over financial reporting. Our audits included consideration of internal control over financial reporting as a basis for designing audit procedures that are appropriate in the circumstances, but not for the purpose of expressing an opinion on the effectiveness of the Trust’s internal control over financial reporting. Accordingly, we express no such opinion. An audit also includes examining, on a test basis, evidence supporting the amounts and disclosures in the financial statements, assessing the accounting principles used and significant estimates made by management, as well as evaluating the overall financial statement presentation. Our procedures included confirmation of securities owned as of January 31, 2008, by correspondence with the custodian and brokers; where replies were not received from brokers, we performed other auditing procedures. We believe that our audits provide a reasonable basis for our opinion.
In our opinion, such financial statements and financial highlights present fairly, in all material respects, the financial position of MFS High Yield Opportunities Fund as of January 31, 2008, the results of its operations for the year then ended, the changes in its net assets for each of the two years in the period then ended, and its financial highlights for each of the five years in the period then ended, in conformity with accounting principles generally accepted in the United States of America.
DELOITTE & TOUCHE LLP
Boston, Massachusetts
March 17, 2008
42
TRUSTEES AND OFFICERS — IDENTIFICATION AND BACKGROUND
The Trustees and officers of the Trust, as of March 1, 2008, are listed below, together with their principal occupations during the past five years. (Their titles may have varied during that period.) The address of each Trustee and officer is 500 Boylston Street, Boston, Massachusetts 02116.
| | | | | | |
Name, Date of Birth | | Position(s) Held
with Fund | | Trustee/Officer
Since(h) | | Principal Occupations During
the Past Five Years & Other
Directorships(j) |
| INTERESTED TRUSTEES | | | | |
Robert J. Manning(k)
(born 10/20/63) | | Trustee | | February 2004 | | Massachusetts Financial Services Company, Chief Executive Officer, President, Chief Investment Officer and Director |
Robert C. Pozen(k)
(born 8/08/46) | | Trustee | | February 2004 | | Massachusetts Financial Services Company, Chairman (since February 2004); MIT Sloan School (education), Senior Lecturer (since 2006); Secretary of Economic Affairs, The Commonwealth of Massachusetts (January 2002 to December 2002); Fidelity Investments, Vice Chairman (June 2000 to December 2001); Fidelity Management & Research Company (investment adviser), President (March 1997 to July 2001); Bell Canada Enterprises (telecommunications), Director; Medtronic, Inc. (medical technology), Director; Telesat (satellite communications), Director (until 2007) |
| INDEPENDENT TRUSTEES | | | | |
J. Atwood Ives
(born 5/01/36) | | Trustee and Chair of Trustees | | February 1992 | | Private investor; KeySpan Corporation (energy related services), Director until 2004; Woodstock Corporation (investment advisory firm), Director until 2003 |
Robert E. Butler(n)
(born 11/29/41) | | Trustee | | January 2006 | | Consultant – regulatory and compliance matters (since July 2002); PricewaterhouseCoopers LLP (professional services firm), Partner (until 2002) |
43
Trustees and Officers – continued
| | | | | | |
Name, Date of Birth | | Position(s) Held
with Fund | | Trustee/Officer
Since(h) | | Principal Occupations During
the Past Five Years & Other
Directorships(j) |
Lawrence H. Cohn, M.D.
(born 3/11/37) | | Trustee | | August 1993 | | Brigham and Women’s Hospital, Chief of Cardiac Surgery (2005); Harvard Medical School, Professor of Cardiac Surgery; Physician Director of Medical Device Technology for Partners HealthCare |
David H. Gunning
(born 5/30/42) | | Trustee | | January 2004 | | Retired; Cleveland-Cliffs Inc. (mining products and service provider), Vice Chairman/Director (until May 2007); Portman Limited (mining), Director (since 2005); Encinitos Ventures (private investment company), Principal (1997 to April 2001); Lincoln Electric Holdings, Inc. (welding equipment manufacturer), Director |
William R. Gutow
(born 9/27/41) | | Trustee | | December 1993 | | Private investor and real estate consultant (since 1998); Capital Entertainment Management Company (video franchise), Vice Chairman (since 1998); Texas Donuts (donut franchise), Vice Chairman (since 2007); Atlantic Coast Tan (tanning salons), Vice Chairman (until 2007) |
Michael Hegarty
(born 12/21/44) | | Trustee | | December 2004 | | Retired; AXA Financial (financial services and insurance), Vice Chairman and Chief Operating Officer (until May 2001); The Equitable Life Assurance Society (insurance), President and Chief Operating Officer
(until May 2001) |
Lawrence T. Perera
(born 6/23/35) | | Trustee | | July 1981 | | Hemenway & Barnes (attorneys), Partner |
J. Dale Sherratt
(born 9/23/38) | | Trustee | | August 1993 | | Insight Resources, Inc. (acquisition planning specialists), President; Wellfleet Investments (investor in health care companies), Managing General Partner (since 1993); Cambridge Nutraceuticals (professional nutritional products), Chief Executive Officer (until May 2001) |
44
Trustees and Officers – continued
| | | | | | |
Name, Date of Birth | | Position(s) Held
with Fund | | Trustee/Officer
Since(h) | | Principal Occupations During
the Past Five Years & Other
Directorships(j) |
Laurie J. Thomsen
(born 8/05/57) | | Trustee | | March 2005 | | New Profit, Inc. (venture philanthropy), Partner (since 2006); Private investor; Prism Venture Partners (venture capital), Co-founder and General Partner (until June 2004); The Travelers Companies (commercial property liability insurance), Director |
Robert W. Uek
(born 5/18/41) | | Trustee | | January 2006 | | Retired (since 1999); PricewaterhouseCoopers LLP (professional services firm), Partner (until 1999); Consultant to investment company industry (since 2000); TT International Funds (mutual fund complex), Trustee (2000 until 2005); Hillview Investment Trust II Funds (mutual fund complex), Trustee (2000 until 2005) |
| OFFICERS | | | | | | |
Maria F. Dwyer(k)
(born 12/01/58) | | President | | November 2005 | | Massachusetts Financial Services Company, Executive Vice President and Chief Regulatory Officer (since March 2004) Chief Compliance Officer (since December 2006); Fidelity Management & Research Company, Vice President (prior to March 2004); Fidelity Group of Funds, President and Treasurer (prior to March 2004) |
Tracy Atkinson(k)
(born 12/30/64) | | Treasurer | | September 2005 | | Massachusetts Financial Services Company, Senior Vice President (since September 2004); PricewaterhouseCoopers LLP, Partner (prior to September 2004) |
Christopher R. Bohane(k)
(born 1/18/74) | | Assistant Secretary and Assistant Clerk | | July 2005 | | Massachusetts Financial Services Company, Vice President and Senior Counsel (since April 2003); Kirkpatrick & Lockhart LLP (law firm), Associate (prior to April 2003) |
Ethan D. Corey(k)
(born 11/21/63) | | Assistant Secretary and Assistant Clerk | | July 2005 | | Massachusetts Financial Services Company, Senior Vice President and Associate General Counsel (since April 2006); Special Counsel (prior to April 2006); Dechert LLP (law firm), Counsel (prior to December 2004) |
45
Trustees and Officers – continued
| | | | | | |
Name, Date of Birth | | Position(s) Held
with Fund | | Trustee/Officer
Since(h) | | Principal Occupations During
the Past Five Years & Other
Directorships(j) |
David L. DiLorenzo(k)
(born 8/10/68) | | Assistant Treasurer | | July 2005 | | Massachusetts Financial Services Company, Vice President (since June 2005); JP Morgan Investor Services, Vice President (prior to June 2005) |
Timothy M. Fagan(k)
(born 7/10/68) | | Assistant Secretary and Assistant Clerk | | September 2005 | | Massachusetts Financial Services Company, Vice President and Senior Counsel (since September 2005); John Hancock Advisers, LLC, Vice President and Chief Compliance Officer (September 2004 to August 2005), Senior Attorney (prior to September 2004); John Hancock Group of Funds, Vice President and Chief Compliance Officer (September 2004 to December 2004) |
Mark D. Fischer(k)
(born 10/27/70) | | Assistant Treasurer | | July 2005 | | Massachusetts Financial Services Company, Vice President (since May 2005); JP Morgan Investment Management Company, Vice President (prior to May 2005) |
Brian E. Langenfeld(k) (born 3/07/73) | | Assistant Secretary and Assistant Clerk | | June 2006 | | Massachusetts Financial Services Company, Assistant Vice President and Counsel (since May 2006); John Hancock Advisers, LLC, Assistant Vice President and Counsel (May 2005 to April 2006); John Hancock Advisers, LLC, Attorney and Assistant Secretary (prior to May 2005) |
Ellen Moynihan(k)
(born 11/13/57) | | Assistant Treasurer | | April 1997 | | Massachusetts Financial Services Company, Senior Vice President |
Susan S. Newton(k) (born 3/07/50) | | Assistant Secretary and Assistant Clerk | | May 2005 | | Massachusetts Financial Services Company, Senior Vice President and Associate General Counsel (since April 2005); John Hancock Advisers, LLC, Senior Vice President, Secretary and Chief Legal Officer (prior to April 2005); John Hancock Group of Funds, Senior Vice President, Secretary and Chief Legal Officer (prior to April 2005) |
46
Trustees and Officers – continued
| | | | | | |
Name, Date of Birth | | Position(s) Held
with Fund | | Trustee/Officer
Since(h) | | Principal Occupations During
the Past Five Years & Other
Directorships(j) |
Susan A. Pereira(k)
(born 11/05/70) | | Assistant Secretary and Assistant Clerk | | July 2005 | | Massachusetts Financial Services Company, Vice President and Senior Counsel (since June 2004); Bingham McCutchen LLP (law firm), Associate (prior to June 2004) |
Mark N. Polebaum(k)
(born 5/01/52) | | Secretary and Clerk | | January 2006 | | Massachusetts Financial Services Company, Executive Vice President, General Counsel and Secretary (since January 2006); Wilmer Cutler Pickering Hale and Dorr LLP (law firm), Partner (prior to January 2006) |
Frank L. Tarantino
(born 3/07/44) | | Independent Chief Compliance Officer | | June 2004 | | Tarantino LLC (provider of compliance services), Principal (since June 2004); CRA Business Strategies Group (consulting services), Executive Vice President (April 2003 to June 2004); David L. Babson & Co. (investment adviser), Managing Director, Chief Administrative Officer and Director (prior to March 2003) |
Richard S. Weiztel(k)
(born 7/16/70) | | Assistant Secretary and Assistant Clerk | | October 2007 | | Massachusetts Financial Services Company, Vice President and Assistant General Counsel (since 2007); Vice President and Senior Counsel (since May 2004); Massachusetts Department of Business and Technology, General Counsel (February 2003 to April 2004); Massachusetts Office of the Attorney General, Assistant Attorney General (April 2001 to February 2003); Ropes and Gray, Associate (prior to April 2001) |
James O. Yost(k)
(born 6/12/60) | | Assistant Treasurer | | September 1990 | | Massachusetts Financial Services Company, Senior Vice President |
| (h) | Date first appointed to serve as Trustee/officer of an MFS fund. Each Trustee has served continuously since appointment unless indicated otherwise. |
| (j) | Directorships or trusteeships of companies required to report to the Securities and Exchange Commission (i.e., “public companies”). |
| (k) | “Interested person” of the Trust within the meaning of the Investment Company Act of 1940 (referred to as the 1940 Act), which is the principal federal law governing investment companies like the fund, as a result of position with MFS. The address of MFS is 500 Boylston Street, Boston, Massachusetts 02116. |
| (n) | In 2004 and 2005, Mr. Butler provided consulting services to the independent compliance consultant retained by MFS pursuant to its settlement with the SEC concerning market timing and related matters. The |
47
Trustees and Officers – continued
| | terms of that settlement required that compensation and expenses related to the independent compliance consultant be borne exclusively by MFS and, therefore, MFS paid Mr. Butler for the services he rendered to the independent compliance consultant. In 2004 and 2005, MFS paid Mr. Butler a total of $351,119.29. |
The Trust held a shareholders’ meeting in 2005 to elect Trustees, and will hold a shareholders’ meeting at least once every five years thereafter, to elect Trustees.
Each Trustee (except Mr. Butler and Mr. Uek) has been elected by shareholders and each Trustee and officer holds office until his or her successor is chosen and qualified or until his or her earlier death, resignation, retirement or removal. Messrs. Butler, Gutow, Sherratt and Uek and Ms. Thomsen are members of the Trust’s Audit Committee.
Each of the Trust’s Trustees and officers holds comparable positions with certain other funds of which MFS or a subsidiary is the investment adviser or distributor, and, in the case of the officers, with certain affiliates of MFS. As of January 1, 2008, the Trustees served as board members of 100 funds within the MFS Family of Funds.
The Statement of Additional Information contains further information about the Trustees and is available without charge upon request by calling 1-800-225-2606.
| | |
| Investment Adviser | | Custodian |
Massachusetts Financial Services Company
500 Boylston Street, Boston, MA 02116-3741 | | JPMorgan Chase Bank
One Chase Manhattan Plaza, New York, NY 10081 |
| Distributor | | Independent Registered Public Accounting Firm |
MFS Fund Distributors, Inc.
500 Boylston Street, Boston, MA 02116-3741 | | Deloitte & Touche LLP
200 Berkeley Street, Boston, MA 02116 |
| Portfolio Managers | | |
| John Addeo | | |
| David Cole | | |
| Matthew Ryan | | |
48
BOARD REVIEW OF INVESTMENT ADVISORY AGREEMENT
A discussion regarding the Board’s most recent review and renewal of the Fund’s investment advisory agreement is available by clicking on the fund’s name under “Select a fund” on the MFS Web site (mfs.com).
PROXY VOTING POLICIES AND INFORMATION
A general description of the MFS funds’ proxy voting policies and procedures is available without charge, upon request, by calling 1-800-225-2606, by visiting the Proxy Voting section of mfs.com or by visiting the SEC’s Web site at http://www.sec.gov.
Information regarding how the fund voted proxies relating to portfolio securities during the most recent twelve-month period ended June 30 is available without charge by visiting the Proxy Voting section of mfs.com or by visiting the SEC’s Web site at http://www.sec.gov.
QUARTERLY PORTFOLIO DISCLOSURE
The fund will file a complete schedule of portfolio holdings with the Securities and Exchange Commission (the Commission) for the first and third quarters of each fiscal year on Form N-Q. The fund’s Form N-Q may be reviewed and copied at the:
Public Reference Room
Securities and Exchange Commission
100 F Street, NE, Room 1580
Washington, D.C. 20549
Information on the operation of the Public Reference Room may be obtained by calling the Commission at 1-800-SEC-0330. The fund’s Form N-Q is available on the EDGAR database on the Commission’s Internet Web site at http://www.sec.gov, and copies of this information may be obtained, upon payment of a duplicating fee, by electronic request at the following e-mail address: publicinfo@sec.gov or by writing the Public Reference Section at the above address.
A shareholder can also obtain the quarterly portfolio holdings report at mfs.com.
FEDERAL TAX INFORMATION (unaudited)
The fund will notify shareholders of amounts for use in preparing 2008 income tax forms in January 2009.
The following information is provided pursuant to provisions of the Internal Revenue Code.
The fund designates $4,666,862 as capital gain dividends paid during the fiscal year.
49
MFS® PRIVACY NOTICE
Privacy is a concern for every investor today. At MFS Investment Management® and the MFS funds, we take this concern very seriously. We want you to understand our policies about the investment products and services that we offer, and how we protect the nonpublic personal information of investors who have a direct relationship with us and our wholly owned subsidiaries.
Throughout our business relationship, you provide us with personal information. We maintain information and records about you, your investments, and the services you use. Examples of the nonpublic personal information we maintain include
| | Ÿ | | data from investment applications and other forms |
| | Ÿ | | share balances and transactional history with us, our affiliates, or others |
| | Ÿ | | facts from a consumer reporting agency |
We do not disclose any nonpublic personal information about our customers or former customers to anyone, except as permitted by law. We may share nonpublic personal information with third parties or certain of our affiliates in connection with servicing your account or processing your transactions. We may share information with companies or financial institutions that perform marketing services on our behalf or with other financial institutions with which we have joint marketing arrangements, subject to any legal requirements.
Authorization to access your nonpublic personal information is limited to appropriate personnel who provide products, services, or information to you. We maintain physical, electronic, and procedural safeguards to help protect the personal information we collect about you.
If you have any questions about the MFS privacy policy, please call 1-800-225-2606 any business day between 8 a.m. and 8 p.m. Eastern time.
Note: If you own MFS products or receive MFS services in the name of a third party such as a bank or broker-dealer, their privacy policy may apply to you instead of ours.
50

ITEM 2. CODE OF ETHICS.
The Registrant has adopted a Code of Ethics pursuant to Section 406 of the Sarbanes-Oxley Act and as defined in Form N-CSR that applies to the Registrant’s principal executive officer and principal financial and accounting officer. The Registrant has not amended any provision in its Code of Ethics (the “Code”) that relates to an element of the Code’s definitions enumerated in paragraph (b) of Item 2 of this Form N-CSR.
A copy of the Code of Ethics is filed as an exhibit to this Form N-CSR.
ITEM 3. AUDIT COMMITTEE FINANCIAL EXPERT.
Messrs. Robert E. Butler and Robert W. Uek and Ms. Laurie J. Thomsen, members of the Audit Committee, have been determined by the Board of Trustees in their reasonable business judgment to meet the definition of “audit committee financial expert” as such term is defined in Form N-CSR. In addition, Messrs. Butler and Uek and Ms. Thomsen are “independent” members of the Audit Committee (as such term has been defined by the Securities and Exchange Commission in regulations implementing Section 407 of the Sarbanes-Oxley Act of 2002). The Securities and Exchange Commission has stated that the designation of a person as an audit committee financial expert pursuant to this Item 3 on the Form N-CSR does not impose on such a person any duties, obligations or liability that are greater than the duties, obligations or liability imposed on such person as a member of the Audit Committee and the Board of Trustees in the absence of such designation or identification.
ITEM 4. PRINCIPAL ACCOUNTANT FEES AND SERVICES.
Items 4(a) through 4(d) and 4(g):
The Board of Trustees has appointed Deloitte & Touche LLP (“Deloitte”) to serve as independent accountants to certain series of the Registrant and Ernst & Young LLP (“E&Y”) to serve in the same capacity to certain other series of the Registrant (the series referred to collectively as the “Funds” and singularly as a “Fund”). The tables below set forth the audit fees billed to the Funds as well as fees for non-audit services provided to the Funds and/or to the Funds’ investment adviser, Massachusetts Financial Services Company (“MFS”), and to various entities either controlling, controlled by, or under common control with MFS that provide ongoing services to the Funds (“MFS Related Entities”).
For the fiscal years ended January 31, 2008 and 2007, audit fees billed to the Funds by Deloitte and E&Y were as follows:
| | | | |
| | | Audit Fees |
Fees billed by Deloitte: | | 2008 | | 2007 |
MFS High Income Fund | | 54,278 | | 52,817 |
MFS High Yield Opportunities Fund | | 56,330 | | 51,689 |
| | | | |
Total | | 110,608 | | 104,506 |
| |
| | | Audit Fees |
Fees billed by E&Y: | | 2008 | | 2007 |
MFS Municipal High Income Fund | | 42,107 | | 41,710 |
For the fiscal years ended January 31, 2008 and 2007, fees billed by Deloitte and E&Y for audit-related, tax and other services provided to the Funds and for audit-related, tax and other services provided to MFS and MFS Related Entities were as follows:
| | | | | | | | | | | | |
| | | Audit-Related Fees1 | | Tax Fees2 | | All Other Fees3 |
Fees billed by Deloitte: | | 2008 | | 2007 | | 2008 | | 2007 | | 2008 | | 2007 |
To MFS High Income Fund | | 0 | | 0 | | 7,209 | | 7,587 | | 1,205 | | 379 |
| | | | | | |
To MFS High Yield Opportunities Fund | | 0 | | 0 | | 5,574 | | 6,006 | | 1,205 | | 379 |
| | | | | | | | | | | | |
| | | | | | |
Total fees billed by Deloitte To above Funds | | 0 | | 0 | | 12,783 | | 13,593 | | 2,410 | | 758 |
| | | | | | |
To MFS and MFS Related Entities of MFS High Income Fund * | | 1,257,835 | | 981,825 | | 0 | | 0 | | 323,714 | | 435,466 |
To MFS and MFS Related Entities of MFS High Yield Opportunities Fund* | | 1,257,835 | | 981,825 | | 0 | | 0 | | 323,714 | | 435,466 |
| | | | |
Aggregate fees for non-audit services: | | 2008 | | 2007 |
To MFS High Income Fund, MFS and MFS Related Entities# | | 1,802,338 | | 1,550,542 |
| | |
To MFS High Yield Opportunities Fund, MFS and MFS Related Entities# | | 1,800,703 | | 1,548,961 |
| | | | | | | | | | | | |
| | | Audit-Related Fees1 | | Tax Fees2 | | All Other Fees4 |
Fees billed by E&Y: | | 2008 | | 2007 | | 2008 | | 2007 | | 2008 | | 2007 |
To MFS Municipal High Income Fund | | 0 | | 0 | | 8,223 | | 8,995 | | 0 | | 0 |
| | | | | | |
To MFS and MFS Related Entities of MFS Municipal High Income Fund* | | 0 | | 0 | | 0 | | 0 | | 0 | | 0 |
| | | | |
Aggregate fees for non-audit services: | | 2008 | | 2007 |
To MFS Municipal High Income Fund, MFS and MFS Related Entities# | | 193,208 | | 116,835 |
* | This amount reflects the fees billed to MFS and MFS Related Entities for non-audit services relating directly to the operations and financial reporting of the Funds (portions of which services also related to the operations and financial reporting of other funds within the MFS Funds complex). |
# | This amount reflects the aggregate fees billed by Deloitte or E&Y, as the case may be, for non-audit services rendered to the Funds and for non-audit services rendered to MFS and the MFS Related Entities. |
1 | The fees included under “Audit-Related Fees” are fees related to assurance and related services that are reasonably related to the performance of the audit or review of financial statements, but not reported under “Audit Fees,” including accounting consultations, agreed-upon procedure reports, attestation reports, comfort letters and internal control reviews. |
2 | The fees included under “Tax Fees” are fees associated with tax compliance, tax advice and tax planning, including services relating to the filing or amendment of federal, state or local income tax returns, regulated investment company qualification reviews and tax distribution and analysis. |
3 | The fees included under “All Other Fees” are fees for products and services provided by Deloitte other than those reported under “Audit Fees,” “Audit-Related Fees” and “Tax Fees,” including fees for services related to sales tax refunds, consultation on internal cost allocations, consultation on allocation of monies pursuant to an administrative proceeding regarding disclosure of brokerage allocation practices in connection with fund sales, analysis of certain portfolio holdings versus investment styles, review of internal controls and review of Rule 38a-1 compliance program. |
4 | The fees included under “All Other Fees” are fees for products and services provided by E&Y other than those reported under “Audit Fees,” “Audit-Related Fees” and “Tax Fees,” including fees for the subscription to tax treatise and for services related to analysis of fund administrative expenses, compliance program and records management projects. |
Item 4(e)(1):
Set forth below are the policies and procedures established by the Audit Committee of the Board of Trustees relating to the pre-approval of audit and non-audit related services:
To the extent required by applicable law, pre-approval by the Audit Committee of the Board is needed for all audit and permissible non-audit services rendered to the Funds and all permissible non-audit services rendered to MFS or MFS Related Entities if the services relate directly to the operations and financial reporting of the Registrant. Pre-approval is currently on an engagement-by-engagement basis. In the event pre-approval of such services is necessary between regular meetings of the Audit Committee and it is not practical to wait to seek pre-approval at the next regular meeting of the Audit Committee, pre-approval of such services may be referred to the Chair of the Audit Committee for approval; provided that the Chair may not pre-approve any individual engagement for such services exceeding $50,000 or multiple engagements for such services in the aggregate exceeding $100,000 in each period between regular meetings of the Audit Committee. Any engagement pre-approved by the Chair between regular meetings of the Audit Committee shall be presented for ratification by the entire Audit Committee at its next regularly scheduled meeting.
Item 4(e)(2):
None, or 0%, of the services relating to the Audit-Related Fees, Tax Fees and All Other Fees paid by the Fund and MFS and MFS Related Entities relating directly to the operations and financial reporting of the Registrant disclosed above were approved by the audit committee pursuant to paragraphs (c)(7)(i)(C) of Rule 2-01 of Regulation S-X (which permits audit committee approval after the start of the engagement with respect to services other than audit, review or attest services, if certain conditions are satisfied).
Item 4(f): Not applicable.
Item 4(h): The Registrant’s Audit Committee has considered whether the provision by a Registrant’s independent registered public accounting firm of non-audit services to MFS and MFS Related Entities that were not pre-approved by the Committee (because such services did not relate directly to the operations and financial reporting of the Registrant) was compatible with maintaining the independence of the independent registered public accounting firm as the Registrant’s principal auditors.
ITEM 5. AUDIT COMMITTEE OF LISTED REGISTRANTS.
Not applicable to the Registrant.
ITEM 6. SCHEDULE OF INVESTMENTS
A schedule of investments of the Registrant is included as part of the report to shareholders of such series under Item 1 of this Form N-CSR.
ITEM 7. DISCLOSURE OF PROXY VOTING POLICIES AND PROCEDURES FOR CLOSED-END MANAGEMENT INVESTMENT COMPANIES.
Not applicable to the Registrant.
ITEM 8. PORTFOLIO MANAGERS OF CLOSED-END MANAGEMENT INVESTMENT COMPANIES.
Not applicable to the Registrant.
ITEM 9. PURCHASES OF EQUITY SECURITIES BY CLOSED-END MANAGEMENT INVESTMENT COMPANY AND AFFILIATED PURCHASERS.
Not applicable to the Registrant.
ITEM 10. SUBMISSION OF MATTERS TO A VOTE OF SECURITY HOLDERS.
There were no material changes to the procedures by which shareholders may send recommendations to the Board for nominees to the Registrant’s Board since the Registrant last provided disclosure as to such procedures in response to the requirements of Item 407(c)(2)(iv) of Regulation S-K (as required by Item 22(b)(15) of Schedule 14A), or this Item.
ITEM 11. CONTROLS AND PROCEDURES.
| (a) | Based upon their evaluation of the effectiveness of the registrant’s disclosure controls and procedures (as defined in Rule 30a-3(c) under the Investment Company Act of 1940 (the “Act”)) as conducted within 90 days of the filing date of this report on Form N-CSR, the registrant’s principal financial officer and principal executive officer have concluded that those disclosure controls and procedures provide reasonable assurance that the material information required to be disclosed by the registrant on this report is recorded, processed, summarized and reported within the time periods specified in the Securities and Exchange Commission’s rules and forms. |
| (b) | There were no changes in the registrant’s internal controls over financial reporting (as defined in Rule 30a-3(d) under the Act) that occurred during the second fiscal quarter of the period covered by the report that have materially affected, or are reasonably likely to materially affect, the registrant’s internal control over financial reporting. |
ITEM 12. EXHIBITS.
| (a) | File the exhibits listed below as part of this form. Letter or number the exhibits in the sequence indicated. |
| | (1) | Any code of ethics, or amendment thereto, that is the subject of the disclosure required by Item 2, to the extent that the registrant intends to satisfy the Item 2 requirements through filing of an exhibit: Code of Ethics attached hereto. |
| | (2) | A separate certification for each principal executive officer and principal financial officer of the registrant as required by Rule 30a-2 under the Act (17 CFR 270.30a-2): Attached hereto. |
| (b) | If the report is filed under Section 13(a) or 15(d) of the Exchange Act, provide the certifications required by Rule 30a-2(b) under the Act (17 CFR 270.30a-2(b)), Rule 13a-14(b) or Rule 15d-14(b) under the Exchange Act (17 CFR 240.13a-14(b) or 240.15d-14(b)) and Section 1350 of Chapter 63 of Title 18 of the United States Code (18 U.S.C. 1350) as an exhibit. A certification furnished pursuant to this paragraph will not be deemed “filed” for the purposes of Section 18 of the Exchange Act (15 U.S.C. 78r), or otherwise subject to the liability of that section. Such certification will not be deemed to be incorporated by reference into any filing under the Securities Act of 1933 or the Exchange Act, except to the extent that the registrant specifically incorporates it by reference: Attached hereto. |
Notice
A copy of the Amended and Restated Declaration of Trust, as amended, of the Registrant is on file with the Secretary of State of The Commonwealth of Massachusetts and notice is hereby given that this instrument is executed on behalf of the Registrant by an officer of the Registrant as an officer and not individually and the obligations of or arising out of this instrument are not binding upon any of the Trustees or shareholders individually, but are binding only upon the assets and property of the respective constituent series of the Registrant.
SIGNATURES
Pursuant to the requirements of the Securities Exchange Act of 1934 and the Investment Company Act of 1940, the registrant has duly caused this report to be signed on its behalf by the undersigned, thereunto duly authorized.
| | | | |
| (Registrant) MFS SERIES TRUST III | | |
| | |
| By (Signature and Title)* | | MARIA F. DWYER | | |
| | Maria F. Dwyer, President | | |
| |
| Date: March 17, 2008 | | |
Pursuant to the requirements of the Securities Exchange Act of 1934 and the Investment Company Act of 1940, this report has been signed below by the following persons on behalf of the registrant and in the capacities and on the dates indicated.
| | | | |
| By (Signature and Title)* | | MARIA F. DWYER | | |
| | Maria F. Dwyer, President (Principal Executive Officer) | | |
| |
| Date: March 17, 2008 | | |
| | |
| By (Signature and Title)* | | TRACY ATKINSON | | |
| | Tracy Atkinson, Treasurer (Principal Financial Officer and Accounting Officer) | | |
| |
| Date: March 17, 2008 | | |
| * | Print name and title of each signing officer under his or her signature. |