UNITED STATES
SECURITIES AND EXCHANGE COMMISSION
Washington, D.C. 20549
FORM N-CSR
CERTIFIED SHAREHOLDER REPORT OF
REGISTERED MANAGEMENT INVESTMENT COMPANIES
Investment Company Act file number 811-2794
MFS SERIES TRUST III
(Exact name of registrant as specified in charter)
111 Huntington Avenue, Boston, Massachusetts 02199
(Address of principal executive offices) (Zip code)
Susan S. Newton
Massachusetts Financial Services Company
111 Huntington Avenue
Boston, Massachusetts 02199
(Name and address of agents for service)
Registrant’s telephone number, including area code: (617) 954-5000
Date of fiscal year end: January 31
Date of reporting period: July 31, 2014
| ITEM 1. | REPORTS TO STOCKHOLDERS. |
SEMIANNUAL REPORT
July 31, 2014

MFS® HIGH INCOME FUND

MFH-SEM
MFS® HIGH INCOME FUND
CONTENTS
The report is prepared for the general information of shareholders. It is authorized for distribution to prospective investors only when preceded or accompanied by a current prospectus.
NOT FDIC INSURED Ÿ MAY LOSE VALUE Ÿ NO BANK GUARANTEE

LETTER FROM THE CHAIRMAN AND CEO
Dear Shareholders:
The U.S. economy has gathered momentum after a slow start to the year. Industrial output, consumer confidence and retail sales have all strengthened along with the labor market. However, the unemployment rate remains elevated and the housing
market has cooled off. With second-quarter economic growth rebounding strongly, economists have a favorable outlook for the rest of the year.
China’s economy has picked up again, and Japan is moving steadily towards Prime Minister Abe’s economic goals, including an inflation rate of 2% by next spring. The eurozone’s economy appears to have turned a corner, with renewed growth. However, historically high unemployment persists, deflation remains a risk and Russian sanctions could present a new obstacle to regional growth.
With corporate earnings surpassing expectations, the greatest concerns now are related to conflicts in the Middle East and Ukraine as well as growing speculation on when the U.S. Federal Reserve will begin increasing interest rates.
As always at MFS®, active risk management is integral to how we manage your investments. We use a collaborative process, sharing insights across asset classes, regions and economic sectors. Our global team of investment professionals uses a multidisciplined, long-term, diversified investment approach.
We understand that these are challenging economic times. We believe that we can serve you best by applying proven principles, such as asset allocation and diversification, over the long term. We are confident that this approach can serve you well as you work with your financial advisors to reach your goals in the years ahead.
Respectfully,

Robert J. Manning
Chairman and Chief Executive Officer
MFS Investment Management
September 15, 2014
The opinions expressed in this letter are subject to change and may not be relied upon for investment advice. No forecasts can be guaranteed.
1
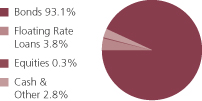
PORTFOLIO COMPOSITION
Portfolio structure (i)
| | | | |
| Top five industries (i) | | | | |
| Energy-Independent | | | 8.8% | |
| Cable TV | | | 5.5% | |
| Midstream | | | 5.1% | |
| Medical & Health Technology & Services | | | 4.9% | |
| Metals & Mining | | | 4.8% | |
| | | | |
| Composition including fixed income credit quality (a)(i) | |
| BBB | | | 2.6% | |
| BB | | | 34.7% | |
| B | | | 46.9% | |
| CCC | | | 12.2% | |
| CC (o) | | | 0.0% | |
| C (o) | | | 0.0% | |
| D (o) | | | 0.0% | |
| Not Rated | | | 0.5% | |
| Non-Fixed Income | | | 0.3% | |
| Cash & Other | | | 2.8% | |
| |
| Portfolio facts (i) | | | | |
| Average Duration (d) | | | 4.5 | |
| Average Effective Maturity (m) | | | 7.0 yrs. | |
| (a) | For all securities other than those specifically described below, ratings are assigned to underlying securities utilizing ratings from Moody’s, Fitch, and Standard & Poor’s rating agencies and applying the following hierarchy: If all three agencies provide a rating, the middle rating (after dropping the highest and lowest ratings) is assigned; if two of the three agencies rate a security, the lower of the two is assigned. Ratings are shown in the S&P and Fitch scale (e.g., AAA). Securities rated BBB or higher are considered investment grade. All ratings are subject to change. Not Rated includes fixed income securities, including fixed income futures contracts, which have not been rated by any rating agency. Non-Fixed Income includes equity securities (including convertible bonds and equity derivatives) and commodities. The fund may not hold all of these instruments. The fund is not rated by these agencies. |
| (d) | Duration is a measure of how much a bond’s price is likely to fluctuate with general changes in interest rates, e.g., if rates rise 1.00%, a bond with a 5-year duration is likely to lose about 5.00% of its value due to the interest rate move. |
| (i) | For purposes of this presentation, the components include the value of securities, and reflect the impact of the equivalent exposure of derivative positions, if any. These amounts may be negative from time to time. Equivalent exposure is a calculated amount that translates the derivative position into a reasonable approximation of the amount of the underlying asset that the portfolio would have to hold at a given point in time to have the same price sensitivity that results from the portfolio’s ownership of the derivative contract. When dealing with derivatives, equivalent exposure is a more representative measure of the potential impact of a position on portfolio performance than value. The bond component will include any accrued interest amounts. |
2
Portfolio Composition – continued
| (m) | In determining an instrument’s effective maturity for purposes of calculating the fund’s dollar-weighted average effective maturity, MFS uses the instrument’s stated maturity or, if applicable, an earlier date on which MFS believes it is probable that a maturity-shortening device (such as a put, pre-refunding or prepayment) will cause the instrument to be repaid. Such an earlier date can be substantially shorter than the instrument’s stated maturity. |
Where the fund holds convertible bonds, these are treated as part of the equity portion of the portfolio.
Cash & Other can include cash, other assets less liabilities, offsets to derivative positions, and short-term securities.
Percentages are based on net assets as of 7/31/14.
The portfolio is actively managed and current holdings may be different.
3
EXPENSE TABLE
Fund expenses borne by the shareholders during the period, February 1, 2014 through July 31, 2014
As a shareholder of the fund, you incur two types of costs: (1) transaction costs, including sales charges (loads) on certain purchase or redemption payments, and (2) ongoing costs, including management fees; distribution and service (12b-1) fees; and other fund expenses. This example is intended to help you understand your ongoing costs (in dollars) of investing in the fund and to compare these costs with the ongoing costs of investing in other mutual funds.
The example is based on an investment of $1,000 invested at the beginning of the period and held for the entire period February 1, 2014 through July 31, 2014.
The expenses include the payment of a portion of the transfer-agent-related expenses of MFS funds that invest in the fund. For further information, please see the Notes to the Financial Statements.
Actual Expenses
The first line for each share class in the following table provides information about actual account values and actual expenses. You may use the information in this line, together with the amount you invested, to estimate the expenses that you paid over the period. Simply divide your account value by $1,000 (for example, an $8,600 account value divided by $1,000 = 8.6), then multiply the result by the number in the first line under the heading entitled “Expenses Paid During Period” to estimate the expenses you paid on your account during this period.
Hypothetical Example for Comparison Purposes
The second line for each share class in the following table provides information about hypothetical account values and hypothetical expenses based on the fund’s actual expense ratio and an assumed rate of return of 5% per year before expenses, which is not the fund’s actual return. The hypothetical account values and expenses may not be used to estimate the actual ending account balance or expenses you paid for the period. You may use this information to compare the ongoing costs of investing in the fund and other funds. To do so, compare this 5% hypothetical example with the 5% hypothetical examples that appear in the shareholder reports of the other funds.
Please note that the expenses shown in the table are meant to highlight your ongoing costs only and do not reflect any transactional costs, such as sales charges (loads). Therefore, the second line for each share class in the table is useful in comparing ongoing costs only, and will not help you determine the relative total costs of owning different funds. In addition, if these transactional costs were included, your costs would have been higher.
4
Expense Table – continued
| | | | | | | | | | | | | | | | | | |
Share
Class | | | | Annualized
Expense
Ratio | | | Beginning
Account Value
2/01/14 | | | Ending
Account Value
7/31/14 | | | Expenses
Paid During
Period (p)
2/01/14-7/31/14 | |
| A | | Actual | | | 0.91% | | | | $1,000.00 | | | | $1,028.77 | | | | $4.58 | |
| | Hypothetical (h) | | | 0.91% | | | | $1,000.00 | | | | $1,020.28 | | | | $4.56 | |
| B | | Actual | | | 1.66% | | | | $1,000.00 | | | | $1,024.96 | | | | $8.33 | |
| | Hypothetical (h) | | | 1.66% | | | | $1,000.00 | | | | $1,016.56 | | | | $8.30 | |
| C | | Actual | | | 1.66% | | | | $1,000.00 | | | | $1,024.96 | | | | $8.33 | |
| | Hypothetical (h) | | | 1.66% | | | | $1,000.00 | | | | $1,016.56 | | | | $8.30 | |
| I | | Actual | | | 0.66% | | | | $1,000.00 | | | | $1,030.07 | | | | $3.32 | |
| | Hypothetical (h) | | | 0.66% | | | | $1,000.00 | | | | $1,021.52 | | | | $3.31 | |
| R1 | | Actual | | | 1.66% | | | | $1,000.00 | | | | $1,024.93 | | | | $8.33 | |
| | Hypothetical (h) | | | 1.66% | | | | $1,000.00 | | | | $1,016.56 | | | | $8.30 | |
| R2 | | Actual | | | 1.16% | | | | $1,000.00 | | | | $1,027.51 | | | | $5.83 | |
| | Hypothetical (h) | | | 1.16% | | | | $1,000.00 | | | | $1,019.04 | | | | $5.81 | |
| R3 | | Actual | | | 0.91% | | | | $1,000.00 | | | | $1,025.93 | | | | $4.57 | |
| | Hypothetical (h) | | | 0.91% | | | | $1,000.00 | | | | $1,020.28 | | | | $4.56 | |
| R4 | | Actual | | | 0.66% | | | | $1,000.00 | | | | $1,030.07 | | | | $3.32 | |
| | Hypothetical (h) | | | 0.66% | | | | $1,000.00 | | | | $1,021.52 | | | | $3.31 | |
| R5 | | Actual | | | 0.59% | | | | $1,000.00 | | | | $1,027.59 | | | | $2.97 | |
| | Hypothetical (h) | | | 0.59% | | | | $1,000.00 | | | | $1,021.87 | | | | $2.96 | |
| 529A | | Actual | | | 0.95% | | | | $1,000.00 | | | | $1,025.78 | | | | $4.77 | |
| | Hypothetical (h) | | | 0.95% | | | | $1,000.00 | | | | $1,020.08 | | | | $4.76 | |
| 529B | | Actual | | | 1.71% | | | | $1,000.00 | | | | $1,021.85 | | | | $8.57 | |
| | Hypothetical (h) | | | 1.71% | | | | $1,000.00 | | | | $1,016.31 | | | | $8.55 | |
| 529C | | Actual | | | 1.71% | | | | $1,000.00 | | | | $1,024.70 | | | | $8.58 | |
| | Hypothetical (h) | | | 1.71% | | | | $1,000.00 | | | | $1,016.31 | | | | $8.55 | |
| (h) | 5% class return per year before expenses. |
| (p) | “Expenses Paid During Period” are equal to each class’s annualized expense ratio, as shown above, multiplied by the average account value over the period, multiplied by 181/365 (to reflect the one-half year period). Expenses paid do not include any applicable sales charges (loads). If these transaction costs had been included, your costs would have been higher. |
Notes to Expense Table
Each class with a Rule 12b-1 service fee is subject to a rebate of a portion of such fee. Such rebates are included in the expense ratios above. For Class A and Class 529A shares, this rebate reduced the expense ratios above by 0.01% and 0.02%, respectively. See Note 3 in the Notes to Financial Statements for additional information.
5
PORTFOLIO OF INVESTMENTS
7/31/14 (unaudited)
The Portfolio of Investments is a complete list of all securities owned by your fund. It is categorized by broad-based asset classes.
| | | | | | | | |
| Bonds - 91.1% | | | | | | | | |
| Issuer | | Shares/Par | | | Value ($) | |
| | | | | | | | |
| Aerospace - 2.2% | | | | | | | | |
| Bombardier, Inc., 7.5%, 3/15/18 (n) | �� | $ | 3,280,000 | | | $ | 3,583,405 | |
| Bombardier, Inc., 7.75%, 3/15/20 (n) | | | 2,770,000 | | | | 2,991,600 | |
| Bombardier, Inc., 6.125%, 1/15/23 (n) | | | 5,020,000 | | | | 4,944,700 | |
| CPI International, Inc., 8.75%, 2/15/18 | | | 4,927,000 | | | | 5,148,715 | |
| Gencorp, Inc., 7.125%, 3/15/21 | | | 5,375,000 | | | | 5,817,363 | |
| Huntington Ingalls Industries, Inc., 7.125%, 3/15/21 | | | 6,395,000 | | | | 6,842,650 | |
| TransDigm, Inc., 6%, 7/15/22 (z) | | | 470,000 | | | | 472,350 | |
| TransDigm, Inc., 6.5%, 7/15/24 (z) | | | 1,975,000 | | | | 1,994,750 | |
| | | | | | | | |
| | | | $ | 31,795,533 | |
| Apparel Manufacturers - 0.4% | | | | | | | | |
| Hanesbrands, Inc., 6.375%, 12/15/20 | | $ | 2,990,000 | | | $ | 3,176,875 | |
| PVH Corp., 4.5%, 12/15/22 | | | 2,945,000 | | | | 2,849,288 | |
| | | | | | | | |
| | | | $ | 6,026,163 | |
| Asset-Backed & Securitized - 0.1% | | | | | | | | |
| Citigroup Commercial Mortgage Trust, FRN, 5.898%, 12/10/49 (d)(q) | | $ | 2,948,120 | | | $ | 405,661 | |
| CW Capital Cobalt Commercial Mortgage Trust, “E2”, CDO, 6%, 5/25/45 (a)(d)(p)(z) | | | 1,387,564 | | | | 192,996 | |
| CW Capital Cobalt Commercial Mortgage Trust, “F”, CDO, FRN, 1.535%, 4/26/50 (a)(d)(p)(z) | | | 659,687 | | | | 7 | |
| CW Capital Cobalt Commercial Mortgage Trust, “G”, CDO, FRN, 1.735%, 4/26/50 (a)(d)(p)(z) | | | 2,063,671 | | | | 21 | |
| Falcon Franchise Loan LLC, FRN, 16.08%, 1/05/25 (i)(z) | | | 743,158 | | | | 245,242 | |
| First Union National Bank Commercial Mortgage Trust, 6.75%, 10/15/32 (d)(q) | | | 1,447,046 | | | | 724,572 | |
| G-Force LLC, CDO, “A2”, 4.83%, 8/22/36 (z) | | | 1,891 | | | | 1,936 | |
| LB Commercial Conduit Mortgage Trust, FRN, 1.248%, 2/18/30 (i) | | | 1,964,768 | | | | 46,946 | |
| Morgan Stanley Capital I, Inc., FRN, 1.414%, 4/28/39 (i)(z) | | | 5,276,328 | | | | 34,903 | |
| | | | | | | | |
| | | | $ | 1,652,284 | |
| Automotive - 2.9% | | | | | | | | |
| Accuride Corp., 9.5%, 8/01/18 | | $ | 6,635,000 | | | $ | 6,966,750 | |
| Allison Transmission, Inc., 7.125%, 5/15/19 (n) | | | 6,660,000 | | | | 7,059,600 | |
| Goodyear Tire & Rubber Co., 6.5%, 3/01/21 | | | 6,650,000 | | | | 7,032,375 | |
| Goodyear Tire & Rubber Co., 7%, 5/15/22 | | | 1,340,000 | | | | 1,453,900 | |
| Jaguar Land Rover PLC, 8.125%, 5/15/21 (n) | | | 7,060,000 | | | | 7,818,950 | |
| Jaguar Land Rover PLC, 5.625%, 2/01/23 (n) | | | 1,055,000 | | | | 1,102,475 | |
6
Portfolio of Investments (unaudited) – continued
| | | | | | | | |
| Issuer | | Shares/Par | | | Value ($) | |
| | | | | | | | |
| Bonds - continued | | | | | | | | |
| Automotive - continued | | | | | | | | |
| Lear Corp., 8.125%, 3/15/20 | | $ | 1,350,000 | | | $ | 1,444,500 | |
| Lear Corp., 4.75%, 1/15/23 | | | 3,035,000 | | | | 2,987,578 | |
| Schaeffler Finance B.V., 6.875%, 8/15/18 (n)(p) | | | 3,050,000 | | | | 3,202,500 | |
| Schaeffler Finance B.V., 4.75%, 5/15/21 (z) | | | 2,795,000 | | | | 2,836,925 | |
| | | | | | | | |
| | | | $ | 41,905,553 | |
| Broadcasting - 2.3% | | | | | | | | |
| AMC Networks, Inc., 7.75%, 7/15/21 | | $ | 3,641,000 | | | $ | 3,986,895 | |
| Clear Channel Communications, Inc., 9%, 3/01/21 | | | 3,262,000 | | | | 3,372,093 | |
| Clear Channel Worldwide Holdings, Inc., “A”, 6.5%, 11/15/22 | | | 830,000 | | | | 867,350 | |
| Clear Channel Worldwide Holdings, Inc., “B”, 6.5%, 11/15/22 | | | 3,080,000 | | | | 3,234,000 | |
| Liberty Media Corp., 8.5%, 7/15/29 | | | 4,285,000 | | | | 4,756,350 | |
| Liberty Media Corp., 8.25%, 2/01/30 | | | 40,000 | | | | 44,200 | |
| Netflix, Inc., 5.375%, 2/01/21 | | | 3,625,000 | | | | 3,742,813 | |
| Nexstar Broadcasting, Inc., 6.875%, 11/15/20 | | | 3,920,000 | | | | 4,155,200 | |
| Univision Communications, Inc., 6.875%, 5/15/19 (n) | | | 3,455,000 | | | | 3,627,750 | |
| Univision Communications, Inc., 7.875%, 11/01/20 (n) | | | 3,145,000 | | | | 3,380,875 | |
| Univision Communications, Inc., 8.5%, 5/15/21 (n) | | | 870,000 | | | | 939,600 | |
| | | | | | | | |
| | | | $ | 32,107,126 | |
| Brokerage & Asset Managers - 0.6% | | | | | | | | |
| E*TRADE Financial Corp., 6.375%, 11/15/19 | | $ | 7,590,000 | | | $ | 8,064,375 | |
|
| Building - 3.4% | |
| Allegion U.S. Holding Co., Inc., 5.75%, 10/01/21 | | $ | 5,631,000 | | | $ | 5,912,550 | |
| Building Materials Holding Corp., 6.875%, 8/15/18 (n) | | | 950,000 | | | | 983,250 | |
| Building Materials Holding Corp., 7%, 2/15/20 (n) | | | 1,150,000 | | | | 1,206,063 | |
| Building Materials Holding Corp., 6.75%, 5/01/21 (n) | | | 4,385,000 | | | | 4,675,506 | |
| CEMEX Espana S.A., 9.25%, 5/12/20 | | | 3,215,000 | | | | 3,480,238 | |
| CEMEX Espana S.A., 9.25%, 5/12/20 (n) | | | 1,180,000 | | | | 1,277,350 | |
| CEMEX S.A.B. de C.V., 5.875%, 3/25/19 (n) | | | 669,000 | | | | 680,708 | |
| CEMEX S.A.B. de C.V., 6.5%, 12/10/19 (n) | | | 546,000 | | | | 569,888 | |
| CEMEX S.A.B. de C.V., 7.25%, 1/15/21 (n) | | | 910,000 | | | | 964,600 | |
| Gibraltar Industries, Inc., 6.25%, 2/01/21 | | | 2,755,000 | | | | 2,816,988 | |
| HD Supply, Inc., 8.125%, 4/15/19 | | | 2,470,000 | | | | 2,667,600 | |
| HD Supply, Inc., 7.5%, 7/15/20 | | | 6,440,000 | | | | 6,874,700 | |
| Headwaters, Inc., 7.25%, 1/15/19 | | | 2,210,000 | | | | 2,309,450 | |
| Headwaters, Inc., 7.625%, 4/01/19 | | | 1,455,000 | | | | 1,527,750 | |
| Nortek, Inc., 8.5%, 4/15/21 | | | 4,750,000 | | | | 5,153,750 | |
| Roofing Supply Group LLC/Roofing Supply Finance, Inc., 10%, 6/01/20 (n) | | | 3,690,000 | | | | 3,929,850 | |
| USG Corp., 7.875%, 3/30/20 (n) | | | 1,570,000 | | | | 1,705,413 | |
| USG Corp., 5.875%, 11/01/21 (n) | | | 910,000 | | | | 937,300 | |
| | | | | | | | |
| | | | $ | 47,672,954 | |
7
Portfolio of Investments (unaudited) – continued
| | | | | | | | |
| Issuer | | Shares/Par | | | Value ($) | |
| | | | | | | | |
| Bonds - continued | | | | | | | | |
| Business Services - 1.4% | | | | | | | | |
| Equinix, Inc., 4.875%, 4/01/20 | | $ | 3,670,000 | | | $ | 3,697,525 | |
| Equinix, Inc., 5.375%, 4/01/23 | | | 1,955,000 | | | | 1,964,775 | |
| Fidelity National Information Services, Inc., 5%, 3/15/22 | | | 3,080,000 | | | | 3,261,674 | |
| Iron Mountain, Inc., 8.375%, 8/15/21 | | | 1,729,000 | | | | 1,793,838 | |
| Iron Mountain, Inc., 6%, 8/15/23 | | | 3,350,000 | | | | 3,492,375 | |
| Lender Processing Services, Inc., 5.75%, 4/15/23 | | | 1,415,000 | | | | 1,515,465 | |
| NeuStar, Inc., 4.5%, 1/15/23 | | | 4,795,000 | | | | 4,075,750 | |
| | | | | | | | |
| | | | $ | 19,801,402 | |
| Cable TV - 5.2% | | | | | | | | |
| CCO Holdings LLC/CCO Holdings Capital Corp., 8.125%, 4/30/20 | | $ | 6,590,000 | | | $ | 7,026,588 | |
| CCO Holdings LLC/CCO Holdings Capital Corp., 7.375%, 6/01/20 | | | 1,305,000 | | | | 1,393,088 | |
| CCO Holdings LLC/CCO Holdings Capital Corp., 6.5%, 4/30/21 | | | 5,360,000 | | | | 5,574,400 | |
| CCO Holdings LLC/CCO Holdings Capital Corp., 5.75%, 1/15/24 | | | 4,205,000 | | | | 4,183,975 | |
| Cequel Communications Holdings, 6.375%, 9/15/20 (n) | | | 5,065,000 | | | | 5,216,950 | |
| DISH DBS Corp., 6.75%, 6/01/21 | | | 3,410,000 | | | | 3,751,000 | |
| DISH DBS Corp., 5%, 3/15/23 | | | 2,975,000 | | | | 2,915,500 | |
| Intelsat Jackson Holdings S.A., 6.625%, 12/15/22 | | | 3,660,000 | | | | 3,696,600 | |
| Intelsat Jackson Holdings S.A., 5.5%, 8/01/23 | | | 6,225,000 | | | | 5,976,000 | |
| Intelsat Luxembourg S.A., 8.125%, 6/01/23 | | | 4,615,000 | | | | 4,799,600 | |
| Lynx I Corp., 5.375%, 4/15/21 (n) | | | 1,575,000 | | | | 1,590,750 | |
| Lynx II Corp., 6.375%, 4/15/23 (n) | | | 2,635,000 | | | | 2,766,750 | |
| Numericable Group S.A., 6%, 5/15/22 (n) | | | 5,325,000 | | | | 5,351,625 | |
| SIRIUS XM Radio, Inc., 4.25%, 5/15/20 (n) | | | 1,020,000 | | | | 981,750 | |
| SIRIUS XM Radio, Inc., 5.875%, 10/01/20 (n) | | | 460,000 | | | | 470,350 | |
| SIRIUS XM Radio, Inc., 4.625%, 5/15/23 (n) | | | 2,535,000 | | | | 2,357,550 | |
| SIRIUS XM Radio, Inc., 6%, 7/15/24 (z) | | | 2,340,000 | | | | 2,351,700 | |
| Telenet Finance Luxembourg, 6.375%, 11/15/20 (n) | | EUR | 1,875,000 | | | | 2,668,291 | |
| Unitymedia Hessen, 5.5%, 1/15/23 (n) | | $ | 4,235,000 | | | | 4,256,175 | |
| UPCB Finance III Ltd., 6.625%, 7/01/20 (n) | | | 3,833,000 | | | | 4,043,815 | |
| Ziggo Bond Co. B.V., 8%, 5/15/18 (n) | | EUR | 2,225,000 | | | | 3,262,130 | |
| | | | | | | | |
| | | | $ | 74,634,587 | |
| Chemicals - 3.0% | | | | | | | | |
| Celanese U.S. Holdings LLC, 5.875%, 6/15/21 | | $ | 4,178,000 | | | $ | 4,522,685 | |
| Celanese U.S. Holdings LLC, 4.625%, 11/15/22 | | | 1,760,000 | | | | 1,751,200 | |
| Flash Dutch 2 B.V./U.S. Coatings Acquisition, 7.375%, 5/01/21 (n) | | | 3,365,000 | | | | 3,575,313 | |
| Hexion U.S. Finance Corp., 6.625%, 4/15/20 | | | 2,190,000 | | | | 2,277,600 | |
| Hexion U.S. Finance Corp./Hexion Nova Scotia Finance, 8.875%, 2/01/18 | | | 4,005,000 | | | | 4,133,160 | |
| Huntsman International LLC, 8.625%, 3/15/21 | | | 4,280,000 | | | | 4,654,500 | |
| INEOS Finance PLC, 8.375%, 2/15/19 (n) | | | 4,145,000 | | | | 4,476,600 | |
| INEOS Group Holdings S.A., 6.125%, 8/15/18 (n) | | | 3,665,000 | | | | 3,701,650 | |
8
Portfolio of Investments (unaudited) – continued
| | | | | | | | |
| Issuer | | Shares/Par | | | Value ($) | |
| | | | | | | | |
| Bonds - continued | | | | | | | | |
| Chemicals - continued | | | | | | | | |
| INEOS Group Holdings S.A., 5.875%, 2/15/19 (n) | | $ | 2,745,000 | | | $ | 2,772,450 | |
| Taminco Global Chemical Corp., 9.75%, 3/31/20 (n) | | | 3,745,000 | | | | 4,110,138 | |
| Tronox Finance LLC, 6.375%, 8/15/20 | | | 7,175,000 | | | | 7,246,750 | |
| | | | | | | | |
| | | | $ | 43,222,046 | |
| Computer Software - 0.4% | | | | | | | | |
| Syniverse Holdings, Inc., 9.125%, 1/15/19 | | $ | 1,453,000 | | | $ | 1,525,650 | |
| VeriSign, Inc., 4.625%, 5/01/23 | | | 4,260,000 | | | | 4,153,500 | |
| | | | | | | | |
| | | | $ | 5,679,150 | |
| Computer Software - Systems - 0.7% | | | | | | | | |
| Audatex North America, Inc., 6%, 6/15/21 (n) | | $ | 3,560,000 | | | $ | 3,729,100 | |
| Audatex North America, Inc., 6.125%, 11/01/23 (n) | | | 835,000 | | | | 872,575 | |
| CDW LLC/CDW Finance Corp., 8.5%, 4/01/19 | | | 3,795,000 | | | | 4,032,188 | |
| CDW LLC/CDW Finance Corp., 6%, 8/15/22 | | | 1,915,000 | | | | 1,915,000 | |
| | | | | | | | |
| | | | $ | 10,548,863 | |
| Conglomerates - 2.0% | | | | | | | | |
| Amsted Industries Co., 5%, 3/15/22 (n) | | $ | 5,085,000 | | | $ | 5,046,863 | |
| BC Mountain LLC, 7%, 2/01/21 (n) | | | 3,290,000 | | | | 3,158,400 | |
| Dynacast International LLC, 9.25%, 7/15/19 | | | 2,295,000 | | | | 2,513,025 | |
| Entegris, Inc., 6%, 4/01/22 (n) | | | 5,505,000 | | | | 5,683,913 | |
| Renaissance Acquisition, 6.875%, 8/15/21 (n) | | | 5,585,000 | | | | 5,626,888 | |
| Rexel S.A., 6.125%, 12/15/19 (n) | | | 3,200,000 | | | | 3,312,000 | |
| Silver II Borrower, 7.75%, 12/15/20 (n) | | | 3,195,000 | | | | 3,346,763 | |
| | | | | | | | |
| | | | $ | 28,687,852 | |
| Construction - 0.3% | | | | | | | | |
| Empresas ICA S.A.B. de C.V., 8.875%, 5/29/24 (n) | | $ | 1,546,000 | | | $ | 1,580,785 | |
| Empresas ICA Sociedad Controladora S.A. de C.V., 8.9%, 2/04/21 | | | 2,555,000 | | | | 2,682,750 | |
| | | | | | | | |
| | | | $ | 4,263,535 | |
| Consumer Products - 0.9% | | | | | | | | |
| Elizabeth Arden, Inc., 7.375%, 3/15/21 | | $ | 4,411,000 | | | $ | 4,554,358 | |
| Prestige Brands, Inc., 8.125%, 2/01/20 | | | 1,531,000 | | | | 1,676,445 | |
| Prestige Brands, Inc., 5.375%, 12/15/21 (n) | | | 3,135,000 | | | | 3,135,000 | |
| Spectrum Brands, Inc., 6.375%, 11/15/20 | | | 3,270,000 | | | | 3,441,675 | |
| | | | | | | | |
| | | | $ | 12,807,478 | |
| Consumer Services - 1.6% | | | | | | | | |
| ADT Corp., 6.25%, 10/15/21 | | $ | 4,995,000 | | | $ | 5,169,825 | |
| ADT Corp., 4.125%, 6/15/23 | | | 1,585,000 | | | | 1,434,425 | |
| Garda World Security Corp., 7.25%, 11/15/21 (z) | | | 2,905,000 | | | | 2,955,838 | |
9
Portfolio of Investments (unaudited) – continued
| | | | | | | | |
| Issuer | | Shares/Par | | | Value ($) | |
| | | | | | | | |
| Bonds - continued | | | | | | | | |
| Consumer Services - continued | | | | | | | | |
| Garda World Security Corp., 7.25%, 11/15/21 (z) | | $ | 1,200,000 | | | $ | 1,221,000 | |
| Grupo Posadas S.A.B. de C.V., 7.875%, 11/30/17 | | | 2,125,000 | | | | 2,156,875 | |
| Monitronics International, Inc., 9.125%, 4/01/20 | | | 3,885,000 | | | | 4,079,250 | |
| Service Corp. International, 7%, 6/15/17 | | | 2,630,000 | | | | 2,912,725 | |
| Service Corp. International, 5.375%, 5/15/24 (n) | | | 2,120,000 | | | | 2,167,700 | |
| | | | | | | | |
| | | | $ | 22,097,638 | |
| Containers - 3.0% | | | | | | | | |
| Ardagh Packaging Finance PLC, 7%, 11/15/20 (n) | | $ | 748,235 | | | $ | 737,012 | |
| Ardagh Packaging Finance PLC, 9.125%, 10/15/20 (n) | | | 4,110,000 | | | | 4,418,250 | |
| Ardagh Packaging Finance PLC, 9.125%, 10/15/20 (n) | | | 400,000 | | | | 432,000 | |
| Ardagh Packaging Finance PLC, 6%, 6/30/21 (z) | | | 2,845,000 | | | | 2,716,975 | |
| Ball Corp., 5%, 3/15/22 | | | 1,624,000 | | | | 1,619,940 | |
| Ball Corp., 4%, 11/15/23 | | | 2,735,000 | | | | 2,523,038 | |
| Berry Plastics Group, Inc., 5.5%, 5/15/22 | | | 5,470,000 | | | | 5,333,250 | |
| Crown American LLC, 4.5%, 1/15/23 | | | 7,310,000 | | | | 6,907,950 | |
| Greif, Inc., 6.75%, 2/01/17 | | | 1,410,000 | | | | 1,533,375 | |
| Greif, Inc., 7.75%, 8/01/19 | | | 795,000 | | | | 898,350 | |
| Reynolds Group, 7.125%, 4/15/19 | | | 2,925,000 | | | | 3,034,688 | |
| Reynolds Group, 9.875%, 8/15/19 | | | 1,030,000 | | | | 1,109,825 | |
| Reynolds Group, 5.75%, 10/15/20 | | | 2,760,000 | | | | 2,815,200 | |
| Reynolds Group, 8.25%, 2/15/21 | | | 5,025,000 | | | | 5,326,500 | |
| Signode Industrial Group, 6.375%, 5/01/22 (z) | | | 3,440,000 | | | | 3,388,400 | |
| | | | | | | | |
| | | | $ | 42,794,753 | |
| Defense Electronics - 0.4% | | | | | | | | |
| Ducommun, Inc., 9.75%, 7/15/18 | | $ | 5,106,000 | | | $ | 5,629,365 | |
|
| Electronics - 1.7% | |
| Advanced Micro Devices, Inc., 6.75%, 3/01/19 (n) | | $ | 4,010,000 | | | $ | 4,110,250 | |
| Advanced Micro Devices, Inc., 7.5%, 8/15/22 | | | 1,500,000 | | | | 1,552,500 | |
| Advanced Micro Devices, Inc., 7%, 7/01/24 (z) | | | 1,165,000 | | | | 1,135,875 | |
| Micron Technology, Inc., 5.875%, 2/15/22 (n) | | | 3,305,000 | | | | 3,470,250 | |
| Micron Technology, Inc., 5.5%, 2/01/25 (z) | | | 2,290,000 | | | | 2,278,550 | |
| Nokia Corp., 5.375%, 5/15/19 | | | 1,075,000 | | | | 1,139,500 | |
| Nokia Corp., 6.625%, 5/15/39 | | | 1,345,000 | | | | 1,435,788 | |
| NXP B.V., 5.75%, 2/15/21 (n) | | | 1,770,000 | | | | 1,840,800 | |
| NXP B.V., 5.75%, 3/15/23 (n) | | | 3,430,000 | | | | 3,541,475 | |
| Sensata Technologies B.V., 6.5%, 5/15/19 (n) | | | 3,770,000 | | | | 3,939,650 | |
| | | | | | | | |
| | | | $ | 24,444,638 | |
| Energy - Independent - 8.5% | | | | | | | | |
| American Energy-Permian Basin LLC, 7.125%, 11/01/20 (z) | | $ | 1,790,000 | | | $ | 1,727,350 | |
| American Energy-Permian Basin LLC, 7.375%, 11/01/21 (z) | | | 1,495,000 | | | | 1,442,675 | |
10
Portfolio of Investments (unaudited) – continued
| | | | | | | | |
| Issuer | | Shares/Par | | | Value ($) | |
| | | | | | | | |
| Bonds - continued | | | | | | | | |
| Energy - Independent - continued | | | | | | | | |
| Antero Resources Finance Corp., 6%, 12/01/20 | | $ | 3,740,000 | | | $ | 3,898,950 | |
| Antero Resources Finance Corp., 5.375%, 11/01/21 | | | 2,650,000 | | | | 2,683,125 | |
| Athlon Holdings LP/Athlon Finance Corp., 6%, 5/01/22 (z) | | | 4,080,000 | | | | 4,090,200 | |
| Baytex Energy Corp., 5.125%, 6/01/21 (z) | | | 585,000 | | | | 580,613 | |
| Baytex Energy Corp., 5.625%, 6/01/24 (z) | | | 2,985,000 | | | | 2,940,225 | |
| Bill Barrett Corp., 7%, 10/15/22 | | | 3,950,000 | | | | 4,048,750 | |
| BreitBurn Energy Partners LP, 8.625%, 10/15/20 | | | 1,395,000 | | | | 1,499,625 | |
| BreitBurn Energy Partners LP, 7.875%, 4/15/22 | | | 6,375,000 | | | | 6,661,875 | |
| Chaparral Energy, Inc., 7.625%, 11/15/22 | | | 3,770,000 | | | | 3,949,075 | |
| Chesapeake Energy Corp., 5.75%, 3/15/23 | | | 1,345,000 | | | | 1,435,788 | |
| Concho Resources, Inc., 6.5%, 1/15/22 | | | 4,690,000 | | | | 4,994,850 | |
| Concho Resources, Inc., 5.5%, 4/01/23 | | | 4,295,000 | | | | 4,445,325 | |
| Denbury Resources, Inc., 4.625%, 7/15/23 | | | 3,755,000 | | | | 3,510,925 | |
| EP Energy LLC, 6.875%, 5/01/19 | | | 1,435,000 | | | | 1,503,163 | |
| EP Energy LLC, 9.375%, 5/01/20 | | | 5,265,000 | | | | 5,830,988 | |
| EP Energy LLC, 7.75%, 9/01/22 | | | 6,260,000 | | | | 6,823,400 | |
| EPL Oil & Gas, Inc., 8.25%, 2/15/18 | | | 4,555,000 | | | | 4,759,975 | |
| Halcon Resources Corp., 8.875%, 5/15/21 | | | 5,825,000 | | | | 6,043,438 | |
| Harvest Operations Corp., 6.875%, 10/01/17 | | | 3,985,000 | | | | 4,293,838 | |
| Hilcorp Energy I/Hilcorp Finance Co., 8%, 2/15/20 (n) | | | 1,870,000 | | | | 1,991,550 | |
| Laredo Petroleum, Inc., 5.625%, 1/15/22 | | | 1,440,000 | | | | 1,465,200 | |
| Laredo Petroleum, Inc., 7.375%, 5/01/22 | | | 1,155,000 | | | | 1,258,950 | |
| LINN Energy LLC, 8.625%, 4/15/20 | | | 2,050,000 | | | | 2,165,313 | |
| LINN Energy LLC, 7.75%, 2/01/21 | | | 3,166,000 | | | | 3,316,385 | |
| MEG Energy Corp., 6.5%, 3/15/21 (n) | | | 2,285,000 | | | | 2,347,838 | |
| MEG Energy Corp., 7%, 3/31/24 (n) | | | 3,245,000 | | | | 3,431,588 | |
| Northern Blizzard Resources, Inc., 7.25%, 2/01/22 (n) | | | 4,205,000 | | | | 4,425,763 | |
| Oasis Petroleum, Inc., 6.875%, 3/15/22 (n) | | | 5,605,000 | | | | 6,067,413 | |
| Range Resources Corp., 5%, 8/15/22 | | | 5,535,000 | | | | 5,673,375 | |
| Sanchez Energy Corp., 6.125%, 1/15/23 (z) | | | 2,985,000 | | | | 2,977,538 | |
| SandRidge Energy, Inc., 8.125%, 10/15/22 | | | 4,415,000 | | | | 4,701,975 | |
| SM Energy Co., 6.5%, 11/15/21 | | | 4,230,000 | | | | 4,536,675 | |
| | | | | | | | |
| | | | $ | 121,523,716 | |
| Entertainment - 1.7% | | | | | | | | |
| Activision Blizzard, Inc., 6.125%, 9/15/23 (n) | | $ | 2,970,000 | | | $ | 3,200,175 | |
| Cedar Fair LP, 5.25%, 3/15/21 | | | 4,270,000 | | | | 4,312,700 | |
| Cedar Fair LP, 5.375%, 6/01/24 (n) | | | 1,790,000 | | | | 1,790,000 | |
| Cinemark USA, Inc., 5.125%, 12/15/22 | | | 2,805,000 | | | | 2,826,038 | |
| Cinemark USA, Inc., 4.875%, 6/01/23 | | | 2,495,000 | | | | 2,438,863 | |
| Seven Seas Cruises S. DE R.L., 9.125%, 5/15/19 | | | 4,755,000 | | | | 5,135,400 | |
| Six Flags Entertainment Corp., 5.25%, 1/15/21 (n) | | | 4,115,000 | | | | 4,094,425 | |
| | | | | | | | |
| | | | $ | 23,797,601 | |
11
Portfolio of Investments (unaudited) – continued
| | | | | | | | |
| Issuer | | Shares/Par | | | Value ($) | |
| | | | | | | | |
| Bonds - continued | | | | | | | | |
| Financial Institutions - 4.8% | | | | | | | | |
| Aircastle Ltd., 4.625%, 12/15/18 | | $ | 3,385,000 | | | $ | 3,444,238 | |
| Aircastle Ltd., 5.125%, 3/15/21 | | | 1,815,000 | | | | 1,819,538 | |
| Aviation Capital Group, 4.625%, 1/31/18 (n) | | | 2,300,000 | | | | 2,433,959 | |
| Aviation Capital Group, 6.75%, 4/06/21 (n) | | | 3,515,000 | | | | 3,958,442 | |
| CIT Group, Inc., 5.25%, 3/15/18 | | | 3,330,000 | | | | 3,513,150 | |
| CIT Group, Inc., 6.625%, 4/01/18 (n) | | | 5,369,000 | | | | 5,919,323 | |
| CIT Group, Inc., 5.5%, 2/15/19 (n) | | | 5,562,000 | | | | 5,937,435 | |
| CIT Group, Inc., 5%, 8/15/22 | | | 4,690,000 | | | | 4,842,425 | |
| Icahn Enterprises LP, 6%, 8/01/20 | | | 3,730,000 | | | | 3,888,525 | |
| Icahn Enterprises LP, 5.875%, 2/01/22 | | | 5,785,000 | | | | 5,897,084 | |
| International Lease Finance Corp., 7.125%, 9/01/18 (n) | | | 2,634,000 | | | | 3,015,930 | |
| Nationstar Mortgage LLC/Capital Corp., 6.5%, 8/01/18 | | | 2,615,000 | | | | 2,588,850 | |
| Nationstar Mortgage LLC/Capital Corp., 7.875%, 10/01/20 | | | 5,115,000 | | | | 5,217,300 | |
| SLM Corp., 4.875%, 6/17/19 | | | 930,000 | | | | 936,975 | |
| SLM Corp., 8%, 3/25/20 | | | 6,735,000 | | | | 7,610,550 | |
| SLM Corp., 7.25%, 1/25/22 | | | 4,225,000 | | | | 4,626,375 | |
| SLM Corp., 6.125%, 3/25/24 | | | 2,140,000 | | | | 2,086,500 | |
| | | | | | | | |
| | | | $ | 67,736,599 | |
| Food & Beverages - 1.4% | | | | | | | | |
| B&G Foods, Inc., 4.625%, 6/01/21 | | $ | 2,800,000 | | | $ | 2,730,000 | |
| Constellation Brands, Inc., 3.75%, 5/01/21 | | | 525,000 | | | | 511,875 | |
| Constellation Brands, Inc., 4.25%, 5/01/23 | | | 3,885,000 | | | | 3,836,438 | |
| Darling Ingrediants, Inc., 5.375%, 1/15/22 (n) | | | 4,595,000 | | | | 4,721,363 | |
| H.J. Heinz Co., 4.25%, 10/15/20 | | | 2,610,000 | | | | 2,593,688 | |
| Sun Merger Sub, Inc., 5.875%, 8/01/21 (n) | | | 4,560,000 | | | | 4,788,000 | |
| | | | | | | | |
| | | | $ | 19,181,364 | |
| Forest & Paper Products - 0.4% | | | | | | | | |
| Appvion, Inc., 9%, 6/01/20 (n) | | $ | 3,130,000 | | | $ | 2,989,150 | |
| Tembec Industries, Inc., 11.25%, 12/15/18 | | | 2,880,000 | | | | 3,088,800 | |
| | | | | | | | |
| | | | $ | 6,077,950 | |
| Gaming & Lodging - 2.3% | | | | | | | | |
| CCM Merger, Inc., 9.125%, 5/01/19 (n) | | $ | 3,945,000 | | | $ | 4,161,975 | |
| Chester Downs & Marina LLC, 9.25%, 2/01/20 (n) | | | 1,750,000 | | | | 1,662,500 | |
| Greektown Holdings LLC, 8.875%, 3/15/19 (n) | | | 3,515,000 | | | | 3,497,425 | |
| Hilton Worldwide Finance Co., 5.625%, 10/15/21 (n) | | | 4,025,000 | | | | 4,216,188 | |
| Isle of Capri Casinos, Inc., 8.875%, 6/15/20 | | | 1,965,000 | | | | 2,082,900 | |
| Isle of Capri Casinos, Inc., 5.875%, 3/15/21 | | | 715,000 | | | | 732,875 | |
| MGM Resorts International, 6.625%, 12/15/21 | | | 3,540,000 | | | | 3,827,625 | |
| Pinnacle Entertainment, Inc., 8.75%, 5/15/20 | | | 2,545,000 | | | | 2,716,788 | |
| Pinnacle Entertainment, Inc., 6.375%, 8/01/21 | | | 2,185,000 | | | | 2,250,550 | |
| Ryman Hospitality Properties, Inc., REIT, 5%, 4/15/21 | | | 3,870,000 | | | | 3,840,975 | |
12
Portfolio of Investments (unaudited) – continued
| | | | | | | | |
| Issuer | | Shares/Par | | | Value ($) | |
| | | | | | | | |
| Bonds - continued | | | | | | | | |
| Gaming & Lodging - continued | | | | | | | | |
| Wynn Las Vegas LLC, 7.75%, 8/15/20 | | $ | 3,830,000 | | | $ | 4,126,825 | |
| | | | | | | | |
| | | | $ | 33,116,626 | |
| Health Maintenance Organizations - 0.0% | | | | | | | | |
| Wellcare Health Plans, Inc., 5.75%, 11/15/20 | | $ | 244,000 | | | $ | 248,880 | |
| | |
| Industrial - 1.3% | | | | | | | | |
| Dematic S.A., 7.75%, 12/15/20 (n) | | $ | 5,925,000 | | | $ | 6,339,750 | |
| Howard Hughes Corp., 6.875%, 10/01/21 (n) | | | 5,615,000 | | | | 5,909,788 | |
| Hyva Global B.V., 8.625%, 3/24/16 (n) | | | 2,489,000 | | | | 2,576,115 | |
| SPL Logistics Escrow LLC, 8.875%, 8/01/20 (n) | | | 3,320,000 | | | | 3,676,900 | |
| | | | | | | | |
| | | | $ | 18,502,553 | |
| International Market Quasi-Sovereign - 0.3% | | | | | | | | |
| Eksportfinans A.S.A., 5.5%, 5/25/16 | | $ | 1,090,000 | | | $ | 1,153,765 | |
| Eksportfinans A.S.A., 5.5%, 6/26/17 | | | 2,745,000 | | | | 2,946,291 | |
| | | | | | | | |
| | | | $ | 4,100,056 | |
| Machinery & Tools - 1.3% | | | | | | | | |
| H&E Equipment Services Co., 7%, 9/01/22 | | $ | 4,955,000 | | | $ | 5,363,788 | |
| Jurassic Holdings III, Inc., 6.875%, 2/15/21 (n) | | | 4,025,000 | | | | 4,004,875 | |
| Light Tower Rentals, Inc., 8.125%, 8/01/19 (z) | | | 1,785,000 | | | | 1,816,238 | |
| RSC Equipment Rental, Inc., 8.25%, 2/01/21 | | | 2,910,000 | | | | 3,175,538 | |
| United Rentals North America, Inc., 7.625%, 4/15/22 | | | 3,667,000 | | | | 4,042,868 | |
| | | | | | | | |
| | | | $ | 18,403,307 | |
| Major Banks - 1.1% | | | | | | | | |
| Bank of America Corp., FRN, 5.2%, 12/31/49 | | $ | 5,305,000 | | | $ | 4,973,438 | |
| JPMorgan Chase & Co., 6% to 8/01/23, FRN to 12/31/49 | | | 4,920,000 | | | | 4,993,800 | |
| Royal Bank of Scotland Group PLC, 6.99% to 10/04/17, FRN to 12/31/49 (n) | | | 1,370,000 | | | | 1,572,075 | |
| Royal Bank of Scotland Group PLC, 7.648% to 9/30/31, FRN to 12/31/49 | | | 3,320,000 | | | | 3,951,464 | |
| | | | | | | | |
| | | | $ | 15,490,777 | |
| Medical & Health Technology & Services - 4.7% | | | | | | | | |
| CHS/Community Health Systems, Inc., 5.125%, 8/01/21 (z) | | $ | 840,000 | | | $ | 846,300 | |
| CHS/Community Health Systems, Inc., 6.875%, 2/01/22 (z) | | | 6,985,000 | | | | 7,142,163 | |
| Davita, Inc., 6.625%, 11/01/20 | | | 5,625,000 | | | | 5,906,250 | |
| Davita, Inc., 5.125%, 7/15/24 | | | 2,205,000 | | | | 2,171,925 | |
| Fresenius Medical Care Capital Trust III, 5.625%, 7/31/19 (n) | | | 2,410,000 | | | | 2,566,650 | |
| Fresenius Medical Care Capital Trust III, 5.875%, 1/31/22 (n) | | | 1,710,000 | | | | 1,868,175 | |
| HCA, Inc., 7.25%, 9/15/20 | | | 1,010,000 | | | | 1,068,075 | |
| HCA, Inc., 7.5%, 2/15/22 | | | 5,995,000 | | | | 6,789,338 | |
| HCA, Inc., 5.875%, 3/15/22 | | | 6,325,000 | | | | 6,736,125 | |
13
Portfolio of Investments (unaudited) – continued
| | | | | | | | |
| Issuer | | Shares/Par | | | Value ($) | |
| | | | | | | | |
| Bonds - continued | | | | | | | | |
| Medical & Health Technology & Services - continued | |
| HCA, Inc., 5%, 3/15/24 | | $ | 2,930,000 | | | $ | 2,908,025 | |
| HealthSouth Corp., 8.125%, 2/15/20 | | | 5,915,000 | | | | 6,240,325 | |
| Lifepoint Hospitals, Inc., 5.5%, 12/01/21 (n) | | | 6,310,000 | | | | 6,451,975 | |
| Tenet Healthcare Corp., 8%, 8/01/20 | | | 6,500,000 | | | | 6,938,750 | |
| Tenet Healthcare Corp., 4.5%, 4/01/21 | | | 5,265,000 | | | | 5,120,213 | |
| Universal Health Services, Inc., 7.625%, 8/15/20 | | | 3,560,000 | | | | 3,631,200 | |
| | | | | | | | |
| | | | $ | 66,385,489 | |
| Medical Equipment - 0.7% | | | | | | | | |
| Biomet, Inc., 6.5%, 8/01/20 | | $ | 2,248,000 | | | $ | 2,424,805 | |
| Physio-Control International, Inc., 9.875%, 1/15/19 (n) | | | 1,767,000 | | | | 1,939,283 | |
| Teleflex, Inc., 6.875%, 6/01/19 | | | 2,975,000 | | | | 3,146,063 | |
| Teleflex, Inc., 5.25%, 6/15/24 (n) | | | 2,700,000 | | | | 2,740,500 | |
| | | | | | | | |
| | | | $ | 10,250,651 | |
| Metals & Mining - 4.6% | | | | | | | | |
| ArcelorMittal S.A., 6.75%, 2/25/22 | | $ | 1,130,000 | | | $ | 1,223,225 | |
| ArcelorMittal S.A., 7.25%, 3/01/41 | | | 2,945,000 | | | | 3,003,900 | |
| Arch Coal, Inc., 8%, 1/15/19 (n) | | | 2,045,000 | | | | 1,973,425 | |
| Arch Coal, Inc., 7.25%, 10/01/20 | | | 2,560,000 | | | | 1,702,400 | |
| Century Aluminum Co., 7.5%, 6/01/21 (n) | | | 4,715,000 | | | | 4,997,900 | |
| Commercial Metals Co., 4.875%, 5/15/23 | | | 3,048,000 | | | | 2,933,700 | |
| Consol Energy, Inc., 8.25%, 4/01/20 | | | 3,985,000 | | | | 4,244,025 | |
| Consol Energy, Inc., 6.375%, 3/01/21 | | | 1,545,000 | | | | 1,622,250 | |
| Consol Energy, Inc., 5.875%, 4/15/22 (n) | | | 3,910,000 | | | | 3,953,988 | |
| First Quantum Minerals Ltd., 7.25%, 10/15/19 (n) | | | 7,343,000 | | | | 7,636,720 | |
| First Quantum Minerals Ltd., 7.25%, 5/15/22 (n) | | | 2,698,000 | | | | 2,775,568 | |
| FMG Resources, 6.875%, 4/01/22 (n) | | | 1,070,000 | | | | 1,138,213 | |
| Fortescue Metals Group Ltd., 8.25%, 11/01/19 (n) | | | 5,220,000 | | | | 5,598,450 | |
| GrafTech International Co., 6.375%, 11/15/20 | | | 4,385,000 | | | | 4,483,663 | |
| Molycorp, Inc., 10%, 6/01/20 | | | 1,205,000 | | | | 1,072,450 | |
| Peabody Energy Corp., 6%, 11/15/18 | | | 2,295,000 | | | | 2,289,263 | |
| Steel Dynamics, Inc., 5.25%, 4/15/23 | | | 2,850,000 | | | | 2,871,375 | |
| Suncoke Energy Partners LP/Suncoke Energy Partners Finance Corp., 7.375%, 2/01/20 (z) | | | 1,440,000 | | | | 1,519,200 | |
| Suncoke Energy, Inc., 7.625%, 8/01/19 | | | 3,270,000 | | | | 3,466,200 | |
| TMS International Corp., 7.625%, 10/15/21 (n) | | | 2,855,000 | | | | 3,026,300 | |
| Walter Energy, Inc., 9.5%, 10/15/19 (n) | | | 1,960,000 | | | | 1,950,200 | |
| Walter Energy, Inc., 8.5%, 4/15/21 | | | 3,680,000 | | | | 1,766,400 | |
| | | | | | | | |
| | | | $ | 65,248,815 | |
| Midstream - 5.1% | | | | | | | | |
| Access Midstream Partners Co., 5.875%, 4/15/21 | | $ | 1,180,000 | | | $ | 1,241,950 | |
| Access Midstream Partners Co., 4.875%, 5/15/23 | | | 5,245,000 | | | | 5,402,350 | |
14
Portfolio of Investments (unaudited) – continued
| | | | | | | | |
| Issuer | | Shares/Par | | | Value ($) | |
| | | | | | | | |
| Bonds - continued | | | | | | | | |
| Midstream - continued | | | | | | | | |
| AmeriGas Finance LLC, 6.75%, 5/20/20 | | $ | 6,375,000 | | | $ | 6,709,688 | |
| Atlas Pipeline Partners LP/Atlas Pipeline, 4.75%, 11/15/21 | | | 1,050,000 | | | | 992,250 | |
| Atlas Pipeline Partners LP/Atlas Pipeline, 5.875%, 8/01/23 | | | 4,155,000 | | | | 4,082,288 | |
| Crestwood Midstream Partners LP, 6%, 12/15/20 | | | 3,815,000 | | | | 3,929,450 | |
| Crestwood Midstream Partners LP, 6.125%, 3/01/22 (n) | | | 2,420,000 | | | | 2,498,650 | |
| El Paso Corp., 7.75%, 1/15/32 | | | 8,280,000 | | | | 9,149,360 | |
| Energy Transfer Equity LP, 7.5%, 10/15/20 | | | 4,955,000 | | | | 5,537,213 | |
| Ferrellgas LP/Ferrellgas Finance Corp., 6.5%, 5/01/21 | | | 1,735,000 | | | | 1,791,388 | |
| Ferrellgas LP/Ferrellgas Finance Corp., 6.75%, 1/15/22 (n) | | | 5,720,000 | | | | 5,963,100 | |
| MarkWest Energy Partners LP, 5.5%, 2/15/23 | | | 3,325,000 | | | | 3,449,688 | |
| MarkWest Energy Partners LP, 4.5%, 7/15/23 | | | 3,644,000 | | | | 3,589,340 | |
| Sabine Pass Liquefaction LLC, 5.625%, 2/01/21 | | | 3,800,000 | | | | 3,933,000 | |
| Sabine Pass Liquefaction LLC, 5.625%, 4/15/23 | | | 6,670,000 | | | | 6,770,050 | |
| Sabine Pass Liquefaction LLC, 5.75%, 5/15/24 (z) | | | 2,130,000 | | | | 2,161,950 | |
| Summit Midstream Holdings LLC/Summit Midstream Finance Corp., 7.5%, 7/01/21 | | | 2,490,000 | | | | 2,707,875 | |
| Summit Midstream Holdings LLC/Summit Midstream Finance Corp., 5.5%, 8/15/22 | | | 2,260,000 | | | | 2,260,000 | |
| | | | | | | | |
| | | | $ | 72,169,590 | |
| Municipals - 0.2% | | | | | | | | |
| Golden State, CA, Tobacco Securitization Corp., Tobacco Settlement Rev., “A-1”, 4.5%, 6/01/27 | | $ | 1,545,000 | | | $ | 1,370,091 | |
| New Jersey Tobacco Settlement Financing Corp., “1-A”, 4.5%, 6/01/23 | | | 1,635,000 | | | | 1,598,801 | |
| | | | | | | | |
| | | | | | | $ | 2,968,892 | |
| Network & Telecom - 1.9% | | | | | | | | |
| Centurylink, Inc., 6.45%, 6/15/21 | | $ | 4,205,000 | | | $ | 4,520,375 | |
| Centurylink, Inc., 6.75%, 12/01/23 | | | 1,205,000 | | | | 1,307,425 | |
| Centurylink, Inc., 7.65%, 3/15/42 | | | 3,030,000 | | | | 3,030,000 | |
| Citizens Communications Co., 9%, 8/15/31 | | | 4,755,000 | | | | 5,064,075 | |
| Frontier Communications Corp., 8.125%, 10/01/18 | | | 1,030,000 | | | | 1,179,350 | |
| Telecom Italia Capital, 6%, 9/30/34 | | | 1,515,000 | | | | 1,484,700 | |
| Telecom Italia S.p.A., 5.303%, 5/30/24 (n) | | | 3,990,000 | | | | 3,870,300 | |
| TW Telecom Holdings, Inc., 5.375%, 10/01/22 | | | 2,580,000 | | | | 2,792,850 | |
| TW Telecom Holdings, Inc., 5.375%, 10/01/22 | | | 1,100,000 | | | | 1,190,750 | |
| Windstream Corp., 7.75%, 10/15/20 | | | 2,615,000 | | | | 2,798,050 | |
| | | | | | | | |
| | | | $ | 27,237,875 | |
| Oil Services - 1.3% | | | | | | | | |
| Bristow Group, Inc., 6.25%, 10/15/22 | | $ | 5,435,000 | | | $ | 5,733,925 | |
| Pacific Drilling S.A., 5.375%, 6/01/20 (n) | | | 4,675,000 | | | | 4,452,938 | |
| Shale-Inland Holdings LLC/Finance Co., 8.75%, 11/15/19 (n) | | | 3,290,000 | | | | 3,409,263 | |
15
Portfolio of Investments (unaudited) – continued
| | | | | | | | |
| Issuer | | Shares/Par | | | Value ($) | |
| | | | | | | | |
| Bonds - continued | | | | | | | | |
| Oil Services - continued | | | | | | | | |
| Unit Corp., 6.625%, 5/15/21 | | $ | 4,525,000 | | | $ | 4,751,250 | |
| | | | | | | | |
| | | | $ | 18,347,376 | |
| Oils - 0.1% | | | | | | | | |
| CITGO Petroleum Corp., 6.25%, 8/15/22 (z) | | $ | 1,475,000 | | | $ | 1,519,250 | |
| | |
| Other Banks & Diversified Financials - 0.4% | | | | | | | | |
| Groupe BPCE S.A., 12.5% to 8/6/19, FRN to 12/31/49 (n) | | $ | 3,791,000 | | | $ | 5,203,148 | |
| | |
| Pharmaceuticals - 1.7% | | | | | | | | |
| Endo Finance LLC/Endo Finco, Inc., 7.25%, 1/15/22 (z) | | $ | 5,255,000 | | | $ | 5,557,163 | |
| Mallinckrodt International Finance S.A., 5.75%, 8/01/22 (n) | | | 3,170,000 | | | | 3,185,850 | |
| Salix Pharmaceuticals Ltd., 6%, 1/15/21 (n) | | | 1,995,000 | | | | 2,084,775 | |
| Valeant Pharmaceuticals International, Inc., 7%, 10/01/20 (n) | | | 6,495,000 | | | | 6,787,275 | |
| Valeant Pharmaceuticals International, Inc., 7.25%, 7/15/22 (n) | | | 3,850,000 | | | | 4,081,000 | |
| Vantage Point Imaging, 7.5%, 7/15/21 (n) | | | 2,850,000 | | | | 3,078,000 | |
| | | | | | | | |
| | | | $ | 24,774,063 | |
| Precious Metals & Minerals - 0.6% | | | | | | | | |
| Aurico Gold, Inc., 7.75%, 4/01/20 (z) | | $ | 2,550,000 | | | $ | 2,581,875 | |
| Eldorado Gold Corp., 6.125%, 12/15/20 (n) | | | 4,155,000 | | | | 4,248,488 | |
| IAMGOLD Corp., 6.75%, 10/01/20 (n) | | | 1,627,000 | | | | 1,496,840 | |
| | | | | | | | |
| | | | $ | 8,327,203 | |
| Printing & Publishing - 0.8% | | | | | | | | |
| American Media, Inc., 13.5%, 6/15/18 (z) | | $ | 297,449 | | | $ | 312,321 | |
| Gannett Co., Inc., 6.375%, 10/15/23 (n) | | | 3,430,000 | | | | 3,618,650 | |
| Gannett Co., Inc., 5.125%, 7/15/20 | | | 1,645,000 | | | | 1,661,450 | |
| Lamar Media Corp., 5%, 5/01/23 | | | 3,160,000 | | | | 3,132,350 | |
| Nielsen Finance LLC, 5%, 4/15/22 (n) | | | 2,765,000 | | | | 2,723,525 | |
| | | | | | | | |
| | | | $ | 11,448,296 | |
| Railroad & Shipping - 0.2% | | | | | | | | |
| Watco Cos. LLC, 6.375%, 4/01/23 (n) | | $ | 2,710,000 | | | $ | 2,750,650 | |
|
| Real Estate - Healthcare - 0.9% | |
| Aviv Healthcare Properties LP/Aviv Healthcare, 6%, 10/15/21 | | $ | 4,880,000 | | | $ | 5,124,000 | |
| MPT Operating Partnership LP, REIT, 6.875%, 5/01/21 | | | 3,435,000 | | | | 3,692,625 | |
| MPT Operating Partnership LP, REIT, 6.375%, 2/15/22 | | | 3,810,000 | | | | 4,057,650 | |
| | | | | | | | |
| | | | $ | 12,874,275 | |
| Real Estate - Other - 1.3% | | | | | | | | |
| CNL Lifestyle Properties, Inc., REIT, 7.25%, 4/15/19 | | $ | 3,105,000 | | | $ | 3,167,100 | |
| DuPont Fabros Technology LP, REIT, 5.875%, 9/15/21 | | | 6,085,000 | | | | 6,206,700 | |
16
Portfolio of Investments (unaudited) – continued
| | | | | | | | |
| Issuer | | Shares/Par | | | Value ($) | |
| | | | | | | | |
| Bonds - continued | | | | | | | | |
| Real Estate - Other - continued | | | | | | | | |
| ERP Properties, REIT, 7.75%, 7/15/20 | | $ | 3,050,000 | | | $ | 3,698,833 | |
| ERP Properties, REIT, 5.75%, 8/15/22 | | | 815,000 | | | | 884,828 | |
| Felcor Lodging LP, REIT, 5.625%, 3/01/23 | | | 4,255,000 | | | | 4,255,000 | |
| | | | | | | | |
| | | | $ | 18,212,461 | |
| Retailers - 1.8% | | | | | | | | |
| Best Buy Co., Inc., 5.5%, 3/15/21 | | $ | 5,555,000 | | | $ | 5,707,763 | |
| Bon Ton Stores, Inc., 8%, 6/15/21 | | | 2,990,000 | | | | 2,720,900 | |
| Burlington Coat Factory Warehouse Corp., 10%, 2/15/19 | | | 3,540,000 | | | | 3,887,380 | |
| Jo-Ann Stores Holdings, Inc., 9.75%, 10/15/19 (n)(p) | | | 3,060,000 | | | | 3,090,600 | |
| Limited Brands, Inc., 7%, 5/01/20 | | | 1,520,000 | | | | 1,717,600 | |
| Limited Brands, Inc., 6.95%, 3/01/33 | | | 1,080,000 | | | | 1,123,200 | |
| Rite Aid Corp., 9.25%, 3/15/20 | | | 4,640,000 | | | | 5,196,800 | |
| Sally Beauty Holdings, Inc., 6.875%, 11/15/19 | | | 1,755,000 | | | | 1,869,075 | |
| | | | | | | | |
| | | | $ | 25,313,318 | |
| Specialty Chemicals - 0.3% | | | | | | | | |
| Chemtura Corp., 5.75%, 7/15/21 | | $ | 4,245,000 | | | $ | 4,329,900 | |
| | |
| Specialty Stores - 0.5% | | | | | | | | |
| Group 1 Automotive, Inc., 5%, 6/01/22 (n) | | $ | 3,340,000 | | | $ | 3,289,900 | |
| Men’s Wearhouse, Inc., 7%, 7/01/22 (z) | | | 1,510,000 | | | | 1,570,400 | |
| Michaels Stores, Inc., 5.875%, 12/15/20 (n) | | | 2,905,000 | | | | 2,861,425 | |
| | | | | | | | |
| | | | $ | 7,721,725 | |
| Telecommunications - Wireless - 4.2% | | | | | | | | |
| Crown Castle International Corp., 4.875%, 4/15/22 | | $ | 1,445,000 | | | $ | 1,430,550 | |
| Crown Castle International Corp., 5.25%, 1/15/23 | | | 3,860,000 | | | | 3,898,600 | |
| Digicel Group Ltd., 8.25%, 9/01/17 (n) | | | 3,050,000 | | | | 3,118,625 | |
| Digicel Group Ltd., 8.25%, 9/30/20 (n) | | | 1,430,000 | | | | 1,540,825 | |
| Digicel Group Ltd., 6%, 4/15/21 (n) | | | 1,535,000 | | | | 1,561,863 | |
| Digicel Group Ltd., 7.125%, 4/01/22 (n) | | | 2,189,000 | | | | 2,221,835 | |
| Eileme 2 AB, 11.625%, 1/31/20 (n) | | | 2,149,000 | | | | 2,522,389 | |
| Sprint Capital Corp., 6.875%, 11/15/28 | | | 4,745,000 | | | | 4,626,375 | |
| Sprint Corp., 7.875%, 9/15/23 (n) | | | 4,665,000 | | | | 4,991,550 | |
| Sprint Corp., 7.125%, 6/15/24 (n) | | | 5,175,000 | | | | 5,278,500 | |
| Sprint Nextel Corp., 9%, 11/15/18 (n) | | | 2,120,000 | | | | 2,485,700 | |
| Sprint Nextel Corp., 6%, 11/15/22 | | | 3,600,000 | | | | 3,546,000 | |
| T-Mobile USA, Inc., 6.125%, 1/15/22 | | | 565,000 | | | | 581,244 | |
| T-Mobile USA, Inc., 6.5%, 1/15/24 | | | 1,715,000 | | | | 1,787,888 | |
| T-Mobile USA, Inc., 6.464%, 4/28/19 | | | 1,760,000 | | | | 1,834,800 | |
| T-Mobile USA, Inc., 6.25%, 4/01/21 | | | 6,685,000 | | | | 6,985,825 | |
| T-Mobile USA, Inc., 6.633%, 4/28/21 | | | 3,350,000 | | | | 3,517,500 | |
| Wind Acquisition Finance S.A., 4.75%, 7/15/20 (n) | | | 3,950,000 | | | | 3,861,125 | |
17
Portfolio of Investments (unaudited) – continued
| | | | | | | | |
| Issuer | | Shares/Par | | | Value ($) | |
| | | | | | | | |
| Bonds - continued | | | | | | | | |
| Telecommunications - Wireless - continued | | | | | | | | |
| Wind Acquisition Finance S.A., 7.375%, 4/23/21 (z) | | $ | 4,430,000 | | | $ | 4,618,275 | |
| | | | | | | | |
| | | | $ | 60,409,469 | |
| Telephone Services - 0.2% | | | | | | | | |
| Cogent Communications Group, Inc., 8.375%, 2/15/18 (n) | | $ | 1,240,000 | | | $ | 1,314,400 | |
| Level 3 Financing, Inc., 8.625%, 7/15/20 | | | 1,315,000 | | | | 1,430,063 | |
| | | | | | | | |
| | | | $ | 2,744,463 | |
| Transportation - Services - 2.2% | | | | | | | | |
| Aguila American Resources Ltd., 7.875%, 1/31/18 (n) | | $ | 4,795,000 | | | $ | 5,016,769 | |
| Jack Cooper Holdings Corp., 9.25%, 6/01/20 (n) | | | 5,805,000 | | | | 6,356,475 | |
| Navios Logistics Finance (U.S.), Inc., 7.25%, 5/01/22 (n) | | | 677,000 | | | | 690,540 | |
| Navios Maritime Acquisition Corp., 8.125%, 11/15/21 (n) | | | 3,914,000 | | | | 3,962,925 | |
| Navios Maritime Holding, Inc., 7.375%, 1/15/22 (n) | | | 4,270,000 | | | | 4,344,725 | |
| Stena AB, 7%, 2/01/24 (n) | | | 6,510,000 | | | | 6,868,050 | |
| Syncreon Group BV/Syncre, 8.625%, 11/01/21 (n) | | | 2,545,000 | | | | 2,554,544 | |
| Ultrapetrol (Bahamas) Ltd., 8.875%, 6/15/21 | | | 953,000 | | | | 1,022,093 | |
| | | | | | | | |
| | | | $ | 30,816,121 | |
| Utilities - Electric Power - 1.8% | | | | | | | | |
| AES Corp., 7.375%, 7/01/21 | | $ | 2,560,000 | | | $ | 2,918,400 | |
| Calpine Corp., 5.375%, 1/15/23 | | | 2,225,000 | | | | 2,180,500 | |
| Covanta Holding Corp., 7.25%, 12/01/20 | | | 4,425,000 | | | | 4,734,750 | |
| Covanta Holding Corp., 6.375%, 10/01/22 | | | 1,520,000 | | | | 1,615,000 | |
| InterGen N.V., 7%, 6/30/23 (n) | | | 2,775,000 | | | | 2,761,125 | |
| NRG Energy, Inc., 8.25%, 9/01/20 | | | 4,950,000 | | | | 5,321,250 | |
| NRG Energy, Inc., 6.25%, 7/15/22 (n) | | | 1,740,000 | | | | 1,792,200 | |
| NRG Energy, Inc., 6.625%, 3/15/23 | | | 4,080,000 | | | | 4,202,400 | |
| | | | | | | | |
| | | | $ | 25,525,625 | |
| Total Bonds (Identified Cost, $1,284,177,471) | | | $ | 1,296,593,379 | |
| | |
| Floating Rate Loans (g)(r) - 3.7% | | | | | | | | |
| Aerospace - 0.2% | | | | | | | | |
| TransDigm, Inc., Term Loan C, 3.75%, 2/28/20 | | $ | 2,864,098 | | | $ | 2,843,640 | |
| | |
| Building - 0.4% | | | | | | | | |
| ABC Supply Co., Inc., Term Loan B, 3.5%, 4/16/20 | | $ | 4,227,594 | | | $ | 4,197,870 | |
| HD Supply, Term Loan B, 6/28/18 (o) | | | 2,319,361 | | | | 2,316,462 | |
| | | | | | | | |
| | | | $ | 6,514,332 | |
| Cable TV - 0.2% | | | | | | | | |
| Cequel Communications LLC, Term Loan, 2/14/19 (o) | | $ | 2,325,940 | | | $ | 2,310,433 | |
18
Portfolio of Investments (unaudited) – continued
| | | | | | | | |
| Issuer | | Shares/Par | | | Value ($) | |
| | | | | | | | |
| Floating Rate Loans (g)(r) - continued | | | | | | | | |
| Conglomerates - 0.5% | | | | | | | | |
| Entegris, Inc., Term Loan B, 3.5%, 2/04/21 | | $ | 3,809,837 | | | $ | 3,771,739 | |
| Silver II U.S. Holdings LLC, Term Loan B, 4%, 12/13/19 | | | 2,804,308 | | | | 2,791,602 | |
| | | | | | | | |
| | | | $ | 6,563,341 | |
| Consumer Services - 0.2% | | | | | | | | |
| Realogy Corp., Term Loan B, 3.75%, 3/05/20 | | $ | 2,775,739 | | | $ | 2,774,873 | |
| | |
| Containers - 0.1% | | | | | | | | |
| Berry Plastics, Term Loan E, 1/06/21 (o) | | $ | 2,164,128 | | | $ | 2,143,164 | |
| | |
| Electronics - 0.3% | | | | | | | | |
| Avago Technologies Ltd., Term Loan B, 3.75%, 5/06/21 | | $ | 3,808,811 | | | $ | 3,799,860 | |
| | |
| Energy - Independent - 0.1% | | | | | | | | |
| MEG Energy Corp., Term Loan B, 3.75%, 3/31/20 | | $ | 1,612,289 | | | $ | 1,611,425 | |
| | |
| Entertainment - 0.1% | | | | | | | | |
| Cedar Fair LP, Term Loan B, 3.25%, 3/06/20 | | $ | 1,503,073 | | | $ | 1,507,567 | |
| | |
| Food & Beverages - 0.1% | | | | | | | | |
| H.J. Heinz Co., Term Loan B2, 3.5%, 6/07/20 | | $ | 1,027,119 | | | $ | 1,026,569 | |
| | |
| Gaming & Lodging - 0.3% | | | | | | | | |
| Hilton Worldwide, Term Loan B, 3.5%, 10/25/20 | | $ | 3,834,534 | | | $ | 3,814,564 | |
| | |
| Medical & Health Technology & Services - 0.1% | | | | | | | | |
| Community Health Systems, Inc., Term Loan, 4.25%, 1/16/21 | | $ | 653,155 | | | $ | 654,425 | |
| Davita Healthcare, Term Loan B, 3.5%, 5/29/21 | | | 1,481,536 | | | | 1,478,097 | |
| | | | | | | | |
| | | | $ | 2,132,522 | |
| Metals & Mining - 0.1% | | | | | | | | |
| Fortescue Metals Group Ltd., Term Loan B, 4.25%, 6/30/19 | | $ | 2,018,849 | | | $ | 2,011,279 | |
| | |
| Printing & Publishing - 0.2% | | | | | | | | |
| CBS Outdoor, Term Loan B, 3%, 1/31/21 | | $ | 2,698,235 | | | $ | 2,681,371 | |
| | |
| Retailers - 0.1% | | | | | | | | |
| Rite Aid Corp., Term Loan, 4.87%, 6/21/21 | | $ | 1,149,016 | | | $ | 1,159,070 | |
| | |
| Specialty Stores - 0.2% | | | | | | | | |
| Mens Wearhouse, Inc., Term Loan B, 4.5%, 4/16/21 | | $ | 3,076,336 | | | $ | 3,099,408 | |
| | |
| Transportation - Services - 0.3% | | | | | | | | |
| American Commercial Lines, Inc., Term Loan, 7.5%, 9/15/19 | | $ | 4,104,700 | | | $ | 4,120,093 | |
19
Portfolio of Investments (unaudited) – continued
| | | | | | | | |
| Issuer | | Shares/Par | | | Value ($) | |
| | | | | | | | |
| Floating Rate Loans (g)(r) - continued | | | | | | | | |
| Utilities - Electric Power - 0.2% | |
| Calpine Construction Finance Co., Term Loan B, 3%, 5/03/20 | | $ | 3,595,367 | | | $ | 3,520,652 | |
| Total Floating Rate Loans (Identified Cost, $53,811,689) | | | $ | 53,634,163 | |
| | |
| Common Stocks - 0.0% | | | | | | | | |
| Automotive - 0.0% | | | | | | | | |
| Accuride Corp. (a) | | | 65,068 | | | $ | 325,340 | |
| | |
| Printing & Publishing - 0.0% | | | | | | | | |
| American Media Operations, Inc. (a) | | | 76,223 | | | $ | 13,682 | |
| Total Common Stocks (Identified Cost, $2,168,949) | | | $ | 339,022 | |
| | |
| Convertible Bonds - 0.1% | | | | | | | | |
| Network & Telecom - 0.1% | | | | | | | | |
Nortel Networks Corp., 2.125%, 4/15/15
(Identified Cost, $821,790) (a)(d) | | $ | 828,000 | | | $ | 840,420 | |
| | |
| Preferred Stocks - 0.2% | | | | | | | | |
| Other Banks & Diversified Financials - 0.2% | | | | | | | | |
| Ally Financial, Inc., 7% (Identified Cost, $2,370,188) (z) | | | 2,489 | | | $ | 2,476,555 | |
| | |
| Money Market Funds - 3.6% | | | | | | | | |
MFS Institutional Money Market Portfolio, 0.09%,
at Cost and Net Asset Value (v) | | | 50,845,650 | | | $ | 50,845,650 | |
| Total Investments (Identified Cost, $1,394,195,737) | | | $ | 1,404,729,189 | |
| |
| Other Assets, Less Liabilities - 1.3% | | | | 18,768,800 | |
| Net Assets - 100.0% | | | $ | 1,423,497,989 | |
| (a) | Non-income producing security. |
| (d) | In default. Interest and/or scheduled principal payment(s) have been missed. |
| (g) | The rate shown represents a weighted average coupon rate on settled positions at period end, unless otherwise indicated. |
| (i) | Interest only security for which the fund receives interest on notional principal (Par amount). Par amount shown is the notional principal and does not reflect the cost of the security. |
| (n) | Securities exempt from registration under Rule 144A of the Securities Act of 1933. These securities may be sold in the ordinary course of business in transactions exempt from registration, normally to qualified institutional buyers. At period end, the aggregate value of these securities was $446,619,178 representing 31.4% of net assets. |
| (o) | All or a portion of this position has not settled. Upon settlement date, interest rates for unsettled amounts will be determined. The rate shown, if any, represents the weighted average coupon rate for settled amounts. |
20
Portfolio of Investments (unaudited) – continued
| (p) | Payment-in-kind security for which interest income may be received in additional securities and/or cash. During the period, the following amount of interest income was received in additional securities and/or cash: |
| | | | | | |
| Payment-in-kind Securities | | Cash | | Additional
Securities | |
| Jo-Ann Stores Holdings, Inc., 9.75%, 10/15/19 | | $149,175 | | | $— | |
| Schaeffler Finance B.V., 6.875%, 8/15/18 | | — | | | — | |
| Total | | $149,175 | | | $— | |
| (q) | Interest received was less than stated coupon rate. |
| (r) | Remaining maturities of floating rate loans may be less than stated maturities shown as a result of contractual or optional prepayments by the borrower. Such prepayments cannot be predicted with certainty. These loans may be subject to restrictions on resale. Floating rate loans generally have rates of interest which are determined periodically by reference to a base lending rate plus a premium. |
| (v) | Underlying affiliated fund that is available only to investment companies managed by MFS. The rate quoted for the MFS Institutional Money Market Portfolio is the annualized seven-day yield of the fund at period end. |
| (z) | Restricted securities are not registered under the Securities Act of 1933 and are subject to legal restrictions on resale. These securities generally may be resold in transactions exempt from registration or to the public if the securities are subsequently registered. Disposal of these securities may involve time-consuming negotiations and prompt sale at an acceptable price may be difficult. The fund holds the following restricted securities: |
| | | | | | | | | | |
| Restricted Securities | | Acquisition
Date | |
Cost | | | Value | |
| Advanced Micro Devices, Inc., 7%, 7/01/24 | | 6/02/14 | | | $1,165,000 | | | | $1,135,875 | |
| Ally Financial, Inc., 7% (Preferred Stock) | | 4/13/11-11/27/12 | | | 2,370,188 | | | | 2,476,555 | |
| American Energy-Permian Basin LLC, 7.125%, 11/01/20 | | 7/16/14 | | | 1,790,000 | | | | 1,727,350 | |
| American Energy-Permian Basin LLC, 7.375%, 11/01/21 | | 7/16/14 | | | 1,495,000 | | | | 1,442,675 | |
| American Media, Inc., 13.5%, 6/15/18 | | 12/28/10 | | | 300,469 | | | | 312,321 | |
| Ardagh Packaging Finance PLC, 6%, 6/30/21 | | 6/20/14-6/24/14 | | | 2,865,552 | | | | 2,716,975 | |
| Athlon Holdings LP/Athlon Finance Corp., 6%, 5/01/22 | | 4/16/14-5/13/14 | | | 4,136,651 | | | | 4,090,200 | |
| Aurico Gold, Inc., 7.75%, 4/01/20 | | 6/27/14-7/15/14 | | | 2,568,331 | | | | 2,581,875 | |
| Baytex Energy Corp., 5.125%, 6/01/21 | | 5/29/14 | | | 585,000 | | | | 580,613 | |
| Baytex Energy Corp., 5.625%, 6/01/24 | | 5/29/14-6/05/14 | | | 3,002,843 | | | | 2,940,225 | |
| CHS/Community Health Systems, Inc., 5.125%, 8/01/21 | | 1/15/14 | | | 840,000 | | | | 846,300 | |
| CHS/Community Health Systems, Inc., 6.875%, 2/01/22 | | 1/15/14-4/24/14 | | | 7,191,954 | | | | 7,142,163 | |
| CITGO Petroleum Corp., 6.25%, 8/15/22 | | 7/23/14 | | | 1,475,000 | | | | 1,519,250 | |
| CW Capital Cobalt Commercial Mortgage Trust, “E2”, CDO, 6%, 5/25/45 | | 3/20/06-5/25/14 | | | 1,348,101 | | | | 192,996 | |
| CW Capital Cobalt Commercial Mortgage Trust, “F”, CDO, FRN, 1.535%, 4/26/50 | | 4/12/06-4/26/14 | | | 657,150 | | | | 7 | |
21
Portfolio of Investments (unaudited) – continued
| | | | | | | | | | |
| Restricted Securities – continued | | Acquisition
Date | |
Cost | | | Value | |
| CW Capital Cobalt Commercial Mortgage Trust, “G”, CDO, FRN, 1.735%, 4/26/50 | | 4/12/06-4/26/14 | | | $2,054,697 | | | | $21 | |
| Endo Finance LLC/Endo Finco, Inc., 7.25%, 1/15/22 | | 9/24/13-6/02/14 | | | 5,601,681 | | | | 5,557,163 | |
| Falcon Franchise Loan LLC, FRN, 16.08%, 1/05/25 | | 1/29/03 | | | 54,276 | | | | 245,242 | |
| G-Force LLC, CDO, “A2”, 4.83%, 8/22/36 | | 2/14/11 | | | 1,843 | | | | 1,936 | |
| Garda World Security Corp., 7.25%, 11/15/21 | | 5/21/14-5/22/14 | | | 1,270,645 | | | | 1,221,000 | |
| Garda World Security Corp., 7.25%, 11/15/21 | | 4/24/14 | | | 3,053,429 | | | | 2,955,838 | |
| Light Tower Rentals, Inc., 8.125%, 8/01/19 | | 7/16/14 | | | 1,785,000 | | | | 1,816,238 | |
| Men’s Wearhouse, Inc., 7%, 7/01/22 | | 6/11/14-6/20/14 | | | 1,560,915 | | | | 1,570,400 | |
| Micron Technology, Inc., 5.5%, 2/01/25 | | 7/23/14 | | | 2,290,000 | | | | 2,278,550 | |
| Morgan Stanley Capital I, Inc., FRN, 1.414%, 4/28/39 | | 7/20/04 | | | 285,614 | | | | 34,903 | |
| SIRIUS XM Radio, Inc., 6%, 7/15/24 | | 5/01/14-5/13/14 | | | 2,372,484 | | | | 2,351,700 | |
| Sabine Pass Liquefaction LLC, 5.75%, 5/15/24 | | 12/12/13-5/13/14 | | | 2,130,000 | | | | 2,161,950 | |
| Sanchez Energy Corp., 6.125%, 1/15/23 | | 6/13/14-6/30/14 | | | 3,039,927 | | | | 2,977,538 | |
| Schaeffler Finance B.V., 4.75%, 5/15/21 | | 7/10/14-7/11/14 | | | 2,878,375 | | | | 2,836,925 | |
| Signode Industrial Group, 6.375%, 5/01/22 | | 4/07/14-4/25/14 | | | 3,469,111 | | | | 3,388,400 | |
| Suncoke Energy Partners LP/Suncoke Energy Partners Finance Corp., 7.375%, 2/01/20 | | 4/29/14 | | | 1,513,031 | | | | 1,519,200 | |
| TransDigm, Inc., 6%, 7/15/22 | | 5/20/14 | | | 470,000 | | | | 472,350 | |
| TransDigm, Inc., 6.5%, 7/15/24 | | 5/20/14-5/21/14 | | | 1,984,800 | | | | 1,994,750 | |
| Wind Acquisition Finance S.A., 7.375%, 4/23/21 | | 4/08/14 | | | 4,430,000 | | | | 4,618,275 | |
| Total Restricted Securities | | | | | | | | | $67,707,759 | |
| % of Net assets | | | | | | | | | 4.8% | |
The following abbreviations are used in this report and are defined:
| CDO | | Collateralized Debt Obligation |
| FRN | | Floating Rate Note. Interest rate resets periodically and may not be the rate reported at period end. |
| PLC | | Public Limited Company |
| REIT | | Real Estate Investment Trust |
Abbreviations indicate amounts shown in currencies other than the U.S. dollar. All amounts are stated in U.S. dollars unless otherwise indicated. A list of abbreviations is shown below:
Derivative Contracts at 7/31/14
Forward Foreign Currency Exchange Contracts at 7/31/14
| | | | | | | | | | | | | | | | | | | | | | | | |
| Type | | Currency | | Counter-
party | | Contracts
to
Deliver/
Receive | | | Settlement
Date Range | | | In
Exchange
for | | | Contracts
at Value | | | Net
Unrealized
Appreciation
(Depreciation) | |
| Asset Derivatives | | | | | | | | | | | | | | | |
| SELL | | EUR | | Credit Suisse Group | | | 8,111,201 | | | | 10/10/14 | | | | $11,044,617 | | | | $10,863,796 | | | | $180,821 | |
| | | | | | | | | | | | | | | | | | | | | | | | |
22
Portfolio of Investments (unaudited) – continued
Forward Foreign Currency Exchange Contracts at 7/31/14 - continued
| | | | | | | | | | | | | | | | | | | | | | | | |
| Type | | Currency | | Counter-
party | | Contracts
to
Deliver/
Receive | | | Settlement
Date Range | | | In
Exchange
for | | | Contracts
at Value | | | Net
Unrealized
Appreciation
(Depreciation) | |
| Liability Derivatives | | | | | | | | | | | | | | | |
| BUY | | EUR | | Deutsche Bank AG | | | 2,067,000 | | | | 10/10/14 | | | | $2,820,883 | | | | $2,768,452 | | | | $(52,431 | ) |
| | | | | | | | | | | | | | | | | | | | | | | | |
Futures Contracts Outstanding at 7/31/14
| | | | | | | | | | | | | | | | | | |
| Description | | Currency | | | Contracts | | | Value | | Expiration
Date | | | Unrealized
Appreciation
(Depreciation) | |
| Asset Derivatives | | | | | | | | | | | |
| Interest Rate Futures | | | | | | | | | | | |
| U.S. Treasury Note 10 yr (Short) | | | USD | | | | 110 | | | $13,707,031 | | | September - 2014 | | | | $119,870 | |
| | | | | | | | | | | | | | | | | | |
Swap Agreements at 7/31/14
| | | | | | | | | | | | | | | | | | |
| Expiration | | | | | Notional
Amount | | | Counterparty | | Cash Flows
to Receive | | Cash Flows
to Pay | | Fair
Value | |
| Asset Derivatives | | | | | | | | | | | |
| Credit Default Swap Agreements | | | | | | | | |
| 12/20/17 | | | USD | | | | 12,761,100 | | | Goldman Sachs International (a) | | 5.0% (fixed rate) | | (1) | | | $1,088,369 | |
| 12/20/17 | | | USD | | | | 4,950,000 | | | JPMorgan Chase Bank, N.A. (b) | | 5.0% (fixed rate) | | (1) | | | 422,175 | |
| | | | | | | | | | | | | | | | | | |
| | | | | | | | | | | | | | | | | $1,510,544 | |
| | | | | | | | | | | | | | | | | | |
| (1) | Fund, as protection seller, to pay notional amount upon a defined credit event by a reference obligation specified in the Markit CDX North America Investment Grade Index, a B rated credit default index. The fund entered into the contract to manage market/sector exposure. |
| (a) | Net unamortized premiums paid by the fund amounted to $443,448. |
| (b) | Net unamortized premiums paid by the fund amounted to $175,779. |
The credit ratings presented here are an indicator of the current payment/performance risk of the related swap agreement, the reference obligation for which may be either a single security or, in the case of a credit default index, a basket of securities issued by corporate or sovereign issuers. Ratings are assigned to each reference security, including each individual security within a reference basket of securities, utilizing ratings from Moody’s, Fitch, and Standard & Poor’s rating agencies and applying the following hierarchy: If all three agencies provide a rating, the middle rating (after dropping the highest and lowest ratings) is assigned; if two of the three agencies rate a security, the lower of the two is assigned. Ratings are shown in the S&P and Fitch scale (e.g., AAA). The ratings for a credit default index are calculated by MFS as a weighted average of the external credit ratings of the individual securities that compose the index’s reference basket of securities.
At July 31, 2014, the fund had cash collateral of $521,947 to cover any commitments for certain derivative contracts. Cash collateral is comprised of “Restricted cash” in the Statement of Assets and Liabilities.
See Notes to Financial Statements
23
Financial Statements
STATEMENT OF ASSETS AND LIABILITIES
At 7/31/14 (unaudited)
This statement represents your fund’s balance sheet, which details the assets and liabilities comprising the total value of the fund.
| | | | |
| Assets | | | | |
Investments- | | | | |
Non-affiliated issuers, at value (identified cost, $1,343,350,087) | | | $1,353,883,539 | |
Underlying affiliated funds, at cost and value | | | 50,845,650 | |
Total investments, at value (identified cost, $1,394,195,737) | | | $1,404,729,189 | |
Cash | | | 1,882,648 | |
Restricted cash | | | 521,947 | |
Receivables for | | | | |
Forward foreign currency exchange contracts | | | 180,821 | |
Daily variation margin on open futures contracts | | | 148,155 | |
Investments sold | | | 12,604,894 | |
Fund shares sold | | | 1,304,583 | |
Interest | | | 24,122,908 | |
Swaps, at value (net unamortized premiums paid, $619,227) | | | 1,510,544 | |
Other assets | | | 2,723 | |
Total assets | | | $1,447,008,412 | |
| Liabilities | | | | |
Payables for | | | | |
Distributions | | | $351,145 | |
Forward foreign currency exchange contracts | | | 52,431 | |
Investments purchased | | | 15,332,841 | |
Fund shares reacquired | | | 6,818,123 | |
Payable to affiliates | | | | |
Investment adviser | | | 30,648 | |
Shareholder servicing costs | | | 754,433 | |
Distribution and service fees | | | 12,505 | |
Program manager fees | | | 15 | |
Payable for independent Trustees’ compensation | | | 55,375 | |
Accrued expenses and other liabilities | | | 102,907 | |
Total liabilities | | | $23,510,423 | |
Net assets | | | $1,423,497,989 | |
| Net assets consist of | | | | |
Paid-in capital | | | $1,587,065,499 | |
Unrealized appreciation (depreciation) on investments and translation of assets and liabilities in foreign currencies | | | 11,669,714 | |
Accumulated net realized gain (loss) on investments and foreign currency | | | (172,342,624 | ) |
Accumulated distributions in excess of net investment income | | | (2,894,600 | ) |
Net assets | | | $1,423,497,989 | |
Shares of beneficial interest outstanding | | | 395,890,290 | |
24
Statement of Assets and Liabilities (unaudited) – continued
| | | | | | | | | | | | |
| | | Net assets | | | Shares
outstanding | | | Net asset value per share (a) | |
Class A | | | $464,065,263 | | | | 129,052,328 | | | | $3.60 | |
Class B | | | 30,268,529 | | | | 8,404,012 | | | | 3.60 | |
Class C | | | 73,819,576 | | | | 20,460,542 | | | | 3.61 | |
Class I | | | 73,230,825 | | | | 20,402,992 | | | | 3.59 | |
Class R1 | | | 1,369,966 | | | | 380,468 | | | | 3.60 | |
Class R2 | | | 3,212,450 | | | | 892,932 | | | | 3.60 | |
Class R3 | | | 7,025,519 | | | | 1,954,635 | | | | 3.59 | |
Class R4 | | | 565,606 | | | | 157,250 | | | | 3.60 | |
Class R5 | | | 764,386,951 | | | | 212,641,085 | | | | 3.59 | |
Class 529A | | | 3,413,181 | | | | 949,678 | | | | 3.59 | |
Class 529B | | | 346,532 | | | | 96,390 | | | | 3.60 | |
Class 529C | | | 1,793,591 | | | | 497,978 | | | | 3.60 | |
| (a) | Maximum offering price per share was equal to the net asset value per share for all share classes, except for Classes A and 529A, for which the maximum offering prices per share were $3.78 [100 / 95.25 x $3.60] and $3.77 [100 / 95.25 x $3.59], respectively. On sales of $50,000 or more, the maximum offering prices of Class A and Class 529A shares are reduced. A contingent deferred sales charge may be imposed on redemptions of Class A, Class B, Class C, Class 529B, and Class 529C shares. Redemption price per share was equal to the net asset value per share for Classes I, R1, R2, R3, R4, R5, and 529A. |
See Notes to Financial Statements
25
Financial Statements
STATEMENT OF OPERATIONS
Six months ended 7/31/14 (unaudited)
This statement describes how much your fund earned in investment income and accrued in expenses. It also describes any gains and/or losses generated by fund operations.
| | | | |
| Net investment income | |
Income | | | | |
Interest | | | $43,856,802 | |
Dividends | | | 133,622 | |
Dividends from underlying affiliated funds | | | 21,701 | |
Total investment income | | | $44,012,125 | |
Expenses | | | | |
Management fee | | | $3,201,787 | |
Distribution and service fees | | | 1,155,376 | |
Program manager fees | | | 2,725 | |
Shareholder servicing costs | | | 822,313 | |
Administrative services fee | | | 85,359 | |
Independent Trustees’ compensation | | | 18,314 | |
Custodian fee | | | 95,925 | |
Shareholder communications | | | 31,986 | |
Audit and tax fees | | | 38,114 | |
Legal fees | | | 7,115 | |
Miscellaneous | | | 96,751 | |
Total expenses | | | $5,555,765 | |
Fees paid indirectly | | | (435 | ) |
Reduction of expenses by investment adviser and distributor | | | (50,702 | ) |
Net expenses | | | $5,504,628 | |
Net investment income | | | $38,507,497 | |
Realized and unrealized gain (loss) on investments and
foreign currency | | | | |
Realized gain (loss) (identified cost basis) | | | | |
Investments | | | $15,428,663 | |
Futures contracts | | | (225,317 | ) |
Swap agreements | | | 189,481 | |
Foreign currency | | | 20,169 | |
Net realized gain (loss) on investments and foreign currency | | | $15,412,996 | |
Change in unrealized appreciation (depreciation) | | | | |
Investments | | | $(14,867,843 | ) |
Futures contracts | | | 119,870 | |
Swap agreements | | | 64,390 | |
Translation of assets and liabilities in foreign currencies | | | (8,735 | ) |
Net unrealized gain (loss) on investments and foreign currency translation | | | $(14,692,318 | ) |
Net realized and unrealized gain (loss) on investments and foreign currency | | | $720,678 | |
Change in net assets from operations | | | $39,228,175 | |
See Notes to Financial Statements
26
Financial Statements
STATEMENTS OF CHANGES IN NET ASSETS
These statements describe the increases and/or decreases in net assets resulting from operations, any distributions, and any shareholder transactions.
| | | | | | | | |
| | | Six months ended 7/31/14 | | | Year ended 1/31/14 | |
| Change in net assets | | (unaudited) | | | | |
| From operations | | | | | | | | |
Net investment income | | | $38,507,497 | | | | $73,069,979 | |
Net realized gain (loss) on investments and foreign currency | | | 15,412,996 | | | | 29,577,477 | |
Net unrealized gain (loss) on investments and foreign currency translation | | | (14,692,318 | ) | | | (29,897,478 | ) |
Change in net assets from operations | | | $39,228,175 | | | | $72,749,978 | |
| Distributions declared to shareholders | | | | | | | | |
From net investment income | | | $(40,769,924 | ) | | | $(75,775,810 | ) |
Change in net assets from fund share transactions | | | $75,588,743 | | | | $129,446,682 | |
Total change in net assets | | | $74,046,994 | | | | $126,420,850 | |
| Net assets | | | | | | | | |
At beginning of period | | | 1,349,450,995 | | | | 1,223,030,145 | |
At end of period (including accumulated distributions in excess of net investment income of $2,894,600 and $632,173, respectively) | | | $1,423,497,989 | | | | $1,349,450,995 | |
See Notes to Financial Statements
27
Financial Statements
FINANCIAL HIGHLIGHTS
The financial highlights table is intended to help you understand the fund’s financial performance for the semiannual period and the past 5 fiscal years (or life of a particular share class, if shorter). Certain information reflects financial results for a single fund share. The total returns in the table represent the rate by which an investor would have earned (or lost) on an investment in the fund share class (assuming reinvestment of all distributions) held for the entire period.
| | | | | | | | | | | | | | | | | | | | | | | | |
| | | Six months ended 7/31/14 | | | Years ended 1/31 | |
| Class A | | | 2014 | | | 2013 | | | 2012 | | | 2011 | | | 2010 | |
| | | (unaudited) | | | | | | | | | | | | | | | | |
Net asset value, beginning of period | | | $3.60 | | | | $3.61 | | | | $3.44 | | | | $3.52 | | | | $3.26 | | | | $2.49 | |
| Income (loss) from investment operations | | | | | | | | | | | | | |
Net investment income (d) | | | $0.10 | | | | $0.20 | | | | $0.22 | | | | $0.23 | | | | $0.25 | | | | $0.25 | |
Net realized and unrealized gain (loss)
on investments and foreign currency | | | 0.00 | (w) | | | (0.00 | )(w) | | | 0.18 | | | | (0.07 | ) | | | 0.26 | | | | 0.77 | |
Total from investment operations | | | $0.10 | | | | $0.20 | | | | $0.40 | | | | $0.16 | | | | $0.51 | | | | $1.02 | |
| Less distributions declared to shareholders | | | | | | | | | | | | | |
From net investment income | | | $(0.10 | ) | | | $(0.21 | ) | | | $(0.23 | ) | | | $(0.24 | ) | | | $(0.25 | ) | | | $(0.25 | ) |
Net asset value, end of period (x) | | | $3.60 | | | | $3.60 | | | | $3.61 | | | | $3.44 | | | | $3.52 | | | | $3.26 | |
Total return (%) (r)(s)(t)(x) | | | 2.88 | (n) | | | 5.71 | | | | 12.05 | | | | 4.77 | | | | 16.22 | | | | 42.99 | |
Ratios (%) (to average net assets)
and Supplemental data: | | | | | | | | | | | | | | | | | | | | | |
Expenses before expense reductions (f) | | | 0.92 | (a) | | | 0.93 | | | | 0.93 | | | | 0.93 | | | | 0.93 | | | | 1.00 | |
Expenses after expense reductions (f) | | | 0.91 | (a) | | | 0.92 | | | | 0.93 | | | | 0.92 | | | | 0.93 | | | | 1.00 | |
Net investment income | | | 5.42 | (a) | | | 5.64 | | | | 6.39 | | | | 6.76 | | | | 7.53 | | | | 8.68 | |
Portfolio turnover | | | 27 | (n) | | | 46 | | | | 38 | | | | 60 | | | | 66 | | | | 58 | |
Net assets at end of period (000 omitted) | | | $464,065 | | | | $457,198 | | | | $504,600 | | | | $462,232 | | | | $501,139 | | | | $531,990 | |
See Notes to Financial Statements
28
Financial Highlights – continued
| | | | | | | | | | | | | | | | | | | | | | | | |
| | | Six months ended 7/31/14 | | | Years ended 1/31 | |
| Class B | | | 2014 | | | 2013 | | | 2012 | | | 2011 | | | 2010 | |
| | | (unaudited) | | | | | | | | | | | | | | | | |
Net asset value, beginning of period | | | $3.60 | | | | $3.61 | | | | $3.44 | | | | $3.53 | | | | $3.26 | | | | $2.50 | |
| Income (loss) from investment operations | | | | | | | | | | | | | |
Net investment income (d) | | | $0.08 | | | | $0.17 | | | | $0.20 | | | | $0.21 | | | | $0.23 | | | | $0.23 | |
Net realized and unrealized gain (loss)
on investments and foreign currency | | | 0.01 | | | | (0.00 | )(w) | | | 0.18 | | | | (0.09 | ) | | | 0.26 | | | | 0.76 | |
Total from investment operations | | | $0.09 | | | | $0.17 | | | | $0.38 | | | | $0.12 | | | | $0.49 | | | | $0.99 | |
| Less distributions declared to shareholders | | | | | | | | | | | | | |
From net investment income | | | $(0.09 | ) | | | $(0.18 | ) | | | $(0.21 | ) | | | $(0.21 | ) | | | $(0.22 | ) | | | $(0.23 | ) |
Net asset value, end of period (x) | | | $3.60 | | | | $3.60 | | | | $3.61 | | | | $3.44 | | | | $3.53 | | | | $3.26 | |
Total return (%) (r)(s)(t)(x) | | | 2.50 | (n) | | | 4.93 | | | | 11.22 | | | | 3.70 | | | | 15.69 | | | | 41.40 | |
Ratios (%) (to average net assets)
and Supplemental data: | | | | | | | | | | | | | | | | | | | | | |
Expenses before expense reductions (f) | | | 1.67 | (a) | | | 1.68 | | | | 1.67 | | | | 1.67 | | | | 1.68 | | | | 1.75 | |
Expenses after expense reductions (f) | | | 1.66 | (a) | | | 1.68 | | | | 1.67 | | | | 1.67 | | | | 1.68 | | | | 1.75 | |
Net investment income | | | 4.66 | (a) | | | 4.86 | | | | 5.59 | | | | 5.99 | | | | 6.78 | | | | 8.11 | |
Portfolio turnover | | | 27 | (n) | | | 46 | | | | 38 | | | | 60 | | | | 66 | | | | 58 | |
Net assets at end of period (000 omitted) | | | $30,269 | | | | $31,175 | | | | $31,656 | | | | $25,983 | | | | $37,772 | | | | $46,690 | |
| | |
| | | Six months ended 7/31/14 | | | Years ended 1/31 | |
| Class C | | | 2014 | | | 2013 | | | 2012 | | | 2011 | | | 2010 | |
| | | (unaudited) | | | | | | | | | | | | | | | | |
Net asset value, beginning of period | | | $3.61 | | | | $3.62 | | | | $3.45 | | | | $3.53 | | | | $3.27 | | | | $2.50 | |
| Income (loss) from investment operations | | | | | | | | | | | | | |
Net investment income (d) | | | $0.08 | | | | $0.17 | | | | $0.20 | | | | $0.21 | | | | $0.23 | | | | $0.23 | |
Net realized and unrealized gain (loss)
on investments and foreign currency | | | 0.01 | | | | (0.00 | )(w) | | | 0.18 | | | | (0.08 | ) | | | 0.25 | | | | 0.77 | |
Total from investment operations | | | $0.09 | | | | $0.17 | | | | $0.38 | | | | $0.13 | | | | $0.48 | | | | $1.00 | |
| Less distributions declared to shareholders | | | | | | | | | | | | | |
From net investment income | | | $(0.09 | ) | | | $(0.18 | ) | | | $(0.21 | ) | | | $(0.21 | ) | | | $(0.22 | ) | | | $(0.23 | ) |
Net asset value, end of period (x) | | | $3.61 | | | | $3.61 | | | | $3.62 | | | | $3.45 | | | | $3.53 | | | | $3.27 | |
Total return (%) (r)(s)(t)(x) | | | 2.50 | (n) | | | 4.93 | | | | 11.21 | | | | 4.00 | | | | 15.34 | | | | 41.82 | |
Ratios (%) (to average net assets)
and Supplemental data: | | | | | | | | | | | | | | | | | | | | | |
Expenses before expense reductions (f) | | | 1.67 | (a) | | | 1.68 | | | | 1.67 | | | | 1.67 | | | | 1.68 | | | | 1.74 | |
Expenses after expense reductions (f) | | | 1.66 | (a) | | | 1.68 | | | | 1.67 | | | | 1.67 | | | | 1.68 | | | | 1.74 | |
Net investment income | | | 4.64 | (a) | | | 4.86 | | | | 5.61 | | | | 5.99 | | | | 6.74 | | | | 7.80 | |
Portfolio turnover | | | 27 | (n) | | | 46 | | | | 38 | | | | 60 | | | | 66 | | | | 58 | |
Net assets at end of period (000 omitted) | | | $73,820 | | | | $76,490 | | | | $81,710 | | | | $75,309 | | | | $80,802 | | | | $73,475 | |
See Notes to Financial Statements
29
Financial Highlights – continued
| | | | | | | | | | | | | | | | | | | | | | | | |
| | | Six months
ended
7/31/14 | | | Years ended 1/31 | |
| Class I | | | 2014 | | | 2013 | | | 2012 | | | 2011 | | | 2010 | |
| | | (unaudited) | | | | | | | | | | | | | | | | |
Net asset value, beginning of period | | | $3.59 | | | | $3.60 | | | | $3.44 | | | | $3.52 | | | | $3.25 | | | | $2.49 | |
| Income (loss) from investment operations | | | | | | | | | | | | | |
Net investment income (d) | | | $0.10 | | | | $0.21 | | | | $0.24 | | | | $0.24 | | | | $0.26 | | | | $0.26 | |
Net realized and unrealized gain (loss)
on investments and foreign currency | | | 0.01 | | | | (0.00 | )(w) | | | 0.16 | | | | (0.07 | ) | | | 0.27 | | | | 0.76 | |
Total from investment operations | | | $0.11 | | | | $0.21 | | | | $0.40 | | | | $0.17 | | | | $0.53 | | | | $1.02 | |
| Less distributions declared to shareholders | | | | | | | | | | | | | |
From net investment income | | | $(0.11 | ) | | | $(0.22 | ) | | | $(0.24 | ) | | | $(0.25 | ) | | | $(0.26 | ) | | | $(0.26 | ) |
Net asset value, end of period (x) | | | $3.59 | | | | $3.59 | | | | $3.60 | | | | $3.44 | | | | $3.52 | | | | $3.25 | |
Total return (%) (r)(s)(x) | | | 3.01 | (n) | | | 5.98 | | | | 12.02 | | | | 5.03 | | | | 16.86 | | | | 42.90 | |
Ratios (%) (to average net assets)
and Supplemental data: | | | | | | | | | | | | | | | | | | | | | |
Expenses before expense reductions (f) | | | 0.67 | (a) | | | 0.68 | | | | 0.67 | | | | 0.68 | | | | 0.68 | | | | 0.75 | |
Expenses after expense reductions (f) | | | 0.66 | (a) | | | 0.68 | | | | 0.67 | | | | 0.68 | | | | 0.68 | | | | 0.75 | |
Net investment income | | | 5.66 | (a) | | | 5.88 | | | | 6.86 | | | | 7.02 | | | | 7.75 | | | | 8.97 | |
Portfolio turnover | | | 27 | (n) | | | 46 | | | | 38 | | | | 60 | | | | 66 | | | | 58 | |
Net assets at end of period (000 omitted) | | | $73,231 | | | | $67,027 | | | | $70,506 | | | | $448,607 | | | | $386,185 | | | | $283,704 | |
| | |
| | | Six months
ended
7/31/14 | | | Years ended 1/31 | |
| Class R1 | | | 2014 | | | 2013 | | | 2012 | | | 2011 | | | 2010 | |
| | | (unaudited) | | | | | | | | | | | | | | | | |
Net asset value, beginning of period | | | $3.60 | | | | $3.61 | | | | $3.44 | | | | $3.52 | | | | $3.26 | | | | $2.50 | |
| Income (loss) from investment operations | | | | | | | | | | | | | |
Net investment income (d) | | | $0.08 | | | | $0.17 | | | | $0.20 | | | | $0.21 | | | | $0.23 | | | | $0.23 | |
Net realized and unrealized gain (loss)
on investments and foreign currency | | | 0.01 | | | | (0.00 | )(w) | | | 0.18 | | | | (0.08 | ) | | | 0.25 | | | | 0.76 | |
Total from investment operations | | | $0.09 | | | | $0.17 | | | | $0.38 | | | | $0.13 | | | | $0.48 | | | | $0.99 | |
| Less distributions declared to shareholders | | | | | | | | | | | | | |
From net investment income | | | $(0.09 | ) | | | $(0.18 | ) | | | $(0.21 | ) | | | $(0.21 | ) | | | $(0.22 | ) | | | $(0.23 | ) |
Net asset value, end of period (x) | | | $3.60 | | | | $3.60 | | | | $3.61 | | | | $3.44 | | | | $3.52 | | | | $3.26 | |
Total return (%) (r)(s)(x) | | | 2.49 | (n) | | | 4.93 | | | | 11.22 | | | | 4.00 | | | | 15.36 | | | | 41.39 | |
Ratios (%) (to average net assets)
and Supplemental data: | | | | | | | | | | | | | | | | | | | | | |
Expenses before expense reductions (f) | | | 1.67 | (a) | | | 1.68 | | | | 1.68 | | | | 1.67 | | | | 1.68 | | | | 1.74 | |
Expenses after expense reductions (f) | | | 1.66 | (a) | | | 1.68 | | | | 1.68 | | | | 1.67 | | | | 1.68 | | | | 1.74 | |
Net investment income | | | 4.65 | (a) | | | 4.87 | | | | 5.65 | | | | 6.01 | | | | 6.78 | | | | 7.96 | |
Portfolio turnover | | | 27 | (n) | | | 46 | | | | 38 | | | | 60 | | | | 66 | | | | 58 | |
Net assets at end of period (000 omitted) | | | $1,370 | | | | $1,199 | | | | $1,137 | | | | $1,201 | | | | $1,138 | | | | $1,200 | |
See Notes to Financial Statements
30
Financial Highlights – continued
| | | | | | | | | | | | | | | | | | | | | | | | |
| | | Six months ended 7/31/14 | | | Years ended 1/31 | |
| Class R2 | | | 2014 | | | 2013 | | | 2012 | | | 2011 | | | 2010 | |
| | | (unaudited) | | | | | | | | | | | | | | | | |
Net asset value, beginning of period | | | $3.60 | | | | $3.61 | | | | $3.44 | | | | $3.52 | | | | $3.26 | | | | $2.49 | |
| Income (loss) from investment operations | | | | | | | | | | | | | |
Net investment income (d) | | | $0.09 | | | | $0.19 | | | | $0.22 | | | | $0.22 | | | | $0.24 | | | | $0.24 | |
Net realized and unrealized gain (loss)
on investments and foreign currency | | | 0.01 | | | | (0.00 | )(w) | | | 0.17 | | | | (0.07 | ) | | | 0.26 | | | | 0.78 | |
Total from investment operations | | | $0.10 | | | | $0.19 | | | | $0.39 | | | | $0.15 | | | | $0.50 | | | | $1.02 | |
| Less distributions declared to shareholders | | | | | | | | | | | | | |
From net investment income | | | $(0.10 | ) | | | $(0.20 | ) | | | $(0.22 | ) | | | $(0.23 | ) | | | $(0.24 | ) | | | $(0.25 | ) |
Net asset value, end of period (x) | | | $3.60 | | | | $3.60 | | | | $3.61 | | | | $3.44 | | | | $3.52 | | | | $3.26 | |
Total return (%) (r)(s)(x) | | | 2.75 | (n) | | | 5.45 | | | | 11.77 | | | | 4.51 | | | | 15.93 | | | | 42.65 | |
Ratios (%) (to average net assets)
and Supplemental data: | | | | | | | | | | | | | | | | | | | | | |
Expenses before expense reductions (f) | | | 1.17 | (a) | | | 1.18 | | | | 1.18 | | | | 1.18 | | | | 1.18 | | | | 1.25 | |
Expenses after expense reductions (f) | | | 1.16 | (a) | | | 1.18 | | | | 1.18 | | | | 1.17 | | | | 1.18 | | | | 1.25 | |
Net investment income | | | 5.16 | (a) | | | 5.38 | | | | 6.18 | | | | 6.52 | | | | 7.27 | | | | 8.47 | |
Portfolio turnover | | | 27 | (n) | | | 46 | | | | 38 | | | | 60 | | | | 66 | | | | 58 | |
Net assets at end of period (000 omitted) | | | $3,212 | | | | $3,469 | | | | $4,103 | | | | $5,639 | | | | $5,653 | | | | $5,251 | |
| | |
| | | Six months ended 7/31/14 | | | Years ended 1/31 | |
| Class R3 | | | 2014 | | | 2013 | | | 2012 | | | 2011 | | | 2010 | |
| | | (unaudited) | | | | | | | | | | | | | | | | |
Net asset value, beginning of period | | | $3.60 | | | | $3.61 | | | | $3.44 | | | | $3.52 | | | | $3.25 | | | | $2.49 | |
| Income (loss) from investment operations | | | | | | | | | | | | | |
Net investment income (d) | | | $0.10 | | | | $0.20 | | | | $0.22 | | | | $0.23 | | | | $0.25 | | | | $0.25 | |
Net realized and unrealized gain (loss)
on investments and foreign currency | | | (0.01 | )(g) | | | (0.00 | )(w) | | | 0.18 | | | | (0.07 | ) | | | 0.27 | | | | 0.76 | |
Total from investment operations | | | $0.09 | | | | $0.20 | | | | $0.40 | | | | $0.16 | | | | $0.52 | | | | $1.01 | |
| Less distributions declared to shareholders | | | | | | | | | | | | | |
From net investment income | | | $(0.10 | ) | | | $(0.21 | ) | | | $(0.23 | ) | | | $(0.24 | ) | | | $(0.25 | ) | | | $(0.25 | ) |
Net asset value, end of period (x) | | | $3.59 | | | | $3.60 | | | | $3.61 | | | | $3.44 | | | | $3.52 | | | | $3.25 | |
Total return (%) (r)(s)(x) | | | 2.59 | (n) | | | 5.71 | | | | 12.05 | | | | 4.77 | | | | 16.58 | | | | 42.55 | |
Ratios (%) (to average net assets)
and Supplemental data: | | | | | | | | | | | | | | | | | | | | | |
Expenses before expense reductions (f) | | | 0.92 | (a) | | | 0.93 | | | | 0.93 | | | | 0.93 | | | | 0.93 | | | | 1.00 | |
Expenses after expense reductions (f) | | | 0.91 | (a) | | | 0.93 | | | | 0.93 | | | | 0.93 | | | | 0.93 | | | | 1.00 | |
Net investment income | | | 5.43 | (a) | | | 5.63 | | | | 6.39 | | | | 6.78 | | | | 7.54 | | | | 8.75 | |
Portfolio turnover | | | 27 | (n) | | | 46 | | | | 38 | | | | 60 | | | | 66 | | | | 58 | |
Net assets at end of period (000 omitted) | | | $7,026 | | | | $8,046 | | | | $8,183 | | | | $7,376 | | | | $7,281 | | | | $7,929 | |
See Notes to Financial Statements
31
Financial Highlights – continued
| | | | | | | | | | | | | | | | | | | | | | | | |
| | | Six months ended 7/31/14 | | | Years ended 1/31 | |
| Class R4 | | | 2014 | | | 2013 | | | 2012 | | | 2011 | | | 2010 | |
| | | (unaudited) | | | | | | | | | | | | | | | | |
Net asset value, beginning of period | | | $3.60 | | | | $3.61 | | | | $3.44 | | | | $3.52 | | | | $3.26 | | | | $2.49 | |
| Income (loss) from investment operations | | | | | | | | | | | | | |
Net investment income (d) | | | $0.10 | | | | $0.21 | | | | $0.23 | | | | $0.24 | | | | $0.26 | | | | $0.26 | |
Net realized and unrealized gain (loss)
on investments and foreign currency | | | 0.01 | | | | (0.00 | )(w) | | | 0.18 | | | | (0.07 | ) | | | 0.26 | | | | 0.77 | |
Total from investment operations | | | $0.11 | | | | $0.21 | | | | $0.41 | | | | $0.17 | | | | $0.52 | | | | $1.03 | |
| Less distributions declared to shareholders | | | | | | | | | | | | | |
From net investment income | | | $(0.11 | ) | | | $(0.22 | ) | | | $(0.24 | ) | | | $(0.25 | ) | | | $(0.26 | ) | | | $(0.26 | ) |
Net asset value, end of period (x) | | | $3.60 | | | | $3.60 | | | | $3.61 | | | | $3.44 | | | | $3.52 | | | | $3.26 | |
Total return (%) (r)(s)(x) | | | 3.01 | (n) | | | 5.98 | | | | 12.33 | | | | 5.04 | | | | 16.50 | | | | 43.33 | |
Ratios (%) (to average net assets)
and Supplemental data: | | | | | | | | | | | | | | | | | | | | | |
Expenses before expense reductions (f) | | | 0.67 | (a) | | | 0.68 | | | | 0.68 | | | | 0.68 | | | | 0.68 | | | | 0.74 | |
Expenses after expense reductions (f) | | | 0.66 | (a) | | | 0.68 | | | | 0.68 | | | | 0.67 | | | | 0.68 | | | | 0.74 | |
Net investment income | | | 5.65 | (a) | | | 5.86 | | | | 6.65 | | | | 7.02 | | | | 7.72 | | | | 8.78 | |
Portfolio turnover | | | 27 | (n) | | | 46 | | | | 38 | | | | 60 | | | | 66 | | | | 58 | |
Net assets at end of period (000 omitted) | | | $566 | | | | $464 | | | | $302 | | | | $331 | | | | $316 | | | | $148 | |
| | | | | | | | | | | | |
| | | Six months ended 7/31/14 | | | Years ended 1/31 | |
| Class R5 | | | 2014 | | | 2013 (i) | |
| | | (unaudited) | | | | | | | |
Net asset value, beginning of period | | | $3.60 | | | | $3.61 | | | | $3.41 | |
| Income (loss) from investment operations | |
Net investment income (d) | | | $0.10 | | | | $0.21 | | | | $0.15 | |
Net realized and unrealized gain (loss)
on investments and foreign currency | | | 0.00 | (w) | | | (0.00 | )(w) | | | 0.21 | |
Total from investment operations | | | $0.10 | | | | $0.21 | | | | $0.36 | |
| Less distributions declared to shareholders | |
From net investment income | | | $(0.11 | ) | | | $(0.22 | ) | | | $(0.16 | ) |
Net asset value, end of period (x) | | | $3.59 | | | | $3.60 | | | | $3.61 | |
Total return (%) (r)(s)(x) | | | 2.76 | (n) | | | 6.06 | | | | 10.74 | (n) |
Ratios (%) (to average net assets)
and Supplemental data: | | | | | | | | | |
Expenses before expense reductions (f) | | | 0.60 | (a) | | | 0.61 | | | | 0.63 | (a) |
Expenses after expense reductions (f) | | | 0.59 | (a) | | | 0.61 | | | | 0.63 | (a) |
Net investment income | | | 5.72 | (a) | | | 5.93 | | | | 6.37 | (a) |
Portfolio turnover | | | 27 | (n) | | | 46 | | | | 38 | |
Net assets at end of period (000 omitted) | | | $764,387 | | | | $699,123 | | | | $516,399 | |
See Notes to Financial Statements
32
Financial Highlights – continued
| | | | | | | | | | | | | | | | | | | | | | | | |
| | | Six months ended 7/31/14 | | | Years ended 1/31 | |
| Class 529A | | | 2014 | | | 2013 | | | 2012 | | | 2011 | | | 2010 | |
| | | (unaudited) | | | | | | | | | | | | | | | | |
Net asset value, beginning of period | | | $3.60 | | | | $3.61 | | | | $3.43 | | | | $3.52 | | | | $3.25 | | | | $2.49 | |
| Income (loss) from investment operations | | | | | | | | | | | | | |
Net investment income (d) | | | $0.10 | | | | $0.20 | | | | $0.22 | | | | $0.23 | | | | $0.25 | | | | $0.25 | |
Net realized and unrealized gain (loss)
on investments and foreign currency | | | (0.01 | )(g) | | | (0.00 | )(w) | | | 0.19 | | | | (0.08 | ) | | | 0.26 | | | | 0.76 | |
Total from investment operations | | | $0.09 | | | | $0.20 | | | | $0.41 | | | | $0.15 | | | | $0.51 | | | | $1.01 | |
| Less distributions declared to shareholders | | | | | | | | | | | | | |
From net investment income | | | $(0.10 | ) | | | $(0.21 | ) | | | $(0.23 | ) | | | $(0.24 | ) | | | $(0.24 | ) | | | $(0.25 | ) |
Net asset value, end of period (x) | | | $3.59 | | | | $3.60 | | | | $3.61 | | | | $3.43 | | | | $3.52 | | | | $3.25 | |
Total return (%) (r)(s)(t)(x) | | | 2.58 | (n) | | | 5.69 | | | | 12.33 | | | | 4.40 | | | | 16.46 | | | | 42.40 | |
Ratios (%) (to average net assets)
and Supplemental data: | | | | | | | | | | | | | | | | | | | | | |
Expenses before expense reductions (f) | | | 1.02 | (a) | | | 1.03 | | | | 1.03 | | | | 1.03 | | | | 1.03 | | | | 1.10 | |
Expenses after expense reductions (f) | | | 0.95 | (a) | | | 0.96 | | | | 0.98 | | | | 1.00 | | | | 1.03 | | | | 1.10 | |
Net investment income | | | 5.38 | (a) | | | 5.60 | | | | 6.31 | | | | 6.71 | | | | 7.41 | | | | 8.62 | |
Portfolio turnover | | | 27 | (n) | | | 46 | | | | 38 | | | | 60 | | | | 66 | | | | 58 | |
Net assets at end of period (000 omitted) | | | $3,413 | | | | $3,164 | | | | $2,748 | | | | $1,719 | | | | $1,215 | | | | $858 | |
| | |
| | | Six months ended 7/31/14 | | | Years ended 1/31 | |
| Class 529B | | | 2014 | | | 2013 | | | 2012 | | | 2011 | | | 2010 | |
| | | (unaudited) | | | | | | | | | | | | | | | | |
Net asset value, beginning of period | | | $3.60 | | | | $3.61 | | | | $3.44 | | | | $3.52 | | | | $3.25 | | | | $2.49 | |
| Income (loss) from investment operations | | | | | | | | | | | | | |
Net investment income (d) | | | $0.08 | | | | $0.17 | | | | $0.20 | | | | $0.20 | | | | $0.22 | | | | $0.23 | |
Net realized and unrealized gain (loss)
on investments and foreign currency | | | 0.01 | | | | (0.00 | )(w) | | | 0.17 | | | | (0.07 | ) | | | 0.27 | | | | 0.76 | |
Total from investment operations | | | $0.09 | | | | $0.17 | | | | $0.37 | | | | $0.13 | | | | $0.49 | | | | $0.99 | |
| Less distributions declared to shareholders | | | | | | | | | | | | | |
From net investment income | | | $(0.09 | ) | | | $(0.18 | ) | | | $(0.20 | ) | | | $(0.21 | ) | | | $(0.22 | ) | | | $(0.23 | ) |
Net asset value, end of period (x) | | | $3.60 | | | | $3.60 | | | | $3.61 | | | | $3.44 | | | | $3.52 | | | | $3.25 | |
Total return (%) (r)(s)(t)(x) | | | 2.47 | (n) | | | 4.87 | | | | 11.17 | | | | 3.92 | | | | 15.60 | | | | 41.40 | |
Ratios (%) (to average net assets)
and Supplemental data: | | | | | | | | | | | | | | | | | | | | | |
Expenses before expense reductions (f) | | | 1.77 | (a) | | | 1.78 | | | | 1.78 | | | | 1.78 | | | | 1.78 | | | | 1.84 | |
Expenses after expense reductions (f) | | | 1.71 | (a) | | | 1.73 | | | | 1.73 | | | | 1.75 | | | | 1.78 | | | | 1.84 | |
Net investment income | | | 4.61 | (a) | | | 4.83 | | | | 5.60 | | | | 5.95 | | | | 6.65 | | | | 7.82 | |
Portfolio turnover | | | 27 | (n) | | | 46 | | | | 38 | | | | 60 | | | | 66 | | | | 58 | |
Net assets at end of period (000 omitted) | | | $347 | | | | $337 | | | | $375 | | | | $362 | | | | $398 | | | | $315 | |
See Notes to Financial Statements
33
Financial Highlights – continued
| | | | | | | | | | | | | | | | | | | | | | | | |
| | | Six months ended 7/31/14 | | | Years ended 1/31 | |
| Class 529C | | | 2014 | | | 2013 | | | 2012 | | | 2011 | | | 2010 | |
| | | (unaudited) | | | | | | | | | | | | | | | | |
Net asset value, beginning of period | | | $3.60 | | | | $3.61 | | | | $3.44 | | | | $3.52 | | | | $3.26 | | | | $2.50 | |
| Income (loss) from investment operations | | | | | | | | | | | | | |
Net investment income (d) | | | $0.08 | | | | $0.17 | | | | $0.20 | | | | $0.20 | | | | $0.22 | | | | $0.23 | |
Net realized and unrealized gain (loss)
on investments and foreign currency | | | 0.01 | | | | (0.00 | )(w) | | | 0.17 | | | | (0.07 | ) | | | 0.26 | | | | 0.76 | |
Total from investment operations | | | $0.09 | | | | $0.17 | | | | $0.37 | | | | $0.13 | | | | $0.48 | | | | $0.99 | |
| Less distributions declared to shareholders | | | | | | | | | | | | | |
From net investment income | | | $(0.09 | ) | | | $(0.18 | ) | | | $(0.20 | ) | | | $(0.21 | ) | | | $(0.22 | ) | | | $(0.23 | ) |
Net asset value, end of period (x) | | | $3.60 | | | | $3.60 | | | | $3.61 | | | | $3.44 | | | | $3.52 | | | | $3.26 | |
Total return (%) (r)(s)(t)(x) | | | 2.47 | (n) | | | 4.88 | | | | 11.17 | | | | 3.92 | | | | 15.25 | | | | 41.26 | |
Ratios (%) (to average net assets)
and Supplemental data: | | | | | | | | | | | | | | | | | | | | | |
Expenses before expense reductions (f) | | | 1.77 | (a) | | | 1.78 | | | | 1.77 | | | | 1.77 | | | | 1.78 | | | | 1.84 | |
Expenses after expense reductions (f) | | | 1.71 | (a) | | | 1.73 | | | | 1.72 | | | | 1.74 | | | | 1.77 | | | | 1.84 | |
Net investment income | | | 4.60 | (a) | | | 4.81 | | | | 5.56 | | | | 5.94 | | | | 6.61 | | | | 7.71 | |
Portfolio turnover | | | 27 | (n) | | | 46 | | | | 38 | | | | 60 | | | | 66 | | | | 58 | |
Net assets at end of period (000 omitted) | | | $1,794 | | | | $1,758 | | | | $1,311 | | | | $1,060 | | | | $739 | | | | $462 | |
| (d) | Per share data is based on average shares outstanding. |
| (f) | Ratios do not reflect reductions from fees paid indirectly, if applicable. |
| (g) | The per share amount varies from the net realized and unrealized gain/loss for the period because of the timing of sales of fund shares and the per share amount of realized and unrealized gains and losses at such time. |
| (i) | For Class R5, the period is from inception, June 1, 2012, through the stated period end. |
| (r) | Certain expenses have been reduced without which performance would have been lower. |
| (s) | From time to time the fund may receive proceeds from litigation settlements, without which performance would be lower. |
| (t) | Total returns do not include any applicable sales charges. |
| (w) | Per share amount was less than $0.01. |
| (x) | The net asset values per share and total returns have been calculated on net assets which include adjustments made in accordance with U.S. generally accepted accounting principles required at period end for financial reporting purposes. |
See Notes to Financial Statements
34
NOTES TO FINANCIAL STATEMENTS
(unaudited)
(1) Business and Organization
MFS High Income Fund (the fund) is a diversified series of MFS Series Trust III (the trust). The trust is organized as a Massachusetts business trust and is registered under the Investment Company Act of 1940, as amended, as an open-end management investment company.
The fund is an investment company and accordingly follows the investment company accounting and reporting guidance of the Financial Accounting Standards Board (FASB) Accounting Standard Codification Topic 946 Financial Services – Investment Companies.
(2) Significant Accounting Policies
General – The preparation of financial statements in conformity with U.S. generally accepted accounting principles requires management to make estimates and assumptions that affect the reported amounts of assets and liabilities, and disclosure of contingent assets and liabilities at the date of the financial statements and the reported amounts of increases and decreases in net assets from operations during the reporting period. Actual results could differ from those estimates. In the preparation of these financial statements, management has evaluated subsequent events occurring after the date of the fund’s Statement of Assets and Liabilities through the date that the financial statements were issued. The fund invests in high-yield securities rated below investment grade. Investments in high-yield securities involve greater degrees of credit and market risk than investments in higher-rated securities and tend to be more sensitive to economic conditions. The fund invests in foreign securities. Investments in foreign securities are vulnerable to the effects of changes in the relative values of the local currency and the U.S. dollar and to the effects of changes in each country’s legal, political, and economic environment.
In June 2014, FASB issued Accounting Standards Update 2014-11, Transfers and Servicing (Topic 860) – Repurchase-to-Maturity Transactions, Repurchase Financings, and Disclosures (“ASU 2014-11”). ASU 2014-11 changes the accounting for repurchase-to-maturity transactions (i.e., repurchase agreements that settle at the same time as the maturity of the transferred financial asset) and enhances the required disclosures for repurchase agreements and other similar transactions. Although still evaluating the potential impacts of ASU 2014-11 to the fund, management expects that the impact of the fund’s adoption will be limited to additional financial statement disclosures which would first be effective for interim reporting periods beginning after March 15, 2015.
Balance Sheet Offsetting – The fund’s accounting policy with respect to balance sheet offsetting is that, absent an event of default by the counterparty or a termination of the agreement, the International Swaps and Derivatives Association (ISDA) Master Agreement does not result in an offset of reported amounts of financial assets and financial liabilities in the Statement of Assets and Liabilities across transactions between the fund and the applicable counterparty. The fund’s right to setoff may be restricted or prohibited by the bankruptcy or insolvency laws of the particular jurisdiction to which a specific master netting agreement counterparty is subject. Balance sheet
35
Notes to Financial Statements (unaudited) – continued
offsetting disclosures, to the extent applicable to the fund, have been included in the fund’s Significant Accounting Policies note under the captions for each of the fund’s in-scope financial instruments and transactions.
Investment Valuations – Debt instruments and floating rate loans (other than short-term instruments), including restricted debt instruments, are generally valued at an evaluated or composite bid as provided by a third-party pricing service. Equity securities, including restricted equity securities, are generally valued at the last sale or official closing price as provided by a third-party pricing service on the market or exchange on which they are primarily traded. Equity securities, for which there were no sales reported that day, are generally valued at the last quoted daily bid quotation as provided by a third-party pricing service on the market or exchange on which such securities are primarily traded. Short-term instruments with a maturity at issuance of 60 days or less generally are valued at amortized cost, which approximates market value. Exchange-traded options are generally valued at the last sale or official closing price as provided by a third-party pricing service on the exchange on which such options are primarily traded. Exchange-traded options for which there were no sales reported that day are generally valued at the last daily bid quotation as provided by a third-party pricing service on the exchange on which such options are primarily traded. Options not traded on an exchange are generally valued at a broker/dealer bid quotation. Foreign currency options are generally valued at valuations provided by a third-party pricing service. Futures contracts are generally valued at last posted settlement price as provided by a third-party pricing service on the market on which they are primarily traded. Futures contracts for which there were no trades that day for a particular position are generally valued at the closing bid quotation as provided by a third-party pricing service on the market on which such futures contracts are primarily traded. Forward foreign currency exchange contracts are generally valued at the mean of bid and asked prices for the time period interpolated from rates provided by a third-party pricing service for proximate time periods. Swap agreements are generally valued at valuations provided by a third-party pricing service, which for cleared swaps includes an evaluation of any trading activity at the clearinghouses. Open-end investment companies are generally valued at net asset value per share. Securities and other assets generally valued on the basis of information from a third-party pricing service may also be valued at a broker/dealer bid quotation. Values obtained from third-party pricing services can utilize both transaction data and market information such as yield, quality, coupon rate, maturity, type of issue, trading characteristics, and other market data. The values of foreign securities and other assets and liabilities expressed in foreign currencies are converted to U.S. dollars using the mean of bid and asked prices for rates provided by a third-party pricing service.
The Board of Trustees has delegated primary responsibility for determining or causing to be determined the value of the fund’s investments (including any fair valuation) to the adviser pursuant to valuation policies and procedures approved by the Board. If the adviser determines that reliable market quotations are not readily available, investments are valued at fair value as determined in good faith by the adviser in accordance with such procedures under the oversight of the Board of Trustees. Under the fund’s valuation policies and procedures, market quotations are not considered to be readily available for most types of debt instruments and floating rate loans and many types of
36
Notes to Financial Statements (unaudited) – continued
derivatives. These investments are generally valued at fair value based on information from third-party pricing services. In addition, investments may be valued at fair value if the adviser determines that an investment’s value has been materially affected by events occurring after the close of the exchange or market on which the investment is principally traded (such as foreign exchange or market) and prior to the determination of the fund’s net asset value, or after the halting of trading of a specific security where trading does not resume prior to the close of the exchange or market on which the security is principally traded. The adviser generally relies on third-party pricing services or other information (such as the correlation with price movements of similar securities in the same or other markets; the type, cost and investment characteristics of the security; the business and financial condition of the issuer; and trading and other market data) to assist in determining whether to fair value and at what value to fair value an investment. The value of an investment for purposes of calculating the fund’s net asset value can differ depending on the source and method used to determine value. When fair valuation is used, the value of an investment used to determine the fund’s net asset value may differ from quoted or published prices for the same investment. There can be no assurance that the fund could obtain the fair value assigned to an investment if it were to sell the investment at the same time at which the fund determines its net asset value per share.
Various inputs are used in determining the value of the fund’s assets or liabilities. These inputs are categorized into three broad levels. In certain cases, the inputs used to measure fair value may fall into different levels of the fair value hierarchy. In such cases, an investment’s level within the fair value hierarchy is based on the lowest level of input that is significant to the fair value measurement. The fund’s assessment of the significance of a particular input to the fair value measurement in its entirety requires judgment, and considers factors specific to the investment. Level 1 includes unadjusted quoted prices in active markets for identical assets or liabilities. Level 2 includes other significant observable market-based inputs (including quoted prices for similar securities, interest rates, prepayment speed, and credit risk). Level 3 includes unobservable inputs, which may include the adviser’s own assumptions in determining the fair value of investments. Other financial instruments are derivative instruments not reflected in total investments, such as futures contracts, forward foreign currency exchange contracts and swap agreements.
37
Notes to Financial Statements (unaudited) – continued
The following is a summary of the levels used as of July 31, 2014 in valuing the fund’s assets or liabilities:
| | | | | | | | | | | | | | | | |
| Investments at Value | | Level 1 | | | Level 2 | | | Level 3 | | | Total | |
| Equity Securities | | | $325,340 | | | | $2,490,237 | | | | $— | | | | $2,815,577 | |
| U.S. Treasury Bonds & U.S. Government Agency & Equivalents | | | — | | | | — | | | | — | | | | — | |
| Non-U.S. Sovereign Debt | | | — | | | | 4,100,056 | | | | — | | | | 4,100,056 | |
| Municipal Bonds | | | — | | | | 2,968,892 | | | | — | | | | 2,968,892 | |
| U.S. Corporate Bonds | | | — | | | | 1,042,479,848 | | | | — | | | | 1,042,479,848 | |
| Residential Mortgage-Backed Securities | | | — | | | | — | | | | — | | | | — | |
| Commercial Mortgage-Backed Securities | | | — | | | | 1,457,325 | | | | — | | | | 1,457,325 | |
| Asset-Backed Securities (including CDOs) | | | — | | | | 194,959 | | | | — | | | | 194,959 | |
| Foreign Bonds | | | — | | | | 246,232,720 | | | | — | | | | 246,232,720 | |
| Other Fixed Income Securities | | | — | | | | — | | | | — | | | | — | |
| Commodity Linked Structured Notes | | | — | | | | — | | | | — | | | | — | |
| Floating Rate Loans | | | — | | | | 53,634,162 | | | | — | | | | 53,634,162 | |
| Purchased Currency Options | | | — | | | | — | | | | — | | | | — | |
| Short Term Securities | | | — | | | | — | | | | — | | | | — | |
| Mutual Funds | | | 50,845,650 | | | | — | | | | — | | | | 50,845,650 | |
| Total Investments | | | $51,170,990 | | | | $1,353,558,199 | | | | $— | | | | $1,404,729,189 | |
| | | | |
| Other Financial Instruments | | | | | | | | | | | | |
| Futures Contracts | | | $119,870 | | | | $— | | | | $— | | | | $119,870 | |
| Swap Agreements | | | — | | | | 1,510,544 | | | | — | | | | 1,510,544 | |
| Forward Foreign Currency Exchange Contracts | | | — | | | | 128,390 | | | | — | | | | 128,390 | |
For further information regarding security characteristics, see the Portfolio of Investments.
The following is a reconciliation of level 3 assets for which significant unobservable inputs were used to determine fair value. The fund’s policy is to recognize transfers between the levels as of the end of the period. The table presents the activity of level 3 securities held at the beginning and the end of the period.
| | | | |
| | | Equity
Securities | |
| Balance as of 1/31/14 | | | $372,730 | |
Change in unrealized appreciation (depreciation) | | | (359,048 | ) |
Transfers out of level 3 | | | (13,682 | ) |
| Balance as of 7/31/14 | | | $— | |
Foreign Currency Translation – Purchases and sales of foreign investments, income, and expenses are converted into U.S. dollars based upon currency exchange rates prevailing on the respective dates of such transactions or on the reporting date for foreign denominated receivables and payables. Gains and losses attributable to foreign
38
Notes to Financial Statements (unaudited) – continued
currency exchange rates on sales of securities are recorded for financial statement purposes as net realized gains and losses on investments. Gains and losses attributable to foreign exchange rate movements on receivables, payables, income and expenses are recorded for financial statement purposes as foreign currency transaction gains and losses. That portion of both realized and unrealized gains and losses on investments that results from fluctuations in foreign currency exchange rates is not separately disclosed.
Derivatives – The fund uses derivatives for different purposes, primarily to increase or decrease exposure to a particular market or segment of the market, or security, to increase or decrease interest rate or currency exposure, or as alternatives to direct investments. Derivatives are used for hedging or non-hedging purposes. While hedging can reduce or eliminate losses, it can also reduce or eliminate gains. When the fund uses derivatives as an investment to increase market exposure, or for hedging purposes, gains and losses from derivative instruments may be substantially greater than the derivative’s original cost.
The derivative instruments used by the fund were purchased options, futures contracts, forward foreign currency exchange contracts, and swap agreements. The fund’s period end derivatives, as presented in the Portfolio of Investments and the associated Derivative Contract tables, generally are indicative of the volume of its derivative activity during the period.
The following table presents, by major type of derivative contract, the fair value, on a gross basis, of the asset and liability components of derivatives held by the fund at July 31, 2014 as reported in the Statement of Assets and Liabilities:
| | | | | | | | | | |
| | | | | Fair Value | |
| Risk | | Derivative Contracts | | Asset Derivatives | | | Liability Derivatives | |
| Interest Rate | | Interest Rate Futures | | | $119,870 | | | | $— | |
| Foreign Exchange | | Forward Foreign Currency Exchange | | | 180,821 | | | | 52,431 | |
| Credit | | Credit Default Swaps | | | 1,510,544 | | | | — | |
| Total | | | | | $1,811,235 | | | | $52,431 | |
The following table presents, by major type of derivative contract, the realized gain (loss) on derivatives held by the fund for the six months ended July 31, 2014 as reported in the Statement of Operations:
| | | | | | | | | | | | | | | | |
| Risk | | Futures
Contracts | | | Swap
Agreements | | | Foreign
Currency | | | Investments
(Purchased
Options) | |
| Interest Rate | | | $(225,317 | ) | | | $— | | | | $— | | | | $— | |
| Foreign Exchange | | | — | | | | — | | | | 32,283 | | | | — | |
| Equity | | | — | | | | — | | | | — | | | | (196,758 | ) |
| Credit | | | — | | | | 189,481 | | | | — | | | | — | |
| Total | | | $(225,317 | ) | | | $189,481 | | | | $32,283 | | | | $(196,758 | ) |
39
Notes to Financial Statements (unaudited) – continued
The following table presents, by major type of derivative contract, the change in unrealized appreciation (depreciation) on derivatives held by the fund for the six months ended July 31, 2014 as reported in the Statement of Operations:
| | | | | | | | | | | | |
| Risk | | Futures
Contracts | | | Swap
Agreements | | | Translation of Assets and Liabilities in Foreign
Currencies | |
| Interest Rate | | | $119,870 | | | | $— | | | | $— | |
| Foreign Exchange | | | — | | | | — | | | | (7,124 | ) |
| Credit | | | — | | | | 64,390 | | | | — | |
| Total | | | $119,870 | | | | $64,390 | | | | $(7,124 | ) |
Derivative counterparty credit risk is managed through formal evaluation of the creditworthiness of all potential counterparties. On certain, but not all, over-the-counter derivatives, the fund attempts to reduce its exposure to counterparty credit risk whenever possible by entering into an ISDA Master Agreement on a bilateral basis with each of the counterparties with whom it undertakes a significant volume of transactions. The ISDA Master Agreement gives each party to the agreement the right to terminate all transactions traded under such agreement if there is a certain deterioration in the credit quality of the other party. Upon an event of default or a termination of the ISDA Master Agreement, the non-defaulting party has the right to close out all transactions traded under such agreement and to net amounts owed under each transaction to one net amount payable by one party to the other. This right to close out and net payments across all transactions traded under the ISDA Master Agreement could result in a reduction of the fund’s credit risk to such counterparty equal to any amounts payable by the fund under the applicable transactions, if any. The fund’s right to setoff may be restricted or prohibited by the bankruptcy or insolvency laws of the particular jurisdiction to which a specific ISDA counterparty is subject.
Collateral and margin requirements differ by type of derivative. Margin requirements are set by the broker or clearing house for cleared derivatives (i.e., futures contracts, cleared swaps, and exchange-traded options) while collateral terms are contract specific for over-the-counter traded derivatives (i.e., forward foreign currency exchange contracts, uncleared swap agreements, and over-the-counter options). For derivatives traded under an ISDA Master Agreement, the collateral requirements are netted across all transactions traded under such agreement and one amount is posted from one party to the other to collateralize such obligations. Cash that has been segregated to cover the fund’s collateral or margin obligations under derivative contracts, if any, will be reported separately in the Statement of Assets and Liabilities as “Restricted cash” or “Deposits with brokers.” Securities pledged as collateral or margin for the same purpose, if any, are noted in the Portfolio of Investments.
Purchased Options – The fund purchased call options for a premium. Purchased call options entitle the holder to buy and sell a specified number of shares or units of a particular security, currency or index at a specified price at a specified date or within a
40
Notes to Financial Statements (unaudited) – continued
specified period of time. Purchasing call options may hedge against an anticipated increase in the dollar cost of securities or currency to be acquired or increase the fund’s exposure to an underlying instrument.
The premium paid is initially recorded as an investment in the Statement of Assets and Liabilities. That investment is subsequently marked-to-market daily with the difference between the premium paid and the market value of the purchased option being recorded as unrealized appreciation or depreciation. Premiums paid for purchased call options which have expired are treated as realized losses on investments in the Statement of Operations. Upon the exercise or closing of a purchased call option, the premium paid is added to the cost of the security or financial instrument purchased.
Whether or not the option is exercised, the fund’s maximum risk of loss from purchasing an option is the amount of premium paid. All option contracts involve credit risk if the counterparty to the option contract fails to perform. For over-the-counter options, this risk is mitigated in cases where there is an ISDA Master Agreement between the fund and the counterparty providing for netting as described above and for posting of collateral by the counterparty to the fund to cover the fund’s exposure to the counterparty under such ISDA Master Agreement.
Futures Contracts – The fund entered into futures contracts which may be used to hedge against or obtain broad market exposure, interest rate exposure, currency exposure, or to manage duration. A futures contract represents a commitment for the future purchase or sale of an asset at a specified price on a specified date.
Upon entering into a futures contract, the fund is required to deposit with the broker, either in cash or securities, an initial margin in an amount equal to a certain percentage of the notional amount of the contract. Subsequent payments (variation margin) are made or received by the fund each day, depending on the daily fluctuations in the value of the contract, and are recorded for financial statement purposes as unrealized gain or loss by the fund until the contract is closed or expires at which point the gain or loss on futures contracts is realized.
The fund bears the risk of interest rates, exchange rates or securities prices moving unexpectedly, in which case, the fund may not achieve the anticipated benefits of the futures contracts and may realize a loss. While futures contracts may present less counterparty risk to the fund since the contracts are exchange traded and the exchange’s clearinghouse guarantees payments to the broker, there is still counterparty credit risk due to the insolvency of the broker. The fund’s maximum risk of loss due to counterparty credit risk is equal to the margin posted by the fund to the broker plus any gains or minus any losses on the outstanding futures contracts.
Forward Foreign Currency Exchange Contracts – The fund entered into forward foreign currency exchange contracts for the purchase or sale of a specific foreign currency at a fixed price on a future date. These contracts may be used to hedge the fund’s currency risk or for non-hedging purposes. For hedging purposes, the fund may enter into contracts to deliver or receive foreign currency that the fund will receive from or use in its normal investment activities. The fund may also use contracts to hedge against declines in the value of foreign currency denominated securities due to unfavorable exchange rate movements. For non-hedging purposes, the fund may enter
41
Notes to Financial Statements (unaudited) – continued
into contracts with the intent of changing the relative exposure of the fund’s portfolio of securities to different currencies to take advantage of anticipated exchange rate changes.
Forward foreign currency exchange contracts are adjusted by the daily exchange rate of the underlying currency and any unrealized gains or losses are recorded as a receivable or payable for forward foreign currency exchange contracts until the contract settlement date. On contract settlement date, any gain or loss on the contract is recorded as realized gains or losses on foreign currency.
Risks may arise upon entering into these contracts from unanticipated movements in the value of the contract and from the potential inability of counterparties to meet the terms of their contracts. Generally, the fund’s maximum risk due to counterparty credit risk is the unrealized gain on the contract due to the use of Continuous Linked Settlement, an industry accepted settlement system. This risk is mitigated in cases where there is an ISDA Master Agreement between the fund and the counterparty providing for netting as described above and for posting of collateral by the counterparty to the fund to cover the fund’s exposure to the counterparty under such ISDA Master Agreement.
Swap Agreements – During the period the fund entered into swap agreements. Effective June 10, 2013, certain types of swaps (“cleared swaps”) are required to be centrally cleared under provisions of the Dodd-Frank Regulatory Reform Bill. In a cleared swap transaction, the swap agreement is novated to a central counterparty (the “clearinghouse”) immediately following execution of the swap contract with an executing broker. Thereafter, throughout the term of the cleared swap, the fund interfaces indirectly with the clearinghouse through a clearing broker.
A swap agreement is generally an exchange of cash payments, at specified intervals or upon the occurrence of specified events, between the fund and a counterparty. The net cash payments exchanged are recorded as a realized gain or loss on swap agreements in the Statement of Operations. The value of the swap agreement, which is adjusted daily and includes any related interest accruals to be paid or received by the fund, is recorded in the Statement of Assets and Liabilities, as “Swaps, at value” for uncleared swaps and is included in “Due from brokers” or “Due to brokers” for cleared swaps. The daily change in value, including any related interest accruals to be paid or received, is recorded as unrealized appreciation or depreciation on swap agreements in the Statement of Operations. The daily change in valuation of cleared swaps is recorded as a receivable or payable for variation margin in the Statement of Assets and Liabilities. Amounts paid or received at the inception of the swap agreement are reflected as premiums paid or received in the Statement of Assets and Liabilities and are amortized using the effective interest method over the term of the agreement. A liquidation payment received or made upon early termination is recorded as a realized gain or loss on swap agreements in the Statement of Operations.
Risks related to swap agreements include the possible lack of a liquid market, unfavorable market and interest rate movements of the underlying instrument and the failure of the counterparty to perform under the terms of the agreements. To address counterparty risk, swap agreements are limited to only highly-rated counterparties. For uncleared swaps, that risk is further reduced by having an ISDA Master Agreement
42
Notes to Financial Statements (unaudited) – continued
between the fund and the counterparty providing for netting as described above and by the posting of collateral by the counterparty to the fund to cover the fund’s exposure to the counterparty under such ISDA Master Agreement. Although not covered by an ISDA Master Agreement, the fund’s counterparty risk due to cleared swaps is mitigated by the clearinghouses’ margining requirements and financial safeguards in the event of a clearing broker default.
The fund entered into credit default swap agreements in order to manage its exposure to the market or certain sectors of the market, to reduce its credit risk exposure to defaults of corporate and sovereign issuers or to create exposure to corporate or sovereign issuers to which it is not otherwise exposed. In a credit default swap agreement, the protection buyer can make an upfront payment and will make a stream of payments to the protection seller based on a fixed percentage applied to the agreement notional amount in exchange for the right to receive a specified return upon the occurrence of a defined credit event on the reference obligation (which may be either a single security or a basket of securities issued by corporate or sovereign issuers) and, with respect to the rare cases where physical settlement applies, the delivery by the buyer to the seller of a defined deliverable obligation. Although agreement-specific, credit events generally consist of a combination of the following: bankruptcy, failure to pay, restructuring, obligation acceleration, obligation default, or repudiation/moratorium, each as defined in the 2003 ISDA Credit Derivatives Definitions as amended by the relevant agreement. Restructuring is generally not applicable when the reference obligation is issued by a North American corporation and obligation acceleration, obligation default, or repudiation/moratorium are generally only applicable when the reference obligation is issued by a sovereign entity or an entity in an emerging country. Upon determination of the final price for the deliverable obligation (or upon delivery of the deliverable obligation in the case of physical settlement), the difference between the value of the deliverable obligation and the swap agreement’s notional amount is recorded as realized gain or loss on swap agreements in the Statement of Operations.
Credit default swap agreements are considered to have credit-risk-related contingent features since they trigger payment by the protection seller to the protection buyer upon the occurrence of a defined credit event. The maximum amount of future, undiscounted payments that the fund, as protection seller, could be required to make is equal to the swap agreement’s notional amount. The protection seller’s payment obligation would be offset to the extent of the value of the agreement’s deliverable obligation. At July 31, 2014, the fund did not hold any credit default swap agreements at an unrealized loss where it is the protection seller.
The fund’s maximum risk of loss from counterparty risk, either as the protection seller or as the protection buyer, is the fair value of the agreement. For uncleared swaps, counterparty risk is reduced by having an ISDA Master Agreement between the fund and the counterparty providing for netting as described above and by the posting of collateral by the counterparty to the fund to cover the fund’s exposure to the counterparty under such ISDA Master Agreement. For cleared swaps, the fund’s counterparty risk is mitigated by the clearinghouses’ margining requirements and financial safeguards in the event of a clearing broker default.
43
Notes to Financial Statements (unaudited) – continued
Loans and Other Direct Debt Instruments – The fund invests in loans and loan participations or other receivables. These investments may include standby financing commitments, including revolving credit facilities, which contractually obligate the fund to supply additional cash to the borrower on demand. The fund generally provides this financial support in order to preserve its existing investment or to obtain a more senior secured interest in the assets of the borrower. Loan participations involve a risk of insolvency of the lending bank or other financial intermediary.
Indemnifications – Under the fund’s organizational documents, its officers and Trustees may be indemnified against certain liabilities and expenses arising out of the performance of their duties to the fund. Additionally, in the normal course of business, the fund enters into agreements with service providers that may contain indemnification clauses. The fund’s maximum exposure under these agreements is unknown as this would involve future claims that may be made against the fund that have not yet occurred.
Investment Transactions and Income – Investment transactions are recorded on the trade date. Interest income is recorded on the accrual basis. All premium and discount is amortized or accreted for financial statement purposes in accordance with U.S. generally accepted accounting principles. The fund earns certain fees in connection with its floating rate loan purchasing activities. These fees are in addition to interest payments earned and may include amendment fees, commitment fees, facility fees, consent fees, and prepayment fees. Commitment fees are recorded on an accrual basis as income in the accompanying financial statements. Dividends received in cash are recorded on the ex-dividend date. Certain dividends from foreign securities will be recorded when the fund is informed of the dividend if such information is obtained subsequent to the ex-dividend date. Dividend and interest payments received in additional securities are recorded on the ex-dividend or ex-interest date in an amount equal to the value of the security on such date. Debt obligations may be placed on non-accrual status or set to accrue at a rate of interest less than the contractual coupon when the collection of all or a portion of interest has become doubtful. Interest income for those debt obligations may be further reduced by the write-off of the related interest receivables when deemed uncollectible.
The fund may receive proceeds from litigation settlements. Any proceeds received from litigation involving portfolio holdings are reflected in the Statement of Operations in realized gain/loss if the security has been disposed of by the fund or in unrealized gain/loss if the security is still held by the fund. Any other proceeds from litigation not related to portfolio holdings are reflected as other income in the Statement of Operations.
Fees Paid Indirectly – The fund’s custody fee may be reduced according to an arrangement that measures the value of cash deposited with the custodian by the fund. This amount, for the six months ended July 31, 2014, is shown as a reduction of total expenses in the Statement of Operations.
Tax Matters and Distributions – The fund intends to qualify as a regulated investment company, as defined under Subchapter M of the Internal Revenue Code, and to distribute all of its taxable income, including realized capital gains. As a result, no provision for federal income tax is required. The fund’s federal tax returns, when
44
Notes to Financial Statements (unaudited) – continued
filed, will remain subject to examination by the Internal Revenue Service for a three year period. Management has analyzed the fund’s tax positions taken on federal and state tax returns for all open tax years and does not believe that there are any uncertain tax positions that require recognition of a tax liability. Foreign taxes, if any, have been accrued by the fund in the accompanying financial statements in accordance with the applicable foreign tax law. Foreign income taxes may be withheld by certain countries in which the fund invests. Additionally, capital gains realized by the fund on securities issued in or by certain foreign countries may be subject to capital gains tax imposed by those countries.
Distributions to shareholders are recorded on the ex-dividend date. Income and capital gain distributions are determined in accordance with income tax regulations, which may differ from U.S. generally accepted accounting principles. Certain capital accounts in the financial statements are periodically adjusted for permanent differences in order to reflect their tax character. These adjustments have no impact on net assets or net asset value per share. Temporary differences which arise from recognizing certain items of income, expense, gain or loss in different periods for financial statement and tax purposes will reverse at some time in the future. Distributions in excess of net investment income or net realized gains are temporary overdistributions for financial statement purposes resulting from differences in the recognition or classification of income or distributions for financial statement and tax purposes.
Book/tax differences primarily relate to amortization and accretion of debt securities.
The tax character of distributions made during the current period will be determined at fiscal year end. The tax character of distributions declared to shareholders for the last fiscal year is as follows:
| | | | |
| | | 1/31/14 | |
Ordinary income (including any
short-term capital gains) | | | $75,775,810 | |
The federal tax cost and the tax basis components of distributable earnings were as follows:
| | | | |
| As of 7/31/14 | | | |
| Cost of investments | | | $1,398,928,426 | |
| Gross appreciation | | | 25,797,320 | |
| Gross depreciation | | | (19,996,557 | ) |
| Net unrealized appreciation (depreciation) | | | $5,800,763 | |
| |
| As of 1/31/14 | | | |
| Undistributed ordinary income | | | 6,997,710 | |
| Capital loss carryforwards | | | (182,691,121 | ) |
| Other temporary differences | | | (6,775,989 | ) |
| Net unrealized appreciation (depreciation) | | | 20,443,639 | |
The aggregate cost above includes prior fiscal year end tax adjustments, if applicable.
Under the Regulated Investment Company Modernization Act of 2010 (the “Act”), net capital losses recognized for fund fiscal years beginning after January 31, 2011 may be
45
Notes to Financial Statements (unaudited) – continued
carried forward indefinitely, and their character is retained as short-term and/or long-term losses (“post-enactment losses”). Previously, net capital losses were carried forward for eight years and treated as short-term losses (“pre-enactment losses”). As a transition rule, the Act requires that all post-enactment net capital losses be used before pre-enactment net capital losses.
As of January 31, 2014, the fund had capital loss carryforwards available to offset future realized gains. Such pre-enactment losses expire as follows:
| | | | |
| 1/31/15 | | | $(39,404,014 | ) |
| 1/31/16 | | | (1,964,268 | ) |
| 1/31/17 | | | (94,687,685 | ) |
| 1/31/18 | | | (46,635,154 | ) |
| Total | | | $(182,691,121 | ) |
The availability of a portion of the capital loss carryforwards, which were acquired on July 24, 2009 in connection with the MFS Floating Rate High Income Fund merger, may be limited in a given year.
Multiple Classes of Shares of Beneficial Interest – The fund offers multiple classes of shares, which differ in their respective distribution, service, and program manager fees. The fund’s income and common expenses are allocated to shareholders based on the value of settled shares outstanding of each class. The fund’s realized and unrealized gain (loss) are allocated to shareholders based on the daily net assets of each class. Dividends are declared separately for each class. Differences in per share dividend rates are generally due to differences in separate class expenses. Class B and Class 529B shares will convert to Class A and Class 529A shares, respectively, approximately eight years after purchase. The fund’s distributions declared to shareholders as reported in the Statements of Changes in Net Assets are presented by class as follows:
| | | | | | | | |
| | | From net investment
income | |
| | | Six months
ended
7/31/14 | | | Year
ended
1/31/14 | |
| Class A | | | $13,297,737 | | | | $27,450,146 | |
| Class B | | | 768,799 | | | | 1,597,298 | |
| Class C | | | 1,905,845 | | | | 3,974,966 | |
| Class I | | | 2,116,450 | | | | 4,156,482 | |
| Class R1 | | | 30,933 | | | | 60,382 | |
| Class R2 | | | 92,797 | | | | 211,219 | |
| Class R3 | | | 214,198 | | | | 466,092 | |
| Class R4 | | | 14,976 | | | | 27,296 | |
| Class R5 | | | 22,181,105 | | | | 37,563,574 | |
| Class 529A | | | 95,107 | | | | 174,398 | |
| Class 529B | | | 8,551 | | | | 18,319 | |
| Class 529C | | | 43,426 | | | | 75,638 | |
| Total | | | $40,769,924 | | | | $75,775,810 | |
46
Notes to Financial Statements (unaudited) – continued
(3) Transactions with Affiliates
Investment Adviser – The fund has an investment advisory agreement with MFS to provide overall investment management and related administrative services and facilities to the fund. The management fee is computed daily and paid monthly at the following annual rates:
| | | | |
| First $1.4 billion of average daily net assets | | | 0.46 | % |
| Average daily net assets in excess of $1.4 billion | | | 0.44 | % |
MFS has agreed in writing to reduce its management fee by a specified amount if certain MFS mutual fund assets exceed thresholds agreed to by MFS and the fund’s Board of Trustees. For the six months ended July 31, 2014, this management fee reduction amounted to $28,126, which is included in the reduction of total expenses in the Statement of Operations. The management fee incurred for the six months ended July 31, 2014 was equivalent to an annual effective rate of 0.46% of the fund’s average daily net assets.
Effective August 1, 2014, the investment adviser has agreed in writing to reduce its management fee to 0.42% of average daily net assets in excess of $3 billion. This written agreement will continue until modified by the fund’s Board of Trustees, but such agreement will continue at least until May 31, 2016.
Distributor – MFS Fund Distributors, Inc. (MFD), a wholly-owned subsidiary of MFS, as distributor, received $96,858 and $895 for the six months ended July 31, 2014, as its portion of the initial sales charge on sales of Class A and Class 529A shares of the fund, respectively.
The Board of Trustees has adopted a distribution plan for certain share classes pursuant to Rule 12b-1 of the Investment Company Act of 1940.
The fund’s distribution plan provides that the fund will pay MFD for services provided by MFD and financial intermediaries in connection with the distribution and servicing of certain share classes. One component of the plan is a distribution fee paid to MFD and another component of the plan is a service fee paid to MFD. MFD may subsequently pay all, or a portion, of the distribution and/or service fees to financial intermediaries.
Distribution Plan Fee Table:
| | | | | | | | | | | | | | | | | | | | |
| | | Distribution
Fee Rate (d) | | | Service
Fee Rate (d) | | | Total
Distribution
Plan (d) | | | Annual
Effective
Rate (e) | | | Distribution
and Service
Fee | |
| Class A | | | — | | | | 0.25% | | | | 0.25% | | | | 0.24% | | | | $579,888 | |
| Class B | | | 0.75% | | | | 0.25% | | | | 1.00% | | | | 1.00% | | | | 154,293 | |
| Class C | | | 0.75% | | | | 0.25% | | | | 1.00% | | | | 1.00% | | | | 382,469 | |
| Class R1 | | | 0.75% | | | | 0.25% | | | | 1.00% | | | | 1.00% | | | | 6,221 | |
| Class R2 | | | 0.25% | | | | 0.25% | | | | 0.50% | | | | 0.50% | | | | 8,462 | |
| Class R3 | | | — | | | | 0.25% | | | | 0.25% | | | | 0.25% | | | | 9,311 | |
| Class 529A | | | — | | | | 0.25% | | | | 0.25% | | | | 0.23% | | | | 4,172 | |
| Class 529B | | | 0.75% | | | | 0.25% | | | | 1.00% | | | | 1.00% | | | | 1,735 | |
| Class 529C | | | 0.75% | | | | 0.25% | | | | 1.00% | | | | 1.00% | | | | 8,825 | |
| Total Distribution and Service Fees | | | | $1,155,376 | |
47
Notes to Financial Statements (unaudited) – continued
| (d) | In accordance with the distribution plan for certain classes, the fund pays distribution and/or service fees equal to these annual percentage rates of each class’s average daily net assets. The distribution and service fee rates disclosed by class represent the current rates in effect at the end of the reporting period. Any rate changes, if applicable, are detailed below. |
| (e) | The annual effective rates represent actual fees incurred under the distribution plan for the six months ended July 31, 2014 based on each class’s average daily net assets. MFD has voluntarily agreed to rebate a portion of each class’s 0.25% service fee attributable to accounts for which MFD retains the 0.25% service fee except for accounts attributable to MFS or its affiliates’ seed money. For the six months ended July 31, 2014, this rebate amounted to $19,043, $186, $271, and $259 for Class A, Class B, Class C, and Class 529A, respectively, and is included in the reduction of total expenses in the Statement of Operations. |
Certain Class A shares are subject to a contingent deferred sales charge (CDSC) in the event of a shareholder redemption within 18 months of purchase for shares purchased on or after August 1, 2012, and within 24 months of purchase for shares purchased prior to August 1, 2012. Class C and Class 529C shares are subject to a CDSC in the event of a shareholder redemption within 12 months of purchase. Class B and Class 529B shares are subject to a CDSC in the event of a shareholder redemption within six years of purchase. All contingent deferred sales charges are paid to MFD and during the six months ended July 31, 2014, were as follows:
| | | | |
| | | Amount | |
| Class A | | | $6,459 | |
| Class B | | | 25,585 | |
| Class C | | | 1,805 | |
| Class 529C | | | 50 | |
The fund has entered into and may from time to time enter into contracts with program managers and other parties which administer the tuition programs through which an investment in the fund’s 529 share classes is made. The fund has entered into an agreement with MFD pursuant to which MFD receives an annual fee of up to 0.10% of the average daily net assets attributable to each 529 share class. MFD has agreed to waive a portion of this fee in an amount equal to 0.05% of the average daily net assets for each 529 share class. This waiver agreement will expire on May 31, 2015, unless MFD elects to extend the waiver. For the six months ended July 31, 2014, this waiver amounted to $1,362 and is included in the reduction of total expenses in the Statement of Operations. The program manager fee incurred for the six months ended July 31, 2014 was equivalent to an annual effective rate of 0.05% of the average daily net assets attributable to each 529 share class. The services provided by MFD, or a third party with which MFD contracts, include recordkeeping and tax reporting and account services, as well as services designed to maintain the program’s compliance with the Internal Revenue Code and other regulatory requirements. Program manager fees and waivers for the six months ended July 31, 2014, were as follows:
| | | | | | | | |
| | | Fee | | | Waiver | |
| Class 529A | | | $1,668 | | | | $834 | |
| Class 529B | | | 174 | | | | 87 | |
| Class 529C | | | 883 | | | | 441 | |
| Total Program Manager Fees and Waivers | | | $2,725 | | | | $1,362 | |
48
Notes to Financial Statements (unaudited) – continued
Shareholder Servicing Agent – MFS Service Center, Inc. (MFSC), a wholly-owned subsidiary of MFS, receives a fee from the fund for its services as shareholder servicing agent calculated as a percentage of the average daily net assets of the fund as determined periodically under the supervision of the fund’s Board of Trustees. For the six months ended July 31, 2014, the fee was $146,090, which equated to 0.0210% annually of the fund’s average daily net assets. MFSC also receives payment from the fund for out-of-pocket expenses, sub-accounting and other shareholder servicing costs which may be paid to affiliated and unaffiliated service providers. Class R5 shares do not incur sub-accounting fees. For the six months ended July 31, 2014, these out-of-pocket expenses, sub-accounting and other shareholder servicing costs amounted to $285,186.
Under a Special Servicing Agreement among MFS, each MFS fund which invests in other MFS funds (“MFS fund-of-funds”) and certain underlying funds in which a MFS fund-of-funds invests (“underlying funds”), each underlying fund may pay a portion of each MFS fund-of-fund’s transfer agent-related expenses, including sub-accounting fees payable to financial intermediaries, to the extent such payments do not exceed the benefits realized or expected to be realized by the underlying fund from the investment in the underlying fund by the MFS fund-of-fund. For the six months ended July 31, 2014, these costs for the fund amounted to $391,037 and are included in “Shareholder servicing costs” in the Statement of Operations.
Administrator – MFS provides certain financial, legal, shareholder communications, compliance, and other administrative services to the fund. Under an administrative services agreement, the fund partially reimburses MFS the costs incurred to provide these services. The fund is charged an annual fixed amount of $17,500 plus a fee based on average daily net assets. The administrative services fee incurred for the six months ended July 31, 2014 was equivalent to an annual effective rate of 0.0123% of the fund’s average daily net assets.
Trustees’ and Officers’ Compensation – The fund pays compensation to independent Trustees in the form of a retainer, attendance fees, and additional compensation to Board and Committee chairpersons. The fund does not pay compensation directly to Trustees or officers of the fund who are also officers of the investment adviser, all of whom receive remuneration for their services to the fund from MFS. Certain officers and Trustees of the fund are officers or directors of MFS, MFD, and MFSC.
Prior to December 31, 2001, the fund had an unfunded defined benefit plan (“DB plan”) for independent Trustees. As of December 31, 2001, the Board took action to terminate the DB plan with respect to then-current and any future independent Trustees, such that the DB plan covers only certain of those former independent Trustees who retired on or before December 31, 2001. Effective January 1, 2002, accrued benefits under the DB plan for then-current independent Trustees who continued were credited to an unfunded retirement deferral plan (the “Retirement Deferral plan”), which was established for and exists solely with respect to these credited amounts, and is not available for other deferrals by these or other independent Trustees. Although the Retirement Deferral plan is unfunded, amounts deferred under the plan are periodically adjusted for investment experience as if they had been invested in shares of the fund. The DB plan resulted in a pension expense of
49
Notes to Financial Statements (unaudited) – continued
$1,591 and the Retirement Deferral plan resulted in an expense of $1,611. Both amounts are included in independent Trustees’ compensation for the six months ended July 31, 2014. The liability for deferred retirement benefits payable to certain independent Trustees under both plans amounted to $55,332 at July 31, 2014, and is included in “Payable for independent Trustees’ compensation” in the Statement of Assets and Liabilities.
Other – This fund and certain other funds managed by MFS (the funds) have entered into services agreements (the Agreements) which provide for payment of fees by the funds to Tarantino LLC and Griffin Compliance LLC in return for the provision of services of an Independent Chief Compliance Officer (ICCO) and Assistant ICCO, respectively, for the funds. The funds can terminate the Agreements with Tarantino LLC and Griffin Compliance LLC at any time under the terms of the Agreements. The ICCO is an officer of the funds and the sole member of Tarantino LLC. Prior to June 1, 2014, Robyn L. Griffin served as the Assistant ICCO and was an officer of the funds. Ms. Griffin is the sole member of Griffin Compliance LLC. Effective May 31, 2014, Ms. Griffin resigned as Assistant ICCO and the service agreement between the funds and Griffin Compliance LLC was terminated. For the six months ended July 31, 2014, the aggregate fees paid by the fund to Tarantino LLC and Griffin Compliance LLC were $2,639 and are included in “Miscellaneous” expense in the Statement of Operations. MFS has agreed to reimburse the fund for a portion of the payments made by the fund in the amount of $1,455, which is included in the reduction of total expenses in the Statement of Operations. Additionally, MFS has agreed to bear all expenses associated with office space, other administrative support, and supplies provided to the ICCO and Assistant ICCO.
The fund invests in the MFS Institutional Money Market Portfolio which is managed by MFS and seeks current income consistent with preservation of capital and liquidity. Income earned on this investment is included in “Dividends from underlying affiliated funds” in the Statement of Operations. This money market fund does not pay a management fee to MFS.
(4) Portfolio Securities
For the six months ended July 31, 2014, purchases and sales of investments, other than short-term obligations, aggregated $427,590,869 and $364,918,417, respectively.
50
Notes to Financial Statements (unaudited) – continued
(5) Shares of Beneficial Interest
The fund’s Declaration of Trust permits the Trustees to issue an unlimited number of full and fractional shares of beneficial interest. Transactions in fund shares were as follows:
| | | | | | | | | | | | | | | | |
| | | Six months ended
7/31/14 | | | Year ended
1/31/14 | |
| | | Shares | | | Amount | | | Shares | | | Amount | |
| Shares sold | | | | | | | | | | | | | | | | |
Class A | | | 10,466,262 | | | | $38,101,381 | | | | 25,630,750 | | | | $91,907,736 | |
Class B | | | 594,158 | | | | 2,166,576 | | | | 2,354,320 | | | | 8,463,048 | |
Class C | | | 1,363,633 | | | | 4,979,321 | | | | 3,866,994 | | | | 13,904,327 | |
Class I | | | 3,552,810 | | | | 12,920,199 | | | | 6,053,937 | | | | 21,543,523 | |
Class R1 | | | 79,559 | | | | 289,223 | | | | 70,368 | | | | 252,695 | |
Class R2 | | | 74,406 | | | | 270,889 | | | | 176,563 | | | | 634,597 | |
Class R3 | | | 135,227 | | | | 491,452 | | | | 599,639 | | | | 2,153,932 | |
Class R4 | | | 35,815 | | | | 130,661 | | | | 54,752 | | | | 197,181 | |
Class R5 | | | 14,212,750 | | | | 51,765,788 | | | | 43,452,780 | | | | 155,743,080 | |
Class 529A | | | 99,486 | | | | 360,948 | | | | 229,648 | | | | 825,301 | |
Class 529B | | | 5,132 | | | | 18,650 | | | | 12,945 | | | | 46,632 | |
Class 529C | | | 34,154 | | | | 124,592 | | | | 169,740 | | | | 611,992 | |
| | | 30,653,392 | | | | $111,619,680 | | | | 82,672,436 | | | | $296,284,044 | |
| | | | |
| Shares issued to shareholders in reinvestment of distributions | | | | | | | | | | | | | | | | |
Class A | | | 3,203,936 | | | | $11,662,026 | | | | 6,398,168 | | | | $22,924,324 | |
Class B | | | 188,041 | | | | 685,394 | | | | 385,184 | | | | 1,382,417 | |
Class C | | | 431,764 | | | | 1,576,668 | | | | 885,645 | | | | 3,185,808 | |
Class I | | | 554,110 | | | | 2,012,075 | | | | 1,106,822 | | | | 3,959,876 | |
Class R1 | | | 8,473 | | | | 30,882 | | | | 16,828 | | | | 60,382 | |
Class R2 | | | 24,830 | | | | 90,385 | | | | 58,091 | | | | 208,225 | |
Class R3 | | | 58,869 | | | | 214,198 | | | | 130,110 | | | | 466,092 | |
Class R4 | | | 4,118 | | | | 14,976 | | | | 7,616 | | | | 27,296 | |
Class R5 | | | 6,097,153 | | | | 22,181,105 | | | | 10,489,697 | | | | 37,563,472 | |
Class 529A | | | 26,014 | | | | 94,601 | | | | 48,507 | | | | 173,730 | |
Class 529B | | | 2,344 | | | | 8,529 | | | | 5,052 | | | | 18,093 | |
Class 529C | | | 11,902 | | | | 43,382 | | | | 21,014 | | | | 75,417 | |
| | | 10,611,554 | | | | $38,614,221 | | | | 19,552,734 | | | | $70,045,132 | |
51
Notes to Financial Statements (unaudited) – continued
| | | | | | | | | | | | | | | | |
| | | Six months ended
7/31/14 | | | Year ended
1/31/14 | |
| | | Shares | | | Amount | | | Shares | | | Amount | |
| Shares reacquired | | | | | | | | | | | | | | | | |
Class A | | | (11,718,885 | ) | | | $(42,647,415 | ) | | | (44,801,118 | ) | | | $(160,678,285 | ) |
Class B | | | (1,030,446 | ) | | | (3,756,890 | ) | | | (2,845,826 | ) | | | (10,206,866 | ) |
Class C | | | (2,526,024 | ) | | | (9,223,721 | ) | | | (6,127,640 | ) | | | (22,016,866 | ) |
Class I | | | (2,370,615 | ) | | | (8,582,418 | ) | | | (8,070,353 | ) | | | (28,903,905 | ) |
Class R1 | | | (40,340 | ) | | | (147,253 | ) | | | (69,109 | ) | | | (249,211 | ) |
Class R2 | | | (170,082 | ) | | | (618,407 | ) | | | (407,569 | ) | | | (1,458,053 | ) |
Class R3 | | | (476,943 | ) | | | (1,735,767 | ) | | | (760,847 | ) | | | (2,729,722 | ) |
Class R4 | | | (11,594 | ) | | | (42,290 | ) | | | (17,097 | ) | | | (61,026 | ) |
Class R5 | | | (2,071,172 | ) | | | (7,539,583 | ) | | | (2,694,150 | ) | | | (9,669,761 | ) |
Class 529A | | | (55,879 | ) | | | (203,007 | ) | | | (160,178 | ) | | | (573,482 | ) |
Class 529B | | | (4,878 | ) | | | (17,841 | ) | | | (28,089 | ) | | | (101,282 | ) |
Class 529C | | | (36,011 | ) | | | (130,566 | ) | | | (65,502 | ) | | | (234,035 | ) |
| | | (20,512,869 | ) | | | $(74,645,158 | ) | | | (66,047,478 | ) | | | $(236,882,494 | ) |
| | | | |
| Net change | | | | | | | | | | | | | | | | |
Class A | | | 1,951,313 | | | | $7,115,992 | | | | (12,772,200 | ) | | | $(45,846,225 | ) |
Class B | | | (248,247 | ) | | | (904,920 | ) | | | (106,322 | ) | | | (361,401 | ) |
Class C | | | (730,627 | ) | | | (2,667,732 | ) | | | (1,375,001 | ) | | | (4,926,731 | ) |
Class I | | | 1,736,305 | | | | 6,349,856 | | | | (909,594 | ) | | | (3,400,506 | ) |
Class R1 | | | 47,692 | | | | 172,852 | | | | 18,087 | | | | 63,866 | |
Class R2 | | | (70,846 | ) | | | (257,133 | ) | | | (172,915 | ) | | | (615,231 | ) |
Class R3 | | | (282,847 | ) | | | (1,030,117 | ) | | | (31,098 | ) | | | (109,698 | ) |
Class R4 | | | 28,339 | | | | 103,347 | | | | 45,271 | | | | 163,451 | |
Class R5 | | | 18,238,731 | | | | 66,407,310 | | | | 51,248,327 | | | | 183,636,791 | |
Class 529A | | | 69,621 | | | | 252,542 | | | | 117,977 | | | | 425,549 | |
Class 529B | | | 2,598 | | | | 9,338 | | | | (10,092 | ) | | | (36,557 | ) |
Class 529C | | | 10,045 | | | | 37,408 | | | | 125,252 | | | | 453,374 | |
| | | 20,752,077 | | | | $75,588,743 | | | | 36,177,692 | | | | $129,446,682 | |
The fund is one of several mutual funds in which certain of the MFS funds-of-funds may invest. The MFS funds-of-funds do not invest in the underlying MFS funds for the purpose of exercising management or control. At the end of the period, the MFS Moderate Allocation Fund, the MFS Growth Allocation Fund, the MFS Conservative Allocation Fund, the MFS Lifetime 2020 Fund, and the MFS Lifetime 2030 Fund were the owners of record of approximately 22%, 18%, 10%, 1%, and 1%, respectively, of the value of outstanding voting shares of the fund. In addition, the MFS Lifetime Income Fund (formerly known as the MFS Lifetime Retirement Income Fund), the MFS Lifetime 2015 Fund, the MFS Lifetime 2025 Fund, and the MFS Lifetime 2035 Fund were each the owners of record of less than 1% of the value of outstanding voting shares of the fund.
(6) Line of Credit
The fund and certain other funds managed by MFS participate in a $1.1 billion unsecured committed line of credit, subject to a $1 billion sublimit, provided by a syndication of banks under a credit agreement. Borrowings may be made for
52
Notes to Financial Statements (unaudited) – continued
temporary financing needs. Interest is charged to each fund, based on its borrowings, generally at a rate equal to the higher of the Federal Reserve funds rate or one month LIBOR plus an agreed upon spread. A commitment fee, based on the average daily, unused portion of the committed line of credit, is allocated among the participating funds at the end of each calendar quarter. In addition, the fund and other funds managed by MFS have established unsecured uncommitted borrowing arrangements with certain banks for temporary financing needs. Interest is charged to each fund, based on its borrowings, at a rate equal to the Federal Reserve funds rate plus an agreed upon spread. For the six months ended July 31, 2014, the fund’s commitment fee and interest expense were $2,715 and $0, respectively, and are included in “Miscellaneous” expense in the Statement of Operations.
(8) Transactions in Underlying Affiliated Funds-Affiliated Issuers
An affiliated issuer may be considered one in which the fund owns 5% or more of the outstanding voting securities, or a company which is under common control. For the purposes of this report, the fund assumes the following to be an affiliated issuer:
| | | | | | | | | | | | | | | | |
| Underlying Affiliated Fund | | Beginning
Shares/Par
Amount | | | Acquisitions
Shares/Par
Amount | | | Dispositions
Shares/Par
Amount | | | Ending
Shares/Par
Amount | |
| MFS Institutional Money Market Portfolio | | | 33,626,266 | | | | 191,039,228 | | | | (173,819,844 | ) | | | 50,845,650 | |
| | | | |
| Underlying Affiliated Fund | | Realized
Gain (Loss) | | | Capital Gain
Distributions | | | Dividend
Income | | | Ending
Value | |
| MFS Institutional Money Market Portfolio | | | $— | | | | $— | | | | $21,701 | | | | $50,845,650 | |
53
BOARD REVIEW OF INVESTMENT ADVISORY AGREEMENT
The Investment Company Act of 1940 requires that both the full Board of Trustees and a majority of the non-interested (“independent”) Trustees, voting separately, annually approve the continuation of the Fund’s investment advisory agreement with MFS. The Trustees consider matters bearing on the Fund and its advisory arrangements at their meetings throughout the year, including a review of performance data at each regular meeting. In addition, the independent Trustees met several times over the course of three months beginning in May and ending in July, 2014 (“contract review meetings”) for the specific purpose of considering whether to approve the continuation of the investment advisory agreement for the Fund and the other investment companies that the Board oversees (the “MFS Funds”). The independent Trustees were assisted in their evaluation of the Fund’s investment advisory agreement by independent legal counsel, from whom they received separate legal advice and with whom they met separately from MFS during various contract review meetings. The independent Trustees were also assisted in this process by the MFS Funds’ Independent Chief Compliance Officer, a full-time senior officer appointed by and reporting to the independent Trustees.
In connection with their deliberations regarding the continuation of the investment advisory agreement, the Trustees, including the independent Trustees, considered such information and factors as they believed, in light of the legal advice furnished to them and their own business judgment, to be relevant. The investment advisory agreement for the Fund was considered separately, although the Trustees also took into account the common interests of all MFS Funds in their review. As described below, the Trustees considered the nature, quality, and extent of the various investment advisory, administrative, and shareholder services performed by MFS under the existing investment advisory agreement and other arrangements with the Fund.
In connection with their contract review meetings, the Trustees received and relied upon materials that included, among other items: (i) information provided by Lipper Inc., an independent third party, on the investment performance of the Fund for various time periods ended December 31, 2013 and the investment performance of a group of funds with substantially similar investment classifications/objectives (the “Lipper performance universe”), (ii) information provided by Lipper Inc. on the Fund’s advisory fees and other expenses and the advisory fees and other expenses of comparable funds identified by Lipper Inc. (the “Lipper expense group”), (iii) information provided by MFS on the advisory fees of comparable portfolios of other clients of MFS, including institutional separate accounts and other clients, (iv) information as to whether and to what extent applicable expense waivers, reimbursements or fee “breakpoints” are observed for the Fund, (v) information regarding MFS’ financial results and financial condition, including MFS’ and certain of its affiliates’ estimated profitability from services performed for the Fund and the MFS Funds as a whole, and compared to MFS’ institutional business, (vi) MFS’ views regarding the outlook for the mutual fund industry and the strategic business plans of MFS, (vii) descriptions of various functions performed by MFS for the Funds, such as compliance monitoring and portfolio trading practices, and (viii) information regarding the overall organization of MFS, including information about MFS’ senior management and other personnel providing investment advisory, administrative and other services to
54
Board Review of Investment Advisory Agreement – continued
the Fund and the other MFS Funds. The comparative performance, fee and expense information prepared and provided by Lipper Inc. was not independently verified and the independent Trustees did not independently verify any information provided to them by MFS.
The Trustees’ conclusion as to the continuation of the investment advisory agreement was based on a comprehensive consideration of all information provided to the Trustees and not the result of any single factor. Some of the factors that figured particularly in the Trustees’ deliberations are described below, although individual Trustees may have evaluated the information presented differently from one another, giving different weights to various factors. It is also important to recognize that the fee arrangements for the Fund and other MFS Funds are the result of years of review and discussion between the independent Trustees and MFS, that certain aspects of such arrangements may receive greater scrutiny in some years than in others, and that the Trustees’ conclusions may be based, in part, on their consideration of these same arrangements during the course of the year and in prior years.
Based on information provided by Lipper Inc. and MFS, the Trustees reviewed the Fund’s total return investment performance as well as the performance of peer groups of funds over various time periods. The Trustees placed particular emphasis on the total return performance of the Fund’s Class A shares in comparison to the performance of funds in its Lipper performance universe over the three-year period ended December 31, 2013, which the Trustees believed was a long enough period to reflect differing market conditions. The total return performance of the Fund’s Class A shares was in the 3rd quintile relative to the other funds in the universe for this three-year period (the 1st quintile being the best performers and the 5th quintile being the worst performers). The total return performance of the Fund’s Class A shares was in the 3rd quintile for each of the one- and five-year periods ended December 31, 2013 relative to the Lipper performance universe. Because of the passage of time, these performance results may differ from the performance results for more recent periods, including those shown elsewhere in this report.
In the course of their deliberations, the Trustees took into account information provided by MFS in connection with the contract review meetings, as well as during investment review meetings conducted with portfolio management personnel during the course of the year regarding the Fund’s performance. After reviewing these and related factors, the Trustees concluded, within the context of their overall conclusions regarding the investment advisory agreement, that they were satisfied with MFS’ responses and efforts relating to investment performance.
In assessing the reasonableness of the Fund’s advisory fee, the Trustees considered, among other information, the Fund’s advisory fee and the total expense ratio of the Fund’s Class A shares as a percentage of average daily net assets and the advisory fee and total expense ratios of peer groups of funds based on information provided by Lipper Inc. The Trustees considered that, according to the Lipper data (which takes into account any fee reductions or expense limitations that were in effect during the Fund’s last fiscal year), the Fund’s effective advisory fee rate was lower than the Lipper expense group median and the total expense ratio was approximately at the Lipper expense group median.
55
Board Review of Investment Advisory Agreement – continued
The Trustees also considered the advisory fees charged by MFS to any comparable institutional accounts. In comparing these fees, the Trustees considered information provided by MFS as to the generally broader scope of services provided by MFS to the Fund in comparison to institutional accounts, the higher demands placed on MFS’ investment personnel and trading infrastructure as a result of the daily cash in-flows and out-flows of the Fund, and the impact on MFS and expenses associated with the more extensive regulatory regime to which the Fund is subject in comparison to institutional accounts.
The Trustees also considered whether the Fund may benefit from any economies of scale in the management of the Fund in the event of growth in assets of the Fund and/or growth in assets of the MFS Funds as a whole. They noted that the Fund’s advisory fee rate schedule is subject to a contractual breakpoint that reduces the Fund’s advisory fee rate on average daily net assets over $1.4 billion, and that MFS has agreed in writing to implement an additional breakpoint that reduces its advisory fee rate on the Fund’s average daily net assets over $3 billion, which may not be changed without the Trustees’ approval. The Trustees also noted that MFS has agreed in writing to waive a portion of the management fees of certain MFS Funds, including the Fund, if the total combined assets of certain funds within the MFS Funds’ complex increase above agreed upon thresholds (the “group fee waiver”), enabling the Fund’s shareholders to share in the benefits from any economies of scale at the complex level. The group fee waiver is reviewed and renewed annually between the Board and MFS. The Trustees concluded that the breakpoints and the group fee waiver were sufficient to allow the Fund to benefit from economies of scale as its assets and overall complex assets grow.
The Trustees also considered information prepared by MFS relating to MFS’ costs and profits with respect to the Fund, the MFS Funds considered as a group, and other investment companies and accounts advised by MFS, as well as MFS’ methodologies used to determine and allocate its costs to the MFS Funds, the Fund and other accounts and products for purposes of estimating profitability.
After reviewing these and other factors described herein, the Trustees concluded, within the context of their overall conclusions regarding the investment advisory agreement, that the advisory fees charged to the Fund represent reasonable compensation in light of the services being provided by MFS to the Fund.
In addition, the Trustees considered MFS’ resources and related efforts to continue to retain, attract and motivate capable personnel to serve the Fund. The Trustees also considered current and developing conditions in the financial services industry, including the presence of large and well-capitalized companies which are spending, and appear to be prepared to continue to spend, substantial sums to engage personnel and to provide services to competing investment companies. In this regard, the Trustees also considered the financial resources of MFS and its ultimate parent, Sun Life Financial Inc. The Trustees also considered the advantages and possible disadvantages to the Fund of having an adviser that also serves other investment companies as well as other accounts.
The Trustees also considered the nature, quality, cost, and extent of administrative, transfer agency, and distribution services provided to the Fund by MFS and its affiliates under agreements and plans other than the investment advisory agreement, including
56
Board Review of Investment Advisory Agreement – continued
any 12b-1 fees the Fund pays to MFS Fund Distributors, Inc., an affiliate of MFS. The Trustees also considered the nature, extent and quality of certain other services MFS performs or arranges for on the Fund’s behalf, which may include securities lending programs, directed expense payment programs, class action recovery programs, and MFS’ interaction with third-party service providers, principally custodians and sub-custodians. The Trustees concluded that the various non-advisory services provided by MFS and its affiliates on behalf of the Fund were satisfactory.
The Trustees also considered benefits to MFS from the use of the Fund’s portfolio brokerage commissions, if applicable, to pay for investment research and various other factors. Additionally, the Trustees considered so-called “fall-out benefits” to MFS such as reputational value derived from serving as investment manager to the Fund.
Based on their evaluation of factors that they deemed to be material, including those factors described above, the Board of Trustees, including the independent Trustees, concluded that the Fund’s investment advisory agreement with MFS should be continued for an additional one-year period, commencing August 1, 2014.
57
PROXY VOTING POLICIES AND INFORMATION
MFS votes proxies on behalf of the fund pursuant to proxy voting policies and procedures that are available without charge, upon request, by calling 1-800-225-2606, by visiting the Proxy Voting section of mfs.com or by visiting the SEC’s Web site at http://www.sec.gov.
Information regarding how the fund voted proxies relating to portfolio securities during the most recent twelve-month period ended June 30 is available without charge by visiting the Proxy Voting section of mfs.com or by visiting the SEC’s Web site at http://www.sec.gov.
QUARTERLY PORTFOLIO DISCLOSURE
The fund will file a complete schedule of portfolio holdings with the Securities and Exchange Commission (the Commission) for the first and third quarters of each fiscal year on Form N-Q. A shareholder can obtain the quarterly portfolio holdings report at mfs.com. The fund’s Form N-Q is also available on the EDGAR database on the Commission’s Internet Web site at http://www.sec.gov, and may be reviewed and copied at the:
Public Reference Room
Securities and Exchange Commission
100 F Street, NE, Room 1580
Washington, D.C. 20549
Information on the operation of the Public Reference Room may be obtained by calling the Commission at 1-800-SEC-0330. Copies of the fund’s Form N-Q also may be obtained, upon payment of a duplicating fee, by electronic request at the following e-mail address: publicinfo@sec.gov, or by writing the Public Reference Section at the above address.
FURTHER INFORMATION
From time to time, MFS may post important information about the fund or the MFS funds on the MFS web site (mfs.com). This information is available by visiting the “Commentary & Announcements” and “Market Outlooks” sections of mfs.com or by clicking on the fund’s name under “Mutual Funds” in the “Products” section of mfs.com.
PROVISION OF FINANCIAL REPORTS AND SUMMARY PROSPECTUSES
The fund produces financial reports every six months and updates its summary prospectus and prospectus annually. To avoid sending duplicate copies of materials to households, only one copy of the fund’s annual and semiannual report and summary prospectus may be mailed to shareholders having the same last name and residential address on the fund’s records. However, any shareholder may contact MFSC (please see back cover for address and telephone number) to request that copies of these reports and summary prospectuses be sent personally to that shareholder.
58
Save paper with eDelivery.

| MFS® will send you prospectuses, |
reports, and proxies directly via e-mail so you will get information faster with less mailbox clutter.
To sign up:
1. Go to mfs.com.
2. Log in via MFS® Access.
3. Select eDelivery.
If you own your MFS fund shares through a financial institution or a retirement plan, MFS® TALK, MFS® Access, or eDelivery may not be available to you.
CONTACT
WEB SITE
mfs.com
MFS TALK
1-800-637-8255
24 hours a day
ACCOUNT SERVICE AND LITERATURE
Shareholders
1-800-225-2606
Financial advisors
1-800-343-2829
Retirement plan services
1-800-637-1255
MAILING ADDRESS
MFS Service Center, Inc.
P.O. Box 55824
Boston, MA 02205-5824
OVERNIGHT MAIL
MFS Service Center, Inc.
c/o Boston Financial Data Services
30 Dan Road
Canton, MA 02021-2809
SEMIANNUAL REPORT
July 31, 2014

MFS® GLOBAL HIGH YIELD FUND
(formerly MFS® High Yield Opportunities Fund)

HYO-SEM
MFS® GLOBAL HIGH YIELD FUND
(formerly MFS® High Yield Opportunities Fund)
CONTENTS
Note to Shareholders: Effective March 31, 2014, the fund’s name changed from MFS High Yield Opportunities Fund to MFS Global High Yield Fund.
The report is prepared for the general information of shareholders.
It is authorized for distribution to prospective investors only when preceded or accompanied by a current prospectus.
NOT FDIC INSURED Ÿ MAY LOSE VALUE Ÿ NO BANK GUARANTEE

LETTER FROM THE CHAIRMAN AND CEO
Dear Shareholders:
The U.S. economy has gathered momentum after a slow start to the year. Industrial output, consumer confidence and retail sales have all strengthened along with the labor market. However, the unemployment rate remains elevated and the housing
market has cooled off. With second-quarter economic growth rebounding strongly, economists have a favorable outlook for the rest of the year.
China’s economy has picked up again, and Japan is moving steadily towards Prime Minister Abe’s economic goals, including an inflation rate of 2% by next spring. The eurozone’s economy appears to have turned a corner, with renewed growth. However, historically high unemployment persists, deflation remains a risk and Russian sanctions could present a new obstacle to regional growth.
With corporate earnings surpassing expectations, the greatest concerns now are related to conflicts in the Middle East and Ukraine as well as growing speculation on when the U.S. Federal Reserve will begin increasing interest rates.
As always at MFS®, active risk management is integral to how we manage your investments. We use a collaborative process, sharing insights across asset classes, regions and economic sectors. Our global team of investment professionals uses a multidisciplined, long-term, diversified investment approach.
We understand that these are challenging economic times. We believe that we can serve you best by applying proven principles, such as asset allocation and diversification, over the long term. We are confident that this approach can serve you well as you work with your financial advisors to reach your goals in the years ahead.
Respectfully,

Robert J. Manning
Chairman and Chief Executive Officer
MFS Investment Management
September 15, 2014
The opinions expressed in this letter are subject to change and may not be relied upon for investment advice. No forecasts can be guaranteed.
1
PORTFOLIO COMPOSITION
Portfolio structure (i)

| | | | |
| Top five industries (i) | | | | |
| Energy-Independent | | | 7.2% | |
| Telecommunications-Wireless | | | 5.8% | |
| Cable TV | | | 5.6% | |
| Building | | | 4.9% | |
| Metals & Mining | | | 4.5% | |
| |
| Composition including fixed income credit quality (a)(i) | | | | |
| BBB | | | 4.5% | |
| BB | | | 35.1% | |
| B | | | 47.3% | |
| CCC | | | 9.9% | |
| CC (o) | | | 0.0% | |
| C | | | 0.1% | |
| Not Rated | | | 0.1% | |
| Non-Fixed Income | | | 0.2% | |
| Cash & Other | | | 2.8% | |
| | | | |
| Portfolio facts (i) | | | | |
| Average Duration (d) | | | 4.7 | |
| Average Effective Maturity (m) | | | 7.1 yrs. | |
|
| Issuer country weightings (i)(x) | |
| United States | | | 61.9% | |
| Canada | | | 4.3% | |
| United Kingdom | | | 3.9% | |
| Mexico | | | 3.3% | |
| Luxembourg | | | 2.8% | |
| Brazil | | | 2.2% | |
| France | | | 2.0% | |
| Italy | | | 1.8% | |
| Netherlands | | | 1.7% | |
| Other Countries | | | 16.1% | |
| (a) | For all securities other than those specifically described below, ratings are assigned to underlying securities utilizing ratings from Moody’s, Fitch, and Standard & Poor’s rating agencies and applying the following hierarchy: If all three agencies provide a rating, the middle rating (after dropping the highest and lowest ratings) is assigned; if two of the three agencies rate a security, the lower of the two is assigned. Ratings are shown in the S&P and Fitch scale (e.g., AAA). Securities rated BBB or higher are considered investment grade. All ratings are subject to change. Not Rated includes fixed income securities, including fixed income futures contracts, which have not been rated by any rating agency. Non-Fixed Income includes equity securities (including convertible bonds and equity derivatives) and commodities. The fund may not hold all of these instruments. The fund is not rated by these agencies. |
2
Portfolio Composition – continued
| (d) | Duration is a measure of how much a bond’s price is likely to fluctuate with general changes in interest rates, e.g., if rates rise 1.00%, a bond with a 5-year duration is likely to lose about 5.00% of its value due to the interest rate move. |
| (i) | For purposes of this presentation, the components include the value of securities, and reflect the impact of the equivalent exposure of derivative positions, if any. These amounts may be negative from time to time. Equivalent exposure is a calculated amount that translates the derivative position into a reasonable approximation of the amount of the underlying asset that the portfolio would have to hold at a given point in time to have the same price sensitivity that results from the portfolio’s ownership of the derivative contract. When dealing with derivatives, equivalent exposure is a more representative measure of the potential impact of a position on portfolio performance than value. The bond component will include any accrued interest amounts. |
| (m) | In determining an instrument’s effective maturity for purposes of calculating the fund’s dollar-weighted average effective maturity, MFS uses the instrument’s stated maturity or, if applicable, an earlier date on which MFS believes it is probable that a maturity-shortening device (such as a put, pre-refunding or prepayment) will cause the instrument to be repaid. Such an earlier date can be substantially shorter than the instrument’s stated maturity. |
| (x) | Represents the portfolio’s exposure to issuer countries as a percentage of a portfolio’s net assets. For purposes of this presentation, United States includes Cash & Other. |
Where the fund holds convertible bonds, these are treated as part of the equity portion of the portfolio.
The fund invests a portion of its assets in the MFS High Yield Pooled Portfolio. Percentages reflect exposure to the underlying holdings of the MFS High Yield Pooled Portfolio and not to the exposure from investing directly in the MFS High Yield Pooled Portfolio itself.
Cash & Other can include cash, other assets less liabilities, offsets to derivative positions, and short-term securities.
Percentages are based on net assets as of 7/31/14.
The portfolio is actively managed and current holdings may be different.
3
EXPENSE TABLE
Fund expenses borne by the shareholders during the period, February 1, 2014 through July 31, 2014
As a shareholder of the fund, you incur two types of costs: (1) transaction costs, including sales charges (loads) on certain purchase or redemption payments, and (2) ongoing costs, including management fees; distribution and service (12b-1) fees; and other fund expenses. This example is intended to help you understand your ongoing costs (in dollars) of investing in the fund and to compare these costs with the ongoing costs of investing in other mutual funds.
In addition to the fees and expenses which the fund bears directly, the fund indirectly bears a pro rata share of the fees and expenses of the underlying MFS Pooled Portfolio in which the fund invests. MFS Pooled Portfolios are mutual funds advised by MFS that do not pay management fees to MFS but do incur investment and operating costs. If these transactional and indirect costs were included, your costs would have been higher.
The example is based on an investment of $1,000 invested at the beginning of the period and held for the entire period February 1, 2014 through July 31, 2014.
Actual Expenses
The first line for each share class in the following table provides information about actual account values and actual expenses. You may use the information in this line, together with the amount you invested, to estimate the expenses that you paid over the period. Simply divide your account value by $1,000 (for example, an $8,600 account value divided by $1,000 = 8.6), then multiply the result by the number in the first line under the heading entitled “Expenses Paid During Period” to estimate the expenses you paid on your account during this period.
Hypothetical Example for Comparison Purposes
The second line for each share class in the following table provides information about hypothetical account values and hypothetical expenses based on the fund’s actual expense ratio and an assumed rate of return of 5% per year before expenses, which is not the fund’s actual return. The hypothetical account values and expenses may not be used to estimate the actual ending account balance or expenses you paid for the period. You may use this information to compare the ongoing costs of investing in the fund and other funds. To do so, compare this 5% hypothetical example with the 5% hypothetical examples that appear in the shareholder reports of the other funds.
Please note that the expenses shown in the table are meant to highlight your ongoing costs only and do not reflect any transactional costs, such as sales charges (loads). Therefore, the second line for each share class in the table is useful in comparing ongoing costs only, and will not help you determine the relative total costs of owning different funds. In addition, if these transactional costs were included, your costs would have been higher.
4
Expense Table – continued
| | | | | | | | | | | | | | | | | | |
Share
Class | | | | Annualized
Expense
Ratio | | | Beginning
Account Value
2/01/14 | | | Ending
Account Value
7/31/14 | | | Expenses
Paid During
Period (p)
2/01/14-7/31/14 | |
| A | | Actual | | | 1.05% | | | | $1,000.00 | | | | $1,034.47 | | | | $5.30 | |
| | Hypothetical (h) | | | 1.05% | | | | $1,000.00 | | | | $1,019.59 | | | | $5.26 | |
| B | | Actual | | | 1.80% | | | | $1,000.00 | | | | $1,030.59 | | | | $9.06 | |
| | Hypothetical (h) | | | 1.80% | | | | $1,000.00 | | | | $1,015.87 | | | | $9.00 | |
| C | | Actual | | | 1.80% | | | | $1,000.00 | | | | $1,032.19 | | | | $9.07 | |
| | Hypothetical (h) | | | 1.80% | | | | $1,000.00 | | | | $1,015.87 | | | | $9.00 | |
| I | | Actual | | | 0.80% | | | | $1,000.00 | | | | $1,035.75 | | | | $4.04 | |
| | Hypothetical (h) | | | 0.80% | | | | $1,000.00 | | | | $1,020.83 | | | | $4.01 | |
| R1 | | Actual | | | 1.80% | | | | $1,000.00 | | | | $1,032.15 | | | | $9.07 | |
| | Hypothetical (h) | | | 1.80% | | | | $1,000.00 | | | | $1,015.87 | | | | $9.00 | |
| R2 | | Actual | | | 1.30% | | | | $1,000.00 | | | | $1,033.16 | | | | $6.55 | |
| | Hypothetical (h) | | | 1.30% | | | | $1,000.00 | | | | $1,018.35 | | | | $6.51 | |
| R3 | | Actual | | | 1.05% | | | | $1,000.00 | | | | $1,036.03 | | | | $5.30 | |
| | Hypothetical (h) | | | 1.05% | | | | $1,000.00 | | | | $1,019.59 | | | | $5.26 | |
| R4 | | Actual | | | 0.80% | | | | $1,000.00 | | | | $1,035.70 | | | | $4.04 | |
| | Hypothetical (h) | | | 0.80% | | | | $1,000.00 | | | | $1,020.83 | | | | $4.01 | |
| R5 | | Actual | | | 0.71% | | | | $1,000.00 | | | | $1,036.22 | | | | $3.58 | |
| | Hypothetical (h) | | | 0.71% | | | | $1,000.00 | | | | $1,021.27 | | | | $3.56 | |
| (h) | 5% class return per year before expenses. |
| (p) | “Expenses Paid During Period” are equal to each class’s annualized expense ratio, as shown above, multiplied by the average account value over the period, multiplied by 181/365 (to reflect the one-half year period). Expenses paid do not include any applicable sales charges (loads). If these transaction costs had been included, your costs would have been higher. In addition to the fees and expenses which the fund bears directly, the fund indirectly bears a pro rata share of the fees and expenses of the underlying funds in which the fund invests. If these indirect costs were included, your costs would have been higher. |
5
PORTFOLIO OF INVESTMENTS
7/31/14 (unaudited)
The Portfolio of Investments is a complete list of all securities owned by your fund. It is categorized by broad-based asset classes.
| | | | | | | | |
| Bonds - 24.9% | | | | | | | | |
| Issuer | | Shares/Par | | | Value ($) | |
| Asset-Backed & Securitized - 0.6% | | | | | | | | |
| Arbor Realty Mortgage Securities, CDO, FRN, 2.534%, 4/21/38 (z) | | $ | 1,136,457 | | | $ | 883,507 | |
| Banc of America Commercial Mortgage, Inc., FRN, 6.277%, 2/10/51 (z) | | | 3,830,049 | | | | 1,959,633 | |
| Citigroup Commercial Mortgage Trust, FRN, 5.71%, 12/10/49 (d)(q) | | | 2,500,000 | | | | 344,000 | |
| Crest Ltd., CDO, 7%, 1/28/40 (a)(p) | | | 1,334,298 | | | | 66,715 | |
| Falcon Franchise Loan LLC, FRN, 16.08%, 1/05/25 (i)(z) | | | 94,278 | | | | 31,112 | |
| G-Force LLC, CDO, “A2”, 4.83%, 8/22/36 (z) | | | 995 | | | | 1,018 | |
| LB Commercial Conduit Mortgage Trust, FRN, 1.176%, 2/18/30 (i) | | | 288,377 | | | | 6,890 | |
| Morgan Stanley Capital I, Inc., FRN, 1.414%, 4/28/39 (i)(z) | | | 1,106,693 | | | | 7,321 | |
| Preferred Term Securities XII Ltd., CDO, 0%, 12/24/33 (a)(c)(z) | | | 1,775,000 | | | | 0 | |
| | | | | | | | |
| | | | $ | 3,300,196 | |
| Automotive - 0.4% | | | | | | | | |
| Jaguar Land Rover PLC, 8.125%, 5/15/21 (n) | | $ | 920,000 | | | $ | 1,018,900 | |
| Schaeffler Finance B.V., 4.25%, 5/15/18 (n) | | EUR | 100,000 | | | | 137,962 | |
| Schaeffler Finance B.V., 6.875%, 8/15/18 (n)(p) | | $ | 640,000 | | | | 672,000 | |
| Schaeffler Finance B.V., 4.75%, 5/15/21 (z) | | | 295,000 | | | | 299,425 | |
| | | | | | | | |
| | | | $ | 2,128,287 | |
| Broadcasting - 0.1% | | | | | | | | |
| Myriad International Holdings B.V., 6%, 7/18/20 (n) | | $ | 486,000 | | | $ | 535,815 | |
| | |
| Building - 2.0% | | | | | | | | |
| Cementos Pacasmayo S.A.A., 4.5%, 2/08/23 | | $ | 1,535,000 | | | $ | 1,450,575 | |
| Cementos Progreso Trust Co., 7.125%, 11/06/23 (n) | | | 1,419,000 | | | | 1,528,973 | |
| CEMEX Espana S.A., 9.25%, 5/12/20 | | | 995,000 | | | | 1,077,088 | |
| CEMEX S.A.B. de C.V., 5.875%, 3/25/19 (n) | | | 345,000 | | | | 351,038 | |
| CEMEX S.A.B. de C.V., 6.5%, 12/10/19 (n) | | | 845,000 | | | | 881,969 | |
| CEMEX S.A.B. de C.V., 7.25%, 1/15/21 (n) | | | 435,000 | | | | 461,100 | |
| Cimpor Financial Operations B.V., 5.75%, 7/17/24 (z) | | | 918,000 | | | | 905,378 | |
| Grupo Cementos de Chihuahua S.A.B. de C.V., 8.125%, 2/08/20 | | | 1,563,000 | | | | 1,715,393 | |
| Grupo Cementos de Chihuahua S.A.B. de C.V., 8.125%, 2/08/20 (n) | | | 795,000 | | | | 872,513 | |
| Lafarge S.A., 7.125%, 7/15/36 | | | 625,000 | | | | 720,313 | |
| Paroc Group Oy, 6.25%, 5/15/20 (z) | | EUR | 1,125,000 | | | | 1,506,431 | |
| | | | | | | | |
| | | | $ | 11,470,771 | |
6
Portfolio of Investments (unaudited) – continued
| | | | | | | | |
| Issuer | | Shares/Par | | | Value ($) | |
| Bonds - continued | | | | | | | | |
| Cable TV - 1.6% | | | | | | | | |
| Cogeco Cable, Inc., 4.875%, 5/01/20 (n) | | $ | 1,135,000 | | | $ | 1,140,675 | |
| Numericable Group S.A., 6%, 5/15/22 (n) | | | 400,000 | | | | 402,000 | |
| Telenet Finance Luxembourg, 6.375%, 11/15/20 (n) | | EUR | 500,000 | | | | 711,544 | |
| Telenet Group Holding N.V., 6.25%, 8/15/22 (n) | | EUR | 780,000 | | | | 1,138,506 | |
| Unitymedia Hessen GmbH & Co. KG, 6.25%, 1/15/29 (n) | | EUR | 1,160,000 | | | | 1,747,460 | |
| Videotron Ltd., 5.375%, 6/15/24 (n) | | $ | 1,890,000 | | | | 1,890,000 | |
| VTR Finance B.V., 6.875%, 1/15/24 (n) | | | 1,120,000 | | | | 1,160,600 | |
| Ziggo Bond Co. B.V., 8%, 5/15/18 (n) | | EUR | 755,000 | | | | 1,106,925 | |
| | | | | | | | |
| | | | $ | 9,297,710 | |
| Chemicals - 0.2% | | | | | | | | |
| INEOS Group Holdings S.A., 5.75%, 2/15/19 (n) | | EUR | 760,000 | | | $ | 1,038,032 | |
| | |
| Conglomerates - 0.5% | | | | | | | | |
| Grupo Kuo S.A.B. de C.V., 6.25%, 12/04/22 | | $ | 1,505,000 | | | $ | 1,576,488 | |
| Metalloinvest Finance Ltd., 5.625%, 4/17/20 (n) | | | 1,420,000 | | | | 1,295,750 | |
| | | | | | | | |
| | | | $ | 2,872,238 | |
| Construction - 0.5% | | | | | | | | |
| Empresas ICA S.A.B. de C.V., 8.375%, 7/24/17 (n) | | $ | 150,000 | | | $ | 158,063 | |
| Empresas ICA S.A.B. de C.V., 8.375%, 7/24/17 | | | 291,000 | | | | 306,641 | |
| Empresas ICA S.A.B. de C.V., 8.875%, 5/29/24 (n) | | | 615,000 | | | | 628,838 | |
| Empresas ICA Sociedad Controladora S.A. de C.V., 8.9%, 2/04/21 | | | 1,639,000 | | | | 1,720,950 | |
| | | | | | | | |
| | | | $ | 2,814,492 | |
| Consumer Products - 0.2% | | | | | | | | |
| Jarden Corp., 3.75%, 10/01/21 (z) | | EUR | 1,125,000 | | | $ | 1,491,367 | |
| | |
| Consumer Services - 0.3% | | | | | | | | |
| Grupo Posadas S.A.B. de C.V., 7.875%, 11/30/17 | | $ | 1,510,000 | | | $ | 1,532,650 | |
| | |
| Containers - 0.4% | | | | | | | | |
| San Miguel Industrias PET S.A., 7.75%, 11/06/20 (n) | | $ | 1,211,000 | | | $ | 1,307,880 | |
| SGD Group SAS, 5.625%, 5/15/19 (z) | | EUR | 755,000 | | | | 1,036,257 | |
| | | | | | | | |
| | | | $ | 2,344,137 | |
| Electronics - 0.1% | | | | | | | | |
| Nokia Corp., 5.375%, 5/15/19 | | $ | 600,000 | | | $ | 636,000 | |
| | |
| Emerging Market Quasi-Sovereign - 0.8% | | | | | | | | |
| Banco de Reservas de la Republica Dominicana, 7%, 2/01/23 (n) | | $ | 606,000 | | | $ | 624,180 | |
| Banco do Estado Rio Grande do Sul S.A., 7.375%, 2/02/22 (n) | | | 1,716,000 | | | | 1,806,845 | |
| Instituto Costarricense, 6.375%, 5/15/43 (n) | | | 923,000 | | | | 821,470 | |
7
Portfolio of Investments (unaudited) – continued
| | | | | | | | |
| Issuer | | Shares/Par | | | Value ($) | |
| Bonds - continued | | | | | | | | |
| Emerging Market Quasi-Sovereign - continued | | | | | | | | |
| Office Cherifien des Phosphates, 6.875%, 4/25/44 (n) | | $ | 1,395,000 | | | $ | 1,478,700 | |
| | | | | | | | |
| | | | $ | 4,731,195 | |
| Emerging Market Sovereign - 0.6% | | | | | | | | |
| Dominican Republic, 7.5%, 5/06/21 (n) | | $ | 790,000 | | | $ | 902,575 | |
| Dominican Republic, 6.6%, 1/28/24 (n) | | | 122,000 | | | | 132,980 | |
| Dominican Republic, 5.875%, 4/18/24 (n) | | | 111,000 | | | | 114,885 | |
| Dominican Republic, 7.45%, 4/30/44 (n) | | | 107,000 | | | | 113,955 | |
| Republic of Croatia, 5.5%, 4/04/23 (n) | | | 1,264,000 | | | | 1,308,240 | |
| Republic of Venezuela, 7%, 3/31/38 | | | 1,433,000 | | | | 987,337 | |
| | | | | | | | |
| | | | $ | 3,559,972 | |
| Energy - Independent - 0.6% | | | | | | | | |
| Afren PLC, 11.5%, 2/01/16 (n) | | $ | 1,000,000 | | | $ | 1,080,000 | |
| Afren PLC, 6.625%, 12/09/20 (n) | | | 528,000 | | | | 550,440 | |
| Northern Blizzard Resources, Inc., 7.25%, 2/01/22 (n) | | | 430,000 | | | | 452,575 | |
| Tullow Oil PLC, 6.25%, 4/15/22 (n) | | | 1,322,000 | | | | 1,328,610 | |
| | | | | | | | |
| | | | $ | 3,411,625 | |
| Energy - Integrated - 0.6% | | | | | | | | |
| Inkia Energy Ltd., 8.375%, 4/04/21 | | $ | 1,397,000 | | | $ | 1,536,700 | |
| Pacific Rubiales Energy Corp., 7.25%, 12/12/21 (n) | | | 2,076,000 | | | | 2,262,840 | |
| | | | | | | | |
| | | | $ | 3,799,540 | |
| Food & Beverages - 1.5% | | | | | | | | |
| Anadolu Efes Biracilik ve Malt Sanayii A.S., 3.375%, 11/01/22 | | $ | 1,415,000 | | | $ | 1,257,935 | |
| BRF S.A., 3.95%, 5/22/23 (n) | | | 1,535,000 | | | | 1,438,602 | |
| Corporacion Lindley S.A., 6.75%, 11/23/21 | | | 389,000 | | | | 428,873 | |
| Corporacion Lindley S.A., 6.75%, 11/23/21 (n) | | | 56,000 | | | | 61,740 | |
| Corporacion Lindley S.A., 4.625%, 4/12/23 (n) | | | 802,000 | | | | 789,970 | |
| JBS Investments GmbH, 7.75%, 10/28/20 (n) | | | 1,558,000 | | | | 1,670,955 | |
| Minerva Luxembourg S.A., 7.75%, 1/31/23 | | | 1,360,000 | | | | 1,456,900 | |
| Premier Foods Finance PLC, 6.5%, 3/15/21 (z) | | GBP | 380,000 | | | | 623,911 | |
| R&R Ice Cream PLC, 5.5%, 5/15/20 (z) | | GBP | 750,000 | | | | 1,245,965 | |
| | | | | | | | |
| | | | $ | 8,974,851 | |
| Gaming & Lodging - 0.4% | | | | | | | | |
| Great Canadian Gaming Corp., 6.625%, 7/25/22 (n) | | CAD | 1,375,000 | | | $ | 1,336,727 | |
| Wynn Macau Ltd., 5.25%, 10/15/21 (n) | | $ | 1,137,000 | | | | 1,137,000 | |
| | | | | | | | |
| | | | $ | 2,473,727 | |
| Industrial - 1.5% | | | | | | | | |
| ASTALDI S.p.A., 7.125%, 12/01/20 (n) | | EUR | 1,550,000 | | | $ | 2,231,192 | |
| Deutsche Raststatten Gruppe IV GmbH, 6.75%, 12/30/20 (n) | | EUR | 385,000 | | | | 549,044 | |
8
Portfolio of Investments (unaudited) – continued
| | | | | | | | |
| Issuer | | Shares/Par | | | Value ($) | |
| Bonds - continued | | | | | | | | |
| Industrial - continued | | | | | | | | |
| Empark Funding S.A., 6.75%, 12/15/19 (n) | | EUR | 385,000 | | | $ | 556,880 | |
| Galapagos Holdings LLC, 7%, 6/15/22 (z) | | EUR | 281,000 | | | | 372,510 | |
| Galapagos SA, 5.375%, 6/15/21 (z) | | EUR | 281,000 | | | | 378,192 | |
| Grupo Isolux Corsan Finance B.V., 6.625%, 4/15/21 (z) | | EUR | 1,330,000 | | | | 1,790,286 | |
| Hyva Global B.V., 8.625%, 3/24/16 (n) | | $ | 1,169,000 | | | | 1,209,915 | |
| Transfield Services Ltd., 8.375%, 5/15/20 (z) | | | 1,500,000 | | | | 1,543,125 | |
| | | | | | | | |
| | | | $ | 8,631,144 | |
| International Market Quasi-Sovereign - 0.5% | |
| Eksportfinans A.S.A., 5.5%, 6/26/17 | | $ | 1,170,000 | | | $ | 1,255,796 | |
| Israel Electric Corp. Ltd., 6.7%, 2/10/17 (n) | | | 819,000 | | | | 889,434 | |
| Israel Electric Corp. Ltd., 6.875%, 6/21/23 (n) | | | 863,000 | | | | 990,293 | |
| | | | | | | | |
| | | | $ | 3,135,523 | |
| Machinery & Tools - 0.8% | | | | | | | | |
| Ferreycorp S.A.A., 4.875%, 4/26/20 (n) | | $ | 1,491,000 | | | $ | 1,478,327 | |
| Ferreyros S.A., 4.875%, 4/26/20 | | | 685,000 | | | | 679,178 | |
| Loxam SAS, 7%, 7/23/22 (z) | | EUR | 1,865,000 | | | | 2,441,138 | |
| | | | | | | | |
| | | | $ | 4,598,643 | |
| Major Banks - 0.3% | | | | | | | | |
| RBS Capital Trust II, 6.425% to 1/03/34, FRN to 12/31/49 | | $ | 1,375,000 | | | $ | 1,463,516 | |
| Royal Bank of Scotland Group PLC, 6.99% to 10/04/17, FRN to 12/31/49 (n) | | | 165,000 | | | | 189,338 | |
| | | | | | | | |
| | | | $ | 1,652,854 | |
| Medical & Health Technology & Services - 0.3% | | | | | | | | |
| Medi-Partenaires SAS, 7%, 5/15/20 | | EUR | 1,300,000 | | | $ | 1,839,118 | |
| | |
| Metals & Mining - 0.9% | | | | | | | | |
| FMG Resources, 6.875%, 4/01/22 (n) | | $ | 460,000 | | | $ | 489,325 | |
| Ovako Group AB, 6.5%, 6/01/19 (z) | | EUR | 1,120,000 | | | | 1,533,480 | |
| Rearden G Holdings Eins GmbH, 7.875%, 3/30/20 | | $ | 1,695,000 | | | | 1,777,547 | |
| Southern Copper Corp., 6.75%, 4/16/40 | | | 1,166,000 | | | | 1,270,940 | |
| | | | | | | | |
| | | | $ | 5,071,292 | |
| Network & Telecom - 0.7% | | | | | | | | |
| Columbus International, Inc., 7.375%, 3/30/21 (n) | | $ | 1,387,000 | | | $ | 1,463,285 | |
| Telecom Italia S.p.A., 5.303%, 5/30/24 (n) | | | 2,620,000 | | | | 2,541,400 | |
| | | | | | | | |
| | | | $ | 4,004,685 | |
| Oil Services - 0.5% | | | | | | | | |
| Odebrecht Offshore Drilling Finance Ltd., 6.75%, 10/01/22 (n) | | $ | 1,372,057 | | | $ | 1,440,659 | |
| QGOG Constellation S.A., 6.25%, 11/09/19 (n) | | | 1,798,000 | | | | 1,842,950 | |
| | | | | | | | |
| | | | $ | 3,283,609 | |
9
Portfolio of Investments (unaudited) – continued
| | | | | | | | |
| Issuer | | Shares/Par | | | Value ($) | |
| Bonds - continued | | | | | | | | |
| Other Banks & Diversified Financials - 0.5% | | | | | | | | |
| BBVA Bancomer S.A. de C.V., 6.5%, 3/10/21 (n) | | $ | 1,375,000 | | | $ | 1,546,875 | |
| Groupe BPCE S.A., 12.5% to 8/6/19, FRN to 12/31/49 (n) | | | 407,000 | | | | 558,608 | |
| MMG S.A., 6.75%, 3/28/23 (n) | | | 700,000 | | | | 700,000 | |
| | | | | | | | |
| | | | $ | 2,805,483 | |
| Pollution Control - 0.3% | | | | | | | | |
| Abengoa Finance SAU, 6%, 3/31/21 (z) | | EUR | 1,135,000 | | | $ | 1,569,216 | |
| | |
| Precious Metals & Minerals - 0.3% | | | | | | | | |
| Aurico Gold, Inc., 7.75%, 4/01/20 (z) | | $ | 1,520,000 | | | $ | 1,539,000 | |
| | |
| Real Estate - Retail - 0.0% | | | | | | | | |
| InRetail Shopping Malls Co., 6.5%, 7/09/21 (z) | | $ | 245,000 | | | $ | 253,575 | |
| | |
| Restaurants - 0.0% | | | | | | | | |
| Stonegate Pub Co. Financing PLC, 5.75%, 4/15/19 (z) | | GBP | 150,000 | | | $ | 254,514 | |
| | |
| Retailers - 0.6% | | | | | | | | |
| Dufry Finance SCA, 4.5%, 7/15/22 (z) | | EUR | 1,125,000 | | | $ | 1,555,390 | |
| Hema Bondco I B.V., 6.25%, 6/15/19 (z) | | EUR | 186,000 | | | | 249,063 | |
| New Look Retail Group Ltd., 8.375%, 5/14/18 (n) | | $ | 1,530,000 | | | | 1,610,325 | |
| | | | | | | | |
| | | | $ | 3,414,778 | |
| Specialty Stores - 0.5% | | | | | | | | |
| Matalan Finance PLC, 6.875%, 6/01/19 (z) | | GBP | 745,000 | | | $ | 1,213,761 | |
| Office Depot de Mexico S.A. de C.V., 6.875%, 9/20/20 (n) | | $ | 1,421,000 | | | | 1,506,260 | |
| | | | | | | | |
| | | | $ | 2,720,021 | |
| Telecommunications - Wireless - 2.6% | | | | | | | | |
| Altice Financing S.A., 7.875%, 12/15/19 (n) | | $ | 1,512,000 | | | $ | 1,631,254 | |
| Altice Finco S.A., 8.125%, 1/15/24 (n) | | | 278,000 | | | | 295,375 | |
| Altice S.A., 7.75%, 5/15/22 (z) | | | 2,260,000 | | | | 2,310,850 | |
| Comcel Trust, 6.875%, 2/06/24 (n) | | | 1,259,000 | | | | 1,353,425 | |
| Digicel Group Ltd., 8.25%, 9/30/20 (n) | | | 830,000 | | | | 894,325 | |
| Digicel Group Ltd., 6%, 4/15/21 (n) | | | 1,436,000 | | | | 1,461,130 | |
| Digicel Group Ltd., 7.125%, 4/01/22 (n) | | | 350,000 | | | | 355,250 | |
| Eileme 2 AB, 11.625%, 1/31/20 (n) | | | 796,000 | | | | 934,305 | |
| Millicom International Cellular S.A., 4.75%, 5/22/20 (n) | | | 768,000 | | | | 758,400 | |
| Millicom International Cellular S.A., 6.625%, 10/15/21 (n) | | | 1,314,000 | | | | 1,396,125 | |
| MTS International Funding Ltd., 5%, 5/30/23 (n) | | | 1,838,000 | | | | 1,704,745 | |
| VimpelCom Ltd., 5.95%, 2/13/23 (n) | | | 2,000,000 | | | | 1,855,000 | |
| Wind Acquisition Finance S.A., 4.75%, 7/15/20 (n) | | | 200,000 | | | | 195,500 | |
| Wind Acquisition Finance S.A., 7.375%, 4/23/21 (z) | | | 225,000 | | | | 234,563 | |
| | | | | | | | |
| | | | $ | 15,380,247 | |
10
Portfolio of Investments (unaudited) – continued
| | | | | | | | |
| Issuer | | Shares/Par | | | Value ($) | |
| Bonds - continued | | | | | | | | |
| Telephone Services - 0.3% | | | | | | | | |
| B Communications Ltd., 7.375%, 2/15/21 (n) | | $ | 1,908,000 | | | $ | 2,029,635 | |
| | |
| Transportation - 0.3% | | | | | | | | |
| Far East Capital Ltd. S.A., 8%, 5/02/18 | | $ | 290,000 | | | $ | 208,800 | |
| Far Eastern Shipping Co., 8%, 5/02/18 (n) | | | 1,387,000 | | | | 998,640 | |
| Far Eastern Shipping Co., 8.75%, 5/02/20 (n) | | | 474,000 | | | | 336,540 | |
| | | | | | | | |
| | | | $ | 1,543,980 | |
| Transportation - Services - 1.2% | | | | | | | | |
| Aguila American Resources Ltd., 7.875%, 1/31/18 (n) | | $ | 1,210,000 | | | $ | 1,265,963 | |
| EC Finance PLC, 5.125%, 7/15/21 (z) | | EUR | 1,860,000 | | | | 2,478,180 | |
| Navios Logistics Finance (U.S.), Inc., 7.25%, 5/01/22 (n) | | $ | 910,000 | | | | 928,200 | |
| Stena AB, 7%, 2/01/24 (n) | | | 530,000 | | | | 559,150 | |
| Topaz Marine S.A., 8.625%, 11/01/18 (n) | | | 1,378,000 | | | | 1,453,790 | |
| Ultrapetrol (Bahamas) Ltd., 8.875%, 6/15/21 | | | 147,000 | | | | 157,658 | |
| | | | | | | | |
| | | | $ | 6,842,941 | |
| Utilities - Electric Power - 1.4% | | | | | | | | |
| CE Energy ASA, 7%, 2/01/21 (n) | | EUR | 1,150,000 | | | $ | 1,618,828 | |
| EDP Finance B.V., 6%, 2/02/18 (n) | | $ | 1,070,000 | | | | 1,164,214 | |
| Empresa de Energia de Bogota S.A., 6.125%, 11/10/21 (n) | | | 1,450,000 | | | | 1,558,750 | |
| Enel S.p.A. , 8.75% to 2013, FRN to 9/24/73 (n) | | | 955,000 | | | | 1,126,900 | |
| Greenko Dutch B.V., 8%, 8/01/19 (z) | | | 1,279,000 | | | | 1,266,210 | |
| InterGen N.V., 7%, 6/30/23 (n) | | | 500,000 | | | | 497,500 | |
| Viridian Group FundCo II, Ltd., 11.125%, 4/01/17 (n) | | | 1,006,000 | | | | 1,101,570 | |
| | | | | | | | |
| | | | $ | 8,333,972 | |
| Total Bonds (Identified Cost, $146,134,885) | | | | | | $ | 145,316,835 | |
| | |
| Floating Rate Loans - 0.0% | | | | | | | | |
| Metals & Mining - 0.0% | | | | | | | | |
| Fortescue Metals Group Ltd., Term Loan B, 4.25%, 6/30/19 (Identified Cost, $4,321) | | $ | 4,331 | | | $ | 4,315 | |
| | |
| Common Stocks - 0.0% | | | | | | | | |
| Printing & Publishing - 0.0% | | | | | | | | |
| American Media Operations, Inc. (Identified Cost, $1,001,968) (a) | | | 70,215 | | | $ | 12,604 | |
| | |
| Underlying Affiliated Funds - 73.1% | | | | | | | | |
MFS High Yield Pooled Portfolio
(Identified Cost, $428,803,395) (v)(y) | | $ | 43,420,820 | | | $ | 427,260,869 | |
11
Portfolio of Investments (unaudited) – continued
| | | | | | | | |
| Money Market Funds - 1.5% | | | | | | | | |
| Issuer | | Shares/Par | | | Value ($) | |
| MFS Institutional Money Market Portfolio, 0.09%, at Cost and Net Asset Value (v) | | | 8,922,761 | | | $ | 8,922,761 | |
| Total Investments (Identified Cost, $584,867,330) | | | | | | $ | 581,517,384 | |
| | |
| Other Assets, Less Liabilities - 0.5% | | | | | | | 2,690,307 | |
| Net Assets - 100.0% | | | | | | $ | 584,207,691 | |
| (a) | Non-income producing security. |
| (c) | The rate shown represents a current effective yield, not a coupon rate. |
| (d) | In default. Interest and/or scheduled principal payment(s) have been missed. |
| (i) | Interest only security for which the fund receives interest on notional principal (Par amount). Par amount shown is the notional principal and does not reflect the cost of the security. |
| (n) | Securities exempt from registration under Rule 144A of the Securities Act of 1933. These securities may be sold in the ordinary course of business in transactions exempt from registration, normally to qualified institutional buyers. At period end, the aggregate value of these securities was $88,868,456 representing 15.2% of net assets. |
| (p) | Payment-in-kind security for which interest income may be received in additional securities and/or cash. During the period, the following amount of interest income was received in additional securities and/or cash: |
| | | | | | |
| Payment-in-kind Securities | | Cash | | Additional
Securities | |
| Schaeffler Finance B.V., 6.875%, 8/15/18 | | $12,838 | | | $— | |
| | | | | | |
| (q) | Interest received was less than stated coupon rate. |
| (v) | Underlying affiliated fund that is available only to investment companies managed by MFS. The rate quoted for the MFS Institutional Money Market Portfolio is the annualized seven-day yield of the fund at period end. |
| (y) | An unaudited Portfolio of Investments for MFS High Yield Pooled Portfolio as of July 31, 2014 has been included as Appendix A. |
| (z) | Restricted securities are not registered under the Securities Act of 1933 and are subject to legal restrictions on resale. These securities generally may be resold in transactions exempt from registration or to the public if the securities are subsequently registered. Disposal of these securities may involve time-consuming negotiations and prompt sale at an acceptable price may be difficult. The fund holds the following restricted securities: |
| | | | | | | | | | |
| Restricted Securities | | Acquisition
Date | |
Cost | | | Value | |
| Abengoa Finance SAU, 6%, 3/31/21 | | 3/21/14 | | | $1,576,821 | | | | $1,569,216 | |
| Altice S.A., 7.75%, 5/15/22 | | 4/23/14 | | | 2,260,000 | | | | 2,310,850 | |
| Arbor Realty Mortgage Securities, CDO, FRN, 2.534%, 4/21/38 | | 12/20/05 | | | 1,136,456 | | | | 883,507 | |
| Aurico Gold, Inc., 7.75%, 4/01/20 | | 3/17/14 | | | 1,492,962 | | | | 1,539,000 | |
| Banc of America Commercial Mortgage, Inc., FRN, 6.277%, 2/10/51 | | 6/19/08 | | | 2,901,699 | | | | 1,959,633 | |
12
Portfolio of Investments (unaudited) – continued
| | | | | | | | | | |
| Restricted Securities – continued | | Acquisition
Date | |
Cost | | | Value | |
| Cimpor Financial Operations B.V., 5.75%, 7/17/24 | | 7/10/14 | | | $909,443 | | | | $905,378 | |
| Dufry Finance SCA, 4.5%, 7/15/22 | | 7/10/14 | | | 1,530,956 | | | | 1,555,390 | |
| EC Finance PLC, 5.125%, 7/15/21 | | 7/17/14 | | | 2,515,929 | | | | 2,478,180 | |
| Falcon Franchise Loan LLC, FRN, 16.08%, 1/05/25 | | 1/29/03 | | | 6,885 | | | | 31,112 | |
| G-Force LLC, CDO, “A2”, 4.83%, 8/22/36 | | 1/20/11-2/14/11 | | | 969 | | | | 1,018 | |
| Galapagos Holdings LLC, 7%, 6/15/22 | | 5/23/14 | | | 382,989 | | | | 372,510 | |
| Galapagos SA, 5.375%, 6/15/21 | | 5/23/14 | | | 382,989 | | | | 378,192 | |
| Greenko Dutch B.V., 8%, 8/01/19 | | 7/24/14 | | | 1,279,000 | | | | 1,266,210 | |
| Grupo Isolux Corsan Finance B.V., 6.625%, 4/15/21 | | 3/13/14 | | | 1,846,173 | | | | 1,790,286 | |
| Hema Bondco I B.V., 6.25%, 6/15/19 | | 6/10/14 | | | 251,965 | | | | 249,063 | |
| InRetail Shopping Malls Co., 6.5%, 7/09/21 | | 7/01/14 | | | 243,319 | | | | 253,575 | |
| Jarden Corp., 3.75%, 10/01/21 | | 7/03/14 | | | 1,507,572 | | | | 1,491,367 | |
| Loxam SAS, 7%, 7/23/22 | | 7/18/14 | | | 2,522,319 | | | | 2,441,138 | |
| Matalan Finance PLC, 6.875%, 6/01/19 | | 5/16/14 | | | 1,253,760 | | | | 1,213,761 | |
| Morgan Stanley Capital I, Inc., FRN, 1.414%, 4/28/39 | | 7/20/04 | | | 59,907 | | | | 7,321 | |
| Ovako Group AB, 6.5%, 6/01/19 | | 5/16/14 | | | 1,547,348 | | | | 1,533,480 | |
| Paroc Group Oy, 6.25%, 5/15/20 | | 5/14/14 | | | 1,568,797 | | | | 1,506,431 | |
| Preferred Term Securities XII Ltd., CDO, 0%, 12/24/33 | | 1/07/05 | | | 1,376,758 | | | | 0 | |
| Premier Foods Finance PLC, 6.5%, 3/15/21 | | 3/06/14 | | | 636,006 | | | | 623,911 | |
| R&R Ice Cream PLC, 5.5%, 5/15/20 | | 5/23/14 | | | 1,251,183 | | | | 1,245,965 | |
| SGD Group SAS, 5.625%, 5/15/19 | | 4/15/14 | | | 1,042,617 | | | | 1,036,257 | |
| Schaeffler Finance B.V., 4.75%, 5/15/21 | | 7/10/14 | | | 303,798 | | | | 299,425 | |
| Stonegate Pub Co. Financing PLC, 5.75%, 4/15/19 | | 4/03/14 | | | 248,858 | | | | 254,514 | |
| Transfield Services Ltd., 8.375%, 5/15/20 | | 5/07/14 | | | 1,500,000 | | | | 1,543,125 | |
| Wind Acquisition Finance S.A., 7.375%, 4/23/21 | | 4/08/14 | | | 225,000 | | | | 234,563 | |
| Total Restricted Securities | | | | $30,974,378 | |
| % of Net assets | | | | 5.3% | |
The following abbreviations are used in this report and are defined:
| CDO | | Collateralized Debt Obligation |
| FRN | | Floating Rate Note. Interest rate resets periodically and may not be the rate reported at period end. |
| PLC | | Public Limited Company |
Abbreviations indicate amounts shown in currencies other than the U.S. dollar. All amounts are stated in U.S. dollars unless otherwise indicated. A list of abbreviations is shown below:
13
Portfolio of Investments (unaudited) – continued
Derivative Contracts at 7/31/14
Forward Foreign Currency Exchange Contracts at 7/31/14
| | | | | | | | | | | | | | | | | | | | | | | | |
| Type | | Currency | | Counter-
party | | Contracts
to
Deliver/
Receive | | | Settlement
Date Range | | | In
Exchange
for | | | Contracts
at Value | | | Net
Unrealized
Appreciation
(Depreciation) | |
| Asset Derivatives | | | | | | | | | | | | | |
| SELL | | CAD | | Merrill Lynch International Bank | | | 1,375,000 | | | | 10/10/14 | | | | $1,287,273 | | | | $1,259,029 | | | | $28,244 | |
| SELL | | EUR | | Citibank N.A. | | | 1,125,000 | | | | 10/10/14 | | | | 1,532,630 | | | | 1,506,777 | | | | 25,853 | |
| SELL | | EUR | | Credit Suisse Group | | | 3,727,648 | | | | 10/10/14 | | | | 5,044,600 | | | | 4,992,653 | | | | 51,947 | |
| SELL | | EUR | | Credit Suisse Group | | | 16,463,869 | | | | 10/10/14 | | | | 22,418,028 | | | | 22,051,004 | | | | 367,024 | |
| SELL | | EUR | | Duetsche Bank AG | | | 1,108,125 | | | | 10/10/14 | | | | 1,509,363 | | | | 1,484,175 | | | | 25,188 | |
| SELL | | EUR | | Goldman Sachs International | | | 1,326,191 | | | | 10/10/14 | | | | 1,804,601 | | | | 1,776,244 | | | | 28,357 | |
| SELL | | GBP | | Credit Suisse Group | | | 1,010,894 | | | | 10/10/14 | | | | 1,729,150 | | | | 1,705,706 | | | | 23,444 | |
| SELL | | GBP | | Merrill Lynch International Bank | | | 1,010,894 | | | | 10/10/14 | | | | 1,729,765 | | | | 1,705,706 | | | | 24,059 | |
| | | | | | | | | | | | | | | | | | | | | | | | |
| | | | | | | | | | | | | | | | | | | | | | | $574,116 | |
| | | | | | | | | | | | | | | | | | | | | | | | |
| | | | |
| Liability Derivatives | | | | | | | | | | | | | |
| BUY | | EUR | | Credit Suisse Group | | | 1,125,281 | | | | 10/10/14 | | | | $1,533,009 | | | | $1,507,154 | | | | $(25,855 | ) |
| BUY | | EUR | | Goldman Sachs International | | | 2,648 | | | | 9/09/14 | | | | 3,566 | | | | 3,546 | | | | (20 | ) |
| | | | | | | | | | | | | | | | | | | | | | | | |
| | | | | | | | | | | | | | | | | | | | | | | $(25,875 | ) |
| | | | | | | | | | | | | | | | | | | | | | | | |
Futures Contracts Outstanding at 7/31/14
| | | | | | | | | | | | | | | | | | |
| Description | | Currency | | | Contracts | | | Value | | Expiration
Date | | | Unrealized
Appreciation
(Depreciation) | |
| Asset Derivatives | |
| Interest Rate Futures | | | | | | | | | | | | | | | |
| U.S. Treasury Note 10 yr (Short) | | | USD | | | | 9 | | | $1,121,484 | | | September - 2014 | | | | $9,808 | |
| | | | | | | | | | | | | | | | | | |
At July 31, 2014, the fund had cash collateral $12,870 to cover any commitments for certain derivative contracts.
See Notes to Financial Statements
14
Financial Statements
STATEMENT OF ASSETS AND LIABILITIES
At 7/31/14 (unaudited)
This statement represents your fund’s balance sheet, which details the assets and liabilities comprising the total value of the fund.
| | | | |
| Assets | | | | |
Investments- | | | | |
Non-affiliated issuers, at value (identified cost, $147,141,174) | | | $145,333,754 | |
Underlying affiliated funds, at value (identified cost, $437,726,156) | | | 436,183,630 | |
Total investments, at value (identified cost, $584,867,330) | | | $581,517,384 | |
Foreign currency, at value (identified cost, $33,060) | | | 12,767 | |
Receivables for | | | | |
Forward foreign currency exchange contracts | | | 574,116 | |
Daily variation margin on open futures contracts | | | 13,292 | |
Investments sold | | | 5,276,271 | |
Fund shares sold | | | 585,325 | |
Interest and dividends | | | 4,718,739 | |
Receivable from investment adviser | | | 14,562 | |
Other assets | | | 1,279 | |
Total assets | | | $592,713,735 | |
| Liabilities | | | | |
Payables for | | | | |
Distributions | | | $370,619 | |
Forward foreign currency exchange contracts | | | 25,875 | |
Investments purchased | | | 3,647,938 | |
Fund shares reacquired | | | 3,941,263 | |
Payable to affiliates | | | | |
Shareholder servicing costs | | | 449,363 | |
Distribution and service fees | | | 11,177 | |
Payable for independent Trustees’ compensation | | | 4,874 | |
Accrued expenses and other liabilities | | | 54,935 | |
Total liabilities | | | $8,506,044 | |
Net assets | | | $584,207,691 | |
| Net assets consist of | | | | |
Paid-in capital | | | $667,987,413 | |
Unrealized appreciation (depreciation) on investments and translation of assets and liabilities in foreign currencies | | | (2,819,499 | ) |
Accumulated net realized gain (loss) on investments and foreign currency | | | (79,553,716 | ) |
Accumulated distributions in excess of net investment income | | | (1,406,507 | ) |
Net assets | | | $584,207,691 | |
Shares of beneficial interest outstanding | | | 88,311,055 | |
15
Statement of Assets and Liabilities (unaudited) – continued
| | | | | | | | | | | | |
| | | Net assets | | | Shares outstanding | | | Net asset value per share (a) | |
Class A | | | $325,375,270 | | | | 49,187,759 | | | | $6.61 | |
Class B | | | 26,151,068 | | | | 3,945,487 | | | | 6.63 | |
Class C | | | 92,587,024 | | | | 14,012,705 | | | | 6.61 | |
Class I | | | 129,306,244 | | | | 19,536,322 | | | | 6.62 | |
Class R1 | | | 233,847 | | | | 35,291 | | | | 6.63 | |
Class R2 | | | 241,501 | | | | 36,433 | | | | 6.63 | |
Class R3 | | | 7,801,661 | | | | 1,179,298 | | | | 6.62 | |
Class R4 | | | 2,001,489 | | | | 300,658 | | | | 6.66 | |
Class R5 | | | 509,587 | | | | 77,102 | | | | 6.61 | |
| (a) | Maximum offering price per share was equal to the net asset value per share for all share classes, except for Class A, for which the maximum offering price per share was $6.94 [100 / 95.25 x $6.61]. On sales of $50,000 or more, the maximum offering price of Class A shares is reduced. A contingent deferred sales charge may be imposed on redemptions of Class A, Class B, and Class C shares. Redemption price per share was equal to the net asset value per share for Classes I, R1, R2, R3, R4, and R5. |
See Notes to Financial Statements
16
Financial Statements
STATEMENT OF OPERATIONS
Six months ended 7/31/14 (unaudited)
This statement describes how much your fund earned in investment income and accrued in expenses. It also describes any gains and/or losses generated by fund operations.
| | | | |
| Net investment income | |
Income | | | | |
Interest | | | $4,602,934 | |
Dividends from underlying affiliated funds | | | 14,862,709 | |
Total investment income | | | $19,465,643 | |
Expenses | | | | |
Management fee | | | $1,911,366 | |
Distribution and service fees | | | 1,047,196 | |
Shareholder servicing costs | | | 351,945 | |
Administrative services fee | | | 39,344 | |
Independent Trustees’ compensation | | | 9,564 | |
Custodian fee | | | 44,217 | |
Shareholder communications | | | 54,514 | |
Audit and tax fees | | | 39,783 | |
Legal fees | | | 3,154 | |
Miscellaneous | | | 82,658 | |
Total expenses | | | $3,583,741 | |
Fees paid indirectly | | | (9 | ) |
Reduction of expenses by investment adviser and distributor | | | (185,466 | ) |
Net expenses | | | $3,398,266 | |
Net investment income | | | $16,067,377 | |
| Realized and unrealized gain (loss) on investments and foreign currency | | | | |
Realized gain (loss) (identified cost basis) | | | | |
Investments: | | | | |
Non-affiliated issuers | | | $(4,166,195 | ) |
Underlying affiliated funds | | | 5,156,201 | |
Capital gain distributions from underlying affiliated funds | | | 231,649 | |
Futures contracts | | | (18,521 | ) |
Foreign currency | | | (21,082 | ) |
Net realized gain (loss) on investments and foreign currency | | | $1,182,052 | |
Change in unrealized appreciation (depreciation) | | | | |
Investments | | | $2,336,350 | |
Futures contracts | | | 9,808 | |
Translation of assets and liabilities in foreign currencies | | | 393,292 | |
Net unrealized gain (loss) on investments and foreign currency translation | | | $2,739,450 | |
Net realized and unrealized gain (loss) on investments and foreign currency | | | $3,921,502 | |
Change in net assets from operations | | | $19,988,879 | |
See Notes to Financial Statements
17
Financial Statements
STATEMENTS OF CHANGES IN NET ASSETS
These statements describe the increases and/or decreases in net assets resulting from operations, any distributions, and any shareholder transactions.
| | | | | | | | |
| Change in net assets | | Six months ended 7/31/14 (unaudited) | | | Year ended 1/31/14 | |
| From operations | | | | | | | | |
Net investment income | | | $16,067,377 | | | | $34,044,563 | |
Net realized gain (loss) on investments and foreign currency | | | 1,182,052 | | | | 20,660,379 | |
Net unrealized gain (loss) on investments and foreign currency translation | | | 2,739,450 | | | | (26,401,483 | ) |
Change in net assets from operations | | | $19,988,879 | | | | $28,303,459 | |
| Distributions declared to shareholders | | | | | | | | |
From net investment income | | | $(16,224,253 | ) | | | $(34,727,300 | ) |
Change in net assets from fund share transactions | | | $(2,911,184 | ) | | | $(36,747,076 | ) |
Total change in net assets | | | $853,442 | | | | $(43,170,917 | ) |
| Net assets | | | | | | | | |
| At beginning of period | | | 583,354,249 | | | | 626,525,166 | |
At end of period (including accumulated distributions in excess of net investment income of $1,406,507 and $1,249,631, respectively) | | | $584,207,691 | | | | $583,354,249 | |
See Notes to Financial Statements
18
Financial Statements
FINANCIAL HIGHLIGHTS
The financial highlights table is intended to help you understand the fund’s financial performance for the semiannual period and the past 5 fiscal years. Certain information reflects financial results for a single fund share. The total returns in the table represent the rate by which an investor would have earned (or lost) on an investment in the fund share class (assuming reinvestment of all distributions) held for the entire period.
| | | | | | | | | | | | | | | | | | | | | | | | |
| Class A | | Six months
ended
7/31/14 | | | Years ended 1/31 | |
| | | 2014 | | | 2013 | | | 2012 | | | 2011 | | | 2010 | |
| | | (unaudited) | | | | | | | | | | | | | | | | |
Net asset value, beginning of period | | | $6.57 | | | | $6.64 | | | | $6.30 | | | | $6.49 | | | | $5.98 | | | | $4.42 | |
| Income (loss) from investment operations | |
Net investment income (d) | | | $0.18 | | | | $0.38 | | | | $0.42 | | | | $0.44 | | | | $0.47 | | | | $0.49 | |
Net realized and unrealized gain (loss)
on investments and foreign currency | | | 0.05 | | | | (0.06 | ) | | | 0.35 | | | | (0.18 | ) | | | 0.51 | | | | 1.59 | |
Total from investment operations | | | $0.23 | | | | $0.32 | | | | $0.77 | | | | $0.26 | | | | $0.98 | | | | $2.08 | |
| Less distributions declared to shareholders | |
From net investment income | | | $(0.19 | ) | | | $(0.39 | ) | | | $(0.43 | ) | | | $(0.45 | ) | | | $(0.47 | ) | | | $(0.51 | ) |
From tax return of capital | | | — | | | | — | | | | — | | | | — | | | | — | | | | (0.01 | ) |
Total distributions declared to
shareholders | | | $(0.19 | ) | | | $(0.39 | ) | | | $(0.43 | ) | | | $(0.45 | ) | | | $(0.47 | ) | | | $(0.52 | ) |
Net asset value, end of period (x) | | | $6.61 | | | | $6.57 | | | | $6.64 | | | | $6.30 | | | | $6.49 | | | | $5.98 | |
Total return (%) (r)(s)(t)(x) | | | 3.45 | (n) | | | 5.00 | | | | 12.73 | | | | 4.21 | | | | 17.06 | | | | 49.74 | |
Ratios (%) (to average net assets)
and Supplemental data: | |
Expenses before expense reductions (f) | | | 1.11 | (a)(h) | | | 1.11 | (h) | | | 1.14 | | | | 1.13 | | | | 1.13 | | | | 1.16 | |
Expenses after expense reductions (f) | | | 1.05 | (a)(h) | | | 1.05 | (h) | | | 1.05 | | | | 1.05 | | | | 1.02 | | | | 0.93 | |
Net investment income | | | 5.59 | (a) | | | 5.84 | | | | 6.54 | | | | 6.96 | | | | 7.64 | | | | 9.36 | |
Portfolio turnover | | | 14 | (n) | | | 38 | | | | 48 | | | | 61 | | | | 68 | | | | 61 | |
Net assets at end of period (000 omitted) | | | $325,375 | | | | $366,654 | | | | $412,834 | | | | $422,926 | | | | $474,643 | | | | $369,073 | |
See Notes to Financial Statements
19
Financial Highlights – continued
| | | | | | | | | | | | | | | | | | | | | | | | |
| Class B | | Six months
ended
7/31/14 | | | Years ended 1/31 | |
| | | 2014 | | | 2013 | | | 2012 | | | 2011 | | | 2010 | |
| | | (unaudited) | | | | | | | | | | | | | | | | |
Net asset value, beginning of period | | | $6.59 | | | | $6.65 | | | | $6.32 | | | | $6.51 | | | | $5.99 | | | | $4.43 | |
| Income (loss) from investment operations | |
Net investment income (d) | | | $0.16 | | | | $0.33 | | | | $0.37 | | | | $0.39 | | | | $0.43 | | | | $0.45 | |
Net realized and unrealized gain (loss)
on investments and foreign currency | | | 0.04 | | | | (0.05 | ) | | | 0.35 | | | | (0.18 | ) | | | 0.52 | | | | 1.59 | |
Total from investment operations | | | $0.20 | | | | $0.28 | | | | $0.72 | | | | $0.21 | | | | $0.95 | | | | $2.04 | |
| Less distributions declared to shareholders | |
From net investment income | | | $(0.16 | ) | | | $(0.34 | ) | | | $(0.39 | ) | | | $(0.40 | ) | | | $(0.43 | ) | | | $(0.47 | ) |
From tax return of capital | | | — | | | | — | | | | — | | | | — | | | | — | | | | (0.01 | ) |
Total distributions declared to
shareholders | | | $(0.16 | ) | | | $(0.34 | ) | | | $(0.39 | ) | | | $(0.40 | ) | | | $(0.43 | ) | | | $(0.48 | ) |
Net asset value, end of period (x) | | | $6.63 | | | | $6.59 | | | | $6.65 | | | | $6.32 | | | | $6.51 | | | | $5.99 | |
Total return (%) (r)(s)(t)(x) | | | 3.06 | (n) | | | 4.37 | | | | 11.71 | | | | 3.44 | | | | 16.37 | | | | 48.59 | |
Ratios (%) (to average net assets)
and Supplemental data: | |
Expenses before expense reductions (f) | | | 1.86 | (a)(h) | | | 1.86 | (h) | | | 1.89 | | | | 1.88 | | | | 1.88 | | | | 1.90 | |
Expenses after expense reductions (f) | | | 1.80 | (a)(h) | | | 1.80 | (h) | | | 1.80 | | | | 1.80 | | | | 1.77 | | | | 1.68 | |
Net investment income | | | 4.82 | (a) | | | 5.08 | | | | 5.77 | | | | 6.21 | | | | 6.92 | | | | 8.64 | |
Portfolio turnover | | | 14 | (n) | | | 38 | | | | 48 | | | | 61 | | | | 68 | | | | 61 | |
Net assets at end of period (000 omitted) | | | $26,151 | | | | $27,959 | | | | $33,338 | | | | $35,751 | | | | $46,297 | | | | $51,506 | |
See Notes to Financial Statements
20
Financial Highlights – continued
| | | | | | | | | | | | | | | | | | | | | | | | |
| Class C | | Six months
ended
7/31/14 | | | Years ended 1/31 | |
| | | 2014 | | | 2013 | | | 2012 | | | 2011 | | | 2010 | |
| | | (unaudited) | | | | | | | | | | | | | | | | |
Net asset value, beginning of period | | | $6.56 | | | | $6.63 | | | | $6.30 | | | | $6.48 | | | | $5.97 | | | | $4.41 | |
| Income (loss) from investment operations | |
Net investment income (d) | | | $0.16 | | | | $0.33 | | | | $0.37 | | | | $0.40 | | | | $0.43 | | | | $0.45 | |
Net realized and unrealized gain (loss)
on investments and foreign currency | | | 0.05 | | | | (0.06 | ) | | | 0.35 | | | | (0.18 | ) | | | 0.50 | | | | 1.59 | |
Total from investment operations | | | $0.21 | | | | $0.27 | | | | $0.72 | | | | $0.22 | | | | $0.93 | | | | $2.04 | |
| Less distributions declared to shareholders | |
From net investment income | | | $(0.16 | ) | | | $(0.34 | ) | | | $(0.39 | ) | | | $(0.40 | ) | | | $(0.42 | ) | | | $(0.47 | ) |
From tax return of capital | | | — | | | | — | | | | — | | | | — | | | | — | | | | (0.01 | ) |
Total distributions declared to
shareholders | | | $(0.16 | ) | | | $(0.34 | ) | | | $(0.39 | ) | | | $(0.40 | ) | | | $(0.42 | ) | | | $(0.48 | ) |
Net asset value, end of period (x) | | | $6.61 | | | | $6.56 | | | | $6.63 | | | | $6.30 | | | | $6.48 | | | | $5.97 | |
Total return (%) (r)(s)(t)(x) | | | 3.22 | (n) | | | 4.21 | | | | 11.73 | | | | 3.59 | | | | 16.22 | | | | 48.77 | |
Ratios (%) (to average net assets)
and Supplemental data: | |
Expenses before expense reductions (f) | | | 1.86 | (a)(h) | | | 1.86 | (h) | | | 1.89 | | | | 1.89 | | | | 1.88 | | | | 1.90 | |
Expenses after expense reductions (f) | | | 1.80 | (a)(h) | | | 1.80 | (h) | | | 1.80 | | | | 1.80 | | | | 1.77 | | | | 1.68 | |
Net investment income | | | 4.83 | (a) | | | 5.10 | | | | 5.79 | | | | 6.25 | | | | 6.94 | | | | 8.52 | |
Portfolio turnover | | | 14 | (n) | | | 38 | | | | 48 | | | | 61 | | | | 68 | | | | 61 | |
Net assets at end of period (000 omitted) | | | $92,587 | | | | $93,058 | | | | $99,786 | | | | $89,483 | | | | $96,519 | | | | $89,930 | |
See Notes to Financial Statements
21
Financial Highlights – continued
| | | | | | | | | | | | | | | | | | | | | | | | |
| Class I | | Six months
ended
7/31/14 | | | Years ended 1/31 | |
| | | 2014 | | | 2013 | | | 2012 | | | 2011 | | | 2010 | |
| | | (unaudited) | | | | | | | | | | | | | | | | |
Net asset value, beginning of period | | | $6.58 | | | | $6.65 | | | | $6.31 | | | | $6.50 | | | | $5.99 | | | | $4.43 | |
| Income (loss) from investment operations | |
Net investment income (d) | | | $0.19 | | | | $0.40 | | | | $0.44 | | | | $0.46 | | | | $0.48 | | | | $0.50 | |
Net realized and unrealized gain (loss)
on investments and foreign currency | | | 0.04 | | | | (0.06 | ) | | | 0.35 | | | | (0.18 | ) | | | 0.52 | | | | 1.60 | |
Total from investment operations | | | $0.23 | | | | $0.34 | | | | $0.79 | | | | $0.28 | | | | $1.00 | | | | $2.10 | |
| Less distributions declared to shareholders | |
From net investment income | | | $(0.19 | ) | | | $(0.41 | ) | | | $(0.45 | ) | | | $(0.47 | ) | | | $(0.49 | ) | | | $(0.53 | ) |
From tax return of capital | | | — | | | | — | | | | — | | | | — | | | | — | | | | (0.01 | ) |
Total distributions declared to
shareholders | | | $(0.19 | ) | | | $(0.41 | ) | | | $(0.45 | ) | | | $(0.47 | ) | | | $(0.49 | ) | | | $(0.54 | ) |
Net asset value, end of period (x) | | | $6.62 | | | | $6.58 | | | | $6.65 | | | | $6.31 | | | | $6.50 | | | | $5.99 | |
Total return (%) (r)(s)(x) | | | 3.58 | (n) | | | 5.26 | | | | 13.00 | | | | 4.47 | | | | 17.33 | | | | 50.02 | |
Ratios (%) (to average net assets)
and Supplemental data: | |
Expenses before expense reductions (f) | | | 0.86 | (a)(h) | | | 0.86 | (h) | | | 0.89 | | | | 0.88 | | | | 0.87 | | | | 0.90 | |
Expenses after expense reductions (f) | | | 0.80 | (a)(h) | | | 0.80 | (h) | | | 0.80 | | | | 0.80 | | | | 0.78 | | | | 0.68 | |
Net investment income | | | 5.76 | (a) | | | 6.05 | | | | 6.74 | | | | 7.21 | | | | 7.76 | | | | 9.45 | |
Portfolio turnover | | | 14 | (n) | | | 38 | | | | 48 | | | | 61 | | | | 68 | | | | 61 | |
Net assets at end of period (000 omitted) | | | $129,306 | | | | $85,542 | | | | $70,977 | | | | $38,143 | | | | $38,266 | | | | $20,317 | |
See Notes to Financial Statements
22
Financial Highlights – continued
| | | | | | | | | | | | | | | | | | | | | | | | |
| Class R1 | | Six months
ended
7/31/14 | | | Years ended 1/31 | |
| | | 2014 | | | 2013 | | | 2012 | | | 2011 | | | 2010 | |
| | | (unaudited) | | | | | | | | | | | | | | | | |
Net asset value, beginning of period | | | $6.58 | | | | $6.65 | | | | $6.32 | | | | $6.51 | | | | $5.99 | | | | $4.43 | |
| Income (loss) from investment operations | |
Net investment income (d) | | | $0.16 | | | | $0.33 | | | | $0.37 | | | | $0.39 | | | | $0.43 | | | | $0.45 | |
Net realized and unrealized gain (loss)
on investments and foreign currency | | | 0.05 | | | | (0.06 | ) | | | 0.35 | | | | (0.18 | ) | | | 0.51 | | | | 1.59 | |
Total from investment operations | | | $0.21 | | | | $0.27 | | | | $0.72 | | | | $0.21 | | | | $0.94 | | | | $2.04 | |
| Less distributions declared to shareholders | |
From net investment income | | | $(0.16 | ) | | | $(0.34 | ) | | | $(0.39 | ) | | | $(0.40 | ) | | | $(0.42 | ) | | | $(0.47 | ) |
From tax return of capital | | | — | | | | — | | | | — | | | | — | | | | — | | | | (0.01 | ) |
Total distributions declared to
shareholders | | | $(0.16 | ) | | | $(0.34 | ) | | | $(0.39 | ) | | | $(0.40 | ) | | | $(0.42 | ) | | | $(0.48 | ) |
Net asset value, end of period (x) | | | $6.63 | | | | $6.58 | | | | $6.65 | | | | $6.32 | | | | $6.51 | | | | $5.99 | |
Total return (%) (r)(s)(x) | | | 3.22 | (n) | | | 4.22 | | | | 11.71 | | | | 3.44 | | | | 16.36 | | | | 48.59 | |
Ratios (%) (to average net assets)
and Supplemental data: | |
Expenses before expense reductions (f) | | | 1.86 | (a)(h) | | | 1.86 | (h) | | | 1.89 | | | | 1.88 | | | | 1.88 | | | | 1.90 | |
Expenses after expense reductions (f) | | | 1.80 | (a)(h) | | | 1.80 | (h) | | | 1.80 | | | | 1.80 | | | | 1.77 | | | | 1.68 | |
Net investment income | | | 4.81 | (a) | | | 5.07 | | | | 5.70 | | | | 6.22 | | | | 6.90 | | | | 8.53 | |
Portfolio turnover | | | 14 | (n) | | | 38 | | | | 48 | | | | 61 | | | | 68 | | | | 61 | |
Net assets at end of period (000 omitted) | | | $234 | | | | $236 | | | | $207 | | | | $132 | | | | $126 | | | | $107 | |
See Notes to Financial Statements
23
Financial Highlights – continued
| | | | | | | | | | | | | | | | | | | | | | | | |
| Class R2 | | Six months
ended
7/31/14 | | | Years ended 1/31 | |
| | | 2014 | | | 2013 | | | 2012 | | | 2011 | | | 2010 | |
| | | (unaudited) | | | | | | | | | | | | | | | | |
Net asset value, beginning of period | | | $6.59 | | | | $6.65 | | | | $6.32 | | | | $6.51 | | | | $5.99 | | | | $4.43 | |
| Income (loss) from investment operations | |
Net investment income (d) | | | $0.18 | | | | $0.37 | | | | $0.40 | | | | $0.43 | | | | $0.46 | | | | $0.47 | |
Net realized and unrealized gain (loss)
on investments and foreign currency | | | 0.04 | | | | (0.06 | ) | | | 0.35 | | | | (0.18 | ) | | | 0.52 | | | | 1.60 | |
Total from investment operations | | | $0.22 | | | | $0.31 | | | | $0.75 | | | | $0.25 | | | | $0.98 | | | | $2.07 | |
| Less distributions declared to shareholders | |
From net investment income | | | $(0.18 | ) | | | $(0.37 | ) | | | $(0.42 | ) | | | $(0.44 | ) | | | $(0.46 | ) | | | $(0.50 | ) |
From tax return of capital | | | — | | | | — | | | | — | | | | — | | | | — | | | | (0.01 | ) |
Total distributions declared to
shareholders | | | $(0.18 | ) | | | $(0.37 | ) | | | $(0.42 | ) | | | $(0.44 | ) | | | $(0.46 | ) | | | $(0.51 | ) |
Net asset value, end of period (x) | | | $6.63 | | | | $6.59 | | | | $6.65 | | | | $6.32 | | | | $6.51 | | | | $5.99 | |
Total return (%) (r)(s)(x) | | | 3.32 | (n) | | | 4.90 | | | | 12.26 | | | | 3.96 | | | | 16.94 | | | | 49.30 | |
Ratios (%) (to average net assets)
and Supplemental data: | |
Expenses before expense reductions (f) | | | 1.36 | (a)(h) | | | 1.36 | (h) | | | 1.39 | | | | 1.38 | | | | 1.37 | | | | 1.40 | |
Expenses after expense reductions (f) | | | 1.30 | (a)(h) | | | 1.30 | (h) | | | 1.30 | | | | 1.30 | | | | 1.27 | | | | 1.18 | |
Net investment income | | | 5.31 | (a) | | | 5.57 | | | | 6.22 | | | | 6.72 | | | | 7.37 | | | | 9.03 | |
Portfolio turnover | | | 14 | (n) | | | 38 | | | | 48 | | | | 61 | | | | 68 | | | | 61 | |
Net assets at end of period (000 omitted) | | | $242 | | | | $232 | | | | $253 | | | | $172 | | | | $162 | | | | $114 | |
See Notes to Financial Statements
24
Financial Highlights – continued
| | | | | | | | | | | | | | | | | | | | | | | | |
| Class R3 | | Six months
ended
7/31/14 | | | Years ended 1/31 | |
| | | 2014 | | | 2013 | | | 2012 | | | 2011 | | | 2010 | |
| | | (unaudited) | | | | | | | | | | | | | | | | |
Net asset value, beginning of period | | | $6.57 | | | | $6.64 | | | | $6.31 | | | | $6.49 | | | | $5.98 | | | | $4.42 | |
| Income (loss) from investment operations | |
Net investment income (d) | | | $0.18 | | | | $0.38 | | | | $0.40 | | | | $0.44 | | | | $0.47 | | | | $0.49 | |
Net realized and unrealized gain (loss)
on investments and foreign currency | | | 0.06 | | | | (0.06 | ) | | | 0.36 | | | | (0.17 | ) | | | 0.51 | | | | 1.59 | |
Total from investment operations | | | $0.24 | | | | $0.32 | | | | $0.76 | | | | $0.27 | | | | $0.98 | | | | $2.08 | |
| Less distributions declared to shareholders | |
From net investment income | | | $(0.19 | ) | | | $(0.39 | ) | | | $(0.43 | ) | | | $(0.45 | ) | | | $(0.47 | ) | | | $(0.51 | ) |
From tax return of capital | | | — | | | | — | | | | — | | | | — | | | | — | | | | (0.01 | ) |
Total distributions declared to
shareholders | | | $(0.19 | ) | | | $(0.39 | ) | | | $(0.43 | ) | | | $(0.45 | ) | | | $(0.47 | ) | | | $(0.52 | ) |
Net asset value, end of period (x) | | | $6.62 | | | | $6.57 | | | | $6.64 | | | | $6.31 | | | | $6.49 | | | | $5.98 | |
Total return (%) (r)(s)(x) | | | 3.60 | (n) | | | 5.00 | | | | 12.55 | | | | 4.37 | | | | 17.06 | | | | 49.75 | |
Ratios (%) (to average net assets)
and Supplemental data: | |
Expenses before expense reductions (f) | | | 1.11 | (a)(h) | | | 1.11 | (h) | | | 1.12 | | | | 1.14 | | | | 1.13 | | | | 1.17 | |
Expenses after expense reductions (f) | | | 1.05 | (a)(h) | | | 1.05 | (h) | | | 1.05 | | | | 1.05 | | | | 1.03 | | | | 0.92 | |
Net investment income | | | 5.57 | (a) | | | 5.83 | | | | 6.06 | | | | 7.00 | | | | 7.60 | | | | 9.91 | |
Portfolio turnover | | | 14 | (n) | | | 38 | | | | 48 | | | | 61 | | | | 68 | | | | 61 | |
Net assets at end of period (000 omitted) | | | $7,802 | | | | $7,751 | | | | $7,588 | | | | $771 | | | | $560 | | | | $352 | |
See Notes to Financial Statements
25
Financial Highlights – continued
| | | | | | | | | | | | | | | | | | | | | | | | |
| Class R4 | | Six months
ended
7/31/14 | | | Years ended 1/31 | |
| | | 2014 | | | 2013 | | | 2012 | | | 2011 | | | 2010 | |
| | | (unaudited) | | | | | | | | | | | | | | | | |
Net asset value, beginning of period | | | $6.62 | | | | $6.69 | | | | $6.30 | | | | $6.49 | | | | $5.98 | | | | $4.42 | |
| Income (loss) from investment operations | |
Net investment income (d) | | | $0.19 | | | | $0.40 | | | | $0.45 | | | | $0.46 | | | | $0.47 | | | | $0.50 | |
Net realized and unrealized gain (loss)
on investments and foreign currency | | | 0.05 | | | | (0.06 | ) | | | 0.39 | | | | (0.18 | ) | | | 0.53 | | | | 1.59 | |
Total from investment operations | | | $0.24 | | | | $0.34 | | | | $0.84 | | | | $0.28 | | | | $1.00 | | | | $2.09 | |
| Less distributions declared to shareholders | |
From net investment income | | | $(0.20 | ) | | | $(0.41 | ) | | | $(0.45 | ) | | | $(0.47 | ) | | | $(0.49 | ) | | | $(0.52 | ) |
From tax return of capital | | | — | | | | — | | | | — | | | | — | | | | — | | | | (0.01 | ) |
Total distributions declared to
shareholders | | | $(0.20 | ) | | | $(0.41 | ) | | | $(0.45 | ) | | | $(0.47 | ) | | | $(0.49 | ) | | | $(0.53 | ) |
Net asset value, end of period (x) | | | $6.66 | | | | $6.62 | | | | $6.69 | | | | $6.30 | | | | $6.49 | | | | $5.98 | |
Total return (%) (r)(s)(x) | | | 3.57 | (n) | | | 5.27 | | | | 13.85 | | | | 4.47 | | | | 17.35 | | | | 50.11 | |
Ratios (%) (to average net assets)
and Supplemental data: | |
Expenses before expense reductions (f) | | | 0.86 | (a)(h) | | | 0.85 | (h) | | | 0.89 | | | | 0.89 | | | | 0.85 | | | | 0.90 | |
Expenses after expense reductions (f) | | | 0.80 | (a)(h) | | | 0.80 | (h) | | | 0.80 | | | | 0.80 | | | | 0.79 | | | | 0.68 | |
Net investment income | | | 5.76 | (a) | | | 6.05 | | | | 6.98 | | | | 7.25 | | | | 7.40 | | | | 9.49 | |
Portfolio turnover | | | 14 | (n) | | | 38 | | | | 48 | | | | 61 | | | | 68 | | | | 61 | |
Net assets at end of period (000 omitted) | | | $2,001 | | | | $1,542 | | | | $1,431 | | | | $3,014 | | | | $3,040 | | | | $122 | |
See Notes to Financial Statements
26
Financial Highlights – continued
| | | | | | | | | | | | | | | | | | | | | | | | |
| Class R5 (y) | | Six months
ended
7/31/14 | | | Years ended 1/31 | |
| | | 2014 | | | 2013 | | | 2012 | | | 2011 | | | 2010 | |
| | | (unaudited) | | | | | | | | | | | | | | | | |
Net asset value, beginning of period | | | $6.57 | | | | $6.63 | | | | $6.29 | | | | $6.49 | | | | $5.97 | | | | $4.42 | |
| Income (loss) from investment operations | |
Net investment income (d) | | | $0.19 | | | | $0.40 | | | | $0.44 | | | | $0.45 | | | | $0.47 | | | | $0.48 | |
Net realized and unrealized gain (loss)
on investments and foreign currency | | | 0.05 | | | | (0.05 | ) | | | 0.35 | | | | (0.19 | ) | | | 0.53 | | | | 1.60 | |
Total from investment operations | | | $0.24 | | | | $0.35 | | | | $0.79 | | | | $0.26 | | | | $1.00 | | | | $2.08 | |
| Less distributions declared to shareholders | |
From net investment income | | | $(0.20 | ) | | | $(0.41 | ) | | | $(0.45 | ) | | | $(0.46 | ) | | | $(0.48 | ) | | | $(0.52 | ) |
From tax return of capital | | | — | | | | — | | | | — | | | | — | | | | — | | | | (0.01 | ) |
Total distributions declared to
shareholders | | | $(0.20 | ) | | | $(0.41 | ) | | | $(0.45 | ) | | | $(0.46 | ) | | | $(0.48 | ) | | | $(0.53 | ) |
Net asset value, end of period (x) | | | $6.61 | | | | $6.57 | | | | $6.63 | | | | $6.29 | | | | $6.49 | | | | $5.97 | |
Total return (%) (r)(s)(x) | | | 3.62 | (n) | | | 5.51 | | | | 13.03 | | | | 4.20 | | | | 17.43 | | | | 49.72 | |
Ratios (%) (to average net assets)
and Supplemental data: | |
Expenses before expense reductions (f) | | | 0.77 | (a)(h) | | | 0.77 | (h) | | | 0.97 | | | | 0.99 | | | | 0.95 | | | | 0.98 | |
Expenses after expense reductions (f) | | | 0.71 | (a)(h) | | | 0.72 | (h) | | | 0.90 | | | | 0.90 | | | | 0.88 | | | | 0.78 | |
Net investment income | | | 5.88 | (a) | | | 6.14 | | | | 6.89 | | | | 7.14 | | | | 7.45 | | | | 9.02 | |
Portfolio turnover | | | 14 | (n) | | | 38 | | | | 48 | | | | 61 | | | | 68 | | | | 61 | |
Net assets at end of period (000 omitted) | | | $510 | | | | $381 | | | | $112 | | | | $7,631 | | | | $1,734 | | | | $364 | |
See Notes to Financial Statements
27
Financial Highlights – continued
| (d) | Per share data is based on average shares outstanding. |
| (f) | Ratios do not reflect reductions from fees paid indirectly, if applicable. |
| (h) | In addition to the fees and expenses which the fund bears directly, the fund indirectly bears a pro rata share of the fees and expenses of the underlying affiliated funds in which the fund invests. Accordingly, the expense ratio for the fund reflects only those fees and expenses borne directly by the fund. Because the underlying affiliated funds have varied expense and fee levels and the fund may own different proportions of the underlying affiliated funds at different times, the amount of fees and expenses incurred indirectly by the fund will vary. |
| (r) | Certain expenses have been reduced without which performance would have been lower. |
| (s) | From time to time the fund may receive proceeds from litigation settlements, without which performance would be lower. |
| (t) | Total returns do not include any applicable sales charges. |
| (x) | The net asset values per share and total returns have been calculated on net assets which include adjustments made in accordance with U.S. generally accepted accounting principles required at period end for financial reporting purposes. |
| (y) | On May 10, 2012, sales of Class W shares (including exchanges) were suspended. On May 11, 2012, certain Class W shares were automatically converted to Class I shares. Shareholders of certain Class W shares became shareholders of Class I and received Class I shares with a total net asset value equal to their Class W shares at the time of the conversion. On May 30, 2012, remaining Class W shares, which represented MFS seed money, were redesignated Class R5. Class R5 shares are generally available only to certain eligible retirement plans and to funds distributed by MFD. Class R5 shares do not pay a 12b-1 distribution fee or sub-accounting costs. On June 1, 2012, Class R5 shares were offered for sale to the public. |
See Notes to Financial Statements
28
NOTES TO FINANCIAL STATEMENTS
(unaudited)
(1) Business and Organization
MFS Global High Yield Fund (the fund) is a diversified series of MFS Series Trust III (the trust). The trust is organized as a Massachusetts business trust and is registered under the Investment Company Act of 1940, as amended, as an open-end management investment company.
The fund is an investment company and accordingly follows the investment company accounting and reporting guidance of the Financial Accounting Standards Board (FASB) Accounting Standard Codification Topic 946 Financial Services – Investment Companies.
(2) Significant Accounting Policies
General – The preparation of financial statements in conformity with U.S. generally accepted accounting principles requires management to make estimates and assumptions that affect the reported amounts of assets and liabilities, and disclosure of contingent assets and liabilities at the date of the financial statements and the reported amounts of increases and decreases in net assets from operations during the reporting period. Actual results could differ from those estimates. In the preparation of these financial statements, management has evaluated subsequent events occurring after the date of the fund’s Statement of Assets and Liabilities through the date that the financial statements were issued. As of July 31, 2014, 73.1% of the fund’s net assets were invested in the MFS High Yield Pooled Portfolio (“High Yield Pooled Portfolio”). MFS does not receive a management fee from the High Yield Pooled Portfolio. The High Yield Pooled Portfolio’s investment objective is to seek total return with an emphasis on high current income, but also considering capital appreciation. The accounting policies of the High Yield Pooled Portfolio are outlined in its shareholder reports, which are available without charge by calling 1-800-225-2606 and on the Securities and Exchange Commission (SEC) web site at http://www.sec.gov or at the SEC’s public reference room in Washington, D.C. The accounting policies detailed in the Significant Accounting Policies note cover both the fund and the High Yield Pooled Portfolio. For purposes of this policy disclosure, “fund” refers to both the fund and the High Yield Pooled Portfolio in which the fund invests. The High Yield Pooled Portfolio’s shareholder reports are not covered by this report. An unaudited Portfolio of Investments for the High Yield Pooled Portfolio as of July 31, 2014 has been included as Appendix A. The fund and the High Yield Pooled Portfolio invest in high-yield securities rated below investment grade. Investments in high-yield securities involve greater degrees of credit and market risk than investments in higher-rated securities and tend to be more sensitive to economic conditions. The fund and the Pooled Portfolio invest in foreign securities. Investments in foreign securities are vulnerable to the effects of changes in the relative values of the local currency and the U.S. dollar and to the effects of changes in each country’s legal, political, and economic environment.
In June 2014, FASB issued Accounting Standards Update 2014-11, Transfers and Servicing (Topic 860) – Repurchase-to-Maturity Transactions, Repurchase Financings, and Disclosures (“ASU 2014-11”). ASU 2014-11 changes the accounting for repurchase-to-maturity transactions (i.e., repurchase agreements that settle at the same
29
Notes to Financial Statements (unaudited) – continued
time as the maturity of the transferred financial asset) and enhances the required disclosures for repurchase agreements and other similar transactions. Although still evaluating the potential impacts of ASU 2014-11 to the fund, management expects that the impact of the fund’s adoption will be limited to additional financial statement disclosures which would first be effective for interim reporting periods beginning after March 15, 2015.
Balance Sheet Offsetting – The fund’s accounting policy with respect to balance sheet offsetting is that, absent an event of default by the counterparty or a termination of the agreement, the International Swaps and Derivatives Association (ISDA) Master Agreement does not result in an offset of reported amounts of financial assets and financial liabilities in the Statement of Assets and Liabilities across transactions between the fund and the applicable counterparty. The fund’s right to setoff may be restricted or prohibited by the bankruptcy or insolvency laws of the particular jurisdiction to which a specific master netting agreement counterparty is subject. Balance sheet offsetting disclosures, to the extent applicable to the fund, have been included in the fund’s Significant Accounting Policies note under the captions for each of the fund’s in-scope financial instruments and transactions.
Investment Valuations – The investments of the fund and the High Yield Pooled Portfolio are valued as described below. Debt instruments and floating rate loans (other than short-term instruments), including restricted debt instruments, are generally valued at an evaluated or composite bid as provided by a third-party pricing service. Equity securities, including restricted equity securities, are generally valued at the last sale or official closing price as provided by a third-party pricing service on the market or exchange on which they are primarily traded. Equity securities, for which there were no sales reported that day, are generally valued at the last quoted daily bid quotation as provided by a third-party pricing service on the market or exchange on which such securities are primarily traded. Short-term instruments with a maturity at issuance of 60 days or less generally are valued at amortized cost, which approximates market value. Exchange-traded options are generally valued at the last sale or official closing price as provided by a third-party pricing service on the exchange on which such options are primarily traded. Exchange-traded options for which there were no sales reported that day are generally valued at the last daily bid quotation as provided by a third-party pricing service on the exchange on which such options are primarily traded. Options not traded on an exchange are generally valued at a broker/dealer bid quotation. Foreign currency options are generally valued at valuations provided by a third-party pricing service. Futures contracts are generally valued at last posted settlement price as provided by a third-party pricing service on the market on which they are primarily traded. Futures contracts for which there were no trades that day for a particular position are generally valued at the closing bid quotation as provided by a third-party pricing service on the market on which such futures contracts are primarily traded. Forward foreign currency exchange contracts are generally valued at the mean of bid and asked prices for the time period interpolated from rates provided by a third-party pricing service for proximate time periods. Swap agreements are generally valued at valuations provided by a third-party pricing service, which for cleared swaps includes an evaluation of any trading activity at the clearinghouses. Open-end investment companies are generally valued at net asset value per share. Securities and
30
Notes to Financial Statements (unaudited) – continued
other assets generally valued on the basis of information from a third-party pricing service may also be valued at a broker/dealer bid quotation. Values obtained from third-party pricing services can utilize both transaction data and market information such as yield, quality, coupon rate, maturity, type of issue, trading characteristics, and other market data. The values of foreign securities and other assets and liabilities expressed in foreign currencies are converted to U.S. dollars using the mean of bid and asked prices for rates provided by a third-party pricing service.
The Board of Trustees has delegated primary responsibility for determining or causing to be determined the value of the fund’s investments (including any fair valuation) to the adviser pursuant to valuation policies and procedures approved by the Board. If the adviser determines that reliable market quotations are not readily available, investments are valued at fair value as determined in good faith by the adviser in accordance with such procedures under the oversight of the Board of Trustees. Under the fund’s valuation policies and procedures, market quotations are not considered to be readily available for most types of debt instruments and floating rate loans and many types of derivatives. These investments are generally valued at fair value based on information from third-party pricing services. In addition, investments may be valued at fair value if the adviser determines that an investment’s value has been materially affected by events occurring after the close of the exchange or market on which the investment is principally traded (such as foreign exchange or market) and prior to the determination of the fund’s net asset value, or after the halting of trading of a specific security where trading does not resume prior to the close of the exchange or market on which the security is principally traded. The adviser generally relies on third-party pricing services or other information (such as the correlation with price movements of similar securities in the same or other markets; the type, cost and investment characteristics of the security; the business and financial condition of the issuer; and trading and other market data) to assist in determining whether to fair value and at what value to fair value an investment. The value of an investment for purposes of calculating the fund’s net asset value can differ depending on the source and method used to determine value. When fair valuation is used, the value of an investment used to determine the fund’s net asset value may differ from quoted or published prices for the same investment. There can be no assurance that the fund could obtain the fair value assigned to an investment if it were to sell the investment at the same time at which the fund determines its net asset value per share.
Various inputs are used in determining the value of the fund’s assets or liabilities. These inputs are categorized into three broad levels. In certain cases, the inputs used to measure fair value may fall into different levels of the fair value hierarchy. In such cases, an investment’s level within the fair value hierarchy is based on the lowest level of input that is significant to the fair value measurement. The fund’s assessment of the significance of a particular input to the fair value measurement in its entirety requires judgment, and considers factors specific to the investment. Level 1 includes unadjusted quoted prices in active markets for identical assets or liabilities. Level 2 includes other significant observable market-based inputs (including quoted prices for similar securities, interest rates, prepayment speed, and credit risk). Level 3 includes unobservable inputs, which may include the adviser’s own assumptions in determining the fair value of investments. Other financial instruments are derivative instruments not
31
Notes to Financial Statements (unaudited) – continued
reflected in total investments, such as futures contracts and forward foreign currency exchange contracts. The following is a summary of the levels used as of July 31, 2014 in valuing the fund’s assets or liabilities:
| | | | | | | | | | | | | | | | |
| Investments at Value | | Level 1 | | | Level 2 | | | Level 3 | | | Total | |
| Equity Securities | | | $— | | | | $12,604 | | | | $— | | | | $12,604 | |
| Non-U.S. Sovereign Debt | | | — | | | | 11,426,690 | | | | — | | | | 11,426,690 | |
| U.S. Corporate Bonds | | | — | | | | 2,273,759 | | | | — | | | | 2,273,759 | |
| Commercial Mortgage-Backed Securities | | | — | | | | 2,348,955 | | | | — | | | | 2,348,955 | |
| Asset-Backed Securities (including CDOs) | | | — | | | | 951,249 | | | | 0 | | | | 951,249 | |
| Foreign Bonds | | | — | | | | 128,316,182 | | | | — | | | | 128,316,182 | |
| Floating Rate Loans | | | — | | | | 4,315 | | | | — | | | | 4,315 | |
| Mutual Funds | | | 436,183,630 | | | | — | | | | — | | | | 436,183,630 | |
| Total Investments | | | $436,183,630 | | | | $145,333,754 | | | | $0 | | | | $581,517,384 | |
| | | | |
| Other Financial Instruments | | | | | | | | | | | | |
| Futures Contracts | | | $9,808 | | | | $— | | | | $— | | | | $9,808 | |
| Forward Foreign Currency Exchange Contracts | | | — | | | | 548,241 | | | | — | | | | 548,241 | |
For further information regarding security characteristics, see the Portfolio of Investments.
The following is a reconciliation of level 3 assets for which significant unobservable inputs were used to determine fair value. The fund’s policy is to recognize transfers between the levels as of the end of the period. The table presents the activity of level 3 securities held at the beginning and the end of the period.
| | | | | | | | | | | | |
| | | Investments in
Equity Securities | | | Asset-Backed
Securities | | | Total | |
| Balance as of 1/31/14 | | | $343,351 | | | | $0 | | | | $343,351 | |
Realized gain (loss) | | | — | | | | (3,992,694 | ) | | | (3,992,694 | ) |
Change in unrealized appreciation (depreciation) | | | (330,747 | ) | | | 3,992,694 | �� | | | 3,661,947 | |
Disposition of worthless securities | | | — | | | | 0 | | | | 0 | |
Transfers into Level 3 | | | — | | | | 0 | | | | 0 | |
Transfers out of Level 3 | | | (12,604 | ) | | | — | | | | (12,604 | ) |
| Balance as of 7/31/14 | | | $— | | | | $0 | | | | $— | |
The net change in unrealized appreciation (depreciation) from investments still held as level 3 at July 31, 2014 is $0. At July 31, 2014, the fund held 1 level 3 security.
Foreign Currency Translation – Purchases and sales of foreign investments, income, and expenses are converted into U.S. dollars based upon currency exchange rates prevailing on the respective dates of such transactions or on the reporting date for foreign denominated receivables and payables. Gains and losses attributable to foreign currency exchange rates on sales of securities are recorded for financial statement purposes as net realized gains and losses on investments. Gains and losses attributable to foreign exchange rate movements on receivables, payables, income and expenses are recorded for financial statement purposes as foreign currency transaction gains and
32
Notes to Financial Statements (unaudited) – continued
losses. That portion of both realized and unrealized gains and losses on investments that results from fluctuations in foreign currency exchange rates is not separately disclosed.
Derivatives – The fund uses derivatives for different purposes, primarily to increase or decrease exposure to a particular market or segment of the market, or security, to increase or decrease interest rate or currency exposure, or as alternatives to direct investments. Derivatives are used for hedging or non-hedging purposes. While hedging can reduce or eliminate losses, it can also reduce or eliminate gains. When the fund uses derivatives as an investment to increase market exposure, or for hedging purposes, gains and losses from derivative instruments may be substantially greater than the derivative’s original cost.
The derivative instruments used by the fund were futures contracts and forward foreign currency exchange contracts. The fund’s period end derivatives, as presented in the Portfolio of Investments and the associated Derivative Contract tables, generally are indicative of the volume of its derivative activity during the period.
The following table presents, by major type of derivative contract, the fair value, on a gross basis, of the asset and liability components of derivatives held by the fund at July 31, 2014 as reported in the Statement of Assets and Liabilities:
| | | | | | | | | | |
| | | | | Fair Value | |
| Risk | | Derivative Contracts | | Asset Derivatives | | | Liability Derivatives | |
| Interest Rate | | Interest Rate Futures | | | $9,808 | | | | $— | |
| Foreign Exchange | | Forward Foreign Currency Exchange | | | 574,116 | | | | (25,875 | ) |
| Total | | | | | $583,924 | | | $ | (25,875 | ) |
The following table presents, by major type of derivative contract, the realized gain (loss) on derivatives held by the fund for the six months ended July 31, 2014 as reported in the Statement of Operations:
| | | | | | | | |
| Risk | | Futures
Contracts | | | Foreign
Currency | |
| Interest Rate | | | $(18,521 | ) | | | $— | |
| Foreign Exchange | | | — | | | | (17,393 | ) |
| Total | | | $(18,521 | ) | | | $(17,393 | ) |
The following table presents, by major type of derivative contract, the change in unrealized appreciation (depreciation) on derivatives held by the fund for the six months ended July 31, 2014 as reported in the Statement of Operations:
| | | | | | | | |
| Risk | | Futures
Contracts | | | Translation of Assets
and Liabilities in Foreign
Currencies | |
| Interest Rate | | | $9,808 | | | | $— | |
| Foreign Exchange | | | — | | | | 399,463 | |
| Total | | | $9,808 | | | | $399,463 | |
33
Notes to Financial Statements (unaudited) – continued
Derivative counterparty credit risk is managed through formal evaluation of the creditworthiness of all potential counterparties. On certain, but not all, over-the-counter derivatives, the fund attempts to reduce its exposure to counterparty credit risk whenever possible by entering into an ISDA Master Agreement on a bilateral basis with each of the counterparties with whom it undertakes a significant volume of transactions. The ISDA Master Agreement gives each party to the agreement the right to terminate all transactions traded under such agreement if there is a certain deterioration in the credit quality of the other party. Upon an event of default or a termination of the ISDA Master Agreement, the non-defaulting party has the right to close out all transactions traded under such agreement and to net amounts owed under each transaction to one net amount payable by one party to the other. This right to close out and net payments across all transactions traded under the ISDA Master Agreement could result in a reduction of the fund’s credit risk to such counterparty equal to any amounts payable by the fund under the applicable transactions, if any. The fund’s right to setoff may be restricted or prohibited by the bankruptcy or insolvency laws of the particular jurisdiction to which a specific ISDA counterparty is subject.
Collateral and margin requirements differ by type of derivative. Margin requirements are set by the broker or clearing house for cleared derivatives (i.e., futures contracts, cleared swaps, and exchange-traded options) while collateral terms are contract specific for over-the-counter traded derivatives (i.e., forward foreign currency exchange contracts, uncleared swap agreements, and over-the-counter options). For derivatives traded under an ISDA Master Agreement, the collateral requirements are netted across all transactions traded under such agreement and one amount is posted from one party to the other to collateralize such obligations. Cash that has been segregated to cover the fund’s collateral or margin obligations under derivative contracts, if any, will be reported separately in the Statement of Assets and Liabilities as “Restricted cash” or “Deposits with brokers.” Securities pledged as collateral or margin for the same purpose, if any, are noted in the Portfolio of Investments.
Purchased Options – The fund purchased call options for a premium. Purchased call options entitle the holder to buy and sell a specified number of shares or units of a particular security, currency or index at a specified price at a specified date or within a specified period of time. Purchasing call options may hedge against an anticipated increase in the dollar cost of securities or currency to be acquired or increase the fund’s exposure to an underlying instrument.
The premium paid is initially recorded as an investment in the Statement of Assets and Liabilities. That investment is subsequently marked-to-market daily with the difference between the premium paid and the market value of the purchased option being recorded as unrealized appreciation or depreciation. Premiums paid for purchased call options which have expired are treated as realized losses on investments in the Statement of Operations. Upon the exercise or closing of a purchased call option, the premium paid is added to the cost of the security or financial instrument purchased.
Whether or not the option is exercised, the fund’s maximum risk of loss from purchasing an option is the amount of premium paid. All option contracts involve credit risk if the counterparty to the option contract fails to perform. For over-the-counter options, this risk is mitigated in cases where there is an ISDA Master
34
Notes to Financial Statements (unaudited) – continued
Agreement between the fund and the counterparty providing for netting as described above and for posting of collateral by the counterparty to the fund to cover the fund’s exposure to the counterparty under such ISDA Master Agreement.
Futures Contracts – The fund entered into futures contracts which may be used to hedge against or obtain broad market exposure, interest rate exposure, currency exposure, or to manage duration. A futures contract represents a commitment for the future purchase or sale of an asset at a specified price on a specified date.
Upon entering into a futures contract, the fund is required to deposit with the broker, either in cash or securities, an initial margin in an amount equal to a certain percentage of the notional amount of the contract. Subsequent payments (variation margin) are made or received by the fund each day, depending on the daily fluctuations in the value of the contract, and are recorded for financial statement purposes as unrealized gain or loss by the fund until the contract is closed or expires at which point the gain or loss on futures contracts is realized.
The fund bears the risk of interest rates, exchange rates or securities prices moving unexpectedly, in which case, the fund may not achieve the anticipated benefits of the futures contracts and may realize a loss. While futures contracts may present less counterparty risk to the fund since the contracts are exchange traded and the exchange’s clearinghouse guarantees payments to the broker, there is still counterparty credit risk due to the insolvency of the broker. The fund’s maximum risk of loss due to counterparty credit risk is equal to the margin posted by the fund to the broker plus any gains or minus any losses on the outstanding futures contracts.
Forward Foreign Currency Exchange Contracts – The fund entered into forward foreign currency exchange contracts for the purchase or sale of a specific foreign currency at a fixed price on a future date. These contracts may be used to hedge the fund’s currency risk or for non-hedging purposes. For hedging purposes, the fund may enter into contracts to deliver or receive foreign currency that the fund will receive from or use in its normal investment activities. The fund may also use contracts to hedge against declines in the value of foreign currency denominated securities due to unfavorable exchange rate movements. For non-hedging purposes, the fund may enter into contracts with the intent of changing the relative exposure of the fund’s portfolio of securities to different currencies to take advantage of anticipated exchange rate changes.
Forward foreign currency exchange contracts are adjusted by the daily exchange rate of the underlying currency and any unrealized gains or losses are recorded as a receivable or payable for forward foreign currency exchange contracts until the contract settlement date. On contract settlement date, any gain or loss on the contract is recorded as realized gains or losses on foreign currency.
Risks may arise upon entering into these contracts from unanticipated movements in the value of the contract and from the potential inability of counterparties to meet the terms of their contracts. Generally, the fund’s maximum risk due to counterparty credit risk is the unrealized gain on the contract due to the use of Continuous Linked Settlement, an industry accepted settlement system. This risk is mitigated in cases where there is an ISDA Master Agreement between the fund and the counterparty
35
Notes to Financial Statements (unaudited) – continued
providing for netting as described above and for posting of collateral by the counterparty to the fund to cover the fund’s exposure to the counterparty under such ISDA Master Agreement.
Swap Agreements – During the period the fund entered into swap agreements. Certain types of swaps (“cleared swaps”) are required to be centrally cleared under provisions of the Dodd-Frank Regulatory Reform Bill. In a cleared swap transaction, the swap agreement is novated to a central counterparty (the “clearinghouse”) immediately following execution of the swap contract with an executing broker. Thereafter, throughout the term of the cleared swap, the fund interfaces indirectly with the clearinghouse through a clearing broker.
A swap agreement is generally an exchange of cash payments, at specified intervals or upon the occurrence of specified events, between the fund and a counterparty. The net cash payments exchanged are recorded as a realized gain or loss on swap agreements in the Statement of Operations. The value of the swap agreement, which is adjusted daily and includes any related interest accruals to be paid or received by the fund, is recorded in the Statement of Assets and Liabilities, as “Swaps, at value” for uncleared swaps and is included in “Due from brokers” or “Due to brokers” for cleared swaps. The daily change in value, including any related interest accruals to be paid or received, is recorded as unrealized appreciation or depreciation on swap agreements in the Statement of Operations. The daily change in valuation of cleared swaps is recorded as a receivable or payable for variation margin in the Statement of Assets and Liabilities. Amounts paid or received at the inception of the swap agreement are reflected as premiums paid or received in the Statement of Assets and Liabilities and are amortized using the effective interest method over the term of the agreement. A liquidation payment received or made upon early termination is recorded as a realized gain or loss on swap agreements in the Statement of Operations.
Risks related to swap agreements include the possible lack of a liquid market, unfavorable market and interest rate movements of the underlying instrument and the failure of the counterparty to perform under the terms of the agreements. To address counterparty risk, swap agreements are limited to only highly-rated counterparties. For uncleared swaps, that risk is further reduced by having an ISDA Master Agreement between the fund and the counterparty providing for netting as described above and by the posting of collateral by the counterparty to the fund to cover the fund’s exposure to the counterparty under such ISDA Master Agreement. Although not covered by an ISDA Master Agreement, the fund’s counterparty risk due to cleared swaps is mitigated by the clearinghouses’ margining requirements and financial safeguards in the event of a clearing broker default.
The fund entered into credit default swap agreements in order to manage its exposure to the market or certain sectors of the market, to reduce its credit risk exposure to defaults of corporate and sovereign issuers or to create exposure to corporate or sovereign issuers to which it is not otherwise exposed. In a credit default swap agreement, the protection buyer can make an upfront payment and will make a stream of payments to the protection seller based on a fixed percentage applied to the agreement notional amount in exchange for the right to receive a specified return upon the occurrence of a defined credit event on the reference obligation (which may be either a single security or a basket of securities issued by corporate or sovereign
36
Notes to Financial Statements (unaudited) – continued
issuers) and, with respect to the rare cases where physical settlement applies, the delivery by the buyer to the seller of a defined deliverable obligation. Although agreement-specific, credit events generally consist of a combination of the following: bankruptcy, failure to pay, restructuring, obligation acceleration, obligation default, or repudiation/moratorium, each as defined in the 2003 ISDA Credit Derivatives Definitions as amended by the relevant agreement. Restructuring is generally not applicable when the reference obligation is issued by a North American corporation and obligation acceleration, obligation default, or repudiation/moratorium are generally only applicable when the reference obligation is issued by a sovereign entity or an entity in an emerging country. Upon determination of the final price for the deliverable obligation (or upon delivery of the deliverable obligation in the case of physical settlement), the difference between the value of the deliverable obligation and the swap agreement’s notional amount is recorded as realized gain or loss on swap agreements in the Statement of Operations. Credit default swap agreements are considered to have credit-risk-related contingent features since they trigger payment by the protection seller to the protection buyer upon the occurrence of a defined credit event. The maximum amount of future, undiscounted payments that the fund, as protection seller, could be required to make is equal to the swap agreement’s notional amount. The protection seller’s payment obligation would be offset to the extent of the value of the agreement’s deliverable obligation. At January 31, 2014, the fund did not hold any credit default swap agreements at an unrealized loss where it is the protection seller.
The fund’s maximum risk of loss from counterparty risk, either as the protection seller or as the protection buyer, is the fair value of the agreement. For uncleared swaps, counterparty risk is reduced by having an ISDA Master Agreement between the fund and the counterparty providing for netting as described above and by the posting of collateral by the counterparty to the fund to cover the fund’s exposure to the counterparty under such ISDA Master Agreement. For cleared swaps, the fund’s counterparty risk is mitigated by the clearinghouses’ margining requirements and financial safeguards in the event of a clearing broker default.
Loans and Other Direct Debt Instruments – The fund invests in loans and loan participations or other receivables. These investments may include standby financing commitments, including revolving credit facilities, which contractually obligate the fund to supply additional cash to the borrower on demand. The fund generally provides this financial support in order to preserve its existing investment or to obtain a more senior secured interest in the assets of the borrower. Loan participations involve a risk of insolvency of the lending bank or other financial intermediary.
Indemnifications – Under the fund’s organizational documents, its officers and Trustees may be indemnified against certain liabilities and expenses arising out of the performance of their duties to the fund. Additionally, in the normal course of business, the fund enters into agreements with service providers that may contain indemnification clauses. The fund’s maximum exposure under these agreements is unknown as this would involve future claims that may be made against the fund that have not yet occurred.
Investment Transactions and Income – Investment transactions are recorded on the trade date. Interest income is recorded on the accrual basis. All premium and discount
37
Notes to Financial Statements (unaudited) – continued
is amortized or accreted for financial statement purposes in accordance with U.S. generally accepted accounting principles. The fund earns certain fees in connection with its floating rate loan purchasing activities. These fees are in addition to interest payments earned and may include amendment fees, commitment fees, facility fees, consent fees, and prepayment fees. Commitment fees are recorded on an accrual basis as income in the accompanying financial statements. Distributions of income and capital gains from the High Yield Pooled Portfolio are recorded on the ex-dividend date.
Dividends received in cash are recorded on the ex-dividend date. Certain dividends from foreign securities will be recorded when the fund is informed of the dividend if such information is obtained subsequent to the ex-dividend date. Dividend and interest payments received in additional securities are recorded on the ex-dividend or ex-interest date in an amount equal to the value of the security on such date. Debt obligations may be placed on non-accrual status or set to accrue at a rate of interest less than the contractual coupon when the collection of all or a portion of interest has become doubtful. Interest income for those debt obligations may be further reduced by the write-off of the related interest receivables when deemed uncollectible.
The fund and/or the High Yield Pooled Portfolio may receive proceeds from litigation settlements. Any proceeds received from litigation involving portfolio holdings are reflected in the Statement of Operations in realized gain/loss if the security has been disposed of by the fund or in unrealized gain/loss if the security is still held by the fund. Any other proceeds from litigation not related to portfolio holdings are reflected as other income in the Statement of Operations.
Fees Paid Indirectly – The fund’s custody fee may be reduced according to an arrangement that measures the value of cash deposited with the custodian by the fund. This amount, for the six months ended July 31, 2014, is shown as a reduction of total expenses in the Statement of Operations.
Tax Matters and Distributions – The fund intends to qualify as a regulated investment company, as defined under Subchapter M of the Internal Revenue Code, and to distribute all of its taxable income, including realized capital gains. As a result, no provision for federal income tax is required. The fund’s federal tax returns, when filed, will remain subject to examination by the Internal Revenue Service for a three year period. Management has analyzed the fund’s tax positions taken on federal and state tax returns for all open tax years and does not believe that there are any uncertain tax positions that require recognition of a tax liability. Foreign taxes, if any, have been accrued by the fund in the accompanying financial statements in accordance with the applicable foreign tax law. Foreign income taxes may be withheld by certain countries in which the fund invests. Additionally, capital gains realized by the fund on securities issued in or by certain foreign countries may be subject to capital gains tax imposed by those countries.
Distributions to shareholders are recorded on the ex-dividend date. Income and capital gain distributions are determined in accordance with income tax regulations, which may differ from U.S. generally accepted accounting principles. Certain capital accounts in the financial statements are periodically adjusted for permanent differences in order to reflect their tax character. These adjustments have no impact on net assets or net asset value per share. Temporary differences which arise from recognizing certain items
38
Notes to Financial Statements (unaudited) – continued
of income, expense, gain or loss in different periods for financial statement and tax purposes will reverse at some time in the future. Distributions in excess of net investment income or net realized gains are temporary overdistributions for financial statement purposes resulting from differences in the recognition or classification of income or distributions for financial statement and tax purposes.
Book/tax differences primarily relate to amortization and accretion of debt securities.
The tax character of distributions made during the current period will be determined at fiscal year end. The tax character of distributions declared to shareholders for the last fiscal year is as follows:
| | | | |
| | | 1/31/14 | |
Ordinary income (including any
short-term capital gains) | | | $34,727,300 | |
The federal tax cost and the tax basis components of distributable earnings were as follows:
| | | | |
| As of 7/31/14 | | | |
| Cost of investments | | | $584,891,901 | |
| Gross appreciation | | | 5,568,923 | |
| Gross depreciation | | | (8,943,440 | ) |
| Net unrealized appreciation (depreciation) | | | $(3,374,517 | ) |
| |
| As of 1/31/14 | | | |
| Undistributed ordinary income | | | 1,647,016 | |
| Capital loss carryforwards | | | (76,228,595 | ) |
| Post-October capital loss deferral | | | (597,950 | ) |
| Other temporary differences | | | (2,769,300 | ) |
| Net unrealized appreciation (depreciation) | | | (9,595,519 | ) |
The aggregate cost above includes prior fiscal year end tax adjustments, if applicable.
Under the Regulated Investment Company Modernization Act of 2010 (the “Act”), net capital losses recognized for fund fiscal years beginning after January 31, 2011 may be carried forward indefinitely, and their character is retained as short-term and/or long-term losses (“post-enactment losses”). Previously, net capital losses were carried forward for eight years and treated as short-term losses (“pre-enactment losses”). As a transition rule, the Act requires that all post-enactment net capital losses be used before pre-enactment net capital losses.
As of January 31, 2014, the fund had capital loss carryforwards available to offset future realized gains. Such pre-enactment losses expire as follows:
| | | | |
| 1/31/17 | | | $(30,697,499 | ) |
| 1/31/18 | | | (45,531,096 | ) |
| Total | | | $(76,228,595 | ) |
Multiple Classes of Shares of Beneficial Interest – The fund offers multiple classes of shares, which differ in their respective distribution, service, and program manager fees. The fund’s income and common expenses are allocated to shareholders based on
39
Notes to Financial Statements (unaudited) – continued
the value of settled shares outstanding of each class. The fund’s realized and unrealized gain (loss) are allocated to shareholders based on the daily net assets of each class. Dividends are declared separately for each class. Differences in per share dividend rates are generally due to differences in separate class expenses. Class B shares will convert to Class A shares approximately eight years after purchase. The fund’s distributions declared to shareholders as reported in the Statements of Changes in Net Assets are presented by class as follows:
| | | | | | | | |
| | | From net investment
income | |
| | | Six months
ended
7/31/14 | | | Year
ended
1/31/14 | |
| Class A | | | $9,771,304 | | | | $22,633,677 | |
| Class B | | | 665,889 | | | | 1,583,072 | |
| Class C | | | 2,267,052 | | | | 5,016,575 | |
| Class I | | | 3,223,762 | | | | 4,903,806 | |
| Class R1 | | | 5,547 | | | | 11,840 | |
| Class R2 | | | 6,375 | | | | 14,884 | |
| Class R3 | | | 222,860 | | | | 462,065 | |
| Class R4 | | | 48,701 | | | | 85,278 | |
| Class R5 | | | 12,763 | | | | 16,103 | |
| Total | | | $16,224,253 | | | | $34,727,300 | |
(3) Transactions with Affiliates
Investment Adviser – The fund has an investment advisory agreement with MFS to provide overall investment management and related administrative services and facilities to the fund. The management fee is computed daily and paid monthly at an annual rate of 0.65% of the fund’s average daily net assets.
The investment adviser has agreed in writing to reduce its management fee to 0.60% of average daily net assets in excess of $1.5 billion to $2.5 billion and 0.55% of average daily net assets in excess of $2.5 billion. This written agreement will continue until modified by the fund’s Board of Trustees, but such agreement will continue at least until May 31, 2016. For six months ended July 31, 2014, the fund’s average daily net assets did not exceed $1.5 billion and therefore, the management fee was not reduced in accordance with this agreement.
MFS has agreed in writing to reduce its management fee by a specified amount if certain MFS mutual fund assets exceed thresholds agreed to by MFS and the fund’s Board of Trustees. For the six months ended July 31, 2014, this management fee reduction amounted to $11,849, which is included in the reduction of total expenses in the Statement of Operations. The management fee incurred for the six months ended July 31, 2014 was equivalent to an annual effective rate of 0.65% of the fund’s average daily net assets.
The investment adviser has agreed in writing to pay a portion of the fund’s total annual operating expenses, exclusive of interest, taxes, extraordinary expenses, brokerage and transaction costs, and investment-related expenses (including fees and expenses
40
Notes to Financial Statements (unaudited) – continued
associated with investments in investment companies and other similar investment vehicles), such that total fund operating expenses do not exceed the following rates annually of each class’s average daily net assets:
| | | | | | | | | | | | | | | | | | | | | | | | | | | | | | | | |
| Classes | |
| A | | B | | | C | | | I | | | R1 | | | R2 | | | R3 | | | R4 | | | R5 | |
| 1.05% | | | 1.80% | | | | 1.80% | | | | 0.80% | | | | 1.80% | | | | 1.30% | | | | 1.05% | | | | 0.80% | | | | 0.73% | |
This written agreement will continue until modified by the fund’s Board of Trustees, but such agreement will continue at least until May 31, 2016. For the six months ended July 31, 2014, this reduction amounted to $170,263 and is included in the reduction of total expenses in the Statement of Operations.
Distributor – MFS Fund Distributors, Inc. (MFD), a wholly-owned subsidiary of MFS, as distributor, received $61,828 for the six months ended July 31, 2014, as its portion of the initial sales charge on sales of Class A shares of the fund. The Board of Trustees has adopted a distribution plan for certain share classes pursuant to Rule 12b-1 of the Investment Company Act of 1940.
The fund’s distribution plan provides that the fund will pay MFD for services provided by MFD and financial intermediaries in connection with the distribution and servicing of certain share classes. One component of the plan is a distribution fee paid to MFD and another component of the plan is a service fee paid to MFD. MFD may subsequently pay all, or a portion, of the distribution and/or service fees to financial intermediaries.
Distribution Plan Fee Table:
| | | | | | | | | | | | | | | | | | | | |
| | | Distribution
Fee Rate (d) | | | Service Fee Rate (d) | | | Total
Distribution
Plan (d) | | | Annual Effective Rate (e) | | | Distribution and Service Fee | |
| Class A | | | — | | | | 0.25% | | | | 0.25% | | | | 0.25% | | | | $433,502 | |
| Class B | | | 0.75% | | | | 0.25% | | | | 1.00% | | | | 1.00% | | | | 136,617 | |
| Class C | | | 0.75% | | | | 0.25% | | | | 1.00% | | | | 1.00% | | | | 465,425 | |
| Class R1 | | | 0.75% | | | | 0.25% | | | | 1.00% | | | | 1.00% | | | | 1,140 | |
| Class R2 | | | 0.25% | | | | 0.25% | | | | 0.50% | | | | 0.50% | | | | 594 | |
| Class R3 | | | — | | | | 0.25% | | | | 0.25% | | | | 0.25% | | | | 9,918 | |
| Total Distribution and Service Fees | | | | $1,047,196 | |
| (d) | In accordance with the distribution plan for certain classes, the fund pays distribution and/or service fees equal to these annual percentage rates of each class’s average daily net assets. The distribution and service fee rates disclosed by class represent the current rates in effect at the end of the reporting period. Any rate changes, if applicable, are detailed below. |
| (e) | The annual effective rates represent actual fees incurred under the distribution plan for the six months ended July 31, 2014 based on each class’s average daily net assets. MFD has voluntarily agreed to rebate a portion of each class’s 0.25% service fee attributable to accounts for which MFD retains the 0.25% service fee except for accounts attributable to MFS or its affiliates’ seed money. For the six months ended July 31, 2014, this rebate amounted to $2,320, $91, and $325 for Class A, Class B, and Class C, respectively, and is included in the reduction of total expenses in the Statement of Operations. |
Certain Class A shares are subject to a contingent deferred sales charge (CDSC) in the event of a shareholder redemption within 18 months of purchase for shares purchased on or after August 1, 2012, and within 24 months of purchase for shares purchased prior to August 1, 2012. Class C shares are subject to a CDSC in the event of a
41
Notes to Financial Statements (unaudited) – continued
shareholder redemption within 12 months of purchase. Class B shares are subject to a CDSC in the event of a shareholder redemption within six years of purchase. All contingent deferred sales charges are paid to MFD and during the six months ended July 31, 2014, were as follows:
| | | | |
| | | Amount | |
| Class A | | | $3,555 | |
| Class B | | | 19,452 | |
| Class C | | | 429 | |
Shareholder Servicing Agent – MFS Service Center, Inc. (MFSC), a wholly-owned subsidiary of MFS, receives a fee from the fund for its services as shareholder servicing agent calculated as a percentage of the average daily net assets of the fund as determined periodically under the supervision of the fund’s Board of Trustees. For the six months ended July 31, 2014, the fee was $55,994, which equated to 0.0190% annually of the fund’s average daily net assets. MFSC also receives payment from the fund for out-of-pocket expenses, sub-accounting and other shareholder servicing costs which may be paid to affiliated and unaffiliated service providers. Class R5 shares do not incur sub-accounting fees. For the six months ended July 31, 2014, these out-of-pocket expenses, sub-accounting and other shareholder servicing costs amounted to $295,951.
Administrator – MFS provides certain financial, legal, shareholder communications, compliance, and other administrative services to the fund. Under an administrative services agreement, the fund partially reimburses MFS the costs incurred to provide these services. The fund is charged an annual fixed amount of $17,500 plus a fee based on average daily net assets. The administrative services fee incurred for the six months ended July 31, 2014 was equivalent to an annual effective rate of 0.0134% of the fund’s average daily net assets.
Trustees’ and Officers’ Compensation – The fund pays compensation to independent Trustees in the form of a retainer, attendance fees, and additional compensation to Board and Committee chairpersons. The fund does not pay compensation directly to Trustees or officers of the fund who are also officers of the investment adviser, all of whom receive remuneration for their services to the fund from MFS. Certain officers and Trustees of the fund are officers or directors of MFS, MFD, and MFSC.
Prior to December 31, 2001, the fund had an unfunded defined benefit plan (“DB plan”) for independent Trustees. As of December 31, 2001, the Board took action to terminate the DB plan with respect to then-current and any future independent Trustees, such that the DB plan covers only certain of those former independent Trustees who retired on or before December 31, 2001. Effective January 1, 2002, accrued benefits under the DB plan for then-current independent Trustees who continued were credited to an unfunded retirement deferral plan (the “Retirement Deferral plan”), which was established for and exists solely with respect to these credited amounts, and is not available for other deferrals by these or other independent Trustees. Although the Retirement Deferral plan is unfunded, amounts deferred under the plan are periodically adjusted for investment experience as if they had been invested in shares of the fund. The Retirement Deferral plan resulted in an
42
Notes to Financial Statements (unaudited) – continued
expense of $249 and is included in independent Trustees’ compensation for the six months ended July 31, 2014. The liability for deferred retirement benefits payable to certain independent Trustees under the Retirement Deferral plan amounted to $4,851 at July 31, 2014, and is included in “Payable for independent Trustees’ compensation” in the Statement of Assets and Liabilities.
Other – This fund and certain other funds managed by MFS (the funds) have entered into services agreements (the Agreements) which provide for payment of fees by the funds to Tarantino LLC and Griffin Compliance LLC in return for the provision of services of an Independent Chief Compliance Officer (ICCO) and Assistant ICCO, respectively, for the funds. The funds can terminate the Agreements with Tarantino LLC and Griffin Compliance LLC at any time under the terms of the Agreements. The ICCO is an officer of the funds and the sole member of Tarantino LLC. Prior to June 1, 2014, Robyn L. Griffin served as the Assistant ICCO and was an officer of the funds. Ms. Griffin is the sole member of Griffin Compliance LLC. Effective May 31, 2014, Ms. Griffin resigned as Assistant ICCO and the service agreement between the funds and Griffin Compliance LLC was terminated. For the six months ended July 31, 2014, the aggregate fees paid by the fund to Tarantino LLC and Griffin Compliance LLC were $954 and are included in “Miscellaneous” expense in the Statement of Operations. MFS has agreed to reimburse the fund for a portion of the payments made by the fund in the amount of $618, which is included in the reduction of total expenses in the Statement of Operations. Additionally, MFS has agreed to bear all expenses associated with office space, other administrative support, and supplies provided to the ICCO and Assistant ICCO.
The fund invests in the MFS Institutional Money Market Portfolio which is managed by MFS and seeks current income consistent with preservation of capital and liquidity. Income earned on this investment is included in “Dividends from underlying affiliated funds” in the Statement of Operations. This money market fund does not pay a management fee to MFS.
The fund invests in the High Yield Pooled Portfolio, which is a mutual fund advised by MFS that does not pay management fees to MFS but does incur investment and operating costs. The High Yield Pooled Portfolio is designed to be used by MFS funds to invest in a particular security type rather than invest in the security type directly. The fund invests in the High Yield Pooled Portfolio to gain exposure to high income debt instruments, rather than investing in high income debt instruments directly (see Appendix A).
At close of business on March 22, 2013, the fund and certain other MFS funds transferred high income debt instruments, accrued interest and cash to the High Yield Pooled Portfolio, a series of MFS series Trust III, in exchange for shares of the High Yield Pooled Portfolio. The purpose of the transaction was to pool the portion of the assets of the fund and certain other MFS funds invested in high income debt instruments in the High Yield Pooled Portfolio. The transfer was accomplished by a tax-free exchange by the fund of investments valued at approximately $516,450,760 with a cost basis of approximately $492,368,794, accrued interest of approximately $9,799,211 and cash of approximately $178,187 for approximately 52,642,816 shares of the High Yield Pooled Portfolio (valued at approximately $526,428,158). For financial reporting
43
Notes to Financial Statements (unaudited) – continued
purposes, investments transferred and shares received by the fund were recorded at fair value; however, the cost basis of the investments delivered to the High Yield Pooled Portfolio was carried forward to the shares received. Income earned on this investment is included in “Dividends from underlying affiliated funds” in the Statement of Operations. The High Yield Pooled Portfolio does not pay a management fee, distribution and/or service fee, or sales charge.
At July 31, 2014 MFS held approximately 63% and 63% of the outstanding shares of Class R1 and R2, respectively.
(4) Portfolio Securities
For the six months ended July 31, 2014, purchases and sales of investments, other than short-term obligations, aggregated $81,799,619 and $93,042,165, respectively.
(5) Shares of Beneficial Interest
The fund’s Declaration of Trust permits the Trustees to issue an unlimited number of full and fractional shares of beneficial interest. Transactions in fund shares were as follows:
| | | | | | | | | | | | | | | | |
| | | Six months ended
7/31/14 | | | Year ended
1/31/14 | |
| | | Shares | | | Amount | | | Shares | | | Amount | |
| Shares sold | | | | | | | | | | | | | | | | |
Class A | | | 5,266,945 | | | | $35,152,368 | | | | 12,853,466 | | | | $84,535,615 | |
Class B | | | 237,947 | | | | 1,587,082 | | | | 552,163 | | | | 3,640,035 | |
Class C | | | 685,060 | | | | 4,556,250 | | | | 1,720,899 | | | | 11,318,254 | |
Class I | | | 9,010,541 | | | | 60,096,046 | | | | 10,345,287 | | | | 67,597,857 | |
Class R1 | | | 1,550 | | | | 10,354 | | | | 8,418 | | | | 54,712 | |
Class R2 | | | 1,200 | | | | 8,034 | | | | 6,903 | | | | 45,670 | |
Class R3 | | | 90,934 | | | | 605,504 | | | | 387,273 | | | | 2,554,016 | |
Class R4 | | | 117,798 | | | | 790,029 | | | | 73,311 | | | | 482,986 | |
Class R5 | | | 20,247 | | | | 135,521 | | | | 40,132 | | | | 266,869 | |
| | | 15,432,222 | | | | $102,941,188 | | | | 25,987,852 | | | | $170,496,014 | |
| | | | |
| Shares issued to shareholders in reinvestment of distributions | | | | | | | | | | | | | | | | |
Class A | | | 1,261,059 | | | | $8,410,168 | | | | 2,843,014 | | | | $18,665,978 | |
Class B | | | 88,165 | | | | 589,492 | | | | 203,437 | | | | 1,338,198 | |
Class C | | | 253,438 | | | | 1,689,076 | | | | 542,240 | | | | 3,553,779 | |
Class I | | | 439,086 | | | | 2,932,332 | | | | 625,904 | | | | 4,107,967 | |
Class R1 | | | 822 | | | | 5,497 | | | | 1,798 | | | | 11,819 | |
Class R2 | | | 953 | | | | 6,375 | | | | 2,244 | | | | 14,759 | |
Class R3 | | | 32,974 | | | | 220,025 | | | | 70,376 | | | | 461,853 | |
Class R4 | | | 7,250 | | | | 48,681 | | | | 12,906 | | | | 85,276 | |
Class R5 | | | 1,915 | | | | 12,763 | | | | 2,470 | | | | 16,103 | |
| | | 2,085,662 | | | | $13,914,409 | | | | 4,304,389 | | | | $28,255,732 | |
44
Notes to Financial Statements (unaudited) – continued
| | | | | | | | | | | | | | | | |
| | | Six months ended
7/31/14 | | | Year ended
1/31/14 | |
| | | Shares | | | Amount | | | Shares | | | Amount | |
| Shares reacquired | | | | | | | | | | | | | | | | |
Class A | | | (13,121,344 | ) | | | $(87,464,394 | ) | | | (22,105,856 | ) | | | $(145,380,703 | ) |
Class B | | | (625,785 | ) | | | (4,184,799 | ) | | | (1,521,729 | ) | | | (10,014,844 | ) |
Class C | | | (1,100,677 | ) | | | (7,329,038 | ) | | | (3,139,479 | ) | | | (20,577,355 | ) |
Class I | | | (2,916,107 | ) | | | (19,534,232 | ) | | | (8,649,325 | ) | | | (56,187,692 | ) |
Class R1 | | | (2,973 | ) | | | (19,654 | ) | | | (5,518 | ) | | | (36,349 | ) |
Class R2 | | | (900 | ) | | | (6,041 | ) | | | (12,037 | ) | | | (78,572 | ) |
Class R3 | | | (123,709 | ) | | | (823,693 | ) | | | (421,490 | ) | | | (2,765,859 | ) |
Class R4 | | | (57,378 | ) | | | (384,879 | ) | | | (67,202 | ) | | | (447,826 | ) |
Class R5 | | | (3,008 | ) | | | (20,051 | ) | | | (1,492 | ) | | | (9,622 | ) |
| | | (17,951,881 | ) | | | $(119,766,781 | ) | | | (35,924,128 | ) | | | $(235,498,822 | ) |
| | | | |
| Net change | | | | | | | | | | | | | | | | |
Class A | | | (6,593,340 | ) | | | $(43,901,858 | ) | | | (6,409,376 | ) | | | $(42,179,110 | ) |
Class B | | | (299,673 | ) | | | (2,008,225 | ) | | | (766,129 | ) | | | (5,036,611 | ) |
Class C | | | (162,179 | ) | | | (1,083,712 | ) | | | (876,340 | ) | | | (5,705,322 | ) |
Class I | | | 6,533,520 | | | | 43,494,146 | | | | 2,321,866 | | | | 15,518,132 | |
Class R1 | | | (601 | ) | | | (3,803 | ) | | | 4,698 | | | | 30,182 | |
Class R2 | | | 1,253 | | | | 8,368 | | | | (2,890 | ) | | | (18,143 | ) |
Class R3 | | | 199 | | | | 1,836 | | | | 36,159 | | | | 250,010 | |
Class R4 | | | 67,670 | | | | 453,831 | | | | 19,015 | | | | 120,436 | |
Class R5 | | | 19,154 | | | | 128,233 | | | | 41,110 | | | | 273,350 | |
| | | (433,997 | ) | | | $(2,911,184 | ) | | | (5,631,887 | ) | | | $(36,747,076 | ) |
(6) Line of Credit
The fund and certain other funds managed by MFS participate in a $1.1 billion unsecured committed line of credit, subject to a $1 billion sublimit, provided by a syndication of banks under a credit agreement. Borrowings may be made for temporary financing needs. Interest is charged to each fund, based on its borrowings, generally at a rate equal to the higher of the Federal Reserve funds rate or one month LIBOR plus an agreed upon spread. A commitment fee, based on the average daily, unused portion of the committed line of credit, is allocated among the participating funds at the end of each calendar quarter. In addition, the fund and other funds managed by MFS have established unsecured uncommitted borrowing arrangements with certain banks for temporary financing needs. Interest is charged to each fund, based on its borrowings, at a rate equal to the Federal Reserve funds rate plus an agreed upon spread. For the six months ended July 31, 2014, the fund’s commitment fee and interest expense were $1,199 and $0, respectively, and are included in “Miscellaneous” expense in the Statement of Operations.
45
Notes to Financial Statements (unaudited) – continued
(7) Transactions in Underlying Affiliated Funds-Affiliated Issuers
An affiliated issuer may be considered one in which the fund owns 5% or more of the outstanding voting securities, or a company which is under common control. For the purposes of this report, the fund assumes the following to be affiliated issuers:
| | | | | | | | | | | | | | | | |
| Underlying Affiliated Funds | | Beginning
Shares/Par
Amount | | | Acquisitions
Shares/Par
Amount | | | Dispositions
Shares/Par
Amount | | | Ending
Shares/Par
Amount | |
| MFS High Yield Pooled Portfolio | | | 47,525,038 | | | | 2,728,890 | | | | (6,833,108 | ) | | | 43,420,820 | |
MFS Institutional Money
Market Portfolio | | | 3,265,647 | | | | 71,113,371 | | | | (65,456,257 | ) | | | 8,922,761 | |
| | | | |
| Underlying Affiliated Funds | | Realized
Gain (Loss) | | | Capital Gain
Distributions | | | Dividend
Income | | | Ending
Value | |
| MFS High Yield Pooled Portfolio | | | $5,312,878 | | | | $231,649 | | | | $14,703,352 | | | | $427,260,869 | |
MFS Institutional Money
Market Portfolio | | | $— | | | | $— | | | | $2,680 | | | | $8,922,761 | |
46
APPENDIX A
MFS HIGH YIELD POOLED PORTFOLIO
PORTFOLIO OF INVESTMENTS
7/31/14 (unaudited)
Appendix A is a complete list of all securities owned by MFS High Yield Pooled Portfolio. It is categorized by broad-based asset classes.
| | | | | | | | |
| Bonds - 92.4% | | | | | | | | |
| Issuer | | Shares/Par | | | Value ($) | |
| Aerospace - 2.3% | | | | | | | | |
| Bombardier, Inc., 7.5%, 3/15/18 (n) | | $ | 2,765,000 | | | $ | 3,020,763 | |
| Bombardier, Inc., 7.75%, 3/15/20 (n) | | | 1,995,000 | | | | 2,154,600 | |
| Bombardier, Inc., 6.125%, 1/15/23 (n) | | | 4,140,000 | | | | 4,077,900 | |
| CPI International, Inc., 8.75%, 2/15/18 | | | 3,875,000 | | | | 4,049,375 | |
| Gencorp, Inc., 7.125%, 3/15/21 | | | 4,205,000 | | | | 4,551,072 | |
| Huntington Ingalls Industries, Inc., 7.125%, 3/15/21 | | | 5,380,000 | | | | 5,756,600 | |
| TransDigm, Inc., 6%, 7/15/22 (z) | | | 375,000 | | | | 376,875 | |
| TransDigm, Inc., 6.5%, 7/15/24 (z) | | | 1,570,000 | | | | 1,585,700 | |
| | | | | | | | |
| | | | $ | 25,572,885 | |
| Apparel Manufacturers - 0.4% | | | | | | | | |
| Hanesbrands, Inc., 6.375%, 12/15/20 | | $ | 2,250,000 | | | $ | 2,390,625 | |
| PVH Corp., 4.5%, 12/15/22 | | | 1,820,000 | | | | 1,760,850 | |
| | | | | | | | |
| | | | $ | 4,151,475 | |
| Automotive - 3.0% | | | | | | | | |
| Accuride Corp., 9.5%, 8/01/18 | | $ | 5,005,000 | | | $ | 5,255,250 | |
| Allison Transmission, Inc., 7.125%, 5/15/19 (n) | | | 5,365,000 | | | | 5,686,900 | |
| Goodyear Tire & Rubber Co., 6.5%, 3/01/21 | | | 4,920,000 | | | | 5,202,900 | |
| Goodyear Tire & Rubber Co., 7%, 5/15/22 | | | 1,110,000 | | | | 1,204,350 | |
| Jaguar Land Rover PLC, 8.125%, 5/15/21 (n) | | | 4,605,000 | | | | 5,100,038 | |
| Jaguar Land Rover PLC, 5.625%, 2/01/23 (n) | | | 1,360,000 | | | | 1,421,200 | |
| Lear Corp., 8.125%, 3/15/20 | | | 1,432,000 | | | | 1,532,240 | |
| Lear Corp., 4.75%, 1/15/23 | | | 2,430,000 | | | | 2,392,031 | |
| Schaeffler Finance B.V., 6.875%, 8/15/18 (p)(n) | | | 2,405,000 | | | | 2,525,250 | |
| Schaeffler Finance B.V., 4.75%, 5/15/21 (z) | | | 2,175,000 | | | | 2,207,625 | |
| | | | | | | | |
| | | | $ | 32,527,784 | |
| Broadcasting - 2.3% | | | | | | | | |
| AMC Networks, Inc., 7.75%, 7/15/21 | | $ | 2,645,000 | | | $ | 2,896,275 | |
| Clear Channel Communications, Inc., 9%, 3/01/21 | | | 2,573,000 | | | | 2,659,839 | |
| Clear Channel Worldwide Holdings, Inc., “A”, 6.5%, 11/15/22 | | | 745,000 | | | | 778,525 | |
| Clear Channel Worldwide Holdings, Inc., “B”, 6.5%, 11/15/22 | | | 2,570,000 | | | | 2,698,500 | |
| Liberty Media Corp., 8.5%, 7/15/29 | | | 2,790,000 | | | | 3,096,900 | |
| Liberty Media Corp., 8.25%, 2/01/30 | | | 1,215,000 | | | | 1,342,575 | |
| Netflix, Inc., 5.375%, 2/01/21 | | | 2,835,000 | | | | 2,927,138 | |
| Nexstar Broadcasting, Inc., 6.875%, 11/15/20 | | | 2,730,000 | | | | 2,893,800 | |
47
MFS High Yield Pooled Portfolio
Portfolio of Investments (unaudited) – continued
| | | | | | | | |
| Issuer | | Shares/Par | | | Value ($) | |
| Bonds - continued | | | | | | | | |
| Broadcasting - continued | | | | | | | | |
| Univision Communications, Inc., 6.875%, 5/15/19 (n) | | $ | 2,200,000 | | | $ | 2,310,000 | |
| Univision Communications, Inc., 7.875%, 11/01/20 (n) | | | 2,610,000 | | | | 2,805,750 | |
| Univision Communications, Inc., 8.5%, 5/15/21 (n) | | | 730,000 | | | | 788,400 | |
| | | | | | | | |
| | | | $ | 25,197,702 | |
| Brokerage & Asset Managers - 0.5% | | | | | | | | |
| E*TRADE Financial Corp., 6.375%, 11/15/19 | | $ | 5,580,000 | | | $ | 5,928,750 | |
| | |
| Building - 3.4% | | | | | | | | |
| Allegion U.S. Holding Co., Inc., 5.75%, 10/01/21 | | $ | 4,375,000 | | | $ | 4,593,750 | |
| Building Materials Holding Corp., 6.875%, 8/15/18 (n) | | | 630,000 | | | | 652,050 | |
| Building Materials Holding Corp., 7%, 2/15/20 (n) | | | 925,000 | | | | 970,094 | |
| Building Materials Holding Corp., 6.75%, 5/01/21 (n) | | | 3,495,000 | | | | 3,726,544 | |
| CEMEX Espana S.A., 9.25%, 5/12/20 | | | 2,640,000 | | | | 2,857,800 | |
| CEMEX Espana S.A., 9.25%, 5/12/20 (n) | | | 1,345,000 | | | | 1,455,963 | |
| CEMEX S.A.B. de C.V., 5.875%, 3/25/19 (n) | | | 202,000 | | | | 205,535 | |
| CEMEX S.A.B. de C.V., 6.5%, 12/10/19 (n) | | | 440,000 | | | | 459,250 | |
| CEMEX S.A.B. de C.V., 7.25%, 1/15/21 (n) | | | 866,000 | | | | 917,960 | |
| Gibraltar Industries, Inc., 6.25%, 2/01/21 | | | 2,275,000 | | | | 2,326,188 | |
| HD Supply, Inc., 8.125%, 4/15/19 | | | 2,060,000 | | | | 2,224,800 | |
| HD Supply, Inc., 7.5%, 7/15/20 | | | 4,555,000 | | | | 4,862,463 | |
| Headwaters, Inc., 7.25%, 1/15/19 | | | 1,795,000 | | | | 1,875,775 | |
| Headwaters, Inc., 7.625%, 4/01/19 | | | 1,215,000 | | | | 1,275,750 | |
| Nortek, Inc., 8.5%, 4/15/21 | | | 3,340,000 | | | | 3,623,900 | |
| Roofing Supply Group LLC/Roofing Supply Finance, Inc., 10%, 6/01/20 (n) | | | 3,047,000 | | | | 3,245,055 | |
| USG Corp., 7.875%, 3/30/20 (n) | | | 1,335,000 | | | | 1,450,144 | |
| USG Corp., 5.875%, 11/01/21 (n) | | | 780,000 | | | | 803,400 | |
| | | | | | | | |
| | | | $ | 37,526,421 | |
| Business Services - 1.5% | | | | | | | | |
| Equinix, Inc., 4.875%, 4/01/20 | | $ | 2,950,000 | | | $ | 2,972,125 | |
| Equinix, Inc., 5.375%, 4/01/23 | | | 1,640,000 | | | | 1,648,200 | |
| Fidelity National Information Services, Inc., 5%, 3/15/22 | | | 3,305,000 | | | | 3,499,945 | |
| Iron Mountain, Inc., 8.375%, 8/15/21 | | | 1,451,000 | | | | 1,505,413 | |
| Iron Mountain, Inc., 6%, 8/15/23 | | | 2,865,000 | | | | 2,986,763 | |
| Lender Processing Services, Inc., 5.75%, 4/15/23 | | | 1,195,000 | | | | 1,279,845 | |
| NeuStar, Inc., 4.5%, 1/15/23 | | | 3,730,000 | | | | 3,170,500 | |
| | | | | | | | |
| | | | $ | 17,062,791 | |
| Cable TV - 5.2% | | | | | | | | |
| CCO Holdings LLC/CCO Holdings Capital Corp., 8.125%, 4/30/20 | | $ | 4,825,000 | | | $ | 5,144,656 | |
| CCO Holdings LLC/CCO Holdings Capital Corp., 7.375%, 6/01/20 | | | 705,000 | | | | 752,588 | |
48
MFS High Yield Pooled Portfolio
Portfolio of Investments (unaudited) – continued
| | | | | | | | |
| Issuer | | Shares/Par | | | Value ($) | |
| Bonds - continued | | | | | | | | |
| Cable TV - continued | | | | | | | | |
| CCO Holdings LLC/CCO Holdings Capital Corp., 6.5%, 4/30/21 | | $ | 3,335,000 | | | $ | 3,468,400 | |
| CCO Holdings LLC/CCO Holdings Capital Corp., 5.75%, 1/15/24 | | | 3,370,000 | | | | 3,353,150 | |
| Cequel Communications Holdings, 6.375%, 9/15/20 (n) | | | 3,775,000 | | | | 3,888,250 | |
| DISH DBS Corp., 6.75%, 6/01/21 | | | 2,540,000 | | | | 2,794,000 | |
| DISH DBS Corp., 5%, 3/15/23 | | | 2,750,000 | | | | 2,695,000 | |
| Intelsat Jackson Holdings S.A., 6.625%, 12/15/22 | | | 2,550,000 | | | | 2,575,500 | |
| Intelsat Jackson Holdings S.A., 5.5%, 8/01/23 | | | 4,995,000 | | | | 4,795,200 | |
| Intelsat Luxembourg S.A., 8.125%, 6/01/23 | | | 3,595,000 | | | | 3,738,800 | |
| Lynx I Corp., 5.375%, 4/15/21 (n) | | | 1,390,000 | | | | 1,403,900 | |
| Lynx II Corp., 6.375%, 4/15/23 (n) | | | 2,030,000 | | | | 2,131,500 | |
| Numericable Group S.A., 6%, 5/15/22 (n) | | | 4,235,000 | | | | 4,256,175 | |
| SIRIUS XM Radio, Inc., 4.25%, 5/15/20 (n) | | | 860,000 | | | | 827,750 | |
| SIRIUS XM Radio, Inc., 5.875%, 10/01/20 (n) | | | 395,000 | | | | 403,888 | |
| SIRIUS XM Radio, Inc., 4.625%, 5/15/23 (n) | | | 1,995,000 | | | | 1,855,350 | |
| SIRIUS XM Radio, Inc., 6%, 7/15/24 (z) | | | 1,860,000 | | | | 1,869,300 | |
| Telenet Finance Luxembourg, 6.375%, 11/15/20 (n) | | EUR | 1,510,000 | | | | 2,148,864 | |
| Unitymedia Hessen, 5.5%, 1/15/23 (n) | | $ | 3,480,000 | | | | 3,497,393 | |
| UPCB Finance III Ltd., 6.625%, 7/01/20 (n) | | | 2,398,000 | | | | 2,529,880 | |
| Ziggo Bond Co. B.V., 8%, 5/15/18 (n) | | EUR | 1,895,000 | | | | 2,778,308 | |
| | | | | | | | |
| | | | $ | 56,907,852 | |
| Chemicals - 3.1% | | | | | | | | |
| Celanese U.S. Holdings LLC, 5.875%, 6/15/21 | | $ | 3,149,000 | | | $ | 3,408,793 | |
| Celanese U.S. Holdings LLC, 4.625%, 11/15/22 | | | 1,485,000 | | | | 1,477,575 | |
| Flash Dutch 2 B.V./U.S. Coatings Acquisition, 7.375%, 5/01/21 (n) | | | 2,775,000 | | | | 2,948,428 | |
| Hexion U.S. Finance Corp., 6.625%, 4/15/20 | | | 1,840,000 | | | | 1,913,600 | |
| Hexion U.S. Finance Corp./Hexion Nova Scotia Finance, 8.875%, 2/01/18 | | | 3,160,000 | | | | 3,261,120 | |
| Huntsman International LLC, 8.625%, 3/15/21 | | | 3,325,000 | | | | 3,615,938 | |
| INEOS Finance PLC, 8.375%, 2/15/19 (n) | | | 3,690,000 | | | | 3,985,200 | |
| INEOS Group Holdings S.A., 6.125%, 8/15/18 (n) | | | 3,090,000 | | | | 3,120,900 | |
| INEOS Group Holdings S.A., 5.875%, 2/15/19 (n) | | | 1,390,000 | | | | 1,403,900 | |
| Taminco Global Chemical Corp., 9.75%, 3/31/20 (n) | | | 3,115,000 | | | | 3,418,713 | |
| Tronox Finance LLC, 6.375%, 8/15/20 | | | 5,160,000 | | | | 5,211,600 | |
| | | | | | | | |
| | | | $ | 33,765,767 | |
| Computer Software - 0.4% | | | | | | | | |
| Syniverse Holdings, Inc., 9.125%, 1/15/19 | | $ | 1,150,000 | | | $ | 1,207,500 | |
| VeriSign, Inc., 4.625%, 5/01/23 | | | 3,490,000 | | | | 3,402,750 | |
| | | | | | | | |
| | | | $ | 4,610,250 | |
49
MFS High Yield Pooled Portfolio
Portfolio of Investments (unaudited) – continued
| | | | | | | | |
| Issuer | | Shares/Par | | | Value ($) | |
| Bonds - continued | | | | | | | | |
| Computer Software - Systems - 0.7% | | | | | | | | |
| Audatex North America, Inc., 6%, 6/15/21 (n) | | $ | 2,445,000 | | | $ | 2,561,138 | |
| Audatex North America, Inc., 6.125%, 11/01/23 (n) | | | 715,000 | | | | 747,175 | |
| CDW LLC/CDW Finance Corp., 8.5%, 4/01/19 | | | 2,920,000 | | | | 3,102,500 | |
| CDW LLC/CDW Finance Corp., 6%, 8/15/22 | | | 1,505,000 | | | | 1,505,000 | |
| | | | | | | | |
| | | | $ | 7,915,813 | |
| Conglomerates - 2.1% | | | | | | | | |
| Amsted Industries Co., 5%, 3/15/22 (n) | | $ | 3,705,000 | | | $ | 3,677,213 | |
| BC Mountain LLC, 7%, 2/01/21 (n) | | | 2,785,000 | | | | 2,673,600 | |
| Dynacast International LLC, 9.25%, 7/15/19 | | | 1,875,000 | | | | 2,053,125 | |
| Entegris, Inc., 6%, 4/01/22 (n) | | | 4,375,000 | | | | 4,517,188 | |
| Renaissance Acquisition, 6.875%, 8/15/21 (n) | | | 4,125,000 | | | | 4,155,938 | |
| Rexel S.A., 6.125%, 12/15/19 (n) | | | 2,780,000 | | | | 2,877,300 | |
| Silver II Borrower, 7.75%, 12/15/20 (n) | | | 2,510,000 | | | | 2,629,225 | |
| | | | | | | | |
| | | | $ | 22,583,589 | |
| Construction - 0.3% | | | | | | | | |
| Empresas ICA S.A.B. de C.V., 8.875%, 5/29/24 (n) | | $ | 1,223,000 | | | $ | 1,250,518 | |
| Empresas ICA Sociedad Controladora S.A. de C.V., 8.9%, 2/04/21 | | | 2,120,000 | | | | 2,226,000 | |
| | | | | | | | |
| | | | $ | 3,476,518 | |
| Consumer Products - 0.9% | | | | | | | | |
| Elizabeth Arden, Inc., 7.375%, 3/15/21 | | $ | 3,482,000 | | | $ | 3,595,165 | |
| Prestige Brands, Inc., 8.125%, 2/01/20 | | | 1,240,000 | | | | 1,357,800 | |
| Prestige Brands, Inc., 5.375%, 12/15/21 (n) | | | 2,585,000 | | | | 2,585,000 | |
| Spectrum Brands, Inc., 6.375%, 11/15/20 | | | 2,760,000 | | | | 2,904,900 | |
| | | | | | | | |
| | | | $ | 10,442,865 | |
| Consumer Services - 1.5% | | | | | | | | |
| ADT Corp., 6.25%, 10/15/21 | | $ | 3,490,000 | | | $ | 3,612,150 | |
| ADT Corp., 4.125%, 6/15/23 | | | 1,360,000 | | | | 1,230,800 | |
| Garda World Security Corp., 7.25%, 11/15/21 (z) | | | 2,330,000 | | | | 2,370,775 | |
| Garda World Security Corp., 7.25%, 11/15/21 (z) | | | 945,000 | | | | 961,538 | |
| Grupo Posadas S.A.B. de C.V., 7.875%, 11/30/17 | | | 1,765,000 | | | | 1,791,475 | |
| Monitronics International, Inc., 9.125%, 4/01/20 | | | 3,265,000 | | | | 3,428,250 | |
| Service Corp. International, 7%, 6/15/17 | | | 1,610,000 | | | | 1,783,075 | |
| Service Corp. International, 5.375%, 5/15/24 (n) | | | 1,655,000 | | | | 1,692,238 | |
| | | | | | | | |
| | | | $ | 16,870,301 | |
| Containers - 3.0% | | | | | | | | |
| Ardagh Packaging Finance PLC, 7%, 11/15/20 (n) | | $ | 317,647 | | | $ | 312,882 | |
| Ardagh Packaging Finance PLC, 9.125%, 10/15/20 (n) | | | 400,000 | | | | 432,000 | |
50
MFS High Yield Pooled Portfolio
Portfolio of Investments (unaudited) – continued
| | | | | | | | |
| Issuer | | Shares/Par | | | Value ($) | |
| Bonds - continued | | | | | | | | |
| Containers - continued | | | | | | | | |
| Ardagh Packaging Finance PLC, 9.125%, 10/15/20 (n) | | $ | 2,980,000 | | | $ | 3,203,500 | |
| Ardagh Packaging Finance PLC, 6%, 6/30/21 (z) | | | 2,210,000 | | | | 2,110,550 | |
| Ball Corp., 5%, 3/15/22 | | | 1,008,000 | | | | 1,005,480 | |
| Ball Corp., 4%, 11/15/23 | | | 2,410,000 | | | | 2,223,225 | |
| Berry Plastics Group, Inc., 5.5%, 5/15/22 | | | 4,290,000 | | | | 4,182,750 | |
| Crown American LLC, 4.5%, 1/15/23 | | | 5,755,000 | | | | 5,438,475 | |
| Greif, Inc., 6.75%, 2/01/17 | | | 1,100,000 | | | | 1,196,250 | |
| Greif, Inc., 7.75%, 8/01/19 | | | 980,000 | | | | 1,107,400 | |
| Reynolds Group, 7.125%, 4/15/19 | | | 1,975,000 | | | | 2,049,063 | |
| Reynolds Group, 9.875%, 8/15/19 | | | 735,000 | | | | 791,963 | |
| Reynolds Group, 5.75%, 10/15/20 | | | 2,050,000 | | | | 2,091,000 | |
| Reynolds Group, 8.25%, 2/15/21 | | | 3,965,000 | | | | 4,202,900 | |
| Signode Industrial Group, 6.375%, 5/01/22 (z) | | | 2,730,000 | | | | 2,689,050 | |
| | | | | | | | |
| | | | $ | 33,036,488 | |
| Defense Electronics - 0.4% | | | | | | | | |
| Ducommun, Inc., 9.75%, 7/15/18 | | $ | 3,927,000 | | | $ | 4,329,518 | |
| | |
| Electronics - 1.8% | | | | | | | | |
| Advanced Micro Devices, Inc., 6.75%, 3/01/19 (n) | | $ | 3,235,000 | | | $ | 3,315,875 | |
| Advanced Micro Devices, Inc., 7.5%, 8/15/22 | | | 1,180,000 | | | | 1,221,300 | |
| Advanced Micro Devices, Inc., 7%, 7/01/24 (z) | | | 925,000 | | | | 901,875 | |
| Micron Technology, Inc., 5.875%, 2/15/22 (n) | | | 2,630,000 | | | | 2,761,500 | |
| Micron Technology, Inc., 5.5%, 2/01/25 (z) | | | 1,765,000 | | | | 1,756,175 | |
| Nokia Corp., 5.375%, 5/15/19 | | | 995,000 | | | | 1,054,700 | |
| Nokia Corp., 6.625%, 5/15/39 | | | 1,015,000 | | | | 1,083,513 | |
| NXP B.V., 5.75%, 2/15/21 (n) | | | 1,375,000 | | | | 1,430,000 | |
| NXP B.V., 5.75%, 3/15/23 (n) | | | 2,610,000 | | | | 2,694,825 | |
| Sensata Technologies B.V., 6.5%, 5/15/19 (n) | | | 3,320,000 | | | | 3,469,400 | |
| | | | | | | | |
| | | | $ | 19,689,163 | |
| Energy - Independent - 8.7% | | | | | | | | |
| American Energy-Permian Basin LLC, 7.125%, 11/01/20 (z) | | $ | 1,410,000 | | | $ | 1,360,650 | |
| American Energy-Permian Basin LLC, 7.375%, 11/01/21 (z) | | | 1,175,000 | | | | 1,133,875 | |
| Antero Resources Finance Corp., 6%, 12/01/20 | | | 2,270,000 | | | | 2,366,475 | |
| Antero Resources Finance Corp., 5.375%, 11/01/21 | | | 2,220,000 | | | | 2,247,750 | |
| Athlon Holdings LP/Athlon Finance Corp., 6%, 5/01/22 (z) | | | 3,240,000 | | | | 3,248,100 | |
| Baytex Energy Corp., 5.125%, 6/01/21 (z) | | | 465,000 | | | | 461,513 | |
| Baytex Energy Corp., 5.625%, 6/01/24 (z) | | | 2,340,000 | | | | 2,304,900 | |
| Bill Barrett Corp., 7%, 10/15/22 | | | 3,070,000 | | | | 3,146,750 | |
| BreitBurn Energy Partners LP, 8.625%, 10/15/20 | | | 1,075,000 | | | | 1,155,625 | |
| BreitBurn Energy Partners LP, 7.875%, 4/15/22 | | | 4,755,000 | | | | 4,968,975 | |
| Chaparral Energy, Inc., 7.625%, 11/15/22 | | | 2,980,000 | | | | 3,121,550 | |
51
MFS High Yield Pooled Portfolio
Portfolio of Investments (unaudited) – continued
| | | | | | | | |
| Issuer | | Shares/Par | | | Value ($) | |
| Bonds - continued | | | | | | | | |
| Energy - Independent - continued | | | | | | | | |
| Chesapeake Energy Corp., 5.75%, 3/15/23 | | $ | 1,060,000 | | | $ | 1,131,550 | |
| Concho Resources, Inc., 6.5%, 1/15/22 | | | 2,440,000 | | | | 2,598,600 | |
| Concho Resources, Inc., 5.5%, 4/01/23 | | | 3,565,000 | | | | 3,689,775 | |
| Denbury Resources, Inc., 4.625%, 7/15/23 | | | 3,050,000 | | | | 2,851,750 | |
| EP Energy LLC, 6.875%, 5/01/19 | | | 1,205,000 | | | | 1,262,238 | |
| EP Energy LLC, 9.375%, 5/01/20 | | | 4,295,000 | | | | 4,756,713 | |
| EP Energy LLC, 7.75%, 9/01/22 | | | 5,050,000 | | | | 5,504,500 | |
| EPL Oil & Gas, Inc., 8.25%, 2/15/18 | | | 3,830,000 | | | | 4,002,350 | |
| Halcon Resources Corp., 8.875%, 5/15/21 | | | 4,605,000 | | | | 4,777,688 | |
| Harvest Operations Corp., 6.875%, 10/01/17 | | | 3,190,000 | | | | 3,437,225 | |
| Hilcorp Energy I/Hilcorp Finance Co., 8%, 2/15/20 (n) | | | 1,670,000 | | | | 1,778,550 | |
| Laredo Petroleum, Inc., 5.625%, 1/15/22 | | | 1,175,000 | | | | 1,195,563 | |
| Laredo Petroleum, Inc., 7.375%, 5/01/22 | | | 960,000 | | | | 1,046,400 | |
| LINN Energy LLC, 8.625%, 4/15/20 | | | 740,000 | | | | 781,625 | |
| LINN Energy LLC, 7.75%, 2/01/21 | | | 3,614,000 | | | | 3,785,665 | |
| MEG Energy Corp., 6.5%, 3/15/21 (n) | | | 1,760,000 | | | | 1,808,400 | |
| MEG Energy Corp., 7%, 3/31/24 (n) | | | 2,595,000 | | | | 2,744,213 | |
| Northern Blizzard Resources, Inc., 7.25%, 2/01/22 (n) | | | 3,460,000 | | | | 3,641,650 | |
| Oasis Petroleum, Inc., 6.875%, 3/15/22 (n) | | | 4,555,000 | | | | 4,930,788 | |
| Range Resources Corp., 5%, 8/15/22 | | | 4,315,000 | | | | 4,422,875 | |
| Sanchez Energy Corp., 6.125%, 1/15/23 (z) | | | 2,345,000 | | | | 2,339,138 | |
| SandRidge Energy, Inc., 8.125%, 10/15/22 | | | 3,430,000 | | | | 3,652,950 | |
| SM Energy Co., 6.5%, 11/15/21 | | | 3,455,000 | | | | 3,705,488 | |
| | | | | | | | |
| | | | $ | 95,361,857 | |
| Entertainment - 1.8% | | | | | | | | |
| Activision Blizzard, Inc., 6.125%, 9/15/23 (n) | | $ | 2,465,000 | | | $ | 2,656,038 | |
| Cedar Fair LP, 5.25%, 3/15/21 | | | 3,555,000 | | | | 3,590,550 | |
| Cedar Fair LP, 5.375%, 6/01/24 (n) | | | 1,420,000 | | | | 1,420,000 | |
| Cinemark USA, Inc., 5.125%, 12/15/22 | | | 2,445,000 | | | | 2,463,338 | |
| Cinemark USA, Inc., 4.875%, 6/01/23 | | | 2,060,000 | | | | 2,013,650 | |
| Seven Seas Cruises S. DE R.L., 9.125%, 5/15/19 | | | 3,845,000 | | | | 4,152,600 | |
| Six Flags Entertainment Corp., 5.25%, 1/15/21 (n) | | | 3,490,000 | | | | 3,472,550 | |
| | | | | | | | |
| | | | $ | 19,768,726 | |
| Financial Institutions - 4.8% | | | | | | | | |
| Aircastle Ltd., 4.625%, 12/15/18 | | $ | 2,840,000 | | | $ | 2,889,700 | |
| Aircastle Ltd., 5.125%, 3/15/21 | | | 1,415,000 | | | | 1,418,538 | |
| Aviation Capital Group, 4.625%, 1/31/18 (n) | | | 3,015,000 | | | | 3,190,603 | |
| Aviation Capital Group, 6.75%, 4/06/21 (n) | | | 1,935,000 | | | | 2,179,114 | |
| CIT Group, Inc., 5.25%, 3/15/18 | | | 2,875,000 | | | | 3,033,125 | |
| CIT Group, Inc., 6.625%, 4/01/18 (n) | | | 4,276,000 | | | | 4,714,290 | |
| CIT Group, Inc., 5.5%, 2/15/19 (n) | | | 4,287,000 | | | | 4,576,373 | |
52
MFS High Yield Pooled Portfolio
Portfolio of Investments (unaudited) – continued
| | | | | | | | |
| Issuer | | Shares/Par | | | Value ($) | |
| Bonds - continued | | | | | | | | |
| Financial Institutions - continued | | | | | | | | |
| CIT Group, Inc., 5%, 8/15/22 | | $ | 2,605,000 | | | $ | 2,689,663 | |
| Icahn Enterprises LP, 6%, 8/01/20 | | | 3,160,000 | | | | 3,294,300 | |
| Icahn Enterprises LP, 5.875%, 2/01/22 | | | 3,930,000 | | | | 4,006,144 | |
| International Lease Finance Corp., 7.125%, 9/01/18 (n) | | | 1,736,000 | | | | 1,987,720 | |
| Nationstar Mortgage LLC/Capital Corp., 6.5%, 8/01/18 | | | 2,220,000 | | | | 2,197,800 | |
| Nationstar Mortgage LLC/Capital Corp., 7.875%, 10/01/20 | | | 3,815,000 | | | | 3,891,300 | |
| SLM Corp., 4.875%, 6/17/19 | | | 788,000 | | | | 793,910 | |
| SLM Corp., 8%, 3/25/20 | | | 5,800,000 | | | | 6,554,000 | |
| SLM Corp., 7.25%, 1/25/22 | | | 3,130,000 | | | | 3,427,350 | |
| SLM Corp., 6.125%, 3/25/24 | | | 1,685,000 | | | | 1,642,875 | |
| | | | | | | | |
| | | | $ | 52,486,805 | |
| Food & Beverages - 1.4% | | | | | | | | |
| B&G Foods, Inc., 4.625%, 6/01/21 | | $ | 2,250,000 | | | $ | 2,193,750 | |
| Constellation Brands, Inc., 3.75%, 5/01/21 | | | 430,000 | | | | 419,250 | |
| Constellation Brands, Inc., 4.25%, 5/01/23 | | | 3,255,000 | | | | 3,214,313 | |
| Darling Ingrediants, Inc., 5.375%, 1/15/22 (n) | | | 3,345,000 | | | | 3,436,988 | |
| H.J. Heinz Co., 4.25%, 10/15/20 | | | 2,185,000 | | | | 2,171,344 | |
| Sun Merger Sub, Inc., 5.875%, 8/01/21 (n) | | | 3,410,000 | | | | 3,580,500 | |
| | | | | | | | |
| | | | $ | 15,016,145 | |
| Forest & Paper Products - 0.5% | | | | | | | | |
| Appvion, Inc., 9%, 6/01/20 (n) | | $ | 2,680,000 | | | $ | 2,559,400 | |
| Tembec Industries, Inc., 11.25%, 12/15/18 | | | 2,440,000 | | | | 2,616,900 | |
| | | | | | | | |
| | | | $ | 5,176,300 | |
| Gaming & Lodging - 2.5% | | | | | | | | |
| CCM Merger, Inc., 9.125%, 5/01/19 (n) | | $ | 3,280,000 | | | $ | 3,460,400 | |
| Chester Downs & Marina LLC, 9.25%, 2/01/20 (n) | | | 1,450,000 | | | | 1,377,500 | |
| Greektown Holdings LLC, 8.875%, 3/15/19 (n) | | | 2,840,000 | | | | 2,825,800 | |
| Hilton Worldwide Finance Co., 5.625%, 10/15/21 (n) | | | 3,315,000 | | | | 3,472,463 | |
| Isle of Capri Casinos, Inc., 8.875%, 6/15/20 | | | 1,550,000 | | | | 1,643,000 | |
| Isle of Capri Casinos, Inc., 5.875%, 3/15/21 | | | 610,000 | | | | 625,250 | |
| MGM Resorts International, 6.625%, 12/15/21 | | | 2,985,000 | | | | 3,227,531 | |
| Pinnacle Entertainment, Inc., 8.75%, 5/15/20 | | | 2,130,000 | | | | 2,273,775 | |
| Pinnacle Entertainment, Inc., 6.375%, 8/01/21 | | | 1,860,000 | | | | 1,915,800 | |
| Ryman Hospitality Properties, Inc., REIT, 5%, 4/15/21 | | | 3,045,000 | | | | 3,022,163 | |
| Wynn Las Vegas LLC, 7.75%, 8/15/20 | | | 3,085,000 | | | | 3,324,088 | |
| | | | | | | | |
| | | | $ | 27,167,770 | |
| Health Maintenance Organizations - 0.0% | | | | | | | | |
| Wellcare Health Plans, Inc., 5.75%, 11/15/20 | | $ | 205,000 | | | $ | 209,100 | |
53
MFS High Yield Pooled Portfolio
Portfolio of Investments (unaudited) – continued
| | | | | | | | |
| Issuer | | Shares/Par | | | Value ($) | |
| Bonds - continued | | | | | | | | |
| Industrial - 1.3% | | | | | | | | |
| Dematic S.A., 7.75%, 12/15/20 (n) | | $ | 4,995,000 | | | $ | 5,344,650 | |
| Howard Hughes Corp., 6.875%, 10/01/21 (n) | | | 3,755,000 | | | | 3,952,138 | |
| Hyva Global B.V., 8.625%, 3/24/16 (n) | | | 1,760,000 | | | | 1,821,600 | |
| SPL Logistics Escrow LLC, 8.875%, 8/01/20 (n) | | | 2,675,000 | | | | 2,962,563 | |
| | | | | | | | |
| | | | $ | 14,080,951 | |
| International Market Quasi-Sovereign - 0.3% | | | | | | | | |
| Eksportfinans A.S.A., 5.5%, 5/25/16 | | $ | 170,000 | | | $ | 179,945 | |
| Eksportfinans A.S.A., 5.5%, 6/26/17 | | | 2,915,000 | | | | 3,128,757 | |
| | | | | | | | |
| | | | $ | 3,308,702 | |
| Machinery & Tools - 1.3% | | | | | | | | |
| H&E Equipment Services Co., 7%, 9/01/22 | | $ | 3,855,000 | | | $ | 4,173,038 | |
| Jurassic Holdings III, Inc., 6.875%, 2/15/21 (n) | | | 3,210,000 | | | | 3,193,950 | |
| Light Tower Rentals, Inc., 8.125%, 8/01/19 (z) | | | 1,415,000 | | | | 1,439,763 | |
| RSC Equipment Rental, Inc., 8.25%, 2/01/21 | | | 1,890,000 | | | | 2,062,463 | |
| United Rentals North America, Inc., 7.625%, 4/15/22 | | | 3,238,000 | | | | 3,569,896 | |
| | | | | | | | |
| | | | $ | 14,439,110 | |
| Major Banks - 1.1% | | | | | | | | |
| Bank of America Corp., FRN, 5.2%, 12/31/49 | | $ | 3,900,000 | | | $ | 3,656,250 | |
| JPMorgan Chase & Co., 6% to 8/01/23, FRN to 12/29/49 | | | 3,680,000 | | | | 3,735,200 | |
| Royal Bank of Scotland Group PLC, 7.648% to 9/30/31, FRN to 8/29/49 | | | 2,800,000 | | | | 3,332,560 | |
| Royal Bank of Scotland Group PLC, 6.99% to 10/04/17, FRN to 10/29/49 (n) | | | 905,000 | | | | 1,038,488 | |
| | | | | | | | |
| | | | $ | 11,762,498 | |
| Medical & Health Technology & Services - 4.6% | | | | | | | | |
| CHS/Community Health Systems, Inc., 5.125%, 8/01/21 (z) | | $ | 700,000 | | | $ | 705,250 | |
| CHS/Community Health Systems, Inc., 6.875%, 2/01/22 (z) | | | 5,695,000 | | | | 5,823,138 | |
| Davita, Inc., 6.625%, 11/01/20 | | | 4,110,000 | | | | 4,315,500 | |
| Davita, Inc., 5.125%, 7/15/24 | | | 1,755,000 | | | | 1,728,675 | |
| Fresenius Medical Care Capital Trust III, 5.625%, 7/31/19 (n) | | | 1,640,000 | | | | 1,746,600 | |
| Fresenius Medical Care Capital Trust III, 5.875%, 1/31/22 (n) | | | 1,375,000 | | | | 1,502,188 | |
| HCA, Inc., 7.25%, 9/15/20 | | | 1,015,000 | | | | 1,073,363 | |
| HCA, Inc., 7.5%, 2/15/22 | | | 5,140,000 | | | | 5,821,050 | |
| HCA, Inc., 5.875%, 3/15/22 | | | 3,575,000 | | | | 3,807,375 | |
| HCA, Inc., 5%, 3/15/24 | | | 2,340,000 | | | | 2,322,450 | |
| HealthSouth Corp., 8.125%, 2/15/20 | | | 4,780,000 | | | | 5,042,900 | |
| Lifepoint Hospitals, Inc., 5.5%, 12/01/21 (n) | | | 5,165,000 | | | | 5,281,213 | |
| Tenet Healthcare Corp., 8%, 8/01/20 | | | 4,790,000 | | | | 5,113,325 | |
| Tenet Healthcare Corp., 4.5%, 4/01/21 | | | 4,100,000 | | | | 3,987,250 | |
54
MFS High Yield Pooled Portfolio
Portfolio of Investments (unaudited) – continued
| | | | | | | | |
| Issuer | | Shares/Par | | | Value ($) | |
| Bonds - continued | | | | | | | | |
| Medical & Health Technology & Services - continued | |
| Universal Health Services, Inc., 7.625%, 8/15/20 | | $ | 2,750,000 | | | $ | 2,805,000 | |
| | | | | | | | |
| | | | $ | 51,075,277 | |
| Medical Equipment - 0.8% | | | | | | | | |
| Biomet, Inc., 6.5%, 8/01/20 | | $ | 1,885,000 | | | $ | 2,033,255 | |
| Physio-Control International, Inc., 9.875%, 1/15/19 (n) | | | 1,430,000 | | | | 1,569,425 | |
| Teleflex, Inc., 6.875%, 6/01/19 | | | 2,550,000 | | | | 2,696,625 | |
| Teleflex, Inc., 5.25%, 6/15/24 (n) | | | 2,155,000 | | | | 2,187,325 | |
| | | | | | | | |
| | | | $ | 8,486,630 | |
| Metals & Mining - 4.7% | | | | | | | | |
| ArcelorMittal S.A., 6.75%, 2/25/22 | | $ | 965,000 | | | $ | 1,044,613 | |
| ArcelorMittal S.A., 7.25%, 3/01/41 | | | 1,735,000 | | | | 1,769,700 | |
| Arch Coal, Inc., 8%, 1/15/19 (n) | | | 1,695,000 | | | | 1,635,675 | |
| Arch Coal, Inc., 7.25%, 10/01/20 | | | 2,190,000 | | | | 1,456,350 | |
| Century Aluminum Co., 7.5%, 6/01/21 (n) | | | 3,675,000 | | | | 3,895,500 | |
| Commercial Metals Co., 4.875%, 5/15/23 | | | 2,493,000 | | | | 2,399,513 | |
| Consol Energy, Inc., 8.25%, 4/01/20 | | | 3,445,000 | | | | 3,668,925 | |
| Consol Energy, Inc., 6.375%, 3/01/21 | | | 1,235,000 | | | | 1,296,750 | |
| Consol Energy, Inc., 5.875%, 4/15/22 (n) | | | 2,990,000 | | | | 3,023,638 | |
| First Quantum Minerals Ltd., 7.25%, 10/15/19 (n) | | | 5,492,000 | | | | 5,711,680 | |
| First Quantum Minerals Ltd., 7.25%, 5/15/22 (n) | | | 2,140,000 | | | | 2,201,525 | |
| FMG Resources, 6.875%, 4/01/22 (n) | | | 855,000 | | | | 909,506 | |
| Fortescue Metals Group Ltd., 8.25%, 11/01/19 (n) | | | 4,060,000 | | | | 4,354,350 | |
| GrafTech International Co., 6.375%, 11/15/20 | | | 3,450,000 | | | | 3,527,625 | |
| Molycorp, Inc., 10%, 6/01/20 | | | 955,000 | | | | 849,950 | |
| Peabody Energy Corp., 6%, 11/15/18 | | | 2,110,000 | | | | 2,104,725 | |
| Steel Dynamics, Inc., 5.25%, 4/15/23 | | | 2,230,000 | | | | 2,246,725 | |
| Suncoke Energy Partners LP/Suncoke Energy Partners Finance Corp., 7.375%, 2/01/20 (z) | | | 1,150,000 | | | | 1,213,250 | |
| Suncoke Energy, Inc., 7.625%, 8/01/19 | | | 2,570,000 | | | | 2,724,200 | |
| TMS International Corp., 7.625%, 10/15/21 (n) | | | 2,400,000 | | | | 2,544,000 | |
| Walter Energy, Inc., 9.5%, 10/15/19 (n) | | | 1,615,000 | | | | 1,606,925 | |
| Walter Energy, Inc., 8.5%, 4/15/21 | | | 3,150,000 | | | | 1,512,000 | |
| | | | | | | | |
| | | | $ | 51,697,125 | |
| Midstream - 5.1% | | | | | | | | |
| Access Midstream Partners Co., 5.875%, 4/15/21 | | $ | 1,020,000 | | | $ | 1,073,550 | |
| Access Midstream Partners Co., 4.875%, 5/15/23 | | | 4,390,000 | | | | 4,521,700 | |
| AmeriGas Finance LLC, 6.75%, 5/20/20 | | | 4,805,000 | | | | 5,057,263 | |
| Atlas Pipeline Partners LP/Atlas Pipeline, 4.75%, 11/15/21 | | | 860,000 | | | | 812,700 | |
| Atlas Pipeline Partners LP/Atlas Pipeline, 5.875%, 8/01/23 | | | 3,225,000 | | | | 3,168,563 | |
| Crestwood Midstream Partners LP, 6%, 12/15/20 | | | 3,240,000 | | | | 3,337,200 | |
55
MFS High Yield Pooled Portfolio
Portfolio of Investments (unaudited) – continued
| | | | | | | | |
| Issuer | | Shares/Par | | | Value ($) | |
| Bonds - continued | | | | | | | | |
| Midstream - continued | | | | | | | | |
| Crestwood Midstream Partners LP, 6.125%, 3/01/22 (n) | | $ | 1,970,000 | | | $ | 2,034,025 | |
| El Paso Corp., 7.75%, 1/15/32 | | | 6,530,000 | | | | 7,215,650 | |
| Energy Transfer Equity LP, 7.5%, 10/15/20 | | | 3,405,000 | | | | 3,805,088 | |
| Ferrellgas LP/Ferrellgas Finance Corp., 6.5%, 5/01/21 | | | 1,085,000 | | | | 1,120,263 | |
| Ferrellgas LP/Ferrellgas Finance Corp., 6.75%, 1/15/22 (n) | | | 4,705,000 | | | | 4,904,963 | |
| MarkWest Energy Partners LP, 5.5%, 2/15/23 | | | 2,825,000 | | | | 2,930,938 | |
| MarkWest Energy Partners LP, 4.5%, 7/15/23 | | | 2,429,000 | | | | 2,392,565 | |
| Sabine Pass Liquefaction LLC, 5.625%, 2/01/21 | | | 2,720,000 | | | | 2,815,200 | |
| Sabine Pass Liquefaction LLC, 5.625%, 4/15/23 | | | 4,800,000 | | | | 4,872,000 | |
| Sabine Pass Liquefaction LLC, 5.75%, 5/15/24 (z) | | | 1,705,000 | | | | 1,730,575 | |
| Summit Midstream Holdings LLC/Summit Midstream Finance Corp., 7.5%, 7/01/21 | | | 2,135,000 | | | | 2,321,813 | |
| Summit Midstream Holdings LLC/Summit Midstream Finance Corp., 5.5%, 8/15/22 | | | 1,685,000 | | | | 1,685,000 | |
| | | | | | | | |
| | | | $ | 55,799,056 | |
| Municipals - 0.1% | | | | | | | | |
| Golden State, CA, Tobacco Securitization Corp., Tobacco Settlement Rev., “A-1”, 4.5%, 6/01/27 | | $ | 1,200,000 | | | $ | 1,064,148 | |
| | |
| Network & Telecom - 1.9% | | | | | | | | |
| Centurylink, Inc., 6.45%, 6/15/21 | | $ | 2,770,000 | | | $ | 2,977,750 | |
| Centurylink, Inc., 6.75%, 12/01/23 | | | 940,000 | | | | 1,019,900 | |
| Centurylink, Inc., 7.65%, 3/15/42 | | | 2,830,000 | | | | 2,830,000 | |
| Citizens Communications Co., 9%, 8/15/31 | | | 3,390,000 | | | | 3,610,350 | |
| Frontier Communications Corp., 8.125%, 10/01/18 | | | 870,000 | | | | 996,150 | |
| Qwest Corp., 7.5%, 10/01/14 | | | 3,000 | | | | 3,032 | |
| Telecom Italia Capital, 6%, 9/30/34 | | | 1,180,000 | | | | 1,156,400 | |
| Telecom Italia S.p.A., 5.303%, 5/30/24 (n) | | | 3,105,000 | | | | 3,011,850 | |
| TW Telecom Holdings, Inc., 5.375%, 10/01/22 | | | 1,900,000 | | | | 2,056,750 | |
| TW Telecom Holdings, Inc., 5.375%, 10/01/22 | | | 950,000 | | | | 1,028,375 | |
| Windstream Corp., 7.75%, 10/15/20 | | | 2,345,000 | | | | 2,509,150 | |
| | | | | | | | |
| | | | $ | 21,199,707 | |
| Oil Services - 1.3% | | | | | | | | |
| Bristow Group, Inc., 6.25%, 10/15/22 | | $ | 4,003,000 | | | $ | 4,223,165 | |
| Pacific Drilling S.A., 5.375%, 6/01/20 (n) | | | 3,865,000 | | | | 3,681,413 | |
| Shale-Inland Holdings LLC/Finance Co., 8.75%, 11/15/19 (n) | | | 2,595,000 | | | | 2,689,069 | |
| Unit Corp., 6.625%, 5/15/21 | | | 3,765,000 | | | | 3,953,240 | |
| | | | | | | | |
| | | | $ | 14,546,887 | |
| Oils - 0.1% | | | | | | | | |
| CITGO Petroleum Corp., 6.25%, 8/15/22 (z) | | $ | 1,170,000 | | | $ | 1,205,100 | |
56
MFS High Yield Pooled Portfolio
Portfolio of Investments (unaudited) – continued
| | | | | | | | |
| Issuer | | Shares/Par | | | Value ($) | |
| Bonds - continued | | | | | | | | |
| Other Banks & Diversified Financials - 0.4% | | | | | | | | |
| Groupe BPCE S.A., 12.5% to 8/6/19, FRN to 8/29/49 (n) | | $ | 2,973,000 | | | $ | 4,080,443 | |
| | |
| Pharmaceuticals - 1.7% | | | | | | | | |
| Endo Finance LLC/Endo Finco, Inc., 7.25%, 1/15/22 (z) | | $ | 4,260,000 | | | $ | 4,504,950 | |
| Mallinckrodt International Finance S.A., 5.75%, 8/01/22 (n) | | | 2,485,000 | | | | 2,497,424 | |
| Salix Pharmaceuticals Ltd., 6%, 1/15/21 (n) | | | 1,670,000 | | | | 1,745,150 | |
| Valeant Pharmaceuticals International, Inc., 7%, 10/01/20 (n) | | | 5,100,000 | | | | 5,329,500 | |
| Valeant Pharmaceuticals International, Inc., 7.25%, 7/15/22 (n) | | | 2,700,000 | | | | 2,862,000 | |
| Vantage Point Imaging, 7.5%, 7/15/21 (n) | | | 1,560,000 | | | | 1,684,800 | |
| | | | | | | | |
| | | | $ | 18,623,824 | |
| Precious Metals & Minerals - 0.6% | | | | | | | | |
| Aurico Gold, Inc., 7.75%, 4/01/20 (z) | | $ | 1,990,000 | | | $ | 2,014,875 | |
| Eldorado Gold Corp., 6.125%, 12/15/20 (n) | | | 3,310,000 | | | | 3,384,475 | |
| IAMGOLD Corp., 6.75%, 10/01/20 (n) | | | 1,444,000 | | | | 1,328,480 | |
| | | | | | | | |
| | | | $ | 6,727,830 | |
| Printing & Publishing - 0.8% | | | | | | | | |
| American Media, Inc., 13.5%, 6/15/18 (z) | | $ | 338,724 | | | $ | 355,660 | |
| Gannett Co., Inc., 6.375%, 10/15/23 (n) | | | 2,900,000 | | | | 3,059,500 | |
| Gannett Co., Inc., 5.125%, 7/15/20 | | | 1,415,000 | | | | 1,429,150 | |
| Lamar Media Corp., 5%, 5/01/23 | | | 2,255,000 | | | | 2,235,269 | |
| Nielsen Finance LLC, 5%, 4/15/22 (n) | | | 2,165,000 | | | | 2,132,525 | |
| | | | | | | | |
| | | | $ | 9,212,104 | |
| Railroad & Shipping - 0.2% | | | | | | | | |
| Watco Cos. LLC, 6.375%, 4/01/23 (n) | | $ | 2,270,000 | | | $ | 2,304,050 | |
| | |
| Real Estate - Healthcare - 0.9% | | | | | | | | |
| Aviv Healthcare Properties LP/Aviv Healthcare, 6%, 10/15/21 | | $ | 3,825,000 | | | $ | 4,016,250 | |
| MPT Operating Partnership LP, REIT, 6.875%, 5/01/21 | | | 2,275,000 | | | | 2,445,625 | |
| MPT Operating Partnership LP, REIT, 6.375%, 2/15/22 | | | 3,400,000 | | | | 3,621,000 | |
| | | | | | | | |
| | | | $ | 10,082,875 | |
| Real Estate - Other - 1.3% | | | | | | | | |
| CNL Lifestyle Properties, Inc., REIT, 7.25%, 4/15/19 | | $ | 2,585,000 | | | $ | 2,636,700 | |
| DuPont Fabros Technology LP, REIT, 5.875%, 9/15/21 | | | 4,725,000 | | | | 4,819,500 | |
| ERP Properties, REIT, 7.75%, 7/15/20 | | | 1,805,000 | | | | 2,188,981 | |
| ERP Properties, REIT, 5.75%, 8/15/22 | | | 805,000 | | | | 873,972 | |
| Felcor Lodging LP, REIT, 5.625%, 3/01/23 | | | 3,460,000 | | | | 3,460,000 | |
| | | | | | | | |
| | | | $ | 13,979,153 | |
57
MFS High Yield Pooled Portfolio
Portfolio of Investments (unaudited) – continued
| | | | | | | | |
| Issuer | | Shares/Par | | | Value ($) | |
| Bonds - continued | | | | | | | | |
| Retailers - 1.8% | | | | | | | | |
| Best Buy Co., Inc., 5.5%, 3/15/21 | | $ | 4,315,000 | | | $ | 4,433,663 | |
| Bon Ton Stores, Inc., 8%, 6/15/21 | | | 2,380,000 | | | | 2,165,800 | |
| Burlington Coat Factory Warehouse Corp., 10%, 2/15/19 | | | 2,770,000 | | | | 3,041,820 | |
| Jo-Ann Stores Holdings, Inc., 9.75%, 10/15/19 (p)(n) | | | 2,580,000 | | | | 2,605,800 | |
| Limited Brands, Inc., 7%, 5/01/20 | | | 1,295,000 | | | | 1,463,350 | |
| Limited Brands, Inc., 6.95%, 3/01/33 | | | 720,000 | | | | 748,800 | |
| Rite Aid Corp., 9.25%, 3/15/20 | | | 3,760,000 | | | | 4,211,200 | |
| Sally Beauty Holdings, Inc., 6.875%, 11/15/19 | | | 1,495,000 | | | | 1,592,175 | |
| | | | | | | | |
| | | | $ | 20,262,608 | |
| Specialty Chemicals - 0.3% | | | | | | | | |
| Chemtura Corp., 5.75%, 7/15/21 | | $ | 3,020,000 | | | $ | 3,080,400 | |
| | |
| Specialty Stores - 0.6% | | | | | | | | |
| Group 1 Automotive, Inc., 5%, 6/01/22 (n) | | $ | 2,635,000 | | | $ | 2,595,475 | |
| Men’s Wearhouse, Inc., 7%, 7/01/22 (z) | | | 1,180,000 | | | | 1,227,200 | |
| Michaels Stores, Inc., 5.875%, 12/15/20 (n) | | | 2,350,000 | | | | 2,314,750 | |
| | | | | | | | |
| | | | $ | 6,137,425 | |
| Telecommunications - Wireless - 4.2% | | | | | | | | |
| Crown Castle International Corp., 4.875%, 4/15/22 | | $ | 1,155,000 | | | $ | 1,143,450 | |
| Crown Castle International Corp., 5.25%, 1/15/23 | | | 2,685,000 | | | | 2,711,850 | |
| Digicel Group Ltd., 8.25%, 9/01/17 (n) | | | 2,420,000 | | | | 2,474,450 | |
| Digicel Group Ltd., 8.25%, 9/30/20 (n) | | | 1,190,000 | | | | 1,282,225 | |
| Digicel Group Ltd., 6%, 4/15/21 (n) | | | 1,225,000 | | | | 1,246,438 | |
| Digicel Group Ltd., 7.125%, 4/01/22 (n) | | | 1,731,000 | | | | 1,756,965 | |
| Eileme 2 AB, 11.625%, 1/31/20 (n) | | | 1,220,000 | | | | 1,431,975 | |
| Sprint Capital Corp., 6.875%, 11/15/28 | | | 3,690,000 | | | | 3,597,750 | |
| Sprint Corp., 7.875%, 9/15/23 (n) | | | 3,340,000 | | | | 3,573,800 | |
| Sprint Corp., 7.125%, 6/15/24 (n) | | | 3,715,000 | | | | 3,789,300 | |
| Sprint Nextel Corp., 9%, 11/15/18 (n) | | | 1,745,000 | | | | 2,046,013 | |
| Sprint Nextel Corp., 6%, 11/15/22 | | | 3,210,000 | | | | 3,161,850 | |
| T-Mobile USA, Inc., 6.125%, 1/15/22 | | | 475,000 | | | | 488,656 | |
| T-Mobile USA, Inc., 6.5%, 1/15/24 | | | 1,440,000 | | | | 1,501,200 | |
| T-Mobile USA, Inc., 6.464%, 4/28/19 | | | 1,465,000 | | | | 1,527,263 | |
| T-Mobile USA, Inc., 6.25%, 4/01/21 | | | 5,495,000 | | | | 5,742,275 | |
| T-Mobile USA, Inc., 6.633%, 4/28/21 | | | 1,890,000 | | | | 1,984,500 | |
| Wind Acquisition Finance S.A., 4.75%, 7/15/20 (n) | | | 3,140,000 | | | | 3,069,350 | |
| Wind Acquisition Finance S.A., 7.375%, 4/23/21 (z) | | | 3,615,000 | | | | 3,768,638 | |
| | | | | | | | |
| | | | $ | 46,297,948 | |
58
MFS High Yield Pooled Portfolio
Portfolio of Investments (unaudited) – continued
| | | | | | | | |
| Issuer | | Shares/Par | | | Value ($) | |
| Bonds - continued | | | | | | | | |
| Telephone Services - 0.2% | | | | | | | | |
| Cogent Communications Group, Inc., 8.375%, 2/15/18 (n) | | $ | 965,000 | | | $ | 1,022,900 | |
| Level 3 Financing, Inc., 8.625%, 7/15/20 | | | 1,320,000 | | | | 1,435,500 | |
| | | | | | | | |
| | | | $ | 2,458,400 | |
| Tobacco - 0.1% | | | | | | | | |
| New Jersey Tobacco Settlement Financing Corp., “1-A”, 4.5%, 6/01/23 | | $ | 1,465,000 | | | $ | 1,432,565 | |
| | |
| Transportation - Services - 2.2% | | | | | | | | |
| Aguila American Resources Ltd., 7.875%, 1/31/18 (n) | | $ | 4,000,000 | | | $ | 4,185,000 | |
| Jack Cooper Holdings Corp., 9.25%, 6/01/20 (n) | | | 4,255,000 | | | | 4,659,225 | |
| Navios Logistics Finance (U.S.), Inc., 7.25%, 5/01/22 (n) | | | 538,000 | | | | 548,760 | |
| Navios Maritime Acquisition Corp., 8.125%, 11/15/21 (n) | | | 3,132,000 | | | | 3,171,150 | |
| Navios Maritime Holding, Inc., 7.375%, 1/15/22 (n) | | | 3,405,000 | | | | 3,464,588 | |
| Stena AB, 7%, 2/01/24 (n) | | | 5,125,000 | | | | 5,406,875 | |
| Syncreon Group BV/Syncre, 8.625%, 11/01/21 (n) | | | 2,140,000 | | | | 2,148,025 | |
| Ultrapetrol (Bahamas) Ltd., 8.875%, 6/15/21 | | | 786,000 | | | | 842,985 | |
| | | | | | | | |
| | | | $ | 24,426,608 | |
| Utilities - Electric Power - 2.0% | | | | | | | | |
| AES Corp., 7.375%, 7/01/21 | | $ | 2,030,000 | | | $ | 2,314,200 | |
| Calpine Corp., 5.375%, 1/15/23 | | | 1,760,000 | | | | 1,724,800 | |
| Covanta Holding Corp., 7.25%, 12/01/20 | | | 4,290,000 | | | | 4,590,300 | |
| Covanta Holding Corp., 6.375%, 10/01/22 | | | 1,185,000 | | | | 1,259,063 | |
| InterGen N.V., 7%, 6/30/23 (n) | | | 2,375,000 | | | | 2,363,125 | |
| NRG Energy, Inc., 8.25%, 9/01/20 | | | 4,025,000 | | | | 4,326,875 | |
| NRG Energy, Inc., 6.25%, 7/15/22 (n) | | | 1,440,000 | | | | 1,483,200 | |
| NRG Energy, Inc., 6.625%, 3/15/23 | | | 3,315,000 | | | | 3,414,450 | |
| | | | | | | | |
| | | | $ | 21,476,013 | |
| Total Bonds (Identified Cost, $997,330,683) | | | $ | 1,016,030,072 | |
| | |
| Floating Rate Loans (g)(r) - 3.8% | | | | | | | | |
| Aerospace - 0.2% | | | | | | | | |
| TransDigm, Inc., Term Loan C, 3.75%, 2/28/20 | | $ | 2,287,745 | | | $ | 2,271,404 | |
| | |
| Building - 0.5% | | | | | | | | |
| ABC Supply Co., Inc., Term Loan B, 3.5%, 4/16/20 | | $ | 3,290,562 | | | $ | 3,267,426 | |
| HD Supply, Term Loan B, 6/28/18 (o) | | | 1,800,951 | | | | 1,798,700 | |
| | | | | | | | |
| | | | $ | 5,066,126 | |
| Cable TV - 0.2% | | | | | | | | |
| Cequel Communications LLC, Term Loan, 2/14/19 (o) | | $ | 1,812,492 | | | $ | 1,800,408 | |
59
MFS High Yield Pooled Portfolio
Portfolio of Investments (unaudited) – continued
| | | | | | | | |
| Issuer | | Shares/Par | | | Value ($) | |
| Floating Rate Loans (g)(r) - continued | | | | | | | | |
| Conglomerates - 0.5% | | | | | | | | |
| Entegris, Inc., Term Loan B, 3.5%, 2/21/21 | | $ | 3,008,243 | | | $ | 2,978,160 | |
| Silver II U.S. Holdings LLC, Term Loan B, 4%, 12/13/19 | | | 2,180,545 | | | | 2,170,665 | |
| | | | | | | | |
| | | | $ | 5,148,825 | |
| Consumer Services - 0.2% | | | | | | | | |
| Realogy Corp., Term Loan B, 3.75%, 3/05/20 | | $ | 2,172,205 | | | $ | 2,171,527 | |
| | |
| Containers - 0.1% | | | | | | | | |
| Berry Plastics, Term Loan E, 1/06/21 (o) | | $ | 1,682,179 | | | $ | 1,665,884 | |
| | |
| Electronics - 0.3% | | | | | | | | |
| Avago Technologies Ltd., Term Loan B, 3.75%, 5/06/21 | | $ | 3,027,718 | | | $ | 3,020,602 | |
| | |
| Energy - Independent - 0.1% | | | | | | | | |
| MEG Energy Corp., Term Loan B, 3.75%, 3/31/20 | | $ | 1,422,407 | | | $ | 1,421,645 | |
| | |
| Entertainment - 0.1% | | | | | | | | |
| Cedar Fair LP, Term Loan B, 3.25%, 3/06/20 | | $ | 1,073,015 | | | $ | 1,076,223 | |
| | |
| Food & Beverages - 0.1% | | | | | | | | |
| H.J. Heinz Co., Term Loan B2, 3.5%, 2/15/20 | | $ | 695,885 | | | $ | 695,512 | |
| | |
| Gaming & Lodging - 0.3% | | | | | | | | |
| Hilton Worldwide, Term Loan B, 3.5%, 10/25/20 | | $ | 3,085,531 | | | $ | 3,069,461 | |
| | |
| Medical & Health Technology & Services - 0.1% | | | | | | | | |
| Community Health Systems, Inc., Term Loan, 3.25%, 1/27/21 | | $ | 549,457 | | | $ | 550,525 | |
| Davita Healthcare, Term Loan B, 3.5%, 5/29/21 | | | 1,177,874 | | | | 1,175,140 | |
| | | | | | | | |
| | | | $ | 1,725,665 | |
| Metals & Mining - 0.1% | | | | | | | | |
| Fortescue Metals Group Ltd., Term Loan B, 4.25%, 6/30/19 | | $ | 1,690,996 | | | $ | 1,684,655 | |
| | |
| Printing & Publishing - 0.2% | | | | | | | | |
| CBS Outdoor, Term Loan B, 3%, 1/31/21 | | $ | 2,111,557 | | | $ | 2,098,360 | |
| | |
| Retailers - 0.1% | | | | | | | | |
| Rite Aid Corp., Term Loan, 4.87%, 6/07/21 | | $ | 937,940 | | | $ | 946,147 | |
| | |
| Specialty Stores - 0.2% | | | | | | | | |
| Mens Wearhouse, Inc., Term Loan B, 4.5%, 3/11/21 | | $ | 2,408,712 | | | $ | 2,426,778 | |
60
MFS High Yield Pooled Portfolio
Portfolio of Investments (unaudited) – continued
| | | | | | | | |
| Issuer | | Shares/Par | | | Value ($) | |
| Floating Rate Loans (g)(r) - continued | | | | | | | | |
| Transportation - Services - 0.3% | | | | | | | | |
| American Commercial Lines, Inc., Term Loan, 7.5%, 9/15/19 | | $ | 3,087,965 | | | $ | 3,099,545 | |
| | |
| Utilities - Electric Power - 0.2% | | | | | | | | |
| Calpine Construction Finance Co., Term Loan B, 3%, 5/07/20 | | $ | 2,619,701 | | | $ | 2,565,261 | |
Total Floating Rate Loans
(Identified Cost, $42,051,534) | | | | | | $ | 41,954,028 | |
| | |
| Common Stocks - 0.0% | | | | | | | | |
| Automotive - 0.0% | | | | | | | | |
| Accuride Corp. (a) (Identified Cost, $699,432) | | | 48,891 | | | $ | 244,455 | |
| | |
| Convertible Bonds - 0.1% | | | | | | | | |
| Network & Telecom - 0.1% | | | | | | | | |
Nortel Networks Corp., 2.125%, 4/15/15 (a)(d)
(Identified Cost, $572,250) | | $ | 582,000 | | | $ | 590,730 | |
| | |
| Preferred Stocks - 0.1% | | | | | | | | |
| Other Banks & Diversified Financials - 0.1% | | | | | | | | |
| Ally Financial, Inc., 7% (z) (Identified Cost, $1,552,313) | | | 1,639 | | | $ | 1,630,805 | |
| | |
| Money Market Funds - 1.8% | | | | | | | | |
MFS Institutional Money Market Portfolio, 0.09%,
at Cost and Net Asset Value (v) | | | 19,455,186 | | | $ | 19,455,186 | |
| Total Investments (Identified Cost, $1,061,661,398) | | | $ | 1,079,905,276 | |
| |
| Other Assets, Less Liabilities - 1.8% | | | | 20,200,142 | |
| Net Assets - 100.0% | | | $ | 1,100,105,418 | |
| (a) | Non-income producing security. |
| (d) | In default. Interest and/or scheduled principal payment(s) have been missed. |
| (g) | The rate shown represents a weighted average coupon rate on settled positions at period end, unless otherwise indicated. |
| (n) | Securities exempt from registration under Rule 144A of the Securities Act of 1933. These securities may be sold in the ordinary course of business in transactions exempt from registration, normally to qualified institutional buyers. At period end, the aggregate value of these securities was $351,027,073, representing 31.9% of net assets. |
| (o) | All or a portion of this position has not settled. Upon settlement date, interest rates for unsettled amounts will be determined. The rate shown, if any, represents the weighted average coupon rate for settled amounts. |
61
MFS High Yield Pooled Portfolio
Portfolio of Investments (unaudited) – continued
| (p) | Payment-in-kind security for which interest income may be received in additional securities and/or cash. During the period, the following amount of interest income was received in additional securities and/or cash: |
| | | | | | | | |
| Payment-in-kind Securities | | Cash | | | Additional
Securities | |
| Jo-Ann Stores Holdings, Inc., 9.75%, 10/15/19 | | | $125,775 | | | | $— | |
| Schaeffler Finance B.V., 6.875%, 8/15/18 | | | — | | | | — | |
| Total | | | $125,775 | | | | $— | |
| | | | | | | | |
| (r) | Remaining maturities of floating rate loans may be less than stated maturities shown as a result of contractual or optional prepayments by the borrower. Such prepayments cannot be predicted with certainty. These loans may be subject to restrictions on resale. Floating rate loans generally have rates of interest which are determined periodically by reference to a base lending rate plus a premium. |
| (v) | Underlying affiliated fund that is available only to investment companies managed by MFS. The rate quoted for the MFS Institutional Money Market Portfolio is the annualized seven-day yield of the fund at period end. |
| (z) | Restricted securities are not registered under the Securities Act of 1933 and are subject to legal restrictions on resale. These securities generally may be resold in transactions exempt from registration or to the public if the securities are subsequently registered. Disposal of these securities may involve time-consuming negotiations and prompt sale at an acceptable price may be difficult. The fund holds the following restricted securities: |
| | | | | | | | | | |
| Restricted Securities | | Acquisition
Date | |
Cost | | | Value | |
| Advanced Micro Devices, Inc., 7%, 7/01/24 | | 6/02/2014 | | | $925,000 | | | | $901,875 | |
| Ally Financial, Inc., 7% (Preferred Stock) | | 4/13/11-11/27/12 | | | 1,552,313 | | | | 1,630,805 | |
| American Energy-Permian Basin LLC, 7.125%, 11/01/20 | | 7/16/14 | | | 1,410,000 | | | | 1,360,650 | |
| American Energy-Permian Basin LLC, 7.375%, 11/01/21 | | 7/16/14 | | | 1,175,000 | | | | 1,133,875 | |
| American Media, Inc., 13.5%, 6/15/18 | | 12/22/10-12/28/10 | | | 342,164 | | | | 355,660 | |
| Ardagh Packaging Finance PLC, 6%, 6/30/21 | | 6/20/14-6/24/14 | | | 2,225,846 | | | | 2,110,550 | |
| Athlon Holdings LP/Athlon Finance Corp., 6%, 5/01/22 | | 4/16/14-5/13/14 | | | 3,284,862 | | | | 3,248,100 | |
| Aurico Gold, Inc., 7.75%, 4/01/20 | | 6/27/14-7/15/14 | | | 2,004,364 | | | | 2,014,875 | |
| Baytex Energy Corp., 5.125%, 6/01/21 | | 5/29/14 | | | 465,000 | | | | 461,513 | |
| Baytex Energy Corp., 5.625%, 6/01/24 | | 5/29/14-6/05/14 | | | 2,353,939 | | | | 2,304,900 | |
| CHS/Community Health Systems, Inc., 5.125%, 8/01/21 | | 1/15/14 | | | 700,000 | | | | 705,250 | |
| CHS/Community Health Systems, Inc., 6.875%, 2/01/22 | | 1/15/14-4/24/14 | | | 5,862,451 | | | | 5,823,138 | |
| CITGO Petroleum Corp., 6.25%, 8/15/22 | | 7/23/14 | | | 1,170,000 | | | | 1,205,100 | |
| Endo Finance LLC/Endo Finco, Inc., 7.25%, 1/15/22 | | 9/24/14-6/02/14 | | | 4,537,508 | | | | 4,504,950 | |
| Garda World Security Corp., 7.25%, 11/15/21 | | 5/21/14-5/22/14 | | | 1,000,633 | | | | 961,538 | |
| Garda World Security Corp., 7.25%, 11/15/21 | | 4/24/14 | | | 2,449,050 | | | | 2,370,775 | |
| Light Tower Rentals, Inc., 8.125%, 8/01/19 | | 7/16/14 | | | 1,415,000 | | | | 1,439,763 | |
62
MFS High Yield Pooled Portfolio
Portfolio of Investments (unaudited) – continued
| | | | | | | | | | |
| Restricted Securities – continued | | Acquisition
Date | |
Cost | | | Value | |
| Men’s Wearhouse, Inc., 7%, 7/01/22 | | 6/11/14-6/20/14 | | | $1,219,764 | | | | $1,227,200 | |
| Micron Technology, Inc., 5.5%, 2/01/25 | | 7/23/14 | | | 1,765,000 | | | | 1,756,175 | |
| SIRIUS XM Radio, Inc., 6%, 7/15/24 | | 5/01/14-5/13/14 | | | 1,885,619 | | | | 1,869,300 | |
| Sabine Pass Liquefaction LLC, 5.75%, 5/15/24 | | 5/13/14 | | | 1,705,000 | | | | 1,730,575 | |
| Sanchez Energy Corp., 6.125%, 1/15/23 | | 6/13/14-6/30/14 | | | 2,387,709 | | | | 2,339,138 | |
| Schaeffler Finance B.V., 4.75%, 5/15/21 | | 7/10/14-7/11/14 | | | 2,239,881 | | | | 2,207,625 | |
| Signode Industrial Group, 6.375%, 5/01/22 | | 4/07/14-4/25/14 | | | 2,752,894 | | | | 2,689,050 | |
| Suncoke Energy Partners LP/Suncoke Energy Partners Finance Corp., 7.375%, 2/01/20 | | 4/29/14 | | | 1,208,323 | | | | 1,213,250 | |
| TransDigm, Inc., 6%, 7/15/22 | | 5/20/14 | | | 375,000 | | | | 376,875 | |
| TransDigm, Inc., 6.5%, 7/15/24 | | 5/20/14-5/21/14 | | | 1,577,786 | | | | 1,585,700 | |
| Wind Acquisition Finance S.A., 7.375%, 4/23/21 | | 4/08/14 | | | 3,615,000 | | | | 3,768,638 | |
| Total Restricted Securities | | | | $53,296,843 | |
| % of Net assets | | | | 4.8% | |
The following abbreviations are used in this report and are defined:
| FRN | | Floating Rate Note. Interest rate resets periodically and may not be the rate reported at period end. |
| PLC | | Public Limited Company |
| REIT | | Real Estate Investment Trust |
Abbreviations indicate amounts shown in currencies other than the U.S. dollar. All amounts are stated in U.S. dollars unless otherwise indicated. A list of abbreviations is shown below:
Derivative Contracts at 7/31/14
Forward Foreign Currency Exchange Contracts at 7/31/14
| | | | | | | | | | | | | | | | | | | | | | | | |
| Type | | Currency | | Counter-
party | | Contracts
to
Deliver/
Receive | | | Settlement
Date Range | | | In
Exchange
for | | | Contracts
at Value | | | Net
Unrealized
Appreciation
(Depreciation) | |
| Asset Derivatives | | | | | | | | | | | | | |
| SELL | | EUR | | Credit Suisse Group | | | 5,754,385 | | | | 10/10/14 | | | | $7,835,458 | | | | $7,707,178 | | | | $128,280 | |
| | | | | | | | | | | | | | | | | | | | | | | | |
| | | | |
| Liability Derivatives | | | | | | | | | | | | | |
| BUY | | EUR | | Deutsche Bank | | | 593,000 | | | | 10/10/14 | | | | $798,788 | | | | $794,239 | | | | $(4,549 | ) |
| | | | | | | | | | | | | | | | | | | | | | | | |
63
MFS High Yield Pooled Portfolio
Portfolio of Investments (unaudited) – continued
Futures Contracts at 7/31/14
| | | | | | | | | | | | | | | | | | |
| Description | | Currency | | | Contracts | | | Value | | Expiration
Date | | | Unrealized
Appreciation
(Depreciation) | |
| Asset Derivatives | | | | | | | | |
| Interest Rate Futures | | | | | | | | |
| U.S. Treasury Note 10 yr (Short) | | | USD | | | | 88 | | | 10,965,625 | | | September - 2014 | | | | $95,896 | |
| | | | | | | | | | | | | | | | | | |
Swap Agreements at 7/31/14
| | | | | | | | | | | | | | | | | | | | |
| Expiration | | | | | Notional
Amount | | | Counterparty | | Cash Flows to
Receive | | Cash Flows
to Pay | | | Fair
Value | |
| Asset Derivatives | | | | | | | | | | |
| Credit Default Swap Agreements | | | | | | | | | | |
| 12/20/17 | | | USD | | | | 14,580,000 | | | Deutsche Bank (a) | | 5.00% (fixed rate) | | | (1 | ) | | | $1,266,526 | |
| | | | | | | | | | | | | | | | | | | | |
| (1) | Fund, as protection seller, to pay notional amount upon a defined credit event by a reference obligation specified in the Markit CDX North America Investment Grade Index, a B rated credit default index. The fund entered into the contract to manage market/sector exposure. |
| (a) | Net unamortized premiums paid by the fund amounted to $760,873. |
The credit ratings presented here are an indicator of the current payment/performance risk of the related swap agreement, the reference obligation for which may be either a single security or, in the case of a credit default index, a basket of securities issued by corporate or sovereign issuers. Ratings are assigned to each reference security, including each individual security within a reference basket of securities, utilizing ratings from Moody’s, Fitch, and Standard & Poor’s rating agencies and applying the following hierarchy: If all three agencies provide a rating, the middle rating (after dropping the highest and lowest ratings) is assigned; if two of the three agencies rate a security, the lower of the two is assigned. Ratings are shown in the S&P and Fitch scale (e.g., AAA). The ratings for a credit default index are calculated by MFS as a weighted average of the external credit ratings of the individual securities that compose the index’s reference basket of securities.
At July 31, 2014, the fund had cash collateral of $1,564,400 to cover any commitments for certain derivative contracts. Cash collateral is comprised of “Restricted cash” in the Statement of Assets and Liabilities.
For more information see notes to financial statements as disclosed in the most recent semiannual or annual report.
64
BOARD REVIEW OF INVESTMENT ADVISORY AGREEMENT
The Investment Company Act of 1940 requires that both the full Board of Trustees and a majority of the non-interested (“independent”) Trustees, voting separately, annually approve the continuation of the Fund’s investment advisory agreement with MFS. The Trustees consider matters bearing on the Fund and its advisory arrangements at their meetings throughout the year, including a review of performance data at each regular meeting. In addition, the independent Trustees met several times over the course of three months beginning in May and ending in July, 2014 (“contract review meetings”) for the specific purpose of considering whether to approve the continuation of the investment advisory agreement for the Fund and the other investment companies that the Board oversees (the “MFS Funds”). The independent Trustees were assisted in their evaluation of the Fund’s investment advisory agreement by independent legal counsel, from whom they received separate legal advice and with whom they met separately from MFS during various contract review meetings. The independent Trustees were also assisted in this process by the MFS Funds’ Independent Chief Compliance Officer, a full-time senior officer appointed by and reporting to the independent Trustees.
In connection with their deliberations regarding the continuation of the investment advisory agreement, the Trustees, including the independent Trustees, considered such information and factors as they believed, in light of the legal advice furnished to them and their own business judgment, to be relevant. The investment advisory agreement for the Fund was considered separately, although the Trustees also took into account the common interests of all MFS Funds in their review. As described below, the Trustees considered the nature, quality, and extent of the various investment advisory, administrative, and shareholder services performed by MFS under the existing investment advisory agreement and other arrangements with the Fund.
In connection with their contract review meetings, the Trustees received and relied upon materials that included, among other items: (i) information provided by Lipper Inc., an independent third party, on the investment performance of the Fund for various time periods ended December 31, 2013 and the investment performance of a group of funds with substantially similar investment classifications/objectives (the “Lipper performance universe”), (ii) information provided by Lipper Inc. on the Fund’s advisory fees and other expenses and the advisory fees and other expenses of comparable funds identified by Lipper Inc. (the “Lipper expense group”), (iii) information provided by MFS on the advisory fees of comparable portfolios of other clients of MFS, including institutional separate accounts and other clients, (iv) information as to whether and to what extent applicable expense waivers, reimbursements or fee “breakpoints” are observed for the Fund, (v) information regarding MFS’ financial results and financial condition, including MFS’ and certain of its affiliates’ estimated profitability from services performed for the Fund and the MFS Funds as a whole, and compared to MFS’ institutional business, (vi) MFS’ views regarding the outlook for the mutual fund industry and the strategic business plans of MFS, (vii) descriptions of various functions performed by MFS for the Funds, such as compliance monitoring and portfolio trading practices, and (viii) information regarding the overall organization of MFS, including information about MFS’ senior management and other personnel providing investment advisory, administrative and other services to the Fund and the other MFS Funds. The comparative performance, fee and expense
65
Board Review of Investment Advisory Agreement – continued
information prepared and provided by Lipper Inc. was not independently verified and the independent Trustees did not independently verify any information provided to them by MFS.
The Trustees’ conclusion as to the continuation of the investment advisory agreement was based on a comprehensive consideration of all information provided to the Trustees and not the result of any single factor. Some of the factors that figured particularly in the Trustees’ deliberations are described below, although individual Trustees may have evaluated the information presented differently from one another, giving different weights to various factors. It is also important to recognize that the fee arrangements for the Fund and other MFS Funds are the result of years of review and discussion between the independent Trustees and MFS, that certain aspects of such arrangements may receive greater scrutiny in some years than in others, and that the Trustees’ conclusions may be based, in part, on their consideration of these same arrangements during the course of the year and in prior years.
Based on information provided by Lipper Inc. and MFS, the Trustees reviewed the Fund’s total return investment performance as well as the performance of peer groups of funds over various time periods. The Trustees placed particular emphasis on the total return performance of the Fund’s Class A shares in comparison to the performance of funds in its Lipper performance universe over the three-year period ended December 31, 2013, which the Trustees believed was a long enough period to reflect differing market conditions. The total return performance of the Fund’s Class A shares was in the 3rd quintile relative to the other funds in the universe for this three-year period (the 1st quintile being the best performers and the 5th quintile being the worst performers). The total return performance of the Fund’s Class A shares was in the 4th quintile for the one-year period and the 2nd quintile for the five-year period ended December 31, 2013 relative to the Lipper performance universe. Because of the passage of time, these performance results may differ from the performance results for more recent periods, including those shown elsewhere in this report.
In the course of their deliberations, the Trustees took into account information provided by MFS in connection with the contract review meetings, as well as during investment review meetings conducted with portfolio management personnel during the course of the year regarding the Fund’s performance. After reviewing these and related factors, the Trustees concluded, within the context of their overall conclusions regarding the investment advisory agreement, that they were satisfied with MFS’ responses and efforts relating to investment performance.
In assessing the reasonableness of the Fund’s advisory fee, the Trustees considered, among other information, the Fund’s advisory fee and the total expense ratio of the Fund’s Class A shares as a percentage of average daily net assets and the advisory fee and total expense ratios of peer groups of funds based on information provided by Lipper Inc. The Trustees considered that MFS currently observes an expense limitation for the Fund, which may not be changed without the Trustees’ approval. The Trustees also considered that, according to the Lipper data (which takes into account any fee reductions or expense limitations that were in effect during the Fund’s last fiscal year), the Fund’s effective advisory fee rate and total expense ratio were each approximately at the Lipper expense group median.
66
Board Review of Investment Advisory Agreement – continued
The Trustees also considered the advisory fees charged by MFS to any comparable institutional accounts. In comparing these fees, the Trustees considered information provided by MFS as to the generally broader scope of services provided by MFS to the Fund in comparison to institutional accounts, the higher demands placed on MFS’ investment personnel and trading infrastructure as a result of the daily cash in-flows and out-flows of the Fund, and the impact on MFS and expenses associated with the more extensive regulatory regime to which the Fund is subject in comparison to institutional accounts.
The Trustees also considered whether the Fund may benefit from any economies of scale in the management of the Fund in the event of growth in assets of the Fund and/or growth in assets of the MFS Funds as a whole. They noted that MFS has agreed in writing to reduce its advisory fee rate on the Fund’s average daily net assets over $1.5 billion and $2.5 billion, which may not be changed without the Trustees’ approval. The Trustees also noted that MFS has agreed in writing to waive a portion of the management fees of certain MFS Funds, including the Fund, if the total combined assets of certain funds within the MFS Funds’ complex increase above agreed upon thresholds (the “group fee waiver”), enabling the Fund’s shareholders to share in the benefits from any economies of scale at the complex level. The group fee waiver is reviewed and renewed annually between the Board and MFS. The Trustees concluded that the breakpoints and the group fee waiver were sufficient to allow the Fund to benefit from economies of scale as its assets and overall complex assets grow.
The Trustees also considered information prepared by MFS relating to MFS’ costs and profits with respect to the Fund, the MFS Funds considered as a group, and other investment companies and accounts advised by MFS, as well as MFS’ methodologies used to determine and allocate its costs to the MFS Funds, the Fund and other accounts and products for purposes of estimating profitability.
After reviewing these and other factors described herein, the Trustees concluded, within the context of their overall conclusions regarding the investment advisory agreement, that the advisory fees charged to the Fund represent reasonable compensation in light of the services being provided by MFS to the Fund.
In addition, the Trustees considered MFS’ resources and related efforts to continue to retain, attract and motivate capable personnel to serve the Fund. The Trustees also considered current and developing conditions in the financial services industry, including the presence of large and well-capitalized companies which are spending, and appear to be prepared to continue to spend, substantial sums to engage personnel and to provide services to competing investment companies. In this regard, the Trustees also considered the financial resources of MFS and its ultimate parent, Sun Life Financial Inc. The Trustees also considered the advantages and possible disadvantages to the Fund of having an adviser that also serves other investment companies as well as other accounts.
The Trustees also considered the nature, quality, cost, and extent of administrative, transfer agency, and distribution services provided to the Fund by MFS and its affiliates under agreements and plans other than the investment advisory agreement, including any 12b-1 fees the Fund pays to MFS Fund Distributors, Inc., an affiliate of MFS. The Trustees also considered the nature, extent and quality of certain other services MFS
67
Board Review of Investment Advisory Agreement – continued
performs or arranges for on the Fund’s behalf, which may include securities lending programs, directed expense payment programs, class action recovery programs, and MFS’ interaction with third-party service providers, principally custodians and sub-custodians. The Trustees concluded that the various non-advisory services provided by MFS and its affiliates on behalf of the Fund were satisfactory.
The Trustees also considered benefits to MFS from the use of the Fund’s portfolio brokerage commissions, if applicable, to pay for investment research and various other factors. Additionally, the Trustees considered so-called “fall-out benefits” to MFS such as reputational value derived from serving as investment manager to the Fund.
Based on their evaluation of factors that they deemed to be material, including those factors described above, the Board of Trustees, including the independent Trustees, concluded that the Fund’s investment advisory agreement with MFS should be continued for an additional one-year period, commencing August 1, 2014.
68
PROXY VOTING POLICIES AND INFORMATION
MFS votes proxies on behalf of the fund pursuant to proxy voting policies and procedures that are available without charge, upon request, by calling 1-800-225-2606, by visiting the Proxy Voting section of mfs.com or by visiting the SEC’s Web site at http://www.sec.gov.
Information regarding how the fund voted proxies relating to portfolio securities during the most recent twelve-month period ended June 30 is available without charge by visiting the Proxy Voting section of mfs.com or by visiting the SEC’s Web site at http://www.sec.gov.
QUARTERLY PORTFOLIO DISCLOSURE
The fund will file a complete schedule of portfolio holdings with the Securities and Exchange Commission (the Commission) for the first and third quarters of each fiscal year on Form N-Q. A shareholder can obtain the quarterly portfolio holdings report at mfs.com. The fund’s Form N-Q is also available on the EDGAR database on the Commission’s Internet Web site at http://www.sec.gov, and may be reviewed and copied at the:
Public Reference Room
Securities and Exchange Commission
100 F Street, NE, Room 1580
Washington, D.C. 20549
Information on the operation of the Public Reference Room may be obtained by calling the Commission at 1-800-SEC-0330. Copies of the fund’s Form N-Q also may be obtained, upon payment of a duplicating fee, by electronic request at the following e-mail address: publicinfo@sec.gov, or by writing the Public Reference Section at the above address.
FURTHER INFORMATION
From time to time, MFS may post important information about the fund or the MFS funds on the MFS web site (mfs.com). This information is available by visiting the “Commentary & Announcements” and “Market Outlooks” sections of mfs.com or by clicking on the fund’s name under “Mutual Funds” in the “Products” section of mfs.com.
PROVISION OF FINANCIAL REPORTS AND SUMMARY PROSPECTUSES
The fund produces financial reports every six months and updates its summary prospectus and prospectus annually. To avoid sending duplicate copies of materials to households, only one copy of the fund’s annual and semiannual report and summary prospectus may be mailed to shareholders having the same last name and residential address on the fund’s records. However, any shareholder may contact MFSC (please see back cover for address and telephone number) to request that copies of these reports and summary prospectuses be sent personally to that shareholder.
69
Save paper with eDelivery.

| MFS® will send you prospectuses, |
reports, and proxies directly via e-mail so you will get information faster with less mailbox clutter.
To sign up:
1. Go to mfs.com.
2. Log in via MFS® Access.
3. Select eDelivery.
If you own your MFS fund shares through a financial institution or a retirement plan, MFS® TALK, MFS® Access, or eDelivery may not be available to you.
CONTACT
WEB SITE
mfs.com
MFS TALK
1-800-637-8255
24 hours a day
ACCOUNT SERVICE AND LITERATURE
Shareholders
1-800-225-2606
Financial advisors
1-800-343-2829
Retirement plan services
1-800-637-1255
MAILING ADDRESS
MFS Service Center, Inc.
P.O. Box 55824
Boston, MA 02205-5824
OVERNIGHT MAIL
MFS Service Center, Inc.
c/o Boston Financial Data Services
30 Dan Road
Canton, MA 02021-2809
SEMIANNUAL REPORT
July 31, 2014

MFS® MUNICIPAL HIGH INCOME FUND

MMH-SEM
MFS® MUNICIPAL HIGH INCOME FUND
CONTENTS
The report is prepared for the general information of shareholders. It is authorized for distribution to prospective investors only when preceded or accompanied by a current prospectus.
NOT FDIC INSURED Ÿ MAY LOSE VALUE Ÿ NO BANK GUARANTEE

LETTER FROM THE CHAIRMAN AND CEO
Dear Shareholders:
The U.S. economy has gathered momentum after a slow start to the year. Industrial output, consumer confidence and retail sales have all strengthened along with the labor market. However, the unemployment rate remains elevated and the housing
market has cooled off. With second-quarter economic growth rebounding strongly, economists have a favorable outlook for the rest of the year.
China’s economy has picked up again, and Japan is moving steadily towards Prime Minister Abe’s economic goals, including an inflation rate of 2% by next spring. The eurozone’s economy appears to have turned a corner, with renewed growth. However, historically high unemployment persists, deflation remains a risk and Russian sanctions could present a new obstacle to regional growth.
With corporate earnings surpassing expectations, the greatest concerns now are related to conflicts in the Middle East and Ukraine as well as growing speculation on when the U.S. Federal Reserve will begin increasing interest rates.
As always at MFS®, active risk management is integral to how we manage your investments. We use a collaborative process, sharing insights across asset classes, regions and economic sectors. Our global team of investment professionals uses a multidisciplined, long-term, diversified investment approach.
We understand that these are challenging economic times. We believe that we can serve you best by applying proven principles, such as asset allocation and diversification, over the long term. We are confident that this approach can serve you well as you work with your financial advisors to reach your goals in the years ahead.
Respectfully,

Robert J. Manning
Chairman and Chief Executive Officer
MFS Investment Management
September 15, 2014
The opinions expressed in this letter are subject to change and may not be relied upon for investment advice. No forecasts can be guaranteed.
1
PORTFOLIO COMPOSITION
Portfolio structure (i)
| | | | |
| Top ten industries (i) | | | | |
| Healthcare Revenue-Hospitals | | | 15.0% | |
| Healthcare Revenue-Long Term Care | | | 12.4% | |
| Universities-Colleges | | | 8.3% | |
| Tobacco | | | 6.9% | |
| Universities-Secondary Schools | | | 6.3% | |
| Industrial Revenue-Airlines | | | 5.6% | |
| Miscellaneous Revenue-Other | | | 3.8% | |
| Tax Assessment | | | 3.6% | |
| General Obligations-General Purpose | | | 3.0% | |
| Utilities-Other | | | 2.6% | |
| | | | |
| Composition including fixed income credit quality (a)(i) | |
| AAA | | | 1.9% | |
| AA | | | 8.5% | |
| A | | | 17.2% | |
| BBB | | | 26.6% | |
| BB | | | 11.0% | |
| B | | | 10.7% | |
| CC | | | 0.2% | |
| C | | | 1.0% | |
| Not Rated | | | 19.9% | |
| Cash & Other | | | 3.0% | |
| |
| Portfolio facts (i) | | | | |
| Average Duration (d) | | | 8.6 | |
| Average Effective Maturity (m) | | | 20.0 yrs. | |
| (a) | For all securities other than those specifically described below, ratings are assigned to underlying securities utilizing ratings from Moody’s, Fitch, and Standard & Poor’s rating agencies and applying the following hierarchy: If all three agencies provide a rating, the middle rating (after dropping the highest and lowest ratings) is assigned; if two of the three agencies rate a security, the lower of the two is assigned. Ratings are shown in the S&P and Fitch scale (e.g., AAA). Securities rated BBB or higher are considered investment grade. All ratings are subject to change. Not Rated includes fixed income securities, including fixed income futures contracts, which have not been rated by any rating agency. The fund may not hold all of these instruments. The fund is not rated by these agencies. |
| (d) | Duration is a measure of how much a bond’s price is likely to fluctuate with general changes in interest rates, e.g., if rates rise 1.00%, a bond with a 5-year duration is likely to lose about 5.00% of its value due to the interest rate move. |
| (i) | For purposes of this presentation, the components include the value of securities, and reflect the impact of the equivalent exposure of derivative positions, if any. These amounts may be negative from time to time. Equivalent exposure is a calculated amount that translates the derivative position into a reasonable approximation of the amount of the underlying asset that the portfolio would have to hold at a given point in time to have the same price sensitivity that results from the portfolio’s ownership of the derivative contract. When dealing with derivatives, equivalent exposure is a more representative measure of the potential impact of a position on portfolio performance than value. The bond component will include any accrued interest amounts. |
2
Portfolio Composition – continued
| (m) | In determining an instrument’s effective maturity for purposes of calculating the fund’s dollar-weighted average effective maturity, MFS uses the instrument’s stated maturity or, if applicable, an earlier date on which MFS believes it is probable that a maturity-shortening device (such as a put, pre-refunding or prepayment) will cause the instrument to be repaid. Such an earlier date can be substantially shorter than the instrument’s stated maturity. |
Where the fund holds convertible bonds, these are treated as part of the equity portion of the portfolio.
Cash & Other can include cash, other assets less liabilities, offsets to derivative positions, and short-term securities.
Percentages are based on net assets as of 7/31/14.
The portfolio is actively managed and current holdings may be different.
3
EXPENSE TABLE
Fund expenses borne by the shareholders during the period,
February 1, 2014 through July 31, 2014
As a shareholder of the fund, you incur two types of costs: (1) transaction costs, including sales charges (loads) on certain purchase or redemption payments, and (2) ongoing costs, including management fees; distribution and service (12b-1) fees; and other fund expenses. This example is intended to help you understand your ongoing costs (in dollars) of investing in the fund and to compare these costs with the ongoing costs of investing in other mutual funds.
The example is based on an investment of $1,000 invested at the beginning of the period and held for the entire period February 1, 2014 through July 31, 2014.
Actual Expenses
The first line for each share class in the following table provides information about actual account values and actual expenses. You may use the information in this line, together with the amount you invested, to estimate the expenses that you paid over the period. Simply divide your account value by $1,000 (for example, an $8,600 account value divided by $1,000 = 8.6), then multiply the result by the number in the first line under the heading entitled “Expenses Paid During Period” to estimate the expenses you paid on your account during this period.
Hypothetical Example for Comparison Purposes
The second line for each share class in the following table provides information about hypothetical account values and hypothetical expenses based on the fund’s actual expense ratio and an assumed rate of return of 5% per year before expenses, which is not the fund’s actual return. The hypothetical account values and expenses may not be used to estimate the actual ending account balance or expenses you paid for the period. You may use this information to compare the ongoing costs of investing in the fund and other funds. To do so, compare this 5% hypothetical example with the 5% hypothetical examples that appear in the shareholder reports of the other funds.
Please note that the expenses shown in the table are meant to highlight your ongoing costs only and do not reflect any transactional costs, such as sales charges (loads). Therefore, the second line for each share class in the table is useful in comparing ongoing costs only, and will not help you determine the relative total costs of owning different funds. In addition, if these transactional costs were included, your costs would have been higher.
4
Expense Table – continued
| | | | | | | | | | | | | | | | | | |
Share
Class | | | | Annualized Expense Ratio | | | Beginning
Account Value
2/01/14 | | | Ending Account Value
7/31/14 | | | Expenses
Paid During
Period (p)
2/01/14-7/31/14 | |
| A | | Actual | | | 0.68% | | | | $1,000.00 | | | | $1,068.41 | | | | $3.49 | |
| | Hypothetical (h) | | | 0.68% | | | | $1,000.00 | | | | $1,021.42 | | | | $3.41 | |
| B | | Actual | | | 1.45% | | | | $1,000.00 | | | | $1,065.67 | | | | $7.43 | |
| | Hypothetical (h) | | | 1.45% | | | | $1,000.00 | | | | $1,017.60 | | | | $7.25 | |
| C | | Actual | | | 1.68% | | | | $1,000.00 | | | | $1,064.48 | | | | $8.60 | |
| | Hypothetical (h) | | | 1.68% | | | | $1,000.00 | | | | $1,016.46 | | | | $8.40 | |
| I | | Actual | | | 0.68% | | | | $1,000.00 | | | | $1,069.68 | | | | $3.49 | |
| | Hypothetical (h) | | | 0.68% | | | | $1,000.00 | | | | $1,021.42 | | | | $3.41 | |
| (h) | 5% class return per year before expenses. |
| (p) | “Expenses Paid During Period” are equal to each class’s annualized expense ratio, as shown above, multiplied by the average account value over the period, multiplied by 181/365 (to reflect the one-half year period). Expenses paid do not include any applicable sales charges (loads). If these transaction costs had been included, your costs would have been higher. |
Notes to Expense Table
Expense ratios include 0.02% of investment related expenses from inverse floaters that are outside of the expense limitation arrangement (See Note 3 of the Notes to Financial Statements).
5
PORTFOLIO OF INVESTMENTS
7/31/14 (unaudited)
The Portfolio of Investments is a complete list of all securities owned by your fund. It is categorized by jurisdiction.
| | | | | | | | |
| Municipal Bonds - 95.8% | | | | | | | | |
| Issuer | | Shares/Par | | | Value ($) | |
| | | | | | | | |
| Alabama - 1.8% | | | | | | | | |
| Alexander City, AL, Special Care Facilities Financing Authority Medical Facilities Rev., “A” (Russell Hospital Corp.), 5.75%, 12/01/36 | | $ | 1,900,000 | | | $ | 1,910,003 | |
| Butler, AL, Industrial Development Board, Solid Waste Disposal Rev. (Georgia-Pacific Corp.), 5.75%, 9/01/28 | | | 4,010,000 | | | | 4,027,925 | |
| Cullman County, AL, Health Care Authority (Cullman Regional Medical Center), “A”, 6.25%, 2/01/23 | | | 1,400,000 | | | | 1,518,678 | |
| Cullman County, AL, Health Care Authority (Cullman Regional Medical Center), “A”, 6.75%, 2/01/29 | | | 4,790,000 | | | | 5,179,188 | |
| Cullman County, AL, Health Care Authority (Cullman Regional Medical Center), “A”, 7%, 2/01/36 | | | 1,000,000 | | | | 1,081,190 | |
| Huntsville-Redstone Village, AL, Special Care Facilities Financing Authority (Redstone Village Project), 5.5%, 1/01/28 | | | 1,795,000 | | | | 1,802,108 | |
| Huntsville-Redstone Village, AL, Special Care Facilities Financing Authority (Redstone Village Project), 5.5%, 1/01/43 | | | 1,560,000 | | | | 1,478,521 | |
| Jefferson County, AL, Sewer Rev. Warrants, Capital Appreciation, Senior Lien, “B”, AGM, 0%, 10/01/25 | | | 65,000 | | | | 37,877 | |
| Jefferson County, AL, Sewer Rev. Warrants, Capital Appreciation, Senior Lien, “B”, AGM, 0%, 10/01/26 | | | 805,000 | | | | 441,132 | |
| Jefferson County, AL, Sewer Rev. Warrants, Capital Appreciation, Senior Lien, “B”, AGM, 0%, 10/01/29 | | | 1,130,000 | | | | 510,771 | |
| Jefferson County, AL, Sewer Rev. Warrants, Capital Appreciation, Senior Lien, “B”, AGM, 0%, 10/01/34 | | | 1,620,000 | | | | 502,670 | |
| Jefferson County, AL, Sewer Rev. Warrants, Capital Appreciation, Senior Lien, “B”, AGM, 0%, 10/01/35 | | | 3,080,000 | | | | 891,414 | |
| Jefferson County, AL, Sewer Rev. Warrants, Subordinate Lien, “D”, 5%, 10/01/15 | | | 390,000 | | | | 402,359 | |
| Jefferson County, AL, Sewer Rev. Warrants, Subordinate Lien, “D”, 5%, 10/01/16 | | | 860,000 | | | | 915,461 | |
| Jefferson County, AL, Sewer Rev. Warrants, Subordinate Lien, “D”, 5%, 10/01/17 | | | 1,165,000 | | | | 1,266,856 | |
| Jefferson County, AL, Sewer Rev. Warrants, Subordinate Lien, “D”, 5%, 10/01/18 | | | 1,210,000 | | | | 1,335,695 | |
| Jefferson County, AL, Sewer Rev. Warrants, Subordinate Lien, “D”, 5%, 10/01/21 | | | 1,360,000 | | | | 1,525,566 | |
| Jefferson County, AL, Sewer Rev. Warrants, Subordinate Lien, “D”, 5%, 10/01/23 | | | 1,995,000 | | | | 2,230,929 | |
| Pell City, AL, Special Care Facilities, Financing Authority Rev. (Noland Health Services, Inc.), 5%, 12/01/39 | | | 1,670,000 | | | | 1,751,229 | |
6
Portfolio of Investments (unaudited) – continued
| | | | | | | | |
| Issuer | | Shares/Par | | | Value ($) | |
| | | | | | | | |
| Municipal Bonds - continued | | | | | | | | |
| Alabama - continued | | | | | | | | |
| Phenix City, AL, Industrial Development Board Environmental Improvement Rev. (MeadWestvaco Coated Board Project), “A”, 4.125%, 5/15/35 | | $ | 6,785,000 | | | $ | 6,103,922 | |
| Selma, AL, Industrial Development Board Rev., Gulf Opportunity Zone (International Paper Co.), “A”, 6.25%, 11/01/33 | | | 6,750,000 | | | | 7,631,078 | |
| Selma, AL, Industrial Development Board Rev., Gulf Opportunity Zone (International Paper Co.), “A”, 5.375%, 12/01/35 | | | 1,635,000 | | | | 1,803,650 | |
| | | | | | | | |
| | | | | | | $ | 44,348,222 | |
| Alaska - 0.1% | | | | | | | | |
| Koyukuk, AK, Tanana Chiefs Conference, Healthcare Facilities Project, 7.75%, 10/01/41 | | $ | 3,315,000 | | | $ | 3,633,107 | |
| | |
| Arizona - 1.5% | | | | | | | | |
| Florence, AZ, Industrial Development Authority Education Rev. (Legacy Traditional School Project - Queen Creek & Casa Grande Campuses), 6%, 7/01/43 | | $ | 3,150,000 | | | $ | 3,197,502 | |
| Maricopa County, AZ, Pollution Control Rev. (El Paso Electric), “B”, 7.25%, 4/01/40 | | | 1,790,000 | | | | 2,025,009 | |
| Maricopa County, AZ, Pollution Control Rev. (Southern California Edison Co.), “A”, 5%, 6/01/35 | | | 4,700,000 | | | | 5,001,975 | |
| Phoenix, AZ, Industrial Development Authority Education Rev. (Choice Academies, Inc. Project), 5.625%, 9/01/42 | | | 2,205,000 | | | | 2,059,977 | |
| Phoenix, AZ, Industrial Development Authority Education Rev. (Eagle College Prep Project), 5%, 7/01/33 | | | 855,000 | | | | 794,637 | |
| Phoenix, AZ, Industrial Development Authority Education Rev. (Eagle College Prep Project), 5%, 7/01/43 | | | 1,715,000 | | | | 1,510,589 | |
| Phoenix, AZ, Industrial Development Authority Education Rev. (Legacy Traditional Schools Project), 6.5%, 7/01/34 | | | 1,970,000 | | | | 2,147,064 | |
| Phoenix, AZ, Industrial Development Authority Education Rev. (Legacy Traditional Schools Project), 6.75%, 7/01/44 | | | 3,155,000 | | | | 3,460,467 | |
| Pima County, AZ, Industrial Development Authority Rev. (Tucson Electric Power Co.), 5.75%, 9/01/29 | | | 5,430,000 | | | | 5,501,405 | |
| Pima County, AZ, Industrial Development Authority Rev. (Tucson Electric Power Co.), “A”, 5.25%, 10/01/40 | | | 4,755,000 | | | | 5,068,212 | |
| Salt Verde Financial Corp., AZ, Senior Gas Rev., 5%, 12/01/32 | | | 2,670,000 | | | | 2,955,423 | |
| Tempe, AZ, Industrial Development Authority Rev. (Friendship Village), “A”, 6.25%, 12/01/42 | | | 1,675,000 | | | | 1,750,744 | |
| Tempe, AZ, Industrial Development Authority Rev. (Friendship Village), “A”, 6.25%, 12/01/46 | | | 1,275,000 | | | | 1,329,545 | |
| | | | | | | | |
| | | | | | | $ | 36,802,549 | |
7
Portfolio of Investments (unaudited) – continued
| | | | | | | | |
| Issuer | | Shares/Par | | | Value ($) | |
| | | | | | | | |
| Municipal Bonds - continued | | | | | | | | |
| California - 10.3% | | | | | | | | |
| ABAG Finance Authority for Non-Profit Corps., CA, Rev. (Episcopal Senior Communities), 6.125%, 7/01/41 | | $ | 4,000,000 | | | $ | 4,424,440 | |
| Acton-Agua Dulce, CA, Unified School District (Election of 2008), Capital Appreciation, AGM, 0%, 5/01/39 | | | 7,550,000 | | | | 2,059,867 | |
| Agua Caliente Band of Cahuilla Indians, CA, Rev., 6%, 7/01/18 (n) | | | 1,455,000 | | | | 1,455,422 | |
| Beverly Hills, CA, Unified School District (Election of 2008), Capital Appreciation, 0%, 8/01/31 | | | 2,060,000 | | | | 1,106,859 | |
| Beverly Hills, CA, Unified School District (Election of 2008), Capital Appreciation, 0%, 8/01/32 | | | 2,095,000 | | | | 1,056,886 | |
| Beverly Hills, CA, Unified School District (Election of 2008), Capital Appreciation, 0%, 8/01/33 | | | 4,185,000 | | | | 2,013,613 | |
| California Educational Facilities Authority Rev., 5%, 2/01/26 (Prerefunded 2/01/17) | | | 900,000 | | | | 1,003,140 | |
| California Educational Facilities Authority Rev., 5%, 2/01/26 | | | 2,690,000 | | | | 2,818,098 | |
| California Educational Facilities Authority Rev. (California Lutheran University), 5.75%, 10/01/38 | | | 2,320,000 | | | | 2,608,933 | |
| California Health Facilities Financing Authority Rev. (St. Joseph Health System), “A”, 5.75%, 7/01/39 | | | 2,765,000 | | | | 3,135,012 | |
| California Housing Finance Agency Rev. (Home Mortgage), “E”, 4.75%, 2/01/30 | | | 2,560,000 | | | | 2,580,890 | |
| California Housing Finance Agency Rev. (Home Mortgage), “G”, 4.95%, 8/01/23 | | | 8,080,000 | | | | 8,246,690 | |
| California Housing Finance Agency Rev. (Home Mortgage), “L”, 5.45%, 8/01/33 | | | 12,730,000 | | | | 13,077,147 | |
| California Housing Finance Agency Rev., “A”, 4.75%, 8/01/21 | | | 1,375,000 | | | | 1,381,710 | |
| California M-S-R Energy Authority Gas Rev., “A”, 7%, 11/01/34 | | | 1,135,000 | | | | 1,548,197 | |
| California M-S-R Energy Authority Gas Rev., “A”, 6.5%, 11/01/39 | | | 5,110,000 | | | | 6,697,779 | |
| California Municipal Finance Authority Rev. (Biola University), 5.8%, 10/01/28 | | | 1,915,000 | | | | 2,157,975 | |
| California Municipal Finance Authority Rev. (Partnerships to Uplift Communities Project), “A”, 5%, 8/01/32 | | | 1,585,000 | | | | 1,629,111 | |
| California Municipal Finance Authority Rev. (University of La Verne), “A”, 6.25%, 6/01/40 | | | 900,000 | | | | 1,027,260 | |
| California Pollution Control Financing Authority, Water Facilities Rev. (American Water Capital Corp. Project), 5.25%, 8/01/40 | | | 3,500,000 | | | | 3,704,190 | |
| California Pollution Control Financing Authority, Water Furnishing Rev. (Poseidon Resources Desalination Project), 5%, 11/21/45 | | | 7,865,000 | | | | 8,065,951 | |
| California Pollution Control Financing Authority, Water Furnishing Rev. (San Diego County Water Desalination Project Pipeline), 5%, 11/21/45 | | | 2,975,000 | | | | 3,019,000 | |
8
Portfolio of Investments (unaudited) – continued
| | | | | | | | |
| Issuer | | Shares/Par | | | Value ($) | |
| | | | | | | | |
| Municipal Bonds - continued | | | | | | | | |
| California - continued | | | | | | | | |
| California Public Works Board Lease Rev. (Various Capital Projects), “G-1”, 5.75%, 10/01/30 | | $ | 3,380,000 | | | $ | 3,901,061 | |
| California Public Works Board Lease Rev., Department of Corrections and Rehabilitation (Various Correctional Facilities), “A”, 5%, 9/01/33 | | | 10,830,000 | | | | 12,179,093 | |
| California School Finance Authority, School Facility Rev. (Kipp LA Projects), “A”, 4.125%, 7/01/24 | | | 450,000 | | | | 451,989 | |
| California School Finance Authority, School Facility Rev. (Kipp LA Projects), “A”, 5.125%, 7/01/44 | | | 430,000 | | | | 435,814 | |
| California Statewide Communities Development Authority Rev. (American Baptist Homes of the West), 6.25%, 10/01/39 | | | 2,985,000 | | | | 3,169,204 | |
| California Statewide Communities Development Authority Rev. (California Baptist University), “A”, 6.125%, 11/01/33 | | | 1,035,000 | | | | 1,117,034 | |
| California Statewide Communities Development Authority Rev. (California Baptist University), “A”, 5.125%, 11/01/23 | | | 540,000 | | | | 569,003 | |
| California Statewide Communities Development Authority Rev. (California Baptist University), “A”, 5.4%, 11/01/27 | | | 1,385,000 | | | | 1,419,764 | |
| California Statewide Communities Development Authority Rev. (Lancer Educational Student Housing Project), 5.625%, 6/01/33 | | | 2,345,000 | | | | 2,298,147 | |
| California Statewide Communities Development Authority Rev. (Lancer Educational Student Housing Project), 7.5%, 6/01/42 | | | 1,575,000 | | | | 1,745,982 | |
| California Statewide Communities Development Authority Rev. (Lancer Plaza Project), 5.625%, 11/01/33 | | | 780,000 | | | | 787,480 | |
| California Statewide Communities Development Authority Rev. (Lancer Plaza Project), 5.125%, 11/01/23 | | | 730,000 | | | | 746,936 | |
| California Statewide Communities Development Authority Rev. (Lancer Plaza Project), 5.875%, 11/01/43 | | | 375,000 | | | | 375,889 | |
| California Statewide Communities Development Authority Rev. (Southern California Presbyterian Homes), 7%, 11/15/29 | | | 1,400,000 | | | | 1,632,694 | |
| California Statewide Communities Development Authority Rev. (Southern California Presbyterian Homes), 7.25%, 11/15/41 | | | 560,000 | | | | 644,342 | |
| California Statewide Communities Development Authority Rev. (Student Housing, SUCI East Campus), 6%, 5/15/40 | | | 2,125,000 | | | | 2,280,975 | |
| California Statewide Communities Development Authority Rev. (The Terraces at San Joaquin Gardens), “A”, 5.625%, 10/01/32 | | | 1,000,000 | | | | 1,042,730 | |
| California Statewide Communities Development Authority Rev. (The Terraces at San Joaquin Gardens), “A”, 6%, 10/01/42 | | | 1,000,000 | | | | 1,050,510 | |
| California Statewide Communities Development Authority Rev. (University of California, Irvine East Campus Apartments), 5.375%, 5/15/38 | | | 3,000,000 | | | | 3,220,470 | |
| California Statewide Communities Development Authority School Facility Rev. (Aspire Public Schools), 6%, 7/01/30 | | | 1,990,000 | | | | 2,027,571 | |
| California Statewide Communities Development Authority School Facility Rev. (Aspire Public Schools), 6.375%, 7/01/45 | | | 5,965,000 | | | | 6,100,883 | |
9
Portfolio of Investments (unaudited) – continued
| | | | | | | | |
| Issuer | | Shares/Par | | | Value ($) | |
| | | | | | | | |
| Municipal Bonds - continued | | | | | | | | |
| California - continued | | | | | | | | |
| California Statewide Communities Development Authority, School Facility Rev. (Aspire Public Schools), 6.125%, 7/01/46 | | $ | 7,630,000 | | | $ | 7,729,114 | |
| California Statewide Communities, Development Authority Environmental Facilities (Microgy Holdings Project), 9%, 12/01/38 (a)(d) | | | 100,980 | | | | 1,010 | |
| California Statewide Financing Authority, Tobacco Settlement, 5.625%, 5/01/29 | | | 2,850,000 | | | | 2,834,211 | |
| Chula Vista, CA, Industrial Development Rev. (San Diego Gas & Electric Co.), “E”, 5.875%, 1/01/34 | | | 1,940,000 | | | | 2,211,949 | |
| Escondido, CA, Union High School District (Election of 2008), Capital Appreciation, “A”, ASSD GTY, 0%, 8/01/30 | | | 4,785,000 | | | | 2,461,835 | |
| Escondido, CA, Union High School District (Election of 2008), Capital Appreciation, “A”, ASSD GTY, 0%, 8/01/31 | | | 4,280,000 | | | | 2,084,446 | |
| Escondido, CA, Union High School District (Election of 2008), Capital Appreciation, “A”, ASSD GTY, 0%, 8/01/32 | | | 3,010,000 | | | | 1,375,751 | |
Golden State, CA, Tobacco Securitization Corp., Tobacco Settlement Rev., “A-1”, 4.5%, 6/01/27 | | | 5,000,000 | | | | 4,433,950 | |
| Golden State, CA, Tobacco Securitization Corp., Tobacco Settlement Rev., “A-1”, 5.75%, 6/01/47 | | | 13,270,000 | | | | 10,555,091 | |
| Golden State, CA, Tobacco Securitization Corp., Tobacco Settlement Rev., Enhanced, “A”, FGIC, 5%, 6/01/35 | | | 2,030,000 | | | | 2,087,124 | |
| Golden State, CA, Tobacco Securitization Corp., Tobacco Settlement Rev., Enhanced, “A”, 5%, 6/01/45 | | | 6,065,000 | | | | 6,171,987 | |
| Golden State, CA, Tobacco Securitization Corp., Tobacco Settlement Rev., Enhanced, “A-1”, AMBAC, 4.6%, 6/01/23 | | | 1,185,000 | | | | 1,285,962 | |
| Hartnell, CA, Community College District (Election of 2002), Capital Appreciation, “D”, 0%, 8/01/39 | | | 10,355,000 | | | | 2,074,728 | |
| Inland Valley, CA, Development Successor Agency Tax Allocation, “A”, 5%, 9/01/44 | | | 1,745,000 | | | | 1,865,405 | |
| Jurupa, CA, Public Financing Authority, Special Tax Rev., “A”, 5%, 9/01/42 | | | 1,535,000 | | | | 1,633,670 | |
| La Verne, CA, COP (Brethren Hillcrest Homes), 5%, 5/15/36 | | | 455,000 | | | | 464,496 | |
| Lake Tahoe, CA, Unified School District (Election of 2008), Capital Appreciation, AGM, 0%, 8/01/45 | | | 4,240,000 | | | | 2,046,097 | |
| Los Angeles County, CA, Regional Financing Authority Rev. (Montecedro Inc. Project), “A”, CALHF, 5%, 11/15/44 | | | 555,000 | | | | 595,365 | |
| Los Angeles County, CA, Regional Financing Authority Rev. (Montecedro Inc. Project), “A”, CALHF, 5%, 11/15/34 | | | 330,000 | | | | 361,565 | |
| Los Angeles County, CA, Regional Financing Authority Rev. (Montecedro Inc. Project), “B-2”, CALHF, 3%, 11/15/20 | | | 290,000 | | | | 295,994 | |
| Los Angeles County, CA, Regional Financing Authority Rev. (Montecedro Inc. Project), “B-3”, CALHF, 2.5%, 11/15/20 | | | 730,000 | | | | 741,972 | |
| Los Angeles, CA, Regional Airports Improvement Corp. Lease Rev. (American Airlines, Inc.), “C”, 7.5%, 12/01/24 | | | 11,330,000 | | | | 11,549,689 | |
| Los Angeles, CA, Unified School District, “D”, 5%, 1/01/34 | | | 525,000 | | | | 583,690 | |
10
Portfolio of Investments (unaudited) – continued
| | | | | | | | |
| Issuer | | Shares/Par | | | Value ($) | |
| | | | | | | | |
| Municipal Bonds - continued | | | | | | | | |
| California - continued | | | | | | | | |
| Madera, CA, Irrigation Financing Authority Rev., 6.5%, 1/01/40 | | $ | 5,970,000 | | | $ | 6,950,274 | |
| Merced, CA, Union High School District, Capital Appreciation, “A”, ASSD GTY, 0%, 8/01/30 | | | 645,000 | | | | 322,119 | |
| Newport Mesa, CA, Unified School District (Election of 2005), Capital Appreciation, 0%, 8/01/41 | | | 12,965,000 | | | | 2,499,911 | |
| Oceanside, CA, Unified School District, Capital Appreciation, ASSD GTY, 0%, 8/01/24 | | | 3,110,000 | | | | 2,173,330 | |
| Oceanside, CA, Unified School District, Capital Appreciation, ASSD GTY, 0%, 8/01/27 | | | 2,070,000 | | | | 1,245,436 | |
| Oceanside, CA, Unified School District, Capital Appreciation, ASSD GTY, 0%, 8/01/29 | | | 4,025,000 | | | | 2,181,027 | |
| Oceanside, CA, Unified School District, Capital Appreciation, ASSD GTY, 0%, 8/01/30 | | | 4,455,000 | | | | 2,284,880 | |
| Palomar Pomerado Health Care District, CA, COP, 6.75%, 11/01/39 | | | 4,080,000 | | | | 4,308,970 | |
| Pittsburg, CA, Redevelopment Successor Agency, Tax Allocation (Los Medanos Community Development Project), AGM, 5%, 8/01/25 | | | 865,000 | | | | 1,003,642 | |
| Pittsburg, CA, Redevelopment Successor Agency, Tax Allocation (Los Medanos Community Development Project), AGM, 5%, 8/01/26 | | | 905,000 | | | | 1,037,501 | |
| Pittsburg, CA, Redevelopment Successor Agency, Tax Allocation (Los Medanos Community Development Project), AGM, 5%, 8/01/27 | | | 1,225,000 | | | | 1,385,389 | |
| Pittsburg, CA, Redevelopment Successor Agency, Tax Allocation (Los Medanos Community Development Project), AGM, 5%, 8/01/28 | | | 635,000 | | | | 712,997 | |
| Rancho Cucamonga, CA, Redevelopment Agency Tax Allocation, AGM, 5%, 9/01/30 | | | 505,000 | | | | 570,196 | |
| San Buenaventura, CA, Rev. (Community Memorial Health System), 7.5%, 12/01/41 | | | 6,000,000 | | | | 6,905,760 | |
| San Francisco, CA, Bay Area Toll Authority, Bridge Rev., “B”, 1.5%, 4/01/47 (Put Date 4/02/18) | | | 3,095,000 | | | | 3,122,700 | |
| San Francisco, CA, Bay Area Toll Authority, Bridge Rev., “C”, 1.875%, 4/01/47 (Put Date 4/01/19) | | | 2,505,000 | | | | 2,536,613 | |
| San Francisco, CA, City & County Redevelopment Successor Agency Tax Allocation (Mission Bay South Public Improvements), “A”, 5%, 8/01/43 | | | 225,000 | | | | 241,841 | |
| San Francisco, CA, City & County Redevelopment Successor Agency, Community Facilities District No. 6 (Mission Bay South Public Improvements), Capital Appreciation, “A”, 0%, 8/01/43 | | | 8,725,000 | | | | 1,633,582 | |
| San Jose, CA, Airport Rev., “A-2”, 5.25%, 3/01/34 | | | 6,545,000 | | | | 7,119,913 | |
| State of California (Veterans), 5.05%, 12/01/36 | | | 600,000 | | | | 616,326 | |
11
Portfolio of Investments (unaudited) – continued
| | | | | | | | |
| Issuer | | Shares/Par | | | Value ($) | |
| | | | | | | | |
| Municipal Bonds - continued | | | | | | | | |
| California - continued | | | | | | | | |
| State of California, General Obligation, “A”, FRN, 0.74%, 5/01/33 (Put Date 11/01/14) | | $ | 10,330,000 | | | $ | 10,341,983 | |
| Upland, CA, COP (San Antonio Community Hospital), 6.375%, 1/01/32 | | | 600,000 | | | | 681,972 | |
| West Contra Costa, CA, Healthcare District, AMBAC, 5.5%, 7/01/29 | | | 700,000 | | | | 702,170 | |
| West Contra Costa, CA, Unified School District (Election of 2005), Capital Appreciation, “C”, ASSD GTY, 0%, 8/01/29 | | | 3,665,000 | | | | 1,968,508 | |
| Whittier, CA, Health Facility Rev. (PIH Health), 5%, 6/01/44 | | | 6,035,000 | | | | 6,455,096 | |
| Whittier, CA, Union High School District, Capital Appreciation, 0%, 8/01/34 | | | 2,270,000 | | | | 739,566 | |
| | | | | | | | |
| | | | | | | $ | 257,202,544 | |
| Colorado - 3.8% | | | | | | | | |
| Arvada, CO, Cimarron Metropolitan District, Rev., 6%, 12/01/22 | | $ | 2,000,000 | | | $ | 1,995,920 | |
| Colorado Educational & Cultural Facilities Authority Rev. (Liberty Common Project), 5%, 1/15/29 | | | 305,000 | | | | 330,535 | |
| Colorado Educational & Cultural Facilities Authority Rev. (Liberty Common Project), 5%, 1/15/39 | | | 395,000 | | | | 410,050 | |
| Colorado Educational & Cultural Facilities Authority Rev. (Liberty Common Project), 5%, 1/15/44 | | | 395,000 | | | | 407,593 | |
| Colorado Educational & Cultural Facilities Authority Rev. (Littleton Preparatory Charter School Project), 5%, 12/01/33 | | | 450,000 | | | | 430,619 | |
| Colorado Educational & Cultural Facilities Authority Rev. (Littleton Preparatory Charter School Project), 5%, 12/01/42 | | | 540,000 | | | | 492,070 | |
| Colorado Educational & Cultural Facilities Authority Rev. (Montessori Charter School Project), 5%, 7/15/37 | | | 490,000 | | | | 504,220 | |
| Colorado Educational & Cultural Facilities Authority Rev. (Peak to Peak Charter School Project), 5%, 8/15/30 | | | 350,000 | | | | 378,676 | |
| Colorado Educational & Cultural Facilities Authority Rev. (Peak to Peak Charter School Project), 5%, 8/15/34 | | | 350,000 | | | | 375,386 | |
| Colorado Health Care Facilities Authority Rev. (American Baptist Homes of the Midwest Obligated Group), 8%, 8/01/43 | | | 2,975,000 | | | | 3,464,031 | |
| Colorado Health Facilities Authority Rev. (American Baptist Homes), “A”, 5.9%, 8/01/37 | | | 1,355,000 | | | | 1,356,450 | |
| Colorado Health Facilities Authority Rev. (Christian Living Communities Project), 6.375%, 1/01/41 | | | 1,620,000 | | | | 1,703,155 | |
| Colorado Health Facilities Authority Rev. (Christian Living Communities Project), “A”, 5.75%, 1/01/37 | | | 2,650,000 | | | | 2,695,580 | |
| Colorado Health Facilities Authority Rev. (Covenant Retirement Communities, Inc.), “A”, 5%, 12/01/33 | | | 4,295,000 | | | | 4,454,516 | |
| Colorado Health Facilities Authority Rev. (Evangelical Lutheran Good Samaritan Society), 5.625%, 6/01/43 | | | 825,000 | | | | 904,497 | |
12
Portfolio of Investments (unaudited) – continued
| | | | | | | | |
| Issuer | | Shares/Par | | | Value ($) | |
| | | | | | | | |
| Municipal Bonds - continued | | | | | | | | |
| Colorado - continued | | | | | | | | |
| Colorado Health Facilities Authority Rev. (Total Longterm Care, Inc.), “A”, 6%, 11/15/30 | | $ | 700,000 | | | $ | 765,212 | |
| Colorado Health Facilities Authority Rev. (Total Longterm Care, Inc.), “A”, 6.25%, 11/15/40 | | | 1,150,000 | | | | 1,251,695 | |
| Colorado Health Facilities Hospital Authority Rev. (Adventist Health System/Sunbelt Obligated Group), “2014-E”, 5%, 11/15/34 | | | 6,530,000 | | | | 7,294,663 | |
| Colorado Housing & Finance Authority, Solid Waste Rev. (Waste Management, Inc.), 5.7%, 7/01/18 | | | 540,000 | | | | 626,384 | |
| Colorado Regional Transportation District, Private Activity Rev. (Denver Transportation Partners), 6%, 1/15/34 | | | 8,490,000 | | | | 9,399,109 | |
| Denver, CO, City & County Airport Rev. (United Airlines), 5.25%, 10/01/32 | | | 13,545,000 | | | | 13,768,222 | |
| Denver, CO, City & County Airport Rev. (United Airlines), 5.75%, 10/01/32 | | | 4,705,000 | | | | 4,866,099 | |
| Denver, CO, Health & Hospital Authority Rev., “A”, 5%, 12/01/39 | | | 560,000 | | | | 589,814 | |
| Denver, CO, Health & Hospital Authority Rev., “A”, 5.25%, 12/01/45 | | | 795,000 | | | | 850,563 | |
| E-470 Public Highway Authority Rev., CO, Capital Appreciation, “B”, NATL, 0%, 9/01/27 | | | 12,305,000 | | | | 6,387,649 | |
| Fruita, CO, Rev. (Family Health West Project), 7%, 1/01/18 | | | 700,000 | | | | 774,074 | |
| Fruita, CO, Rev. (Family Health West Project), 8%, 1/01/43 | | | 4,440,000 | | | | 4,998,152 | |
| Public Authority for Colorado Energy Natural Gas Purchase Rev., 6.25%, 11/15/28 | | | 5,275,000 | | | | 6,452,538 | |
| Public Authority for Colorado Energy Natural Gas Purchase Rev., 6.5%, 11/15/38 | | | 7,145,000 | | | | 9,317,937 | |
| Salida, CO, Hospital District Rev., 5.25%, 10/01/36 | | | 5,991,000 | | | | 6,001,424 | |
| Stone Ridge, CO, Metropolitan District No. 2, 7.25%, 12/01/31 (d)(q) | | | 2,396,000 | | | | 619,486 | |
| Tallyn’s Reach, CO, Metropolitan District No. 3, CO, 5%, 12/01/33 | | | 404,000 | | | | 408,472 | |
| Tallyn’s Reach, CO, Metropolitan District No. 3, CO, 5.125%, 11/01/38 | | | 824,000 | | | | 829,101 | |
| | | | | | | | |
| | | | | | | $ | 95,103,892 | |
| Delaware - 0.0% | | | | | | | | |
| Delaware Economic Development Authority Rev. (Newark Charter School, Inc. Project), 5%, 9/01/42 | | $ | 1,170,000 | | | $ | 1,201,110 | |
| | |
| District of Columbia - 0.9% | | | | | | | | |
| District of Columbia Rev. (Kipp, D.C. Charter School), “A”, 6%, 7/01/43 | | $ | 1,095,000 | | | $ | 1,231,470 | |
13
Portfolio of Investments (unaudited) – continued
| | | | | | | | |
| Issuer | | Shares/Par | | | Value ($) | |
| | | | | | | | |
| Municipal Bonds - continued | | | | | | | | |
| District of Columbia - continued | | | | | | | | |
| District of Columbia Rev. (Kipp, D.C. Charter School), “A”, 6%, 7/01/33 | | $ | 420,000 | | | $ | 481,379 | |
| District of Columbia Student Dormitory Rev. (Provident Group - Howard Properties LLC), 5%, 10/01/30 | | | 1,475,000 | | | | 1,524,796 | |
| District of Columbia Student Dormitory Rev. (Provident Group - Howard Properties LLC), 5%, 10/01/35 | | | 5,000,000 | | | | 5,019,600 | |
| District of Columbia Student Dormitory Rev. (Provident Group - Howard Properties LLC), 5%, 10/01/45 | | | 8,820,000 | | | | 8,628,606 | |
| District of Columbia, Tobacco Settlement, 6.25%, 5/15/24 | | | 1,100,000 | | | | 1,107,733 | |
| District of Columbia, Tobacco Settlement, 6.75%, 5/15/40 | | | 885,000 | | | | 891,089 | |
| Metropolitan Washington, DC, Airports Authority Rev. Senior Lien (Dulles Toll Road), 5%, 10/01/53 | | | 2,920,000 | | | | 3,002,081 | |
| | | | | | | | |
| | | | $ | 21,886,754 | |
| Florida - 7.8% | | | | | | | | |
| Alachua County, FL, Health Facilities Authority Rev. (East Ridge Retirement Village, Inc.), 6%, 11/15/34 | | $ | 1,180,000 | | | $ | 1,232,522 | |
| Alachua County, FL, Health Facilities Authority Rev. (East Ridge Retirement Village, Inc.), 6.25%, 11/15/44 | | | 2,955,000 | | | | 3,103,725 | |
| Alachua County, FL, Health Facilities Authority Rev. (East Ridge Retirement Village, Inc.), 6.375%, 11/15/49 | | | 1,970,000 | | | | 2,069,012 | |
| Alachua County, FL, Health Facilities Authority, Continuing Care Rev. (Oak Hammock at the University of Florida, Inc.), “A”, 8%, 10/01/32 | | | 1,250,000 | | | | 1,488,250 | |
| Alachua County, FL, Health Facilities Authority, Continuing Care Rev. (Oak Hammock at the University of Florida, Inc.), “A”, 8%, 10/01/42 | | | 2,000,000 | | | | 2,357,780 | |
| Alachua County, FL, Health Facilities Authority, Continuing Care Rev. (Oak Hammock at the University of Florida, Inc.), “A”, 8%, 10/01/46 | | | 1,000,000 | | | | 1,170,210 | |
| Arborwood Community Development District, FL, Capital Improvement Rev. (Centex Homes Project), “A-1”, 5.5%, 5/01/36 (a)(d) | | | 635,000 | | | | 381,000 | |
| Arborwood Community Development District, FL, Capital Improvement Rev. (Centex Homes Project), “A-3”, 5.5%, 5/01/36 | | | 305,000 | | | | 304,430 | |
| Arborwood Community Development District, FL, Capital Improvement Rev. (Master Infrastructure Project), “B”, 5.1%, 5/01/15 (a)(d) | | | 165,000 | | | | 99,000 | |
| Arborwood Community Development District, FL, Capital Improvement Rev. (Master Infrastructure Projects), “A”, 5.35%, 5/01/36 (a)(d) | | | 350,000 | | | | 210,000 | |
14
Portfolio of Investments (unaudited) – continued
| | | | | | | | |
| Issuer | | Shares/Par | | | Value ($) | |
| | | | | | | | |
| Municipal Bonds - continued | | | | | | | | |
| Florida - continued | | | | | | | | |
| Arborwood Community Development District, FL, Capital Improvement Rev. (Master Infrastructure Projects), “A-2”, 5.35%, 5/01/36 | | $ | 1,295,000 | | | $ | 1,295,026 | |
| Baker, FL, Correctional Development Corp. (Baker County Detention Center), 7.5%, 2/01/30 | | | 1,560,000 | | | | 1,120,844 | |
| Bay County, FL, Housing Finance Authority, Multi-Family Rev. (Andrews Place II Apartments), AGM, 5%, 10/01/35 | | | 635,000 | | | | 636,537 | |
| Bellalago, FL, Educational Facilities Benefit District (Osceola County) Capital Improvement Refunding Rev., 4.375%, 5/01/30 | | | 690,000 | | | | 684,149 | |
| Bellalago, FL, Educational Facilities Benefit District (Osceola County) Capital Improvement Refunding Rev., 4.5%, 5/01/33 | | | 320,000 | | | | 318,778 | |
| Bellalago, FL, Educational Facilities Benefit District (Osceola County) Capital Improvement Refunding Rev., 4.6%, 5/01/34 | | | 490,000 | | | | 490,730 | |
| Brevard County, FL, Industrial Development Rev. (TUFF Florida Tech LLC Project), 6.75%, 11/01/39 | | | 4,720,000 | | | | 5,187,233 | |
| Capital Region Community Development District, FL, Capital Improvement Rev., “A”, 7%, 5/01/39 | | | 2,525,000 | | | | 2,546,261 | |
| Century Gardens Village Community Development District, FL, Special Assessment, 5.1%, 5/01/37 | | | 915,000 | | | | 878,071 | |
| Citrus County, FL, Hospital Board Rev. (Citrus Memorial Hospital), 6.25%, 8/15/23 | | | 2,905,000 | | | | 2,905,058 | |
| Citrus County, FL, Hospital Board Rev. (Citrus Memorial Hospital), 6.375%, 8/15/32 | | | 5,810,000 | | | | 5,810,058 | |
| Collier County, FL, Educational Facilities Authority Rev. (Ave Maria University, Inc. Project), “A”, 6.125%, 6/01/43 | | | 3,200,000 | | | | 3,463,488 | |
| Collier County, FL, Industrial Development Authority Continuing Care Community Rev. (The Arlington of Naples Project), “A”, 8.125%, 5/15/44 | | | 4,970,000 | | | | 5,363,922 | |
| Concord Station Community Development District, FL, Special Assessment, 5%, 5/01/15 | | | 120,000 | | | | 120,162 | |
| Creekside Community Development District, FL, Special Assessment, 5.2%, 5/01/38 (a)(d) | | | 1,400,000 | | | | 434,000 | |
| Escambia County, FL, Health Facilities Authority (Baptist Hospital, Inc.), “A”, 6%, 8/15/36 | | | 3,050,000 | | | | 3,480,660 | |
| Florida Board of Education, Lottery Rev., “A”, 5%, 7/01/20 | | | 8,410,000 | | | | 10,035,989 | |
| Florida Citizens Property Insurance Corp., “A-1”, 5%, 6/01/19 | | | 660,000 | | | | 762,399 | |
| Florida Development Finance Corp. Educational Facilities Rev. (Bay Area Charter Foundation LLC), “A”, 7.75%, 6/15/42 | | | 3,480,000 | | | | 3,718,310 | |
| Florida Development Finance Corp. Educational Facilities Rev. (Renaissance Charter School), “A”, 6%, 6/15/32 | | | 1,950,000 | | | | 1,895,771 | |
| Florida Development Finance Corp. Educational Facilities Rev. (Renaissance Charter School), “A”, 6.125%, 6/15/43 | | | 4,070,000 | | | | 3,949,121 | |
| Florida Development Finance Corp. Educational Facilities Rev. (Renaissance Charter School), “A”, 6%, 9/15/30 | | | 2,575,000 | | | | 2,658,404 | |
15
Portfolio of Investments (unaudited) – continued
| | | | | | | | |
| Issuer | | Shares/Par | | | Value ($) | |
| | | | | | | | |
| Municipal Bonds - continued | | | | | | | | |
| Florida - continued | | | | | | | | |
| Florida Development Finance Corp. Educational Facilities Rev. (Renaissance Charter School), “A”, 6%, 9/15/40 | | $ | 5,490,000 | | | $ | 5,567,958 | |
| Florida Development Finance Corp. Educational Facilities Rev. (Renaissance Charter School), “A”, 7.625%, 6/15/41 | | | 10,125,000 | | | | 10,740,499 | |
| Heritage Harbour North Community Development District, FL, Capital Improvement Rev., 6.375%, 5/01/38 | | | 1,780,000 | | | | 1,753,033 | |
| Hillsborough County, FL, Industrial Development Authority Rev. (University Community Hospital), “A”, 5.625%, 8/15/29 (Prerefunded 8/15/18) | | | 4,700,000 | | | | 5,574,435 | |
| Killarney Community Development District, FL, Special Assessment, “B”, 5.125%, 5/01/09 (a)(d) | | | 640,000 | | | | 288,000 | |
| Lee County, FL, Industrial Development Authority Healthcare Facilities Rev. (Shell Point Alliance), “B”, 6.5%, 11/15/31 | | | 1,600,000 | | | | 1,752,128 | |
| Lee County, FL, Industrial Development Authority Rev. (Lee Charter Foundation), “A”, 5.25%, 6/15/27 | | | 2,070,000 | | | | 2,097,262 | |
| Lee County, FL, Industrial Development Authority Rev. (Lee Charter Foundation), “A”, 5.375%, 6/15/37 | | | 3,155,000 | | | | 3,157,682 | |
| Legends Bay Community Development District, FL, “A”, 5.875%, 5/01/38 | | | 1,330,000 | | | | 983,469 | |
| Main Street Community Development District, FL, “A”, 6.8%, 5/01/38 | | | 1,675,000 | | | | 1,692,755 | |
| Miami Beach, FL, Health Facilities Authority Rev. (Mount Sinai Medical Center), 6.75%, 11/15/21 | | | 1,115,000 | | | | 1,132,996 | |
| Miami Beach, FL, Health Facilities Authority Rev. (Mount Sinai Medical Center), 6.75%, 11/15/29 (Prerefunded 11/15/14) | | | 338,500 | | | | 344,654 | |
| Miami Beach, FL, Health Facilities Authority Rev. (Mount Sinai Medical Center), 6.75%, 11/15/29 | | | 2,151,500 | | | | 2,186,053 | |
| Miami-Dade County, FL, Health Facilities Authority Hospital Rev. (Miami Childrens Hospital), 6%, 8/01/46 | | | 7,250,000 | | | | 8,220,920 | |
| Miami-Dade County, FL, Industrial Development Authority Rev. (Pinecrest Academy Project), 5.25%, 9/15/44 | | | 1,715,000 | | | | 1,709,752 | |
| Miami-Dade County, FL, Industrial Development Authority Rev. (Pinecrest Academy Project), 5%, 9/15/24 | | | 345,000 | | | | 372,848 | |
| Mid-Bay Bridge Authority, FL, Springing Lien Rev., “A”, 7.25%, 10/01/34 | | | 300,000 | | | | 362,412 | |
| Mid-Bay Bridge Authority, FL, Springing Lien Rev., “A”, 7.25%, 10/01/40 | | | 8,365,000 | | | | 10,024,365 | |
| Middle Village Community Development District, FL, Special Assessment, “A”, 5.8%, 5/01/22 | | | 510,000 | | | | 442,333 | |
| Midtown Miami, FL, Community Development District Special Assessment (Infrastructure Project), “B”, 5%, 5/01/29 | | | 1,220,000 | | | | 1,243,265 | |
| Midtown Miami, FL, Community Development District Special Assessment (Infrastructure Project), “B”, 5%, 5/01/37 | | | 750,000 | | | | 757,350 | |
| Midtown Miami, FL, Community Development District Special Assessment (Parking Garage Project), “A”, 5%, 5/01/37 | | | 1,065,000 | | | | 1,078,270 | |
16
Portfolio of Investments (unaudited) – continued
| | | | | | | | |
| Issuer | | Shares/Par | | | Value ($) | |
| | | | | | | | |
| Municipal Bonds - continued | | | | | | | | |
| Florida - continued | | | | | | | | |
| Miromar Lakes, FL, Community Development District, Capital Improvement Rev., 4.875%, 5/01/22 | | $ | 830,000 | | | $ | 876,181 | |
| Miromar Lakes, FL, Community Development District, Capital Improvement Rev., 5.375%, 5/01/32 | | | 990,000 | | | | 1,051,994 | |
| Naturewalk Community Development District, FL, Capital Improvement Rev., “B”, 5.3%, 5/01/16 (d)(q) | | | 2,300,000 | | | | 1,196,000 | |
| OTC Community Development District, FL, Special Assessment, “A”, 5.3%, 5/01/38 | | | 4,505,000 | | | | 4,500,495 | |
| Palm Beach County, FL, Health Facilities Rev. (Sinai Residences of Boca Raton Project), 7.5%, 6/01/49 | | | 2,030,000 | | | | 2,255,330 | |
| Palm Glades Community Development District, FL, Special Assessment, “A”, 5.3%, 5/01/36 | | | 910,000 | | | | 918,345 | |
| Palm River, FL, Community Development District, Special Assessment Rev., “A”, 5.375%, 5/01/36 (a)(d) | | | 895,000 | | | | 331,150 | |
| Palm River, FL, Community Development District, Special Assessment Rev., “B”, 5.15%, 5/01/15 (a)(d) | | | 1,000,000 | | | | 370,000 | |
| Parkway Center Community Development District, FL, Special Assessment, “B”, 7%, 5/01/23 | | | 1,670,000 | | | | 1,650,695 | |
| Pasco County, FL, Estancia At Wiregrass Community Development District, Capital Improvement, 7%, 11/01/45 | | | 1,995,000 | | | | 2,204,475 | |
| Paseo Community Development District, FL, Capital Improvement Rev., “B”, 4.875%, 5/01/10 (a)(d) | | | 1,415,000 | | | | 14 | |
| Paseo Community Development District, FL, Capital Improvement Rev., Capital Appreciation, “A-2”, 0%, 5/01/36 | | | 2,625,000 | | | | 1,070,239 | |
| Paseo Community Development District, FL, Special Assessment, “A-1”, 5.4%, 5/01/36 | | | 245,000 | | | | 252,509 | |
| Pinellas County, FL, Educational Facilities Authority Rev. (Barry University), 6%, 10/01/41 | | | 5,330,000 | | | | 5,906,919 | |
| Sarasota County, FL, Health Facility Authority Rev. (Sarasota Manatee), 5.75%, 7/01/37 | | | 3,240,000 | | | | 3,127,928 | |
| Sarasota County, FL, Health Facility Authority Rev. (Sarasota Manatee), 5.75%, 7/01/45 | | | 395,000 | | | | 373,236 | |
| Seminole County, FL, Industrial Development Authority Rev. (Choices in Learning, Inc.), “A”, 7.375%, 11/15/41 | | | 2,500,000 | | | | 2,733,375 | |
| Seminole Tribe, FL, Special Obligation Rev., “A”, 5.75%, 10/01/22 (n) | | | 4,150,000 | | | | 4,569,939 | |
| Seminole Tribe, FL, Special Obligation Rev., “A”, 5.5%, 10/01/24 (n) | | | 2,505,000 | | | | 2,725,215 | |
| Seminole Tribe, FL, Special Obligation Rev., “A”, 5.25%, 10/01/27 (n) | | | 1,840,000 | | | | 1,925,229 | |
| South Lake County, FL, Hospital District Rev. (South Lake Hospital), “A”, 6%, 4/01/29 | | | 1,155,000 | | | | 1,274,866 | |
| South Lake County, FL, Hospital District Rev. (South Lake Hospital), “A”, 6.25%, 4/01/39 | | | 1,715,000 | | | | 1,891,868 | |
17
Portfolio of Investments (unaudited) – continued
| | | | | | | | |
| Issuer | | Shares/Par | | | Value ($) | |
| | | | | | | | |
| Municipal Bonds - continued | | | | | | | | |
| Florida - continued | | | | | | | | |
| St. John’s County, FL, Industrial Development Authority Rev. (Bayview Project), “A”, 5.2%, 10/01/27 | | $ | 1,590,000 | | | $ | 1,417,994 | |
| St. John’s County, FL, Industrial Development Authority Rev. (Bayview Project), “A”, 5.25%, 10/01/41 | | | 2,800,000 | | | | 2,283,064 | |
| St. John’s County, FL, Industrial Development Authority Rev. (Presbyterian Retirement), “A”, 6%, 8/01/45 | | | 7,715,000 | | | | 8,278,967 | |
| Sterling Hill Community Development District, FL, Capital Improvement Rev., “B”, 5.5%, 11/01/10 (d) | | | 545,000 | | | | 349,018 | |
| Stonebrier Community Development District, FL, Special Assessment, 5.5%, 5/01/37 | | | 1,640,000 | | | | 1,633,014 | |
| Sumter County, FL, Industrial Development Authority Hospital Rev. (Central Florida Health Alliance Projects), “A”, 5%, 7/01/26 | | | 155,000 | | | | 169,975 | |
| Sumter County, FL, Industrial Development Authority Hospital Rev. (Central Florida Health Alliance Projects), “A”, 5%, 7/01/29 | | | 145,000 | | | | 155,679 | |
| Sumter County, FL, Industrial Development Authority Hospital Rev. (Central Florida Health Alliance Projects), “A”, 5.125%, 7/01/34 | | | 315,000 | | | | 333,916 | |
| Sumter County, FL, Industrial Development Authority Hospital Rev. (Central Florida Health Alliance Projects), “A”, 5.25%, 7/01/44 | | | 935,000 | | | | 982,395 | |
| Tuscany Reserve Community Development District, FL, Special Assessment, “B”, 5.25%, 5/01/16 | | | 1,935,000 | | | | 1,949,416 | |
| Two Creeks Community Development District, FL, Capital Improvement Rev., 5.25%, 5/01/37 | | | 1,915,000 | | | | 1,905,559 | |
| Villa Portofino East Community Development District, FL, Special Assessment, 5.2%, 5/01/37 | | | 1,810,000 | | | | 1,844,517 | |
| Villa Vizcaya Community Development District, FL, “A”, 5.55%, 5/01/39 (a)(d) | | | 790,000 | | | | 339,700 | |
| Watergrass Community Development District, FL, “A”, 5.375%, 5/01/39 | | | 1,360,000 | | | | 957,630 | |
| Watergrass Community Development District, FL, Special Assessment, “B”, 6.96%, 11/01/17 | | | 270,000 | | | | 264,149 | |
| | | | | | | | |
| | | | | | | $ | 195,724,334 | |
| Georgia - 2.0% | | | | | | | | |
| Americus and Sumter County, GA, Hospital Authority Rev. (Magnolia Manor Obligated Group), “A”, 6.25%, 5/15/33 | | $ | 1,060,000 | | | $ | 1,130,617 | |
| Americus and Sumter County, GA, Hospital Authority Rev. (Magnolia Manor Obligated Group), “A”, 6.375%, 5/15/43 | | | 1,060,000 | | | | 1,126,059 | |
| Atlanta, GA, Tax Allocation (Eastside Project), “B”, 5.6%, 1/01/30 | | | 2,450,000 | | | | 2,538,078 | |
18
Portfolio of Investments (unaudited) – continued
| | | | | | | | |
| Issuer | | Shares/Par | | | Value ($) | |
| | | | | | | | |
| Municipal Bonds - continued | | | | | | | | |
| Georgia - continued | | | | | | | | |
| Atlanta, GA, Tax Allocation (Princeton Lakes Project), 5.5%, 1/01/31 | | $ | 1,515,000 | | | $ | 1,527,620 | |
| Atlanta, GA, Water & Wastewater Rev., “A”, 6%, 11/01/22 | | | 2,895,000 | | | | 3,552,223 | |
| Brunswick, GA, Hospital Authority Rev. (Glynn-Brunswick Memorial Hospital), 5.625%, 8/01/34 | | | 1,375,000 | | | | 1,481,838 | |
| Clayton County, GA, Development Authority Special Facilities Rev. (Delta Airlines, Inc.), “A”, 8.75%, 6/01/29 | | | 4,070,000 | | | | 5,060,109 | |
| Clayton County, GA, Development Authority Special Facilities Rev. (Delta Airlines, Inc.), “B”, 9%, 6/01/35 | | | 1,290,000 | | | | 1,349,701 | |
| DeKalb County, GA, Hospital Authority Rev. (DeKalb Medical Center, Inc.), 6.125%, 9/01/40 | | | 7,170,000 | | | | 7,591,453 | |
| DeKalb County, GA, Water & Sewer Rev., “A”, 5.25%, 10/01/31 | | | 175,000 | | | | 199,938 | |
| Fulton County, GA, Residential Care Facilities Authority Rev., “A”, 6.125%, 2/15/34 | | | 1,020,000 | | | | 1,029,945 | |
| Georgia Housing & Finance Authority Rev., Single Family Mortgage, “A-1”, 4%, 6/01/44 | | | 1,645,000 | | | | 1,811,129 | |
| Georgia Main Street Natural Gas, Inc., Gas Project Rev., “A”, 5.5%, 9/15/28 | | | 2,245,000 | | | | 2,618,568 | |
| Georgia Medical Center Hospital Authority Rev. (Spring Harbor Green Island Project), 5.25%, 7/01/37 | | | 4,610,000 | | | | 4,624,522 | |
| Marietta, GA, Development Facilities Authority Rev. (Life University), 7%, 6/15/30 | | | 2,330,000 | | | | 2,455,680 | |
| Marietta, GA, Development Facilities Authority Rev. (Life University), 7%, 6/15/39 | | | 4,360,000 | | | | 4,547,436 | |
| Monroe County, GA, Development Authority Pollution Control Rev. (Georgia Power Company Plant Scherer Project), FRN, 2%, 7/01/25 (Put Date 6/13/19) | | | 1,230,000 | | | | 1,233,961 | |
| Private Colleges & Universities, GA, Authority Rev. (Mercer University), “C”, 5.25%, 10/01/27 | | | 920,000 | | | | 1,014,788 | |
| Rockdale County, GA, Development Authority Project Rev. (Visy Paper Project), “A”, 6.125%, 1/01/34 | | | 4,835,000 | | | | 4,928,509 | |
| | | | | | | | |
| | | | | | | $ | 49,822,174 | |
| Guam - 0.2% | | | | | | | | |
| Guam Government Department of Education (John F. Kennedy High School), “A”, COP, 6.875%, 12/01/40 | | $ | 3,055,000 | | | $ | 3,374,125 | |
| Guam Government, “A”, 7%, 11/15/39 | | | 1,115,000 | | | | 1,217,212 | |
| Guam International Airport Authority Rev., “C”, 5%, 10/01/16 | | | 255,000 | | | | 271,167 | |
| | | | | | | | |
| | | | | | | $ | 4,862,504 | |
| Hawaii - 0.6% | |
| Hawaii Department of Budget & Finance, Special Purpose Rev. (15 Craigside Project), “A”, 8.75%, 11/15/29 | | $ | 415,000 | | | $ | 481,977 | |
19
Portfolio of Investments (unaudited) – continued
| | | | | | | | |
| Issuer | | Shares/Par | | | Value ($) | |
| | | | | | | | |
| Municipal Bonds - continued | | | | | | | | |
| Hawaii - continued | | | | | | | | |
| Hawaii Department of Budget & Finance, Special Purpose Rev. (15 Craigside Project), “A”, 9%, 11/15/44 | | $ | 1,190,000 | | | $ | 1,386,076 | |
| Hawaii Department of Budget & Finance, Special Purpose Rev. (Hawaiian Electric Co. & Subsidiary), 6.5%, 7/01/39 | | | 10,580,000 | | | | 12,122,035 | |
| | | | | | | | |
| | | | | | | $ | 13,990,088 | |
| Idaho - 0.2% | | | | | | | | |
| Idaho Health Facilities Authority Rev. (The Terraces of Boise Project), “B2”, 6%, 10/01/21 | | $ | 2,120,000 | | | $ | 2,137,193 | |
| Idaho Health Facilities Authority Rev. (The Terraces of Boise Project), “B3”, 5.25%, 10/01/20 | | | 2,060,000 | | | | 2,084,761 | |
| | | | | | | | |
| | | | | | | $ | 4,221,954 | |
| Illinois - 5.6% | | | | | | | | |
| Bellwood, IL, 5.875%, 12/01/27 | | $ | 2,300,000 | | | $ | 2,248,940 | |
| Bellwood, IL, 6.15%, 12/01/32 | | | 4,800,000 | | | | 4,671,072 | |
| Chicago, IL, O’Hare International Airport Rev., Customer Facility Charge, AGM, 5.25%, 1/01/32 | | | 675,000 | | | | 738,734 | |
| Chicago, IL, O’Hare International Airport Rev., Customer Facility Charge, AGM, 5.25%, 1/01/33 | | | 335,000 | | | | 364,631 | |
| Chicago, IL, O’Hare International Airport Rev., Customer Facility Charge, AGM, 5.5%, 1/01/43 | | | 1,350,000 | | | | 1,422,306 | |
| Chicago, IL, O’Hare International Airport Rev., Third Lien, “A”, 5.625%, 1/01/35 | | | 5,645,000 | | | | 6,296,941 | |
| Chicago, IL, Transit Authority Sales Tax Receipts Rev., 5.25%, 12/01/31 | | | 540,000 | | | | 599,076 | |
| Du Page County, IL, Special Service Area No. 31 Special Tax (Monarch Landing Project), 5.625%, 3/01/36 | | | 945,000 | | | | 948,374 | |
| Illinois Finance Authority Charter School Rev. (Uno Charter School Network, Inc.), “A”, 7.125%, 10/01/41 | | | 2,000,000 | | | | 2,298,220 | |
| Illinois Finance Authority Rev. (Centegra Health System), “A”, 5%, 9/01/39 | | | 3,780,000 | | | | 3,866,978 | |
| Illinois Finance Authority Rev. (Christian Homes, Inc.), 6.125%, 5/15/27 | | | 4,150,000 | | | | 4,634,637 | |
| Illinois Finance Authority Rev. (Evangelical Retirement Homes of Greater Chicago, Inc.), 7.25%, 2/15/45 | | | 3,600,000 | | | | 3,800,340 | |
| Illinois Finance Authority Rev. (Franciscan Communities, Inc.), “A”, 5.5%, 5/15/27 | | | 1,600,000 | | | | 1,658,560 | |
| Illinois Finance Authority Rev. (Franciscan Communities, Inc.), “A”, 4.75%, 5/15/33 | | | 2,685,000 | | | | 2,610,035 | |
| Illinois Finance Authority Rev. (Franciscan Communities, Inc.), “A”, 5.5%, 5/15/37 | | | 8,015,000 | | | | 8,152,377 | |
| Illinois Finance Authority Rev. (Franciscan Communities, Inc.), “A”, 5.125%, 5/15/43 | | | 3,410,000 | | | | 3,331,945 | |
20
Portfolio of Investments (unaudited) – continued
| | | | | | | | |
| Issuer | | Shares/Par | | | Value ($) | |
| | | | | | | | |
| Municipal Bonds - continued | | | | | | | | |
| Illinois - continued | | | | | | | | |
| Illinois Finance Authority Rev. (Friendship Village), “A”, 5.375%, 2/15/25 | | $ | 4,630,000 | | | $ | 4,634,306 | |
| Illinois Finance Authority Rev. (Illinois Institute of Technology), “A”, 5%, 4/01/31 | | | 3,125,000 | | | | 3,093,469 | |
| Illinois Finance Authority Rev. (KishHealth Systems Obligated Group), 5.75%, 10/01/28 | | | 3,770,000 | | | | 4,066,473 | |
| Illinois Finance Authority Rev. (Lutheran Home & Services), 5.625%, 5/15/42 | | | 3,110,000 | | | | 3,151,705 | |
| Illinois Finance Authority Rev. (Montgomery Place), “A”, 5.75%, 5/15/38 | | | 1,730,000 | | | | 1,753,718 | |
| Illinois Finance Authority Rev. (O.S.F. Healthcare Systems) “A”, 7%, 11/15/29 | | | 3,025,000 | | | | 3,638,833 | |
| Illinois Finance Authority Rev. (O.S.F. Healthcare Systems) “A”, 7.125%, 11/15/37 | | | 2,555,000 | | | | 3,018,222 | |
| Illinois Finance Authority Rev. (Provena Health), “A”, 6%, 5/01/28 | | | 4,000,000 | | | | 4,363,480 | |
| Illinois Finance Authority Rev. (Provena Health), “A”, 7.75%, 8/15/34 | | | 3,865,000 | | | | 4,705,753 | |
| Illinois Finance Authority Rev. (Rehabilitation Institute of Chicago), “A”, 6%, 7/01/43 | | | 1,305,000 | | | | 1,483,159 | |
| Illinois Finance Authority Rev. (Resurrection Health), 6.125%, 5/15/25 | | | 2,620,000 | | | | 2,918,916 | |
| Illinois Finance Authority Rev. (Roosevelt University Project), 6.25%, 4/01/29 | | | 6,045,000 | | | | 6,347,794 | |
| Illinois Finance Authority Rev. (Silver Cross Hospital & Medical Centers), 6.875%, 8/15/38 | | | 1,500,000 | | | | 1,716,645 | |
| Illinois Finance Authority Rev. (Silver Cross Hospital & Medical Centers), 7%, 8/15/44 | | | 2,545,000 | | | | 2,914,509 | |
| Illinois Finance Authority Rev. (Smith Village), “A”, 6.125%, 11/15/25 | | | 1,185,000 | | | | 1,194,113 | |
| Illinois Finance Authority Rev. (Smith Village), “A”, 6.25%, 11/15/35 | | | 2,195,000 | | | | 2,199,807 | |
| Illinois Finance Authority Rev. (The Clare at Water Tower), “A-6”, 6%, 5/15/28 (a)(d) | | | 1,057,000 | | | | 106 | |
| Illinois Finance Authority Rev. (The Clare at Water Tower), Capital Appreciation, “B”, 0%, 5/15/50 (a) | | | 453,000 | | | | 45 | |
| Illinois Finance Authority Student Housing Rev. (Illinois State University), 6.75%, 4/01/31 | | | 1,875,000 | | | | 2,215,594 | |
| Illinois Finance Authority Student Housing Rev. (Northern Illinois University Project), 6.625%, 10/01/31 | | | 5,785,000 | | | | 6,859,853 | |
| Illinois Railsplitter Tobacco Settlement Authority, 5.5%, 6/01/23 | | | 560,000 | | | | 652,529 | |
| Illinois Railsplitter Tobacco Settlement Authority, 6.25%, 6/01/24 | | | 3,110,000 | | | | 3,395,747 | |
21
Portfolio of Investments (unaudited) – continued
| | | | | | | | |
| Issuer | | Shares/Par | | | Value ($) | |
| | | | | | | | |
| Municipal Bonds - continued | | | | | | | | |
| Illinois - continued | | | | | | | | |
| Illinois Railsplitter Tobacco Settlement Authority, 6%, 6/01/28 | | $ | 14,375,000 | | | $ | 16,737,388 | |
| Illinois Toll Highway Authority Rev., “B”, 5.5%, 1/01/33 | | | 4,355,000 | | | | 4,868,019 | |
| Lincolnshire, IL, Special Service Area No. 1 (Sedgebrook Project), 6.25%, 3/01/34 | | | 3,052,000 | | | | 3,118,015 | |
| Upper Illinois River Valley Development Authority (Pleasant View Lutheran Home), 7.25%, 11/15/40 | | | 1,080,000 | | | | 1,141,528 | |
| Upper Illinois River Valley Development Authority (Pleasant View Lutheran Home), 7.375%, 11/15/45 | | | 1,250,000 | | | | 1,321,925 | |
| | | | | | | | |
| | | | | | | $ | 139,154,817 | |
| Indiana - 2.5% | | | | | | | | |
| Carmel, IN, Rev. (Barrington of Carmel Project), “A”, 7.125%, 11/15/42 | | $ | 3,000,000 | | | $ | 3,191,130 | |
| Indiana Economic Development Finance Authority Rev. (Republic Services, Inc. Project), “B”, 0.3%, 5/01/28 (Put Date 9/02/14) | | | 1,315,000 | | | | 1,315,000 | |
| Indiana Finance Authority Rev. (I-69 Section 5 Project), 5.25%, 9/01/34 | | | 1,960,000 | | | | 2,089,380 | |
| Indiana Finance Authority Rev. (I-69 Section 5 Project), 5.25%, 9/01/40 | | | 3,005,000 | | | | 3,168,382 | |
| Indiana Finance Authority Rev. (Marquette Project), 4.75%, 3/01/32 | | | 4,790,000 | | | | 4,865,969 | |
| Indiana Finance Authority Rev. (Marquette Project), 5%, 3/01/39 | | | 1,215,000 | | | | 1,222,569 | |
| Indiana Finance Authority Rev. (Ohio River Bridges East End Crossing Project), “A”, 5%, 7/01/35 | | | 2,095,000 | | | | 2,193,004 | |
| Indiana Finance Authority Rev. (Ohio River Bridges East End Crossing Project), “A”, 5%, 7/01/40 | | | 5,350,000 | | | | 5,540,300 | |
| Indiana Finance Authority Rev. (Ohio River Bridges East End Crossing Project), “A”, 5%, 7/01/44 | | | 3,260,000 | | | | 3,361,484 | |
| Indiana Finance Authority Rev. (Ohio River Bridges East End Crossing Project), “B”, 5%, 1/01/19 | | | 1,640,000 | | | | 1,765,804 | |
| Indiana Health & Educational Facilities Finance Authority, Hospital Rev. (Clarian Health), “A”, 5%, 2/15/39 | | | 2,000,000 | | | | 2,049,640 | |
| Indiana Health & Educational Facilities Finance Authority, Hospital Rev. (Clarian Health), “B”, 5%, 2/15/33 | | | 2,510,000 | | | | 2,583,643 | |
| Indianapolis, IN, Multi-Family Rev. (Cambridge Station Apartments II), FNMA, 5.25%, 1/01/39 (Put Date 1/01/27) | | | 1,345,000 | | | | 1,351,792 | |
| Knox County, IN, Economic Development Rev. (Good Samaritan Hospital), “A”, 5%, 4/01/42 | | | 1,030,000 | | | | 1,056,935 | |
| Richmond, IN, Hospital Authority Rev. (Reid Hospital & Health Center Services), “A”, 6.625%, 1/01/39 | | | 4,760,000 | | | | 5,443,726 | |
| Terre Haute, IN, Rev. (Westminster Village), 6%, 8/01/39 | | | 3,600,000 | | | | 3,447,468 | |
22
Portfolio of Investments (unaudited) – continued
| | | | | | | | |
| Issuer | | Shares/Par | | | Value ($) | |
| | | | | | | | |
| Municipal Bonds - continued | | | | | | | | |
| Indiana - continued | | | | | | | | |
| University of Southern Indiana Rev. (Student Fee), “J”, ASSD GTY, 5.75%, 10/01/28 | | $ | 1,445,000 | | | $ | 1,670,796 | |
| Valparaiso, IN, Exempt Facilities Rev. (Pratt Paper LLC Project), 6.75%, 1/01/34 | | | 4,370,000 | | | | 4,830,904 | |
| Valparaiso, IN, Exempt Facilities Rev. (Pratt Paper LLC Project), 7%, 1/01/44 | | | 10,875,000 | | | | 11,884,200 | |
| | | | | | | | |
| | | | $ | 63,032,126 | |
| Iowa - 1.2% | | | | | | | | |
| Altoona, IA, Urban Renewal Tax Increment Rev., 6%, 6/01/43 | | $ | 3,000,000 | | | $ | 3,134,760 | |
| Iowa Finance Authority Health Facilities Rev. (UnityPoint Health), “C”, 5%, 2/15/30 | | | 800,000 | | | | 902,032 | |
| Iowa Finance Authority Health Facilities Rev. (UnityPoint Health), “C”, 5%, 2/15/31 | | | 1,480,000 | | | | 1,659,805 | |
| Iowa Finance Authority Health Facilities Rev. (UnityPoint Health), “C”, 5%, 2/15/32 | | | 715,000 | | | | 797,568 | |
| Iowa Finance Authority Midwestern Disaster Area Rev. (Iowa Fertilizer Co.), 5%, 12/01/19 | | | 1,455,000 | | | | 1,528,317 | |
| Iowa Finance Authority Midwestern Disaster Area Rev. (Iowa Fertilizer Co.), 5.5%, 12/01/22 | | | 2,910,000 | | | | 3,041,532 | |
| Iowa Finance Authority Midwestern Disaster Area Rev. (Iowa Fertilizer Co.), 5.25%, 12/01/25 | | | 2,910,000 | | | | 3,060,913 | |
| Iowa Finance Authority, Health Care Facilities Rev. (Care Initiatives), “A”, 5.5%, 7/01/21 | | | 1,530,000 | | | | 1,607,556 | |
| Iowa Finance Authority, Health Care Facilities Rev. (Care Initiatives), “A”, 5.5%, 7/01/25 | | | 2,495,000 | | | | 2,583,897 | |
| Iowa Student Loan Liquidity Corp., “A-2”, 5.5%, 12/01/25 | | | 1,395,000 | | | | 1,491,897 | |
| Iowa Student Loan Liquidity Corp., “A-2”, 5.6%, 12/01/26 | | | 1,400,000 | | | | 1,496,236 | |
| Iowa Student Loan Liquidity Corp., “A-2”, 5.7%, 12/01/27 | | | 165,000 | | | | 176,385 | |
| Iowa Student Loan Liquidity Corp., “A-2”, 5.75%, 12/01/28 | | | 2,825,000 | | | | 3,012,665 | |
| Iowa Tobacco Settlement Authority, Tobacco Settlement Rev., Asset Backed, “B”, 5.6%, 6/01/34 | | | 4,295,000 | | | | 3,754,861 | |
| Scott County, IA, Rev. (Christian Retirement Homes, Inc.), 5.25%, 11/15/21 | | | 2,410,000 | | | | 2,453,766 | |
| | | | | | | | |
| | | | $ | 30,702,190 | |
| Kansas - 0.9% | | | | | | | | |
| Atchison, KS, Hospital Rev. (Atchison Hospital Assn.), “A”, 6.75%, 9/01/30 | | $ | 2,600,000 | | | $ | 2,799,992 | |
| Lenexa, KS, Health Care Facilities Rev. (Lakeview Village, Inc.), 5.375%, 5/15/27 | | | 1,185,000 | | | | 1,202,123 | |
| Lenexa, KS, Health Care Facilities Rev. (Lakeview Village, Inc.), 7.125%, 5/15/29 | | | 1,555,000 | | | | 1,756,373 | |
23
Portfolio of Investments (unaudited) – continued
| | | | | | | | |
| Issuer | | Shares/Par | | | Value ($) | |
| | | | | | | | |
| Municipal Bonds - continued | | | | | | | | |
| Kansas - continued | | | | | | | | |
| Lenexa, KS, Health Care Facilities Rev. (Lakeview Village, Inc.), 5.5%, 5/15/39 | | $ | 2,325,000 | | | $ | 2,336,067 | |
| Overland Park, KS, Special Assessment (Tallgrass Creek), 4.85%, 9/01/16 | | | 361,000 | | | | 362,025 | |
| Overland Park, KS, Special Assessment (Tallgrass Creek), 5.125%, 9/01/28 | | | 3,848,000 | | | | 3,725,826 | |
| Sedgwick & Shawnee Counties, KS, Single Family Housing Rev., “A-1”, GNMA, 5.75%, 12/01/37 | | | 90,000 | | | | 94,428 | |
| Sedgwick & Shawnee Counties, KS, Single Family Housing Rev., “A-2”, GNMA, 5.75%, 12/01/37 | | | 325,000 | | | | 331,900 | |
| Sedgwick & Shawnee Counties, KS, Single Family Housing Rev., “A-4”, GNMA, 5.625%, 6/01/36 | | | 335,000 | | | | 357,472 | |
| Sedgwick & Shawnee Counties, KS, Single Family Housing Rev., “A-4”, GNMA, 5.85%, 6/01/37 | | | 490,000 | | | | 505,455 | |
| Sedgwick & Shawnee Counties, KS, Single Family Housing Rev., “A-5”, GNMA, 5.9%, 12/01/37 | | | 125,000 | | | | 130,555 | |
| Wichita, KS, Health Care Facilities Rev. (Presbyterian Manors, Inc.), “A”, 6.375%, 5/15/43 | | | 4,165,000 | | | | 4,436,516 | |
| Wichita, KS, Health Care Facilities Rev. (Presbyterian Manors, Inc.), “IV-B2”, 3.375%, 11/15/20 | | | 635,000 | | | | 621,767 | |
| Wyandotte County/Kansas City, KS, Unified Government Special Obligation Rev., Capital Appreciation, “B”, 0%, 6/01/21 | | | 3,210,000 | | | | 2,232,523 | |
| Wyandotte County/Kansas City, KS, Unified Government Utility System Improvement Rev., “A”, 5%, 9/01/44 | | | 1,740,000 | | | | 1,890,562 | |
| | | | | | | | |
| | | | $ | 22,783,584 | |
| Kentucky - 1.5% | | | | | | | | |
| Glasgow, KY, Healthcare Rev. (TJ Samson Community Hospital), 6.375%, 2/01/35 | | $ | 2,840,000 | | | $ | 3,179,749 | |
| Kentucky Economic Development Finance Authority Health Care Rev. (Masonic Homes of Kentucky, Inc.), 5.375%, 11/15/42 | | | 2,130,000 | | | | 2,112,981 | |
| Kentucky Economic Development Finance Authority Health Care Rev. (Masonic Homes of Kentucky, Inc.), 5.5%, 11/15/45 | | | 1,325,000 | | | | 1,327,491 | |
| Kentucky Economic Development Finance Authority Rev. (Masonic Home Independent Living II), 7.25%, 5/15/41 | | | 3,000,000 | | | | 3,363,570 | |
| Kentucky Economic Development Finance Authority Rev. (Masonic Home Independent Living II), 7.375%, 5/15/46 | | | 1,050,000 | | | | 1,170,057 | |
Kentucky Economic Development Finance Authority, Hospital Facilities Rev. (Baptist Healthcare System), “A”,
5.625%, 8/15/27 | | | 815,000 | | | | 909,027 | |
Kentucky Economic Development Finance Authority, Hospital Facilities Rev. (Owensboro Medical Health System), “A”,
6%, 6/01/30 | | | 710,000 | | | | 799,538 | |
24
Portfolio of Investments (unaudited) – continued
| | | | | | | | |
| Issuer | | Shares/Par | | | Value ($) | |
| | | | | | | | |
| Municipal Bonds - continued | | | | | | | | |
| Kentucky - continued | | | | | | | | |
| Kentucky Economic Development Finance Authority, Hospital Facilities Rev. (Owensboro Medical Health System), “A”, 6.375%, 6/01/40 | | $ | 6,215,000 | | | $ | 6,964,218 | |
| Kentucky Economic Development Finance Authority, Hospital Facilities Rev. (Owensboro Medical Health System), “A”, 6.5%, 3/01/45 | | | 1,955,000 | | | | 2,194,624 | |
| Kentucky Economic Development Finance Authority, Solid Waste Refunding Rev. (Republic Services, Inc.), “A”, 0.4%, 4/01/31 (Put Date 9/02/14) | | | 565,000 | | | | 565,000 | |
| Kentucky Economic Development Finance Authority, Solid Waste Refunding Rev. (Republic Services, Inc.), “B”, 0.3%, 4/01/31 (Put Date 9/02/14) | | | 655,000 | | | | 655,000 | |
| Louisville & Jefferson County, KY, Metropolitan Government Healthcare Systems Rev. (Norton Healthcare, Inc.), 5.25%, 10/01/36 | | | 5,180,000 | | | | 5,290,697 | |
| Owen County, KY, Waterworks System Rev. (American Water Co. Project), “A”, 6.25%, 6/01/39 | | | 1,635,000 | | | | 1,819,788 | |
| Owen County, KY, Waterworks System Rev. (American Water Co. Project), “B”, 5.625%, 9/01/39 | | | 1,830,000 | | | | 1,972,209 | |
| University of Kentucky, General Receipts, “A”, 5%, 4/01/36 | | | 1,460,000 | | | | 1,649,552 | |
| University of Kentucky, General Receipts, “A”, 5%, 4/01/37 | | | 2,715,000 | | | | 3,057,959 | |
| | | | | | | | |
| | | | $ | 37,031,460 | |
| Louisiana - 1.7% | | | | | | | | |
| Jefferson Parish, LA, Hospital Service District No. 1 (West Jefferson Medical Center), “A”, 6%, 1/01/39 | | $ | 1,500,000 | | | $ | 1,655,505 | |
| Jefferson Parish, LA, Hospital Service District No. 2 (East Jefferson General Hospital), 6.25%, 7/01/31 | | | 3,200,000 | | | | 3,517,120 | |
| Jefferson Parish, LA, Hospital Service District No. 2 (East Jefferson General Hospital), 6.375%, 7/01/41 | | | 2,000,000 | | | | 2,158,800 | |
| Lakeshore Villages Master Community Development District, LA, Special Assessment, “A”, 5.25%, 7/01/17 (a)(d) | | | 2,862,000 | | | | 1,001,700 | |
| Louisiana Environmental Facilities & Community Development Authority Rev. (Westlake Chemical), 6.75%, 11/01/32 | | | 4,800,000 | | | | 5,345,040 | |
| Louisiana Environmental Facilities & Community Development Authority Rev. (Westlake Chemical), “A”, 6.5%, 8/01/29 | | | 2,990,000 | | | | 3,429,111 | |
| Louisiana Environmental Facilities & Community Development Authority Rev. (Westlake Chemical), “A-2”, 6.5%, 11/01/35 | | | 4,000,000 | | | | 4,596,960 | |
| Louisiana Local Government, Environmental Facilities & Community Development Authority Rev. (CDF Healthcare), “A”, 7%, 6/01/36 | | | 1,530,000 | | | | 1,542,990 | |
| Louisiana Local Government, Environmental Facilities & Community Development Authority Rev. (CDF Healthcare), “C”, 7%, 6/01/36 | | | 1,255,000 | | | | 1,262,467 | |
25
Portfolio of Investments (unaudited) – continued
| | | | | | | | |
| Issuer | | Shares/Par | | | Value ($) | |
| | | | | | | | |
| Municipal Bonds - continued | | | | | | | | |
| Louisiana - continued | | | | | | | | |
| Louisiana Local Government, Environmental Facilities & Community Development Authority Rev. (Westside Rehab Center Project), “A”, 6.85%, 10/01/36 | | $ | 6,995,000 | | | $ | 7,140,636 | |
| Louisiana Public Facilities Authority Hospital Rev. (Lake Charles Memorial Hospital), 6.375%, 12/01/34 | | | 5,470,000 | | | | 5,928,058 | |
| New Orleans, LA, Aviation Board Gulf Opportunity Zone CFC Rev. (Consolidated Rental Car), “A”, 6.25%, 1/01/30 | | | 2,050,000 | | | | 2,339,317 | |
| Sabine River, LA, Water Facilities Authority Rev. (International Paper Co.), 6.2%, 2/01/25 | | | 2,250,000 | | | | 2,259,383 | |
| | | | | | | | |
| | | | | | | $ | 42,177,087 | |
| Maine - 0.6% | | | | | | | | |
| Maine Finance Authority Solid Waste Disposal Rev. (Casella Waste Systems, Inc.), 6.25%, 1/01/25 (Put Date 2/01/17) | | $ | 3,985,000 | | | $ | 4,068,446 | |
| State of Maine, “B”, 5%, 6/01/21 | | | 9,675,000 | | | | 11,654,021 | |
| | | | | | | | |
| | | | $ | 15,722,467 | |
| Maryland - 0.6% | | | | | | | | |
| Anne Arundel County, MD, Special Obligation (National Business Park-North Project), 6.1%, 7/01/40 | | $ | 1,320,000 | | | $ | 1,405,232 | |
| Anne Arundel County, MD, Special Obligation (VLG South Waugh Chapel Project), 6.25%, 7/01/40 | | | 4,700,000 | | | | 5,012,738 | |
| Baltimore, MD, Special Obligation (East Baltimore Research Park Project), “A”, 7%, 9/01/38 | | | 2,600,000 | | | | 2,778,464 | |
| Maryland Economic Development Corp. Rev. (Port America Chesapeake Terminal Project), “B”, 5.375%, 6/01/25 | | | 885,000 | | | | 957,145 | |
| Maryland Health & Higher Educational Facilities Authority Rev. (Charlestown Community), 6.25%, 1/01/41 | | | 2,360,000 | | | | 2,577,899 | |
| Maryland Industrial Development Financing Authority, Economic Development Authority Rev. (Our Lady of Good Council), “A”, 6%, 5/01/35 | | | 450,000 | | | | 469,260 | |
| Westminster, MD, Refunding Rev. (Carroll Lutheran Village, Inc.), 5.125%, 7/01/40 | | | 2,600,000 | | | | 2,625,012 | |
| | | | | | | | |
| | | | $ | 15,825,750 | |
| Massachusetts - 3.2% | | | | | | | | |
| Massachusetts College Building Authority Rev., “A”, 5%, 5/01/31 | | $ | 2,535,000 | | | $ | 2,901,130 | |
| Massachusetts College Building Authority Rev., “C”, 3%, 5/01/42 | | | 835,000 | | | | 691,706 | |
| Massachusetts Development Finance Agency Rev. (Adventcare), “A”, 6.75%, 10/15/37 | | | 4,640,000 | | | | 4,826,574 | |
| Massachusetts Development Finance Agency Rev. (Linden Ponds, Inc.), “A-1”, 6.25%, 11/15/31 | | | 869,621 | | | | 780,659 | |
26
Portfolio of Investments (unaudited) – continued
| | | | | | | | |
| Issuer | | Shares/Par | | | Value ($) | |
| | | | | | | | |
| Municipal Bonds - continued | | | | | | | | |
| Massachusetts - continued | | | | | | | | |
| Massachusetts Development Finance Agency Rev. (Linden Ponds, Inc.), “A-1”, 6.25%, 11/15/39 | | $ | 218,601 | | | $ | 186,279 | |
| Massachusetts Development Finance Agency Rev. (Linden Ponds, Inc.), “A-2”, 5.5%, 11/15/46 | | | 58,153 | | | | 42,187 | |
| Massachusetts Development Finance Agency Rev. (Linden Ponds, Inc.), Capital Appreciation, “B”, 0%, 11/15/56 | | | 289,249 | | | | 2,175 | |
| Massachusetts Development Finance Agency Rev. (North Hill Communities), “A”, 6.25%, 11/15/33 | | | 1,350,000 | | | | 1,440,869 | |
| Massachusetts Development Finance Agency Rev. (North Hill Communities), “A”, 6.5%, 11/15/43 | | | 2,080,000 | | | | 2,230,925 | |
| Massachusetts Development Finance Agency Rev. (Simmons College), “H”, SYNCORA, 5.25%, 10/01/33 | | | 430,000 | | | | 491,443 | |
| Massachusetts Development Finance Agency Rev. (Williams College), “P”, 5%, 7/01/43 | | | 1,000,000 | | | | 1,115,510 | |
| Massachusetts Development Finance Agency, Resource Recovery Rev. (Covanta Energy Project), “A”, 4.875%, 11/01/27 | | | 3,585,000 | | | | 3,603,929 | |
| Massachusetts Development Finance Agency, Resource Recovery Rev. (Covanta Energy Project), “C”, 5.25%, 11/01/42 | | | 11,780,000 | | | | 11,818,992 | |
| Massachusetts Development Finance Agency, Solid Waste Disposal Rev. (Dominion Energy Brayton), 5.75%, 12/01/42 (Prerefunded 5/01/19) | | | 685,000 | | | | 828,501 | |
| Massachusetts Educational Financing Authority, Education Loan Rev., “H”, ASSD GTY, 6.35%, 1/01/30 | | | 2,315,000 | | | | 2,472,814 | |
| Massachusetts Educational Financing Authority, Education Loan Rev., “I-A”, 5.5%, 1/01/22 | | | 250,000 | | | | 279,988 | |
| Massachusetts Educational Financing Authority, Education Loan Rev., “J”, 4.7%, 7/01/26 | | | 2,175,000 | | | | 2,266,002 | |
| Massachusetts Educational Financing Authority, Education Loan Rev., “J”, 4.9%, 7/01/28 | | | 2,265,000 | | | | 2,359,111 | |
| Massachusetts Health & Educational Facilities Authority Rev. (Harvard University), 5.5%, 11/15/36 (u) | | | 25,000,000 | | | | 29,060,250 | |
| Massachusetts Health & Educational Facilities Authority Rev. (Jordan Hospital), “D”, 5.25%, 10/01/18 | | | 3,750,000 | | | | 3,753,488 | |
| Massachusetts Health & Educational Facilities Authority Rev. (Simmons College), 8%, 10/01/29 (Prerefunded 10/01/15) | | | 875,000 | | | | 954,161 | |
| Massachusetts Health & Educational Facilities Authority Rev. (Simmons College), 8%, 10/01/29 | | | 1,265,000 | | | | 1,370,767 | |
| Massachusetts Health & Educational Facilities Authority Rev. (Suffolk University), “A”, 6.25%, 7/01/30 | | | 6,130,000 | | | | 7,181,785 | |
| Massachusetts Port Authority Facilities Rev. (Conrac Project), “A”, 5.125%, 7/01/41 | | | 340,000 | | | | 364,140 | |
| | | | | | | | |
| | | | | | | $ | 81,023,385 | |
27
Portfolio of Investments (unaudited) – continued
| | | | | | | | |
| Issuer | | Shares/Par | | | Value ($) | |
| | | | | | | | |
| Municipal Bonds - continued | | | | | | | | |
| Michigan - 2.1% | | | | | | | | |
Detroit, MI, (Financial Recovery Bonds), FRN, 3.5%, 10/07/16 | | $ | 9,550,000 | | | $ | 9,550,000 | |
| Detroit, MI, Sewage Disposal System Rev., Senior Lien, “A”, 5.25%, 7/01/39 | | | 2,735,000 | | | | 2,738,364 | |
| Detroit, MI, Water & Sewerage Department, Senior Lien Sewage Disposal System Rev., “A”, 5%, 7/01/19 | | | 3,270,000 | | | | 3,281,118 | |
| Detroit, MI, Water & Sewerage Department, Senior Lien Sewage Disposal System Rev., “A”, 5%, 7/01/20 | | | 3,275,000 | | | | 3,284,792 | |
| Detroit, MI, Water & Sewerage Department, Senior Lien Sewage Disposal System Rev., “A”, AGM, 5%, 7/01/16 | | | 1,695,000 | | | | 1,706,238 | |
| Detroit, MI, Water Supply System Rev., Senior Lien, “A”, AGM, 5%, 7/01/23 | | | 1,020,000 | | | | 1,024,182 | |
| Detroit, MI, Water Supply System Rev., Senior Lien, “A”, AGM, 5%, 7/01/25 | | | 155,000 | | | | 155,467 | |
| Grand Valley, MI, State University Rev., 5.5%, 12/01/27 | | | 1,015,000 | | | | 1,110,471 | |
| Grand Valley, MI, State University Rev., 5.625%, 12/01/29 | | | 495,000 | | | | 541,535 | |
| Kalamazoo, MI, Economic Development Corp. Rev. (Heritage Community), 5.375%, 5/15/27 | | | 750,000 | | | | 723,405 | |
| Kalamazoo, MI, Economic Development Corp. Rev. (Heritage Community), 5.5%, 5/15/36 | | | 2,550,000 | | | | 2,404,752 | |
| Michigan Hospital Finance Authority Rev. (Henry Ford Health System), 5.75%, 11/15/39 | | | 4,405,000 | | | | 4,803,212 | |
| Michigan Strategic Fund (Waste Management, Inc.), 1.5%, 8/01/27 (Put Date 8/01/17) | | | 4,505,000 | | | | 4,505,000 | |
| Michigan Strategic Fund Ltd. Obligation Rev. (Detroit Edison Co.), 5.625%, 7/01/20 | | | 1,050,000 | | | | 1,231,608 | |
| Royal Oak, MI, Hospital Finance Authority Rev. (William Beaumont Hospital), 5%, 9/01/39 | | | 6,055,000 | | | | 6,472,795 | |
| Royal Oak, MI, Hospital Finance Authority Rev. (William Beaumont Hospital), “V”, 8.25%, 9/01/39 (Prerefunded 9/01/19) | | | 6,945,000 | | | | 8,962,106 | |
| | | | | | | | |
| | | | $ | 52,495,045 | |
| Minnesota - 0.2% | | | | | | | | |
| Anoka County, MN, Charter School Lease Rev. (Spectrum Building Co.), “A”, 5%, 6/01/43 | | $ | 1,000,000 | | | $ | 977,530 | |
| St. Paul, MN, Housing & Redevelopment Authority Charter School Lease Rev. (Nova Classical Academy), “A”, 6.375%, 9/01/31 | | | 630,000 | | | | 687,305 | |
| St. Paul, MN, Housing & Redevelopment Authority Charter School Lease Rev. (Nova Classical Academy), “A”, 6.625%, 9/01/42 | | | 1,260,000 | | | | 1,375,958 | |
| St. Paul, MN, Port Authority Rev. (Energy Park Utility Co. Project), 5.45%, 8/01/28 | | | 250,000 | | | | 259,668 | |
28
Portfolio of Investments (unaudited) – continued
| | | | | | | | |
| Issuer | | Shares/Par | | | Value ($) | |
| | | | | | | | |
| Municipal Bonds - continued | | | | | | | | |
| Minnesota - continued | | | | | | | | |
| St. Paul, MN, Port Authority Rev. (Energy Park Utility Co. Project), 5.7%, 8/01/36 | | $ | 1,250,000 | | | $ | 1,289,600 | |
| | | | | | | | |
| | | | | | | $ | 4,590,061 | |
| Mississippi - 0.1% | | | | | | | | |
| Mississippi Development Bank Special Obligation (Greenville, MS Project), 5%, 4/01/27 | | $ | 1,355,000 | | | $ | 1,374,404 | |
| Mississippi Home Corp. Rev. (Kirkwood Apartments Project), 6.8%, 11/01/37 (d)(q) | | | 3,665,000 | | | | 2,350,878 | |
| | | | | | | | |
| | | | | | | $ | 3,725,282 | |
| Missouri - 0.7% | | | | | | | | |
| Dardenne, MO, Town Square Transportation Development District, “A”, 5%, 5/01/26 (d)(q) | | $ | 2,495,000 | | | $ | 923,150 | |
| Grundy County, MO, Industrial Development Authority, Health Facilities Rev. (Wright Memorial Hospital), 6.75%, 9/01/34 | | | 1,590,000 | | | | 1,725,071 | |
| Missouri Health & Educational Facilities Authority Rev. (A.T. Still University Health Services), 5%, 10/01/39 | | | 465,000 | | | | 498,122 | |
| Missouri Health & Educational Facilities Authority Rev. (Lutheran Senior Service Projects), “A”, 5%, 2/01/35 | | | 3,190,000 | | | | 3,365,003 | |
| Missouri Health & Educational Facilities Authority Rev. (Lutheran Senior Service Projects), “A”, 5%, 2/01/44 | | | 795,000 | | | | 829,789 | |
| Missouri Health & Educational Facilities Authority Rev. (SSM Health Care), “A”, 5%, 6/01/31 | | | 1,735,000 | | | | 1,939,557 | |
| Missouri Housing Development Commission, Single Family Mortgage Rev. (Home Loan Program), “B”, GNMA, 6.05%, 3/01/37 | | | 680,000 | | | | 695,735 | |
| Osage Beach, MO, Tax Increment Rev. (Prewitts), 4.8%, 5/01/16 | | | 735,000 | | | | 735,074 | |
| Osage Beach, MO, Tax Increment Rev. (Prewitts), 5%, 5/01/23 | | | 1,500,000 | | | | 1,447,110 | |
| St. Louis, MO, Land Clearance Redevelopment Authority, Facilities Improvement Special Rev. (Kiel Opera House), “B”, 7%, 9/01/35 | | | 4,390,000 | | | | 4,493,955 | |
| | | | | | | | |
| | | | | | | $ | 16,652,566 | |
| Nebraska - 0.2% | | | | | | | | |
| Nebraska Investment Finance Authority, Housing Rev., “A”, 3%, 3/01/44 | | $ | 1,425,000 | | | $ | 1,498,844 | |
| Nebraska Investment Finance Authority, Housing Rev., “A”, 4%, 9/01/44 | | | 2,465,000 | | | | 2,710,021 | |
| | | | | | | | |
| | | | | | | $ | 4,208,865 | |
| New Hampshire - 1.3% | | | | | | | | |
| New Hampshire Business Finance Authority Rev. (Elliot Hospital Obligated Group), “A”, 6%, 10/01/27 | | $ | 4,935,000 | | | $ | 5,380,828 | |
29
Portfolio of Investments (unaudited) – continued
| | | | | | | | |
| Issuer | | Shares/Par | | | Value ($) | |
| | | | | | | | |
| Municipal Bonds - continued | | | | | | | | |
| New Hampshire - continued | | | | | | | | |
| New Hampshire Business Finance Authority Rev. (Huggins Hospital), 6.875%, 10/01/39 | | $ | 830,000 | | | $ | 890,540 | |
| New Hampshire Health & Education Facilities Authority Rev. (Dartmouth College), 5.25%, 6/01/39 (u) | | | 20,000,000 | | | | 22,570,600 | |
| New Hampshire Health & Education Facilities Authority Rev. (Rivermead), “A”, 6.875%, 7/01/41 | | | 2,625,000 | | | | 2,886,791 | |
| | | | | | | | |
| | | | | | | $ | 31,728,759 | |
| New Jersey - 5.7% | | | | | | | | |
| Bayonne, NJ, Redevelopment Agency (Royal Caribbean Project), “A”, 5.375%, 11/01/35 | | $ | 2,500,000 | | | $ | 2,463,975 | |
| New Jersey Economic Development Authority (Waste Management, Inc.), “A”, 0.55%, 6/01/15 | | | 915,000 | | | | 915,677 | |
| New Jersey Economic Development Authority Rev. (GMT Realty LLC), “B”, 6.875%, 1/01/37 | | | 1,570,000 | | | | 1,595,104 | |
| New Jersey Economic Development Authority Rev. (GMT Realty LLC), “C”, 6.5%, 1/01/15 | | | 505,000 | | | | 510,111 | |
| New Jersey Economic Development Authority Rev. (Kapkowski Road Landfill Project), 5.75%, 10/01/21 | | | 200,000 | | | | 220,638 | |
| New Jersey Economic Development Authority Rev. (Kapkowski Road Landfill Project), 6.5%, 4/01/28 | | | 1,500,000 | | | | 1,783,125 | |
| New Jersey Economic Development Authority Rev. (Kapkowski Road Landfill Project), 6.5%, 4/01/31 | | | 5,850,000 | | | | 6,914,174 | |
| New Jersey Economic Development Authority Rev. (Kapkowski Road Landfill Project), “B”, 6.5%, 4/01/18 | | | 2,145,000 | | | | 2,302,979 | |
| New Jersey Economic Development Authority Rev. (Lions Gate Project), 5%, 1/01/34 | | | 850,000 | | | | 843,702 | |
| New Jersey Economic Development Authority Rev. (Lions Gate Project), 5.25%, 1/01/44 | | | 1,695,000 | | | | 1,687,356 | |
| New Jersey Economic Development Authority Rev. (Seabrook Village, Inc.), 5.25%, 11/15/36 | | | 2,735,000 | | | | 2,773,427 | |
| New Jersey Economic Development Authority Rev. (The Goethals Bridge Replacement Project), 5.5%, 1/01/27 | | | 325,000 | | | | 369,717 | |
| New Jersey Economic Development Authority Rev. (The Goethals Bridge Replacement Project), 5%, 1/01/28 | | | 325,000 | | | | 354,517 | |
| New Jersey Economic Development Authority Rev. (The Goethals Bridge Replacement Project), AGM, 5%, 1/01/31 | | | 975,000 | | | | 1,060,332 | |
| New Jersey Economic Development Authority, Special Facilities Rev. (Continental Airlines, Inc.), 4.875%, 9/15/19 | | | 12,100,000 | | | | 12,365,474 | |
| New Jersey Economic Development Authority, Special Facilities Rev. (Continental Airlines, Inc.), 5.125%, 9/15/23 | | | 5,870,000 | | | | 6,141,488 | |
| New Jersey Economic Development Authority, Special Facilities Rev. (Continental Airlines, Inc.), 5.25%, 9/15/29 | | | 5,770,000 | | | | 6,031,900 | |
30
Portfolio of Investments (unaudited) – continued
| | | | | | | | |
| Issuer | | Shares/Par | | | Value ($) | |
| | | | | | | | |
| Municipal Bonds - continued | | | | | | | | |
| New Jersey - continued | | | | | | | | |
| New Jersey Economic Development Authority, Special Facilities Rev. (Continental Airlines, Inc.), “A”, 5.625%, 11/15/30 | | $ | 1,820,000 | | | $ | 1,941,813 | |
| New Jersey Economic Development Authority, Special Facilities Rev. (Continental Airlines, Inc.), “B”, 5.625%, 11/15/30 | | | 1,655,000 | | | | 1,765,769 | |
| New Jersey Educational Facilities Authority Rev. (University of Medicine & Dentistry), “B”, 7.5%, 12/01/32 (Prerefunded 6/01/19) | | | 4,280,000 | | | | 5,516,321 | |
| New Jersey Educational Facilities Authority Rev. (University of Medicine & Dentistry), “B”, ETM, 6%, 12/01/17 | | | 2,335,000 | | | | 2,678,805 | |
| New Jersey Health Care Facilities, Financing Authority Rev. (St. Joseph’s Healthcare System), 6.625%, 7/01/38 | | | 8,000,000 | | | | 8,679,680 | |
New Jersey Tobacco Settlement Financing Corp., “1-A”, 4.5%, 6/01/23 | | | 18,930,000 | | | | 18,510,890 | |
New Jersey Tobacco Settlement Financing Corp., “1-A”, 4.75%, 6/01/34 | | | 31,335,000 | | | | 23,266,551 | |
| New Jersey Tobacco Settlement Financing Corp., “1-A”, 5%, 6/01/41 | | | 34,705,000 | | | | 25,654,977 | |
| New Jersey Tobacco Settlement Financing Corp., Capital Appreciation, “1-B”, 0%, 6/01/41 | | | 29,790,000 | | | | 7,200,839 | |
| New Jersey Tobacco Settlement Financing Corp., Capital Appreciation, “1-C”, 0%, 6/01/41 | | | 400,000 | | | | 93,896 | |
| | | | | | | | |
| | | | $ | 143,643,237 | |
| New Mexico - 1.0% | | | | | | | | |
| Farmington, NM, Pollution Control Rev. (Public Service New Mexico), “D”, 5.9%, 6/01/40 | | $ | 11,915,000 | | | $ | 13,125,207 | |
| New Mexico Hospital Equipment Loan Council, Hospital Rev. (Rehoboth McKinley Christian Hospital), “A”, 5%, 8/15/17 | | | 200,000 | | | | 205,878 | |
| New Mexico Hospital Equipment Loan Council, Hospital Rev. (Rehoboth McKinley Christian Hospital), “A”, 5.25%, 8/15/26 | | | 1,580,000 | | | | 1,522,678 | |
| New Mexico Municipal Energy Acquisition Authority, Gas Supply Rev., “A”, 5%, 11/01/39 (Put Date 8/01/19) | | | 8,250,000 | | | | 9,554,820 | |
| | | | | | | | |
| | | | $ | 24,408,583 | |
| New York - 5.4% | | | | | | | | |
| Brooklyn, NY, Arena Local Development Corp. (Barclays Center Project), 6%, 7/15/30 | | $ | 2,265,000 | | | $ | 2,545,815 | |
| Build NYC Resource Corp. Rev. (International Leadership Charter School Project), 5.75%, 7/01/33 (n) | | | 3,860,000 | | | | 3,870,422 | |
| Build NYC Resource Corp. Rev. (International Leadership Charter School Project), 6%, 7/01/43 (n) | | | 4,025,000 | | | | 4,027,455 | |
| Build NYC Resource Corp. Rev. (South Bronx Charter School for International Cultures and the Arts), “A”, 5%, 4/15/43 | | | 1,790,000 | | | | 1,563,816 | |
| Chautauqua County, NY, Capital Resource Corp. Rev. (Women’s Christian Assn.), “A”, 8%, 11/15/30 | | | 3,890,000 | | | | 4,074,697 | |
31
Portfolio of Investments (unaudited) – continued
| | | | | | | | |
| Issuer | | Shares/Par | | | Value ($) | |
| | | | | | | | |
| Municipal Bonds - continued | | | | | | | | |
| New York - continued | | | | | | | | |
| East Rochester, NY, Housing Authority Rev. (Woodland Village Project), 5.5%, 8/01/33 | | $ | 600,000 | | | $ | 582,126 | |
| Hudson Yards, NY, Infrastructure Corp. Rev., “A”, 5%, 2/15/47 | | | 3,340,000 | | | | 3,456,065 | |
| Hudson Yards, NY, Infrastructure Corp. Rev., “A”, 5.75%, 2/15/47 | | | 3,230,000 | | | | 3,681,102 | |
| Liberty, NY, Development Corp. Rev. (Goldman Sachs Headquarters), 5.25%, 10/01/35 | | | 17,535,000 | | | | 20,340,951 | |
| New York Dormitory Authority Rev., Non-State Supported Debt (Bronx-Lebanon Hospital Center), LOC, 6.5%, 8/15/30 | | | 1,570,000 | | | | 1,835,047 | |
| New York Dormitory Authority Rev., Non-State Supported Debt (Bronx-Lebanon Hospital Center), LOC, 6.25%, 2/15/35 | | | 975,000 | | | | 1,108,214 | |
| New York Liberty Development Corp., Liberty Rev. (One Bryant Park LLC), 6.375%, 7/15/49 | | | 4,760,000 | | | | 5,268,796 | |
| New York Urban Development Corp., State Personal Income Tax Rev., “C”, 5%, 3/15/31 | | | 8,320,000 | | | | 9,445,862 | |
| New York, NY, “J-9”, FRN, 0.46%, 8/01/27 | | | 3,355,000 | | | | 3,354,698 | |
| New York, NY, City Industrial Development Agency Rev., Liberty Bonds (IAC/InterActiveCorp), 5%, 9/01/35 | | | 2,440,000 | | | | 2,457,129 | |
| New York, NY, City Industrial Development Agency Special Facility Rev. (American Airlines, Inc. - JFK International Airport Project), 7.625%, 8/01/25 | | | 18,935,000 | | | | 20,977,518 | |
| New York, NY, City Industrial Development Agency Special Facility Rev. (American Airlines, Inc. - JFK International Airport Project), 7.75%, 8/01/31 | | | 8,045,000 | | | | 8,885,461 | |
| New York, NY, City Industrial Development Agency Special Facility Rev. (American Airlines, Inc. - JFK International Airport Project), “B”, 8.5%, 8/01/28 | | | 3,125,000 | | | | 3,216,219 | |
| Niagara County, NY, Industrial Development Agency, Solid Waste Disposal Rev. (Covanta Energy Project), “A”, 5.25%, 11/01/42 | | | 12,055,000 | | | | 12,094,902 | |
| Onondaga, NY, Civic Development Corp. Rev. (St. Joseph’s Hospital Health Center), 5%, 7/01/25 | | | 505,000 | | | | 527,503 | |
| Onondaga, NY, Civic Development Corp. Rev. (St. Joseph’s Hospital Health Center), 5.125%, 7/01/31 | | | 510,000 | | | | 522,969 | |
Orange County, NY, Funding Corp. Assisted Living Residence Rev. (The Hamlet at Wallkill Assisted Living Project), 6.5%, 1/01/46 | | | 3,000,000 | | | | 2,894,880 | |
| Port Authority of NY & NJ, Special Obligation Rev. (JFK International Air Terminal LLC), 6%, 12/01/36 | | | 2,435,000 | | | | 2,811,768 | |
| Port Authority of NY & NJ, Special Obligation Rev. (JFK International Air Terminal LLC), 6%, 12/01/42 | | | 2,780,000 | | | | 3,176,039 | |
| Seneca Nation of Indians, NY, Capital Improvements Authority, Special Obligation, 5%, 12/01/23 (n) | | | 6,470,000 | | | | 6,779,784 | |
32
Portfolio of Investments (unaudited) – continued
| | | | | | | | |
| Issuer | | Shares/Par | | | Value ($) | |
| | | | | | | | |
| Municipal Bonds - continued | | | | | | | | |
| New York - continued | | | | | | | | |
| Seneca Nation of Indians, NY, Capital Improvements Authority, Special Obligation, “A”, 5.25%, 12/01/16 (n) | | $ | 215,000 | | | $ | 227,752 | |
| Suffolk County, NY, Industrial Development Agency (Medford Hamlet Assisted Living), 6.375%, 1/01/39 | | | 1,400,000 | | | | 1,400,952 | |
| Ulster County, NY, Industrial Development Agency (Woodland Pond), “A”, 6%, 9/15/37 | | | 3,925,000 | | | | 3,193,027 | |
| | | | | | | | |
| | | | | | | $ | 134,320,969 | |
| North Carolina - 0.5% | | | | | | | | |
| North Carolina Housing Finance Agency Rev., “30-A”, 5.25%, 7/01/39 (u) | | $ | 10,565,000 | | | $ | 10,690,407 | |
| University of North Carolina, Greensboro, Rev., 5%, 4/01/39 | | | 955,000 | | | | 1,064,013 | |
| | | | | | | | |
| | | | $ | 11,754,420 | |
| North Dakota - 0.1% | | | | | | | | |
| Burleigh County, ND, Health Care Rev. (St. Alexius Medical Center Project), “A”, 5%, 7/01/31 | | $ | 385,000 | | | $ | 405,405 | |
| Burleigh County, ND, Health Care Rev. (St. Alexius Medical Center Project), “A”, 5%, 7/01/35 | | | 385,000 | | | | 401,405 | |
| North Dakota Housing Finance Agency Rev. (Home Mortgage Finance Program), “A”, 4%, 7/01/34 | | | 1,050,000 | | | | 1,141,655 | |
| | | | | | | | |
| | | | | | | $ | 1,948,465 | |
| Ohio - 5.6% | | | | | | | | |
| Bowling Green, OH, Student Housing Rev. (State University Project), 6%, 6/01/45 | | $ | 5,990,000 | | | $ | 6,215,404 | |
| Buckeye, OH, Tobacco Settlement Financing Authority, “A-2”, 5.125%, 6/01/24 | | | 5,000,000 | | | | 4,175,150 | |
| Buckeye, OH, Tobacco Settlement Financing Authority, “A-2”, 5.875%, 6/01/30 | | | 3,310,000 | | | | 2,671,799 | |
| Buckeye, OH, Tobacco Settlement Financing Authority, “A-2”, 5.75%, 6/01/34 | | | 4,485,000 | | | | 3,552,972 | |
| Buckeye, OH, Tobacco Settlement Financing Authority, “A-2”, 5.875%, 6/01/47 | | | 15,065,000 | | | | 11,718,762 | |
| Buckeye, OH, Tobacco Settlement Financing Authority, “A-2”, 6.5%, 6/01/47 | | | 25,000,000 | | | | 20,914,250 | |
| Buckeye, OH, Tobacco Settlement Financing Authority, “A-3”, 6.25%, 6/01/37 | | | 11,535,000 | | | | 9,514,299 | |
| Butler County, OH, Hospital Facilities Rev. (UC Health), 5.5%, 11/01/40 | | | 5,435,000 | | | | 5,912,139 | |
| Butler County, OH, Hospital Facilities Rev. (UC Health), 5.75%, 11/01/40 | | | 2,210,000 | | | | 2,440,768 | |
| Cleveland-Cuyahoga County, OH, Port Authority Rev., 7%, 5/15/40 | | | 1,165,000 | | | | 1,275,058 | |
33
Portfolio of Investments (unaudited) – continued
| | | | | | | | |
| Issuer | | Shares/Par | | | Value ($) | |
| | | | | | | | |
| Municipal Bonds - continued | | | | | | | | |
| Ohio - continued | | | | | | | | |
| Cleveland-Cuyahoga County, OH, Port Authority Rev. (Columbia National Group), 5%, 5/15/20 | | $ | 860,000 | | | $ | 855,760 | |
| Cleveland-Cuyahoga County, OH, Port Authority Rev. (Fairmount), “B”, 5.125%, 5/15/25 | | | 420,000 | | | | 434,087 | |
| Gallia County, OH, Hospital Facilities Rev. (Holzer Health Systems), “A”, 8%, 7/01/42 | | | 7,730,000 | | | | 8,432,271 | |
| Lake County, OH, Hospital Facilities Rev. (Lake Hospital), “C”, 6%, 8/15/43 | | | 2,870,000 | | | | 3,055,172 | |
| Montgomery County, OH, Health Care & Multifamily Housing Rev. (St. Leonard), 6.375%, 4/01/30 | | | 2,235,000 | | | | 2,439,704 | |
| Montgomery County, OH, Health Care & Multifamily Housing Rev. (St. Leonard), 6.625%, 4/01/40 | | | 3,230,000 | | | | 3,528,710 | |
| Muskingum County, OH, Hospital Facilities Rev. (Genesis Health System Obligated Group), 5%, 2/15/33 | | | 3,400,000 | | | | 3,371,576 | |
| Muskingum County, OH, Hospital Facilities Rev. (Genesis Health System Obligated Group), 5%, 2/15/44 | | | 1,635,000 | | | | 1,600,387 | |
| Muskingum County, OH, Hospital Facilities Rev. (Genesis Health System Obligated Group), 5%, 2/15/48 | | | 3,400,000 | | | | 3,282,122 | |
| Ohio Air Quality Development Authority Rev. (FirstEnergy Corp.), “A”, 5.7%, 8/01/20 | | | 4,335,000 | | | | 4,990,192 | |
| Ohio Higher Educational Facility Commission (University Hospital Health System), “A”, 6.75%, 1/15/39 (Prerefunded 1/01/15) | | | 5,390,000 | | | | 5,547,981 | |
| Ohio Solid Waste Rev. (Republic Services, Inc. Project), 0.3%, 11/01/35 (Put Date 9/02/14) | | | 3,280,000 | | | | 3,280,000 | |
| Riversouth, OH, Authority Rev. (Lazarus Building), “A”, 5.75%, 12/01/27 | | | 3,975,000 | | | | 4,034,546 | |
| Scioto County, OH, Hospital Facilities Rev. (Southern Ohio Medical Center), 5.625%, 2/15/31 | | | 1,370,000 | | | | 1,470,983 | |
| Scioto County, OH, Hospital Facilities Rev. (Southern Ohio Medical Center), 5.75%, 2/15/38 | | | 4,100,000 | | | | 4,368,550 | |
| Southeastern Ohio Port Authority, Hospital Facilities Rev. (Memorial Health System), 5.75%, 12/01/32 | | | 3,725,000 | | | | 3,791,156 | |
| Summit County, OH, Port Authority Building Rev. (Flats East Development Recovery Zone Facility Bonds), 6.875%, 5/15/40 | | | 440,000 | | | | 481,510 | |
| Summit County, OH, Port Authority Building Rev. (Seville Project), “A”, 5.1%, 5/15/25 | | | 475,000 | | | | 475,404 | |
| Summit County, OH, Port Authority Building Rev. (Workforce Policy Board), “F”, 4.875%, 11/15/25 | | | 2,380,000 | | | | 2,384,736 | |
| The Ohio State University, Special Purpose Rev., “A”, 5%, 6/01/38 (u) | | | 3,355,000 | | | | 3,704,490 | |
| The Ohio State University, Special Purpose Rev., “A”, 5%, 6/01/43 (u) | | | 8,150,000 | | | | 8,953,753 | |
| | | | | | | | |
| | | | $ | 138,873,691 | |
34
Portfolio of Investments (unaudited) – continued
| | | | | | | | |
| Issuer | | Shares/Par | | | Value ($) | |
| | | | | | | | |
| Municipal Bonds - continued | | | | | | | | |
| Oklahoma - 1.1% | | | | | | | | |
| Fort Sill Apache Tribe, OK, Economic Development Authority, Gaming Enterprise., “A”, 8.5%, 8/25/26 (n) | | $ | 2,710,000 | | | $ | 3,146,798 | |
| Norman, OK, Regional Hospital Authority Rev., 5%, 9/01/27 | | | 1,350,000 | | | | 1,397,709 | |
| Norman, OK, Regional Hospital Authority Rev., 5.375%, 9/01/29 | | | 795,000 | | | | 816,982 | |
| Oklahoma Development Finance Authority Continuing Care Retirement Community Rev. (Inverness Village), 5.75%, 1/01/37 | | | 3,720,000 | | | | 3,771,708 | |
| Tulsa County, OK, Industrial Authority, Senior Living Community Rev. (Montereau, Inc.), “A”, 7.25%, 11/01/45 | | | 3,500,000 | | | | 3,796,660 | |
| Tulsa, OK, Industrial Authority Rev. (University of Tulsa), 6%, 10/01/27 | | | 4,795,000 | | | | 5,514,250 | |
| Tulsa, OK, Municipal Airport Trust Rev. (American Airlines, Inc.), “B”, 5.5%, 6/01/35 | | | 2,205,000 | | | | 2,276,354 | |
| Tulsa, OK, Municipal Airport Trust Rev. (American Airlines, Inc.), “B”, 5.5%, 12/01/35 | | | 6,615,000 | | | | 6,872,059 | |
| | | | | | | | |
| | | | $ | 27,592,520 | |
| Oregon - 0.4% | | | | | | | | |
| Forest Grove, OR, Campus Improvement Rev. (Pacific University Project), “A”, 4.5%, 5/01/29 | | $ | 655,000 | | | $ | 678,783 | |
| Forest Grove, OR, Campus Improvement Rev. (Pacific University Project), “A”, 5%, 5/01/40 | | | 815,000 | | | | 869,295 | |
| Forest Grove, OR, Student Housing Rev. (Oak Tree Foundation, Inc.), 5.5%, 3/01/37 | | | 2,775,000 | | | | 2,785,406 | |
| Oregon Facilities Authority Rev. (Concordia University Project), “A”, 6.125%, 9/01/30 | | | 2,585,000 | | | | 2,741,134 | |
| Oregon Facilities Authority Rev. (Concordia University Project), “A”, 6.375%, 9/01/40 | | | 4,100,000 | | | | 4,358,874 | |
| | | | | | | | |
| | | | | | | $ | 11,433,492 | |
| Pennsylvania - 4.4% | | | | | | | | |
| Allegheny County, PA, Higher Education Building Authority Rev. (Robert Morris University), “A”, 5.9%, 10/15/28 | | $ | 1,305,000 | | | $ | 1,465,084 | |
| Allegheny County, PA, Higher Education Building Authority Rev. (Robert Morris University), “A”, 6%, 10/15/38 | | | 2,025,000 | | | | 2,151,704 | |
| Allentown, PA, Neighborhood Improvement Zone Development Authority Tax Rev., “A”, 5%, 5/01/35 | | | 1,110,000 | | | | 1,142,934 | |
| Allentown, PA, Neighborhood Improvement Zone Development Authority Tax Rev., “A”, 5%, 5/01/42 | | | 4,605,000 | | | | 4,714,461 | |
| Bucks County, PA, Industrial Development Authority Rev. (Lutheran Community Telford Center), 5.75%, 1/01/27 | | | 620,000 | | | | 627,725 | |
| Bucks County, PA, Industrial Development Authority Rev. (Lutheran Community Telford Center), 5.75%, 1/01/37 | | | 800,000 | | | | 802,080 | |
| Chartiers Valley, PA, Industrial & Commercial Development Authority (Asbury Health Center Project), 5.75%, 12/01/22 | | | 500,000 | | | | 504,055 | |
35
Portfolio of Investments (unaudited) – continued
| | | | | | | | |
| Issuer | | Shares/Par | | | Value ($) | |
| | | | | | | | |
| Municipal Bonds - continued | | | | | | | | |
| Pennsylvania - continued | | | | | | | | |
| Clairton, PA, Municipal Authority, “B”, 5%, 12/01/37 | | $ | 1,735,000 | | | $ | 1,820,345 | |
| Clarion County, PA, Industrial Development Authority, Student Housing Rev. (Clarion University Foundation, Inc.), 5%, 7/01/34 | | | 330,000 | | | | 339,336 | |
| Commonwealth of Pennsylvania, State Public School Building Authority Lease Rev. (School District of Philadelphia Project), 5%, 4/01/28 | | | 1,740,000 | | | | 1,895,573 | |
| Cumberland County, PA, Municipal Authority Rev. (Asbury Atlantic, Inc.), 6%, 1/01/30 | | | 1,035,000 | | | | 1,104,624 | |
| Cumberland County, PA, Municipal Authority Rev. (Asbury Atlantic, Inc.), 6%, 1/01/40 | | | 2,495,000 | | | | 2,648,118 | |
| Cumberland County, PA, Municipal Authority Rev. (Asbury Atlantic, Inc.), 5.25%, 1/01/41 | | | 965,000 | | | | 966,119 | |
| Cumberland County, PA, Municipal Authority Rev. (Asbury Atlantic, Inc.), 6.125%, 1/01/45 | | | 7,220,000 | | | | 7,702,152 | |
| Cumberland County, PA, Municipal Authority Rev. (Diakon Lutheran Social Ministries), 6.125%, 1/01/29 | | | 905,000 | | | | 986,133 | |
| Cumberland County, PA, Municipal Authority Rev. (Diakon Lutheran Social Ministries), 6.375%, 1/01/39 | | | 7,060,000 | | | | 7,656,641 | |
| Delaware County, PA, Authority College Rev. (Neumann University), 6%, 10/01/25 | | | 510,000 | | | | 580,666 | |
| Delaware County, PA, Authority University Rev. (Neumann University), 6.125%, 10/01/34 | | | 250,000 | | | | 284,808 | |
| Delaware Valley, PA, Regional Finance Authority, 5.75%, 7/01/17 | | | 3,520,000 | | | | 3,939,443 | |
| Delaware Valley, PA, Regional Finance Authority, AMBAC, 5.5%, 8/01/18 | | | 1,380,000 | | | | 1,567,694 | |
| Delaware Valley, PA, Regional Finance Authority, “B”, FRN, AMBAC, 0.035%, 8/01/18 | | | 500,000 | | | | 500,000 | |
| Delaware Valley, PA, Regional Finance Authority, RITES, FRN, AMBAC, 10.352%, 8/01/18 (p) | | | 150,000 | | | | 190,805 | |
| East Hempfield, PA, Industrial Development Authority Rev. (Millersville University Student Services), 5%, 7/01/39 | | | 325,000 | | | | 332,121 | |
| East Hempfield, PA, Industrial Development Authority Rev. (Millersville University Student Services), 5%, 7/01/46 | | | 180,000 | | | | 182,945 | |
| Lebanon County, PA, Health Facilities Authority Rev. (Good Samaritan Hospital), 5.9%, 11/15/28 | | | 1,890,000 | | | | 1,890,284 | |
| Lebanon County, PA, Health Facilities Authority Rev. (Good Samaritan Hospital), 6%, 11/15/35 | | | 5,500,000 | | | | 5,500,220 | |
| Lehigh County, PA, Water and Sewer Authority Rev. (Allentown Concession), “A”, 5%, 12/01/43 | | | 7,735,000 | | | | 8,269,411 | |
| Luzerne County, PA, AGM, 6.75%, 11/01/23 | | | 1,220,000 | | | | 1,400,658 | |
| Montgomery County, PA, Higher Education & Health Authority Rev. (AHF/Montgomery), 6.875%, 4/01/36 | | | 4,455,000 | | | | 4,653,337 | |
36
Portfolio of Investments (unaudited) – continued
| | | | | | | | |
| Issuer | | Shares/Par | | | Value ($) | |
| | | | | | | | |
| Municipal Bonds - continued | | | | | | | | |
| Pennsylvania - continued | | | | | | | | |
| Montgomery County, PA, Industrial Development Authority (Wordsworth Academy), 8%, 9/01/24 | | $ | 2,145,000 | | | $ | 2,146,351 | |
| Northampton County, PA, General Purpose Authority Hospital Rev. (St. Luke’s Hospital), “A”, 5.5%, 8/15/40 | | | 1,075,000 | | | | 1,127,084 | |
| Pennsylvania Economic Development Financing Authority Rev., Resource Recovery Rev. (Colver), “G”, 5.125%, 12/01/15 | | | 800,000 | | | | 826,480 | |
| Pennsylvania Economic Development Financing Authority, Sewer Sludge Disposal Rev. (Philadelphia Biosolids Facility), 6.25%, 1/01/32 | | | 3,415,000 | | | | 3,705,582 | |
| Pennsylvania Higher Educational Facilities Authority Rev. (East Stroudsburg University), 5%, 7/01/42 | | | 2,525,000 | | | | 2,575,298 | |
| Pennsylvania Higher Educational Facilities Authority Rev. (Edinboro University Foundation), 5.8%, 7/01/30 | | | 740,000 | | | | 793,332 | |
| Pennsylvania Higher Educational Facilities Authority Rev. (Edinboro University Foundation), 6%, 7/01/43 | | | 1,050,000 | | | | 1,103,613 | |
| Pennsylvania Higher Educational Facilities Authority Rev. (Saint Francis University Project), “JJ2”, 6.25%, 11/01/41 | | | 1,545,000 | | | | 1,705,325 | |
| Pennsylvania Higher Educational Facilities Authority Rev. (Shippensburg University Student Services), 6.25%, 10/01/43 | | | 5,500,000 | | | | 6,154,225 | |
| Philadelphia, PA, Authority for Industrial Development Rev. (Discovery Charter School Project), 6.25%, 4/01/37 | | | 1,065,000 | | | | 1,096,173 | |
| Philadelphia, PA, Authority for Industrial Development Rev. (Discovery Charter School Project), 6.25%, 4/01/42 | | | 1,950,000 | | | | 1,992,569 | |
| Philadelphia, PA, Authority for Industrial Development Rev. (MaST Charter School), 6%, 8/01/35 | | | 470,000 | | | | 503,088 | |
| Philadelphia, PA, Authority for Industrial Development Rev. (Philadelphia Performing Arts Charter School Project), 6.5%, 6/15/33 | | | 2,780,000 | | | | 2,887,836 | |
| Philadelphia, PA, Authority for Industrial Development Rev. (Philadelphia Performing Arts Charter School Project), 6.75%, 6/15/43 | | | 5,820,000 | | | | 6,035,340 | |
| Philadelphia, PA, Authority for Industrial Development Rev. (Tacony Academy Charter School ), 6.875%, 6/15/33 | | | 1,145,000 | | | | 1,193,010 | |
| Philadelphia, PA, Authority for Industrial Development Rev. (Tacony Academy Charter School Project), “A-1”, 6.75%, 6/15/33 | | | 850,000 | | | | 878,492 | |
| Philadelphia, PA, Authority for Industrial Development Rev. (Tacony Academy Charter School Project), “A-1”, 7%, 6/15/43 | | | 1,670,000 | | | | 1,724,258 | |
| Philadelphia, PA, Authority for Industrial Development Rev. (Tacony Academy Charter School), 7.375%, 6/15/43 | | | 1,975,000 | | | | 2,088,444 | |
| Philadelphia, PA, Municipal Authority Rev., 6.5%, 4/01/34 | | | 1,060,000 | | | | 1,221,523 | |
| Washington County, PA, Redevelopment Authority (Victory Centre Project), “A”, 5.45%, 7/01/35 | | | 750,000 | | | | 763,185 | |
37
Portfolio of Investments (unaudited) – continued
| | | | | | | | |
| Issuer | | Shares/Par | | | Value ($) | |
| | | | | | | | |
| Municipal Bonds - continued | | | | | | | | |
| Pennsylvania - continued | | | | | | | | |
| Wilkes-Barre, PA, Finance Authority Rev. (Wilkes University), 5%, 3/01/37 | | $ | 3,000,000 | | | $ | 3,038,130 | |
| | | | | | | | |
| | | | $ | 109,378,814 | |
| Puerto Rico - 0.7% | | | | | | | | |
| Commonwealth of Puerto Rico Highway & Transportation Authority Rev., AGM, 5.5%, 7/01/29 | | $ | 80,000 | | | $ | 76,166 | |
| Commonwealth of Puerto Rico, Public Improvement, “A”, NATL, 5.5%, 7/01/16 | | | 345,000 | | | | 351,914 | |
| Puerto Rico Electric Power Authority Rev., NATL, 5%, 7/01/19 | | | 740,000 | | | | 751,862 | |
| Puerto Rico Electric Power Authority Rev., “KK”, NATL, 5.5%, 7/01/16 | | | 175,000 | | | | 178,892 | |
| Puerto Rico Electric Power Authority Rev., “LL”, NATL, 5.5%, 7/01/17 | | | 145,000 | | | | 148,386 | |
| Puerto Rico Electric Power Authority Rev., “MM”, NATL, 5%, 7/01/20 | | | 65,000 | | | | 62,742 | |
| Puerto Rico Electric Power Authority Rev., “PP”, NATL, 5%, 7/01/24 | | | 70,000 | | | | 64,875 | |
| Puerto Rico Electric Power Authority Rev., “UU”, NATL, 4.5%, 7/01/18 | | | 155,000 | | | | 149,558 | |
| Puerto Rico Electric Power Authority Rev., “UU”, NATL, 5%, 7/01/22 | | | 260,000 | | | | 252,390 | |
| Puerto Rico Industrial, Tourist, Educational, Medical & Environmental Control Facilities Financing Authority (Cogeneration Facilities - AES Puerto Rico Project), 6.625%, 6/01/26 | | | 4,530,000 | | | | 3,770,455 | |
| Puerto Rico Industrial, Tourist, Educational, Medical, & Environmental Control Facilities Financing Authority, Higher Education Rev. (Ana G. Mendez University System Project), 5%, 4/01/17 | | | 505,000 | | | | 496,486 | |
| Puerto Rico Industrial, Tourist, Educational, Medical, & Environmental Control Facilities Financing Authority, Higher Education Rev. (Ana G. Mendez University System Project), 5%, 4/01/18 | | | 320,000 | | | | 312,678 | |
| Puerto Rico Industrial, Tourist, Educational, Medical, & Environmental Control Facilities Financing Authority, Higher Education Rev. (Ana G. Mendez University System Project), 4%, 4/01/20 | | | 165,000 | | | | 151,440 | |
| Puerto Rico Industrial, Tourist, Educational, Medical, & Environmental Control Facilities Financing Authority, Higher Education Rev. (Ana G. Mendez University System Project), 5%, 4/01/21 | | | 570,000 | | | | 547,200 | |
38
Portfolio of Investments (unaudited) – continued
| | | | | | | | |
| Issuer | | Shares/Par | | | Value ($) | |
| | | | | | | | |
| Municipal Bonds - continued | | | | | | | | |
| Puerto Rico - continued | | | | | | | | |
| Puerto Rico Industrial, Tourist, Educational, Medical, & Environmental Control Facilities Financing Authority, Higher Education Rev. (Ana G. Mendez University System Project), 5%, 4/01/22 | | $ | 645,000 | | | $ | 615,717 | |
| Puerto Rico Industrial, Tourist, Educational, Medical, & Environmental Control Facilities Financing Authority, Higher Education Rev. (Ana G. Mendez University System Project), 5%, 4/01/27 | | | 1,090,000 | | | | 994,222 | |
| Puerto Rico Industrial, Tourist, Educational, Medical, & Environmental Control Facilities Financing Authority, Higher Education Rev. (Ana G. Mendez University System Project), 5.125%, 4/01/32 | | | 840,000 | | | | 725,214 | |
| Puerto Rico Industrial, Tourist, Educational, Medical, & Environmental Control Facilities Financing Authority, Higher Education Rev. (Ana G. Mendez University System Project), 5.375%, 4/01/42 | | | 1,625,000 | | | | 1,332,695 | |
| Puerto Rico Industrial, Tourist, Medical, & Environmental Central Facilities (University of Sacred Heart), 4.375%, 10/01/31 | | | 525,000 | | | | 418,189 | |
| Puerto Rico Industrial, Tourist, Medical, & Environmental Central Facilities (University of Sacred Heart), 5%, 10/01/42 | | | 260,000 | | | | 202,966 | |
| Puerto Rico Sales Tax Financing Corp., Sales Tax Rev., “C”, 5%, 8/01/40 | | | 5,570,000 | | | | 4,315,859 | |
| Puerto Rico Sales Tax Financing Corp., Sales Tax Rev., Capital Appreciation, “A”, 0%, 8/01/47 | | | 14,305,000 | | | | 1,616,322 | |
| | | | | | | | |
| | | | $ | 17,536,228 | |
| South Carolina - 0.5% | | | | | | | | |
| Lancaster County, SC, Assessment Rev. (Sun City Carolina Lakes), 5.45%, 12/01/37 | | $ | 1,440,000 | | | $ | 1,439,611 | |
| North Charleston, SC, Housing Authority Rev. (Horizon Village), “A”, GNMA, 5.15%, 2/20/48 | | | 1,380,000 | | | | 1,390,322 | |
| Richland County, SC, Environmental Improvement Rev. (International Paper), “A”, 3.875%, 4/01/23 | | | 4,130,000 | | | | 4,332,783 | |
| South Carolina Jobs & Economic Development Authority Rev. (Woodlands at Furman), “A”, 6%, 11/15/32 | | | 1,311,828 | | | | 1,091,454 | |
| South Carolina Jobs & Economic Development Authority Rev. (Woodlands at Furman), “A”, 6%, 11/15/47 | | | 2,712,274 | | | | 2,019,966 | |
| South Carolina Jobs & Economic Development Authority Rev. (Woodlands at Furman), Capital Appreciation, “B”, 0%, 11/15/47 | | | 562,212 | | | | 9,282 | |
| South Carolina Jobs & Economic Development Authority Rev. (Woodlands at Furman), Capital Appreciation, “B”, 0%, 11/15/47 | | | 516,379 | | | | 8,525 | |
39
Portfolio of Investments (unaudited) – continued
| | | | | | | | |
| Issuer | | Shares/Par | | | Value ($) | |
| | | | | | | | |
| Municipal Bonds - continued | | | | | | | | |
| South Carolina - continued | | | | | | | | |
| South Carolina Jobs & Economic Development Authority, Health Facilities Rev. (Lutheran Homes of South Carolina, Inc.), 5.125%, 5/01/48 | | $ | 805,000 | | | $ | 768,324 | |
| South Carolina Jobs & Economic Development Authority, Hospital Rev. (Palmetto Health), 5.75%, 8/01/39 | | | 940,000 | | | | 1,011,966 | |
| York County, SC, Industrial Rev. (Hoechst Celanese), 5.7%, 1/01/24 | | | 130,000 | | | | 130,013 | |
| | | | | | | | |
| | | | | | | $ | 12,202,246 | |
| Tennessee - 2.4% | | | | | | | | |
| Chattanooga, TN, Health Educational & Housing Facility Board Rev. (Catholic Health Initiatives), “A”, 5.25%, 1/01/45 | | $ | 2,270,000 | | | $ | 2,469,079 | |
| Claiborne County, TN, Industrial Development Board Rev. (Lincoln Memorial University Project), 6.125%, 10/01/40 | | | 5,000,000 | | | | 5,382,200 | |
| Hardeman County, TN, Correctional Facilities Rev., 7.75%, 8/01/17 | | | 2,200,000 | | | | 2,212,518 | |
| Johnson City, TN, Health & Educational Facilities Board Rev. (Appalachian Christian Village Project), “A”, 5%, 2/15/43 | | | 3,000,000 | | | | 2,986,410 | |
| Johnson City, TN, Health & Educational Facilities Board, Hospital Rev. (Mountain States Health Alliance), 6%, 7/01/38 | | | 1,700,000 | | | | 1,906,618 | |
| Memphis, TN, Refunding General Improvement, “B”, 5%, 4/01/31 | | | 2,735,000 | | | | 3,128,813 | |
| Nashville & Davidson County, TN, Metropolitan Government Health & Educational Facilities Board (Vanderbilt University), “A”, 5%, 10/01/39 (u) | | | 10,000,000 | | | | 11,114,900 | |
| Nashville & Davidson County, TN, Metropolitan Government Health & Educational Facilities Board (Vanderbilt University), “B”, 5%, 10/01/39 (u) | | | 10,000,000 | | | | 11,038,900 | |
| Tennessee Energy Acquisition Corp., Gas Rev., “A”, 5.25%, 9/01/19 | | | 12,055,000 | | | | 13,686,283 | |
| Tennessee Energy Acquisition Corp., Gas Rev., “A”, 5.25%, 9/01/22 | | | 2,105,000 | | | | 2,409,804 | |
| Tennessee Energy Acquisition Corp., Gas Rev., “A”, 5.25%, 9/01/24 | | | 3,625,000 | | | | 4,133,044 | |
| | | | | | | | |
| | | | | | | $ | 60,468,569 | |
| Texas - 9.2% | | | | | | | | |
| Austin, TX, Convention Center (Convention Enterprises, Inc.), “A”, SYNCORA, 5.25%, 1/01/17 | | $ | 845,000 | | | $ | 891,805 | |
| Austin, TX, Convention Center (Convention Enterprises, Inc.), “A”, SYNCORA, 5.25%, 1/01/20 | | | 830,000 | | | | 879,153 | |
| Austin, TX, Convention Center (Convention Enterprises, Inc.), “A”, SYNCORA, 5.25%, 1/01/24 | | | 4,640,000 | | | | 4,852,930 | |
40
Portfolio of Investments (unaudited) – continued
| | | | | | | | |
| Issuer | | Shares/Par | | | Value ($) | |
| | | | | | | | |
| Municipal Bonds - continued | | | | | | | | |
| Texas - continued | | | | | | | | |
| Bell County, TX, Health Facility Development Corp. (Advanced Living Technologies, Inc.), Capital Appreciation 8%, 12/15/36 (a)(d) | | $ | 4,650,000 | | | $ | 930 | |
| Brazoria County, TX, Health Facilities Development Corp., Hospital Rev. (Brazosport Regional Health System), 5.5%, 7/01/42 | | | 4,500,000 | | | | 4,320,180 | |
| Brazos River, TX, Harbor Navigation District (Dow Chemical Co.), “A”, 5.95%, 5/15/33 | | | 8,190,000 | | | | 8,942,743 | |
| Brazos River, TX, Harbor Navigation District (Dow Chemical Co.), “B-2”, 4.95%, 5/15/33 | | | 1,625,000 | | | | 1,728,350 | |
| Cass County, TX, Industrial Development Corp. (International Paper Co.), “A”, 4.625%, 3/01/27 | | | 3,750,000 | | | | 3,807,563 | |
| Clifton, TX, Higher Education Finance Corp. Rev. (Idea Public Schools), 6%, 8/15/33 | | | 845,000 | | | | 964,432 | |
| Clifton, TX, Higher Education Finance Corp. Rev. (Idea Public Schools), 5.75%, 8/15/41 | | | 695,000 | | | | 754,680 | |
| Clifton, TX, Higher Education Finance Corp. Rev. (Idea Public Schools), 5%, 8/15/42 | | | 2,385,000 | | | | 2,490,703 | |
| Clifton, TX, Higher Education Finance Corp. Rev. (Idea Public Schools), 6%, 8/15/43 | | | 1,850,000 | | | | 2,099,528 | |
| Clifton, TX, Higher Education Finance Corp. Rev. (Uplift Education), “A”, 6.125%, 12/01/40 | | | 4,940,000 | | | | 5,538,530 | |
| Clifton, TX, Higher Education Finance Corp. Rev. (Uplift Education), “A”, 6.25%, 12/01/45 | | | 1,670,000 | | | | 1,878,950 | |
| Dallas and Fort Worth, TX, International Airport Rev., “A”, 5%, 11/01/38 | | | 4,430,000 | | | | 4,615,041 | |
| Dallas and Fort Worth, TX, International Airport Rev., “B”, 5%, 11/01/44 | | | 4,370,000 | | | | 4,712,084 | |
| Dallas and Fort Worth, TX, International Airport Rev., “C”, 5%, 11/01/45 | | | 9,175,000 | | | | 9,811,653 | |
| Deaf Smith County, TX, Hospital District, “A”, 6.5%, 3/01/40 | | | 3,800,000 | | | | 4,355,902 | |
| Decatur Hospital Authority Rev. (Wise Regional Health System), “A”, 5.25%, 9/01/44 | | | 1,860,000 | | | | 1,880,813 | |
| Gulf Coast Waste Disposal Authority (Waste Management, Inc.), 5.2%, 5/01/28 | | | 3,260,000 | | | | 3,402,364 | |
| Gulf Coast, TX, Industrial Development Authority Rev. (CITGO Petroleum Corp.), 4.875%, 5/01/25 | | | 4,640,000 | | | | 4,666,077 | |
| Gulf Coast, TX, Industrial Development Authority Rev. (Microgy Holdings Project), 7%, 12/01/36 (a)(d) | | | 746,831 | | | | 7,468 | |
| Harris County, Houston, TX, Sports Authority Rev., Capital Appreciation, “A”, 0%, 11/15/34 | | | 4,580,000 | | | | 1,586,741 | |
| Harris County, Houston, TX, Sports Authority Rev., Capital Appreciation, “A”, 0%, 11/15/38 | | | 40,280,000 | | | | 10,768,455 | |
41
Portfolio of Investments (unaudited) – continued
| | | | | | | | |
| Issuer | | Shares/Par | | | Value ($) | |
| | | | | | | | |
| Municipal Bonds - continued | | | | | | | | |
| Texas - continued | | | | | | | | |
| Harris County, Houston, TX, Sports Authority, Special Rev., “A”, NATL, 5%, 11/15/25 | | $ | 6,780,000 | | | $ | 6,783,661 | |
| Harris County, TX, 5.625%, 5/01/20 | | | 1,165,857 | | | | 1,166,906 | |
| Harris County, TX, Cultural Education Facilities Finance Corp. Medical Facilities Rev. (Baylor College of Medicine), “D”, 5.625%, 11/15/32 | | | 4,535,000 | | | | 5,173,619 | |
| Harris County, TX, Cultural Education Facilities Finance Corp. Rev. (Brazos Presbyterian Homes Inc. Project), 7%, 1/01/43 | | | 2,265,000 | | | | 2,534,716 | |
| Harris County, TX, Health Facilities Development Corp., Hospital Rev. (Memorial Hermann Healthcare Systems), “B”, 7.25%, 12/01/35 (Prerefunded 12/01/18) | | | 2,400,000 | | | | 3,030,600 | |
| Houston, TX, Airport Systems Rev., “B”, 5%, 7/01/26 | | | 1,335,000 | | | | 1,511,060 | |
| Houston, TX, Airport Systems Rev., Special Facilities Rev. (Continental Airlines, Inc.), 6.625%, 7/15/38 | | | 5,630,000 | | | | 6,265,627 | |
| Houston, TX, Airport Systems Rev., Special Facilities Rev. (Continental Airlines, Inc.), “B”, 6.125%, 7/15/17 | | | 1,430,000 | | | | 1,432,274 | |
| Houston, TX, Airport Systems Rev., Special Facilities Rev. (United Airlines, Inc. Terminal E Project), 4.5%, 7/01/20 | | | 2,630,000 | | | | 2,688,754 | |
| Houston, TX, Airport Systems Rev., Special Facilities Rev. (United Airlines, Inc. Terminal E Project), 4.75%, 7/01/24 | | | 5,015,000 | | | | 5,162,642 | |
| Houston, TX, Airport Systems Rev., Special Facilities Rev. (United Airlines, Inc. Terminal E Project), 5%, 7/01/29 | | | 9,655,000 | | | | 9,744,695 | |
| Houston, TX, Industrial Development Corp. (United Parcel Service, Inc.), 6%, 3/01/23 | | | 190,000 | | | | 194,083 | |
| Jefferson County, TX, Housing Finance Corp., Capital Appreciation, NATL, 0%, 9/01/15 | | | 236,436 | | | | 210,991 | |
| La Vernia, TX, Higher Education Finance Corp. Rev. (KIPP, Inc.), “A”, 6.25%, 8/15/39 | | | 1,670,000 | | | | 1,830,036 | |
| La Vernia, TX, Higher Education Finance Corp. Rev. (Lifeschool of Dallas), “A”, 7.5%, 8/15/41 (Prerefunded 8/15/19) | | | 4,385,000 | | | | 5,704,008 | |
| Lufkin, TX, Health Facilities Development Corp. Rev. (Memorial Health System), 5.5%, 2/15/37 | | | 6,400,000 | | | | 6,662,912 | |
| Lufkin, TX, Health Facilities Development Corp. Rev. (Memorial Health System), 6.25%, 2/15/37 | | | 4,340,000 | | | | 4,782,203 | |
| Matagorda County, TX, Pollution Control Rev. (Central Power & Light Co.), “A”, 6.3%, 11/01/29 | | | 2,680,000 | | | | 3,064,580 | |
| New Hope, TX, Cultural Education Facilities Corp., Student Housing Rev. (Texas A&M University Project), “A”, 5%, 4/01/44 | | | 5,000,000 | | | | 5,099,500 | |
| New Hope, TX, Cultural Education Facilities Finance Corp. Student Housing Rev. (Texas A&M University Project), “A”, 5%, 4/01/46 | | | 805,000 | | | | 853,670 | |
| North Texas Education Finance Corp., Education Rev. (Uplift Education), “A”, 5.125%, 12/01/42 | | | 2,355,000 | | | | 2,433,728 | |
| North Texas Tollway Authority Rev., 6%, 1/01/43 | | | 1,280,000 | | | | 1,478,029 | |
42
Portfolio of Investments (unaudited) – continued
| | | | | | | | |
| Issuer | | Shares/Par | | | Value ($) | |
| | | | | | | | |
| Municipal Bonds - continued | | | | | | | | |
| Texas - continued | | | | | | | | |
| Port of Bay, TX, City Authority (Hoechst Celanese Corp.), 6.5%, 5/01/26 | | $ | 2,500,000 | | | $ | 2,503,775 | |
| Red River Authority, TX, Pollution Control Rev. (Celanese Project) “A”, 6.45%, 11/01/30 | | | 430,000 | | | | 430,942 | |
| Red River Authority, TX, Pollution Control Rev. (Celanese Project) “B”, 6.7%, 11/01/30 | | | 5,380,000 | | | | 5,391,782 | |
| Red River, TX, Health Facilities Development Corp., 5.4%, 11/15/28 (a) | | | 880,000 | | | | 325,600 | |
| Red River, TX, Health Facilities Development Corp., 6.05%, 11/15/46 (a) | | | 3,654,000 | | | | 1,351,980 | |
| Red River, TX, Health Facilities Development Corp., 6.05%, 11/15/46 (a) | | | 766,000 | | | | 283,420 | |
| Red River, TX, Health Facilities Development Corp., 6.25%, 5/09/53 (a) | | | 390,000 | | | | 144,300 | |
| Red River, TX, Health Facilities Development Corp., Retirement Facilities Rev. (MRC The Crossings Project), “A”, 7.5%, 11/15/34 | | | 1,075,000 | | | | 1,105,820 | |
| Red River, TX, Health Facilities Development Corp., Retirement Facilities Rev. (MRC The Crossings Project), “A”, 7.75%, 11/15/44 | | | 1,970,000 | | | | 2,034,419 | |
| Red River, TX, Health Facilities Development Corp., Retirement Facilities Rev. (MRC The Crossings Project), “A”, 8%, 11/15/49 | | | 1,680,000 | | | | 1,749,518 | |
| Red River, TX, Health Facilities Development Corp., Retirement Facilities Rev. (MRC The Crossings Project), “B-2”, 5%, 11/15/19 | | | 355,000 | | | | 359,278 | |
| Royse City, TX, Independent School District, School Building, Capital Appreciation, PSF, 0%, 8/15/27 | | | 2,960,000 | | | | 1,619,653 | |
| Royse City, TX, Independent School District, School Building, Capital Appreciation, PSF, 0%, 8/15/29 | | | 2,995,000 | | | | 1,470,575 | |
| SA Energy Acquisition Public Facility Corp. (Tex Gas Supply), 5.5%, 8/01/27 | | | 4,000,000 | | | | 4,603,200 | |
| San Juan, TX, Higher Education Finance Authority Education Rev. (Idea Public Schools), “A”, 6.7%, 8/15/40 | | | 2,955,000 | | | | 3,466,599 | |
| San Leanna, TX, Educational Facilities Corp., Higher Education Rev. (St. Edwards University), 5.125%, 6/01/36 | | | 1,055,000 | | | | 1,075,024 | |
| Tarrant County, TX, Cultural Education Facilities Finance Corp. Retirement Facility (Air Force Village Foundation, Inc.), 5.75%, 11/15/19 | | | 500,000 | | | | 558,605 | |
| Tarrant County, TX, Cultural Education Facilities Finance Corp. Retirement Facility (Air Force Village Foundation, Inc.), 6.125%, 11/15/29 | | | 520,000 | | | | 561,288 | |
| Tarrant County, TX, Cultural Education Facilities Finance Corp. Retirement Facility (Air Force Village Foundation, Inc.), 5.125%, 5/15/37 | | | 835,000 | | | | 831,042 | |
43
Portfolio of Investments (unaudited) – continued
| | | | | | | | |
| Issuer | | Shares/Par | | | Value ($) | |
| | | | | | | | |
| Municipal Bonds - continued | | | | | | | | |
| Texas - continued | | | | | | | | |
| Tarrant County, TX, Cultural Education Facilities Finance Corp. Retirement Facility (Air Force Village Foundation, Inc.), 6.375%, 11/15/44 | | $ | 3,515,000 | | | $ | 3,746,498 | |
| Tarrant County, TX, Cultural Education Facilities Finance Corp. Retirement Facility (Stayton at Museum Way), 8%, 11/15/28 | | | 1,000,000 | | | | 882,830 | |
| Tarrant County, TX, Cultural Education Facilities Finance Corp. Retirement Facility (Stayton at Museum Way), 8.25%, 11/15/44 | | | 7,500,000 | | | | 6,630,825 | |
| Texas Affordable Housing Corp. (Single Family Mortgage), “B”, GNMA, 5.25%, 9/01/39 | | | 1,155,000 | | | | 1,192,076 | |
| Texas Private Activity Surface Transportation Corp. Senior Lien Rev. (NTE Mobility Partners Segments 3 LLC Segments 3A & 3B Facility), 7%, 12/31/38 | | | 1,375,000 | | | | 1,672,179 | |
| Texas Private Activity Surface Transportation Corp. Senior Lien Rev. (NTE Mobility Partners Segments 3 LLC Segments 3A & 3B Facility), 6.75%, 6/30/43 | | | 1,105,000 | | | | 1,312,033 | |
| Texas Transportation Commission State Highway Fund (First Tier), “A”, 4.75%, 4/01/17 | | | 6,620,000 | | | | 7,355,681 | |
| Travis County, TX, Health Facilities Development Corp. Rev. (Westminster Manor Health), 7%, 11/01/30 | | | 3,940,000 | | | | 4,463,390 | |
| Travis County, TX, Health Facilities Development Corp. Rev. (Westminster Manor Health), 7.125%, 11/01/40 | | | 3,560,000 | | | | 3,991,152 | |
| Travis County, TX, Health Facilities Development Corp., Retirement Facilities Rev. (Querencia Barton Creek), 5.5%, 11/15/25 | | | 1,440,000 | | | | 1,453,118 | |
| Tyler, TX, Health Facilities Development Corp. (East Texas Medical Center), “A”, 5.25%, 11/01/32 | | | 3,515,000 | | | | 3,548,006 | |
| | | | | | | | |
| | | | $ | 228,879,977 | |
| U.S. Virgin Islands - 0.2% | | | | | | | | |
| Virgin Islands Public Finance Authority Rev. (Diageo Project), “A”, 6.75%, 10/01/37 | | $ | 4,090,000 | | | $ | 4,459,859 | |
| | |
| Utah - 0.7% | | | | | | | | |
| Utah County, UT, Charter School Finance Authority, Charter School Rev. (Early Light Academy Project), 8.25%, 7/15/35 | | $ | 3,730,000 | | | $ | 4,197,593 | |
| Utah County, UT, Charter School Finance Authority, Charter School Rev. (Hawthorne Academy Project), 8.25%, 7/15/35 (Prerefunded 7/15/18) | | | 4,015,000 | | | | 5,166,181 | |
| Utah County, UT, Charter School Rev. (Renaissance Academy), “A”, 5.625%, 7/15/37 | | | 2,405,000 | | | | 2,239,584 | |
| Utah County, UT, Charter School Rev. (Ronald Wilson Reagan Academy), “A”, 6%, 2/15/38 | | | 6,070,000 | | | | 6,195,224 | |
| | | | | | | | |
| | | | $ | 17,798,582 | |
44
Portfolio of Investments (unaudited) – continued
| | | | | | | | |
| Issuer | | Shares/Par | | | Value ($) | |
| | | | | | | | |
| Municipal Bonds - continued | | | | | | | | |
| Vermont - 0.2% | | | | | | | | |
| Burlington, VT, Airport Rev., “A”, 4%, 7/01/28 | | $ | 1,565,000 | | | $ | 1,403,633 | |
| Vermont Economic Development Authority, Solid Waste Disposal Rev. (Casella Waste Systems, Inc.), 4.75%, 4/01/36 (Put Date 4/02/18) | | | 3,275,000 | | | | 3,206,029 | |
| | | | | | | | |
| | | | $ | 4,609,662 | |
| Virginia - 1.1% | | | | | | | | |
| Embrey Mill Community Development Authority, VA, Special Assessment Rev., 7.25%, 3/01/43 | | $ | 4,785,000 | | | $ | 4,848,497 | |
| Giles County, VA, Industrial Development Authority Rev. (Celanese Corp.), 6.45%, 5/01/26 | | | 1,000,000 | | | | 1,000,630 | |
| James City County, VA, Economic Development Authority, Residential Care Facilities Rev. (Virginia United Methodist Homes of Williamsburg), “A”, 2%, 10/01/48 (a) | | | 981,912 | | | | 26,001 | |
| Norfolk, VA, Redevelopment & Housing Authority Rev. (Fort Norfolk Retirement Community), “A”, 6%, 1/01/25 | | | 785,000 | | | | 785,228 | |
| Norfolk, VA, Redevelopment & Housing Authority Rev. (Fort Norfolk Retirement Community), “A”, 6.125%, 1/01/35 | | | 3,530,000 | | | | 3,540,025 | |
| Peninsula Ports Authority, VA, Coal Terminal Rev. (Dominion Terminal Associates), 6%, 4/01/33 | | | 530,000 | | | | 530,228 | |
| Virginia Small Business Financing Authority Rev. (Elizabeth River Crossings Opco LLC Project), 6%, 1/01/37 | | | 6,065,000 | | | | 6,689,756 | |
| Virginia Small Business Financing Authority Rev. (Elizabeth River Crossings Opco LLC Project), 5.5%, 1/01/42 | | | 9,705,000 | | | | 10,277,983 | |
| West Point, VA, Industrial Development Authority, Solid Waste Disposal Rev. (Chesapeake Corp.), “A”, 6.375%, 3/01/19 (a)(d) | | | 769,496 | | | | 77 | |
| West Point, VA, Industrial Development Authority, Solid Waste Disposal Rev. (Chesapeake Corp.), “B”, 6.25%, 3/01/19 (a)(d) | | | 6,569,571 | | | | 657 | |
| | | | | | | | |
| | | | | | | $ | 27,699,082 | |
| Washington - 2.5% | | | | | | | | |
| Port Seattle, WA, Industrial Development Corp., Special Facilities Rev. (Delta Airlines, Inc.), 5%, 4/01/30 | | $ | 4,000,000 | | | $ | 4,013,680 | |
| Skagit County, WA, Public Hospital District No. 001 Rev. (Skagit Valley Hospital), 5.5%, 12/01/30 | | | 2,750,000 | | | | 2,782,258 | |
| Skagit County, WA, Public Hospital District No. 001 Rev. (Skagit Valley Hospital), 5.75%, 12/01/32 | | | 2,205,000 | | | | 2,405,501 | |
| Washington Health Care Facilities Authority Rev. (Central Washington Health Services), 6.75%, 7/01/29 | | | 1,550,000 | | | | 1,765,450 | |
| Washington Health Care Facilities Authority Rev. (Central Washington Health Services), 7%, 7/01/39 | | | 3,665,000 | | | | 4,181,692 | |
| Washington Health Care Facilities Authority Rev. (Highline Medical Center), FHA, 6.25%, 8/01/36 | | | 5,670,000 | | | | 6,828,721 | |
| Washington Health Care Facilities Authority Rev. (Virginia Mason Medical Center), “A”, 6.25%, 8/15/42 | | | 5,075,000 | | | | 5,313,474 | |
45
Portfolio of Investments (unaudited) – continued
| | | | | | | | |
| Issuer | | Shares/Par | | | Value ($) | |
| | | | | | | | |
| Municipal Bonds - continued | | | | | | | | |
| Washington - continued | | | | | | | | |
| Washington Health Care Facilities Authority Rev. (Virginia Mason Medical Center), “B”, ACA, 5.75%, 8/15/37 | | $ | 1,000,000 | | | $ | 1,050,010 | |
| Washington Higher Education Facilities Authority Rev. (Whitworth University), 5.875%, 10/01/34 | | | 2,435,000 | | | | 2,747,143 | |
| Washington Housing Finance Community Nonprofit Housing Rev. (Rockwood Retirement Communities), 5.125%, 1/01/20 | | | 4,095,000 | | | | 4,143,976 | |
| Washington Motor Vehicle Fuel Tax, “B”, NATL, 5%, 7/01/32 (u) | | | 25,010,000 | | | | 27,564,521 | |
| | | | | | | | |
| | | | $ | 62,796,426 | |
| West Virginia - 0.3% | | | | | | | | |
| Ohio County, WV, Commission Tax Increment Rev. (Fort Henry Centre), “A”, 5.85%, 6/01/34 | | $ | 865,000 | | | $ | 888,640 | |
| West Virginia Hospital Finance Authority Rev. (Charleston Area Medical Center), “A”, 5%, 9/01/27 | | | 2,100,000 | | | | 2,335,221 | |
| West Virginia Hospital Finance Authority Rev. (Charleston Area Medical Center), “A”, 5%, 9/01/28 | | | 1,000,000 | | | | 1,104,030 | |
| West Virginia Hospital Finance Authority, Hospital Rev. (Thomas Health System), 6.5%, 10/01/38 | | | 3,450,000 | | | | 3,538,976 | |
| | | | | | | | |
| | | | $ | 7,866,867 | |
| Wisconsin - 2.2% | | | | | | | | |
| Wisconsin Health & Educational Facilities Authority Rev. (American Eagle Nursing Home), 7.15%, 6/01/28 | | $ | 3,300,000 | | | $ | 3,466,518 | |
| Wisconsin Health & Educational Facilities Authority Rev. (Beloit College), “A”, 6.125%, 6/01/35 | | | 710,000 | | | | 772,636 | |
| Wisconsin Health & Educational Facilities Authority Rev. (Beloit College), “A”, 6.125%, 6/01/39 | | | 1,435,000 | | | | 1,557,750 | |
| Wisconsin Health & Educational Facilities Authority Rev. (Meritor Hospital), “A”, 5.5%, 5/01/31 (Prerefunded 5/01/21) | | | 1,855,000 | | | | 2,303,316 | |
| Wisconsin Health & Educational Facilities Authority Rev. (Meritor Hospital), “A”, 6%, 5/01/41 (Prerefunded 5/01/21) | | | 1,405,000 | | | | 1,789,127 | |
| Wisconsin Health & Educational Facilities Authority Rev. (Sauk-Prairie Memorial Hospital), 5.25%, 2/01/43 | | | 4,695,000 | | | | 4,667,487 | |
| Wisconsin Health & Educational Facilities Authority Rev. (Sauk-Prairie Memorial Hospital), “A”, 5.125%, 2/01/38 | | | 3,000,000 | | | | 2,973,690 | |
| Wisconsin Health & Educational Facilities Authority Rev. (St. John’s Community, Inc.), “A”, 7.25%, 9/15/29 | | | 485,000 | | | | 556,460 | |
| Wisconsin Health & Educational Facilities Authority Rev. (St. John’s Community, Inc.), “A”, 7.625%, 9/15/39 | | | 1,960,000 | | | | 2,265,780 | |
| Wisconsin Health & Educational Facilities Authority Rev. (Wheaton Franciscan Services), 5.25%, 8/15/34 | | | 4,155,000 | | | | 4,281,312 | |
| Wisconsin Public Finance Authority Senior Living Rev. (Rose Villa Project), “A”, 5.125%, 11/15/29 | | | 1,905,000 | | | | 1,862,423 | |
46
Portfolio of Investments (unaudited) – continued
| | | | | | | | |
| Issuer | | Shares/Par | | | Value ($) | |
| | | | | | | | |
| Municipal Bonds - continued | | | | | | | | |
| Wisconsin - continued | | | | | | | | |
| Wisconsin Public Finance Authority Senior Living Rev. (Rose Villa Project), “A”, 5.5%, 11/15/34 | | $ | 1,730,000 | | | $ | 1,705,936 | |
| Wisconsin Public Finance Authority Senior Living Rev. (Rose Villa Project), “A”, 5.75%, 11/15/44 | | | 1,685,000 | | | | 1,686,129 | |
| Wisconsin Public Finance Authority Senior Living Rev. (Rose Villa Project), “A”, 6%, 11/15/49 | | | 1,350,000 | | | | 1,366,376 | |
| Wisconsin Public Finance Authority Senior Living Rev. (Rose Villa Project), “B-3”, 3.75%, 11/15/19 | | | 1,160,000 | | | | 1,173,908 | |
| Wisconsin Public Finance Authority, Airport Facilities Rev. (Transportation Infrastructure Properties LLC), “B”, 5%, 7/01/22 | | | 1,470,000 | | | | 1,617,882 | |
| Wisconsin Public Finance Authority, Airport Facilities Rev. (Transportation Infrastructure Properties LLC), “B”, 5.25%, 7/01/28 | | | 2,175,000 | | | | 2,377,667 | |
| Wisconsin Public Finance Authority, Airport Facilities Rev. (Transportation Infrastructure Properties LLC), “B”, 5%, 7/01/42 | | | 17,610,000 | | | | 17,711,962 | |
| | | | | | | | |
| | | | | | | $ | 54,136,359 | |
Total Municipal Bonds
(Identified Cost, $2,266,105,869) | | | | | | $ | 2,391,460,724 | |
| | |
| Floating Rate Demand Notes - 0.2% | | | | | | | | |
| Sublette County, WY, Pollution Control Rev. (Exxon Mobil Corp.), 0.04%, due 8/01/14, at Identified Cost | | $ | 6,100,000 | | | $ | 6,100,000 | |
| | |
| Money Market Funds - 6.1% | | | | | | | | |
| MFS Institutional Money Market Portfolio, 0.09%, at Cost and Net Asset Value (v) | | | 151,341,143 | | | $ | 151,341,143 | |
| Total Investments (Identified Cost, $2,423,547,012) | | | | | | $ | 2,548,901,867 | |
| | |
| Other Assets, Less Liabilities - (2.1)% | | | | | | | (52,424,058 | ) |
| Net Assets - 100.0% | | | | | | $ | 2,496,477,809 | |
| (a) | Non-income producing security. |
| (d) | In default. Interest and/or scheduled principal payment(s) have been missed. |
| (n) | Securities exempt from registration under Rule 144A of the Securities Act of 1933. These securities may be sold in the ordinary course of business in transactions exempt from registration, normally to qualified institutional buyers. At period end, the aggregate value of these securities was $28,728,016 representing 1.2% of net assets. |
| (p) | Primary inverse floater. |
| (q) | Interest received was less than stated coupon rate. |
| (u) | Underlying security deposited into special purpose trust (“the trust”) by investment banker upon creation of self-deposited inverse floaters. |
| (v) | Underlying affiliated fund that is available only to investment companies managed by MFS. The rate quoted for the MFS Institutional Money Market Portfolio is the annualized seven-day yield of the fund at period end. |
47
Portfolio of Investments (unaudited) – continued
The following abbreviations are used in this report and are defined:
| COP | | Certificate of Participation |
| FRN | | Floating Rate Note. Interest rate resets periodically and may not be the rate reported at period end. |
| | | | | | |
| Insurers | | Inverse Floaters |
| ACA | | ACA Financial Guaranty Corp. | | RITES | | Residual Interest Tax-Exempt Security |
| AGM | | Assured Guaranty Municipal | | | | |
| AMBAC | | AMBAC Indemnity Corp. | | | | |
| ASSD GTY | | Assured Guaranty Insurance Co. | | | | |
| CALHF | | California Health Facility Construction Loan Program | | | | |
| FGIC | | Financial Guaranty Insurance Co. | | | | |
| FHA | | Federal Housing Administration | | | | |
| FNMA | | Federal National Mortgage Assn. | | | | |
| GNMA | | Government National Mortgage Assn. | | | | |
| NATL | | National Public Finance Guarantee Corp. | | | | |
| PSF | | Permanent School Fund | | | | |
| SYNCORA | | Syncora Guarantee Inc. | | | | |
See Notes to Financial Statements
48
Financial Statements
STATEMENT OF ASSETS AND LIABILITIES
At 7/31/14 (unaudited)
This statement represents your fund’s balance sheet, which details the assets and liabilities comprising the total value of the fund.
| | | | |
| Assets | | | | |
Investments- | | | | |
Non-affiliated issuers, at value (identified cost, $2,272,205,869) | | | $2,397,560,724 | |
Underlying affiliated funds, at cost and value | | | 151,341,143 | |
Total investments, at value (identified cost, $2,423,547,012) | | | $2,548,901,867 | |
Receivables for | | | | |
Investments sold | | | 2,821,282 | |
Fund shares sold | | | 10,852,346 | |
Interest | | | 30,290,112 | |
Other assets | | | 3,831 | |
Total assets | | | $2,592,869,438 | |
| Liabilities | | | | |
Payables for | | | | |
Distributions | | | $1,507,919 | |
Investments purchased | | | 32,586,804 | |
Interest expense and fees | | | 68,472 | |
Fund shares reacquired | | | 4,232,470 | |
Payable to the holders of the floating rate certificates from trust assets | | | 56,158,389 | |
Payable to affiliates | | | | |
Investment adviser | | | 46,186 | |
Shareholder servicing costs | | | 1,612,552 | |
Distribution and service fees | | | 14,910 | |
Payable for independent Trustees’ compensation | | | 12,956 | |
Accrued expenses and other liabilities | | | 150,971 | |
Total liabilities | | | $96,391,629 | |
Net assets | | | $2,496,477,809 | |
| Net assets consist of | | | | |
Paid-in capital | | | $2,501,683,197 | |
Unrealized appreciation (depreciation) on investments | | | 125,354,855 | |
Accumulated net realized gain (loss) on investments | | | (140,637,671 | ) |
Undistributed net investment income | | | 10,077,428 | |
Net assets | | | $2,496,477,809 | |
Shares of beneficial interest outstanding | | | 314,328,309 | |
| | | | | | | | | | | | |
| | | Net assets | | | Shares outstanding | | | Net asset value per share (a) | |
Class A | | | $1,497,177,272 | | | | 188,487,842 | | | | $7.94 | |
Class B | | | 33,845,167 | | | | 4,256,638 | | | | 7.95 | |
Class C | | | 233,842,720 | | | | 29,409,434 | | | | 7.95 | |
Class I | | | 731,612,650 | | | | 92,174,395 | | | | 7.94 | |
| (a) | Maximum offering price per share was equal to the net asset value per share for all share classes, except for Class A, for which the maximum offering price per share was $8.34 [100 / 95.25 x $7.94]. On sales of $50,000 or more, the maximum offering price of Class A shares is reduced. A contingent deferred sales charge may be imposed on redemptions of Class A, Class B, and Class C shares. Redemption price per share was equal to the net asset value per share for Class I. |
See Notes to Financial Statements
49
Financial Statements
STATEMENT OF OPERATIONS
Six months ended 7/31/14 (unaudited)
This statement describes how much your fund earned in investment income and accrued in expenses. It also describes any gains and/or losses generated by fund operations.
| | | | |
| Net investment income | |
Income | | | | |
Interest | | | $63,953,986 | |
Dividends from underlying affiliated funds | | | 45,392 | |
Total investment income | | | $63,999,378 | |
Expenses | | | | |
Management fee | | | $6,252,858 | |
Distribution and service fees | | | 1,300,156 | |
Shareholder servicing costs | | | 1,071,512 | |
Administrative services fee | | | 135,564 | |
Independent Trustees’ compensation | | | 26,023 | |
Custodian fee | | | 101,232 | |
Shareholder communications | | | 58,740 | |
Audit and tax fees | | | 29,901 | |
Legal fees | | | 26,081 | |
Interest expense and fees | | | 183,577 | |
Miscellaneous | | | 128,232 | |
Total expenses | | | $9,313,876 | |
Fees paid indirectly | | | (27 | ) |
Reduction of expenses by investment adviser | | | (294,229 | ) |
Net expenses | | | $9,019,620 | |
Net investment income | | | $54,979,758 | |
| Realized and unrealized gain (loss) on investments | | | | |
Realized gain (loss) on investments (identified cost basis) | | | $(6,559,545 | ) |
Change in unrealized appreciation (depreciation) on investments | | | $101,727,894 | |
Net realized and unrealized gain (loss) on investments | | | $95,168,349 | |
Change in net assets from operations | | | $150,148,107 | |
See Notes to Financial Statements
50
Financial Statements
STATEMENTS OF CHANGES IN NET ASSETS
These statements describe the increases and/or decreases in net assets resulting from operations, any distributions, and any shareholder transactions.
| | | | | | | | |
| | | Six months ended 7/31/14 | | | Year ended 1/31/14 | |
| Change in net assets | | (unaudited) | | | | |
| From operations | | | | | | | | |
Net investment income | | | $54,979,758 | | | | $119,497,795 | |
Net realized gain (loss) on investments | | | (6,559,545 | ) | | | (36,000,910 | ) |
Net unrealized gain (loss) on investments | | | 101,727,894 | | | | (204,886,066 | ) |
Change in net assets from operations | | | $150,148,107 | | | | $(121,389,181 | ) |
| Distributions declared to shareholders | | | | | | | | |
From net investment income | | | $(53,280,549 | ) | | | $(117,740,818 | ) |
Change in net assets from fund share transactions | | | $311,220,415 | | | | $(631,619,752 | ) |
Total change in net assets | | | $408,087,973 | | | | $(870,749,751 | ) |
| Net assets | | | | | | | | |
At beginning of period | | | 2,088,389,836 | | | | 2,959,139,587 | |
At end of period (including undistributed net investment income of $10,077,428 and $8,378,219, respectively) | | | $2,496,477,809 | | | | $2,088,389,836 | |
See Notes to Financial Statements
51
Financial Statements
FINANCIAL HIGHLIGHTS
The financial highlights table is intended to help you understand the fund’s financial performance for the semiannual period and the past 5 fiscal years. Certain information reflects financial results for a single fund share. The total returns in the table represent the rate by which an investor would have earned (or lost) on an investment in the fund share class (assuming reinvestment of all distributions) held for the entire period.
| | | | | | | | | | | | | | | | | | | | | | | | |
| | | Six months
ended
7/31/14 (unaudited) | | | Years ended 1/31 | |
| Class A | | | 2014 | | | 2013 | | | 2012 | | | 2011 | | | 2010 | |
| | | | | | | | | | | | | | | | | |
Net asset value, beginning of
period | | | $7.61 | | | | $8.34 | | | | $7.89 | | | | $7.13 | | | | $7.39 | | | | $6.33 | |
| Income (loss) from investment operations | | | | | | | | | | | | | |
Net investment income (d) | | | $0.19 | | | | $0.40 | | | | $0.39 | | | | $0.41 | | | | $0.43 | | | | $0.43 | |
Net realized and unrealized
gain (loss) on investments | | | 0.33 | | | | (0.74 | ) | | | 0.44 | | | | 0.75 | | | | (0.27 | ) | | | 1.05 | |
Total from investment operations | | | $0.52 | | | | $(0.34 | ) | | | $0.83 | | | | $1.16 | | | | $0.16 | | | | $1.48 | |
| Less distributions declared to shareholders | | | | | | | | | | | | | | | | | |
From net investment income | | | $(0.19 | ) | | | $(0.39 | ) | | | $(0.38 | ) | | | $(0.40 | ) | | | $(0.42 | ) | | | $(0.42 | ) |
Net asset value, end of period (x) | | | $7.94 | | | | $7.61 | | | | $8.34 | | | | $7.89 | | | | $7.13 | | | | $7.39 | |
Total return (%) (r)(s)(t)(x) | | | 6.84 | (n) | | | (4.05 | ) | | | 10.72 | | | | 16.83 | | | | 2.03 | | | | 24.03 | |
Ratios (%) (to average net assets)
and Supplemental data: | | | | | | | | | | | | | | | | | | | | | |
Expenses before expense
reductions (f) | | | 0.71 | (a) | | | 0.72 | | | | 0.72 | | | | 0.71 | | | | 0.72 | | | | 0.72 | |
Expenses after expense
reductions (f) | | | 0.68 | (a) | | | 0.69 | | | | 0.70 | | | | 0.70 | | | | 0.70 | | | | 0.69 | |
Net investment income | | | 4.96 | (a) | | | 5.03 | | | | 4.83 | | | | 5.49 | | | | 5.68 | | | | 6.17 | |
Portfolio turnover | | | 6 | (n) | | | 18 | | | | 18 | | | | 21 | | | | 20 | | | | 17 | |
Net assets at end of period
(000 omitted) | | | $1,497,177 | | | | $1,445,607 | | | | $2,161,677 | | | | $1,858,416 | | | | $1,463,867 | | | | $1,452,126 | |
| Supplemental Ratios (%): | | | | | | | | | | | | | | | | | | | | | |
Ratio of expenses to average net
assets after expense
reductions and excluding
interest expense and fees (f)(l) | | | 0.67 | (a) | | | 0.67 | | | | 0.67 | | | | 0.67 | | | | 0.67 | | | | 0.67 | |
See Notes to Financial Statements
52
Financial Highlights – continued
| | | | | | | | | | | | | | | | | | | | | | | | |
| | | Six months
ended
7/31/14 (unaudited) | | | Years ended 1/31 | |
| Class B | | | 2014 | | | 2013 | | | 2012 | | | 2011 | | | 2010 | |
| | | | | | | | | | | | | | | | | |
Net asset value, beginning of
period | | | $7.61 | | | | $8.35 | | | | $7.90 | | | | $7.13 | | | | $7.40 | | | | $6.33 | |
| Income (loss) from investment operations | | | | | | | | | | | | | |
Net investment income (d) | | | $0.16 | | | | $0.33 | | | | $0.33 | | | | $0.35 | | | | $0.37 | | | | $0.38 | |
Net realized and unrealized
gain (loss) on investments | | | 0.34 | | | | (0.74 | ) | | | 0.43 | | | | 0.76 | | | | (0.28 | ) | | | 1.06 | |
Total from investment operations | | | $0.50 | | | | $(0.41 | ) | | | $0.76 | | | | $1.11 | | | | $0.09 | | | | $1.44 | |
| Less distributions declared to shareholders | | | | | | | | | | | | | | | | | |
From net investment income | | | $(0.16 | ) | | | $(0.33 | ) | | | $(0.31 | ) | | | $(0.34 | ) | | | $(0.36 | ) | | | $(0.37 | ) |
Net asset value, end of period (x) | | | $7.95 | | | | $7.61 | | | | $8.35 | | | | $7.90 | | | | $7.13 | | | | $7.40 | |
Total return (%) (r)(s)(t)(x) | | | 6.57 | (n) | | | (4.92 | ) | | | 9.82 | | | | 16.06 | | | | 1.10 | | | | 23.25 | |
Ratios (%) (to average net assets)
and Supplemental data: | | | | | | | | | | | | | | | | | | | | | |
Expenses before expense
reductions (f) | | | 1.71 | (a) | | | 1.72 | | | | 1.71 | | | | 1.71 | | | | 1.64 | | | | 1.50 | |
Expenses after expense
reductions (f) | | | 1.45 | (a) | | | 1.48 | | | | 1.51 | | | | 1.49 | | | | 1.49 | | | | 1.47 | |
Net investment income | | | 4.19 | (a) | | | 4.25 | | | | 4.02 | | | | 4.74 | | | | 4.89 | | | | 5.45 | |
Portfolio turnover | | | 6 | (n) | | | 18 | | | | 18 | | | | 21 | | | | 20 | | | | 17 | |
Net assets at end of period
(000 omitted) | | | $33,845 | | | | $34,969 | | | | $52,886 | | | | $47,927 | | | | $50,750 | | | | $68,348 | |
| Supplemental Ratios (%): | | | | | | | | | | | | | | | | | | | | | | | | |
Ratio of expenses to average net
assets after expense
reductions and excluding
interest expense and fees (f)(l) | | | 1.44 | (a) | | | 1.46 | | | | 1.48 | | | | 1.46 | | | | 1.46 | | | | 1.45 | |
See Notes to Financial Statements
53
Financial Highlights – continued
| | | | | | | | | | | | | | | | | | | | | | | | |
| | | Six months ended 7/31/14 (unaudited) | | | Years ended 1/31 | |
| Class C | | | 2014 | | | 2013 | | | 2012 | | | 2011 | | | 2010 | |
| | | | | | | | | | | | | | | | | |
Net asset value, beginning of
period | | | $7.61 | | | | $8.35 | | | | $7.90 | | | | $7.13 | | | | $7.40 | | | | $6.33 | |
| Income (loss) from investment operations | | | | | | | | | | | | | |
Net investment income (d) | | | $0.15 | | | | $0.32 | | | | $0.31 | | | | $0.33 | | | | $0.35 | | | | $0.36 | |
Net realized and unrealized
gain (loss) on investments | | | 0.34 | | | | (0.75 | ) | | | 0.44 | | | | 0.77 | | | | (0.27 | ) | | | 1.06 | |
Total from investment operations | | | $0.49 | | | | $(0.43 | ) | | | $0.75 | | | | $1.10 | | | | $0.08 | | | | $1.42 | |
| Less distributions declared to shareholders | | | | | | | | | | | | | | | | | |
From net investment income | | | $(0.15 | ) | | | $(0.31 | ) | | | $(0.30 | ) | | | $(0.33 | ) | | | $(0.35 | ) | | | $(0.35 | ) |
Net asset value, end of period (x) | | | $7.95 | | | | $7.61 | | | | $8.35 | | | | $7.90 | | | | $7.13 | | | | $7.40 | |
Total return (%) (r)(s)(t)(x) | | | 6.45 | (n) | | | (5.12 | ) | | | 9.61 | | | | 15.82 | | | | 0.88 | | | | 22.99 | |
Ratios (%) (to average net assets)
and Supplemental data: | | | | | | | | | | | | | | | | | | | | | |
Expenses before expense
reductions (f) | | | 1.71 | (a) | | | 1.72 | | | | 1.71 | | | | 1.71 | | | | 1.72 | | | | 1.72 | |
Expenses after expense
reductions (f) | | | 1.68 | (a) | | | 1.69 | | | | 1.70 | | | | 1.70 | | | | 1.70 | | | | 1.69 | |
Net investment income | | | 3.96 | (a) | | | 4.05 | | | | 3.82 | | | | 4.51 | | | | 4.68 | | | | 5.17 | |
Portfolio turnover | | | 6 | (n) | | | 18 | | | | 18 | | | | 21 | | | | 20 | | | | 17 | |
Net assets at end of period
(000 omitted) | | | $233,843 | | | | $221,393 | | | | $299,381 | | | | $236,487 | | | | $209,064 | | | | $213,166 | |
| Supplemental Ratios (%): | | | | | | | | | | | | | | | | | | | | | | | | |
Ratio of expenses to average net
assets after expense
reductions and excluding
interest expense and fees (f)(l) | | | 1.67 | (a) | | | 1.67 | | | | 1.67 | | | | 1.67 | | | | 1.67 | | | | 1.67 | |
See Notes to Financial Statements
54
Financial Highlights – continued
| | | | | | | | | | | | | | | | |
| | | Six months
ended
7/31/14 | | | Years ended 1/31 | |
| Class I | | | 2014 | | | 2013 | | | 2012 (i) | |
| | | (unaudited) | | | | | | | | | | |
Net asset value, beginning of period | | | $7.60 | | | | $8.34 | | | | $7.89 | | | | $7.28 | |
| Income (loss) from investment operations | | | | | |
Net investment income (d) | | | $0.19 | | | | $0.40 | | | | $0.39 | | | | $0.26 | |
Net realized and unrealized gain (loss) on investments | | | 0.34 | | | | (0.75 | ) | | | 0.44 | | | | 0.61 | |
Total from investment operations | | | $0.53 | | | | $(0.35 | ) | | | $0.83 | | | | $0.87 | |
| Less distributions declared to shareholders | | | | | | | | | |
From net investment income | | | $(0.19 | ) | | | $(0.39 | ) | | | $(0.38 | ) | | | $(0.26 | ) |
Net asset value, end of period (x) | | | $7.94 | | | | $7.60 | | | | $8.34 | | | | $7.89 | |
Total return (%) (r)(s)(x) | | | 6.97 | (n) | | | (4.18 | ) | | | 10.71 | | | | 12.22 | (n) |
Ratios (%) (to average net assets)
and Supplemental data: | | | | | | | | | | | | | |
Expenses before expense reductions (f) | | | 0.70 | (a) | | | 0.72 | | | | 0.72 | | | | 0.72 | (a) |
Expenses after expense reductions (f) | | | 0.68 | (a) | | | 0.69 | | | | 0.70 | | | | 0.69 | (a) |
Net investment income | | | 4.90 | (a) | | | 5.04 | | | | 4.82 | | | | 5.03 | (a) |
Portfolio turnover | | | 6 | (n) | | | 18 | | | | 18 | | | | 21 | |
Net assets at end of period (000 omitted) | | | $731,613 | | | | $386,421 | | | | $445,195 | | | | $145,622 | |
| Supplemental Ratios (%): | | | | | | | | | | | | | | | | |
Ratio of expenses to average net assets after expense
reductions and excluding interest expense and fees (f)(l) | | | 0.66 | (a) | | | 0.67 | | | | 0.67 | | | | 0.67 | (a) |
| (d) | Per share data is based on average shares outstanding. |
| (f) | Ratios do not reflect reductions from fees paid indirectly, if applicable. |
| (i) | For the period from the class inception, June 1, 2011, through the stated period end. |
| (l) | Interest expense and fees relate to payments made to the holders of the floating rate certificates from trust assets. |
| (r) | Certain expenses have been reduced without which performance would have been lower. |
| (s) | From time to time the fund may receive proceeds from litigation settlements, without which performance would be lower. |
| (t) | Total returns do not include any applicable sales charges. |
| (x) | The net asset values per share and total returns have been calculated on net assets which include adjustments made in accordance with U.S. generally accepted accounting principles required at period end for financial reporting purposes. |
See Notes to Financial Statements
55
NOTES TO FINANCIAL STATEMENTS
(unaudited)
(1) Business and Organization
MFS Municipal High Income Fund (the fund) is a diversified series of MFS Series Trust III which is organized as a Massachusetts business trust and is registered under the Investment Company Act of 1940, as amended, as an open-end management investment company.
The fund is an investment company and accordingly follows the investment company accounting and reporting guidance of the Financial Accounting Standards Board (FASB) Accounting Standard Codification Topic 946 Financial Services – Investment Companies.
(2) Significant Accounting Policies
General – The preparation of financial statements in conformity with U.S. generally accepted accounting principles requires management to make estimates and assumptions that affect the reported amounts of assets and liabilities, and disclosure of contingent assets and liabilities at the date of the financial statements and the reported amounts of increases and decreases in net assets from operations during the reporting period. Actual results could differ from those estimates. In the preparation of these financial statements, management has evaluated subsequent events occurring after the date of the fund’s Statement of Assets and Liabilities through the date that the financial statements were issued. The fund invests primarily in municipal instruments. The value of municipal instruments can be affected by changes in their actual or perceived credit quality. The credit quality of municipal instruments can be affected by, among other things, the financial condition of the issuer or guarantor, the issuer’s future borrowing plans and sources of revenue, the economic feasibility of the revenue bond project or general borrowing purpose, political or economic developments in the region where the instrument is issued and the liquidity of the security. Municipal instruments generally trade in the over-the-counter market. Municipal instruments backed by current and anticipated revenues from a specific project or specific assets can be negatively affected by the discontinuance of the taxation supporting the projects or assets or the inability to collect revenues for the project or from the assets. If the Internal Revenue Service determines an issuer of a municipal instrument has not complied with the applicable tax requirements, interest from the security could become taxable, the security could decline in value, and distributions made by the fund could be taxable to shareholders. The fund invests in high-yield securities rated below investment grade. Investments in high-yield securities involve greater degrees of credit and market risk than investments in higher-rated securities and tend to be more sensitive to economic conditions.
In June 2014, FASB issued Accounting Standards Update 2014-11, Transfers and Servicing (Topic 860) – Repurchase-to-Maturity Transactions, Repurchase Financings, and Disclosures (“ASU 2014-11”). ASU 2014-11 changes the accounting for repurchase-to-maturity transactions (i.e., repurchase agreements that settle at the same time as the maturity of the transferred financial asset) and enhances the required disclosures for repurchase agreements and other similar transactions. Although still evaluating the potential impacts of ASU 2014-11 to the fund, management expects
56
Notes to Financial Statements (unaudited) – continued
that the impact of the fund’s adoption will be limited to additional financial statement disclosures which would first be effective for interim reporting periods beginning after March 15, 2015.
Balance Sheet Offsetting – The fund’s accounting policy with respect to balance sheet offsetting is that, absent an event of default by the counterparty or a termination of the agreement, the International Swaps and Derivatives Association (ISDA) Master Agreement does not result in an offset of reported amounts of financial assets and financial liabilities in the Statement of Assets and Liabilities across transactions between the fund and the applicable counterparty. The fund’s right to setoff may be restricted or prohibited by the bankruptcy or insolvency laws of the particular jurisdiction to which a specific master netting agreement counterparty is subject. Balance sheet offsetting disclosures, to the extent applicable to the fund, have been included in the fund’s Significant Accounting Policies note under the captions for each of the fund’s in-scope financial instruments and transactions.
Investment Valuations – Debt instruments and floating rate loans (other than short-term instruments), including restricted debt instruments, are generally valued at an evaluated or composite bid as provided by a third-party pricing service. Short-term instruments with a maturity at issuance of 60 days or less generally are valued at amortized cost, which approximates market value. Open-end investment companies are generally valued at net asset value per share. Securities and other assets generally valued on the basis of information from a third-party pricing service may also be valued at a broker/dealer bid quotation. Values obtained from third-party pricing services can utilize both transaction data and market information such as yield, quality, coupon rate, maturity, type of issue, trading characteristics, and other market data.
The Board of Trustees has delegated primary responsibility for determining or causing to be determined the value of the fund’s investments (including any fair valuation) to the adviser pursuant to valuation policies and procedures approved by the Board. If the adviser determines that reliable market quotations are not readily available, investments are valued at fair value as determined in good faith by the adviser in accordance with such procedures under the oversight of the Board of Trustees. Under the fund’s valuation policies and procedures, market quotations are not considered to be readily available for most types of debt instruments and floating rate loans and many types of derivatives. These investments are generally valued at fair value based on information from third-party pricing services. In addition, investments may be valued at fair value if the adviser determines that an investment’s value has been materially affected by events occurring after the close of the exchange or market on which the investment is principally traded (such as foreign exchange or market) and prior to the determination of the fund’s net asset value, or after the halting of trading of a specific security where trading does not resume prior to the close of the exchange or market on which the security is principally traded. The adviser generally relies on third-party pricing services or other information (such as the correlation with price movements of similar securities in the same or other markets; the type, cost and investment characteristics of the security; the business and financial condition of the issuer; and trading and other market data) to assist in determining whether to fair value and at what value to fair value an investment. The value of an investment for purposes of calculating the fund’s net asset value can differ depending on the source and method used to determine
57
Notes to Financial Statements (unaudited) – continued
value. When fair valuation is used, the value of an investment used to determine the fund’s net asset value may differ from quoted or published prices for the same investment. There can be no assurance that the fund could obtain the fair value assigned to an investment if it were to sell the investment at the same time at which the fund determines its net asset value per share.
Various inputs are used in determining the value of the fund’s assets or liabilities. These inputs are categorized into three broad levels. In certain cases, the inputs used to measure fair value may fall into different levels of the fair value hierarchy. In such cases, an investment’s level within the fair value hierarchy is based on the lowest level of input that is significant to the fair value measurement. The fund’s assessment of the significance of a particular input to the fair value measurement in its entirety requires judgment, and considers factors specific to the investment. Level 1 includes unadjusted quoted prices in active markets for identical assets or liabilities. Level 2 includes other significant observable market-based inputs (including quoted prices for similar securities, interest rates, prepayment speed, and credit risk). Level 3 includes unobservable inputs, which may include the adviser’s own assumptions in determining the fair value of investments. The following is a summary of the levels used as of July 31, 2014 in valuing the fund’s assets or liabilities:
| | | | | | | | | | | | | | | | |
| Investments at Value | | Level 1 | | | Level 2 | | | Level 3 | | | Total | |
| Municipal Bonds | | | $— | | | | $2,391,460,724 | | | | $— | | | | $2,391,460,724 | |
| Short Term Securities | | | — | | | | 6,100,000 | | | | — | | | | 6,100,000 | |
| Mutual Funds | | | 151,341,143 | | | | — | | | | — | | | | 151,341,143 | |
| Total Investments | | | $151,341,143 | | | | $2,397,560,724 | | | | $— | | | | $2,548,901,867 | |
For further information regarding security characteristics, see the Portfolio of Investments.
Inverse Floaters – The fund invests in municipal inverse floating rate securities which are structured by the issuer (known as primary market inverse floating rate securities) or by an investment banker utilizing municipal bonds which have already been issued (known as secondary market inverse floating rate securities) to have variable rates of interest which typically move in the opposite direction of short term interest rates. A secondary market inverse floating rate security is created when an investment banker transfers a fixed rate municipal bond to a special purpose trust, and causes the trust to (a) issue floating rate certificates to third parties, in an amount equal to a fraction of the par amount of the deposited bonds (these certificates usually pay tax-exempt interest at short-term interest rates that typically reset weekly; and the certificate holders typically, on seven days notice, have the option to tender their certificates to the investment banker or another party for redemption at par plus accrued interest), and (b) issue inverse floating rate certificates (sometimes referred to as “inverse floaters”). If the holders of the inverse floaters transfer the municipal bonds to an investment banker for the purpose of depositing the municipal bonds into the special purpose trust, the inverse floating rate certificates that are issued by the trust are referred to as “self-deposited inverse floaters.” If the bonds held by the trust are purchased by the investment banker for deposit into the trust from someone other than the purchasers of the inverse floaters, the inverse floating rate certificates that are issued by the trust are referred to as “externally deposited inverse floaters.” Such
58
Notes to Financial Statements (unaudited) – continued
self-deposited inverse floaters held by the fund are accounted for as secured borrowings, with the municipal bonds reflected in the investments of the fund and amounts owed to the holders of the floating rate certificates under the provisions of the trust, which amounts are paid solely from the assets of the trust, reflected as liabilities of the fund in the Statement of Assets and Liabilities under the caption, “Payable to the holders of the floating rate certificates from trust assets”. The carrying value of the fund’s payable to the holders of the floating rate certificates from trust assets as reported in the fund’s Statement of Assets and Liabilities approximates its fair value. The value of the payable to the holders of the floating rate certificates from trust assets as of the reporting date is considered level 2 under the fair value hierarchy disclosure. At July 31, 2014, the fund’s payable to the holders of the floating rate certificates from trust assets was $56,158,389 and the interest rate on the floating rate certificates issued by the trust was 0.08%. For the six months ended July 31, 2014, the average payable to the holders of the floating rate certificates from trust assets was $62,782,329 at a weighted average interest rate of 0.08%. Interest expense and fees relate to interest payments made to the holders of certain floating rate certificates and associated fees, both of which are made from trust assets. Interest expense and fees are recorded as incurred. For the six months ended July 31, 2014, interest expense and fees in connection with self-deposited inverse floaters were $183,577. Primary and externally deposited inverse floaters held by the fund are not accounted for as secured borrowings.
Indemnifications – Under the fund’s organizational documents, its officers and Trustees may be indemnified against certain liabilities and expenses arising out of the performance of their duties to the fund. Additionally, in the normal course of business, the fund enters into agreements with service providers that may contain indemnification clauses. The fund’s maximum exposure under these agreements is unknown as this would involve future claims that may be made against the fund that have not yet occurred.
Investment Transactions and Income – Investment transactions are recorded on the trade date. Interest income is recorded on the accrual basis. All premium and discount is amortized or accreted for financial statement purposes in accordance with U.S. generally accepted accounting principles. Interest payments received in additional securities are recorded on the ex-interest date in an amount equal to the value of the security on such date. Debt obligations may be placed on non-accrual status or set to accrue at a rate of interest less than the contractual coupon when the collection of all or a portion of interest has become doubtful. Interest income for those debt obligations may be further reduced by the write-off of the related interest receivables when deemed uncollectible.
The fund may receive proceeds from litigation settlements. Any proceeds received from litigation involving portfolio holdings are reflected in the Statement of Operations in realized gain/loss if the security has been disposed of by the fund or in unrealized gain/loss if the security is still held by the fund. Any other proceeds from litigation not related to portfolio holdings are reflected as other income in the Statement of Operations.
Legal fees and other related expenses incurred to preserve and protect the value of a security owned are added to the cost of the security; other legal fees are expensed.
59
Notes to Financial Statements (unaudited) – continued
Capital infusions made directly to the security issuer, which are generally non-recurring, incurred to protect or enhance the value of high-yield debt securities, are reported as additions to the cost basis of the security. Costs that are incurred to negotiate the terms or conditions of capital infusions or that are expected to result in a plan of reorganization are reported as realized losses. Ongoing costs incurred to protect or enhance an investment, or costs incurred to pursue other claims or legal actions, are expensed.
Fees Paid Indirectly – The fund’s custody fee may be reduced according to an arrangement that measures the value of cash deposited with the custodian by the fund. This amount, for the six months ended July 31, 2014, is shown as a reduction of total expenses in the Statement of Operations.
Tax Matters and Distributions – The fund intends to qualify as a regulated investment company, as defined under Subchapter M of the Internal Revenue Code, and to distribute all of its taxable and tax-exempt income, including realized capital gains. As a result, no provision for federal income tax is required. The fund’s federal tax returns, when filed, will remain subject to examination by the Internal Revenue Service for a three year period. Management has analyzed the fund’s tax positions taken on federal and state tax returns for all open tax years and does not believe that there are any uncertain tax positions that require recognition of a tax liability.
Distributions to shareholders are recorded on the ex-dividend date. Income and capital gain distributions are determined in accordance with income tax regulations, which may differ from U.S. generally accepted accounting principles. Certain capital accounts in the financial statements are periodically adjusted for permanent differences in order to reflect their tax character. These adjustments have no impact on net assets or net asset value per share. Temporary differences which arise from recognizing certain items of income, expense, gain or loss in different periods for financial statement and tax purposes will reverse at some time in the future. Distributions in excess of net investment income or net realized gains are temporary overdistributions for financial statement purposes resulting from differences in the recognition or classification of income or distributions for financial statement and tax purposes.
Book/tax differences primarily relate to expiration of capital loss carryforwards, amortization and accretion of debt securities and defaulted bonds.
The tax character of distributions made during the current period will be determined at fiscal year end. The tax character of distributions declared to shareholders for the last fiscal year is as follows:
| | | | |
| | | 1/31/14 | |
Ordinary income (including any
short-term capital gains) | | | $2,660,724 | |
| Tax-exempt income | | | 115,080,094 | |
| Total distributions | | | $117,740,818 | |
60
Notes to Financial Statements (unaudited) – continued
The federal tax cost and the tax basis components of distributable earnings were as follows:
| | | | |
| As of 7/31/14 | | | |
| Cost of investments | | | $2,356,327,850 | |
| Gross appreciation | | | 175,757,222 | |
| Gross depreciation | | | (39,341,594 | ) |
| Net unrealized appreciation (depreciation) | | | $136,415,628 | |
| |
| As of 1/31/14 | | | |
| Undistributed ordinary income | | | 1,434,566 | |
| Undistributed tax-exempt income | | | 17,646,954 | |
| Capital loss carryforwards | | | (140,316,438 | ) |
| Post-October capital loss deferral | | | (4,020,867 | ) |
| Other temporary differences | | | (10,703,301 | ) |
| Net unrealized appreciation (depreciation) | | | 33,886,140 | |
The aggregate cost above includes prior fiscal year end tax adjustments, if applicable.
Under the Regulated Investment Company Modernization Act of 2010 (the “Act”), net capital losses recognized for fund fiscal years beginning after January 31, 2011 may be carried forward indefinitely, and their character is retained as short-term and/or long-term losses (“post-enactment losses”). Previously, net capital losses were carried forward for eight years and treated as short-term losses (“pre-enactment losses”). As a transition rule, the Act requires that all post-enactment net capital losses be used before pre-enactment net capital losses.
As of January 31, 2014 the fund had capital loss carryforwards available to offset future realized gains as follows:
| | | | |
Pre-enactment losses which
expire as follows: | |
| 1/31/15 | | | $(230,213 | ) |
| 1/31/17 | | | (18,935,036 | ) |
| 1/31/18 | | | (28,497,487 | ) |
| 1/31/19 | | | (16,085,714 | ) |
| Total | | | $(63,748,450 | ) |
|
Post-enactment losses which are
characterized as follows: | |
| Short-Term | | | $(18,166,242 | ) |
| Long-Term | | | (58,401,746 | ) |
| Total | | | $(76,567,988 | ) |
Multiple Classes of Shares of Beneficial Interest – The fund offers multiple classes of shares, which differ in their respective distribution and service fees. The fund’s income and common expenses are allocated to shareholders based on the value of settled shares outstanding of each class. The fund’s realized and unrealized gain (loss) are allocated to shareholders based on the daily net assets of each class. Dividends are declared separately for each class. Differences in per share dividend rates are generally due to differences in separate class expenses. Class B shares will convert to Class A
61
Notes to Financial Statements (unaudited) – continued
shares approximately eight years after purchase. The fund’s distributions declared to shareholders as reported in the Statements of Changes in Net Assets are presented by class as follows:
| | | | | | | | |
| | | From net investment
income | |
| | | Six months
ended
7/31/14 | | | Year
ended
1/31/14 | |
| Class A | | | $35,238,238 | | | | $85,515,458 | |
| Class B | | | 691,025 | | | | 1,827,375 | |
| Class C | | | 4,297,163 | | | | 10,410,666 | |
| Class I | | | 13,054,123 | | | | 19,987,319 | |
| Total | | | $53,280,549 | | | | $117,740,818 | |
(3) Transactions with Affiliates
Investment Adviser – The fund has an investment advisory agreement with MFS to provide overall investment management and related administrative services and facilities to the fund. The management fee is computed daily and paid monthly at an annual rate of 0.55% of the fund’s average daily net assets.
The investment adviser has agreed in writing to reduce its management fee to 0.50% of average daily net assets in excess of $2.5 billion. This written agreement will continue until modified by the fund’s Board of Trustees, but such agreement will continue at least until May 31, 2016. For the six months ended July 31, 2014, the fund’s average daily net assets did not exceed $2.5 billion and therefore, the management fee was not reduced in accordance with this agreement. MFS has also agreed in writing to reduce its management fee by a specified amount if certain MFS mutual fund assets exceed thresholds agreed to by MFS and the fund’s Board of Trustees. For the six months ended July 31, 2014, this management fee reduction amounted to $46,273, which is included in the reduction of total expenses in the Statement of Operations. The management fee incurred for the six months ended July 31, 2014 was equivalent to an annual effective rate of 0.55% of the fund’s average daily net assets.
The investment adviser has agreed in writing to pay a portion of the fund’s operating expenses, exclusive of management fee, distribution and service fees, interest, taxes, extraordinary expenses, brokerage and transaction costs and investment-related expenses (such as interest expenses and fees associated with investments in inverse floating rate instruments), such that fund operating expenses do not exceed 0.12% annually of the fund’s average daily net assets. This written agreement will continue until modified by the fund’s Board of Trustees, but such agreement will continue at least until May 31, 2016. For the six months ended July 31, 2014, this reduction amounted to $205,823 and is included in the reduction of total expenses in the Statement of Operations.
Distributor – MFS Fund Distributors, Inc. (MFD), a wholly-owned subsidiary of MFS, as distributor, received $287,190 for the six months ended July 31, 2014, as its portion of the initial sales charge on sales of Class A shares of the fund.
62
Notes to Financial Statements (unaudited) – continued
The Board of Trustees has adopted a distribution plan for certain share classes pursuant to Rule 12b-1 of the Investment Company Act of 1940.
The fund’s distribution plan provides that the fund will pay MFD for services provided by MFD and financial intermediaries in connection with the distribution and servicing of certain share classes. One component of the plan is a distribution fee paid to MFD and another component of the plan is a service fee paid to MFD. MFD may subsequently pay all, or a portion, of the distribution and/or service fees to financial intermediaries.
Distribution Plan Fee Table:
| | | | | | | | | | | | | | | | | | | | |
| | | Distribution
Fee Rate (d) | | | Service
Fee Rate (d) | | | Total
Distribution
Plan (d) | | | Annual
Effective
Rate (e) | | | Distribution
and Service
Fee | |
| Class B | | | 0.75% | | | | 0.25% | | | | 1.00% | | | | 0.77% | | | | $171,061 | |
| Class C | | | 0.75% | | | | 0.25% | | | | 1.00% | | | | 1.00% | | | | 1,129,095 | |
| Total Distribution and Service Fees | | | | $1,300,156 | |
| (d) | In accordance with the distribution plan for certain classes, the fund pays distribution and/or service fees equal to these annual percentage rates of each class’s average daily net assets. The distribution and service fee rates disclosed by class represent the current rates in effect at the end of the reporting period. Any rate changes, if applicable, are detailed below. |
| (e) | The annual effective rates represent actual fees incurred under the distribution plan for the six months ended July 31, 2014 based on each class’s average daily net assets. For one year from the date of sale of Class B shares, assets attributable to such Class B shares are subject to the 0.25% annual Class B service fee. On assets attributable to all other Class B shares, MFD has agreed in writing to waive the service fee. This agreement will continue until modified by the fund’s Board of Trustees, but such agreement will continue at least until May 31, 2015. For the six months ended July 31, 2014, this waiver amounted to $39,211 and is included in the reduction of total expenses in the Statement of Operations. MFD has voluntarily agreed to rebate a portion of each class’s 0.25% service fee attributable to accounts for which MFD retains the 0.25% service fee except for accounts attributable to MFS or its affiliates’ seed money. For the six months ended July 31, 2014, this rebate amounted to $570 for Class C and is included in the reduction of total expenses in the Statement of Operations. |
Certain Class A shares are subject to a contingent deferred sales charge (CDSC) in the event of a shareholder redemption within 18 months of purchase for shares purchased on or after August 1, 2012, and within 24 months of purchase for shares purchased prior to August 1, 2012. Class C shares are subject to a CDSC in the event of a shareholder redemption within 12 months of purchase. Class B shares are subject to a CDSC in the event of a shareholder redemption within six years of purchase. All contingent deferred sales charges are paid to MFD and during the six months ended July 31, 2014, were as follows:
| | | | |
| | | Amount | |
| Class A | | | $8,194 | |
| Class B | | | 32,753 | |
| Class C | | | 6,170 | |
Shareholder Servicing Agent – MFS Service Center, Inc. (MFSC), a wholly-owned subsidiary of MFS, receives a fee from the fund for its services as shareholder servicing agent calculated as a percentage of the average daily net assets of the fund as determined periodically under the supervision of the fund’s Board of Trustees. For the six months ended July 31, 2014, the fee was $102,077, which equated to 0.0090%
63
Notes to Financial Statements (unaudited) – continued
annually of the fund’s average daily net assets. MFSC also receives payment from the fund for out-of-pocket expenses, sub-accounting and other shareholder servicing costs which may be paid to affiliated and unaffiliated service providers. For the six months ended July 31, 2014, these out-of-pocket expenses, sub-accounting and other shareholder servicing costs amounted to $969,435.
Administrator – MFS provides certain financial, legal, shareholder communications, compliance, and other administrative services to the fund. Under an administrative services agreement, the fund partially reimburses MFS the costs incurred to provide these services. The fund is charged an annual fixed amount of $17,500 plus a fee based on average daily net assets. The administrative services fee incurred for the six months ended July 31, 2014 was equivalent to an annual effective rate of 0.0119% of the fund’s average daily net assets.
Trustees’ and Officers’ Compensation – The fund pays compensation to independent Trustees in the form of a retainer, attendance fees, and additional compensation to Board and Committee chairpersons. The fund does not pay compensation directly to Trustees or officers of the fund who are also officers of the investment adviser, all of whom receive remuneration for their services to the fund from MFS. Certain officers and Trustees of the fund are officers or directors of MFS, MFD, and MFSC.
Prior to December 31, 2001, the fund had an unfunded defined benefit plan (“DB plan”) for independent Trustees. As of December 31, 2001, the Board took action to terminate the DB plan with respect to then-current and any future independent Trustees, such that the DB plan covers only certain of those former independent Trustees who retired on or before December 31, 2001. Effective January 1, 2002, accrued benefits under the DB plan for then-current independent Trustees who continued were credited to an unfunded retirement deferral plan (the “Retirement Deferral plan”), which was established for and exists solely with respect to these credited amounts, and is not available for other deferrals by these or other independent Trustees. Although the Retirement Deferral plan is unfunded, amounts deferred under the plan are periodically adjusted for investment experience as if they had been invested in shares of the fund. The DB plan resulted in a pension expense of $1,202 and is included in independent Trustees’ compensation for the six months ended July 31, 2014. The liability for deferred retirement benefits payable to certain independent Trustees under both plans amounted to $12,890 at July 31, 2014, and is included in “Payable for independent Trustees’ compensation” in the Statement of Assets and Liabilities.
Other – This fund and certain other funds managed by MFS (the funds) have entered into services agreements (the Agreements) which provide for payment of fees by the funds to Tarantino LLC and Griffin Compliance LLC in return for the provision of services of an Independent Chief Compliance Officer (ICCO) and Assistant ICCO, respectively, for the funds. The funds can terminate the Agreements with Tarantino LLC and Griffin Compliance LLC at any time under the terms of the Agreements. The ICCO is an officer of the funds and the sole member of Tarantino LLC. Prior to June 1, 2014, Robyn L. Griffin served as the Assistant ICCO and was an officer of the funds. Ms. Griffin is the sole member of Griffin Compliance LLC. Effective May 31, 2014, Ms. Griffin resigned as Assistant ICCO and the service agreement between the funds
64
Notes to Financial Statements (unaudited) – continued
and Griffin Compliance LLC was terminated. For the six months ended July 31, 2014, the aggregate fees paid by the fund to Tarantino LLC and Griffin Compliance LLC were $3,343 and are included in “Miscellaneous” expense in the Statement of Operations. MFS has agreed to reimburse the fund for a portion of the payments made by the fund in the amount of $2,352, which is included in the reduction of total expenses in the Statement of Operations. Additionally, MFS has agreed to bear all expenses associated with office space, other administrative support, and supplies provided to the ICCO and Assistant ICCO.
The fund invests in the MFS Institutional Money Market Portfolio which is managed by MFS and seeks current income consistent with preservation of capital and liquidity. Income earned on this investment is included in “Dividends from underlying affiliated funds” in the Statement of Operations. This money market fund does not pay a management fee to MFS.
(4) Portfolio Securities
For the six months ended July 31, 2014, purchases and sales of investments, other than short-term obligations, aggregated $383,097,507 and $137,021,763, respectively.
(5) Shares of Beneficial Interest
The fund’s Declaration of Trust permits the Trustees to issue an unlimited number of full and fractional shares of beneficial interest. Transactions in fund shares were as follows:
| | | | | | | | | | | | | | | | |
| | | Six months ended
7/31/14 | | | Year ended
1/31/14 | |
| | | Shares | | | Amount | | | Shares | | | Amount | |
| Shares sold | | | | | | | | | | | | | | | | |
Class A | | | 20,291,240 | | | | $158,688,719 | | | | 44,514,342 | | | | $352,701,695 | |
Class B | | | 196,538 | | | | 1,534,559 | | | | 307,212 | | | | 2,439,936 | |
Class C | | | 2,461,005 | | | | 19,277,904 | | | | 4,663,621 | | | | 37,096,211 | |
Class I | | | 47,089,840 | | | | 368,409,921 | | | | 33,583,975 | | | | 259,565,999 | |
| | | 70,038,623 | | | | $547,911,103 | | | | 83,069,150 | | | | $651,803,841 | |
| | | |
| Shares issued to shareholders in reinvestment of distributions | | | | | | | | | | | | | |
Class A | | | 4,010,341 | | | | $31,475,150 | | | | 9,414,498 | | | | $73,360,147 | |
Class B | | | 71,563 | | | | 562,097 | | | | 185,289 | | | | 1,442,550 | |
Class C | | | 407,651 | | | | 3,203,164 | | | | 966,160 | | | | 7,510,034 | |
Class I | | | 1,228,575 | | | | 9,661,988 | | | | 1,884,839 | | | | 14,596,597 | |
| | | 5,718,130 | | | | $44,902,399 | | | | 12,450,786 | | | | $96,909,328 | |
| | | | |
| Shares reacquired | | | | | | | | | | | | | | | | |
Class A | | | (25,891,541 | ) | | | $(202,282,366 | ) | | | (122,897,571 | ) | | | $(972,648,919 | ) |
Class B | | | (604,817 | ) | | | (4,722,032 | ) | | | (2,230,077 | ) | | | (17,246,107 | ) |
Class C | | | (2,538,898 | ) | | | (19,846,828 | ) | | | (12,388,606 | ) | | | (95,711,451 | ) |
Class I | | | (6,989,594 | ) | | | (54,741,861 | ) | | | (38,012,376 | ) | | | (294,726,444 | ) |
| | | (36,024,850 | ) | | | $(281,593,087 | ) | | | (175,528,630 | ) | | | $(1,380,332,921 | ) |
65
Notes to Financial Statements (unaudited) – continued
| | | | | | | | | | | | | | | | |
| | | Six months ended
7/31/14 | | | Year ended
1/31/14 | |
| | | Shares | | | Amount | | | Shares | | | Amount | |
| Net change | | | | | | | | | | | | | | | | |
Class A | | | (1,589,960 | ) | | | $(12,118,497 | ) | | | (68,968,731 | ) | | | $(546,587,077 | ) |
Class B | | | (336,716 | ) | | | (2,625,376 | ) | | | (1,737,576 | ) | | | (13,363,621 | ) |
Class C | | | 329,758 | | | | 2,634,240 | | | | (6,758,825 | ) | | | (51,105,206 | ) |
Class I | | | 41,328,821 | | | | 323,330,048 | | | | (2,543,562 | ) | | | (20,563,848 | ) |
| | | 39,731,903 | | | | $311,220,415 | | | | (80,008,694 | ) | | | $(631,619,752 | ) |
(6) Line of Credit
The fund and certain other funds managed by MFS participate in a $1.1 billion unsecured committed line of credit, subject to a $1 billion sublimit, provided by a syndication of banks under a credit agreement. Borrowings may be made for temporary financing needs. Interest is charged to each fund, based on its borrowings, generally at a rate equal to the higher of the Federal Reserve funds rate or one month LIBOR plus an agreed upon spread. A commitment fee, based on the average daily, unused portion of the committed line of credit, is allocated among the participating funds at the end of each calendar quarter. In addition, the fund and other funds managed by MFS have established unsecured uncommitted borrowing arrangements with certain banks for temporary financing needs. Interest is charged to each fund, based on its borrowings, at a rate equal to the Federal Reserve funds rate plus an agreed upon spread. For the six months ended July 31, 2014, the fund’s commitment fee and interest expense were $4,400 and $0, respectively, and are included in “Miscellaneous” expense in the Statement of Operations.
(7) Transactions in Underlying Affiliated Funds-Affiliated Issuers
An affiliated issuer may be considered one in which the fund owns 5% or more of the outstanding voting securities, or a company which is under common control. For the purposes of this report, the fund assumes the following to be an affiliated issuer:
| | | | | | | | | | | | | | | | |
| Underlying Affiliated Fund | | Beginning
Shares/Par
Amount | | | Acquisitions
Shares/Par
Amount | | | Dispositions
Shares/Par
Amount | | | Ending
Shares/Par
Amount | |
MFS Institutional Money
Market Portfolio | | | 78,636,485 | | | | 289,432,134 | | | | (216,727,476 | ) | | | 151,341,143 | |
| | | | |
| Underlying Affiliated Fund | | Realized
Gain (Loss) | | | Capital Gain
Distributions | | | Dividend
Income | | | Ending
Value | |
MFS Institutional Money
Market Portfolio | | | $— | | | | $— | | | | $45,392 | | | | $151,341,143 | |
66
BOARD REVIEW OF INVESTMENT ADVISORY AGREEMENT
The Investment Company Act of 1940 requires that both the full Board of Trustees and a majority of the non-interested (“independent”) Trustees, voting separately, annually approve the continuation of the Fund’s investment advisory agreement with MFS. The Trustees consider matters bearing on the Fund and its advisory arrangements at their meetings throughout the year, including a review of performance data at each regular meeting. In addition, the independent Trustees met several times over the course of three months beginning in May and ending in July, 2014 (“contract review meetings”) for the specific purpose of considering whether to approve the continuation of the investment advisory agreement for the Fund and the other investment companies that the Board oversees (the “MFS Funds”). The independent Trustees were assisted in their evaluation of the Fund’s investment advisory agreement by independent legal counsel, from whom they received separate legal advice and with whom they met separately from MFS during various contract review meetings. The independent Trustees were also assisted in this process by the MFS Funds’ Independent Chief Compliance Officer, a full-time senior officer appointed by and reporting to the independent Trustees.
In connection with their deliberations regarding the continuation of the investment advisory agreement, the Trustees, including the independent Trustees, considered such information and factors as they believed, in light of the legal advice furnished to them and their own business judgment, to be relevant. The investment advisory agreement for the Fund was considered separately, although the Trustees also took into account the common interests of all MFS Funds in their review. As described below, the Trustees considered the nature, quality, and extent of the various investment advisory, administrative, and shareholder services performed by MFS under the existing investment advisory agreement and other arrangements with the Fund.
In connection with their contract review meetings, the Trustees received and relied upon materials that included, among other items: (i) information provided by Lipper Inc., an independent third party, on the investment performance of the Fund for various time periods ended December 31, 2013 and the investment performance of a group of funds with substantially similar investment classifications/objectives (the “Lipper performance universe”), (ii) information provided by Lipper Inc. on the Fund’s advisory fees and other expenses and the advisory fees and other expenses of comparable funds identified by Lipper Inc. (the “Lipper expense group”), (iii) information provided by MFS on the advisory fees of comparable portfolios of other clients of MFS, including institutional separate accounts and other clients, (iv) information as to whether and to what extent applicable expense waivers, reimbursements or fee “breakpoints” are observed for the Fund, (v) information regarding MFS’ financial results and financial condition, including MFS’ and certain of its affiliates’ estimated profitability from services performed for the Fund and the MFS Funds as a whole, and compared to MFS’ institutional business, (vi) MFS’ views regarding the outlook for the mutual fund industry and the strategic business plans of MFS, (vii) descriptions of various functions performed by MFS for the Funds, such as compliance monitoring and portfolio trading practices, and (viii) information regarding the overall organization of MFS, including information about MFS’ senior management and other personnel providing investment advisory, administrative and other services to
67
Board Review of Investment Advisory Agreement – continued
the Fund and the other MFS Funds. The comparative performance, fee and expense information prepared and provided by Lipper Inc. was not independently verified and the independent Trustees did not independently verify any information provided to them by MFS.
The Trustees’ conclusion as to the continuation of the investment advisory agreement was based on a comprehensive consideration of all information provided to the Trustees and not the result of any single factor. Some of the factors that figured particularly in the Trustees’ deliberations are described below, although individual Trustees may have evaluated the information presented differently from one another, giving different weights to various factors. It is also important to recognize that the fee arrangements for the Fund and other MFS Funds are the result of years of review and discussion between the independent Trustees and MFS, that certain aspects of such arrangements may receive greater scrutiny in some years than in others, and that the Trustees’ conclusions may be based, in part, on their consideration of these same arrangements during the course of the year and in prior years.
Based on information provided by Lipper Inc. and MFS, the Trustees reviewed the Fund’s total return investment performance as well as the performance of peer groups of funds over various time periods. The Trustees placed particular emphasis on the total return performance of the Fund’s Class A shares in comparison to the performance of funds in its Lipper performance universe over the three-year period ended December 31, 2013, which the Trustees believed was a long enough period to reflect differing market conditions. The total return performance of the Fund’s Class A shares was in the 2nd quintile relative to the other funds in the universe for this three-year period (the 1st quintile being the best performers and the 5th quintile being the worst performers). The total return performance of the Fund’s Class A shares was in the 3rd quintile for each of the one- and five-year periods ended December 31, 2013 relative to the Lipper performance universe. Because of the passage of time, these performance results may differ from the performance results for more recent periods, including those shown elsewhere in this report.
In the course of their deliberations, the Trustees took into account information provided by MFS in connection with the contract review meetings, as well as during investment review meetings conducted with portfolio management personnel during the course of the year regarding the Fund’s performance. After reviewing these and related factors, the Trustees concluded, within the context of their overall conclusions regarding the investment advisory agreement, that they were satisfied with MFS’ responses and efforts relating to investment performance.
In assessing the reasonableness of the Fund’s advisory fee, the Trustees considered, among other information, the Fund’s advisory fee and the total expense ratio of the Fund’s Class A shares as a percentage of average daily net assets and the advisory fee and total expense ratios of peer groups of funds based on information provided by Lipper Inc. The Trustees considered that MFS currently observes an expense limitation for the Fund, which may not be changed without the Trustees’ approval. The Trustees also considered that, according to the Lipper data (which takes into account any fee reductions or expense limitations that were in effect during the Fund’s last fiscal year),
68
Board Review of Investment Advisory Agreement – continued
the Fund’s effective advisory fee rate was higher than the Lipper expense group median, and the Fund’s total expense ratio was lower than the Lipper expense group median.
The Trustees also considered the advisory fees charged by MFS to any comparable institutional accounts. In comparing these fees, the Trustees considered information provided by MFS as to the generally broader scope of services provided by MFS to the Fund in comparison to institutional accounts, the higher demands placed on MFS’ investment personnel and trading infrastructure as a result of the daily cash in-flows and out-flows of the Fund, and the impact on MFS and expenses associated with the more extensive regulatory regime to which the Fund is subject in comparison to institutional accounts.
The Trustees also considered whether the Fund may benefit from any economies of scale in the management of the Fund in the event of growth in assets of the Fund and/or growth in assets of the MFS Funds as a whole. They noted that MFS has agreed in writing to reduce its advisory fee rate on the Fund’s average daily net assets over $2.5 billion, which may not be changed without the Trustees’ approval. The Trustees also noted that MFS has agreed in writing to waive a portion of the management fees of certain MFS Funds, including the Fund, if the total combined assets of certain funds within the MFS Funds’ complex increase above agreed upon thresholds (the “group fee waiver”), enabling the Fund’s shareholders to share in the benefits from any economies of scale at the complex level. The group fee waiver is reviewed and renewed annually between the Board and MFS. The Trustees concluded that the breakpoint and the group fee waiver were sufficient to allow the Fund to benefit from economies of scale as its assets and overall complex assets grow.
The Trustees also considered information prepared by MFS relating to MFS’ costs and profits with respect to the Fund, the MFS Funds considered as a group, and other investment companies and accounts advised by MFS, as well as MFS’ methodologies used to determine and allocate its costs to the MFS Funds, the Fund and other accounts and products for purposes of estimating profitability.
After reviewing these and other factors described herein, the Trustees concluded, within the context of their overall conclusions regarding the investment advisory agreement, that the advisory fees charged to the Fund represent reasonable compensation in light of the services being provided by MFS to the Fund.
In addition, the Trustees considered MFS’ resources and related efforts to continue to retain, attract and motivate capable personnel to serve the Fund. The Trustees also considered current and developing conditions in the financial services industry, including the presence of large and well-capitalized companies which are spending, and appear to be prepared to continue to spend, substantial sums to engage personnel and to provide services to competing investment companies. In this regard, the Trustees also considered the financial resources of MFS and its ultimate parent, Sun Life Financial Inc. The Trustees also considered the advantages and possible disadvantages to the Fund of having an adviser that also serves other investment companies as well as other accounts.
The Trustees also considered the nature, quality, cost, and extent of administrative, transfer agency, and distribution services provided to the Fund by MFS and its affiliates
69
Board Review of Investment Advisory Agreement – continued
under agreements and plans other than the investment advisory agreement, including any 12b-1 fees the Fund pays to MFS Fund Distributors, Inc., an affiliate of MFS. The Trustees also considered the nature, extent and quality of certain other services MFS performs or arranges for on the Fund’s behalf, which may include securities lending programs, directed expense payment programs, class action recovery programs, and MFS’ interaction with third-party service providers, principally custodians and sub-custodians. The Trustees concluded that the various non-advisory services provided by MFS and its affiliates on behalf of the Fund were satisfactory.
The Trustees also considered benefits to MFS from the use of the Fund’s portfolio brokerage commissions, if applicable, to pay for investment research and various other factors. Additionally, the Trustees considered so-called “fall-out benefits” to MFS such as reputational value derived from serving as investment manager to the Fund.
Based on their evaluation of factors that they deemed to be material, including those factors described above, the Board of Trustees, including the independent Trustees, concluded that the Fund’s investment advisory agreement with MFS should be continued for an additional one-year period, commencing August 1, 2014.
70
PROXY VOTING POLICIES AND INFORMATION
MFS votes proxies on behalf of the fund pursuant to proxy voting policies and procedures that are available without charge, upon request, by calling 1-800-225-2606, by visiting the Proxy Voting section of mfs.com or by visiting the SEC’s Web site at http://www.sec.gov.
Information regarding how the fund voted proxies relating to portfolio securities during the most recent twelve-month period ended June 30 is available without charge by visiting the Proxy Voting section of mfs.com or by visiting the SEC’s Web site at http://www.sec.gov.
QUARTERLY PORTFOLIO DISCLOSURE
The fund will file a complete schedule of portfolio holdings with the Securities and Exchange Commission (the Commission) for the first and third quarters of each fiscal year on Form N-Q. A shareholder can obtain the quarterly portfolio holdings report at mfs.com. The fund’s Form N-Q is also available on the EDGAR database on the Commission’s Internet Web site at http://www.sec.gov, and may be reviewed and copied at the:
Public Reference Room
Securities and Exchange Commission
100 F Street, NE, Room 1580
Washington, D.C. 20549
Information on the operation of the Public Reference Room may be obtained by calling the Commission at 1-800-SEC-0330. Copies of the fund’s Form N-Q also may be obtained, upon payment of a duplicating fee, by electronic request at the following e-mail address: publicinfo@sec.gov, or by writing the Public Reference Section at the above address.
FURTHER INFORMATION
From time to time, MFS may post important information about the fund or the MFS funds on the MFS web site (mfs.com). This information is available by visiting the “Commentary & Announcements” and “Market Outlooks” sections of mfs.com or by clicking on the fund’s name under “Mutual Funds” in the “Products” section of mfs.com.
PROVISION OF FINANCIAL REPORTS AND SUMMARY PROSPECTUSES
The fund produces financial reports every six months and updates its summary prospectus and prospectus annually. To avoid sending duplicate copies of materials to households, only one copy of the fund’s annual and semiannual report and summary prospectus may be mailed to shareholders having the same last name and residential address on the fund’s records. However, any shareholder may contact MFSC (please see back cover for address and telephone number) to request that copies of these reports and summary prospectuses be sent personally to that shareholder.
71
Save paper with eDelivery.

| MFS® will send you prospectuses, |
reports, and proxies directly via e-mail so you will get information faster with less mailbox clutter.
To sign up:
1. Go to mfs.com.
2. Log in via MFS® Access.
3. Select eDelivery.
If you own your MFS fund shares through a financial institution or a retirement plan, MFS® TALK, MFS® Access, or eDelivery may not be available to you.
CONTACT
WEB SITE
mfs.com
MFS TALK
1-800-637-8255
24 hours a day
ACCOUNT SERVICE AND LITERATURE
Shareholders
1-800-225-2606
Financial advisors
1-800-343-2829
Retirement plan services
1-800-637-1255
MAILING ADDRESS
MFS Service Center, Inc.
P.O. Box 55824
Boston, MA 02205-5824
OVERNIGHT MAIL
MFS Service Center, Inc.
c/o Boston Financial Data Services
30 Dan Road
Canton, MA 02021-2809
SEMIANNUAL REPORT
July 31, 2014

MFS® HIGH YIELD POOLED PORTFOLIO

HYP-SEM
MFS® HIGH YIELD POOLED PORTFOLIO
CONTENTS
The report is prepared for the general information of shareholders. It is authorized for distribution to prospective investors only when preceded or accompanied by a current prospectus.
NOT FDIC INSURED Ÿ MAY LOSE VALUE Ÿ NO BANK GUARANTEE

LETTER FROM THE CHAIRMAN AND CEO
Dear Shareholders:
The U.S. economy has gathered momentum after a slow start to the year. Industrial output, consumer confidence and retail sales have all strengthened along with the labor market. However, the unemployment rate remains elevated and the housing
market has cooled off. With second-quarter economic growth rebounding strongly, economists have a favorable outlook for the rest of the year.
China’s economy has picked up again, and Japan is moving steadily towards Prime Minister Abe’s economic goals, including an inflation rate of 2% by next spring. The eurozone’s economy appears to have turned a corner, with renewed growth. However, historically high unemployment persists, deflation remains a risk and Russian sanctions could present a new obstacle to regional growth.
With corporate earnings surpassing expectations, the greatest concerns now are related to conflicts in the Middle East and Ukraine as well as growing speculation on when the U.S. Federal Reserve will begin increasing interest rates.
As always at MFS®, active risk management is integral to how we manage your investments. We use a collaborative process, sharing insights across asset classes, regions and economic sectors. Our global team of investment professionals uses a multidisciplined, long-term, diversified investment approach.
We understand that these are challenging economic times. We believe that we can serve you best by applying proven principles, such as asset allocation and diversification, over the long term. We are confident that this approach can serve you well as you work with your financial advisors to reach your goals in the years ahead.
Respectfully,

Robert J. Manning
Chairman and Chief Executive Officer
MFS Investment Management
September 15, 2014
The opinions expressed in this letter are subject to change and may not be relied upon for investment advice. No forecasts can be guaranteed.
1
PORTFOLIO COMPOSITION
Portfolio structure (i)
| | | | |
| Top five industries (i) | | | | |
| Energy-Independent | | | 9.0% | |
| Cable TV | | | 5.4% | |
| Midstream | | | 5.1% | |
| Metals & Mining | | | 5.0% | |
| Medical & Health Technology & Services | | | 4.9% | |
| | | | |
Composition including fixed income
credit quality (a)(i) | |
| BBB | | | 2.6% | |
| BB | | | 35.1% | |
| B | | | 47.7% | |
| CCC | | | 12.4% | |
| Not Rated | | | 0.5% | |
| Non-Fixed Income | | | 0.2% | |
| Cash & Other | | | 1.5% | |
| |
| Portfolio facts (i) | | | | |
| Average Duration (d) | | | 4.6 | |
| Average Effective Maturity (m) | | | 7.0 yrs. | |
| (a) | For all securities other than those specifically described below, ratings are assigned to underlying securities utilizing ratings from Moody’s, Fitch, and Standard & Poor’s rating agencies and applying the following hierarchy: If all three agencies provide a rating, the middle rating (after dropping the highest and lowest ratings) is assigned; if two of the three agencies rate a security, the lower of the two is assigned. Ratings are shown in the S&P and Fitch scale (e.g., AAA). Securities rated BBB or higher are considered investment grade. All ratings are subject to change. Not Rated includes fixed income securities, including fixed income futures contracts, which have not been rated by any rating agency. Non-Fixed Income includes equity securities (including convertible bonds and equity derivatives) and commodities. The fund may not hold all of these instruments. The fund is not rated by these agencies. |
| (d) | Duration is a measure of how much a bond’s price is likely to fluctuate with general changes in interest rates, e.g., if rates rise 1.00%, a bond with a 5-year duration is likely to lose about 5.00% of its value due to the interest rate move. |
| (i) | For purposes of this presentation, the components include the value of securities, and reflect the impact of the equivalent exposure of derivative positions, if any. These amounts may be negative from time to time. Equivalent exposure is a calculated amount that translates the derivative position into a reasonable approximation of the amount of the underlying asset that the portfolio would have to hold at a given point in time to have the same price sensitivity that results from the portfolio’s ownership of the derivative contract. When dealing with derivatives, equivalent exposure is a more representative measure of the potential impact of a position on portfolio performance than value. The bond component will include any accrued interest amounts. |
2
Portfolio Composition – continued
| (m) | In determining an instrument’s effective maturity for purposes of calculating the fund’s dollar-weighted average effective maturity, MFS uses the instrument’s stated maturity or, if applicable, an earlier date on which MFS believes it is probable that a maturity-shortening device (such as a put, pre-refunding or prepayment) will cause the instrument to be repaid. Such an earlier date can be substantially shorter than the instrument’s stated maturity. |
Where the fund holds convertible bonds, these are treated as part of the equity portion of the portfolio.
Cash & Other can include cash, other assets less liabilities, offsets to derivative positions, and short-term securities.
Percentages are based on net assets as of 7/31/14.
The portfolio is actively managed and current holdings may be different.
3
EXPENSE TABLE
Fund expenses borne by the shareholders during the period, February 1, 2014 through July 31, 2014
As a shareholder of the fund, you incur ongoing costs, including fund expenses. This example is intended to help you understand your ongoing costs (in dollars) of investing in the fund and to compare these costs with the ongoing costs of investing in other mutual funds.
The example is based on an investment of $1,000 invested at the beginning of the period and held for the entire period February 1, 2014 through July 31, 2014.
Actual Expenses
The first line of the following table provides information about actual account values and actual expenses. You may use the information in this line, together with the amount you invested, to estimate the expenses that you paid over the period. Simply divide your account value by $1,000 (for example, an $8,600 account value divided by $1,000 = 8.6), then multiply the result by the number in the first line under the heading entitled “Expenses Paid During Period” to estimate the expenses you paid on your account during this period.
Hypothetical Example for Comparison Purposes
The second line of the following table provides information about hypothetical account values and hypothetical expenses based on the fund’s actual expense ratio and an assumed rate of return of 5% per year before expenses, which is not the fund’s actual return. The hypothetical account values and expenses may not be used to estimate the actual ending account balance or expenses you paid for the period. You may use this information to compare the ongoing costs of investing in the fund and other funds. To do so, compare this 5% hypothetical example with the 5% hypothetical examples that appear in the shareholder reports of the other funds.
Please note that the expenses shown in the table are meant to highlight your ongoing costs only and do not reflect any transactional costs, such as sales charges (loads). Therefore, the second line of the table is useful in comparing ongoing costs only, and will not help you determine the relative total costs of owning different funds. In addition, if these transactional costs were included, your costs would have been higher.
| | | | | | | | |
| | | Annualized Expense Ratio | | Beginning
Account Value
2/01/14 | | Ending Account Value
7/31/14 | | Expenses Paid During
Period (p) 2/01/14-7/31/14 |
| Actual | | 0.03% | | $1,000.00 | | $1,032.66 | | $0.15 |
| Hypothetical (h) | | 0.03% | | $1,000.00 | | $1,024.65 | | $0.15 |
| (h) | 5% fund return per year before expenses. |
| (p) | “Expenses Paid During Period” are equal to the fund’s annualized expense ratio, as shown above, multiplied by the average account value over the period, multiplied by 181/365 (to reflect the one-half year period). |
4
PORTFOLIO OF INVESTMENTS
7/31/14 (unaudited)
The Portfolio of Investments is a complete list of all securities owned by your fund. It is categorized by broad-based asset classes.
| | | | | | | | |
| Bonds - 92.4% | | | | | | | | |
| Issuer | | Shares/Par | | | Value ($) | |
| | | | | | | | |
| Aerospace - 2.3% | | | | | | | | |
| Bombardier, Inc., 7.5%, 3/15/18 (n) | | $ | 2,765,000 | | | $ | 3,020,763 | |
| Bombardier, Inc., 7.75%, 3/15/20 (n) | | | 1,995,000 | | | | 2,154,600 | |
| Bombardier, Inc., 6.125%, 1/15/23 (n) | | | 4,140,000 | | | | 4,077,900 | |
| CPI International, Inc., 8.75%, 2/15/18 | | | 3,875,000 | | | | 4,049,375 | |
| Gencorp, Inc., 7.125%, 3/15/21 | | | 4,205,000 | | | | 4,551,072 | |
| Huntington Ingalls Industries, Inc., 7.125%, 3/15/21 | | | 5,380,000 | | | | 5,756,600 | |
| TransDigm, Inc., 6%, 7/15/22 (z) | | | 375,000 | | | | 376,875 | |
| TransDigm, Inc., 6.5%, 7/15/24 (z) | | | 1,570,000 | | | | 1,585,700 | |
| | | | | | | | |
| | | | $ | 25,572,885 | |
| Apparel Manufacturers - 0.4% | | | | | | | | |
| Hanesbrands, Inc., 6.375%, 12/15/20 | | $ | 2,250,000 | | | $ | 2,390,625 | |
| PVH Corp., 4.5%, 12/15/22 | | | 1,820,000 | | | | 1,760,850 | |
| | | | | | | | |
| | | | $ | 4,151,475 | |
| Automotive - 3.0% | | | | | | | | |
| Accuride Corp., 9.5%, 8/01/18 | | $ | 5,005,000 | | | $ | 5,255,250 | |
| Allison Transmission, Inc., 7.125%, 5/15/19 (n) | | | 5,365,000 | | | | 5,686,900 | |
| Goodyear Tire & Rubber Co., 6.5%, 3/01/21 | | | 4,920,000 | | | | 5,202,900 | |
| Goodyear Tire & Rubber Co., 7%, 5/15/22 | | | 1,110,000 | | | | 1,204,350 | |
| Jaguar Land Rover PLC, 8.125%, 5/15/21 (n) | | | 4,605,000 | | | | 5,100,038 | |
| Jaguar Land Rover PLC, 5.625%, 2/01/23 (n) | | | 1,360,000 | | | | 1,421,200 | |
| Lear Corp., 8.125%, 3/15/20 | | | 1,432,000 | | | | 1,532,240 | |
| Lear Corp., 4.75%, 1/15/23 | | | 2,430,000 | | | | 2,392,031 | |
| Schaeffler Finance B.V., 6.875%, 8/15/18 (p)(n) | | | 2,405,000 | | | | 2,525,250 | |
| Schaeffler Finance B.V., 4.75%, 5/15/21 (z) | | | 2,175,000 | | | | 2,207,625 | |
| | | | | | | | |
| | | | $ | 32,527,784 | |
| Broadcasting - 2.3% | | | | | | | | |
| AMC Networks, Inc., 7.75%, 7/15/21 | | $ | 2,645,000 | | | $ | 2,896,275 | |
| Clear Channel Communications, Inc., 9%, 3/01/21 | | | 2,573,000 | | | | 2,659,839 | |
| Clear Channel Worldwide Holdings, Inc., “A”, 6.5%, 11/15/22 | | | 745,000 | | | | 778,525 | |
| Clear Channel Worldwide Holdings, Inc., “B”, 6.5%, 11/15/22 | | | 2,570,000 | | | | 2,698,500 | |
| Liberty Media Corp., 8.5%, 7/15/29 | | | 2,790,000 | | | | 3,096,900 | |
| Liberty Media Corp., 8.25%, 2/01/30 | | | 1,215,000 | | | | 1,342,575 | |
| Netflix, Inc., 5.375%, 2/01/21 | | | 2,835,000 | | | | 2,927,138 | |
| Nexstar Broadcasting, Inc., 6.875%, 11/15/20 | | | 2,730,000 | | | | 2,893,800 | |
| Univision Communications, Inc., 6.875%, 5/15/19 (n) | | | 2,200,000 | | | | 2,310,000 | |
| Univision Communications, Inc., 7.875%, 11/01/20 (n) | | | 2,610,000 | | | | 2,805,750 | |
5
Portfolio of Investments (unaudited) – continued
| | | | | | | | |
| Issuer | | Shares/Par | | | Value ($) | |
| | | | | | | | |
| Bonds - continued | | | | | | | | |
| Broadcasting - continued | | | | | | | | |
| Univision Communications, Inc., 8.5%, 5/15/21 (n) | | $ | 730,000 | | | $ | 788,400 | |
| | | | | | | | |
| | | | $ | 25,197,702 | |
| Brokerage & Asset Managers - 0.5% | | | | | | | | |
| E*TRADE Financial Corp., 6.375%, 11/15/19 | | $ | 5,580,000 | | | $ | 5,928,750 | |
| | |
| Building - 3.4% | | | | | | | | |
| Allegion U.S. Holding Co., Inc., 5.75%, 10/01/21 | | $ | 4,375,000 | | | $ | 4,593,750 | |
| Building Materials Holding Corp., 6.875%, 8/15/18 (n) | | | 630,000 | | | | 652,050 | |
| Building Materials Holding Corp., 7%, 2/15/20 (n) | | | 925,000 | | | | 970,094 | |
| Building Materials Holding Corp., 6.75%, 5/01/21 (n) | | | 3,495,000 | | | | 3,726,544 | |
| CEMEX Espana S.A., 9.25%, 5/12/20 | | | 2,640,000 | | | | 2,857,800 | |
| CEMEX Espana S.A., 9.25%, 5/12/20 (n) | | | 1,345,000 | | | | 1,455,963 | |
| CEMEX S.A.B. de C.V., 5.875%, 3/25/19 (n) | | | 202,000 | | | | 205,535 | |
| CEMEX S.A.B. de C.V., 6.5%, 12/10/19 (n) | | | 440,000 | | | | 459,250 | |
| CEMEX S.A.B. de C.V., 7.25%, 1/15/21 (n) | | | 866,000 | | | | 917,960 | |
| Gibraltar Industries, Inc., 6.25%, 2/01/21 | | | 2,275,000 | | | | 2,326,188 | |
| HD Supply, Inc., 8.125%, 4/15/19 | | | 2,060,000 | | | | 2,224,800 | |
| HD Supply, Inc., 7.5%, 7/15/20 | | | 4,555,000 | | | | 4,862,463 | |
| Headwaters, Inc., 7.25%, 1/15/19 | | | 1,795,000 | | | | 1,875,775 | |
| Headwaters, Inc., 7.625%, 4/01/19 | | | 1,215,000 | | | | 1,275,750 | |
| Nortek, Inc., 8.5%, 4/15/21 | | | 3,340,000 | | | | 3,623,900 | |
| Roofing Supply Group LLC/Roofing Supply Finance, Inc., 10%, 6/01/20 (n) | | | 3,047,000 | | | | 3,245,055 | |
| USG Corp., 7.875%, 3/30/20 (n) | | | 1,335,000 | | | | 1,450,144 | |
| USG Corp., 5.875%, 11/01/21 (n) | | | 780,000 | | | | 803,400 | |
| | | | | | | | |
| | | | $ | 37,526,421 | |
| Business Services - 1.5% | | | | | | | | |
| Equinix, Inc., 4.875%, 4/01/20 | | $ | 2,950,000 | | | $ | 2,972,125 | |
| Equinix, Inc., 5.375%, 4/01/23 | | | 1,640,000 | | | | 1,648,200 | |
| Fidelity National Information Services, Inc., 5%, 3/15/22 | | | 3,305,000 | | | | 3,499,945 | |
| Iron Mountain, Inc., 8.375%, 8/15/21 | | | 1,451,000 | | | | 1,505,413 | |
| Iron Mountain, Inc., 6%, 8/15/23 | | | 2,865,000 | | | | 2,986,763 | |
| Lender Processing Services, Inc., 5.75%, 4/15/23 | | | 1,195,000 | | | | 1,279,845 | |
| NeuStar, Inc., 4.5%, 1/15/23 | | | 3,730,000 | | | | 3,170,500 | |
| | | | | | | | |
| | | | $ | 17,062,791 | |
| Cable TV - 5.2% | | | | | | | | |
| CCO Holdings LLC/CCO Holdings Capital Corp., 8.125%, 4/30/20 | | $ | 4,825,000 | | | $ | 5,144,656 | |
| CCO Holdings LLC/CCO Holdings Capital Corp., 7.375%, 6/01/20 | | | 705,000 | | | | 752,588 | |
| CCO Holdings LLC/CCO Holdings Capital Corp., 6.5%, 4/30/21 | | | 3,335,000 | | | | 3,468,400 | |
6
Portfolio of Investments (unaudited) – continued
| | | | | | | | |
| Issuer | | Shares/Par | | | Value ($) | |
| | | | | | | | |
| Bonds - continued | | | | | | | | |
| Cable TV - continued | | | | | | | | |
| CCO Holdings LLC/CCO Holdings Capital Corp., 5.75%, 1/15/24 | | $ | 3,370,000 | | | $ | 3,353,150 | |
| Cequel Communications Holdings, 6.375%, 9/15/20 (n) | | | 3,775,000 | | | | 3,888,250 | |
| DISH DBS Corp., 6.75%, 6/01/21 | | | 2,540,000 | | | | 2,794,000 | |
| DISH DBS Corp., 5%, 3/15/23 | | | 2,750,000 | | | | 2,695,000 | |
| Intelsat Jackson Holdings S.A., 6.625%, 12/15/22 | | | 2,550,000 | | | | 2,575,500 | |
| Intelsat Jackson Holdings S.A., 5.5%, 8/01/23 | | | 4,995,000 | | | | 4,795,200 | |
| Intelsat Luxembourg S.A., 8.125%, 6/01/23 | | | 3,595,000 | | | | 3,738,800 | |
| Lynx I Corp., 5.375%, 4/15/21 (n) | | | 1,390,000 | | | | 1,403,900 | |
| Lynx II Corp., 6.375%, 4/15/23 (n) | | | 2,030,000 | | | | 2,131,500 | |
| Numericable Group S.A., 6%, 5/15/22 (n) | | | 4,235,000 | | | | 4,256,175 | |
| SIRIUS XM Radio, Inc., 4.25%, 5/15/20 (n) | | | 860,000 | | | | 827,750 | |
| SIRIUS XM Radio, Inc., 5.875%, 10/01/20 (n) | | | 395,000 | | | | 403,888 | |
| SIRIUS XM Radio, Inc., 4.625%, 5/15/23 (n) | | | 1,995,000 | | | | 1,855,350 | |
| SIRIUS XM Radio, Inc., 6%, 7/15/24 (z) | | | 1,860,000 | | | | 1,869,300 | |
| Telenet Finance Luxembourg, 6.375%, 11/15/20 (n) | | EUR | 1,510,000 | | | | 2,148,864 | |
| Unitymedia Hessen, 5.5%, 1/15/23 (n) | | $ | 3,480,000 | | | | 3,497,393 | |
| UPCB Finance III Ltd., 6.625%, 7/01/20 (n) | | | 2,398,000 | | | | 2,529,880 | |
| Ziggo Bond Co. B.V., 8%, 5/15/18 (n) | | EUR | 1,895,000 | | | | 2,778,308 | |
| | | | | | | | |
| | | | $ | 56,907,852 | |
| Chemicals - 3.1% | | | | | | | | |
| Celanese U.S. Holdings LLC, 5.875%, 6/15/21 | | $ | 3,149,000 | | | $ | 3,408,793 | |
| Celanese U.S. Holdings LLC, 4.625%, 11/15/22 | | | 1,485,000 | | | | 1,477,575 | |
| Flash Dutch 2 B.V./U.S. Coatings Acquisition, 7.375%, 5/01/21 (n) | | | 2,775,000 | | | | 2,948,428 | |
| Hexion U.S. Finance Corp., 6.625%, 4/15/20 | | | 1,840,000 | | | | 1,913,600 | |
| Hexion U.S. Finance Corp./Hexion Nova Scotia Finance, 8.875%, 2/01/18 | | | 3,160,000 | | | | 3,261,120 | |
| Huntsman International LLC, 8.625%, 3/15/21 | | | 3,325,000 | | | | 3,615,938 | |
| INEOS Finance PLC, 8.375%, 2/15/19 (n) | | | 3,690,000 | | | | 3,985,200 | |
| INEOS Group Holdings S.A., 6.125%, 8/15/18 (n) | | | 3,090,000 | | | | 3,120,900 | |
| INEOS Group Holdings S.A., 5.875%, 2/15/19 (n) | | | 1,390,000 | | | | 1,403,900 | |
| Taminco Global Chemical Corp., 9.75%, 3/31/20 (n) | | | 3,115,000 | | | | 3,418,713 | |
| Tronox Finance LLC, 6.375%, 8/15/20 | | | 5,160,000 | | | | 5,211,600 | |
| | | | | | | | |
| | | | $ | 33,765,767 | |
| Computer Software - 0.4% | | | | | | | | |
| Syniverse Holdings, Inc., 9.125%, 1/15/19 | | $ | 1,150,000 | | | $ | 1,207,500 | |
| VeriSign, Inc., 4.625%, 5/01/23 | | | 3,490,000 | | | | 3,402,750 | |
| | | | | | | | |
| | | | $ | 4,610,250 | |
| Computer Software - Systems - 0.7% | | | | | | | | |
| Audatex North America, Inc., 6%, 6/15/21 (n) | | $ | 2,445,000 | | | $ | 2,561,138 | |
| Audatex North America, Inc., 6.125%, 11/01/23 (n) | | | 715,000 | | | | 747,175 | |
7
Portfolio of Investments (unaudited) – continued
| | | | | | | | |
| Issuer | | Shares/Par | | | Value ($) | |
| | | | | | | | |
| Bonds - continued | | | | | | | | |
| Computer Software - Systems - continued | | | | | | | | |
| CDW LLC/CDW Finance Corp., 8.5%, 4/01/19 | | $ | 2,920,000 | | | $ | 3,102,500 | |
| CDW LLC/CDW Finance Corp., 6%, 8/15/22 | | | 1,505,000 | | | | 1,505,000 | |
| | | | | | | | |
| | | | $ | 7,915,813 | |
| Conglomerates - 2.1% | |
| Amsted Industries Co., 5%, 3/15/22 (n) | | $ | 3,705,000 | | | $ | 3,677,213 | |
| BC Mountain LLC, 7%, 2/01/21 (n) | | | 2,785,000 | | | | 2,673,600 | |
| Dynacast International LLC, 9.25%, 7/15/19 | | | 1,875,000 | | | | 2,053,125 | |
| Entegris, Inc., 6%, 4/01/22 (n) | | | 4,375,000 | | | | 4,517,188 | |
| Renaissance Acquisition, 6.875%, 8/15/21 (n) | | | 4,125,000 | | | | 4,155,938 | |
| Rexel S.A., 6.125%, 12/15/19 (n) | | | 2,780,000 | | | | 2,877,300 | |
| Silver II Borrower, 7.75%, 12/15/20 (n) | | | 2,510,000 | | | | 2,629,225 | |
| | | | | | | | |
| | | | $ | 22,583,589 | |
| Construction - 0.3% | | | | | | | | |
| Empresas ICA S.A.B. de C.V., 8.875%, 5/29/24 (n) | | $ | 1,223,000 | | | $ | 1,250,518 | |
| Empresas ICA Sociedad Controladora S.A. de C.V., 8.9%, 2/04/21 | | | 2,120,000 | | | | 2,226,000 | |
| | | | | | | | |
| | | | $ | 3,476,518 | |
| Consumer Products - 0.9% | | | | | | | | |
| Elizabeth Arden, Inc., 7.375%, 3/15/21 | | $ | 3,482,000 | | | $ | 3,595,165 | |
| Prestige Brands, Inc., 8.125%, 2/01/20 | | | 1,240,000 | | | | 1,357,800 | |
| Prestige Brands, Inc., 5.375%, 12/15/21 (n) | | | 2,585,000 | | | | 2,585,000 | |
| Spectrum Brands, Inc., 6.375%, 11/15/20 | | | 2,760,000 | | | | 2,904,900 | |
| | | | | | | | |
| | | | $ | 10,442,865 | |
| Consumer Services - 1.5% | | | | | | | | |
| ADT Corp., 6.25%, 10/15/21 | | $ | 3,490,000 | | | $ | 3,612,150 | |
| ADT Corp., 4.125%, 6/15/23 | | | 1,360,000 | | | | 1,230,800 | |
| Garda World Security Corp., 7.25%, 11/15/21 (z) | | | 2,330,000 | | | | 2,370,775 | |
| Garda World Security Corp., 7.25%, 11/15/21 (z) | | | 945,000 | | | | 961,538 | |
| Grupo Posadas S.A.B. de C.V., 7.875%, 11/30/17 | | | 1,765,000 | | | | 1,791,475 | |
| Monitronics International, Inc., 9.125%, 4/01/20 | | | 3,265,000 | | | | 3,428,250 | |
| Service Corp. International, 7%, 6/15/17 | | | 1,610,000 | | | | 1,783,075 | |
| Service Corp. International, 5.375%, 5/15/24 (n) | | | 1,655,000 | | | | 1,692,238 | |
| | | | | | | | |
| | | | $ | 16,870,301 | |
| Containers - 3.0% | | | | | | | | |
| Ardagh Packaging Finance PLC, 7%, 11/15/20 (n) | | $ | 317,647 | | | $ | 312,882 | |
| Ardagh Packaging Finance PLC, 9.125%, 10/15/20 (n) | | | 400,000 | | | | 432,000 | |
| Ardagh Packaging Finance PLC, 9.125%, 10/15/20 (n) | | | 2,980,000 | | | | 3,203,500 | |
| Ardagh Packaging Finance PLC, 6%, 6/30/21 (z) | | | 2,210,000 | | | | 2,110,550 | |
| Ball Corp., 5%, 3/15/22 | | | 1,008,000 | | | | 1,005,480 | |
8
Portfolio of Investments (unaudited) – continued
| | | | | | | | |
| Issuer | | Shares/Par | | | Value ($) | |
| | | | | | | | |
| Bonds - continued | | | | | | | | |
| Containers - continued | | | | | | | | |
| Ball Corp., 4%, 11/15/23 | | $ | 2,410,000 | | | $ | 2,223,225 | |
| Berry Plastics Group, Inc., 5.5%, 5/15/22 | | | 4,290,000 | | | | 4,182,750 | |
| Crown American LLC, 4.5%, 1/15/23 | | | 5,755,000 | | | | 5,438,475 | |
| Greif, Inc., 6.75%, 2/01/17 | | | 1,100,000 | | | | 1,196,250 | |
| Greif, Inc., 7.75%, 8/01/19 | | | 980,000 | | | | 1,107,400 | |
| Reynolds Group, 7.125%, 4/15/19 | | | 1,975,000 | | | | 2,049,063 | |
| Reynolds Group, 9.875%, 8/15/19 | | | 735,000 | | | | 791,963 | |
| Reynolds Group, 5.75%, 10/15/20 | | | 2,050,000 | | | | 2,091,000 | |
| Reynolds Group, 8.25%, 2/15/21 | | | 3,965,000 | | | | 4,202,900 | |
| Signode Industrial Group, 6.375%, 5/01/22 (z) | | | 2,730,000 | | | | 2,689,050 | |
| | | | | | | | |
| | | | $ | 33,036,488 | |
| Defense Electronics - 0.4% | | | | | | | | |
| Ducommun, Inc., 9.75%, 7/15/18 | | $ | 3,927,000 | | | $ | 4,329,518 | |
| | |
| Electronics - 1.8% | | | | | | | | |
| Advanced Micro Devices, Inc., 6.75%, 3/01/19 (n) | | $ | 3,235,000 | | | $ | 3,315,875 | |
| Advanced Micro Devices, Inc., 7.5%, 8/15/22 | | | 1,180,000 | | | | 1,221,300 | |
| Advanced Micro Devices, Inc., 7%, 7/01/24 (z) | | | 925,000 | | | | 901,875 | |
| Micron Technology, Inc., 5.875%, 2/15/22 (n) | | | 2,630,000 | | | | 2,761,500 | |
| Micron Technology, Inc., 5.5%, 2/01/25 (z) | | | 1,765,000 | | | | 1,756,175 | |
| Nokia Corp., 5.375%, 5/15/19 | | | 995,000 | | | | 1,054,700 | |
| Nokia Corp., 6.625%, 5/15/39 | | | 1,015,000 | | | | 1,083,513 | |
| NXP B.V., 5.75%, 2/15/21 (n) | | | 1,375,000 | | | | 1,430,000 | |
| NXP B.V., 5.75%, 3/15/23 (n) | | | 2,610,000 | | | | 2,694,825 | |
| Sensata Technologies B.V., 6.5%, 5/15/19 (n) | | | 3,320,000 | | | | 3,469,400 | |
| | | | | | | | |
| | | | $ | 19,689,163 | |
| Energy - Independent - 8.7% | | | | | | | | |
| American Energy-Permian Basin LLC, 7.125%, 11/01/20 (z) | | $ | 1,410,000 | | | $ | 1,360,650 | |
| American Energy-Permian Basin LLC, 7.375%, 11/01/21 (z) | | | 1,175,000 | | | | 1,133,875 | |
| Antero Resources Finance Corp., 6%, 12/01/20 | | | 2,270,000 | | | | 2,366,475 | |
| Antero Resources Finance Corp., 5.375%, 11/01/21 | | | 2,220,000 | | | | 2,247,750 | |
| Athlon Holdings LP/Athlon Finance Corp., 6%, 5/01/22 (z) | | | 3,240,000 | | | | 3,248,100 | |
| Baytex Energy Corp., 5.125%, 6/01/21 (z) | | | 465,000 | | | | 461,513 | |
| Baytex Energy Corp., 5.625%, 6/01/24 (z) | | | 2,340,000 | | | | 2,304,900 | |
| Bill Barrett Corp., 7%, 10/15/22 | | | 3,070,000 | | | | 3,146,750 | |
| BreitBurn Energy Partners LP, 8.625%, 10/15/20 | | | 1,075,000 | | | | 1,155,625 | |
| BreitBurn Energy Partners LP, 7.875%, 4/15/22 | | | 4,755,000 | | | | 4,968,975 | |
| Chaparral Energy, Inc., 7.625%, 11/15/22 | | | 2,980,000 | | | | 3,121,550 | |
| Chesapeake Energy Corp., 5.75%, 3/15/23 | | | 1,060,000 | | | | 1,131,550 | |
| Concho Resources, Inc., 6.5%, 1/15/22 | | | 2,440,000 | | | | 2,598,600 | |
| Concho Resources, Inc., 5.5%, 4/01/23 | | | 3,565,000 | | | | 3,689,775 | |
| Denbury Resources, Inc., 4.625%, 7/15/23 | | | 3,050,000 | | | | 2,851,750 | |
9
Portfolio of Investments (unaudited) – continued
| | | | | | | | |
| Issuer | | Shares/Par | | | Value ($) | |
| | | | | | | | |
| Bonds - continued | | | | | | | | |
| Energy - Independent - continued | | | | | | | | |
| EP Energy LLC, 6.875%, 5/01/19 | | $ | 1,205,000 | | | $ | 1,262,238 | |
| EP Energy LLC, 9.375%, 5/01/20 | | | 4,295,000 | | | | 4,756,713 | |
| EP Energy LLC, 7.75%, 9/01/22 | | | 5,050,000 | | | | 5,504,500 | |
| EPL Oil & Gas, Inc., 8.25%, 2/15/18 | | | 3,830,000 | | | | 4,002,350 | |
| Halcon Resources Corp., 8.875%, 5/15/21 | | | 4,605,000 | | | | 4,777,688 | |
| Harvest Operations Corp., 6.875%, 10/01/17 | | | 3,190,000 | | | | 3,437,225 | |
| Hilcorp Energy I/Hilcorp Finance Co., 8%, 2/15/20 (n) | | | 1,670,000 | | | | 1,778,550 | |
| Laredo Petroleum, Inc., 5.625%, 1/15/22 | | | 1,175,000 | | | | 1,195,563 | |
| Laredo Petroleum, Inc., 7.375%, 5/01/22 | | | 960,000 | | | | 1,046,400 | |
| LINN Energy LLC, 8.625%, 4/15/20 | | | 740,000 | | | | 781,625 | |
| LINN Energy LLC, 7.75%, 2/01/21 | | | 3,614,000 | | | | 3,785,665 | |
| MEG Energy Corp., 6.5%, 3/15/21 (n) | | | 1,760,000 | | | | 1,808,400 | |
| MEG Energy Corp., 7%, 3/31/24 (n) | | | 2,595,000 | | | | 2,744,213 | |
| Northern Blizzard Resources, Inc., 7.25%, 2/01/22 (n) | | | 3,460,000 | | | | 3,641,650 | |
| Oasis Petroleum, Inc., 6.875%, 3/15/22 (n) | | | 4,555,000 | | | | 4,930,788 | |
| Range Resources Corp., 5%, 8/15/22 | | | 4,315,000 | | | | 4,422,875 | |
| Sanchez Energy Corp., 6.125%, 1/15/23 (z) | | | 2,345,000 | | | | 2,339,138 | |
| SandRidge Energy, Inc., 8.125%, 10/15/22 | | | 3,430,000 | | | | 3,652,950 | |
| SM Energy Co., 6.5%, 11/15/21 | | | 3,455,000 | | | | 3,705,488 | |
| | | | | | | | |
| | | | $ | 95,361,857 | |
| Entertainment - 1.8% | | | | | | | | |
| Activision Blizzard, Inc., 6.125%, 9/15/23 (n) | | $ | 2,465,000 | | | $ | 2,656,038 | |
| Cedar Fair LP, 5.25%, 3/15/21 | | | 3,555,000 | | | | 3,590,550 | |
| Cedar Fair LP, 5.375%, 6/01/24 (n) | | | 1,420,000 | | | | 1,420,000 | |
| Cinemark USA, Inc., 5.125%, 12/15/22 | | | 2,445,000 | | | | 2,463,338 | |
| Cinemark USA, Inc., 4.875%, 6/01/23 | | | 2,060,000 | | | | 2,013,650 | |
| Seven Seas Cruises S. DE R.L., 9.125%, 5/15/19 | | | 3,845,000 | | | | 4,152,600 | |
| Six Flags Entertainment Corp., 5.25%, 1/15/21 (n) | | | 3,490,000 | | | | 3,472,550 | |
| | | | | | | | |
| | | | $ | 19,768,726 | |
| Financial Institutions - 4.8% | | | | | | | | |
| Aircastle Ltd., 4.625%, 12/15/18 | | $ | 2,840,000 | | | $ | 2,889,700 | |
| Aircastle Ltd., 5.125%, 3/15/21 | | | 1,415,000 | | | | 1,418,538 | |
| Aviation Capital Group, 4.625%, 1/31/18 (n) | | | 3,015,000 | | | | 3,190,603 | |
| Aviation Capital Group, 6.75%, 4/06/21 (n) | | | 1,935,000 | | | | 2,179,114 | |
| CIT Group, Inc., 5.25%, 3/15/18 | | | 2,875,000 | | | | 3,033,125 | |
| CIT Group, Inc., 6.625%, 4/01/18 (n) | | | 4,276,000 | | | | 4,714,290 | |
| CIT Group, Inc., 5.5%, 2/15/19 (n) | | | 4,287,000 | | | | 4,576,373 | |
| CIT Group, Inc., 5%, 8/15/22 | | | 2,605,000 | | | | 2,689,663 | |
| Icahn Enterprises LP, 6%, 8/01/20 | | | 3,160,000 | | | | 3,294,300 | |
| Icahn Enterprises LP, 5.875%, 2/01/22 | | | 3,930,000 | | | | 4,006,144 | |
| International Lease Finance Corp., 7.125%, 9/01/18 (n) | | | 1,736,000 | | | | 1,987,720 | |
| Nationstar Mortgage LLC/Capital Corp., 6.5%, 8/01/18 | | | 2,220,000 | | | | 2,197,800 | |
10
Portfolio of Investments (unaudited) – continued
| | | | | | | | |
| Issuer | | Shares/Par | | | Value ($) | |
| | | | | | | | |
| Bonds - continued | | | | | | | | |
| Financial Institutions - continued | | | | | | | | |
| Nationstar Mortgage LLC/Capital Corp., 7.875%, 10/01/20 | | $ | 3,815,000 | | | $ | 3,891,300 | |
| SLM Corp., 4.875%, 6/17/19 | | | 788,000 | | | | 793,910 | |
| SLM Corp., 8%, 3/25/20 | | | 5,800,000 | | | | 6,554,000 | |
| SLM Corp., 7.25%, 1/25/22 | | | 3,130,000 | | | | 3,427,350 | |
| SLM Corp., 6.125%, 3/25/24 | | | 1,685,000 | | | | 1,642,875 | |
| | | | | | | | |
| | | | $ | 52,486,805 | |
| Food & Beverages - 1.4% | | | | | | | | |
| B&G Foods, Inc., 4.625%, 6/01/21 | | $ | 2,250,000 | | | $ | 2,193,750 | |
| Constellation Brands, Inc., 3.75%, 5/01/21 | | | 430,000 | | | | 419,250 | |
| Constellation Brands, Inc., 4.25%, 5/01/23 | | | 3,255,000 | | | | 3,214,313 | |
| Darling Ingrediants, Inc., 5.375%, 1/15/22 (n) | | | 3,345,000 | | | | 3,436,988 | |
| H.J. Heinz Co., 4.25%, 10/15/20 | | | 2,185,000 | | | | 2,171,344 | |
| Sun Merger Sub, Inc., 5.875%, 8/01/21 (n) | | | 3,410,000 | | | | 3,580,500 | |
| | | | | | | | |
| | | | $ | 15,016,145 | |
| Forest & Paper Products - 0.5% | | | | | | | | |
| Appvion, Inc., 9%, 6/01/20 (n) | | $ | 2,680,000 | | | $ | 2,559,400 | |
| Tembec Industries, Inc., 11.25%, 12/15/18 | | | 2,440,000 | | | | 2,616,900 | |
| | | | | | | | |
| | | | $ | 5,176,300 | |
| Gaming & Lodging - 2.5% | | | | | | | | |
| CCM Merger, Inc., 9.125%, 5/01/19 (n) | | $ | 3,280,000 | | | $ | 3,460,400 | |
| Chester Downs & Marina LLC, 9.25%, 2/01/20 (n) | | | 1,450,000 | | | | 1,377,500 | |
| Greektown Holdings LLC, 8.875%, 3/15/19 (n) | | | 2,840,000 | | | | 2,825,800 | |
| Hilton Worldwide Finance Co., 5.625%, 10/15/21 (n) | | | 3,315,000 | | | | 3,472,463 | |
| Isle of Capri Casinos, Inc., 8.875%, 6/15/20 | | | 1,550,000 | | | | 1,643,000 | |
| Isle of Capri Casinos, Inc., 5.875%, 3/15/21 | | | 610,000 | | | | 625,250 | |
| MGM Resorts International, 6.625%, 12/15/21 | | | 2,985,000 | | | | 3,227,531 | |
| Pinnacle Entertainment, Inc., 8.75%, 5/15/20 | | | 2,130,000 | | | | 2,273,775 | |
| Pinnacle Entertainment, Inc., 6.375%, 8/01/21 | | | 1,860,000 | | | | 1,915,800 | |
| Ryman Hospitality Properties, Inc., REIT, 5%, 4/15/21 | | | 3,045,000 | | | | 3,022,163 | |
| Wynn Las Vegas LLC, 7.75%, 8/15/20 | | | 3,085,000 | | | | 3,324,088 | |
| | | | | | | | |
| | | | $ | 27,167,770 | |
| Health Maintenance Organizations - 0.0% | | | | | | | | |
| Wellcare Health Plans, Inc., 5.75%, 11/15/20 | | $ | 205,000 | | | $ | 209,100 | |
| | |
| Industrial - 1.3% | | | | | | | | |
| Dematic S.A., 7.75%, 12/15/20 (n) | | $ | 4,995,000 | | | $ | 5,344,650 | |
| Howard Hughes Corp., 6.875%, 10/01/21 (n) | | | 3,755,000 | | | | 3,952,138 | |
| Hyva Global B.V., 8.625%, 3/24/16 (n) | | | 1,760,000 | | | | 1,821,600 | |
| SPL Logistics Escrow LLC, 8.875%, 8/01/20 (n) | | | 2,675,000 | | | | 2,962,563 | |
| | | | | | | | |
| | | | $ | 14,080,951 | |
11
Portfolio of Investments (unaudited) – continued
| | | | | | | | |
| Issuer | | Shares/Par | | | Value ($) | |
| | | | | | | | |
| Bonds - continued | | | | | | | | |
| International Market Quasi-Sovereign - 0.3% | | | | | | | | |
| Eksportfinans A.S.A., 5.5%, 5/25/16 | | $ | 170,000 | | | $ | 179,945 | |
| Eksportfinans A.S.A., 5.5%, 6/26/17 | | | 2,915,000 | | | | 3,128,757 | |
| | | | | | | | |
| | | | $ | 3,308,702 | |
| Machinery & Tools - 1.3% | | | | | | | | |
| H&E Equipment Services Co., 7%, 9/01/22 | | $ | 3,855,000 | | | $ | 4,173,038 | |
| Jurassic Holdings III, Inc., 6.875%, 2/15/21 (n) | | | 3,210,000 | | | | 3,193,950 | |
| Light Tower Rentals, Inc., 8.125%, 8/01/19 (z) | | | 1,415,000 | | | | 1,439,763 | |
| RSC Equipment Rental, Inc., 8.25%, 2/01/21 | | | 1,890,000 | | | | 2,062,463 | |
| United Rentals North America, Inc., 7.625%, 4/15/22 | | | 3,238,000 | | | | 3,569,896 | |
| | | | | | | | |
| | | | $ | 14,439,110 | |
| Major Banks - 1.1% | | | | | | | | |
| Bank of America Corp., FRN, 5.2%, 12/31/49 | | $ | 3,900,000 | | | $ | 3,656,250 | |
| JPMorgan Chase & Co., 6% to 8/01/23, FRN to 12/29/49 | | | 3,680,000 | | | | 3,735,200 | |
| Royal Bank of Scotland Group PLC, 7.648% to 9/30/31, FRN to 8/29/49 | | | 2,800,000 | | | | 3,332,560 | |
| Royal Bank of Scotland Group PLC, 6.99% to 10/04/17, FRN to 10/29/49 (n) | | | 905,000 | | | | 1,038,488 | |
| | | | | | | | |
| | | | $ | 11,762,498 | |
| Medical & Health Technology & Services - 4.6% | | | | | | | | |
| CHS/Community Health Systems, Inc., 5.125%, 8/01/21 (z) | | $ | 700,000 | | | $ | 705,250 | |
| CHS/Community Health Systems, Inc., 6.875%, 2/01/22 (z) | | | 5,695,000 | | | | 5,823,138 | |
| Davita, Inc., 6.625%, 11/01/20 | | | 4,110,000 | | | | 4,315,500 | |
| Davita, Inc., 5.125%, 7/15/24 | | | 1,755,000 | | | | 1,728,675 | |
| Fresenius Medical Care Capital Trust III, 5.625%, 7/31/19 (n) | | | 1,640,000 | | | | 1,746,600 | |
| Fresenius Medical Care Capital Trust III, 5.875%, 1/31/22 (n) | | | 1,375,000 | | | | 1,502,188 | |
| HCA, Inc., 7.25%, 9/15/20 | | | 1,015,000 | | | | 1,073,363 | |
| HCA, Inc., 7.5%, 2/15/22 | | | 5,140,000 | | | | 5,821,050 | |
| HCA, Inc., 5.875%, 3/15/22 | | | 3,575,000 | | | | 3,807,375 | |
| HCA, Inc., 5%, 3/15/24 | | | 2,340,000 | | | | 2,322,450 | |
| HealthSouth Corp., 8.125%, 2/15/20 | | | 4,780,000 | | | | 5,042,900 | |
| Lifepoint Hospitals, Inc., 5.5%, 12/01/21 (n) | | | 5,165,000 | | | | 5,281,213 | |
| Tenet Healthcare Corp., 8%, 8/01/20 | | | 4,790,000 | | | | 5,113,325 | |
| Tenet Healthcare Corp., 4.5%, 4/01/21 | | | 4,100,000 | | | | 3,987,250 | |
| Universal Health Services, Inc., 7.625%, 8/15/20 | | | 2,750,000 | | | | 2,805,000 | |
| | | | | | | | |
| | | | $ | 51,075,277 | |
| Medical Equipment - 0.8% | | | | | | | | |
| Biomet, Inc., 6.5%, 8/01/20 | | $ | 1,885,000 | | | $ | 2,033,255 | |
| Physio-Control International, Inc., 9.875%, 1/15/19 (n) | | | 1,430,000 | | | | 1,569,425 | |
| Teleflex, Inc., 6.875%, 6/01/19 | | | 2,550,000 | | | | 2,696,625 | |
12
Portfolio of Investments (unaudited) – continued
| | | | | | | | |
| Issuer | | Shares/Par | | | Value ($) | |
| | | | | | | | |
| Bonds - continued | | | | | | | | |
| Medical Equipment - continued | | | | | | | | |
| Teleflex, Inc., 5.25%, 6/15/24 (n) | | $ | 2,155,000 | | | $ | 2,187,325 | |
| | | | | | | | |
| | | | $ | 8,486,630 | |
| Metals & Mining - 4.7% | | | | | | | | |
| ArcelorMittal S.A., 6.75%, 2/25/22 | | $ | 965,000 | | | $ | 1,044,613 | |
| ArcelorMittal S.A., 7.25%, 3/01/41 | | | 1,735,000 | | | | 1,769,700 | |
| Arch Coal, Inc., 8%, 1/15/19 (n) | | | 1,695,000 | | | | 1,635,675 | |
| Arch Coal, Inc., 7.25%, 10/01/20 | | | 2,190,000 | | | | 1,456,350 | |
| Century Aluminum Co., 7.5%, 6/01/21 (n) | | | 3,675,000 | | | | 3,895,500 | |
| Commercial Metals Co., 4.875%, 5/15/23 | | | 2,493,000 | | | | 2,399,513 | |
| Consol Energy, Inc., 8.25%, 4/01/20 | | | 3,445,000 | | | | 3,668,925 | |
| Consol Energy, Inc., 6.375%, 3/01/21 | | | 1,235,000 | | | | 1,296,750 | |
| Consol Energy, Inc., 5.875%, 4/15/22 (n) | | | 2,990,000 | | | | 3,023,638 | |
| First Quantum Minerals Ltd., 7.25%, 10/15/19 (n) | | | 5,492,000 | | | | 5,711,680 | |
| First Quantum Minerals Ltd., 7.25%, 5/15/22 (n) | | | 2,140,000 | | | | 2,201,525 | |
| FMG Resources, 6.875%, 4/01/22 (n) | | | 855,000 | | | | 909,506 | |
| Fortescue Metals Group Ltd., 8.25%, 11/01/19 (n) | | | 4,060,000 | | | | 4,354,350 | |
| GrafTech International Co., 6.375%, 11/15/20 | | | 3,450,000 | | | | 3,527,625 | |
| Molycorp, Inc., 10%, 6/01/20 | | | 955,000 | | | | 849,950 | |
| Peabody Energy Corp., 6%, 11/15/18 | | | 2,110,000 | | | | 2,104,725 | |
| Steel Dynamics, Inc., 5.25%, 4/15/23 | | | 2,230,000 | | | | 2,246,725 | |
| Suncoke Energy Partners LP/Suncoke Energy Partners Finance Corp., 7.375%, 2/01/20 (z) | | | 1,150,000 | | | | 1,213,250 | |
| Suncoke Energy, Inc., 7.625%, 8/01/19 | | | 2,570,000 | | | | 2,724,200 | |
| TMS International Corp., 7.625%, 10/15/21 (n) | | | 2,400,000 | | | | 2,544,000 | |
| Walter Energy, Inc., 9.5%, 10/15/19 (n) | | | 1,615,000 | | | | 1,606,925 | |
| Walter Energy, Inc., 8.5%, 4/15/21 | | | 3,150,000 | | | | 1,512,000 | |
| | | | | | | | |
| | | | $ | 51,697,125 | |
| Midstream - 5.1% | | | | | | | | |
| Access Midstream Partners Co., 5.875%, 4/15/21 | | $ | 1,020,000 | | | $ | 1,073,550 | |
| Access Midstream Partners Co., 4.875%, 5/15/23 | | | 4,390,000 | | | | 4,521,700 | |
| AmeriGas Finance LLC, 6.75%, 5/20/20 | | | 4,805,000 | | | | 5,057,263 | |
| Atlas Pipeline Partners LP/Atlas Pipeline, 4.75%, 11/15/21 | | | 860,000 | | | | 812,700 | |
| Atlas Pipeline Partners LP/Atlas Pipeline, 5.875%, 8/01/23 | | | 3,225,000 | | | | 3,168,563 | |
| Crestwood Midstream Partners LP, 6%, 12/15/20 | | | 3,240,000 | | | | 3,337,200 | |
| Crestwood Midstream Partners LP, 6.125%, 3/01/22 (n) | | | 1,970,000 | | | | 2,034,025 | |
| El Paso Corp., 7.75%, 1/15/32 | | | 6,530,000 | | | | 7,215,650 | |
| Energy Transfer Equity LP, 7.5%, 10/15/20 | | | 3,405,000 | | | | 3,805,088 | |
| Ferrellgas LP/Ferrellgas Finance Corp., 6.5%, 5/01/21 | | | 1,085,000 | | | | 1,120,263 | |
| Ferrellgas LP/Ferrellgas Finance Corp., 6.75%, 1/15/22 (n) | | | 4,705,000 | | | | 4,904,963 | |
| MarkWest Energy Partners LP, 5.5%, 2/15/23 | | | 2,825,000 | | | | 2,930,938 | |
| MarkWest Energy Partners LP, 4.5%, 7/15/23 | | | 2,429,000 | | | | 2,392,565 | |
| Sabine Pass Liquefaction LLC, 5.625%, 2/01/21 | | | 2,720,000 | | | | 2,815,200 | |
13
Portfolio of Investments (unaudited) – continued
| | | | | | | | |
| Issuer | | Shares/Par | | | Value ($) | |
| | | | | | | | |
| Bonds - continued | | | | | | | | |
| Midstream - continued | | | | | | | | |
| Sabine Pass Liquefaction LLC, 5.625%, 4/15/23 | | $ | 4,800,000 | | | $ | 4,872,000 | |
| Sabine Pass Liquefaction LLC, 5.75%, 5/15/24 (z) | | | 1,705,000 | | | | 1,730,575 | |
| Summit Midstream Holdings LLC/Summit Midstream Finance Corp., 7.5%, 7/01/21 | | | 2,135,000 | | | | 2,321,813 | |
| Summit Midstream Holdings LLC/Summit Midstream Finance Corp., 5.5%, 8/15/22 | | | 1,685,000 | | | | 1,685,000 | |
| | | | | | | | |
| | | | $ | 55,799,056 | |
| Municipals - 0.1% | | | | | | | | |
| Golden State, CA, Tobacco Securitization Corp., Tobacco Settlement Rev., “A-1”, 4.5%, 6/01/27 | | $ | 1,200,000 | | | $ | 1,064,148 | |
| | |
| Network & Telecom - 1.9% | | | | | | | | |
| Centurylink, Inc., 6.45%, 6/15/21 | | $ | 2,770,000 | | | $ | 2,977,750 | |
| Centurylink, Inc., 6.75%, 12/01/23 | | | 940,000 | | | | 1,019,900 | |
| Centurylink, Inc., 7.65%, 3/15/42 | | | 2,830,000 | | | | 2,830,000 | |
| Citizens Communications Co., 9%, 8/15/31 | | | 3,390,000 | | | | 3,610,350 | |
| Frontier Communications Corp., 8.125%, 10/01/18 | | | 870,000 | | | | 996,150 | |
| Qwest Corp., 7.5%, 10/01/14 | | | 3,000 | | | | 3,032 | |
| Telecom Italia Capital, 6%, 9/30/34 | | | 1,180,000 | | | | 1,156,400 | |
| Telecom Italia S.p.A., 5.303%, 5/30/24 (n) | | | 3,105,000 | | | | 3,011,850 | |
| TW Telecom Holdings, Inc., 5.375%, 10/01/22 | | | 1,900,000 | | | | 2,056,750 | |
| TW Telecom Holdings, Inc., 5.375%, 10/01/22 | | | 950,000 | | | | 1,028,375 | |
| Windstream Corp., 7.75%, 10/15/20 | | | 2,345,000 | | | | 2,509,150 | |
| | | | | | | | |
| | | | $ | 21,199,707 | |
| Oil Services - 1.3% | | | | | | | | |
| Bristow Group, Inc., 6.25%, 10/15/22 | | $ | 4,003,000 | | | $ | 4,223,165 | |
| Pacific Drilling S.A., 5.375%, 6/01/20 (n) | | | 3,865,000 | | | | 3,681,413 | |
| Shale-Inland Holdings LLC/Finance Co., 8.75%, 11/15/19 (n) | | | 2,595,000 | | | | 2,689,069 | |
| Unit Corp., 6.625%, 5/15/21 | | | 3,765,000 | | | | 3,953,240 | |
| | | | | | | | |
| | | | $ | 14,546,887 | |
| Oils - 0.1% | | | | | | | | |
| CITGO Petroleum Corp., 6.25%, 8/15/22 (z) | | $ | 1,170,000 | | | $ | 1,205,100 | |
| | |
| Other Banks & Diversified Financials - 0.4% | | | | | | | | |
| Groupe BPCE S.A., 12.5% to 8/6/19, FRN to 8/29/49 (n) | | $ | 2,973,000 | | | $ | 4,080,443 | |
| | |
| Pharmaceuticals - 1.7% | | | | | | | | |
| Endo Finance LLC/Endo Finco, Inc., 7.25%, 1/15/22 (z) | | $ | 4,260,000 | | | $ | 4,504,950 | |
| Mallinckrodt International Finance S.A., 5.75%, 8/01/22 (n) | | | 2,485,000 | | | | 2,497,424 | |
| Salix Pharmaceuticals Ltd., 6%, 1/15/21 (n) | | | 1,670,000 | | | | 1,745,150 | |
14
Portfolio of Investments (unaudited) – continued
| | | | | | | | |
| Issuer | | Shares/Par | | | Value ($) | |
| | | | | | | | |
| Bonds - continued | | | | | | | | |
| Pharmaceuticals - continued | | | | | | | | |
| Valeant Pharmaceuticals International, Inc., 7%, 10/01/20 (n) | | $ | 5,100,000 | | | $ | 5,329,500 | |
| Valeant Pharmaceuticals International, Inc., 7.25%, 7/15/22 (n) | | | 2,700,000 | | | | 2,862,000 | |
| Vantage Point Imaging, 7.5%, 7/15/21 (n) | | | 1,560,000 | | | | 1,684,800 | |
| | | | | | | | |
| | | | $ | 18,623,824 | |
| Precious Metals & Minerals - 0.6% | | | | | | | | |
| Aurico Gold, Inc., 7.75%, 4/01/20 (z) | | $ | 1,990,000 | | | $ | 2,014,875 | |
| Eldorado Gold Corp., 6.125%, 12/15/20 (n) | | | 3,310,000 | | | | 3,384,475 | |
| IAMGOLD Corp., 6.75%, 10/01/20 (n) | | | 1,444,000 | | | | 1,328,480 | |
| | | | | | | | |
| | | | $ | 6,727,830 | |
| Printing & Publishing - 0.8% | | | | | | | | |
| American Media, Inc., 13.5%, 6/15/18 (z) | | $ | 338,724 | | | $ | 355,660 | |
| Gannett Co., Inc., 6.375%, 10/15/23 (n) | | | 2,900,000 | | | | 3,059,500 | |
| Gannett Co., Inc., 5.125%, 7/15/20 | | | 1,415,000 | | | | 1,429,150 | |
| Lamar Media Corp., 5%, 5/01/23 | | | 2,255,000 | | | | 2,235,269 | |
| Nielsen Finance LLC, 5%, 4/15/22 (n) | | | 2,165,000 | | | | 2,132,525 | |
| | | | | | | | |
| | | | $ | 9,212,104 | |
| Railroad & Shipping - 0.2% | | | | | | | | |
| Watco Cos. LLC, 6.375%, 4/01/23 (n) | | $ | 2,270,000 | | | $ | 2,304,050 | |
| | |
| Real Estate - Healthcare - 0.9% | | | | | | | | |
| Aviv Healthcare Properties LP/Aviv Healthcare, 6%, 10/15/21 | | $ | 3,825,000 | | | $ | 4,016,250 | |
| MPT Operating Partnership LP, REIT, 6.875%, 5/01/21 | | | 2,275,000 | | | | 2,445,625 | |
| MPT Operating Partnership LP, REIT, 6.375%, 2/15/22 | | | 3,400,000 | | | | 3,621,000 | |
| | | | | | | | |
| | | | $ | 10,082,875 | |
| Real Estate - Other - 1.3% | | | | | | | | |
| CNL Lifestyle Properties, Inc., REIT, 7.25%, 4/15/19 | | $ | 2,585,000 | | | $ | 2,636,700 | |
| DuPont Fabros Technology LP, REIT, 5.875%, 9/15/21 | | | 4,725,000 | | | | 4,819,500 | |
| ERP Properties, REIT, 7.75%, 7/15/20 | | | 1,805,000 | | | | 2,188,981 | |
| ERP Properties, REIT, 5.75%, 8/15/22 | | | 805,000 | | | | 873,972 | |
| Felcor Lodging LP, REIT, 5.625%, 3/01/23 | | | 3,460,000 | | | | 3,460,000 | |
| | | | | | | | |
| | | | $ | 13,979,153 | |
| Retailers - 1.8% | | | | | | | | |
| Best Buy Co., Inc., 5.5%, 3/15/21 | | $ | 4,315,000 | | | $ | 4,433,663 | |
| Bon Ton Stores, Inc., 8%, 6/15/21 | | | 2,380,000 | | | | 2,165,800 | |
| Burlington Coat Factory Warehouse Corp., 10%, 2/15/19 | | | 2,770,000 | | | | 3,041,820 | |
| Jo-Ann Stores Holdings, Inc., 9.75%, 10/15/19 (p)(n) | | | 2,580,000 | | | | 2,605,800 | |
| Limited Brands, Inc., 7%, 5/01/20 | | | 1,295,000 | | | | 1,463,350 | |
| Limited Brands, Inc., 6.95%, 3/01/33 | | | 720,000 | | | | 748,800 | |
| Rite Aid Corp., 9.25%, 3/15/20 | | | 3,760,000 | | | | 4,211,200 | |
15
Portfolio of Investments (unaudited) – continued
| | | | | | | | |
| Issuer | | Shares/Par | | | Value ($) | |
| | | | | | | | |
| Bonds - continued | | | | | | | | |
| Retailers - continued | | | | | | | | |
| Sally Beauty Holdings, Inc., 6.875%, 11/15/19 | | $ | 1,495,000 | | | $ | 1,592,175 | |
| | | | | | | | |
| | | | $ | 20,262,608 | |
| Specialty Chemicals - 0.3% | | | | | | | | |
| Chemtura Corp., 5.75%, 7/15/21 | | $ | 3,020,000 | | | $ | 3,080,400 | |
| | |
| Specialty Stores - 0.6% | | | | | | | | |
| Group 1 Automotive, Inc., 5%, 6/01/22 (n) | | $ | 2,635,000 | | | $ | 2,595,475 | |
| Men’s Wearhouse, Inc., 7%, 7/01/22 (z) | | | 1,180,000 | | | | 1,227,200 | |
| Michaels Stores, Inc., 5.875%, 12/15/20 (n) | | | 2,350,000 | | | | 2,314,750 | |
| | | | | | | | |
| | | | $ | 6,137,425 | |
| Telecommunications - Wireless - 4.2% | | | | | | | | |
| Crown Castle International Corp., 4.875%, 4/15/22 | | $ | 1,155,000 | | | $ | 1,143,450 | |
| Crown Castle International Corp., 5.25%, 1/15/23 | | | 2,685,000 | | | | 2,711,850 | |
| Digicel Group Ltd., 8.25%, 9/01/17 (n) | | | 2,420,000 | | | | 2,474,450 | |
| Digicel Group Ltd., 8.25%, 9/30/20 (n) | | | 1,190,000 | | | | 1,282,225 | |
| Digicel Group Ltd., 6%, 4/15/21 (n) | | | 1,225,000 | | | | 1,246,438 | |
| Digicel Group Ltd., 7.125%, 4/01/22 (n) | | | 1,731,000 | | | | 1,756,965 | |
| Eileme 2 AB, 11.625%, 1/31/20 (n) | | | 1,220,000 | | | | 1,431,975 | |
| Sprint Capital Corp., 6.875%, 11/15/28 | | | 3,690,000 | | | | 3,597,750 | |
| Sprint Corp., 7.875%, 9/15/23 (n) | | | 3,340,000 | | | | 3,573,800 | |
| Sprint Corp., 7.125%, 6/15/24 (n) | | | 3,715,000 | | | | 3,789,300 | |
| Sprint Nextel Corp., 9%, 11/15/18 (n) | | | 1,745,000 | | | | 2,046,013 | |
| Sprint Nextel Corp., 6%, 11/15/22 | | | 3,210,000 | | | | 3,161,850 | |
| T-Mobile USA, Inc., 6.125%, 1/15/22 | | | 475,000 | | | | 488,656 | |
| T-Mobile USA, Inc., 6.5%, 1/15/24 | | | 1,440,000 | | | | 1,501,200 | |
| T-Mobile USA, Inc., 6.464%, 4/28/19 | | | 1,465,000 | | | | 1,527,263 | |
| T-Mobile USA, Inc., 6.25%, 4/01/21 | | | 5,495,000 | | | | 5,742,275 | |
| T-Mobile USA, Inc., 6.633%, 4/28/21 | | | 1,890,000 | | | | 1,984,500 | |
| Wind Acquisition Finance S.A., 4.75%, 7/15/20 (n) | | | 3,140,000 | | | | 3,069,350 | |
| Wind Acquisition Finance S.A., 7.375%, 4/23/21 (z) | | | 3,615,000 | | | | 3,768,638 | |
| | | | | | | | |
| | | | $ | 46,297,948 | |
| Telephone Services - 0.2% | | | | | | | | |
| Cogent Communications Group, Inc., 8.375%, 2/15/18 (n) | | $ | 965,000 | | | $ | 1,022,900 | |
| Level 3 Financing, Inc., 8.625%, 7/15/20 | | | 1,320,000 | | | | 1,435,500 | |
| | | | | | | | |
| | | | $ | 2,458,400 | |
| Tobacco - 0.1% | | | | | | | | |
| New Jersey Tobacco Settlement Financing Corp., “1-A”, 4.5%, 6/01/23 | | $ | 1,465,000 | | | $ | 1,432,565 | |
16
Portfolio of Investments (unaudited) – continued
| | | | | | | | |
| Issuer | | Shares/Par | | | Value ($) | |
| | | | | | | | |
| Bonds - continued | | | | | | | | |
| Transportation - Services - 2.2% | | | | | | | | |
| Aguila American Resources Ltd., 7.875%, 1/31/18 (n) | | $ | 4,000,000 | | | $ | 4,185,000 | |
| Jack Cooper Holdings Corp., 9.25%, 6/01/20 (n) | | | 4,255,000 | | | | 4,659,225 | |
| Navios Logistics Finance (U.S.), Inc., 7.25%, 5/01/22 (n) | | | 538,000 | | | | 548,760 | |
| Navios Maritime Acquisition Corp., 8.125%, 11/15/21 (n) | | | 3,132,000 | | | | 3,171,150 | |
| Navios Maritime Holding, Inc., 7.375%, 1/15/22 (n) | | | 3,405,000 | | | | 3,464,588 | |
| Stena AB, 7%, 2/01/24 (n) | | | 5,125,000 | | | | 5,406,875 | |
| Syncreon Group BV/Syncre, 8.625%, 11/01/21 (n) | | | 2,140,000 | | | | 2,148,025 | |
| Ultrapetrol (Bahamas) Ltd., 8.875%, 6/15/21 | | | 786,000 | | | | 842,985 | |
| | | | | | | | |
| | | | $ | 24,426,608 | |
| Utilities - Electric Power - 2.0% | | | | | | | | |
| AES Corp., 7.375%, 7/01/21 | | $ | 2,030,000 | | | $ | 2,314,200 | |
| Calpine Corp., 5.375%, 1/15/23 | | | 1,760,000 | | | | 1,724,800 | |
| Covanta Holding Corp., 7.25%, 12/01/20 | | | 4,290,000 | | | | 4,590,300 | |
| Covanta Holding Corp., 6.375%, 10/01/22 | | | 1,185,000 | | | | 1,259,063 | |
| InterGen N.V., 7%, 6/30/23 (n) | | | 2,375,000 | | | | 2,363,125 | |
| NRG Energy, Inc., 8.25%, 9/01/20 | | | 4,025,000 | | | | 4,326,875 | |
| NRG Energy, Inc., 6.25%, 7/15/22 (n) | | | 1,440,000 | | | | 1,483,200 | |
| NRG Energy, Inc., 6.625%, 3/15/23 | | | 3,315,000 | | | | 3,414,450 | |
| | | | | | | | |
| | | | $ | 21,476,013 | |
| Total Bonds (Identified Cost, $997,330,683) | | | $ | 1,016,030,072 | |
| | |
| Floating Rate Loans (g)(r) - 3.8% | | | | | | | | |
| Aerospace - 0.2% | | | | | | | | |
| TransDigm, Inc., Term Loan C, 3.75%, 2/28/20 | | $ | 2,287,745 | | | $ | 2,271,404 | |
| | |
| Building - 0.5% | | | | | | | | |
| ABC Supply Co., Inc., Term Loan B, 3.5%, 4/16/20 | | $ | 3,290,562 | | | $ | 3,267,426 | |
| HD Supply, Term Loan B, 6/28/18 (o) | | | 1,800,951 | | | | 1,798,700 | |
| | | | | | | | |
| | | | $ | 5,066,126 | |
| Cable TV - 0.2% | | | | | | | | |
| Cequel Communications LLC, Term Loan, 2/14/19 (o) | | $ | 1,812,492 | | | $ | 1,800,408 | |
| | |
| Conglomerates - 0.5% | | | | | | | | |
| Entegris, Inc., Term Loan B, 3.5%, 2/21/21 | | $ | 3,008,243 | | | $ | 2,978,160 | |
| Silver II U.S. Holdings LLC, Term Loan B, 4%, 12/13/19 | | | 2,180,545 | | | | 2,170,665 | |
| | | | | | | | |
| | | | $ | 5,148,825 | |
| Consumer Services - 0.2% | | | | | | | | |
| Realogy Corp., Term Loan B, 3.75%, 3/05/20 | | $ | 2,172,205 | | | $ | 2,171,527 | |
| | |
| Containers - 0.1% | | | | | | | | |
| Berry Plastics, Term Loan E, 1/06/21 (o) | | $ | 1,682,179 | | | $ | 1,665,884 | |
17
Portfolio of Investments (unaudited) – continued
| | | | | | | | |
| Issuer | | Shares/Par | | | Value ($) | |
| | | | | | | | |
| Floating Rate Loans (g)(r) - continued | | | | | | | | |
| Electronics - 0.3% | | | | | | | | |
| Avago Technologies Ltd., Term Loan B, 3.75%, 5/06/21 | | $ | 3,027,718 | | | $ | 3,020,602 | |
| | |
| Energy - Independent - 0.1% | | | | | | | | |
| MEG Energy Corp., Term Loan B, 3.75%, 3/31/20 | | $ | 1,422,407 | | | $ | 1,421,645 | |
| | |
| Entertainment - 0.1% | | | | | | | | |
| Cedar Fair LP, Term Loan B, 3.25%, 3/06/20 | | $ | 1,073,015 | | | $ | 1,076,223 | |
| | |
| Food & Beverages - 0.1% | | | | | | | | |
| H.J. Heinz Co., Term Loan B2, 3.5%, 2/15/20 | | $ | 695,885 | | | $ | 695,512 | |
| | |
| Gaming & Lodging - 0.3% | | | | | | | | |
| Hilton Worldwide, Term Loan B, 3.5%, 10/25/20 | | $ | 3,085,531 | | | $ | 3,069,461 | |
| | |
| Medical & Health Technology & Services - 0.1% | | | | | | | | |
| Community Health Systems, Inc., Term Loan, 3.25%, 1/27/21 | | $ | 549,457 | | | $ | 550,525 | |
| Davita Healthcare, Term Loan B, 3.5%, 5/29/21 | | | 1,177,874 | | | | 1,175,140 | |
| | | | | | | | |
| | | | $ | 1,725,665 | |
| Metals & Mining - 0.1% | | | | | | | | |
| Fortescue Metals Group Ltd., Term Loan B, 4.25%, 6/30/19 | | $ | 1,690,996 | | | $ | 1,684,655 | |
| | |
| Printing & Publishing - 0.2% | | | | | | | | |
| CBS Outdoor, Term Loan B, 3%, 1/31/21 | | $ | 2,111,557 | | | $ | 2,098,360 | |
| | |
| Retailers - 0.1% | | | | | | | | |
| Rite Aid Corp., Term Loan, 4.87%, 6/07/21 | | $ | 937,940 | | | $ | 946,147 | |
| | |
| Specialty Stores - 0.2% | | | | | | | | |
| Mens Wearhouse, Inc., Term Loan B, 4.5%, 3/11/21 | | $ | 2,408,712 | | | $ | 2,426,778 | |
| | |
| Transportation - Services - 0.3% | | | | | | | | |
| American Commercial Lines, Inc., Term Loan, 7.5%, 9/15/19 | | $ | 3,087,965 | | | $ | 3,099,545 | |
| | |
| Utilities - Electric Power - 0.2% | | | | | | | | |
| Calpine Construction Finance Co., Term Loan B, 3%, 5/07/20 | | $ | 2,619,701 | | | $ | 2,565,261 | |
| Total Floating Rate Loans (Identified Cost, $42,051,534) | | | $ | 41,954,028 | |
| | |
| Common Stocks - 0.0% | | | | | | | | |
| Automotive - 0.0% | | | | | | | | |
| Accuride Corp. (a) (Identified Cost, $699,432) | | | 48,891 | | | $ | 244,455 | |
18
Portfolio of Investments (unaudited) – continued
| | | | | | | | |
| Convertible Bonds - 0.1% | | | | | | | | |
| Issuer | | Shares/Par | | | Value ($) | |
| | | | | | | | |
| Network & Telecom - 0.1% | | | | | | | | |
Nortel Networks Corp., 2.125%, 4/15/15 (a)(d)
(Identified Cost, $572,250) | | $ | 582,000 | | | $ | 590,730 | |
| | |
| Preferred Stocks - 0.1% | | | | | | | | |
| Other Banks & Diversified Financials - 0.1% | | | | | | | | |
| Ally Financial, Inc., 7% (z) (Identified Cost, $1,552,313) | | | 1,639 | | | $ | 1,630,805 | |
| | |
| Money Market Funds - 1.8% | | | | | | | | |
MFS Institutional Money Market Portfolio, 0.09%,
at Cost and Net Asset Value (v) | | | 19,455,186 | | | $ | 19,455,186 | |
| Total Investments (Identified Cost, $1,061,661,398) | | | $ | 1,079,905,276 | |
| |
| Other Assets, Less Liabilities - 1.8% | | | | 20,200,142 | |
| Net Assets - 100.0% | | | $ | 1,100,105,418 | |
| (a) | Non-income producing security. |
| (d) | In default. Interest and/or scheduled principal payment(s) have been missed. |
| (g) | The rate shown represents a weighted average coupon rate on settled positions at period end, unless otherwise indicated. |
| (n) | Securities exempt from registration under Rule 144A of the Securities Act of 1933. These securities may be sold in the ordinary course of business in transactions exempt from registration, normally to qualified institutional buyers. At period end, the aggregate value of these securities was $351,027,073, representing 31.9% of net assets. |
| (o) | All or a portion of this position has not settled. Upon settlement date, interest rates for unsettled amounts will be determined. The rate shown, if any, represents the weighted average coupon rate for settled amounts. |
| (p) | Payment-in-kind security for which interest income may be received in additional securities and/or cash. During the period, the following amount of interest income was received in additional securities and/or cash: |
| | | | | | | | |
| Payment-in-kind Securities | | Cash | | | Additional
Securities | |
| Jo-Ann Stores Holdings, Inc., 9.75%, 10/15/19 | | | $125,775 | | | | $— | |
| Schaeffler Finance B.V., 6.875%, 8/15/18 | | | — | | | | — | |
| Total | | | $125,775 | | | | $— | |
| | | | | | | | |
| (r) | Remaining maturities of floating rate loans may be less than stated maturities shown as a result of contractual or optional prepayments by the borrower. Such prepayments cannot be predicted with certainty. These loans may be subject to restrictions on resale. Floating rate loans generally have rates of interest which are determined periodically by reference to a base lending rate plus a premium. |
| (v) | Underlying affiliated fund that is available only to investment companies managed by MFS. The rate quoted for the MFS Institutional Money Market Portfolio is the annualized seven-day yield of the fund at period end. |
| (z) | Restricted securities are not registered under the Securities Act of 1933 and are subject to legal restrictions on resale. These securities generally may be resold in transactions exempt from |
19
Portfolio of Investments (unaudited) – continued
| | registration or to the public if the securities are subsequently registered. Disposal of these securities may involve time-consuming negotiations and prompt sale at an acceptable price may be difficult. The fund holds the following restricted securities: |
| | | | | | | | | | |
| Restricted Securities | | Acquisition
Date | |
Cost | | | Value | |
| Advanced Micro Devices, Inc., 7%, 7/01/24 | | 6/02/2014 | | | $925,000 | | | | $901,875 | |
| Ally Financial, Inc., 7% (Preferred Stock) | | 4/13/11-11/27/12 | | | 1,552,313 | | | | 1,630,805 | |
| American Energy-Permian Basin LLC, 7.125%, 11/01/20 | | 7/16/14 | | | 1,410,000 | | | | 1,360,650 | |
| American Energy-Permian Basin LLC, 7.375%, 11/01/21 | | 7/16/14 | | | 1,175,000 | | | | 1,133,875 | |
| American Media, Inc., 13.5%, 6/15/18 | | 12/22/10-12/28/10 | | | 342,164 | | | | 355,660 | |
| Ardagh Packaging Finance PLC, 6%, 6/30/21 | | 6/20/14-6/24/14 | | | 2,225,846 | | | | 2,110,550 | |
| Athlon Holdings LP/Athlon Finance Corp., 6%, 5/01/22 | | 4/16/14-5/13/14 | | | 3,284,862 | | | | 3,248,100 | |
| Aurico Gold, Inc., 7.75%, 4/01/20 | | 6/27/14-7/15/14 | | | 2,004,364 | | | | 2,014,875 | |
| Baytex Energy Corp., 5.125%, 6/01/21 | | 5/29/14 | | | 465,000 | | | | 461,513 | |
| Baytex Energy Corp., 5.625%, 6/01/24 | | 5/29/14-6/05/14 | | | 2,353,939 | | | | 2,304,900 | |
| CHS/Community Health Systems, Inc., 5.125%, 8/01/21 | | 1/15/14 | | | 700,000 | | | | 705,250 | |
| CHS/Community Health Systems, Inc., 6.875%, 2/01/22 | | 1/15/14-4/24/14 | | | 5,862,451 | | | | 5,823,138 | |
| CITGO Petroleum Corp., 6.25%, 8/15/22 | | 7/23/14 | | | 1,170,000 | | | | 1,205,100 | |
| Endo Finance LLC/Endo Finco, Inc., 7.25%, 1/15/22 | | 9/24/14-6/02/14 | | | 4,537,508 | | | | 4,504,950 | |
| Garda World Security Corp., 7.25%, 11/15/21 | | 5/21/14-5/22/14 | | | 1,000,633 | | | | 961,538 | |
| Garda World Security Corp., 7.25%, 11/15/21 | | 4/24/14 | | | 2,449,050 | | | | 2,370,775 | |
| Light Tower Rentals, Inc., 8.125%, 8/01/19 | | 7/16/14 | | | 1,415,000 | | | | 1,439,763 | |
| Men’s Wearhouse, Inc., 7%, 7/01/22 | | 6/11/14-6/20/14 | | | 1,219,764 | | | | 1,227,200 | |
| Micron Technology, Inc., 5.5%, 2/01/25 | | 7/23/14 | | | 1,765,000 | | | | 1,756,175 | |
| SIRIUS XM Radio, Inc., 6%, 7/15/24 | | 5/01/14-5/13/14 | | | 1,885,619 | | | | 1,869,300 | |
| Sabine Pass Liquefaction LLC, 5.75%, 5/15/24 | | 5/13/14 | | | 1,705,000 | | | | 1,730,575 | |
| Sanchez Energy Corp., 6.125%, 1/15/23 | | 6/13/14-6/30/14 | | | 2,387,709 | | | | 2,339,138 | |
| Schaeffler Finance B.V., 4.75%, 5/15/21 | | 7/10/14-7/11/14 | | | 2,239,881 | | | | 2,207,625 | |
| Signode Industrial Group, 6.375%, 5/01/22 | | 4/07/14-4/25/14 | | | 2,752,894 | | | | 2,689,050 | |
| Suncoke Energy Partners LP/Suncoke Energy Partners Finance Corp., 7.375%, 2/01/20 | | 4/29/14 | | | 1,208,323 | | | | 1,213,250 | |
| TransDigm, Inc., 6%, 7/15/22 | | 5/20/14 | | | 375,000 | | | | 376,875 | |
| TransDigm, Inc., 6.5%, 7/15/24 | | 5/20/14-5/21/14 | | | 1,577,786 | | | | 1,585,700 | |
| Wind Acquisition Finance S.A., 7.375%, 4/23/21 | | 4/08/14 | | | 3,615,000 | | | | 3,768,638 | |
| Total Restricted Securities | | | | $53,296,843 | |
| % of Net assets | | | | 4.8% | |
The following abbreviations are used in this report and are defined:
| FRN | | Floating Rate Note. Interest rate resets periodically and may not be the rate reported at period end. |
20
Portfolio of Investments (unaudited) – continued
| PLC | | Public Limited Company |
| REIT | | Real Estate Investment Trust |
Abbreviations indicate amounts shown in currencies other than the U.S. dollar. All amounts are stated in U.S. dollars unless otherwise indicated. A list of abbreviations is shown below:
Derivative Contracts at 7/31/14
Forward Foreign Currency Exchange Contracts at 7/31/14
| | | | | | | | | | | | | | | | | | | | | | | | |
| Type | | Currency | | Counter-
party | | Contracts
to
Deliver/
Receive | | | Settlement
Date Range | | | In
Exchange
for | | | Contracts
at Value | | | Net
Unrealized
Appreciation
(Depreciation) | |
| Asset Derivatives | | | | | | | | | | | | | |
| SELL | | EUR | | Credit Suisse Group | | | 5,754,385 | | | | 10/10/14 | | | | $7,835,458 | | | | $7,707,178 | | | | $128,280 | |
| | | | | | | | | | | | | | | | | | | | | | | | |
| | | | |
| Liability Derivatives | | | | | | | | | | | | | |
| BUY | | EUR | | Deutsche Bank | | | 593,000 | | | | 10/10/14 | | | | $798,788 | | | | $794,239 | | | | $(4,549 | ) |
| | | | | | | | | | | | | | | | | | | | | | | | |
Futures Contracts at 7/31/14
| | | | | | | | | | | | | | | | | | |
| Description | | Currency | | | Contracts | | | Value | | Expiration
Date | | | Unrealized
Appreciation
(Depreciation) | |
| Asset Derivatives | | | | | | | | | | | | | | | |
| Interest Rate Futures | | | | | | | | | | | | | | | |
| U.S. Treasury Note 10 yr (Short) | | | USD | | | | 88 | | | $10,965,625 | | | September - 2014 | | | | $95,896 | |
| | | | | | | | | | | | | | | | | | |
Swap Agreements at 7/31/14
| | | | | | | | | | | | | | | | | | |
| Expiration | | | | | Notional
Amount | | | Counterparty | | Cash Flows to
Receive | | Cash Flows
to Pay | | Fair
Value | |
| Asset Derivatives | | | | | | | | |
| Credit Default Swap Agreements | | | | | | | | |
| 12/20/17 | | | USD | | | | 14,580,000 | | | Deutsche Bank (a) | | 5.00% (fixed rate) | | (1) | | | $1,266,526 | |
| | | | | | | | | | | | | | | | | | |
| (1) | Fund, as protection seller, to pay notional amount upon a defined credit event by a reference obligation specified in the Markit CDX North America Investment Grade Index, a B rated credit default index. The fund entered into the contract to manage market/sector exposure. |
| (a) | Net unamortized premiums paid by the fund amounted to $760,873. |
The credit ratings presented here are an indicator of the current payment/performance risk of the related swap agreement, the reference obligation for which may be either a single security or, in the case of a credit default index, a basket of securities issued by corporate or sovereign issuers. Ratings are assigned to each reference security, including each individual security within a reference basket of securities, utilizing ratings from Moody’s, Fitch, and Standard & Poor’s rating agencies and applying the following hierarchy: If all three agencies provide a rating, the middle rating (after dropping the highest and lowest ratings) is assigned; if two of the three agencies rate a security, the lower of the two is assigned. Ratings are shown in the S&P and Fitch scale (e.g., AAA). The ratings for a credit default index are calculated by MFS as a weighted average of the external credit ratings of the individual securities that compose the index’s reference basket of securities.
21
Portfolio of Investments (unaudited) – continued
At July 31, 2014, the fund had cash collateral of $1,564,400 to cover any commitments for certain derivative contracts. Cash collateral is comprised of “Restricted cash” in the Statement of Assets and Liabilities.
See Notes to Financial Statements
22
Financial Statements
STATEMENT OF ASSETS AND LIABILITIES
At 7/31/14 (unaudited)
This statement represents your fund’s balance sheet, which details the assets and liabilities comprising the total value of the fund.
| | | | |
| Assets | | | | |
Investments- | | | | |
Non-affiliated issuers, at value (identified cost, $1,042,206,212) | | | $1,060,450,090 | |
Underlying affiliated funds, at cost and value | | | 19,455,186 | |
Total investments, at value (identified cost, $1,061,661,398) | | | $1,079,905,276 | |
Cash | | | 312,497 | |
Restricted cash | | | 1,564,400 | |
Receivables for | | | | |
Forward foreign currency exchange contracts | | | 128,280 | |
Daily variation margin on open futures contracts | | | 118,524 | |
Investments sold | | | 11,000,641 | |
Fund shares sold | | | 482,588 | |
Interest and dividends | | | 18,976,750 | |
Swaps, at value (net unamortized premiums paid, $760,873) | | | 1,266,526 | |
Other assets | | | 2,829 | |
Total assets | | | $1,113,758,311 | |
| Liabilities | | | | |
Payables for | | | | |
Distributions | | | $15 | |
Forward foreign currency exchange contracts | | | 4,549 | |
Investments purchased | | | 11,488,462 | |
Fund shares reacquired | | | 2,091,364 | |
Payable to affiliates | | | | |
Investment adviser | | | 96 | |
Shareholder servicing costs | | | 12 | |
Accrued expenses and other liabilities | | | 68,395 | |
Total liabilities | | | $13,652,893 | |
Net assets | | | $1,100,105,418 | |
| Net assets consist of | | | | |
Paid-in capital | | | $1,074,909,103 | |
Unrealized appreciation (depreciation) on investments and translation of assets and liabilities in foreign currencies | | | 18,966,203 | |
Accumulated net realized gain (loss) on investments and foreign currency | | | 8,225,449 | |
Accumulated distributions in excess of net investment income | | | (1,995,337 | ) |
Net assets | | | $1,100,105,418 | |
Shares of beneficial interest outstanding | | | 111,752,364 | |
Net asset value per share (net assets of $1,100,105,418 / 111,752,364 shares of beneficial interest outstanding) | | | $9.84 | |
See Notes to Financial Statements
23
Financial Statements
STATEMENT OF OPERATIONS
Six months ended 7/31/14 (unaudited)
This statement describes how much your fund earned in investment income and accrued in expenses. It also describes any gains and/or losses generated by fund operations.
| | | | |
| Net investment income | |
Income | | | | |
Interest | | | $35,223,182 | |
Dividends | | | 112,689 | |
Dividends from underlying affiliated funds | | | 8,496 | |
Total investment income | | | $35,344,367 | |
Expenses | | | | |
Shareholder servicing costs | | | $24 | |
Administrative services fee | | | 8,679 | |
Custodian fee | | | 65,343 | |
Shareholder communications | | | 3,504 | |
Audit and tax fees | | | 20,064 | |
Legal fees | | | 5,842 | |
Registration fees | | | 68,819 | |
Miscellaneous | | | 19,198 | |
Total expenses | | | $191,473 | |
Fees paid indirectly | | | (475 | ) |
Reduction of expenses by investment adviser | | | (1,155 | ) |
Net expenses | | | $189,843 | |
Net investment income | | | $35,154,524 | |
| Realized and unrealized gain (loss) on investments and foreign currency | |
Realized gain (loss) (identified cost basis) | | | | |
Investments | | | $12,538,514 | |
Futures contracts | | | (179,939 | ) |
Swap agreements | | | 120,712 | |
Foreign currency | | | 7,048 | |
Net realized gain (loss) on investments and foreign currency | | | $12,486,335 | |
Change in unrealized appreciation (depreciation) | | | | |
Investments | | | $(11,608,607 | ) |
Futures contracts | | | 95,896 | |
Swap agreements | | | 92,149 | |
Translation of assets and liabilities in foreign currencies | | | 8,764 | |
Net unrealized gain (loss) on investments and foreign currency translation | | | $(11,411,798 | ) |
Net realized and unrealized gain (loss) on investments and foreign currency | | | $1,074,537 | |
Change in net assets from operations | | | $36,229,061 | |
See Notes to Financial Statements
24
Financial Statements
STATEMENTS OF CHANGES IN NET ASSETS
These statements describe the increases and/or decreases in net assets resulting from operations, any distributions, and any shareholder transactions.
| | | | | | | | |
| | | Six months ended
7/31/14 | | | Period ended
1/31/14 (c) | |
| Change in net assets | | (unaudited) | | | | |
| From operations | | | | | | | | |
Net investment income | | | $35,154,524 | | | | $59,893,365 | |
Net realized gain (loss) on investments and foreign currency | | | 12,486,335 | | | | 7,836,022 | |
Net unrealized gain (loss) on investments and foreign currency translation | | | (11,411,798 | ) | | | (12,177,417 | ) |
Change in net assets from operations | | | $36,229,061 | | | | $55,551,970 | |
| Distributions declared to shareholders | | | | | | | | |
From net investment income | | | $(36,188,794 | ) | | | $(63,296,637 | ) |
From net realized gain on investments | | | (571,666 | ) | | | (7,958,402 | ) |
Total distributions declared to shareholders | | | $(36,760,460 | ) | | | $(71,255,039 | ) |
Change in net assets from fund share transactions | | | $(13,072,022 | ) | | | $1,129,411,908 | |
Total change in net assets | | | $(13,603,421 | ) | | | $1,113,708,839 | |
| Net assets | | | | | | | | |
At beginning of period | | | 1,113,708,839 | | | | — | |
At end of period (including accumulated distributions in excess of net investment income of $1,995,337 and $961,067, respectively) | | | $1,100,105,418 | | | | $1,113,708,839 | |
| (c) | For the period from the commencement of the fund’s investment operations, March 25, 2013, through the stated period end. |
See Notes to Financial Statements
25
Financial Statements
FINANCIAL HIGHLIGHTS
The financial highlights table is intended to help you understand the fund’s financial performance for the semiannual period and the past 5 fiscal years (or life of a particular share class, if shorter). Certain information reflects financial results for a single fund share. The total returns in the table represent the rate by which an investor would have earned (or lost) on an investment in the fund share class (assuming reinvestment of all distributions) held for the entire period.
| | | | | | | | |
| | | Six months ended
7/31/14
(unaudited) | | | Period Ended
1/31/14 (c) | |
Net asset value, beginning of period | | | $9.85 | | | | $10.00 | |
| Income (loss) from investment operations | | | | | | | | |
Net investment income (d) | | | $0.32 | | | | $0.55 | |
Net realized and unrealized gain (loss) on investments
and foreign currency | | | 0.06 | | | | (0.04 | ) |
Total from investment operations | | | $0.38 | | | | $0.51 | |
| Less distributions declared to shareholders | | | | | | | | |
From net investment income | | | $(0.38 | ) | | | $(0.59 | ) |
From net realized gain on investments | | | (0.01 | ) | | | (0.07 | ) |
Total distributions declared to shareholders | | | $(0.39 | ) | | | $(0.66 | ) |
Net asset value, end of period (x) | | | $9.84 | | | | $9.85 | |
Total return (%) (r)(s)(x) | | | 3.27 | (n) | | | 5.26 | (n) |
Ratios (%) (to average net assets)
and Supplemental data: | | | | | | | | |
Expenses before expense reductions (f) | | | 0.03 | (a) | | | 0.02 | (a) |
Expenses after expense reductions (f) | | | 0.03 | (a) | | | 0.02 | (a) |
Net investment income | | | 6.41 | (a) | | | 6.54 | (a) |
Portfolio turnover | | | 28 | (n) | | | 42 | (n) |
Net assets at end of period (000 omitted) | | | $1,100,105 | | | | $1,113,709 | |
| (c) | For the period from the commencement of the fund’s investment operations, March 25, 2013, through the stated period end. |
| (d) | Per share data is based on average shares outstanding. |
| (f) | Ratios do not reflect reductions from fees paid indirectly, if applicable. |
| (r) | Certain expenses have been reduced without which performance would have been lower. |
| (s) | From time to time the fund may receive proceeds from litigation settlements, without which performance would be lower. |
| (x) | The net asset values per share and total returns have been calculated on net assets which include adjustments made in accordance with U.S. generally accepted accounting principles required at period end for financial reporting purposes. |
See Notes to Financial Statements
26
NOTES TO FINANCIAL STATEMENTS
(unaudited)
(1) Business and Organization
MFS High Yield Pooled Portfolio (the fund) is a diversified series of MFS Series Trust III (the trust). The trust is organized as a Massachusetts business trust and is registered under the Investment Company Act of 1940, as amended, as an open-end management investment company. This fund is available only to investment companies managed by MFS. MFS does not receive a management fee from this fund.
The fund is an investment company and accordingly follows the investment company accounting and reporting guidance of the Financial Accounting Standards Board (FASB) Accounting Standard Codification Topic 946 Financial Services – Investment Companies.
(2) Significant Accounting Policies
General – The preparation of financial statements in conformity with U.S. generally accepted accounting principles requires management to make estimates and assumptions that affect the reported amounts of assets and liabilities, and disclosure of contingent assets and liabilities at the date of the financial statements and the reported amounts of increases and decreases in net assets from operations during the reporting period. Actual results could differ from those estimates. In the preparation of these financial statements, management has evaluated subsequent events occurring after the date of the fund’s Statement of Assets and Liabilities through the date that the financial statements were issued. The fund invests in high-yield securities rated below investment grade. Investments in high-yield securities involve greater degrees of credit and market risk than investments in higher-rated securities and tend to be more sensitive to economic conditions. The fund invests in foreign securities. Investments in foreign securities are vulnerable to the effects of changes in the relative values of the local currency and the U.S. dollar and to the effects of changes in each country’s legal, political, and economic environment.
In June 2014, FASB issued Accounting Standards Update 2014-11, Transfers and Servicing (Topic 860) – Repurchase-to-Maturity Transactions, Repurchase Financings, and Disclosures (“ASU 2014-11”). ASU 2014-11 changes the accounting for repurchase-to-maturity transactions (i.e., repurchase agreements that settle at the same time as the maturity of the transferred financial asset) and enhances the required disclosures for repurchase agreements and other similar transactions. Although still evaluating the potential impacts of ASU 2014-11 to the fund, management expects that the impact of the fund’s adoption will be limited to additional financial statement disclosures which would first be effective for interim reporting periods beginning after March 15, 2015.
Balance Sheet Offsetting – The fund’s accounting policy with respect to balance sheet offsetting is that, absent an event of default by the counterparty or a termination of the agreement, the International Swaps and Derivatives Association (ISDA) Master Agreement does not result in an offset of reported amounts of financial assets and financial liabilities in the Statement of Assets and Liabilities across transactions between the fund and the applicable counterparty. The fund’s right to setoff may be restricted or prohibited by the bankruptcy or insolvency laws of the particular jurisdiction to which a specific master netting agreement counterparty is subject. Balance sheet
27
Notes to Financial Statements (unaudited) – continued
offsetting disclosures, to the extent applicable to the fund, have been included in the fund’s Significant Accounting Policies note under the captions for each of the fund’s in-scope financial instruments and transactions.
Investment Valuations – Debt instruments and floating rate loans (other than short-term instruments), including restricted debt instruments, are generally valued at an evaluated or composite bid as provided by a third-party pricing service. Equity securities, including restricted equity securities, are generally valued at the last sale or official closing price as provided by a third-party pricing service on the market or exchange on which they are primarily traded. Equity securities, for which there were no sales reported that day, are generally valued at the last quoted daily bid quotation as provided by a third-party pricing service on the market or exchange on which such securities are primarily traded. Short-term instruments with a maturity at issuance of 60 days or less generally are valued at amortized cost, which approximates market value. Exchange-traded options are generally valued at the last sale or official closing price as provided by a third-party pricing service on the exchange on which such options are primarily traded. Exchange-traded options for which there were no sales reported that day are generally valued at the last daily bid quotation as provided by a third-party pricing service on the exchange on which such options are primarily traded. Options not traded on an exchange are generally valued at a broker/dealer bid quotation. Foreign currency options are generally valued at valuations provided by a third-party pricing service. Futures contracts are generally valued at last posted settlement price as provided by a third-party pricing service on the market on which they are primarily traded. Futures contracts for which there were no trades that day for a particular position are generally valued at the closing bid quotation as provided by a third-party pricing service on the market on which such futures contracts are primarily traded. Forward foreign currency exchange contracts are generally valued at the mean of bid and asked prices for the time period interpolated from rates provided by a third-party pricing service for proximate time periods. Swap agreements are generally valued at valuations provided by a third-party pricing service, which for cleared swaps includes an evaluation of any trading activity at the clearinghouses. Open-end investment companies are generally valued at net asset value per share. Securities and other assets generally valued on the basis of information from a third-party pricing service may also be valued at a broker/dealer bid quotation. Values obtained from third-party pricing services can utilize both transaction data and market information such as yield, quality, coupon rate, maturity, type of issue, trading characteristics, and other market data. The values of foreign securities and other assets and liabilities expressed in foreign currencies are converted to U.S. dollars using the mean of bid and asked prices for rates provided by a third-party pricing service.
The Board of Trustees has delegated primary responsibility for determining or causing to be determined the value of the fund’s investments (including any fair valuation) to the adviser pursuant to valuation policies and procedures approved by the Board. If the adviser determines that reliable market quotations are not readily available, investments are valued at fair value as determined in good faith by the adviser in accordance with such procedures under the oversight of the Board of Trustees. Under the fund’s valuation policies and procedures, market quotations are not considered to be readily available for most types of debt instruments and floating rate loans and many types of
28
Notes to Financial Statements (unaudited) – continued
derivatives. These investments are generally valued at fair value based on information from third-party pricing services. In addition, investments may be valued at fair value if the adviser determines that an investment’s value has been materially affected by events occurring after the close of the exchange or market on which the investment is principally traded (such as foreign exchange or market) and prior to the determination of the fund’s net asset value, or after the halting of trading of a specific security where trading does not resume prior to the close of the exchange or market on which the security is principally traded. The adviser generally relies on third-party pricing services or other information (such as the correlation with price movements of similar securities in the same or other markets; the type, cost and investment characteristics of the security; the business and financial condition of the issuer; and trading and other market data) to assist in determining whether to fair value and at what value to fair value an investment. The value of an investment for purposes of calculating the fund’s net asset value can differ depending on the source and method used to determine value. When fair valuation is used, the value of an investment used to determine the fund’s net asset value may differ from quoted or published prices for the same investment. There can be no assurance that the fund could obtain the fair value assigned to an investment if it were to sell the investment at the same time at which the fund determines its net asset value per share.
Various inputs are used in determining the value of the fund’s assets or liabilities. These inputs are categorized into three broad levels. In certain cases, the inputs used to measure fair value may fall into different levels of the fair value hierarchy. In such cases, an investment’s level within the fair value hierarchy is based on the lowest level of input that is significant to the fair value measurement. The fund’s assessment of the significance of a particular input to the fair value measurement in its entirety requires judgment, and considers factors specific to the investment. Level 1 includes unadjusted quoted prices in active markets for identical assets or liabilities. Level 2 includes other significant observable market-based inputs (including quoted prices for similar securities, interest rates, prepayment speed, and credit risk). Level 3 includes unobservable inputs, which may include the adviser’s own assumptions in determining the fair value of investments. Other financial instruments are derivative instruments not reflected in total investments, such as futures contracts, forward foreign currency exchange contracts, and swap agreements.
29
Notes to Financial Statements (unaudited) – continued
The following is a summary of the levels used as of July 31, 2014 in valuing the fund’s assets or liabilities:
| | | | | | | | | | | | | | | | |
| Investments at Value | | Level 1 | | | Level 2 | | | Level 3 | | | Total | |
| Equity Securities | | | $244,455 | | | | $1,630,805 | | | | $— | | | | $1,875,260 | |
| Non-U.S. Sovereign Debt | | | — | | | | 3,308,702 | | | | — | | | | 3,308,702 | |
| Municipal Bonds | | | — | | | | 2,496,713 | | | | — | | | | 2,496,713 | |
| U.S. Corporate Bonds | | | — | | | | 817,766,163 | | | | — | | | | 817,766,163 | |
| Foreign Bonds | | | — | | | | 193,049,224 | | | | — | | | | 193,049,224 | |
| Floating Rate Loans | | | — | | | | 41,954,028 | | | | — | | | | 41,954,028 | |
| Mutual Funds | | | 19,455,186 | | | | — | | | | — | | | | 19,455,186 | |
| Total Investments | | | $19,699,641 | | | | $1,060,205,635 | | | | $— | | | | $1,079,905,276 | |
| | |
| Other Financial Instruments | | | | | | | |
| Futures Contracts | | | $95,896 | | | | $— | | | | $— | | | | $95,896 | |
| Swap Agreements | | | — | | | | 1,266,526 | | | | — | | | | 1,266,526 | |
| Forward Foreign Currency Exchange Contracts | | | — | | | | 123,731 | | | | — | | | | 123,731 | |
For further information regarding security characteristics, see the Portfolio of Investments.
Foreign Currency Translation – Purchases and sales of foreign investments, income, and expenses are converted into U.S. dollars based upon currency exchange rates prevailing on the respective dates of such transactions or on the reporting date for foreign denominated receivables and payables. Gains and losses attributable to foreign currency exchange rates on sales of securities are recorded for financial statement purposes as net realized gains and losses on investments. Gains and losses attributable to foreign exchange rate movements on receivables, payables, income and expenses are recorded for financial statement purposes as foreign currency transaction gains and losses. That portion of both realized and unrealized gains and losses on investments that results from fluctuations in foreign currency exchange rates is not separately disclosed.
Derivatives – The fund uses derivatives for different purposes, primarily to increase or decrease exposure to a particular market or segment of the market, or security, to increase or decrease interest rate or currency exposure, or as alternatives to direct investments. Derivatives are used for hedging or non-hedging purposes. While hedging can reduce or eliminate losses, it can also reduce or eliminate gains. When the fund uses derivatives as an investment to increase market exposure, or for hedging purposes, gains and losses from derivative instruments may be substantially greater than the derivative’s original cost.
The derivative instruments used by the fund were purchased options, futures contracts, forward foreign currency exchange contracts, and swap agreements. The fund’s period end derivatives, as presented in the Portfolio of Investments and the associated Derivative Contract tables, generally are indicative of the volume of its derivative activity during the period.
30
Notes to Financial Statements (unaudited) – continued
The following table presents, by major type of derivative contract, the fair value, on a gross basis, of the asset and liability components of derivatives held by the fund at July 31, 2014 as reported in the Statement of Assets and Liabilities:
| | | | | | | | | | |
| | | | | Fair Value (a) | |
| Risk | | Derivative Contracts | | Asset Derivatives | | | Liability Derivatives | |
| Interest Rate | | Interest Rate Futures | | | $95,896 | | | | $— | |
| Foreign Exchange | | Forward Foreign Currency Exchange | | | 128,280 | | | | (4,549 | ) |
| Credit | | Credit Default Swaps | | | 1,266,526 | | | | — | |
| Total | | | | | $1,490,702 | | | | $(4,549 | ) |
| (a) | The value of futures contracts includes cumulative appreciation (depreciation) as reported in the fund’s Portfolio of Investments. Only the current day variation margin for futures contracts is separately reported within the fund’s Statement of Assets and Liabilities. |
The following table presents, by major type of derivative contract, the realized gain (loss) on derivatives held by the fund for the six months ended July 31, 2014 as reported in the Statement of Operations:
| | | | | | | | | | | | | | | | |
| Risk | | Futures
Contracts | | | Swap
Agreements | | | Foreign
Currency | | | Investments
(Purchased
Options) | |
| Interest Rate | | | $(179,939 | ) | | | $— | | | | $— | | | | $— | |
| Foreign Exchange | | | — | | | | — | | | | 29,583 | | | | — | |
| Equity | | | — | | | | — | | | | — | | | | (155,258 | ) |
| Credit | | | — | | | | 120,712 | | | | — | | | | — | |
| Total | | | $(179,939 | ) | | | $120,712 | | | | $29,583 | | | | $(155,258 | ) |
The following table presents, by major type of derivative contract, the change in unrealized appreciation (depreciation) on derivatives held by the fund for the six months ended July 31, 2014 as reported in the Statement of Operations:
| | | | | | | | | | | | |
| Risk | | Futures
Contracts | | | Swap
Agreements | | | Translation of Assets and Liabilities in Foreign
Currencies | |
| Interest Rate | | | $95,896 | | | | $— | | | | $— | |
| Foreign Exchange | | | — | | | | — | | | | 9,190 | |
| Credit | | | — | | | | 92,149 | | | | — | |
| Total | | | $95,896 | | | | $92,149 | | | | $9,190 | |
Derivative counterparty credit risk is managed through formal evaluation of the creditworthiness of all potential counterparties. On certain, but not all, over-the-counter derivatives, the fund attempts to reduce its exposure to counterparty credit risk whenever possible by entering into an ISDA Master Agreement on a bilateral basis with each of the counterparties with whom it undertakes a significant volume of transactions. The ISDA Master Agreement gives each party to the agreement the right to terminate all transactions traded under such agreement if there is a certain deterioration in the credit quality of the other party. Upon an event of default or a
31
Notes to Financial Statements (unaudited) – continued
termination of the ISDA Master Agreement, the non-defaulting party has the right to close out all transactions traded under such agreement and to net amounts owed under each transaction to one net amount payable by one party to the other. This right to close out and net payments across all transactions traded under the ISDA Master Agreement could result in a reduction of the fund’s credit risk to such counterparty equal to any amounts payable by the fund under the applicable transactions, if any. The fund’s right to setoff may be restricted or prohibited by the bankruptcy or insolvency laws of the particular jurisdiction to which a specific ISDA counterparty is subject.
Collateral and margin requirements differ by type of derivative. Margin requirements are set by the broker or clearing house for cleared derivatives (i.e., futures contracts, cleared swaps, and exchange-traded options) while collateral terms are contract specific for over-the-counter traded derivatives (i.e., forward foreign currency exchange contracts, uncleared swap agreements, and over-the-counter options). For derivatives traded under an ISDA Master Agreement, the collateral requirements are netted across all transactions traded under such agreement and one amount is posted from one party to the other to collateralize such obligations. Cash that has been segregated to cover the fund’s collateral or margin obligations under derivative contracts, if any, will be reported separately in the Statement of Assets and Liabilities as “Restricted cash” or “Deposits with brokers.” Securities pledged as collateral or margin for the same purpose, if any, are noted in the Portfolio of Investments.
Purchased Options – The fund purchased call options for a premium. Purchased call options entitle the holder to buy a specified number of shares or units of a particular security, currency or index at a specified price at a specified date or within a specified period of time. Purchasing call options may hedge against an anticipated increase in the dollar cost of securities or currency to be acquired or increase the fund’s exposure to an underlying instrument.
The premium paid is initially recorded as an investment in the Statement of Assets and Liabilities. That investment is subsequently marked-to-market daily with the difference between the premium paid and the market value of the purchased option being recorded as unrealized appreciation or depreciation. Premiums paid for purchased call options which have expired are treated as realized losses on investments in the Statement of Operations. Upon the exercise or closing of a purchased call option, the premium paid is added to the cost of the security or financial instrument purchased.
Whether or not the option is exercised, the fund’s maximum risk of loss from purchasing an option is the amount of premium paid. All option contracts involve credit risk if the counterparty to the option contract fails to perform. For over-the-counter options, this risk is mitigated in cases where there is an ISDA Master Agreement between the fund and the counterparty providing for netting as described above and for posting of collateral by the counterparty to the fund to cover the fund’s exposure to the counterparty under such ISDA Master Agreement.
Futures Contracts – The fund entered into futures contracts which may be used to hedge against or obtain broad market exposure, interest rate exposure, currency exposure, or to manage duration. A futures contract represents a commitment for the future purchase or sale of an asset at a specified price on a specified date.
32
Notes to Financial Statements (unaudited) – continued
Upon entering into a futures contract, the fund is required to deposit with the broker, either in cash or securities, an initial margin in an amount equal to a certain percentage of the notional amount of the contract. Subsequent payments (variation margin) are made or received by the fund each day, depending on the daily fluctuations in the value of the contract, and are recorded for financial statement purposes as unrealized gain or loss by the fund until the contract is closed or expires at which point the gain or loss on futures contracts is realized.
The fund bears the risk of interest rates, exchange rates or securities prices moving unexpectedly, in which case, the fund may not achieve the anticipated benefits of the futures contracts and may realize a loss. While futures contracts may present less counterparty risk to the fund since the contracts are exchange traded and the exchange’s clearinghouse guarantees payments to the broker, there is still counterparty credit risk due to the insolvency of the broker. The fund’s maximum risk of loss due to counterparty credit risk is equal to the margin posted by the fund to the broker plus any gains or minus any losses on the outstanding futures contracts.
Forward Foreign Currency Exchange Contracts – The fund entered into forward foreign currency exchange contracts for the purchase or sale of a specific foreign currency at a fixed price on a future date. These contracts may be used to hedge the fund’s currency risk or for non-hedging purposes. For hedging purposes, the fund may enter into contracts to deliver or receive foreign currency that the fund will receive from or use in its normal investment activities. The fund may also use contracts to hedge against declines in the value of foreign currency denominated securities due to unfavorable exchange rate movements. For non-hedging purposes, the fund may enter into contracts with the intent of changing the relative exposure of the fund’s portfolio of securities to different currencies to take advantage of anticipated exchange rate changes.
Forward foreign currency exchange contracts are adjusted by the daily exchange rate of the underlying currency and any unrealized gains or losses are recorded as a receivable or payable for forward foreign currency exchange contracts until the contract settlement date. On contract settlement date, any gain or loss on the contract is recorded as realized gains or losses on foreign currency.
Risks may arise upon entering into these contracts from unanticipated movements in the value of the contract and from the potential inability of counterparties to meet the terms of their contracts. Generally, the fund’s maximum risk due to counterparty credit risk is the unrealized gain on the contract due to the use of Continuous Linked Settlement, an industry accepted settlement system. This risk is mitigated in cases where there is an ISDA Master Agreement between the fund and the counterparty providing for netting as described above and for posting of collateral by the counterparty to the fund to cover the fund’s exposure to the counterparty under such ISDA Master Agreement.
Swap Agreements – During the period the fund entered into swap agreements. Certain types of swaps (“cleared swaps”) are required to be centrally cleared under provisions of the Dodd-Frank Regulatory Reform Bill. In a cleared swap transaction, the swap agreement is novated to a central counterparty (the “clearinghouse”)
33
Notes to Financial Statements (unaudited) – continued
immediately following execution of the swap contract with an executing broker. Thereafter, throughout the term of the cleared swap, the fund interfaces indirectly with the clearinghouse through a clearing broker.
A swap agreement is generally an exchange of cash payments, at specified intervals or upon the occurrence of specified events, between the fund and a counterparty. The net cash payments exchanged are recorded as a realized gain or loss on swap agreements in the Statement of Operations. The value of the swap agreement, which is adjusted daily and includes any related interest accruals to be paid or received by the fund, is recorded in the Statement of Assets and Liabilities, as “Swaps, at value” for uncleared swaps and is included in “Due from brokers” or “Due to brokers” for cleared swaps. The daily change in value, including any related interest accruals to be paid or received, is recorded as unrealized appreciation or depreciation on swap agreements in the Statement of Operations. The daily change in valuation of cleared swaps is recorded as a receivable or payable for variation margin in the Statement of Assets and Liabilities. Amounts paid or received at the inception of the swap agreement are reflected as premiums paid or received in the Statement of Assets and Liabilities and are amortized using the effective interest method over the term of the agreement. A liquidation payment received or made upon early termination is recorded as a realized gain or loss on swap agreements in the Statement of Operations.
Risks related to swap agreements include the possible lack of a liquid market, unfavorable market and interest rate movements of the underlying instrument and the failure of the counterparty to perform under the terms of the agreements. To address counterparty risk, swap agreements are limited to only highly-rated counterparties. For uncleared swaps, that risk is further reduced by having an ISDA Master Agreement between the fund and the counterparty providing for netting as described above and by the posting of collateral by the counterparty to the fund to cover the fund’s exposure to the counterparty under such ISDA Master Agreement. Although not covered by an ISDA Master Agreement, the fund’s counterparty risk due to cleared swaps is mitigated by the clearinghouses’ margining requirements and financial safeguards in the event of a clearing broker default.
The fund entered into credit default swap agreements in order to manage its exposure to the market or certain sectors of the market, to reduce its credit risk exposure to defaults of corporate and sovereign issuers or to create exposure to corporate or sovereign issuers to which it is not otherwise exposed. In a credit default swap agreement, the protection buyer can make an upfront payment and will make a stream of payments to the protection seller based on a fixed percentage applied to the agreement notional amount in exchange for the right to receive a specified return upon the occurrence of a defined credit event on the reference obligation (which may be either a single security or a basket of securities issued by corporate or sovereign issuers) and, with respect to the rare cases where physical settlement applies, the delivery by the buyer to the seller of a defined deliverable obligation. Although agreement-specific, credit events generally consist of a combination of the following: bankruptcy, failure to pay, restructuring, obligation acceleration, obligation default, or repudiation/moratorium, each as defined in the 2003 ISDA Credit Derivatives Definitions as amended by the relevant agreement. Restructuring is generally not applicable when the reference obligation is issued by a North American corporation
34
Notes to Financial Statements (unaudited) – continued
and obligation acceleration, obligation default, or repudiation/moratorium are generally only applicable when the reference obligation is issued by a sovereign entity or an entity in an emerging country. Upon determination of the final price for the deliverable obligation (or upon delivery of the deliverable obligation in the case of physical settlement), the difference between the value of the deliverable obligation and the swap agreement’s notional amount is recorded as realized gain or loss on swap agreements in the Statement of Operations.
Credit default swap agreements are considered to have credit-risk-related contingent features since they trigger payment by the protection seller to the protection buyer upon the occurrence of a defined credit event. The maximum amount of future, undiscounted payments that the fund, as protection seller, could be required to make is equal to the swap agreement’s notional amount. The protection seller’s payment obligation would be offset to the extent of the value of the agreement’s deliverable obligation. At July 31, 2014, the fund did not hold any credit default swap agreements at an unrealized loss where it is the protection seller.
The fund’s maximum risk of loss from counterparty risk, either as the protection seller or as the protection buyer, is the fair value of the agreement. For uncleared swaps, counterparty risk is reduced by having an ISDA Master Agreement between the fund and the counterparty providing for netting as described above and by the posting of collateral by the counterparty to the fund to cover the fund’s exposure to the counterparty under such ISDA Master Agreement. For cleared swaps, the fund’s counterparty risk is mitigated by the clearinghouses’ margining requirements and financial safeguards in the event of a clearing broker default.
Loans and Other Direct Debt Instruments – The fund invests in loans and loan participations or other receivables. These investments may include standby financing commitments, including revolving credit facilities, which contractually obligate the fund to supply additional cash to the borrower on demand. The fund generally provides this financial support in order to preserve its existing investment or to obtain a more senior secured interest in the assets of the borrower. Loan participations involve a risk of insolvency of the lending bank or other financial intermediary.
Indemnifications – Under the fund’s organizational documents, its officers and Trustees may be indemnified against certain liabilities and expenses arising out of the performance of their duties to the fund. Additionally, in the normal course of business, the fund enters into agreements with service providers that may contain indemnification clauses. The fund’s maximum exposure under these agreements is unknown as this would involve future claims that may be made against the fund that have not yet occurred.
Investment Transactions and Income – Investment transactions are recorded on the trade date. Interest income is recorded on the accrual basis. All premium and discount is amortized or accreted for financial statement purposes in accordance with U.S. generally accepted accounting principles. The fund earns certain fees in connection with its floating rate loan purchasing activities. These fees are in addition to interest payments earned and may include amendment fees, commitment fees, facility fees, consent fees, and prepayment fees. Commitment fees are recorded on an accrual basis as income in the accompanying financial statements. Dividends received in cash are
35
Notes to Financial Statements (unaudited) – continued
recorded on the ex-dividend date. Certain dividends from foreign securities will be recorded when the fund is informed of the dividend if such information is obtained subsequent to the ex-dividend date. Dividend and interest payments received in additional securities are recorded on the ex-dividend or ex-interest date in an amount equal to the value of the security on such date. Debt obligations may be placed on non-accrual status or set to accrue at a rate of interest less than the contractual coupon when the collection of all or a portion of interest has become doubtful. Interest income for those debt obligations may be further reduced by the write-off of the related interest receivables when deemed uncollectible.
The fund may receive proceeds from litigation settlements. Any proceeds received from litigation involving portfolio holdings are reflected in the Statement of Operations in realized gain/loss if the security has been disposed of by the fund or in unrealized gain/loss if the security is still held by the fund. Any other proceeds from litigation not related to portfolio holdings are reflected as other income in the Statement of Operations.
Fees Paid Indirectly – The fund’s custody fee may be reduced according to an arrangement that measures the value of cash deposited with the custodian by the fund. This amount, for the six months ended July 31, 2014, is shown as a reduction of total expenses in the Statement of Operations.
Tax Matters and Distributions – The fund intends to qualify as a regulated investment company, as defined under Subchapter M of the Internal Revenue Code, and to distribute all of its taxable income, including realized capital gains. As a result, no provision for federal income tax is required. The fund’s federal tax returns, when filed, will remain subject to examination by the Internal Revenue Service for a three year period. Management has analyzed the fund’s tax positions taken on federal and state tax returns for all open tax years and does not believe that there are any uncertain tax positions that require recognition of a tax liability. Foreign taxes, if any, have been accrued by the fund in the accompanying financial statements in accordance with the applicable foreign tax law. Foreign income taxes may be withheld by certain countries in which the fund invests. Additionally, capital gains realized by the fund on securities issued in or by certain foreign countries may be subject to capital gains tax imposed by those countries.
Distributions to shareholders are recorded on the ex-dividend date. Income and capital gain distributions are determined in accordance with income tax regulations, which may differ from U.S. generally accepted accounting principles. Certain capital accounts in the financial statements are periodically adjusted for permanent differences in order to reflect their tax character. These adjustments have no impact on net assets or net asset value per share. Temporary differences which arise from recognizing certain items of income, expense, gain or loss in different periods for financial statement and tax purposes will reverse at some time in the future. Distributions in excess of net investment income or net realized gains are temporary overdistributions for financial statement purposes resulting from differences in the recognition or classification of income or distributions for financial statement and tax purposes.
36
Notes to Financial Statements (unaudited) – continued
Book/tax differences primarily relate to amortization and accretion of debt securities and treating a portion of the proceeds from redemptions as a distribution for tax purposes.
The tax character of distributions made during the current period will be determined at fiscal year end. The tax character of distributions declared to shareholders for the last fiscal year is as follows:
| | | | |
| | | 1/31/14 | |
| Ordinary income (including any short-term capital gains) | | | $63,296,637 | |
| Long-term capital gains | | | 7,958,402 | |
| Total distributions | | | $71,255,039 | |
The federal tax cost and the tax basis components of distributable earnings were as follows:
| | | | |
| As of 7/31/14 | | | |
| Cost of investments | | | $1,061,714,599 | |
| Gross appreciation | | | 25,946,538 | |
| Gross depreciation | | | (7,755,861 | ) |
| Net unrealized appreciation (depreciation) | | | $18,190,677 | |
| |
| As of 1/31/14 | | | |
| Undistributed ordinary income | | | 6,155,826 | |
| Undistributed long-term capital gain | | | 385,606 | |
| Post-October capital loss deferral | | | (313,726 | ) |
| Other temporary differences | | | (6,497,623 | ) |
| Net unrealized appreciation (depreciation) | | | 25,997,631 | |
The aggregate cost above includes prior fiscal year end tax adjustments, if applicable.
(3) Transactions with Affiliates
Investment Adviser – The fund has an investment advisory agreement with MFS to provide overall investment management and related administrative services and facilities to the fund. MFS receives no compensation under this agreement; however MFS receives management fees from MFS funds that invest in the fund.
Shareholder Servicing Agent – MFS Service Center, Inc. (MFSC), a wholly-owned subsidiary of MFS, provides transfer agent and recordkeeping functions in connection with the issuance, transfer, and redemption of shares of the fund under a Shareholder Servicing Agent Agreement. MFSC is not paid a fee for providing these services. MFSC may receive payment from the fund for out-of-pocket expenses, sub-accounting and other shareholder servicing costs which may be paid to affiliated and unaffiliated service providers. For the six months ended July 31, 2014, out-of-pocket expenses amounted to $24. The fund may also pay shareholder servicing related costs to non-related parties.
Administrator – MFS provides certain financial, legal, shareholder communications, compliance, and other administrative services to the fund. Under an administrative services agreement, the fund partially reimburses MFS the costs incurred to provide
37
Notes to Financial Statements (unaudited) – continued
these services. The fund is charged an annual fixed amount of $17,500 plus a fee based on average daily net assets. The administrative services fee incurred for the six months ended July 31, 2014 was equivalent to an annual effective rate of 0.0016% of the fund’s average daily net assets.
Trustees’ and Officers’ Compensation – The fund pays compensation to independent Trustees in the form of a retainer, attendance fees, and additional compensation to Board and Committee chairpersons. The fund does not pay compensation directly to Trustees or to officers of the fund who are also officers of the investment adviser, all of whom receive remuneration for their services to the fund from MFS. Certain officers and Trustees of the fund are officers or directors of MFS, MFS Fund Distributors, Inc. (MFD), and MFSC. The independent Trustees currently are not receiving any payments for their services to the fund.
Other – This fund and certain other funds managed by MFS (the funds) have entered into services agreements (the Agreements) which provide for payment of fees by the funds to Tarantino LLC and Griffin Compliance LLC in return for the provision of services of an Independent Chief Compliance Officer (ICCO) and Assistant ICCO, respectively, for the funds. The funds can terminate the Agreements with Tarantino LLC and Griffin Compliance LLC at any time under the terms of the Agreements. The ICCO is an officer of the funds and the sole member of Tarantino LLC. Prior to June 1, 2014, Robyn L. Griffin served as the Assistant ICCO and was an officer of the funds. Ms. Griffin is the sole member of Griffin Compliance LLC. Effective May 31, 2014, Ms. Griffin resigned as Assistant ICCO and the service agreement between the funds and Griffin Compliance LLC was terminated. For the six months ended July 31, 2014, the aggregate fees paid by the fund to Tarantino LLC and Griffin Compliance LLC were $1,490 and are included in “Miscellaneous” expense in the Statement of Operations. MFS has agreed to reimburse the fund for a portion of the payments made by the fund in the amount of $1,155, which is included in the reduction of total expenses in the Statement of Operations. Additionally, MFS has agreed to bear all expenses associated with office space, other administrative support, and supplies provided to the ICCO and Assistant ICCO.
The fund invests in the MFS Institutional Money Market Portfolio which is managed by MFS and seeks current income consistent with preservation of capital and liquidity. Income earned on this investment is included in “Dividends from underlying affiliated funds” in the Statement of Operations. This money market fund does not pay a management fee to MFS.
On March 22, 2013, MFS purchased 3 shares of the fund for an aggregate amount of $30. On March 25, 2013, the fund recorded a tax-free exchange of shares of the fund for high income debt instruments, accrued interest, and cash from certain other MFS funds. The transfer was accomplished by a tax-free exchange by the fund of 101,722,062 shares valued at $1,017,220,613 for investments from certain other MFS funds valued at approximately $979,990,962, with a cost basis of approximately $937,435,544, accrued interest of approximately $18,451,190, and cash of approximately $18,778,461. For financial reporting purposes, assets received and shares issued by the fund were recorded at fair value; however, the cost basis of the investments received from the other MFS funds were carried forward.
38
Notes to Financial Statements (unaudited) – continued
(4) Portfolio Securities
For the six months ended July 31, 2014, purchases and sales of investments, other than purchased option transactions and short-term obligations, aggregated $301,655,857 and $315,309,753, respectively.
(5) Shares of Beneficial Interest
The fund’s Declaration of Trust permits the Trustees to issue an unlimited number of full and fractional shares of beneficial interest. Transactions in fund shares were as follows:
| | | | | | | | | | | | | | | | |
| | | Six months ended
7/31/14 | | | Period ended
1/31/14 (c) | |
| | | Shares | | | Amount | | | Shares | | | Amount | |
| Shares sold | | | 5,296,050 | | | | $52,814,230 | | | | 20,852,835 | | | | $206,073,744 | |
| Shares issued in connection with in-kind transfer | | | — | | | | — | | | | 101,722,062 | | | | 1,017,220,613 | |
| Shares issued to shareholders in reinvestment of distributions | | | 3,690,028 | | | | 36,760,460 | | | | 7,226,002 | | | | 71,253,854 | |
| Shares reacquired | | | (10,320,098 | ) | | | (102,646,712 | ) | | | (16,714,515 | ) | | | (165,136,303 | ) |
| Net change | | | (1,334,020 | ) | | | $(13,072,022 | ) | | | 113,086,384 | | | | $1,129,411,908 | |
| (c) | For the period from the commencement of the fund’s investment operations, March 25, 2013, through the stated period end. |
The fund is an MFS Pooled Portfolio, which is designed to be used by certain MFS funds to invest in a particular security type rather than invest in the security type directly. The fund is solely invested in by other MFS funds for the purpose of gaining exposure to high income debt instruments, rather than investing in high income debt instruments directly. The MFS funds do not invest in this fund for the purpose of exercising management or control. At the end of the period, the MFS Diversified Income Fund, the MFS High Yield Opportunities Fund, the MFS Strategic Income Fund, and the MFS Strategic Income Portfolio were the owners of record of approximately 48%, 39%, 10%, and 3%, respectively, of the value of outstanding voting shares of the fund.
(6) Line of Credit
The fund and certain other funds managed by MFS participate in a $1.1 billion unsecured committed line of credit, subject to a $1 billion sublimit, provided by a syndication of banks under a credit agreement. Borrowings may be made for temporary financing needs. Interest is charged to each fund, based on its borrowings, generally at a rate equal to the higher of the Federal Reserve funds rate or one month LIBOR plus an agreed upon spread. A commitment fee, based on the average daily, unused portion of the committed line of credit, is allocated among the participating funds at the end of each calendar quarter. In addition, the fund and other funds managed by MFS have established unsecured uncommitted borrowing arrangements with certain banks for temporary financing needs. Interest is charged to each fund, based on its borrowings, at a rate equal to the Federal Reserve funds rate plus an agreed upon spread. For the six months ended July 31, 2014, the fund’s commitment fee and interest expense were $2,231 and $0, respectively, and are included in “Miscellaneous” expense in the Statement of Operations.
39
Notes to Financial Statements (unaudited) – continued
(7) Transactions in Underlying Affiliated Funds-Affiliated Issuers
An affiliated issuer may be considered one in which the fund owns 5% or more of the outstanding voting securities, or a company which is under common control. For the purposes of this report, the fund assumes the following to be an affiliated issuer:
| | | | | | | | | | | | | | | | |
| Underlying Affiliated Fund | | Beginning
Shares/Par
Amount | | | Acquisitions
Shares/Par
Amount | | | Dispositions
Shares/Par
Amount | | | Ending
Shares/Par
Amount | |
| MFS Institutional Money Market Portfolio | | | 9,978,615 | | | | 170,719,254 | | | | (161,242,683 | ) | | | 19,455,186 | |
| | | | |
| Underlying Affiliated Fund | | Realized
Gain (Loss) | | | Capital Gain
Distributions | | | Dividend
Income | | | Ending
Value | |
| MFS Institutional Money Market Portfolio | | | $— | | | | $— | | | | $8,496 | | | | $19,455,186 | |
40
BOARD REVIEW OF INVESTMENT ADVISORY AGREEMENT
The Investment Company Act of 1940 requires that both the full Board of Trustees and a majority of the non-interested (“independent”) Trustees, voting separately, annually approve the continuation of the Fund’s investment advisory agreement with MFS. The Trustees consider matters bearing on the Fund and its advisory arrangements at their meetings throughout the year, including a review of performance data at each regular meeting. In addition, the independent Trustees met several times over the course of three months beginning in May and ending in July, 2014 (“contract review meetings”) for the specific purpose of considering whether to approve the continuation of the investment advisory agreement for the Fund and the other investment companies that the Board oversees (the “MFS Funds”). The independent Trustees were assisted in their evaluation of the Fund’s investment advisory agreement by independent legal counsel, from whom they received separate legal advice and with whom they met separately from MFS during various contract review meetings. The independent Trustees were also assisted in this process by the MFS Funds’ Independent Chief Compliance Officer, a full-time senior officer appointed by and reporting to the independent Trustees.
In connection with their deliberations regarding the continuation of the investment advisory agreement, the Trustees, including the independent Trustees, considered such information and factors as they believed, in light of the legal advice furnished to them and their own business judgment, to be relevant. The investment advisory agreement for the Fund was considered separately, although the Trustees also took into account the common interests of all MFS Funds in their review. As described below, the Trustees considered the nature, quality, and extent of the various investment advisory, administrative, and shareholder services performed by MFS under the existing investment advisory agreement and other arrangements with the Fund.
As part of their deliberations, the Trustees took into account that the Fund was formed solely to act as a vehicle to pool the portions of other MFS funds invested in U.S. high yield bonds, and that shares of the Fund are not distributed or sold to the public. The Trustees gave substantial consideration to the fact that MFS does not charge a separate advisory fee to the Fund under the investment advisory agreement or charge transfer agency fees, administrative services fees, sales loads or distribution and service fees to the Fund, but that MFS receives advisory and other fees from the MFS funds that invest a portion of their assets in the Fund.
In connection with their contract review meetings, the Trustees received and relied upon materials that included, among other items: (i) information provided by Lipper Inc., an independent third party, on the Fund’s fees and expenses and the fees and expenses of comparable funds identified by Lipper Inc. (the “Lipper expense group”), (ii) information as to whether and to what extent applicable expense waivers, reimbursements or fee “breakpoints” are observed for the Fund, (iii) information regarding MFS’ financial results and financial condition, including MFS’ and certain of its affiliates’ estimated profitability from services performed for the Fund and the MFS Funds as a whole, and compared to MFS’ institutional business, (iv) MFS’ views regarding the outlook for the mutual fund industry and the strategic business plans of MFS, (v) descriptions of various functions performed by MFS for the Funds, such as compliance monitoring and portfolio trading practices, and (vi) information regarding
41
Board Review of Investment Advisory Agreement – continued
the overall organization of MFS, including information about MFS’ senior management and other personnel providing investment advisory, administrative and other services to the Fund and the other MFS Funds. The comparative fee and expense information prepared and provided by Lipper Inc. was not independently verified and the independent Trustees did not independently verify any information provided to them by MFS.
The Trustees’ conclusion as to the continuation of the investment advisory agreement was based on a comprehensive consideration of all information provided to the Trustees and not the result of any single factor. Some of the factors that figured particularly in the Trustees’ deliberations are described below, although individual Trustees may have evaluated the information presented differently from one another, giving different weights to various factors. It is also important to recognize that the fee arrangements for the Fund and other MFS Funds are the result of years of review and discussion between the independent Trustees and MFS, that certain aspects of such arrangements may receive greater scrutiny in some years than in others, and that the Trustees’ conclusions may be based, in part, on their consideration of these same arrangements during the course of the year and in prior years.
The Fund commenced operations on March 25, 2013 and has a limited operating history and performance record. As a result, the Trustees did not receive information provided by Lipper Inc. on the investment performance of the Fund. In the course of their deliberations, the Trustees took into account information provided by MFS in connection with the contract review meetings, as well as during investment review meetings conducted with portfolio management personnel during the course of the year regarding the Fund’s performance. After reviewing this information and related factors, the Trustees concluded, within the context of their overall conclusions regarding the investment advisory agreement, that they were satisfied with MFS’ responses and efforts relating to investment performance.
In assessing the reasonableness of the Fund’s expenses, the Trustees considered, among other information, the total expense ratio of the Fund’s shares as a percentage of average daily net assets and the total expense ratios of peer groups of funds based on information provided by Lipper Inc., noting that the Fund’s total expense ratio was expected to be relatively low because, as noted above, the Fund does not bear advisory expenses. The Trustees considered that, according to the Lipper data (which takes into account any expense limitations that were in effect during the Fund’s last fiscal year), the Fund’s total expense ratio was lower than the Lipper expense group median. Because the Fund does not pay an advisory fee, the Trustees did not consider the extent to which economies of scale would be realized due to the Fund’s growth of assets, whether fee levels reflect economies of scale for shareholders, or the fees paid by similar funds to other investment advisers or by similar clients of MFS.
The Trustees also considered information prepared by MFS relating to MFS’ costs and profits with respect to the Fund, the MFS Funds considered as a group, and other investment companies and accounts advised by MFS, as well as MFS’ methodologies used to determine and allocate its costs to the MFS Funds, the Fund and other accounts and products for purposes of estimating profitability.
42
Board Review of Investment Advisory Agreement – continued
In addition, the Trustees considered MFS’ resources and related efforts to continue to retain, attract and motivate capable personnel to serve the Fund. The Trustees also considered current and developing conditions in the financial services industry, including the presence of large and well-capitalized companies which are spending, and appear to be prepared to continue to spend, substantial sums to engage personnel and to provide services to competing investment companies. In this regard, the Trustees also considered the financial resources of MFS and its ultimate parent, Sun Life Financial Inc. The Trustees also considered the advantages and possible disadvantages to the Fund of having an adviser that also serves other investment companies as well as other accounts.
The Trustees also considered the nature, quality, cost, and extent of administrative services provided to the Fund by MFS under an agreement other than the investment advisory agreement. The Trustees also considered the nature, extent and quality of certain other services MFS performs or arranges for on the Fund’s behalf, which may include securities lending programs, directed expense payment programs, class action recovery programs, and MFS’ interaction with third-party service providers, principally custodians and sub-custodians. The Trustees concluded that the various non-advisory services provided by MFS and its affiliates on behalf of the Fund were satisfactory.
The Trustees also considered benefits to MFS from the use of the Fund’s portfolio brokerage commissions, if applicable, to pay for investment research and various other factors. Additionally, the Trustees considered so-called “fall-out benefits” to MFS such as reputational value derived from serving as investment manager to the Fund.
Based on their evaluation of factors that they deemed to be material, including those factors described above, the Board of Trustees, including the independent Trustees, concluded that the Fund’s investment advisory agreement with MFS should be continued for an additional one-year period, commencing August 1, 2014.
43
PROXY VOTING POLICIES AND INFORMATION
MFS votes proxies on behalf of the fund pursuant to proxy voting policies and procedures that are available without charge, upon request, by calling 1-800-225-2606, by visiting the Proxy Voting section of mfs.com or by visiting the SEC’s Web site at http://www.sec.gov.
Information regarding how the fund voted proxies relating to portfolio securities during the most recent twelve-month period ended June 30 is available without charge by visiting the Proxy Voting section of mfs.com or by visiting the SEC’s Web site at http://www.sec.gov.
QUARTERLY PORTFOLIO DISCLOSURE
The fund will file a complete schedule of portfolio holdings with the Securities and Exchange Commission (the Commission) for the first and third quarters of each fiscal year on Form N-Q. A shareholder can obtain the quarterly portfolio holdings report at mfs.com. The fund’s Form N-Q is also available on the EDGAR database on the Commission’s Internet Web site at http://www.sec.gov, and may be reviewed and copied at the:
Public Reference Room
Securities and Exchange Commission
100 F Street, NE, Room 1580
Washington, D.C. 20549
Information on the operation of the Public Reference Room may be obtained by calling the Commission at 1-800-SEC-0330. Copies of the fund’s Form N-Q also may be obtained, upon payment of a duplicating fee, by electronic request at the following e-mail address: publicinfo@sec.gov, or by writing the Public Reference Section at the above address.
FURTHER INFORMATION
From time to time, MFS may post important information about the fund or the MFS funds on the MFS web site (mfs.com). This information is available by visiting the “Commentary & Announcements” and “Market Outlooks” sections of mfs.com.
PROVISION OF FINANCIAL REPORTS AND SUMMARY PROSPECTUSES
The fund produces financial reports every six months and updates its summary prospectus and prospectus annually. To avoid sending duplicate copies of materials to households, only one copy of the fund’s annual and semiannual report and summary prospectus may be mailed to shareholders having the same last name and residential address on the fund’s records. However, any shareholder may contact MFSC (please see back cover for address and telephone number) to request that copies of these reports and summary prospectuses be sent personally to that shareholder.
44
Save paper with eDelivery.

| MFS® will send you prospectuses, |
reports, and proxies directly via e-mail so you will get information faster with less mailbox clutter.
To sign up:
1. Go to mfs.com.
2. Log in via MFS® Access.
3. Select eDelivery.
If you own your MFS fund shares through a financial institution or a retirement plan, MFS® TALK, MFS® Access, or eDelivery may not be available to you.
CONTACT
WEB SITE
mfs.com
MFS TALK
1-800-637-8255
24 hours a day
ACCOUNT SERVICE AND LITERATURE
Shareholders
1-800-225-2606
Financial advisors
1-800-343-2829
Retirement plan services
1-800-637-1255
MAILING ADDRESS
MFS Service Center, Inc.
P.O. Box 55824
Boston, MA 02205-5824
OVERNIGHT MAIL
MFS Service Center, Inc.
c/o Boston Financial Data Services
30 Dan Road
Canton, MA 02021-2809
During the period covered by this report, the Registrant has not amended any provision in its Code of Ethics (the “Code”) that relates to an element of the Code’s definitions enumerated in paragraph (b) of Item 2 of this Form N-CSR. During the period covered by this report, the Registrant did not grant a waiver, including an implicit waiver, from any provision of the Code.
| ITEM 3. | AUDIT COMMITTEE FINANCIAL EXPERT. |
Not applicable for semi-annual reports.
| ITEM 4. | PRINCIPAL ACCOUNTANT FEES AND SERVICES. |
Not applicable for semi-annual reports.
| ITEM 5. | AUDIT COMMITTEE OF LISTED REGISTRANTS. |
Not applicable to the Registrant.
A schedule of investments for each series of the Registrant is included as part of the report to shareholders of such series under Item 1 of this Form N-CSR.
| ITEM 7. | DISCLOSURE OF PROXY VOTING POLICIES AND PROCEDURES FOR CLOSED-END MANAGEMENT INVESTMENT COMPANIES. |
Not applicable to the Registrant.
| ITEM 8. | PORTFOLIO MANAGERS OF CLOSED-END MANAGEMENT INVESTMENT COMPANIES. |
Not applicable to the Registrant.
| ITEM 9. | PURCHASES OF EQUITY SECURITIES BY CLOSED-END MANAGEMENT INVESTMENT COMPANY AND AFFILIATED PURCHASERS. |
Not applicable to the Registrant.
| ITEM 10. | SUBMISSION OF MATTERS TO A VOTE OF SECURITY HOLDERS. |
There were no material changes to the procedures by which shareholders may send recommendations to the Board for nominees to the Registrant’s Board since the Registrant last provided disclosure as to such procedures in response to the requirements of Item 407 (c)(2)(iv) of Regulation S-K or this Item.
| ITEM 11. | CONTROLS AND PROCEDURES. |
| (a) | Based upon their evaluation of the effectiveness of the registrant’s disclosure controls and procedures (as defined in Rule 30a-3(c) under the Investment Company Act of 1940 (the “Act”)) as conducted within 90 days of the filing date of this report on Form N-CSR, the registrant’s principal financial officer and principal executive officer have concluded that those disclosure controls and procedures provide reasonable assurance that the material information required to be disclosed by the registrant on this report is recorded, processed, summarized and reported within the time periods specified in the Securities and Exchange Commission’s rules and forms. |
| (b) | There were no changes in the registrant’s internal controls over financial reporting (as defined in Rule 30a-3(d) under the Act) that occurred during the second fiscal quarter of the period covered by the report that have materially affected, or are reasonably likely to materially affect, the registrant’s internal control over financial reporting. |
| (a) | File the exhibits listed below as part of this form. Letter or number the exhibits in the sequence indicated. |
| | (1) | Any code of ethics, or amendment thereto, that is the subject of the disclosure required by Item 2, to the extent that the registrant intends to satisfy the Item 2 requirements through filing of an exhibit. |
| | (2) | A separate certification for each principal executive officer and principal financial officer of the registrant as required by Rule 30a-2(a) under the Act (17 CFR 270.30a-2): Attached hereto. |
| (b) | If the report is filed under Section 13(a) or 15(d) of the Exchange Act, provide the certifications required by Rule 30a-2(b) under the Act (17 CFR 270.30a-2(b)), Rule 13a-14(b) or Rule 15d-14(b) under the Exchange Act (17 CFR 240.13a-14(b) or 240.15d-14(b)) and Section 1350 of Chapter 63 of Title 18 of the United States Code (18 U.S.C. 1350) as an exhibit. A certification furnished pursuant to this paragraph will not be deemed “filed” for the purposes of Section 18 of the Exchange Act (15 U.S.C. 78r), or otherwise subject to the liability of that section. Such certification will not be deemed to be incorporated by reference into any filing under the Securities Act of 1933 or the Exchange Act, except to the extent that the registrant specifically incorporates it by reference: Attached hereto. |
Notice
A copy of the Amended and Restated Declaration of Trust, as amended, of the Registrant is on file with the Secretary of State of The Commonwealth of Massachusetts and notice is hereby given that this instrument is executed on behalf of the Registrant by an officer of the Registrant as an officer and not individually and the obligations of or arising out of this instrument are not binding upon any of the Trustees or shareholders individually, but are binding only upon the assets and property of the respective constituent series of the Registrant.
SIGNATURES
Pursuant to the requirements of the Securities Exchange Act of 1934 and the Investment Company Act of 1940, the registrant has duly caused this report to be signed on its behalf by the undersigned, thereunto duly authorized.
(Registrant) MFS SERIES TRUST III
| | |
| By (Signature and Title)* | | JOHN M. CORCORAN |
| | John M. Corcoran, President |
Date: September 15, 2014
Pursuant to the requirements of the Securities Exchange Act of 1934 and the Investment Company Act of 1940, this report has been signed below by the following persons on behalf of the registrant and in the capacities and on the dates indicated.
| | |
| By (Signature and Title)* | | JOHN M. CORCORAN |
| | John M. Corcoran, President (Principal Executive Officer) |
Date: September 15, 2014
| | |
| By (Signature and Title)* | | DAVID L. DILORENZO |
| | David L. DiLorenzo, Treasurer (Principal Financial Officer and Accounting Officer) |
Date: September 15, 2014
| * | Print name and title of each signing officer under his or her signature. |