UNITEDSTATES
SECURITIESANDEXCHANGECOMMISSION
Washington,D.C.20549
FORM N-CSRS
CERTIFIED SHAREHOLDER REPORT OF REGISTERED MANAGEMENT
INVESTMENT COMPANIES
Investment Company Act file number 811-02688
Name of Fund: BlackRock Municipal Bond Fund, Inc.
BlackRock High Yield Municipal Fund
BlackRock Municipal Fund (formerly, BlackRock Municipal Insured Fund)
BlackRock National Municipal Fund
BlackRock Short-Term Municipal Fund
Fund Address: 100 Bellevue Parkway, Wilmington, DE 19809
Name and address of agent for service: John M. Perlowski, Chief Executive Officer, BlackRock
Municipal Bond Fund, Inc., 40 East 52nd Street, New York, NY 10022
Registrant’s telephone number, including area code: (800) 441-7762
Date of fiscal year end: 06/30/2011
Date of reporting period: 12/31/2010
Item 1 – Report to Stockholders
December 31, 2010
Semi-Annual Report (Unaudited)
BlackRock Municipal Bond Fund, Inc.
} BlackRock Short-Term Municipal Fund
} BlackRock Municipal Fund
} BlackRock National Municipal Fund
} BlackRock High Yield Municipal Fund
BlackRock New York Municipal Bond Fund | of BlackRock Multi-State Municipal Series Trust
Not FDIC Insured • No Bank Guarantee • May Lose Value
Table of Contents
| Page | |
| Dear Shareholder | 3 |
| Semi-Annual Report: | |
| Fund Summaries | 4 |
| About Fund Performance | 14 |
| Disclosure of Expenses | 15 |
| The Benefits and Risks of Leveraging | 16 |
| Derivative Financial Instruments | 16 |
| Financial Statements: | |
| Schedules of Investments | 17 |
| Statements of Assets and Liabilities | 43 |
| Statements of Operations | 45 |
| Statements of Changes in Net Assets | 46 |
| Financial Highlights | 51 |
| Notes to Financial Statements | 76 |
| Officers and Directors | 86 |
| Additional Information | 87 |
| Mutual Fund Family | 90 |
2 SEMI-ANNUAL REPORT DECEMBER 31, 2010
Dear Shareholder
Economic data fluctuated widely throughout 2010 as the global economy continued to emerge from the “Great Recession.” As the year drew to a close, it
became clear that cyclical stimulus had beaten out structural problems as economic data releases generally became more positive and financial markets
showed signs of continuing improvement.
Debt and deflationary risks remained present throughout 2010, causing central banks worldwide to respond with unprecedented actions, most notably a
second round of quantitative easing (informally known as “QE2”) from the US Federal Reserve Board (the “Fed”). Inflation remained a non-issue in the
developed world, but continued to rear its ugly head in some emerging economies, most evidently in China. Global and US gross domestic product (“GDP”)
growth both continued in a positive direction but remained subpar compared to most historical economic recoveries. In the United States, the corporate
sector has been an important area of strength and consumer spending has shown improvement, although weakness in the housing and labor markets con-
tinues to burden the economy.
Stocks moved higher in the early months of 2010 on the continuation of the 2009 asset recovery story. The mid-year months saw a double-digit percentage
correction on the back of the Greek sovereign debt crisis and a stalling in jobs growth, leading to fears of a double-dip recession. After touching a late
summer low, equity markets rallied through year end as these concerns receded. The announcement of QE2 and extension of the Bush-era tax cuts further
boosted equities as the year came to a close. Although the course was uneven and high volatility remained a constant for stocks, equity markets globally
ended the year strong. Emerging markets outpaced the developed world in terms of economic growth and posted respectable gains for the year despite
sovereign debt problems and heightening inflationary pressures. US stocks recorded double-digit percentage gains for the second consecutive year. Small
cap stocks outperformed large caps as investors began to move into higher-risk assets.
In fixed income markets, yields trended lower over most of the year as investors continued to favor safer assets. That trend reversed abruptly in the fourth
quarter when market fears abated and investors began seeking higher-risk assets, driving yields sharply upward through year end. However, yields were lower
overall for the year and fixed income markets finished 2010 in positive territory. Although fixed income securities generally underperformed equities, high
yield bonds only marginally trailed large cap stocks. Conversely, the tax-exempt municipal market was dealt an additional blow as it became apparent that
an extension of the Build America Bond program was unlikely. In addition, the fourth quarter brought an increase in negative headlines regarding fiscal
challenges faced by state and local governments, sparking additional volatility in the municipal market.
Cash investments, as represented by the 3-month Treasury bill, returned only a fraction over 0% for the year as short-term interest rates remained low. Yields
on money market securities remain near all-time lows.
| Total Returns as of December 31, 2010 | 6-month | 12-month |
| US large cap equities (S&P 500 Index) | 23.27% | 15.06% |
| US small cap equities (Russell 2000 Index) | 29.38 | 26.85 |
| International equities (MSCI Europe, Australasia, Far East Index) | 24.18 | 7.75 |
| 3-month Treasury bill (BofA Merrill Lynch 3-Month Treasury Bill Index) | 0.08 | 0.13 |
| US Treasury securities (BofA Merrill Lynch 10-Year US Treasury Index) | (1.33) | 7.90 |
| US investment grade bonds (Barclays Capital US Aggregate Bond Index) | 1.15 | 6.54 |
| Tax-exempt municipal bonds (Barclays Capital Municipal Bond Index) | (0.90) | 2.38 |
| US high yield bonds (Barclays Capital US Corporate High Yield 2% Issuer Capped Index) | 10.04 | 14.94 |
| Past performance is no guarantee of future results. Index performance shown for illustrative purposes only. You cannot invest directly in an index. | ||
While no one can peer into a crystal ball and eliminate the uncertainties presented by the economic landscape and financial markets, BlackRock can offer
investors the next best thing: partnership with the world’s largest asset management firm and a unique global perspective that allows us to identify trends
early and capitalize on market opportunities. For additional market perspective and investment insight, visit www.blackrock.com/shareholdermagazine,
where you’ll find the most recent issue of our award-winning Shareholder® magazine, as well as its quarterly companion newsletter, Shareholder
Perspectives. As always, we thank you for entrusting BlackRock with your investments, and we look forward to your continued partnership in the months
and years ahead.
Sincerely,
Rob Kapito
President, BlackRock Advisors, LLC
THIS PAGE NOT PART OF YOUR FUND REPORT 3
Fund Summary as of December 31, 2010 BlackRock Short-Term Municipal Fund
Portfolio Management Commentary
How did the Fund perform?
•For the six-month period ended December 31, 2010, BlackRock Short-Term
Municipal Fund (the “Fund”) outperformed its primary benchmark, the
S&P/Investortools Main Municipal Bond Index, while it underperformed its
secondary benchmark, the S&P/Investortools Limited Maturity Municipal
Bond Index. The following discussion of relative performance pertains to
the Fund’s secondary benchmark, the S&P/Investortools Limited Maturity
Municipal Bond Index.
What factors influenced performance?
•As the Fund maintains a shorter weighted average maturity than the index,
it will generally underperform during periods of falling interest rates and
outperform during periods of rising rates. During the third quarter, yields on
municipal securities fell while the yield curve remained steep. As a result,
the Fund’s shorter average portfolio duration was the primary contributor
to its underperformance of the index.
•Conversely, the Fund performed well during the fourth quarter when munici-
pal bond redemptions resulted in a dramatic rise in yields across the yield
curve. The Fund’s shorter average portfolio duration (sensitivity to interest
rates) and high quality bias insulated the Fund from the increased volatility
seen in the municipal market near the end of the year.
Describe recent portfolio activity.
•Early in the period, short-term municipal issuance remained constrained
and yields on securities with maturities under five years were pushed to
historic lows. Given these conditions, we limited new purchases in the
Fund. However, these conditions changed in the last quarter of the year and
we then sought to capitalize on the increase in new issuance, with a focus
on essential service revenue bonds. Also during the fourth quarter, we
began selling securities we believed were most subject to headline risk, as
negative comments regarding the safety of municipal bonds emerged in the
media. The Fund’s purchases during the period were funded by proceeds
from the sale of short-term bonds and money market-eligible securities,
which we had utilized as cash equivalents over the past year.
Describe Fund positioning at period end.
•At period end, the Fund was fully invested with minimal cash reserves, and
its average duration was neutral to the benchmark. The Fund maintains a
high quality bias, although we have begun purchasing credit spread securi-
ties at the short end of the yield curve in order to obtain higher yields with-
out assuming the greater interest rate risk associated with the longer end
of the yield curve.
The views expressed reflect the opinions of BlackRock as of the date of this report and are
subject to change based on changes in market, economic or other conditions. These
views are not intended to be a forecast of future events and are no guarantee of future results.
Portfolio Information
| Percent of | |
| Sector Allocations | Long-Term Investments |
| State | 34% |
| County/City/Special District/School District | 22 |
| Utilities | 17 |
| Education | 7 |
| Transportation | 7 |
| Corporate | 6 |
| Health | 6 |
| Housing | 1 |
| Percent of | |
| Credit Quality Allocations1 | Long-Term Investments |
| AAA/Aaa | 26% |
| AA/Aa | 55 |
| A | 11 |
| BBB/Baa | 5 |
| Not Rated2 | 3 |
1 Using the higher of Standard & Poor’s (“S&P’s”) or Moody’s Investors Service
(“Moody’s”) ratings.
2 The investment advisor has deemed certain of these non-related securities to be
of investment grade quality. As of December 31, 2010, the market value of these
securities was $12,072,182, representing 1% of the Fund’s long-term investments.
4 SEMI-ANNUAL REPORT DECEMBER 31, 2010
BlackRock Short-Term Municipal Fund
Total Return Based on a $10,000 Investment
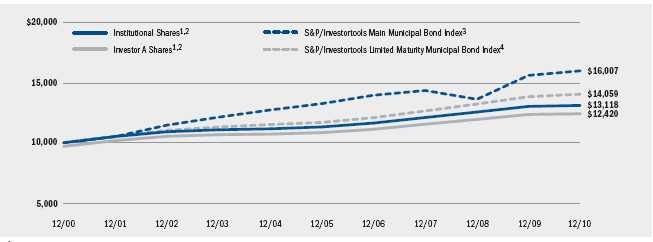
1 Assuming maximum sales charge, transaction costs and other operating expenses, including advisory fees, if any. Institutional Shares do not have a sales charge.
2 The Fund invests primarily in investment grade municipal bonds or in municipal notes having a maturity of less than four years. The Fund will maintain a dollar
weighted maturity of no more than two years.
3 The S&P/Investortools Main Municipal Bond Index is composed of bonds held by managed municipal bond fund customers of Standard & Poor’s Securities Pricing,
Inc. that are priced daily. Bonds in the S&P/Investortools Main Municipal Bond Index must have an outstanding par value of at least $2 million and a remaining
maturity of not less than 1 month.
4 The S&P/Investortools Limited Maturity Municipal Bond Index includes all bonds in the S&P/Investortools Main Municipal Bond Index with a remaining maturity of
less than 4 years.
Performance Summary for the Period Ended December 31, 2010
| Average Annual Total Returns | ||||||||
| 1 Year | 5 Years | 10 Years | ||||||
| Standardized | 6-Month | w/o sales | w/sales | w/o sales | w/sales | w/o sales | w/sales | |
| 30-Day Yields | Total Returns | charge | charge | charge | charge | charge | charge | |
| BlackRock | 0.74% | 0.07% | 0.65% | N/A | 2.99% | N/A | 2.75% | N/A |
| Institutional | 0.65 | 0.06 | 0.65 | N/A | 2.99 | N/A | 2.75 | N/A |
| Investor A | 0.37 | (0.07) | 0.48 | (2.54)% | 2.75 | 2.12% | 2.50 | 2.19% |
| Investor A1 | 0.52 | 0.00 | 0.53 | (0.48) | 2.90 | 2.70 | 2.65 | 2.54 |
| Investor B | 0.23 | (0.14) | 0.24 | (0.75) | 2.61 | 2.61 | 2.38 | 2.38 |
| Investor C | 0.00 | (0.36) | (0.30) | (1.30) | 1.97 | 1.97 | 1.73 | 1.73 |
| S&P/Investortools Main Municipal Bond Index | — | (0.85) | 2.45 | N/A | 3.83 | N/A | 4.82 | N/A |
| S&P/Investortools Limited Maturity Municipal | ||||||||
| Bond Index | — | 0.32 | 1.54 | N/A | 3.74 | N/A | 3.47 | N/A |
5 Assuming maximum sales charges, if any. Average annual total returns with and without sales charges reflect reductions for distribution and service fees. See “About Fund
Performance” on page 14 for a detailed description of share classes, including any related sales charges and fees.
N/A — Not applicable as share class and index do not have a sales charge.
Past performance is not indicative of future results.
Expense Example
| Actual | Hypothetical7 | ||||||
| Beginning | Ending | Beginning | Ending | Annualized | |||
| Account Value | Account Value | Expenses Paid | Account Value | Account Value | Expenses Paid | Expense | |
| July 1, 2010 | December 31, 2010 During the Period6 | July 1, 2010 | December 31, 2010 During the Period8 | Ratio | |||
| BlackRock | $1,000.00 | $1,000.70 | $1.97 | $1,000.00 | $1,023.23 | $1.99 | 0.39% |
| Institutional | $1,000.00 | $1,000.60 | $2.02 | $1,000.00 | $1,023.18 | $2.04 | 0.40% |
| Investor A | $1,000.00 | $ 999.30 | $3.33 | $1,000.00 | $1,021.87 | $3.36 | 0.66% |
| Investor A1 | $1,000.00 | $1,000.00 | $2.62 | $1,000.00 | $1,022.58 | $2.65 | 0.52% |
| Investor B | $1,000.00 | $ 998.60 | $4.08 | $1,000.00 | $1,021.12 | $4.13 | 0.81% |
| Investor C | $1,000.00 | $ 996.40 | $7.75 | $1,000.00 | $1,017.94 | $7.32 | 1.44% |
6 For each class of the Fund, expenses are equal to the annualized expense ratio for the class, multiplied by the average account value over the period, multiplied by 184/365
(to reflect the one-half year period shown). Expenses are net of waiver.
7 Hypothetical 5% annual return before expenses is calculated by pro rating the number of days in the most recent fiscal half-year divided by 365.
See “Disclosure of Expenses” on page 15 for further information on how expenses were calculated.
SEMI-ANNUAL REPORT DECEMBER 31, 2010 5
Fund Summary as of December 31, 2010 BlackRock Municipal Fund
(Formerly BlackRock Municipal Insured Fund)
Portfolio Management Commentary
How did the Fund perform?
For the six-month period ended December 31, 2010, BlackRock
Municipal Fund (the “Fund”) underperformed its primary benchmark, the
S&P/Investortools Main Municipal Bond Index, and its secondary bench-
mark, the S&P/Investortools Customized Insured Municipal Bond Index.
Effective January 3, 2011, BlackRock Municipal Insured Fund was renamed
BlackRock Municipal Fund.
What factors influenced performance?
Detracting from performance during the period was the Fund’s positive
stance toward the market, i.e., a long duration relative to the benchmark,
during a period that ultimately ended with sharply higher rates. The Fund’s
exposure to the long end of the yield curve also detracted as interest rates
rose more in the long end. Yields on tax-exempt bonds increased and,
accordingly, prices fell, in the last two months of the period as US Treasury
bond yields increased sharply on positive economic news, concerns about
municipal credit quality escalated, and market participants expected an
increase in tax-exempt supply as the Build America Bond (“BAB”) program
approached its expiration.
On the positive side, the Fund’s competitive yield contributed positively to
performance. In addition, exposure to the housing sector proved beneficial
as the sector performed well during the period.
Describe recent portfolio activity.
•During the six-month period, changes to the portfolio were generally mini-
mal. Trading activity was focused on the goal of improving the portfolio’s
overall credit quality, call structure and coupon rates. Throughout the
period, tax-exempt issuance continued to decline as the BAB program
diverted municipal supply to the taxable market. As such, we sought
opportunities in the longer end of the curve as we found it most attractive
due to the impact of the BAB program.
Describe Fund positioning at period end.
•At period end, the Fund continued to exhibit a positive stance toward
the market with its long duration relative to the benchmark. The yield
curve remains very steep and, with the recent increase in yields, municipal
market valuations are historically attractive on both an absolute basis and
relative to their taxable counterparts; meanwhile, cash equivalents continue
to yield near 0%. The expiration of the BAB program, coupled with height-
ened concerns about municipal credit quality and improving economic
growth, has clearly placed pressure on the tax-exempt market. However,
on the back of all of these recent developments, the market presents
compelling yields.
The views expressed reflect the opinions of BlackRock as of the date of this report and are subject
to change based on changes in market, economic or other conditions. These
views are not intended to be a forecast of future events and are no guarantee of future results.
| Portfolio Information | |
| Percent of | |
| Sector Allocations | Long-Term Investments |
| County/City/SpecialDistrict/School District | 29% |
| Transportation | 21 |
| State | 16 |
| Utilities | 14 |
| Corporate | 6 |
| Housing | 6 |
| Health | 6 |
| Education | 2 |
| Percent of | |
| Credit Quality Allocations1 | Long-Term Investments |
| AAA/Aaa | 14% |
| AA/Aa | 54 |
| A | 26 |
| BBB/Baa | 3 |
| BB/Ba | 1 |
| Not Rated2 | 2 |
1 Using the higher of S&P’s or Moody’s ratings.
2 The investment advisor has deemed certain of these non-rated securities to be
of investment grade quality. As of December 31, 2010, the market value of these
securities was $12,965,380 representing 2% of the Fund’s long-term investments.
6 SEMI-ANNUAL REPORT DECEMBER 31, 2010
BlackRock Municipal Fund
Total Return Based on a $10,000 Investment
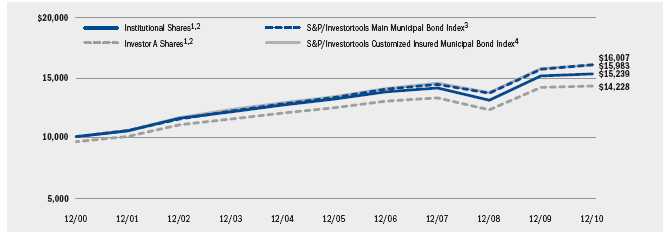
1 Assuming maximum sales charge, transaction costs and other operating expenses, including advisory fees, if any. Institutional Shares do not have a sales charge.
2 The Fund invests primarily in investment grade municipal bonds. The Fund will usually invest in municipal bonds that have a maturity of five years or longer. The
Fund may invest in insured and uninsured municipal bonds.
3 The S&P/Investortools Main Municipal Bond Index is composed of bonds held by managed municipal bond fund customers of Standard & Poor’s Securities Pricing,
Inc. that are priced daily. Bonds in the S&P/Investortools Main Municipal Bond Index must have an outstanding par value of at least $2 million and a remaining
maturity of not less than 1 month.
4 The S&P/Investortools Customized Insured Municipal Bond Index includes insured bonds in the S&P/Investortools Main Municipal Bond Index, excluding those that
are pre-refunded, escrowed to maturity, or insured by ACA Financial Guaranty Corporation.
Performance Summary for the Period Ended December 31, 2010
| Average Annual Total Returns5 | ||||||||
| 1 Year | 5 Years | 10 Years | ||||||
| Standardized | 6-Month | w/o sales | w/sales | w/o sales | w/sales | w/o sales | w/sales | |
| 30-Day Yields | Total Returns | charge | charge | charge | charge | charge | charge | |
| Institutional | 4.67% | (2.10)% | 1.09% | N/A | 3.01% | N/A | 4.30% | N/A |
| Investor A | 4.21 | (2.23) | 0.83 | (3.46)% | 2.77 | 1.88% | 4.04 | 3.59% |
| Investor B | 3.86 | (2.49) | 0.17 | (3.68) | 2.22 | 1.88 | 3.50 | 3.50 |
| Investor C | 3.63 | (2.73) | (0.06) | (1.02) | 1.98 | 1.98 | 3.27 | 3.27 |
| Investor C1 | 3.82 | (2.51) | 0.27 | (0.70) | 2.20 | 2.20 | 3.46 | 3.46 |
| S&P/Investortools Main Municipal Bond Index | — | (0.85) | 2.45 | N/A | 3.83 | N/A | 4.82 | N/A |
| S&P/Investortools Customized Insured | ||||||||
| Municipal Bond Index | — | (1.30) | 1.92 | N/A | 3.70 | N/A | 4.80 | N/A |
5 Assuming maximum sales charges, if any. Average annual total returns with and without sales charges reflect reductions for distribution and service fees. See “About Fund
Performance” on page 14 for a detailed description of share classes, including any related sales charges and fees.
N/A — Not applicable as share class and index do not have a sales charge.
Past performance is not indicative of future results.
Expense Example
| Actual | Hypothetical8 | ||||||||
| Expenses Paid | Including Interest Expense | Excluding Interest Expense | |||||||
| During the Period | and Fees | and Fees | |||||||
| Ending | Including | Excluding | Ending | Ending | |||||
| Beginning | Account Value | Interest | Interest | Beginning | Account Value Expenses | Account Value | Expenses | ||
| Account Value December 31, | Expense | Expense | Account Value | December 31, Paid During | December 31, | Paid During | |||
| July 1, 2010 | 2010 | and Fees6 | and Fees7 | July 1, 2010 | 2010 | the Period6 | 2010 | the Period7 | |
| Institutional | $1,000.00 | $979.00 | $2.54 | $2.29 | $1,000.00 | $1,022.63 | $2.60 | $1,022.88 | $2.35 |
| Investor A | $1,000.00 | $977.70 | $3.84 | $3.59 | $1,000.00 | $1,021.32 | $3.92 | $1,021.57 | $3.67 |
| Investor B | $1,000.00 | $975.10 | $6.42 | $6.17 | $1,000.00 | $1,018.70 | $6.56 | $1,018.95 | $6.31 |
| Investor C | $1,000.00 | $972.70 | $7.56 | $7.26 | $1,000.00 | $1,017.54 | $7.73 | $1,017.84 | $7.43 |
| Investor C1 | $1,000.00 | $974.90 | $6.62 | $6.32 | $1,000.00 | $1,018.50 | $6.77 | $1,018.80 | $6.46 |
6 For each class of the Fund, expenses are equal to the annualized expense ratio for the class (0.51% for Institutional, 0.77% for Investor A, 1.29% for Investor B, 1.52% for Investor C
and 1.33% for Investor C1), multiplied by the average account value over the period, multiplied by 184/365 (to reflect the one-half year period shown).
7 For each class of the Fund, expenses are equal to the annualized expense ratio for the class (0.46% for Institutional, 0.72% for Investor A, 1.24% for Investor B, 1.46% for Investor C
and 1.27% for Investor C1), multiplied by the average account value over the period, multiplied by 184/365 (to reflect the one-half year period shown).
8 Hypothetical 5% annual return before expenses is calculated by pro rating the number of days in the most recent fiscal half-year divided by 365.
See “Disclosure of Expenses” on page 15 for further information on how expenses were calculated.
SEMI-ANNUAL REPORT DECEMBER 31, 2010 7
Fund Summary as of December 31, 2010 BlackRock National Municipal Fund
Portfolio Management Commentary
How did the Fund perform?
•For the six-month period ended December 31, 2010, BlackRock
National Municipal Fund (the “Fund”) underperformed its benchmark,
the S&P/Investortools Main Municipal Bond Index.
What factors influenced performance?
•Tightening credit spreads during the year led to improved valuations on
lower-rated sectors, but not all lower-rated sectors and geographic regions
participated equally in the price improvement. For example, the Fund’s
holdings in California did not depreciate, but also did not improve in val-
uation to the same degree as other regions. On the positive side, many of
the Fund’s California holdings deliver a high level of income. An additional
detractor was the Fund’s longer duration stance relative to the benchmark
near period end, as the municipal market saw rates rise due to credit con-
cerns and a general rise in long-term investment rates (i.e., rates on US
Treasuries and other fixed income securities).
•A larger exposure to tender option bonds benefited performance, allowing
the Fund to take advantage of the steep yield curve and historically low
short-term borrowing rates to generate a higher income level while holding
higher-quality assets. The Fund also capitalized on tightening credit quality
spreads caused by generous cash flows into mutual funds at the beginning
of the reporting period. In this environment, we were able to sell lower-
quality securities that had outperformed and that had very limited liquidity
in past periods. Finally, the Fund’s cash reserves served it well toward
period-end, when the municipal markets saw cash flows into funds turn
dramatically negative.
Describe recent portfolio activity.
•During the period, we increased the Fund’s exposure to tender option
bonds in order to take advantage of the historically steep municipal yield
curve. This strategy helped to improve the Fund’s yield distribution. In addi-
tion, we looked to capitalize on the tightening in credit quality spreads by
selling select lower-rated holdings that had outperformed. This allowed us
to secure gains on those lower-rated holdings, while also improving the
Fund’s overall credit quality.
Describe Fund positioning at period end.
•At period end, the Fund’s duration was long relative to the benchmark. With
cash equivalent reserves at about 3.2% at period end to ensure a measure
of liquidity, the Fund is nearly fully invested to take advantage of municipal
market valuations that are historically attractive on both an absolute basis
and relative to their taxable counterparts. During the period, the Fund’s
exposure to tender option bonds was increased to just under 12.7% of
total assets. We continue to maintain the Fund’s bias for high-quality secu-
rities and a high average coupon rate, which stood at 6.0% at period-end.
•Generally, our efforts remain focused on maximizing the Fund’s income
accrual using a high-quality asset mix, while managing NAV volatility.
The views expressed reflect the opinions of BlackRock as of the date of this report and are
subject to change based on changes in market, economic or other conditions. These
views are not intended to be a forecast of future events and are no guarantee of future results.
| Portfolio Information | |
| Percent of | |
| Sector Allocations | Long-Term Investments |
| Utilities | 22% |
| County/City/Special District/School District | 20 |
| Transportation | 19 |
| Health | 17 |
| State | 9 |
| Corporate | 7 |
| Education | 3 |
| Housing | 3 |
| Percent of | |
| Credit Quality Allocations1 | Long-Term Investments |
| AAA/Aaa | 11% |
| AA/Aa | 43 |
| A | 30 |
| BBB/Baa | 9 |
| BB/Ba | 2 |
| Not Rated2 | 5 |
1 Using the higher of S&P’s or Moody’s ratings.
2 The investment advisor has deemed certain of these non-rated securities to be
of investment grade quality. As of December 31, 2010, the market value of these
securities was $55,952,765 representing 2% of the Fund’s long-term investments.
8 SEMI-ANNUAL REPORT DECEMBER 31, 2010
BlackRock National Municipal Fund
Total Return Based on a $10,000 Investment
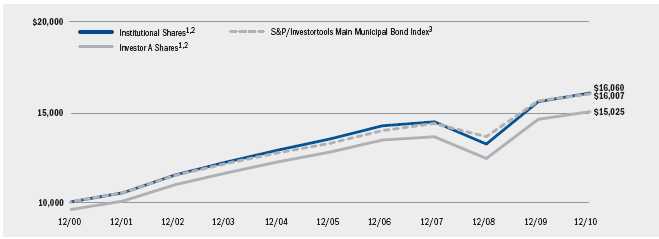
1 Assuming maximum sales charge, transaction costs and other operating expenses, including advisory fees, if any. Institutional Shares do not have a sales charge.
2 The Fund invests primarily in long-term municipal bonds rated in any rating category or in unrated municipal bonds.
3 The S&P/Investortools Main Municipal Bond Index is composed of bonds held by managed municipal bond fund customers of Standard & Poor’s Securities Pricing,
Inc. that are priced daily. Bonds in the S&P/Investortools Main Municipal Bond Index must have an outstanding par value of at least $2 million and a remaining
maturity of not less than 1 month.
Performance Summary for the Period Ended December 31, 2010
| Average Annual Total Returns4 | ||||||||
| 1 Year | 5 Years | 10 Years | ||||||
| Standardized | 6-Month | w/o sales | w/sales | w/o sales | w/sales | w/o sales | w/sales | |
| 30-Day Yields | Total Returns | charge | charge | charge | charge | charge | charge | |
| Institutional | 4.85% | (0.99)% | 3.09% | N/A | 3.52% | N/A | 4.85% | N/A |
| Investor A | 4.42 | (1.01) | 2.94 | (1.43)% | 3.29 | 2.40% | 4.61 | 4.16% |
| Investor B | 4.06 | (1.28) | 2.41 | (1.53) | 2.76 | 2.42 | 4.07 | 4.07 |
| Investor C | 3.84 | (1.38) | 2.18 | 1.20 | 2.49 | 2.49 | 3.81 | 3.81 |
| Investor C1 | 4.02 | (1.39) | 2.28 | 1.29 | 2.70 | 2.70 | 4.02 | 4.02 |
| S&P/Investortools Main Municipal Bond Index | — | (0.85) | 2.45 | N/A | 3.83 | N/A | 4.82 | N/A |
4 Assuming maximum sales charges, if any. Average annual total returns with and without sales charges reflect reductions for distribution and service fees. See “About Fund
Performance” on page 14 for a detailed description of share classes, including any related sales charges and fees.
N/A — Not applicable as share class and index do not have a sales charge.
Past performance is not indicative of future results.
Expense Example
| Actual | Hypothetical7 | ||||||||
| Expenses Paid | Including Interest Expense | Excluding Interest Expense | |||||||
| During the Period | and Fees | and Fees | |||||||
| Ending | Including | Excluding | Ending | Ending | |||||
| Beginning | Account Value | Interest | Interest | Beginning | Account Value Expenses | Account Value | Expenses | ||
| Account Value December 31, | Expense | Expense | Account Value | December 31, Paid During | December 31, | Paid During | |||
| July 1, 2010 | 2010 | and Fees5 | and Fees6 | July 1, 2010 | 2010 | the Period5 | 2010 | the Period6 | |
| Institutional | $1,000.00 | $990.10 | $3.21 | $2.91 | $1,000.00 | $1,021.97 | $3.26 | $1,022.28 | $2.96 |
| Investor A | $1,000.00 | $989.90 | $4.41 | $4.11 | $1,000.00 | $1,020.76 | $4.48 | $1,021.07 | $4.18 |
| Investor B | $1,000.00 | $987.20 | $7.11 | $6.76 | $1,000.00 | $1,018.04 | $7.22 | $1,018.39 | $6.87 |
| Investor C | $1,000.00 | $986.20 | $8.16 | $7.86 | $1,000.00 | $1,016.98 | $8.39 | $1,017.29 | $7.98 |
| Investor C1 | $1,000.00 | $986.10 | $7.21 | $6.91 | $1,000.00 | $1,017.94 | $7.32 | $1,018.24 | $7.02 |
5 For each class of the Fund, expenses are equal to the annualized expense ratio for the class (0.64% for Institutional, 0.88% for Investor A, 1.42% for Investor B, 1.63% for Investor C
and 1.44% for Investor C1), multiplied by the average account value over the period, multiplied by 184/365 (to reflect the one-half year period shown).
6 For each class of the Fund, expenses are equal to the annualized expense ratio for the class (0.58% for Institutional, 0.82% for Investor A, 1.35% for Investor B, 1.57% for Investor C
and 1.38% for Investor C1), multiplied by the average account value over the period, multiplied by 184/365 (to reflect the one-half year period shown).
7 Hypothetical 5% annual return before expenses is calculated by pro rating the number of days in the most recent fiscal half-year divided by 365.
See “Disclosure of Expenses” on page 15 for further information on how expenses were calculated.
SEMI-ANNUAL REPORT DECEMBER 31, 2010 9
Fund Summary as of December 31, 2010 BlackRock High Yield Municipal Fund
Portfolio Management Commentary
How did the Fund perform?
•During the six-month period ended December 31, 2010, BlackRock High
Yield Municipal Fund’s (the “Fund”) Institutional Shares’ returns outpaced
that of the primary benchmark, the S&P/Investortools Main Municipal
Bond Index, but lagged the secondary benchmark, the S&P/Investortools
Customized High Yield Municipal Bond Index. The Fund’s Investor A and
Investor C Shares lagged both the primary and the secondary benchmarks.
The following discussion of performance is relative to the Fund’s secondary
benchmark, the S&P/Investortools Customized High Yield Municipal
Bond Index.
What factors influenced performance?
•As the municipal market rallied in the first half of the reporting period and
yields fell, the Fund’s above-market duration stance and its emphasis on
longer-dated securities were beneficial to performance. Fund performance
also benefited from sector concentrations in health care and corporate-
related bonds, which outperformed the broad market. Finally, the Fund was
aided by its underweight exposure to tobacco bonds, which suffered dispro-
portionately in relation to the rest of the municipal market due to credit
downgrades by Standard & Poor’s.
•Just as the Fund’s above-market duration stance and its emphasis on
longer-dated securities were beneficial to performance in the first half of
the period, these same factors detracted in the second half as municipal
yields rose and the yield curve steepened. In addition, the Fund’s exposure
to zero-coupon bonds hurt performance, as those bonds experienced
greater declines than the broad municipal market during the last two
months of the period.
Describe recent Fund activity.
•Fund activity during the quarter continued to reflect efforts to maximize the
Fund’s distribution yield while maintaining a generally favorable average
coupon rate and credit spread profile. To that end, we believe the primary
market offered the greatest value and it was there that most new pur-
chases were concentrated. Purchases during the period included increases
in exposure to the health care, transportation and industrial development
sectors. Given the slowdown in new subscriptions, funding for these pur-
chases originated with the sale of existing holdings, including tobacco,
California and shorter-dated bonds.
Describe Fund positioning at period end.
•At period end, the fund remains positioned with a longer duration relative
to the benchmark and an emphasis on longer-dated bonds. We believe
the Fund’s credit and sector exposures, which reflect the changes already
outlined, will allow the Fund to benefit fully should credit spreads
resume tightening.
•In anticipation of typical liquidity needs for the end of a calendar year, the
Fund’s cash reserve level at period end was slightly higher than is typical.
The cash reserve level remained below 5%.
The views expressed reflect the opinions of BlackRock as of the date of this report and are
subject to change based on changes in market, economic or other conditions. These
views are not intended to be a forecast of future events and are no guarantee of future results.
Portfolio Information
| Percent of | |
| Sector Allocations | Long-Term Investments |
| Health | 34% |
| Transportation | 15 |
| Corporate | 14 |
| County/City/Special District/School District | 10 |
| Utilities | 10 |
| Education | 5 |
| Housing | 5 |
| State | 4 |
| Tobacco | 3 |
| Percent of | |
| Credit Quality Allocations1 | Long-Term Investments |
| AAA/Aaa | 3% |
| AA/Aa | 15 |
| A | 15 |
| BBB/Baa | 32 |
| BB/Ba | 5 |
| B | 4 |
| CCC/Caa | 3 |
| Not Rated2 | 23 |
1 Using the higher of S&P’s or Moody’s ratings.
2 The investment advisor has deemed certain of these non-rated securities to be
of investment grade quality. As of December 31, 2010, the market value of these
securities was $10,898,073 representing 7% of the Fund’s long-term investments.
10 SEMI-ANNUAL REPORT DECEMBER 31, 2010
BlackRock High Yield Municipal Fund
Total Return Based on a $10,000 Investment
![]()
1 Assuming maximum sales charge, transaction costs and other operating expenses, including advisory fees, if any. Institutional Shares do not have a sales charge.
2 The Fund invests primarily in municipal bonds rated in any rating category or in unrated municipal bonds.
3 The S&P/Investortools Main Municipal Bond Index is composed of bonds held by managed municipal bond fund customers of Standard & Poor’s Securities Pricing,
Inc. that are priced daily. Bonds in the S&P/Investortools Main Municipal Bond Index must have an outstanding par value of at least $2 million and a remaining
maturity of not less than 1 month.
4 The S&P/Investortools Customized High Yield Municipal Bond Index is a blended subset of the S&P/Investortools Main Municipal Bond Index that includes non-
insured bonds rated below BBB– or non-rated (85%) and bonds rated BBB (15%), excluding those that are in default, are pre-refunded, or are escrowed to maturity.
5 Commencement of Operations.
Performance Summary for the Period Ended December 31, 2010
| Average Annual Total Returns6 | ||||||
| 1 Year | Since Inception7 | |||||
| Standardized | 6-Month | w/o sales | w/sales | w/o sales | w/sales | |
| 30-Day Yields | Total Returns | charge | charge | charge | charge | |
| Institutional | 5.93% | (0.71)% | 5.60% | N/A | 0.84% | N/A |
| Investor A | 5.33 | (0.96) | 5.19 | 0.72% | 0.53 | (0.46)% |
| Investor C | 4.92 | (1.23) | 4.37 | 3.37 | (0.17) | (0.17) |
| S&P/Investortools Main Municipal Bond Index | — | (0.85) | 2.45 | N/A | 3.92 | N/A |
| S&P/Investortools Customized High Yield Municipal Bond Index | — | (0.15) | 6.68 | N/A | 1.51 | N/A |
6 Assuming maximum sales charges, if any. Average annual total returns with and without sales charges reflect reductions for distribution and service fees. See “About Fund
Performance” on page 14 for a detailed description of share classes, including any related sales charges and fees.
7 The Portfolio commenced operations on 8/01/06.
N/A — Not applicable as share class and index do not have a sales charge.
Past performance is not indicative of future results.
Expense Example
| Actual | Hypothetical10 | ||||||||
| Expenses Paid | Including Interest Expense | Excluding Interest Expense | |||||||
| During the Period | and Fees | and Fees | |||||||
| Ending | Including | Excluding | Ending | Ending | |||||
| Beginning | Account Value | Interest | Interest | Beginning | Account Value | Expenses | Account Value | Expenses | |
| Account Value December 31, | Expense | Expense | Account Value | December 31, Paid During | December 31, | Paid During | |||
| July 1, 2010 | 2010 | and Fees8 | and Fees9 | July 1, 2010 | 2010 | the Period8 | 2010 | the Period9 | |
| Institutional | $1,000.00 | $992.90 | $3.82 | $3.57 | $1,000.00 | $1,021.37 | $3.87 | $1,021.62 | $3.62 |
| Investor A | $1,000.00 | $990.40 | $5.17 | $4.92 | $1,000.00 | $1,020.01 | $5.24 | $1,020.26 | $4.99 |
| Investor C | $1,000.00 | $987.70 | $9.02 | $8.77 | $1,000.00 | $1,016.13 | $9.15 | $1,016.18 | $8.89 |
8 For each class of the Fund, expenses are equal to the annualized expense ratio for the class (0.76% for Institutional, 1.03% for Investor A, and 1.80% for Investor C), multiplied by
the average account value over the period, multiplied by 184/365 (to reflect the one-half year period shown).
9 For each class of the Fund, expenses are equal to the annualized expense ratio for the class (0.71% for Institutional, 0.98% for Investor A, and 1.75% for Investor C), multiplied by
the average account value over the period, multiplied by 184/365 (to reflect the one-half year period shown).
10 Hypothetical 5% annual return before expenses is calculated by pro rating the number of days in the most recent fiscal half-year divided by 365.
See “Disclosure of Expenses” on page 15 for further information on how expenses were calculated.
SEMI-ANNUAL REPORT DECEMBER 31, 2010 11
Fund Summary as of December 31, 2010 BlackRock New York Municipal Bond Fund
Portfolio Management Commentary
How did the Fund perform?
•For the six-month period ended December 31, 2010, BlackRock New York
Municipal Bond Fund (the “Fund”) underperformed its primary benchmark,
the S&P/Investortools Main Municipal Bond Index, and its secondary
benchmark, the S&P/Investortools New York Municipal Bond Index. The
following discussion of relative performance pertains to the Portfolio’s sec-
ondary benchmark, the S&P/Investortools New York Municipal Bond Index.
What factors influenced performance?
•As the municipal market rallied in the first half of the reporting period and
yields fell, the Fund’s above-market duration stance and its emphasis on
longer-dated securities were beneficial to performance. Unfortunately, these
same factors detracted in the second half as municipal yields rose and the
yield curve steepened. All told, the Fund gave back more than it had gained
early on, and both factors detracted over the six-month period. In addition,
the Fund’s exposure to higher-quality bonds hurt performance as those
bonds underperformed the broad municipal market. Finally, the Fund’s
exposure to zero-coupon bonds hurt performance, as those bonds exper-
ienced greater declines than the broad municipal market during the last
two months of the period.
•Fund performance benefited during the period from notable exposure to
lower-quality bonds, which outperformed the market as credit spreads
tightened. We also took advantage of opportunities to add economically
sensitive industrial development bonds to the Fund, and these bonds
outperformed the general municipal market. Finally, the Fund’s total
return benefited from an above-average distribution yield.
Describe recent portfolio activity.
•The municipal market began the period with a strong supply-and-demand
technical profile amid an overall low-interest-rate environment. However,
during the fourth quarter, the municipal market was hit by a “perfect storm”
of rising inflation fears, rising US Treasury yields, systemic credit concerns,
heavy shareholder redemptions, year-end liquidity fears and the possibility
(ultimately realized) of the demise of the Build America Bonds (BAB)
Program. The Fund bought more than it sold over the period, on balance
adding bonds with above-average yields and slightly longer maturities. With
much of the longer-dated new-issue bonds coming as taxable BABs, Fund
purchases tended to be secondary trades and additions to existing posi-
tions. The Fund took advantage of the limited New York new-issue supply to
reduce its exposure in several lower-quality and long duration holdings with
poor risk/reward valuations. Whenever possible, we will continue to add
new credits in order to maintain the benefits of diversification. Also, we pre-
ferred adding economically sensitive and higher yielding credits in order to
benefit from further tightening in credit spreads and improvement in the
economy. However, as the end of 2010 approached and municipal market
volatility increased, the Fund sold out of some of the higher-quality and
shorter duration bonds that had held their value. These sales allowed the
Fund to have ample cash reserves through the end of the period.
Describe Fund positioning at period end.
•The Fund ended the period with a longer duration relative to the
S&P/Investortools New York Municipal Bond Index, and with a cash
reserve position below 5% of total assets.
The views expressed reflect the opinions of BlackRock as of the date of this report and
are subject to change based on changes in market, economic or other conditions. These
views are not intended to be a forecast of future events and are no guarantee of future results.
Portfolio Information
| Percent of | |
| Sector Allocations | Long-Term Investments |
| County/City/Special District/School District | 20% |
| Health | 15 |
| Education | 14 |
| Transportation | 13 |
| Corporate | 12 |
| State | 8 |
| Housing | 8 |
| Utilities | 7 |
| Tobacco | 3 |
| Percent of | |
| Credit Quality Allocations1 | Long-Term Investments |
| AAA/Aaa | 4% |
| AA/Aa | 30 |
| A | 34 |
| BBB/Baa | 14 |
| BB/Ba | 5 |
| B | 1 |
| CCC/Caa | 2 |
| Not Rated2 | 10 |
1 Using the higher of S&P’s or Moody’s ratings.
2 The investment advisor has deemed certain of these non-rated securities to be
of investment grade quality. As of December 31, 2010, the market value of these
securities was $8,685,327 representing 3% of the Fund’s long-term investments.
12 SEMI-ANNUAL REPORT DECEMBER 31, 2010
BlackRock New York Municipal Bond Fund
Total Return Based on a $10,000 Investment
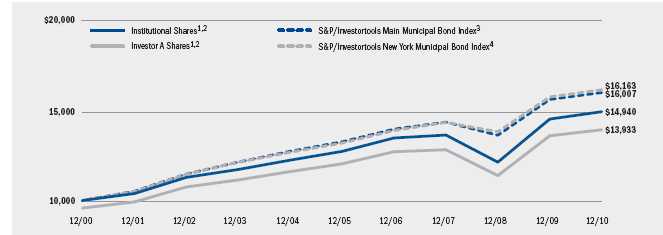
1 Assuming maximum sales charge, transaction costs and other operating expenses, including advisory fees, if any. Institutional Shares do not have a sales charge.
2 The Fund invests primarily in a portfolio of investment grade New York municipal bonds. The Fund expects to maintain an average weighted maturity of greater than
ten years.
3 The S&P/Investortools Main Municipal Bond Index is composed of bonds held by managed municipal bond fund customers of Standard & Poor’s Securities Pricing,
Inc. that are priced daily. Bonds in the S&P/Investortools Main Municipal Bond Index must have an outstanding par value of at least $2 million and a remaining
maturity of not less than 1 month.
4 The S&P/Investortools New York Municipal Bond Index includes all New York bonds in the S&P/Investortools Main Municipal Bond Index.
Performance Summary for the Period Ended December 31, 2010
| Average Annual Total Returns5 | ||||||||
| 1 Year | 5 Years | 10 Years | ||||||
| Standardized | 6-Month | w/o sales | w/sales | w/o sales | w/sales | w/o sales | w/sales | |
| 30-Day Yields | Total Returns | charge | charge | charge | charge | charge | charge | |
| Institutional | 4.44% | (0.98)% | 2.81% | N/A | 3.25% | N/A | 4.10% | N/A |
| Investor A | 3.95 | (1.12) | 2.43 | (1.92)% | 2.96 | 2.07% | 3.82 | 3.37% |
| Investor A1 | 4.15 | (1.03) | 2.59 | (1.51) | 3.14 | 2.30 | 4.00 | 3.57 |
| Investor B | 3.88 | (1.24) | 2.27 | (1.66) | 2.72 | 2.38 | 3.57 | 3.57 |
| Investor C | 3.38 | (1.48) | 1.78 | 0.80 | 2.20 | 2.20 | 3.05 | 3.05 |
| Investor C1 | 3.81 | (1.28) | 2.09 | 1.11 | 2.61 | 2.61 | 3.47 | 3.47 |
| S&P/Investortools Main Municipal Bond Index | — | (0.85) | 2.45 | N/A | 3.83 | N/A | 4.82 | N/A |
| S&P/Investortools New York Municipal Bond Index | — | (0.73) | 2.52 | N/A | 4.14 | N/A | 4.92 | N/A |
5 Assuming maximum sales charges, if any. Average annual total returns with and without sales charges reflect reductions for distribution and service fees. See “About Fund
Performance” on page 14 for a detailed description of share classes, including any related sales charges and fees.
N/A — Not applicable as share class and index do not have a sales charge.
Past performance is not indicative of future results.
Expense Example
| Actual | Hypothetical8 | ||||||||
| Expenses Paid | Including Interest Expense | Excluding Interest Expense | |||||||
| During the Period | and Fees | and Fees | |||||||
| Ending | Including | Excluding | Ending | Ending | |||||
| Beginning | Account Value | Interest | Interest | Beginning | Account Value Expenses | Account Value | Expenses | ||
| Account Value December 31, | Expense | Expense | Account Value | December 31, Paid During | December 31, | Paid During | |||
| July 1, 2010 | 2010 | and Fees6 | and Fees7 | July 1, 2010 | 2010 | the Period6 | 2010 | the Period7 | |
| Institutional | $1,000.00 | $990.20 | $3.61 | $3.56 | $1,000.00 | $1,021.57 | $3.67 | $1,021.62 | $3.62 |
| Investor A | $1,000.00 | $988.80 | $5.06 | $4.96 | $1,000.00 | $1,020.11 | $5.14 | $1,020.21 | $5.04 |
| Investor A1 | $1,000.00 | $989.70 | $4.21 | $4.16 | $1,000.00 | $1,020.97 | $4.28 | $1,021.02 | $4.23 |
| Investor B | $1,000.00 | $987.60 | $6.31 | $6.26 | $1,000.00 | $1,018.85 | $6.41 | $1,018.90 | $6.36 |
| Investor C | $1,000.00 | $985.20 | $8.71 | $8.61 | $1,000.00 | $1,016.43 | $8.84 | $1,016.53 | $8.74 |
| Investor C1 | $1,000.00 | $987.20 | $6.71 | $6.66 | $1,000.00 | $1,018.44 | $6.82 | $1,018.50 | $6.77 |
6 For each class of the Fund, expenses are equal to the annualized expense ratio for the class (0.72% for Institutional, 1.01% for Investor A, 0.84% for Investor A1, 1.26% for Investor B,
1.74% for Investor C and 1.34% for Investor C1), multiplied by the average account value over the period, multiplied by 184/365 (to reflect the one-half year period shown).
7 For each class of the Fund, expenses are equal to the annualized expense ratio for the class (0.71% for Institutional, 0.99% for Investor A, 0.83% for Investor A1, 1.25% for Investor B,
1.72% for Investor C and 1.33% for Investor C1), multiplied by the average account value over the period, multiplied by 184/365 (to reflect the one-half year period shown).
8 Hypothetical 5% annual return before expenses is calculated by pro rating the number of days in the most recent fiscal half-year divided by 365.
See “Disclosure of Expenses” on page 15 for further information on how expenses were calculated.
SEMI-ANNUAL REPORT DECEMBER 31, 2010 13
About Fund Performance
•BlackRock and Institutional Shares (BlackRock Shares are available only
in BlackRock Short-Term Municipal Fund) are not subject to any sales
charge. These shares bear no ongoing distribution or service fees and are
available only to eligible investors. Prior to October 2, 2006, BlackRock
Share performance results are those of the Institutional Shares.
•Investor A Shares incur a maximum initial sales charge (front-end load)
of 4.25% for all Funds except BlackRock Short-Term Municipal Fund which
incurs a 3.00% maximum initial sales charge and all Funds incur a service
fee of 0.25% per year (but no distribution fee). Prior to the Investor A
Shares inception date of October 2, 2006 (for all Funds except BlackRock
High Yield Municipal Fund, BlackRock Municipal Fund and BlackRock
National Municipal Fund), Investor A Share performance results are those
of the Institutional Shares (which have no distribution or service fees)
restated to reflect Investor A Share fees.
•Investor A1 Shares (available only in BlackRock Short-Term Municipal
Fund and BlackRock New York Municipal Bond Fund) incur a maximum
initial sales charge (front-end load) of 1% for BlackRock Short-Term
Municipal Fund and 4% for BlackRock New York Municipal Fund; and
a service fee of 0.10% per year (but no distribution fee).
•Investor B Shares (available to all Funds except BlackRock High Yield
Municipal Fund) are subject to the following maximum contingent deferred
sales charges:
| Maximum Contingent | |
| Deferred Sales Charges | |
| BlackRock Short-Term Municipal Fund | 1%, declining to 0% after 3 years |
| BlackRock Municipal Fund | 4%, declining to 0% after 6 years |
| BlackRock National Municipal Fund | 4%, declining to 0% after 6 years |
| BlackRock New York Municipal Bond Fund | 4%, declining to 0% after 6 years |
In addition, these shares are subject to distribution and service fees per
year as follows:
| Distribution | Service | |
| Fee | Fee | |
| BlackRock Short-Term Municipal Fund | 0.20% | 0.15% |
| BlackRock Municipal Fund | 0.50% | 0.25% |
| BlackRock National Municipal Fund | 0.50% | 0.25% |
| BlackRock New York Municipal Bond Fund | 0.25% | 0.25% |
For BlackRock Short-Term Municipal Fund and BlackRock New York
Municipal Bond Fund, the shares automatically convert to Investor A1
Shares after approximately 10 years. For BlackRock Municipal Fund and
BlackRock National Municipal Fund, the shares automatically convert to
Investor A Shares after approximately 10 years. (There is no initial sales
charge for automatic sales conversions.)
•Investor C Shares are subject to a 1.00% contingent deferred sales
charge if redeemed within one year of purchase. In addition, these shares
are subject to a distribution fee of 0.75% per year and a service fee of
0.25% per year. Prior to the Investor C Shares inception date of October 2,
2006 (for all Funds except BlackRock High Yield Municipal Fund), Investor
C Share performance results are those of Institutional Shares (which have
no distribution or service fees) restated to reflect Investor C Share fees.
•Investor C1 Shares (available to all Funds except BlackRock High Yield
Municipal Fund and BlackRock Short-Term Municipal Fund) are subject
to a 1.00% contingent deferred sales charge if redeemed within one year
of purchase.
In addition, these shares are subject to distribution and service fees per
year as follows:
| Distribution | Service | |
| Fee | Fee | |
| BlackRock Municipal Fund | 0.55% | 0.25% |
| BlackRock National Municipal Fund | 0.55% | 0.25% |
| BlackRock New York Municipal Bond Fund | 0.35% | 0.25% |
Investor A1, Investor B and Investor C1 Shares of each Fund are only
available through exchanges and dividend reinvestments by existing share-
holders or for purchase by certain qualified employee benefit plans.
Performance information reflects past performance and does not guarantee
future results. Current performance may be lower or higher than the per-
formance data quoted. Refer to www.blackrock.com/funds to obtain per-
formance data current to the most recent month-end. Performance results
do not reflect the deduction of taxes that a shareholder would pay on fund
distributions or the redemption of fund shares. Figures shown in each of
the performance tables on the previous pages assume reinvestment of all
dividends and capital gain distributions, if any, at net asset value on the
payable date.
The Funds’ investment advisor reimbursed a portion of each Fund’s
expenses. Without such reimbursement, a Fund’s performance would have
been lower. Investment return and principal value of shares will fluctuate
so that shares, when redeemed, may be worth more or less than their origi-
nal cost. Dividends paid to each class of shares will vary because of the
different levels of service, distribution and transfer agency fees applicable
to each class, which are deducted from the income available to be paid
to shareholders.
14 SEMI-ANNUAL REPORT DECEMBER 31, 2010
Disclosure of Expenses
Shareholders of these Funds may incur the following charges: (a) expenses
related to transactions, including sales charges, redemption fees and
exchange fees; and (b) operating expenses including advisory fees, service
and distribution fees including 12b-1 fees, and other Fund expenses.
The expense examples on the previous pages (which are based on a
hypothetical investment of $1,000 invested on July 1, 2010 and held
through December 31, 2010) are intended to assist shareholders both in
calculating expenses based on an investment in a Fund and in comparing
these expenses with similar costs of investing in other mutual funds.
The tables provide information about actual account values and actual
expenses. In order to estimate the expenses a shareholder paid during the
period covered by this report, shareholders can divide their account value by
$1,000 and then multiply the result by the number corresponding to their
Fund and share class under the headings entitled “Expenses Paid During the
Period.”
The tables also provide information about hypothetical account values and
hypothetical expenses based on a Fund’s actual expense ratio and an
assumed rate of return of 5% per year before expenses. In order to assist
shareholders in comparing the ongoing expenses of investing in these
Funds and other funds, compare the 5% hypothetical example with the 5%
hypothetical examples that appear in other funds’ shareholder reports.
The expenses shown in the tables are intended to highlight shareholders’
ongoing costs only and do not reflect any transactional expenses, such as
sales charges, redemption fees or exchange fees. Therefore, the hypotheti-
cal examples are useful in comparing ongoing expenses only, and will not
help shareholders determine the relative total expenses of owning different
funds. If these transactional expenses were included, shareholder expenses
would have been higher.
SEMI-ANNUAL REPORT DECEMBER 31, 2010 15
The Benefits and Risks of Leveraging
The Funds may utilize leverage to seek to enhance the yield and net asset
value (“NAV”). However, these objectives cannot be achieved in all interest
rate environments.
The Funds may leverage their assets through the use of tender option bond
(“TOB”) programs, as described in Note 1 of the Notes to Financial
Statements. TOB investments generally will provide the Funds with eco-
nomic benefits in periods of declining short-term interest rates, but
expose the Funds to risks during periods of rising short-term interest rates.
Additionally, fluctuations in the market value of municipal bonds deposited
into the TOB trust may adversely affect each Fund’s NAVs per share.
In general, the concept of leveraging is based on the premise that the
financing cost of assets to be obtained from leverage will be based on
short-term interest rates, which normally will be lower than the income
earned by each Fund on its longer-term portfolio investments. To the extent
that the total assets of each Fund (including the assets obtained from
leverage) are invested in higher-yielding portfolio investments, each Fund
will benefit from the incremental net income.
Furthermore, the value of the Funds’ investments generally varies inversely
with the direction of long-term interest rates, although other factors can
influence the value of portfolio investments. As a result, changes in interest
rates can influence the Funds’ NAV positively or negatively in addition to
the impact on the Funds’ performance from leverage.
The use of leverage may enhance opportunities for increased income to
the Funds, but as described above, it also creates risks as short- or long-
term interest rates fluctuate. Leverage also will generally cause greater
changes in a Fund’s NAV and dividend rate than a comparable portfolio
without leverage. If the income derived from securities purchased with
assets received from leverage exceeds the cost of leverage, the Fund’s net
income will be greater than if leverage had not been used. Conversely, if the
income from the securities purchased is not sufficient to cover the cost of
leverage, the Fund’s net income will be less than if leverage had not been
used, and therefore the amount available for distribution to shareholders
will be reduced. A Fund may be required to sell portfolio securities at inop-
portune times or at distressed values in order to comply with regulatory
requirements applicable to the use of leverage or as required by the terms
of leverage instruments, which may cause a Fund to incur losses. The use
of leverage may limit a Fund’s ability to invest in certain types of securities
or use certain types of hedging strategies. A Fund will incur expenses in
connection with the use of leverage and may reduce investment returns.
Derivative Financial Instruments
The Funds may invest in various derivative instruments, including financial
futures contracts, as specified in Note 2 of the Notes to Financial State-
ments, which may constitute forms of economic leverage. Such instruments
are used to obtain exposure to a market without owning or taking physical
custody of securities or to hedge market and/or interest rate risks. Such
derivative instruments involve risks, including the imperfect correlation
between the value of a derivative instrument and the underlying asset,
possible default of the counterparty to the transaction or illiquidity of
the derivative instrument. A Fund’s ability to successfully use a derivative
instrument depends on the investment advisor’s ability to accurately predict
pertinent market movements, which cannot be assured. The use of deriva-
tive instruments may result in losses greater than if they had not been
used, may require a Fund to sell or purchase portfolio investments
at inopportune times or for distressed values, may limit the amount of
appreciation a Fund can realize on an investment, may result in lower
dividends paid to shareholders or may cause a Fund to hold an investment
that it might otherwise sell. The Funds’ investments in these instruments are
discussed in detail in the Notes to Financial Statements.
16 SEMI-ANNUAL REPORT DECEMBER 31, 2010
Schedule of Investments December 31, 2010 (Unaudited) BlackRock Short-Term Municipal Fund
(Percentages shown are based on Net Assets)
| Par | ||
| Municipal Bonds | (000) | Value |
| Arizona — 1.1% | ||
| Arizona State Transportation Board, RB, Maricopa County | ||
| Regional Area Road, 5.00%, 7/01/12 | $ 3,250 | $ 3,456,667 |
| Salt River Project Agricultural Improvement & Power | ||
| District, Refunding RB, Salt River Project, Series A, | ||
| 5.00%, 1/01/12 | 3,160 | 3,299,704 |
| Yavapai County IDA, RB, Waste Management Inc. | ||
| Project, Series A, Mandatory Put Bonds, AMT, | ||
| 2.88%, 3/01/28 (a) | 5,000 | 4,947,450 |
| 11,703,821 | ||
| California — 9.4% | ||
| California Infrastructure & Economic Development Bank, | ||
| Refunding RB, J. Paul, Series A-4, Mandatory Put Bonds, | ||
| 1.65%, 10/01/47 (a) | 5,500 | 5,516,335 |
| California Municipal Finance Authority, RB, Waste | ||
| Management Inc. Project, Series A, Mandatory Put | ||
| Bonds, 1.63%, 2/01/19 (a) | 7,000 | 6,999,230 |
| California Pollution Control Financing Authority, | ||
| Refunding RB, USA Waste Services Inc., Series A, | ||
| Mandatory Put Bonds, AMT, 2.00%, 6/01/11 (a) | 13,520 | 13,493,906 |
| California State Department of Water Resources, | ||
| Refunding RB: | ||
| Series L, 5.00%, 5/01/12 | 10,000 | 10,543,600 |
| Series M, 3.00%, 5/01/13 | 3,095 | 3,213,910 |
| Series M, 5.00%, 5/01/14 | 35,000 | 38,639,300 |
| California Statewide Communities Development Authority, | ||
| RB, Kaiser Permanente, Series A: | ||
| 5.00%, 4/01/13 | 5,000 | 5,296,450 |
| 5.00%, 4/01/14 | 1,000 | 1,073,320 |
| City & County of San Francisco California, GO, Refunding, | ||
| Series 2008-R1, 5.00%, 6/15/11 | 5,000 | 5,106,050 |
| City of Long Beach California, Refunding RB, Series B, | ||
| AMT (NPFGC), 5.50%, 5/15/14 | 5,215 | 5,752,301 |
| State of California, GO: | ||
| 5.25%, 4/01/12 (b) | 4,845 | 5,124,460 |
| Various Purpose, 5.00%, 3/01/12 | 2,420 | 2,524,278 |
| 103,283,140 | ||
| Colorado — 1.2% | ||
| Adams Country Colorado School District #12, GO, | ||
| Refunding, Series A (AGM), 5.00%, 12/15/11 | 4,190 | 4,372,056 |
| City & County of Denver Colorado, Refunding RB, | ||
| Series B (NPFGC), 5.50%, 11/15/14 | 3,500 | 3,621,520 |
| Colorado Health Facilities Authority, Refunding RB, | ||
| Catholic Healthcare, Series B, Mandatory Put Bonds, | ||
| 5.00%, 7/01/39 (a) | 5,000 | 5,332,150 |
| 13,325,726 |
| Par | |||
| Municipal Bonds | (000) | Value | |
| Connecticut — 3.8% | |||
| Connecticut Municipal Electric Energy Cooperative, | |||
| Refunding RB, Series A (AGC), 5.00%, 1/01/14 | $ 2,115 | $ 2,330,053 | |
| Connecticut State Development Authority, RB, Connecticut | |||
| Light & Power, Series A, Mandatory Put Bonds, AMT, | |||
| 1.40%, 4/01/10 (a) | 7,600 | 7,599,848 | |
| State of Connecticut, GO: | |||
| BAN, Series B, 4.00%, 6/01/11 | 2,385 | 2,421,252 | |
| Economic Recovery, Series A, 5.00%, 1/01/13 | 11,500 | 12,446,795 | |
| Economic Recovery, Series A, 5.00%, 1/01/14 | 7,280 | 8,070,026 | |
| State of Connecticut, RB, Transportation Infrastructure, | |||
| Series A, 5.00%, 11/01/14 | 2,700 | 3,022,083 | |
| State of Connecticut, Special Tax Bonds, Transportation | |||
| Infrastructure, Series A, 5.00%, 11/01/13 | 5,000 | 5,504,950 | |
| 41,395,007 | |||
| Delaware — 1.1% | |||
| State of Delaware, GO, Refunding, Series 2009C, | |||
| 5.00%, 10/01/13 | 7,700 | 8,547,693 | |
| University of Delaware, RB, Series A, Mandatory | |||
| Put Bonds, 2.00%, 11/01/37 (a) | 4,000 | 4,016,840 | |
| 12,564,533 | |||
| District of Columbia — 0.5% | |||
| Metropolitan Washington Airports Authority, RB, Series A, | |||
| AMT (NPFGC), 5.25%, 10/01/13 | 5,000 | 5,453,600 | |
| Florida — 4.2% | |||
| County of Escambia Florida, Refunding RB, Gulf Power Co. | |||
| Project, First Series, Mandatory Put Bonds, | |||
| 2.00%, 4/01/39 (a) | 9,000 | 9,040,860 | |
| Florida State Board of Education, GO, Refunding, | |||
| Public Education: | |||
| Series C, 5.00%, 6/01/12 | 5,000 | 5,295,800 | |
| Series G (NPFGC), 5.25%, 6/01/11 | 5,600 | 5,711,216 | |
| Florida State Department of Environmental Protection, | |||
| RB, Florida Forever, Series A, 5.00%, 7/01/13 | 4,675 | 5,055,358 | |
| Florida State Department of Environmental Protection, | |||
| Refunding RB, Series C, 4.00%, 7/01/12 | 8,500 | 8,874,255 | |
| Florida State Department of Transportation, Refunding RB, | |||
| Department of Transportation, Series A, 5.00%, 7/01/12 | 4,575 | 4,863,774 | |
| Jacksonville Electric Authority Florida, RB, Issue Three, | |||
| Series One, 4.00%, 10/01/11 | 2,320 | 2,380,598 | |
| Jacksonville Electric Authority Florida, Refunding RB, | |||
| Issue Two, 17th Series, 5.25%, 10/01/12 | 5,000 | 5,166,150 | |
| 46,388,011 | |||
Portfolio Abbreviations
| To simplify the listings of portfolio holdings in the | CIFG | CDC IXIS Financial Guaranty | IDRB | Industrial Development Revenue Bonds | |
| Schedules of Investments, the names and descriptions of | COP | Certificates of Participation | ISD | Independent School District | |
| many of the securities have been abbreviated according to | EDA | Economic Development Authority | LRB | Lease Revenue Bonds | |
| the following list: | EDC | Economic Development Corp. | M/F | Multi-Family | |
| ERB | Education Revenue Bond | MRB | Mortgage Revenue Bonds | ||
| ACA | ACA Financial Guaranty Corp. | ERS | Extendible Reset Securities | NPFGC | National Public Finance Guarantee Corp. |
| AGC | Assured Guaranty Corp. | FGIC | Financial Guaranty Insurance Co. | PCRB | Pollution Control Revenue Bonds |
| AGM | Assured Guaranty Municipal Corp. | FHA | Federal Housing Administration | PILOT | Payment in Lieu of Taxes |
| AMBAC | American Municipal Bond Assurance Corp. | GO | General Obligation Bonds | RB | Revenue Bonds |
| AMT | Alternative Minimum Tax (subject to) | HDA | Housing Development Agency | S/F | Single-Family |
| ARB | Airport Revenue Bonds | HFA | Housing Finance Agency | SAN | State Aid Notes |
| BAN | Bond Anticipation Notes | HRB | Housing Revenue Bonds | SONYMA | State of New York Mortgage Agency |
| BHAC | Berkshire Hathaway Assurance Corp. | IDA | Industrial Development Authority | TIF | Tax Increment Financing |
| CAB | Capital Appreciation Bonds | IDB | Industrial Development Board | VRDN | Variable Rate Demand Notes |
See Notes to Financial Statements.
SEMI-ANNUAL REPORT DECEMBER 31, 2010 17
Schedule of Investments (continued) BlackRock Short-Term Municipal Fund
(Percentages shown are based on Net Assets)
| Par | |||
| Municipal Bonds | (000) | Value | |
| Georgia — 2.5% | |||
| Burke County Development Authority, Refunding RB, | |||
| Georgia Power Co. Plant Vogtle Project, Mandatory | |||
| Put Bonds, 5.05%, 11/01/48 (a) | $ 6,000 | $ 6,223,920 | |
| Henry County School District, GO, Series A, | |||
| 5.00%, 4/01/11 | 5,600 | 5,665,688 | |
| Private Colleges & Universities Authority, Refunding RB, | |||
| Emory University, Series A, 5.25%, 9/01/11 | 10,280 | 10,613,175 | |
| State of Georgia, GO, Series G, 4.00%, 11/01/11 | 5,000 | 5,151,400 | |
| 27,654,183 | |||
| Hawaii — 0.4% | |||
| State of Hawaii, Refunding RB, Series B, AMT, | |||
| 5.00%, 7/01/13 | 4,000 | 4,301,960 | |
| Illinois — 1.1% | |||
| Illinois Finance Authority, RB, University of Chicago, | |||
| Series B, 5.00%, 7/01/13 | 2,000 | 2,193,380 | |
| Illinois Finance Authority, Refunding RB, University of | |||
| Chicago, Series A, 5.25%, 7/01/11 (b) | 5,000 | 5,172,950 | |
| Railsplitter Tobacco Settlement Authority, RB, | |||
| 4.00%, 6/01/13 | 5,100 | 5,261,262 | |
| 12,627,592 | |||
| Indiana — 0.5% | |||
| Indiana Finance Authority, RB, Ascension Health Credit | |||
| Group, Mandatory Put Bonds (a): | |||
| Series A1, 3.63%, 11/15/36 | 4,135 | 4,211,332 | |
| Series A3, 5.00%, 11/01/27 | 1,000 | 1,022,490 | |
| 5,233,822 | |||
| Iowa — 0.3% | |||
| Iowa Higher Education Loan Authority, RB, Private | |||
| College Facility: | |||
| 4.00%, 12/01/12 | 1,500 | 1,592,445 | |
| 4.00%, 12/01/13 | 1,150 | 1,244,358 | |
| 2,836,803 | |||
| Kansas — 0.5% | |||
| Kansas State Department of Transportation, Refunding RB, | |||
| Series A, 5.00%, 9/01/12 | 5,000 | 5,361,300 | |
| Kentucky — 0.4% | |||
| Kentucky Economic Development Finance Authority, | |||
| Refunding RB, Baptist Healthcare System, Series A, | |||
| 5.00%, 8/15/12 | 2,650 | 2,799,937 | |
| Kentucky State Property & Buildings Commission, | |||
| Refunding RB, Project No. 87 (NPFGC), 5.00%, 3/01/12 | 2,000 | 2,096,520 | |
| 4,896,457 | |||
| Louisiana — 2.6% | |||
| Louisiana Offshore Terminal Authority, RB, Loop LLC | |||
| Project, Series B-1, Mandatory Put Bonds, | |||
| 1.88%, 10/01/40 (a) | 3,250 | 3,210,350 | |
| State of Louisiana, GO, Refunding: | |||
| Series A (NPFGC), 5.00%, 8/1/14 | 12,000 | 13,449,960 | |
| Series B, 5.00%, 4/15/12 | 4,220 | 4,456,024 | |
| State of Louisiana, GO, Series A, 5.00%, 5/01/13 | 7,075 | 7,718,613 | |
| 28,834,947 | |||
| Maine — 0.7% | |||
| Maine Municipal Bond Bank, RB, Series D, | |||
| 5.00%, 11/01/12 | 1,460 | 1,574,990 | |
| Maine Municipal Bond Bank, Refunding RB, Series F, | |||
| 4.00%, 11/01/11 | 6,000 | 6,180,360 | |
| 7,755,350 | |||
| Par | ||
| Municipal Bonds | (000) | Value |
| Maryland — 1.9% | ||
| County of Baltimore Maryland, GO, Refunding, | ||
| Metropolitan District, 4.00%, 8/01/11 | $ 2,525 | $ 2,579,893 |
| State of Maryland, GO, Refunding, State and Local | ||
| Facilities Loan, First Series B, 5.25%, 2/15/12 | 8,980 | 9,461,687 |
| State of Maryland, GO, State & Local Facilities Loan, | ||
| 2nd Series, 5.00%, 7/15/11 | 3,815 | 3,911,291 |
| University System of Maryland, Refunding RB, Auxiliary | ||
| Facility & Tuition, Series C, 4.00%, 10/01/11 | 4,695 | 4,822,516 |
| 20,775,387 | ||
| Massachusetts — 4.1% | ||
| Commonwealth of Massachusetts, GO, Consolidated Loan, | ||
| Series A, 5.00%, 8/01/12 | 1,180 | 1,259,851 |
| Commonwealth of Massachusetts, GO, Refunding, | ||
| Consolidated Loan, Series D (NPFGC): | ||
| 5.50%, 11/01/12 | 4,235 | 4,601,370 |
| 6.00%, 11/01/13 | 5,000 | 5,660,350 |
| Massachusetts Bay Transportation Authority, Refunding RB, | ||
| General Transportation System, Series A (FGIC), | ||
| 5.80%, 3/01/12 | 3,745 | 3,973,557 |
| Massachusetts Health & Educational Facilities | ||
| Authority, Refunding RB, Partners Health, Series C, | ||
| 5.75%, 7/01/11 (b) | 7,600 | 7,880,744 |
| Massachusetts State Department of Transportation, | ||
| Refunding RB, Senior Series B, 5.00%, 1/01/14 | 12,155 | 13,252,475 |
| University of Massachusetts Building Authority, RB, | ||
| Senior Series 1, 5.00%, 11/01/13 | 7,555 | 8,364,745 |
| 44,993,092 | ||
| Michigan — 0.9% | ||
| City of Detroit Michigan, RB, Second Lien, Series B | ||
| (FGIC), 5.50%, 7/01/11 (b) | 5,000 | 5,178,450 |
| Michigan Municipal Bond Authority, Refunding RB, SAN, | ||
| Series B, 5.00%, 3/21/11 | 5,000 | 5,038,600 |
| 10,217,050 | ||
| Minnesota — 2.7% | ||
| State of Minnesota, GO: | ||
| 5.00%, 8/01/11 (c) | 3,675 | 3,774,409 |
| Highway & Various Purpose, 5.00%, 8/01/11 | 2,900 | 2,979,083 |
| State of Minnesota, GO, Refunding, State Various | ||
| Purpose, Series D, 5.00%, 8/01/14 | 6,000 | 6,774,300 |
| State of Minnesota, GO, Series H, 5.00%, 11/01/12 | 15,000 | 16,191,750 |
| 29,719,542 | ||
| Missouri — 1.3% | ||
| County of Jackson Missouri, RB, Harry S. Truman Sports | ||
| Complex (AMBAC), 5.00%, 12/01/12 | 2,000 | 2,142,960 |
| Missouri State Health & Educational Facilities Authority, | ||
| RB, Ascension Health Senior Credit, Series C-4, | ||
| Mandatory Put Bonds, 1.25%, 11/15/26 (a) | 12,000 | 12,060,480 |
| 14,203,440 | ||
| Nebraska — 0.3% | ||
| Nebraska Public Power District, Refunding RB, General, | ||
| Series B-1 (NPFGC), 5.00%, 1/01/14 | 3,000 | 3,293,910 |
| Nevada — 1.4% | ||
| Clark County School District, GO, Limited Tax, Building, | ||
| Series C, 5.00%, 6/15/13 | 6,305 | 6,879,133 |
| Clark County School District, GO, Refunding, Series B | ||
| (NPFGC), 5.00%, 6/15/12 | 6,000 | 6,366,540 |
| Truckee Meadows Water Authority, RB, Series A (AGM), | ||
| 5.13%, 7/01/11 (b) | 2,590 | 2,652,134 |
| 15,897,807 |
See Notes to Financial Statements.
18 SEMI-ANNUAL REPORT DECEMBER 31, 2010
Schedule of Investments (continued) BlackRock Short-Term Municipal Fund
(Percentages shown are based on Net Assets)
| Par | |||
| Municipal Bonds | (000) | Value | |
| New Hampshire — 0.1% | |||
| State of New Hampshire, GO, Refunding, Capital | |||
| Improvement, Series B, 4.00%, 3/01/12 | $ 1,000 | $ 1,041,070 | |
| New Jersey — 5.4% | |||
| County of Essex New Jersey, GO, Improvement, Series A, | |||
| 5.00%, 8/01/13 | 2,290 | 2,502,398 | |
| Gloucester County Improvement Authority, Refunding RB, | |||
| Waste Management Inc. Project, Series A, Mandatory | |||
| Put Bonds, 2.63%, 12/01/29 (a) | 4,625 | 4,600,487 | |
| New Jersey State Housing & Mortgage Finance Agency, | |||
| RB, Series B (AGM), 1.15%, 11/01/12 | 6,800 | 6,788,304 | |
| New Jersey Transportation Trust Fund Authority, RB, | |||
| Transportation System, Series A, 5.75%, 6/15/11 (c) | 3,000 | 3,073,710 | |
| New Jersey Transportation Trust Fund Authority, | |||
| Refunding RB, Transportation System, Series B | |||
| (NPFGC), 5.25%, 12/15/12 | 4,990 | 5,350,577 | |
| Salem County Utilities Authority, Refunding RB, Public | |||
| Service Electric and Gas Co., Series A, Mandatory | |||
| Put Bonds, 0.95%, 5/01/28 (a) | 13,000 | 12,983,100 | |
| State of New Jersey, GO, Refunding: | |||
| 4.00%, 8/01/12 | 7,115 | 7,468,687 | |
| Series Q, 4.00%, 8/15/13 | 15,000 | 16,071,600 | |
| 58,838,863 | |||
| New Mexico — 1.2% | |||
| New Mexico Finance Authority, Refunding RB, Senior Lien, | |||
| Series A: | |||
| 5.00%, 6/15/11 | 4,000 | 4,085,200 | |
| 5.00%, 6/15/13 | 8,000 | 8,774,640 | |
| 12,859,840 | |||
| New York — 12.9% | |||
| City of New York New York, GO, Refunding: | |||
| Series B, 5.25%, 8/01/11 | 4,000 | 4,111,920 | |
| Series B, 5.00%, 8/01/13 | 22,750 | 24,878,945 | |
| Series B (NPFGC), 5.75%, 8/01/13 | 3,050 | 3,257,309 | |
| Series C, 5.00%, 8/01/13 | 8,225 | 8,994,695 | |
| Series D, 5.00%, 2/01/13 | 2,000 | 2,153,860 | |
| Series H, 5.00%, 8/01/12 | 3,400 | 3,622,700 | |
| Long Island Power Authority, Refunding RB, General, | |||
| Series A (AMBAC), 5.50%, 12/01/11 | 1,730 | 1,806,189 | |
| Metropolitan Transportation Authority, RB, Transportation, | |||
| Series B, Mandatory Put Bonds, 5.00%, 11/15/16 (a) | 4,000 | 4,129,960 | |
| New York City Transitional Finance Authority, RB, Series C, | |||
| 5.50%, 2/15/12 | 6,000 | 6,326,520 | |
| New York City Transitional Finance Authority, Refunding RB, | |||
| Future Tax Secured, Sub-Series D-2, 5.00%, 11/01/12 | 20,315 | 21,894,085 | |
| New York State Dormitory Authority, RB, General Purpose, | |||
| Series E, 5.00%, 2/15/13 | 5,865 | 6,355,725 | |
| New York State Dormitory Authority, Refunding RB: | |||
| Mount Sinai School of Medicine, Series A, | |||
| 5.00%, 7/01/14 | 1,195 | 1,296,025 | |
| State University Educational Facilities, 3rd General | |||
| Resolution, Series B, Mandatory Put Bonds, | |||
| 5.25%, 11/15/23 (a) | 6,000 | 6,274,620 | |
| New York State Energy Research & Development Authority, | |||
| Refunding RB, Consolidated Edison Co. of New York, Inc. | |||
| Project, Mandatory Put Bonds, AMT, 1.45%, 6/01/36 (a) | 5,000 | 4,981,900 | |
| New York State Environmental Facilities Corp., RB, | |||
| Waste Management Inc. Project, Series A, Mandatory | |||
| Put Bonds, 2.50%, 7/01/17 (a) | 5,000 | 4,964,800 | |
| New York State Thruway Authority, RB, BAN: | |||
| 3.00%, 7/15/11 | 2,860 | 2,894,892 | |
| 4.00%, 7/15/11 | 9,000 | 9,177,300 | |
| New York State Thruway Authority, Refunding RB: | |||
| General, Second Series B (NPFGC), 5.00%, 4/01/13 | 5,550 | 6,033,516 | |
| Series A, 5.00%, 4/01/12 | 5,000 | 5,256,750 | |
| Par | ||
| Municipal Bonds | (000) | Value |
| New York (concluded) | ||
| New York State Urban Development Corp., Refunding RB, | ||
| Service Contract, Series A-1, 5.00%, 1/01/13 | $ 7,320 | $ 7,851,505 |
| State of New York, GO, Refunding, Series C, | ||
| 5.00%, 4/15/12 | 5,285 | 5,582,281 |
| 141,845,497 | ||
| North Carolina — 2.6% | ||
| County of Mecklenburg, GO, Refunding, Series C, | ||
| 5.00%, 2/01/13 | 9,400 | 10,220,714 |
| County of Wake North Carolina, GO, Refunding, Series C, | ||
| 5.00%, 3/01/12 | 5,185 | 5,458,198 |
| State of North Carolina, GO, Public Improvement, Series A, | ||
| 5.00%, 3/01/13 | 9,000 | 9,811,890 |
| University of North Carolina at Chapel Hill, RB, Series A: | ||
| 3.00%, 2/01/12 | 1,515 | 1,545,724 |
| 4.00%, 2/01/13 | 1,605 | 1,686,646 |
| 28,723,172 | ||
| Ohio — 3.3% | ||
| Ohio Air Quality Development Authority, Refunding PCRB, | ||
| FirstEnergy, Mandatory Put Bonds (a): | ||
| Series D, 4.75%, 8/01/29 | 10,000 | 10,377,300 |
| 2.25%, 12/01/23 | 5,000 | 4,926,750 |
| Ohio Air Quality Development Authority, Refunding RB, | ||
| Ohio Power Co. Galvin Project, Series A, Mandatory | ||
| Put Bonds, AMT, 2.88%, 12/01/27 (a) | 8,000 | 7,900,000 |
| Ohio State University, Refunding RB, Series A, | ||
| 5.00%, 12/01/12 | 4,000 | 4,293,840 |
| Ohio State Water Development Authority, RB, Water Quality, | ||
| Loan Fund, 5.00%, 12/01/11 | 5,000 | 5,209,600 |
| State of Ohio, GO, Common Schools, Series A, | ||
| 5.00%, 3/15/11 (c) | 3,875 | 3,912,084 |
| 36,619,574 | ||
| Oregon — 0.8% | ||
| City of Portland Oregon, Refunding RB, Second Lien, | ||
| Series A, 5.00%, 3/01/14 | 4,950 | 5,499,648 |
| County of Gilliam Oregon, RB, Waste Management Inc. | ||
| Project, Mandatory Put Bonds, 1.70%, 10/01/18 (a) | 1,000 | 999,850 |
| Oregon State Department of Administrative Services, COP, | ||
| Refunding, Series A (AGM), 5.00%, 5/01/11 | 1,725 | 1,751,582 |
| 8,251,080 | ||
| Pennsylvania — 5.7% | ||
| City of Philadelphia Pennsylvania, Refunding RB, Series A | ||
| (AGM), 5.00%, 6/15/13 | 9,000 | 9,732,960 |
| Commonwealth of Pennsylvania, GO: | ||
| First Series, 5.00%, 3/15/13 | 7,455 | 8,123,341 |
| First, Series A, 5.00%, 2/15/13 | 8,280 | 8,998,373 |
| Commonwealth of Pennsylvania, GO, Refunding: | ||
| 5.00%, 7/15/12 | 2,500 | 2,667,550 |
| Second Series (NPFGC), 5.00%, 7/01/12 | 13,000 | 13,850,850 |
| Pennsylvania Economic Development Financing | ||
| Authority, RB: | ||
| Convention Center Project, Series A, 5.00%, 6/15/12 | 4,000 | 4,227,840 |
| Waste Management Inc. Project, 2.75%, 9/01/13 | 4,250 | 4,212,642 |
| Waste Management Inc. Project, Mandatory | ||
| Put Bonds, 2.63%, 12/01/33 (a) | 3,500 | 3,518,480 |
| Pennsylvania Higher Educational Facilities Authority, RB, | ||
| Series AH, 4.00%, 6/15/11 | 3,650 | 3,708,473 |
| Pennsylvania Intergovernmental Cooperation Authority, | ||
| Special Tax Bonds, Refunding, Philadelphia Funding | ||
| Program, 5.00%, 6/15/13 | 3,085 | 3,364,285 |
| 62,404,794 | ||
| Rhode Island — 0.1% | ||
| State of Rhode Island, GO, Refunding, Consolidated | ||
| Capital Development Loan, Series A, 5.00%, 7/15/11 | 1,000 | 1,024,800 |
See Notes to Financial Statements.
SEMI-ANNUAL REPORT DECEMBER 31, 2010 19
Schedule of Investments (continued) BlackRock Short-Term Municipal Fund
(Percentages shown are based on Net Assets)
| Municipal Bonds | (000) | Value |
| South Carolina — 0.8% | ||
| South Carolina State Public Service Authority, | ||
| Refunding RB, Series A, 5.00%, 1/01/12 | $ 3,000 | $ 3,133,260 |
| State of South Carolina, GO, State Highway, Series B, | ||
| 4.50%, 4/01/12 | 6,000 | 6,119,820 |
| 9,253,080 | ||
| Tennessee — 1.4% | ||
| County of Shelby Tennessee, GO, Refunding, Series A | ||
| (AMBAC), 5.00%, 4/01/12 | 4,000 | 4,223,720 |
| Metropolitan Government of Nashville & Davidson County | ||
| Tennessee, GO, 5.00%, 4/01/12 (b) | 2,000 | 2,107,600 |
| Metropolitan Government of Nashville & Davidson County | ||
| Tennessee, Refunding RB (NPFGC), 5.00%, 1/01/14 | 8,110 | 8,984,988 |
| 15,316,308 | ||
| Texas — 8.1% | ||
| City of Dallas Texas, GO, 5.00%, 2/15/12 | 4,775 | 5,013,511 |
| City of El Paso Texas, Refunding RB, Series A, | ||
| 4.00%, 3/01/14 | 2,000 | 2,152,360 |
| County of Harris Texas, Refunding RB, Toll Road, | ||
| Senior Lien, Series B-1 (NPFGC), 5.00%, 8/15/14 | 1,295 | 1,449,714 |
| Dallas ISD, GO, Refunding, 4.50%, 2/15/12 | 6,000 | 6,257,700 |
| Harris County Cultural Education Facilities Finance Corp., | ||
| Refunding RB, Methodist Hospital System: | ||
| 5.00%, 6/01/12 | 3,450 | 3,634,230 |
| 5.00%, 6/01/13 | 10,000 | 10,812,600 |
| Harris County Health Facilities Development Corp., | ||
| Refunding RB, St. Luke’s Episcopal Hospital, Series A, | ||
| 5.38%, 8/15/11 (b) | 5,500 | 5,672,480 |
| Lower Colorado River Authority, Refunding RB, | ||
| 5.00%, 5/15/13 | 6,000 | 6,513,180 |
| Matagorda County Navigation District No. 1, Refunding RB, | ||
| AEP Texas Central Co. Project, Mandatory Put Bonds, | ||
| 5.13%, 6/01/30 (a) | 5,000 | 5,068,200 |
| North Texas Tollway Authority, RB, System, First Tier, | ||
| Series L-2, Mandatory Put Bonds, 6.00%, 1/01/38 (a) | 3,700 | 4,000,144 |
| State of Texas, GO, Refunding Public Finance Authority: | ||
| 5.00%, 10/01/12 | 11,170 | 12,004,846 |
| Series A, 4.00%, 10/01/11 | 3,750 | 3,851,550 |
| Series A, 5.00%, 10/01/12 | 3,500 | 3,764,145 |
| Texas A&M University, RB, Financing System, Series D, | ||
| 5.00%, 5/15/13 | 3,325 | 3,641,407 |
| Texas A&M University, Refunding RB, Financing System, | ||
| Series B, 5.00%, 5/15/12 | 4,000 | 4,238,560 |
| Texas Public Finance Authority, RB, Unemployment | ||
| Compensation, Series A, 5.00%, 7/01/13 | 10,000 | 10,948,700 |
| 89,023,327 | ||
| Utah — 0.8% | ||
| City of Riverton Utah, RB, IHC Health Services Inc., | ||
| 5.00%, 8/15/13 | 1,400 | 1,524,180 |
| State of Utah, GO, Series C, 3.00%, 7/01/12 | 7,500 | 7,770,675 |
| 9,294,855 | ||
| Virginia — 6.1% | ||
| County of Fairfax Virginia, GO, Refunding, Public | ||
| Improvement, Series A, 5.25%, 4/01/12 | 3,940 | 4,173,642 |
| County of Fairfax Virginia, GO, Series D: | ||
| 4.00%, 10/01/11 | 8,380 | 8,608,858 |
| 5.00%, 10/01/13 | 10,000 | 11,100,900 |
| Louisa IDA, RB, Virginia Electric & Power Co. | ||
| Project, Series A, Mandatory Put Bonds, AMT, | ||
| 1.38%, 9/01/30 (a) | 7,000 | 7,001,400 |
| Virginia College Building Authority, RB, 21st Century | ||
| College & Equipment, Series F-1, 4.00%, 2/01/12 | 7,200 | 7,470,792 |
| Municipal Bonds | (000) | Value |
| Virginia (concluded) | ||
| Virginia College Building Authority, Refunding RB, | ||
| Public Higher Education Financing, Series B, | ||
| 5.00%, 9/01/13 | $ 8,935 | $ 9,841,455 |
| Virginia Public Building Authority, RB: | ||
| Series B, 5.00%, 8/01/12 | 7,185 | 7,671,209 |
| Series C, 5.00%, 8/01/12 | 1,000 | 1,067,670 |
| Virginia Public School Authority, RB, School Educational | ||
| Technology Notes, Series IX, 5.00%, 4/15/12 | 4,065 | 4,297,640 |
| Virginia Public School Authority, Refunding RB, Series A, | ||
| 5.00%, 8/01/12 | 1,000 | 1,068,820 |
| Virginia Resources Authority, Refunding RB, Series A, | ||
| 4.00%, 10/01/12 | 4,145 | 4,380,229 |
| 66,682,615 | ||
| Washington — 2.5% | ||
| City of Seattle Washington, GO, Refunding, Limited Tax, | ||
| Series B, 5.00%, 8/01/13 | 5,000 | 5,510,250 |
| City of Seattle Washington, Refunding RB, Improvement, | ||
| Series B, 5.00%, 2/01/14 | 10,000 | 11,086,700 |
| State of Washington, GO, Refunding, Various Purpose, | ||
| Series R-2011B, 5.00%, 7/01/14 | 10,000 | 11,207,200 |
| 27,804,150 | ||
| Wisconsin — 0.5% | ||
| City of Madison Wisconsin, GO, Refunding, Promissory | ||
| Notes, Series E, 4.00%, 10/01/12 | 5,000 | 5,294,100 |
| Total Long-Term Investments | ||
| (Cost — $1,043,203,596) — 95.2% | 1,046,993,605 | |
| Short-Term Securities | ||
| Illinois — 1.8% | ||
| Regional Transit Authority, Refunding RB, VRDN, ERS, | ||
| Series B, 1.50%, 1/03/11 (d) | 20,000 | 20,000,000 |
| Virginia — 1.8% | ||
| Louisa IDA, IDB, RB, VRDN, Virginia Electric & Power Co. | ||
| Project, Series A, Mandatory Put Bonds, AMT | ||
| 2.50%, 2/03/11 (d) | 20,000 | 20,000,000 |
| Shares | ||
| Money Market Fund — 0.1% | ||
| FFI Institutional Tax-Exempt Fund, 0.18% (e)(f) | 226,455 | 226,455 |
| Total Short-Term Securities | ||
| (Cost — $40,226,455) — 3.7% | 40,226,455 | |
| Total Investments (Cost — $1,083,430,051*) — 98.9% | 1,087,220,060 | |
| Other Assets Less Liabilities — 1.1% | 12,112,059 | |
| Net Assets — 100.0% | $1,099,332,119 |
* The cost and unrealized appreciation (depreciation) of investments as of
December 31, 2010, as computed for federal income tax purposes, were as follows:
| Aggregate cost | $1,083,430,051 |
| Gross unrealized appreciation | $ 5,263,065 |
| Gross unrealized depreciation | (1,473,056) |
| Net unrealized appreciation | $ 3,790,009 |
See Notes to Financial Statements.
20 SEMI-ANNUAL REPORT DECEMBER 31, 2010
Schedule of Investments (concluded) BlackRock Short-Term Municipal Fund
(a) Variable rate security. Rate shown is as of report date.
(b) US government securities, held in escrow, are used to pay interest on this security as
well as to retire the bond in full at the date indicated, typically at a premium to par.
(c) Security is collateralized by Municipal or US Treasury obligations.
(d) Variable rate security. Rate shown is as of report date and maturity shown is the
date the principal owed can be recovered through demand.
(e) Investments in companies considered to be an affiliate of the Fund during the
year, for purposes of Section 2(a)(3) of the Investment Company Act of 1940, as
amended, were as follows:
| Shares Held | Shares Held | |||
| at June 30, | Net | at December 31, | ||
| Affiliate | 2010 | Activity | 2010 | Income |
| FFI Institutional | ||||
| Tax-Exempt Fund | 25,582,016 | (25,355,561) | 226,455 | $57,712 |
(f) Represents the current yield as of report date.
•Fair Value Measurements — Various inputs are used in determining the fair value of
investments, which are as follows:
•Level 1 — price quotations in active markets/exchanges for identical assets
and liabilities
•Level 2 — other observable inputs (including, but not limited to: quoted prices for
similar assets or liabilities in markets that are active, quoted prices for identical
or similar assets or liabilities in markets that are not active, inputs other than
quoted prices that are observable for the assets or liabilities (such as interest
rates, yield curves, volatilities, prepayment speeds, loss severities, credit risks and
default rates) or other market-corroborated inputs)
•Level 3 — unobservable inputs based on the best information available in the
circumstances, to the extent observable inputs are not available (including the
Fund’s own assumptions used in determining the fair value of investments)
The inputs or methodologies used for valuing securities are not necessarily an
indication of the risk associated with investing in those securities. For information
about the Fund’s policy regarding valuation of investments and other significant
accounting policies, please refer to Note 1 of the Notes to Financial Statements.
The following table summarizes the inputs used as of December 31, 2010 in deter-
mining the fair valuation of the Fund’s investments:
| Valuation Inputs | Level 1 | Level 2 | Level 3 | Total |
| Assets: | ||||
| Investments in | ||||
| Securities:1 | ||||
| Long-Term | ||||
| Investments | — | $1,046,993,605 | — | $1,046,993,605 |
| Short-Term | ||||
| Securities | $ 226,455 | 40,000,000 | — | 40,226,455 |
| Total | $ 226,455 | $1,086,993,605 | — | $1,087,220,060 |
1 See above Schedule of Investments for values in each state or
political subdivision.
See Notes to Financial Statements.
SEMI-ANNUAL REPORT DECEMBER 31, 2010 21
Schedule of Investments December 31, 2010 (Unaudited) BlackRock Municipal Fund
(Percentages shown are based on Net Assets)
| Par | ||
| Municipal Bonds | (000) | Value |
| Alabama — 0.2% | ||
| Birmingham Special Care Facilities Financing Authority, | ||
| RB, Children’s Hospital (AGC), 6.00%, 6/01/39 | $ 1,350 | $ 1,417,730 |
| Alaska — 1.0% | ||
| Borough of Matanuska-Susitna Alaska, RB, Goose Creek | ||
| Correctional Center (AGC): | ||
| 6.00%, 9/01/28 | 2,000 | 2,177,260 |
| 6.00%, 9/01/32 | 5,250 | 5,603,745 |
| 7,781,005 | ||
| Arizona — 0.5% | ||
| State of Arizona, COP, Department of Administration, | ||
| Series A (AGM): | ||
| 5.00%, 10/01/27 | 2,375 | 2,343,009 |
| 5.25%, 10/01/28 | 1,025 | 1,027,767 |
| 3,370,776 | ||
| California — 14.5% | ||
| Antelope Valley Community College District, GO, Election | ||
| of 2004, Series B (NPFGC), 5.25%, 8/01/39 | 1,050 | 1,031,646 |
| Arcadia Unified School District California, GO, CAB, | ||
| Election of 2006, Series A (AGM), 7.13%, 8/01/39 (a) | 2,800 | 378,000 |
| Cabrillo Community College District California, | ||
| GO, CAB, Election of 2004, Series B (NPFGC), | ||
| 7.04%, 8/01/37 (a) | 4,100 | 650,957 |
| California Health Facilities Financing Authority, | ||
| Refunding RB, St. Joseph Health System, Series A, | ||
| 5.75%, 7/01/39 | 1,000 | 1,006,010 |
| City of San Jose California, GO, Libraries, Parks, and | ||
| Public Safety Project (NPFGC), 5.00%, 9/01/30 | 3,700 | 3,699,741 |
| City of San Jose California, Refunding RB, Series A, AMT | ||
| (AMBAC), 5.50%, 3/01/32 | 6,285 | 5,903,375 |
| Coast Community College District California, GO, | ||
| Refunding, CAB, Election of 2002, Series C (AGM) (a): | ||
| 5.87%, 8/01/13 | 6,475 | 5,041,370 |
| 6.97%, 8/01/36 | 5,800 | 1,005,082 |
| Fresno Unified School District California, GO, Election | ||
| of 2001: | ||
| Series D (NPFGC), 5.00%, 8/01/27 | 5,070 | 4,980,109 |
| Series E (AGM), 5.00%, 8/01/30 | 1,500 | 1,479,660 |
| Hesperia Public Financing Authority California, | ||
| Tax Allocation Bonds, Redevelopment & Housing | ||
| Projects, Series A (Syncora), 5.50%, 9/01/27 | 10,000 | 8,484,500 |
| Los Angeles Department of Airports, RB, Los Angeles | ||
| International, Sub-Series B, 5.00%, 5/15/35 | 5,000 | 4,698,150 |
| Los Angeles Municipal Improvement Corp., RB, Series B1 | ||
| (NPFGC), 4.75%, 8/01/37 | 9,550 | 8,268,294 |
| Modesto Schools Infrastructure Financing Agency, | ||
| Special Tax Bonds (AMBAC), 5.50%, 9/01/36 | 8,965 | 7,644,545 |
| Mount Diablo Unified School District California, GO, | ||
| Election of 2002 (NPFGC), 5.00%, 7/01/27 | 7,250 | 6,997,265 |
| Norwalk-La Mirada Unified School District California, GO, | ||
| Refunding, CAB, Election of 2002, Series E (AGC), | ||
| 6.84%, 8/01/38 (a) | 4,900 | 766,507 |
| Orange County Sanitation District, COP, Series B (AGM), | ||
| 5.00%, 2/01/31 | 1,380 | 1,384,250 |
| Palm Springs Financing Authority, Refunding RB, | ||
| Convention Center Project, Series A (NPFGC), | ||
| 5.50%, 11/01/35 | 6,190 | 5,845,774 |
| Palomar Community College District, GO, CAB, Election | ||
| of 2006, Series B, 6.87%, 8/01/39 (b) | 15,000 | 5,267,250 |
| Rialto Unified School District California, GO, CAB, Series A | ||
| (NPFGC), 7.10%, 6/01/25 (a) | 11,685 | 4,506,087 |
| Roseville Joint Union High School District California, GO, | ||
| Election of 2004, Series A (NPFGC), 5.00%, 8/01/29 | 5,000 | 4,922,500 |
| Par | ||
| Municipal Bonds | (000) | Value |
| California (concluded) | ||
| Sacramento Unified School District California, GO, | ||
| Election of 1999, Series B (NPFGC), 5.00%, 7/01/26 $ | 5,015 | $ 5,022,874 |
| San Diego Community College District California, GO, | ||
| Election of 2002 (AGM), 5.00%, 5/01/30 | 2,685 | 2,674,931 |
| San Jose Unified School District Santa Clara County | ||
| California, GO, Election of 2002, Series B (NPFGC), | ||
| 5.00%, 8/01/29 | 3,650 | 3,652,811 |
| Tahoe-Truckee Unified School District, GO, School Facility | ||
| Improvement District 2, Election of 2002, Series A | ||
| (NPFGC), 5.25%, 8/01/29 | 2,535 | 2,542,757 |
| Tustin Unified School District California, Special Tax Bonds, | ||
| Senior Lien, Community Facilities District 97-1, Series A | ||
| (AGM), 5.00%, 9/01/32 | 7,730 | 7,484,031 |
| University of California, RB, Series O, 5.75%, 5/15/34 | 1,450 | 1,549,122 |
| 106,887,598 | ||
| Florida — 8.8% | ||
| Collier County School Board, COP (AGM), | ||
| 5.00%, 2/15/23 | 2,000 | 2,059,120 |
| County of Broward Florida, RB, Series A, | ||
| 5.25%, 10/01/34 | 1,450 | 1,456,293 |
| County of Duval Florida, COP, Master Lease Program | ||
| (AGM), 5.00%, 7/01/33 | 7,050 | 6,546,630 |
| County of Miami-Dade Florida, GO, Building Better | ||
| Communities Program, Series B-1, 5.75%, 7/01/33 | 2,400 | 2,475,120 |
| County of Miami-Dade Florida, RB: | ||
| Jackson Health System (AGC), 5.75%, 6/01/39 | 4,885 | 4,971,416 |
| Miami International Airport, Series A, AMT (AGC), | ||
| 5.50%, 10/01/26 | 7,000 | 6,905,080 |
| Miami International Airport, Series A, AMT (AGC), | ||
| 5.50%, 10/01/27 | 5,495 | 5,376,857 |
| Water & Sewer System (AGM), 5.00%, 10/01/39 | 7,150 | 6,937,287 |
| County of Miami-Dade Florida, Refunding RB, Miami | ||
| International Airport, AMT (AGC), 5.00%, 10/01/40 | 7,380 | 6,537,721 |
| Florida Housing Finance Corp., Refunding RB, Homeowner | ||
| Mortgage, Series 4, AMT (Ginnie Mae), 5.15%, 7/01/37 | 3,860 | 3,880,304 |
| Hillsborough County Aviation Authority Florida, RB, | ||
| Series A, AMT (AGC), 5.38%, 10/01/33 | 5,000 | 4,745,000 |
| Miami-Dade County School Board, COP, Refunding, | ||
| Series B (AGC), 5.25%, 5/01/31 | 2,500 | 2,505,850 |
| Orange County School Board, COP, Series A (NPFGC), | ||
| 5.00%, 8/01/32 | 6,975 | 6,570,799 |
| Sarasota County Public Hospital District, RB, Sarasota | ||
| Memorial Hospital Project, Series A, 5.63%, 7/01/39 | 500 | 502,515 |
| South Florida Water Management District, COP (AGC), | ||
| 5.00%, 10/01/22 | 3,500 | 3,595,935 |
| 65,065,927 | ||
| Georgia — 4.4% | ||
| County of DeKalb Georgia, Refunding RB, Series B (AGM), | ||
| 5.25%, 10/01/32 | 1,500 | 1,542,075 |
| Gwinnett County Hospital Authority, Refunding RB, | ||
| Gwinnett Hospital System, Series D (AGM), | ||
| 5.50%, 7/01/41 | 475 | 458,014 |
| Municipal Electric Authority of Georgia, RB, Series Y | ||
| (AMBAC): | ||
| 6.40%, 1/01/11 (c) | 90 | 90,000 |
| 6.40%, 1/01/13 | 5,740 | 6,008,747 |
| 6.40%, 1/01/13 (d) | 340 | 359,067 |
| Municipal Electric Authority of Georgia, Refunding RB, | ||
| Series EE (AMBAC), 7.00%, 1/01/25 | 20,000 | 24,471,200 |
| 32,929,103 |
See Notes to Financial Statements.
22 SEMI-ANNUAL REPORT DECEMBER 31, 2010
Schedule of Investments (continued) BlackRock Municipal Fund
(Percentages shown are based on Net Assets)
| Par | ||
| Municipal Bonds | (000) | Value |
| Illinois — 8.1% | ||
| Chicago Park District, GO, Harbor Facilities, Series C, | ||
| 5.25%, 1/01/40 | $ 1,000 | $ 968,190 |
| City of Chicago Illinois, ARB, General, Third Lien, | ||
| Series B-2, AMT (NPFGC), 6.00%, 1/01/27 | 17,690 | 18,137,557 |
| City of Chicago Illinois, GO, CAB, City Colleges (NPFGC), | ||
| 6.50%, 1/01/33 (a) | 22,500 | 5,508,225 |
| City of Chicago Illinois, GO, Refunding: | ||
| Series A (AGM), 5.00%, 1/01/25 | 5,000 | 4,901,400 |
| Series C (NPFGC), 5.00%, 1/01/31 | 5,000 | 4,585,500 |
| City of Chicago Illinois, RB, Series A (BHAC), | ||
| 5.50%, 1/01/38 | 3,000 | 3,031,230 |
| County of Cook Illinois, GO, Refunding, Series A, | ||
| 5.25%, 11/15/33 | 2,300 | 2,278,702 |
| Illinois Finance Authority, Refunding RB, Central DuPage | ||
| Health, Series B, 5.50%, 11/01/39 | 4,200 | 4,163,628 |
| Illinois State Toll Highway Authority, RB, Series B, | ||
| 5.50%, 1/01/33 | 3,125 | 3,126,781 |
| Illinois State Toll Highway Authority, Refunding RB, | ||
| Senior Series A-1, 5.00%, 1/01/31 | 5,000 | 4,739,650 |
| Metropolitan Pier & Exposition Authority, RB, CAB, | ||
| McCormick Place Expansion Project, Series A (NPFGC), | ||
| 6.48%, 6/15/30 (a) | 10,000 | 2,891,700 |
| Metropolitan Pier & Exposition Authority, Refunding RB, | ||
| CAB, McCormick Place Expansion Project, Series B | ||
| (AGM) (a): | ||
| 6.22%, 6/15/27 | 2,250 | 821,182 |
| 6.73%, 6/15/44 | 5,950 | 649,800 |
| State of Illinois, RB, Build Illinois, Series B, | ||
| 5.25%, 6/15/34 | 4,500 | 4,289,985 |
| 60,093,530 | ||
| Indiana — 0.9% | ||
| Indiana Municipal Power Agency, RB, Series B, | ||
| 5.75%, 1/01/34 | 700 | 708,050 |
| Indianapolis Local Public Improvement Bond Bank, | ||
| RB, Waterworks Project, Series 2007-L (NPFGC), | ||
| 5.25%, 7/01/23 | 2,500 | 2,588,000 |
| Indianapolis Local Public Improvement Bond Bank, | ||
| Refunding RB, Waterworks Project, Series A (AGC), | ||
| 5.50%, 1/01/38 | 3,150 | 3,252,816 |
| 6,548,866 | ||
| Iowa — 0.8% | ||
| Iowa Finance Authority, RB, Series A (AGC), | ||
| 5.63%, 8/15/37 | 5,600 | 5,767,216 |
| Maryland — 1.7% | ||
| Maryland Community Development Administration, | ||
| Refunding RB, Residential, Series A, AMT, | ||
| 5.75%, 9/01/39 | 7,110 | 7,397,671 |
| Maryland Health & Higher Educational Facilities Authority, | ||
| RB, University of Maryland Medical System, Series B | ||
| (NPFGC), 7.00%, 7/01/22 | 4,400 | 5,043,544 |
| 12,441,215 | ||
| Massachusetts — 3.9% | ||
| Massachusetts HFA, RB, AMT (AGM): | ||
| Rental Mortgage, Series C, 5.60%, 1/01/45 | 4,000 | 3,934,320 |
| S/F Housing, Series 128, 4.80%, 12/01/27 (e) | 2,845 | 2,689,094 |
| S/F Housing, Series 128, 4.88%, 12/01/38 (e) | 6,510 | 5,820,331 |
| Massachusetts HFA, Refunding RB, AMT: | ||
| Rental Housing, Series A (AGM), 5.15%, 7/01/26 | 4,785 | 4,782,464 |
| Series C, 5.35%, 12/01/42 | 1,950 | 1,775,787 |
| Par | |||
| Municipal Bonds | (000) | Value | |
| Massachusetts (concluded) | |||
| Massachusetts School Building Authority, RB, Series A | |||
| (AGM), 5.00%, 8/15/30 | $ 7,000 | $ 7,068,600 | |
| Massachusetts Water Resources Authority, Refunding RB, | |||
| General, Series A (NPFGC), 5.00%, 8/01/34 | 2,800 | 2,813,916 | |
| 28,884,512 | |||
| Michigan — 3.1% | |||
| City of Detroit Michigan, RB: | |||
| Second Lien, Series B (AGM), 6.25%, 7/01/36 | 675 | 719,381 | |
| Second Lien, Series B (AGM), 7.00%, 7/01/36 | 350 | 392,077 | |
| Senior Lien, Series A (NPFGC), 5.00%, 7/01/30 | 1,500 | 1,365,840 | |
| System, Second Lien, Series B (NPFGC), | |||
| 5.00%, 7/01/36 | 3,500 | 3,095,680 | |
| City of Detroit Michigan, Refunding RB, Second Lien, | |||
| Series E (BHAC), 5.75%, 7/01/31 | 4,000 | 4,087,880 | |
| Kalamazoo Hospital Finance Authority, RB, Bronson | |||
| Methodist Hospital (AGM), 5.25%, 5/15/36 | 750 | 708,803 | |
| Michigan State HDA, RB, Series C, AMT, 5.50%, 12/01/28 | 1,800 | 1,724,760 | |
| Michigan Strategic Fund, Refunding RB, Detroit Edison Co. | |||
| Project, Series A, AMT (Syncora), 5.50%, 6/01/30 | 11,845 | 10,676,017 | |
| 22,770,438 | |||
| Mississippi — 0.8% | |||
| Harrison County Wastewater Management District, | |||
| Refunding RB, Wastewater Treatment Facilities, Series A | |||
| (FGIC), 8.50%, 2/01/13 (d) | 1,320 | 1,465,900 | |
| Mississippi Development Bank Special Obligation, | |||
| Refunding RB, Jackson Mississippi Water and Sewer | |||
| System (AGM), 5.00%, 9/01/34 | 4,500 | 4,255,065 | |
| 5,720,965 | |||
| Nevada — 1.5% | |||
| City of Las Vegas Nevada, GO, Limited Tax, Performing Arts | |||
| Center, 6.00%, 4/01/34 | 1,450 | 1,527,880 | |
| Clark County Water Reclamation District, GO, Series B, | |||
| 5.75%, 7/01/34 | 3,125 | 3,323,500 | |
| County of Clark Nevada, RB: | |||
| Las Vegas-McCarran International Airport, Series A | |||
| (AGC), 5.25%, 7/01/39 | 3,300 | 3,118,566 | |
| Southwest Gas Corp. Project, Series D, AMT (NPFGC), | |||
| 5.25%, 3/01/38 | 1,200 | 1,066,524 | |
| System, Subordinate Lien, Series C (AGM), | |||
| 5.00%, 7/01/26 | 2,350 | 2,285,774 | |
| 11,322,244 | |||
| New Jersey — 8.5% | |||
| Cape May County Industrial Pollution Control Financing | |||
| Authority, Refunding RB, Atlantic City Electric Co., | |||
| Series A (NPFGC), 6.80%, 3/01/21 | 6,810 | 8,069,986 | |
| Garden State Preservation Trust, RB, Election of 2005, | |||
| Series A (AGM): | |||
| 5.80%, 11/01/21 | 3,125 | 3,548,531 | |
| 5.80%, 11/01/22 | 8,310 | 9,398,278 | |
| 5.80%, 11/01/23 | 4,340 | 4,894,261 | |
| New Jersey EDA, RB, Motor Vehicle Surcharge, Series A | |||
| (NPFGC), 5.25%, 7/01/33 | 26,500 | 26,500,000 | |
| New Jersey EDA, Refunding RB, School Facilities | |||
| Construction, Series N-1 (NPFGC), 5.50%, 9/01/28 | 1,400 | 1,441,496 | |
| New Jersey State Housing & Mortgage Finance Agency, | |||
| RB, Series AA, 6.38%, 10/01/28 | 1,870 | 1,986,613 | |
| New Jersey Transportation Trust Fund Authority, RB: | |||
| CAB, Transportation System, Series C (AGM), | |||
| 6.78%, 12/15/34 (a) | 11,000 | 2,225,960 | |
| Transportation System, Series A, 5.88%, 12/15/38 | 4,255 | 4,482,515 | |
| 62,547,640 | |||
See Notes to Financial Statements.
SEMI-ANNUAL REPORT DECEMBER 31, 2010 23
Schedule of Investments (continued) BlackRock Municipal Fund
(Percentages shown are based on Net Assets)
| Par | ||
| Municipal Bonds | (000) | Value |
| New York — 7.3% | ||
| City of New York New York, GO, Series C (Syncora), | ||
| 5.63%, 3/15/18 | $ 5 | $ 5,232 |
| City of Niagara Falls New York, GO, Public Improvement | ||
| (NPFGC), 6.90%, 3/01/24 | 5 | 5,004 |
| New York City Municipal Water Finance Authority, RB, | ||
| Fiscal 2009, Series A, 5.75%, 6/15/40 | 700 | 743,953 |
| New York State Thruway Authority, RB, Series G (AGM), | ||
| 5.00%, 1/01/32 | 16,830 | 16,856,928 |
| New York State Urban Development Corp., RB, State | ||
| Personal Income Tax, State Facilities, Series A-1 | ||
| (NPFGC), 5.25%, 3/15/34 | 9,900 | 9,904,950 |
| Sales Tax Asset Receivable Corp., RB, Series A: | ||
| (AMBAC), 5.00%, 10/15/32 | 15,650 | 15,680,987 |
| (NPFGC), 5.00%, 10/15/20 | 10,000 | 10,584,200 |
| 53,781,254 | ||
| North Carolina — 0.8% | ||
| North Carolina HFA, RB, Home Ownership, Series 14A, | ||
| AMT (AMBAC), 5.35%, 1/01/22 | 2,380 | 2,385,236 |
| North Carolina Medical Care Commission, RB, Novant | ||
| Health Obligation, Series A, 4.75%, 11/01/43 | 3,950 | 3,364,412 |
| 5,749,648 | ||
| North Dakota — 0.2% | ||
| North Dakota State HFA, RB, Housing Finance Program, | ||
| Series C, AMT (AMBAC), 5.30%, 7/01/22 | 1,825 | 1,859,711 |
| Ohio — 0.2% | ||
| Ohio Higher Educational Facility Commission, | ||
| Refunding RB, Summa Health System, 2010 | ||
| Project (AGC), 5.25%, 11/15/40 | 1,775 | 1,673,736 |
| Oregon — 0.6% | ||
| Port of Portland Oregon, Refunding RB, International | ||
| Airport, Series 7-B, AMT (NPFGC), 7.10%, 1/01/12 (c) | 3,865 | 4,108,070 |
| Pennsylvania — 1.7% | ||
| City of Philadelphia Pennsylvania, RB, 12th Series B | ||
| (NPFGC), 7.00%, 5/15/20 (d) | 4,670 | 5,724,206 |
| Pennsylvania Turnpike Commission, RB, CAB, | ||
| Sub-Series E, 6.01%, 12/01/38 (b) | 1,250 | 852,450 |
| Philadelphia Redevelopment Authority, RB, Neighborhood | ||
| Transformation, Series A (NPFGC), 5.50%, 4/15/20 | 3,830 | 3,937,967 |
| Philadelphia School District, GO, Series E, | ||
| 6.00%, 9/01/38 | 2,300 | 2,382,570 |
| 12,897,193 | ||
| Puerto Rico — 1.5% | ||
| Puerto Rico Sales Tax Financing Corp., RB, First | ||
| Sub-Series A, 6.38%, 8/01/39 | 7,100 | 7,545,028 |
| Puerto Rico Sales Tax Financing Corp., Refunding RB, | ||
| CAB, Series A (NPFGC) (a): | ||
| 6.56%, 8/01/41 | 11,000 | 1,530,100 |
| 6.64%, 8/01/43 | 15,000 | 1,787,100 |
| 10,862,228 | ||
| South Carolina — 0.3% | ||
| South Carolina State Public Service Authority, RB, Santee | ||
| Cooper, Series A, 5.50%, 1/01/38 | 2,300 | 2,396,600 |
| Par | ||
| Municipal Bonds | (000) | Value |
| Texas — 10.3% | ||
| City of Houston Texas, COP, Series J (AMBAC), | ||
| 6.25%, 12/15/13 | $ 3,500 | $ 3,854,935 |
| City of Houston Texas, Refunding RB, Combined, | ||
| First Lien, Series A (AGC), 6.00%, 11/15/35 | 3,650 | 3,964,557 |
| Dallas-Fort Worth International Airport Facilities | ||
| Improvement Corp., RB, AMT: | ||
| Improvement, Joint, Series B (AGM), | ||
| 5.25%, 11/01/22 | 2,000 | 2,024,900 |
| Series A (NPFGC), 6.00%, 11/01/28 | 25,950 | 25,969,981 |
| Series A (NPFGC), 5.50%, 11/01/33 | 2,000 | 1,909,820 |
| Lewisville ISD Texas, GO, Refunding, CAB, School Building | ||
| (NPFGC), 5.06%, 8/15/24 (a) | 8,110 | 4,104,633 |
| Mansfield ISD Texas, GO, School Building (PSF-GTD), | ||
| 5.00%, 2/15/33 | 3,000 | 3,056,820 |
| North Texas Tollway Authority, Refunding RB: | ||
| CAB, System, First Tier Series I (AGC), | ||
| 6.27%, 1/01/15 (b) | 10,000 | 7,741,100 |
| First Tier, Series A, 6.00%, 1/01/28 | 1,000 | 1,024,860 |
| System, First Tier (NPFGC), 5.75%, 1/01/40 | 7,700 | 7,406,322 |
| System, First Tier, Series A (AMBAC), 5.63%, 1/01/33 | 2,040 | 1,959,257 |
| System, First Tier, Series B (NPFGC), 5.75%, 1/01/40 | 9,870 | 9,493,558 |
| Texas Department of Housing & Community Affairs, MRB, | ||
| Series A, AMT (NPFGC): | ||
| 5.45%, 9/01/23 | 1,750 | 1,760,658 |
| 5.50%, 3/01/26 | 2,230 | 2,235,553 |
| 76,506,954 | ||
| Utah — 0.9% | ||
| Utah Transit Authority, RB, Series A (AGM), | ||
| 5.00%, 6/15/36 | 4,000 | 4,027,120 |
| Utah Transit Authority, Refunding RB, CAB, Sub-Series A | ||
| (NPFGC), 6.21%, 6/15/36 (a) | 11,930 | 2,516,395 |
| 6,543,515 | ||
| Vermont — 0.1% | ||
| Vermont HFA, Refunding RB, Multiple Purpose, Series C, | ||
| AMT (AGM), 5.50%, 11/01/38 (e) | 1,120 | 1,096,480 |
| Virginia — 0.1% | ||
| Fairfax County IDA Virginia, Refunding RB, Health Care, | ||
| Inova Health System, Series A, 5.50%, 5/15/35 | 600 | 617,388 |
| Washington — 1.7% | ||
| Chelan County Public Utility District No. 1, RB, | ||
| Chelan Hydro System, Series A, AMT (AMBAC), | ||
| 5.45%, 7/01/37 | 10,710 | 9,959,979 |
| Washington Health Care Facilities Authority, RB, | ||
| Providence Health & Services, Series A: | ||
| 5.00%, 10/01/39 | 1,950 | 1,850,238 |
| 5.25%, 10/01/39 | 1,075 | 1,051,500 |
| 12,861,717 | ||
| Wisconsin — 2.0% | ||
| City of Superior Wisconsin, Refunding RB, Midwest Energy | ||
| Resources, Series E (NPFGC), 6.90%, 8/01/21 | 9,000 | 11,080,350 |
| Wisconsin Health & Educational Facilities Authority, | ||
| RB, Ascension Health Senior Credit Group, | ||
| 5.00%, 11/15/33 | 2,400 | 2,314,608 |
| Wisconsin Housing & EDA, Refunding RB, Series E, AMT, | ||
| 5.50%, 9/01/38 | 1,030 | 1,079,430 |
| 14,474,388 | ||
| Total Municipal Bonds — 86.4% | 638,977,647 |
See Notes to Financial Statements.
24 SEMI-ANNUAL REPORT DECEMBER 31, 2010
Schedule of Investments (continued) BlackRock Municipal Fund
(Percentages shown are based on Net Assets)
| Municipal Bonds Transferred to | Par | |
| Tender Option Bond Trusts (f) | (000) | Value |
| California — 2.0% | ||
| San Diego County Water Authority, COP, Refunding, | ||
| Series 2008-A (AGM), 5.00%, 5/01/33 | $ 4,500 | $ 4,428,315 |
| Sequoia Union High School District California, GO, | ||
| Refunding, Election of 2004, Series B (AGM), | ||
| 5.50%, 7/01/35 | 10,055 | 10,135,500 |
| 14,563,815 | ||
| Colorado — 0.2% | ||
| Colorado Health Facilities Authority, Refunding RB, | ||
| Catholic Healthcare, Series A, 5.50%, 7/01/34 | 1,580 | 1,603,138 |
| District of Columbia — 1.3% | ||
| Metropolitan Washington Airports Authority, RB, Series B, | ||
| AMT (AGM), 5.00%, 10/01/36 | 10,000 | 9,379,572 |
| Florida — 3.7% | ||
| Broward County School Board Florida, COP, Series A | ||
| (AGM), 5.25%, 7/01/33 | 10,000 | 9,421,400 |
| City of Tallahassee Florida, RB (NPFGC), | ||
| 5.00%, 10/01/37 | 10,000 | 9,683,900 |
| Jacksonville Electric Authority Florida, RB, Sub-Series A, | ||
| 5.63%, 10/01/32 | 6,300 | 6,614,559 |
| Orange County School Board, COP, Series A (NPFGC), | ||
| 5.00%, 8/01/30 | 2,000 | 1,927,340 |
| 27,647,199 | ||
| Illinois — 0.7% | ||
| City of Chicago Illinois, Refunding RB, Second Lien (AGM), | ||
| 5.25%, 11/01/33 | 5,000 | 4,986,450 |
| Louisiana — 1.6% | ||
| State of Louisiana, RB, Series A (AGM), 5.00%, 5/01/31 | 11,950 | 11,813,890 |
| Massachusetts — 2.0% | ||
| Massachusetts School Building Authority, RB, Series A | ||
| (AGM), 5.00%, 8/15/30 | 15,000 | 15,147,000 |
| New Jersey — 1.9% | ||
| New Jersey State Turnpike Authority, RB, Series C (AGM), | ||
| 5.00%, 1/01/30 | 13,500 | 13,695,210 |
| New York — 2.3% | ||
| New York State Dormitory Authority, ERB, Series B, | ||
| 5.75%, 3/15/36 | 2,010 | 2,146,519 |
| Sales Tax Asset Receivable Corp., RB, Series A (AMBAC), | ||
| 5.25%, 10/15/27 | 13,931 | 14,483,732 |
| 16,630,251 | ||
| Ohio — 0.1% | ||
| State of Ohio, RB, Cleveland Clinic Health, Series B, | ||
| 5.50%, 1/01/34 | 1,000 | 1,024,690 |
| Texas — 2.5% | ||
| Cypress-Fairbanks ISD, GO, Refunding, Schoolhouse | ||
| (PSF-GTD), 5.00%, 2/15/32 | 10,000 | 10,200,100 |
| Harris County Cultural Education Facilities Finance | ||
| Corp., RB, Hospital, Texas Children’s Hospital Project, | ||
| 5.50%, 10/01/39 | 8,500 | 8,510,880 |
| 18,710,980 |
| Municipal Bonds Transferred to | Par | |
| Tender Option Bond Trusts (f) | (000) | Value |
| Washington — 1.4% | ||
| State of Washington, GO, Series D (AGM), | ||
| 5.00%, 1/01/28 | $10,000 | $ 10,170,200 |
| Wisconsin — 0.3% | ||
| Wisconsin Health & Educational Facilities Authority, | ||
| Refunding RB, Froedtert & Community Health Inc., | ||
| 5.25%, 4/01/39 | 2,499 | 2,424,096 |
| Total Municipal Bonds Transferred to | ||
| Tender Option Bond Trusts — 20.0% | 147,796,491 | |
| Total Long-Term Investments | ||
| (Cost — $801,835,782) — 106.4% | 786,774,138 | |
| Short-Term Securities | ||
| FFI Institutional Tax-Exempt Fund, 0.18% (g)(h) | 14,851,433 | 14,851,433 |
| Total Short-Term Securities | ||
| (Cost — $14,851,433) — 2.0% | 14,851,433 | |
| Total Investments (Cost — $816,687,215*) — 108.4% | 801,625,571 | |
| Other Assets Less Liabilities — 1.4% | 10,383,861 | |
| Liability for Trust Certificates, Including Interest | ||
| Expense and Fees Payable — (9.8)% | (72,827,007) | |
| Net Assets — 100.0% | $739,182,425 | |
* The cost and unrealized appreciation (depreciation) of investments as of
December 31, 2010, as computed for federal income tax purposes, were as follows:
| Aggregate cost | $ 745,857,539 |
| Gross unrealized appreciation | $ 15,384,541 |
| Gross unrealized depreciation | (32,366,812) |
| Net unrealized depreciation | $ (16,982,271) |
(a) Represents a zero-coupon bond. Rate shown reflects the current yield as of
report date.
(b) Represents a step-up bond that pays an initial coupon rate for the first period
and then a higher coupon rate for the following periods. Rate shown reflects the
current yield.
(c) US government securities, held in escrow, are used to pay interest on this security as
well as to retire the bond in full at the date indicated, typically at a premium to par.
(d) Security is collateralized by Municipal or US Treasury Obligations.
(e) Variable rate security. Rate shown is as of report date.
(f) Securities represent bonds transferred to a tender option bond trust in exchange
for which the Fund acquired residual interest certificates. These securities serve
as collateral in a financing transaction. See Note 1 of the Notes to Financial
Statements for details of municipal bonds transferred to tender option bond trusts.
See Notes to Financial Statements.
SEMI-ANNUAL REPORT DECEMBER 31, 2010 25
Schedule of Investments (concluded) BlackRock Municipal Fund
(g) Investments in companies considered to be an affiliate of the Fund during the period, for purposes of Section 2(a)(3) of the Investment Company Act of 1940, as amended, were
as follows:
| Shares Held at | Shares Held at | Value at | |||||
| June 30, | Shares | Shares | December 31, | December 31 | Realized | ||
| Affiliate | 2010 | Purchased | Sold | 2010 | 2010 | Loss | Income |
| Black Rock Insured | |||||||
| Municipal Term Trust, Inc. | 204,800 | — | (204,800) | — | $(213,126) | $89,498 | |
| FFI Institutional | |||||||
| Tax-Exempt Fund | 16,338,498 | — | (1,487,065)1 | 14,851,433 | $14,851,433 | — | $14,541 |
| 1 Represents net shares sold. | |||||||
(h) Represents the current yield as of report date.
•Fair Value Measurements — Various inputs are used in determining the fair value of
investments and derivatives, which are as follows:
•Level 1 — price quotations in active markets/exchanges for identical assets
and liabilities
•Level 2 — other observable inputs (including, but not limited to: quoted prices for
similar assets or liabilities in markets that are active, quoted prices for identical
or similar assets or liabilities in markets that are not active, inputs other than
quoted prices that are observable for the assets or liabilities (such as interest
rates, yield curves, volatilities, prepayment speeds, loss severities, credit risks and
default rates) or other market-corroborated inputs)
•Level 3 — unobservable inputs based on the best information available in the
circumstances, to the extent observable inputs are not available (including the
Fund’s own assumptions used in determining the fair value of investments)
The inputs or methodologies used for valuing securities are not necessarily an
indication of the risk associated with investing in those securities. For information
about the Fund’s policy regarding valuation of investments and other significant
accounting policies, please refer to Note 1 of the Notes to Financial Statements.
The following table summarizes the inputs used as of December 31, 2010 in deter-
mining the fair valuation of the Fund’s investments:
| Valuation Inputs | Level 1 | Level 2 | Level3 | Total |
| Assets: | ||||
| Investments in | ||||
| Securities: | ||||
| Long-Term | ||||
| Investments1 | — | $ 786,774,138 | — | $ 786,774,138 |
| Short-Term | ||||
| Securities | $ 14,851,433 | — | — | 14,851,433 |
| Total | $ 14,851,433 | $ 786,774,138 | — | $ 801,625,571 |
1 See above Schedule of Investments for values in each state or political
subdivision, excluding security types in Level 1 within the table.
See Notes to Financial Statements.
26 SEMI-ANNUAL REPORT DECEMBER 31, 2010
Schedule of Investments December 31, 2010 (Unaudited) BlackRock National Municipal Fund
(Percentages shown are based on Net Assets)
| Par | ||
| Municipal Bonds | (000) | Value |
| Alabama — 1.3% | ||
| Alabama State Docks Department, Refunding RB, | ||
| 6.00%, 10/01/40 | $19,030 | $ 18,314,091 |
| Birmingham Special Care Facilities Financing Authority, | ||
| RB, Children’s Hospital (AGC), 6.00%, 6/01/39 | 10,235 | 10,748,490 |
| Courtland IDB Alabama, RB, International Paper Co. | ||
| Projects, Series A, 6.25%, 11/01/33 | 2,530 | 2,588,645 |
| Courtland IDB, Refunding RB, AMT: | ||
| Champion International Corp. Project, | ||
| 6.00%, 8/01/29 | 185 | 182,928 |
| International Paper Co., Series B, 6.25%, 8/01/25 | 750 | 752,603 |
| 32,586,757 | ||
| Arizona — 1.4% | ||
| Maricopa County & Phoenix Industrial Development | ||
| Authorities, Refunding RB, S/F, Series A-2, AMT | ||
| (Ginnie Mae), 5.80%, 7/01/40 | 2,745 | 2,794,218 |
| Maricopa County IDA Arizona, RB, Arizona Charter | ||
| Schools Project, Series A, 6.75%, 7/01/29 | 3,100 | 2,074,613 |
| Peoria Improvement District No. 8401 Arizona, Special | ||
| Assessment Bonds: | ||
| No. 8801, 7.30%, 1/01/11 | 395 | 395,000 |
| No. 8802, 7.20%, 1/01/13 | 510 | 519,889 |
| Pima County IDA, IDRB, Tucson Electric Power, Series A, | ||
| 6.38%, 9/01/29 | 3,785 | 3,831,404 |
| Pima County IDA, Refunding IDRB, Tucson Electric Power, | ||
| 5.75%, 9/01/29 | 8,525 | 8,428,156 |
| Pima County IDA, Refunding RB, Tucson Electric | ||
| Power Co., San Juan, Series A, 4.95%, 10/01/20 | 9,425 | 9,286,829 |
| Pinal County IDA Arizona, RB, San Manuel Facility Project, | ||
| AMT, 6.25%, 6/01/26 | 500 | 416,455 |
| Prescott Valley Improvement District Arizona, Special | ||
| Assessment Bonds, Sewer Collection System Roadway | ||
| Repair, 7.90%, 1/01/12 | 60 | 62,993 |
| Vistancia Community Facilities District Arizona, GO: | ||
| 6.75%, 7/15/22 | 3,000 | 3,092,280 |
| 5.75%, 7/15/24 | 2,125 | 2,189,813 |
| 33,091,650 | ||
| California — 15.3% | ||
| Cabrillo Community College District, GO, Election of 2004, | ||
| Series B (NPFGC), 5.00%, 8/01/36 | 10,000 | 9,857,500 |
| California Health Facilities Financing Authority, RB, Sutter | ||
| Health, Series A, 6.25%, 8/15/35 | 2,500 | 2,507,775 |
| California Health Facilities Financing Authority, | ||
| Refunding RB, Catholic Healthcare West: | ||
| Series A, 6.00%, 7/01/39 | 11,905 | 12,175,124 |
| Series E, 5.63%, 7/01/25 | 15,000 | 15,495,900 |
| California State Public Works Board, RB, Various | ||
| Capital Projects: | ||
| Sub-Series A-1, 6.00%, 3/01/35 | 10,000 | 9,948,500 |
| Sub-Series I-1, 6.38%, 11/01/34 | 7,455 | 7,661,727 |
| California Statewide Communities Development Authority, | ||
| RB, Health Facility, Memorial Health Services, Series A, | ||
| 6.00%, 10/01/23 | 9,880 | 10,227,183 |
| California Statewide Communities Development Authority, | ||
| Refunding RB, Catholic Healthcare West, Series B, | ||
| 5.50%, 7/01/30 | 3,000 | 3,000,000 |
| Chula Vista Community Facilities District California, | ||
| Special Tax Bonds, District No. 06-1, Eastlake-Woods, | ||
| Improvement Area A, 6.15%, 9/01/26 | 3,215 | 3,224,034 |
| City of Bakersfield California, RB, Series A (AGM), | ||
| 5.00%, 9/15/28 | 8,840 | 8,706,693 |
| City of Chula Vista California, Refunding RB, San Diego | ||
| Gas & Electric, Series A, 5.88%, 2/15/34 | 4,875 | 5,168,329 |
| Municipal Bonds | (000) | Value |
| California (concluded) | ||
| City of Los Angeles California, Refunding RB, | ||
| Sub-Series A, 5.00%, 6/01/28 | $ 4,000 | $ 4,032,720 |
| City of Roseville California, Special Tax Bonds, Stoneridge | ||
| Community Facilities No. 1, 6.30%, 9/01/11 (a) | 2,500 | 2,649,050 |
| County of Sacramento California, RB, Subordinated and | ||
| Passenger Facility Charges/Grant, Series C, | ||
| 6.00%, 7/01/39 | 13,265 | 13,775,437 |
| Imperial Irrigation District, Refunding RB, System, | ||
| 5.13%, 11/01/38 | 20,250 | 19,851,277 |
| Los Angeles Municipal Improvement Corp., RB, Real | ||
| Property, Series E: | ||
| 6.00%, 9/01/34 | 2,685 | 2,789,447 |
| 6.00%, 9/01/39 | 9,450 | 9,797,760 |
| Modesto Irrigation District, COP: | ||
| Capital Improvements, Series A, 6.00%, 10/01/39 | 9,775 | 10,200,017 |
| Series B, 5.50%, 7/01/35 | 15,000 | 15,220,800 |
| Orange County Water District, COP, Series B (NPFGC), | ||
| 5.00%, 8/15/34 | 12,400 | 12,047,716 |
| Pittsburg Redevelopment Agency, Tax Allocation Bonds, | ||
| Refunding, Subordinate, Los Medanos Community | ||
| Project, Series A, 6.50%, 9/01/28 | 10,000 | 10,611,300 |
| Pittsburg Unified School District, COP, 6.20%, 9/01/34 | 10,465 | 10,470,860 |
| Port of Oakland, RB, Series K, AMT (NPFGC), | ||
| 5.88%, 11/01/30 | 2,950 | 2,949,971 |
| San Diego County Water Authority, COP, Refunding, | ||
| Series 2002-A (NPFGC), 5.00%, 5/01/32 | 10,000 | 9,472,000 |
| San Francisco City & County Airports Commission, RB, | ||
| Series E, 6.00%, 5/01/39 | 24,300 | 25,784,730 |
| San Francisco City & County Airports Commission, | ||
| Refunding RB, Second Series 34E, AMT (AGM): | ||
| 5.75%, 5/01/21 | 8,220 | 8,913,932 |
| 5.75%, 5/01/23 | 17,000 | 18,070,320 |
| San Francisco City & County Redevelopment Agency, | ||
| Special Tax Bonds, Community Facilities District | ||
| No. 6-Mission, Series A: | ||
| 6.00%, 8/01/21 | 5,000 | 5,001,100 |
| 6.00%, 8/01/25 | 2,550 | 2,449,377 |
| San Francisco Uptown Parking Corp. California, RB, | ||
| Union Square (NPFGC), 6.00%, 7/01/20 | 1,075 | 1,120,516 |
| San Juan Water District, COP, Series A, 6.00%, 2/01/39 | 10,000 | 10,576,000 |
| Santa Clara County Financing Authority, Refunding LRB, | ||
| Series L, 5.25%, 5/15/36 | 12,000 | 11,639,280 |
| Santa Margarita Water District California, Special | ||
| Tax Bonds, Refunding, Facilities District No. 99-1, | ||
| 6.20%, 9/01/20 | 2,650 | 2,690,386 |
| State of California, GO, Various Purpose: | ||
| 6.00%, 3/01/33 | 16,000 | 16,545,280 |
| 6.50%, 4/01/33 | 38,000 | 40,723,080 |
| Tuolumne Wind Project Authority, RB, Tuolumne Co. | ||
| Project, Series A, 5.88%, 1/01/29 | 16,130 | 17,018,602 |
| 372,373,723 | ||
| Colorado — 1.0% | ||
| Colorado Health Facilities Authority, RB, Catholic Health | ||
| Initiatives, Series D, 6.25%, 10/01/33 | 3,520 | 3,744,189 |
| Colorado Housing & Finance Authority, RB, S/F Program, | ||
| Senior Series B-3, 6.55%, 10/01/16 | 105 | 109,269 |
| Colorado Housing & Finance Authority, Refunding RB, | ||
| S/F Program: | ||
| Senior Series A-2, AMT, 7.50%, 4/01/31 | 135 | 141,361 |
| Senior Series A-3, 7.35%, 10/01/30 | 60 | 62,870 |
| Senior Series C-3 (FHA), 6.75%, 10/01/21 | 235 | 255,111 |
| Senior Series C-3 (FHA), 7.15%, 10/01/30 | 55 | 56,078 |
| Series B-2, AMT, 7.10%, 4/01/17 | 45 | 46,568 |
| Series B-2, AMT, 7.25%, 10/01/31 | 430 | 440,784 |
| Series C-2, AMT (FHA), 7.25%, 10/01/31 | 165 | 165,934 |
See Notes to Financial Statements.
SEMI-ANNUAL REPORT DECEMBER 31, 2010 27
Schedule of Investments (continued) BlackRock National Municipal Fund
(Percentages shown are based on Net Assets)
| Par | ||
| Municipal Bonds | (000) | Value |
| Colorado (concluded) | ||
| Elk Valley Public Improvement Corp., RB, Public | ||
| Improvement Fee: | ||
| Series A, 7.35%, 9/01/31 | $ 7,560 | $ 7,955,766 |
| Series B, 7.45%, 9/01/31 | 705 | 742,372 |
| Plaza Metropolitan District No. 1 Colorado, Tax Allocation | ||
| Bonds, Public Improvement Fee, Tax Increment: | ||
| 8.00%, 12/01/25 | 7,700 | 7,575,722 |
| Subordinate, 8.13%, 12/01/25 | 1,885 | 1,692,504 |
| 22,988,528 | ||
| Connecticut — 0.1% | ||
| Connecticut State Development Authority, RB, Bridgeport, | ||
| AMT (AMBAC), 6.15%, 4/01/35 | 1,250 | 1,210,125 |
| Connecticut State Health & Educational Facility | ||
| Authority, RB, Bridgeport Hospital, Series A (NPFGC), | ||
| 6.63%, 7/01/18 | 1,000 | 1,012,360 |
| Connecticut State Health & Educational Facility Authority, | ||
| Refunding RB (Radian), 6.63%, 7/01/26 | 640 | 640,141 |
| 2,862,626 | ||
| Delaware — 0.8% | ||
| County of Sussex Delaware, RB, NRG Energy, Inc., Indian | ||
| River Project, 6.00%, 10/01/40 | 12,000 | 11,517,480 |
| Delaware State EDA, RB, Exempt Facilities, Indian River | ||
| Power, 5.38%, 10/01/45 | 9,000 | 7,964,640 |
| 19,482,120 | ||
| District of Columbia — 1.4% | ||
| District of Columbia, RB, Series A, 5.50%, 12/01/30 | 17,000 | 18,044,140 |
| District of Columbia Water & Sewer Authority, RB, Series A: | ||
| 6.00%, 10/01/35 | 7,630 | 8,251,998 |
| 5.50%, 10/01/39 | 6,475 | 6,684,531 |
| 32,980,669 | ||
| Florida — 7.8% | ||
| Anthem Park Community Development District, Special | ||
| Assessment Bonds, 5.80%, 5/01/36 (b)(c) | 1,815 | 1,188,698 |
| County of Escambia Florida, RB, International Paper Co. | ||
| Projects, Series B, 6.25%, 11/01/33 | 7,500 | 7,673,850 |
| County of Lee Florida, RB, Series A, AMT (AGM), | ||
| 6.00%, 10/01/29 | 13,015 | 13,082,678 |
| County of Miami-Dade Florida, GO, Building Better | ||
| Communities Program: | ||
| Series B, 6.38%, 7/01/28 | 7,750 | 8,478,112 |
| Series B-1, 6.00%, 7/01/38 | 25,000 | 26,612,000 |
| County of Miami-Dade Florida, Refunding RB: | ||
| Miami International Airport, Series A-1, | ||
| 5.50%, 10/01/30 | 8,855 | 8,836,227 |
| Series C, 6.00%, 10/01/23 | 20,000 | 22,272,200 |
| Fiddlers Creek Community Development District No. 2, | ||
| Special Assessment Bonds (b)(c): | ||
| Series A, 6.38%, 5/01/35 | 6,850 | 2,187,890 |
| Series B, 5.75%, 5/01/13 | 555 | 177,267 |
| Florida Housing Finance Corp., RB, Homeowner Mortgage, | ||
| Series 3, AMT (NPFGC), 6.35%, 7/01/28 | 510 | 533,827 |
| Florida Housing Finance Corp., Refunding RB, AMT, | ||
| Homeowner Mortgage: | ||
| Series 1 (Ginnie Mae), 6.00%, 7/01/39 | 4,265 | 4,386,425 |
| Series 4 (AGM), 6.25%, 7/01/22 | 290 | 293,637 |
| Harbor Bay Community Development District Florida, | ||
| Special Assessment Bonds, Series A, 7.00%, 5/01/33 | 935 | 886,502 |
| Highland Meadows Community Development | ||
| District, Special Assessment Bonds, Series A, | ||
| 5.50%, 5/01/36 (b)(c) | 1,090 | 420,032 |
| Par | |||
| Municipal Bonds | (000) | Value | |
| Florida (concluded) | |||
| Hillsborough County IDA, RB, AMT, National Gypsum Co.: | |||
| Series A, 7.13%, 4/01/30 | $ 6,000 | $ 5,427,960 | |
| Series B, 7.13%, 4/01/30 | 7,750 | 7,011,115 | |
| Jacksonville Economic Development Commission, RB: | |||
| Mayo Clinic Jacksonville, Series B, 5.50%, 11/15/36 | 2,000 | 2,014,340 | |
| Mayo Clinic, Series A (NPFGC), 5.50%, 11/15/36 | 1,000 | 1,007,170 | |
| Jacksonville Electric Authority Florida, RB: | |||
| Scherer 4 Project, Series A, 6.00%, 10/01/37 | 8,225 | 8,857,256 | |
| Sub-Series A, 5.63%, 10/01/32 | 10,525 | 11,050,513 | |
| Jacksonville Electric Authority Florida, Refunding RB, | |||
| Series D, 5.00%, 10/01/39 | 1,795 | 1,762,618 | |
| Jacksonville Port Authority, RB, AMT (AGC), | |||
| 6.00%, 11/01/38 | 8,105 | 8,174,460 | |
| Lee County Housing Finance Authority, RB, Multi-County | |||
| Program, Series A-2, AMT (Ginnie Mae), 6.00%, 9/01/40 | 560 | 596,624 | |
| Lexington Oaks Community District, Special Assessment | |||
| Bonds, Series A, 6.70%, 5/01/33 | 1,075 | 1,084,008 | |
| Orange County Health Facilities Authority, RB, The Nemours | |||
| Foundation Project, Series A, 5.00%, 1/01/39 | 5,000 | 4,789,450 | |
| Orange County School Board, COP, Series A (AGC), | |||
| 5.50%, 8/01/34 | 11,100 | 11,343,090 | |
| Orlando Urban Community Development District Florida, | |||
| Special Assessment Bonds, Capital Improvement, | |||
| Series A, 6.95%, 5/01/11 (a) | 930 | 955,166 | |
| Panther Trace II Community Development District, | |||
| Special Assessment Bonds, Special Assessment, | |||
| 5.13%, 11/01/13 | 8,020 | 7,063,214 | |
| Santa Rosa County School Board, COP, Refunding, | |||
| Series 2 (NPFGC), 5.25%, 2/01/26 | 2,000 | 2,038,280 | |
| Sarasota County Public Hospital District, RB, Sarasota | |||
| Memorial Hospital Project, Series A, 5.63%, 7/01/39 | 14,570 | 14,643,287 | |
| St. Lucie West Services District, Refunding RB, Senior Lien | |||
| (NPFGC), 6.00%, 10/01/22 | 2,000 | 2,046,040 | |
| Sterling Hill Community Development District, | |||
| Special Assessment Bonds, Refunding, Series B, | |||
| 5.50%, 11/01/10 (b)(c) | 165 | 115,401 | |
| Watergrass Community Development District, Special | |||
| Assessment Bonds, Series B: | |||
| 5.13%, 11/01/14 | 1,000 | 611,000 | |
| 6.96%, 11/01/17 | 2,280 | 2,058,247 | |
| 189,678,584 | |||
| Georgia — 2.9% | |||
| City of Atlanta Georgia, RB, General, Series B, AMT | |||
| (NPFGC), 5.63%, 1/01/30 | 20,000 | 20,124,000 | |
| City of Atlanta Georgia, Refunding RB, General, Series C, | |||
| 6.00%, 1/01/30 | 25,000 | 26,464,250 | |
| DeKalb County Hospital Authority Georgia, RB, DeKalb | |||
| Medical Center Inc. Project, 6.13%, 9/01/40 | 3,535 | 3,442,772 | |
| Fulton County Residential Care Facilities for the Elderly | |||
| Authority, Refunding RB, Canterbury Court Project, | |||
| Series A, 6.00%, 2/15/22 | 2,250 | 2,099,273 | |
| Municipal Electric Authority of Georgia, Refunding RB, | |||
| Project One, Sub-Series D, 6.00%, 1/01/23 | 10,000 | 10,959,200 | |
| Richmond County Development Authority, RB, Recovery | |||
| Zone Facility, International Paper Co., Series B, | |||
| 6.25%, 11/01/33 | 3,625 | 3,709,027 | |
| Rockdale County Development Authority, RB, Visy Paper | |||
| Project, Series A, AMT, 6.13%, 1/01/34 | 5,000 | 4,581,600 | |
| 71,380,122 | |||
See Notes to Financial Statements.
28 SEMI-ANNUAL REPORT DECEMBER 31, 2010
Schedule of Investments (continued) BlackRock National Municipal Fund
(Percentages shown are based on Net Assets)
| Par | ||
| Municipal Bonds | (000) | Value |
| Illinois — 8.4% | ||
| Bolingbrook Special Service Area No. 1, Special | ||
| Tax Bonds, Forest City Project, 5.90%, 3/01/27 | $ 1,000 | $ 795,880 |
| Chicago Park District, GO, Harbor Facilities, Series C, | ||
| 5.25%, 1/01/37 | 12,135 | 11,816,214 |
| Chicago Transit Authority, RB, Federal Transit Administration | ||
| Section 5309, Series A (AGC), 6.00%, 6/01/26 | 12,425 | 13,662,903 |
| City of Chicago Illinois, ARB, General, Third Lien, | ||
| Series B-2, AMT (Syncora), 6.00%, 1/01/29 | 55,000 | 56,177,000 |
| City of Chicago Illinois, Refunding RB, Second Lien, | ||
| 5.25%, 11/01/38 | 12,870 | 12,831,647 |
| City of Chicago Illinois, Special Assessment Bonds, | ||
| Lake Shore East, 6.75%, 12/01/32 | 2,000 | 1,829,660 |
| County of Cook Illinois, RB, Navistar International Corp. | ||
| Project, Recovery Zone Facility, 6.50%, 10/15/40 | 6,500 | 6,467,825 |
| Illinois Finance Authority, RB: | ||
| Advocate Health Care Network, Series D, | ||
| 6.50%, 11/01/38 | 5,700 | 6,095,694 |
| Community Rehabilitation Providers Facilities, | ||
| Series A, 6.50%, 7/01/22 | 3,140 | 2,967,708 |
| Navistar International, Recovery Zone, | ||
| 6.50%, 10/15/40 | 4,500 | 4,477,725 |
| Roosevelt University Project, 6.50%, 4/01/39 | 8,000 | 8,185,200 |
| Rush University Medical Center Obligation Group, | ||
| Series A, 7.25%, 11/01/30 | 6,900 | 7,627,053 |
| Rush University Medical Center Obligation Group, | ||
| Series B, 7.25%, 11/01/30 | 5,280 | 5,836,354 |
| Rush University Medical Center, Series C, | ||
| 6.38%, 11/01/29 | 2,860 | 2,976,745 |
| University of Chicago, Series B, 6.25%, 7/01/38 | 20,000 | 22,060,000 |
| Illinois Finance Authority, Refunding RB, Series A: | ||
| Northwestern Memorial Hospital, 6.00%, 8/15/39 | 9,400 | 9,883,254 |
| OSF Healthcare System, 7.00%, 11/15/27 | 3,335 | 3,431,048 |
| OSF Healthcare System, 7.13%, 11/15/35 | 1,790 | 1,832,477 |
| OSF Healthcare System, 6.00%, 5/15/39 | 6,000 | 5,627,820 |
| Railsplitter Tobacco Settlement Authority, RB, | ||
| 6.00%, 6/01/28 | 8,750 | 8,573,775 |
| Village of Hodgkins Illinois, RB, Metropolitan Biosolids | ||
| Management LLC Project, AMT, 6.00%, 11/01/23 | 10,000 | 10,001,200 |
| Village of Wheeling Illinois, Tax Allocation Bonds, North | ||
| Milwaukee/Lake-Cook TIF Project, 6.00%, 1/01/25 | 1,540 | 1,379,932 |
| 204,537,114 | ||
| Indiana — 3.1% | ||
| Indiana Finance Authority, RB, Trinity Health, Series A, | ||
| 5.63%, 12/01/38 | 10,000 | 10,292,500 |
| Indiana Finance Authority, Refunding RB: | ||
| Duke Energy Indiana Project, Series B, | ||
| 6.00%, 8/01/39 | 8,335 | 8,686,070 |
| Improvement, U.S. Steel Corp., 6.00%, 12/01/26 | 10,500 | 10,106,145 |
| Indiana Municipal Power Agency, RB, Series B, | ||
| 6.00%, 1/01/39 | 10,500 | 10,925,670 |
| Indianapolis Local Public Improvement Bond Bank, | ||
| Refunding RB, Waterworks Project, Series A (AGC), | ||
| 5.50%, 1/01/38 | 34,125 | 35,238,840 |
| 75,249,225 | ||
| Kansas — 0.0% | ||
| Sedgwick & Shawnee Counties Kansas, RB, Mortgage- | ||
| Backed Securities, Series A1, AMT (Ginnie Mae), | ||
| 6.95%, 6/01/29 | 685 | 721,606 |
| Kentucky — 0.8% | ||
| Kentucky Economic Development Finance Authority, | ||
| RB, Louisville Arena, Sub-Series A-1 (AGC), | ||
| 6.00%, 12/01/42 | 2,500 | 2,561,550 |
| Par | ||
| Municipal Bonds | (000) | Value |
| Kentucky (concluded) | ||
| Kentucky Economic Development Finance Authority, | ||
| Refunding RB, Owensboro Medical Health System, | ||
| Series A, 6.38%, 6/01/40 | $ 5,000 | $ 4,937,500 |
| Louisville/Jefferson County Metropolitan Government, | ||
| Refunding RB, Jewish Hospital & St. Mary’s HealthCare, | ||
| 6.13%, 2/01/37 | 12,000 | 12,335,280 |
| 19,834,330 | ||
| Louisiana — 0.8% | ||
| Louisiana HFA, RB, S/F, Series D-2, AMT (Ginnie Mae), | ||
| 5.80%, 6/01/20 | 145 | 149,708 |
| Louisiana Local Government Environmental Facilities | ||
| & Community Development Authority, RB, Westlake | ||
| Chemical Corp.: | ||
| Projects, 6.75%, 11/01/32 | 3,500 | 3,517,395 |
| Series A, 6.50%, 8/01/29 | 6,665 | 6,656,669 |
| Louisiana Local Government Environmental Facilities | ||
| & Community Development Authority, RB, Westlake | ||
| Chemical Corp.: | ||
| Series A-1, 6.50%, 11/01/35 | 8,360 | 8,276,734 |
| 18,600,506 | ||
| Maryland — 0.4% | ||
| Maryland Community Development Administration, HRB, | ||
| Series B, AMT, 6.15%, 1/01/21 | 730 | 730,818 |
| Maryland Community Development Administration, RB, | ||
| Waters Landing II Apartments, Series A, Mandatory | ||
| Put Bonds, AMT, 5.88%, 8/01/33 (d) | 1,000 | 1,008,620 |
| Maryland EDC, RB: | ||
| Term Project, Series B, 5.75%, 6/01/35 | 1,500 | 1,424,580 |
| Transportation Facilities Project, Series A, | ||
| 5.75%, 6/01/35 | 2,350 | 2,209,282 |
| Maryland Health & Higher Educational Facilities Authority, | ||
| Refunding RB, Charlestown Community, 6.25%, 1/01/41 5,000 | 4,887,500 | |
| 10,260,800 | ||
| Massachusetts — 0.2% | ||
| Massachusetts HFA, RB, Series B, 7.00%, 12/01/38 | 5,000 | 5,399,300 |
| Michigan — 2.8% | ||
| County of Wayne Michigan, GO, Building Improvement, | ||
| Series A, 6.75%, 11/01/39 | 2,170 | 2,200,271 |
| Eastern Michigan University, Refunding RB, General | ||
| (AMBAC), 6.00%, 6/01/24 | 415 | 420,412 |
| Flint Hospital Building Authority Michigan, Refunding RB, | ||
| Hurley Medical Center, 6.00%, 7/01/20 | 2,635 | 2,499,824 |
| Kalamazoo Hospital Finance Authority, Refunding RB, | ||
| Bronson Methodist Hospital, 5.50%, 5/15/36 | 14,565 | 13,894,282 |
| Michigan State Building Authority, Refunding RB, Facilities | ||
| Program, Series I: | ||
| 6.00%, 10/15/38 | 10,875 | 11,340,559 |
| 6.25%, 10/15/38 | 6,250 | 6,616,125 |
| Michigan State Hospital Finance Authority, Refunding RB: | ||
| Henry Ford Health System, Series A, | ||
| 5.25%, 11/15/32 | 5,500 | 5,025,735 |
| Hospital, Henry Ford Health, 5.75%, 11/15/39 | 7,360 | 7,021,219 |
| Royal Oak Hospital Finance Authority Michigan, | ||
| Refunding RB: | ||
| William Beaumont Hospital, 8.25%, 9/01/39 | 15,195 | 17,481,088 |
| William Beaumont, Series W, 6.00%, 8/01/39 | 2,640 | 2,586,830 |
| 69,086,345 | ||
| Minnesota — 1.1% | ||
| City of Eden Prairie Minnesota, RB, Rolling Hills Project, | ||
| Series A (Ginnie Mae), 6.15%, 8/20/31 | 1,000 | 1,053,210 |
| City of Minneapolis Minnesota, Refunding RB, Fairview | ||
| Health Services: | ||
| Series A, 6.75%, 11/15/32 | 4,800 | 5,166,096 |
| Series B (AGC), 6.50%, 11/15/38 | 14,660 | 15,614,219 |
See Notes to Financial Statements.
SEMI-ANNUAL REPORT DECEMBER 31, 2010 29
Schedule of Investments (continued) BlackRock National Municipal Fund
(Percentages shown are based on Net Assets)
| Par | |||
| Municipal Bonds | (000) | Value | |
| Minnesota (concluded) | |||
| Minneapolis & St. Paul Metropolitan Airports Commission, | |||
| RB, Sub-Series D, AMT (NPFGC) (a): | |||
| 5.75%, 1/01/11 | $ 470 | $ 470,000 | |
| 5.75%, 1/01/11 | 470 | 470,000 | |
| 5.75%, 1/01/11 | 2,060 | 2,060,000 | |
| Ramsey County Housing & Redevelopment Authority | |||
| Minnesota, RB, Hanover Townhouses Project, AMT, | |||
| 6.00%, 7/01/31 | 1,110 | 1,111,887 | |
| 25,945,412 | |||
| Mississippi — 0.1% | |||
| County of Warren Mississippi, Refunding RB, International | |||
| Paper Co. Project, Series B, AMT, 6.75%, 8/01/21 | 1,700 | 1,718,207 | |
| Missouri — 0.0% | |||
| City of Fenton Missouri, Tax Allocation Bonds, Refunding, | |||
| Gravois Bluffs Redevelopment Project, 5.00%, 4/01/14 | 1,000 | 1,052,880 | |
| Multi-State — 0.1% | |||
| MuniMae TE Bond Subsidiary LLC, 7.50%, 6/30/49 (e)(f) | 1,866 | 1,734,963 | |
| Nevada — 4.2% | |||
| City of Las Vegas Nevada, GO, Limited Tax, Performing Arts | |||
| Center, 6.00%, 4/01/34 | 10,000 | 10,537,100 | |
| City of Reno Nevada, Special Assessment Bonds, | |||
| Somerset Parkway, 6.63%, 12/01/22 | 1,675 | 1,501,185 | |
| Clark County Water Reclamation District, GO, Series B, | |||
| 5.75%, 7/01/38 | 26,000 | 27,558,440 | |
| County of Clark Nevada, RB, Series B: | |||
| 5.13%, 7/01/36 | 20,000 | 18,489,000 | |
| 5.75%, 7/01/42 | 37,400 | 38,216,442 | |
| County of Clark Nevada, Special Assessment Bonds, | |||
| Special Improvement District No. 142, Local | |||
| Improvement, 6.38%, 8/01/23 | 1,450 | 1,323,995 | |
| Nevada Housing Division, RB, Multi-Unit Housing, | |||
| Series A, AMT (Freddie Mac), 6.30%, 4/01/32 | 4,950 | 4,952,228 | |
| 102,578,390 | |||
| New Hampshire — 0.1% | |||
| New Hampshire Business Finance Authority, Refunding RB, | |||
| Public Service Co. of New Hampshire Project, Series C | |||
| (NPFGC), 5.45%, 5/01/21 | 2,000 | 2,024,440 | |
| New Jersey — 0.9% | |||
| New Jersey EDA, RB, Cedar Crest Village Inc. Facility, | |||
| Series A, 7.25%, 11/15/11 (a) | 3,300 | 3,526,314 | |
| New Jersey EDA, Refunding RB, New Jersey American | |||
| Water Co., Inc. Project, Series B, AMT, 5.60%, 11/01/34 | 8,000 | 7,773,920 | |
| New Jersey Educational Facilities Authority, Refunding RB, | |||
| University of Medicine & Dentistry, Series B: | |||
| 7.13%, 12/01/23 | 1,870 | 2,104,068 | |
| 7.50%, 12/01/32 | 7,200 | 7,873,200 | |
| New Jersey State Housing & Mortgage Finance Agency, | |||
| Refunding RB, Series B (AGM), 6.25%, 11/01/26 | 640 | 640,512 | |
| 21,918,014 | |||
| New Mexico — 0.1% | |||
| County of Santa Fe New Mexico, RB (AGM), | |||
| 6.00%, 2/01/27 | 250 | 280,678 | |
| New Mexico Mortgage Finance Authority, RB, S/F Mortgage | |||
| Program, Series D, AMT (Fannie Mae), 6.15%, 7/01/35 | 1,630 | 1,740,106 | |
| 2,020,784 | |||
| New York — 5.2% | |||
| City of New York New York, GO, Series E-1, | |||
| 6.25%, 10/15/28 | 7,600 | 8,391,540 | |
| Long Island Power Authority, Refunding RB, General, | |||
| Series A, 6.00%, 5/01/33 | 40,800 | 43,520,952 | |
| Metropolitan Transportation Authority, RB, Series 2008C, | |||
| 6.50%, 11/15/28 | 17,420 | 19,269,133 | |
| Par | ||
| Municipal Bonds | (000) | Value |
| New York (concluded) | ||
| New York City Housing Development Corp., RB, Series M: | ||
| 6.50%, 11/01/28 | $ 4,300 | $ 4,445,942 |
| 6.88%, 11/01/38 | 5,700 | 5,917,341 |
| New York City Industrial Development Agency, RB, | ||
| Special Needs Facilities Pooled Program, Series C-1, | ||
| 6.00%, 7/01/12 | 1,295 | 1,289,212 |
| New York State Dormitory Authority, ERB, Series B, | ||
| 5.75%, 3/15/36 | 13,900 | 14,844,088 |
| New York State Dormitory Authority, Refunding RB, | ||
| State University Educational Facilities, Series A, | ||
| 7.50%, 5/15/13 | 3,000 | 3,414,480 |
| New York State Urban Development Corp., RB, State | ||
| Personal Income Tax, Series B, 5.00%, 3/15/37 | 10,000 | 9,970,300 |
| Oneida County Industrial Development Agency New York, | ||
| RB, Civic Facility, Faxton Hospital, Series C (Radian), | ||
| 6.63%, 1/01/15 | 1,885 | 1,899,175 |
| Port Authority of New York & New Jersey, Refunding RB, | ||
| Consolidated, 152nd Series, AMT, 5.75%, 11/01/30 | 3,250 | 3,365,570 |
| Westchester County Industrial Development Agency | ||
| New York, MRB, Kendal on Hudson Project, Series A, | ||
| 6.50%, 1/01/13 (a) | 8,095 | 8,959,060 |
| Westchester County Industrial Development Agency | ||
| New York, RB, Special Needs Facilities Pooled Program, | ||
| Series E-1, 6.00%, 7/01/12 | 300 | 298,659 |
| 125,585,452 | ||
| North Carolina — 0.4% | ||
| Columbus County Industrial Facilities & Pollution Control | ||
| Financing Authority North Carolina, RB, International | ||
| Paper Co. Projects, Series B, 6.25%, 11/01/33 | 3,000 | 3,069,540 |
| North Carolina HFA, RB, Homeownership Ownership, | ||
| Series 9A, AMT, 5.80%, 1/01/20 | 3,020 | 3,118,059 |
| North Carolina Medical Care Commission, RB, First | ||
| Mortgage (a): | ||
| Forest at Duke Project, 6.38%, 9/01/12 | 1,000 | 1,087,610 |
| Givens Estates Project, Series A, 6.50%, 7/01/13 | 2,500 | 2,842,950 |
| 10,118,159 | ||
| Ohio — 2.6% | ||
| County of Allen Ohio, Refunding RB, Catholic Healthcare, | ||
| Series B, 5.25%, 9/01/27 | 14,345 | 14,671,492 |
| County of Montgomery Ohio, Refunding RB, Catholic | ||
| Healthcare, Series A, 5.50%, 5/01/34 | 21,850 | 22,405,864 |
| Ohio HFA, Refunding RB, Residential Mortgage Backed, | ||
| Series C, AMT (Ginnie Mae), 5.90%, 9/01/35 | 420 | 426,506 |
| Ohio State Water Development Authority, Refunding RB, | ||
| FirstEnergy Nuclear Generation Corp. Project, Series A, | ||
| Mandatory Put Bonds (d): | ||
| 5.88%, 6/01/33 | 8,300 | 9,052,146 |
| 3.38%, 7/01/33 | 16,000 | 15,805,920 |
| 62,361,928 | ||
| Oregon — 0.0% | ||
| City of Portland Oregon, HRB, Lovejoy Station Apartments | ||
| Project, AMT (NPFGC), 5.90%, 7/01/23 | 500 | 500,380 |
| Pennsylvania — 3.0% | ||
| Allegheny County Hospital Development Authority, | ||
| Refunding RB, Health System, West Penn, Series A, | ||
| 5.38%, 11/15/40 | 7,250 | 4,861,850 |
| Cumberland County Municipal Authority, RB, Diakon | ||
| Lutheran, 6.38%, 1/01/39 | 8,975 | 8,865,415 |
| Cumberland County Municipal Authority, Refunding RB, | ||
| Diakon Lutheran, 6.50%, 1/01/39 | 2,245 | 2,246,818 |
| Dauphin County General Authority, Refunding RB, | ||
| Pinnacle Health System Project, Series A: | ||
| 6.00%, 6/01/29 | 8,000 | 8,083,680 |
| 6.00%, 6/01/36 | 2,775 | 2,774,833 |
See Notes to Financial Statements.
30 SEMI-ANNUAL REPORT DECEMBER 31, 2010
Schedule of Investments (continued) BlackRock National Municipal Fund
(Percentages shown are based on Net Assets)
| Par | ||
| Municipal Bonds | (000) | Value |
| Pennsylvania (concluded) | ||
| Delaware County IDA Pennsylvania, Refunding RB, | ||
| Resource Recovery Facility, Series A, 6.10%, 7/01/13 | $ 5,200 | $ 5,199,636 |
| Lancaster County Hospital Authority, RB, Brethren Village | ||
| Project, Series A: | ||
| 6.25%, 7/01/26 | 1,160 | 1,133,042 |
| 6.50%, 7/01/40 | 2,500 | 2,315,700 |
| Pennsylvania Economic Development Financing | ||
| Authority, RB: | ||
| Allegheny Energy Supply Co., 7.00%, 7/15/39 | 10,000 | 10,764,000 |
| American Water Co. Project, 6.20%, 4/01/39 | 2,475 | 2,580,089 |
| Pennsylvania HFA, Refunding RB, S/F Mortgage, | ||
| Series 62A, AMT, 5.45%, 10/01/29 | 3,000 | 2,999,910 |
| Pennsylvania Turnpike Commission, RB, Sub-Series B, | ||
| 5.25%, 6/01/39 | 18,865 | 18,375,076 |
| Philadelphia Authority for Industrial Development, RB, | ||
| Commercial Development, AMT, 7.75%, 12/01/17 | 1,265 | 1,265,810 |
| Sayre Health Care Facilities Authority, Refunding RB, | ||
| Guthrie Health, Series A, 5.88%, 12/01/31 | 1,085 | 1,090,295 |
| 72,556,154 | ||
| Puerto Rico — 2.9% | ||
| Commonwealth of Puerto Rico, GO, Refunding, Public | ||
| Improvement, Series B, 6.50%, 7/01/37 | 15,000 | 16,039,200 |
| Puerto Rico Industrial Tourist Educational Medical | ||
| & Environmental Control Facilities Financing | ||
| Authority, RB, Hospital De La Concepcion, Series A, | ||
| 6.13%, 11/15/25 | 4,000 | 4,051,160 |
| Puerto Rico Sales Tax Financing Corp., RB, First | ||
| Sub-Series A, 6.50%, 8/01/44 | 20,000 | 21,608,200 |
| Puerto Rico Sales Tax Financing Corp., Refunding RB, | ||
| First Sub-Series C: | ||
| 5.38%, 8/01/38 | 14,105 | 13,584,384 |
| 6.00%, 8/01/39 | 15,800 | 16,133,696 |
| 71,416,640 | ||
| Rhode Island — 0.8% | ||
| Rhode Island Health & Educational Building Corp., RB, | ||
| Hospital Financing, LifeSpan Obligation, Series A (AGC), | ||
| 7.00%, 5/15/39 | 6,250 | 6,936,312 |
| Rhode Island Health & Educational Building Corp., | ||
| Refunding RB, Public Schools Financing Program, | ||
| Series E (AGC), 6.00%, 5/15/29 | 11,070 | 11,733,536 |
| 18,669,848 | ||
| South Carolina — 0.4% | ||
| Medical University Hospital Authority, Refunding RB, | ||
| Series A (a): | ||
| 6.38%, 8/15/12 | 5,400 | 5,888,322 |
| 6.50%, 8/15/12 | 2,450 | 2,676,478 |
| 8,564,800 | ||
| Tennessee — 0.4% | ||
| Memphis-Shelby County Airport Authority, RB, AMT: | ||
| Series B, 5.75%, 7/01/25 | 2,000 | 2,016,020 |
| Series D (AMBAC), 6.00%, 3/01/24 | 715 | 716,087 |
| Shelby County Health Educational & Housing Facilities | ||
| Board, Refunding RB, Methodist Healthcare (a): | ||
| 6.50%, 9/01/12 | 2,920 | 3,197,838 |
| 6.50%, 9/01/12 | 4,380 | 4,796,757 |
| 10,726,702 | ||
| Texas — 10.6% | ||
| Austin Texas Convention Enterprises Inc., RB, First Tier, | ||
| Series A (a): | ||
| 6.60%, 1/01/11 | 5,300 | 5,300,000 |
| 6.70%, 1/01/11 | 2,300 | 2,300,000 |
| Par | ||
| Municipal Bonds | (000) | Value |
| Texas (concluded) | ||
| Bexar County Health Facilities Development Corp. Texas, | ||
| Refunding RB, Army Retirement Residence Project, | ||
| 6.30%, 7/01/12 (a) | $ 1,750 | $ 1,899,748 |
| Brazos River Authority, Refunding RB, TXU Electric Co. | ||
| Project, Series C, Mandatory Put Bonds, AMT, | ||
| 5.75%, 5/01/36 (d) | 3,000 | 2,795,640 |
| Brazos River Harbor Navigation District, Refunding RB, | ||
| Dow Chemical Co. Project, Series A7, AMT, | ||
| 6.63%, 5/15/33 | 6,865 | 6,881,888 |
| City of Houston Texas, RB, Subordinate Lien, Series A, | ||
| AMT (AGM), 5.63%, 7/01/30 | 1,150 | 1,131,290 |
| City of Houston Texas, Refunding RB, Combined, | ||
| First Lien, Series A (AGC), 6.00%, 11/15/35 | 23,900 | 25,959,702 |
| County of Montgomery Texas, GO, Series 08-B, | ||
| 5.13%, 3/01/31 | 5,000 | 5,027,800 |
| Dallas-Fort Worth International Airport Facilities | ||
| Improvement Corp., RB, Series A, AMT (NPFGC), | ||
| 6.00%, 11/01/24 | 30,000 | 30,033,900 |
| Gulf Coast Waste Disposal Authority, Refunding RB, | ||
| Series A, AMT, 6.10%, 8/01/24 | 4,025 | 4,027,737 |
| Harris County Cultural Education Facilities Finance Corp., | ||
| Refunding RB, St. Luke’s, 5.63%, 2/15/25 | 10,000 | 10,453,100 |
| Harris County Health Facilities Development Corp., | ||
| Refunding RB, Memorial Hermann Healthcare System, | ||
| Series B, 7.25%, 12/01/35 | 3,900 | 4,241,757 |
| La Vernia Higher Education Finance Corp., RB, KIPP Inc., | ||
| 6.25%, 8/15/39 | 1,000 | 971,400 |
| Love Field Airport Modernization Corp., RB, Southwest | ||
| Airlines Co. Project, 5.25%, 11/01/40 | 5,430 | 4,846,492 |
| Matagorda County Navigation District No. 1 Texas, | ||
| Refunding RB, Central Power & Light Co. Project, | ||
| Series A, 6.30%, 11/01/29 | 7,300 | 7,566,596 |
| North Texas Tollway Authority, RB, Toll, Second Tier, | ||
| Series F, 6.13%, 1/01/31 | 16,865 | 16,990,982 |
| North Texas Tollway Authority, Refunding RB, System, | ||
| First Tier, 6.00%, 1/01/34 | 11,355 | 11,380,322 |
| Port of Bay City Authority Texas, RB, Hoechst Celanese | ||
| Corp. Project, AMT, 6.50%, 5/01/26 | 7,495 | 7,365,861 |
| State of Texas, GO, Transportation Commission, | ||
| Mobility Fund, 5.00%, 4/01/37 | 12,750 | 12,816,937 |
| Tarrant County Cultural Education Facilities Finance Corp., | ||
| RB, Scott & White Healthcare, 6.00%, 8/15/45 | 40,000 | 40,876,400 |
| Tarrant County Cultural Education Facilities Finance Corp., | ||
| Refunding RB, Northwest Senior Housing, Edgemere | ||
| Project, Series A, 6.00%, 11/15/26 | 2,200 | 2,171,048 |
| Texas Private Activity Bond Surface Transportation Corp., | ||
| RB, Senior Lien: | ||
| LBJ Infrastructure Group LLC, LBJ Freeway Managed | ||
| Lanes Project, 7.00%, 6/30/40 | 20,000 | 20,248,800 |
| NTE Mobility Partners LLC, North Tarrant Express | ||
| Managed Lanes Project, 6.88%, 12/31/39 | 20,350 | 20,451,546 |
| Texas State University Systems, RB, Series A, | ||
| 5.00%, 3/15/35 | 10,685 | 10,699,852 |
| 256,438,798 | ||
| Washington — 1.5% | ||
| Port of Seattle Washington, Refunding RB, Intermediate | ||
| Lien, Series B, 5.00%, 6/01/40 | 20,075 | 19,152,955 |
| Seattle Housing Authority Washington, HRB, Replacement | ||
| Housing Projects, 6.13%, 12/01/32 | 4,355 | 3,935,309 |
| Seattle Housing Authority Washington, RB, Newholly | ||
| Project, AMT, 6.25%, 12/01/35 | 2,750 | 2,268,970 |
| Washington Health Care Facilities Authority, Refunding RB, | ||
| Catholic Health Initiatives, Series D, 6.38%, 10/01/36 | 10,000 | 10,655,400 |
| 36,012,634 |
See Notes to Financial Statements.
SEMI-ANNUAL REPORT DECEMBER 31, 2010 31
Schedule of Investments (continued) BlackRock National Municipal Fund
(Percentages shown are based on Net Assets)
| Par | ||
| Municipal Bonds | (000) | Value |
| Wisconsin — 1.5% | ||
| State of Wisconsin, Refunding RB, Series A, | ||
| 6.00%, 5/01/36 | $12,500 | $ 13,404,000 |
| Wisconsin Health & Educational Facilities Authority, RB: | ||
| Health Facilities, SSM Health Care, Series A, | ||
| 5.25%, 6/01/34 | 8,360 | 8,107,612 |
| SynergyHealth Inc., 6.00%, 11/15/23 | 5,010 | 5,127,334 |
| Wisconsin Health & Educational Facilities Authority, | ||
| Refunding RB, Froedtert & Community Health Inc., | ||
| 5.25%, 4/01/39 | 10,000 | 9,698,500 |
| Wisconsin Housing & EDA, RB, Series C, AMT, | ||
| 6.00%, 9/01/36 | 440 | 458,027 |
| 36,795,473 | ||
| Wyoming — 0.4% | ||
| County of Sweetwater Wyoming, Refunding RB, Idaho | ||
| Power Co. Project, 5.25%, 7/15/26 | 10,000 | 10,054,500 |
| Total Municipal Bonds — 84.8% | 2,059,908,563 | |
| Municipal Bonds Transferred to | ||
| Tender Option Bond Trusts (g) | ||
| Arizona — 2.2% | ||
| Salt River Project Agricultural Improvement & Power | ||
| District, RB, Series A: | ||
| 5.00%, 1/01/37 | 13,217 | 13,178,945 |
| 5.00%, 1/01/38 | 26,745 | 26,627,298 |
| Salt River Project Agricultural Improvement & Power | ||
| District, Refunding RB, Salt River Project, Series A, | ||
| 5.00%, 1/01/35 | 13,700 | 13,700,000 |
| 53,506,243 | ||
| Arkansas — 0.9% | ||
| University of Arkansas, RB, Various Facilities, | ||
| UAMS Campus (NPFGC), 5.00%, 3/01/36 | 21,290 | 21,077,952 |
| California — 7.4% | ||
| Anaheim Public Financing Authority, RB, Distribution | ||
| System, Second Lien (BHAC), 5.00%, 10/01/34 | 10,995 | 10,918,545 |
| Los Angeles Department of Airports, Refunding RB, | ||
| Senior, Los Angeles International Airport, Series A, | ||
| 5.00%, 5/15/40 | 19,510 | 18,670,094 |
| Los Angeles Department of Water & Power, RB, Power | ||
| System, Sub-Series A-1 (AMBAC), 5.00%, 7/01/37 | 20,000 | 19,711,000 |
| Metropolitan Water District of Southern California, RB, | ||
| Series A: | ||
| 5.00%, 1/01/39 | 10,000 | 10,019,600 |
| (AGM), 5.00%, 7/01/30 | 4,999 | 5,018,600 |
| Metropolitan Water District of Southern California, | ||
| Refunding RB: | ||
| Series B, 5.00%, 7/01/35 | 4,999 | 5,018,600 |
| Series C, 5.00%, 7/01/35 | 13,375 | 13,439,287 |
| San Diego Community College District California, | ||
| GO (AGM): | ||
| Election of 2002, 5.00%, 5/01/30 | 20,000 | 19,925,000 |
| Election of 2006, 5.00%, 8/01/32 | 18,000 | 17,928,540 |
| San Diego Public Facilities Financing Authority, | ||
| Refunding RB, Series B, 5.38%, 8/01/34 | 15,000 | 15,314,550 |
| San Francisco City & County Public Utilities Commission, | ||
| Refunding RB, Series A, 5.13%, 11/01/39 | 23,000 | 23,136,390 |
| University of California, RB, Series O, 5.25%, 5/15/39 | 20,695 | 20,945,150 |
| 180,045,356 | ||
| Florida — 3.7% | ||
| Florida State Board of Education, GO: | ||
| Capital Outlay 2008, Series E, 5.00%, 6/01/37 | 39,730 | 39,440,368 |
| Series 2006C, 5.00%, 6/01/37 | 49,996 | 49,631,675 |
| 89,072,043 |
| Municipal Bonds Transferred | Par | |
| to Tender Option Bond Trusts (g) | (000) | Value |
| Indiana — 1.8% | ||
| Indiana Finance Authority, RB, Sisters of St. Francis | ||
| Health, 5.25%, 11/01/39 | $20,640 | $ 19,867,651 |
| Indianapolis Local Public Improvement Bond Bank, | ||
| Refunding RB, PILOT, Infrastructure Project, Series F | ||
| (AGM), 5.00%, 1/01/35 | 23,550 | 23,130,104 |
| 42,997,755 | ||
| Nebraska — 0.4% | ||
| Omaha Public Power District, RB, Series A, | ||
| 5.00%, 2/01/43 | 10,000 | 9,904,900 |
| New York — 1.6% | ||
| New York City Municipal Water Finance Authority, | ||
| Refunding RB, Series A, 5.13%, 6/15/34 | 8,935 | 8,946,486 |
| New York State Environmental Facilities Corp., | ||
| Refunding RB, Revolving Funds, New York City Municipal | ||
| Water Project, Series K, 5.00%, 6/15/28 | 30,000 | 30,738,900 |
| 39,685,386 | ||
| Ohio — 0.8% | ||
| County of Hamilton Ohio, Refunding RB, Sub-Series A | ||
| (AGM), 5.00%, 12/01/32 | 20,000 | 20,019,400 |
| Pennsylvania — 0.7% | ||
| Pennsylvania HFA, Refunding RB, Series 105C, | ||
| 5.00%, 10/01/39 | 19,470 | 18,501,173 |
| Texas — 4.1% | ||
| City of Houston Texas, Refunding RB, Combined, First Lien, | ||
| Series A: | ||
| (AGC), 5.38%, 11/15/38 | 26,160 | 26,715,115 |
| (NPFGC), 5.13%, 5/15/28 | 20,000 | 20,329,600 |
| City of San Antonio Texas, Refunding RB: | ||
| 5.00%, 2/01/17 (a) | 12,000 | 12,113,700 |
| 5.00%, 2/01/32 | 12,000 | 12,113,700 |
| Dallas Area Rapid Transit, Refunding RB, Senior Lien | ||
| (AMBAC), 5.00%, 12/01/36 | 27,860 | 27,698,628 |
| 98,970,743 | ||
| Total Municipal Bonds Transferred to | ||
| Tender Option Bond Trusts — 23.6% | 573,780,951 | |
| Total Long-Term Investments | ||
| (Cost — $2,636,817,499) — 108.4% | 2,633,689,514 | |
| Short-Term Securities | ||
| FFI Institutional Tax-Exempt Fund, 0.18% (h)(i) | 29,958,892 | 29,958,892 |
| Total Short-Term Securities | ||
| (Cost — $29,958,892) — 1.2% | 29,958,892 | |
| Total Investments (Cost — $2,666,776,391*) — 109.6% | 2,663,648,406 | |
| Other Assets Less Liabilities — 2.2% | 54,605,058 | |
| Liability for Trust Certificates, Including Interest | ||
| Expense and Fees Payable — (11.8)% | (288,076,277) | |
| Net Assets — 100.0% | $2,430,177,187 | |
* The cost and unrealized appreciation (depreciation) of investments as of
December 31, 2010, as computed for federal income tax purposes, were as follows:
| Aggregate cost | $2,378,711,185 |
| Gross unrealized appreciation | $ 36,121,809 |
| Gross unrealized depreciation | (39,095,386) |
| Net unrealized depreciation | $ (2,973,577) |
See Notes to Financial Statements.
32 SEMI-ANNUAL REPORT DECEMBER 31, 2010
Schedule of Investments (concluded) BlackRock National Municipal Fund
(a) US government securities, held in escrow, are used to pay interest on this security as
well as to retire the bond in full at the date indicated, typically at a premium to par.
(b) Issuer filed for bankruptcy and/or is in default of interest payments.
(c) Non-income producing security.
(d) Variable rate security. Rate shown is as of report date.
(e) Security exempt from registration under Rule 144A of the Securities Act of 1933.
These securities may be resold in transactions exempt from registration to qualified
institutional investors.
(f) Security represents a beneficial interest in a trust. The collateral deposited into the
trust is federally tax-exempt revenue bonds issued by various state or local govern-
ments, or their respective agencies or authorities. The security is subject to remarket-
ing prior to its stated maturity.
(g) Securities represent bonds transferred to a tender option bond trust in exchange
for which the Fund acquired residual interest certificates. These securities serve
as collateral in a financing transaction. See Note 1 of the Notes to Financial
Statements for details of municipal bonds transferred to tender option bond trusts.
(h) Investments in companies considered to be an affiliate of the Fund during the
period, for purposes of Section 2(a)(3) of the Investment Company Act of 1940, as
amended, were as follows:
| Shares Held | Shares Held | |||
| at June 30, | Net | at December 31, | ||
| Affiliate | 2010 | Activity | 2010 | Income |
| FFI Institutional | ||||
| Tax-Exempt Fund | 115,316,742 | (85,357,850) 29,958,892 | $150,246 | |
(i) Represents the current yield as of report date.
•Fair Value Measurements — Various inputs are used in determining the fair value of
investments and derivatives, which are as follows:
•Level 1 — price quotations in active markets/exchanges for identical assets
and liabilities
•Level 2 — other observable inputs (including, but not limited to: quoted prices for
similar assets or liabilities in markets that are active, quoted prices for identical
or similar assets or liabilities in markets that are not active, inputs other than
quoted prices that are observable for the assets or liabilities (such as interest
rates, yield curves, volatilities, prepayment speeds, loss severities, credit risks and
default rates) or other market-corroborated inputs)
•Level 3 — unobservable inputs based on the best information available in the
circumstances, to the extent observable inputs are not available (including the
Fund’s own assumptions used in determining the fair value of investments)
The inputs or methodologies used for valuing securities are not necessarily an
indication of the risk associated with investing in those securities. For information
about the Fund’s policy regarding valuation of investments and other significant
accounting policies, please refer to Note 1 of the Notes to Financial Statements.
The following table summarizes the inputs used as of December 31, 2010 in
determining the fair valuation of the Fund’s investments:
| Valuation Inputs | Level 1 | Level 2 | Level 3 | Total |
| Assets: | ||||
| Investments in | ||||
| Securities: | ||||
| Long-Term | ||||
| Investments1 | — | $2,633,689,514 | — | $2,633,689,514 |
| Short-Term | ||||
| Securities | $ 29,958,892 | — | — | 29,958,892 |
| Total | $ 29,958,892 | $2,633,689,514 | — | $2,663,648,406 |
1 See above Schedule of Investments for values in each state or
political subdivision.
See Notes to Financial Statements.
SEMI-ANNUAL REPORT DECEMBER 31, 2010 33
Schedule of Investments December 31, 2010 (Unaudited) BlackRock High Yield Municipal Fund
(Percentages shown are based on Net Assets)
| Par | ||
| Municipal Bonds | (000) | Value |
| Alabama — 1.6% | ||
| Alabama State Docks Department, Refunding RB, | ||
| 6.00%, 10/01/40 | $ 710 | $ 683,290 |
| County of Jefferson Alabama, RB, Series A: | ||
| 5.25%, 1/01/17 | 1,000 | 950,220 |
| 5.25%, 1/01/20 | 500 | 463,830 |
| 4.75%, 1/01/25 | 260 | 213,377 |
| 2,310,717 | ||
| Arizona — 5.3% | ||
| Maricopa County IDA Arizona, RB, Arizona Charter Schools | ||
| Project, Series A: | ||
| 6.63%, 7/01/20 | 140 | 107,250 |
| 6.75%, 7/01/29 | 300 | 200,769 |
| Phoenix IDA Arizona, Refunding RB, America West | ||
| Airlines Inc. Project, AMT, 6.30%, 4/01/23 | 1,000 | 835,700 |
| Pima County IDA, IDRB, Tucson Electric Power, Series A, | ||
| 6.38%, 9/01/29 | 780 | 789,563 |
| Pima County IDA, RB, Tucson Electric Power Co., Series A, | ||
| 5.25%, 10/01/40 | 1,390 | 1,213,192 |
| Pima County IDA, Refunding IDRB, Tucson Electric Power, | ||
| 5.75%, 9/01/29 | 290 | 286,706 |
| Queen Creek Improvement District No. 1, Special | ||
| Assessment Bonds, 5.00%, 1/01/32 | 500 | 451,795 |
| Salt Verde Financial Corp., RB, Senior: | ||
| 5.00%, 12/01/32 | 750 | 650,955 |
| 5.00%, 12/01/37 | 3,180 | 2,697,975 |
| University Medical Center Corp. Arizona, RB, | ||
| 6.25%, 7/01/29 | 180 | 186,352 |
| 7,420,257 | ||
| Arkansas — 0.5% | ||
| Benton County Public Facilities Board, Refunding RB, | ||
| BCCSO Project, Series A, 6.00%, 6/01/40 | 750 | 729,773 |
| California — 6.3% | ||
| California Health Facilities Financing Authority, | ||
| Refunding RB, Series A: | ||
| Catholic Healthcare West, 6.00%, 7/01/39 | 265 | 271,013 |
| St. Joseph Health System, 5.75%, 7/01/39 | 1,000 | 1,006,010 |
| California Pollution Control Financing Authority, RB, | ||
| Waste Management Inc. Project, Series C, AMT, | ||
| 5.13%, 11/01/23 | 750 | 741,270 |
| California Pollution Control Financing Authority, | ||
| Refunding RB, Waste Management Inc. Project, | ||
| Series B, AMT, 5.00%, 7/01/27 | 1,000 | 949,350 |
| California Statewide Communities Development Authority, | ||
| RB, John Muir Health, 5.13%, 7/01/39 | 425 | 385,781 |
| California Statewide Communities Development Authority, | ||
| Refunding RB: | ||
| American Baptist Homes of the West, | ||
| 6.25%, 10/01/39 | 575 | 540,029 |
| Senior Living, Southern California, 6.63%, 11/15/24 | 650 | 675,760 |
| City of Chula Vista California, Refunding RB, San Diego | ||
| Gas & Electric, Series A, 5.88%, 2/15/34 | 500 | 530,085 |
| City of Roseville California, Special Tax Bonds, | ||
| Fiddyment Ranch Community Facilities District No. 1, | ||
| 5.25%, 9/01/36 | 465 | 367,201 |
| Lammersville School District Community Facilities District, | ||
| Special Tax Bonds, District No. 2002, Mountain House, | ||
| 5.13%, 9/01/35 | 325 | 254,813 |
| Oakland Unified School District Alameda County | ||
| California, GO, Election of 2006, Series A, | ||
| 6.13%, 8/01/29 | 1,000 | 1,013,580 |
| Par | |||
| Municipal Bonds | (000) | Value | |
| California (concluded) | |||
| Roseville Finance Authority, Special Tax Bonds, Refunding, | |||
| Senior Lien, Series A (AMBAC), 4.50%, 9/01/33 | $ 725 | $ 541,009 | |
| State of California, GO, Various Purpose, 6.00%, 3/01/33 | 1,400 | 1,447,712 | |
| Temecula Public Financing Authority, Special Tax Bonds, | |||
| Refunding, Harveston, Sub-Series B, 5.10%, 9/01/36 | 180 | 138,955 | |
| 8,862,568 | |||
| Colorado — 1.2% | |||
| Colorado Health Facilities Authority, Refunding RB, Total | |||
| Longterm Care National Obligated Group Project, | |||
| Series A, 6.00%, 11/15/30 | 590 | 561,709 | |
| E-470 Public Highway Authority, Refunding RB, CAB, | |||
| 7.08%, 9/01/35 (a) | 1,305 | 204,337 | |
| Regional Transportation District, RB, Denver Transport | |||
| Partners, 6.00%, 1/15/41 | 1,000 | 979,530 | |
| 1,745,576 | |||
| Connecticut — 1.1% | |||
| Harbor Point Infrastructure Improvement District, | |||
| Tax Allocation Bonds, Harbor Point Project, Series A, | |||
| 7.88%, 4/01/39 | 1,050 | 1,075,956 | |
| Mohegan Tribe of Indians of Connecticut, RB, Public | |||
| Improvement, Priority Distribution, 6.25%, 1/01/31 | 605 | 472,511 | |
| 1,548,467 | |||
| Delaware — 0.9% | |||
| Delaware State EDA, RB, Exempt Facilities, Indian River | |||
| Power, 5.38%, 10/01/45 | 1,480 | 1,309,741 | |
| District of Columbia — 3.4% | |||
| District of Columbia Tobacco Settlement Financing Corp., | |||
| Refunding RB, Asset-Backed, 6.50%, 5/15/33 | 1,510 | 1,488,845 | |
| District of Columbia, RB, Methodist Home District of | |||
| Columbia, Series A: | |||
| 7.38%, 1/01/30 | 310 | 310,688 | |
| 7.50%, 1/01/39 | 500 | 501,535 | |
| Metropolitan Washington Airports Authority, RB: | |||
| CAB, 2nd Senior Lien, Series B (AGC), | |||
| 6.54%, 10/01/30 (a) | 3,005 | 823,941 | |
| First Senior Lien, Series A, 5.00%, 10/01/39 | 85 | 81,493 | |
| First Senior Lien, Series A, 5.25%, 10/01/44 | 1,610 | 1,594,769 | |
| 4,801,271 | |||
| Florida — 6.2% | |||
| County of Miami-Dade Florida, Refunding RB, Miami | |||
| International Airport, Series A-1, 5.38%, 10/01/41 | 315 | 299,893 | |
| Florida Housing Finance Corp., HRB, Willow Lake | |||
| Apartments, Series J-1, AMT (AMBAC), 5.35%, 7/01/27 | 2,400 | 2,152,248 | |
| Highland Meadows Community Development District, | |||
| Special Assessment Bonds, Special Assessment, | |||
| Series A, 5.50%, 5/01/36 (b)(c) | 490 | 188,821 | |
| Hillsborough County IDA, RB: | |||
| National Gypsum Co., Series B, AMT, 7.13%, 4/01/30 | 1,250 | 1,130,825 | |
| Tampa General Hospital Project, 5.25%, 10/01/41 | 1,000 | 868,890 | |
| Jacksonville Economic Development Commission, RB, | |||
| Gerdau Ameristeel US Inc., AMT, 5.30%, 5/01/37 | 300 | 240,408 | |
| Lee County IDA Florida, RB, Series A, Lee Charter | |||
| Foundation, 5.38%, 6/15/37 | 570 | 438,963 | |
| Palm Beach County Health Facilities Authority, RB, | |||
| Acts Retirement Life Community, 5.50%, 11/15/33 | 1,500 | 1,391,415 | |
| Santa Rosa Bay Bridge Authority, RB, 6.25%, 7/01/28 | 500 | 234,330 | |
| Sarasota County Health Facilities Authority, Refunding RB, | |||
| Village On The Isle Project: | |||
| 5.50%, 1/01/27 | 210 | 181,967 | |
| 5.50%, 1/01/32 | 190 | 158,886 | |
| Sumter Landing Community Development District Florida, | |||
| RB, Sub-Series B, 5.70%, 10/01/38 | 815 | 626,947 | |
See Notes to Financial Statements.
34 SEMI-ANNUAL REPORT DECEMBER 31, 2010
Schedule of Investments (continued) BlackRock High Yield Municipal Fund
(Percentages shown are based on Net Assets)
| Par | |||
| Municipal Bonds | (000) | Value | |
| Florida (concluded) | |||
| Tolomato Community Development District, | |||
| Special Assessment Bonds, Special Assessment, | |||
| 6.65%, 5/01/40 | $ 700 | $ 474,985 | |
| Watergrass Community Development District, Special | |||
| Assessment Bonds, Series A, 5.38%, 5/01/39 | 650 | 321,327 | |
| 8,709,905 | |||
| Georgia — 2.2% | |||
| Clayton County Development Authority, RB, Delta Air | |||
| Lines Inc. Project, Series A, 8.75%, 6/01/29 | 635 | 737,610 | |
| County of Clayton Georgia, Tax Allocation Bonds, | |||
| Ellenwood Project, 7.50%, 7/01/33 | 465 | 423,871 | |
| DeKalb County Hospital Authority Georgia, RB, DeKalb | |||
| Medical Center Inc. Project, 6.13%, 9/01/40 | 1,240 | 1,207,648 | |
| Gainesville & Hall County Development Authority, | |||
| Refunding RB, Acts Retirement Life Community, | |||
| Series A-2, 6.63%, 11/15/39 | 220 | 222,547 | |
| Richmond County Development Authority, RB, International | |||
| Paper Co. Projects, Series A, AMT, 5.00%, 8/01/30 | 500 | 430,950 | |
| 3,022,626 | |||
| Guam — 0.8% | |||
| Guam Government Waterworks Authority, Refunding RB, | |||
| Water, 6.00%, 7/01/25 | 235 | 235,963 | |
| Territory of Guam, GO, Series A: | |||
| 6.00%, 11/15/19 | 100 | 103,112 | |
| 6.75%, 11/15/29 | 150 | 160,298 | |
| 7.00%, 11/15/39 | 160 | 172,971 | |
| Territory of Guam, RB, Section 30, Series A, | |||
| 5.63%, 12/01/29 | 440 | 429,229 | |
| 1,101,573 | |||
| Idaho — 0.2% | |||
| Power County Industrial Development Corp., RB, | |||
| FMC Corp. Project, AMT, 6.45%, 8/01/32 | 265 | 261,041 | |
| Illinois — 4.8% | |||
| City of Chicago Illinois, Refunding RB, American | |||
| Airlines Inc. Project, 5.50%, 12/01/30 | 1,000 | 812,570 | |
| Illinois Finance Authority, RB: | |||
| MJH Education Assistance IV LLC, Sub-Series A, | |||
| 5.13%, 6/01/35 (b)(c) | 90 | 49,369 | |
| Navistar International, Recovery Zone, | |||
| 6.50%, 10/15/40 | 565 | 562,203 | |
| Roosevelt University Project, 6.50%, 4/01/44 | 830 | 845,961 | |
| Illinois Finance Authority, Refunding RB: | |||
| Central DuPage Health, Series B, 5.50%, 11/01/39 | 1,400 | 1,387,876 | |
| Friendship Village of Schaumburg, 7.13%, 2/15/39 | 1,000 | 955,620 | |
| Swedish Covenant, Series A, 6.00%, 8/15/38 | 1,000 | 955,850 | |
| Metropolitan Pier & Exposition Authority, Refunding RB, | |||
| CAB, McCormick Place Expansion Project, Series B | |||
| (AGM), 6.25%, 6/15/44 (a) | 3,455 | 377,321 | |
| Railsplitter Tobacco Settlement Authority, RB: | |||
| 5.50%, 6/01/23 | 355 | 345,340 | |
| 6.00%, 6/01/28 | 390 | 382,145 | |
| 6,674,255 | |||
| Indiana — 0.6% | |||
| Indiana Health Facility Financing Authority, Refunding RB, | |||
| Methodist Hospital Inc.: | |||
| 5.38%, 9/15/22 | 185 | 167,682 | |
| 5.50%, 9/15/31 | 525 | 424,342 | |
| Vigo County Hospital Authority Indiana, RB, Union | |||
| Hospital Inc. (d): | |||
| 5.70%, 9/01/37 | 155 | 132,243 | |
| 5.75%, 9/01/42 | 190 | 161,369 | |
| 885,636 | |||
| Par | |||
| Municipal Bonds | (000) | Value | |
| Iowa — 0.3% | |||
| Iowa Finance Authority, Refunding RB, Development, | |||
| Care Initiatives Project, Series A, 5.00%, 7/01/19 | $ 500 | $ 435,000 | |
| Kansas — 1.3% | |||
| Kansas Development Finance Authority, Refunding RB, | |||
| Lifespace Communities Inc., Series S, 5.00%, 5/15/30 | 2,000 | 1,800,080 | |
| Kentucky — 0.8% | |||
| Kentucky Economic Development Finance Authority, | |||
| Refunding RB: | |||
| Norton Healthcare Inc., Series B (NPFGC), | |||
| 5.89%, 10/01/24 (a) | 250 | 107,000 | |
| Owensboro Medical Health System, Series A, | |||
| 6.38%, 6/01/40 | 1,050 | 1,036,875 | |
| 1,143,875 | |||
| Louisiana — 0.7% | |||
| Louisiana Local Government Environmental Facilities | |||
| & Community Development Authority, RB, Westlake | |||
| Chemical Corp. Projects, 6.75%, 11/01/32 | 1,000 | 1,004,970 | |
| Maryland — 4.5% | |||
| County of Howard Maryland, Refunding RB, Vantage | |||
| House Facility, Series A, 5.25%, 4/01/33 | 500 | 378,215 | |
| Gaithersburg Maryland, Refunding RB, Asbury Maryland | |||
| Obligation, Series B, 6.00%, 1/01/23 | 750 | 752,070 | |
| Maryland EDC, RB: | |||
| Term Project, Series B, 5.75%, 6/01/35 | 1,500 | 1,424,580 | |
| Transportation Facilities Project, Series A, | |||
| 5.75%, 6/01/35 | 265 | 249,132 | |
| Maryland EDC, Refunding RB, CNX Marine Terminals, Inc., | |||
| 5.75%, 9/01/25 | 1,415�� | 1,346,259 | |
| Maryland Health & Higher Educational Facilities | |||
| Authority, RB, Washington Christian Academy, | |||
| 5.25%, 7/01/18 (b)(c) | 250 | 107,100 | |
| Maryland Health & Higher Educational Facilities Authority, | |||
| Refunding RB: | |||
| Doctor’s Community Hospital, 5.75%, 7/01/38 | 890 | 780,388 | |
| University of Maryland Medical System, | |||
| 5.00%, 7/01/34 | 280 | 264,121 | |
| Maryland State Energy Financing Administration, RB, | |||
| Cogeneration, AES Warrior Run, AMT, 7.40%, 9/01/19 | 1,000 | 999,950 | |
| 6,301,815 | |||
| Massachusetts — 0.8% | |||
| Massachusetts Development Finance Agency, RB, | |||
| Series A: | |||
| Foxborough Regional Charter School, | |||
| 7.00%, 7/01/42 | 350 | 356,556 | |
| Linden Ponds Inc. Facility, 5.75%, 11/15/35 | 500 | 354,670 | |
| Massachusetts Development Finance Agency, Refunding | |||
| RB, Eastern Nazarene College, 5.63%, 4/01/29 | 500 | 436,210 | |
| 1,147,436 | |||
| Michigan — 1.6% | |||
| Advanced Technology Academy, RB, 6.00%, 11/01/37 | 275 | 232,017 | |
| County of Wayne Michigan, GO, Building Improvement, | |||
| Series A, 6.75%, 11/01/39 | 165 | 167,302 | |
| Garden City Hospital Finance Authority Michigan, | |||
| Refunding RB, Garden City Hospital Obligation, Series A, | |||
| 5.00%, 8/15/38 | 310 | 199,287 | |
| Michigan State Hospital Finance Authority, Refunding RB, | |||
| Hospital, Henry Ford Health, 5.75%, 11/15/39 | 585 | 558,072 | |
| Royal Oak Hospital Finance Authority Michigan, Refunding | |||
| RB, William Beaumont Hospital, 8.25%, 9/01/39 | 915 | 1,052,662 | |
| 2,209,340 | |||
See Notes to Financial Statements.
SEMI-ANNUAL REPORT DECEMBER 31, 2010 35
Schedule of Investments (continued) BlackRock High Yield Municipal Fund
(Percentages shown are based on Net Assets)
| Par | |||
| Municipal Bonds | (000) | Value | |
| Missouri — 0.7% | |||
| City of Kansas City Missouri, Tax Allocation | |||
| Bonds, Kansas City MainCor Project, Series A, | |||
| 5.25%, 3/01/18 | $ 600 | $ 567,366 | |
| Kirkwood IDA Missouri, RB, Aberdeen Heights, Series A, | |||
| 8.25%, 5/15/39 | 435 | 446,910 | |
| 1,014,276 | |||
| Multi-State — 0.2% | |||
| MuniMae TE Bond Subsidiary LLC, 7.50%, 6/30/49 (d)(e) | 280 | 260,244 | |
| Nevada — 2.0% | |||
| County of Clark Nevada, RB: | |||
| Series B, 5.75%, 7/01/42 | 2,800 | 2,861,124 | |
| Southwest Gas Corp. Project, Series A, AMT (FGIC), | |||
| 4.75%, 9/01/36 | 20 | 16,297 | |
| 2,877,421 | |||
| New Hampshire — 0.6% | |||
| New Hampshire Health & Education Facilities Authority, | |||
| Refunding RB: | |||
| Dartmouth-Hitchcock, 6.00%, 8/01/38 | 435 | 455,454 | |
| Havenwood-Heritage Heights, Series A, | |||
| 5.40%, 1/01/30 | 500 | 432,165 | |
| 887,619 | |||
| New Jersey — 3.5% | |||
| Burlington County Bridge Commission, Refunding RB, | |||
| The Evergreens Project, 5.63%, 1/01/38 | 750 | 614,040 | |
| New Jersey EDA, RB: | |||
| Cigarette Tax, 5.50%, 6/15/24 | 650 | 615,095 | |
| Continental Airlines Inc. Project, AMT, | |||
| 6.63%, 9/15/12 | 1,380 | 1,394,518 | |
| Continental Airlines Inc. Project, AMT, | |||
| 6.40%, 9/15/23 | 1,000 | 957,200 | |
| New Jersey Educational Facilities Authority, Refunding RB, | |||
| University of Medicine & Dentistry, Series B, | |||
| 7.13%, 12/01/23 | 580 | 652,599 | |
| New Jersey Health Care Facilities Financing | |||
| Authority, RB, Pascack Valley Hospital Association, | |||
| 6.63%, 7/01/36 (b)(c) | 650 | 6 | |
| New Jersey Health Care Facilities Financing Authority, | |||
| Refunding RB, St. Joseph’s Healthcare System, | |||
| 6.63%, 7/01/38 | 725 | 731,597 | |
| 4,965,055 | |||
| New Mexico — 0.3% | |||
| City of Farmington New Mexico, Refunding RB, Arizona | |||
| Public Service, Series A, 4.70%, 5/01/24 | 500 | 454,140 | |
| New York — 5.0% | |||
| Brooklyn Arena Local Development Corp., RB, Barclays | |||
| Center Project, 6.38%, 7/15/43 | 1,315 | 1,331,240 | |
| Chautauqua County Industrial Development Agency, RB, | |||
| NRG Dunkirk Power Project, 5.88%, 4/01/42 | 1,115 | 1,072,229 | |
| Genesee County Industrial Development Agency New York, | |||
| Refunding RB, United Memorial Medical Center Project, | |||
| 5.00%, 12/01/32 | 500 | 390,135 | |
| Hudson Yards Infrastructure Corp., RB, Series A, | |||
| 5.00%, 2/15/47 | 1,000 | 900,270 | |
| New York City Industrial Development Agency, RB, AMT: | |||
| American Airlines Inc., JFK International Airport, | |||
| 8.00%, 8/01/28 | 235 | 248,623 | |
| JetBlue Airways Corp. Project, 5.13%, 5/15/30 | 750 | 603,382 | |
| New York Liberty Development Corp., Refunding RB, | |||
| Second Priority, Bank of America Tower at One Bryant | |||
| Park Project, 6.38%, 7/15/49 | 375 | 384,375 | |
| Port Authority of New York & New Jersey, RB, | |||
| JFK International Air Terminal, 6.00%, 12/01/42 | 430 | 424,079 | |
| Par | ||
| Municipal Bonds | (000) | Value |
| New York (concluded) | ||
| Westchester County Industrial Development Agency | ||
| New York, MRB, Kendal on Hudson Project, Series A, | ||
| 6.38%, 1/01/24 | $ 1,250 | $ 1,200,162 |
| Yonkers Industrial Development Agency New York, | ||
| RB, Sarah Lawrence College Project, Series A, | ||
| 6.00%, 6/01/41 | 410 | 412,936 |
| 6,967,431 | ||
| North Carolina — 2.3% | ||
| North Carolina Capital Facilities Finance Agency, RB, | ||
| Duke Energy Carolinas, Series B, 4.38%, 10/01/31 | 540 | 472,305 |
| North Carolina Capital Facilities Finance Agency, | ||
| Refunding RB, Duke Energy Carolinas, Series B, | ||
| 4.63%, 11/01/40 | 540 | 467,894 |
| North Carolina Medical Care Commission, Refunding RB: | ||
| Carolina Village Project, 6.00%, 4/01/38 | 1,000 | 852,210 |
| First Mortgage, Galloway Ridge Project, Series A, | ||
| 6.00%, 1/01/39 | 1,520 | 1,404,252 |
| 3,196,661 | ||
| Ohio — 1.0% | ||
| State of Ohio, RB, Ford Motor Co. Project, AMT, | ||
| 5.75%, 4/01/35 | 1,620 | 1,409,092 |
| Pennsylvania — 4.6% | ||
| Allegheny County Hospital Development Authority, | ||
| Refunding RB, Health System, West Penn, Series A, | ||
| 5.38%, 11/15/40 | 2,140 | 1,435,084 |
| City of Philadelphia Pennsylvania, RB, Ninth Series, | ||
| 5.25%, 8/01/40 | 1,000 | 925,250 |
| Cumberland County Municipal Authority, RB, Diakon | ||
| Lutheran, 6.38%, 1/01/39 | 2,335 | 2,306,489 |
| Lancaster County Hospital Authority, RB, Brethren Village | ||
| Project, Series A, 6.50%, 7/01/40 | 835 | 773,444 |
| Pennsylvania Economic Development Financing Authority, | ||
| RB, US Airways Group, Series A, 7.50%, 5/01/20 | 1,100 | 1,082,510 |
| 6,522,777 | ||
| Puerto Rico — 3.0% | ||
| Commonwealth of Puerto Rico, GO, Refunding, Public | ||
| Improvement, Series C, 6.00%, 7/01/39 | 1,560 | 1,575,491 |
| Puerto Rico Electric Power Authority, RB, Series WW, | ||
| 5.50%, 7/01/38 | 1,000 | 965,670 |
| Puerto Rico Sales Tax Financing Corp., RB, | ||
| First Sub-Series A, 6.50%, 8/01/44 | 750 | 810,307 |
| Puerto Rico Sales Tax Financing Corp., Refunding RB, | ||
| CAB, First Sub-Series C, 6.61%, 8/01/38 (a) | 5,000 | 809,750 |
| 4,161,218 | ||
| Rhode Island — 0.6% | ||
| Rhode Island Housing & Mortgage Finance Corp., RB, | ||
| Homeownership Opportunity, Series 53B, AMT, | ||
| 5.00%, 10/01/46 | 1,000 | 872,440 |
| South Carolina — 0.7% | ||
| City of Myrtle Beach South Carolina, Tax Allocation | ||
| Bonds, Myrtle Beach Air Force Base, Series A, | ||
| 5.25%, 10/01/26 | 500 | 335,755 |
| Connector 2000 Association Inc., RB, CAB, Senior | ||
| Series B, 10.93%, 1/01/15 (a)(b)(c) | 1,000 | 119,590 |
| South Carolina Jobs-EDA, Refunding RB, First Mortgage, | ||
| Lutheran Homes, 5.50%, 5/01/28 | 600 | 506,130 |
| 961,475 | ||
| Tennessee — 0.8% | ||
| Tennessee Energy Acquisition Corp., RB, Series A, | ||
| 5.25%, 9/01/26 | 1,250 | 1,180,988 |
See Notes to Financial Statements.
36 SEMI-ANNUAL REPORT DECEMBER 31, 2010
Schedule of Investments (continued) BlackRock High Yield Municipal Fund
(Percentages shown are based on Net Assets)
| Par | ||
| Municipal Bonds | (000) | Value |
| Texas — 12.0% | ||
| Bexar County Health Facilities Development Corp., RB, | ||
| Army Retirement Residence Project, 6.20%, 7/01/45 $ | 1,320 | $ 1,274,566 |
| Brazos River Authority, RB, TXU Electric, Series A, AMT, | ||
| 8.25%, 10/01/30 | 750 | 232,507 |
| Central Texas Regional Mobility Authority, RB: | ||
| CAB, 7.48%, 1/01/28 (a) | 3,000 | 920,790 |
| CAB, 7.56%, 1/01/29 (a) | 500 | 141,925 |
| CAB, 7.65%, 1/01/30 (a) | 1,330 | 340,573 |
| Senior Lien, 5.75%, 1/01/25 | 295 | 289,997 |
| City of Houston Texas, RB: | ||
| Senior Lien, Series A, 5.50%, 7/01/39 | 120 | 122,586 |
| Special Facilities, Continental Airlines, Series E, AMT, | ||
| 6.75%, 7/01/21 | 630 | 623,946 |
| Special Facilities, Continental Airlines, Series E, AMT, | ||
| 7.38%, 7/01/22 | 500 | 502,910 |
| Dallas-Fort Worth International Airport Facilities | ||
| Improvement Corp., Refunding RB, American | ||
| Airlines Inc. Project, AMT, 5.50%, 11/01/30 | 1,000 | 765,530 |
| Danbury Higher Education Authority Inc., RB, A.W. Brown | ||
| Fellowship Charter, Series A (ACA), 5.00%, 8/15/26 | 355 | 403,866 |
| Love Field Airport Modernization Corp., RB, Southwest | ||
| Airlines Co. Project, 5.25%, 11/01/40 | 1,000 | 892,540 |
| Matagorda County Navigation District No. 1 Texas, | ||
| Refunding RB, Central Power & Light Co. Project, | ||
| Series A, 6.30%, 11/01/29 | 290 | 300,591 |
| North Texas Tollway Authority, RB, Toll, 2nd Tier, Series F, | ||
| 6.13%, 1/01/31 | 1,150 | 1,158,590 |
| Tarrant County Cultural Education Facilities Finance | ||
| Corp., RB: | ||
| CC Young Memorial Home, Series A, 8.00%, 2/15/38 | 330 | 335,927 |
| Senior Living Center Project, Series A, | ||
| 8.25%, 11/15/44 | 800 | 783,832 |
| Tarrant County Cultural Education Facilities Finance Corp., | ||
| Refunding RB, Northwest Senior Housing, Edgemere | ||
| Project, Series A, 6.00%, 11/15/36 | 1,500 | 1,371,630 |
| Texas Private Activity Bond Surface Transportation Corp., | ||
| RB, Senior Lien: | ||
| LBJ Infrastructure Group LLC, LBJ Freeway Managed | ||
| Lanes Project, 7.00%, 6/30/40 | 2,320 | 2,348,861 |
| NTE Mobility Partners LLC, North Tarrant Express | ||
| Managed Lanes Project, 6.88%, 12/31/39 | 1,740 | 1,748,682 |
| Texas State Public Finance Authority, Refunding, ERB, | ||
| KIPP Inc., Series A (ACA): | ||
| 5.00%, 2/15/28 | 680 | 588,792 |
| 5.00%, 2/15/36 | 2,000 | 1,639,360 |
| 16,788,001 | ||
| Utah — 0.6% | ||
| Utah State Charter School Finance Authority, RB, | ||
| Navigator Pointe Academy, Series A, 5.63%, 7/15/40 | 1,000 | 851,140 |
| Vermont — 0.7% | ||
| Vermont Economic Development Authority, Refunding | ||
| MRB, Wake Robin Corp. Project, Series A (ACA), | ||
| 6.30%, 3/01/33 | 1,000 | 912,240 |
| Virginia — 3.5% | ||
| Albemarle County IDA, Refunding RB, Westminster- | ||
| Canterbury, 5.00%, 1/01/31 | 500 | 422,150 |
| Chesterfield County EDA, Refunding RB, Virginia Electric | ||
| & Power, Series A, 5.00%, 5/01/23 | 1,000 | 1,034,370 |
| City of Norfolk Virginia, Refunding RB, Series B (AMBAC), | ||
| 5.50%, 2/01/31 | 260 | 239,858 |
| Fairfax County EDA, Refunding RB: | ||
| Goodwin House Inc., 5.13%, 10/01/37 | 2,040 | 1,776,677 |
| Goodwin House Inc., 5.13%, 10/01/42 | 450 | 384,259 |
| Retirement, Greenspring, Series A, 4.88%, 10/01/36 | 155 | 130,484 |
| Par | |||
| Municipal Bonds | (000) | Value | |
| Virginia (concluded) | |||
| Lexington IDA, Refunding MRB, Kendal at Lexington, | |||
| Series A, 5.38%, 1/01/28 | $ 210 | $ 180,113 | |
| Watkins Centre Community Development Authority, RB, | |||
| 5.40%, 3/01/20 | 750 | 706,455 | |
| 4,874,366 | |||
| Washington — 1.7% | |||
| Tobacco Settlement Authority of Washington, RB, | |||
| Asset-Backed, 6.50%, 6/01/26 | 2,295 | 2,321,186 | |
| Wisconsin — 1.1% | |||
| Wisconsin Health & Educational Facilities Authority, RB, | |||
| Wheaton Franciscan Healthcare, 5.25%, 8/15/34 | 1,565 | 1,367,778 | |
| Wisconsin Health & Educational Facilities Authority, | |||
| Refunding RB, St. John’s Communities Inc., Series A: | |||
| 7.25%, 9/15/29 | 75 | 75,783 | |
| 7.63%, 9/15/39 | 145 | 147,806 | |
| 1,591,367 | |||
| Wyoming — 1.0% | |||
| County of Sweetwater Wyoming, Refunding RB, | |||
| FMC Corp. Project, AMT, 5.60%, 12/01/35 | 1,500 | 1,350,060 | |
| Total Municipal Bonds — 91.0% | 127,845,119 | ||
| Municipal Bonds Transferred to | |||
| Tender Option Bond Trusts (f) | |||
| California — 1.5% | |||
| Bay Area Toll Authority, Refunding RB, San Francisco | |||
| Bay Area, Series F-1, 5.63%, 4/01/44 | 480 | 491,649 | |
| Los Angeles Department of Airports, Refunding RB, | |||
| Senior, Los Angeles International Airport, Series A, | |||
| 5.00%, 5/15/40 | 1,680 | 1,607,676 | |
| 2,099,325 | |||
| District of Columbia — 0.7% | |||
| District of Columbia Water & Sewer Authority, RB, | |||
| Series A, 6.00%, 10/01/35 | 950 | 1,027,599 | |
| New York — 1.2% | |||
| New York State Dormitory Authority, ERB, Series F, | |||
| 5.00%, 3/15/35 | 1,710 | 1,707,348 | |
| Ohio — 3.0% | |||
| County of Allen Ohio, Refunding RB, Catholic Healthcare, | |||
| Series A, 5.25%, 6/01/38 | 2,200 | 2,143,746 | |
| State of Ohio, Refunding RB, Cleveland Clinic Health, | |||
| Series A, 5.50%, 1/01/39 | 2,000 | 2,045,420 | |
| 4,189,166 | |||
| South Carolina — 1.3% | |||
| South Carolina State Housing Finance & Development | |||
| Authority, Refunding RB, Series B-1, 5.55%, 7/01/39 | 1,879 | 1,885,777 | |
| Virginia — 3.3% | |||
| Virginia HDA, RB, Sub-Series H-1 (NPFGC), | |||
| 5.38%, 7/01/36 | 2,110 | 2,124,770 | |
| Virginia Small Business Financing Authority, Refunding RB, | |||
| Sentara Healthcare, 5.00%, 11/01/40 | 2,501 | 2,454,996 | |
| 4,579,766 | |||
| Wisconsin — 1.5% | |||
| Wisconsin Health & Educational Facilities Authority, | |||
| Refunding RB, Froedtert & Community Health Inc., | |||
| 5.25%, 4/01/39 | 2,180 | 2,113,812 | |
| Total Municipal Bonds Transferred to | |||
| Tender Option Bond Trusts — 12.5% | 17,602,793 | ||
| Total Long-Term Investments | |||
| (Cost — $152,302,446) — 103.5% | 145,447,912 | ||
| See Notes to Financial Statements. | ||
| SEMI-ANNUAL REPORT | DECEMBER 31, 2010 | 37 |
Schedule of Investments (concluded) BlackRock High Yield Municipal Fund
(Percentages shown are based on Net Assets)
| Short-Term Securities | Shares | Value |
| FFI Institutional Tax-Exempt Fund, 0.18% (g)(h) | 3,715,532 | $ 3,715,532 |
| Total Short-Term Securities | ||
| (Cost — $3,715,532) — 2.7% | 3,715,532 | |
| Total Investments (Cost — $156,017,978*) — 106.2% | 149,163,444 | |
| Other Assets Less Liabilities — 0.3% | 469,131 | |
| Liability for Trust Certificates, Including Interest | ||
| Expense and Fees Payable — (6.5)% | (9,187,617) | |
| Net Assets — 100.0% | $ 140,444,958 |
* The cost and unrealized appreciation (depreciation) of investments as of
December 31, 2010, as computed for federal income tax purposes, were as follows:
| Aggregate cost | $ 146,737,765 |
| Gross unrealized appreciation | $ 2,609,721 |
| Gross unrealized depreciation | (9,363,776) |
| Net unrealized depreciation | $ (6,754,055) |
(a) Represents a zero-coupon bond. Rate shown reflects the current yield as of
report date.
(b) Issuer filed for bankruptcy and/or is in default of interest payments.
(c) Non-income producing security.
(d) Security exempt from registration under Rule 144A of the Securities Act of 1933.
These securities may be resold in transactions exempt from registration to qualified
institutional investors.
(e) Security represents a beneficial interest in a trust. The collateral deposited into the
trust is federally tax-exempt revenue bonds issued by various state or local govern-
ments, or their respective agencies or authorities. The security is subject to remarket-
ing prior to its stated maturity.
(f) Securities represent bonds transferred to a tender option bond trust in exchange for
which the Fund acquired residual interest certificates. These securities serve as col-
lateral in a financing transaction. See Note 1 of the Notes to Financial Statements
for details of municipal bonds transferred to tender option bond trusts.
(g) Investments in companies considered to be an affiliate of the Fund during the
period, for purposes of Section 2(a)(3) of the Investment Company Act of 1940, as
amended, were as follows:
| Shares Held | Shares Held | |||
| at June 30, | Net | at December 31, | ||
| Affiliate | 2010 | Activity | 2010 | Income |
| FFI Institutional | ||||
| Tax-Exempt Fund | 1,632,976 | 2,082,556 | 3,715,532 | $ 5,981 |
(h) Represents the current yield as of report date.
•Fair Value Measurements — Various inputs are used in determining the fair value of
investments, which are as follows:
•Level 1 — price quotations in active markets/exchanges for identical assets
and liabilities
•Level 2 — other observable inputs (including, but not limited to: quoted prices for
similar assets or liabilities in markets that are active, quoted prices for identical
or similar assets or liabilities in markets that are not active, inputs other than
quoted prices that are observable for the assets or liabilities (such as interest
rates, yield curves, volatilities, prepayment speeds, loss severities, credit risks and
default rates) or other market-corroborated inputs)
•Level 3 — unobservable inputs based on the best information available in the
circumstances, to the extent observable inputs are not available (including the
Fund’s own assumptions used in determining the fair value of investments)
The inputs or methodologies used for valuing securities are not necessarily an
indication of the risk associated with investing in those securities. For information
about the Fund’s policy regarding valuation of investments and other significant
accounting policies, please refer to Note 1 of the Notes to Financial Statements.
The following table summarizes the inputs used as of December 31, 2010 in deter-
mining the fair valuation of the Fund’s investments:
| Valuation Inputs | Level 1 | Level 2 |
Level3 | Total |
| Assets: | ||||
| Investments in | ||||
| Securities: | ||||
| Long-Term | ||||
| Investments1 | — | $ 145,447,912 | — | $ 145,447,912 |
| Short-Term | ||||
| Securities | $ 3,715,532 | — | — | 3,715,532 |
| Total | $ 3,715,532 | $ 145,447,912 | — | $ 149,163,444 |
1 See above Schedule of Investments for values in each state or
political classification.
See Notes to Financial Statements.
38 SEMI-ANNUAL REPORT DECEMBER 31, 2010
Schedule of Investments December 31, 2010 (Unaudited) BlackRock New York Municipal Bond Fund
(Percentages shown are based on Net Assets)
| Par | |||
| Municipal Bonds | (000) | Value | |
| New York — 84.8% | |||
| Corporate — 9.8% | |||
| Chautauqua County Industrial Development Agency, RB, | |||
| NRG Dunkirk Power Project, 5.88%, 4/01/42 | $ 1,000 | $ 961,640 | |
| Essex County Industrial Development Agency New York, | |||
| RB, International Paper Co. Project, Series A, AMT, | |||
| 6.63%, 9/01/32 | 350 | 358,074 | |
| Jefferson County Industrial Development Agency New York, | |||
| Refunding RB, Solid Waste, Series A, AMT, | |||
| 5.20%, 12/01/20 | 250 | 238,795 | |
| New York City Industrial Development Agency, RB, AMT: | |||
| 1990 American Airlines Inc. Project, 5.40%, 7/01/20 | 3,500 | 2,933,280 | |
| American Airlines Inc., JFK International Airport, | |||
| 7.75%, 8/01/31 (a) | 2,000 | 2,085,540 | |
| British Airways Plc Project, 5.25%, 12/01/32 | 1,000 | 768,490 | |
| Continental Airlines Inc. Project, 8.00%, 11/01/12 | 750 | 755,430 | |
| Continental Airlines Inc. Project, Mandatory | |||
| Put Bonds, 8.38%, 11/01/16 | 250 | 251,693 | |
| New York City Industrial Development Agency, Refunding | |||
| RB, Terminal One Group Association Project, AMT, | |||
| 5.50%, 1/01/24 (a) | 2,500 | 2,483,975 | |
| New York Liberty Development Corp., RB, Goldman Sachs | |||
| Headquarters: | |||
| 5.25%, 10/01/35 | 5,100 | 4,934,964 | |
| 5.50%, 10/01/37 | 405 | 403,838 | |
| Suffolk County Industrial Development Agency New York, | |||
| RB, KeySpan, Port Jefferson, AMT, 5.25%, 6/01/27 | 1,360 | 1,262,379 | |
| Suffolk County Industrial Development Agency New York, | |||
| Refunding RB, Ogden Martin System Huntington, AMT | |||
| (AMBAC), 6.25%, 10/01/12 | 7,155 | 7,700,354 | |
| 25,138,452 | |||
| County/City/Special District/School District — 18.0% | |||
| Amherst Development Corp., RB, University at Buffalo | |||
| Foundation Faculty-Student Housing Corp., Series A | |||
| (AGM), 4.63%, 10/01/40 | 555 | 498,040 | |
| Brooklyn Arena Local Development Corp., RB, Barclays | |||
| Center Project, 6.38%, 7/15/43 | 200 | 202,470 | |
| City of New York New York, GO, Sub-Series I-1, | |||
| 5.38%, 4/01/36 | 2,650 | 2,718,079 | |
| Hudson Yards Infrastructure Corp., RB, Series A: | |||
| 5.00%, 2/15/47 | 6,750 | 6,076,822 | |
| (FGIC), 5.00%, 2/15/47 | 1,000 | 900,270 | |
| (NPFGC), 4.50%, 2/15/47 | 1,815 | 1,482,964 | |
| New York City Industrial Development Agency, RB, PILOT: | |||
| CAB, Yankee Stadium (AGC), 6.03%, 3/01/42 (b) | 5,000 | 719,050 | |
| Queens Baseball Stadium (AGC), 6.50%, 1/01/46 | 700 | 741,566 | |
| Queens Baseball Stadium (AMBAC), 5.00%, 1/01/36 | 1,970 | 1,641,089 | |
| Queens Baseball Stadium (AMBAC), 5.00%, 1/01/39 | 2,850 | 2,342,957 | |
| New York City Transitional Finance Authority, RB: | |||
| Fiscal 2008, Series S-1, 4.50%, 1/15/38 | 500 | 453,515 | |
| Fiscal 2009, Series S-1, 5.63%, 7/15/38 | 200 | 209,556 | |
| Fiscal 2009, Series S-3, 5.25%, 1/15/39 | 2,100 | 2,127,426 | |
| Series S-2 (NPFGC), 4.50%, 1/15/31 | 1,250 | 1,153,563 | |
| New York Convention Center Development Corp., RB, | |||
| Hotel Unit Fee Secured (AMBAC): | |||
| 5.00%, 11/15/35 | 4,450 | 4,138,722 | |
| 5.00%, 11/15/44 | 2,990 | 2,739,886 | |
| New York Liberty Development Corp., Refunding RB, | |||
| Second Priority, Bank of America Tower at One Bryant | |||
| Park Project: | |||
| 5.63%, 7/15/47 | 8,555 | 8,521,807 | |
| 6.38%, 7/15/49 | 1,200 | 1,230,000 | |
| New York State Dormitory Authority, RB, State University | |||
| Dormitory Facilities, Series A: | |||
| 5.25%, 7/01/29 | 5 | 5,159 | |
| 5.00%, 7/01/39 | 750 | 746,610 | |
| Par | |||
| Municipal Bonds | (000) | Value | |
| New York (continued) | |||
| County/City/Special District/School District (concluded) | |||
| Niagara County Industrial Development Agency, | |||
| Refunding RB, Series A, Mandatory Put Bonds, AMT, | |||
| 5.45%, 11/15/26 (a) | $ 3,975 | $ 4,050,604 | |
| North Country Development Authority, Refunding RB | |||
| (AGM), 6.00%, 5/15/15 | 760 | 826,584 | |
| Sachem Central School District of Holbrook New York, | |||
| GO, Series B (NPFGC): | |||
| 5.00%, 10/15/13 | 1,000 | 1,106,930 | |
| 5.00%, 10/15/13 | 1,300 | 1,439,009 | |
| 46,072,678 | |||
| Education — 13.5% | |||
| City of Troy New York, Refunding RB, Rensselaer | |||
| Polytechnic, Series A, 5.13%, 9/01/40 | 4,375 | 4,135,994 | |
| Hempstead Town Industrial Development Agency, RB, | |||
| Adelphi University Civic Facility: | |||
| 5.75%, 6/01/22 | 1,700 | 1,735,547 | |
| 5.50%, 6/01/32 | 2,250 | 2,258,077 | |
| Madison County Industrial Development Agency New York, | |||
| RB, Commons II LLC, Student Housing, Series A (CIFG), | |||
| 5.00%, 6/01/33 | 400 | 346,604 | |
| Nassau County Industrial Development Agency, Refunding | |||
| RB, New York Institute of Technology Project, Series A, | |||
| 4.75%, 3/01/26 | 1,000 | 935,170 | |
| New York City Industrial Development Agency, RB: | |||
| Lycee Francais de New York Project, Series A (ACA), | |||
| 5.50%, 6/01/15 | 250 | 262,028 | |
| Lycee Francais de New York Project, Series A (ACA), | |||
| 5.38%, 6/01/23 | 195 | 197,685 | |
| Series C, 6.80%, 6/01/28 | 2,500 | 2,583,950 | |
| New York State Dormitory Authority, RB: | |||
| 5.83%, 7/01/39 (c) | 1,000 | 831,480 | |
| The New School (AGM), 5.50%, 7/01/43 | 2,550 | 2,564,994 | |
| New York University, Series 1 (AMBAC), | |||
| 5.50%, 7/01/40 | 1,000 | 1,055,550 | |
| Rochester Institute of Technology, Series A, | |||
| 6.00%, 7/01/33 | 1,000 | 1,053,600 | |
| Rochester University, Series A, 5.13%, 7/01/14 (d) | 1,500 | 1,701,750 | |
| University of Rochester, Series A, 5.13%, 7/01/39 | 1,015 | 1,006,728 | |
| Vassar College, 5.00%, 7/01/49 | 825 | 805,984 | |
| New York State Dormitory Authority, Refunding RB: | |||
| Brooklyn Law School, 5.75%, 7/01/33 | 475 | 492,599 | |
| Teachers College, 5.50%, 3/01/39 | 850 | 863,336 | |
| Schenectady County Industrial Development Agency, | |||
| Refunding RB, Union College Project, 5.00%, 7/01/31 | 2,900 | 2,911,049 | |
| Suffolk County Industrial Development Agency, | |||
| Refunding RB, New York Institute of Technology Project, | |||
| 5.00%, 3/01/26 | 750 | 717,653 | |
| Trust for Cultural Resources, RB, Series A: | |||
| Carnegie Hall, 4.75%, 12/01/39 | 1,550 | 1,422,388 | |
| Carnegie Hall, 5.00%, 12/01/39 | 1,325 | 1,264,580 | |
| Juilliard School, 5.00%, 1/01/39 | 1,050 | 1,057,570 | |
| Utica Industrial Development Agency New York, RB: | |||
| Munson-Williams-Proctor Arts Institute, | |||
| 5.38%, 7/15/20 | 1,000 | 1,015,410 | |
| Munson-Williams-Proctor Arts Institute, | |||
| 5.40%, 7/15/30 | 1,210 | 1,215,276 | |
| Utica College Project, Series A, 5.75%, 8/01/28 | 1,430 | 1,239,023 | |
| Yonkers Industrial Development Agency New York, | |||
| RB, Sarah Lawrence College Project, Series A, | |||
| 6.00%, 6/01/41 | 1,000 | 1,007,160 | |
| 34,681,185 | |||
See Notes to Financial Statements.
SEMI-ANNUAL REPORT DECEMBER 31, 2010 39
Schedule of Investments (continued) BlackRock New York Municipal Bond Fund
(Percentages shown are based on Net Assets)
| Par | |||
| Municipal Bonds | (000) | Value | |
| New York (continued) | |||
| Health — 15.2% | |||
| Dutchess County Industrial Development Agency New York, | |||
| RB, St. Francis Hospital, Series B, 7.25%, 3/01/19 | $ 900 | $ 889,272 | |
| Dutchess County Local Development Corp., Refunding RB, | |||
| Health Quest System Inc., Series A, 5.75%, 7/01/40 | 300 | 291,300 | |
| Erie County Industrial Development Agency, RB, Episcopal | |||
| Church Home, Series A: | |||
| 5.88%, 2/01/18 | 1,265 | 1,265,089 | |
| 6.00%, 2/01/28 | 375 | 364,260 | |
| Genesee County Industrial Development Agency New York, | |||
| Refunding RB, United Memorial Medical Center Project: | |||
| 5.00%, 12/01/27 | 500 | 407,890 | |
| 5.00%, 12/01/32 | 1,080 | 842,692 | |
| Monroe County Industrial Development Corp., RB, Unity | |||
| Hospital of Rochester Project (FHA), 5.50%, 8/15/40 | 1,050 | 1,076,712 | |
| Nassau County Industrial Development Agency, Refunding | |||
| RB, Special Needs Facilities Pooled Program, Series F-1 | |||
| (ACA), 4.90%, 7/01/21 | 525 | 433,293 | |
| New York City Health & Hospital Corp., Refunding RB, | |||
| Health System, Series A, 5.00%, 2/15/30 | 1,600 | 1,586,304 | |
| New York City Industrial Development Agency, RB: | |||
| A Very Special Place Inc. Project, Series A, | |||
| 6.13%, 1/01/13 | 190 | 187,327 | |
| A Very Special Place Inc. Project, Series A, | |||
| 7.00%, 1/01/33 | 1,600 | 1,463,264 | |
| PSCH Inc. Project, 6.38%, 7/01/33 | 2,555 | 2,167,636 | |
| Special Needs Facilities Pooled Program, Series A-1, | |||
| 6.50%, 7/01/17 | 1,000 | 966,220 | |
| Special Needs Facilities Pooled Program, Series C-1, | |||
| 6.50%, 7/01/17 | 2,540 | 2,454,199 | |
| New York City Industrial Development Agency, Special | |||
| Needs Facilities Pooled Program, Refunding RB (ACA): | |||
| Series A-1, 4.38%, 7/01/20 | 1,000 | 806,470 | |
| Series A-1, 4.50%, 7/01/30 | 210 | 143,695 | |
| Series C-1, 5.10%, 7/01/31 | 525 | 385,439 | |
| New York State Dormitory Authority, RB: | |||
| Hudson Valley Hospital (BHAC), 5.00%, 8/15/36 | 750 | 755,002 | |
| NYU Hospital Center, Series B, 5.63%, 7/01/37 | 530 | 515,430 | |
| New York & Presbyterian Hospital (AGM), | |||
| 5.00%, 8/15/36 | 1,000 | 971,800 | |
| New York State Association for Retarded Children, Inc., | |||
| Series B (AMBAC), 6.00%, 7/01/32 | 700 | 725,914 | |
| North Shore-Long Island Jewish Health System, | |||
| Series A, 5.50%, 5/01/37 | 1,675 | 1,667,931 | |
| North Shore-Long Island Jewish Health System, | |||
| Series A, 5.75%, 5/01/37 | 1,725 | 1,749,926 | |
| New York State Dormitory Authority, Refunding RB: | |||
| Mount Sinai Hospital, Series A, 5.00%, 7/01/26 | 1,635 | 1,576,058 | |
| North Shore-Long Island Jewish Health System, | |||
| Series E, 5.50%, 5/01/33 | 1,000 | 993,560 | |
| Orange County Industrial Development Agency New York, | |||
| RB, Special Needs Facilities Pooled Program, Series G-1 | |||
| (ACA), 4.90%, 7/01/21 | 845 | 697,395 | |
| Suffolk County Industrial Development Agency | |||
| New York, RB: | |||
| Huntington Hospital Project, Series B, | |||
| 5.88%, 11/01/32 | 2,000 | 1,972,000 | |
| Special Needs Facilities Pooled Program, Series D-1, | |||
| 6.50%, 7/01/17 | 135 | 130,440 | |
| Special Needs Facilities Pooled Program, Series D-1 | |||
| (ACA), 4.90%, 7/01/21 | 330 | 272,356 | |
| Sullivan County Industrial Development Agency New York, | |||
| RB, Special Needs Facilities Pooled Program, Series H-1 | |||
| (ACA), 4.90%, 7/01/21 | 330 | 272,356 | |
| Par | |||
| Municipal Bonds | (000) | Value | |
| New York (continued) | |||
| Health (concluded) | |||
| Tompkins County Industrial Development Agency New York, | |||
| Refunding RB, Continuing Care Retirement Community, | |||
| Kendal at Ithaca Project, | |||
| Series A-2: | |||
| 5.75%, 7/01/18 | $ 900 | $ 900,648 | |
| 6.00%, 7/01/24 | 1,000 | 1,000,090 | |
| Westchester County Healthcare Corp. New York, Refunding | |||
| RB, Senior Lien, Series B, 6.00%, 11/01/30 | 375 | 370,684 | |
| Westchester County Industrial Development Agency | |||
| New York, MRB, Kendal on Hudson Project, Series A: | |||
| 6.50%, 1/01/13 (d) | 5,200 | 5,755,048 | |
| 6.38%, 1/01/24 | 1,000 | 960,130 | |
| Westchester County Industrial Development Agency | |||
| New York, RB, Special Needs Facilities Pooled Program, | |||
| Series E-1 (ACA), 4.90%, 7/01/21 | 350 | 288,862 | |
| Yonkers Industrial Development Agency New York, RB, | |||
| Sacred Heart Associations Project, Series A, AMT | |||
| (SONYMA), 5.00%, 10/01/37 | 1,640 | 1,497,894 | |
| 38,804,586 | |||
| Housing — 6.2% | |||
| Monroe County Industrial Development Agency, | |||
| IDRB, Southview Towers Project, AMT (SONYMA), | |||
| 6.25%, 2/01/31 | 1,000 | 1,004,700 | |
| New York City Housing Development Corp., RB, AMT: | |||
| Series A, 5.50%, 11/01/34 | 2,500 | 2,483,375 | |
| Series C, 5.05%, 11/01/36 | 1,220 | 1,081,799 | |
| New York Mortgage Agency, Refunding RB, AMT: | |||
| Series 101, 5.40%, 4/01/32 | 2,240 | 2,189,981 | |
| Series 133, 4.95%, 10/01/21 | 395 | 397,180 | |
| Series 143, 4.90%, 10/01/37 | 1,835 | 1,648,454 | |
| New York State HFA, RB, AMT: | |||
| Division Street, Series A (SONYMA), 5.10%, 2/15/38 | 875 | 811,991 | |
| Highland Avenue Senior Apartments, Series A | |||
| (SONYMA), 5.00%, 2/15/39 | 2,000 | 1,720,100 | |
| Kensico Terrace Apartments, Series A (SONYMA), | |||
| 4.90%, 2/15/38 | 645 | 576,920 | |
| M/F Housing, Watergate II, Series A, 4.75%, 2/15/34 | 580 | 525,544 | |
| Yonkers Economic Development Corp., Refunding RB, | |||
| Riverview II (Freddie Mac), 4.50%, 5/01/25 | 3,000 | 2,838,810 | |
| Yonkers Industrial Development Agency New York, | |||
| RB, Monastery Manor Associates LP Project, AMT | |||
| (SONYMA), 5.25%, 4/01/37 | 585 | 532,327 | |
| 15,811,181 | |||
| State — 5.7% | |||
| New York Municipal Bond Bank Agency, RB, Series C, | |||
| 5.25%, 12/01/22 | 1,000 | 1,023,100 | |
| New York State Dormitory Authority, LRB, Municipal Health | |||
| Facilities, Sub-Series 2-4, 4.75%, 1/15/30 | 2,100 | 1,967,301 | |
| New York State Dormitory Authority, RB, Mental Health | |||
| Services Facilities Improvement, Series A (AGM), | |||
| 5.00%, 2/15/22 | 1,000 | 1,050,410 | |
| New York State Dormitory Authority, Refunding RB, | |||
| Upstate Community Colleges, Series B, 5.25%, 7/01/21 | 1,565 | 1,648,962 | |
| New York State Thruway Authority, Refunding RB, | |||
| Series A-1, 5.00%, 4/01/29 | 1,000 | 1,005,970 | |
| New York State Urban Development Corp., Refunding RB: | |||
| Clarkson Center for Advance Materials, | |||
| 5.50%, 1/01/20 | 1,685 | 1,901,624 | |
| University Facilities Grants, 5.50%, 1/01/19 | 3,500 | 3,982,160 | |
| State of New York, GO, Series A, 5.00%, 2/15/39 | 1,950 | 1,953,763 | |
| 14,533,290 | |||
See Notes to Financial Statements.
40 SEMI-ANNUAL REPORT DECEMBER 31, 2010
Schedule of Investments (continued) BlackRock New York Municipal Bond Fund
(Percentages shown are based on Net Assets)
| Par | ||
| Municipal Bonds | (000) | Value |
| New York (continued) | ||
| Tobacco — 2.3% | ||
| Chautauqua Tobacco Asset Securitization Corp. New York, | ||
| RB, 6.75%, 7/01/40 | $ 1,000 | $ 951,100 |
| Nassau County Tobacco Settlement Corp., Refunding RB, | ||
| Asset-Backed, Senior Series A-3, 5.00%, 6/01/35 | 2,000 | 1,493,740 |
| New York Counties Tobacco Trust I, RB, Tobacco Pass Thru, | ||
| Series B: | ||
| 6.50%, 6/01/35 | 750 | 698,917 |
| 6.63%, 6/01/42 | 490 | 457,077 |
| Niagara County Tobacco Asset Securitization Corp. | ||
| New York, RB, Asset-Backed, 6.25%, 5/15/40 | 1,000 | 890,010 |
| Tobacco Settlement Financing Corp. New York, RB, | ||
| Asset-Backed, Series A-1 (AMBAC), 5.25%, 6/01/20 | 1,455 | 1,547,960 |
| 6,038,804 | ||
| Transportation — 9.8% | ||
| Hudson Yards Infrastructure Corp., RB: | ||
| (AGC), 5.00%, 2/15/47 | 1,000 | 913,110 |
| Series A (AGM), 5.00%, 2/15/47 | 500 | 456,555 |
| Metropolitan Transportation Authority, RB: | ||
| Series 2008C, 6.50%, 11/15/28 | 1,760 | 1,946,824 |
| Series A, 4.50%, 11/15/38 | 1,400 | 1,217,622 |
| Series A, 5.63%, 11/15/39 | 500 | 518,780 |
| Series B, 4.50%, 11/15/37 | 1,000 | 871,810 |
| Onondaga County Industrial Development Agency | ||
| New York, RB, AMT: | ||
| Senior, Air Cargo, 6.13%, 1/01/32 | 3,945 | 3,473,888 |
| Subordinate, Air Cargo, 7.25%, 1/01/32 | 1,365 | 1,244,962 |
| Port Authority of New York & New Jersey, RB: | ||
| Consolidated, 116th Series, 4.13%, 9/15/32 | 1,500 | 1,324,905 |
| JFK International Air Terminal, 6.00%, 12/01/42 | 2,000 | 1,972,460 |
| Special Project, JFK International Air Terminal, | ||
| Series 6, AMT (NPFGC), 6.25%, 12/01/11 | 2,555 | 2,613,101 |
| Special Project, JFK International Air Terminal, | ||
| Series 6, AMT (NPFGC), 6.25%, 12/01/13 | 2,575 | 2,711,140 |
| Special Project, JFK International Air Terminal, | ||
| Series 6, AMT (NPFGC), 6.25%, 12/01/14 | 2,620 | 2,765,515 |
| Triborough Bridge & Tunnel Authority, Refunding RB | ||
| (NPFGC), 5.25%, 11/15/23 | 2,900 | 2,987,493 |
| 25,018,165 | ||
| Utilities — 4.3% | ||
| Long Island Power Authority, RB, General, Series C (CIFG), | ||
| 5.25%, 9/01/29 | 3,000 | 3,017,550 |
| Long Island Power Authority, Refunding RB, Series A: | ||
| 5.50%, 4/01/24 | 1,250 | 1,322,013 |
| 5.75%, 4/01/39 | 300 | 309,708 |
| General, 6.00%, 5/01/33 | 2,450 | 2,613,390 |
| New York City Municipal Water Finance Authority, RB: | ||
| Fiscal 2008, Series A, 5.00%, 6/15/38 | 1,570 | 1,551,474 |
| Fiscal 2009, Series A, 5.75%, 6/15/40 | 500 | 531,395 |
| Series D, 4.75%, 6/15/38 | 770 | 741,402 |
| Series FF-2, 5.50%, 6/15/40 | 800 | 833,448 |
| 10,920,380 | ||
| Total Municipal Bonds in New York | 217,018,721 | |
| Guam — 1.5% | ||
| State — 0.4% | ||
| Territory of Guam, GO, Series A, 7.00%, 11/15/39 | 970 | 1,048,638 |
| Tobacco — 0.4% | ||
| Guam Economic Development & Commerce Authority, | ||
| efunding RB, Tobacco Settlement Asset-Backed, | ||
| 5.63%, 6/01/47 | 1,075 | 925,833 |
| Par | ||
| Municipal Bonds | (000) | Value |
| Guam (concluded) | ||
| Utilities — 0.7% | ||
| Guam Government Waterworks Authority, Refunding RB, | ||
| Water, 5.88%, 7/01/35 | $ 2,000 | $ 1,937,720 |
| Total Municipal Bonds in Guam | 3,912,191 | |
| Puerto Rico — 8.2% | ||
| Corporate — 0.4% | ||
| Puerto Rico Industrial Medical & Environmental Pollution | ||
| Control Facilities Financing Authority, RB, Special | ||
| Facilities, American Airlines, Series A, 6.45%, 12/01/25 | 1,000 | 906,850 |
| County/City/Special District/School District — 0.8% | ||
| Puerto Rico Sales Tax Financing Corp., RB, First | ||
| Sub-Series A (AGM), 5.00%, 8/01/40 | 1,000 | 951,100 |
| Puerto Rico Sales Tax Financing Corp., Refunding RB, | ||
| CAB, Series A (NPFGC), 5.76%, 8/01/41 (b) | 7,500 | 1,043,250 |
| 1,994,350 | ||
| Education — 0.3% | ||
| Puerto Rico Industrial Tourist Educational Medical | ||
| & Environmental Control Facilities Financing Authority, | ||
| RB, University Plaza Project, Series A (NPFGC), | ||
| 5.00%, 7/01/33 | 1,000 | 903,660 |
| Housing — 1.2% | ||
| Puerto Rico Housing Finance Authority, Refunding RB, | ||
| Subordinate, Capital Fund Modernization, | ||
| 5.13%, 12/01/27 | 3,000 | 2,964,780 |
| State — 1.8% | ||
| Commonwealth of Puerto Rico, GO, Refunding, Public | ||
| Improvement, Series C, 6.00%, 7/01/39 | 700 | 706,951 |
| Puerto Rico Commonwealth Infrastructure Financing | ||
| Authority, RB, CAB, Series A (b): | ||
| (AMBAC), 4.99%, 7/01/44 | 1,100 | 95,656 |
| (FGIC), 4.77%, 7/01/42 | 7,470 | 760,744 |
| Puerto Rico Highway & Transportation Authority, | ||
| Refunding RB, Series CC (AGM), 5.50%, 7/01/30 | 500 | 507,190 |
| Puerto Rico Public Buildings Authority, RB, Government | ||
| Facilities, Series I, 5.25%, 7/01/14 (d) | 55 | 61,907 |
| Puerto Rico Sales Tax Financing Corp., RB, First | ||
| Sub-Series A, 5.75%, 8/01/37 | 2,500 | 2,520,050 |
| 4,652,498 | ||
| Tobacco — 0.3% | ||
| Children’s Trust Fund, Refunding RB, Asset-Backed, | ||
| 5.63%, 5/15/43 | 1,000 | 877,430 |
| Transportation — 2.9% | ||
| Puerto Rico Highway & Transportation Authority, RB, | ||
| Series Y (AGM), 6.25%, 7/01/21 | 1,000 | 1,090,480 |
| Puerto Rico Highway & Transportation Authority, | ||
| Refunding RB: | ||
| Series AA-1 (AGM), 4.95%, 7/01/26 | 5,000 | 4,925,600 |
| Series M, 5.00%, 7/01/32 | 1,500 | 1,362,180 |
| 7,378,260 | ||
| Utilities — 0.5% | ||
| Puerto Rico Aqueduct & Sewer Authority, RB, Senior Lien, | ||
| Series A, 6.00%, 7/01/38 | 500 | 502,095 |
| Puerto Rico Electric Power Authority, Refunding RB, | ||
| Series VV (NPFGC), 5.25%, 7/01/30 | 745 | 721,160 |
| 1,223,255 | ||
| Total Municipal Bonds in Puerto Rico | 20,901,083 |
See Notes to Financial Statements.
SEMI-ANNUAL REPORT DECEMBER 31, 2010 41
Schedule of Investments (concluded) BlackRock New York Municipal Bond Fund
(Percentages shown are based on Net Assets)
| Par | |||
| Municipal Bonds | (000) | Value | |
| U.S. Virgin Islands — 1.8% | |||
| Corporate — 1.8% | |||
| United States Virgin Islands, Refunding RB, Senior | |||
| Secured, Hovensa Coker Project, AMT, 6.50%, 7/01/21 $ 4,500 | $ 4,511,070 | ||
| Total Municipal Bonds in the U.S. Virgin Islands | 4,511,070 | ||
| Total Municipal Bonds — 96.3% | 246,343,065 | ||
| Municipal Bonds Transferred to | |||
| Tender Option Bond Trusts (e) | |||
| New York — 2.8% | |||
| County/City/Special District/School District — 1.3% | |||
| City of New York New York, GO, Series J, 5.00%, 5/15/23 | 1,800 | 1,874,160 | |
| New York State Dormitory Authority, RB, State University | |||
| Dormitory Facilities, Series A, 5.25%, 7/01/29 | 1,350 | 1,392,944 | |
| 3,267,104 | |||
| Utilities — 1.5% | |||
| New York City Municipal Water Finance Authority, | |||
| Refunding RB, Series A, 4.75%, 6/15/30 | 4,000 | 3,950,400 | |
| Total Municipal Bonds Transferred to | |||
| Tender Option Bond Trusts — 2.8% | 7,217,504 | ||
| Total Long-Term Investments | |||
| (Cost — $256,651,714) — 99.1% | 253,560,569 | ||
| Short-Term Securities | Shares | ||
| BIF New York Municipal Money Fund, 0.00% (f)(g) | 3,972,530 | 3,972,530 | |
| Total Short-Term Securities | |||
| (Cost — $3,972,530) — 1.5% | 3,972,530 | ||
| Total (Cost — $260,624,244*) — 100.6% | 257,533,099 | ||
| Other Assets Less Liabilities — 0.8% | 1,963,438 | ||
| Liability for Trust Certificates, Including Interest | |||
| Expense and Fees Payable — (1.4)% | (3,576,633) | ||
| Net Assets — 100.0% | $255,919,904 | ||
| * The cost and unrealized appreciation (depreciation) of investments as of | |||
| December 31, 2010, as computed for federal income tax purposes, were as follows: | |||
| Aggregate cost | $ 256,890,480 | ||
| Gross unrealized appreciation | $ 6,896,042 | ||
| Gross unrealized depreciation | (9,828,423) | ||
| Net unrealized depreciation | $ (2,932,381) | ||
(a) Variable rate security. Rate shown is as of report date.
(b) Represents a zero-coupon bond. Rate shown reflects the current yield as of
report date.
(c) Represents a step-up bond that pays an initial coupon rate for the first period and
then a higher coupon rate for the following periods. Rate shown reflects the current
yield as of report date.
(d) US government securities, held in escrow, are used to pay interest on this security as
well as to retire the bond in full at the date indicated, typically at a premium to par.
(e) Securities represent bonds transferred to a tender option bond trust in exchange for
which the Fund acquired residual interest certificates. These securities serve as col-
lateral in a financing transaction. See Note 1 of the Notes to Financial Statements
for details of municipal bonds transferred to tender option bond trusts.
(f) Investments in companies considered to be an affiliate of the Fund during the
period, for purposes of Section 2(a)(3) of the Investment Company Act of 1940,
as amended, were as follows:
| Shares Held | Shares Held | |||
| at June 30, | Net | at December 31, | ||
| Affiliate | 2010 | Activity | 2010 | Income |
| BIF New York | ||||
| Municipal | ||||
| Money Fund | 366,652 | 3,605,878 | 3,972,530 | — |
(g) Represents the current yield as of report date.
•For Fund compliance purposes, the Fund’s industry classifications refer to any one
or more of the industry sub-classifications used by one or more widely recognized
market indexes or rating group indexes, and/or as defined by Fund management.
This definition may not apply for purposes of this report, which may combine such
industry sub-classifications for reporting ease.
•Fair Value Measurements — Various inputs are used in determining the fair value of
investments and derivatives, which are as follows:
•Level 1 — price quotations in active markets/exchanges for identical assets
and liabilities
•Level 2 — other observable inputs (including, but not limited to: quoted prices for
similar assets or liabilities in markets that are active, quoted prices for identical
or similar assets or liabilities in markets that are not active, inputs other than
quoted prices that are observable for the assets or liabilities (such as interest
rates, yield curves, volatilities, prepayment speeds, loss severities, credit risks and
default rates) or other market-corroborated inputs)
•Level 3 — unobservable inputs based on the best information available in the
circumstances, to the extent observable inputs are not available (including the
Fund’s own assumptions used in determining the fair value of investments)
The inputs or methodologies used for valuing securities are not necessarily an
indication of the risk associated with investing in those securities. For information
about the Fund’s policy regarding valuation of investments and other significant
accounting policies, please refer to Note 1 of the Notes to Financial Statements.
The following table summarizes the inputs used as of December 31, 2010 in deter-
mining the fair valuation of the Fund’s investments:
| Valuation Inputs | Level 1 | Level 2 | Level 3 | Total |
| Assets: | ||||
| Investments in | ||||
| Securities: | ||||
| Long-Term | ||||
| Investments1 | — | $ 253,560,569 | — | $ 253,560,569 |
| Short-Term | ||||
| Securities | $ 3,972,530 | — | — | 3,972,530 |
| Total | $ 3,972,530 | $ 253,560,569 | — | $ 257,533,099 |
1 See above Schedule of Investments for values in each sector.
See Notes to Financial Statements.
42 SEMI-ANNUAL REPORT DECEMBER 31, 2010
Statements of Assets and Liabilities
| BlackRock | BlackRock | BlackRock | BlackRock | ||
| Short-Term | BlackRock | National | High Yield | New York | |
| Municipal | Municipal | Municipal | Municipal | Municipal | |
| December 31, 2010 (Unaudited) | Fund | Fund | Fund | Fund | Bond Fund |
| Assets | |||||
| Investments at value — unaffiliated1 | $1,086,993,605 | $ 786,774,138 | $2,633,689,514 | $ 145,447,912 | $ 253,560,569 |
| Investments at value — affiliated2 | 226,455 | 14,851,433 | 29,958,892 | 3,715,532 | 3,972,530 |
| Cash | 961 | 1,967,719 | — | — | 5 |
| Interest receivable | 12,927,468 | 13,783,642 | 40,620,748 | 2,504,599 | 4,481,351 |
| Capital shares sold receivable | 4,491,973 | 1,093,584 | 6,638,146 | 664,848 | 686,050 |
| Investments sold receivable | — | 3,140,000 | 25,879,000 | 155,000 | 90,000 |
| Prepaid expenses | 59,613 | 29,818 | 95,445 | 30,599 | 33,720 |
| Other assets | 56 | 653,393 | — | — | 118 |
| Total assets | 1,104,700,131 | 822,293,727 | 2,736,881,745 | 152,518,490 | 262,824,343 |
| Liabilities | |||||
| Capital shares redeemed payable | 3,925,249 | 1,289,120 | 9,716,154 | 2,161,054 | 487,513 |
| Income dividends payable | 831,207 | 2,498,395 | 6,899,511 | 562,100 | 773,529 |
| Investment advisory fees payable | 291,100 | 246,041 | 1,058,525 | 71,218 | 127,763 |
| Service and distribution fees payable | 165,945 | 118,755 | 550,335 | 20,144 | 49,764 |
| Other affiliates payable | 14,637 | 12,394 | 39,192 | 2,035 | 4,062 |
| Officer’s and Directors’ fees payable | 1,190 | 900 | 2,298 | 330 | 437 |
| Interest expense and fees payable | — | 76,704 | 165,479 | 7,883 | 1,633 |
| Investments purchased payable | — | 5,994,678 | — | — | 1,813,709 |
| Other accrued expenses payable | 134,407 | 124,012 | 361,562 | 69,034 | 71,029 |
| Other liabilities | 4,277 | — | 704 | — | — |
| Total accrued liabilities | 5,368,012 | 10,360,999 | 18,793,760 | 2,893,798 | 3,329,439 |
| Other Liabilities | |||||
| Trust certificates3 | — | 72,750,303 | 287,910,798 | 9,179,734 | 3,575,000 |
| Total liabilities | 5,368,012 | 83,111,302 | 306,704,558 | 12,073,532 | 6,904,439 |
| Net Assets | $1,099,332,119 | $ 739,182,425 | $2,430,177,187 | $ 140,444,958 | $ 255,919,904 |
| Net Assets Consist of | |||||
| Paid-in capital | $1,103,079,453 | $ 767,426,931 | $2,500,149,942 | $158,078,710 | $ 270,657,562 |
| Undistributed net investment income | 484,230 | 2,303,666 | 1,820,332 | 291,850 | 740,636 |
| Accumulated net realized loss | (8,021,573) | (15,486,528) | (68,665,102) | (11,071,068) | (12,387,149) |
| Net unrealized appreciation/depreciation | 3,790,009 | (15,061,644) | (3,127,985) | (6,854,534) | (3,091,145) |
| Net Assets | $1,099,332,119 | $ 739,182,425 | $2,430,177,187 | $140,444,958 | $ 255,919,904 |
| 1 Investments at cost — unaffiliated | $1,083,203,596 | $ 801,835,782 | $2,636,817,499 | $152,302,446 | $ 256,651,714 |
| 2 Investments at cost — affiliated | $ 226,455 | $ 14,851,433 | $ 29,958,892 | $ 3,715,532 | $ 3,972,530 |
| 3 Represents short-term floating rate certificates issued by | |||||
| tender option bond trusts. |
See Notes to Financial Statements.
SEMI-ANNUAL REPORT DECEMBER 31, 2010 43
Statements of Assets and Liabilities (concluded)
| BlackRock | BlackRock | BlackRock | BlackRock | |||||
| Short-Term | BlackRock | National | High Yield | New York | ||||
| Municipal | Municipal | Municipal | Municipal | Municipal | ||||
| December 31, 2010 (Unaudited) | Fund | Fund | Fund | Fund | Bond Fund | |||
| Net Asset Value | ||||||||
| BlackRock: | ||||||||
| Net assets | $ 26,555,410 | — | — | — | — | |||
| Shares outstanding, $0.10 par value4 | 2,622,588 | — | — | — | — | |||
| Net asset value | $ 10.13 | — | — | — | — | |||
| Par value per share | $ 0.10 | — | — | — | — | |||
| Shares authorized | 150 Million | — | — | — | — | |||
| Institutional: | ||||||||
| Net assets | $ 650,131,071 | $ 462,576,457 | $1,181,871,831 | $ 100,443,452 | $ 25,028,115 | |||
| Shares outstanding | 64,228,128 | 64,345,301 | 119,858,891 | 12,262,233 | 2,452,293 | |||
| Net asset value | $ 10.12 | $ 7.19 | $ 9.86 | $ 8.19 | $ 10.21 | |||
| Par value per share | $ 0.10 | $ 0.10 | $ 0.10 | $ 0.10 | $ 0.10 | |||
| Shares authorized | 150 Million | 500 Million | 375 Million | 100 Million | Unlimited | |||
| Investor A: | ||||||||
| Net assets | $ 252,646,538 | $ 185,492,545 | $ 834,436,151 | $ 23,861,821 | $ 39,436,509 | |||
| Shares outstanding | 24,945,021 | 25,813,645 | 84,581,146 | 2,919,049 | 3,860,968 | |||
| Net asset value | $ 10.13 | $ 7.19 | $ 9.87 | $ 8.17 | $ 10.21 | |||
| Par value per share | $ 0.10 | $ 0.10 | $ 0.10 | $ 0.10 | $ 0.10 | |||
| Shares authorized | 150 Million | 500 Million | 375 Million | 100 Million | Unlimited | |||
| Investor A1: | ||||||||
| Net assets | $ 57,662,114 | — | — | — | $ 153,832,019 | |||
| Shares outstanding | 5,692,037 | — | — | — | 15,062,041 | |||
| Net asset value | $ 10.13 | — | — | — | $ 10.21 | |||
| Par value per share | $ 0.10 | — | — | — | $ 0.10 | |||
| Shares authorized | 150 Million | — | — | — | Unlimited | |||
| Investor B: | ||||||||
| Net assets | $ 6,852,493 | $ 13,665,166 | $ 37,649,436 | — | $ 8,046,979 | |||
| Shares outstanding | 676,888 | 1,902,344 | 3,819,561 | — | 788,172 | |||
| Net asset value | $ 10.12 | $ 7.18 | $ 9.86 | — | $ 10.21 | |||
| Par value per share | $ 0.10 | $ 0.10 | $ 0.10 | — | $ 0.10 | |||
| Shares authorized | 150 Million | 375 Million | 375 Million | — | Unlimited | |||
| Investor C: | ||||||||
| Net assets | $ 105,484,493 | $ 47,115,887 | $ 296,459,217 | $ 16,139,685 | $ 18,408,416 | |||
| Shares outstanding | 10,418,106 | 6,549,036 | 30,048,767 | 1,969,940 | 1,803,054 | |||
| Net asset value | $ 10.13 | $ 7.19 | $ 9.87 | $ 8.19 | $ 10.21 | |||
| Par value per share | $ 0.10 | $ 0.10 | $ 0.10 | $ 0.10 | $ 0.10 | |||
| Shares authorized | 150 Million | 375 Million | 375 Million | 100 Million | Unlimited | |||
| Investor C1: | ||||||||
| Net assets | — | $ 30,332,370 | $ 79,760,552 | — | $ 11,167,866 | |||
| Shares outstanding | — | 4,221,408 | 8,087,654 | — | 1,093,591 | |||
| Net asset value | — | $ 7.19 | $ 9.86 | — | $ 10.21 | |||
| Par value per share | — | $ 0.10 | $ 0.10 | — | $ 0.10 | |||
| Shares authorized | — | 375 Million | 375 Million | — | Unlimited | |||
See Notes to Financial Statements.
44 SEMI-ANNUAL REPORT DECEMBER 31, 2010
Statements of Operations
| BlackRock | BlackRock | BlackRock | BlackRock | ||
| Short-Term | BlackRock | National | High Yield | New York | |
| Municipal | Municipal | Municipal | Municipal | Municipal | |
| Six Months Ended December 31, 2010 (Unaudited) | Fund | Fund | Fund | Fund | Bond Fund |
| Investment Income | |||||
| Interest | $ 9,789,965 | $ 21,034,481 | $ 65,403,744 | $ 4,541,478 | $ 7,219,645 |
| Income — affiliated | 57,712 | 104,039 | 150,246 | 5,981 | — |
| Total income | 9,847,677 | 21,138,520 | 65,553,990 | 4,547,459 | 7,219,645 |
| Expenses | |||||
| Investment advisory | 1,925,985 | 1,472,131 | 6,070,559 | 424,562 | 754,431 |
| Service — Investor A | 368,431 | 257,664 | 1,099,521 | 35,040 | 51,283 |
| Service — Investor A1 | 31,702 | — | — | — | 83,053 |
| Service and distribution — Investor B | 14,053 | 60,856 | 164,516 | — | 23,580 |
| Service and distribution — Investor C | 574,896 | 246,856 | 1,565,350 | 86,695 | 95,900 |
| Service and distribution — Investor C1 | — | 134,606 | 352,298 | — | 37,419 |
| Transfer agent — BlackRock | 90 | — | — | — | — |
| Transfer agent — Institutional | 304,233 | 83,291 | 371,115 | 8,640 | 3,567 |
| Transfer agent — Investor A | 29,871 | 44,802 | 228,268 | 4,053 | 12,728 |
| Transfer agent — Investor A1 | 15,453 | — | — | — | 38,782 |
| Transfer agent — Investor B | 2,848 | 5,095 | 18,581 | — | 3,049 |
| Transfer agent — Investor C | 29,984 | 9,384 | 74,006 | 4,247 | 3,820 |
| Transfer agent — Investor C1 | — | 8,482 | 25,460 | — | 2,627 |
| Accounting services | 116,060 | 88,903 | 214,553 | 17,731 | 27,612 |
| Registration | 61,934 | 34,631 | 79,756 | 30,913 | 36,405 |
| Printing | 38,294 | 27,553 | 71,909 | 5,851 | 24,781 |
| Custodian | 35,131 | 26,938 | 56,753 | 9,001 | 9,458 |
| Professional | 30,591 | 33,160 | 50,256 | 21,050 | 48,346 |
| Officer and Directors | 21,303 | 18,237 | 36,010 | 10,522 | 13,117 |
| Miscellaneous | 32,204 | 31,751 | 59,171 | 21,326 | 27,605 |
| Total expenses excluding interest expense and fees | 3,633,063 | 2,584,340 | 10,538,082 | 679,631 | 1,297,563 |
| Interest expense and fees1 | — | 230,719 | 806,781 | 38,495 | 16,790 |
| Total expenses | 3,633,063 | 2,815,059 | 11,344,863 | 718,126 | 1,314,353 |
| Less fees waived by advisor | (2,943) | (4,065) | (42,266) | (1,639) | (5,081) |
| Less transfer agent fees waived and/or reimbursed — class specific | (273,585) | — | — | — | — |
| Total expenses after fees waived and/or reimbursed | 3,356,535 | 2,810,994 | 11,302,597 | 716,487 | 1,309,272 |
| Net investment income | 6,491,142 | 18,327,526 | 54,251,393 | 3,830,972 | 5,910,373 |
| Realized and Unrealized Gain (Loss) | |||||
| Net realized gain (loss) from: | |||||
| Investments — unaffiliated | 496,072 | 1,071,817 | 1,266,171 | (1,764,125) | (695,446) |
| Investments — affiliated | — | (213,126) | — | — | — |
| Financial futures contracts | — | (267,577) | (842,822) | — | (66,014) |
| 496,072 | 591,114 | 423,349 | (1,764,125) | (761,460) | |
| Net change in unrealized appreciation/depreciation on: | |||||
| Investments | (7,098,477) | (35,905,922) | (87,476,524) | (3,500,460) | (7,982,273) |
| Financial futures contracts | — | 84,818 | 393,128 | — | 606 |
| (7,098,477) | (35,821,104) | (87,083,396) | (3,500,460) | (7,981,667) | |
| Total realized and unrealized loss | (6,602,405) | (35,229,990) | (86,660,047) | (5,264,585) | (8,743,127) |
| Net Decrease in Net Assets Resulting from Operations | $ (111,263) | $ (16,902,464) | $ (32,408,654) | $ (1,433,613) | $ (2,832,754) |
| 1 Related to tender option bond trusts. |
See Notes to Financial Statements.
SEMI-ANNUAL REPORT DECEMBER 31, 2010 45
Statements of Changes in Net Assets BlackRock Short-Term Municipal Fund
| Six Months Ended | ||
| December 31, | Year Ended | |
| 2010 | June 30, | |
| Increase (Decrease) in Net Assets: | (Unaudited) | 2010 |
| Operations | ||
| Net investment income | $ 6,491,142 | $ 13,068,301 |
| Net realized gain | 496,072 | 494,322 |
| Net change in unrealized appreciation/depreciation | (7,098,477) | 3,555,853 |
| Net increase (decrease) in net assets resulting from operations | (111,263) | 17,118,476 |
| Dividends and Distributions to Shareholders From | ||
| Net investment income: | ||
| BlackRock | (107,614) | (126,369) |
| Institutional | (4,297,283) | (8,667,629) |
| Investor A | (1,530,100) | (2,658,864) |
| Investor A1 | (373,253) | (1,043,367) |
| Investor B | (35,752) | (101,560) |
| Investor C | (147,279) | (470,373) |
| Net realized gain: | ||
| BlackRock | (6) | — |
| Institutional | (131) | — |
| Investor A | (53) | — |
| Investor A1 | (11) | — |
| Investor B | (1) | — |
| Investor C | (21) | — |
| Decrease in net assets resulting from dividends and distributions to shareholders | (6,491,504) | (13,068,162) |
| Capital Share Transactions | ||
| Net increase (decrease) in net assets derived from capital share transactions | (29,538,826) | 446,346,568 |
| Net Assets | ||
| Total increase (decrease) in net assets | (36,141,593) | 450,396,882 |
| Beginning of period | 1,135,473,712 | 685,076,830 |
| End of period | $ 1,099,332,119 | $ 1,135,473,712 |
| Undistributed net investment income | $ 484,230 | $ 484,369 |
See Notes to Financial Statements.
46 SEMI-ANNUAL REPORT DECEMBER 31, 2010
Statements of Changes in Net Assets BlackRock Municipal Fund
| Six Months Ended | ||
| December 31, | Year Ended | |
| 2010 | June 30, | |
| Increase (Decrease) in Net Assets: | (Unaudited) | 2010 |
| Operations | ||
| Net investment income | $ 18,327,526 | $ 36,974,681 |
| Net realized gain | 591,114 | 109,019 |
| Net change in unrealized appreciation/depreciation | (35,821,104) | 37,425,412 |
| Net increase (decrease) in net assets resulting from operations | (16,902,464) | 74,509,112 |
| Dividends to Shareholders From | ||
| Net investment income: | ||
| Institutional | (12,009,651) | (24,523,908) |
| Investor A | (4,556,154) | (8,923,096) |
| Investor B | (316,690) | (776,512) |
| Investor C | (907,868) | (1,381,082) |
| Investor C1 | (650,214) | (1,392,487) |
| Decrease in net assets resulting from dividends to shareholders | (18,440,577) | (36,997,085) |
| Capital Share Transactions | ||
| Net decrease in net assets derived from capital share transactions | (21,355,041) | (7,051,731) |
| Net Assets | ||
| Total increase (decrease) in net assets | (56,698,082) | 30,460,296 |
| Beginning of period | 795,880,507 | 765,420,211 |
| End of period | $ 739,182,425 | $ 795,880,507 |
| Undistributed net investment income | $ 2,303,666 | $ 2,416,717 |
See Notes to Financial Statements.
SEMI-ANNUAL REPORT DECEMBER 31, 2010 47
Statements of Changes in Net Assets BlackRock National Municipal Fund
| Six Months Ended | ||
| December 31, | Year Ended | |
| 2010 | June 30, | |
| Increase (Decrease) in Net Assets: | (Unaudited) | 2010 |
| Operations | ||
| Net investment income | $ 54,251,393 | $ 96,333,720 |
| Net realized gain (loss) | 423,349 | (2,064,058) |
| Net change in unrealized appreciation/depreciation | (87,083,396) | 120,680,314 |
| Net increase (decrease) in net assets resulting from operations | (32,408,654) | 214,949,976 |
| Dividends to Shareholders From | ||
| Net investment income: | ||
| Institutional | (27,901,754) | (48,071,614) |
| Investor A | (18,986,416) | (32,665,327) |
| Investor B | (829,949) | (2,064,417) |
| Investor C | (5,588,791) | (9,329,434) |
| Investor C1 | (1,656,288) | (3,673,746) |
| Decrease in net assets resulting from dividends to shareholders | (54,963,198) | (95,804,538) |
| Capital Share Transactions | ||
| Net increase in net assets derived from capital share transactions | 167,448,226 | 311,714,029 |
| Net Assets | ||
| Total increase in net assets | 80,076,374 | 430,859,467 |
| Beginning of period | 2,350,100,813 | 1,919,241,346 |
| End of period | $ 2,430,177,187 | $ 2,350,100,813 |
| Undistributed net investment income | $ 1,820,332 | $ 2,532,137 |
See Notes to Financial Statements.
48 SEMI-ANNUAL REPORT DECEMBER 31, 2010
Statements of Changes in Net Assets BlackRock High Yield Municipal Fund
| Six Months Ended | ||
| December 31, | Year Ended | |
| 2010 | June 30, | |
| Increase (Decrease) in Net Assets: | (Unaudited) | 2010 |
| Operations | ||
| Net investment income | $ 3,830,972 | $ 5,380,956 |
| Net realized loss | (1,764,125) | (862,425) |
| Net change in unrealized appreciation/depreciation | (3,500,460) | 12,678,898 |
| Net increase (decrease) in net assets resulting from operations | (1,433,613) | 17,197,429 |
| Dividends and Distributions to Shareholders From | ||
| Net investment income: | ||
| Institutional | (2,814,921) | (4,001,250) |
| Investor A | (684,327) | (889,571) |
| Investor C | (356,111) | (440,107) |
| Net realized gain: | ||
| Institutional | (54,819) | — |
| Investor A | (12,029) | — |
| Investor C | (8,508) | — |
| Decrease in net assets resulting from dividends and distributions to shareholders | (3,930,715) | (5,330,928) |
| Capital Share Transactions | ||
| Net increase in net assets derived from capital share transactions | 11,998,408 | 65,759,877 |
| Net Assets | ||
| Total increase in net assets | 6,634,080 | 77,626,378 |
| Beginning of period | 133,810,878 | 56,184,500 |
| End of period | $ 140,444,958 | $133,810,878 |
| Undistributed net investment income | $ 291,850 | $ 316,237 |
See Notes to Financial Statements.
SEMI-ANNUAL REPORT DECEMBER 31, 2010 49
Statements of Changes in Net Assets BlackRock New York Municipal Bond Fund
| Six Months Ended | ||
| December 31, | Year Ended | |
| 2010 | June 30, | |
| Increase (Decrease) in Net Assets: | (Unaudited) | 2010 |
| Operations | ||
| Net investment income | $ 5,910,373 | $ 11,530,532 |
| Net realized gain (loss) | (761,460) | 837,288 |
| Net change in unrealized appreciation/depreciation | (7,981,667) | 16,848,788 |
| Net increase (decrease) in net assets resulting from operations | (2,832,754) | 29,216,608 |
| Dividends and Distributions to Shareholders From | ||
| Net investment income: | ||
| Institutional | (593,048) | (994,195) |
| Investor A | (869,747) | (1,383,566) |
| Investor A1 | (3,668,610) | (7,515,339) |
| Investor B | (188,987) | (454,361) |
| Investor C | (337,596) | (588,088) |
| Investor C1 | (244,555) | (514,636) |
| Net realized gain: | ||
| Institutional | (3,107) | — |
| Investor A | (4,810) | — |
| Investor A1 | (18,760) | — |
| Investor B | (980) | — |
| Investor C | (2,215) | — |
| Investor C1 | (1,368) | — |
| Decrease in net assets resulting from dividends and distributions to shareholders | (5,933,783) | (11,450,185) |
| Capital Share Transactions | ||
| Net increase in net assets derived from capital share transactions | 1,171,539 | 11,855,642 |
| Net Assets Applicable to Shareholders | ||
| Total increase (decrease) in net assets | (7,594,998) | 29,622,065 |
| Beginning of period | 263,514,902 | 233,892,837 |
| End of period | $ 255,919,904 | $ 263,514,902 |
| Undistributed net investment income | $ 740,636 | $ 732,806 |
See Notes to Financial Statements.
50 SEMI-ANNUAL REPORT DECEMBER 31, 2010
Financial Highlights BlackRock Short-Term Municipal Fund
| BlackRock | ||||||
| Six Months Ended | Period | |||||
| December 31, | Year Ended June 30, | October 2, 20061 | ||||
| 2010 | to June 30, | |||||
| (Unaudited) | 2010 | 2009 | 2008 | 2007 | ||
| Per Share Operating Performance | ||||||
| Net asset value, beginning of period | $ 10.19 | $ 10.14 | $ 9.98 | $ 9.89 | $ 9.93 | |
| Net investment income2 | 0.06 | 0.15 | 0.26 | 0.33 | 0.25 | |
| Net realized and unrealized gain (loss) | (0.05) | 0.06 | 0.17 | 0.09 | (0.04) | |
| Net increase from investment operations | 0.01 | 0.21 | 0.43 | 0.42 | 0.21 | |
| Dividends and distributions from: | ||||||
| Net investment income | (0.07) | (0.16) | (0.27) | (0.33) | (0.25) | |
| Net realized gain | (0.00)3 | — | — | — | — | |
| Total dividends and distributions | (0.07) | (0.16) | (0.27) | (0.33) | (0.25) | |
| Net asset value, end of period | $ 10.13 | $ 10.19 | $ 10.14 | $ 9.98 | $ 9.89 | |
| Total Investment Return4 | ||||||
| Based on net asset value | 0.07%5 | 2.04% | 4.36% | 4.26% | 2.09%5 | |
| Ratios to Average Net Assets | ||||||
| Total expenses | 0.39%6 | 0.41% | 0.45% | 0.42% | 0.45%6 | |
| Total expenses after fees waived | 0.39%6 | 0.40% | 0.44% | 0.39% | 0.35%6 | |
| Net investment income | 1.30%6 | 1.42% | 2.65% | 3.28% | 3.34%6 | |
| Supplemental Data | ||||||
| Net assets, end of period (000) | $ 26,555 | $ 17,244 | $ 2,424 | $ 1,822 | $ 2,457 | |
| Portfolio turnover | 27% | 36% | 21% | 33% | 110% | |
1 Commencement of operations.
2 Based on average shares outstanding.
3 Amount is less than $(0.01) per share.
4 Where applicable, total investment returns include the reinvestment of dividends and distributions.
5 Aggregate total investment return.
6 Annualized.
See Notes to Financial Statements.
SEMI-ANNUAL REPORT DECEMBER 31, 2010 51
Financial Highlights (continued) BlackRock Short-Term Municipal Fund
| Institutional | ||||||||
| Six Months Ended | ||||||||
| December 31, | ||||||||
| 2010 | Year Ended June 30, | |||||||
| (Unaudited) | 2010 | 2009 | 2008 | 2007 | 2006 | |||
| Per Share Operating Performance | ||||||||
| Net asset value, beginning of period | $ 10.18 | $ 10.13 | $ 9.97 | $ 9.88 | $ 9.88 | $ 9.99 | ||
| Net investment income1 | 0.07 | 0.15 | 0.27 | 0.33 | 0.32 | 0.27 | ||
| Net realized and unrealized gain (loss) | (0.06) | 0.06 | 0.17 | 0.09 | 0.002 | (0.11) | ||
| Net increase from investment operations | 0.01 | 0.21 | 0.44 | 0.42 | 0.32 | 0.16 | ||
| Dividends and distributions from: | ||||||||
| Net investment income | (0.07) | (0.16) | (0.28) | (0.33) | (0.32) | (0.27) | ||
| Net realized gain | (0.00)3 | — | — | — | — | — | ||
| Total dividends and distributions | (0.07) | (0.16) | (0.28) | (0.33) | (0.32) | (0.27) | ||
| Net asset value, end of period | $ 10.12 | $ 10.18 | $ 10.13 | $ 9.97 | $ 9.88 | $ 9.88 | ||
| Total Investment Return4 | ||||||||
| Based on net asset value | 0.06%5 | 2.04% | 4.45% | 4.31% | 3.32% | 1.57% | ||
| Ratios to Average Net Assets | ||||||||
| Total expenses | 0.48%6 | 0.48% | 0.47% | 0.49% | 0.48% | 0.45% | ||
| Total expenses after fees waived | 0.40%6 | 0.40% | 0.35% | 0.35% | 0.38% | 0.44% | ||
| Net investment income | 1.30%6 | 1.50% | 2.68% | 3.30% | 3.27% | 2.66% | ||
| Supplemental Data | ||||||||
| Net assets, end of period (000) | $ 650,131 | $ 628,194 | $403,143 | $181,624 | $131,061 | $149,333 | ||
| Portfolio turnover | 27% | 36% | 21% | 33% | 110% | 83% | ||
1 Based on average shares outstanding.
2 Amount is less than $0.01 per share.
3 Amount is less than $(0.01) per share.
4 Where applicable, total investment returns exclude the effects of any sales charges and include the reinvestment of dividends and distributions.
5 Aggregate total investment return.
6 Annualized.
See Notes to Financial Statements.
52 SEMI-ANNUAL REPORT DECEMBER 31, 2010
Financial Highlights (continued) BlackRock Short-Term Municipal Fund
| Investor A | |||||||
| Six Months Ended | Period | ||||||
| December 31, | Year Ended June 30, | October 2, 20061 | |||||
| 2010 | to June 30, | ||||||
| (Unaudited) | 2010 | 2009 | 2008 | 2007 | |||
| Per Share Operating Performance | |||||||
| Net asset value, beginning of period | $ 10.19 | $ 10.13 | $ 9.98 | $ 9.88 | $ 9.93 | ||
| Net investment income2 | 0.05 | 0.12 | 0.21 | 0.30 | 0.23 | ||
| Net realized and unrealized gain (loss) | (0.06) | 0.07 | 0.19 | 0.11 | (0.05) | ||
| Net increase (decrease) from investment operations | (0.01) | 0.19 | 0.40 | 0.41 | 0.18 | ||
| Dividends and distributions from: | |||||||
| Net investment income | (0.05) | (0.13) | (0.25) | (0.31) | (0.23) | ||
| Net realized gain | (0.00)3 | — | — | — | — | ||
| Total dividends and distributions | (0.05) | (0.13) | (0.25) | (0.31) | (0.23) | ||
| Net asset value, end of period | $ 10.13 | $ 10.19 | $ 10.13 | $ 9.98 | $ 9.88 | ||
| Total Investment Return4 | |||||||
| Based on net asset value | (0.07)%5 | 1.86% | 4.08% | 4.15% | 1.79%5 | ||
| Ratios to Average Net Assets | |||||||
| Total expenses | 0.66%6 | 0.68% | 0.72% | 0.79% | 1.06%6 | ||
| Total expenses after fees waived | 0.66%6 | 0.67% | 0.60% | 0.60% | 0.61%6 | ||
| Net investment income | 1.04%6 | 1.20% | 2.26% | 3.03% | 3.12%6 | ||
| Supplemental Data | |||||||
| Net assets, end of period (000) | $ 252,647 | $ 297,336 | $ 121,355 | $ 9,403 | $ 1,456 | ||
| Portfolio turnover | 27% | 36% | 21% | 33% | 110% | ||
1 Commencement of operations.
2 Based on average shares outstanding.
3 Amount is less than $(0.01) per share.
4 Where applicable, total investment returns exclude the effects of any sales charges and include the reinvestment of dividends and distributions.
5 Aggregate total investment return.
6 Annualized.
See Notes to Financial Statements.
SEMI-ANNUAL REPORT DECEMBER 31, 2010 53
Financial Highlights (continued) BlackRock Short-Term Municipal Fund
| Investor A1 | ||||||
| Six Months Ended | ||||||
| December 31, | ||||||
| 2010 | Year Ended June 30, | |||||
| (Unaudited) | 2010 | 2009 | 2008 | 2007 | 2006 | |
| Per Share Operating Performance | ||||||
| Net asset value, beginning of period | $ 10.19 | $ 10.14 | $ 9.98 | $ 9.89 | $ 9.89 | $ 10.00 |
| Net investment income1 | 0.06 | 0.14 | 0.27 | 0.32 | 0.32 | 0.26 |
| Net realized and unrealized gain (loss) | (0.06) | 0.05 | 0.16 | 0.09 | (0.01) | (0.11) |
| Net increase (decrease) from investment operations | — | 0.19 | 0.43 | 0.41 | 0.31 | 0.15 |
| Dividends and distributions from: | ||||||
| Net investment income | (0.06) | (0.14) | (0.27) | (0.32) | (0.31) | (0.26) |
| Net realized gain | (0.00)2 | — | — | — | — | — |
| Total dividends and distributions | (0.06) | (0.14) | (0.27) | (0.32) | (0.31) | (0.26) |
| Net asset value, end of period | $ 10.13 | $ 10.19 | $ 10.14 | $ 9.98 | $ 9.89 | $ 9.89 |
| Total Investment Return3 | ||||||
| Based on net asset value | 0.00%4 | 1.91% | 4.34% | 4.20% | 3.21% | 1.47% |
| Ratios to Average Net Assets | ||||||
| Total expenses | 0.54%5 | 0.55% | 0.58% | 0.59% | 0.58% | 0.55% |
| Total expenses after fees waived | 0.52%5 | 0.52% | 0.45% | 0.45% | 0.48% | 0.54% |
| Net investment income | 1.18%5 | 1.41% | 2.70% | 3.22% | 3.18% | 2.55% |
| Supplemental Data | ||||||
| Net assets, end of period (000) | $ 57,662 | $ 66,404 | $ 78,606 | $105,580 | $122,281 | $ 99,293 |
| Portfolio turnover | 27% | 36% | 21% | 33% | 110% | 83% |
1 Based on average shares outstanding.
2 Amount is less than $(0.01) per share.
3 Where applicable, total investment returns exclude the effects of any sales charges and include the reinvestment of dividends and distributions.
4 Aggregate total investment return.
5 Annualized.
See Notes to Financial Statements.
54 SEMI-ANNUAL REPORT DECEMBER 31, 2010
Financial Highlights (continued) BlackRock Short-Term Municipal Fund
| Investor B | ||||||
| Six Months Ended | ||||||
| December 31, | ||||||
| 2010 | Year Ended June 30, | |||||
| (Unaudited) | 2010 | 2009 | 2008 | 2007 | 2006 | |
| Per Share Operating Performance | ||||||
| Net asset value, beginning of period | $ 10.18 | $ 10.13 | $ 9.97 | $ 9.88 | $ 9.88 | $ 10.00 |
| Net investment income1 | 0.05 | 0.11 | 0.24 | 0.30 | 0.29 | 0.23 |
| Net realized and unrealized gain (loss) | (0.06) | 0.05 | 0.16 | 0.08 | (0.00)2 | (0.12) |
| Net increase (decrease) from investment operations | (0.01) | 0.16 | 0.40 | 0.38 | 0.29 | 0.11 |
| Dividends and distributions from: | ||||||
| Net investment income | (0.05) | (0.11) | (0.24) | (0.29) | (0.29) | (0.23) |
| Net realized gain | (0.00)2 | — | — | — | — | — |
| Total dividends and distributions | (0.05) | (0.11) | (0.24) | (0.29) | (0.29) | (0.23) |
| Net asset value, end of period | $ 10.12 | $ 10.18 | $ 10.13 | $ 9.97 | $ 9.88 | $ 9.88 |
| Total Investment Return3 | ||||||
| Based on net asset value | (0.14)%4 | 1.62% | 4.08% | 3.94% | 2.95% | 1.11% |
| Ratios to Average Net Assets | ||||||
| Total expenses | 0.81%5 | 0.82% | 0.85% | 0.85% | 0.85% | 0.81% |
| Total expenses after fees waived | 0.81%5 | 0.81% | 0.70% | 0.70% | 0.74% | 0.80% |
| Net investment income | 0.89%5 | 1.13% | 2.41% | 2.97% | 2.90% | 2.28% |
| Supplemental Data | ||||||
| Net assets, end of period (000) | $ 6,852 | $ 8,503 | $ 9,917 | $ 10,612 | $ 14,380 | $ 23,769 |
| Portfolio turnover | 27% | 36% | 21% | 33% | 110% | 83% |
1 Based on average shares outstanding.
2 Amount is less than $(0.01) per share.
3 Where applicable, total investment returns exclude the effects of any sales charges and include the reinvestment of dividends and distributions.
4 Aggregate total investment return.
5 Annualized.
See Notes to Financial Statements.
SEMI-ANNUAL REPORT DECEMBER 31, 2010 55
Financial Highlights (concluded) BlackRock Short-Term Municipal Fund
| Investor C | |||||||
| Six Months Ended | Period | ||||||
| December 31, | Year Ended June 30, | October 2, 20061 | |||||
| 2010 | to June 30, | ||||||
| (Unaudited) | 2010 | 2009 | 2008 | 2007 | |||
| Per Share Operating Performance | |||||||
| Net asset value, beginning of period | $ 10.18 | $ 10.13 | $ 9.97 | $ 9.88 | $ 9.93 | ||
| Net investment income2 | 0.01 | 0.05 | 0.15 | 0.23 | 0.17 | ||
| Net realized and unrealized gain (loss) | (0.05) | 0.05 | 0.19 | 0.09 | (0.05) | ||
| Net increase (decrease) from investment operations | (0.04) | 0.10 | 0.34 | 0.32 | 0.12 | ||
| Dividends and distributions from: | |||||||
| Net investment income | (0.01) | (0.05) | (0.18) | (0.23) | (0.17) | ||
| Net realized gain | (0.00)3 | — | — | — | — | ||
| Total dividends and distributions | (0.01) | (0.05) | (0.18) | (0.23) | (0.17) | ||
| Net asset value, end of period | $ 10.13 | $ 10.18 | $ 10.13 | $ 9.97 | $ 9.88 | ||
| Total Investment Return4 | |||||||
| Based on net asset value | (0.36)%5 | 0.97% | 3.41% | 3.27% | 1.23%5 | ||
| Ratios to Average Net Assets | |||||||
| Total expenses | 1.44%6 | 1.46% | 1.52% | 1.78% | 2.06%6 | ||
| Total expenses after fees waived | 1.44%6 | 1.45% | 1.35% | 1.35% | 1.36%6 | ||
| Net investment income | 0.26%6 | 0.44% | 1.56% | 2.28% | 2.37%6 | ||
| Supplemental Data | |||||||
| Net assets, end of period (000) | $ 105,484 | $ 117,792 | $ 69,632 | $ 7,365 | $ 2,084 | ||
| Portfolio turnover | 27% | 36% | 21% | 33% | 110% | ||
1 Commencement of operations.
2 Based on average shares outstanding.
3 Amount is less than $(0.01) per share.
4 Where applicable, total investment returns exclude the effects of any sales charges and include the reinvestment of dividends and distributions.
5 Aggregate total investment return.
6 Annualized.
See Notes to Financial Statements.
56 SEMI-ANNUAL REPORT DECEMBER 31, 2010
Financial Highlights BlackRock Municipal Fund
| Institutional | |||||||
| Six Months Ended | |||||||
| December 31, | |||||||
| 2010 | Year Ended June 30, | ||||||
| (Unaudited) | 2010 | 2009 | 2008 | 2007 | 2006 | ||
| Per Share Operating Performance | |||||||
| Net asset value, beginning of period | $ 7.52 | $ 7.17 | $ 7.42 | $ 7.67 | $ 7.69 | $ 8.00 | |
| Net investment income1 | 0.18 | 0.36 | 0.35 | 0.33 | 0.32 | 0.35 | |
| Net realized and unrealized gain (loss) | (0.36) | 0.35 | (0.25) | (0.23) | 0.03 | (0.28) | |
| Net increase (decrease) from investment operations | (0.18) | 0.71 | 0.10 | 0.10 | 0.35 | 0.07 | |
| Dividends and distributions from: | |||||||
| Net investment income | (0.15) | (0.36) | (0.35) | (0.34) | (0.33) | (0.35) | |
| Net realized gain | — | — | (0.00)2 | (0.01) | (0.04) | (0.03) | |
| Total dividends and distributions | (0.15) | (0.36) | (0.35) | (0.35) | (0.37) | (0.38) | |
| Net asset value, end of period | $ 7.19 | $ 7.52 | $ 7.17 | $ 7.42 | $ 7.67 | $ 7.69 | |
| Total Investment Return3 | |||||||
| Based on net asset value | (2.10)%4 | 10.04% | 1.52% | 1.37% | 4.60% | 0.82% | |
| Ratios to Average Net Assets | |||||||
| Total expenses | 0.51%5 | 0.52% | 0.67% | 0.85% | 0.87% | 0.74% | |
| Total expenses after fees waived | 0.51%5 | 0.52% | 0.66% | 0.84% | 0.87% | 0.74% | |
| Total expenses after fees waived and excluding interest expense and fees6 | 0.46%5 | 0.46% | 0.47% | 0.46% | 0.47% | 0.45% | |
| Net investment income | 4.66%5 | 4.82% | 4.93% | 4.38% | 4.42% | 4.40% | |
| Supplemental Data | |||||||
| Net assets, end of period (000) | $ 462,576 | $505,547 | $493,427 | $545,130 | $604,691 | $639,687 | |
| Portfolio turnover | 9% | 14% | 15% | 40% | 36% | 41% | |
1 Based on average shares outstanding.
2 Amount is less than $(0.01) per share.
3 Where applicable, total investment returns exclude the effects of any sales charges and include the reinvestment of dividends and distributions.
4 Aggregate total investment return.
5 Annualized.
6 Interest expense and fees relate to tender option bond trusts. See Note 1 of the Notes to Financial Statements for details of municipal bonds transferred to tender option
bond trusts.
See Notes to Financial Statements.
SEMI-ANNUAL REPORT DECEMBER 31, 2010 57
Financial Highlights (continued) BlackRock Municipal Fund
| Investor A | ||||||
| Six Months Ended | ||||||
| December 31, | ||||||
| 2010 | Year Ended June 30, | |||||
| (Unaudited) | 2010 | 2009 | 2008 | 2007 | 2006 | |
| Per Share Operating Performance | ||||||
| Net asset value, beginning of period | $ 7.52 | $ 7.17 | $ 7.41 | $ 7.67 | $ 7.68 | $ 8.00 |
| Net investment income1 | 0.17 | 0.34 | 0.33 | 0.31 | 0.33 | 0.33 |
| Net realized and unrealized gain (loss) | (0.35) | 0.35 | (0.24) | (0.24) | 0.01 | (0.29) |
| Net increase (decrease) from investment operations | (0.18) | 0.69 | 0.09 | 0.07 | 0.34 | 0.04 |
| Dividends and distributions from: | ||||||
| Net investment income | (0.15) | (0.34) | (0.33) | (0.32) | (0.31) | (0.33) |
| Net realized gain | — | — | (0.00)2 | (0.01) | (0.04) | (0.03) |
| Total dividends and distributions | (0.15) | (0.34) | (0.33) | (0.33) | (0.35) | (0.36) |
| Net asset value, end of period | $ 7.19 | $ 7.52 | $ 7.17 | $ 7.41 | $ 7.67 | $ 7.68 |
| Total Investment Return3 | ||||||
| Based on net asset value | (2.23)%4 | 9.76% | 1.39% | 0.96% | 4.47% | 0.44% |
| Ratios to Average Net Assets | ||||||
| Total expenses | 0.77%5 | 0.78% | 0.93% | 1.11% | 1.13% | 0.99% |
| Total expenses after fees waived | 0.77%5 | 0.78% | 0.92% | 1.10% | 1.12% | 0.99% |
| Total expenses after fees waived and excluding interest expense and fees6 | 0.72%5 | 0.72% | 0.73% | 0.72% | 0.72% | 0.70% |
| Net investment income | 4.39%5 | 4.56% | 4.67% | 4.12% | 4.17% | 4.15% |
| Supplemental Data | ||||||
| Net assets, end of period (000) | $ 185,493 | $196,325 | $189,614 | $169,010 | $172,236 | $172,083 |
| Portfolio turnover | 9% | 14% | 15% | 40% | 36% | 41% |
1 Based on average shares outstanding.
2 Amount is less than $(0.01) per share.
3 Where applicable, total investment returns exclude the effects of any sales charges and include the reinvestment of dividends and distributions.
4 Aggregate total investment return.
5 Annualized.
6 Interest expense and fees relate to tender option bond trusts. See Note 1 of the Notes to Financial Statements for details of municipal bonds transferred to tender option
bond trusts.
See Notes to Financial Statements.
58 SEMI-ANNUAL REPORT DECEMBER 31, 2010
Financial Highlights (continued) BlackRock Municipal Fund
| Investor B | |||||||||
| Six Months Ended | |||||||||
| December 31, | |||||||||
| 2010 | Year Ended June 30, | ||||||||
| (Unaudited) | 2010 | 2009 | 2008 | 2007 | 2006 | ||||
| Per Share Operating Performance | |||||||||
| Net asset value, beginning of period | $ 7.51 | $ 7.16 | $ 7.41 | $ 7.67 | $ 7.68 | $ 7.99 | |||
| Net investment income1 | 0.15 | 0.30 | 0.29 | 0.27 | 0.29 | 0.29 | |||
| Net realized and unrealized gain (loss) | (0.35) | 0.35 | (0.25) | (0.24) | 0.01 | (0.28) | |||
| Net increase (decrease) from investment operations | (0.20) | 0.65 | 0.04 | 0.03 | 0.30 | 0.01 | |||
| Dividends and distributions from: | |||||||||
| Net investment income | (0.13) | (0.30) | (0.29) | (0.28) | (0.27) | (0.29) | |||
| Net realized gain | — | — | (0.00)2 | (0.01) | (0.04) | (0.03) | |||
| Total dividends and distributions | (0.13) | (0.30) | (0.29) | (0.29) | (0.31) | (0.32) | |||
| Net asset value, end of period | $ 7.18 | $ 7.51 | $ 7.16 | $ 7.41 | $ 7.67 | $ 7.68 | |||
| Total Investment Return3 | �� | ||||||||
| Based on net asset value | (2.49)%4 | 9.20% | 0.73% | 0.45% | 3.95% | 0.05% | |||
| Ratios to Average Net Assets | |||||||||
| Total expenses | 1.29%5 | 1.30% | 1.45% | 1.61% | 1.63% | 1.50% | |||
| Total expenses after fees waived | 1.29%5 | 1.29% | 1.44% | 1.61% | 1.63% | 1.50% | |||
| Total expenses after fees waived and excluding interest expense and fees6 | 1.24%5 | 1.24% | 1.25% | 1.23% | 1.23% | 1.21% | |||
| Net investment income | 3.87%5 | 4.04% | 4.15% | 3.61% | 3.67% | 3.64% | |||
| Supplemental Data | |||||||||
| Net assets, end of period (000) | $ 13,665 | $ 16,987 | $ 20,504 | $ 33,422 | $ 45,533 | $ 66,477 | |||
| Portfolio turnover | 9% | 14% | 15% | 40% | 36% | 41% | |||
1 Based on average shares outstanding.
2 Amount is less than $(0.01) per share.
3 Where applicable, total investment returns exclude the effects of any sales charges and include the reinvestment of dividends and distributions.
4 Aggregate total investment return.
5 Annualized.
6 Interest expense and fees relate to tender option bond trusts. See Note 1 of the Notes to Financial Statements for details of municipal bonds transferred to tender option
bond trusts.
See Notes to Financial Statements.
SEMI-ANNUAL REPORT DECEMBER 31, 2010 59
Financial Highlights (continued) BlackRock Municipal Fund
| Investor C | |||||
| Six Months Ended | Period | ||||
| December 31, | Year Ended June 30, | October 2, 20061 | |||
| 2010 | to June 30, | ||||
| (Unaudited) | 2010 | 2009 | 2008 | 2007 | |
| Per Share Operating Performance | |||||
| Net asset value, beginning of period | $ 7.53 | $ 7.17 | $ 7.42 | $ 7.68 | $ 7.88 |
| Net investment income2 | 0.14 | 0.28 | 0.28 | 0.25 | 0.17 |
| Net realized and unrealized gain (loss) | (0.36) | 0.36 | (0.26) | (0.24) | (0.14) |
| Net increase (decrease) from investment operations | (0.22) | 0.64 | 0.02 | 0.01 | 0.03 |
| Dividends and distributions from: | |||||
| Net investment income | (0.12) | (0.28) | (0.27) | (0.26) | (0.19) |
| Net realized gain | — | — | (0.00)3 | (0.01) | (0.04) |
| Total dividends and distributions | (0.12) | (0.28) | (0.27) | (0.27) | (0.23) |
| Net asset value, end of period | $ 7.19 | $ 7.53 | $ 7.17 | $ 7.42 | $ 7.68 |
| Total Investment Return4 | |||||
| Based on net asset value | (2.73)%5 | 9.09% | 0.51% | 0.22% | 0.34%5 |
| Ratios to Average Net Assets | |||||
| Total expenses | 1.52%6 | 1.53% | 1.68% | 1.85% | 1.90%6 |
| Total expenses after fees waived | 1.52%6 | 1.53% | 1.67% | 1.84% | 1.90%6 |
| Total expenses after fees waived and excluding interest expense and fees7 | 1.46%6 | 1.47% | 1.48% | 1.46% | 1.51%6 |
| Net investment income | 3.65%6 | 3.81% | 3.92% | 3.37% | 3.37%6 |
| Supplemental Data | |||||
| Net assets, end of period (000) | $ 47,116 | $ 43,505 | $ 27,375 | $ 13,674 | $ 4,542 |
| Portfolio turnover | 9% | 14% | 15% | 40% | 36% |
1 Commencement of operations.
2 Based on average shares outstanding.
3 Amount is less than $(0.01) per share.
4 Where applicable, total investment returns exclude the effects of any sales charges and include the reinvestment of dividends and distributions.
5 Aggregate total investment return.
6 Annualized.
7 Interest expense and fees relate to tender option bond trusts. See Note 1 of the Notes to Financial Statements for details of municipal bonds transferred to tender option
bond trusts.
See Notes to Financial Statements.
60 SEMI-ANNUAL REPORT DECEMBER 31, 2010
Financial Highlights (concluded) BlackRock Municipal Fund
| Investor C1 | ||||||
| Six Months Ended | ||||||
| December 31, | ||||||
| 2010 | Year Ended June 30, | |||||
| (Unaudited) | 2010 | 2009 | 2008 | 2007 | 2006 | |
| Per Share Operating Performance | ||||||
| Net asset value, beginning of period | $ 7.52 | $ 7.16 | $ 7.41 | $ 7.67 | $ 7.68 | $ 8.00 |
| Net investment income1 | 0.15 | 0.30 | 0.29 | 0.27 | 0.28 | 0.28 |
| Net realized and unrealized gain (loss) | (0.35) | 0.36 | (0.25) | (0.24) | 0.02 | (0.29) |
| Net increase (decrease) from investment operations | (0.20) | 0.66 | 0.04 | 0.03 | 0.30 | (0.01) |
| Dividends and distributions from: | ||||||
| Net investment income | (0.13) | (0.30) | (0.29) | (0.28) | (0.27) | (0.28) |
| Net realized gain | — | — | (0.00)2 | (0.01) | (0.04) | (0.03) |
| Total dividends and distributions | (0.13) | (0.30) | (0.29) | (0.29) | (0.31) | (0.31) |
| Net asset value, end of period | $ 7.19 | $ 7.52 | $ 7.16 | $ 7.41 | $ 7.67 | $ 7.68 |
| Total Investment Return3 | ||||||
| Based on net asset value | (2.51)%4 | 9.30% | 0.69% | 0.41% | 3.90% | (0.12)% |
| Ratios to Average Net Assets | ||||||
| Total expenses | 1.33%5 | 1.34% | 1.49% | 1.66% | 1.68% | 1.55% |
| Total expenses after fees waived | 1.33%5 | 1.34% | 1.48% | 1.65% | 1.68% | 1.55% |
| Total expenses after fees waived and excluding interest expense and fees6 | 1.27%5 | 1.28% | 1.29% | 1.27% | 1.28% | 1.26% |
| Net investment income | 3.84%5 | 4.00% | 4.11% | 3.57% | 3.63% | 3.59% |
| Supplemental Data | ||||||
| Net assets, end of period (000) | $ 30,332 | $ 33,515 | $ 34,500 | $ 42,655 | $ 51,452 | $ 61,046 |
| Portfolio turnover | 9% | 14% | 15% | 40% | 36% | 41% |
1 Based on average shares outstanding.
2 Amount is less than $(0.01) per share.
3 Where applicable, total investment returns exclude the effects of any sales charges and include the reinvestment of dividends and distributions.
4 Aggregate total investment return.
5 Annualized.
6 Interest expense and fees relate to tender option bond trusts. See Note 1 of the Notes to Financial Statements for details of municipal bonds transferred to tender option
bond trusts.
See Notes to Financial Statements.
SEMI-ANNUAL REPORT DECEMBER 31, 2010 61
Financial Highlights BlackRock National Municipal Fund
| Institutional | |||||||
| Six Months Ended | |||||||
| December 31, | |||||||
| 2010 | Year Ended June 30, | ||||||
| (Unaudited) | 2010 | 2009 | 2008 | 2007 | 2006 | ||
| Per Share Operating Performance | |||||||
| Net asset value, beginning of period | $ 10.19 | $ 9.61 | $ 9.95 | $ 10.39 | $ 10.36 | $ 10.66 | |
| Net investment income1 | 0.24 | 0.48 | 0.48 | 0.48 | 0.49 | 0.51 | |
| Net realized and unrealized gain (loss) | (0.33) | 0.57 | (0.35) | (0.44) | 0.05 | (0.30) | |
| Net increase (decrease) from investment operations | (0.09) | 1.05 | 0.13 | 0.04 | 0.54 | 0.21 | |
| Dividends from net investment income | (0.24) | (0.47) | (0.47) | (0.48) | (0.51) | (0.51) | |
| Net asset value, end of period | $ 9.86 | $ 10.19 | $ 9.61 | $ 9.95 | $ 10.39 | $ 10.36 | |
| Total Investment Return2 | |||||||
| Based on net asset value | (0.99)%3 | 11.16% | 1.56% | 0.35% | 5.06% | 2.02% | |
| Ratios to Average Net Assets | |||||||
| Total expenses | 0.64%4 | 0.62% | 0.67% | 0.79% | 1.00% | 0.85% | |
| Total expenses after fees waived | 0.64%4 | 0.62% | 0.65% | 0.78% | 0.99% | 0.84% | |
| Total expenses after fees waived and excluding interest expense and fees5 | 0.58%4 | 0.59% | 0.60% | 0.60% | 0.59% | 0.58% | |
| Net investment income | 4.50%4 | 4.76% | 5.10% | 4.69% | 4.66% | 4.87% | |
| Supplemental Data | |||||||
| Net assets, end of period (000) | $ 1,181,872 | $1,103,381 | $934,807 | $977,642 | $976,153 | $890,984 | |
| Portfolio turnover | 27% | 70% | 65% | 61% | 46% | 56% | |
1 Based on average shares outstanding.
2 Where applicable, total investment returns exclude the effects of any sales charges and include the reinvestment of dividends and distributions.
3 Aggregate total investment return.
4 Annualized.
5 Interest expense and fees relate to tender option bond trusts. See Note 1 of the Notes to Financial Statements for details of municipal bonds transferred to tender option
bond trusts.
See Notes to Financial Statements.
62 SEMI-ANNUAL REPORT DECEMBER 31, 2010
Financial Highlights (continued) BlackRock National Municipal Fund
| Investor A | ||||||
| Six Months Ended | ||||||
| December 31, | ||||||
| 2010 | Year Ended June 30, | |||||
| (Unaudited) | 2010 | 2009 | 2008 | 2007 | 2006 | |
| Per Share Operating Performance | ||||||
| Net asset value, beginning of period | $ 10.19 | $ 9.62 | $ 9.96 | $ 10.39 | $ 10.37 | $ 10.67 |
| Net investment income1 | 0.22 | 0.45 | 0.46 | 0.45 | 0.46 | 0.49 |
| Net realized and unrealized gain (loss) | (0.32) | 0.57 | (0.35) | (0.43) | 0.03 | (0.30) |
| Net increase (decrease) from investment operations | (0.10) | 1.02 | 0.11 | 0.02 | 0.49 | 0.19 |
| Dividends from net investment income | (0.22) | (0.45) | (0.45) | (0.45) | (0.47) | (0.49) |
| Net asset value, end of period | $ 9.87 | $ 10.19 | $ 9.62 | $ 9.96 | $ 10.39 | $ 10.37 |
| Total Investment Return2 | ||||||
| Based on net asset value | (1.01)%3 | 10.77% | 1.32% | 0.22% | 4.71% | 1.77% |
| Ratios to Average Net Assets | ||||||
| Total expenses | 0.89%4 | 0.87% | 0.91% | 1.02% | 1.24% | 1.10% |
| Total expenses after fees waived | 0.88%4 | 0.87% | 0.90% | 1.01% | 1.24% | 1.09% |
| Total expenses after fees waived and excluding interest expense and fees5 | 0.82%4 | 0.84% | 0.84% | 0.82% | 0.84% | 0.83% |
| Net investment income | 4.26%4 | 4.52% | 4.87% | 4.46% | 4.43% | 4.61% |
| Supplemental Data | ||||||
| Net assets, end of period (000) | $ 834,436 | $820,009 | $635,090 | $472,018 | $349,225 | $283,814 |
| Portfolio turnover | 27% | 70% | 65% | 61% | 46% | 56% |
1 Based on average shares outstanding.
2 Where applicable, total investment returns exclude the effects of any sales charges and include the reinvestment of dividends and distributions.
3 Aggregate total investment return.
4 Annualized.
5 Interest expense and fees relate to tender option bond trusts. See Note 1 of the Notes to Financial Statements for details of municipal bonds transferred to tender option
bond trusts.
See Notes to Financial Statements.
SEMI-ANNUAL REPORT DECEMBER 31, 2010 63
Financial Highlights (continued) BlackRock National Municipal Fund
| Investor B | |||||||||
| Six Months Ended | |||||||||
| December 31, | |||||||||
| 2010 | Year Ended June 30, | ||||||||
| (Unaudited) | 2010 | 2009 | 2008 | 2007 | 2006 | ||||
| Per Share Operating Performance | |||||||||
| Net asset value, beginning of period | $ 10.18 | $ 9.61 | $ 9.95 | $ 10.38 | $ 10.36 | $ 10.66 | |||
| Net investment income1 | 0.19 | 0.40 | 0.41 | 0.40 | 0.41 | 0.43 | |||
| Net realized and unrealized gain (loss) | (0.31) | 0.57 | (0.35) | (0.43) | 0.02 | (0.30) | |||
| Net increase (decrease) from investment operations | (0.12) | 0.97 | 0.06 | (0.03) | 0.43 | 0.13 | |||
| Dividends from net investment income | (0.20) | (0.40) | (0.40) | (0.40) | (0.41) | (0.43) | |||
| Net asset value, end of period | $ 9.86 | $ 10.18 | $ 9.61 | $ 9.95 | $ 10.38 | $ 10.36 | |||
| Total Investment Return2 | |||||||||
| Based on net asset value | (1.28)%3 | 10.21% | 0.79% | (0.30)% | 4.18% | 1.25% | |||
| Ratios to Average Net Assets | |||||||||
| Total expenses | 1.42%4 | 1.39% | 1.43% | 1.54% | 1.75% | 1.61% | |||
| Total expenses after fees waived | 1.42%4 | 1.38% | 1.41% | 1.53% | 1.75% | 1.60% | |||
| Total expenses after fees waived and excluding interest expense and fees5 | 1.35%4 | 1.36% | 1.36% | 1.35% | 1.34% | 1.34% | |||
| Net investment income | 3.73%4 | 3.99% | 4.35% | 3.94% | 3.92% | 4.11% | |||
| Supplemental Data | |||||||||
| Net assets, end of period (000) | $ 37,649 | $ 46,152 | $ 58,079 | $ 69,859 | $ 101,260 | $ 134,177 | |||
| Portfolio turnover | 27% | 70% | 65% | 61% | 46% | 56% | |||
1 Based on average shares outstanding.
2 Where applicable, total investment returns exclude the effects of any sales charges and include the reinvestment of dividends and distributions.
3 Aggregate total investment return.
4 Annualized.
5 Interest expense and fees relate to tender option bond trusts. See Note 1 of the Notes to Financial Statements for details of municipal bonds transferred to tender option
bond trusts.
See Notes to Financial Statements.
64 SEMI-ANNUAL REPORT DECEMBER 31, 2010
Financial Highlights (continued) BlackRock National Municipal Fund
| Investor C | |||||
| Six Months Ended | Period | ||||
| December 31, | Year Ended June 30, | October 2, 20061 | |||
| 2010 | to June 30, | ||||
| (Unaudited) | 2010 | 2009 | 2008 | 2007 | |
| Per Share Operating Performance | |||||
| Net asset value, beginning of period | $ 10.19 | $ 9.62 | $ 9.96 | $ 10.39 | $ 10.57 |
| Net investment income2 | 0.18 | 0.38 | 0.39 | 0.37 | 0.25 |
| Net realized and unrealized gain (loss) | (0.32) | 0.57 | (0.35) | (0.43) | (0.16) |
| Net increase (decrease) from investment operations | (0.14) | 0.95 | 0.04 | (0.06) | 0.09 |
| Dividends from net investment income | (0.18) | (0.38) | (0.38) | (0.37) | (0.27) |
| Net asset value, end of period | $ 9.87 | $ 10.19 | $ 9.62 | $ 9.96 | $ 10.39 |
| Total Investment Return3 | |||||
| Based on net asset value | (1.38)%4 | 9.95% | 0.56% | (0.57)% | 0.96%4 |
| Ratios to Average Net Assets | |||||
| Total expenses | 1.63%5 | 1.61% | 1.66% | 1.82% | 2.05%5 |
| Total expenses after fees waived | 1.63%5 | 1.61% | 1.65% | 1.81% | 2.05%5 |
| Total expenses after fees waived and excluding interest expense and fees6 | 1.57%5 | 1.58% | 1.59% | 1.62% | 1.65%5 |
| Net investment income | 3.52%5 | 3.77% | 4.12% | 3.66% | 3.59%5 |
| Supplemental Data | |||||
| Net assets, end of period (000) | $ 296,459 | $292,132 | $195,475 | $103,504 | $ 41,676 |
| Portfolio turnover | 27% | 70% | 65% | 61% | 46% |
1 Commencement of operations.
2 Based on average shares outstanding.
3 Where applicable, total investment returns exclude the effects of any sales charges and include the reinvestment of dividends and distributions.
4 Aggregate total investment return.
5 Annualized.
6 Interest expense and fees relate to tender option bond trusts. See Note 1 of the Notes to Financial Statements for details of municipal bonds transferred to tender option
bond trusts.
See Notes to Financial Statements.
SEMI-ANNUAL REPORT DECEMBER 31, 2010 65
Financial Highlights (concluded) BlackRock National Municipal Fund
| Investor C1 | ||||||
| Six Months Ended | ||||||
| December 31, | ||||||
| 2010 | Year Ended June 30, | |||||
| (Unaudited) | 2010 | 2009 | 2008 | 2007 | 2006 | |
| Per Share Operating Performance | ||||||
| Net asset value, beginning of period | $ 10.19 | $ 9.61 | $ 9.95 | $ 10.39 | $ 10.36 | $ 10.66 |
| Net investment income1 | 0.19 | 0.40 | 0.41 | 0.40 | 0.41 | 0.43 |
| Net realized and unrealized gain (loss) | (0.33) | 0.57 | (0.35) | (0.44) | 0.04 | (0.29) |
| Net increase (decrease) from investment operations | (0.14) | 0.97 | 0.06 | (0.04) | 0.45 | 0.14 |
| Dividends from net investment income | (0.19) | (0.39) | (0.40) | (0.40) | (0.42) | (0.44) |
| Net asset value, end of period | $ 9.86 | $ 10.19 | $ 9.61 | $ 9.95 | $ 10.39 | $ 10.36 |
| Total Investment Return2 | ||||||
| Based on net asset value | (1.39)%3 | 10.28% | 0.76% | (0.44)% | 4.23% | 1.20% |
| Ratios to Average Net Assets | ||||||
| Total expenses | 1.44%4 | 1.42% | 1.46% | 1.58% | 1.80% | 1.65% |
| Total expenses after fees waived | 1.44%4 | 1.42% | 1.44% | 1.57% | 1.80% | 1.65% |
| Total expenses after fees waived and excluding interest expense and fees5 | 1.38%4 | 1.39% | 1.39% | 1.39% | 1.39% | 1.39% |
| Net investment income | 3.71%4 | 3.96% | 4.32% | 3.90% | 3.88% | 4.05% |
| Supplemental Data | ||||||
| Net assets, end of period (000) | $ 79,761 | $ 88,427 | $ 95,790 | $114,746 | $140,653 | $139,447 |
| Portfolio turnover | 27% | 70% | 65% | 61% | 46% | 56% |
1 Based on average shares outstanding.
2 Where applicable, total investment returns exclude the effects of any sales charges and include the reinvestment of dividends and distributions.
3 Aggregate total investment return.
4 Annualized.
5 Interest expense and fees relate to tender option bond trusts. See Note 1 of the Notes to Financial Statements for details of municipal bonds transferred to tender option
bond trusts.
See Notes to Financial Statements.
66 SEMI-ANNUAL REPORT DECEMBER 31, 2010
Financial Highlights BlackRock High Yield Municipal Fund
| Institutional | |||||
| Six Months Ended | Period | ||||
| December 31, | Year Ended June 30, | August 1, 20061 | |||
| 2010 | to June 30, | ||||
| (Unaudited) | 2010 | 2009 | 2008 | 2007 | |
| Per Share Operating Performance | |||||
| Net asset value, beginning of period | $ 8.47 | $ 7.29 | $ 8.68 | $ 9.96 | $ 10.00 |
| Net investment income2 | 0.23 | 0.46 | 0.48 | 0.44 | 0.39 |
| Net realized and unrealized gain (loss) | (0.29) | 1.18 | (1.40) | (1.26) | (0.03) |
| Net increase (decrease) from investment operations | (0.06) | 1.64 | (0.92) | (0.82) | 0.36 |
| Dividends and distributions from: | |||||
| Net investment income | (0.22) | (0.46) | (0.47) | (0.44) | (0.40) |
| Net realized gain | (0.00)3 | — | — | (0.02) | (0.00)3 |
| Total dividends and distributions | (0.22) | (0.46) | (0.47) | (0.46) | (0.40) |
| Net asset value, end of period | $ 8.19 | $ 8.47 | $ 7.29 | $ 8.68 | $ 9.96 |
| Total Investment Return4 | |||||
| Based on net asset value | (0.71)%5 | 22.88% | (10.40)% | (8.38)% | 3.59%5 |
| Ratios to Average Net Assets | |||||
| Total expenses | 0.77%6 | 0.83% | 0.93% | 0.84% | 0.96%6 |
| Total expenses after fees waived | 0.76%6 | 0.83% | 0.92% | 0.81% | 0.62%6 |
| Total expenses after fees waived and excluding interest expense and fees7 | 0.71%6 | 0.79% | 0.89% | 0.78% | 0.62%6 |
| Net investment income | 5.13%6 | 5.63% | 6.52% | 4.76% | 4.35%6 |
| Supplemental Data | |||||
| Net assets, end of period (000) | $ 100,443 | $ 94,146 | $ 45,997 | $ 71,203 | $ 62,464 |
| Portfolio turnover | 21% | 32% | 39% | 33% | 16% |
1 Commencement of operations.
2 Based on average shares outstanding.
3 Amount is less than $(0.01) per share.
4 Where applicable, total investment returns include the reinvestment of dividends and distributions.
5 Aggregate total investment return.
6 Annualized.
7 Interest expense and fees relate to tender option bond trusts. See Note 1 of the Notes to Financial Statements for details of municipal bonds transferred to tender option
bond trusts.
See Notes to Financial Statements.
SEMI-ANNUAL REPORT DECEMBER 31, 2010 67
Financial Highlights (continued) BlackRock High Yield Municipal Fund
| Investor A | |||||
| Six Months Ended | Period | ||||
| December 31, | Year Ended June 30, | August 1, 20061 | |||
| 2010 | to June 30, | ||||
| (Unaudited) | 2010 | 2009 | 2008 | 2007 | |
| Per Share Operating Performance | |||||
| Net asset value, beginning of period | $ 8.46 | $ 7.28 | $ 8.67 | $ 9.95 | $ 10.00 |
| Net investment income2 | 0.21 | 0.43 | 0.44 | 0.41 | 0.32 |
| Net realized and unrealized gain (loss) | (0.29) | 1.18 | (1.39) | (1.26) | 0.01 |
| Net increase (decrease) from investment operations | (0.08) | 1.61 | (0.95) | (0.85) | 0.33 |
| Dividends and distributions from: | |||||
| Net investment income | (0.21) | (0.43) | (0.44) | (0.41) | (0.38) |
| Net realized gain | (0.00)3 | — | — | (0.02) | (0.00)3 |
| Total dividends and distributions | (0.21) | (0.43) | (0.44) | (0.43) | (0.38) |
| Net asset value, end of period | $ 8.17 | $ 8.46 | $ 7.28 | $ 8.67 | $ 9.95 |
| Total Investment Return4 | |||||
| Based on net asset value | (0.96)%5 | 22.58% | (10.67)% | (8.62)% | 3.26%5 |
| Ratios to Average Net Assets | |||||
| Total expenses | 1.03%6 | 1.09% | 1.18% | 1.08% | 1.19%6 |
| Total expenses after fees waived | 1.03%6 | 1.09% | 1.17% | 1.05% | 0.89%6 |
| Total expenses after fees waived and excluding interest expense and fees7 | 0.98%6 | 1.05% | 1.14% | 1.03% | 0.89%6 |
| Net investment income | 4.85%6 | 5.33% | 6.13% | 4.52% | 4.16%6 |
| Supplemental Data | |||||
| Net assets, end of period (000) | $ 23,862 | $ 25,105 | $ 4,798 | $ 6,513 | $ 5,892 |
| Portfolio turnover | 21% | 32% | 39% | 33% | 16% |
1 Commencement of operations.
2 Based on average shares outstanding.
3 Amount is less than $(0.01) per share.
4 Where applicable, total investment returns exclude the effects of any sales charges and include the reinvestment of dividends and distributions.
5 Aggregate total investment return.
6 Annualized.
7 Interest expense and fees relate to tender option bond trusts. See Note 1 of the Notes to Financial Statements for details of municipal bonds transferred to tender option
bond trusts.
See Notes to Financial Statements.
68 SEMI-ANNUAL REPORT DECEMBER 31, 2010
Financial Highlights (concluded) BlackRock High Yield Municipal Fund
| Investor C | |||||||
| Six Months Ended | Period | ||||||
| December 31, | Year Ended June 30, | August 1, 20061 | |||||
| 2010 | to June 30, | ||||||
| (Unaudited) | 2010 | 2009 | 2008 | 2007 | |||
| Per Share Operating Performance | |||||||
| Net asset value, beginning of period | $ 8.47 | $ 7.29 | $ 8.68 | $ 9.97 | $ 10.00 | ||
| Net investment income2 | 0.18 | 0.37 | 0.41 | 0.34 | 0.30 | ||
| Net realized and unrealized gain (loss) | (0.28) | 1.18 | (1.41) | (1.27) | (0.02) | ||
| Net increase (decrease) from investment operations | (0.10) | 1.55 | (1.00) | (0.93) | 0.28 | ||
| Dividends and distributions from: | |||||||
| Net investment income | (0.18) | (0.37) | (0.39) | (0.34) | (0.31) | ||
| Net realized gain | (0.00)3 | — | — | (0.02) | (0.00)3 | ||
| Total dividends and distributions | (0.18) | (0.37) | (0.39) | (0.36) | (0.31) | ||
| Net asset value, end of period | $ 8.19 | $ 8.47 | $ 7.29 | $ 8.68 | $ 9.97 | ||
| Total Investment Return4 | |||||||
| Based on net asset value | (1.23)%5 | 21.61% | (11.33)% | (9.40)% | 2.84%5 | ||
| Ratios to Average Net Assets | |||||||
| Total expenses | 1.80%6 | 1.88% | 1.97% | 1.85% | 1.84%6 | ||
| Total expenses after fees waived | 1.80%6 | 1.88% | 1.97% | 1.82% | 1.53%6 | ||
| Total expenses after fees waived and excluding interest expense and fees7 | 1.75%6 | 1.84% | 1.94% | 1.80% | 1.53%6 | ||
| Net investment income | 4.09%6 | 4.58% | 5.59% | 3.76% | 3.50%6 | ||
| Supplemental Data | |||||||
| Net assets, end of period (000) | $ 16,140 | $ 14,560 | $ 5,389 | $ 4,527 | $ 4,378 | ||
| Portfolio turnover | 21% | 32% | 39% | 33% | 16% | ||
1 Commencement of operations.
2 Based on average shares outstanding.
3 Amount is less than $(0.01) per share.
4 Where applicable, total investment returns exclude the effects of any sales charges and include the reinvestment of dividends and distributions.
5 Aggregate total investment return.
6 Annualized.
7 Interest expense and fees relate to tender option bond trusts. See Note 1 of the Notes to Financial Statements for details of municipal bonds transferred to tender option
bond trusts.
See Notes to Financial Statements.
SEMI-ANNUAL REPORT DECEMBER 31, 2010 69
Financial Highlights BlackRock New York Municipal Bond Fund
| Institutional | |||||||
| Six Months | Period | ||||||
| Ended | October 1, | ||||||
| December 31, | Year Ended June 30, | 2007 to | Year Ended September 30, | ||||
| 2010 | June 30, | ||||||
| (Unaudited) | 2010 | 2009 | 2008 | 2007 | 2006 | 2005 | |
| Per Share Operating Performance | |||||||
| Net asset value, beginning of period | $ 10.55 | $ 9.81 | $ 10.38 | $ 10.84 | $ 11.10 | $ 11.05 | $ 11.03 |
| Net investment income1 | 0.25 | 0.49 | 0.48 | 0.36 | 0.49 | 0.51 | 0.54 |
| Net realized and unrealized gain (loss) | (0.35) | 0.74 | (0.56) | (0.46) | (0.26) | 0.04 | 0.02 |
| Net increase (decrease) from investment operations | (0.10) | 1.23 | (0.08) | (0.10) | 0.23 | 0.55 | 0.56 |
| Dividends and distributions from: | |||||||
| Net investment income | (0.24) | (0.49) | (0.49) | (0.36) | (0.49) | (0.50) | (0.54) |
| Net realized gain | (0.00)2 | — | — | — | — | — | — |
| Total dividends and distributions | (0.24) | (0.49) | (0.49) | (0.36) | (0.49) | (0.50) | (0.54) |
| Net asset value, end of period | $ 10.21 | $ 10.55 | $ 9.81 | $ 10.38 | $ 10.84 | $ 11.10 | $ 11.05 |
| Total Investment Return3 | |||||||
| Based on net asset value | (0.98)%4 | 12.74% | (0.60)% | (0.91)%4 | 2.12% | 5.19% | 5.15% |
| Ratios to Average Net Assets | |||||||
| Total expenses | 0.73%5 | 0.76% | 0.78% | 0.82%5 | 0.85% | 0.90% | 0.89% |
| Total expenses, after fees waived | 0.72%5 | 0.76% | 0.77% | 0.81%5 | 0.85% | 0.90% | 0.89% |
| Total expenses after fees waived and excluding interest | |||||||
| expense and fees6 | 0.71%5 | 0.75% | 0.76% | 0.74%5 | 0.73% | 0.74% | 0.74% |
| Net investment income | 4.54%5 | 4.77% | 5.01% | 4.56%5 | 4.51% | 4.64% | 4.89% |
| Supplemental Data | |||||||
| Net assets, end of period (000) | $ 25,028 | $ 23,841 | $ 19,105 | $ 17,949 | $ 14,927 | $ 10,995 | $ 10,593 |
| Portfolio turnover | 13% | 19% | 30% | 16% | 19% | 46% | 24% |
1 Based on average shares outstanding.
2 Amount is less than $(0.01) per share.
3 Where applicable, total investment returns exclude the effects of any sales charges and include the reinvestment of dividends and distributions.
4 Aggregate total investment return.
5 Annualized.
6 Interest expense and fees relate to tender option bond trusts. See Note 1 of the Notes to Financial Statements for details of municipal bonds transferred to tender option
bond trusts.
See Notes to Financial Statements.
70 SEMI-ANNUAL REPORT DECEMBER 31, 2010
Financial Highlights (continued) BlackRock New York Municipal Bond Fund
| Investor A | |||||
| Six Months | Period | Period�� | |||
| Ended | October 1, | October 2, | |||
| December 31, | Year Ended June 30, | 2007 | 20061 to | ||
| 2010 | to June 30, | September 30, | |||
| (Unaudited) | 2010 | 2009 | 2008 | 2007 | |
| Per Share Operating Performance | |||||
| Net asset value, beginning of period | $ 10.55 | $ 9.82 | $ 10.39 | $ 10.85 | $ 11.10 |
| Net investment income2 | 0.23 | 0.47 | 0.46 | 0.34 | 0.46 |
| Net realized and unrealized gain (loss) | (0.34) | 0.72 | (0.57) | (0.46) | (0.25) |
| Net increase (decrease) from investment operations | (0.11) | 1.19 | (0.11) | (0.12) | 0.21 |
| Dividends and distributions from: | |||||
| Net investment income | (0.23) | (0.46) | (0.46) | (0.34) | (0.46) |
| Net realized gain | (0.00)3 | — | — | — | — |
| Total dividends and distributions | (0.23) | (0.46) | (0.46) | (0.34) | (0.46) |
| Net asset value, end of period | $ 10.21 | $ 10.55 | $ 9.82 | $ 10.39 | $ 10.85 |
| Total Investment Return4 | |||||
| Based on net asset value | (1.12)%5 | 12.33% | (0.85)% | (1.10)%5 | 1.93%5 |
| Ratios to Average Net Assets | |||||
| Total expenses | 1.01%6 | 1.02% | 1.05% | 1.07%6 | 1.10%6 |
| Total expenses after fees waived | 1.01%6 | 1.02% | 1.04% | 1.06%6 | 1.10%6 |
| Total expenses after fees waived and excluding interest expense and fees7 | 0.99%6 | 1.01% | 1.02% | 0.99%6 | 0.99%6 |
| Net investment income | 4.25%6 | 4.50% | 4.77% | 4.31%6 | 4.27%6 |
| Supplemental Data | |||||
| Net assets, end of period (000) | $ 39,437 | $ 37,736 | $ 20,528 | $ 16,181 | $ 11,964 |
| Portfolio turnover | 13% | 19% | 30% | 16% | 19% |
1 Commencement of operations.
2 Based on average shares outstanding.
3 Amount is less than $(0.01) per share.
4 Where applicable, total investment returns exclude the effects of any sales charges and include the reinvestment of dividends and distributions.
5 Aggregate total investment return.
6 Annualized.
7 Interest expense and fees relate to tender option bond trusts. See Note 1 of the Notes to Financial Statements for details of municipal bonds transferred to tender option
bond trusts.
See Notes to Financial Statements.
SEMI-ANNUAL REPORT DECEMBER 31, 2010 71
Financial Highlights (continued) BlackRock New York Municipal Bond Fund
| Investor A1 | |||||||
| Six Months | Period | ||||||
| Ended | October 1, | ||||||
| December 31, | Year Ended June 30, | 2007 to | Year Ended September 30, | ||||
| 2010 | June 30, | ||||||
| (Unaudited) | 2010 | 2009 | 2008 | 2007 | 2006 | 2005 | |
| Per Share Operating Performance | |||||||
| Net asset value, beginning of period | $ 10.55 | $ 9.82 | $ 10.39 | $ 10.85 | $ 11.10 | $ 11.05 | $ 11.03 |
| Net investment income1 | 0.24 | 0.48 | 0.48 | 0.36 | 0.49 | 0.50 | 0.53 |
| Net realized and unrealized gain (loss) | (0.34) | 0.73 | (0.57) | (0.47) | (0.26) | 0.04 | 0.02 |
| Net increase (decrease) from investment operations | (0.10) | 1.21 | (0.09) | (0.11) | 0.23 | 0.54 | 0.55 |
| Dividends and distributions from: | |||||||
| Net investment income | (0.24) | (0.48) | (0.48) | (0.35) | (0.48) | (0.49) | (0.53) |
| Net realized gain | (0.00)2 | — | — | — | — | — | — |
| Total dividends and distributions | (0.24) | (0.48) | (0.48) | (0.35) | (0.48) | (0.49) | (0.53) |
| Net asset value, end of period | $ 10.21 | $ 10.55 | $ 9.82 | $ 10.39 | $ 10.85 | $ 11.10 | $ 11.05 |
| Total Investment Return3 | |||||||
| Based on net asset value | (1.03)%4 | 12.49% | (0.70)% | (0.99)%4 | 2.11% | 5.08% | 5.05% |
| Ratios to Average Net Assets | |||||||
| Total expenses | 0.85%5 | 0.88% | 0.89% | 0.92%5 | 0.95% | 1.00% | 0.99% |
| Total expenses after fees waived | 0.84%5 | 0.87% | 0.88% | 0.91%5 | 0.95% | 0.99% | 0.99% |
| Total expenses after fees waived and excluding interest | |||||||
| expense and fees6 | 0.83%5 | 0.86% | 0.87% | 0.84%5 | 0.83% | 0.84% | 0.84% |
| Net investment income | 4.42%5 | 4.65% | 4.90% | 4.45%5 | 4.40% | 4.52% | 4.79% |
| Supplemental Data | |||||||
| Net assets, end of period (000) | $ 153,832 | $ 162,305 | $ 157,706 | $ 177,080 | $ 204,497 | $ 223,322 | $ 141,319 |
| Portfolio turnover | 13% | 19% | 30% | 16% | 19% | 46% | 24% |
1 Based on average shares outstanding.
2 Amount is less than $(0.01) per share.
3 Where applicable, total investment returns exclude the effects of any sales charges and include the reinvestment of dividends and distributions.
4 Aggregate total investment return.
5 Annualized.
6 Interest expense and fees relate to tender option bond trusts. See Note 1 of the Notes to Financial Statements for details of municipal bonds transferred to tender option
bond trusts.
See Notes to Financial Statements.
72 SEMI-ANNUAL REPORT DECEMBER 31, 2010
Financial Highlights (continued) BlackRock New York Municipal Bond Fund
| Investor B | |||||||
| Six Months | Period | ||||||
| Ended | October 1, | ||||||
| December 31, | Year Ended June 30, | 2007 to | Year Ended September 30, | ||||
| 2010 | June 30, | ||||||
| (Unaudited) | 2010 | 2009 | 2008 | 2007 | 2006 | 2005 | |
| Per Share Operating Performance | |||||||
| Net asset value, beginning of period | $ 10.55 | $ 9.81 | $ 10.38 | $ 10.84 | $ 11.10 | $ 11.06 | $ 11.04 |
| Net investment income1 | 0.22 | 0.44 | 0.44 | 0.33 | 0.44 | 0.45 | 0.49 |
| Net realized and unrealized gain (loss) | (0.35) | 0.74 | (0.57) | (0.47) | (0.26) | 0.04 | 0.01 |
| Net increase (decrease) from investment operations | (0.13) | 1.18 | (0.13) | (0.14) | 0.18 | 0.49 | 0.50 |
| Dividends and distributions from: | |||||||
| Net investment income | (0.21) | (0.44) | (0.44) | (0.32) | (0.44) | (0.45) | (0.48) |
| Net realized gain | (0.00)2 | — | — | — | — | — | — |
| Total dividends and distributions | (0.21) | (0.44) | (0.44) | (0.32) | (0.44) | (0.45) | (0.48) |
| Net asset value, end of period | $ 10.21 | $ 10.55 | $ 9.81 | $ 10.38 | $ 10.84 | $ 11.10 | $ 11.06 |
| Total Investment Return3 | |||||||
| Based on net asset value | (1.24)%4 | 12.15% | (1.11)% | (1.29)%4 | 1.60% | 4.56% | 4.62% |
| Ratios to Average Net Assets | |||||||
| Total expenses | 1.26%5 | 1.29% | 1.30% | 1.31%5 | 1.36% | 1.41% | 1.40% |
| Total expenses after fees waived | 1.26%5 | 1.28% | 1.29% | 1.31%5 | 1.36% | 1.41% | 1.40% |
| Total expenses after fees waived and excluding interest | |||||||
| expense and fees6 | 1.25%5 | 1.28% | 1.27% | 1.24%5 | 1.24% | 1.25% | 1.25% |
| Net investment income | 4.00%5 | 4.25% | 4.48% | 4.06%5 | 3.99% | 4.14% | 4.38% |
| Supplemental Data | |||||||
| Net assets, end of period (000) | $ 8,047 | $ 9,645 | $ 11,770 | $ 18,535 | $ 25,264 | $ 34,921 | $ 45,506 |
| Portfolio turnover | 13% | 19% | 30% | 16% | 19% | 46% | 24% |
1 Based on average shares outstanding.
2 Amount is less than $(0.01) per share.
3 Where applicable, total investment returns exclude the effects of any sales charges and include the reinvestment of dividends and distributions.
4 Aggregate total investment return.
5 Annualized.
6 Interest expense and fees relate to tender option bond trusts. See Note 1 of the Notes to Financial Statements for details of municipal bonds transferred to tender option
bond trusts.
See Notes to Financial Statements.
SEMI-ANNUAL REPORT DECEMBER 31, 2010 73
Financial Highlights (continued) BlackRock New York Municipal Bond Fund
| Investor C | |||||
| Six Months | Period | Period | |||
| Ended | October 1, | October 2, | |||
| December 31, | Year Ended June 30, | 2007 | 20061 to | ||
| 2010 | to June 30, | September 30, | |||
| (Unaudited) | 2010 | 2009 | 2008 | 2007 | |
| Per Share Operating Performance | |||||
| Net asset value, beginning of period | $ 10.55 | $ 9.81 | $ 10.38 | $ 10.84 | $ 11.10 |
| Net investment income2 | 0.19 | 0.39 | 0.39 | 0.28 | 0.37 |
| Net realized and unrealized gain (loss) | (0.34) | 0.74 | (0.56) | (0.46) | (0.25) |
| Net increase (decrease) from investment operations | (0.15) | 1.13 | (0.17) | (0.18) | 0.12 |
| Dividends and distributions from: | |||||
| Net investment income | (0.19) | (0.39) | (0.40) | (0.28) | (0.38) |
| Net realized gain | (0.00)3 | — | — | — | — |
| Total dividends and distributions | (0.19) | (0.39) | (0.40) | (0.28) | (0.38) |
| Net asset value, end of period | $ 10.21 | $ 10.55 | $ 9.81 | $ 10.38 | $ 10.84 |
| Total Investment Return4 | |||||
| Based on net asset value | (1.48)%5 | 11.62% | (1.59)% | (1.65)%5 | 1.08%5 |
| Ratios to Average Net Assets | |||||
| Total expenses | 1.74%6 | 1.77% | 1.79% | 1.82%6 | 1.85%6 |
| Total expenses after fees waived | 1.74%6 | 1.76% | 1.78% | 1.81%6 | 1.85%6 |
| Total expenses after fees waived and excluding interest expense and fees7 | 1.72%6 | 1.75% | 1.76% | 1.74%6 | 1.74%6 |
| Net investment income | 3.53%6 | 3.76% | 4.03% | 3.57%6 | 3.52%6 |
| Supplemental Data | |||||
| Net assets, end of period (000) | $ 18,408 | $ 17,597 | $ 12,294 | $ 8,535 | $ 4,611 |
| Portfolio turnover | 13% | 19% | 30% | 16% | 19% |
1 Commencement of operations.
2 Based on average shares outstanding.
3 Amount is less than $(0.01) per share.
4 Where applicable, total investment returns exclude the effects of any sales charges and include the reinvestment of dividends and distributions.
5 Aggregate total investment return.
6 Annualized.
7 Interest expense and fees relate to tender option bond trusts. See Note 1 of the Notes to Financial Statements for details of municipal bonds transferred to tender option
bond trusts.
See Notes to Financial Statements.
74 SEMI-ANNUAL REPORT DECEMBER 31, 2010
Financial Highlights (concluded) BlackRock New York Municipal Bond Fund
| Investor C1 | |||||||
| Six Months | Period | ||||||
| Ended | October 1, | ||||||
| December 31, | Year Ended June 30, | 2007 to | Year Ended September 30, | ||||
| 2010 | June 30, | ||||||
| (Unaudited) | 2010 | 2009 | 2008 | 2007 | 2006 | 2005 | |
| Per Share Operating Performance | |||||||
| Net asset value, beginning of period | $ 10.55 | $ 9.81 | $ 10.39 | $ 10.85 | $ 11.10 | $ 11.06 | $ 11.04 |
| Net investment income1 | 0.21 | 0.43 | 0.43 | 0.32 | 0.43 | 0.44 | 0.48 |
| Net realized and unrealized gain (loss) | (0.34) | 0.74 | (0.58) | (0.47) | (0.25) | 0.04 | 0.01 |
| Net increase (decrease) from investment operations | (0.13) | 1.17 | (0.15) | (0.15) | 0.18 | 0.48 | 0.49 |
| Dividends and distributions from: | |||||||
| Net investment income | (0.21) | (0.43) | (0.43) | (0.31) | (0.43) | (0.44) | (0.47) |
| Net realized gain | (0.00)2 | — | — | — | — | — | — |
| Total dividends and distributions | (0.21) | (0.43) | (0.43) | (0.31) | (0.43) | (0.44) | (0.47) |
| Net asset value, end of period | $ 10.21 | $ 10.55 | $ 9.81 | $ 10.39 | $ 10.85 | $ 11.10 | $ 11.06 |
| Total Investment Return3 | |||||||
| Based on net asset value | (1.28)%4 | 12.06% | (1.29)% | (1.35)%4 | 1.61% | 4.46% | 4.52% |
| Ratios to Average Net Assets | |||||||
| Total expenses | 1.34%5 | 1.37% | 1.38% | 1.41%5 | 1.45% | 1.51% | 1.50% |
| Total expenses after fees waived | 1.34%5 | 1.37% | 1.37% | 1.40%5 | 1.45% | 1.50% | 1.50% |
| Total expenses after fees waived and excluding interest | |||||||
| expense and fees6 | 1.33%5 | 1.36% | 1.36% | 1.33%5 | 1.33% | 1.35% | 1.35% |
| Net investment income | 3.93%5 | 4.16% | 4.41% | 3.97%5 | 3.91% | 4.03% | 4.28% |
| Supplemental Data | |||||||
| Net assets, end of period (000) | $ 11,168 | $ 12,391 | $ 12,491 | $ 14,217 | $ 16,364 | $ 18,984 | $ 17,080 |
| Portfolio turnover | 13% | 19% | 30% | 16% | 19% | 46% | 24% |
1 Based on average shares outstanding.
2 Amount is less than $(0.01) per share.
3 Where applicable, total investment returns exclude the effects of any sales charges and include the reinvestment of dividends and distributions.
4 Aggregate total investment return.
5 Annualized.
6 Interest expense and fees relate to tender option bond trusts. See Note 1 of the Notes to Financial Statements for details of municipal bonds transferred to tender option
bond trusts.
See Notes to Financial Statements.
SEMI-ANNUAL REPORT DECEMBER 31, 2010 75
Notes to Financial Statements (Unaudited)
1. Organization and Significant Accounting Policies:
BlackRock Short-Term Municipal Fund (“Short-Term Municipal”), BlackRock
Municipal Fund (formerly BlackRock Municipal Insured Fund) (“Municipal”),
BlackRock National Municipal Fund (“National Municipal”) and BlackRock
High Yield Municipal Fund (“High Yield Municipal”) of BlackRock Municipal
Bond Fund, Inc. (“The Bond Fund”) and BlackRock New York Municipal
Bond Fund (“New York Municipal”) of BlackRock Multi-State Municipal
Series Trust (collectively, the “Funds” or individually as the “Fund”) are
registered under the Investment Company Act of 1940, as amended (the
“1940 Act”), as diversified, open-end management investment companies.
The Bond Fund is organized as a Maryland corporation. BlackRock Multi-
State Municipal Series Trust is organized as a Massachusetts business
trust. The Funds’ financial statements are prepared in conformity with
accounting principles generally accepted in the United States of America
(“US GAAP”), which may require management to make estimates and
assumptions that affect the reported amounts and disclosures in the
financial statements. Actual results could differ from those estimates. The
Boards of Directors and the Board of Trustees of the Funds are referred
to throughout this report as the “Board of Directors” or the “Board”. Each
Fund offers multiple classes of shares. BlackRock and Institutional Shares
are sold without a sales charge and only to certain eligible investors.
Investor A and Investor A1 Shares are generally sold with a front-end sales
charge. Investor B, Investor C and Investor C1 Shares may be subject to a
contingent deferred sales charge. All classes of shares have identical vot-
ing, dividend, liquidation and other rights and the same terms and condi-
tions, except that Investor A, Investor A1, Investor B, Investor C and Investor
C1 Shares bear certain expenses related to the shareholder servicing of
such shares, and Investor B, Investor C and Investor C1 Shares also bear
certain expenses related to the distribution of such shares. For Short-Term
Municipal and New York Municipal, Investor B Shares automatically convert
to Investor A1 Shares after approximately 10 years. For Municipal and
National Municipal, Investor B Shares automatically convert to Investor A
Shares after approximately 10 years. Investor A1, Investor B and Investor
C1 Shares are only available through exchanges, dividend reinvestment
by existing shareholders or for purchase by certain qualified employee ben-
efits plans. Each class has exclusive voting rights with respect to matters
relating to its shareholder servicing and distribution expenditures (except
that Investor B shareholders may vote on material changes to the Investor
A and Investor A1 distribution plan).
The following is a summary of significant accounting policies followed by
the Funds:
Valuation: The Funds fair value their financial instruments at market value
using independent dealers or pricing services under policies approved by
the Board. Municipal investments (including commitments to purchase
such investments on a “when-issued” basis) are valued on the basis of
prices provided by dealers or pricing services. In determining the value
of a particular investment, pricing services may use certain information
with respect to transactions in such investments, quotations from dealers,
pricing matrixes, market transactions in comparable investments and
information with respect to various relationships between investments.
Financial futures contracts traded on exchanges are valued at their last
sale price. Investments in open-end registered investment companies are
valued at net asset value each business day. Short-term securities with
remaining maturities of 60 days or less may be valued at amortized cost,
which approximates fair value.
In the event that application of these methods of valuation results in a
price for an investment which is deemed not to be representative of the
market value of such investment or is not available, the investment will be
valued in accordance with a policy approved by the Board as reflecting
fair value (“Fair Value Assets”). When determining the price for Fair Value
Assets, the investment advisor and/or the sub-advisor seeks to determine
the price that each Fund might reasonably expect to receive from the cur-
rent sale of that asset in an arm’s-length transaction. Fair value determina-
tions shall be based upon all available factors that the investment advisor
and/or sub-advisor deems relevant. The pricing of all Fair Value Assets is
subsequently reported to the Board or a committee thereof.
Zero-Coupon Bonds: The Funds may invest in zero-coupon bonds, which
are normally issued at a significant discount from face value and do not
provide for periodic interest payments. Zero-coupon bonds may experience
greater volatility in market value than similar maturity debt obligations
which provide for regular interest payments.
Forward Commitments and When-Issued Delayed Delivery Securities: The
Funds may purchase securities on a when-issued basis and may purchase
or sell securities on a forward commitment basis. Settlement of such
transactions normally occurs within a month or more after the purchase
or sale commitment is made. The Funds may purchase securities under
such conditions with the intention of actually acquiring them, but may enter
into a separate agreement to sell the securities before the settlement date.
Since the value of securities purchased may fluctuate prior to settlement,
the Funds may be required to pay more at settlement than the security is
worth. In addition, the Funds are not entitled to any of the interest earned
prior to settlement. When purchasing a security on a delayed delivery basis,
the Funds assume the rights and risks of ownership of the security, includ-
ing the risk of price and yield fluctuations. In the event of default by the
counterparty, the Funds’ maximum amount of loss is the unrealized appre-
ciation of unsettled when-issued transactions, which is shown on the
Schedules of Investments, if any.
Municipal Bonds Transferred to Tender Option Bond Trusts: The Funds
leverage their assets through the use of tender option bond trusts (“TOBs”).
A TOB is established by a third party sponsor forming a special purpose
entity, into which one or more funds, or an agent on behalf of the funds,
transfers municipal bonds. Other funds managed by the investment advisor
may also contribute municipal bonds to a TOB into which a Fund has
contributed bonds. A TOB typically issues two classes of beneficial inter-
ests: short-term floating rate certificates, which are sold to third party
investors, and residual certificates (“TOB Residuals”), which are generally
issued to the participating funds that made the transfer. The TOB Residuals
held by a Fund include the right of a Fund (1) to cause the holders of a
proportional share of the short-term floating rate certificates to tender their
certificates at par, including during instances of a rise in short-term interest
rates, and (2) to transfer, within seven days, a corresponding share of the
municipal bonds from the TOB to a Fund. The TOB may also be terminated
without the consent of a Fund upon the occurrence of certain events as
defined in the TOB agreements. Such termination events may include the
bankruptcy or default of the municipal bond, a substantial downgrade in
credit quality of the municipal bond, the inability of the TOB to obtain quar-
terly or annual renewal of the liquidity support agreement, a substantial
decline in market value of the municipal bond or the inability to remarket
the short-term floating rate certificates to third party investors. During
the six months ended December 31, 2010, no TOBs that the Funds
participated in were terminated without the consent of the Funds.
76 SEMI-ANNUAL REPORT DECEMBER 31, 2010
Notes to Financial Statements (continued)
The cash received by the TOB from the sale of the short-term floating rate
certificates, less transaction expenses, is paid to a Fund, which typically
invests the cash in additional municipal bonds. Each Fund’s transfer of
the municipal bonds to a TOB is accounted for as a secured borrowing,
therefore the municipal bonds deposited into a TOB are presented in the
Funds’ Schedules of Investments and the proceeds from the issuance of
the short-term floating rate certificates are shown as trust certificates in
the Statements of Assets and Liabilities.
Interest income, including amortization and accretion of premiums
and discounts, from the underlying municipal bonds is recorded by the
Funds on an accrual basis. Interest expense incurred on the secured
borrowing and other expenses related to remarketing, administration and
trustee services to a TOB are shown as interest expense and fees in the
Statements of Operations. The short-term floating rate certificates have
interest rates that generally reset weekly and their holders have the option
to tender certificates to the TOB for redemption at par at each reset date.
At December 31, 2010, the aggregate value of the underlying municipal
bonds transferred to TOBs, the related liability for trust certificates and the
range of interest rates on the liability for trust certificates were as follows:
| Underlying | |||
| Municipal | |||
| Bonds | Liability | Range of | |
| Transferred | for Trust | Interest | |
| to TOBs | Certificates | Rates | |
| Municipal | $147,796,491 | $ 72,750,303 | 0.29% — 0.46% |
| National Municipal. | $573,780,951 | $287,910,798 | 0.29% — 0.49% |
| High Yield Municipal | $ 17,602,793 | $ 9,179,734 | 0.34% — 0.40% |
| New York Municipal | $ 7,217,504 | $ 3,575,000 | 0.34% — 0.40% |
For the six months ended December 31, 2010, the Funds’ average trust
certificates outstanding and the daily weighted average interest rate,
including fees, were as follows:
| Average Trust | Daily Weighted | |
| Certificates | Average | |
| Outstanding | Interest Rate | |
| Municipal. | $ 67,722,197 | 0.67% |
| National Municipal | $195,380,450 | 0.81% |
| High Yield Municipal. | $ 8,891,274 | 0.84% |
| New York Municipal | $ 4,151,010 | 0.79% |
Should short-term interest rates rise, the Funds’ investments in TOBs
may adversely affect the Funds’ net investment income and dividends to
shareholders. Also, fluctuations in the market values of municipal bonds
deposited into the TOB may adversely affect the Funds’ net asset values
per share.
Segregation and Collateralization: In cases in which the 1940 Act and the
interpretive positions of the Securities and Exchange Commission (“SEC”)
require that the Funds either deliver collateral or segregate assets in con-
nection with certain investments (e.g., financial futures contracts) the
Funds will, consistent with SEC rules and/or certain interpretive letters
issued by the SEC, segregate collateral or designate on their books and
records cash or other liquid securities having a market value at least equal
to the amount that would otherwise be required to be physically segre-
gated. Furthermore, based on requirements and agreements with certain
exchanges and third party broker-dealers, each party has requirements to
deliver/deposit securities as collateral for certain investments.
Investment Transactions and Investment Income: For financial reporting
purposes, investment transactions are recorded on the dates the trans-
actions are entered into (the trade dates). Realized gains and losses
on investment transactions are determined on the identified cost basis.
Interest income, including amortization and accretion of premiums and
discounts on debt securities, is recognized on the accrual basis. Income
and realized and unrealized gains and losses are allocated daily to each
class based on its relative net assets.
Dividends and Distributions: Dividends from net investment income are
declared daily and paid monthly. Distributions of capital gains are recorded
on the ex-dividend dates. The amount and timing of dividends and distribu-
tions are determined in accordance with federal income tax regulations,
which may differ from US GAAP.
Income Taxes: It is each Fund’s policy to comply with the requirements of
the Internal Revenue Code of 1986, as amended, applicable to regulated
investment companies and to distribute substantially all of its taxable
income to its shareholders. Therefore, no federal income tax provision
is required.
Each Fund files US federal and various state and local tax returns. No
income tax returns are currently under examination. The statute of limita-
tions on the Funds’ US federal tax returns remains open for each of the
four years ended June 30, 2010, except for New York Municipal. The statute
of limitations on New York Municipal’s US federal tax returns remains open
for each of the years ended September 30, 2006 and September 30,
2007, the period ended June 30, 2008 and the years ended June 30,
2009 and June 30, 2010. The statutes of limitations on each Funds’
state and local tax returns may remain open for an additional year
depending upon the jurisdiction. Management does not believe there are
any uncertain tax positions that require recognition of a tax liability.
Other: Expenses directly related to a Fund or its classes are charged to
that Fund or class. Other operating expenses shared by several funds are
pro rated among those funds on the basis of relative net assets or other
appropriate methods. Other expenses of the Fund are allocated daily to
each class based on its relative net assets.
The Funds have an arrangement with the custodians whereby fees may be
reduced by credits earned on uninvested cash balances, which if applica-
ble are shown as fees paid indirectly in the Statements of Operations. The
custodians impose fees on overdrawn cash balances, which can be offset
by accumulated credits earned or may result in additional custody charges.
2. Derivative Financial Instruments:
The Funds engage in various portfolio investment strategies using derivative
contracts both to increase the returns of the Funds and to economically
hedge, or protect, their exposure to certain risks such as interest rate risk.
These contracts may be transacted on an exchange.
Losses may arise if the value of the contract decreases due to an unfavor-
able change in the market rates or values of the underlying instrument or
if the counterparty does not perform under the contract. Counterparty risk
related to exchange-traded financial futures contracts is deemed to be
minimal due to the protection against defaults provided by the exchange
on which these contracts trade.
SEMI-ANNUAL REPORT DECEMBER 31, 2010 77
Notes to Financial Statements (continued)
Financial Futures Contracts: The Funds purchase or sell financial futures
contracts and options on financial futures contracts to gain exposure to, or
economically hedge against, changes in interest rates (interest rate risk).
Financial futures contracts are agreements between the Funds and coun-
terparty to buy or sell a specific quantity of an underlying instrument at a
specified price and at a specified date. Depending on the terms of the par-
ticular contract, futures contracts are settled either through physical deliv-
ery of the underlying instrument on the settlement date or by payment of a
cash settlement amount on settlement date. Pursuant to the contract, the
Funds agree to receive from or pay to the broker an amount of cash equal
to the daily fluctuation in value of the contract. Such receipts or payments
are known as margin variation and are recorded by the Funds as unrealized
gains or losses. When the contract is closed, the Funds record a realized
gain or loss equal to the difference between the value of the contract at
the time it was opened and the value at the time it was closed. The use of
financial futures transactions involves the risk of an imperfect correlation in
the movements in the price of financial futures contracts, interest rates and
the underlying assets.
| Derivative Instruments Categorized by Risk Exposure: | ||
| The Effect of Derivative Instruments in the Statements of Operations | ||
| Six Months Ended December 31, 2010 | ||
| Net Realized (Loss) from | ||
| National | New York | |
| Municipal Municipal | Municipal | |
| Interest rate contracts: | ||
| Financial futures contracts: | $(267,577) $(842,822) | $ (66,014) |
| Net Change in Unrealized Appreciation/Depreciation on | ||
| National | New York | |
| Municipal Municipal | Municipal | |
| Interest rate contracts: | ||
| Financial futures contracts: | $ 84,818 $ 393,128 | $ 606 |
For the six months ended December 31, 2010, the average quarterly
balances of outstanding derivative financial instruments were as follows:
| National | New York | ||
| Municipal | Municipal | Municipal | |
| Financial futures contracts: | |||
| Average number of contracts sold | 48 | 125 | 17 |
| Average notional value of | |||
| contracts sold | $ 5,778,567 | $15,303,455 | $ 2,115,936 |
3. Investment Advisory Agreement and Other Transactions
with Affiliates:
The PNC Financial Services Group, Inc. (“PNC”), Bank of America
Corporation (“BAC”) and Barclays Bank PLC (“Barclays”) are the largest
stockholders of BlackRock, Inc. (“BlackRock”). Due to the ownership
structure, PNC is an affiliate of the Funds for 1940 Act purposes, but
BAC and Barclays are not.
Each Fund entered into an Investment Advisory Agreement with BlackRock
Advisors, LLC (the “Manager”), the Funds’ investment advisor, an indirect,
wholly owned subsidiary of BlackRock, to provide investment advisory and
administration services. The Manager is responsible for the management
of each Fund’s portfolio and provides the necessary personnel, facilities,
equipment and certain other services necessary to the operations of each
Fund. For such services, each Fund pays the Manager a monthly fee at
the following annual rates of each Fund’s average daily net as follows:
| Aggregate of Average | Rate of Advisory Fee | ||
| Daily Net Assets of the | Short-Term | National | |
| Three Combined Funds1 | Municipal | Municipal | Municipal |
| Not exceeding $250 million | 0.400% | 0.400% | 0.500% |
| In excess of $250 million, | |||
| but not exceeding $400 million | 0.375% | 0.375% | 0.475% |
| In excess of $400 million, | |||
| but not exceeding $550 million | 0.350% | 0.375% | 0.475% |
| In excess of $550 million, | |||
| but not exceeding $1.5 billion | 0.325% | 0.375% | 0.475% |
| In excess of $1.5 billion | 0.325% | 0.350% | 0.475% |
1 The portion of the assets of a Fund to which the rate of each breakpoint level applies
will be determined on a “uniform percentage” basis. The uniform percentage applica-
ble to a breakpoint level is determined by dividing the amount of the aggregate aver-
age daily net assets of the three combined Funds that falls within that breakpoint
level by the aggregate average daily net assets of the three combined Funds. The
amount of the fee for a Fund at each breakpoint level is determined by multiplying
the average daily net assets of that Fund by the uniform percentage applicable to
that breakpoint level and multiplying the product by the advisory fee rate.
For Short-Term Municipal, the Manager voluntarily agreed to waive and/or
reimburse fees and expenses, excluding interest expense, dividend
expense, acquired fund fees and expenses and certain other fund
expenses, in order to limit expenses. The expense limitations as a
percentage of net assets are as follows:
| Institutional | 0.40% |
| Investor A | 0.69% |
| Investor A1 | 0.52% |
| Investor B | 0.81% |
| Investor C | 1.55% |
These voluntary waivers and/or reimbursements may be reduced or
discontinued at any time without notice.
As a result, for Short-Term Municipal, the Manager waived or reimbursed
the following amounts which are shown as transfer agent fees waived
and/or reimbursed — class specific in the Statements of Operations:
| Institutional | $267,851 |
| Investor A1 | $ 5,667 |
| Investor B | $ 67 |
High Yield Municipal’s rates are as follows:
| Portion of Average Daily Net Assets | Rate |
| Not exceeding $250 million | 0.550% |
| In excess of $250 million, but not exceeding $500 million | 0.525% |
| In excess of $500 million | 0.500% |
New York Municipal’s rates are as follows:
| Portion of Average Daily Net Assets | Rate |
| Not exceeding $500 million | 0.550% |
| In excess of $500 million, but not exceeding $1 billion | 0.525% |
| In excess of $1 billion | 0.500% |
78 SEMI-ANNUAL REPORT DECEMBER 31, 2010
Notes to Financial Statements (continued)
The Manager voluntarily agreed to waive its investment advisory fees by
the amount of investment advisory fees each Fund pays to the Manager
indirectly through its investment in affiliated money market funds, however
the Manager does not waive its investment advisory fees by the amount
of investment advisory fees paid through each Fund’s investment in other
affiliated investment companies, if any. These amounts are shown as fees
waived by advisor in the Statements of Operations. For the six months
ended December 31, 2010, the amounts waived were as follows:
| Short-Term Municipal | $ 2,943 |
| Municipal | $ 4,065 |
| National Municipal | $42,266 |
| High Yield Municipal | $ 1,639 |
| New York Municipal | $ 5,081 |
The Manager entered into a sub-advisory agreement with BlackRock
Investment Management, LLC (“BIM”), an affiliate of the Manager. The
Manager pays BIM for services it provides, a monthly fee that is a percent-
age of the investment advisory fees paid by each Fund to the Manager.
For the six months ended December 31, 2010, each Fund reimbursed
the Manager for certain accounting services, which are included in
accounting services in the Statements of Operations. The reimbursements
were as follows:
| Short-Term Municipal | $11,475 |
| Municipal | $ 9,017 |
| National Municipal | $23,911 |
| High Yield Municipal | $ 1,649 |
| New York Municipal | $ 2,893 |
The Funds entered into a Distribution Agreement and Distribution and
Service Plan with BlackRock Investments, LLC (“BRIL”), an affiliate of
BlackRock. Pursuant to the Distribution and Service Plan and in accor-
dance with Rule 12b-1 under the 1940 Act, each Fund pays BRIL ongoing
service and distribution fees. The fees are accrued daily and paid monthly
at annual rates based upon the average daily net assets of the shares of
each Fund as follows:
| Service Fee | |||||
| Short-Term | National | High Yield | New York | ||
| Municipal | Municipal | Municipal | Municipal | Municipal | |
| Investor A | 0.25% | 0.25% | 0.25% | 0.25% | 0.25% |
| Investor A1. | 0.10% | — | — | — | 0.10% |
| Investor B. | 0.15% | 0.25% | 0.25% | — | 0.25% |
| Investor C. | 0.25% | 0.25% | 0.25% | 0.25% | 0.25% |
| Investor C1. | — | 0.25% | 0.25% | — | 0.25% |
| Distribution Fee | |||||
| Short-Term | National | High Yield | New York | ||
| Municipal | Municipal | Municipal | Municipal | Municipal | |
| Investor B. | 0.20% | 0.50% | 0.50% | — | 0.25% |
| Investor C. | 0.75% | 0.75% | 0.75% | 0.75% | 0.75% |
| Investor C1. | — | 0.55% | 0.55% | — | 0.35% |
Pursuant to sub-agreements with BRIL, broker-dealers and BRIL provide
shareholder servicing and distribution services to each Fund. The ongoing
service and/or distribution fee compensates BRIL and each broker-dealer
for providing shareholder servicing and/or distribution related services to
Investor A, Investor A1, Investor B, Investor C and Investor C1 shareholders.
For the six months ended December 31, 2010, affiliates earned underwrit-
ing discounts, direct commissions and dealer concessions on sales of the
Funds’ Investor A Shares as follows:
| Short-Term | National | High Yield | New York | ||
| Municipal | Municipal | Municipal | Municipal | Municipal | |
| Investor A | $11,082 | $16,391 | $77,075 | $12,147 | $ 4,365 |
For the six months ended December 31, 2010, affiliates received the
following contingent deferred sales charges relating to transactions in
Investor B and Investor C Shares and Investor C1 Shares as follows:
| Short-Term | National | High Yield | New York | ||
| Municipal | Municipal | Municipal | Municipal | Municipal | |
| Investor B | — | $ 80 | $ 5,392 | — | $ 765 |
| Investor C | $25,940 | $8,845 | $40,141 | $2,095 | $1,688 |
| Investor C1 | — | $ 983 | $ 824 | — | — |
Furthermore, affiliates received contingent deferred sale charges relating to
transactions subject to front-end sales charge waivers as follows:
| Short-Term | National | High Yield | New York | ||
| Municipal | Municipal | Municipal | Municipal | Municipal | |
| Investor A | $78,855 | $1,450 | $36,518 | $50,000 | — |
The Manager maintains a call center, which is responsible for providing
certain shareholder services to the Funds, such as responding to share-
holder inquiries and processing transactions based upon instructions
from shareholders with respect to the subscription and redemption of
Fund shares. For the six months ended December 31, 2010, the Funds
reimbursed the Manager the following amounts for costs incurred in run-
ning the call center, which are included in transfer agent — class specific
in the Statements of Operations:
| Call Center Fees | |||||
| Short-Term | National | High Yield | New York | ||
| Municipal | Municipal | Municipal | Municipal | Municipal | |
| BlackRock | $ 26 | — | — | — | — |
| Institutional | $1,198 | $2,416 | $ 8,651 | $150 | $ 57 |
| Investor A | $1,348 | $ 948 | $ 5,297 | $173 | $ 168 |
| Investor A1 | $ 284 | — | — | — | $ 942 |
| Investor B | $ 48 | $ 78 | $ 282 | — | $ 48 |
| Investor C | $ 639 | $ 202 | $ 1,441 | $117 | $ 108 |
| Investor C1 | — | $ 165 | $ 391 | — | $ 57 |
4. Investments:
Purchases and sales of investments, excluding short-term securities for the
six months ended December 31, 2010, were as follows:
| Purchases | Sales | |
| Short-Term Municipal | $ 309,553,688 | $ 303,215,853 |
| Municipal | $ 80,260,935 | $ 101,561,713 |
| National Municipal | $1,031,031,812 | $ 689,994,692 |
| High Yield Municipal | $ 45,204,333 | $ 31,204,382 |
| New York Municipal | $ 33,632,243 | $ 39,023,689 |
SEMI-ANNUAL REPORT DECEMBER 31, 2010 79
Notes to Financial Statements (continued)
5. Capital Loss Carryforwards:
As of June 30, 2010, the Funds had capital loss carryforwards available to
offset future realized capital gains through the indicated expiration dates:
| Expires | Short-Term | National | High Yield | New York | |
| June 30, | Municipal | Municipal | Municipal | Municipal | Municipal |
| 2011 | — | — | $ 942,957 | — | — |
| 2012 | — | — | 1,591,140 | — | — |
| 2013 | $1,096,327 | — | 48,027 | — | $ 8,935,207 |
| 2014 | 4,110,940 | — | — | — | — |
| 2015 | 2,987,949 | — | 259,851 | — | — |
| 2016 | 322,206 | — | 1,320,166 | $258,523 | — |
| 2017 | — | $ 6,021,988 | 19,350,079 | 3,758,709 | 2,020,225 |
| 2018 | — | 7,049,052 | 40,719,990 | 4,665,271 | 367,311 |
| Total | $8,517,422 | $13,071,040 | $64,232,210 $8,682,503 | $11,322,743 | |
Under the recently enacted Regulated Investment Company Modernization
Act of 2010, capital losses incurred by the Funds after June 30, 2011 will
not be subject to expiration. In addition, such losses must be utilized prior
to the losses incurred in the years preceding enactment.
6. Borrowings:
The Funds, along with certain other funds managed by the Manager and
its affiliates, are a party to a $500 million credit agreement with a group
of lenders, which expired in November 2010. The Funds may borrow under
the credit agreement to fund shareholder redemptions. Effective November
2009, the credit agreement had the following terms: 0.02% upfront fee
on the aggregate commitment amount which was allocated to each Fund
based on its net assets as of October 31, 2009, a commitment fee of
0.10% per annum based on each Fund’s pro rata share of the unused
portion of the credit agreement and interest at a rate equal to the higher
of (a) the one-month LIBOR plus 1.25% per annum and (b) the Fed
Funds rate plus 1.25% per annum on amounts borrowed. In addition, the
Funds paid administration and arrangement fees which were allocated to
the Funds based on their net assets as of October 31, 2009. Effective
November 2010, the credit agreement was renewed until November 2011
with the following terms: a commitment fee of 0.08% per annum based
on the Funds’ pro rata share of the unused portion of the credit agreement
and interest at a rate equal to the higher of (a) the one-month LIBOR plus
1.00% per annum and (b) the Fed Funds rate plus 1.00% per annum on
amounts borrowed. In addition, the Funds paid administration and arrange-
ment fees which were allocated to the Funds based on their net assets as
of October 31, 2010. The Funds did not borrow under the credit agreement
during the six months ended December 31, 2010.
7. Concentration, Market and Credit Risk:
New York Municipal invests a substantial amount of its assets in issuers
located in a single state or limited number of states. Please see the
Schedules of Investments for concentrations in specific states.
Many municipalities insure repayment of their bonds, which may reduce
the potential for loss due to credit risk. The market value of these bonds
may fluctuate for other reasons, including market perception of the value
of such insurance, and there is no guarantee that the insurer will meet
its obligation.
In the normal course of business, the Funds invest in securities and
enter into transactions where risks exist due to fluctuations in the market
(market risk) or failure of the issuer of a security to meet all its obligations
(issuer credit risk). The value of securities held by the Funds may decline in
response to certain events, including those directly involving the issuers
whose securities are owned by the Funds; conditions affecting the general
economy; overall market changes; local, regional or global political, social
or economic instability; and currency and interest rate and price fluctua-
tions. Similar to issuer credit risk, the Funds may be exposed to counter-
party credit risk, or the risk that an entity with which the Funds have
unsettled or open transactions may fail to or be unable to perform on its
commitments. The Funds manage counterparty credit risk by entering into
transactions only with counterparties that they believe have the financial
resources to honor their obligations and by monitoring the financial stability
of those counterparties. Financial assets, which potentially expose the
Funds to market, issuer and counterparty credit risks, consist principally of
financial instruments and receivables due from counterparties. The extent
of the Funds’ exposure to market, issuer and counterparty credit risks with
respect to these financial assets is generally approximated by their value
recorded in the Funds’ Statements of Assets and Liabilities, less any collat-
eral held by the Funds.
80 SEMI-ANNUAL REPORT DECEMBER 31, 2010
Notes to Financial Statements (continued)
8. Capital Share Transactions:
Transactions in capital shares for each class were as follows:
| Six Months Ended | Year Ended | ||||
| December 31, 2010 | June 30, 2010 | ||||
| Short-Term Municipal | Shares | Amount | Shares | Amount | |
| BlackRock | |||||
| Shares sold | 1,522,056 | $ 15,406,000 | 1,582,401 | $ 16,127,185 | |
| Shares issued to shareholders in reinvestment of dividends | 10,375 | 105,671 | 12,328 | 125,546 | |
| Total issued | 1,532,431 | 15,511,671 | 1,594,729 | 16,252,731 | |
| Shares redeemed | (602,469) | (6,134,904) | (141,213) | (1,436,769) | |
| Net increase | 929,962 | $ 9,376,767 | 1,453,516 | $ 14,815,962 | |
| Institutional | |||||
| Shares sold | 18,695,451 | $190,209,708 | 52,363,133 | $532,717,993 | |
| Shares issued to shareholders in reinvestment of dividends | 185,022 | 1,883,171 | 377,255 | 3,839,445 | |
| Total issued | 18,880,473 | 192,092,879 | 52,740,388 | 536,557,438 | |
| Shares redeemed | (16,349,885) | (166,262,076) | (30,848,241) | (313,950,174) | |
| Net increase | 2,530,588 | $ 25,830,803 | 21,892,147 | $222,607,264 | |
| Investor A | |||||
| Shares sold and automatic conversion of shares | 6,069,957 | $ 61,852,544 | 28,575,477 | $290,988,619 | |
| Shares issued to shareholders in reinvestment of dividends | 116,669 | 1,188,480 | 204,464 | 2,081,727 | |
| Total issued | 6,186,626 | 63,041,024 | 28,779,941 | 293,070,346 | |
| Shares redeemed | (10,426,842) | (106,094,302) | (11,570,462) | (117,804,897) | |
| Net increase (decrease) | (4,240,216) | $ (43,053,278) | 17,209,479 | $175,265,449 | |
| Investor A1 | |||||
| Shares sold and automatic conversion of shares | 49,633 | $ 505,442 | 54,166 | $ 551,863 | |
| Shares issued to shareholders in reinvestment of dividends | 20,169 | 205,528 | 59,182 | 602,778 | |
| Total issued | 69,802 | 710,970 | 113,348 | 1,154,641 | |
| Shares redeemed | (894,344) | (9,115,453) | (1,351,733) | (13,766,456) | |
| Net decrease | (824,542) | $ (8,404,483) | (1,238,385) | $ (12,611,815) | |
| Investor B | |||||
| Shares sold | 17,763 | $ 180,382 | 73,159 | $ 744,817 | |
| Shares issued to shareholders in reinvestment of dividends | 2,448 | 24,936 | 6,889 | 70,104 | |
| Total issued | 20,211 | 205,318 | 80,048 | 814,921 | |
| Shares redeemed and automatic conversion of shares | (178,314) | (1,813,662) | (224,138) | (2,280,979) | |
| Net decrease | (158,103) | $ (1,608,344) | (144,090) | $ (1,466,058) | |
| Investor C | |||||
| Shares sold | 1,409,170 | $ 14,355,415 | 8,054,247 | $ 81,953,486 | |
| Shares issued to shareholders in reinvestment | |||||
| of dividends and distributions | 10,567 | 107,624 | 33,652 | 342,474 | |
| Total issued | 1,419,737 | 14,463,039 | 8,087,899 | 82,295,960 | |
| Shares redeemed | (2,567,116) | (26,143,330) | (3,395,705) | (34,560,194) | |
| Net increase (decrease) | (1,147,379) | $ (11,680,291) | 4,692,194 | $ 47,735,766 | |
SEMI-ANNUAL REPORT DECEMBER 31, 2010 81
Notes to Financial Statements (continued)
| Six Months Ended | Year Ended | ||||
| December 31, 2010 | June 30, 2010 | ||||
| Municipal | Shares | Amount | Shares | Amount | |
| Institutional | |||||
| Shares sold | 1,432,226 | $ 10,749,998 | 3,442,209 | $ 25,773,152 | |
| Shares issued to shareholders in reinvestment of dividends | 775,999 | 5,854,886 | 1,603,346 | 11,976,884 | |
| Total issued | 2,208,225 | 16,604,884 | 5,045,555 | 37,750,036 | |
| Shares redeemed | (5,082,928) | (37,605,730) | (6,661,286) | (49,761,757) | |
| Net decrease | (2,874,703) | $ (21,000,846) | (1,615,731) | $ (12,011,721) | |
| Investor A | |||||
| Shares sold and automatic conversion of shares | 2,515,747 | $ 19,015,772 | 4,807,352 | $ 35,778,191 | |
| Shares issued to shareholders in reinvestment of dividends | 308,723 | 2,327,920 | 609,674 | 4,552,842 | |
| Total issued | 2,824,470 | 21,343,692 | 5,417,026 | 40,331,033 | |
| Shares redeemed | (3,126,427) | (23,196,762) | (5,763,518) | (42,864,852) | |
| Net decrease | (301,957) | $ (1,853,070) | (346,492) | $ (2,533,819) | |
| Investor B | |||||
| Shares sold | 15,092 | $ 114,922 | 51,725 | $ 386,429 | |
| Shares issued to shareholders in reinvestment of dividends | 17,025 | 128,431 | 43,534 | 324,831 | |
| Total issued | 32,117 | 243,353 | 95,259 | 711,260 | |
| Shares redeemed and automatic conversion of shares | (390,293) | (2,922,987) | (697,429) | (5,192,938) | |
| Net decrease | (358,176) | $ (2,679,634) | (602,170) | $ (4,481,678) | |
| Investor C | |||||
| Shares sold | 1,330,372 | $ 10,111,334 | 2,722,025 | $ 20,321,090 | |
| Shares issued to shareholders in reinvestment of dividends | 79,162 | 597,164 | 118,621 | 887,801 | |
| Total issued | 1,409,534 | 10,708,498 | 2,840,646 | 21,208,891 | |
| Shares redeemed | (640,694) | (4,750,795) | (876,537) | (6,569,384) | |
| Net increase | 768,840 | $ 5,957,703 | 1,964,109 | $ 14,639,507 | |
| Investor C1 | |||||
| Shares sold | 767 | $ 5,675 | 1,530 | $ 11,444 | |
| Shares issued to shareholders in reinvestment of dividends | 44,462 | 335,416 | 100,282 | 748,709 | |
| Total issued | 45,229 | 341,091 | 101,812 | 760,153 | |
| Shares redeemed | (282,396) | (2,120,285) | (458,405) | (3,424,173) | |
| Net decrease | (237,167) | $ (1,779,194) | (356,593) | $ (2,664,020) | |
82 SEMI-ANNUAL REPORT DECEMBER 31, 2010
Notes to Financial Statements (continued)
| Six Months Ended | Year Ended | ||||
| December 31, 2010 | June 30, 2010 | ||||
| National Municipal | Shares | Amount | Shares | Amount | |
| Institutional | |||||
| Shares sold | 25,218,984 | $261,100,311 | 23,929,880 | $240,734,514 | |
| Shares issued to shareholders in reinvestment of dividends | 1,916,255 | 19,608,330 | 3,264,368 | 32,795,888 | |
| Total issued | 27,135,239 | 280,708,641 | 27,194,248 | 273,530,402 | |
| Shares redeemed | (15,579,941) | (158,437,866) | (16,149,886) | (162,180,381) | |
| Net increase | 11,555,298 | $122,270,775 | 11,044,362 | $111,350,021 | |
| Investor A | |||||
| Shares sold and automatic conversion of shares | 14,329,781 | $146,440,949 | 25,587,832 | $257,098,651 | |
| Shares issued to shareholders in reinvestment of dividends | 1,083,659 | 11,095,733 | 1,751,962 | 17,621,515 | |
| Total issued | 15,413,440 | 157,536,682 | 27,339,794 | 274,720,166 | |
| Shares redeemed | (11,280,347) | (113,794,548) | (12,935,435) | (129,790,408) | |
| Net increase | 4,133,093 | $ 43,742,134 | 14,404,359 | $144,929,758 | |
| Investor B | |||||
| Shares sold | 27,930 | $ 287,561 | 115,773 | $ 1,161,245 | |
| Shares issued to shareholders in reinvestment of dividends | 36,684 | 375,497 | 95,845 | 960,773 | |
| Total issued | 64,614 | 663,058 | 211,618 | 2,122,018 | |
| Shares redeemed and automatic conversion of shares | (776,794) | (7,938,406) | (1,724,753) | (17,212,430) | |
| Net decrease | (712,180) | $ (7,275,348) | (1,513,135) | $ (15,090,412) | |
| Investor C | |||||
| Shares sold | 4,728,807 | $ 48,547,180 | 12,581,518 | $126,083,884 | |
| Shares issued to shareholders in reinvestment of dividends | 382,085 | 3,912,442 | 660,323 | 6,642,068 | |
| Total issued | 5,110,892 | 52,459,622 | 13,241,841 | 132,725,952 | |
| Shares redeemed | (3,720,691) | (37,738,114) | (4,909,381) | (49,343,444) | |
| Net increase | 1,390,201 | $ 14,721,508 | 8,332,460 | $ 83,382,508 | |
| Investor C1 | |||||
| Shares sold | 4,191 | $ 43,323 | 6,202 | $ 61,511 | |
| Shares issued to shareholders in reinvestment of dividends | 97,456 | 998,162 | 220,956 | 2,218,142 | |
| Total issued | 101,647 | 1,041,485 | 227,158 | 2,279,653 | |
| Shares redeemed | (692,360) | (7,052,328) | (1,513,481) | (15,137,499) | |
| Net decrease | (590,713) | $ (6,010,843) | (1,286,323) | $ (12,857,846) | |
SEMI-ANNUAL REPORT DECEMBER 31, 2010 83
Notes to Financial Statements (continued)
| Six Months Ended | Year Ended | |||||
| December 31, 2010 | June 30, 2010 | |||||
| High Yield Municipal | Shares | Amount | Shares | Amount | ||
| Institutional | ||||||
| Shares sold | 3,183,406 | $ 27,515,187 | 6,465,527 | $ 52,954,961 | ||
| Shares issued to shareholders in reinvestment | ||||||
| of dividends and distributions | 109,991 | 944,353 | 107,697 | 900,772 | ||
| Total issued | 3,293,397 | 28,459,540 | 6,573,224 | 53,855,733 | ||
| Shares redeemed | (2,145,183) | (18,292,080) | (1,767,419) | (14,445,195) | ||
| Net increase | 1,148,214 | $ 10,167,460 | 4,805,805 | $ 39,410,538 | ||
| Investor A | ||||||
| Shares sold and automatic conversion of shares | 1,417,738 | $ 12,101,110 | 3,588,086 | $ 28,712,678 | ||
| Shares issued to shareholders in reinvestment | ||||||
| of dividends and distributions | 52,859 | 453,526 | 67,920 | 560,971 | ||
| Total issued | 1,470,597 | 12,554,636 | 3,656,006 | 29,273,649 | ||
| Shares redeemed | (1,520,595) | (12,992,420) | (1,346,044) | (10,935,891) | ||
| Net increase (decrease) | (49,998) | $ (437,784) | 2,309,962 | $ 18,337,758 | ||
| Investor C | ||||||
| Shares sold | 718,706 | $ 6,222,559 | 1,174,052 | $ 9,607,134 | ||
| Shares issued to shareholders in reinvestment | ||||||
| of dividends and distributions | 27,139 | 232,503 | 31,696 | 260,753 | ||
| Total issued | 745,845 | 6,455,062 | 1,205,748 | 9,867,887 | ||
| Shares redeemed | (494,388) | (4,186,330) | (226,312) | (1,856,306) | ||
| Net increase | 251,457 | $ 2,268,732 | 979,436 | $ 8,011,581 | ||
84 SEMI-ANNUAL REPORT DECEMBER 31, 2010
Notes to Financial Statements (concluded)
| Six Months Ended | Year Ended | |||||
| December 31, 2010 | June 30, 2010 | |||||
| New York Municipal | Shares | Amount | Shares | Amount | ||
| Institutional | ||||||
| Shares sold | 507,692 | $ 5,443,415 | 886,783 | $ 9,279,487 | ||
| Shares issued to shareholders in reinvestment of dividends | 32,129 | 341,328 | 50,961 | 529,695 | ||
| Total issued | 539,821 | 5,784,743 | 937,744 | 9,809,182 | ||
| Shares redeemed | (348,324) | (3,651,835) | (624,770) | (6,490,743) | ||
| Net increase | 191,497 | $ 2,132,908 | 312,974 | $ 3,318,439 | ||
| Investor A | ||||||
| Shares sold and automatic conversion of shares | 649,697 | $ 6,964,683 | 2,099,796 | $ 21,588,976 | ||
| Shares issued to shareholders in reinvestment of dividends | 61,143 | 649,536 | 97,249 | 1,014,531 | ||
| Total issued | 710,840 | 7,614,219 | 2,197,045 | 22,603,507 | ||
| Shares redeemed | (425,553) | (4,524,824) | (712,498) | (7,337,173) | ||
| Net increase | 285,287 | $ 3,089,395 | 1,484,547 | $ 15,266,334 | ||
| Investor A1 | ||||||
| Shares sold and automatic conversion of shares | 51,601 | $ 549,894 | 172,822 | $ 1,789,159 | ||
| Shares issued to shareholders in reinvestment of dividends | 211,707 | 2,251,592 | 443,216 | 4,607,722 | ||
| Total issued | 263,308 | 2,801,486 | 616,038 | 6,396,881 | ||
| Shares redeemed | (581,322) | (6,122,700) | (1,302,313) | (13,478,561) | ||
| Net decrease | (318,014) | $ (3,321,214) | (686,275) | $ (7,081,680) | ||
| Investor B | ||||||
| Shares sold | 1,154 | $ 12,519 | 4,270 | $ 43,229 | ||
| Shares issued to shareholders in reinvestment of dividends | 8,428 | 89,671 | 19,786 | 205,456 | ||
| Total issued | 9,582 | 102,190 | 24,056 | 248,685 | ||
| Shares redeemed and automatic conversion of shares | (135,649) | (1,439,518) | (309,285) | (3,191,369) | ||
| Net decrease | (126,067) | $ (1,337,328) | (285,229) | $ (2,942,684) | ||
| Investor C | ||||||
| Shares sold | 288,288 | $ 3,082,354 | 704,190 | $ 7,313,334 | ||
| Shares issued to shareholders in reinvestment of | ||||||
| dividends and distributions | 18,386 | 195,367 | 31,573 | 328,646 | ||
| Total issued | 306,674 | 3,277,721 | 735,763 | 7,641,980 | ||
| Shares redeemed | (171,684) | (1,823,015) | (320,565) | (3,353,350) | ||
| Net increase | 134,990 | $ 1,454,706 | 415,198 | $ 4,288,630 | ||
| Investor C1 | ||||||
| Shares sold | 11 | $ 120 | 98 | $ 1,002 | ||
| Shares issued to shareholders in reinvestment of | ||||||
| dividends and distributions | 13,775 | 146,561 | 29,872 | 310,513 | ||
| Total issued | 13,786 | 146,681 | 29,970 | 311,515 | ||
| Shares redeemed | (94,480) | (993,609) | (128,288) | (1,304,912) | ||
| Net decrease | (80,694) | $ (846,928) | (98,318) | $ (993,397) | ||
9. Subsequent Events:
Management’s evaluation of the impact of all subsequent events on the Funds’ financial statements was completed through the date the financial
statements were issued and the following items were noted:
Effective January 3, 2011, BlackRock Municipal Insured Fund was renamed BlackRock Municipal Fund.
SEMI-ANNUAL REPORT DECEMBER 31, 2010 85
Officers and Directors
Robert M. Hernandez, Chairman of the Board, Director and Member
of the Audit Committee
Fred G. Weiss, Vice Chairman of the Board, Chairman of
the Audit Committee and Director
James H. Bodurtha, Director
Bruce R. Bond, Director
Donald W. Burton, Director
Richard S. Davis, President1 and Director
Stuart E. Eizenstat, Director
Laurence D. Fink, Director
Kenneth A. Froot, Director
Henry Gabbay, Director
John F. O’Brien, Director
Roberta Cooper Ramo, Director
David H. Walsh, Director
John M. Perlowski, President2 and Chief Executive Officer
Brendan Kyne, Vice President
Brian Schmidt, Vice President
Neal Andrews, Chief Financial Officer
Jay Fife, Treasurer
Brian Kindelan, Chief Compliance Officer of the Fund
Ira Shapiro, Secretary
1 President for BlackRock Multi-State Series Trust.
2 President for BlackRock Municipal Bond Fund, Inc.
Investment Advisor
BlackRock Advisors, LLC
Wilmington, DE 19809
Sub-Advisor
BlackRock Investment Management, LLC
Plainsboro, NJ 08536
Custodians
The Bank of New York Mellon3
New York, NY 10286
State Street Bank and Trust Company4
Boston, MA 02111
Transfer Agent
BNY Mellon Investment Servicing (US) Inc.
Wilmington, DE 19809
Accounting Agent
State Street Bank and Trust Company
Princeton, NJ 08540
Distributor
BlackRock Investments, LLC
New York, NY 10022
Independent Registered
Public Accounting Firm
Deloitte & Touche LLP
Princeton, NJ 08540
Legal Counsel
Willkie Farr & Gallagher LLP
New York, NY 10019
Address For All Funds
100 Bellevue Parkway
Wilmington, DE 19809
3 For BlackRock Municipal Bond Fund, Inc.
4 For BlackRock Multi-State Series Trust.
Effective September 15, 2010, John M. Perlowski became
President and Chief Executive Officer of the Funds.
Effective November 10, 2010, Ira Shapiro became Secretary
of the Funds.
Effective December 31, 2010, Richard R. West retired as
a Director of the Funds. The Board wishes Mr. West well
in his retirement.
86 SEMI-ANNUAL REPORT DECEMBER 31, 2010
Additional Information
General Information
Electronic Delivery
Electronic copies of most financial reports and prospectuses are available
on the Fund’s website or shareholders can sign up for e-mail notifications
of quarterly statements, annual and semi-annual reports and prospectuses
by enrolling in the Fund’s electronic delivery program.
To enroll:
Shareholders Who Hold Accounts with Investment Advisors, Banks or
Brokerages:
Please contact your financial advisor. Please note that not all investment
advisors, banks or brokerages may offer this service.
Shareholders Who Hold Accounts Directly with BlackRock:
1) Access the BlackRock website at
http://www.blackrock.com/edelivery
2) Select “eDelivery” under the “More Information” section
3) Log into your account
Householding
The Funds will mail only one copy of shareholder documents, including
prospectuses, annual and semi-annual reports and proxy statements, to
shareholders with multiple accounts at the same address. This practice is
commonly called “householding” and it is intended to reduce expenses
and eliminate duplicate mailings of shareholder documents. Mailings of
your shareholder documents may be householded indefinitely unless you
instruct us otherwise. If you do not want the mailing of these documents to
be combined with those for other members of your household, please con-
tact the Fund at (800) 441-7762.
Availability of Quarterly Portfolio Schedule of Investments
The Funds file their complete schedule of portfolio holdings with the
Securities and Exchange Commission (the “SEC”) for the first and third
quarters of each fiscal year on Form N-Q. The Funds’ Forms N-Q are avail-
able on the SEC’s website at http://www.sec.gov and may also be reviewed
and copied at the SEC’s Public Reference Room in Washington, D.C.
Information on the operation of the Public Reference Room may be
obtained by calling (800) SEC-0330. The Funds’ Forms N-Q may also be
obtained upon request and without charge by calling (800) 441-7762.
Availability of Proxy Voting Policies and Procedures
A description of the policies and procedures that the Funds use to
determine how to vote proxies relating to portfolio securities is avail-
able (1) without charge, upon request, by calling (800) 441-7762;
(2) at http://www.blackrock.com; and (3) on the SEC’s website at
http://www.sec.gov.
Availability of Proxy Voting Record
Information about how the Funds voted proxies relating to securities
held in the Funds’ portfolio during the most recent 12-month period
ended June 30 is available upon request and without charge (1) at
http://www.blackrock.com or by calling (800) 441-7762 and (2) on the
SEC’s website at http://www.sec.gov.
SEMI-ANNUAL REPORT DECEMBER 31, 2010 87
Additional Information (continued)
Shareholder Privileges
Account Information
Call us at (800) 441-7762 from 8:00 AM to 6:00 PM EST on any business
day to get information about your account balances, recent transactions
and share prices. You can also reach us on the Web at
http://www.blackrock.com/funds.
Automatic Investment Plans
Investor Class shareholders who want to invest regularly can arrange to
have $50 or more automatically deducted from their checking or savings
account and invested in any of the BlackRock funds.
Systematic Withdrawal Plans
Investor Class shareholders can establish a systematic withdrawal plan and
receive periodic payments of $50 or more from their BlackRock funds, as
long as their account balance is at least $10,000.
Retirement Plans
Shareholders may make investments in conjunction with Traditional, Rollover,
Roth, Coverdell, Simple IRAs, SEP IRAs and 403(b) Plans.
88 SEMI-ANNUAL REPORT DECEMBER 31, 2010
Additional Information (concluded)
BlackRock Privacy Principles
BlackRock is committed to maintaining the privacy of its current and
former fund investors and individual clients (collectively, “Clients”) and
to safeguarding their non-public personal information. The following infor-
mation is provided to help you understand what personal information
BlackRock collects, how we protect that information and why in certain
cases we share such information with select parties.
If you are located in a jurisdiction where specific laws, rules or regulations
require BlackRock to provide you with additional or different privacy-related
rights beyond what is set forth below, then BlackRock will comply with
those specific laws, rules or regulations.
BlackRock obtains or verifies personal non-public information from and
about you from different sources, including the following: (i) information we
receive from you or, if applicable, your financial intermediary, on applica-
tions, forms or other documents; (ii) information about your transactions
with us, our affiliates, or others; (iii) information we receive from a con-
sumer reporting agency; and (iv) from visits to our websites.
BlackRock does not sell or disclose to non-affiliated third parties any non-
public personal information about its Clients, except as permitted by law or
as is necessary to respond to regulatory requests or to service Client
accounts. These non-affiliated third parties are required to protect the con-
fidentiality and security of this information and to use it only for its
intended purpose.
We may share information with our affiliates to service your account or to
provide you with information about other BlackRock products or services
that may be of interest to you. In addition, BlackRock restricts access to
non-public personal information about its Clients to those BlackRock
employees with a legitimate business need for the information. BlackRock
maintains physical, electronic and procedural safeguards that are designed
to protect the non-public personal information of its Clients, including pro-
cedures relating to the proper storage and disposal of such information.
SEMI-ANNUAL REPORT DECEMBER 31, 2010 89
A World-Class Mutual Fund Family
BlackRock offers a diverse lineup of open-end mutual funds crossing all investment styles and managed by experts in equity, fixed income and
tax-exempt investing.
| Equity Funds | ||||
| BlackRock All-Cap Energy & Resources Portfolio | BlackRock Global SmallCap Fund | BlackRock Natural Resources Trust | ||
| BlackRock Asset Allocation Portfolio† | BlackRock Health Sciences Opportunities Portfolio | BlackRock Pacific Fund | ||
| BlackRock Balanced Capital Fund† | BlackRock Healthcare Fund | BlackRock Science & Technology | ||
| BlackRock Basic Value Fund | BlackRock Index Equity Portfolio* | Opportunities Portfolio | ||
| BlackRock Capital Appreciation Fund | BlackRock International Fund | BlackRock Small Cap Core Equity Portfolio | ||
| BlackRock Energy & Resources Portfolio | BlackRock International Index Fund | BlackRock Small Cap Growth Equity Portfolio | ||
| BlackRock Equity Dividend Fund | BlackRock International Opportunities Portfolio | BlackRock Small Cap Growth Fund II | ||
| BlackRock EuroFund | BlackRock International Value Fund | BlackRock Small Cap Index Fund | ||
| BlackRock Focus Growth Fund | BlackRock Large Cap Core Fund | BlackRock Small/Mid-Cap Growth Portfolio | ||
| BlackRock Focus Value Fund | BlackRock Large Cap Core Plus Fund | BlackRock S&P 500 Index Fund | ||
| BlackRock Global Allocation Fund† | BlackRock Large Cap Growth Fund | BlackRock S&P 500 Stock Fund | ||
| BlackRock Global Dynamic Equity Fund | BlackRock Large Cap Value Fund | BlackRock U.S. Opportunities Portfolio | ||
| BlackRock Global Emerging Markets Fund | BlackRock Latin America Fund | BlackRock Utilities and Telecommunications Fund | ||
| BlackRock Global Financial Services Fund | BlackRock Mid-Cap Growth Equity Portfolio | BlackRock Value Opportunities Fund | ||
| BlackRock Global Growth Fund | BlackRock Mid-Cap Value Equity Portfolio | BlackRock World Gold Fund | ||
| BlackRock Global Opportunities Portfolio | BlackRock Mid Cap Value Opportunities Fund | |||
| Fixed Income Funds | ||||
| BlackRock Bond Index Fund | BlackRock High Yield Bond Portfolio | BlackRock Managed Income Portfolio | ||
| BlackRock Bond Portfolio | BlackRock Income Portfolio† | BlackRock Multi-Sector Bond Portfolio | ||
| BlackRock Emerging Market Debt Portfolio | BlackRock Inflation Protected Bond Portfolio | BlackRock Short-Term Bond Fund | ||
| BlackRock Floating Rate Income Portfolio | BlackRock Intermediate Government | BlackRock Strategic Income | ||
| BlackRock GNMA Portfolio | Bond Portfolio | Opportunities Portfolio | ||
| BlackRock Global Dividend Income Portfolio† | BlackRock International Bond Portfolio | BlackRock Total Return Fund | ||
| BlackRock Government Income Portfolio | BlackRock Long Duration Bond Portfolio | BlackRock Total Return Portfolio II | ||
| BlackRock High Income Fund | BlackRock Low Duration Bond Portfolio | BlackRock World Income Fund | ||
| Municipal Bond Funds | ||||
| BlackRock AMT-Free Municipal Bond Portfolio | BlackRock Kentucky Municipal Bond Portfolio | BlackRock New York Municipal Bond Fund | ||
| BlackRock California Municipal Bond Fund | BlackRock Municipal Fund | BlackRock Ohio Municipal Bond Portfolio | ||
| BlackRock High Yield Municipal Fund | BlackRock National Municipal Fund | BlackRock Pennsylvania Municipal Bond Fund | ||
| BlackRock Intermediate Municipal Fund | BlackRock New Jersey Municipal Bond Fund | BlackRock Short-Term Municipal Fund | ||
| Target Risk & Target Date Funds† | ||||
| BlackRock Prepared Portfolios | BlackRock Lifecycle Prepared Portfolios | BlackRock LifePath Portfolios | ||
| Conservative Prepared Portfolio | 2015 | 2035 | Retirement | 2040 |
| Moderate Prepared Portfolio | 2020 | 2040 | 2020 | 2045 |
| Growth Prepared Portfolio | 2025 | 2045 | 2025 | 2050 |
| Aggressive Growth Prepared Portfolio | 2030 | 2050 | 2030 | 2055 |
| 2035 | ||||
* See the prospectus for information on specific limitations on investments in the fund.
† Mixed asset fund.
BlackRock mutual funds are currently distributed by BlackRock Investments, LLC. You should consider the investment objectives, risks, charges and
expenses of the funds under consideration carefully before investing. Each fund’s prospectus contains this and other information and is available at
www.blackrock.com or by calling (800) 441-7762 or from your financial advisor. The prospectus should be read carefully before investing.
90 SEMI-ANNUAL REPORT DECEMBER 31, 2010
This report is not authorized for use as an offer of sale or a solicitation of an offer to buy shares of the Funds unless accompanied or
preceded by the Funds’ current prospectus. Past performance results shown in this report should not be considered a representation
of future performance. Investment return and principal value of shares will fluctuate so that shares, when redeemed, may be worth
more or less than their original cost. Statements and other information herein are as dated and are subject to change.

Item 2 – Code of Ethics – Not Applicable to this semi-annual report
Item 3 – Audit Committee Financial Expert – Not Applicable to this semi-annual report
Item 4 – Principal Accountant Fees and Services – Not Applicable to this semi-annual report
Item 5 – Audit Committee of Listed Registrants – Not Applicable
Item 6 – Investments
(a) The registrant’s Schedule of Investments is included as part of the Report to
Stockholders filed under Item 1 of this form.
(b) Not Applicable due to no such divestments during the semi-annual period covered since
the previous Form N-CSR filing.
Item 7 – Disclosure of Proxy Voting Policies and Procedures for Closed-End Management
Investment Companies – Not Applicable
Item 8 – Portfolio Managers of Closed-End Management Investment Companies – Not Applicable
Item 9 – Purchases of Equity Securities by Closed-End Management Investment Company and
Affiliated Purchasers – Not Applicable
Item 10 – Submission of Matters to a Vote of Security Holders – The registrant’s Nominating and
Governance Committee will consider nominees to the board of directors recommended by
shareholders when a vacancy becomes available. Shareholders who wish to recommend a
nominee should send nominations that include biographical information and set forth the
qualifications of the proposed nominee to the registrant’s Secretary. There have been no
material changes to these procedures.
Item 11 – Controls and Procedures
(a) – The registrant’s principal executive and principal financial officers or persons
performing similar functions have concluded that the registrant’s disclosure controls and
procedures (as defined in Rule 30a-3(c) under the Investment Company Act of 1940, as
amended (the “1940 Act”)) are effective as of a date within 90 days of the filing of this
report based on the evaluation of these controls and procedures required by Rule 30a-3(b)
under the 1940 Act and Rule 15d-15(b) under the Securities Exchange Act of 1934, as
amended.
(b) – There were no changes in the registrant’s internal control over financial reporting (as
defined in Rule 30a-3(d) under the 1940 Act) that occurred during the second fiscal quarter
of the period covered by this report that have materially affected, or are reasonably likely to
materially affect, the registrant’s internal control over financial reporting.
Item 12 – Exhibits attached hereto
(a)(1) – Code of Ethics – Not Applicable to this semi-annual report
(a)(2) – Certifications – Attached hereto
(a)(3) – Not Applicable
(b) – Certifications – Attached hereto
Pursuant to the requirements of the Securities Exchange Act of 1934 and the Investment
Company Act of 1940, the registrant has duly caused this report to be signed on its behalf by
the undersigned, thereunto duly authorized.
BlackRock Municipal Bond Fund, Inc.
By: /S/ John M. Perlowski
John M. Perlowski
Chief Executive Officer (principal executive officer) of
BlackRock Municipal Bond Fund, Inc.
Date: March 4, 2011
Pursuant to the requirements of the Securities Exchange Act of 1934 and the Investment
Company Act of 1940, this report has been signed below by the following persons on behalf
of the registrant and in the capacities and on the dates indicated.
By: /S/ John M. Perlowski
John M. Perlowski
Chief Executive Officer (principal executive officer) of
BlackRock Municipal Bond Fund, Inc.
Date: March 4, 2011
By: /S/ Neal J. Andrews
Neal J. Andrews
Chief Financial Officer (principal financial officer) of
BlackRock Municipal Bond Fund, Inc.
Date: March 4, 2011