UNITED STATES
SECURITIES AND EXCHANGE COMMISSION
Washington, D.C. 20549
FORM N-CSR
CERTIFIED SHAREHOLDER REPORT OF REGISTERED MANAGEMENT
INVESTMENT COMPANIES
Investment Company Act file number: 811-02688
Name of Fund: BlackRock Municipal Bond Fund, Inc.
BlackRock High Yield Municipal Fund
BlackRock National Municipal Fund
BlackRock Short-Term Municipal Fund
Fund Address: 100 Bellevue Parkway, Wilmington, DE 19809
Name and address of agent for service: John M. Perlowski, Chief Executive Officer, BlackRock Municipal
Bond Fund, Inc., 55 East 52nd Street, New York, NY 10055
Registrant’s telephone number, including area code: (800) 441-7762
Date of fiscal year end: 06/30/2018
Date of reporting period: 06/30/2018
Item 1 – Report to Stockholders
JUNE 30, 2018
ANNUAL REPORT |  |
BlackRock Municipal Bond Fund, Inc.
| Ø | BlackRock High Yield Municipal Fund |
| Ø | BlackRock National Municipal Fund |
| Ø | BlackRock Short-Term Municipal Fund |
BlackRock Multi-State Municipal Series Trust
| Ø | BlackRock New York Municipal Opportunities Fund |
| Not FDIC Insured • May Lose Value • No Bank Guarantee |
Dear Shareholder,
In the 12 months ended June 30, 2018, the strongest corporate profits in seven years drove the equity market higher, while rising interest rates constrained bond returns. Though the market’s appetite for risk remained healthy, risk taking was tempered somewhat, as shorter-term, higher-quality securities led the bond market, and U.S. equities outperformed most international stock markets.
Strong equity performance worldwide was driven by synchronized economic growth across the most influential economies. However, volatility in emerging market stocks rose, as U.S.-China trade relations and debt concerns weighed heavily on the Chinese stock market.
Short-term U.S. Treasury interest rates rose the fastest, while longer-term rates slightly increased, leading to a substantial flattening of the yield curve. The annual return for the three-month U.S. Treasury bill surpassed 1.0%, but remained well below the annual headline inflation rate of 2.9%. In contrast, the ten-year U.S. Treasury — a bellwether of the bond market — posted a negative return, as rising inflation expectations drove yields higher. Although the fundamentals in credit markets remained relatively solid, investment-grade bonds declined slightly, and high-yield bonds posted modest returns.
In response to rising growth and inflation, the U.S. Federal Reserve (the “Fed”) increased short-term interest rates three times during the reporting period. The Fed also announced plans to reduce its $4.4 trillion balance sheet by $420 billion in 2018, which began the process of gradually reversing its unprecedented stimulus measures after the financial crisis. Meanwhile, the European Central Bank announced that its bond-purchasing program would conclude at the end of the year, while also expressing an open-ended commitment to low interest rates. In contrast, the Bank of Japan continued to expand its balance sheet through bond purchasing while lowering its expectations for inflation.
The U.S. economy continued to gain momentum despite the Fed’s modest reduction of economic stimulus; unemployment declined to 4.0%, wages increased, and the number of job openings reached a record high. Strong economic performance may justify a more rapid pace of rate hikes in 2018, as the headline inflation rate and investors’ expectations for inflation have already surpassed the Fed’s target of 2.0%.
While U.S. monetary policy is seeking to restrain economic growth and inflation, fiscal policy has produced new sources of growth that could nourish the economy for the next few years. Corporate tax cuts and repatriation of capital held abroad could encourage a virtuous cycle of business spending. Lower individual tax rates coupled with the robust job market may refresh consumer spending. Proposed infrastructure spending would deliver growth from the government sector, generate demand, and improve economic activity in other sectors.
We continue to believe the primary risks to economic expansion are trade protectionism, rapidly rising interest rates, and geopolitical tension. Given the deflationary forces of technology and globalization, a substantial increase in inflation is unlikely to materialize as long as the unemployment rate remains above 3.0%. However, we are closely monitoring trade protectionism and the rise of populism in Western nations. In particular, the outcome of trade negotiations between the United States and China is likely to influence the global growth trajectory and set the tone for free trade in many other nations.
In this environment, investors need to think globally, extend their scope across a broad array of asset classes, and be nimble as market conditions change. We encourage you to talk with your financial advisor and visit blackrock.com for further insight about investing in today’s markets.
Sincerely,

Rob Kapito
President, BlackRock Advisors, LLC

Rob Kapito
President, BlackRock Advisors, LLC
| Total Returns as of June 30, 2018 | ||||
| 6-month | 12-month | |||
U.S. large cap equities | 2.65% | 14.37% | ||
U.S. small cap equities | 7.66 | 17.57 | ||
International equities | (2.75) | 6.84 | ||
Emerging market equities | (6.66) | 8.20 | ||
3-month Treasury bills | 0.81 | 1.36 | ||
U.S. Treasury securities | (2.68) | (2.69) | ||
U.S. investment grade bonds | (1.62) | (0.40) | ||
Tax-exempt municipal bonds | (0.02) | 1.61 | ||
U.S. high yield bonds | 0.16 | 2.62 | ||
| Past performance is no guarantee of future results. Index performance is shown for illustrative purposes only. You cannot invest directly in an index. | ||||
| 2 | THIS PAGEISNOT PARTOF YOUR FUND REPORT |
| Page | ||||
| 2 | ||||
Annual Report: | ||||
| 4 | ||||
| 20 | ||||
| 21 | ||||
| 21 | ||||
| 21 | ||||
| 22 | ||||
| 57 | ||||
| 59 | ||||
| 60 | ||||
| 62 | ||||
| 83 | ||||
| 98 | ||||
| 99 | ||||
| 103 | ||||
| 108 | ||||
| 110 | ||||
| 3 |
| Fund Summary as of June 30, 2018 | BlackRock High Yield Municipal Fund |
Investment Objective
BlackRock High Yield Municipal Fund’s (the “Fund”) investment objective is to provide shareholders with as high a level of income exempt from Federal income taxes as is consistent with the investment policies of the Fund.
Portfolio Management Commentary
How did the Fund perform?
For the 12-month period ended June 30, 2018, the Fund outperformed its primary benchmark, the S&P® Municipal Bond Index, but it underperformed its secondary benchmark, the Custom High Yield Index. The following discussion of relative performance pertains to the Fund’s secondary benchmark, the Custom High Yield Index.
What factors influenced performance?
High-yield municipal bonds performed well and outpaced investment-grade debt in the 12-month period. Consistent with this trend, lower-quality securities within the high-yield category typically produced the best returns. In this environment, the Fund’s bias toward higher-quality issues detracted from relative performance. This was most evident in the Fund’s underweight allocations to unrated bonds and CCC rated securities.
At the sector level, the Fund was hurt by its underweight in state and local tax-backed credits, which outperformed the broader market. Having no position in zero-coupon tobacco bonds was an additional detractor.
On the positive side, the Fund’s below-benchmark duration contributed to performance at a time of rising yields. (Duration is a measure of interest rate sensitivity.) Concentrations in the transportation sector, project-finance issues and development-district bonds also aided performance.
The Fund sought to manage interest rate risk using U.S. Treasury futures. Given that Treasury yields rose, this aspect of the Fund’s positioning had a positive impact on relative performance. Additionally, the Fund’s use of leverage provided both incremental return and income.
Describe recent portfolio activity.
Late in the reporting period, the investment adviser modestly increased the Fund’s cash reserves in response to both richer valuations in high yield and a relatively limited opportunity set stemming from low-new issue supply. The Fund also rotated out of some current holdings into new positions in order to enhance portfolio income.
The investment adviser continued to increase exposure to state and local tax-backed credits, thereby reducing the extent of the portfolio’s underweight posture in both areas. Additionally, the investment adviser reduced the magnitude of the Fund’s overweight position in the tobacco sector.
Describe portfolio positioning at period end.
The Fund remained positioned with a shorter duration than its secondary benchmark, and it maintained a bias toward higher-quality securities. At the sector level, the Fund’s largest overweight positions included transportation and health care issues. The investment adviser maintained a modest degree of leverage in the portfolio.
The views expressed reflect the opinions of BlackRock as of the date of this report and are subject to change based on changes in market, economic or other conditions. These views are not intended to be a forecast of future events and are no guarantee of future results.
| 4 | 2018 BLACKROCK ANNUAL REPORTTO SHAREHOLDERS |
| Fund Summary as of June 30, 2018 (continued) | BlackRock High Yield Municipal Fund |
TOTAL RETURN BASED ON A $10,000 INVESTMENT
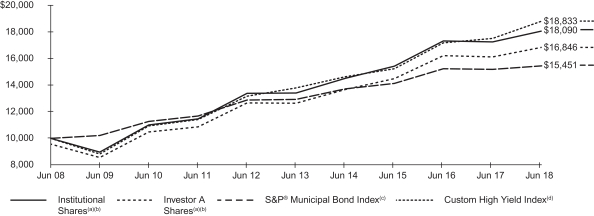
| (a) | Assuming maximum sales charge, if any, transaction costs and other operating expenses, including advisory fees. Institutional Shares do not have a sales charge. |
| (b) | Under normal circumstances, the Fund seeks to achieve its objective by investing at least 80% of its assets in municipal bonds and may invest in municipal bonds rated in any rating category or in unrated municipal bonds. The Fund will usually invest in municipal bonds that have a maturity of five years or longer. |
| (c) | The S&P® Municipal Bond Index is composed of bonds held by managed municipal bond fund customers of Standard & Poor’s Securities Pricing, Inc. that are priced daily. Bonds in the S&P® Municipal Bond Index must have an outstanding par value of at least $2 million and a remaining maturity of not less than one month. |
| (d) | The Custom High Yield Index is a customized benchmark that reflects the returns of the S&P® Customized High Yield Municipal Bond Index for periods prior to January 1, 2013, and the returns of only those bonds in the S&P® Customized High Yield Municipal Bond Index that have maturities greater than five years for periods subsequent to January 1, 2013. |
Performance Summary for the Period Ended June 30, 2018
| Average Annual Total Returns (a) | ||||||||||||||||||||||||||||||||||||||||||||||||
| 1 Year | 5 Years | 10 Years | ||||||||||||||||||||||||||||||||||||||||||||||
| Standardized 30-Day Yields | Unsubsidized 30-Day Yields | 6-Month Total Returns | w/o sales charge | w/sales charge | w/o sales charge | w/sales charge | w/o sales charge | w/sales charge | ||||||||||||||||||||||||||||||||||||||||
Institutional | 3.33 | % | 3.27 | % | 1.34 | % | 4.78 | % | N/A | 6.18 | % | N/A | 6.11 | % | N/A | |||||||||||||||||||||||||||||||||
Investor A | 2.94 | 2.88 | 1.21 | 4.40 | (0.04 | )% | 5.89 | 4.98 | % | 5.81 | 5.35 | % | ||||||||||||||||||||||||||||||||||||
Investor C | 2.31 | 2.25 | 0.84 | 3.62 | 2.62 | 5.09 | 5.09 | 5.03 | 5.03 | |||||||||||||||||||||||||||||||||||||||
Class K | 3.37 | | 3.31 | | 1.36 | 4.79 | N/A | 6.18 | | N/A | | 6.11 | N/A | |||||||||||||||||||||||||||||||||||
S&P® Municipal Bond Index | — | — | (0.02 | ) | 1.61 | N/A | 3.60 | N/A | 4.45 | N/A | ||||||||||||||||||||||||||||||||||||||
Custom High Yield Index | — | — | 3.78 | 7.38 | N/A | 6.42 | N/A | 6.53 | N/A | |||||||||||||||||||||||||||||||||||||||
| (a) | Assuming maximum sales charges, if any. Average annual total returns with and without sales charges reflect reductions for distribution and service fees. See “About Fund Performance” on page 20 for a detailed description of share classes, including any related sales charges and fees, and how performance was calculated for certain share classes. |
N/A — Not applicable as share class and index do not have a sales charge. |
Past performance is not indicative of future results. |
Performance results may include adjustments made for financial reporting purposes in accordance with U.S. generally accepted accounting principles. |
| FUND SUMMARY | 5 |
| Fund Summary as of June 30, 2018 (continued) | BlackRock High Yield Municipal Fund |
Expense Example
| Actual | Hypothetical (c) | |||||||||||||||||||||||||||||||||||||||
| Expenses Paid During the Period | Including Interest Expense and Fees | Excluding Interest Expense and Fees | ||||||||||||||||||||||||||||||||||||||
| Beginning Account Value (01/01/18) | Ending Account Value (06/30/18) | Including and Fees (a) | Excluding Interest Expense and Fees (b) | Beginning Account Value (01/01/18) | Ending Account Value (06/30/18) | Expenses Paid During the Period (a) | Ending Account Value (06/30/18) | Expenses Paid During the Period (b) | ||||||||||||||||||||||||||||||||
Institutional | $ | 1,000.00 | $ | 1,013.40 | $ | 3.99 | $ | 2.70 | $ | 1,000.00 | $ | 1,020.83 | $ | 4.01 | $ | 1,022.12 | $ | 2.71 | ||||||||||||||||||||||
Investor A | 1,000.00 | 1,012.10 | 5.29 | 3.99 | 1,000.00 | 1,019.54 | 5.31 | 1,020.83 | 4.01 | |||||||||||||||||||||||||||||||
Investor C | 1,000.00 | 1,008.40 | 8.86 | 7.57 | 1,000.00 | 1,015.97 | 8.90 | 1,017.26 | 7.60 | |||||||||||||||||||||||||||||||
Class K | 1,000.00 | 1,013.60 | 3.44 | 2.10 | 1,000.00 | 1,021.37 | 3.46 | 1,022.71 | 2.11 | |||||||||||||||||||||||||||||||
| (a) | For each class of the Fund, expenses are equal to the annualized net expense ratio for the class (0.68% for Institutional, 0.94% for Investor A, 1.69% for Investor C and 0.62% for Class K), multiplied by the average account value over the period, multiplied by 181/365 (to reflect the one-half year period shown), except Class K which is multiplied by 156/365 (to reflect the period since inception date of January 25, 2018). |
| (b) | For each class of the Fund, expenses are equal to the annualized net expense ratio for the class (0.54% for Institutional, 0.80% for Investor A, 1.56% for Investor C and 0.49% for Class K), multiplied by the average account value over the period, multiplied by 181/365 (to reflect the one-half year period shown), except Class K which is multiplied by 156/365 (to reflect the period since inception date of January 25, 2018). |
| (c) | Hypothetical 5% annual return before expenses is calculated by prorating the number of days in the most recent fiscal half year divided by 365. |
See “Disclosure of Expenses” on page 21 for further information on how expenses were calculated.
| 6 | 2018 BLACKROCK ANNUAL REPORTTO SHAREHOLDERS |
| Fund Summary as of June 30, 2018 (continued) | BlackRock High Yield Municipal Fund |
Overview of the Fund’s Total Investments*
SECTOR ALLOCATION
| Sector | 06/30/18 | |||
Transportation | 15 | % | ||
Tobacco. | 15 | |||
Health | 13 | |||
County/City/Special District/School District . | 13 | |||
Education | 11 | |||
Utilities | 8 | |||
Health | 6 | |||
Corporate | 6 | |||
State | 6 | |||
Financing & Development | 4 | |||
General Government | 2 | |||
Housing | 1 | |||
For Fund compliance purposes, the Fund’s sector classifications refer to one or more of the sector sub-classifications used by one or more widely recognized market indexes or rating group indexes, and/or as defined by the investment adviser. These definitions may not apply for purposes of this report, which may combine such sector sub-classifications for reporting ease.
CALL/MATURITY SCHEDULE (c)
| Percent of Total Investments | ||||
Calendar Year Ended December 31, | ||||
2018 | 11 | % | ||
2019 | 3 | |||
2020 | 7 | |||
2021 | 7 | |||
2022 | 8 | |||
| (c) | Scheduled maturity dates and/or bonds that are subject to potential calls by issuers over the next five years. |
| * | Excludes short-term securities. |
CREDIT QUALITY ALLOCATION (a)
| Credit Rating | 06/30/18 | |||
AAA/Aaa | 3 | % | ||
AA/Aa | 10 | |||
A | 12 | |||
BBB/Baa | 21 | |||
BB/Ba | 12 | |||
B/B | 9 | |||
N/R(b) | 33 | |||
| (a) | For financial reporting purposes, credit quality ratings shown above reflect the highest rating assigned by either Standard & Poor’s (“S&P”) or Moody’s Investors Service (“Moody’s”) if ratings differ. These rating agencies are independent, nationally recognized statistical rating organizations and are widely used. Investment grade ratings are credit ratings of BBB/Baa or higher. Below investment grade ratings are credit ratings of BB/Ba or lower. Investments designated N/R are not rated by either rating agency. Unrated investments do not necessarily indicate low credit quality. Credit quality ratings are subject to change. |
| (b) | The investment adviser evaluates the credit quality of unrated investments based upon certain factors including, but not limited to, credit ratings for similar investments and financial analysis of sectors and individual investments. Using this approach, the investment adviser has deemed certain of these unrated securities as investment grade quality. As of June 30, 2018, the market value of unrated securities deemed by the investment adviser to be investment grade represents 2% of the Fund’s total investments. |
| FUND SUMMARY | 7 |
| Fund Summary as of June 30, 2018 | BlackRock National Municipal Fund |
Investment Objective
BlackRock National Municipal Fund’s (the “Fund”) investment objective is to provide shareholders with as high a level of income exempt from Federal income taxes as is consistent with the investment policies of the Fund.
Portfolio Management Commentary
How did the Fund perform?
For the 12-month period ended June 30, 2018, the Fund outperformed the primary benchmark, the S&P® Municipal Bond Index, except for the Fund’s Investor C and C1 Shares, which underperformed. For the same period, the Fund underperformed the secondary benchmark, the Custom National Index, with the exception of the Fund’s Class K Shares, which outperformed, and Institutional Shares, which performed in line. The following discussion of relative performance pertains to the Fund’s secondary benchmark, the Custom National Index.
What factors influenced performance?
The Fund’s tilt toward higher-quality securities detracted from performance since lower-quality, higher-yielding bonds outperformed. Specifically, the portfolio’s allocation to pre-refunded securities — which are higher-quality, short-duration issues — was a drag on results.
Municipal bonds generated positive returns, with income offsetting a modest downturn in prices. Long-term issues, which were less affected by the Fed’s ongoing interest rate increases, outperformed short-maturity issues. As a result, the Fund’s allocation to longer-term bonds contributed to performance.
The Fund sought to manage interest rate risk using U.S. Treasury futures, which aided results given that Treasury yields rose (as prices fell).
Overweight positions in the transportation and utilities sectors, both of which outpaced the broader market, also had a positive effect on performance.
The Fund generally kept duration below that of the benchmark, reflecting the investment adviser’s emphasis on income over price appreciation. (Duration is a measure of interest-rate sensitivity.) This aspect of the Fund’s positioning contributed to performance at a time of rising yields.
Describe recent portfolio activity.
Strong inflows into the Fund, in combination with the investment adviser’s defensive posture, led to the build-up of significant cash reserves early in the period. However, management was able to use these reserves to capitalize on the increase in municipal yields that occurred in late 2017. The Fund concentrated its purchases in higher-quality securities, with a mix of both new issues and secondary-market issues. As the period progressed, the investment adviser adjusted the portfolio’s positioning to take advantage of market volatility as the 10-year U.S. Treasury yield moved in a range between 2.50% and 3.10%.
The Fund established overweight positions in the pre-refunded, transportation and utilities sectors. The last two represent essential-revenue sectors that benefit from strong market liquidity. This represents a contrast to general obligations, which have become less popular with investors.
The Fund reduced its leverage position to zero in the early part of the period. Although this move lowered the portfolio’s sensitivity to market volatility, it also reduced income.
Describe portfolio positioning at period end.
The Fund had an average credit quality of AA-, and its cash position stood at about 2%. Its duration (interest-rate sensitivity) was 6 years, compared with 7.45 years for the benchmark. The portfolio was overweight in pre-refunded securities, as well as in the transportation and utilities sectors.
The views expressed reflect the opinions of BlackRock as of the date of this report and are subject to change based on changes in market, economic or other conditions. These views are not intended to be a forecast of future events and are no guarantee of future results.
| 8 | 2018 BLACKROCK ANNUAL REPORTTO SHAREHOLDERS |
| Fund Summary as of June 30, 2018 (continued) | BlackRock National Municipal Fund |
TOTAL RETURN BASED ON A $10,000 INVESTMENT
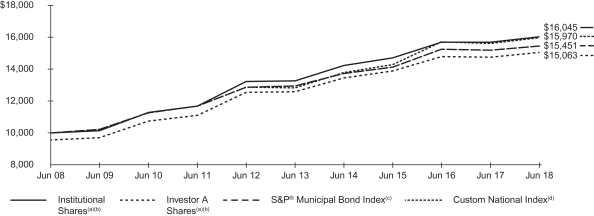
| (a) | Assuming maximum sales charge, if any, transaction costs and other operating expenses, including advisory fees. Institutional Shares do not have a sales charge. |
| (b) | Under normal circumstances, the Fund seeks to achieve its objective by investing at least 80% of its assets in municipal bonds and may invest in municipal bonds rated in any rating category or in unrated municipal bonds. The Fund will usually invest in municipal bonds that have a maturity of five years or longer. |
| (c) | The S&P® Municipal Bond Index is composed of bonds held by managed municipal bond fund customers of Standard & Poor’s Securities Pricing, Inc. that are priced daily. Bonds in the S&P® Municipal Bond Index must have an outstanding par value of at least $2 million and a remaining maturity of not less than one month. |
| (d) | The Custom National Index is a customized benchmark that reflects the returns of the S&P® Municipal Bond Index for periods prior to January 1, 2013, and the returns of only those bonds in the S&P® Municipal Bond Index that have maturities greater than five years for periods subsequent to January 1, 2013. |
Performance Summary for the Period Ended June 30, 2018
| Average Annual Total Returns (a) | ||||||||||||||||||||||||||||||||||||||||||||||||
| 1 Year | 5 Years | 10 Years | ||||||||||||||||||||||||||||||||||||||||||||||
| Standardized 30-Day Yields | Unsubsidized 30-Day Yields | 6-Month Total Returns | w/o sales charge | w/sales charge | w/o sales charge | w/sales charge | w/o sales charge | w/sales charge | ||||||||||||||||||||||||||||||||||||||||
Institutional | 2.36 | % | 2.27 | % | 0.15 | % | 2.23 | % | N/A | 3.85 | % | N/A | 4.84 | % | N/A | |||||||||||||||||||||||||||||||||
Service | 2.12 | 2.06 | 0.03 | 1.99 | N/A | 3.63 | N/A | 4.57 | N/A | |||||||||||||||||||||||||||||||||||||||
Investor A | 2.03 | 1.93 | 0.03 | 2.07 | (2.27 | )% | 3.65 | 2.76 | % | 4.63 | 4.18 | % | ||||||||||||||||||||||||||||||||||||
Investor C | 1.38 | 1.33 | (0.34 | ) | 1.31 | 0.32 | 2.88 | 2.88 | 3.86 | 3.86 | ||||||||||||||||||||||||||||||||||||||
Investor C1 | 1.58 | 1.53 | (0.33 | ) | 1.42 | N/A | 3.08 | N/A | 4.06 | N/A | ||||||||||||||||||||||||||||||||||||||
Class K | 2.42 | 2.35 | 0.09 | 2.28 | N/A | 3.94 | N/A | 4.91 | N/A | |||||||||||||||||||||||||||||||||||||||
S&P® Municipal Bond Index | — | — | (0.02 | ) | 1.61 | N/A | 3.60 | N/A | 4.45 | N/A | ||||||||||||||||||||||||||||||||||||||
Custom National Index | — | — | (0.31 | ) | 2.19 | N/A | 4.46 | N/A | 4.79 | N/A | ||||||||||||||||||||||||||||||||||||||
| (a) | Assuming maximum sales charges, if any. Average annual total returns with and without sales charges reflect reductions for distribution and service fees. See “About Fund Performance” on page 20 for a detailed description of share classes, including any related sales charges and fees, and how performance was calculated for certain share classes. |
N/A — Not applicable as share class and index do not have a sales charge. |
Past performance is not indicative of future results. |
Performance results may include adjustments made for financial reporting purposes in accordance with U.S. generally accepted accounting principles. |
| FUND SUMMARY | 9 |
| Fund Summary as of June 30, 2018 (continued) | BlackRock National Municipal Fund |
Expense Example
| Actual | Hypothetical (b) | |||||||||||||||||||||||||||||||
Beginning Account Value (01/01/18) | Ending Account Value (06/30/18) | Expenses Paid During | Beginning Account Value (01/01/18) | Ending Account Value (06/30/18) | Expenses Paid During the Period (a) | Annualized Expense Ratio | ||||||||||||||||||||||||||
Institutional | $ | 1,000.00 | $ | 1,001.50 | $ | 2.18 | $ | 1,000.00 | $ | 1,022.61 | $ | 2.21 | 0.44 | % | ||||||||||||||||||
Service | 1,000.00 | 1,000.30 | 3.37 | 1,000.00 | 1,021.42 | 3.41 | 0.68 | |||||||||||||||||||||||||
Investor A | 1,000.00 | 1,000.30 | 3.42 | 1,000.00 | 1,021.37 | 3.46 | 0.69 | |||||||||||||||||||||||||
Investor C | 1,000.00 | 996.60 | 7.08 | 1,000.00 | 1,017.70 | 7.15 | 1.43 | |||||||||||||||||||||||||
Investor C1 | 1,000.00 | 996.70 | 6.09 | 1,000.00 | 1,018.70 | 6.16 | 1.23 | |||||||||||||||||||||||||
Class K | 1,000.00 | 1,000.90 | 1.93 | 1,000.00 | 1,022.86 | 1.96 | 0.39 | |||||||||||||||||||||||||
| (a) | For each class of the Fund, expenses are equal to the annualized net expense ratio for the class, multiplied by the average account value over the period, multiplied by 181/365 (to reflect the one-half year period shown). |
| (b) | Hypothetical 5% annual return before expenses is calculated by prorating the number of days in the most recent fiscal half year divided by 365. |
See “Disclosure of Expenses” on page 21 for further information on how expenses were calculated.
| 10 | 2018 BLACKROCK ANNUAL REPORTTO SHAREHOLDERS |
| Fund Summary as of June 30, 2018 (continued) | BlackRock National Municipal Fund |
Overview of the Fund’s Total Investments*
SECTOR ALLOCATION
| Sector | 06/30/18 | |||
Transportation | 28 | % | ||
Utilities | 23 | |||
Health | 12 | |||
State | 12 | |||
County/City/Special District/School District | 11 | |||
Education | 10 | |||
Tobacco | 2 | |||
Corporate | 2 | |||
For Fund compliance purposes, the Fund’s sector classifications refer to one or more of the sector sub-classifications used by one or more widely recognized market indexes or rating group indexes, and/or as defined by the investment adviser. These definitions may not apply for purposes of this report, which may combine such sector sub-classifications for reporting ease.
CALL/MATURITY SCHEDULE (c)
| Percent of Total Investments | ||||
Calendar Year Ended December 31, |
| |||
2018 | 6 | % | ||
2019 | 14 | |||
2020 | 5 | |||
2021 | 8 | |||
2022 | 3 | |||
| (c) | Scheduled maturity dates and/or bonds that are subject to potential calls by issuers over the next five years. |
| * | Excludes short-term securities. |
CREDIT QUALITY ALLOCATION (a)
| Credit Rating | 06/30/18 | |||
AAA/Aaa | 11 | % | ||
AA/Aa | 48 | |||
A | 28 | |||
BBB/Baa | 7 | |||
BB/Ba | 2 | |||
N/R(b) | 4 | |||
| (a) | For financial reporting purposes, credit quality ratings shown above reflect the highest rating assigned by either S&P or Moody’s if ratings differ. These rating agencies are independent, nationally recognized statistical rating organizations and are widely used. Investment grade ratings are credit ratings of BBB/Baa or higher. Below investment grade ratings are credit ratings of BB/Ba or lower. Investments designated N/R are not rated by either rating agency. Unrated investments do not necessarily indicate low credit quality. Credit quality ratings are subject to change. |
| (b) | The investment adviser evaluates the credit quality of unrated investments based upon certain factors including, but not limited to, credit ratings for similar investments and financial analysis of sectors and individual investments. Using this approach, the investment adviser has deemed certain of these unrated securities as investment grade quality. As of June 30, 2018, the market value of unrated securities deemed by the investment adviser to be investment grade represents less than 1% of the Fund’s total investments. |
| FUND SUMMARY | 11 |
| Fund Summary as of June 30, 2018 | BlackRock Short-Term Municipal Fund |
Investment Objective
BlackRock Short-Term Municipal Fund’s (the “Fund”) investment objective is to provide shareholders with as high a level of income exempt from Federal income taxes as is consistent with the investment policies of the Fund.
Portfolio Management Commentary
How did the Fund perform?
For the 12-month period ended June 30, 2018, the Fund underperformed its primary benchmark, the S&P® Municipal Bond Index. For the same period, the Fund underperformed the secondary benchmark, the S&P® Limited Maturity Municipal Bond Index, except for the Fund’s Institutional and Class K Shares, which performed in line. The following discussion of relative performance pertains to the Fund’s secondary benchmark, the S&P® Limited Maturity Municipal Bond Index.
What factors influenced performance?
Security selection in the A & BBB rated credit tiers, together with an overweight in these areas, detracted from results. The Fund’s underweight in AAA rated pre-refunded bonds was an additional detractor, as were its overweights in the transportation, utilities and tobacco sectors.
The Fund’s yield curve positioning helped performance. Specifically, an overweight in zero- to two-year bonds and an underweight in three- to four-year issues aided results. The Fund was also helped by maintaining a duration (interest-rate sensitivity) below that of the benchmark, which was a positive at a time of rising yields.
The Fund’s decision to purchase floating-rate variable rate demand note (“VRDN”) securities aided performance by offsetting the impact of the Fed’s interest rate increases. Since VRDNs reset weekly, their yields move higher as short-term rates climb. In addition, their seven-day maturities limit the impact these securities have on overall portfolio duration. Purchases of non-rated one-year municipal notes with equivalent underlying ratings of A & AA was an additional positive.
Overweights in the tax-backed (state), tax-backed (local), transportation and corporate sectors further contributed to returns, as did an underweight in the school district sector.
Describe recent portfolio activity.
With the Fed raising interest rates, the investment adviser pursued a defensive strategy while tactically repositioning the portfolio. The Fund reduced its position in lower-yielding, fixed-rate holdings that it believed would underperform the broader market as rates rose. In addition, the investment adviser increased the Fund’s weighting in floating-rate securities.
As municipalities issued annual operating financing notes, the Fund increased its exposure to non-rated issues with attractive yields and equivalent underlying ratings of A and AA. The Fund also invested in A and BBB rated bonds with two- and three-year maturities that offered favorable yield spreads over AAA rated debt. More generally speaking, the investment adviser sought opportunities to position the Fund to capitalize on continued Fed interest rate increases.
Describe portfolio positioning at period end.
The Fund was overweight in short-term bonds, contributing to a duration that was lower than that of the benchmark. The Fund continued to add A and BBB rated issues to maintain its credit positioning.
The views expressed reflect the opinions of BlackRock as of the date of this report and are subject to change based on changes in market, economic or other conditions. These views are not intended to be a forecast of future events and are no guarantee of future results.
| 12 | 2018 BLACKROCK ANNUAL REPORTTO SHAREHOLDERS |
| Fund Summary as of June 30, 2018 (continued) | BlackRock Short-Term Municipal Fund |
TOTAL RETURN BASED ON A $10,000 INVESTMENT
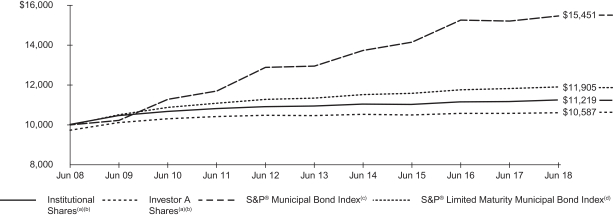
| (a) | Assuming maximum sales charge, if any, transaction costs and other operating expenses, including advisory fees. Institutional Shares do not have a sales charge. |
| (b) | Under normal circumstances, the Fund seeks to achieve its objective by investing at least 80% of its assets in municipal bonds and invests primarily in investment grade municipal bonds or municipal notes, including variable rate demand obligations. The Fund will maintain a dollar-weighted maturity of no more than two years. |
| (c) | The S&P® Municipal Bond Index is composed of bonds held by managed municipal bond fund customers of Standard & Poor’s Securities Pricing, Inc. that are priced daily. Bonds in the S&P® Municipal Bond Index must have an outstanding par value of at least $2 million and a remaining maturity of not less than one month. |
| (d) | The S&P® Limited Maturity Municipal Bond Index includes all bonds in the S&P® Municipal Bond Index with a remaining maturity of less than four years. |
Performance Summary for the Period Ended June 30, 2018
| Average Annual Total Returns (a) | ||||||||||||||||||||||||||||||||||||||||||||||||
| 1 Year | 5 Years | 10 Years | ||||||||||||||||||||||||||||||||||||||||||||||
| Standardized 30-Day Yields | Unsubsidized 30-Day Yields | 6-Month Total Returns | w/o sales charge | w/sales charge | w/o sales charge | w/sales charge | w/o sales charge | w/sales charge | ||||||||||||||||||||||||||||||||||||||||
Institutional | 1.54 | % | 1.45 | % | 0.73 | % | 0.71 | % | N/A | 0.55 | % | N/A | 1.16 | % | N/A | |||||||||||||||||||||||||||||||||
Investor A | 1.27 | 1.24 | 0.62 | 0.37 | (2.65 | )% | 0.28 | (0.33 | )% | 0.88 | 0.57 | % | ||||||||||||||||||||||||||||||||||||
Investor A1 | 1.43 | 1.38 | 0.58 | 0.51 | N/A | 0.44 | N/A | 1.03 | N/A | |||||||||||||||||||||||||||||||||||||||
Investor C | 0.55 | 0.50 | 0.24 | (0.26 | ) | (1.26 | ) | (0.48 | ) | (0.48 | ) | 0.11 | 0.11 | |||||||||||||||||||||||||||||||||||
Class K | 1.59 | 1.56 | 0.76 | 0.76 | N/A | 0.58 | N/A | 1.15 | N/A | |||||||||||||||||||||||||||||||||||||||
S&P® Municipal Bond Index | | — | | — | (0.02 | ) | 1.61 | N/A | 3.60 | N/A | 4.45 | N/A | ||||||||||||||||||||||||||||||||||||
S&P® Limited Maturity Municipal Bond Index | — | — | 0.81 | 0.73 | N/A | 0.98 | N/A | 1.76 | N/A | |||||||||||||||||||||||||||||||||||||||
| (a) | Assuming maximum sales charges, if any. Average annual total returns with and without sales charges reflect reductions for distribution and service fees. See “About Fund Performance” on page 20 for a detailed description of share classes, including any related sales charges and fees. |
N/A — Not applicable as share class and index do not have a sales charge. |
Past performance is not indicative of future results. |
Performance results may include adjustments made for financial reporting purposes in accordance with U.S. generally accepted accounting principles. |
| FUND SUMMARY | 13 |
| Fund Summary as of June 30, 2018 (continued) | BlackRock Short-Term Municipal Fund |
Expense Example
| Actual | Hypothetical (b) | |||||||||||||||||||||||||||||||
| Beginning Account Value (01/01/18) | Ending Account Value (06/30/18) | Expenses the Period (a) | Beginning Account Value (01/01/18) | Ending Account Value (06/30/18) | Expenses Paid During the Period (a) | Annualized Expense Ratio | ||||||||||||||||||||||||||
Institutional | $ | 1,000.00 | $ | 1,007.30 | $ | 1.79 | $ | 1,000.00 | $ | 1,023.01 | $ | 1.81 | 0.36 | % | ||||||||||||||||||
Investor A | 1,000.00 | 1,006.20 | 2.98 | 1,000.00 | 1,021.82 | 3.01 | 0.60 | |||||||||||||||||||||||||
Investor A1 | 1,000.00 | 1,005.80 | 2.29 | 1,000.00 | 1,022.51 | 2.31 | 0.46 | |||||||||||||||||||||||||
Investor C | 1,000.00 | 1,002.40 | 6.75 | 1,000.00 | 1,018.05 | 6.80 | 1.36 | |||||||||||||||||||||||||
Class K | 1,000.00 | 1,007.60 | 1.54 | 1,000.00 | 1,023.26 | 1.56 | 0.31 | |||||||||||||||||||||||||
| (a) | For each class of the Fund, expenses are equal to the annualized net expense ratio for the class, multiplied by the average account value over the period, multiplied by 181/365 (to reflect the one-half year period shown). |
| (b) | Hypothetical 5% return before expenses is calculated by prorating the number of days in the most recent fiscal half year divided by 365. |
See “Disclosure of Expenses” on page 21 for further information on how expenses were calculated.
| 14 | 2018 BLACKROCK ANNUAL REPORTTO SHAREHOLDERS |
| Fund Summary as of June 30, 2018 (continued) | BlackRock Short-Term Municipal Fund |
Overview of the Fund’s Total Investments*
SECTOR ALLOCATION
| Sector | 06/30/18 | |||
State | 23 | % | ||
County/City/Special District/School District | 18 | |||
Education | 15 | |||
Transportation | 15 | |||
Health | 12 | |||
Utilities | 10 | |||
Housing | 4 | |||
Tobacco | 3 | |||
For Fund compliance purposes, the Fund’s sector classifications refer to one or more of the sector sub-classifications used by one or more widely recognized market indexes or rating group indexes, and/or as defined by the investment adviser. These definitions may not apply for purposes of this report, which may combine such sector sub-classifications for reporting ease.
CALL/MATURITY SCHEDULE (c)
| Percent of Total Investments | ||||
Calendar Year Ended December 31, | ||||
2018 | 8 | % | ||
2019 | 14 | |||
2020 | 25 | |||
2021 | 22 | |||
2022 | 10 | |||
| (c) | Scheduled maturity dates and/or bonds that are subject to potential calls by issuers over the next five years. |
| * | Excludes short-term securities. |
CREDIT QUALITY ALLOCATION (a)
| Credit Rating | 06/30/18 | |||
AAA/Aaa | 6 | % | ||
AA/Aa | 40 | |||
A | 39 | |||
BBB/Baa | 11 | |||
N/R(b) | 4 | |||
| (a) | For financial reporting purposes, credit quality ratings shown above reflect the highest rating assigned by either S&P or Moody’s if ratings differ. These rating agencies are independent, nationally recognized statistical rating organizations and are widely used. Investment grade ratings are credit ratings of BBB/Baa or higher. Below investment grade ratings are credit ratings of BB/Ba or lower. Investments designated N/R are not rated by either rating agency. Unrated investments do not necessarily indicate low credit quality. Credit quality ratings are subject to change. |
| (b) | The investment adviser evaluates the credit quality of unrated investments based upon certain factors including, but not limited to, credit ratings for similar investments and financial analysis of sectors and individual investments. Using this approach, the investment adviser has deemed certain of these unrated securities as investment grade quality. As of June 30, 2018, the market value of unrated securities deemed by the investment adviser to be investment grade represents less than 1% of the Fund’s total investments. |
| FUND SUMMARY | 15 |
| Fund Summary as of June 30, 2018 | BlackRock New York Municipal Opportunities Fund |
Investment Objective
BlackRock New York Municipal Opportunities Fund’s (the “Fund”) investment objective is to provide shareholders with income exempt from Federal income tax and New York State and New York City personal income taxes.
Portfolio Management Commentary
How did the Fund perform?
For the 12-month period ended June 30, 2018, the Fund outperformed both the primary benchmark, the S&P® Municipal Bond Index, and the secondary benchmark, the S&P® New York Municipal Bond Index. The following discussion of relative performance pertains to the Fund’s secondary benchmark, the S&P® New York Municipal Bond Index.
What factors influenced performance?
The national municipal market produced a positive total return in the 12-month period, with the benefit of income offsetting a modest decline in prices. New York municipal bonds underperformed slightly due to above-average new issue supply.
The Fund sought to manage interest rate risk using U.S. Treasury futures. Given that Treasury yields rose, this aspect of the Fund’s positioning had a positive impact on relative performance.
The Fund also benefited from having an overweight position in longer-term bonds, which outpaced short-term debt in the period. Additionally, the Fund’s overweight in lower-rated bonds aided results.
The Fund’s position in Puerto Rico issues, while limited, detracted from performance. These securities experienced the most pronounced weakness in the wake of last year’s hurricanes.
Describe recent portfolio activity.
Portfolio activity was largely driven by two themes — new issuance and interest-rate volatility. Both issuance and volatility picked toward year-end 2017 due to the prospect of federal tax reform. In fact, December produced record new issuance as issuers rushed to market before any potential tax law changes. The new issuance, as well as the volatility that resulted, presented several opportunities that the investment adviser sought to capitalize on as 2017 drew to a close. During the second half of the reporting period, new issuance declined following the high volume of late 2017. Further, the issuance was largely concentrated in a handful of issuers in which the Fund already had substantial positions, which limited the opportunity set somewhat. The Fund also actively managed its interest-rate positioning throughout the period through the use of U.S. Treasury futures.
Describe portfolio positioning at period end.
The Fund’s duration (interest-rate sensitivity) was below that of the S&P® New York Municipal Bond Index. The Fund maintained overweight positions in both longer-term bonds and lower-rated issues.
The views expressed reflect the opinions of BlackRock as of the date of this report and are subject to change based on changes in market, economic or other conditions. These views are not intended to be a forecast of future events and are no guarantee of future results.
| 16 | 2018 BLACKROCK ANNUAL REPORTTO SHAREHOLDERS |
| Fund Summary as of June 30, 2018 (continued) | BlackRock New York Municipal Opportunities Fund |
TOTAL RETURN BASED ON A $10,000 INVESTMENT
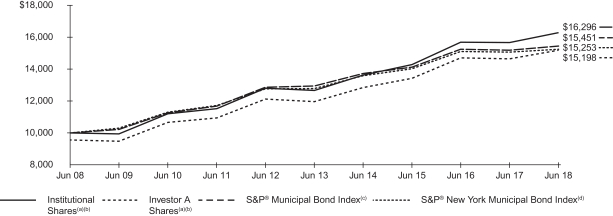
| (a) | Assuming maximum sales charges, if any, transaction costs and other operating expenses, including advisory fees. Institutional Shares do not have a sales charge. |
| (b) | Under normal circumstances, the Fund will invest at least 80% of its assets in investment grade New York municipal bonds. The Fund’s returns prior to February 18, 2015 are the returns of the Fund when it followed different investment strategies under the name BlackRock New York Municipal Bond Fund. |
| (c) | The S&P® Municipal Bond Index is composed of bonds held by managed municipal bond fund customers of Standard & Poor’s Securities Pricing, Inc. that are priced daily. Bonds in the S&P® Municipal Bond Index must have an outstanding par value of at least $2 million and a remaining maturity of not less than one month. |
| (d) | The S&P® New York Municipal Bond Index includes all New York bonds in the S&P® Municipal Bond Index. |
Performance Summary for the Period Ended June 30, 2018
| Average Annual Total Returns (a) | ||||||||||||||||||||||||||||||||||||||||||||||||
| 1 Year | 5 Years | 10 Years | ||||||||||||||||||||||||||||||||||||||||||||||
| Standardized 30-Day Yields | Unsubsidized 30-Day Yields | 6-Month Total Returns | w/o sales charge | w/sales charge | w/o sales charge | w/sales charge | w/o sales charge | w/sales charge | ||||||||||||||||||||||||||||||||||||||||
Institutional | 2.58 | % | 2.45 | % | 0.83 | % | 3.93 | % | N/A | 5.15 | % | N/A | 5.00 | % | N/A | |||||||||||||||||||||||||||||||||
Investor A | 2.23 | 2.13 | 0.71 | 3.67 | (0.74 | )% | 4.87 | 3.97 | % | 4.73 | 4.27 | % | ||||||||||||||||||||||||||||||||||||
Investor A1 | 2.38 | 2.28 | 0.79 | 3.83 | N/A | 5.03 | N/A | 4.88 | N/A | |||||||||||||||||||||||||||||||||||||||
Investor C | 1.58 | 1.46 | 0.34 | 2.89 | 1.89 | 4.11 | 4.11 | 3.97 | 3.97 | |||||||||||||||||||||||||||||||||||||||
Investor C1 | 1.97 | 1.81 | 0.53 | 3.31 | N/A | 4.52 | N/A | 4.37 | N/A | |||||||||||||||||||||||||||||||||||||||
Class K | 2.63 | 2.52 | 0.86 | 3.95 | N/A | 5.15 | N/A | 5.01 | N/A | |||||||||||||||||||||||||||||||||||||||
S&P® Municipal Bond Index | — | — | (0.02 | ) | 1.61 | N/A | 3.60 | N/A | 4.45 | N/A | ||||||||||||||||||||||||||||||||||||||
S&P® New York Municipal Bond Index | — | — | (0.27 | ) | 1.20 | N/A | 3.58 | N/A | 4.31 | N/A | ||||||||||||||||||||||||||||||||||||||
| (a) | Assuming maximum sales charges, if any. Average annual total returns with and without sales charges reflect reductions for distribution and service fees. See “About Fund Performance” on page 20 for a detailed description of share classes, including any related sales charges and fees, and how performance was calculated for certain share classes. |
N/A — Not applicable as share class and index do not have a sales charge. |
Past performance is not indicative of future results. |
Performance results may include adjustments made for financial reporting purposes in accordance with U.S. generally accepted accounting principles |
| FUND SUMMARY | 17 |
| Fund Summary as of June 30, 2018 (continued) | BlackRock New York Municipal Opportunities Fund |
Expense Example
| Actual | Hypothetical (c) | |||||||||||||||||||||||||||||||||||||||
| Expenses Paid During the Period | Including Interest Expense and Fees | Excluding Interest Expense and Fees | ||||||||||||||||||||||||||||||||||||||
| Beginning Account Value (01/01/18) | Ending Account Value (06/30/18) | Including Interest Expense and Fees (a) | Excluding Interest Expense and Fees (b) | Beginning Account Value (01/01/18) | Ending Account Value (06/30/18) | Expenses Paid During the Period (a) | Ending Account Value (06/30/18) | Expenses Paid During the Period (b) | ||||||||||||||||||||||||||||||||
Institutional | $ | 1,000.00 | $ | 1,008.30 | $ | 2.49 | $ | 2.04 | $ | 1,000.00 | $ | 1,0222.32 | $ | 2.51 | $ | 1,022.76 | $ | 2.06 | ||||||||||||||||||||||
Investor A | 1,000.00 | 1,007.10 | 3.73 | 3.23 | 1,000.00 | 1,021.08 | 3.76 | 1,021.57 | 3.26 | |||||||||||||||||||||||||||||||
Investor A1 | 1,000.00 | 1,007.90 | 2.94 | 2.34 | 1,000.00 | 1,021.87 | 2.96 | 1,022.46 | 2.36 | |||||||||||||||||||||||||||||||
Investor C | 1,000.00 | 1,003.40 | 7.45 | 6.90 | 1,000.00 | 1,017.36 | 7.50 | 1,017.90 | 6.95 | |||||||||||||||||||||||||||||||
Investor C1 | 1,000.00 | 1,005.30 | 5.47 | 4.82 | 1,000.00 | 1,019.34 | 5.51 | 1,019.98 | 4.86 | |||||||||||||||||||||||||||||||
Class K | 1,000.00 | 1,008.60 | 2.53 | 1.93 | 1,000.00 | 1,018.89 | 2.50 | 1,019.45 | 1.94 | |||||||||||||||||||||||||||||||
| (a) | For each class of the Fund, expenses are equal to the annualized net expense ratio for the class (0.63% for Institutional, 0.88% for Investor A, 0.72% for Investor A1, 1.63% for Investor C, 1.23% for Investor C1 and 0.58% for Class K), multiplied by the average account value over the period, multiplied by 181/365 (to reflect the one-half year period shown), except Class K which is multiplied by 156/365 (to reflect the period since inception date of January 25, 2018). |
| (b) | For each class of the Fund, expenses are equal to the annualized net expense ratio for the class (0.50% for Institutional, 0.75% for Investor A, 0.60% for Investor A1, 1.50% for Investor C and 1.10% for Investor C1 and 0.45% for Class K), multiplied by the average account value over the period, multiplied by 181/365 (to reflect the one-half year period shown), except Class K which is multiplied by 156/365 (to reflect the period since inception date of January 25, 2018). |
| (c) | Hypothetical 5% annual return before expenses is calculated by prorating the number of days in the most recent fiscal half year divided by 365. |
See “Disclosure of Expenses” on page 21 for further information on how expenses were calculated.
| 18 | 2018 BLACKROCK ANNUAL REPORTTO SHAREHOLDERS |
| Fund Summary as of June 30, 2018 (continued) | BlackRock New York Municipal Opportunities Fund |
Overview of the Fund’s Total Investments*
SECTOR ALLOCATION
| Sector | 06/30/18 | |||
Transportation | 27 | % | ||
State | 19 | |||
County/City/Special District/School District | 16 | |||
Utilities | 12 | |||
Education | 10 | |||
Health | 5 | |||
Housing | 4 | |||
Tobacco | 3 | |||
Corporate | 3 | |||
Health Care Providers & Services | 1 | |||
For Fund compliance purposes, the Fund’s sector classifications refer to one or more of the sector sub-classifications used by one or more widely recognized market indexes or rating group indexes, and/or as defined by the investment adviser. These definitions may not apply for purposes of this report, which may combine such sector sub-classifications for reporting ease.
CALL/MATURITY SCHEDULE (c)
| Percent of Total Investments | ||||
Calendar Year Ended December 31, | ||||
2018 | 5 | % | ||
2019 | 5 | |||
2020 | 3 | |||
2021 | 6 | |||
2022 | 3 | |||
| (c) | Scheduled maturity dates and/or bonds that are subject to potential calls by issuers over the next five years. |
| * | Excludes short-term securities. |
CREDIT QUALITY ALLOCATION (a)
| Credit Rating | 06/30/18 | |||
AAA/Aaa | 16 | % | ||
AA/Aa | 37 | |||
A | 22 | |||
BBB/Baa | 6 | |||
BB/Ba | 2 | |||
B/B | 1 | |||
N/R(b) | 16 | |||
| (a) | For financial reporting purposes, credit quality ratings shown above reflect the highest rating assigned by either S&P or Moody’s if ratings differ. These rating agencies are independent, nationally recognized statistical rating organizations and are widely used. Investment grade ratings are credit ratings of BBB/Baa or higher. Below investment grade ratings are credit ratings of BB/Ba or lower. Investments designated N/R are not rated by either rating agency. Unrated investments do not necessarily indicate low credit quality. Credit quality ratings are subject to change. |
| (b) | The investment adviser evaluates the credit quality of unrated investments based upon certain factors including, but not limited to, credit ratings for similar investments and financial analysis of sectors and individual investments. Using this approach, the investment adviser has deemed certain of these unrated securities as investment grade quality. As of June 30, 2018, the market value of unrated securities deemed by the investment adviser to be investment grade represents 1% of the Fund’s total investments. |
| FUND SUMMARY | 19 |
Institutional and Class K Shares are not subject to any sales charge. These shares bear no ongoing distribution or service fees and are available only to certain eligible investors. BlackRock High Yield Municipal Fund and BlackRock New York Municipal Opportunities Fund Class K Share performance shown prior to the January 25, 2018 inception date is that of Institutional Shares. BlackRock National Municipal Fund Class K Share performance shown prior to the July 18, 2011 inception date is that of Institutional Shares. The performance of each Fund’s Class K Shares would be substantially similar to Institutional Shares because Class K Shares and Institutional Shares invest in the same portfolio of securities and performance would only differ to the extent that Class K Shares and Institutional Shares have different expenses. The actual returns of Class K Shares would have been higher than those of the Institutional Shares because Class K Shares have lower expenses than the Institutional Shares. On the close of business on August 15, 2016, all of the issued and outstanding BlackRock Shares of BlackRock National Municipal Fund were redesignated as Class K Shares.
Service Shares (available only in BlackRock National Municipal Fund) are not subject to any sales charge (front-end load) or deferred sales charge. These shares are subject to a service fee of 0.25% per year (but no distribution fee) and are only available to certain eligible investors. Prior to July 18, 2011, Service Share performance results are those of the Institutional Shares restated to reflect Service Share fees.
Investor A Shares are subject to a maximum initial sales charge (front-end load) of 4.25% for all Funds except BlackRock Short-Term Municipal Fund, which incurs a 3.00% maximum initial sales charge, and all Funds incur a service fee of 0.25% per year (but no distribution fee). Certain redemptions of these shares may be subject to a contingent deferred sales charge (“CDSC”) where no initial sales charge was paid at the time of purchase. These shares are generally available through financial intermediaries. On December 27, 2017, BlackRock National Municipal Fund’s issued and outstanding Investor B Shares converted into Investor A Shares with the same relative aggregate net asset value (“NAV”).
Investor A1 Shares (available only in BlackRock Short-Term Municipal Fund and BlackRock New York Municipal Opportunities Fund) are subject to a maximum initial sales charge (front-end load) of 1.00% for BlackRock Short-Term Municipal Fund and 4.00% for BlackRock New York Municipal Opportunities Fund; and a service fee of 0.10% per year (but no distribution fee). The maximum initial sales charge does not apply to current eligible investors of Investor A1 Shares of the Funds. Certain redemptions of these shares may be subject to a CDSC where no initial sales charge was paid at the time of purchase. However, the CDSC does not apply to redemptions by certain employer-sponsored retirement plans or to redemptions of shares acquired through reinvestment of dividends and capital gains by existing shareholders.
Investor C Shares are subject to a 1.00% CDSC if redeemed within one year of purchase. In addition, these shares are subject to a distribution fee of 0.75% per year and a service fee of 0.25% per year. These shares are generally available through financial intermediaries.
Investor C1 Shares (available only in BlackRock National Municipal Fund and BlackRock New York Municipal Opportunities Fund) are subject to a 1.00% CDSC if redeemed within one year of purchase. However, the CDSC does not apply to redemptions by certain employer-sponsored retirement plans and, for BlackRock National Municipal Fund only, fee based programs previously approved by the Fund, or to redemptions of shares acquired through reinvestment of dividends and capital gains by existing shareholders. In addition, these shares are subject to a distribution and service fees per year as follows:
| Distribution Fee | Service Fee | |||||||
BlackRock National Municipal Fund | 0.55 | % | 0.25 | % | ||||
BlackRock New York Municipal Opportunities Fund | 0.35 | % | 0.25 | % | ||||
Investor A1 and Investor C1 Shares of their respective Funds are only available for dividend and capital gain reinvestments by existing shareholders, and for purchase by certain employer-sponsored retirement plans and, for BlackRock National Municipal Fund only, fee based programs previously approved by the Fund.
Performance information reflects past performance and does not guarantee future results. Current performance may be lower or higher than the performance data quoted. Refer to www.blackrock.com to obtain performance data current to the most recent month end. Performance results do not reflect the deduction of taxes that a shareholder would pay on fund distributions or the redemption of fund shares. Figures shown in each of the performance tables on the previous pages assume reinvestment of all distributions, if any, at net asset value (“NAV”) on the ex-dividend date/payable date. Investment return and principal value of shares will fluctuate so that shares, when redeemed, may be worth more or less than their original cost. Distributions paid to each class of shares will vary because of the different levels of service, distribution and transfer agency fees applicable to each class, which are deducted from the income available to be paid to shareholders.
BlackRock Advisors, LLC (the “Manager”), each Fund’s investment adviser, has contractually agreed to waive and/or reimburse a portion of each Fund’s expenses. Without such waiver and/or reimbursement, each Fund’s performance would have been lower. The Manager is under no obligation to continue waiving and/or reimbursing its fees after the applicable termination date of such agreement. See Note 6 of the Notes to Financial Statements for additional information on waivers and/or reimbursements.
The standardized 30-day yield includes the effects of any waivers and/or reimbursements. The unsubsidized 30-day yield excludes the effects of any waivers and/or reimbursements.
| 20 | 2018 BLACKROCK ANNUAL REPORTTO SHAREHOLDERS |
| Disclosure of Expenses |
Shareholders of these Funds may incur the following charges: (a) transactional expenses such as sales charges; and (b) operating expenses, including investment advisory fees, service and distribution fees including 12b-1 fees, acquired fund fees and expenses and other fund expenses. The expense examples on the previous pages (which are based on a hypothetical investment of $1,000 invested on January 1, 2018 and held through June 30, 2018) are intended to assist shareholders both in calculating expenses based on an investment in each Fund and in comparing these expenses with similar costs of investing in other mutual funds.
The expense examples provide information about actual account values and actual expenses. In order to estimate the expenses a shareholder paid during the period covered by this report, shareholders can divide their account value by $1,000 and then multiply the result by the number corresponding to their Fund and share class under the headings entitled “Expenses Paid During the Period.”
The expense examples also provide information about hypothetical account values and hypothetical expenses based on a Fund’s actual expense ratio and an assumed rate of return of 5% per year before expenses. In order to assist shareholders in comparing the ongoing expenses of investing in these Funds and other funds, compare the 5% hypothetical examples with the 5% hypothetical examples that appear in shareholder reports of other funds.
The expenses shown in the expense examples are intended to highlight shareholders’ ongoing costs only and do not reflect any transactional expenses, such as sales charges, if any. Therefore, the hypothetical examples are useful in comparing ongoing expenses only, and will not help shareholders determine the relative total expenses of owning different funds. If these transactional expenses were included, shareholder expenses would have been higher.
The Benefits and Risks of Leveraging
The Funds may utilize leverage to seek to enhance returns and NAV. However, these objectives cannot be achieved in all interest rate environments.
BlackRock High Yield Fund and BlackRock New York Municipal Opportunities Fund may leverage its assets through the use of proceeds received in tender option bond (“TOB”) transactions, as described in the Notes to Financial Statements. In a TOB Trust transaction, the Funds transfer municipal bonds or other municipal securities into a special purpose entity (a “TOB Trust”). TOB investments generally provide the Funds with economic benefits in periods of declining short-term interest rates, but expose the Funds to risks during periods of rising short-term interest rates. Additionally, fluctuations in the market value of municipal bonds deposited into a TOB Trust may adversely affect the Funds’ NAV per share.
In general, the concept of leveraging is based on the premise that the financing cost of leverage, which is based on short-term interest rates, is normally lower than the income earned by a Fund on its longer-term portfolio investments purchased with the proceeds from leverage. To the extent that the total assets of the Funds (including the assets obtained from leverage) are invested in higher-yielding portfolio investments, the Funds’ shareholders benefit from the incremental net income.
The interest earned on securities purchased with the proceeds from leverage is distributed to the Funds’ shareholders, and the value of these portfolio holdings is reflected in the Funds’ per share NAV. However, in order to benefit shareholders, the return on assets purchased with leverage proceeds must exceed the ongoing costs associated with the leverage. If interest and other ongoing costs of leverage exceed a Fund’s return on assets purchased with leverage proceeds, income to shareholders is lower than if the Funds had not used leverage.
Furthermore, the value of each Fund’s portfolio investments generally varies inversely with the direction of long-term interest rates, although other factors can also influence the value of portfolio investments. As a result, changes in interest rates can influence each Fund’s NAV positively or negatively in addition to the impact on each Fund’s performance from leverage. Changes in the direction of interest rates are difficult to predict accurately, and there is no assurance that a Fund’s leveraging strategy will be successful.
The use of leverage also generally causes greater changes in each Fund’s NAV and dividend rates than comparable portfolios without leverage. In a declining market, leverage is likely to cause a greater decline in the NAV of a Fund’s shares than if the Fund were not leveraged. In addition, each Fund may be required to sell portfolio securities at inopportune times or at distressed values in order to comply with regulatory requirements applicable to the use of leverage or as required by the terms of the leverage instruments, which may cause the Funds to incur losses. The use of leverage may limit a Fund’s ability to invest in certain types of securities or use certain types of hedging strategies. Each Fund incurs expenses in connection with the use of leverage, all of which are borne by each Fund’s shareholders and may reduce income.
Derivative Financial Instruments
The Funds may invest in various derivative financial instruments. These instruments are used to obtain exposure to a security, commodity, index, market, and/or other assets without owning or taking physical custody of securities, commodities and/or other referenced assets or to manage market, equity, credit, interest rate, foreign currency exchange rate, commodity and/or other risks. Derivative financial instruments may give rise to a form of economic leverage and involve risks, including the imperfect correlation between the value of a derivative financial instrument and the underlying asset, possible default of the counterparty to the transaction or illiquidity of the instrument. The Funds’ successful use of a derivative financial instrument depends on the investment adviser’s ability to predict pertinent market movements accurately, which cannot be assured. The use of these instruments may result in losses greater than if they had not been used, may limit the amount of appreciation a Fund can realize on an investment and/or may result in lower distributions paid to shareholders. The Funds’ investments in these instruments, if any, are discussed in detail in the Notes to Financial Statements.
| DISCLOSURE OF EXPENSES / THE BENEFITSAND RISKSOF LEVERAGING / DERIVATIVE FINANCIAL INSTRUMENTS | 21 |
June 30, 2018 | BlackRock High Yield Municipal Fund (Percentages shown are based on Net Assets) |
| Security | Shares | Value | ||||||
Investment Companies — 0.2% |
| |||||||
VanEck Vectors High-Yield Municipal Index ETF | 50,000 | $ | 1,573,500 | |||||
|
| |||||||
Total Investment Companies — 0.2% |
| 1,573,500 | ||||||
|
| |||||||
| Par (000) | ||||||||
Municipal Bonds — 89.0% |
| |||||||
| Alabama — 2.1% | ||||||||
Alabama Special Care Facilities Financing Authority-Birmingham, RB, Methodist Home For The Aging: | ||||||||
5.75%, 06/01/35 | $ | 200 | 220,958 | |||||
5.75%, 06/01/45 | 355 | 389,694 | ||||||
6.00%, 06/01/50 | 450 | 499,864 | ||||||
Black Belt Energy Gas District, RB, Series A, 4.00%, 12/01/48(a) | 4,585 | 4,894,029 | ||||||
County of Jefferson Alabama Sewer, Refunding RB: | ||||||||
Senior Lien, Series A (AGM), 5.00%, 10/01/44 | 365 | 399,675 | ||||||
Sub-Lien, Series D, 7.00%, 10/01/51 | 2,355 | 2,843,498 | ||||||
Sub-Lien, Series D, 6.50%, 10/01/53 | 3,465 | 4,073,697 | ||||||
Lower Alabama Gas District, RB, Series A, 5.00%, 09/01/46 | 3,090 | 3,733,647 | ||||||
State of Alabama Docks Department, Refunding RB, 6.00%, 10/01/20(b) | 710 | 774,787 | ||||||
|
| |||||||
| 17,829,849 | ||||||||
| Alaska — 0.3% | ||||||||
Northern Tobacco Securitization Corp., Refunding RB, Tobacco Settlement, Asset-Backed, Series A: | ||||||||
4.63%, 06/01/23 | 165 | 169,034 | ||||||
5.00%, 06/01/32 | 1,510 | 1,510,076 | ||||||
5.00%, 06/01/46 | 880 | 879,991 | ||||||
|
| |||||||
| 2,559,101 | ||||||||
| Arizona — 2.3% | ||||||||
Arizona IDA, Refunding RB, Odyssey Preparatory Academy Project, Series A, 5.50%, 07/01/52(c) | 2,290 | 2,276,031 | ||||||
Arizona Industrial Development Authority, RB, Academies of Math & Science Project, Series B, 5.25%, 07/01/51(c) | 570 | 556,035 | ||||||
Arizona Industrial Development Authority, Refunding RB, Basis Schools, Inc. Projects, Series A, 5.00%, 07/01/26(c) | 760 | 813,170 | ||||||
City of Phoenix Arizona IDA, ERB, Eagle College Prep Project, Series A, 5.00%, 07/01/43 | 1,445 | 1,446,546 | ||||||
City of Phoenix Arizona IDA, RB: | ||||||||
Great Hearts Academies — Veritas Project, 6.40%, 07/01/21(b) | 415 | 468,722 | ||||||
Legacy Traditional Schools Project, Series A, 6.50%, 07/01/34(c) | 465 | 515,704 | ||||||
Legacy Traditional Schools Projects, Series A, 6.75%, 07/01/44(c) | 810 | 899,440 | ||||||
City of Phoenix Arizona IDA, Refunding RB(c): | ||||||||
Basis Schools, Inc. Projects, 5.00%, 07/01/35 | 300 | 309,642 | ||||||
Basis Schools, Inc. Projects, 5.00%, 07/01/45 | 895 | 916,203 | ||||||
Basis Schools, Inc. Projects, Series A, 5.00%, 07/01/35 | 295 | 304,481 | ||||||
Basis Schools, Inc. Projects, Series A, 5.00%, 07/01/46 | 325 | 332,504 | ||||||
Legacy Traditional School Projects, 5.00%, 07/01/35 | 315 | 325,124 | ||||||
Legacy Traditional School Projects, 5.00%, 07/01/45 | 250 | 255,770 | ||||||
City of Phoenix Industrial Development Authority, RB, Legacy Traditional Schools Projects, Series A(c): | ||||||||
5.00%, 07/01/36 | 1,225 | 1,279,292 | ||||||
5.00%, 07/01/41 | 1,685 | 1,739,341 | ||||||
County of La Paz IDA, RB, Imagine Schools Desert West Middle Project, 5.88%, 06/15/48(c) | 1,340 | 1,349,219 | ||||||
| Security | Par (000) | Value | ||||||
| Arizona (continued) | ||||||||
State of Arizona IDA, RB, Academies of Math & Science Project, Series B, 5.13%, 07/01/47(c) | $ | 420 | $ | 408,568 | ||||
State of Arizona IDA, Refunding RB, Basis Schools, Inc. Projects, Series A, 5.25%, 07/01/47(c) | 3,235 | 3,369,932 | ||||||
Town of Florence, Inc. Arizona, IDA, ERB, Legacy Traditional School Project, Queen Creek and Casa Grande Campuses, 6.00%, 07/01/43 | 1,375 | 1,453,127 | ||||||
|
| |||||||
| 19,018,851 | ||||||||
| Arkansas — 0.1% | ||||||||
County of Benton Arkansas Public Facilities Board, RB, BCCSO Project, Series A, 6.00%, 06/01/20(b)(c) | 750 | 809,198 | ||||||
|
| |||||||
| California — 6.5% | ||||||||
California Health Facilities Financing Authority, RB: | ||||||||
St. Joseph Health System, Series A, 5.75%, 07/01/39 | 1,000 | 1,041,900 | ||||||
Sutter Health, Series B, 6.00%, 08/15/20(b) | 1,000 | 1,093,610 | ||||||
California Health Facilities Financing Authority, Refunding RB, Catholic Healthcare West, Series A, 6.00%, 07/01/19(b) | 265 | 277,076 | ||||||
California Municipal Finance Authority, RB: | ||||||||
Senior Lien-Linxs APM Project, AMT, 4.00%, 12/31/47 | 2,560 | 2,566,272 | ||||||
Urban Discovery Academy Project, 5.50%, 08/01/34(c) | 310 | 313,097 | ||||||
Urban Discovery Academy Project, 6.00%, 08/01/44(c) | 655 | 669,318 | ||||||
Urban Discovery Academy Project, 6.13%, 08/01/49(c) | 570 | 584,615 | ||||||
California Municipal Finance Authority, Refunding RB, Community Medical Centers, Series A, 5.00%, 02/01/42 | 345 | 381,166 | ||||||
California School Finance Authority, RB, Value Schools: | ||||||||
6.65%, 07/01/33 | 295 | 331,335 | ||||||
6.90%, 07/01/43 | 650 | 712,582 | ||||||
California Statewide Communities Development Authority, RB, Series A: | ||||||||
Loma Linda University Medical Center, 5.00%, 12/01/46(c) | 970 | 1,030,460 | ||||||
Loma Linda University Medical Center, 5.25%, 12/01/56(c) | 875 | 942,979 | ||||||
Sutter Health, 6.00%, 08/15/20(b) | 400 | 437,004 | ||||||
California Statewide Communities Development Authority, Refunding RB, American Baptist Homes of the West, 6.25%, 10/01/39 | 2,575 | 2,692,137 | ||||||
California Statewide Financing Authority, RB, Asset-Backed, Tobacco Settlement: | ||||||||
Series A, 6.00%, 05/01/43 | 2,500 | 2,500,675 | ||||||
Series B, 6.00%, 05/01/43 | 3,485 | 3,485,941 | ||||||
City & County of San Francisco California Redevelopment Agency, Tax Allocation Bonds, Mission Bay South Redevelopment Project, Series D(c): | ||||||||
3.00%, 08/01/21 | 675 | 680,535 | ||||||
0.00%, 08/01/23(d) | 1,000 | 796,160 | ||||||
0.00%, 08/01/26(d) | 580 | 397,074 | ||||||
0.00%, 08/01/31(d) | 1,155 | 607,796 | ||||||
City of Chula Vista California, Refunding RB, San Diego Gas & Electric, Series A, 5.88%, 02/15/34 | 500 | 518,415 | ||||||
City of San Jose California Hotel Tax, RB, Convention Center Expansion & Renovation Project: | ||||||||
6.50%, 05/01/36 | 310 | 347,792 | ||||||
6.50%, 05/01/42 | 760 | 852,652 | ||||||
City of Stockton California Public Financing Authority, RB, Delta Water Supply Project, Series A, 6.25%, 10/01/40 | 240 | 283,450 | ||||||
County of California Tobacco Securitization Agency, RB, 5.45%, 06/01/28 | 500 | 505,500 | ||||||
County of California Tobacco Securitization Agency, Refunding RB, Golden Gate Tobacco Funding Corp., Series A, 5.00%, 06/01/36 | 1,665 | 1,665,033 | ||||||
| 22 | 2018 BLACKROCK ANNUAL REPORTTO SHAREHOLDERS |
Schedule of Investments (continued) June 30, 2018 | BlackRock High Yield Municipal Fund (Percentages shown are based on Net Assets) |
| Security | Par (000) | Value | ||||||
| California (continued) | ||||||||
County of Los Angeles California Tobacco Securitization Agency, RB, Asset-Backed, Los Angeles County Securitization Corp.: | ||||||||
5.70%, 06/01/46 | $ | 4,260 | $ | 4,284,324 | ||||
5.60%, 06/01/36 | 1,385 | 1,396,828 | ||||||
County of Riverside California Transportation Commission, RB, Senior Lien, Series A, 5.75%, 06/01/48 | 2,115 | 2,337,984 | ||||||
Golden State Tobacco Securitization Corp., Refunding RB, Series A-1: | ||||||||
Asset-Backed, Senior, 5.75%, 06/01/47 | 6,570 | 6,571,577 | ||||||
5.25%, 06/01/47 | 1,730 | 1,799,892 | ||||||
Successor Agency to the San Francisco City & County Redevelopment Agency, Special Tax Bonds, Community Facilities District No. 6 (Mission Bay South Public Improvements), Series C, CAB, 0.00%, 08/01/43(d) | 3,000 | 761,790 | ||||||
Tobacco Securitization Authority of Southern California, Refunding RB, Tobacco Settlement, Asset-Backed, Senior Series A-1: | ||||||||
4.75%, 06/01/25 | 560 | 561,053 | ||||||
5.00%, 06/01/37 | 7,410 | 7,428,525 | ||||||
5.13%, 06/01/46 | 3,590 | 3,597,826 | ||||||
|
| |||||||
| 54,454,373 | ||||||||
| Colorado — 2.7% | ||||||||
Bromley Park Metropolitan District No. 2, GO, Refunding Sub-Series B, 6.38%, 12/15/47 | 1,000 | 1,001,750 | ||||||
Castle Oaks Metropolitan District No. 3, GO, 6.25%, 12/01/20(b) | 535 | 605,738 | ||||||
Centerra Metropolitan District No. 1, Tax Allocation Bonds, 5.00%, 12/01/47(c) | 820 | 836,228 | ||||||
Colorado Educational & Cultural Facilities Authority, RB, Littleton Preparatory Charter School Project: | ||||||||
5.00%, 12/01/33 | 450 | 458,712 | ||||||
5.00%, 12/01/42 | 545 | 545,828 | ||||||
Colorado Health Facilities Authority, Catholic Health Initiatives, Series A, 5.25%, 01/01/40 | 1,250 | 1,336,487 | ||||||
Colorado Health Facilities Authority, Refunding RB, Sunny Vista Living Center Project, Series A, | 375 | 396,323 | ||||||
Colorado High Performance Transportation Enterprise, RB, C-470 Express Lanes, 5.00%, 12/31/56 | 2,500 | 2,698,075 | ||||||
Copperleaf Metropolitan District No. 2, GO, Refunding, 5.75%, 12/01/45 | 780 | 818,696 | ||||||
Copperleaf Metropolitan District No. 3, GO, Limited Tax, Series A: | ||||||||
5.00%, 12/01/37 | 500 | 494,470 | ||||||
5.13%, 12/01/47 | 1,200 | 1,184,676 | ||||||
Denver Gateway Center Metropolitan District, GO, Series A(e): | ||||||||
5.50%, 12/01/38 | 860 | 856,921 | ||||||
5.63%, 12/01/48 | 930 | 926,047 | ||||||
Green Gables Metropolitan District No. 1, GO, Series A, 5.30%, 12/01/46 | 1,000 | 1,008,600 | ||||||
Leyden Rock Metropolitan District No. 10, GO, Series A, 5.00%, 12/01/45 | 1,250 | 1,273,962 | ||||||
North Holly Metropolitan District, GO, Series A, 5.50%, 12/01/48(e) | 760 | 759,742 | ||||||
Regional Transportation District, RB, Denver Transit Partners Eagle P3 Project: | ||||||||
6.00%, 01/15/34 | 1,500 | 1,575,075 | ||||||
6.00%, 01/15/41 | 1,000 | 1,048,840 | ||||||
Southlands Metropolitan District No. 1, GO, Refunding Series A-1: | ||||||||
5.00%, 12/01/37 | 1,115 | 1,196,261 | ||||||
5.00%, 12/01/47 | 2,585 | 2,754,654 | ||||||
| Security | Par (000) | Value | ||||||
| Colorado (continued) | ||||||||
Tallyns Reach Metropolitan District No. 3, GO, 6.75%, 11/01/38 | $ | 1,220 | $ | 1,223,087 | ||||
|
| |||||||
| 23,000,172 | ||||||||
| Connecticut — 1.0% | ||||||||
Mohegan Tribal Finance Authority, RB, 7.00%, 02/01/45(c) | 1,485 | 1,526,862 | ||||||
Mohegan Tribe of Indians of Connecticut, RB, Series A, 6.75%, 02/01/45(c) | 984 | 1,066,918 | ||||||
Mohegan Tribe of Indians of Connecticut, Refunding RB, Public Improvement, Priority Distribution, Series C, 6.25%, 02/01/30(c) | 2,045 | 2,268,396 | ||||||
State of Connecticut, GO, Series C: | ||||||||
5.00%, 06/15/33 | 1,775 | 1,985,976 | ||||||
5.00%, 06/15/34 | 1,375 | 1,531,118 | ||||||
|
| |||||||
| 8,379,270 | ||||||||
| Delaware — 1.4% | ||||||||
Delaware State Economic Development Authority, RB: | ||||||||
5.00%, 06/01/46 | 1,000 | 1,002,550 | ||||||
5.00%, 11/15/48 | 4,000 | 4,457,160 | ||||||
State of Delaware EDA, RB, Exempt Facilities, Indian River Power LLC Project, 5.38%, 10/01/45 | 5,930 | 6,144,903 | ||||||
|
| |||||||
| 11,604,613 | ||||||||
| District of Columbia — 0.5% | ||||||||
District of Columbia Tobacco Settlement Financing Corp., Refunding RB, Asset-Backed, 6.75%, 05/15/40 | 385 | 399,310 | ||||||
Metropolitan Washington Airports Authority, Refunding RB: | ||||||||
CAB, 2nd Senior Lien, Series B (AGC), | 3,005 | 1,890,716 | ||||||
Dulles Toll Road, 1st Senior Lien, Series A, 5.00%, 10/01/39 | 185 | 191,318 | ||||||
Dulles Toll Road, 1st Senior Lien, Series A, 5.25%, 10/01/44 | 1,610 | 1,669,296 | ||||||
|
| |||||||
| 4,150,640 | ||||||||
| Florida — 5.9% | ||||||||
Boggy Creek Improvement District, Refunding RB, Special Assessment Bonds, 5.13%, 05/01/43 | 1,335 | 1,349,391 | ||||||
Capital Region Community Development District, Refunding, Special Assessment, Capital Improvement Revenue Bond, Series A-1, 5.13%, 05/01/39 | 2,290 | 2,302,137 | ||||||
Capital Trust Agency, Inc., RB, Silver Creek St. Augustine Project, Series A(f)(g): | ||||||||
1st Mortgage, 8.25%, 01/01/44 | 445 | 333,750 | ||||||
1st Mortgage, 8.25%, 01/01/49 | 950 | 712,500 | ||||||
5.75%, 01/01/50 | 570 | 510,042 | ||||||
Celebration Pointe Community Development District, Special Assessment Bonds: | ||||||||
4.75%, 05/01/24 | 490 | 502,505 | ||||||
5.00%, 05/01/34 | 1,250 | 1,272,663 | ||||||
Alachua County, 4.00%, 05/01/22(c) | 310 | 315,704 | ||||||
City of Tallahassee Florida, RB, Tallahassee Memorial HealthCare, Inc. Project, Series A, 5.00%, 12/01/55 | 2,600 | 2,779,010 | ||||||
County of Alachua Florida Health Facilities Authority, RB: | ||||||||
East Ridge Retirement Village, Inc. Project, 6.25%, 11/15/44 | 2,000 | 2,116,880 | ||||||
Shands Teaching Hospital and Clinics, Series A, 5.00%, 12/01/44 | 1,720 | 1,864,910 | ||||||
County of Broward Florida Airport System Revenue, ARB, AMT, 5.00%, 10/01/47 | 485 | 544,864 | ||||||
County of Collier Florida IDA, Refunding RB, Arlington of Naples Project, Series A, 8.13%, 05/15/44(c) | 370 | 407,784 | ||||||
County of Martin Florida Health Facilities Authority, RB, 5.50%, 11/15/42 | 1,000 | 1,082,450 | ||||||
| SCHEDULES OF INVESTMENTS | 23 |
Schedule of Investments (continued) June 30, 2018 | BlackRock High Yield Municipal Fund (Percentages shown are based on Net Assets) |
| Security | Par (000) | Value | ||||||
| Florida (continued) | ||||||||
County of Miami-Dade Florida IDA, RB, Doral Academy Project, 5.00%, 01/15/48 | $ | 1,405 | $ | 1,488,007 | ||||
County of Palm Beach Florida Health Facilities Authority, Refunding RB, Sinai Residences Boca Raton Project, 7.50%, 06/01/49 | 1,000 | 1,152,890 | ||||||
Florida Development Finance Corp., RB: | ||||||||
Renaissance Charter School, Series A, 5.75%, 06/15/29 | 695 | 735,609 | ||||||
Renaissance Charter School, Series A, 6.00%, 06/15/34 | 835 | 880,082 | ||||||
Renaissance Charter School, Series A, 6.13%, 06/15/44 | 3,185 | 3,313,801 | ||||||
Solid Waste Disposal Facility, Waste Pro USA, Inc. Project, AMT, 5.00%, 08/01/29(a)(c) | 2,240 | 2,326,867 | ||||||
Florida Higher Educational Facilities Financial Authority, RB, 5.00%, 06/01/48(c) | 1,730 | 1,815,410 | ||||||
Greater Orlando Aviation Authority Florida, Refunding RB, Special Purpose, Jetblue Airways Corp. Project, AMT, 5.00%, 11/15/36 | 2,000 | 2,110,180 | ||||||
Greeneway Improvement District, RB, Special Assessment Bonds, 5.13%, 05/01/43 | 1,340 | 1,357,326 | ||||||
Lakewood Ranch Stewardship District Special Assessment Bonds: | ||||||||
4.25%, 05/01/25 | 135 | 136,733 | ||||||
4.88%, 05/01/35 | 285 | 290,198 | ||||||
4.88%, 05/01/45 | 580 | 583,811 | ||||||
Village of Lakewood Ranch Sector Projects, 4.00%, 05/01/21 | 130 | 131,621 | ||||||
Lakewood Ranch Stewardship District Special Assessment Bonds, Refunding, Lakewood Center & New Sector Projects, 8.00%, 05/01/40 | 515 | 591,076 | ||||||
Lakewood Ranch Stewardship District Special Assessment Bonds, Village of Lakewood Ranch Sector Projects: | ||||||||
4.25%, 05/01/26 | 185 | 188,091 | ||||||
5.13%, 05/01/46 | 1,060 | 1,100,407 | ||||||
Miami Health Facilities Authority, Refunding RB, Miami Jewish Health Systems, Inc. Project, 5.13%, 07/01/46 | 2,000 | 2,198,700 | ||||||
Mid-Bay Florida Bridge Authority, RB, Springing Lien, Series A, 7.25%, 10/01/21(b) | 1,450 | 1,684,944 | ||||||
Midtown Miami Community Development District, Refunding, Special Assessment Bonds, Series A: | ||||||||
5.00%, 05/01/29 | 1,745 | 1,845,948 | ||||||
5.00%, 05/01/37 | 890 | 937,864 | ||||||
Pine Island Community Development District, RB, 0.00%, 11/01/24(d) | 1,150 | 820,859 | ||||||
Santa Rosa Bay Bridge Authority, RB: | ||||||||
6.25%, 07/01/28(f)(g) | 392 | 290,417 | ||||||
(ACA), 6.25%, 07/01/28 | 65 | 61,522 | ||||||
Tolomato Community Development District, Refunding, Special Assessment Bonds(h): | ||||||||
Convertible CAB, Series A3, 6.61%, 05/01/40 | 90 | 85,978 | ||||||
Convertible CAB, Series A4, 6.61%, 05/01/40 | 50 | 40,098 | ||||||
Series 2015-2, 0.00%, 05/01/40 | 125 | 81,909 | ||||||
Tolomato Community Development District: | ||||||||
Series 1, 0.00%, 05/01/40(h) | 205 | 163,270 | ||||||
Series 1, 6.65%, 05/01/40(f)(g) | 5 | 4,848 | ||||||
Series 3, 6.61%, 05/01/40(f)(g) | 135 | 1 | ||||||
Series 3, 6.65%, 05/01/40(f)(g) | 105 | 1 | ||||||
Trout Creek Community Development District(e): | ||||||||
5.38%, 05/01/38 | 670 | 669,940 | ||||||
5.50%, 05/01/49 | 1,700 | 1,699,847 | ||||||
Viera East Community Development District, Refunding, Special Assessment Bonds, 5.00%, 05/01/26 | 640 | 690,746 | ||||||
| Security | Par (000) | Value | ||||||
| Florida (continued) | ||||||||
Village Community Development District No. 9, Special Assessment Bonds: | ||||||||
7.00%, 05/01/41 | $ | 1,320 | $ | 1,502,477 | ||||
5.50%, 05/01/42 | 500 | 539,040 | ||||||
Village Community Development District No.10, Special Assessment Bonds, 5.13%, 05/01/43 | 1,595 | 1,759,763 | ||||||
|
| |||||||
| 49,374,871 | ||||||||
| Georgia — 0.6% | ||||||||
County of Clayton Georgia Development Authority, Refunding RB, Delta Air Lines, Inc. Project, Series A, 8.75%, 06/01/29 | 635 | 706,444 | ||||||
County of Dalton Whitfield Joint Development Authority, RB, Hamilton Health Care System Obligation, 4.00%, 08/15/48 | 3,135 | 3,197,700 | ||||||
County of Gainesville & Hall Georgia Development Authority, Refunding RB, Acts Retirement Life Community, Series A-2, 6.63%, 11/15/19(b) | 225 | 239,965 | ||||||
County of Gainesville Georgia & Hall Hospital Authority, Refunding RB, Northeast Georgia Health System, Inc. Project, Series A, 5.50%, 08/15/54 | 555 | 638,766 | ||||||
|
| |||||||
| 4,782,875 | ||||||||
| Guam — 0.2% | ||||||||
Territory of Guam, GO, Series A: | ||||||||
6.00%, 11/15/19 | 40 | 41,020 | ||||||
6.75%, 11/15/19(b) | 1,650 | 1,763,206 | ||||||
|
| |||||||
| 1,804,226 | ||||||||
| Hawaii — 0.2% | ||||||||
State of Hawaii Department of Budget & Finance, Refunding RB, 5.00%, 01/01/45(c) | 1,345 | 1,329,425 | ||||||
|
| |||||||
| Idaho — 0.3% | ||||||||
County of Power Idaho Industrial Development Corp., RB, FMC Corp. Project, AMT, 6.45%, 08/01/32 | 265 | 266,007 | ||||||
Idaho Health Facilities Authority, Refunding RB, Madison Hospital Memorial Project: | ||||||||
3.50%, 09/01/33 | 375 | 330,686 | ||||||
5.00%, 09/01/37 | 1,000 | 1,066,840 | ||||||
Idaho Housing & Finance Association, RB, Idaho Arts Charter School, Inc., 5.00%, 12/01/46(c) | 1,000 | 1,044,630 | ||||||
|
| |||||||
| 2,708,163 | ||||||||
| Illinois — 7.0% | ||||||||
Chicago Board of Education, GO: | ||||||||
Dedicated Revenues, Series H, 5.00%, 12/01/46 | 725 | 738,594 | ||||||
Series A, 5.00%, 12/01/42 | 1,570 | 1,569,937 | ||||||
Refunding Dedicated Revenues, Series C, 5.00%, 12/01/30 | 1,370 | 1,430,581 | ||||||
Refunding Dedicated Revenues, Series D, 5.00%, 12/01/31 | 1,500 | 1,561,635 | ||||||
Refunding Dedicated Revenues, Series F, 5.00%, 12/01/22 | 1,030 | 1,074,197 | ||||||
Refunding Dedicated Revenues, Series G, 5.00%, 12/01/44 | 3,700 | 3,775,036 | ||||||
Chicago O’Hare International Airport, RB, AMT, 5.00%, 07/01/48 | 2,000 | 2,199,780 | ||||||
City of Chicago Illinois, GO, Refunding, Series A: | ||||||||
6.00%, 01/01/38 | 1,850 | 2,083,026 | ||||||
5.00%, 01/01/36 | 3,000 | 3,098,820 | ||||||
City of Chicago Illinois O’Hare International Airport, Refunding RB, Series C, AMT, 5.00%, 01/01/46 | 3,000 | 3,243,090 | ||||||
Illinois Finance Authority, RB, Lake Forest College, Series A, 6.00%, 10/01/48 | 1,700 | 1,818,116 | ||||||
| 24 | 2018 BLACKROCK ANNUAL REPORTTO SHAREHOLDERS |
Schedule of Investments (continued) June 30, 2018 | BlackRock High Yield Municipal Fund (Percentages shown are based on Net Assets) |
| Security | Par (000) | Value | ||||||
| Illinois (continued) | ||||||||
Illinois Finance Authority, Refunding RB: | ||||||||
Central Dupage Health, Series B, 5.50%, 11/01/19(b) | $ | 1,400 | $ | 1,469,902 | ||||
Friendship Village of Schaumburg, 7.13%, 02/15/20(b) | 1,000 | 1,083,100 | ||||||
Lutheran Home & Services Obligated Group, 5.63%, 05/15/42 | 2,805 | 2,941,043 | ||||||
Presence Health Network, Series C, 5.00%, 02/15/36 | 1,805 | 2,055,209 | ||||||
Presence Health Network, Series C, 5.00%, 02/15/41 | 3,000 | 3,408,600 | ||||||
Rogers Park Montessori School Project, Series 2014, 6.00%, 02/01/34 | 335 | 351,780 | ||||||
Rogers Park Montessori School Project, Series 2014, 6.13%, 02/01/45 | 790 | 827,675 | ||||||
Swedish Covenant, Series A, 6.00%, 02/15/20(b) | 1,000 | 1,065,280 | ||||||
Metropolitan Pier & Exposition Authority, RB, Series A, McCormick Place Expansion Project: | ||||||||
Bonds, 0.00%, 12/15/56(d) | 7,645 | 1,076,645 | ||||||
Bonds, 5.00%, 06/15/57 | 2,085 | 2,190,710 | ||||||
5.50%, 06/15/53 | 3,925 | 4,212,075 | ||||||
Metropolitan Pier & Exposition Authority, Refunding RB, McCormick Place Expansion Project, Series B(d): | ||||||||
CAB (AGM), 0.00%, 06/15/44 | 3,455 | 1,061,445 | ||||||
Bonds, 0.00%, 12/15/54 | 9,660 | 1,517,296 | ||||||
Quad Cities Regional EDA, Refunding RB, Augustana College, 4.75%, 10/01/32 | 675 | 705,807 | ||||||
Railsplitter Tobacco Settlement Authority, RB, 6.00%, 06/01/21(b) | 390 | 435,302 | ||||||
State of Illinois, GO: | ||||||||
5.25%, 02/01/29 | 1,500 | 1,577,550 | ||||||
5.00%, 03/01/35 | 1,095 | 1,116,933 | ||||||
5.00%, 02/01/39 | 510 | 523,954 | ||||||
Series A, 5.00%, 04/01/35 | 1,460 | 1,497,040 | ||||||
Series A, 5.00%, 04/01/38 | 2,190 | 2,244,619 | ||||||
Series D, 5.00%, 11/01/28 | 5,000 | 5,309,750 | ||||||
|
| |||||||
| 59,264,527 | ||||||||
| Indiana — 1.8% | ||||||||
City of Valparaiso Indiana, RB, Exempt Facilities, Pratt Paper LLC Project, AMT: | ||||||||
6.75%, 01/01/34 | 525 | 613,904 | ||||||
7.00%, 01/01/44 | 1,270 | 1,494,599 | ||||||
City of Vincennes Indiana, Refunding RB, Southwest Indiana Regional Youth Village Project, 6.25%, 01/01/29(c) | 3,140 | 3,225,502 | ||||||
County of Allen Indiana, RB, StoryPoint Fort Wayne Project, Series A-1(c): | ||||||||
6.63%, 01/15/34 | 430 | 463,798 | ||||||
6.75%, 01/15/43 | 1,220 | 1,314,123 | ||||||
6.88%, 01/15/52 | 1,270 | 1,370,584 | ||||||
Indiana Finance Authority, RB, Private Activity Bond, Ohio River Bridges East End Crossing Project, Series A, AMT: | ||||||||
5.00%, 07/01/44 | 370 | 394,705 | ||||||
5.00%, 07/01/48 | 1,230 | 1,308,646 | ||||||
5.25%, 01/01/51 | 2,500 | 2,683,475 | ||||||
Indiana Finance Authority, Refunding RB, Marquette Project, 5.00%, 03/01/39 | 725 | 754,943 | ||||||
Town of Chesterton Indiana, RB, StoryPoint Chesterton Project, Series A-1, 6.38%, 01/15/51(c) | 1,745 | 1,826,073 | ||||||
|
| |||||||
| 15,450,352 | ||||||||
| Iowa — 1.9% | ||||||||
Iowa Finance Authority, Refunding RB: | ||||||||
Iowa Fertilizer Co. Project, 5.25%, 12/01/50(a) | 595 | 624,619 | ||||||
Iowa Fertilizer Co. Project, Series B, 5.25%, 12/01/50(a) | 6,105 | 6,495,964 | ||||||
Midwestern Disaster Area, Iowa Fertilizer Co. Project, 5.50%, 12/01/22 | 20 | 20,205 | ||||||
Sunrise Retirement Community Project, 5.50%, 09/01/37 | 890 | 899,808 | ||||||
| Security | Par (000) | Value | ||||||
| Iowa (continued) | ||||||||
Sunrise Retirement Community Project, 5.75%, 09/01/43 | $ | 1,385 | $ | 1,412,021 | ||||
Iowa Student Loan Liquidity Corp., Refunding RB, AMT, Senior Series A-1, 5.00%, 12/01/21 | 1,815 | 1,894,279 | ||||||
Iowa Tobacco Settlement Authority, Refunding RB, Series C: | ||||||||
Asset-Backed, 5.50%, 06/01/42 | 2,000 | 2,007,500 | ||||||
5.38%, 06/01/38 | 3,075 | 3,082,196 | ||||||
|
| |||||||
| 16,436,592 | ||||||||
| Kentucky — 0.4% | ||||||||
Kentucky Economic Development Finance Authority, Refunding RB, Norton Healthcare, Inc., Series B (NPFGC), 0.00%, 10/01/24(d) | 250 | 205,800 | ||||||
Kentucky Public Transportation Infrastructure Authority, RB, 6.00%, 07/01/53 | 3,000 | 3,319,950 | ||||||
|
| |||||||
| 3,525,750 | ||||||||
| Louisiana — 1.2% | ||||||||
Juban Crossing Economic Development District, Refunding RB, General Infrastructure Project, Series C, 7.00%, 09/15/44(c) | 3,145 | 3,260,673 | ||||||
Louisiana Local Government Environmental Facilities & Community Development Authority, RB, Westlake Chemical Corp., Series A-2, 6.50%, 11/01/35 | 1,630 | 1,787,751 | ||||||
Louisiana Public Facilities Authority, RB, Belle Chasse Educational Foundation Project, 6.75%, 05/01/41 | 645 | 685,371 | ||||||
Tobacco Settlement Financing Corp., Refunding RB, Asset-Backed, Series A, 5.25%, 05/15/35 | 3,910 | 4,221,392 | ||||||
|
| |||||||
| 9,955,187 | ||||||||
| Maine — 0.1% | ||||||||
Maine Health & Higher Educational Facilities Authority, RB, Maine General Medical Center, 6.75%, 07/01/41 | 1,075 | 1,162,376 | ||||||
|
| |||||||
| Maryland — 1.4% | ||||||||
City of Baltimore Maryland, Refunding RB, East Baltimore Research Park Project, 4.00%, 09/01/27 | 325 | 335,962 | ||||||
City of Baltimore Maryland, Tax Allocation Bonds, Center/West Development, Series A, 5.50%, 06/01/43 | 1,200 | 1,226,172 | ||||||
City of Gaithersburg Maryland, Refunding RB, Asbury Maryland Obligation, Series B, 6.00%, 01/01/23 | 750 | 793,155 | ||||||
County of Frederick Maryland, RB, Jefferson Technology Park Project, Series B, 7.13%, 07/01/43(c) | 2,905 | 3,132,346 | ||||||
Maryland EDC, RB: | ||||||||
Purple Line Light Rail Project, AMT, 5.00%, 03/31/51 | 3,135 | 3,410,441 | ||||||
Term Project, Series B, 5.75%, 06/01/20(b) | 1,500 | 1,612,845 | ||||||
Transportation Facilities Project, Series A, 5.75%, 06/01/20(b) | 265 | 284,936 | ||||||
Maryland EDC, Refunding RB, University of Maryland Project, 5.00%, 07/01/39 | 950 | 1,021,858 | ||||||
|
| |||||||
| 11,817,715 | ||||||||
| Massachusetts — 1.9% | ||||||||
Massachusetts Development Finance Agency, RB: | ||||||||
Boston Medical Center, Series D, 4.00%, 07/01/45 | 715 | 706,849 | ||||||
Boston Medical Center, Series D, 5.00%, 07/01/44 | 3,865 | 4,186,993 | ||||||
Foxborough Regional Charter School, Series A, 7.00%, 07/01/20(b) | 350 | 386,372 | ||||||
Linden Ponds, Inc. Facility, 5.50%, 11/15/46 | 19 | 18,824 | ||||||
Linden Ponds, Inc. Facility, Series A-1, | 352 | 364,993 | ||||||
Linden Ponds, Inc. Facility, Series B, 0.00%, 11/15/56(d) | 94 | 19,143 | ||||||
North Hill Communities Issue, Series A, 6.50%, 11/15/23(b)(c) | 2,480 | 3,019,747 | ||||||
UMass Boston Student Housing Project, 5.00%, 10/01/41 | 2,500 | 2,721,575 | ||||||
| SCHEDULES OF INVESTMENTS | 25 |
Schedule of Investments (continued) June 30, 2018 | BlackRock High Yield Municipal Fund (Percentages shown are based on Net Assets) |
| Security | Par (000) | Value | ||||||
| Massachusetts (continued) | ||||||||
Massachusetts Development Finance Agency, Refunding RB: | ||||||||
Covanta Energy Project, Series C, AMT, 5.25%, 11/01/42(c) | $ | 3,000 | $ | 3,001,950 | ||||
New Bridge Charles, Inc., 4.00%, 10/01/32(c) | 355 | 354,219 | ||||||
New Bridge Charles, Inc., 4.13%, 10/01/42(c) | 220 | 219,487 | ||||||
New Bridge Charles, Inc., 5.00%, 10/01/57(c) | 570 | 605,500 | ||||||
Tufts Medical Center, Series I, 6.75%, 01/01/21(b) | 305 | 340,712 | ||||||
Tufts Medical Center, Series I, 6.75%, 01/01/36 | 205 | 227,784 | ||||||
|
| |||||||
| 16,174,148 | ||||||||
| Michigan — 0.5% | ||||||||
Kentwood EDC, Refunding RB, Limited Obligation, Holland Home, 5.63%, 11/15/41 | 1,000 | 1,075,060 | ||||||
Michigan Finance Authority, RB, Detroit Water & Sewage Disposal System, Senior Lien, Series 2014 C-2, AMT, 5.00%, 07/01/44 | 350 | 374,395 | ||||||
Michigan Finance Authority, Refunding RB, Detroit Water & Sewage Department Project, Senior Lien, Series C-1, 5.00%, 07/01/44 | 800 | 867,648 | ||||||
Michigan State Hospital Finance Authority, Refunding RB, Henry Ford Health System, 5.75%, 11/15/19(b) | 1,710 | 1,803,605 | ||||||
|
| |||||||
| 4,120,708 | ||||||||
| Minnesota — 0.4% | ||||||||
City of Cologne Minnesota Charter School, LRB, Cologne Academy Project, Series A, 5.00%, 07/01/45 | 2,065 | 2,073,487 | ||||||
City of Deephaven Minnesota, Refunding RB, Eagle Ridge Academy Project, Series A, 5.25%, 07/01/40 | 500 | 526,580 | ||||||
St. Paul Housing & Redevelopment Authority, RB, Nova Classical Academy, Series A, 6.63%, 09/01/21(b) | 500 | 571,305 | ||||||
|
| |||||||
| 3,171,372 | ||||||||
| Missouri — 1.7% | ||||||||
City of St. Louis Missouri IDA, Refunding RB, BallPark Village Development Project, Series A: | ||||||||
4.38%, 11/15/35 | 1,020 | 1,047,662 | ||||||
4.75%, 11/15/47 | 1,135 | 1,168,914 | ||||||
Health & Educational Facilities Authority of the State of Missouri, Refunding RB, St. Lukes Health Syatem, Series A, 4.00%, 11/15/48 | 4,000 | 4,048,720 | ||||||
Kansas City Land Clearance Redevelopment Authority, Tax Allocation Bonds(c): | ||||||||
4.38%, 02/01/31 | 830 | 847,247 | ||||||
5.00%, 02/01/40 | 1,240 | 1,290,270 | ||||||
Kansas City Missouri IDA, Refunding RB, Kansas City United Methodist Church(c): | ||||||||
5.75%, 11/15/36 | 1,390 | 1,344,019 | ||||||
6.00%, 11/15/51 | 110 | 106,603 | ||||||
Kirkwood Missouri IDA, RB, Aberdeen Heights, Series A, 8.25%, 05/15/20(b) | 435 | 485,408 | ||||||
Lees Summit Missouri IDA, RB, John Knox Obligated Group, 5.25%, 08/15/39 | 1,890 | 2,002,247 | ||||||
Poplar Bluff Regional Transportation Development District, RB, 4.75%, 12/01/42 | 2,200 | 2,260,676 | ||||||
|
| |||||||
| 14,601,766 | ||||||||
| Nebraska — 0.5% | ||||||||
Central Plains Nebraska Energy Project, RB, Gas Project No. 3, 5.00%, 09/01/42 | 780 | 853,351 | ||||||
Central Plains Nebraska Energy Project, Refunding RB, Gas Project No. 3, Series A, 5.00%, 09/01/42 | 3,000 | 3,603,060 | ||||||
|
| |||||||
| 4,456,411 | ||||||||
| Security | Par (000) | Value | ||||||
| Nevada — 0.1% | ||||||||
County of Clark Nevada, Refunding, Special Assessment, Special Improvement District No. 142, Mountain’s Edge: | ||||||||
4.00%, 08/01/22 | $ | 665 | $ | 686,459 | ||||
4.00%, 08/01/23 | 410 | 421,804 | ||||||
|
| |||||||
| 1,108,263 | ||||||||
| New Hampshire — 0.1% | ||||||||
New Hampshire Health & Education Facilities Authority, Refunding RB, Dartmouth-Hitchcock, | 435 | 455,219 | ||||||
|
| |||||||
| New Jersey — 4.4% | ||||||||
Casino Reinvestment Development Authority, Refunding RB, 5.25%, 11/01/44 | 5,750 | 6,171,245 | ||||||
County of Essex New Jersey Improvement Authority, RB, AMT, 5.25%, 07/01/45(c) | 1,155 | 1,167,613 | ||||||
County of Gloucester New Jersey Pollution Control Financing Authority, Refunding RB, Keystone Urban Renewal Project, Series A, AMT, 5.00%, 12/01/24 | 1,500 | 1,618,335 | ||||||
New Jersey EDA, ARB, Continental Airlines, Inc. Project, 5.13%, 09/15/23 | 1,965 | 2,129,077 | ||||||
New Jersey EDA, RB: | ||||||||
Continental Airlines, Inc. Project, AMT, 4.88%, 09/15/19 | 450 | 459,050 | ||||||
Continental Airlines, Inc. Project, AMT, 5.25%, 09/15/29 | �� | 840 | 912,106 | |||||
Goethals Bridge Replacement Project, AMT, Private Activity Bond, 5.38%, 01/01/43 | 1,360 | 1,482,903 | ||||||
Kapkowski Road Landfill Project, Series B, AMT, 6.50%, 04/01/31 | 3,000 | 3,427,710 | ||||||
Provident Group-Kean Properties, Series A, 5.00%, 07/01/32 | 235 | 258,173 | ||||||
Provident Group-Kean Properties, Series A, 5.00%, 07/01/37 | 375 | 406,275 | ||||||
Team Academy Charter School Project, | 970 | 1,068,600 | ||||||
New Jersey Health Care Facilities Financing Authority, Refunding RB, Princeton HealthCare System: | ||||||||
5.00%, 07/01/32 | 1,140 | 1,311,479 | ||||||
5.00%, 07/01/33 | 1,450 | 1,662,541 | ||||||
New Jersey Transportation Trust Fund Authority, RB: | ||||||||
Federal Highway Reimbursement Revenue Notes, | 7,050 | 7,742,310 | ||||||
Transportation Program, Series AA, 5.25%, 06/15/41 | 1,265 | 1,356,915 | ||||||
Transportation Program, Series AA, 5.00%, 06/15/44 | 1,005 | 1,053,933 | ||||||
Transportation Program, Series AA, 5.00%, 06/15/44 | 1,860 | 1,940,203 | ||||||
South Jersey Port Corp., RB, Sub-Marine Terminal, Series B, AMT, 5.00%, 01/01/36 | 575 | 629,568 | ||||||
Tobacco Settlement Financing Corp., Refunding RB: | ||||||||
Series A, 5.25%, 06/01/46 | 900 | 1,012,446 | ||||||
Sub-Series B, 5.00%, 06/01/46 | 1,275 | 1,369,796 | ||||||
|
| |||||||
| 37,180,278 | ||||||||
| New Mexico — 0.3% | ||||||||
New Mexico Hospital Equipment Loan Council, Refunding RB, Gerald Champion Regional Medical Center Project, 5.50%, 07/01/42 | 2,030 | 2,168,405 | ||||||
|
| |||||||
| New York — 13.5% | ||||||||
Build NYC Resource Corp., Refunding RB, Pratt Paper, Inc. Project, AMT, 5.00%, 01/01/35(c) | 1,215 | 1,306,903 | ||||||
Chautauqua Tobacco Asset Securitization Corp., Refunding RB, 5.00%, 06/01/48 | 4,475 | 4,552,641 | ||||||
Counties of New York Tobacco Trust II, RB, Settlement Pass-Through, 5.75%, 06/01/43 | 485 | 491,984 | ||||||
Counties of New York Tobacco Trust IV, Refunding RB, Settlement Pass-Through Turbo, Series A: | ||||||||
5.00%, 06/01/42 | 4,520 | 4,519,819 | ||||||
5.00%, 06/01/45 | 1,695 | 1,687,898 | ||||||
| 26 | 2018 BLACKROCK ANNUAL REPORTTO SHAREHOLDERS |
Schedule of Investments (continued) June 30, 2018 | BlackRock High Yield Municipal Fund (Percentages shown are based on Net Assets) |
| Security | Par (000) | Value | ||||||
| New York (continued) | ||||||||
Counties of New York Tobacco Trust VI, Refunding RB, Tobacco Settlement Pass-Through: | ||||||||
Series A-2B, 5.00%, 06/01/51 | $ | 6,865 | $ | 7,174,749 | ||||
Series B, 5.00%, 06/01/45 | 4,010 | 4,282,319 | ||||||
County of Dutchess New York Industrial Development Agency, Refunding RB, Bard College Civic Facility, Series A-1, 5.00%, 08/01/46 | 4,755 | 4,574,453 | ||||||
County of Westchester New York Healthcare Corp., RB, Senior Lien, Series A, 5.00%, 11/01/44 | 1,400 | 1,495,653 | ||||||
County of Westchester New York Local Development Corp., Refunding RB, Westchester Medical Center Obligation, 5.00%, 11/01/46 | 4,495 | 4,828,035 | ||||||
Erie Tobacco Asset Securitization Corp., Refunding RB, Asset-Backed, Series A, 5.00%, 06/01/45 | 3,210 | 3,196,550 | ||||||
Metropolitan Transportation Authority, Refunding RB, Series C-1, 5.25%, 11/15/56 | 11,705 | 13,297,231 | ||||||
Metropolitan Transportation Authority Hudson Rail Yards Trust Obligations, Refunding RB, Series A: | ||||||||
5.00%, 11/15/56 | 6,425 | 6,941,506 | ||||||
5.00%, 11/15/51 | 3,135 | 3,333,226 | ||||||
New York Counties Tobacco Trust IV, Refunding RB, Settlement Pass-Through Turbo, Series A, 6.25%, 06/01/41(c) | 8,100 | 8,425,701 | ||||||
New York Liberty Development Corp., Refunding RB: | ||||||||
2nd Priority, Bank of America Tower at One Bryant Park Project, Class 3, 6.38%, 07/15/49 | 375 | 395,966 | ||||||
3 World Trade Center Project, Class 1, | 9,165 | 9,717,466 | ||||||
3 World Trade Center Project, Class 2, | 450 | 494,843 | ||||||
3 World Trade Center Project, Class 2, | 1,070 | 1,179,761 | ||||||
3 World Trade Center Project, Class 3, | 3,115 | 3,700,028 | ||||||
New York Transportation Development Corp., ARB, LaGuardia Airport Terminal B Redevelopment Project, Series A, AMT, 5.25%, 01/01/50 | 3,000 | 3,264,750 | ||||||
New York Transportation Development Corp., RB, AMT, 4.00%, 01/01/36 | 5,000 | 5,079,050 | ||||||
New York Transportation Development Corp., Refunding ARB, American Airlines, Inc., AMT: | ||||||||
5.00%, 08/01/26 | 3,130 | 3,302,275 | ||||||
5.00%, 08/01/31 | 6,995 | 7,338,035 | ||||||
Niagara Area Development Corp., Refunding RB, Solid Waste Disposal Facility, Covanta Energy Project, Series A, AMT, 5.25%, 11/01/42(c) | 3,895 | 3,897,532 | ||||||
Rockland Tobacco Asset Securitization Corp., RB, Asset-Backed, 5.75%, 08/15/43 | 690 | 707,643 | ||||||
State of New York Dormitory Authority, Refunding RB, Orange Regional Medical Center(c): | ||||||||
5.00%, 12/01/33 | 590 | 658,186 | ||||||
5.00%, 12/01/35 | 785 | 870,015 | ||||||
Westchester New York Tobacco Asset Securitization, Refunding RB, Tobacco Settlement Bonds, Sub-Series C, 4.00%, 06/01/42 | 970 | 953,820 | ||||||
Westchester Tobacco Asset Securitization, Refunding RB, Tobacco Settlement Bonds, Sub-Series C, 5.13%, 06/01/51 | 2,000 | 2,058,280 | ||||||
|
| |||||||
| 113,726,318 | ||||||||
| North Carolina — 0.6% | ||||||||
North Carolina Department of Transportation, RB, AMT, I-77 Hot Lanes Project, 5.00%, 06/30/54 | 1,385 | 1,482,698 | ||||||
| Security | Par (000) | Value | ||||||
| North Carolina (continued) | ||||||||
North Carolina Medical Care Commission, Refunding RB, 1st Mortgage, Retirement Facilities Whitestone Project, Series A, 7.75%, 03/01/21(b) | $ | 3,055 | $ | 3,507,048 | ||||
|
| |||||||
| 4,989,746 | ||||||||
| North Dakota — 0.5% | ||||||||
County of Ward North Dakota, RB, Trinity Obligated Group, Series C: | ||||||||
5.00%, 06/01/43 | 2,000 | 2,187,960 | ||||||
5.00%, 06/01/48 | 2,000 | 2,175,920 | ||||||
|
| |||||||
| 4,363,880 | ||||||||
| Ohio — 3.2% | ||||||||
Buckeye Tobacco Settlement Financing Authority, RB, Asset-Backed, Series A-2: | ||||||||
Senior Turbo Term, 5.88%, 06/01/47 | 8,045 | 8,079,352 | ||||||
6.00%, 06/01/42 | 10,000 | 9,999,800 | ||||||
County of Butler Port Authority, RB, Series A-1(c): | ||||||||
Storypoint Fairfield Project, 6.25%, 01/15/34 | 1,575 | 1,658,932 | ||||||
StoryPoint Fairfield Project, 6.38%, 01/15/43 | 840 | 883,663 | ||||||
County of Gallia Ohio, Refunding RB, Holzer Health System Obligated Group, 8.00%, 07/01/42 | 1,245 | 1,422,711 | ||||||
County of Hamilton Ohio, Refunding RB, Improvement-Life Enriching Communities, 5.00%, 01/01/46 | 1,435 | 1,542,510 | ||||||
Port of Greater Cincinnati Development Authority, RB, AHA-Colonial Village Athens Garden, 5.25%, 12/01/50 | 740 | 631,346 | ||||||
State of Ohio, RB, Portsmouth Bypass Project, AMT, 5.00%, 06/30/53 | 2,410 | 2,630,925 | ||||||
|
| |||||||
| 26,849,239 | ||||||||
| Oklahoma — 1.7% | ||||||||
County of Tulsa Oklahoma Industrial Authority, Refunding RB, Montereau, Inc. Project, 5.25%, 11/15/37 | 1,050 | 1,163,610 | ||||||
Oklahoma Development Finance Authority, RB, OU Medicine Project, Series B: | ||||||||
5.00%, 08/15/38 | 4,585 | 5,100,400 | ||||||
5.25%, 08/15/43 | 4,130 | 4,662,233 | ||||||
Oklahoma Turnpike Authority, RB, 2nd Series C, | 3,340 | 3,474,268 | ||||||
|
| |||||||
| 14,400,511 | ||||||||
| Oregon — 0.3% | ||||||||
Polk County Hospital Facility Authority, RB, Dallas Retirement Village Project, Series A: | ||||||||
5.13%, 07/01/35 | 620 | 645,674 | ||||||
5.38%, 07/01/45 | 1,445 | 1,518,377 | ||||||
|
| |||||||
| 2,164,051 | ||||||||
| Pennsylvania — 3.3% | ||||||||
Allentown Neighborhood Improvement Zone Development Authority, Refunding RB, Series A: | ||||||||
5.00%, 05/01/35 | 1,185 | 1,236,014 | ||||||
5.00%, 05/01/42 | 2,730 | 2,832,730 | ||||||
City of Philadelphia Pennsylvania Hospitals & Higher Education Facilities Authority, RB, Temple University Health System, Series A, 5.63%, 07/01/36 | 3,000 | 3,264,900 | ||||||
Commonwealth Financing Authority, RB, Tobacco Master Settlement Payment: | ||||||||
5.00%, 06/01/33 | 170 | 192,566 | ||||||
5.00%, 06/01/34 | 225 | 253,656 | ||||||
County of Cumberland Pennsylvania Municipal Authority, Refunding RB, Diakon Lutheran: | ||||||||
6.38%, 01/01/19(b) | 2,415 | 2,472,405 | ||||||
6.38%, 01/01/39 | 265 | 269,685 | ||||||
County of Lehigh Pennsylvania General Purpose Authority, Refunding RB, Bible Fellowship Church Homes, 5.13%, 07/01/32 | 745 | 755,862 | ||||||
| SCHEDULES OF INVESTMENTS | 27 |
Schedule of Investments (continued) June 30, 2018 | BlackRock High Yield Municipal Fund (Percentages shown are based on Net Assets) |
| Security | Par (000) | Value | ||||||
| Pennsylvania (continued) | ||||||||
County of Montgomery Higher Education & Health Authority, Refunding RB, Thomas Jefferson University, Series A: | ||||||||
4.00%, 09/01/49 | $ | 950 | $ | 955,491 | ||||
5.00%, 09/01/43 | 2,095 | 2,354,047 | ||||||
County of Montgomery Pennsylvania IDA, RB, Foulkeways Gwynedd Project, 5.00%, 12/01/46 | 470 | 506,547 | ||||||
County of Northampton Pennsylvania IDA, Route 33 Project, Tax Allocation Bonds, 7.00%, 07/01/32 | 1,240 | 1,414,728 | ||||||
East Hempfield Township Pennsylvania IDA, RB: | ||||||||
5.00%, 07/01/34 | 1,000 | 1,063,240 | ||||||
5.00%, 07/01/46 | 1,750 | 1,842,453 | ||||||
Pennsylvania Economic Development Financing Authority, RB: | ||||||||
AMT, 5.00%, 06/30/42 | 895 | 975,505 | ||||||
U.S. Airways Group, Series A, 7.50%, 05/01/20 | 1,200 | 1,302,660 | ||||||
Pennsylvania Economic Development Financing Authority, Refunding RB, National Gypsum Co., AMT, 5.50%, 11/01/44 | 5,390 | 5,695,721 | ||||||
|
| |||||||
| 27,388,210 | ||||||||
| Puerto Rico — 1.6% | ||||||||
Children’s Trust Fund, Refunding RB, Tobacco Settlement Asset-Backed Bonds: | ||||||||
5.50%, 05/15/39 | 1,205 | 1,212,339 | ||||||
5.63%, 05/15/43 | 3,070 | 3,103,709 | ||||||
Commonwealth of Puerto Rico, GO, Refunding, Series A(f)(g): | ||||||||
Public Improvement, 5.50%, 07/01/39 | 1,080 | 453,600 | ||||||
8.00%, 07/01/35 | 13,260 | 5,370,300 | ||||||
Commonwealth of Puerto Rico, GO(f)(g): | ||||||||
6.00%, 07/01/38 | 1,210 | 514,250 | ||||||
Refunding Series C, 6.50%, 07/01/40 | 400 | 168,000 | ||||||
Commonwealth of Puerto Rico Aqueduct & Sewer Authority, RB, Senior Lien, Series A, 6.00%, 07/01/44 | 1,920 | 1,608,000 | ||||||
Commonwealth of Puerto Rico Aqueduct & Sewer Authority, Refunding RB, Senior Lien, Series A, 6.00%, 07/01/38 | 800 | 670,000 | ||||||
|
| |||||||
| 13,100,198 | ||||||||
| Rhode Island — 1.9% | ||||||||
Rhode Island Student Loan Authority, Refunding RB, Senior-Series A, AMT, 3.50%, 12/01/34 | 1,975 | 1,978,792 | ||||||
Tobacco Settlement Financing Corp., Refunding RB: | ||||||||
Series A, 5.00%, 06/01/35 | 1,005 | 1,084,636 | ||||||
Series A, 5.00%, 06/01/40 | 1,000 | 1,066,040 | ||||||
Series B, 4.50%, 06/01/45 | 6,350 | 6,455,410 | ||||||
Series B, 5.00%, 06/01/50 | 5,650 | 5,822,721 | ||||||
|
| |||||||
| 16,407,599 | ||||||||
| South Carolina — 1.8% | ||||||||
South Carolina Jobs-Economic Development Authority, Refunding RB: | ||||||||
The Lutheran Homes of South Carolina, Inc., Series B, 5.00%, 05/01/37 | 620 | 651,564 | ||||||
The Woodlands at Furman, 4.00%, 11/15/27 | 910 | 915,897 | ||||||
State of South Carolina Ports Authority, RB, AMT, 5.00%, 07/01/45 | 1,975 | 2,181,881 | ||||||
State of South Carolina Public Service Authority, RB, Series E, 5.50%, 12/01/53 | 3,475 | 3,756,058 | ||||||
State of South Carolina Public Service Authority, Refunding RB, Series E, 5.25%, 12/01/55 | 7,000 | 7,607,600 | ||||||
|
| |||||||
| 15,113,000 | ||||||||
| Tennessee — 0.6% | ||||||||
County of Knox Health Educational & Housing Facility Board, Refunding RB, University Health System, Inc., 5.00%, 04/01/36 | 560 | 608,698 | ||||||
| Security | Par (000) | Value | ||||||
| Tennessee (continued) | ||||||||
County of Memphis-Shelby Tennessee Industrial Development Board, Refunding, Tax Allocation Bonds, Senior Tax Increment, Graceland Project, Series A: | ||||||||
5.50%, 07/01/37 | $ | 1,650 | $ | 1,764,642 | ||||
5.63%, 01/01/46 | 1,875 | 1,999,612 | ||||||
County of Nashville & Davidson Metropolitan Government Health & Educational Facilities Board, RB, Vanderbilt University Medical Center, Series A, 5.00%, 07/01/40 | 925 | 1,027,842 | ||||||
|
| |||||||
| 5,400,794 | ||||||||
| Texas — 6.3% | ||||||||
Arlington Higher Education Finance Corp., RB, Series A, 5.88%, 03/01/24 | 500 | 506,065 | ||||||
Central Texas Regional Mobility Authority, Refunding RB: | ||||||||
CAB, 0.00%, 01/01/28(d) | 3,000 | 2,118,120 | ||||||
CAB, 0.00%, 01/01/29(d) | 500 | 336,825 | ||||||
CAB, 0.00%, 01/01/30(d) | 1,330 | 854,139 | ||||||
CAB, 0.00%, 01/01/31(d) | 4,000 | 2,438,640 | ||||||
Senior Lien, 6.25%, 01/01/21(b) | 765 | 844,315 | ||||||
City of Austin Texas Airport System Revenue, RB, Series B, AMT, 5.00%, 11/15/46 | 3,500 | 3,896,585 | ||||||
City of Houston Texas Airport System, Refunding ARB: | ||||||||
Senior Lien, Series A, 5.50%, 07/01/39 | 120 | 120,354 | ||||||
Special Facilities, Continental Airlines, Inc., Series A, AMT, 6.63%, 07/15/38 | 1,110 | 1,218,036 | ||||||
United Airlines, Inc. Terminal E Project, AMT, 5.00%, 07/01/29 | 1,000 | 1,082,160 | ||||||
United Airlines, Inc., Airport Improvement Projects, Series C, AMT, 5.00%, 07/15/20 | 825 | 868,659 | ||||||
Clifton Higher Education Finance Corp., ERB, Idea Public Schools(b): | ||||||||
5.50%, 08/15/21 | 255 | 281,099 | ||||||
5.75%, 08/15/21 | 280 | 310,758 | ||||||
County of Bexar Texas Health Facilities Development Corp., RB, Army Retirement Residence Project, 6.20%, 07/01/20(b) | 1,320 | 1,431,118 | ||||||
County of Harris Texas Cultural Education Facilities Finance Corp., Refunding, MRB, Brazos Presbyterian Homes, Inc. Project, Series A: | ||||||||
5.00%, 01/01/38 | 510 | 529,727 | ||||||
5.00%, 01/01/43 | 520 | 539,032 | ||||||
5.13%, 01/01/48 | 1,535 | 1,595,786 | ||||||
County of Harris Texas Houston Sports Authority, Refunding RB, CAB, Senior Lien, Series G (NPFGC), 0.00%, 11/15/41(d) | 350 | 112,616 | ||||||
County of Matagorda Texas Navigation District No. 1, Refunding RB, Central Power & Light Co., Project, Series A, 6.30%, 11/01/29 | 290 | 307,905 | ||||||
County of Tarrant Texas Cultural Education Facilities Finance Corp., RB, Senior Living Center Project, Series A, 8.25%, 11/15/44 | 800 | 789,208 | ||||||
County of Tarrant Texas Cultural Education Facilities Finance Corp., Refunding RB, Barton Creek Senior Living Center, 4.75%, 11/15/35 | 110 | 112,342 | ||||||
County of Travis Texas Health Facilities Development Corp., Refunding RB, 7.13%, 01/01/21(b) | 1,920 | 2,164,781 | ||||||
Fort Bend County Industrial Development Corp., RB, NRG Energy Inc. Project, Series B, 4.75%, 11/01/42 | 3,380 | 3,455,374 | ||||||
Houston Higher Education Finance Corp., RB, Cosmos Foundation, Inc., 6.50%, 05/15/21(b) | 535 | 602,212 | ||||||
Mesquite Health Facility Development Corp., Refunding RB, 5.13%, 02/15/42 | 690 | 713,584 | ||||||
Mission Texas Economic Development Corp., RB, Senior Lien, Natural Gasoline Project, Series B, AMT, 5.75%, 10/01/31(c) | 2,565 | 2,654,442 | ||||||
| 28 | 2018 BLACKROCK ANNUAL REPORTTO SHAREHOLDERS |
Schedule of Investments (continued) June 30, 2018 | BlackRock High Yield Municipal Fund (Percentages shown are based on Net Assets) |
| Security | Par (000) | Value | ||||||
| Texas (continued) | ||||||||
New Hope Cultural Education Facilities Corp., RB, Stephenville LLC Tarleton State University Project: | ||||||||
5.88%, 04/01/36 | $ | 890 | $ | 991,077 | ||||
6.00%, 04/01/45 | 1,355 | 1,508,074 | ||||||
New Hope Cultural Education Facilities Finance Corp., Refunding RB, Jubilee Academic, Series A(c): | ||||||||
5.00%, 08/15/36 | 695 | 696,348 | ||||||
5.00%, 08/15/46 | 695 | 684,638 | ||||||
Newark Higher Education Finance Corp., RB, Series A(c): | ||||||||
5.50%, 08/15/35 | 375 | 397,601 | ||||||
5.75%, 08/15/45 | 645 | 686,732 | ||||||
North Texas Tollway Authority, Refunding RB, 2nd Tier-Series B, 5.00%, 01/01/43 | 5,145 | 5,772,124 | ||||||
Red River Health Facilities Development Corp., First MRB, Project: | ||||||||
Eden Home, Inc., 7.25%, 12/15/42(f)(g) | 1,330 | 771,400 | ||||||
Wichita Falls Retirement Foundation, | 600 | 617,274 | ||||||
Texas Private Activity Bond Surface Transportation Corp., RB, Senior Lien: | ||||||||
AMT, Blueridge Transportation Group, | 3,480 | 3,750,118 | ||||||
LBJ Infrastructure Group LLC, 7.00%, 06/30/40 | 1,000 | 1,084,460 | ||||||
NTE Mobility Partners LLC, North Tarrant Express Managed Lanes Project, 6.88%, 12/31/39 | 4,740 | 5,040,184 | ||||||
Town of Flower Mound Texas, Special Assessment Bonds, 6.50%, 09/01/36 | 1,500 | 1,524,570 | ||||||
|
| |||||||
| 53,408,482 | ||||||||
| Utah — 0.6% | ||||||||
State of Utah Charter School Finance Authority, RB: | ||||||||
Navigator Pointe Academy, Series A, 5.63%, 07/15/40 | 1,000 | 1,016,170 | ||||||
Spectrum Academy Project, 6.00%, 04/15/45(c) | 2,000 | 2,071,180 | ||||||
State of Utah Charter School Finance Authority, Refunding RB, 6.75%, 10/15/43 | 2,050 | 2,058,385 | ||||||
|
| |||||||
| 5,145,735 | ||||||||
| Virginia — 2.7% | ||||||||
County of Hanover Virginia EDA, Refunding RB, Covenant Woods, Series A: | ||||||||
5.00%, 07/01/42 | 2,000 | 2,065,700 | ||||||
Residential Care Facility, 5.00%, 07/01/47 | 1,015 | 1,046,079 | ||||||
Hampton Roads Transportation Accountability Commission, RB, Transportation Fund, Senior Lien, Series A, 5.50%, 07/01/57 | 1,925 | 2,309,480 | ||||||
Lower Magnolia Green Community Development Authority, Special Assessment Bonds(c): | ||||||||
5.00%, 03/01/35 | 490 | 499,976 | ||||||
5.00%, 03/01/45 | 505 | 511,818 | ||||||
Mosaic District Community Development Authority, Special Assessment, Series A: | ||||||||
6.63%, 03/01/26 | 515 | 556,885 | ||||||
6.88%, 03/01/36 | 450 | 488,723 | ||||||
Tobacco Settlement Financing Corp., Refunding RB, Senior Series B-1, 5.00%, 06/01/47 | 7,120 | 7,119,786 | ||||||
Virginia College Building Authority, RB, Marymount University Project, Series B, 5.00%, 07/01/45(c) | 535 | 563,023 | ||||||
Virginia Small Business Financing Authority, RB, Senior Lien, AMT: | ||||||||
Elizabeth River Crossings OpCo LLC Project, 6.00%, 01/01/37 | 3,360 | 3,718,109 | ||||||
Express Lanes LLC, 5.00%, 07/01/34 | 3,300 | 3,504,996 | ||||||
|
| |||||||
| 22,384,575 | ||||||||
| Security | Par (000) | Value | ||||||
| Washington — 0.3% | ||||||||
County of King Washington Public Hospital District No. 4, GO, Refunding, Snoqualmie Valley Hospital, 7.00%, 12/01/40 | $ | 545 | $ | 563,241 | ||||
Greater Wenatchee Regional Events Center Public Facilities District, Refunding RB, Series A, 5.50%, 09/01/42 | 1,005 | 1,028,517 | ||||||
Washington State Housing Finance Commission, Refunding RB(c): | ||||||||
5.75%, 01/01/35 | 355 | 359,406 | ||||||
6.00%, 01/01/45 | 940 | 955,632 | ||||||
|
| |||||||
| 2,906,796 | ||||||||
| Wisconsin — 2.3% | ||||||||
Public Finance Authority, RB: | ||||||||
Alabama Proton Therapy Center, Series A, 6.25%, 10/01/31(c) | 910 | 891,463 | ||||||
Alabama Proton Therapy Center, Series A, 7.00%, 10/01/47(c) | 910 | 914,159 | ||||||
American Preparatory Academy — Las Vegas Project, Series A, 5.38%, 07/15/47(c) | 1,595 | 1,642,691 | ||||||
Delray Beach Radiation Therapy, 6.85%, 11/01/46(c) | 1,325 | 1,371,508 | ||||||
Delray Beach Radiation Therapy, 7.00%, 11/01/46(c) | 805 | 840,984 | ||||||
Series A, 5.00%, 12/01/45 | 1,910 | 2,005,137 | ||||||
Series A, 5.15%, 12/01/50 | 1,315 | 1,385,247 | ||||||
Voyager Foundation, Inc. Project, Series A, 5.13%, 10/01/45 | 1,850 | 1,864,226 | ||||||
Public Finance Authority, Refunding RB: | ||||||||
Celanese Project, Series C, AMT, 4.30%, 11/01/30 | 525 | 544,766 | ||||||
Celanese Project, Series D, 4.05%, 11/01/30 | 525 | 534,151 | ||||||
Senior Obligated Group, Series B, AMT, | 2,150 | 2,277,473 | ||||||
White Stone Retirement Facilities, 5.00%, 03/01/52(c) | 1,300 | 1,386,073 | ||||||
Wisconsin Health & Educational Facilities Authority, Refunding RB: | ||||||||
Benevolent Corporation Cedar Community, 5.00%, 06/01/41 | 350 | 365,278 | ||||||
Mile Bluff Medical Center, 5.50%, 05/01/34 | 875 | 917,079 | ||||||
Mile Bluff Medical Center, 5.75%, 05/01/39 | 1,065 | 1,123,575 | ||||||
St. Johns Communities, Inc., Series A, | 75 | 79,967 | ||||||
St. Johns Communities, Inc., Series A, | 145 | 155,247 | ||||||
Wisconsin Housing & Economic Development Authority, RB, M/F Housning, WHPC Madison Pool Project, Series A, 4.70%, 07/01/47 | 740 | 790,919 | ||||||
|
| |||||||
| 19,089,943 | ||||||||
|
| |||||||
Total Municipal Bonds — 89.0% |
| 749,693,773 | ||||||
|
| |||||||
Municipal Bonds Transferred to Tender Option Bond Trusts(i) |
| |||||||
| California — 0.3% | ||||||||
Bay Area Toll Authority, Refunding RB, San Francisco Bay Area, Series F-1, 5.63%, 04/01/19(b) | 480 | 495,078 | ||||||
City of Los Angeles California Department of Airports, Refunding ARB, Los Angeles International Airport, Senior Series A, 5.00%, 05/15/40 | 1,678 | 1,776,387 | ||||||
|
| |||||||
| 2,271,465 | ||||||||
| Colorado — 0.7% | ||||||||
Colorado Health Facilities Authority, Refunding RB, Sisters of Leavenworth Health System, Series A, 5.00%, 01/01/40 | 5,592 | 5,811,120 | ||||||
|
| |||||||
| District of Columbia — 0.1% | ||||||||
District of Columbia Water & Sewer Authority, Refunding RB, Series A, 6.00%, 10/01/18(b)(j) | 939 | 949,608 | ||||||
|
| |||||||
| SCHEDULES OF INVESTMENTS | 29 |
Schedule of Investments (continued) June 30, 2018 | BlackRock High Yield Municipal Fund (Percentages shown are based on Net Assets) |
| Security | Par (000) | Value | ||||||
| Florida — 0.5% | ||||||||
County of Miami-Dade Florida, RB, Water & Sewer System, 5.00%, 10/01/20(b) | $ | 3,499 | $ | 3,747,810 | ||||
|
| |||||||
| Illinois — 1.8% | ||||||||
Illinois Finance Authority, RB, The Carle Foundation, Series A (AGM), 6.00%, 08/15/41 | 2,480 | 2,729,277 | ||||||
Illinois Finance Authority, Refunding RB, Presence Health Network, Series C, 4.00%, 02/15/41 | 6,510 | 6,716,584 | ||||||
State of Illinois Toll Highway Authority, RB, Series A, 5.00%, 01/01/40 | 5,011 | 5,554,435 | ||||||
|
| |||||||
| 15,000,296 | ||||||||
| Massachusetts — 0.4% | ||||||||
Commonwealth of Massachusetts Transportation Fund Revenue, RB, Rail Enhancement Program, Series A, 4.00%, 06/01/45 | 3,464 | 3,567,916 | ||||||
|
| |||||||
| New York — 5.3% | ||||||||
City of New York New York Water & Sewer System, Refunding RB, 2nd General Resolution, Series HH, 5.00%, 06/15/31(j) | 3,015 | 3,265,667 | ||||||
Hudson Yards Infrastructure Corp., RB, Fiscal 2012, Series A, 5.75%, 02/15/47(j) | 1,720 | 1,880,746 | ||||||
New York Liberty Development Corp., ARB, 1 World Trade Center Port Authority Consolidated Bonds, 5.25%, 12/15/43 | 7,725 | 8,461,131 | ||||||
New York Liberty Development Corp., Refunding RB, 4 World Trade Center Project, 5.75%, 11/15/51(j) | 2,520 | 2,802,226 | ||||||
New York State Dormitory Authority, Refunding RB, Series E, 5.00%, 03/15/36 | 21,670 | 24,551,893 | ||||||
Port Authority of New York & New Jersey, Refunding ARB, 194th Series, 5.25%, 10/15/55 | 2,925 | 3,325,832 | ||||||
|
| |||||||
| 44,287,495 | ||||||||
| North Carolina — 0.4% | ||||||||
North Carolina Capital Facilities Finance Agency, Refunding RB, Duke University Project, Series B, 5.00%, 10/01/55 | 2,930 | 3,271,550 | ||||||
|
| |||||||
| Ohio — 0.2% | ||||||||
State of Ohio, Refunding RB, Cleveland Clinic Health System Obligated Group, Series A, 5.50%, 01/01/19(b) | 2,010 | 2,049,844 | ||||||
|
| |||||||
| Pennsylvania — 0.5% | ||||||||
Pennsylvania Turnpike Commission, RB, Sub-Series A, 5.50%, 12/01/42 | 3,677 | 4,223,381 | ||||||
|
| |||||||
| Rhode Island — 0.3% | ||||||||
Narragansett Bay Commission, Refunding RB, Wastewater System, Series A, 4.00%, 09/01/43 | 2,641 | 2,688,847 | ||||||
|
| |||||||
| Texas — 0.4% | ||||||||
Lower Colorado River Authority, Refunding RB, LCRA Transmission Services Corporation Project, 4.00%, 05/15/43 | 3,480 | 3,522,526 | ||||||
|
| |||||||
| Virginia — 0.3% | ||||||||
Virginia Small Business Financing Authority, Refunding RB, Sentara Healthcare, 5.00%, 11/01/40 | 2,501 | 2,635,732 | ||||||
|
| |||||||
| Washington — 1.5% | ||||||||
City of Bellingham Washington Water & Sewer Revenue, RB, Water & Sewer, 5.00%, 08/01/40 | 2,999 | 3,233,052 | ||||||
Snohomish County Public Utility District No 1, 5.00%, 12/01/45 | 8,664 | 9,621,426 | ||||||
|
| |||||||
| 12,854,478 | ||||||||
| Security | Par (000) | Value | ||||||
| Wisconsin — 0.5% | ||||||||
Wisconsin Health & Educational Facilities Authority, Refunding RB: | ||||||||
Medical College Wis, 4.00%, 12/01/46 | $ | 1,774 | $ | 1,799,122 | ||||
Froedtert & Community Health, Inc., Obligated Group, Series C, 5.25%, 04/01/19(b)(j) | 2,179 | 2,239,291 | ||||||
|
| |||||||
| 4,038,413 | ||||||||
|
| |||||||
Total Municipal Bonds Transferred to Tender Option |
| 110,920,481 | ||||||
|
| |||||||
Total Long-Term Investments — 102.4% |
| 862,187,754 | ||||||
|
| |||||||
| Shares | ||||||||
| Short-Term Securities — 4.5% | ||||||||
BlackRock Liquidity Funds, MuniCash, Institutional Class, | 37,605,441 | 37,609,202 | ||||||
|
| |||||||
Total Short-Term Securities — 4.5% |
| 37,609,202 | ||||||
|
| |||||||
Total Investments — 106.9% |
| 899,796,956 | ||||||
Other Assets Less Liabilities — 0.4% |
| 3,400,216 | ||||||
Liability for TOB Trust Certificates, Including Interest Expense and Fees Payable — (7.3)% |
| (61,211,561 | ) | |||||
|
| |||||||
Net Assets — 100.0% |
| $ | 841,985,611 | |||||
|
| |||||||
| (a) | Variable or floating rate security, which interest rate adjusts periodically based on changes in current interest rates and prepayments on the underlying pool of assets. Rate shown is the rate in effect as of period end. |
| (b) | U.S. Government securities, held in escrow, are used to pay interest on this security, as well as to retire the bond in full at the date indicated, typically at a premium to par. |
| (c) | Security exempt from registration pursuant to Rule 144A under the Securities Act of 1933, as amended. These securities may be resold in transactions exempt from registration to qualified institutional investors. |
| (d) | Zero-coupon bond. |
| (e) | When-issued security. |
| (f) | Issuer filed for bankruptcy and/or is in default. |
| (g) | Non-income producing security. |
| (h) | Step-up bond that pays an initial coupon rate for the first period and then a higher coupon rate for the following periods. Rate as of period end. |
| (i) | Represent bonds transferred to a TOB Trust in exchange of cash and residual certificates received by the Fund. These bonds serve as collateral in a secured borrowing. See Note 4 of the Notes to Financial Statements for details. |
| (j) | All or a portion of security is subject to a recourse agreement. The aggregate maximum potential amount the Fund could ultimately be required to pay under the agreements, which expires between October 01, 2018 to November 15, 2019, is $6,220,511. See Note 4 of the Notes to Financial Statements for details. |
| (k) | Annualized 7-day yield as of period end. |
| 30 | 2018 BLACKROCK ANNUAL REPORTTO SHAREHOLDERS |
Schedule of Investments (continued) June 30, 2018 | BlackRock High Yield Municipal Fund |
| (l) | During the year ended June 30, 2018, investments in issuers considered to be an affiliate of the Fund for purposes of Section 2(a)(3) of the Investment Company Act of 1940, as amended, were as follows: |
| Affiliate | Shares Held at 06/30/17 | Net Activity | Shares Held at 06/30/18 | Value at 06/30/18 | Income | Net Realized Gain (Loss) (a) | Change in Unrealized Appreciation (Depreciation) | |||||||||||||||||||||
BlackRock Liquidity Funds, MuniCash, Institutional Class | 17,704,249 | 19,901,192 | 37,605,441 | $ | 37,609,202 | $ | 367,748 | $ | (2,445 | ) | $ | 355 | ||||||||||||||||
|
|
|
|
|
|
|
| |||||||||||||||||||||
| (a) | Includes net capital gain distributions, if applicable. |
Derivative Financial Instruments Outstanding as of Period End
Futures Contracts
| Description | Number of Contracts | Expiration Date | Notional Amount (000) | Value/ Unrealized Appreciation (Depreciation) | ||||||||||||
Short Contracts: | ||||||||||||||||
10-Year U.S. Treasury Note | 99 | 09/19/18 | $ | 11,899 | $ | (46,296 | ) | |||||||||
Long U.S. Treasury Bond | 171 | 09/19/18 | 24,795 | (440,979 | ) | |||||||||||
5-Year U.S. Treasury Note | 24 | 09/28/18 | 2,727 | (11,452 | ) | |||||||||||
|
| |||||||||||||||
| $ | (498,727 | ) | ||||||||||||||
|
| |||||||||||||||
Derivative Financial Instruments Categorized by Risk Exposure
As of period end, the fair values of derivative financial instruments located in the Statements of Assets and Liabilities were as follows:
| Commodity Contracts | Credit Contracts | Equity Contracts | Foreign Currency Exchange Contracts | Interest Rate Contracts | Other Contracts | Total | ||||||||||||||||||||||
Liabilities — Derivative Financial Instruments | ||||||||||||||||||||||||||||
Futures contracts | ||||||||||||||||||||||||||||
Net unrealized depreciation(a) | $ | — | $ | — | $ | — | $ | — | $ | 498,727 | $ | — | $ | 498,727 | ||||||||||||||
|
|
|
|
|
|
|
|
|
|
|
|
|
| |||||||||||||||
| (a) | Includes cumulative appreciation (depreciation) on futures contracts if any, as reported in the Schedule of Investments. Only current day’s variation margin is reported within the Statements of Assets and Liabilities. |
For the year ended June 30, 2018, the effect of derivative financial instruments in the Statements of Operations was as follows:
| Commodity Contracts | Credit Contracts | Equity Contracts | Foreign Currency Exchange Contracts | Interest Rate Contracts | Other Contracts | Total | ||||||||||||||||||||||
Net Realized Gain (Loss) from: | ||||||||||||||||||||||||||||
Futures contracts | $ | — | $ | — | $ | — | $ | — | $ | 2,312,224 | $ | — | $ | 2,312,224 | ||||||||||||||
|
|
|
|
|
|
|
|
|
|
|
|
|
| |||||||||||||||
Net Change in Unrealized Appreciation (Depreciation) on: | ||||||||||||||||||||||||||||
Futures contracts | $ | — | $ | — | $ | — | $ | — | $ | (256,945 | ) | $ | — | $ | (256,945 | ) | ||||||||||||
|
|
|
|
|
|
|
|
|
|
|
|
|
| |||||||||||||||
Average Quarterly Balances of Outstanding Derivative Financial Instruments
Futures contracts: |
| |||
Average notional value of contracts — short | $ | 48,770,963 | ||
For more information about the Fund’s investment risks regarding derivative financial instruments, refer to the Notes to Financial Statements.
| SCHEDULES OF INVESTMENTS | 31 |
Schedule of Investments (continued) June 30, 2018 | BlackRock High Yield Municipal Fund |
Fair Value Hierarchy as of Period End
Various inputs are used in determining the fair value of investments and derivative financial instruments. For information about the Fund’s policy regarding valuation ofinvestments and derivative financial instruments, refer to the Notes to Financial Statements.
The following tables summarize the Fund’s investments and derivative financial instruments categorized in the disclosure hierarchy:
| Level 1 | Level 2 | Level 3 | Total | |||||||||||||
Assets: |
| |||||||||||||||
Investments: |
| |||||||||||||||
Long-Term Investments(a) | $ | 1,573,500 | $ | 860,614,254 | $ | — | $ | 862,187,754 | ||||||||
Short-Term Securities | 37,609,202 | — | — | 37,609,202 | ||||||||||||
|
|
|
|
|
|
|
| |||||||||
| $ | 39,182,702 | 860,614,254 | $ | — | $ | 899,796,956 | ||||||||||
|
|
|
|
|
|
|
| |||||||||
Derivative Financial Instruments(b) |
| |||||||||||||||
Liabilities: |
| |||||||||||||||
Interest rate contracts | $ | (498,727 | ) | $ | — | $ | — | $ | (498,727 | ) | ||||||
|
|
|
|
|
|
|
| |||||||||
| (a) | See above Schedule of Investments for values in each industry, state or political subdivision. |
| (b) | Derivative financial instruments are futures contracts which are valued at the unrealized appreciation (depreciation) on the instrument. |
The Fund may hold assets and/or liabilities in which the fair value approximates the carrying amount for financial statement purposes. As of period end TOB Trust Certificates of $61,022,202 are categorized as Level 2 within the disclosure hierarchy
During the year ended June 30, 2018, there were no transfers between levels.
See notes to financial statements.
| 32 | 2018 BLACKROCK ANNUAL REPORTTO SHAREHOLDERS |
Schedule of Investments June 30, 2018 | BlackRock National Municipal Fund (Percentages shown are based on Net Assets) |
| Security | Par (000) | Value | ||||||
Municipal Bonds — 99.0% |
| |||||||
| Alabama — 4.8% | ||||||||
Alabama Federal Aid Highway Finance Authority, RB, Series A, 5.00%, 06/01/37 | $ | 43,695 | $ | 51,067,491 | ||||
Alabama Special Care Facilities Financing Authority-Birmingham, Refunding RB, Ascension Senior Credit Group, Series C, 5.00%, 11/15/46 | 73,875 | 83,055,446 | ||||||
Auburn University, RB, Series A, 5.00%, 06/01/43(a) | 11,890 | 13,834,491 | ||||||
Black Belt Energy Gas District, RB, Series A(b): | ||||||||
4.00%, 08/01/47 | 70,000 | 74,296,600 | ||||||
4.00%, 12/01/48 | 20,000 | 21,348,000 | ||||||
City of Birmingham Alabama Special Care Facilities Financing Authority, RB, Children’s Hospital (AGC), 6.00%, 06/01/19(c) | 15,955 | 16,590,168 | ||||||
City of Homewood, GO, Refunding, 5.25%, 09/01/46 | 27,625 | 32,311,581 | ||||||
Prattville Alabama IDB, RB, Recovery Zone Facility, Series C, 6.25%, 11/01/33 | 3,380 | 3,572,221 | ||||||
Southeast Alabama Gas Supply District, RB, Project #2, Series A, 4.00%, 06/01/49(b) | 85,000 | 90,556,450 | ||||||
State of Alabama Docks Department, Refunding RB, 6.00%, 10/01/20(c) | 16,315 | 17,803,744 | ||||||
UAB Medicine Finance Authority, Refunding RB, Series B-2: | ||||||||
5.00%, 09/01/37 | 5,000 | 5,684,000 | ||||||
5.00%, 09/01/41 | 9,500 | 10,768,820 | ||||||
Water Works Board of the City of Birmingham, Refunding RB, Sub-Series B, 5.00%, 01/01/43 | 16,715 | 19,044,068 | ||||||
|
| |||||||
| 439,933,080 | ||||||||
| Alaska — 0.1% | ||||||||
Borough of Matanuska-Susitna Alaska, RB, Goose Creek Correctional Center (AGC)(c): | ||||||||
6.00%, 09/01/19 | 1,270 | 1,333,995 | ||||||
6.00%, 09/01/19 | 730 | 766,785 | ||||||
6.00%, 09/01/19 | 5,250 | 5,514,547 | ||||||
|
| |||||||
| 7,615,327 | ||||||||
| Arizona — 1.0% | ||||||||
City of Mesa Arizona Utility System, RB, Utility System, 5.00%, 07/01/35 | 30,000 | 32,358,000 | ||||||
City of Phoenix Arizona IDA, RB: | ||||||||
Candeo School, Inc. Project, 6.88%, 07/01/44 | 3,440 | 3,801,819 | ||||||
Legacy Traditional Schools Project, Series A, 6.50%, 07/01/34(d) | 2,000 | 2,218,080 | ||||||
Legacy Traditional Schools Projects, Series A, 6.75%, 07/01/44(d) | 3,500 | 3,886,470 | ||||||
City of Phoenix Arizona IDA, Refunding RB, Basis Schools, Inc. Projects, 5.00%, 07/01/45(d) | 2,280 | 2,334,013 | ||||||
City of Phoenix Civic Improvement Corp., ARB, AMT, Series A, 5.00%, 07/01/42 | 3,750 | 4,205,438 | ||||||
County of Maricopa Arizona IDA, RB, Banner Health, Series A, 5.00%, 01/01/41 | 17,000 | 19,353,990 | ||||||
County of Pinal Arizona, RB, Electric District No. 4, 6.00%, 12/01/18(c) | 1,200 | 1,222,176 | ||||||
County of Pinal Arizona IDA, RB, San Manuel Facility Project, AMT, 6.25%, 06/01/26 | 495 | 499,970 | ||||||
Salt River Project Agricultural Improvement & Power District, Refunding RB, Salt River Project Electric System, 5.00%, 01/01/36 | 20,000 | 23,554,800 | ||||||
|
| |||||||
| 93,434,756 | ||||||||
| Arkansas — 0.1% | ||||||||
University of Arkansas, RB, Athletic Facilities, Fayetteville Campus, Series A, 5.00%, 09/15/36 | 5,000 | 5,729,750 | ||||||
|
| |||||||
| Security | Par (000) | Value | ||||||
| California — 15.3% | ||||||||
ABAG Finance Authority for Nonprofit Corps., Refunding RB, Sharp Healthcare, Series B, 6.25%, 08/01/19(c) | $ | 11,525 | $ | 12,124,531 | ||||
California Health Facilities Financing Authority, RB, Sutter Health, Series B, 6.00%, 08/15/20(c) | 21,340 | 23,337,637 | ||||||
California Health Facilities Financing Authority, Refunding RB, Catholic Healthcare West, Series A, 6.00%, 07/01/19(c) | 26,655 | 27,869,668 | ||||||
California State University, Refunding RB, Systemwide, Series A, 5.00%, 11/01/42 | 25,000 | 29,019,750 | ||||||
California Statewide Communities Development Authority, RB, Sutter Health, Series A, 6.00%, 08/15/20(c) | 11,600 | 12,673,116 | ||||||
City & County of San Francisco California Airports Commission, ARB, Series E, 6.00%, 05/01/39 | 59,800 | 62,004,228 | ||||||
City & County of San Francisco California Airports Commission, Refunding ARB, San Francisco International Airport, Series A, AMT, 5.00%, 05/01/41 | 20,000 | 22,415,600 | ||||||
City of Los Angeles California Department of Water & Power, Refunding RB, Water System, Series A, 5.25%, 07/01/39 | 40,000 | 43,464,000 | ||||||
City of Los Angeles California Municipal Improvement Corp., RB, Real Property, Series E(c): | ||||||||
6.00%, 09/01/19 | 4,915 | 5,172,055 | ||||||
6.00%, 09/01/19 | 9,450 | 9,944,235 | ||||||
City of Los Angeles California Wastewater System Revenue, Refunding RB, Green Bond, Sub-Series A, 5.25%, 06/01/47 | 27,620 | 32,755,663 | ||||||
City of San Jose California, Refunding ARB, Norman Y Mineta San Jose International Airport SJC, Series A-1, AMT: | ||||||||
5.75%, 03/01/34 | 7,010 | 7,622,954 | ||||||
6.25%, 03/01/34 | 5,250 | 5,819,468 | ||||||
City of San Jose California Hotel Tax, RB, Convention Center Expansion & Renovation Project: | ||||||||
6.50%, 05/01/36 | 1,510 | 1,694,084 | ||||||
6.50%, 05/01/42 | 5,130 | 5,755,398 | ||||||
City of San Juan California Water District, COP, Series A, 6.00%, 02/01/19(c) | 10,000 | 10,267,800 | ||||||
County of Alameda & City of Oakland California, GO, Election of 2012, 6.63%, 08/01/21(c) | 3,750 | 4,311,225 | ||||||
County of Orange California Sanitation District, COP, Series A, 5.00%, 02/01/19(c) | 10,000 | 10,213,400 | ||||||
County of Orange California Water District, COP, Refunding, 5.00%, 08/15/19(c) | 15,000 | 15,601,200 | ||||||
County of Sacramento California, RB, Subordinated & Passenger Facility Charges/Grant, Series C(c): | ||||||||
6.00%, 07/01/18 | 16,920 | 16,920,000 | ||||||
6.00%, 07/01/18 | 13,285 | 13,285,000 | ||||||
County of San Joaquin California Transportation Authority, Refunding RB, Limited Tax, Measure K, Series A(c): | ||||||||
5.50%, 03/01/21 | 26,390 | 29,031,111 | ||||||
6.00%, 03/01/21 | 12,830 | 14,280,432 | ||||||
Cucamonga Valley Water District, Refunding RB, Series A: | ||||||||
5.38%, 09/01/21(c) | 19,025 | 21,211,163 | ||||||
5.38%, 09/01/35 | 7,290 | 8,049,254 | ||||||
Gilroy Public Facilities Financing Authority, Refunding RB, 6.00%, 11/01/33 | 6,535 | 7,751,490 | ||||||
Golden State Tobacco Securitization Corp., Refunding RB, Series A-1: | ||||||||
Asset-Backed, Senior, 5.75%, 06/01/47 | 49,815 | 49,826,956 | ||||||
5.25%, 06/01/47 | 17,490 | 18,196,596 | ||||||
Los Angeles Community College District California, GO, Refunding, Election of 2008, Series A, | 15,555 | 16,322,639 | ||||||
| SCHEDULES OF INVESTMENTS | 33 |
Schedule of Investments (continued) June 30, 2018 | BlackRock National Municipal Fund (Percentages shown are based on Net Assets) |
| Security | Par (000) | Value | ||||||
| California (continued) | ||||||||
Los Angeles Department of Water, Refunding RB, Series A: | ||||||||
5.00%, 07/01/41 | $ | 10,000 | $ | 11,620,100 | ||||
5.25%, 07/01/44 | 19,000 | 22,371,740 | ||||||
Los Angeles Department of Water & Power, Refunding RB, Power System, Series B: | ||||||||
5.25%, 07/01/37 | 13,500 | 16,018,695 | ||||||
5.25%, 07/01/38 | 15,000 | 17,786,100 | ||||||
5.25%, 07/01/39 | 7,000 | 8,282,680 | ||||||
Los Angeles Unified School District, GO: | ||||||||
Election 2005, Series M-1, 5.25%, 07/01/42 | 20,000 | 23,913,000 | ||||||
Election of 2008, Series B-1, 5.25%, 07/01/42 | 70,950 | 84,831,367 | ||||||
Madera Redevelopment Agency Successor Agency, Refunding, Tax Allocation Bonds, Series A, 5.00%, 09/01/35(a) | 2,205 | 2,603,664 | ||||||
Metropolitan Water District of Southern California, RB, Authorization, Series A, 5.00%, 01/01/39 | 10,000 | 10,165,300 | ||||||
Modesto Irrigation District, COP(c): | ||||||||
6.00%, 04/01/19 | 3,450 | 3,566,783 | ||||||
Series A, 6.00%, 04/01/19 | 8,305 | 8,589,280 | ||||||
Municipal Improvement Corp. of Los Angeles, Refunding RB, Real Property, Series B, 5.00%, 11/01/36 | 15,590 | 18,133,976 | ||||||
Palomar Community College District, GO, Election of 2006, Series D, 5.25%, 08/01/45 | 24,540 | 29,177,815 | ||||||
Port of Oakland California, Refunding RB, Senior Lien, Series P, AMT, 5.00%, 05/01/31 | 13,010 | 14,155,010 | ||||||
San Diego County Regional Transportation Commission, Refunding RB, Series A, 5.00%, 04/01/41 | 40,000 | 46,117,200 | ||||||
San Diego Public Facilities Financing Authority, RB, Water Utility, Series B, 5.38%, 08/01/19(c) | 15,000 | 15,640,350 | ||||||
San Diego Public Facilities Financing Authority, Refunding RB, Series A, 5.00%, 05/15/39 | 10,000 | 11,612,300 | ||||||
State of California, GO, Refunding, 5.25%, 10/01/39 | 20,000 | 23,389,400 | ||||||
State of California, GO, Various Purpose: | ||||||||
6.00%, 04/01/19(c) | 33,235 | 34,385,263 | ||||||
6.50%, 04/01/19(c) | 47,155 | 48,961,036 | ||||||
6.50%, 04/01/33 | 39,915 | 41,379,880 | ||||||
6.00%, 04/01/38 | 60,720 | 62,678,220 | ||||||
6.00%, 11/01/39 | 64,190 | 67,857,817 | ||||||
State of California Public Works Board, LRB, Various Capital Projects(c): | ||||||||
Sub-Series A-1, 6.00%, 03/01/20 | 14,125 | 15,175,759 | ||||||
Sub-Series I-1, 6.13%, 11/01/19 | 10,015 | 10,632,425 | ||||||
Sub-Series I-1, 6.38%, 11/01/19 | 11,680 | 12,438,266 | ||||||
Tobacco Securitization Authority of Southern California, Refunding RB, Tobacco Settlement, Asset-Backed, Senior Series A-1, 5.00%, 06/01/37 | 6,895 | 6,912,238 | ||||||
Tuolumne Wind Project Authority, RB, Tuolumne Co. Project, Series A, 5.88%, 01/01/19(c) | 19,355 | 19,787,971 | ||||||
University of California, RB: | ||||||||
Limited Project, Series M, 5.00%, 05/15/42 | 82,500 | 95,468,175 | ||||||
Series AV, 5.25%, 05/15/42 | 52,075 | 61,670,339 | ||||||
Series O, 5.25%, 05/15/19(c) | 11,445 | 11,830,124 | ||||||
|
| |||||||
| 1,394,092,926 | ||||||||
| Colorado — 0.9% | ||||||||
Centerra Metropolitan District No. 1, Tax Allocation Bonds, 5.00%, 12/01/47(d) | 6,930 | 7,067,145 | ||||||
City & County of Denver Colorado, Refunding RB, United Airlines, Inc. Project, AMT, 5.00%, 10/01/32 | 31,475 | 33,842,549 | ||||||
Colorado Health Facilities Authority, RB, Catholic Health Initiatives, Series D, 6.25%, 10/01/33 | 4,655 | 4,710,115 | ||||||
Colorado Health Facilities Authority, Refunding RB, Series A: | ||||||||
Catholic Health Initiative, 5.50%, 07/01/34 | 1,600 | 1,646,048 | ||||||
| Security | Par (000) | Value | ||||||
| Colorado (continued) | ||||||||
Frasier Meadows Retirement Community Project, 5.25%, 05/15/47 | $ | 2,500 | $ | 2,717,600 | ||||
State of Colorado, COP, Series J, 5.25%, 03/15/42 | 30,000 | 35,058,600 | ||||||
|
| |||||||
| 85,042,057 | ||||||||
| Delaware — 0.4% | ||||||||
County of Sussex Delaware, RB, NRG Energy, Inc., Indian River Power LLC Project, 6.00%, 10/01/40 | 31,500 | 33,474,420 | ||||||
|
| |||||||
| District of Columbia — 4.1% | ||||||||
District of Columbia, GO: | ||||||||
Series A, 5.00%, 06/01/41 | 20,000 | 22,767,600 | ||||||
Series D, 5.00%, 06/01/42 | 36,295 | 41,780,263 | ||||||
District of Columbia, RB, Series A, 5.50%, 12/01/30 | 20,530 | 21,603,924 | ||||||
District of Columbia Water & Sewer Authority, Refunding RB: | ||||||||
Series A, 6.00%, 10/01/18(c) | 12,630 | 12,772,466 | ||||||
Series B, 5.25%, 10/01/40 | 48,060 | 55,729,896 | ||||||
Series B, 5.25%, 10/01/44 | 63,075 | 72,962,637 | ||||||
Metropolitan Washington Airports Authority, Refunding ARB, AMT: | ||||||||
5.00%, 10/01/42 | 10,805 | 12,276,209 | ||||||
Series A, 5.00%, 10/01/34(a) | 6,375 | 7,406,539 | ||||||
Series A, 5.00%, 10/01/35(a) | 6,530 | 7,574,212 | ||||||
Series A, 5.00%, 10/01/36(a) | 6,000 | 6,942,420 | ||||||
Series A, 5.00%, 10/01/37(a) | 6,000 | 6,936,720 | ||||||
Series A, 5.00%, 10/01/43(a) | 15,800 | 18,132,712 | ||||||
Metropolitan Washington Airports Authority, Refunding RB, Dulles Toll Road, 1st Senior Lien, Series A, 5.25%, 10/01/44 | 5,765 | 5,977,325 | ||||||
Washington Metropolitan Area Transit Authority, RB, Series B, 5.00%, 07/01/42 | 71,040 | 81,804,691 | ||||||
|
| |||||||
| 374,667,614 | ||||||||
| Florida — 5.5% | ||||||||
City of Jacksonville Florida, Refunding RB, Series A, 5.25%, 10/01/42 | 12,285 | 14,523,327 | ||||||
City of St. Augustines Florida, RB, 5.75%, 10/01/21(c) | 1,345 | 1,506,696 | ||||||
City of Tampa Florida, Special Assessment Bonds, Green Bonds, Central and Lower Basis Stormwater Improvements: | ||||||||
5.25%, 05/01/43 | 13,220 | 15,697,825 | ||||||
5.25%, 05/01/46 | 15,430 | 18,278,841 | ||||||
County of Broward Florida Airport System Revenue, ARB, AMT, 5.00%, 10/01/42 | 15,560 | 17,546,234 | ||||||
County of Escambia Florida, RB, International Paper Co. Projects, Series B, 6.25%, 11/01/33 | 7,500 | 7,926,525 | ||||||
County of Highlands Florida Health Facilities Authority, RB, Adventist Health System/Sunbelt Obligated Group: | ||||||||
6.00%, 11/15/19(c) | 10 | 10,588 | ||||||
6.00%, 11/15/37 | 4,980 | 5,295,931 | ||||||
County of Miami-Dade Florida, GO, Building Better Communities Program(c): | ||||||||
Series B, 6.38%, 07/01/18 | 9,300 | 9,300,000 | ||||||
Series B-1, 6.00%, 07/01/18 | 30,000 | 30,000,000 | ||||||
County of Miami-Dade Florida, RB, Seaport Department: | ||||||||
Series A, 6.00%, 10/01/38 | 6,325 | 7,292,219 | ||||||
Series A, 5.50%, 10/01/42 | 5,375 | 5,997,479 | ||||||
Series B, AMT, 6.25%, 10/01/38 | 5,000 | 5,782,850 | ||||||
Series B, AMT, 6.00%, 10/01/42 | 2,350 | 2,678,624 | ||||||
County of Miami-Dade Florida, Refunding ARB, Miami International Airport, Series A, AMT (AGC)(c): | ||||||||
5.50%, 10/01/18 | 5,505 | 5,557,683 | ||||||
5.50%, 10/01/18 | 7,000 | 7,066,990 | ||||||
| 34 | 2018 BLACKROCK ANNUAL REPORTTO SHAREHOLDERS |
Schedule of Investments (continued) June 30, 2018 | BlackRock National Municipal Fund (Percentages shown are based on Net Assets) |
| Security | Par (000) | Value | ||||||
| Florida (continued) | ||||||||
County of Miami-Dade Florida, Refunding RB: | ||||||||
5.00%, 10/01/41 | $ | 10,790 | $ | 12,262,511 | ||||
Water & Sewer Systems, Series C, | 25,000 | 25,282,000 | ||||||
County of Miami-Dade Florida Aviation, Refunding RB, Series B, AMT, 5.00%, 10/01/40 | 93,485 | 105,655,812 | ||||||
County of Miami-Dade Florida Water & Sewer System Revenue, Refunding RB, Series B, 5.00%, 10/01/33 | 10,000 | 11,348,900 | ||||||
County of Putnam Florida Development Authority, Refunding RB, Seminole Project, Series A, 5.00%, 03/15/42 | 8,085 | 9,107,267 | ||||||
East Central Regional Wastewater Treatment Facilities Operation Board, RB, Green Bond Biosolids Project, 5.50%, 10/01/24(c) | 29,160 | 34,801,002 | ||||||
Florida Ports Financing Commission, Refunding RB, State Transportation Trust Fund, Series B, AMT, 5.13%, 06/01/27 | 10,010 | 10,848,738 | ||||||
Greater Orlando Aviation Authority, ARB, Priority Sub-Series A, AMT, 5.00%, 10/01/42 | 34,250 | 38,680,237 | ||||||
Harbor Bay Community Development District Florida, Special Assessment Bonds, Series A, 7.00%, 05/01/33 | 835 | 837,814 | ||||||
Lakewood Ranch Stewardship District, Special Assessment Bonds: | ||||||||
Del Webb Project, 5.00%, 05/01/37(d) | 1,655 | 1,729,359 | ||||||
Del Webb Project, 5.13%, 05/01/47(d) | 1,990 | 2,081,142 | ||||||
Lakewood National & Polo Run Projects, 4.63%, 05/01/27 | 1,745 | 1,800,735 | ||||||
Lakewood National & Polo Run Projects, 5.25%, 05/01/37 | 2,760 | 2,929,906 | ||||||
Lakewood National & Polo Run Projects, 5.38%, 05/01/47 | 4,785 | 5,072,626 | ||||||
Mid-Bay Florida Bridge Authority, RB, Springing Lien, Series A, 7.25%, 10/01/21(c) | 11,125 | 12,927,584 | ||||||
South Miami Health Facilities Authority, Refunding RB, Baptist Health South Florida Obligated Group, 5.00%, 08/15/42 | 29,095 | 32,814,214 | ||||||
State of Florida, GO, Board of Education, Series E, 5.00%, 06/01/37 | 29,730 | 31,393,691 | ||||||
State of Florida, RB, Board of Education Lottery Revenue, Series A, 5.75%, 07/01/18(c) | 3,890 | 3,928,900 | ||||||
Sterling Hill Community Development District, Refunding, Special Assessment Bonds, Series B, | 147 | 94,270 | ||||||
|
| |||||||
| 498,058,520 | ||||||||
| Georgia — 2.3% | ||||||||
City of Atlanta Georgia Department of Aviation, Refunding GARB, Series C, 6.00%, 01/01/30 | 30,000 | 33,036,900 | ||||||
County of Gainesville Georgia & Hall Hospital Authority, Refunding RB, Northeast Georgia Health System, Inc. Project, Series A, 5.50%, 08/15/54 | 4,950 | 5,697,104 | ||||||
County of Richmond Georgia Development Authority, RB, Recovery Zone Facility, International Paper Co., Series B, 6.25%, 11/01/33 | 3,625 | 3,831,154 | ||||||
Main Street Natural Gas Inc., RB, Series A, 4.00%, 04/01/48(b) | 125,000 | 133,710,000 | ||||||
Municipal Electric Authority of Georgia, Refunding RB: | ||||||||
Project One, Series D, 6.00%, 07/01/18(c) | 7,395 | 7,395,000 | ||||||
Project One, Series D, 6.00%, 01/01/23 | 2,605 | 2,611,981 | ||||||
Series EE (AMBAC), 7.00%, 01/01/25 | 20,000 | 25,200,200 | ||||||
|
| |||||||
| 211,482,339 | ||||||||
| Hawaii — 0.5% | ||||||||
State of Hawaii, GO, Series FT, 5.00%, 01/01/38 | 38,555 | 45,093,157 | ||||||
|
| |||||||
| Security | Par (000) | Value | ||||||
| Illinois — 8.0% | ||||||||
Bolingbrook Special Service Area No. 1, Special Tax Bonds, Forest City Project, 5.90%, 03/01/27 | $ | 1,000 | $ | 1,000,810 | ||||
Chicago Board of Education, GO, Refunding Dedicated Revenues, Dedicated Revenues, Series H: | ||||||||
5.00%, 12/01/36 | 4,620 | 4,738,364 | ||||||
5.00%, 12/01/46 | 4,475 | 4,558,906 | ||||||
Chicago Board of Education, GO, Refunding, Dedicated Revenues, Series G, 5.00%, 12/01/34 | 5,000 | 5,155,050 | ||||||
Chicago Board of Education, GO: | ||||||||
Series A, 5.00%, 12/01/42 | 15,895 | 15,894,364 | ||||||
Series C, 5.00%, 12/01/25 | 12,760 | 13,337,773 | ||||||
Series F, 5.00%, 12/01/24 | 9,585 | 10,017,188 | ||||||
City of Chicago Illinois O’Hare International Airport, ARB, Senior Lien, Series D, 5.25%, 01/01/35 | 5,000 | 5,789,350 | ||||||
City of Chicago Illinois O’Hare International Airport, GARB: | ||||||||
3rd Lien, Series C, 6.50%, 01/01/21(c) | 29,835 | 33,186,366 | ||||||
Senior Lien, Series D, 5.25%, 01/01/42 | 49,415 | 56,541,631 | ||||||
City of Chicago Illinois O’Hare International Airport, Refunding GARB, Senior Lien, Series C, AMT, 5.50%, 01/01/34 | 5,380 | 5,960,663 | ||||||
City of Chicago Illinois O’Hare International Airport, Refunding RB, Senior Lien, Series B: | ||||||||
5.00%, 01/01/38 | 31,410 | 35,362,320 | ||||||
5.00%, 01/01/39 | 59,885 | 67,325,711 | ||||||
City of Chicago Illinois Transit Authority, RB, Federal Transit Administration, Section 5309, Series A (AGC), 6.00%, 12/01/18(c) | 15,000 | 15,280,350 | ||||||
City of Chicago O’Hare International Airport, ARB, Senior Lien, Series D, 5.25%, 01/01/33 | 7,340 | 8,534,438 | ||||||
Illinois Finance Authority, RB: | ||||||||
Advocate Health Care Network, Series D, 6.50%, 11/01/18(c) | 7,020 | 7,134,567 | ||||||
Carle Foundation, Series A, 6.00%, 08/15/41 | 6,500 | 7,161,375 | ||||||
Carle Foundation, Series A (AGM), 6.00%, 08/15/41 | 19,285 | 21,247,249 | ||||||
DePaul University, Series A, 6.13%, 04/01/21(c) | 11,935 | 13,256,443 | ||||||
Memorial Health System, Series A, 5.25%, 07/01/44 | 8,370 | 9,019,931 | ||||||
Rush University Medical Center, Series B, 7.25%, 11/01/18(c) | 5,280 | 5,379,950 | ||||||
Rush University Medical Center, Series C, 6.38%, 05/01/19(c) | 2,860 | 2,972,026 | ||||||
University of Chicago, Series B, 6.25%, 07/01/18(c) | 25,035 | 25,035,000 | ||||||
Illinois Finance Authority, Refunding RB: | ||||||||
Central Dupage Health, Series B, 5.50%, 11/01/19(c) | 4,220 | 4,430,705 | ||||||
Central Dupage Health, Series B, 5.75%, 11/01/19(c) | 6,000 | 6,319,140 | ||||||
Northwestern Memorial Healthcare, Series A, 5.00%, 07/15/42 | 20,945 | 23,873,739 | ||||||
Northwestern Memorial Hospital, Series A, 6.00%, 08/15/19(c) | 40,655 | 42,658,479 | ||||||
OSF Healthcare System, 6.00%, 05/15/20(c) | 7,875 | 8,476,256 | ||||||
OSF Healthcare System, 6.00%, 05/15/39 | 2,470 | 2,617,237 | ||||||
Presence Health Network, Series C, 5.00%, 02/15/41 | 26,575 | 30,194,515 | ||||||
Rush University Medical Center Obligated Group, Series A, 7.25%, 11/01/18(c) | 7,605 | 7,748,963 | ||||||
Rush University Medical Center Obligation Group, Series A, 7.25%, 11/01/18(c) | 6,900 | 7,030,617 | ||||||
Illinois State Toll Highway Authority, RB, Series A: | ||||||||
5.00%, 01/01/37 | 3,000 | 3,338,010 | ||||||
5.00%, 01/01/42 | 50,945 | 58,044,186 | ||||||
Railsplitter Tobacco Settlement Authority, RB: | ||||||||
6.00%, 06/01/21(c) | 13,865 | 15,475,559 | ||||||
5.00%, 06/01/26 | 15,000 | 17,178,000 | ||||||
5.00%, 06/01/27 | 6,500 | 7,399,470 | ||||||
| SCHEDULES OF INVESTMENTS | 35 |
Schedule of Investments (continued) June 30, 2018 | BlackRock National Municipal Fund (Percentages shown are based on Net Assets) |
| Security | Par (000) | Value | ||||||
| Illinois (continued) | ||||||||
State of Illinois, GO: | ||||||||
Series A, 5.00%, 09/01/33 | $ | 550 | $ | 550,660 | ||||
Series D, 5.00%, 11/01/25 | 20,500 | 21,816,715 | ||||||
Series D, 5.00%, 11/01/27 | 11,240 | 11,981,053 | ||||||
Series D, 5.00%, 11/01/28 | 60,935 | 64,709,923 | ||||||
State of Illinois Toll Highway Authority, RB, Series B, 5.00%, 01/01/40 | 13,515 | 15,105,580 | ||||||
Village of Hodgkins Illinois, RB, Metropolitan Biosolids Management LLC Project, AMT, 6.00%, 11/01/23 | 10,000 | 10,013,400 | ||||||
|
| |||||||
| 732,852,032 | ||||||||
| Indiana — 2.0% | ||||||||
City of Valparaiso Indiana, RB, Exempt Facilities, Pratt Paper LLC Project, AMT: | ||||||||
6.75%, 01/01/34 | 3,870 | 4,525,346 | ||||||
7.00%, 01/01/44 | 7,330 | 8,626,311 | ||||||
Indiana Finance Authority, RB, Series A: | ||||||||
CWA Authority Project, 1st Lien, 5.25%, 10/01/38 | 17,510 | 19,109,538 | ||||||
Sisters of St. Francis Health Services, | 31,460 | 32,949,002 | ||||||
Indiana Finance Authority, Refunding RB, Series A: | ||||||||
Parkview Health System, 5.75%, 05/01/19(c) | 1,360 | 1,406,879 | ||||||
Parkview Health System, 5.75%, 05/01/31 | 300 | 310,467 | ||||||
Trinity Health, 5.63%, 12/01/19(c) | 12,000 | 12,662,400 | ||||||
Indiana Municipal Power Agency, RB, Series B, 6.00%, 01/01/19(c) | 19,620 | 20,060,273 | ||||||
Indiana Municipal Power Agency, Refunding RB, Series A: | ||||||||
5.00%, 01/01/37 | 1,000 | 1,143,520 | ||||||
5.00%, 01/01/42 | 12,500 | 14,296,750 | ||||||
Indianapolis Local Public Improvement Bond Bank, Refunding RB, Waterworks Project, Series A: | ||||||||
5.75%, 01/01/19(c) | 2,550 | 2,604,086 | ||||||
5.75%, 01/01/38 | 10,505 | 10,708,902 | ||||||
(AGC), 5.50%, 01/01/19(c) | 11,090 | 11,311,578 | ||||||
(AGC), 5.50%, 01/01/38 | 45,635 | 46,464,644 | ||||||
|
| |||||||
| 186,179,696 | ||||||||
| Iowa — 1.0% | ||||||||
Iowa Finance Authority, RB, Iowa Health Care Facilities: | ||||||||
Genesis Health System, 5.50%, 07/01/33 | 18,750 | 21,366,188 | ||||||
Series A (AGC), 5.63%, 08/15/19(c) | 5,240 | 5,470,612 | ||||||
Iowa Finance Authority, Refunding RB, Iowa Fertilizer Co. Project: | ||||||||
Series B, 5.25%, 12/01/50(b) | 47,270 | 50,297,171 | ||||||
Midwestern Disaster Area, 5.50%, 12/01/22 | 120 | 121,226 | ||||||
Midwestern Disaster Area, 5.25%, 12/01/25 | 2,500 | 2,671,925 | ||||||
Iowa Student Loan Liquidity Corp., RB, Senior Series A-2, AMT: | ||||||||
5.40%, 12/01/24 | 5,440 | 5,662,333 | ||||||
5.50%, 12/01/25 | 3,615 | 3,759,455 | ||||||
|
| |||||||
| 89,348,910 | ||||||||
| Kansas — 0.4% | ||||||||
Counties of Sedgwick & Shawnee Kansas, RB, AMT (Ginnie Mae), 6.95%, 06/01/29 | 55 | 55,249 | ||||||
County of Wyandotte Kansas Unified School District, GO, Series A, 5.50%, 09/01/47 | 30,210 | 36,001,559 | ||||||
|
| |||||||
| 36,056,808 | ||||||||
| Kentucky — 1.7% | ||||||||
Kentucky Public Energy Authority, RB, Series A, 4.00%, 04/01/48(b) | 146,500 | 156,164,605 | ||||||
|
| |||||||
| Louisiana — 0.4% | ||||||||
City of New Orleans Louisiana Aviation Board, Refunding GARB, Restructuring, Series A-2 (AGC), | 1,370 | 1,400,743 | ||||||
| Security | Par (000) | Value | ||||||
| Louisiana (continued) | ||||||||
Jefferson Sales Tax District, RB, Special Sales Tax, Series B (AGM), 5.00%, 12/01/42 | $ | 12,160 | $ | 13,958,221 | ||||
Juban Crossing Economic Development District, Refunding RB, General Infrastructure Project, Series C, 7.00%, 09/15/44(d) | 2,500 | 2,591,950 | ||||||
Louisiana Local Government Environmental Facilities & Community Development Authority, RB, Westlake Chemical Corp. Project, Series A-1, 6.50%, 11/01/35 | 17,185 | 18,848,164 | ||||||
|
| |||||||
| 36,799,078 | ||||||||
| Maine — 0.1% | ||||||||
Maine Health & Higher Educational Facilities Authority, RB, Maine General Medical Center, 7.50%, 07/01/32 | 5,365 | 5,971,674 | ||||||
|
| |||||||
| Maryland — 0.2% | ||||||||
City of Baltimore Maryland, Refunding RB, East Baltimore Research Park, Series A: | ||||||||
4.50%, 09/01/33 | 2,735 | 2,843,169 | ||||||
5.00%, 09/01/38 | 1,400 | 1,499,764 | ||||||
Maryland Health & Higher Educational Facilities Authority, RB, University of Maryland Medical System, Series B (NPFGC), 7.00%, 07/01/22(g) | 2,700 | 3,049,245 | ||||||
Maryland Health & Higher Educational Facilities Authority, Refunding RB, Charlestown Community Project, 6.25%, 01/01/21(c) | 11,000 | 12,140,480 | ||||||
|
| |||||||
| 19,532,658 | ||||||||
| Massachusetts — 4.4% | ||||||||
Commonwealth of Massachusetts, GO, Consolidated Loan, Series A: | ||||||||
5.25%, 04/01/42 | 42,000 | 49,289,940 | ||||||
5.25%, 04/01/47 | 91,000 | 106,412,670 | ||||||
Commonwealth of Massachusetts Transportation Fund Revenue, RB, Rail Enhancement & Accelerated Bridge Programs, Series A: | ||||||||
5.00%, 06/01/42 | 10,000 | 11,545,000 | ||||||
5.00%, 06/01/47 | 6,370 | 7,321,933 | ||||||
Massachusetts Development Finance Agency, RB, Series A: | ||||||||
Emerson College Issue, 5.25%, 01/01/42 | 9,655 | 10,774,594 | ||||||
Foxborough Regional Charter School, | 1,375 | 1,517,890 | ||||||
Massachusetts Development Finance Agency, Refunding RB: | ||||||||
Emerson College, Series A, 5.00%, 01/01/40 | 3,735 | 4,139,687 | ||||||
Harvard University, Series A, 5.50%, 11/15/18(c) | 65,395 | 66,375,271 | ||||||
Newbridge on the Charles, Inc., 5.00%, 10/01/37(d) | 1,000 | 1,078,190 | ||||||
Newbridge on the Charles, Inc., 5.00%, 10/01/47(d) | 1,250 | 1,336,750 | ||||||
Partners Healthcare System, 5.00%, 07/01/33 | 5,000 | 5,834,350 | ||||||
Partners Healthcare System, 5.00%, 07/01/34 | 6,000 | 6,952,800 | ||||||
Massachusetts HFA, RB, M/F Housing, Series B, 7.00%, 12/01/38 | 4,585 | 4,644,513 | ||||||
Massachusetts Port Authority, Refunding ARB, AMT, Series A: | ||||||||
5.00%, 07/01/35 | 1,000 | 1,139,720 | ||||||
5.00%, 07/01/37 | 1,600 | 1,818,192 | ||||||
Massachusetts School Building Authority, RB, Senior, Series B: | ||||||||
5.00%, 11/15/36 | 15,270 | 17,636,545 | ||||||
5.00%, 11/15/39 | 12,500 | 14,367,125 | ||||||
University of Massachusetts Building Authority, Refunding RB, Senior Series A: | ||||||||
5.25%, 11/01/42 | 58,840 | 69,908,392 | ||||||
5.25%, 11/01/47 | 14,425 | 17,073,863 | ||||||
|
| |||||||
| 399,167,425 | ||||||||
| 36 | 2018 BLACKROCK ANNUAL REPORTTO SHAREHOLDERS |
Schedule of Investments (continued) June 30, 2018 | BlackRock National Municipal Fund (Percentages shown are based on Net Assets) |
| Security | Par (000) | Value | ||||||
| Michigan — 2.0% | ||||||||
City of Lansing Michigan, RB, Board of Water & Light Utilities System, Series A, 5.50%, 07/01/41 | $ | 6,485 | $ | 7,103,864 | ||||
Great Lakes Water Authority Water Supply System Revenue, Refunding RB, Senior Lien, Series C: | ||||||||
5.25%, 07/01/34 | 17,775 | 20,599,092 | ||||||
5.25%, 07/01/35 | 30,730 | 35,470,717 | ||||||
Michigan Finance Authority, RB, Beaumont Health Credit Group, Series A, 5.00%, 11/01/44 | 5,000 | 5,497,800 | ||||||
Michigan Finance Authority, Refunding RB: | ||||||||
Henry Ford Health System, 5.00%, 11/15/41 | 14,055 | 15,561,415 | ||||||
Trinity Health Credit Group, Series A, 5.00%, 12/01/37 | 23,405 | 26,804,576 | ||||||
Trinity Health Credit Group, Series A, 5.00%, 12/01/42 | 10,150 | 11,518,321 | ||||||
Michigan State Building Authority, Refunding RB, Facilities Program: | ||||||||
Series, 6.00%, 10/15/18(c) | 7,550 | 7,648,754 | ||||||
Series, 6.00%, 10/15/18(c) | 4,490 | 4,548,729 | ||||||
Series, 6.00%, 10/15/38 | 415 | 420,221 | ||||||
Series II-A, 5.38%, 10/15/41 | 3,300 | 3,628,911 | ||||||
Royal Oak Hospital Finance Authority Michigan, Refunding RB: | ||||||||
Beaumont Health Credit Group, Series D, 5.00%, 09/01/39 | 10,010 | 10,962,952 | ||||||
William Beaumont Hospital, Series V, 8.25%, 09/01/18(c) | 18,130 | 18,327,980 | ||||||
William Beaumont Hospital, Series W, 6.00%, 08/01/19(c) | 5,145 | 5,381,310 | ||||||
State of Michigan Building Authority, Refunding RB, Facilities Program, Series I: | ||||||||
6.25%, 10/15/18(c) | 4,540 | 4,602,561 | ||||||
6.25%, 10/15/18(c) | 2,710 | 2,747,344 | ||||||
6.25%, 10/15/38 | 250 | 253,322 | ||||||
|
| |||||||
| 181,077,869 | ||||||||
| Minnesota — 0.4% | ||||||||
City of Minneapolis Minnesota, Refunding RB, Fairview Health Services: | ||||||||
Series A, 6.75%, 11/15/18(c) | 5,940 | 6,056,127 | ||||||
Series B (AGC), 6.50%, 11/15/18(c) | 2,775 | 2,826,726 | ||||||
Series B (AGC), 6.50%, 11/15/38 | 15,240 | 15,524,074 | ||||||
Western Minnesota Municipal Power Agency, RB, Red Rock Hydroelectric Project, Series A, | 6,210 | 7,180,809 | ||||||
|
| |||||||
| 31,587,736 | ||||||||
| Mississippi — 0.0% | ||||||||
County of Warren Mississippi, RB, International Paper Co. Project, Series A, 6.50%, 09/01/32 | 1,890 | 1,904,610 | ||||||
|
| |||||||
| Missouri — 0.0% | ||||||||
City of St. Louis Missouri, RB, Lambert-St. Louis International Airport, Series A-1, 6.25%, 07/01/29 | 1,175 | 1,226,183 | ||||||
|
| |||||||
| Montana — 0.0% | ||||||||
City of Kalispell Montana, Refunding RB, Immanuel Lutheran Corporation Project, Series A: | ||||||||
5.25%, 05/15/37 | 405 | 426,680 | ||||||
5.25%, 05/15/47 | 1,500 | 1,570,245 | ||||||
5.25%, 05/15/52 | 1,500 | 1,564,695 | ||||||
|
| |||||||
| 3,561,620 | ||||||||
| Nebraska — 0.4% | ||||||||
Omaha Public Power District, Seperate Electric System, Refunding RB, Series A: | ||||||||
5.25%, 02/01/42 | 14,265 | 16,185,925 | ||||||
| Security | Par (000) | Value | ||||||
| Nebraska (continued) | ||||||||
5.25%, 02/01/46 | $ | 14,670 | $ | 16,608,054 | ||||
|
| |||||||
| 32,793,979 | ||||||||
| Nevada — 2.2% | ||||||||
City of Las Vegas Nevada, GO, Limited Tax, Performing Arts Center, 6.00%, 04/01/19(c) | 12,925 | 13,351,654 | ||||||
County of Clark Nevada, GO, Stadium Improvement, Series A, 5.00%, 06/01/43 | 74,740 | 86,499,592 | ||||||
County of Clark Nevada Airport System, ARB, Series B, 5.75%, 07/01/42 | 57,700 | 61,195,466 | ||||||
County of Clark Nevada Water Reclamation District, GO, Series B, 5.75%, 07/01/19(c) | 32,685 | 34,024,431 | ||||||
Nevada Department of Business & Industry, RB, Series A(d): | ||||||||
5.00%, 07/15/37 | 875 | 897,400 | ||||||
5.00%, 07/15/47 | 1,400 | 1,424,864 | ||||||
State of Nevada Department of Business & Industry, RB, Somerset Academy, Series A(d): | ||||||||
4.50%, 12/15/29 | 400 | 407,600 | ||||||
5.00%, 12/15/38 | 685 | 705,584 | ||||||
5.00%, 12/15/48 | 810 | 828,679 | ||||||
|
| |||||||
| 199,335,270 | ||||||||
| New Hampshire — 0.3% | ||||||||
New Hampshire Health & Education Facilities Authority, Refunding RB, Dartmouth-Hitchcock, | 15,605 | 16,330,320 | ||||||
New Hampshire Health and Education Facilities Authority Act, Refunding RB, Dartmouth-Hitchcock Obligated Group Issue, Series A: | ||||||||
5.00%, 08/01/36 | 4,000 | 4,515,840 | ||||||
5.00%, 08/01/37 | 3,250 | 3,671,980 | ||||||
|
| |||||||
| 24,518,140 | ||||||||
| New Jersey — 5.7% | ||||||||
County of Cape May New Jersey Industrial Pollution Control Financing Authority, Refunding RB, Atlantic City Electric Co., Series A (NPFGC), 6.80%, 03/01/21 | 5,000 | 5,514,600 | ||||||
County of Essex New Jersey Improvement Authority, RB, AMT, 5.25%, 07/01/45(d) | 5,180 | 5,236,566 | ||||||
County of Monmouth New Jersey Improvement Authority, RB, Brookdale Community College Project, 6.00%, 08/01/18(c) | 3,600 | 3,612,924 | ||||||
New Jersey Economic Development Authority, Refunding RB, School Facilities Construction, Series PP, 5.00%, 06/15/26 | 8,380 | 9,054,422 | ||||||
New Jersey EDA, ARB, Continental Airlines, Inc. Project, 5.13%, 09/15/23 | 5,340 | 5,785,890 | ||||||
New Jersey EDA, RB, Series WW, 5.25%, 06/15/40 | 14,965 | 16,080,491 | ||||||
New Jersey EDA, Refunding RB: | ||||||||
Provident Group-Monteclair Properites LLC (AGM), 5.00%, 06/01/28 | 1,000 | 1,148,600 | ||||||
Provident Group-Monteclair Properites LLC (AGM), 5.00%, 06/01/29 | 1,000 | 1,142,740 | ||||||
Provident Group-Monteclair Properites LLC (AGM), 5.00%, 06/01/37 | 5,800 | 6,475,004 | ||||||
New Jersey American Water Co., Inc. Project, Series B, AMT, 5.60%, 11/01/34 | 8,280 | 8,730,929 | ||||||
Series B, 5.50%, 06/15/30 | 44,645 | 50,707,345 | ||||||
New Jersey Educational Facilities Authority, Refunding RB, University of Medicine & Dentistry, Series B(c): | ||||||||
7.13%, 06/01/19 | 2,870 | 3,014,677 | ||||||
7.50%, 06/01/19 | 9,200 | 9,694,868 | ||||||
| SCHEDULES OF INVESTMENTS | 37 |
Schedule of Investments (continued) June 30, 2018 | BlackRock National Municipal Fund (Percentages shown are based on Net Assets) |
| Security | Par (000) | Value | ||||||
| New Jersey (continued) | ||||||||
New Jersey Health Care Facilities Financing Authority, Refunding RB: | ||||||||
AHS Hospital Corp., 6.00%, 07/01/21(c) | $ | 1,200 | $ | 1,345,164 | ||||
AHS Hospital Corp., 6.00%, 07/01/21(c) | 33,185 | 37,199,389 | ||||||
Hackensack Meridian Health Obligated Group Issue, Series A, 5.00%, 07/01/35 | 7,375 | 8,467,533 | ||||||
Hackensack Meridian Health Obligated Group Issue, Series A, 5.00%, 07/01/38 | 6,450 | 7,378,284 | ||||||
Hackensack Meridian Health Obligated Group Issue, Series A, 5.00%, 07/01/39 | 22,245 | 25,390,443 | ||||||
RWJ Barnabas Health Obligated Group, Series A, 5.00%, 07/01/43 | 17,110 | 18,974,306 | ||||||
St. Joseph’s Healthcare System, 6.63%, 07/01/18(c) | 200 | 200,000 | ||||||
New Jersey Higher Education Student Assistance Authority, Refunding RB, AMT: | ||||||||
Series 1, 5.75%, 12/01/27 | 280 | 300,362 | ||||||
Series 1, 5.75%, 12/01/28 | 230 | 246,266 | ||||||
Student Loan, Series 1B, 2.95%, 12/01/28 | 16,000 | 15,922,400 | ||||||
New Jersey Transportation Trust Fund Authority, RB: | ||||||||
Federal Highway Reimbursement Revenue Notes, Series A, 5.00%, 06/15/31 | 7,600 | 7,616,720 | ||||||
Transportation System, Series A, 6.00%, 06/15/35 | 2,155 | 2,347,635 | ||||||
Transportation System, Series A, 5.88%, 12/15/38 | 14,255 | 14,480,229 | ||||||
Transportation System, Series A, 5.50%, 06/15/41 | 1,855 | 1,937,436 | ||||||
Transportation System, Series A, 5.00%, 06/15/42 | 5,695 | 5,913,688 | ||||||
Transportation System, Series AA, 5.50%, 06/15/39 | 39,890 | 42,662,754 | ||||||
Transportation System, Series B, 5.25%, 06/15/36 | 14,410 | 15,008,015 | ||||||
Transportation System, Series C, 5.25%, 06/15/32 | 19,810 | 21,403,714 | ||||||
New Jersey Turnpike Authority, RB, Series A, 5.00%, 01/01/34 | 6,500 | 7,431,775 | ||||||
New Jersey Turnpike Authority, Refunding RB: | ||||||||
Series B, 5.00%, 01/01/34 | 3,000 | 3,463,050 | ||||||
Series E, 5.00%, 01/01/31 | 6,500 | 7,625,800 | ||||||
Series G, 5.00%, 01/01/36 | 34,850 | 40,043,695 | ||||||
Series G, 5.00%, 01/01/37 | 27,230 | 31,263,852 | ||||||
South Jersey Port Corp., ARB, Marine Terminal, Series B, AMT, 5.00%, 01/01/42 | 2,535 | 2,762,897 | ||||||
State of New Jersey, GO: | ||||||||
4.00%, 06/01/28 | 15,620 | 16,219,339 | ||||||
4.00%, 06/01/30 | 22,355 | 23,109,928 | ||||||
4.00%, 06/01/31 | 13,000 | 13,409,110 | ||||||
4.00%, 06/01/32 | 9,180 | 9,447,964 | ||||||
Tobacco Settlement Financing Corp., Refunding RB, Series A, 5.25%, 06/01/46 | 10,350 | 11,643,129 | ||||||
|
| |||||||
| 519,413,933 | ||||||||
| New Mexico — 0.1% | ||||||||
County of Santa Fe New Mexico, RB, (AGM), 6.00%, 02/01/27 | 250 | 290,500 | ||||||
University of New Mexico, RB, Sub Lien, System Improvement, 5.00%, 06/01/47 | 7,365 | 8,373,342 | ||||||
|
| |||||||
| 8,663,842 | ||||||||
| New York — 15.1% | ||||||||
City of New York New York, GO: | ||||||||
Sub-Series E-1, 6.25%, 10/15/18(c) | 12,875 | 13,053,190 | ||||||
Sub-Series E-1, 6.25%, 10/15/28 | 575 | 582,987 | ||||||
Sub-Series F-1, 5.00%, 04/01/43 | 72,410 | 83,901,467 | ||||||
City of New York New York Housing Development Corp., RB, M/F Housing, Series M: | ||||||||
6.50%, 11/01/28 | 4,300 | 4,355,728 | ||||||
6.88%, 11/01/38 | 7,785 | 7,886,127 | ||||||
| Security | Par (000) | Value | ||||||
| New York (continued) | ||||||||
City of New York New York Municipal Water Finance Authority, Refunding RB, 2nd General Resolution: | ||||||||
Subseries, 5.25%, 06/15/37 | $ | 45,000 | $ | 53,095,950 | ||||
Water & Sewer System, Fiscal 2017, Series EE, 5.25%, 06/15/37 | 7,525 | 8,884,090 | ||||||
Water & Sewer System, Series EE, 5.38%, 06/15/43 | 9,825 | 10,655,704 | ||||||
City of New York New York Water & Sewer System, Refunding RB: | ||||||||
2nd General Resolution, Fiscal 2009, Series EE, 5.25%, 06/15/40 | 13,355 | 13,793,311 | ||||||
2nd General Resolution, Series FF-2, 5.50%, 06/15/40 | 73,585 | 76,222,286 | ||||||
Second Generation Resolution, Series GG-2, 5.25%, 06/15/40 | 7,500 | 7,746,150 | ||||||
City of New York Transitional Finance Authority Building Aid Revenue, RB, Series S-3, 5.25%, 07/15/45 | 21,790 | 25,782,364 | ||||||
City of New York Transitional Finance Authority Future Tax Secured Revenue, RB, Subordinate, Series C-3, 5.00%, 05/01/40 | 20,000 | 23,197,200 | ||||||
City of New York Water & Sewer System, Refunding RB: | ||||||||
2nd Generation Resolution, Series FF, 5.00%, 06/15/40 | 20,000 | 23,306,400 | ||||||
Series EE, 5.00%, 06/15/40 | 26,000 | 30,111,900 | ||||||
Counties of New York Tobacco Trust IV, Refunding RB, Settlement Pass-Through Turbo, Series A, 5.00%, 06/01/45 | 16,695 | 16,625,048 | ||||||
Counties of New York Tobacco Trust VI, Refunding RB, Tobacco Settlement Pass-Through, Series A-2B, 5.00%, 06/01/51 | 4,325 | 4,520,144 | ||||||
Hudson Yards Infrastructure Corp., RB, Senior, Fiscal 2012: | ||||||||
5.75%, 02/15/21(c) | 5,590 | 6,157,832 | ||||||
5.75%, 02/15/47 | 3,435 | 3,728,693 | ||||||
Hudson Yards Infrastructure Corp., Refunding RB, Series A: | ||||||||
5.00%, 02/15/38 | 10,260 | 11,765,655 | ||||||
5.00%, 02/15/39 | 17,650 | 20,182,598 | ||||||
Long Island Power Authority, RB, General, Electric Systems, 5.00%, 09/01/42 | 9,000 | 10,254,150 | ||||||
Long Island Power Authority, Refunding RB, Electric System, Series A, 6.00%, 05/01/19(c) | 56,950 | 59,058,858 | ||||||
Metropolitan Transportation Authority, RB: | ||||||||
Series A-1, 5.25%, 11/15/39 | 30,000 | 33,829,200 | ||||||
Series C, 6.50%, 11/15/18(c) | 17,505 | 17,839,170 | ||||||
Series C, 6.50%, 11/15/18(c) | 1,450 | 1,477,681 | ||||||
Series C, 6.50%, 11/15/28 | 4,510 | 4,590,819 | ||||||
Sub-Series D-1, 5.25%, 11/15/44 | 38,000 | 43,203,340 | ||||||
Metropolitan Transportation Authority, Refunding RB: | ||||||||
Green Bond, Series C-1, 5.00%, 11/15/34 | 45,015 | 52,277,270 | ||||||
Series B, 5.00%, 11/15/37 | 20,000 | 22,670,600 | ||||||
Series D, 5.00%, 11/15/35 | 17,670 | 20,390,650 | ||||||
SubSeries C-1, 5.25%, 11/15/31 | 14,000 | 16,187,780 | ||||||
New York City Transitional Finance Authority Building Aid Revenue, RB, Series S-3, 5.00%, 07/15/43 | 10,000 | 11,543,500 | ||||||
New York City Transitional Finance Authority Future Tax Secured Revenue, RB, Subordinate, Series C-3, 5.00%, 05/01/39 | 25,000 | 28,996,500 | ||||||
New York City Water & Sewer System, Refunding RB: | ||||||||
2nd General Resolution Series CC, 5.25%, 06/15/46 | 65,965 | 76,595,260 | ||||||
2nd General Resolution Sub Series CC1, 5.00%, 06/15/37 | 25,000 | 28,727,250 | ||||||
Second Genration Resolution, 5.00%, 06/15/37 | 10,000 | 11,551,000 | ||||||
| 38 | 2018 BLACKROCK ANNUAL REPORTTO SHAREHOLDERS |
Schedule of Investments (continued) June 30, 2018 | BlackRock National Municipal Fund (Percentages shown are based on Net Assets) |
| Security | Par (000) | Value | ||||||
| New York (continued) | ||||||||
Series DD-2, Block 5, 5.00%, 06/15/40 | $ | 24,530 | $ | 28,409,419 | ||||
Series EE, 5.25%, 06/15/36 | 15,500 | 18,312,785 | ||||||
New York Counties Tobacco Trust IV, Refunding RB, Settlement Pass-Through Turbo, Series A, 6.25%, 06/01/41(d) | 8,100 | 8,425,701 | ||||||
New York State Dormitory Authority, RB, Bid Group 3, Series A, 5.00%, 03/15/41 | 14,310 | 16,611,191 | ||||||
New York Transportation Development Corp., ARB, LaGuardia Airport Terminal B Redevelopment Project, Series A, AMT, 5.00%, 07/01/41 | 5,115 | 5,529,520 | ||||||
New York Transportation Development Corp., Refunding ARB, American Airlines, Inc., AMT: | ||||||||
5.00%, 08/01/26 | 6,000 | 6,330,240 | ||||||
5.00%, 08/01/31 | 48,265 | 50,631,916 | ||||||
Niagara Area Development Corp., Refunding RB, Solid Waste Disposal Facility, Covanta Energy Project, Series A, AMT, 5.25%, 11/01/42(d) | 5,000 | 5,003,250 | ||||||
Port Authority of New York & New Jersey, Refunding ARB: | ||||||||
194th Series, 5.25%, 10/15/55 | 37,020 | 42,120,245 | ||||||
Consolidated, 198th Series, 5.25%, 11/15/56 | 55,140 | 63,683,943 | ||||||
State of New York Dormitory Authority, RB: | ||||||||
Bid Group 3, Series A, 5.00%, 03/15/42 | 10,000 | 11,598,900 | ||||||
Bid Group 3, Series A, 5.00%, 03/15/43 | 10,000 | 11,589,900 | ||||||
Education, Series B, 5.75%, 03/15/19(c) | 19,280 | 19,856,279 | ||||||
Group 4, Series A, 5.00%, 03/15/45 | 5,000 | 5,785,850 | ||||||
Sales Tax, Series A-Group C, 5.00%, 03/15/42 | 7,120 | 8,161,870 | ||||||
Sales Tax, Series A-Group C, 5.00%, 03/15/43 | 5,050 | 5,784,826 | ||||||
Sales Tax, Series A-Group C, 5.00%, 03/15/44 | 7,770 | 8,887,870 | ||||||
Series A, 5.00%, 02/15/42 | 10,000 | 11,361,600 | ||||||
Triborough Bridge & Tunnel Authority, RB, MTA Bridges & Tunnels, Series A, 5.00%, 11/15/45 | 15,535 | 17,998,385 | ||||||
Triborough Bridge & Tunnel Authority, Refunding RB: | ||||||||
General, MTA Bridges & Tunnels, Series C-2, 5.00%, 11/15/42 | 52,330 | 60,495,573 | ||||||
General, Series A, 5.25%, 11/15/45 | 7,805 | 8,944,530 | ||||||
MTA Bridges & Tunnels, Series A, 5.00%, 11/15/43 | 16,470 | 19,111,953 | ||||||
Utility Debt Securitization Authority, Refunding RB, Restructuring, Series E, 5.00%, 12/15/41 | 51,670 | 58,016,626 | ||||||
Westchester Tobacco Asset Securitization, Refunding RB, Tobacco Settlement Bonds, Sub-Series C, 5.13%, 06/01/51 | 2,500 | 2,572,850 | ||||||
|
| |||||||
| 1,379,973,074 | ||||||||
| North Carolina — 0.0% | ||||||||
County of Columbus North Carolina Industrial Facilities & Pollution Control Financing Authority, RB, International Paper Co. Projects, Series B, 6.25%, 11/01/33 | 3,000 | 3,170,610 | ||||||
|
| |||||||
| Ohio — 1.3% | ||||||||
Buckeye Tobacco Settlement Financing Authority, RB: | ||||||||
6.25%, 06/01/37 | 15,450 | 16,131,654 | ||||||
Asset-Backed, Senior Turbo Term, Series A-2, 5.75%, 06/01/34 | 2,500 | 2,503,100 | ||||||
Asset-Backed, Senior Turbo Term, Series A-2, 5.88%, 06/01/47 | 10,250 | 10,293,767 | ||||||
County of Butler Port Authority, RB, StoryPoint Fairfield Project, Series A-1(d): | ||||||||
6.38%, 01/15/43 | 1,500 | 1,577,970 | ||||||
6.50%, 01/15/52 | 3,335 | 3,515,524 | ||||||
County of Lucas Ohio, Refunding RB, Promedica Healthcare, Series A(c): | ||||||||
5.75%, 11/15/21 | 500 | 562,130 | ||||||
6.00%, 11/15/21 | 4,415 | 4,999,414 | ||||||
6.50%, 11/15/21 | 12,690 | 14,575,734 | ||||||
| Security | Par (000) | Value | ||||||
| Ohio (continued) | ||||||||
County of Montgomery Ohio, Refunding RB, Catholic Health: | ||||||||
5.50%, 05/01/19(c) | $ | 3,695 | $ | 3,813,240 | ||||
Series A, 5.50%, 05/01/34 | 6,900 | 7,065,393 | ||||||
State of Ohio, GO, Series A, 5.00%, 02/01/38 | 20,690 | 23,611,221 | ||||||
State of Ohio, Refunding RB, Cleveland Clinic Health, Series A, 5.50%, 01/01/19(c) | 17,195 | 17,538,556 | ||||||
State of Ohio Turnpike Commission, RB, Junior Lien, Series A, 5.25%, 02/15/39 | 7,500 | 8,297,175 | ||||||
|
| |||||||
| 114,484,878 | ||||||||
| Pennsylvania — 3.9% | ||||||||
Allegheny County Hospital Development Authority, RB, University of Pittsburgh Medical Center, 5.63%, 08/15/39 | 9,380 | 9,764,017 | ||||||
Allentown Neighborhood Improvement Zone Development Authority, RB, City Center Project(d): | ||||||||
5.00%, 05/01/27 | 3,250 | 3,609,515 | ||||||
5.00%, 05/01/32 | 3,750 | 4,090,500 | ||||||
5.00%, 05/01/42 | 6,305 | 6,803,789 | ||||||
City of Philadelphia Pennsylvania Gas Works, RB, 12th Series B (NPFGC), 7.00%, 05/15/20(g) | 1,170 | 1,248,390 | ||||||
County of Cumberland Pennsylvania Municipal Authority, Refunding RB, Diakon Lutheran: | ||||||||
6.38%, 01/01/19(c) | 9,520 | 9,746,290 | ||||||
6.38%, 01/01/39 | 1,055 | 1,073,652 | ||||||
County of Dauphin General Authority, Refunding RB, Pinnacle Health System Project: | ||||||||
6.00%, 06/01/29 | 6,670 | 6,911,387 | ||||||
6.00%, 06/01/19(c) | 6,090 | 6,332,443 | ||||||
County of Dauphin Pennsylvania General Authority, Refunding RB, Pinnacle Health System Project: | ||||||||
6.00%, 06/01/19(c) | 3,295 | 3,426,174 | ||||||
6.00%, 06/01/36 | 595 | 614,831 | ||||||
County of Northampton Pennsylvania IDA, Route 33 Project, Tax Allocation Bonds, 7.00%, 07/01/32 | 2,265 | 2,584,161 | ||||||
Pennsylvania Economic Development Financing Authority, RB, Project: | ||||||||
American Water Co., 6.20%, 04/01/39 | 3,475 | 3,584,289 | ||||||
Waste Management, Inc., Series A, AMT, 1.70%, 08/01/37(b) | 8,570 | 8,426,453 | ||||||
Pennsylvania Turnpike Commission, RB: | ||||||||
Series A, 5.25%, 12/01/44 | 30,000 | 35,525,100 | ||||||
Series B, 5.25%, 12/01/39 | 3,560 | 3,995,246 | ||||||
Series B (BAM), 5.25%, 12/01/44 | 8,000 | 8,963,280 | ||||||
Sub-Series A, 5.50%, 12/01/46 | 46,430 | 53,216,673 | ||||||
Sub-Series B-1, 5.00%, 06/01/37 | 11,205 | 12,445,618 | ||||||
Sub-Series B-1, 5.00%, 06/01/42 | 8,000 | 8,834,240 | ||||||
Sub-Series B-1, 5.25%, 06/01/47 | 79,500 | 89,614,785 | ||||||
Subordinate, Special Motor License Fund, 6.00%, 12/01/20(c) | 1,195 | 1,314,667 | ||||||
Pennsylvania Turnpike Commission, Refunding RB, Sub-Series A-1, 5.25%, 12/01/45 | 22,000 | 24,584,780 | ||||||
Philadelphia Authority for Industrial Development, RB, University of the Sciences, 5.00%, 11/01/47 | 30,000 | 33,390,600 | ||||||
Philadelphia Gas Works Co, Refunding RB, 1988 General Ordinance, Series Fifteenth, 5.00%, 08/01/42 | 15,000 | 16,798,500 | ||||||
|
| |||||||
| 356,899,380 | ||||||||
| Rhode Island — 0.1% | ||||||||
Tobacco Settlement Financing Corp., Refunding RB, Series B, 5.00%, 06/01/50 | 10,000 | 10,305,700 | ||||||
|
| |||||||
| SCHEDULES OF INVESTMENTS | 39 |
Schedule of Investments (continued) June 30, 2018 | BlackRock National Municipal Fund (Percentages shown are based on Net Assets) |
| Security | Par (000) | Value | ||||||
| South Carolina — 0.5% | ||||||||
South Carolina Jobs EDA, Refunding RB, Palmetto Health, Series A (AGM)(c): | ||||||||
6.50%, 08/01/21 | $ | 4,455 | $ | 5,059,009 | ||||
6.25%, 08/01/21 | 1,525 | 1,720,429 | ||||||
South Carolina Jobs-Economic Development Authority, Refunding RB, the Woodlands at Furman, 5.25%, 11/15/37 | 6,005 | 6,523,832 | ||||||
South Carolina Jobs-EDA, Refunding RB, The Lutheran Homes of South Carolina, Inc., 5.00%, 05/01/42 | 250 | 261,418 | ||||||
South Carolina Ports Authority, ARB, AMT: | ||||||||
5.00%, 07/01/35 | 5,250 | 6,009,360 | ||||||
5.00%, 07/01/36 | 6,380 | 7,285,322 | ||||||
5.00%, 07/01/37 | 3,750 | 4,275,262 | ||||||
5.00%, 07/01/43 | 6,500 | 7,386,795 | ||||||
State of South Carolina Public Service Authority, Refunding RB, Santee Cooper, Series A, 5.75%, 12/01/43 | 10,000 | 11,063,700 | ||||||
|
| |||||||
| 49,585,127 | ||||||||
| Tennessee — 0.3% | ||||||||
Tennessee Energy Acquisition Corp., RB, Series A, 5.25%, 09/01/18 | 25,000 | 25,143,750 | ||||||
|
| |||||||
| Texas — 9.0% | ||||||||
City of Arlington Texas, Special Tax Bonds, Series A (AGM), 5.00%, 02/15/43 | 12,500 | 14,304,875 | ||||||
City of Houston Texas Airport System, Refunding ARB: | ||||||||
Senior Lien, Series A, 5.50%, 07/01/39 | 10,000 | 10,029,500 | ||||||
United Airlines, Inc., Airport Improvement Projects, Series C, AMT, 5.00%, 07/15/20 | 6,535 | 6,880,832 | ||||||
City of Houston Texas Combined Utility System Revenue, Refunding RB, Combined 1st Lien, Series A (AGC): | ||||||||
6.00%, 05/15/19(c) | 30,645 | 31,803,075 | ||||||
6.00%, 11/15/35 | 1,705 | 1,770,182 | ||||||
5.38%, 11/15/38 | 1,855 | 1,912,709 | ||||||
City of Houston Texas Utility System, Refunding RB, Series A, 1st Lien, 5.25%, 11/15/30 | 24,305 | 26,191,797 | ||||||
City of San Antonio Texas Electric & Gas Systems Revenue, Refunding RB, 5.00%, 02/01/41 | 4,175 | 4,809,057 | ||||||
City of Texas El Paso, GO, 5.00%, 08/15/42 | 15,845 | 17,941,610 | ||||||
County of Harris Texas Cultural Education Facilities Finance Corp., RB: | ||||||||
1st Mortgage, Brazos Presbyterian Homes, Inc. Project, Series B, 7.00%, 01/01/23(c) | 1,075 | 1,297,740 | ||||||
1st Mortgage, Brazos Presbyterian Homes, Inc. Project, Series B, 7.00%, 01/01/23(c) | 2,625 | 3,168,900 | ||||||
1st Mortgage, Brazos Presbyterian Homes, Inc. Project, Series B, 6.38%, 01/01/33 | 465 | 522,618 | ||||||
Texas Children’s Hospital Project, 5.50%, 10/01/39 | 8,500 | 8,895,845 | ||||||
County of Matagorda Texas Navigation District No. 1, Refunding RB, Central Power & Light Co., Project, Series A, 6.30%, 11/01/29 | 9,775 | 10,378,509 | ||||||
County of Tarrant Texas Cultural Education Facilities Finance Corp., RB, Scott & White Healthcare(c): | ||||||||
6.00%, 08/15/20 | 3,700 | 4,022,048 | ||||||
6.00%, 08/15/20 | 46,300 | 50,380,419 | ||||||
Dallas Area Rapid Transit, Refunding RB, Series A, 5.00%, 12/01/46 | 18,230 | 20,532,996 | ||||||
Dallas-Fort Worth International Airport, ARB, Joint Improvement, AMT: | ||||||||
Series D, 5.00%, 11/01/38 | 11,265 | 12,080,248 | ||||||
Series D, 5.00%, 11/01/43 | 11,850 | 12,529,242 | ||||||
Series H, 5.00%, 11/01/42 | 25,265 | 26,869,328 | ||||||
Dallas-Fort Worth Texas International Airport, ARB, Joint Improvement, Series H, AMT, 5.00%, 11/01/37 | 32,100 | 34,444,263 | ||||||
| Security | Par (000) | Value | ||||||
| Texas (continued) | ||||||||
Grand Parkway Transportation Corp., RB: | ||||||||
Series B, 5.25%, 10/01/51 | $ | 22,155 | $ | 24,773,056 | ||||
Subordinate Tier, Tela Supported, Series A, 5.00%, 10/01/43 | 74,060 | 85,408,954 | ||||||
Little Elm Independent School District, GO, School Building (PSF-GTD), 5.00%, 08/15/46 | 17,340 | 19,967,530 | ||||||
Lower Colorado River Authority, Refunding RB, 5.50%, 05/15/30 | 6,085 | 6,964,465 | ||||||
New Hope Cultural Education Facilities Finance Corp., RB, Jubilee Academic Center Project, Series A(d): | ||||||||
5.00%, 08/15/37 | 2,000 | 2,002,180 | ||||||
5.13%, 08/15/47 | 2,085 | 2,085,167 | ||||||
North Texas Tollway Authority, RB, Special Projects System, Series A, 6.00%, 09/01/21(c) | 4,815 | 5,401,997 | ||||||
North Texas Tollway Authority, Refunding RB: | ||||||||
6.00%, 01/01/19(c) | 10,265 | 10,495,347 | ||||||
6.00%, 01/01/25 | 2,365 | 2,413,790 | ||||||
1st Tier System, 6.00%, 01/01/21(c) | 11,490 | 12,656,005 | ||||||
1st Tier System, Series A, 6.00%, 01/01/28 | 185 | 188,789 | ||||||
1st Tier System, Series K-2 (AGC), 6.00%, 01/01/19(c) | 2,245 | 2,295,378 | ||||||
1st Tier-Series A, 5.00%, 01/01/43 | 48,975 | 55,799,666 | ||||||
Northwest Independent School District, GO, School Building (PSF-GTD), 5.00%, 02/15/45 | 41,750 | 46,514,093 | ||||||
San Antonio Water System, Refunding RB, Junior Lien: | ||||||||
Series A, 5.00%, 05/15/43 | 6,000 | 6,934,860 | ||||||
System, Series C, 5.00%, 05/15/36 | 5,490 | 6,296,920 | ||||||
System, Series C, 5.00%, 05/15/41 | 8,765 | 10,004,546 | ||||||
Tarrant County Cultural Education Facilities Finance Corp., Refunding RB, 5.00%, 02/15/47 | 5,000 | 5,585,650 | ||||||
Texas Private Activity Bond Surface Transportation Corp., RB, Senior Lien: | ||||||||
LBJ Infrastructure Group LLC, 7.00%, 06/30/40 | 48,215 | 52,287,239 | ||||||
NTE Mobility Partners LLC, North Tarrant Express Managed Lanes Project, 6.88%, 12/31/39 | 33,065 | 35,159,006 | ||||||
Texas Water Development Board, RB: | ||||||||
State Revolving Fund, 5.00%, 08/01/37 | 7,000 | 8,135,400 | ||||||
State Water Implementation Fund, Series A, 5.00%, 10/15/43 | 35,000 | 40,573,400 | ||||||
State Water Implementation Revenue, 5.25%, 10/15/46 | 65,170 | 76,007,119 | ||||||
|
| |||||||
| 818,716,350 | ||||||||
| Utah — 2.0% | ||||||||
County of Utah Utah, RB, IHC Health Services, Inc.: | ||||||||
5.00%, 05/15/43 | 70,000 | 75,597,200 | ||||||
Series B, 5.00%, 05/15/46 | 22,500 | 25,396,200 | ||||||
County of Utah, Utah, RB, IHC Health Services, Inc., Series A, 5.00%, 05/15/41(a) | 44,970 | 50,467,582 | ||||||
Utah State Charter School Finance Authority, Refunding RB, The Freedom Academy Foundation Project(d): | ||||||||
5.25%, 06/15/37 | 3,795 | 3,849,003 | ||||||
5.38%, 06/15/48 | 4,740 | 4,801,952 | ||||||
Utah Transit Authority, Refunding RB, Series A, 5.00%, 06/15/38 | 20,000 | 22,693,600 | ||||||
|
| |||||||
| 182,805,537 | ||||||||
| Virginia — 0.4% | ||||||||
Ballston Quarter Community Development Authority, Tax Allocation Bonds, Series A, 5.50%, 03/01/46 | 1,815 | 1,900,940 | ||||||
Virginia Commonwealth Transportation Board, Refunding RB, Series A, 5.00%, 05/15/33 | 2,500 | 2,943,550 | ||||||
| 40 | 2018 BLACKROCK ANNUAL REPORTTO SHAREHOLDERS |
Schedule of Investments (continued) June 30, 2018 | BlackRock National Municipal Fund (Percentages shown are based on Net Assets) |
| Security | Par (000) | Value | ||||||
| Virginia (continued) | ||||||||
Virginia Small Business Financing Authority, RB, Senior Lien, Elizabeth River Crossings OpCo LLC Project, AMT, 6.00%, 01/01/37 | $ | 25,515 | $ | 28,234,389 | ||||
|
| |||||||
| 33,078,879 | ||||||||
| Washington — 1.8% | ||||||||
Port of Seattle Washington, ARB, Intermediate Lien, Series C, AMT, 5.25%, 05/01/42 | 36,500 | 41,970,985 | ||||||
Port of Seattle Washington, RB, AMT, Series A, 5.00%, 05/01/43 | 17,910 | 20,093,229 | ||||||
University of Washington, Refunding RB, Series A, 5.25%, 12/01/46 | 30,385 | 35,482,388 | ||||||
Washington Health Care Facilities Authority, RB: | ||||||||
Catholic Health Initiatives, Series A, 5.75%, 01/01/45 | 21,355 | 23,365,146 | ||||||
MultiCare Health System, Series B (AGC), 6.00%, 08/15/19(c) | 2,000 | 2,096,280 | ||||||
Swedish Health Services, Series A, 6.75%, 05/15/21(c) | 16,000 | 18,193,120 | ||||||
Washington Health Care Facilities Authority, Refunding RB: | ||||||||
Catholic Health Initiatives, Series D, 6.38%, 10/01/36 | 10,090 | 10,192,817 | ||||||
Multicare Health System, Series B, 5.00%, 08/15/37 | 10,680 | 12,250,601 | ||||||
|
| |||||||
| 163,644,566 | ||||||||
| Wisconsin — 0.3% | ||||||||
Public Finance Authority, RB(d): | ||||||||
Alabama Proton Therapy Center, Series A, 6.25%, 10/01/31 | 1,715 | 1,680,065 | ||||||
Alabama Proton Therapy Center, Series A, 7.00%, 10/01/47 | 1,715 | 1,722,838 | ||||||
American Preparatory AcAdemy, 5.38%, 07/15/52 | 6,760 | 6,912,708 | ||||||
Delray Beach Radiation Therapy, 7.00%, 11/01/46 | 6,385 | 6,670,410 | ||||||
Mary’s Woods at Marylhurst Project, 5.25%, 05/15/47 | 1,000 | 1,088,340 | ||||||
Public Finance Authority, Refunding RB: | ||||||||
AMT, National Gypsum Co., 5.25%, 04/01/30 | 5,900 | 6,308,398 | ||||||
WhiteStone, Retirement Facilities First Mortgage Revenue, 5.00%, 03/01/37(d) | 760 | 820,367 | ||||||
|
| |||||||
| 25,203,126 | ||||||||
|
| |||||||
Total Long-Term Investments — 99.0% |
| 9,017,790,991 | ||||||
|
| |||||||
| Security | Shares | Value | ||||||
| Short-Term Securities — 1.0% | ||||||||
BlackRock Liquidity Funds, MuniCash, Institutional Class, | 91,132,514 | $ | 91,141,627 | |||||
|
| |||||||
Total Short-Term Securities — 1.0% |
| 91,141,627 | ||||||
|
| |||||||
Total Investments — 100.0% |
| 9,108,932,618 | ||||||
Other Assets Less Liabilities — 0.0% |
| 2,612,013 | ||||||
|
| |||||||
Net Assets — 100.0% |
| $ | 9,111,544,631 | |||||
|
| |||||||
| (a) | When-issued security. |
| (b) | Variable or floating rate security, which interest rate adjusts periodically based on changes in current interest rates and prepayments on the underlying pool of assets. Rate shown is the rate in effect as of period end. |
| (c) | U.S. Government securities, held in escrow, are used to pay interest on this security, as well as to retire the bond in full at the date indicated, typically at a premium to par. |
| (d) | Security exempt from registration pursuant to Rule 144A under the Securities Act of 1933, as amended. These securities may be resold in transactions exempt from registration to qualified institutional investors. |
| (e) | Issuer filed for bankruptcy and/or is in default. |
| (f) | Non-income producing security. |
| (g) | Security is collateralized by municipal bonds or U.S. Treasury obligations. |
| (h) | Annualized 7-day yield as of period end. |
| (i) | During the year ended June 30, 2018, investments in issuers considered to be an affiliate of the Fund for purposes of Section 2(a)(3) of the Investment Company Act of 1940, as amended, were as follows: |
| Affiliated | Shares Held at 06/30/17 | Net Activity | Shares Investment Value Held at 06/30/18 | Value at 06/30/18 | Income | Net Realized | Change in Unrealized Appreciation (Depreciation) | |||||||||||||||||||||
BlackRock Liquidity Funds, MuniCash, Institutional Class | 429,034,619 | (337,902,105 | ) | 91,132,514 | $ | 91,141,627 | $ | 3,587,475 | $ | 23,438 | $ | (35,618 | ) | |||||||||||||||
|
|
|
|
|
|
|
| |||||||||||||||||||||
| (a) | Includes net capital gain distributions, if applicable. |
Derivative Financial Instruments Outstanding as of Period End
Futures Contracts
| Description | Number of Contracts | Expiration Date | Notional Amount (000) | Value/ Unrealized Appreciation (Depreciation) | ||||||||||||
Short Contracts: | ||||||||||||||||
10-Year U.S. Treasury Note | 1,343 | 09/19/18 | $ | 161,412 | $ | (500,627 | ) | |||||||||
Long U.S. Treasury Bond | 1,308 | 09/19/18 | 189,660 | (2,339,041 | ) | |||||||||||
5-Year U.S. Treasury Note | 200 | 09/28/18 | 22,723 | (14,524 | ) | |||||||||||
|
| |||||||||||||||
| $ | (2,854,192 | ) | ||||||||||||||
|
| |||||||||||||||
| SCHEDULES OF INVESTMENTS | 41 |
Schedule of Investments (continued) June 30, 2018 | BlackRock National Municipal Fund |
Derivative Financial Instruments Categorized by Risk Exposure
As of year end, the fair values of derivative financial instruments located in the Statements of Assets and Liabilities were as follows:
| Commodity Contracts | Credit Contracts | Equity Contracts | Foreign Currency Exchange Contracts | Interest Rate Contracts | Other Contracts | Total | ||||||||||||||||||||||
Liabilities — Derivative Financial Instruments | ||||||||||||||||||||||||||||
Futures contracts | ||||||||||||||||||||||||||||
Net unrealized depreciation(a) | $ | — | $ | — | $ | — | $ | — | $ | 2,854,192 | $ | — | $ | 2,854,192 | ||||||||||||||
|
|
|
|
|
|
|
|
|
|
|
|
|
| |||||||||||||||
| (a) | Includes cumulative appreciation (depreciation) on futures contracts if any, as reported in the Schedule of Investments. Only current day’s variation margin is reported within the Statements of Assets and Liabilities. |
For the year ended June 30, 2018, the effect of derivative financial instruments in the Statements of Operations was as follows:
| Commodity Contracts | Credit Contracts | Equity Contracts | Foreign Currency Exchange Contracts | Interest Rate Contracts | Other Contracts | Total | ||||||||||||||||||||||
Net Realized Gain (Loss) from: | ||||||||||||||||||||||||||||
Futures contracts | $ | — | $ | — | $ | — | $ | — | $ | 22,567,889 | $ | — | $ | 22,567,889 | ||||||||||||||
|
|
|
|
|
|
|
|
|
|
|
|
|
| |||||||||||||||
Net Change in Unrealized Appreciation (Depreciation) on: | ||||||||||||||||||||||||||||
Futures contracts | $ | — | $ | — | $ | — | $ | — | $ | (2,717,461 | ) | $ | — | $ | (2,717,461 | ) | ||||||||||||
|
|
|
|
|
|
|
|
|
|
|
|
|
| |||||||||||||||
Average Quarterly Balances of Outstanding Derivative Financial Instruments
Futures contracts: | ||||
Average notional value of contracts — short | $ | 462,576,647 |
For more information about the Fund’s investment risks regarding derivative financial instruments, refer to the Notes to Financial Statements
Fair Value Hierarchy as of Period End
Various inputs are used in determining the fair value of investments and derivative financial instruments. For information about the Fund’s policy regarding valuation of investments and derivative financial instruments, refer to the Notes to Financial Statements.
The following tables summarize the Fund’s investments and derivative financial instruments categorized in the disclosure hierarchy:
| Level 1 | Level 2 | Level 3 | Total | |||||||||||||
Assets: | ||||||||||||||||
Investments: | ||||||||||||||||
Long-Term Investments(a) | $ | — | $ | 9,017,790,991 | $ | — | $ | 9,017,790,991 | ||||||||
Short-Term Securities | 91,141,627 | — | — | 91,141,627 | ||||||||||||
|
|
|
|
|
|
|
| |||||||||
| $ | 91,141,627 | $ | 9,017,790,991 | $ | — | $ | 9,108,932,618 | |||||||||
|
|
|
|
|
|
|
| |||||||||
Derivative Financial Instruments(b) | ||||||||||||||||
Liabilities: | ||||||||||||||||
Interest rate contracts | $ | (2,854,192 | ) | $ | — | $ | — | $ | (2,854,192 | ) | ||||||
|
|
|
|
|
|
|
| |||||||||
| (a) | See above Schedule of Investments for values in each state. |
| (b) | Derivative financial instruments are futures contracts which are valued at the unrealized appreciation (depreciation) on the instrument. |
During the year ended June 30, 2018, there were no transfers between levels.
See notes to financial statements.
| 42 | 2018 BLACKROCK ANNUAL REPORTTO SHAREHOLDERS |
Schedule of Investments June 30, 2018 | BlackRock Short-Term Municipal Fund (Percentages shown are based on Net Assets) |
| Security | Par (000) | Value | ||||||
Municipal Bonds — 100.9% |
| |||||||
| Alabama — 2.0% | ||||||||
Bessemer Governmental Utility Services Corp., Refunding RB, (BAM), 5.00%, 06/01/21 | $ | 470 | $ | 507,595 | ||||
Black Belt Energy Gas District, RB, Series A: | ||||||||
5.00%, 12/01/20 | 730 | 779,684 | ||||||
5.00%, 12/01/21 | 1,950 | 2,121,737 | ||||||
Southeast Alabama Gas Supply District, RB, Project No. 2, Series A, 4.00%, 06/01/22 | 1,760 | 1,867,888 | ||||||
State of Alabama Docks Department, Refunding RB, Docks Facilities Revenue, Series B: | ||||||||
5.00%, 10/01/18 | 1,000 | 1,007,660 | ||||||
5.00%, 10/01/19 | 1,000 | 1,036,280 | ||||||
5.00%, 10/01/20 | 1,750 | 1,860,250 | ||||||
|
| |||||||
| 9,181,094 | ||||||||
| Arizona — 2.2% | ||||||||
County of Yavapai Industrial Development Authority, RB, VRDN, Skanon Investments, Inc. (Drake Cement Project) (Citi Bank NA LOC), Series A, 1.55%, 09/01/35(a) | 10,000 | 10,000,000 | ||||||
|
| |||||||
| California — 5.0% | ||||||||
California Health Facilities Financing Authority, RB, Sutter Health, Series A, 5.00%, 11/15/21 | 1,305 | 1,441,699 | ||||||
California Municipal Finance Authority, Refunding RB: | ||||||||
Biola University, 5.00%, 10/01/20 | 305 | 325,670 | ||||||
Community Medical Centers, Series A, 5.00%, 02/01/19 | 1,000 | 1,017,360 | ||||||
City of Los Angeles Department of Airports, RB, Los Angeles International Airport, Series B, AMT, 5.00%, 05/15/20 | 1,100 | 1,166,814 | ||||||
City of Riverside California Sewer Revenue, Refunding RB, Series A, 4.00%, 08/01/18 | 1,020 | 1,022,152 | ||||||
Fresno Joint Powers Financing Authority, Refunding RB, Master Lease Project, Series A: | ||||||||
5.00%, 04/01/20 | 1,000 | 1,051,150 | ||||||
5.00%, 04/01/21 | 1,250 | 1,351,012 | ||||||
Golden State Tobacco Securitization Corp., Refunding RB, Asset-Backed: | ||||||||
Series A, 5.00%, 06/01/19 | 1,000 | 1,031,260 | ||||||
Series A-1, 5.00%, 06/01/20 | 8,000 | 8,472,480 | ||||||
Palmdale Financing Authority, Refunding RB, (AGM): | ||||||||
4.00%, 11/01/19 | 325 | 335,985 | ||||||
4.00%, 11/01/20 | 340 | 358,166 | ||||||
Semitropic Improvement District, Refunding RB, Series A, 5.25%, 12/01/19(b) | 500 | 525,790 | ||||||
State of California Public Works Board, RB, Various Capital Projects, Sub Series I-1, 5.38%, 11/01/19(b) | 5,000 | 5,259,100 | ||||||
|
| |||||||
| 23,358,638 | ||||||||
| Colorado — 0.6% | ||||||||
Adams & Arapahoe Joint School District 28J Aurora, GO, Refunding, Series A, 5.00%, 12/01/20 | 355 | 382,555 | ||||||
City & County of Denver Colorado Airport System Revenue, Refunding RB, Series A, 5.00%, 11/15/19 | 500 | 522,950 | ||||||
City of Colorado Springs Co. Utilities System Revenue, Refunding RB, VRDN (Sumitomo Mitsui Banking SBPA), Series B, 1.53%, 11/01/26(a) | 1,450 | 1,450,000 | ||||||
Colorado Educational & Cultural Facilities Authority, RB, VRDN, National Jewish Federation Bond Program (TD Bank NA LOC), Series B-4, 1.55%, 12/01/35(a) | 400 | 400,000 | ||||||
|
| |||||||
| 2,755,505 | ||||||||
| Connecticut — 7.2% | ||||||||
State of Connecticut, GO: | ||||||||
Series A, 5.00%, 04/15/20 | 8,800 | 9,242,552 | ||||||
Series A, 5.00%, 04/15/21 | 11,000 | 11,781,613 | ||||||
Series B, 5.00%, 04/15/21 | 685 | 733,799 | ||||||
Series D, 5.00%, 11/01/19 | 1,425 | 1,482,613 | ||||||
Series E, 4.00%, 09/15/21 | 770 | 808,192 | ||||||
| Security | Par (000) | Value | ||||||
| Connecticut (continued) | ||||||||
State of Connecticut Health & Educational Facilities Authority, Refunding RB: | ||||||||
Fairfileld University, Series S, 5.00%, 07/01/21 | $ | 1,030 | $ | 1,118,127 | ||||
Sacred Heart University, Series I -1, 5.00%, 07/01/21 | 700 | 759,892 | ||||||
State of Connecticut Special Tax Revenue, RB, Transportation Infrastructure Purposes, Series A, 5.00%, 01/01/20 | 1,500 | 1,567,065 | ||||||
University of Connecticut, RB, Series A: | ||||||||
5.00%, 04/15/20 | 800 | 844,272 | ||||||
5.00%, 04/15/22 | 4,000 | 4,372,320 | ||||||
University of Connecticut, Refunding RB, Series A, 5.00%, 02/15/22 | 720 | 784,461 | ||||||
|
| |||||||
| 33,494,906 | ||||||||
| Florida — 4.2% | ||||||||
County of Escambia Health Facilities Authority, Refunding RB, VRDN (TD Bank NA SBPA), Azalea Trace, Inc, Series B (AGC), 1.62%, 11/15/29(a) | 1,500 | 1,500,000 | ||||||
County of Monroe School District, RB, Florida Sales Tax (AGM), 5.00%, 10/01/20 | 500 | 534,570 | ||||||
County of Orange Health Facilities Authority, Refunding RB, VRDN, Lakeside Behavioral Healthcare, Inc. Project (SunTrust Bank LOC), 1.56%, 07/01/27(a) | 1,855 | 1,855,000 | ||||||
County of Sarasota Public Hospital District, Refunding RB, VRDN, Sarasota Memorial Hospital (Wells Fargo Bank NA LOC), Series B, 1.51%, 07/01/37(a) | 1,000 | 1,000,000 | ||||||
Florida Gulf Coast University Financing Corp., Refunding RB, Housing Project, Series A, 5.00%, 08/01/21 | 2,160 | 2,340,338 | ||||||
Orlando Utilities Commission, Refunding RB, Series A, 5.00%, 10/01/27(a) | 5,000 | 5,335,450 | ||||||
South Miami Health Facilities Authority, Refunding RB, Baptist Health South Florida Obligated Group, 5.00%, 08/15/21 | 2,500 | 2,712,050 | ||||||
State of Sunshine Governmental Financing Commission, RB, VRDN, Miami-Dade County Program (MUFG Union Bank NA LOC), Series A, 1.54%, 09/01/35(a) | 4,000 | 4,000,000 | ||||||
|
| |||||||
| 19,277,408 | ||||||||
| Georgia — 0.8% | ||||||||
City of Atlanta Georgia, Refunding, Tax Allocation Bonds, Atlantic Station Project: | ||||||||
5.00%, 12/01/20 | 2,000 | 2,133,200 | ||||||
5.00%, 12/01/21 | 1,150 | 1,251,683 | ||||||
County of Cobb Kennestone Hospital Authority, Refunding RB, Revenue Anticipation Certificates: | ||||||||
5.00%, 04/01/20 | 110 | 116,054 | ||||||
5.00%, 04/01/21 | 200 | 215,606 | ||||||
County of Fulton Development Authority, RB, Revenue Anticipation Certificates, Series A, 5.00%, 04/01/21 | 125 | 134,754 | ||||||
|
| |||||||
| 3,851,297 | ||||||||
| Illinois — 5.2% | ||||||||
Chicago O’Hare International Airport, Refunding RB, General, Senior Lien, Series B, 5.00%, 01/01/20 | 7,000 | 7,326,690 | ||||||
Chicago Transit Authority, Refunding RB, Section 5337, State of Good Repair Formula Funds: | ||||||||
5.00%, 06/01/20 | 1,000 | 1,055,960 | ||||||
5.00%, 06/01/21 | 2,000 | 2,151,180 | ||||||
Illinois Finance Authority, RB, VRDN, Chicago Horticultural Project (BMO Harris Bank NA LOC), 1.52%, 01/01/43(a) | 1,600 | 1,600,000 | ||||||
Illinois Finance Authority, Refunding RB: | ||||||||
Southern Illinois Healthcare, 5.00%, 03/01/21 | 265 | 284,425 | ||||||
VRDN, Advocate Health (Northern Trust Co. SPBA), Sub-Series C3-A, 1.48%, 11/01/38(a) | 5,200 | 5,200,000 | ||||||
VRDN, National Louis University (JP Morgan Chase Bank NA LOC), Series B, 1.55%, 06/01/29(a) | 2,595 | 2,595,000 | ||||||
State of Illinois Sales Tax, Refunding RB, Build Illinois Bonds, 5.00%, 06/15/19 | 3,715 | 3,819,317 | ||||||
|
| |||||||
| 24,032,572 | ||||||||
| SCHEDULES OF INVESTMENTS | 43 |
Schedule of Investments (continued) June 30, 2018 | BlackRock Short-Term Municipal Fund (Percentages shown are based on Net Assets) |
| Security | Par (000) | Value | ||||||
| Indiana — 0.4% | ||||||||
Indiana Finance Authority, Refunding RB, Indiana University Health Obligated Group, VRDN (Wells Fargo Bank NA LOC), 1.48%, 12/01/31(a) | $ | 1,700 | $ | 1,700,000 | ||||
|
| |||||||
| Iowa — 7.6% | ||||||||
Iowa Finance Authority, RB, VRDN(a): | ||||||||
CJ BIO America, Inc. Project (Korea Development Bank LOC), 1.73%, 04/01/22 | 22,500 | 22,500,000 | ||||||
Mortgage Backed Security Program (Ginnie Mae, Fannie Mae & Federal Home Loan Bank SBPA), 1.50%, 07/01/46 | 5,000 | 5,000,000 | ||||||
Iowa Finance Authority, Refunding RB, VRDN, MidAmerican Energy Project, Series A, 1.52%, 09/01/36(a) | 6,050 | 6,050,000 | ||||||
Iowa Student Loan Liquidity Corp., Refunding RB, AMT, Series A: | ||||||||
5.00%, 12/01/20 | 650 | 689,351 | ||||||
5.00%, 12/01/21 | 750 | 807,615 | ||||||
|
| |||||||
| 35,046,966 | ||||||||
| Kansas — 0.8% | ||||||||
County of Geary Unified School District No. 475, GO, Refunding Series B: | ||||||||
5.00%, 09/01/20 | 750 | 798,818 | ||||||
5.00%, 09/01/21 | 2,215 | 2,413,242 | ||||||
County of Johnson Unified School District No. 233 Olathe, GO, Refunding Series B, 3.00%, 09/01/21 | 500 | 516,790 | ||||||
|
| |||||||
| 3,728,850 | ||||||||
| Kentucky — 2.1% | ||||||||
Kentucky Public Energy Authority, RB, Series A: | ||||||||
4.00%, 04/01/20 | 785 | 812,177 | ||||||
4.00%, 04/01/21 | 775 | 812,572 | ||||||
Kentucky State Property & Building Commission, Refunding RB, Project No.117, Series D: | ||||||||
5.00%, 05/01/20 | 3,000 | 3,159,540 | ||||||
5.00%, 05/01/21 | 4,400 | 4,737,084 | ||||||
|
| |||||||
| 9,521,373 | ||||||||
| Louisiana — 1.7% | ||||||||
Louisiana Public Facilities Authority, RB, VRDN, Air Products & Chemicals Project, 1.52%, 08/01/50(a) | 1,500 | 1,500,000 | ||||||
Louisiana Public Facilities Authority, Refunding RB, Ochsner Clinic Foundation Project, 5.00%, 05/15/20 | 225 | 237,472 | ||||||
State of Parish Charles Louisiana, Refunding RB, VRDN, Shell Oil Co. Project, Series B, 1.58%, 10/01/22(a) | 5,100 | 5,100,000 | ||||||
State Tammany Parish Wide School District No. 12, GO, Series A, 4.00%, 03/01/21 | 300 | 315,468 | ||||||
West Baton Rouge Parish School District No. 3, GO, (AGM): | ||||||||
3.00%, 03/01/21 | 300 | 307,653 | ||||||
5.00%, 03/01/21 | 225 | 242,341 | ||||||
|
| |||||||
| 7,702,934 | ||||||||
| Maryland — 0.7% | ||||||||
Maryland Community Development Administration, RB, VRDN, M/F Housing, Residential (TD Bank NA SBPA), Series M, 1.50%, 09/01/43(a) | 3,000 | 3,000,000 | ||||||
Maryland Health & Higher Educational Facilities Authority, Refunding RB, LifeBridge Health Issue, 5.00%, 07/01/21 | 235 | 255,534 | ||||||
|
| |||||||
| 3,255,534 | ||||||||
| Massachusetts — 2.1% | ||||||||
Commonwealth of Massachusetts, GO, Refunding Series D (AGM), 5.50%, 11/01/19 | 4,250 | 4,467,387 | ||||||
Massachusetts Development Finance Agency, Refunding RB: | ||||||||
Harvard University, Series B-1, 5.00%, 10/15/20(b) | 765 | 820,746 | ||||||
Partners HealthCare System Issue, 5.00%, 07/01/21 | 3,485 | 3,795,897 | ||||||
Massachusetts State Educational Financing Authority, Refunding RB, Issue K, Senior Series A, AMT, 4.00%, 07/01/20 | 375 | 388,620 | ||||||
|
| |||||||
| 9,472,650 | ||||||||
| Security | Par (000) | Value | ||||||
| Michigan — 2.3% | ||||||||
City of Battle Creek Michigan, Refunding, GOL, Downtown Development Bonds: | ||||||||
5.00%, 05/01/20 | $ | 360 | $ | 380,880 | ||||
5.00%, 05/01/21 | 565 | 610,223 | ||||||
Grand Rapids Public Schools, GO, Refunding, (AGM): | ||||||||
5.00%, 05/01/19 | 220 | 225,975 | ||||||
5.00%, 05/01/20 | 475 | 501,405 | ||||||
Grand Valley State University, Refunding RB, 5.00%, 12/01/20 | 630 | 674,106 | ||||||
Karegnondi Water Authority, Refunding RB: | ||||||||
4.00%, 11/01/19 | 500 | 514,090 | ||||||
5.00%, 11/01/21 | 450 | 489,150 | ||||||
Michigan State Hospital Finance Authority, Refunding RB, Trinity Health Credit Group, Series C: | ||||||||
5.00%, 12/01/20 | 1,000 | 1,073,680 | ||||||
5.00%, 12/01/21 | 1,000 | 1,097,040 | ||||||
Michigan State Housing Development Authority, Refunding RB (IND & Comm BK of China BA SBPA), Series D, VRDN, 1.57%, 06/01/30(a) | 4,225 | 4,225,000 | ||||||
University of Michigan, Refunding RB, General, Series A, 5.00%, 04/01/20 | 1,000 | 1,057,530 | ||||||
|
| |||||||
| 10,849,079 | ||||||||
| Minnesota — 1.2% | ||||||||
City of Minneapolis, RB, VRDN, University Gateway Project (Wells Fargo Bank NA SBPA), 1.50%, 12/01/40(a) | 5,450 | 5,450,000 | ||||||
|
| |||||||
| Mississippi — 0.4% | ||||||||
Mississippi Business Finance Corp., RB, VRDN, Chevron USA, Inc. Project, Series A, 1.53%, 12/01/30(a) | 900 | 900,000 | ||||||
Mississippi Development Bank, RB, Special Obligation, Hinds County Bond Project: | ||||||||
3.00%, 11/01/20 | 460 | 469,770 | ||||||
5.00%, 11/01/21 | 500 | 545,850 | ||||||
|
| |||||||
| 1,915,620 | ||||||||
| Nebraska — 2.0% | ||||||||
Central Plains Energy Project, Refunding RB (Royal Bank of Canada SBPA), 5.00%, 12/01/19(a) | 9,000 | 9,391,680 | ||||||
|
| |||||||
| Nevada — 1.6% | ||||||||
County of Clark Department of Aviation, Refunding RB, Series B, 5.00%, 07/01/18(c) | 2,250 | 2,250,000 | ||||||
County of Clark School District, GO, Refunding Series C: | ||||||||
5.00%, 06/15/20 | 2,500 | 2,646,175 | ||||||
5.00%, 06/15/21 | 2,500 | 2,709,300 | ||||||
|
| |||||||
| 7,605,475 | ||||||||
| New Jersey — 23.6% | ||||||||
Belleville Board of Education, GO, (BAM), 3.00%, 09/01/21 | 1,245 | 1,281,777 | ||||||
County of Camden Improvement Authority, Refunding RB, Camden County College Project, 4.00%, 01/15/20 | 1,230 | 1,269,975 | ||||||
Gloucester County Improvement Authority, Refunding RB, Rowan University Project, Series A, 5.00%, 11/01/20 | 520 | 555,906 | ||||||
Hasbrouck Heights Board of Education, GO, Promissory Notes: | ||||||||
2.00%, 07/13/18 | 5,125 | 5,125,256 | ||||||
2.75%, 07/12/19(d) | 5,000 | 5,039,800 | ||||||
New Jersey Building Authority, Refunding RB, Series A: | ||||||||
5.00%, 06/15/21 | 2,325 | 2,473,591 | ||||||
5.00%, 06/15/22 | 3,005 | 3,231,908 | ||||||
New Jersey EDA, RB, Series DDD: | ||||||||
5.00%, 06/15/20 | 1,310 | 1,371,426 | ||||||
5.00%, 06/15/21 | 3,000 | 3,191,730 | ||||||
New Jersey EDA, Refunding RB: | ||||||||
School Facilities Construction, 5.25%, 09/01/19 | 1,350 | 1,399,126 | ||||||
School Facilities Construction, 5.00%, 03/01/20 | 1,700 | 1,772,913 | ||||||
School Facilities Construction, 5.50%, 09/01/21 | 2,395 | 2,564,063 | ||||||
School Facilities Construction, Series DD-1, 5.00%, 12/15/18 | 1,725 | 1,748,512 | ||||||
| 44 | 2018 BLACKROCK ANNUAL REPORTTO SHAREHOLDERS |
Schedule of Investments (continued) June 30, 2018 | BlackRock Short-Term Municipal Fund (Percentages shown are based on Net Assets) |
| Security | Par (000) | Value | ||||||
| New Jersey (continued) | ||||||||
School Facilities Construction, Series K (AMBAC), 5.25%, 12/15/20 | $ | 700 | $ | 746,319 | ||||
School Facilities Construction, Series NN, 5.00%, 03/01/21 | 555 | 587,545 | ||||||
School Facilities Construction, Series PP, 5.00%, 06/15/19 | 4,500 | 4,625,505 | ||||||
School Facilities Construction, Series PP, 5.00%, 06/15/20 | 4,200 | 4,408,404 | ||||||
Series A, 5.00%, 06/15/19 | 475 | 488,248 | ||||||
Series XX, 5.00%, 06/15/21 | 1,390 | 1,478,835 | ||||||
Transit Corp. Projects, Series B, 5.00%, 11/01/19 | 4,500 | 4,671,090 | ||||||
New Jersey Educational Facilities Authority, RB, Higher Education Capital Improvement Fund, Series A: | ||||||||
5.00%, 09/01/19 | 2,840 | 2,935,225 | ||||||
5.00%, 09/01/20 | 1,650 | 1,734,777 | ||||||
New Jersey Educational Facilities Authority, Refunding RB: | ||||||||
Ramapo College, Series B, 5.00%, 07/01/21 | 890 | 962,375 | ||||||
The William Paterson University of New Jersey, Series E (BAM), 5.00%, 07/01/20 | 2,160 | 2,296,123 | ||||||
New Jersey Health Care Facilities Financing Authority, RB, Inspira Health Obligated Group, 5.00%, 07/01/21 | 100 | 108,465 | ||||||
New Jersey Health Care Facilities Financing Authority, Refunding RB: | ||||||||
Hospital Asset Transformation Program, 5.00%, 10/01/20 | 600 | 631,848 | ||||||
Hospital Asset Transformation Program, 5.00%, 10/01/21 | 2,500 | 2,673,350 | ||||||
Inspira Health Obligated Group, Series A, 5.00%, 07/01/20 | 1,000 | 1,060,590 | ||||||
New Jersey Housing & Mortgage Finance Agency, RB (TD Bank NA SBPA), VRDN, 1.58%, 10/01/39(a) | 6,255 | 6,255,000 | ||||||
New Jersey Transportation Trust Fund Authority, RB: | ||||||||
Federal Highway Reimbursement Revenue Notes, Series A, 5.00%, 06/15/19 | 1,000 | 1,027,890 | ||||||
Federal Highway Reimbursement Revenue Notes, Series A, 5.00%, 06/15/20 | 11,500 | 12,070,630 | ||||||
Federal Highway Reimbursement Revenue Notes, Series A, 5.00%, 06/15/21 | 1,320 | 1,404,361 | ||||||
Transportation Program, Series AA, 5.00%, 06/15/20 | 500 | 523,835 | ||||||
Transportation System, Series B, 5.00%, 06/15/21 | 3,235 | 3,441,749 | ||||||
New Jersey Transportation Trust Fund Authority, Refunding RB, Transportation System, Series A, 5.50%, 12/15/21 | 4,695 | 5,115,484 | ||||||
New Jersey Turnpike Authority, Refunding RB, Series B: | ||||||||
5.00%, 01/01/19 | 2,670 | 2,715,871 | ||||||
5.00%, 01/01/20 | 3,190 | 3,339,866 | ||||||
State of Garden Preservation Trust, Refunding RB, Series A, 5.00%, 11/01/21 | 2,195 | 2,366,188 | ||||||
State of New Jersey, GO, Refunding Series Q, 5.00%, 08/15/20 | 1,720 | 1,827,122 | ||||||
Tobacco Settlement Financing Corp., Refunding RB, Series A, 5.00%, 06/01/21 | 2,000 | 2,154,680 | ||||||
Township of Pennsauken, GO, Series A, 3.00%, 06/18/19 | 2,600 | 2,623,868 | ||||||
Township of Vernon, GO, 2.00%, 09/14/18 | 3,887 | 3,889,332 | ||||||
|
| |||||||
| 109,190,558 | ||||||||
| New Mexico — 0.4% | ||||||||
Albuquerque Municipal School District No 12, GO, 5.00%, 08/01/21 | 1,675 | 1,827,392 | ||||||
|
| |||||||
| New York — 8.6% | ||||||||
City of New York New York, GO, VRDN(a): | ||||||||
Sub-Series A-3 (Mizuho Corporate Bank LOC), 1.67%, 10/01/40 | 500 | 500,000 | ||||||
Sub-Series F-6 (JPMorgan Chase Bank NA SBPA), 1.53%, 06/01/44 | 3,000 | 3,000,000 | ||||||
Sub-Series G-6 (Mizuho Corporate Bank LOC), 1.60%, 04/01/42 | 5,245 | 5,245,000 | ||||||
City of Yonkers, GO, Series A (AGM), 4.00%, 11/15/19 | 600 | 619,134 | ||||||
County of Nassau New York, GO, Series C, 5.00%, 10/01/21 | 4,500 | 4,915,980 | ||||||
| Security | Par (000) | Value | ||||||
| New York (continued) | ||||||||
New York City Transitional Finance Authority Future Tax Secured Revenue, RB: | ||||||||
Future Tax Secured, Fiscal 2015, Sub-Series E-1, 5.00%, 02/01/19(b)(c) | $ | 1,660 | $ | 1,692,984 | ||||
Future Tax Secured, Fiscal 2015, Sub-Series E-1, 5.00%, 02/01/19 | 3,340 | 3,410,675 | ||||||
VRDN (Mizuho Corporate Bank LOC), 1.67%, 02/01/44(a) | 2,235 | 2,235,000 | ||||||
New York City Transitional Finance Authority Future Tax Secured Revenue, Refunding RB, VRDN, New York City Recovery, Series 3, Sub-Series 3G (Bank of New York Mellon SBPA), 1.50%, 11/01/22(a) | 3,485 | 3,485,000 | ||||||
Port Authority of New York & New Jersey, Refunding RB: | ||||||||
167th Series, 5.00%, 09/15/19 | 5,000 | 5,201,150 | ||||||
172nd Series, 5.00%, 10/01/18 | 8,765 | 8,842,395 | ||||||
TSASC, Inc., Refunding RB, Senior, Series A, 5.00%, 06/01/20 | 770 | 811,749 | ||||||
|
| |||||||
| 39,959,067 | ||||||||
| Ohio — 0.7% | ||||||||
County of Allen Ohio Hospital Facilities Revenue, Refunding RB, Series A: | ||||||||
5.00%, 08/01/20 | 605 | 641,494 | ||||||
5.00%, 08/01/21 | 1,840 | 1,991,910 | ||||||
County of Butler Ohio, Refunding RB, 5.00%, 11/15/21 | 750 | 819,300 | ||||||
|
| |||||||
| 3,452,704 | ||||||||
| Oklahoma — 0.5% | ||||||||
Norman Regional Hospital Authority, Refunding RB: | ||||||||
4.00%, 09/01/19 | 1,000 | 1,023,050 | ||||||
5.00%, 09/01/20 | 1,000 | 1,060,930 | ||||||
|
| |||||||
| 2,083,980 | ||||||||
| Oregon — 0.4% | ||||||||
State of Oregon Facilities Authority, Refunding RB, VRDN, PeaceHealth (US Bank LOC), Series A, 1.52%, 08/01/34(a) | 2,000 | 2,000,000 | ||||||
|
| |||||||
| Pennsylvania — 3.5% | ||||||||
Boyertown Area School District, Refunding, GOL, 4.00%, 11/01/21 | 910 | 964,973 | ||||||
City of Philadelphia, GO, Refunding Series A, 5.00%, 08/01/20 | 2,250 | 2,390,468 | ||||||
City of Williamsport Pennsylvania, GO, Refunding(AGM), 5.00%, 07/01/21 | 365 | 395,675 | ||||||
Commonwealth Financing Authority, RB, Tobacco Master Settlement payment, 5.00%, 06/01/20 | 635 | 668,693 | ||||||
Commonwealth of Pennsylvania, GO, 1st Series, 5.00%, 06/01/20 | 2,740 | 2,897,029 | ||||||
Commonwealth of Pennsylvania, GO, Refunding, 2nd Series, 5.00%, 01/15/22 | 1,000 | 1,091,470 | ||||||
Commonwealth of Pennsylvania, GO, Refunding 2nd Series, 5.00%, 07/01/20 | 5,160 | 5,464,285 | ||||||
County of Centre Hospital Authority, Refunding RB, Mount Nittany Medical Centre Project, Series A, 5.00%, 11/15/21 | 400 | 436,008 | ||||||
East Penn School District, Refunding, GOL, 4.00%, 08/01/21 | 1,030 | 1,090,863 | ||||||
Philadelphia Municipal Authority, Refunding RB, Juvenile Justice Services Center, 5.00%, 04/01/20 | 700 | 737,905 | ||||||
|
| |||||||
| 16,137,369 | ||||||||
| South Carolina — 0.4% | ||||||||
Lexington County Health Services District, Inc., Refunding RB, Lexmed Obligated Group: | ||||||||
5.00%, 11/01/20 | 500 | 531,350 | ||||||
5.00%, 11/01/21 | 250 | 270,495 | ||||||
South Carolina Jobs-Economic Development Authority, RB, VRDN, Brashier Charter LLC Project (SunTrust Bank LOC), 1.56%, 12/01/38(a) | 1,070 | 1,070,000 | ||||||
|
| |||||||
| 1,871,845 | ||||||||
| SCHEDULES OF INVESTMENTS | 45 |
Schedule of Investments (continued) June 30, 2018 | BlackRock Short-Term Municipal Fund (Percentages shown are based on Net Assets) |
| Security | Par (000) | Value | ||||||
| Tennessee — 0.4% | ||||||||
Jackson Energy Authority, Refunding RB, 5.00%, 12/01/20 | $ | 1,000 | $ | 1,072,700 | ||||
Shelby County Health Educational & Housing Facilities Board, RB, Methodist Le Bonheur Healthcare, Series A, 5.00%, 05/01/20 | 690 | 729,509 | ||||||
|
| |||||||
| 1,802,209 | ||||||||
| Texas — 4.9% | ||||||||
City of Denton Texas ISD, GO, VRDN, School Building, Series B (Bank of Tokyo-Mitsubishi SBPA), 1.55%, 08/01/35(a) | 2,250 | 2,250,000 | ||||||
City of Houston Texas, GO, Refunding Series A: | ||||||||
5.00%, 03/01/20 | 2,000 | 2,106,580 | ||||||
5.00%, 03/01/21 | 3,500 | 3,780,175 | ||||||
County of Harris Texas Cultural Education Facilities Finance Corp., Refunding RB: | ||||||||
Teco Project, 5.00%, 11/15/20 | 800 | 858,072 | ||||||
Teco Project, 5.00%, 11/15/21 | 725 | 794,963 | ||||||
VRDN, Methodist Hospital, Sub-Series C-2, 1.58%, 12/01/27(a) | 6,600 | 6,600,000 | ||||||
County of Harris Texas Health Facilities Development Corp., Refunding RB, VRDN, Methodist Hospital System, Series A-1, 1.58%, 12/01/41(a) | 2,200 | 2,200,000 | ||||||
State of Texas, GO, VRDN, Veterans Bonds (Federal Home Loan Bank Liq Agreement), 1.57%, 12/01/49(a) | 3,000 | 3,000,000 | ||||||
Texas A&M University, Refunding RB, Financing System, Series E, 5.00%, 05/15/21 | 1,200 | 1,305,384 | ||||||
|
| |||||||
| 22,895,174 | ||||||||
| Utah — 2.9% | ||||||||
Central Utah Water Conservancy District, Refunding RB, Series B: | ||||||||
5.00%, 10/01/20 | 1,850 | 1,982,996 | ||||||
5.00%, 10/01/21 | 1,875 | 2,058,244 | ||||||
County of Emery Utah, Refunding RB, VRDN, Pacificorp Projects (Canadian Imperial Bank LOC), 1.54%, 11/01/24(a) | 5,350 | 5,350,000 | ||||||
County of Weber Utah, RB, VRDN, IHC Health Service, Inc.(a): | ||||||||
Series A (Bank of New York Mellon SBPA), 1.55%, 02/15/31 | 1,200 | 1,200,000 | ||||||
Series C (Bank of New York Mellon Trust SBPA), 1.55%, 02/15/35 | 1,000 | 1,000,000 | ||||||
Jordanelle Special Service District, Refunding RB, VRDN, Tuhaye Project (Wells Fargo Bank NA LOC), 1.51%, 09/01/25(a) | 1,882 | 1,882,000 | ||||||
|
| |||||||
| 13,473,240 | ||||||||
| Virginia — 0.7% | ||||||||
Lynchburg EDA, Refunding RB, Cental Health, Series A: | ||||||||
5.00%, 01/01/20 | 500 | 523,260 | ||||||
5.00%, 01/01/21 | 500 | 536,195 | ||||||
Virginia Commonwealth Transportation Board, Refunding RB, 5.00%, 09/15/21 | 2,000 | 2,196,120 | ||||||
|
| |||||||
| 3,255,575 | ||||||||
| Security | Par (000) | Value | ||||||
| Washington — 3.5% | ||||||||
Grant County Public Utility District No. 2, Refunding RB, Electric System Revenue, 2.00%, 12/02/20(a) | $ | 9,000 | $ | 8,993,610 | ||||
King County Washington Sewer Revenue, Refunding RB: | ||||||||
5.00%, 07/01/20 | 1,250 | 1,331,312 | ||||||
5.00%, 07/01/21 | 1,000 | 1,091,350 | ||||||
State of Washington Housing Finance Commission, Refunding RB (State Street Bank & Trust SBPA), VRDN, 1.50%, 12/01/46(a) | 1,150 | 1,150,000 | ||||||
Tobacco Settlement Authority, Refunding RB, 5.00%, 06/01/22 | 2,500 | 2,763,875 | ||||||
Washington Health Care Facilities Authority, Refunding RB, MultiCare Health System, Series B, 5.00%, 08/15/21 | 625 | 681,963 | ||||||
|
| |||||||
| 16,012,110 | ||||||||
| Wisconsin — 0.3% | ||||||||
Public Finance Authority, Refunding RB, Retirement Housing Foundation: | ||||||||
5.00%, 11/15/19 | 440 | 460,073 | ||||||
5.00%, 11/15/20 | 425 | 455,647 | ||||||
Wisconsin Health & Educational Facilities Authority, Refunding RB, Ascension Health Alliance, 4.00%, 11/15/21 | 350 | 372,673 | ||||||
|
| |||||||
| 1,288,393 | ||||||||
|
| |||||||
Total Long-Term Investments — 100.9% |
| 466,841,197 | ||||||
|
| |||||||
| Shares | ||||||||
Short-Term Securities — 0.0% |
| |||||||
BlackRock Liquidity Funds, MuniCash, Institutional Class, 1.31%(e)(f) | 22,770 | 22,772 | ||||||
|
| |||||||
Total Short-Term Securities — 0.0% |
| 22,772 | ||||||
|
| |||||||
Total Investments — 100.9% |
| 466,863,969 | ||||||
Liabilities in Excess of Other Assets — (0.9)% |
| (3,943,517 | ) | |||||
|
| |||||||
Net Assets — 100.0% |
| $ | 462,920,452 | |||||
|
| |||||||
| (a) | Variable or floating rate security, which interest rate adjusts periodically based on changes in current interest rates and prepayments on the underlying pool of assets. Rate shown is the rate in effect as of period end. |
| (b) | U.S. Government securities, held in escrow, are used to pay interest on this security, as well as to retire the bond in full at the date indicated, typically at a premium to par. |
| (c) | Security is collateralized by municipal bonds or U.S. Treasury obligations. |
| (d) | When-issued security. |
| (e) | Annualized 7-day yield as of period end. |
| (f) | During the year ended June 30, 2018, investments in issuers considered to be affiliate of the Fund for purposes of Section 2(a)(3) of the Investment Company Act of 1940, as amended, were as follows: |
| Affiliated | Shares Held at 06/30/17 | Net Activity | Shares Held at 06/30/18 | Value at 06/30/18 | Income | Net Realized Gain (Loss) (a) | Change in Unrealized Appreciation (Depreciation) | |||||||||||||||||||||
BlackRock Liquidity Funds, MuniCash, Institutional Class | 68,139 | (45,369 | ) | 22,770 | $ | 22,772 | $ | 4,852 | $ | 3,130 | $ | — | ||||||||||||||||
|
|
|
|
|
|
|
| |||||||||||||||||||||
| (a) | Includes net capital gain distributions, if applicable. |
| 46 | 2018 BLACKROCK ANNUAL REPORTTO SHAREHOLDERS |
Schedule of Investments (continued) June 30, 2018 | BlackRock Short-Term Municipal Fund |
Fair Value Hierarchy as of Period End
Various inputs are used in determining the fair value of investments. For information about the Fund’s policy regarding valuation of investments, refer to the Notes to Financial Statements.
The following tables summarize the Fund’s investments categorized in the disclosure hierarchy:
| Level 1 | Level 2 | Level 3 | Total | |||||||||||||
Assets: |
| |||||||||||||||
Investments: |
| |||||||||||||||
Long-Term Investments(a) | $ | — | $ | 466,841,197 | $ | — | $ | 466,841,197 | ||||||||
Short-Term Securities | 22,772 | — | — | 22,772 | ||||||||||||
|
|
|
|
|
|
|
| |||||||||
| $ | 22,772 | $ | 466,841,197 | $ | — | $ | 466,863,969 | |||||||||
|
|
|
|
|
|
|
| |||||||||
| (a) | See above Schedule of Investments for values in each state or political subdivision. |
During the year ended June 30, 2018, there were no transfers between levels.
See notes to financial statements.
| SCHEDULES OF INVESTMENTS | 47 |
Schedule of Investments June 30, 2018 | BlackRock New York Municipal Opportunities Fund (Percentages shown are based on Net Assets) |
| Security | Par (000) | Value | ||||||
Corporate Bonds — 2.0% |
| |||||||
| New York — 2.0% | ||||||||
| Consumer Finance — 0.4% | ||||||||
American Express Co., 3.40%, 02/27/23 | $ | 2,455 | $ | 2,426,501 | ||||
Capital One Financial Corp., 3.80%, 01/31/28 | 1,690 | 1,595,262 | ||||||
|
| |||||||
| 4,021,763 | ||||||||
| Education — 0.7% | ||||||||
American Museum of Natural History, 4.37%, 07/15/45 | 1,000 | 1,029,948 | ||||||
The Metropolitan Museum of Art, Series 2015, 3.40%, 07/01/45 | 5,000 | 4,666,044 | ||||||
New York Public Library Astor Lenox & Tilden Foundations, 4.31%, 07/01/45 | 1,000 | 1,030,333 | ||||||
|
| |||||||
| 6,726,325 | ||||||||
| Food & Staples Retailing — 0.2% | ||||||||
Walmart, Inc., 3.55%, 06/26/25 | 2,037 | 2,049,917 | ||||||
|
| |||||||
| Health Care Providers & Services — 0.5% | ||||||||
New York & Presbyterian Hospital, 4.06%, 08/01/56 | 2,000 | 1,974,508 | ||||||
Northwell Healthcare, Inc., 3.98%, 11/01/46 | 4,000 | 3,673,141 | ||||||
|
| |||||||
| 5,647,649 | ||||||||
| Pharmaceuticals — 0.1% | ||||||||
CVS Health Corp., 5.05%, 03/25/48 | 904 | 919,997 | ||||||
|
| |||||||
| Road & Rail — 0.1% | ||||||||
Union Pacific Corp., 4.50%, 09/10/48 | 1,211 | 1,231,033 | ||||||
|
| |||||||
| 20,596,684 | ||||||||
|
| |||||||
Total Corporate Bonds — 2.0% |
| 20,596,684 | ||||||
|
| |||||||
Municipal Bonds — 87.5% |
| |||||||
| New York — 87.2% | ||||||||
| Corporate — 2.4% | ||||||||
Build NYC Resource Corp., Refunding RB, Pratt Paper, Inc. Project, AMT, 5.00%, 01/01/35(a) | 280 | 301,179 | ||||||
City of New York Industrial Development Agency, Refunding RB, Transportation Infrastructure Properties LLC, Series A, AMT: | ||||||||
5.00%, 07/01/22 | 500 | 548,835 | ||||||
5.00%, 07/01/28 | 1,520 | 1,621,825 | ||||||
County of Essex New York Industrial Development Agency, RB, International Paper Co. Project, Series A, AMT, 6.63%, 09/01/32 | 350 | 352,776 | ||||||
County of Onondaga New York Industrial Development Agency, RB, Bristol-Meyers Squibb Co. Project, AMT, 5.75%, 03/01/24 | 750 | 869,310 | ||||||
New York Liberty Development Corp., RB, Goldman Sachs Headquarters, 5.50%, 10/01/37 | 780 | 1,006,044 | ||||||
New York Liberty Development Corp., Refunding RB, Goldman Sachs Headquarters, 5.25%, 10/01/35 | 8,740 | 10,849,137 | ||||||
New York Transportation Development Corp., Refunding ARB, American Airlines, Inc., AMT, 5.00%, 08/01/26 | 2,870 | 3,027,965 | ||||||
Niagara Area Development Corp., Refunding RB, Solid Waste Disposal Facility, Covanta Energy Project, Series A, AMT, 5.25%, 11/01/42(a) | 2,150 | 2,151,397 | ||||||
Southold Local Development Corp., RB, Peconic Landing Inc., Project, 4.00%, 12/01/45 | 1,900 | 1,771,009 | ||||||
State of New York Energy Research & Development Authority, RB, New York State Electric & Gas Corporation Project, Series A, AMT, | 2,390 | 2,399,560 | ||||||
|
| |||||||
| 24,899,037 | ||||||||
| Security | Par (000) | Value | ||||||
| County/City/Special District/School District — 13.5% | ||||||||
City of New York, GO, Future Tax Secured Subordinate, Sub-Series E-1, 5.00%, 03/01/41 | $ | 2,695 | $ | 3,117,118 | ||||
City of New York, GO, Refunding, Series A, 5.00%, 08/01/30 | 2,250 | 2,587,590 | ||||||
City of New York, GO: | ||||||||
Series B-1, 5.00%, 12/01/37 | 4,765 | 5,461,071 | ||||||
Series B-1, 5.00%, 10/01/38 | 1,255 | 1,448,596 | ||||||
Series E-1, 5.00%, 03/01/37 | 1,615 | 1,876,743 | ||||||
Sub-Series D-1, Fiscal 2014, 5.00%, 08/01/31 | 690 | 774,215 | ||||||
Sub-Series F-1, 5.00%, 04/01/40 | 10,000 | 11,596,100 | ||||||
Sub-Series I-1, 5.38%, 04/01/19(c) | 705 | 725,614 | ||||||
Sub-Series I-1, 5.38%, 04/01/36 | 100 | 102,697 | ||||||
City of New York Convention Center Development Corp., RB, CAB, Sub Lien, Hotel Unit Fee, Series B (AGM), 0.00%, 11/15/55(d) | 5,000 | 1,077,450 | ||||||
City of New York Convention Center Development Corp., Refunding RB, Hotel Unit Fee Secured, 5.00%, 11/15/45 | 8,490 | 9,509,224 | ||||||
City of New York Industrial Development Agency, RB, PILOT: | ||||||||
CAB, Yankee Stadium Project, Series A (AGC), 0.00%, 03/01/42(d) | 5,000 | 1,940,700 | ||||||
CAB, Yankee Stadium Project, Series A (AGC), 0.00%, 03/01/45(d) | 1,500 | 504,375 | ||||||
(AMBAC), 5.00%, 01/01/39 | 1,850 | 1,873,199 | ||||||
Queens Baseball Stadium (AGC), 6.38%, 01/01/39 | 1,455 | 1,487,767 | ||||||
Queens Baseball Stadium (AMBAC), 5.00%, 01/01/46 | 790 | 800,641 | ||||||
City of New York Convention Center Development Corp., Refunding RB, Hotel Unit Fee Secured, 5.00%, 11/15/40 | 7,555 | 8,509,574 | ||||||
City of New York Industrial Development Agency, RB, PILOT, Yankee Stadium Project (NPFGC): | ||||||||
4.75%, 03/01/46 | 250 | 250,170 | ||||||
5.00%, 03/01/46 | 1,000 | 1,005,320 | ||||||
City of New York New York, GO, Refunding: | ||||||||
Series B, 5.00%, 08/01/31 | 1,250 | 1,433,200 | ||||||
Series C, 5.00%, 08/01/34 | 500 | 564,695 | ||||||
City of New York New York, GO: | ||||||||
Series A-1, 5.00%, 08/01/35 | 400 | 432,652 | ||||||
Series B-1, 5.00%, 10/01/39 | 8,045 | 9,279,023 | ||||||
City of New York New York Convention Center Development Corp., Refunding RB, Hotel Unit Fee Secured, 5.00%, 11/15/35 | 3,500 | 3,971,835 | ||||||
City of New York New York Industrial Development Agency, RB, PILOT, Queens Baseball Stadium (AGC), 6.50%, 01/01/46 | 700 | 716,401 | ||||||
City of Poughkeepsie New York, GO, Refunding Bond Anticipation Notes, Series A, 4.00%, 05/03/19 | 1,820 | 1,838,473 | ||||||
City of Syracuse New York, GO, Airport Terminal Security & Access, Series A, AMT (AGM), 4.75%, 11/01/31 | 500 | 525,875 | ||||||
County of Erie New York Fiscal Stability Authority, RB, Sales Tax and State Aid Secured Refunding Bonds, Series D: | ||||||||
5.00%, 09/01/35 | 445 | 521,255 | ||||||
5.00%, 09/01/36 | 400 | 467,492 | ||||||
5.00%, 09/01/37 | 445 | 520,085 | ||||||
5.00%, 09/01/38 | 685 | 799,977 | ||||||
5.00%, 09/01/39 | 555 | 645,731 | ||||||
| 48 | 2018 BLACKROCK ANNUAL REPORTTO SHAREHOLDERS |
Schedule of Investments (continued) June 30, 2018 | BlackRock New York Municipal Opportunities Fund (Percentages shown are based on Net Assets) |
| Security | Par (000) | Value | ||||||
| County/City/Special District/School District (continued) | ||||||||
County of Monroe Industrial Development Agency, Refunding RB, Rochester Schools Modernization Project: | ||||||||
5.00%, 05/01/32 | $ | 1,690 | $ | 1,977,520 | ||||
5.00%, 05/01/33 | 1,750 | 2,038,785 | ||||||
County of Nassau New York, GO: | ||||||||
Refunding Series A, 5.00%, 01/01/38 | 1,500 | 1,672,305 | ||||||
Refunding Series C, 5.00%, 10/01/31 | 3,600 | 4,155,336 | ||||||
Haverstraw-Stony Point Central School District, GO, Refunding, (AGM), 5.00%, 10/15/36 | 140 | 156,043 | ||||||
Hudson Yards Infrastructure Corp., RB, Senior, Fiscal 2012: | ||||||||
5.75%, 02/15/21(c) | 60 | 66,095 | ||||||
5.75%, 02/15/47 | 40 | 43,420 | ||||||
Hudson Yards Infrastructure Corp., Refunding RB, Fiscal 2017, Series A, 5.00%, 02/15/42 | 22,365 | 25,483,352 | ||||||
New York Liberty Development Corp., Refunding RB: | ||||||||
2nd Priority, Bank of America Tower at One Bryant Park Project, Class 2, 5.63%, 07/15/47 | 9,305 | 9,842,271 | ||||||
2nd Priority, Bank of America Tower at One Bryant Park Project, Class 3, 6.38%, 07/15/49 | 1,200 | 1,267,092 | ||||||
3 World Trade Center Project, Class 1, 5.00%, 11/15/44(a) | 5,000 | 5,301,400 | ||||||
3 World Trade Center Project, Class 2, 5.38%, 11/15/40(a) | 400 | 441,032 | ||||||
4 World Trade Center Project, 5.00%, 11/15/31 | 860 | 936,540 | ||||||
4 World Trade Center Project, 5.00%, 11/15/44 | 1,500 | 1,620,825 | ||||||
7 World Trade Center Project, Class 1, 4.00%, 09/15/35 | 425 | 444,316 | ||||||
7 World Trade Center Project, Class 2, 5.00%, 09/15/43 | 3,085 | 3,330,875 | ||||||
7 World Trade Center Project, Class 3, 5.00%, 03/15/44 | 1,720 | 1,849,550 | ||||||
World Trade Center Project, 5.75%, 11/15/51 | 1,250 | 1,392,775 | ||||||
|
| |||||||
| 138,384,390 | ||||||||
| Education — 9.1% | ||||||||
Amherst Development Corp., Refunding RB: | ||||||||
Daemen College Project, 5.00%, 10/01/43 | 1,280 | 1,384,410 | ||||||
Daemen College Project, 5.00%, 10/01/48 | 975 | 1,050,270 | ||||||
University at Buffalo Foundation Faculty-Student Housing Corp., Series A (AGM), 4.63%, 10/01/20(c) | 305 | 324,419 | ||||||
State of New York Dormitory Authority, RB, State University Dormitory Facilities, Series A, | 5 | 5,186 | ||||||
Build NYC Resource Corp., RB, Inwood Academy for Leadership Charter School Project, Series A(a): | ||||||||
5.13%, 05/01/38 | 140 | 141,879 | ||||||
5.50%, 05/01/48 | 2,025 | 2,091,582 | ||||||
Build NYC Resource Corp., Refunding RB: | ||||||||
City University Queens College, Series A, 5.00%, 06/01/43 | 325 | 360,519 | ||||||
Manhattan College Project, 5.00%, 08/01/47 | 1,860 | 2,083,014 | ||||||
City of New York Trust for Cultural Resources, RB, Juilliard School, Series A, 5.00%, 01/01/39 | 500 | 508,315 | ||||||
City of New York Trust for Cultural Resources, Refunding RB, Series A: | ||||||||
American Museum of Natural History, 5.00%, 07/01/37 | 885 | 993,315 | ||||||
Carnegie Hall, 4.75%, 12/01/39 | 1,550 | 1,602,188 | ||||||
City of New York New York Trust for Cultural Resources, Refunding RB, Carnegie Hall, Series A, 5.00%, 12/01/39 | 1,325 | 1,379,828 | ||||||
| Security | Par (000) | Value | ||||||
| Education (continued) | ||||||||
City of Troy New York Capital Resource Corp., Refunding RB, Rensselaer Polytechnic Institute Project: | ||||||||
5.00%, 08/01/28 | $ | 2,690 | $ | 3,071,765 | ||||
Series A, 5.13%, 09/01/40 | 9,280 | 9,753,002 | ||||||
Series B, 4.00%, 08/01/35 | 1,000 | 1,033,010 | ||||||
City of Yonkers New York Industrial Development Agency, RB, Sarah Lawrence College Project, Series A, 6.00%, 06/01/19(c) | 1,000 | 1,039,440 | ||||||
Counties of Buffalo & Erie New York Industrial Land Development Corp., Refunding RB, Series A: | ||||||||
Buffalo State College Foundation Housing Corp. Project, 5.38%, 10/01/41 | 620 | 671,435 | ||||||
The Charter School for Applied Technologies Project, 5.00%, 06/01/35 | 600 | 649,182 | ||||||
County of Cattaraugus New York, RB, St. Bonaventure University Project: | ||||||||
5.00%, 05/01/34 | 130 | 141,336 | ||||||
5.00%, 05/01/39 | 165 | 178,844 | ||||||
County of Dutchess New York Industrial Development Agency, Refunding RB, Bard College Civic Facility, Series A-1, 5.00%, 08/01/46 | 2,475 | 2,381,024 | ||||||
County of Dutchess New York Local Development Corp., Refunding RB, Vassar College Project, 5.00%, 07/01/42 | 1,980 | 2,269,971 | ||||||
County of Monroe New York Industrial Development Corp., Refunding RB: | ||||||||
Nazareth College of Rochester Project, 4.00%, 10/01/47 | 345 | 343,213 | ||||||
University of Rochester Project, Series A, 5.00%, 07/01/23(c) | 240 | 274,550 | ||||||
University of Rochester Project, Series A, 5.00%, 07/01/32 | 300 | 352,941 | ||||||
University of Rochester Project, Series A, 5.00%, 07/01/33 | 350 | 409,941 | ||||||
University of Rochester Project, Series A, 5.00%, 07/01/34 | 350 | 408,125 | ||||||
University of Rochester Project, Series A, 5.00%, 07/01/35 | 800 | 930,792 | ||||||
University of Rochester Project, Series A, 5.00%, 07/01/36 | 1,000 | 1,160,920 | ||||||
University of Rochester Project, Series A, 5.00%, 07/01/37 | 500 | 580,030 | ||||||
University of Rochester Project, Series C, 5.05%, 07/01/28 | 1,000 | 1,098,700 | ||||||
County of Nassau New York Industrial Development Agency, Refunding RB, New York Institute of Technology Project, Series A, 4.75%, 03/01/20(c) | 1,000 | 1,049,890 | ||||||
County of Orange New York Funding Corp., Refunding RB, Mount St. Mary College Project, Series A: | ||||||||
5.00%, 07/01/37 | 360 | 385,790 | ||||||
5.00%, 07/01/42 | 220 | 234,313 | ||||||
County of St. Lawrence New York Industrial Development Agency, RB, Clarkson University Project, 5.38%, 09/01/41 | 500 | 543,730 | ||||||
County of St. Lawrence New York Industrial Development Agency, Refunding RB, St. Lawrence University Project, Series B, 4.43%, 07/01/56 | 1,500 | 1,486,605 | ||||||
County of Tompkins New York Development Corp., RB, Ithaca College Project (AGM), 5.50%, 01/01/21(c) | 450 | 490,549 | ||||||
Dobbs Ferry Local Development Corp., RB, Mercy College Project: | ||||||||
5.00%, 07/01/39 | 1,000 | 1,122,980 | ||||||
5.00%, 07/01/44 | 2,000 | 2,236,580 | ||||||
| SCHEDULES OF INVESTMENTS | 49 |
Schedule of Investments (continued) June 30, 2018 | BlackRock New York Municipal Opportunities Fund (Percentages shown are based on Net Assets) |
| Security | Par (000) | Value | ||||||
| Education (continued) | ||||||||
Dutchess County Local Development Corp., Refunding RB, Culinary Institute of America Project: | ||||||||
5.00%, 07/01/30 | $ | 200 | $ | 225,518 | ||||
5.00%, 07/01/31 | 200 | 224,916 | ||||||
5.00%, 07/01/32 | 440 | 493,500 | ||||||
5.00%, 07/01/35 | 155 | 172,348 | ||||||
5.00%, 07/01/36 | 100 | 110,970 | ||||||
5.00%, 07/01/41 | 215 | 237,162 | ||||||
5.00%, 07/01/46 | 300 | 329,826 | ||||||
Horace Mann School, Series 2017, 3.27%, 07/01/27 | 2,000 | 1,931,110 | ||||||
State of New York Dormitory Authority, RB: | ||||||||
Icahn School of Medicine at Mount Sinai, Series A, 5.00%, 07/01/40 | 2,500 | 2,750,400 | ||||||
New School (AGM), 5.50%, 07/01/20(c) | 1,000 | 1,073,800 | ||||||
New York University, Series 1 (AMBAC), 5.50%, 07/01/40 | 500 | 657,005 | ||||||
New York University, Series 1 (AMBAC) (BHAC), 5.50%, 07/01/31 | 230 | 279,979 | ||||||
State University Dormitory Facilities, Series A, 5.00%, 07/01/19(c) | 750 | 775,665 | ||||||
Touro College & University System Obligation Group, Series A, 4.13%, 01/01/30 | 600 | 610,044 | ||||||
Touro College & University System, Series A, 5.50%, 01/01/44 | 2,000 | 2,204,380 | ||||||
Touro College and University System, 5.00%, 01/01/42 | 5,000 | 5,441,200 | ||||||
University of Rochester, Series A, 5.75%, 07/01/19(c) | 865 | 900,975 | ||||||
University of Rochester, Series A, 5.75%, 07/01/39 | 135 | 140,492 | ||||||
State of New York Dormitory Authority, Refunding RB: | ||||||||
Barnard College, Series A, 5.00%, 07/01/33 | 470 | 533,671 | ||||||
Barnard College, Series A, 5.00%, 07/01/43 | 1,000 | 1,111,340 | ||||||
Brooklyn Law School, 5.75%, 07/01/33 | 475 | 489,687 | ||||||
Columbia University, Series B, 5.00%, 10/01/38 | 2,415 | 2,863,007 | ||||||
Culinary Institute of America, 5.00%, 07/01/42 | 300 | 321,492 | ||||||
Fordham University, 5.00%, 07/01/32 | 250 | 290,658 | ||||||
Fordham University, 4.00%, 07/01/35 | 1,060 | 1,104,753 | ||||||
Fordham University, 5.00%, 07/01/44 | 850 | 940,669 | ||||||
Icahn School of Medicine at Mount Sinai, Series A, 5.00%, 07/01/35 | 800 | 885,376 | ||||||
New York University, Series A, 5.00%, 07/01/42 | 1,000 | 1,101,280 | ||||||
Pratt Institute, Series A, 5.00%, 07/01/44 | 1,000 | 1,091,210 | ||||||
Rochester Institute of Technology, 5.00%, 07/01/34 | 750 | 821,752 | ||||||
Rochester Institute of Technology, 5.00%, 07/01/42 | 1,460 | 1,590,962 | ||||||
Skidmore College, Series A, 5.25%, 07/01/29 | 135 | 147,280 | ||||||
St. John’s University, Series A, 5.00%, 07/01/37 | 350 | 389,897 | ||||||
State University Dormitory Facilities, Series A, 5.25%, 07/01/30 | 2,095 | 2,383,963 | ||||||
State University Dormitory Facilities, Series A, 5.25%, 07/01/32 | 2,095 | 2,380,779 | ||||||
State University Dormitory Facilities, Series A, 5.00%, 07/01/42 | 895 | 971,746 | ||||||
State University Dormitory Facilities, Series A, 5.00%, 07/01/46 | 1,875 | 2,140,125 | ||||||
State University of New York Dormitory Facilities, Series A, 5.00%, 07/01/35 | 1,320 | 1,523,386 | ||||||
State University of New York Dormitory Facilities, Series A, 5.00%, 07/01/38 | 1,655 | 1,902,985 | ||||||
Teachers College, 5.50%, 03/01/19(c) | 850 | 872,032 | ||||||
Town of Hempstead New York Local Development Corp., Refunding RB: | ||||||||
Adelphi University Project, 5.00%, 10/01/34 | 465 | 517,857 | ||||||
Adelphi University Project, 5.00%, 10/01/35 | 265 | 296,726 | ||||||
Hofstra University Project, 5.00%, 07/01/47 | 2,065 | 2,332,851 | ||||||
|
| |||||||
| 93,788,357 | ||||||||
| Security | Par (000) | Value | ||||||
| Health — 5.3% | ||||||||
Build NYC Resource Corp., Refunding RB, New York Methodist Hospital Project, 5.00%, 07/01/30 | $ | 600 | $ | 662,616 | ||||
City of New York New York Health & Hospital Corp., Refunding RB, Health System, Series A, 5.00%, 02/15/30 | 1,000 | 1,046,330 | ||||||
City of New York New York Industrial Development Agency, Refunding RB, Special Needs FAS Pool, Series A-1 (ACA), 4.38%, 07/01/20 | 225 | 223,792 | ||||||
Counties of Buffalo & Erie New York Industrial Land Development Corp., RB, Catholic Health System Obligation, 5.25%, 07/01/35 | 500 | 551,260 | ||||||
County of Dutchess New York Local Development Corp., RB, Health Quest Systems, Inc.: | ||||||||
Series A, 5.00%, 07/01/34 | 750 | 828,270 | ||||||
Series B, 4.00%, 07/01/41 | 13,105 | 13,221,110 | ||||||
County of Dutchess New York Local Development Corp., Refunding RB, Health Quest System, Inc., Series A, 5.75%, 07/01/40 | 300 | 324,774 | ||||||
County of Erie New York Industrial Development Agency, RB, Episcopal Church Home, Series A, 6.00%, 02/01/28 | 185 | 185,490 | ||||||
County of Genesee New York Industrial Development Agency, Refunding RB, United Memorial Medical Center Project: | ||||||||
5.00%, 12/01/27 | 430 | 430,262 | ||||||
5.00%, 12/01/32 | 580 | 580,215 | ||||||
County of Monroe New York Industrial Development Corp., RB, Rochester General Hospital Project, 5.00%, 12/01/46 | 4,800 | 5,280,144 | ||||||
County of Monroe New York Industrial Development Corp., Refunding RB, Unity Hospital of Rochester Project (FHA), 5.50%, 08/15/40 | 1,050 | 1,140,688 | ||||||
County of Nassau New York Industrial Development Agency, Refunding RB, Special Needs Facility Pooled Program (ACA), 4.90%, 07/01/21 | 210 | 209,538 | ||||||
County of Orange New York Industrial Development Agency, RB, Special Needs Facilities Pooled Program, Series G-1 (ACA), 4.90%, 07/01/21 | 625 | 623,450 | ||||||
County of Suffolk New York EDC, RB, Catholic Health Services, Series C, 5.00%, 07/01/32 | 305 | 334,033 | ||||||
County of Sullivan New York Industrial Development Agency, RB, Special Needs Facilities Pooled Program, Series H-1 (ACA), 4.90%, 07/01/21 | 235 | 234,417 | ||||||
County of Tompkins New York Development Corp., Refunding RB, Kendal at Ithaca, Inc. Project, Series A: | ||||||||
4.25%, 07/01/44 | 1,595 | 1,605,256 | ||||||
5.00%, 07/01/44 | 1,250 | 1,338,725 | ||||||
County of Westchester New York Healthcare Corp., Refunding RB, Senior Lien: | ||||||||
Remarketing, Series A, 5.00%, 11/01/30 | 3,645 | 3,880,030 | ||||||
Series B, 6.00%, 11/01/20(c) | 325 | 356,129 | ||||||
Series B, 6.00%, 11/01/30 | 50 | 53,908 | ||||||
County of Westchester New York Local Development Corp., Refunding RB: | ||||||||
Kendal On Hudson Project, 5.00%, 01/01/28 | 930 | 1,006,437 | ||||||
Kendal On Hudson Project, 5.00%, 01/01/34 | 875 | 934,771 | ||||||
Westchester Medical Center Obligation, 5.00%, 11/01/46 | 1,610 | 1,729,285 | ||||||
State of New York Dormitory Authority, RB: | ||||||||
Healthcare, Series A, 5.00%, 03/15/19(c) | 250 | 256,170 | ||||||
Mental Health Services (AGM), 5.00%, 08/15/18(c) | 5 | 5,022 | ||||||
Mental Health Services (AGM), 5.00%, 02/15/22 | 80 | 80,341 | ||||||
| 50 | 2018 BLACKROCK ANNUAL REPORTTO SHAREHOLDERS |
Schedule of Investments (continued) June 30, 2018 | BlackRock New York Municipal Opportunities Fund (Percentages shown are based on Net Assets) |
| Security | Par (000) | Value | ||||||
| Health (continued) | ||||||||
Mental Health Services, 2nd Series (AGM), 5.00%, 08/15/18(c) | $ | 5 | $ | 5,022 | ||||
New York State Association for Retarded Children, Inc., Series B (AMBAC), 6.00%, 07/01/19(c) | 700 | 730,478 | ||||||
New York University Hospitals Center, Series A, 5.75%, 07/01/20(c) | 1,055 | 1,136,931 | ||||||
North Shore-Long Island Jewish Obligated Group, Series A, 5.50%, 05/01/19(c) | 1,675 | 1,730,158 | ||||||
North Shore-Long Island Jewish Obligated Group, Series A, 5.75%, 05/01/19(c) | 1,725 | 1,785,340 | ||||||
Orange Regional Medical Center, 5.00%, 12/01/40(a) | 1,300 | 1,410,435 | ||||||
Orange Regional Medical Center, 5.00%, 12/01/45(a) | 1,700 | 1,839,026 | ||||||
State of New York Dormitory Authority, Refunding RB: | ||||||||
Memorial Sloan-Kettering Cancer Center, Series 1, 5.00%, 07/01/42 | 825 | 945,128 | ||||||
Miriam Osborn Memorial Home Association, | 290 | 297,308 | ||||||
Mount Sinai Hospital, Series A, 5.00%, 07/01/26 | 1,635 | 1,731,416 | ||||||
North Shore-Long Island Jewish Obligated Group, Series A, 5.00%, 05/01/21(c) | 2,500 | 2,720,250 | ||||||
North Shore-Long Island Jewish Obligated Group, Series A, 5.00%, 05/01/43 | 1,570 | 1,723,844 | ||||||
North Shore-Long Island Jewish Obligated Group, Series E, 5.50%, 05/01/33 | 1,000 | 1,029,400 | ||||||
|
| |||||||
| 54,207,199 | ||||||||
| Housing — 3.9% | ||||||||
City of New York Housing Development Corp., RB: | ||||||||
M/F Housing, Fund Grant Program, New York City Housing Authority Program, Series B1, | 2,020 | 2,220,505 | ||||||
M/F Housing, Fund Grant Program, New York City Housing Authority Program, Series B1, | 400 | 433,568 | ||||||
Series C-2A, 2.35%, 07/01/22 | 12,000 | 11,995,440 | ||||||
City of New York Housing Development Corp., Refunding RB: | ||||||||
M/F Housing, 8 Spruce Street, Class F, | 770 | 799,129 | ||||||
Series D, 4.10%, 11/01/38 | 5,000 | 5,044,050 | ||||||
City of New York New York Housing Development Corp., RB: | ||||||||
M/F Housing, Sustainable Neighbourhood, Series G, 2.00%, 11/01/57(b) | 8,000 | 7,991,920 | ||||||
Sustainable Neighborhood Bonds, | 2,805 | 2,867,159 | ||||||
City of Yonkers New York Industrial Development Agency, RB, Series A, AMT (SONYMA): | ||||||||
Monastery Manor Associates LP Project, 5.25%, 04/01/37 | 585 | 586,591 | ||||||
Sacred Heart Association Project, 5.00%, 10/01/37 | 1,640 | 1,642,985 | ||||||
County of Monroe New York Industrial Development Agency, IDRB, Southview Towers Project, AMT (SONYMA), 6.25%, 02/01/31 | 1,000 | 1,001,710 | ||||||
County Westchester Local Development Corp., Refunding RB, Waterburg Senior Housing, Series A, 5.00%, 06/01/30(a) | 965 | 969,999 | ||||||
State of New York HFA, RB, M/F Housing, Series A, AMT: | ||||||||
Division Street (SONYMA), 5.10%, 02/15/38 | 875 | 875,840 | ||||||
Highland Avenue Senior Apartments (SONYMA), 5.00%, 02/15/39 | 1,950 | 1,956,689 | ||||||
Kensico Terrace Apartments (SONYMA), | 645 | 645,522 | ||||||
Watergate II, 4.75%, 02/15/34 | 580 | 580,423 | ||||||
|
| |||||||
| 39,611,530 | ||||||||
| Security | Par (000) | Value | ||||||
| State — 14.4% | ||||||||
City of New York New York Transitional Finance Authority, BARB, Sub-Series E-1, Fiscal 2015, Sub-Series B-1: | ||||||||
Fiscal 2009, Series S-1, 5.63%, 07/15/38 | $ | 200 | $ | 200,636 | ||||
Fiscal 2011, Sub-Series S-1B, Build America Bonds, 6.83%, 07/15/40 | 1,500 | 2,002,110 | ||||||
City of New York New York Transitional Finance Authority, RB, Fiscal 2009, Series S-3, 5.25%, 01/15/39 | 5,000 | 5,091,400 | ||||||
City of New York New York Transitional Finance Authority Future Tax Secured, RB: | ||||||||
Fiscal 2012, 5.00%, 02/01/42 | 650 | 705,042 | ||||||
Fiscal 2014, Sub-Series A-1, 5.00%, 11/01/38 | 1,000 | 1,122,890 | ||||||
5.00%, 08/01/42 | 2,800 | 3,118,836 | ||||||
5.00%, 02/01/41 | 3,000 | 3,353,790 | ||||||
Fiscal 2016, 5.00%, 11/01/38 | 5,000 | 5,660,250 | ||||||
City of New York Transitional Finance Authority, Refunding RB, Fiscal 2018: | ||||||||
Series S-1, 5.00%, 07/15/35 | 1,250 | 1,440,113 | ||||||
Series S-2, 5.00%, 07/15/35 | 1,250 | 1,440,113 | ||||||
City of New York Transitional Finance Authority Building Aid Revenue, RB: | ||||||||
Fiscal 2015, Series S-1, 5.00%, 07/15/40 | 1,015 | 1,133,339 | ||||||
Series S-1, 5.00%, 07/15/37 | 2,430 | 2,746,750 | ||||||
Series S-3, 5.25%, 07/15/36 | 2,080 | 2,486,848 | ||||||
Series S-3, 5.25%, 07/15/45 | 5,000 | 5,916,100 | ||||||
City of New York Transitional Finance Authority Building Aid Revenue, Refunding RB, Series 4-A: | ||||||||
5.25%, 07/15/35 | 2,500 | 2,996,200 | ||||||
5.25%, 07/15/36 | 5,000 | 5,978,000 | ||||||
City of New York Transitional Finance Authority Future Tax Secured, RB: | ||||||||
Fiscal 2014, Sub-Series B-1, 5.00%, 11/01/36 | 680 | 764,177 | ||||||
Sub-Series E-1, 5.00%, 02/01/39 | 5,000 | 5,644,300 | ||||||
Sub-Series F-1, 5.00%, 05/01/38 | 3,450 | 3,967,086 | ||||||
Sub-Series F-1, 5.00%, 05/01/39 | 615 | 705,122 | ||||||
City of New York Transitional Finance Authority Future Tax Secured, RB, Future Tax Secured, Fiscal 2017, Series A, Sub-Series E-1, 5.00%, 02/01/36 | 3,500 | 4,023,005 | ||||||
City of New York Transitional Finance Authority Future Tax Secured Revenue, RB, Build America Bonds, 5.51%, 08/01/37 | 3,000 | 3,552,210 | ||||||
City of New York Transitional Finance Authority Future Tax Secured Revenue, RB, Subordinate: | ||||||||
Series C-3, 5.00%, 05/01/40 | 5,000 | 5,799,300 | ||||||
Sub-Series C-3, 4.00%, 05/01/42 | 5,090 | 5,299,912 | ||||||
New York State Dormitory Authority, RB, Series A: | ||||||||
Income Tax, 5.00%, 02/15/36 | 9,000 | 10,294,920 | ||||||
3.74%, 12/01/23 | 4,000 | 4,101,880 | ||||||
5.00%, 02/15/38 | 5,000 | 5,703,900 | ||||||
New York State Urban Development Corp., Refunding RB, Series B, 5.25%, 01/01/25 | 9,700 | 9,727,839 | ||||||
Sales Tax Asset Receivable Corp., Refunding RB, Fiscal 2015, Series A, 5.00%, 10/15/31 | 1,625 | 1,863,875 | ||||||
State of New York, GO, Series A, 5.00%, 02/15/39 | 750 | 765,435 | ||||||
State of New York Dormitory Authority, RB: | ||||||||
Group 4, Series A, 5.00%, 03/15/45 | 3,615 | 4,183,170 | ||||||
Personal Income Tax, Series G, 5.00%, 08/15/32 | 1,975 | 2,146,864 | ||||||
Series A, 5.00%, 03/15/36 | 8,335 | 9,564,579 | ||||||
Series A, 5.00%, 02/15/42 | 4,390 | 4,987,742 | ||||||
Series B, 5.00%, 03/15/37 | 1,500 | 1,697,055 | ||||||
State of New York State Dormitory Authority, RB, Series C, 5.00%, 10/01/42 | 1,695 | 1,911,350 | ||||||
State of New York Thruway Authority, Refunding RB, Series A-1, 5.00%, 04/01/19(c) | 1,000 | 1,026,090 | ||||||
| SCHEDULES OF INVESTMENTS | 51 |
Schedule of Investments (continued) June 30, 2018 | BlackRock New York Municipal Opportunities Fund (Percentages shown are based on Net Assets) |
| Security | Par (000) | Value | ||||||
| State (continued) | ||||||||
State of New York Urban Development Corp., RB, State Personal Income Tax: | ||||||||
General Purpose, Series A, 5.00%, 03/15/38 | $ | 5,000 | $ | 5,731,650 | ||||
Series C, 5.00%, 03/15/31 | 2,500 | 2,786,000 | ||||||
Series C, 5.00%, 03/15/32 | 4,000 | 4,450,080 | ||||||
State of New York Urban Development Corp., Refunding RB: | ||||||||
Clarkson Center Advance Materials, | 730 | 757,762 | ||||||
University Facilities Grants, 5.50%, 01/01/19 | 945 | 962,369 | ||||||
|
| |||||||
| 147,810,089 | ||||||||
| Tobacco — 3.1% | ||||||||
Counties of New York Tobacco Trust IV, Refunding RB, Settlement Pass-Through Turbo, Series A: | ||||||||
5.00%, 06/01/42 | 3,775 | 3,774,849 | ||||||
5.00%, 06/01/45 | 895 | 891,250 | ||||||
Counties of New York Tobacco Trust VI, Refunding RB: | ||||||||
Settlement Pass-Through Turbo, Series C, 4.00%, 06/01/51 | 3,655 | 3,456,607 | ||||||
Tobacco Settlement Pass-Through, Series A-2B, 5.00%, 06/01/51 | 3,615 | 3,778,109 | ||||||
County of Chautauqua New York Tobacco Asset Securitization Corp., Refunding RB, Asset-Backed, 4.75%, 06/01/39 | 750 | 758,445 | ||||||
County of Niagara New York Tobacco Asset Securitization Corp., Refunding RB, Asset-Backed: | ||||||||
5.25%, 05/15/34 | 1,750 | 1,890,840 | ||||||
5.25%, 05/15/40 | 1,080 | 1,157,501 | ||||||
Erie Tobacco Asset Securitization Corp., Refunding RB, Asset-Backed, Series A, 5.00%, 06/01/45 | 4,595 | 4,575,747 | ||||||
New York Counties Tobacco Trust IV, Refunding RB, Settlement Pass-Through Turbo, Series A, 6.25%, 06/01/41(a) | 3,600 | 3,744,756 | ||||||
Westchester New York Tobacco Asset Securitization, Refunding RB, Tobacco Settlement Bonds, Sub-Series C, 4.00%, 06/01/42 | 5,945 | 5,845,837 | ||||||
Westchester Tobacco Asset Securitization, Refunding RB, Tobacco Settlement Bonds, Sub-Series C, 5.13%, 06/01/51 | 2,175 | 2,238,379 | ||||||
|
| |||||||
| 32,112,320 | ||||||||
| Transportation — 24.5% | ||||||||
Buffalo & Fort Erie Public Bridge Authority, RB, Toll Bridge System: | ||||||||
5.00%, 01/01/42 | 955 | 1,085,014 | ||||||
5.00%, 01/01/47 | 320 | 362,291 | ||||||
Metropolitan Transportation Authority, RB: | ||||||||
Build America Bonds, 6.67%, 11/15/39 | 1,400 | 1,866,326 | ||||||
Green Bonds, Series A, 5.00%, 11/15/42 | 5,000 | 5,723,050 | ||||||
Series A, 5.63%, 11/15/18(c) | 90 | 91,414 | ||||||
Series A-1, 5.25%, 11/15/23(c) | 540 | 629,473 | ||||||
Series B, 5.25%, 11/15/39 | 5,795 | 6,547,944 | ||||||
Series B, 5.25%, 11/15/44 | 2,125 | 2,394,981 | ||||||
Series C, 6.50%, 11/15/28 | 335 | 341,003 | ||||||
Series E, 5.00%, 11/15/38 | 2,350 | 2,594,776 | ||||||
Metropolitan Transportation Authority, Refunding RB: | ||||||||
Green Bond, Sub-Series B-1, 5.00%, 11/15/35 | 3,100 | 3,570,487 | ||||||
Green Bond, Sub-Series B-1, 5.00%, 11/15/36 | 13,500 | 15,516,495 | ||||||
Green Bonds, Series A-1, 5.25%, 11/15/56 | 1,560 | 1,761,115 | ||||||
Green Bonds, Series A-1, 5.25%, 11/15/57 | 5,410 | 6,157,067 | ||||||
Series A, 5.25%, 11/15/35 | 10,000 | 11,758,700 | ||||||
Series B, 5.00%, 11/15/34 | 1,750 | 1,994,720 | ||||||
Series B, 5.00%, 11/15/37 | 2,240 | 2,539,107 | ||||||
| Security | Par (000) | Value | ||||||
| Transportation (continued) | ||||||||
Series F, 5.00%, 11/15/30 | $ | 1,000 | $ | 1,105,840 | ||||
Series F, 5.00%, 11/15/35 | 1,500 | 1,684,260 | ||||||
Sub-Series B-1, 5.00%, 11/15/34 | 1,060 | 1,223,431 | ||||||
Metropolitan Transportation Authority Hudson Rail Yards Trust Obligations, Refunding RB, Series A, | 9,985 | 10,787,694 | ||||||
MTA Hudson Rail Yards Trust Obligations, Refunding RB, Series A, 5.00%, 11/15/46 | 19,870 | 20,562,668 | ||||||
New York Transportation Development Corp., ARB, LaGuardia Airport Terminal B Redevelopment Project: | ||||||||
Series A, AMT, 4.00%, 07/01/31 | 4,850 | 4,964,266 | ||||||
Series A, AMT, 5.00%, 07/01/34 | 250 | 272,235 | ||||||
Series A, AMT, 5.00%, 07/01/46 | 7,805 | 8,415,585 | ||||||
Series A, AMT, 5.25%, 01/01/50 | 9,975 | 10,855,294 | ||||||
Series B, 3.02%, 07/01/24 | 4,150 | 3,969,600 | ||||||
Series B, 3.22%, 07/01/25 | 1,000 | 954,820 | ||||||
New York Transportation Development Corp., Refunding ARB, American Airlines, Inc., AMT, 5.00%, 08/01/31 | 6,130 | 6,430,615 | ||||||
Niagara Falls Bridge Commission, RB, Toll Bridge System (AGM), 4.16%, 10/01/33 | 1,650 | 1,675,608 | ||||||
Port Authority of New York & New Jersey, ARB: | ||||||||
192nd Series, 4.81%, 10/15/65 | 2,000 | 2,250,840 | ||||||
Consolidated, 160th Series, 5.65%, 11/01/40 | 1,800 | 2,229,696 | ||||||
Consolidated, 169th Series, 5.00%, 10/15/41 | 1,000 | 1,073,720 | ||||||
Special Project, JFK International Air Terminal LLC Project, Series 8, 6.00%, 12/01/42 | 2,000 | 2,190,820 | ||||||
Port Authority of New York & New Jersey, Refunding ARB, Consolidated, AMT: | ||||||||
178th Series, 5.00%, 12/01/43 | 285 | 312,970 | ||||||
186th Series, 5.00%, 10/15/44 | 5,700 | 6,272,736 | ||||||
193rd Series, 5.00%, 10/15/34 | 1,825 | 2,043,124 | ||||||
195th Series, 5.00%, 04/01/36 | 4,430 | 4,976,308 | ||||||
197th Series, 5.00%, 11/15/41 | 1,000 | 1,119,490 | ||||||
202th Series, 5.00%, 04/15/37 | 5,000 | 5,647,400 | ||||||
206th Series, 5.00%, 11/15/37 | 1,525 | 1,733,681 | ||||||
Port Authority of New York & New Jersey, Refunding RB, AMT: | ||||||||
178th Series, 5.00%, 12/01/32 | 1,000 | 1,108,670 | ||||||
Consolidated, 197th Series, 5.00%, 11/15/36 | 3,000 | 3,374,760 | ||||||
State of New York Thruway Authority, RB, Junior Lien, Series A: | ||||||||
5.00%, 01/01/41 | 7,440 | 8,336,594 | ||||||
5.25%, 01/01/56 | 4,675 | 5,285,835 | ||||||
State of New York Thruway Authority, Refunding RB: | ||||||||
General, Series I, 5.00%, 01/01/42 | 280 | 303,089 | ||||||
General, Series J, 5.00%, 01/01/41 | 5,750 | 6,331,612 | ||||||
General, Series K, 5.00%, 01/01/29 | 5,000 | 5,693,600 | ||||||
General, Series K, 5.00%, 01/01/31 | 2,500 | 2,832,450 | ||||||
General, Series K, 5.00%, 01/01/32 | 3,500 | 3,947,685 | ||||||
Series L, 5.00%, 01/01/33 | 2,065 | 2,407,728 | ||||||
Series L, 5.00%, 01/01/34 | 910 | 1,056,956 | ||||||
Series L, 5.00%, 01/01/35 | 1,050 | 1,216,740 | ||||||
Triborough Bridge & Tunnel Authority, RB, Series B: | ||||||||
5.00%, 11/15/40 | 1,290 | 1,464,821 | ||||||
5.00%, 11/15/45 | 2,000 | 2,261,140 | ||||||
Triborough Bridge & Tunnel Authority, Refunding RB: | ||||||||
General, MTA Bridges & Tunnels, Series C-2, 5.00%, 11/15/42 | 6,420 | 7,421,777 | ||||||
General, Series A, 5.00%, 11/15/41 | 3,750 | 4,269,150 | ||||||
General, Series A, 5.00%, 11/15/50 | 1,000 | 1,111,440 | ||||||
General, Series B, 5.00%, 11/15/37 | 10,070 | 11,610,509 | ||||||
General, Series B, 5.00%, 11/15/38 | 4,500 | 5,184,630 | ||||||
MTA Bridges & Tunnels, Series A, 5.00%, 11/15/43 | 7,890 | 9,155,635 | ||||||
|
| |||||||
| 252,061,485 | ||||||||
| 52 | 2018 BLACKROCK ANNUAL REPORTTO SHAREHOLDERS |
Schedule of Investments (continued) June 30, 2018 | BlackRock New York Municipal Opportunities Fund (Percentages shown are based on Net Assets) |
| Security | Par (000) | Value | ||||||
| Utilities — 11.1% | ||||||||
City of New York Municipal Water Finance Authority, RB, Water & Sewer System, 2nd General Resolution, Fiscal 2017, Series DD, 5.25%, 06/15/47 | $ | 2,455 | $ | 2,870,558 | ||||
City of New York Municipal Water Finance Authority, Refunding RB, Water & Sewer System, 2nd General Resolution, Fiscal 2015, Series HH, 5.00%, 06/15/39 | 1,000 | 1,125,950 | ||||||
City of New York New York Municipal Water & Sewer System, Refunding RB, 2nd General Resolution, Fiscal 2013, Series BB, 5.00%, 06/15/47 | 2,000 | 2,181,980 | ||||||
City of New York New York Municipal Water Finance Authority, Refunding RB, Water & Sewer System, 2nd General Resolution, Fiscal 2017, Series EE: | ||||||||
5.00%, 06/15/37 | 2,735 | 3,159,198 | ||||||
5.25%, 06/15/37 | 1,075 | 1,269,156 | ||||||
City of New York New York Water & Sewer System, Refunding RB, 2nd General Resolution, Series FF-2, 5.50%, 06/15/40 | 5,800 | 6,007,872 | ||||||
City of New York Water & Sewer System, Refunding RB: | ||||||||
2nd Generation Resolution, Series FF, | 8,000 | 9,322,560 | ||||||
Series EE, 5.00%, 06/15/40 | 5,215 | 6,039,752 | ||||||
Long Island Power Authority, RB, General: | ||||||||
5.00%, 09/01/37 | 1,000 | 1,146,180 | ||||||
Electric Systems, 5.00%, 09/01/36 | 2,000 | 2,297,520 | ||||||
Electric Systems, 5.00%, 09/01/42 | 1,365 | 1,555,213 | ||||||
Electric Systems, Series A (AGM), | 500 | 544,050 | ||||||
Electric Systems, Series C (CIFG), 5.25%, 09/01/29 | 3,000 | 3,593,910 | ||||||
Long Island Power Authority, Refunding RB, Electric System: | ||||||||
Series A, 5.50%, 04/01/19(c) | 875 | 901,390 | ||||||
Series A, 5.75%, 04/01/19(c) | 300 | 309,600 | ||||||
Series A, 6.00%, 05/01/19(c) | 2,450 | 2,540,723 | ||||||
Series A, 5.00%, 09/01/34 | 4,280 | 4,773,398 | ||||||
Series B, 5.00%, 09/01/41 | 1,500 | 1,693,665 | ||||||
Series B, 5.00%, 09/01/46 | 2,000 | 2,250,580 | ||||||
New York State Environmental Facilities Corp., RB, Series A, 5.00%, 06/15/34 | 10,000 | 10,302,900 | ||||||
Onondaga County Resource Recovery Agency, Refunding RB, AMT, Series A (AGM), 5.00%, 05/01/26 | 1,595 | 1,766,670 | ||||||
State of New York Environmental Facilities Corp., RB: | ||||||||
Green Bonds, Series B, 5.00%, 03/15/45 | 2,535 | 2,868,479 | ||||||
New York City Municipal Water Finance Authority Projects, Series E, 5.00%, 06/15/38 | 2,500 | 2,906,925 | ||||||
Series D, 3.26%, 01/15/30 | 1,500 | 1,461,315 | ||||||
State of New York Environmental Facilities Corp., Refunding RB, Revolving Funds, New York City Municipal Water, Series B, 5.00%, 06/15/36 | 1,000 | 1,084,020 | ||||||
Upper Mohawk Valley Regional Water Finance Authority, Refunding RB: | ||||||||
5.00%, 04/01/28 | 100 | 115,897 | ||||||
5.00%, 04/01/29 | 375 | 432,349 | ||||||
4.00%, 04/01/32 | 100 | 106,363 | ||||||
Utility Debt Securitization Authority, Refunding RB: | ||||||||
5.00%, 12/15/38 | 8,460 | 9,903,953 | ||||||
Restructuring Bonds, 5.00%, 12/15/33 | 10,000 | 11,542,600 | ||||||
Restructuring Bonds, Series A, 5.00%, 12/15/35 | 1,145 | 1,321,639 | ||||||
Restructuring Bonds, Series B, 5.00%, 12/15/34 | 3,025 | 3,501,014 | ||||||
Restructuring, Series E, 5.00%, 12/15/41 | 11,725 | 13,165,182 | ||||||
|
| |||||||
| 114,062,561 | ||||||||
| Security | Par (000) | Value | ||||||
| Puerto Rico — 0.3% | ||||||||
| State — 0.2% | ||||||||
Commonwealth of Puerto Rico, GO, Refunding, Series A(e)(f): | ||||||||
Public Improvement, 5.50%, 07/01/39 | $ | 800 | $ | 336,000 | ||||
8.00%, 07/01/35 | 2,030 | 822,150 | ||||||
Commonwealth of Puerto Rico, GO, | 885 | 376,125 | ||||||
|
| |||||||
| 1,534,275 | ||||||||
| Utilities — 0.1% | ||||||||
Commonwealth of Puerto Rico Aqueduct & Sewer Authority, RB, Senior Lien, Series A, | 1,045 | 875,187 | ||||||
Commonwealth of Puerto Rico Aqueduct & Sewer Authority, Refunding RB, Senior Lien, Series A, 6.00%, 07/01/38 | 575 | 481,563 | ||||||
|
| |||||||
| 1,356,750 | ||||||||
|
| |||||||
Total Municipal Bonds in Puerto Rico |
| 2,891,025 | ||||||
|
| |||||||
Total Municipal Bonds — 87.5% |
| 899,827,993 | ||||||
|
| |||||||
Municipal Bonds Transferred to Tender Option Bond Trusts(g) |
| |||||||
| New York — 12.2% | ||||||||
| County/City/Special District/School District — 1.4% | ||||||||
City of New York, GO: | ||||||||
Sub-Series G-1, 5.00%, 04/01/29 | 750 | 822,030 | ||||||
Sub-Series I-1, 5.00%, 03/01/36 | 1,500 | 1,677,937 | ||||||
City of New York Convention Center Development Corp., Refunding RB, Hotel Unit Fee Secured, | 2,000 | 2,295,290 | ||||||
Hudson Yards Infrastructure Corp., RB, Fiscal 2012, Series A, 5.75%, 02/15/47(h) | 2,250 | 2,460,278 | ||||||
New York Liberty Development Corp., ARB, 1 World Trade Center Port Authority Consolidated Bonds, 5.25%, 12/15/43 | 6,495 | 7,113,922 | ||||||
|
| |||||||
| 14,369,457 | ||||||||
| Education — 0.1% | ||||||||
State of New York Dormitory Authority, RB, State University Dormitory Facilities, New York University, Series A, 5.25%, 07/01/19(c) | 1,350 | 1,399,694 | ||||||
|
| |||||||
| State — 6.0% | ||||||||
City of New York Transitional Finance Authority, BARB, Fiscal 2009, Series S-3, 5.25%, 01/15/39 | 2,100 | 2,137,437 | ||||||
City of New York New York Transitional Finance Authority, RB, Future Tax Secured, Sub-Series D-1, | 1,650 | 1,788,573 | ||||||
Sales Tax Asset Receivable Corp., Refunding RB, Fiscal 2015, Series A, 4.00%, 10/15/32 | 1,440 | 1,560,470 | ||||||
State of New York Dormitory Authority, RB: | ||||||||
General Purpose, Series C, 5.00%, 03/15/41 | 1,000 | 1,071,905 | ||||||
Group 2, State Sales Tax, Series A, 5.00%, 03/15/32 | 5,000 | 5,911,500 | ||||||
Group B, State Sales Tax, Series A, 5.00%, 03/15/39 | 15,393 | 17,658,933 | ||||||
Series A, 5.00%, 03/15/44 | 3,299 | 3,682,245 | ||||||
State Personal Income Tax, Series A, | 10,000 | 11,485,373 | ||||||
State of New York Urban Development Corp., Refunding RB, State Personal Income Tax, Series A: | ||||||||
4.00%, 03/15/37 | 8,740 | 9,158,733 | ||||||
5.00%, 03/15/45 | 6,003 | 6,754,920 | ||||||
|
| |||||||
| 61,210,089 | ||||||||
| SCHEDULES OF INVESTMENTS | 53 |
Schedule of Investments (continued) June 30, 2018 | BlackRock New York Municipal Opportunities Fund (Percentages shown are based on Net Assets) |
| Security | Par (000) | Value | ||||||
| Transportation — 3.2% | ||||||||
Metropolitan Transportation Authority, RB, Sub-Series D-1, 5.00%, 11/15/39 | $ | 4,260 | $ | 4,737,092 | ||||
Metropolitan Transportation Authority, Refunding RB, Green Bonds, Sub-Series B-1, 5.00%, 11/15/51 | 10,000 | 11,319,057 | ||||||
Port Authority of New York & New Jersey, Refunding ARB: | ||||||||
194th Series, 5.25%, 10/15/55 | 1,950 | 2,217,221 | ||||||
Consolidated, Series 169th, 5.00%, 10/15/26 | 1,500 | 1,624,807 | ||||||
State of New York Thruway Authority, Refunding RB, Transportation, Personal Income Tax, Series A, 5.00%, 03/15/31 | 1,560 | 1,697,093 | ||||||
Triborough Bridge & Tunnel Authority, Refunding RB, Series A, 5.00%, 11/15/41 | 10,000 | 11,384,350 | ||||||
|
| |||||||
| 32,979,620 | ||||||||
| Utilities — 1.5% | ||||||||
City of New York Municipal Water Finance Authority, Refunding RB, Water & Sewer System, 2nd General Resolution: | ||||||||
Fiscal 2011, Series HH, 5.00%, 06/15/32 | 2,790 | 3,015,451 | ||||||
Fiscal 2012, Series BB, 5.00%, 06/15/44 | 3,751 | 4,066,439 | ||||||
New York State Environmental Facilities Corp., Refunding RB, Subordinated SRF Bonds, Series 2016 A, 4.00%, 06/15/46 | 1,503 | 1,564,917 | ||||||
Utility Debt Securitization Authority, Refunding RB, Restructuring: | ||||||||
Series A, 5.00%, 12/15/34 | 5,000 | 5,785,500 | ||||||
Series B, 4.00%, 12/15/35 | 1,300 | 1,382,231 | ||||||
|
| |||||||
| 15,814,538 | ||||||||
|
| |||||||
Total Municipal Bonds Transferred to Tender Option |
| 125,773,398 | ||||||
|
| |||||||
Total Long-Term Investments — 101.7% |
| 1,046,198,075 | ||||||
|
| |||||||
| Security | Shares | Value | ||||||
| Short-Term Securities — 3.7% | ||||||||
BlackRock Liquidity Funds, MuniCash, Institutional Class, | 37,673,273 | $ | 37,677,040 | |||||
|
| |||||||
Total Short-Term Securities — 3.7% |
| 37,677,040 | ||||||
|
| |||||||
Total Investments — 105.4% |
| 1,083,875,115 | ||||||
Other Assets Less Liabilities — 1.2% |
| 11,636,099 | ||||||
Liability for TOB Trust Certificates, Including Interest Expense and Fees Payable — (6.6)% |
| (67,558,682 | ) | |||||
|
| |||||||
Net Assets — 100.0% |
| $ | 1,027,952,532 | |||||
|
| |||||||
| (a) | Security exempt from registration pursuant to Rule 144A under the Securities Act of 1933, as amended. These securities may be resold in transactions exempt from registration to qualified institutional investors. |
| (b) | Variable or floating rate security, which interest rate adjusts periodically based on changes in current interest rates and prepayments on the underlying pool of assets. Rate shown is the rate in effect as of period end. |
| (c) | U.S. Government securities, held in escrow, are used to pay interest on this security, as well as to retire the bond in full at the date indicated, typically at a premium to par. |
| (d) | Zero-coupon bond. |
| (e) | Non-income producing security. |
| (f) | Issuer filed for bankruptcy and/or is in default. |
| (g) | Represent bonds transferred to a TOB Trust in exchange of cash and residual certificates received by the Fund. These bonds serve as collateral in a secured borrowing. See Note 4 of the Notes to Financial Statements for details. |
| (h) | All or a portion of security is subject to a recourse agreement. The aggregate maximum potential amount the Fund could ultimately be required to pay under the agreement, which expires on February 15, 2019, is $1,191,479. See Note 4 of the Notes to Financial Statements for details. |
| (i) | Annualized 7-day yield as of period end. |
| (j) | During the year ended June 30, 2018, investments in issuers considered to be an affiliate of the Fund for purposes of Section 2(a)(3) of the Investment Company Act of 1940, as amended, were as follows: |
| Affiliate | Shares Held at 06/30/17 | Net Activity | Shares Held at 06/30/18 | Value at 06/30/18 | Income | Net Realized Gain (Loss) (a) | Change in Unrealized Appreciation (Depreciation) | |||||||||||||||||||||
BlackRock Liquidity Funds, MuniCash, Institutional Class | 27,004,384 | 10,668,889 | 37,673,273 | $ | 37,677,040 | $ | 382,853 | $ | (1,930 | ) | $ | (166 | ) | |||||||||||||||
|
|
|
|
|
|
|
| |||||||||||||||||||||
| (a) | Includes net capital gain distributions, if applicable. |
For Fund compliance purposes, the Fund’s sector classifications refer to one or more of the sector sub-classifications used by one or more widely recognized market indexes or rating group indexes, and/or as defined by the investment adviser. These definitions may not apply for purposes of this report, which may combine such sector sub-classifications for reporting ease.
| 54 | 2018 BLACKROCK ANNUAL REPORTTO SHAREHOLDERS |
Schedule of Investments (continued) June 30, 2018 | BlackRock New York Municipal Opportunities Fund |
Derivative Financial Instruments Outstanding as of Period End
Futures Contracts
| Description | Number of Contracts | �� | Expiration Date | Notional Amount (000) | Value/ Unrealized Appreciation (Depreciation) | |||||||||||
Short Contracts: | ||||||||||||||||
10-Year U.S. Treasury Note | 925 | 09/19/18 | $ | 111,173 | $ | (264,683 | ) | |||||||||
Long U.S. Treasury Bond | 1,152 | 09/19/18 | 167,040 | (2,526,665 | ) | |||||||||||
5-Year U.S. Treasury Note | 163 | 09/28/18 | 18,520 | (63,009 | ) | |||||||||||
|
| |||||||||||||||
| $ | (2,854,357 | ) | ||||||||||||||
|
| |||||||||||||||
Derivative Financial Instruments Categorized by Risk Exposure
As of year end, the fair values of derivative financial instruments located in the Statements of Assets and Liabilitie were as follows:
| Commodity Contracts | Credit Contracts | Equity Contracts | Foreign Currency Exchange Contracts | Interest Rate Contracts | Other Contracts | Total | ||||||||||||||||||||||
Liabilities — Derivative Financial Instruments | ||||||||||||||||||||||||||||
Futures contracts | ||||||||||||||||||||||||||||
Net unrealized depreciation(a) | $ | — | $ | — | $ | — | $ | — | $ | 2,854,357 | $ | — | $ | 2,854,357 | ||||||||||||||
|
|
|
|
|
|
|
|
|
|
|
|
|
| |||||||||||||||
| (a) | Includes cummulative appreciation (depreciation) on futures contracts, if any, as reported in the Schedule of Investments. Only current day’s variation margin is reported within the Statements of Assets and Liabilities. |
For the year ended June 30, 2018, the effect of derivative financial instruments in the Statements of Operations was as follows:
| Commodity Contracts | Credit Contracts | Equity Contracts | Foreign Currency Exchange Contracts | Interest Rate Contracts | Other Contracts | Total | ||||||||||||||||||||||
Net Realized Gain (Loss) from: | ||||||||||||||||||||||||||||
Futures contracts | $ | — | $ | — | $ | — | $ | — | $ | 18,874,233 | $ | — | $ | 18,874,233 | ||||||||||||||
|
|
|
|
|
|
|
|
|
|
|
|
|
| |||||||||||||||
| Net Change in Unrealized Appreciation (Depreciation) on: | ||||||||||||||||||||||||||||
Futures contracts | $ | — | $ | — | $ | — | $ | — | $ | (1,585,315 | ) | $ | — | $ | (1,585,315 | ) | ||||||||||||
|
|
|
|
|
|
|
|
|
|
|
|
|
| |||||||||||||||
Average Quarterly Balances of Outstanding Derivative Financial Instruments
Futures contracts: |
| |||
Average notional value of contracts — long | $ | — | (a) | |
Average notional value of contracts — short | $ | 364,383,463 | ||
| (a) | Derivative not held at quarter-end. The amount shown in the Statements of Operations reflect the results of activity during the period. |
For more information about the Fund’s investment risks regarding derivative financial instruments, refer to the Notes to Financial Statements.
| SCHEDULES OF INVESTMENTS | 55 |
Schedule of Investments (continued) June 30, 2018 | BlackRock New York Municipal Opportunities Fund |
Fair Value Hierarchy as of Period End
Various inputs are used in determining the fair value of investments and derivative financial instruments. For information about the Fund’s policy regarding valuation of investments and derivative financial instruments, refer to the Notes to Financial Statements.
The following tables summarize the Fund’s investments and derivative financial instruments categorized in the disclosure hierarchy:
| Level 1 | Level 2 | Level 3 | Total | |||||||||||||
Assets: |
| |||||||||||||||
Investments: |
| |||||||||||||||
Long-Term Investments(a) | $ | — | $ | 1,046,198,075 | $ | — | $ | 1,046,198,075 | ||||||||
Short-Term Securities | 37,677,040 | — | — | 37,677,040 | ||||||||||||
|
|
|
|
|
|
|
| |||||||||
| $ | 37,677,040 | $ | 1,046,198,075 | $ | — | $ | 1,083,875,115 | |||||||||
|
|
|
|
|
|
|
| |||||||||
Derivative Financial Instruments(b) |
| |||||||||||||||
Liabilities: |
| |||||||||||||||
Interest rate contracts | $ | (2,854,357 | ) | $ | — | $ | — | $ | (2,854,357 | ) | ||||||
|
|
|
|
|
|
|
| |||||||||
| (a) | See above Schedule of Investments for values in each sector or political subdivision. |
| (b) | Derivative financial instruments are futures contracts which are valued at the unrealized appreciation (depreciation) on the instrument. |
The Fund may hold assets and/or liabilities in which the fair value approximates the carrying amount for financial statement purposes. As of period end TOB Trust Certificates of $67,388,640 are categorized as Level 2 within the disclosure hierarchy.
During the year ended June 30, 2018, there were no transfers between levels.
| 56 | 2018 BLACKROCK ANNUAL REPORTTO SHAREHOLDERS |
Statements of Assets and Liabilities
June 30, 2018
BlackRock Fund | BlackRock National Municipal Fund | BlackRock Short-Term Municipal Fund | BlackRock New York Opportunities Fund | |||||||||||||
ASSETS | ||||||||||||||||
Investments at value — unaffiliated(a) | $ | 862,187,754 | $ | 9,017,790,991 | $ | 466,841,197 | $ | 1,046,198,075 | ||||||||
Investments at value — affiliated(b) | 37,609,202 | 91,141,627 | 22,772 | 37,677,040 | ||||||||||||
Cash | 61,639 | 774,174 | 2,252,230 | 564,320 | ||||||||||||
Cash pledged for futures contracts | 519,500 | 4,790,000 | — | 3,747,350 | ||||||||||||
Receivables: | ||||||||||||||||
Interest — unaffiliated | 10,230,372 | 110,074,906 | 3,579,280 | 11,856,977 | ||||||||||||
Capital shares sold | 1,463,296 | 16,397,921 | 247,126 | 2,635,126 | ||||||||||||
Investments sold | 70,000 | 27,840,203 | 275,000 | 380,328 | ||||||||||||
Dividends — affiliated | 44,380 | 139,377 | 218 | 39,756 | ||||||||||||
Receivable from the Manager | — | — | — | 5,355 | ||||||||||||
Offering costs | 22,932 | — | — | 22,932 | ||||||||||||
Prepaid expenses | 62,414 | 267,718 | 75,519 | 40,264 | ||||||||||||
Other assets | 3,512 | — | — | — | ||||||||||||
|
|
|
|
|
|
|
| |||||||||
Total assets | 912,275,001 | 9,269,216,917 | 473,293,342 | 1,103,167,523 | ||||||||||||
|
|
|
|
|
|
|
| |||||||||
LIABILITIES | ||||||||||||||||
Payables: | ||||||||||||||||
Investments purchased | 4,920,000 | 120,980,965 | 8,891,830 | 4,671,089 | ||||||||||||
Capital shares redeemed | 2,107,806 | 25,181,379 | 798,565 | 1,383,982 | ||||||||||||
Income dividend distributions | 1,272,722 | 5,870,459 | 331,888 | 685,759 | ||||||||||||
Other accrued expenses | 377,498 | 2,090,643 | 218,901 | 399,626 | ||||||||||||
Investment advisory fees | 281,148 | 2,515,631 | 94,128 | 301,458 | ||||||||||||
Interest expense and fees | 190,624 | — | — | 170,042 | ||||||||||||
Service and distribution fees | 94,715 | 840,017 | 28,231 | 162,180 | ||||||||||||
Offering costs | 5,918 | — | — | 5,572 | ||||||||||||
Directors’ and Officer’s fees | 5,242 | 29,695 | 4,140 | 5,535 | ||||||||||||
Variation margin on futures contracts | 4,781 | 46,622 | — | 32,179 | ||||||||||||
Board realignment and consolidation | 4,509 | 95,383 | 4,049 | 5,355 | ||||||||||||
Other affiliates | 2,225 | 21,492 | 1,158 | 2,058 | ||||||||||||
Recoupment of past waived fees | — | — | — | 1,516 | ||||||||||||
|
|
|
|
|
|
|
| |||||||||
Total accrued liabilities | 9,267,188 | 157,672,286 | 10,372,890 | 7,826,351 | ||||||||||||
|
|
|
|
|
|
|
| |||||||||
OTHER LIABILITIES | ||||||||||||||||
TOB Trust Certificates | 61,022,202 | — | — | 67,388,640 | ||||||||||||
|
|
|
|
|
|
|
| |||||||||
Total liabilities | 70,289,390 | 157,672,286 | 10,372,890 | 75,214,991 | ||||||||||||
|
|
|
|
|
|
|
| |||||||||
NET ASSETS | $ | 841,985,611 | $ | 9,111,544,631 | $ | 462,920,452 | $ | 1,027,952,532 | ||||||||
|
|
|
|
|
|
|
| |||||||||
NET ASSETS CONSIST OF | ||||||||||||||||
Paid-in capital | $ | 815,130,679 | $ | 8,936,737,548 | $ | 464,929,434 | $ | 1,004,525,401 | ||||||||
Undistributed net investment income | 627,163 | 2,019,556 | 477,104 | 471,694 | ||||||||||||
Accumulated net realized gain (loss) | (7,282,185 | ) | 1,500,123 | (1,608,430 | ) | 9,886,282 | ||||||||||
Net unrealized appreciation (depreciation) | 33,509,954 | 171,287,404 | (877,656 | ) | 13,069,155 | |||||||||||
|
|
|
|
|
|
|
| |||||||||
NET ASSETS | $ | 841,985,611 | $ | 9,111,544,631 | $ | 462,920,452 | $ | 1,027,952,532 | ||||||||
|
|
|
|
|
|
|
| |||||||||
(a) Investments at cost — unaffiliated | $ | 828,181,696 | $ | 8,843,658,052 | $ | 467,718,853 | $ | 1,030,277,504 | ||||||||
(b) Investments at cost — affiliated | $ | 37,606,579 | $ | 91,132,970 | $ | 22,772 | $ | 37,674,099 | ||||||||
See notes to financial statements.
| FINANCIAL STATEMENTS | 57 |
Statements of Assets and Liabilities (continued)
June 30, 2018
BlackRock Fund | BlackRock National Municipal Fund | BlackRock Short-Term Municipal Fund | BlackRock New York Opportunities Fund | |||||||||||||
Institutional | ||||||||||||||||
Net assets | $ | 549,216,540 | $ | 3,028,848,563 | $ | 360,542,979 | $ | 455,378,386 | ||||||||
|
|
|
|
|
|
|
| |||||||||
Shares outstanding, $0.10 par value | 57,288,826 | 280,732,909 | 35,776,757 | 40,271,432 | ||||||||||||
|
|
|
|
|
|
|
| |||||||||
Net asset value | $ | 9.59 | $ | 10.79 | $ | 10.08 | $ | 11.31 | ||||||||
|
|
|
|
|
|
|
| |||||||||
Shares authorized | 100 million | 800 Million | 150 million | Unlimited | ||||||||||||
|
|
|
|
|
|
|
| |||||||||
Service | ||||||||||||||||
Net assets | $ | — | $ | 2,406,624 | $ | — | $ | — | ||||||||
|
|
|
|
|
|
|
| |||||||||
Shares outstanding, $0.10 par value | — | 223,225 | — | — | ||||||||||||
|
|
|
|
|
|
|
| |||||||||
Net asset value | $ | — | $ | 10.78 | $ | — | $ | — | ||||||||
|
|
|
|
|
|
|
| |||||||||
Shares authorized | — | 375 Million | — | — | ||||||||||||
|
|
|
|
|
|
|
| |||||||||
Investor A | ||||||||||||||||
Net assets | $ | 220,992,360 | $ | 2,730,622,323 | $ | 61,443,926 | $ | 362,961,277 | ||||||||
|
|
|
|
|
|
|
| |||||||||
Shares outstanding, $0.10 par value | 23,105,550 | 252,918,143 | 6,093,893 | 32,080,361 | ||||||||||||
|
|
|
|
|
|
|
| |||||||||
Net asset value | $ | 9.56 | $ | 10.80 | $ | 10.08 | $ | 11.31 | ||||||||
|
|
|
|
|
|
|
| |||||||||
Shares authorized | 100 million | 800 Million | 150 Million | Unlimited | ||||||||||||
|
|
|
|
|
|
|
| |||||||||
Investor A1 | ||||||||||||||||
Net assets | $ | — | $ | — | $ | 17,389,147 | $ | 107,538,274 | ||||||||
|
|
|
|
|
|
|
| |||||||||
Shares outstanding, $ 0.10 par value | — | — | 1,724,266 | 9,505,022 | ||||||||||||
|
|
|
|
|
|
|
| |||||||||
Net asset value | $ | — | $ | — | $ | 10.08 | $ | 11.31 | ||||||||
|
|
|
|
|
|
|
| |||||||||
Shares authorized | — | — | 150 Million | Unlimited | ||||||||||||
|
|
|
|
|
|
|
| |||||||||
Investor C | ||||||||||||||||
Net assets | $ | 60,064,573 | $ | 327,384,312 | $ | 16,825,034 | $ | 98,722,199 | ||||||||
|
|
|
|
|
|
|
| |||||||||
Shares outstanding, $0.10 par value | 6,262,195 | 30,320,069 | 1,713,883 | 8,728,718 | ||||||||||||
|
|
|
|
|
|
|
| |||||||||
Net asset value | $ | 9.59 | $ | 10.80 | $ | 9.82 | $ | 11.31 | ||||||||
|
|
|
|
|
|
|
| |||||||||
Shares authorized | 100 million | 375 Million | 150 Million | Unlimited | ||||||||||||
|
|
|
|
|
|
|
| |||||||||
Investor C1 | ||||||||||||||||
Net assets | $ | — | $ | 9,788,275 | $ | — | $ | 741,740 | ||||||||
|
|
|
|
|
|
|
| |||||||||
Shares outstanding, $0.10 par value | — | 906,922 | — | 65,575 | ||||||||||||
|
|
|
|
|
|
|
| |||||||||
Net asset value | $ | — | $ | 10.79 | $ | — | $ | 11.31 | ||||||||
|
|
|
|
|
|
|
| |||||||||
Shares authorized | — | 375 Million | — | Unlimited | ||||||||||||
|
|
|
|
|
|
|
| |||||||||
Class K | ||||||||||||||||
Net assets | $ | 11,712,138 | $ | 3,012,494,534 | $ | 6,719,366 | $ | 2,610,646 | ||||||||
|
|
|
|
|
|
|
| |||||||||
Shares outstanding, $0.10 par value | 1,221,561 | 279,106,544 | 666,807 | 230,846 | ||||||||||||
|
|
|
|
|
|
|
| |||||||||
Net asset value | $ | 9.59 | $ | 10.79 | $ | 10.08 | $ | 11.31 | ||||||||
|
|
|
|
|
|
|
| |||||||||
Shares authorized | 2 Billion | 375 million | 150 million | Unlimited | ||||||||||||
|
|
|
|
|
|
|
| |||||||||
See notes to financial statements.
| 58 | 2018 BLACKROCK ANNUAL REPORTTO SHAREHOLDERS |
Year Ended June 30, 2018
BlackRock High Yield Municipal Fund | BlackRock National Municipal Fund | BlackRock Short-Term Municipal Fund | BlackRock Opportunities Fund | |||||||||||||
INVESTMENT INCOME | ||||||||||||||||
Interest — unaffiliated | $ | 38,869,616 | $ | 291,704,107 | $ | 6,720,249 | $ | 30,613,988 | ||||||||
Dividends — affiliated | 367,748 | 3,587,475 | 4,852 | 382,853 | ||||||||||||
|
|
|
|
|
|
|
| |||||||||
Total investment income | 39,237,364 | 295,291,582 | 6,725,101 | 30,996,841 | ||||||||||||
|
|
|
|
|
|
|
| |||||||||
EXPENSES | ||||||||||||||||
Investment advisory | 3,827,869 | 32,744,598 | 1,346,674 | 4,060,468 | ||||||||||||
Service and distribution — class specific | 1,155,546 | 9,995,035 | 375,006 | 1,812,212 | ||||||||||||
Transfer agent — class specific | 307,952 | 6,393,479 | 434,209 | 502,289 | ||||||||||||
Accounting services | 180,687 | 1,152,746 | 86,970 | 204,633 | ||||||||||||
Registration | 113,140 | 871,779 | 145,915 | 78,034 | ||||||||||||
Professional | 92,194 | 302,643 | 62,151 | 131,464 | ||||||||||||
Custodian | 37,772 | 281,222 | 21,826 | 39,923 | ||||||||||||
Directors and Officer | 26,769 | 128,791 | 21,987 | 27,476 | ||||||||||||
Printing | 18,157 | 117,754 | 19,324 | 42,970 | ||||||||||||
Offering costs | 17,118 | — | — | 17,118 | ||||||||||||
Board realignment and consolidation | 4,509 | 95,383 | 4,049 | 5,355 | ||||||||||||
Miscellaneous | 56,940 | 209,456 | 37,494 | 58,682 | ||||||||||||
Recoupment of past waived and/or reimbursed fees — class specific | — | — | — | 1,516 | ||||||||||||
|
|
|
|
|
|
|
| |||||||||
Total expenses excluding interest expense and fees | 5,838,653 | 52,292,886 | 2,555,605 | 6,982,140 | ||||||||||||
Interest expense and fees(a) | 1,088,981 | — | — | 1,092,960 | ||||||||||||
|
|
|
|
|
|
|
| |||||||||
Total expenses | 6,927,634 | 52,292,886 | 2,555,605 | 8,075,100 | ||||||||||||
Less: | ||||||||||||||||
Fees waived and/or reimbursed by the Manager | (195,261 | ) | (2,775,356 | ) | (318,170 | ) | (547,743 | ) | ||||||||
Transfer agent fees waived and/or reimbursed — class specific | (35,070 | ) | (3,290,412 | ) | (211,999 | ) | (304,009 | ) | ||||||||
|
|
|
|
|
|
|
| |||||||||
Total expenses after fees waived and/or reimbursed | 6,697,303 | 46,227,118 | 2,025,436 | 7,223,348 | ||||||||||||
|
|
|
|
|
|
|
| |||||||||
Net investment income | 32,540,061 | 249,064,464 | 4,699,665 | 23,773,493 | ||||||||||||
|
|
|
|
|
|
|
| |||||||||
REALIZED AND UNREALIZED GAIN (LOSS) | ||||||||||||||||
Net realized gain (loss) from: | ||||||||||||||||
Investments — unaffiliated | 1,693,021 | 18,381,219 | (706,162 | ) | (2,625,884 | ) | ||||||||||
Investments — affiliated | (5,957 | ) | (49,554 | ) | 239 | (12,752 | ) | |||||||||
Futures contracts | 2,312,224 | 22,567,889 | — | 18,874,233 | ||||||||||||
Capital gain distributions from investment companies — affiliated | 3,512 | 72,992 | 2,891 | 10,822 | ||||||||||||
|
|
|
|
|
|
|
| |||||||||
| 4,002,800 | 40,972,546 | (703,032 | ) | 16,246,419 | ||||||||||||
|
|
|
|
|
|
|
| |||||||||
Net change in unrealized appreciation (depreciation) on: | ||||||||||||||||
Investments — unaffiliated | (337,306 | ) | (109,407,356 | ) | (1,245,104 | ) | (8,028,463 | ) | ||||||||
Investments — affiliated | 355 | (35,618 | ) | — | (166 | ) | ||||||||||
Futures contracts | (256,945 | ) | (2,717,461 | ) | — | (1,585,315 | ) | |||||||||
|
|
|
|
|
|
|
| |||||||||
| (593,896 | ) | (112,160,435 | ) | (1,245,104 | ) | (9,613,944 | ) | |||||||||
|
|
|
|
|
|
|
| |||||||||
Net realized and unrealized gain (loss) | 3,408,904 | (71,187,889 | ) | (1,948,136 | ) | 6,632,475 | ||||||||||
|
|
|
|
|
|
|
| |||||||||
NET INCREASE IN NET ASSETS RESULTING FROM OPERATIONS | $ | 35,948,965 | $ | 177,876,575 | $ | 2,751,529 | $ | 30,405,968 | ||||||||
|
|
|
|
|
|
|
| |||||||||
| (a) | Related to TOB Trusts. |
See notes to financial statements.
| FINANCIAL STATEMENTS | 59 |
Statements of Changes in Net Assets
| BlackRock High Yield Municipal Fund | BlackRock National Municipal Fund | |||||||||||||||||||
| Year Ended June 30, | Year Ended June 30, | |||||||||||||||||||
| 2018 | 2017 | 2018 | 2017 | |||||||||||||||||
INCREASE (DECREASE) IN NET ASSETS |
| |||||||||||||||||||
OPERATIONS |
| |||||||||||||||||||
Net investment income | $ | 32,540,061 | $ | 32,815,906 | $ | 249,064,464 | $ | 205,363,448 | ||||||||||||
Net realized gain (loss) | 4,002,800 | (740,852 | ) | 40,972,546 | (4,431,754 | ) | ||||||||||||||
Net change in unrealized appreciation (depreciation) | (593,896 | ) | (40,134,451 | ) | (112,160,435 | ) | (211,125,691 | ) | ||||||||||||
|
|
|
|
|
|
|
|
|
| |||||||||||
Net increase (decrease) in net assets resulting from operations | 35,948,965 | (8,059,397 | ) | 177,876,575 | (10,193,997 | ) | ||||||||||||||
|
|
|
|
|
|
|
|
|
| |||||||||||
DISTRIBUTIONS TO SHAREHOLDERS(a) |
| |||||||||||||||||||
From net investment income: |
| |||||||||||||||||||
Institutional | (22,269,205 | ) | (21,576,847 | ) | (102,169,525 | ) | (99,278,624 | ) | ||||||||||||
Service | — | — | (79,545 | ) | (82,290 | ) | ||||||||||||||
Investor A | (8,349,393 | ) | (8,823,863 | ) | (70,549,749 | ) | (71,481,738 | ) | ||||||||||||
Investor B | — | — | (7,152 | ) | (24,892 | ) | ||||||||||||||
Investor C | (1,953,705 | ) | (2,195,096 | ) | (7,327,250 | ) | (9,633,517 | ) | ||||||||||||
Investor C1 | — | — | (252,996 | ) | (1,267,351 | ) | ||||||||||||||
Class K | (139,812 | ) | — | (69,394,304 | ) | (23,451,485 | ) | |||||||||||||
|
|
|
|
|
|
|
|
|
| |||||||||||
Decrease in net assets resulting from distributions to shareholders | (32,712,115 | ) | (32,595,806 | ) | (249,780,521 | ) | (205,219,897 | ) | ||||||||||||
|
|
|
|
|
|
|
|
|
| |||||||||||
CAPITAL SHARE TRANSACTIONS |
| |||||||||||||||||||
Net increase (decrease) in net assets derived from capital share transactions | 57,975,788 | (32,575,193 | ) | 1,369,051,416 | 1,168,454,766 | |||||||||||||||
|
|
|
|
|
|
|
|
|
| |||||||||||
NET ASSETS |
| |||||||||||||||||||
Total increase (decrease) in net assets | 61,212,638 | (73,230,396 | ) | 1,297,147,470 | 953,040,872 | |||||||||||||||
Beginning of year | 780,772,973 | 854,003,369 | 7,814,397,161 | 6,861,356,289 | ||||||||||||||||
|
|
|
|
|
|
|
|
|
| |||||||||||
End of year | $ | 841,985,611 | $ | 780,772,973 | $ | 9,111,544,631 | $ | 7,814,397,161 | ||||||||||||
|
|
|
|
|
|
|
|
|
| |||||||||||
Undistributed net investment income, end of year | $ | 627,163 | $ | 786,528 | $ | 2,019,556 | $ | 2,742,708 | ||||||||||||
|
|
|
|
|
|
|
|
|
| |||||||||||
| (a) | Distributions for annual periods determined in accordance with U.S. federal income tax regulations. |
See notes to financial statements.
| 60 | 2018 BLACKROCK ANNUAL REPORTTO SHAREHOLDERS |
Statements of Changes in Net Assets (continued)
| BlackRock Short-Term Municipal Fund | BlackRock New York Municipal Opportunities Fund | |||||||||||||||||||
| Year Ended June 30, | Year Ended June 30, | |||||||||||||||||||
| 2018 | 2017 | 2018 | 2017 | |||||||||||||||||
INCREASE (DECREASE) IN NET ASSETS | ||||||||||||||||||||
OPERATIONS | ||||||||||||||||||||
Net investment income | $ | 4,699,665 | $ | 3,198,267 | $ | 23,773,493 | $ | 19,570,548 | ||||||||||||
Net realized gain (loss) | (703,032 | ) | (839,466 | ) | 16,246,419 | 4,106,987 | ||||||||||||||
Net change in unrealized appreciation (depreciation) | (1,245,104 | ) | (2,584,686 | ) | (9,613,944 | ) | (25,828,124 | ) | ||||||||||||
|
|
|
|
|
|
|
|
|
| |||||||||||
Net increase (decrease) in net assets resulting from operations | 2,751,529 | (225,885 | ) | 30,405,968 | (2,150,589 | ) | ||||||||||||||
|
|
|
|
|
|
|
|
|
| |||||||||||
DISTRIBUTIONS TO SHAREHOLDERS(a) | ||||||||||||||||||||
From net investment income: | ||||||||||||||||||||
Institutional | (3,917,346 | ) | (2,734,887 | ) | (10,312,712 | ) | (6,897,068 | ) | ||||||||||||
Investor A | (542,423 | ) | (323,093 | ) | (8,484,778 | ) | (7,067,022 | ) | ||||||||||||
Investor A1 | (184,330 | ) | (117,071 | ) | (3,200,212 | ) | (3,573,248 | ) | ||||||||||||
Investor C | (26,247 | ) | — | (1,801,015 | ) | (1,809,064 | ) | |||||||||||||
Investor C1 | — | — | (18,602 | ) | (139,370 | ) | ||||||||||||||
Class K | (47,113 | ) | (21,941 | ) | (17,062 | ) | — | |||||||||||||
From net realized gain: | ||||||||||||||||||||
Institutional | — | (200,434 | ) | — | — | |||||||||||||||
Investor A | — | (39,387 | ) | — | — | |||||||||||||||
Investor A1 | — | (8,306 | ) | — | — | |||||||||||||||
Investor C | — | (11,552 | ) | — | — | |||||||||||||||
Class K | — | (1,268 | ) | — | — | |||||||||||||||
|
|
|
|
|
|
|
|
|
| |||||||||||
Decrease in net assets resulting from distributions to shareholders | (4,717,459 | ) | (3,457,939 | ) | (23,834,381 | ) | (19,485,772 | ) | ||||||||||||
|
|
|
|
|
|
|
|
|
| |||||||||||
CAPITAL SHARE TRANSACTIONS | ||||||||||||||||||||
Net increase (decrease) in net assets derived from capital share transactions | (5,554,353 | ) | (118,652,283 | ) | 293,293,175 | 140,475,077 | ||||||||||||||
|
|
|
|
|
|
|
|
|
| |||||||||||
NET ASSETS | ||||||||||||||||||||
Total increase (decrease) in net assets | (7,520,283 | ) | (122,336,107 | ) | 299,864,762 | 118,838,716 | ||||||||||||||
Beginning of year | 470,440,735 | 592,776,842 | 728,087,770 | 609,249,054 | ||||||||||||||||
|
|
|
|
|
|
|
|
|
| |||||||||||
End of year | $ | 462,920,452 | $ | 470,440,735 | $ | 1,027,952,532 | $ | 728,087,770 | ||||||||||||
|
|
|
|
|
|
|
|
|
| |||||||||||
Undistributed net investment income, end of year | $ | 477,104 | $ | 494,898 | $ | 471,694 | $ | 522,399 | ||||||||||||
|
|
|
|
|
|
|
|
|
| |||||||||||
| (a) | Distributions for annual periods determined in accordance with U.S. federal income tax regulations. |
See notes to financial statements.
| FINANCIAL STATEMENTS | 61 |
(For a share outstanding throughout each period)
| BlackRock High Yield Municipal Fund | ||||||||||||||||||||
| Institutional | ||||||||||||||||||||
| Year Ended June 30, | ||||||||||||||||||||
| 2018 | 2017 | 2016 | 2015 | 2014 | ||||||||||||||||
Net asset value, beginning of year | $ | 9.54 | $ | 9.99 | $ | 9.28 | $ | 9.12 | $ | 8.86 | ||||||||||
|
|
|
|
|
|
|
|
|
| |||||||||||
Net investment income(a) | 0.40 | 0.41 | 0.40 | 0.41 | 0.44 | |||||||||||||||
Net realized and unrealized gain (loss) | 0.05 | (0.46 | ) | 0.72 | 0.16 | 0.26 | ||||||||||||||
|
|
|
|
|
|
|
|
|
| |||||||||||
Net increase (decrease) from investment operations | 0.45 | (0.05 | ) | 1.12 | 0.57 | 0.70 | ||||||||||||||
|
|
|
|
|
|
|
|
|
| |||||||||||
Distributions from net investment income(b) | (0.40 | ) | (0.40 | ) | (0.41 | ) | (0.41 | ) | (0.44 | ) | ||||||||||
|
|
|
|
|
|
|
|
|
| |||||||||||
Net asset value, end of year | $ | 9.59 | $ | 9.54 | $ | 9.99 | $ | 9.28 | $ | 9.12 | ||||||||||
|
|
|
|
|
|
|
|
|
| |||||||||||
Total Return(c) | ||||||||||||||||||||
Based on net asset value | 4.78 | % | (0.38 | )% | 12.32 | % | 6.27 | % | 8.31 | % | ||||||||||
|
|
|
|
|
|
|
|
|
| |||||||||||
Ratios to Average Net Assets | ||||||||||||||||||||
Total expenses | 0.70 | %(d) | 0.71 | %(d) | 0.71 | %(d) | 0.70 | % | 0.76 | %(d) | ||||||||||
|
|
|
|
|
|
|
|
|
| |||||||||||
Total expenses after fees waived and paid indirectly | 0.68 | %(d) | 0.66 | %(d) | 0.71 | %(d) | 0.70 | % | 0.76 | %(d) | ||||||||||
|
|
|
|
|
|
|
|
|
| |||||||||||
Total expenses after fees waived and paid indirectly and excluding interest expense and fees(e) | 0.54 | %(d) | 0.57 | %(d) | 0.65 | %(d) | 0.66 | % | 0.69 | %(d) | ||||||||||
|
|
|
|
|
|
|
|
|
| |||||||||||
Net investment income | 4.14 | %(d) | 4.24 | %(d) | 4.23 | %(d) | 4.37 | % | 5.02 | %(d) | ||||||||||
|
|
|
|
|
|
|
|
|
| |||||||||||
Supplemental Data | ||||||||||||||||||||
Net assets, end of year (000) | $ | 549,217 | $ | 516,247 | $ | 554,336 | $ | 327,422 | $ | 242,949 | ||||||||||
|
|
|
|
|
|
|
|
|
| |||||||||||
Borrowings outstanding, end of year (000) | $ | 61,022 | $ | 60,043 | $ | 46,657 | $ | 26,216 | $ | 28,976 | ||||||||||
|
|
|
|
|
|
|
|
|
| |||||||||||
Portfolio turnover rate | 25 | % | 36 | % | 19 | % | 41 | % | 40 | % | ||||||||||
|
|
|
|
|
|
|
|
|
| |||||||||||
| (a) | Based on average shares outstanding. |
| (b) | Distributions for annual periods determined in accordance with U.S. federal income tax regulations. |
| (c) | Where applicable, assumes the reinvestment of distributions. |
| (d) | Excludes 0.01% of expenses incurred indirectly as a result of investments in underlying funds. |
| (e) | Interest expense and fees relate to TOB Trusts. See Note 4 of the Notes to Financial Statements for details. |
See notes to financial statements.
| 62 | 2018 BLACKROCK ANNUAL REPORTTO SHAREHOLDERS |
Financial Highlights (continued)
(For a share outstanding throughout each period)
| BlackRock High Yield Municipal Fund (continued) | ||||||||||||||||||||
| Investor A | ||||||||||||||||||||
| Year Ended June 30, | ||||||||||||||||||||
| 2018 | 2017 | 2016 | 2015 | 2014 | ||||||||||||||||
Net asset value, beginning of year | $ | 9.52 | $ | 9.97 | $ | 9.26 | $ | 9.10 | $ | 8.84 | ||||||||||
|
|
|
|
|
|
|
|
|
| |||||||||||
Net investment income(a) | 0.37 | 0.38 | 0.38 | 0.38 | 0.41 | |||||||||||||||
Net realized and unrealized gain (loss) | 0.04 | (0.45 | ) | 0.71 | 0.16 | 0.26 | ||||||||||||||
|
|
|
|
|
|
|
|
|
| |||||||||||
Net increase (decrease) from investment operations | 0.41 | (0.07 | ) | 1.09 | 0.54 | 0.67 | ||||||||||||||
|
|
|
|
|
|
|
|
|
| |||||||||||
Distributions from net investment income(b) | (0.37 | ) | (0.38 | ) | (0.38 | ) | (0.38 | ) | (0.41 | ) | ||||||||||
|
|
|
|
|
|
|
|
|
| |||||||||||
Net asset value, end of year | $ | 9.56 | $ | 9.52 | $ | 9.97 | $ | 9.26 | $ | 9.10 | ||||||||||
|
|
|
|
|
|
|
|
|
| |||||||||||
Total Return(c) | ||||||||||||||||||||
Based on net asset value | 4.40 | % | (0.63 | )% | 12.05 | % | 6.00 | % | 8.05 | % | ||||||||||
|
|
|
|
|
|
|
|
|
| |||||||||||
Ratios to Average Net Assets | ||||||||||||||||||||
Total expenses | 0.96 | %(d) | 0.94 | %(d) | 0.96 | %(d) | 0.97 | % | 1.01 | %(d) | ||||||||||
|
|
|
|
|
|
|
|
|
| |||||||||||
Total expenses after fees waived and paid indirectly | 0.94 | %(d) | 0.91 | %(d) | 0.96 | %(d) | 0.97 | % | 1.01 | %(d) | ||||||||||
|
|
|
|
|
|
|
|
|
| |||||||||||
Total expenses after fees waived and paid indirectly and excluding interest expense and fees(e) | 0.80 | %(d) | 0.82 | %(d) | 0.90 | %(d) | 0.93 | % | 0.94 | %(d) | ||||||||||
|
|
|
|
|
|
|
|
|
| |||||||||||
Net investment income | 3.88 | %(d) | 4.00 | %(d) | 3.99 | %(d) | 4.11 | % | 4.80 | %(d) | ||||||||||
|
|
|
|
|
|
|
|
|
| |||||||||||
Supplemental Data | ||||||||||||||||||||
Net assets, end of year (000) | $ | 220,992 | $ | 201,212 | $ | 228,140 | $ | 156,348 | $ | 161,218 | ||||||||||
|
|
|
|
|
|
|
|
|
| |||||||||||
Borrowings outstanding, end of year (000) | $ | 61,022 | $ | 60,043 | $ | 46,657 | $ | 26,216 | $ | 28,976 | ||||||||||
|
|
|
|
|
|
|
|
|
| |||||||||||
Portfolio turnover rate | 25 | % | 36 | % | 19 | % | 41 | % | 40 | % | ||||||||||
|
|
|
|
|
|
|
|
|
| |||||||||||
| (a) | Based on average shares outstanding. |
| (b) | Distributions for annual periods determined in accordance with U.S. federal income tax regulations. |
| (c) | Where applicable, excludes the effects of any sales charges and assumes the reinvestment of distributions. |
| (d) | Excludes 0.01% of expenses incurred indirectly as a result of investments in underlying funds. |
| (e) | Interest expense and fees relate to TOBs. See Note 4 of the Notes to Financial Statements for details of municipal bonds transferred to TOBs. |
See notes to financial statements
| FINANCIAL HIGHLIGHTS | 63 |
Financial Highlights (continued)
(For a share outstanding throughout each period)
| BlackRock High Yield Municipal Fund (continued) | ||||||||||||||||||||
| Investor C | ||||||||||||||||||||
| Year Ended June 30, | ||||||||||||||||||||
| 2018 | 2017 | 2016 | 2015 | 2014 | ||||||||||||||||
Net asset value, beginning of year | $ | 9.55 | $ | 9.99 | $ | 9.28 | $ | 9.12 | $ | 8.87 | ||||||||||
|
|
|
|
|
|
|
|
|
| |||||||||||
Net investment income(a) | 0.30 | 0.31 | 0.31 | 0.31 | 0.35 | |||||||||||||||
Net realized and unrealized gain (loss) | 0.04 | (0.44 | ) | 0.71 | 0.16 | 0.25 | ||||||||||||||
|
|
|
|
|
|
|
|
|
| |||||||||||
Net increase (decrease) from investment operations | 0.34 | (0.13 | ) | 1.02 | 0.47 | 0.60 | ||||||||||||||
|
|
|
|
|
|
|
|
|
| |||||||||||
Distributions from net investment income(b) | (0.30 | ) | (0.31 | ) | (0.31 | ) | (0.31 | ) | (0.35 | ) | ||||||||||
|
|
|
|
|
|
|
|
|
| |||||||||||
Net asset value, end of year | $ | 9.59 | $ | 9.55 | $ | 9.99 | $ | 9.28 | $ | 9.12 | ||||||||||
|
|
|
|
|
|
|
|
|
| |||||||||||
Total Return(c) | ||||||||||||||||||||
Based on net asset value | 3.62 | % | (1.26 | )% | 11.20 | % | 5.20 | % | 7.11 | % | ||||||||||
|
|
|
|
|
|
|
|
|
| |||||||||||
Ratios to Average Net Assets | ||||||||||||||||||||
Total expenses | 1.73 | %(d) | 1.70 | %(d) | 1.72 | %(d) | 1.72 | % | 1.78 | %(d) | ||||||||||
|
|
|
|
|
|
|
|
|
| |||||||||||
Total expenses after fees waived and paid indirectly | 1.69 | %(d) | 1.66 | %(d) | 1.72 | %(d) | 1.72 | % | 1.78 | %(d) | ||||||||||
|
|
|
|
|
|
|
|
|
| |||||||||||
Total expenses after fees waived and paid indirectly and excluding interest expense and fees(e) | 1.56 | %(d) | 1.57 | %(d) | 1.66 | %(d) | 1.68 | % | 1.70 | %(d) | ||||||||||
|
|
|
|
|
|
|
|
|
| |||||||||||
Net investment income | 3.13 | %(d) | 3.25 | %(d) | 3.23 | %(d) | 3.36 | % | 4.08 | %(d) | ||||||||||
|
|
|
|
|
|
|
|
|
| |||||||||||
Supplemental Data | ||||||||||||||||||||
Net assets, end of year (000) | $ | 60,065 | $ | 63,314 | $ | 71,527 | $ | 54,239 | $ | 51,858 | ||||||||||
|
|
|
|
|
|
|
|
|
| |||||||||||
Borrowings outstanding, end of year (000) | $ | 61,022 | $ | 60,043 | $ | 46,657 | $ | 26,216 | $ | 28,976 | ||||||||||
|
|
|
|
|
|
|
|
|
| |||||||||||
Portfolio turnover rate | 25 | % | 36 | % | 19 | % | 41 | % | 40 | % | ||||||||||
|
|
|
|
|
|
|
|
|
| |||||||||||
| (a) | Based on average shares outstanding. |
| (b) | Distributions for annual periods determined in accordance with U.S. federal income tax regulations. |
| (c) | Where applicable, excludes the effects of any sales charges and assumes the reinvestment of distributions. |
| (d) | Excludes 0.01% of expenses incurred indirectly as a result of investments in underlying funds. |
| (e) | Interest expense and fees relate to TOBs. See Note 4 of the Notes to Financial Statements for details of municipal bonds transferred to TOBs. |
See notes to financial statements.
| 64 | 2018 BLACKROCK ANNUAL REPORTTO SHAREHOLDERS |
Financial Highlights (continued)
(For a share outstanding throughout each period)
| BlackRock High Yield Municipal Fund (continued) | ||||
| Class K | ||||
Period from 01/25/18(a) to 06/30/18 | ||||
Net asset value, beginning of period | $ | 9.62 | ||
|
| |||
Net investment income(b) | 0.18 | |||
Net realized and unrealized loss | (0.04 | ) | ||
|
| |||
Net increase from investment operations | 0.14 | |||
|
| |||
Distributions from net investment income(c) | (0.17 | ) | ||
|
| |||
Net asset value, end of period | $ | 9.59 | ||
|
| |||
Total Return(d) | ||||
Based on net asset value | 1.50 | %(e) | ||
|
| |||
Ratios to Average Net Assets(f)(g) | ||||
Total expenses | 0.67 | %(h) | ||
|
| |||
Total expenses after fees waived and paid indirectly | 0.62 | % | ||
|
| |||
Total expenses after fees waived and paid indirectly and excluding interest expense and fees, and amortization of offering costs(i) | 0.49 | % | ||
|
| |||
Net investment income | 4.48 | % | ||
|
| |||
Supplemental Data | ||||
Net assets, end of period (000) | $ | 11,712 | ||
|
| |||
Borrowings outstanding, end of period (000) | $ | 61,022 | ||
|
| |||
Portfolio turnover rate | 25 | % | ||
|
| |||
| (a) | Commencement of operations. |
| (b) | Based on average Common Shares outstanding. |
| (c) | Distributions for annual periods determined in accordance with U.S. federal income tax regulations. |
| (d) | Where applicable, assumes the reinvestment of distributions. |
| (e) | Aggregate total return. |
| (f) | Annualized. |
| (g) | Excludes 0.01% of expenses incurred indirectly as a result of investments in underlying funds. |
| (h) | Offering costs were not annualized in the calculation of the expense ratios. If these expenses were annualized, the total expenses would have been 0.68%. |
| (i) | Interest expense and fees relate to TOB Trusts. See Note 4 of the Notes to Financial Statements for details. |
See notes to financial statements.
| FINANCIAL HIGHLIGHTS | 65 |
Financial Highlights (continued)
(For a share outstanding throughout each period)
| BlackRock National Municipal Fund | ||||||||||||||||||||
| Institutional | ||||||||||||||||||||
| Year Ended June 30, | ||||||||||||||||||||
| 2018 | 2017 | 2016 | 2015 | 2014 | ||||||||||||||||
Net asset value, beginning of year | $ | 10.88 | $ | 11.22 | $ | 10.86 | $ | 10.88 | $ | 10.56 | ||||||||||
|
|
|
|
|
|
|
|
|
| |||||||||||
Net investment income(a) | 0.33 | 0.34 | 0.34 | 0.38 | 0.42 | |||||||||||||||
Net realized and unrealized gain (loss) | (0.09 | ) | (0.34 | ) | 0.36 | (0.02 | ) | 0.32 | ||||||||||||
|
|
|
|
|
|
|
|
|
| |||||||||||
Net increase from investment operations | 0.24 | 0.00 | 0.70 | 0.36 | 0.74 | |||||||||||||||
|
|
|
|
|
|
|
|
|
| |||||||||||
Distributions from net investment income(b) | (0.33 | ) | (0.34 | ) | (0.34 | ) | (0.38 | ) | (0.42 | ) | ||||||||||
|
|
|
|
|
|
|
|
|
| |||||||||||
Net asset value, end of year | $ | 10.79 | $ | 10.88 | $ | 11.22 | $ | 10.86 | $ | 10.88 | ||||||||||
|
|
|
|
|
|
|
|
|
| |||||||||||
Total Return(c) | ||||||||||||||||||||
Based on net asset value | 2.23 | % | 0.09 | % | 6.68 | % | 3.33 | % | 7.19 | % | ||||||||||
|
|
|
|
|
|
|
|
|
| |||||||||||
Ratios to Average Net Assets | ||||||||||||||||||||
Total expenses | 0.52 | %(d) | 0.57 | %(d) | 0.60 | % | 0.64 | % | 0.68 | % | ||||||||||
|
|
|
|
|
|
|
|
|
| |||||||||||
Total expenses after fees waived and/or reimbursed and paid indirectly | 0.44 | %(d) | 0.49 | %(d) | 0.58 | % | 0.59 | % | 0.63 | % | ||||||||||
|
|
|
|
|
|
|
|
|
| |||||||||||
Total expenses after fees waived and/or reimbursed and/or paid indirectly and excluding interest expense, fees, and reorganization costs | 0.44 | %(d) | 0.48 | %(d) | 0.57 | % | 0.55 | %(e) | 0.57 | %(e) | ||||||||||
|
|
|
|
|
|
|
|
|
| |||||||||||
Net investment income | 3.04 | %(d) | 3.15 | %(d) | 3.10 | % | 3.47 | % | 3.98 | % | ||||||||||
|
|
|
|
|
|
|
|
|
| |||||||||||
Supplemental Data | ||||||||||||||||||||
Net assets, end of year (000) | $ | 3,028,849 | $ | 3,225,595 | $ | 3,326,972 | $ | 2,088,580 | $ | 1,796,660 | ||||||||||
|
|
|
|
|
|
|
|
|
| |||||||||||
Borrowings outstanding, end of year (000) | — | — | — | $ | 275,550 | $ | 286,095 | |||||||||||||
|
|
|
|
|
|
|
|
|
| |||||||||||
Portfolio turnover rate | 51 | % | 83 | % | 83 | % | 28 | % | 35 | % | ||||||||||
|
|
|
|
|
|
|
|
|
| |||||||||||
| (a) | Based on average shares outstanding. |
| (b) | Distributions for annual periods determined in accordance with U.S. federal income tax regulations. |
| (c) | Where applicable, assumes the reinvestment of distributions. |
| (d) | Excludes 0.01% of expenses incurred indirectly as a result of investments in underlying funds. |
| (e) | Interest expense and fees relate to TOB Trusts. See Note 4 of the Notes to Financial Statements for details. |
See notes to financial statements.
| 66 | 2018 BLACKROCK ANNUAL REPORTTO SHAREHOLDERS |
Financial Highlights (continued)
(For a share outstanding throughout each period)
| BlackRock National Municipal Fund (continued) | ||||||||||||||||||||
| Service | ||||||||||||||||||||
| Year Ended June 30, | ||||||||||||||||||||
| 2018 | 2017 | 2016 | 2015 | 2014 | ||||||||||||||||
Net asset value, beginning of year | $ | 10.87 | $ | 11.21 | $ | 10.85 | $ | 10.86 | $ | 10.55 | ||||||||||
|
|
|
|
|
|
|
|
|
| |||||||||||
Net investment income(a) | 0.31 | 0.33 | 0.34 | 0.38 | 0.43 | |||||||||||||||
Net realized and unrealized gain (loss) | (0.10 | ) | (0.35 | ) | 0.34 | (0.03 | ) | 0.27 | ||||||||||||
|
|
|
|
|
|
|
|
|
| |||||||||||
Net increase (decrease) from investment operations | 0.21 | (0.02 | ) | 0.68 | 0.35 | 0.70 | ||||||||||||||
|
|
|
|
|
|
|
|
|
| |||||||||||
Distributions from net investment income(b) | (0.30 | ) | (0.32 | ) | (0.32 | ) | (0.36 | ) | (0.39 | ) | ||||||||||
|
|
|
|
|
|
|
|
|
| |||||||||||
Net asset value, end of year | $ | 10.78 | $ | 10.87 | $ | 11.21 | $ | 10.85 | $ | 10.86 | ||||||||||
|
|
|
|
|
|
|
|
|
| |||||||||||
Total Return(c) | ||||||||||||||||||||
Based on net asset value | 1.99 | % | (0.14 | )% | 6.47 | % | 3.23 | % | 6.85 | % | ||||||||||
|
|
|
|
|
|
|
|
|
| |||||||||||
Ratios to Average Net Assets | ||||||||||||||||||||
Total expenses | 0.71 | %(d) | 0.76 | %(d) | 0.80 | % | 0.82 | % | 0.90 | % | ||||||||||
|
|
|
|
|
|
|
|
|
| |||||||||||
Total expenses after fees waived and/or reimbursed and paid indirectly | 0.67 | %(d) | 0.71 | %(d) | 0.78 | % | 0.77 | % | 0.85 | % | ||||||||||
|
|
|
|
|
|
|
|
|
| |||||||||||
Total expenses after fees waived and/or reimbursed and/or paid indirectly and excluding interest expense, fees, and reorganization costs | 0.67 | %(d) | 0.71 | %(d) | 0.77 | % | 0.74 | %(e) | 0.79 | %(e) | ||||||||||
|
|
|
|
|
|
|
|
|
| |||||||||||
Net investment income | 2.90 | %(d) | 3.04 | %(d) | 3.06 | % | 3.52 | % | 4.04 | % | ||||||||||
|
|
|
|
|
|
|
|
|
| |||||||||||
Supplemental Data | ||||||||||||||||||||
Net assets, end of year (000) | $ | 2,407 | $ | 3,150 | $ | 2,505 | $ | 1,739 | $ | 1,089 | ||||||||||
|
|
|
|
|
|
|
|
|
| |||||||||||
Borrowings outstanding, end of year (000) | — | — | — | $ | 275,550 | $ | 286,095 | |||||||||||||
|
|
|
|
|
|
|
|
|
| |||||||||||
Portfolio turnover rate | 51 | % | 83 | % | 83 | % | 28 | % | 35 | % | ||||||||||
|
|
|
|
|
|
|
|
|
| |||||||||||
| (a) | Based on average shares outstanding. |
| (b) | Distributions for annual periods determined in accordance with U.S. federal income tax regulations. |
| (c) | Where applicable, assumes the reinvestment of distributions. |
| (d) | Excludes 0.01% of expenses incurred indirectly as a result of investments in underlying funds. |
| (e) | Interest expense and fees relate to TOB Trusts. See Note 4 of the Notes to Financial Statements for details. |
See notes to financial statements.
| FINANCIAL HIGHLIGHTS | 67 |
Financial Highlights (continued)
(For a share outstanding throughout each period)
| BlackRock National Municipal Fund (continued) | ||||||||||||||||||||
| Investor A | ||||||||||||||||||||
| Year Ended June 30, | ||||||||||||||||||||
| 2018 | 2017 | 2016 | 2015 | 2014 | ||||||||||||||||
Net asset value, beginning of year | $ | 10.88 | $ | 11.23 | $ | 10.87 | $ | 10.88 | $ | 10.57 | ||||||||||
|
|
|
|
|
|
|
|
|
| |||||||||||
Net investment income(a) | 0.30 | 0.32 | 0.33 | 0.36 | 0.40 | |||||||||||||||
Net realized and unrealized gain (loss) | (0.08 | ) | (0.35 | ) | 0.36 | (0.01 | ) | 0.31 | ||||||||||||
|
|
|
|
|
|
|
|
|
| |||||||||||
Net increase (decrease) from investment operations | 0.22 | (0.03 | ) | 0.69 | 0.35 | 0.71 | ||||||||||||||
|
|
|
|
|
|
|
|
|
| |||||||||||
Distributions from net investment income(b) | (0.30 | ) | (0.32 | ) | (0.33 | ) | (0.36 | ) | (0.40 | ) | ||||||||||
|
|
|
|
|
|
|
|
|
| |||||||||||
Net asset value, end of year | $ | 10.80 | $ | 10.88 | $ | 11.23 | $ | 10.87 | $ | 10.88 | ||||||||||
|
|
|
|
|
|
|
|
|
| |||||||||||
Total Return(c) | ||||||||||||||||||||
Based on net asset value | 2.07 | % | (0.22 | )% | 6.42 | % | 3.26 | % | 6.93 | % | ||||||||||
|
|
|
|
|
|
|
|
|
| |||||||||||
Ratios to Average Net Assets | ||||||||||||||||||||
Total expenses | 0.77 | %(d) | 0.81 | %(d) | 0.85 | % | 0.90 | % | 0.90 | % | ||||||||||
|
|
|
|
|
|
|
|
|
| |||||||||||
Total expenses after fees waived and/or reimbursed and paid indirectly | 0.69 | %(d) | 0.70 | %(d) | 0.74 | % | 0.75 | % | 0.78 | % | ||||||||||
|
|
|
|
|
|
|
|
|
| |||||||||||
Total expenses after fees waived and/or reimbursed and/or paid indirectly and excluding interest expense, fees, and reorganization costs | 0.69 | %(d) | 0.70 | %(d) | 0.72 | % | 0.72 | %(e) | 0.72 | %(e) | ||||||||||
|
|
|
|
|
|
|
|
|
| |||||||||||
Net investment income | 2.79 | %(d) | 2.93 | %(d) | 2.97 | % | 3.30 | % | 3.81 | % | ||||||||||
|
|
|
|
|
|
|
|
|
| |||||||||||
Supplemental Data | ||||||||||||||||||||
Net assets, end of year (000) | $ | 2,730,622 | $ | 2,342,752 | $ | 2,669,101 | $ | 2,388,743 | $ | 1,990,729 | ||||||||||
|
|
|
|
|
|
|
|
|
| |||||||||||
Borrowings outstanding, end of year (000) | — | — | — | $ | 275,550 | $ | 286,095 | |||||||||||||
|
|
|
|
|
|
|
|
|
| |||||||||||
Portfolio turnover rate | 51 | % | 83 | % | 83 | % | 28 | % | 35 | % | ||||||||||
|
|
|
|
|
|
|
|
|
| |||||||||||
| (a) | Based on average shares outstanding. |
| (b) | Distributions for annual periods determined in accordance with U.S. federal income tax regulations. |
| (c) | Where applicable, excludes the effects of any sales charges and assumes the reinvestment of distributions. |
| (d) | Excludes 0.01% of expenses incurred indirectly as a result of investments in underlying funds. |
| (e) | Interest expense and fees relate to TOB Trusts. See Note 4 of the Notes to Financial Statements for details. |
See notes to financial statements.
| 68 | 2018 BLACKROCK ANNUAL REPORTTO SHAREHOLDERS |
Financial Highlights (continued)
(For a share outstanding throughout each period)
| BlackRock National Municipal Fund (continued) | ||||||||||||||||||||
| Investor C | ||||||||||||||||||||
| Year Ended June 30, | ||||||||||||||||||||
| 2018 | 2017 | 2016 | 2015 | 2014 | ||||||||||||||||
Net asset value, beginning of year | $ | 10.88 | $ | 11.23 | $ | 10.87 | $ | 10.88 | $ | 10.57 | ||||||||||
|
|
|
|
|
|
|
|
|
| |||||||||||
Net investment income(a) | 0.22 | 0.24 | 0.24 | 0.28 | 0.32 | |||||||||||||||
Net realized and unrealized gain (loss) | (0.08 | ) | (0.35 | ) | 0.36 | (0.01 | ) | 0.31 | ||||||||||||
|
|
|
|
|
|
|
|
|
| |||||||||||
Net increase (decrease) from investment operations | 0.14 | (0.11 | ) | 0.60 | 0.27 | 0.63 | ||||||||||||||
|
|
|
|
|
|
|
|
|
| |||||||||||
Distributions from net investment income(b) | (0.22 | ) | (0.24 | ) | (0.24 | ) | (0.28 | ) | (0.32 | ) | ||||||||||
|
|
|
|
|
|
|
|
|
| |||||||||||
Net asset value, end of year | $ | 10.80 | $ | 10.88 | $ | 11.23 | $ | 10.87 | $ | 10.88 | ||||||||||
|
|
|
|
|
|
|
|
|
| |||||||||||
Total Return(c) | ||||||||||||||||||||
Based on net asset value | 1.31 | % | (0.96 | )% | 5.63 | % | 2.49 | % | 6.13 | % | ||||||||||
|
|
|
|
|
|
|
|
|
| |||||||||||
Ratios to Average Net Assets | ||||||||||||||||||||
Total expenses | 1.47 | %(d) | 1.51 | %(d) | 1.54 | % | 1.59 | % | 1.62 | % | ||||||||||
|
|
|
|
|
|
|
|
|
| |||||||||||
Total expenses after fees waived and/or reimbursed and paid indirectly | 1.43 | %(d) | 1.45 | %(d) | 1.49 | % | 1.50 | % | 1.53 | % | ||||||||||
|
|
|
|
|
|
|
|
|
| |||||||||||
Total expenses after fees waived and/or reimbursed and/or paid indirectly and excluding interest expense, fees, and reorganization costs | 1.43 | %(d) | 1.44 | %(d) | 1.47 | % | 1.47 | %(e) | 1.47 | %(e) | ||||||||||
|
|
|
|
|
|
|
|
|
| |||||||||||
Net investment income | 2.04 | %(d) | 2.19 | %(d) | 2.22 | % | 2.55 | % | 3.08 | % | ||||||||||
|
|
|
|
|
|
|
|
|
| |||||||||||
Supplemental Data | ||||||||||||||||||||
Net assets, end of year (000) | $ | 327,384 | $ | 382,703 | $ | 467,928 | $ | 397,945 | $ | 389,612 | ||||||||||
|
|
|
|
|
|
|
|
|
| |||||||||||
Borrowings outstanding, end of year (000) | — | — | — | $ | 275,550 | $ | 286,095 | |||||||||||||
|
|
|
|
|
|
|
|
|
| |||||||||||
Portfolio turnover rate | 51 | % | 83 | % | 83 | % | 28 | % | 35 | % | ||||||||||
|
|
|
|
|
|
|
|
|
| |||||||||||
| (a) | Based on average shares outstanding. |
| (b) | Distributions for annual periods determined in accordance with U.S. federal income tax regulations. |
| (c) | Where applicable, excludes the effects of any sales charges and assumes the reinvestment of distributions. |
| (d) | Excludes 0.01% of expenses incurred indirectly as a result of investments in underlying funds. |
| (e) | Interest expense and fees relate to TOB Trusts. See Note 4 of the Notes to Financial Statements for details. |
See notes to financial statements.
| FINANCIAL HIGHLIGHTS | 69 |
Financial Highlights (continued)
(For a share outstanding throughout each period)
| BlackRock National Municipal Fund (continued) | ||||||||||||||||||||
| Investor C1 | ||||||||||||||||||||
| Year Ended June 30, | ||||||||||||||||||||
| 2018 | 2017 | 2016 | 2015 | 2014 | ||||||||||||||||
Net asset value, beginning of year | $ | 10.88 | $ | 11.22 | $ | 10.87 | $ | 10.88 | $ | 10.56 | ||||||||||
|
|
|
|
|
|
|
|
|
| |||||||||||
Net investment income(a) | 0.25 | 0.26 | 0.27 | 0.30 | 0.34 | |||||||||||||||
Net realized and unrealized gain (loss) | (0.10 | ) | (0.34 | ) | 0.35 | (0.01 | ) | 0.32 | ||||||||||||
|
|
|
|
|
|
|
|
|
| |||||||||||
Net increase (decrease) from investment operations | 0.15 | (0.08 | ) | 0.62 | 0.29 | 0.66 | ||||||||||||||
|
|
|
|
|
|
|
|
|
| |||||||||||
Distributions from net investment income(b) | (0.24 | ) | (0.26 | ) | (0.27 | ) | (0.30 | ) | (0.34 | ) | ||||||||||
|
|
|
|
|
|
|
|
|
| |||||||||||
Net asset value, end of year | $ | 10.79 | $ | 10.88 | $ | 11.22 | $ | 10.87 | $ | 10.88 | ||||||||||
|
|
|
|
|
|
|
|
|
| |||||||||||
Total Return(c) | ||||||||||||||||||||
Based on net asset value | 1.42 | % | (0.68 | )% | 5.83 | % | 2.68 | % | 6.43 | % | ||||||||||
|
|
|
|
|
|
|
|
|
| |||||||||||
Ratios to Average Net Assets | ||||||||||||||||||||
Total expenses | 1.28 | %(d) | 1.31 | %(d) | 1.34 | % | 1.39 | % | 1.42 | % | ||||||||||
|
|
|
|
|
|
|
|
|
| |||||||||||
Total expenses after fees waived and/or reimbursed and paid indirectly | 1.24 | %(d) | 1.25 | %(d) | 1.30 | % | 1.31 | % | 1.34 | % | ||||||||||
|
|
|
|
|
|
|
|
|
| |||||||||||
Total expenses after fees waived and/or reimbursed and/or paid indirectly and excluding interest expense, fees, and reorganization costs | 1.24 | %(d) | 1.25 | %(d) | 1.28 | % | 1.28 | %(e) | 1.28 | %(e) | ||||||||||
|
|
|
|
|
|
|
|
|
| |||||||||||
Net investment income | 2.24 | %(d) | 2.40 | %(d) | 2.42 | % | 2.74 | % | 3.27 | % | ||||||||||
|
|
|
|
|
|
|
|
|
| |||||||||||
Supplemental Data | ||||||||||||||||||||
Net assets, end of year (000) | $ | 9,788 | $ | 12,072 | $ | 61,362 | $ | 64,049 | $ | 71,147 | ||||||||||
|
|
|
|
|
|
|
|
|
| |||||||||||
Borrowings outstanding, end of year (000) | — | — | — | $ | 275,550 | $ | 286,095 | |||||||||||||
|
|
|
|
|
|
|
|
|
| |||||||||||
Portfolio turnover rate | 51 | % | 83 | % | 83 | % | 28 | % | 35 | % | ||||||||||
|
|
|
|
|
|
|
|
|
| |||||||||||
| (a) | Based on average shares outstanding. |
| (b) | Distributions for annual periods determined in accordance with U.S. federal income tax regulations. |
| (c) | Where applicable, excludes the effects of any sales charges and assumes the reinvestment of distributions. |
| (d) | Excludes 0.01% of expenses incurred indirectly as a result of investments in underlying funds. |
| (e) | Interest expense and fees relate to TOB Trusts. See Note 4 of the Notes to Financial Statements for details. |
See notes to financial statements.
| 70 | 2018 BLACKROCK ANNUAL REPORTTO SHAREHOLDERS |
Financial Highlights (continued)
(For a share outstanding throughout each period)
| BlackRock National Municipal Fund (continued) | ||||||||||||||||||||
| Class K | ||||||||||||||||||||
| Year Ended June 30, | ||||||||||||||||||||
| 2018 | 2017 | 2016 | 2015 | 2014 | ||||||||||||||||
Net asset value, beginning of year | $ | 10.88 | $ | 11.22 | $ | 10.87 | $ | 10.88 | $ | 10.56 | ||||||||||
|
|
|
|
|
|
|
|
|
| |||||||||||
Net investment income(a) | 0.33 | 0.35 | 0.36 | 0.39 | 0.43 | |||||||||||||||
Net realized and unrealized gain (loss) | (0.09 | ) | (0.34 | ) | 0.35 | (0.01 | ) | 0.32 | ||||||||||||
|
|
|
|
|
|
|
|
|
| |||||||||||
Net increase from investment operations | 0.24 | 0.01 | 0.71 | 0.38 | 0.75 | |||||||||||||||
|
|
|
|
|
|
|
|
|
| |||||||||||
Distributions from net investment income(b) | (0.33 | ) | (0.35 | ) | (0.36 | ) | (0.39 | ) | (0.43 | ) | ||||||||||
|
|
|
|
|
|
|
|
|
| |||||||||||
Net asset value, end of year | $ | 10.79 | $ | 10.88 | $ | 11.22 | $ | 10.87 | $ | 10.88 | ||||||||||
|
|
|
|
|
|
|
|
|
| |||||||||||
Total Return(c) | ||||||||||||||||||||
Based on net asset value | 2.28 | % | 0.15 | % | 6.70 | % | 3.53 | % | 7.30 | % | ||||||||||
|
|
|
|
|
|
|
|
|
| |||||||||||
Ratios to Average Net Assets | ||||||||||||||||||||
Total expenses | 0.44 | %(d) | 0.48 | %(d) | 0.53 | % | 0.58 | % | 0.61 | % | ||||||||||
|
|
|
|
|
|
|
|
|
| |||||||||||
Total expenses after fees waived and/or reimbursed and paid indirectly | 0.39 | %(d) | 0.41 | %(d) | 0.48 | % | 0.49 | % | 0.52 | % | ||||||||||
|
|
|
|
|
|
|
|
|
| |||||||||||
Total expenses after fees waived and/or reimbursed and/or paid indirectly and excluding interest expense, fees, and reorganization costs(e) | 0.39 | %(d) | 0.40 | %(d) | 0.46 | % | 0.46 | %(e) | 0.46 | %(e) | ||||||||||
|
|
|
|
|
|
|
|
|
| |||||||||||
Net investment income | 3.09 | %(d) | 3.24 | %(d) | 3.24 | % | 3.56 | % | 4.09 | % | ||||||||||
|
|
|
|
|
|
|
|
|
| |||||||||||
Supplemental Data | ||||||||||||||||||||
Net assets, end of year (000) | $ | 3,012,495 | $ | 1,847,397 | $ | 332,000 | $ | 341,071 | $ | 366,179 | ||||||||||
|
|
|
|
|
|
|
|
|
| |||||||||||
Borrowings outstanding, end of year (000) | — | — | — | $ | 275,550 | $ | 286,095 | |||||||||||||
|
|
|
|
|
|
|
|
|
| |||||||||||
Portfolio turnover rate | 51 | % | 83 | % | 83 | % | 28 | % | 35 | % | ||||||||||
|
|
|
|
|
|
|
|
|
| |||||||||||
| (a) | Based on average shares outstanding. |
| (b) | Distributions for annual periods determined in accordance with U.S. federal income tax regulations. |
| (c) | Where applicable, assumes the reinvestment of distributions. |
| (d) | Excludes 0.01% of expenses incurred indirectly as a result of investments in underlying funds. |
| (e) | Interest expense and fees relate to TOB Trusts. See Note 4 of the Notes to Financial Statements for details. |
See notes to financial statements.
| FINANCIAL HIGHLIGHTS | 71 |
Financial Highlights (continued)
(For a share outstanding throughout each period)
| BlackRock Short-Term Municipal Fund | ||||||||||||||||||||
| Institutional | ||||||||||||||||||||
| Year Ended June 30, | ||||||||||||||||||||
| 2018 | 2017 | 2016 | 2015 | 2014 | ||||||||||||||||
Net asset value, beginning of year | $ | 10.12 | $ | 10.18 | $ | 10.11 | $ | 10.16 | $ | 10.12 | ||||||||||
|
|
|
|
|
|
|
|
|
| |||||||||||
Net investment income(a) | 0.11 | 0.07 | 0.05 | 0.04 | 0.05 | |||||||||||||||
Net realized and unrealized gain (loss) | (0.04 | ) | (0.06 | ) | 0.07 | (0.05 | ) | 0.04 | ||||||||||||
|
|
|
|
|
|
|
|
|
| |||||||||||
Net increase (decrease) from investment operations | 0.07 | 0.01 | 0.12 | (0.01 | ) | 0.09 | ||||||||||||||
|
|
|
|
|
|
|
|
|
| |||||||||||
| Distributions(b) | ||||||||||||||||||||
From net investment income | (0.11 | ) | (0.07 | ) | (0.05 | ) | (0.04 | ) | (0.05 | ) | ||||||||||
From net realized gain | — | (0.00 | )(c) | (0.00 | )(c) | — | — | |||||||||||||
|
|
|
|
|
|
|
|
|
| |||||||||||
Total distributions | (0.11 | ) | (0.07 | ) | (0.05 | ) | (0.04 | ) | (0.05 | ) | ||||||||||
|
|
|
|
|
|
|
|
|
| |||||||||||
Net asset value, end of year | $ | 10.08 | $ | 10.12 | $ | 10.18 | $ | 10.11 | $ | 10.16 | ||||||||||
|
|
|
|
|
|
|
|
|
| |||||||||||
Total Return(d) | ||||||||||||||||||||
Based on net asset value | 0.71 | % | 0.10 | % | 1.15 | % | (0.11 | )% | 0.90 | % | ||||||||||
|
|
|
|
|
|
|
|
|
| |||||||||||
Ratios to Average Net Assets | ||||||||||||||||||||
Total expenses | 0.49 | % | 0.52 | % | 0.52 | % | 0.51 | % | 0.51 | % | ||||||||||
|
|
|
|
|
|
|
|
|
| |||||||||||
Total expenses after fees waived and/or reimbursed and/or paid indirectly | 0.36 | % | 0.37 | % | 0.40 | % | 0.40 | % | 0.40 | % | ||||||||||
|
|
|
|
|
|
|
|
|
| |||||||||||
Net investment income | 1.12 | % | 0.66 | % | 0.48 | % | 0.42 | % | 0.54 | % | ||||||||||
|
|
|
|
|
|
|
|
|
| |||||||||||
Supplemental Data | ||||||||||||||||||||
Net assets, end of year (000) | $ | 360,543 | $ | 357,427 | $ | 454,165 | $ | 492,702 | $ | 619,700 | ||||||||||
|
|
|
|
|
|
|
|
|
| |||||||||||
Portfolio turnover rate | 153 | % | 88 | % | 67 | % | 72 | % | 56 | % | ||||||||||
|
|
|
|
|
|
|
|
|
| |||||||||||
| (a) | Based on average shares outstanding. |
| (b) | Distributions for annual periods determined in accordance with U.S. federal income tax regulations. |
| (c) | Amount is greater than $(0.005) per share. |
| (d) | Where applicable, assumes the reinvestment of distributions. |
See notes to financial statements.
| 72 | 2018 BLACKROCK ANNUAL REPORTTO SHAREHOLDERS |
Financial Highlights (continued)
(For a share outstanding throughout each period)
| BlackRock Short-Term Municipal Fund (continued) | ||||||||||||||||||||
| Investor A | ||||||||||||||||||||
| Year Ended June 30, | ||||||||||||||||||||
| 2018 | 2017 | 2016 | 2015 | 2014 | ||||||||||||||||
Net asset value, beginning of year | $ | 10.13 | $ | 10.18 | $ | 10.12 | $ | 10.16 | $ | 10.12 | ||||||||||
|
|
|
|
|
|
|
|
|
| |||||||||||
Net investment income(a) | 0.09 | 0.04 | 0.02 | 0.01 | 0.03 | |||||||||||||||
Net realized and unrealized gain (loss) | (0.05 | ) | (0.05 | ) | 0.06 | (0.04 | ) | 0.03 | ||||||||||||
|
|
|
|
|
|
|
|
|
| |||||||||||
Net increase (decrease) from investment operations | 0.04 | (0.01 | ) | 0.08 | (0.03 | ) | 0.06 | |||||||||||||
|
|
|
|
|
|
|
|
|
| |||||||||||
| Distributions(b) | ||||||||||||||||||||
From net investment income | (0.09 | ) | (0.04 | ) | (0.02 | ) | (0.01 | ) | (0.02 | ) | ||||||||||
From net realized gain | — | (0.00 | )(c) | (0.00 | )(c) | — | — | |||||||||||||
|
|
|
|
|
|
|
|
|
| |||||||||||
Total distributions | (0.09 | ) | (0.04 | ) | (0.02 | ) | (0.01 | ) | (0.02 | ) | ||||||||||
|
|
|
|
|
|
|
|
|
| |||||||||||
Net asset value, end of year | $ | 10.08 | $ | 10.13 | $ | 10.18 | $ | 10.12 | $ | 10.16 | ||||||||||
| �� |
|
|
|
|
|
|
|
|
|
| ||||||||||
Total Return(d) | ||||||||||||||||||||
Based on net asset value | 0.37 | % | (0.06 | )% | 0.76 | % | (0.29 | )% | 0.64 | % | ||||||||||
|
|
|
|
|
|
|
|
|
| |||||||||||
Ratios to Average Net Assets | ||||||||||||||||||||
Total expenses | 0.68 | % | 0.72 | % | 0.71 | % | 0.70 | % | 0.67 | % | ||||||||||
|
|
|
|
|
|
|
|
|
| |||||||||||
Total expenses after fees waived and/or reimbursed and/or paid indirectly | 0.60 | % | 0.63 | % | 0.69 | % | 0.69 | % | 0.67 | % | ||||||||||
|
|
|
|
|
|
|
|
|
| |||||||||||
Net investment income | 0.85 | % | 0.40 | % | 0.19 | % | 0.13 | % | 0.26 | % | ||||||||||
|
|
|
|
|
|
|
|
|
| |||||||||||
Supplemental Data | ||||||||||||||||||||
Net assets, end of year (000) | $ | 61,444 | $ | 67,193 | $ | 78,879 | $ | 100,980 | $ | 137,629 | ||||||||||
|
|
|
|
|
|
|
|
|
| |||||||||||
Portfolio turnover rate | 153 | % | 88 | % | 67 | % | 72 | % | 56 | % | ||||||||||
|
|
|
|
|
|
|
|
|
| |||||||||||
| (a) | Based on average shares outstanding. |
| (b) | Distributions for annual periods determined in accordance with U.S. federal income tax regulations. |
| (c) | Amount is greater than $(0.005) per share. |
| (d) | Where applicable, excludes the effects of any sales charges and assumes the reinvestment of distributions. |
See notes to financial statements.
| FINANCIAL HIGHLIGHTS | 73 |
Financial Highlights (continued)
(For a share outstanding throughout each period)
| BlackRock Short-Term Municipal Fund (continued) | ||||||||||||||||||||
| Investor A1 | ||||||||||||||||||||
| Year Ended June 30, | ||||||||||||||||||||
| 2018 | 2017 | 2016 | 2015 | 2014 | ||||||||||||||||
Net asset value, beginning of year | $ | 10.13 | $ | 10.19 | $ | 10.12 | $ | 10.17 | $ | 10.12 | ||||||||||
|
|
|
|
|
|
|
|
|
| |||||||||||
Net investment income(a) | 0.10 | 0.06 | 0.04 | 0.03 | 0.04 | |||||||||||||||
Net realized and unrealized gain (loss) | (0.05 | ) | (0.06 | ) | 0.06 | (0.05 | ) | 0.05 | ||||||||||||
|
|
|
|
|
|
|
|
|
| |||||||||||
Net increase (decrease) from investment operations | 0.05 | 0.00 | 0.10 | (0.02 | ) | 0.09 | ||||||||||||||
|
|
|
|
|
|
|
|
|
| |||||||||||
| Distributions(b) | ||||||||||||||||||||
From net investment income | (0.10 | ) | (0.06 | ) | (0.03 | ) | (0.03 | ) | (0.04 | ) | ||||||||||
From net realized gain | — | (0.00 | )(c) | (0.00 | )(c) | — | — | |||||||||||||
|
|
|
|
|
|
|
|
|
| |||||||||||
Total distributions | (0.10 | ) | (0.06 | ) | (0.03 | ) | (0.03 | ) | (0.04 | ) | ||||||||||
|
|
|
|
|
|
|
|
|
| |||||||||||
Net asset value, end of year | $ | 10.08 | $ | 10.13 | $ | 10.19 | $ | 10.12 | $ | 10.17 | ||||||||||
|
|
|
|
|
|
|
|
|
| |||||||||||
Total Return(d) | ||||||||||||||||||||
Based on net asset value | 0.51 | % | (0.01 | )% | 1.03 | % | (0.23 | )% | 0.88 | % | ||||||||||
|
|
|
|
|
|
|
|
|
| |||||||||||
Ratios to Average Net Assets | ||||||||||||||||||||
Total expenses | 0.55 | % | 0.56 | % | 0.55 | % | 0.55 | % | 0.54 | % | ||||||||||
|
|
|
|
|
|
|
|
|
| |||||||||||
Total expenses after fees waived and/or reimbursed and/or paid indirectly | 0.46 | % | 0.48 | % | 0.52 | % | 0.52 | % | 0.52 | % | ||||||||||
|
|
|
|
|
|
|
|
|
| |||||||||||
Net investment income | 0.98 | % | 0.54 | % | 0.36 | % | 0.30 | % | 0.42 | % | ||||||||||
|
|
|
|
|
|
|
|
|
| |||||||||||
Supplemental Data | ||||||||||||||||||||
Net assets, end of year (000) | $ | 17,389 | $ | 19,724 | $ | 25,203 | $ | 33,292 | $ | 37,280 | ||||||||||
|
|
|
|
|
|
|
|
|
| |||||||||||
Portfolio turnover rate | 153 | % | 88 | % | 67 | % | 72 | % | 56 | % | ||||||||||
|
|
|
|
|
|
|
|
|
| |||||||||||
| (a) | Based on average shares outstanding. |
| (b) | Distributions for annual periods determined in accordance with U.S. federal income tax regulations. |
| (c) | Amount is greater than $(0.005) per share. |
| (d) | Where applicable, excludes the effects of any sales charges and assumes the reinvestment of distributions. |
See notes to financial statements.
| 74 | 2018 BLACKROCK ANNUAL REPORTTO SHAREHOLDERS |
Financial Highlights (continued)
(For a share outstanding throughout each period)
| BlackRock Short-Term Municipal Fund (continued) | ||||||||||||||||||||
| Investor C | ||||||||||||||||||||
| Year Ended June 30, | ||||||||||||||||||||
| 2018 | 2017 | 2016 | 2015 | 2014 | ||||||||||||||||
Net asset value, beginning of year | $ | 9.86 | $ | 9.96 | $ | 9.95 | $ | 10.07 | $ | 10.08 | ||||||||||
|
|
|
|
|
|
|
|
|
| |||||||||||
Net investment income (loss)(a) | — | (0.04 | ) | (0.06 | ) | (0.07 | ) | (0.06 | ) | |||||||||||
Net realized and unrealized gain (loss) | (0.03 | ) | (0.06 | ) | 0.07 | (0.05 | ) | 0.05 | ||||||||||||
|
|
|
|
|
|
|
|
|
| |||||||||||
Net increase (decrease) from investment operations | (0.03 | ) | (0.10 | ) | 0.01 | (0.12 | ) | (0.01 | ) | |||||||||||
|
|
|
|
|
|
|
|
|
| |||||||||||
| Distributions(b) | ||||||||||||||||||||
From net investment income | (0.01 | ) | — | — | — | — | ||||||||||||||
From net realized gain | — | (0.00 | )(c) | (0.00 | )(c) | — | — | |||||||||||||
|
|
|
|
|
|
|
|
|
| |||||||||||
Total distributions | (0.01 | ) | — | — | — | — | ||||||||||||||
|
|
|
|
|
|
|
|
|
| |||||||||||
Net asset value, end of year | $ | 9.82 | $ | 9.86 | $ | 9.96 | $ | 9.95 | $ | 10.07 | ||||||||||
|
|
|
|
|
|
|
|
|
| |||||||||||
Total Return(d) | ||||||||||||||||||||
Based on net asset value | (0.26 | )% | (0.96 | )% | 0.11 | % | (1.19 | )% | (0.10 | )% | ||||||||||
|
|
|
|
|
|
|
|
|
| |||||||||||
Ratios to Average Net Assets | ||||||||||||||||||||
Total expenses | 1.46 | % | 1.48 | % | 1.48 | % | 1.47 | % | 1.45 | % | ||||||||||
|
|
|
|
|
|
|
|
|
| |||||||||||
Total expenses after fees waived and/or reimbursed and/or paid indirectly | 1.36 | % | 1.39 | % | 1.48 | % | 1.47 | % | 1.45 | % | ||||||||||
|
|
|
|
|
|
|
|
|
| |||||||||||
Net investment income (loss) | 0.01 | % | (0.41 | )% | (0.60 | )% | (0.70 | )% | (0.55 | )% | ||||||||||
|
|
|
|
|
|
|
|
|
| |||||||||||
Supplemental Data | ||||||||||||||||||||
Net assets, end of year (000) | $ | 16,825 | $ | 22,859 | $ | 31,251 | $ | 31,121 | $ | 38,520 | ||||||||||
|
|
|
|
|
|
|
|
|
| |||||||||||
Portfolio turnover rate | 153 | % | 88 | % | 67 | % | 72 | % | 56 | % | ||||||||||
|
|
|
|
|
|
|
|
|
| |||||||||||
| (a) | Based on average shares outstanding. |
| (b) | Distributions for annual periods determined in accordance with U.S. federal income tax regulations. |
| (c) | Amount is greater than $(0.005) per share. |
| (d) | Where applicable, excludes the effects of any sales charges and assumes the reinvestment of distributions. |
See notes to financial statements.
| FINANCIAL HIGHLIGHTS | 75 |
Financial Highlights (continued)
(For a share outstanding throughout each period)
| BlackRock Short-Term Municipal Fund (continued) | ||||||||||||||||||||
| Class K | ||||||||||||||||||||
| Year Ended June 30, | ||||||||||||||||||||
| 2018 | 2017 | 2016 | 2015 | 2014 | ||||||||||||||||
Net asset value, beginning of year | $ | 10.12 | $ | 10.18 | $ | 10.11 | $ | 10.15 | $ | 10.11 | ||||||||||
|
|
|
|
|
|
|
|
|
| |||||||||||
Net investment income(a) | 0.08 | 0.00 | (b) | 0.05 | 0.02 | 0.04 | ||||||||||||||
Net realized and unrealized gain (loss) | — | 0.01 | 0.06 | (0.02 | ) | 0.05 | ||||||||||||||
|
|
|
|
|
|
|
|
|
| |||||||||||
Net increase from investment operations | 0.08 | 0.01 | 0.11 | — | 0.09 | |||||||||||||||
|
|
|
|
|
|
|
|
|
| |||||||||||
| Distributions(c) | ||||||||||||||||||||
From net investment income | (0.12 | ) | (0.07 | ) | (0.04 | ) | (0.04 | ) | (0.05 | ) | ||||||||||
From net realized gain | — | (0.00 | )(d) | (0.00 | )(d) | — | — | |||||||||||||
|
|
|
|
|
|
|
|
|
| |||||||||||
Total distributions | (0.12 | ) | (0.07 | ) | (0.04 | ) | (0.04 | ) | (0.05 | ) | ||||||||||
|
|
|
|
|
|
|
|
|
| |||||||||||
Net asset value, end of year | $ | 10.08 | $ | 10.12 | $ | 10.18 | $ | 10.11 | $ | 10.15 | ||||||||||
|
|
|
|
|
|
|
|
|
| |||||||||||
Total Return(e) | ||||||||||||||||||||
Based on net asset value | 0.76 | % | 0.13 | % | 1.13 | % | (0.01 | )% | 0.91 | % | ||||||||||
|
|
|
|
|
|
|
|
|
| |||||||||||
Ratios to Average Net Assets | ||||||||||||||||||||
Total expenses | 0.38 | % | 0.43 | % | 0.42 | % | 0.41 | % | 0.39 | % | ||||||||||
|
|
|
|
|
|
|
|
|
| |||||||||||
Total expenses after fees waived and/or reimbursed and/or paid indirectly | 0.31 | % | 0.34 | % | 0.42 | % | 0.40 | % | 0.39 | % | ||||||||||
|
|
|
|
|
|
|
|
|
| |||||||||||
Net investment income | 0.75 | % | 0.02 | % | 0.45 | % | 0.21 | % | 0.35 | % | ||||||||||
|
|
|
|
|
|
|
|
|
| |||||||||||
Supplemental Data | ||||||||||||||||||||
Net assets, end of year (000) | $ | 6,719 | $ | 3,238 | $ | 3,279 | $ | 6,732 | $ | 8,814 | ||||||||||
|
|
|
|
|
|
|
|
|
| |||||||||||
Portfolio turnover rate | 153 | % | 88 | % | 67 | % | 72 | % | 56 | % | ||||||||||
|
|
|
|
|
|
|
|
|
| |||||||||||
| (a) | Based on average shares outstanding. |
| (b) | Amount is less than $0.005 per share. |
| (c) | Distributions for annual periods determined in accordance with U.S. federal income tax regulations. |
| (d) | Amount is greater than $(0.005) per share. |
| (e) | Where applicable, assumes the reinvestment of distributions. |
See notes to financial statements.
| 76 | 2018 BLACKROCK ANNUAL REPORTTO SHAREHOLDERS |
Financial Highlights (continued)
(For a share outstanding throughout each period)
| BlackRock New York Municipal Opportunities Fund | ||||||||||||||||||||
| Institutional | ||||||||||||||||||||
| Year Ended June 30, | ||||||||||||||||||||
| 2018 | 2017 | 2016 | 2015 | 2014 | ||||||||||||||||
Net asset value, beginning of year | $ | 11.21 | $ | 11.58 | $ | 10.90 | $ | 10.79 | $ | 10.46 | ||||||||||
|
|
|
|
|
|
|
|
|
| |||||||||||
Net investment income(a) | 0.33 | 0.35 | 0.36 | 0.41 | 0.43 | |||||||||||||||
Net realized and unrealized gain (loss) | 0.10 | (0.37 | ) | 0.69 | 0.11 | 0.33 | ||||||||||||||
|
|
|
|
|
|
|
|
|
| |||||||||||
Net increase (decrease) from investment operations | 0.43 | (0.02 | ) | 1.05 | 0.52 | 0.76 | ||||||||||||||
|
|
|
|
|
|
|
|
|
| |||||||||||
Distributions from net investment income(b) | (0.33 | ) | (0.35 | ) | (0.37 | ) | (0.41 | ) | (0.43 | ) | ||||||||||
|
|
|
|
|
|
|
|
|
| |||||||||||
Net asset value, end of year | $ | 11.31 | $ | 11.21 | $ | 11.58 | $ | 10.90 | $ | 10.79 | ||||||||||
|
|
|
|
|
|
|
|
|
| |||||||||||
Total Return(c) | ||||||||||||||||||||
Based on net asset value | 3.93 | % | (0.09 | )% | 9.80 | % | 4.86 | % | 7.52 | % | ||||||||||
|
|
|
|
|
|
|
|
|
| |||||||||||
Ratios to Average Net Assets | ||||||||||||||||||||
Total expenses | 0.74 | %(d) | 0.75 | %(d) | 0.76 | % | 0.78 | % | 0.80 | % | ||||||||||
|
|
|
|
|
|
|
|
|
| |||||||||||
Total expenses after fees waived and paid indirectly | 0.63 | %(d) | 0.63 | %(d) | 0.70 | % | 0.69 | % | 0.79 | % | ||||||||||
|
|
|
|
|
|
|
|
|
| |||||||||||
Total expenses after fees waived and paid indirectly and excluding interest expense and fees(e) | 0.50 | %(d) | 0.52 | %(d) | 0.65 | % | 0.65 | % | 0.74 | % | ||||||||||
|
|
|
|
|
|
|
|
|
| |||||||||||
Net investment income | 2.96 | %(d) | 3.17 | %(d) | 3.26 | % | 3.73 | % | 4.16 | % | ||||||||||
|
|
|
|
|
|
|
|
|
| |||||||||||
Supplemental Data | ||||||||||||||||||||
Net assets, end of year (000) | $ | 455,378 | $ | 266,540 | $ | 186,378 | $ | 79,506 | $ | 34,777 | ||||||||||
|
|
|
|
|
|
|
|
|
| |||||||||||
Borrowings outstanding, end of year (000) | $ | 67,389 | $ | 60,785 | $ | 49,774 | $ | 18,711 | $ | 18,711 | ||||||||||
|
|
|
|
|
|
|
|
|
| |||||||||||
Portfolio turnover rate | 43 | % | 34 | % | 20 | % | 22 | % | 18 | % | ||||||||||
|
|
|
|
|
|
|
|
|
| |||||||||||
| (a) | Based on average shares outstanding. |
| (b) | Distributions for annual periods determined in accordance with U.S. federal income tax regulations. |
| (c) | Where applicable, assumes the reinvestment of distributions. |
| (d) | Excludes 0.01% of expenses incurred indirectly as a result of investments in underlying funds. |
| (e) | Interest expense and fees relate to TOB Trusts. See Note 4 of the Notes to Financial Statements for details. |
See notes to financial statements.
| FINANCIAL HIGHLIGHTS | 77 |
Financial Highlights (continued)
(For a share outstanding throughout each period)
| BlackRock New York Municipal Opportunities Fund (continued) | ||||||||||||||||||||
| Investor A | ||||||||||||||||||||
| Year Ended June 30, | ||||||||||||||||||||
| 2018 | 2017 | 2016 | 2015 | 2014 | ||||||||||||||||
Net asset value, beginning of year | $ | 11.21 | $ | 11.58 | $ | 10.91 | $ | 10.80 | $ | 10.47 | ||||||||||
|
|
|
|
|
|
|
|
|
| |||||||||||
Net investment income(a) | 0.31 | 0.33 | 0.33 | 0.38 | 0.41 | |||||||||||||||
Net realized and unrealized gain (loss) | 0.10 | (0.38 | ) | 0.68 | 0.11 | 0.33 | ||||||||||||||
|
|
|
|
|
|
|
|
|
| |||||||||||
Net increase (decrease) from investment operations | 0.41 | (0.05 | ) | 1.01 | 0.49 | 0.74 | ||||||||||||||
|
|
|
|
|
|
|
|
|
| |||||||||||
Distributions from net investment income(b) | (0.31 | ) | (0.32 | ) | (0.34 | ) | (0.38 | ) | (0.41 | ) | ||||||||||
|
|
|
|
|
|
|
|
|
| |||||||||||
Net asset value, end of year | $ | 11.31 | $ | 11.21 | $ | 11.58 | $ | 10.91 | $ | 10.80 | ||||||||||
|
|
|
|
|
|
|
|
|
| |||||||||||
Total Return(c) | ||||||||||||||||||||
Based on net asset value | 3.67 | % | (0.34 | )% | 9.53 | % | 4.61 | % | 7.26 | % | ||||||||||
|
|
|
|
|
|
|
|
|
| |||||||||||
Ratios to Average Net Assets | ||||||||||||||||||||
Total expenses | 0.96 | %(d) | 0.96 | %(d) | 1.01 | % | 1.04 | % | 1.03 | % | ||||||||||
|
|
|
|
|
|
|
|
|
| |||||||||||
Total expenses after fees waived and paid indirectly | 0.88 | %(d) | 0.88 | %(d) | 0.94 | % | 0.93 | % | 1.03 | % | ||||||||||
|
|
|
|
|
|
|
|
|
| |||||||||||
Total expenses after fees waived and paid indirectly and excluding interest expense and fees(e) | 0.75 | %(d) | 0.77 | %(d) | 0.89 | % | 0.89 | % | 0.98 | % | ||||||||||
|
|
|
|
|
|
|
|
|
| |||||||||||
Net investment income | 2.71 | %(d) | 2.92 | %(d) | 3.01 | % | 3.50 | % | 3.92 | % | ||||||||||
|
|
|
|
|
|
|
|
|
| |||||||||||
Supplemental Data | ||||||||||||||||||||
Net assets, end of year (000) | $ | 362,961 | $ | 260,308 | $ | 213,000 | $ | 82,376 | $ | 46,084 | ||||||||||
|
|
|
|
|
|
|
|
|
| |||||||||||
Borrowings outstanding, end of year (000) | $ | 67,389 | $ | 60,785 | $ | 49,774 | $ | 18,711 | $ | 18,711 | ||||||||||
|
|
|
|
|
|
|
|
|
| |||||||||||
Portfolio turnover rate | 43 | % | 34 | % | 20 | % | 22 | % | 18 | % | ||||||||||
|
|
|
|
|
|
|
|
|
| |||||||||||
| (a) | Based on average shares outstanding. |
| (b) | Distributions for annual periods determined in accordance with U.S. federal income tax regulations. |
| (c) | Where applicable, excludes the effects of any sales charges and assumes the reinvestment of distributions. |
| (d) | Excludes 0.01% of expenses incurred indirectly as a result of investments in underlying funds. |
| (e) | Interest expense and fees relate to TOB Trusts. See Note 4 of the Notes to Financial Statements for details. |
See notes to financial statements.
| 78 | 2018 BLACKROCK ANNUAL REPORTTO SHAREHOLDERS |
Financial Highlights (continued)
(For a share outstanding throughout each period)
| BlackRock New York Municipal Opportunities Fund (continued) | ||||||||||||||||||||
| Investor A1 | ||||||||||||||||||||
| Year Ended June 30, | ||||||||||||||||||||
| 2018 | 2017 | 2016 | 2015 | 2014 | ||||||||||||||||
Net asset value, beginning of year | $ | 11.21 | $ | 11.58 | $ | 10.91 | $ | 10.80 | $ | 10.46 | ||||||||||
|
|
|
|
|
|
|
|
|
| |||||||||||
Net investment income(a) | 0.32 | 0.34 | 0.35 | 0.40 | 0.42 | |||||||||||||||
Net realized and unrealized gain (loss) | 0.10 | (0.37 | ) | 0.67 | 0.11 | 0.34 | ||||||||||||||
|
|
|
|
|
|
|
|
|
| |||||||||||
Net increase (decrease) from investment operations | 0.42 | (0.03 | ) | 1.02 | 0.51 | 0.76 | ||||||||||||||
|
|
|
|
|
|
|
|
|
| |||||||||||
Distributions from net investment income(b) | (0.32 | ) | (0.34 | ) | (0.35 | ) | (0.40 | ) | (0.42 | ) | ||||||||||
|
|
|
|
|
|
|
|
|
| |||||||||||
Net asset value, end of year | $ | 11.31 | $ | 11.21 | $ | 11.58 | $ | 10.91 | $ | 10.80 | ||||||||||
|
|
|
|
|
|
|
|
|
| |||||||||||
Total Return(c) | ||||||||||||||||||||
Based on net asset value | 3.83 | % | (0.19 | )% | 9.55 | % | 4.71 | % | 7.53 | % | ||||||||||
|
|
|
|
|
|
|
|
|
| |||||||||||
Ratios to Average Net Assets | ||||||||||||||||||||
Total expenses | 0.81 | %(d) | 0.81 | %(d)(e) | 0.86 | % | 0.88 | % | 0.88 | % | ||||||||||
|
|
|
|
|
|
|
|
|
| |||||||||||
Total expenses after fees waived and paid indirectly | 0.72 | %(d) | 0.73 | %(d) | 0.83 | % | 0.83 | % | 0.88 | % | ||||||||||
|
|
|
|
|
|
|
|
|
| |||||||||||
Total expenses after fees waived and paid indirectly and excluding interest expense and fees(f) | 0.60 | %(d) | 0.63 | %(d) | 0.78 | % | 0.79 | % | 0.83 | % | ||||||||||
|
|
|
|
|
|
|
|
|
| |||||||||||
Net investment income | 2.87 | %(d) | 3.06 | %(d) | 3.17 | % | 3.61 | % | 4.07 | % | ||||||||||
|
|
|
|
|
|
|
|
|
| |||||||||||
Supplemental Data | ||||||||||||||||||||
Net assets, end of year (000) | $ | 107,538 | $ | 114,821 | $ | 124,864 | $ | 125,718 | $ | 132,184 | ||||||||||
|
|
|
|
|
|
|
|
|
| |||||||||||
Borrowings outstanding, end of year (000) | $ | 67,389 | $ | 60,785 | $ | 49,774 | $ | 18,711 | $ | 18,711 | ||||||||||
|
|
|
|
|
|
|
|
|
| |||||||||||
Portfolio turnover rate | 43 | % | 34 | % | 20 | % | 22 | % | 18 | % | ||||||||||
|
|
|
|
|
|
|
|
|
| |||||||||||
| (a) | Based on average shares outstanding. |
| (b) | Distributions for annual periods determined in accordance with U.S. federal income tax regulations. |
| (c) | Where applicable, excludes the effects of any sales charges and assumes the reinvestment of distributions. |
| (d) | Excludes 0.01% of expenses incurred indirectly as a result of investments in underlying funds. |
| (e) | Includes recoupment of past waived and/or reimbursed fees with no financial impact to the expense ratios. |
| (f) | Interest expense and fees relate to TOB Trusts. See Note 4 of the Notes to Financial Statements for details. |
See notes to financial statements.
| FINANCIAL HIGHLIGHTS | 79 |
Financial Highlights (continued)
(For a share outstanding throughout each period)
| BlackRock New York Municipal Opportunities Fund (continued) | ||||||||||||||||||||
| Investor C | ||||||||||||||||||||
| Year Ended June 30, | ||||||||||||||||||||
| 2018 | 2017 | 2016 | 2015 | 2014 | ||||||||||||||||
Net asset value, beginning of year | $ | 11.21 | $ | 11.58 | $ | 10.90 | $ | 10.80 | $ | 10.46 | ||||||||||
|
|
|
|
|
|
|
|
|
| |||||||||||
Net investment income(a) | 0.22 | 0.24 | 0.25 | 0.30 | 0.33 | |||||||||||||||
Net realized and unrealized gain (loss) | 0.10 | (0.37 | ) | 0.69 | 0.10 | 0.34 | ||||||||||||||
|
|
|
|
|
|
|
|
|
| |||||||||||
Net increase (decrease) from investment operations | 0.32 | (0.13 | ) | 0.94 | 0.40 | 0.67 | ||||||||||||||
|
|
|
|
|
|
|
|
|
| |||||||||||
Distributions from net investment income(b) | (0.22 | ) | (0.24 | ) | (0.26 | ) | (0.30 | ) | (0.33 | ) | ||||||||||
|
|
|
|
|
|
|
|
|
| |||||||||||
Net asset value, end of year | $ | 11.31 | $ | 11.21 | $ | 11.58 | $ | 10.90 | $ | 10.80 | ||||||||||
|
|
|
|
|
|
|
|
|
| |||||||||||
Total Return(c) | ||||||||||||||||||||
Based on net asset value | 2.89 | % | (1.08 | )% | 8.72 | % | 3.74 | % | 6.57 | % | ||||||||||
|
|
|
|
|
|
|
|
|
| |||||||||||
Ratios to Average Net Assets | ||||||||||||||||||||
Total expenses | 1.73 | %(d) | 1.72 | %(d) | 1.76 | % | 1.78 | % | 1.78 | % | ||||||||||
|
|
|
|
|
|
|
|
|
| |||||||||||
Total expenses after fees waived and paid indirectly | 1.63 | %(d) | 1.63 | %(d) | 1.69 | % | 1.68 | % | 1.77 | % | ||||||||||
|
|
|
|
|
|
|
|
|
| |||||||||||
Total expenses after fees waived and paid indirectly and excluding interest expense and fees(e) | 1.50 | %(d) | 1.52 | %(d) | 1.64 | % | 1.64 | % | 1.72 | % | ||||||||||
|
|
|
|
|
|
|
|
|
| |||||||||||
Net investment income | 1.96 | %(d) | 2.17 | %(d) | 2.27 | % | 2.75 | % | 3.17 | % | ||||||||||
|
|
|
|
|
|
|
|
|
| |||||||||||
Supplemental Data | ||||||||||||||||||||
Net assets, end of year (000) | $ | 98,722 | $ | 85,612 | $ | 77,338 | $ | 37,670 | $ | 27,595 | ||||||||||
|
|
|
|
|
|
|
|
|
| |||||||||||
Borrowings outstanding, end of year (000) | $ | 67,389 | $ | 60,785 | $ | 49,774 | $ | 18,711 | $ | 18,711 | ||||||||||
|
|
|
|
|
|
|
|
|
| |||||||||||
Portfolio turnover rate | 43 | % | 34 | % | 20 | % | 22 | % | 18 | % | ||||||||||
|
|
|
|
|
|
|
|
|
| |||||||||||
| (a) | Based on average shares outstanding. |
| (b) | Distributions for annual periods determined in accordance with U.S. federal income tax regulations. |
| (c) | Where applicable, excludes the effects of any sales charges and assumes the reinvestment of distributions. |
| (d) | Excludes 0.01% of expenses incurred indirectly as a result of investments in underlying funds. |
| (e) | Interest expense and fees relate to TOB Trusts. See Note 4 of the Notes to Financial Statements for details. |
See notes to financial statements.
| 80 | 2018 BLACKROCK ANNUAL REPORTTO SHAREHOLDERS |
Financial Highlights (continued)
(For a share outstanding throughout each period)
| BlackRock New York Municipal Opportunities Fund (continued) | ||||||||||||||||||||
| Investor C1 | ||||||||||||||||||||
| Year Ended June 30, | ||||||||||||||||||||
| 2018 | 2017 | 2016 | 2015 | 2014 | ||||||||||||||||
Net asset value, beginning of year | $ | 11.21 | $ | 11.58 | $ | 10.90 | $ | 10.80 | $ | 10.46 | ||||||||||
|
|
|
|
|
|
|
|
|
| |||||||||||
Net investment income(a) | 0.27 | 0.29 | 0.30 | 0.34 | 0.37 | |||||||||||||||
Net realized and unrealized gain (loss) | 0.10 | (0.37 | ) | 0.68 | 0.10 | 0.34 | ||||||||||||||
|
|
|
|
|
|
|
|
|
| |||||||||||
Net increase (decrease) from investment operations | 0.37 | (0.08 | ) | 0.98 | 0.44 | 0.71 | ||||||||||||||
|
|
|
|
|
|
|
|
|
| |||||||||||
Distributions from net investment income(b) | (0.27 | ) | (0.29 | ) | (0.30 | ) | (0.34 | ) | (0.37 | ) | ||||||||||
|
|
|
|
|
|
|
|
|
| |||||||||||
Net asset value, end of year | $ | 11.31 | $ | 11.21 | $ | 11.58 | $ | 10.90 | $ | 10.80 | ||||||||||
|
|
|
|
|
|
|
|
|
| |||||||||||
Total Return(c) | ||||||||||||||||||||
Based on net asset value | 3.31 | % | (0.69 | )% | 9.12 | % | 4.11 | % | 7.00 | % | ||||||||||
|
|
|
|
|
|
|
|
|
| |||||||||||
Ratios to Average Net Assets | ||||||||||||||||||||
Total expenses | 1.38 | %(d) | 1.30 | %(d) | 1.35 | % | 1.37 | % | 1.37 | % | ||||||||||
|
|
|
|
|
|
|
|
|
| |||||||||||
Total expenses after fees waived and paid indirectly | 1.23 | %(d) | 1.23 | %(d) | 1.32 | % | 1.32 | % | 1.36 | % | ||||||||||
|
|
|
|
|
|
|
|
|
| |||||||||||
Total expenses after fees waived and paid indirectly and excluding interest expense and fees(e) | 1.10 | %(d) | 1.12 | %(d) | 1.27 | % | 1.28 | % | 1.31 | % | ||||||||||
|
|
|
|
|
|
|
|
|
| |||||||||||
Net investment income | 2.36 | %(d) | 2.56 | %(d) | 2.68 | % | 3.12 | % | 3.58 | % | ||||||||||
|
|
|
|
|
|
|
|
|
| |||||||||||
Supplemental Data | ||||||||||||||||||||
Net assets, end of year (000) | $ | 742 | $ | 807 | $ | 7,670 | $ | 7,762 | $ | 8,827 | ||||||||||
|
|
|
|
|
|
|
|
|
| |||||||||||
Borrowings outstanding, end of year (000) | $ | 67,389 | $ | 60,785 | $ | 49,774 | $ | 18,711 | $ | 18,711 | ||||||||||
|
|
|
|
|
|
|
|
|
| |||||||||||
Portfolio turnover rate | 43 | % | 34 | % | 20 | % | 22 | % | 18 | % | ||||||||||
|
|
|
|
|
|
|
|
|
| |||||||||||
| (a) | Based on average shares outstanding. |
| (b) | Distributions for annual periods determined in accordance with U.S. federal income tax regulations. |
| (c) | Where applicable, excludes the effects of any sales charges and assumes the reinvestment of distributions. |
| (d) | Excludes 0.01% of expenses incurred indirectly as a result of investments in underlying funds. |
| (e) | Interest expense and fees relate to TOB Trusts. See Note 4 of the Notes to Financial Statements for details. |
See notes to financial statements.
| FINANCIAL HIGHLIGHTS | 81 |
Financial Highlights (continued)
(For a share outstanding throughout each period)
| BlackRock New York Municipal Opportunities Fund (continued) | ||||
| Class K | ||||
| Period from 01/25/18 (a) to 06/30/18 | ||||
Net asset value, beginning of period | $ | 11.34 | ||
|
| |||
Net investment income(b) | 0.16 | |||
Net realized and unrealized (loss) | (0.05 | ) | ||
|
| |||
Net increase from investment operations | 0.11 | |||
|
| |||
Distributions from net investment income(c) | (0.14 | ) | ||
|
| |||
| Net asset value, end of period | $ 11.31 | |||
|
| |||
Total Return(d) | ||||
Based on net asset value | 1.02 | %(e) | ||
|
| |||
Ratios to Average Net Assets | ||||
Total expenses | 0.67 | %(f)(g) | ||
|
| |||
Total expenses after fees waived and paid indirectly | 0.58 | %(f)(g) | ||
|
| |||
Total expenses after fees waived and paid indirectly and excluding interest expense and fees, and amortization of offering costs(h) | 0.45 | %(f)(g) | ||
|
| |||
Net investment income | 3.42 | %(f)(g) | ||
|
| |||
Supplemental Data | ||||
Net assets, end of period (000) | $ | 2,611 | ||
|
| |||
Borrowings outstanding, end of period (000) | $ | 67,389 | ||
|
| |||
Portfolio turnover rate | 43 | % | ||
|
| |||
| (a) | Commencement of operations. |
| (b) | Based on average shares outstanding. |
| (c) | Distributions for annual periods determined in accordance with U.S. federal income tax regulations. |
| (d) | Where applicable, assumes the reinvestment of distributions. |
| (e) | Aggregate total return. |
| (f) | Annualized. |
| (g) | Excludes 0.01% of expenses incurred indirectly as a result of investments in underlying funds. |
| (h) | Interest expense and fees relate to TOB Trusts. See Note 4 of the Notes to Financial Statements for details. |
See notes to financial statements.
| 82 | 2018 BLACKROCK ANNUAL REPORTTO SHAREHOLDERS |
| 1. | ORGANIZATION |
BlackRock Municipal Bond Fund, Inc. (the “Corporation”) and BlackRock Multi-State Municipal Series Trust (the “Trust”) are each registered under the Investment Company Act of 1940, as amended (the “1940 Act”), as open-end management investment companies. The Corporation is organized as a Maryland Corporation. The Trust is organized as a Massachusetts business trust. The following are referred to herein collectively as the “Funds” or individually as a “Fund”:
| Registrant Name | Fund Name | Herein Referred To As | Diversification Classification | |||
BlackRock Municipal Bond Fund, Inc. | BlackRock High Yield Municipal Fund | High Yield Municipal | Diversified | |||
BlackRock Municipal Bond Fund, Inc. | BlackRock National Municipal Fund | National Municipal | Diversified | |||
BlackRock Municipal Bond Fund, Inc. | BlackRock Short-Term Municipal Fund | Short-Term Municipal | Diversified | |||
BlackRock Multi-State Municipal Series Trust | BlackRock New York Municipal Opportunities Fund | New York Municipal | Diversified |
Each Fund offers multiple classes of shares. All classes of shares have identical voting, dividend, liquidation and other rights and are subject to the same terms and conditions, except that certain classes bear expenses related to the shareholder servicing and distribution of such shares. Institutional, Service and Class K Shares are sold only to certain eligible investors. Investor A and Investor C Shares are generally available through financial intermediaries. Investor A1 and C1 Shares are only available for dividend and capital gain reinvestment by existing shareholders, and for purchase by certain employer-sponsored retirement plans. Each class has exclusive voting rights with respect to matters relating to its shareholder servicing and distribution expenditures.
| Share Class | Initial Sales Charge | CDSC | Conversion Privilege | |||||||
Institutional, Service and Class K Shares(a) | No | No | None | |||||||
Investor A Shares | Yes | No | (b) | None | ||||||
Investor A1 Shares | No | (c) | No | (d) | None | |||||
Investor C Shares | No | Yes | None | |||||||
Investor C1 Shares | No | No | (e) | None | ||||||
| (a) | Class K Shares of High Yield Municipal and New York Municipal commenced operations on January 25, 2018. |
| (b) | Investor A Shares may be subject to a contingent deferred sales charge (“CDSC”) for certain redemptions where no initial sales charge was paid at the time of purchase. |
| (c) | Investor A1 Shares are subject to a maximum sales charge on purchases of 1.00% for Short-Term Municipal and 4.00% for New York Municipal. The sales charge does not apply to dividend and capital gain reinvestments by existing shareholders and new purchases for certain employer-sponsored retirement plans, which are currently the only investors who may invest in Investor A1 Shares. |
| (d) | Investor A1 Shares may be subject to CDSC for certain redemptions where no initial sales charge was paid at the time of purchase. However, the CDSC does not apply to redemptions by certain employer-sponsored retirement plans or to redemptions of shares acquired through reinvestment of dividends and capital gains by existing shareholders. |
| (e) | A CDSC of 1.00% is assessed on certain redemptions of Investor C1 Shares made within one year after purchase. The CDSC does not apply to redemptions by certain employer-sponsored retirement plans or to redemptions of shares acquired through reinvestment of dividends and capital gains by existing shareholders. |
On December 27, 2017, National Municipal’s issued and outstanding Investor B Shares converted into Investor A Shares, with the same relative aggregate net asset value (“NAV”) as the original shares held immediately prior to conversion.
The Funds, together with certain other registered investment companies advised by BlackRock Advisors, LLC (the “Manager”) or its affiliates, are included in a complex of open-end funds referred to as the Equity-Bond Complex.
| 2. | SIGNIFICANT ACCOUNTING POLICIES |
The financial statements are prepared in conformity with accounting principles generally accepted in the United States of America (“U.S. GAAP”), which may require management to make estimates and assumptions that affect the reported amounts of assets and liabilities in the financial statements, disclosure of contingent assets and liabilities at the date of the financial statements and the reported amounts of increases and decreases in net assets from operations during the reporting period. Actual results could differ from those estimates. Each Fund is considered an investment company under U.S. GAAP and follows the accounting and reporting guidance applicable to investment companies. Below is a summary of significant accounting policies:
Investment Transactions and Income Recognition: For financial reporting purposes, investment transactions are recorded on the dates the transactions are entered into (the “trade dates”). Realized gains and losses on investment transactions are determined on the identified cost basis. Interest income, including amortization and accretion of premiums and discounts on debt securities, is recognized on an accrual basis. Income, expenses and realized and unrealized gains and losses are allocated daily to each class based on its relative net assets.
Segregation and Collateralization: In cases where a Fund enters into certain investments (e.g., futures contracts,) or certain borrowings (e.g., TOB Trust transactions) that would be treated as “senior securities” for 1940 Act purposes, a Fund may segregate or designate on its books and records cash or liquid assets having a market value at least equal to the amount of its future obligations under such investments or borrowings. Doing so allows the investment or borrowings to be excluded from treatment as a “senior security.” Furthermore, if required by an exchange or counterparty agreement, the Funds may be required to deliver/deposit cash and/or securities to/with an exchange, or broker-dealer or custodian as collateral for certain investments or obligations.
Distributions: Distributions from net investment income are declared and reinvested monthly. Distributions of capital gains are distributed at least annually and are recorded on the ex-dividend dates. The character and timing of distributions are determined in accordance with U.S. federal income tax regulations, which may differ from U.S. GAAP.
Recent Accounting Standards: In March 2017, the Financial Accounting Standards Board issued Accounting Standards Update “Premium Amortization of Purchased Callable Debt Securities” which amends the amortization period for certain purchased callable debt securities. Under the new guidance, the premium amortization of
| NOTESTO FINANCIAL STATEMENTS | 83 |
Notes to Financial Statements (continued)
purchased callable debt securities that have explicit, non-contingent call features and are callable at fixed prices will be amortized to the earliest call date. The guidance will be applied on a modified retrospective basis and is effective for fiscal years, and their interim periods, beginning after December 15, 2018. Management is currently evaluating the impact of this guidance to the Funds.
Indemnifications: In the normal course of business, a Fund enters into contracts that contain a variety of representations that provide general indemnification. A Fund’s maximum exposure under these arrangements is unknown because it involves future potential claims against a Fund, which cannot be predicted with any certainty.
Other: Expenses directly related to a Fund or its classes are charged to that Fund or the applicable class. Other operating expenses shared by several funds, including other funds managed by the Manager, are prorated among those funds on the basis of relative net assets or other appropriate methods. Expenses directly related to the Funds and other shared expenses prorated to the Funds are allocated daily to each class based on their relative net assets or other appropriate methods.
| 3. | INVESTMENT VALUATION AND FAIR VALUE MEASUREMENTS |
Investment Valuation Policies: The Funds’ investments are valued at fair value (also referred to as “market value” within the financial statements) as of the close of trading on the New York Stock Exchange (“NYSE”) (generally 4:00 p.m., Eastern time) (or if the reporting date falls on a day the NYSE is closed, investments are valued at fair value as of the period end). U.S. GAAP defines fair value as the price the Funds would receive to sell an asset or pay to transfer a liability in an orderly transaction between market participants at the measurement date. The Funds determine the fair values of their financial instruments using various independent dealers or pricing services under policies approved by the Board of Directors of each Fund (the “Board”). The BlackRock Global Valuation Methodologies Committee (the “Global Valuation Committee”) is the committee formed by management to develop global pricing policies and procedures and to oversee the pricing function for all financial instruments.
Fair Value Inputs and Methodologies: The following methods and inputs are used to establish the fair value of each Fund’s assets and liabilities:
| • | Fixed-income securities for which market quotations are readily available are generally valued using the last available bid prices or current market quotations provided by independent dealers or third party pricing services. Floating rate loan interests are valued at the mean of the bid prices from one or more independent brokers or dealers as obtained from a third party pricing service. Pricing services generally value fixed-income securities assuming orderly transactions of an institutional round lot size, but a fund may hold or transact in such securities in smaller, odd lot sizes. Odd lots may trade at lower prices than institutional round lots. The pricing services may use matrix pricing or valuation models that utilize certain inputs and assumptions to derive values, including transaction data (e.g., recent representative bids and offers), credit quality information, perceived market movements, news, and other relevant information. Certain fixed-income securities, including asset-backed and mortgage related securities may be valued based on valuation models that consider the estimated cash flows of each tranche of the entity, establish a benchmark yield and develop an estimated tranche specific spread to the benchmark yield based on the unique attributes of the tranche. The amortized cost method of valuation may be used with respect to debt obligations with sixty days or less remaining to maturity unless the Manager determines such method does not represent fair value. |
| • | Municipal investments (including commitments to purchase such investments on a “when-issued” basis) are valued on the basis of prices provided by dealers or pricing services. In determining the value of a particular investment, pricing services may use certain information with respect to transactions in such investments, quotations from dealers, pricing matrixes, market transactions in comparable investments and information with respect to various relationships between investments. |
| • | Investments in open-end U.S. mutual funds are valued at net asset value (“NAV”) each business day. |
| • | Futures contracts traded on exchanges are valued at their last sale price. |
If events (e.g., a company announcement, market volatility or a natural disaster) occur that are expected to materially affect the value of such investments, or in the event that the application of these methods of valuation results in a price for an investment that is deemed not to be representative of the market value of such investment, or if a price is not available, the investment will be valued by the Global Valuation Committee, or its delegate, in accordance with a policy approved by the Board as reflecting fair value (“Fair Valued Investments”). The fair valuation approaches that may be used by the Global Valuation Committee will include market approach, income approach and cost approach. Valuation techniques such as discounted cash flow, use of market comparables and matrix pricing are types of valuation approaches and are typically used in determining fair value. When determining the price for Fair Valued Investments, the Global Valuation Committee, or its delegate, seeks to determine the price that each Fund might reasonably expect to receive or pay from the current sale or purchase of that asset or liability in an arm’s-length transaction. Fair value determinations shall be based upon all available factors that the Global Valuation Committee, or its delegate, deems relevant and consistent with the principles of fair value measurement. The pricing of all Fair Valued Investments is subsequently reported to the Board or a committee thereof on a quarterly basis.
Fair Value Hierarchy: Various inputs are used in determining the fair value of investments and derivative financial instruments. These inputs to valuation techniques are categorized into a fair value hierarchy consisting of three broad levels for financial statement purposes as follows:
| • | Level 1 — Unadjusted price quotations in active markets/exchanges for identical assets or liabilities that each Fund has the ability to access |
| • | Level 2 — Other observable inputs (including, but not limited to, quoted prices for similar assets or liabilities in markets that are active, quoted prices for identical or similar assets or liabilities in markets that are not active, inputs other than quoted prices that are observable for the assets or liabilities (such as interest rates, yield curves, volatilities, prepayment speeds, loss severities, credit risks and default rates) or other market–corroborated inputs) |
| • | Level 3 — Unobservable inputs based on the best information available in the circumstances, to the extent observable inputs are not available (including each Fund’s own assumptions used in determining the fair value of investments and derivative financial instruments) |
The hierarchy gives the highest priority to unadjusted quoted prices in active markets for identical assets or liabilities (Level 1 measurements) and the lowest priority to unobservable inputs (Level 3 measurements). Accordingly, the degree of judgment exercised in determining fair value is greatest for instruments categorized in Level 3.
| 84 | 2018 BLACKROCK ANNUAL REPORTTO SHAREHOLDERS |
Notes to Financial Statements (continued)
The inputs used to measure fair value may fall into different levels of the fair value hierarchy. In such cases, for disclosure purposes, the fair value hierarchy classification is determined based on the lowest level input that is significant to the fair value measurement in its entirety. Investments classified within Level 3 have significant unobservable inputs used by the Global Valuation Committee in determining the price for Fair Valued Investments. Level 3 investments include equity or debt issued by privately held companies or funds. There may not be a secondary market, and/or there are a limited number of investors. Level 3 investments may also be adjusted to reflect illiquidity and/or non-transferability, with the amount of such discount estimated by the Global Valuation Committee in the absence of market information.
Changes in valuation techniques may result in transfers into or out of an assigned level within the hierarchy. In accordance with each Fund’s policy, transfers between different levels of the fair value hierarchy are deemed to have occurred as of the beginning of the reporting period. The categorization of a value determined for investments and derivative financial instruments is based on the pricing transparency of the investments and derivative financial instruments and is not necessarily an indication of the risks associated with investing in those securities.
| 4. | SECURITIES AND OTHER INVESTMENTS |
Zero-Coupon Bonds: Zero-coupon bonds are normally issued at a significant discount from face value and do not provide for periodic interest payments. These bonds may experience greater volatility in market value than other debt obligations of similar maturity which provide for regular interest payments.
Forward Commitments and When-Issued Delayed Delivery Securities: Certain Funds may purchase securities on a when-issued basis and may purchase or sell securities on a forward commitment basis. Settlement of such transactions normally occurs within a month or more after the purchase or sale commitment is made. A Fund may purchase securities under such conditions with the intention of actually acquiring them, but may enter into a separate agreement to sell the securities before the settlement date. Since the value of securities purchased may fluctuate prior to settlement, a Fund may be required to pay more at settlement than the security is worth. In addition, a Fund is not entitled to any of the interest earned prior to settlement. When purchasing a security on a delayed delivery basis, a Fund assumes the rights and risks of ownership of the security, including the risk of price and yield fluctuations. In the event of default by the counterparty, a Fund’s maximum amount of loss is the unrealized appreciation of unsettled when-issued transactions.
Municipal Bonds Transferred to TOB Trusts: Certain Funds leverage their assets through the use of “TOB Trust” transactions. The Funds transfer municipal bonds into a special purpose trust (a “TOB Trust”). A TOB Trust issues two classes of beneficial interests: short-term floating rate interests (“TOB Trust Certificates”), which are sold to third party investors, and residual inverse floating rate interests (“TOB Residuals”), which are issued to the participating funds that contributed the municipal bonds to the TOB Trust. The TOB Trust Certificates have interest rates that reset weekly and their holders have the option to tender such certificates to the TOB Trust for redemption at par and any accrued interest at each reset date. The TOB Residuals held by a Fund provides the Fund with the right to cause the holders of a proportional share of the TOB Trust Certificates to tender their certificates to the TOB Trust at par plus accrued interest. The Funds may withdraw a corresponding share of the municipal bonds from the TOB Trust. Other funds managed by the investment adviser may also contribute municipal bonds to a TOB Trust into which a Fund has contributed bonds. If multiple BlackRock advised funds participate in the same TOB Trust, the economic rights and obligations under the TOB Residuals will be shared among the funds ratably in proportion to their participation in the TOB Trust.
TOB Trusts are supported by a liquidity facility provided by a third party bank or other financial institution (the “Liquidity Provider”) that allows the holders of the TOB Trust Certificates to tender their certificates in exchange for payment of par plus accrued interest on any business day. The tendered TOB Trust Certificates are remarketed by a Remarketing Agent. In the event of a failed remarketing, the TOB Trust may draw upon a loan from the Liquidity Provider to purchase the tendered TOB Trust Certificates. Any loans made by the Liquidity Provider will be secured by the purchased TOB Trust Certificates held by the TOB Trust and will be subject to an increased interest rate based on number of days the loan is outstanding.
The TOB Trust may be collapsed without the consent of a Fund, upon the occurrence of a termination event, as defined in the TOB Trust agreement. Upon the occurrence of a termination event, a TOB Trust would be liquidated with the proceeds applied first to any accrued fees owed to the trustee of the TOB Trust, the Remarketing Agent and the Liquidity Provider. Upon certain termination events, TOB Trust Certificates holders will be paid before the TOB Residuals holders (i.e., the Funds) whereas in other termination events, TOB Trust Certificates holders and TOB Residuals holders will be paid pro rata.
While a Fund’s investment policies and restrictions expressly permit investments in inverse floating rate securities, such as TOB Residuals, they restrict the ability of a Fund to borrow money for purposes of making investments. Each Fund’s transfer of the municipal bonds to a TOB Trust is considered a secured borrowing for financial reporting purposes. The cash received by the TOB Trust from the sale of the TOB Trust Certificates, less certain transaction expenses, is paid to a Fund. A Fund typically invests the cash received in additional municipal bonds.
Accounting for TOB Trusts: The municipal bonds deposited into a TOB Trust are presented in a Fund’s Schedule of Investments and the TOB Trust Certificates are shown in Other Liabilities in the Statements of Assets and Liabilities. Any loans drawn by the TOB Trust pursuant to the liquidity facility to purchase tendered TOB Trust Certificates are shown as Loan for TOB Trust Certificates. The carrying amount of a Fund’s payable to the holder of the TOB Trust Certificates or the Liquidity Provider, as reported in the Statements of Assets and Liabilities as TOB Trust Certificates, approximates its fair value.
Interest income, including amortization and accretion of premiums and discounts, from the underlying municipal bonds is recorded by a Fund on an accrual basis. Interest expense incurred on the TOB Trust transaction and other expenses related to remarketing, administration, trustee, liquidity and other services to a TOB Trust are shown as interest expense, fees and amortization of offering costs in the Statements of Operations. Fees paid upon creation of the TOB Trust are recorded as debt issuance costs and are amortized to interest expense, fees and amortization of offering costs in the Statements of Operations to the expected maturity of the TOB Trust. In connection with the restructurings of the TOB Trusts to non-bank sponsored TOB Trusts, a Fund incurred non-recurring, legal and restructuring fees, which are recorded as interest expense, fees and amortization of deferred offering costs in the Statements of Operations.
| NOTESTO FINANCIAL STATEMENTS | 85 |
Notes to Financial Statements (continued)
Amounts recorded within interest expense, fees and amortization of offering costs in the Statements of Operations are:
| Interest Expense | Liquidity Fees | Other Expenses | Total | |||||||||||||
High Yield Municipal | $ | 712,231 | $ | 282,261 | $ | 94,489 | $ | 1,088,981 | ||||||||
New York Municipal | 718,385 | 287,590 | 86,985 | 1,092,960 | ||||||||||||
For the year ended June 30, 2018, the following table is a summary of each Fund’s TOB Trusts:
| Underlying Municipal Bonds Transferred to TOB Trusts (a) | Liability for TOB Trust | Range of Interest Rates on TOB Trust Period End | Average TOB Trust Certificates | Daily Weighted Average Rate | ||||||||||||||||
High Yield Municipal | $ | 110,920,481 | $ | 61,022,202 | 1.51% — 1.71% | $ | 60,605,087 | 1.79 | % | |||||||||||
New York Municipal | 125,773,398 | 67,388,640 | 1.53% — 1.66% | 62,091,474 | 1.76 | |||||||||||||||
| (a) | The municipal bonds transferred to a TOB Trust are generally high grade municipal bonds. In certain cases, when municipal bonds transferred are lower grade municipal bonds, the TOB Trust transaction may include a credit enhancement feature that provides for the timely payment of principal and interest on the bonds to the TOB Trust by a credit enhancement provider in the event of default of the municipal bond. The TOB Trust would be responsible for the payment of the credit enhancement fee and the funds, as a TOB Residuals holder, would be responsible for reimbursement of any payments of principal and interest made by the credit enhancement provider. The maximum potential amounts owed by the funds, for such reimbursements, as applicable, are included in the maximum potential amounts disclosed for recourse TOB Trusts. |
| (b) | TOB Trusts may be structured on a non-recourse or recourse basis. When a fund invests in TOB Trusts on a non-recourse basis, the Liquidity Provider may be required to make a payment under the liquidity facility to allow the TOB Trust to repurchase TOB Trust Certificates. The Liquidity Provider will be reimbursed from the liquidation of bonds held in the TOB Trust. If a fund invests in a TOB Trust on a recourse basis, a Fund enters into a reimbursement agreement with the Liquidity Provider where a fund is required to reimburse the Liquidity Provider for any shortfall between the amount paid by the Liquidity Provider and proceeds received from liquidation of municipal bonds held in the TOB Trust (the “Liquidation Shortfall”). As a result, if a fund invests in a recourse TOB Trust, a fund will bear the risk of loss with respect to any Liquidation Shortfall. If multiple funds participate in any such TOB Trust, these losses will be shared ratably, including the maximum potential amounts owed by a fund at June 30, 2018, in proportion to their participation in the TOB Trust. The recourse TOB Trusts are identified in the Schedules of Investments including the maximum potential amounts owed by a fund at June 30, 2018. |
For the year ended June 30, 2018, the following table is a summary of each Fund’s Loan for TOB Trust Certificates:
Loans Outstanding | Range of Interest Rates on Loans at Period End | Average Loans Outstanding | Daily Weighted Average Rate | |||||||||||||
High Yield Municipal | $ | — | $ | — | $ | 14,060 | 0.78 | % | ||||||||
New York Municipal | — | — | 21,918 | 0.78 | ||||||||||||
| 5. | DERIVATIVE FINANCIAL INSTRUMENTS |
The Funds engage in various portfolio investment strategies using derivative contracts both to increase the returns of the Funds and/or to manage their exposure to certain risks such as credit risk, equity risk, interest rate risk, foreign currency exchange rate risk, commodity price risk or other risks (e.g., inflation risk). Derivative financial instruments categorized by risk exposure are included in the Schedules of Investments. These contracts may be transacted on an exchange or over-the-counter (“OTC”).
Futures Contracts: Futures contracts are purchased or sold to gain exposure to, or manage exposure to, changes in interest rates (interest rate risk), and changes in the value of equity securities (equity risk) or foreign currencies (foreign currency exchange rate risk).
Futures contracts are agreements between the Funds and a counterparty to buy or sell a specific quantity of an underlying instrument at a specified price and on a specified date. Depending on the terms of a contract, it is settled either through physical delivery of the underlying instrument on the settlement date or by payment of a cash amount on the settlement date. Upon entering into a futures contract, the Funds are required to deposit initial margin with the broker in the form of cash or securities in an amount that varies depending on a contract’s size and risk profile. The initial margin deposit must then be maintained at an established level over the life of the contract. Amounts pledged, which are considered restricted, are included in cash pledged for futures contracts on the Statements of Assets and Liabilities.
Securities deposited as initial margin are designated in the Schedules of Investments and cash deposited, if any, is shown as cash pledged for futures contracts in the Statements of Assets and Liabilities. Pursuant to the contract, the Funds agree to receive from or pay to the broker an amount of cash equal to the daily fluctuation in market value of the contract (“variation margin”). Variation margin is recorded as unrealized appreciation (depreciation) and, if any, shown as variation margin receivable (or payable) on futures contracts in the Statements of Assets and Liabilities. When the contract is closed, a realized gain or loss is recorded in the Statements of Operations equal to the difference between the notional amount of the contract at the time it was opened and the notional amount at the time it was closed. The use of futures contracts involves the risk of an imperfect correlation in the movements in the price of futures contracts and interest, foreign currency exchange rates or underlying assets.
| 86 | 2018 BLACKROCK ANNUAL REPORTTO SHAREHOLDERS |
Notes to Financial Statements (continued)
| 6. | INVESTMENT ADVISORY AGREEMENT AND OTHER TRANSACTIONS WITH AFFILIATES |
The PNC Financial Services Group, Inc. is the largest stockholder and an affiliate of BlackRock, Inc. (“BlackRock”) for 1940 Act purposes.
Investment Advisory: The Corporation and the Trust, on behalf of the Funds, entered into Investment Advisory Agreements with the Manager, the Funds’ investment adviser, an indirect, wholly-owned subsidiary of BlackRock, to provide investment advisory services. The Manager is responsible for the management of each Fund’s portfolio and provides the personnel, facilities, equipment and certain other services necessary to the operations of each Fund.
For such services, each Fund pays the Manager a monthly fee at an annual rate equal to the following percentages of the average daily value of each Fund’s net assets.
High Yield Municipal and New York Municipal:
| Average Daily Net Assets | Investment Advisory Fee | |||
First $1 Billion | 0.470 | % | ||
$1 Billion — $3 Billion | 0.440 | |||
$3 Billion — $5 Billion | 0.420 | |||
$5 Billion — $10 Billion | 0.410 | |||
Greater than $10 Billion | 0.400 | |||
National Municipal and Short-Term Municipal:
| Rate of Investment Advisory Fee | ||||||||
| Aggregate of Average Daily Net Assets of the Two Combined Funds (a) | National Municipal | Short-Term Municipal | ||||||
First $250 Million | 0.410 | % | 0.360 | % | ||||
$250 Million — $400 Million | 0.385 | 0.340 | ||||||
$400 Million — $550 Million | 0.385 | 0.320 | ||||||
Greater than $550 Million | 0.385 | 0.290 | ||||||
| (a) | The portion of the assets of a Fund to which the rate of each breakpoint level applies will be determined on a “uniform percentage” basis. The uniform percentage applicable to a breakpoint level is determined by dividing the amount of the aggregate average daily net assets of the two combined Funds that falls within that breakpoint level by the aggregate average daily net assets of the two combined Funds. The amount of the fee for a Fund at each breakpoint level is determined by multiplying the average daily net assets of that Fund by the uniform percentage applicable to that breakpoint level and multiplying the product by the advisory fee rate. |
Service and Distribution Fees: The Corporation and the Trust, on behalf of the Funds, entered into a Distribution Agreement and a Distribution and Service Plan with BlackRock Investments, LLC (“BRIL”), an affiliate of the Manager. Pursuant to the Distribution and Service Plan and in accordance with Rule 12b-1 under the 1940 Act, each Fund pays BRIL ongoing service and distribution fees. The fees are accrued daily and paid monthly at annual rates based upon the average daily net assets of the relevant share class of each Fund as follows:
| Service Fees | ||||||||||||||||
High Yield Municipal | National Municipal | Short-Term Municipal | New York Municipal | |||||||||||||
Service | N/A | 0.25 | % | N/A | N/A | |||||||||||
Investor A | 0.25 | % | 0.25 | 0.25 | % | 0.25 | % | |||||||||
Investor A1 | N/A | N/A | 0.10 | 0.10 | ||||||||||||
Investor B(a) | N/A | 0.25 | N/A | N/A | ||||||||||||
Investor C | 0.25 | 0.25 | 0.25 | 0.25 | ||||||||||||
Investor C1 | N/A | 0.25 | N/A | 0.25 | ||||||||||||
| Distribution Fees | ||||||||||||||||
High Yield Municipal | National Municipal | Short-Term Municipal | New York Municipal | |||||||||||||
Investor B(a) | N/A | 0.50 | % | N/A | N/A | |||||||||||
Investor C | 0.75 | % | 0.75 | 0.75 | % | 0.75 | % | |||||||||
Investor C1 | N/A | 0.55 | N/A | 0.35 | ||||||||||||
| (a) | On December 27, 2017, National Municipal’s Investor B Shares converted into Investor A Shares. |
BRIL and broker-dealers, pursuant to sub-agreements with BRIL, provide shareholder servicing and distribution services to the Funds. The ongoing service and/or distribution fee compensates BRIL and each broker-dealer for providing shareholder servicing and/or distribution related services to shareholders.
| NOTESTO FINANCIAL STATEMENTS | 87 |
Notes to Financial Statements (continued)
For the year ended June 30, 2018, the following table shows the class specific service and distribution fees borne directly by each share class of each Fund:
| Service | Investor A | Investor A1 | Investor B (a) | Investor C | Investor C1 | Total | ||||||||||||||||||||||
High Yield Municipal | $ | — | $ | 534,915 | $ | — | $ | — | $ | 620,631 | $ | — | $ | 1,155,546 | ||||||||||||||
National Municipal | 7,103 | 6,311,813 | — | 2,397 | 3,583,879 | 89,843 | 9,995,035 | |||||||||||||||||||||
Short-Term Municipal | — | 157,412 | 18,464 | — | 199,130 | — | 375,006 | |||||||||||||||||||||
New York Municipal | — | 780,773 | 111,277 | — | 915,526 | 4,636 | 1,812,212 | |||||||||||||||||||||
| (a) | On December 27, 2017, National Municipal’s Investor B Shares converted into Investor A Shares. |
Transfer Agent: Pursuant to written agreements, certain financial intermediaries, some of which may be affiliates, provide the Funds with sub-accounting, recordkeeping, sub-transfer agency and other administrative services with respect to sub-accounts they service. For these services, these entities receive an asset-based fee or an annual fee per shareholder account, which will vary depending on share class and/or net assets, which are included in transfer agent — class specific in the Statements of Operations:
| Institutional | Service | Investor A | Investor A1 | Investor B (a) | Investor C | Investor C1 | Class K | Total | ||||||||||||||||||||||||||||
High Yield Municipal | $ | 2 | $ | — | $ | — | $ | — | $ | — | $ | — | $ | — | $ | — | $ | 2 | ||||||||||||||||||
National Municipal | 1,004,831 | 2 | 279 | — | — | 57 | — | — | 1,005,169 | |||||||||||||||||||||||||||
Short-Term Municipal | 219,474 | — | — | — | — | 3 | — | — | 219,477 | |||||||||||||||||||||||||||
| (a) | On December 27, 2017, National Municipal’s Investor B Shares converted into Investor A Shares. |
The Manager maintains a call center that is responsible for providing certain shareholder services to the Funds. Shareholder services include responding to inquiries and processing subscriptions and redemptions based upon instructions from shareholders. For the year ended June 30, 2018, each Fund reimbursed the Manager the following amounts for costs incurred in running the call center, which are included in transfer agent — class specific in the Statements of Operations:
| Institutional | Service | Investor A | Investor A1 | Investor B (a) | Investor C | Investor C1 | Class K | Total | ||||||||||||||||||||||||||||
High Yield Municipal | $ | 1,428 | $ | — | $ | 1,723 | $ | — | $ | — | $ | 797 | $ | — | $ | — | $ | 3,948 | ||||||||||||||||||
National Municipal | 38,989 | 138 | 11,760 | — | 11 | 2,989 | 238 | 40,305 | 94,430 | |||||||||||||||||||||||||||
Short-Term Municipal | 1,645 | — | 664 | 153 | — | 216 | — | — | 2,678 | |||||||||||||||||||||||||||
New York Municipal | 1,032 | — | 1,302 | 2,366 | — | 854 | 25 | — | 5,579 | |||||||||||||||||||||||||||
| (a) | On December 27, 2017, National Municipal’s Investor B Shares converted into Investor A Shares. |
For the year ended June 30, 2018, the following table shows the class specific transfer agent fees borne directly by each share class of each Fund:
| Institutional | Service | Investor A | Investor A1 | Investor B (a) | Investor C | Investor C1 | Class K | Total | ||||||||||||||||||||||||||||
High Yield Municipal | $ | 178,440 | $ | — | $ | 94,832 | $ | — | $ | — | $ | 34,680 | $ | — | $ | — | $ | 307,952 | ||||||||||||||||||
National Municipal | 3,298,593 | 1,024 | 2,511,168 | — | 693 | 160,396 | 6,495 | 415,110 | 6,393,479 | |||||||||||||||||||||||||||
Short-Term Municipal | 378,305 | — | 28,614 | 11,837 | — | 15,451 | — | 2 | 434,209 | |||||||||||||||||||||||||||
New York Municipal | 255,657 | — | 143,202 | 45,793 | — | 56,648 | 989 | — | 502,289 | |||||||||||||||||||||||||||
| (a) | On December 27, 2017, National Municipal’s Investor B Shares converted into Investor A Shares. |
Other Fees: For the year ended June 30, 2018, affiliates earned underwriting discounts, direct commissions and dealer concessions on sales of each Fund’s Investor A Shares as follows:
| High Yield Municipal | National Municipal | Short-Term Municipal | New York Municipal | |||||||||||||
Investor A | $ | 12,015 | $ | 43,851 | $ | 1,261 | $ | 20,917 | ||||||||
For the year ended June 30, 2018, affiliates received CDSCs as follows:
| High Yield Municipal | National Municipal (a) | Short-Term Municipal | New York Municipal | |||||||||||||
Investor A | $ | 37,737 | $ | 94,350 | $ | 5,029 | $ | 41,814 | ||||||||
Investor A1 | — | — | — | 37 | ||||||||||||
Investor C | 3,026 | 15,041 | — | 8,888 | ||||||||||||
| (a) | On December 27, 2017, National Municipal’s Investor B Shares converted into Investor A Shares. |
Expense Limitations, Waivers, Reimbursements and Recoupments: With respect to each Fund, the Manager voluntarily agreed to waive its investment advisory fees by the amount of investment advisory fees each Fund pays to the Manager indirectly through its investment in affiliated money market funds (the “affiliated money market fund waiver”). The amount of waivers and/or reimbursements of fees and expenses made pursuant to the expense limitation caps, as applicable, will be reduced by the
| 88 | 2018 BLACKROCK ANNUAL REPORTTO SHAREHOLDERS |
Notes to Financial Statements (continued)
amount of the affiliated money market fund waiver. These amounts are included in fees waived and/or reimbursed by the Manager in the Statements of Operations. For the year ended June 30, 2018, the amounts waived were as follows:
| High Yield Municipal | National Municipal | Short-Term Municipal | New York Municipal | |||||||||||||
Amounts waived | $ | 35,668 | $ | 363,893 | $ | 659 | $ | 35,333 | ||||||||
The Manager has contractually agreed to waive its investment advisory fee with respect to any portion of each Fund’s assets invested in affiliated equity and fixed-income mutual funds and affiliated exchange-traded funds that have a contractual management fee through October 31, 2018 for Short-Term Municipal and through October 31, 2019 for New York Municipal, High Yield Municipal and National Municipal. The contractual agreement may be terminated upon 90 days’ notice by a majority of the directors/trustees of the Corporation/Trust who are not “interested persons of the Funds, as defined in the 1940 Act (“Independent Directors”), or by a vote of a majority of the outstanding voting securities of a Fund. For the year ended June 30, 2018, there were no fees waived by the manager.
For the year ended June 30, 2018, the Funds reimbursed the Manager for certain accounting services, which is included in accounting services in the Statements of Operations. The reimbursements were as follows:
High Yield Municipal | National Municipal | Short-Term Municipal | New York Municipal | |||||||||||||
Amounts reimbursed | $ | 7,843 | $ | 90,666 | $ | 4,652 | $ | 9,230 | ||||||||
With respect to each Fund, the Manager contractually agreed to waive and/or reimburse fees or expenses in order to limit expenses, excluding interest expense, dividend expense, tax expense, acquired fund fees and expenses, and certain other fund expenses, which constitute extraordinary expenses not incurred in the ordinary course of each Fund’s business (“expense limitation”). The current expense limitations as a percentage of average daily net assets are as follows:
| Share Class | High Yield Municipal | National Municipal | Short-Term Municipal | New York Municipal | ||||||||||||
Institutional | 0.54 | % | 0.43 | % | 0.36 | % | 0.50 | % | ||||||||
Service | N/A | 0.68 | N/A | N/A | ||||||||||||
Investor A | 0.79 | 0.68 | 0.61 | 0.75 | ||||||||||||
Investor A1 | N/A | N/A | 0.46 | 0.60 | ||||||||||||
Investor B(a) | N/A | N/A | N/A | N/A | ||||||||||||
Investor C | 1.54 | 1.43 | 1.36 | 1.50 | ||||||||||||
Investor C1 | N/A | 1.23 | N/A | 1.10 | ||||||||||||
Class K(b) | 0.49 | 0.38 | 0.31 | 0.45 | ||||||||||||
| (a) | On December 27, 2017, National Municipal’s Investor B Shares converted to Investor A Shares. |
| (b) | Effective January 25, 2018 for High Yield Municipal and New York Municipal. |
Prior to December 29, 2017, the contractual expense limitations for High Yield Municipal were as follows:
| Share Class | High Yield Municipal | |||
Institutional | 0.57 | % | ||
Investor A | 0.82 | |||
Investor C | 1.57 | |||
Prior to May 31, 2018, the contractual expense limitations for National Municipal were as follows:
| Share Class | National Municipal | |||
Institutional | 0.44 | % | ||
Service | 0.69 | |||
Investor A | 0.69 | |||
Investor B(a) | 1.19 | |||
Investor C | 1.44 | |||
Investor C1 | 1.24 | |||
Class K | 0.39 | |||
| (a) | On December 27, 2017, Investor B Shares converted to Investor A Shares. |
The Manager has agreed not to reduce or discontinue this contractual expense limitation through October 31, 2018 for New York Municipal except Class K shares which is through October 31, 2019 and Short-Term Municipal, and through October 31, 2019 for High Yield Municipal and National Municipal, unless approved the Board, including a majority of the Independent Directors or by a vote of a majority of the outstanding voting securities of a Fund. For the year ended June 30, 2018, the Manager waived and/or reimbursed the following amounts, which are included in fees waived and/or reimbursed by the Manager in the Statements of Operations:
High Yield Municipal | National Municipal | Short-Term Municipal | New York Municipal | |||||||||||||
Amounts waived | $ | 159,593 | $ | 2,411,463 | $ | 317,511 | $ | 507,055 | ||||||||
| NOTESTO FINANCIAL STATEMENTS | 89 |
Notes to Financial Statements (continued)
These amounts waived and/or reimbursed are included in transfer agent fees waived and/or reimbursed — class specific in the Statements of Operations. For the year ended June 30, 2018, class specific expense waivers and/or reimbursements are:
| Institutional | Service | Investor A | Investor A1 | Investor B (a) | Investor C | Investor C1 | Class K | Total | ||||||||||||||||||||||||||||
High Yield Municipal | $ | 15,309 | $ | — | $ | 11,190 | $ | — | $ | — | $ | 8,571 | $ | — | $ | — | $ | 35,070 | ||||||||||||||||||
National Municipal | 1,619,893 | 48 | 1,253,911 | — | 529 | — | 922 | 415,109 | 3,290,412 | |||||||||||||||||||||||||||
Short-Term Municipal | 201,391 | — | 2,570 | 2,630 | — | 5,405 | — | 3 | 211,999 | |||||||||||||||||||||||||||
New York Municipal. | 169,145 | — | 70,876 | 27,033 | — | 36,200 | �� | 755 | — | 304,009 | ||||||||||||||||||||||||||
| (a) | On December 27, 2017, Investor B Shares converted to Investor A Shares. |
With respect to the contractual expense caps, if during New York Municipal’s fiscal year the operating expenses of a share class, that at any time during the prior two fiscal years received a waiver and/or reimbursement from the Manager, are less than the expense cap for that share class, the Manager is entitled to be reimbursed by such share class up to the lesser of: (a) the amount of fees waived and/or expenses reimbursed during those prior two fiscal years under the agreement and (b) an amount not to exceed either the current expense limitation of that share class or the expense limitation of the share class in effect at the time that the share class received the applicable waiver and/or reimbursement, provided that:
(1) the Fund, of which the share class is a part, has more than $50 million in assets for the fiscal year; and
(2) the Manager or an affiliate continues to serve as a Fund’s investment adviser or administrator.
This repayment applies only to the contractual expense limitation on net expenses and does not apply to the contractual investment advisory fee waiver described above or any voluntary waivers that may be in effect from time to time.
For the year ended June 30, 2018, the Manager recouped the following fund level and class specific waivers and/or reimbursements previously recorded by New York Municipal:
Investor A1 | $ | 1,516 |
On June 30, 2018, New York Municipal’s fund level and class specific waivers and/or reimbursements subject to possible future recoupment under the expense limitation agreement are as follows:
Expiring 06/30/19 | Expiring 06/30/20 | |||||||
Fund level | $ | 126,519 | $ | 507,055 | ||||
Institutional | 156,521 | 169,145 | ||||||
Investor A | 84,248 | 70,876 | ||||||
Investor A1 | 30,295 | 27,033 | ||||||
Investor C | 35,926 | 36,200 | ||||||
Investor C1 | 1,235 | 755 | ||||||
The following fund level and class specific waivers and/or reimbursements previously recorded by New York Municipal, which were subject to recoupment by the Manager, expired on June 30, 2018:
| New York Municipal | ||||
Fund level | $ | 101,617 | ||
Institutional | 44,470 | |||
Investor A | 59,301 | |||
Investor A1 | — | |||
Investor C | 21,896 | |||
Investor C1 | — | |||
Each Fund has begun to incur expenses in connection with a potential realignment and consolidation of the boards of directors of certain BlackRock-advised funds. The Manager has voluntarily agreed to reimburse the Funds for all or a portion of such expenses, which amounts are included in fees waived and/or reimbursed by the Manager in the Statements of Operations. For the year ended June 30, 2018, the amount reimbursed was as follows:
High Yield Municipal | National Municipal | Short-Term Municipal | New York Municipal | |||||||||||||
Amounts reimbursed | $ | — | $ | — | $ | — | $ | 5,355 | ||||||||
Interfund Lending: In accordance with an exemptive order (the “Order”) from the U.S. Securities and Exchange Commission (“SEC”), each Fund may participate in a joint lending and borrowing facility for temporary purposes (the “Interfund Lending Program”), subject to compliance with the terms and conditions of the Order, and to the extent permitted by each Fund’s investment policies and restrictions. National Municipal, Short-Term Municipal and New York Municipal are currently permitted to borrow under the Interfund Lending Program. High Yield Municipal is currently permitted to borrow and lend under the Interfund Lending Program.
A lending BlackRock fund may lend in aggregate up to 15% of its net assets, but may not lend more than 5% of its net assets, to any one borrowing fund through the Interfund Lending Program. A borrowing BlackRock fund may not borrow through the Interfund Lending Program or from any other source more than 33 1/3% of its total assets (or any lower threshold provided for by the fund’s investment restrictions). If a borrowing BlackRock fund’s total outstanding borrowings exceed 10% of its total
| 90 | 2018 BLACKROCK ANNUAL REPORTTO SHAREHOLDERS |
Notes to Financial Statements (continued)
assets, each of its outstanding interfund loans will be subject to collateralization of at least 102% of the outstanding principal value of the loan. All interfund loans are for temporary or emergency purposes and the interest rate to be charged will be the average of the highest current overnight repurchase agreement rate available to a lending fund and the bank loan rate, as calculated according to a formula established by the Board.
During the year ended June 30, 2018, no Fund participated in the Interfund Lending Program.
Directors and Officers: Certain directors and/or officers of the Funds are directors and/or officers of BlackRock or its affiliates. The Funds reimburse the Manager for a portion of the compensation paid to the Funds’ Chief Compliance Officer, which is included in Directors and Officer in the Statements of Operations.
Other Transactions: The Funds may purchase securities from, or sell securities to, an affiliated fund provided the affiliation is due solely to having a common investment adviser, common officers, or common directors. For the year ended June 30, 2018, the purchase and sale transactions and any net realized gains (losses) with affiliated funds in compliance with Rule 17a-7 under the 1940 Act were as follows:
| Purchases | Sales | Net Realized Gain (Loss) | ||||||||||
National Municipal | $ | — | $ | 3,906,042 | $ | (1,165 | ) | |||||
Short-Term Municipal | 9,118,580 | 35,658,412 | — | |||||||||
| 7. | PURCHASES AND SALES |
For the year ended June 30, 2018, purchases and sales of investments and excluding short-term securities, were as follows:
| Purchases | Sales | |||||||
High Yield Municipal | $ | 250,717,845 | $ | 206,352,985 | ||||
National Municipal | 5,984,118,592 | 4,117,844,008 | ||||||
Short-Term Municipal | 702,750,295 | 707,718,147 | ||||||
New York Municipal | 687,459,127 | 376,133,195 | ||||||
| 8. | INCOME TAX INFORMATION |
It is each Fund’s policy to comply with the requirements of the Internal Revenue Code of 1986, as amended, applicable to regulated investment companies, and to distribute substantially all of its taxable income to its shareholders. Therefore, no U.S. federal income tax provision is required.
Each Fund files U.S. federal and various state and local tax returns. No income tax returns are currently under examination. The statute of limitations on each Fund’s U.S. federal tax returns generally remains open for each of the four years ended June 30, 2018. The statutes of limitations on each Fund’s state and local tax returns may remain open for an additional year depending upon the jurisdiction.
Management has analyzed tax laws and regulations and their application to the Funds as of June 30, 2018, inclusive of the open tax return years, and does not believe that there are any uncertain tax positions that require recognition of a tax liability in the Funds’ financial statements.
U.S. GAAP requires that certain components of net assets be adjusted to reflect permanent differences between financial and tax reporting. These reclassifications have no effect on net assets or net asset values per share. As of period end, the following permanent differences attributable to non-deductible expenses, the expiration of capital loss carryforwards, the amortization methods on fixed income securities and the sale of bonds received from TOB Trusts were reclassified to the following accounts:
| High Yield Municipal | National Municipal | Short-Term Municipal | New York Municipal | |||||||||||||
Paid-in capital | $ | (4,682,389 | ) | $ | (19,695,278 | ) | $ | — | (17,118 | ) | ||||||
Undistributed net investment income | $ | 12,689 | $ | (7,095 | ) | $ | — | $ | 10,183 | |||||||
Accumulated net realized gain (loss) | $ | 4,669,700 | $ | 19,702,373 | $ | — | $ | 6,935 | ||||||||
The tax character of distributions paid was as follows:
| High Yield Municipal | National Municipal | Short-Term Municipal | New York Municipal | |||||||||||||||||
Tax-exempt income(a) | 06/30/18 | $ | 32,489,538 | $ | 249,682,064 | $ | 4,717,311 | $ | 22,970,296 | |||||||||||
| 06/30/17 | 32,556,470 | 205,179,880 | 3,192,484 | 18,868,890 | ||||||||||||||||
Ordinary income(b) | 06/30/18 | 222,577 | 98,457 | 148 | 864,085 | |||||||||||||||
| 06/30/17 | 39,336 | 40,017 | 36,643 | 616,882 | ||||||||||||||||
Long-term capital gains | 06/30/18 | — | — | — | — | |||||||||||||||
| 06/30/17 | — | — | 228,812 | — | ||||||||||||||||
|
|
|
|
|
|
|
| |||||||||||||
Total | 06/30/18 | $ | 32,712,115 | $ | 249,780,521 | $ | 4,717,459 | $ | 23,834,381 | |||||||||||
|
|
|
|
|
|
|
| |||||||||||||
| 06/30/17 | $ | 32,595,806 | $ | 205,219,897 | $ | 3,457,939 | $ | 19,485,772 | ||||||||||||
|
|
|
|
|
|
|
| |||||||||||||
| (a) | The Funds designate these amounts paid during the fiscal year ended June 30, 2018, as exempt-interest dividends. |
| (b) | Ordinary income consists primarily of taxable income recognized from market discount. Additionally, all ordinary income distributions are comprised of interest related dividends for non-U.S. residents and are eligible for exemption from U.S. withholding tax for nonresident aliens and foreign corporations. |
| NOTESTO FINANCIAL STATEMENTS | 91 |
Notes to Financial Statements (continued)
As of period end, the tax components of accumulated net earnings (losses) were as follows:
| High Yield Municipal | National Municipal | Short-Term Municipal | New York Municipal | |||||||||||||
Undistributed tax-exempt income | $ | 41,190 | $ | 2,184,854 | $ | 477,104 | $ | 79,196 | ||||||||
Undistributed ordinary income | 73,391 | 310,755 | — | 12,867 | ||||||||||||
Undistributed long-term capital gains | — | — | — | 7,399,126 | ||||||||||||
Capital loss carryforwards | (7,405,885 | ) | — | (1,608,430 | ) | — | ||||||||||
Net unrealized gain (loss)(a) | 34,146,236 | 172,311,474 | (877,656 | ) | 15,935,942 | |||||||||||
|
|
|
|
|
|
|
| |||||||||
| �� | $ | 26,854,932 | $ | 174,807,083 | $ | (2,008,982 | ) | $ | 23,427,131 | |||||||
|
|
|
|
|
|
|
| |||||||||
| (a) | The difference between book-basis and tax-basis net unrealized gains was attributable primarily to the tax deferral of losses on wash sales, amortization methods for premiums and discounts on fixed income securities, the realization for tax purposes of unrealized gains/losses on certain futures contracts and the treatment of residual interests in TOB Trusts. |
As of June 30, 2018, the Funds had capital loss carryforwards available to offset future realized capital gains through the indicated expiration dates as follows:
| Expires June 30, | High Yield Municipal | Short-Term Municipal | ||||||
No expiration date(a) | $ | 5,432,628 | $ | 1,608,430 | ||||
2019 | 1,973,257 | — | ||||||
|
|
|
| |||||
| $ | 7,405,885 | $ | 1,608,430 | |||||
|
|
|
| |||||
| (a) | Must be utilized prior to losses subject to expiration. |
During the year ended June 30, 2018, the Funds listed below utilized the following amounts of their respective capital loss carryforward:
BlackRock High Yield Municipal Bond Fund | $ | 3,885,202 | ||
BlackRock National Municipal Bond Fund | $ | 21,560,479 | ||
BlackRock New York Municipal Opportunities Fund | $ | 7,362,005 |
As of June 30, 2018, gross unrealized appreciation and depreciation for investments and derivatives based on cost for U.S. federal income tax purposes were as follows:
| High Yield Municipal | National Municipal | Short-Term Municipal | New York Municipal | |||||||||||||
Tax cost | $ | 804,609,040 | $ | 8,936,621,144 | $ | 467,741,625 | $ | 1,000,550,534 | ||||||||
|
|
|
|
|
|
|
| |||||||||
Gross unrealized appreciation | $ | 38,754,760 | $ | 191,197,015 | $ | 295,731 | $ | 21,076,195 | ||||||||
Gross unrealized depreciation | (4,589,046 | ) | (18,885,541 | ) | (1,173,387 | ) | (5,140,253 | ) | ||||||||
|
|
|
|
|
|
|
| |||||||||
Net unrealized appreciation (depreciation) | $ | 34,165,714 | $ | 172,311,474 | $ | (877,656 | ) | $ | 15,935,942 | |||||||
|
|
|
|
|
|
|
| |||||||||
The Tax Cuts and Jobs Act (the “Act”) was enacted on December 22, 2017. Certain provisions of the Act were effective upon enactment with the remainder becoming effective for tax years beginning after December 31, 2017. Although the Act does not amend any provisions directly related to the qualification or taxation of regulated investment companies (“RICs”), the Act does change the taxation of entities in which some RICs invest, the tax treatment of income derived from those entities and the taxation of RIC shareholders. While management does not anticipate significant impact to the Funds or to their shareholders, there is uncertainty in the application of certain provisions in the Act. Specifically, provisions in the Act may increase the amount of or accelerate the recognition of taxable income and may limit the deductibility of certain expenses by RICs. Until full clarity around these provisions is obtained, the impact on the Funds’ financial statements, if any, cannot be fully determined.
| 9. | BANK BORROWINGS |
The Corporation and the Trust on, behalf of the Funds, along with certain other funds managed by the Manager and its affiliates (“Participating Funds”), is a party to a 364-day, $2.25 billion credit agreement with a group of lenders. Under this agreement, the Funds may borrow to fund shareholder redemptions. Excluding commitments designated for certain individual funds, the Participating Funds, including the Funds, can borrow up to an aggregate commitment amount of $1.75 billion at any time outstanding, subject to asset coverage and other limitations as specified in the agreement. The credit agreement has the following terms: a fee of 0.10% per annum on unused commitment amounts and interest at a rate equal to the higher of (a) one-month LIBOR (but, in any event, not less than 0.00%) on the date the loan is made plus 0.80% per annum or (b) the Fed Funds rate (but, in any event, not less than 0.00%) in effect from time to time plus 0.80% per annum on amounts borrowed. The agreement expires in April 2019 unless extended or renewed. Prior to April 19, 2018, the aggregate commitment amount was $2.1 billion and the fee was 0.12% per annum. Participating Funds paid an upfront commitment fee of 0.02% on the total commitment amounts, in addition to administration, legal and arrangement fees, which are included in miscellaneous expenses in the Statements of Operations. These fees were allocated among such funds based upon portions of the aggregate commitment available to them and relative net assets of Participating Funds. During the year ended June 30, 2018, the Funds did not borrow under the credit agreement.
| 10. | PRINCIPAL RISKS |
Many municipalities insure repayment of their bonds, which may reduce the potential for loss due to credit risk. The market value of these bonds may fluctuate for other reasons, including market perception of the value of such insurance, and there is no guarantee that the insurer will meet its obligation.
| 92 | 2018 BLACKROCK ANNUAL REPORTTO SHAREHOLDERS |
Notes to Financial Statements (continued)
Inventories of municipal bonds held by brokers and dealers may decrease, which would lessen their ability to make a market in these securities. Such a reduction in market making capacity could potentially decrease a Fund’s ability to buy or sell bonds. As a result, a Fund may sell a security at a lower price, sell other securities to raise cash, or give up an investment opportunity, any of which could have a negative impact on performance. If a Fund needed to sell large blocks of bonds, those sales could further reduce the bonds’ prices and impact performance.
In the normal course of business, certain Funds invest in securities or other instruments and may enter into certain transactions, and such activities subject each Fund to various risks, including among others, fluctuations in the market (market risk) or failure of an issuer to meet all of its obligations. The value of securities or other instruments may also be affected by various factors, including, without limitation: (i) the general economy; (ii) the overall market as well as local, regional or global political and/or social instability; (iii) regulation, taxation or international tax treaties between various countries; or (iv) currency, interest rate and price fluctuations. Each Fund’s prospectus provides details of the risks to which each Fund is subject.
Each Fund may be exposed to prepayment risk, which is the risk that borrowers may exercise their option to prepay principal earlier than scheduled during periods of declining interest rates, which would force each Fund to reinvest in lower yielding securities. Each Fund may also be exposed to reinvestment risk, which is the risk that income from each Fund’s portfolio will decline if each Fund invests the proceeds from matured, traded or called fixed-income securities at market interest rates that are below each Fund portfolio’s current earnings rate.
The Funds may hold a significant amount of bonds subject to calls by the issuers at defined dates and prices. When bonds are called by issuers and the Funds reinvest the proceeds received, such investments may be in securities with lower yields than the bonds originally held, and correspondingly, could adversely impact the yield and total return performance of a Fund.
A Fund structures and “sponsors” the TOB Trusts in which it holds TOB Residuals and has certain duties and responsibilities, which may give rise to certain additional risks including, but not limited to, compliance, securities law and operational risks.
Should short-term interest rates rise, the Funds’ investments in the TOB Trusts may adversely affect the Funds’ net investment income and dividends to shareholders. Also, fluctuations in the market value of municipal bonds deposited into the TOB Trust may adversely affect the Funds’ NAVs per share.
The SEC and various federal banking and housing agencies have adopted credit risk retention rules for securitizations (the “Risk Retention Rules”). The Risk Retention Rules would require the sponsor of a TOB Trust to retain at least 5% of the credit risk of the underlying assets supporting the TOB Trust’s municipal bonds. The Risk Retention Rules may adversely affect the Funds’ ability to engage in TOB Trust transactions or increase the costs of such transactions in certain circumstances.
TOB Trusts constitute an important component of the municipal bond market. Any modifications or changes to rules governing TOB Trusts may adversely impact the municipal market and the Funds, including through reduced demand for and liquidity of municipal bonds and increased financing costs for municipal issuers. The ultimate impact of any potential modifications on the TOB Trust market and the overall municipal market is not yet certain.
Counterparty Credit Risk: The Funds may be exposed to counterparty credit risk, or the risk that an entity may fail to or be unable to perform on its commitments related to unsettled or open transactions. The Funds manage counterparty credit risk by entering into transactions only with counterparties that the Manager believes have the financial resources to honor their obligations and by monitoring the financial stability of those counterparties. Financial assets, which potentially expose the Funds to market, issuer and counterparty credit risks, consist principally of financial instruments and receivables due from counterparties. The extent of the Funds’ exposure to market, issuer and counterparty credit risks with respect to these financial assets is approximately their value recorded in the Statements of Assets and Liabilities, less any collateral held by the Funds.
A derivative contract may suffer a mark-to-market loss if the value of the contract decreases due to an unfavorable change in the market rates or values of the underlying instrument. Losses can also occur if the counterparty does not perform under the contract.
With exchange-traded futures, there is less counterparty credit risk to the Funds since the exchange or clearinghouse, as counterparty to such instruments, guarantees against a possible default. The clearinghouse stands between the buyer and the seller of the contract; therefore, credit risk is limited to failure of the clearinghouse. While offset rights may exist under applicable law, a Fund does not have a contractual right of offset against a clearing broker or clearinghouse in the event of a default (including the bankruptcy or insolvency). Additionally, credit risk exists in exchange-traded futures with respect to initial and variation margin that is held in a clearing broker’s customer accounts. While clearing brokers are required to segregate customer margin from their own assets, in the event that a clearing broker becomes insolvent or goes into bankruptcy and at that time there is a shortfall in the aggregate amount of margin held by the clearing broker for all its clients, typically the shortfall would be allocated on a pro rata basis across all the clearing broker’s customers, potentially resulting in losses to the Funds.
Concentration Risk: New York Municipal invests a substantial amount of its assets in issuers located in a single state or limited number of states. This may subject each Fund to the risk that economic, political or social issues impacting a particular state or group of states could have an adverse and disproportionate impact on the income from, or the value or liquidity of, the Funds’ respective portfolios. Investment percentages in specific states or U.S. territories are presented in the Schedules of Investments.
As of period end, National Municipal Fund and New York Municipal Opportunities Fund invested a significant portion of their assets in securities in the Transportation sector. Changes in economic conditions affecting such sector would have a greater impact on the Funds and could affect the value, income and/or liquidity of positions in such securities.
Certain Funds invest a significant portion of their assets in fixed-income securities and/or use derivatives tied to the fixed-income markets. Changes in market interest rates or economic conditions may affect the value and/or liquidity of such investments. Interest rate risk is the risk that prices of bonds and other fixed-income securities will increase as interest rates fall and decrease as interest rates rise.
| NOTESTO FINANCIAL STATEMENTS | 93 |
Notes to Financial Statements (continued)
| 11. | CAPITAL SHARE TRANSACTIONS |
Transactions in capital shares for each class were as follows:
| Year Ended 06/30/18 | Year Ended 06/30/17 | |||||||||||||||
| High Yield Municipal | Shares | Amount | Shares | Amount | ||||||||||||
Institutional | ||||||||||||||||
Shares sold | 25,757,537 | $ | 247,126,112 | 39,198,169 | $ | 372,295,866 | ||||||||||
Shares issued in reinvestment of distributions | 1,369,213 | 13,118,462 | 1,349,615 | 12,896,264 | ||||||||||||
Shares redeemed | (23,938,584 | ) | (229,252,942 | ) | (41,948,615 | ) | (398,574,646 | ) | ||||||||
|
|
|
|
|
|
|
| |||||||||
Net increase (decrease) | 3,188,166 | $ | 30,991,632 | (1,400,831 | ) | $ | (13,382,516 | ) | ||||||||
|
|
|
|
|
|
|
| |||||||||
Investor A | ||||||||||||||||
Shares sold | 7,999,972 | $ | 76,567,442 | 13,662,667 | $ | 130,942,614 | ||||||||||
Shares issued in reinvestment of distributions | 706,375 | 6,751,806 | 765,635 | 7,283,906 | ||||||||||||
Shares redeemed | (6,737,294 | ) | (64,449,583 | ) | (16,185,881 | ) | (152,726,325 | ) | ||||||||
|
|
|
|
|
|
|
| |||||||||
Net increase (decrease) | 1,969,053 | $ | 18,869,665 | (1,757,579 | ) | $ | (14,499,805 | ) | ||||||||
|
|
|
|
|
|
|
| |||||||||
Investor C | ||||||||||||||||
Shares sold | 877,139 | $ | 8,415,002 | 1,354,250 | $ | 13,064,898 | ||||||||||
Shares issued in reinvestment of distributions | 166,263 | 1,593,876 | 188,069 | 1,792,150 | ||||||||||||
Shares redeemed | (1,413,173 | ) | (13,552,056 | ) | (2,068,126 | ) | (19,549,920 | ) | ||||||||
|
|
|
|
|
|
|
| |||||||||
Net decrease | (369,771 | ) | $ | (3,543,178 | ) | (525,807 | ) | $ | (4,692,872 | ) | ||||||
|
|
|
|
|
|
|
| |||||||||
| Period from 01/25/18 (a) to 06/30/18 | ||||||||||||||||
Class K | ||||||||||||||||
Shares sold | 1,298,932 | $ | 12,396,937 | |||||||||||||
Shares issued in reinvestment of distributions | 6,542 | 62,602 | ||||||||||||||
Shares redeemed | (83,913 | ) | (801,870 | ) | ||||||||||||
|
|
|
| |||||||||||||
Net increase | 1,221,561 | $ | 11,657,669 | |||||||||||||
|
|
|
| |||||||||||||
Total Net Increase (Decrease) | 6,009,009 | $ | 57,975,788 | (3,684,217 | ) | $ | (32,575,193 | ) | ||||||||
|
|
|
|
|
|
|
| |||||||||
| (a) | Commencement of operations. |
| 94 | 2018 BLACKROCK ANNUAL REPORTTO SHAREHOLDERS |
Notes to Financial Statements (continued)
| Year Ended 06/30/18 | Year Ended 06/30/17 | |||||||||||||||
| National Municipal | Shares | Amount | Shares | Amount | ||||||||||||
Institutional | ||||||||||||||||
Shares sold | 114,620,197 | $ | 1,245,253,060 | 115,666,914 | $ | 1,254,236,767 | ||||||||||
Shares issued in reinvestment of distributions | 6,737,245 | 73,049,511 | 6,268,611 | 68,181,972 | ||||||||||||
Shares redeemed | (137,185,853 | ) | (1,480,522,940 | ) | (121,875,014 | ) | (1,321,158,279 | ) | ||||||||
|
|
|
|
|
|
|
| |||||||||
Net increase (decrease) | (15,828,411 | ) | $ | (162,220,369 | ) | 60,511 | $ | 1,260,460 | ||||||||
|
|
|
|
|
|
|
| |||||||||
Service | ||||||||||||||||
Shares sold | 56,989 | $ | 616,945 | 115,360 | $ | 1,255,972 | ||||||||||
Shares issued in reinvestment of distributions | 5,789 | 62,781 | 5,756 | 62,505 | ||||||||||||
Shares redeemed | (129,391 | ) | (1,396,794 | ) | (54,728 | ) | (586,522 | ) | ||||||||
|
|
|
|
|
|
|
| |||||||||
Net increase (decrease) | (66,613 | ) | $ | (717,068 | ) | 66,388 | $ | 731,955 | ||||||||
|
|
|
|
|
|
|
| |||||||||
Investor A | ||||||||||||||||
Shares sold | 86,041,828 | $ | 933,789,923 | 90,552,031 | $ | 981,197,641 | ||||||||||
Shares issued in reinvestment of distributions | 5,933,994 | 64,353,988 | 5,984,695 | 65,168,015 | ||||||||||||
Shares redeemed | (54,306,510 | ) | (589,012,149 | ) | (118,999,743 | ) | (1,283,046,274 | ) | ||||||||
|
|
|
|
|
|
|
| |||||||||
Net increase (decrease) | 37,669,312 | $ | 409,131,762 | (22,463,017 | ) | $ | (236,680,618 | ) | ||||||||
|
|
|
|
|
|
|
| |||||||||
Investor B (a) | ||||||||||||||||
Shares sold | — | $ | 6 | 1,041 | $ | 11,639 | ||||||||||
Shares issued in reinvestment of distributions | 436 | 4,752 | 1,488 | 16,190 | ||||||||||||
Shares redeemed | (67,440 | ) | (736,609 | ) | (68,127 | ) | (744,860 | ) | ||||||||
|
|
|
|
|
|
|
| |||||||||
Net decrease | (67,004 | ) | $ | (731,851 | ) | (65,598 | ) | $ | (717,031 | ) | ||||||
|
|
|
|
|
|
|
| |||||||||
Investor C | ||||||||||||||||
Shares sold | 2,627,666 | $ | 28,547,897 | 5,143,508 | $ | 56,380,337 | ||||||||||
Shares issued in reinvestment of distributions | 557,622 | 6,050,918 | 714,837 | 7,780,809 | ||||||||||||
Shares redeemed | (8,024,190 | ) | (87,078,490 | ) | (12,371,126 | ) | (134,235,729 | ) | ||||||||
|
|
|
|
|
|
|
| |||||||||
Net decrease | (4,838,902 | ) | $ | (52,479,675 | ) | (6,512,781 | ) | $ | (70,074,583 | ) | ||||||
|
|
|
|
|
|
|
| |||||||||
Investor C1 | ||||||||||||||||
Shares sold | 12 | $ | 131 | 1,384 | $ | 25,101 | ||||||||||
Shares issued in reinvestment of distributions | 23,052 | 250,049 | 66,277 | 721,020 | ||||||||||||
Shares redeemed | (225,692 | ) | (2,445,084 | ) | (4,425,087 | ) | (48,186,909 | ) | ||||||||
|
|
|
|
|
|
|
| |||||||||
Net decrease | (202,628 | ) | $ | (2,194,904 | ) | (4,357,426 | ) | $ | (47,440,788 | ) | ||||||
|
|
|
|
|
|
|
| |||||||||
Class K | ||||||||||||||||
Shares sold | 146,297,714 | $ | 1,579,243,035 | 149,800,582 | $ | 1,625,097,771 | ||||||||||
Shares issued in reinvestment of distributions | 4,826,893 | 52,206,912 | 665,777 | 7,243,587 | ||||||||||||
Shares redeemed | (41,803,297 | ) | (453,186,426 | ) | (10,264,324 | ) | (110,965,987 | ) | ||||||||
|
|
|
|
|
|
|
| |||||||||
Net increase | 109,321,310 | $ | 1,178,263,521 | 140,202,035 | $ | 1,521,375,371 | ||||||||||
|
|
|
|
|
|
|
| |||||||||
Total Net Increase | 125,987,064 | $ | 1,369,051,416 | 106,930,112 | $ | 1,168,454,766 | ||||||||||
|
|
|
|
|
|
|
| |||||||||
| (a) | On December 27, 2017, all issued and outstanding Investor B Shares converted to Investor A Shares. |
| NOTESTO FINANCIAL STATEMENTS | 95 |
Notes to Financial Statements (continued)
| Year Ended 06/30/18 | Year Ended 06/30/17 | |||||||||||||||
| Short-Term Municipal | Shares | Amount | Shares | Amount | ||||||||||||
Institutional | ||||||||||||||||
Shares sold | 14,902,943 | $ | 150,277,966 | 22,558,904 | $ | 228,239,184 | ||||||||||
Shares issued in reinvestment of distributions | 192,520 | 1,942,159 | 139,339 | 1,409,989 | ||||||||||||
Shares redeemed | (14,631,659 | ) | (147,581,056 | ) | (32,003,825 | ) | (323,526,766 | ) | ||||||||
|
|
|
|
|
|
|
| |||||||||
Net increase (decrease) | 463,804 | $ | 4,639,069 | (9,305,582 | ) | $ | (93,877,593 | ) | ||||||||
|
|
|
|
|
|
|
| |||||||||
Investor A | ||||||||||||||||
Shares sold | 2,780,387 | $ | 28,058,227 | 6,124,038 | $ | 61,923,484 | ||||||||||
Shares issued in reinvestment of distributions | 47,182 | 476,049 | 34,489 | 348,994 | ||||||||||||
Shares redeemed | (3,368,075 | ) | (34,031,813 | ) | (7,268,836 | ) | (73,562,764 | ) | ||||||||
|
|
|
|
|
|
|
| |||||||||
Net decrease | (540,506 | ) | $ | (5,497,537 | ) | (1,110,309 | ) | $ | (11,290,286 | ) | ||||||
|
|
|
|
|
|
|
| |||||||||
Investor A1 | ||||||||||||||||
Shares sold | 669 | $ | 6,741 | 82 | $ | 826 | ||||||||||
Shares issued in reinvestment of distributions | 10,894 | 109,986 | 7,832 | 79,329 | ||||||||||||
Shares redeemed | (234,519 | ) | (2,368,988 | ) | (534,723 | ) | (5,418,055 | ) | ||||||||
|
|
|
|
|
|
|
| |||||||||
Net decrease | (222,956 | ) | $ | (2,252,261 | ) | (526,809 | ) | $ | (5,337,900 | ) | ||||||
|
|
|
|
|
|
|
| |||||||||
Investor C | ||||||||||||||||
Shares sold | 311,952 | $ | 3,064,252 | 673,726 | $ | 6,641,796 | ||||||||||
Shares issued in reinvestment of distributions | 2,089 | 20,482 | 977 | 9,588 | ||||||||||||
Shares redeemed | (917,552 | ) | (9,017,547 | ) | (1,496,127 | ) | (14,775,337 | ) | ||||||||
|
|
|
|
|
|
|
| |||||||||
Net decrease | (603,511 | ) | $ | (5,932,813 | ) | (821,424 | ) | $ | (8,123,953 | ) | ||||||
|
|
|
|
|
|
|
| |||||||||
Class K | ||||||||||||||||
Shares sold | 380,963 | $ | 3,832,420 | — | $ | — | ||||||||||
Shares issued in reinvestment of distributions | 4,633 | 46,715 | 2,293 | 23,209 | ||||||||||||
Shares redeemed | (38,728 | ) | (389,946 | ) | (4,491 | ) | (45,760 | ) | ||||||||
|
|
|
|
|
|
|
| |||||||||
Net increase (decrease) | 346,868 | $ | 3,489,189 | (2,198 | ) | $ | (22,551 | ) | ||||||||
|
|
|
|
|
|
|
| |||||||||
Total Net Decrease | (556,301 | ) | $ | (5,554,353 | ) | (11,766,322 | ) | $ | (118,652,283 | ) | ||||||
|
|
|
|
|
|
|
| |||||||||
| 96 | 2018 BLACKROCK ANNUAL REPORTTO SHAREHOLDERS |
Notes to Financial Statements (continued)
| Year Ended 06/30/18 | Year Ended 06/30/17 | |||||||||||||||
| New York Municipal Opportunities | Shares | Amount | Shares | Amount | ||||||||||||
Institutional | ||||||||||||||||
Shares sold | 21,962,851 | $ | 248,214,176 | 13,037,863 | $ | 145,616,260 | ||||||||||
Shares issued in reinvestment of distributions | 765,737 | 8,639,733 | 489,558 | 5,470,745 | ||||||||||||
Shares redeemed | (6,239,274 | ) | (70,446,362 | ) | (5,844,591 | ) | (64,609,995 | ) | ||||||||
|
|
|
|
|
|
|
| |||||||||
Net increase | 16,489,314 | $ | 186,407,547 | 7,682,830 | $ | 86,477,010 | ||||||||||
|
|
|
|
|
|
|
| |||||||||
Investor A | ||||||||||||||||
Shares sold | 14,256,153 | $ | 161,175,846 | 12,210,129 | $ | 137,594,021 | ||||||||||
Shares issued in reinvestment of distributions | 689,693 | 7,785,014 | 580,535 | 6,488,974 | ||||||||||||
Shares redeemed | (6,078,255 | ) | (68,650,124 | ) | (7,966,062 | ) | (88,376,574 | ) | ||||||||
|
|
|
|
|
|
|
| |||||||||
Net increase | 8,867,591 | $ | 100,310,736 | 4,824,602 | $ | 55,706,421 | ||||||||||
|
|
|
|
|
|
|
| |||||||||
Investor A1 | ||||||||||||||||
Shares sold | 28,807 | $ | 326,600 | 62,605 | $ | 698,271 | ||||||||||
Shares issued in reinvestment of distributions | 186,464 | 2,103,644 | 219,169 | 2,451,830 | ||||||||||||
Shares redeemed | (949,664 | ) | (10,728,418 | ) | (822,430 | ) | (9,233,010 | ) | ||||||||
|
|
|
|
|
|
|
| |||||||||
Net decrease | (734,393 | ) | $ | (8,298,174 | ) | (540,656 | ) | $ | (6,082,909 | ) | ||||||
|
|
|
|
|
|
|
| |||||||||
Investor C | ||||||||||||||||
Shares sold | 2,527,938 | $ | 28,567,879 | 2,610,838 | $ | 29,403,233 | ||||||||||
Shares issued in reinvestment of distributions | 148,127 | 1,671,614 | 149,904 | 1,674,336 | ||||||||||||
Shares redeemed | (1,584,754 | ) | (17,900,018 | ) | (1,802,627 | ) | (20,038,397 | ) | ||||||||
|
|
|
|
|
|
|
| |||||||||
Net increase | 1,091,311 | $ | 12,339,475 | 958,115 | $ | 11,039,172 | ||||||||||
|
|
|
|
|
|
|
| |||||||||
Investor C1 | ||||||||||||||||
Shares sold | — | $ | — | 14 | $ | 152 | ||||||||||
Shares issued in reinvestment of distributions | 1,644 | 18,555 | 6,939 | 77,620 | ||||||||||||
Shares redeemed | (8,073 | ) | (91,270 | ) | (597,222 | ) | (6,742,389 | ) | ||||||||
|
|
|
|
|
|
|
| |||||||||
Net decrease | (6,429 | ) | $ | (72,715 | ) | (590,269 | ) | $ | (6,664,617 | ) | ||||||
|
|
|
|
|
|
|
| |||||||||
| Period from 01/25/18 (a) to 06/30/18 | ||||||||||||||||
Class K | ||||||||||||||||
Shares sold | 231,318 | $ | 2,611,653 | |||||||||||||
Shares issued in reinvestment of distributions | 1,363 | 15,381 | ||||||||||||||
Shares redeemed | (1,835 | ) | (20,728 | ) | ||||||||||||
|
|
|
| |||||||||||||
Net increase | 230,846 | $ | 2,606,306 | |||||||||||||
|
|
|
| |||||||||||||
Total Net Increase | 25,938,240 | $ | 293,293,175 | 12,334,622 | $ | 140,475,077 | ||||||||||
|
|
|
|
|
|
|
| |||||||||
| (a) | Commencement of operations. |
| 12. | SUBSEQUENT EVENTS |
Management’s evaluation of the impact of all subsequent events on the Funds’ financial statements was completed through the date the financial statements were issued and has determined that there were no subsequent events requiring adjustment or additional disclosure in the financial statements.
| NOTESTO FINANCIAL STATEMENTS | 97 |
Report of Independent Registered Public Accounting Firm
To the Shareholders of BlackRock High Yield Municipal Fund, BlackRock National Municipal Fund, BlackRock Short-Term Municipal Fund, BlackRock New York Municipal Opportunities Fund and the Board of Directors/Trustees of BlackRock Municipal Bond Fund, Inc. and BlackRock Multi-State Municipal Series Trust:
Opinion on the Financial Statements and Financial Highlights
We have audited the accompanying statements of assets and liabilities of BlackRock High Yield Municipal Fund, BlackRock National Municipal Fund, and BlackRock Short-Term Municipal Fund of BlackRock Municipal Bond Fund, Inc. and BlackRock New York Municipal Opportunities Fund of BlackRock Multi-State Municipal Series Trust (the “Funds”), including the schedules of investments, as of June 30, 2018, the related statements of operations for the year then ended, the statements of changes in net assets for each of the two years in the period then ended, the financial highlights for each of the five years in the period then ended, and the related notes. In our opinion, the financial statements and financial highlights present fairly, in all material respects, the financial position of the Funds as of June 30, 2018, and the results of their operations for the year then ended, the changes in their net assets for each of the two years in the period then ended, and the financial highlights for each of the five years in the period then ended, in conformity with accounting principles generally accepted in the United States of America.
Basis for Opinion
These financial statements and financial highlights are the responsibility of the Funds’ management. Our responsibility is to express an opinion on the Funds’ financial statements and financial highlights based on our audits. We are a public accounting firm registered with the Public Company Accounting Oversight Board (United States) (PCAOB) and are required to be independent with respect to the Funds in accordance with the U.S. federal securities laws and the applicable rules and regulations of the Securities and Exchange Commission and the PCAOB.
We conducted our audits in accordance with the standards of the PCAOB. Those standards require that we plan and perform the audit to obtain reasonable assurance about whether the financial statements and financial highlights are free of material misstatement, whether due to error or fraud. The Funds are not required to have, nor were we engaged to perform, an audit of their internal control over financial reporting. As part of our audits we are required to obtain an understanding of internal control over financial reporting but not for the purpose of expressing an opinion on the effectiveness of the Funds’ internal control over financial reporting. Accordingly, we express no such opinion.
Our audits included performing procedures to assess the risks of material misstatement of the financial statements and financial highlights, whether due to error or fraud, and performing procedures that respond to those risks. Such procedures included examining, on a test basis, evidence regarding the amounts and disclosures in the financial statements and financial highlights. Our audits also included evaluating the accounting principles used and significant estimates made by management, as well as evaluating the overall presentation of the financial statements and financial highlights. Our procedures included confirmation of securities owned as of June 30, 2018, by correspondence with the custodian and brokers; when replies were not received from brokers, we performed other auditing procedures. We believe that our audits provide a reasonable basis for our opinion.
Deloitte & Touche LLP
Boston, Massachusetts
August 22, 2018
We have served as the auditor of one or more BlackRock investment companies since 1992.
| 98 | 2018 BLACKROCK ANNUAL REPORTTO SHAREHOLDERS |
Disclosure of Investment Advisory Agreements
The Board of Directors of BlackRock Municipal Bond Fund (the “Corporation”) and the Board of Trustees of BlackRock Multi-State Municipal Series Trust (the “Trust”), (collectively, the “Board,” the members of which are referred to as “Board Members”) met in person on April 10, 2018 (the “April Meeting”) and May 8, 2018 (the “May Meeting”) to consider the approval of the investment advisory agreements (collectively, the “Advisory Agreements” or the “Agreements”) between the Corporation, on behalf of BlackRock High Yield Municipal Fund (the “High Yield Fund”), BlackRock National Municipal Fund (the “National Fund”) and BlackRock Short-Term Municipal Fund (the “Short-Term Fund”), each a series of the Corporation, and BlackRock Advisors, LLC (the “Manager” or “BlackRock”), and between the Trust, on behalf of the BlackRock New York Municipal Opportunities Fund (the “New York Fund,” along with the High Yield Fund, National Fund and Short-Term Fund, each a “Fund,” and collectively, the “Funds”), a series of Trust, and BlackRock, each Fund’s investment advisor.
Activities and Composition of the Board
On the date of the May Meeting, the Board consisted of eleven individuals, nine of whom were not “interested persons” of the Corporation or the Trust as defined in the Investment Company Act of 1940, as amended (the “1940 Act”) (the “Independent Board Members”). The Board Members are responsible for the oversight of the operations of the Funds and perform the various duties imposed on the directors of investment companies by the 1940 Act. The Independent Board Members have retained independent legal counsel to assist them in connection with their duties. The Chair of the Board is an Independent Board Member. The Board has established five standing committees: an Audit Committee, a Governance and Nominating Committee, a Compliance Committee, a Performance Oversight Committee and an Executive Committee, each of which is chaired by an Independent Board Member and composed of Independent Board Members (except for the Performance Oversight Committee and the Executive Committee, each of which also has one interested Board Member).
The Agreements
Pursuant to the 1940 Act, the Board is required to consider the continuation of the Agreements on an annual basis. The Board has four quarterly meetings per year, each typically extending for two days, and additional in-person and telephonic meetings throughout the year, as needed. The Board also has a fifth one-day meeting to consider specific information surrounding the consideration of renewing the Agreements. The Board’s consideration of the Agreements is a year-long deliberative process, during which the Board assessed, among other things, the nature, extent and quality of the services provided to each Fund by BlackRock, BlackRock’s personnel and affiliates, including (as applicable): investment management; accounting, administrative and shareholder services; oversight of each Fund’s service providers; marketing and promotional services; risk management and oversight; legal and compliance services; and ability to meet applicable legal and regulatory requirements.
The Board, acting directly and through its committees, considers at each of its meetings, and from time to time as appropriate, factors that are relevant to its annual consideration of the renewal of the Agreements, including the services and support provided by BlackRock to each Fund and its shareholders. BlackRock also furnished additional information to the Board in response to specific questions from the Board. This additional information is discussed further below in the section titled “Board Considerations in Approving the Agreements.” Among the matters the Board considered were: (a) investment performance for one-year, three-year, five-year, ten-year, and/or since inception periods, as applicable, against peer funds, applicable benchmark, and performance metrics, as applicable, as well as senior management’s and portfolio managers’ analysis of the reasons for any over-performance or underperformance relative to its peers, benchmarks, and other performance metrics, as applicable; (b) fees, including advisory, administration, if applicable, and other amounts paid to BlackRock and its affiliates by each Fund for services; (c) Fund operating expenses and how BlackRock allocates expenses to each Fund; (d) the resources devoted to, risk oversight of, and compliance reports relating to, implementation of each Fund’s investment objective(s), policies and restrictions, and meeting regulatory requirements; (e) each Fund’s adherence to its compliance policies and procedures; (f) the nature, character and scope of non-investment management services provided by BlackRock and its affiliates and the estimated cost of such services; (g) BlackRock’s and other service providers’ internal controls and risk and compliance oversight mechanisms; (h) BlackRock’s implementation of the proxy voting policies approved by the Board; (i) execution quality of portfolio transactions; (j) BlackRock’s implementation of each Fund’s valuation and liquidity procedures; (k) an analysis of management fees for products with similar investment mandates across the open-end fund, exchange-traded fund (“ETF”), closed-end fund, sub-advised mutual fund, separately managed account, collective investment trust, and institutional separate account product channels, as applicable, and the similarities and differences between these products and the services provided as compared to each Fund; (l) BlackRock’s compensation methodology for its investment professionals and the incentives and accountability it creates, along with investment professionals’ investments in the fund(s) they manage; and (m) periodic updates on BlackRock’s business.
Board Considerations in Approving the Agreements
The Approval Process: Prior to the April Meeting, the Board requested and received materials specifically relating to the Agreements. The Board is continuously engaged in a process with its independent legal counsel and BlackRock to review the nature and scope of the information provided to better assist its deliberations. The materials provided in connection with the April Meeting included, among other things: (a) information independently compiled and prepared by Broadridge Financial Solutions, Inc. (“Broadridge”), based on either a Lipper classification or Morningstar category, regarding each Fund’s fees and expenses as compared with a peer group of funds as determined by Broadridge (“Expense Peers”), the investment performance of each Fund as compared with a peer group of funds (“Performance Peers”) and other metrics, as applicable; (b) information on the composition of the Expense Peers and Performance Peers, and a description of Broadridge’s methodology; (c) information on the estimated profits realized by BlackRock and its affiliates pursuant to the Agreements and a discussion of fall-out benefits to BlackRock and its affiliates; (d) a general analysis provided by BlackRock concerning investment management fees received in connection with other types of investment products, such as institutional accounts, sub-advised mutual funds, ETFs, closed-end funds, open-end funds, and separately managed accounts, under similar investment mandates, as well as the performance of such other products, as applicable; (e) review of non-management fees; (f) the existence and impact of potential economies of scale, if any, and the sharing of potential economies of scale with each Fund; (g) a summary of aggregate amounts paid by each Fund to BlackRock; (h) sales and redemption data regarding each Fund’s shares; and (i) various additional information requested by the Board as appropriate regarding BlackRock’s and each Fund’s operations.
At the April Meeting, the Board reviewed materials relating to its consideration of the Agreements. As a result of the discussions that occurred during the April Meeting, and as a culmination of the Board’s year-long deliberative process, the Board presented BlackRock with questions and requests for additional information. BlackRock responded to these requests with additional written information in advance of the May Meeting.
| DISCLOSUREOF INVESTMENT ADVISORY AGREEMENTS | 99 |
Disclosure of Investment Advisory Agreements (continued)
At the May Meeting, the Board considered, among other things: (a) the nature, extent and quality of the services provided by BlackRock; (b) the investment performance of each Fund as compared with Performance Peers and other metrics, as applicable; (c) the advisory fee and the estimated cost of the services and estimated profits realized by BlackRock and its affiliates from their relationship with each Fund; (d) each Fund’s fees and expenses compared to Expense Peers; (e) the sharing of potential economies of scale; (f) fall-out benefits to BlackRock and its affiliates as a result of BlackRock’s relationship with each Fund; and (g) other factors deemed relevant by the Board Members.
The Board also considered other matters it deemed important to the approval process, such as other payments made to BlackRock or its affiliates, securities lending and cash management, services related to the valuation and pricing of Fund portfolio holdings, and advice from independent legal counsel with respect to the review process and materials submitted for the Board’s review. The Board noted the willingness of BlackRock personnel to engage in open, candid discussions with the Board. The Board did not identify any particular information as determinative, and each Board Member may have attributed different weights to the various items considered.
A. Nature, Extent and Quality of the Services Provided by BlackRock: The Board, including the Independent Board Members, reviewed the nature, extent and quality of services provided by BlackRock, including the investment advisory services and the resulting performance of each Fund. Throughout the year, the Board compared Fund performance to the performance of a comparable group of mutual funds, a relevant benchmark, and performance metrics, as applicable. The Board met with BlackRock’s senior management personnel responsible for investment activities, including the senior investment officers. The Board also reviewed the materials provided by each Fund’s portfolio management team discussing each Fund’s performance and each Fund’s investment objective(s), strategies and outlook.
The Board considered, among other factors, with respect to BlackRock: the number, education and experience of investment personnel generally and each Fund’s portfolio management team; BlackRock’s research capabilities; investments by portfolio managers in the funds they manage; portfolio trading capabilities; use of technology; commitment to compliance; credit analysis capabilities; risk analysis and oversight capabilities; and the approach to training and retaining portfolio managers and other research, advisory and management personnel. The Board also considered BlackRock’s overall risk management program, including the continued efforts of BlackRock and its affiliates to address cybersecurity risks and the role of BlackRock’s Risk & Quantitative Analysis Group. The Board engaged in a review of BlackRock’s compensation structure with respect to each Fund’s portfolio management team and BlackRock’s ability to attract and retain high-quality talent and create performance incentives.
In addition to investment advisory services, the Board considered the quality of the administrative and other non-investment advisory services provided to each Fund. BlackRock and its affiliates provide each Fund with certain administrative, shareholder and other services (in addition to any such services provided to each Fund by third parties) and officers and other personnel as are necessary for the operations of each Fund. In particular, BlackRock and its affiliates provide each Fund with administrative services including, among others: (i) responsibility for disclosure documents, such as the prospectus, the summary prospectus (as applicable), the statement of additional information and periodic shareholder reports; (ii) oversight of daily accounting and pricing; (iii) responsibility for periodic filings with regulators; (iv) overseeing and coordinating the activities of other service providers including, among others, each Fund’s custodian, fund accountant, transfer agent, and auditor; (v) organizing Board meetings and preparing the materials for such Board meetings; (vi) providing legal and compliance support; (vii) furnishing analytical and other support to assist the Board in its consideration of strategic issues such as the merger, consolidation or repurposing of certain open-end funds; and (viii) performing administrative functions necessary for the operation of each Fund, such as tax reporting, expense management, fulfilling regulatory filing requirements, overseeing each Fund’s distribution partners, and shareholder call center and other services. The Board reviewed the structure and duties of BlackRock’s fund administration, shareholder services, and legal & compliance departments and considered BlackRock’s policies and procedures for assuring compliance with applicable laws and regulations.
B. The Investment Performance of each Fund and BlackRock: The Board, including the Independent Board Members, also reviewed and considered the performance history of each Fund. In preparation for the April Meeting, the Board was provided with reports independently prepared by Broadridge, which included a comprehensive analysis of each Fund’s performance as of December 31, 2017. Broadridge ranks funds in quartiles, ranging from first to fourth, where first is the most desirable quartile position and fourth is the least desirable. In connection with its review, the Board received and reviewed information regarding the investment performance of each Fund as compared to its Performance Peers and, for the Short-Term Fund, a custom peer group of funds as defined by BlackRock (“Customized Peer Group”). The Board and its Performance Oversight Committee regularly review, and meet with Fund management to discuss, the performance of each Fund throughout the year.
In evaluating performance, the Board recognized that the performance data reflects a snapshot of a period as of a particular date and that selecting a different performance period could produce significantly different results. Further, the Board recognized that it is possible that long-term performance can be impacted by even one period of significant outperformance or underperformance, so that a single investment theme has the ability to affect long-term performance disproportionately.
The Board noted that for each of the one-, three- and five-year periods reported, the High Yield Fund ranked in the second quartile against its Performance Peers.
The Board noted that for the one-, three- and five-year periods reported, the National Fund ranked in the third, second, and second quartiles, respectively, against its Performance Peers. The Board and BlackRock reviewed the National Fund’s underperformance during the applicable period.
The Board noted that for each of the one-, three- and five-year periods reported, the Short-Term Fund ranked in the fourth quartile against its Customized Peer Group. BlackRock believes that the Customized Peer Group is an appropriate performance metric for the Short-Term Fund. Nevertheless, the Board noted in reviewing with BlackRock the Short-Term Fund’s underperformance during these periods that the Short-Term Fund’s investment mandate requires it to hold securities with less than a four year maturity, unlike most of its Customized Peer Group, and this has a significant impact on relative performance.
The Board and BlackRock discussed BlackRock’s strategy for improving the Short-Term Fund’s investment performance. Discussions covered topics such as performance attribution, the Short-Term Fund’s investment personnel, and the resources appropriate to support the Short-Term Fund’s investment processes.
The Board noted that for each of the one-, three- and five-year periods reported, the New York Fund ranked in the first quartile against its Performance Peers.
C. Consideration of the Advisory/Management Fees and the Estimated Cost of the Services and Estimated Profits Realized by BlackRock and its Affiliates from their Relationship with each Fund: The Board, including the Independent Board Members, reviewed each Fund’s contractual management fee rate compared with
| 100 | 2018 BLACKROCK ANNUAL REPORTTO SHAREHOLDERS |
Disclosure of Investment Advisory Agreements (continued)
those of its Expense Peers. The contractual management fee rate represents a combination of the advisory fee and any administrative fees, before taking into account any reimbursements or fee waivers. The Board also compared each Fund’s total expense ratio, as well as its actual management fee rate, to those of its Expense Peers. The total expense ratio represents a fund’s total net operating expenses, including any 12b-1 or non 12b-1 service fees. The total expense ratio gives effect to any expense reimbursements or fee waivers that benefit a fund, and the actual management fee rate gives effect to any management fee reimbursements or waivers that benefit a fund. The Board considered the services provided and the fees charged by BlackRock and its affiliates to other types of clients with similar investment mandates, as applicable, including institutional accounts and sub-advised mutual funds (including mutual funds sponsored by third parties).
The Board received and reviewed statements relating to BlackRock’s financial condition. The Board reviewed BlackRock’s profitability methodology and was also provided with an estimated profitability analysis that detailed the revenues earned and the expenses incurred by BlackRock for services provided to each Fund. The Board reviewed BlackRock’s estimated profitability with respect to each Fund and other funds the Board currently oversees for the year ended December 31, 2017 compared to available aggregate estimated profitability data provided for the prior two years. The Board reviewed BlackRock’s estimated profitability with respect to certain other U.S. fund complexes managed by the Manager and/or its affiliates. The Board reviewed BlackRock’s assumptions and methodology of allocating expenses in the estimated profitability analysis, noting the inherent limitations in allocating costs among various advisory products. The Board recognized that profitability may be affected by numerous factors including, among other things, fee waivers and expense reimbursements by the Manager, the types of funds managed, precision of expense allocations and business mix. As a result, calculating and comparing profitability at individual fund levels is difficult.
The Board noted that, in general, individual fund or product line profitability of other advisors is not publicly available. The Board reviewed BlackRock’s overall operating margin, in general, compared to that of certain other publicly-traded asset management firms. The Board considered the differences between BlackRock and these other firms, including the contribution of technology at BlackRock, BlackRock’s expense management, and the relative product mix.
In addition, the Board considered the estimated cost of the services provided to each Fund by BlackRock, and BlackRock’s and its affiliates’ estimated profits relating to the management and distribution of each Fund and the other funds advised by BlackRock and its affiliates. As part of its analysis, the Board reviewed BlackRock’s methodology in allocating its costs of managing the Funds, to each Fund. The Board considered whether BlackRock has the financial resources necessary to attract and retain high quality investment management personnel to perform its obligations under the Agreements and to continue to provide the high quality of services that is expected by the Board. The Board further considered factors including but not limited to BlackRock’s commitment of time, assumption of risk, and liability profile in servicing each Fund in contrast to what is required of BlackRock with respect to other products with similar investment mandates across the open-end fund, ETF, closed-end fund, sub-advised mutual fund, separately managed account, collective investment trust, and institutional separate account product channels, as applicable.
The Board noted that the High Yield Fund’s contractual management fee rate ranked in the first quartile, and that the actual management fee rate and total expense ratio each ranked in the first quartile, relative to the High Yield Fund’s Expense Peers. The Board also noted that the High Yield Fund has an advisory fee arrangement that includes breakpoints that adjust the fee rate downward as the size of the High Yield Fund increases above certain contractually specified levels. In addition, the Board noted that BlackRock and the Board have contractually agreed to a cap on the High Yield Fund’s total expenses as a percentage of the High Yield Fund’s average daily net assets on a class-by-class basis. The Board also noted that BlackRock proposed, and the Board agreed to, a lower contractual expense cap on a class-by-class basis. This expense cap reduction was implemented on December 29, 2017.
The Board noted that the National Fund’s contractual management fee rate ranked in the first quartile, and that the actual management fee rate and total expense ratio each ranked in the first quartile, relative to the National Fund’s Expense Peers. The Board also noted that the National Fund has an advisory fee arrangement that includes breakpoints that adjust the fee rate downward as the aggregate assets of the National Fund, combined with the assets of the Short-Term Fund, increase above certain contractually specified levels. The Board noted that BlackRock proposed, and the Board agreed to, a contractual adjustment to reduce specified levels within the breakpoint schedule. This adjustment was implemented on June 12, 2017. The Board further noted that BlackRock and the Board have contractually agreed to a cap on the National Fund’s total expenses as a percentage of the National Fund’s average daily net assets on a class-by-class basis.
The Board noted that the Short-Term Fund’s contractual management fee rate ranked in the first quartile, and that the actual management fee rate and total expense ratio each ranked in the first quartile, relative to the Short-Term Fund’s Expense Peers. The Board also noted that the Short-Term Fund has an advisory fee arrangement that includes breakpoints that adjust the fee rate downward as the aggregate assets of the Short-Term Fund, combined with the assets of the National Fund, increase above certain contractually specified levels. In addition, the Board noted that BlackRock proposed, and the Board agreed to, a contractual adjustment to reduce specified levels within the breakpoint schedule. This adjustment was implemented on June 12, 2017. The Board further noted that BlackRock and the Board have contractually agreed to a cap on the Short-Term Fund’s total expenses as a percentage of the Short-Term Fund’s average daily net assets on a class-by-class basis.
The Board noted that the New York Fund’s contractual management fee rate ranked in the second quartile, and that the actual management fee rate and total expense ratio ranked in the third and second quartiles, respectively, relative to the New York Fund’s Expense Peers. The Board also noted that the New York Fund has an advisory fee arrangement that includes breakpoints that adjust the fee rate downward as the size of the New York Fund increases above certain contractually specified levels. In addition, the Board noted that BlackRock and the Board have contractually agreed to a cap on the New York Fund’s total expenses as a percentage of the New York Fund’s average daily net assets on a class-by-class basis.
D. Economies of Scale: The Board, including the Independent Board Members, considered the extent to which economies of scale might be realized as the assets of each Fund increase, including the existence of fee waivers and/or expense caps, as applicable, noting that any contractual fee waivers and expense caps had been approved by the Board. The Board also considered the extent to which each Fund benefits from such economies in a variety of ways, and whether there should be changes in the advisory fee rate or breakpoint structure in order to enable each Fund to more fully participate in these economies of scale. The Board considered each Fund’s asset levels and whether the current fee schedule was appropriate. In its consideration, the Board Members took into account the existence of any expense caps and further considered the continuation and/or implementation, as applicable, of such caps.
E. Other Factors Deemed Relevant by the Board Members: The Board, including the Independent Board Members, also took into account other ancillary or “fall-out” benefits that BlackRock or its affiliates may derive from BlackRock’s respective relationships with each Fund, both tangible and intangible, such as BlackRock’s ability to
| DISCLOSUREOF INVESTMENT ADVISORY AGREEMENTS | 101 |
Disclosure of Investment Advisory Agreements (continued)
leverage its investment professionals who manage other portfolios and risk management personnel, an increase in BlackRock’s profile in the investment advisory community, and the engagement of BlackRock’s affiliates as service providers to each Fund, including for administrative, distribution, securities lending and cash management services. The Board also considered BlackRock’s overall operations and its efforts to expand the scale of, and improve the quality of, its operations. The Board also noted that, subject to applicable law, BlackRock may use and benefit from third party research obtained by soft dollars generated by certain registered fund transactions to assist in managing all or a number of its other client accounts.
In connection with its consideration of the Agreements, the Board also received information regarding BlackRock’s brokerage and soft dollar practices. The Board received reports from BlackRock which included information on brokerage commissions and trade execution practices throughout the year.
The Board noted the competitive nature of the open-end fund marketplace, and that shareholders are able to redeem their Fund shares if they believe that each Fund’s fees and expenses are too high or if they are dissatisfied with the performance of each Fund.
Conclusion
The Board, including the Independent Board Members, approved the continuation of the Advisory Agreements between the Manager and the Corporation, on behalf of the High Yield Fund, the National Fund and the Short-Term Fund, and the Trust, on behalf of the New York Fund, each for a one-year term ending June 30, 2019. Based upon its evaluation of all of the aforementioned factors in their totality, as well as other information, the Board, including the Independent Board Members, was satisfied that the terms of the Agreements were fair and reasonable and in the best interest of each Fund and its shareholders. In arriving at its decision to approve the Agreements, the Board did not identify any single factor or group of factors as all-important or controlling, but considered all factors together, and different Board Members may have attributed different weights to the various factors considered. The Independent Board Members were also assisted by the advice of independent legal counsel in making this determination.
| 102 | 2018 BLACKROCK ANNUAL REPORTTO SHAREHOLDERS |
Director and Officer Information
| Independent Directors (a) | ||||||||
| Name Year of Birth (b) | Position(s) Held (Length of Service) (c) | Principal Occupation(s) During Past Five Years | Number of BlackRock-Advised Registered Investment Companies (“RICs”) Consisting of Investment Portfolios (“Portfolios”) Overseen | Public Company and Other Investment Company Directorships During Past Five Years | ||||
Robert M. Hernandez 1944 | Chair of the Board and Director (Since 2007) | Director, Vice Chairman and Chief Financial Officer of USX Corporation (energy and steel business) from 1991 to 2001; Director and non-executive Chairman, RTI International Metals, Inc. from 1990 to 2015; Director, TE Connectivity (electronics) from 2006 to 2012. | 27 RICs consisting of 96 Portfolios | Chubb Limited (insurance company); Eastman Chemical Company | ||||
James H. Bodurtha 1944 | Director (Since 2007) | Director, The China Business Group, Inc. (consulting and investing firm) from 1996 to 2013 and Executive Vice President thereof from 1996 to 2003; Chairman of the Board, Berkshire Holding Corporation since 1980; Director, ICI Mutual since 2010. | 27 RICs consisting of 96 Portfolios | None | ||||
Bruce R. Bond 1946 | Director (Since 2007) | Trustee and Member of the Governance Committee, State Street Research Mutual Funds from 1997 to 2005; Board Member of Governance, Audit and Finance Committee, Avaya Inc. (computer equipment) from 2003 to 2007. | 27 RICs consisting of 96 Portfolios | None | ||||
Honorable Stuart E. Eizenstat 1943 | Director (Since 2007) | Senior Counsel of Covington and Burling LLP (law firm) since 2016, Head of International Practice thereof since 2001, and Partner thereof from 2001 to 2016; Advisory Board Member, OCP S.A. (phosphates) since 2010; International Advisory Board Member, The Coca-Cola Company from 2002 to 2011; Advisory Board Member, Veracity Worldwide, LLC (risk management) from 2007 to 2012; Member of the International Advisory Board GML Ltd. (energy) since 2003; Board of Directors, Ferroglobe (silicon metals) since 2016. | 27 RICs consisting of 96 Portfolios | Alcatel-Lucent (telecommunications); Global Specialty Metallurgical; UPS Corporation (delivery service) | ||||
Henry Gabbay 1947 | Director (Since 2007) | Consultant, BlackRock, Inc. from 2007 to 2008; Managing Director, BlackRock, Inc. from 1989 to 2007; Chief Administrative Officer, BlackRock Advisors, LLC from 1998 to 2007; President of BlackRock Funds and BlackRock Allocation Target Shares (formerly, BlackRock Bond Allocation Target Shares) from 2005 to 2007 and Treasurer of certain closed-end funds in the BlackRock fund complex from 1989 to 2006. | 27 RICs consisting of 96 Portfolios | None | ||||
Lena G. Goldberg 1949 | Director (Since 2016) | Senior Lecturer, Harvard Business School since 2008; Executive Vice President, FMR LLC/Fidelity Investments (financial services) from 2007 to 2008, Executive Vice President and General Counsel thereof from 2002 to 2007, Senior Vice President and General Counsel thereof from 1999 to 2002, Vice President and General Counsel thereof from 1997 to 1999, Senior Vice President and Deputy General Counsel thereof in 1997, and Vice President and Corporate Counsel thereof from 1996 to 1997; Partner, Sullivan & Worcester LLP from 1985 to 1996 and Associate thereof from 1979 to 1985. | 27 RICs consisting of 96 Portfolios | None | ||||
| DIRECTORAND OFFICER INFORMATION | 103 |
Director and Officer Information (continued)
| Independent Directors (a) (continued) | ||||||||
| Name Year of Birth (b) | Position(s) Held (Length of Service) (c) | Principal Occupation(s) During Past Five Years | Number of BlackRock-Advised Registered Investment Companies (“RICs”) Consisting of Investment Portfolios (“Portfolios”) Overseen | Public Company and Other Investment Company Directorships During Past Five Years | ||||
Henry R. Keizer 1956 | Director (Since 2016) | Director, Park Indemnity Ltd. (captive insurer) since 2010; Director, MUFG Americas Holdings Corporation and MUFG Union Bank, N.A. (financial and bank holding company) from 2014 to 2016; Director, Montpelier Re Holdings, Ltd. (publicly held property and casual reinsurance) from 2013 to 2015; Director, American Institute of Certified Public Accountants from 2009 to 2011; Director, KPMG LLP (audit, tax and advisory services)from 2004 to 2005 and 2010 to 2012; Director, KPMG International in 2012, Deputy Chairman and Chief Operating Officer thereof from 2010 to 2012 and U.S. Vice Chairman of Audit thereof from 2005 to 2010; Global Head of Audit, KPMGI (consortium of KPMG firms) from 2006 to 2010; Director, YMCA of Greater New York from 2006 to 2010. | 27 RICs consisting of 96 Portfolios | Hertz Global Holdings (car rental); WABCO (commercial vehicle safety systems); Sealed Air Corp. (packaging) | ||||
John F. O’Brien 1943 | Director (Since 2007) | Trustee, Woods Hole Oceanographic Institute since 2003 and Chairman thereof from 2009 to 2015; Co-Founder and Managing Director, Board Leaders LLC (director education) since 2005. | 27 RICs consisting of 96 Portfolios | Cabot Corporation (chemicals); LKQ Corporation (auto parts manufacturing); TJX Companies, Inc. (retailer) | ||||
Donald C. Opatrny 1952 | Director (Since 2015) | Trustee, Member of the Executive Committee and Chair of the Investment Committee, Cornell University since 2004; Member of the Board and Investment Committee, University School since 2007; Member of the Investment Committee, Mellon Foundation from 2009 to 2015; President and Trustee, the Center for the Arts, Jackson Hole since 2011; Director, Athena Capital Advisors LLC (investment management firm) since 2013; Trustee and Chair of the Investment Committee, Community Foundation of Jackson Hole since 2014; Trustee, Artstor (a Mellon Foundation affiliate) from 2010 to 2015; President, Trustee and Member of the Investment Committee, The Aldrich Contemporary Art Museum from 2007 to 2014. | 27 RICs consisting of 96 Portfolios | None | ||||
| Interested Directors (a)(d) | ||||||||
| Name Year of Birth (b) | Position(s) Held (Length of Service) (c) | Principal Occupation(s) During Past Five Years | Number of BlackRock-Advised Registered Investment Companies (“RICs”) Consisting of Investment Portfolios (“Portfolios”) Overseen | Public Company and Investment Company Directorships During Past Five Years | ||||
Robert Fairbairn 1965 | Director (Since 2018) | Senior Managing Director of BlackRock, Inc. since 2010; oversees BlackRock’s Strategic Partner Program and Strategic Product Management Group; Member of BlackRock’s Global Executive and Global Operating Committees; Co-Chair of BlackRock’s Human Capital Committee; Global Head of BlackRock’s Retail and iShares® businesses from 2012 to 2016; Head of BlackRock’s Global Client Group from 2009 to 2012; Chairman of BlackRock’s international businesses from 2007 to 2010. | 125 RICs consisting of 309 Portfolios | None | ||||
| 104 | 2018 BLACKROCK ANNUAL REPORTTO SHAREHOLDERS |
Director and Officer Information (continued)
| Interested Directors (a)(d) (continued) | ||||||||
| Name Year of Birth (b) | Position(s) Held (Length of Service) (c) | Principal Occupation(s) During Past Five Years | Number of BlackRock-Advised Registered Investment Companies (“RICs”) Consisting of Investment Portfolios (“Portfolios”) Overseen | Public Company and Investment Company Directorships During Past Five Years | ||||
John M. Perlowski 1964 | Director (Since 2015); President and Chief Executive Officer (Since 2010) | Managing Director of BlackRock, Inc. since 2009; Head of BlackRock Global Accounting and Product Services since 2009. Advisory Director of Family Resource Network (charitable foundation) since 2009. | 125 RICs consisting of 309 Portfolios | None | ||||
(a) The address of each Director is c/o BlackRock, Inc., 55 East 52nd Street, New York, NY 10055. | ||||||||
(b) Each Independent Director holds office until his or her successor is duly elected and qualifies or until his or her earlier death, resignation, retirement or removal as provided by the Fund’s by-laws or charter or statute, or until December 31 of the year in which he or she turns 75. The Board may determine to extend the terms of Independent Directors on a case-by-case basis, as appropriate. Interested Directors serve until their successor is duly elected and qualifies or until their earlier death, resignation, retirement or removal as provided by the Fund’s by-laws or statute, or until December 31 of the year in which they turn 72. | ||||||||
(c) Following the combination of Merrill Lynch Investment Managers, L.P. (“MLIM”) and BlackRock, Inc. in September 2006, the various legacy MLIM and legacy BlackRock fund boards were realigned and consolidated into three new fund boards in 2007. As a result, although the chart shows certain Independent Directors as joining the Fund’s board in 2007, those Directors first became members of the boards of other legacy MLIM or legacy BlackRock funds as follows: James H. Bodurtha, 1995; Bruce R. Bond, 2005; Honorable Stuart E. Eizenstat, 2001; Robert M. Hernandez, 1996; and John F. O’Brien, 2005. | ||||||||
(d) Mr. Fairbairn and Mr. Perlowski are both “interested persons,” as defined in the 1940 Act, of the Funds based on their positions with BlackRock, Inc. and its affiliates. Mr. Fairbairn and Mr. Perlowski are also board members of the BlackRock Closed-End Complex and the BlackRock Equity-Liquidity Complex. | ||||||||
| DIRECTORAND OFFICER INFORMATION | 105 |
Director and Officer Information (continued)
| Officers Who Are Not Directors (a) | ||||
| Name Year of Birth (b) | Position(s) Held (Length of Service) | Principal Occupation(s) During Past Five Years | ||
Jennifer McGovern 1977 | Vice President (Since 2014) | Managing Director of BlackRock, Inc. since 2016; Director of BlackRock, Inc. from 2011 to 2015; Head of Product Structure and Oversight for BlackRock’s U.S. Wealth Advisory Group since 2013. | ||
Neal J. Andrews 1966 | Chief Financial Officer (Since 2007) | Managing Director of BlackRock, Inc. since 2006. | ||
Jay M. Fife 1970 | Treasurer (Since 2007) | Managing Director of BlackRock, Inc. since 2007. | ||
Charles Park 1967 | Chief Compliance Officer (Since 2014) | Anti-Money Laundering Compliance Officer for the BlackRock-advised Funds in the Equity-Bond Complex, the Equity-Liquidity Complex and the Closed-End Complex from 2014 to 2015; Chief Compliance Officer of BlackRock Advisors, LLC and the BlackRock-advised Funds in the Equity-Bond Complex, the Equity-Liquidity Complex and the Closed-End Complex since 2014; Principal of and Chief Compliance Officer for iShares® Delaware Trust Sponsor LLC since 2012 and BlackRock Fund Advisors (“BFA”) since 2006; Chief Compliance Officer for the BFA-advised iShares® exchange traded funds since 2006; Chief Compliance Officer for BlackRock Asset Management International Inc. since 2012. | ||
John MacKessy 1972 | Anti-Money Laundering Compliance Officer (Since 2018) | Director of BlackRock, Inc. since 2017; Global Head of Anti-Money Laundering at BlackRock, Inc. since 2017; Director of AML Monitoring and Investigations Group of Citibank from 2015 to 2017; Global Anti-Money Laundering and Economic Sanctions Officer for MasterCard from 2011 to 2015. | ||
Benjamin Archibald 1975 | Secretary (Since 2012) | Managing Director of BlackRock, Inc. since 2014; Director of BlackRock, Inc. from 2010 to 2013; Secretary of the iShares® exchange traded funds since 2015; Secretary of the BlackRock-advised mutual funds since 2012. | ||
(a) The address of each Officer is c/o BlackRock, Inc., 55 East 52nd Street, New York, NY 10055. | ||||
(b) Officers of the Funds serve at the pleasure of the Board. | ||||
Further information about the Fund’s Officers and Directors is available in the Fund’s Statement of Additional Information, which can be obtained without charge by calling (800) 441 7762.
Effective May 8, 2018, John MacKessy replaced Fernanda Piedra as the Anti-Money Laundering Compliance Officer of the Funds.
| 106 | 2018 BLACKROCK ANNUAL REPORTTO SHAREHOLDERS |
Director and Officer Information (continued)
Investment Adviser
BlackRock Advisors, LLC
Wilmington, DE 19809
Accounting Agent and Custodian
State Street Bank and Trust Company
Boston, MA 02111
Transfer Agent
BNY Mellon Investment Servicing (US) Inc.
Wilmington, DE 19809
Distributor
BlackRock Investments, LLC
New York, NY 10022
Independent Registered Public Accounting Firm
Deloitte & Touche LLP
Boston, MA 02116
Legal Counsel
Willkie Farr & Gallagher LLP
New York, NY 10019
Address of the Funds
100 Bellevue Parkway
Wilmington, DE 19809
| DIRECTORAND OFFICER INFORMATION | 107 |
General Information
Effective September 26, 2016, BlackRock implemented a new methodology for calculating “effective duration” for BlackRock’s municipal bond portfolios. The new methodology replaces the model previously used by BlackRock to evaluate municipal bond duration and is a common indicator of an investment’s sensitivity to interest rate movements. The new methodology is applied to each Fund’s duration reported for periods after September 26, 2016.
Quarterly performance, semi-annual and annual reports, current net asset value and other information regarding the Funds, including each Fund’s effective duration and additional information about the new methodology may be found on BlackRock’s website, which can be accessed at http://www.blackrock.com. Any reference to BlackRock’s website in this report is intended to allow investors public access to information regarding the Funds and does not, and is not intended to, incorporate BlackRock’s website in this report.
Householding
The Funds will mail only one copy of shareholder documents, including prospectuses, annual and semi-annual reports and proxy statements, to shareholders with multiple accounts at the same address. This practice is commonly called “householding” and it is intended to reduce expenses and eliminate duplicate mailings of shareholder documents. Mailings of your shareholder documents may be householded indefinitely unless you instruct us otherwise. If you do not want the mailing of these documents to be combined with those for other members of your household, please call the Funds at (800) 441-7762.
Availability of Quarterly Schedule of Investments
The Funds file their complete schedules of portfolio holdings with the SEC for the first and third quarters of each fiscal year on Form N-Q. The Funds’ Forms N-Q are available on the SEC’s website at http://www.sec.gov and may also be reviewed and copied at the SEC’s Public Reference Room in Washington, D.C. Information on the operation of the Public Reference Room or how to access documents on the SEC’s website without charge may be obtained by calling (800) SEC-0330. The Funds’ Forms N-Q may also be obtained upon request and without charge by calling (800) 441-7762.
Availability of Proxy Voting Policies and Procedures
A description of the policies and procedures that the Funds use to determine how to vote proxies relating to portfolio securities is available upon request and without charge (1) by calling (800) 441-7762; (2) at http://www.blackrock.com; and (3) on the SEC’s website at http://www.sec.gov.
Availability of Proxy Voting Record
Information about how the Funds voted proxies relating to securities held in the Funds’ portfolios during the most recent 12-month period ended June 30 is available upon request and without charge (1) at http://www.blackrock.com; or by calling (800) 441-7762; and (2) on the SEC’s website at http://www.sec.gov.
BlackRock’s Mutual Fund Family
BlackRock offers a diverse lineup of open-end mutual funds crossing all investment styles and managed by experts in equity, fixed income and tax-exempt investing. Visit http://www.blackrock.com for more information.
| 108 | 2018 BLACKROCK ANNUAL REPORTTO SHAREHOLDERS |
Additional Information (continued)
Shareholder Privileges
Account Information
Call us at (800) 441-7762 from 8:00 AM to 6:00 PM ET on any business day to get information about your account balances, recent transactions and share prices. You can also reach us on the Web at http://www.blackrock.com.
Automatic Investment Plans
Investor Class shareholders who want to invest regularly can arrange to have $50 or more automatically deducted from their checking or savings account and invested in any of the BlackRock funds.
Systematic Withdrawal Plans
Investor Class shareholders can establish a systematic withdrawal plan and receive periodic payments of $50 or more from their BlackRock funds, as long as their account balance is at least $10,000.
Retirement Plans
Shareholders may make investments in conjunction with Traditional, Rollover, Roth, Coverdell, Simple IRAs, SEP IRAs and 403(b) Plans.
BlackRock Privacy Principles
BlackRock is committed to maintaining the privacy of its current and former fund investors and individual clients (collectively, “Clients”) and to safeguarding their non-public personal information. The following information is provided to help you understand what personal information BlackRock collects, how we protect that information and why in certain cases we share such information with select parties.
If you are located in a jurisdiction where specific laws, rules or regulations require BlackRock to provide you with additional or different privacy-related rights beyond what is set forth below, then BlackRock will comply with those specific laws, rules or regulations.
BlackRock obtains or verifies personal non-public information from and about you from different sources, including the following: (i) information we receive from you or, if applicable, your financial intermediary, on applications, forms or other documents; (ii) information about your transactions with us, our affiliates, or others; (iii) information we receive from a consumer reporting agency; and (iv) from visits to our websites.
BlackRock does not sell or disclose to non-affiliated third parties any non-public personal information about its Clients, except as permitted by law or as is necessary to respond to regulatory requests or to service Client accounts. These non-affiliated third parties are required to protect the confidentiality and security of this information and to use it only for its intended purpose.
We may share information with our affiliates to service your account or to provide you with information about other BlackRock products or services that may be of interest to you. In addition, BlackRock restricts access to non-public personal information about its Clients to those BlackRock employees with a legitimate business need for the information. BlackRock maintains physical, electronic and procedural safeguards that are designed to protect the non-public personal information of its Clients, including procedures relating to the proper storage and disposal of such information.
| ADDITIONAL INFORMATION | 109 |
Glossary of Terms Used in this Report
| Portfolio Abbreviations | ||
| ACA | American Capital Access Holding Ltd. | |
| AGC | Assured Guarantee Corp. | |
| AGM | Assured Guaranty Municipal Corp. | |
| AMBAC | American Municipal Bond Assurance Corp. | |
| AMT | Alternative Minimum Tax (subject to) | |
| ARB | Airport Revenue Bonds | |
| BAM | Build America Mutual Assurance Co. | |
| BAN | Bond Anticipation Notes | |
| BARB | Building Aid Revenue Bonds | |
| BHAC | Berkshire Hathaway Assurance Corp. | |
| CAB | Capital Appreciation Bonds | |
| CIFG | CIFG Assurance North America, Inc. | |
| COP | Certificates of Participation | |
| EDA | Economic Development Authority | |
| EDC | Economic Development Corp. | |
| ERB | Education Revenue Bonds | |
| ETF | Exchange-Traded Fund | |
| FHA | Federal Housing Administration | |
| GARB | General Airport Revenue Bonds | |
| GO | General Obligation Bonds | |
| HFA | Housing Finance Agency | |
| IDA | Industrial Development Authority | |
| IDB | Industrial Development Board | |
| IDRB | Industrial Development Revenue Bonds | |
| LOC | Letter of Credit | |
| LRB | Lease Revenue Bonds | |
| M/F | Multi-Family | |
| MRB | Mortgage Revenue Bonds | |
| NPFGC | National Public Finance Guarantee Corp. | |
| PILOT | Payment in Lieu of Taxes | |
| PSF-GTD | Permanent School Fund Guaranteed | |
| RB | Revenue Bonds | |
| SBPA | Stand-by Bond Purchase Agreements | |
| SONYMA | State of New York Mortgage Agency | |
| SRF | State Revolving Fund | |
| VRDN | Variable Rate Demand Notes | |
| 110 | 2018 BLACKROCK ANNUAL REPORTTO SHAREHOLDERS |
This report is intended for current holders. It is not authorized for use as an offer of sale or a solicitation of an offer to buy shares of a Fund unless preceded or accompanied by the Fund’s current prospectus. Past performance results shown in this report should not be considered a representation of future performance. Investment returns and principal value of shares will fluctuate so that shares, when redeemed, may be worth more or less than their original cost. Statements and other information herein are as dated and are subject to change.

| MBNYMB-6/18-AR |  |
| Item 2 – | Code of Ethics – The registrant (or the “Fund”) has adopted a code of ethics, as of the end of the period covered by this report, applicable to the registrant’s principal executive officer, principal financial officer, principal accounting officer or controller, or persons performing similar functions. During the period covered by this report, the code of ethics was ethics was amended to clarify an inconsistency as to whom persons covered by the code should report suspected violations of the code. The amendment clarifies that such reporting should be made to BlackRock Advisors, LLC’s (“Investment Adviser” or “BlackRock”) General Counsel, and retains the alternative option of anonymous reporting following “whistleblower” policies. Other non-material changes were also made in connection with this amendment. During the period covered by this report, there have been no waivers granted under the code of ethics. The registrant undertakes to provide a copy of the code of ethics to any person upon request, without charge, by calling 1-800-441-7762. |
| Item 3 – | Audit Committee Financial Expert – The registrant’s board of trustees (the “board of trustees”), has determined that (i) the registrant has the following audit committee financial experts serving on its audit committee and (ii) each audit committee financial expert is independent: |
Robert M. Hernandez
Henry R. Keizer
Bruce R. Bond
Under applicable securities laws, a person determined to be an audit committee financial expert will not be deemed an “expert” for any purpose, including without limitation for the purposes of Section 11 of the Securities Act of 1933, as a result of being designated or identified as an audit committee financial expert. The designation or identification of a person as an audit committee financial expert does not impose on such person any duties, obligations, or liabilities greater than the duties, obligations, and liabilities imposed on such person as a member of the audit committee and board of trustees in the absence of such designation or identification.
| Item 4 – | Principal Accountant Fees and Services |
The following table presents fees billed by Deloitte & Touche LLP (“D&T”) in each of the last two fiscal years for the services rendered to the Fund:
| (a) Audit Fees | (b) Audit-Related Fees1 | (c) Tax Fees2 | (d) All Other Fees | |||||||||||||
| Entity Name | Current Fiscal Year End | Previous Fiscal Year End | Current Fiscal Year End | Previous Fiscal Year End | Current Fiscal Year End | Previous Fiscal Year End | Current Fiscal Year End | Previous Fiscal Year End | ||||||||
| BlackRock High Yield Municipal Fund | $38,862 | $37,587 | $0 | $0 | $13,500 | $12,890 | $0 | $0 | ||||||||
| BlackRock National Municipal Fund | $38,862 | $40,086 | $0 | $0 | $13,500 | $12,852 | $0 | $0 | ||||||||
| BlackRock Short-Term Municipal Fund | $30,804 | $30,804 | $0 | $0 | $13,500 | $12,852 | $0 | $0 | ||||||||
The following table presents fees billed by D&T that were required to be approved by the registrant’s audit committee (the “Committee”) for services that relate directly to the operations or financial reporting of the Fund and that are rendered on behalf of BlackRock and entities controlling,
2
controlled by, or under common control with BlackRock (not including any sub-adviser whose role is primarily portfolio management and is subcontracted with or overseen by another investment adviser) that provide ongoing services to the Fund (“Affiliated Service Providers”):
| Current Fiscal Year End | Previous Fiscal Year End | |||
| (b) Audit-Related Fees1 | $0 | $0 | ||
| (c) Tax Fees2 | $0 | $0 | ||
| (d) All Other Fees3 | $2,274,000 | $2,129,000 |
1 The nature of the services includes assurance and related services reasonably related to the performance of the audit or review of financial statements not included in Audit Fees, including accounting consultations, agreed-upon procedure reports, attestation reports, comfort letters, out-of-pocket expenses and internal control reviews not required by regulators.
2 The nature of the services includes tax compliance and/or tax preparation, including services relating to the filing or amendment of federal, state or local income tax returns, regulated investment company qualification reviews, taxable income and tax distribution calculations.
3 Non-audit fees of $2,274,000 and $2,129,000 for the current fiscal year and previous fiscal year, respectively, were paid to the Fund’s principal accountant in their entirety by BlackRock, in connection with services provided to the Affiliated Service Providers of the Fund and of certain other funds sponsored and advised by BlackRock or its affiliates for a service organization review and an accounting research tool subscription. These amounts represent aggregate fees paid by BlackRock and were not allocated on a per fund basis.
(e)(1) Audit Committee Pre-Approval Policies and Procedures:
The Committee has adopted policies and procedures with regard to the pre-approval of services. Audit, audit-related and tax compliance services provided to the registrant on an annual basis require specific pre-approval by the Committee. The Committee also must approve other non-audit services provided to the registrant and those non-audit services provided to the Investment Adviser and Affiliated Service Providers that relate directly to the operations and the financial reporting of the registrant. Certain of these non-audit services that the Committee believes are (a) consistent with the SEC’s auditor independence rules and (b) routine and recurring services that will not impair the independence of the independent accountants may be approved by the Committee without consideration on a specific case-by-case basis (“general pre-approval”). The term of any general pre-approval is 12 months from the date of the pre-approval, unless the Committee provides for a different period. Tax or other non-audit services provided to the registrant which have a direct impact on the operations or financial reporting of the registrant will only be deemed pre-approved provided that any individual project does not exceed $10,000 attributable to the registrant or $50,000 per project. For this purpose, multiple projects will be aggregated to determine if they exceed the previously mentioned cost levels.
Any proposed services exceeding the pre-approved cost levels will require specific pre-approval by the Committee, as will any other services not subject to general pre-approval (e.g., unanticipated but permissible services). The Committee is informed of each service approved subject to general pre-approval at the next regularly scheduled in-person board meeting. At this meeting, an analysis of such services is presented to the Committee for ratification. The Committee may delegate to the Committee Chairman the authority to approve the provision of and fees for any specific engagement of permitted non-audit services, including services exceeding pre-approved cost levels.
(e)(2) None of the services described in each of Items 4(b) through (d) were approved by the Committee pursuant to the de minimis exception in paragraph (c)(7)(i)(C) of Rule 2-01 of Regulation S-X.
(f) Not Applicable
3
(g) The aggregate non-audit fees, defined as the sum of the fees shown under “Audit-Related Fees,” “Tax Fees” and “All Other Fees,” paid to the accountant for services rendered by the accountant to the registrant, the Investment Adviser and the Affiliated Service Providers were:
Entity Name | Current Fiscal Year End | Previous Fiscal Year End | ||||
| BlackRock High Yield Municipal Fund | $13,500 | $12,890 | ||||
| BlackRock National Municipal Fund | $13,500 | $12,852 | ||||
| BlackRock Short-Term Municipal Fund | $13,500 | $12,852 |
Additionally, the amounts billed by D&T in connection with services provided to the Affiliated Service Providers of the Fund and of other funds sponsored and advised by BlackRock or its affiliates during the current and previous fiscal years for a service organization review and an accounting research tool subscription were:
| Current Fiscal Year End | Previous Fiscal Year End | |
$2,274,000 | $2,129,000 |
These amounts represent aggregate fees paid by BlackRock and were not allocated on a per fund basis.
(h) The Committee has considered and determined that the provision of non-audit services that were rendered to the Investment Adviser and the Fund Service Providers that were not pre-approved pursuant to paragraph (c)(7)(ii) of Rule 2-01 of Regulation S-X is compatible with maintaining the principal accountant’s independence.
| Item 5 – | Audit Committee of Listed Registrants – Not Applicable |
| Item 6 – | Investments |
(a) The registrant’s Schedule of Investments is included as part of the Report to Stockholders filed under Item 1 of this Form.
(b) Not Applicable due to no such divestments during the semi-annual period covered since the previous Form N-CSR filing.
| Item 7 – | Disclosure of Proxy Voting Policies and Procedures for Closed-End Management Investment Companies – Not Applicable |
| Item 8 – | Portfolio Managers of Closed-End Management Investment Companies – Not Applicable |
| Item 9 – | Purchases of Equity Securities by Closed-End Management Investment Company and Affiliated Purchasers – Not Applicable |
4
| Item 10 – | Submission of Matters to a Vote of Security Holders – There have been no material changes to these procedures. |
| Item 11 – | Controls and Procedures |
(a) The registrant’s principal executive and principal financial officers, or persons performing similar functions, have concluded that the registrant’s disclosure controls and procedures (as defined in Rule 30a-3(c) under the Investment Company Act of 1940, as amended (the “1940 Act”)) are effective as of a date within 90 days of the filing of this report based on the evaluation of these controls and procedures required by Rule 30a-3(b) under the 1940 Act and Rule 15d-15(b) under the Securities Exchange Act of 1934, as amended.
(b) There were no changes in the registrant’s internal control over financial reporting (as defined in Rule 30a-3(d) under the 1940 Act) that occurred during the second fiscal quarter of the period covered by this report that have materially affected, or are reasonably likely to materially affect, the registrant’s internal control over financial reporting.
| Item 12 – | Disclosure of Securities Lending Activities for Closed-End Management Investment Companies – Not Applicable |
| Item 13 – | Exhibits attached hereto |
(a)(1) Code of Ethics – See Item 2
(a)(2) Certifications – Attached hereto
(a)(3) Not Applicable
(a)(4) Not Applicable
(b) Certifications attached hereto
5
Pursuant to the requirements of the Securities Exchange Act of 1934 and the Investment Company Act of 1940, the registrant has duly caused this report to be signed on its behalf by the undersigned, thereunto duly authorized.
BlackRock Municipal Bond Fund, Inc.
| By: | /s/ John M. Perlowski | |
| John M. Perlowski | ||
| Chief Executive Officer (principal executive officer) of | ||
| BlackRock Municipal Bond Fund, Inc. |
Date: September 4, 2018
Pursuant to the requirements of the Securities Exchange Act of 1934 and the Investment Company Act of 1940, this report has been signed below by the following persons on behalf of the registrant and in the capacities and on the dates indicated.
| By: | /s/ John M. Perlowski | |
| John M. Perlowski | ||
| Chief Executive Officer (principal executive officer) of | ||
| BlackRock Municipal Bond Fund, Inc. |
Date: September 4, 2018
| By: | /s/ Neal J. Andrews | |
| Neal J. Andrews | ||
| Chief Financial Officer (principal financial officer) of | ||
| BlackRock Municipal Bond Fund, Inc. |
Date: September 4, 2018
6