UNITED STATES
SECURITIES AND EXCHANGE COMMISSION
Washington, D.C. 20549
FORM N-CSR
CERTIFIED SHAREHOLDER REPORT OF REGISTERED MANAGEMENT
INVESTMENT COMPANIES
Investment Company Act file number: 811-02688
| Name of Fund: | | BlackRock Municipal Bond Fund, Inc. |
| | | BlackRock High Yield Municipal Fund |
| | | BlackRock National Municipal Fund |
| | | BlackRock Short-Term Municipal Fund |
| Fund Address: 100 | | Bellevue Parkway, Wilmington, DE 19809 |
Name and address of agent for service: John M. Perlowski, Chief Executive Officer, BlackRock Municipal Bond Fund, Inc., 55 East 52nd Street, New York, NY 10055
Registrant’s telephone number, including area code: (800) 441-7762
Date of fiscal year end: 06/30/2021
Date of reporting period: 06/30/2021
| Item 1 – | Report to Stockholders |
(a) The Report to Shareholders is attached herewith.
| | |

| | JUNE 30, 2021 |
BlackRock Multi-State Municipal Series Trust
| · | | BlackRock New York Municipal Opportunities Fund |
BlackRock Municipal Bond Fund, Inc.
| · | | BlackRock High Yield Municipal Fund |
| · | | BlackRock National Municipal Fund |
| · | | BlackRock Short-Term Municipal Fund |
|
| Not FDIC Insured • May Lose Value • No Bank Guarantee |
The Markets in Review
Dear Shareholder,
The 12-month reporting period as of June 30, 2021 was a remarkable period of adaptation and recovery, as the global economy dealt with the implications of the coronavirus (or “COVID-19”) pandemic. The United States, along with most of the world, began the reporting period emerging from a severe recession, prompted by pandemic-related restrictions that disrupted many aspects of daily life. However, easing restrictions and robust government intervention led to a strong rebound, and the economy grew at a significant pace for the reporting period, recovering much of the output lost at the beginning of the pandemic.
Equity prices rose with the broader economy, as investors became increasingly optimistic about the economic outlook. Stocks rose through the summer of 2020, fed by strong fiscal and monetary support and positive economic indicators. The implementation of mass vaccination campaigns and passage of an additional $1.9 trillion of fiscal stimulus further boosted stocks, and many equity indices neared or surpassed all-time highs late in the reporting period. In the United States, both large- and small-capitalization stocks posted a significant advance. International equities also gained, as both developed countries and emerging markets rebounded substantially.
The 10-year U.S. Treasury yield (which is inversely related to bond prices) had fallen sharply prior to the beginning of the reporting period, which meant bonds were priced for extreme risk avoidance and economic disruption. Despite expectations of doom and gloom, the economy expanded rapidly, stoking inflation concerns in early 2021, which led to higher yields and a negative overall return for most U.S. Treasuries. In the corporate bond market, support from the U.S. Federal Reserve (the “Fed”) assuaged credit concerns and led to substantial returns for high-yield corporate bonds, although investment-grade corporates declined slightly.
The Fed remained committed to accommodative monetary policy by maintaining near zero interest rates and by reiterating that inflation could exceed its 2% target for a sustained period without triggering a rate increase. Late in the period the Fed elaborated on their expected timeline, raising the likelihood of slower bond purchasing and the possibility of higher rates in 2023.
Looking ahead, while coronavirus-related disruptions have clearly hindered worldwide economic growth, we believe that the global expansion will continue to accelerate as vaccination efforts ramp up and pent-up consumer demand leads to higher spending. While we expect inflation to increase somewhat as the expansion continues, we believe the recent uptick owes more to temporary supply disruptions than a lasting change in fundamentals. The change in Fed policy also means that moderate inflation is less likely to be followed by interest rate hikes that could threaten the economic expansion.
Overall, we favor a moderately positive stance toward risk, with an overweight in equities. Sectors that are better poised to manage the transition to a lower-carbon world, such as technology and healthcare, are particularly attractive in the long-term. U.S. small-caps and European equities are likely to benefit from the continuing vaccine-led restart. We are underweight long-term on credit, but inflation-protected U.S. Treasuries, Asian fixed income, and Chinese government bonds offer potential opportunities. We believe that international diversification and a focus on sustainability can help provide portfolio resilience, and the disruption created by the coronavirus appears to be accelerating the shift toward sustainable investments.
In this environment, our view is that investors need to think globally, extend their scope across a broad array of asset classes, and be nimble as market conditions change. We encourage you to talk with your financial advisor and visit blackrock.com for further insight about investing in today’s markets.
Sincerely,

Rob Kapito
President, BlackRock Advisors, LLC

Rob Kapito
President, BlackRock Advisors, LLC
| | | | |
| Total Returns as of June 30, 2021 |
| | | |
| | | 6-Month | | 12-Month |
U.S. large cap equities
(S&P 500® Index) | | 15.25% | | 40.79% |
| | |
U.S. small cap equities
(Russell 2000® Index) | | 17.54 | | 62.03 |
| | |
International equities
(MSCI Europe, Australasia, Far East Index) | | 8.83 | | 32.35 |
| | |
Emerging market equities
(MSCI Emerging Markets Index) | | 7.45 | | 40.90 |
| | |
3-month Treasury bills
(ICE BofA 3-Month U.S. Treasury Bill Index) | | 0.02 | | 0.09 |
| | |
U.S. Treasury securities
(ICE BofA 10-Year U.S. Treasury Index) | | (4.10) | | (5.89) |
| | |
U.S. investment grade bonds
(Bloomberg Barclays U.S. Aggregate Bond Index) | | (1.60) | | (0.33) |
| | |
Tax-exempt municipal bonds
(S&P Municipal Bond Index) | | 1.24 | | 4.20 |
| | |
U.S. high yield bonds
(Bloomberg Barclays U.S. Corporate High Yield 2% Issuer Capped Index) | | 3.61 | | 15.34 |
|
| Past performance is not an indication of future results. Index performance is shown for illustrative purposes only. You cannot invest directly in an index. |
| | |
| 2 | | THIS PAGE IS NOT PART OF YOUR FUND REPORT |
Table of Contents

| | |
| Fund Summary as of June 30, 2021 | | BlackRock New York Municipal Opportunities Fund |
Investment Objective
BlackRock New York Municipal Opportunities Fund’s (the “Fund”) investment objective is to provide shareholders with income exempt from Federal income tax and New York State and New York City personal income taxes.
Portfolio Management Commentary
How did the Fund perform?
For the 12-month period ended June 30, 2021, the Fund outperformed the primary benchmark, the S&P® Municipal Bond Index, and the secondary benchmark, the S&P® New York Municipal Bond Index. The following discussion of relative performance pertains to the Fund’s secondary benchmark, the S&P® New York Municipal Bond Index.
What factors influenced performance?
Despite rising U.S. Treasury yields, municipal bonds delivered strong returns in the past 12 months. (Prices and yields move in opposite directions.) When the period began in July 2020, the market was still suffering from the dislocations caused by COVID-19. However, tax-exempt bonds gradually climbed off of their pandemic-driven lows due to the release of multiple coronavirus vaccines, better-than-expected growth, improving municipal finances and robust investor demand. The prospect of substantial fiscal stimulus and higher taxes were additional tailwinds for the market. These factors led to a decline in yield spreads versus U.S. Treasuries, fueling gains for municipal debt. New York municipal bonds modestly outpaced the national index. The state, which experienced an above-average impact from the coronavirus-induced downturn, has outperformed in the subsequent recovery.
Both security selection and asset allocation contributed to the Fund’s positive performance.
With respect to allocation, the Fund benefited from its overweight position in lower-rated bonds due to the category’s strong outperformance relative to higher-quality debt. Holdings in the tobacco sector also aided results, as did an overweight in long-term bonds.
In terms of selection, the best results came from the state tax-backed and utilities sectors. In both cases, the relative strength largely stemmed from holdings in Puerto Rico.
The Fund’s use of U.S. Treasury futures to manage interest-rate risk further helped performance given that Treasury yields rose even as municipals gained ground.
The Fund experienced a small, negative impact from security selection in the transportation sector. The portfolio’s cash position, while limited, nonetheless detracted somewhat at a time of positive returns for the market as a whole.
Describe recent portfolio activity.
Portfolio activity was largely driven by the investment adviser’s efforts to put cash to work by capitalizing on relative valuations and the opportunities created by new issuance. The Fund increased its allocations to lower-quality securities and Puerto Rico and reduced its cash position marginally as market liquidity returned. In terms of maturity exposure, the investment adviser decreased the Fund’s weightings in securities with maturities of 20 years and above and increased its weighting in those with maturities of less than 20 years.
Describe portfolio positioning at period end.
The Fund ended the period with an overweight position in longer-maturity bonds, largely those in the 15- to 20-year area. Additionally, the Fund maintained an overweight in lower-quality issues (those rated A and below). The Fund’s duration was below the benchmark at the end of the period, but to a lesser extent than it was at the beginning of the period.
The views expressed reflect the opinions of BlackRock as of the date of this report and are subject to change based on changes in market, economic or other conditions. These views are not intended to be a forecast of future events and are no guarantee of future results.
| | |
| 4 | | 2 0 2 1 BLACK ROCK ANNUAL REPORT TO SHAREHOLDERS |
| | |
| Fund Summary as of June 30, 2021 (continued) | | BlackRock New York Municipal Opportunities Fund |
TOTAL RETURN BASED ON A $10,000 INVESTMENT
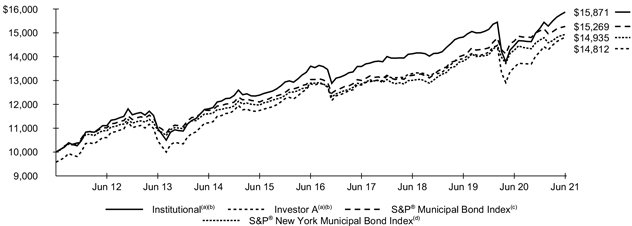
| | (a) | Assuming maximum sales charges, if any, transaction costs and other operating expenses, including advisory fees. Institutional Shares do not have a sales charge. | |
| | (b) | Under normal circumstances, the Fund will invest at least 80% of its assets in investment grade New York municipal bonds. The Fund’s returns prior to February 18, 2015 are the returns of the Fund when it followed different investment strategies under the name BlackRock New York Municipal Bond Fund. | |
| | (c) | The S&P® Municipal Bond Index, a broad, market value-weighted index that seeks to measure the performance of the U.S. municipal bond market. Bonds in the S&P® Municipal Bond Index must have an outstanding par value of at least $2 million and a remaining maturity of not less than one month. | |
| | (d) | The S&P® New York Municipal Bond Index includes all New York bonds in the S&P® Municipal Bond Index. | |
Performance Summary for the Period Ended June 30, 2021
| | | | | | | | | | | | | | | | | | | | | | | | | | | | | | | | | | | | | | | | | | | | | | | | |
| | | | | | | | | | | | | | | Average Annual Total Returns(a)(b) | |
| | | | | | | | | | | | | | | 1 Year | | | | | | 5 Years | | | | | | 10 Years | |
| | | Standardized
30-Day Yields | | | Unsubsidized
30-Day Yields | | | 6-Month
Total
Returns | | | | | | Without
Sales
Charge | | | With
Sales
Charge | | | | | | Without
Sales
Charge | | | With
Sales
Charge | | | | | | Without
Sales
Charge | | | With Sales
Charge | |
Institutional | | | 0.86 | % | | | 0.78 | % | | | 4.55 | % | | | | | | | 9.71 | % | | | N/A | | | | | | | | 3.13 | % | | | N/A | | | | | | | | 4.73 | % | | | N/A | |
Investor A | | | 0.59 | | | | 0.53 | | | | 4.42 | | | | | | | | 9.34 | | | | 4.69 | % | | | | | | | 2.86 | | | | 1.97 | % | | | | | | | 4.46 | | | | 4.01 | % |
Investor A1 | | | 0.73 | | | | 0.67 | | | | 4.50 | | | | | | | | 9.50 | | | | N/A | | | | | | | | 3.03 | | | | N/A | | | | | | | | 4.61 | | | | N/A | |
Investor C | | | (0.12 | ) | | | (0.20 | ) | | | 4.04 | | | | | | | | 8.62 | | | | 7.62 | | | | | | | | 2.11 | | | | 2.11 | | | | | | | | 3.83 | | | | 3.83 | |
Class K | | | 0.92 | | | | 0.84 | | | | 4.49 | | | | | | | | 9.67 | | | | N/A | | | | | | | | 3.15 | | | | N/A | | | | | | | | 4.74 | | | | N/A | |
S&P® Municipal Bond Index | | | — | | | | — | | | | 1.24 | | | | | | | | 4.20 | | | | N/A | | | | | | | | 3.20 | | | | N/A | | | | | | | | 4.32 | | | | N/A | |
S&P® New York Municipal Bond Index | | | — | | | | — | | | | 1.63 | | | | | | | | 4.65 | | | | N/A | | | | | | | | 2.99 | | | | N/A | | | | | | | | 4.09 | | | | N/A | |
| | (a) | Assuming maximum sales charges, if any. Average annual total returns with and without sales charges reflect reductions for distribution and service fees. See “About Fund Performance” for a detailed description of share classes, including any related sales charges and fees, and how performance was calculated for certain share classes. | |
| | (b) | Under normal circumstances, the Fund will invest at least 80% of its assets in investment grade New York municipal bonds. The Fund’s returns prior to February 18, 2015 are the returns of the Fund when it followed different investment strategies under the name BlackRock New York Municipal Bond Fund. | |
N/A — Not applicable as the share class and index do not have a sales charge.
Past performance is not an indication of future results.
Performance results may include adjustments made for financial reporting purposes in accordance with U.S. generally accepted accounting principles.
Expense Example
| | | | | | | | | | | | | | | | | | | | | | | | | | | | | | | | | | | | | | | | | | | | | | | | | | |
| | | | | Actual | | | | | | Hypothetical(a) | | | | |
| | | | | | | | | | | Expenses Paid During the
Period | | | | | | | | | Including Interest
Expense
and Fees | | | Excluding Interest
Expense
and Fees | | | Annualized Expense Ratio | |
| | | | | Beginning
Account
Value
(01/01/21) | | | Ending
Account
Value
(06/30/21) | | | Including
Interest
Expense
and Fees(b) | | | Excluding
Interest
Expense
and Fees(b) | | | | | | Beginning
Account
Value
(01/01/21) | | | Ending
Account
Value
(06/30/21) | | | Expenses
Paid
During
the
Period(b) | | | Ending
Account
Value
(06/30/21) | | | Expenses
Paid During the
Period(b) | | | Including
Interest
Expense
and Fees | | | Excluding
Interest
Expense
and Fees | |
| | Institutional | | $ | 1,000.00 | | | $ | 1,045.50 | | | $ | 2.74 | | | $ | 2.54 | | | | | | | $ | 1,000.00 | | | $ | 1,022.12 | | | $ | 2.71 | | | $ | 1,022.32 | | | $ | 2.51 | | | | 0.54 | % | | | 0.50 | % |
| | Investor A | | | 1,000.00 | | | | 1,044.20 | | | | 4.00 | | | | 3.80 | | | | | | | | 1,000.00 | | | | 1,020.88 | | | | 3.96 | | | | 1,021.08 | | | | 3.76 | | | | 0.79 | | | | 0.75 | |
| | Investor A1 | | | 1,000.00 | | | | 1,045.00 | | | | 3.25 | | | | 3.04 | | | | | | | | 1,000.00 | | | | 1,021.62 | | | | 3.21 | | | | 1,021.82 | | | | 3.01 | | | | 0.64 | | | | 0.60 | |
| | Investor C | | | 1,000.00 | | | | 1,040.40 | | | | 7.79 | | | | 7.59 | | | | | | | | 1,000.00 | | | | 1,017.16 | | | | 7.70 | | | | 1,017.36 | | | | 7.50 | | | | 1.54 | | | | 1.50 | |
| | |
| Fund Summary as of June 30, 2021 (continued) | | BlackRock New York Municipal Opportunities Fund |
Expense Example (continued)
| | | | | | | | | | | | | | | | | | | | | | | | | | | | | | | | | | | | | | | | | | | | | | | | | | | | | | |
| | | | | Actual | | | | | | Hypothetical(a) | | | | | | | |
| | | | | | | | | | | Expenses Paid During the
Period | | | | | | | | | Including Interest
Expense
and Fees | | | Excluding Interest
Expense
and Fees | | | Annualized Expense
Ratio | | | | |
| | | | | Beginning
Account
Value
(01/01/21) | | | Ending
Account
Value
(06/30/21) | | | Including
Interest
Expense
and Fees(b) | | | Excluding
Interest
Expense
and Fees(b) | | | | | | Beginning
Account
Value
(01/01/21) | | | Ending
Account
Value
(06/30/21) | | | Expenses
Paid
During
the
Period(b) | | | Ending
Account
Value
(06/30/21) | | | Expenses
Paid During the
Period(b) | | | Including
Interest
Expense
and Fees | | | Excluding
Interest
Expense
and Fees | | | | |
| | Class K | | $ | 1,000.00 | | | $ | 1,044.90 | | | $ | 2.48 | | | $ | 2.28 | | | | | | | $ | 1,000.00 | | | $ | 1,022.36 | | | $ | 2.46 | | | $ | 1,022.56 | | | $ | 2.26 | | | | 0.49 | % | | | 0.45 | % | | | | |
| | (a) | Hypothetical 5% annual return before expenses is calculated by prorating the number of days in the most recent fiscal half year divided by 365. | |
| | (b) | For each class of the Fund, expenses are equal to the annualized expense ratio for the class, multiplied by the average account value over the period, multiplied by 181/365 (to reflect the six-month period shown). | |
Portfolio Information
SECTOR ALLOCATION
| | | | |
| Sector(a)(b) | | Percent of
Total Investments | |
Transportation | | | 22 | % |
County/City/Special District/School District | | | 20 | |
State | | | 18 | |
Utilities | | | 14 | |
Education | | | 9 | |
Housing | | | 7 | |
Tobacco | | | 4 | |
Corporate | | | 3 | |
Health | | | 3 | |
Other* | | | — | (c) |
CALL/MATURITY SCHEDULE
| | | | |
| Calendar Year Ended December 31,(a)(d) | | Percentage | |
2021 | | | 5 | % |
2022 | | | 2 | |
2023 | | | 5 | |
2024 | | | 4 | |
2025 | | | 1 | |
CREDIT QUALITY ALLOCATION
| | | | |
| Credit Rating(a)(e) | | Percent of
Total Investments | |
AAA/Aaa | | | 11 | % |
AA/Aa | | | 49 | |
A | | | 21 | |
BBB/Baa | | | 4 | |
BB/Ba | | | 2 | |
B | | | 1 | |
C | | | 2 | |
N/R | | | 10 | |
| (a) | Excludes short-term securities. |
| (b) | For Fund compliance purposes, the Fund’s sector classifications refer to one or more of the sector sub-classifications used by one or more widely recognized market indexes or rating group indexes, and/or as defined by the investment adviser. These definitions may not apply for purposes of this report, which may combine such sector sub-classifications for reporting ease. |
| (c) | Represents less than 1% of the Fund’s long-term investments. |
| (d) | Scheduled maturity dates and/or bonds that are subject to potential calls by issuers over the next five years. |
| (e) | For financial reporting purposes, credit quality ratings shown above reflect the highest rating assigned by either S&P Global Ratings or Moody’s Investors Service, Inc. if ratings differ. These rating agencies are independent, nationally recognized statistical rating organizations and are widely used. Investment grade ratings are credit ratings of BBB/Baa or higher. Below investment grade ratings are credit ratings of BB/Ba or lower. Investments designated N/R are not rated by either rating agency. Unrated investments do not necessarily indicate low credit quality. Credit quality ratings are subject to change. |
| * | Includes one or more investment categories that individually represents less than 1% of the Fund’s long-term investments. Please refer to the Schedule of Investments for details. |
| | |
| 6 | | 2 0 2 1 BLACK ROCK ANNUAL REPORT TO SHAREHOLDERS |
| | |
| Fund Summary as of June 30, 2021 | | BlackRock High Yield Municipal Fund |
Investment Objective
BlackRock High Yield Municipal Fund’s (the “Fund”) investment objective is to provide shareholders with as high a level of income exempt from Federal income taxes as is consistent with the investment policies of the Fund.
Portfolio Management Commentary
How did the Fund perform?
For the 12-month period ended June 30, 2021, the Fund outperformed both its primary benchmark, the S&P® Municipal Bond Index, and its secondary benchmark, the Custom High Yield Index. The following discussion of relative performance pertains to the Custom High Yield Index.
What factors influenced performance?
Despite rising U.S. Treasury yields, municipal bonds delivered healthy gains in the past 12 months. (Prices and yields move in opposite directions.) When the period began in July 2020, the market was still suffering from the dislocations caused by COVID-19. However, tax-exempt bonds gradually climbed off of their pandemic-driven lows thanks to the release of multiple coronavirus vaccines, better-than-expected growth, improving municipal finances and robust investor demand. The prospect of substantial fiscal stimulus and higher taxes were additional tailwinds for the market. These factors led to a decline in yield spreads versus U.S. Treasuries, fueling gains for municipal debt. High-yield bonds, which benefited from investors’ appetite for both risk and yield, were especially strong performers.
Positions in longer-dated securities with maturities of 20 years and above contributed to Fund performance, as did holdings in bonds on the lower end of the investment-grade spectrum. At the sector level, the largest contributions came from utilities, state tax-backed, education and corporate-related debt. Investments in distressed obligations issued in Puerto Rico and elsewhere strongly outperformed the broader high yield category, further helping performance.
The Fund’s underweight in BB rated securities detracted from performance. Underweight positions in the five- to 20-year maturity range and the local tax-backed sector also weighed on relative performance. In the latter part of the period, a cash position hurt results by preventing the Fund from benefiting from the market’s positive return in this time. Despite the modest drag from holding cash, the portfolio remained positioned in an aggressive enough manner to offset much of the effect. The Fund also sought to manage interest-rate risk using U.S. Treasury futures late in the period, which was a very small detractor.
Describe recent portfolio activity.
The Fund adopted a more aggressive posture with respect to credit risk in late 2020. Later, the uptick in yields in the first quarter of 2021 created opportunities to capture better value in both investment-grade and non-investment grade securities. Elevated cash reserves provided the latitude to satisfy much of the shareholder redemptions that coincided with the rise in yields, eliminating the need to sell into weakness and facilitating the investment adviser’s ability to capitalize on the opportunity.
As the period progressed, the investment adviser turned its efforts to unearthing bespoke opportunities where it could structure transactions to its own liking and purchase them in their entirety, thereby avoiding the need to compete for bonds in what has become a frothy, risk-loving public market. Recent opportunities included investments in the senior living and charter school sectors.
Describe portfolio positioning at period end.
The Fund at times held an elevated cash balance during the period. This was in part a reflection of elevated inflows into the Fund, as well as the investment adviser’s desire to maintain sufficient liquidity in the event market conditions become less favorable. With that said, the portfolio remained positioned for a continuation of the positive investment environment. The portfolio’s duration (interest-rate sensitivity) was modestly higher than that of the benchmark.
Despite stretched valuations on both an absolute and relative basis, the investment adviser saw the combination of low supply and robust demand as a source of ongoing support for municipal bonds. Nonetheless, the investment adviser sought to offset the potential for increased market volatility by trimming some of the Fund’s more aggressive positions and maintaining its risk-management strategy with respect to interest rates.
The views expressed reflect the opinions of BlackRock as of the date of this report and are subject to change based on changes in market, economic or other conditions. These views are not intended to be a forecast of future events and are no guarantee of future results.
| | |
| Fund Summary as of June 30, 2021 (continued) | | BlackRock High Yield Municipal Fund |
TOTAL RETURN BASED ON A $10,000 INVESTMENT
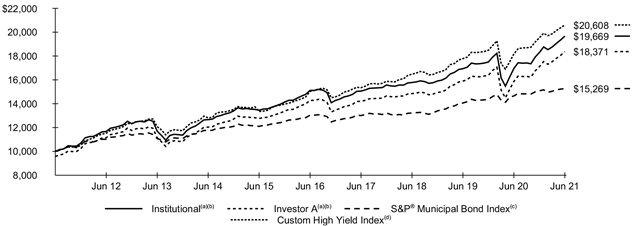
| | (a) | Assuming maximum sales charge, if any, transaction costs and other operating expenses, including advisory fees. Institutional Shares do not have a sales charge. |
| | (b) | Under normal circumstances, the Fund seeks to achieve its objective by investing at least 80% of its assets in municipal bonds and may invest in municipal bonds rated in any rating category or in unrated municipal bonds. The Fund will usually invest in municipal bonds that have a maturity of five years or longer. |
| | (c) | The S&P® Municipal Bond Index, a broad, market value-weighted index that seeks to measure the performance of the U.S. municipal bond market. Bonds in the S&P® Municipal Bond Index must have an outstanding par value of at least $2 million and a remaining maturity of not less than one month. |
| | (d) | The Custom High Yield Index is a customized benchmark that reflects the returns of the S&P® Customized High Yield Municipal Bond Index for periods prior to January 1, 2013, and the returns of only those bonds in the S&P® Customized High Yield Municipal Bond Index that have maturities greater than five years for periods subsequent to January 1, 2013. |
Performance Summary for the Period Ended June 30, 2021
| | | | | | | | | | | | | | | | | | | | | | | | | | | | | | | | | | | | | | | | | | | | |
| | | | | | | | | | | | Average Annual Total Returns(a) | |
| | | | | | | | | | | | 1 Year | | | | | | 5 Years | | | | | | 10 Years | |
| | | Standardized
30-Day Yields | | | Unsubsidized
30-Day Yields | | | 6-Month
Total
Returns | | | Without
Sales
Charge | | | With
Sales
Charge | | | | | | Without
Sales
Charge | | | With
Sales
Charge | | | | | | Without
Sales
Charge | | | With
Sales
Charge | |
Institutional | | | 1.92 | % | | | 1.88 | % | | | 7.54 | % | | | 16.00 | % | | | N/A | | | | | | | | 5.41 | % | | | N/A | | | | | | | | 7.00 | % | | | N/A | |
Investor A | | | 1.60 | | | | 1.57 | | | | 7.42 | | | | 15.73 | | | | 10.81 | % | | | | | | | 5.17 | | | | 4.26 | % | | | | | | | 6.73 | | | | 6.27 | % |
Investor C | | | 0.92 | | | | 0.86 | | | | 7.00 | | | | 14.83 | | | | 13.83 | | | | | | | | 4.37 | | | | 4.37 | | | | | | | | 6.09 | | | | 6.09 | |
Class K | | | 1.98 | | | | 1.93 | | | | 7.56 | | | | 16.05 | | | | N/A | | | | | | | | 5.44 | | | | N/A | | | | | | | | 7.01 | | | | N/A | |
S&P® Municipal Bond Index | | | — | | | | — | | | | 1.24 | | | | 4.20 | | | | N/A | | | | | | | | 3.20 | | | | N/A | | | | | | | | 4.32 | | | | N/A | |
Custom High Yield Index | | | — | | | | — | | | | 5.53 | | | | 13.37 | | | | N/A | | | | | | | | 6.51 | | | | N/A | | | | | | | | 7.50 | | | | N/A | |
| | (a) | Assuming maximum sales charges, if any. Average annual total returns with and without sales charges reflect reductions for distribution and service fees. See “About Fund Performance” for a detailed description of share classes, including any related sales charges and fees, and how performance was calculated for certain share classes. | |
N/A — Not applicable as the share class and index do not have a sales charge.
Past performance is not an indication of future results.
Performance results may include adjustments made for financial reporting purposes in accordance with U.S. generally accepted accounting principles.
Expense Example
| | | | | | | | | | | | | | | | | | | | | | | | | | | | | | | | | | | | | | | | | | | | | | | | | | |
| | | | | Actual | | | | | | Hypothetical(a) | | | | |
| | | | | | | | | | | Expenses Paid During the
Period | | | | | | | | | Including Interest
Expense
and Fees | | | Excluding Interest
Expense
and Fees | | | Annualized Expense Ratio | |
| | | | | Beginning
Account
Value
(01/01/21) | | | Ending
Account
Value
(06/30/21) | | | Including
Interest
Expense
and Fees(b) | | | Excluding
Interest
Expense
and Fees(b) | | | | | | Beginning
Account
Value
(01/01/21) | | | Ending
Account
Value
(06/30/21) | | | Expenses
Paid
During
the
Period(b) | | | Ending
Account
Value
(06/30/21) | | | Expenses
Paid During the
Period(b) | | | Including
Interest
Expense
and Fees | | | Excluding
Interest
Expense
and Fees | |
| | Institutional | | $ | 1,000.00 | | | $ | 1,075.40 | | | $ | 2.98 | | | $ | 2.78 | | | | | | | $ | 1,000.00 | | | $ | 1,021.92 | | | $ | 2.91 | | | $ | 1,022.12 | | | $ | 2.71 | | | | 0.58 | % | | | 0.54 | % |
| | Investor A | | | 1,000.00 | | | | 1,074.20 | | | | 4.27 | | | | 4.01 | | | | | | | | 1,000.00 | | | | 1,020.68 | | | | 4.16 | | | | 1,020.93 | | | | 3.91 | | | | 0.83 | | | | 0.78 | |
| | Investor C | | | 1,000.00 | | | | 1,070.00 | | | | 8.11 | | | | 7.90 | | | | | | | | 1,000.00 | | | | 1,016.96 | | | | 7.90 | | | | 1,017.16 | | | | 7.70 | | | | 1.58 | | | | 1.54 | |
| | Class K | | | 1,000.00 | | | | 1,075.60 | | | | 2.73 | | | | 2.52 | | | | | | | | 1,000.00 | | | | 1,022.17 | | | | 2.66 | | | | 1,022.36 | | | | 2.46 | | | | 0.53 | | | | 0.49 | |
| | (a) | Hypothetical 5% annual return before expenses is calculated by prorating the number of days in the most recent fiscal half year divided by 365. | |
| | (b) | For each class of the Fund, expenses are equal to the annualized expense ratio for the class, multiplied by the average account value over the period, multiplied by 181/365 (to reflect the six-month period shown). | |
| | |
| 8 | | 2 0 2 1 BLACK ROCK ANNUAL REPORT TO SHAREHOLDERS |
| | |
| Fund Summary as of June 30, 2021 (continued) | | BlackRock High Yield Municipal Fund |
Portfolio Information
SECTOR ALLOCATION
| | | | |
| Sector(a)(b) | | Percent of
Total Investments | |
Education | | | 17 | % |
State | | | 16 | |
County/City/Special District/School District | | | 15 | |
Health | | | 15 | |
Transportation | | | 9 | |
Housing | | | 8 | |
Utilities | | | 7 | |
Corporate | | | 7 | |
Tobacco | | | 6 | |
Other* | | | — | (c) |
CALL/MATURITY SCHEDULE
| | | | |
| Calendar Year Ended December 31,(a)(d) | | Percentage | |
2021 | | | 6 | % |
2022 | | | 4 | |
2023 | | | 4 | |
2024 | | | 5 | |
2025 | | | 2 | |
CREDIT QUALITY ALLOCATION
| | | | |
| Credit Rating(a)(e) | | Percent of
Total Investments | |
AAA/Aaa | | | 1 | % |
AA/Aa | | | 12 | |
A | | | 11 | |
BBB/Baa | | | 17 | |
BB/Ba | | | 9 | |
B | | | 3 | |
CCC/Caa | | | — | (f) |
C | | | 3 | |
N/R | | | 44 | |
| (a) | Excludes short-term securities. |
| (b) | For Fund compliance purposes, the Fund’s sector classifications refer to one or more of the sector sub-classifications used by one or more widely recognized market indexes or rating group indexes, and/or as defined by the investment adviser. These definitions may not apply for purposes of this report, which may combine such sector sub-classifications for reporting ease. |
| (c) | Represents less than 1% of the Fund’s long-term investments. |
| (d) | Scheduled maturity dates and/or bonds that are subject to potential calls by issuers over the next five years. |
| (e) | For financial reporting purposes, credit quality ratings shown above reflect the highest rating assigned by either S&P Global Ratings or Moody’s Investors Service, Inc. if ratings differ. These rating agencies are independent, nationally recognized statistical rating organizations and are widely used. Investment grade ratings are credit ratings of BBB/Baa or higher. Below investment grade ratings are credit ratings of BB/Ba or lower. Investments designated N/R are not rated by either rating agency. Unrated investments do not necessarily indicate low credit quality. Credit quality ratings are subject to change. |
| (f) | Rounds to less than 1% of total investments. |
| * | Includes one or more investment categories that individually represents less than 1% of the Fund’s long-term investments. Please refer to the Schedule of Investments for details. |
| | |
| Fund Summary as of June 30, 2021 | | BlackRock National Municipal Fund |
Investment Objective
BlackRock National Municipal Fund’s (the “Fund”) investment objective is to provide shareholders with as high a level of income exempt from Federal income taxes as is consistent with the investment policies of the Fund.
Portfolio Management Commentary
How did the Fund perform?
For the 12-month period ended June 30, 2021, the Fund outperformed the primary benchmark, the S&P® Municipal Bond Index. For the same period, the Fund’s Institutional and Class K Shares outperformed the secondary benchmark, the Custom National Index, while the Fund’s Service, Investor A and Investor C Shares underperformed. The following discussion of relative performance pertains to the Custom National Index.
What factors influenced performance?
Despite rising U.S. Treasury yields, municipal bonds delivered strong returns in the past 12 months. (Prices and yields move in opposite directions.) When the period began in July 2020, the market was still suffering the dislocations caused by COVID-19. However, tax-exempt bonds gradually climbed off of their pandemic-driven lows thanks to the release of multiple coronavirus vaccines, better-than-expected growth, improving municipal finances and robust investor demand. The prospect of substantial fiscal stimulus and higher taxes were additional tailwinds for the market. These factors led to a decline in yield spreads versus U.S. Treasuries, fueling impressive gains for municipal debt.
The Fund benefited from its holdings in longer-duration, longer-maturity securities. (Duration is a measure of interest rate sensitivity). The Fund’s use of U.S. Treasury futures to manage interest-rate risk also aided performance given that Treasury yields rose even as municipal bonds gained ground.
At the sector level, the Fund was helped by its positions in the health care, education, transportation, utilities and corporate-backed sectors. Positions in bonds with shorter call dates—a market segment that benefited from rising demand—also added value. (A call is when an issuer redeems a bond prior to its maturity date.) An allocation to high-yield bonds and lower-rated investment-grade securities—particularly in the tobacco sector—was a further plus, as investors were willing to move down in credit quality in order to earn higher income.
The Fund’s above-average cash position detracted from Fund performance given the rally in municipal bonds. The Fund’s allocations to state-tax backed and local-authority debt, which lagged the broader market, also detracted.
Describe recent portfolio activity.
The investment adviser continued to focus on constructing a balanced, higher-quality and income-oriented portfolio. The investment adviser maintained an elevated cash position to provide liquidity in the event that the coronavirus pandemic endangered the tax revenues of state and local municipalities. For most issuers, this threat did not in fact materialize. The investment adviser raised the Fund’s allocation to high-yield bonds from 10% to 12% on the belief that this segment offered a greater representation of attractively valued securities.
Describe portfolio positioning at period end.
The Fund had an average credit quality of AA-, up from A+ one year ago, and it held a 9.0% weighting in bonds subject to the alternative minimum tax. Duration stood at 6.0 years on June 30, 2021, in line with the benchmark. Leverage was 1.4% of assets, versus 5% at the beginning of the period. The portfolio was overweight in the health care and corporate-backed sectors, while its largest underweight was in the state tax-backed category.
The views expressed reflect the opinions of BlackRock as of the date of this report and are subject to change based on changes in market, economic or other conditions. These views are not intended to be a forecast of future events and are no guarantee of future results.
| | |
| 10 | | 2 0 2 1 BLACK ROCK ANNUAL REPORT TO SHAREHOLDERS |
| | |
| Fund Summary as of June 30, 2021 (continued) | | BlackRock National Municipal Fund |
TOTAL RETURN BASED ON A $10,000 INVESTMENT
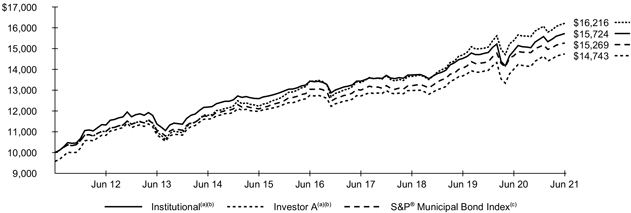
| | (a) | Assuming maximum sales charge, if any, transaction costs and other operating expenses, including advisory fees. Institutional Shares do not have a sales charge. |
| | (b) | Under normal circumstances, the Fund seeks to achieve its objective by investing at least 80% of its assets in municipal bonds and may invest in municipal bonds rated in any rating category or in unrated municipal bonds. The Fund will usually invest in municipal bonds that have a maturity of five years or longer. |
| | (c) | The S&P® Municipal Bond Index, a broad, market value-weighted index that seeks to measure the performance of the U.S. municipal bond market. Bonds in the S&P® Municipal Bond Index must have an outstanding par value of at least $2 million and a remaining maturity of not less than one month. |
| | (d) | The Custom National Index is a customized benchmark that reflects the returns of the S&P® Municipal Bond Index for periods prior to January 1, 2013, and the returns of only those bonds in the S&P® Municipal Bond Index that have maturities greater than five years for periods subsequent to January 1, 2013. |
Performance Summary for the Period Ended June 30, 2021
| | | | | | | | | | | | | | | | | | | | | | | | | | | | | | | | | | | | | | | | | | | | |
| | | | | | | | | | | | Average Annual Total Returns(a) | |
| | | | | | | | | | | | 1 Year | | | | | | 5 Years | | | | | | 10 Years | |
| | | Standardized
30-Day Yields | | | Unsubsidized
30-Day Yields | | | 6-Month
Total
Returns | | | Without
Sales
Charge | | | With
Sales
Charge | | | | | | Without
Sales
Charge | | | With
Sales
Charge | | | | | | Without
Sales
Charge | | | With
Sales
Charge | |
Institutional | | | 0.84 | % | | | 0.78 | % | | | 1.81 | % | | | 5.59 | % | | | N/A | | | | | | | | 3.20 | % | | | N/A | | | | | | | | 4.63 | % | | | N/A | |
Service | | | 0.59 | | | | 0.55 | | | | 1.68 | | | | 5.24 | | | | N/A | | | | | | | | 2.95 | | | | N/A | | | | | | | | 4.36 | | | | N/A | |
Investor A | | | 0.57 | | | | 0.50 | | | | 1.68 | | | | 5.23 | | | | 0.76 | % | | | | | | | 2.95 | | | | 2.06 | % | | | | | | | 4.41 | | | | 3.96 | % |
Investor C | | | (0.15 | ) | | | (0.20 | ) | | | 1.30 | | | | 4.53 | | | | 3.53 | | | | | | | | 2.20 | | | | 2.20 | | | | | | | | 3.79 | | | | 3.79 | |
Class K | | | 0.89 | | | | 0.85 | | | | 1.83 | | | | 5.54 | | | | N/A | | | | | | | | 3.25 | | | | N/A | | | | | | | | 4.71 | | | | N/A | |
S&P® Municipal Bond Index | | | — | | | | — | | | | 1.24 | | | | 4.20 | | | | N/A | | | | | | | | 3.20 | | | | N/A | | | | | | | | 4.32 | | | | N/A | |
Custom National Index | | | — | | | | — | | | | 1.60 | | | | 5.38 | | | | N/A | | | | | | | | 3.83 | | | | N/A | | | | | | | | 4.95 | | | | N/A | |
| | (a) | Assuming maximum sales charges, if any. Average annual total returns with and without sales charges reflect reductions for distribution and service fees. See “About Fund Performance” for a detailed description of share classes, including any related sales charges and fees, and how performance was calculated for certain share classes. | |
N/A — Not applicable as the share class and index do not have a sales charge.
Past performance is not an indication of future results.
Performance results may include adjustments made for financial reporting purposes in accordance with U.S. generally accepted accounting principles.
Expense Example
| | | | | | | | | | | | | | | | | | | | | | | | | | | | | | | | | | | | | | | | | | | | | | | | | | |
| | | | | Actual | | | Hypothetical(a) | | | | | | | | | | |
| | | | | | | | | | | Expenses Paid During the
Period | | | | | | Including Interest
Expense
and Fees | | | Excluding Interest
Expense
and Fees | | | Annualized Expense Ratio | | | | |
| | | |
| Beginning
Account
Value
(01/01/21) |
| |
| Ending
Account
Value
(06/30/21) |
| |
| Including
Interest
Expense
and Fees |
(b) | |
| Excluding
Interest
Expense
and Fees |
(b) | |
| Beginning
Account
Value
(01/01/21) |
| |
| Ending
Account
Value
(06/30/21) |
| |
| Expenses
Paid
During
the
Period |
(b) | |
| Ending
Account
Value
(06/30/21) |
| |
| Expenses
Paid
During
the
Period |
(b) | |
| Including
Interest
Expense
and Fees |
| |
| Excluding
Interest
Expense
and Fees |
| | | | |
| | Institutional | | $ | 1,000.00 | | | $ | 1,018.10 | | | $ | 2.20 | | | $ | 2.15 | | | $ | 1,000.00 | | | $ | 1,022.61 | | | $ | 2.21 | | | $ | 1,022.66 | | | $ | 2.16 | | | | 0.44 | % | | | 0.43 | % | | | | |
| | Service | | | 1,000.00 | | | | 1,016.80 | | | | 3.40 | | | | 3.40 | | | | 1,000.00 | | | | 1,021.42 | | | | 3.41 | | | | 1,021.42 | | | | 3.41 | | | | 0.68 | | | | 0.68 | | | | | |
| | Investor A | | | 1,000.00 | | | | 1,016.80 | | | | 3.45 | | | | 3.40 | | | | 1,000.00 | | | | 1,021.37 | | | | 3.46 | | | | 1,021.42 | | | | 3.41 | | | | 0.69 | | | | 0.68 | | | | | |
| | Investor C | | | 1,000.00 | | | | 1,013.00 | | | | 7.19 | | | | 7.14 | | | | 1,000.00 | | | | 1,017.65 | | | | 7.20 | | | | 1,017.70 | | | | 7.15 | | | | 1.44 | | | | 1.43 | | | | | |
| | Class K | | | 1,000.00 | | | | 1,018.30 | | | | 1.95 | | | | 1.90 | | | | 1,000.00 | | | | 1,022.86 | | | | 1.96 | | | | 1,022.91 | | | | 1.91 | | | | 0.39 | | | | 0.38 | | | | | |
| | (a) | Hypothetical 5% annual return before expenses is calculated by prorating the number of days in the most recent fiscal half year divided by 365. | |
| | |
| Fund Summary as of June 30, 2021 (continued) | | BlackRock National Municipal Fund |
Expense Example (continued)
| | (b) | For each class of the Fund, expenses are equal to the annualized expense ratio for the class, multiplied by the average account value over the period, multiplied by 181/365 (to reflect the six-month period shown). | |
Portfolio Information
SECTOR ALLOCATION
| | | | |
| Sector(a)(b) | | Percent of
Total Investments | |
Transportation | | | 21 | % |
State | | | 21 | |
County/City/Special District/School District | | | 16 | |
Utilities | | | 15 | |
Corporate | | | 8 | |
Education | | | 7 | |
Health | | | 7 | |
Equity Funds | | | 2 | |
Tobacco | | | 2 | |
Housing | | | 1 | |
CALL/MATURITY SCHEDULE
| | | | |
| Calendar Year Ended December 31,(a)(c) | | Percentage | |
2021 | | | 1 | % |
2022 | | | 3 | |
2023 | | | 2 | |
2024 | | | 2 | |
2025 | | | 2 | |
CREDIT QUALITY ALLOCATION
| | | | |
| Credit Rating(a)(d) | | Percent of
Total Investments | |
AAA/Aaa | | | 9 | % |
AA/Aa | | | 51 | |
A | | | 18 | |
BBB/Baa | | | 5 | |
BB/Ba | | | 3 | |
B | | | 1 | |
N/R | | | 13 | |
| (a) | Excludes short-term securities. |
| (b) | For Fund compliance purposes, the Fund’s sector classifications refer to one or more of the sector sub-classifications used by one or more widely recognized market indexes or rating group indexes, and/or as defined by the investment adviser. These definitions may not apply for purposes of this report, which may combine such sector sub-classifications for reporting ease. |
| (c) | Scheduled maturity dates and/or bonds that are subject to potential calls by issuers over the next five years. |
| (d) | For financial reporting purposes, credit quality ratings shown above reflect the highest rating assigned by either S&P Global Ratings or Moody’s Investors Service, Inc. if ratings differ. These rating agencies are independent, nationally recognized statistical rating organizations and are widely used. Investment grade ratings are credit ratings of BBB/Baa or higher. Below investment grade ratings are credit ratings of BB/Ba or lower. Investments designated N/R are not rated by either rating agency. Unrated investments do not necessarily indicate low credit quality. Credit quality ratings are subject to change. |
| | |
| 12 | | 2 0 2 1 BLACK ROCK ANNUAL REPORT TO SHAREHOLDERS |
| | |
| Fund Summary as of June 30, 2021 | | BlackRock Short-Term Municipal Fund |
Investment Objective
BlackRock Short-Term Municipal Fund’s (the “Fund”) investment objective is to provide shareholders with as high a level of income exempt from Federal income taxes as is consistent with the investment policies of the Fund.
Portfolio Management Commentary
How did the Fund perform?
For the 12-month period ended June 30, 2021, the Fund underperformed its primary benchmark, the S&P® Municipal Bond Index, and its secondary benchmark, the S&P® Limited Maturity Municipal Bond Index. The following discussion of relative performance pertains to the Fund’s secondary benchmark, the S&P® Limited Maturity Municipal Bond Index.
What factors influenced performance?
Short-term municipal bonds delivered muted gains in the past 12 months. Although the improving outlook for state and local finances led to positive returns for municipal bonds, shorter-term issues—which are more sensitive to expectations regarding U.S. Federal Reserve policy—finished somewhat behind the broader market.
The Fund’s underperformance stemmed, in part, from an underweight in high-grade securities (those rated AAA and AA). At the sector level, underweights in pre-refunded issues, local tax-backed debt, education, transportation and utilities hurt results, as did an overweight in state tax-backed issues. An underweight in the four-year portion of the yield curve also pressured relative performance.
On the positive side, the Fund benefited from its overweights in A and BBB rated bonds. An overweight in the zero- to one-year part of the yield curve helped performance, as did an underweight in one- to three-year issues. At the sector level, overweight positions in health care, corporate-backed, housing and tobacco securities contributed positively to Fund performance.
Describe recent portfolio activity.
The Fed kept the Fed Funds rate near zero and pledged to use all of the tools at its disposal to keep the economy stable. In addition, Congress provided fiscal stimulus packages to support economic growth. With this as the backdrop, the investment adviser’s investment strategy initially focused on tactically positioning the Fund by increasing duration (interest-rate sensitivity) in anticipation of an extended period of low interest rates. However, this strategy became challenged as the Fund experienced large inflows, and new bond issuance—especially inside of four years—was limited. The investment adviser therefore increased its focus on the secondary market as a means of uncovering additional opportunities to help execute its strategy. The low-rate environment also prompted the investment adviser to search for compelling investments in lower-rated debt.
Supply-and-demand conditions remained favorable later in the period, but signs of rising inflation fostered concerns that the Fed may need to tighten policy. With yields near historical lows, the investment adviser became more cautious in adding longer-dated issues. The Fund used short-term, high-quality variable rate demand notes (“VRDNs”) as a low-risk investment alternative as it sought opportunities in longer-term debt. The Fund, after reducing its positions in VRDNs over the first nine months of the period, subsequently increased the allocation due to a large amount of bond holdings that matured. The Fund had an allocation of approximately 26% in VRDNs at the end of the period.
Describe portfolio positioning at period end.
At the end of June 30, 2021, the Fund held 47% of assets in securities maturing in less than a year and 14% in those with maturities of one to two years. The Fund’s weightings in the two- to three-year and three- to four-year portions of the curve were 27% and 12%, respectively. However, the investment adviser continued to look for specific opportunities in longer-dated securities.
The Fund’s maintained overweight positions in A and BBB rated debt and an underweight in AAA rated debt.
The views expressed reflect the opinions of BlackRock as of the date of this report and are subject to change based on changes in market, economic or other conditions. These views are not intended to be a forecast of future events and are no guarantee of future results.
| | |
| Fund Summary as of June 30, 2021 (continued) | | BlackRock Short-Term Municipal Fund |
TOTAL RETURN BASED ON A $10,000 INVESTMENT
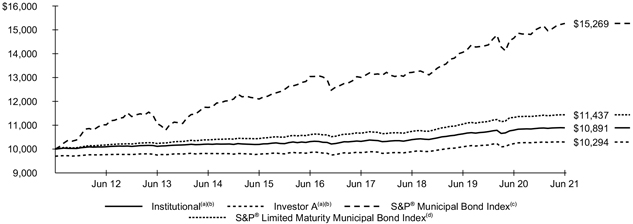
| | (a) | Assuming maximum sales charge, if any, transaction costs and other operating expenses, including advisory fees. Institutional Shares do not have a sales charge. |
| | (b) | Under normal circumstances, the Fund seeks to achieve its objective by investing at least 80% of its assets in municipal bonds and invests primarily in investment grade municipal bonds or municipal notes, including variable rate demand obligations. The Fund will maintain a dollar-weighted maturity of no more than three years. |
| | (c) | The S&P® Municipal Bond Index, a broad, market value-weighted index that seeks to measure the performance of the U.S. municipal bond market. Bonds in the S&P® Municipal Bond Index must have an outstanding par value of at least $2 million and a remaining maturity of not less than one month. |
| | (d) | The S&P® Limited Maturity Municipal Bond Index includes all bonds in the S&P® Municipal Bond Index with a remaining maturity of less than four years. |
Performance Summary for the Period Ended June 30, 2021
| | | | | | | | | | | | | | | | | | | | | | | | | | | | | | | | | | | | | | | | | | | | |
| | | | | | | | | | | | Average Annual Total Returns(a) | |
| | | | | | | | | | | | 1 Year | | | | | | 5 Years | | | | | | 10 Years | |
| | | Standardized
30-Day Yields | | | Unsubsidized
30-Day Yields | | | 6-Month
Total
Returns | | | Without
Sales
Charge | | | With
Sales
Charge | | | | | | Without
Sales
Charge | | | With
Sales
Charge | | | | | | Without
Sales
Charge | | | With
Sales
Charge | |
Institutional | | | 0.03 | % | | | (0.05 | )% | | | 0.23 | % | | | 0.90 | % | | | N/A | | | | | | | | 1.10 | % | | | N/A | | | | | | | | 0.86 | % | | | N/A | |
Investor A | | | (0.19 | ) | | | (0.24 | ) | | | 0.11 | | | | 0.66 | | | | (2.36 | )% | | | | | | | 0.87 | | | | 0.26 | % | | | | | | | 0.60 | | | | 0.29 | % |
Investor A1 | | | (0.07 | ) | | | (0.12 | ) | | | 0.18 | | | | 0.80 | | | | N/A | | | | | | | | 1.00 | | | | N/A | | | | | | | | 0.75 | | | | N/A | |
Investor C | | | (0.95 | ) | | | (1.03 | ) | | | (0.30 | ) | | | (0.10 | ) | | | (1.10 | ) | | | | | | | 0.09 | | | | 0.09 | | | | | | | | (0.01 | ) | | | (0.01 | ) |
Class K | | | 0.08 | | | | 0.03 | | | | 0.25 | | | | 0.95 | | | | N/A | | | | | | | | 1.14 | | | | N/A | | | | | | | | 0.88 | | | | N/A | |
S&P® Municipal Bond Index | | | — | | | | — | | | | 1.24 | | | | 4.20 | | | | N/A | | | | | | | | 3.20 | | | | N/A | | | | | | | | 4.32 | | | | N/A | |
S&P® Limited Maturity Municipal Bond Index | | | — | | | | — | | | | 0.33 | | | | 1.01 | | | | N/A | | | | | | | | 1.52 | | | | N/A | | | | | | | | 1.35 | | | | N/A | |
| | (a) | Assuming maximum sales charges, if any. Average annual total returns with and without sales charges reflect reductions for distribution and service fees. See “About Fund Performance” for a detailed description of share classes, including any related sales charges and fees. | |
N/A — Not applicable as the share class and index do not have a sales charge.
Past performance is not an indication of future results.
Performance results may include adjustments made for financial reporting purposes in accordance with U.S. generally accepted accounting principles.
Expense Example
| | | | | | | | | | | | | | | | | | | | | | | | | | | | | | | | |
| | | Actual | | | | | | Hypothetical(a) | | | | |
| | | Beginning
Account Value
(01/01/21) | | | Ending
Account Value
(06/30/21) | | | Expenses
Paid During
the Period(b) | | | | | | Beginning
Account Value
(01/01/21) | | | Ending
Account Value
(06/30/21) | | | Expenses
Paid During
the Period(b) | | | Annualized
Expense
Ratio | |
Institutional | | $ | 1,000.00 | | | $ | 1,002.30 | | | $ | 1.79 | | | | | | | $ | 1,000.00 | | | $ | 1,023.01 | | | $ | 1.81 | | | | 0.36 | % |
Investor A | | | 1,000.00 | | | | 1,001.10 | | | | 2.93 | | | | | | | | 1,000.00 | | | | 1,021.87 | | | | 2.96 | | | | 0.59 | |
Investor A1 | | | 1,000.00 | | | | 1,001.80 | | | | 2.28 | | | | | | | | 1,000.00 | | | | 1,022.51 | | | | 2.31 | | | | 0.46 | |
Investor C | | | 1,000.00 | | | | 997.00 | | | | 6.73 | | | | | | | | 1,000.00 | | | | 1,018.05 | | | | 6.81 | | | | 1.36 | |
Class K | | | 1,000.00 | | | | 1,002.50 | | | | 1.54 | | | | | | | | 1,000.00 | | | | 1,023.26 | | | | 1.56 �� | | | | 0.31 | |
| | (a) | Hypothetical 5% annual return before expenses is calculated by prorating the number of days in the most recent fiscal half year divided by 365. | |
| | (b) | For each class of the Fund, expenses are equal to the annualized expense ratio for the class, multiplied by the average account value over the period, multiplied by 181/365 (to reflect the six-month period shown). | |
| | |
| 14 | | 2 0 2 1 BLACK ROCK ANNUAL REPORT TO SHAREHOLDERS |
| | |
| Fund Summary as of June 30, 2021 (continued) | | BlackRock Short-Term Municipal Fund |
Portfolio Information
SECTOR ALLOCATION
| | | | |
| Sector(a)(b) | | Percent of
Total Investments | |
Corporate | | | 22 | % |
State | | | 21 | |
Housing | | | 15 | |
County/City/Special District/School District | | | 13 | |
Health | | | 8 | |
Utilities | | | 8 | |
Transportation | | | 7 | |
Education | | | 5 | |
Tobacco | | | 1 | |
CALL/MATURITY SCHEDULE
| | | | |
| Calendar Year Ended December 31,(a)(c) | | Percentage | |
2021 | | | 6 | % |
2022 | | | — | |
2023 | | | 1 | |
2024 | | | 2 | |
2025 | | | — | |
CREDIT QUALITY ALLOCATION
| | | | |
| Credit Rating(a)(d) | | Percent of
Total Investments | |
AAA/Aaa | | | 2 | % |
AA/Aa | | | 37 | |
A | | | 42 | |
BBB/Baa | | | 11 | |
N/R | | | 8 | |
| (a) | Excludes short-term securities. |
| (b) | For Fund compliance purposes, the Fund’s sector classifications refer to one or more of the sector sub-classifications used by one or more widely recognized market indexes or rating group indexes, and/or as defined by the investment adviser. These definitions may not apply for purposes of this report, which may combine such sector sub-classifications for reporting ease. |
| (c) | Scheduled maturity dates and/or bonds that are subject to potential calls by issuers over the next five years. |
| (d) | For financial reporting purposes, credit quality ratings shown above reflect the highest rating assigned by either S&P Global Ratings or Moody’s Investors Service, Inc. if ratings differ. These rating agencies are independent, nationally recognized statistical rating organizations and are widely used. Investment grade ratings are credit ratings of BBB/Baa or higher. Below investment grade ratings are credit ratings of BB/Ba or lower. Investments designated N/R are not rated by either rating agency. Unrated investments do not necessarily indicate low credit quality. Credit quality ratings are subject to change. |
About Fund Performance
Institutional and Class K Shares are not subject to any sales charge. These shares bear no ongoing distribution or service fees and are available only to certain eligible investors. BlackRock High Yield Municipal Fund’s and BlackRock New York Municipal Opportunities Fund’s Class K Share performance shown prior to the Class K shares inception date of January 25, 2018 is that of the respective Fund’s Institutional Shares. BlackRock National Municipal Fund’s Class K Share performance shown prior to the Class K shares inception date of July 18, 2011 is that of Institutional Shares. The performance of each Fund’s Class K Shares would be substantially similar to Institutional Shares because Class K Shares and Institutional Shares invest in the same portfolio of securities and performance would only differ to the extent that Class K Shares and Institutional Shares have different expenses. The actual returns of Class K Shares would have been higher than those of the Institutional Shares because Class K Shares have lower expenses than the Institutional Shares. On the close of business on August 15, 2016, all of the issued and outstanding BlackRock Shares of BlackRock National Municipal Fund were redesignated as Class K Shares.
Service Shares (available only in BlackRock National Municipal Fund) are not subject to any sales charge. These shares are subject to a service fee of 0.25% per year (but no distribution fee) and are only available to certain eligible investors. Prior to July 18, 2011, Service Share performance results are those of the Institutional Shares restated to reflect Service Share fees.
Investor A Shares are subject to a maximum initial sales charge (front-end load) of 4.25% for all Funds except BlackRock Short-Term Municipal Fund, which incurs a 3.00% maximum initial sales charge, and all Funds incur a service fee of 0.25% per year (but no distribution fee). Certain redemptions of these shares may be subject to a contingent deferred sales charge (“CDSC”) where no initial sales charge was paid at the time of purchase. These shares are generally available through financial intermediaries.
Investor A1 Shares (available only in BlackRock Short-Term Municipal Fund and BlackRock New York Municipal Opportunities Fund) are subject to a maximum initial sales charge (front-end load) of 1.00% for BlackRock Short-Term Municipal Fund and 4.00% for BlackRock New York Municipal Opportunities Fund and a service fee of 0.10% per year (but no distribution fee). The maximum initial sales charge does not apply to current eligible investors of Investor A1 Shares of the Funds. These shares are only available for dividend and capital gain reinvestment by existing shareholders and for purchase by certain eligible employer-sponsored retirement plans. Certain redemptions of these shares may be subject to a CDSC where no initial sales charge was paid at the time of purchase. However, the CDSC does not apply to redemptions by certain employer-sponsored retirement plans or to redemptions of shares acquired through reinvestment of dividends and capital gains by existing shareholders.
Investor C Shares are subject to a 1.00% CDSC if redeemed within one year of purchase. In addition, these shares are subject to a distribution fee of 0.75% per year and a service fee of 0.25% per year. These shares are generally available through financial intermediaries. These shares automatically convert to Investor A Shares after approximately eight years.
Past performance is not an indication of future results. Financial markets have experienced extreme volatility and trading in many instruments has been disrupted. These circumstances may continue for an extended period of time, and may continue to affect adversely the value and liquidity of the Fund’s investments. As a result, current performance may be lower or higher than the performance data quoted. Refer to blackrock.com to obtain performance data current to the most recent month-end. Performance results do not reflect the deduction of taxes that a shareholder would pay on Fund distributions or the redemption of Fund shares. Figures shown in the performance tables assume reinvestment of all distributions, if any, at net asset value (“NAV”) on the ex-dividend date or payable date, as applicable. Investment return and principal value of shares will fluctuate so that shares, when redeemed, may be worth more or less than their original cost. Distributions paid to each class of shares will vary because of the different levels of service, distribution and transfer agency fees applicable to each class, which are deducted from the income available to be paid to shareholders.
BlackRock Advisors, LLC (the “Manager”), each Fund’s investment adviser, has contractually and/or voluntarily agreed to waive and/or reimburse a portion of each Fund’s expenses. Without such waiver(s) and/or reimbursement(s), each Fund’s performance would have been lower. With respect to each Fund’s voluntary waiver(s), if any, the Manager is under no obligation to waive and/or reimburse or to continue waiving and/or reimbursing its fees and such voluntary waiver(s) may be reduced or discontinued at any time. With respect to each Fund’s contractual waiver(s), if any, the Manager is under no obligation to continue waiving and/or reimbursing its fees after the applicable termination date of such agreement. See the Notes to Financial Statements for additional information on waivers and/or reimbursements.
The standardized 30-day yield includes the effects of any waivers and/or reimbursements. The unsubsidized 30-day yield excludes the effects of any waivers and/or reimbursements.
Disclosure of Expenses
Shareholders of each Fund may incur the following charges: (a) transactional expenses, such as sales charges; and (b) operating expenses, including investment advisory fees, service and distribution fees, including 12b-1 fees, acquired fund fees and expenses, and other fund expenses. The expense examples shown (which are based on a
| | |
| 16 | | 2 0 2 1 BLACK ROCK ANNUAL REPORT TO SHAREHOLDERS |
Disclosure of Expenses (continued)
hypothetical investment of $1,000 invested on January 1, 2021 and held through June 30, 2021) are intended to assist shareholders both in calculating expenses based on an investment in each Fund and in comparing these expenses with similar costs of investing in other mutual funds.
The expense examples provide information about actual account values and actual expenses. In order to estimate the expenses a shareholder paid during the period covered by this report, shareholders can divide their account value by $1,000 and then multiply the result by the number corresponding to their Fund and share class under the heading entitled “Expenses Paid During the Period.”
The expense examples also provide information about hypothetical account values and hypothetical expenses based on a Fund’s actual expense ratio and an assumed rate of return of 5% per year before expenses. In order to assist shareholders in comparing the ongoing expenses of investing in these Funds and other funds, compare the 5% hypothetical examples with the 5% hypothetical examples that appear in shareholder reports of other funds.
The expenses shown in the expense examples are intended to highlight shareholders’ ongoing costs only and do not reflect transactional expenses, such as sales charges, if any. Therefore, the hypothetical examples are useful in comparing ongoing expenses only, and will not help shareholders determine the relative total expenses of owning different funds. If these transactional expenses were included, shareholder expenses would have been higher.
| | |
DISCLOSURE OF EXPENSES | | 17 |
The Benefits and Risks of Leveraging
The Funds may utilize leverage to seek to enhance returns and net asset value (“NAV”). However, there is no guarantee that these objectives can be achieved in all interest rate environments.
Each of BlackRock High Yield Municipal Fund, BlackRock New York Municipal Opportunities Fund and BlackRock National Municipal Fund may leverage its assets through the use of proceeds received in tender option bond (“TOB”) transactions, as described in the Notes to Financial Statements. In a TOB Trust transaction, each Fund transfers municipal bonds or other municipal securities into a special purpose entity (a “TOB Trust”). TOB investments generally provide each Fund with economic benefits in periods of declining short-term interest rates, but expose each Fund to risks during periods of rising short-term interest rates. Additionally, fluctuations in the market value of municipal bonds deposited into a TOB Trust may adversely affect each Fund’s NAV per share.
In general, the concept of leveraging is based on the premise that the financing cost of leverage, which is based on short-term interest rates, is normally lower than the income earned by each Fund on its longer-term portfolio investments purchased with the proceeds from leverage. To the extent that the total assets of each Fund (including the assets obtained from leverage) are invested in higher-yielding portfolio investments, the Fund’s shareholders benefit from the incremental net income.
The interest earned on securities purchased with the proceeds from leverage is distributed to the Funds’ shareholders, and the value of these portfolio holdings is reflected in each Fund’s per share NAV. However, in order to benefit shareholders, the return on assets purchased with leverage proceeds must exceed the ongoing costs associated with the leverage. If interest and other ongoing costs of leverage exceed a Fund’s return on assets purchased with leverage proceeds, income to shareholders is lower than if the Fund had not used leverage.
Furthermore, the value of each Fund’s portfolio investments generally varies inversely with the direction of long-term interest rates, although other factors can also influence the value of portfolio investments. As a result, changes in interest rates can influence each Fund’s NAV positively or negatively in addition to the impact on each Fund’s performance from leverage. Changes in the direction of interest rates are difficult to predict accurately, and there is no assurance that a Fund’s leveraging strategy will be successful.
The use of leverage also generally causes greater changes in each Fund’s NAV and dividend rates than comparable portfolios without leverage. In a declining market, leverage is likely to cause a greater decline in the NAV of a Fund’s shares than if the Fund was not leveraged. In addition, each Fund may be required to sell portfolio securities at inopportune times or at distressed values in order to comply with regulatory requirements applicable to the use of leverage or as required by the terms of the leverage instruments, which may cause the Funds to incur losses. The use of leverage may limit a Fund’s ability to invest in certain types of securities or use certain types of hedging strategies. Each Fund incurs expenses in connection with the use of leverage, all of which are borne by each Fund’s shareholders and may reduce income.
Derivative Financial Instruments
The Funds may invest in various derivative financial instruments. These instruments are used to obtain exposure to a security, commodity, index, market, and/or other assets without owning or taking physical custody of securities, commodities and/or other referenced assets or to manage market, equity, credit, interest rate, foreign currency exchange rate, commodity and/or other risks. Derivative financial instruments may give rise to a form of economic leverage and involve risks, including the imperfect correlation between the value of a derivative financial instrument and the underlying asset, possible default of the counterparty to the transaction or illiquidity of the instrument. The Funds’ successful use of a derivative financial instrument depends on the investment adviser’s ability to predict pertinent market movements accurately, which cannot be assured. The use of these instruments may result in losses greater than if they had not been used, may limit the amount of appreciation a Fund can realize on an investment and/or may result in lower distributions paid to shareholders. The Funds’ investments in these instruments, if any, are discussed in detail in the Notes to Financial Statements.
| | |
| 18 | | 2 0 2 1 BLACK ROCK ANNUAL REPORT TO SHAREHOLDERS |
| | |
Schedule of Investments June 30, 2021 | | BlackRock New York Municipal Opportunities Fund (Percentages shown are based on Net Assets) |
| | | | | | | | |
| Security | | Par
(000) | | | Value | |
Corporate Bonds | | | | | | | | |
| | |
Diversified Financial Services — 0.2% | | | | | | | | |
Bank of America Corp., (SOFR + 1.32%), 2.69%, 04/22/32(a) | | $ | 3,062 | | | $ | 3,150,169 | |
| | | | | | | | |
| | |
| Education — 0.1% | | | | | | |
Rensselaer Polytechnic Institute, 5.25%, 09/01/48 | | | 1,910 | | | | 2,432,302 | |
| | | | | | | | |
| | |
| Health Care Providers & Services — 0.2% | | | | | | |
Northwell Healthcare, Inc., 4.26%, 11/01/47 | | | 2,500 | | | | 2,947,747 | |
| | | | | | | | |
| | |
| Thrifts & Mortgage Finance — 0.4% | | | | | | |
Community Preservation Corp., 2.87%, 02/01/30 | | | 5,760 | | | | 6,016,638 | |
| | | | | | | | |
| | |
| Tobacco — 0.2% | | | | | | |
Altria Group, Inc., 3.70%, 02/04/51 | | | 3,895 | | | | 3,694,963 | |
| | | | | | | | |
| | |
Total Corporate Bonds — 1.1%
(Cost: $17,508,926) | | | | | | | 18,241,819 | |
| | | | | | | | |
| | |
Municipal Bonds | | | | | | | | |
| | |
Guam(b) — 0.2% | | | | | | | | |
| | |
| State — 0.2% | | | | | | |
Territory of Guam, Refunding RB | | | | | | | | |
Series F, 4.00%, 01/01/36 | | | 1,225 | | | | 1,430,298 | |
Series F, 4.00%, 01/01/42 | | | 1,565 | | | | 1,786,228 | |
| | | | | | | | |
| | |
Total Municipal Bonds in Guam | | | | | | | 3,216,526 | |
| | |
Illinois — 1.2% | | | | | | | | |
|
| County/City/Special District/School District — 1.2% | |
Chicago Board of Education, GO, 6.32%, 11/01/29 | | | 1,645 | | | | 2,018,300 | |
Chicago Board of Education, GO, BAB | | | | | | | | |
6.04%, 12/01/29 | | | 3,425 | | | | 4,034,616 | |
6.14%, 12/01/39 | | | 6,150 | | | | 7,711,915 | |
6.52%, 12/01/40 | | | 3,600 | | | | 4,599,072 | |
| | | | | | | | |
| | |
Total Municipal Bonds in Illinois | | | | | | | 18,363,903 | |
| | |
New York — 79.3% | | | | | | | | |
| | |
| Corporate — 3.3% | | | | | | |
Build NYC Resource Corp., Refunding RB, AMT, 4.50%, 01/01/25(c) | | | 360 | | | | 390,085 | |
New York Liberty Development Corp., RB, 5.50%, 10/01/37 | | | 4,780 | | | | 7,202,408 | |
New York Liberty Development Corp., Refunding RB, 5.25%, 10/01/35 | | | 9,365 | | | | 13,440,742 | |
New York State Energy Research & Development Authority, Refunding RB, Series C, 2.63%, 04/01/34(a) | | | 20,000 | | | | 20,855,800 | |
Niagara Area Development Corp., Refunding RB(c) | | | | | |
Series B, 3.50%, 11/01/24 | | | 1,000 | | | | 1,035,280 | |
Series A, AMT, 4.75%, 11/01/42 | | | 7,990 | | | | 8,421,860 | |
| | | | | | | | |
| | | | | | | 51,346,175 | |
|
| County/City/Special District/School District — 17.0% | |
Battery Park City Authority, Refunding RB | | | | | | | | |
Series B, 5.00%, 11/01/39 | | | 6,600 | | | | 8,569,110 | |
Series B, 5.00%, 11/01/40 | | | 8,500 | | | | 11,019,230 | |
City of New York, Sub-Series G-1, 5.00%, 04/01/22(d) | | | 1,000 | | | | 1,036,140 | |
City of New York, GO | | | | | | | | |
Series A-1, 5.00%, 08/01/21(d) | | | 400 | | | | 401,568 | |
Series B-1, 5.00%, 12/01/37 | | | 2,500 | | | | 3,016,325 | |
Series B-1, 5.00%, 10/01/39 | | | 5,845 | | | | 7,165,035 | |
Series D, 5.38%, 06/01/32 | | | 15 | | | | 15,064 | |
| | | | | | | | |
| Security | | Par
(000) | | | Value | |
| |
| County/City/Special District/School District (continued) | | | | |
City of New York, GO (continued) | | | | | | | | |
Series D, 5.00%, 12/01/42 | | $ | 2,490 | | | $ | 3,112,400 | |
Series E-1, 5.00%, 03/01/41 | | | 2,695 | | | | 3,331,936 | |
Series E-1, 5.00%, 03/01/44 | | | 2,140 | | | | 2,632,179 | |
Series F-1, 5.00%, 03/01/39 | | | 2,000 | | | | 2,618,840 | |
Series F-3, 3.75%, 06/01/28 | | | 2,500 | | | | 2,737,600 | |
Sub-Series A-1, 5.00%, 08/01/33 | | | 700 | | | | 765,954 | |
Sub-Series D-1, 5.00%, 08/01/31 | | | 935 | | | | 1,024,218 | |
Sub-Series F-1, 5.00%, 04/01/39 | | | 3,000 | | | | 3,716,430 | |
Sub-Series F-2, 1.94%, 03/01/29 | | | 9,410 | | | | 9,550,303 | |
City of New York, Refunding GO | | | | | | | | |
Series C, 5.00%, 08/01/34 | | | 500 | | | | 576,780 | |
Series C-3, 2.46%, 08/01/33 | | | 2,145 | | | | 2,200,920 | |
Series D, 1.72%, 08/01/29 | | | 2,630 | | | | 2,625,897 | |
Series D, 1.92%, 08/01/31 | | | 2,500 | | | | 2,484,425 | |
Series E, 5.00%, 02/01/23(d) | | | 1,250 | | | | 1,344,713 | |
City of Syracuse New York, GO, Series A, AMT, (AGM), 4.75%, 11/01/31 | | | 500 | | | | 505,605 | |
City of Yonkers, GO | | | | | | | | |
Series A, (AGM), 5.00%, 02/15/34 | | | 300 | | | | 394,452 | |
Series A, (AGM), 4.00%, 02/15/35 | | | 350 | | | | 423,878 | |
Series A, (AGM), 4.00%, 02/15/36 | | | 350 | | | | 422,044 | |
County of Nassau New York, GO | | | | | | | | |
Series B, (AGM), 5.00%, 07/01/37 | | | 1,145 | | | | 1,423,086 | |
Series B, (AGM), 5.00%, 07/01/45 | | | 4,960 | | | | 6,131,155 | |
Series C, 5.00%, 10/01/29 | | | 500 | | | | 616,990 | |
County of Nassau New York, Refunding GO, Series B, 5.00%, 04/01/35 | | | 3,600 | | | | 4,358,880 | |
Monroe County Industrial Development Corp., RB | | | | | | | | |
(SAW), 5.00%, 05/01/33 | | | 2,885 | | | | 3,615,280 | |
(SAW), 5.00%, 05/01/34 | | | 2,375 | | | | 2,968,394 | |
Nassau County Interim Finance Authority, Refunding RB, Series B, 1.28%, 11/15/28 | | | 3,750 | | | | 3,680,400 | |
Nassau County, Refunding GO, Series A, (AGM), 4.00%, 04/01/38 | | | 2,635 | | | | 3,167,244 | |
New York City Industrial Development Agency, RB(e) | | | | | |
(AGC), 0.00%, 03/01/41 | | | 4,155 | | | | 2,494,454 | |
(AGC), 0.00%, 03/01/42 | | | 5,500 | | | | 3,186,535 | |
(AGC), 0.00%, 03/01/43 | | | 2,000 | | | | 1,116,900 | |
(AGC), 0.00%, 03/01/45 | | | 2,450 | | | | 1,270,717 | |
New York City Industrial Development Agency, Refunding RB | | | | | | | | |
Class A, (AGM), 4.00%, 01/01/32 | | | 750 | | | | 929,933 | |
Series A, AMT, 5.00%, 07/01/28 | | | 2,210 | | | | 2,305,759 | |
New York City Transitional Finance Authority Future Tax Secured Revenue, RB | | | | | | | | |
5.25%, 08/01/37 | | | 10,000 | | | | 12,721,100 | |
Series A-1, 5.00%, 11/01/38 | | | 1,000 | | | | 1,102,960 | |
Series A-2, 5.00%, 08/01/38 | | | 490 | | | | 605,140 | |
Series A-E1, 5.00%, 02/01/36 | | | 3,500 | | | | 4,273,290 | |
Series C-4, 0.03%, 11/01/36(a) | | | 1,400 | | | | 1,400,000 | |
Series E-1, 5.00%, 02/01/39 | | | 1,500 | | | | 1,774,320 | |
Series E-1, 5.00%, 02/01/41 | | | 3,000 | | | | 3,432,420 | |
Series E-1, 4.00%, 02/01/42 | | | 5,000 | | | | 5,981,350 | |
Sub-Series A-1, 5.00%, 08/01/40 | | | 13,360 | | | | 16,685,170 | |
Sub-Series B-1, 5.00%, 11/01/35 | | | 200 | | | | 225,054 | |
Sub-Series B-1, 5.00%, 11/01/36 | | | 680 | | | | 764,674 | |
Sub-Series B-1, 5.00%, 11/01/38 | | | 5,000 | | | | 5,899,750 | |
Sub-Series E-1, 5.00%, 02/01/42 | | | 650 | | | | 667,349 | |
Series C-1, Subordinate, 4.00%, 11/01/42 | | | 6,500 | | | | 7,611,240 | |
| | |
SCHEDULE OF INVESTMENTS | | 19 |
| | |
Schedule of Investments (continued) June 30, 2021 | | BlackRock New York Municipal Opportunities Fund (Percentages shown are based on Net Assets) |
| | | | | | | | |
| Security | | Par
(000) | | | Value | |
|
| County/City/Special District/School District (continued) | |
New York City Transitional Finance Authority Future Tax Secured Revenue, RB (continued) | | | | | | | | |
Series C-3, Subordinate, 5.00%, 05/01/41 | | $ | 7,100 | | | $ | 8,799,527 | |
New York Convention Center Development Corp., RB, CAB, Series B, Sub Lien, (AGM-CR), 0.00%, 11/15/55(e) | | | 5,500 | | | | 2,104,245 | |
New York Convention Center Development Corp., Refunding RB | | | | | | | | |
5.00%, 11/15/35 | | | 3,500 | | | | 4,131,190 | |
5.00%, 11/15/40 | | | 7,690 | | | | 9,057,820 | |
5.00%, 11/15/45 | | | 8,490 | | | | 9,929,649 | |
New York Liberty Development Corp., Refunding RB | | | | | | | | |
5.00%, 11/15/31 | | | 2,610 | | | | 2,654,892 | |
5.00%, 11/15/44 | | | 1,500 | | | | 1,523,895 | |
5.75%, 11/15/51 | | | 1,590 | | | | 1,618,604 | |
2.45%, 09/15/69 | | | 10,000 | | | | 10,394,400 | |
2.63%, 09/15/69 | | | 10,000 | | | | 10,364,600 | |
2.80%, 09/15/69 | | | 12,500 | | | | 12,867,250 | |
Class 1, 4.00%, 09/15/35 | | | 745 | | | | 764,556 | |
Class 2, 5.00%, 09/15/43 | | | 3,585 | | | | 3,695,669 | |
Class 3, 5.00%, 03/15/44 | | | 2,240 | | | | 2,302,720 | |
Series 1, Class 1, 5.00%, 11/15/44(c) | | | 12,570 | | | | 13,851,009 | |
Series 2, Class 2, 5.38%, 11/15/40(c) | | | 520 | | | | 586,128 | |
New York State Dormitory Authority, RB, 5.00%, 07/01/26 | | | 1,015 | | | | 1,019,121 | |
New York State Dormitory Authority, Refunding RB(d) | | | | | | | | |
Series A, 5.00%, 07/01/22 | | | 895 | | | | 937,978 | |
Series B, 5.00%, 08/15/27 | | | 5 | | | | 6,296 | |
| | | | | | | | |
| | | | | | | 268,710,139 | |
| | |
| Education — 8.5% | | | | | | |
Amherst Development Corp., Refunding RB | | | | | | | | |
5.00%, 10/01/43 | | | 85 | | | | 90,977 | |
5.00%, 10/01/48 | | | 1,040 | | | | 1,102,535 | |
Buffalo & Erie County Industrial Land Development Corp., Refunding RB | | | | | | | | |
Series A, 4.50%, 06/01/27 | | | 1,000 | | | | 1,119,690 | |
Series A, 5.00%, 06/01/35 | | | 655 | | | | 738,532 | |
Build NYC Resource Corp., RB | | | | | | | | |
5.00%, 02/01/33(c) | | | 845 | | | | 910,606 | |
5.63%, 02/01/39(c) | | | 1,285 | | | | 1,406,060 | |
4.00%, 06/15/41 | | | 195 | | | | 216,405 | |
5.75%, 02/01/49(c) | | | 1,145 | | | | 1,238,741 | |
4.00%, 06/15/51 | | | 735 | | | | 796,872 | |
Class A, 5.00%, 12/01/41(c) | | | 1,350 | | | | 1,575,126 | |
Class A, 5.00%, 12/01/51(c) | | | 1,500 | | | | 1,717,185 | |
Class A, 5.00%, 12/01/55(c) | | | 1,000 | | | | 1,138,290 | |
Series A, 4.88%, 05/01/31(c) | | | 750 | | | | 859,312 | |
Series A, 5.13%, 05/01/38(c) | | | 140 | | | | 160,037 | |
Series A, 5.50%, 05/01/48(c) | | | 2,175 | | | | 2,472,997 | |
Build NYC Resource Corp., Refunding RB | | | | | | | | |
5.00%, 06/01/30 | | | 385 | | | | 444,282 | |
5.00%, 08/01/33 | | | 275 | | | | 338,660 | |
5.00%, 06/01/35 | | | 250 | | | | 288,493 | |
5.00%, 08/01/35 | | | 740 | | | | 906,300 | |
5.00%, 06/01/40 | | | 310 | | | | 351,974 | |
5.00%, 08/01/47 | | | 725 | | | | 870,290 | |
5.00%, 11/01/47 | | | 2,900 | | | | 4,449,847 | |
Series A, 5.00%, 06/01/43 | | | 325 | | | | 363,695 | |
AMT, 5.00%, 01/01/35(c) | | | 100 | | | | 114,368 | |
| | | | | | | | |
| Security | | Par
(000) | | | Value | |
| | |
| Education (continued) | | | | | | |
County of Cattaraugus New York, RB | | | | | | | | |
5.00%, 05/01/34 | | $ | 130 | | | $ | 141,869 | |
5.00%, 05/01/39 | | | 225 | | | | 244,616 | |
Dobbs Ferry Local Development Corp., RB | | | | | | | | |
5.00%, 07/01/39 | | | 1,000 | | | | 1,128,310 | |
5.00%, 07/01/44 | | | 2,000 | | | | 2,250,260 | |
Dutchess County Local Development Corp., RB | | | | | | | | |
5.00%, 07/01/43 | | | 955 | | | | 1,188,536 | |
5.00%, 07/01/48 | | | 1,435 | | | | 1,779,730 | |
Dutchess County Local Development Corp., Refunding RB, 5.00%, 07/01/42 | | | 1,980 | | | | 2,427,955 | |
Erie County Industrial Development Agency, Refunding RB, (SAW), 5.00%, 05/01/31 | | | 1,925 | | | | 2,602,773 | |
Geneva Development Corp., RB, 5.25%, 09/01/23(d) | | | 160 | | | | 177,352 | |
Hempstead Town Local Development Corp., Refunding RB | | | | | | | | |
5.00%, 10/01/34 | | | 570 | | | | 647,195 | |
5.00%, 10/01/35 | | | 265 | | | | 300,648 | |
5.00%, 07/01/47 | | | 2,165 | | | | 2,636,299 | |
Monroe County Industrial Development Corp., Refunding RB | | | | | | | | |
Series A, 5.00%, 07/01/23(d) | | | 1,360 | | | | 1,489,798 | |
Series A, 5.00%, 07/01/32 | | | 300 | | | | 372,786 | |
Series A, 5.00%, 07/01/33 | | | 350 | | | | 434,550 | |
Series A, 5.00%, 07/01/34 | | | 350 | | | | 434,070 | |
Series A, 5.00%, 07/01/35 | | | 800 | | | | 990,992 | |
Series A, 5.00%, 07/01/36 | | | 1,000 | | | | 1,237,310 | |
Series A, 5.00%, 07/01/37 | | | 500 | | | | 617,940 | |
Series A, 4.00%, 07/01/50 | | | 5,000 | | | | 5,871,700 | |
Series C, 5.05%, 07/01/28 | | | 1,000 | | | | 1,195,340 | |
New York State Dormitory Authority, RB | | | | | | | | |
5.00%, 01/01/42 | | | 5,000 | | | | 5,776,350 | |
5.00%, 07/01/42 | | | 750 | | | | 782,760 | |
1st Series, (AMBAC), 5.50%, 07/01/40 | | | 500 | | | | 744,845 | |
Series 1, (BHAC-CR AMBAC), 5.50%, 07/01/31 | | | 475 | | | | 632,705 | |
Series A, (NPFGC), 5.15%, 07/01/24 | | | 250 | | | | 274,128 | |
Series A, 5.25%, 07/01/25(d) | | | 500 | | | | 500,000 | |
Series A, 4.13%, 01/01/30 | | | 1,600 | | | | 1,727,216 | |
Series A, 5.00%, 07/01/33 | | | 1,000 | | | | 1,264,530 | |
Series A, 5.25%, 01/01/34 | | | 250 | | | | 277,083 | |
Series A, 5.50%, 01/01/39 | | | 500 | | | | 555,765 | |
Series A, 5.00%, 07/01/43 | | | 8,065 | | | | 10,109,961 | |
Series A, 5.50%, 01/01/44 | | | 2,000 | | | | 2,216,760 | |
Series A, 4.00%, 07/01/44 | | | 2,010 | | | | 2,337,369 | |
Series C, 2.15%, 03/15/31 | | | 3,000 | | | | 3,034,560 | |
New York State Dormitory Authority, Refunding RB | | | | | | | | |
5.00%, 07/01/28 | | | 500 | | | | 520,845 | |
5.00%, 07/01/29 | | | 375 | | | | 426,086 | |
5.00%, 07/01/30 | | | 300 | | | | 340,605 | |
5.00%, 07/01/42 | | | 300 | | | | 310,671 | |
5.00%, 07/01/44 | | | 1,190 | | | | 1,339,440 | |
Series A, 5.00%, 07/01/22(d) | | | 1,000 | | | | 1,048,020 | |
Series A, 5.25%, 07/01/23(d) | | | 5,590 | | | | 6,151,348 | |
Series A, 5.00%, 07/01/24(d) | | | 1,000 | | | | 1,140,420 | |
Series A, 5.00%, 05/01/27 | | | 980 | | | | 1,050,638 | |
Series A, 5.00%, 07/01/28 | | | 250 | | | | 250,000 | |
Series A, 5.25%, 07/01/29 | | | 135 | | | | 135,000 | |
Series A, 4.00%, 07/01/33 | | | 1,000 | | | | 1,227,280 | |
Series A, 5.00%, 07/01/33 | | | 470 | | | | 547,729 | |
Series A, 4.00%, 07/01/34 | | | 2,000 | | | | 2,437,480 | |
Series A, 5.00%, 07/01/36 | | | 1,850 | | | | 2,282,030 | |
| | |
| 20 | | 2 0 2 1 BLACK ROCK ANNUAL REPORT TO SHAREHOLDERS |
| | |
Schedule of Investments (continued) June 30, 2021 | | BlackRock New York Municipal Opportunities Fund (Percentages shown are based on Net Assets) |
| | | | | | | | |
| Security | | Par
(000) | | | Value | |
| |
| Education (continued) | | | | |
New York State Dormitory Authority, Refunding RB (continued) | | | | | | | | |
Series A, 5.00%, 07/01/37 | | $ | 350 | | | $ | 406,203 | |
Series A, 5.00%, 07/01/38 | | | 1,005 | | | | 1,239,617 | |
Series A, 5.00%, 07/01/41 | | | 500 | | | | 595,515 | |
Series A, 5.00%, 07/01/42 | | | 2,000 | | | | 2,443,260 | |
Series A, 5.00%, 07/01/43 | | | 1,000 | | | | 1,152,510 | |
Series B, 5.00%, 10/01/38 | | | 10,000 | | | | 12,525,000 | |
Series C, 4.00%, 07/01/49 | | | 2,500 | | | | 2,911,350 | |
Onondaga County Trust for Cultural Resources, Refunding RB, 5.00%, 05/01/40 | | | 135 | | | | 154,487 | |
Orange County Funding Corp., Refunding RB | | | | | | | | |
Series A, 5.00%, 07/01/37 | | | 360 | | | | 375,937 | |
Series A, 5.00%, 07/01/42 | | | 220 | | | | 229,293 | |
Schenectady County Capital Resource Corp., Refunding RB, 5.00%, 07/01/32 | | | 500 | | | | 523,400 | |
St. Lawrence County Industrial Development Agency, RB, 5.38%, 09/01/41 | | | 500 | | | | 504,310 | |
St. Lawrence County Industrial Development Agency, Refunding RB, Series B, 4.43%, 07/01/56 | | | 1,500 | | | | 1,752,120 | |
Troy Capital Resource Corp., Refunding RB | | | | | | | | |
5.00%, 08/01/28 | | | 2,690 | | | | 3,197,737 | |
5.00%, 08/01/32 | | | 1,000 | | | | 1,184,010 | |
4.00%, 08/01/35 | | | 1,110 | | | | 1,249,427 | |
4.00%, 09/01/40 | | | 160 | | | | 187,691 | |
Trust for Cultural Resources of The City of New York, Refunding RB | | | | | | | | |
Series A, 5.00%, 07/01/32 | | | 500 | | | | 565,880 | |
Series A, 5.00%, 07/01/37 | | | 885 | | | | 998,554 | |
Yonkers Economic Development Corp., RB | | | | | | | | |
Series A, 4.00%, 10/15/29 | | | 200 | | | | 225,892 | |
Series A, 5.00%, 10/15/39 | | | 580 | | | | 691,430 | |
Series A, 5.00%, 10/15/49 | | | 460 | | | | 537,800 | |
Series A, 5.00%, 10/15/54 | | | 300 | | | | 348,744 | |
| | | | | | | | |
| | | | | | | 135,283,094 | |
| |
| Health — 3.1% | | | | |
Buffalo & Erie County Industrial Land Development Corp., RB, 5.25%, 07/01/35 | | | 1,000 | | | | 1,164,120 | |
Build NYC Resource Corp., Refunding RB, 5.00%, 07/01/24(d) | | | 1,100 | | | | 1,254,363 | |
Dutchess County Local Development Corp., RB, Series B, 4.00%, 07/01/41 | | | 10,050 | | | | 11,366,047 | |
Dutchess County Local Development Corp., Refunding RB, Series A, 5.00%, 07/01/24(d) | | | 750 | | | | 855,247 | |
Huntington Local Development Corp., RB, Series A, 5.25%, 07/01/56 | | | 525 | | | | 576,324 | |
Monroe County Industrial Development Corp., RB | | | | | | | | |
5.00%, 12/01/29 | | | 660 | | | | 796,541 | |
4.00%, 12/01/41 | | | 100 | | | | 111,182 | |
5.00%, 12/01/46 | | | 4,960 | | | | 5,832,216 | |
Monroe County Industrial Development Corp., Refunding RB, Series A, 5.00%, 12/01/37 | | | 370 | | | | 392,108 | |
New York State Dormitory Authority, RB(c) | | | | | | | | |
5.00%, 12/01/40 | | | 1,300 | | | | 1,485,250 | |
5.00%, 12/01/45 | | | 1,700 | | | | 1,928,718 | |
New York State Dormitory Authority, Refunding RB | | | | | | | | |
5.00%, 12/01/27(c) | | | 100 | | | | 121,387 | |
5.00%, 07/01/32 | | | 365 | | | | 460,594 | |
5.00%, 07/01/34 | | | 320 | | | | 402,570 | |
5.00%, 07/01/35 | | | 350 | | | | 440,129 | |
| | | | | | | | |
| Security | | Par
(000) | | | Value | |
| |
| Health (continued) | | | | |
New York State Dormitory Authority, Refunding RB (continued) | | | | | | | | |
5.00%, 07/01/36 | | $ | 275 | | | $ | 345,334 | |
4.00%, 07/01/38 | | | 110 | | | | 128,604 | |
4.00%, 07/01/39 | | | 140 | | | | 163,310 | |
4.00%, 07/01/40 | | | 325 | | | | 377,546 | |
5.00%, 07/01/41 | | | 450 | | | | 560,137 | |
4.00%, 07/01/45 | | | 810 | | | | 919,893 | |
Series A, 5.00%, 05/01/32 | | | 1,270 | | | | 1,472,933 | |
Series A, 5.00%, 05/01/43 | | | 1,570 | | | | 1,805,751 | |
Southold Local Development Corp., RB, 4.00%, 12/01/45 | | | 1,900 | | | | 1,971,611 | |
Suffolk County Economic Development Corp., RB, Series C, 5.00%, 07/01/32 | | | 385 | | | | 434,311 | |
Tompkins County Development Corp., Refunding RB | | | | | | | | |
4.25%, 07/01/44 | | | 1,595 | | | | 1,599,243 | |
5.00%, 07/01/44 | | | 1,145 | | | | 1,246,997 | |
Westchester County Healthcare Corp., Refunding RB | | | | | | | | |
Series A, Senior Lien, 5.00%, 11/01/21(d) | | | 5,135 | | | | 5,217,571 | |
Series B, Senior Lien, 6.00%, 11/01/30 | | | 110 | | | | 110,498 | |
Westchester County Local Development Corp., Refunding RB | | | | | | | | |
4.00%, 01/01/23 | | | 170 | | | | 175,290 | |
5.00%, 01/01/28 | | | 1,805 | | | | 1,909,943 | |
5.00%, 01/01/34 | | | 1,375 | | | | 1,443,282 | |
5.00%, 11/01/34 | | | 500 | | | | 582,560 | |
Yonkers Industrial Development Corp., RB, Series A, AMT, (SONYMA), 5.00%, 10/01/37 | | | 1,640 | | | | 1,644,379 | |
| | | | | | | | |
| | | | | | | 49,295,989 | |
| |
| Housing — 7.0% | | | | |
New York City Housing Development Corp., RB, M/F Housing | | | | | | | | |
4.15%, 11/01/46 | | | 2,805 | | | | 3,040,199 | |
1.75%, 05/01/59(a) | | | 11,000 | | | | 11,063,470 | |
Series B-1, 5.25%, 07/01/30 | | | 500 | | | | 543,660 | |
Series B-1, 5.25%, 07/01/32 | | | 2,755 | | | | 2,986,448 | |
Series B-1, 5.00%, 07/01/33 | | | 650 | | | | 701,285 | |
Series C-2A, 2.35%, 07/01/22 | | | 7,500 | | | | 7,557,900 | |
Series F-2, 0.60%, 05/01/61(a) | | | 5,000 | | | | 4,987,800 | |
Series K, 3.85%, 11/01/38 | | | 4,000 | | | | 4,385,320 | |
Series K, 4.00%, 11/01/48 | | | 4,000 | | | | 4,312,200 | |
Series L, 2.75%, 05/01/50(a) | | | 6,500 | | | | 6,719,050 | |
New York City Housing Development Corp., Refunding RB, M/F Housing | | | | | | | | |
Series B-1B, 2.10%, 11/01/58(a) | | | 3,655 | | | | 3,691,587 | |
Series D, 4.10%, 11/01/38 | | | 2,500 | | | | 2,913,375 | |
New York State Housing Finance Agency, RB, M/F Housing | | | | | | | | |
Series B, (SONYMA), 2.35%, 05/01/22 | | | 5,000 | | | | 5,043,850 | |
Series C, (FHLMC, FNMA, SONYMA GNMA), 2.75%, 11/01/31 | | | 1,000 | | | | 1,041,400 | |
Series D, (SONYMA), 2.05%, 05/01/23 | | | 5,250 | | | | 5,254,882 | |
Series E, (SONYMA), 2.13%, 11/01/23 | | | 2,500 | | | | 2,503,650 | |
Series E, (SONYMA FANNIE MAE), 4.15%, 11/01/47 | | | 165 | | | | 178,520 | |
Series I, (SONYMA FNMA), 1.75%, 05/01/24 | | | 3,000 | | | | 3,024,030 | |
Series P, 1.60%, 11/01/24 | | | 20,000 | | | | 20,100,200 | |
Series A, AMT, (SONYMA), 4.90%, 02/15/38 | | | 645 | | | | 646,587 | |
Series A, AMT, (SONYMA), 5.10%, 02/15/38 | | | 875 | | | | 877,459 | |
Series A, AMT, (SONYMA), 5.00%, 02/15/39 | | | 2,225 | | | | 2,230,540 | |
| | |
SCHEDULE OF INVESTMENTS | | 21 |
| | |
Schedule of Investments (continued) June 30, 2021 | | BlackRock New York Municipal Opportunities Fund (Percentages shown are based on Net Assets) |
| | | | | | | | |
| Security | | Par
(000) | | | Value | |
|
| Housing (continued) | |
New York State Housing Finance Agency, Refunding RB, Series C, (SONYMA FANNIE MAE), 3.85%, 11/01/39 | | $ | 4,425 | | | $ | 4,905,466 | |
State of New York Mortgage Agency, RB, S/F Housing, 49th Series, 3.25%, 10/01/28 | | | 5,000 | | | | 5,118,550 | |
State of New York Mortgage Agency, Refunding RB | | | | | | | | |
218th Series, AMT, 3.25%, 04/01/30 | | | 1,380 | | | | 1,489,972 | |
Series 209, AMT, 3.35%, 04/01/29 | | | 4,385 | | | | 4,759,435 | |
State of New York Mortgage Agency, Refunding RB, S/F Housing, Series 213, 4.10%, 10/01/38 | | | 410 | | | | 464,981 | |
Yonkers Industrial Development Corp., RB | | | | | | | | |
AMT, (SONYMA), 5.25%, 04/01/37 | | | 585 | | | | 586,884 | |
Series A, AMT, (SONYMA), 4.80%, 10/01/26 | | | 490 | | | | 491,612 | |
| | | | | | | | |
| | | | | | | 111,620,312 | |
|
| State — 8.4% | |
New York City Transitional Finance Authority Building Aid Revenue, RB
Sub-Series S1B, (SAW), 4.00%, 07/15/41 | | | 2,500 | | | | 2,939,625 | |
Series S, Subordinate, (SAW), 5.00%, 07/15/40 | | | 4,000 | | | | 4,678,440 | |
Series S-1, Subordinate, (SAW), 5.00%, 07/15/38 | | | 2,250 | | | | 2,843,685 | |
Series S-1, Subordinate, (SAW), 5.00%, 07/15/43 | | | 4,865 | | | | 5,784,144 | |
Series S-3, Subordinate, (SAW), 5.25%, 07/15/36 | | | 2,080 | | | | 2,673,320 | |
Series S-3, Subordinate, (SAW), 5.00%, 07/15/37 | | | 3,015 | | | | 3,800,558 | |
Series S-3, Subordinate, (SAW), 5.25%, 07/15/45 | | | 5,000 | | | | 6,372,800 | |
New York City Transitional Finance Authority Building Aid Revenue, Refunding RB | | | | | | | | |
Series S-3, Subordinate, (SAW), 5.00%, 07/15/37 | | | 7,000 | | | | 8,854,510 | |
Series S-4A, Subordinate, (SAW), 5.25%, 07/15/35 | | | 9,165 | | | | 11,769,051 | |
New York State Dormitory Authority, RB | | | | | | | | |
Series A, 5.00%, 02/15/36 | | | 9,000 | | | | 10,898,100 | |
Series A, 5.00%, 02/15/38 | | | 5,000 | | | | 6,045,900 | |
Series A, 5.00%, 03/15/39 | | | 1,630 | | | | 2,042,846 | |
Series A, 5.00%, 03/15/40 | | | 2,500 | | | | 3,058,525 | |
Series A, 5.00%, 03/15/43 | | | 4,995 | | | | 6,067,327 | |
Series G, 5.00%, 08/15/32 | | | 1,975 | | | | 1,986,317 | |
New York State Dormitory Authority, RB, BAB, Series D, 5.50%, 03/15/30 | | | 2,990 | | | | 3,613,385 | |
New York State Dormitory Authority, Refunding RB | |
Series A, 5.25%, 03/15/39 | | | 7,250 | | | | 9,276,883 | |
Series E, 5.00%, 03/15/40 | | | 5,645 | | | | 7,140,869 | |
Series E, 5.00%, 03/15/41 | | | 3,615 | | | | 4,560,503 | |
New York State Urban Development Corp., RB, Series C, 5.00%, 03/15/30 | | | 250 | | | | 269,995 | |
New York State Urban Development Corp., Refunding RB | |
Series A, 5.00%, 03/15/38 | | | 5,000 | | | | 6,127,650 | |
Series B, 2.77%, 03/15/31 | | | 7,500 | | | | 7,935,375 | |
Series C-3, 5.00%, 03/15/39 | | | 5,000 | | | | 6,214,450 | |
Orange County Industrial Development Agency, RB, Series G-1, (ACA), 4.90%, 07/01/21 | | | 460 | | | | 460,055 | |
Sales Tax Asset Receivable Corp., Refunding RB, 5.00%, 10/15/24(d) | | | 2,715 | | | | 3,128,142 | |
State of New York, Refunding GO, Series B, 1.74%, 03/15/29 | | | 5,000 | | | | 5,106,150 | |
| | | | | | | | |
| | | | | | | 133,648,605 | |
| | | | | | | | |
| Security | | Par
(000) | | | Value | |
|
| Tobacco — 3.3% | |
Chautauqua Tobacco Asset Securitization Corp., Refunding RB, 4.75%, 06/01/39 | | $ | 825 | | | $ | 856,193 | |
Erie Tobacco Asset Securitization Corp., Refunding RB, Series A, 5.00%, 06/01/45 | | | 4,595 | | | | 4,632,955 | |
New York Counties Tobacco Trust IV, Refunding RB | | | | | | | | |
Series A, 6.25%, 06/01/41(c) | | | 2,200 | | | | 2,233,880 | |
Series A, 5.00%, 06/01/42 | | | 3,775 | | | | 3,812,750 | |
Series A, 5.00%, 06/01/45 | | | 895 | | | | 903,905 | |
New York Counties Tobacco Trust VI, Refunding RB | | | | | | | | |
Series A-2-B, 5.00%, 06/01/45 | | | 6,350 | | | | 6,846,697 | |
Series A-2-B, 5.00%, 06/01/51 | | | 3,955 | | | | 4,199,854 | |
Series B, 5.00%, 06/01/28 | | | 90 | | | | 108,640 | |
Series B, 5.00%, 06/01/29 | | | 105 | | | | 126,642 | |
Series C, 4.00%, 06/01/51 | | | 4,055 | | | | 4,124,989 | |
Niagara Tobacco Asset Securitization Corp., Refunding RB | | | | | | | | |
5.25%, 05/15/34 | | | 2,250 | | | | 2,533,680 | |
5.25%, 05/15/40 | | | 1,250 | | | | 1,378,613 | |
TSASC Inc., Refunding RB | | | | | | | | |
Series A, 5.00%, 06/01/30 | | | 775 | | | | 952,584 | |
Series A, 5.00%, 06/01/33 | | | 3,000 | | | | 3,670,290 | |
Series A, 5.00%, 06/01/36 | | | 5,835 | | | | 7,107,030 | |
Westchester Tobacco Asset Securitization Corp., | | | | | | | | |
Refunding RB | | | | | | | | |
Sub-Series C, 4.00%, 06/01/42 | | | 5,420 | | | | 5,933,111 | |
Sub-Series C, 5.13%, 06/01/51 | | | 2,375 | | | | 2,711,727 | |
| | | | | | | | |
| | | | | | | 52,133,540 | |
|
| Transportation — 19.4% | |
Albany County Airport Authority, Refunding RB | | | | | | | | |
Series B, AMT, 4.00%, 12/15/35 | | | 120 | | | | 135,286 | |
Series B, AMT, 4.00%, 12/15/34 | | | 235 | | | | 265,625 | |
Hudson Yards Infrastructure Corp., Refunding RB | | | | | | | | |
Series A, 5.00%, 02/15/35 | | | 2,500 | | | | 3,034,300 | |
Series A, 5.00%, 02/15/36 | | | 2,000 | | | | 2,424,480 | |
Series A, 5.00%, 02/15/39 | | | 2,500 | | | | 3,018,950 | |
Series A, 5.00%, 02/15/42 | | | 27,495 | | | | 32,972,554 | |
Metropolitan Transportation Authority,
Sub-Series D-1, 5.00%, 11/15/39 | | | 4,250 | | | | 4,830,380 | |
Metropolitan Transportation Authority, RB | | | | | | | | |
Series A, 5.00%, 11/15/21(d) | | | 1,000 | | | | 1,017,970 | |
Series A, 5.00%, 11/15/35 | | | 2,500 | | | | 3,046,000 | |
Series A, 5.00%, 11/15/42 | | | 5,000 | | | | 6,008,100 | |
Series A-1, 5.25%, 11/15/23(d) | | | 1,040 | | | | 1,163,011 | |
Series B, 5.25%, 11/15/33 | | | 500 | | | | 564,680 | |
Series B, 5.25%, 11/15/38 | | | 1,855 | | | | 2,088,897 | |
Series B, 5.25%, 11/15/39 | | | 5,795 | | | | 6,521,867 | |
Series B, 5.25%, 11/15/44 | | | 2,125 | | | | 2,384,696 | |
Series E, 5.00%, 11/15/38 | | | 2,350 | | | | 2,575,952 | |
Sub-Series A-1, 5.00%, 11/15/40 | | | 1,645 | | | | 1,897,228 | |
Sub-Series B-1, 5.00%, 11/15/21(d) | | | 460 | | | | 468,266 | |
Sub-Series B-4, 5.00%, 11/15/21(d) | | | 300 | | | | 305,391 | |
Metropolitan Transportation Authority, Refunding RB | | | | | | | | |
2nd Sub Series, (AGM), 0.83%, 11/01/32(a) | | | 675 | | | | 670,409 | |
Series A, 5.25%, 11/15/35 | | | 5,000 | | | | 6,082,550 | |
Series A, (AGM), 5.00%, 11/15/44 | | | 12,500 | | | | 15,504,750 | |
Series B, 5.00%, 11/15/35 | | | 1,750 | | | | 2,113,492 | |
Series B, 5.00%, 11/15/37 | | | 1,500 | | | | 1,785,555 | |
Series B-1, 5.00%, 11/15/36 | | | 13,500 | | | | 16,097,400 | |
Series D, 5.25%, 11/15/23(d) | | | 670 | | | | 749,243 | |
| | |
| 22 | | 2 0 2 1 BLACK ROCK ANNUAL REPORT TO SHAREHOLDERS |
| | |
Schedule of Investments (continued) June 30, 2021 | | BlackRock New York Municipal Opportunities Fund (Percentages shown are based on Net Assets) |
| | | | | | | | |
| Security | | Par
(000) | | | Value | |
|
| Transportation (continued) | |
Metropolitan Transportation Authority, Refunding RB (continued) | | | | | | | | |
Series D, 5.00%, 11/15/35 | | $ | 2,500 | | | $ | 3,096,075 | |
Series F, 5.00%, 11/15/30 | | | 1,500 | | | | 1,592,925 | |
MTA Hudson Rail Yards Trust Obligations, Refunding RB, Series A, 5.00%, 11/15/56 | | | 7,985 | | | | 8,661,090 | |
New York State Thruway Authority Highway & Bridge Trust Fund, Refunding RB, Series A, 5.00%, 04/01/32 | | | 1,000 | | | | 1,035,670 | |
New York State Thruway Authority, RB | | | | | | | | |
Series A, Junior Lien, 5.00%, 01/01/41 | | | 7,440 | | | | 8,719,457 | |
Series A, Junior Lien, 5.25%, 01/01/56 | | | 10,000 | | | | 11,696,200 | |
New York State Thruway Authority, Refunding RB | | | | | | | | |
Series I, 5.00%, 01/01/22(d) | | | 940 | | | | 962,711 | |
Series J, 5.00%, 01/01/41 | | | 5,750 | | | | 6,353,290 | |
Series K, 5.00%, 01/01/29 | | | 5,000 | | | | 5,758,300 | |
Series K, 5.00%, 01/01/31 | | | 2,500 | | | | 2,874,575 | |
Series K, 5.00%, 01/01/32 | | | 1,500 | | | | 1,723,785 | |
Series L, 5.00%, 01/01/33 | | | 2,065 | | | | 2,582,510 | |
Series L, 5.00%, 01/01/34 | | | 910 | | | | 1,130,329 | |
Series L, 5.00%, 01/01/35 | | | 1,050 | | | | 1,304,383 | |
Series M, 2.90%, 01/01/35 | | | 4,000 | | | | 4,269,760 | |
Series B, Subordinate, 4.00%, 01/01/38 | | | 4,560 | | | | 5,380,982 | |
Series B, Subordinate, 4.00%, 01/01/39 | | | 1,500 | | | | 1,758,525 | |
Series B, Subordinate, 4.00%, 01/01/41 | | | 4,900 | | | | 5,730,109 | |
Series B, Subordinate, 4.00%, 01/01/45 | | | 1,500 | | | | 1,743,975 | |
New York Transportation Development Corp., ARB | | | | | | | | |
Series A, AMT, 4.00%, 07/01/31 | | | 7,100 | | | | 7,840,033 | |
Series A, AMT, 5.00%, 07/01/34 | | | 250 | | | | 282,938 | |
Series A, AMT, 5.00%, 07/01/41 | | | 750 | | | | 845,040 | |
Series A, AMT, 5.00%, 07/01/46 | | | 1,500 | | | | 1,682,520 | |
Series A, AMT, 5.25%, 01/01/50 | | | 17,140 | | | | 19,379,341 | |
New York Transportation Development Corp., RB | | | | | | | | |
AMT, 5.00%, 01/01/33 | | | 1,000 | | | | 1,225,020 | |
AMT, 5.00%, 10/01/35 | | | 1,125 | | | | 1,443,937 | |
AMT, 5.00%, 10/01/40 | | | 3,040 | | | | 3,844,810 | |
New York Transportation Development Corp., Refunding RB, 5.00%, 12/01/34 | | | 3,790 | | | | 4,975,398 | |
Niagara Falls Bridge Commission, RB, (AGM), 4.16%, 10/01/33 | | | 1,650 | | | | 1,799,770 | |
Niagara Frontier Transportation Authority, Refunding ARB | | | | | | | | |
AMT, 5.00%, 04/01/32 | | | 400 | | | | 498,476 | |
AMT, 5.00%, 04/01/33 | | | 375 | | | | 465,488 | |
AMT, 5.00%, 04/01/34 | | | 225 | | | | 278,462 | |
AMT, 5.00%, 04/01/35 | | | 200 | | | | 247,084 | |
AMT, 5.00%, 04/01/36 | | | 210 | | | | 258,924 | |
AMT, 5.00%, 04/01/37 | | | 250 | | | | 307,535 | |
AMT, 5.00%, 04/01/38 | | | 250 | | | | 306,930 | |
AMT, 5.00%, 04/01/39 | | | 175 | | | | 214,470 | |
Port Authority of New York & New Jersey, ARB, 218th Series, AMT, 4.00%, 11/01/41 | | | 8,090 | | | | 9,383,510 | |
Port Authority of New York & New Jersey, Refunding ARB | | | | | | | | |
Series 179, 5.00%, 12/01/38 | | | 150 | | | | 166,103 | |
178th Series, AMT, 5.00%, 12/01/32 | | | 2,270 | | | | 2,509,099 | |
178th Series, AMT, 5.00%, 12/01/43 | | | 285 | | | | 313,178 | |
193rd Series, AMT, 5.00%, 10/15/34 | | | 3,445 | | | | 4,042,122 | |
195th Series, AMT, 5.00%, 04/01/36 | | | 4,680 | | | | 5,703,937 | |
202nd Series, AMT, 5.00%, 04/15/37 | | | 5,000 | | | | 6,101,000 | |
| | | | | | | | |
| Security | | Par
(000) | | | Value | |
|
| Transportation (continued) | |
Port Authority of New York & New Jersey, Refunding ARB (continued) | | | | | | | | |
206th Series, AMT, 5.00%, 11/15/37 | | $ | 1,525 | | | $ | 1,868,826 | |
Consolidated, 169th Series, AMT, 5.00%, 10/15/41 | | | 1,000 | | | | 1,012,690 | |
Consolidated, 186th Series, AMT, 5.00%, 10/15/44 | | | 1,000 | | | | 1,130,620 | |
Series 197, AMT, 5.00%, 11/15/41 | | | 1,250 | | | | 1,519,937 | |
Triborough Bridge & Tunnel Authority, RB | | | | | | | | |
Series A, 5.00%, 11/01/25 | | | 7,500 | | | | 8,936,325 | |
Series A, 5.00%, 11/15/51 | | | 2,500 | | | | 3,233,650 | |
Series B-3, 5.00%, 11/15/33 | | | 500 | | | | 594,135 | |
Triborough Bridge & Tunnel Authority, Refunding RB | | | | | | | | |
Series A, 5.00%, 01/01/22(d) | | | 500 | | | | 512,080 | |
Series A, 5.00%, 11/15/50 | | | 1,000 | | | | 1,154,730 | |
Series B, 5.00%, 11/15/37 | | | 10,070 | | | | 12,462,934 | |
Series C, 5.00%, 11/15/37 | | | 6,000 | | | | 7,614,900 | |
| | | | | | | | |
| | | | | | | 308,257,635 | |
| |
| Utilities — 9.3% | | | | |
Long Island Power Authority, RB | | | | | | | | |
5.00%, 09/01/36 | | | 1,080 | | | | 1,337,418 | |
5.00%, 09/01/37 | | | 2,000 | | | | 2,525,380 | |
5.00%, 09/01/38 | | | 4,200 | | | | 5,299,518 | |
5.00%, 09/01/39 | | | 8,000 | | | | 10,083,520 | |
Series B, 1.65%, 09/01/49(a) | | | 5,000 | | | | 5,170,750 | |
Series C, (AGC), 5.25%, 09/01/29 | | | 3,500 | | | | 4,548,670 | |
Long Island Power Authority, Refunding RB, Series B, 5.00%, 09/01/46 | | | 2,075 | | | | 2,472,881 | |
New York City Water & Sewer System, RB | | | | | | | | |
Series AA, 4.00%, 06/15/43 | | | 5,000 | | | | 6,027,150 | |
Series DD, 5.25%, 06/15/47 | | | 2,455 | | | | 3,001,017 | |
New York City Water & Sewer System, Refunding RB | | | | | | | | |
4.00%, 06/15/40 | | | 5,000 | | | | 5,958,400 | |
Series BB, 5.00%, 06/15/47 | | | 2,000 | | | | 2,129,920 | |
Series BB-2, 0.02%, 06/15/49(a) | | | 15,000 | | | | 15,000,000 | |
Series DD-2, 5.00%, 06/15/40 | | | 4,850 | | | | 6,053,382 | |
Series EE, 5.00%, 06/15/37 | | | 2,735 | | | | 3,372,528 | |
Series EE, 5.25%, 06/15/37 | | | 1,075 | | | | 1,350,544 | |
Series EE, 5.00%, 06/15/40 | | | 8,355 | | | | 10,356,190 | |
Series FF, 5.00%, 06/15/40 | | | 11,500 | | | | 14,416,170 | |
Series HH, 5.00%, 06/15/39 | | | 1,000 | | | | 1,168,360 | |
Series CC-3, Subordinate, 5.00%, 06/15/32 | | | 5,000 | | | | 6,803,450 | |
Sub-Series FF-2, Subordinate, 4.00%, 06/15/41 | | | 2,500 | | | | 2,967,950 | |
New York Power Authority, Refunding RB, Series A, 5.00%, 11/15/21(d) | | | 600 | | | | 610,782 | |
New York State Environmental Facilities Corp., Refunding RB, Series A, 5.00%, 06/15/32 | | | 5,000 | | | | 5,456,250 | |
Suffolk County Water Authority, Refunding RB, Series A, 3.75%, 06/01/36 | | | 5,815 | | | | 6,179,426 | |
Utility Debt Securitization Authority, Refunding RB | | | | | |
5.00%, 12/15/37 | | | 5,000 | | | | 5,942,650 | |
Series TE, Restructured, 5.00%, 12/15/32 | | | 1,000 | | | | 1,110,190 | |
Series TE, Restructured, 5.00%, 12/15/41 | | | 16,760 | | | | 18,536,895 | |
| | | | | | | | |
| | | | | | | 147,879,391 | |
| | | | | | | | |
| | |
Total Municipal Bonds in New York | | | | | | | 1,258,174,880 | |
|
Puerto Rico — 8.3% | |
|
| State — 5.1% | |
Commonwealth of Puerto Rico, GO(f)(g) | | | | | | | | |
Series A, 5.25%, 07/01/22 | | | 440 | | | | 404,928 | |
Series A, 5.25%, 07/01/26 | | | 150 | | | | 138,044 | |
Series A, 5.13%, 07/01/31 | | | 1,560 | | | | 1,435,656 | |
| | |
SCHEDULE OF INVESTMENTS | | 23 |
| | |
Schedule of Investments (continued) June 30, 2021 | | BlackRock New York Municipal Opportunities Fund (Percentages shown are based on Net Assets) |
| | | | | | | | |
| Security | | Par
(000) | | | Value | |
| | |
| State (continued) | | | | | | |
Commonwealth of Puerto Rico, GO(f)(g) (continued) | | | | | |
Series A, 5.38%, 07/01/33 | | $ | 475 | | | $ | 437,139 | |
Series A, 6.00%, 07/01/38 | | | 1,885 | | | | 1,760,119 | |
Series B, 5.25%, 07/01/17 | | | 205 | | | | 187,063 | |
Commonwealth of Puerto Rico, Refunding
GO(f)(g) | | | | | | | | |
Series A, 5.50%, 07/01/18 | | | 330 | | | | 301,125 | |
Series A, 5.50%, 07/01/32 | | | 545 | | | | 501,559 | |
Series A, 6.00%, 07/01/34 | | | 445 | | | | 411,625 | |
Series A, 8.00%, 07/01/35 | | | 13,150 | | | | 10,866,279 | |
Series A, 5.50%, 07/01/39 | | | 4,190 | | | | 3,678,921 | |
Series A, 5.00%, 07/01/41 | | | 6,765 | | | | 5,623,406 | |
Series B, 6.00%, 07/01/39 | | | 750 | | | | 700,312 | |
Series C, 6.00%, 07/01/39 | | | 220 | | | | 205,425 | |
Series D, 5.75%, 07/01/41 | | | 520 | | | | 467,675 | |
Puerto Rico Public Buildings Authority, Refunding RB(f)(g) | | | | | | | | |
Series F, (GTD), 5.25%, 07/01/24 | | | 260 | | | | 264,767 | |
Series M-2, (GTD), 10.00%, 07/01/34 | | | 490 | | | | 532,875 | |
Puerto Rico Sales Tax Financing Corp. ST Revenue, RB | | | | | | | | |
Series A-1, Restructured, 4.75%, 07/01/53 | | | 16,715 | | | | 18,955,980 | |
Series A-1, Restructured, 5.00%, 07/01/58 | | | 7,337 | | | | 8,456,846 | |
Series A-2, Restructured, 4.33%, 07/01/40 | | | 10,560 | | | | 11,864,899 | |
Series A-2, Restructured, 4.54%, 07/01/53 | | | 49 | | | | 54,933 | |
Series A-2, Restructured, 4.78%, 07/01/58 | | | 7,067 | | | | 8,024,366 | |
Puerto Rico Sales Tax Financing Corp. ST Revenue, RB, CAB(e) | | | | | | | | |
Series A-1, Restructured, 0.00%, 07/01/29 | | | 490 | | | | 433,675 | |
Series A-1, Restructured, 0.00%, 07/01/31 | | | 582 | | | | 466,473 | |
Series A-1, Restructured, 0.00%, 07/01/33 | | | 841 | | | | 626,200 | |
Series A-1, Restructured, 0.00%, 07/01/46 | | | 4,317 | | | | 1,421,243 | |
Series A-1, Restructured, 0.00%, 07/01/51 | | | 6,111 | | | | 1,456,251 | |
Series B-1, Restructured, 0.00%, 07/01/46 | | | 2,677 | | | | 882,071 | |
| | | | | | | | |
| | | | | | | 80,559,855 | |
| | |
| Tobacco — 0.0% | | | | | | |
Children’s Trust Fund, RB, Series B, 0.00%, 05/15/57(e) | | | — | | | | — | |
Children’s Trust Fund, Refunding RB, 5.63%, 05/15/43 | | | 225 | | | | 227,961 | |
| | | | | | | | |
| | | | | | | 227,961 | |
| | |
| Utilities — 3.2% | | | | | | |
Puerto Rico Commonwealth Aqueduct & Sewer Authority, RB | | | | | | | | |
Series A, Senior Lien, 5.00%, 07/01/33 | | | 355 | | | | 367,478 | |
Series A, Senior Lien, 5.13%, 07/01/37 | | | 100 | | | | 103,561 | |
Puerto Rico Electric Power Authority, 3rd Series, 5.40%, 01/01/22(a)(f)(g) | | | 278 | | | | 273,340 | |
Puerto Rico Electric Power Authority, RB | | | | | | | | |
Series A, 5.00%, 07/01/29(f)(g) | | | 1,860 | | | | 1,817,255 | |
Series A, 7.00%, 07/01/33(f)(g) | | | 1,025 | | | | 1,023,399 | |
Series A, 6.75%, 07/01/36(f)(g) | | | 3,560 | | | | 3,554,439 | |
Series A, 5.00%, 07/01/42(f)(g) | | | 3,150 | | | | 3,077,610 | |
Series A, 7.00%, 07/01/43(f)(g) | | | 410 | | | | 409,360 | |
Series A-3, 10.00%, 07/01/19(f)(g) | | | 999 | | | | 1,049,005 | |
Series B-3, 10.00%, 07/01/19(f)(g) | | | 999 | | | | 1,049,005 | |
Series C-1, 5.40%, 01/01/18(f)(g) | | | 2,745 | | | | 2,703,667 | |
Series C-2, 5.40%, 07/01/18(f)(g) | | | 2,745 | | | | 2,704,105 | |
Series C-4, 5.40%, 07/01/20(f)(g) | | | 277 | | | | 273,340 | |
Series CCC, 5.25%, 07/01/26(f)(g) | | | 770 | | | | 752,305 | |
| | | | | | | | |
| Security | | Par
(000) | | | Value | |
| | |
| Utilities (continued) | | | | | | |
Puerto Rico Electric Power Authority, RB (continued) | | | | | | | | |
Series CCC, 5.25%, 07/01/28(f)(g) | | $ | 440 | | | $ | 429,888 | |
Series D-4, 7.50%, 07/01/20 | | | 762 | | | | 760,810 | |
Series TT, 5.00%, 07/01/25(f)(g) | | | 210 | | | | 205,174 | |
Series TT, 5.00%, 07/01/26(f)(g) | | | 565 | | | | 552,016 | |
Series WW, 5.50%, 07/01/17(f)(g) | | | 610 | | | | 600,850 | |
Series WW, 5.50%, 07/01/18(f)(g) | | | 535 | | | | 526,975 | |
Series WW, 5.50%, 07/01/19(f)(g) | | | 435 | | | | 428,475 | |
Series WW, 5.38%, 07/01/24(f)(g) | | | 385 | | | | 376,152 | |
Series WW, 5.25%, 07/01/33(f)(g) | | | 420 | | | | 410,348 | |
Series WW, 5.50%, 07/01/38(f)(g) | | | 520 | | | | 508,050 | |
Series XX, 5.25%, 07/01/27(f)(g) | | | 285 | | | | 278,450 | |
Series XX, 5.25%, 07/01/35(f)(g) | | | 185 | | | | 180,749 | |
Series XX, 5.75%, 07/01/36(f)(g) | | | 260 | | | | 254,025 | |
Series XX, 5.25%, 07/01/40(f)(g) | | | 5,345 | | | | 5,222,167 | |
Puerto Rico Electric Power Authority, Refunding RB | | | | | | | | |
Series AAA, 5.25%, 07/01/22(f)(g) | | | 990 | | | | 967,249 | |
Series AAA, 5.25%, 07/01/23(f)(g) | | | 2,670 | | | | 2,608,641 | |
Series AAA, 5.25%, 07/01/28(f)(g) | | | 5,655 | | | | 5,525,042 | |
Series AAA, 5.25%, 07/01/29(f)(g) | | | 235 | | | | 229,600 | |
Series BBB, 5.40%, 07/01/28(f)(g) | | | 1,240 | | | | 1,184,588 | |
Series UU, 1.16%, 07/01/17(a)(f)(g) | | | 185 | | | | 150,775 | |
Series UU, 1.00%, 07/01/18(a)(f)(g) | | | 165 | | | | 134,475 | |
Series UU, 1.00%, 07/01/20(a)(f)(g) | | | 1,475 | | | | 1,312,086 | |
Series UU, 0.80%, 07/01/31(a)(f)(g) | | | 1,755 | | | | 1,561,160 | |
Series ZZ, 5.00%, 07/01/17(f)(g) | | | 430 | | | | 423,550 | |
Series ZZ, 5.25%, 07/01/19(f)(g) | | | 1,370 | | | | 1,349,450 | |
Series ZZ, 5.00%, 07/01/20 | | | 2,220 | | | | 2,186,700 | |
Series ZZ, 5.25%, 07/01/24(f)(g) | | | 875 | | | | 854,892 | |
Series ZZ, 5.00%, 07/01/28(f)(g) | | | 435 | | | | 425,003 | |
Puerto Rico Electric Power Authority, Refunding RB, BAB, Series YY, 6.13%, 07/01/40(f)(g) | | | 1,860 | | | | 1,776,882 | |
| | | | | | | | |
| | | | | | | 50,582,091 | |
| | | | | | | | |
| |
Total Municipal Bonds in Puerto Rico | | | | 131,369,907 | |
| | | | | | | | |
| |
Total Municipal Bonds — 89.0%
(Cost: $1,281,708,761) | | | | 1,411,125,216 | |
| | | | | | | | |
|
Municipal Bonds Transferred to Tender Option Bond Trusts(h) | |
| | |
New York — 13.3% | | | | | | | | |
|
| County/City/Special District/School District — 2.8% | |
City of New York, GO | | | | | | | | |
Sub-Series 1-I, 5.00%, 03/01/32 | | | 991 | | | | 1,108,978 | |
Sub-Series F-1, 5.00%, 04/01/39 | | | 10,000 | | | | 12,388,098 | |
Sub-Series I-1, 5.00%, 03/01/36 | | | 1,750 | | | | 1,954,575 | |
Sub-Series-D1, Series D, 5.00%, 12/01/43(i) | | | 1,010 | | | | 1,267,065 | |
Hudson Yards Infrastructure Corp., RB, 5.75%, 02/15/47(i) | | | 956 | | | | 961,061 | |
New York City Transitional Finance Authority Future Tax Secured Revenue, Sub-Series B-1, 4.00%, 11/01/45 | | | 10,000 | | | | 11,744,800 | |
New York City Transitional Finance Authority Future Tax Secured Revenue, RB | | | | | | | | |
Sub-Series B-1, 5.00%, 08/01/36 | | | 3,001 | | | | 3,620,385 | |
Sub-Series D-1, 5.00%, 11/01/38 | | | 2,475 | | | | 2,513,660 | |
| | |
| 24 | | 2 0 2 1 BLACK ROCK ANNUAL REPORT TO SHAREHOLDERS |
| | |
Schedule of Investments (continued) June 30, 2021 | | BlackRock New York Municipal Opportunities Fund (Percentages shown are based on Net Assets) |
| | | | | | | | |
| Security | | Par
(000) | | | Value | |
|
| County/City/Special District/School District (continued) | |
New York City Transitional Finance Authority Future Tax Secured Revenue, RB (continued) | | | | | | | | |
Sub-Series F-1, 5.00%, 05/01/38 | | $ | 3,448 | | | $ | 4,247,934 | |
New York Convention Center Development Corp., Refunding RB, 5.00%, 11/15/32 | | | 3,540 | | | | 4,184,811 | |
| | | | | | | | |
| | | | | | | 43,991,367 | |
| | |
| Housing — 0.0% | | | | | | |
New York City Housing Development Corp., Refunding RB, Series A, 4.25%, 11/01/43 | | | 640 | | | | 711,104 | |
| | | | | | | | |
| | |
| State — 4.8% | | | | | | |
New York State Dormitory Authority, RB | | | | | | | | |
Series A, 5.00%, 03/15/32 | | | 5,000 | | | | 6,334,350 | |
Series A, 5.00%, 02/15/34 | | | 10,000 | | | | 12,127,197 | |
Series A, 5.00%, 03/15/39 | | | 15,393 | | | | 18,831,137 | |
New York State Dormitory Authority, Refunding RB | | | | | | | | |
Series A, 5.00%, 03/15/36(i) | | | 1,995 | | | | 2,426,858 | |
Series C, 5.00%, 03/15/39 | | | 9,000 | | | | 11,279,520 | |
New York State Thruway Authority, Refunding RB, | | | | | | | | |
Series A, 5.00%, 03/15/31 | | | 2,160 | | | | 2,181,038 | |
New York State Urban Development Corp., RB | | | | | | | | |
Series A, 4.00%, 03/15/47 | | | 1,497 | | | | 1,733,757 | |
Series A-1, 5.00%, 03/15/32 | | | 1,499 | | | | 1,617,689 | |
New York State Urban Development Corp., Refunding RB | | | | | | | | |
Series A, 4.00%, 03/15/37 | | | 8,740 | | | | 9,960,279 | |
Series A, 5.00%, 03/15/45 | | | 6,004 | | | | 7,023,543 | |
Sales Tax Asset Receivable Corp., Refunding RB(d) | | | | | | | | |
Series A, 4.00%, 10/15/24 | | | 1,440 | | | | 1,611,590 | |
Series A, 5.00%, 10/15/24 | | | 1,245 | | | | 1,434,626 | |
| | | | | | | | |
| | | | | | | 76,561,584 | |
| | |
| Transportation — 3.5% | | | | | | |
Metropolitan Transportation Authority, Refunding RB, Series B-1, 5.00%, 11/15/51 | | | 10,000 | | | | 11,820,297 | |
New York Liberty Development Corp., ARB, 5.25%, 12/15/43 | | | 7,125 | | | | 7,279,836 | |
New York Liberty Development Corp., Refunding RB, Class 1, 5.00%, 09/15/40 | | | 1,050 | | | | 1,084,094 | |
New York State Thruway Authority, Refunding RB, Subordinate, Series B, 4.00%, 01/01/53(i) | | | 1,156 | | | | 1,341,381 | |
Port Authority of New York & New Jersey, ARB, AMT, Series 221, 4.00%, 07/15/60 | | | 479 | | | | 554,769 | |
Port Authority of New York & New Jersey, Refunding ARB | | | | | | | | |
178th Series, AMT, 5.00%, 12/01/32 | | | 991 | | | | 1,095,372 | |
194th Series, 5.25%, 10/15/55 | | | 2,310 | | | | 2,728,272 | |
Consolidated, 169th Series, AMT, 5.00%, 10/15/26 | | | 2,250 | | | | 2,279,925 | |
Consolidated, Series 211, 5.00%, 09/01/48 | | | 960 | | | | 1,210,685 | |
Triborough Bridge & Tunnel Authority, RB, Series A, 4.00%, 11/15/54(i) | | | 1,606 | | | | 1,896,630 | |
Triborough Bridge & Tunnel Authority, Refunding RB | | | | | | | | |
Series A, 5.00%, 11/15/41 | | | 10,000 | | | | 11,921,100 | |
Series A, 5.00%, 11/15/46 | | | 500 | | | | 596,075 | |
Series B, 5.00%, 11/15/38 | | | 9,000 | | | | 11,125,350 | |
| | | | | | | | |
| | | | | | | 54,933,786 | |
| | | | | | | | |
| Security | | Par
(000) | | | Value | |
| | |
| Utilities — 2.2% | | | | | | |
New York City Water & Sewer System, Refunding RB | | | | | | | | |
5.00%, 06/15/38(i) | | $ | 7,504 | | | $ | 9,306,956 | |
Series BB, 5.00%, 06/15/44 | | | 5,251 | | | | 5,360,269 | |
New York Power Authority, Refunding RB, Series A, 4.00%, 11/15/60 | | | 872 | | | | 1,025,218 | |
Utility Debt Securitization Authority, Refunding RB | | | | | | | | |
5.00%, 12/15/41 | | | 7,800 | | | | 9,774,492 | |
Series A, 5.00%, 12/15/34 | | | 5,000 | | | | 6,045,950 | |
Series A, Restructured, 5.00%, 12/15/35 | | | 1,000 | | | | 1,208,970 | |
Series B, 4.00%, 12/15/35 | | | 1,580 | | | | 1,833,416 | |
| | | | | | | | |
| | | | | | | 34,555,271 | |
| | | | | | | | |
| | |
Total Municipal Bonds in New York | | | | | | | 210,753,112 | |
| | | | | | | | |
| | |
Total Municipal Bonds Transferred to Tender Option Bond Trusts — 13.3%
(Cost: $192,874,668) | | | | | | | 210,753,112 | |
| | | | | | | | |
| | |
Total Long-Term Investments — 103.4%
(Cost: $1,492,092,355) | | | | | | | 1,640,120,147 | |
| | | | | | | | |
| | |
| | | Shares | | | | |
| | |
| Short-Term Securities | | | | | | |
| | |
| Money Market Funds — 2.1% | | | | | | |
BlackRock Liquidity Funds New York Money Fund Portfolio, 0.01%(j)(k) | | | 32,939,572 | | | | 32,939,572 | |
| | | | | | | | |
| |
Total Short-Term Securities — 2.1%
(Cost: $32,937,129) | | | | 32,939,572 | |
| | | | | | | | |
| |
Total Investments — 105.5%
(Cost: $1,525,029,484) | | | | 1,673,059,719 | |
| |
Other Assets Less Liabilities — 1.1% | | | | 18,127,064 | |
| |
Liability for TOB Trust Certificates, Including Interest Expense and Fees Payable — (6.6)% | | | | (104,948,628 | ) |
| | | | | | | | |
| |
Net Assets — 100.0% | | | $ | 1,586,238,155 | |
| | | | | | | | |
| (a) | Variable rate security. Interest rate resets periodically. The rate shown is the effective interest rate as of period end. Security description also includes the reference rate and spread if published and available. |
| (b) | When-issued security. |
| (c) | Security exempt from registration pursuant to Rule 144A under the Securities Act of 1933, as amended. These securities may be resold in transactions exempt from registration to qualified institutional investors. |
| (d) | U.S. Government securities held in escrow, are used to pay interest on this security as well as to retire the bond in full at the date indicated, typically at a premium to par. |
| (f) | Issuer filed for bankruptcy and/or is in default. |
| (g) | Non-income producing security. |
| (h) | Represent bonds transferred to a TOB Trust in exchange of cash and residual certificates received by the Fund. These bonds serve as collateral in a secured borrowing. See Note 4 of the Notes to Financial Statements for details. |
| (i) | All or a portion of the security is subject to a recourse agreement. The aggregate maximum potential amount the Fund could ultimately be required to pay under the agreements, which expire between September 15, 2024 to February 15, 2047, is $8,273,103. See Note 4 of the Notes to Financial Statements for details. |
| (j) | Affiliate of the Fund. |
| (k) | Annualized 7-day yield as of period end. |
| | |
SCHEDULE OF INVESTMENTS | | 25 |
| | |
Schedule of Investments (continued) June 30, 2021 | | BlackRock New York Municipal Opportunities Fund |
Affiliates
Investments in issuers considered to be affiliate(s) of the Fund during the year ended June 30, 2021 for purposes of Section 2(a)(3) of the Investment Company Act of 1940, as amended, were as follows:
| | | | | | | | | | | | | | | | | | | | | | | | | | | | | | | | | | | | |
| Affiliated Issuer | | Value at
06/30/20 | | | Purchases
at Cost | | | Proceeds
from Sales | | | Net
Realized
Gain (Loss) | | | Change in
Unrealized
Appreciation
(Depreciation) | | | Value at
06/30/21 | | | Shares
Held at
06/30/21 | | | Income | | | Capital Gain
Distributions
from
Underlying
Funds | |
BlackRock Liquidity Funds New York Money Fund Portfolio | | $ | 72,755,940 | | | $ | — | | | $ | (39,818,813 | )(a) | | $ | 3,511 | | | $ | (1,066 | ) | | $ | 32,939,572 | | | | 32,939,572 | | | $ | 5,376 | | | $ | — | |
| | | | | | | | | | | | | | | | | | | | | | | | | | | | | | | | | | | | |
| | (a) | Represents net amount purchased (sold). | |
Derivative Financial Instruments Outstanding as of Period End
Futures Contracts
| | | | | | | | | | | | | | | | |
| Description | | Number of
Contracts | | | Expiration
Date | | | Notional
Amount (000) | | | Value/
Unrealized
Appreciation
(Depreciation)
| |
Short Contracts | | | | | | | | | | | | | | | | |
10-Year U.S. Treasury Note | | | 1,951 | | | | 09/21/21 | | | $ | 258,355 | | | $ | (607,232 | ) |
U.S. Long Bond | | | 939 | | | | 09/21/21 | | | | 150,768 | | | | (3,637,956 | ) |
5-Year U.S. Treasury Note | | | 776 | | | | 09/30/21 | | | | 95,745 | | | | (50,347 | ) |
| | | | | | | | | | | | | | | | |
| | | | | | | | | | | | | | $ | (4,295,535 | ) |
| | | | | | | | | | | | | | | | |
Derivative Financial Instruments Categorized by Risk Exposure
As of period end, the fair values of derivative financial instruments located in the Statements of Assets and Liabilities were as follows:
| | | | | | | | | | | | | | | | | | | | | | | | | | | | |
| | | Commodity
Contracts | | | Credit
Contracts | | | Equity
Contracts | | | Foreign
Currency
Exchange
Contracts | | | Interest
Rate
Contracts | | | Other
Contracts | | | Total | |
Liabilities — Derivative Financial Instruments | | | | | | | | | | | | | |
Futures contracts | | | | | | | | | | | | | | | | | | | | | | | | | | | | |
Unrealized depreciation on futures contracts(a) | | $ | — | | | $ | — | | | $ | — | | | $ | — | | | $ | 4,295,535 | | | $ | — | | | $ | 4,295,535 | |
| | | | | | | | | | | | | | | | | | | | | | | | | | | | |
| | (a) | Net cumulative unrealized appreciation (depreciation) on futures contracts and centrally cleared swaps, if any, are reported in the Schedule of Investments. In the Statements of Assets and Liabilities, only current day’s variation margin is reported in receivables or payables and the net cumulative unrealized appreciation (depreciation) is included in accumulated earnings (loss). | |
For the year ended June 30, 2021, the effect of derivative financial instruments in the Statements of Operations was as follows:
| | | | | | | | | | | | | | | | | | | | | | | | | | | | |
| | | Commodity
Contracts | | | Credit
Contracts | | | Equity
Contracts | | | Foreign
Currency
Exchange
Contracts | | | Interest
Rate
Contracts | | | Other
Contracts | | | Total | |
Net Realized Gain (Loss) from | | | | | | | | | | | | | | | | | | | | | | | | | | | | |
Futures contracts | | $ | — | | | $ | — | | | $ | — | | | $ | — | | | $ | 18,742,094 | | | $ | — | | | $ | 18,742,094 | |
| | | | | | | | | | | | | | | | | | | | | | | | | | | | |
| | | | | | | |
| Net Change in Unrealized Appreciation (Depreciation) on | | | | | | | | | | | | | | | | | | | | | |
Futures contracts | | $ | — | | | $ | — | | | $ | — | | | $ | — | | | $ | 2,355,708 | | | $ | — | | | $ | 2,355,708 | |
| | | | | | | | | | | | | | | | | | | | | | | | | | | | |
Average Quarterly Balances of Outstanding Derivative Financial Instruments
| | | | |
Futures contracts | | | | |
Average notional value of contracts — short | | $ | 457,780,152 | |
For more information about the Fund’s investment risks regarding derivative financial instruments, refer to the Notes to Financial Statements.
| | |
| 26 | | 2 0 2 1 BLACK ROCK ANNUAL REPORT TO SHAREHOLDERS |
| | |
Schedule of Investments (continued) June 30, 2021 | | BlackRock New York Municipal Opportunities Fund |
Fair Value Hierarchy as of Period End
Various inputs are used in determining the fair value of financial instruments. For a description of the input levels and information about the Fund’s policy regarding valuation of financial instruments, refer to the Notes to Financial Statements.
The following table summarizes the Fund’s financial instruments categorized in the fair value hierarchy. The breakdown of the Fund’s financial instruments into major categories is disclosed in the Schedule of Investments above.
| | | | | | | | | | | | | | | | |
| | | Level 1 | | | Level 2 | | | Level 3 | | | Total | |
Assets | | | | | | | | | | | | | | | | |
Investments | | | | | | | | | | | | | | | | |
Long-Term Investments | | | | | | | | | | | | | | | | |
Corporate Bonds | | $ | — | | | $ | 18,241,819 | | | $ | — | | | $ | 18,241,819 | |
Municipal Bonds | | | — | | | | 1,411,125,216 | | | | — | | | | 1,411,125,216 | |
Municipal Bonds Transferred to Tender Option Bond Trusts | | | — | | | | 210,753,112 | | | | — | | | | 210,753,112 | |
Short-Term Securities | | | | | | | | | | | | | | | | |
Money Market Funds | | | 32,939,572 | | | | — | | | | — | | | | 32,939,572 | |
| | | | | | | | | | | | | | | | |
| | $ | 32,939,572 | | | $ | 1,640,120,147 | | | $ | — | | | $ | 1,673,059,719 | |
| | | | | | | | | | | | | | | | |
Derivative Financial Instruments(a) | | | | | | | | | | | | | | | | |
Liabilities | | | | | | | | | | | | | | | | |
| | | | | | | | | | | | | | | | |
Interest Rate Contracts | | $ | (4,295,535 | ) | | $ | — | | | $ | — | | | $ | (4,295,535 | ) |
| | | | | | | | | | | | | | | | |
| | (a) | Derivative financial instruments are futures contracts. Futures contracts are valued at the unrealized appreciation (depreciation) on the instrument. | |
The Fund may hold assets and/or liabilities in which the fair value approximates the carrying amount for financial statement purposes. As of period end, TOB Trust Certificates of $104,930,048 are categorized as Level 2 within the fair value hierarchy.
See notes to financial statements.
| | |
SCHEDULE OF INVESTMENTS | | 27 |
| | |
Schedule of Investments June 30, 2021 | | BlackRock High Yield Municipal Fund (Percentages shown are based on Net Assets) |
| | | | | | | | |
| Security | | Par
(000) | | | Value | |
|
Municipal Bonds | |
|
| Alabama — 1.7% | |
Chelsea Park Cooperative District, SAB, 5.00%, 05/01/48 | | $ | 945 | | | $ | 993,913 | |
County of Jefferson Alabama Sewer Revenue, Refunding RB
Series A, Senior Lien, (AGM), 5.00%, 10/01/44 | | | 365 | | | | 402,989 | |
Series D, Sub Lien, 7.00%, 10/01/51 | | | 2,355 | | | | 2,742,916 | |
Series D, Sub-Lien, 6.50%, 10/01/53 | | | 3,465 | | | | 3,982,879 | |
Hoover Industrial Development Board, RB, AMT, 6.38%, 11/01/50(a) | | | 7,155 | | | | 9,126,131 | |
Southeast Energy Authority A Cooperative District, RB, Series B, 4.00%, 12/01/51(a) | | | 7,590 | | | | 9,398,014 | |
Tuscaloosa County Industrial Development Authority, Refunding RB(b) | | | | | | | | |
Series A, 4.50%, 05/01/32 | | | 1,161 | | | | 1,253,500 | |
Series A, 5.25%, 05/01/44 | | | 6,430 | | | | 7,328,528 | |
| | | | | | | | |
| | | | | | | 35,228,870 | |
|
| Alaska — 0.2% | |
Northern Tobacco Securitization Corp., Refunding RB, Series B-2, 0.00%,
06/01/66(c)(d) | | | 22,235 | | | | 4,976,638 | |
| | | | | | | | |
|
| American Samoa — 0.1% | |
American Samoa Economic Development Authority RB, Series A, 5.00%, 09/01/38(b) | | | 1,235 | | | | 1,522,335 | |
| | | | | | | | |
|
| Arizona — 2.3% | |
Arizona Industrial Development Authority,
RB(b) | | | | | | | | |
5.00%, 07/01/45 | | | 1,135 | | | | 1,255,287 | |
7.10%, 01/01/55 | | | 4,760 | | | | 4,837,493 | |
5.00%, 07/01/55 | | | 1,215 | | | | 1,321,106 | |
Series A, 5.00%, 07/01/39 | | | 1,270 | | | | 1,353,185 | |
Series A, 5.00%, 12/15/39 | | | 150 | | | | 175,370 | |
Series A, 5.00%, 07/01/49 | | | 2,790 | | | | 2,937,116 | |
Series A, 5.00%, 07/15/49 | | | 675 | | | | 756,783 | |
Series A, 5.00%, 12/15/49 | | | 345 | | | | 394,601 | |
Series A, 5.00%, 07/01/54 | | | 1,110 | | | | 1,164,590 | |
Series B, 5.13%, 07/01/47 | | | 420 | | | | 475,629 | |
Series B, 5.25%, 07/01/51 | | | 570 | | | | 645,702 | |
Arizona Industrial Development Authority, Refunding RB(b) | | | | | | | | |
Series A, 5.00%, 07/01/26 | | | 760 | | | | 850,615 | |
Series A, 5.25%, 07/01/47 | | | 3,235 | | | | 3,682,174 | |
Series A, 5.50%, 07/01/52 | | | 2,970 | | | | 3,224,796 | |
Florence Town, Inc. Industrial Development Authority, RB, 6.00%, 07/01/43 | | | 1,375 | | | | 1,467,757 | |
Glendale Industrial Development Authority, RB 5.00%, 05/15/41 | | | 275 | | | | 311,429 | |
5.00%, 05/15/56 | | | 1,090 | | | | 1,213,333 | |
Industrial Development Authority of the City of Phoenix, RB
5.00%, 07/01/54 | | | 1,330 | | | | 1,578,484 | |
5.00%, 07/01/59 | | | 655 | | | | 775,527 | |
Series A, 5.00%, 07/01/34(b) | | | 250 | | | | 257,793 | |
Series A, 6.50%, 07/01/34(b) | | | 465 | | | | 538,512 | |
Series A, 5.00%, 07/01/36(b) | | | 1,225 | | | | 1,387,153 | |
Series A, 5.00%, 07/01/39(b) | | | 205 | | | | 210,949 | |
Series A, 5.00%, 07/01/41(b) | | | 1,685 | | | | 1,887,638 | |
Series A, 5.00%, 07/01/43 | | | 1,445 | | | | 1,480,272 | |
Series A, 6.75%, 07/01/44(b) | | | 810 | | | | 948,494 | |
Series A, 5.25%, 07/01/48(b) | | | 1,690 | | | | 1,736,458 | |
| | | | | | | | |
| Security | | Par
(000) | | | Value | |
| | |
| Arizona (continued) | | | | | | |
Industrial Development Authority of the City of Phoenix, RB (continued) | | | | | | | | |
Series A, 5.00%, 07/01/49(b) | | $ | 320 | | | $ | 327,904 | |
Series A, 5.00%, 07/01/54(b) | | | 530 | | | | 542,455 | |
Industrial Development Authority of the City of Phoenix, Refunding RB(b)
5.00%, 07/01/35. | | | 615 | | | | 685,688 | |
5.00%, 07/01/45 | | | 1,500 | | | | 1,654,155 | |
Series A, 5.00%, 07/01/35 | | | 295 | | | | 331,011 | |
Industrial Development Authority of the County of Pima, RB
5.13%, 07/01/39 | | | 700 | | | | 734,664 | |
5.25%, 07/01/49 | | | 870 | | | | 904,061 | |
Industrial Development Authority of the County of Pima, Refunding RB, 5.00%, 07/01/56(b) | | | 1,300 | | | | 1,444,352 | |
La Paz County Industrial Development Authority, RB, 5.88%, 06/15/48(b) | | | 1,340 | | | | 1,461,417 | |
Maricopa County Industrial Development Authority, RB(b)
5.25%, 10/01/40 | | | 1,255 | | | | 1,333,965 | |
5.50%, 10/01/51 | | | 1,255 | | | | 1,335,458 | |
| | | | | | | | |
| | | | | | | 47,623,376 | |
|
| Arkansas(b) — 1.4% | |
Arkansas Development Finance Authority, RB | | | | | | | | |
Series A, AMT, 4.50%, 09/01/49 | | | 17,755 | | | | 19,905,486 | |
Series A, AMT, 4.75%, 09/01/49 | | | 8,190 | | | | 9,429,065 | |
| | | | | | | | |
| | | | | | | 29,334,551 | |
|
| California — 5.7% | |
California Community Housing Agency, RB, M/F Housing(b) | | | | | | | | |
4.00%, 02/01/56 | | | 6,310 | | | | 6,792,273 | |
Series A, 5.00%, 04/01/49 | | | 690 | | | | 787,870 | |
Series A-2, 4.00%, 08/01/47 | | | 4,430 | | | | 4,883,278 | |
California County Tobacco Securitization Agency, Refunding RB, Series A, 5.00%, 06/01/36 | | | 1,665 | | | | 1,682,516 | |
California Educational Facilities Authority, Refunding RB, 2.25%, 04/01/51 | | | 10,000 | | | | 9,937,800 | |
California Housing Finance, RB, M/F Housing, Series 2021-1, Class A, 3.50%, 11/20/35 | | | 5,864 | | | | 6,865,092 | |
California Municipal Finance Authority, ARB, AMT, Senior Lien, 4.00%, 12/31/47 | | | 2,560 | | | | 2,813,030 | |
California Municipal Finance Authority, RB(b) | | | | | | | | |
Series A, 5.50%, 08/01/34 | | | 290 | | | | 314,343 | |
Series A, 6.00%, 08/01/44 | | | 655 | | | | 710,387 | |
Series A, 6.13%, 08/01/49 | | | 570 | | | | 616,934 | |
California Municipal Finance Authority, Refunding RB | | | | | | | | |
Series A, 5.00%, 02/01/42 | | | 345 | | | | 417,905 | |
Series A, 3.00%, 11/01/48 | | | 2,000 | | | | 2,101,020 | |
California Public Finance Authority, RB(b) | | | | | | | | |
Series A, 6.25%, 07/01/54 | | | 5,270 | | | | 6,043,320 | |
Series B-3, 2.13%, 11/15/27 | | | 4,750 | | | | 4,810,847 | |
California School Finance Authority, RB | | | | | | | | |
6.65%, 07/01/33 | | | 295 | | | | 324,105 | |
6.90%, 07/01/43 | | | 650 | | | | 712,484 | |
California Statewide Communities Development
Authority, RB(b) | | | | | | | | |
5.25%, 12/01/38 | | | 1,420 | | | | 1,717,987 | |
5.25%, 12/01/48 | | | 1,000 | | | | 1,172,720 | |
| | |
| 28 | | 2 0 2 1 BLACK ROCK ANNUAL REPORT TO SHAREHOLDERS |
| | |
Schedule of Investments (continued) June 30, 2021 | | BlackRock High Yield Municipal Fund (Percentages shown are based on Net Assets) |
| | | | | | | | |
| Security | | Par
(000) | | | Value | |
| | |
| California (continued) | | | | | | |
California Statewide Communities Development Authority, SAB, Series 2021-A, 4.00%, 09/02/51 | | $ | 2,000 | | | $ | 2,174,500 | |
City of San Jose California Hotel Tax Revenue, RB
6.50%, 05/01/36 | | | 310 | | | | 311,426 | |
6.50%, 05/01/42 | | | 760 | | | | 763,428 | |
CMFA Special Finance Agency I, RB, M/F Housing, Series A, 4.00%, 04/01/56(b) | | | 9,320 | | | | 10,100,923 | |
CSCDA Community Improvement Authority, RB, M/F Housing
2.65%, 12/01/46(b) | | | 3,500 | | | | 3,570,525 | |
4.00%, 08/01/56(b) | | | 5,000 | | | | 5,515,550 | |
3.00%, 12/01/56 | | | 2,915 | | | | 2,971,318 | |
4.00%, 12/01/56(b) | | | 4,355 | | | | 4,754,049 | |
Series A, 5.00%, 01/01/54(b) | | | 1,050 | | | | 1,236,910 | |
Series A-2, 4.00%, 10/01/56(b) | | | 8,600 | | | | 9,365,744 | |
Golden State Tobacco Securitization Corp., Refunding RB | | | | | | | | |
Series A-1, 3.50%, 06/01/36 | | | 4,360 | | | | 4,442,099 | |
Series A-1, 5.00%, 06/01/47 | | | 5,195 | | | | 5,380,254 | |
Series A-1, 5.25%, 06/01/47 | | | 945 | | | | 980,957 | |
Series A-2, 5.00%, 06/01/47 | | | 3,950 | | | | 4,090,857 | |
Hastings Campus Housing Finance Authority, RB, CAB, Sub-Series A, 6.75%,
07/01/35(b)(e) | | | 4,420 | | | | 2,567,578 | |
Riverside County Transportation Commission, RB, Series A, Senior Lien, 5.75%, 06/01/48 | | | 2,115 | | | | 2,318,399 | |
San Francisco City & County Redevelopment Agency Successor Agency, ST, CAB, 0.00%, 08/01/43(d) | | | 3,000 | | | | 860,730 | |
San Francisco City & County Redevelopment Agency Successor Agency, TA,
Sub-Series D, 3.00%, 08/01/21(b) | | | 500 | | | | 500,910 | |
San Francisco City & County Redevelopment Agency Successor Agency, TA, CAB(b)(d) | | | | | | | | |
Series D, 0.00%, 08/01/23 | | | 1,000 | | | | 913,010 | |
Series D, 0.00%, 08/01/26 | | | 580 | | | | 457,539 | |
Series D, 0.00%, 08/01/31 | | | 1,155 | | | | 711,457 | |
| | | | | | | | |
| | | | | | | 116,692,074 | |
|
| Colorado — 4.1% | |
9th Avenue Metropolitan District No.2, GO, 5.00%, 12/01/48 | | | 1,565 | | | | 1,670,684 | |
Aspen Street Metropolitan District, GO, Series A, 5.13%, 12/01/50 | | | 1,075 | | | | 1,117,248 | |
Aurora Crossroads Metropolitan District No.2, GO | | | | | | | | |
Series A, 5.00%, 12/01/40 | | | 1,000 | | | | 1,108,770 | |
Series A, 5.00%, 12/01/50 | | | 500 | | | | 548,295 | |
Aviation Station North Metropolitan District No.2, GO | | | | | | | | |
Series A, 5.00%, 12/01/39 | | | 750 | | | | 814,590 | |
Series A, 5.00%, 12/01/48 | | | 1,350 | | | | 1,454,004 | |
Brighton Crossing Metropolitan District No.6, GO, Series A, 5.00%, 12/01/50 | | | 500 | | | | 550,030 | |
Broadway Station Metropolitan District No.2, GO | | | | | | | | |
Series A, 5.00%, 12/01/35 | | | 735 | | | | 801,047 | |
Series A, 5.13%, 12/01/48 | | | 3,925 | | | | 4,233,584 | |
Bromley Park Metropolitan District No.2, Refunding GO, Sub-Series B, 6.38%, 12/15/47 | | | 937 | | | | 1,013,122 | |
Cascade Ridge Metropolitan District GOL, 5.00%, 12/01/51 | | | 3,000 | | | | 3,012,210 | |
Centerra Metropolitan District No.1, TA,
5.00%, 12/01/47(b) | | | 820 | | | | 860,319 | |
| | | | | | | | |
| Security | | Par
(000) | | | Value | |
| | |
| Colorado (continued) | | | | | | |
Clear Creek Transit Metropolitan District No 2, GO Series A, 5.00%, 12/01/41 | | $ | 575 | | | $ | 630,752 | |
Series A, 5.00%, 12/01/50 | | | 1,000 | | | | 1,090,610 | |
Colorado Educational & Cultural Facilities Authority, RB
5.00%, 12/01/33 | | | 450 | | | | 467,762 | |
5.00%, 12/01/42 | | | 545 | | | | 563,873 | |
Colorado Educational & Cultural Facilities Authority, Refunding RB(b) | | | | | | | | |
5.00%, 12/01/40 | | | 115 | | | | 126,339 | |
5.00%, 12/01/50 | | | 155 | | | | 166,129 | |
5.00%, 12/01/55 | | | 180 | | | | 191,529 | |
Colorado Health Facilities Authority, Refunding RB, Series A, 4.00%, 08/01/44 | | | 4,620 | | | | 5,344,924 | |
Colorado High Performance Transportation Enterprise, RB, 5.00%, 12/31/56 | | | 2,500 | | | | 2,855,000 | |
Constitution Heights Metropolitan District, Refunding GO, 5.00%, 12/01/49 | | | 1,260 | | | | 1,372,064 | |
Copperleaf Metropolitan District No.3, GO(f) Series A, 5.13%, 12/01/22 | | | 1,200 | | | | 1,262,256 | |
Series A, 5.00%, 12/01/37 | | | 500 | | | | 527,755 | |
E-470 Public Highway Authority, Refunding RB, Series B, 0.38%, 09/01/39(a) | | | 2,560 | | | | 2,553,705 | |
Green Gables Metropolitan District No.1, Refunding GO, Series A, 5.30%, 12/01/21(f) | | | 990 | | | | 1,040,906 | |
Green Valley Ranch East Metropolitan District No.6, GO, Series A, 5.88%, 12/01/50 | | | 2,615 | | | | 2,834,268 | |
Home Place Metropolitan District, GO, Series A, 5.75%, 12/01/50 | | | 2,345 | | | | 2,592,069 | |
Inspiration Metropolitan District, GO, Series D, 7.50%, 12/15/51 | | | 2,487 | | | | 2,484,065 | |
Jefferson Center Metropolitan District No.1, RB Series A-2, 4.13%, 12/01/40 | | | 580 | | | | 604,464 | |
Series A-2, 4.38%, 12/01/47 | | | 1,000 | | | | 1,044,370 | |
Karl’s Farm Metropolitan District No.2, GO(b) Series A, 5.38%, 12/01/40 | | | 515 | | | | 568,488 | |
Series A, 5.63%, 12/01/50 | | | 1,350 | | | | 1,491,777 | |
Leyden Rock Metropolitan District No.10, GO, Series A, 5.00%, 12/01/45 | | | 1,250 | | | | 1,296,100 | |
Loretto Heights Community Authority, RB, 4.88%, 12/01/51 | | | 2,640 | | | | 2,645,306 | |
North Holly Metropolitan District, GO, Series A, 5.50%, 12/01/48 | | | 760 | | | | 812,835 | |
Palisade Metropolitan District No.2, GO, Subordinate, 7.25%, 12/15/49 | | | 2,825 | | | | 3,065,182 | |
Palisade Park West Metropolitan District, GO,
Series A, 5.13%, 12/01/49 | | | 1,500 | | | | 1,599,990 | |
Peak Metropolitan District No.1, GO,
Series A, 5.00%, 12/01/51(b) | | | — | | | | — | |
Pomponio Terrace Metropolitan District, GO, Series A, 5.00%, 12/01/49 | | | 1,450 | | | | 1,541,698 | |
Prairie Farm Metropolitan District, GO,
Series A, 5.25%, 12/01/48 | | | 1,240 | | | | 1,327,544 | |
Pueblo Urban Renewal Authority, TA,
4.75%, 12/01/45(b) | | | 3,900 | | | | 4,476,576 | |
Reunion Metropolitan District, RB, Series A,
3.63%, 12/01/44 | | | 1,045 | | | | 1,009,261 | |
Rocky Mountain Rail Park Metropolitan District, GO(b) | | | | | | | | |
Series A, 5.00%, 12/01/41 | | | 500 | | | | 545,340 | |
Series A, 5.00%, 12/01/51 | | | 1,500 | | | | 1,620,540 | |
| | |
SCHEDULE OF INVESTMENTS | | 29 |
| | |
Schedule of Investments (continued) June 30, 2021 | | BlackRock High Yield Municipal Fund (Percentages shown are based on Net Assets) |
| | | | | | | | |
| Security | | Par
(000) | | | Value | |
| | |
| Colorado (continued) | | | | | | |
Southlands Metropolitan District No.1, Refunding GO | | | | | | | | |
Series A-1, 5.00%, 12/01/37 | | $ | 1,115 | | | $ | 1,264,087 | |
Series A-1, 5.00%, 12/01/47 | | | 3,990 | | | | 4,424,232 | |
Sterling Ranch Community Authority Board, RB, Series B, Subordinate, 7.13%, 12/15/50 | | | 750 | | | | 807,323 | |
Tallyn’s Reach Metropolitan District No.3, GO, Subordinate, 6.75%, 12/15/21(f) | | | 698 | | | | 739,782 | |
Thompson Crossing Metropolitan District No.4,
Refunding GO | | | | | | | | |
5.00%, 12/01/39 | | | 1,400 | | | | 1,523,620 | |
5.00%, 12/01/49 | | | 1,480 | | | | 1,595,410 | |
Timberleaf Metropolitan District, GO, Series A,
5.75%, 12/01/50 | | | 1,730 | | | | 1,912,273 | |
Waters’ Edge Metropolitan District No 2 GOL,
5.00%, 12/01/51 | | | 2,595 | | | | 2,607,456 | |
Westcreek Metropolitan District No.2, GO, Series A, 5.38%, 12/01/48 | | | 800 | | | | 859,088 | |
Wild Plum Metropolitan District, GO, Series A,
5.00%, 12/01/49 | | | 595 | | | | 643,683 | |
| | | | | | | | |
| | | | | | | 83,314,334 | |
| | |
| Connecticut — 0.6% | | | | | | |
Connecticut Housing Finance Authority, Refunding RB, S/F Housing | | | | | | | | |
Series C-2, AMT, 2.00%, 05/15/30 | | | 175 | | | | 177,356 | |
Series C-2, AMT, 2.05%, 11/15/30 | | | 500 | | | | 506,480 | |
Series C-2, AMT, 2.15%, 11/15/31 | | | 400 | | | | 405,196 | |
Connecticut State Health & Educational Facilities Authority, RB(b) | | | | | | | | |
Series A, 5.00%, 01/01/45 | | | 825 | | | | 905,330 | |
Series A, 5.00%, 01/01/55 | | | 1,100 | | | | 1,198,890 | |
Mashantucket Western Pequot Tribe, RB, 7.35%, 07/01/26 | | | — | | | | — | |
Mohegan Tribal Finance Authority, RB, 7.00%, 02/01/45(b) | | | 3,780 | | | | 4,023,432 | |
Mohegan Tribe of Indians of Connecticut, RB, Series A, 6.75%, 02/01/45(b) | | | 977 | | | | 990,157 | |
Mohegan Tribe of Indians of Connecticut, Refunding RB, Series C, 6.25%, 02/01/30(b) | | | 2,045 | | | | 2,336,085 | |
State of Connecticut, GO, Series A, 4.00%, 04/15/37 | | | 1,800 | | | | 2,136,870 | |
| | | | | | | | |
| | | | | | | 12,679,796 | |
| | |
| Delaware — 0.1% | | | | | | |
County of Kent, RB, Series A, 5.00%, 07/01/58 | | | 1,500 | | | | 1,643,670 | |
Delaware State Economic Development Authority, RB, Series A, 5.00%, 06/01/46 | | | 1,000 | | | | 1,105,270 | |
| | | | | | | | |
| | | | | | | 2,748,940 | |
| | |
| District of Columbia — 1.7% | | | | | | |
District of Columbia Tobacco Settlement Financing Corp., RB, Series B, 0.00%, 06/15/46(d) | | | 43,620 | | | | 7,820,268 | |
District of Columbia Tobacco Settlement Financing Corp., RB, CAB(d) | | | | | | | | |
Series A, 0.00%, 06/15/46 | | | 40,740 | | | | 8,850,765 | |
Series C, 0.00%, 06/15/55 | | | 88,900 | | | | 8,697,087 | |
District of Columbia Tobacco Settlement Financing Corp., Refunding RB, 6.75%, 05/15/40 | | | 385 | | | | 397,770 | |
| | | | | | | | |
| Security | | Par
(000) | | | Value | |
| | |
| District of Columbia (continued) | | | | | | |
Metropolitan Washington Airports Authority Dulles Toll Road Revenue, Refunding RB | | | | | | | | |
Series A, 5.00%, 10/01/53 | | $ | 3,830 | | | $ | 3,948,156 | |
Series B, Subordinate, 4.00%, 10/01/49 | | | 2,170 | | | | 2,473,670 | |
Metropolitan Washington Airports Authority Dulles Toll Road Revenue, Refunding RB, CAB, Series B, 2nd Lien, (AGC), 0.00%,
10/01/30(d) | | | 3,005 | | | | 2,601,909 | |
| | | | | | | | |
| | | | | | | 34,789,625 | |
| | |
| Florida — 9.3% | | | | | | |
Alachua County Health Facilities Authority, RB,
Series A, 5.00%, 12/01/44 | | | 1,720 | | | | 1,959,923 | |
Artisan Lakes East Community Development District Special Assessment(c) | | | | | | | | |
Series 2021-1, 3.13%, 05/01/41 | | | 475 | | | | 470,896 | |
Series 2021-1, 4.00%, 05/01/51 | | | 450 | | | | 473,369 | |
Series 2021-2, 3.13%, 05/01/41(b) | | | 510 | | | | 505,594 | |
Series 2021-2, 4.00%, 05/01/52(b) | | | 550 | | | | 578,177 | |
Boggy Branch Community Development District, SAB, 4.00%, 05/01/51 | | | 1,365 | | | | 1,419,641 | |
Boggy Creek Improvement District, Refunding SAB, Series 2013, 5.13%, 05/01/43 | | | 1,220 | | | | 1,270,959 | |
Brevard County Health Facilities Authority,
RB(b)(c)
4.00%, 11/15/45 | | | 4,040 | | | | 4,147,302 | |
4.00%, 11/15/55 | | | 5,960 | | | | 6,086,531 | |
California Statewide Communities Development Authority, SAB, Series A-1, 5.13%, 05/01/39 | | | 2,280 | | | | 2,556,496 | |
Capital Trust Agency, Inc., RB
4.50%, 01/01/35(b) | | | 2,250 | | | | 2,536,492 | |
5.00%, 06/01/41(b) | | | 220 | | | | 244,862 | |
8.25%, 01/01/44 | | | 445 | | | | 8,900 | |
8.25%, 01/01/49 | | | 950 | | | | 19,000 | |
5.00%, 07/01/49(b) | | | 1,270 | | | | 1,440,650 | |
5.00%, 01/01/55(b) | | | 4,350 | | | | 4,880,787 | |
5.00%, 06/01/56(b) | | | 740 | | | | 800,495 | |
Series A, 5.00%, 06/15/49(b) | | | 500 | | | | 534,530 | |
Series A, 5.00%, 12/15/49 | | | 300 | | | | 331,476 | |
Series A, 5.75%, 06/01/54(b) | | | 1,925 | | | | 2,067,007 | |
Series A, 5.00%, 12/15/54 | | | 260 | | | | 286,385 | |
Series B, 0.00%, 01/01/35(d) | | | 3,585 | | | | 1,708,862 | |
Series B, 0.00%, 01/01/60(d) | | | 64,500 | | | | 5,692,770 | |
Capital Trust Agency, Inc., RB, CAB, 0.00%, 07/01/61(b)(d) | | | 166,025 | | | | 17,034,165 | |
Celebration Pointe Community Development District, SAB | | | | | | | | |
4.00%, 05/01/22(b) | | | 75 | | | | 76,109 | |
4.75%, 05/01/24 | | | 240 | | | | 250,188 | |
5.00%, 05/01/34 | | | 1,180 | | | | 1,241,171 | |
Charles Cove Community Development District, SAB
3.25%, 05/01/25 | | | 300 | | | | 305,904 | |
3.75%, 05/01/30 | | | 360 | | | | 383,184 | |
4.25%, 05/01/40 | | | 975 | | | | 1,047,813 | |
4.38%, 05/01/50 | | | 1,505 | | | | 1,600,868 | |
Charlotte County Industrial Development Authority, RB(b) | | | | | | | | |
AMT, 5.00%, 10/01/34 | | | 530 | | | | 598,137 | |
AMT, 5.00%, 10/01/49 | | | 2,510 | | | | 2,770,663 | |
| | |
| 30 | | 2 0 2 1 BLACK ROCK ANNUAL REPORT TO SHAREHOLDERS |
| | |
Schedule of Investments (continued) June 30, 2021 | | BlackRock High Yield Municipal Fund (Percentages shown are based on Net Assets) |
| | | | | | | | |
| Security | | Par
(000) | | | Value | |
| | |
| Florida (continued) | | | | | | |
City of Pompano Beach Florida, Refunding RB,
4.00%, 09/01/50 | | $ | 2,500 | | | $ | 2,679,325 | |
City of Tallahassee Florida, RB, Series A, 5.00%, 12/01/55 | | | 2,600 | | | | 2,989,506 | |
Collier County Health Facilities Authority, RB,
Series A, 5.00%, 05/01/48 | | | 2,090 | | | | 2,489,420 | |
Collier County Industrial Development Authority,
Refunding RB, Series A, 8.13%,
05/15/44(b)(g)(h) | | | 370 | | | | 285,180 | |
County of Lake Florida, RB(b)
5.00%, 01/15/39 | | | 550 | | | | 611,105 | |
5.00%, 01/15/49 | | | 825 | | | | 894,869 | |
5.00%, 01/15/54 | | | 830 | | | | 893,553 | |
County of Osceola Florida Transportation Revenue, Refunding RB, Sereis A-1, 4.00%, 10/01/54 | | | 2,500 | | | | 2,874,325 | |
County of Osceola Florida Transportation Revenue, Refunding RB, CAB(d) | | | | | | | | |
Series A-2, 0.00%, 10/01/50 | | | 1,770 | | | | 680,052 | |
Series A-2, 0.00%, 10/01/51 | | | 2,125 | | | | 783,636 | |
Series A-2, 0.00%, 10/01/52 | | | 2,125 | | | | 753,780 | |
Series A-2, 0.00%, 10/01/53 | | | 5,675 | | | | 1,935,459 | |
Series A-2, 0.00%, 10/01/54 | | | 2,125 | | | | 696,681 | |
County of Palm Beach Florida, RB,
5.00%, 04/01/51(b) | | | 540 | | | | 590,906 | |
Escambia County Health Facilities Authority, Refunding RB, 4.00%, 08/15/45 | | | 6,530 | | | | 7,549,921 | |
Florida Development Finance Corp., RB
5.25%, 06/01/55(b) | | | 2,830 | | | | 3,176,901 | |
Series A, 5.75%, 06/15/29 | | | 695 | | | | 751,399 | |
Series A, 6.00%, 06/15/34 | | | 835 | | | | 903,737 | |
Series A, 6.13%, 06/15/44 | | | 3,185 | | | | 3,429,067 | |
Series A, 5.13%, 06/15/55(b) | | | 10,455 | | | | 10,888,882 | |
AMT, 5.00%, 05/01/29(b) | | | 3,300 | | | | 3,554,001 | |
AMT, 3.00%, 06/01/32 | | | 915 | | | | 983,451 | |
Series A, AMT, 5.00%, 08/01/29(a)(b) | | | 2,240 | | | | 2,319,184 | |
Series B, AMT, 7.38%, 01/01/49(b) | | | 4,670 | | | | 5,126,586 | |
Florida Development Finance Corp., Refunding RB, 5.00%, 06/01/51 | | | 1,135 | | | | 1,308,916 | |
Grand Oaks Community Development District, SAB
4.25%, 05/01/40 | | | 915 | | | | 989,911 | |
4.50%, 05/01/52 | | | 1,015 | | | | 1,093,135 | |
Greater Orlando Aviation Authority, Refunding RB, AMT, 5.00%, 11/15/36 | | | 2,000 | | | | 2,130,160 | |
Greeneway Improvement District, SAB,
5.13%, 05/01/43 | | | 1,230 | | | | 1,267,207 | |
Hills Minneola Community Development District, SAB(b)
4.00%, 05/01/40 | | | 1,025 | | | | 1,079,038 | |
4.00%, 05/01/50 | | | 1,500 | | | | 1,552,905 | |
Lakewood Ranch Stewardship District, SAB
3.90%, 05/01/23 | | | 195 | | | | 199,684 | |
4.25%, 05/01/25 | | | 80 | | | | 83,878 | |
4.25%, 05/01/26 | | | 175 | | | | 183,855 | |
4.25%, 05/01/28 | | | 535 | | | | 582,112 | |
4.95%, 05/01/29(b) | | | 665 | | | | 757,781 | |
4.88%, 05/01/35 | | | 265 | | | | 284,671 | |
5.00%, 05/01/38 | | | 1,175 | | | | 1,324,613 | |
3.75%, 05/01/39(b) | | | 570 | | | | 600,997 | |
5.50%, 05/01/39(b) | | | 670 | | | | 787,826 | |
3.75%, 05/01/40 | | | 525 | | | | 557,855 | |
4.88%, 05/01/45 | | | 545 | | | | 580,234 | |
5.13%, 05/01/46 | | | 990 | | | | 1,063,418 | |
| | | | | | | | |
| Security | | Par
(000) | | | Value | |
| | |
| Florida (continued) | | | | | | |
Lakewood Ranch Stewardship District,
SAB (continued)
5.10%, 05/01/48 | | $ | 2,545 | | | $ | 2,852,920 | |
5.65%, 05/01/48(b) | | | 1,125 | | | | 1,321,425 | |
4.00%, 05/01/49(b) | | | 355 | | | | 376,094 | |
3.90%, 05/01/50 | | | 525 | | | | 554,521 | |
Series 1B, 4.75%, 05/01/29 | | | 955 | | | | 1,077,794 | |
Series 1B, 5.30%, 05/01/39 | | | 1,090 | | | | 1,266,547 | |
Series 1B, 5.45%, 05/01/48 | | | 1,935 | | | | 2,246,148 | |
Miami-Dade County Industrial Development
Authority, RB, 5.00%, 01/15/48 | | | 1,405 | | | | 1,576,382 | |
Mid-Bay Bridge Authority, RB, Series A, 7.25%, 10/01/21(f) | | | 1,450 | | | | 1,475,795 | |
Midtown Miami Community Development District, Refunding SAB | | | | | | | | |
Series A, 5.00%, 05/01/29 | | | 1,745 | | | | 1,816,021 | |
Series A, 5.00%, 05/01/37 | | | 890 | | | | 920,483 | |
Mirada II Community Development District, SAB
3.13%, 05/01/31 | | | 500 | | | | 514,730 | |
4.00%, 05/01/51 | | | 1,500 | | | | 1,575,180 | |
North River Ranch Community Development District, SAB | | | | | | | | |
Series A-1, 4.00%, 05/01/40 | | | 845 | | | | 892,016 | |
Series A-1, 4.25%, 05/01/51 | | | 1,430 | | | | 1,505,347 | |
Series A-2, 4.20%, 05/01/35 | | | 1,220 | | | | 1,286,929 | |
Series A-3, 4.75%, 05/01/40 | | | 1,615 | | | | 1,615,872 | |
Palm Beach County Health Facilities Authority,
Refunding RB, Series A, 7.50%, 06/01/49 | | | 1,000 | | | | 1,068,450 | |
Pine Island Community Development District, RB,
CAB, 0.00%, 11/01/24(d) | | | 820 | | | | 704,159 | |
Pinellas County Industrial Development Authority,
RB, 5.00%, 07/01/39 | | | 220 | | | | 260,350 | |
Sandridge Community Development District, SAB | | | | | | | | |
Series A1, 3.88%, 05/01/41 | | | 615 | | | | 642,374 | |
Series A1, 4.00%, 05/01/51 | | | 600 | | | | 622,290 | |
Series A-2, 3.88%, 05/01/31 | | | 730 | | | | 760,032 | |
Santa Rosa Bay Bridge Authority, RB
6.25%, 07/01/28(g)(h) | | | 338 | | | | 294,013 | |
(ACA-CBI), 6.25%, 07/01/28 | | | 56 | | | | 55,874 | |
Seminole County Industrial Development Authority, Refunding RB
5.50%, 11/15/49 | | | 3,025 | | | | 3,316,610 | |
5.75%, 11/15/54 | | | 2,420 | | | | 2,670,155 | |
Southern Groves Community Development District No.5, SAB
3.38%, 05/01/25 | | | 330 | | | | 338,181 | |
4.00%, 05/01/30 | | | 205 | | | | 222,683 | |
4.30%, 05/01/40 | | | 875 | | | | 945,507 | |
4.50%, 05/01/46 | | | 615 | | | | 663,677 | |
State Johns County Industrial Development Authority, RB(c)
4.00%, 12/15/41 | | | 450 | | | | 498,425 | |
4.00%, 12/15/46 | | | 450 | | | | 494,816 | |
4.00%, 12/15/50 | | | 660 | | | | 723,030 | |
Tolomato Community Development District, Refunding SAB | | | | | | | | |
Series 2015-2, 6.61%, 11/01/24(e) | | | 125 | | | | 95,049 | |
Series A-2, 4.25%, 05/01/37 | | | 915 | | | | 990,323 | |
Tolomato Community Development District, Refunding SAB, CAB, Series A-4, Convertible, 6.61%, 05/01/22(e) | | | 50 | | | | 48,237 | |
| | |
SCHEDULE OF INVESTMENTS | | 31 |
| | |
Schedule of Investments (continued) June 30, 2021 | | BlackRock High Yield Municipal Fund (Percentages shown are based on Net Assets) |
| | | | | | | | |
| Security | | Par
(000) | | | Value | |
| | |
| Florida (continued) | | | | | | |
Tolomato Community Development District, SAB
3rd Series, 6.65%, 05/01/40(g)(h) | | $ | 105 | | | $ | 1 | |
Series 2015-1, 6.61%, 11/01/21(e) | | | 205 | | | | 196,070 | |
Series 2015-3, 6.61%, 05/01/40(g)(h) | | | 135 | | | | 1 | |
Trout Creek Community Development District, SAB
5.38%, 05/01/38 | | | 670 | | | | 757,335 | |
5.50%, 05/01/49 | | | 1,700 | | | | 1,902,810 | |
V-Dana Community Development District, SAB(b)
3.00%, 05/01/25 | | | 300 | | | | 304,002 | |
3.50%, 05/01/31 | | | 525 | | | | 550,316 | |
4.00%, 05/01/40 | | | 750 | | | | 794,220 | |
4.00%, 05/01/51 | | | 1,200 | | | | 1,242,144 | |
Viera East Community Development District, Refunding SAB, 5.00%, 05/01/26 | | | 640 | | | | 662,278 | |
Village Community Development District No.10, SAB, 5.13%, 05/01/43 | | | 1,475 | | | | 1,528,070 | |
Village Community Development District No.9, SAB, 5.50%, 05/01/42 | | | 450 | | | | 458,276 | |
West Villages Improvement District, SAB
4.25%, 05/01/29 | | | 400 | | | | 433,664 | |
4.75%, 05/01/39 | | | 885 | | | | 974,668 | |
5.00%, 05/01/50 | | | 1,415 | | | | 1,556,047 | |
| | | | | | | | |
| | | | | | | 189,246,769 | |
| | |
| Georgia — 1.5% | | | | | | |
Gainesville & Hall County Hospital Authority, Refunding RB, Series A, (GTD), 5.50%, 08/15/54 | | | 555 | | | | 642,834 | |
George L Smith II Congress Center Authority, RB, 4.00%, 01/01/54 | | | 1,170 | | | | 1,367,484 | |
Main Street Natural Gas, Inc., RB | | | | | | | | |
Series A, 5.00%, 05/15/35 | | | 1,020 | | | | 1,437,119 | |
Series A, 5.00%, 05/15/36 | | | 1,020 | | | | 1,455,724 | |
Series A, 5.00%, 05/15/37 | | | 1,120 | | | | 1,619,139 | |
Series A, 5.00%, 05/15/38 | | | 615 | | | | 900,483 | |
Series A, 5.00%, 05/15/49 | | | 2,055 | | | | 3,102,454 | |
Municipal Electric Authority of Georgia, RB
4.00%, 01/01/49 | | | 4,150 | | | | 4,652,109 | |
Series A, 5.00%, 01/01/49 | | | 3,235 | | | | 3,865,825 | |
Series A, 5.00%, 01/01/59 | | | 525 | | | | 621,999 | |
Municipal Electric Authority of Georgia, Refunding RB | | | | | | | | |
Series A-R, Subordinate, 5.00%, 01/01/45 | | | 3,000 | | | | 3,830,700 | |
Series A-R, Subordinate, 5.00%, 01/01/50 | | | 4,000 | | | | 5,085,440 | |
Private Colleges & Universities Authority Refunding RB, 4.00%, 10/01/50(c) | | | 1,155 | | | | 1,365,314 | |
| | | | | | | | |
| | | | | | | 29,946,624 | |
| | |
| Guam — 0.4% | | | | | | |
Territory of Guam, Refunding RB | | | | | | | | |
Series a, 5.00%, 11/01/40 | | | 1,545 | | | | 1,932,965 | |
Series A, 5.00%, 11/01/35 | | | 1,100 | | | | 1,401,576 | |
Series F, 4.00%, 01/01/36(c) | | | 1,460 | | | | 1,704,681 | |
Series F, 4.00%, 01/01/42(c) | | | 1,870 | | | | 2,134,343 | |
| | | | | | | | |
| | | | | | | 7,173,565 | |
| | |
| Idaho — 0.3% | | | | | | |
Idaho Health Facilities Authority, Refunding RB
3.50%, 09/01/33 | | | 375 | | | | 395,584 | |
5.00%, 09/01/37 | | | 1,000 | | | | 1,116,340 | |
Idaho Housing & Finance Association, RB(b)
5.00%, 12/01/46 | | | 1,000 | | | | 1,131,030 | |
Series A, 6.00%, 07/01/39 | | | 370 | | | | 453,601 | |
| | | | | | | | |
| Security | | Par
(000) | | | Value | |
| | |
| Idaho (continued) | | | | | | |
Idaho Housing & Finance Association,
RB(b) (continued) | | | | | | | | |
Series A, 6.00%, 07/01/49 | | $ | 595 | | | $ | 713,667 | |
Series A, 6.00%, 07/01/54 | | | 570 | | | | 679,144 | |
Series A, 6.95%, 06/15/55 | | | 1,540 | | | | 1,685,946 | |
Power County Industrial Development Corp., RB, AMT, 6.45%, 08/01/32 | | | 265 | | | | 266,248 | |
| | | | | | | | |
| | | | | | | 6,441,560 | |
| | |
| Illinois — 7.2% | | | | | | |
Chicago Board of Education, GO | | | | | | | | |
Series A, 5.00%, 12/01/38 | | | 655 | | | | 839,651 | |
Series A, 5.00%, 12/01/39 | | | 2,095 | | | | 2,677,682 | |
Series A, 5.00%, 12/01/40 | | | 2,750 | | | | 3,505,067 | |
Series A, 5.00%, 12/01/41 | | | 5,790 | | | | 7,359,322 | |
Series A, 5.00%, 12/01/42 | | | 1,570 | | | | 1,648,783 | |
Series C, 5.25%, 12/01/39 | | | 2,250 | | | | 2,534,940 | |
Series D, 5.00%, 12/01/46 | | | 3,620 | | | | 4,029,451 | |
Series H, 5.00%, 12/01/46 | | | 725 | | | | 861,329 | |
Chicago Board of Education, Refunding GO | | | | | | | | |
Series A, 5.00%, 12/01/28 | | | 530 | | | | 672,628 | |
Series A, 5.00%, 12/01/30 | | | 2,210 | | | | 2,855,033 | |
Series B, 4.00%, 12/01/35 | | | 1,155 | | | | 1,198,613 | |
Series C, 5.00%, 12/01/25 | | | 1,220 | | | | 1,433,561 | |
Series C, 5.00%, 12/01/30 | | | 1,370 | | | | 1,685,922 | |
Series D, 5.00%, 12/01/31 | | | 1,500 | | | | 1,842,465 | |
Series G, 5.00%, 12/01/44 | | | 3,700 | | | | 4,409,956 | |
Chicago Board of Education, Refunding GO, CAB, Series A, 0.00%, 12/01/25(d) | | | 590 | | | | 557,125 | |
City of Chicago Illinois, Refunding GO | | | | | | | | |
Series A, 5.25%, 01/01/32 | | | 2,315 | | | | 2,555,320 | |
Series A, 6.00%, 01/01/38 | | | 1,850 | | | | 2,293,371 | |
Series B, 5.43%, 01/01/42 | | | 8,210 | | | | 9,835,169 | |
Illinois Finance Authority, RB, Series A, 6.00%, 10/01/48 | | | 1,700 | | | | 1,777,129 | |
Illinois Finance Authority, Refunding RB
6.00%, 02/01/34 | | | 335 | | | | 352,259 | |
4.00%, 09/01/35 | | | 1,000 | | | | 1,150,280 | |
4.00%, 09/01/37 | | | 1,000 | | | | 1,118,570 | |
4.00%, 09/01/39 | | | 2,000 | | | | 2,228,900 | |
4.00%, 09/01/41 | | | 1,250 | | | | 1,391,563 | |
6.13%, 02/01/45 | | | 790 | | | | 823,109 | |
5.00%, 05/15/56 | | | 815 | | | | 926,859 | |
Series A, 3.00%, 08/15/48 | | | 11,350 | | | | 12,125,886 | |
Series C, 5.00%, 02/15/36 | | | 1,805 | | | | 2,188,238 | |
Series C, 5.00%, 02/15/41 | | | 3,000 | | | | 3,574,200 | |
Metropolitan Pier & Exposition Authority, RB | | | | | | | | |
Series A, 5.50%, 06/15/53 | | | 3,925 | | | | 4,658,386 | |
Series A, 5.00%, 06/15/57 | | | 4,555 | | | | 5,413,936 | |
Metropolitan Pier & Exposition Authority, Refunding RB, CAB, Series B, 0.00%, 12/15/54(d) | | | 41,770 | | | | 16,400,573 | |
Quad Cities Regional Economic Development Authority, Refunding RB, 4.75%, 10/01/32 | | | 675 | | | | 708,001 | |
State of Illinois, GO
5.50%, 05/01/30 | | | 1,235 | | | | 1,647,823 | |
5.00%, 02/01/39 | | | 510 | | | | 553,651 | |
5.50%, 05/01/39 | | | 2,460 | | | | 3,189,218 | |
Series A, 5.00%, 12/01/25 | | | 3,000 | | | | 3,537,000 | |
Series A, 5.00%, 04/01/35 | | | 1,460 | | | | 1,545,950 | |
Series A, 4.00%, 03/01/38 | | | 2,250 | | | | 2,658,240 | |
Series A, 5.00%, 04/01/38 | | | 2,190 | | | | 2,311,129 | |
| | |
| 32 | | 2 0 2 1 BLACK ROCK ANNUAL REPORT TO SHAREHOLDERS |
| | |
Schedule of Investments (continued) June 30, 2021 | | BlackRock High Yield Municipal Fund (Percentages shown are based on Net Assets) |
| | | | | | | | |
| Security | | Par
(000) | | | Value | |
| | |
| Illinois (continued) | | | | | | |
State of Illinois, GO (continued) | | | | | | | | |
Series A, 4.00%, 03/01/39 | | $ | 2,100 | | | $ | 2,474,136 | |
Series A, 4.00%, 03/01/40 | | | 2,300 | | | | 2,701,051 | |
Series D, 5.00%, 11/01/24 | | | 12,715 | | | | 14,551,173 | |
State of Illinois, Refunding GO, Series A, 5.00%, 10/01/25 | | | 3,000 | | | | 3,521,340 | |
| | | | | | | | |
| | | | | | | 146,323,988 | |
| | |
| Indiana — 0.9% | | | | | | |
City of Anderson Indiana, RB, 5.38%, 01/01/40 | | | 1,540 | | | | 1,600,491 | |
City of Valparaiso Indiana, RB | | | | | | | | |
AMT, 6.75%, 01/01/34 | | | 525 | | | | 581,511 | |
AMT, 7.00%, 01/01/44 | | | 1,270 | | | | 1,405,750 | |
City of Vincennes Indiana, Refunding RB, 6.25%, 01/01/29(b) | | | 2,550 | | | | 2,554,284 | |
Indiana Finance Authority, RB | | | | | | | | |
Series A, AMT, 6.75%, 05/01/39 | | | 2,785 | | | | 3,580,480 | |
Series A, AMT, 5.00%, 07/01/44 | | | 370 | | | | 395,630 | |
Series A, AMT, 5.00%, 07/01/48 | | | 1,230 | | | | 1,322,902 | |
Series A, AMT, 5.25%, 01/01/51 | | | 2,500 | | | | 2,710,150 | |
Indiana Finance Authority, Refunding RB, 5.00%, 03/01/22(f) | | | 725 | | | | 748,388 | |
Indiana Housing & Community Development
Authority, RB, 5.38%, 10/01/40(b) | | | 3,175 | | | | 3,318,415 | |
| | | | | | | | |
| | | | | | | 18,218,001 | |
| | |
| Iowa — 0.3% | | | | | | |
Iowa Finance Authority, RB, Series A, 5.00%, 05/15/48 | | | 2,360 | | | | 2,690,801 | |
Iowa Finance Authority, Refunding RB, Series A, 5.25%, 12/01/50(a) | | | 595 | | | | 645,676 | |
Iowa Higher Education Loan Authority, Refunding RB, 5.50%, 11/01/51 | | | 3,000 | | | | 3,358,920 | |
| | | | | | | | |
| | | | | | | 6,695,397 | |
| | |
| Kansas(b) — 0.2% | | | | | | |
City of Shawnee, RB
5.00%, 08/01/41 | | | 770 | | | | 833,995 | |
5.00%, 08/01/56 | | | 2,800 | | | | 2,971,052 | |
| | | | | | | | |
| | | | | | | 3,805,047 | |
| | |
| Kentucky — 0.3% | | | | | | |
City of Hazard Refunding RB, 3.00%, 07/01/46 | | | 2,500 | | | | 2,676,925 | |
Kentucky Economic Development Finance Authority, Refunding RB, Series B, (NPFGC), 0.00%, 10/01/24(d) | | | 250 | | | | 244,807 | |
Kentucky Public Transportation Infrastructure Authority, RB, Series A, 6.00%, 07/01/53 | | | 3,000 | | | | 3,304,950 | |
| | | | | | | | |
| | | | | | | 6,226,682 | |
| | |
| Louisiana — 1.5% | | | | | | |
Juban Crossing Economic Development District, Refunding RB, Series C, 7.00%, 09/15/44(b) | | | 3,055 | | | | 2,977,189 | |
Louisiana Local Government Environmental Facilities & Community Development Authority, RB, 5.00%, 07/01/54(b) | | | 1,990 | | | | 2,070,575 | |
Louisiana Public Facilities Authority, RB(b) Series A, 5.00%, 06/01/41 | | | 990 | | | | 1,089,911 | |
Series A, 5.00%, 04/01/49 | | | 500 | | | | 533,360 | |
| | | | | | | | |
| Security | | Par
(000) | | | Value | |
| | |
| Louisiana (continued) | | | | | | |
Louisiana Public Facilities Authority,
RB(b) (continued) | | | | | | | | |
Series A, 5.25%, 06/01/51 | | $ | 1,830 | | | $ | 2,005,643 | |
Series A, 5.25%, 06/01/60 | | | 3,385 | | | | 3,676,855 | |
Louisiana Public Facilities Authority, Refunding RB, 4.00%, 04/01/50 | | | 12,320 | | | | 14,337,153 | |
Parish of St. James Louisiana, RB, 2nd Series, 6.35%, 07/01/40(b) | | | 3,160 | | | | 4,219,169 | |
| | | | | | | | |
| | | | | | | 30,909,855 | |
| | |
| Maryland — 1.1% | | | | | | |
City of Baltimore Maryland, Refunding RB
5.00%, 09/01/46 | | | 1,500 | | | | 1,530,990 | |
Series A, 4.00%, 09/01/27 | | | 325 | | | | 344,325 | |
County of Frederick Maryland, Refunding TA, 4.63%, 07/01/43(b) | | | 4,965 | | | | 5,948,169 | |
Maryland Economic Development Corp., RB, 5.00%, 07/01/56 | | | 985 | | | | 1,212,643 | |
Maryland Economic Development Corp., Refunding RB, 5.00%, 07/01/39 | | | 950 | | | | 1,023,577 | |
Maryland Economic Development Corp., TA, 4.00%, 09/01/50 | | | 605 | | | | 698,158 | |
Maryland Health & Higher Educational Facilities Authority, RB, Series A, 7.00%, 03/01/55(b) | | | 8,165 | | | | 9,295,363 | |
Maryland State Transportation Authority, Refunding RB, Series A, 2.50%, 07/01/47 | | | 2,750 | | | | 2,799,280 | |
| | | | | | | | |
| | | | | | | 22,852,505 | |
| | |
| Massachusetts — 0.6% | | | | | | |
Massachusetts Development Finance Agency, RB | | | | | | | | |
Series B, 0.00%, 11/15/56(d) | | | 94 | | | | 13,807 | |
Series D, 4.00%, 07/01/45 | | | 715 | | | | 767,495 | |
Massachusetts Development Finance Agency, Refunding RB
4.00%, 10/01/32(b) | | | 355 | | | | 386,482 | |
4.13%, 10/01/42(b) | | | 855 | | | | 927,923 | |
4.00%, 07/01/45 | | | 560 | | | | 653,481 | |
4.00%, 07/01/50 | | | 1,050 | | | | 1,218,966 | |
Series A, 5.00%, 07/01/38 | | | 1,200 | | | | 1,468,692 | |
Series A, 5.00%, 07/01/39 | | | 3,055 | | | | 3,729,208 | |
Series A, 5.00%, 07/01/44 | | | 2,000 | | | | 2,430,500 | |
| | | | | | | | |
| | | | | | | 11,596,554 | |
| | |
| Michigan — 0.5% | | | | | | |
Advanced Technology Academy, Refunding RB
3.50%, 11/01/24 | | | 250 | | | | 256,435 | |
3.88%, 11/01/29 | | | 150 | | | | 162,426 | |
5.00%, 11/01/34 | | | 400 | | | | 453,748 | |
5.00%, 11/01/44 | | | 160 | | | | 177,350 | |
City of Detroit Michigan, GO
5.00%, 04/01/34 | | | 485 | | | | 580,603 | |
5.00%, 04/01/35 | | | 485 | | | | 579,051 | |
5.00%, 04/01/36 | | | 340 | | | | 404,947 | |
5.00%, 04/01/37 | | | 545 | | | | 647,635 | |
5.00%, 04/01/38 | | | 240 | | | | 284,460 | |
Grand Traverse County Hospital Finance Authority Refunding RB, 3.00%, 07/01/51(c) | | | 2,000 | | | | 2,129,240 | |
| | |
SCHEDULE OF INVESTMENTS | | 33 |
| | |
Schedule of Investments (continued) June 30, 2021 | | BlackRock High Yield Municipal Fund (Percentages shown are based on Net Assets) |
| | | | | | | | |
| Security | | Par
(000) | | | Value | |
| | |
| Michigan (continued) | | | | | | |
Kentwood Economic Development Corp., Refunding RB, 5.63%, 11/15/41 | | $ | 1,000 | | | $ | 1,035,070 | |
Michigan Finance Authority, RB(f)
Series C-2, AMT, Senior Lien, 5.00%, 07/01/22 | | | 350 | | | | 366,282 | |
Series C-1, Senior Lien, 5.00%, 07/01/22 | | | 800 | | | | 838,696 | |
Michigan Strategic Fund, RB, AMT, 5.00%, 06/30/48 | | | 2,030 | | | | 2,454,534 | |
| | | | | | | | |
| | | | | | | 10,370,477 | |
| | |
| Minnesota — 0.9% | | | | | | |
City of Cologne Minnesota,RB, Series A, 5.00%, 07/01/45 | | | 2,065 | | | | 2,195,157 | |
City of Deephaven Minnesota, Refunding RB,
Series A, 5.25%, 07/01/40 | | | 500 | | | | 554,530 | |
City of Minneapolis Minnesota, RB | | | | | | | | |
Series A, 5.00%, 07/01/55 | | | 1,405 | | | | 1,525,254 | |
Series A, 5.75%, 07/01/55 | | | 3,435 | | | | 4,031,316 | |
Duluth Economic Development Authority, Refunding RB | | | | | | | | |
Series A, 4.25%, 02/15/48 | | | 1,925 | | | | 2,201,584 | |
Series A, 5.25%, 02/15/53 | | | 3,850 | | | | 4,749,437 | |
Housing & Redevelopment Authority of The City of St. Paul Minnesota, RB
5.00%, 07/01/49 | | | 555 | | | | 631,485 | |
5.00%, 07/01/55 | | | 870 | | | | 982,334 | |
Housing & Redevelopment Authority of The City of St. Paul Minnesota, Refunding RB, Series A, 6.63%, 09/01/21(f) | | | 500 | | | | 505,335 | |
| | | | | | | | |
| | | | | | | 17,376,432 | |
| | |
| Mississippi — 0.8% | | | | | | |
Mississippi Home Corp., RB, Series B, (GNMA, FNMA, FHLMC), 2.10%, 12/01/41(c) | | | 17,000 | | | | 16,821,160 | |
| | | | | | | | |
| | |
| Missouri — 0.8% | | | | | | |
Health & Educational Facilities Authority of the State of Missouri, Refunding RB, Series A, 4.00%, 11/15/48 | | | 3,650 | | | | 4,193,339 | |
Industrial Development Authority of the City of St. Louis Missouri, Refunding RB | | | | | | | | |
Series A, 4.38%, 11/15/35 | | | 1,020 | | | | 1,035,382 | |
Series A, 4.75%, 11/15/47 | | | 1,135 | | | | 1,140,073 | |
Kansas City Industrial Development Authority, Refunding RB(b)(g)(h)
5.75%, 11/15/36 | | | 1,350 | | | | 462,985 | |
6.00%, 11/15/51 | | | 110 | | | | 37,725 | |
Kansas City Land Clearance Redevelopment Authority, TA(b) | | | | | | | | |
Series B, 4.38%, 02/01/31 | | | 3,245 | | | | 3,499,960 | |
Series B, 5.00%, 02/01/40 | | | 1,240 | | | | 1,350,645 | |
Plaza at Noah’s Ark Community Improvement District, Refunding RB
3.00%, 05/01/25 | | | 350 | | | | 360,363 | |
3.00%, 05/01/26 | | | 275 | | | | 284,026 | |
3.00%, 05/01/30 | | | 475 | | | | 489,810 | |
| | | | | | | | |
| Security | | Par
(000) | | | Value | |
| | |
| Missouri (continued) | | | | | | |
Plaza at Noah’s Ark Community Improvement District, Refunding RB (continued) 3.13%, 05/01/35 | | $ | 500 | | | $ | 504,270 | |
Poplar Bluff Regional Transportation Development District, RB, 4.75%, 12/01/42 | | | 2,200 | | | | 2,287,252 | |
| | | | | | | | |
| | | | | | | 15,645,830 | |
| | |
| Nebraska — 0.5% | | | | | | |
Central Plains Energy Project, RB, 5.00%, 09/01/42 | | | 780 | | | | 821,301 | |
Central Plains Energy Project, Refunding RB,
Series A, 5.00%, 09/01/42 | | | 6,090 | | | | 9,099,191 | |
| | | | | | | | |
| | | | | | | 9,920,492 | |
| | |
| Nevada — 0.2% | | | | | | |
City of Las Vegas Nevada Special Improvement District No.815, SAB, 5.00%, 12/01/49 | | | 810 | | | | 925,554 | |
County of Clark Nevada, Refunding SAB
4.00%, 08/01/22 | | | 430 | | | | 446,521 | |
4.00%, 08/01/23 | | | 265 | | | | 275,163 | |
Tahoe-Douglas Visitors Authority, RB
5.00%, 07/01/40 | | | 825 | | | | 972,130 | |
5.00%, 07/01/45 | | | 1,025 | | | | 1,191,583 | |
5.00%, 07/01/51 | | | 1,100 | | | | 1,266,023 | |
| | | | | | | | |
| | | | | | | 5,076,974 | |
| | |
| New Hampshire — 0.8% | | | | | | |
New Hampshire Business Finance Authority, RB | | | | | | | | |
Series A, 4.13%, 08/15/40 | | | 1,435 | | | | 1,489,673 | |
Series A, 4.25%, 08/15/46 | | | 1,610 | | | | 1,661,810 | |
Series A, 4.50%, 08/15/55 | | | 3,350 | | | | 3,481,320 | |
New Hampshire Business Finance Authority, Refunding RB
4.00%, 01/01/41 | | | 2,200 | | | | 2,433,596 | |
Series B, 4.63%, 11/01/42(b) | | | 4,650 | | | | 4,888,173 | |
Series C, AMT, 4.88%, 11/01/42(b) | | | 2,515 | | | | 2,656,041 | |
| | | | | | | | |
| | | | | | | 16,610,613 | |
| | |
| New Jersey — 4.0% | | | | | | |
Casino Reinvestment Development Authority, Inc., Refunding RB, 5.25%, 11/01/44 | | | 5,750 | | | | 6,385,030 | |
Industrial Pollution Control Financing Authority of Gloucester County, Refunding RB, Series A, AMT, 5.00%, 12/01/24. | | | 1,015 | | | | 1,061,822 | |
New Jersey Economic Development Authority, RB
4.00%, 11/01/38 | | | 1,455 | | | | 1,657,609 | |
4.00%, 11/01/39 | | | 1,165 | | | | 1,324,290 | |
6.00%, 10/01/43 | | | 970 | | | | 1,063,430 | |
Series A, 5.00%, 07/01/32 | | | 235 | | | | 255,765 | |
Series A, 5.00%, 07/01/37 | | | 375 | | | | 403,995 | |
Series A, 5.00%, 01/01/48 | | | 1,110 | | | | 1,153,812 | |
Series A, 5.25%, 11/01/54(b) | | | 3,955 | | | | 4,232,641 | |
Series B, 5.00%, 06/15/43 | | | 3,755 | | | | 4,567,056 | |
Series EEE, 5.00%, 06/15/43 | | | 5,550 | | | | 6,800,692 | |
AMT, 5.13%, 09/15/23 | | | 1,520 | | | | 1,613,070 | |
AMT, 5.38%, 01/01/43 | | | 1,360 | | | | 1,496,830 | |
Series B, AMT, 6.50%, 04/01/31 | | | 2,585 | | | | 2,795,057 | |
| | |
| 34 | | 2 0 2 1 BLACK ROCK ANNUAL REPORT TO SHAREHOLDERS |
| | |
Schedule of Investments (continued) June 30, 2021 | | BlackRock High Yield Municipal Fund (Percentages shown are based on Net Assets) |
| | | | | | | | |
| Security | | Par
(000) | | | Value | |
| | |
| New Jersey (continued) | | | | | | |
New Jersey Health Care Facilities Financing Authority, Refunding RB
5.00%, 07/01/32 | | $ | 1,140 | | | $ | 1,376,185 | |
5.00%, 07/01/33 | | | 1,450 | | | | 1,748,888 | |
New Jersey Higher Education Student Assistance Authority, RB | | | | | | | | |
Series B, AMT, 2.50%, 12/01/40 | | | 3,660 | | | | 3,702,566 | |
Series C, AMT, 3.25%, 12/01/51 | | | 1,700 | | | | 1,722,287 | |
New Jersey Transportation Trust Fund Authority, RB | | | | | | | | |
Series AA, 5.25%, 06/15/41 | | | 1,265 | | | | 1,469,905 | |
Series AA, 5.00%, 06/15/44 | | | 1,005 | | | | 1,111,671 | |
Series BB, 4.00%, 06/15/50 | | | 10,940 | | | | 12,476,851 | |
Series BB, 5.00%, 06/15/50 | | | 8,560 | | | | 10,361,880 | |
Series S, 5.25%, 06/15/43 | | | 4,095 | | | | 5,150,650 | |
New Jersey Transportation Trust Fund Authority, Refunding RB, Series A, 5.00%, 12/15/36 | | | 1,195 | | | | 1,474,570 | |
South Jersey Port Corp., ARB, Series B, AMT, 5.00%, 01/01/36 | | | 575 | | | | 685,067 | |
Tobacco Settlement Financing Corp., Refunding RB | | | | | | | | |
Series A, 5.25%, 06/01/46 | | | 900 | | | | 1,098,513 | |
Sub-Series B, 5.00%, 06/01/46 | | | 3,175 | | | | 3,775,837 | |
| | | | | | | | |
| | | | | | | 80,965,969 | |
| | |
| New Mexico — 0.1% | | | | | | |
New Mexico Hospital Equipment Loan Council, Refunding RB, 5.50%, 07/01/42 | | | 2,030 | | | | 2,126,993 | |
| | | | | | | | |
| | |
| New York — 6.9% | | | | | | |
Build NYC Resource Corp., Refunding RB, AMT, 5.00%, 01/01/35(b) | | | 1,215 | | | | 1,389,571 | |
Chautauqua Tobacco Asset Securitization Corp., Refunding RB, 5.00%, 06/01/48 | | | 4,475 | | | | 4,637,219 | |
Erie Tobacco Asset Securitization Corp., Refunding RB, Series A, 5.00%, 06/01/45 | | | 3,210 | | | | 3,236,515 | |
Huntington Local Development Corp., RB, Series A, 5.25%, 07/01/56 | | | 585 | | | | 642,190 | |
Metropolitan Transportation Authority, Refunding RB | | | | | | | | |
Series C-1, 4.75%, 11/15/45 | | | 4,115 | | | | 5,108,032 | |
Series C-1, 5.00%, 11/15/50 | | | 1,340 | | | | 1,672,454 | |
Series C-1, 5.25%, 11/15/55 | | | 1,980 | | | | 2,513,788 | |
Monroe County Industrial Development Corp., Refunding RB, 4.00%, 12/01/39 | | | 1,200 | | | | 1,398,576 | |
New York City Housing Development Corp., RB, M/F Housing, Series F-1, (FHA 542(C)), 2.25%, 11/01/41 | | | 34,100 | | | | 33,724,900 | |
New York City Industrial Development Agency, Refunding RB | | | | | | | | |
Class A, (AGM), 2.00%, 01/01/38 | | | 3,000 | | | | 2,952,180 | |
Series A, Class A, (AGM), 3.00%, 01/01/37 | | | 755 | | | | 830,719 | |
Series A, Class A, (AGM), 3.00%, 01/01/39 | | | 755 | | | | 828,507 | |
Series A, Class A, (AGM), 3.00%, 01/01/40 | | | 525 | | | | 576,082 | |
New York Counties Tobacco Trust IV, Refunding RB | | | | | | | | |
Series A, 6.25%, 06/01/41(b) | | | 7,900 | | | | 8,021,660 | |
Series A, 5.00%, 06/01/42 | | | 4,520 | | | | 4,565,200 | |
Series A, 5.00%, 06/01/45 | | | 1,695 | | | | 1,711,865 | |
New York Counties Tobacco Trust VI, Refunding RB | | | | | | | | |
Series A-2-B, 5.00%, 06/01/45 | | | 4,010 | | | | 4,323,662 | |
Series A-2-B, 5.00%, 06/01/51 | | | 6,865 | | | | 7,290,012 | |
New York Liberty Development Corp., Refunding RB(b) | | | | | | | | |
Series 1, Class 1, 5.00%, 11/15/44 | | | 15,115 | | | | 16,655,370 | |
| | | | | | | | |
| Security | | Par
(000) | | | Value | |
| | |
| New York (continued) | | | | | | |
New York Liberty Development Corp., Refunding RB(b) (continued) | | | | | | | | |
Series 2, Class 2, 5.15%, 11/15/34 | | $ | 450 | | | $ | 505,211 | |
Series 2, Class 2, 5.38%, 11/15/40 | | | 1,070 | | | | 1,206,072 | |
New York State Dormitory Authority, Refunding RB(b)
5.00%, 12/01/33 | | | 590 | | | | 714,024 | |
5.00%, 12/01/35 | | | 785 | | | | 949,277 | |
New York State Housing Finance Agency, RB, M/F Housing, Series L-1, (SONYMA), 2.60%, 11/01/50 | | | 3,750 | | | | 3,782,137 | |
New York Transportation Development Corp., ARB, Series A, AMT, 5.25%, 01/01/50 | | | 3,000 | | | | 3,391,950 | |
New York Transportation Development Corp., RB | | | | | | | | |
AMT, 5.00%, 10/01/35 | | | 1,295 | | | | 1,662,132 | |
AMT, 4.00%, 01/01/36 | | | 5,000 | | | | 5,733,300 | |
AMT, 5.00%, 10/01/40 | | | 3,650 | | | | 4,616,301 | |
AMT, 4.00%, 10/31/46 | | | 2,220 | | | | 2,606,369 | |
AMT, 4.00%, 04/30/53 | | | 1,145 | | | | 1,336,455 | |
New York Transportation Development Corp., Refunding ARB, AMT, 5.38%, 08/01/36 | | | 3,665 | | | | 4,663,786 | |
Niagara Area Development Corp., Refunding RB, Series A, AMT, 4.75%, 11/01/42(b) | | | 530 | | | | 558,647 | |
Triborough Bridge & Tunnel Authority, RB, Series A, 4.00%, 11/15/54 | | | 670 | | | | 791,330 | |
Westchester County Healthcare Corp., RB, Series A, Senior Lien, 5.00%, 11/01/44. | | | 1,320 | | | | 1,464,426 | |
Westchester County Local Development Corp., Refunding RB, Series A, 5.13%, 07/01/55 | | | 1,100 | | | | 1,145,287 | |
Westchester Tobacco Asset Securitization Corp., Refunding RB | | | | | | | | |
Sub-Series C, 4.00%, 06/01/42 | | | 850 | | | | 930,469 | |
Sub-Series C, 5.13%, 06/01/51 | | | 2,000 | | | | 2,283,560 | |
| | | | | | | | |
| | | | | | | 140,419,235 | |
| | |
| North Carolina — 0.3% | | | | | | |
North Carolina Medical Care Commission, RB, 4.00%, 03/01/51. | | | 2,395 | | | | 2,616,322 | |
North Carolina Turnpike Authority, RB, Senior Lien, 4.00%, 01/01/55 | | | 3,000 | | �� | | 3,397,530 | |
| | | | | | | | |
| | | | | | | 6,013,852 | |
| | |
| North Dakota — 0.1% | | | | | | |
County of Cass North Dakota, Refunding RB, Series B, 5.25%, 02/15/58 | | | 1,785 | | | | 2,196,353 | |
| | | | | | | | |
| | |
| Ohio — 1.8% | | | | | | |
Buckeye Tobacco Settlement Financing Authority, Refunding RB, Series B-2, Class 2, 5.00%, 06/01/55 | | | 5,490 | | | | 6,421,323 | |
Cleveland-Cuyahoga County Port Authority, RB 4.00%, 07/01/46 | | | 190 | | | | 222,416 | |
4.00%, 07/01/51 | | | 260 | | | | 302,058 | |
County of Hamilton Ohio, Refunding RB, Series C, 5.00%, 01/01/46 | | | 1,435 | | | | 1,601,331 | |
County of Hardin Ohio, Refunding RB
5.00%, 05/01/30 | | | 620 | | | | 675,186 | |
5.25%, 05/01/40 | | | 1,235 | | | | 1,333,578 | |
5.50%, 05/01/50 | | | 2,895 | | | | 3,132,535 | |
Franklin County Convention Facilities Authority, RB
5.00%, 12/01/44 | | | 1,800 | | | | 2,129,058 | |
5.00%, 12/01/51 | | | 4,000 | | | | 4,692,120 | |
| | |
SCHEDULE OF INVESTMENTS | | 35 |
| | |
Schedule of Investments (continued) June 30, 2021 | | BlackRock High Yield Municipal Fund (Percentages shown are based on Net Assets) |
| | | | | | | | |
| Security | | Par (000) | | | Value | |
| | |
| Ohio (continued) | | | | | | |
Hickory Chase Community Authority, Refunding RB, 5.00%, 12/01/40(b) | | $ | 1,890 | | | $ | 2,010,166 | |
Ohio Air Quality Development Authority, RB, AMT, 5.00%, 07/01/49(b) | | | 5,000 | | | | 5,601,550 | |
Port of Greater Cincinnati Development Authority, RB, 4.25%, 12/01/50(b) | | | 1,100 | | | | 1,113,277 | |
Southern Ohio Port Authority, RB, Series A, AMT, 7.00%, 12/01/42(b) | | | 5,980 | | | | 6,750,463 | |
| | | | | | | | |
| | | | | | | 35,985,061 | |
| | |
| Oklahoma — 1.8% | | | | | | |
Norman Regional Hospital Authority, RB, 4.00%, 09/01/45 | | | 3,565 | | | | 4,052,015 | |
Oklahoma Development Finance Authority, RB 7.25%, 09/01/51(b) | | | 14,390 | | | | 17,545,439 | |
Series A-2, 7.25%, 09/01/51(b) | | | 1,920 | | | | 2,341,018 | |
Series B, 5.00%, 08/15/38 | | | 4,585 | | | | 5,573,342 | |
Series B, 5.25%, 08/15/43 | | | 4,130 | | | | 5,069,658 | |
Tulsa County Industrial Authority, Refunding RB, 5.25%, 11/15/37 | | | 1,050 | | | | 1,168,471 | |
| | | | | | | | |
| | | | | | | 35,749,943 | |
| | |
| Oregon — 0.5% | | | | | | |
Medford Hospital Facilities Authority, Refunding RB | | | | | | | | |
Series A, 4.00%, 08/15/50 | | | 4,845 | | | | 5,633,378 | |
Series A, 5.00%, 08/15/50 | | | 2,000 | | | | 2,513,220 | |
Oregon State Facilities Authority, RB(b) | | | | | | | | |
Series A, 5.00%, 06/15/49 | | | 915 | | | | 982,390 | |
Series A, 5.25%, 06/15/55 | | | 505 | | | | 544,436 | |
| | | | | | | | |
| | | | | | | 9,673,424 | |
| | |
| Pennsylvania — 1.4% | | | | | | |
Allentown Neighborhood Improvement Zone Development Authority, Refunding RB | | | | | | | | |
Series A, 5.00%, 05/01/35 | | | 1,185 | | | | 1,222,659 | |
Series A, 5.00%, 05/01/42 | | | 2,730 | | | | 2,816,787 | |
Bucks County Industrial Development Authority, RB 4.00%, 07/01/46 | | | 275 | | | | 309,499 | |
4.00%, 07/01/51 | | | 200 | | | | 222,892 | |
City of Philadelphia Water & Wastewater Revenue, RB, Series A, 5.00%, 11/01/50 | | | 6,000 | | | | 7,692,900 | |
East Hempfield Township Industrial Development Authority, RB 5.00%, 07/01/34 | | | 1,000 | | | | 1,148,990 | |
5.00%, 07/01/46 | | | 1,750 | | | | 1,996,347 | |
Montgomery County Higher Education and Health Authority, Refunding RB, Series A, 4.00%, 09/01/49 | | | 880 | | | | 980,056 | |
Montgomery County Industrial Development Authority, Refunding RB | | | | | | | | |
5.00%, 12/01/46 | | | 1,470 | | | | 1,654,926 | |
5.38%, 01/01/50 | | | 1,865 | | | | 1,954,856 | |
Northampton County Industrial Development Authority, TA, 7.00%, 07/01/32 | | | 1,050 | | | | 1,125,967 | |
Pennsylvania Economic Development Financing Authority, RB, AMT, 5.00%, 06/30/42 | | | 895 | | | | 1,030,190 | |
Pennsylvania Economic Development Financing Authority, Refunding RB, AMT, 5.50%, 11/01/44 | | | 5,390 | | | | 5,743,800 | |
| | | | | | | | |
| | | | | | | 27,899,869 | |
| | |
| Puerto Rico — 10.0% | | | | | | |
Children’s Trust Fund, RB(d) | | | | | | | | |
Series A, 0.00%, 05/15/57 | | | 63,950 | | | | 4,383,133 | |
| | | | | | | | |
| Security | | Par
(000) | | | Value | |
| | |
| Puerto Rico (continued) | | | | | | |
Children’s Trust Fund, RB(d) (continued) | | | | | | | | |
Series B, 0.00%, 05/15/57 | | $ | — | | | $ | — | |
Children’s Trust Fund, Refunding RB, Series B, 0.00%, 05/15/55(d) | | | 2,000 | | | | 179,980 | |
Commonwealth of Puerto Rico, GO(g)(h) | | | | | | | | |
Series A, 5.25%, 07/01/22 | | | 335 | | | | 308,298 | |
Series A, 5.00%, 07/01/23 | | | 1,250 | | | | 1,150,365 | |
Series A, 5.13%, 07/01/31 | | | 215 | | | | 197,863 | |
Series A, 6.00%, 07/01/38 | | | 1,210 | | | | 1,129,838 | |
Series B, 5.25%, 07/01/17 | | | 1,060 | | | | 967,250 | |
Commonwealth of Puerto Rico, Refunding
GO(g)(h) | | | | | | | | |
Series A, 5.25%, 07/01/16 | | | 1,135 | | | | 1,035,688 | |
Series A, 5.50%, 07/01/18 | | | 200 | | | | 182,500 | |
Series A, 5.50%, 07/01/26 | | | 1,000 | | | | 878,024 | |
Series A, 8.00%, 07/01/35 | | | 22,191 | | | | 18,337,156 | |
Series A, 5.50%, 07/01/39 | | | 4,285 | | | | 3,762,333 | |
Series A, 6.50%, 07/01/40 | | | 2,610 | | | | 2,414,250 | |
Series A, 5.00%, 07/01/41 | | | 7,715 | | | | 6,413,094 | |
Series C, 6.00%, 07/01/39 | | | 168 | | | | 156,870 | |
Series C, 6.50%, 07/01/40 | | | 400 | | | | 370,000 | |
Series D, 5.75%, 07/01/41 | | | 385 | | | | 346,259 | |
Puerto Rico Commonwealth Aqueduct & Sewer Authority, RB | | | | | | | | |
Series A, Senior Lien, 5.75%, 07/01/37 | | | 1,565 | | | | 1,630,417 | |
Series A, Senior Lien, 5.25%, 07/01/42 | | | 4,890 | | | | 5,052,348 | |
Puerto Rico Commonwealth Aqueduct & Sewer Authority, Refunding RB(b) | | | | | | | | |
Series A, Senior Lien, 5.00%, 07/01/35 | | | 4,890 | | | | 5,891,179 | |
Series A, Senior Lien, 5.00%, 07/01/47 | | | 8,605 | | | | 10,282,459 | |
Puerto Rico Electric Power Authority 3rd Series, 5.40%, 01/01/22 | | | 208 | | | | 204,562 | |
RB, 5.40%, 01/01/20 | | | — | | | | — | |
Puerto Rico Electric Power Authority, RB
7.50%, 01/01/22 | | | 4,430 | | | | 4,423,011 | |
Series A, 7.25%, 07/01/30(g)(h) | | | 250 | | | | 249,610 | |
Series A, 7.00%, 07/01/33(g)(h) | | | 8,735 | | | | 8,721,356 | |
Series A, 6.75%, 07/01/36(g)(h) | | | 5,165 | | | | 5,156,932 | |
Series A, 7.00%, 07/01/40(g)(h) | | | 1,000 | | | | 998,438 | |
Series A, 5.00%, 07/01/42(g)(h) | | | 2,315 | | | | 2,261,799 | |
Series A, 5.05%, 07/01/42(g)(h) | | | 1,080 | | | | 1,055,181 | |
Series A, 7.00%, 07/01/43(g)(h) | | | 775 | | | | 773,789 | |
Series A-3, 10.00%, 07/01/19(g)(h) | | | 747 | | | | 785,051 | |
Series B-3, 10.00%, 07/01/19(g)(h) | | | 748 | | | | 785,051 | |
Series C-1, 5.40%, 01/01/18(g)(h) | | | 2,054 | | | | 2,023,363 | |
Series C-2, 5.40%, 07/01/18(g)(h) | | | 2,054 | | | | 2,023,690 | |
Series C-4, 5.40%, 07/01/20(g)(h) | | | 208 | | | | 204,562 | |
Series CCC, 5.00%, 07/01/22(g)(h) | | | 715 | | | | 698,569 | |
Series CCC, 5.00%, 07/01/25(g)(h) | | | 620 | | | | 605,752 | |
Series CCC, 5.25%, 07/01/26(g)(h) | | | 590 | | | | 576,441 | |
Series CCC, 5.25%, 07/01/28(g)(h) | | | 1,945 | | | | 1,740,574 | |
Series TT, 5.00%, 07/01/25(g)(h) | | | 3,270 | | | | 3,194,852 | |
Series TT, 5.00%, 07/01/26(g)(h) | | | 455 | | | | 444,544 | |
Series WW, 5.50%, 07/01/17(g)(h) | | | 475 | | | | 467,875 | |
Series WW, 5.50%, 07/01/18(g)(h) | | | 415 | | | | 408,775 | |
Series WW, 5.50%, 07/01/19(g)(h) | | | 335 | | | | 329,975 | |
Series WW, 5.38%, 07/01/24(g)(h) | | | 815 | | | | 796,270 | |
Series WW, 5.25%, 07/01/25(g)(h) | | | 1,940 | | | | 1,895,417 | |
Series WW, 5.25%, 07/01/33(g)(h) | | | 315 | | | | 307,761 | |
Series WW, 5.50%, 07/01/38(g)(h) | | | 415 | | | | 405,463 | |
Series XX, 5.25%, 07/01/27(g)(h) | | | 230 | | | | 224,714 | |
Series XX, 5.25%, 07/01/35(g)(h) | | | 705 | | | | 688,798 | |
| | |
| 36 | | 2 0 2 1 BLACK ROCK ANNUAL REPORT TO SHAREHOLDERS |
| | |
Schedule of Investments (continued) June 30, 2021 | | BlackRock High Yield Municipal Fund (Percentages shown are based on Net Assets) |
| | | | | | | | |
| Security | | Par (000) | | | Value | |
| | |
| Puerto Rico (continued) | | | | | | |
Puerto Rico Electric Power Authority, RB (continued) | | | | | | | | |
Series XX, 5.75%, 07/01/36(g)(h) | | $ | 200 | | | $ | 195,404 | |
Series XX, 5.25%, 07/01/40(g)(h) | | | 8,385 | | | | 8,192,304 | |
Puerto Rico Electric Power Authority, Refunding RB(g)(h) | | | | | | | | |
Series AAA, 5.25%, 07/01/22 | | | 765 | | | | 747,420 | |
Series AAA, 5.25%, 07/01/25 | | | 3,560 | | | | 3,292,584 | |
Series AAA, 5.25%, 07/01/28 | | | 3,655 | | | | 3,371,966 | |
Series AAA, 5.25%, 07/01/29 | | | 190 | | | | 185,634 | |
Series UU, 1.16%, 07/01/17(a) | | | 2,520 | | | | 2,241,666 | |
Series UU, 1.16%, 07/01/17(a) | | | 140 | | | | 114,100 | |
Series UU, 1.00%, 07/01/18(a) | | | 125 | | | | 101,875 | |
Series UU, 1.00%, 07/01/20(a) | | | 1,135 | | | | 1,009,639 | |
Series UU, 0.80%, 07/01/31(a) | | | 1,345 | | | | 1,196,445 | |
Series ZZ, 5.00%, 07/01/17 | | | 330 | | | | 325,050 | |
Series ZZ, 5.25%, 07/01/19 | | | 1,050 | | | | 1,034,250 | |
Series ZZ, 5.25%, 07/01/23 | | | 370 | | | | 324,675 | |
Series ZZ, 5.25%, 07/01/24 | | | 5,050 | | | | 4,501,535 | |
Series ZZ, 5.25%, 07/01/25 | | | 265 | | | | 258,910 | |
Series ZZ, 5.00%, 07/01/28 | | | 345 | | | | 337,072 | |
Puerto Rico Public Buildings Authority, Refunding RB(g)(h) | | | | | | | | |
Series F, (GTD), 5.25%, 07/01/24 | | | 1,495 | | | | 1,522,408 | |
Series G, (GTD), 4.75%, 07/01/32 | | | 1,230 | | | | 1,252,550 | |
Series M, (GTD), 6.25%, 07/01/31 | | | 2,000 | | | | 2,091,666 | |
Puerto Rico Sales Tax Financing Corp. ST Revenue, RB | | | | | | | | |
Series A-1, Restructured, 4.75%, 07/01/53 | | | 15,177 | | | | 17,211,780 | |
Series A-1, Restructured, 5.00%, 07/01/58 | | | 13,313 | | | | 15,344,963 | |
Series A-2, Restructured, 4.33%, 07/01/40 | | | 9,257 | | | | 10,400,887 | |
Series A-2, Restructured, 4.54%, 07/01/53 | | | 1,564 | | | | 1,753,385 | |
Series A-2, Restructured, 4.78%, 07/01/58 | | | 8,434 | | | | 9,576,554 | |
Puerto Rico Sales Tax Financing Corp. ST Revenue, RB, CAB(d) | | | | | | | | |
Series A-1, Restructured, 0.00%, 07/01/29 | | | 2,914 | | | | 2,579,036 | |
Series A-1, Restructured, 0.00%, 07/01/31 | | | 1,895 | | | | 1,518,842 | |
Series A-1, Restructured, 0.00%, 07/01/33 | | | 679 | | | | 505,577 | |
Series A-1, Restructured, 0.00%, 07/01/46 | | | 9,554 | | | | 3,145,368 | |
Series A-1, Restructured, 0.00%, 07/01/51 | | | 6,487 | | | | 1,545,852 | |
Series B-1, Restructured, 0.00%, 07/01/46 | | | 2,066 | | | | 680,747 | |
| | | | | | | | |
| | | | | | | 204,081,623 | |
| | |
| Rhode Island — 1.0% | | | | | | |
Tobacco Settlement Financing Corp., Refunding RB | | | | | | | | |
Series A, 5.00%, 06/01/35 | | | 1,005 | | | | 1,155,278 | |
Series A, 5.00%, 06/01/40 | | | 5,500 | | | | 6,213,735 | |
Series B, 4.50%, 06/01/45 | | | 6,350 | | | | 7,099,808 | |
Series B, 5.00%, 06/01/50 | | | 5,650 | | | | 6,463,600 | |
| | | | | | | | |
| | | | | | | 20,932,421 | |
| | |
| South Carolina — 0.8% | | | | | | |
City of Hardeeville SC, SAB(b)
3.00%, 05/01/27 | | | 500 | | | | 500,580 | |
3.50%, 05/01/32 | | | 850 | | | | 855,253 | |
3.88%, 05/01/41 | | | 1,400 | | | | 1,406,902 | |
4.00%, 05/01/52 | | | 1,350 | | | | 1,345,154 | |
County of Dorchester South Carolina, SAB, 6.00%, 10/01/51(b) | | | 2,240 | | | | 2,472,176 | |
South Carolina Jobs-Economic Development Authority Refunding RB, 5.25%, 11/15/52 | | | 800 | | | | 867,616 | |
| | | | | | | | |
| Security | | Par (000) | | | Value | |
| | |
| South Carolina (continued) | | | | | | |
South Carolina Jobs-Economic Development Authority, RB | | | | | | | | |
Series A, 5.00%, 11/15/42 | | $ | 585 | | | $ | 650,801 | |
Series A, 5.00%, 11/15/54 | | | 280 | | | | 307,798 | |
South Carolina Jobs-Economic Development Authority, Refunding RB | | | | | | | | |
4.00%, 11/15/27 | | | 670 | | | | 713,898 | |
Series A, 5.00%, 05/01/48 | | | 5,825 | | | | 7,100,267 | |
| | | | | | | | |
| | | | | | | 16,220,445 | |
| | |
| Tennessee — 1.7% | | | | | | |
Chattanooga Health Educational & Housing Facility Board, Refunding RB, Series A, 4.00%, 08/01/44 | | | 410 | | | | 474,358 | |
Franklin Health & Educational Facilities Board, Refunding RB, Series A, 7.50%, 06/01/47(b)(g)(h) | | | 4,060 | | | | 1,219,794 | |
Knox County Health Educational & Housing Facility Board, Refunding RB, 5.00%, 04/01/36 | | | 560 | | | | 669,799 | |
Memphis-Shelby County Industrial Development Board, Refunding TA | | | | | | | | |
Series A, 5.50%, 07/01/37 | | | 1,650 | | | | 1,700,523 | |
Series A, 5.63%, 01/01/46 | | | 1,875 | | | | 1,905,319 | |
Metropolitan Government Nashville & Davidson County Health & Educational Facilities Board, RB, Series A, 5.00%, 07/01/40 | | | 925 | | | | 1,094,090 | |
Metropolitan Government Nashville & Davidson County Health & Educational Facilities Board, Refunding RB | | | | | | | | |
Series A, 4.00%, 10/01/49 | | | 1,635 | | | | 1,796,669 | |
Series A, 5.25%, 10/01/58 | | | 7,565 | | | | 9,083,069 | |
Nashville Metropolitan Development & Housing Agency, TA, 5.13%, 06/01/36(b) | | | 500 | | | | 572,255 | |
Tennergy Corp., RB, Series A, 4.00%, 12/01/51(a) | | | 9,000 | | | | 10,782,900 | |
Tennessee Energy Acquisition Corp., RB, Series A, 5.00%, 05/01/52(a) | | | 3,680 | | | | 4,876,478 | |
| | | | | | | | |
| | | | | | | 34,175,254 | |
| | |
| Texas — 4.6% | | | | | | |
Angelina & Neches River Authority RB, Series A,
7.50%, 12/01/45(b) | | | 2,340 | | | | 2,346,248 | |
Arlington Higher Education Finance Corp., RB | | | | | | | | |
5.00%, 06/15/51 | | | 2,045 | | | | 2,163,712 | |
5.63%, 08/15/54(b) | | | 6,260 | | | | 6,771,129 | |
Series A, 5.88%, 03/01/24 | | | 340 | | | | 360,968 | |
Series A, 4.63%, 08/15/46 | | | 830 | | | | 833,436 | |
Arlington Higher Education Finance Corp., Refunding RB, 5.00%, 08/15/51 | | | 1,000 | | | | 1,079,940 | |
Brazoria County Industrial Development Corp., RB, AMT, 7.00%, 03/01/39 | | | 1,610 | | | | 1,731,024 | |
Central Texas Regional Mobility Authority, Refunding RB, 0.00%, 01/01/31(d) | | | 4,000 | | | | 3,396,360 | |
Central Texas Regional Mobility Authority, Refunding RB, CAB(d)
0.00%, 01/01/28 | | | 3,000 | | | | 2,762,730 | |
0.00%, 01/01/29 | | | 500 | | | | 449,800 | |
0.00%, 01/01/30 | | | 1,330 | | | | 1,162,686 | |
City of Crandall Special Assessment(b) | | | | | | | | |
3.38%, 09/15/26 | | | 100 | | | | 99,988 | |
4.00%, 09/15/31 | | | 200 | | | | 204,078 | |
4.75%, 09/15/31 | | | 100 | | | | 100,731 | |
4.25%, 09/15/41 | | | 770 | | | | 765,811 | |
| | |
SCHEDULE OF INVESTMENTS | | 37 |
| | |
Schedule of Investments (continued) June 30, 2021 | | BlackRock High Yield Municipal Fund (Percentages shown are based on Net Assets) |
| | | | | | | | |
| Security | | Par
(000) | | | Value | |
| | |
| Texas (continued) | | | | | | |
City of Crandall Special Assessment(b) (continued) | | | | | | | | |
5.00%, 09/15/41 | | $ | 500 | | | $ | 497,560 | |
5.25%, 09/15/51 | | | 305 | | | | 304,863 | |
City of Houston Texas Airport System Revenue, RB, AMT, 5.00%, 07/15/28 | | | 2,725 | | | | 3,291,745 | |
City of Houston Texas Airport System Revenue, Refunding ARB, AMT, 5.00%, 07/15/27 | | | 615 | | | | 728,597 | |
City of Houston Texas Airport System Revenue, Refunding RB | | | | | | | | |
Series A, AMT, 6.63%, 07/15/38 | | | 1,110 | | | | 1,115,517 | |
Series C, AMT, 5.00%, 07/15/27 | | | 3,925 | | | | 4,599,668 | |
Fort Bend County Industrial Development Corp., RB, Series B, 4.75%, 11/01/42 | | | 3,380 | | | | 3,551,231 | |
Harris County Cultural Education Facilities Finance Corp., Refunding RB | | | | | | | | |
Series A, 5.00%, 01/01/38 | | | 510 | | | | 535,974 | |
Series A, 5.00%, 01/01/43 | | | 520 | | | | 545,589 | |
Series A, 5.13%, 01/01/48 | | | 1,535 | | | | 1,611,151 | |
Harris County-Houston Sports Authority, Refunding RB, Series G, Senior Lien, (NPFGC), 0.00%, 11/15/41(d) | | | 350 | | | | 149,436 | |
Hemphill County Hospital District, GO
4.63%, 02/01/39 | | | 1,500 | | | | 1,493,355 | |
4.75%, 02/01/45 | | | 2,500 | | | | 2,445,275 | |
Houston Higher Education Finance Corp., RB, 4.00%, 10/01/51 | | | 1,400 | | | | 1,548,750 | |
Mission Economic Development Corp., Refunding RB, AMT, Senior Lien, 4.63%, 10/01/31(b) | | | 1,385 | | | | 1,466,299 | |
New Hope Cultural Education Facilities Finance Corp., RB
5.00%, 08/15/39(b) | | | 420 | | | | 456,246 | |
5.00%, 08/15/49(b) | | | 825 | | | | 885,984 | |
Series A, 5.88%, 04/01/23(f) | | | 890 | | | | 977,825 | |
Series A, 6.00%, 04/01/23(f) | | | 1,355 | | | | 1,491,665 | |
Series A, 10.00%, 12/01/25(b) | | | 3,165 | | | | 3,160,854 | |
Series A, 5.00%, 07/01/57 | | | 3,000 | | | | 3,258,840 | |
New Hope Cultural Education Facilities Finance Corp., Refunding RB(b) | | | | | | | | |
Series A, 5.00%, 08/15/36 | | | 2,520 | | | | 2,528,114 | |
Series A, 5.00%, 08/15/46 | | | 695 | | | | 697,092 | |
New Hope Higher Education Finance Corp., RB, Series A, 5.75%, 06/15/51(b)(c) | | | 5,580 | | | | 5,585,636 | |
Newark Higher Education Finance Corp., RB 5.00%, 06/15/48 | | | 1,500 | | | | 1,527,885 | |
Series A, 5.50%, 08/15/35(b) | | | 375 | | | | 438,908 | |
Series A, 5.75%, 08/15/45(b) | | | 735 | | | | 861,788 | |
Port Beaumont Navigation District, Refunding RB, Series A, AMT, 4.00%, 01/01/50(b) | | | 3,600 | | | | 3,713,652 | |
Red River Health Facilities Development Corp., RB
5.13%, 01/01/41 | | | 600 | | | | 607,530 | |
7.25%, 12/15/42(g)(h) | | | 1,330 | | | | 879,883 | |
Tarrant County Cultural Education Facilities Finance Corp., RB, Series B, 5.00%, 07/01/48 | | | 8,560 | | | | 10,440,632 | |
Texas Transportation Commission, RB, CAB(d)
0.00%, 08/01/46 | | | 2,580 | | | | 878,851 | |
0.00%, 08/01/47 | | | 3,850 | | | | 1,246,746 | |
0.00%, 08/01/48 | | | 4,070 | | | | 1,250,548 | |
0.00%, 08/01/49 | | | 3,825 | | | | 1,110,933 | |
0.00%, 08/01/50 | | | 5,485 | | | | 1,508,101 | |
| | | | | | | | |
| Security | | Par
(000) | | | Value | |
| | |
| Texas (continued) | | | | | | |
Texas Transportation Commission, RB, CAB(d) (continued) | | | | | | | | |
0.00%, 08/01/51 | | $ | 3,230 | | | $ | 835,698 | |
0.00%, 08/01/52 | | | 3,230 | | | | 789,186 | |
0.00%, 08/01/53 | | | 290 | | | | 67,016 | |
| | | | | | | | |
| | | | | | | 93,313,264 | |
| | |
| Utah(b) — 0.1% | | | | | | |
Utah Charter School Finance Authority, RB | | | | | | | | |
Series A, 5.00%, 06/15/41 | | | 590 | | | | 688,536 | |
Series A, 5.00%, 06/15/52 | | | 750 | | | | 854,145 | |
| | | | | | | | |
| | | | | | | 1,542,681 | |
| | |
| Vermont — 0.5% | | | | | | |
East Central Vermont Telecommunications District, RB(b) | | | | | | | | |
Series A, 4.75%, 12/01/40 | | | 2,850 | | | | 2,909,223 | |
Series A, 4.50%, 12/01/50 | | | 3,000 | | | | 3,036,300 | |
Vermont Student Assistance Corp., RB, AMT, 2.38%, 06/15/39 | | | 3,500 | | | | 3,460,450 | |
| | | | | | | | |
| | | | | | | 9,405,973 | |
| | |
| Virginia — 0.8% | | | | | | |
Hanover County Economic Development Authority, Refunding RB, Series A, 5.00%, 07/01/47 | | | 1,015 | | | | 1,036,406 | |
Henrico County Economic Development Authority, Refunding RB, 4.00%, 10/01/50 | | | 1,250 | | | | 1,359,700 | |
Lower Magnolia Green Community Development Authority, SAB(b)
5.00%, 03/01/35 | | | 490 | | | | 529,131 | |
5.00%, 03/01/45 | | | 505 | | | | 540,547 | |
Norfolk Redevelopment & Housing Authority, RB | | | | | | | | |
Series A, 5.00%, 01/01/49 | | | 1,250 | | | | 1,332,638 | |
Series A, 5.25%, 01/01/54 | | | 3,750 | | | | 4,018,088 | |
Salem Economic Development Authority, Refunding RB, 4.00%, 04/01/45 | | | 830 | | | | 935,136 | |
Virginia Beach Development Authority, Refunding RB, 4.00%, 09/01/48 | | | 2,885 | | | | 3,106,712 | |
Virginia Small Business Financing Authority, RB, AMT, Senior Lien, 6.00%, 01/01/37 | | | 3,360 | | | | 3,544,330 | |
| | | | | | | | |
| | | | | | | 16,402,688 | |
| | |
| Washington — 3.2% | | | | | | |
Greater Wenatchee Regional Events Center Public Facilities District, Refunding RB, Series A, 5.50%, 09/01/42 | | | 1,005 | | | | 1,021,894 | |
Port of Seattle Washington, Refunding RB, Series C, 5.00%, 08/01/46 | | | 11,915 | | | | 15,246,315 | |
Washington Economic Development Finance Authority, RB, AMT, 5.63%, 12/01/40(b) | | | 3,470 | | | | 4,216,085 | |
Washington Health Care Facilities Authority, Refunding RB, Series A, 4.00%, 08/01/44 | | | 885 | | | | 1,023,856 | |
Washington State Convention Center Public Facilities District, RB
4.00%, 07/01/31 | | | 3,750 | | | | 4,383,225 | |
4.00%, 07/01/58 | | | 4,800 | | | | 5,295,264 | |
Washington State Housing Finance Commission, RB(b) | | | | | | | | |
Series A, 5.00%, 07/01/50 | | | 620 | | | | 711,345 | |
Series A, 5.00%, 07/01/56 | | | 700 | | | | 792,253 | |
| | |
| 38 | | 2 0 2 1 BLACK ROCK ANNUAL REPORT TO SHAREHOLDERS |
| | |
Schedule of Investments (continued) June 30, 2021 | | BlackRock High Yield Municipal Fund (Percentages shown are based on Net Assets) |
| | | | | | | | |
| Security | | Par
(000) | | | Value | |
| | |
| Washington (continued) | | | | | | |
Washington State Housing Finance Commission, RB, M/F Housing, Series A-1, 3.50%, 12/20/35 | | $ | 24,073 | | | $ | 28,079,186 | |
Washington State Housing Finance Commission, Refunding RB(b)
5.75%, 01/01/35 | | | 355 | | | | 391,093 | |
6.00%, 01/01/45 | | | 940 | | | | 1,032,947 | |
5.00%, 01/01/48 | | | 2,410 | | | | 2,792,587 | |
| | | | | | | | |
| | | | | | | 64,986,050 | |
| | |
| Wisconsin — 3.2% | | | | | | |
Public Finance Authority, RB
5.00%, 12/01/35(b) | | | 200 | | | | 230,486 | |
5.00%, 06/15/39 | | | 310 | | | | 377,961 | |
5.00%, 06/15/41(b) | | | 925 | | | | 989,510 | |
5.00%, 01/01/42(b) | | | 1,555 | | | | 1,703,502 | |
5.00%, 12/01/45(b) | | | 280 | | | | 316,736 | |
6.85%, 11/01/46(b) | | | 1,325 | | | | 1,401,227 | |
7.00%, 11/01/46(b) | | | 805 | | | | 856,810 | |
5.00%, 06/15/49 | | | 955 | | | | 1,134,215 | |
5.63%, 06/15/49(b) | | | 6,000 | | | | 6,118,560 | |
5.00%, 04/01/50(b) | | | 315 | | | | 373,930 | |
5.00%, 06/15/53 | | | 645 | | | | 764,757 | |
5.00%, 06/15/55(b) | | | 2,405 | | | | 2,491,748 | |
5.00%, 12/01/55(b) | | | 955 | | | | 1,064,032 | |
5.00%, 01/01/56(b) | | | 3,790 | | | | 4,047,493 | |
Series A, 6.25%, 10/01/31(b) | | | 910 | | | | 973,982 | |
Series A, 5.00%, 06/01/40(b) | | | 750 | | | | 838,283 | |
Series A, 5.38%, 06/01/44(b) | | | 1,215 | | | | 1,245,253 | |
Series A, 5.38%, 07/15/47(b) | | | 1,595 | | | | 1,828,077 | |
Series A, 7.00%, 10/01/47(b) | | | 910 | | | | 960,305 | |
Series A, 5.00%, 06/01/49(b) | | | 1,340 | | | | 1,465,719 | |
Series A, 5.63%, 06/15/49(b) | | | 8,105 | | | | 8,777,715 | |
Series A, 5.50%, 06/01/54(b) | | | 1,500 | | | | 1,524,540 | |
Series A, 5.00%, 06/15/55(b) | | | 11,540 | | | | 11,856,081 | |
Series A-1, 4.50%, 01/01/35(b) | | | 895 | | | | 1,005,640 | |
Series A-1, 5.50%, 12/01/48(b)(g)(h) | | | 38 | | | | 12,653 | |
Series A-1, 5.00%, 01/01/55(b) | | | 2,470 | | | | 2,756,273 | |
Series B, 0.00%, 01/01/35(b)(d) | | | 1,210 | | | | 576,093 | |
Series B, 0.00%, 01/01/60(b)(d) | | | 31,635 | | | | 2,715,865 | |
Public Finance Authority, Refunding RB(b) 5.00%, 03/01/52 | | | 1,300 | | | | 1,375,582 | |
Series A, 5.00%, 10/01/34 | | | 280 | | | | 345,974 | |
Series A, 5.00%, 10/01/39 | | | 680 | | | | 828,920 | |
Wisconsin Health & Educational Facilities Authority, Refunding RB | | | | | | | | |
5.00%, 11/01/46 | | | 1,130 | | | | 1,222,095 | |
5.00%, 11/01/54 | | | 1,880 | | | | 2,013,875 | |
Wisconsin Housing & Economic Development Authority, RB, M/F Housing, Series A, 4.70%, 07/01/47 | | | 740 | | | | 792,237 | |
| | | | | | | | |
| | | | | | | 64,986,129 | |
| | | | | | | | |
| | |
Total Municipal Bonds — 88.8%
(Cost: $1,632,520,958) | | | | | | | 1,807,246,291 | |
| | | | | | | | |
| | | | | | | | |
| Security | | Par
(000) | | | Value | |
|
Municipal Bonds Transferred to Tender Option Bond Trusts(i) | |
| | |
Georgia — 0.2% | | | | | | | | |
Dalton Whitfield County Joint Development Authority, RB, 4.00%, 08/15/48 | | $ | 3,140 | | | $ | 3,611,973 | |
| | | | | | | | |
| | |
| Illinois — 0.8% | | | | | | |
Illinois Finance Authority, RB, Series A, (AGM), 6.00%, 08/15/41. | | | 2,480 | | | | 2,497,087 | |
Illinois Finance Authority, Refunding RB | | | | | | | | |
Series C, 4.00%, 02/15/41 | | | 6,497 | | | | 7,343,916 | |
Series C, 4.00%, 02/15/41(f) | | | 13 | | | | 14,205 | |
Illinois State Toll Highway Authority, RB, Series A, 5.00%, 01/01/40 | | | 5,011 | | | | 5,819,813 | |
| | | | | | | | |
| | | | | | | 15,675,021 | |
| | |
| Maryland — 0.8% | | | | | | |
Maryland Health & Higher Educational Facilities Authority, RB, Series B, 4.00%, 04/15/50 | | | 15,000 | | | | 17,438,700 | |
| | | | | | | | |
| | |
| Massachusetts — 0.2% | | | | | | |
Commonwealth of Massachusetts Transportation Fund Revenue, RB, Series A, 4.00%, 06/01/45 | | | 3,463 | | | | 3,855,694 | |
| | | | | | | | |
| | |
| New York — 5.5% | | | | | | |
Hudson Yards Infrastructure Corp., RB, 5.75%, 02/15/47(j) | | | 557 | | | | 560,347 | |
New York City Housing Development Corp., RB, M/F Housing | | | | | | | | |
Series C-1A, 4.15%, 11/01/39 | | | 3,107 | | | | 3,243,506 | |
Series C-1A, 4.20%, 11/01/44 | | | 5,695 | | | | 5,945,232 | |
Series C-1A, 4.30%, 11/01/47 | | | 4,660 | | | | 4,865,188 | |
New York Liberty Development Corp., ARB, 5.25%, 12/15/43 | | | 7,725 | | | | 7,892,875 | |
New York Liberty Development Corp., Refunding RB, 5.75%, 11/15/51(j) | | | 2,520 | | | | 2,565,475 | |
New York Power Authority, Refunding RB, Series A, 4.00%, 11/15/60 | | | 3,421 | | | | 4,021,189 | |
New York State Dormitory Authority, Refunding RB | | | | | | | | |
Series D, 4.00%, 02/15/47 | | | 17,080 | | | | 19,997,606 | |
Series E, 5.00%, 03/15/36 | | | 21,670 | | | | 25,498,439 | |
New York State Urban Development Corp., RB, Series A, 4.00%, 03/15/46 | | | 13,005 | | | | 15,115,321 | |
Port Authority of New York & New Jersey, ARB, Series 221, AMT, 4.00%, 07/15/60 | | | 16,595 | | | | 19,217,673 | |
Port Authority of New York & New Jersey, Refunding ARB, 194th Series, 5.25%, 10/15/55 | | | 2,925 | | | | 3,454,630 | |
| | | | | | | | |
| | | | | | | 112,377,481 | |
| | |
| North Carolina — 0.2% | | | | | | |
North Carolina Capital Facilities Finance Agency, Refunding RB, Series B, 5.00%, 10/01/55(f) | | | 2,930 | | | | 3,486,055 | |
| | | | | | | | |
| | |
| Pennsylvania — 0.8% | | | | | | |
Pennsylvania Economic Development Financing Authority, RB, Series A-1, 4.00%, 04/15/50 | | | 11,000 | | | | 12,773,969 | |
Pennsylvania Turnpike Commission, RB, Sub-Series A, 5.50%, 12/01/42 | | | 3,677 | | | | 4,497,393 | |
| | | | | | | | |
| | | | | | | 17,271,362 | |
| | |
SCHEDULE OF INVESTMENTS | | 39 |
| | |
Schedule of Investments (continued) June 30, 2021 | | BlackRock High Yield Municipal Fund (Percentages shown are based on Net Assets) |
| | | | | | | | |
| Security | | Par (000) | | | Value | |
|
| Rhode Island — 0.1% | |
Narragansett Bay Commission, Refunding RB, Series A, 4.00%, 09/01/43(f) | | $ | 2,641 | | | $ | 2,759,083 | |
| | | | | | | | |
|
| Texas — 0.2% | |
Lower Colorado River Authority, Refunding, RB, 4.00%, 05/15/43. | | | 3,480 | | | | 3,572,116 | |
| | | | | | | | |
| | |
| Virginia — 0.4% | | | | | | |
Hampton Roads Transportation Accountability Commission, RB, Series A, Senior Lien, 4.00%, 07/01/60(j) | | | 6,249 | | | | 7,325,766 | |
| | | | | | | | |
|
| Washington — 0.6% | |
City of Bellingham Washington Water & Sewer Revenue, RB, 5.00%, 08/01/40 | | | 2,998 | | | | 3,010,296 | |
Snohomish County Public Utility District No.1, RB, 5.00%, 12/01/45 | | | 8,664 | | | | 10,153,120 | |
| | | | | | | | |
| | | | | | | 13,163,416 | |
|
| Wisconsin — 0.1% | |
Wisconsin Health & Educational Facilities Authority, Refunding RB, 4.00%, 12/01/46 | | | 1,774 | | | | 2,005,015 | |
| | | | | | | | |
| |
Total Municipal Bonds Transferred to Tender Option Bond Trusts — 9.9%
(Cost: $186,691,520) | | | | 202,541,682 | |
| | | | | | | | |
| |
Total Long-Term Investments — 98.7%
(Cost: $1,819,212,478) | | | | 2,009,787,973 | |
| | | | | | | | |
| | |
| | | Shares | | | | |
| | |
Short-Term Securities | | | | | | | | |
| | |
| Money Market Funds — 7.7% | | | | | | |
BlackRock Liquidity Funds, MuniCash, Institutional Class, 0.01%(k)(l) | | | 156,261,655 | | | | 156,292,907 | |
| | | | | | | | |
| |
Total Short-Term Securities — 7.7%
(Cost: $156,292,487) | | | | 156,292,907 | |
| | | | | | | | |
| |
Total Investments — 106.4%
(Cost: $1,975,504,965) | | | | 2,166,080,880 | |
| |
Liabilities in Excess of Other Assets — (0.8)% | | | | (15,944,358 | ) |
| |
Liability for TOB Trust Certificates, Including Interest Expense and Fees Payable — (5.6)% | | | | (114,854,960 | ) |
| | | | | | | | |
| | |
Net Assets — 100.0% | | | | | | $ | 2,035,281,562 | |
| | | | | | | | |
| (a) | Variable rate security. Interest rate resets periodically. The rate shown is the effective interest rate as of period end. Security description also includes the reference rate and spread if published and available. |
| (b) | Security exempt from registration pursuant to Rule 144A under the Securities Act of 1933, as amended. These securities may be resold in transactions exempt from registration to qualified institutional investors. |
| (c) | When-issued security. |
| (e) | Step-up bond that pays an initial coupon rate for the first period and then a higher coupon rate for the following periods. Rate as of period end. |
| (f) | U.S. Government securities held in escrow, are used to pay interest on this security as well as to retire the bond in full at the date indicated, typically at a premium to par. |
| (g) | Issuer filed for bankruptcy and/or is in default. |
| (h) | Non-income producing security. |
| (i) | Represent bonds transferred to a TOB Trust in exchange of cash and residual certificates received by the Fund. These bonds serve as collateral in a secured borrowing. See Note 4 of the Notes to Financial Statements for details. |
| (j) | All or a portion of the security is subject to a recourse agreement. The aggregate maximum potential amount the Fund could ultimately be required to pay under the agreements, which expire between July 1, 2028 to November 15, 2051, is $5,923,259. See Note 4 of the Notes to Financial Statements for details. |
| (k) | Affiliate of the Fund. |
| (l) | Annualized 7-day yield as of period end. |
Affiliates
Investments in issuers considered to be affiliate(s) of the Fund during the year ended June 30, 2021 for purposes of Section 2(a)(3) of the Investment Company Act of 1940, as amended, were as follows:
| | | | | | | | | | | | | | | | | | | | | | | | | | | | | | | | | | | | |
| | | | | | | | | | |
| Affiliated Issuer | | Value at
06/30/20 | | | Purchases
at Cost | | | Proceeds
from Sales | | | Net
Realized
Gain (Loss) | | | Change in
Unrealized
Appreciation
(Depreciation) | | | Value at
06/30/21 | | | Shares Held at 06/30/21 | | | Income | | | Capital Gain
Distributions
from
Underlying
Funds | |
BlackRock Liquidity Funds, MuniCash, Institutional Class | | $ | 93,924,405 | | | $ | 62,369,693 | (a) | | $ | — | | | $ | 2,108 | | | $ | (3,299 | ) | | $ | 156,292,907 | | | | 156,261,655 | | | $ | 11,549 | | | $ | — | |
| | | | | | | | | | | | | | | | | | | | | | | | | | | | | | | | | | | | |
| | (a) | Represents net amount purchased (sold). | |
| | |
| 40 | | 2 0 2 1 BLACK ROCK ANNUAL REPORT TO SHAREHOLDERS |
| | |
Schedule of Investments (continued) June 30, 2021 | | BlackRock High Yield Municipal Fund |
Derivative Financial Instruments Outstanding as of Period End
Futures Contracts
| | | | | | | | | | | | | | | | |
| Description | | Number of
Contracts | | | Expiration
Date | | | Notional
Amount (000) | | | Value/
Unrealized
Appreciation
(Depreciation) | |
Short Contracts | | | | | | | | | | | | | | | | |
10-Year U.S. Treasury Note | | | 301 | | | | 09/21/21 | | | $ | 39,859 | | | $ | (4,574 | ) |
U.S. Long Bond | | | 276 | | | | 09/21/21 | | | | 44,315 | | | | (945,101 | ) |
5-Year U.S. Treasury Note | | | 187 | | | | 09/30/21 | | | | 23,073 | | | | (11,907 | ) |
| | | | | | | | | | | | | | | | |
| | | | | | | | | | | | | | $ | (961,582 | ) |
| | | | | | | | | | | | | | | | |
Derivative Financial Instruments Categorized by Risk Exposure
As of period end, the fair values of derivative financial instruments located in the Statements of Assets and Liabilities were as follows:
| | | | | | | | | | | | | | | | | | | | | | | | | | | | |
| | | Commodity
Contracts | | | Credit
Contracts | | | Equity
Contracts | | | Foreign
Currency
Exchange
Contracts | | | Interest
Rate
Contracts | | | Other
Contracts | | | Total | |
Liabilities — Derivative Financial Instruments | | | | | | | | | | | | | | | | | | | | | | | | | |
Futures contracts | | | | | | | | | | | | | | | | | | | | | | | | | | | | |
Unrealized depreciation on futures
contracts(a) | | $ | — | | | $ | — | | | $ | — | | | $ | — | | | $ | 961,582 | | | $ | — | | | $ | 961,582 | |
| | | | | | | | | | | | | | | | | | | | | | | | | | | | |
| | (a) | Net cumulative unrealized appreciation (depreciation) on futures contracts and centrally cleared swaps, if any, are reported in the Schedule of Investments. In the Statements of Assets and Liabilities, only current day’s variation margin is reported in receivables or payables and the net cumulative unrealized appreciation (depreciation) is included in accumulated earnings (loss). | |
For the year ended June 30, 2021, the effect of derivative financial instruments in the Statements of Operations was as follows:
| | | | | | | | | | | | | | | | | | | | | | | | | | | | |
| | | Commodity
Contracts | | | Credit
Contracts | | | Equity
Contracts | | | Foreign
Currency
Exchange
Contracts | | | Interest
Rate
Contracts | | | Other
Contracts | | | Total | |
Net Realized Gain (Loss) from | | | | | | | | | | | | | | | | | | | | | | | | | | | | |
Futures contracts | | $ | — | | | $ | — | | | $ | — | | | $ | — | | | $ | (680,279 | ) | | $ | — | | | $ | (680,279 | ) |
| | | | | | | | | | | | | | | | | | | | | | | | | | | | |
| | | | | |
Net Change in Unrealized Appreciation (Depreciation) on | | | | | | | | | | | | | | | | | | | | | |
Futures contracts | | $ | — | | | $ | — | | | $ | — | | | $ | — | | | $ | (961,582 | ) | | $ | — | | | $ | (961,582 | ) |
| | | | | | | | | | | | | | | | | | | | | | | | | | | | |
Average Quarterly Balances of Outstanding Derivative Financial Instruments
| | | | |
| |
Futures contracts | | | | |
Average notional value of contracts — short | | $ | 26,811,705 | |
| |
For more information about the Fund’s investment risks regarding derivative financial instruments, refer to the Notes to Financial Statements.
Fair Value Hierarchy as of Period End
Various inputs are used in determining the fair value of financial instruments. For a description of the input levels and information about the Fund’s policy regarding valuation of financial instruments, refer to the Notes to Financial Statements.
The following table summarizes the Fund’s financial instruments categorized in the fair value hierarchy. The breakdown of the Fund’s financial instruments into major categories is disclosed in the Schedule of Investments above.
| | | | | | | | | | | | | | | | |
| | | | | |
| | | Level 1 | | | Level 2 | | | Level 3 | | | Total | |
Assets | | | | | | | | | | | | | | | | |
Investments | | | | | | | | | | | | | | | | |
Long-Term Investments | | | | | | | | | | | | | | | | |
Municipal Bonds | | $ | — | | | $ | 1,807,246,291 | | | $ | — | | | $ | 1,807,246,291 | |
Municipal Bonds Transferred to Tender Option Bond Trusts | | | — | | | | 202,541,682 | | | | — | | | | 202,541,682 | |
| | |
SCHEDULE OF INVESTMENTS | | 41 |
| | |
Schedule of Investments (continued) June 30, 2021 | | BlackRock High Yield Municipal Fund |
Fair Value Hierarchy as of Period End (continued)
| | | | | | | | | | | | | | | | |
| | | Level 1 | | | Level 2 | | | Level 3 | | | Total | |
Short-Term Securities | | | | | | | | | | | | | | | | |
Money Market Funds | | $ | 156,292,907 | | | $ | — | | | $ | — | | | $ | 156,292,907 | |
| | | | | | | | | | | | | | | | |
| | $ | 156,292,907 | | | $ | 2,009,787,973 | | | $ | — | | | $ | 2,166,080,880 | |
| | | | | | | | | | | | | | | | |
Derivative Financial Instruments(a) | | | | | | | | | | | | | | | | |
Liabilities | | | | | | | | | | | | | | | | |
Interest Rate Contracts | | $ | (961,582 | ) | | $ | — | | | $ | — | | | $ | (961,582 | ) |
| | | | | | | | | | | | | | | | |
| | (a) | Derivative financial instruments are futures contracts. Futures contracts are valued at the unrealized appreciation (depreciation) on the instrument. | |
The Fund may hold assets and/or liabilities in which the fair value approximates the carrying amount for financial statement purposes. As of period end, TOB Trust Certificates of $114,823,537 are categorized as Level 2 within the fair value hierarchy.
See notes to financial statements.
| | |
| 42 | | 2 0 2 1 BLACK ROCK ANNUAL REPORT TO SHAREHOLDERS |
| | |
Schedule of Investments June 30, 2021 | | BlackRock National Municipal Fund (Percentages shown are based on Net Assets) |
| | | | | | | | |
| Security | |
Shares | | | Value | |
| | |
Investment Companies | | | | | | | | |
| | |
| Equity Funds(a)(b) — 2.2% | | | | | | |
iShares National Muni Bond ETF | | | 1,730,481 | | | $ | 202,812,373 | |
iShares Short-Term National Muni Bond ETF | | | 1,170,000 | | | | 126,149,400 | |
| | | | | | | | |
| | | | | | | 328,961,773 | |
| | | | | | | | |
| | |
Total Investment Companies — 2.2%
(Cost: $327,754,510) | | | | | | | 328,961,773 | |
| | | | | | | | |
| | |
| | | Par
(000) | | | | |
| | |
Municipal Bonds | | | | | | | | |
| | |
| Alabama — 4.9% | | | | | | |
Alabama Special Care Facilities Financing Authority-Birmingham Alabama, Refunding RB, Series C, 5.00%, 11/15/46 | | $ | 60,000 | | | | 70,985,400 | |
Black Belt Energy Gas District, RB, Series A-1, 4.00%, 12/01/49(c) | | | 215,000 | | | | 244,818,350 | |
Black Belt Energy Gas District, Refunding RB, 4.00%, 06/01/51(c) | | | 30,000 | | | | 37,287,900 | |
City of Homewood Albama, Refunding GO, 5.25%, 09/01/26(d) | | | 25,000 | | | | 30,909,250 | |
Southeast Alabama Gas Supply District, RB, Series A, 4.00%, 06/01/49(c) | | | 220,000 | | | | 241,465,400 | |
Southeast Energy Authority A Cooperative District, RB, Series B, 4.00%, 12/01/51(c) | | | 75,850 | | | | 93,918,229 | |
Tuscaloosa County Industrial Development Authority, Refunding RB(e) | | | | | | | | |
Series A, 4.50%, 05/01/32 | | | 10,029 | | | | 10,825,223 | |
Series A, 5.25%, 05/01/44 | | | 7,780 | | | | 8,867,177 | |
| | | | | | | | |
| | | | | | | 739,076,929 | |
| | |
| Arizona — 2.0% | | | | | | |
Arizona Industrial Development Authority,
RB(e)
5.00%, 07/01/39 | | | 1,000 | | | | 1,189,580 | |
5.00%, 07/01/49 | | | 3,305 | | | | 3,751,818 | |
5.00%, 07/01/54 | | | 10,655 | | | | 11,789,971 | |
Series A, 5.00%, 07/01/39 | | | 1,300 | | | | 1,385,150 | |
Series A, 5.00%, 07/01/49 | | | 2,010 | | | | 2,115,987 | |
Arizona Industrial Development Authority, Refunding RB(e) | | | | | | | | |
Series A, 5.25%, 07/01/37 | | | 2,830 | | | | 3,093,869 | |
Series A, 5.50%, 07/01/52 | | | 2,450 | | | | 2,660,186 | |
City of Phoenix Civic Improvement Corp., RB, 5.00%, 07/01/44 | | | 40,000 | | | | 52,308,800 | |
Industrial Development Authority of the City of Phoenix, RB
6.88%, 07/01/23(d) | | | 3,440 | | | | 3,894,596 | |
Series A, 6.50%, 07/01/34(e) | | | 2,000 | | | | 2,316,180 | |
Series A, 6.75%, 07/01/44(e) | | | 2,190 | | | | 2,564,446 | |
Industrial Development Authority of the City of Phoenix, Refunding RB, 5.00%, 07/01/45(e) | | | 2,280 | | | | 2,519,788 | |
Industrial Development Authority of the County of Pima, RB(e)
5.00%, 06/15/47 | | | 10,400 | | | | 10,625,264 | |
5.00%, 06/15/52 | | | 19,280 | | | | 19,542,786 | |
Maricopa County Industrial Development Authority, RB | | | | | | | | |
Series 2019E, 4.00%, 01/01/45 | | | 21,350 | | | | 25,271,141 | |
Series 2019F, 4.00%, 01/01/45 | | | 35,220 | | | | 41,688,505 | |
| | | | | | | | |
| Security | | Par
(000) | | | Value | |
| | |
| Arizona (continued) | | | | | | |
Maricopa County Industrial Development Authority, RB (continued) | | | | | | | | |
Series A, 4.00%, 01/01/41 | | $ | 5,150 | | | $ | 5,933,006 | |
Maricopa County Industrial Development Authority, Refunding RB, Series A, 5.00%, 01/01/38 | | | 27,000 | | | | 32,796,360 | |
Pinal County Industrial Development Authority, | | | | | | | | |
RB, AMT, 6.25%, 06/01/26 | | | 340 | | | | 363,912 | |
Salt River Project Agricultural Improvement & | | | | | | | | |
Power District, RB, 4.00%, 01/01/39 | | | 24,180 | | | | 29,096,036 | |
Salt River Project Agricultural Improvement & | | | | | | | | |
Power District, Refunding RB | | | | | | | | |
Series A, 4.00%, 01/01/45 | | | 21,350 | | | | 25,775,855 | |
Series A, 5.00%, 12/01/45 | | | 15,000 | | | | 17,374,350 | |
| | | | | | | | |
| | | | | | | 298,057,586 | |
| | |
| Arkansas(e) — 0.5% | | | | | | |
Arkansas Development Finance Authority, RB | | | | | | | | |
Series A, AMT, 4.50%, 09/01/49 | | | 40,990 | | | | 45,954,709 | |
Series A, AMT, 4.75%, 09/01/49 | | | 31,500 | | | | 36,265,635 | |
| | | | | | | | |
| | | | | | | 82,220,344 | |
| | |
| California — 14.4% | | | | | | |
Bay Area Toll Authority, Refunding RB, 4.00%, 04/01/47 | | | 10,000 | | | | 11,376,800 | |
California Health Facilities Financing Authority, Refunding RB, Series A, 5.00%, 11/15/48 | | | 10,000 | | | | 12,345,400 | |
California Infrastructure & Economic Development Bank, RB(e) | | | | | | | | |
Series A-1, 5.00%, 01/01/56 | | | 2,200 | | | | 2,550,614 | |
Series A, AMT, 0.20%, 01/01/50(c)(f) | | | 38,820 | | | | 38,769,883 | |
Series A, AMT, 0.45%, 01/01/50(c) | | | 24,000 | | | | 24,000,000 | |
California Infrastructure & Economic Development Bank, RB, CAB, Class B, 0.00%, 01/01/61(e)(g) | | | 48,480 | | | | 3,663,149 | |
California State Public Works Board, RB | | | | | | | | |
Series A, 5.00%, 09/01/39 | | | 5,000 | | | | 5,679,200 | |
Series B, 4.00%, 05/01/39 | | | 5,995 | | | | 7,334,463 | |
Series B, 4.00%, 05/01/40 | | | 7,280 | | | | 8,900,892 | |
Series B, 4.00%, 05/01/46 | | | 18,250 | | | | 22,029,210 | |
California Statewide Communities Development Authority, RB, 5.25%, 12/01/48(e) | | | 2,000 | | | | 2,345,440 | |
California Statewide Communities Development Authority, SAB, Series C, 3.00%, 09/02/30 | | | 3,510 | | | | 3,700,172 | |
City of Los Angeles California Wastewater System Revenue, RB, Series A, 5.25%, 06/01/47 | | | 27,620 | | | | 34,241,895 | |
City of Los Angeles California, RB, 4.00%, 06/23/22(f) | | | 500,000 | | | | 518,895,000 | |
City of Los Angeles Department of Airports, ARB, Series C, AMT, 5.00%, 05/15/45 | | | 16,260 | | | | 20,639,306 | |
City of Los Angeles Department of Airports, Refunding ARB | | | | | | | | |
Series B, 5.00%, 05/15/48 | | | 15,000 | | | | 19,609,800 | |
AMT, 5.00%, 05/15/48 | | | 20,520 | | | | 25,356,564 | |
AMT, Subordinate, 5.00%, 05/15/44 | | | 10,000 | | | | 12,506,200 | |
City of Los Angeles Department of Airports, Refunding RB | | | | | | | | |
Series A, 5.00%, 05/15/38 | | | 19,000 | | | | 24,642,050 | |
Series A, 5.00%, 05/15/40 | | | 31,740 | | | | 41,053,468 | |
| | |
SCHEDULE OF INVESTMENTS | | 43 |
| | |
Schedule of Investments (continued) June 30, 2021 | | BlackRock National Municipal Fund (Percentages shown are based on Net Assets) |
| | | | | | | | |
| Security | | Par
(000) | | | Value | |
| | |
| California (continued) | | | | | | |
City of San Jose California Hotel Tax Revenue, RB | | | | | | | | |
6.50%, 05/01/36 | | $ | 1,510 | | | $ | 1,516,946 | |
6.50%, 05/01/42 | | | 5,130 | | | | 5,153,136 | |
County of Los Angeles California, RB, 4.00%, 06/30/22(f) | | | 151,000 | | | | 156,784,810 | |
County of Riverside California, RB, 2.00%, 06/30/22(f) | | | 65,000 | | | | 66,202,500 | |
CSCDA Community Improvement Authority, RB, M/F Housing(e) | | | | | | | | |
Series A, 5.00%, 01/01/54 | | | 8,950 | | | | 10,543,190 | |
Series A-2, 4.00%, 10/01/56 | | | 36,750 | | | | 40,022,220 | |
Gilroy Public Facilities Financing Authority, | | | | | | | | |
Refunding RB, 6.00%, 11/01/33 | | | 6,535 | | | | 7,381,805 | |
Golden State Tobacco Securitization Corp., | | | | | | | | |
Refunding RB | | | | | | | | |
Series A-1, 5.00%, 06/01/47 | | | 19,600 | | | | 20,298,936 | |
Series A-1, 5.25%, 06/01/47 | | | 9,535 | | | | 9,897,807 | |
Series A-2, 5.00%, 06/01/47 | | | 31,735 | | | | 32,866,670 | |
Los Angeles County Metropolitan Transportation Authority, RB | | | | | | | | |
Series A, 5.00%, 07/01/42 | | | 18,700 | | | | 25,116,531 | |
Series A, 5.00%, 07/01/43 | | | 19,635 | | | | 26,290,676 | |
Series A, 5.00%, 07/01/44 | | | 15,060 | | | | 20,099,678 | |
Series A, 5.00%, 07/01/45 | | | 21,645 | | | | 28,833,737 | |
Los Angeles Department of Water & Power Power System Revenue, Series A, 5.25%, 07/01/44 | | | 19,000 | | | | 23,358,980 | |
Los Angeles Department of Water & Power Power System Revenue, Refunding RB | | | | | | | | |
Series B, 5.25%, 07/01/37 | | | 13,500 | | | | 16,766,325 | |
Series B, 5.25%, 07/01/38 | | | 15,000 | | | | 18,608,400 | |
Series B, 5.25%, 07/01/39 | | | 7,000 | | | | 8,674,190 | |
Los Angeles Department of Water & Power, Power Systems Refunding RB, Series B, 5.00%, 07/01/50 | | | 45,000 | | | | 57,786,750 | |
Oakland Unified School District/Alameda County, Refunding GO, 6.63%,
08/01/21(d) | | | 3,750 | | | | 3,769,688 | |
Palomar Community College District, GO, Series D, Election 2006, 5.25%, 08/01/45 | | | 24,540 | | | | 30,612,178 | |
Port of Oakland, Refunding RB, Series P, AMT, Senior Lien, 5.00%, 05/01/31 | | | 13,010 | | | | 13,476,539 | |
San Diego County Regional Transportation | | | | | | | | |
Commission, Refunding RB | | | | | | | | |
Series A, 5.00%, 10/01/22 | | | 65,800 | | | | 69,760,502 | |
Series A, 5.00%, 04/01/41 | | | 35,000 | | | | 41,839,000 | |
San Diego County Water Authority, Refunding RB | | | | | | | | |
Series B, 4.00%, 05/01/37 | | | 12,905 | | | | 16,161,190 | |
Series B, 4.00%, 05/01/38 | | | 10,215 | | | | 12,769,465 | |
San Diego Public Facilities Financing Authority, Refunding RB
Series A, 5.00%, 05/15/39 | | | 10,000 | | | | 12,024,800 | |
Series A, Subordinate, 5.25%, 08/01/47 | | | 13,645 | | | | 17,210,575 | |
San Francisco Bay Area Rapid Transit District, GO, Series C-1, 4.00%, 08/01/45 | | | 35,295 | | | | 42,016,580 | |
San Francisco City & County Airport Comm-San Francisco International Airport, Refunding ARB
2nd Series, AMT, 5.00%, 05/01/48 | | | 10,500 | | | | 12,807,480 | |
Series A, AMT, 5.00%, 05/01/44 | | | 32,765 | | | | 40,733,448 | |
| | | | | | | | |
| Security | | Par
(000) | | | Value | |
| | |
| California (continued) | | | | | | |
San Francisco City & County Airport Comm-San Francisco International Airport, Refunding ARB (continued) | | | | | | | | |
Series A, AMT, 5.00%, 05/01/49 | | $ | 67,700 | | | $ | 84,090,170 | |
Series B, AMT, 5.00%, 05/01/41 | | | 20,000 | | | | 23,711,400 | |
Series B, AMT, 5.00%, 05/01/46 | | | 20,000 | | | | 23,583,600 | |
Series E, AMT, 5.00%, 05/01/45 | | | 24,750 | | | | 30,745,440 | |
San Ramon Valley Unified School District, GO, 4.00%, 08/01/37 | | | 23,850 | | | | 25,603,213 | |
State of California, Refunding GO 5.00%, 03/01/35 | | | 26,465 | | | | 34,699,320 | |
4.00%, 10/01/37 | | | 23,360 | | | | 28,326,803 | |
5.25%, 10/01/39 | | | 20,100 | | | | 24,280,197 | |
University of California, RB, Series AV, 5.25%, 05/15/42 | | | 58,825 | | | | 73,521,838 | |
University of California, Refunding RB, Series Q, 5.00%, 05/15/46 | | | 90,860 | | | | 119,350,970 | |
| | | | | | | | |
| | | | | | | 2,196,937,189 | |
| | |
| Colorado — 2.1% | | | | | | |
Arista Metropolitan District, Refunding GO, | | | | | | | | |
Series A, 5.13%, 12/01/48 | | | 3,500 | | | | 3,746,435 | |
Brighton Crossing Metropolitan District No.6, GO | | | | | | | | |
Series A, 5.00%, 12/01/35 | | | 525 | | | | 590,000 | |
Series A, 5.00%, 12/01/40 | | | 515 | | | | 572,778 | |
Series A, 5.00%, 12/01/50 | | | 1,500 | | | | 1,650,090 | |
Broadway Station Metropolitan District No.2, GO, Series A, 5.13%, 12/01/48 | | | 5,000 | | | | 5,393,100 | |
Centerra Metropolitan District No.1, TA, 5.00%, 12/01/47(e) | | | 6,930 | | | | 7,270,748 | |
City & County of Denver Colorado Airport System Revenue, Refunding ARB | | | | | | | | |
Series A, AMT, 5.00%, 12/01/37 | | | 25,015 | | | | 31,065,378 | |
Series A, AMT, 5.00%, 12/01/38 | | | 5,250 | | | | 6,520,658 | |
Series A, AMT, 5.25%, 12/01/43 | | | 62,620 | | | | 78,122,207 | |
City & County of Denver Colorado, COP, | | | | | | | | |
Series A, 5.38%, 06/01/43 | | | 10,000 | | | | 12,110,600 | |
City & County of Denver Colorado, Refunding RB, AMT, 5.00%, 10/01/32 | | | 36,115 | | | | 38,267,093 | |
Colorado Educational & Cultural Facilities Authority, Refunding RB(e)
5.00%, 12/01/40 | | | 990 | | | | 1,087,614 | |
5.00%, 12/01/50 | | | 1,320 | | | | 1,414,776 | |
5.00%, 12/01/55 | | | 1,540 | | | | 1,638,637 | |
Copperleaf Metropolitan District No.3, GO, | | | | | | | | |
Series A, 5.13%, 12/01/22(d) | | | 1,200 | | | | 1,262,256 | |
Cottonwood Highlands Metropolitan District No.1, GO, Series A, 5.00%, 12/01/49 | | | 900 | | | | 966,942 | |
Mayfield Metropolitan District, GO, Series A, 5.75%, 12/01/50 | | | 1,190 | | | | 1,327,350 | |
Regional Transportation District Sales Tax Revenue, Refunding RB, Series A, 3.50%, 11/01/22(d) | | | 75,000 | | | | 78,571,500 | |
Southlands Metropolitan District No.1, Refunding GO, Series A-1, 5.00%, 12/01/47 | | | 3,000 | | | | 3,326,490 | |
| | |
| 44 | | 2 0 2 1 BLACK ROCK ANNUAL REPORT TO SHAREHOLDERS |
| | |
Schedule of Investments (continued) June 30, 2021 | | BlackRock National Municipal Fund (Percentages shown are based on Net Assets) |
| | | | | | | | |
| Security | | Par
(000) | | | Value | |
| | |
| Colorado (continued) | | | | | | |
State of Colorado, COP, Series J, 5.25%, 03/15/42 | | $ | 30,000 | | | $ | 36,820,200 | |
STC Metropolitan District No.2, Refunding GO, Series A, 4.00%, 12/01/29 | | | 1,500 | | | | 1,617,930 | |
| | | | | | | | |
| | | | | | | 313,342,782 | |
| | |
| Connecticut — 1.1% | | | | | | |
Connecticut State Health & Educational Facilities Authority, RB(c)
Series 2010-A, 0.25%, 07/01/49 | | | 15,000 | | | | 14,978,550 | |
Series X-2, 0.25%, 07/01/37 | | | 11,000 | | | | 10,984,160 | |
Connecticut State Health & Educational Facilities Authority, Refunding RB
Series 2015-A, 0.38%, 07/01/35(c)(f) | | | 36,965 | | | | 36,972,393 | |
Series G-1, 5.00%, 07/01/39(e) | | | 1,500 | | | | 1,757,040 | |
Series G-1, 5.00%, 07/01/44(e) | | | 2,000 | | | | 2,307,000 | |
Series G-1, 5.00%, 07/01/50(e) | | | 2,350 | | | | 2,685,721 | |
Mohegan Tribal Finance Authority, RB, 7.00%, 02/01/45(e) | | | 3,945 | | | | 4,199,058 | |
State of Connecticut Special Tax Revenue, RB
Series A, 4.00%, 05/01/39 | | | 21,000 | | | | 25,440,870 | |
Series A, 4.00%, 05/01/40 | | | 14,530 | | | | 17,546,138 | |
State of Connecticut, GO | | | | | | | | |
Series 2021-A, 3.00%, 01/15/35 | | | 8,090 | | | | 9,042,678 | |
Series 2021-A, 3.00%, 01/15/38 | | | 12,000 | | | | 13,205,400 | |
Series 2021-A, 3.00%, 01/15/39 | | | 18,675 | | | | 20,498,427 | |
Series A, 4.00%, 01/15/38 | | | 5,000 | | | | 5,980,550 | |
| | | | | | | | |
| | | | | | | 165,597,985 | |
| | |
| Delaware — 0.2% | | | | | | |
Delaware State Economic Development Authority, Refunding RB, Series A, 1.25%, 10/01/45(c) | | | 25,165 | | | | 25,209,039 | |
| | | | | | | | |
| | |
| District of Columbia — 3.2% | | | | | | |
District of Columbia Water & Sewer Authority, Refunding RB
Series B, Sub-Lien, 5.25%, 10/01/40 | | | 48,060 | | | | 56,836,236 | |
Series B, Sub-Lien, 5.25%, 10/01/44 | | | 63,075 | | | | 74,363,533 | |
District of Columbia, GO | | | | | | | | |
Series A, 5.00%, 06/01/41 | | | 30,000 | | | | 35,846,400 | |
Series D, 5.00%, 06/01/42 | | | 40,000 | | | | 48,963,600 | |
Metropolitan Washington Airports Authority
Aviation Revenue, Refunding RB | | | | | | | | |
Series A, AMT, 5.00%, 10/01/23(f) | | | 4,500 | | | | 4,969,125 | |
Series A, AMT, 5.00%, 10/01/24(f) | | | 7,000 | | | | 8,019,690 | |
Series A, AMT, 5.00%, 10/01/25(f) | | | 8,000 | | | | 9,452,080 | |
Series A, AMT, 5.00%, 10/01/36 | | | 10,000 | | | | 12,654,500 | |
Series A, AMT, 5.00%, 10/01/46(f) | | | 24,000 | | | | 31,194,720 | |
Series B, AMT, 5.00%, 10/01/35 | | | 41,900 | | | | 49,026,771 | |
Washington Metropolitan Area Transit Authority, RB
5.00%, 07/01/43 | | | 35,480 | | | | 43,179,160 | |
Series A, 5.00%, 07/15/45 | | | 35,000 | | | | 45,301,550 | |
Series B, 5.00%, 07/01/42 | | | 50,000 | | | | 60,863,500 | |
| | | | | | | | |
| | | | | | | 480,670,865 | |
| | |
| Florida — 2.7% | | | | | | |
Brevard County Health Facilities Authority,
RB(e)(f)
4.00%, 11/15/45 | | | 2,830 | | | | 2,905,165 | |
4.00%, 11/15/55 | | | 4,170 | | | | 4,258,529 | |
Capital Trust Agency, Inc., RB(e)
5.00%, 07/01/54 | | | 2,095 | | | | 2,365,988 | |
5.00%, 01/01/56 | | | 1,550 | | | | 1,781,585 | |
| | | | | | | | |
| Security | | Par
(000) | | | Value | |
| | |
| Florida (continued) | | | | | | |
Capital Trust Agency, Inc., RB(e) (continued) | | | | | | | | |
Series A, 5.00%, 06/15/49 | | $ | 4,365 | | | $ | 4,666,447 | |
Series A-1, 5.00%, 07/01/56 | | | 13,030 | | | | 15,438,726 | |
Capital Trust Agency, Inc., RB, CAB, 0.00%, 01/01/61(e)(g) | | | 7,200 | | | | 518,184 | |
Central Florida Expressway Authority, RB, Series A, Senior Lien, 5.00%, 07/01/44 | | | 10,000 | | | | 12,562,300 | |
City of Tampa Florida, RB, Series A, 5.00%, 11/15/46 | | | 12,910 | | | | 15,333,078 | |
City of Tampa Florida, SAB
5.25%, 05/01/43 | | | 11,720 | | | | 14,763,098 | |
5.25%, 05/01/46 | | | 15,430 | | | | 19,436,554 | |
County of Miami-Dade Florida Aviation Revenue, Refunding ARB, Series A, AMT, 5.00%, 10/01/44 | | | 8,000 | | | | 9,958,240 | |
County of Miami-Dade Florida Aviation Revenue, Refunding RB
5.00%, 10/01/41 | | | 7,220 | | | | 8,671,148 | |
Series B, AMT, 5.00%, 10/01/40 | | | 90,000 | | | | 110,142,000 | |
County of Miami-Dade Seaport Department, ARB | | | | | | | | |
Series A, 6.00%, 10/01/38 | | | 6,325 | | | | 7,082,039 | |
Series A, 5.50%, 10/01/42 | | | 5,375 | | | | 5,946,631 | |
Series B, AMT, 6.25%, 10/01/38 | | | 5,000 | | | | 5,599,600 | |
Series B, AMT, 6.00%, 10/01/42 | | | 2,350 | | | | 2,626,078 | |
County of Palm Beach Florida, RB, 5.00%, 04/01/51(e) | | | 4,770 | | | | 5,219,668 | |
Florida Development Finance Corp., RB
AMT, 3.00%, 06/01/32 | | | 6,760 | | | | 7,265,716 | |
Series B, AMT, 7.38%, 01/01/49(e) | | | 7,530 | | | | 8,266,208 | |
Greater Orlando Aviation Authority, ARB | | | | | | | | |
Series A, AMT, 5.00%, 10/01/44 | | | 8,970 | | | | 11,154,733 | |
Sub-Series A, AMT, 5.00%, 10/01/42 | | | 49,795 | | | | 60,389,384 | |
Hillsborough County Port District, ARB, Series A, 5.25%, 06/01/48 | | | 8,375 | | | | 10,239,359 | |
Lakewood Ranch Stewardship District, Refunding SAB, 4.00%, 05/01/50(e) | | | 1,250 | | | | 1,331,225 | |
Lakewood Ranch Stewardship District, SAB 4.63%, 05/01/27 | | | 1,745 | | | | 1,898,228 | |
5.00%, 05/01/37(e) | | | 1,655 | | | | 1,841,204 | |
5.25%, 05/01/37 | | | 2,755 | | | | 3,101,662 | |
4.70%, 05/01/39 | | | 1,160 | | | | 1,299,583 | |
5.13%, 05/01/47(e) | | | 1,990 | | | | 2,203,029 | |
5.38%, 05/01/47 | | | 4,785 | | | | 5,360,588 | |
4.88%, 05/01/49 | | | 1,250 | | | | 1,399,675 | |
Live Oak Lake Community Development District, SAB
4.40%, 05/01/40 | | | 1,600 | | | | 1,737,760 | |
4.60%, 05/01/51 | | | 2,840 | | | | 3,064,417 | |
Miami-Dade County Industrial Development Authority, RB, 5.10%, 11/01/43 | | | 8,370 | | | | 8,902,499 | |
Mid-Bay Bridge Authority, RB, Series A, 7.25%, 10/01/21(d) | | | 11,125 | | | | 11,322,914 | |
Orlando Utilities Commission, RB, Series B, 1.25%, 10/01/46(c) | | | 7,560 | | | | 7,673,702 | |
River Landing Community Development District, SAB | | | | | | | | |
Series A, 4.13%, 05/01/40 | | | 860 | | | | 916,038 | |
Series A, 4.35%, 05/01/51 | | | 1,100 | | | | 1,166,242 | |
Series B, 4.25%, 11/01/35 | | | 1,200 | | | | 1,315,848 | |
| | |
SCHEDULE OF INVESTMENTS | | 45 |
| | |
Schedule of Investments (continued) June 30, 2021 | | BlackRock National Municipal Fund (Percentages shown are based on Net Assets) |
| | | | | | | | |
| Security | | Par
(000) | | | Value | |
| | |
| Florida (continued) | | | | | | |
Sarasota National Community Development District, Refunding SAB, 4.00%, 05/01/39 | | $ | 1,750 | | | $ | 1,895,215 | |
Sterling Hill Community Development District, Refunding SAB, Series B, 5.50%,
11/01/10(h)(i) | | | 147 | | | | 93,809 | |
Windward Community Development District, SAB | | | | | | | | |
Series A-1, 4.50%, 05/01/51 | | | 500 | | | | 535,750 | |
Series A-2, 4.40%, 11/01/35 | | | 2,000 | | | | 2,226,900 | |
| | | | | | | | |
| | | | | | | 405,876,746 | |
| | |
| Georgia — 0.4% | | | | | | |
City of Atlanta Georgia Airport Passenger Facility Charge, ARB, Series D, AMT, 4.00%, 07/01/35 | | | 10,850 | | | | 12,810,812 | |
Metropolitan Atlanta Rapid Transit Authority, Refunding RB, Series A, 4.00%, 07/01/44 | | | 20,000 | | | | 21,154,200 | |
Municipal Electric Authority of Georgia, Refunding RB, Series EE, (AMBAC), 7.00%, 01/01/25 | | | 20,000 | | | | 24,405,600 | |
| | | | | | | | |
| | | | | | | 58,370,612 | |
| | |
| Illinois — 6.3% | | | | | | |
Chicago Board of Education, GO | | | | | | | | |
Series A, 5.00%, 12/01/42 | | | 15,895 | | | | 16,692,611 | |
Series C, 5.25%, 12/01/39 | | | 7,275 | | | | 8,196,306 | |
Series D, 5.00%, 12/01/46 | | | 33,615 | | | | 37,253,144 | |
Series H, 5.00%, 12/01/36 | | | 4,620 | | | | 5,605,076 | |
Series H, 5.00%, 12/01/46 | | | 4,475 | | | | 5,316,479 | |
Chicago Board of Education, Refunding GO | | | | | | | | |
Series A, 5.00%, 12/01/28 | | | 11,160 | | | | 14,163,268 | |
Series A, 5.00%, 12/01/30 | | | 365 | | | | 471,533 | |
Series B, 5.00%, 12/01/26 | | | 2,000 | | | | 2,412,920 | |
Series B, 5.00%, 12/01/28 | | | 2,060 | | | | 2,612,018 | |
Series B, 5.00%, 12/01/29 | | | 2,000 | | | | 2,586,720 | |
Series B, 5.00%, 12/01/30 | | | 2,000 | | | | 2,583,740 | |
Series B, 4.00%, 12/01/35 | | | 11,640 | | | | 12,079,526 | |
Series C, 5.00%, 12/01/23 | | | 4,310 | | | | 4,758,068 | |
Series C, 5.00%, 12/01/24 | | | 4,445 | | | | 5,071,656 | |
Series C, 5.00%, 12/01/25 | | | 12,760 | | | | 14,982,664 | |
Series C, 5.00%, 12/01/26 | | | 3,060 | | | | 3,696,082 | |
Series F, 5.00%, 12/01/24 | | | 9,585 | | | | 10,935,431 | |
Series G, 5.00%, 12/01/34 | | | 5,000 | | | | 6,128,600 | |
Chicago Board of Education, Refunding GO, CAB(g) | | | | | | | | |
Series A, 0.00%, 12/01/25 | | | 650 | | | | 613,782 | |
Series A, 0.00%, 12/01/26 | | | 4,000 | | | | 3,705,960 | |
Series A, 0.00%, 12/01/27 | | | 500 | | | | 453,060 | |
Chicago O’Hare International Airport, ARB, Series D, Senior Lien, 5.25%, 01/01/42 | | | 49,415 | | | | 60,606,015 | |
Chicago O’Hare International Airport, Refunding ARB
Series C, AMT, Senior Lien, 5.50%, 01/01/34 | | | 5,380 | | | | 5,771,664 | |
Series B, Senior Lien, 5.00%, 01/01/48 | | | 16,250 | | | | 20,085,325 | |
Chicago O’Hare International Airport, Refunding RB | | | | | | | | |
Series B, Senior Lien, 5.00%, 01/01/35 | | | 4,340 | | | | 5,141,685 | |
Series B, Senior Lien, 5.00%, 01/01/38 | | | 30,000 | | | | 36,324,300 | |
Series B, Senior Lien, 5.00%, 01/01/39 | | | 59,885 | | | | 72,358,447 | |
Illinois Finance Authority, RB
5.00%, 07/01/36 | | | 29,530 | | | | 39,157,666 | |
4.00%, 12/01/36 | | | 10,810 | | | | 13,059,993 | |
4.00%, 07/01/37 | | | 23,000 | | | | 28,128,080 | |
4.00%, 07/01/38 | | | 16,835 | | | | 20,529,946 | |
Series A, (AGM), 6.00%, 08/15/41 | | | 19,285 | | | | 19,417,874 | |
| | | | | | | | |
| Security | | Par
(000) | | | Value | |
| | |
| Illinois (continued) | | | | | | |
Illinois Finance Authority, RB (continued) | | | | | | | | |
Series A, 6.00%, 08/15/41 | | $ | 6,500 | | | $ | 6,545,110 | |
Illinois Finance Authority, Refunding RB | | | | | | | | |
Series A, 4.00%, 04/01/23(d) | | | 30,000 | | | | 31,989,900 | |
Series A, 4.00%, 10/01/38 | | | 24,500 | | | | 27,161,680 | |
Series A, 5.00%, 07/15/42 | | | 23,695 | | | | 29,226,835 | |
Series C, 5.00%, 02/15/41 | | | 28,920 | | | | 34,455,288 | |
Illinois State Toll Highway Authority, RB | | | | | | | | |
Series A, 5.00%, 01/01/38 | | | 4,000 | | | | 4,265,560 | |
Series A, 5.00%, 01/01/40 | | | 18,000 | | | | 20,906,100 | |
Series A, 5.00%, 01/01/42 | | | 48,000 | | | | 58,947,360 | |
Series A, 5.00%, 01/01/45 | | | 49,000 | | | | 63,199,220 | |
Series B, 5.00%, 01/01/40 | | | 21,000 | | | | 24,759,000 | |
Series B, 5.00%, 01/01/41 | | | 28,000 | | | | 33,439,840 | |
Metropolitan Pier & Exposition Authority, Refunding RB, 5.00%, 06/15/42 | | | 5,000 | | | | 6,297,750 | |
Railsplitter Tobacco Settlement Authority, RB, 5.00%, 06/01/26 | | | 15,000 | | | | 18,047,700 | |
State of Illinois, GO
5.00%, 11/01/38 | | | 2,500 | | | | 2,908,450 | |
5.50%, 05/01/39 | | | 9,040 | | | | 11,719,727 | |
Series A, 5.00%, 11/01/29 | | | 27,500 | | | | 35,172,775 | |
Series A, 5.00%, 05/01/34 | | | 2,145 | | | | 2,628,419 | |
Series B, 5.00%, 11/01/32 | | | 14,000 | | | | 17,668,560 | |
State of Illinois, Refunding GO
5.00%, 02/01/26 | | | 10,750 | | | | 12,728,645 | |
Series A, 5.00%, 10/01/28 | | | 19,250 | | | | 24,101,962 | |
Village of Hodgkins Illinois, RB, AMT, 6.00%, 11/01/23 | | | 5,435 | | | | 5,460,055 | |
| | | | | | | | |
| | | | | | | 952,529,575 | |
| | |
| Indiana — 0.1% | | | | | | |
City of Valparaiso Indiana, RB | | | | | | | | |
AMT, 6.75%, 01/01/34 | | | 3,870 | | | | 4,286,567 | |
AMT, 7.00%, 01/01/44 | | | 7,330 | | | | 8,113,504 | |
| | | | | | | | |
| | | | | | | 12,400,071 | |
| | |
| Iowa — 0.5% | | | | | | |
Iowa Finance Authority, RB, 5.50%, 07/01/33 | | | 18,750 | | | | 20,617,500 | |
Iowa Finance Authority, Refunding RB
5.25%, 12/01/25 | | | 2,500 | | | | 2,739,550 | |
Series B, 5.25%, 12/01/50(c) | | | 47,270 | | | | 52,172,844 | |
| | | | | | | | |
| | | | | | | 75,529,894 | |
| | |
| Kansas — 0.7% | | | | | | |
City of Olathe Kansas, Refunding, GO, Series A, 4.00%, 08/01/22(f) | | | 32,595 | | | | 33,898,474 | |
County of Johnson Kansas, GO, Series A, 4.00%, 09/01/35 | | | 10,000 | | | | 11,833,800 | |
Kansas Development Finance Authority, Refunding RB, Series B, 5.00%, 11/15/54(c)(f) | | | 40,265 | | | | 54,936,761 | |
| | | | | | | | |
| | | | | | | 100,669,035 | |
| | |
| Kentucky — 0.6% | | | | | | |
Kentucky Public Energy Authority, RB, | | | | | | | | |
Series C-1, 4.00%, 12/01/49(c) | | | 79,760 | | | | 89,608,765 | |
| | | | | | | | |
| | |
| Louisiana — 0.2% | | | | | | |
Juban Crossing Economic Development District, Refunding RB, Series C, 7.00%, 09/15/44(e) | | | 2,415 | | | | 2,353,490 | |
Louisiana Local Government Environmental Facilities & Community Development Authority, Refunding RB, 0.88%, 02/01/46(c) | | | 21,580 | | | | 21,550,867 | |
| | |
| 46 | | 2 0 2 1 BLACK ROCK ANNUAL REPORT TO SHAREHOLDERS |
| | |
Schedule of Investments (continued) June 30, 2021 | | BlackRock National Municipal Fund (Percentages shown are based on Net Assets) |
| | | | | | | | |
| Security | | Par (000) | | | Value | |
| | |
| Louisiana (continued) | | | | | | |
Louisiana Public Facilities Authority, RB(e) | | | | | | | | |
Series A, 5.00%, 04/01/39 | | $ | 1,425 | | | $ | 1,552,153 | |
Series A, 5.00%, 06/01/39 | | | 1,300 | | | | 1,393,470 | |
Series A, 5.00%, 04/01/49 | | | 2,800 | | | | 2,986,816 | |
Series A, 5.00%, 06/01/49 | | | 3,000 | | | | 3,150,510 | |
Series A, 5.00%, 06/01/58 | | | 4,500 | | | | 4,680,540 | |
| | | | | | | | |
| | | | | | | 37,667,846 | |
| | |
| Maine — 0.0% | | | | | | |
Maine Health & Higher Educational Facilities Authority, RB, 7.50%, 07/01/21 | | | 5,365 | | | | 5,365,000 | |
| | | | | | | | |
| | |
| Maryland — 0.1% | | | | | | |
City of Baltimore Maryland, Refunding RB | | | | | | | | |
Series A, 4.50%, 09/01/33 | | | 2,735 | | | | 2,922,047 | |
Series A, 5.00%, 09/01/38 | | | 1,400 | | | | 1,512,210 | |
Maryland Economic Development Corp., TA, 4.00%, 09/01/50 | | | 5,145 | | | | 5,937,227 | |
Maryland Health & Higher Educational Facilities Authority, RB, Series B, (NPFGC), 7.00%, 07/01/22(j) | | | 1,665 | | | | 1,777,704 | |
| | | | | | | | |
| | | | | | | 12,149,188 | |
| | |
| Massachusetts — 5.2% | | | | | | |
City of Quincy Massachusetts, Refunding, GO, 2.00%, 07/08/22(f) | | | 50,001 | | | | 50,933,356 | |
Commonwealth of Massachusetts Transportation Fund Revenue, RB, 5.00%, 06/01/49 | | | 39,250 | | | | 49,750,553 | |
Commonwealth of Massachusetts, GO | | | | | | | | |
Series A, 5.25%, 04/01/42 | | | 42,000 | | | | 52,232,460 | |
Series A, 5.25%, 01/01/44 | | | 6,660 | | | | 8,548,310 | |
Series A, 5.25%, 04/01/47 | | | 93,350 | | | | 115,133,222 | |
Series E, 5.00%, 05/01/30 | | | 23,300 | | | | 26,331,796 | |
Series E, 5.00%, 05/01/33 | | | 22,000 | | | | 24,828,540 | |
Series E, 5.25%, 09/01/43 | | | 92,000 | | | | 117,668,000 | |
Massachusetts Development Finance Agency, RB, Series A, 5.25%, 01/01/42 | | | 9,655 | | | | 11,622,689 | |
Massachusetts Development Finance Agency, Refunding RB
5.00%, 10/01/37(e) | | | 1,000 | | | | 1,100,870 | |
5.00%, 10/01/47(e) | | | 1,250 | | | | 1,370,388 | |
Series A, 4.00%, 07/15/36 | | | 46,000 | | | | 52,927,600 | |
Massachusetts Port Authority, ARB | | | | | | | | |
Series E, AMT, 5.00%, 07/01/46 | | | 21,300 | | | | 27,420,981 | |
Series E, AMT, 5.00%, 07/01/51 | | | 37,340 | | | | 48,022,227 | |
Massachusetts School Building Authority, RB | | | | | | | | |
Series B, 5.25%, 02/15/48 | | | 70,505 | | | | 89,181,069 | |
Sub-Series B, 4.00%, 02/15/41 | | | 12,420 | | | | 13,540,532 | |
Sub-Series B, 4.00%, 02/15/42 | | | 10,000 | | | | 10,896,500 | |
University of Massachusetts Building Authority, Refunding RB | | | | | | | | |
Series 1, 5.25%, 11/01/42 | | | 58,840 | | | | 74,460,843 | |
Series 1, 5.25%, 11/01/47 | | | 14,425 | | | | 18,151,410 | |
| | | | | | | | |
| | | | | | | 794,121,346 | |
| | |
| Michigan — 1.2% | | | | | | |
Michigan Finance Authority, RB, 4.00%, 02/15/44 | | | 60,000 | | | | 69,722,400 | |
Michigan Finance Authority, Refunding RB 5.00%, 11/15/41 | | | 40,000 | | | | 48,230,400 | |
| | | | | | | | |
| Security | | Par (000) | | | Value | |
| | |
| Michigan (continued) | | | | | | |
Michigan Finance Authority, Refunding RB (continued) | | | | | | | | |
Series A, 5.00%, 12/01/37 | | $ | 25,105 | | | $ | 31,405,853 | |
Michigan Strategic Fund, RB, AMT, 5.00%, 12/31/43 | | | 16,470 | | | | 19,888,184 | |
Royal Oak Hospital Finance Authority, Refunding RB, Series D, 5.00%, 09/01/39 | | | 10,010 | | | | 11,145,434 | |
| | | | | | | | |
| | | | | | | 180,392,271 | |
| | |
| Missouri — 0.0% | | | | | | |
Health & Educational Facilities Authority of the State of Missouri, Refunding RB, Series A, 4.00%, 07/01/46 | | | 5,375 | | | | 6,466,985 | |
| | | | | | | | |
| | |
| Montana — 0.0% | | | | | | |
City of Kalispell Montana, Refunding RB | | | | | | | | |
Series A, 5.25%, 05/15/37 | | | 405 | | | | 445,771 | |
Series A, 5.25%, 05/15/47 | | | 1,500 | | | | 1,630,965 | |
Series A, 5.25%, 05/15/52 | | | 1,500 | | | | 1,626,855 | |
| | | | | | | | |
| | | | | | | 3,703,591 | |
| | |
| Nebraska — 0.1% | | | | | | |
Omaha Public Power District Nebraska City Station Unit 2, Refunding RB | | | | | | | | |
Series A, 5.25%, 02/01/42 | | | 10,000 | | | | 11,523,500 | |
Series A, 5.25%, 02/01/46 | | | 10,000 | | | | 11,492,400 | |
| | | | | | | | |
| | | | | | | 23,015,900 | |
| | |
| Nevada(e) — 0.0% | | | | | | |
Nevada Department of Business & Industry, RB, Series A, 5.00%, 07/15/37 | | | 875 | | | | 966,306 | |
State of Nevada Department of Business & Industry, RB | | | | | | | | |
Series A, 4.50%, 12/15/29 | | | 345 | | | | 382,419 | |
Series A, 5.00%, 12/15/38 | | | 1,080 | | | | 1,205,820 | |
Series A, 5.00%, 07/15/47 | | | 1,400 | | | | 1,526,630 | |
| | | | | | | | |
| | | | | | | 4,081,175 | |
| | |
| New Hampshire(e) — 0.1% | | | | | | |
New Hampshire Business Finance Authority, Refunding RB | | | | | | | | |
Series B, 4.63%, 11/01/42 | | | 9,085 | | | | 9,550,334 | |
Series C, AMT, 4.88%, 11/01/42 | | | 3,700 | | | | 3,907,496 | |
| | | | | | | | |
| | | | | | | 13,457,830 | |
| | |
| New Jersey — 4.0% | | | | | | |
New Jersey Economic Development Authority, RB | | | | | | | | |
Series A, 5.00%, 01/01/48 | | | 9,250 | | | | 9,615,098 | |
Series WW, 5.25%, 06/15/40 | | | 14,145 | | | | 16,366,189 | |
AMT, 5.13%, 09/15/23 | | | 4,125 | | | | 4,377,574 | |
New Jersey Economic Development Authority, Refunding RB, Series BBB, 5.50%, 06/15/30 | | | 45,895 | | | | 56,823,517 | |
New Jersey Health Care Facilities Financing Authority, Refunding RB
6.00%, 07/01/21 | | | 33,185 | | | | 33,185,000 | |
Series A, 6.00%, 07/01/21 | | | 1,200 | | | | 1,200,000 | |
Series A, 5.00%, 07/01/35 | | | 7,375 | | | | 9,126,931 | |
Series A, 5.00%, 07/01/38 | | | 11,950 | | | | 14,729,331 | |
Series A, 5.00%, 07/01/39 | | | 22,245 | | | | 27,382,705 | |
Series A, 5.00%, 07/01/43 | | | 10,000 | | | | 11,931,600 | |
| | |
SCHEDULE OF INVESTMENTS | | 47 |
| | |
Schedule of Investments (continued) June 30, 2021 | | BlackRock National Municipal Fund (Percentages shown are based on Net Assets) |
| | | | | | | | |
| Security | | Par
(000) | | | Value | |
| | |
| New Jersey (continued) | | | | | | |
New Jersey Higher Education Student Assistance Authority, Refunding RB | | | | | | | | |
1st Series, AMT, 5.75%, 12/01/27 | | $ | 200 | | | $ | 203,718 | |
1st Series, AMT, 5.75%, 12/01/28 | | | 160 | | | | 162,971 | |
New Jersey Transportation Trust Fund Authority, RB | | | | | | | | |
Series AA, 5.50%, 06/15/39 | | | 39,890 | | | | 43,560,279 | |
Series AA, 4.00%, 06/15/45 | | | 61,090 | | | | 71,480,187 | |
Series BB, 4.00%, 06/15/44 | | | 25,000 | | | | 28,492,750 | |
Series BB, 5.00%, 06/15/44 | | | 10,000 | | | | 12,107,900 | |
Series C, 5.25%, 06/15/32 | | | 20,010 | | | | 23,056,523 | |
New Jersey Transportation Trust Fund Authority, Refunding RB, Series A, 5.00%, 06/15/30 | | | 20,110 | | | | 23,722,963 | |
New Jersey Turnpike Authority, RB | | | | | | | | |
Series A, 4.00%, 01/01/42 | | | 63,630 | | | | 76,439,355 | |
Series A, 4.00%, 01/01/48 | | | 20,000 | | | | 23,077,200 | |
Series A, 4.00%, 01/01/51 | | | 5,000 | | | | 5,933,050 | |
State of New Jersey, GO
5.00%, 06/01/38 | | | 12,000 | | | | 15,379,200 | |
5.00%, 06/01/39 | | | 13,165 | | | | 16,847,909 | |
5.00%, 06/01/40 | | | 18,310 | | | | 23,383,152 | |
5.00%, 06/01/41 | | | 15,940 | | | | 20,317,443 | |
Tobacco Settlement Financing Corp., Refunding RB | | | | | | | | |
Series A, 5.00%, 06/01/46 | | | 18,260 | | | | 21,860,689 | |
Series A, 5.25%, 06/01/46 | | | 20,350 | | | | 24,838,599 | |
| | | | | | | | |
| | | | | | | 615,601,833 | |
| | |
| New Mexico — 0.2% | | | | | | |
City of Farmington New Mexico, Refunding RB(c) | | | | | | | | |
Series C, 1.15%, 06/01/40 | | | 12,000 | | | | 12,159,840 | |
Series D, 1.10%, 06/01/40 | | | 16,000 | | | | 16,157,920 | |
County of Santa Fe New Mexico, RB, (AGM), 6.00%, 02/01/27 | | | 180 | | | | 207,738 | |
| | | | | | | | |
| | | | | | | 28,525,498 | |
| | |
| New York — 15.4% | | | | | | |
City of New York, GO, Sub-Series F-1, 5.00%, 04/01/43 | | | 54,000 | | | | 66,633,840 | |
Hudson Yards Infrastructure Corp., RB
5.25%, 02/15/47 | | | 13,165 | | | | 13,214,500 | |
5.75%, 02/15/47 | | | 2,925 | | | | 2,939,801 | |
Hudson Yards Infrastructure Corp., Refunding RB | | | | | | | | |
Series A, 5.00%, 02/15/37 | | | 10,420 | | | | 12,615,390 | |
Series A, 5.00%, 02/15/42 | | | 23,825 | | | | 28,571,416 | |
Long Island Power Authority, Refunding RB, | | | | | | | | |
Series B, 0.85%, 09/01/50(c) | | | 17,500 | | | | 17,569,125 | |
Metropolitan Transportation Authority, RB, | | | | | | | | |
Series A-1, 5.25%, 11/15/39 | | | 10,000 | | | | 10,998,900 | |
New York City Housing Development Corp., RB, M/F Housing, Series F-2, 0.60%, 05/01/61(c) | | | 13,460 | | | | 13,427,158 | |
New York City Transitional Finance Authority Building Aid Revenue, RB | | | | | | | | |
Series S-1, (SAW), 5.00%, 07/15/37 | | | 25,000 | | | | 26,202,250 | |
Series S-1B, (SAW), 4.00%, 07/15/40 | | | 10,000 | | | | 11,880,500 | |
Series S-3, Subordinate, (SAW), 5.25%,
07/15/45 | | | 31,165 | | | | 39,721,662 | |
New York City Transitional Finance Authority Future Tax Secured Revenue, RB | | | | | | | | |
Series B-1, 4.00%, 11/01/39 | | | 30,000 | | | | 35,703,300 | |
Series B-1, 4.00%, 11/01/42 | | | 30,000 | | | | 35,434,200 | |
| | | | | | | | |
| Security | | Par
(000) | | | Value | |
| | |
| New York (continued) | | | | | | |
New York City Transitional Finance Authority Future Tax Secured Revenue, RB (continued) | | | | | | | | |
Series B-1, 4.00%, 11/01/43 | | $ | 28,635 | | | $ | 33,744,916 | |
Series E-1, 4.00%, 02/01/46 | | | 60,000 | | | | 71,238,600 | |
Subordinate, 4.00%, 05/01/45 | | | 10,000 | | | | 11,844,600 | |
Series C-1, Subordinate, 4.00%, 11/01/42 | | | 20,925 | | | | 24,502,338 | |
Series C-3, Subordinate, 5.00%, 05/01/40 | | | 20,000 | | | | 24,875,200 | |
New York City Water & Sewer System, RB | | | | | | | | |
Series AA, 4.00%, 06/15/42 | | | 25,000 | | | | 29,974,000 | |
Series AA, 4.00%, 06/15/43 | | | 23,500 | | | | 28,327,605 | |
Series BB-1, 4.00%, 06/15/50 | | | 20,000 | | | | 23,722,800 | |
Series CC-1, Subordinate, 5.00%, 06/15/51 | | | 20,000 | | | | 25,903,600 | |
New York City Water & Sewer System, Refunding RB
5.00%, 06/15/40 | | | 10,000 | | | | 12,906,900 | |
4.00%, 06/15/41 | | | 14,500 | | | | 17,402,465 | |
Series CC, 4.00%, 06/15/42 | | | 29,000 | | | | 34,554,660 | |
Series CC, 5.25%, 06/15/46 | | | 61,465 | | | | 74,330,239 | |
Series CC-1, 5.00%, 06/15/37 | | | 24,000 | | | | 29,346,960 | |
Series CC-1, 5.25%, 06/15/37 | | | 39,000 | | | | 48,308,130 | |
Series DD-2, 5.00%, 06/15/40 | | | 39,865 | | | | 49,756,304 | |
Series DD-3, 4.00%, 06/15/42 | | | 64,105 | | | | 76,602,270 | |
Series EE, 5.25%, 06/15/36 | | | 14,500 | | | | 18,238,390 | |
Series EE, 5.00%, 06/15/40 | | | 34,240 | | | | 42,441,165 | |
Series EE, 4.00%, 06/15/42 | | | 33,340 | | | | 40,069,679 | |
Series FF, 5.00%, 06/15/40 | | | 23,790 | | | | 29,822,668 | |
Sub-Series AA-1, 4.00%, 06/15/50 | | | 8,025 | | | | 9,550,874 | |
New York Counties Tobacco Trust IV, Refunding RB | | | | | | | | |
Series A, 6.25%, 06/01/41(e) | | | 7,800 | | | | 7,920,120 | |
Series A, 5.00%, 06/01/45 | | | 16,695 | | | | 16,861,115 | |
New York Counties Tobacco Trust VI, Refunding RB, Series A-2-B, 5.00%, 06/01/51 | | | 4,325 | | | | 4,592,761 | |
New York Liberty Development Corp., Refunding RB, Series 1, Class 1, 5.00%, 11/15/44(e) | | | 34,385 | | | | 37,889,175 | |
New York Power Authority, Refunding RB, | | | | | | | | |
Series A, 4.00%, 11/15/45 | | | 60,000 | | | | 71,487,000 | |
New York State Dormitory Authority, RB, Series A, 5.00%, 03/15/43 | | | 19,020 | | | | 23,103,214 | |
New York State Dormitory Authority, Refunding RB | | | | | | | | |
Series A, 5.25%, 03/15/39 | | | 5,000 | | | | 6,397,850 | |
Series A, 4.00%, 03/15/41 | | | 43,750 | | | | 52,538,062 | |
Series A, 5.00%, 03/15/41 | | | 5,000 | | | | 6,304,250 | |
Series A, 4.00%, 03/15/45 | | | 75,000 | | | | 88,799,250 | |
Series E, 5.00%, 03/15/41 | | | 20,150 | | | | 25,420,233 | |
Series E, 5.00%, 03/15/44 | | | 10,000 | | | | 12,546,200 | |
New York State Environmental Facilities Corp., Refunding RB, 5.00%, 06/15/42 | | | 10,000 | | | | 12,363,300 | |
New York State Housing Finance Agency, RB, M/F Housing | | | | | | | | |
Series L-2, (SONYMA), 0.75%, 11/01/25 | | | 7,650 | | | | 7,631,640 | |
Series M-2, (SONYMA FHA), 0.75%,
11/01/25 | | | 4,380 | | | | 4,382,059 | |
New York State Thruway Authority, Refunding RB | | | | | | | | |
Series I, 5.00%, 01/01/22(d) | | | 45,000 | | | | 46,087,200 | |
Series B, Subordinate, 4.00%, 01/01/38 | | | 17,020 | | | | 20,084,281 | |
Series B, Subordinate, 4.00%, 01/01/39 | | | 21,000 | | | | 24,619,350 | |
Series B, Subordinate, 4.00%, 01/01/41 | | | 29,505 | | | | 34,503,442 | |
Series B, Subordinate, 4.00%, 01/01/45 | | | 10,000 | | | | 11,626,500 | |
| | |
| 48 | | 2 0 2 1 BLACK ROCK ANNUAL REPORT TO SHAREHOLDERS |
| | |
Schedule of Investments (continued) June 30, 2021 | | BlackRock National Municipal Fund (Percentages shown are based on Net Assets) |
| | | | | | | | |
| Security | | Par
(000) | | | Value | |
| | |
| New York (continued) | | | | | | |
New York State Urban Development Corp., RB, Series A, 4.00%, 03/15/45 | | $ | 23,295 | | | $ | 27,527,701 | |
New York State Urban Development Corp., Refunding RB
5.00%, 03/15/47 | | | 51,850 | | | | 66,379,407 | |
Series A, 4.00%, 03/15/42 | | | 12,000 | | | | 14,179,680 | |
Series A, 4.00%, 03/15/44 | | | 30,000 | | | | 35,065,500 | |
New York Transportation Development Corp., RB | | | | | | | | |
AMT, 5.00%, 10/01/35 | | | 9,610 | | | | 12,334,435 | |
AMT, 5.00%, 10/01/40 | | | 27,095 | | | | 34,268,130 | |
Niagara Area Development Corp., Refunding RB, Series A, AMT, 4.75%, 11/01/42(e) | | | 5,190 | | | | 5,470,520 | |
Port Authority of New York & New Jersey, ARB
217th Series, 4.00%, 11/01/41 | | | 10,000 | | | | 11,871,400 | |
217th Series, 5.00%, 11/01/44 | | | 22,500 | | | | 28,662,075 | |
217th Series, 4.00%, 11/01/49 | | | 24,055 | | | | 28,231,910 | |
218th Series, AMT, 5.00%, 11/01/32 | | | 10,000 | | | | 12,806,000 | |
218th Series, AMT, 4.00%, 11/01/41 | | | 17,725 | | | | 20,559,050 | |
Consolidated, 218th Series, AMT, 5.00%, 11/01/44 | | | 45,000 | | | | 56,165,400 | |
Port Authority of New York & New Jersey, Refunding ARB | | | | | | | | |
Series 224, 4.00%, 07/15/40 | | | 11,520 | | | | 13,995,418 | |
Series 224, 4.00%, 07/15/41 | | | 11,295 | | | | 13,700,157 | |
169th Series, AMT, 5.00%, 10/15/36 | | | 7,195 | | | | 7,288,607 | |
Port Authority of New York & New Jersey, Refunding RB, 213th Series, 5.00%, 09/01/37 | | | 12,500 | | | | 16,064,500 | |
Sales Tax Asset Receivable Corp., Refunding RB, Series A,
4.00%, 10/15/24(d) | | | 97,500 | | | | 109,118,100 | |
Suffolk County Water Authority, Refunding RB, Series A, 3.75%, 06/01/36 | | | 20,000 | | | | 21,253,400 | |
Triborough Bridge & Tunnel Authority, RB Series A, 5.00%, 11/01/25 | | | 21,500 | | | | 25,617,465 | |
Series A, 5.00%, 11/15/51 | | | 12,500 | | | | 16,168,250 | |
Series C, 4.00%, 11/15/40 | | | 15,000 | | | | 17,958,150 | |
Series C, 4.00%, 11/15/41 | | | 25,000 | | | | 29,842,000 | |
Triborough Bridge & Tunnel Authority, Refunding RB | | | | | | | | |
Series A, 5.25%, 11/15/45 | | | 7,805 | | | | 9,123,186 | |
Series B, 5.00%, 11/15/38 | | | 9,800 | | | | 12,114,270 | |
Series C-2, 5.00%, 11/15/42 | | | 72,915 | | | | 90,079,920 | |
Utility Debt Securitization Authority, Refunding RB, Series TE, Restructured, 5.00%, 12/15/41 | | | 20,000 | | | | 22,120,400 | |
Westchester Tobacco Asset Securitization Corp., Refunding RB, Sub-Series C, 5.13%, 06/01/51 | | | 2,500 | | | | 2,854,450 | |
| | | | | | | | |
| | | | | | | 2,348,352,888 | |
| | |
| North Carolina — 0.2% | | | | | | |
North Carolina Capital Facilities Finance Agency, Refunding RB, Series B, 5.00%, 04/01/22(d) | | | 23,570 | | | | 24,418,049 | |
North Carolina Medical Care Commission, RB
5.00%, 10/01/40 | | | 1,050 | | | | 1,220,089 | |
5.00%, 10/01/45 | | | 1,000 | | | | 1,151,590 | |
5.00%, 10/01/50 | | | 1,500 | | | | 1,718,460 | |
| | | | | | | | |
| | | | | | | 28,508,188 | |
| | | | | | | | |
| Security | | Par
(000) | | | Value | |
| | |
| North Dakota — 0.1% | | | | | | |
Cass County Joint Water Resource District, GO, Series A, 0.48%, 05/01/24 | | $ | 12,935 | | | $ | 12,891,668 | |
| | | | | | | | |
| | |
| Ohio — 0.8% | | | | | | |
Buckeye Tobacco Settlement Financing Authority, Refunding RB, Series B-2, Class 2, 5.00%, 06/01/55 | | | 69,375 | | | | 81,143,775 | |
County of Lucas Ohio, Refunding RB(d) | | | | | | | | |
Series A, 5.75%, 11/15/21 | | | 500 | | | | 510,425 | |
Series A, 6.00%, 11/15/21 | | | 4,415 | | | | 4,511,159 | |
Series A, 6.50%, 11/15/21 | | | 12,690 | | | | 12,989,738 | |
Ohio Air Quality Development Authority, RB(e) | | | | | | | | |
AMT, 4.50%, 01/15/48 | | | 1,480 | | | | 1,717,066 | |
AMT, 5.00%, 07/01/49 | | | 16,560 | | | | 18,552,334 | |
Ohio Turnpike & Infrastructure Commission, RB, Series A-1, Junior Lien, 5.25%, 02/15/39 | | | 7,500 | | | | 8,073,000 | |
| | | | | | | | |
| | | | | | | 127,497,497 | |
| | |
| Oklahoma — 0.1% | | | | | | |
Oklahoma Development Finance Authority, RB, 7.25%, 09/01/51(e) | | | 7,990 | | | | 9,742,047 | |
| | | | | | | | |
| | |
| Pennsylvania — 0.9% | | | | | | |
Allentown Neighborhood Improvement Zone Development Authority, RB(e)
5.00%, 05/01/27 | | | 3,250 | | | | 3,793,238 | |
5.00%, 05/01/32 | | | 3,750 | | | | 4,402,650 | |
5.00%, 05/01/42 | | | 6,305 | | | | 7,215,316 | |
Bucks County Industrial Development Authority, RB
4.00%, 07/01/46 | | | 2,205 | | | | 2,481,617 | |
4.00%, 07/01/51 | | | 1,500 | | | | 1,671,690 | |
Northampton County Industrial Development Authority, TA, 7.00%, 07/01/32 | | | 1,930 | | | | 2,069,635 | |
Pennsylvania Turnpike Commission, RB
Series A, 5.25%, 12/01/44 | | | 32,500 | | | | 41,988,700 | |
Series B, 5.25%, 12/01/39 | | | 3,560 | | | | 4,087,450 | |
Sub-Series A, 5.50%, 12/01/46 | | | 46,430 | | | | 57,730,598 | |
Series A, Subordinate, 3.00%, 12/01/42 | | | 12,070 | | | | 12,976,698 | |
| | | | | | | | |
| | | | | | | 138,417,592 | |
| | |
| Puerto Rico — 3.7% | | | | | | |
Children’s Trust Fund, RB, Series A, 0.00%, 05/15/57(g) | | | 300,000 | | | | 20,562,000 | |
Puerto Rico Commonwealth Aqueduct & Sewer Authority, Refunding RB(e) | | | | | | | | |
Series A, Senior Lien, 5.00%, 07/01/35 | | | 40,935 | | | | 49,316,032 | |
Series A, Senior Lien, 5.00%, 07/01/47 | | | 72,080 | | | | 86,131,275 | |
Puerto Rico Sales Tax Financing Corp. Sales Tax Revenue, RB, CAB, Series A-1, Restructured, 0.00%, 07/01/24(g) | | | 3,582 | | | | 3,440,439 | |
Puerto Rico Sales Tax Financing Corp. ST Revenue, RB | | | | | | | | |
Series A-1, Restructured, 4.75%, 07/01/53 | | | 96,014 | | | | 108,886,597 | |
Series A-1, Restructured, 5.00%, 07/01/58 | | | 101,796 | | | | 117,333,123 | |
Series A-2, Restructured, 4.33%, 07/01/40 | | | 48,060 | | | | 53,998,774 | |
Series A-2, Restructured, 4.78%, 07/01/58 | | | 59,265 | | | | 67,293,630 | |
| | |
SCHEDULE OF INVESTMENTS | | 49 |
| | |
Schedule of Investments (continued) June 30, 2021 | | BlackRock National Municipal Fund (Percentages shown are based on Net Assets) |
| | | | | | | | |
| Security | | Par
(000) | | | Value | |
| | |
| Puerto Rico (continued) | | | | | | |
Puerto Rico Sales Tax Financing Corp. ST Revenue, RB, CAB(g) | | | | | | | | |
Series A-1, Restructured, 0.00%, 07/01/46 | | $ | 89,802 | | | $ | 29,564,614 | |
Series A-1, Restructured, 0.00%, 07/01/51 | | | 96,225 | | | | 22,930,418 | |
Series B-1, Restructured, 0.00%, 07/01/46 | | | 18,123 | | | | 5,971,529 | |
| | | | | | | | |
| | | | | | | 565,428,431 | |
| | |
| Rhode Island — 0.2% | | | | | | |
Rhode Island Student Loan Authority, RB, | | | | | | | | |
Series A, AMT, 2.88%, 12/01/35 | | | 16,340 | | | | 16,903,893 | |
Tobacco Settlement Financing Corp., Refunding RB, Series B, 5.00%, 06/01/50 | | | 10,000 | | | | 11,440,000 | |
| | | | | | | | |
| | | | | | | 28,343,893 | |
| | |
| South Carolina — 0.9% | | | | | | |
County of Dorchester South Carolina, SAB(e) 5.88%, 10/01/40. | | | 1,245 | | | | 1,387,080 | |
6.00%, 10/01/51 | | | 3,000 | | | | 3,310,950 | |
Patriots Energy Group Financing Agency, RB, Series A, 4.00%, 10/01/48(c) | | | 95,000 | | | | 103,183,300 | |
South Carolina Jobs-Economic Development Authority, Refunding RB
5.25%, 11/15/37 | | | 6,005 | | | | 6,548,272 | |
Series A, (AGM), 6.25%, 08/01/21(d) | | | 1,525 | | | | 1,532,518 | |
Series A, (AGM), 6.50%, 08/01/21(d) | | | 4,455 | | | | 4,477,854 | |
South Carolina Public Service Authority, Refunding RB | | | | | | | | |
Series A, 4.00%, 12/01/40 | | | 7,385 | | | | 8,722,054 | |
Series A, 4.00%, 12/01/42 | | | 7,500 | | | | 8,835,150 | |
| | | | | | | | |
| | | | | | | 137,997,178 | |
| | |
| Tennessee — 0.9% | | | | | | |
Metropolitan Government of Nashville & Davidson County Tennessee Water & Sewer Revenue, Refunding RB, 4.00%, 07/01/43 | | | 49,005 | | | | 51,899,235 | |
Tennessee Energy Acquisition Corp., RB, Series A, 5.00%, 05/01/52(c) | | | 70,540 | | | | 93,474,670 | |
| | | | | | | | |
| | | | | | | 145,373,905 | |
| | |
| Texas — 7.7% | | | | | | |
Central Texas Turnpike System, Refunding RB, Series A, 5.00%, 08/15/39 | | | 5,000 | | | | 6,463,550 | |
City of Houston Texas Combined Utility System Revenue, Refunding RB | | | | | | | | |
Series B, 1st Lien, 5.00%, 11/15/42 | | | 25,000 | | | | 30,771,250 | |
Series D, Subordinate, 5.00%, 11/15/43 | | | 2,000 | | | | 2,518,060 | |
Dallas Fort Worth International Airport, ARB, Series D, AMT, 5.00%, 11/01/21(d) | | | 29,555 | | | | 30,011,625 | |
Dallas Fort Worth International Airport, Refunding RB, 4.00%, 11/01/34 | | | 15,250 | | | | 18,815,297 | |
Fort Bend Independent School District, Refunding GO, Series B, (PSF), 0.72%, 08/01/51(c) | | | 17,240 | | | | 17,278,273 | |
Harris County Cultural Education Facilities Finance Corp., RB | | | | | | | | |
Series B, 7.00%, 01/01/23(d) | | | 3,700 | | | | 4,076,660 | |
Series B, 6.38%, 01/01/33 | | | 465 | | | | 499,126 | |
Lower Colorado River Authority, Refunding RB, 5.50%, 05/15/30 | | | 6,085 | | | | 6,654,921 | |
Mission Economic Development Corp., Refunding RB, AMT, Senior Lien, 4.63%, 10/01/31(e) | | | 13,495 | | | | 14,287,157 | |
New Hope Cultural Education Facilities Finance Corp., RB | | | | | | | | |
Series A, 5.00%, 08/15/37(e) | | | 2,000 | | | | 2,006,900 | |
| | | | | | | | |
| Security | | Par
(000) | | | Value | |
| | |
| Texas (continued) | | | | | | |
New Hope Cultural Education Facilities Finance Corp., RB (continued)
Series A, 5.00%, 07/01/40 | | $ | 4,000 | | | $ | 4,450,840 | |
Series A, 5.13%, 08/15/47(e) | | | 3,085 | | | | 3,094,625 | |
Series A, 5.00%, 07/01/57 | | | 7,000 | | | | 7,603,960 | |
North Texas Tollway Authority, RB, Series A, 6.00%, 09/01/21(d) | | | 4,815 | | | | 4,861,272 | |
Northwest Independent School District, GO, (PSF), 3.00%, 02/15/46(f) | | | 47,730 | | | | 51,554,605 | |
Pasadena Independent School District, Refunding GO, (PSF-GTD), 5.00%, 02/15/43 | | | 20,000 | | | | 21,404,800 | |
State of Texas, RB, 4.00%, 08/26/21 | | | 675,000 | | | | 678,982,500 | |
Tarrant County Cultural Education Facilities Finance Corp., RB, Series B, 5.00%, 07/01/43 | | | 35,000 | | | | 43,009,050 | |
Texas Water Development Board, RB
4.00%, 10/15/45 | | | 89,200 | | | | 107,357,552 | |
5.25%, 10/15/46 | | | 60,000 | | | | 73,062,600 | |
Series A, 5.00%, 10/15/42 | | | 10,000 | | | | 12,405,800 | |
Series B, 4.00%, 10/15/43 | | | 20,000 | | | | 23,563,000 | |
| | | | | | | | |
| | | | | | | 1,164,733,423 | |
| | |
| Utah — 0.7% | | | | | | |
County of Utah, RB, Series B, 5.00%, 05/15/46 | | | 30,000 | | | | 35,704,200 | |
County of Utah, Refunding RB, Series A, 5.00%, 05/15/41 | | | 44,970 | | | | 53,746,795 | |
Utah Charter School Finance Authority, RB, 5.63%, 06/15/54(e) | | | 4,940 | | | | 5,054,559 | |
Utah Charter School Finance Authority, Refunding RB(e)
5.25%, 06/15/37 | | | 3,795 | | | | 4,282,354 | |
5.38%, 06/15/48 | | | 4,740 | | | | 5,278,843 | |
| | | | | | | | |
| | | | | | | 104,066,751 | |
| | |
| Vermont(e) — 0.1% | | | | | | |
East Central Vermont Telecommunications District, RB | | | | | | | | |
Series A, 4.00%, 12/01/30 | | | 2,010 | | | | 2,080,149 | |
Series A, 4.25%, 12/01/40 | | | 4,030 | | | | 4,079,650 | |
Series A, 4.50%, 12/01/50 | | | 2,960 | | | | 2,995,816 | |
| | | | | | | | |
| | | | | | | 9,155,615 | |
| | |
| Virginia — 0.3% | | | | | | |
Ballston Quarter Community Development Authority, TA, Series A, 5.50%, 03/01/46 | | | 1,815 | | | | 1,812,024 | |
Hanover County Economic Development Authority, Refunding RB 5.00%, 07/01/38 | | | 125 | | | | 136,606 | |
5.00%, 07/01/48 | | | 370 | | | | 402,815 | |
Virginia Small Business Financing Authority, RB, AMT, Senior Lien, 6.00%, 01/01/37 | | | 25,515 | | | | 26,914,753 | |
Virginia Small Business Financing Authority, Refunding RB, Series A, 4.00%, 01/01/45 | | | 17,000 | | | | 19,316,420 | |
| | | | | | | | |
| | | | | | | 48,582,618 | |
| | |
| Washington — 3.4% | | | | | | |
City of Tacoma Washington Electric System Revenue, Refunding RB, Series A, 4.00%, 01/01/42 | | | 32,415 | | | | 34,262,655 | |
City of Tacoma Washington Water Revenue, Refunding RB, 4.00%, 12/01/43 | | | 50,535 | | | | 53,355,358 | |
Energy Northwest, Refunding RB
5.00%, 07/01/22 | | | 55,000 | | | | 57,657,050 | |
5.00%, 07/01/23 | | | 63,500 | | | | 69,578,855 | |
| | |
| 50 | | 2 0 2 1 BLACK ROCK ANNUAL REPORT TO SHAREHOLDERS |
| | |
Schedule of Investments (continued) June 30, 2021 | | BlackRock National Municipal Fund (Percentages shown are based on Net Assets) |
| | | | | | | | |
| Security | | Par (000) | | | Value | |
| | |
| Washington (continued) | | | | | | |
Energy Northwest, Refunding RB (continued)
4.00%, 07/01/42. | | $ | 50,000 | | | $ | 60,819,000 | |
Port of Seattle Washington, ARB, Series C, AMT, Intermediate Lien, 5.25%, 05/01/42 | | | 48,000 | | | | 58,149,120 | |
Port of Seattle Washington, Refunding RB, Series C, 5.00%, 08/01/46 | | | 32,230 | | | | 41,241,186 | |
State of Washington, GO, Series E, 4.00%, 02/01/43 | | | 23,000 | | | | 24,165,870 | |
University of Washington, Refunding RB, Series A, 5.25%, 12/01/46 | | | 23,385 | | | | 28,611,547 | |
Washington Health Care Facilities Authority, RB, Series A, 5.75%, 01/01/23(d) | | | 21,355 | | | | 23,130,241 | |
Washington State Convention Center Public Facilities District, RB | | | | | | | | |
4.00%, 07/01/31 | | | 17,475 | | | | 20,425,829 | |
4.00%, 07/01/58 | | | 9,605 | | | | 10,596,044 | |
Washington State Housing Finance Commission, RB, M/F Housing, Series A-1, 3.50%, 12/20/35 | | | 24,622 | | | | 28,719,997 | |
| | | | | | | | |
| | | | | | | 510,712,752 | |
| | |
| Wisconsin(e) — 0.5% | | | | | | |
Public Finance Authority, RB | | | | | | | | |
5.00%, 12/01/35. | | | 1,690 | | | | 1,947,607 | |
4.00%, 06/15/40(f) | | | 2,020 | | | | 2,115,647 | |
5.00%, 12/01/45 | | | 2,370 | | | | 2,680,944 | |
7.00%, 11/01/46 | | | 6,385 | | | | 6,795,939 | |
4.00%, 06/15/50(f) | | | 2,995 | | | | 3,077,003 | |
5.00%, 12/01/55 | | | 8,045 | | | | 8,963,498 | |
4.00%, 06/15/56(f) | | | 2,445 | | | | 2,491,479 | |
Series A, 6.25%, 10/01/31 | | | 1,715 | | | | 1,835,582 | |
Series A, 5.25%, 03/01/45 | | | 3,325 | | | | 3,665,147 | |
Series A, 7.00%, 10/01/47 | | | 1,715 | | | | 1,809,805 | |
Series A, 5.63%, 06/15/49 | | | 12,360 | | | | 13,385,880 | |
Series A, 5.38%, 07/15/52 | | | 6,760 | | | | 7,688,621 | |
Series A, 5.25%, 03/01/55 | | | 9,500 | | | | 10,333,530 | |
Series A-1, 5.00%, 01/01/56 | | | 2,515 | | | | 2,889,433 | |
Public Finance Authority, RB, CAB, Series B, 0.00%, 01/01/61(g) | | | 25,000 | | | | 2,036,750 | |
Public Finance Authority, Refunding RB, 5.00%, 03/01/37 | | | 760 | | | | 825,421 | |
| | | | | | | | |
| | | | | | | 72,542,286 | |
| | | | | | | | |
| | |
Total Municipal Bonds — 86.7%
(Cost: $12,354,249,793) | | | | | | | 13,172,992,612 | |
| | | | | | | | |
|
Municipal Bonds Transferred to Tender Option Bond Trusts(k) | |
| | |
| California — 0.8% | | | | | | |
University of California, RB, Series M, 5.00%, 05/15/42 | | | 100,000 | | | | 122,755,000 | |
| | | | | | | | |
| | | | | | | | |
| Security | | Par (000) | | | Value | |
| | |
| Nevada — 0.6% | | | | | | |
County of Clark Nevada, GO, Series A, 5.00%, 06/01/43 | | $ | 74,740 | | | $ | 92,318,100 | |
| | | | | | | | |
| | |
| Texas — 0.6% | | | | | | |
Grand Parkway Transportation Corp., RB, Series A, 5.00%, 10/01/43(l) | | | 79,060 | | | | 97,892,883 | |
| | | | | | | | |
| |
Total Municipal Bonds Transferred to Tender Option Bond Trusts — 2.0%
(Cost: $280,701,396) | | | | 312,965,983 | |
| | | | | | | | |
| |
Total Long-Term Investments — 90.9% (Cost: $12,962,705,699) | | | | 13,814,920,368 | |
| | | | | | | | |
| | |
| | | Shares | | | | |
| | |
Short-Term Securities | | | | | | | | |
| | |
| Money Market Funds — 16.0% | | | | | | |
BlackRock Liquidity Funds, MuniCash, Institutional Class, 0.01%(a)(b) | | | 2,423,929,275 | | | | 2,424,414,061 | |
| | | | | | | | |
| |
Total Short-Term Securities — 16.0%
(Cost: $2,423,717,621) | | | | 2,424,414,061 | |
| | | | | | | | |
| |
Total Investments — 106.9% (Cost: $15,386,423,320) | | | | 16,239,334,429 | |
| |
Liabilities in Excess of Other Assets — (6.1)% | | | | (918,843,291 | ) |
| |
Liability for TOB Trust Certificates, Including Interest Expense and Fees Payable — (0.8)% | | | | (126,915,641 | ) |
| | | | | | | | |
| | |
Net Assets — 100.0% | | | | | | $ | 15,193,575,497 | |
| | | | | | | | |
| (a) | Affiliate of the Fund. |
| (b) | Annualized 7-day yield as of period end. |
| (c) | Variable rate security. Interest rate resets periodically. The rate shown is the effective interest rate as of period end. Security description also includes the reference rate and spread if published and available. |
| (d) | U.S. Government securities held in escrow, are used to pay interest on this security as well as to retire the bond in full at the date indicated, typically at a premium to par. |
| (e) | Security exempt from registration pursuant to Rule 144A under the Securities Act of 1933, as amended. These securities may be resold in transactions exempt from registration to qualified institutional investors. |
| (h) | Issuer filed for bankruptcy and/or is in default. |
| (i) | Non-income producing security. |
| (j) | Security is collateralized by municipal bonds or U.S. Treasury obligations. |
| (k) | Represent bonds transferred to a TOB Trust in exchange of cash and residual certificates received by the Fund. These bonds serve as collateral in a secured borrowing. See Note 4 of the Notes to Financial Statements for details. |
| (l) | All or a portion of the security is subject to a recourse agreement. The aggregate maximum potential amount the Fund could ultimately be required to pay under the agreement, which expires on April 1, 2026, is $41,561,403. See Note 4 of the Notes to Financial Statements for details. |
| | |
SCHEDULE OF INVESTMENTS | | 51 |
| | |
Schedule of Investments (continued) June 30, 2021 | | BlackRock National Municipal Fund |
Affiliates
Investments in issuers considered to be affiliate(s) of the Fund during the year ended June 30, 2021 for purposes of Section 2(a)(3) of the Investment Company Act of 1940, as amended, were as follows:
| | | | | | | | | | | | | | | | | | | | | | | | | | | | | | | | | | | | |
| Affiliated Issuer | | Value at
06/30/20 | | | Purchases
at Cost | | | Proceeds
from Sales | | | Net
Realized
Gain (Loss) | | | Change in
Unrealized
Appreciation
(Depreciation) | | | Value at
06/30/21 | | | Shares
Held at
06/30/21 | | | Income | | | Capital Gain
Distributions
from
Underlying
Funds | |
BlackRock Liquidity Funds, MuniCash, | | | | | | | | | | | | | | | | | | | | | | | | | | | | | | | | | | | | |
Institutional Class | | $ | 2,578,972,237 | | | $ | — | | | $ | (154,579,459 | )(a) | | $ | (15,882 | ) | | $ | 37,165 | | | $ | 2,424,414,061 | | | | 2,423,929,275 | | | $ | 238,333 | | | $ | — | |
iShares National Muni Bond ETF | | | — | | | | 201,574,894 | | | | — | | | | — | | | | 1,237,479 | | | | 202,812,373 | | | | 1,730,481 | | | | 305,511 | | | | — | |
iShares Short-Term National Muni Bond ETF | | | — | | | | 126,179,616 | | | | — | | | | — | | | | (30,216 | ) | | | 126,149,400 | | | | 1,170,000 | | | | 213,428 | | | | — | |
| | | | | | | | | | | | | | | | | | | | | | | | | | | | | | | | | | | | |
| | | | | | | | | | | | | | $ | (15,882 | ) | | $ | 1,244,428 | | | $ | 2,753,375,834 | | | | | | | $ | 757,272 | | | $ | — | |
| | | | | | | | | | | | | | | | | | | | | | | | | | | | | | | | | | | | |
| | (a) | Represents net amount purchased (sold). | |
Derivative Financial Instruments Outstanding as of Period End
Futures Contracts
| | | | | | | | | | | | | | | | |
| Description | | Number of
Contracts | | | Expiration
Date | | | Notional
Amount (000) | | | Value/
Unrealized
Appreciation
(Depreciation) | |
Short Contracts | | | | | | | | | | | | | | | | |
10-Year U.S. Treasury Note | | | 2,121 | | | | 09/21/21 | | | $ | 280,867 | | | $ | (1,199,991 | ) |
U.S. Long Bond | | | 1,250 | | | | 09/21/21 | | | | 200,703 | | | | (6,115,099 | ) |
5-Year U.S. Treasury Note | | | 1,570 | | | | 09/30/21 | | | | 193,711 | | | | 3,094 | |
| | | | | | | | | | | | | | | | |
| | | | | | | | | | | | | | $ | (7,311,996 | ) |
| | | | | | | | | | | | | | | | |
Derivative Financial Instruments Categorized by Risk Exposure
As of period end, the fair values of derivative financial instruments located in the Statements of Assets and Liabilities were as follows:
| | | | | | | | | | | | | | | | | | | | | | | | | | | | |
| | | Commodity
Contracts | | | Credit
Contracts | | | Equity
Contracts | | | Foreign Currency
Exchange
Contracts | | | Interest
Rate
Contracts | | | Other
Contracts | | | Total | |
Assets — Derivative Financial Instruments | | | | | | | | | | | | | | | | | | | | | | | | | |
Futures contracts | | | | | | | | | | | | | | | | | | | | | | | | | | | | |
Unrealized appreciation on futures
contracts(a) | | $ | — | | | $ | — | | | $ | — | | | $ | — | | | $ | 3,094 | | | $ | — | | | $ | 3,094 | |
| | | | | | | | | | | | | | | | | | | | | | | | | | | | |
| | | | | |
Liabilities — Derivative Financial Instruments | | | | | | | | | | | | | | | | | | | | | |
Futures contracts | | | | | | | | | | | | | | | | | | | | | | | | | | | | |
Unrealized depreciation on futures
contracts(a) | | $ | — | | | $ | — | | | $ | — | | | $ | — | | | $ | 7,315,090 | | | $ | — | | | $ | 7,315,090 | |
| | | | | | | | | | | | | | | | | | | | | | | | | | | | |
| | (a) | Net cumulative unrealized appreciation (depreciation) on futures contracts and centrally cleared swaps, if any, are reported in the Schedule of Investments. In the Statements of Assets and Liabilities, only current day’s variation margin is reported in receivables or payables and the net cumulative unrealized appreciation (depreciation) is included in accumulated earnings (loss). | |
For the year ended June 30, 2021, the effect of derivative financial instruments in the Statements of Operations was as follows:
| | | | | | | | | | | | | | | | | | | | | | | | | | | | |
| | | Commodity
Contracts | | | Credit
Contracts | | | Equity
Contracts | | | Foreign
Currency
Exchange
Contracts | | | Interest
Rate
Contracts | | | Other
Contracts | | | Total | |
Net Realized Gain (Loss) from | | | | | | | | | | | | | | | | | | | | | | | | | | | | |
Futures contracts | | $ | — | | | $ | — | | | $ | — | | | $ | — | | | $ | 38,617,223 | | | $ | — | | | $ | 38,617,223 | |
| | | | | | | | | | | | | | | | | | | | | | | | | | | | |
| | | | | |
Net Change in Unrealized Appreciation (Depreciation) on | | | | | | | | | | | | | | | | | | | | | |
Futures contracts | | $ | — | | | $ | — | | | $ | — | | | $ | — | | | $ | (7,873,659 | ) | | $ | — | | | $ | (7,873,659 | ) |
| | | | | | | | | | | | | | | | | | | | | | | | | | | | |
| | |
| 52 | | 2 0 2 1 BLACK ROCK ANNUAL REPORT TO SHAREHOLDERS |
| | |
Schedule of Investments (continued) June 30, 2021 | | BlackRock National Municipal Fund |
Average Quarterly Balances of Outstanding Derivative Financial Instruments
| | | | |
| |
Futures contracts | | | | |
Average notional value of contracts — short | | $ | 614,454,047 | |
| |
For more information about the Fund’s investment risks regarding derivative financial instruments, refer to the Notes to Financial Statements.
Fair Value Hierarchy as of Period End
Various inputs are used in determining the fair value of financial instruments. For a description of the input levels and information about the Fund’s policy regarding valuation of financial instruments, refer to the Notes to Financial Statements.
The following table summarizes the Fund’s financial instruments categorized in the fair value hierarchy. The breakdown of the Fund’s financial instruments into major categories is disclosed in the Schedule of Investments above.
| | | | | | | | | | | | | | | | |
| | | Level 1 | | | Level 2 | | | Level 3 | | | Total | |
Assets | | | | | | | | | | | | | | | | |
Investments | | | | | | | | | | | | | | | | |
Long-Term Investments | | | | | | | | | | | | | | | | |
Investment Companies | | $ | 328,961,773 | | | $ | — | | | $ | — | | | $ | 328,961,773 | |
Municipal Bonds | | | — | | | | 13,172,992,612 | | | | — | | | | 13,172,992,612 | |
Municipal Bonds Transferred to Tender Option Bond Trusts | | | — | | | | 312,965,983 | | | | — | | | | 312,965,983 | |
Short-Term Securities | | | | | | | | | | | | | | | | |
Money Market Funds | | | 2,424,414,061 | | | | — | | | | — | | | | 2,424,414,061 | |
| | | | | | | | | | | | | | | | |
| | $ | 2,753,375,834 | | | $ | 13,485,958,595 | | | $ | — | | | $ | 16,239,334,429 | |
| | | | | | | | | | | | | | | | |
Derivative Financial Instruments(a) | | | | | | | | | | | | | | | | |
Assets | | | | | | | | | | | | | | | | |
Interest Rate Contracts | | $ | 3,094 | | | $ | — | | | $ | — | | | $ | 3,094 | |
Liabilities | | | | | | | | | | | | | | | | |
Interest Rate Contracts | | | (7,315,090 | ) | | | — | | | | — | | | | (7,315,090 | ) |
| | | | | | | | | | | | | | | | |
| | $ | (7,311,996 | ) | | $ | — | | | $ | — | | | $ | (7,311,996 | ) |
| | | | | | | | | | | | | | | | |
| | (a) | Derivative financial instruments are futures contracts. Futures contracts are valued at the unrealized appreciation (depreciation) on the instrument. | |
The Fund may hold assets and/or liabilities in which the fair value approximates the carrying amount for financial statement purposes. As of period end, TOB Trust Certificates of $126,900,000 are categorized as Level 2 within the fair value hierarchy.
See notes to financial statements.
| | |
SCHEDULE OF INVESTMENTS | | 53 |
| | |
Schedule of Investments June 30, 2021 | | BlackRock Short-Term Municipal Fund (Percentages shown are based on Net Assets) |
| | | | | | | | |
| Security | | Par (000) | | | Value | |
|
Municipal Bonds | |
|
Alabama — 4.0% | |
Birmingham Airport Authority, Refunding RB, (BAM), 5.00%, 07/01/23 | | $ | 225 | | | $ | 246,467 | |
Black Belt Energy Gas District, RB | | | | | | | | |
Series A, 5.00%, 12/01/21 | | | 1,950 | | | | 1,987,674 | |
Series A-1, 4.00%, 06/01/22 | | | 825 | | | | 853,223 | |
Black Belt Energy Gas District, Refunding RB 4.00%, 12/01/23 | | | 440 | | | | 477,215 | |
4.00%, 06/01/24 | | | 400 | | | | 440,292 | |
4.00%, 12/01/24 | | | 475 | | | | 529,644 | |
Lower Alabama Gas District, RB | | | | | | | | |
4.00%, 12/01/22 | | | 640 | | | | 672,627 | |
4.00%, 12/01/23 | | | 375 | | | | 406,849 | |
Southeast Alabama Gas Supply District, RB | | | | | | | | |
Series A, 4.00%, 06/01/22 | | | 1,760 | | | | 1,819,400 | |
Series A, 4.00%, 06/01/23 | | | 2,225 | | | | 2,379,905 | |
Series A, 4.00%, 04/01/49(a) | | | 1,600 | | | | 1,740,640 | |
Series A, 4.00%, 06/01/49(a) | | | 16,995 | | | | 18,653,202 | |
Southeast Energy Authority A Cooperative District, RB | | | | | | | | |
Series A, 4.00%, 10/01/24 | | | 650 | | | | 720,636 | |
Series B, 4.00%, 06/01/25 | | | 1,750 | | | | 1,980,510 | |
| | | | | | | | |
| | | | | | | 32,908,284 | |
|
| Alaska — 0.7% | |
Alaska Municipal Bond Bank Authority, RB, 5.00%, 12/01/24 | | | 645 | | | | 743,782 | |
Alaska Municipal Bond Bank Authority, Refunding RB | | | | | | | | |
5.00%, 12/01/22 | | | 750 | | | | 800,077 | |
5.00%, 12/01/23 | | | 2,000 | | | | 2,224,020 | |
Northern Tobacco Securitization Corp. Refunding RB | | | | | | | | |
5.00%, 06/01/24 | | | 1,000 | | | | 1,133,980 | |
5.00%, 06/01/25 | | | 1,000 | | | | 1,174,040 | |
| | | | | | | | |
| | | | | | | 6,075,899 | |
|
| Arizona — 0.7% | |
Glendale Union High School District No.205, GO, Series C, 5.00%, 07/01/22 | | | 1,000 | | | | 1,047,490 | |
Industrial Development Authority of the County of Yavapai, RB, Series A, 0.07%, 09/01/35(a) | | | 3,500 | | | | 3,500,000 | |
Maricopa County Industrial Development Authority, Refunding RB | | | | | | | | |
Series A, 5.00%, 09/01/21 | | | 770 | | | | 776,068 | |
Series A, 5.00%, 09/01/22 | | | 750 | | | | 791,407 | |
| | | | | | | | |
| | | | | | | 6,114,965 | |
| | |
| California — 1.8% | | | | | | |
California County Tobacco Securitization Agency, Refunding RB
4.00%, 06/01/23 | | | 530 | | | | 566,247 | |
Series A, 4.00%, 06/01/23 | | | 450 | | | | 480,438 | |
Series A, 5.00%, 06/01/24 | | | 600 | | | | 678,654 | |
California Health Facilities Financing Authority, RB, Series A, 5.00%, 11/15/21 | | | 1,305 | | | | 1,328,111 | |
California Statewide Communities Development Authority, RB | | | | | | | | |
Series A, 5.00%, 04/01/23 | | | 525 | | | | 567,840 | |
Series A, 5.00%, 04/01/24 | | | 485 | | | | 546,125 | |
| | | | | | | | |
| Security | | Par (000) | | | Value | |
| | |
| California (continued) | | | | | | |
City of Long Beach California Harbor Revenue, ARB, Series C, 4.00%, 07/15/21 | | $ | 4,770 | | | $ | 4,776,678 | |
Northern California Energy Authority, RB, Series A, 4.00%, 07/01/49(a) | | | 1,765 | | | | 1,950,960 | |
State of California, Refunding GO, 5.00%, 12/01/24 | | | 3,300 | | | | 3,824,502 | |
| | | | | | | | |
| | | | | | | 14,719,555 | |
| | |
| Colorado — 2.6% | | | | | | |
City of Colorado Springs Colorado Utilities System Revenue, Refunding RB, Series C, 0.03%, 11/01/28(a) | | | 20,550 | | | | 20,550,000 | |
Regional Transportation District, Refunding RB | | | | | | | | |
Series A, 5.00%, 01/15/24 | | | 350 | | | | 386,284 | |
Series A, 5.00%, 07/15/24 | | | 350 | | | | 392,742 | |
| | | | | | | | |
| | | | | | | 21,329,026 | |
| | |
| Connecticut — 4.3% | | | | | | |
Connecticut State Health & Educational Facilities Authority, Refunding RB | | | | | | | | |
Series I-1, 5.00%, 07/01/21 | | | 700 | | | | 700,084 | |
Series L-1, 4.00%, 07/01/23 | | | 550 | | | | 587,890 | |
Series L-1, 4.00%, 07/01/24 | | | 650 | | | | 715,345 | |
Series S, 5.00%, 07/01/21 | | | 1,030 | | | | 1,030,124 | |
State of Connecticut Special Tax Revenue, RB | | | | | | | | |
Series A, 5.00%, 09/01/21 | | | 1,500 | | | | 1,511,865 | |
Series A, 5.00%, 08/01/22 | | | 900 | | | | 946,386 | |
Series A, 5.00%, 10/01/22 | | | 340 | | | | 360,199 | |
Series A, 5.00%, 05/01/23 | | | 475 | | | | 516,206 | |
Series A, 5.00%, 05/01/24 | | | 865 | | | | 978,427 | |
Series B, 5.00%, 10/01/22 | | | 3,400 | | | | 3,601,994 | |
Series B, 5.00%, 10/01/23 | | | 225 | | | | 248,776 | |
State of Connecticut Special Tax Revenue, Refunding RB, Series B, 5.00%, 08/01/23 | | | 190 | | | | 208,666 | |
State of Connecticut, GO | | | | | | | | |
Series A, 5.00%, 10/15/22 | | | 1,000 | | | | 1,062,270 | |
Series A, 5.00%, 03/15/23 | | | 695 | | | | 752,025 | |
Series C, 5.00%, 07/15/22 | | | 1,000 | | | | 1,050,310 | |
Series C, 3.00%, 06/01/23 | | | 650 | | | | 684,970 | |
Series C, 4.00%, 06/01/23 | | | 325 | | | | 348,689 | |
Series C, 3.00%, 06/01/24 | | | 1,065 | | | | 1,148,688 | |
Series C, 4.00%, 06/01/24 | | | 550 | | | | 609,043 | |
Series C, 4.00%, 06/15/24 | | | 750 | | | | 831,652 | |
Series D, 5.00%, 08/15/21 | | | 400 | | | | 402,348 | |
Series E, 4.00%, 09/15/21 | | | 770 | | | | 776,114 | |
State of Connecticut, Refunding GO | | | | | | | | |
Series B, 5.00%, 05/15/22 | | | 4,955 | | | | 5,164,844 | |
Series B, 5.00%, 01/15/24 | | | 750 | | | | 840,052 | |
Series C, 5.00%, 06/01/22 | | | 600 | | | | 626,718 | |
Series C, 5.00%, 12/15/22 | | | 1,300 | | | | 1,391,273 | |
University of Connecticut, RB Series A,
5.00%, 01/15/22 | | | 525 | | | | 538,661 | |
Series A, 5.00%, 03/15/22 | | | 1,550 | | | | 1,602,715 | |
Series A, 5.00%, 04/15/22 | | | 4,000 | | | | 4,151,920 | |
Series A, 5.00%, 04/15/24 | | | 650 | | | | 733,544 | |
Series A, 5.00%, 01/15/25 | | | 720 | | | | 833,263 | |
University of Connecticut, Refunding RB, Series A, 5.00%, 02/15/22 | | | 720 | | | | 741,614 | |
| | | | | | | | |
| | | | | | | 35,696,675 | |
| | |
| 54 | | 2 0 2 1 BLACK ROCK ANNUAL REPORT TO SHAREHOLDERS |
| | |
Schedule of Investments (continued) June 30, 2021 | | BlackRock Short-Term Municipal Fund (Percentages shown are based on Net Assets) |
| | | | | | | | |
| Security | | Par (000) | | | Value | |
| | |
| District of Columbia — 0.2% | | | | | | |
District of Columbia, RB, 0.08%, 04/01/38(a) | | $ | 1,445 | | | $ | 1,445,000 | |
District of Columbia, Refunding RB | | | | | | | | |
5.00%, 10/01/21 | | | 250 | | | | 252,902 | |
5.00%, 10/01/22 | | | 325 | | | | 343,743 | |
| | | | | | | | |
| | | | | | | 2,041,645 | |
| | |
| Florida — 2.1% | | | | | | |
Alachua County Health Facilities Authority, Refunding RB, 5.00%, 12/01/22 | | | 515 | | | | 550,097 | |
Central Florida Expressway Authority, Refunding RB | | | | | | | | |
Senior Lien, 5.00%, 07/01/22 | | | 1,550 | | | | 1,623,687 | |
Senior Lien, (AGM), 5.00%, 07/01/24 | | | 885 | | | | 1,007,590 | |
City Of South Miami Health Facilities Authority Inc., Refunding RB, 5.00%, 08/15/21 | | | 2,500 | | | | 2,514,650 | |
County of Miami-Dade Florida Aviation Revenue, Refunding RB, Series A, 5.00%, 10/01/24 | | | 2,500 | | | | 2,866,175 | |
County of Osceola Florida Transportation Revenue, Refunding RB | | | | | | | | |
Sereis A-1, 5.00%, 10/01/22 | | | 325 | | | | 343,015 | |
Sereis A-1, 5.00%, 10/01/23 | | | 400 | | | | 439,548 | |
County of Palm Beach Florida, RB, 0.03%, 07/01/32(a) | | | 2,070 | | | | 2,070,000 | |
Orange County Health Facilities Authority, Refunding RB, 0.05%, 07/01/27(a) | | | 1,265 | | | | 1,265,000 | |
Palm Beach County Health Facilities Authority, Refunding RB, 5.00%, 08/15/23 | | | 500 | | | | 550,720 | |
Pasco County School Board, RB, 5.00%, 10/01/22 | | | 1,525 | | | | 1,613,679 | |
School Board of Miami-Dade County, Refunding COP, Series D, 5.00%, 11/01/22 | | | 2,085 | | | | 2,215,292 | |
Tolomato Community Development District, Refunding SAB, Series A-1, (AGM), 2.00%, 05/01/22 | | | 605 | | | | 611,171 | |
| | | | | | | | |
| | | | | | | 17,670,624 | |
| | |
| Georgia — 7.5% | | | | | | |
Atlanta Urban Residential Finance Authority, RB, M/F Housing, 1.36%, 12/01/22(a) | | | 594 | | | | 596,465 | |
Bartow County Development Authority, Refunding RB, 1.55%, 08/01/43(a) | | | 1,730 | | | | 1,751,469 | |
City of Atlanta Georgia Department of Aviation, Refunding RB, Series A, 5.00%, 07/01/24 | | | 1,470 | | | | 1,677,211 | |
City of Atlanta Georgia, Refunding TA, 5.00%, 12/01/21 | | | 1,150 | | | | 1,169,504 | |
Development Authority of Burke County, Refunding RB, 1.55%, 12/01/49(a) | | | 3,245 | | | | 3,285,270 | |
Development Authority of Monroe County, RB, 0.05%, 06/01/49(a) | | | 2,900 | | | | 2,900,000 | |
Main Street Natural Gas, Inc., RB | | | | | | | | |
Series A, 5.00%, 05/15/22 | | | 1,145 | | | | 1,190,537 | |
Series A, 4.00%, 04/01/48(a) | | | 30,500 | | | | 32,732,905 | |
Series C, 5.00%, 09/01/22 | | | 500 | | | | 526,490 | |
Series C, 5.00%, 09/01/23 | | | 1,000 | | | | 1,097,000 | |
Sub-Series C, 4.00%, 08/01/48(a) | | | 2,200 | | | | 2,377,826 | |
Municipal Electric Authority of Georgia, Refunding RB
4.00%, 11/01/24 | | | 3,000 | | | | 3,355,170 | |
Series A, 5.00%, 01/01/22 | | | 675 | | | | 690,437 | |
Series A, 5.00%, 01/01/23 | | | 900 | | | | 960,759 | |
Series A-R, Subordinate, 5.00%, 01/01/23 | | | 3,550 | | | | 3,789,661 | |
Series A-R, Subordinate, 5.00%, 01/01/24 | | | 2,500 | | | | 2,775,650 | |
Oconee County School District, GO, (SAW), 4.00%, 03/01/25 | | | 1,000 | | | | 1,128,420 | |
| | | | | | | | |
| | | | | | | 62,004,774 | |
| | | | | | | | |
| Security | | Par (000) | | | Value | |
| | |
| Idaho — 0.1% | | | | | | |
Idaho Housing & Finance Association, RB, S/F Housing, Series A-1, 2.95%, 07/01/23 | | $ | 895 | | | $ | 930,209 | |
| | | | | | | | |
| | |
| Illinois — 2.2% | | | | | | |
Chicago Housing Authority, RB, M/F Housing, Series A, (HUD SEC 8), 5.00%, 01/01/22 | | | 1,400 | | | | 1,432,004 | |
Chicago O’Hare International Airport, Refunding RB, Series B, Senior Lien, 5.00%, 01/01/24 | | | 500 | | | | 558,370 | |
Illinois Finance Authority, Refunding RB
5.00%, 08/15/21 | | | 1,000 | | | | 1,005,690 | |
5.00%, 08/15/22 | | | 750 | | | | 789,502 | |
5.00%, 08/15/23 | | | 1,000 | | | | 1,098,660 | |
Series C2B, 0.05%, 11/01/38(a) | | | 1,000 | | | | 1,000,000 | |
Illinois Housing Development Authority RB, (FHLMC,FNMA,GNMA), 0.03%, 02/01/38(a) | | | 11,485 | | | | 11,485,000 | |
Regional Transportation Authority, RB, Series A, (NPFGC), 6.70%, 11/01/21 | | | 785 | | | | 801,077 | |
| | | | | | | | |
| | | | | | | 18,170,303 | |
| | |
| Indiana — 1.8% | | | | | | |
City of Indianapolis Department of Public Utilities Gas Utility Revenue, Refunding RB, Series A, 2nd Lien, 5.00%, 08/15/23 | | | 2,000 | | | | 2,194,860 | |
City of Rockport Indiana, Refunding RB, Series A, 1.35%, 07/01/25(a) | | | 2,250 | | | | 2,275,312 | |
Indiana Finance Authority Refunding RB, 5.00%, 10/01/24(b) | | | 500 | | | | 573,975 | |
Indiana Finance Authority, RB
3.00%, 02/01/23 | | | 225 | | | | 234,185 | |
Series 2005 A-1, 0.05%, 02/01/35(a) | | | 5,000 | | | | 5,000,000 | |
Indiana Finance Authority, Refunding RB, Series A, 5.00%, 05/01/23(c) | | | 1,400 | | | | 1,523,018 | |
Indianapolis Local Public Improvement Bond Bank, Refunding RB, Series A, 5.00%, 06/01/24 | | | 2,000 | | | | 2,262,860 | |
Lawrence Township School Building Corp., RB, (NPFGC), 4.00%, 01/15/24 | | | 550 | | | | 600,529 | |
Southwest Allen Multi School Building Corp., RB, (NPFGC), 4.00%, 07/15/24 | | | 325 | | | | 361,013 | |
| | | | | | | | |
| | | | | | | 15,025,752 | |
| | |
| Iowa — 3.4% | | | | | | |
Iowa Finance Authority, RB, 0.09%, 04/01/22(a) | | | 27,000 | | | | 27,000,000 | |
Iowa Student Loan Liquidity Corp., Refunding RB, | | | | | | | | |
Series A, AMT, 5.00%, 12/01/21 | | | 750 | | | | 762,637 | |
| | | | | | | | |
| | | | | | | 27,762,637 | |
| | |
| Kansas — 3.3% | | | | | | |
City of Burlington Kansas, Refunding RB(a) | | | | | | | | |
Series A, 0.11%, 09/01/35 | | | 18,000 | | | | 18,000,000 | |
Series B, 0.11%, 09/01/35 | | | 6,000 | | | | 6,000,000 | |
City of Dodge City Kansas, GO | | | | | | | | |
Series 2019-A, (BAM), 4.00%, 09/01/22 | | | 280 | | | | 292,174 | |
Series 2019-A, (BAM), 4.00%, 09/01/23 | | | 1,080 | | | | 1,166,173 | |
City of Goddard, GO, Series 2019-1, 3.00%, 12/01/22 | | | 1,465 | | | | 1,481,628 | |
Johnson County Unified School District No.233 Olathe, Refunding GO, Series B, 3.00%, 09/01/21 | | | 500 | | | | 502,310 | |
| | | | | | | | |
| | | | | | | 27,442,285 | |
| | |
| Kentucky — 5.0% | | | | | | |
City of Owensboro Kentucky Electric Light & Power System Revenue, Refunding RB | | | | | | | | |
Series B, 5.00%, 01/01/22 | | | 2,700 | | | | 2,761,668 | |
Series B, 4.00%, 01/01/23 | | | 1,750 | | | | 1,842,155 | |
| | |
SCHEDULE OF INVESTMENTS | | 55 |
| | |
Schedule of Investments (continued) June 30, 2021 | | BlackRock Short-Term Municipal Fund (Percentages shown are based on Net Assets) |
| | | | | | | | |
| Security | | Par
(000) | | | Value | |
| | |
| Kentucky (continued) | | | | | | |
Kentucky Asset Liability Commission Refunding RB, Series A, 5.00%, 11/01/24 | | $ | 2,500 | | | $ | 2,874,325 | |
Kentucky Asset Liability Commission, RB, Series A, 5.00%, 09/01/21 | | | 2,000 | | | | 2,015,740 | |
Kentucky Public Energy Authority, RB | | | | | | | | |
Series A, 4.00%, 04/01/48(a) | | | 2,000 | | | | 2,184,540 | |
Series A-1, 4.00%, 12/01/22 | | | 1,000 | | | | 1,052,090 | |
Series A-1, 4.00%, 12/01/49(a) | | | 12,000 | | | | 13,492,680 | |
Series C, 4.00%, 08/01/22 | | | 615 | | | | 639,594 | |
Series C, 4.00%, 08/01/23 | | | 500 | | | | 537,895 | |
Series C-1, 4.00%, 12/01/21 | | | 1,500 | | | | 1,523,310 | |
Series C-1, 4.00%, 06/01/22 | | | 1,750 | | | | 1,809,377 | |
Series C-1, 4.00%, 12/01/22 | | | 2,500 | | | | 2,630,225 | |
Kentucky State Property & Building Commission, RB
5.00%, 05/01/24 | | | 1,540 | | | | 1,737,074 | |
Series A, 5.00%, 11/01/23 | | | 1,000 | | | | 1,108,900 | |
Kentucky State Property & Building Commission, Refunding RB, Series B, 5.00%, 08/01/24 | | | 2,790 | | | | 3,174,546 | |
Louisville and Jefferson County Metropolitan Sewer District, Refunding RB, 0.07%, 06/01/33(a) | | | 1,500 | | | | 1,500,000 | |
| | | | | | | | |
| | | | | | | 40,884,119 | |
| | |
| Louisiana — 2.7% | | | | | | |
Ascension Parish School Board, GO, 4.00%, 03/01/24 | | | 570 | | | | 627,131 | |
Consolidated Govt. of the City of Baton Rouge & Parish of E Baton Rouge Sales Tax, Refunding RB | | | | | | | | |
(AGM), 5.00%, 08/01/23 | | | 600 | | | | 659,154 | |
(AGM), 5.00%, 08/01/24 | | | 500 | | | | 570,520 | |
East Baton Rouge Parish Industrial Development Board Inc., RB, Series B, 0.01%, 12/01/40(a) | | | 8,100 | | | | 8,100,000 | |
Greater Ouachita Water Co., Refunding RB | | | | | | | | |
(BAM), 5.00%, 09/01/22 | | | 500 | | | | 526,200 | |
(BAM), 3.00%, 09/01/23 | | | 500 | | | | 526,035 | |
Livingston Parish School Board, Refunding RB, Series A, 4.00%, 05/01/24 | | | 680 | | | | 749,088 | |
Parish of St. John the Baptist Louisiana, Refunding RB, 2.00%, 06/01/37(a) | | | 10,315 | | | | 10,509,335 | |
| | | | | | | | |
| | | | | | | 22,267,463 | |
| | |
| Maine — 0.7% | | | | | | |
State of Maine GO, Series B, 4.00%, 06/01/25 | | | 4,975 | | | | 5,670,207 | |
| | | | | | | | |
| | |
| Maryland — 0.5% | | | | | | |
Maryland Health & Higher Educational Facilities Authority, RB | | | | | | | | |
Series B, 5.00%, 04/15/22 | | | 700 | | | | 726,481 | |
Series B, 5.00%, 04/15/23 | | | 675 | | | | 732,307 | |
Series B, 5.00%, 04/15/24 | | | 700 | | | | 790,685 | |
Maryland Health & Higher Educational Facilities Authority, Refunding RB, 5.00%, 07/01/21 | | | 235 | | | | 235,031 | |
Maryland State Transportation Authority, Refunding RB, Series A, 5.00%, 07/01/24 | | | 1,225 | | | | 1,396,708 | |
| | | | | | | | |
| | | | | | | 3,881,212 | |
| | |
| Massachusetts — 1.9% | | | | | | |
Massachusetts Development Finance Agency, Refunding RB
5.00%, 07/01/21 | | | 3,485 | | | | 3,485,453 | |
Series A, 5.00%, 07/01/22 | | | 525 | | | | 548,552 | |
| | | | | | | | |
| Security | | Par
(000) | | | Value | |
| | |
| Massachusetts (continued) | | | | | | |
Massachusetts Housing Finance Agency RB, (HUD SECT 8), 0.45%, 12/01/24 | | $ | 1,500 | | | $ | 1,493,475 | |
Massachusetts Transportation Trust Fund Metropolitan Highway System Revenue, Refunding RB, Series A, 5.00%, 01/01/25 | | | 2,100 | | | | 2,432,997 | |
University of Massachusetts Building Authority, Refunding RB, Series 1, 5.00%, 11/01/24 | | | 6,600 | | | | 7,631,250 | |
| | | | | | | | |
| | | | | | | 15,591,727 | |
| | |
| Michigan — 2.1% | | | | | | |
Central Michigan University, Refunding RB, Series A, 0.03%, 10/01/32(a) | | | 5,000 | | | | 5,000,000 | |
Karegnondi Water Authority, Refunding RB, 5.00%, 11/01/21 | | | 450 | | | | 457,146 | |
Livonia Public Schools GO, Series I, (BAM), 4.00%, 05/01/25 | | | 1,700 | | | | 1,922,258 | |
Michigan Finance Authority, RB, 2nd Lien, (NPFGC), 5.00%, 11/01/23 | | | 310 | | | | 343,889 | |
Michigan Finance Authority, Refunding RB | | | | | | | | |
Series A, Class 1, 4.00%, 06/01/23 | | | 1,000 | | | | 1,068,860 | |
Series D-1, 0.55%, 10/15/24 | | | 1,300 | | | | 1,296,178 | |
Michigan State Hospital Finance Authority, Refunding RB, Series C, 5.00%, 12/01/21 | | | 1,000 | | | | 1,020,420 | |
Michigan State Housing Development Authority RB, Series A, 0.55%, 04/01/25 | | | 1,500 | | | | 1,499,145 | |
Michigan State Housing Development Authority, RB, M/F Housing, Series A-1, 0.65%, 10/01/24 | | | 1,010 | | | | 1,010,263 | |
Michigan State Housing Development Authority, Refunding RB, S/F Housing, Series D, 0.06%, 06/01/30(a) | | | 2,475 | | | | 2,475,000 | |
Mona Shores Public Schools, GO, (Q-SBLF), 4.00%, 05/01/24 | | | 500 | | | | 551,340 | |
Wayne-Westland Community Schools, GO | | | | | | | | |
(Q-SBLF), 4.00%, 05/01/22 | | | 150 | | | | 154,706 | |
(Q-SBLF), 5.00%, 11/01/22 | | | 290 | | | | 308,290 | |
| | | | | | | | |
| | | | | | | 17,107,495 | |
| | |
| Mississippi — 4.4% | | | | | | |
Mississippi Business Finance Corp. RB, 0.03%, 12/01/30(a) | | | 35,000 | | | | 35,000,000 | |
Mississippi Development Bank, RB, 5.00%, 11/01/21 | | | 500 | | | | 507,760 | |
State of Mississippi, RB, Series A, 5.00%, 10/15/22 | | | 500 | | | | 528,880 | |
| | | | | | | | |
| | | | | | | 36,036,640 | |
| | |
| Missouri — 0.2% | | | | | | |
City of St. Charles, Refunding COP, Series B, 4.00%, 02/01/24 | | | 140 | | | | 152,765 | |
City of Washington, Refunding COP, 5.00%, 03/01/23 | | | 370 | | | | 396,970 | |
County of Greene MO, COP | | | | | | | | |
Series A, 4.00%, 03/01/24 | | | 275 | | | | 300,572 | |
Series A, 4.00%, 03/01/25 | | | 400 | | | | 448,488 | |
| | | | | | | | |
| | | | | | | 1,298,795 | |
| | |
| Nebraska — 1.7% | | | | | | |
Central Plains Energy Project, RB, 5.00%, 03/01/50(a) | | | 8,455 | | | | 9,355,289 | |
Central Plains Energy Project, Refunding RB 4.00%, 02/01/22 | | | 485 | | | | 495,311 | |
4.00%, 08/01/22 | | | 1,500 | | | | 1,558,740 | |
4.00%, 02/01/23 | | | 1,055 | | | | 1,115,135 | |
| | |
| 56 | | 2 0 2 1 BLACK ROCK ANNUAL REPORT TO SHAREHOLDERS |
| | |
Schedule of Investments (continued) June 30, 2021 | | BlackRock Short-Term Municipal Fund (Percentages shown are based on Net Assets) |
| | | | | | | | |
| Security | | Par
(000) | | | Value | |
| | |
| Nebraska (continued) | | | | | | |
Central Plains Energy Project, Refunding RB (continued) | | | | | | | | |
4.00%, 08/01/23 | | $ | 875 | | | $ | 940,240 | |
Douglas County Hospital Authority No. 2, Refunding RB
5.00%, 11/15/22 | | | 135 | | | | 143,660 | |
5.00%, 11/15/23 | | | 110 | | | | 122,011 | |
| | | | | | | | |
| | | | | | | 13,730,386 | |
| | |
| Nevada — 0.2% | | | | | | |
Clark County Department of Aviation Refunding RB, Series B, AMT, 5.00%, 07/01/24 | | | 1,000 | | | | 1,134,650 | |
Public Finance Authority, Refunding RB
5.00%, 06/01/23 | | | 195 | | | | 212,269 | |
5.00%, 06/01/24 | | | 200 | | | | 226,310 | |
| | | | | | | | |
| | | | | | | 1,573,229 | |
| | |
| New Hampshire — 0.2% | | | | | | |
New Hampshire State Turnpike System, Refunding RB, Series B, 5.00%, 02/01/24 | | | 1,775 | | | | 1,824,718 | |
| | | | | | | | |
| | |
| New Jersey — 15.0% | | | | | | |
Belleville Board of Education, GO, (BAM SCH BD RES FD), 3.00%, 09/01/21 | | | 1,245 | | | | 1,250,503 | |
Borough of Mountain Lakes New Jersey, GO, 1.25%, 09/30/21 | | | 4,760 | | | | 4,770,214 | |
Garden State Preservation Trust, Refunding RB, | | | | | | | | |
Series A, 5.00%, 11/01/21 | | | 2,195 | | | | 2,218,069 | |
Jersey City Municipal Utilities Authority, RB, 3.00%, 07/01/22 | | | 2,000 | | | | 2,056,500 | |
New Jersey Building Authority, Refunding RB, Series A, 5.00%, 06/15/22 | | | 3,005 | | | | 3,139,834 | |
New Jersey Economic Development Authority, RB
5.00%, 06/15/23 | | | 250 | | | | 272,870 | |
5.00%, 06/15/24 | | | 300 | | | | 340,287 | |
Series UU, 5.00%, 06/15/24 | | | 250 | | | | 283,573 | |
New Jersey Economic Development Authority, Refunding RB
5.50%, 09/01/21 | | | 2,300 | | | | 2,308,096 | |
Series A, 1.00%, 06/01/23 | | | 1,350 | | | | 1,367,509 | |
Series B, 5.00%, 11/01/23 | | | 1,010 | | | | 1,119,151 | |
Series II, 5.00%, 03/01/22 | | | 1,310 | | | | 1,351,239 | |
Series NN, 5.00%, 03/01/22 | | | 4,505 | | | | 4,646,817 | |
Series NN, 5.00%, 03/01/23 | | | 5,945 | | | | 6,409,007 | |
Series XX, 5.00%, 06/15/23 | | | 8,010 | | | | 8,742,755 | |
Series XX, 5.00%, 06/15/24 | | | 2,990 | | | | 3,391,527 | |
New Jersey Educational Facilities Authority, RB 5.00%, 06/15/22 | | | 2,100 | | | | 2,194,227 | |
(SAP), 5.00%, 06/01/24 | | | 280 | | | | 317,150 | |
New Jersey Educational Facilities Authority, Refunding RB, Series B, 5.00%, 07/01/21 | | | 890 | | | | 890,107 | |
New Jersey Health Care Facilities Financing Authority, RB, 5.00%, 07/01/21 | | | 100 | | | | 100,013 | |
New Jersey Health Care Facilities Financing Authority, Refunding RB
5.00%, 10/01/21 | | | 2,500 | | | | 2,529,575 | |
5.00%, 10/01/23 | | | 3,500 | | | | 3,865,575 | |
Series A, 5.00%, 07/01/23 | | | 1,015 | | | | 1,110,836 | |
New Jersey Sports & Exposition Authority, Refunding RB, Series A, 5.00%, 09/01/21 | | | 1,235 | | | | 1,244,942 | |
New Jersey Transportation Trust Fund Authority, RB
5.00%, 06/15/23 | | | 1,500 | | | | 1,634,685 | |
Series A, (AMBAC), 5.25%, 12/15/22 | | | 650 | | | | 696,690 | |
Series AA, 5.00%, 06/15/22 | | | 500 | | | | 522,435 | |
| | | | | | | | |
| Security | | Par
(000) | | | Value | |
| | |
| New Jersey (continued) | | | | | | |
New Jersey Transportation Trust Fund Authority, RB (continued) | | | | | | | | |
Series AA, 5.00%, 06/15/23 | | $ | 175 | | | $ | 191,009 | |
New Jersey Transportation Trust Fund Authority, Refunding RB | | | | | | | | |
Series A, 5.50%, 12/15/21 | | | 5,845 | | | | 5,984,345 | |
Series A, (NPFGC-IBC), 5.50%, 12/15/21 | | | 305 | | | | 312,271 | |
Series A, 5.50%, 12/15/22 | | | 1,330 | | | | 1,430,362 | |
Series A, 5.25%, 12/15/23 | | | 2,000 | | | | 2,238,800 | |
Series A, 5.50%, 12/15/23 | | | 3,095 | | | | 3,483,422 | |
Series A, 5.00%, 06/15/24 | | | 5,820 | | | | 6,584,981 | |
Series B, (NPFGC), 5.50%, 12/15/21 | | | 1,000 | | | | 1,024,580 | |
Series B, (AMBAC), 5.25%, 12/15/23 | | | 1,130 | | | | 1,264,922 | |
Series D, 5.00%, 12/15/23 | | | 275 | | | | 306,270 | |
Series D, 5.25%, 12/15/23 | | | 7,690 | | | | 8,608,186 | |
South Orange & Maplewood School District, GO, (SCH BD RES FD), 2.00%, 08/15/23 | | | 1,075 | | | | 1,112,679 | |
State of New Jersey, GO
5.00%, 06/01/24 | | | 680 | | | | 770,304 | |
Series A, 5.00%, 06/01/24 | | | 8,330 | | | | 9,436,141 | |
Series A, 5.00%, 06/01/25 | | | 1,600 | | | | 1,873,312 | |
Township of Maplewood, Refunding GO, 1.50%, 07/30/21 | | | 12,869 | | | | 12,881,827 | |
Township of West Orange, Refunding GO, 1.50%, 07/30/21 | | | 7,307 | | | | 7,315,173 | |
| | | | | | | | |
| | | | | | | 123,592,770 | |
| | |
| New Mexico — 0.5% | | | | | | |
Albuquerque Municipal School District No.12, GO | | | | | | | | |
(SAW), 5.00%, 08/01/21 | | | 1,675 | | | | 1,681,532 | |
Series A, (SAW), 5.00%, 08/01/24 | | | 250 | | | | 285,548 | |
Albuquerque Municipal School District No.12, Refunding GO, Series B, (SAW), 5.00%, 08/01/24 | | | 1,000 | | | | 1,142,190 | |
New Mexico Municipal Energy Acquisition Authority, Refunding RB, Series A, 4.00%, 05/01/23 | | | 1,200 | | | | 1,279,260 | |
| | | | | | | | |
| | | | | | | 4,388,530 | |
| | |
| New York — 5.2% | | | | | | |
County of Monroe New York, Refunding GO, (AGM), 4.00%, 06/01/23 | | | 775 | | | | 828,467 | |
County of Nassau New York, GO, Series C, 5.00%, 10/01/21 | | | 4,500 | | | | 4,553,415 | |
Erie County Industrial Development Agency, Refunding RB, (SAW), 5.00%, 05/01/25 | | | 1,925 | | | | 2,255,561 | |
Monroe County Industrial Development Corp., Refunding RB | | | | | | | | |
5.00%, 12/01/22 | | | 600 | | | | 637,890 | |
5.00%, 12/01/23 | | | 500 | | | | 553,130 | |
Nassau Health Care Corp. Refunding RB, (GTD), 5.00%, 08/01/24(b) | | | 2,215 | | | | 2,522,531 | |
New York City Transitional Finance Authority Future Tax Secured Revenue, Refunding RB, 5.00%, 11/01/24 | | | 10,000 | | | | 11,550,100 | |
New York State Dormitory Authority, Refunding RB, Series A, 5.00%, 03/15/25 | | | 5,000 | | | | 5,840,000 | |
New York State Housing Finance Agency, RB, M/F Housing, Series P, 1.55%, 11/01/23 | | | 5,295 | | | | 5,330,953 | |
New York State Urban Development Corp., Refunding RB, 5.00%, 03/15/24 | | | 3,000 | | | | 3,381,390 | |
New York Transportation Development Corp., Refunding RB 5.00%, 12/01/23 | | | 550 | | | | 610,819 | |
| | |
SCHEDULE OF INVESTMENTS | | 57 |
| | |
Schedule of Investments (continued) June 30, 2021 | | BlackRock Short-Term Municipal Fund (Percentages shown are based on Net Assets) |
| | | | | | | | |
| Security | | Par
(000) | | | Value | |
|
| New York (continued) | |
New York Transportation Development Corp., Refunding RB (continued)
5.00%, 12/01/24 | | $ | 1,030 | | | $ | 1,187,106 | |
Queensbury Union Free School District, Refunding GO, Series B, (SAW), 1.50%, 07/29/21 | | | 1,132 | | | | 1,133,242 | |
South Colonie Central School District, GO, (SAW), 1.50%, 07/09/21 | | | 2,300 | | | | 2,300,552 | |
Town of Oyster Bay, Refunding GO, 4.00%, 03/01/24 | | | 390 | | | | 423,255 | |
| | | | | | | | |
| | | | | | | 43,108,411 | |
| | |
| North Carolina — 0.4% | | | | | | |
North Carolina Turnpike Authority, RB, 5.00%, 02/01/24 | | | 2,855 | | | | 3,193,260 | |
| | | | | | | | |
| | |
| Ohio — 2.2% | | | | | | |
City of Cleveland Ohio, GO, Series A,
3.00%, 12/01/23 | | | 350 | | | | 372,299 | |
County of Allen Ohio Hospital Facilities Revenue, Refunding RB
5.00%, 12/01/21 | | | 600 | | | | 611,904 | |
5.00%, 12/01/22 | | | 800 | | | | 853,392 | |
5.00%, 12/01/23 | | | 1,100 | | | | 1,223,266 | |
Series A, 5.00%, 08/01/21 | | | 1,840 | | | | 1,847,102 | |
Series A, 5.00%, 08/01/23 | | | 300 | | | | 329,217 | |
County of Butler Ohio, Refunding RB, 5.00%, 11/15/21 | | | 750 | | | | 763,073 | |
Lancaster Port Authority, Refunding RB | | | | | | | | |
Series A, 5.00%, 08/01/22 | | | 235 | | | | 246,755 | |
Series A, 5.00%, 02/01/23 | | | 250 | | | | 268,220 | |
Ohio Higher Educational Facility Commission Refunding RB, 0.02%, 01/01/39(a) | | | 10,000 | | | | 10,000,000 | |
State of Ohio, RB, 5.00%, 10/01/24 | | | 1,250 | | | | 1,435,737 | |
| | | | | | | | |
| | | | | | | 17,950,965 | |
| | |
| Oklahoma — 0.1% | | | | | | |
Oklahoma Municipal Power Authority Refunding RB, Series A, (AGM), 5.00%, 01/01/25(b) | | | 390 | | | | 451,047 | |
| | | | | | | | |
| | |
| Oregon — 0.0% | | | | | | |
City of Hermiston Oregon, GO, 4.00%, 06/01/24 | | | 345 | | | | 379,945 | |
| | | | | | | | |
| | |
| Pennsylvania — 8.1% | | | | | | |
Allegheny County Hospital Development Authority, Refunding RB | | | | | | | | |
Series A, 5.00%, 04/01/23 | | | 4,000 | | | | 4,326,680 | |
Series A, 5.00%, 04/01/24 | | | 2,400 | | | | 2,701,296 | |
Avon Grove School District Chester County, GO, (SAW), 4.00%, 11/15/22 | | | 425 | | | | 446,344 | |
Boyertown Area School District, Refunding GO | | | | | | | | |
(BAM SAW), 4.00%, 11/01/21 | | | 910 | | | | 921,302 | |
(SAW), 4.00%, 09/01/22 | | | 225 | | | | 234,353 | |
Centre County Hospital Authority, Refunding RB, Series A, 5.00%, 11/15/21 | | | 400 | | | | 407,112 | |
Chester County Health and Education Facilities Authority, RB, Series B, 5.00%, 06/01/24 | | | 1,250 | | | | 1,418,213 | |
City of Philadelphia Pennsylvania Airport Revenue, Refunding RB, Series A, 5.00%, 07/01/24 | | | 735 | | | | 838,914 | |
City of Philadelphia Pennsylvania Water & Wastewater Revenue, RB, Series A, 5.00%, 10/01/22 | | | 1,000 | | | | 1,058,980 | |
City of Philadelphia, Refunding GO, Series A, 5.00%, 08/01/22 | | | 1,660 | | | | 1,742,884 | |
City of Williamsport, Refunding GO, (AGM), 5.00%, 07/01/21 | | | 365 | | | | 365,047 | |
Commonwealth Financing Authority Refunding RB, Series B, 5.00%, 06/01/25 | | | 620 | | | | 728,556 | |
| | | | | | | | |
| Security | | Par
(000) | | | Value | |
| | |
| Pennsylvania (continued) | | | | | | |
Commonwealth Financing Authority, RB | | | | | | | | |
5.00%, 06/01/22 | | $ | 1,000 | | | $ | 1,041,730 | |
5.00%, 06/01/24 | | | 2,975 | | | | 3,358,864 | |
Commonwealth of Pennsylvania, GO | | | | | | | | |
1st Series, 5.00%, 06/01/22(d) | | | 5,000 | | | | 5,218,750 | |
1st Series, 5.00%, 03/15/24 | | | 1,585 | | | | 1,785,788 | |
Commonwealth of Pennsylvania, Refunding GO | | | | | | | | |
1st Series, 5.00%, 07/01/21 | | | 1,700 | | | | 1,700,221 | |
1st Series, 5.00%, 08/15/23 | | | 1,000 | | | | 1,100,660 | |
2nd Series, 5.00%, 01/15/22 | | | 1,000 | | | | 1,025,990 | |
County of Lehigh, Refunding RB | | | | | | | | |
5.00%, 07/01/22 | | | 1,385 | | | | 1,450,843 | |
5.00%, 07/01/23 | | | 700 | | | | 765,947 | |
DuBois Area School District, Refunding GO | | | | | | | | |
Series B, (BAM SAW), 4.00%, 11/01/22 | | | 225 | | | | 235,420 | |
Series B, (BAM SAW), 4.00%, 11/01/23 | | | 325 | | | | 350,805 | |
East Penn School District, Refunding GO, (SAW), 4.00%, 08/01/21 | | | 1,030 | | | | 1,033,100 | |
Easton Area School District, Refunding GO, Series A, (SAW), 4.00%, 04/01/23 | | | 375 | | | | 398,899 | |
Geisinger Authority, Refunding RB, 5.00%, 04/01/22 | | | 4,000 | | | | 4,143,000 | |
Muhlenberg School District, Refunding GO | | | | | | | | |
(SAW), 4.00%, 05/15/23 | | | 525 | | | | 560,742 | |
(SAW), 4.00%, 05/15/24 | | | 200 | | | | 220,284 | |
Palmyra Area School District, Refunding GO | | | | | | | | |
(SAW), 4.00%, 04/01/22 | | | 915 | | | | 939,760 | |
(SAW), 4.00%, 04/01/23 | | | 590 | | | | 626,745 | |
Pennsylvania Economic Development Financing Authority, RB | | | | | | | | |
Series A, 2.15%, 11/01/21 | | | 1,500 | | | | 1,510,290 | |
Series A-1, 5.00%, 04/15/22 | | | 545 | | | | 565,388 | |
Series A-1, 5.00%, 04/15/24 | | | 575 | | | | 648,376 | |
Pennsylvania Economic Development Financing Authority, Refunding RB
0.40%, 10/01/23 | | | 10,000 | | | | 10,012,600 | |
Series A, 4.00%, 10/15/24 | | | 425 | | | | 473,888 | |
Pennsylvania Housing Finance Agency, RB, S/F Housing, Series 133, 5.00%, 10/01/23 | | | 400 | | | | 439,928 | |
Perkasie Regional Authority, Refunding RB, (BAM), 4.00%, 02/01/23 | | | 230 | | | | 242,694 | |
Philadelphia Gas Works Co., RB, Series A, (AGM), 5.00%, 08/01/24 | | | 500 | | | | 568,135 | |
Philadelphia Gas Works Co., Refunding RB 5.00%, 08/01/21 | | | 2,000 | | | | 2,007,420 | |
Series B, 5.00%, 08/01/23 | | | 1,000 | | | | 1,093,000 | |
Series B, (AGM), 5.00%, 08/01/24 | | | 500 | | | | 568,135 | |
Pottstown School District, Refunding GO, (BAM SAW), 4.00%, 06/01/23 | | | 385 | | | | 411,500 | |
Public Parking Authority Of Pittsburgh, Refunding RB | | | | | | | | |
Series A, 5.00%, 12/01/22 | | | 665 | | | | 709,907 | |
Series A, 5.00%, 12/01/22(d) | | | 345 | | | | 368,256 | |
School District of Philadelphia, GO | | | | | | | | |
Series A, (SAW), 5.00%, 09/01/22 | | | 1,150 | | | | 1,213,503 | |
Series A, (SAW), 5.00%, 09/01/23 | | | 1,250 | | | | 1,376,675 | |
Southeastern Pennsylvania Transportation Authority, RB | | | | | | | | |
5.00%, 06/01/23 | | | 1,000 | | | | 1,088,710 | |
5.00%, 06/01/24 | | | 900 | | | | 1,018,575 | |
| | |
| 58 | | 2 0 2 1 BLACK ROCK ANNUAL REPORT TO SHAREHOLDERS |
| | |
Schedule of Investments (continued) June 30, 2021 | | BlackRock Short-Term Municipal Fund (Percentages shown are based on Net Assets) |
| | | | | | | | |
| Security | | Par
(000) | | | Value | |
| | |
| Pennsylvania (continued) | | | | | | |
Wilson Area School District, Refunding GO | | | | | | | | |
(SAW), 4.00%, 03/15/22 | | $ | 285 | | | $ | 292,262 | |
(SAW), 4.00%, 03/15/23 | | | 900 | | | | 954,657 | |
| | | | | | | | |
| | | | | | | 66,711,128 | |
| | |
| Puerto Rico — 0.6% | | | | | | |
Puerto Rico Housing Finance Authority, Refunding RB, 5.00%, 12/01/23 | | | 4,500 | | | | 5,007,240 | |
| | | | | | | | |
| | |
| Rhode Island — 0.1% | | | | | | |
Rhode Island Commerce Corp., Refunding RB, Series A, 5.00%, 06/15/23 | | | 800 | | | | 874,912 | |
| | | | | | | | |
| | |
| South Carolina — 1.8% | | | | | | |
College of Charleston, Refunding RB, Series A, 5.00%, 04/01/24 | | | 1,640 | | | | 1,849,395 | |
Lexington County Health Services District Inc., Refunding RB, 5.00%, 11/01/21 | | | 250 | | | | 253,985 | |
Patriots Energy Group Financing Agency, RB, Series A, 4.00%, 10/01/48(a) | | | 9,255 | | | | 10,052,226 | |
Piedmont Municipal Power Agency Refunding RB, Series A, 4.00%, 01/01/25 | | | 1,480 | | | | 1,660,737 | |
South Carolina Jobs-Economic Development Authority, RB, 0.05%, 12/01/38(a) | | | 1,005 | | | | 1,005,000 | |
| | | | | | | | |
| | | | | | | 14,821,343 | |
| | |
| South Dakota — 0.1% | | | | | | |
South Dakota Health & Educational Facilities Authority, Refunding RB | | | | | | | | |
Series A, 5.00%, 09/01/23 | | | 335 | | | | 368,986 | |
Series A, 5.00%, 09/01/24 | | | 350 | | | | 400,477 | |
| | | | | | | | |
| | | | | | | 769,463 | |
| | |
| Tennessee — 0.3% | | | | | | |
Tennergy Corp., RB | | | | | | | | |
Series A, 4.00%, 03/01/24 | | | 350 | | | | 382,557 | |
Series A, 4.00%, 09/01/24 | | | 500 | | | | 553,970 | |
Series A, 4.00%, 03/01/25 | | | 500 | | | | 560,545 | |
Tennessee Energy Acquisition Corp., RB | | | | | | | | |
5.00%, 11/01/24 | | | 250 | | | | 285,942 | |
Series A, 5.25%, 09/01/24 | | | 910 | | | | 1,041,823 | |
| | | | | | | | |
| | | | | | | 2,824,837 | |
| | |
| Texas — 8.9% | | | | | | |
Clear Creek Independent School District, GO, (PSF-GTD), 5.00%, 02/15/25 | | | 650 | | | | 756,633 | |
Dallas Fort Worth International Airport, Refunding RB
5.00%, 11/01/23 | | | 2,500 | | | | 2,779,150 | |
Series A, 5.00%, 11/01/23 | | | 1,250 | | | | 1,389,575 | |
Fort Worth Independent School District GO, Series A, (PSF), 5.00%, 02/15/25(b) | | | 1,150 | | | | 1,336,806 | |
Goose Creek Consolidated Independent School District, GO, (PSF-GTD), 2.00%, 02/15/25 | | | 1,285 | | | | 1,356,754 | |
Harris County Cultural Education Facilities Finance Corp., Refunding RB, 5.00%, 11/15/21 | | | 725 | | | | 737,804 | |
Port of Arthur Navigation District Industrial Development Corp., RB(a)
0.06%, 06/01/41 | | | 8,000 | | | | 8,000,000 | |
| | | | | | | | |
| Security | | Par
(000) | | | Value | |
| | |
| Texas (continued) | | | | | | |
Port of Arthur Navigation District Industrial Development Corp., RB(a) (continued) 0.06%, 03/01/42 | | $ | 13,000 | | | $ | 13,000,000 | |
Richardson Independent School District GO, (PSF), 5.00%, 02/15/25(b) | | | 1,250 | | | | 1,452,350 | |
San Antonio Water System RB, Series A, 5.00%, 05/15/25(b) | | | 1,950 | | | | 2,288,364 | |
State of Texas, GO(a) | | | | | | | | |
Series A, 0.05%, 06/01/41 | | | 4,105 | | | | 4,105,000 | |
Series A, 0.05%, 06/01/43 | | | 3,450 | | | | 3,450,000 | |
Series A, 0.05%, 06/01/45 | | | 4,180 | | | | 4,180,000 | |
Series B, 0.05%, 12/01/41 | | | 9,500 | | | | 9,500,000 | |
Series B, 0.05%, 12/01/42 | | | 5,590 | | | | 5,590,000 | |
Tarrant County Cultural Education Facilities Finance Corp., Refunding RB, Series A, 5.00%, 07/01/22 | | | 1,815 | | | | 1,899,996 | |
Texas Municipal Gas Acquisition & Supply Corp. III, Refunding RB | | | | | | | | |
5.00%, 12/15/23 | | | 1,000 | | | | 1,108,960 | |
5.00%, 12/15/24 | | | 2,900 | | | | 3,327,025 | |
Texas Transportation Commission State Highway Fund, RB, Series B-1, 0.03%, 04/01/32(a) | | | 7,000 | | | | 7,000,000 | |
Waco Educational Finance Corp., RB, 4.00%, 03/01/25(b) | | | 400 | | | | 451,328 | |
| | | | | | | | |
| | | | | | | 73,709,745 | |
| | |
| Utah — 0.2% | | | | | | |
Central Utah Water Conservancy District, Refunding RB, Series B, 5.00%, 10/01/21 | | | 1,875 | | | | 1,897,444 | |
| | | | | | | | |
| | |
| Virginia — 0.2% | | | | | | |
Virginia College Building Authority, RB, Seties A, 5.00%, 02/01/25 | | | 1,300 | | | | 1,512,680 | |
| | | | | | | | |
| | |
| Washington — 1.4% | | | | | | |
County of King, Refunding GO, Series A, 0.03%, 01/01/46(a) | | | 2,900 | | | | 2,900,000 | |
King County Housing Authority, Refunding RB | | | | | | | | |
3.00%, 06/01/23 | | | 200 | | | | 209,322 | |
3.00%, 06/01/24 | | | 225 | | | | 239,942 | |
Port of Seattle, Refunding ARB, Series B, 5.00%, 03/01/24 | | | 1,375 | | | | 1,546,724 | |
Seattle Housing Authority, RB, M/F Housing, Series A, 3.00%, 06/01/23 | | | 3,000 | | | | 3,139,170 | |
State of Washington, RB, Series F, 5.00%, 09/01/22 | | | 460 | | | | 485,921 | |
Tobacco Settlement Authority, Refunding RB, 5.00%, 06/01/22 | | | 2,500 | | | | 2,614,000 | |
Washington Health Care Facilities Authority, Refunding RB, Series B, 5.00%, 08/15/21 | | | 625 | | | | 628,556 | |
| | | | | | | | |
| | | | | | | 11,763,635 | |
| | |
| Wisconsin — 0.1% | | | | | | |
Public Finance Authority, Refunding RB 5.00%, 01/01/23 | | | 300 | | | | 320,757 | |
| | |
SCHEDULE OF INVESTMENTS | | 59 |
| | |
Schedule of Investments (continued) June 30, 2021 | | BlackRock Short-Term Municipal Fund (Percentages shown are based on Net Assets) |
| | | | | | | | |
| Security | | Par
(000) | | | Value | |
| |
| Wisconsin (continued) | | | | |
Public Finance Authority, Refunding RB (continued)
5.00%, 01/01/24 | | $ | 300 | | | $ | 333,954 | |
Wisconsin Health & Educational Facilities Authority, Refunding RB, 4.00%, 11/15/21 | | | 350 | | | | 354,879 | |
| | | | | | | | |
| | | | | | | 1,009,590 | |
| | | | | | | | |
| |
Total Long-Term Investments — 99.5%
(Cost: $816,492,005) | | | | 821,725,569 | |
| | | | | | | | |
| | |
| | | Shares | | | | |
|
Short-Term Securities | |
|
| Money Market Funds — 1.0% | |
BlackRock Liquidity Funds, MuniCash, Institutional Class, 0.01%(e)(f) | | | 8,171,379 | | | | 8,173,013 | |
| | | | | | | | |
| |
Total Short-Term Securities — 1.0%
(Cost: $8,173,013) | | | | 8,173,013 | |
| | | | | | | | |
| |
Total Investments — 100.5%
(Cost: $824,665,018) | | | | 829,898,582 | |
| |
Liabilities in Excess of Other Assets — (0.5)% | | | | (3,953,448 | ) |
| | | | | | | | |
| |
Net Assets — 100.0% | | | $ | 825,945,134 | |
| | | | | | | | |
| (a) | Variable rate security. Interest rate resets periodically. The rate shown is the effective interest rate as of period end. Security description also includes the reference rate and spread if published and available. |
| (b) | When-issued security. |
| (c) | U.S. Government securities held in escrow, are used to pay interest on this security as well as to retire the bond in full at the date indicated, typically at a premium to par. |
| (d) | Security is collateralized by municipal bonds or U.S. Treasury obligations. |
| (e) | Affiliate of the Fund. |
| (f) | Annualized 7-day yield as of period end. |
Affiliates
Investments in issuers considered to be affiliate(s) of the Fund during the year ended June 30, 2021 for purposes of Section 2(a)(3) of the Investment Company Act of 1940, as amended, were as follows:
| | | | | | | | | | | | | | | | | | | | | | | | | | | | | | | | | | | | |
| Affiliated Issuer | | Value at
06/30/20 | | | Purchases
at Cost | | | Proceeds
from Sales | | | Net
Realized
Gain (Loss) | | | Change in
Unrealized
Appreciation
(Depreciation) | | | Value at
06/30/21 | | | Shares
Held at
06/30/21 | | | Income | | | Capital Gain
Distributions
from
Underlying
Funds | |
BlackRock Liquidity Funds, MuniCash, Institutional Class | | $ | 29,737,268 | | | $ | — | | | $ | (21,565,902 | )(a) | | $ | 174 | | | $ | 1,473 | | | $ | 8,173,013 | | | | 8,171,379 | | | $ | 3,022 | | | $ | — | |
| | | | | | | | | | | | | | | | | | | | | | | | | | | | | | | | | | | | |
| | (a) | Represents net amount purchased (sold). | |
Fair Value Hierarchy as of Period End
Various inputs are used in determining the fair value of financial instruments. For a description of the input levels and information about the Fund’s policy regarding valuation of financial instruments, refer to the Notes to Financial Statements.
The following table summarizes the Fund’s financial instruments categorized in the fair value hierarchy. The breakdown of the Fund’s financial instruments into major categories is disclosed in the Schedule of Investments above.
| | | | | | | | | | | | | | | | |
| | | Level 1 | | | Level 2 | | | Level 3 | | | Total | |
Assets | | | | | | | | | | | | | | | | |
Investments | | | | | | | | | | | | | | | | |
Long-Term Investments | | | | | | | | | | | | | | | | |
Municipal Bonds | | $ | — | | | $ | 821,725,569 | | | $ | — | | | $ | 821,725,569 | |
Short-Term Securities | | | | | | | | | | | | | | | | |
Money Market Funds | | | 8,173,013 | | | | — | | | | — | | | | 8,173,013 | |
| | | | | | | | | | | | | | | | |
| | $ | 8,173,013 | | | $ | 821,725,569 | | | $ | — | | | $ | 829,898,582 | |
| | | | | | | | | | | | | | | | |
See notes to financial statements.
| | |
| 60 | | 2 0 2 1 BLACK ROCK ANNUAL REPORT TO SHAREHOLDERS |
Statements of Assets and Liabilities
June 30, 2021
| | | | | | | | | | | | | | | | |
| | | BlackRock
New York Municipal Opportunities Fund | | | BlackRock High Yield Municipal Fund | | | BlackRock National Municipal
Fund | | | BlackRock
Short-Term
Municipal Fund | |
| | | | |
ASSETS | | | | | | | | | | | | | | | | |
Investments, at value — unaffiliated(a) | | $ | 1,640,120,147 | | | $ | 2,009,787,973 | | | $ | 13,485,958,595 | | | $ | 821,725,569 | |
Investments, at value — affiliated(b) | | | 32,939,572 | | | | 156,292,907 | | | | 2,753,375,834 | | | | 8,173,013 | |
Cash | | | 25,999 | | | | — | | | | — | | | | — | |
Cash pledged for futures contracts | | | 6,952,000 | | | | 1,591,000 | | | | 8,955,000 | | | | — | |
Receivables: | | | | | | | | | | | | | | | | |
Investments sold | | | 2,281,126 | | | | 9,649,419 | | | | 41,511,129 | | | | 1,910,025 | |
Capital shares sold | | | 3,890,872 | | | | 8,445,822 | | | | 31,196,932 | | | | 3,356,847 | |
Dividends — affiliated | | | 150 | | | | 776 | | | | 7,640 | | | | 127 | |
Interest — unaffiliated | | | 15,800,709 | | | | 19,776,683 | | | | 135,853,380 | | | | 5,641,883 | |
From the Manager | | | 18,403 | | | | — | | | | — | | | | — | |
Prepaid expenses | | | 43,060 | | | | 68,904 | | | | 265,627 | | | | 85,297 | |
| | | | | | | | | | | | | | | | |
Total assets | | | 1,702,072,038 | | | | 2,205,613,484 | | | | 16,457,124,137 | | | | 840,892,761 | |
| | | | | | | | | | | | | | | | |
| | | | |
ACCRUED LIABILITIES | | | | | | | | | | | | | | | | |
Bank overdraft | | | — | | | | — | | | | 54,119 | | | | — | |
Payables: | | | | | | | | | | | | | | | | |
Investments purchased | | | 3,149,263 | | | | 48,731,608 | | | | 1,094,862,021 | | | | 11,385,343 | |
Capital shares redeemed | | | 5,246,329 | | | | 4,142,758 | | | | 30,347,571 | | | | 2,969,424 | |
Income dividend distributions | | | 633,029 | | | | 1,209,015 | | | | 3,028,788 | | | | 153,665 | |
Interest expense and fees | | | 18,580 | | | | 31,423 | | | | 15,641 | | | | — | |
Investment advisory fees | | | 511,922 | | | | 680,717 | | | | 4,341,275 | | | | 163,584 | |
Directors’ and Officer’s fees | | | 16,241 | | | | — | | | | 80,851 | | | | 257 | |
Other accrued expenses | | | 341,200 | | | | 367,361 | | | | 1,907,771 | | | | 209,208 | |
Other affiliates | | | 8,370 | | | | 6,863 | | | | 69,792 | | | | 3,385 | |
Service and distribution fees | | | 221,741 | | | | 159,329 | | | | 998,920 | | | | 62,761 | |
Variation margin on futures contracts | | | 757,160 | | | | 179,311 | | | | 941,891 | | | | — | |
| | | | | | | | | | | | | | | | |
Total accrued liabilities | | | 10,903,835 | | | | 55,508,385 | | | | 1,136,648,640 | | | | 14,947,627 | |
| | | | | | | | | | | | | | | | |
| | | | |
OTHER LIABILITIES | | | | | | | | | | | | | | | | |
TOB Trust Certificates | | | 104,930,048 | | | | 114,823,537 | | | | 126,900,000 | | | | — | |
| | | | | | | | | | | | | | | | |
Total liabilities | | | 115,833,883 | | | | 170,331,922 | | | | 1,263,548,640 | | | | 14,947,627 | |
| | | | | | | | | | | | | | | | |
| | | | |
NET ASSETS | | $ | 1,586,238,155 | | | $ | 2,035,281,562 | | | $ | 15,193,575,497 | | | $ | 825,945,134 | |
| | | | | | | | | | | | | | | | |
| | | | |
NET ASSETS CONSIST OF | | | | | | | | | | | | | | | | |
Paid-in capital | | $ | 1,543,782,186 | | | $ | 1,850,811,669 | | | $ | 14,298,329,945 | | | $ | 822,362,309 | |
Accumulated earnings | | | 42,455,969 | | | | 184,469,893 | | | | 895,245,552 | | | | 3,582,825 | |
| | | | | | | | | | | | | | | | |
NET ASSETS | | $ | 1,586,238,155 | | | $ | 2,035,281,562 | | | $ | 15,193,575,497 | | | $ | 825,945,134 | |
| | | | | | | | | | | | | | | | |
| | | | |
(a) Investments, at cost — unaffiliated | | $ | 1,492,092,355 | | | $ | 1,819,212,478 | | | $ | 12,634,951,189 | | | $ | 816,492,005 | |
(b) Investments, at cost — affiliated | | $ | 32,937,129 | | | $ | 156,292,487 | | | $ | 2,751,472,131 | | | $ | 8,173,013 | |
Statements of Assets and Liabilities (continued)
June 30, 2021
| | | | | | | | | | | | | | | | |
| | | BlackRock
New York
Municipal
Opportunities
Fund | | | BlackRock High Yield
Municipal Fund | | | BlackRock
National
Municipal Fund | | | BlackRock
Short-Term
Municipal Fund | |
| | | | |
NET ASSET VALUE | | | | | | | | | | | | | | | | |
| | | | |
| Institutional | | | | | | | | | | | | |
Net assets | | $ | 706,228,697 | | | $ | 1,190,526,322 | | | $ | 5,801,296,447 | | �� | $ | 502,164,302 | |
| | | | | | | | | | | | | | | | |
Shares outstanding | | | 60,955,257 | | | | 111,352,751 | | | | 505,919,802 | | | | 49,363,190 | |
| | | | | | | | | | | | | | | | |
Net asset value | | $ | 11.59 | | | $ | 10.69 | | | $ | 11.47 | | | $ | 10.17 | |
| | | | | | | | | | | | | | | | |
Shares authorized | | | Unlimited | | | | 350 Million | | | | 800 Million | | | | 150 Million | |
| | | | | | | | | | | | | | | | |
Par value | | $ | 0.10 | | | $ | 0.10 | | | $ | 0.10 | | | $ | 0.10 | |
| | | | | | | | | | | | | | | | |
| | | | |
| Service | | | | | | | | | | | | |
Net assets | | | N/A | | | | N/A | | | $ | 3,563,563 | | | | N/A | |
| | | | | | | | | | | | | | | | |
Shares outstanding | | | N/A | | | | N/A | | | | 311,008 | | | | N/A | |
| | | | | | | | | | | | | | | | |
Net asset value | | | N/A | | | | N/A | | | $ | 11.46 | | | | N/A | |
| | | | | | | | | | | | | | | | |
Shares authorized | | | N/A | | | | N/A | | | | 375 Million | | | | N/A | |
| | | | | | | | | | | | | | | | |
Par value | | | N/A | | | | N/A | | | $ | 0.10 | | | | N/A | |
| | | | | | | | | | | | | | | | |
| | | | |
| Investor A | | | | | | | | | | | | |
Net assets | | $ | 697,841,979 | | | $ | 634,326,124 | | | $ | 4,427,190,897 | | | $ | 287,551,429 | |
| | | | | | | | | | | | | | | | |
Shares outstanding | | | 60,194,707 | | | | 59,471,872 | | | | 385,820,634 | | | | 28,247,606 | |
| | | | | | | | | | | | | | | | |
Net asset value | | $ | 11.59 | | | $ | 10.67 | | | $ | 11.47 | | | $ | 10.18 | |
| | | | | | | | | | | | | | | | |
Shares authorized | | | Unlimited | | | | 100 Million | | | | 800 Million | | | | 150 Million | |
| | | | | | | | | | | | | | | | |
Par value | | $ | 0.10 | | | $ | 0.10 | | | $ | 0.10 | | | $ | 0.10 | |
| | | | | | | | | | | | | | | | |
| | | | |
| Investor A1 | | | | | | | | | | | | |
Net assets | | $ | 89,500,553 | | | | N/A | | | | N/A | | | $ | 12,929,917 | |
| | | | | | | | | | | | | | | | |
Shares outstanding | | | 7,720,492 | | | | N/A | | | | N/A | | | | 1,269,910 | |
| | | | | | | | | | | | | | | | |
Net asset value | | $ | 11.59 | | | | N/A | | | | N/A | | | $ | 10.18 | |
| | | | | | | | | | | | | | | | |
Shares authorized | | | Unlimited | | | | N/A | | | | N/A | | | | 150 Million | |
| | | | | | | | | | | | | | | | |
Par value | | $ | 0.10 | | | | N/A | | | | N/A | | | $ | 0.10 | |
| | | | | | | | | | | | | | | | |
| | | | |
| Investor C | | | | | | | | | | | | |
Net assets | | $ | 87,465,362 | | | $ | 44,049,895 | | | $ | 129,601,307 | | | $ | 5,122,599 | |
| | | | | | | | | | | | | | | | |
Shares outstanding | | | 7,547,423 | | | | 4,118,488 | | | | 11,293,246 | | | | 518,471 | |
| | | | | | | | | | | | | | | | |
Net asset value | | $ | 11.59 | | | $ | 10.70 | | | $ | 11.48 | | | $ | 9.88 | |
| | | | | | | | | | | | | | | | |
Shares authorized | | | Unlimited | | | | 100 Million | | | | 375 Million | | | | 150 Million | |
| | | | | | | | | | | | | | | | |
Par value | | $ | 0.10 | | | $ | 0.10 | | | $ | 0.10 | | | $ | 0.10 | |
| | | | | | | | | | | | | | | | |
| | | | |
| Class K | | | | | | | | | | | | |
Net assets | | $ | 5,201,564 | | | $ | 166,379,221 | | | $ | 4,831,923,283 | | | $ | 18,176,887 | |
| | | | | | | | | | | | | | | | |
Shares outstanding | | | 449,003 | | | | 15,563,804 | | | | 421,196,473 | | | | 1,786,862 | |
| | | | | | | | | | | | | | | | |
Net asset value | | $ | 11.58 | | | $ | 10.69 | | | $ | 11.47 | | | $ | 10.17 | |
| | | | | | | | | | | | | | | | |
Shares authorized | | | Unlimited | | | | 2 Billion | | | | 1.35 Billion | | | | 150 Million | |
| | | | | | | | | | | | | | | | |
Par value | | $ | 0.10 | | | $ | 0.10 | | | $ | 0.10 | | | $ | 0.10 | |
| | | | | | | | | | | | | | | | |
See notes to financial statements.
| | |
| 62 | | 2 0 2 1 BLACK ROCK ANNUAL REPORT TO SHAREHOLDERS |
Statements of Operations
Year Ended June 30, 2021
| | | | | | | | | | | | | | | | |
| | | BlackRock
New York
Municipal
Opportunities
Fund | | | BlackRock
High Yield
Municipal
Fund | | | BlackRock
National
Municipal
Fund | | | BlackRock
Short-Term
Municipal Fund | |
| | | | |
INVESTMENT INCOME | | | | | | | | | | | | | | | | |
Dividends — affiliated | | $ | 5,376 | | | $ | 11,549 | | | $ | 757,272 | | | $ | 3,022 | |
Interest — unaffiliated | | | 47,847,483 | | | | 64,372,152 | | | | 324,227,246 | | | | 7,930,539 | |
| | | | | | | | | | | | | | | | |
Total investment income | | | 47,852,859 | | | | 64,383,701 | | | | 324,984,518 | | | | 7,933,561 | |
| | | | | | | | | | | | | | | | |
| | | | |
EXPENSES | | | | | | | | | | | | | | | | |
Investment advisory | | | 7,248,035 | | | | 7,334,297 | | | | 53,817,646 | | | | 2,203,546 | |
Service and distribution — class specific | | | 2,818,814 | | | | 1,741,079 | | | | 12,118,494 | | | | 743,503 | |
Transfer agent — class specific | | | 814,563 | | | | 703,047 | | | | 7,877,865 | | | | 476,136 | |
Professional | | | 238,294 | | | | 258,013 | | | | 306,093 | | | | 60,862 | |
Accounting services | | | 217,632 | | | | 194,633 | | | | 1,224,448 | | | | 121,047 | |
Registration | | | 118,019 | | | | 227,843 | | | | 826,401 | | | | 216,513 | |
Reorganization | | | 86,834 | | | | — | | | | — | | | | — | |
Printing and postage | | | 64,365 | | | | 24,775 | | | | 20,537 | | | | 17,781 | |
Custodian | | | 22,483 | | | | 35,077 | | | | 213,894 | | | | 9,165 | |
Directors and Officer | | | 20,521 | | | | 16,246 | | | | 151,533 | | | | 9,262 | |
Miscellaneous | | | 84,717 | | | | 78,900 | | | | 278,071 | | | | 37,054 | |
| | | | | | | | | | | | | | | | |
Total expenses excluding interest expense | | | 11,734,277 | | | | 10,613,910 | | | | 76,834,982 | | | | 3,894,869 | |
Interest expense(a) | | | 691,475 | | | | 769,830 | | | | 788,048 | | | | — | |
| | | | | | | | | | | | | | | | |
Total expenses | | | 12,425,752 | | | | 11,383,740 | | | | 77,623,030 | | | | 3,894,869 | |
Less: | | | | | | | | | | | | | | | | |
Fees waived and/or reimbursed by the Manager | | | (991,212 | ) | | | (335,978 | ) | | | (3,768,362 | ) | | | (335,716 | ) |
Transfer agent fees waived and/or reimbursed — class specific | | | (71,716 | ) | | | (31,875 | ) | | | (3,134,055 | ) | | | (146,265 | ) |
| | | | | | | | | | | | | | | | |
Total expenses after fees waived and/or reimbursed | | | 11,362,824 | | | | 11,015,887 | | | | 70,720,613 | | | | 3,412,888 | |
| | | | | | | | | | | | | | | | |
Net investment income | | | 36,490,035 | | | | 53,367,814 | | | | 254,263,905 | | | | 4,520,673 | |
| | | | | | | | | | | | | | | | |
| | | | |
REALIZED AND UNREALIZED GAIN (LOSS) | | | | | | | | | | | | | | | | |
Net realized gain (loss) from: | | | | | | | | | | | | | | | | |
Investments — unaffiliated | | | 22,839,763 | | | | 30,890,419 | | | | 155,798,428 | | | | (34,894 | ) |
Investments — affiliated | | | 3,511 | | | | 2,108 | | | | (15,882 | ) | | | 174 | |
Futures contracts | | | 18,742,094 | | | | (680,279 | ) | | | 38,617,223 | | | | — | |
| | | | | | | | | | | | | | | | |
| | | 41,585,368 | | | | 30,212,248 | | | | 194,399,769 | | | | (34,720 | ) |
| | | | | | | | | | | | | | | | |
| | | | |
Net change in unrealized appreciation (depreciation) on: | | | | | | | | | | | | | | | | |
Investments — unaffiliated | | | 62,568,056 | | | | 154,036,947 | | | | 286,758,497 | | | | 1,279,490 | |
Investments — affiliated | | | (1,066 | ) | | | (3,299 | ) | | | 1,244,428 | | | | 1,473 | |
Futures contracts | | | 2,355,708 | | | | (961,582 | ) | | | (7,873,659 | ) | | | — | |
| | | | | | | | | | | | | | | | |
| | | 64,922,698 | | | | 153,072,066 | | | | 280,129,266 | | | | 1,280,963 | |
| | | | | | | | | | | | | | | | |
Net realized and unrealized gain | | | 106,508,066 | | | | 183,284,314 | | | | 474,529,035 | | | | 1,246,243 | |
| | | | | | | | | | | | | | | | |
| | | | |
NET INCREASE IN NET ASSETS RESULTING FROM OPERATIONS | | $ | 142,998,101 | | | $ | 236,652,128 | | | $ | 728,792,940 | | | $ | 5,766,916 | |
| | | | | | | | | | | | | | | | |
| (a) | Related to TOBs Trusts. |
See notes to financial statements.
Statements of Changes in Net Assets
| | | | | | | | | | | | | | | | |
| | | BlackRock New York
Municipal Opportunities Fund | | | BlackRock High Yield
Municipal Fund | |
| | | | | | | | |
| | | Year Ended June 30, | | | Year Ended June 30, | |
| | | | | | | | |
| | | 2021 | | | 2020 | | | 2021 | | | 2020 | |
| |
| | | | |
INCREASE (DECREASE) IN NET ASSETS | | | | | | | | | | | | | | | | |
| | | | |
OPERATIONS | | | | | | | | | | | | | | | | |
Net investment income | | $ | 36,490,035 | | | $ | 41,222,854 | | | $ | 53,367,814 | | | $ | 47,074,029 | |
Net realized gain (loss) | | | 41,585,368 | | | | (106,554,783 | ) | | | 30,212,248 | | | | (29,196,503 | ) |
Net change in unrealized appreciation (depreciation) | | | 64,922,698 | | | | (1,576,667 | ) | | | 153,072,066 | | | | (33,680,968 | ) |
| | | | | | | | | | | | | | | | |
Net increase (decrease) in net assets resulting from operations | | | 142,998,101 | | | | (66,908,596 | ) | | | 236,652,128 | | | | (15,803,442 | ) |
| | | | | | | | | | | | | | | | |
| | | | |
DISTRIBUTIONS TO SHAREHOLDERS(a) | | | | | | | | | | | | | | | | |
Institutional | | | (16,925,281 | ) | | | (19,989,098 | ) | | | (31,948,494 | ) | | | (28,738,136 | ) |
Investor A | | | (15,856,840 | ) | | | (16,753,072 | ) | | | (16,231,308 | ) | | | (14,007,682 | ) |
Investor A1 | | | (2,171,880 | ) | | | (2,387,660 | ) | | | — | | | | — | |
Investor C | | | (1,425,757 | ) | | | (1,869,511 | ) | | | (1,167,144 | ) | | | (1,686,708 | ) |
Investor C1 | | | — | | | | (577 | ) | | | — | | | | — | |
Class K | | | (110,917 | ) | | | (185,363 | ) | | | (3,945,319 | ) | | | (2,506,737 | ) |
| | | | | | | | | | | | | | | | |
Decrease in net assets resulting from distributions to shareholders | | | (36,490,675 | ) | | | (41,185,281 | ) | | | (53,292,265 | ) | | | (46,939,263 | ) |
| | | | | | | | | | | | | | | | |
| | | | |
CAPITAL SHARE TRANSACTIONS | | | | | | | | | | | | | | | | |
Net increase (decrease) in net assets derived from capital share transactions | | | (186,279,396 | ) | | | 204,240,421 | | | | 529,983,558 | | | | 145,068,604 | |
| | | | | | | | | | | | | | | | |
| | | | |
NET ASSETS | | | | | | | | | | | | | | | | |
Total increase (decrease) in net assets | | | (79,771,970 | ) | | | 96,146,544 | | | | 713,343,421 | | | | 82,325,899 | |
Beginning of year | | | 1,666,010,125 | | | | 1,569,863,581 | | | | 1,321,938,141 | | | | 1,239,612,242 | |
| | | | | | | | | | | | | | | | |
End of year | | $ | 1,586,238,155 | | | $ | 1,666,010,125 | | | $ | 2,035,281,562 | | | $ | 1,321,938,141 | |
| | | | | | | | | | | | | | | | |
| (a) | Distributions for annual periods determined in accordance with U.S. federal income tax regulations. |
See notes to financial statements.
| | |
| 64 | | 2 0 2 1 BLACK ROCK ANNUAL REPORT TO SHAREHOLDERS |
Statements of Changes in Net Assets (continued)
| | | | | | | | | | | | | | | | |
| | | BlackRock National
Municipal Fund | | | BlackRock Short-Term
Municipal Fund | |
| | | | | | | | |
| | | Year Ended June 30, | | | Year Ended June 30, | |
| | | | | | | | |
| | | 2021 | | | 2020 | | | 2021 | | | 2020 | |
| |
| | | | |
INCREASE (DECREASE) IN NET ASSETS | | | | | | | | | | | | | | | | |
| | | | |
OPERATIONS | | | | | | | | | | | | | | | | |
Net investment income | | $ | 254,263,905 | | | $ | 288,408,961 | | | $ | 4,520,673 | | | $ | 7,042,279 | |
Net realized gain (loss) | | | 194,399,769 | | | | (151,058,362 | ) | | | (34,720 | ) | | | (41,500 | ) |
Net change in unrealized appreciation (depreciation) | | | 280,129,266 | | | | 141,723,030 | | | | 1,280,963 | | | | 641,672 | |
| | | | | | | | | | | | | | | | |
Net increase in net assets resulting from operations | | | 728,792,940 | | | | 279,073,629 | | | | 5,766,916 | | | | 7,642,451 | |
| | | | | | | | | | | | | | | | |
| | | | |
DISTRIBUTIONS TO SHAREHOLDERS(a) | | | | | | | | | | | | | | | | |
Institutional | | | (96,342,920 | ) | | | (109,372,132 | ) | | | (3,176,503 | ) | | | (5,199,554 | ) |
Service | | | (58,285 | ) | | | (77,353 | ) | | | — | | | | — | |
Investor A | | | (68,908,582 | ) | | | (82,685,594 | ) | | | (1,220,634 | ) | | | (1,511,259 | ) |
Investor A1 | | | — | | | | — | | | | (81,573 | ) | | | (202,016 | ) |
Investor C | | | (1,413,914 | ) | | | (3,773,946 | ) | | | — | | | | (58,742 | ) |
Investor C1 | | | — | | | | (8,855 | ) | | | — | | | | — | |
Class K | | | (86,606,452 | ) | | | (106,062,753 | ) | | | (83,481 | ) | | | (102,105 | ) |
| | | | | | | | | | | | | | | | |
Decrease in net assets resulting from distributions to shareholders | | | (253,330,153 | ) | | | (301,980,633 | ) | | | (4,562,191 | ) | | | (7,073,676 | ) |
| | | | | | | | | | | | | | | | |
| | | | |
CAPITAL SHARE TRANSACTIONS | | | | | | | | | | | | | | | | |
Net increase in net assets derived from capital share transactions | | | 1,327,537,307 | | | | 2,110,970,443 | | | | 174,867,777 | | | | 150,668,719 | |
| | | | | | | | | | | | | | | | |
| | | | |
NET ASSETS | | | | | | | | | | | | | | | | |
Total increase in net assets | | | 1,803,000,094 | | | | 2,088,063,439 | | | | 176,072,502 | | | | 151,237,494 | |
Beginning of year | | | 13,390,575,403 | | | | 11,302,511,964 | | | | 649,872,632 | | | | 498,635,138 | |
| | | | | | | | | | | | | | | | |
End of year | | $ | 15,193,575,497 | | | $ | 13,390,575,403 | | | $ | 825,945,134 | | | $ | 649,872,632 | |
| | | | | | | | | | | | | | | | |
| (a) | Distributions for annual periods determined in accordance with U.S. federal income tax regulations. |
See notes to financial statements.
Financial Highlights
(For a share outstanding throughout each period)
| | | | | | | | | | | | | | | | | | | | |
| | | BlackRock New York Municipal Opportunities Fund | |
| | | Institutional | |
| | | Year Ended June 30, | |
| | | 2021 | | | 2020 | | | 2019 | | | 2018 | | | 2017 | |
| | | | | |
Net asset value, beginning of year | | $ | 10.83 | | | $ | 11.38 | | | $ | 11.31 | | | $ | 11.21 | | | $ | 11.58 | |
| | | | | | | | | | | | | | | | | | | | |
Net investment income(a) | | | 0.28 | | | | 0.28 | | | | 0.33 | | | | 0.33 | | | | 0.35 | |
Net realized and unrealized gain (loss) | | | 0.76 | | | | (0.55 | ) | | | 0.22 | | | | 0.10 | | | | (0.37 | ) |
| | | | | | | | | | | | | | | | | | | | |
Net increase (decrease) from investment operations | | | 1.04 | | | | (0.27 | ) | | | 0.55 | | | | 0.43 | | | | (0.02 | ) |
| | | | | | | | | | | | | | | | | | | | |
| | | | | |
Distributions(b) | | | | | | | | | | | | | | | | | | | | |
From net investment income | | | (0.28 | ) | | | (0.28 | ) | | | (0.36 | ) | | | (0.33 | ) | | | (0.35 | ) |
From net realized gain | | | — | | | | — | | | | (0.12 | ) | | | — | | | | — | |
| | | | | | | | | | | | | | | | | | | | |
Total distributions | | | (0.28 | ) | | | (0.28 | ) | | | (0.48 | ) | | | (0.33 | ) | | | (0.35 | ) |
| | | | | | | | | | | | | | | | | | | | |
| | | | | |
Net asset value, end of year | | $ | 11.59 | | | $ | 10.83 | | | $ | 11.38 | | | $ | 11.31 | | | $ | 11.21 | |
| | | | | | | | | | | | | | | | | | | | |
| | | | | |
Total Return(c) | | | | | | | | | | | | | | | | | | | | |
Based on net asset value | | | 9.71 | % | | | (2.41 | )% | | | 4.96 | % | | | 3.93 | % | | | (0.09 | )% |
| | | | | | | | | | | | | | | | | | | | |
| | | | | |
Ratios to Average Net Assets(d) | | | | | | | | | | | | | | | | | | | | |
Total expenses | | | 0.61 | % | | | 0.63 | % | | | 0.71 | % | | | 0.74 | % | | | 0.75 | % |
| | | | | | | | | | | | | | | | | | | | |
Total expenses after fees waived and/or reimbursed | | | 0.54 | % | | | 0.58 | % | | | 0.65 | % | | | 0.63 | % | | | 0.63 | % |
| | | | | | | | | | | | | | | | | | | | |
Total expenses after fees waived and/or reimbursed and excluding interest expense(e) | | | 0.50 | % | | | 0.50 | % | | | 0.50 | % | | | 0.50 | % | | | 0.52 | % |
| | | | | | | | | | | | | | | | | | | | |
Net investment income | | | 2.49 | % | | | 2.52 | % | | | 2.99 | % | | | 2.96 | % | | | 3.17 | % |
| | | | | | | | | | | | | | | | | | | | |
| | | | | |
Supplemental Data | | | | | | | | | | | | | | | | | | | | |
Net assets, end of year (000) | | $ | 706,229 | | | $ | 702,632 | | | $ | 733,534 | | | $ | 455,378 | | | $ | 266,540 | |
| | | | | | | | | | | | | | | | | | | | |
Borrowings outstanding, end of year (000) | | $ | 104,930 | | | $ | 94,386 | | | $ | 88,529 | | | $ | 67,389 | | | $ | 60,785 | |
| | | | | | | | | | | | | | | | | | | | |
Portfolio turnover rate | | | 15 | % | | | 43 | % | | | 43 | % | | | 43 | % | | | 34 | % |
| | | | | | | | | | | | | | | | | | | | |
| (a) | Based on average shares outstanding. |
| (b) | Distributions for annual periods determined in accordance with U.S. federal income tax regulations. |
| (c) | Where applicable, assumes the reinvestment of distributions. |
| (d) | Excludes expenses incurred indirectly as a result of investments in underlying funds as follows: |
| | | | | | | | | | | | | | | | | | | | |
| | | Year Ended June 30, | |
| | | 2021 | | | 2020 | | | 2019 | | | 2018 | | | 2017 | |
Investments in underlying funds | | | — | % | | | 0.01 | % | | | 0.01 | % | | | 0.01 | % | | | 0.01 | % |
| | | | | | | | | | | | | | | | | | | | |
| (e) | Interest expense and fees relate to TOB Trusts. See Note 4 of the Notes to Financial Statements for details. |
See notes to financial statements.
| | |
| 66 | | 2 0 2 1 BLACK ROCK ANNUAL REPORT TO SHAREHOLDERS |
Financial Highlights (continued)
(For a share outstanding throughout each period)
| | | | | | | | | | | | | | | | | | | | |
| | | BlackRock New York Municipal Opportunities Fund (continued) | |
| | | Investor A | |
| | | Year Ended June 30, | |
| | | 2021 | | | 2020 | | | 2019 | | | 2018 | | | 2017 | |
| | | | | |
Net asset value, beginning of year | | $ | 10.84 | | | $ | 11.39 | | | $ | 11.31 | | | $ | 11.21 | | | $ | 11.58 | |
| | | | | | | | | | | | | | | | | | | | |
Net investment income(a) | | | 0.25 | | | | 0.25 | | | | 0.31 | | | | 0.31 | | | | 0.33 | |
Net realized and unrealized gain (loss) | | | 0.75 | | | | (0.55 | ) | | | 0.22 | | | | 0.10 | | | | (0.38 | ) |
| | | | | | | | | | | | | | | | | | | | |
Net increase (decrease) from investment operations | | | 1.00 | | | | (0.30 | ) | | | 0.53 | | | | 0.41 | | | | (0.05 | ) |
| | | | | | | | | | | | | | | | | | | | |
| | | | | |
Distributions(b) | | | | | | | | | | | | | | | | | | | | |
From net investment income | | | (0.25 | ) | | | (0.25 | ) | | | (0.33 | ) | | | (0.31 | ) | | | (0.32 | ) |
From net realized gain | | | — | | | | — | | | | (0.12 | ) | | | — | | | | — | |
| | | | | | | | | | | | | | | | | | | | |
Total distributions | | | (0.25 | ) | | | (0.25 | ) | | | (0.45 | ) | | | (0.31 | ) | | | (0.32 | ) |
| | | | | | | | | | | | | | | | | | | | |
| | | | | |
Net asset value, end of year | | $ | 11.59 | | | $ | 10.84 | | | $ | 11.39 | | | $ | 11.31 | | | $ | 11.21 | |
| | | | | | | | | | | | | | | | | | | | |
| | | | | |
Total Return(c) | | | | | | | | | | | | | | | | | | | | |
Based on net asset value | | | 9.34 | % | | | (2.65 | )% | | | 4.79 | % | | | 3.67 | % | | | (0.34 | )% |
| | | | | | | | | | | | | | | | | | | | |
| | | | | |
Ratios to Average Net Assets(d) | | | | | | | | | | | | | | | | | | | | |
Total expenses | | | 0.85 | % | | | 0.88 | %(e) | | | 0.97 | % | | | 0.96 | % | | | 0.96 | % |
| | | | | | | | | | | | | | | | | | | | |
Total expenses after fees waived and/or reimbursed | | | 0.79 | % | | | 0.84 | % | | | 0.90 | % | | | 0.88 | % | | | 0.88 | % |
| | | | | | | | | | | | | | | | | | | | |
Total expenses after fees waived and/or reimbursed and excluding interest expense(f) | | | 0.75 | % | | | 0.75 | % | | | 0.75 | % | | | 0.75 | % | | | 0.77 | % |
| | | | | | | | | | | | | | | | | | | | |
Net investment income | | | 2.24 | % | | | 2.27 | % | | | 2.73 | % | | | 2.71 | % | | | 2.92 | % |
| | | | | | | | | �� | | | | | | | | | | | |
| | | | | |
Supplemental Data | | | | | | | | | | | | | | | | | | | | |
Net assets, end of year (000) | | $ | 697,842 | | | $ | 756,236 | | | $ | 609,557 | | | $ | 362,961 | | | $ | 260,308 | |
| | | | | | | | | | | | | | | | | | | | |
Borrowings outstanding, end of year (000) | | $ | 104,930 | | | $ | 94,386 | | | $ | 88,529 | | | $ | 67,389 | | | $ | 60,785 | |
| | | | | | | | | | | | | | | | | | | | |
Portfolio turnover rate | | | 15 | % | | | 43 | % | | | 43 | % | | | 43 | % | | | 34 | % |
| | | | | | | | | | | | | | | | | | | | |
| (a) | Based on average shares outstanding. |
| (b) | Distributions for annual periods determined in accordance with U.S. federal income tax regulations. |
| (c) | Where applicable, excludes the effects of any sales charges and assumes the reinvestment of distributions. |
| (d) | Excludes expenses incurred indirectly as a result of investments in underlying funds as follows: |
| | | | | | | | | | | | | | | | | | | | |
| | | Year Ended June 30, | |
| | | 2021 | | | 2020 | | | 2019 | | | 2018 | | | 2017 | |
Investments in underlying funds | | | — | % | | | 0.01 | % | | | 0.01 | % | | | 0.01 | % | | | 0.01 | % |
| | | | | | | | | | | | | | | | | | | | |
| (e) | Includes recoupment of past waived and/or reimbursed fees with no financial impact to the expense ratio. |
| (f) | Interest expense and fees relate to TOB Trusts. See Note 4 of the Notes to Financial Statements for details. |
See notes to financial statements.
Financial Highlights (continued)
(For a share outstanding throughout each period)
| | | | | | | | | | | | | | | | | | | | |
| | | BlackRock New York Municipal Opportunities Fund (continued) | |
| | | Investor A1 | |
| | | Year Ended June 30, | |
| | | 2021 | | | 2020 | | | 2019 | | | 2018 | | | 2017 | |
| | | | | |
Net asset value, beginning of year | | $ | 10.84 | | | $ | 11.38 | | | $ | 11.31 | | | $ | 11.21 | | | $ | 11.58 | |
| | | | | | | | | | | | | | | | | | | | |
Net investment income(a) | | | 0.27 | | | | 0.27 | | | | 0.32 | | | | 0.32 | | | | 0.34 | |
Net realized and unrealized gain (loss) | | | 0.75 | | | | (0.54 | ) | | | 0.21 | | | | 0.10 | | | | (0.37 | ) |
| | | | | | | | | | | | | | | | | | | | |
Net increase (decrease) from investment operations | | | 1.02 | | | | (0.27 | ) | | | 0.53 | | | | 0.42 | | | | (0.03 | ) |
| | | | | | | | | | | | | | | | | | | | |
| | | | | |
Distributions(b) | | | | | | | | | | | | | | | | | | | | |
From net investment income | | | (0.27 | ) | | | (0.27 | ) | | | (0.34 | ) | | | (0.32 | ) | | | (0.34 | ) |
From net realized gain | | | — | | | | — | | | | (0.12 | ) | | | — | | | | — | |
| | | | | | | | | | | | | | | | | | | | |
Total distributions | | | (0.27 | ) | | | (0.27 | ) | | | (0.46 | ) | | | (0.32 | ) | | | (0.34 | ) |
| | | | | | | | | | | | | | | | | | | | |
| | | | | |
Net asset value, end of year | | $ | 11.59 | | | $ | 10.84 | | | $ | 11.38 | | | $ | 11.31 | | | $ | 11.21 | |
| | | | | | | | | | | | | | | | | | | | |
| | | | | |
Total Return(c) | | | | | | | | | | | | | | | | | | | | |
Based on net asset value | | | 9.50 | % | | | (2.42 | )% | | | 4.85 | % | | | 3.83 | % | | | (0.19 | )% |
| | | | | | | | | | | | | | | | | | | | |
| | | | | |
Ratios to Average Net Assets(d) | | | | | | | | | | | | | | | | | | | | |
Total expenses | | | 0.70 | % | | | 0.73 | %(e) | | | 0.81 | % | | | 0.81 | % | | | 0.81 | %(e) |
| | | | | | | | | | | | | | | | | | | | |
Total expenses after fees waived and/or reimbursed | | | 0.64 | % | | | 0.69 | % | | | 0.75 | % | | | 0.72 | % | | | 0.73 | % |
| | | | | | | | | | | | | | | | | | | | |
Total expenses after fees waived and/or reimbursed and excluding interest expense(f) | | | 0.60 | % | | | 0.60 | % | | | 0.60 | % | | | 0.60 | % | | | 0.63 | % |
| | | | | | | | | | | | | | | | | | | | |
Net investment income | | | 2.39 | % | | | 2.42 | % | | | 2.89 | % | | | 2.87 | % | | | 3.06 | % |
| | | | | | | | | | | | | | | | | | | | |
| | | | | |
Supplemental Data | | | | | | | | | | | | | | | | | | | | |
Net assets, end of year (000) | | $ | 89,501 | | | $ | 91,458 | | | $ | 103,286 | | | $ | 107,538 | | | $ | 114,821 | |
| | | | | | | | | | | | | | | | | | | | |
Borrowings outstanding, end of year (000) | | $ | 104,930 | | | $ | 94,386 | | | $ | 88,529 | | | $ | 67,389 | | | $ | 60,785 | |
| | | | | | | | | | | | | | | | | | | | |
Portfolio turnover rate | | | 15 | % | | | 43 | % | | | 43 | % | | | 43 | % | | | 34 | % |
| | | | | | | | | | | | | | | | | | | | |
| (a) | Based on average shares outstanding. |
| (b) | Distributions for annual periods determined in accordance with U.S. federal income tax regulations. |
| (c) | Where applicable, excludes the effects of any sales charges and assumes the reinvestment of distributions. |
| (d) | Excludes expenses incurred indirectly as a result of investments in underlying funds as follows: |
| | | | | | | | | | | | | | | | | | | | |
| | | Year Ended June 30, | |
| | | 2021 | | | 2020 | | | 2019 | | | 2018 | | | 2017 | |
Investments in underlying funds | | | — | % | | | 0.01 | % | | | 0.01 | % | | | 0.01 | % | | | 0.01 | % |
| | | | | | | | | | | | | | | | | | | | |
| (e) | Includes recoupment of past waived and/or reimbursed fees with no financial impact to the expense ratio. |
| (f) | Interest expense and fees relate to TOB Trusts. See Note 4 of the Notes to Financial Statements for details. |
See notes to financial statements.
| | |
| 68 | | 2 0 2 1 BLACK ROCK ANNUAL REPORT TO SHAREHOLDERS |
Financial Highlights (continued)
(For a share outstanding throughout each period)
| | | | | | | | | | | | | | | | | | | | |
| | | BlackRock New York Municipal Opportunities Fund (continued) | |
| | | Investor C | |
| | | Year Ended June 30, | |
| | | 2021 | | | 2020 | | | 2019 | | | 2018 | | | 2017 | |
| | | | | |
Net asset value, beginning of year | | $ | 10.83 | | | $ | 11.38 | | | $ | 11.31 | | | $ | 11.21 | | | $ | 11.58 | |
| | | | | | | | | | | | | | | | | | | | |
Net investment income(a) | | | 0.17 | | | | 0.17 | | | | 0.22 | | | | 0.22 | | | | 0.24 | |
Net realized and unrealized gain (loss) | | | 0.76 | | | | (0.55 | ) | | | 0.21 | | | | 0.10 | | | | (0.37 | ) |
| | | | | | | | | | | | | | | | | | | | |
Net increase (decrease) from investment operations | | | 0.93 | | | | (0.38 | ) | | | 0.43 | | | | 0.32 | | | | (0.13 | ) |
| | | | | | | | | | | | | | | | | | | | |
| | | | | |
Distributions(b) | | | | | | | | | | | | | | | | | | | | |
From net investment income | | | (0.17 | ) | | | (0.17 | ) | | | (0.24 | ) | | | (0.22 | ) | | | (0.24 | ) |
From net realized gain | | | — | | | | — | | | | (0.12 | ) | | | — | | | | — | |
| | | | | | | | | | | | | | | | | | | | |
Total distributions | | | (0.17 | ) | | | (0.17 | ) | | | (0.36 | ) | | | (0.22 | ) | | | (0.24 | ) |
| | | | | | | | | | | | | | | | | | | | |
| | | | | |
Net asset value, end of year | | $ | 11.59 | | | $ | 10.83 | | | $ | 11.38 | | | $ | 11.31 | | | $ | 11.21 | |
| | | | | | | | | | | | | | | | | | | | |
| | | | | |
Total Return(c) | | | | | | | | | | | | | | | | | | | | |
Based on net asset value | | | 8.62 | % | | | (3.38 | )% | | | 3.92 | % | | | 2.89 | % | | | (1.08 | )% |
| | | | | | | | | | | | | | | | | | | | |
| | | | | |
Ratios to Average Net Assets(d) | | | | | | | | | | | | | | | | | | | | |
Total expenses | | | 1.62 | % | | | 1.64 | % | | | 1.72 | % | | | 1.73 | % | | | 1.72 | % |
| | | | | | | | | | | | | | | | | | | | |
Total expenses after fees waived and/or reimbursed | | | 1.54 | % | | | 1.59 | % | | | 1.65 | % | | | 1.63 | % | | | 1.63 | % |
| | | | | | | | | | | | | | | | | | | | |
Total expenses after fees waived and/or reimbursed and excluding interest expense(e) | | | 1.50 | % | | | 1.50 | % | | | 1.50 | % | | | 1.50 | % | | | 1.52 | % |
| | | | | | | | | | | | | | | | | | | | |
Net investment income | | | 1.49 | % | | | 1.52 | % | | | 1.99 | % | | | 1.96 | % | | | 2.17 | % |
| | | | | | | | | | | | | | | | | | | | |
| | | | | |
Supplemental Data | | | | | | | | | | | | | | | | | | | | |
Net assets, end of year (000) | | $ | 87,465 | | | $ | 111,588 | | | $ | 119,391 | | | $ | 98,722 | | | $ | 85,612 | |
| | | | | | | | | | | | | | | | | | | | |
Borrowings outstanding, end of year (000) | | $ | 104,930 | | | $ | 94,386 | | | $ | 88,529 | | | $ | 67,389 | | | $ | 60,785 | |
| | | | | | | | | | | | | | | | | | | | |
Portfolio turnover rate | | | 15 | % | | | 43 | % | | | 43 | % | | | 43 | % | | | 34 | % |
| | | | | | | | | | | | | | | | | | | | |
| (a) | Based on average shares outstanding. |
| (b) | Distributions for annual periods determined in accordance with U.S. federal income tax regulations. |
| (c) | Where applicable, excludes the effects of any sales charges and assumes the reinvestment of distributions. |
| (d) | Excludes expenses incurred indirectly as a result of investments in underlying funds as follows: |
| | | | | | | | | | | | | | | | | | | | |
| | | Year Ended June 30, | |
| | | 2021 | | | 2020 | | | 2019 | | | 2018 | | | 2017 | |
Investments in underlying funds | | | — | % | | | 0.01 | % | | | 0.01 | % | | | 0.01 | % | | | 0.01 | % |
| | | | | | | | | | | | | | | | | | | | |
| (e) | Interest expense and fees relate to TOB Trusts. See Note 4 of the Notes to Financial Statements for details. |
See notes to financial statements.
Financial Highlights (continued)
(For a share outstanding throughout each period)
| | | | | | | | | | | | | | | | | | | | |
| | | BlackRock New York Municipal Opportunities Fund (continued) | |
| | | Class K | |
| | | Year Ended June 30, | | | | | | |
| Period from
01/25/18 to 06/30/18 |
(a) |
| | | 2021 | | | 2020 | | | 2019 | | | | |
| | | | | | |
Net asset value, beginning of period | | $ | 10.83 | | | $ | 11.38 | | | $ | 11.31 | | | | | | | $ | 11.34 | |
| | | | | | | | | | | | | | | | | | | | |
Net investment income(b) | | | 0.28 | | | | 0.29 | | | | 0.34 | | | | | | | | 0.16 | |
Net realized and unrealized gain (loss) | | | 0.75 | | | | (0.55 | ) | | | 0.21 | | | | | | | | (0.05 | ) |
| | | | | | | | | | | | | | | | | | | | |
Net increase (decrease) from investment operations | | | 1.03 | | | | (0.26 | ) | | | 0.55 | | | | | | | | 0.11 | |
| | | | | | | | | | | | | | | | | | | | |
| | | | | |
Distributions(c) | | | | | | | | | | | | | | | | | | | | |
From net investment income | | | (0.28 | ) | | | (0.29 | ) | | | (0.36 | ) | | | | | | | (0.14 | ) |
From net realized gain | | | — | | | | — | | | | (0.12 | ) | | | | | | | — | |
| | | | | | | | | | | | | | | | | | | | |
Total distributions | | | (0.28 | ) | | | (0.29 | ) | | | (0.48 | ) | | | | | | | (0.14 | ) |
| | | | | | | | | | | | | | | | | | | | |
| | | | | |
Net asset value, end of period | | $ | 11.58 | | | $ | 10.83 | | | $ | 11.38 | | | | | | | $ | 11.31 | |
| | | | | | | | | | | | | | | | | | | | |
| | | | | |
Total Return(d) | | | | | | | | | | | | | | | | | | | | |
Based on net asset value | | | 9.67 | % | | | (2.36 | )% | | | 5.01 | % | | | | | | | 1.02 | %(e) |
| | | | | | | | | | | | | | | | | | | | |
| | | | | |
Ratios to Average Net Assets(f) | | | | | | | | | | | | | | | | | | | | |
Total expenses | | | 0.57 | % | | | 0.59 | % | | | 0.67 | % | | | | | | | 0.67 | %(g)(h) |
| | | | | | | | | | | | | | | | | | | | |
Total expenses after fees waived and/or reimbursed | | | 0.49 | % | | | 0.54 | % | | | 0.60 | % | | | | | | | 0.58 | %(g) |
| | | | | | | | | | | | | | | | | | | | |
Total expenses after fees waived and/or reimbursed and excluding interest expense(i) | | | 0.45 | % | | | 0.45 | % | | | 0.45 | % | | | | | | | 0.45 | %(g) |
| | | | | | | | | | | | | | | | | | | | |
Net investment income | | | 2.53 | % | | | 2.54 | % | | | 3.05 | % | | | | | | | 3.42 | %(g) |
| | | | | | | | | | | | | | | | | | | | |
| | | | | |
Supplemental Data | | | | | | | | | | | | | | | | | | | | |
Net assets, end of period (000) | | $ | 5,202 | | | $ | 4,097 | | | $ | 4,050 | | | | | | | $ | 2,611 | |
| | | | | | | | | | | | | | | | | | | | |
Borrowings outstanding, end of year (000) | | $ | 104,930 | | | $ | 94,386 | | | $ | 88,529 | | | | | | | $ | 67,389 | |
| | | | | | | | | | | | | | | | | | | | |
Portfolio turnover rate | | | 15 | % | | | 43 | % | | | 43 | % | | | | | | | 43 | % |
| | | | | | | | | | | | | | | | | | | | |
| (a) | Commencement of operations. |
| (b) | Based on average shares outstanding. |
| (c) | Distributions for annual periods determined in accordance with U.S. federal income tax regulations. |
| (d) | Where applicable, assumes the reinvestment of distributions. |
| (e) | Aggregate total return. |
| (f) | Excludes expenses incurred indirectly as a result of investments in underlying funds as follows: |
| | | | | | | | | | | | | | | | | | | | |
| | | | Year Ended June 30, | | | | | | |
| Period from
01/25/18 to 06/30/18 |
(a) |
| | | 2021 | | | 2020 | | | 2019 | | | | |
Investments in underlying funds | | | — | % | | | 0.01 | % | | | 0.01 | % | | | | | | | 0.01 | % |
| | | | | | | | | | | | | | | | | | | | |
| (h) | Offering costs were not annualized in the calculation of the expense ratios. If these expenses were annualized, the total expenses would have been 0.68%. |
| (i) | Interest expense and fees relate to TOB Trusts. See Note 4 of the Notes to Financial Statements for details. |
See notes to financial statements.
| | |
| 70 | | 2 0 2 1 BLACK ROCK ANNUAL REPORT TO SHAREHOLDERS |
Financial Highlights (continued)
(For a share outstanding throughout each period)
| | | | | | | | | | | | | | | | | | | | |
| | | BlackRock High Yield Municipal Fund | |
| | | Institutional | |
| | | Year Ended June 30, | |
| | | 2021 | | | 2020 | | | 2019 | | | 2018 | | | 2017 | |
| | | | | |
Net asset value, beginning of year | | $ | 9.54 | | | $ | 9.89 | | | $ | 9.59 | | | $ | 9.54 | | | $ | 9.99 | |
| | | | | | | | | | | | | | | | | | | | |
Net investment income(a) | | | 0.35 | | | | 0.36 | | | | 0.39 | | | | 0.40 | | | | 0.41 | |
Net realized and unrealized gain (loss) | | | 1.15 | | | | (0.35 | ) | | | 0.30 | | | | 0.05 | | | | (0.46 | ) |
| | | | | | | | | | | | | | | | | | | | |
Net increase (decrease) from investment operations | | | 1.50 | | | | 0.01 | | | | 0.69 | | | | 0.45 | | | | (0.05 | ) |
| | | | | | | | | | | | | | | | | | | | |
Distributions from net investment income(b) | | | (0.35 | ) | | | (0.36 | ) | | | (0.39 | ) | | | (0.40 | ) | | | (0.40 | ) |
| | | | | | | | | | | | | | | | | | | | |
| | | | | |
Net asset value, end of year | | $ | 10.69 | | | $ | 9.54 | | | $ | 9.89 | | | $ | 9.59 | | | $ | 9.54 | |
| | | | | | | | | | | | | | | | | | | | |
| | | | | |
Total Return(c) | | | | | | | | | | | | | | | | | | | | |
Based on net asset value | | | 16.00 | % | | | 0.10 | % | | | 7.36 | % | | | 4.78 | % | | | (0.38 | )% |
| | | | | | | | | | | | | | | | | | | | |
| | | | | |
Ratios to Average Net Assets(d) | | | | | | | | | | | | | | | | | | | | |
Total expenses | | | 0.61 | % | | | 0.66 | % | | | 0.71 | % | | | 0.70 | % | | | 0.71 | % |
| | | | | | | | | | | | | | | | | | | | |
Total expenses after fees waived and/or reimbursed | | | 0.58 | % | | | 0.64 | % | | | 0.68 | % | | | 0.68 | % | | | 0.66 | % |
| | | | | | | | | | | | | | | | | | | | |
Total expenses after fees waived and/or reimbursed and excluding interest
expense(e) | | | 0.54 | % | | | 0.53 | % | | | 0.52 | % | | | 0.54 | % | | | 0.57 | % |
| | | | | | | | | | | | | | | | | | | | |
Net investment income | | | 3.44 | % | | | 3.71 | % | | | 4.03 | % | | | 4.14 | % | | | 4.24 | % |
| | | | | | | | | | | | | | | | | | | | |
| | | | | |
Supplemental Data | | | | | | | | | | | | | | | | | | | | |
Net assets, end of year (000) | | $ | 1,190,526 | | | $ | 757,746 | | | $ | 780,811 | | | $ | 549,217 | | | $ | 516,247 | |
| | | | | | | | | | | | | | | | | | | | |
Borrowings outstanding, end of year (000) | | $ | 114,824 | | | $ | 102,624 | | | $ | 75,301 | | | $ | 61,022 | | | $ | 60,043 | |
| | | | | | | | | | | | | | | | | | | | |
Portfolio turnover rate | | | 23 | % | | | 31 | % | | | 14 | % | | | 25 | % | | | 36 | % |
| | | | | | | | | | | | | | | | | | | | |
| (a) | Based on average shares outstanding. |
| (b) | Distributions for annual periods determined in accordance with U.S. federal income tax regulations. |
| (c) | Where applicable, assumes the reinvestment of distributions. |
| (d) | Excludes expenses incurred indirectly as a result of investments in underlying funds as follows: |
| | | | | | | | | | | | | | | | | | | | |
| | | Year Ended June 30, | |
| | | 2021 | | | 2020 | | | 2019 | | | 2018 | | | 2017 | |
Investments in underlying funds | | | 0.01 | % | | | 0.01 | % | | | 0.01 | % | | | 0.01 | % | | | 0.01 | % |
| | | | | | | | | | | | | | | | | | | | |
| (e) | Interest expense and fees relate to TOB Trusts. See Note 4 of the Notes to Financial Statements for details. |
See notes to financial statements.
Financial Highlights (continued)
(For a share outstanding throughout each period)
| | | | | | | | | | | | | | | | | | | | |
| | | BlackRock High Yield Municipal Fund (continued) | |
| | | Investor A | |
| | | Year Ended June 30, | |
| | | 2021 | | | 2020 | | | 2019 | | | 2018 | | | 2017 | |
| | | | | |
Net asset value, beginning of year | | $ | 9.52 | | | $ | 9.87 | | | $ | 9.56 | | | $ | 9.52 | | | $ | 9.97 | |
| | | | | | | | | | | | | | | | | | | | |
Net investment income(a) | | | 0.32 | | | | 0.34 | | | | 0.36 | | | | 0.37 | | | | 0.38 | |
Net realized and unrealized gain (loss) | | | 1.15 | | | | (0.35 | ) | | | 0.31 | | | | 0.04 | | | | (0.45 | ) |
| | | | | | | | | | | | | | | | | | | | |
Net increase (decrease) from investment operations | | | 1.47 | | | | (0.01 | ) | | | 0.67 | | | | 0.41 | | | | (0.07 | ) |
| | | | | | | | | | | | | | | | | | | | |
Distributions from net investment income(b) | | | (0.32 | ) | | | (0.34 | ) | | | (0.36 | ) | | | (0.37 | ) | | | (0.38 | ) |
| | | | | | | | | | | | | | | | | | | | |
| | | | | |
Net asset value, end of year | | $ | 10.67 | | | $ | 9.52 | | | $ | 9.87 | | | $ | 9.56 | | | $ | 9.52 | |
| | | | | | | | | | | | | | | | | | | | |
| | | | | |
Total Return(c) | | | | | | | | | | | | | | | | | | | | |
Based on net asset value | | | 15.73 | % | | | (0.16 | )% | | | 7.21 | % | | | 4.40 | % | | | (0.63 | )% |
| | | | | | | | | | | | | | | | | | | | |
| | | | | |
Ratios to Average Net Assets(d) | | | | | | | | | | | | | | | | | | | | |
Total expenses | | | 0.85 | % | | | 0.92 | % | | | 0.98 | % | | | 0.96 | % | | | 0.94 | % |
| | | | | | | | | | | | | | | | | | | | |
Total expenses after fees waived and/or reimbursed | | | 0.83 | % | | | 0.89 | % | | | 0.95 | % | | | 0.94 | % | | | 0.91 | % |
| | | | | | | | | | | | | | | | | | | | |
Total expenses after fees waived and/or reimbursed and excluding interest expense(e) | | | 0.78 | % | | | 0.78 | % | | | 0.79 | % | | | 0.80 | % | | | 0.82 | % |
| | | | | | | | | | | | | | | | | | | | |
Net investment income | | | 3.20 | % | | | 3.46 | % | | | 3.76 | % | | | 3.88 | % | | | 4.00 | % |
| | | | | | | | | | | | | | | | | | | | |
| | | | | |
Supplemental Data | | | | | | | | | | | | | | | | | | | | |
Net assets, end of year (000) | | $ | 634,326 | | | $ | 422,270 | | | $ | 345,255 | | | $ | 220,992 | | | $ | 201,212 | |
| | | | | | | | | | | | | | | | | | | | |
Borrowings outstanding, end of year (000) | | $ | 114,824 | | | $ | 102,624 | | | $ | 75,301 | | | $ | 61,022 | | | $ | 60,043 | |
| | | | | | | | | | | | | | | | | | | | |
Portfolio turnover rate | | | 23 | % | | | 31 | % | | | 14 | % | | | 25 | % | | | 36 | % |
| | | | | | | | | | | | | | | | | | | | |
| (a) | Based on average shares outstanding. |
| (b) | Distributions for annual periods determined in accordance with U.S. federal income tax regulations. |
| (c) | Where applicable, excludes the effects of any sales charges and assumes the reinvestment of distributions. |
| (d) | Excludes expenses incurred indirectly as a result of investments in underlying funds as follows: |
| | | | | | | | | | | | | | | | | | | | |
| | | Year Ended June 30, | |
| | | 2021 | | | 2020 | | | 2019 | | | 2018 | | | 2017 | |
Investments in underlying funds | | | 0.01 | % | | | 0.01 | % | | | 0.01 | % | | | 0.01 | % | | | 0.01 | % |
| | | | | | | | | | | | | | | | | | | | |
| (e) | Interest expense and fees relate to TOB Trusts. See Note 4 of the Notes to Financial Statements for details. |
See notes to financial statements.
| | |
| 72 | | 2 0 2 1 BLACK ROCK ANNUAL REPORT TO SHAREHOLDERS |
Financial Highlights (continued)
(For a share outstanding throughout each period)
| | | | | | | | | | | | | | | | | | | | |
| | | BlackRock High Yield Municipal Fund (continued) | |
| | | Investor C | |
| | | Year Ended June 30, | |
| | | 2021 | | | 2020 | | | 2019 | | | 2018 | | | 2017 | |
| | | | | |
Net asset value, beginning of year | | $ | 9.55 | | | $ | 9.89 | | | $ | 9.59 | | | $ | 9.55 | | | $ | 9.99 | |
| | | | | | | | | | | | | | | | | | | | |
Net investment income(a) | | | 0.25 | | | | 0.26 | | | | 0.29 | | | | 0.30 | | | | 0.31 | |
Net realized and unrealized gain (loss) | | | 1.15 | | | | (0.34 | ) | | | 0.30 | | | | 0.04 | | | | (0.44 | ) |
| | | | | | | | | | | | | | | | | | | | |
Net increase (decrease) from investment operations | | | 1.40 | | | | (0.08 | ) | | | 0.59 | | | | 0.34 | | | | (0.13 | ) |
| | | | | | | | | | | | | | | | | | | | |
Distributions from net investment income(b) | | | (0.25 | ) | | | (0.26 | ) | | | (0.29 | ) | | | (0.30 | ) | | | (0.31 | ) |
| | | | | | | | | | | | | | | | | | | | |
| | | | | |
Net asset value, end of year | | $ | 10.70 | | | $ | 9.55 | | | $ | 9.89 | | | $ | 9.59 | | | $ | 9.55 | |
| | | | | | | | | | | | | | | | | | | | |
| | | | | |
Total Return(c) | | | | | | | | | | | | | | | | | | | | |
Based on net asset value | | | 14.83 | % | | | (0.80 | )% | | | 6.28 | % | | | 3.62 | % | | | (1.26 | )% |
| | | | | | | | | | | | | | | | | | | | |
| | | | | |
Ratios to Average Net Assets(d) | | | | | | | | | | | | | | | | | | | | |
Total expenses | | | 1.63 | % | | | 1.69 | % | | | 1.74 | % | | | 1.73 | % | | | 1.70 | % |
| | | | | | | | | | | | | | | | | | | | |
Total expenses after fees waived and/or reimbursed | | | 1.59 | % | | | 1.65 | % | | | 1.70 | % | | | 1.69 | % | | | 1.66 | % |
| | | | | | | | | | | | | | | | | | | | |
Total expenses after fees waived and/or reimbursed and excluding interest expense(e) | | | 1.54 | % | | | 1.54 | % | | | 1.54 | % | | | 1.56 | % | | | 1.57 | % |
| | | | | | | | | | | | | | | | | | | | |
Net investment income | | | 2.49 | % | | | 2.70 | % | | | 3.02 | % | | | 3.13 | % | | | 3.25 | % |
| | | | | | | | | | | | | | | | | | | | |
| | | | | |
Supplemental Data | | | | | | | | | | | | | | | | | | | | |
Net assets, end of year (000) | | $ | 44,050 | | | $ | 58,114 | | | $ | 64,484 | | | $ | 60,065 | | | $ | 63,314 | |
| | | | | | | | | | | | | | | | | | | | |
Borrowings outstanding, end of year (000) | | $ | 114,824 | | | $ | 102,624 | | | $ | 75,301 | | | $ | 61,022 | | | $ | 60,043 | |
| | | | | | | | | | | | | | | | | | | | |
Portfolio turnover rate | | | 23 | % | | | 31 | % | | | 14 | % | | | 25 | % | | | 36 | % |
| | | | | | | | | | | | | | | | | | | | |
| (a) | Based on average shares outstanding. |
| (b) | Distributions for annual periods determined in accordance with U.S. federal income tax regulations. |
| (c) | Where applicable, excludes the effects of any sales charges and assumes the reinvestment of distributions. |
| (d) | Excludes expenses incurred indirectly as a result of investments in underlying funds as follows: |
| | | | | | | | | | | | | | | | | | | | |
| | | Year Ended June 30, | |
| | | 2021 | | | 2020 | | | 2019 | | | 2018 | | | 2017 | |
Investments in underlying funds | | | 0.01 | % | | | 0.01 | % | | | 0.01 | % | | | 0.01 | % | | | 0.01 | % |
| | | | | | | | | | | | | | | | | | | | |
| (e) | Interest expense and fees relate to TOB Trusts. See Note 4 of the Notes to Financial Statements for details. |
See notes to financial statements.
Financial Highlights (continued)
(For a share outstanding throughout each period)
| | | | | | | | | | | | | | | | | | | | |
| | | BlackRock High Yield Municipal Fund (continued) | |
| | | Class K | |
| | | Year Ended June 30, | | | | | | |
| Period from
01/25/18to 06/30/18 |
(a) |
| | | 2021 | | | 2020 | | | 2019 | |
| | | | | | |
Net asset value, beginning of period | | $ | 9.54 | | | $ | 9.89 | | | $ | 9.59 | | | | | | | $ | 9.62 | |
| | | | | | | | | | | | | | | | | | | | |
Net investment income(b) | | | 0.35 | | | | 0.36 | | | | 0.39 | | | | | | | | 0.18 | |
Net realized and unrealized gain (loss) | | | 1.15 | | | | (0.34 | ) | | | 0.30 | | | | | | | | (0.04 | ) |
| | | | | | | | | | | | | | | | | | | | |
Net increase from investment operations | | | 1.50 | | | | 0.02 | | | | 0.69 | | | | | | | | 0.14 | |
| | | | | | | | | | | | | | | | | | | | |
Distributions from net investment income(c) | | | (0.35 | ) | | | (0.37 | ) | | | (0.39 | ) | | | | | | | (0.17 | ) |
| | | | | | | | | | | | | | | | | | | | |
| | | | | |
Net asset value, end of period | | $ | 10.69 | | | $ | 9.54 | | | $ | 9.89 | | | | | | | $ | 9.59 | |
| | | | | | | | | | | | | | | | | | | | |
| | | | | |
Total Return(d) | | | | | | | | | | | | | | | | | | | | |
Based on net asset value | | | 16.05 | % | | | 0.14 | % | | | 7.40 | % | | | | | | | 1.50 | %(e) |
| | | | | | | | | | | | | | | | | | | | |
| | | | | |
Ratios to Average Net Assets(f) | | | | | | | | | | | | | | | | | | | | |
Total expenses | | | 0.57 | % | | | 0.64 | % | | | 0.69 | % | | | | | | | 0.67 | %(g)(h) |
| | | | | | | | | | | | | | | | | | | | |
Total expenses after fees waived and/or reimbursed | | | 0.54 | % | | | 0.60 | % | | | 0.65 | % | | | | | | | 0.62 | %(g) |
| | | | | | | | | | | | | | | | | | | | |
Total expenses after fees waived and/or reimbursed and excluding interest expense(i) | | | 0.49 | % | | | 0.49 | % | | | 0.49 | % | | | | | | | 0.49 | %(g) |
| | | | | | | | | | | | | | | | | | | | |
Net investment income | | | 3.47 | % | | | 3.77 | % | | | 4.04 | % | | | | | | | 4.48 | %(g) |
| | | | | | | | | | | | | | | | | | | | |
| | | | | |
Supplemental Data | | | | | | | | | | | | | | | | | | | | |
Net assets, end of period (000) | | $ | 166,379 | | | $ | 83,809 | | | $ | 49,062 | | | | | | | $ | 11,712 | |
| | | | | | | | | | | | | | | | | | | | |
Borrowings outstanding, end of year (000) | | $ | 114,824 | | | $ | 102,624 | | | $ | 75,301 | | | | | | | $ | 61,022 | |
| | | | | | | | | | | | | | | | | | | | |
Portfolio turnover rate | | | 23 | % | | | 31 | % | | | 14 | % | | | | | | | 25 | % |
| | | | | | | | | | | | | | | | | | | | |
| (a) | Commencement of operations. |
| (b) | Based on average shares outstanding. |
| (c) | Distributions for annual periods determined in accordance with U.S. federal income tax regulations. |
| (d) | Where applicable, assumes the reinvestment of distributions. |
| (e) | Aggregate total return. |
| (f) | Excludes expenses incurred indirectly as a result of investments in underlying funds as follows: |
| | | | | | | | | | | | | | | | | | | | |
| | | | Year Ended June 30, | | | | | | |
| Period from
01/25/18to 06/30/18 |
(a) |
| | | 2021 | | | 2020 | | | 2019 | |
Investments in underlying funds | | | 0.01 | % | | | 0.01 | % | | | 0.01 | % | | | | | | | 0.01 | % |
| | | | | | | | | | | | | | | | | | | | |
| (h) | Offering costs were not annualized in the calculation of the expense ratios. If these expenses were annualized, the total expenses would have been 0.68%. |
| (i) | Interest expense and fees relate to TOB Trusts. See Note 4 of the Notes to Financial Statements for details. |
See notes to financial statements.
| | |
| 74 | | 2 0 2 1 BLACK ROCK ANNUAL REPORT TO SHAREHOLDERS |
Financial Highlights (continued)
(For a share outstanding throughout each period)
| | | | | | | | | | | | | | | | | | | | |
| | | BlackRock National Municipal Fund | |
| | | Institutional | |
| | | Year Ended June 30, | |
| | | 2021 | | | 2020 | | | 2019 | | | 2018 | | | 2017 | |
| | | | | |
Net asset value, beginning of year | | $ | 11.07 | | | $ | 11.06 | | | $ | 10.79 | | | $ | 10.88 | | | $ | 11.22 | |
| | | | | | | | | | | | | | | | | | | | |
Net investment income(a) | | | 0.21 | | | | 0.26 | | | | 0.33 | | | | 0.33 | | | | 0.34 | |
Net realized and unrealized gain (loss) | | | 0.40 | | | | 0.02 | | | | 0.27 | | | | (0.09 | ) | | | (0.34 | ) |
| | | | | | | | | | | | | | | | | | | | |
Net increase from investment operations | | | 0.61 | | | | 0.28 | | | | 0.60 | | | | 0.24 | | | | 0.00 | |
| | | | | | | | | | | | | | | | | | | | |
| | | | | |
Distributions(b) | | | | | | | | | | | | | | | | | | | | |
From net investment income | | | (0.21 | ) | | | (0.26 | ) | | | (0.33 | ) | | | (0.33 | ) | | | (0.34 | ) |
From net realized gain | | | — | | | | (0.01 | ) | | | — | | | | — | | | | — | |
| | | | | | | | | | | | | | | | | | | | |
Total distributions | | | (0.21 | ) | | | (0.27 | ) | | | (0.33 | ) | | | (0.33 | ) | | | (0.34 | ) |
| | | | | | | | | | | | | | | | | | | | |
| | | | | |
Net asset value, end of year | | $ | 11.47 | | | $ | 11.07 | | | $ | 11.06 | | | $ | 10.79 | | | $ | 10.88 | |
| | | | | | | | | | | | | | | | | | | | |
| | | | | |
Total Return(c) | | | | | | | | | | | | | | | | | | | | |
Based on net asset value | | | 5.59 | % | | | 2.62 | % | | | 5.68 | % | | | 2.23 | % | | | 0.09 | % |
| | | | | | | | | | | | | | | | | | | | |
| | | | | |
Ratios to Average Net Assets(d) | | | | | | | | | | | | | | | | | | | | |
Total expenses | | | 0.49 | % | | | 0.53 | % | | | 0.53 | % | | | 0.52 | % | | | 0.57 | % |
| | | | | | | | | | | | | | | | | | | | |
Total expenses after fees waived and/or reimbursed | | | 0.44 | % | | | 0.47 | % | | | 0.48 | % | | | 0.44 | % | | | 0.49 | % |
| | | | | | | | | | | | | | | | | | | | |
Total expenses after fees waived and/or reimbursed and excluding interest expense | | | 0.43 | %(e) | | | 0.43 | %(e) | | | 0.43 | %(e) | | | 0.44 | % | | | 0.48 | %(e) |
| | | | | | | | | | | | | | | | | | | | |
Net investment income | | | 1.89 | % | | | 2.39 | % | | | 3.04 | % | | | 3.04 | % | | | 3.15 | % |
| | | | | | | | | | | | | | | | | | | | |
| | | | | |
Supplemental Data | | | | | | | | | | | | | | | | | | | | |
Net assets, end of year (000) | | $ | 5,801,296 | | | $ | 4,650,471 | | | $ | 4,063,258 | | | $ | 3,028,849 | | | $ | 3,225,595 | |
| | | | | | | | | | | | | | | | | | | | |
Borrowings outstanding, end of year (000) | | $ | 126,900 | | | $ | 126,900 | | | $ | 324,360 | | | $ | — | | | $ | — | |
| | | | | | | | | | | | | | | | | | | | |
Portfolio turnover rate | | | 42 | % | | | 75 | % | | | 77 | % | | | 51 | % | | | 83 | % |
| | | | | | | | | | | | | | | | | | | | |
| (a) | Based on average shares outstanding. |
| (b) | Distributions for annual periods determined in accordance with U.S. federal income tax regulations. |
| (c) | Where applicable, assumes the reinvestment of distributions. |
| (d) | Excludes expenses incurred indirectly as a result of investments in underlying funds as follows: |
| | | | | | | | | | | | | | | | | | | | |
| | | Year Ended June 30, | |
| | | 2021 | | | 2020 | | | 2019 | | | 2018 | | | 2017 | |
Investments in underlying funds | | | 0.01 | % | | | 0.02 | % | | | 0.01 | % | | | 0.01 | % | | | 0.01 | % |
| | | | | | | | | | | | | | | | | | | | |
| (e) | Interest expense and fees relate to TOB Trusts. See Note 4 of the Notes to Financial Statements for details. |
See notes to financial statements.
Financial Highlights (continued)
(For a share outstanding throughout each period)
| | | | | | | | | | | | | | | | | | | | |
| | | BlackRock National Municipal Fund (continued) | |
| | | Service | |
| | | Year Ended June 30, | |
| | | 2021 | | | 2020 | | | 2019 | | | 2018 | | | 2017 | |
| | | | | |
Net asset value, beginning of year | | $ | 11.07 | | | $ | 11.06 | | | $ | 10.78 | | | $ | 10.87 | | | $ | 11.21 | |
| | | | | | | | | | | | | | | | | | | | |
Net investment income(a) | | | 0.19 | | | | 0.25 | | | | 0.31 | | | | 0.31 | | | | 0.33 | |
Net realized and unrealized gain (loss) | | | 0.39 | | | | 0.01 | | | | 0.27 | | | | (0.10 | ) | | | (0.35 | ) |
| | | | | | | | | | | | | | | | | | | | |
Net increase (decrease) from investment operations | | | 0.58 | | | | 0.26 | | | | 0.58 | | | | 0.21 | | | | (0.02 | ) |
| | | | | | | | | | | | | | | | | | | | |
| | | | | |
Distributions(b) | | | | | | | | | | | | | | | | | | | | |
From net investment income | | | (0.19 | ) | | | (0.24 | ) | | | (0.30 | ) | | | (0.30 | ) | | | (0.32 | ) |
From net realized gain | | | — | | | | (0.01 | ) | | | — | | | | — | | | | — | |
| | | | | | | | | | | | | | | | | | | | |
Total distributions | | | (0.19 | ) | | | (0.25 | ) | | | (0.30 | ) | | | (0.30 | ) | | | (0.32 | ) |
| | | | | | | | | | | | | | | | | | | | |
| | | | | |
Net asset value, end of year | | $ | 11.46 | | | $ | 11.07 | | | $ | 11.06 | | | $ | 10.78 | | | $ | 10.87 | |
| | | | | | | | | | | | | | | | | | | | |
| | | | | |
Total Return(c) | | | | | | | | | | | | | | | | | | | | |
Based on net asset value | | | 5.24 | % | | | 2.37 | % | | | 5.51 | % | | | 1.99 | % | | | (0.14 | )% |
| | | | | | | | | | | | | | | | | | | | |
| | | | | |
Ratios to Average Net Assets(d) | | | | | | | | | | | | | | | | | | | | |
Total expenses | | | 0.71 | % | | | 0.74 | % | | | 0.76 | % | | | 0.71 | % | | | 0.76 | % |
| | | | | | | | | | | | | | | | | | | | |
Total expenses after fees waived and/or reimbursed | | | 0.68 | % | | | 0.71 | % | | | 0.73 | % | | | 0.67 | % | | | 0.71 | % |
| | | | | | | | | | | | | | | | | | | | |
Total expenses after fees waived and/or reimbursed and excluding interest expense | | | 0.67 | %(e) | | | 0.67 | %(e) | | | 0.68 | %(e) | | | 0.67 | % | | | 0.71 | %(e) |
| | | | | | | | | | | | | | | | | | | | |
Net investment income | | | 1.65 | % | | | 2.25 | % | | | 2.90 | % | | | 2.90 | % | | | 3.04 | % |
| | | | | | | | | | | | | | | | | | | | |
| | | | | |
Supplemental Data | | | | | | | | | | | | | | | | | | | | |
Net assets, end of year (000) | | $ | 3,564 | | | $ | 3,494 | | | $ | 3,318 | | | $ | 2,407 | | | $ | 3,150 | |
| | | | | | | | | | | | | | | | | | | | |
Borrowings outstanding, end of year (000) | | $ | 126,900 | | | $ | 126,900 | | | $ | 324,360 | | | $ | — | | | $ | — | |
| | | | | | | | | | | | | | | | | | | | |
Portfolio turnover rate | | | 42 | % | | | 75 | % | | | 77 | % | | | 51 | % | | | 83 | % |
| | | | | | | | | | | | | | | | | | | | |
| (a) | Based on average shares outstanding. |
| (b) | Distributions for annual periods determined in accordance with U.S. federal income tax regulations. |
| (c) | Where applicable, assumes the reinvestment of distributions. |
| (d) | Excludes expenses incurred indirectly as a result of investments in underlying funds as follows: |
| | | | | | | | | | | | | | | | | | | | |
| | | Year Ended June 30, | |
| | | 2021 | | | 2020 | | | 2019 | | | 2018 | | | 2017 | |
Investments in underlying funds | | | 0.01 | % | | | 0.02 | % | | | 0.01 | % | | | 0.01 | % | | | 0.01 | % |
| | | | | | | | | | | | | | | | | | | | |
| (e) | Interest expense and fees relate to TOB Trusts. See Note 4 of the Notes to Financial Statements for details. |
See notes to financial statements.
| | |
| 76 | | 2 0 2 1 BLACK ROCK ANNUAL REPORT TO SHAREHOLDERS |
Financial Highlights (continued)
(For a share outstanding throughout each period)
| | | | | | | | | | | | | | | | | | | | |
| | | BlackRock National Municipal Fund (continued) | |
| | | Investor A | |
| | | Year Ended June 30, | |
| | | 2021 | | | 2020 | | | 2019 | | | 2018 | | | 2017 | |
| | | | | |
Net asset value, beginning of year | | $ | 11.08 | | | $ | 11.07 | | | $ | 10.80 | | | $ | 10.88 | | | $ | 11.23 | |
| | | | | | | | | | | | | | | | | | | | |
Net investment income(a) | | | 0.19 | | | | 0.24 | | | | 0.30 | | | | 0.30 | | | | 0.32 | |
Net realized and unrealized gain (loss) | | | 0.39 | | | | 0.02 | | | | 0.27 | | | | (0.08 | ) | | | (0.35 | ) |
| | | | | | | | | | | | | | | | | | | | |
Net increase (decrease) from investment operations | | | 0.58 | | | | 0.26 | | | | 0.57 | | | | 0.22 | | | | (0.03 | ) |
| | | | | | | | | | | | | | | | | | | | |
| | | | | |
Distributions(b) | | | | | | | | | | | | | | | | | | | | |
From net investment income | | | (0.19 | ) | | | (0.24 | ) | | | (0.30 | ) | | | (0.30 | ) | | | (0.32 | ) |
From net realized gain | | | — | | | | (0.01 | ) | | | — | | | | — | | | | — | |
| | | | | | | | | | | | | | | | | | | | |
Total distributions | | | (0.19 | ) | | | (0.25 | ) | | | (0.30 | ) | | | (0.30 | ) | | | (0.32 | ) |
| | | | | | | | | | | | | | | | | | | | |
| | | | | |
Net asset value, end of year | | $ | 11.47 | | | $ | 11.08 | | | $ | 11.07 | | | $ | 10.80 | | | $ | 10.88 | |
| | | | | | | | | | | | | | | | | | | | |
| | | | | |
Total Return(c) | | | | | | | | | | | | | | | | | | | | |
Based on net asset value | | | 5.23 | % | | | 2.36 | % | | | 5.41 | % | | | 2.07 | % | | | (0.22 | )% |
| | | | | | | | | | | | | | | | | | | | |
| | | | | |
Ratios to Average Net Assets(d) | | | | | | | | | | | | | | | | | | | | |
Total expenses | | | 0.75 | % | | | 0.80 | % | | | 0.82 | % | | | 0.77 | % | | | 0.81 | % |
| | | | | | | | | | | | | | | | | | | | |
Total expenses after fees waived and/or reimbursed | | | 0.69 | % | | | 0.72 | % | | | 0.73 | % | | | 0.69 | % | | | 0.70 | % |
| | | | | | | | | | | | | | | | | | | | |
Total expenses after fees waived and/or reimbursed and excluding interest expense | | | 0.68 | %(e) | | | 0.68 | %(e) | | | 0.68 | %(e) | | | 0.69 | % | | | 0.70 | %(e) |
| | | | | | | | | | | | | | | | | | | | |
Net investment income | | | 1.64 | % | | | 2.13 | % | | | 2.79 | % | | | 2.79 | % | | | 2.93 | % |
| | | | | | | | | | | | | | | | | | | | |
| | | | | |
Supplemental Data | | | | | | | | | | | | | | | | | | | | |
Net assets, end of year (000) | | $ | 4,427,191 | | | $ | 3,978,736 | | | $ | 3,227,894 | | | $ | 2,730,622 | | | $ | 2,342,752 | |
| | | | | | | | | | | | | | | | | | | | |
Borrowings outstanding, end of year (000) | | $ | 126,900 | | | $ | 126,900 | | | $ | 324,360 | | | $ | — | | | $ | — | |
| | | | | | | | | | | | | | | | | | | | |
Portfolio turnover rate | | | 42 | % | | | 75 | % | | | 77 | % | | | 51 | % | | | 83 | % |
| | | | | | | | | | | | | | | | | | | | |
| (a) | Based on average shares outstanding. |
| (b) | Distributions for annual periods determined in accordance with U.S. federal income tax regulations. |
| (c) | Where applicable, excludes the effects of any sales charges and assumes the reinvestment of distributions. |
| (d) | Excludes expenses incurred indirectly as a result of investments in underlying funds as follows: |
| | | | | | | | | | | | | | | | | | | | |
| | | Year Ended June 30, | |
| | | 2021 | | | 2020 | | | 2019 | | | 2018 | | | 2017 | |
Investments in underlying funds | | | 0.01 | % | | | 0.02 | % | | | 0.01 | % | | | 0.01 | % | | | 0.01 | % |
| | | | | | | | | | | | | | | | | | | | |
| (e) | Interest expense and fees relate to TOB Trusts. See Note 4 of the Notes to Financial Statements for details. |
See notes to financial statements.
Financial Highlights (continued)
(For a share outstanding throughout each period)
| | | | | | | | | | | | | | | | | | | | |
| | | BlackRock National Municipal Fund (continued) | |
| | | Investor C | |
| | | Year Ended June 30, | |
| | | 2021 | | | 2020 | | | 2019 | | | 2018 | | | 2017 | |
| | | | | |
Net asset value, beginning of year | | $ | 11.08 | | | $ | 11.07 | | | $ | 10.80 | | | $ | 10.88 | | | $ | 11.23 | |
| | | | | | | | | | | | | | | | | | | | |
Net investment income(a) | | | 0.10 | | | | 0.15 | | | | 0.22 | | | | 0.22 | | | | 0.24 | |
Net realized and unrealized gain (loss) | | | 0.40 | | | | 0.02 | | | | 0.27 | | | | (0.08 | ) | | | (0.35 | ) |
| | | | | | | | | | | | | | | | | | | | |
Net increase (decrease) from investment operations | | | 0.50 | | | | 0.17 | | | | 0.49 | | | | 0.14 | | | | (0.11 | ) |
| | | | | | | | | | | | | | | | | | | | |
| | | | | |
Distributions(b) | | | | | | | | | | | | | | | | | | | | |
From net investment income | | | (0.10 | ) | | | (0.15 | ) | | | (0.22 | ) | | | (0.22 | ) | | | (0.24 | ) |
From net realized gain | | | — | | | | (0.01 | ) | | | — | | | | — | | | | — | |
| | | | | | | | | | | | | | | | | | | | |
Total distributions | | | (0.10 | ) | | | (0.16 | ) | | | (0.22 | ) | | | (0.22 | ) | | | (0.24 | ) |
| | | | | | | | | | | | | | | | | | | | |
| | | | | |
Net asset value, end of year | | $ | 11.48 | | | $ | 11.08 | | | $ | 11.07 | | | $ | 10.80 | | | $ | 10.88 | |
| | | | | | | | | | | | | | | | | | | | |
| | | | | |
Total Return(c) | | | | | | | | | | | | | | | | | | | | |
Based on net asset value | | | 4.53 | % | | | 1.60 | % | | | 4.63 | % | | | 1.31 | % | | | (0.96 | )% |
| | | | | | | | | | | | | | | | | | | | |
| | | | | |
Ratios to Average Net Assets(d) | | | | | | | | | | | | | | | | | | | | |
Total expenses | | | 1.48 | % | | | 1.51 | % | | | 1.51 | % | | | 1.47 | % | | | 1.51 | % |
| | | | | | | | | | | | | | | | | | | | |
Total expenses after fees waived and/or reimbursed | | | 1.44 | % | | | 1.47 | % | | | 1.48 | % | | | 1.43 | % | | | 1.45 | % |
| | | | | | | | | | | | | | | | | | | | |
Total expenses after fees waived and/or reimbursed and excluding interest expense | | | 1.43 | %(e) | | | 1.43 | %(e) | | | 1.43 | %(e) | | | 1.43 | % | | | 1.44 | %(e) |
| | | | | | | | | | | | | | | | | | | | |
Net investment income | | | 0.90 | % | | | 1.39 | % | | | 2.06 | % | | | 2.04 | % | | | 2.19 | % |
| | | | | | | | | | | | | | | | | | | | |
| | | | | |
Supplemental Data | | | | | | | | | | | | | | | | | | | | |
Net assets, end of year (000) | | $ | 129,601 | | | $ | 232,884 | | | $ | 270,445 | | | $ | 327,384 | | | $ | 382,703 | |
| | | | | | | | | | | | | | | | | | | | |
Borrowings outstanding, end of year (000) | | $ | 126,900 | | | $ | 126,900 | | | $ | 324,360 | | | $ | — | | | $ | — | |
| | | | | | | | | | | | | | | | | | | | |
Portfolio turnover rate | | | 42 | % | | | 75 | % | | | 77 | % | | | 51 | % | | | 83 | % |
| | | | | | | | | | | | | | | | | | | | |
| (a) | Based on average shares outstanding. |
| (b) | Distributions for annual periods determined in accordance with U.S. federal income tax regulations. |
| (c) | Where applicable, excludes the effects of any sales charges and assumes the reinvestment of distributions. |
| (d) | Excludes expenses incurred indirectly as a result of investments in underlying funds as follows: |
| | | | | | | | | | | | | | | | | | | | |
| | | Year Ended June 30, | |
| | | 2021 | | | 2020 | | | 2019 | | | 2018 | | | 2017 | |
Investments in underlying funds | | | 0.01 | % | | | 0.02 | % | | | 0.01 | % | | | 0.01 | % | | | 0.01 | % |
| | | | | | | | | | | | | | | | | | | | |
| (e) | Interest expense and fees relate to TOB Trusts. See Note 4 of the Notes to Financial Statements for details. |
See notes to financial statements.
| | |
| 78 | | 2 0 2 1 BLACK ROCK ANNUAL REPORT TO SHAREHOLDERS |
Financial Highlights (continued)
(For a share outstanding throughout each period)
| | | | | | | | | | | | | | | | | | | | |
| | | BlackRock National Municipal Fund (continued) | |
| | | Class K | |
| | | Year Ended June 30, | |
| | | 2021 | | | 2020 | | | 2019 | | | 2018 | | | 2017 | |
| | | | | |
Net asset value, beginning of year | | $ | 11.08 | | | $ | 11.07 | | | $ | 10.79 | | | $ | 10.88 | | | $ | 11.22 | |
| | | | | | | | | | | | | | | | | | | | |
Net investment income(a) | | | 0.22 | | | | 0.27 | | | | 0.33 | | | | 0.33 | | | | 0.35 | |
Net realized and unrealized gain (loss) | | | 0.39 | | | | 0.02 | | | | 0.28 | | | | (0.09 | ) | | | (0.34 | ) |
| | | | | | | | | | | | | | | | | | | | |
Net increase from investment operations | | | 0.61 | | | | 0.29 | | | | 0.61 | | | | 0.24 | | | | 0.01 | |
| | | | | | | | | | | | | | | | | | | | |
| | | | | |
Distributions(b) | | | | | | | | | | | | | | | | | | | | |
From net investment income | | | (0.22 | ) | | | (0.27 | ) | | | (0.33 | ) | | | (0.33 | ) | | | (0.35 | ) |
From net realized gain | | | — | | | | (0.01 | ) | | | — | | | | — | | | | — | |
| | | | | | | | | | | | | | | | | | | | |
Total distributions | | | (0.22 | ) | | | (0.28 | ) | | | (0.33 | ) | | | (0.33 | ) | | | (0.35 | ) |
| | | | | | | | | | | | | | | | | | | | |
| | | | | |
Net asset value, end of year | | $ | 11.47 | | | $ | 11.08 | | | $ | 11.07 | | | $ | 10.79 | | | $ | 10.88 | |
| | | | | | | | | | | | | | | | | | | | |
| | | | | |
Total Return(c) | | | | | | | | | | | | | | | | | | | | |
Based on net asset value | | | 5.54 | % | | | 2.67 | % | | | 5.82 | % | | | 2.28 | % | | | 0.15 | % |
| | | | | | | | | | | | | | | | | | | | |
| | | | | |
Ratios to Average Net Assets(d) | | | | | | | | | | | | | | | | | | | | |
Total expenses | | | 0.42 | % | | | 0.46 | % | | | 0.46 | % | | | 0.44 | % | | | 0.48 | % |
| | | | | | | | | | | | | | | | | | | | |
Total expenses after fees waived and/or reimbursed | | | 0.39 | % | | | 0.42 | % | | | 0.43 | % | | | 0.39 | % | | | 0.41 | % |
| | | | | | | | | | | | | | | | | | | | |
Total expenses after fees waived and/or reimbursed and excluding interest expense | | | 0.38 | %(e) | | | 0.38 | %(e) | | | 0.38 | %(e) | | | 0.39 | % | | | 0.40 | %(e) |
| | | | | | | | | | | | | | | | | | | | |
Net investment income | | | 1.94 | % | | | 2.43 | % | | | 3.09 | % | | | 3.09 | % | | | 3.24 | % |
| | | | | | | | | | | | | | | | | | | | |
| | | | | |
Supplemental Data | | | | | | | | | | | | | | | | | | | | |
Net assets, end of year (000) | | $ | 4,831,923 | | | $ | 4,524,990 | | | $ | 3,736,686 | | | $ | 3,012,495 | | | $ | 1,847,397 | |
| | | | | | | | | | | | | | | | | | | | |
Borrowings outstanding, end of year (000) | | $ | 126,900 | | | $ | 126,900 | | | $ | 324,360 | | | $ | — | | | $ | — | |
| | | | | | | | | | | | | | | | | | | | |
Portfolio turnover rate | | | 42 | % | | | 75 | % | | | 77 | % | | | 51 | % | | | 83 | % |
| | | | | | | | | | | | | | | | | | | | |
| (a) | Based on average shares outstanding. |
| (b) | Distributions for annual periods determined in accordance with U.S. federal income tax regulations. |
| (c) | Where applicable, assumes the reinvestment of distributions. |
| (d) | Excludes expenses incurred indirectly as a result of investments in underlying funds as follows: |
| | | | | | | | | | | | | | | | | | | | |
| | | Year Ended June 30, | |
| | | 2021 | | | 2020 | | | 2019 | | | 2018 | | | 2017 | |
Investments in underlying funds | | | 0.01 | % | | | 0.02 | % | | | 0.01 | % | | | 0.01 | % | | | 0.01 | % |
| | | | | | | | | | | | | | | | | | | | |
| (e) | Interest expense and fees relate to TOB Trusts. See Note 4 of the Notes to Financial Statements for details. |
See notes to financial statements.
Financial Highlights (continued)
(For a share outstanding throughout each period)
| | | | | | | | | | | | | | | | | | | | |
| | | BlackRock Short-Term Municipal Fund | |
| | | Institutional | |
| | | Year Ended June 30, | |
| | | 2021 | | | 2020 | | | 2019 | | | 2018 | | | 2017 | |
| | | | | |
Net asset value, beginning of year | | $ | 10.15 | | | $ | 10.15 | | | $ | 10.08 | | | $ | 10.12 | | | $ | 10.18 | |
| | | | | | | | | | | | | | | | | | | | |
Net investment income(a) | | | 0.07 | | | | 0.15 | | | | 0.16 | | | | 0.11 | | | | 0.07 | |
Net realized and unrealized gain (loss) | | | 0.02 | | | | — | | | | 0.07 | | | | (0.04 | ) | | | (0.06 | ) |
| | | | | | | | | | | | | | | | | | | | |
Net increase from investment operations | | | 0.09 | | | | 0.15 | | | | 0.23 | | | | 0.07 | | | | 0.01 | |
| | | | | | | | | | | | | | | | | | | | |
| | | | | |
Distributions(b) | | | | | | | | | | | | | | | | | | | | |
From net investment income | | | (0.07 | ) | | | (0.15 | ) | | | (0.16 | ) | | | (0.11 | ) | | | (0.07 | ) |
From net realized gain | | | — | | | | — | | | | — | | | | — | | | | (0.00 | )(c) |
| | | | | | | | | | | | | | | | | | | | |
Total distributions | | | (0.07 | ) | | | (0.15 | ) | | | (0.16 | ) | | | (0.11 | ) | | | (0.07 | ) |
| | | | | | | | | | | | | | | | | | | | |
| | | | | |
Net asset value, end of year | | $ | 10.17 | | | $ | 10.15 | | | $ | 10.15 | | | $ | 10.08 | | | $ | 10.12 | |
| | | | | | | | | | | | | | | | | | | | |
| | | | | |
Total Return(d) | | | | | | | | | | | | | | | | | | | | |
Based on net asset value | | | 0.90 | % | | | 1.47 | % | | | 2.32 | % | | | 0.71 | % | | | 0.10 | % |
| | | | | | | | | | | | | | | | | | | | |
| | | | | |
Ratios to Average Net Assets | | | | | | | | | | | | | | | | | | | | |
Total expenses | | | 0.44 | % | | | 0.46 | % | | | 0.46 | % | | | 0.49 | % | | | 0.52 | % |
| | | | | | | | | | | | | | | | | | | | |
Total expenses after fees waived and/or reimbursed | | | 0.36 | % | | | 0.36 | % | | | 0.36 | % | | | 0.36 | % | | | 0.37 | % |
| | | | | | | | | | | | | | | | | | | | |
Net investment income | | | 0.70 | % | | | 1.46 | % | | | 1.61 | % | | | 1.12 | % | | | 0.66 | % |
| | | | | | | | | | | | | | | | | | | | |
| | | | | |
Supplemental Data | | | | | | | | | | | | | | | | | | | | |
Net assets, end of year (000) | | $ | 502,164 | | | $ | 418,338 | | | $ | 350,720 | | | $ | 360,543 | | | $ | 357,427 | |
| | | | | | | | | | | | | | | | | | | | |
Portfolio turnover rate | | | 41 | % | | | 94 | % | | | 129 | % | | | 153 | % | | | 88 | % |
| | | | | | | | | | | | | | | | | | | | |
| (a) | Based on average shares outstanding. |
| (b) | Distributions for annual periods determined in accordance with U.S. federal income tax regulations. |
| (c) | Amount is greater than $(0.005) per share. |
| (d) | Where applicable, assumes the reinvestment of distributions. |
See notes to financial statements.
| | |
| 80 | | 2 0 2 1 BLACK ROCK ANNUAL REPORT TO SHAREHOLDERS |
Financial Highlights (continued)
(For a share outstanding throughout each period)
| | | | | | | | | | | | | | | | | | | | |
| | | BlackRock Short-Term Municipal Fund (continued) | |
| | | Investor A | |
| | | Year Ended June 30, | |
| | | 2021 | | | 2020 | | | 2019 | | | 2018 | | | 2017 | |
| | | | | |
Net asset value, beginning of year | | $ | 10.16 | | | $ | 10.15 | | | $ | 10.08 | | | $ | 10.13 | | | $ | 10.18 | |
| | | | | | | | | | | | | | | | | | | | |
Net investment income(a) | | | 0.05 | | | | 0.12 | | | | 0.14 | | | | 0.09 | | | | 0.04 | |
Net realized and unrealized gain (loss) | | | 0.02 | | | | 0.01 | | | | 0.07 | | | | (0.05 | ) | | | (0.05 | ) |
| | | | | | | | | | | | | | | | | | | | |
Net increase (decrease) from investment operations | | | 0.07 | | | | 0.13 | | | | 0.21 | | | | 0.04 | | | | (0.01 | ) |
| | | | | | | | | | | | | | | | | | | | |
| | | | | |
Distributions(b) | | | | | | | | | | | | | | | | | | | | |
From net investment income | | | (0.05 | ) | | | (0.12 | ) | | | (0.14 | ) | | | (0.09 | ) | | | (0.04 | ) |
From net realized gain | | | — | | | | — | | | | — | | | | — | | | | (0.00 | )(c) |
| | | | | | | | | | | | | | | | | | | | |
Total distributions | | | (0.05 | ) | | | (0.12 | ) | | | (0.14 | ) | | | (0.09 | ) | | | (0.04 | ) |
| | | | | | | | | | | | | | | | | | | | |
| | | | | |
Net asset value, end of year | | $ | 10.18 | | | $ | 10.16 | | | $ | 10.15 | | | $ | 10.08 | | | $ | 10.13 | |
| | | | | | | | | | | | | | | | | | | | |
| | | | | |
Total Return(d) | | | | | | | | | | | | | | | | | | | | |
Based on net asset value | | | 0.66 | % | | | 1.32 | % | | | 2.08 | % | | | 0.37 | % | | | (0.06 | )% |
| | | | | | | | | | | | | | | | | | | | |
| | | | | |
Ratios to Average Net Assets | | | | | | | | | | | | | | | | | | | | |
Total expenses | | | 0.64 | % | | | 0.65 | % | | | 0.67 | % | | | 0.68 | % | | | 0.72 | % |
| | | | | | | | | | | | | | | | | | | | |
Total expenses after fees waived and/or reimbursed | | | 0.59 | % | | | 0.60 | % | | | 0.60 | % | | | 0.60 | % | | | 0.63 | % |
| | | | | | | | | | | | | | | | | | | | |
Net investment income | | | 0.45 | % | | | 1.19 | % | | | 1.39 | % | | | 0.85 | % | | | 0.40 | % |
| | | | | | | | | | | | | | | | | | | | |
| | | | | |
Supplemental Data | | | | | | | | | | | | | | | | | | | | |
Net assets, end of year (000) | | $ | 287,551 | | | $ | 199,842 | | | $ | 109,462 | | | $ | 61,444 | | | $ | 67,193 | |
| | | | | | | | | | | | | | | | | | | | |
Portfolio turnover rate | | | 41 | % | | | 94 | % | | | 129 | % | | | 153 | % | | | 88 | % |
| | | | | | | | | | | | | | | | | | | | |
| (a) | Based on average shares outstanding. |
| (b) | Distributions for annual periods determined in accordance with U.S. federal income tax regulations. |
| (c) | Amount is greater than $(0.005) per share. |
| (d) | Where applicable, excludes the effects of any sales charges and assumes the reinvestment of distributions. |
See notes to financial statements.
Financial Highlights (continued)
(For a share outstanding throughout each period)
| | | | | | | | | | | | | | | | | | | | |
| | | BlackRock Short-Term Municipal Fund (continued) | |
| | | Investor A1 | |
| | | Year Ended June 30, | |
| | | 2021 | | | 2020 | | | 2019 | | | 2018 | | | 2017 | |
| | | | | |
Net asset value, beginning of year | | $ | 10.16 | | | $ | 10.16 | | | $ | 10.08 | | | $ | 10.13 | | | $ | 10.19 | |
| | | | | | | | | | | | | | | | | | | | |
Net investment income(a) | | | 0.06 | | | | 0.13 | | | | 0.15 | | | | 0.10 | | | | 0.06 | |
Net realized and unrealized gain (loss) | | | 0.02 | | | | 0.01 | | | | 0.08 | | | | (0.05 | ) | | | (0.06 | ) |
| | | | | | | | | | | | | | | | | | | | |
Net increase from investment operations | | | 0.08 | | | | 0.14 | | | | 0.23 | | | | 0.05 | | | | 0.00 | |
| | | | | | | | | | | | | | | | | | | | |
| | | | | |
Distributions(b) | | | | | | | | | | | | | | | | | | | | |
From net investment income | | | (0.06 | ) | | | (0.14 | ) | | | (0.15 | ) | | | (0.10 | ) | | | (0.06 | ) |
From net realized gain | | | — | | | | — | | | | — | | | | — | | | | (0.00 | )(c) |
| | | | | | | | | | | | | | | | | | | | |
Total distributions | | | (0.06 | ) | | | (0.14 | ) | | | (0.15 | ) | | | (0.10 | ) | | | (0.06 | ) |
| | | | | | | | | | | | | | | | | | | | |
| | | | | |
Net asset value, end of year | | $ | 10.18 | | | $ | 10.16 | | | $ | 10.16 | | | $ | 10.08 | | | $ | 10.13 | |
| | | | | | | | | | | | | | | | | | | | |
| | | | | |
Total Return(d) | | | | | | | | | | | | | | | | | | | | |
Based on net asset value | | | 0.80 | % | | | 1.37 | % | | | 2.32 | % | | | 0.51 | % | | | (0.01 | )% |
| | | | | | | | | | | | | | | | | | | | |
| | | | | |
Ratios to Average Net Assets | | | | | | | | | | | | | | | | | | | | |
Total expenses | | | 0.51 | % | | | 0.51 | % | | | 0.53 | % | | | 0.55 | % | | | 0.56 | % |
| | | | | | | | | | | | | | | | | | | | |
Total expenses after fees waived and/or reimbursed | | | 0.46 | % | | | 0.46 | % | | | 0.46 | % | | | 0.46 | % | | | 0.48 | % |
| | | | | | | | | | | | | | | | | | | | |
Net investment income | | | 0.57 | % | | | 1.33 | % | | | 1.47 | % | | | 0.98 | % | | | 0.54 | % |
| | | | | | | | | | | | | | | | | | | | |
| | | | | |
Supplemental Data | | | | | | | | | | | | | | | | | | | | |
Net assets, end of year (000) | | $ | 12,930 | | | $ | 14,172 | | | $ | 15,570 | | | $ | 17,389 | | | $ | 19,724 | |
| | | | | | | | | | | | | | | | | | | | |
Portfolio turnover rate | | | 41 | % | | | 94 | % | | | 129 | % | | | 153 | % | | | 88 | % |
| | | | | | | | | | | | | | | | | | | | |
| (a) | Based on average shares outstanding. |
| (b) | Distributions for annual periods determined in accordance with U.S. federal income tax regulations. |
| (c) | Amount is greater than $(0.005) per share. |
| (d) | Where applicable, excludes the effects of any sales charges and assumes the reinvestment of distributions. |
See notes to financial statements.
| | |
| 82 | | 2 0 2 1 BLACK ROCK ANNUAL REPORT TO SHAREHOLDERS |
Financial Highlights (continued)
(For a share outstanding throughout each period)
| | | | | | | | | | | | | | | | | | | | |
| | | BlackRock Short-Term Municipal Fund (continued) | |
| | | Investor C | |
| | | Year Ended June 30, | |
| | | 2021 | | | 2020 | | | 2019 | | | 2018 | | | 2017 | |
| | | | | |
Net asset value, beginning of year | | $ | 9.89 | | | $ | 9.89 | | | $ | 9.82 | | | $ | 9.86 | | | $ | 9.96 | |
| | | | | | | | | | | | | | | | | | | | |
Net investment income (loss)(a) | | | (0.05 | ) | | | 0.03 | | | | 0.05 | | | | — | | | | (0.04 | ) |
Net realized and unrealized gain (loss) | | | 0.04 | | | | 0.02 | | | | 0.08 | | | | (0.03 | ) | | | (0.06 | ) |
| | | | | | | | | | | | | | | | | | | | |
Net increase (decrease) from investment operations | | | (0.01 | ) | | | 0.05 | | | | 0.13 | | | | (0.03 | ) | | | (0.10 | ) |
| | | | | | | | | | | | | | | | | | | | |
| | | | | |
Distributions(b) | | | | | | | | | | | | | | | | | | | | |
From net investment income | | | — | | | | (0.05 | ) | | | (0.06 | ) | | | (0.01 | ) | | | — | |
From net realized gain | | | — | | | | — | | | | — | | | | — | | | | (0.00 | )(c) |
| | | | | | | | | | | | | | | | | | | | |
Total distributions | | | — | | | | (0.05 | ) | | | (0.06 | ) | | | (0.01 | ) | | | — | |
| | | | | | | | | | | | | | | | | | | | |
| | | | | |
Net asset value, end of year | | $ | 9.88 | | | $ | 9.89 | | | $ | 9.89 | | | $ | 9.82 | | | $ | 9.86 | |
| | | | | | | | | | | | | | | | | | | | |
| | | | | |
Total Return(d) | | | | | | | | | | | | | | | | | | | | |
Based on net asset value | | | (0.10 | )% | | | 0.46 | % | | | 1.33 | % | | | (0.26 | )% | | | (0.96 | )% |
| | | | | | | | | | | | | | | | | | | | |
| | | | | |
Ratios to Average Net Assets | | | | | | | | | | | | | | | | | | | | |
Total expenses | | | 1.43 | % | | | 1.43 | % | | | 1.45 | % | | | 1.46 | % | | | 1.48 | % |
| | | | | | | | | | | | | | | | | | | | |
Total expenses after fees waived and/or reimbursed | | | 1.36 | % | | | 1.36 | % | | | 1.36 | % | | | 1.36 | % | | | 1.39 | % |
| | | | | | | | | | | | | | | | | | | | |
Net investment income (loss) | | | (0.53 | )% | | | 0.34 | % | | | 0.52 | % | | | 0.01 | % | | | (0.41 | )% |
| | | | | | | | | | | | | | | | | | | | |
| | | | | |
Supplemental Data | | | | | | | | | | | | | | | | | | | | |
Net assets, end of year (000) | | $ | 5,123 | | | $ | 10,373 | | | $ | 15,434 | | | $ | 16,825 | | | $ | 22,859 | |
| | | | | | | | | | | | | | | | | | | | |
Portfolio turnover rate | | | 41 | % | | | 94 | % | | | 129 | % | | | 153 | % | | | 88 | % |
| | | | | | | | | | | | | | | | | | | | |
| (a) | Based on average shares outstanding. |
| (b) | Distributions for annual periods determined in accordance with U.S. federal income tax regulations. |
| (c) | Amount is greater than $(0.005) per share. |
| (d) | Where applicable, excludes the effects of any sales charges and assumes the reinvestment of distributions. |
See notes to financial statements.
Financial Highlights (continued)
(For a share outstanding throughout each period)
| | | | | | | | | | | | | | | | | | | | |
| | | BlackRock Short-Term Municipal Fund (continued) | |
| | | Class K | |
| | | Year Ended June 30, | |
| | | 2021 | | | 2020 | | | 2019 | | | 2018 | | | 2017 | |
| | | | | |
Net asset value, beginning of year | | $ | 10.15 | | | $ | 10.15 | | | $ | 10.08 | | | $ | 10.12 | | | $ | 10.18 | |
| | | | | | | | | | | | | | | | | | | | |
Net investment income(a) | | | 0.06 | | | | 0.12 | | | | 0.14 | | | | 0.08 | | | | 0.00 | (b) |
Net realized and unrealized gain | | | 0.04 | | | | 0.03 | | | | 0.10 | | | | — | | | | 0.01 | |
| | | | | | | | | | | | | | | | | | | | |
Net increase from investment operations | | | 0.10 | | | | 0.15 | | | | 0.24 | | | | 0.08 | | | | 0.01 | |
| | | | | | | | | | | | | | | | | | | | |
| | | | | |
Distributions(c) | | | | | | | | | | | | | | | | | | | | |
From net investment income | | | (0.08 | ) | | | (0.15 | ) | | | (0.17 | ) | | | (0.12 | ) | | | (0.07 | ) |
From net realized gain | | | — | | | | — | | | | — | | | | — | | | | (0.00 | )(d) |
| | | | | | | | | | | | | | | | | | | | |
Total distributions | | | (0.08 | ) | | | (0.15 | ) | | | (0.17 | ) | | | (0.12 | ) | | | (0.07 | ) |
| | | | | | | | | | | | | | | | | | | | |
| | | | | |
Net asset value, end of year | | $ | 10.17 | | | $ | 10.15 | | | $ | 10.15 | | | $ | 10.08 | | | $ | 10.12 | |
| | | | | | | | | | | | | | | | | | | | |
| | | | | |
Total Return(e) | | | | | | | | | | | | | | | | | | | | |
Based on net asset value | | | 0.95 | % | | | 1.52 | % | | | 2.37 | % | | | 0.76 | % | | | 0.13 | % |
| | | | | | | | | | | | | | | | | | | | |
| | | | | |
Ratios to Average Net Assets | | | | | | | | | | | | | | | | | | | | |
Total expenses | | | 0.36 | % | | | 0.37 | % | | | 0.38 | % | | | 0.38 | % | | | 0.43 | % |
| | | | | | | | | | | | | | | | | | | | |
Total expenses after fees waived and/or reimbursed | | | 0.31 | % | | | 0.31 | % | | | 0.31 | % | | | 0.31 | % | | | 0.34 | % |
| | | | | | | | | | | | | | | | | | | | |
Net investment income | | | 0.57 | % | | | 1.23 | % | | | 1.43 | % | | | 0.75 | % | | | 0.02 | % |
| | | | | | | | | | | | | | | | | | | | |
| | | | | |
Supplemental Data | | | | | | | | | | | | | | | | | | | | |
Net assets, end of year (000) | | $ | 18,177 | | | $ | 7,148 | | | $ | 7,450 | | | $ | 6,719 | | | $ | 3,238 | |
| | | | | | | | | | | | | | | | | | | | |
Portfolio turnover rate | | | 41 | % | | | 94 | % | | | 129 | % | | | 153 | % | | | 88 | % |
| | | | | | | | | | | | | | | | | | | | |
| (a) | Based on average shares outstanding. |
| (b) | Amount is less than $0.005 per share. |
| (c) | Distributions for annual periods determined in accordance with U.S. federal income tax regulations. |
| (d) | Amount is greater than $(0.005) per share. |
| (e) | Where applicable, assumes the reinvestment of distributions. |
See notes to financial statements.
| | |
| 84 | | 2 0 2 1 BLACK ROCK ANNUAL REPORT TO SHAREHOLDERS |
Notes to Financial Statements
BlackRock Multi-State Municipal Series Trust (the “Trust”) and BlackRock Municipal Bond Fund, Inc. (the “Corporation”) are each registered under the Investment Company Act of 1940, as amended (the “1940 Act”), as open-end management investment companies. The Trust is organized as a Massachusetts business trust. The Corporation is organized as a Maryland corporation. The following are referred to herein collectively as the “Funds” or individually as a “Fund”:
| | | | | | |
| Registrant Name | | Fund Name | | Herein Referred To As | | Diversification
Classification |
BlackRock Multi-State Municipal Series Trust | | BlackRock New York Municipal Opportunities Fund | | New York Municipal | | Diversified |
BlackRock Municipal Bond Fund, Inc. | | BlackRock High Yield Municipal Fund | | High Yield Municipal | | Diversified |
| | BlackRock National Municipal Fund | | National Municipal | | Diversified |
| | | BlackRock Short-Term Municipal Fund | | Short-Term Municipal | | Diversified |
Each Fund offers multiple classes of shares. All classes of shares have identical voting, dividend, liquidation and other rights and are subject to the same terms and conditions, except that certain classes bear expenses related to the shareholder servicing and distribution of such shares. Institutional, Service and Class K Shares are sold only to certain eligible investors. Service, Investor A, Investor A1 and Investor C Shares bear certain expenses related to shareholder servicing of such shares, and Investor C Shares also bear certain expenses related to the distribution of such shares. Investor A and Investor C Shares are generally available through financial intermediaries. Investor A1 Shares are only available for dividend and capital gain reinvestment by existing shareholders, and for purchase by certain employer-sponsored retirement plans. Each class has exclusive voting rights with respect to matters relating to its shareholder servicing and distribution expenditures (except that Investor C shareholders may vote on material changes to the Investor A Shares distribution and service plan).
| | | | | | | | | | | | |
| Share Class | | Initial Sales Charge | | | CDSC | | | Conversion Privilege | |
Institutional, Service and Class K Shares | | | No | | | | No | | | | None | |
Investor A Shares | | | Yes | | | | No | (a) | | | None | |
Investor A1 Shares | | | No | (b) | | | No | (c) | | | None | |
Investor C Shares | | | No | | | | Yes | (d) | | | To Investor A Shares after approximately 8 years | |
| | (a) | Investor A Shares may be subject to a contingent deferred sales charge (“CDSC”) for certain redemptions where no initial sales charge was paid at the time of purchase. | |
| | (b) | Investor A1 Shares are subject to a maximum sales charge on purchases of 1.00% for all Funds other than New York Municipal Opportunities, which is subject to a maximum sales charge of 4.00%. The sales charge does not apply to dividend and capital gain reinvestments by existing shareholders and new purchases for certain employer-sponsored retirement plans, which are currently the only investors who may invest in Investor A1 Shares. | |
| | (c) | Investor A1 Shares may be subject to CDSC for certain redemptions where no initial sales charge was paid at the time of purchase. However, the CDSC does not apply to redemptions by certain employer-sponsored retirement plans or to redemptions of shares acquired through reinvestment of dividends and capital gains by existing shareholders. | |
| | (d) | A CDSC of 1.00% is assessed on certain redemptions of Investor C Shares made within one year after purchase. | |
The Board of Trustees of BlackRock Multi-State Municipal Series Trust and Board of Directors of BlackRock Municipal Bond Fund, Inc. are collectively referred to throughout this report as the “Board,” and the directors/trustees thereof are collectively referred to throughout this report as “Directors”.
The Funds, together with certain other registered investment companies advised by BlackRock Advisors, LLC (the “Manager”) or its affiliates, are included in a complex of non-index fixed-income mutual funds and all BlackRock-advised closed-end funds referred to as the BlackRock Fixed-Income Complex.
Reorganization: The Board and shareholders of BlackRock New York Municipal Opportunities Fund (the “Acquiring Fund”) and the Board and shareholders of BlackRock New York Municipal Bond Trust (the “Target Fund”) approved the reorganization of the Target Fund into the Acquiring Fund. As a result, the Acquiring Fund acquired substantially all of the assets and assumed substantially all of the liabilities of the Target Fund in exchange for an equal aggregate value of newly-issued shares of the Acquiring Fund.
Each Common Shareholder of the Target Fund received shares of the Acquiring Fund in an amount equal to the aggregate net asset value (“NAV”) of such Common Shareholder’s Target Fund Common Shares, as determined at the close of business on October 23, 2020, less the costs of the Target Fund’s reorganization. Cash was distributed for any fractional shares.
The reorganization was accomplished by a tax-free exchange of Common shares of the Acquiring Fund in the following amounts and at the following conversion ratios:
| | | | | | | | | | | | | | | | | | | | |
| Target Fund | | Target
Fund’s
Share
Class | | | Shares Prior to
Reorganization | | | Conversion
Ratio | | | Acquiring Fund’s
Share
Class | | | Shares of
the Acquiring Fund | |
BlackRock New York Municipal Bond Trust | | | Common | | | | 2,800,434 | | | | 1.44320473 | | | | Investor A | | | | 4,041,600 | |
The Target Fund’s net assets and composition of net assets on October 23, 2020, the valuation date of the reorganization were as follows:
| | | | |
| | | Target Fund | |
Net assets | | $ | 43,902,809 | |
Paid-in-capital | | | 39,293,626 | |
Accumulated earnings | | | 4,609,183 | |
| | |
NOTES TO FINANCIAL STATEMENTS | | 85 |
Notes to Financial Statements (continued)
For financial reporting purposes, assets received and shares issued by the Acquiring Fund were recorded at fair value. However, the cost basis of the investments received from the Target Fund was carried forward to align ongoing reporting of the Acquiring Fund’s realized and unrealized gains and losses with amounts distributable to shareholders for tax purposes.
The net assets of the Acquiring Fund before the reorganization were $1,548,364,641. The aggregate net assets of the Acquiring Fund immediately after the reorganization amounted to $1,592,267,450. The Target Fund’s fair value and cost of financial instruments prior to the reorganization were as follows:
| | | | | | | | | | | | |
| Target Fund | | Fair Value of
Investments | | | Cost of
Investments | | | TOB Trust
Certificates | |
BlackRock New York Municipal Bond Trust | | $ | 53,220,158 | | | $ | 48,329,859 | | | $ | 10,600,472 | |
The purpose of these transactions was to combine funds managed by the Manager with the same or substantially similar (but not identical) investment objectives, investment policies, strategies, risks and restrictions. The reorganization was a tax-free event and was effective on October 23, 2020.
Assuming the reorganization had been completed on July 1, 2020, the beginning of the fiscal reporting period of the Acquiring Fund, the pro forma results of operations for the year ended June 30, 2021, are as follows:
| • | | Net investment income: $ 36,735,555 |
| • | | Net realized and change in unrealized gain/loss on investments: $ 111,168,142 |
| • | | Net increase in net assets resulting from operations: $ 147,903,697 |
Because the combined investment portfolios have been managed as a single integrated portfolio since the reorganization was completed, it is not practicable to separate the amounts of revenue and earnings of the Target Fund that have been included in the Acquiring Fund’s Statement of Operations since October 26, 2020.
Reorganization costs incurred by BlackRock New York Municipal Opportunities Fund in connection with the reorganization were expensed by BlackRock New York Municipal Opportunities Fund. The Manager reimbursed the Fund $86,834, which is included in fees waived and/or reimbursed by the Manager in the Statements of Operations.
Prior Year Reorganization: The Board and shareholders of New York Municipal and the Board and shareholders of BlackRock Muni New York Intermediate Duration Fund, Inc. (the “Prior Year Target Fund”) approved the reorganization of the Prior year Target Fund into New York Municipal. As a result, New York Municipal acquired substantially all of the assets and assumed substantially all of the liabilities of the Prior Year Target Fund in exchange for an equal aggregate value of newly-issued shares of New York Municipal.
Each Common Shareholder of the Prior Year Target Fund received shares of New York Municipal in an amount equal to the aggregate NAV of such Common Shareholder’s the Prior Year Target Fund Common Shares, as determined at the close of business on June 19, 2020, less the costs of the Prior Year Target Fund’s reorganization. Cash was distributed for any fractional shares.
The reorganization was accomplished by a tax-free exchange of shares of New York Municipal in the following amounts and at the following conversion ratios:
| | | | | | | | | | | | | | | | | | | | |
| Target Fund | | Target
Fund’s
Share
Class | | | Shares Prior to
Reorganization | | | Conversion
Ratio | | | Fund’s
Share
Class | | | Shares of
the Fund | |
BlackRock Muni New York Intermediate Duration Fund, Inc. | | | Common | | | | 4,209,844 | | | | 1.36098961 | | | | Investor A | | | | 5,729,554 | |
The Prior Year Target Fund’s net assets and composition of net assets on June 19, 2020, the valuation date of the reorganization were as follows:
| | | | |
| | | Target Fund | |
Net assets | | $ | 62,088,752 | |
Paid-in-capital | | | 59,006,263 | |
Accumulated earnings | | | 3,082,489 | |
For financial reporting purposes, assets received and shares issued by New York Municipal were recorded at fair value. However, the cost basis of the investments received from the Prior Year Target Fund was carried forward to align ongoing reporting of New York Municipal’s realized and unrealized gains and losses with amounts distributable to shareholders for tax purposes.
The net assets of New York Municipal before the reorganization were $1,622,641,229. The aggregate net assets of New York Municipal immediately after the reorganization amounted to $1,684,729,981. The Prior Year Target Fund’s fair value and cost of investments prior to the reorganization was as follows:
| | | | | | | | | | | | |
| Target Fund | | Fair Value of
Investments | | | Cost of
Investments | | | TOB Trust
Certificates | |
BlackRock Muni New York Intermediate Duration Fund, Inc. | | $ | 70,713,095 | | | $ | 66,961,872 | | | $ | 9,746,745 | |
The purpose of this transaction was to combine funds managed by the Manager with the same or substantially similar (but not identical) investment objectives, investment policies, strategies, risks and restrictions. The reorganization was a tax-free event and was effective on June 22, 2020.
| | |
| 86 | | 2 0 2 1 BLACK ROCK ANNUAL REPORT TO SHAREHOLDERS |
Notes to Financial Statements (continued)
Assuming the reorganization had been completed on July 1, 2019, the beginning of the fiscal reporting period of New York Municipal, the pro forma results of operations for the year ended June 30, 2020, are as follows:
| • | | Net investment income: $ 42,795,244 |
| • | | Net realized and change in unrealized loss on investments: $ (110,826,573) |
| • | | Net decrease in net assets resulting from operations: $ (68,031,329) |
Because the combined investment portfolios have been managed as a single integrated portfolio since the reorganization was completed, it is not practicable to separate the amounts of revenue and earnings of the Prior Year Target Fund that have been included in New York Municipal’s Statements of Operations since June 22, 2020.
| 2. | SIGNIFICANT ACCOUNTING POLICIES |
The financial statements are prepared in conformity with accounting principles generally accepted in the United States of America (“U.S. GAAP”), which may require management to make estimates and assumptions that affect the reported amounts of assets and liabilities in the financial statements, disclosure of contingent assets and liabilities at the date of the financial statements and the reported amounts of increases and decreases in net assets from operations during the reporting period. Actual results could differ from those estimates. Each Fund is considered an investment company under U.S. GAAP and follows the accounting and reporting guidance applicable to investment companies. Below is a summary of significant accounting policies:
Investment Transactions and Income Recognition: For financial reporting purposes, investment transactions are recorded on the dates the transactions are executed. Realized gains and losses on investment transactions are determined using the specific identification method. Dividend income and capital gain distributions, if any, are recorded on the ex-dividend dates. Non-cash dividends, if any, are recorded on the ex-dividend dates at fair value. Interest income, including amortization and accretion of premiums and discounts on debt securities, is recognized daily on an accrual basis. Income, expenses and realized and unrealized gains and losses are allocated daily to each class based on its relative net assets.
Segregation and Collateralization: In cases where a Fund enters into certain investments (e.g., futures contracts,) or certain borrowings (e.g., TOB Trust transactions) that would be treated as “senior securities” for 1940 Act purposes, a Fund may segregate or designate on its books and records cash or liquid assets having a market value at least equal to the amount of its future obligations under such investments or borrowings. Doing so allows the investment or borrowings to be excluded from treatment as a “senior security.” Furthermore, if required by an exchange or counterparty agreement, the Funds may be required to deliver/deposit cash and/or securities to/with an exchange, or broker-dealer or custodian as collateral for certain investments or obligations.
Distributions: Distributions from net investment income are declared and paid monthly. Distributions of capital gains are recorded on the ex-dividend dates and made at least annually. The character and timing of distributions are determined in accordance with U.S. federal income tax regulations, which may differ from U.S. GAAP.
Deferred Compensation Plan: Under the Deferred Compensation Plan (the “Plan”) approved by each Fund’s Board, the directors who are not “interested persons” of the Funds, as defined in the 1940 Act (“Independent Directors”), may defer a portion of their annual complex-wide compensation. Deferred amounts earn an approximate return as though equivalent dollar amounts had been invested in common shares of certain funds in the BlackRock Fixed-Income Complex selected by the Independent Directors. This has the same economic effect for the Independent Directors as if the Independent Directors had invested the deferred amounts directly in certain funds in the BlackRock Fixed-Income Complex.
The Plan is not funded and obligations thereunder represent general unsecured claims against the general assets of each Fund, as applicable. Deferred compensation liabilities, if any, are included in the Directors’ and Officer’s fees payable in the Statements of Assets and Liabilities and will remain as a liability of the Funds until such amounts are distributed in accordance with the Plan.
Indemnifications: In the normal course of business, a Fund enters into contracts that contain a variety of representations that provide general indemnification. A Fund’s maximum exposure under these arrangements is unknown because it involves future potential claims against a Fund, which cannot be predicted with any certainty.
Other: Expenses directly related to a Fund or its classes are charged to that Fund or the applicable class. Expenses directly related to the Funds and other shared expenses prorated to the Funds are allocated daily to each class based on their relative net assets or other appropriate methods. Other operating expenses shared by several funds, including other funds managed by the Manager, are prorated among those funds on the basis of relative net assets or other appropriate methods.
| 3. | INVESTMENT VALUATION AND FAIR VALUE MEASUREMENTS |
Investment Valuation Policies: Each Fund’s investments are valued at fair value (also referred to as “market value” within the financial statements) each day that the Fund is open for business and, for financial reporting purposes, as of the report date. U.S. GAAP defines fair value as the price a fund would receive to sell an asset or pay to transfer a liability in an orderly transaction between market participants at the measurement date. Each Fund determines the fair values of its financial instruments using various independent dealers or pricing services under policies approved by the Board. If a security’s market price is not readily available or does not otherwise accurately represent the fair value of the security, the security will be valued in accordance with a policy approved by the Board as reflecting fair value. The BlackRock Global Valuation Methodologies Committee (the “Global Valuation Committee”) is the committee formed by management to develop global pricing policies and procedures and to oversee the pricing function for all financial instruments.
| | |
NOTES TO FINANCIAL STATEMENTS | | 87 |
Notes to Financial Statements (continued)
Fair Value Inputs and Methodologies: The following methods and inputs are used to establish the fair value of each Fund’s assets and liabilities:
| | • | | Fixed-income investments for which market quotations are readily available are generally valued using the last available bid price or current market quotations provided by independent dealers or third party pricing services. Pricing services generally value fixed-income securities assuming orderly transactions of an institutional round lot size, but a fund may hold or transact in such securities in smaller, odd lot sizes. Odd lots may trade at lower prices than institutional round lots. The pricing services may use matrix pricing or valuation models that utilize certain inputs and assumptions to derive values, including transaction data (e.g., recent representative bids and offers), market data, credit quality information, perceived market movements, news, and other relevant information. Certain fixed-income securities, including asset-backed and mortgage related securities may be valued based on valuation models that consider the estimated cash flows of each tranche of the entity, establish a benchmark yield and develop an estimated tranche specific spread to the benchmark yield based on the unique attributes of the tranche. The amortized cost method of valuation may be used with respect to debt obligations with sixty days or less remaining to maturity unless the Manager determines such method does not represent fair value. |
| | • | | Exchange-traded funds (“ETFs”) and closed-end funds traded on a recognized securities exchange are valued at that day’s official closing price, as applicable, on the exchange where the stock is primarily traded. ETFs and closed-end funds traded on a recognized exchange for which there were no sales on that day may be valued at the last available bid (long positions) or ask (short positions) price. |
| | • | | Investments in open-end U.S. mutual funds (including money market funds) are valued at that day’s published NAV. |
| | • | | Futures contracts are valued based on that day’s last reported settlement or trade price on the exchange where the contract is traded. |
If events (e.g., a market closure, market volatility, company announcement or a natural disaster) occur that are expected to materially affect the value of such investment, or in the event that application of these methods of valuation results in a price for an investment that is deemed not to be representative of the market value of such investment, or if a price is not available, the investment will be valued by the Global Valuation Committee, or its delegate, in accordance with a policy approved by the Board as reflecting fair value (“Fair Valued Investments”). The fair valuation approaches that may be used by the Global Valuation Committee include market approach, income approach and cost approach. Valuation techniques such as discounted cash flow, use of market comparables and matrix pricing are types of valuation approaches and are typically used in determining fair value. When determining the price for Fair Valued Investments, the Global Valuation Committee, or its delegate, seeks to determine the price that each Fund might reasonably expect to receive or pay from the current sale or purchase of that asset or liability in an arm’s-length transaction. Fair value determinations shall be based upon all available factors that the Global Valuation Committee, or its delegate, deems relevant and consistent with the principles of fair value measurement. The pricing of all Fair Valued Investments is subsequently reported to the Board or a committee thereof on a quarterly basis.
Fair Value Hierarchy: Various inputs are used in determining the fair value of financial instruments. These inputs to valuation techniques are categorized into a fair value hierarchy consisting of three broad levels for financial reporting purposes as follows:
| | • | | Level 1 – Unadjusted price quotations in active markets/exchanges for identical assets or liabilities that each Fund has the ability to access; |
| | • | | Level 2 – Other observable inputs (including, but not limited to, quoted prices for similar assets or liabilities in markets that are active, quoted prices for identical or similar assets or liabilities in markets that are not active, inputs other than quoted prices that are observable for the assets or liabilities (such as interest rates, yield curves, volatilities, prepayment speeds, loss severities, credit risks and default rates) or other market–corroborated inputs); and |
| | • | | Level 3 – Unobservable inputs based on the best information available in the circumstances, to the extent observable inputs are not available (including the Global Valuation Committee’s assumptions used in determining the fair value of financial instruments). |
The hierarchy gives the highest priority to unadjusted quoted prices in active markets for identical assets or liabilities (Level 1 measurements) and the lowest priority to unobservable inputs (Level 3 measurements). Accordingly, the degree of judgment exercised in determining fair value is greatest for instruments categorized in Level 3. The inputs used to measure fair value may fall into different levels of the fair value hierarchy. In such cases, for disclosure purposes, the fair value hierarchy classification is determined based on the lowest level input that is significant to the fair value measurement in its entirety. Investments classified within Level 3 have significant unobservable inputs used by the Global Valuation Committee in determining the price for Fair Valued Investments. Level 3 investments include equity or debt issued by privately held companies or funds that may not have a secondary market and/or may have a limited number of investors. The categorization of a value determined for financial instruments is based on the pricing transparency of the financial instruments and is not necessarily an indication of the risks associated with investing in those securities.
| 4. | SECURITIES AND OTHER INVESTMENTS |
Zero-Coupon Bonds: Zero-coupon bonds are normally issued at a significant discount from face value and do not provide for periodic interest payments. These bonds may experience greater volatility in market value than other debt obligations of similar maturity which provide for regular interest payments.
Forward Commitments, When-Issued and Delayed Delivery Securities: The Funds may purchase securities on a when-issued basis and may purchase or sell securities on a forward commitment basis. Settlement of such transactions normally occurs within a month or more after the purchase or sale commitment is made. A Fund may purchase securities under such conditions with the intention of actually acquiring them, but may enter into a separate agreement to sell the securities before the settlement date. Since the value of securities purchased may fluctuate prior to settlement, a Fund may be required to pay more at settlement than the security is worth. In addition, a Fund is not entitled to any of the interest earned prior to settlement. When purchasing a security on a delayed delivery basis, a Fund assumes the rights and risks of ownership of the security, including the risk of price and yield fluctuations. In the event of default by the counterparty, a Fund’s maximum amount of loss is the unrealized appreciation of unsettled when-issued transactions.
| | |
| 88 | | 2 0 2 1 BLACK ROCK ANNUAL REPORT TO SHAREHOLDERS |
Notes to Financial Statements (continued)
Municipal Bonds Transferred to TOB Trusts: Certain Funds leverage their assets through the use of “TOB Trust” transactions. The funds transfer municipal bonds into a special purpose trust (a “TOB Trust”). A TOB Trust issues two classes of beneficial interests: short-term floating rate interests (“TOB Trust Certificates”), which are sold to third party investors, and residual inverse floating rate interests (“TOB Residuals”), which are issued to the participating funds that contributed the municipal bonds to the TOB Trust. The TOB Trust Certificates have interest rates that reset weekly and their holders have the option to tender such certificates to the TOB Trust for redemption at par and any accrued interest at each reset date. The TOB Residuals held by a fund provide the fund with the right to cause the holders of a proportional share of the TOB Trust Certificates to tender their certificates to the TOB Trust at par plus accrued interest. The funds may withdraw a corresponding share of the municipal bonds from the TOB Trust. Other funds managed by the investment adviser may also contribute municipal bonds to a TOB Trust into which a fund has contributed bonds. If multiple BlackRock-advised funds participate in the same TOB Trust, the economic rights and obligations under the TOB Residuals will be shared among the funds ratably in proportion to their participation in the TOB Trust.
TOB Trusts are supported by a liquidity facility provided by a third party bank or other financial institution (the “Liquidity Provider”) that allows the holders of the TOB Trust Certificates to tender their certificates in exchange for payment of par plus accrued interest on any business day. The tendered TOB Trust Certificates are remarketed by a Remarketing Agent. In the event of a failed remarketing, the TOB Trust may draw upon a loan from the Liquidity Provider to purchase the tendered TOB Trust Certificates. Any loans made by the Liquidity Provider will be secured by the purchased TOB Trust Certificates held by the TOB Trust and will be subject to an increased interest rate based on number of days the loan is outstanding.
The TOB Trust may be collapsed without the consent of a fund, upon the occurrence of a termination event as defined in the TOB Trust agreement. Upon the occurrence of a termination event, a TOB Trust would be liquidated with the proceeds applied first to any accrued fees owed to the trustee of the TOB Trust, the Remarketing Agent and the Liquidity Provider. Upon certain termination events, TOB Trust Certificates holders will be paid before the TOB Residuals holders (i.e., the Funds) whereas in other termination events, TOB Trust Certificates holders and TOB Residuals holders will be paid pro rata.
While a fund’s investment policies and restrictions expressly permit investments in inverse floating rate securities, such as TOB Residuals, they restrict the ability of a fund to borrow money for purposes of making investments. Each fund’s transfer of the municipal bonds to a TOB Trust is considered a secured borrowing for financial reporting purposes. The cash received by the TOB Trust from the sale of the TOB Trust Certificates, less certain transaction expenses, is paid to a fund. A fund typically invests the cash received in additional municipal bonds.
Accounting for TOB Trusts: The municipal bonds deposited into a TOB Trust are presented in a fund’s Schedule of Investments and the TOB Trust Certificates are shown in Other Liabilities in the Statements of Assets and Liabilities. Any loans drawn by the TOB Trust pursuant to the liquidity facility to purchase tendered TOB Trust Certificates are shown as Loan for TOB Trust Certificates. The carrying amount of a fund’s payable to the holder of the TOB Trust Certificates, as reported in the Statements of Assets and Liabilities as TOB Trust Certificates, approximates its fair value.
Interest income, including amortization and accretion of premiums and discounts, from the underlying municipal bonds is recorded by a fund on an accrual basis. Interest expense incurred on the TOB Trust transaction and other expenses related to remarketing, administration, trustee, liquidity and other services to a TOB Trust are shown as interest expense, fees and amortization of offering costs in the Statements of Operations. Fees paid upon creation of the TOB Trust are recorded as debt issuance costs and are amortized to interest expense, fees and amortization of offering costs in the Statements of Operations to the expected maturity of the TOB Trust. In connection with the restructurings of the TOB Trusts to non-bank sponsored TOB Trusts, a fund incurred non-recurring, legal and restructuring fees, which are recorded as interest expense, fees and amortization of offering costs in the Statements of Operations. Amounts recorded within interest expense, fees and amortization of offering costs in the Statements of Operations are:
| | | | | | | | | | | | | | | | |
| Fund Name | | Interest Expense | | | Liquidity Fees | | | Other Expenses | | | Total | |
New York Municipal | | $ | 134,048 | | | $ | 436,948 | | | $ | 120,479 | | | $ | 691,475 | |
High Yield Municipal | | | 157,297 | | | | 487,422 | | | | 125,111 | | | | 769,830 | |
National Municipal | | | 143,980 | | | | 497,403 | | | | 146,665 | | | | 788,048 | |
For the year ended June 30, 2021, the following table is a summary of each Fund’s TOB Trusts:
| | | | | | | | | | | | | | | | | | | | |
| Fund Name | | Underlying
Municipal Bonds
Transferred to
TOB Trusts(a) | | | Liability for
TOB Trust
Certificates(b) | | | Range of
Interest Rates
on TOB Trust
Certificates at
Period End | | | Average
TOB Trust
Certificates
Outstanding | | | Daily Weighted
Average Rate of
Interest and
Other Expenses
on TOB Trusts | |
New York Municipal | | $ | 210,753,112 | | | $ | 104,930,048 | | | | 0.05% — 0.25% | | | $ | 101,791,781 | | | | 0.68% | |
High Yield Municipal | | | 202,541,682 | | | | 114,823,537 | | | | 0.04 — 0.19 | | | | 112,931,703 | | | | 0.68 | |
National Municipal | | | 312,965,983 | | | | 126,900,000 | | | | 0.06 — 0.07 | | | | 126,900,000 | | | | 0.62 | |
| | (a) | The municipal bonds transferred to a TOB Trust are generally high grade municipal bonds. In certain cases, when municipal bonds transferred are lower grade municipal bonds, the TOB Trust transaction may include a credit enhancement feature that provides for the timely payment of principal and interest on the bonds to the TOB Trust by a credit enhancement provider in the event of default of the municipal bond. The TOB Trust would be responsible for the payment of the credit enhancement fee and the funds, as TOB Residuals holders, would be responsible for reimbursement of any payments of principal and interest made by the credit enhancement provider. The maximum potential amounts owed by the funds, for such reimbursements, as applicable, are included in the maximum potential amounts disclosed for recourse TOB Trusts in the Schedules of Investments. | |
| | (b) | TOB Trusts may be structured on a non-recourse or recourse basis. When a Fund invests in TOB Trusts on a non-recourse basis, the Liquidity Provider may be required to make a payment under the liquidity facility to allow the TOB Trust to repurchase TOB Trust Certificates. The Liquidity Provider will be reimbursed from the liquidation of bonds held in the TOB Trust. If a fund invests in a TOB Trust on a recourse basis, a fund enters into a reimbursement agreement with the Liquidity Provider where a fund is required to reimburse the Liquidity Provider for any shortfall between the amount paid by the Liquidity Provider and proceeds received from liquidation of municipal bonds held in the TOB Trust (the “Liquidation Shortfall”). As a result, if a fund invests in a recourse TOB Trust, a fund will bear the risk of loss with respect to any Liquidation Shortfall. If multiple funds participate in any such TOB Trust, these losses will be shared ratably, including the maximum potential amounts owed by a fund at June 30, 2021, in proportion to their participation in the TOB Trust. The recourse TOB Trusts are identified in the Schedules of Investments including the maximum potential amounts owed by a fund at June 30, 2021. | |
| | |
NOTES TO FINANCIAL STATEMENTS | | 89 |
Notes to Financial Statements (continued)
For the year ended June 30, 2021, the following table is a summary of each Fund’s Loan for TOB Trust Certificates:
| | | | | | | | | | | | | | | | |
| Fund Name | | Loans
Outstanding
at Period End | | | Range of
Interest Rates
on Loans at
Period End | | | Average
Loans
Outstanding | | | Daily Weighted
Average Rate
of Interest and
Other Expenses
on Loans | |
New York Municipal | | $ | — | | | | — | % | | $ | 235,943 | | | | 0.71 | % |
| 5. | DERIVATIVE FINANCIAL INSTRUMENTS |
The Funds engage in various portfolio investment strategies using derivative contracts both to increase the returns of the Funds and/or to manage their exposure to certain risks such as credit risk, equity risk, interest rate risk, foreign currency exchange rate risk, commodity price risk or other risks (e.g., inflation risk). Derivative financial instruments categorized by risk exposure are included in the Schedules of Investments. These contracts may be transacted on an exchange or over-the-counter (“OTC”).
Futures Contracts: Futures contracts are purchased or sold to gain exposure to, or manage exposure to, changes in interest rates (interest rate risk) and changes in the value of equity securities (equity risk) or foreign currencies (foreign currency exchange rate risk).
Futures contracts are exchange-traded agreements between the Funds and a counterparty to buy or sell a specific quantity of an underlying instrument at a specified price and on a specified date. Depending on the terms of a contract, it is settled either through physical delivery of the underlying instrument on the settlement date or by payment of a cash amount on the settlement date. Upon entering into a futures contract, the Funds are required to deposit initial margin with the broker in the form of cash or securities in an amount that varies depending on a contract’s size and risk profile. The initial margin deposit must then be maintained at an established level over the life of the contract. Amounts pledged, which are considered restricted, are included in cash pledged for futures contracts in the Statements of Assets and Liabilities.
Securities deposited as initial margin are designated in the Schedules of Investments and cash deposited, if any, are shown as cash pledged for futures contracts in the Statements of Assets and Liabilities. Pursuant to the contract, the Funds agree to receive from or pay to the broker an amount of cash equal to the daily fluctuation in market value of the contract (“variation margin”). Variation margin is recorded as unrealized appreciation (depreciation) and, if any, shown as variation margin receivable (or payable) on futures contracts in the Statements of Assets and Liabilities. When the contract is closed, a realized gain or loss is recorded in the Statements of Operations equal to the difference between the notional amount of the contract at the time it was opened and the notional amount at the time it was closed. The use of futures contracts involves the risk of an imperfect correlation in the movements in the price of futures contracts and interest rates, foreign currency exchange rates or underlying assets.
| 6. | INVESTMENT ADVISORY AGREEMENT AND OTHER TRANSACTIONS WITH AFFILIATES |
Investment Advisory: The Corporation and the Trust, on behalf of the applicable Funds, entered into an Investment Advisory Agreement with the Manager, the Funds’ investment adviser and an indirect, wholly-owned subsidiary of BlackRock, Inc. (“BlackRock”), to provide investment advisory and administrative services. The Manager is responsible for the management of each Fund’s portfolio and provides the personnel, facilities, equipment and certain other services necessary to the operations of each Fund.
For such services, each Fund pays the Manager a monthly fee at an annual rate equal to the following percentages of the average daily value of each Fund’s net assets:
| | | | | | | | |
| | | Investment Advisory Fees | |
| Average Daily Net Assets | | New York
Municipal | | | High Yield
Municipal | |
First $1 billion | | | 0.47 | % | | | 0.47 | % |
$1 billion — $3 billion | | | 0.44 | | | | 0.44 | |
$3 billion — $5 billion | | | 0.42 | | | | 0.42 | |
$5 billion — $10 billion | | | 0.41 | | | | 0.41 | |
Greater than $10 billion | | | 0.40 | | | | 0.40 | |
| | | | | | | | |
| | | Investment Advisory Fees | |
| Aggregate of Average Daily Net Assets of the Two Combined Funds(a) | | National
Municipal | | | Short-Term
Municipal | |
First $250 Million | | | 0.410 | % | | | 0.360 | % |
$250 Million — $400 Million | | | 0.385 | | | | 0.340 | |
$400 Million — $550 Million | | | 0.385 | | | | 0.320 | |
Greater than $550 Million | | | 0.385 | | | | 0.290 | |
| | (a) | The portion of the assets of a Fund to which the rate of each breakpoint level applies will be determined on a “uniform percentage” basis. The uniform percentage applicable to a breakpoint level is determined by dividing the amount of the aggregate average daily net assets of National Municipal and Short-Term Municipal (the “two combined Funds”) that falls within that breakpoint level by the aggregate average daily net assets of the two combined Funds. The amount of the fee for a Fund at each breakpoint level is determined by multiplying the average daily net assets of that Fund by the uniform percentage applicable to that breakpoint level and multiplying the product by the advisory fee rate. | |
| | |
| 90 | | 2 0 2 1 BLACK ROCK ANNUAL REPORT TO SHAREHOLDERS |
Notes to Financial Statements (continued)
For the year ended June 30, 2021, the Funds reimbursed the Manager for certain accounting services, which is included in accounting services in the Statements of Operations. The reimbursements were as follows:
| | | | |
| Fund Name | | Amounts Reimbursed | |
New York Municipal | | $ | 18,094 | |
High Yield Municipal | | | 15,826 | |
National Municipal | | | 159,105 | |
Short-Term Municipal | | | 8,140 | |
Service and Distribution Fees: The Corporation and the Trust, on behalf of the applicable Funds, entered into a Distribution Agreement and a Distribution and Service Plan with BlackRock Investments, LLC (“BRIL”), an affiliate of the Manager. Pursuant to the Distribution and Service Plan and in accordance with Rule 12b-1 under the 1940 Act, each Fund pays BRIL ongoing service and distribution fees. The fees are accrued daily and paid monthly at annual rates based upon the average daily net assets of the relevant share class of the Fund as follows:
| | | | | | | | | | | | | | | | | | | | | | | | | | | | | | | | |
| | | New York Municipal | | | High Yield Municipal | | | National Municipal | | | Short-Term Municipal | |
| Share Class | | Service Fees | | | Distribution Fees | | | Service Fees | | | Distribution Fees | | | Service Fees | | | Distribution Fees | | | Service Fees | | | Distribution Fees | |
| Service | | | N/A | | | | N/A | | | | N/A | | | | N/A | | | | 0.25 | % | | | N/A | | | | N/A | | | | N/A | |
| Investor A | | | 0.25 | % | | | N/A | | | | 0.25 | % | | | N/A | | | | 0.25 | | | | N/A | | | | 0.25 | % | | | N/A | |
| Investor A1 | | | 0.10 | | | | N/A | | | | N/A | | | | N/A | | | | N/A | | | | N/A | | | | 0.10 | | | | N/A | |
| Investor C | | | 0.25 | | | | 0.75 | % | | | 0.25 | | | | 0.75 | % | | | 0.25 | | | | 0.75 | % | | | 0.25 | | | | 0.75 | % |
BRIL and broker-dealers, pursuant to sub-agreements with BRIL, provide shareholder servicing and distribution services to the Funds. The ongoing service and/or distribution fee compensates BRIL and each broker-dealer for providing shareholder servicing and/or distribution related services to shareholders.
For the year ended June 30, 2021, the following table shows the class specific service fees borne directly by each share class of each Fund:
| | | | | | | | | | | | | | | | | | | | |
| Fund Name | | Service | | | Investor A | | | Investor A1 | | | Investor C | | | Total | |
New York Municipal | | $ | — | | | $ | 1,769,849 | | | $ | 90,866 | | | $ | 958,099 | | | $ | 2,818,814 | |
High Yield Municipal | | | — | | | | 1,271,122 | | | | — | | | | 469,957 | | | | 1,741,079 | |
National Municipal | | | 8,862 | | | | 10,531,553 | | | | — | | | | 1,578,079 | | | | 12,118,494 | |
Short-Term Municipal | | | — | | | | 664,174 | | | | 13,579 | | | | 65,750 | | | | 743,503 | |
Transfer Agent: Pursuant to written agreements, certain financial intermediaries, some of which may be affiliates, provide the Funds with sub-accounting, recordkeeping, sub-transfer agency and other administrative services with respect to servicing of underlying investor accounts. For these services, these entities receive an asset-based fee or an annual fee per shareholder account, which will vary depending on share class and/or net assets. For the year ended June 30, 2021, the Funds paid the following amounts to affiliates of BlackRock in return for these services, which are included in transfer agent — class specific in the Statements of Operations:
| | | | |
| Fund Name | | Institutional | |
National Municipal | | $ | 970,000 | |
Short-Term Municipal | | | 152,373 | |
The Manager maintains a call center that is responsible for providing certain shareholder services to the Funds. Shareholder services include responding to inquiries and processing purchases and sales based upon instructions from shareholders. For the year ended June 30, 2021, each Fund reimbursed the Manager the following amounts for costs incurred in running the call center, which are included in transfer agent — class specific in the Statements of Operations:
| | | | | | | | | | | | | | | | | | | | | | | | | | | | |
| Fund Name | | Institutional | | | Service | | | Investor A | | | Investor A1 | | | Investor C | | | Class K | | | Total | |
New York Municipal | | $ | 1,734 | | | $ | — | | | $ | 4,766 | | | $ | 2,668 | | | $ | 1,090 | | | $ | 44 | | | $ | 10,302 | |
High Yield Municipal | | | 1,957 | | | | — | | | | 3,487 | | | | — | | | | 1,087 | | | | 307 | | | | 6,838 | |
National Municipal | | | 56,558 | | | | 168 | | | | 23,629 | | | | — | | | | 2,483 | | | | 20,605 | | | | 103,443 | |
Short-Term Municipal | | | 1,925 | | | | — | | | | 1,258 | | | | 151 | | | | 160 | | | | 6 | | | | 3,500 | |
For the year ended June 30, 2021, the following table shows the class specific transfer agent fees borne directly by each share class of each Fund:
| | | | | | | | | | | | | | | | | | | | | | | | | | | | |
| Fund Name | | Institutional | | | Service | | | Investor A | | | Investor A1 | | | Investor C | | | Class K | | | Total | |
New York Municipal | | $ | 379,687 | | | $ | — | | | $ | 335,021 | | | $ | 42,710 | | | $ | 56,724 | | | $ | 421 | | | $ | 814,563 | |
High Yield Municipal | | | 436,432 | | | | — | | | | 223,030 | | | | 0 | | | | 34,557 | | | | 9,028 | | | | 703,047 | |
National Municipal | | | 3,868,883 | | | | 1,575 | | | | 3,783,939 | | | | 0 | | | | 104,134 | | | | 119,334 | | | | 7,877,865 | |
Short-Term Municipal | | | 372,061 | | | | — | | | | 91,119 | | | | 7,186 | | | | 5,120 | | | | 650 | | | | 476,136 | |
Other Fees: For the year ended June 30, 2021, affiliates earned underwriting discounts, direct commissions and dealer concessions on sales of each Fund’s Investor A Shares as follows:
| | | | |
| Fund Name | | Investor A | |
New York Municipal | | $ | 6,778 | |
High Yield Municipal | | | 24,851 | |
National Municipal | | | 64,978 | |
Short-Term Municipal | | | 13,068 | |
| | |
NOTES TO FINANCIAL STATEMENTS | | 91 |
Notes to Financial Statements (continued)
For the year ended June 30, 2021, affiliates received CDSCs as follows:
| | | | | | | | |
| Fund Name | | Investor A | | | Investor C | |
New York Municipal | | $ | 189,834 | | | $ | 7,899 | |
High Yield Municipal | | | 91,782 | | | | 7,210 | |
National Municipal | | | 350,319 | | | | 13,165 | |
Short-Term Municipal | | | 56,217 | | | | 246 | |
Expense Limitations, Waivers and Reimbursements: With respect to each Fund, the Manager contractually agreed to waive its investment advisory fees by the amount of investment advisory fees each Fund pays to the Manager indirectly through its investment in affiliated money market funds (the “affiliated money market fund waiver”) through October 31, 2021. The contractual agreement may be terminated upon 90 days’ notice by a majority of the trustees who are not “interested persons” of the Trust, as defined in the 1940 Act (“Independent Directors”), or by a vote of a majority of the outstanding voting securities of a Fund. The amount of waivers and/or reimbursements of fees and expenses made pursuant to the expense limitation described below will be reduced by the amount of the affiliated money market fund waiver. Prior to October 28, 2020, this waiver was voluntary. These amounts are included in fees waived and/or reimbursed by the Manager in the Statements of Operations. For the year ended June 30, 2021, the amounts waived were as follows:
| | | | |
| Fund Name | | Fees Waived and/or Reimbursed
by the Manager | |
New York Municipal | | $ | 8,209 | |
High Yield Municipal | | | 47,588 | |
National Municipal | | | 1,215,984 | |
Short-Term Municipal | | | 13,377 | |
The Manager has contractually agreed to waive its investment advisory fee with respect to any portion of each Fund’s assets invested in affiliated equity and fixed-income mutual funds and affiliated exchange-traded funds that have a contractual management fee through October 31, 2021. The contractual agreement may be terminated upon 90 days’ notice by a majority of the Independent Directors, or by a vote of a majority of the outstanding voting securities of a Fund. This amount is included in fees waived and/or reimbursed by the Manager in the Statements of Operations. With respect to National Municipal, for the year ended June 30, 2021, the Manager waived $193,579 in investment advisory fees pursuant to this arrangement.
With respect to each Fund, the Manager contractually agreed to waive and/or reimburse fees or expenses in order to limit expenses, excluding interest expense, dividend expense, tax expense, acquired fund fees and expenses, and certain other fund expenses, which constitute extraordinary expenses not incurred in the ordinary course of each Fund’s business (“expense limitation”). The expense limitations as a percentage of average daily net assets are as follows:
| | | | | | | | | | | | | | | | | | | | | | | | |
| Fund Name | | Institutional | | | Service | | | Investor A | | | Investor A1 | | | Investor C | | | Class K | |
New York Municipal | | | 0.50 | % | | | — | | | | 0.75 | % | | | 0.60 | % | | | 1.50 | % | | | 0.45 | % |
High Yield Municipal | | | 0.54 | | | | — | | | | 0.79 | | | | — | | | | 1.54 | | | | 0.49 | |
National Municipal | | | 0.43 | | | | 0.68 | % | | | 0.68 | | | | — | | | | 1.43 | | | | 0.38 | |
Short-Term Municipal | | | 0.36 | | | | — | | | | 0.61 | | | | 0.46 | | | | 1.36 | | | | 0.31 | |
The Manager has agreed not to reduce or discontinue this contractual expense limitation through October 31, 2021, unless approved by the Board, including a majority of the Independent Directors or by a vote of a majority of the outstanding voting securities of a Fund. For the year ended June 30, 2021, the Manager waived and/or reimbursed the following amounts, which are included in fees waived and/or reimbursed by the Manager in the Statements of Operations.
| | | | |
| Fund Name | | Fees Waived and/or Reimbursed
by the Manager | |
New York Municipal | | $ | 896,169 | |
High Yield Municipal | | | 288,390 | |
National Municipal | | | 2,358,799 | |
Short-Term Municipal | | | 322,339 | |
These amounts waived and/or reimbursed are included in transfer agent fees waived and/or reimbursed — class specific in the Statements of Operations. For the year ended June 30, 2021, class specific expense waivers and/or reimbursements are as follows:
| | | | | | | | | | | | | | | | | | | | | | | | | | | | |
| | | Transfer Agent Fees Waived and/or Reimbursed - Class Specific | |
| Fund Name | | Institutional | | | Service | | | Investor A | | | Investor A1 | | | Investor C | | | Class K | | | Total | |
New York Municipal. | | $ | 58,991 | | | $ | — | | | $ | 2,965 | | | $ | 661 | | | $ | 8,684 | | | $ | 415 | | | $ | 71,716 | |
High Yield Municipal | | | 11,790 | | | | — | | | | — | | | | — | | | | 11,059 | | | | 9,026 | | | | 31,875 | |
National Municipal | | | 1,311,845 | | | | 20 | | | | 1,677,631 | | | | — | | | | 25,230 | | | | 119,329 | | | | 3,134,055 | |
Short-Term Municipal | | | 143,386 | | | | — | | | | — | | | | 396 | | | | 1,834 | | | | 649 | | | | 146,265 | |
Interfund Lending: In accordance with an exemptive order (the “Order”) from the SEC, each Fund may participate in a joint lending and borrowing facility for temporary purposes (the “Interfund Lending Program”), subject to compliance with the terms and conditions of the Order, and to the extent permitted by each Fund’s investment policies and restrictions. New York Municipal, National Municipal and Short-Term Municipal are currently permitted to borrow under the Interfund Lending Program. High Yield Municipal is currently permitted to borrow and lend under the Interfund Lending Program.
| | |
| 92 | | 2 0 2 1 BLACK ROCK ANNUAL REPORT TO SHAREHOLDERS |
Notes to Financial Statements (continued)
A lending BlackRock fund may lend in aggregate up to 15% of its net assets, but may not lend more than 5% of its net assets to any one borrowing fund through the Interfund Lending Program. A borrowing BlackRock fund may not borrow through the Interfund Lending Program or from any other source more than 33 1/3% of its total assets (or any lower threshold provided for by the fund’s investment restrictions). If a borrowing BlackRock fund’s total outstanding borrowings exceed 10% of its total assets, each of its outstanding interfund loans will be subject to collateralization of at least 102% of the outstanding principal value of the loan. All interfund loans are for temporary or emergency purposes and the interest rate to be charged will be the average of the highest current overnight repurchase agreement rate available to a lending fund and the bank loan rate, as calculated according to a formula established by the Board.
During the year ended June 30, 2021, the Funds did not participate in the Interfund Lending Program.
Directors and Officers: Certain directors and/or officers of the Trust and the Corporation are directors and/or officers of BlackRock or its affiliates. The Funds reimburse the Manager for a portion of the compensation paid to the Trust’s and the Corporation’s Chief Compliance Officer, which is included in Directors and Officer in the Statements of Operations.
Other Transactions: The Funds may purchase securities from, or sell securities to, an affiliated fund provided the affiliation is due solely to having a common investment adviser, common officers, or common directors. For the year ended June 30, 2021, the purchase and sale transactions and any net realized gains (losses) with affiliated funds in compliance with Rule 17a-7 under the 1940 Act were as follows:
| | | | | | | | | | | | |
| Fund Name | | Purchases | | | Sales | | | Net Realized
Gain (Loss) | |
Short-Term Municipal | | | $ 9,400,000 | | | $ | 24,785,902 | | | $ | — | |
For the year ended June 30, 2021, purchases and sales of investments, excluding short-term investments, were as follows:
| | | | | | | | |
| Fund Name | | Purchases | | | Sales | |
New York Municipal | | $ | 241,960,640 | | | $ | 393,057,304 | |
High Yield Municipal | | | 873,038,844 | | | | 375,721,279 | |
National Municipal | | | 7,242,252,285 | | | | 4,889,042,324 | |
Short-Term Municipal | | | 543,185,250 | | | | 282,323,181 | |
It is each Fund’s policy to comply with the requirements of the Internal Revenue Code of 1986, as amended, applicable to regulated investment companies, and to distribute substantially all of its taxable income to its shareholders. Therefore, no U.S. federal income tax provision is required.
Each Fund files U.S. federal and various state and local tax returns. No income tax returns are currently under examination. The statute of limitations on each Fund’s U.S. federal tax returns generally remains open for a period of three fiscal years after they are filed. The statutes of limitations on each Fund’s state and local tax returns may remain open for an additional year depending upon the jurisdiction.
Management has analyzed tax laws and regulations and their application to the Funds as of June 30, 2021, inclusive of the open tax return years, and does not believe that there are any uncertain tax positions that require recognition of a tax liability in the Funds’ financial statements.
The tax character of distributions paid was as follows:
| | | | | | | | |
| Fund Name | | Year Ended
06/30/21 | | | Year Ended
06/30/20 | |
New York Municipal | | | | | | | | |
Tax-exempt income(a) | | $ | 34,768,427 | | | $ | 37,548,027 | |
Ordinary income(b) | | | 1,722,248 | | | | 3,637,254 | |
| | | | | | | | |
| | $ | 36,490,675 | | | $ | 41,185,281 | |
| | | | | | | | |
High Yield Municipal | | | | | | | | |
Tax-exempt income(a) | | $ | 52,561,355 | | | | 46,909,848 | |
Ordinary income(b) | | | 730,910 | | | | 29,415 | |
| | | | | | | | |
| | $ | 53,292,265 | | | $ | 46,939,263 | |
| | | | | | | | |
National Municipal | | | | | | | | |
Tax-exempt income(a) | | $ | 253,251,006 | | | | 288,089,045 | |
Ordinary income(b) | | | 79,147 | | | | 13,891,588 | |
| | | | | | | | |
| | $ | 253,330,153 | | | $ | 301,980,633 | |
| | | | | | | | |
Short-Term Municipal | | | | | | | | |
Tax-exempt income(a) | | $ | 4,562,191 | | | $ | 7,073,676 | |
| | | | | | | | |
| | (a) | The Funds designate these amounts paid during the fiscal year ended June 30, 2021, as exempt-interest dividends. | |
| | |
NOTES TO FINANCIAL STATEMENTS | | 93 |
Notes to Financial Statements (continued)
| | (b) | Ordinary income consists primarily of taxable income from bonds not federally tax-exempt and recognized market discount. Additionally, all ordinary income distributions are comprised of interest related dividends for non-U.S. residents and are eligible for exemption from U.S. withholding tax for nonresident aliens and foreign corporations. | |
As of period end, the tax components of accumulated earnings (loss) were as follows:
| | | | | | | | | | | | | | | | | | | | | | | | | | |
| Fund Name | | | | Undistributed
Tax-Exempt Income | | | Undistributed
Ordinary Income | | | Undistributed
Long-Term
Capital Gains | | | Non-Expiring
Capital Loss Carryforwards(a) | | | Net Unrealized
Gains (Losses)(b) | | | Total | |
New York Municipal | | $ | 248,859 | | | $ | 72,612 | | | $ | — | | | $ | (105,991,077 | ) | | $ | 148,125,575 | | | $ | 42,455,969 | |
High Yield Municipal | | | 133,470 | | | | 132,887 | | | | — | | | | (3,027,730 | ) | | | 187,231,266 | | | | 184,469,893 | |
National Municipal | | | 4,829,170 | | | | 25,932,263 | | | | 18,564,847 | | | | — | | | | 845,919,272 | | | | 895,245,552 | |
Short-Term Municipal | | | 477,527 | | | | — | | | | — | | | | (2,065,781 | ) | | | 5,171,079 | | | | 3,582,825 | |
| | (a) | Amounts available to offset future realized capital gains. | |
| | (b) | The difference between book-basis and tax-basis net unrealized gains was attributable primarily to the tax deferral of losses on wash sales, amortization methods for premiums and discounts on fixed income securities, the realization for tax purposes of unrealized gains/losses on certain futures contracts, the treatment of residual interests in TOB Trusts and the deferral of compensation to trustees. | |
During the year ended June 30, 2021, the Funds listed below utilized the following amounts of their respective capital loss carryforward:
| | | | |
| Fund Name | | Amounts | |
New York Municipal | | $ | 42,386,265 | |
High Yield Municipal | | | 28,897,687 | |
As of June 30, 2021, gross unrealized appreciation and depreciation based on cost of investments (including short positions and derivatives, if any) for U.S. federal income tax purposes were as follows:
| | | | | | | | | | | | | | | | |
| Fund Name | | Tax Cost | | | Gross Unrealized
Appreciation | | | Gross Unrealized
Depreciation | | | Net Unrealized
Appreciation (Depreciation) | |
New York Municipal | | $ | 1,419,988,672 | | | $ | 148,626,838 | | | $ | (485,840 | ) | | $ | 148,140,998 | |
High Yield Municipal | | | 1,864,026,077 | | | | 192,609,531 | | | | (5,378,265 | ) | | | 187,231,266 | |
National Municipal | | | 15,266,440,041 | | | | 847,112,286 | | | | (1,117,898 | ) | | | 845,994,388 | |
Short-Term Municipal | | | 824,727,503 | | | | 5,290,317 | | | | (119,238 | ) | | | 5,171,079 | |
The Trust and the Corporation,, on behalf of the Funds, along with certain other funds managed by the Manager and its affiliates (“Participating Funds”), is a party to a 364-day, $2.25 billion credit agreement with a group of lenders. Under this agreement, the Funds may borrow to fund shareholder redemptions. Excluding commitments designated for certain individual funds, the Participating Funds, including the Funds, can borrow up to an aggregate commitment amount of $1.75 billion at any time outstanding, subject to asset coverage and other limitations as specified in the agreement. The credit agreement has the following terms: a fee of 0.10% per annum on unused commitment amounts and interest at a rate equal to the higher of (a) one-month LIBOR (but, in any event, not less than 0.00%) on the date the loan is made plus 0.80% per annum or (b) the Fed Funds rate (but, in any event, not less than 0.00%) in effect from time to time plus 0.80% per annum on amounts borrowed. The agreement expires in April 2022 unless extended or renewed. These fees were allocated among such funds based upon portions of the aggregate commitment available to them and relative net assets of Participating Funds. During the year ended June 30, 2021, the Funds did not borrow under the credit agreement.
In the normal course of business, the Funds invest in securities or other instruments and may enter into certain transactions, and such activities subject each Fund to various risks, including among others, fluctuations in the market (market risk) or failure of an issuer to meet all of its obligations. The value of securities or other instruments may also be affected by various factors, including, without limitation: (i) the general economy; (ii) the overall market as well as local, regional or global political and/or social instability; (iii) regulation, taxation or international tax treaties between various countries; or (iv) currency, interest rate and price fluctuations. Local, regional or global events such as war, acts of terrorism, the spread of infectious illness or other public health issues, recessions, or other events could have a significant impact on the Funds and their investments. Each Fund’s prospectus provides details of the risks to which each Fund is subject.
A Fund structures and “sponsors” the TOB Trusts in which it holds TOB Residuals and has certain duties and responsibilities, which may give rise to certain additional risks including, but not limited to, compliance, securities law and operational risks.
Should short-term interest rates rise, the Funds’ investments in the TOB Trusts may adversely affect the Funds’ net investment income and dividends to shareholders. Also, fluctuations in the market value of municipal bonds deposited into the TOB Trust may adversely affect the Funds’ NAVs per share.
The U.S. Securities and Exchange Commission (“SEC”) and various federal banking and housing agencies have adopted credit risk retention rules for securitizations (the “Risk Retention Rules”). The Risk Retention Rules would require the sponsor of a TOB Trust to retain at least 5% of the credit risk of the underlying assets supporting the TOB Trust’s municipal bonds. The Risk Retention Rules may adversely affect the Funds’ ability to engage in TOB Trust transactions or increase the costs of such transactions in certain circumstances.
| | |
| 94 | | 2 0 2 1 BLACK ROCK ANNUAL REPORT TO SHAREHOLDERS |
Notes to Financial Statements (continued)
TOB Trusts constitute an important component of the municipal bond market. Any modifications or changes to rules governing TOB Trusts may adversely impact the municipal market and the Funds, including through reduced demand for and liquidity of municipal bonds and increased financing costs for municipal issuers. The ultimate impact of any potential modifications on the TOB Trust market and the overall municipal market is not yet certain.
Market Risk: Each Fund may be exposed to prepayment risk, which is the risk that borrowers may exercise their option to prepay principal earlier than scheduled during periods of declining interest rates, which would force each Fund to reinvest in lower yielding securities. Each Fund may also be exposed to reinvestment risk, which is the risk that income from each Fund’s portfolio will decline if each Fund invests the proceeds from matured, traded or called fixed-income securities at market interest rates that are below each Fund portfolio’s current earnings rate.
Municipal securities are subject to the risk that litigation, legislation or other political events, local business or economic conditions, credit rating downgrades, or the bankruptcy of the issuer could have a significant effect on an issuer’s ability to make payments of principal and/or interest or otherwise affect the value of such securities. Municipal securities can be significantly affected by political or economic changes, including changes made in the law after issuance of the securities, as well as uncertainties in the municipal market related to, taxation, legislative changes or the rights of municipal security holders, including in connection with an issuer insolvency. Municipal securities backed by current or anticipated revenues from a specific project or specific assets can be negatively affected by the discontinuance of the tax benefits supporting the project or assets or the inability to collect revenues for the project or from the assets. Municipal securities may be less liquid than taxable bonds, and there may be less publicly available information on the financial condition of municipal security issuers than for issuers of other securities.
An outbreak of respiratory disease caused by a novel coronavirus has developed into a global pandemic and has resulted in closing borders, quarantines, disruptions to supply chains and customer activity, as well as general concern and uncertainty. The impact of this pandemic, and other global health crises that may arise in the future, could affect the economies of many nations, individual companies and the market in general in ways that cannot necessarily be foreseen at the present time. This pandemic may result in substantial market volatility and may adversely impact the prices and liquidity of a fund’s investments. The duration of this pandemic and its effects cannot be determined with certainty.
Counterparty Credit Risk: The Funds may be exposed to counterparty credit risk, or the risk that an entity may fail to or be unable to perform on its commitments related to unsettled or open transactions, including making timely interest and/or principal payments or otherwise honoring its obligations. The Funds manage counterparty credit risk by entering into transactions only with counterparties that the Manager believes have the financial resources to honor their obligations and by monitoring the financial stability of those counterparties. Financial assets, which potentially expose the Funds to market, issuer and counterparty credit risks, consist principally of financial instruments and receivables due from counterparties. The extent of the Funds’ exposure to market, issuer and counterparty credit risks with respect to these financial assets is approximately their value recorded in the Statements of Assets and Liabilities, less any collateral held by the Funds.
A derivative contract may suffer a mark-to-market loss if the value of the contract decreases due to an unfavorable change in the market rates or values of the underlying instrument. Losses can also occur if the counterparty does not perform under the contract.
With exchange-traded futures, there is less counterparty credit risk to the Funds since the exchange or clearinghouse, as counterparty to such instruments, guarantees against a possible default. The clearinghouse stands between the buyer and the seller of the contract; therefore, credit risk is limited to failure of the clearinghouse. While offset rights may exist under applicable law, a Fund does not have a contractual right of offset against a clearing broker or clearinghouse in the event of a default (including the bankruptcy or insolvency). Additionally, credit risk exists in exchange-traded futures with respect to initial and variation margin that is held in a clearing broker’s customer accounts. While clearing brokers are required to segregate customer margin from their own assets, in the event that a clearing broker becomes insolvent or goes into bankruptcy and at that time there is a shortfall in the aggregate amount of margin held by the clearing broker for all its clients, typically the shortfall would be allocated on a pro rata basis across all the clearing broker’s customers, potentially resulting in losses to the Funds.
Concentration Risk: A diversified portfolio, where this is appropriate and consistent with a fund’s objectives, minimizes the risk that a price change of a particular investment will have a material impact on the NAV of a fund. The investment concentrations within each Fund’s portfolio are disclosed in its Schedule of Investments.
Certain Funds invest a significant amount of their assets in issuers located in a single state or limited number of states. When a Fund concentrates its investments in this manner, it assumes the risk that economic, regulatory, political or social conditions affecting that state or group of states could have a significant impact on the fund and could affect the income from, or the value or liquidity of, the fund’s portfolio. Investment percentages in specific states or U.S. territories are presented in the Schedules of Investments.
Certain Funds invest a significant portion of their assets in high yield securities. High yield securities that are rated below investment-grade (commonly referred to as “junk bonds”) or are unrated may be deemed speculative, involve greater levels of risk than higher-rated securities of similar maturity and are more likely to default. High yield securities may be issued by less creditworthy issuers, and issuers of high yield securities may be unable to meet their interest or principal payment obligations. High yield securities are subject to extreme price fluctuations, may be less liquid than higher rated fixed-income securities, even under normal economic conditions, and frequently have redemption features.
Certain Funds invest a significant portion of their assets in fixed-income securities and/or use derivatives tied to the fixed-income markets. Changes in market interest rates or economic conditions may affect the value and/or liquidity of such investments. Interest rate risk is the risk that prices of bonds and other fixed-income securities will increase as interest rates fall and decrease as interest rates rise. The Funds may be subject to a greater risk of rising interest rates due to the current period of historically low rates.
LIBOR Transition Risk: The United Kingdom’s Financial Conduct Authority announced a phase out of the London Interbank Offered Rate (“LIBOR”). Although many LIBOR rates will be phased out by the end of 2021, a selection of widely used USD LIBOR rates will continue to be published through June 2023 in order to assist with the transition. The Funds may be exposed to financial instruments tied to LIBOR to determine payment obligations, financing terms, hedging strategies or investment value. The transition process away from LIBOR might lead to increased volatility and illiquidity in markets for, and reduce the effectiveness of new hedges placed against, instruments whose terms currently include LIBOR. The ultimate effect of the LIBOR transition process on the Funds is uncertain.
| | |
NOTES TO FINANCIAL STATEMENTS | | 95 |
Notes to Financial Statements (continued)
| 11. | CAPITAL SHARE TRANSACTIONS |
Transactions in capital shares for each class were as follows:
| | | | | | | | | | | | | | | | |
| |
| | | Year Ended
06/30/21 | | | Year Ended
06/30/20 | |
| | | | | | | | |
| Fund Name / Share Class | | Shares | | | Amounts | | | Shares | | | Amounts | |
| |
New York Municipal | | | | | | | | | | | | | | | | |
Institutional | | | | | | | | | | | | | | | | |
Shares sold | | | 13,848,197 | | | $ | 155,507,120 | | | | 28,568,439 | | | $ | 322,739,311 | |
Shares issued in reinvestment of distributions | | | 1,348,863 | | | | 15,110,397 | | | | 1,573,382 | | | | 17,654,551 | |
Shares redeemed | | | (19,121,397 | ) | | | (212,555,106 | ) | | | (29,729,657 | ) | | | (321,787,189 | ) |
| | | | | | | | | | | | | | | | |
| | | (3,924,337 | ) | | $ | (41,937,589 | ) | | | 412,164 | | | $ | 18,606,673 | |
| | | | | | | | | | | | | | | | |
Investor A | | | | | | | | | | | | | | | | |
Shares sold and automatic conversion of shares | | | 10,562,487 | | | $ | 118,504,113 | | | | 29,123,947 | | | $ | 332,135,607 | |
Shares issued in reinvestment of distributions | | | 1,315,719 | | | | 14,744,743 | | | | 1,413,831 | | | | 15,858,534 | |
Shares issued in reorganization | | | 4,041,600 | | | | 43,902,809 | | | | 5,729,554 | | | | 62,088,752 | |
Shares redeemed | | | (25,511,082 | ) | | | (283,643,088 | ) | | | (20,021,125 | ) | | | (218,329,073 | ) |
| | | | | | | | | | | | | | | | |
| | | (9,591,276 | ) | | $ | (106,491,423) | | | | 16,246,207 | | | $ | 191,753,820 | |
| | | | | | | | | | | | | | | | |
Investor A1 | | | | | | | | | | | | | | | | |
Shares sold | | | 20 | | | $ | 230 | | | | 9 | | | $ | 744 | |
Shares issued in reinvestment of distributions | | | 136,438 | | | | 1,529,710 | | | | 147,454 | | | | 1,655,817 | |
Shares redeemed | | | (856,304 | ) | | | (9,612,927 | ) | | | (779,707 | ) | | | (8,691,610 | ) |
| | | | | | | | | | | | | | | | |
| | | (719,846 | ) | | $ | (8,082,987) | | | | (632,244 | ) | | $ | (7,035,049 | ) |
| | | | | | | | | | | | | | | | |
Investor C | | | | | | | | | | | | | | | | |
Shares sold | | | 514,952 | | | $ | 5,811,463 | | | | 2,571,849 | | | $ | 29,392,314 | |
Shares issued in reinvestment of distributions | | | 121,711 | | | | 1,362,215 | | | | 155,298 | | | | 1,742,978 | |
Shares redeemed and automatic conversion of shares | | | (3,390,963 | ) | | | (37,771,210 | ) | | | (2,916,220 | ) | | | (32,207,489 | ) |
| | | | | | | | | | | | | | | | |
| | | (2,754,300 | ) | | $ | (30,597,532) | | | | (189,073 | ) | | $ | (1,072,197 | ) |
| | | | | | | | | | | | | | | | |
Investor C1(a) | | | | | | | | | | | | | | | | |
Shares sold | | | — | | | $ | — | | | | — | | | $ | — | |
Shares issued in reinvestment of distributions | | | — | | | | — | | | | 46 | | | | 518 | |
Shares redeemed | | | — | | | | — | | | | (4,024 | ) | | | (46,998 | ) |
| | | | | | | | | | | | | | | | |
| | | — | | | $ | — | | | | (3,978 | ) | | $ | (46,480 | ) |
| | | | | | | | | | | | | | | | |
Class K | | | | | | | | | | | | | | | | |
Shares sold | | | 217,388 | | | $ | 2,442,555 | | | | 1,585,590 | | | $ | 18,322,229 | |
Shares issued in reinvestment of distributions | | | 9,605 | | | | 107,792 | | | | 9,675 | | | | 108,590 | |
Shares redeemed | | | (156,270 | ) | | | (1,720,212 | ) | | | (1,572,897 | ) | | | (16,397,165 | ) |
| | | | | | | | | | | | | | | | |
| | | 70,723 | | | $ | 830,135 | | | | 22,368 | | | $ | 2,033,654 | |
| | | | | | | | | | | | | | | | |
| | | (16,919,036 | ) | | $ | (186,279,396 | ) | | | 15,855,444 | | | $ | 204,240,421 | |
| | | | | | | | | | | | | | | | |
| | | | | | | | | | | | | | | | |
| |
| | | Year Ended
06/30/21 | | | Year Ended
06/30/20 | |
| | | | | | | | |
| Fund Name / Share Class | | Shares | | | Amounts | | | Shares | | | Amounts | |
| |
High Yield Municipal | | | | | | | | | | | | | | | | |
Institutional | | | | | | | | | | | | | | | | |
Shares sold | | | 80,225,583 | | | $ | 812,822,260 | | | | 51,221,958 | | | $ | 489,211,451 | |
Shares issued in reinvestment of distributions | | | 2,092,490 | | | | 21,177,896 | | | | 1,773,868 | | | | 17,320,931 | |
Shares redeemed | | | (50,372,071 | ) | | | (507,813,592 | ) | | | (52,533,019 | ) | | | (493,585,345 | ) |
| | | | | | | | | | | | | | | | |
| | | 31,946,002 | | | $ | 326,186,564 | | | | 462,807 | | | $ | 12,947,037 | |
| | | | | | | | | | | | | | | | |
Investor A | | | | | | | | | | | | | | | | |
Shares sold and automatic conversion of shares | | | 25,262,343 | | | $ | 255,762,012 | | | | 25,002,934 | | | $ | 246,309,845 | |
Shares issued in reinvestment of distributions | | | 1,469,096 | | | | 14,813,468 | | | | 1,321,589 | | | | 12,841,343 | |
Shares redeemed | | | (11,617,203 | ) | | | (116,675,561 | ) | | | (16,955,691 | ) | | | (161,182,472 | ) |
| | | | | | | | | | | | | | | | |
| | | 15,114,236 | | | $ | 153,899,919 | | | | 9,368,832 | | | $ | 97,968,716 | |
| | | | | | | | | | | | | | | | |
Investor C | | | | | | | | | | | | | | | | |
Shares sold | | | 680,133 | | | $ | 6,912,015 | | | | 1,365,184 | | | $ | 13,507,419 | |
Shares issued in reinvestment of distributions | | | 109,135 | | | | 1,096,742 | | | | 147,893 | | | | 1,442,581 | |
Shares redeemed and automatic conversion of shares | | | (2,758,364 | ) | | | (27,477,684 | ) | | | (1,942,387 | ) | | | (18,859,452 | ) |
| | | | | | | | | | | | | | | | |
| | | (1,969,096 | ) | | $ | (19,468,927) | | | | (429,310 | ) | | $ | (3,909,452) | |
| | | | | | | | | | | | | | | | |
| | |
| 96 | | 2 0 2 1 BLACK ROCK ANNUAL REPORT TO SHAREHOLDERS |
Notes to Financial Statements (continued)
| | | | | | | | | | | | | | | | |
| |
| | | Year Ended
06/30/21 | | | Year Ended 06/30/20 | |
| | | | | | | | |
| Fund Name / Share Class (continued) | | Shares | | | Amounts | | | Shares | | | Amounts | |
| |
High Yield Municipal (continued) | | | | | | | | | | | | | | | | |
Class K | | | | | | | | | | | | | | | | |
Shares sold | | | 8,312,590 | | | $ | 84,662,095 | | | | 6,041,301 | | | $ | 58,629,673 | |
Shares issued in reinvestment of distributions | | | 365,163 | | | | 3,702,154 | | | | 230,634 | | | | 2,238,184 | |
Shares redeemed | | | (1,897,492 | ) | | | (18,998,247 | ) | | | (2,448,988) | | | | (22,805,554 | ) |
| | | | | | | | | | | | | | | | |
| | | 6,780,261 | | | $ | 69,366,002 | | | | 3,822,947 | | | $ | 38,062,303 | |
| | | | | | | | | | | | | | | | |
| | | 51,871,403 | | | $ | 529,983,558 | | | | 13,225,276 | | | $ | 145,068,604 | |
| | | | | | | | | | | | | | | | |
| | | | | | | | | | | | | | | | |
| |
| | | Year Ended
06/30/21 | | | Year Ended
06/30/20 | |
| | | | | | | | |
| Fund Name / Share Class | | Shares | | | Amounts | | | Shares | | | Amounts | |
| |
National Municipal | | | | | | | | | | | | | | | | |
Institutional | | | | | | | | | | | | | | | | |
Shares sold | | | 160,105,364 | | | $ | 1,813,103,490 | | | | 166,644,457 | | | $ | 1,832,817,562 | |
Shares issued in reinvestment of distributions | | | 6,828,180 | | | | 77,211,863 | | | | 7,672,644 | | | | 84,928,356 | |
Shares redeemed | | | (80,951,041 | ) | | | (914,687,595 | ) | | | (121,597,184 | ) | | | (1,323,335,706 | ) |
| | | | | | | | | | | | | | | | |
| | | 85,982,503 | | | $ | 975,627,758 | | | | 52,719,917 | | | $ | 594,410,212 | |
| | | | | | | | | | | | | | | | |
Service | | | | | | | | | | | | | | | | |
Shares sold | | | 57,239 | | | $ | 646,897 | | | | 104,224 | | | $ | 1,152,548 | |
Shares issued in reinvestment of distributions | | | 4,034 | | | | 45,536 | | | | 6,164 | | | | 68,236 | |
Shares redeemed | | | (66,051 | ) | | | (744,852 | ) | | | (94,727 | ) | | | (1,042,372 | ) |
| | | | | | | | | | | | | | | | |
| | | (4,778 | ) | | $ | (52,419) | | | | 15,661 | | | $ | 178,412 | |
| | | | | | | | | | | | | | | | |
Investor A | | | | | | | | | | | | | | | | |
Shares sold and automatic conversion of shares | | | 96,917,199 | | | $ | 1,095,484,079 | | | | 171,265,742 | | | $ | 1,886,615,807 | |
Shares issued in reinvestment of distributions | | | 5,745,103 | | | | 64,978,467 | | | | 7,016,909 | | | | 77,741,769 | |
Shares redeemed | | | (75,876,848 | ) | | | (855,695,947 | ) | | | (110,765,588 | ) | | | (1,207,534,336 | ) |
| | | | | | | | | | | | | | | | |
| | | 26,785,454 | | | $ | 304,766,599 | | | | 67,517,063 | | | $ | 756,823,240 | |
| | | | | | | | | | | | | | | | |
Investor C | | | | | | | | | | | | | | | | |
Shares sold | | | 1,672,543 | | | $ | 18,921,004 | | | | 3,759,175 | | | $ | 41,706,762 | |
Shares issued in reinvestment of distributions | | | 115,070 | | | | 1,299,773 | | | | 286,397 | | | | 3,174,969 | |
Shares redeemed and automatic conversion of shares | | | (11,506,688 | ) | | | (129,731,912 | ) | | | (7,454,944 | ) | | | (82,352,848 | ) |
| | | | | | | | | | | | | | | | |
| | | (9,719,075 | ) | | $ | (109,511,135) | | | | (3,409,372 | ) | | $ | (37,471,117) | |
| | | | | | | | | | | | | | | | |
Investor C1(a) | | | | | | | | | | | | | | | | |
Shares sold | | | — | | | $ | — | | | | — | | | $ | — | |
Shares issued in reinvestment of distributions | | | — | | | | — | | | | 705 | | | | 7,872 | |
Shares redeemed | | | — | | | | — | | | | (83,055 | ) | | | (941,879 | ) |
| | | | | | | | | | | | | | | | |
| | | — | | | $ | — | | | | (82,350 | ) | | $ | (934,007) | |
| | | | | | | | | | | | | | | | |
Class K | | | | | | | | | | | | | | | | |
Shares sold | | | 116,520,193 | | | $ | 1,320,450,163 | | | | 137,112,682 | | | $ | 1,517,044,530 | |
Shares issued in reinvestment of distributions | | | 7,268,952 | | | | 82,176,284 | | | | 9,097,612 | | | | 100,754,125 | |
Shares redeemed | | | (111,027,917 | ) | | | (1,245,919,943 | ) | | | (75,334,190 | ) | | | (819,834,952 | ) |
| | | | | | | | | | | | | | | | |
| | | 12,761,228 | | | $ | 156,706,504 | | | | 70,876,104 | | | $ | 797,963,703 | |
| | | | | | | | | | | | | | | | |
| | | 115,805,332 | | | $ | 1,327,537,307 | | | | 187,637,023 | | | $ | 2,110,970,443 | |
| | | | | | | | | | | | | | | | |
| | | | | | | | | | | | | | | | |
| |
| | | Year Ended
06/30/21 | | | Year Ended
06/30/20 | |
| | | | | | | | |
| Fund Name / Share Class | | Shares | | | Amounts | | | Shares | | | Amounts | |
| |
Short-Term Municipal | | | | | | | | | | | | | | | | |
Institutional | | | | | | | | | | | | | | | | |
Shares sold | | | 34,089,781 | | | $ | 346,989,221 | | | | 26,623,745 | | | $ | 269,158,015 | |
Shares issued in reinvestment of distributions | | | 202,156 | | | | 2,057,745 | | | | 328,175 | | | | 3,328,008 | |
Shares redeemed | | | (26,132,269 | ) | | | (266,042,579 | ) | | | (20,305,543 | ) | | | (205,353,358 | ) |
| | | | | | | | | | | | | | | | |
| | | 8,159,668 | | | $ | 83,004,387 | | | | 6,646,377 | | | $ | 67,132,665 | |
| | | | | | | | | | | | | | | | |
| | |
NOTES TO FINANCIAL STATEMENTS | | 97 |
Notes to Financial Statements (continued)
| | | | | | | | | | | | | | | | |
| |
| | | Year Ended
06/30/21 | | | Year Ended
06/30/20 | |
| | | | | | | | |
| Fund Name / Share Class (continued) | | Shares | | | Amounts | | | Shares | | | Amounts | |
| |
Short-Term Municipal (continued) | | | | | | | | | | | | | | | | |
Investor A | | | | | | | | | | | | | | | | |
Shares sold and automatic conversion of shares | | | 22,160,804 | | | $ | 225,757,351 | | | | 17,782,637 | | | $ | 180,325,431 | |
Shares issued in reinvestment of distributions | | | 112,679 | | | | 1,147,978 | | | | 137,511 | | | | 1,394,796 | |
Shares redeemed | | | (13,697,234 | ) | | | (139,540,505 | ) | | | (9,028,033 | ) | | | (91,420,518 | ) |
| | | | | | | | | | | | | | | | |
| | | 8,576,249 | | | $ | 87,364,824 | | | | 8,892,115 | | | $ | 90,299,709 | |
| | | | | | | | | | | | | | | | |
Investor A1 | | | | | | | | | | | | | | | | |
Shares sold | | | — | | | $ | — | | | | 1 | | | $ | 14 | |
Shares issued in reinvestment of distributions | | | 4,872 | | | | 49,638 | | | | 12,527 | | | | 127,155 | |
Shares redeemed | | | (129,712 | ) | | | (1,321,957 | ) | | | (150,722 | ) | | | (1,527,942 | ) |
| | | | | | | | | | | | | | | | |
| | | (124,840 | ) | | $ | (1,272,319) | | | | (138,194) | | | $ | (1,400,773) | |
| | | | | | | | | | | | | | | | |
Investor C | | | | | | | | | | | | | | | | |
Shares sold | | | 171,961 | | | $ | 1,702,853 | | | | 404,842 | | | $ | 3,986,573 | |
Shares issued in reinvestment of distributions | | | — | | | | — | | | | 4,618 | | | | 45,620 | |
Shares redeemed and automatic conversion of shares. | | | (702,262 | ) | | | (6,958,029 | ) | | | (921,806 | ) | | | (9,096,861 | ) |
| | | | | | | | | | | | | | | | |
| | | (530,301 | ) | | $ | (5,255,176) | | | | (512,346 | ) | | $ | (5,064,668) | |
| | | | | | | | | | | | | | | | |
Class K | | | | | | | | | | | | | | | | |
Shares sold | | | 1,442,077 | | | $ | 14,683,695 | | | | 446,154 | | | $ | 4,522,781 | |
Shares issued in reinvestment of distributions | | | 6,628 | | | | 67,463 | | | | 9,830 | | | | 99,670 | |
Shares redeemed | | | (365,894 | ) | | | (3,725,097 | ) | | | (486,098 | ) | | | (4,920,665 | ) |
| | | | | | | | | | | | | | | | |
| | | 1,082,811 | | | $ | 11,026,061 | | | | (30,114 | ) | | $ | (298,214) | |
| | | | | | | | | | | | | | | | |
| | | 17,163,587 | | | $ | 174,867,777 | | | | 14,857,838 | | | $ | 150,668,719 | |
| | | | | | | | | | | | | | | | |
| | (a) | On February 24, 2020, the Fund’s issued and outstanding Investor C1 Shares converted into Investor A Shares. | |
Management has evaluated the impact of all subsequent events on the Funds through the date the financial statements were issued and has determined that there were no subsequent events requiring adjustment or additional disclosure in the financial statements.
| | |
| 98 | | 2 0 2 1 BLACK ROCK ANNUAL REPORT TO SHAREHOLDERS |
Report of Independent Registered Public Accounting Firm
To the Shareholders of BlackRock High Yield Municipal Fund, BlackRock National Municipal Fund, BlackRock Short-Term Municipal Fund, and BlackRock New York Municipal Opportunities Fund and the Board of Directors/Trustees of BlackRock Municipal Bond Fund, Inc. and BlackRock Multi-State Municipal Series Trust:
Opinion on the Financial Statements and Financial Highlights
We have audited the accompanying statements of assets and liabilities of BlackRock High Yield Municipal Fund, BlackRock National Municipal Fund, and BlackRock Short-Term Municipal Fund of BlackRock Municipal Bond Fund, Inc. and BlackRock New York Municipal Opportunities Fund of BlackRock Multi-State Municipal Series Trust (the “Funds”), including the schedules of investments, as of June 30, 2021, the related statements of operations for the year then ended, the statements of changes in net assets for each of the two years in the period then ended, the financial highlights for each of the five years in the period then ended, and the related notes. In our opinion, the financial statements and financial highlights present fairly, in all material respects, the financial position of the Funds as of June 30, 2021, and the results of their operations for the year then ended, the changes in their net assets for each of the two years in the period then ended, and the financial highlights for each of the five years in the period then ended, in conformity with accounting principles generally accepted in the United States of America.
Basis for Opinion
These financial statements and financial highlights are the responsibility of the Funds’ management. Our responsibility is to express an opinion on the Funds’ financial statements and financial highlights based on our audits. We are a public accounting firm registered with the Public Company Accounting Oversight Board (United States) (PCAOB) and are required to be independent with respect to the Funds in accordance with the U.S. federal securities laws and the applicable rules and regulations of the Securities and Exchange Commission and the PCAOB.
We conducted our audits in accordance with the standards of the PCAOB. Those standards require that we plan and perform the audit to obtain reasonable assurance about whether the financial statements and financial highlights are free of material misstatement, whether due to error or fraud. The Funds are not required to have, nor were we engaged to perform, an audit of their internal control over financial reporting. As part of our audits we are required to obtain an understanding of internal control over financial reporting but not for the purpose of expressing an opinion on the effectiveness of the Funds’ internal control over financial reporting. Accordingly, we express no such opinion.
Our audits included performing procedures to assess the risks of material misstatement of the financial statements and financial highlights, whether due to error or fraud, and performing procedures that respond to those risks. Such procedures included examining, on a test basis, evidence regarding the amounts and disclosures in the financial statements and financial highlights. Our audits also included evaluating the accounting principles used and significant estimates made by management, as well as evaluating the overall presentation of the financial statements and financial highlights. Our procedures included confirmation of securities owned as of June 30, 2021, by correspondence with the custodian and brokers; when replies were not received from brokers, we performed other auditing procedures. We believe that our audits provide a reasonable basis for our opinion.
Deloitte & Touche LLP
Boston, Massachusetts
August 20, 2021
We have served as the auditor of one or more BlackRock investment companies since 1992.
| | |
REPORT OF INDEPENDENT REGISTERED PUBLIC ACCOUNTING FIRM | | 99 |
Important Tax Information (unaudited)
For the fiscal period ended October 26, 2020, the below noted Fund designated the following amounts paid as exempt-interest dividends:
| | | | |
| Fund Name | | Exempt-Interest
Dividends | |
BQH | | $ | 507,076 | |
| | |
| 100 | | 2 0 2 1 BLACK ROCK ANNUAL REPORT TO SHAREHOLDERS |
Disclosure of Investment Advisory Agreements
The Board of Directors of BlackRock Municipal Bond Fund, Inc. (the “Company”) and the Board of Trustees of BlackRock Multi-State Municipal Series Trust (the “Trust”) (together, the “Board,” the members of which are referred to as “Board Members”) met on May 4, 2021 (the “May Meeting”) and June 8-9, 2021 (the “June Meeting”) to consider the approval to continue the investment advisory agreements (the “Agreements”) between the Company, on behalf of BlackRock High Yield Municipal Fund (the “High Yield Fund”), BlackRock National Municipal Fund (the “National Fund”) and BlackRock Short-Term Municipal Fund (the “Short-Term Fund”), each a series of the Company, and BlackRock Advisors, LLC (the “Manager” or “BlackRock”), and between the Trust, on behalf of BlackRock New York Municipal Opportunities Fund (the “New York Fund,” and together with the High Yield Fund, National Fund and Short-Term Fund, the “Funds” and each, a “Fund”), a series of the Trust, and BlackRock, each Fund’s investment adviser.
The Approval Process
Consistent with the requirements of the Investment Company Act of 1940 (the “1940 Act”), the Board considers the approval of the continuation of the Agreements for each Fund on an annual basis. The Board members whom are not “interested persons” of the Company or the Trust, as defined in the 1940 Act, are considered independent Board members (the “Independent Board Members”). The Board’s consideration entailed a year-long deliberative process during which the Board and its committees assessed BlackRock’s various services to each Fund, including through the review of written materials and oral presentations, and the review of additional information provided in response to requests from the Independent Board Members. The Board had four quarterly meetings per year, each typically extending for two days, as well as additional ad hoc meetings and executive sessions throughout the year, as needed. The committees of the Board similarly met throughout the year. The Board also had a fifth one-day meeting to consider specific information surrounding the renewal of the Agreements. In particular, the Board assessed, among other things, the nature, extent and quality of the services provided to each Fund by BlackRock, BlackRock’s personnel and affiliates, including (as applicable): investment management services; accounting oversight; administrative and shareholder services; oversight of each Fund’s service providers; risk management and oversight; and legal, regulatory and compliance services. Throughout the year, including during the contract renewal process, the Independent Board Members were advised by independent legal counsel, and met with independent legal counsel in various executive sessions outside of the presence of BlackRock’s management.
During the year, the Board, acting directly and through its committees, considered information that was relevant to its annual consideration of the renewal of the Agreements, including the services and support provided by BlackRock to each Fund and its shareholders. BlackRock also furnished additional information to the Board in response to specific questions from the Board. Among the matters the Board considered were: (a) investment performance for one-year, three-year, five-year, and/or since inception periods, as applicable, against peer funds, relevant benchmarks, and other performance metrics, as applicable, as well as BlackRock senior management’s and portfolio managers’ analyses of the reasons for any outperformance or underperformance relative to its peers, benchmarks, and other performance metrics, as applicable; (b) fees, including advisory, administration, if applicable, and other amounts paid to BlackRock and its affiliates by each Fund for services; (c) Fund operating expenses and how BlackRock allocates expenses to each Fund; (d) the resources devoted to, risk oversight of, and compliance reports relating to, implementation of each Fund’s investment objective, policies and restrictions, and meeting regulatory requirements; (e) BlackRock’s and each Fund’s adherence to applicable compliance policies and procedures; (f) the nature, character and scope of non-investment management services provided by BlackRock and its affiliates and the estimated cost of such services, as applicable; (g) BlackRock’s and other service providers’ internal controls and risk and compliance oversight mechanisms; (h) BlackRock’s implementation of the proxy voting policies approved by the Board; (i) execution quality of portfolio transactions; (j) BlackRock’s implementation of each Fund’s valuation and liquidity procedures; (k) an analysis of management fees paid to BlackRock for products with similar investment mandates across the open-end fund, exchange-traded fund (“ETF”), closed-end fund, sub-advised mutual fund, separately managed account, collective investment trust, and institutional separate account product channels, as applicable, and the similarities and differences between these products and the services provided as compared to each Fund; (l) BlackRock’s compensation methodology for its investment professionals and the incentives and accountability it creates, along with investment professionals’ investments in the fund(s) they manage; and (m) periodic updates on BlackRock’s business.
Prior to and in preparation for the May Meeting, the Board received and reviewed materials specifically relating to the renewal of the Agreements. The Independent Board Members continuously engaged in a process with their independent legal counsel and BlackRock to review the nature and scope of the information provided to the Board to better assist its deliberations. The materials provided in connection with the May Meeting included, among other things: (a) information independently compiled and prepared by Broadridge Financial Solutions, Inc. (“Broadridge”), based on either a Lipper classification or Morningstar category, regarding each Fund’s fees and expenses as compared with a peer group of funds as determined by Broadridge (“Expense Peers”) and the investment performance of each Fund as compared with a peer group of funds (“Performance Peers”); (b) information on the composition of the Expense Peers and Performance Peers and a description of Broadridge’s methodology; (c) information on the estimated profits realized by BlackRock and its affiliates pursuant to the Agreements and a discussion of fall-out benefits to BlackRock and its affiliates; (d) a general analysis provided by BlackRock concerning investment management fees received in connection with other types of investment products, such as institutional accounts, sub-advised mutual funds, ETFs, closed-end funds, open-end funds, and separately managed accounts, under similar investment mandates, as well as the performance of such other products, as applicable; (e) a review of non-management fees; (f) the existence, impact and sharing of potential economies of scale, if any, with each Fund; (g) a summary of aggregate amounts paid by each Fund to BlackRock; (h) sales and redemption data regarding each Fund’s shares; and (i) various additional information requested by the Board as appropriate regarding BlackRock’s and each Fund’s operations.
At the May Meeting, the Board reviewed materials relating to its consideration of the Agreements. As a result of the discussions that occurred during the May Meeting, and as a culmination of the Board’s year-long deliberative process, the Board presented BlackRock with questions and requests for additional information. BlackRock responded to these questions and requests with additional written information in advance of the June Meeting.
At the June Meeting, the Board concluded its assessment of, among other things: (a) the nature, extent and quality of the services provided by BlackRock; (b) the investment performance of each Fund as compared to its Performance Peers and to other metrics, as applicable; (c) the advisory fee and the estimated cost of the services and estimated profits realized by BlackRock and its affiliates from their relationship with each Fund; (d) each Fund’s fees and expenses compared to its Expense Peers; (e) the existence and sharing of potential economies of scale; (f) any fall-out benefits to BlackRock and its affiliates as a result of BlackRock’s relationship with each Fund; and (g) other factors deemed relevant by the Board Members.
The Board also considered other matters it deemed important to the approval process, such as other payments made to BlackRock or its affiliates relating to securities lending and cash management, and BlackRock’s services related to the valuation and pricing of Fund portfolio holdings. The Board noted the willingness of BlackRock’s personnel to engage in open, candid discussions with the Board. The Board Members did not identify any particular information, or any single factor as determinative, and each Board Member may have attributed different weights to the various items and factors considered.
| | |
DISCLOSURE OF INVESTMENT ADVISORY AGREEMENTS | | 101 |
Disclosure of Investment Advisory Agreements (continued)
A. Nature, Extent and Quality of the Services Provided by BlackRock
The Board, including the Independent Board Members, reviewed the nature, extent and quality of services provided by BlackRock, including the investment advisory services, and the resulting performance of each Fund. Throughout the year, the Board compared Fund performance to the performance of a comparable group of mutual funds, relevant benchmarks, and performance metrics, as applicable. The Board met with BlackRock’s senior management personnel responsible for investment activities, including the senior investment officers. The Board also reviewed the materials provided by each Fund’s portfolio management team discussing each Fund’s performance, investment strategies and outlook.
The Board considered, among other factors, with respect to BlackRock: the number, education and experience of investment personnel generally and each Fund’s portfolio management team; research capabilities; investments by portfolio managers in the funds they manage; portfolio trading capabilities; use of technology; commitment to compliance; credit analysis capabilities; risk analysis and oversight capabilities; and the approach to training and retaining portfolio managers and other research, advisory and management personnel. The Board also considered BlackRock’s overall risk management program, including the continued efforts of BlackRock and its affiliates to address cybersecurity risks and the role of BlackRock’s Risk & Quantitative Analysis Group. The Board engaged in a review of BlackRock’s compensation structure with respect to each Fund’s portfolio management team and BlackRock’s ability to attract and retain high-quality talent and create performance incentives.
In addition to investment advisory services, the Board considered the nature and quality of the administrative and other non-investment advisory services provided to each Fund. BlackRock and its affiliates provide each Fund with certain administrative, shareholder and other services (in addition to any such services provided to each Fund by third parties) and officers and other personnel as are necessary for the operations of each Fund. In particular, BlackRock and its affiliates provide each Fund with administrative services including, among others: (i) responsibility for disclosure documents, such as the prospectus, the summary prospectus (as applicable), the statement of additional information and periodic shareholder reports; (ii) oversight of daily accounting and pricing; (iii) responsibility for periodic filings with regulators; (iv) overseeing and coordinating the activities of third-party service providers including, among others, each Fund’s custodian, fund accountant, transfer agent, and auditor; (v) organizing Board meetings and preparing the materials for such Board meetings; (vi) providing legal and compliance support; (vii) furnishing analytical and other support to assist the Board in its consideration of strategic issues such as the merger, consolidation or repurposing of certain open-end funds; and (viii) performing or managing administrative functions necessary for the operation of each Fund, such as tax reporting, expense management, fulfilling regulatory filing requirements, overseeing each Fund’s distribution partners, and shareholder call center and other services. The Board reviewed the structure and duties of BlackRock’s fund administration, shareholder services, and legal and compliance departments and considered BlackRock’s policies and procedures for assuring compliance with applicable laws and regulations. The Board considered the operation of BlackRock’s business continuity plans, including in light of the ongoing COVID-19 pandemic.
B. The Investment Performance of each Fund and BlackRock
The Board, including the Independent Board Members, reviewed and considered the performance history of each Fund throughout the year and at the May meeting. In preparation for the May Meeting, the Board was provided with reports independently prepared by Broadridge, which included an analysis of each Fund’s performance as of December 31, 2020, as compared to its Performance Peers. Broadridge ranks funds in quartiles, ranging from first to fourth, where first is the most desirable quartile position and fourth is the least desirable. In connection with its review, the Board received and reviewed information regarding the investment performance of each Fund as compared to its Performance Peers and, in light of each Fund’s outcome-oriented investment objective, certain performance metrics (“Outcome-Oriented Performance Metrics”). The Board and its Performance Oversight Committee regularly review and meet with Fund management to discuss the performance of each Fund throughout the year.
In evaluating performance, the Board focused particular attention on funds with less favorable performance records. The Board also noted that while it found the data provided by Broadridge generally useful, it recognized the limitations of such data, including in particular, that notable differences may exist between a fund and its Performance Peers (for example, the investment objectives and strategies). Further, the Board recognized that the performance data reflects a snapshot of a period as of a particular date and that selecting a different performance period could produce significantly different results. The Board also acknowledged that long-term performance could be impacted by even one period of significant outperformance or underperformance, and that a single investment theme could have the ability to disproportionately affect long-term performance.
The Board noted that for the one-, three- and five-year periods reported, the High Yield Fund ranked in the second, first and first quartiles, respectively, against its Performance Peers.
The Board noted that for the one-, three- and five-year periods reported, the National Fund ranked in the third, second and second quartiles, respectively, against its Performance Peers. The Board and BlackRock reviewed the National Fund’s underperformance relative to its Performance Peers during the applicable period.
The Board noted that for each of the one-, three- and five-year periods reported, the Short-Term Fund ranked in the fourth, third and fourth quartiles, respectively, against its Performance Peers. The Board and BlackRock reviewed the Short-Term Fund’s underperformance relative to its Performance Peers during the applicable periods.
The Board noted that for the one-, three- and five-year periods reported, the New York Fund ranked in the fourth, fourth and first quartiles, respectively, against its Performance Peers. The Board and BlackRock reviewed the New York Fund’s underperformance relative to its Performance Peers during the applicable periods.
C. Consideration of the Advisory/Management Fees and the Estimated Cost of the Services and Estimated Profits Realized by BlackRock and its Affiliates from their Relationship with each Fund
The Board, including the Independent Board Members, reviewed each Fund’s contractual management fee rate compared with those of its Expense Peers. The contractual management fee rate represents a combination of the advisory fee and any administrative fees, before taking into account any reimbursements or fee waivers. The Board also compared each Fund’s total expense ratio, as well as its actual management fee rate, to those of its Expense Peers. The total expense ratio represents a fund’s total net operating expenses, including any 12b-1 or non-12b-1 service fees. The total expense ratio gives effect to any expense reimbursements or fee waivers, and the actual management fee rate gives effect to any management fee reimbursements or waivers. The Board considered the services provided and the fees charged by BlackRock and its affiliates to other types of clients with similar investment mandates, as applicable, including institutional accounts and sub-advised mutual funds (including mutual funds sponsored by third parties).
| | |
| 102 | | 2 0 2 1 BLACK ROCK ANNUAL REPORT TO SHAREHOLDERS |
Disclosure of Investment Advisory Agreements (continued)
The Board received and reviewed statements relating to BlackRock’s financial condition. The Board reviewed BlackRock’s profitability methodology and was also provided with an estimated profitability analysis that detailed the revenues earned and the expenses incurred by BlackRock for services provided to each Fund. The Board reviewed BlackRock’s estimated profitability with respect to each Fund and other funds the Board currently oversees for the year ended December 31, 2020 compared to available aggregate estimated profitability data provided for the prior two years. The Board reviewed BlackRock’s estimated profitability with respect to certain other U.S. fund complexes managed by the Manager and/or its affiliates. The Board reviewed BlackRock’s assumptions and methodology of allocating expenses in the estimated profitability analysis, noting the inherent limitations in allocating costs among various advisory products. The Board recognized that profitability may be affected by numerous factors including, among other things, fee waivers and expense reimbursements by the Manager, the types of funds managed, precision of expense allocations and business mix. The Board thus recognized that calculating and comparing profitability at the individual fund level is difficult.
The Board noted that, in general, individual fund or product line profitability of other advisors is not publicly available. The Board reviewed BlackRock’s overall operating margin, in general, compared to that of certain other publicly traded asset management firms. The Board considered the differences between BlackRock and these other firms, including the contribution of technology at BlackRock, BlackRock’s expense management, and the relative product mix.
The Board considered whether BlackRock has the financial resources necessary to attract and retain high quality investment management personnel to perform its obligations under the Agreements and to continue to provide the high quality of services that is expected by the Board. The Board further considered factors including but not limited to BlackRock’s commitment of time, assumption of risk, and liability profile in servicing each Fund, including in contrast to what is required of BlackRock with respect to other products with similar investment mandates across the open-end fund, ETF, closed-end fund, sub-advised mutual fund, separately managed account, collective investment trust, and institutional separate account product channels, as applicable.
The Board noted that the High Yield Fund’s contractual management fee rate ranked in the first quartile, and that the actual management fee rate and total expense ratio each ranked in the first quartile, relative to the High Yield Fund’s Expense Peers. The Board also noted that the High Yield Fund has an advisory fee arrangement that includes breakpoints that adjust the fee rate downward as the size of the High Yield Fund increases above certain contractually specified levels. The Board noted that if the size of the High Yield Fund were to decrease, the High Yield Fund could lose the benefit of one or more breakpoints. In addition, the Board noted that BlackRock and the Board have contractually agreed to a cap on the High Yield Fund’s total expenses as a percentage of the High Yield Fund’s average daily net assets on a class-by-class basis.
The Board noted that the National Fund’s contractual management fee rate ranked in the third quartile, and that the actual management fee rate and total expense ratio each ranked in the second quartile, relative to the National Fund’s Expense Peers. The Board also noted that the National Fund has an advisory fee arrangement that includes breakpoints that adjust the fee rate downward as the aggregate assets of the National Fund, combined with the assets of the Short-Term Fund, increase above certain contractually specified levels. The Board noted that if the size of the National Fund or the Short-Term Fund were to decrease, the National Fund could lose the benefit of one or more breakpoints. The Board further noted that BlackRock and the Board have contractually agreed to a cap on the National Fund’s total expenses as a percentage of the National Fund’s average daily net assets on a class-by-class basis.
The Board noted that the Short-Term Fund’s contractual management fee rate ranked in the first quartile, and that the actual management fee rate and total expense ratio ranked in the first and second quartiles, respectively, relative to the Short-Term Fund’s Expense Peers. The Board also noted that the Short-Term Fund has an advisory fee arrangement that includes breakpoints that adjust the fee rate downward as the aggregate assets of the Short-Term Fund, combined with the assets of the National Fund, increase above certain contractually specified levels. The Board noted that if the size of the Short-Term Fund or the National Fund were to decrease, the Short-Term Fund could lose the benefit of one or more breakpoints. The Board further noted that BlackRock and the Board have contractually agreed to a cap on the Short-Term Fund’s total expenses as a percentage of the Short-Term Fund’s average daily net assets on a class-by-class basis.
The Board noted that the New York Fund’s contractual management fee rate ranked in the third quartile, and that the actual management fee rate and total expense ratio ranked in the third and second quartiles, respectively, relative to the New York Fund’s Expense Peers. The Board also noted that the New York Fund has an advisory fee arrangement that includes breakpoints that adjust the fee rate downward as the size of the New York Fund increases above certain contractually specified levels. The Board noted that if the size of the New York Fund were to decrease, the New York Fund could lose the benefit of one or more breakpoints. In addition, the Board noted that BlackRock and the Board have contractually agreed to a cap on the New York Fund’s total expenses as a percentage of the New York Fund’s average daily net assets on a class-by-class basis.
D. Economies of Scale
The Board, including the Independent Board Members, considered the extent to which economies of scale might be realized as the assets of each Fund increase, including the existence of fee waivers and/or expense caps, as applicable, noting that any contractual fee waivers and contractual expense caps had been approved by the Board. In its consideration, the Board further considered the continuation and/or implementation of fee waivers and/or expense caps, as applicable. The Board also considered the extent to which each Fund benefits from such economies of scale in a variety of ways, and whether there should be changes in the advisory fee rate or breakpoint structure in order to enable each Fund to more fully participate in these economies of scale. The Board considered each Fund’s asset levels and whether the current fee schedule was appropriate.
E. Other Factors Deemed Relevant by the Board Members
The Board, including the Independent Board Members, also took into account other ancillary or “fall-out” benefits that BlackRock or its affiliates may derive from BlackRock’s respective relationships with each Fund, both tangible and intangible, such as BlackRock’s ability to leverage its investment professionals who manage other portfolios and its risk management personnel, an increase in BlackRock’s profile in the investment advisory community, and the engagement of BlackRock’s affiliates as service providers to each Fund, including for administrative, distribution, securities lending and cash management services. The Board also considered BlackRock’s overall operations and its efforts to expand the scale of, and improve the quality of, its operations. The Board also noted that, subject to applicable law, BlackRock may use and benefit from third-party research obtained by soft dollars generated by certain registered fund transactions to assist in managing all or a number of its other client accounts.
| | |
DISCLOSURE OF INVESTMENT ADVISORY AGREEMENTS | | 103 |
Disclosure of Investment Advisory Agreements (continued)
In connection with its consideration of the Agreements, the Board also received information regarding BlackRock’s brokerage and soft dollar practices. The Board received reports from BlackRock which included information on brokerage commissions and trade execution practices throughout the year.
The Board noted the competitive nature of the open-end fund marketplace, and that shareholders are able to redeem their Fund shares if they believe that each Fund’s fees and expenses are too high or if they are dissatisfied with the performance of each Fund.
Conclusion
The Board, including the Independent Board Members, unanimously approved the continuation of the Advisory Agreements between the Manager and the Company, on behalf of the High Yield Fund, the National Fund and the Short-Term Fund, and the Trust, on behalf of the New York Fund, for a one-year term ending June 30, 2022. Based upon its evaluation of all of the aforementioned factors in their totality, as well as other information, the Board, including the Independent Board Members, was satisfied that the terms of the Agreements were fair and reasonable and in the best interest of each Fund and its shareholders. In arriving at its decision to approve the Agreements, the Board did not identify any single factor or group of factors as all-important or controlling, but considered all factors together, and different Board Members may have attributed different weights to the various factors considered. The Independent Board Members were also assisted by the advice of independent legal counsel in making this determination.
| | |
| 104 | | 2 0 2 1 BLACK ROCK ANNUAL REPORT TO SHAREHOLDERS |
Director and Officer Information
| | | | | | | | |
| Independent Directors(a) |
| | | | | |
Name Year of Birth(b) | | Position(s) Held
(Length of Service)(c) | | Principal Occupation(s) During Past Five Years | | Number of BlackRock-Advised
Registered Investment Companies
(“RICs”) Consisting of
Investment Portfolios
(“Portfolios”) Overseen | | Public Company
and Other
Investment
Company
Directorships Held
During
Past Five Years |
| | | | |
Richard E. Cavanagh 1946 | | Co-Chair of the Board and Director
(Since 2019) | | Director, The Guardian Life Insurance Company of America since 1998; Board Chair, Volunteers of America (a not-for-profit organization) from 2015 to 2018 (board member since 2009); Director, Arch Chemicals (chemical and allied products) from 1999 to 2011; Trustee, Educational Testing Service from 1997 to 2009 and Chairman thereof from 2005 to 2009; Senior Advisor, The Fremont Group since 2008 and Director thereof since 1996; Faculty Member/Adjunct Lecturer, Harvard University since 2007 and Executive Dean from 1987 to 1995; President and Chief Executive Officer, The Conference Board, Inc. (global business research organization) from 1995 to 2007. | | 73 RICs consisting of 99 Portfolios | | None |
| | | | |
Karen P. Robards 1950 | | Co-Chair of the Board and Director
(Since 2019) | | Principal of Robards & Company, LLC (consulting and private investing) since 1987; Co-founder and Director of the Cooke Center for Learning and Development (a not-for-profit organization) since 1987; Director of Enable Injections, LLC (medical devices) since 2019; Investment Banker at Morgan Stanley from 1976 to 1987. | | 73 RICs consisting of 99 Portfolios | | Greenhill & Co., Inc.;
AtriCure, Inc. (medical devices) from 2000 until 2017. |
| | | | |
Michael J. Castellano 1946 | | Director
(Since 2019) | | Chief Financial Officer of Lazard Group LLC from 2001 to 2011; Chief Financial Officer of Lazard Ltd from 2004 to 2011; Director, Support Our Aging Religious (non-profit) from 2009 to June 2015 and from 2017 to September 2020; Director, National Advisory Board of Church Management at Villanova University since 2010; Trustee, Domestic Church Media Foundation since 2012; Director, CircleBlack Inc. (financial technology company) from 2015 to July 2020. | | 73 RICs consisting of 99 Portfolios | | None |
| | | | |
Cynthia L. Egan 1955 | | Director
(Since 2019) | | Advisor, U.S. Department of the Treasury from 2014 to 2015; President, Retirement Plan Services, for T. Rowe Price Group, Inc. from 2007 to 2012; executive positions within Fidelity Investments from 1989 to 2007. | | 73 RICs consisting of 99 Portfolios | | Unum (insurance); The Hanover Insurance Group (Board Chair) (insurance);
Huntsman Corporation (chemical products);
Envestnet (investment platform) from 2013 until 2016. |
| | | | |
Frank J. Fabozzi(d) 1948 | | Director
(Since 2019) | | Editor of The Journal of Portfolio Management since 1986; Professor of Finance, EDHEC Business School (France) since 2011; Visiting Professor, Princeton University for the 2013 to 2014 academic year and Spring 2017 semester; Professor in the Practice of Finance, Yale University School of Management from 1994 to 2011 and currently a Teaching Fellow in Yale’s Executive Programs; Board Member, BlackRock Equity-Liquidity Funds from 2014 to 2016; affiliated professor Karlsruhe Institute of Technology from 2008 to 2011; Visiting Professor, Rutgers University for the Spring 2019 semester; Visiting Professor, New York University for the 2019 academic year. Adjunct Professor of Finance, Carnegie Mellon University in fall 2020 semester. | | 75 RICs consisting of 101 Portfolios | | None |
| | |
DIRECTOR AND OFFICER INFORMATION | | 105 |
Director and Officer Information (continued)
| | | | | | | | |
| Independent Directors(a) (continued) |
| | | | | |
Name Year of Birth(b) | | Position(s) Held
(Length of Service)(c) | | Principal Occupation(s) During Past Five Years | | Number of BlackRock-Advised
Registered Investment Companies
(“RICs”) Consisting of
Investment Portfolios
(“Portfolios”) Overseen | | Public Company
and Other
Investment
Company
Directorships Held
During
Past Five Years |
| | | | |
Stayce D. Harris 1959 | | Director
(Since 2021) | | Lieutenant General, Inspector General, Office of the Secretary of the United States Air Force from 2017 to 2019; Lieutenant General, Assistant Vice Chief of Staff and Director, Air Staff, United States Air Force from 2016 to 2017; Major General, Commander, 22nd Air Force, AFRC, Dobbins Air Reserve Base, Georgia from 2014 to 2016; Pilot, United Airlines from 1990 to 2020. | | 73 RICs consisting of 99 Portfolios | | None |
| | | | |
J. Phillip Holloman 1955 | | Director
(Since 2021) | | President and Chief Operating Officer, Cintas Corporation from 2008 to 2018. | | 73 RICs consisting of 99 Portfolios | | PulteGroup, Inc. (home construction);
Rockwell Automation Inc. (industrial automation) |
| | | | |
R. Glenn Hubbard 1958 | | Director
(Since 2019) | | Dean, Columbia Business School from 2004 to 2019; Faculty member, Columbia Business School since 1988. | | 73 RICs consisting of 99 Portfolios | | ADP (data and information services) 2004-2020;
Metropolitan Life Insurance Company (insurance);
KKR Financial Corporation (finance) from 2004 until 2014. |
| | | | |
W. Carl Kester(d) 1951 | | Director
(Since 2019) | | George Fisher Baker Jr. Professor of Business Administration, Harvard Business School since 2008; Deputy Dean for Academic Affairs from 2006 to 2010; Chairman of the Finance Unit, from 2005 to 2006; Senior Associate Dean and Chairman of the MBA Program from 1999 to 2005; Member of the faculty of Harvard Business School since 1981. | | 75 RICs consisting of 101 Portfolios | | None |
| | | | |
Catherine A. Lynch(d) 1961 | | Director
(Since 2019) | | Chief Executive Officer, Chief Investment Officer and various other positions, National Railroad Retirement Investment Trust from 2003 to 2016; Associate Vice President for Treasury Management, The George Washington University from 1999 to 2003; Assistant Treasurer, Episcopal Church of America from 1995 to 1999. | | 75 RICs consisting of 101 Portfolios | | None |
| | |
| 106 | | 2 0 2 1 BLACK ROCK ANNUAL REPORT TO SHAREHOLDERS |
Director and Officer Information (continued)
| | | | | | | | |
| Interested Directors(a)(e) |
| | | | | |
Name Year of Birth(b) | | Position(s) Held
(Length of Service)(c) | | Principal Occupation(s) During Past Five Years | | Number of BlackRock-Advised
Registered Investment Companies
(“RICs”) Consisting of
Investment Portfolios
(“Portfolios”) Overseen | | Public Company
and Other
Investment
Company
Directorships Held
During
Past Five Years |
| | | | |
Robert Fairbairn 1965 | | Director
(Since 2015) | | Vice Chairman of BlackRock, Inc. since 2019; Member of BlackRock’s Global Executive and Global Operating Committees; Co-Chair of BlackRock’s Human Capital Committee; Senior Managing Director of BlackRock, Inc. from 2010 to 2019; oversaw BlackRock’s Strategic Partner Program and Strategic Product Management Group from 2012 to 2019; Member of the Board of Managers of BlackRock Investments, LLC from 2011 to 2018; Global Head of BlackRock’s Retail and iShares® businesses from 2012 to 2016. | | 103 RICs consisting of 252 Portfolios | | None |
| | | | |
John M. Perlowski(d) 1964 | | Director
(Since 2015)
President and Chief Executive Officer
(Since 2010) | | Managing Director of BlackRock, Inc. since 2009; Head of BlackRock Global Accounting and Product Services since 2009; Advisory Director of Family Resource Network (charitable foundation) since 2009. | | 105 RICs consisting of 254 Portfolios | | None |
(a) The address of each Director is c/o BlackRock, Inc., 55 East 52nd Street, New York, New York 10055. |
(b) Each Independent Director holds office until his or her successor is duly elected and qualifies or until his or her earlier death, resignation, retirement or removal as provided by the Fund’s by-laws or charter or statute, or until December 31 of the year in which he or she turns 75. Directors who are “interested persons,” as defined in the Investment Company Act serve until their successor is duly elected and qualifies or until their earlier death, resignation, retirement or removal as provided by the Fund’s by-laws or statute, or until December 31 of the year in which they turn 72. The Board may determine to extend the terms of Independent Directors on a case-by-case basis, as appropriate. |
(c) Following the combination of Merrill Lynch Investment Managers, L.P. (“MLIM”) and BlackRock, Inc. in September 2006, the various legacy MLIM and legacy BlackRock fund boards were realigned and consolidated into three new fund boards in 2007. Certain Independent Directors first became members of the boards of other legacy MLIM or legacy BlackRock funds as follows: Richard E. Cavanagh, 1994; Frank J. Fabozzi, 1988; R. Glenn Hubbard, 2004; W. Carl Kester, 1995; and Karen P. Robards, 1998. Certain other Independent Directors became members of the boards of the closed-end funds in the Fixed-Income Complex as follows: Michael J. Castellano, 2011; Cynthia L. Egan, 2016; and Catherine A. Lynch, 2016. |
(d) Dr. Fabozzi, Dr. Kester, Ms. Lynch and Mr. Perlowski are also trustees of the BlackRock Credit Strategies Fund and BlackRock Private Investments Fund. |
(e) Mr. Fairbairn and Mr. Perlowski are both “interested persons,” as defined in the 1940 Act, of the Fund based on their positions with BlackRock, Inc. and its affiliates. Mr. Fairbairn and Mr. Perlowski are also board members of the BlackRock Multi-Asset Complex. |
| | | | |
| Officers Who Are Not Directors(a) |
| | | |
Name Year of Birth(b) | | Position(s) Held
(Length of Service) | | Principal Occupation(s) During Past Five Years |
| | |
Jennifer McGovern 1977 | | Vice President
(Since 2014) | | Managing Director of BlackRock, Inc. since 2016; Director of BlackRock, Inc. from 2011 to 2015; Head of Americas Product Development and Governance for BlackRock’s Global Product Group since 2019; Head of Product Structure and Oversight for BlackRock’s U.S. Wealth Advisory Group from 2013 to 2019. |
| | |
Trent Walker 1974 | | Chief Financial Officer
(Since 2021) | | Managing Director of BlackRock, Inc. since September 2019; Executive Vice President of PIMCO from 2016 to 2019; Senior Vice President of PIMCO from 2008 to 2015; Treasurer from 2013 to 2019 and Assistant Treasurer from 2007 to 2017 of PIMCO Funds, PIMCO Variable Insurance Trust, PIMCO ETF Trust, PIMCO Equity Series, PIMCO Equity Series VIT, PIMCO Managed Accounts Trust, 2 PIMCO-sponsored interval funds and 21 PIMCO-sponsored closed-end funds. |
| | |
Jay M. Fife 1970 | | Treasurer
(Since 2007) | | Managing Director of BlackRock, Inc. since 2007. |
| | |
Charles Park 1967 | | Chief Compliance Officer
(Since 2014) | | Anti-Money Laundering Compliance Officer for certain BlackRock-advised Funds from 2014 to 2015; Chief Compliance Officer of BlackRock Advisors, LLC and the BlackRock-advised Funds in the BlackRock Multi-Asset Complex and the BlackRock Fixed-Income Complex since 2014; Principal of and Chief Compliance Officer for iShares® Delaware Trust Sponsor LLC since 2012 and BlackRock Fund Advisors (“BFA”) since 2006; Chief Compliance Officer for the BFA-advised iShares® exchange traded funds since 2006; Chief Compliance Officer for BlackRock Asset Management International Inc. since 2012. |
| | |
Lisa Belle 1968 | | Anti-Money Laundering Compliance Officer
(Since 2019) | | Managing Director of BlackRock, Inc. since 2019; Global Financial Crime Head for Asset and Wealth Management of JP Morgan from 2013 to 2019; Managing Director of RBS Securities from 2012 to 2013; Head of Financial Crimes for Barclays Wealth Americas from 2010 to 2012. |
| | |
DIRECTOR AND OFFICER INFORMATION | | 107 |
Director and Officer Information (continued)
| | | | |
| Officers Who Are Not Directors(a) (continued) |
| | | |
Name Year of Birth(b) | | Position(s) Held
(Length of Service) | | Principal Occupation(s) During Past Five Years |
| | |
Janey Ahn 1975 | | Secretary
(Since 2019) | | Managing Director of BlackRock, Inc. since 2018; Director of BlackRock, Inc. from 2009 to 2017. |
(a) The address of each Officer is c/o BlackRock, Inc., 55 East 52nd Street, New York, New York 10055. |
(b) Officers of the Fund serve at the pleasure of the Board. |
Further information about the Fund’s Directors and Officers is available in the Fund’s Statement of Additional Information, which can be obtained without charge by calling (800) 441-7762.
Neal J. Andrews retired as the Chief Financial Officer effective December 31, 2020, and Trent Walker was elected as the Chief Financial Officer effective January 1, 2021.
Effective July 30, 2021, Lorenzo A. Flores was appointed to serve as a Director of the Funds.
| | |
| 108 | | 2 0 2 1 BLACK ROCK ANNUAL REPORT TO SHAREHOLDERS |
Additional Information
Regulation Regarding Derivatives
On October 28, 2020, the Securities and Exchange Commission (the “SEC”) adopted new regulations governing the use of derivatives by registered investment companies (“Rule 18f-4”). The Funds will be required to implement and comply with Rule 18f-4 by August 19, 2022. Once implemented, Rule 18f-4 will impose limits on the amount of derivatives a fund can enter into, eliminate the asset segregation framework currently used by funds to comply with Section 18 of the 1940 Act, treat derivatives as senior securities and require funds whose use of derivatives is more than a limited specified exposure amount to establish and maintain a comprehensive derivatives risk management program and appoint a derivatives risk manager.
Dividend Policy
Each Fund’s dividend policy is to distribute all or a portion of its net investment income to its shareholders on a monthly/quarterly basis. In order to provide shareholders with a more stable level of dividend distributions, the distributions paid by a Fund for any particular month/quarter may be more or less than the amount of net investment income earned by a Fund during such month/quarter. The portion of distributions that exceeds a Fund current and accumulated earnings and profits, which are measured on a tax basis, will constitute a nontaxable return of capital. The Funds’ current accumulated but undistributed net investment income, if any, is disclosed as accumulated earnings (loss) in the Statements of Assets and Liabilities, which comprises part of the financial information included in this report.
General Information
Quarterly performance, semi-annual and annual reports, current net asset value and other information regarding the Funds may be found on BlackRock’s website, which can be accessed at blackrock.com. Any reference to BlackRock’s website in this report is intended to allow investors public access to information regarding the Funds and does not, and is not intended to, incorporate BlackRock’s website in this report.
Householding
The Funds will mail only one copy of shareholder documents, including prospectuses, annual and semi-annual reports, Rule 30e-3 notices and proxy statements, to shareholders with multiple accounts at the same address. This practice is commonly called “householding” and is intended to reduce expenses and eliminate duplicate mailings of shareholder documents. Mailings of your shareholder documents may be householded indefinitely unless you instruct us otherwise. If you do not want the mailing of these documents to be combined with those for other members of your household, please call the Funds at (800) 441-7762.
Availability of Quarterly Schedule of Investments
The Funds file their complete schedules of portfolio holdings with the SEC for the first and third quarters of each fiscal year as an exhibit to their reports on Form N-PORT. The Funds’ Forms N-PORT are available on the SEC’s website at sec.gov. Additionally, each Fund makes its portfolio holdings for the first and third quarters of each fiscal year available at blackrock.com/fundreports.
Availability of Proxy Voting Policies, Procedures and Voting Records
A description of the policies and procedures that the Funds use to determine how to vote proxies relating to portfolio securities and information about how the Funds voted proxies relating to securities held in the Funds’ portfolios during the most recent 12-month period ended June 30 is available without charge, upon request (1) by calling (800) 441-7762; (2) on the BlackRock website at blackrock.com; and (3) on the SEC’s website at sec.gov.
BlackRock’s Mutual Fund Family
BlackRock offers a diverse lineup of open-end mutual funds crossing all investment styles and managed by experts in equity, fixed-income and tax-exempt investing. Visit blackrock.com for more information.
Shareholder Privileges
Account Information
Call us at (800) 441-7762 from 8:00 AM to 6:00 PM ET on any business day to get information about your account balances, recent transactions and share prices. You can also visit blackrock.com for more information.
Automatic Investment Plans
Investor class shareholders who want to invest regularly can arrange to have $50 or more automatically deducted from their checking or savings account and invested in any of the BlackRock funds.
| | |
ADDITIONAL INFORMATION | | 109 |
Additional Information (continued)
Systematic Withdrawal Plans
Investor class shareholders can establish a systematic withdrawal plan and receive periodic payments of $50 or more from their BlackRock funds, as long as their account balance is at least $10,000.
Retirement Plans
Shareholders may make investments in conjunction with Traditional, Rollover, Roth, Coverdell, Simple IRAs, SEP IRAs and 403(b) Plans.
BlackRock Privacy Principles
BlackRock is committed to maintaining the privacy of its current and former fund investors and individual clients (collectively, “Clients”) and to safeguarding their non-public personal information. The following information is provided to help you understand what personal information BlackRock collects, how we protect that information and why in certain cases we share such information with select parties.
If you are located in a jurisdiction where specific laws, rules or regulations require BlackRock to provide you with additional or different privacy-related rights beyond what is set forth below, then BlackRock will comply with those specific laws, rules or regulations.
BlackRock obtains or verifies personal non-public information from and about you from different sources, including the following: (i) information we receive from you or, if applicable, your financial intermediary, on applications, forms or other documents; (ii) information about your transactions with us, our affiliates, or others; (iii) information we receive from a consumer reporting agency; and (iv) from visits to our websites.
BlackRock does not sell or disclose to non-affiliated third parties any non-public personal information about its Clients, except as permitted by law or as is necessary to respond to regulatory requests or to service Client accounts. These non-affiliated third parties are required to protect the confidentiality and security of this information and to use it only for its intended purpose.
We may share information with our affiliates to service your account or to provide you with information about other BlackRock products or services that may be of interest to you. In addition, BlackRock restricts access to non-public personal information about its Clients to those BlackRock employees with a legitimate business need for the information. BlackRock maintains physical, electronic and procedural safeguards that are designed to protect the non-public personal information of its Clients, including procedures relating to the proper storage and disposal of such information.
Fund and Service Providers
Investment Adviser
BlackRock Advisors, LLC
Wilmington, DE 19809
Accounting Agent and Custodian
State Street Bank and Trust Company
Boston, MA 02111
Transfer Agent
BNY Mellon Investment Servicing (US) Inc.
Wilmington, DE 19809
Distributor
BlackRock Investments, LLC
New York, NY 10022
Independent Registered Public Accounting Firm
Deloitte & Touche LLP
Boston, MA 02116
Legal Counsel
Willkie Farr & Gallagher LLP
New York, NY 10019
Address of the Funds
100 Bellevue Parkway
Wilmington, DE 19809
| | |
| 110 | | 2 0 2 1 BLACK ROCK ANNUAL REPORT TO SHAREHOLDERS |
Glossary of Terms Used in this Report
| | |
| Portfolio Abbreviation |
| |
| AGC | | Assured Guaranty Corp. |
| |
| AGM | | Assured Guaranty Municipal Corp. |
| |
| AGM-CR | | AGM Insured Custodial Receipt |
| |
| AMBAC | | AMBAC Assurance Corp. |
| |
| AMT | | Alternative Minimum Tax |
| |
| ARB | | Airport Revenue Bonds |
| |
| BAB | | Build America Bond |
| |
| BAM | | Build America Mutual Assurance Co. |
| |
| BHAC-CR | | Berkshire Hathaway Assurance Corp. - Custodian Receipt |
| |
| CAB | | Capital Appreciation Bonds |
| |
| CBI | | Certificate of Beneficial Interest |
| |
| COP | | Certificates of Participation |
| |
| CR | | Custodian Receipt |
| |
| ETF | | Exchange-Traded Fund |
| |
| FHA | | Federal Housing Administration |
| |
| FHLMC | | Federal Home Loan Mortgage Corp. |
| |
| FNMA | | Federal National Mortgage Association |
| |
| GNMA | | Government National Mortgage Association |
| |
| GO | | General Obligation Bonds |
| |
| GOL | | General Obligation Ltd. |
| |
| GTD | | GTD Guaranteed |
| |
| HUD SECT 8 | | U.S. Department of Housing and Urban Development Section 8 |
| |
| M/F | | Multi-Family |
| |
| MO | | Moral Obligation |
| |
| NPFGC | | National Public Finance Guarantee Corp. |
| |
| NPFGC-IBC | | National Public Finance Guarantee Corp. — Insured Bond Certificate |
| |
| PSF | | Permanent School Fund |
| |
| PSF-GTD | | Permanent School Fund Guaranteed |
| |
| Q-SBLF | | Qualified School Bond Loan Fund |
| |
| RB | | Revenue Bond |
| |
| S/F | | Single-Family |
| |
| SAB | | Special Assessment Bonds |
| |
| SAN | | State Aid Notes |
| |
| SAP | | Subject to Appropriations |
| |
| SAW | | State Aid Withholding |
| |
| SCH BD RES FD | | School Board Resolution Fund |
| |
| SOFR | | Secured Overnight Financing Rate |
| |
| SONYMA | | State of New York Mortgage Agency |
| |
| ST | | Special Tax |
| |
| TA | | Tax Allocation |
| | |
GLOSSARY OF TERMS USED IN THIS REPORT | | 111 |
Want to know more?
blackrock.com | 800-441-7762
This report is intended for current holders. It is not authorized for use as an offer of sale or a solicitation of an offer to buy shares of the Funds unless preceded or accompanied by the Funds’ current prospectus. Past performance results shown in this report should not be considered a representation of future performance. Investment returns and principal value of shares will fluctuate so that shares, when redeemed, may be worth more or less than their original cost. Statements and other information herein are as dated and are subject to change.
MBNYMB-06/21-AR
(b) Not Applicable
| Item 2 – | Code of Ethics – The registrant (or the “Fund”) has adopted a code of ethics, as of the end of the period covered by this report, applicable to the registrant’s principal executive officer, principal financial officer, principal accounting officer or controller, or persons performing similar functions. During the period covered by this report, the code of ethics was amended to update certain information and to make other non-material changes. During the period covered by this report, there have been no waivers granted under the code of ethics. The registrant undertakes to provide a copy of the code of ethics to any person upon request, without charge, who calls 1-800-441-7762. |
| Item 3 – | Audit Committee Financial Expert – The registrant’s board of directors (the “board of directors”), has determined that (i) the registrant has the following audit committee financial experts serving on its audit committee and (ii) each audit committee financial expert is independent: |
Michael Castellano
Frank J. Fabozzi
Catherine A. Lynch
Karen P. Robards
The registrant’s board of directors has determined that Karen P. Robards qualifies as an audit committee financial expert pursuant to Item 3(c)(4) of Form N-CSR.
Ms. Robards has a thorough understanding of generally accepted accounting principles, financial statements and internal control over financial reporting as well as audit committee functions. Ms. Robards has been President of Robards & Company, a financial advisory firm, since 1987. Ms. Robards was formerly an investment banker for more than 10 years where she was responsible for evaluating and assessing the performance of companies based on their financial results. Ms. Robards has over 30 years of experience analyzing financial statements. She also is a member of the audit committee of one publicly held company and a non-profit organization. Under applicable securities laws, a person determined to be an audit committee financial expert will not be deemed an “expert” for any purpose, including without limitation for the purposes of Section 11 of the Securities Act of 1933, as a result of being designated or identified as an audit committee financial expert. The designation or identification of a person as an audit committee financial expert does not impose on such person any duties, obligations, or liabilities greater than the duties, obligations, and liabilities imposed on such person as a member of the audit committee and board of directors in the absence of such designation or identification. The designation or identification of a person as an audit committee financial expert does not affect the duties, obligations, or liability of any other member of the audit committee or board of directors.
| Item 4 – | Principal Accountant Fees and Services |
The following table presents fees billed by Deloitte & Touche LLP (“D&T”) in each of the last two fiscal years for the services rendered to the Fund:
| | | | | | | | | | | | | | | | |
| | | (a) Audit Fees | | (b) Audit-Related Fees1 | | (c) Tax Fees2 | | (d) All Other Fees |
| Entity Name | | Current Fiscal
| | Previous Fiscal
| | Current Fiscal
| | Previous Fiscal
| | Current Fiscal
| | Previous Fiscal
| | Current Fiscal
| | Previous Fiscal
|
2
| | | | | | | | | | | | | | | | |
| | | Year End | | Year End | | Year End | | Year End | | Year End | | Year End | | Year End | | Year End |
BlackRock High Yield Municipal Fund | | $37,673 | | $38,862 | | $0 | | $0 | | $12,500 | | $13,700 | | $0 | | $0 |
BlackRock National Municipal Fund | | $36,562 | | $37,638 | | $0 | | $0 | | $12,500 | | $13,700 | | $0 | | $0 |
BlackRock Short- Term Municipal Fund | | $29,896 | | $30,804 | | $0 | | $0 | | $12,500 | | $13,700 | | $0 | | $0 |
The following table presents fees billed by D&T that were required to be approved by the registrant’s audit committee (the “Committee”) for services that relate directly to the operations or financial reporting of the Fund and that are rendered on behalf of BlackRock Advisors, LLC (the “Investment Adviser” or “BlackRock”) and entities controlling, controlled by, or under common control with BlackRock (not including any sub-adviser whose role is primarily portfolio management and is subcontracted with or overseen by another investment adviser) that provide ongoing services to the Fund (“Affiliated Service Providers”):
| | | | |
| | | Current Fiscal Year End | | Previous Fiscal Year End |
(b) Audit-Related Fees1 | | $0 | | $0 |
(c) Tax Fees2 | | $0 | | $0 |
(d) All Other Fees3 | | $2,032,000 | | $1,984,000 |
1 The nature of the services includes assurance and related services reasonably related to the performance of the audit or review of financial statements not included in Audit Fees, including accounting consultations, agreed-upon procedure reports, attestation reports, comfort letters, out-of-pocket expenses and internal control reviews not required by regulators.
2 The nature of the services includes tax compliance and/or tax preparation, including services relating to the filing or amendment of federal, state or local income tax returns, regulated investment company qualification reviews, taxable income and tax distribution calculations.
3 Non-audit fees of $2,032,000 and $1,984,000 for the current fiscal year and previous fiscal year, respectively, were paid to the Fund’s principal accountant in their entirety by BlackRock, in connection with services provided to the Affiliated Service Providers of the Fund and of certain other funds sponsored and advised by BlackRock or its affiliates for a service organization review and an accounting research tool subscription. These amounts represent aggregate fees paid by BlackRock and were not allocated on a per fund basis.
(e)(1) Audit Committee Pre-Approval Policies and Procedures:
The Committee has adopted policies and procedures with regard to the pre-approval of services. Audit, audit-related and tax compliance services provided to the registrant on an annual basis require specific pre-approval by the Committee. The Committee also must approve other non-audit services provided to the registrant and those non-audit services provided to the Investment Adviser and Affiliated Service Providers that relate directly to the operations and the financial reporting of the registrant. Certain of these non-audit services that the Committee believes are (a) consistent with the SEC’s auditor independence rules and (b) routine and recurring services that will not impair the independence of the independent accountants may be approved by the Committee without consideration on a specific case-by-case basis (“general pre-approval”). The term of any general pre-approval is 12 months from the date of the pre-approval, unless the Committee provides for a different period. Tax or other non-audit services provided to the registrant which have a direct impact on the operations or financial reporting of the registrant will only be deemed pre-approved provided that any individual project does not exceed $10,000 attributable to the registrant or $50,000 per project. For this purpose, multiple projects will be aggregated to determine if they exceed the previously mentioned cost levels.
Any proposed services exceeding the pre-approved cost levels will require specific pre-approval by the Committee, as will any othe services not subject to general pre-approval (e.g.,
3
unanticipated but permissible services). The Committee is informed of each service approved subject to general pre-approval at the next regularly scheduled in-person board meeting. At this meeting, an analysis of such services is presented to the Committee for ratification. The Committee may delegate to the Committee Chairman the authority to approve the provision of and fees for any specific engagement of permitted non-audit services, including services exceeding pre-approved cost levels.
(e)(2) None of the services described in each of Items 4(b) through (d) were approved by the Committee pursuant to the de minimis exception in paragraph (c)(7)(i)(C) of Rule 2-01 of Regulation S-X.
(f) Not Applicable
(g) The aggregate non-audit fees, defined as the sum of the fees shown under “Audit-Related Fees,” “Tax Fees” and “All Other Fees,” paid to the accountant for services rendered by the accountant to the registrant, the Investment Adviser and the Affiliated Service Providers were:
| | | | |
| Entity Name | | Current Fiscal
Year End | | Previous Fiscal
Year End |
BlackRock High Yield Municipal Fund | | $12,500 | | $13,700 |
BlackRock National Municipal Fund | | $12,500 | | $13,700 |
BlackRock Short-Term Municipal Fund | | $12,500 | | $13,700 |
Additionally, the amounts billed by D&T in connection with services provided to the Affiliated Service Providers of the Fund and of other funds sponsored and advised by BlackRock or its affiliates during the current and previous fiscal years for a service organization review and an accounting research tool subscription were:
| | |
Current Fiscal Year
End | | Previous Fiscal Year
End |
| $2,032,000 | | $1,984,000 |
These amounts represent aggregate fees paid by BlackRock and were not allocated on a per fund basis.
(h) The Committee has considered and determined that the provision of non-audit services that were rendered to the Investment Adviser and the Affiliated Service Providers that were not pre-approved pursuant to paragraph (c)(7)(ii) of Rule 2-01 of Regulation S-X is compatible with maintaining the principal accountant’s independence.
| Item 5 – | Audit Committee of Listed Registrants – Not Applicable |
(a) The registrant’s Schedule of Investments is included as part of the Report to Stockholders filed under Item 1(a) of this Form.
4
(b) Not Applicable due to no such divestments during the semi-annual period covered since the previous Form N-CSR filing.
| Item 7 – | Disclosure of Proxy Voting Policies and Procedures for Closed-End Management Investment Companies – Not Applicable |
| Item 8 – | Portfolio Managers of Closed-End Management Investment Companies – Not Applicable |
| Item 9 – | Purchases of Equity Securities by Closed-End Management Investment Company and Affiliated Purchasers – Not Applicable |
| Item 10 – | Submission of Matters to a Vote of Security Holders – There have been no material changes to these procedures. |
| Item | 11 – Controls and Procedures |
(a) The registrant’s principal executive and principal financial officers, or persons performing similar functions, have concluded that the registrant’s disclosure controls and procedures (as defined in Rule 30a-3(c) under the Investment Company Act of 1940, as amended (the “1940 Act”)) are effective as of a date within 90 days of the filing of this report based on the evaluation of these controls and procedures required by Rule 30a-3(b) under the 1940 Act and Rule 15d-15(b) under the Securities Exchange Act of 1934, as amended.
(b) There were no changes in the registrant’s internal control over financial reporting (as defined in Rule 30a-3(d) under the 1940 Act) that occurred during the period covered by this report that have materially affected, or are reasonably likely to materially affect, the registrant’s internal control over financial reporting.
| Item 12 – | Disclosure of Securities Lending Activities for Closed-End Management Investment Companies – Not Applicable |
| Item 13 – | Exhibits attached hereto |
(a)(1) Code of Ethics – See Item 2
(a)(2) Section 302 Certifications are attached
(a)(3) Not Applicable
(a)(4) Not Applicable
(b) Section 906 Certifications are attached
5
Pursuant to the requirements of the Securities Exchange Act of 1934 and the Investment Company Act of 1940, the registrant has duly caused this report to be signed on its behalf by the undersigned, thereunto duly authorized.
BlackRock Municipal Bond Fund, Inc.
| | | | |
| | By: | | /s/ John M. Perlowski |
| | | | John M. Perlowski |
| | | | Chief Executive Officer (principal executive officer) of |
| | | | BlackRock Municipal Bond Fund, Inc. |
Date: September 2, 2021
Pursuant to the requirements of the Securities Exchange Act of 1934 and the Investment Company Act of 1940, this report has been signed below by the following persons on behalf of the registrant and in the capacities and on the dates indicated.
| | | | |
| | By: | | /s/ John M. Perlowski |
| | | | John M. Perlowski |
| | | | Chief Executive Officer (principal executive officer) of |
| | | | BlackRock Municipal Bond Fund, Inc. |
Date: September 2, 2021
| | | | |
| | By: | | /s/ Trent Walker |
| | | | Trent Walker |
| | | | Chief Financial Officer (principal financial officer) of |
| | | | BlackRock Municipal Bond Fund, Inc. |
Date: September 2, 2021
6