UNITED STATES
SECURITIES AND EXCHANGE COMMISSION
Washington, D.C. 20549
FORM N-CSR
CERTIFIED SHAREHOLDER REPORT OF REGISTERED MANAGEMENT INVESTMENT COMPANIES
Investment Company Act file number:
Name of Fund:
| BlackRock Municipal Bond Fund, Inc. |
| BlackRock High Yield Municipal Fund |
| BlackRock National Municipal Fund |
| BlackRock Short-Term Municipal Fund |
|
|
|
|
|
|
|
|
|
|
|
|
|
|
|
|
|
|
|
|
|
|
|
|
|
|
Fund Address: 100 Bellevue Parkway, Wilmington, DE 19809
Name and address of agent for service: John M. Perlowski, Chief Executive Officer, BlackRock Municipal Bond Fund, Inc., 50 Hudson Yards, New York, NY 10001
Registrant's telephone number, including area code:
Date of reporting period:
Item 1 — Report to Stockholders
(a) The Report to Shareholders is attached herewith
BlackRock High Yield Municipal Fund
Institutional Shares | MAYHX
Annual Shareholder Report — June 30, 2024
This annual shareholder report contains important information about BlackRock High Yield Municipal Fund (the “Fund”) for the period of July 1, 2023 to June 30, 2024. You can find additional information about the Fund at blackrock.com/fundreports. You can also request this information by contacting us at (800) 441‑7762.
This report describes changes to the Fund that occurred during the reporting period.
What were the Fund costs for the last year?
(based on a hypothetical $10,000 investment)
| Class name | Costs of a $10,000
investment | Costs paid as a percentage of a
$10,000 investment |
| Institutional Shares | $60 | 0.57% |
How did the Fund perform last year?
High-yield municipal bonds gained ground during the reporting period, with price appreciation augmenting the contribution from income.
Declining inflation fueled expectations that the U.S. Federal Reserve was set to begin cutting interest rates in 2024, benefiting the broader fixed-income market from November 2023 onward.
Municipal bonds were well supported by positive economic growth, strong issuer fundamentals, and favorable supply-and-demand trends.
What contributed to performance?
Longer-duration securities with maturities of 20 years and longer made the largest contribution, with a significant portion of the positive return coming from bonds having maturities of 25 years and above. (Duration is a measure of interest rate sensitivity). In terms of credit tiers, the strongest absolute returns came from not rated and BB rated bonds, respectively. Other industries and tax-backed states were the top contributors at the sector level. Among individual securities, Puerto Rico Commonwealth contingent value instruments and Port Beaumont Navigation District of Jefferson County, TX were the top performing bonds. The Fund’s cash position had no material effect on performance.
What detracted from performance?
At a time of positive returns for the broader market, few aspects of the Fund’s positioning detracted from absolute performance. With that said, certain individual securities lost ground due to issuer-specific developments. For instance, the bonds of the industrial wood-pellet supplier Enviva, Inc. slid in price after the issuer filed for Chapter 11 bankruptcy. In addition, the bonds of Puerto Rico Electric Power Authority declined as bankruptcy hearing proceedings continued to cloud the outcome for bondholder recovery.
The views expressed reflect the opinions of BlackRock as of the date of this report and are subject to change based on changes in market, economic or other conditions. These views are not intended to be a forecast of future events and are no guarantee of future results.
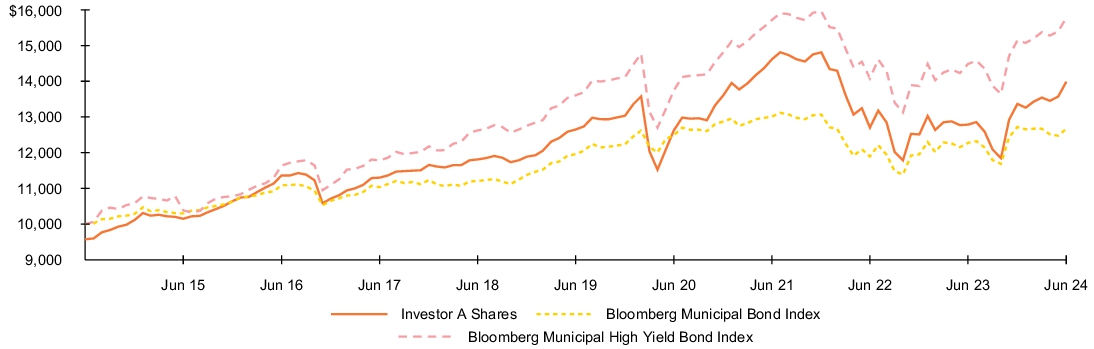
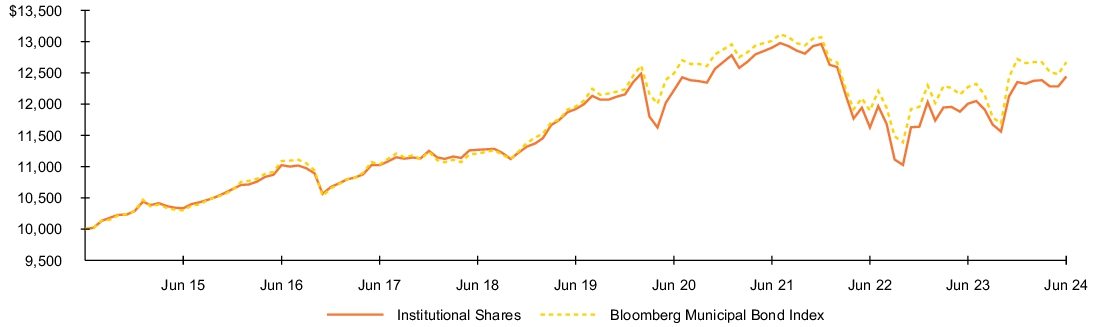
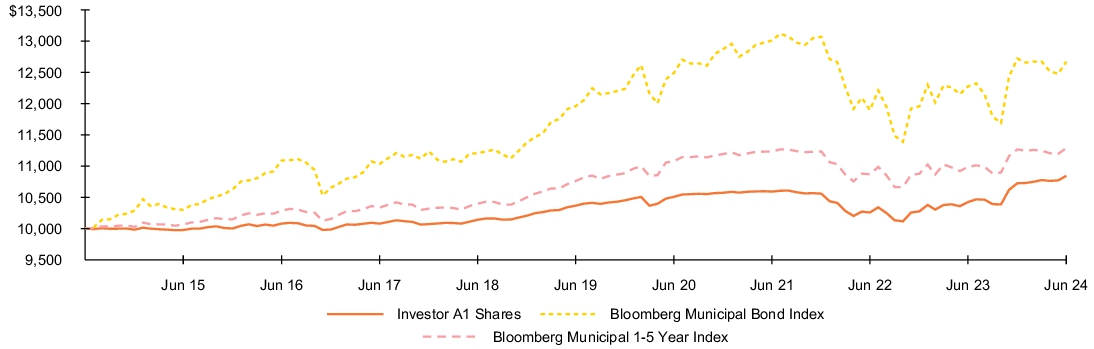
Fund performance
Cumulative performance: July 1, 2014 through June 30, 2024
Initial investment of $10,000
See “Average annual total returns” for additional information on fund performance.
| Average annual total returns | | | |
| 1 Year | 5 Years | 10 Years |
| Institutional Shares | 9.64% | 2.28% | 4.12% |
| Bloomberg Municipal Bond Index | 3.21% | 1.16% | 2.39% |
| Bloomberg Municipal High Yield Bond Index | 8.90% | 3.00% | 4.66% |
| High Yield Customized Reference Benchmark | 7.06% | 2.43% | N/A |
| Key Fund statistics | |
| Net Assets | $1,644,901,083% |
| Number of Portfolio Holdings | $700% |
| Net Investment Advisory Fees | $7,095,681% |
| Portfolio Turnover Rate | $34% |
The Fund has added the Bloomberg Municipal Bond Index in response to new regulatory requirements.
The High Yield Customized Reference Benchmark (commenced on September 30, 2016) is comprised of Bloomberg Municipal Bond Rated Baa Index (20%), Bloomberg Municipal Bond: High Yield (non-Investment Grade) Total Return Index (60%) and Bloomberg Municipal Investment Grade ex BBB (20%).
Past performance is not an indication of future results. Performance results may include adjustments made for financial reporting purposes in accordance with U.S. generally accepted accounting principles. Performance results do not reflect the deduction of taxes that a shareholder would pay on fund distributions or on the redemption or sale of fund shares. Visit blackrock.com for more recent performance information.
What did the Fund invest in?
(as of June 30, 2024)
| Sector allocation |
| Sector(a) | Percent of
Total Investments(b) |
| State | 19.4% |
| Corporate | 16.1% |
| Transportation | 13.1% |
| Education | 12.9% |
| Health | 12.6% |
| County/City/Special District/School District | 11.1% |
| Utilities | 5.2% |
| Housing | 4.8% |
| Tobacco | 4.0% |
| Other* | 0.8% |
| Credit quality allocation |
| Credit Rating(c) | Percent of
Total Investments(b) |
| AAA/Aaa | 0.3% |
| AA/Aa | 11.7% |
| A | 10.5% |
| BBB/Baa | 8.8% |
| BB/Ba | 9.4% |
| B | 1.9% |
| N/R(d) | 57.4% |
| (a) | For purposes of this report, sector sub-classifications may differ from those utilized for compliance purposes. |
| (b) | Excludes short-term securities. |
| (c) | For purposes of this report, credit quality ratings shown above reflect the highest rating assigned by either S&P Global Ratings or Moody’s Investors Service, Inc. if ratings differ. These rating agencies are independent, nationally recognized statistical rating organizations and are widely used. Investment grade ratings are credit ratings of BBB/Baa or higher. Below investment grade ratings are credit ratings of BB/Ba or lower. Investments designated N/R are not rated by either rating agency. Unrated investments do not necessarily indicate low credit quality. Credit quality ratings are subject to change. |
| (d) | The investment adviser evaluates the credit quality of unrated investments based upon certain factors including, but not limited to, credit ratings for similar investments and financial analysis of sectors and individual investments. Using this approach, the investment adviser has deemed certain of these unrated securities as investment grade quality. As of June 30, 2024, the market value of unrated securities deemed by the investment adviser to be investment grade represents less than 1.0% of total investments. |
| * | Ten largest sectors are presented. Additional sectors are found in Other. |
Material Fund changes
This is a summary of certain changes to the Fund since June 30, 2023. For more complete information, you may review the Fund’s next prospectus, which we expect to be available approximately 120 days after June 30, 2024 at blackrock.com/fundreports or upon request by contacting us at (800) 441-7762.
The net expense ratio decreased from the prior fiscal year end primarily due to a decrease in expenses related to financing activities.
Additional information
If you wish to view additional information about the Fund, including but not limited to financial statements, the Fund’s prospectus, and proxy voting policies and procedures, please visit blackrock.com/fundreports. For proxy voting records, visit blackrock.com/proxyrecords.
Householding
The Fund will mail only one copy of shareholder documents, including prospectuses, annual and semi-annual reports and proxy statements, to shareholders with multiple accounts at the same address. This practice is commonly called “householding” and is intended to reduce expenses and eliminate duplicate mailings of shareholder documents. Mailings of your shareholder documents may be householded indefinitely unless you instruct us otherwise. If you do not want the mailing of these documents to be combined with those for other members of your household, please call the Fund at (800) 441-7762.
The Fund is not sponsored, endorsed, issued, sold, or promoted by Bloomberg Index Services Limited and its affiliates, nor does this company make any representation regarding the advisability of investing in the Fund. BlackRock is not affiliated with the company listed above.
©2024 BlackRock, Inc. or its affiliates. All rights reserved. BLACKROCK is a registered trademark of BlackRock, Inc. or its affiliates. All other trademarks are those of their respective owners.
BlackRock High Yield Municipal Fund
Institutional Shares | MAYHX
Annual Shareholder Report — June 30, 2024
MAYHX-06/24-AR
BlackRock High Yield Municipal Fund
Investor A Shares | MDYHX
Annual Shareholder Report — June 30, 2024
This annual shareholder report contains important information about BlackRock High Yield Municipal Fund (the “Fund”) for the period of July 1, 2023 to June 30, 2024. You can find additional information about the Fund at blackrock.com/fundreports. You can also request this information by contacting us at (800) 441‑7762.
What were the Fund costs for the last year?
(based on a hypothetical $10,000 investment)
| Class name | Costs of a $10,000
investment | Costs paid as a percentage of a
$10,000 investment |
| Investor A Shares | $86 | 0.82% |
How did the Fund perform last year?
High-yield municipal bonds gained ground during the reporting period, with price appreciation augmenting the contribution from income.
Declining inflation fueled expectations that the U.S. Federal Reserve was set to begin cutting interest rates in 2024, benefiting the broader fixed-income market from November 2023 onward.
Municipal bonds were well supported by positive economic growth, strong issuer fundamentals, and favorable supply-and-demand trends.
What contributed to performance?
Longer-duration securities with maturities of 20 years and longer made the largest contribution, with a significant portion of the positive return coming from bonds having maturities of 25 years and above. (Duration is a measure of interest rate sensitivity). In terms of credit tiers, the strongest absolute returns came from not rated and BB rated bonds, respectively. Other industries and tax-backed states were the top contributors at the sector level. Among individual securities, Puerto Rico Commonwealth contingent value instruments and Port Beaumont Navigation District of Jefferson County, TX were the top performing bonds. The Fund’s cash position had no material effect on performance.
What detracted from performance?
At a time of positive returns for the broader market, few aspects of the Fund’s positioning detracted from absolute performance. With that said, certain individual securities lost ground due to issuer-specific developments. For instance, the bonds of the industrial wood-pellet supplier Enviva, Inc. slid in price after the issuer filed for Chapter 11 bankruptcy. In addition, the bonds of Puerto Rico Electric Power Authority declined as bankruptcy hearing proceedings continued to cloud the outcome for bondholder recovery.
The views expressed reflect the opinions of BlackRock as of the date of this report and are subject to change based on changes in market, economic or other conditions. These views are not intended to be a forecast of future events and are no guarantee of future results.
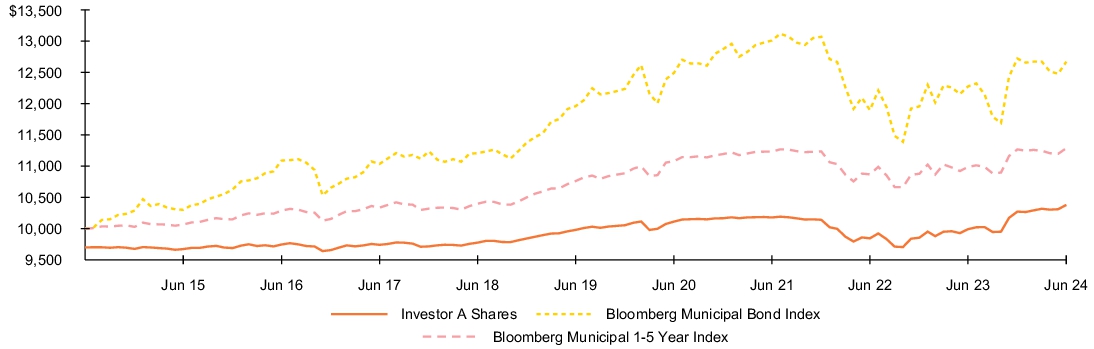
Fund performance
Cumulative performance: July 1, 2014 through June 30, 2024
Initial investment of $10,000
See “Average annual total returns” for additional information on fund performance.
| Average annual total returns | | | |
| 1 Year | 5 Years | 10 Years |
| Investor A Shares | 9.38% | 2.03% | 3.86% |
| Investor A Shares (with sales charge) | 4.73% | 1.14% | 3.41% |
| Bloomberg Municipal Bond Index | 3.21% | 1.16% | 2.39% |
| Bloomberg Municipal High Yield Bond Index | 8.90% | 3.00% | 4.66% |
| High Yield Customized Reference Benchmark | 7.06% | 2.43% | N/A |
| Key Fund statistics | |
| Net Assets | $1,644,901,083% |
| Number of Portfolio Holdings | $700% |
| Net Investment Advisory Fees | $7,095,681% |
| Portfolio Turnover Rate | $34% |
The Fund has added the Bloomberg Municipal Bond Index in response to new regulatory requirements.
The High Yield Customized Reference Benchmark (commenced on September 30, 2016) is comprised of Bloomberg Municipal Bond Rated Baa Index (20%), Bloomberg Municipal Bond: High Yield (non-Investment Grade) Total Return Index (60%) and Bloomberg Municipal Investment Grade ex BBB (20%).
Assuming maximum sales charges. Average annual total returns with and without sales charges reflect reductions for service fees.
Past performance is not an indication of future results. Performance results may include adjustments made for financial reporting purposes in accordance with U.S. generally accepted accounting principles. Performance results do not reflect the deduction of taxes that a shareholder would pay on fund distributions or on the redemption or sale of fund shares. Visit blackrock.com for more recent performance information.
What did the Fund invest in?
(as of June 30, 2024)
| Sector allocation |
| Sector(a) | Percent of
Total Investments(b) |
| State | 19.4% |
| Corporate | 16.1% |
| Transportation | 13.1% |
| Education | 12.9% |
| Health | 12.6% |
| County/City/Special District/School District | 11.1% |
| Utilities | 5.2% |
| Housing | 4.8% |
| Tobacco | 4.0% |
| Other* | 0.8% |
| Credit quality allocation |
| Credit Rating(c) | Percent of
Total Investments(b) |
| AAA/Aaa | 0.3% |
| AA/Aa | 11.7% |
| A | 10.5% |
| BBB/Baa | 8.8% |
| BB/Ba | 9.4% |
| B | 1.9% |
| N/R(d) | 57.4% |
| (a) | For purposes of this report, sector sub-classifications may differ from those utilized for compliance purposes. |
| (b) | Excludes short-term securities. |
| (c) | For purposes of this report, credit quality ratings shown above reflect the highest rating assigned by either S&P Global Ratings or Moody’s Investors Service, Inc. if ratings differ. These rating agencies are independent, nationally recognized statistical rating organizations and are widely used. Investment grade ratings are credit ratings of BBB/Baa or higher. Below investment grade ratings are credit ratings of BB/Ba or lower. Investments designated N/R are not rated by either rating agency. Unrated investments do not necessarily indicate low credit quality. Credit quality ratings are subject to change. |
| (d) | The investment adviser evaluates the credit quality of unrated investments based upon certain factors including, but not limited to, credit ratings for similar investments and financial analysis of sectors and individual investments. Using this approach, the investment adviser has deemed certain of these unrated securities as investment grade quality. As of June 30, 2024, the market value of unrated securities deemed by the investment adviser to be investment grade represents less than 1.0% of total investments. |
| * | Ten largest sectors are presented. Additional sectors are found in Other. |
Additional information
If you wish to view additional information about the Fund, including but not limited to financial statements, the Fund’s prospectus, and proxy voting policies and procedures, please visit blackrock.com/fundreports. For proxy voting records, visit blackrock.com/proxyrecords.
Householding
The Fund will mail only one copy of shareholder documents, including prospectuses, annual and semi-annual reports and proxy statements, to shareholders with multiple accounts at the same address. This practice is commonly called “householding” and is intended to reduce expenses and eliminate duplicate mailings of shareholder documents. Mailings of your shareholder documents may be householded indefinitely unless you instruct us otherwise. If you do not want the mailing of these documents to be combined with those for other members of your household, please call the Fund at (800) 441-7762.
The Fund is not sponsored, endorsed, issued, sold, or promoted by Bloomberg Index Services Limited and its affiliates, nor does this company make any representation regarding the advisability of investing in the Fund. BlackRock is not affiliated with the company listed above.
©2024 BlackRock, Inc. or its affiliates. All rights reserved. BLACKROCK is a registered trademark of BlackRock, Inc. or its affiliates. All other trademarks are those of their respective owners.
BlackRock High Yield Municipal Fund
Investor A Shares | MDYHX
Annual Shareholder Report — June 30, 2024
MDYHX-06/24-AR
BlackRock High Yield Municipal Fund
Investor C Shares | MCYHX
Annual Shareholder Report — June 30, 2024
This annual shareholder report contains important information about BlackRock High Yield Municipal Fund (the “Fund”) for the period of July 1, 2023 to June 30, 2024. You can find additional information about the Fund at blackrock.com/fundreports. You can also request this information by contacting us at (800) 441‑7762.
What were the Fund costs for the last year?
(based on a hypothetical $10,000 investment)
| Class name | Costs of a $10,000
investment | Costs paid as a percentage of a
$10,000 investment |
| Investor C Shares | $164 | 1.57% |
How did the Fund perform last year?
High-yield municipal bonds gained ground during the reporting period, with price appreciation augmenting the contribution from income.
Declining inflation fueled expectations that the U.S. Federal Reserve was set to begin cutting interest rates in 2024, benefiting the broader fixed-income market from November 2023 onward.
Municipal bonds were well supported by positive economic growth, strong issuer fundamentals, and favorable supply-and-demand trends.
What contributed to performance?
Longer-duration securities with maturities of 20 years and longer made the largest contribution, with a significant portion of the positive return coming from bonds having maturities of 25 years and above. (Duration is a measure of interest rate sensitivity). In terms of credit tiers, the strongest absolute returns came from not rated and BB rated bonds, respectively. Other industries and tax-backed states were the top contributors at the sector level. Among individual securities, Puerto Rico Commonwealth contingent value instruments and Port Beaumont Navigation District of Jefferson County, TX were the top performing bonds. The Fund’s cash position had no material effect on performance.
What detracted from performance?
At a time of positive returns for the broader market, few aspects of the Fund’s positioning detracted from absolute performance. With that said, certain individual securities lost ground due to issuer-specific developments. For instance, the bonds of the industrial wood-pellet supplier Enviva, Inc. slid in price after the issuer filed for Chapter 11 bankruptcy. In addition, the bonds of Puerto Rico Electric Power Authority declined as bankruptcy hearing proceedings continued to cloud the outcome for bondholder recovery.
The views expressed reflect the opinions of BlackRock as of the date of this report and are subject to change based on changes in market, economic or other conditions. These views are not intended to be a forecast of future events and are no guarantee of future results.
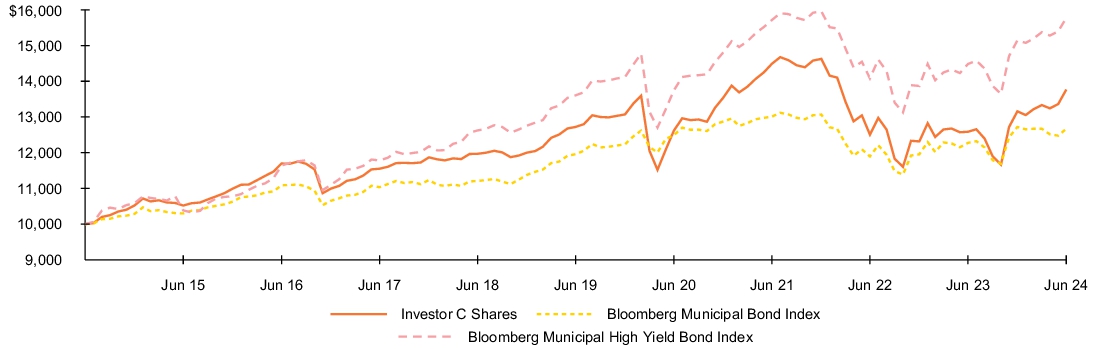
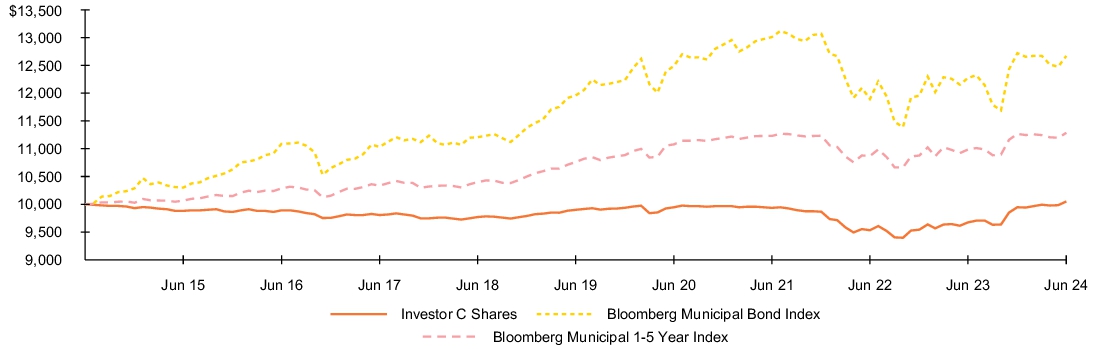
Fund performance
Cumulative performance: July 1, 2014 through June 30, 2024
Initial investment of $10,000
See “Average annual total returns” for additional information on fund performance.
| Average annual total returns | | | |
| 1 Year | 5 Years | 10 Years |
| Investor C Shares | 8.67% | 1.29% | 3.25% |
| Investor C Shares (with sales charge) | 7.67% | 1.29% | 3.25% |
| Bloomberg Municipal Bond Index | 3.21% | 1.16% | 2.39% |
| Bloomberg Municipal High Yield Bond Index | 8.90% | 3.00% | 4.66% |
| High Yield Customized Reference Benchmark | 7.06% | 2.43% | N/A |
| Key Fund statistics | |
| Net Assets | $1,644,901,083% |
| Number of Portfolio Holdings | $700% |
| Net Investment Advisory Fees | $7,095,681% |
| Portfolio Turnover Rate | $34% |
The Fund has added the Bloomberg Municipal Bond Index in response to new regulatory requirements.
The High Yield Customized Reference Benchmark (commenced on September 30, 2016) is comprised of Bloomberg Municipal Bond Rated Baa Index (20%), Bloomberg Municipal Bond: High Yield (non-Investment Grade) Total Return Index (60%) and Bloomberg Municipal Investment Grade ex BBB (20%).
Assuming maximum sales charges. Average annual total returns with and without sales charges reflect reductions for distribution and service fees.
Past performance is not an indication of future results. Performance results may include adjustments made for financial reporting purposes in accordance with U.S. generally accepted accounting principles. Performance results do not reflect the deduction of taxes that a shareholder would pay on fund distributions or on the redemption or sale of fund shares. Visit blackrock.com for more recent performance information.
What did the Fund invest in?
(as of June 30, 2024)
| Sector allocation |
| Sector(a) | Percent of
Total Investments(b) |
| State | 19.4% |
| Corporate | 16.1% |
| Transportation | 13.1% |
| Education | 12.9% |
| Health | 12.6% |
| County/City/Special District/School District | 11.1% |
| Utilities | 5.2% |
| Housing | 4.8% |
| Tobacco | 4.0% |
| Other* | 0.8% |
| Credit quality allocation |
| Credit Rating(c) | Percent of
Total Investments(b) |
| AAA/Aaa | 0.3% |
| AA/Aa | 11.7% |
| A | 10.5% |
| BBB/Baa | 8.8% |
| BB/Ba | 9.4% |
| B | 1.9% |
| N/R(d) | 57.4% |
| (a) | For purposes of this report, sector sub-classifications may differ from those utilized for compliance purposes. |
| (b) | Excludes short-term securities. |
| (c) | For purposes of this report, credit quality ratings shown above reflect the highest rating assigned by either S&P Global Ratings or Moody’s Investors Service, Inc. if ratings differ. These rating agencies are independent, nationally recognized statistical rating organizations and are widely used. Investment grade ratings are credit ratings of BBB/Baa or higher. Below investment grade ratings are credit ratings of BB/Ba or lower. Investments designated N/R are not rated by either rating agency. Unrated investments do not necessarily indicate low credit quality. Credit quality ratings are subject to change. |
| (d) | The investment adviser evaluates the credit quality of unrated investments based upon certain factors including, but not limited to, credit ratings for similar investments and financial analysis of sectors and individual investments. Using this approach, the investment adviser has deemed certain of these unrated securities as investment grade quality. As of June 30, 2024, the market value of unrated securities deemed by the investment adviser to be investment grade represents less than 1.0% of total investments. |
| * | Ten largest sectors are presented. Additional sectors are found in Other. |
Additional information
If you wish to view additional information about the Fund, including but not limited to financial statements, the Fund’s prospectus, and proxy voting policies and procedures, please visit blackrock.com/fundreports. For proxy voting records, visit blackrock.com/proxyrecords.
Householding
The Fund will mail only one copy of shareholder documents, including prospectuses, annual and semi-annual reports and proxy statements, to shareholders with multiple accounts at the same address. This practice is commonly called “householding” and is intended to reduce expenses and eliminate duplicate mailings of shareholder documents. Mailings of your shareholder documents may be householded indefinitely unless you instruct us otherwise. If you do not want the mailing of these documents to be combined with those for other members of your household, please call the Fund at (800) 441-7762.
The Fund is not sponsored, endorsed, issued, sold, or promoted by Bloomberg Index Services Limited and its affiliates, nor does this company make any representation regarding the advisability of investing in the Fund. BlackRock is not affiliated with the company listed above.
©2024 BlackRock, Inc. or its affiliates. All rights reserved. BLACKROCK is a registered trademark of BlackRock, Inc. or its affiliates. All other trademarks are those of their respective owners.
BlackRock High Yield Municipal Fund
Investor C Shares | MCYHX
Annual Shareholder Report — June 30, 2024
MCYHX-06/24-AR
BlackRock High Yield Municipal Fund
Class K Shares | MKYHX
Annual Shareholder Report — June 30, 2024
This annual shareholder report contains important information about BlackRock High Yield Municipal Fund (the “Fund”) for the period of July 1, 2023 to June 30, 2024. You can find additional information about the Fund at blackrock.com/fundreports. You can also request this information by contacting us at (800) 441‑7762.
This report describes changes to the Fund that occurred during the reporting period.
What were the Fund costs for the last year?
(based on a hypothetical $10,000 investment)
| Class name | Costs of a $10,000
investment | Costs paid as a percentage of a
$10,000 investment |
| Class K Shares | $55 | 0.52% |
How did the Fund perform last year?
High-yield municipal bonds gained ground during the reporting period, with price appreciation augmenting the contribution from income.
Declining inflation fueled expectations that the U.S. Federal Reserve was set to begin cutting interest rates in 2024, benefiting the broader fixed-income market from November 2023 onward.
Municipal bonds were well supported by positive economic growth, strong issuer fundamentals, and favorable supply-and-demand trends.
What contributed to performance?
Longer-duration securities with maturities of 20 years and longer made the largest contribution, with a significant portion of the positive return coming from bonds having maturities of 25 years and above. (Duration is a measure of interest rate sensitivity). In terms of credit tiers, the strongest absolute returns came from not rated and BB rated bonds, respectively. Other industries and tax-backed states were the top contributors at the sector level. Among individual securities, Puerto Rico Commonwealth contingent value instruments and Port Beaumont Navigation District of Jefferson County, TX were the top performing bonds. The Fund’s cash position had no material effect on performance.
What detracted from performance?
At a time of positive returns for the broader market, few aspects of the Fund’s positioning detracted from absolute performance. With that said, certain individual securities lost ground due to issuer-specific developments. For instance, the bonds of the industrial wood-pellet supplier Enviva, Inc. slid in price after the issuer filed for Chapter 11 bankruptcy. In addition, the bonds of Puerto Rico Electric Power Authority declined as bankruptcy hearing proceedings continued to cloud the outcome for bondholder recovery.
The views expressed reflect the opinions of BlackRock as of the date of this report and are subject to change based on changes in market, economic or other conditions. These views are not intended to be a forecast of future events and are no guarantee of future results.
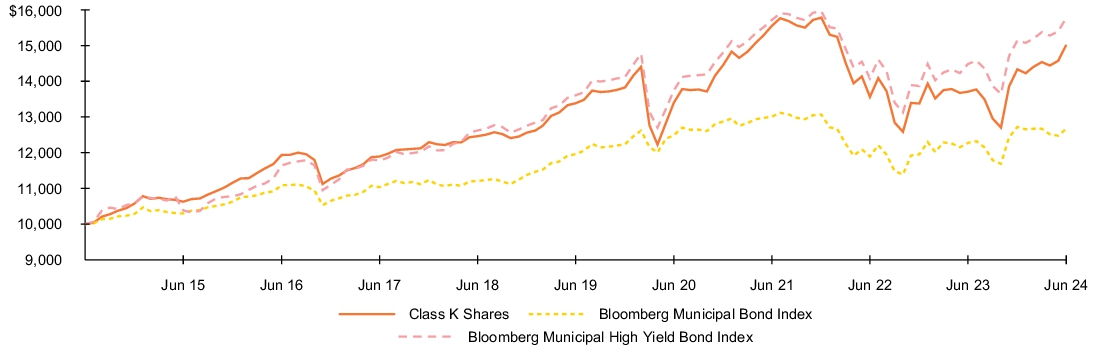
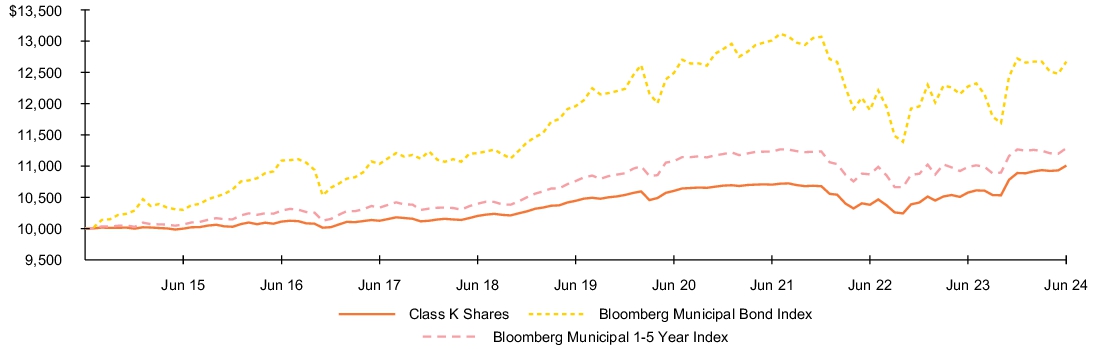
Fund performance
Cumulative performance: July 1, 2014 through June 30, 2024
Initial investment of $10,000
See “Average annual total returns” for additional information on fund performance.
| Average annual total returns | | | |
| 1 Year | 5 Years | 10 Years |
| Class K Shares | 9.70% | 2.33% | 4.15% |
| Bloomberg Municipal Bond Index | 3.21% | 1.16% | 2.39% |
| Bloomberg Municipal High Yield Bond Index | 8.90% | 3.00% | 4.66% |
| High Yield Customized Reference Benchmark | 7.06% | 2.43% | N/A |
| Key Fund statistics | |
| Net Assets | $1,644,901,083% |
| Number of Portfolio Holdings | $700% |
| Net Investment Advisory Fees | $7,095,681% |
| Portfolio Turnover Rate | $34% |
The Fund has added the Bloomberg Municipal Bond Index in response to new regulatory requirements.
The High Yield Customized Reference Benchmark (commenced on September 30, 2016) is comprised of Bloomberg Municipal Bond Rated Baa Index (20%), Bloomberg Municipal Bond: High Yield (non-Investment Grade) Total Return Index (60%) and Bloomberg Municipal Investment Grade ex BBB (20%).
Performance shown prior to the Class K Shares inception date of January 25, 2018 is that of Institutional Shares. The performance of Class K Shares would be substantially similar to Institutional Shares because Class K Shares and Institutional Shares invest in the same portfolio of securities and performance would only differ to the extent that Class K Shares and Institutional Shares have different expenses. The actual returns of Class K Shares would have been higher than those of the Institutional Shares because Class K Shares have lower expenses than the Institutional Shares.
Past performance is not an indication of future results. Performance results may include adjustments made for financial reporting purposes in accordance with U.S. generally accepted accounting principles. Performance results do not reflect the deduction of taxes that a shareholder would pay on fund distributions or on the redemption or sale of fund shares. Visit blackrock.com for more recent performance information.
What did the Fund invest in?
(as of June 30, 2024)
| Sector allocation |
| Sector(a) | Percent of
Total Investments(b) |
| State | 19.4% |
| Corporate | 16.1% |
| Transportation | 13.1% |
| Education | 12.9% |
| Health | 12.6% |
| County/City/Special District/School District | 11.1% |
| Utilities | 5.2% |
| Housing | 4.8% |
| Tobacco | 4.0% |
| Other* | 0.8% |
| Credit quality allocation |
| Credit Rating(c) | Percent of
Total Investments(b) |
| AAA/Aaa | 0.3% |
| AA/Aa | 11.7% |
| A | 10.5% |
| BBB/Baa | 8.8% |
| BB/Ba | 9.4% |
| B | 1.9% |
| N/R(d) | 57.4% |
| (a) | For purposes of this report, sector sub-classifications may differ from those utilized for compliance purposes. |
| (b) | Excludes short-term securities. |
| (c) | For purposes of this report, credit quality ratings shown above reflect the highest rating assigned by either S&P Global Ratings or Moody’s Investors Service, Inc. if ratings differ. These rating agencies are independent, nationally recognized statistical rating organizations and are widely used. Investment grade ratings are credit ratings of BBB/Baa or higher. Below investment grade ratings are credit ratings of BB/Ba or lower. Investments designated N/R are not rated by either rating agency. Unrated investments do not necessarily indicate low credit quality. Credit quality ratings are subject to change. |
| (d) | The investment adviser evaluates the credit quality of unrated investments based upon certain factors including, but not limited to, credit ratings for similar investments and financial analysis of sectors and individual investments. Using this approach, the investment adviser has deemed certain of these unrated securities as investment grade quality. As of June 30, 2024, the market value of unrated securities deemed by the investment adviser to be investment grade represents less than 1.0% of total investments. |
| * | Ten largest sectors are presented. Additional sectors are found in Other. |
Material Fund changes
This is a summary of certain changes to the Fund since June 30, 2023. For more complete information, you may review the Fund’s next prospectus, which we expect to be available approximately 120 days after June 30, 2024 at blackrock.com/fundreports or upon request by contacting us at (800) 441-7762.
The net expense ratio decreased from the prior fiscal year end primarily due to a decrease in expenses related to financing activities.
Additional information
If you wish to view additional information about the Fund, including but not limited to financial statements, the Fund’s prospectus, and proxy voting policies and procedures, please visit blackrock.com/fundreports. For proxy voting records, visit blackrock.com/proxyrecords.
Householding
The Fund will mail only one copy of shareholder documents, including prospectuses, annual and semi-annual reports and proxy statements, to shareholders with multiple accounts at the same address. This practice is commonly called “householding” and is intended to reduce expenses and eliminate duplicate mailings of shareholder documents. Mailings of your shareholder documents may be householded indefinitely unless you instruct us otherwise. If you do not want the mailing of these documents to be combined with those for other members of your household, please call the Fund at (800) 441-7762.
The Fund is not sponsored, endorsed, issued, sold, or promoted by Bloomberg Index Services Limited and its affiliates, nor does this company make any representation regarding the advisability of investing in the Fund. BlackRock is not affiliated with the company listed above.
©2024 BlackRock, Inc. or its affiliates. All rights reserved. BLACKROCK is a registered trademark of BlackRock, Inc. or its affiliates. All other trademarks are those of their respective owners.
BlackRock High Yield Municipal Fund
Class K Shares | MKYHX
Annual Shareholder Report — June 30, 2024
MKYHX-06/24-AR
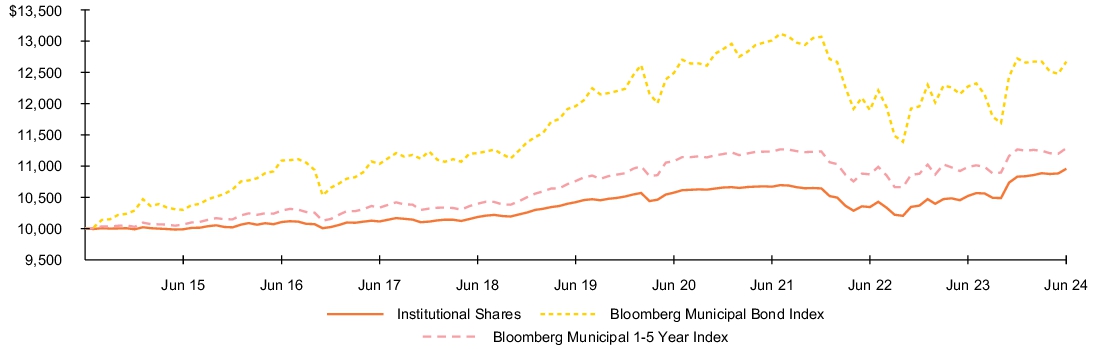
BlackRock National Municipal Fund
Institutional Shares | MANLX
Annual Shareholder Report — June 30, 2024
This annual shareholder report contains important information about BlackRock National Municipal Fund (the “Fund”) for the period of July 1, 2023 to June 30, 2024. You can find additional information about the Fund at blackrock.com/fundreports. You can also request this information by contacting us at (800) 441‑7762.
What were the Fund costs for the last year?
(based on a hypothetical $10,000 investment)
| Class name | Costs of a $10,000
investment | Costs paid as a percentage of a
$10,000 investment |
| Institutional Shares | $51 | 0.50% |
How did the Fund perform last year?
The municipal bond market gained ground during the reporting period, with income playing the largest role in total returns.
Declining inflation fueled expectations that the U.S. Federal Reserve was set to begin cutting interest rates in 2024, benefiting the broader fixed-income market from November 2023 onward.
Municipal bonds were well supported by positive economic growth, strong issuer fundamentals, and favorable supply-and-demand trends.
What contributed to performance?
Holdings in longer-duration securities (those with above-average interest rate sensitivity) performed well during the reporting period. At the sector level, corporate-backed securities (primarily pre-paid gas) provided the largest absolute returns, followed by transportation, tax-backed states, and utilities. In terms of credit tiers, AA and A rated securities were the strongest performers. The Fund’s cash position had no material effect on performance.
What detracted from performance?
At a time of positive performance for the broader market, few aspects of the Fund’s positioning detracted from absolute returns. With that said, there were a few BB and non-rated securities that became distressed during the reporting period. For example, the bonds of Michigan Finance Authority for Explore Academy—a charter school—fell sharply after the issuer deferred its interest payments.
The views expressed reflect the opinions of BlackRock as of the date of this report and are subject to change based on changes in market, economic or other conditions. These views are not intended to be a forecast of future events and are no guarantee of future results.
Fund performance
Cumulative performance: July 1, 2014 through June 30, 2024
Initial investment of $10,000
See “Average annual total returns” for additional information on fund performance.
| Average annual total returns | | | |
| 1 Year | 5 Years | 10 Years |
| Institutional Shares | 3.62% | 0.86% | 2.21% |
| Bloomberg Municipal Bond Index | 3.21% | 1.16% | 2.39% |
| Key Fund statistics | |
| Net Assets | $7,420,334,025% |
| Number of Portfolio Holdings | $453% |
| Net Investment Advisory Fees | $31,854,084% |
| Portfolio Turnover Rate | $58% |
Past performance is not an indication of future results. Performance results may include adjustments made for financial reporting purposes in accordance with U.S. generally accepted accounting principles. Performance results do not reflect the deduction of taxes that a shareholder would pay on fund distributions or on the redemption or sale of fund shares. Visit blackrock.com for more recent performance information.
What did the Fund invest in?
(as of June 30, 2024)
| Sector allocation |
| Sector(a) | Percent of
Total Investments(b) |
| Transportation | 22.9% |
| State | 18.0% |
| Corporate | 16.3% |
| Utilities | 10.8% |
| County/City/Special District/School District | 9.4% |
| Health | 9.2% |
| Education | 9.2% |
| Housing | 3.7% |
| Tobacco | 0.4% |
| Other* | 0.1% |
| Credit quality allocation |
| Credit Rating(c) | Percent of
Total Investments(b) |
| AAA/Aaa | 12.5% |
| AA/Aa | 53.9% |
| A | 24.6% |
| BBB/Baa | 2.6% |
| BB/Ba | 1.5% |
| B | 0.1% |
| N/R(d) | 4.8% |
| (a) | For purposes of this report, sector sub-classifications may differ from those utilized for compliance purposes. |
| (b) | Excludes short-term securities. |
| (c) | For purposes of this report, credit quality ratings shown above reflect the highest rating assigned by either S&P Global Ratings or Moody’s Investors Service, Inc. if ratings differ. These rating agencies are independent, nationally recognized statistical rating organizations and are widely used. Investment grade ratings are credit ratings of BBB/Baa or higher. Below investment grade ratings are credit ratings of BB/Ba or lower. Investments designated N/R are not rated by either rating agency. Unrated investments do not necessarily indicate low credit quality. Credit quality ratings are subject to change. |
| (d) | The investment adviser evaluates the credit quality of unrated investments based upon certain factors including, but not limited to, credit ratings for similar investments and financial analysis of sectors and individual investments. Using this approach, the investment adviser has deemed certain of these unrated securities as investment grade quality. As of June 30, 2024, the market value of unrated securities deemed by the investment adviser to be investment grade represents less than 1.0% of total investments. |
| * | Ten largest sectors are presented. Additional sectors are found in Other. |
Additional information
If you wish to view additional information about the Fund, including but not limited to financial statements, the Fund’s prospectus, and proxy voting policies and procedures, please visit blackrock.com/fundreports. For proxy voting records, visit blackrock.com/proxyrecords.
Householding
The Fund will mail only one copy of shareholder documents, including prospectuses, annual and semi-annual reports and proxy statements, to shareholders with multiple accounts at the same address. This practice is commonly called “householding” and is intended to reduce expenses and eliminate duplicate mailings of shareholder documents. Mailings of your shareholder documents may be householded indefinitely unless you instruct us otherwise. If you do not want the mailing of these documents to be combined with those for other members of your household, please call the Fund at (800) 441-7762.
The Fund is not sponsored, endorsed, issued, sold, or promoted by Bloomberg Index Services Limited and its affiliates, nor does this company make any representation regarding the advisability of investing in the Fund. BlackRock is not affiliated with the company listed above.
©2024 BlackRock, Inc. or its affiliates. All rights reserved. BLACKROCK is a registered trademark of BlackRock, Inc. or its affiliates. All other trademarks are those of their respective owners.
BlackRock National Municipal Fund
Institutional Shares | MANLX
Annual Shareholder Report — June 30, 2024
MANLX-06/24-AR
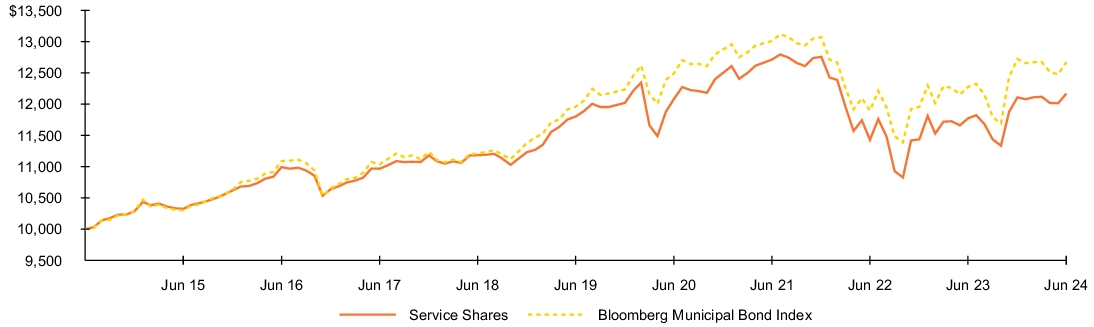
BlackRock National Municipal Fund
Service Shares | BNMSX
Annual Shareholder Report — June 30, 2024
This annual shareholder report contains important information about BlackRock National Municipal Fund (the “Fund”) for the period of July 1, 2023 to June 30, 2024. You can find additional information about the Fund at blackrock.com/fundreports. You can also request this information by contacting us at (800) 441‑7762.
What were the Fund costs for the last year?
(based on a hypothetical $10,000 investment)
| Class name | Costs of a $10,000
investment | Costs paid as a percentage of a
$10,000 investment |
| Service Shares | $76 | 0.75% |
How did the Fund perform last year?
The municipal bond market gained ground during the reporting period, with income playing the largest role in total returns.
Declining inflation fueled expectations that the U.S. Federal Reserve was set to begin cutting interest rates in 2024, benefiting the broader fixed-income market from November 2023 onward.
Municipal bonds were well supported by positive economic growth, strong issuer fundamentals, and favorable supply-and-demand trends.
What contributed to performance?
Holdings in longer-duration securities (those with above-average interest rate sensitivity) performed well during the reporting period. At the sector level, corporate-backed securities (primarily pre-paid gas) provided the largest absolute returns, followed by transportation, tax-backed states, and utilities. In terms of credit tiers, AA and A rated securities were the strongest performers. The Fund’s cash position had no material effect on performance.
What detracted from performance?
At a time of positive performance for the broader market, few aspects of the Fund’s positioning detracted from absolute returns. With that said, there were a few BB and non-rated securities that became distressed during the reporting period. For example, the bonds of Michigan Finance Authority for Explore Academy—a charter school—fell sharply after the issuer deferred its interest payments.
The views expressed reflect the opinions of BlackRock as of the date of this report and are subject to change based on changes in market, economic or other conditions. These views are not intended to be a forecast of future events and are no guarantee of future results.
Fund performance
Cumulative performance: July 1, 2014 through June 30, 2024
Initial investment of $10,000
See “Average annual total returns” for additional information on fund performance.
| Average annual total returns | | | |
| 1 Year | 5 Years | 10 Years |
| Service Shares | 3.36% | 0.61% | 1.98% |
| Bloomberg Municipal Bond Index | 3.21% | 1.16% | 2.39% |
| Key Fund statistics | |
| Net Assets | $7,420,334,025% |
| Number of Portfolio Holdings | $453% |
| Net Investment Advisory Fees | $31,854,084% |
| Portfolio Turnover Rate | $58% |
Average annual total returns reflect reductions for service fees.
Past performance is not an indication of future results. Performance results may include adjustments made for financial reporting purposes in accordance with U.S. generally accepted accounting principles. Performance results do not reflect the deduction of taxes that a shareholder would pay on fund distributions or on the redemption or sale of fund shares. Visit blackrock.com for more recent performance information.
What did the Fund invest in?
(as of June 30, 2024)
| Sector allocation |
| Sector(a) | Percent of
Total Investments(b) |
| Transportation | 22.9% |
| State | 18.0% |
| Corporate | 16.3% |
| Utilities | 10.8% |
| County/City/Special District/School District | 9.4% |
| Health | 9.2% |
| Education | 9.2% |
| Housing | 3.7% |
| Tobacco | 0.4% |
| Other* | 0.1% |
| Credit quality allocation |
| Credit Rating(c) | Percent of
Total Investments(b) |
| AAA/Aaa | 12.5% |
| AA/Aa | 53.9% |
| A | 24.6% |
| BBB/Baa | 2.6% |
| BB/Ba | 1.5% |
| B | 0.1% |
| N/R(d) | 4.8% |
| (a) | For purposes of this report, sector sub-classifications may differ from those utilized for compliance purposes. |
| (b) | Excludes short-term securities. |
| (c) | For purposes of this report, credit quality ratings shown above reflect the highest rating assigned by either S&P Global Ratings or Moody’s Investors Service, Inc. if ratings differ. These rating agencies are independent, nationally recognized statistical rating organizations and are widely used. Investment grade ratings are credit ratings of BBB/Baa or higher. Below investment grade ratings are credit ratings of BB/Ba or lower. Investments designated N/R are not rated by either rating agency. Unrated investments do not necessarily indicate low credit quality. Credit quality ratings are subject to change. |
| (d) | The investment adviser evaluates the credit quality of unrated investments based upon certain factors including, but not limited to, credit ratings for similar investments and financial analysis of sectors and individual investments. Using this approach, the investment adviser has deemed certain of these unrated securities as investment grade quality. As of June 30, 2024, the market value of unrated securities deemed by the investment adviser to be investment grade represents less than 1.0% of total investments. |
| * | Ten largest sectors are presented. Additional sectors are found in Other. |
Additional information
If you wish to view additional information about the Fund, including but not limited to financial statements, the Fund’s prospectus, and proxy voting policies and procedures, please visit blackrock.com/fundreports. For proxy voting records, visit blackrock.com/proxyrecords.
Householding
The Fund will mail only one copy of shareholder documents, including prospectuses, annual and semi-annual reports and proxy statements, to shareholders with multiple accounts at the same address. This practice is commonly called “householding” and is intended to reduce expenses and eliminate duplicate mailings of shareholder documents. Mailings of your shareholder documents may be householded indefinitely unless you instruct us otherwise. If you do not want the mailing of these documents to be combined with those for other members of your household, please call the Fund at (800) 441-7762.
The Fund is not sponsored, endorsed, issued, sold, or promoted by Bloomberg Index Services Limited and its affiliates, nor does this company make any representation regarding the advisability of investing in the Fund. BlackRock is not affiliated with the company listed above.
©2024 BlackRock, Inc. or its affiliates. All rights reserved. BLACKROCK is a registered trademark of BlackRock, Inc. or its affiliates. All other trademarks are those of their respective owners.
BlackRock National Municipal Fund
Service Shares | BNMSX
Annual Shareholder Report — June 30, 2024
BNMSX-06/24-AR
BlackRock National Municipal Fund
Investor A Shares | MDNLX
Annual Shareholder Report — June 30, 2024
This annual shareholder report contains important information about BlackRock National Municipal Fund (the “Fund”) for the period of July 1, 2023 to June 30, 2024. You can find additional information about the Fund at blackrock.com/fundreports. You can also request this information by contacting us at (800) 441‑7762.
What were the Fund costs for the last year?
(based on a hypothetical $10,000 investment)
| Class name | Costs of a $10,000
investment | Costs paid as a percentage of a
$10,000 investment |
| Investor A Shares | $76 | 0.75% |
How did the Fund perform last year?
The municipal bond market gained ground during the reporting period, with income playing the largest role in total returns.
Declining inflation fueled expectations that the U.S. Federal Reserve was set to begin cutting interest rates in 2024, benefiting the broader fixed-income market from November 2023 onward.
Municipal bonds were well supported by positive economic growth, strong issuer fundamentals, and favorable supply-and-demand trends.
What contributed to performance?
Holdings in longer-duration securities (those with above-average interest rate sensitivity) performed well during the reporting period. At the sector level, corporate-backed securities (primarily pre-paid gas) provided the largest absolute returns, followed by transportation, tax-backed states, and utilities. In terms of credit tiers, AA and A rated securities were the strongest performers. The Fund’s cash position had no material effect on performance.
What detracted from performance?
At a time of positive performance for the broader market, few aspects of the Fund’s positioning detracted from absolute returns. With that said, there were a few BB and non-rated securities that became distressed during the reporting period. For example, the bonds of Michigan Finance Authority for Explore Academy—a charter school—fell sharply after the issuer deferred its interest payments.
The views expressed reflect the opinions of BlackRock as of the date of this report and are subject to change based on changes in market, economic or other conditions. These views are not intended to be a forecast of future events and are no guarantee of future results.
Fund performance
Cumulative performance: July 1, 2014 through June 30, 2024
Initial investment of $10,000
See “Average annual total returns” for additional information on fund performance.
| Average annual total returns | | | |
| 1 Year | 5 Years | 10 Years |
| Investor A Shares | 3.46)% | 0.63)% | 1.98% |
| Investor A Shares (with sales charge) | (0.94)% | (0.24)% | 1.54% |
| Bloomberg Municipal Bond Index | 3.21)% | 1.16)% | 2.39% |
| Key Fund statistics | |
| Net Assets | $7,420,334,025% |
| Number of Portfolio Holdings | $453% |
| Net Investment Advisory Fees | $31,854,084% |
| Portfolio Turnover Rate | $58% |
Assuming maximum sales charges. Average annual total returns with and without sales charges reflect reductions for service fees.
Past performance is not an indication of future results. Performance results may include adjustments made for financial reporting purposes in accordance with U.S. generally accepted accounting principles. Performance results do not reflect the deduction of taxes that a shareholder would pay on fund distributions or on the redemption or sale of fund shares. Visit blackrock.com for more recent performance information.
What did the Fund invest in?
(as of June 30, 2024)
| Sector allocation |
| Sector(a) | Percent of
Total Investments(b) |
| Transportation | 22.9% |
| State | 18.0% |
| Corporate | 16.3% |
| Utilities | 10.8% |
| County/City/Special District/School District | 9.4% |
| Health | 9.2% |
| Education | 9.2% |
| Housing | 3.7% |
| Tobacco | 0.4% |
| Other* | 0.1% |
| Credit quality allocation |
| Credit Rating(c) | Percent of
Total Investments(b) |
| AAA/Aaa | 12.5% |
| AA/Aa | 53.9% |
| A | 24.6% |
| BBB/Baa | 2.6% |
| BB/Ba | 1.5% |
| B | 0.1% |
| N/R(d) | 4.8% |
| (a) | For purposes of this report, sector sub-classifications may differ from those utilized for compliance purposes. |
| (b) | Excludes short-term securities. |
| (c) | For purposes of this report, credit quality ratings shown above reflect the highest rating assigned by either S&P Global Ratings or Moody’s Investors Service, Inc. if ratings differ. These rating agencies are independent, nationally recognized statistical rating organizations and are widely used. Investment grade ratings are credit ratings of BBB/Baa or higher. Below investment grade ratings are credit ratings of BB/Ba or lower. Investments designated N/R are not rated by either rating agency. Unrated investments do not necessarily indicate low credit quality. Credit quality ratings are subject to change. |
| (d) | The investment adviser evaluates the credit quality of unrated investments based upon certain factors including, but not limited to, credit ratings for similar investments and financial analysis of sectors and individual investments. Using this approach, the investment adviser has deemed certain of these unrated securities as investment grade quality. As of June 30, 2024, the market value of unrated securities deemed by the investment adviser to be investment grade represents less than 1.0% of total investments. |
| * | Ten largest sectors are presented. Additional sectors are found in Other. |
Additional information
If you wish to view additional information about the Fund, including but not limited to financial statements, the Fund’s prospectus, and proxy voting policies and procedures, please visit blackrock.com/fundreports. For proxy voting records, visit blackrock.com/proxyrecords.
Householding
The Fund will mail only one copy of shareholder documents, including prospectuses, annual and semi-annual reports and proxy statements, to shareholders with multiple accounts at the same address. This practice is commonly called “householding” and is intended to reduce expenses and eliminate duplicate mailings of shareholder documents. Mailings of your shareholder documents may be householded indefinitely unless you instruct us otherwise. If you do not want the mailing of these documents to be combined with those for other members of your household, please call the Fund at (800) 441-7762.
The Fund is not sponsored, endorsed, issued, sold, or promoted by Bloomberg Index Services Limited and its affiliates, nor does this company make any representation regarding the advisability of investing in the Fund. BlackRock is not affiliated with the company listed above.
©2024 BlackRock, Inc. or its affiliates. All rights reserved. BLACKROCK is a registered trademark of BlackRock, Inc. or its affiliates. All other trademarks are those of their respective owners.
BlackRock National Municipal Fund
Investor A Shares | MDNLX
Annual Shareholder Report — June 30, 2024
MDNLX-06/24-AR
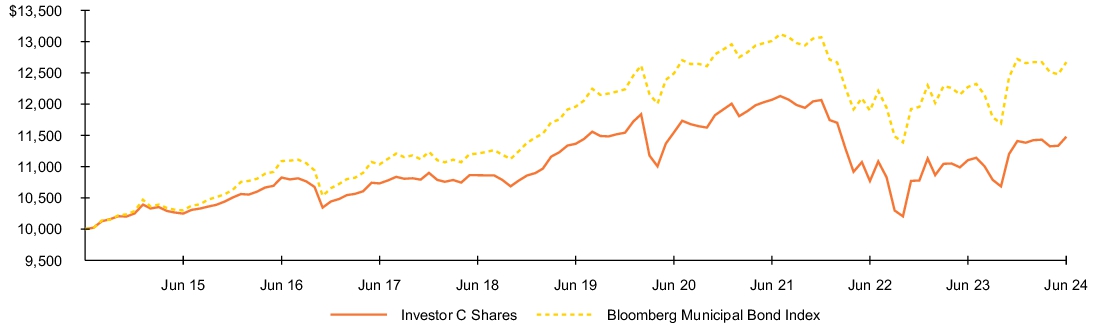
BlackRock National Municipal Fund
Investor C Shares | MFNLX
Annual Shareholder Report — June 30, 2024
This annual shareholder report contains important information about BlackRock National Municipal Fund (the “Fund”) for the period of July 1, 2023 to June 30, 2024. You can find additional information about the Fund at blackrock.com/fundreports. You can also request this information by contacting us at (800) 441‑7762.
What were the Fund costs for the last year?
(based on a hypothetical $10,000 investment)
| Class name | Costs of a $10,000
investment | Costs paid as a percentage of a
$10,000 investment |
| Investor C Shares | $152 | 1.50% |
How did the Fund perform last year?
The municipal bond market gained ground during the reporting period, with income playing the largest role in total returns.
Declining inflation fueled expectations that the U.S. Federal Reserve was set to begin cutting interest rates in 2024, benefiting the broader fixed-income market from November 2023 onward.
Municipal bonds were well supported by positive economic growth, strong issuer fundamentals, and favorable supply-and-demand trends.
What contributed to performance?
Holdings in longer-duration securities (those with above-average interest rate sensitivity) performed well during the reporting period. At the sector level, corporate-backed securities (primarily pre-paid gas) provided the largest absolute returns, followed by transportation, tax-backed states, and utilities. In terms of credit tiers, AA and A rated securities were the strongest performers. The Fund’s cash position had no material effect on performance.
What detracted from performance?
At a time of positive performance for the broader market, few aspects of the Fund’s positioning detracted from absolute returns. With that said, there were a few BB and non-rated securities that became distressed during the reporting period. For example, the bonds of Michigan Finance Authority for Explore Academy—a charter school—fell sharply after the issuer deferred its interest payments.
The views expressed reflect the opinions of BlackRock as of the date of this report and are subject to change based on changes in market, economic or other conditions. These views are not intended to be a forecast of future events and are no guarantee of future results.
Fund performance
Cumulative performance: July 1, 2014 through June 30, 2024
Initial investment of $10,000
See “Average annual total returns” for additional information on fund performance.
| Average annual total returns | | | |
| 1 Year | 5 Years | 10 Years |
| Investor C Shares | 2.59% | (0.12)% | 1.39% |
| Investor C Shares (with sales charge) | 1.59% | (0.12)% | 1.39% |
| Bloomberg Municipal Bond Index | 3.21% | 1.16)% | 2.39% |
| Key Fund statistics | |
| Net Assets | $7,420,334,025% |
| Number of Portfolio Holdings | $453% |
| Net Investment Advisory Fees | $31,854,084% |
| Portfolio Turnover Rate | $58% |
Assuming maximum sales charges. Average annual total returns with and without sales charges reflect reductions for distribution and service fees.
Past performance is not an indication of future results. Performance results may include adjustments made for financial reporting purposes in accordance with U.S. generally accepted accounting principles. Performance results do not reflect the deduction of taxes that a shareholder would pay on fund distributions or on the redemption or sale of fund shares. Visit blackrock.com for more recent performance information.
What did the Fund invest in?
(as of June 30, 2024)
| Sector allocation |
| Sector(a) | Percent of
Total Investments(b) |
| Transportation | 22.9% |
| State | 18.0% |
| Corporate | 16.3% |
| Utilities | 10.8% |
| County/City/Special District/School District | 9.4% |
| Health | 9.2% |
| Education | 9.2% |
| Housing | 3.7% |
| Tobacco | 0.4% |
| Other* | 0.1% |
| Credit quality allocation |
| Credit Rating(c) | Percent of
Total Investments(b) |
| AAA/Aaa | 12.5% |
| AA/Aa | 53.9% |
| A | 24.6% |
| BBB/Baa | 2.6% |
| BB/Ba | 1.5% |
| B | 0.1% |
| N/R(d) | 4.8% |
| (a) | For purposes of this report, sector sub-classifications may differ from those utilized for compliance purposes. |
| (b) | Excludes short-term securities. |
| (c) | For purposes of this report, credit quality ratings shown above reflect the highest rating assigned by either S&P Global Ratings or Moody’s Investors Service, Inc. if ratings differ. These rating agencies are independent, nationally recognized statistical rating organizations and are widely used. Investment grade ratings are credit ratings of BBB/Baa or higher. Below investment grade ratings are credit ratings of BB/Ba or lower. Investments designated N/R are not rated by either rating agency. Unrated investments do not necessarily indicate low credit quality. Credit quality ratings are subject to change. |
| (d) | The investment adviser evaluates the credit quality of unrated investments based upon certain factors including, but not limited to, credit ratings for similar investments and financial analysis of sectors and individual investments. Using this approach, the investment adviser has deemed certain of these unrated securities as investment grade quality. As of June 30, 2024, the market value of unrated securities deemed by the investment adviser to be investment grade represents less than 1.0% of total investments. |
| * | Ten largest sectors are presented. Additional sectors are found in Other. |
Additional information
If you wish to view additional information about the Fund, including but not limited to financial statements, the Fund’s prospectus, and proxy voting policies and procedures, please visit blackrock.com/fundreports. For proxy voting records, visit blackrock.com/proxyrecords.
Householding
The Fund will mail only one copy of shareholder documents, including prospectuses, annual and semi-annual reports and proxy statements, to shareholders with multiple accounts at the same address. This practice is commonly called “householding” and is intended to reduce expenses and eliminate duplicate mailings of shareholder documents. Mailings of your shareholder documents may be householded indefinitely unless you instruct us otherwise. If you do not want the mailing of these documents to be combined with those for other members of your household, please call the Fund at (800) 441-7762.
The Fund is not sponsored, endorsed, issued, sold, or promoted by Bloomberg Index Services Limited and its affiliates, nor does this company make any representation regarding the advisability of investing in the Fund. BlackRock is not affiliated with the company listed above.
©2024 BlackRock, Inc. or its affiliates. All rights reserved. BLACKROCK is a registered trademark of BlackRock, Inc. or its affiliates. All other trademarks are those of their respective owners.
BlackRock National Municipal Fund
Investor C Shares | MFNLX
Annual Shareholder Report — June 30, 2024
MFNLX-06/24-AR
BlackRock National Municipal Fund
Class K Shares | BNMLX
Annual Shareholder Report — June 30, 2024
This annual shareholder report contains important information about BlackRock National Municipal Fund (the “Fund”) for the period of July 1, 2023 to June 30, 2024. You can find additional information about the Fund at blackrock.com/fundreports. You can also request this information by contacting us at (800) 441‑7762.
This report describes changes to the Fund that occurred during the reporting period.
What were the Fund costs for the last year?
(based on a hypothetical $10,000 investment)
| Class name | Costs of a $10,000
investment | Costs paid as a percentage of a
$10,000 investment |
| Class K Shares | $46 | 0.45% |
How did the Fund perform last year?
The municipal bond market gained ground during the reporting period, with income playing the largest role in total returns.
Declining inflation fueled expectations that the U.S. Federal Reserve was set to begin cutting interest rates in 2024, benefiting the broader fixed-income market from November 2023 onward.
Municipal bonds were well supported by positive economic growth, strong issuer fundamentals, and favorable supply-and-demand trends.
What contributed to performance?
Holdings in longer-duration securities (those with above-average interest rate sensitivity) performed well during the reporting period. At the sector level, corporate-backed securities (primarily pre-paid gas) provided the largest absolute returns, followed by transportation, tax-backed states, and utilities. In terms of credit tiers, AA and A rated securities were the strongest performers. The Fund’s cash position had no material effect on performance.
What detracted from performance?
At a time of positive performance for the broader market, few aspects of the Fund’s positioning detracted from absolute returns. With that said, there were a few BB and non-rated securities that became distressed during the reporting period. For example, the bonds of Michigan Finance Authority for Explore Academy—a charter school—fell sharply after the issuer deferred its interest payments.
The views expressed reflect the opinions of BlackRock as of the date of this report and are subject to change based on changes in market, economic or other conditions. These views are not intended to be a forecast of future events and are no guarantee of future results.
Fund performance
Cumulative performance: July 1, 2014 through June 30, 2024
Initial investment of $10,000
See “Average annual total returns” for additional information on fund performance.
| Average annual total returns | | | |
| 1 Year | 5 Years | 10 Years |
| Class K Shares | 3.67% | 0.91% | 2.27% |
| Bloomberg Municipal Bond Index | 3.21% | 1.16% | 2.39% |
| Key Fund statistics | |
| Net Assets | $7,420,334,025% |
| Number of Portfolio Holdings | $453% |
| Net Investment Advisory Fees | $31,854,084% |
| Portfolio Turnover Rate | $58% |
On the close of business on August 15, 2016, all of the issued and outstanding BlackRock Shares of BlackRock National Municipal Fund were redesignated as Class K Shares.
Past performance is not an indication of future results. Performance results may include adjustments made for financial reporting purposes in accordance with U.S. generally accepted accounting principles. Performance results do not reflect the deduction of taxes that a shareholder would pay on fund distributions or on the redemption or sale of fund shares. Visit blackrock.com for more recent performance information.
What did the Fund invest in?
(as of June 30, 2024)
| Sector allocation |
| Sector(a) | Percent of
Total Investments(b) |
| Transportation | 22.9% |
| State | 18.0% |
| Corporate | 16.3% |
| Utilities | 10.8% |
| County/City/Special District/School District | 9.4% |
| Health | 9.2% |
| Education | 9.2% |
| Housing | 3.7% |
| Tobacco | 0.4% |
| Other* | 0.1% |
| Credit quality allocation |
| Credit Rating(c) | Percent of
Total Investments(b) |
| AAA/Aaa | 12.5% |
| AA/Aa | 53.9% |
| A | 24.6% |
| BBB/Baa | 2.6% |
| BB/Ba | 1.5% |
| B | 0.1% |
| N/R(d) | 4.8% |
| (a) | For purposes of this report, sector sub-classifications may differ from those utilized for compliance purposes. |
| (b) | Excludes short-term securities. |
| (c) | For purposes of this report, credit quality ratings shown above reflect the highest rating assigned by either S&P Global Ratings or Moody’s Investors Service, Inc. if ratings differ. These rating agencies are independent, nationally recognized statistical rating organizations and are widely used. Investment grade ratings are credit ratings of BBB/Baa or higher. Below investment grade ratings are credit ratings of BB/Ba or lower. Investments designated N/R are not rated by either rating agency. Unrated investments do not necessarily indicate low credit quality. Credit quality ratings are subject to change. |
| (d) | The investment adviser evaluates the credit quality of unrated investments based upon certain factors including, but not limited to, credit ratings for similar investments and financial analysis of sectors and individual investments. Using this approach, the investment adviser has deemed certain of these unrated securities as investment grade quality. As of June 30, 2024, the market value of unrated securities deemed by the investment adviser to be investment grade represents less than 1.0% of total investments. |
| * | Ten largest sectors are presented. Additional sectors are found in Other. |
Material Fund changes
This is a summary of certain changes to the Fund since June 30, 2023. For more complete information, you may review the Fund’s next prospectus, which we expect to be available approximately 120 days after June 30, 2024 at blackrock.com/fundreports or upon request by contacting us at (800) 441-7762.
The net expense ratio decreased from the prior fiscal year end primarily due to a decrease in expenses related to financing activities.
Additional information
If you wish to view additional information about the Fund, including but not limited to financial statements, the Fund’s prospectus, and proxy voting policies and procedures, please visit blackrock.com/fundreports. For proxy voting records, visit blackrock.com/proxyrecords.
Householding
The Fund will mail only one copy of shareholder documents, including prospectuses, annual and semi-annual reports and proxy statements, to shareholders with multiple accounts at the same address. This practice is commonly called “householding” and is intended to reduce expenses and eliminate duplicate mailings of shareholder documents. Mailings of your shareholder documents may be householded indefinitely unless you instruct us otherwise. If you do not want the mailing of these documents to be combined with those for other members of your household, please call the Fund at (800) 441-7762.
The Fund is not sponsored, endorsed, issued, sold, or promoted by Bloomberg Index Services Limited and its affiliates, nor does this company make any representation regarding the advisability of investing in the Fund. BlackRock is not affiliated with the company listed above.
©2024 BlackRock, Inc. or its affiliates. All rights reserved. BLACKROCK is a registered trademark of BlackRock, Inc. or its affiliates. All other trademarks are those of their respective owners.
BlackRock National Municipal Fund
Class K Shares | BNMLX
Annual Shareholder Report — June 30, 2024
BNMLX-06/24-AR
BlackRock Short-Term Municipal Fund
Institutional Shares | MALMX
Annual Shareholder Report — June 30, 2024
This annual shareholder report contains important information about BlackRock Short-Term Municipal Fund (the “Fund”) for the period of July 1, 2023 to June 30, 2024. You can find additional information about the Fund at blackrock.com/fundreports. You can also request this information by contacting us at (800) 441‑7762.
What were the Fund costs for the last year?
(based on a hypothetical $10,000 investment)
| Class name | Costs of a $10,000
investment | Costs paid as a percentage of a
$10,000 investment |
| Institutional Shares | $37 | 0.36% |
How did the Fund perform last year?
The municipal broader bond market gained ground during the reporting period, with income playing the largest role in total returns. Short-term municipals lagged relative to the market as a whole.
Declining inflation fueled expectations that the U.S. Federal Reserve was set to begin cutting interest rates in 2024, benefiting the broader fixed-income market from November 2023 onward.
Municipal bonds were well supported by positive economic growth, strong issuer fundamentals, and favorable supply-and-demand trends.
What contributed to performance?
Yield was the largest contributor to the Fund’s performance. Positions in lower-rated bonds provided strong absolute returns and outpaced the broader investment-grade market. Yield curve positioning also added value, as did the Fund’s allocation to cash.
What detracted from performance?
At a time of positive returns for the broader market, few aspects of the Fund’s positioning detracted from absolute performance. With that said, a few individual securities lost ground due to the timing of the purchases.
The views expressed reflect the opinions of BlackRock as of the date of this report and are subject to change based on changes in market, economic or other conditions. These views are not intended to be a forecast of future events and are no guarantee of future results.
Fund performance
Cumulative performance: July 1, 2014 through June 30, 2024
Initial investment of $10,000
See “Average annual total returns” for additional information on fund performance.
| Average annual total returns | | | |
| 1 Year | 5 Years | 10 Years |
| Institutional Shares | 4.13% | 1.01% | 0.92% |
| Bloomberg Municipal Bond Index | 3.21% | 1.16% | 2.39% |
| Bloomberg Municipal 1-5 Year Index | 2.72% | 0.96% | 1.22% |
| New Short-Term Customized Reference Benchmark | 2.87% | 1.10% | N/A |
| Short-Term Customized Reference Benchmark | 2.98% | 1.07% | N/A |
| Key Fund statistics | |
| Net Assets | $470,417,947% |
| Number of Portfolio Holdings | $171% |
| Net Investment Advisory Fees | $1,271,655% |
| Portfolio Turnover Rate | $90% |
The Fund has added the Bloomberg Municipal Bond Index in response to new regulatory requirements.
The New Short-Term Customized Reference Benchmark (commenced on October 31, 2017) is comprised of the Bloomberg National Short 0-5 year maturities, excluding non-investment grade. The Short-Term Customized Reference Benchmark (commenced on September 30, 2016) is comprised of the Bloomberg National Short 0-3 year maturities, excluding non-investment grade. Effective November 1, 2023, the Fund has changed the benchmarks against which it measures its performance from the Short-Term Customized Reference Benchmark to the New Short-Term Customized Reference Benchmark.
Past performance is not an indication of future results. Performance results may include adjustments made for financial reporting purposes in accordance with U.S. generally accepted accounting principles. Performance results do not reflect the deduction of taxes that a shareholder would pay on fund distributions or on the redemption or sale of fund shares. Visit blackrock.com for more recent performance information.
What did the Fund invest in?
(as of June 30, 2024)
| Sector allocation |
| Sector(a) | Percent of
Total Investments(b) |
| Corporate | 31.2% |
| Health | 14.6% |
| State | 13.6% |
| County/City/Special District/School District | 13.4% |
| Transportation | 9.6% |
| Utilities | 7.6% |
| Housing | 5.2% |
| Education | 4.8% |
| Credit quality allocation |
| Credit Rating(c) | Percent of
Total Investments(b) |
| AAA/Aaa | 4.6% |
| AA/Aa | 30.1% |
| A | 54.7% |
| BBB/Baa | 8.4% |
| N/R(d) | 2.2% |
| (a) | For purposes of this report, sector sub-classifications may differ from those utilized for compliance purposes. |
| (b) | Excludes short-term securities. |
| (c) | For purposes of this report, credit quality ratings shown above reflect the highest rating assigned by either S&P Global Ratings or Moody’s Investors Service, Inc. if ratings differ. These rating agencies are independent, nationally recognized statistical rating organizations and are widely used. Investment grade ratings are credit ratings of BBB/Baa or higher. Below investment grade ratings are credit ratings of BB/Ba or lower. Investments designated N/R are not rated by either rating agency. Unrated investments do not necessarily indicate low credit quality. Credit quality ratings are subject to change. |
| (d) | The investment adviser evaluates the credit quality of unrated investments based upon certain factors including, but not limited to, credit ratings for similar investments and financial analysis of sectors and individual investments. Using this approach, the investment adviser has deemed certain of these unrated securities as investment grade quality. As of June 30, 2024, the market value of unrated securities deemed by the investment adviser to be investment grade represents less than 1.0% of total investments. |
Additional information
If you wish to view additional information about the Fund, including but not limited to financial statements, the Fund’s prospectus, and proxy voting policies and procedures, please visit blackrock.com/fundreports. For proxy voting records, visit blackrock.com/proxyrecords.
Householding
The Fund will mail only one copy of shareholder documents, including prospectuses, annual and semi-annual reports and proxy statements, to shareholders with multiple accounts at the same address. This practice is commonly called “householding” and is intended to reduce expenses and eliminate duplicate mailings of shareholder documents. Mailings of your shareholder documents may be householded indefinitely unless you instruct us otherwise. If you do not want the mailing of these documents to be combined with those for other members of your household, please call the Fund at (800) 441-7762.
The Fund is not sponsored, endorsed, issued, sold, or promoted by Bloomberg Index Services Limited and its affiliates, nor does this company make any representation regarding the advisability of investing in the Fund. BlackRock is not affiliated with the company listed above.
©2024 BlackRock, Inc. or its affiliates. All rights reserved. BLACKROCK is a registered trademark of BlackRock, Inc. or its affiliates. All other trademarks are those of their respective owners.
BlackRock Short-Term Municipal Fund
Institutional Shares | MALMX
Annual Shareholder Report — June 30, 2024
MALMX-06/24-AR
BlackRock Short-Term Municipal Fund
Investor A Shares | MELMX
Annual Shareholder Report — June 30, 2024
This annual shareholder report contains important information about BlackRock Short-Term Municipal Fund (the “Fund”) for the period of July 1, 2023 to June 30, 2024. You can find additional information about the Fund at blackrock.com/fundreports. You can also request this information by contacting us at (800) 441‑7762.
What were the Fund costs for the last year?
(based on a hypothetical $10,000 investment)
| Class name | Costs of a $10,000
investment | Costs paid as a percentage of a
$10,000 investment |
| Investor A Shares | $61 | 0.60% |
How did the Fund perform last year?
The municipal broader bond market gained ground during the reporting period, with income playing the largest role in total returns. Short-term municipals lagged relative to the market as a whole.
Declining inflation fueled expectations that the U.S. Federal Reserve was set to begin cutting interest rates in 2024, benefiting the broader fixed-income market from November 2023 onward.
Municipal bonds were well supported by positive economic growth, strong issuer fundamentals, and favorable supply-and-demand trends.
What contributed to performance?
Yield was the largest contributor to the Fund’s performance. Positions in lower-rated bonds provided strong absolute returns and outpaced the broader investment-grade market. Yield curve positioning also added value, as did the Fund’s allocation to cash.
What detracted from performance?
At a time of positive returns for the broader market, few aspects of the Fund’s positioning detracted from absolute performance. With that said, a few individual securities lost ground due to the timing of the purchases.
The views expressed reflect the opinions of BlackRock as of the date of this report and are subject to change based on changes in market, economic or other conditions. These views are not intended to be a forecast of future events and are no guarantee of future results.
Fund performance
Cumulative performance: July 1, 2014 through June 30, 2024
Initial investment of $10,000
See “Average annual total returns” for additional information on fund performance.
| Average annual total returns | | | |
| 1 Year | 5 Years | 10 Years |
| Investor A Shares | 3.88% | 0.79% | 0.68% |
| Investor A Shares (with sales charge) | 0.77% | 0.17% | 0.37% |
| Bloomberg Municipal Bond Index | 3.21% | 1.16% | 2.39% |
| Bloomberg Municipal 1-5 Year Index | 2.72% | 0.96% | 1.22% |
| New Short-Term Customized Reference Benchmark | 2.87% | 1.10% | N/A |
| Short-Term Customized Reference Benchmark | 2.98% | 1.07% | N/A |
| Key Fund statistics | |
| Net Assets | $470,417,947% |
| Number of Portfolio Holdings | $171% |
| Net Investment Advisory Fees | $1,271,655% |
| Portfolio Turnover Rate | $90% |
The Fund has added the Bloomberg Municipal Bond Index in response to new regulatory requirements.
The New Short-Term Customized Reference Benchmark (commenced on October 31, 2017) is comprised of the Bloomberg National Short 0-5 year maturities, excluding non-investment grade. The Short-Term Customized Reference Benchmark (commenced on September 30, 2016) is comprised of the Bloomberg National Short 0-3 year maturities, excluding non-investment grade. Effective November 1, 2023, the Fund has changed the benchmarks against which it measures its performance from the Short-Term Customized Reference Benchmark to the New Short-Term Customized Reference Benchmark.
Assuming maximum sales charges. Average annual total returns with and without sales charges reflect reductions for service fees.
Past performance is not an indication of future results. Performance results may include adjustments made for financial reporting purposes in accordance with U.S. generally accepted accounting principles. Performance results do not reflect the deduction of taxes that a shareholder would pay on fund distributions or on the redemption or sale of fund shares. Visit blackrock.com for more recent performance information.
What did the Fund invest in?
(as of June 30, 2024)
| Sector allocation |
| Sector(a) | Percent of
Total Investments(b) |
| Corporate | 31.2% |
| Health | 14.6% |
| State | 13.6% |
| County/City/Special District/School District | 13.4% |
| Transportation | 9.6% |
| Utilities | 7.6% |
| Housing | 5.2% |
| Education | 4.8% |
| Credit quality allocation |
| Credit Rating(c) | Percent of
Total Investments(b) |
| AAA/Aaa | 4.6% |
| AA/Aa | 30.1% |
| A | 54.7% |
| BBB/Baa | 8.4% |
| N/R(d) | 2.2% |
| (a) | For purposes of this report, sector sub-classifications may differ from those utilized for compliance purposes. |
| (b) | Excludes short-term securities. |
| (c) | For purposes of this report, credit quality ratings shown above reflect the highest rating assigned by either S&P Global Ratings or Moody’s Investors Service, Inc. if ratings differ. These rating agencies are independent, nationally recognized statistical rating organizations and are widely used. Investment grade ratings are credit ratings of BBB/Baa or higher. Below investment grade ratings are credit ratings of BB/Ba or lower. Investments designated N/R are not rated by either rating agency. Unrated investments do not necessarily indicate low credit quality. Credit quality ratings are subject to change. |
| (d) | The investment adviser evaluates the credit quality of unrated investments based upon certain factors including, but not limited to, credit ratings for similar investments and financial analysis of sectors and individual investments. Using this approach, the investment adviser has deemed certain of these unrated securities as investment grade quality. As of June 30, 2024, the market value of unrated securities deemed by the investment adviser to be investment grade represents less than 1.0% of total investments. |
Additional information
If you wish to view additional information about the Fund, including but not limited to financial statements, the Fund’s prospectus, and proxy voting policies and procedures, please visit blackrock.com/fundreports. For proxy voting records, visit blackrock.com/proxyrecords.
Householding
The Fund will mail only one copy of shareholder documents, including prospectuses, annual and semi-annual reports and proxy statements, to shareholders with multiple accounts at the same address. This practice is commonly called “householding” and is intended to reduce expenses and eliminate duplicate mailings of shareholder documents. Mailings of your shareholder documents may be householded indefinitely unless you instruct us otherwise. If you do not want the mailing of these documents to be combined with those for other members of your household, please call the Fund at (800) 441-7762.
The Fund is not sponsored, endorsed, issued, sold, or promoted by Bloomberg Index Services Limited and its affiliates, nor does this company make any representation regarding the advisability of investing in the Fund. BlackRock is not affiliated with the company listed above.
©2024 BlackRock, Inc. or its affiliates. All rights reserved. BLACKROCK is a registered trademark of BlackRock, Inc. or its affiliates. All other trademarks are those of their respective owners.
BlackRock Short-Term Municipal Fund
Investor A Shares | MELMX
Annual Shareholder Report — June 30, 2024
MELMX-06/24-AR
BlackRock Short-Term Municipal Fund
Investor A1 Shares | MDLMX
Annual Shareholder Report — June 30, 2024
This annual shareholder report contains important information about BlackRock Short-Term Municipal Fund (the “Fund”) for the period of July 1, 2023 to June 30, 2024. You can find additional information about the Fund at blackrock.com/fundreports. You can also request this information by contacting us at (800) 441‑7762.
What were the Fund costs for the last year?
(based on a hypothetical $10,000 investment)
| Class name | Costs of a $10,000
investment | Costs paid as a percentage of a
$10,000 investment |
| Investor A1 Shares | $47 | 0.46% |
How did the Fund perform last year?
The municipal broader bond market gained ground during the reporting period, with income playing the largest role in total returns. Short-term municipals lagged relative to the market as a whole.
Declining inflation fueled expectations that the U.S. Federal Reserve was set to begin cutting interest rates in 2024, benefiting the broader fixed-income market from November 2023 onward.
Municipal bonds were well supported by positive economic growth, strong issuer fundamentals, and favorable supply-and-demand trends.
What contributed to performance?
Yield was the largest contributor to the Fund’s performance. Positions in lower-rated bonds provided strong absolute returns and outpaced the broader investment-grade market. Yield curve positioning also added value, as did the Fund’s allocation to cash.
What detracted from performance?
At a time of positive returns for the broader market, few aspects of the Fund’s positioning detracted from absolute performance. With that said, a few individual securities lost ground due to the timing of the purchases.
The views expressed reflect the opinions of BlackRock as of the date of this report and are subject to change based on changes in market, economic or other conditions. These views are not intended to be a forecast of future events and are no guarantee of future results.
Fund performance
Cumulative performance: July 1, 2014 through June 30, 2024
Initial investment of $10,000
See “Average annual total returns” for additional information on fund performance.
| Average annual total returns | | | |
| 1 Year | 5 Years | 10 Years |
| Investor A1 Shares | 4.03% | 0.90% | 0.81% |
| Bloomberg Municipal Bond Index | 3.21% | 1.16% | 2.39% |
| Bloomberg Municipal 1-5 Year Index | 2.72% | 0.96% | 1.22% |
| New Short-Term Customized Reference Benchmark | 2.87% | 1.10% | N/A |
| Short-Term Customized Reference Benchmark | 2.98% | 1.07% | N/A |
| Key Fund statistics | |
| Net Assets | $470,417,947% |
| Number of Portfolio Holdings | $171% |
| Net Investment Advisory Fees | $1,271,655% |
| Portfolio Turnover Rate | $90% |
The Fund has added the Bloomberg Municipal Bond Index in response to new regulatory requirements.
The New Short-Term Customized Reference Benchmark (commenced on October 31, 2017) is comprised of the Bloomberg National Short 0-5 year maturities, excluding non-investment grade. The Short-Term Customized Reference Benchmark (commenced on September 30, 2016) is comprised of the Bloomberg National Short 0-3 year maturities, excluding non-investment grade. Effective November 1, 2023, the Fund has changed the benchmarks against which it measures its performance from the Short-Term Customized Reference Benchmark to the New Short-Term Customized Reference Benchmark.
Average annual total returns reflect reductions for service fees.
Past performance is not an indication of future results. Performance results may include adjustments made for financial reporting purposes in accordance with U.S. generally accepted accounting principles. Performance results do not reflect the deduction of taxes that a shareholder would pay on fund distributions or on the redemption or sale of fund shares. Visit blackrock.com for more recent performance information.
What did the Fund invest in?
(as of June 30, 2024)
| Sector allocation |
| Sector(a) | Percent of
Total Investments(b) |
| Corporate | 31.2% |
| Health | 14.6% |
| State | 13.6% |
| County/City/Special District/School District | 13.4% |
| Transportation | 9.6% |
| Utilities | 7.6% |
| Housing | 5.2% |
| Education | 4.8% |
| Credit quality allocation |
| Credit Rating(c) | Percent of
Total Investments(b) |
| AAA/Aaa | 4.6% |
| AA/Aa | 30.1% |
| A | 54.7% |
| BBB/Baa | 8.4% |
| N/R(d) | 2.2% |
| (a) | For purposes of this report, sector sub-classifications may differ from those utilized for compliance purposes. |
| (b) | Excludes short-term securities. |
| (c) | For purposes of this report, credit quality ratings shown above reflect the highest rating assigned by either S&P Global Ratings or Moody’s Investors Service, Inc. if ratings differ. These rating agencies are independent, nationally recognized statistical rating organizations and are widely used. Investment grade ratings are credit ratings of BBB/Baa or higher. Below investment grade ratings are credit ratings of BB/Ba or lower. Investments designated N/R are not rated by either rating agency. Unrated investments do not necessarily indicate low credit quality. Credit quality ratings are subject to change. |
| (d) | The investment adviser evaluates the credit quality of unrated investments based upon certain factors including, but not limited to, credit ratings for similar investments and financial analysis of sectors and individual investments. Using this approach, the investment adviser has deemed certain of these unrated securities as investment grade quality. As of June 30, 2024, the market value of unrated securities deemed by the investment adviser to be investment grade represents less than 1.0% of total investments. |
Additional information
If you wish to view additional information about the Fund, including but not limited to financial statements, the Fund’s prospectus, and proxy voting policies and procedures, please visit blackrock.com/fundreports. For proxy voting records, visit blackrock.com/proxyrecords.
Householding
The Fund will mail only one copy of shareholder documents, including prospectuses, annual and semi-annual reports and proxy statements, to shareholders with multiple accounts at the same address. This practice is commonly called “householding” and is intended to reduce expenses and eliminate duplicate mailings of shareholder documents. Mailings of your shareholder documents may be householded indefinitely unless you instruct us otherwise. If you do not want the mailing of these documents to be combined with those for other members of your household, please call the Fund at (800) 441-7762.
The Fund is not sponsored, endorsed, issued, sold, or promoted by Bloomberg Index Services Limited and its affiliates, nor does this company make any representation regarding the advisability of investing in the Fund. BlackRock is not affiliated with the company listed above.
©2024 BlackRock, Inc. or its affiliates. All rights reserved. BLACKROCK is a registered trademark of BlackRock, Inc. or its affiliates. All other trademarks are those of their respective owners.
BlackRock Short-Term Municipal Fund
Investor A1 Shares | MDLMX
Annual Shareholder Report — June 30, 2024
MDLMX-06/24-AR
BlackRock Short-Term Municipal Fund
Investor C Shares | MFLMX
Annual Shareholder Report — June 30, 2024
This annual shareholder report contains important information about BlackRock Short-Term Municipal Fund (the “Fund”) for the period of July 1, 2023 to June 30, 2024. You can find additional information about the Fund at blackrock.com/fundreports. You can also request this information by contacting us at (800) 441‑7762.
What were the Fund costs for the last year?
(based on a hypothetical $10,000 investment)
| Class name | Costs of a $10,000
investment | Costs paid as a percentage of a
$10,000 investment |
| Investor C Shares | $138 | 1.36% |
How did the Fund perform last year?
The municipal broader bond market gained ground during the reporting period, with income playing the largest role in total returns. Short-term municipals lagged relative to the market as a whole.
Declining inflation fueled expectations that the U.S. Federal Reserve was set to begin cutting interest rates in 2024, benefiting the broader fixed-income market from November 2023 onward.
Municipal bonds were well supported by positive economic growth, strong issuer fundamentals, and favorable supply-and-demand trends.
What contributed to performance?
Yield was the largest contributor to the Fund’s performance. Positions in lower-rated bonds provided strong absolute returns and outpaced the broader investment-grade market. Yield curve positioning also added value, as did the Fund’s allocation to cash.
What detracted from performance?
At a time of positive returns for the broader market, few aspects of the Fund’s positioning detracted from absolute performance. With that said, a few individual securities lost ground due to the timing of the purchases.
The views expressed reflect the opinions of BlackRock as of the date of this report and are subject to change based on changes in market, economic or other conditions. These views are not intended to be a forecast of future events and are no guarantee of future results.
Fund performance
Cumulative performance: July 1, 2014 through June 30, 2024
Initial investment of $10,000
See “Average annual total returns” for additional information on fund performance.
| Average annual total returns | | | |
| 1 Year | 5 Years | 10 Years |
| Investor C Shares | 3.01% | 0.00% | 0.05% |
| Investor C Shares (with sales charge) | 2.01% | 0.00% | 0.05% |
| Bloomberg Municipal Bond Index | 3.21% | 1.16% | 2.39% |
| Bloomberg Municipal 1-5 Year Index | 2.72% | 0.96% | 1.22% |
| New Short-Term Customized Reference Benchmark | 2.87% | 1.10% | N/A |
| Short-Term Customized Reference Benchmark | 2.98% | 1.07% | N/A |
| Key Fund statistics | |
| Net Assets | $470,417,947% |
| Number of Portfolio Holdings | $171% |
| Net Investment Advisory Fees | $1,271,655% |
| Portfolio Turnover Rate | $90% |
The Fund has added the Bloomberg Municipal Bond Index in response to new regulatory requirements.
The New Short-Term Customized Reference Benchmark (commenced on October 31, 2017) is comprised of the Bloomberg National Short 0-5 year maturities, excluding non-investment grade. The Short-Term Customized Reference Benchmark (commenced on September 30, 2016) is comprised of the Bloomberg National Short 0-3 year maturities, excluding non-investment grade. Effective November 1, 2023, the Fund has changed the benchmarks against which it measures its performance from the Short-Term Customized Reference Benchmark to the New Short-Term Customized Reference Benchmark.
Assuming maximum sales charges. Average annual total returns with and without sales charges reflect reductions for distribution and service fees.
Past performance is not an indication of future results. Performance results may include adjustments made for financial reporting purposes in accordance with U.S. generally accepted accounting principles. Performance results do not reflect the deduction of taxes that a shareholder would pay on fund distributions or on the redemption or sale of fund shares. Visit blackrock.com for more recent performance information.
What did the Fund invest in?
(as of June 30, 2024)
| Sector allocation |
| Sector(a) | Percent of
Total Investments(b) |
| Corporate | 31.2% |
| Health | 14.6% |
| State | 13.6% |
| County/City/Special District/School District | 13.4% |
| Transportation | 9.6% |
| Utilities | 7.6% |
| Housing | 5.2% |
| Education | 4.8% |
| Credit quality allocation |
| Credit Rating(c) | Percent of
Total Investments(b) |
| AAA/Aaa | 4.6% |
| AA/Aa | 30.1% |
| A | 54.7% |
| BBB/Baa | 8.4% |
| N/R(d) | 2.2% |
| (a) | For purposes of this report, sector sub-classifications may differ from those utilized for compliance purposes. |
| (b) | Excludes short-term securities. |
| (c) | For purposes of this report, credit quality ratings shown above reflect the highest rating assigned by either S&P Global Ratings or Moody’s Investors Service, Inc. if ratings differ. These rating agencies are independent, nationally recognized statistical rating organizations and are widely used. Investment grade ratings are credit ratings of BBB/Baa or higher. Below investment grade ratings are credit ratings of BB/Ba or lower. Investments designated N/R are not rated by either rating agency. Unrated investments do not necessarily indicate low credit quality. Credit quality ratings are subject to change. |
| (d) | The investment adviser evaluates the credit quality of unrated investments based upon certain factors including, but not limited to, credit ratings for similar investments and financial analysis of sectors and individual investments. Using this approach, the investment adviser has deemed certain of these unrated securities as investment grade quality. As of June 30, 2024, the market value of unrated securities deemed by the investment adviser to be investment grade represents less than 1.0% of total investments. |
Additional information
If you wish to view additional information about the Fund, including but not limited to financial statements, the Fund’s prospectus, and proxy voting policies and procedures, please visit blackrock.com/fundreports. For proxy voting records, visit blackrock.com/proxyrecords.
Householding
The Fund will mail only one copy of shareholder documents, including prospectuses, annual and semi-annual reports and proxy statements, to shareholders with multiple accounts at the same address. This practice is commonly called “householding” and is intended to reduce expenses and eliminate duplicate mailings of shareholder documents. Mailings of your shareholder documents may be householded indefinitely unless you instruct us otherwise. If you do not want the mailing of these documents to be combined with those for other members of your household, please call the Fund at (800) 441-7762.
The Fund is not sponsored, endorsed, issued, sold, or promoted by Bloomberg Index Services Limited and its affiliates, nor does this company make any representation regarding the advisability of investing in the Fund. BlackRock is not affiliated with the company listed above.
©2024 BlackRock, Inc. or its affiliates. All rights reserved. BLACKROCK is a registered trademark of BlackRock, Inc. or its affiliates. All other trademarks are those of their respective owners.
BlackRock Short-Term Municipal Fund
Investor C Shares | MFLMX
Annual Shareholder Report — June 30, 2024
MFLMX-06/24-AR
BlackRock Short-Term Municipal Fund
Class K Shares | MPLMX
Annual Shareholder Report — June 30, 2024
This annual shareholder report contains important information about BlackRock Short-Term Municipal Fund (the “Fund”) for the period of July 1, 2023 to June 30, 2024. You can find additional information about the Fund at blackrock.com/fundreports. You can also request this information by contacting us at (800) 441‑7762.
What were the Fund costs for the last year?
(based on a hypothetical $10,000 investment)
| Class name | Costs of a $10,000
investment | Costs paid as a percentage of a
$10,000 investment |
| Class K Shares | $32 | 0.31% |
How did the Fund perform last year?
The municipal broader bond market gained ground during the reporting period, with income playing the largest role in total returns. Short-term municipals lagged relative to the market as a whole.
Declining inflation fueled expectations that the U.S. Federal Reserve was set to begin cutting interest rates in 2024, benefiting the broader fixed-income market from November 2023 onward.
Municipal bonds were well supported by positive economic growth, strong issuer fundamentals, and favorable supply-and-demand trends.
What contributed to performance?
Yield was the largest contributor to the Fund’s performance. Positions in lower-rated bonds provided strong absolute returns and outpaced the broader investment-grade market. Yield curve positioning also added value, as did the Fund’s allocation to cash.
What detracted from performance?
At a time of positive returns for the broader market, few aspects of the Fund’s positioning detracted from absolute performance. With that said, a few individual securities lost ground due to the timing of the purchases.
The views expressed reflect the opinions of BlackRock as of the date of this report and are subject to change based on changes in market, economic or other conditions. These views are not intended to be a forecast of future events and are no guarantee of future results.
Fund performance
Cumulative performance: July 1, 2014 through June 30, 2024
Initial investment of $10,000
See “Average annual total returns” for additional information on fund performance.
| Average annual total returns | | | |
| 1 Year | 5 Years | 10 Years |
| Class K Shares | 4.08% | 1.06% | 0.96% |
| Bloomberg Municipal Bond Index | 3.21% | 1.16% | 2.39% |
| Bloomberg Municipal 1-5 Year Index | 2.72% | 0.96% | 1.22% |
| New Short-Term Customized Reference Benchmark | 2.87% | 1.10% | N/A |
| Short-Term Customized Reference Benchmark | 2.98% | 1.07% | N/A |
| Key Fund statistics | |
| Net Assets | $470,417,947% |
| Number of Portfolio Holdings | $171% |
| Net Investment Advisory Fees | $1,271,655% |
| Portfolio Turnover Rate | $90% |
The Fund has added the Bloomberg Municipal Bond Index in response to new regulatory requirements.
The New Short-Term Customized Reference Benchmark (commenced on October 31, 2017) is comprised of the Bloomberg National Short 0-5 year maturities, excluding non-investment grade. The Short-Term Customized Reference Benchmark (commenced on September 30, 2016) is comprised of the Bloomberg National Short 0-3 year maturities, excluding non-investment grade. Effective November 1, 2023, the Fund has changed the benchmarks against which it measures its performance from the Short-Term Customized Reference Benchmark to the New Short-Term Customized Reference Benchmark.
Past performance is not an indication of future results. Performance results may include adjustments made for financial reporting purposes in accordance with U.S. generally accepted accounting principles. Performance results do not reflect the deduction of taxes that a shareholder would pay on fund distributions or on the redemption or sale of fund shares. Visit blackrock.com for more recent performance information.
What did the Fund invest in?
(as of June 30, 2024)
| Sector allocation |
| Sector(a) | Percent of
Total Investments(b) |
| Corporate | 31.2% |
| Health | 14.6% |
| State | 13.6% |
| County/City/Special District/School District | 13.4% |
| Transportation | 9.6% |
| Utilities | 7.6% |
| Housing | 5.2% |
| Education | 4.8% |
| Credit quality allocation |
| Credit Rating(c) | Percent of
Total Investments(b) |
| AAA/Aaa | 4.6% |
| AA/Aa | 30.1% |
| A | 54.7% |
| BBB/Baa | 8.4% |
| N/R(d) | 2.2% |
| (a) | For purposes of this report, sector sub-classifications may differ from those utilized for compliance purposes. |
| (b) | Excludes short-term securities. |
| (c) | For purposes of this report, credit quality ratings shown above reflect the highest rating assigned by either S&P Global Ratings or Moody’s Investors Service, Inc. if ratings differ. These rating agencies are independent, nationally recognized statistical rating organizations and are widely used. Investment grade ratings are credit ratings of BBB/Baa or higher. Below investment grade ratings are credit ratings of BB/Ba or lower. Investments designated N/R are not rated by either rating agency. Unrated investments do not necessarily indicate low credit quality. Credit quality ratings are subject to change. |
| (d) | The investment adviser evaluates the credit quality of unrated investments based upon certain factors including, but not limited to, credit ratings for similar investments and financial analysis of sectors and individual investments. Using this approach, the investment adviser has deemed certain of these unrated securities as investment grade quality. As of June 30, 2024, the market value of unrated securities deemed by the investment adviser to be investment grade represents less than 1.0% of total investments. |
Additional information
If you wish to view additional information about the Fund, including but not limited to financial statements, the Fund’s prospectus, and proxy voting policies and procedures, please visit blackrock.com/fundreports. For proxy voting records, visit blackrock.com/proxyrecords.
Householding
The Fund will mail only one copy of shareholder documents, including prospectuses, annual and semi-annual reports and proxy statements, to shareholders with multiple accounts at the same address. This practice is commonly called “householding” and is intended to reduce expenses and eliminate duplicate mailings of shareholder documents. Mailings of your shareholder documents may be householded indefinitely unless you instruct us otherwise. If you do not want the mailing of these documents to be combined with those for other members of your household, please call the Fund at (800) 441-7762.
The Fund is not sponsored, endorsed, issued, sold, or promoted by Bloomberg Index Services Limited and its affiliates, nor does this company make any representation regarding the advisability of investing in the Fund. BlackRock is not affiliated with the company listed above.
©2024 BlackRock, Inc. or its affiliates. All rights reserved. BLACKROCK is a registered trademark of BlackRock, Inc. or its affiliates. All other trademarks are those of their respective owners.
BlackRock Short-Term Municipal Fund
Class K Shares | MPLMX
Annual Shareholder Report — June 30, 2024
MPLMX-06/24-AR
(b) Not Applicable
| Item 2 – | Code of Ethics – The registrant (or the “Fund”) has adopted a code of ethics, as of the end of the period covered by this report, applicable to the registrant’s principal executive officer, principal financial officer, principal accounting officer or controller, or persons performing similar functions. During the period covered by this report, the code of ethics was amended to update certain information and to make other non-material changes. During the period covered by this report, there have been no waivers granted under the code of ethics. The registrant undertakes to provide a copy of the code of ethics to any person upon request, without charge, who calls 1-800-441-7762. |
| Item 3 – | Audit Committee Financial Expert – The registrant’s board of directors (the “board of directors”), has determined that (i) the registrant has the following audit committee financial experts serving on its audit committee and (ii) each audit committee financial expert is independent: |
Lorenzo A. Flores
Catherine A. Lynch
Arthur P. Steinmetz
Under applicable securities laws, a person determined to be an audit committee financial expert will not be deemed an “expert” for any purpose, including without limitation for the purposes of Section 11 of the Securities Act of 1933, as a result of being designated or identified as an audit committee financial expert. The designation or identification of a person as an audit committee financial expert does not impose on such person any duties, obligations, or liabilities greater than the duties, obligations, and liabilities imposed on such person as a member of the audit committee and board of directors in the absence of such designation or identification. The designation or identification of a person as an audit committee financial expert does not affect the duties, obligations, or liability of any other member of the audit committee or board of directors.
| Item 4 – | Principal Accountant Fees and Services |
The following table presents fees billed by Deloitte & Touche LLP (“D&T”) in each of the last two fiscal years for the services rendered to the Fund:
| | | | | | | | | | | | | | | | |
| | | (a) Audit Fees | | (b) Audit-Related
Fees1 | | (c) Tax Fees2 | | (d) All Other Fees |
| Entity Name | | Current
Fiscal Year End | | Previous
Fiscal Year End | | Current
Fiscal Year End | | Previous
Fiscal Year End | | Current
Fiscal Year End | | Previous
Fiscal Year End | | Current
Fiscal Year End | | Previous
Fiscal Year End |
BlackRock High Yield Municipal Fund | | $39,576 | | $39,576 | | $0 | | $44 | | $15,080 | | $16,900 | | $407 | | $0 |
BlackRock National Municipal Fund | | $38,352 | | $38,352 | | $0 | | $44 | | $15,080 | | $16,900 | | $407 | | $0 |
BlackRock Short-Term Municipal Fund | | $31,416 | | $31,416 | | $0 | | $44 | | $15,080 | | $16,300 | | $407 | | $0 |
The following table presents fees billed by D&T that were required to be approved by the registrant’s audit committee (the “Committee”) for services that relate directly to the operations or financial reporting of the Fund and that are rendered on behalf of BlackRock Advisors, LLC (the “Investment Adviser” or “BlackRock”) and entities controlling, controlled by, or under common control with BlackRock (not including any sub-adviser whose role is primarily portfolio management and is subcontracted with or overseen by another investment adviser) that provide ongoing services to the Fund (“Affiliated Service Providers”):
| | | | |
| | | Current Fiscal Year End | | Previous Fiscal Year End |
(b) Audit-Related Fees1 | | $0 | | $0 |
(c) Tax Fees2 | | $0 | | $0 |
(d) All Other Fees3 | | $2,149,000 | | $2,154,000 |
1 The nature of the services includes assurance and related services reasonably related to the performance of the audit or review of financial statements not included in Audit Fees, including accounting consultations, agreed-upon procedure reports, attestation reports, comfort letters, out-of-pocket expenses and internal control reviews not required by regulators.
2 The nature of the services includes tax compliance and/or tax preparation, including services relating to the filing or amendment of federal, state or local income tax returns, regulated investment company qualification reviews, taxable income and tax distribution calculations.
3 Non-audit fees of $2,149,000 and $2,154,000 for the current fiscal year and previous fiscal year, respectively, were paid to the Fund’s principal accountant in their entirety by BlackRock, in connection with services provided to the Affiliated Service Providers of the Fund and of certain other funds sponsored and advised by BlackRock or its affiliates for a service organization review and an accounting research tool subscription. These amounts represent aggregate fees paid by BlackRock and were not allocated on a per fund basis.
(e)(1) Audit Committee Pre-Approval Policies and Procedures:
The Committee has adopted policies and procedures with regard to the pre-approval of services. Audit, audit-related and tax compliance services provided to the registrant on an annual basis require specific pre-approval by the Committee. The Committee also must approve other non-audit services provided to the registrant and those non-audit services provided to the Investment Adviser and Affiliated Service Providers that relate directly to the operations and the financial reporting of the registrant. Certain of these non-audit services that the Committee believes are (a) consistent with the SEC’s auditor independence rules and (b) routine and recurring services that will not impair the independence of the independent accountants may be approved by the Committee without consideration on a specific case-by-case basis (“general pre-approval”). The term of any general pre-approval is 12 months from the date of the pre-approval, unless the Committee provides for a different period. Tax or other non-audit services provided to the registrant which have a direct impact on the operations or financial reporting of the registrant will only be deemed pre-approved provided that any individual project does not exceed $10,000 attributable to the registrant or $50,000 per project. For this purpose, multiple projects will be aggregated to determine if they exceed the previously mentioned cost levels.
Any proposed services exceeding the pre-approved cost levels will require specific pre-approval by the Committee, as will any other services not subject to general pre-approval (e.g., unanticipated but permissible services). The Committee is informed of each service approved subject to general pre-approval at the next regularly scheduled in-person board meeting. At this meeting, an analysis of such services is presented to the Committee for ratification. The Committee may delegate to the Committee Chairman the authority to approve the provision of and fees for any specific engagement of permitted non-audit services, including services exceeding pre-approved cost levels.
(e)(2) None of the services described in each of Items 4(b) through (d) were approved by the Committee pursuant to the de minimis exception in paragraph (c)(7)(i)(C) of Rule 2-01 of Regulation S-X.
(f) Not Applicable
(g) The aggregate non-audit fees, defined as the sum of the fees shown under “Audit-Related Fees,” “Tax Fees” and “All Other Fees,” paid to the accountant for services rendered by the accountant to the registrant, the Investment Adviser and the Affiliated Service Providers were:
| | | | |
| Entity Name | | Current Fiscal Year End | | Previous Fiscal Year End |
BlackRock High Yield Municipal Fund | | $15,487 | | $16,944 |
BlackRock National Municipal Fund | | $15,487 | | $16,944 |
BlackRock Short-Term Municipal Fund | | $15,487 | | $16,344 |
Additionally, the amounts billed by D&T in connection with services provided to the Affiliated Service Providers of the Fund and of other funds sponsored or advised by BlackRock or its affiliates during the current and previous fiscal years for a service organization review and an accounting research tool subscription were:
| | |
| Current Fiscal Year End | | Previous Fiscal Year End |
$2,149,000 | | $2,154,000 |
These amounts represent aggregate fees paid by BlackRock and were not allocated on a per fund basis.
(h) The Committee has considered and determined that the provision of non-audit services that were rendered to the Investment Adviser and the Affiliated Service Providers that were not pre-approved pursuant to paragraph (c)(7)(ii) of Rule 2-01 of Regulation S-X is compatible with maintaining the principal accountant’s independence.
(i) Not Applicable
(j) Not Applicable
| Item 5 – | Audit Committee of Listed Registrant – Not Applicable |
(a) The registrant’s Schedule of Investments is included as part of the Financial Statements and Financial Highlights for Open-End Management Investment Companies filed under Item 7 of this Form.
(b) Not Applicable due to no such divestments during the semi-annual period covered since the previous Form N-CSR filing.
| Item 7 – | Financial Statements and Financial Highlights for Open-End Management Investment Companies |
(a) The registrant’s Financial Statements are attached herewith.
(b) The registrant’s Financial Highlights are attached herewith.
June 30, 2024
2024 Annual Financial Statements |
BlackRock Multi-State Municipal Series Trust |
• BlackRock New York Municipal Opportunities Fund |
BlackRock Municipal Bond Fund, Inc. |
• BlackRock High Yield Municipal Fund |
• BlackRock National Municipal Fund |
• BlackRock Short-Term Municipal Fund |
Not FDIC Insured • May Lose Value • No Bank Guarantee |
The Benefits and Risks of Leveraging
The Funds may utilize leverage to seek to enhance returns and net asset value (“NAV”). However, there is no guarantee that these objectives can be achieved in all interest rate environments.
Each of BlackRock New York Municipal Opportunities Fund, BlackRock High Yield Municipal Fund and BlackRock National Municipal Fund may leverage its assets through the use of proceeds received in tender option bond (“TOB”) transactions, as described in the Notes to Financial Statements. In a TOB Trust transaction, each Fund transfers municipal bonds or other municipal securities into a special purpose entity (a “TOB Trust”). TOB investments generally provide each Fund with economic benefits in periods of declining short-term interest rates but expose each Fund to risks during periods of rising short-term interest rates. Additionally, fluctuations in the market value of municipal bonds deposited into a TOB Trust may adversely affect each Fund’s NAV per share.
In general, the concept of leveraging is based on the premise that the financing cost of leverage, which is based on short-term interest rates, is normally lower than the income earned by each Fund on its longer-term portfolio investments purchased with the proceeds from leverage. To the extent that the total assets of each Fund (including the assets obtained from leverage) are invested in higher-yielding portfolio investments, each Fund’s shareholders benefit from the incremental net income.
The interest earned on securities purchased with the proceeds from leverage is distributed to each Fund’s shareholders, and the value of these portfolio holdings is reflected in each Fund’s per share NAV. However, in order to benefit shareholders, the return on assets purchased with leverage proceeds must exceed the ongoing costs associated with the leverage. If interest and other ongoing costs of leverage exceed a Fund’s return on assets purchased with leverage proceeds, income to shareholders is lower than if the Funds had not used leverage.
Furthermore, the value of each Fund’s portfolio investments generally varies inversely with the direction of long-term interest rates, although other factors can also influence the value of portfolio investments. As a result, changes in interest rates can influence each Fund’s NAV positively or negatively in addition to the impact on each Fund’s performance from leverage. Changes in the direction of interest rates are difficult to predict accurately, and there is no assurance that a Fund’s leveraging strategy will be successful.
The use of leverage also generally causes greater changes in each Fund’s NAV and dividend rates than comparable portfolios without leverage. In a declining market, leverage is likely to cause a greater decline in the NAV of a Fund’s shares than if the Fund were not leveraged. In addition, each Fund may be required to sell portfolio securities at inopportune times or at distressed values in order to comply with regulatory requirements applicable to the use of leverage or as required by the terms of the leverage instruments, which may cause the Fund to incur losses. The use of leverage may limit a Fund’s ability to invest in certain types of securities or use certain types of hedging strategies. Each Fund incurs expenses in connection with the use of leverage, all of which are borne by each Fund’s shareholders and may reduce income.
Derivative Financial Instruments
The Funds may invest in various derivative financial instruments. These instruments are used to obtain exposure to a security, commodity, index, market, and/or other assets without owning or taking physical custody of securities, commodities and/or other referenced assets or to manage market, equity, credit, interest rate, foreign currency exchange rate, commodity and/or other risks. Derivative financial instruments may give rise to a form of economic leverage and involve risks, including the imperfect correlation between the value of a derivative financial instrument and the underlying asset, possible default of the counterparty to the transaction or illiquidity of the instrument. Pursuant to Rule 18f-4 under the 1940 Act, among other things, the Funds must either use derivative financial instruments with embedded leverage in a limited manner or comply with an outer limit on fund leverage risk based on value-at-risk. The Funds’ successful use of a derivative financial instrument depends on the investment adviser’s ability to predict pertinent market movements accurately, which cannot be assured. The use of these instruments may result in losses greater than if they had not been used, may limit the amount of appreciation a Fund can realize on an investment and/or may result in lower distributions paid to shareholders. The Funds’ investments in these instruments, if any, are discussed in detail in the Notes to Financial Statements.
The Benefits and Risks of Leveraging / Derivative Financial Instruments3
Schedule of InvestmentsJune 30, 2024
BlackRock New York Municipal Opportunities Fund(Percentages shown are based on Net Assets)
| | | |
|
Hotels, Restaurants & Leisure — 0.1% |
YMCA of Greater New York, 2.30%, 08/01/26 | | | |
Total Corporate Bonds — 0.1%
(Cost: $1,000,000) | |
|
| |
| |
Florida Development Finance Corp., Refunding RB, AMT, 12.00%, 07/15/32(a)(b) | | | |
| |
County/City/Special District/School District — 0.0% | |
Chicago Board of Education, GO, BAB, 6.14%, 12/01/39 | | | |
| |
| |
Build NYC Resource Corp., Refunding RB(b) | | | |
| | | |
| | | |
New York Liberty Development Corp., Refunding RB, 5.25%, 10/01/35 | | | |
New York State Energy Research & Development Authority, Refunding RB, Series C, 4.00%, 04/01/34 | | | |
| | | |
County/City/Special District/School District — 13.9% | |
Battery Park City Authority, Refunding RB | | | |
Series B, 5.00%, 11/01/38 | | | |
Series B, 5.00%, 11/01/40 | | | |
| | | |
Series B, 5.25%, 10/01/43 | | | |
Series B-1, 5.00%, 10/01/43 | | | |
Series C, 5.25%, 03/01/49 | | | |
Series D, 5.38%, 06/01/32 | | | |
Series D, 5.50%, 04/01/48 | | | |
Series D-1, 5.00%, 03/01/43 | | | |
Series D-1, 5.50%, 05/01/44 | | | |
Series E-1, 5.00%, 03/01/40 | | | |
Series I, 5.00%, 03/01/36 | | | |
Sub-Series E1, 5.25%, 04/01/47 | | | |
Sub-Series E-1, 4.00%, 04/01/45 | | | |
City of New York, Refunding GO, Series C-3, 2.46%, 08/01/33 | | | |
County of Nassau New York, GOL | | | |
Series A, 4.00%, 04/01/39 | | | |
Series A, 4.00%, 04/01/42 | | | |
Series A, 5.00%, 04/01/45 | | | |
Series A, 5.00%, 04/01/47 | | | |
Series B, (AGM), 5.00%, 07/01/42 | | | |
Series B, (AGM), 5.00%, 07/01/45 | | | |
County of Nassau New York, Refunding GOL | | | |
Series B, 5.00%, 04/01/41 | | | |
Series B, 5.00%, 04/01/42 | | | |
Series B, (AGM), 5.00%, 04/01/44 | | | |
New York City Industrial Development Agency, RB(c) | | | |
| | | |
| | | |
| | | |
County/City/Special District/School District (continued) | |
New York City Industrial Development Agency, RB(c) (continued) | | | |
| | | |
| | | |
New York City Transitional Finance Authority Future Tax Secured Revenue, RB | | | |
Sub-Series B-1, 5.00%, 11/01/35 | | | |
Sub-Series B-1, 5.00%, 11/01/36 | | | |
Series A, Subordinate, 5.00%, 05/01/45 | | | |
Series A, Subordinate, 5.00%, 05/01/46 | | | |
Series C-1, Subordinate, 4.00%, 02/01/42 | | | |
Series C-3, Subordinate, 5.00%, 05/01/40 | | | |
New York City Transitional Finance Authority, RB, Series F-1, 5.25%, 02/01/53 | | | |
New York Convention Center Development Corp., RB, CAB, Series B, Sub Lien, (AGM-CR), 0.00%, 11/15/55(c) | | | |
New York Convention Center Development Corp., Refunding RB | | | |
| | | |
| | | |
New York Liberty Development Corp., Refunding RB | | | |
Class 1, 5.00%, 11/15/44(b) | | | |
Series A, Sustainability Bonds, 2.75%, 11/15/41 | | | |
Suffolk Regional Off-Track Betting Co., RB, 5.00%, 12/01/34 | | | |
| | | |
| |
Albany Capital Resource Corp., Refunding RB(d)(e) | | | |
| | | |
| | | |
Amherst Development Corp., Refunding RB | | | |
| | | |
| | | |
Buffalo & Erie County Industrial Land Development Corp., Refunding RB | | | |
Series A, 4.50%, 06/01/27 | | | |
Series A, 5.00%, 06/01/35 | | | |
Build NYC Resource Corp., RB(b) | | | |
| | | |
| | | |
| | | |
Series A, 4.88%, 05/01/31 | | | |
Series A, 5.13%, 05/01/38 | | | |
Series A, 5.50%, 05/01/48 | | | |
Sustainability Bonds, 5.75%, 06/01/42 | | | |
Build NYC Resource Corp., Refunding RB | | | |
| | | |
| | | |
| | | |
| | | |
| | | |
| | | |
Series A, 5.00%, 06/01/43 | | | |
County of Cattaraugus New York, RB | | | |
| | | |
| | | |
Dobbs Ferry Local Development Corp., RB, 5.00%, 07/01/39 | | | |
42024 BlackRock Annual Financial Statements
Schedule of Investments (continued)June 30, 2024
BlackRock New York Municipal Opportunities Fund(Percentages shown are based on Net Assets)
| | | |
| |
Dutchess County Local Development Corp., RB | | | |
| | | |
| | | |
| | | |
Dutchess County Local Development Corp., Refunding RB | | | |
| | | |
| | | |
Hempstead Town Local Development Corp., Refunding RB | | | |
| | | |
| | | |
| | | |
Monroe County Industrial Development Corp., RB | | | |
Series A, 5.00%, 07/01/53 | | | |
Series B, 5.13%, 07/01/33 | | | |
Monroe County Industrial Development Corp., Refunding RB, Series C, 4.00%, 07/01/37 | | | |
New York State Dormitory Authority, RB | | | |
| | | |
Series 1, (BHAC-CR AMBAC), 5.50%, 07/01/31 | | | |
Series 1, (AMBAC), 5.50%, 07/01/40 | | | |
Series A, 5.25%, 07/01/24(f) | | | |
Series A, 5.50%, 07/01/24(f) | | | |
Series A, 5.00%, 07/01/43 | | | |
Series A, 5.00%, 07/01/49 | | | |
Series A, Sustainability Bonds, 5.00%, 07/01/48 | | | |
New York State Dormitory Authority, Refunding RB | | | |
| | | |
| | | |
Series A, 2.58%, 07/01/33 | | | |
Series A, 4.00%, 07/01/37 | | | |
Series A, 5.00%, 07/01/37 | | | |
Series A, 5.00%, 07/01/41 | | | |
Series A, 4.00%, 07/01/46 | | | |
Series A, 5.00%, 07/01/46 | | | |
Series A, 5.00%, 07/01/51 | | | |
Series A, 5.50%, 07/01/54 | | | |
Series B, 1.64%, 07/01/26 | | | |
Series B, 3.78%, 07/01/34 | | | |
Series B, 5.00%, 10/01/38 | | | |
Onondaga County Trust for Cultural Resources, Refunding RB | | | |
| | | |
| | | |
| | | |
Schenectady County Capital Resource Corp., Refunding RB, 5.25%, 07/01/52 | | | |
Trust for Cultural Resources of The City of New York, Refunding RB, Series A, 5.00%, 07/01/37 | | | |
| | | |
| |
Buffalo & Erie County Industrial Land Development Corp., RB, 5.25%, 07/01/35 | | | |
Dutchess County Local Development Corp., RB, Series A, 5.00%, 07/01/24(f) | | | |
Genesee County Funding Corp., Refunding RB, Series A, 5.25%, 12/01/52 | | | |
Huntington Local Development Corp., RB, Series A, 5.25%, 07/01/56 | | | |
| | | |
| |
Monroe County Industrial Development Corp., RB | | | |
| | | |
| | | |
Series A, 5.00%, 12/01/37 | | | |
New York State Dormitory Authority, Refunding RB | | | |
| | | |
| | | |
| | | |
| | | |
| | | |
| | | |
| | | |
Southold Local Development Corp., RB, 4.00%, 12/01/45 | | | |
Suffolk County Economic Development Corp., RB, Series C, 5.00%, 07/01/32 | | | |
Tompkins County Development Corp., Refunding RB, 5.00%, 07/01/44 | | | |
Westchester County Healthcare Corp., Refunding RB, Series B, Senior Lien, 6.00%, 11/01/30 | | | |
Westchester County Local Development Corp., Refunding RB | | | |
| | | |
| | | |
| | | |
| | | |
| |
New York City Housing Development Corp., RB, M/F Housing | | | |
Sustainability Bonds, 3.15%, 11/01/36 | | | |
Class F-1, Sustainability Bonds, 4.60%, 11/01/42 | | | |
Class F-1, Sustainability Bonds, 4.75%, 11/01/47 | | | |
Series A-1, Sustainability Bonds, 4.55%, 11/01/44 | | | |
Series E-1, Sustainability Bonds, 4.55%, 11/01/43 | | | |
New York City Housing Development Corp., Refunding RB | | | |
Sustainability Bonds, 3.76%, 01/01/29 | | | |
Series A, Sustainability Bonds, 4.25%, 11/01/43 | | | |
New York City Housing Development Corp., Refunding RB, M/F Housing, Series D, Sustainability Bonds, 4.10%, 11/01/38 | | | |
New York State Housing Finance Agency, RB, M/F Housing | | | |
Series A, (SONYMA), 4.90%, 02/15/38 | | | |
Series A, (SONYMA), 5.10%, 02/15/38 | | | |
Series C, (FHLMC, FNMA, GNMA, SONYMA), 2.75%, 11/01/31 | | | |
Series E, (SONYMA), 4.15%, 11/01/47 | | | |
Series C, Sustainability Bonds, (SONYMA), 3.25%, 05/01/27 | | | |
Series J, Sustainability Bonds, (SONYMA), 1.10%, 11/01/61(a) | | | |
Series J-1, Sustainability Bonds, (SONYMA), 2.80%, 11/01/51 | | | |
Series L-2, Sustainability Bonds, (SONYMA), 0.75%, 11/01/25 | | | |
Series M-2, Sustainability Bonds, (SONYMA), 0.75%, 11/01/25 | | | |
New York State Housing Finance Agency, Refunding RB, Series C, (SONYMA), 3.85%, 11/01/39 | | | |
Schedule of Investments (continued)June 30, 2024
BlackRock New York Municipal Opportunities Fund(Percentages shown are based on Net Assets)
| | | |
| |
State of New York Mortgage Agency Homeowner Mortgage Revenue, RB, S/F Housing, Series 250, Sustainability Bonds, (SONYMA), 4.80%, 10/01/48 | | | |
State of New York Mortgage Agency Homeowner Mortgage Revenue, Refunding RB, S/F Housing | | | |
AMT, Sustainability Bonds, 1.40%, 10/01/27 | | | |
AMT, Sustainability Bonds, 1.50%, 04/01/28 | | | |
Yonkers Industrial Development Agency, RB | | | |
Series A, (SONYMA), 4.80%, 10/01/26 | | | |
Series A, (SONYMA), 5.00%, 10/01/37 | | | |
| | | |
| |
Hudson Yards Infrastructure Corp., Refunding RB, Series 2022, Sustainability Bonds, 4.00%, 02/15/42 | | | |
New York City Transitional Finance Authority Building Aid Revenue, RB | | | |
Series S-1, Subordinate, (SAW), 4.00%, 07/15/45 | | | |
Series S-3, Subordinate, (SAW), 5.25%, 07/15/45 | | | |
New York City Transitional Finance Authority Building Aid Revenue, Refunding RB, Series S-1A, (SAW), 4.00%, 07/15/39 | | | |
New York State Dormitory Authority, RB | | | |
Series A, 4.80%, 12/01/34 | | | |
Series A, 5.00%, 03/15/42 | | | |
New York State Dormitory Authority, Refunding RB | | | |
Series A, 5.25%, 03/15/39 | | | |
Series A, 5.00%, 03/15/41 | | | |
Series A, 4.00%, 03/15/43 | | | |
Series A, 5.00%, 03/15/44 | | | |
Series A, 5.00%, 03/15/45 | | | |
Series A-1, 5.00%, 03/15/42 | | | |
Series B, 5.00%, 08/15/27(f) | | | |
Series C, 2.15%, 03/15/31 | | | |
Series C, 5.00%, 03/15/41 | | | |
Series E, 5.00%, 03/15/40 | | | |
Series E, 5.00%, 03/15/42 | | | |
New York State Urban Development Corp., RB, Series A, 5.00%, 03/15/45 | | | |
New York State Urban Development Corp., Refunding RB | | | |
| | | |
| | | |
Series B, 2.77%, 03/15/31 | | | |
Triborough Bridge & Tunnel Authority Sales Tax Revenue, RB, Series A, 5.25%, 05/15/52 | | | |
| | | |
| |
Chautauqua Tobacco Asset Securitization Corp., Refunding RB, 4.75%, 06/01/39 | | | |
Erie Tobacco Asset Securitization Corp., Refunding RB, Series A, 5.00%, 06/01/45 | | | |
New York Counties Tobacco Trust IV, Refunding RB, Series A, 5.00%, 06/01/42 | | | |
New York Counties Tobacco Trust VI, Refunding RB | | | |
Series A-2B, 5.00%, 06/01/51 | | | |
Series B, 5.00%, 06/01/28 | | | |
Series B, 5.00%, 06/01/29 | | | |
Series C, 4.00%, 06/01/51 | | | |
Niagara Tobacco Asset Securitization Corp., Refunding RB, 5.25%, 05/15/40 | | | |
| | | |
| |
TSASC, Inc., Refunding RB | | | |
Series A, 5.00%, 06/01/30 | | | |
Series A, 5.00%, 06/01/33 | | | |
Series A, 5.00%, 06/01/36 | | | |
Westchester Tobacco Asset Securitization Corp., Refunding RB | | | |
Sub-Series C, 4.00%, 06/01/42 | | | |
Sub-Series C, 5.13%, 06/01/51 | | | |
| | | |
| |
Albany County Airport Authority, Refunding RB | | | |
Series B, AMT, 4.00%, 12/15/35 | | | |
Series B, AMT, 4.00%, 12/15/34 | | | |
Metropolitan Transportation Authority Payroll Mobility Tax Revenue, RB, Series A, 5.37%, 12/19/24 | | | |
Metropolitan Transportation Authority, RB | | | |
Series A-2, 4.00%, 11/15/43 | | | |
Sub-Series A-1, 5.00%, 11/15/40 | | | |
Series A-1, Sustainability Bonds, 4.00%, 11/15/44 | | | |
Series D-3, Sustainability Bonds, 4.00%, 11/15/47 | | | |
Metropolitan Transportation Authority, Refunding RB | | | |
Series B, 5.00%, 11/15/37 | | | |
Series A, Sustainability Bonds, 5.50%, 11/15/47 | | | |
Series B-1, Sustainability Bonds, 5.00%, 11/15/42 | | | |
Series C, Sustainability Bonds, (AGM-CR), 5.00%, 11/15/38 | | | |
Series C, Sustainability Bonds, (BAM-TCRS), 5.00%, 11/15/42 | | | |
Series C, Sustainability Bonds, (BAM), 5.00%, 11/15/44 | | | |
New York City Industrial Development Agency, Refunding RB, Series A, 5.00%, 07/01/28 | | | |
New York Liberty Development Corp., Refunding RB, Series 1, 2.75%, 02/15/44 | | | |
New York State Bridge Authority, RB | | | |
Series A, 4.00%, 01/01/39 | | | |
Series A, 4.00%, 01/01/41 | | | |
New York State Thruway Authority, RB, Series N, 4.00%, 01/01/45 | | | |
New York State Thruway Authority, Refunding RB | | | |
| | | |
Series O, 4.00%, 01/01/37 | | | |
Series O, 4.00%, 01/01/45 | | | |
Series O, 4.00%, 01/01/47 | | | |
Series P, 5.00%, 01/01/49 | | | |
Series P, 5.25%, 01/01/54 | | | |
New York Transportation Development Corp., ARB | | | |
| | | |
| | | |
| | | |
| | | |
| | | |
| | | |
Series A, AMT, 5.00%, 07/01/34 | | | |
Series A, AMT, 5.00%, 07/01/41 | | | |
Series A, AMT, 5.25%, 01/01/50 | | | |
New York Transportation Development Corp., RB | | | |
| | | |
| | | |
AMT, Sustainability Bonds, (AGM), 5.00%, 06/30/49 | | | |
AMT, Sustainability Bonds, 5.50%, 06/30/54 | | | |
62024 BlackRock Annual Financial Statements
Schedule of Investments (continued)June 30, 2024
BlackRock New York Municipal Opportunities Fund(Percentages shown are based on Net Assets)
| | | |
Transportation (continued) | |
New York Transportation Development Corp., RB (continued) | | | |
AMT, Sustainability Bonds, 6.00%, 06/30/54 | | | |
New York Transportation Development Corp., Refunding RB, 5.00%, 12/01/38 | | | |
Niagara Falls Bridge Commission, RB, (AGM), 4.16%, 10/01/33 | | | |
Niagara Frontier Transportation Authority, Refunding ARB | | | |
| | | |
| | | |
| | | |
| | | |
| | | |
| | | |
| | | |
Niagara Frontier Transportation Authority, Refunding RB, AMT, 5.00%, 04/01/37 | | | |
Port Authority of New York & New Jersey, ARB | | | |
Series 221, AMT, 4.00%, 07/15/38 | | | |
Series 218, AMT, 5.00%, 11/01/44 | | | |
Port Authority of New York & New Jersey, Refunding ARB | | | |
Series 23, 5.25%, 08/01/52 | | | |
Series 244, 5.00%, 07/15/49 | | | |
Series 197, AMT, 5.00%, 11/15/41 | | | |
Series 202, AMT, 5.00%, 04/15/37 | | | |
Series 206, AMT, 5.00%, 11/15/37 | | | |
Series 223, AMT, 4.00%, 07/15/41 | | | |
Series 231, AMT, 5.00%, 08/01/38 | | | |
Series 231, AMT, 5.50%, 08/01/39 | | | |
Series 234, AMT, 5.25%, 08/01/47 | | | |
Series 238, AMT, 5.00%, 07/15/39 | | | |
Triborough Bridge & Tunnel Authority, RB | | | |
Series A, 5.00%, 11/15/47 | | | |
Series A, 5.00%, 11/15/49 | | | |
Sub-Series B-1, 5.00%, 11/15/48 | | | |
Triborough Bridge & Tunnel Authority, Refunding RB | | | |
Series B, 5.00%, 11/15/38 | | | |
Series C, 5.25%, 05/15/52 | | | |
Series C-2, 5.00%, 11/15/42 | | | |
Series B-1, Sustainability Bonds, 5.25%, 05/15/54 | | | |
Series C, Sustainability Bonds, 5.25%, 11/15/42 | | | |
| | | |
| |
Long Island Power Authority, RB | | | |
| | | |
| | | |
| | | |
Series C, (AGC), 5.25%, 09/01/29 | | | |
Series E, Sustainability Bonds, 5.00%, 09/01/48 | | | |
Long Island Power Authority, Refunding RB | | | |
Series A, 4.00%, 09/01/38 | | | |
Series A, 4.00%, 09/01/39 | | | |
Series A, 4.00%, 09/01/41 | | | |
Series A, 5.00%, 09/01/43 | | | |
Series B, 1.50%, 09/01/51(a) | | | |
New York City Municipal Water Finance Authority, RB | | | |
Series AA, 4.00%, 06/15/43 | | | |
Sub-Series BB-1, 5.25%, 06/15/54 | | | |
| | | |
| |
New York City Municipal Water Finance Authority, RB (continued) | | | |
Sub-Series CC-1, 5.25%, 06/15/54 | | | |
New York City Municipal Water Finance Authority, Refunding RB | | | |
Series DD, 4.13%, 06/15/46 | | | |
Series DD, 5.25%, 06/15/46 | | | |
Series EE, 4.00%, 06/15/39 | | | |
Series FF, 5.00%, 06/15/40 | | | |
Series BB-2, VRDN, 4.90%, 07/01/24(a)(g) | | | |
New York Power Authority, RB | | | |
Series A, (AGM), 5.75%, 11/15/33(h) | | | |
Sustainability Bonds, (AGM), 4.00%, 11/15/47 | | | |
Series A, Sustainability Bonds, (AGM), 5.00%, 11/15/48 | | | |
New York Power Authority, Refunding RB, Series A, 4.00%, 11/15/45 | | | |
New York State Environmental Facilities Corp., Refunding RB, Series A, 5.25%, 06/15/45 | | | |
Utility Debt Securitization Authority, RB | | | |
Restructured, 5.00%, 12/15/38 | | | |
Restructured, 5.00%, 12/15/40 | | | |
Utility Debt Securitization Authority, Refunding RB | | | |
Series 1, 5.00%, 12/15/40 | | | |
Restructured, 5.00%, 12/15/36 | | | |
Restructured, 5.00%, 12/15/37 | | | |
Series TE1, Restructured, 5.00%, 12/15/38 | | | |
Series 2, Sustainability Bonds, 5.00%, 12/15/50 | | | |
| | | |
Total Municipal Bonds in New York | |
| |
| |
Commonwealth of Puerto Rico, GO | | | |
| | | |
Series A-1, 0.00%, 11/01/43(a) | | | |
Series A-1, Restructured, 5.63%, 07/01/29 | | | |
Series A-1, Restructured, 5.75%, 07/01/31 | | | |
Series A-1, Restructured, 4.00%, 07/01/33 | | | |
Series A-1, Restructured, 4.00%, 07/01/35 | | | |
Series A-1, Restructured, 4.00%, 07/01/37 | | | |
Series A-1, Restructured, 4.00%, 07/01/41 | | | |
Series A-1, Restructured, 4.00%, 07/01/46 | | | |
Commonwealth of Puerto Rico, GO, CAB, Series A, Restructured, 0.00%, 07/01/33(c) | | | |
Commonwealth of Puerto Rico, RB, 0.00%, 11/01/51(a) | | | |
Puerto Rico Sales Tax Financing Corp. Sales Tax Revenue, RB | | | |
Series A-1, Restructured, 4.75%, 07/01/53 | | | |
Series A-2, Restructured, 4.54%, 07/01/53 | | | |
Series A-2, Restructured, 4.78%, 07/01/58 | | | |
Series A-2, Restructured, 4.33%, 07/01/40 | | | |
Puerto Rico Sales Tax Financing Corp. Sales Tax | | | |
Series A-1, Restructured, 0.00%, 07/01/29 | | | |
Series A-1, Restructured, 0.00%, 07/01/33 | | | |
Series A-1, Restructured, 0.00%, 07/01/46 | | | |
Series B-1, Restructured, 0.00%, 07/01/46 | | | |
| | | |
Schedule of Investments (continued)June 30, 2024
BlackRock New York Municipal Opportunities Fund(Percentages shown are based on Net Assets)
| | | |
| |
Puerto Rico Electric Power Authority, RB | | | |
Series A, 5.00%, 07/01/29 | | | |
Series A, 7.00%, 07/01/33(d)(e) | | | |
Series A, 6.75%, 07/01/36(d)(e) | | | |
Series A, 5.00%, 07/01/42(d)(e) | | | |
Series A, 7.00%, 07/01/43(d)(e) | | | |
Series A-3, 10.00%, 07/01/19(d)(e) | | | |
Series B-3, 10.00%, 07/01/19(d)(e) | | | |
Series C-1, 5.40%, 01/01/18(d)(e) | | | |
Series C-2, 5.40%, 07/01/18(d)(e) | | | |
Series C-3, 5.40%, 01/01/20 | | | |
Series C-4, 5.40%, 07/01/20(d)(e) | | | |
Series CCC, 5.25%, 07/01/26 | | | |
Series CCC, 5.25%, 07/01/28(d)(e) | | | |
Series D-4, 7.50%, 07/01/20(d)(e) | | | |
Series TT, 5.00%, 07/01/25(d)(e) | | | |
Series TT, 5.00%, 07/01/26 | | | |
Series WW, 5.50%, 07/01/17(d)(e) | | | |
Series WW, 5.50%, 07/01/18(d)(e) | | | |
Series WW, 5.50%, 07/01/19(d)(e) | | | |
Series WW, 5.38%, 07/01/24(d)(e) | | | |
Series WW, 5.25%, 07/01/33(d)(e) | | | |
Series WW, 5.50%, 07/01/38 | | | |
Series XX, 5.25%, 07/01/17(d)(e) | | | |
Series XX, 5.25%, 07/01/35(d)(e) | | | |
Series XX, 5.75%, 07/01/36(d)(e) | | | |
Series XX, 5.25%, 07/01/40 | | | |
Puerto Rico Electric Power Authority, Refunding RB | | | |
Series AAA, 5.25%, 07/01/22 | | | |
Series AAA, 5.25%, 07/01/23 | | | |
Series AAA, 5.25%, 07/01/28(d)(e) | | | |
Series AAA, 5.25%, 07/01/29(d)(e) | | | |
Series BBB, 5.40%, 07/01/28 | | | |
Series UU, 0.00%, 07/01/17(a)(d)(e) | | | |
Series UU, 0.00%, 07/01/18(a)(d)(e) | | | |
Series UU, 4.43%, 07/01/31(a) | | | |
Series UU, 0.00%, 07/01/49(a) | | | |
Series ZZ, 5.25%, 07/01/19(d)(e) | | | |
Series ZZ, 5.00%, 07/01/20 | | | |
Series ZZ, 5.25%, 07/01/24 | | | |
Series ZZ, 5.00%, 07/01/28 | | | |
Series ZZ, 5.00%, 12/29/49(d)(e) | | | |
Puerto Rico Electric Power Authority, Refunding RB, BAB, Series YY, 6.13%, 07/01/40 | | | |
| | | |
Total Municipal Bonds in Puerto Rico | |
Total Municipal Bonds — 90.5%
(Cost: $1,095,260,096) | |
Municipal Bonds Transferred to Tender Option Bond Trusts(i) |
|
County/City/Special District/School District — 2.7% | |
City of New York, GO, Series A-1, 5.25%, 09/01/43(a) | | | |
New York City Transitional Finance Authority Future Tax Secured Revenue, RB | | | |
Series D-1, 5.25%, 11/01/43(a) | | | |
| | | |
County/City/Special District/School District (continued) | |
New York City Transitional Finance Authority Future Tax Secured Revenue, RB (continued) | | | |
Series D-1, 5.50%, 11/01/45(a) | | | |
Series D-1, 5.25%, 11/01/48 | | | |
| | | |
| |
Hudson Yards Infrastructure Corp., Refunding RB | | | |
Series A, 5.00%, 02/15/38(a) | | | |
Series A, 5.00%, 02/15/39 | | | |
New York State Dormitory Authority, Refunding RB, Series E, 5.00%, 03/15/42 | | | |
New York State Urban Development Corp., Refunding RB | | | |
| | | |
| | | |
| | | |
| |
Metropolitan Transportation Authority, Refunding RB, Sustainability Bonds, Series C, 5.00%, 11/15/41 | | | |
Triborough Bridge & Tunnel Authority, RB, Senior Lien, Sustainability Bonds, Series D-2, 5.25%, 05/15/47 | | | |
Triborough Bridge & Tunnel Authority, Refunding RB, Series A, 5.00%, 11/15/45(a) | | | |
| | | |
| |
New York City Municipal Water Finance Authority, Refunding RB, Series AA-3, 5.00%, 06/15/47 | | | |
Total Municipal Bonds in New York | |
Total Municipal Bonds Transferred to Tender Option Bond
Trusts — 10.9%
(Cost: $125,756,108) | |
Total Long-Term Investments — 101.5%
(Cost: $1,222,016,204) | |
| | | |
|
Money Market Funds — 0.8% | |
BlackRock Liquidity Funds, MuniCash, Institutional Shares, 3.88%(j)(k) | | | |
| | | |
U.S. Treasury Obligations — 1.2% | |
U.S. Treasury Bills, 5.40%, 08/01/24(l) | | | |
Total Short-Term Securities — 2.0%
(Cost: $24,166,104) | |
Total Investments — 103.5%
(Cost: $1,246,182,308) | |
Other Assets Less Liabilities — 1.6% | |
Liability for TOB Trust Certificates, Including Interest Expense and Fees Payable — (5.1)% | |
| |
82024 BlackRock Annual Financial Statements
Schedule of Investments (continued)June 30, 2024
BlackRock New York Municipal Opportunities Fund
| Variable rate security. Interest rate resets periodically. The rate shown is the effective interest rate as of period end. Security description also includes the reference rate and spread if published and available. |
| Security exempt from registration pursuant to Rule 144A under the Securities Act of 1933, as amended. These securities may be resold in transactions exempt from registration to qualified institutional investors. |
| |
| Issuer filed for bankruptcy and/or is in default. |
| Non-income producing security. |
| U.S. Government securities held in escrow, are used to pay interest on this security as well as to retire the bond in full at the date indicated, typically at a premium to par. |
| Variable rate security. Rate as of period end and maturity is the date the principal owed can be recovered through demand. |
| Security is collateralized by municipal bonds or U.S. Treasury obligations. |
| Represent bonds transferred to a TOB Trust in exchange of cash and residual certificates received by the Fund. These bonds serve as collateral in a secured borrowing. See Note 4 of the Notes to Financial Statements for details. |
| |
| Annualized 7-day yield as of period end. |
| Rates are discount rates or a range of discount rates as of period end. |
Investments in issuers considered to be affiliate(s) of the Fund during the year ended June 30, 2024 for purposes of Section 2(a)(3) of the Investment Company Act of 1940, as amended, were as follows:
| | | | | Change in
Unrealized
Appreciation
(Depreciation) | | | | Capital Gain
Distributions
from
Underlying
Funds |
BlackRock Liquidity Funds New York Money Fund Portfolio(a) | | | | | | | | | |
BlackRock Liquidity Funds, MuniCash, Institutional Shares | | | | | | | | | |
| | | | | | | | | |
| As of period end, the entity is no longer held. |
| Represents net amount purchased (sold). |
Derivative Financial Instruments Outstanding as of Period End
| | | | Value/
Unrealized
Appreciation
(Depreciation) |
| | | | |
10-Year U.S. Treasury Note | | | | |
| | | | |
5-Year U.S. Treasury Note | | | | |
| | | | |
Derivative Financial Instruments Categorized by Risk Exposure
As of period end, the fair values of derivative financial instruments located in the Statements of Assets and Liabilities were as follows:
| | | | Foreign
Currency
Exchange
Contracts | | | |
Assets — Derivative Financial Instruments | | | | | | | |
Futures contracts
Unrealized appreciation on futures contracts(a) | | | | | | | |
| Net cumulative unrealized appreciation (depreciation) on futures contracts and centrally cleared swaps, if any, are reported in the Schedule of Investments. In the Statements of Assets and Liabilities, only current day’s variation margin is reported in receivables or payables and the net cumulative unrealized appreciation (depreciation) is included in accumulated earnings (loss). |
Schedule of Investments (continued)June 30, 2024
BlackRock New York Municipal Opportunities Fund
For the period ended June 30, 2024, the effect of derivative financial instruments in the Statements of Operations was as follows:
| | | | Foreign
Currency
Exchange
Contracts | | | |
Net Realized Gain (Loss) from: | | | | | | | |
| | | | | | | |
Net Change in Unrealized Appreciation (Depreciation) on: | | | | | | | |
| | | | | | | |
Average Quarterly Balances of Outstanding Derivative Financial Instruments
| |
Average notional value of contracts — short | |
For more information about the Fund’s investment risks regarding derivative financial instruments, refer to the Notes to Financial Statements.
Fair Value Hierarchy as of Period End
Various inputs are used in determining the fair value of financial instruments. For a description of the input levels and information about the Fund’s policy regarding valuation of financial instruments, refer to the Notes to Financial Statements.
The following table summarizes the Fund’s financial instruments categorized in the fair value hierarchy. The breakdown of the Fund’s financial instruments into major categories is disclosed in the Schedule of Investments above.
| | | | |
| | | | |
| | | | |
| | | | |
| | | | |
| | | | |
Municipal Bonds Transferred to Tender Option Bond Trusts | | | | |
| | | | |
| | | | |
U.S. Treasury Obligations | | | | |
| | | | |
| | | | |
Derivative Financial Instruments(b) | | | | |
| | | | |
| | | | |
| Unfunded commitments are valued at the unrealized appreciation (depreciation) on the commitment. |
| Derivative financial instruments are futures contracts. Futures contracts are valued at the unrealized appreciation (depreciation) on the instrument. |
The Fund may hold assets and/or liabilities in which the fair value approximates the carrying amount for financial statement purposes. As of period end, TOB Trust Certificates of $60,639,997 are categorized as Level 2 within the fair value hierarchy.
See notes to financial statements.
102024 BlackRock Annual Financial Statements
Schedule of InvestmentsJune 30, 2024
BlackRock High Yield Municipal Fund(Percentages shown are based on Net Assets)
| | | |
|
| |
Black Belt Energy Gas District, RB(a) | | | |
Series A, 5.25%, 01/01/54 | | | |
Series A, 5.25%, 05/01/55 | | | |
Series C-1, 5.25%, 02/01/53 | | | |
Series F, 5.50%, 11/01/53 | | | |
Black Belt Energy Gas District, Refunding RB, 4.00%, 06/01/51(a) | | | |
Chelsea Park Cooperative District, SAB, 5.00%, 05/01/48 | | | |
County of Jefferson Alabama Sewer Revenue, Refunding RB, 5.25%, 10/01/49 | | | |
Energy Southeast A Cooperative District, RB, Series B, 5.25%, 07/01/54(a) | | | |
Hoover Industrial Development Board, RB, AMT, Sustainability Bonds, 6.38%, 11/01/50(a) | | | |
MidCity Improvement District, SAB | | | |
| | | |
| | | |
| | | |
Mobile County Industrial Development Authority, RB, Series A, AMT, 5.00%, 06/01/54 | | | |
Southeast Alabama Gas Supply District, Refunding | | | |
Series A, 5.00%, 08/01/54 | | | |
Series B, 5.00%, 06/01/49 | | | |
Southeast Energy Authority A Cooperative District, RB, Series B-1, 5.00%, 05/01/53(a) | | | |
Stadium Trace Village Improvement District, RB, 3.63%, 03/01/36 | | | |
Sumter County Industrial Development Authority, RB, AMT, Sustainability Bonds, 6.00%, 07/15/52(a) | | | |
Tuscaloosa County Industrial Development Authority, Refunding RB, Series A, 5.25%, 05/01/44(b) | | | |
| | | |
| |
Arizona Industrial Development Authority, RB | | | |
| | | |
Series A, 5.00%, 12/15/39(b) | | | |
Series A, 5.00%, 07/01/49(b) | | | |
Series A, 5.00%, 07/15/49 | | | |
Series A, 5.00%, 07/01/54(b) | | | |
Series B, 5.13%, 07/01/47(b) | | | |
Series B, 5.25%, 07/01/51(b) | | | |
Sustainability Bonds, 5.00%, 07/01/45(b) | | | |
Sustainability Bonds, 5.00%, 07/01/55(b) | | | |
Arizona Industrial Development Authority, Refunding | | | |
Series A, 5.00%, 07/01/26 | | | |
Series A, 5.50%, 07/01/52 | | | |
Glendale Industrial Development Authority, RB, 5.00%, 05/15/56 | | | |
Industrial Development Authority of the City of Phoenix Arizona, RB, Series A, 6.75%, 07/01/44(b) | | | |
Industrial Development Authority of the County of Pima, RB | | | |
| | | |
| | | |
Industrial Development Authority of the County of | | | |
| | | |
| | | |
| |
Industrial Development Authority of the County of Pima, Refunding RB(b) (continued) | | | |
| | | |
La Paz County Industrial Development Authority, RB, 5.88%, 06/15/48(b) | | | |
Maricopa County Industrial Development Authority, RB | | | |
| | | |
| | | |
Series A, 3.00%, 09/01/51 | | | |
| | | |
Sierra Vista Industrial Development Authority, RB(b) | | | |
| | | |
| | | |
| | | |
| | | |
| |
Arkansas Development Finance Authority, RB | | | |
| | | |
| | | |
AMT, Sustainability Bonds, 7.38%, 07/01/48(b) | | | |
AMT, Sustainability Bonds, 5.70%, 05/01/53 | | | |
Series A, AMT, Sustainability Bonds, 6.88%, 07/01/48(b) | | | |
| | | |
| |
California Municipal Finance Authority, ARB, AMT, Senior Lien, 4.00%, 12/31/47 | | | |
California Municipal Finance Authority, RB(b) | | | |
| | | |
| | | |
| | | |
Series A, 5.00%, 05/01/34 | | | |
Series A, 5.50%, 05/01/44 | | | |
Series A, 5.75%, 05/01/54 | | | |
Series A, 5.88%, 05/01/59 | | | |
California Municipal Finance Authority, ST | | | |
Series A, 5.00%, 09/01/44 | | | |
Series A, 5.00%, 09/01/49 | | | |
Series A, 5.00%, 09/01/54 | | | |
California Statewide Financing Authority, RB, Series L, 0.00%, 06/01/55(b)(c) | | | |
City of Los Angeles Department of Airports, Refunding ARB, AMT, 5.25%, 05/15/47 | | | |
CMFA Special Finance Agency I, RB, M/F Housing, Series A, Sustainability Bonds, 4.00%, 04/01/56(b) | | | |
CMFA Special Finance Agency XII, RB, M/F Housing, 4.38%, 08/01/49(b) | | | |
CSCDA Community Improvement Authority, RB, M/F | | | |
Series A, 3.00%, 09/01/56 | | | |
Mezzanine Lien, 4.00%, 03/01/57 | | | |
Mezzanine Lien, Sustainability Bonds, 4.00%, 06/01/57 | | | |
Series B, Mezzanine Lien, Sustainability Bonds, 4.00%, 12/01/59 | | | |
Series B, Sub Lien, Sustainability Bonds, 4.00%, 12/01/59 | | | |
Sustainability Bonds, 4.00%, 07/01/56 | | | |
Sustainability Bonds, 4.00%, 07/01/58 | | | |
Series B, Sustainability Bonds, 4.00%, 07/01/58 | | | |
Schedule of Investments11
Schedule of Investments (continued)June 30, 2024
BlackRock High Yield Municipal Fund(Percentages shown are based on Net Assets)
| | | |
| |
Golden State Tobacco Securitization Corp., Refunding RB, CAB, Series B-2, Subordinate, 0.00%, 06/01/66(c) | | | |
Hastings Campus Housing Finance Authority, RB, CAB, Sub-Series A, Sustainability Bonds, 6.75%, 07/01/61(b)(d) | | | |
Rancho Mirage Community Facilities District, ST | | | |
Series A, 5.00%, 09/01/49 | | | |
Series A, 5.00%, 09/01/54 | | | |
San Diego County Regional Airport Authority, ARB, Series B, AMT, Subordinate, 4.00%, 07/01/56 | | | |
San Francisco City & County Redevelopment Agency Successor Agency, TA, CAB, Series D, 0.00%, 08/01/31(b)(c) | | | |
| | | |
| |
9th Avenue Metropolitan District No. 2, GOL, 5.00%, 12/01/48 | | | |
Aurora Crossroads Metropolitan District No. 2, GOL | | | |
Series A, 5.00%, 12/01/40 | | | |
Series A, 5.00%, 12/01/50 | | | |
Aviation Station North Metropolitan District No. 2, GOL | | | |
Series A, 5.00%, 12/01/39 | | | |
Series A, 5.00%, 12/01/48 | | | |
Banning Lewis Ranch Metropolitan District No. 8, GOL, 4.88%, 12/01/51(b) | | | |
Cascade Ridge Metropolitan District, GOL, 5.00%, 12/01/51 | | | |
Centerra Metropolitan District No. 1, TA, 5.00%, 12/01/47(b) | | | |
City & County of Denver Colorado Airport System Revenue, Refunding ARB | | | |
Series A, AMT, 4.13%, 11/15/47 | | | |
Series A, AMT, 4.13%, 11/15/53 | | | |
Colorado Educational & Cultural Facilities Authority, Refunding RB, 4.00%, 12/01/30(b) | | | |
Colorado Health Facilities Authority, RB | | | |
| | | |
| | | |
Series A, 5.00%, 05/15/35 | | | |
Series A, 5.00%, 05/15/44 | | | |
Series A, 5.00%, 05/15/49 | | | |
Constitution Heights Metropolitan District, Refunding GOL, 5.00%, 12/01/49 | | | |
Eagle Brook Meadows Metropolitan District No. 3, GOL, Series 2021, 5.00%, 12/01/51 | | | |
Fitzsimons Village Metropolitan District No. 3, Refunding GOL | | | |
Series A-1, 4.00%, 12/01/26 | | | |
Series A-1, 4.00%, 12/01/41 | | | |
Series A-1, 4.25%, 12/01/55 | | | |
Four Corners Business Improvement District, GOL, 6.00%, 12/01/52 | | | |
Green Valley Ranch East Metropolitan District No. 6, GOL, Series A, 5.88%, 12/01/50 | | | |
Home Place Metropolitan District, GOL, Series A, 5.75%, 12/01/50 | | | |
Horizon Metropolitan District No. 2, GOL, 4.50%, 12/01/51(b) | | | |
| | | |
| |
Jefferson Center Metropolitan District No. 1, RB | | | |
Series A-2, 4.13%, 12/01/40 | | | |
Series A-2, 4.38%, 12/01/47 | | | |
Karl’s Farm Metropolitan District No. 2, GOL(b) | | | |
Series A, 5.38%, 12/01/40 | | | |
Series A, 5.63%, 12/01/50 | | | |
Lanterns Metropolitan District No. 2, GOL, Series A, 4.50%, 12/01/50 | | | |
Longs Peak Metropolitan District, GOL, 5.25%, 12/01/51(b) | | | |
Loretto Heights Community Authority, RB, 4.88%, 12/01/51 | | | |
North Holly Metropolitan District, GOL, Series A, 5.50%, 12/01/48 | | | |
North Range Metropolitan District No. 3, GOL, Series A, 5.25%, 12/01/50 | | | |
Palisade Metropolitan District No. 2, GOL, Subordinate, 7.25%, 12/15/49 | | | |
Palisade Park West Metropolitan District, GOL, Series A, 5.13%, 12/01/49 | | | |
Pomponio Terrace Metropolitan District, GOL, Series A, 5.00%, 12/01/49 | | | |
Prairie Farm Metropolitan District, GOL, Series A, 5.25%, 12/01/48 | | | |
Pronghorn Valley Metropolitan District, GOL, Series A, 4.00%, 12/01/51 | | | |
Pueblo Urban Renewal Authority, TA, 4.75%, 12/01/45(b) | | | |
Reunion Metropolitan District, RB, Series A, 3.63%, 12/01/44 | | | |
Sky Ranch Community Authority Board, RB, Series A, 5.75%, 12/01/52 | | | |
Sterling Ranch Community Authority Board, RB, Series B, Subordinate, 7.13%, 12/15/50 | | | |
Thompson Crossing Metropolitan District No. 4, Refunding GOL, 5.00%, 12/01/49 | | | |
Timberleaf Metropolitan District, GOL, Series A, 5.75%, 12/01/50 | | | |
Waters’ Edge Metropolitan District No. 2, GOL, 5.00%, 12/01/51 | | | |
Westcreek Metropolitan District No. 2, GOL, Series A, 5.38%, 12/01/48 | | | |
Wild Plum Metropolitan District, GOL, Series A, 5.00%, 12/01/24(e) | | | |
| | | |
| |
Connecticut State Health & Educational Facilities Authority, RB | | | |
Series A, 5.00%, 01/01/45(b) | | | |
Series A, 5.00%, 01/01/55(b) | | | |
Series A, Sustainability Bonds, 07/01/54(f) | | | |
Mohegan Tribal Finance Authority, RB, 7.00%, 02/01/45(b) | | | |
| | | |
| |
Affordable Housing Opportunities Trust, RB, Series AH-01, Class B, 6.88%, 05/01/39(b) | | | |
County of Kent Delaware, RB, Series A, 5.00%, 07/01/53 | | | |
122024 BlackRock Annual Financial Statements
Schedule of Investments (continued)June 30, 2024
BlackRock High Yield Municipal Fund(Percentages shown are based on Net Assets)
| | | |
| |
Town of Bridgeville Delaware, ST(b) | | | |
| | | |
| | | |
| | | |
District of Columbia — 1.7% | |
District of Columbia Tobacco Settlement Financing | | | |
Series A, 0.00%, 06/15/46 | | | |
Series B, 0.00%, 06/15/46 | | | |
Series C, 0.00%, 06/15/55 | | | |
District of Columbia Tobacco Settlement Financing Corp., Refunding RB, 6.75%, 05/15/40 | | | |
District of Columbia, RB, Series A, AMT, Sustainability Bonds, 5.50%, 02/28/37 | | | |
District of Columbia, Refunding RB, 5.00%, 06/01/46 | | | |
Metropolitan Washington Airports Authority Dulles Toll Road Revenue, Refunding RB | | | |
Series B, 2nd Lien, (AGC), 0.00%, 10/01/30(c) | | | |
Series B, Subordinate, 4.00%, 10/01/49 | | | |
| | | |
| |
Antillia Community Development District, SAB | | | |
| | | |
| | | |
Artisan Lakes East Community Development District, SAB, Series 2021-1, 4.00%, 05/01/51 | | | |
Babcock Ranch Community Independent Special District, SAB | | | |
Series 2022, 5.00%, 05/01/42 | | | |
Series 2022, 5.00%, 05/01/53 | | | |
Boggy Branch Community Development District, SAB, 4.00%, 05/01/51 | | | |
Boggy Creek Improvement District, Refunding SAB, Series 2013, 5.13%, 05/01/43 | | | |
Brevard County Health Facilities Authority, Refunding | | | |
| | | |
| | | |
Buckhead Trails Community Development District, SAB | | | |
| | | |
| | | |
Series 2022, 5.63%, 05/01/42 | | | |
Series 2022, 5.75%, 05/01/52 | | | |
Cabot Citrus Farms Community Development District, SAB, 5.25%, 03/01/29 | | | |
Capital Projects Finance Authority, RB(b) | | | |
| | | |
| | | |
Capital Region Community Development District, Refunding SAB, Series A-1, 5.13%, 05/01/39 | | | |
Capital Trust Agency, Inc., RB | | | |
| | | |
| | | |
Series A, 5.00%, 06/15/49(b) | | | |
Series A, 5.75%, 06/01/54(b) | | | |
Series B, 0.00%, 01/01/35(c) | | | |
Series B, 0.00%, 01/01/60(c) | | | |
Capital Trust Agency, Inc., RB, CAB, 0.00%, 07/01/61(b)(c) | | | |
| | | |
| |
Celebration Pointe Community Development District No. 1, SAB, 5.00%, 05/01/34 | | | |
Central Parc Community Development District, SAB | | | |
| | | |
| | | |
Charles Cove Community Development District, SAB | | | |
| | | |
| | | |
| | | |
Charlotte County Industrial Development Authority, | | | |
| | | |
| | | |
Collier County Industrial Development Authority, Refunding RB, Series A, 8.13%, 05/15/44(b) | | | |
Coral Creek Community Development District, SAB, 5.75%, 05/01/54 | | | |
County of Lake Florida, RB, 5.00%, 01/15/49(b) | | | |
County of Osceola Florida Transportation Revenue, | | | |
Series A-2, 0.00%, 10/01/48 | | | |
Series A-2, 0.00%, 10/01/49 | | | |
Crosswinds East Community Development District, SAB, 5.75%, 05/01/54 | | | |
Darby Community Development District, SAB, Series A-2, 5.88%, 05/01/35 | | | |
Elevation Pointe Community Development District, SAB | | | |
Series A-1, 4.40%, 05/01/42 | | | |
Series A-1, 4.60%, 05/01/52 | | | |
Series A-2, 4.40%, 05/01/32 | | | |
Escambia County Health Facilities Authority, Refunding RB | | | |
| | | |
| | | |
Florida Development Finance Corp., RB | | | |
| | | |
| | | |
Series A, 5.75%, 06/15/29(b) | | | |
Series A, 6.00%, 06/15/34(b) | | | |
Series A, 4.00%, 06/15/52 | | | |
Series A, 5.00%, 06/15/56 | | | |
Series A, 5.13%, 06/15/55(b) | | | |
Series B, 4.50%, 12/15/56(b) | | | |
Series C, 5.75%, 12/15/56(b) | | | |
| | | |
AMT, 6.13%, 07/01/32(a)(b) | | | |
Florida Development Finance Corp., Refunding RB | | | |
Series A, 4.00%, 06/01/36(b) | | | |
Series A, 4.00%, 06/01/46(b) | | | |
Series A, 4.00%, 06/01/55(b) | | | |
| | | |
AMT, (AGM), 5.25%, 07/01/53 | | | |
| | | |
Series C, AMT, 8.25%, 07/01/57(a)(b) | | | |
Gardens at Hammock Beach Community Development District, SAB | | | |
Series 1, 4.80%, 05/01/31 | | | |
Series 1, 5.38%, 05/01/44 | | | |
Series 1, 5.65%, 05/01/54 | | | |
Series 2, 5.00%, 05/01/31 | | | |
Schedule of Investments13
Schedule of Investments (continued)June 30, 2024
BlackRock High Yield Municipal Fund(Percentages shown are based on Net Assets)
| | | |
| |
Gardens at Hammock Beach Community Development District, SAB (continued) | | | |
Series 2, 5.60%, 05/01/44 | | | |
Series 2, 5.88%, 05/01/55 | | | |
Golden Gem Community Development District, SAB | | | |
| | | |
| | | |
| | | |
Grand Oaks Community Development District, SAB | | | |
| | | |
| | | |
Hammock Oaks Community Development District, SAB | | | |
| | | |
| | | |
Hills of Minneola Community Development District, | | | |
| | | |
| | | |
Hobe-St Lucie Conservancy District, SAB, 5.88%, 05/01/55 | | | |
Lakeside Preserve Community Development District, SAB, Series 2023, 6.38%, 05/01/54 | | | |
Lakewood Ranch Stewardship District, SAB | | | |
| | | |
| | | |
| | | |
| | | |
| | | |
| | | |
| | | |
| | | |
| | | |
| | | |
| | | |
| | | |
| | | |
Series 1A, 4.25%, 05/01/28 | | | |
Series 1A, 5.00%, 05/01/38 | | | |
Series 1A, 5.10%, 05/01/48 | | | |
Series 1B, 4.75%, 05/01/29 | | | |
Series 1B, 5.30%, 05/01/39 | | | |
Series 1B, 5.45%, 05/01/48 | | | |
Laurel Road Community Development District, SAB | | | |
Series A-1, 3.25%, 05/01/41 | | | |
Series A-1, 4.00%, 05/01/52 | | | |
Lee County Industrial Development Authority, RB, Series B-1, 11/15/29(f) | | | |
LT Ranch Community Development District, SAB | | | |
| | | |
| | | |
LTC Ranch West Residential Community Development District, SAB | | | |
Series AA2, 5.70%, 05/01/44 | | | |
Series AA2, 6.00%, 05/01/54 | | | |
Marion Ranch Community Development District, SAB | | | |
| | | |
| | | |
| | | |
Midtown Miami Community Development District, Refunding SAB, Series A, 5.00%, 05/01/37 | | | |
Mirada II Community Development District, SAB, 4.00%, 05/01/51 | | | |
| | | |
| |
North AR-1 Pasco Community Development District, SAB | | | |
Series A, 5.75%, 05/01/44 | | | |
Series A, 6.00%, 05/01/54 | | | |
North River Ranch Community Development District, SAB | | | |
Series A-1, 4.00%, 05/01/40 | | | |
Series A-1, 4.25%, 05/01/51 | | | |
Series A-2, 4.20%, 05/01/35 | | | |
Orange County Health Facilities Authority, RB, 4.00%, 10/01/52 | | | |
Parrish Plantation Community Development District, SAB | | | |
| | | |
| | | |
| | | |
Poitras East Community Development District, SAB | | | |
| | | |
| | | |
Sandridge Community Development District, SAB | | | |
Series A1, 3.88%, 05/01/41 | | | |
Series A1, 4.00%, 05/01/51 | | | |
Sawyers Landing Community Development District, SAB, 4.25%, 05/01/53 | | | |
Seminole County Industrial Development Authority, Refunding RB, 5.75%, 11/15/54 | | | |
Shadowlawn Community Development District, SAB, 5.85%, 05/01/54 | | | |
Somerset Bay Community Development District, | | | |
| | | |
| | | |
| | | |
South Broward Hospital District, RB, (BAM-TCRS), 3.00%, 05/01/51 | | | |
Southern Groves Community Development District No. 5, SAB | | | |
| | | |
| | | |
| | | |
| | | |
Talavera Community Development District, SAB, 4.35%, 05/01/40 | | | |
Tolomato Community Development District, Refunding SAB | | | |
Series 2015-2, 6.61%, 05/01/40(d) | | | |
Series A-2, 4.25%, 05/01/37 | | | |
Tolomato Community Development District, SAB, Series 2015-3, 6.61%, 05/01/40 | | | |
Trout Creek Community Development District, SAB | | | |
| | | |
| | | |
Two Rivers West Community Development District, | | | |
Series 2024, 4.80%, 05/01/31 | | | |
Series 2024, 5.63%, 05/01/44 | | | |
Series 2024, 5.88%, 05/01/54 | | | |
V-Dana Community Development District, SAB(b) | | | |
| | | |
| | | |
| | | |
Village Community Development District No. 14, SAB | | | |
| | | |
142024 BlackRock Annual Financial Statements
Schedule of Investments (continued)June 30, 2024
BlackRock High Yield Municipal Fund(Percentages shown are based on Net Assets)
| | | |
| |
Village Community Development District No. 14, SAB (continued) | | | |
| | | |
Village Community Development District No. 15, SAB, 5.25%, 05/01/54(b) | | | |
Volusia County Educational Facility Authority, RB, 5.25%, 06/01/49 | | | |
West Villages Improvement District, SAB | | | |
| | | |
| | | |
| | | |
| | | |
| | | |
Westside Haines City Community Development District, SAB, 6.00%, 05/01/54 | | | |
| | | |
| |
Atlanta Urban Redevelopment Agency, RB, 3.88%, 07/01/51(b) | | | |
Dalton Whitfield County Joint Development Authority, RB, 4.00%, 08/15/48 | | | |
Development Authority of Cobb County, RB, Series A, 6.38%, 06/15/58(b) | | | |
East Point Business & Industrial Development Authority, RB, Series A, 5.25%, 06/15/62(b) | | | |
Main Street Natural Gas, Inc., RB, Series A, 5.00%, 06/01/53(a) | | | |
Municipal Electric Authority of Georgia, RB | | | |
Series A, 5.00%, 01/01/49 | | | |
Series A, 5.00%, 07/01/52 | | | |
| | | |
| |
Idaho Health Facilities Authority, Refunding RB, 3.50%, 09/01/33 | | | |
Idaho Housing & Finance Association, RB(b) | | | |
Series A, 6.00%, 07/01/39 | | | |
Series A, 6.00%, 07/01/49 | | | |
Series A, 6.00%, 07/01/54 | | | |
Series A, 6.95%, 06/15/55 | | | |
Series C, 5.00%, 12/01/46 | | | |
Power County Industrial Development Corp., RB, 6.45%, 08/01/32 | | | |
| | | |
| |
Chicago Board of Education, GO, Series A, 5.00%, 12/01/42 | | | |
Chicago Board of Education, Refunding GO | | | |
Series B, 4.00%, 12/01/35 | | | |
Series B, 4.00%, 12/01/41 | | | |
Chicago Transit Authority Sales Tax Receipts Fund, Refunding RB, Series A, 2nd Lien, 5.00%, 12/01/57 | | | |
City of Chicago Illinois, Refunding GO, Series B, 4.00%, 01/01/37 | | | |
Illinois Finance Authority, Refunding RB | | | |
| | | |
| | | |
Series A, 5.00%, 05/15/56 | | | |
| | | |
| |
Illinois State Toll Highway Authority, RB, Series A, 5.00%, 01/01/46 | | | |
Metropolitan Pier & Exposition Authority, Refunding RB, 4.00%, 06/15/50 | | | |
State of Illinois, GO, 5.50%, 05/01/39 | | | |
| | | |
| |
City of Valparaiso Indiana, Refunding RB, AMT, 4.50%, 01/01/34(b) | | | |
City of Vincennes Indiana, Refunding RB, 6.25%, 01/01/29(b) | | | |
Indiana Finance Authority, RB, Series A, AMT, 6.75%, 05/01/39 | | | |
Indianapolis Local Public Improvement Bond Bank, RB, Series E, 6.00%, 03/01/53 | | | |
| | | |
| |
Iowa Higher Education Loan Authority, Refunding RB, 5.50%, 11/01/51 | | | |
PEFA, Inc., RB, 5.00%, 09/01/49(a) | | | |
| | | |
| |
City of Shawnee Kansas, RB | | | |
| | | |
| | | |
| | | |
| |
City of Henderson Kentucky, RB(b) | | | |
Series A, AMT, 4.70%, 01/01/52 | | | |
Series B, AMT, 4.45%, 01/01/42 | | | |
Series B, AMT, 4.70%, 01/01/52 | | | |
Kentucky Economic Development Finance Authority, Refunding RB, CAB, Series B, (NPFGC), 0.00%, 10/01/24(c) | | | |
Kentucky Public Energy Authority, RB, Series C, 4.00%, 02/01/50(a) | | | |
| | | |
| |
Louisiana Public Facilities Authority, RB | | | |
Series A, 5.25%, 06/01/51 | | | |
Series A, 5.25%, 06/01/60 | | | |
Series A, 6.50%, 06/01/62 | | | |
Class R2, AMT, 6.50%, 10/01/53 | | | |
Parish of St. James Louisiana, RB, Series 2, 6.35%, 07/01/40 | | | |
| | | |
| |
Finance Authority of Maine, RB, AMT, Sustainability Bonds, 8.00%, 12/01/51(b) | | | |
Maine Health & Higher Educational Facilities Authority, RB, Series A, 4.00%, 07/01/50 | | | |
Maine Health & Higher Educational Facilities Authority, Refunding RB, 4.00%, 07/01/37(b) | | | |
| | | |
| |
City of Baltimore Maryland, RB | | | |
| | | |
| | | |
Schedule of Investments15
Schedule of Investments (continued)June 30, 2024
BlackRock High Yield Municipal Fund(Percentages shown are based on Net Assets)
| | | |
| |
City of Baltimore Maryland, Refunding RB, Convertible, 5.00%, 09/01/46 | | | |
Maryland Economic Development Corp., TA, 4.00%, 09/01/50 | | | |
Maryland Health & Higher Educational Facilities Authority, RB, 7.00%, 03/01/55(b) | | | |
| | | |
| |
Massachusetts Development Finance Agency, RB, Series D, Sustainability Bonds, 4.00%, 07/01/45 | | | |
Massachusetts Development Finance Agency, | | | |
| | | |
| | | |
| | | |
Massachusetts Port Authority, ARB, Series E, AMT, 5.00%, 07/01/51 | | | |
| | | |
| |
Advanced Technology Academy, Refunding RB | | | |
| | | |
| | | |
Michigan Strategic Fund, RB | | | |
| | | |
| | | |
AMT, Sustainability Bonds, 4.00%, 10/01/61(a) | | | |
| | | |
| |
City of Minneapolis Minnesota, RB, Series A, 5.75%, 07/01/55 | | | |
Duluth Economic Development Authority, Refunding RB | | | |
Series A, 4.25%, 02/15/48 | | | |
Series A, 5.25%, 02/15/58 | | | |
| | | |
| |
Industrial Development Authority of the City of St. Louis Missouri, Refunding RB | | | |
Series A, 4.88%, 06/15/34 | | | |
Series A, 4.38%, 11/15/35 | | | |
Series A, 5.75%, 06/15/54 | | | |
Kansas City Industrial Development Authority, RB, Series C, 7.50%, 11/15/46 | | | |
Kansas City Industrial Development Authority, Refunding RB | | | |
| | | |
| | | |
Kansas City Land Clearance Redevelopment Authority, TA, Series B, 5.00%, 02/01/40(b) | | | |
| | | |
| |
City of Forsyth Montana, Refunding RB, Series A, 3.90%, 03/01/31(a) | | | |
| |
Central Plains Energy Project, RB, Series 1, 5.00%, 05/01/53(a) | | | |
| | | |
| |
City of Las Vegas Nevada Special Improvement District No. 613, SAB | | | |
| | | |
| | | |
| | | |
City of Las Vegas Nevada Special Improvement District No. 815, SAB, 5.00%, 12/01/49 | | | |
Tahoe-Douglas Visitors Authority, RB | | | |
| | | |
| | | |
| | | |
| |
New Hampshire Business Finance Authority, RB | | | |
Series A, 4.13%, 08/15/40 | | | |
Series A, 4.25%, 08/15/46 | | | |
Series A, 4.50%, 08/15/55 | | | |
New Hampshire Business Finance Authority, RB, M/F Housing, Series 2, Sustainability Bonds, 4.25%, 07/20/41 | | | |
New Hampshire Business Finance Authority, Refunding RB, Series C, AMT, 4.88%, 11/01/42(b) | | | |
| | | |
| |
Industrial Pollution Control Financing Authority of Gloucester County, Refunding RB, Series A, AMT, 5.00%, 12/01/24(g) | | | |
Middlesex County Improvement Authority, RB | | | |
Series B, 6.13%, 01/01/25 | | | |
Series B, 6.25%, 01/01/37 | | | |
New Jersey Economic Development Authority, RB | | | |
| | | |
Series A, 5.00%, 07/01/37 | | | |
Series A, 5.25%, 11/01/54(b) | | | |
Series B, 6.50%, 04/01/31 | | | |
New Jersey Health Care Facilities Financing Authority, RB, 4.00%, 07/01/51 | | | |
New Jersey Higher Education Student Assistance Authority, RB, Series B, AMT, 4.25%, 12/01/45 | | | |
New Jersey Transportation Trust Fund Authority, RB, Series AA, 4.00%, 06/15/50 | | | |
| | | |
| |
Albany Capital Resource Corp., Refunding RB, 4.00%, 07/01/41 | | | |
Build NYC Resource Corp., RB | | | |
Series A, 5.00%, 07/01/32 | | | |
Series A, 5.13%, 07/01/33 | | | |
Series A, 6.13%, 07/01/43 | | | |
Series A, 6.38%, 07/01/53 | | | |
Build NYC Resource Corp., Refunding RB, AMT, 5.00%, 01/01/35(b) | | | |
City of New York, GO, Series A-1, 4.00%, 09/01/46 | | | |
Huntington Local Development Corp., RB, Series A, 5.25%, 07/01/56 | | | |
New York City Housing Development Corp., RB, M/F Housing | | | |
Series C-1A, 4.15%, 11/01/39 | | | |
Series C-1A, 4.20%, 11/01/44 | | | |
Series C-1A, 4.30%, 11/01/47 | | | |
New York Liberty Development Corp., Refunding RB | | | |
| | | |
162024 BlackRock Annual Financial Statements
Schedule of Investments (continued)June 30, 2024
BlackRock High Yield Municipal Fund(Percentages shown are based on Net Assets)
| | | |
| |
New York Liberty Development Corp., Refunding RB (continued) | | | |
Series 1, 2.75%, 02/15/44 | | | |
Series A, Sustainability Bonds, 3.00%, 11/15/51 | | | |
New York Power Authority, Refunding RB, Series A, Sustainability Bonds, 4.00%, 11/15/50 | | | |
New York State Dormitory Authority, Refunding RB | | | |
Series A, 3.00%, 03/15/51 | | | |
Series D, 4.00%, 02/15/47 | | | |
New York Transportation Development Corp., ARB | | | |
| | | |
| | | |
| | | |
| | | |
New York Transportation Development Corp., RB | | | |
| | | |
| | | |
AMT, Sustainability Bonds, 5.50%, 06/30/54 | | | |
New York Transportation Development Corp., Refunding ARB, AMT, 5.38%, 08/01/36 | | | |
Niagara Area Development Corp., Refunding RB, Series A, AMT, 4.75%, 11/01/42(b) | | | |
Oneida Indian Nation of New York, RB, Series B, 6.00%, 09/01/43(b) | | | |
Onondaga Civic Development Corp., Refunding RB(f) | | | |
| | | |
| | | |
Port Authority of New York & New Jersey, Refunding ARB, Series 223, AMT, 4.00%, 07/15/61 | | | |
Suffolk Regional Off-Track Betting Co., RB | | | |
| | | |
| | | |
| | | |
Westchester County Local Development Corp., Refunding RB | | | |
| | | |
| | | |
Series A, 5.13%, 07/01/55 | | | |
Westchester Tobacco Asset Securitization Corp., Refunding RB | | | |
Sub-Series C, 4.00%, 06/01/42 | | | |
Sub-Series C, 5.13%, 06/01/51 | | | |
| | | |
| |
North Carolina Medical Care Commission, RB, Series A, 4.00%, 10/01/35 | | | |
| |
City of Grand Forks North Dakota, RB, Series A, (AGM), 5.00%, 12/01/48 | | | |
County of Cass North Dakota, Refunding RB, Series B, 5.25%, 02/15/58 | | | |
| | | |
| |
Buckeye Tobacco Settlement Financing Authority, Refunding RB, Series B-2, Class 2, 5.00%, 06/01/55 | | | |
County of Hamilton Ohio, Refunding RB, 5.00%, 01/01/46 | | | |
| | | |
| |
County of Hardin Ohio, Refunding RB | | | |
| | | |
| | | |
| | | |
Hickory Chase Community Authority, Refunding RB, 5.00%, 12/01/40(b) | | | |
Jefferson County Port Authority, RB, AMT, 3.50%, 12/01/51(b) | | | |
Ohio Air Quality Development Authority, RB, AMT, 5.00%, 07/01/49(b) | | | |
Ohio Higher Educational Facility Commission, Refunding RB, 4.00%, 10/01/47 | | | |
Port of Greater Cincinnati Development Authority, RB, 4.25%, 12/01/50(b) | | | |
| | | |
| |
Oklahoma Development Finance Authority, RB | | | |
| | | |
Series A-2, 7.25%, 09/01/51(b) | | | |
Series B, 5.00%, 08/15/38 | | | |
Series B, 5.50%, 08/15/52 | | | |
Tulsa Authority for Economic Opportunity, TA, 4.38%, 12/01/41(b) | | | |
Tulsa County Industrial Authority, Refunding RB, 5.25%, 11/15/37 | | | |
| | | |
| |
Clackamas County Hospital Facility Authority, Refunding RB, Series A, 5.25%, 11/15/50 | | | |
Oregon State Facilities Authority, RB(b) | | | |
Series A, 5.00%, 06/15/49 | | | |
Series A, 5.25%, 06/15/55 | | | |
| | | |
| |
Allentown Neighborhood Improvement Zone Development Authority, RB, 5.00%, 05/01/42(b) | | | |
Beaver County Industrial Development Authority, Refunding RB, Series B, 3.75%, 10/01/47 | | | |
Bucks County Industrial Development Authority, RB, 4.00%, 07/01/46 | | | |
Doylestown Hospital Authority, Refunding RB(b) | | | |
| | | |
| | | |
East Hempfield Township Industrial Development Authority, RB, 5.00%, 07/01/24(e) | | | |
Montgomery County Higher Education and Health Authority, Refunding RB, Series A, 4.00%, 09/01/49 | | | |
Montgomery County Industrial Development Authority, Refunding RB, 5.00%, 12/01/46 | | | |
Northampton County Industrial Development Authority, TA, 7.00%, 07/01/32 | | | |
Pennsylvania Economic Development Financing Authority, RB | | | |
| | | |
| | | |
Pennsylvania Economic Development Financing Authority, Refunding RB | | | |
Series B, 5.25%, 12/01/38(a) | | | |
Schedule of Investments17
Schedule of Investments (continued)June 30, 2024
BlackRock High Yield Municipal Fund(Percentages shown are based on Net Assets)
| | | |
| |
Pennsylvania Economic Development Financing Authority, Refunding RB (continued) | | | |
Series C, 5.25%, 12/01/37(a) | | | |
| | | |
Pennsylvania Higher Education Assistance Agency, RB, Series 1C, AMT, 5.00%, 06/01/51 | | | |
School District of Philadelphia, GOL, Series A, (SAW), 5.50%, 09/01/48 | | | |
| | | |
| |
Children’s Trust Fund, RB, Series A, 0.00%, 05/15/57(c) | | | |
Children’s Trust Fund, Refunding RB, Series B, 0.00%, 05/15/55(c) | | | |
Commonwealth of Puerto Rico, GO | | | |
| | | |
Series A-1, 0.00%, 11/01/43(a) | | | |
Series A-1, Restructured, 5.38%, 07/01/25 | | | |
Series A-1, Restructured, 5.63%, 07/01/29 | | | |
Series A-1, Restructured, 5.75%, 07/01/31 | | | |
Series A-1, Restructured, 4.00%, 07/01/33 | | | |
Series A-1, Restructured, 4.00%, 07/01/35 | | | |
Series A-1, Restructured, 4.00%, 07/01/37 | | | |
Series A-1, Restructured, 4.00%, 07/01/41 | | | |
Series A-1, Restructured, 4.00%, 07/01/46 | | | |
Commonwealth of Puerto Rico, GO, CAB, Series A, Restructured, 0.00%, 07/01/33(c) | | | |
Commonwealth of Puerto Rico, RB, 0.00%, 11/01/51(a) | | | |
PRIFA Custodial Trust, RB, Series 2005, 0.00%, 03/15/49 | | | |
Puerto Rico Commonwealth Aqueduct & Sewer Authority, RB, Series A, 4.00%, 07/01/42(b) | | | |
Puerto Rico Commonwealth Aqueduct & Sewer Authority, Refunding RB, Series B, 4.00%, 07/01/42(b) | | | |
Puerto Rico Electric Power Authority, RB | | | |
Series A, 7.25%, 07/01/30 | | | |
Series A, 7.00%, 07/01/33(i)(j) | | | |
Series A, 6.75%, 07/01/36(i)(j) | | | |
Series A, 7.00%, 07/01/40 | | | |
Series A, 5.00%, 07/01/42(i)(j) | | | |
Series A, 5.05%, 07/01/42(i)(j) | | | |
Series A, 7.00%, 07/01/43(i)(j) | | | |
Series A-1, 10.00%, 07/01/19 | | | |
Series A-2, 10.00%, 07/01/19(i)(j) | | | |
Series A-3, 10.00%, 07/01/19(i)(j) | | | |
Series B-3, 10.00%, 07/01/19(i)(j) | | | |
Series C-1, 5.40%, 01/01/18(i)(j) | | | |
Series C-2, 5.40%, 07/01/18(i)(j) | | | |
Series C-3, 5.40%, 01/01/20(i)(j) | | | |
Series C-4, 5.40%, 07/01/20(i)(j) | | | |
Series CCC, 5.00%, 07/01/22 | | | |
Series CCC, 5.00%, 07/01/25 | | | |
Series CCC, 5.25%, 07/01/26(i)(j) | | | |
Series CCC, 5.25%, 07/01/28(i)(j) | | | |
Series D-1, 7.50%, 01/01/20 | | | |
Series D-2, 7.50%, 01/01/20 | | | |
Series D-4, 7.50%, 07/01/20(i)(j) | | | |
Series TT, 5.00%, 07/01/18(i)(j) | | | |
| | | |
| |
Puerto Rico Electric Power Authority, RB (continued) | | | |
Series TT, 5.00%, 07/01/25(i)(j) | | | |
Series TT, 5.00%, 07/01/26(i)(j) | | | |
Series WW, 5.50%, 07/01/17(i)(j) | | | |
Series WW, 5.50%, 07/01/18(i)(j) | | | |
Series WW, 5.50%, 07/01/19(i)(j) | | | |
Series WW, 5.38%, 07/01/22 | | | |
Series WW, 5.38%, 07/01/24(i)(j) | | | |
Series WW, 5.25%, 07/01/25 | | | |
Series WW, 5.25%, 07/01/33(i)(j) | | | |
Series WW, 5.50%, 07/01/38(i)(j) | | | |
Series XX, 5.25%, 07/01/17(i)(j) | | | |
Series XX, 5.25%, 07/01/35(i)(j) | | | |
Series XX, 5.75%, 07/01/36(i)(j) | | | |
Series XX, 5.25%, 07/01/40(i)(j) | | | |
Puerto Rico Electric Power Authority, Refunding RB | | | |
Series AAA, 5.25%, 07/01/22(i)(j) | | | |
Series AAA, 5.25%, 07/01/25 | | | |
Series AAA, 5.25%, 07/01/28(i)(j) | | | |
Series AAA, 5.25%, 07/01/29(i)(j) | | | |
Series UU, 0.00%, 07/01/17(a)(i)(j) | | | |
Series UU, 0.00%, 07/01/18(a)(i)(j) | | | |
Series UU, 4.43%, 07/01/31(a)(i)(j) | | | |
Series UU, 0.00%, 07/01/49(a) | | | |
Series ZZ, 5.25%, 07/01/19(i)(j) | | | |
Series ZZ, 5.25%, 07/01/23(i)(j) | | | |
Series ZZ, 5.25%, 07/01/24(i)(j) | | | |
Series ZZ, 5.25%, 07/01/25 | | | |
Series ZZ, 5.00%, 07/01/28 | | | |
Series ZZ, 5.00%, 12/29/49(i)(j) | | | |
Puerto Rico Industrial Tourist Educational Medical & Envirml Ctl Facs Fing Authority, ARB | | | |
Series A-1, AMT, 6.75%, 01/01/45 | | | |
Series A-2, AMT, 6.50%, 01/01/42 | | | |
Series A-2, AMT, 6.75%, 01/01/45 | | | |
Puerto Rico Sales Tax Financing Corp. Sales Tax Revenue, RB, Series A-2, Restructured, 4.54%, 07/01/53 | | | |
Puerto Rico Sales Tax Financing Corp. Sales Tax | | | |
Series A-1, Restructured, 0.00%, 07/01/33 | | | |
Series A-1, Restructured, 0.00%, 07/01/46 | | | |
Series A-1, Restructured, 0.00%, 07/01/51 | | | |
Series B-1, Restructured, 0.00%, 07/01/46 | | | |
| | | |
| |
City of Hardeeville South Carolina, SAB(b) | | | |
| | | |
| | | |
| | | |
| | | |
County of Dorchester South Carolina, SAB, 6.00%, 10/01/51(b) | | | |
South Carolina Jobs-Economic Development Authority, RB | | | |
| | | |
Series A, 5.00%, 11/15/42 | | | |
182024 BlackRock Annual Financial Statements
Schedule of Investments (continued)June 30, 2024
BlackRock High Yield Municipal Fund(Percentages shown are based on Net Assets)
| | | |
South Carolina (continued) | |
South Carolina Jobs-Economic Development Authority, RB (continued) | | | |
Series A, 5.50%, 11/01/54 | | | |
South Carolina Jobs-Economic Development Authority, Refunding RB, 4.00%, 11/15/27 | | | |
| | | |
| |
Franklin Health & Educational Facilities Board, Refunding RB, Series A, 7.50%, 06/01/47(b) | | | |
Metropolitan Government Nashville & Davidson County Health & Educational Facilities Board, Refunding RB, 4.00%, 10/01/49 | | | |
Metropolitan Government Nashville & Davidson County Industrial Development Board, SAB, 4.00%, 06/01/51(b) | | | |
Metropolitan Government Nashville & Davidson County Industrial Development Board, SAB, CAB, 0.00%, 06/01/43(b)(c) | | | |
Nashville Metropolitan Development & Housing Agency, TA, 5.13%, 06/01/36(b) | | | |
Tennergy Corp., RB, Series A, 5.50%, 10/01/53(a) | | | |
Tennessee Energy Acquisition Corp., RB, Series A, 5.00%, 05/01/52(a) | | | |
| | | |
| |
Angelina & Neches River Authority, RB, Series A, AMT, 7.50%, 12/01/45(b) | | | |
Arlington Higher Education Finance Corp., RB(b) | | | |
| | | |
| | | |
| | | |
Brazoria County Industrial Development Corp., RB, AMT, 7.00%, 03/01/39 | | | |
Central Texas Regional Mobility Authority, Refunding | | | |
| | | |
| | | |
| | | |
| | | |
City of Crandall Texas, SAB(b) | | | |
| | | |
| | | |
| | | |
| | | |
City of Fate Texas, SAB, 5.75%, 08/15/54(b) | | | |
City of Houston Texas Airport System Revenue, ARB | | | |
| | | |
Series A, AMT, 6.63%, 07/15/38 | | | |
Series A, AMT, 4.00%, 07/01/41 | | | |
Series B-1, AMT, 5.00%, 07/15/35 | | | |
City of Houston Texas Airport System Revenue, Refunding ARB, AMT, 5.00%, 07/15/27 | | | |
City of Houston Texas Airport System Revenue, Refunding RB | | | |
| | | |
| | | |
Series C, AMT, 5.00%, 07/15/27 | | | |
City of Marble Falls Texas, SAB(b) | | | |
| | | |
| | | |
| | | |
| |
City of Marble Falls Texas, SAB(b) (continued) | | | |
| | | |
City of San Marcos Texas, SAB(b) | | | |
| | | |
| | | |
| | | |
| | | |
Fort Bend County Industrial Development Corp., RB, Series B, 4.75%, 11/01/42 | | | |
Harris County Cultural Education Facilities Finance Corp., Refunding RB | | | |
Series A, 5.00%, 01/01/38 | | | |
Series A, 5.00%, 01/01/43 | | | |
Series A, 5.13%, 01/01/48 | | | |
Hemphill County Hospital District, GOL | | | |
| | | |
| | | |
Houston Higher Education Finance Corp., RB, 4.00%, 10/01/51 | | | |
New Hope Cultural Education Facilities Finance Corp., RB | | | |
Series A, 5.00%, 01/01/55 | | | |
Series A, 5.00%, 07/01/57 | | | |
Series A-1, 5.50%, 01/01/57 | | | |
New Hope Cultural Education Facilities Finance Corp., Refunding RB, Series A, 6.75%, 10/01/52 | | | |
New Hope Higher Education Finance Corp., RB, Series A, 5.75%, 06/15/51(b) | | | |
Newark Higher Education Finance Corp., RB(b) | | | |
Series A, 5.50%, 08/15/35 | | | |
Series A, 5.75%, 08/15/45 | | | |
Port of Beaumont Navigation District, ARB(b) | | | |
Series A, AMT, 5.00%, 01/01/39 | | | |
Series A, AMT, 5.13%, 01/01/44 | | | |
Port of Beaumont Navigation District, RB, AMT, 2.88%, 01/01/41(b) | | | |
Port of Beaumont Navigation District, Refunding RB(b) | | | |
Series A, AMT, 3.63%, 01/01/35 | | | |
Series A, AMT, 4.00%, 01/01/50 | | | |
San Antonio Education Facilities Corp., RB | | | |
Series A, 5.00%, 10/01/41 | | | |
Series A, 5.00%, 10/01/51 | | | |
Texas Municipal Gas Acquisition & Supply Corp. III, Refunding RB, 5.00%, 12/15/32 | | | |
Texas Transportation Commission State Highway | | | |
| | | |
| | | |
| | | |
| | | |
| | | |
| | | |
| | | |
| | | |
| | | |
| |
Black Desert Public Infrastructure District, SAB, 5.63%, 12/01/53(b) | | | |
County of Utah, RB, Series A, 3.00%, 05/15/50 | | | |
Utah Charter School Finance Authority, RB, Series A, 5.00%, 06/15/52(b) | | | |
Schedule of Investments19
Schedule of Investments (continued)June 30, 2024
BlackRock High Yield Municipal Fund(Percentages shown are based on Net Assets)
| | | |
| |
Utah Housing Corp., RB, S/F Housing | | | |
Series A, (GNMA), 4.50%, 01/21/49 | | | |
Series B, (GNMA), 4.50%, 02/21/49 | | | |
Series C, (GNMA), 4.50%, 03/21/49 | | | |
Series D, (GNMA), 4.50%, 04/21/49 | | | |
Series E, (GNMA), 4.50%, 05/21/49 | | | |
Series F-G2, (GNMA), 4.50%, 06/21/49 | | | |
Series G-G2, (GNMA), 4.50%, 07/21/49 | | | |
Series H, (GNMA), 4.50%, 08/21/49 | | | |
Series I, (GNMA), 4.50%, 11/21/48 | | | |
Series J, (GNMA), 4.50%, 12/21/48 | | | |
Wood Ranch Public Infrastructure District, SAB, 5.63%, 12/01/53(b) | | | |
| | | |
| |
East Central Vermont Telecommunications District, RB | | | |
Series A, 4.75%, 12/01/40 | | | |
Series A, 4.50%, 12/01/44 | | | |
Series A, 6.88%, 12/01/46 | | | |
Series A, 4.50%, 12/01/50 | | | |
| | | |
| |
Ballston Quarter Community Development Authority, TA, Series A-1, 5.50%, 03/01/46 | | | |
Ballston Quarter Community Development Authority, TA, CAB, Series A-2, 7.13%, 03/01/30(d) | | | |
Hanover County Economic Development Authority, Refunding RB, 4.00%, 07/01/40(b) | | | |
James City County Economic Development Authority, RB | | | |
Series A, 6.88%, 12/01/58 | | | |
Series C3, 5.25%, 12/01/27 | | | |
Lower Magnolia Green Community Development | | | |
| | | |
| | | |
Norfolk Economic Development Authority, Refunding RB, Series B, 4.00%, 11/01/48 | | | |
Norfolk Redevelopment & Housing Authority, RB | | | |
Series A, 5.00%, 01/01/49 | | | |
Series B, 4.00%, 01/01/25 | | | |
Tobacco Settlement Financing Corp., Refunding RB, Series B-1, 5.00%, 06/01/47 | | | |
Virginia Beach Development Authority, RB | | | |
Series A, 7.00%, 09/01/53 | | | |
Series B3, 5.38%, 09/01/29 | | | |
Virginia Beach Development Authority, Refunding RB, 4.00%, 09/01/48 | | | |
| | | |
| |
Washington Economic Development Finance Authority, RB, Series A, AMT, Sustainability Bonds, 5.63%, 12/01/40(b) | | | |
Washington State Housing Finance Commission, RB, Series A, 5.00%, 07/01/50(b) | | | |
| | | |
| |
Washington State Housing Finance Commission, Refunding RB | | | |
| | | |
| | | |
| | | |
| | | |
Series A, 5.00%, 07/01/43 | | | |
Series A, 5.00%, 07/01/48 | | | |
| | | |
| |
Public Finance Authority, ARB | | | |
| | | |
| | | |
Public Finance Authority, RB | | | |
| | | |
| | | |
| | | |
| | | |
| | | |
| | | |
| | | |
Series A, 12.00%, 05/16/29(b) | | | |
Series A, 4.25%, 06/15/31(b) | | | |
Series A, 5.00%, 06/01/40(b) | | | |
Series A, 5.00%, 06/15/41(b) | | | |
Series A, 7.75%, 07/01/43(b) | | | |
Series A, 6.85%, 11/01/46(b) | | | |
Series A, 7.00%, 11/01/46(b) | | | |
Series A, 5.38%, 07/15/47(b) | | | |
Series A, 5.00%, 06/01/49(b) | | | |
Series A, 5.63%, 06/15/49(b) | | | |
Series A, 5.00%, 06/15/51(b) | | | |
Series A, 5.25%, 12/01/51(b) | | | |
Series A, 5.00%, 06/15/55(b) | | | |
Series A, 4.75%, 06/15/56(b) | | | |
Series A-1, 4.50%, 01/01/35(b) | | | |
Series B, 0.00%, 01/01/35(b)(c) | | | |
Series B, 0.00%, 01/01/60(b)(c) | | | |
AMT, Sustainability Bonds, 4.00%, 09/30/51 | | | |
AMT, Sustainability Bonds, 4.00%, 03/31/56 | | | |
Public Finance Authority, Refunding RB(b) | | | |
| | | |
| | | |
Wisconsin Health & Educational Facilities Authority, RB, Series A, Senior Lien, 5.75%, 08/15/54 | | | |
Wisconsin Health & Educational Facilities Authority, Refunding RB, 4.00%, 01/01/47 | | | |
Wisconsin Housing & Economic Development Authority, RB, M/F Housing, Series A, 4.70%, 07/01/47 | | | |
| | | |
Total Municipal Bonds — 90.9%
(Cost: $1,539,322,665) | |
202024 BlackRock Annual Financial Statements
Schedule of Investments (continued)June 30, 2024
BlackRock High Yield Municipal Fund(Percentages shown are based on Net Assets)
| | | |
Municipal Bonds Transferred to Tender Option Bond Trusts(k) |
| |
Triborough Bridge & Tunnel Authority, Refunding RB, Sub-Series B-1, Senior Lien, 5.00%, 05/15/56 | | | |
| |
Pennsylvania Housing Finance Agency, RB, S/F Housing, Series 143A, Sustainability Bonds, 5.45%, 04/01/51 | | | |
Total Municipal Bonds Transferred to Tender Option Bond
Trusts — 1.6%
(Cost: $24,701,509) | |
Total Long-Term Investments — 92.5%
(Cost: $1,564,024,174) | |
|
| |
City of San Antonio, 3.75%, 09/20/24(l) | | | |
| | | |
Money Market Funds — 5.8% | |
BlackRock Liquidity Funds, MuniCash, Institutional Shares, 3.88%(m)(n) | | | |
Total Short-Term Securities — 7.6%
(Cost: $125,272,427) | |
Total Investments — 100.1%
(Cost: $1,689,296,601) | |
Other Assets Less Liabilities — 0.9% | |
Liability for TOB Trust Certificates, Including Interest Expense and Fees Payable — (1.0)% | |
| |
| Variable rate security. Interest rate resets periodically. The rate shown is the effective interest rate as of period end. Security description also includes the reference rate and spread if published and available. |
| Security exempt from registration pursuant to Rule 144A under the Securities Act of 1933, as amended. These securities may be resold in transactions exempt from registration to qualified institutional investors. |
| |
| Step coupon security. Coupon rate will either increase (step-up bond) or decrease (step- down bond) at regular intervals until maturity. Interest rate shown reflects the rate currently in effect. |
| U.S. Government securities held in escrow, are used to pay interest on this security as well as to retire the bond in full at the date indicated, typically at a premium to par. |
| |
| Security is collateralized by municipal bonds or U.S. Treasury obligations. |
| Rounds to less than 1,000. |
| Issuer filed for bankruptcy and/or is in default. |
| Non-income producing security. |
| Represent bonds transferred to a TOB Trust in exchange of cash and residual certificates received by the Fund. These bonds serve as collateral in a secured borrowing. See Note 4 of the Notes to Financial Statements for details. |
| Rates are discount rates or a range of discount rates as of period end. |
| |
| Annualized 7-day yield as of period end. |
Investments in issuers considered to be affiliate(s) of the Fund during the year ended June 30, 2024 for purposes of Section 2(a)(3) of the Investment Company Act of 1940, as amended, were as follows:
| | | | | Change in
Unrealized
Appreciation
(Depreciation) | | | | Capital Gain
Distributions
from
Underlying
Funds |
BlackRock Liquidity Funds, MuniCash, Institutional Shares | | | | | | | | | |
| Represents net amount purchased (sold). |
Schedule of Investments21
Schedule of Investments (continued)June 30, 2024
BlackRock High Yield Municipal Fund
Derivative Financial Instruments Outstanding as of Period End
| | | | Value/
Unrealized
Appreciation
(Depreciation) |
| | | | |
10-Year U.S. Treasury Note | | | | |
| | | | |
| | | | |
Derivative Financial Instruments Categorized by Risk Exposure
As of period end, the fair values of derivative financial instruments located in the Statements of Assets and Liabilities were as follows:
| | | | Foreign
Currency
Exchange
Contracts | | | |
Liabilities — Derivative Financial Instruments | | | | | | | |
Futures contracts
Unrealized depreciation on futures contracts(a) | | | | | | | |
| Net cumulative unrealized appreciation (depreciation) on futures contracts and centrally cleared swaps, if any, are reported in the Schedule of Investments. In the Statements of Assets and Liabilities, only current day’s variation margin is reported in receivables or payables and the net cumulative unrealized appreciation (depreciation) is included in accumulated earnings (loss). |
For the period ended June 30, 2024, the effect of derivative financial instruments in the Statements of Operations was as follows:
| | | | Foreign
Currency
Exchange
Contracts | | | |
Net Realized Gain (Loss) from: | | | | | | | |
| | | | | | | |
Net Change in Unrealized Appreciation (Depreciation) on: | | | | | | | |
| | | | | | | |
Average Quarterly Balances of Outstanding Derivative Financial Instruments
| |
Average notional value of contracts — short | |
For more information about the Fund’s investment risks regarding derivative financial instruments, refer to the Notes to Financial Statements.
Fair Value Hierarchy as of Period End
Various inputs are used in determining the fair value of financial instruments. For a description of the input levels and information about the Fund’s policy regarding valuation of financial instruments, refer to the Notes to Financial Statements.
The following table summarizes the Fund’s financial instruments categorized in the fair value hierarchy. The breakdown of the Fund’s financial instruments into major categories is disclosed in the Schedule of Investments above.
| | | | |
| | | | |
| | | | |
| | | | |
| | | | |
Municipal Bonds Transferred to Tender Option Bond Trusts | | | | |
| | | | |
| | | | |
222024 BlackRock Annual Financial Statements
Schedule of Investments (continued)June 30, 2024
BlackRock High Yield Municipal Fund
Fair Value Hierarchy as of Period End (continued)
| | | | |
| | | | |
| | | | |
| | | | |
Derivative Financial Instruments(b) | | | | |
| | | | |
| | | | |
| Unfunded commitments are valued at the unrealized appreciation (depreciation) on the commitment. |
| Derivative financial instruments are futures contracts. Futures contracts are valued at the unrealized appreciation (depreciation) on the instrument. |
The Fund may hold assets and/or liabilities in which the fair value approximates the carrying amount for financial statement purposes. As of period end, TOB Trust Certificates of $16,330,000 are categorized as Level 2 within the fair value hierarchy.
See notes to financial statements.
Schedule of Investments23
Schedule of InvestmentsJune 30, 2024
BlackRock National Municipal Fund(Percentages shown are based on Net Assets)
| | | |
|
| |
Black Belt Energy Gas District, RB(a) | | | |
Series C, 5.50%, 10/01/54 | | | |
Series F, 5.50%, 11/01/53 | | | |
County of Jefferson Alabama Sewer Revenue, Refunding RB | | | |
| | | |
| | | |
| | | |
| | | |
| | | |
| | | |
Energy Southeast A Cooperative District, RB(a) | | | |
Series A-1, 5.50%, 11/01/53 | | | |
Series B-1, 5.75%, 04/01/54 | | | |
Southeast Energy Authority A Cooperative District, | | | |
Series A, 4.00%, 11/01/51 | | | |
Series B, 4.00%, 12/01/51 | | | |
Series B-1, 5.00%, 05/01/53 | | | |
| | | |
| |
Arizona Industrial Development Authority, Refunding | | | |
Series A, 5.25%, 07/01/37 | | | |
Series A, 5.50%, 07/01/52 | | | |
City of Phoenix Civic Improvement Corp., RB | | | |
Junior Lien, 5.00%, 07/01/40 | | | |
Junior Lien, 5.00%, 07/01/42 | | | |
Junior Lien, Sustainability Bonds, 5.00%, 07/01/44 | | | |
Subordinate, 5.00%, 07/01/44 | | | |
Pinal County Industrial Development Authority, RB, 6.25%, 06/01/26 | | | |
Salt River Project Agricultural Improvement & Power District, Refunding RB, Series A, 4.00%, 01/01/38 | | | |
Tucson Industrial Development Authority/Pima County Industrial Development Authority, RB, S/F Housing, Series A, (FHLMC, FNMA, GNMA), 6.00%, 01/01/55 | | | |
| | | |
| |
Arkansas Development Finance Authority, RB(b) | | | |
| | | |
AMT, Sustainability Bonds, 7.38%, 07/01/48 | | | |
Series A, AMT, Sustainability Bonds, 6.88%, 07/01/48 | | | |
University of Arkansas, RB, Series A, 5.00%, 12/01/45 | | | |
| | | |
| |
California Community Choice Financing Authority, RB, Sustainability Bonds, 5.50%, 10/01/54(a) | | | |
California Health Facilities Financing Authority, RB, Series A, 5.00%, 12/01/36 | | | |
California Statewide Communities Development Authority, SAB, Series C, 3.00%, 09/02/30 | | | |
City of Los Angeles Department of Airports, ARB | | | |
Series A, AMT, 5.00%, 05/15/44 | | | |
Series A, AMT, 5.25%, 05/15/48 | | | |
Sub-Series A, AMT, 5.00%, 05/15/47 | | | |
| | | |
| |
City of Los Angeles Department of Airports, ARB (continued) | | | |
AMT, Sustainability Bonds, 5.00%, 05/15/47 | | | |
City of Los Angeles Department of Airports, Refunding ARB, AMT, 5.00%, 05/15/45 | | | |
CMFA Special Finance Agency XII, RB, M/F Housing, 4.38%, 08/01/49(b) | | | |
CSCDA Community Improvement Authority, RB, M/F | | | |
Mezzanine Lien, Sustainability Bonds, 4.00%, 06/01/57 | | | |
Series B, Mezzanine Lien, Sustainability Bonds, 4.00%, 12/01/59 | | | |
Series B, Sub Lien, Sustainability Bonds, 4.00%, 12/01/59 | | | |
Series B, Sustainability Bonds, 4.00%, 07/01/58 | | | |
San Francisco City & County Airport Comm-San Francisco International Airport, Refunding ARB | | | |
Series A, AMT, 5.00%, 05/01/39 | | | |
Series A, AMT, 5.25%, 05/01/42 | | | |
Series A, AMT, 5.00%, 05/01/49 | | | |
Series B, AMT, 5.00%, 05/01/46 | | | |
Series D, AMT, 5.00%, 05/01/43 | | | |
Series D, AMT, 5.00%, 05/01/48 | | | |
San Francisco City & County Airport Comm-San Francisco International Airport, Refunding RB, Series A, AMT, 5.00%, 05/01/38 | | | |
San Francisco City & County Public Utilities Commission Wastewater Revenue, RB, Series B, Sustainability Bonds, 1.00%, 10/01/26(c) | | | |
University of California, RB | | | |
Series M, 5.00%, 05/15/37 | | | |
Series M, 5.00%, 05/15/42 | | | |
University of California, Refunding RB, Series Q, 5.00%, 05/15/46 | | | |
| | | |
| |
City & County of Denver Colorado Airport System Revenue, Refunding ARB | | | |
Series A, AMT, 5.00%, 12/01/36 | | | |
Series A, AMT, 5.00%, 12/01/38 | | | |
Series A, AMT, 5.00%, 12/01/43 | | | |
Series A, AMT, 5.25%, 12/01/43 | | | |
Series A, AMT, 5.25%, 12/01/48 | | | |
Series D, AMT, 5.75%, 11/15/45 | | | |
Colorado Educational & Cultural Facilities Authority, Refunding RB, 4.00%, 07/01/31(b) | | | |
Colorado Health Facilities Authority, RB, Series A, 5.00%, 12/01/34 | | | |
Colorado Health Facilities Authority, Refunding RB, Series A, 5.00%, 05/15/47 | | | |
Mayfield Metropolitan District, GOL, Series A, 5.75%, 12/01/50 | | | |
| | | |
| |
Connecticut Housing Finance Authority, Refunding RB, S/F Housing, Series B, Sustainability Bonds, 5.75%, 11/15/53 | | | |
Connecticut State Health & Educational Facilities Authority, Refunding RB(a) | | | |
Series 2015-A, 0.38%, 07/01/35 | | | |
242024 BlackRock Annual Financial Statements
Schedule of Investments (continued)June 30, 2024
BlackRock National Municipal Fund(Percentages shown are based on Net Assets)
| | | |
| |
Connecticut State Health & Educational Facilities Authority, Refunding RB(a) (continued) | | | |
| | | |
Mohegan Tribal Finance Authority, RB, 7.00%, 02/01/45(b) | | | |
State of Connecticut Special Tax Revenue, RB | | | |
Series A, 4.00%, 05/01/40 | | | |
Series A, 5.00%, 07/01/41 | | | |
State of Connecticut, GO, Series A, 5.00%, 04/15/39 | | | |
| | | |
| |
Delaware State Economic Development Authority, Refunding RB, Series A, 1.25%, 10/01/45(a) | | | |
Delaware State Housing Authority, RB, S/F Housing, Series B, (FHLMC, FNMA, GNMA), 6.00%, 01/01/55 | | | |
| | | |
District of Columbia — 3.3% | |
District of Columbia Income Tax Revenue, RB, Series C, 5.00%, 05/01/45 | | | |
District of Columbia Water & Sewer Authority, Refunding RB, Series B, 5.00%, 10/01/49 | | | |
District of Columbia, GO, Series D, 5.00%, 06/01/42 | | | |
District of Columbia, Refunding GO, Series A, 5.25%, 01/01/48 | | | |
Metropolitan Washington Airports Authority Aviation Revenue, Refunding ARB | | | |
Series A, AMT, 10/01/29(d) | | | |
Series A, AMT, 10/01/30(d) | | | |
Series A, AMT, 10/01/33(d) | | | |
Series A, AMT, 5.00%, 10/01/48 | | | |
Washington Metropolitan Area Transit Authority, RB | | | |
| | | |
Series B, 5.00%, 07/01/42 | | | |
Washington Metropolitan Area Transit Authority, Refunding RB, Series A-1, 5.00%, 07/01/31 | | | |
| | | |
| |
Capital Trust Agency, Inc., RB, Series A, 5.00%, 06/15/49(b) | | | |
County of Miami-Dade Florida Aviation Revenue, Refunding RB, Series B, AMT, 5.00%, 10/01/40 | | | |
Florida Development Finance Corp., RB(b) | | | |
| | | |
Series C, 5.75%, 12/15/56 | | | |
| | | |
| | | |
Florida Development Finance Corp., Refunding RB, Series A, 4.50%, 12/15/56(b) | | | |
Greater Orlando Aviation Authority, ARB | | | |
Series A, AMT, 5.00%, 10/01/44 | | | |
Sub-Series A, AMT, 5.00%, 10/01/42 | | | |
Sub-Series A, AMT, 5.00%, 10/01/47 | | | |
Lakewood Ranch Stewardship District, SAB, 4.63%, 05/01/27 | | | |
Live Oak Lake Community Development District, SAB | | | |
| | | |
| | | |
Miami-Dade County Industrial Development Authority, RB, 5.10%, 11/01/43 | | | |
| | | |
| |
River Landing Community Development District, SAB | | | |
Series A, 4.13%, 05/01/40 | | | |
Series B, 4.25%, 11/01/35 | | | |
Sterling Hill Community Development District, Refunding SAB, Series B, 5.50%, 11/01/10 | | | |
Windward Community Development District, SAB, Series A-2, 4.40%, 11/01/35 | | | |
| | | |
| |
City of Atlanta Georgia Airport Passenger Facility Charge, ARB, Series D, AMT, Subordinate, 4.00%, 07/01/34 | | | |
East Point Business & Industrial Development Authority, RB, Series A, 5.25%, 06/15/62(b) | | | |
Main Street Natural Gas, Inc., RB(a) | | | |
Series A, 5.00%, 05/01/54 | | | |
Series B, 5.00%, 07/01/53 | | | |
Series C, 4.00%, 03/01/50 | | | |
Series C, 5.00%, 09/01/53 | | | |
Main Street Natural Gas, Inc., Refunding RB, Series E-1, 5.00%, 12/01/53(a) | | | |
| | | |
| |
Idaho Housing & Finance Association, RB, Series A, 5.25%, 08/15/48 | | | |
| |
Chicago Board of Education, GO | | | |
Series A, 5.00%, 12/01/42 | | | |
Series H, 5.00%, 12/01/36 | | | |
Chicago Board of Education, Refunding GO | | | |
Series A, 5.00%, 12/01/28 | | | |
Series B, 4.00%, 12/01/35 | | | |
Series C, 5.00%, 12/01/24 | | | |
Series C, 5.00%, 12/01/25 | | | |
Series C, 5.00%, 12/01/26 | | | |
Series F, 5.00%, 12/01/24 | | | |
Series G, 5.00%, 12/01/34 | | | |
Chicago O’Hare International Airport, ARB | | | |
Series A, AMT, Senior Lien, (AGM), 5.25%, 01/01/45 | | | |
Series D, AMT, Senior Lien, 5.00%, 01/01/42 | | | |
Series D, Senior Lien, 5.25%, 01/01/42 | | | |
Series D, Senior Lien, 5.00%, 01/01/47 | | | |
Chicago O’Hare International Airport, Refunding RB, Series A, AMT, 5.00%, 01/01/33 | | | |
Illinois Finance Authority, Refunding RB | | | |
Series A, 5.00%, 10/01/38 | | | |
Series A, 5.00%, 07/15/42 | | | |
Series A, 5.00%, 10/01/48 | | | |
Series C, 5.00%, 02/15/41 | | | |
Illinois Housing Development Authority, Refunding RB, S/F Housing, Series H, Sustainability Bonds, (FHLMC, FNMA, GNMA), 5.75%, 10/01/53 | | | |
Illinois State Toll Highway Authority, RB | | | |
Series A, 5.00%, 01/01/44 | | | |
Series A, 5.00%, 01/01/45 | | | |
Series A, 5.25%, 01/01/45 | | | |
| | | |
| | | |
Series A, 5.00%, 11/01/29 | | | |
Series C, 5.50%, 10/01/42 | | | |
Schedule of Investments25
Schedule of Investments (continued)June 30, 2024
BlackRock National Municipal Fund(Percentages shown are based on Net Assets)
| | | |
| |
State of Illinois, GO, BAB, Series B, 5.00%, 11/01/32 | | | |
State of Illinois, Refunding GO, Series A, 5.00%, 10/01/28 | | | |
| | | |
| |
Indianapolis Local Public Improvement Bond Bank, Refunding RB, Series A, 5.00%, 02/01/44 | | | |
| |
Kentucky Public Energy Authority, Refunding RB, Series A-1, 5.25%, 04/01/54(a) | | | |
University of Kentucky, RB | | | |
Series B, 4.00%, 04/01/40 | | | |
Series B, 4.00%, 04/01/41 | | | |
| | | |
| |
Lake Charles Harbor & Terminal District, RB, AMT, 1.00%, 12/01/51(a) | | | |
Louisiana Local Government Environmental Facilities & Community Development Authority, Refunding RB, 0.88%, 02/01/46(a) | | | |
Louisiana Public Facilities Authority, RB | | | |
| | | |
| | | |
Series A, 5.00%, 04/01/39(b) | | | |
Series A, 5.00%, 06/01/39(b) | | | |
Series A, 5.00%, 06/01/49(b) | | | |
Series A, 5.00%, 06/01/58(b) | | | |
| | | |
| |
City of Baltimore Maryland, Refunding RB | | | |
Series A, 4.50%, 09/01/33 | | | |
Series A, 5.00%, 09/01/38 | | | |
County of Anne Arundel Maryland, GOL, 5.00%, 10/01/47 | | | |
County of Montgomery Maryland, RB | | | |
| | | |
Series 2016, 5.00%, 12/01/45 | | | |
County of Prince George’s Maryland, COP, 5.00%, 10/01/48 | | | |
Washington Suburban Sanitary Commission, RB | | | |
| | | |
| | | |
| | | |
| |
Commonwealth of Massachusetts Transportation Fund Revenue, RB, Series A, 5.00%, 06/01/42 | | | |
Commonwealth of Massachusetts, GO, Series C, 5.25%, 10/01/47 | | | |
Commonwealth of Massachusetts, GOL | | | |
Series A, 5.00%, 01/01/41 | | | |
Series A, 5.00%, 01/01/42 | | | |
Series A, 5.25%, 01/01/44 | | | |
Series A, 5.25%, 04/01/47 | | | |
Series E, 5.25%, 09/01/43 | | | |
Series F, 5.00%, 11/01/43 | | | |
Commonwealth of Massachusetts, Refunding GOL, Series B, 5.00%, 11/01/41 | | | |
Massachusetts Bay Transportation Authority Sales Tax Revenue, Refunding RB | | | |
Series A, 5.00%, 07/01/39 | | | |
| | | |
Massachusetts (continued) | |
Massachusetts Bay Transportation Authority Sales Tax Revenue, Refunding RB (continued) | | | |
Series A-2, 5.00%, 07/01/42 | | | |
Sub-Series A-1, 5.25%, 07/01/48 | | | |
Massachusetts Port Authority, ARB, Series E, AMT, 5.00%, 07/01/46 | | | |
Massachusetts Port Authority, Refunding ARB | | | |
Series A, AMT, 5.00%, 07/01/47 | | | |
Series B, AMT, 5.00%, 07/01/43 | | | |
Series C, AMT, 5.00%, 07/01/44 | | | |
Series C, AMT, 5.00%, 07/01/49 | | | |
Massachusetts School Building Authority, RB, Series B, 5.25%, 02/15/48 | | | |
Nauset Regional School District, Refunding GO | | | |
| | | |
| | | |
| | | |
University of Massachusetts Building Authority, Refunding RB, Series 1, 5.25%, 11/01/42 | | | |
| | | |
| |
Lansing Board of Water & Light, Refunding RB, Series A, 5.00%, 07/01/44 | | | |
Michigan Finance Authority, RB | | | |
| | | |
Series A, 6.50%, 06/01/57(b) | | | |
Sustainability Bonds, 5.50%, 02/28/49 | | | |
Michigan Finance Authority, Refunding RB | | | |
| | | |
Series 2016, 5.25%, 12/01/41 | | | |
Series A, 5.00%, 12/01/41 | | | |
Series A, 5.00%, 12/01/42 | | | |
Michigan State Hospital Finance Authority, Refunding RB, 5.00%, 11/15/47 | | | |
Michigan State University, Refunding RB, Series A, 5.00%, 08/15/49 | | | |
Michigan Strategic Fund, RB, AMT, 5.00%, 12/31/43 | | | |
State of Michigan Trunk Line Revenue, RB | | | |
| | | |
| | | |
| | | |
| |
Minnesota Agricultural & Economic Development Board, RB | | | |
| | | |
| | | |
| | | |
Minnesota Housing Finance Agency, RB, S/F Housing | | | |
Series F, Sustainability Bonds, (FHLMC, FNMA, GNMA), 5.75%, 07/01/53 | | | |
Series O, Sustainability Bonds, (FHLMC, FNMA, GNMA), 6.00%, 07/01/53 | | | |
| | | |
Series A, 4.00%, 09/01/40 | | | |
Series A, 4.00%, 09/01/41 | | | |
| | | |
262024 BlackRock Annual Financial Statements
Schedule of Investments (continued)June 30, 2024
BlackRock National Municipal Fund(Percentages shown are based on Net Assets)
| | | |
| |
Medical Center Educational Building Corp., Refunding RB, 5.00%, 06/01/47 | | | |
State of Mississippi, GO, Series C, 4.00%, 10/01/40 | | | |
| | | |
| |
Health & Educational Facilities Authority of the State of Missouri, RB | | | |
| | | |
Series A, 5.00%, 10/01/46 | | | |
Missouri Housing Development Commission, RB, S/F Housing, Series C, (FHLMC, FNMA, GNMA), 6.00%, 05/01/55 | | | |
| | | |
| |
Montana Board of Housing, RB, S/F Housing, Series A, 5.75%, 12/01/53 | | | |
| |
Omaha School District, GO, 4.00%, 12/15/42 | | | |
| |
County of Clark Nevada, GOL, Series A, 5.00%, 06/01/43 | | | |
State of Nevada Department of Business & Industry, RB | | | |
Series A, 4.50%, 12/15/29(b) | | | |
Series A, 5.00%, 07/15/37 | | | |
| | | |
| |
New Jersey Economic Development Authority, RB, 5.00%, 06/15/43 | | | |
New Jersey Health Care Facilities Financing Authority, Refunding RB | | | |
Series A, 5.00%, 07/01/37 | | | |
Series A, 5.00%, 07/01/38 | | | |
New Jersey Housing & Mortgage Finance Agency, RB, S/F Housing, Series K, Sustainability Bonds, 6.00%, 10/01/55 | | | |
New Jersey Transportation Trust Fund Authority, RB | | | |
| | | |
| | | |
Series C, 5.25%, 06/15/32 | | | |
New Jersey Transportation Trust Fund Authority, Refunding RB | | | |
Series AA, 5.00%, 06/15/39 | | | |
Series AA, 5.00%, 06/15/40 | | | |
New Jersey Turnpike Authority, RB | | | |
Series B, 5.00%, 01/01/46 | | | |
Series B, 5.25%, 01/01/49 | | | |
Series E, 5.00%, 01/01/32 | | | |
| | | |
| | | |
| | | |
| | | |
| | | |
| |
Tobacco Settlement Financing Corp., Refunding RB | | | |
Series A, 5.00%, 06/01/46 | | | |
Series A, 5.25%, 06/01/46 | | | |
| | | |
| |
County of Santa Fe New Mexico, RB, (AGM), 6.00%, 02/01/27 | | | |
New Mexico Mortgage Finance Authority, RB, S/F Housing, (FHLMC, FNMA, GNMA), 5.75%, 03/01/54 | | | |
| | | |
| |
| | | |
Series E-1, 5.00%, 03/01/39 | | | |
Sub-Series F-1, 5.00%, 04/01/43 | | | |
Hudson Yards Infrastructure Corp., Refunding RB, Series A, 5.00%, 02/15/42 | | | |
New York City Municipal Water Finance Authority, Refunding RB | | | |
| | | |
Series CC1, 5.00%, 06/15/37 | | | |
Series EE, 5.00%, 06/15/40 | | | |
Series EE, 5.00%, 06/15/45 | | | |
Series EE2, 5.00%, 06/15/40 | | | |
New York City Transitional Finance Authority Building Aid Revenue, RB, Series S, Subordinate, (SAW), 5.00%, 07/15/41 | | | |
New York City Transitional Finance Authority Future Tax Secured Revenue, RB | | | |
Series B-1, 5.00%, 08/01/39 | | | |
Series D-1, 5.50%, 11/01/45 | | | |
Series E-1, 5.00%, 02/01/41 | | | |
Sub-Series A-1, 5.00%, 08/01/37 | | | |
Sub-Series E-1, 5.00%, 02/01/39 | | | |
Sub-Series F-1, 5.00%, 05/01/42 | | | |
Series C-3, Subordinate, 5.00%, 05/01/39 | | | |
Series F-1, Subordinate, 5.00%, 02/01/44 | | | |
New York City Transitional Finance Authority, RB | | | |
Series C, 5.50%, 05/01/40 | | | |
Series C, 5.50%, 05/01/41 | | | |
Series G-1, 5.00%, 05/01/40 | | | |
Series G-1, 5.00%, 05/01/41 | | | |
Series G-1, 5.00%, 05/01/42 | | | |
New York State Dormitory Authority, RB | | | |
Series A, 5.00%, 03/15/40 | | | |
Series A, 5.00%, 03/15/41 | | | |
Series A, 5.00%, 07/01/43 | | | |
New York State Dormitory Authority, Refunding RB | | | |
| | | |
Series A, 5.25%, 03/15/38 | | | |
Series A, 5.00%, 03/15/39 | | | |
Series A, 4.00%, 03/15/40 | | | |
Series A, 5.00%, 03/15/40 | | | |
Series A, 5.00%, 03/15/41 | | | |
Series A, 5.00%, 03/15/42 | | | |
Series A, 5.00%, 03/15/46 | | | |
Series E, 5.00%, 03/15/40 | | | |
Schedule of Investments27
Schedule of Investments (continued)June 30, 2024
BlackRock National Municipal Fund(Percentages shown are based on Net Assets)
| | | |
| |
New York State Dormitory Authority, Refunding RB (continued) | | | |
Series E, 5.00%, 03/15/42 | | | |
New York State Housing Finance Agency, RB, M/F Housing, Series J, Sustainability Bonds, (SONYMA), 1.10%, 11/01/61(a) | | | |
New York State Urban Development Corp., RB, Series A, 5.00%, 03/15/44 | | | |
New York State Urban Development Corp., Refunding RB | | | |
| | | |
Series A, 5.00%, 03/15/46 | | | |
Series E, 4.00%, 03/15/41 | | | |
New York Transportation Development Corp., ARB | | | |
| | | |
| | | |
| | | |
New York Transportation Development Corp., RB | | | |
| | | |
AMT, Sustainability Bonds, (AGM), 5.00%, 06/30/49 | | | |
AMT, Sustainability Bonds, 5.25%, 06/30/49 | | | |
Port Authority of New York & New Jersey, ARB, AMT, 5.00%, 11/01/49 | | | |
Port Authority of New York & New Jersey, Refunding ARB | | | |
| | | |
Series 205, 5.00%, 11/15/47 | | | |
| | | |
Series 207, AMT, 5.00%, 09/15/31 | | | |
Series 207, AMT, 5.00%, 09/15/32 | | | |
Series 231, AMT, 5.50%, 08/01/39 | | | |
Series 231, AMT, 5.50%, 08/01/47 | | | |
Triborough Bridge & Tunnel Authority, Refunding RB | | | |
Series A, 5.00%, 11/15/41 | | | |
Series C, Sustainability Bonds, 5.25%, 11/15/40 | | | |
Westchester Tobacco Asset Securitization Corp., Refunding RB, Sub-Series C, 5.13%, 06/01/51 | | | |
| | | |
| |
North Carolina Housing Finance Agency, RB, S/F Housing, Series 52A, Sustainability Bonds, (FHLMC, FNMA, GNMA), 6.25%, 01/01/55 | | | |
| |
Ohio University, Refunding RB | | | |
Series A, 5.00%, 12/01/44 | | | |
Series A, 5.00%, 12/01/45 | | | |
Ohio Water Development Authority Water Pollution Control Loan Fund, RB | | | |
Series B, Sustainability Bonds, 5.00%, 12/01/39 | | | |
Series B, Sustainability Bonds, 5.00%, 12/01/40 | | | |
Series B, Sustainability Bonds, 5.00%, 12/01/41 | | | |
State of Ohio, GO, Series A, 5.00%, 03/01/41 | | | |
State of Ohio, RB, 4.00%, 01/01/40 | | | |
University of Cincinnati, RB | | | |
Series A, 5.25%, 06/01/49 | | | |
Series C, 5.00%, 06/01/41 | | | |
| | | |
| | | |
| |
Oklahoma County Finance Authority, RB | | | |
| | | |
| | | |
| | | |
| | | |
Oklahoma Development Finance Authority, RB, 7.25%, 09/01/51(b) | | | |
Oklahoma Industries Authority, RB | | | |
| | | |
| | | |
| | | |
| |
Allentown Neighborhood Improvement Zone Development Authority, RB(b) | | | |
| | | |
| | | |
Northampton County General Purpose Authority, Refunding RB, 5.00%, 11/01/47 | | | |
Northampton County Industrial Development Authority, TA, 7.00%, 07/01/32 | | | |
Pennsylvania Housing Finance Agency, RB, S/F Housing, Series 143A, Sustainability Bonds, 6.25%, 10/01/53 | | | |
Pennsylvania Turnpike Commission Oil Franchise Tax Revenue, RB, Series A, 5.25%, 12/01/44 | | | |
Pennsylvania Turnpike Commission, RB | | | |
Sub-Series A, 5.50%, 12/01/46 | | | |
Series A, Subordinate, 5.00%, 12/01/44 | | | |
Sub-Series A-1, Subordinate, 5.00%, 12/01/41 | | | |
| | | |
| |
Commonwealth of Puerto Rico, GO | | | |
Series A-1, Restructured, 5.75%, 07/01/31 | | | |
Series A-1, Restructured, 4.00%, 07/01/33 | | | |
Series A-1, Restructured, 4.00%, 07/01/35 | | | |
Series A-1, Restructured, 4.00%, 07/01/37 | | | |
| | | |
| |
County of Dorchester South Carolina, SAB(b) | | | |
| | | |
| | | |
Patriots Energy Group Financing Agency, RB, Series A1, 5.25%, 10/01/54(a) | | | |
Patriots Energy Group Financing Agency, Refunding RB, Series B-1, 5.25%, 02/01/54(a) | | | |
South Carolina Jobs-Economic Development Authority, RB | | | |
| | | |
Series A, 5.25%, 11/01/41 | | | |
Series A, 5.25%, 11/01/43 | | | |
Series A, 5.50%, 11/01/48 | | | |
Series A, 5.50%, 11/01/49 | | | |
South Carolina Jobs-Economic Development Authority, Refunding RB, 5.25%, 11/15/37 | | | |
South Carolina State Housing Finance & Development Authority, Refunding RB, S/F Housing, Series B, 6.00%, 01/01/54 | | | |
| | | |
282024 BlackRock Annual Financial Statements
Schedule of Investments (continued)June 30, 2024
BlackRock National Municipal Fund(Percentages shown are based on Net Assets)
| | | |
| |
South Dakota State Building Authority, Refunding RB, Series C, 4.00%, 06/01/40 | | | |
| |
County of Knox Tennessee, GO | | | |
| | | |
| | | |
| | | |
Tennergy Corp., RB, Series A, 10/01/54(a)(d) | | | |
Tennessee Energy Acquisition Corp., Refunding RB, Series A-1, 5.00%, 05/01/53(a) | | | |
Tennessee Housing Development Agency, RB, S/F Housing, Series 2A, Sustainability Bonds, 5.75%, 01/01/54 | | | |
Tennessee Housing Development Agency, Refunding RB, S/F Housing, Series 3A, Sustainability Bonds, 6.25%, 01/01/54 | | | |
| | | |
| |
Arlington Higher Education Finance Corp., RB | | | |
| | | |
Series A, 5.30%, 04/01/62(b) | | | |
Series A, 5.75%, 08/15/62 | | | |
Austin Independent School District, GO | | | |
| | | |
| | | |
| | | |
| | | |
| | | |
| | | |
| | | |
Board of Regents of the University of Texas System, Refunding RB, Series A, 5.00%, 08/15/43 | | | |
City of Dallas Texas Waterworks & Sewer System Revenue, Refunding RB | | | |
| | | |
Series C, 5.00%, 10/01/45 | | | |
City of Dallas Texas, Refunding GOL, Series A, 4.00%, 02/15/37 | | | |
City of Houston Texas, Refunding GOL | | | |
Series A, 5.25%, 03/01/42 | | | |
Series A, 5.25%, 03/01/43 | | | |
City of Midland Texas, Refunding GOL, Series B, 5.00%, 03/01/47 | | | |
City of San Antonio Texas Electric & Gas Systems Revenue, Refunding RB | | | |
Series A, 5.25%, 02/01/40 | | | |
Series A, 5.25%, 02/01/41 | | | |
Series A, 5.25%, 02/01/42 | | | |
Series A, 5.25%, 02/01/49 | | | |
Series B, 5.25%, 02/01/49 | | | |
Conroe Independent School District, GO | | | |
| | | |
| | | |
County of Harris Texas Toll Road Revenue, Refunding RB | | | |
Series A, 1st Lien, 5.25%, 08/15/49 | | | |
Series A, Senior Lien, 5.00%, 08/15/43 | | | |
County of Lubbock Texas, GO, 5.00%, 02/15/41 | | | |
Dallas Independent School District, Refunding GO, (PSF), 5.00%, 02/15/48 | | | |
| | | |
| |
Del Mar College District, GOL, 4.00%, 08/15/36 | | | |
Grand Parkway Transportation Corp., RB | | | |
Series A, 5.00%, 10/01/43 | | | |
Series A, 5.00%, 10/01/48 | | | |
Greater Texoma Utility Authority, RB | | | |
Series A, (BAM), 5.25%, 10/01/48 | | | |
Series R, (BAM), 5.00%, 10/01/42 | | | |
Series R, (BAM), 5.00%, 10/01/43 | | | |
Harris County Cultural Education Facilities Finance Corp., RB, Series B, 6.38%, 01/01/33 | | | |
Lewisville Independent School District, GO | | | |
| | | |
| | | |
Lower Colorado River Authority, Refunding RB | | | |
| | | |
| | | |
| | | |
| | | |
| | | |
Series A, 5.50%, 05/15/47 | | | |
Midland Independent School District, GO | | | |
| | | |
| | | |
New Hope Cultural Education Facilities Finance Corp., RB | | | |
Series A, 5.00%, 07/01/40 | | | |
Series A, 5.00%, 07/01/57 | | | |
New Hope Cultural Education Facilities Finance Corp., Refunding RB | | | |
Series A, 4.00%, 08/15/40 | | | |
Series A, 6.75%, 10/01/52 | | | |
Series B2, 4.50%, 10/01/26 | | | |
North Fort Bend Water Authority, Refunding RB, Series A, 4.00%, 12/15/41 | | | |
North Texas Tollway Authority, Refunding RB | | | |
Series A, 5.00%, 01/01/40 | | | |
Series A, 5.00%, 01/01/43 | | | |
Series B, 5.00%, 01/01/43 | | | |
Northwest Independent School District, GO, (PSF), 5.00%, 02/15/49 | | | |
Pasadena Independent School District, Refunding GO, (PSF), 4.00%, 02/15/39 | | | |
Pflugerville Independent School District, GO, Series A, 5.00%, 02/15/41 | | | |
Port Authority of Houston of Harris County Texas, ARB, 1st Lien, 5.00%, 10/01/48 | | | |
Tarrant County Cultural Education Facilities Finance Corp., RB | | | |
| | | |
Series B, 5.00%, 07/01/38 | | | |
Series B, 5.00%, 07/01/43 | | | |
Series B, 5.00%, 07/01/48 | | | |
Tarrant County Cultural Education Facilities Finance Corp., Refunding RB | | | |
Series A, 5.00%, 02/15/41 | | | |
Series A, 5.00%, 11/15/45 | | | |
Series A, 5.00%, 02/15/47 | | | |
Texas Department of Housing & Community Affairs, RB, S/F Housing | | | |
Series A, (GNMA), 5.75%, 03/01/54 | | | |
Schedule of Investments29
Schedule of Investments (continued)June 30, 2024
BlackRock National Municipal Fund(Percentages shown are based on Net Assets)
| | | |
| |
Texas Department of Housing & Community Affairs, RB, S/F Housing (continued) | | | |
Series B, (GNMA), 6.00%, 03/01/53 | | | |
Texas Water Development Board, RB | | | |
| | | |
| | | |
Series B, 4.00%, 10/15/43 | | | |
Series B, 5.00%, 04/15/49 | | | |
| | | |
| |
County of Utah Utah, Refunding RB, Series A, 5.00%, 05/15/41 | | | |
Intermountain Power Agency, RB, Series A, 5.25%, 07/01/45 | | | |
Utah Charter School Finance Authority, RB(b) | | | |
| | | |
| | | |
| | | |
Utah Charter School Finance Authority, Refunding RB, 5.25%, 06/15/37(b) | | | |
| | | |
| |
East Central Vermont Telecommunications District, | | | |
Series A, 4.00%, 12/01/30 | | | |
Series A, 4.25%, 12/01/40 | | | |
Series A, 4.50%, 12/01/50 | | | |
Vermont Housing Finance Agency, RB, S/F Housing, Series C, Sustainability Bonds, (FHLMC, FNMA, GNMA), 5.75%, 11/01/53 | | | |
| | | |
| |
Ballston Quarter Community Development Authority, TA, Series A-1, 5.50%, 03/01/46 | | | |
Ballston Quarter Community Development Authority, TA, CAB, Series A-2, 7.13%, 03/01/30(e) | | | |
Hanover County Economic Development Authority, Refunding RB, 5.00%, 07/01/38 | | | |
Prince William County Industrial Development Authority, RB, Series A, 5.00%, 10/01/41 | | | |
University of Virginia, Refunding RB | | | |
Series A, 5.00%, 04/01/39 | | | |
Series A, 5.00%, 04/01/42 | | | |
Series A, 5.00%, 04/01/47 | | | |
Virginia Commonwealth Transportation Board, RB | | | |
| | | |
| | | |
| | | |
Virginia Port Authority Commonwealth Port Fund, ARB, Series A, 5.25%, 07/01/48 | | | |
Virginia Public Building Authority, ARB | | | |
Series A, 4.00%, 08/01/35 | | | |
Series A, 4.00%, 08/01/38 | | | |
Series B, AMT, 4.00%, 08/01/36 | | | |
Virginia Public Building Authority, RB | | | |
Series A, 4.00%, 08/01/41 | | | |
| | | |
| |
Virginia Public Building Authority, RB (continued) | | | |
Series A, 4.00%, 08/01/42 | | | |
Series A-2, 4.00%, 08/01/38 | | | |
| | | |
| |
King & Snohomish Counties School District No. 417 Northshore, Refunding GO | | | |
| | | |
| | | |
Port of Seattle Washington, ARB | | | |
Series A, AMT, 5.00%, 05/01/43 | | | |
Series C, AMT, Intermediate Lien, 5.25%, 05/01/42 | | | |
| | | |
Series 2020A, 5.00%, 08/01/40 | | | |
Series C, 5.00%, 02/01/42 | | | |
Series F, 5.00%, 06/01/45 | | | |
State of Washington, Refunding GO, Series D, 4.00%, 07/01/37 | | | |
| | | |
| |
West Virginia University, RB, 5.00%, 10/01/49 | | | |
| |
Milwaukee Metropolitan Sewerage District, GO, Series D, Sustainability Bonds, 4.00%, 10/01/40 | | | |
Public Finance Authority, ARB | | | |
| | | |
| | | |
Public Finance Authority, RB(b) | | | |
| | | |
| | | |
Series A, 7.00%, 07/01/33 | | | |
Series A, 5.25%, 03/01/45 | | | |
Series A, 7.00%, 11/01/46 | | | |
Series A, 5.63%, 06/15/49 | | | |
Series A, 4.75%, 06/15/56 | | | |
Wisconsin Housing & Economic Development Authority Home Ownership Revenue, RB, S/F Housing, Series A, Sustainability Bonds, (FHLMC, FNMA, GNMA), 6.00%, 03/01/54 | | | |
| | | |
Total Municipal Bonds — 94.6%
(Cost: $6,978,388,123) | |
Municipal Bonds Transferred to Tender Option Bond Trusts(h) |
| |
California State University, RB, Series A, 5.00%, 11/01/51 | | | |
District of Columbia — 0.7% | |
Washington Metropolitan Area Transit Authority Dedicated Revenue, RB, Series A, 5.00%, 07/15/45 | | | |
302024 BlackRock Annual Financial Statements
Schedule of Investments (continued)June 30, 2024
BlackRock National Municipal Fund(Percentages shown are based on Net Assets)
| | | |
| |
Commonwealth of Massachusetts, GO, Series C, 5.25%, 10/01/47 | | | |
Total Municipal Bonds Transferred to Tender Option Bond
Trusts — 2.1%
(Cost: $155,156,185) | |
Total Long-Term Investments — 96.7%
(Cost: $7,133,544,308) | |
| | | |
|
Money Market Funds — 5.2% | |
BlackRock Liquidity Funds, MuniCash, Institutional Shares, 3.88%(i)(j) | | | |
Total Short-Term Securities — 5.2%
(Cost: $388,464,926) | |
Total Investments — 101.9%
(Cost: $7,522,009,234) | |
Liabilities in Excess of Other Assets — (0.9)% | |
Liability for TOB Trust Certificates, Including Interest Expense and Fees Payable — (1.0)% | |
| |
| Variable rate security. Interest rate resets periodically. The rate shown is the effective interest rate as of period end. Security description also includes the reference rate and spread if published and available. |
| Security exempt from registration pursuant to Rule 144A under the Securities Act of 1933, as amended. These securities may be resold in transactions exempt from registration to qualified institutional investors. |
| Security is collateralized by municipal bonds or U.S. Treasury obligations. |
| |
| Step coupon security. Coupon rate will either increase (step-up bond) or decrease (step- down bond) at regular intervals until maturity. Interest rate shown reflects the rate currently in effect. |
| Issuer filed for bankruptcy and/or is in default. |
| Non-income producing security. |
| Represent bonds transferred to a TOB Trust in exchange of cash and residual certificates received by the Fund. These bonds serve as collateral in a secured borrowing. See Note 4 of the Notes to Financial Statements for details. |
| |
| Annualized 7-day yield as of period end. |
Investments in issuers considered to be affiliate(s) of the Fund during the year ended June 30, 2024 for purposes of Section 2(a)(3) of the Investment Company Act of 1940, as amended, were as follows:
| | | | | Change in
Unrealized
Appreciation
(Depreciation) | | | | Capital Gain
Distributions
from
Underlying
Funds |
BlackRock Liquidity Funds, MuniCash, Institutional Shares | | | | | | | | | |
iShares National Muni Bond ETF(b) | | | | | | | | | |
| | | | | | | | | |
| Represents net amount purchased (sold). |
| As of period end, the entity is no longer held. |
Derivative Financial Instruments Categorized by Risk Exposure
For the period ended June 30, 2024, the effect of derivative financial instruments in the Statements of Operations was as follows:
| | | | Foreign
Currency
Exchange
Contracts | | | |
Net Realized Gain (Loss) from: | | | | | | | |
| | | | | | | |
Net Change in Unrealized Appreciation (Depreciation) on: | | | | | | | |
| | | | | | | |
Schedule of Investments31
Schedule of Investments (continued)June 30, 2024
BlackRock National Municipal Fund
Average Quarterly Balances of Outstanding Derivative Financial Instruments
| |
Average notional value of contracts — long | |
Average notional value of contracts — short | |
| Derivative financial instrument not held at any quarter-end. The risk exposure table serves as an indicator of activity during the period. |
For more information about the Fund’s investment risks regarding derivative financial instruments, refer to the Notes to Financial Statements.
Fair Value Hierarchy as of Period End
Various inputs are used in determining the fair value of financial instruments. For a description of the input levels and information about the Fund’s policy regarding valuation of financial instruments, refer to the Notes to Financial Statements.
The following table summarizes the Fund’s financial instruments categorized in the fair value hierarchy. The breakdown of the Fund’s financial instruments into major categories is disclosed in the Schedule of Investments above.
| | | | |
| | | | |
| | | | |
| | | | |
| | | | |
Municipal Bonds Transferred to Tender Option Bond Trusts | | | | |
| | | | |
| | | | |
| | | | |
The Fund may hold assets and/or liabilities in which the fair value approximates the carrying amount for financial statement purposes. As of period end, TOB Trust Certificates of $70,530,007 are categorized as Level 2 within the fair value hierarchy.
See notes to financial statements.
322024 BlackRock Annual Financial Statements
Schedule of InvestmentsJune 30, 2024
BlackRock Short-Term Municipal Fund(Percentages shown are based on Net Assets)
| | | |
|
| |
Black Belt Energy Gas District, RB | | | |
| | | |
Series A, 5.00%, 09/01/25 | | | |
Series A, 5.00%, 09/01/26 | | | |
Series A, 5.00%, 09/01/27 | | | |
Series A, 5.00%, 09/01/28 | | | |
Series A, 5.00%, 09/01/29 | | | |
Series A, 5.00%, 09/01/30 | | | |
Series A, 5.25%, 01/01/54(a) | | | |
Series C-1, 5.25%, 02/01/53(a) | | | |
Series F, 5.25%, 12/01/26 | | | |
Black Belt Energy Gas District, Refunding RB, Series D2, 4.98%, 07/01/52(a) | | | |
Columbia Industrial Development Board, Refunding RB, Series A, VRDN, 4.80%, 07/01/24(a)(b) | | | |
County of Jefferson Alabama Sewer Revenue, Refunding RB, 5.00%, 10/01/29 | | | |
Energy Southeast A Cooperative District, RB | | | |
Series B, 5.00%, 12/01/26 | | | |
Series B, 5.00%, 06/01/27 | | | |
Series B, 5.00%, 12/01/27 | | | |
Series B, 5.00%, 06/01/28 | | | |
Series B, 5.00%, 12/01/28 | | | |
Southeast Energy Authority A Cooperative District, RB | | | |
Series A, 5.25%, 01/01/54(a) | | | |
Series A-1, 5.00%, 12/01/26 | | | |
Series B, 5.00%, 01/01/54(a) | | | |
| | | |
| |
Arizona Health Facilities Authority, RB, Series B, 4.13%, 01/01/46(a) | | | |
Chandler Industrial Development Authority, RB(a) | | | |
| | | |
Series 2, AMT, 5.00%, 09/01/52 | | | |
Salt Verde Financial Corp., RB, 5.50%, 12/01/29 | | | |
| | | |
| |
California Community Choice Financing Authority, RB, Sustainability Bonds, 5.52%, 12/01/53(a) | | | |
| |
Colorado Health Facilities Authority, RB(a) | | | |
Series A, 5.00%, 11/15/59 | | | |
Series B-2, 5.00%, 08/01/49 | | | |
Regional Transportation District, Refunding RB, Series A, 3.00%, 01/15/26 | | | |
| | | |
| |
Connecticut Housing Finance Authority, Refunding RB, S/F Housing | | | |
Series D-1, Sustainability Bonds, 5.00%, 11/15/26 | | | |
Series D-1, Sustainability Bonds, 5.00%, 05/15/27 | | | |
Series D-1, Sustainability Bonds, 5.00%, 11/15/27 | | | |
Connecticut State Health & Educational Facilities Authority, Refunding RB, Series L-1, 4.00%, 07/01/24 | | | |
State of Connecticut, GO, Series A, 4.87%, 03/01/25(a) | | | |
| | | |
| | | |
| |
Delaware State Economic Development Authority, Refunding RB, Series B, 1.25%, 10/01/40(a) | | | |
District of Columbia — 0.4% | |
District of Columbia, RB, Series A, AMT, Sustainability Bonds, 5.00%, 02/28/27 | | | |
Metropolitan Washington Airports Authority Aviation Revenue, Refunding ARB, Series A, AMT, 5.00%, 10/01/27 | | | |
| | | |
| |
County of Broward Florida Airport System Revenue, ARB, Series A, AMT, 5.00%, 10/01/28 | | | |
County of Broward Florida Port Facilities Revenue, ARB, AMT, 5.00%, 09/01/26 | | | |
County of Miami-Dade Florida Aviation Revenue, Refunding RB | | | |
| | | |
Series A, AMT, 5.00%, 10/01/28 | | | |
Greater Orlando Aviation Authority, ARB, Series A, AMT, 5.00%, 10/01/30 | | | |
Miami-Dade County Expressway Authority, Refunding RB, Series B, 5.00%, 07/01/30 | | | |
School Board of Miami-Dade County, Refunding COP, Series D, 5.00%, 11/01/27 | | | |
| | | |
| |
Development Authority of Burke County, RB, 3.38%, 11/01/48 | | | |
Main Street Natural Gas, Inc., RB | | | |
Series A, 5.00%, 06/01/53 | | | |
Series B, 5.00%, 07/01/53 | | | |
| | | |
| |
Guam Power Authority, Refunding RB, Series A, 5.00%, 10/01/25 | | | |
| |
Chicago O’Hare International Airport, Refunding RB, Series C, Senior Lien, 5.00%, 01/01/30 | | | |
City of Chicago Illinois Waterworks Revenue, Refunding RB, Series B, 2nd Lien, 5.00%, 11/01/24 | | | |
City of Chicago Illinois, Refunding GO, Series A, 5.00%, 01/01/26 | | | |
Illinois Finance Authority, Refunding RB, Series B, 4.58%, 05/01/42(a) | | | |
Illinois Housing Development Authority, RB, S/F Housing | | | |
Series G, Sustainability Bonds, (FHLMC, FNMA, GNMA), 5.50%, 04/01/28 | | | |
Series G, Sustainability Bonds, (FHLMC, FNMA, GNMA), 5.50%, 10/01/28 | | | |
Series G, Sustainability Bonds, (FHLMC, FNMA, GNMA), 5.50%, 04/01/29 | | | |
Series G, Sustainability Bonds, (FHLMC, FNMA, GNMA), 5.50%, 10/01/29 | | | |
| | | |
Series B, 5.00%, 05/01/25 | | | |
Series B, 5.00%, 05/01/29 | | | |
Series D, 5.00%, 11/01/28 | | | |
| | | |
Schedule of Investments33
Schedule of Investments (continued)June 30, 2024
BlackRock Short-Term Municipal Fund(Percentages shown are based on Net Assets)
| | | |
| |
City of Whiting Indiana, RB, AMT, 5.00%, 11/01/47 | | | |
City of Whiting Indiana, Refunding RB, AMT, 5.00%, 12/01/44 | | | |
| | | |
| |
City of Burlington Kansas, Refunding RB, Series A, VRDN, 4.15%, 07/05/24(a)(b) | | | |
| |
Kentucky Public Energy Authority, Refunding RB | | | |
Series B, 5.00%, 02/01/28 | | | |
Series B, 5.00%, 02/01/29 | | | |
Series B, 5.00%, 02/01/30 | | | |
Series B, 5.00%, 02/01/31 | | | |
Kentucky State Property & Building Commission, Refunding RB | | | |
Series B, 5.00%, 11/01/25 | | | |
Series B, (SAP), 5.00%, 11/01/25 | | | |
Louisville/Jefferson County Metropolitan Government, Refunding RB, 5.00%, 10/01/30 | | | |
| | | |
| |
Lake Charles Harbor & Terminal District, RB, AMT, 1.00%, 12/01/51 | | | |
Louisiana Public Facilities Authority, RB, 5.00%, 10/01/43(c) | | | |
Parish of St. James Louisiana, RB, Series A-1, VRDN, 4.07%, 07/05/24(b) | | | |
| | | |
| |
Massachusetts Educational Financing Authority, RB | | | |
| | | |
Series B, AMT, 5.00%, 07/01/26 | | | |
Massachusetts Educational Financing Authority, Refunding RB, Series B, AMT, 5.00%, 07/01/28 | | | |
Massachusetts Housing Finance Agency, RB, M/F Housing | | | |
Series A-2, Sustainability Bonds, 0.45%, 12/01/24 | | | |
Series C2, Sustainability Bonds, 4.00%, 12/01/27 | | | |
| | | |
| |
Michigan Finance Authority, RB, 4.73%, 12/01/39(a) | | | |
Michigan Finance Authority, Refunding RB | | | |
| | | |
Series D-1, 0.55%, 10/15/24 | | | |
Michigan State Housing Development Authority, RB, M/F Housing | | | |
Series A, 0.55%, 04/01/25 | | | |
Series A-1, 0.65%, 10/01/24 | | | |
Michigan Strategic Fund, RB | | | |
| | | |
| | | |
| | | |
| |
Hastings Independent School District No. 200, GO, CAB, Series A, 0.00%, 02/01/26(d) | | | |
Housing & Redevelopment Authority of The City of St. Paul Minnesota, Refunding RB, Series A, 5.00%, 07/01/28 | | | |
Minnesota Housing Finance Agency, RB, S/F Housing | | | |
Series E, AMT, Sustainability Bonds, 0.70%, 01/01/25 | | | |
| | | |
| |
Minnesota Housing Finance Agency, RB, S/F Housing (continued) | | | |
Series E, AMT, Sustainability Bonds, 0.90%, 01/01/26 | | | |
Series E, AMT, Sustainability Bonds, 1.10%, 01/01/27 | | | |
| | | |
| |
Kansas City Industrial Development Authority, ARB, Series A, AMT, 5.00%, 03/01/30 | | | |
| |
County of Douglas Nebraska, Refunding RB, 4.41%, 07/01/35(a) | | | |
| |
Clark County Water Reclamation District, Refunding GO, 5.00%, 07/01/24 | | | |
County of Clark Nevada, Refunding GO, Series A, 5.00%, 07/01/24 | | | |
County of Clark Nevada, Refunding RB, Series B, 5.00%, 07/01/24 | | | |
County of Washoe Nevada, Refunding RB(a) | | | |
Series C3, 4.13%, 03/01/36 | | | |
Series F, 4.13%, 03/01/36 | | | |
| | | |
| |
Jersey City Municipal Utilities Authority, RB, Series A, (GTD), 5.00%, 05/01/25 | | | |
New Jersey Economic Development Authority, RB | | | |
| | | |
| | | |
New Jersey Economic Development Authority, Refunding RB | | | |
Series B, 5.00%, 11/01/26 | | | |
Series RRR, 5.00%, 03/01/28 | | | |
New Jersey Transportation Trust Fund Authority, RB | | | |
| | | |
Series BB, 5.00%, 06/15/29 | | | |
New Jersey Transportation Trust Fund Authority, Refunding RB, Series AA, 5.00%, 06/15/25 | | | |
| | | |
| |
City of Farmington New Mexico, Refunding RB, Series C, 3.88%, 06/01/40(a) | | | |
New Mexico Educational Assistance Foundation, Refunding RB, Series 1A, AMT, 5.00%, 09/01/27 | | | |
New Mexico Mortgage Finance Authority, RB, M/F Housing, 5.00%, 02/01/42(a) | | | |
| | | |
| |
Genesee County Funding Corp., Refunding RB | | | |
Series A, 5.00%, 12/01/24 | | | |
Series A, 5.00%, 12/01/25 | | | |
Metropolitan Transportation Authority, Refunding RB, Series D, 5.00%, 11/15/27 | | | |
New York City Housing Development Corp., RB, M/F | | | |
Seires A-2, Sustainability Bonds, 3.70%, 05/01/63 | | | |
Series E-2, Sustainability Bonds, 3.80%, 11/01/63 | | | |
New York City Housing Development Corp., Refunding RB, Sustainability Bonds, 1.05%, 05/01/28 | | | |
New York City Municipal Water Finance Authority, Refunding RB, Series A-1, Class DD, VRDN, 4.95%, 07/01/24(a)(b) | | | |
342024 BlackRock Annual Financial Statements
Schedule of Investments (continued)June 30, 2024
BlackRock Short-Term Municipal Fund(Percentages shown are based on Net Assets)
| | | |
| |
New York Transportation Development Corp., ARB, Series A, AMT, 5.00%, 07/01/30 | | | |
New York Transportation Development Corp., Refunding RB, Series A, AMT, 5.00%, 12/01/25 | | | |
Port Authority of New York & New Jersey, Refunding ARB, Series 207, AMT, 5.00%, 09/15/29 | | | |
Port Authority of New York & New Jersey, Refunding RB, Series 227, AMT, 3.00%, 10/01/27 | | | |
State of New York Mortgage Agency Homeowner Mortgage Revenue, Refunding RB, S/F Housing | | | |
AMT, Sustainability Bonds, 0.75%, 10/01/24 | | | |
AMT, Sustainability Bonds, 0.88%, 04/01/25 | | | |
Triborough Bridge & Tunnel Authority, Refunding RB, Series E2A, Sustainability Bonds, 4.63%, 04/01/26(a) | | | |
Troy Capital Resource Corp., Refunding RB, 5.00%, 09/01/30 | | | |
| | | |
| |
North Carolina Turnpike Authority, Refunding RB, Senior Lien, 5.00%, 01/01/30 | | | |
| |
Ohio Air Quality Development Authority, Refunding RB(a) | | | |
| | | |
Series A, AMT, 4.25%, 11/01/39 | | | |
Ohio Higher Educational Facility Commission, Refunding RB, Series B, 4.11%, 12/01/42(a) | | | |
State of Ohio, Refunding GO, Series B, 5.00%, 08/01/24 | | | |
| | | |
| |
Port of Portland Oregon Airport Revenue, Refunding ARB, Series 28, AMT, 5.00%, 07/01/30 | | | |
| |
Allegheny County Hospital Development Authority, RB, Series D2, 4.46%, 11/15/26(a) | | | |
City of Philadelphia Pennsylvania Airport Revenue, Refunding RB, Series C, AMT, 5.00%, 07/01/28 | | | |
Commonwealth of Pennsylvania, Refunding GO, 5.00%, 08/15/24 | | | |
Montgomery County Higher Education and Health Authority, Refunding RB, 5.00%, 09/01/28 | | | |
Pennsylvania Higher Education Assistance Agency, RB, Series A, AMT, 5.00%, 06/01/28 | | | |
School District of Philadelphia, GOL | | | |
Series A, (SAW), 5.00%, 09/01/24 | | | |
Series A, (SAW), 5.00%, 09/01/29 | | | |
State Public School Building Authority, Refunding RB, Series B, (AGM SAW), 5.00%, 06/01/29 | | | |
| | | |
| |
Rhode Island Health and Educational Building Corp., Refunding RB, VRDN, 3.90%, 07/05/24(a)(b) | | | |
| |
South Carolina Public Service Authority, Refunding RB, Series A, 5.00%, 12/01/28 | | | |
| | | |
| |
Johnson City Health & Educational Facilities Board, Refunding RB | | | |
Series A, 5.00%, 07/01/24 | | | |
Series A, 5.00%, 07/01/25 | | | |
New Memphis Arena Public Building Authority, RB, CAB, Convertible, 4.00%, 04/01/26(e) | | | |
| | | |
| |
Goose Creek Consolidated Independent School District, GO, (PSF), 2.00%, 02/15/25 | | | |
Harris County Cultural Education Facilities Finance Corp., | | | |
| | | |
| | | |
Matagorda County Navigation District No. 1, Refunding RB | | | |
| | | |
Series B-1, 4.00%, 06/01/30 | | | |
Series B-2, 4.00%, 06/01/30 | | | |
| | | |
North Central Texas Housing Finance Corp., RB, M/F Housing, 0.38%, 08/01/40(a) | | | |
North Texas Tollway Authority, Refunding RB, Series A, 5.00%, 01/01/27 | | | |
Port Authority of Houston of Harris County Texas, Refunding GO, Series A, AMT, 5.00%, 10/01/27 | | | |
Tarrant County Cultural Education Facilities Finance Corp., Refunding RB | | | |
Series B, 5.00%, 07/01/25 | | | |
Series B, 5.00%, 07/01/30 | | | |
Texas Municipal Gas Acquisition & Supply Corp. III, Refunding RB | | | |
| | | |
| | | |
Texas Municipal Gas Acquisition & Supply Corp. IV, RB, Series A, 5.50%, 01/01/54(a) | | | |
Texas Municipal Gas Acquisition and Supply Corp. II, RB, Series C, 4.39%, 09/15/27(a) | | | |
| | | |
| |
Isle Wight County Industrial Development Authority, RB | | | |
| | | |
| | | |
Louisa Industrial Development Authority, RB, Series C, 3.80%, 11/01/35(a) | | | |
| | | |
| |
State of Washington, GO, Series A, 0.00%, 12/01/28(d) | | | |
Washington Health Care Facilities Authority, Refunding RB | | | |
Series B, 5.00%, 08/15/25 | | | |
Series B, 5.00%, 08/01/49(a) | | | |
Series B-3, 5.00%, 08/01/49(a) | | | |
| | | |
| |
State of Wisconsin, GO, Series A, 4.30%, 05/01/25(a) | | | |
Schedule of Investments35
Schedule of Investments (continued)June 30, 2024
BlackRock Short-Term Municipal Fund(Percentages shown are based on Net Assets)
| | | |
| |
Wisconsin Health & Educational Facilities Authority, RB, 5.00%, 08/01/27(c) | | | |
Wisconsin Health & Educational Facilities Authority, Refunding RB, Series C-2, 4.06%, 08/15/54(a) | | | |
| | | |
Total Long-Term Investments — 94.3%
(Cost: $441,726,197) | |
|
| |
Dallas Fort Worth International Airport, 4.00%, 07/02/24 | | | |
El Paso Water & Sewer Revenue, 3.90%, 09/10/24 - 09/17/24 | | | |
| |
| | | |
Money Market Funds — 0.0% | |
BlackRock Liquidity Funds, MuniCash, Institutional Shares, 3.88%(f)(g) | | | |
Total Short-Term Securities — 4.3%
(Cost: $20,084,866) | |
Total Investments — 98.6%
(Cost: $461,811,063) | |
Other Assets Less Liabilities — 1.4% | |
| |
| Variable rate security. Interest rate resets periodically. The rate shown is the effective interest rate as of period end. Security description also includes the reference rate and spread if published and available. |
| Variable rate security. Rate as of period end and maturity is the date the principal owed can be recovered through demand. |
| Security exempt from registration pursuant to Rule 144A under the Securities Act of 1933, as amended. These securities may be resold in transactions exempt from registration to qualified institutional investors. |
| |
| Step coupon security. Coupon rate will either increase (step-up bond) or decrease (step- down bond) at regular intervals until maturity. Interest rate shown reflects the rate currently in effect. |
| |
| Annualized 7-day yield as of period end. |
Investments in issuers considered to be affiliate(s) of the Fund during the year ended June 30, 2024 for purposes of Section 2(a)(3) of the Investment Company Act of 1940, as amended, were as follows:
| | | | | Change in
Unrealized
Appreciation
(Depreciation) | | | | Capital Gain
Distributions
from
Underlying
Funds |
BlackRock Liquidity Funds, MuniCash, Institutional Shares | | | | | | | | | |
| Represents net amount purchased (sold). |
Fair Value Hierarchy as of Period End
Various inputs are used in determining the fair value of financial instruments. For a description of the input levels and information about the Fund’s policy regarding valuation of financial instruments, refer to the Notes to Financial Statements.
The following table summarizes the Fund’s financial instruments categorized in the fair value hierarchy. The breakdown of the Fund’s financial instruments into major categories is disclosed in the Schedule of Investments above.
362024 BlackRock Annual Financial Statements
Schedule of Investments (continued)June 30, 2024
BlackRock Short-Term Municipal Fund
Fair Value Hierarchy as of Period End (continued)
See notes to financial statements.
Schedule of Investments37
Statements of Assets and LiabilitiesJune 30, 2024
| BlackRock
New York
Municipal
Opportunities
Fund | BlackRock
High Yield
Municipal
Fund | BlackRock
National
Municipal
Fund | BlackRock
Short-Term
Municipal Fund |
| | | | |
Investments, at value — unaffiliated(a) | | | | |
Investments, at value — affiliated(b) | | | | |
Cash pledged for futures contracts | | | | |
| | | | |
| | | | |
| | | | |
| | | | |
| | | | |
Variation margin on futures contracts | | | | |
Unrealized appreciation on unfunded commitments | | | | |
| | | | |
| | | | |
| | | | |
| | | | |
| | | | |
| | | | |
| | | | |
| | | | |
| | | | |
Income dividend distributions | | | | |
Interest expense and fees | | | | |
| | | | |
Directors’ and Officer’s fees | | | | |
| | | | |
| | | | |
Service and distribution fees | | | | |
| | | | |
Total accrued liabilities | | | | |
| | | | |
| | | | |
| | | | |
Commitments and contingent liabilities | | | | |
| | | | |
| | | | |
| | | | |
| | | | |
| | | | |
(a) Investments, at cost—unaffiliated | | | | |
(b) Investments, at cost—affiliated | | | | |
382024 BlackRock Annual Financial Statements
Statements of Assets and Liabilities (continued)June 30, 2024
| BlackRock
New York
Municipal
Opportunities
Fund | BlackRock
High Yield
Municipal
Fund | BlackRock
National
Municipal
Fund | BlackRock
Short-Term
Municipal Fund |
| | | | |
| | | | |
| | | | |
| | | | |
| | | | |
| | | | |
| | | | |
| | | | |
| | | | |
| | | | |
| | | | |
| | | | |
| | | | |
| | | | |
| | | | |
| | | | |
| | | | |
| | | | |
| | | | |
| | | | |
| | | | |
| | | | |
| | | | |
| | | | |
| | | | |
| | | | |
| | | | |
| | | | |
| | | | |
| | | | |
| | | | |
| | | | |
| | | | |
| | | | |
| | | | |
| | | | |
| | | | |
See notes to financial statements.
Statements of Assets and Liabilities39
Statements of OperationsYear Ended June 30, 2024
| BlackRock
New York
Municipal
Opportunities
Fund | BlackRock
High Yield
Municipal
Fund | BlackRock
National
Municipal
Fund | BlackRock
Short-Term
Municipal Fund |
| | | | |
| | | | |
| | | | |
| | | | |
| | | | |
| | | | |
Service and distribution — class specific | | | | |
Transfer agent — class specific | | | | |
| | | | |
| | | | |
| | | | |
| | | | |
| | | | |
| | | | |
| | | | |
| | | | |
Total expenses excluding interest expense and fees | | | | |
Interest expense and fees — unaffiliated(a) | | | | |
| | | | |
| | | | |
Fees waived and/or reimbursed by the Manager | | | | |
Transfer agent fees waived and/or reimbursed by the Manager — class specific | | | | |
Total expenses after fees waived and/or reimbursed | | | | |
| | | | |
REALIZED AND UNREALIZED GAIN (LOSS) | | | | |
Net realized gain (loss) from: | | | | |
Investments — unaffiliated | | | | |
| | | | |
| | | | |
| | | | |
| | | | |
Net change in unrealized appreciation (depreciation) on: | | | | |
Investments — unaffiliated | | | | |
| | | | |
| | | | |
| | | | |
| | | | |
Net realized and unrealized gain (loss) | | | | |
NET INCREASE IN NET ASSETS RESULTING FROM OPERATIONS | | | | |
(a) All or a portion of is related to TOB Trusts. |
See notes to financial statements.
402024 BlackRock Annual Financial Statements
Statements of Changes in Net Assets
| BlackRock New York
Municipal Opportunities Fund | BlackRock High Yield
Municipal Fund |
| | | | |
|
INCREASE (DECREASE) IN NET ASSETS | | | | |
| | | | |
| | | | |
| | | | |
Net change in unrealized appreciation (depreciation) | | | | |
Net increase in net assets resulting from operations | | | | |
DISTRIBUTIONS TO SHAREHOLDERS(a) | | | | |
| | | | |
| | | | |
| | | | |
| | | | |
| | | | |
Decrease in net assets resulting from distributions to shareholders | | | | |
CAPITAL SHARE TRANSACTIONS | | | | |
Net decrease in net assets derived from capital share transactions | | | | |
| | | | |
Total decrease in net assets | | | | |
| | | | |
| | | | |
| Distributions for annual periods determined in accordance with U.S. federal income tax regulations. |
See notes to financial statements.
Statements of Changes in Net Assets41
Statements of Changes in Net Assets (continued)
| BlackRock National
Municipal Fund | BlackRock Short-Term
Municipal Fund |
| | | | |
|
INCREASE (DECREASE) IN NET ASSETS | | | | |
| | | | |
| | | | |
| | | | |
Net change in unrealized appreciation (depreciation) | | | | |
Net increase in net assets resulting from operations | | | | |
DISTRIBUTIONS TO SHAREHOLDERS(a) | | | | |
| | | | |
| | | | |
| | | | |
| | | | |
| | | | |
| | | | |
Decrease in net assets resulting from distributions to shareholders | | | | |
CAPITAL SHARE TRANSACTIONS | | | | |
Net decrease in net assets derived from capital share transactions | | | | |
| | | | |
Total decrease in net assets | | | | |
| | | | |
| | | | |
| Distributions for annual periods determined in accordance with U.S. federal income tax regulations. |
See notes to financial statements.
422024 BlackRock Annual Financial Statements
Financial Highlights(For a share outstanding throughout each period)
| BlackRock New York Municipal Opportunities Fund |
| |
| | | | | |
|
Net asset value, beginning of year | | | | | |
| | | | | |
Net realized and unrealized gain (loss) | | | | | |
Net increase (decrease) from investment operations | | | | | |
Distributions from net investment income(b) | | | | | |
Net asset value, end of year | | | | | |
| | | | | |
| | | | | |
Ratios to Average Net Assets(e) | | | | | |
| | | | | |
Total expenses after fees waived and/or reimbursed | | | | | |
Total expenses after fees waived and/or reimbursed and excluding interest expense and fees(f) | | | | | |
| | | | | |
| | | | | |
Net assets, end of year (000) | | | | | |
Borrowings outstanding, end of year (000) | | | | | |
| | | | | |
| Based on average shares outstanding. |
| Distributions for annual periods determined in accordance with U.S. federal income tax regulations. |
| Where applicable, assumes the reinvestment of distributions. |
| Includes payment from an affiliate, which had no impact on the Fund’s total return. |
| Excludes fees and expenses incurred indirectly as a result of investments in underlying funds. |
| Interest expense and fees relate to TOB Trusts. See Note 4 of the Notes to Financial Statements for details. |
See notes to financial statements.
Financial Highlights (continued)(For a share outstanding throughout each period)
| BlackRock New York Municipal Opportunities Fund (continued) |
| |
| | | | | |
|
Net asset value, beginning of year | | | | | |
| | | | | |
Net realized and unrealized gain (loss) | | | | | |
Net increase (decrease) from investment operations | | | | | |
Distributions from net investment income(b) | | | | | |
Net asset value, end of year | | | | | |
| | | | | |
| | | | | |
Ratios to Average Net Assets(e) | | | | | |
| | | | | |
Total expenses after fees waived and/or reimbursed | | | | | |
Total expenses after fees waived and/or reimbursed and excluding interest expense and fees(g) | | | | | |
| | | | | |
| | | | | |
Net assets, end of year (000) | | | | | |
Borrowings outstanding, end of year (000) | | | | | |
| | | | | |
| Based on average shares outstanding. |
| Distributions for annual periods determined in accordance with U.S. federal income tax regulations. |
| Where applicable, excludes the effects of any sales charges and assumes the reinvestment of distributions. |
| Includes payment from an affiliate, which had no impact on the Fund’s total return. |
| Excludes fees and expenses incurred indirectly as a result of investments in underlying funds. |
| Includes recoupment of past waived and/or reimbursed fees with no financial impact to the expense ratio. |
| Interest expense and fees relate to TOB Trusts. See Note 4 of the Notes to Financial Statements for details. |
See notes to financial statements.
442024 BlackRock Annual Financial Statements
Financial Highlights (continued)(For a share outstanding throughout each period)
| BlackRock New York Municipal Opportunities Fund (continued) |
| |
| | | | | |
|
Net asset value, beginning of year | | | | | |
| | | | | |
Net realized and unrealized gain (loss) | | | | | |
Net increase (decrease) from investment operations | | | | | |
Distributions from net investment income(b) | | | | | |
Net asset value, end of year | | | | | |
| | | | | |
| | | | | |
Ratios to Average Net Assets(e) | | | | | |
| | | | | |
Total expenses after fees waived and/or reimbursed | | | | | |
Total expenses after fees waived and/or reimbursed and excluding interest expense and fees(g) | | | | | |
| | | | | |
| | | | | |
Net assets, end of year (000) | | | | | |
Borrowings outstanding, end of year (000) | | | | | |
| | | | | |
| Based on average shares outstanding. |
| Distributions for annual periods determined in accordance with U.S. federal income tax regulations. |
| Where applicable, excludes the effects of any sales charges and assumes the reinvestment of distributions. |
| Includes payment from an affiliate, which had no impact on the Fund’s total return. |
| Excludes fees and expenses incurred indirectly as a result of investments in underlying funds. |
| Includes recoupment of past waived and/or reimbursed fees with no financial impact to the expense ratio. |
| Interest expense and fees relate to TOB Trusts. See Note 4 of the Notes to Financial Statements for details. |
See notes to financial statements.
Financial Highlights (continued)(For a share outstanding throughout each period)
| BlackRock New York Municipal Opportunities Fund (continued) |
| |
| | | | | |
|
Net asset value, beginning of year | | | | | |
| | | | | |
Net realized and unrealized gain (loss) | | | | | |
Net increase (decrease) from investment operations | | | | | |
Distributions from net investment income(b) | | | | | |
Net asset value, end of year | | | | | |
| | | | | |
| | | | | |
Ratios to Average Net Assets(e) | | | | | |
| | | | | |
Total expenses after fees waived and/or reimbursed | | | | | |
Total expenses after fees waived and/or reimbursed and excluding interest expense and fees(f) | | | | | |
| | | | | |
| | | | | |
Net assets, end of year (000) | | | | | |
Borrowings outstanding, end of year (000) | | | | | |
| | | | | |
| Based on average shares outstanding. |
| Distributions for annual periods determined in accordance with U.S. federal income tax regulations. |
| Where applicable, excludes the effects of any sales charges and assumes the reinvestment of distributions. |
| Includes payment from an affiliate, which had no impact on the Fund’s total return. |
| Excludes fees and expenses incurred indirectly as a result of investments in underlying funds. |
| Interest expense and fees relate to TOB Trusts. See Note 4 of the Notes to Financial Statements for details. |
See notes to financial statements.
462024 BlackRock Annual Financial Statements
Financial Highlights (continued)(For a share outstanding throughout each period)
| BlackRock New York Municipal Opportunities Fund (continued) |
| |
| | | | | |
|
Net asset value, beginning of year | | | | | |
| | | | | |
Net realized and unrealized gain (loss) | | | | | |
Net increase (decrease) from investment operations | | | | | |
Distributions from net investment income(b) | | | | | |
Net asset value, end of year | | | | | |
| | | | | |
| | | | | |
Ratios to Average Net Assets(d) | | | | | |
| | | | | |
Total expenses after fees waived and/or reimbursed | | | | | |
Total expenses after fees waived and/or reimbursed and excluding interest expense and fees(e) | | | | | |
| | | | | |
| | | | | |
Net assets, end of year (000) | | | | | |
Borrowings outstanding, end of year (000) | | | | | |
| | | | | |
| Based on average shares outstanding. |
| Distributions for annual periods determined in accordance with U.S. federal income tax regulations. |
| Where applicable, assumes the reinvestment of distributions. |
| Excludes fees and expenses incurred indirectly as a result of investments in underlying funds. |
| Interest expense and fees relate to TOB Trusts. See Note 4 of the Notes to Financial Statements for details. |
See notes to financial statements.
Financial Highlights (continued)(For a share outstanding throughout each period)
| BlackRock High Yield Municipal Fund |
| |
| | | | | |
|
Net asset value, beginning of year | | | | | |
| | | | | |
Net realized and unrealized gain (loss) | | | | | |
Net increase (decrease) from investment operations | | | | | |
| | | | | |
From net investment income | | | | | |
| | | | | |
| | | | | |
Net asset value, end of year | | | | | |
| | | | | |
| | | | | |
Ratios to Average Net Assets(e) | | | | | |
| | | | | |
Total expenses after fees waived and/or reimbursed | | | | | |
Total expenses after fees waived and/or reimbursed and excluding interest expense and fees(f) | | | | | |
| | | | | |
| | | | | |
Net assets, end of year (000) | | | | | |
Borrowings outstanding, end of year (000) | | | | | |
| | | | | |
| Based on average shares outstanding. |
| Distributions for annual periods determined in accordance with U.S. federal income tax regulations. |
| Where applicable, assumes the reinvestment of distributions. |
| Includes payment from an affiliate, which had no impact on the Fund’s total return. |
| Excludes fees and expenses incurred indirectly as a result of investments in underlying funds. |
| Interest expense and fees relate to TOB Trusts. See Note 4 of the Notes to Financial Statements for details. |
See notes to financial statements.
482024 BlackRock Annual Financial Statements
Financial Highlights (continued)(For a share outstanding throughout each period)
| BlackRock High Yield Municipal Fund (continued) |
| |
| | | | | |
|
Net asset value, beginning of year | | | | | |
| | | | | |
Net realized and unrealized gain (loss) | | | | | |
Net increase (decrease) from investment operations | | | | | |
| | | | | |
From net investment income | | | | | |
| | | | | |
| | | | | |
Net asset value, end of year | | | | | |
| | | | | |
| | | | | |
Ratios to Average Net Assets(e) | | | | | |
| | | | | |
Total expenses after fees waived and/or reimbursed | | | | | |
Total expenses after fees waived and/or reimbursed and excluding interest expense and fees(f) | | | | | |
| | | | | |
| | | | | |
Net assets, end of year (000) | | | | | |
Borrowings outstanding, end of year (000) | | | | | |
| | | | | |
| Based on average shares outstanding. |
| Distributions for annual periods determined in accordance with U.S. federal income tax regulations. |
| Where applicable, excludes the effects of any sales charges and assumes the reinvestment of distributions. |
| Includes payment from an affiliate, which had no impact on the Fund’s total return. |
| Excludes fees and expenses incurred indirectly as a result of investments in underlying funds. |
| Interest expense and fees relate to TOB Trusts. See Note 4 of the Notes to Financial Statements for details. |
See notes to financial statements.
502024 BlackRock Annual Financial Statements
Financial Highlights (continued)(For a share outstanding throughout each period)
| BlackRock High Yield Municipal Fund (continued) |
| |
| | | | | |
|
Net asset value, beginning of year | | | | | |
| | | | | |
Net realized and unrealized gain (loss) | | | | | |
Net increase (decrease) from investment operations | | | | | |
| | | | | |
From net investment income | | | | | |
| | | | | |
| | | | | |
Net asset value, end of year | | | | | |
| | | | | |
| | | | | |
Ratios to Average Net Assets(e) | | | | | |
| | | | | |
Total expenses after fees waived and/or reimbursed | | | | | |
Total expenses after fees waived and/or reimbursed and excluding interest expense and fees(f) | | | | | |
| | | | | |
| | | | | |
Net assets, end of year (000) | | | | | |
Borrowings outstanding, end of year (000) | | | | | |
| | | | | |
| Based on average shares outstanding. |
| Distributions for annual periods determined in accordance with U.S. federal income tax regulations. |
| Where applicable, assumes the reinvestment of distributions. |
| Includes payment from an affiliate, which had no impact on the Fund’s total return. |
| Excludes fees and expenses incurred indirectly as a result of investments in underlying funds. |
| Interest expense and fees relate to TOB Trusts. See Note 4 of the Notes to Financial Statements for details. |
See notes to financial statements.
Financial Highlights (continued)(For a share outstanding throughout each period)
| BlackRock National Municipal Fund |
| |
| | | | | |
|
Net asset value, beginning of year | | | | | |
| | | | | |
Net realized and unrealized gain (loss) | | | | | |
Net increase (decrease) from investment operations | | | | | |
| | | | | |
From net investment income | | | | | |
| | | | | |
| | | | | |
Net asset value, end of year | | | | | |
| | | | | |
| | | | | |
Ratios to Average Net Assets(f) | | | | | |
| | | | | |
Total expenses after fees waived and/or reimbursed | | | | | |
Total expenses after fees waived and/or reimbursed and excluding interest expense and fees(g) | | | | | |
| | | | | |
| | | | | |
Net assets, end of year (000) | | | | | |
Borrowings outstanding, end of year (000) | | | | | |
| | | | | |
| Based on average shares outstanding. |
| Distributions for annual periods determined in accordance with U.S. federal income tax regulations. |
| Amount is greater than $(0.00005) per share. |
| Where applicable, assumes the reinvestment of distributions. |
| Includes payment from an affiliate, which had no impact on the Fund’s total return. |
| Excludes fees and expenses incurred indirectly as a result of investments in underlying funds. |
| Interest expense and fees relate to TOB Trusts. See Note 4 of the Notes to Financial Statements for details. |
See notes to financial statements.
522024 BlackRock Annual Financial Statements
Financial Highlights (continued)(For a share outstanding throughout each period)
| BlackRock National Municipal Fund (continued) |
| |
| | | | | |
|
Net asset value, beginning of year | | | | | |
| | | | | |
Net realized and unrealized gain (loss) | | | | | |
Net increase (decrease) from investment operations | | | | | |
| | | | | |
From net investment income | | | | | |
| | | | | |
| | | | | |
Net asset value, end of year | | | | | |
| | | | | |
| | | | | |
Ratios to Average Net Assets(f) | | | | | |
| | | | | |
Total expenses after fees waived and/or reimbursed | | | | | |
Total expenses after fees waived and/or reimbursed and excluding interest expense and fees(g) | | | | | |
| | | | | |
| | | | | |
Net assets, end of year (000) | | | | | |
Borrowings outstanding, end of year (000) | | | | | |
| | | | | |
| Based on average shares outstanding. |
| Distributions for annual periods determined in accordance with U.S. federal income tax regulations. |
| Amount is greater than $(0.00005) per share. |
| Where applicable, assumes the reinvestment of distributions. |
| Includes payment from an affiliate, which had no impact on the Fund’s total return. |
| Excludes fees and expenses incurred indirectly as a result of investments in underlying funds. |
| Interest expense and fees relate to TOB Trusts. See Note 4 of the Notes to Financial Statements for details. |
See notes to financial statements.
Financial Highlights (continued)(For a share outstanding throughout each period)
| BlackRock National Municipal Fund (continued) |
| |
| | | | | |
|
Net asset value, beginning of year | | | | | |
| | | | | |
Net realized and unrealized gain (loss) | | | | | |
Net increase (decrease) from investment operations | | | | | |
| | | | | |
From net investment income | | | | | |
| | | | | |
| | | | | |
Net asset value, end of year | | | | | |
| | | | | |
| | | | | |
Ratios to Average Net Assets(f) | | | | | |
| | | | | |
Total expenses after fees waived and/or reimbursed | | | | | |
Total expenses after fees waived and/or reimbursed and excluding interest expense and fees(g) | | | | | |
| | | | | |
| | | | | |
Net assets, end of year (000) | | | | | |
Borrowings outstanding, end of year (000) | | | | | |
| | | | | |
| Based on average shares outstanding. |
| Distributions for annual periods determined in accordance with U.S. federal income tax regulations. |
| Amount is greater than $(0.00005) per share. |
| Where applicable, excludes the effects of any sales charges and assumes the reinvestment of distributions. |
| Includes payment from an affiliate, which had no impact on the Fund’s total return. |
| Excludes fees and expenses incurred indirectly as a result of investments in underlying funds. |
| Interest expense and fees relate to TOB Trusts. See Note 4 of the Notes to Financial Statements for details. |
See notes to financial statements.
542024 BlackRock Annual Financial Statements
Financial Highlights (continued)(For a share outstanding throughout each period)
| BlackRock National Municipal Fund (continued) |
| |
| | | | | |
|
Net asset value, beginning of year | | | | | |
| | | | | |
Net realized and unrealized gain (loss) | | | | | |
Net increase (decrease) from investment operations | | | | | |
| | | | | |
From net investment income | | | | | |
| | | | | |
| | | | | |
Net asset value, end of year | | | | | |
| | | | | |
| | | | | |
Ratios to Average Net Assets(f) | | | | | |
| | | | | |
Total expenses after fees waived and/or reimbursed | | | | | |
Total expenses after fees waived and/or reimbursed and excluding interest expense and fees(g) | | | | | |
| | | | | |
| | | | | |
Net assets, end of year (000) | | | | | |
Borrowings outstanding, end of year (000) | | | | | |
| | | | | |
| Based on average shares outstanding. |
| Distributions for annual periods determined in accordance with U.S. federal income tax regulations. |
| Amount is greater than $(0.00005) per share. |
| Where applicable, excludes the effects of any sales charges and assumes the reinvestment of distributions. |
| Includes payment from an affiliate, which had no impact on the Fund’s total return. |
| Excludes fees and expenses incurred indirectly as a result of investments in underlying funds. |
| Interest expense and fees relate to TOB Trusts. See Note 4 of the Notes to Financial Statements for details. |
See notes to financial statements.
Financial Highlights (continued)(For a share outstanding throughout each period)
| BlackRock National Municipal Fund (continued) |
| |
| | | | | |
|
Net asset value, beginning of year | | | | | |
| | | | | |
Net realized and unrealized gain (loss) | | | | | |
Net increase (decrease) from investment operations | | | | | |
| | | | | |
From net investment income | | | | | |
| | | | | |
| | | | | |
Net asset value, end of year | | | | | |
| | | | | |
| | | | | |
Ratios to Average Net Assets(f) | | | | | |
| | | | | |
Total expenses after fees waived and/or reimbursed | | | | | |
Total expenses after fees waived and/or reimbursed and excluding interest expense and fees(g) | | | | | |
| | | | | |
| | | | | |
Net assets, end of year (000) | | | | | |
Borrowings outstanding, end of year (000) | | | | | |
| | | | | |
| Based on average shares outstanding. |
| Distributions for annual periods determined in accordance with U.S. federal income tax regulations. |
| Amount is greater than $(0.00005) per share. |
| Where applicable, assumes the reinvestment of distributions. |
| Includes payment from an affiliate, which had no impact on the Fund’s total return. |
| Excludes fees and expenses incurred indirectly as a result of investments in underlying funds. |
| Interest expense and fees relate to TOB Trusts. See Note 4 of the Notes to Financial Statements for details. |
See notes to financial statements.
562024 BlackRock Annual Financial Statements
Financial Highlights (continued)(For a share outstanding throughout each period)
| BlackRock Short-Term Municipal Fund |
| |
| | | | | |
|
Net asset value, beginning of year | | | | | |
| | | | | |
Net realized and unrealized gain (loss) | | | | | |
Net increase (decrease) from investment operations | | | | | |
Distributions from net investment income(b) | | | | | |
Net asset value, end of year | | | | | |
| | | | | |
| | | | | |
Ratios to Average Net Assets(d) | | | | | |
| | | | | |
Total expenses after fees waived and/or reimbursed | | | | | |
| | | | | |
| | | | | |
Net assets, end of year (000) | | | | | |
| | | | | |
| Based on average shares outstanding. |
| Distributions for annual periods determined in accordance with U.S. federal income tax regulations. |
| Where applicable, assumes the reinvestment of distributions. |
| Excludes fees and expenses incurred indirectly as a result of investments in underlying funds. |
See notes to financial statements.
Financial Highlights (continued)(For a share outstanding throughout each period)
| BlackRock Short-Term Municipal Fund (continued) |
| |
| | | | | |
|
Net asset value, beginning of year | | | | | |
| | | | | |
Net realized and unrealized gain (loss) | | | | | |
Net increase (decrease) from investment operations | | | | | |
Distributions from net investment income(b) | | | | | |
Net asset value, end of year | | | | | |
| | | | | |
| | | | | |
Ratios to Average Net Assets(d) | | | | | |
| | | | | |
Total expenses after fees waived and/or reimbursed | | | | | |
| | | | | |
| | | | | |
Net assets, end of year (000) | | | | | |
| | | | | |
| Based on average shares outstanding. |
| Distributions for annual periods determined in accordance with U.S. federal income tax regulations. |
| Where applicable, excludes the effects of any sales charges and assumes the reinvestment of distributions. |
| Excludes fees and expenses incurred indirectly as a result of investments in underlying funds. |
See notes to financial statements.
582024 BlackRock Annual Financial Statements
Financial Highlights (continued)(For a share outstanding throughout each period)
| BlackRock Short-Term Municipal Fund (continued) |
| |
| | | | | |
|
Net asset value, beginning of year | | | | | |
| | | | | |
Net realized and unrealized gain (loss) | | | | | |
Net increase (decrease) from investment operations | | | | | |
Distributions from net investment income(b) | | | | | |
Net asset value, end of year | | | | | |
| | | | | |
| | | | | |
Ratios to Average Net Assets(d) | | | | | |
| | | | | |
Total expenses after fees waived and/or reimbursed | | | | | |
| | | | | |
| | | | | |
Net assets, end of year (000) | | | | | |
| | | | | |
| Based on average shares outstanding. |
| Distributions for annual periods determined in accordance with U.S. federal income tax regulations. |
| Where applicable, excludes the effects of any sales charges and assumes the reinvestment of distributions. |
| Excludes fees and expenses incurred indirectly as a result of investments in underlying funds. |
See notes to financial statements.
Financial Highlights (continued)(For a share outstanding throughout each period)
| BlackRock Short-Term Municipal Fund (continued) |
| |
| | | | | |
|
Net asset value, beginning of year | | | | | |
Net investment income (loss)(a) | | | | | |
Net realized and unrealized gain (loss) | | | | | |
Net increase (decrease) from investment operations | | | | | |
Distributions from net investment income(b) | | | | | |
Net asset value, end of year | | | | | |
| | | | | |
| | | | | |
Ratios to Average Net Assets(d) | | | | | |
| | | | | |
Total expenses after fees waived and/or reimbursed | | | | | |
Net investment income (loss) | | | | | |
| | | | | |
Net assets, end of year (000) | | | | | |
| | | | | |
| Based on average shares outstanding. |
| Distributions for annual periods determined in accordance with U.S. federal income tax regulations. |
| Where applicable, excludes the effects of any sales charges and assumes the reinvestment of distributions. |
| Excludes fees and expenses incurred indirectly as a result of investments in underlying funds. |
See notes to financial statements.
602024 BlackRock Annual Financial Statements
Financial Highlights (continued)(For a share outstanding throughout each period)
| BlackRock Short-Term Municipal Fund (continued) |
| |
| | | | | |
|
Net asset value, beginning of year | | | | | |
| | | | | |
Net realized and unrealized gain (loss) | | | | | |
Net increase (decrease) from investment operations | | | | | |
Distributions from net investment income(b) | | | | | |
Net asset value, end of year | | | | | |
| | | | | |
| | | | | |
Ratios to Average Net Assets(d) | | | | | |
| | | | | |
Total expenses after fees waived and/or reimbursed | | | | | |
| | | | | |
| | | | | |
Net assets, end of year (000) | | | | | |
| | | | | |
| Based on average shares outstanding. |
| Distributions for annual periods determined in accordance with U.S. federal income tax regulations. |
| Where applicable, assumes the reinvestment of distributions. |
| Excludes fees and expenses incurred indirectly as a result of investments in underlying funds. |
See notes to financial statements.
Notes to Financial Statements
BlackRock Multi-State Municipal Series Trust (the “Trust”) and BlackRock Municipal Bond Fund, Inc. (the “Corporation”) are each registered under the Investment Company Act of 1940, as amended (the “1940 Act”), as open-end management investment companies. The Trust is organized as a Massachusetts business trust. The Corporation is organized as a Maryland corporation. The following are referred to herein collectively as the “Funds” or individually as a “Fund”:
| | | Diversification
Classification |
BlackRock Multi-State Municipal Series Trust | BlackRock New York Municipal Opportunities Fund | | |
BlackRock Municipal Bond Fund, Inc. | BlackRock High Yield Municipal Fund | | |
| BlackRock National Municipal Fund | | |
| BlackRock Short-Term Municipal Fund | | |
Each Fund offers multiple classes of shares. All classes of shares have identical voting, dividend, liquidation and other rights and are subject to the same terms and conditions, except that certain classes bear expenses related to the shareholder servicing and distribution of such shares. Institutional, Service and Class K Shares are sold only to certain eligible investors. Service, Investor A, Investor A1 and Investor C Shares bear certain expenses related to shareholder servicing of such shares, and Investor C Shares also bear certain expenses related to the distribution of such shares. Investor A and Investor C Shares are generally available through financial intermediaries. Investor A1 Shares are only available for dividend and capital gain reinvestment by existing shareholders, and for purchase by certain employer-sponsored retirement plans. Each class has exclusive voting rights with respect to matters relating to its shareholder servicing and distribution expenditures (except that Investor C shareholders may vote on material changes to the Investor A Shares distribution and service plan).
| | | |
Institutional, Service and Class K Shares | | | |
| | | |
| | | |
| | | To Investor A Shares after approximately 8 years |
| Investor A Shares may be subject to a contingent deferred sales charge (“CDSC”) for certain redemptions where no initial sales charge was paid at the time of purchase. |
| Investor A1 Shares are subject to a maximum sales charge on purchases of 1.00% for all Funds other than New York Municipal, which is subject to a maximum sales charge of 4.00%. The sales charge does not apply to dividend and capital gain reinvestments by existing shareholders and new purchases for certain employer-sponsored retirement plans, which are currently the only investors who may invest in Investor A1 Shares. |
| Investor A1 Shares may be subject to CDSC for certain redemptions where no initial sales charge was paid at the time of purchase. However, the CDSC does not apply to redemptions by certain employer-sponsored retirement plans or to redemptions of shares acquired through reinvestment of dividends and capital gains by existing shareholders. |
| A CDSC of 1.00% is assessed on certain redemptions of Investor C Shares made within one year after purchase. |
The Board of Trustees of BlackRock Multi-State Municipal Series Trust and Board of Directors of BlackRock Municipal Bond Fund, Inc. are collectively referred to throughout this report as the “Board,” and the directors/trustees thereof are collectively referred to throughout this report as “Directors”.
The Funds, together with certain other registered investment companies advised by BlackRock Advisors, LLC (the “Manager”) or its affiliates, are included in a complex of funds referred to as the BlackRock Fixed-Income Complex.
2.
SIGNIFICANT ACCOUNTING POLICIES
The financial statements are prepared in conformity with accounting principles generally accepted in the United States of America (“U.S. GAAP”), which may require management to make estimates and assumptions that affect the reported amounts of assets and liabilities in the financial statements, disclosure of contingent assets and liabilities at the date of the financial statements and the reported amounts of increases and decreases in net assets from operations during the reporting period. Actual results could differ from those estimates. Each Fund is considered an investment company under U.S. GAAP and follows the accounting and reporting guidance applicable to investment companies. Below is a summary of significant accounting policies:
Investment Transactions and Income Recognition: For financial reporting purposes, investment transactions are recorded on the dates the transactions are executed. Realized gains and losses on investment transactions are determined using the specific identification method. Dividend income and capital gain distributions, if any, are recorded on the ex-dividend dates. Non-cash dividends, if any, are recorded on the ex-dividend dates at fair value. Interest income, including amortization and accretion of premiums and discounts on debt securities, is recognized daily on an accrual basis. Income, expenses and realized and unrealized gains and losses are allocated daily to each class based on its relative net assets.
Bank Overdraft: The Funds had outstanding cash disbursements exceeding deposited cash amounts at the custodian during the reporting period. The Funds are obligated to repay the custodian for any overdraft, including any related costs or expenses, where applicable. For financial reporting purposes, overdraft fees, if any, are included in interest expense in the Statements of Operations.
Collateralization: If required by an exchange or counterparty agreement, the Funds may be required to deliver/deposit cash and/or securities to/with an exchange, or broker-dealer or custodian as collateral for certain investments.
Distributions: Distributions from net investment income are declared and paid monthly. Distributions of capital gains are recorded on the ex-dividend dates and made at least annually. The character and timing of distributions are determined in accordance with U.S. federal income tax regulations, which may differ from U.S. GAAP.
622024 BlackRock Annual Financial Statements
Notes to Financial Statements (continued)
Deferred Compensation Plan: Under the Deferred Compensation Plan (the “Plan”) approved by each Fund’s Board, the directors who are not “interested persons” of the Funds, as defined in the 1940 Act (“Independent Directors”), may defer a portion of their annual complex-wide compensation. Deferred amounts earn an approximate return as though equivalent dollar amounts had been invested in common shares of certain funds in the BlackRock Fixed-Income Complex selected by the Independent Directors. This has the same economic effect for the Independent Directors as if the Independent Directors had invested the deferred amounts directly in certain funds in the BlackRock Fixed-Income Complex.
The Plan is not funded and obligations thereunder represent general unsecured claims against the general assets of each Fund, as applicable. Deferred compensation liabilities, if any, are included in the Directors’ and Officer’s fees payable in the Statements of Assets and Liabilities and will remain as a liability of the Funds until such amounts are distributed in accordance with the Plan. Net appreciation (depreciation) in the value of participants’ deferral accounts is allocated among the participating funds in the BlackRock Fixed-Income Complex and reflected as Directors and Officer expense on the Statements of Operations. The Directors and Officer expense may be negative as a result of a decrease in value of the deferred accounts.
Indemnifications: In the normal course of business, a Fund enters into contracts that contain a variety of representations that provide general indemnification. A Fund’s maximum exposure under these arrangements is unknown because it involves future potential claims against a Fund, which cannot be predicted with any certainty.
Other: Expenses directly related to a Fund or its classes are charged to that Fund or the applicable class. Expenses directly related to the Funds and other shared expenses prorated to the Funds are allocated daily to each class based on their relative net assets or other appropriate methods. Other operating expenses shared by several funds, including other funds managed by the Manager, are prorated among those funds on the basis of relative net assets or other appropriate methods.
The Funds have an arrangement with their custodian whereby credits are earned on uninvested cash balances, which could be used to reduce custody fees and/or overdraft charges.
3.
INVESTMENT VALUATION AND FAIR VALUE MEASUREMENTS
Investment Valuation Policies: Each Fund’s investments are valued at fair value (also referred to as “market value” within the financial statements) each day that the Fund is open for business and, for financial reporting purposes, as of the report date. U.S. GAAP defines fair value as the price a fund would receive to sell an asset or pay to transfer a liability in an orderly transaction between market participants at the measurement date. The Board has approved the designation of each Fund’s Manager as the valuation designee for each Fund. Each Fund determines the fair values of its financial instruments using various independent dealers or pricing services under the Manager’s policies. If a security’s market price is not readily available or does not otherwise accurately represent the fair value of the security, the security will be valued in accordance with the Manager’s policies and procedures as reflecting fair value. The Manager has formed a committee (the “Valuation Committee”) to develop pricing policies and procedures and to oversee the pricing function for all financial instruments, with assistance from other BlackRock pricing committees.
Fair Value Inputs and Methodologies: The following methods and inputs are used to establish the fair value of each Fund’s assets and liabilities:
•Fixed-income investments for which market quotations are readily available are generally valued using the last available bid price or current market quotations provided by independent dealers or third-party pricing services. Pricing services generally value fixed-income securities assuming orderly transactions of an institutional round lot size, but a fund may hold or transact in such securities in smaller, odd lot sizes. Odd lots may trade at lower prices than institutional round lots. The pricing services may use matrix pricing or valuation models that utilize certain inputs and assumptions to derive values, including transaction data (e.g., recent representative bids and offers), market data, credit quality information, perceived market movements, news, and other relevant information. Certain fixed-income securities, including asset-backed and mortgage related securities may be valued based on valuation models that consider the estimated cash flows of each tranche of the entity, establish a benchmark yield and develop an estimated tranche specific spread to the benchmark yield based on the unique attributes of the tranche. The amortized cost method of valuation may be used with respect to debt obligations with sixty days or less remaining to maturity unless the Manager determines such method does not represent fair value.
•Investments in open-end U.S. mutual funds (including money market funds) are valued at that day’s published net asset value (“NAV”).
•Futures contracts are valued based on that day’s last reported settlement or trade price on the exchange where the contract is traded.
If events (e.g., market volatility, company announcement or a natural disaster) occur that are expected to materially affect the value of such investment, or in the event that application of these methods of valuation results in a price for an investment that is deemed not to be representative of the market value of such investment, or if a price is not available, the investment will be valued by the Valuation Committee in accordance with the Manager’s policies and procedures as reflecting fair value (“Fair Valued Investments”). The fair valuation approaches that may be used by the Valuation Committee include market approach, income approach and cost approach. Valuation techniques such as discounted cash flow, use of market comparables and matrix pricing are types of valuation approaches and are typically used in determining fair value. When determining the price for Fair Valued Investments, the Valuation Committee seeks to determine the price that each Fund might reasonably expect to receive or pay from the current sale or purchase of that asset or liability in an arm’s-length transaction. Fair value determinations shall be based upon all available factors that the Valuation Committee deems relevant and consistent with the principles of fair value measurement.
For investments in equity or debt issued by privately held companies or funds (“Private Company” or collectively, the “Private Companies”) and other Fair Valued Investments, the fair valuation approaches that are used by the Valuation Committee and third-party pricing services utilized by the Valuation Committee include one or a combination of, but not limited to, the following inputs.
| Standard Inputs Generally Considered By The Valuation Committee And Third-Party Pricing Services |
| | recent market transactions, including subsequent rounds of financing, in the underlying investment or comparable issuers; |
| | recapitalizations and other transactions across the capital structure; and |
Notes to Financial Statements63
Notes to Financial Statements (continued)
| Standard Inputs Generally Considered By The Valuation Committee And Third-Party Pricing Services |
| | market multiples of comparable issuers. |
| | future cash flows discounted to present and adjusted as appropriate for liquidity, credit, and/or market risks; |
| | quoted prices for similar investments or assets in active markets; and |
| | other risk factors, such as interest rates, yield curves, volatilities, prepayment speeds, loss severities, credit risks, recovery rates, liquidation amounts and/or default rates. |
| | audited or unaudited financial statements, investor communications and financial or operational metrics issued by the Private Company; |
| | changes in the valuation of relevant indices or publicly traded companies comparable to the Private Company; |
| | relevant news and other public sources; and |
| | known secondary market transactions in the Private Company’s interests and merger or acquisition activity in companies comparable to the Private Company. |
Investments in series of preferred stock issued by Private Companies are typically valued utilizing market approach in determining the enterprise value of the company. Such investments often contain rights and preferences that differ from other series of preferred and common stock of the same issuer. Enterprise valuation techniques such as an option pricing model (“OPM”), a probability weighted expected return model (“PWERM”), current value method or a hybrid of those techniques are used as deemed appropriate under the circumstances. The use of these valuation techniques involves a determination of the exit scenarios of the investment in order to appropriately allocate the enterprise value of the company among the various parts of its capital structure.
The Private Companies are not subject to the public company disclosure, timing, and reporting standards applicable to other investments held by a Fund. Typically, the most recently available information by a Private Company is as of a date that is earlier than the date a Fund is calculating its NAV. This factor may result in a difference between the value of the investment and the price a Fund could receive upon the sale of the investment.
Fair Value Hierarchy: Various inputs are used in determining the fair value of financial instruments. These inputs to valuation techniques are categorized into a fair value hierarchy consisting of three broad levels for financial reporting purposes as follows:
•Level 1 – Unadjusted price quotations in active markets/exchanges for identical assets or liabilities that each Fund has the ability to access;
•Level 2 – Other observable inputs (including, but not limited to, quoted prices for similar assets or liabilities in markets that are active, quoted prices for identical or similar assets or liabilities in markets that are not active, inputs other than quoted prices that are observable for the assets or liabilities (such as interest rates, yield curves, volatilities, prepayment speeds, loss severities, credit risks and default rates) or other market–corroborated inputs); and
•Level 3 – Unobservable inputs based on the best information available in the circumstances, to the extent observable inputs are not available (including the Valuation Committee’s assumptions used in determining the fair value of financial instruments).
The hierarchy gives the highest priority to unadjusted quoted prices in active markets for identical assets or liabilities (Level 1 measurements) and the lowest priority to unobservable inputs (Level 3 measurements). Accordingly, the degree of judgment exercised in determining fair value is greatest for instruments categorized in Level 3. The inputs used to measure fair value may fall into different levels of the fair value hierarchy. In such cases, for disclosure purposes, the fair value hierarchy classification is determined based on the lowest level input that is significant to the fair value measurement in its entirety. Investments classified within Level 3 have significant unobservable inputs used by the Valuation Committee in determining the price for Fair Valued Investments. Level 3 investments include equity or debt issued by privately held companies or funds that may not have a secondary market and/or may have a limited number of investors. The categorization of a value determined for financial instruments is based on the pricing transparency of the financial instruments and is not necessarily an indication of the risks associated with investing in those securities.
4.
SECURITIES AND OTHER INVESTMENTS
Zero-Coupon Bonds: Zero-coupon bonds are normally issued at a significant discount from face value and do not provide for periodic interest payments. These bonds may experience greater volatility in market value than other debt obligations of similar maturity which provide for regular interest payments.
Forward Commitments, When-Issued and Delayed Delivery Securities: The Funds may purchase securities on a when-issued basis and may purchase or sell securities on a forward commitment basis. Settlement of such transactions normally occurs within a month or more after the purchase or sale commitment is made. The Funds may purchase securities under such conditions with the intention of actually acquiring them but may enter into a separate agreement to sell the securities before the settlement date. Since the value of securities purchased may fluctuate prior to settlement, the Funds may be required to pay more at settlement than the security is worth. In addition, a fund is not entitled to any of the interest earned prior to settlement. When purchasing a security on a delayed delivery basis, the Funds assume the rights and risks of ownership of the security, including the risk of price and yield fluctuations. In the event of default by the counterparty, the Funds’ maximum amount of loss is the unrealized appreciation of unsettled when-issued transactions. These types of securities may be considered unfunded and may obligate the Funds to make future cash payments. An unfunded
642024 BlackRock Annual Financial Statements
Notes to Financial Statements (continued)
commitment is marked-to-market and any unrealized appreciation (depreciation) is separately presented in the Statements of Assets and Liabilities and Statements of Operations. As of period end, the Funds had the following unfunded commitments:
| | | | | Unrealized
Appreciation
(Depreciation) |
| Puerto Rico Electric Power Authority, Series B-1 | | | | |
| Puerto Rico Electric Power Authority, Series B-2 | | | | |
| | | | | |
| Puerto Rico Electric Power Authority, Series B-1 | | | | |
| Puerto Rico Electric Power Authority, Series B-2 | | | | |
| | | | | |
Municipal Bonds Transferred to TOB Trusts: Certain Funds leverage their assets through the use of “TOB Trust” transactions. The funds transfer municipal bonds into a special purpose trust (a “TOB Trust”). A TOB Trust issues two classes of beneficial interests: short-term floating rate interests (“TOB Trust Certificates”), which are sold to third-party investors, and residual inverse floating rate interests (“TOB Residuals”), which are issued to the participating funds that contributed the municipal bonds to the TOB Trust. The TOB Trust Certificates have interest rates that reset weekly and their holders have the option to tender such certificates to the TOB Trust for redemption at par and any accrued interest at each reset date. The TOB Residuals held by a fund provide the fund with the right to cause the holders of a proportional share of the TOB Trust Certificates to tender their certificates to the TOB Trust at par plus accrued interest. The funds may withdraw a corresponding share of the municipal bonds from the TOB Trust. Other funds managed by the investment adviser may also contribute municipal bonds to a TOB Trust into which a fund has contributed bonds. If multiple BlackRock-advised funds participate in the same TOB Trust, the economic rights and obligations under the TOB Residuals will be shared among the funds ratably in proportion to their participation in the TOB Trust.
TOB Trusts are supported by a liquidity facility provided by a third-party bank or other financial institution (the “Liquidity Provider”) that allows the holders of the TOB Trust Certificates to tender their certificates in exchange for payment of par plus accrued interest on any business day. The tendered TOB Trust Certificates are remarketed by a Remarketing Agent. In the event of a failed remarketing, the TOB Trust may draw upon a loan from the Liquidity Provider to purchase the tendered TOB Trust Certificates. Any loans made by the Liquidity Provider will be secured by the purchased TOB Trust Certificates held by the TOB Trust and will be subject to an increased interest rate based on number of days the loan is outstanding.
The TOB Trust may be collapsed without the consent of a fund, upon the occurrence of a termination event as defined in the TOB Trust agreement. Upon the occurrence of a termination event, a TOB Trust would be liquidated with the proceeds applied first to any accrued fees owed to the trustee of the TOB Trust, the Remarketing Agent and the Liquidity Provider. Upon certain termination events, TOB Trust Certificates holders will be paid before the TOB Residuals holders (i.e., the Funds) whereas in other termination events, TOB Trust Certificates holders and TOB Residuals holders will be paid pro rata.
While a fund’s investment policies and restrictions expressly permit investments in inverse floating rate securities, such as TOB Residuals, they restrict the ability of a fund to borrow money for purposes of making investments. Each Fund’s transfer of the municipal bonds to a TOB Trust is considered a secured borrowing for financial reporting purposes. The cash received by the TOB Trust from the sale of the TOB Trust Certificates, less certain transaction expenses, is paid to a Fund. A Fund typically invests the cash received in additional municipal bonds.
Accounting for TOB Trusts: The municipal bonds deposited into a TOB Trust are presented in a Fund’s Schedule of Investments and the TOB Trust Certificates are shown in Other Liabilities in the Statements of Assets and Liabilities. Any loans drawn by the TOB Trust pursuant to the liquidity facility to purchase tendered TOB Trust Certificates are shown as Loan for TOB Trust Certificates. The carrying amount of a Fund’s payable to the holder of the TOB Trust Certificates, as reported in the Statements of Assets and Liabilities as TOB Trust Certificates, approximates its fair value.
Interest income, including amortization and accretion of premiums and discounts, from the underlying municipal bonds is recorded by a Fund on an accrual basis. Interest expense incurred on the TOB Trust transaction and other expenses related to remarketing, administration, trustee, liquidity and other services to a TOB Trust are shown as interest expense, fees and amortization of offering costs in the Statements of Operations. Fees paid upon creation of the TOB Trust are recorded as debt issuance costs and are amortized to interest expense, fees and amortization of offering costs in the Statements of Operations to the expected maturity of the TOB Trust. In connection with the restructurings of the TOB Trusts to non-bank sponsored TOB Trusts, a Fund incurred non-recurring, legal and restructuring fees, which are recorded as interest expense, fees and amortization of offering costs in the Statements of Operations. Amounts recorded within interest expense, fees and amortization of offering costs in the Statements of Operations are:
Notes to Financial Statements65
Notes to Financial Statements (continued)
For the year ended June 30, 2024, the following table is a summary of each Fund’s TOB Trusts:
| Underlying
Municipal Bonds
Transferred to
TOB Trusts(a) | Liability for
TOB Trust
Certificates(b) | Range of
Interest Rates
on TOB Trust
Certificates at
Period End | Average
TOB Trust
Certificates
Outstanding | Daily Weighted
Average Rate
of Interest and
Other Expenses
on TOB Trusts |
| | | | | |
| | | | | |
| | | | | |
| The municipal bonds transferred to a TOB Trust are generally high grade municipal bonds. In certain cases, when municipal bonds transferred are lower grade municipal bonds, the TOB Trust transaction may include a credit enhancement feature that provides for the timely payment of principal and interest on the bonds to the TOB Trust by a credit enhancement provider in the event of default of the municipal bond. The TOB Trust would be responsible for the payment of the credit enhancement fee and the Funds, as TOB Residuals holders, would be responsible for reimbursement of any payments of principal and interest made by the credit enhancement provider. The maximum potential amounts owed by the Funds, for such reimbursements, as applicable, are included in the maximum potential amounts disclosed for recourse TOB Trusts in the Schedules of Investments. |
| TOB Trusts may be structured on a non-recourse or recourse basis. When a Fund invests in TOB Trusts on a non-recourse basis, the Liquidity Provider may be required to make a payment under the liquidity facility to allow the TOB Trust to repurchase TOB Trust Certificates. The Liquidity Provider will be reimbursed from the liquidation of bonds held in the TOB Trust. If a Fund invests in a TOB Trust on a recourse basis, a Fund enters into a reimbursement agreement with the Liquidity Provider where a Fund is required to reimburse the Liquidity Provider for any shortfall between the amount paid by the Liquidity Provider and proceeds received from liquidation of municipal bonds held in the TOB Trust (the “Liquidation Shortfall”). As a result, if a Fund invests in a recourse TOB Trust, a Fund will bear the risk of loss with respect to any Liquidation Shortfall. If multiple funds participate in any such TOB Trust, these losses will be shared ratably, including the maximum potential amounts owed by a Fund at June 30, 2024, in proportion to their participation in the TOB Trust. The recourse TOB Trusts are identified in the Schedules of Investments including the maximum potential amounts owed by a Fund at June 30, 2024. |
5.
DERIVATIVE FINANCIAL INSTRUMENTS
The Funds engage in various portfolio investment strategies using derivative contracts both to increase the returns of the Funds and/or to manage their exposure to certain risks such as credit risk, equity risk, interest rate risk, foreign currency exchange rate risk, commodity price risk or other risks (e.g., inflation risk). Derivative financial instruments categorized by risk exposure are included in the Schedules of Investments. These contracts may be transacted on an exchange or over-the-counter (“OTC”).
Futures Contracts: Futures contracts are purchased or sold to gain exposure to, or manage exposure to, changes in interest rates (interest rate risk) and changes in the value of equity securities (equity risk) or foreign currencies (foreign currency exchange rate risk).
Futures contracts are exchange-traded agreements between the Funds and a counterparty to buy or sell a specific quantity of an underlying instrument at a specified price and on a specified date. Depending on the terms of a contract, it is settled either through physical delivery of the underlying instrument on the settlement date or by payment of a cash amount on the settlement date. Upon entering into a futures contract, the Funds are required to deposit initial margin with the broker in the form of cash or securities in an amount that varies depending on a contract’s size and risk profile. The initial margin deposit must then be maintained at an established level over the life of the contract. Amounts pledged, which are considered restricted, are included in cash pledged for futures contracts in the Statements of Assets and Liabilities.
Securities deposited as initial margin are designated in the Schedules of Investments and cash deposited, if any, are shown as cash pledged for futures contracts in the Statements of Assets and Liabilities. Pursuant to the contract, the Funds agree to receive from or pay to the broker an amount of cash equal to the daily fluctuation in market value of the contract (“variation margin”). Variation margin is recorded as unrealized appreciation (depreciation) and, if any, shown as variation margin receivable (or payable) on futures contracts in the Statements of Assets and Liabilities. When the contract is closed, a realized gain or loss is recorded in the Statements of Operations equal to the difference between the notional amount of the contract at the time it was opened and the notional amount at the time it was closed. The use of futures contracts involves the risk of an imperfect correlation in the movements in the price of futures contracts and interest rates, foreign currency exchange rates or underlying assets.
6.
INVESTMENT ADVISORY AGREEMENT AND OTHER TRANSACTIONS WITH AFFILIATES
Investment Advisory: The Corporation and the Trust, on behalf of the applicable Funds, entered into an Investment Advisory Agreement with the Manager, the Funds’ investment adviser and an indirect, wholly-owned subsidiary of BlackRock, Inc. (“BlackRock”), to provide investment advisory and administrative services. The Manager is responsible for the management of each Fund’s portfolio and provides the personnel, facilities, equipment and certain other services necessary to the operations of each Fund.
For such services, each Fund pays the Manager a monthly fee at an annual rate equal to the following percentages of the average daily value of each Fund’s net assets:
662024 BlackRock Annual Financial Statements
Notes to Financial Statements (continued)
| |
Aggregate of Average Daily Net Assets of the Two Combined Funds(a) | | |
| | |
$250 Million — $400 Million | | |
$400 Million — $550 Million | | |
Greater than $550 Million | | |
(a) The portion of the assets of a Fund to which the rate of each breakpoint level applies will be determined on a “uniform percentage” basis. The uniform percentage applicable to a breakpoint level is determined by dividing the amount of the aggregate average daily net assets of National Municipal and Short-Term Municipal (the “two combined Funds”) that falls within that breakpoint level by the aggregate average daily net assets of the two combined Funds. The amount of the fee for a Fund at each breakpoint level is determined by multiplying the average daily net assets of that Fund by the uniform percentage applicable to that breakpoint level and multiplying the product by the advisory fee rate.
Service and Distribution Fees: The Corporation and the Trust, on behalf of the applicable Funds, entered into a Distribution Agreement and a Distribution and Service Plan with BlackRock Investments, LLC (“BRIL”), an affiliate of the Manager. Pursuant to the Distribution and Service Plan and in accordance with Rule 12b-1 under the 1940 Act, each Fund pays BRIL ongoing service and distribution fees. The fees are accrued daily and paid monthly at annual rates based upon the average daily net assets of the relevant share class of each Fund as follows:
BRIL and broker-dealers, pursuant to sub-agreements with BRIL, provide shareholder servicing and distribution services to the Funds. The ongoing service and/or distribution fee compensates BRIL and each broker-dealer for providing shareholder servicing and/or distribution related services to shareholders.
For the year ended June 30, 2024, the following table shows the class specific service and distribution fees borne directly by each share class of each Fund:
Transfer Agent: Pursuant to written agreements, certain financial intermediaries, some of which may be affiliates, provide the Funds with sub-accounting, recordkeeping, sub-transfer agency and other administrative services with respect to servicing of underlying investor accounts. For these services, these entities receive an asset-based fee or an annual fee per shareholder account, which will vary depending on share class and/or net assets. For the year ended June 30, 2024, the Funds did not pay any amounts to affiliates in return for these services.
The Manager maintains a call center that is responsible for providing certain shareholder services to the Funds. Shareholder services include responding to inquiries and processing purchases and sales based upon instructions from shareholders. For the year ended June 30, 2024, each Fund reimbursed the Manager the following amounts for costs incurred in running the call center, which are included in transfer agent — class specific in the Statements of Operations:
For the year ended June 30, 2024, the following table shows the class specific transfer agent fees borne directly by each share class of each Fund:
Other Fees: For the year ended June 30, 2024, affiliates earned underwriting discounts, direct commissions and dealer concessions on sales of each Fund’s Investor A Shares as follows:
Notes to Financial Statements67
Notes to Financial Statements (continued)
For the year ended June 30, 2024, affiliates received CDSCs as follows:
Expense Limitations, Waivers and Reimbursements: With respect to each Fund, the Manager contractually agreed to waive its investment advisory fees by the amount of investment advisory fees each Fund pays to the Manager indirectly through its investment in affiliated money market funds (the “affiliated money market fund waiver”) through June 30, 2025. The contractual agreement may be terminated upon 90 days’ notice by a majority of the Independent Directors, or by a vote of a majority of the outstanding voting securities of a Fund. The amount of waivers and/or reimbursements of fees and expenses made pursuant to the expense limitation described below will be reduced by the amount of the affiliated money market fund waiver. These amounts are included in fees waived and/or reimbursed by the Manager in the Statements of Operations. For the year ended June 30, 2024, the amounts waived were as follows:
| Fees Waived and/or Reimbursed
by the Manager |
| |
| |
| |
| |
The Manager has contractually agreed to waive its investment advisory fee with respect to any portion of each Fund’s assets invested in affiliated equity and fixed-income mutual funds and affiliated exchange-traded funds that have a contractual management fee through June 30, 2025. The contractual agreement may be terminated upon 90 days’ notice by a majority of the Independent Directors, or by a vote of a majority of the outstanding voting securities of a Fund. This amount is included in fees waived and/or reimbursed by the Manager in the Statements of Operations. With respect to National Municipal, for the year ended June 30, 2024, the Manager waived $119,009 in investment advisory fees pursuant to this arrangement.
With respect to each Fund, the Manager contractually agreed to waive and/or reimburse fees or expenses in order to limit expenses, excluding interest expense, dividend expense, tax expense, acquired fund fees and expenses, and certain other fund expenses, which constitute extraordinary expenses not incurred in the ordinary course of each Fund’s business (“expense limitation”). The expense limitations as a percentage of average daily net assets are as follows:
The Manager has agreed not to reduce or discontinue this contractual expense limitation through June 30, 2025, unless approved by the Board, including a majority of the Independent Directors or by a vote of a majority of the outstanding voting securities of a Fund. For the year ended June 30, 2024, the Manager waived and/or reimbursed the following amounts, which are included in fees waived and/or reimbursed by the Manager in the Statements of Operations.
| Fees Waived and/or Reimbursed
by the Manager |
| |
| |
| |
| |
In addition, these amounts waived and/or reimbursed by the Manager are included in transfer agent fees waived and/or reimbursed by the Manager — class specific in the Statements of Operations. For the year ended June 30, 2024, class specific expense waivers and/or reimbursements were as follows:
| Transfer Agent Fees Waived and/or
Reimbursed by the Manager - Class Specific |
| | | | | | | |
| | | | | | | |
| | | | | | | |
| | | | | | | |
| | | | | | | |
Interfund Lending: In accordance with an exemptive order (the “Order”) from the U.S. Securities and Exchange Commission (“SEC”), each Fund may participate in a joint lending and borrowing facility for temporary purposes (the “Interfund Lending Program”), subject to compliance with the terms and conditions of the Order, and to the extent
682024 BlackRock Annual Financial Statements
Notes to Financial Statements (continued)
permitted by each Fund’s investment policies and restrictions. New York Municipal, National Municipal and Short-Term Municipal are currently permitted to borrow under the Interfund Lending Program. High Yield Municipal is currently permitted to borrow and lend under the Interfund Lending Program.
A lending BlackRock fund may lend in aggregate up to 15% of its net assets but may not lend more than 5% of its net assets to any one borrowing fund through the Interfund Lending Program. A borrowing BlackRock fund may not borrow through the Interfund Lending Program or from any other source more than 33 1/3% of its total assets (or any lower threshold provided for by the fund’s investment restrictions). If a borrowing BlackRock fund’s total outstanding borrowings exceed 10% of its total assets, each of its outstanding interfund loans will be subject to collateralization of at least 102% of the outstanding principal value of the loan. All interfund loans are for temporary or emergency purposes and the interest rate to be charged will be the average of the highest current overnight repurchase agreement rate available to a lending fund and the bank loan rate, as calculated according to a formula established by the Board.
During the year ended June 30, 2024, the Funds did not participate in the Interfund Lending Program.
Directors and Officers: Certain directors and/or officers of the Trust and the Corporation are directors and/or officers of BlackRock or its affiliates. The Funds reimburse the Manager for a portion of the compensation paid to the Trust’s and the Corporation’s Chief Compliance Officer, which is included in Directors and Officer in the Statements of Operations.
Other Transactions: During the six months ended December 31, 2023, High Yield Municipal and National Municipal received a reimbursement of $5,419 and $12,317, respectively, from an affiliate, which is included in payment by affiliate in the Statements of Operations, related to an operating event.
The Funds may purchase securities from, or sell securities to, an affiliated fund provided the affiliation is due solely to having a common investment adviser, common officers, or common directors. For the year ended June 30, 2024, the purchase and sale transactions and any net realized gains (losses) with affiliated funds in compliance with Rule 17a-7 under the 1940 Act were as follows:
For the year ended June 30, 2024, purchases and sales of investments, excluding short-term securities, were as follows:
It is each Fund’s policy to comply with the requirements of the Internal Revenue Code of 1986, as amended, applicable to regulated investment companies, and to distribute substantially all of its taxable income to its shareholders. Therefore, no U.S. federal income tax provision is required.
Each Fund files U.S. federal and various state and local tax returns. No income tax returns are currently under examination. The statute of limitations on each Fund’ s U.S. federal tax returns generally remains open for a period of three years after they are filed. The statutes of limitations on each Fund’s state and local tax returns may remain open for an additional year depending upon the jurisdiction.
Management has analyzed tax laws and regulations and their application to the Funds as of June 30, 2024, inclusive of the open tax return years, and does not believe that there are any uncertain tax positions that require recognition of a tax liability in the Funds’ financial statements.
The tax character of distributions paid was as follows:
Notes to Financial Statements69
Notes to Financial Statements (continued)
As of June 30, 2024, the tax components of accumulated earnings (loss) were as follows:
| Undistributed
Tax-Exempt Income | Undistributed
Ordinary Income | | | |
| | | | | |
| | | | | |
| | | | | |
| | | | | |
| Amounts available to offset future realized capital gains. |
| The difference between book-basis and tax-basis net unrealized gains was attributable primarily to the tax deferral of losses on wash sales, amortization methods for premiums fixed income securities, the accrual of income on securities in default, the realization for tax purposes of unrealized gains/losses on certain futures contracts, the treatment of residual interests in TOB Trusts and the deferral of compensation to trustees. |
As of June 30, 2024, gross unrealized appreciation and depreciation based on cost of investments (including short positions and derivatives, if any) for U.S. federal income tax purposes were as follows:
| | Gross Unrealized
Appreciation | Gross Unrealized
Depreciation | Net Unrealized
Appreciation
(Depreciation) |
| | | | |
| | | | |
| | | | |
| | | | |
The Trust and the Corporation, on behalf of the Funds, along with certain other funds managed by the Manager and its affiliates (“Participating Funds”), is party to a 364-day, $2.40 billion credit agreement with a group of lenders. Under this agreement, the Funds may borrow to fund shareholder redemptions. Excluding commitments designated for certain individual funds, the Participating Funds, including the Funds, can borrow up to an aggregate commitment amount of $1.75 billion at any time outstanding, subject to asset coverage and other limitations as specified in the agreement. The credit agreement has the following terms: a fee of 0.10% per annum on unused commitment amounts and interest at a rate equal to the higher of (a) Overnight Bank Funding Rate (“OBFR”) (but, in any event, not less than 0.00%) on the date the loan is made plus 0.80% per annum, (b) the Fed Funds rate (but, in any event, not less than 0.00%) in effect from time to time plus 0.80% per annum on amounts borrowed or (c) the sum of (x) Daily Simple Secured Overnight Financing Rate (“SOFR”) (but, in any event, not less than 0.00%) on the date the loan is made plus 0.10% and (y) 0.80% per annum. The agreement expires in April 2025 unless extended or renewed. Prior to April 11, 2024, the aggregate commitment amount was $2.50 billion. These fees were allocated among such funds based upon portions of the aggregate commitment available to them and relative net assets of Participating Funds. During the year ended June 30, 2024, the Funds did not borrow under the credit agreement.
In the normal course of business, the Funds invest in securities or other instruments and may enter into certain transactions, and such activities subject each Fund to various risks, including among others, fluctuations in the market (market risk) or failure of an issuer to meet all of its obligations. The value of securities or other instruments may also be affected by various factors, including, without limitation: (i) the general economy; (ii) the overall market as well as local, regional or global political and/or social instability; (iii) regulation, taxation or international tax treaties between various countries; or (iv) currency, interest rate and price fluctuations. Local, regional or global events such as war, acts of terrorism, the spread of infectious illness or other public health issues, recessions, or other events could have a significant impact on the Funds and their investments. Each Fund’s prospectus provides details of the risks to which each Fund is subject.
A Fund structures and “sponsors” the TOB Trusts in which it holds TOB Residuals and has certain duties and responsibilities, which may give rise to certain additional risks including, but not limited to, compliance, securities law and operational risks.
As short-term interest rates rise, the Funds’ investments in the TOB Trusts may adversely affect the Funds’ net investment income and dividends to shareholders. Also, fluctuations in the market value of municipal bonds deposited into the TOB Trust may adversely affect the Funds’ NAVs per share.
702024 BlackRock Annual Financial Statements
Notes to Financial Statements (continued)
The SEC and various federal banking and housing agencies have adopted credit risk retention rules for securitizations (the “Risk Retention Rules”). The Risk Retention Rules would require the sponsor of a TOB Trust to retain at least 5% of the credit risk of the underlying assets supporting the TOB Trust’s municipal bonds. The Risk Retention Rules may adversely affect the Funds’ ability to engage in TOB Trust transactions or increase the costs of such transactions in certain circumstances.
TOB Trusts constitute an important component of the municipal bond market. Any modifications or changes to rules governing TOB Trusts may adversely impact the municipal market and the Funds, including through reduced demand for and liquidity of municipal bonds and increased financing costs for municipal issuers. The ultimate impact of any potential modifications on the TOB Trust market and the overall municipal market is not yet certain.
Market Risk: Each Fund may be exposed to prepayment risk, which is the risk that borrowers may exercise their option to prepay principal earlier than scheduled during periods of declining interest rates, which would force each Fund to reinvest in lower yielding securities. Each Fund may also be exposed to reinvestment risk, which is the risk that income from each Fund’s portfolio will decline if each Fund invests the proceeds from matured, traded or called fixed-income securities at market interest rates that are below each Fund portfolio’s current earnings rate.
Municipal securities are subject to the risk that litigation, legislation or other political events, local business or economic conditions, credit rating downgrades, or the bankruptcy of the issuer could have a significant effect on an issuer’s ability to make payments of principal and/or interest or otherwise affect the value of such securities. Municipal securities can be significantly affected by political or economic changes, including changes made in the law after issuance of the securities, as well as uncertainties in the municipal market related to, taxation, legislative changes or the rights of municipal security holders, including in connection with an issuer insolvency. Municipal securities backed by current or anticipated revenues from a specific project or specific assets can be negatively affected by the discontinuance of the tax benefits supporting the project or assets or the inability to collect revenues for the project or from the assets. Municipal securities may be less liquid than taxable bonds, and there may be less publicly available information on the financial condition of municipal security issuers than for issuers of other securities.
Valuation Risk: The price a Fund could receive upon the sale of any particular portfolio investment may differ from a Fund’s valuation of the investment, particularly for securities that trade in thin or volatile markets or that are valued using a fair valuation technique or a price provided by an independent pricing service. Changes to significant unobservable inputs and assumptions (i.e., publicly traded company multiples, growth rate, time to exit) due to the lack of observable inputs may significantly impact the resulting fair value and therefore a Fund’s results of operations. As a result, the price received upon the sale of an investment may be less than the value ascribed by a Fund, and a Fund could realize a greater than expected loss or lesser than expected gain upon the sale of the investment. A Fund’s ability to value its investments may also be impacted by technological issues and/or errors by pricing services or other third-party service providers.
Counterparty Credit Risk: The Funds may be exposed to counterparty credit risk, or the risk that an entity may fail to or be unable to perform on its commitments related to unsettled or open transactions, including making timely interest and/or principal payments or otherwise honoring its obligations. The Funds manage counterparty credit risk by entering into transactions only with counterparties that the Manager believes have the financial resources to honor their obligations and by monitoring the financial stability of those counterparties. Financial assets, which potentially expose the Funds to market, issuer and counterparty credit risks, consist principally of financial instruments and receivables due from counterparties. The extent of the Funds’ exposure to market, issuer and counterparty credit risks with respect to these financial assets is approximately their value recorded in the Statements of Assets and Liabilities, less any collateral held by the Funds.
A derivative contract may suffer a mark-to-market loss if the value of the contract decreases due to an unfavorable change in the market rates or values of the underlying instrument. Losses can also occur if the counterparty does not perform under the contract.
With exchange-traded futures, there is less counterparty credit risk to the Funds since the exchange or clearinghouse, as counterparty to such instruments, guarantees against a possible default. The clearinghouse stands between the buyer and the seller of the contract; therefore, credit risk is limited to failure of the clearinghouse. While offset rights may exist under applicable law, a Fund does not have a contractual right of offset against a clearing broker or clearinghouse in the event of a default (including the bankruptcy or insolvency). Additionally, credit risk exists in exchange-traded futures with respect to initial and variation margin that is held in a clearing broker’s customer accounts. While clearing brokers are required to segregate customer margin from their own assets, in the event that a clearing broker becomes insolvent or goes into bankruptcy and at that time there is a shortfall in the aggregate amount of margin held by the clearing broker for all its clients, typically the shortfall would be allocated on a pro rata basis across all the clearing broker’s customers, potentially resulting in losses to the Funds.
Geographic/Asset Class Risk: A diversified portfolio, where this is appropriate and consistent with a fund’s objectives, minimizes the risk that a price change of a particular investment will have a material impact on the NAV of a fund. The investment concentrations within each Fund’s portfolio are disclosed in its Schedule of Investments.
Certain Funds invest a substantial amount of their assets in issuers located in a single state or limited number of states. When a Fund concentrates its investments in this manner, it assumes the risk that economic, regulatory, political or social conditions affecting that state or group of states could have a significant impact on the fund and could affect the income from, or the value or liquidity of, the fund’s portfolio. Investment percentages in specific states or U.S. territories are presented in the Schedules of Investments.
Certain Funds invest a significant portion of their assets in securities within a single or limited number of market sectors. When a fund concentrates its investments in this manner, it assumes the risk that economic, regulatory, political and social conditions affecting such sectors may have a significant impact on the Fund and could affect the income from, or the value or liquidity of, the Fund’s portfolio. Investment percentages in specific sectors are presented in the Schedules of Investments.
Certain Funds invest a significant portion of their assets in high yield securities. High yield securities that are rated below investment-grade (commonly referred to as “junk bonds”) or are unrated may be deemed speculative, involve greater levels of risk than higher-rated securities of similar maturity and are more likely to default. High yield securities may be issued by less creditworthy issuers, and issuers of high yield securities may be unable to meet their interest or principal payment obligations. High yield securities are subject to extreme price fluctuations, may be less liquid than higher rated fixed-income securities, even under normal economic conditions, and frequently have redemption features.
Notes to Financial Statements71
Notes to Financial Statements (continued)
The Funds invest a significant portion of their assets in fixed-income securities and/or use derivatives tied to the fixed-income markets. Changes in market interest rates or economic conditions may affect the value and/or liquidity of such investments. Interest rate risk is the risk that prices of bonds and other fixed-income securities will decrease as interest rates rise and increase as interest rates fall. The Funds may be subject to a greater risk of rising interest rates during a period of historically low interest rates. The Federal Reserve has raised the federal funds rate as part of its efforts to address inflation. Changing interest rates may have unpredictable effects on markets, may result in heightened market volatility, and could negatively impact the Funds’ performance.
The Funds invest a significant portion of their assets in securities of issuers located in the United States. A decrease in imports or exports, changes in trade regulations, inflation and/or an economic recession in the United States may have a material adverse effect on the U.S. economy and the securities listed on U.S. exchanges. Proposed and adopted policy and legislative changes in the United States may also have a significant effect on U.S. markets generally, as well as on the value of certain securities. Governmental agencies project that the United States will continue to maintain elevated public debt levels for the foreseeable future which may constrain future economic growth. Circumstances could arise that could prevent the timely payment of interest or principal on U.S. government debt, such as reaching the legislative “debt ceiling.” Such non-payment would result in substantial negative consequences for the U.S. economy and the global financial system. If U.S. relations with certain countries deteriorate, it could adversely affect issuers that rely on the United States for trade. The United States has also experienced increased internal unrest and discord. If these trends were to continue, they may have an adverse impact on the U.S. economy and the issuers in which the Funds invest.
Significant Shareholder Redemption Risk: Certain shareholders may own or manage a substantial amount of fund shares and/or hold their fund investments for a limited period of time. Large redemptions of fund shares by these shareholders may force a fund to sell portfolio securities, which may negatively impact the fund’s NAV, increase the fund’s brokerage costs, and/or accelerate the realization of taxable income/gains and cause the fund to make additional taxable distributions to shareholders.
11.
CAPITAL SHARE TRANSACTIONS
Transactions in capital shares for each class were as follows:
| | |
| | | | |
| | | | |
| | | | |
| | | | |
Shares issued in reinvestment of distributions | | | | |
| | | | |
| | | | |
| | | | |
Shares sold and automatic conversion of shares | | | | |
Shares issued in reinvestment of distributions | | | | |
| | | | |
| | | | |
| | | | |
| | | | |
Shares issued in reinvestment of distributions | | | | |
| | | | |
| | | | |
| | | | |
| | | | |
Shares issued in reinvestment of distributions | | | | |
Shares redeemed and automatic conversion of shares | | | | |
| | | | |
| | | | |
| | | | |
Shares issued in reinvestment of distributions | | | | |
| | | | |
| | | | |
| | | | |
722024 BlackRock Annual Financial Statements
Notes to Financial Statements (continued)
| | |
| | | | |
| | | | |
| | | | |
| | | | |
Shares issued in reinvestment of distributions | | | | |
| | | | |
| | | | |
| | | | |
Shares sold and automatic conversion of shares | | | | |
Shares issued in reinvestment of distributions | | | | |
| | | | |
| | | | |
| | | | |
| | | | |
Shares issued in reinvestment of distributions | | | | |
Shares redeemed and automatic conversion of shares | | | | |
| | | | |
| | | | |
| | | | |
Shares issued in reinvestment of distributions | | | | |
| | | | |
| | | | |
| | | | |
| | |
| | | | |
| | | | |
| | | | |
| | | | |
Shares issued in reinvestment of distributions | | | | |
| | | | |
| | | | |
| | | | |
| | | | |
Shares issued in reinvestment of distributions | | | | |
| | | | |
| | | | |
| | | | |
Shares sold and automatic conversion of shares | | | | |
Shares issued in reinvestment of distributions | | | | |
| | | | |
| | | | |
| | | | |
| | | | |
Shares issued in reinvestment of distributions | | | | |
Shares redeemed and automatic conversion of shares | | | | |
| | | | |
| | | | |
| | | | |
Shares issued in reinvestment of distributions | | | | |
| | | | |
| | | | |
| | | | |
Notes to Financial Statements73
Notes to Financial Statements (continued)
| | |
| | | | |
| | | | |
| | | | |
| | | | |
Shares issued in reinvestment of distributions | | | | |
| | | | |
| | | | |
| | | | |
Shares sold and automatic conversion of shares | | | | |
Shares issued in reinvestment of distributions | | | | |
| | | | |
| | | | |
| | | | |
Shares issued in reinvestment of distributions | | | | |
| | | | |
| | | | |
| | | | |
| | | | |
Shares issued in reinvestment of distributions | | | | |
Shares redeemed and automatic conversion of shares | | | | |
| | | | |
| | | | |
| | | | |
Shares issued in reinvestment of distributions | | | | |
| | | | |
| | | | |
| | | | |
Management has evaluated the impact of all subsequent events on the Funds through the date the financial statements were issued and has determined that there were no subsequent events requiring adjustment or additional disclosure in the financial statements.
742024 BlackRock Annual Financial Statements
Report of Independent Registered Public Accounting Firm
To the Shareholders of BlackRock New York Municipal Opportunities Fund, BlackRock High Yield Municipal Fund, BlackRock National Municipal Fund, and BlackRock Short-Term Municipal Fund and the Board of Trustees/Directors of BlackRock Multi-State Municipal Series Trust and BlackRock Municipal Bond Fund, Inc.:
Opinion on the Financial Statements and Financial Highlights
We have audited the accompanying statements of assets and liabilities of BlackRock New York Municipal Opportunities Fund of BlackRock Multi-State Municipal Series Trust, and BlackRock High Yield Municipal Fund, BlackRock National Municipal Fund, and BlackRock Short-Term Municipal Fund of BlackRock Municipal Bond Fund, Inc. (the “Funds”), including the schedules of investments, as of June 30, 2024, the related statements of operations for the year then ended, the statements of changes in net assets for each of the two years in the period then ended, the financial highlights for each of the five years in the period then ended, and the related notes. In our opinion, the financial statements and financial highlights present fairly, in all material respects, the financial position of the Funds as of June 30, 2024, and the results of their operations for the year then ended, the changes in their net assets for each of the two years in the period then ended, and the financial highlights for each of the five years in the period then ended, in conformity with accounting principles generally accepted in the United States of America.
These financial statements and financial highlights are the responsibility of the Funds’ management. Our responsibility is to express an opinion on the Funds’ financial statements and financial highlights based on our audits. We are a public accounting firm registered with the Public Company Accounting Oversight Board (United States) (PCAOB) and are required to be independent with respect to the Funds in accordance with the U.S. federal securities laws and the applicable rules and regulations of the Securities and Exchange Commission and the PCAOB.
We conducted our audits in accordance with the standards of the PCAOB. Those standards require that we plan and perform the audit to obtain reasonable assurance about whether the financial statements and financial highlights are free of material misstatement, whether due to error or fraud. The Funds are not required to have, nor were we engaged to perform, an audit of their internal control over financial reporting. As part of our audits we are required to obtain an understanding of internal control over financial reporting but not for the purpose of expressing an opinion on the effectiveness of the Funds’ internal control over financial reporting. Accordingly, we express no such opinion.
Our audits included performing procedures to assess the risks of material misstatement of the financial statements and financial highlights, whether due to error or fraud, and performing procedures that respond to those risks. Such procedures included examining, on a test basis, evidence regarding the amounts and disclosures in the financial statements and financial highlights. Our audits also included evaluating the accounting principles used and significant estimates made by management, as well as evaluating the overall presentation of the financial statements and financial highlights. Our procedures included confirmation of securities owned as of June 30, 2024, by correspondence with custodians or counterparties; when replies were not received, we performed other auditing procedures. We believe that our audits provide a reasonable basis for our opinion.
Deloitte & Touche LLP
Boston, Massachusetts
August 22, 2024
We have served as the auditor of one or more BlackRock investment companies since 1992.
Report of Independent Registered Public Accounting Firm75
Important Tax Information (unaudited)
The following amounts, or maximum amounts allowable by law, are hereby designated as tax-exempt interest dividends for the fiscal year ended June 30, 2024:
The Funds hereby designate the following amounts, or maximum amounts allowable by law, of distributions from direct federal obligation interest for the fiscal year ended June 30, 2024:
| Federal Obligation
Interest |
| |
The Funds hereby designate the following amounts, or maximum amounts allowable by law, as interest income eligible to be treated as a Section 163(j) interest dividend for the fiscal year ended June 30, 2024:
The Funds hereby designate the following amounts, or maximum amounts allowable by law, as interest-related dividends eligible for exemption from U.S. withholding tax for nonresident aliens and foreign corporations for the fiscal year ended June 30, 2024:
| Interest-
Related
Dividends |
| |
| |
| |
762024 BlackRock Annual Financial Statements
Changes in and Disagreements with Accountants
Remuneration Paid to Directors, Officers, and Others
Compensation to the independent directors/trustees of the Corporation and the Trust is paid by the Corporation and the Trust, on behalf of the Funds.
Each Fund’s dividend policy is to make regular monthly cash distributions to holders of its common shares (stated in terms of a fixed cents per common share dividend distribution rate). Each Fund intends to distribute all or a portion of its net investment income to its shareholders on a monthly basis. In addition, in any monthly period, in order to maintain its declared distribution amount, each Fund may pay out more or less than the entire amount of net investment income earned in any particular month. In the event a Fund distributes more than its net investment income during any yearly period, such distributions may also come from sources other than net income, including return of capital. The Funds’ current accumulated but undistributed net investment income, if any, is disclosed as accumulated earnings (loss) in the Statements of Assets and Liabilities, which comprises part of the financial information included in this report.
Quarterly performance, semi-annual and annual reports, current net asset value and other information regarding the Funds may be found on BlackRock’s website, which can be accessed at blackrock.com. Any reference to BlackRock’s website in this report is intended to allow investors public access to information regarding the Funds and does not, and is not intended to, incorporate BlackRock’s website in this report.
Shareholders can sign up for e-mail notifications of quarterly statements, annual and semi-annual shareholder reports and prospectuses by enrolling in the electronic delivery program.
To enroll in electronic delivery:
Shareholders Who Hold Accounts with Investment Advisors, Banks or Brokerages:
Please contact your financial advisor. Please note that not all investment advisors, banks or brokerages may offer this service.
Shareholders Who Hold Accounts Directly with BlackRock:
1. Access the BlackRock website at blackrock.com
2. Select “Access Your Account”
3. Next, select “eDelivery” in the “Related Resources” box and follow the sign-up instructions.
BlackRock’s Mutual Fund Family
BlackRock offers a diverse lineup of open-end mutual funds crossing all investment styles and managed by experts in equity, fixed-income and tax-exempt investing. Visit blackrock.com for more information.
Call us at (800) 441-7762 from 8:00 AM to 6:00 PM ET on any business day to get information about your account balances, recent transactions and share prices. You can also visit blackrock.com for more information.
Automatic Investment Plans
Investor class shareholders who want to invest regularly can arrange to have $50 or more automatically deducted from their checking or savings account and invested in any of the BlackRock funds.
Additional Information (continued)
Systematic Withdrawal Plans
Investor class shareholders can establish a systematic withdrawal plan and receive periodic payments of $50 or more from their BlackRock funds, as long as their account balance is at least $10,000.
Shareholders may make investments in conjunction with Traditional, Rollover, Roth, Coverdell, Simple IRAs, SEP IRAs and 403(b) Plans.
Fund and Service Providers
Investment Adviser
BlackRock Advisors, LLC
Wilmington, DE 19809
Accounting Agent and Custodian
State Street Bank and Trust Company
Boston, MA 02114
BNY Mellon Investment Servicing (US) Inc.
Wilmington, DE 19809
BlackRock Investments, LLC
New York, NY 10001
Independent Registered Public Accounting Firm
Deloitte & Touche LLP
Boston, MA 02116
Willkie Farr & Gallagher LLP
New York, NY 10019
100 Bellevue Parkway
Wilmington, DE 19809
782024 BlackRock Annual Financial Statements
Disclosure of Investment Advisory Agreements
The Board of Directors/Trustees (the “Board,” the members of which are referred to as “Board Members”) of BlackRock Multi-State Municipal Series Trust (the “Trust”) and BlackRock Municipal Bond Fund, Inc. (the “Company”) met on May 3, 2024 (the “May Meeting”) and June 6-7, 2024 (the “June Meeting”) to consider the approval to continue the investment advisory agreements (the “Agreements”) between each of the Trust, on behalf of BlackRock New York Municipal Opportunities Fund (the “New York Municipal Opportunities Fund”) and the Company, on behalf of BlackRock High Yield Municipal Fund (the “High Yield Fund”), BlackRock National Municipal Fund (the “National Fund”) and BlackRock Short-Term Municipal Fund (the “Short-Term Fund” and collectively with the High Yield Fund, the National Fund and the New York Municipal Opportunities Fund, the “Funds” and each, a “Fund”), and BlackRock Advisors, LLC (the “Manager” or “BlackRock”), each Fund’s investment advisor.
Consistent with the requirements of the Investment Company Act of 1940 (the “1940 Act”), the Board considers the approval of the continuation of the Agreements for each Fund on an annual basis. The Board members who are not “interested persons” of the Company or the Trust, as defined in the 1940 Act, are considered independent Board members (the “Independent Board Members”). The Board’s consideration entailed a year-long deliberative process during which the Board and its committees assessed BlackRock’s various services to each Fund, including through the review of written materials and oral presentations, and the review of additional information provided in response to requests from the Independent Board Members. The Board had four quarterly meetings per year, each of which extended over a two-day period, as well as additional ad hoc meetings and executive sessions throughout the year, as needed. The committees of the Board similarly met throughout the year. The Board also had an additional one-day meeting to consider specific information regarding the renewal of the Agreements. In considering the renewal of the Agreements, the Board assessed, among other things, the nature, extent and quality of the services provided to each Fund by BlackRock, BlackRock’s personnel and affiliates, including (as applicable): investment management services; accounting oversight; administrative and shareholder services; oversight of each Fund’s service providers; risk management and oversight; and legal, regulatory and compliance services. Throughout the year, including during the contract renewal process, the Independent Board Members were advised by independent legal counsel, and met with independent legal counsel in various executive sessions outside of the presence of BlackRock’s management.
During the year, the Board, acting directly and through its committees, considered information that was relevant to its annual consideration of the renewal of the Agreements, including the services and support provided by BlackRock to each Fund and its shareholders. BlackRock also furnished additional information to the Board in response to specific questions from the Board. Among the matters the Board considered were: (a) investment performance for one-year, three-year, five-year, and/or since inception periods, as applicable, against peer funds, relevant benchmarks, and other performance metrics, as applicable, as well as BlackRock senior management’s and portfolio managers’ investment performance analyses, and the reasons for any outperformance or underperformance relative to its peers, benchmarks, and other performance metrics, as applicable; (b) fees, including advisory, administration, if applicable, and other amounts paid to BlackRock and its affiliates by each Fund for services; (c) Fund operating expenses and how BlackRock allocates expenses to each Fund; (d) the resources devoted to, risk oversight of, and compliance reports relating to, implementation of each Fund’s investment objective, policies and restrictions, and meeting regulatory requirements; (e) BlackRock’s and each Fund’s adherence to applicable compliance policies and procedures; (f) the nature, character and scope of non-investment management services provided by BlackRock and its affiliates and the estimated cost of such services, as applicable; (g) BlackRock’s and other service providers’ internal controls and risk and compliance oversight mechanisms; (h) BlackRock’s implementation of the proxy voting policies approved by the Board; (i) execution quality of portfolio transactions; (j) BlackRock’s implementation of each Fund’s valuation and liquidity procedures; (k) an analysis of management fees paid to BlackRock for products with similar investment mandates across the open-end fund, exchange-traded fund (“ETF”), closed-end fund, sub-advised mutual fund, separately managed account, collective investment trust, and institutional separate account product channels, as applicable, and the similarities and differences between these products and the services provided as compared to each Fund; (l) BlackRock’s compensation methodology for its investment professionals and the incentives and accountability it creates, along with investment professionals’ investments in the fund(s) they manage; and (m) periodic updates on BlackRock’s business.
Prior to and in preparation for the May Meeting, the Board received and reviewed materials specifically relating to the renewal of the Agreements. The Independent Board Members continuously engaged in a process with their independent legal counsel and BlackRock to review the nature and scope of the information provided to the Board to better assist its deliberations. The materials provided in connection with the May Meeting included, among other things: (a) information independently compiled and prepared by Broadridge Financial Solutions, Inc. (“Broadridge”), based on either a Lipper classification or Morningstar category, regarding each Fund’s fees and expenses as compared with a peer group of funds as determined by Broadridge (“Expense Peers”) and the investment performance of each Fund as compared with a peer group of funds (“Performance Peers”); (b) information on the composition of the Expense Peers and Performance Peers and a description of Broadridge’s methodology; (c) information on the estimated profits realized by BlackRock and its affiliates pursuant to the Agreements and a discussion of fall-out benefits to BlackRock and its affiliates; (d) a general analysis provided by BlackRock concerning investment management fees received in connection with other types of investment products, such as institutional accounts, sub-advised mutual funds, ETFs, closed-end funds, open-end funds, and separately managed accounts, under similar investment mandates, as well as the performance of such other products, as applicable; (e) a review of non-management fees; (f) the existence, impact and sharing of potential economies of scale, if any, with each Fund; (g) a summary of aggregate amounts paid by each Fund to BlackRock; (h) sales and redemption data regarding each Fund’s shares; and (i) various additional information requested by the Board as appropriate regarding BlackRock’s and each Fund’s operations.
At the May Meeting, the Board reviewed materials relating to its consideration of the Agreements and the Independent Board Members presented BlackRock with questions and requests for additional information. BlackRock responded to these questions and requests with additional written information in advance of the June Meeting, and such responses were reviewed by the Board Members.
At the June Meeting, the Board concluded its assessment of, among other things: (a) the nature, extent and quality of the services provided by BlackRock; (b) the investment performance of each Fund as compared to its Performance Peers and to other metrics, as applicable; (c) the advisory fee and the estimated cost of the services and estimated profits realized by BlackRock and its affiliates from their relationship with each Fund; (d) each Fund’s fees and expenses compared to its Expense Peers; (e) the existence and sharing of potential economies of scale; (f) any fall-out benefits to BlackRock and its affiliates as a result of BlackRock’s relationship with each Fund; and (g) other factors deemed relevant by the Board Members.
The Board also considered other matters it deemed important to the approval process, such as other payments made to BlackRock or its affiliates relating to securities lending and cash management, and BlackRock’s services related to the valuation and pricing of Fund portfolio holdings. The Board noted the willingness of BlackRock’s personnel to engage in open, candid discussions with the Board. The Board evaluated the information available to it on a fund-by-fund basis. The following paragraphs provide more
Disclosure of Investment Advisory Agreements79
Disclosure of Investment Advisory Agreements (continued)
information about some of the primary factors that were relevant to the Board’s decision. The Board Members did not identify any particular information, or any single factor as determinative, and each Board Member may have attributed different weights to the various items and factors considered.
A. Nature, Extent and Quality of the Services Provided by BlackRock
The Board, including the Independent Board Members, reviewed the nature, extent and quality of services provided by BlackRock, including the investment advisory services, and the resulting performance of each Fund. Throughout the year, the Board compared Fund performance to the performance of a comparable group of mutual funds, relevant benchmarks, and performance metrics, as applicable. The Board met with BlackRock’s senior management personnel responsible for investment activities, including the senior investment officers. The Board also reviewed the materials provided by each Fund’s portfolio management team discussing each Fund’s performance, investment strategies and outlook.
The Board considered, among other factors, with respect to BlackRock: the experience of each Fund’s portfolio management team; research capabilities; investments by portfolio managers in the funds they manage; portfolio trading capabilities; use of technology; commitment to compliance; credit analysis capabilities; risk analysis and oversight capabilities; and the approach to training and retaining portfolio managers and other research, advisory and management personnel. The Board also considered BlackRock’s overall risk management program, including the continued efforts of BlackRock and its affiliates to address cybersecurity risks and the role of BlackRock’s Risk & Quantitative Analysis Group. The Board engaged in a review of BlackRock’s compensation structure with respect to each Fund’s portfolio management team and BlackRock’s ability to attract and retain high-quality talent and create performance incentives.
In addition to investment advisory services, the Board considered the nature and quality of the administrative and other non-investment advisory services provided to each Fund. BlackRock and its affiliates provide each Fund with certain administrative, shareholder and other services (in addition to any such services provided to each Fund by third parties) and officers and other personnel as are necessary for the operations of each Fund. In particular, BlackRock and its affiliates provide each Fund with administrative services including, among others: (i) responsibility for disclosure documents, such as the prospectus, the summary prospectus (as applicable), the statement of additional information and periodic shareholder reports; (ii) oversight of daily accounting and pricing; (iii) responsibility for periodic filings with regulators; (iv) overseeing and coordinating the activities of third-party service providers including, among others, each Fund’s custodian, fund accountant, transfer agent, and auditor; (v) organizing Board meetings and preparing the materials for such Board meetings; (vi) providing legal and compliance support; (vii) furnishing analytical and other support to assist the Board in its consideration of strategic issues such as the merger, consolidation or repurposing of certain open-end funds; and (viii) performing or managing administrative functions necessary for the operation of each Fund, such as tax reporting, expense management, fulfilling regulatory filing requirements, overseeing each Fund’s distribution partners, and shareholder call center and other services. The Board reviewed the structure and duties of BlackRock’s fund administration, shareholder services, and legal and compliance departments and considered BlackRock’s policies and procedures for assuring compliance with applicable laws and regulations. The Board considered the operation of BlackRock’s business continuity plans.
B. The Investment Performance of each Fund
The Board, including the Independent Board Members, reviewed and considered the performance history of each Fund throughout the year and at the May Meeting. In preparation for the May Meeting, the Board was provided with reports independently prepared by Broadridge, which included an analysis of each Fund’s performance as of December 31, 2023, as compared to its Performance Peers. Broadridge ranks funds in quartiles, ranging from first to fourth, where first is the most desirable quartile position and fourth is the least desirable. In connection with its review, the Board received and reviewed information regarding the investment performance of each Fund as compared to its Performance Peers and the respective Morningstar Category (“Morningstar Category”). The Board and its Performance Oversight Committee regularly review and meet with Fund management to discuss the performance of each Fund throughout the year.
In evaluating performance, the Board focused particular attention on funds with less favorable performance records. The Board also noted that while it found the data provided by Broadridge generally useful, it recognized the limitations of such data, including in particular, that notable differences may exist between a fund and its Performance Peers (for example, the investment objectives and strategies). Further, the Board recognized that the performance data reflects a snapshot of a period as of a particular date and that selecting a different performance period could produce significantly different results. The Board also acknowledged that long-term performance could be impacted by even one period of significant outperformance or underperformance, and that a single investment theme could have the ability to disproportionately affect long-term performance.
The Board noted that for the one-, three- and five-year periods reported, the New York Municipal Opportunities Fund ranked in the third, first and second quartiles, respectively, against its Morningstar Category. The Board noted that BlackRock believes that the Morningstar Category is an appropriate performance metric for the New York Municipal Opportunities Fund, and that BlackRock has explained its rationale for this belief to the Board. The Board and BlackRock reviewed the New York Municipal Opportunities Fund’s underperformance relative to its Morningstar Category during the applicable period.
The Board noted that for the one-, three- and five-year periods reported, the High Yield Fund ranked in the second, first and first quartiles, respectively, against its Morningstar Category. The Board noted that BlackRock believes that the Morningstar Category is an appropriate performance metric for the High Yield Fund, and that BlackRock has explained its rationale for this belief to the Board.
The Board noted that for the one-, three- and five-year periods reported, the National Fund ranked in the first, third and third quartiles, respectively against its Morningstar Category. The Board noted that BlackRock believes that the Morningstar Category is an appropriate performance metric for the National Fund, and that BlackRock has explained its rationale for this belief to the Board. The Board and BlackRock reviewed the National Fund’s underperformance relative to its Morningstar Category during the applicable periods.
The Board noted that for the one-, three- and five-year periods reported, the Short-Term Fund ranked in the first, second and third quartiles, respectively, against its Morningstar Category. The Board noted that BlackRock believes that the Morningstar Category is an appropriate performance metric for the Short-Term Fund, and that BlackRock has explained its rationale for this belief to the Board. The Board and BlackRock reviewed the Short-Term Fund’s underperformance relative to its Morningstar Category during the applicable period.
802024 BlackRock Annual Financial Statements
Disclosure of Investment Advisory Agreements (continued)
C. Consideration of the Advisory/Management Fees and the Estimated Cost of the Services and Estimated Profits Realized by BlackRock and its Affiliates from their Relationship with each Fund
The Board, including the Independent Board Members, reviewed each Fund’s contractual management fee rate compared with those of its Expense Peers. The contractual management fee rate represents a combination of the advisory fee and any administrative fees, before taking into account any reimbursements or fee waivers. The Board also compared each Fund’s total expense ratio, as well as its actual management fee rate, to those of its Expense Peers. The total expense ratio represents a fund’s total net operating expenses, including any 12b-1 or non-12b-1 service fees. The total expense ratio gives effect to any expense reimbursements or fee waivers, and the actual management fee rate gives effect to any management fee reimbursements or waivers. The Board considered that the fee and expense information in the Broadridge report for each Fund reflected information for a specific period and that historical asset levels and expenses may differ from current levels, particularly in a period of market volatility. The Board considered the services provided and the fees charged by BlackRock and its affiliates to other types of clients with similar investment mandates, as applicable, including institutional accounts and sub-advised mutual funds (including mutual funds sponsored by third parties).
The Board received and reviewed statements relating to BlackRock’s financial condition. The Board reviewed BlackRock’s profitability methodology and was also provided with an estimated profitability analysis that detailed the revenues earned and the expenses incurred by BlackRock for services provided to each Fund. The Board reviewed BlackRock’s estimated profitability with respect to each Fund and other funds the Board currently oversees for the year ended December 31, 2023 compared to available aggregate estimated profitability data provided for the prior two years. The Board reviewed BlackRock’s estimated profitability with respect to certain other U.S. fund complexes managed by the Manager and/or its affiliates. The Board reviewed BlackRock’s assumptions and methodology of allocating expenses in the estimated profitability analysis, noting the inherent limitations in allocating costs among various advisory products. The Board recognized that profitability may be affected by numerous factors including, among other things, fee waivers and expense reimbursements by the Manager, the types of funds managed, precision of expense allocations and business mix. The Board thus recognized that calculating and comparing profitability at the individual fund level is difficult.
The Board noted that, in general, individual fund or product line profitability of other advisors is not publicly available. The Board reviewed BlackRock’s overall operating margin, in general, compared to that of certain other publicly traded asset management firms. The Board considered the differences between BlackRock and these other firms, including the contribution of technology at BlackRock, BlackRock’s expense management, and the relative product mix.
The Board considered whether BlackRock has the financial resources necessary to attract and retain high quality investment management personnel to perform its obligations under the Agreements and to continue to provide the high quality of services that is expected by the Board. The Board further considered factors including but not limited to BlackRock’s commitment of time and resources, assumption of risk, and liability profile in servicing each Fund, including in contrast to what is required of BlackRock with respect to other products with similar investment mandates across the open-end fund, ETF, closed-end fund, sub-advised mutual fund, separately managed account, collective investment trust, and institutional separate account product channels, as applicable.
The Board noted that the New York Municipal Opportunities Fund’s contractual management fee rate ranked in the third quartile, and that the actual management fee rate and total expense ratio each ranked in the first quartile relative to the New York Municipal Opportunities Fund’s Expense Peers. The Board also noted that the New York Municipal Opportunities Fund has an advisory fee arrangement that includes breakpoints that adjust the fee rate downward as the size of the New York Municipal Opportunities Fund increases above certain contractually specified levels. The Board additionally noted that the breakpoints can, conversely, adjust the advisory fee rate upward as the size of the New York Municipal Opportunities Fund decreases below certain contractually specified levels. In addition, the Board noted that BlackRock and the Board have contractually agreed to a cap on the New York Municipal Opportunities Fund’s total expenses as a percentage of the New York Municipal Opportunities Fund’s average daily net assets on a class-by-class basis.
The Board noted that the High Yield Fund’s contractual management fee rate ranked in the second quartile, and that the actual management fee rate and total expense ratio ranked in the second and first quartiles, respectively, relative to the High Yield Fund’s Expense Peers. The Board also noted that the High Yield Fund has an advisory fee arrangement that includes breakpoints that adjust the fee rate downward as the size of the High Yield Fund increases above certain contractually specified levels. The Board additionally noted that the breakpoints can, conversely, adjust the advisory fee rate upward as the size of the High Yield Fund decreases below certain contractually specified levels. In addition, the Board noted that BlackRock and the Board have contractually agreed to a cap on the High Yield Fund’s total expenses as a percentage of the High Yield Fund’s average daily net assets on a class-by-class basis.
The Board noted that the National Fund’s contractual management fee rate ranked in the third quartile, and that the actual management fee rate and total expense ratio ranked in the third and second quartiles, respectively, relative to the National Fund’s Expense Peers. The Board also noted that the National Fund has an advisory fee arrangement that includes breakpoints that adjust the fee rate downward as the aggregate assets of the National Fund, combined with the assets of the Short-Term Fund, increase above certain contractually specified levels. The Board additionally noted that the breakpoints can, conversely, adjust the advisory fee rate upward as the aggregate size of the National Fund and the Short-Term Fund, decrease below certain contractually specified levels. The Board further noted that BlackRock and the Board have contractually agreed to a cap on the National Fund’s total expenses as a percentage of the National Fund’s average daily net assets on a class-by-class basis.
The Board noted that the Short-Term Fund’s contractual management fee rate ranked in the first quartile, and that the actual management fee rate and total expense ratio each ranked in the first quartile relative to the Short-Term Fund’s Expense Peers. The Board also noted that the Short-Term Fund has an advisory fee arrangement that includes breakpoints that adjust the fee rate downward as the aggregate assets of the Short-Term Fund, combined with the assets of the National Fund, increase above certain contractually specified levels. The Board additionally noted that the breakpoints can, conversely, adjust the advisory fee rate upward as the aggregate size of the Short-Term Fund and the National Fund, decrease below certain contractually specified levels. The Board further noted that BlackRock and the Board have contractually agreed to a cap on the Short-Term Fund’s total expenses as a percentage of the Short-Term Fund’s average daily net assets on a class-by-class basis.
Disclosure of Investment Advisory Agreements81
Disclosure of Investment Advisory Agreements (continued)
D. Economies of Scale
The Board, including the Independent Board Members, considered the extent to which any economies of scale might benefit each Fund in a variety of ways as the assets of each Fund increase. The Board considered multiple factors, including the advisory fee rate and breakpoints, unitary fee structure, fee waivers, and/or expense caps, as applicable. The Board considered each Fund’s asset levels and whether the current fee schedule was appropriate.
E. Other Factors Deemed Relevant by the Board Members
The Board, including the Independent Board Members, also took into account other ancillary or “fall-out” benefits that BlackRock or its affiliates may derive from BlackRock’s respective relationships with each Fund, both tangible and intangible, such as BlackRock’s ability to leverage its investment professionals who manage other portfolios and its risk management personnel, an increase in BlackRock’s profile in the investment advisory community, and the engagement of BlackRock’s affiliates as service providers to each Fund, including for administrative, distribution, securities lending, and cash management services. With respect to securities lending, during the year the Board also considered information provided by independent third-party consultants related to the performance of each BlackRock affiliate as securities lending agent. The Board also considered BlackRock’s overall operations and its efforts to expand the scale of, and improve the quality of, its operations. The Board also noted that, subject to applicable law, BlackRock may use and benefit from third-party research obtained by soft dollars generated by certain registered fund transactions to assist in managing all or a number of its other client accounts.
In connection with its consideration of the Agreements, the Board also received information regarding BlackRock’s brokerage and soft dollar practices. The Board received reports from BlackRock which included information on brokerage commissions and trade execution practices throughout the year.
The Board noted the competitive nature of the open-end fund marketplace, and that shareholders are able to redeem their Fund shares if they believe that each Fund’s fees and expenses are too high or if they are dissatisfied with the performance of each Fund.
At the June Meeting, in a continuation of the discussions that occurred during the May Meeting, and as a culmination of the Board’s year-long deliberative process, the Board, including the Independent Board Members, unanimously approved the continuation of the Advisory Agreements between the Manager and the Company, on behalf of the High Yield Fund, the National Fund and the Short-Term Fund, and the Trust, on behalf of the New York Municipal Opportunities Fund, for a one-year term ending June 30, 2025. Based upon its evaluation of all of the aforementioned factors in their totality, as well as other information, the Board, including the Independent Board Members, was satisfied that the terms of the Agreements were fair and reasonable and in the best interest of each Fund and its shareholders. In arriving at its decision to approve the Agreements, the Board did not identify any single factor or group of factors as all-important or controlling, but considered all factors together, and different Board Members may have attributed different weights to the various factors considered. The Independent Board Members were advised by independent legal counsel throughout the deliberative process.
822024 BlackRock Annual Financial Statements
Glossary of Terms Used in this Report
|
| |
| Assured Guaranty Municipal Corp. |
| AGM Insured Custodial Receipt |
| |
| |
| |
| |
| Build America Mutual Assurance Co. |
| Build America Mutual Assurance Co. - Transferable Custodial Receipts |
| Berkshire Hathaway Assurance Corp. - Custodian Receipt |
| Capital Appreciation Bonds |
| Certificates of Participation |
| |
| |
| Federal Home Loan Mortgage Corp. |
| Federal National Mortgage Association |
| Government National Mortgage Association |
| |
| |
| |
| |
| National Public Finance Guarantee Corp. |
| |
| |
| |
| |
| Subject to Appropriations |
| |
| State of New York Mortgage Agency |
| |
| |
| Variable Rate Demand Note |
Glossary of Terms Used in This Report83
Want to know more?
blackrock.com | 800-441-7762
This report is intended for current holders. It is not authorized for use as an offer of sale or a solicitation of an offer to buy shares of the Funds unless preceded or accompanied by the Funds’ current prospectus. Past performance results shown in this report should not be considered a representation of future performance. Investment returns and principal value of shares will fluctuate so that shares, when redeemed, may be worth more or less than their original cost. Statements and other information herein are as dated and are subject to change.
Item 8 – Changes in and Disagreements with Accountants for Open-End Management Investment Companies – See Item 7
Item 9 – Proxy Disclosures for Open-End Management Investment Companies – See Item 7
| Item 10 – | Remuneration Paid to Directors, Officers, and Others of Open-End Management Investment Companies – See Item 7 |
Item 11 – Statement Regarding Basis for Approval of Investment Advisory Contract – See Item 7
| Item 12 – | Disclosure of Proxy Voting Policies and Procedures for Closed-End Management Investment Companies – Not Applicable |
Item 13 – Portfolio Managers of Closed-End Management Investment Companies – Not Applicable
| Item 14 – | Purchases of Equity Securities by Closed-End Management Investment Company and Affiliated Purchasers – Not Applicable |
Item 15 – Submission of Matters to a Vote of Security Holders – There have been no material changes to these procedures.
Item 16 – Controls and Procedures
(a) The registrant’s principal executive and principal financial officers, or persons performing similar functions, have concluded that the registrant’s disclosure controls and procedures (as defined in Rule 30a-3(c) under the Investment Company Act of 1940, as amended (the “1940 Act”)) are effective as of a date within 90 days of the filing date of this report based on the evaluation of these controls and procedures required by Rule 30a-3(b) under the 1940 Act and Rule 13a-15(b) or 15d-15(b) under the Securities Exchange Act of 1934, as amended.
(b) There were no changes in the registrant’s internal control over financial reporting (as defined in Rule 30a-3(d) under the 1940 Act) that occurred during the period covered by this report that have materially affected, or are reasonably likely to materially affect, the registrant’s internal control over financial reporting.
| Item 17 – | Disclosure of Securities Lending Activities for Closed-End Management Investment Companies – Not Applicable |
Item 18 – Recovery of Erroneously Awarded Compensation – Not Applicable
Item 19 – Exhibits attached hereto
(a)(1) Code of Ethics – See Item 2
(a)(2) Any policy required by the listing standards adopted pursuant to Rule 10D-1 under the Exchange Act (17 CFR 240.10D-1) by the registered national securities exchange or registered national securities association upon which the registrant’s securities are listed – Not Applicable
(a)(3) Section 302 Certifications are attached
(a)(4) Any written solicitation to purchase securities under Rule 23c-1 – Not Applicable
(a)(5) Change in Registrant’s independent public accountant – Not Applicable
(b) Section 906 Certifications are attached
Pursuant to the requirements of the Securities Exchange Act of 1934 and the Investment Company Act of 1940, the registrant has duly caused this report to be signed on its behalf by the undersigned, thereunto duly authorized.
BlackRock Municipal Bond Fund, Inc.
| | |
By: | | /s/ John M. Perlowski |
| | John M. Perlowski |
| | Chief Executive Officer (principal executive officer) of |
| | BlackRock Municipal Bond Fund, Inc. |
Date: August 22, 2024
Pursuant to the requirements of the Securities Exchange Act of 1934 and the Investment Company Act of 1940, this report has been signed below by the following persons on behalf of the registrant and in the capacities and on the dates indicated.
| | |
By: | | /s/ John M. Perlowski |
| | John M. Perlowski |
| | Chief Executive Officer (principal executive officer) of |
| | BlackRock Municipal Bond Fund, Inc. |
Date: August 22, 2024
| | |
By: | | /s/ Trent Walker |
| | Trent Walker |
| | Chief Financial Officer (principal financial officer) of |
| | BlackRock Municipal Bond Fund, Inc. |
Date: August 22, 2024