UNITED STATES
SECURITIES AND EXCHANGE COMMISSION
Washington, D.C. 20549
FORM N-CSR
CERTIFIED SHAREHOLDER REPORT OF REGISTERED
MANAGEMENT INVESTMENT COMPANIES
Investment Company Act file number: (811- 02796 )
Exact name of registrant as specified in charter: Putnam High Yield Trust
Address of principal executive offices: One Post Office Square, Boston, Massachusetts 02109
| Name and address of agent for service: | Beth S. Mazor, Vice President |
| | One Post Office Square |
| | Boston, Massachusetts 02109 |
| |
| Copy to: | John W. Gerstmayr, Esq. |
| | Ropes & Gray LLP |
| | One International Place |
| | Boston, Massachusetts 02110 |
| |
| Registrant’s telephone number, including area code: | (617) 292-1000 |
Date of fiscal year end: August 31, 2006
Date of reporting period: September 1, 2005—August 31, 2006
Item 1. Report to Stockholders:
The following is a copy of the report transmitted to stockholders pursuant to Rule 30e-1 under the Investment Company Act of 1940:

What makes Putnam different?
A time-honored tradition in money management
Since 1937, our values have been rooted in a profound sense of responsibility for the money entrusted to us.
A prudent approach to investing
We use a research-driven team approach to seek consistent, dependable, superior investment results over time, although there is no guarantee a fund will meet its objectives.
Funds for every investment goal
We offer a broad range of mutual funds and other financial products so investors and their financial representatives can build diversified portfolios.
A commitment to doing what’s right for investors
We have below-average expenses and stringent investor protections, and provide a wealth of information about the Putnam funds.
Industry-leading service
We help investors, along with their financial representatives, make informed investment decisions with confidence.

In 1830, Massachusetts Supreme Judicial Court Justice Samuel Putnam established The Prudent Man Rule, a legal foundation for responsible money management.
THE PRUDENT MAN RULE
All that can be required of a trustee to invest is that he shall conduct himself faithfully and exercise a sound discretion. He is to observe how men of prudence, discretion, and intelligence manage their own affairs, not in regard to speculation, but in regard to the permanent disposition of their funds, considering the probable income, as well as the probable safety of the capital to be invested.
Putnam High Yield Trust
8| 31| 06
Annual Report
| Message from the Trustees | 1 |
| About the fund | 2 |
| Report from the fund managers | 5 |
| Performance | 9 |
| Expenses | 11 |
| Portfolio turnover | 13 |
| Risk | 13 |
| Your fund’s management | 14 |
| Terms and definitions | 16 |
| Trustee approval of management contract | 17 |
| Other information for shareholders | 20 |
| Financial statements | 21 |
| About the Trustees | 49 |
| Officers | 52 |

Cover photograph: © Richard H. Johnson
Message from the Trustees
Dear Fellow Shareholder:
Beginning in May of this year, investors became increasingly preoccupied with the course of the economy. A more pessimistic outlook pervaded the markets as leading economic indicators began to warn of slower growth. The resulting correction undercut much of the progress that markets had achieved in the previous three months. However, in August, the Federal Reserve (the Fed) made the decision to leave interest rates unchanged, marking a milestone in its shift to a tighter monetary policy and contributing to a more favorable market environment as your fund’s reporting period drew to a close.
Despite investors’ ongoing concerns about the impact of higher rates, we believe that today’s interest-rate levels, far from being a threat to global economic fundamentals, are in fact an integral part of them. Higher rates in Europe and Japan are shifting the landscape in the fixed-income market and may lead to stronger performance from non-U.S. asset classes in the future. Economic growth may, indeed, be slowing somewhat, but we consider this a typical development for the middle of an economic cycle, and one that could help provide the basis for a longer and more durable business expansion and a continued healthy investment environment going forward.
Putnam Investments’ management team, under the leadership of Chief Executive Officer Ed Haldeman, continues to focus on investment performance, and the investment professionals managing your fund have been working to take advantage of the opportunities presented by this environment.
We would like to take this opportunity to announce the retirement of one of your fund’s Trustees, John Mullin, an independent Trustee of the Putnam funds since 1997. We thank him for his service.
In the following pages, members of your fund’s management team discuss the fund’s performance and strategies for the fiscal period ended August 31, 2006, and provide their outlook for the months ahead. As always, we thank you for your support of the Putnam funds.
Respectfully yours,


Putnam High Yield Trust: a disciplined approach
to seeking high current income and capital growth
Unlike most types of fixed-income investments, high-yield bonds are more influenced by the performance of issuing companies than by interest rates. For this reason, distinguishing between opportunities and pitfalls in the high-yield bond market requires a rigorous selection process. With Putnam High Yield Trust, this process is highlighted by exhaustive research, investment diversification, and timely portfolio adjustments.
Because of the risks of high-yield bond investing, in-depth credit research is essential. The fund’s research team — more than 20 professionals, including analysts who specialize by industry — visits with the management of issuing companies and analyzes each company’s profitability and capital structure. The team then considers this information in the context of the bond’s total return profile before deciding whether it is an appropriate investment for the fund.
The fund’s portfolio typically consists of a broad range of industries and companies. Holdings are diversified across industry sectors and among bonds with different credit ratings. While the fund invests primarily in the bonds of U.S. companies, its diversified approach allows it to include foreign bonds as well. Among these securities, investments in emerging-market bonds can enhance the fund’s appreciation potential. The fund also invests in convertible securities as well as bank loans. Although diversification does not ensure a profit or protect against a loss and it is possible to lose money in a diversified portfolio, the fund’s diversifica-tion can help reduce the volatility that typically comes with higher-risk investments.
As the bond markets shift over time, the fund’s management team looks for ways to capitalize on developments that affect fixed-income securities in
general and high-yield bonds in particular. For example, when interest rates are low, the fund may pursue the higher income potential offered by lower-quality issues. On the other hand, when interest rates are on the rise, yield spreads — that is, the difference in yield between higher- and lower-rated bonds of comparable maturities —typically narrow. In response, the fund may shift its emphasis to higher-quality high-yield bonds.
Lower-rated bonds may offer higher yields in return for more risk. Mutual funds that invest in bonds are subject to certain risks, including interest-rate risk, credit risk, and inflation risk. As interest rates rise, the prices of bonds fall. Long-term bonds are more exposed to interest-rate risk than short-term bonds. Unlike bonds, bond funds have ongoing fees and expenses.
What makes a bond “high yield”?
High-yield bonds are fixed-income investments typically issued by companies that lack an established earnings track record or a solid credit history. In general, high-yield bonds offer higher interest rates than investment-grade bonds to compensate for their increased risk. Because of this added risk, these bonds are rated below investment grade by an independent rating agency (for example, the lowest Moody’s Investors Service rating of investment-grade bonds is Baa). The lower the rating, the greater the possibility that a bond’s issuer will be unable to make interest payments or repay the principal.
BOND RATINGS
Moody’s Grade
Aaa Investment Aa Investment Baa Investment Ba, B High yield Caa/Ca High yield C High yield
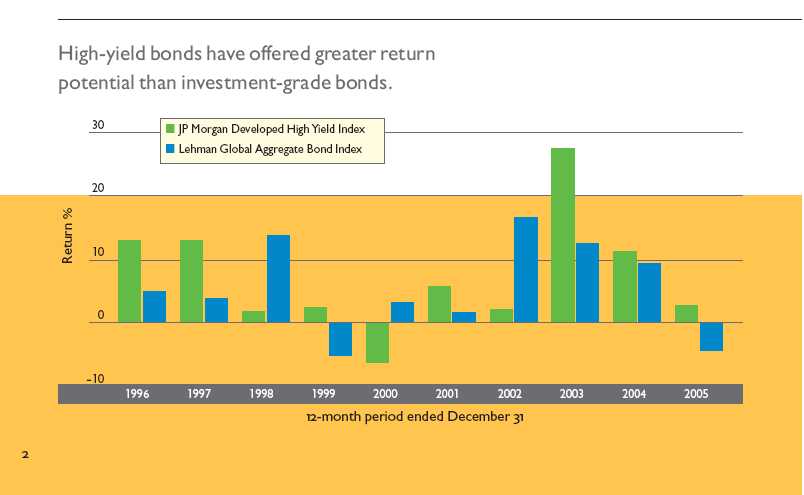
In general, the performance of high-yield bonds tends to be less dependent on interest rates than that of higher-quality bonds. Over the past 10 years, the JP Morgan Developed High Yield Index (the fund’s benchmark) largely outperformed the Lehman Global Aggregate Bond Index (which is made up of a variety of investment-grade bonds), particularly when corporate stocks were rallying.
The JP Morgan Developed High Yield Index is an unmanaged index of high-yield fixed-income securities issued in developed countries. The Lehman Global Aggregate Bond Index is an unmanaged index of global investment-grade fixed-income securities. You cannot invest directly in an index.
3
Putnam High Yield Trust seeks high current income through a portfolio of higher-yielding, lower-rated corporate bonds diversified across different industry sectors. It has a secondary objective of capital growth when consistent with high current income. This fund may be suitable for investors who can accept a higher level of risk in exchange for a potentially higher level of income than that available from higher-quality bonds.
Highlights
• For the fiscal year ended August 31, 2006, Putnam High Yield Trust’s class A shares returned 4.64% without sales charges.
• The fund’s benchmark, the JP Morgan Developed High Yield Index, returned 5.37% .
• The average return for the fund’s Lipper category, High Current Yield Funds, was 4.67% .
• Additional fund performance, comparative performance, and Lipper data can be found in the performance section beginning on page 9.
Performance
Total return for class A shares for periods ended 8/31/06
Since the fund’s inception (2/14/78), average annual return is 9.08% at NAV and 8.93% at POP.
| | Average annual return | Cumulative return |
| | NAV | POP | NAV | POP |
|
| 10 years | 5.47% | 5.07% | 70.28% | 63.92% |
|
| 5 years | 8.44 | 7.61 | 49.97 | 44.27 |
|
| 3 years | 9.23 | 7.86 | 30.31 | 25.49 |
|
| 1 year | 4.64 | 0.67 | 4.64 | 0.67 |
|
Data is historical. Past performance does not guarantee future results. More recent returns may be less or more than those shown. Investment return and principal value will fluctuate, and you may have a gain or a loss when you sell your shares. Performance assumes reinvestment of distributions and does not account for taxes. Returns at NAV do not reflect a sales charge of 3.75% . For the most recent month-end performance, visit www.putnam.com. A 1% short-term trading fee may apply.
4
Report from the fund managers
The year in review
During the fiscal year ended August 31, 2006, your fund underperformed its benchmark, the JP Morgan Developed High Yield Index, based on results at net asset value (NAV, or without sales charges). However, the fund’s return at NAV was in line with the average return for its Lipper peer group, High Current Yield Funds. The main detractor from the fund’s performance relative to the benchmark was our decision to underweight defaulted and distressed securities, which posted strong returns, particularly during the first four months of 2006. Overweighting cable TV and underweighting fixed-line telecommunications companies also dampened returns. On the plus side, our overweighting of wireless telecom, energy, and diversified media issues bolstered relative performance.
Market overview
During the last four months of 2005, performance in the high-yield bond market was subdued by a series of credit downgrades. High-profile bankruptcies, including those of Delta and Northwest Airlines, auto supplier Delphi, and electric utility Calpine, also had a negative impact. However, the market rallied starting in January 2006, a run that lasted until the end of April, thanks to positive influences that included continued healthy business fundamentals, large deals that came to the market, consolidation activity, strong liquidity, and news of General Motors’ plan to sell its financing arm. In addition, even with the bankruptcies cited above, the overall default rate remained below historical averages, indicating the relative financial health of high-yield companies.
The Fed continued to raise short-term interest rates at each of its Open Market Committee meetings until August 8, when it decided to pause. Typically, the relative health of corporate business fundamentals has a greater effect on high-yield market trends than do interest-rate changes, and this was the case for much of the fund’s fiscal year. However, May brought with it increasing volatility, due to concerns about inflation that made investors more risk-averse.
Market sector performance
These indexes provide an overview of performance in different market sectors for the 12 months ended 8/31/06.
| Bonds | |
|
| JP Morgan Developed High Yield Index | |
| (high-yield corporate bonds) | 5.37% |
|
| Lehman Aggregate Bond Index | |
| (broad bond market) | 1.71% |
|
| Lehman Municipal Bond Index | |
| (tax-exempt bonds) | 3.02% |
|
| Equities | |
|
| S&P 500 Index | |
| (broad stock market) | 8.88% |
|
| Russell 2000 Value Index | |
| (small-company value stocks) | 12.72% |
|
| Russell 2500 Growth Index | |
| (growth stocks of small and midsize companies) | 6.06% |
5
From May through the end of August, two countervailing forces affected the high-yield market. On the one hand, there was a widening of the yield spread, or yield advantage, offered by high-yield bonds over Treasuries, indicating underperformance of the high-yield market. On the other hand, a rally in the Treasury market during that time frame — when longer-term Treasury yields were falling and their prices rising — helped provide some support to the high-yield market, where bond prices rose in concert with Treasuries.
Strategy overview
We favored the higher-quality segments of the high-yield bond market throughout the fiscal year. That’s because high-yield bond spreads remained at historically narrow levels, meaning that investors were not being paid for taking on the additional risks inherent in investing in lower-quality bonds. We also felt that the Fed’s extended program of tightening short-term interest rates would begin to erode economic growth, and that higher-quality bonds would likely strengthen as a result. Our defensive positioning was an appropriate response. We kept the portfolio diversified and focused on bonds issued by companies that we believed offered a competitive advantage, a viable capital structure, solid cash-flow generation, and some kind of downside protection. We remained very selective when adding new names to the fund, relying on our rigorous fundamental credit research to evaluate potential investments.
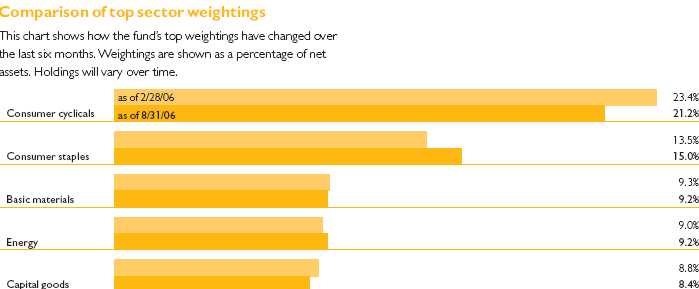
With regard to industry and sector weightings, we increased the fund’s overweight position in bonds issued by energy-related companies, particularly exploration and production companies, which continued to benefit from robust global demand and constrained supply. We also favored media, because valuations in the sector were appealing as generally steady economic growth buoyed advertising spending. In addition, we focused on wireless telecommunications companies, which enjoyed strong subscriber growth, increased market penetration, and solid consolidation activity.
Other moves of note included our adding to the fund’s transportation holdings, particularly in the automotive industry. We made this adjustment as we became more comfortable with changes at industry giant General Motors. We were pleased, in particular, by the company’s decision to spin off GMAC, its financing business. At the same time, we decreased holdings in bonds issued by companies in the chemicals industry, feeling that pricing in the sector had peaked. Areas we underweighted, relative to the benchmark, included gaming and leisure, grocery and drug stores, food and tobacco, and retailers.
Your fund’s holdings
Overall, during the course of your fund’s fiscal year, it appears that our diversified approach helped stabilize returns. Although our high-quality bias dampened performance during the rally among low-quality issues at
6
the beginning of 2006, we believe it helped bolster relative returns during the final months of 2005 and again from May 2006 through the end of the period.
During the 12 months ended August 31, 2006, our decision to hold a large position in bonds issued by broadcaster Paxson Communications contributed favorably to the fund’s performance relative to the benchmark. The bonds rebounded in price as the company refinanced its debt, which helped to improve its credit profile. Our decision to overweight the bonds of aircraft parts supplier Decrane Aircraft Holdings also buoyed performance, as the company continued to benefit from sustained demand from its customers in the rapidly growing corporate aircraft industry. The fund also benefited from not owning electric utility Calpine, which sought bankruptcy relief in December. The bonds rebounded temporarily during the rally at the beginning of 2006, but, for the year, posted negative performance. Another top contributor was Doane Pet Care. When this pet food manufacturer company was acquired by another company during the period, its bonds and preferred stock obligations were redeemed, resulting in significant capital appreciation for your fund. Although the fund had limited exposure to the air transportation industry, an overweight position in CalAir, an affiliate of Continental Airlines, bolstered returns, as these bonds appreciated due to a more favorable supply-demand backdrop for domestic airlines.
As usual, there were some holdings that did not perform as well as we had anticipated. The fund’s holdings in cable television firm Charter Communications lagged as operators in this industry struggled with increased competition from satellite providers and other sources. Communications technology firm Level 3 Communications, a distressed security, and auto parts supplier Dana Corp. both rebounded strongly during the market rally in early 2006. However, we chose to underweight Level 3 and sold out of Dana bonds before the rally because we felt it was not a solid long-term investment. Both decisions dampened relative performance. Another holding that struggled was building materials provider Owens Corning. The company is working to emerge from bankruptcy. During the period, Owens’ stock valuation declined, reflecting an overall weakening of the housing sector, and the bond prices fell in tandem. Bonds issued by hospital operator HCA also declined in price, due to the announcement of a leveraged buyout of the firm. Should this take place, it is expected to be the largest such buyout in history. Leveraged buyouts tend to be negative for bondholders. We have, accordingly, reduced the size of the fund’s position in HCA.
Please note that the holdings discussed in this report may not have been held by the fund for the entire period. Portfolio composition is subject to review in accordance with the fund’s investment strategy and may vary in the future.
| Top holdings | | |
| This table shows the fund’s top holdings, and the percentage of | |
| the fund’s net assets that each comprised, as of 8/31/06. The fund’s | |
| holdings will change over time. | | |
|
| Holding (percent of fund’s net assets) | Coupon (%) and maturity date | Industry |
|
| CCH I, LLC/Capital Corp. (1.0%) | 11%, 2015 | Cable television |
|
| Qwest Corp. (0.7%) | 8.875%, 2012 | Communications services |
|
| General Motors Acceptance Corp. (0.6%) | 7.75%, 2010 | Automotive |
|
| Novelis, Inc. (0.6%) | 7.25%, 2015 | Basic materials |
|
| General Motors Acceptance Corp. (0.6%) | 6.875%, 2012 | Automotive |
|
| Equistar Chemicals LP/Equistar Funding Corp. (0.6%) | 10.125%, 2008 | Basic materials |
|
| Qwest Communications International, Inc. (0.6%) | 7.5%, 2014 | Communications services |
|
| NRG Energy, Inc. (0.6%) | 7.375%, 2016 | Utilities and power |
|
| Legrand SA (0.6%) | 8.5%, 2025 | Capital goods |
|
| Echostar DBS Corp. (0.6%) | 6.375%, 2011 | Broadcasting |
|
7
The outlook for your fund
The following commentary reflects anticipated developments that could affect your fund over the next six months, as well as your management team’s plans for responding to them.
As we embark on your fund’s new fiscal year, we will, as always, focus on three main factors to determine our outlook. First, we consider company fundamentals. While some industries currently are facing challenges, the overall fundamental backdrop for corporations remains positive. We also examine technicals, or trends with regard to the supply of high-yield bonds as well as the demand for them. There, we are cautious. For the rest of 2006, there is a large calendar of new issuance that is scheduled to come to market, which will add to supply. Many of these potential deals are tied to leveraged buyouts. These types of deals tend to carry more aggressive financing structures, and thus may result in credit downgrades or an influx of lower-quality bonds into the market. Finally, we consider valuations. While high-yield spreads are tight by historical standards, they remain at levels we consider to be generally fair, given the low default rate. As of the end of the period, spr eads were actually substantially wider than they had been in May 2006, indicating some improvement in valuations.
Overall, we believe that returns in the foreseeable future will be generated mainly through interest income rather than capital appreciation or depreciation. Therefore, we intend to continue to build and maintain a diversified portfolio of relatively higher-quality lower-rated bonds.
The views expressed in this report are exclusively those of Putnam Management. They are not meant as investment advice.
Lower-rated bonds may offer higher yields in return for more risk. Funds that invest in bonds are subject to certain risks including interest-rate risk, credit risk, and inflation risk. As interest rates rise, the prices of bonds fall. Long-term bonds are more exposed to interest-rate risk than short-term bonds. Unlike bonds, bond funds have ongoing fees and expenses.
8
Your fund’s performance
This section shows your fund’s performance for periods ended August 31, 2006, the end of its fiscal year. In accordance with regulatory requirements for mutual funds, we also include performance as of the most recent calendar quarter-end. Performance should always be considered in light of a fund’s investment strategy. Data represents past performance. Past performance does not guarantee future results. More recent returns may be less or more than those shown. Investment return and principal value will fluctuate, and you may have a gain or a loss when you sell your shares. For the most recent month-end performance, please visit www.putnam.com or call Putnam at 1-800-225-1581. Class Y shares are generally only available to corporate and institutional clients. See the Terms and Definitions section in this report for definitions of the share classes offered by your fund.
| Fund performance Total return for periods ended 8/31/06 | | | | | | |
|
| |
| | Class A | | Class B | | Class C | | Class M | | Class R | Class Y |
| (inception dates) | (2/14/78) | | (3/1/93) | | (3/19/02) | | (7/3/95) | | (1/21/03) | (12/31/98) |
| | NAV | POP | NAV | CDSC | NAV | CDSC | NAV | POP | NAV | NAV |
|
| Annual average | | | | | | | | | | |
| (life of fund) | 9.08% | 8.93% | 8.15% | 8.15% | 8.25% | 8.25% | 8.69% | 8.57% | 8.80% | 9.14% |
|
| 10 years | 70.28 | 63.92 | 58.41 | 58.41 | 57.71 | 57.71 | 66.15 | 60.70 | 65.84 | 73.24 |
| Annual average | 5.47 | 5.07 | 4.71 | 4.71 | 4.66 | 4.66 | 5.21 | 4.86 | 5.19 | 5.65 |
|
| 5 years | 49.97 | 44.27 | 44.65 | 42.71 | 44.24 | 44.24 | 48.07 | 43.29 | 47.79 | 51.75 |
| Annual average | 8.44 | 7.61 | 7.66 | 7.37 | 7.60 | 7.60 | 8.17 | 7.46 | 8.13 | 8.70 |
|
| 3 years | 30.31 | 25.49 | 27.49 | 24.49 | 27.56 | 27.56 | 29.33 | 25.18 | 29.03 | 31.29 |
| Annual average | 9.23 | 7.86 | 8.43 | 7.58 | 8.45 | 8.45 | 8.95 | 7.77 | 8.87 | 9.50 |
|
| 1 year | 4.64 | 0.67 | 3.99 | -0.87 | 4.02 | 3.05 | 4.46 | 1.09 | 4.37 | 4.99 |
|
Performance assumes reinvestment of distributions and does not account for taxes. Returns at public offering price (POP) for class A and M shares reflect a sales charge of 3.75% and 3.25%, respectively. Class B share returns reflect the applicable contingent deferred sales charge (CDSC), which is 5% in the first year, declining to 1% in the sixth year, and is eliminated thereafter. Class C shares reflect a 1% CDSC the first year that is eliminated thereafter. Class R and Y shares have no initial sales charge or CDSC. Performance for class B, C, M, R, and Y shares before their inception is derived from the historical performance of class A shares, adjusted for the applicable sales charge (or CDSC) and, except for class Y shares, the higher operating expenses for such shares.
A 1% short-term trading fee may be applied to shares exchanged or sold within 90 days of purchase.
Change in the value of a $10,000 investment ($9,625 after sales charge)
Cumulative total return from 8/31/96 to 8/31/06
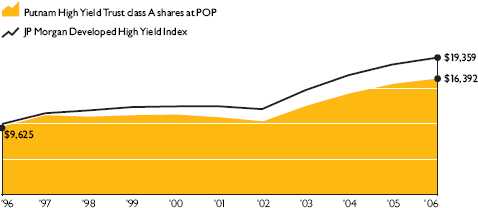
Past performance does not indicate future results. At the end of the same time period, a $10,000 investment in the fund’s class B and class C shares would have been valued at $15,841 and $15,771, respectively, and no contingent deferred sales charges would apply. A $10,000 investment in the fund’s class M shares ($9,675 after sales charge) would have been valued at $16,070 at public offering price. A $10,000 investment in the fund’s class R and class Y shares would have been valued at $16,584 and $17,324, respectively. See first page of performance section for performance calculation method.
9
| Comparative index returns For periods ended 8/31/06 | | |
|
| |
| | JP Morgan | Lipper High |
| | Developed | Current Yield Funds |
| | High Yield Index | category average† |
|
| Annual average | | |
| (life of fund) | —* | 8.82% |
|
| 10 years | 93.59% | 69.62 |
| Annual average | 6.83 | 5.29 |
|
| 5 years | 54.97 | 43.69 |
| Annual average | 9.16 | 7.46 |
|
| 3 years | 31.19 | 27.52 |
| Annual average | 9.47 | 8.42 |
|
| 1 year | 5.37 | 4.67 |
|
Index and Lipper results should be compared to fund performance at net asset value.
* This index began operations on 12/31/94.
† Over the 1-, 3-, 5-, and 10-year periods ended 8/31/06, there were 458, 392, 316, and 119 funds, respectively, in this Lipper category.
| Fund price and distribution information For the 12-month period ended 8/31/06 | | | |
|
| Distributions | Class A | Class B | Class C | Class M | Class R | Class Y |
|
| Number | 12 | | 12 | 12 | 12 | | 12 | 12 |
|
| Income | $0.588 | $0.527 | $0.529 | $0.564 | $0.566 | $0.612 |
|
| Capital gains | — | | — | — | — | | — | — |
|
| Total | $0.588 | $0.527 | $0.529 | $0.564 | $0.566 | $0.612 |
|
| Share value: | NAV | POP | NAV | NAV | NAV | POP | NAV | NAV |
|
| 8/31/05 | $8.10 | $8.42 | $8.06 | $8.06 | $8.10 | $8.37 | $8.08 | $8.06 |
|
| 8/31/06 | 7.87 | 8.18 | 7.84 | 7.84 | 7.88 | 8.14 | 7.85 | 7.83 |
|
| Current yield (end of period) | | | | | | | | |
|
| Current dividend rate1 | 7.47% | 7.19% | 6.73% | 6.89% | 7.16% | 6.93% | 7.18% | 7.82% |
|
| Current 30-day SEC yield2 | 7.41 | 7.12 | 6.65 | 6.65 | 7.16 | 6.93 | 7.16 | 7.66 |
|
1 Most recent distribution, excluding capital gains, annualized and divided by NAV or POP at end of period.
2 Based only on investment income, calculated using SEC guidelines.
| Fund performance for most recent calendar quarter Total return for periods ended 9/30/06 | | |
|
| |
| | Class A | | Class B | | Class C | | Class M | | Class R | Class Y |
| (inception dates) | (2/14/78) | | (3/1/93) | | (3/19/02) | | (7/3/95) | | (1/21/03) | (12/31/98) |
| | NAV | POP | NAV | CDSC | NAV | CDSC | NAV | POP | NAV | NAV |
|
| Annual average | | | | | | | | | | |
| (life of fund) | 9.10% | 8.95% | 8.17% | 8.17% | 8.27% | 8.27% | 8.71% | 8.59% | 8.82% | 9.16% |
|
| 10 years | 67.13 | 60.91 | 55.46 | 55.46 | 54.54 | 54.54 | 62.92 | 57.58 | 62.60 | 69.88 |
| Annual average | 5.27 | 4.87 | 4.51 | 4.51 | 4.45 | 4.45 | 5.00 | 4.65 | 4.98 | 5.44 |
|
| 5 years | 60.81 | 54.88 | 54.95 | 52.95 | 54.56 | 54.56 | 58.56 | 53.50 | 58.43 | 62.32 |
| Annual average | 9.97 | 9.14 | 9.15 | 8.87 | 9.10 | 9.10 | 9.66 | 8.95 | 9.64 | 10.17 |
|
| 3 years | 28.79 | 23.95 | 26.17 | 23.17 | 25.92 | 25.92 | 27.98 | 23.79 | 27.38 | 29.60 |
| Annual average | 8.80 | 7.42 | 8.06 | 7.19 | 7.99 | 7.99 | 8.57 | 7.37 | 8.40 | 9.03 |
|
| 1 year | 6.64 | 2.66 | 5.99 | 1.03 | 5.75 | 4.76 | 6.31 | 2.85 | 6.24 | 6.87 |
|
10
Your fund’s expenses
As a mutual fund investor, you pay ongoing expenses, such as management fees, distribution fees (12b-1 fees), and other expenses. In the most recent six-month period, your fund limited these expenses; had it not done so, expenses would have been higher. Using the information below, you can estimate how these expenses affect your investment and compare them with the expenses of other funds. You may also pay one-time transaction expenses, including sales charges (loads) and redemption fees, which are not shown in this section and would have resulted in higher total expenses. For more information, see your fund’s prospectus or talk to your financial advisor.
Review your fund’s expenses
The table below shows the expenses you would have paid on a $1,000 investment in Putnam High Yield Trust from March 1, 2006, to August 31, 2006. It also shows how much a $1,000 investment would be worth at the close of the period, assuming actual returns and expenses.
| | Class A | Class B | Class C | Class M | Class R | Class Y |
|
| Expenses paid per $1,000* | $ 5.20 | $ 9.01 | $ 9.01 | $ 6.47 | $ | 6.47 | $ 3.93 |
|
| Ending value (after expenses) | $1,022.30 | $1,019.70 | $1,018.60 | $1,020.80 | $1,021.00 | $1,024.10 |
|
* Expenses for each share class are calculated using the fund’s annualized expense ratio for each class, which represents the ongoing expenses as a percentage of net assets for the six months ended 8/31/06. The expense ratio may differ for each share class (see the last table in this section). Expenses are calculated by multiplying the expense ratio by the average account value for the period; then multiplying the result by the number of days in the period; and then dividing that result by the number of days in the year. Does not reflect the effect of a non-recurring reimbursement by Putnam. If this amount had been reflected in the table above, expenses for each share class would have been lower.
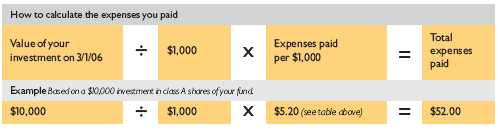
Estimate the expenses you paid
To estimate the ongoing expenses you paid for the six months ended August 31, 2006, use the calculation method below. To find the value of your investment on March 1, 2006, go to www.putnam.com and log on to your account. Click on the “Transaction History” tab in your Daily Statement and enter 03/01/2006 in both the “from” and “to” fields. Alternatively, call Putnam at 1-800-225-1581.
Compare expenses using the SEC’s method
The Securities and Exchange Commission (SEC) has established guidelines to help investors assess fund expenses. Per these guidelines, the table below shows your fund’s expenses based on a $1,000 investment, assuming a hypothetical 5% annualized return. You can use this information to compare the ongoing expenses (but not transaction expenses or total costs) of investing in the fund with those of other funds. All mutual fund shareholder reports will provide this information to help you make this comparison. Please note that you cannot use this information to estimate your actual ending account balance and expenses paid during the period.
| | Class A | Class B | Class C | Class M | Class R | Class Y |
|
| Expenses paid per $1,000* | $ 5.19 | $ 9.00 | $ 9.00 | $ 6.46 | $ | 6.46 | $ 3.92 |
|
| Ending value (after expenses) | $1,020.06 | $1,016.28 | $1,016.28 | $1,018.80 | $1,018.80 | $1,021.32 |
|
* Expenses for each share class are calculated using the fund’s annualized expense ratio for each class, which represents the ongoing expenses as a percentage of net assets for the six months ended 8/31/06. The expense ratio may differ for each share class (see the last table in this section). Expenses are calculated by multiplying the expense ratio by the average account value for the period; then multiplying the result by the number of days in the period; and then dividing that result by the number of days in the year. Does not reflect the effect of a non-recurring reimbursement by Putnam. If this amount had been reflected in the table above, expenses for each share class would have been lower.
11
Compare expenses using industry averages
You can also compare your fund’s expenses with the average of its peer group, as defined by Lipper, an independent fund-rating agency that ranks funds relative to others that Lipper considers to have similar investment styles or objectives. The expense ratio for each share class shown below indicates how much of your fund’s net assets have been used to pay ongoing expenses during the period.
| | Class A | Class B | Class C | Class M | Class R | Class Y |
|
| Your fund’s annualized expense ratio* | 1.02% | 1.77% | 1.77% | 1.27% | 1.27% | 0.77% |
|
| Average annualized expense ratio for Lipper peer group† | 1.12% | 1.87% | 1.87% | 1.37% | 1.37% | 0.87% |
|
* For the fund’s most recent fiscal half year; may differ from expense ratios based on one-year data in the financial highlights. Does not reflect the effect of a non-recurring reimbursement by Putnam. If this amount had been reflected in the table above, the expense ratio for each share class would have been lower.
† Simple average of the expenses of all front-end load funds in the fund’s Lipper peer group, calculated in accordance with Lipper’s standard method for comparing fund expenses (excluding 12b-1 fees and without giving effect to any expense offset and brokerage service arrangements that may reduce fund expenses). This average reflects each fund’s expenses for its most recent fiscal year available to Lipper as of 6/30/06. To facilitate comparison, Putnam has adjusted this average to reflect the 12b-1 fees carried by each class of shares other than class Y shares, which do not incur 12b-1 fees. The peer group may include funds that are significantly smaller or larger than the fund, which may limit the comparability of the fund’s expenses to the simple average, which typically is higher than the asset-weighted average.
12
Your fund’s portfolio turnover
and Overall Morningstar® Risk
Putnam funds are actively managed by teams of experts who buy and sell securities based on intensive analysis of companies, industries, economies, and markets. Portfolio turnover is a measure of how often a fund’s managers buy and sell securities for your fund. A portfolio turnover of 100%, for example, means that the managers sold and replaced securities valued at 100% of a fund’s assets within a one-year period. Funds with high turnover may be more likely to generate capital gains and dividends that must be distributed to shareholders as taxable income. High turnover may also cause a fund to pay more brokerage commissions and other transaction costs, which may detract from performance.
Funds that invest in bonds or other fixed-income instruments may have higher turnover than funds that invest only in stocks. Short-term bond funds tend to have higher turnover than longer-term bond funds, because shorter-term bonds will mature or be sold more frequently than longer-term bonds. You can use the table below to compare your fund’s turnover with the average turnover for funds in its Lipper category.
Turnover comparisons
Percentage of holdings that change every year
| | 2006 | 2005 | 2004 | 2003 | 2002 |
|
| Putnam High Yield Trust | 46% | 41% | 62% | 75% | 74%* |
|
| Lipper High Current Yield Funds category average | 88% | 73% | 95% | 98% | 99% |
|
Turnover data for the fund is calculated based on the fund’s fiscal-year period, which ends on August 31. Turnover data for the fund’s Lipper category is calculated based on the average of the turnover of each fund in the category for its fiscal year ended during the indicated year. Fiscal years vary across funds in the Lipper category, which may limit the comparability of the fund’s portfolio turnover rate to the Lipper average. Comparative data for 2006 is based on information available as of 8/31/06.
* Portfolio turnover excludes the impact of assets received from the acquisition of Putnam High Yield Trust II.
Your fund’s Overall Morningstar® Risk
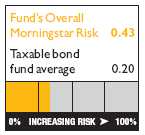
This risk comparison is designed to help you understand how your fund compares with other funds. The comparison utilizes a risk measure developed by Morningstar, an independent fund-rating agency. This risk measure is referred to as the fund’s Overall Morningstar Risk.
Your fund’s Overall Morningstar Risk is shown alongside that of the average fund in its broad asset class, as determined by Morningstar. The risk bar broadens the comparison by translating the fund’s Overall Morningstar Risk into a percentile, which is based on the fund’s ranking among all funds rated by Morningstar as of September 30, 2006. A higher Overall Morningstar Risk generally indicates that a fund’s monthly returns have varied more widely.
Morningstar determines a fund’s Overall Morningstar Risk by assessing variations in the fund’s monthly returns — with an emphasis on downside variations — over 3-, 5-, and 10-year periods, if available. Those measures are weighted and averaged to produce the fund’s Overall Morningstar Risk. The information shown is provided for the fund’s class A shares only; information for other classes may vary. Overall Morningstar Risk is based on historical data and does not indicate future results. Morningstar does not purport to measure the risk associated with a current investment in a fund, either on an absolute basis or on a relative basis. Low Overall Morningstar Risk does not mean that you cannot lose money on an investment in a fund. Copyright 2006 Morningstar, Inc. All Rights Reserved. The information contained herein (1) is proprietary to Morningstar and/or its content providers; (2) may not be copied or distributed; and (3) is not warran ted to be accurate, complete, or timely. Neither Morningstar nor its content providers are responsible for any damages or losses arising from any use of this information.
13
Your fund’s management
Your fund is managed by the members of the Putnam Core Fixed-Income High-Yield Team. Paul Scanlon is the Portfolio Leader and Norman Boucher and Robert Salvin are Portfolio Members of your fund. The Portfolio Leader and Portfolio Members coordinate the team’s management of the fund.
For a complete listing of the members of the Putnam Core Fixed-Income High-Yield Team, including those who are not Portfolio Leaders or Portfolio Members of your fund, visit Putnam’s Individual Investor Web site at www.putnam.com.
Investment team fund ownership
The table below shows how much the fund’s current Portfolio Leader and Portfolio Members have invested in the fund and in all Putnam mutual funds (in dollar ranges). Information shown is as of August 31, 2006, and August 31, 2005.

Trustee and Putnam employee fund ownership
As of August 31, 2006, all of the 11 Trustees then on the Board of the Putnam funds owned fund shares. The table below shows the approximate value of investments in the fund and all Putnam funds as of that date by the Trustees and Putnam employees. These amounts include investments by the Trustees’ and employees’ immediate family members and investments through retirement and deferred compensation plans.
| | | Total assets in |
|
| | Assets in the fund | all Putnam funds |
| Trustees | $ 554,000 | $ 93,000,000 |
|
| Putnam employees | $4,149,000 | $413,000,000 |
|
Fund manager compensation
The total 2005 fund manager compensation that is attributable to your fund is approximately $1,700,000. This amount includes a portion of 2005 compensation paid by Putnam Management to the fund managers listed in this section for their portfolio management responsibilities, calculated based on the fund assets they manage taken as a percentage of the total assets they manage. The compensation amount also includes a portion of the 2005 compensation paid to the Group Chief Investment Officer of the fund’s broader investment category for his oversight responsibilities, calculated based on the fund assets he oversees taken as a percentage of the total assets he oversees. This amount does not include compensation of other personnel involved in research, trading, administration, systems, compliance, or fund operations; nor does it include non-compensation costs. These percentages are determined as of the fund’s fiscal period-en d. For personnel who joined Putnam Management during or after 2005, the calculation reflects annualized 2005 compensation or an estimate of 2006 compensation, as applicable.
14
Other Putnam funds managed by the Portfolio Leader and Portfolio Members
Paul Scanlon is also a Portfolio Leader of Putnam Floating Rate Income Fund, Putnam High Yield Advantage Fund, and Putnam Managed High Yield Trust. He is also a Portfolio Member of Putnam Diversified Income Trust, Putnam Master Intermediate Income Trust, and Putnam Premier Income Trust.
Norman Boucher is also a Portfolio Member of Putnam High Yield Advantage Fund and Putnam Managed High Yield Trust.
Robert Salvin is also a Portfolio Leader of Putnam High Income Securities Fund and a Portfolio Member of Putnam Convertible Income-Growth Trust, Putnam High Yield Advantage Fund, and Putnam Managed High Yield Trust.
Paul Scanlon, Norman Boucher, and Robert Salvin may also manage other accounts and variable trust funds advised by Putnam Management or an affiliate.
Changes in your fund’s Portfolio Leader and Portfolio Members
During the year ended August 31, 2006, Portfolio Member Geoffrey Kelley took up other fund management responsibilities within Putnam.
Putnam fund ownership by Putnam’s Executive Board
The table below shows how much the members of Putnam’s Executive Board have invested in all Putnam mutual funds (in dollar ranges). Information shown is as of August 31, 2006, and August 31, 2005.
| | | | $1 – | $10,001 – | $50,001 – | $100,001 – | $500,001 – | $1,000,001 |
| | Year | $0 | $10,000 | $50,000 | $100,000 | $500,000 | $1,000,000 | and over |
|
| Philippe Bibi | 2006 | | | | | | | • |
| Chief Technology Officer | 2005 | | | | | | | • |
|
| Joshua Brooks | 2006 | | | | | | | • |
| Deputy Head of Investments | 2005 | | | | | | | • |
|
| William Connolly | 2006 | | | | | | | • |
| Head of Retail Management | 2005 | | | | | | | • |
|
| Kevin Cronin | 2006 | | | | | | | • |
| Head of Investments | 2005 | | | | | | | • |
|
| Charles Haldeman, Jr. | 2006 | | | | | | | • |
| President and CEO | 2005 | | | | | | | • |
|
| Amrit Kanwal | 2006 | | | | | | | • |
| Chief Financial Officer | 2005 | | | | | | • | |
|
| Steven Krichmar | 2006 | | | | | | • | |
| Chief of Operations | 2005 | | | | | | | • |
|
| Francis McNamara, III | 2006 | | | | | | | • |
| General Counsel | 2005 | | | | | | | • |
|
| Jeffrey Peters | N/A | | | | | | | |
| Head of International Business | N/A | | | | | | | |
|
| Richard Robie, III | 2006 | | | | | | • | |
| Chief Administrative Officer | 2005 | | | | | | • | |
|
| Edward Shadek | 2006 | | | | | | | • |
| Deputy Head of Investments | 2005 | | | | | | | • |
|
| Sandra Whiston | 2006 | | | | | | • | |
| Head of Institutional Management | 2005 | | | | | | • | |
|
N/A indicates the individual became a member of Putnam’s Executive Board after the reporting date.
15
Terms and definitions
Important terms
Total return shows how the value of the fund’s shares changed over time, assuming you held the shares through the entire period and reinvested all distributions in the fund.
Net asset value (NAV) is the price, or value, of one share of a mutual fund, without a sales charge. NAVs fluctuate with market conditions. NAV is calculated by dividing the net assets of each class of shares by the number of outstanding shares in the class.
Public offering price (POP) is the price of a mutual fund share plus the maximum sales charge levied at the time of purchase. POP performance figures shown here assume the 3.75% maximum sales charge for class A shares and 3.25% for class M shares.
Contingent deferred sales charge (CDSC) is generally a charge applied at the time of the redemption of class B or C shares and assumes redemption at the end of the period. Your fund’s class B CDSC declines from a 5% maximum during the first year to 1% during the sixth year. After the sixth year, the CDSC no longer applies. The CDSC for class C shares is 1% for one year after purchase.
Share classes
Class A shares are generally subject to an initial sales charge and no CDSC (except on certain redemptions of shares bought without an initial sales charge).
Class B shares are not subject to an initial sales charge. They may be subject to a CDSC.
Class C shares are not subject to an initial sales charge and are subject to a CDSC only if the shares are redeemed during the first year.
Class M shares have a lower initial sales charge and a higher 12b-1 fee than class A shares and no CDSC (except on certain redemptions of shares bought without an initial sales charge).
Class R shares are not subject to an initial sales charge or CDSC and are available only to certain defined contribution plans.
Class Y shares are not subject to an initial sales charge or CDSC, and carry no 12b-1 fee. They are only available to eligible purchasers, including eligible defined contribution plans or corporate IRAs.
Comparative indexes
JP Morgan Developed High Yield Index is an unmanaged index of high-yield fixed-income securities issued in developed countries.
Lehman Aggregate Bond Index is an unmanaged index of U.S. investment-grade fixed-income securities.
Lehman Global Aggregate Bond Index is an unmanaged index of global investment-grade fixed-income securities.
Lehman Government/Credit Bond Index is an unmanaged index of U.S. Treasuries, agency securities, and investment-grade corporate bonds.
Lehman Municipal Bond Index is an unmanaged index of long-term fixed-rate investment-grade tax-exempt bonds.
Russell 2000 Value Index is an unmanaged index of those companies in the small-cap Russell 2000 Index chosen for their value orientation.
Russell 2500 Growth Index is an unmanaged index of those companies in the small-mid-cap Russell 2500 Index chosen for their growth orientation.
S&P 500 Index is an unmanaged index of common stock performance.
Indexes assume reinvestment of all distributions and do not account for fees. Securities and performance of a fund and an index will differ. You cannot invest directly in an index.
Lipper is a third-party industry-ranking entity that ranks mutual funds. Its rankings do not reflect sales charges. Lipper rankings are based on total return at net asset value relative to other funds that have similar current investment styles or objectives as determined by Lipper. Lipper may change a fund’s category assignment at its discretion. Lipper category averages reflect performance trends for funds within a category.
16
Trustee approval of management contract
General conclusions
The Board of Trustees of the Putnam funds oversees the management of each fund and, as required by law, determines annually whether to approve the continuance of your fund’s management contract with Putnam Management and the sub-management contract between Putnam Management’s affiliate, Putnam Investments Limited (“PIL”), and Putnam Management. In this regard, the Board of Trustees, with the assistance of its Contract Committee consisting solely of Trustees who are not “interested persons” (as such term is defined in the Investment Company Act of 1940, as amended) of the Putnam funds (the “Independent Trustees”), requests and evaluates all information it deems reasonably necessary under the circumstances. Over the course of several months ending in June 2006, the Contract Committee met four times to consider the information provided by Putnam Management and other information developed with the assistance of the Board’s in dependent counsel and independent staff. The Contract Committee reviewed and discussed key aspects of this information with all of the Independent Trustees. Upon completion of this review, the Contract Committee recommended, and the Independent Trustees approved, the continuance of your fund’s management contract and sub-management contract, effective July 1, 2006. (Because PIL is an affiliate of Putnam Management and Putnam Management remains fully responsible for all services provided by PIL, the Trustees have not evaluated PIL as a separate entity, and all subsequent references to Putnam Management below include reference to PIL as necessary or appropriate in the context.)
This approval was based on the following conclusions:
• That the fee schedule in effect for your fund represents reasonable compensation in light of the nature and quality of the services being provided to the fund, the fees paid by competitive funds and the costs incurred by Putnam Management in providing such services, and • That such fee schedule represents an appropriate sharing between fund shareholders and Putnam Management of such economies of scale as may exist in the management of the fund at current asset levels.
These conclusions were based on a comprehensive consideration of all information provided to the Trustees and were not the result of any single factor. Some of the factors that figured particularly in the Trustees’ deliberations and how the Trustees considered these factors are described below, although individual Trustees may have evaluated the information presented differently, giving different weights to various factors. It is also important to recognize that the fee arrangements for your fund and the other Putnam funds are the result of many years of review and discussion between the Independent Trustees and Putnam Management, that certain aspects of such arrangements may receive greater scrutiny in some years than others, and that the Trustees’ conclusions may be based, in part, on their consideration of these same arrangements in prior years.
Management fee schedules and categories; total expenses
The Trustees reviewed the management fee schedules in effect for all Putnam funds, including fee levels and breakpoints, and the assignment of funds to particular fee categories. In reviewing fees and expenses, the Trustees generally focused their attention on material changes in circumstances — for example, changes in a fund’s size or investment style, changes in Putnam Management’s operating costs, or changes in competitive practices in the mutual fund industry — that suggest that consideration of fee changes might be warranted. The Trustees concluded that the circumstances did not warrant changes to the management fee structure of your fund, which had been carefully developed over the years, re-examined on many occasions and adjusted where appropriate. The Trustees focused on two areas of particular interest, as discussed further below:
Competitiveness. The Trustees reviewed comparative fee and expense information for competitive funds, which indicated that, in a custom peer group of competitive funds selected by Lipper Inc., your fund ranked in the 48th percentile in management fees and in the 31st percentile in total expenses (less any applicable 12b-1 fees) as of December 31, 2005 (the first percentile being the least expensive funds and the 100th percentile being the most expensive funds). (Because the fund’s custom peer group is smaller than the fund’s broad Lipper Inc. peer group, this expense information may differ from the Lipper peer expense information found elsewhere in this report.) The Trustees noted that expense ratios for a number of Putnam funds, which show the percentage of fund assets used to pay for management and administrative services, distribution (12b-1) fees and other expenses, had been increa sing recently as a result of declining net assets and the natural operation of fee breakpoints.
The Trustees noted that the expense ratio increases described above were currently being controlled by expense limitations implemented in January 2004 and which Putnam Management, in consultation with the Contract Committee, has committed to
17
maintain at least through 2007. These expense limitations give effect to a commitment by Putnam Management that the expense ratio of each open-end fund would be no higher than the average expense ratio of the competitive funds included in the fund’s relevant Lipper universe (exclusive of any applicable 12b-1 charges in each case). The Trustees observed that this commitment to limit fund expenses has served shareholders well since its inception. In order to ensure that the expenses of the Putnam funds continue to meet evolving competitive standards, the Trustees requested, and Putnam Management agreed, to implement an additional expense limitation for certain funds for the twelve months beginning January 1, 2007 equal to the average expense ratio (exclusive of 12b-1 charges) of a custom peer group of competitive funds selected by Lipper based on the size of the fund. This additional expense limitation will be applied to those open-end funds that had above-averag e expense ratios (exclusive of 12b-1 charges) based on the Lipper custom peer group data for the period ended December 31, 2005. This additional expense limitation will not be applied to your fund.
Economies of scale. Your fund currently has the benefit of breakpoints in its management fee that provide shareholders with significant economies of scale, which means that the effective management fee rate of a fund (as a percentage of fund assets) declines as a fund grows in size and crosses specified asset thresholds. Conversely, as a fund shrinks in size — as has been the case for many Putnam funds in recent years — these breakpoints result in increasing fee levels. In recent years, the Trustees have examined the operation of the existing breakpoint structure during periods of both growth and decline in asset levels. The Trustees concluded that the fee schedules in effect for the funds represented an appropriate sharing of economies of scale at current asset levels. In reaching this conclusion, the Trustees considered the Contract Committee’s stated intent to continue to work with Putnam Management to plan for an eventual resumption in the growth of assets, including a study of potential economies that might be produced under various growth assumptions.
In connection with their review of the management fees and total expenses of the Putnam funds, the Trustees also reviewed the costs of the services to be provided and profits to be realized by Putnam Management and its affiliates from the relationship with the funds. This information included trends in revenues, expenses and profitability of Putnam Management and its affiliates relating to the investment management and distribution services provided to the funds. In this regard, the Trustees also reviewed an analysis of Putnam Management’s revenues, expenses and profitability with respect to the funds’ management contracts, allocated on a fund-by-fund basis. Because many of the costs incurred by Putnam Management in managing the funds are not readily identifiable to particular funds, the Trustees observed that the methodology for allocating costs is an important factor in evaluating Putnam Management’s costs and profitability, both as to the Putnam fu nds in the aggregate and as to individual funds. The Trustees reviewed Putnam Management’s cost allocation methodology with the assistance of independent consultants and concluded that this methodology was reasonable and well-considered.
Investment performance
The quality of the investment process provided by Putnam Management represented a major factor in the Trustees’ evaluation of the quality of services provided by Putnam Management under your fund’s management contract. The Trustees were assisted in their review of the Putnam funds’ investment process and performance by the work of the Investment Process Committee of the Trustees and the Investment Oversight Committee of the Trustees, which meet on a regular monthly basis with the funds’ portfolio teams throughout the year. The Trustees concluded that Putnam Management generally provides a high-quality investment process — as measured by the experience and skills of the individuals assigned to the management of fund portfolios, the resources made available to such personnel, and in general the ability of Putnam Management to attract and retain high-quality personnel —but also recognize that this does not guarantee favorable investment re sults for every fund in every time period. The Trustees considered the investment performance of each fund over multiple time periods and considered information comparing each fund’s performance with various benchmarks and with the performance of competitive funds.
The Trustees noted the satisfactory investment performance of many Putnam funds. They also noted the disappointing investment performance of certain funds in recent years and discussed with senior management of Putnam Management the factors contributing to such underperformance and actions being taken to improve performance. The Trustees recognized that, in recent years, Putnam Management has made significant changes in its investment personnel and processes and in the fund product line to address areas of underperformance. In particular, they noted the important contributions of Putnam Management’s leadership in attracting, retaining and supporting high-quality investment professionals and in systematically implementing an investment process that seeks to merge the best features of fundamental and quantitative analysis. The Trustees indicated their intention to
18
continue to monitor performance trends to assess the effectiveness of these changes and to evaluate whether additional changes to address areas of underperformance are warranted.
In the case of your fund, the Trustees considered that your fund’s class A share cumulative total return performance at net asset value was in the following percentiles of its Lipper Inc. peer group (Lipper High Current Yield Funds) for the one-, three- and five-year periods ended March 31, 2006 (the first percentile being the best performing funds and the 100th percentile being the worst performing funds):
| One-year period | Three-year period | Five-year period |
|
| 22nd | 24th | 28th |
(Because of the passage of time, these performance results may differ from the performance results for more recent periods shown elsewhere in this report. Over the one-, three- and five-year periods ended March 31, 2006, there were 435, 382, and 310 funds, respectively, in your fund’s Lipper peer group.* Past performance is no guarantee of future performance.)
As a general matter, the Trustees concluded that cooperative efforts between the Trustees and Putnam Management represent the most effective way to address investment performance problems. The Trustees noted that investors in the Putnam funds have, in effect, placed their trust in the Putnam organization, under the oversight of the funds’ Trustees, to make appropriate decisions regarding the management of the funds. Based on the responsiveness of Putnam Management in the recent past to Trustee concerns about investment performance, the Trustees concluded that it is preferable to seek change within Putnam Management to address performance shortcomings. In the Trustees’ view, the alternative of terminating a management contract and engaging a new investment adviser for an underperforming fund would entail significant disruptions and would not provide any greater assurance of improved investment performance.
Brokerage and soft-dollar allocations; other benefits
The Trustees considered various potential benefits that Putnam Management may receive in connection with the services it provides under the management contract with your fund. These include benefits related to brokerage and soft-dollar allocations, whereby a portion of the commissions paid by a fund for brokerage may be used to acquire research services that may be useful to Putnam Management in managing the assets of the fund and of other clients. The Trustees indicated their continued intent to monitor the potential benefits associated with the allocation of fund brokerage to ensure that the principle of seeking “best price and execution” remains paramount in the portfolio trading process.
The Trustees’ annual review of your fund’s management contract also included the review of its distributor’s contract and distribution plan with Putnam Retail Management Limited Partnership and the custodian agreement and investor servicing agreement with Putnam Fiduciary Trust Company, all of which provide benefits to affiliates of Putnam Management.
Comparison of retail and institutional fee schedules
The information examined by the Trustees as part of their annual contract review has included for many years information regarding fees charged by Putnam Management and its affiliates to institutional clients such as defined benefit pension plans, college endowments, etc. This information included comparison of such fees with fees charged to the funds, as well as a detailed assessment of the differences in the services provided to these two types of clients. The Trustees observed, in this regard, that the differences in fee rates between institutional clients and the mutual funds are by no means uniform when examined by individual asset sectors, suggesting that differences in the pricing of investment management services to these types of clients reflect to a substantial degree historical competitive forces operating in separate market places. The Trustees considered the fact that fee rates across all asset sectors are higher on a verage for mutual funds than for institutional clients, as well as the differences between the services that Putnam Management provides to the Putnam funds and those that it provides to institutional clients of the firm, but did not rely on such comparisons to any significant extent in concluding that the management fees paid by your fund are reasonable.
* The percentile rankings for your fund’s class A share annualized total return performance in the Lipper High Current Yield Funds category for the one-, five- and ten-year periods ended September 30, 2006, were 50%, 30%, and 49%, respectively. Over the one-, five- and ten-year periods ended September 30, 2006, the fund ranked 228th out of 458, 95th out of 321, and 59th out of 120 funds, respectively. Note that this more recent information was not available when the Trustees approved the continuance of your fund’s management contract.
19
Other information for shareholders
Putnam’s policy on confidentiality
In order to conduct business with our shareholders, we must obtain certain personal information such as account holders’ addresses, telephone numbers, Social Security numbers, and the names of their financial advisors. We use this information to assign an account number and to help us maintain accurate records of transactions and account balances. It is our policy to protect the confidentiality of your information, whether or not you currently own shares of our funds, and in particular, not to sell information about you or your accounts to outside marketing firms. We have safeguards in place designed to prevent unauthorized access to our computer systems and procedures to protect personal information from unauthorized use. Under certain circumstances, we share this information with outside vendors who provide services to us, such as mailing and proxy solicitation. In those cases, the service providers enter into confidentiali ty agreements with us, and we provide only the information necessary to process transactions and perform other services related to your account. We may also share this information with our Putnam affiliates to service your account or provide you with information about other Putnam products or services. It is also our policy to share account information with your financial advisor, if you’ve listed one on your Putnam account. If you would like clarification about our confiden-tiality policies or have any questions or concerns, please don’t hesitate to contact us at 1-800-225-1581, Monday through Friday, 8:30 a.m. to 7:00 p.m., or Saturdays from 9:00 a.m. to 5:00 p.m. Eastern Time.
Proxy voting
Putnam is committed to managing our mutual funds in the best interests of our shareholders. The Putnam funds’ proxy voting guidelines and procedures, as well as information regarding how your fund voted proxies relating to portfolio securities during the 12-month period ended June 30, 2006, are available on the Putnam Individual Investor Web site, www.putnam.com/individual, and on the SEC’s Web site, www.sec.gov. If you have questions about finding forms on the SEC’s Web site, you may call the SEC at 1-800-SEC-0330. You may also obtain the Putnam funds’ proxy voting guidelines and procedures at no charge by calling Putnam’s Shareholder Services at 1-800-225-1581.
Fund portfolio holdings
The fund will file a complete schedule of its portfolio holdings with the SEC for the first and third quarters of each fiscal year on Form N-Q. Shareholders may obtain the fund’s Forms N-Q on the SEC’s Web site at www.sec.gov. In addition, the fund’s Forms N-Q may be reviewed and copied at the SEC’s Public Reference Room in Washington, D.C. You may call the SEC at 1-800-SEC-0330 for information about the SEC’s Web site or the operation of the Public Reference Room.
Federal tax information (Unaudited)
The fund designated 2.23% of ordinary income distributions as qualifying for the dividends received deduction for corporations.
For its tax year ended August 31, 2006, the fund hereby designates 2.26% or the maximum amount allowable, of its taxable ordinary income distributions as qualified dividends taxed at the individual net capital gain rates.
The Form 1099 you receive in January 2007 will show the tax status of all distributions paid to your account in calendar 2006.
20
Financial statements
These sections of the report, as well as the accompanying Notes, preceded by the Report of Independent Registered Public Accounting Firm, constitute the fund’s financial statements.
The fund’s portfolio lists all the fund’s investments and their values as of the last day of the reporting period. Holdings are organized by asset type and industry sector, country, or state to show areas of concentration and diversification.
Statement of assets and liabilities shows how the fund’s net assets and share price are determined. All investment and nonin-vestment assets are added together. Any unpaid expenses and other liabilities are subtracted from this total. The result is divided by the number of shares to determine the net asset value per share, which is calculated separately for each class of shares. (For funds with preferred shares, the amount subtracted from total assets includes the liquidation preference of preferred shares.)
Statement of operations shows the fund’s net investment gain or loss. This is done by first adding up all the fund’s earnings — from dividends and interest income — and subtracting its operating expenses to determine net investment income (or loss). Then, any net gain or loss the fund realized on the sales of its holdings — as well as any unrealized gains or losses over the period — is added to or subtracted from the net investment result to determine the fund’s net gain or loss for the fiscal year.
Statement of changes in net assets shows how the fund’s net assets were affected by the fund’s net investment gain or loss, by distributions to shareholders, and by changes in the number of the fund’s shares. It lists distributions and their sources (net investment income or realized capital gains) over the current reporting period and the most recent fiscal year-end. The distributions listed here may not match the sources listed in the Statement of operations because the distributions are determined on a tax basis and may be paid in a different period from the one in which they were earned.
Financial highlights provide an overview of the fund’s investment results, per-share distributions, expense ratios, net investment income ratios, and portfolio turnover in one summary table, reflecting the five most recent reporting periods. In a semiannual report, the highlight table also includes the current reporting period.
21
Report of Independent Registered Public Accounting Firm
The Board of Trustees and Shareholders
Putnam High Yield Trust:
We have audited the accompanying statement of assets and liabilities of Putnam High Yield Trust, including the fund’s portfolio, as of August 31, 2006, and the related statement of operations for the year then ended, the statements of changes in net assets for each of the two years in the period then ended and the financial highlights for each of the five years or periods in the period then ended. These financial statements and financial highlights are the responsibility of the fund’s management. Our responsibility is to express an opinion on these financial statements and financial highlights based on our audits.
We conducted our audits in accordance with the standards of the Public Company Accounting Oversight Board (United States). Those standards require that we plan and perform our audit to obtain reasonable assurance about whether the financial statements and financial highlights are free of material misstatement. An audit includes examining, on a test basis, evidence supporting the amounts and disclosures in the financial statements. Our procedures included confirmation of securities owned as of August 31, 2006 by correspondence with the custodian and brokers or by other appropriate auditing procedures. An audit also includes assessing the accounting principles used and significant estimates made by management, as well as evaluating the overall financial statement presentation. We believe that our audits provide a reasonable basis for our opinion.
In our opinion, the financial statements and financial highlights referred to above present fairly, in all material respects, the financial position of Putnam High Yield Trust as of August 31, 2006, the results of its operations for the year then ended, the changes in its net assets for each of the two years in the period then ended, and the financial highlights for each of the five years or periods in the period then ended, in conformity with U.S. generally accepted accounting principles.

Boston, Massachusetts
October 10, 2006
22
| The fund’s portfolio 8/31/06 | | | |
|
| |
| |
| CORPORATE BONDS AND NOTES (86.6%)* | | |
|
| | | Principal amount | | Value |
|
| Advertising and Marketing Services (0.3%) | | | |
| Lamar Media Corp. | | | | |
| company guaranty 7 1/4s, 2013 | $ | 3,950,000 | $ | 3,920,375 |
| Lamar Media Corp. 144A sr. sub. | | | | |
| notes 6 5/8s, 2015 | | 2,080,000 | | 1,955,200 |
| | | | | 5,875,575 |
|
| |
| Automotive (5.6%) | | | | |
| ArvinMeritor, Inc. sr. unsecd. notes | | | | |
| 8 1/8s, 2015 | | 1,460,000 | | 1,350,500 |
| Delco Remy International, Inc. | | | | |
| company guaranty 11s, 2009 | | 3,000 | | 1,826 |
| Ford Motor Co. notes 7.45s, | | | | |
| 2031 (S) | | 10,515,000 | | 8,254,275 |
| Ford Motor Credit Corp. bonds | | | | |
| 7 3/8s, 2011 | | 2,675,000 | | 2,573,147 |
| Ford Motor Credit Corp. notes | | | | |
| 7 7/8s, 2010 | | 7,400,000 | | 7,272,861 |
| Ford Motor Credit Corp. notes | | | | |
| 7 3/8s, 2009 | | 11,460,000 | | 11,240,083 |
| Ford Motor Credit Corp. sr. notes | | | | |
| 9 7/8s, 2011 | | 11,170,000 | | 11,629,204 |
| Ford Motor Credit Corp. 144A sr. | | | | |
| unsecd. notes 9 3/4s, 2010 | | 5,285,000 | | 5,470,530 |
| General Motors Acceptance Corp. | | | | |
| notes 7 3/4s, 2010 (S) | | 14,440,000 | | 14,677,581 |
| General Motors Acceptance Corp. | | | | |
| notes 6 7/8s, 2012 | | 14,715,000 | | 14,364,842 |
| General Motors Acceptance Corp. | | | | |
| notes 6 3/4s, 2014 (S) | | 10,220,000 | | 9,797,781 |
| General Motors Acceptance Corp. | | | | |
| notes 5 1/8s, 2008 | | 3,838,000 | | 3,731,595 |
| General Motors Acceptance Corp. | | | | |
| sr. unsub. notes 5.85s, 2009 | | 7,695,000 | | 7,468,221 |
| General Motors Corp. notes | | | | |
| 7.2s, 2011 | | 2,635,000 | | 2,361,619 |
| Lear Corp. company guaranty Ser. B, | | | | |
| 8.11s, 2009 | | 2,635,000 | | 2,542,775 |
| Lear Corp. sr. notes 8 1/8s, 2008 | EUR | 860,000 | | 1,119,976 |
| Tenneco Automotive, Inc. company | | | | |
| guaranty 8 5/8s, 2014 | $ | 3,770,000 | | 3,760,575 |
| Tenneco Automotive, Inc. sec. notes | | | | |
| Ser. B, 10 1/4s, 2013 | | 7,565,000 | | 8,236,394 |
| TRW Automotive, Inc. sr. notes | | | | |
| 9 3/8s, 2013 | | 2,755,000 | | 2,940,962 |
| TRW Automotive, Inc. sr. sub. notes | | | | |
| 11s, 2013 | | 8,488,000 | | 9,230,700 |
| Visteon Corp. sr. notes 7s, 2014 | | 245,000 | | 217,438 |
| | | | | 128,242,885 |
|
| |
| Basic Materials (9.2%) | | | | |
| Abitibi-Consolidated, Inc. debs. | | | | |
| 8.85s, 2030 (Canada) | | 1,590,000 | | 1,355,475 |
| Abitibi-Consolidated, Inc. notes | | | | |
| 7 3/4s, 2011(Canada) | | 1,510,000 | | 1,392,975 |
| Abitibi-Consolidated, Inc. notes 6s, | | | | |
| 2013 (Canada) | | 3,188,000 | | 2,630,100 |
| AK Steel Corp. company guaranty | | | | |
| 7 3/4s, 2012 | | 10,200,000 | | 9,945,000 |
| CORPORATE BONDS AND NOTES (86.6%)* continued | | |
|
| | | Principal amount | | Value |
|
| Basic Materials continued | | | | |
| BCP Crystal US Holdings Corp. | | | | |
| sr. sub. notes 9 5/8s,2014 | $ | 4,875,000 | $ | 5,283,281 |
| Boise Cascade, LLC company | | | | |
| guaranty 7 1/8s, 2014 | | 5,794,000 | | 5,388,420 |
| Builders FirstSource, Inc. company | | | | |
| guaranty FRB 9.655s, 2012 | | 2,170,000 | | 2,197,125 |
| Century Aluminum Co. company | | | | |
| guaranty 7 1/2s, 2014 | | 2,725,000 | | 2,711,375 |
| Chaparral Steel Co. company | | | | |
| guaranty 10s, 2013 | | 9,425,000 | | 10,414,625 |
| Chesapeake Corp. sr. sub. notes | | | | |
| 7s, 2014 | EUR | 1,215,000 | | 1,415,899 |
| Clondalkin Industries BV 144A | | | | |
| sr. notes 8s, 2014 (Netherlands) | EUR | 1,750,000 | | 2,364,135 |
| Cognis Holding GmbH & Co. | | | | |
| 144A sr. notes 12.282s, | | | | |
| 2015 (Germany) ‡‡ | EUR | 3,822,774 | | 4,809,591 |
| Cognis Holding GmbH & Co. | | | | |
| 144A sr. notes 9 1/2s, | | | | |
| 2014 (Germany) | EUR | 1,260,000 | | 1,738,463 |
| Compass Minerals International, | | | | |
| Inc. sr. disc. notes stepped-coupon | | | | |
| Ser. B, zero % (12s, 6/1/08), 2013 †† | $ | 2,540,000 | | 2,355,850 |
| Compass Minerals International, Inc. | | | | |
| sr. notes stepped-coupon zero % | | | | |
| (12 3/4s, 12/15/07), 2012 †† | | 10,532,000 | | 10,176,545 |
| Covalence Specialty Materials Corp. | | | | |
| 144A sr. sub. notes 10 1/4s, 2016 | | 9,405,000 | | 9,028,800 |
| Crystal US Holdings, LLC sr. disc. | | | | |
| notes stepped-coupon Ser. A, | | | | |
| zero % (10s, 10/1/09), 2014 †† | | 5,419,000 | | 4,389,390 |
| Equistar Chemicals LP/Equistar | | | | |
| Funding Corp. company guaranty | | | | |
| 10 1/8s, 2008 | | 12,778,000 | | 13,512,735 |
| Georgia-Pacific Corp. debs. | | | | |
| 9 1/2s, 2011 | | 6,385,000 | | 6,879,837 |
| Gerdau Ameristeel Corp. sr. notes | | | | |
| 10 3/8s, 2011 (Canada) | | 7,150,000 | | 7,704,125 |
| Huntsman, LLC company guaranty | | | | |
| 11 5/8s, 2010 | | 2,408,000 | | 2,672,880 |
| Huntsman, LLC company guaranty | | | | |
| 11 1/2s, 2012 | | 1,681,000 | | 1,907,935 |
| Innophos, Inc. company guaranty | | | | |
| 8 7/8s, 2014 | | 3,355,000 | | 3,355,000 |
| Jefferson Smurfit Corp. company | | | | |
| guaranty 8 1/4s, 2012 | | 1,525,000 | | 1,444,938 |
| Jefferson Smurfit Corp. company | | | | |
| guaranty 7 1/2s, 2013 | | 276,000 | | 252,540 |
| MDP Acquisitions PLC sr. notes | | | | |
| 9 5/8s, 2012 (Ireland) | | 8,695,000 | | 9,075,406 |
| MDP Acquisitions PLC sr. notes | | | | |
| Ser. EUR, 10 1/8s, 2012 (Ireland) | EUR | 322,000 | | 449,425 |
| Metals USA, Inc. 144A sec. notes | | | | |
| 11 1/8s, 2015 | $ | 4,280,000 | | 4,718,700 |
| Nalco Co. sr. sub. notes 9s, 2013 | EUR | 1,530,000 | | 2,108,053 |
| Nalco Co. sr. sub. notes 8 7/8s, 2013 | $ | 4,515,000 | | 4,650,450 |
| Nell AF S.a.r.l. 144A sr. notes 8 3/8s, | | | | |
| 2015 (Luxembourg) (S) | | 3,930,000 | | 3,934,913 |
23
| CORPORATE BONDS AND NOTES (86.6%)* continued | | |
|
| | | Principal amount | | Value |
|
| Basic Materials continued | | | | |
| Nell AF S.a.r.l. 144A sr. notes 8 3/8s, | | | | |
| 2015 (Luxembourg) | EUR | 2,885,000 | $ | 3,845,751 |
| NewPage Corp. sec. notes 10s, 2012 | $ | 4,170,000 | | 4,305,525 |
| Norske Skog Canada, Ltd. company | | | | |
| guaranty Ser. D, 8 5/8s, 2011 (Canada) | | 4,888,000 | | 4,802,460 |
| Norske Skog Canada, Ltd. sr. notes | | | | |
| 7 3/8s, 2014 (Canada) | | 3,455,000 | | 3,152,688 |
| Novelis, Inc. 144A sr. notes 7 1/4s, 2015 | | 15,270,000 | | 14,506,500 |
| PCI Chemicals Canada sec. sr. notes | | | | |
| 10s, 2008 (Canada) | | 1,694,026 | | 1,757,552 |
| PQ Corp. company guaranty | | | | |
| 7 1/2s, 2013 | | 5,950,000 | | 5,697,125 |
| Rockwood Specialties Group, Inc. | | | | |
| company guaranty 7 5/8s, 2014 | EUR | 6,050,000 | | 7,979,569 |
| Steel Dynamics, Inc. company guaranty | | | | |
| 9 1/2s, 2009 | $ | 4,379,000 | | 4,532,265 |
| Stone Container Corp. sr. notes | | | | |
| 9 3/4s, 2011 | | 11,147,000 | | 11,453,543 |
| Stone Container Finance company | | | | |
| guaranty 7 3/8s, 2014 (Canada) | | 1,385,000 | | 1,246,500 |
| United States Steel Corp. sr. notes | | | | |
| 9 3/4s, 2010 | | 1,396,000 | | 1,483,250 |
| United States Steel, LLC sr. notes | | | | |
| 10 3/4s, 2008 | | 2,637,000 | | 2,841,367 |
| Wheeling-Pittsburgh Steel Corp. | | | | |
| sr. notes Ser. A, 5s, 2011 ‡‡ | | 748,545 | | 583,865 |
| Wheeling-Pittsburgh Steel Corp. | | | | |
| sr. notes Ser. B, 6s, 2010 ‡‡ | | 424,922 | | 331,439 |
| | | | | 208,783,385 |
|
| |
| Beverage (0.2%) | | | | |
| Constellation Brands, Inc. company | | | | |
| guaranty Ser. B, 8s, 2008 | | 3,088,000 | | 3,184,500 |
| Constellation Brands, Inc. sr. sub. | | | | |
| notes Ser. B, 8 1/8s, 2012 | | 338,000 | | 350,252 |
| | | | | 3,534,752 |
|
| |
| Broadcasting (2.4%) | | | | |
| DirecTV Holdings, LLC company | | | | |
| guaranty 6 3/8s, 2015 | | 11,515,000 | | 10,766,525 |
| Echostar DBS Corp. company | | | | |
| guaranty 6 5/8s, 2014 | | 4,440,000 | | 4,267,950 |
| Echostar DBS Corp. sr. notes | | | | |
| 6 3/8s, 2011 | | 12,880,000 | | 12,541,900 |
| Gray Television, Inc. company | | | | |
| guaranty 9 1/4s, 2011 | | 1,783,000 | | 1,854,320 |
| LIN Television Corp. company | | | | |
| guaranty Ser. B, 6 1/2s, 2013 | | 1,840,000 | | 1,697,400 |
| Paxson Communications Corp. 144A | | | | |
| sec. FRN 11.757s, 2013 | | 2,660,000 | | 2,679,950 |
| Paxson Communications Corp. 144A | | | | |
| sec. FRN 8.757s, 2012 | | 3,210,000 | | 3,234,075 |
| Radio One, Inc. company guaranty | | | | |
| 6 3/8s, 2013 | | 3,305,000 | | 2,991,025 |
| Sirius Satellite Radio, Inc. sr. unsecd. | | | | |
| notes 9 5/8s, 2013 | | 5,470,000 | | 5,196,500 |
| CORPORATE BONDS AND NOTES (86.6%)* continued | | |
|
| | | Principal amount | | Value |
|
| Broadcasting continued | | | | |
| Young Broadcasting, Inc. company | | | | |
| guaranty 10s, 2011 | $ | 5,933,000 | $ | 5,488,025 |
| Young Broadcasting, Inc. sr. sub. | | | | |
| notes 8 3/4s, 2014 | | 3,385,000 | | 2,877,250 |
| | | | | 53,594,920 |
|
| |
| Building Materials (1.7%) | | | | |
| Associated Materials, Inc. company | | | |
| guaranty 9 3/4s, 2012 | | 8,427,000 | | 8,258,460 |
| Building Materials Corp. company | | | | |
| guaranty 8s, 2008 | | 2,869,000 | | 2,858,241 |
| Goodman Global Holding Co., Inc. | | | |
| sr. notes FRN Ser. B, 8.329s, 2012 | | 4,155,000 | | 4,155,000 |
| NTK Holdings, Inc. sr. disc. notes | | | | |
| zero %, 2014 | | 6,735,000 | | 4,512,450 |
| Owens Corning bonds 7 1/2s, 2018 | | | |
| (In default) † | | 5,424,000 | | 2,983,200 |
| Owens Corning notes 7 1/2s, 2005 | | | |
| (In default) † **** | | 5,755,000 | | 3,150,863 |
| Ply Gem Industries, Inc. sr. sub. notes | | | |
| 9s, 2012 | | 1,075,000 | | 870,750 |
| Texas Industries, Inc. sr. unsecd. notes | | | |
| 7 1/4s, 2013 | | 3,800,000 | | 3,800,000 |
| THL Buildco, Inc. (Nortek Holdings, | | | |
| Inc.) sr. sub. notes 8 1/2s, 2014 | | 9,760,000 | | 9,076,800 |
| | | | | 39,665,764 |
|
| |
| Cable Television (2.9%) | | | | |
| Adelphia Communications Corp. | | | | |
| sr. notes 10 7/8s, 2010 (In default) † | 3,211,000 | | 1,902,518 |
| Adelphia Communications Corp. | | | | |
| sr. notes 7 7/8s, 2009 (In default) † | | 2,918,000 | | 1,707,030 |
| Adelphia Communications Corp. | | | | |
| sr. notes Ser. B, 9 7/8s, 2007 (In default) † | 2,431,000 | | 1,446,445 |
| Atlantic Broadband Finance, LLC | | | | |
| company guaranty 9 3/8s, 2014 | | 3,950,000 | | 3,811,750 |
| Cablevision Systems Corp. sr. notes | | | |
| Ser. B, 8s, 2012 | | 1,050,000 | | 1,055,250 |
| CCH I, LLC/Capital Corp. sec. notes | | | |
| 11s, 2015 | | 24,384,000 | | 21,640,800 |
| CCH I Holdings, LLC company | | | | |
| guaranty stepped-coupon | | | | |
| zero % (12 1/8s, 1/15/07), 2015 †† | | 1,098,000 | | 688,995 |
| CCH II, LLC/Capital Corp. sr. notes | | | |
| Ser. B, 10 1/4s, 2010 | | 6,225,000 | | 6,287,250 |
| CCH, LLC/Capital Corp. sr. notes | | | | |
| 10 1/4s, 2010 | | 2,185,000 | | 2,212,313 |
| CSC Holdings, Inc. debs. 7 5/8s, 2018 | 2,579,000 | | 2,601,566 |
| CSC Holdings, Inc. sr. notes Ser. B, | | | | |
| 7 5/8s, 2011 | | 5,045,000 | | 5,158,513 |
| CSC Holdings, Inc. 144A sr. notes | | | | |
| 7 1/4s, 2012 | | 6,350,000 | | 6,238,875 |
| NTL Cable PLC sr. notes 9 1/8s, | | | | |
| 2016 (United Kingdom) | | 2,200,000 | | 2,271,500 |
| Rainbow National Services, LLC 144A | | | |
| sr. notes 8 3/4s, 2012 | | 8,810,000 | | 9,294,550 |
| | | | | 66,317,355 |
24
| CORPORATE BONDS AND NOTES (86.6%)* continued | | |
|
| | | Principal amount | | Value |
|
| Capital Goods (8.4%) | | | | |
| Alliant Techsystems, Inc. sr. sub. | | | | |
| notes 6 3/4s, 2016 | $ | 9,415,000 | $ | 9,156,088 |
| Allied Waste North America, Inc. | | | | |
| company guaranty Ser. B, 8 1/2s, 2008 | | 8,932,000 | | 9,311,610 |
| Allied Waste North America, Inc. | | | | |
| sec. notes Ser. B, 5 3/4s, 2011 (S) | | 860,000 | | 817,000 |
| Amsted Industries, Inc. 144A | | | | |
| sr. notes 10 1/4s, 2011 | | 8,520,000 | | 9,201,600 |
| Berry Plastics Corp. company | | | | |
| guaranty 10 3/4s, 2012 | | 870,000 | | 948,300 |
| Blount, Inc. sr. sub. notes 8 7/8s, 2012 | | 6,405,000 | | 6,413,006 |
| Browning-Ferris Industries, Inc. | | | | |
| sr. notes 6 3/8s, 2008 | | 4,215,000 | | 4,183,388 |
| Crown Americas, LLC/Crown | | | | |
| Americas Capital Corp. | | | | |
| sr. notes 7 5/8s, 2013 | | 6,990,000 | | 7,024,950 |
| Crown Cork & Seal Co. Inc. | | | | |
| debs. 8s, 2023 | | 4,350,000 | | 4,110,750 |
| Crown Euro Holdings SA company | | | | |
| guaranty 6 1/4s, 2011 (France) | EUR | 5,110,000 | | 6,939,247 |
| Decrane Aircraft Holdings Co. | | | | |
| company guaranty zero %, 2008 | | | | |
| (acquired 7/23/04, cost $4,705,611) ‡ | $ | 14,344,000 | | 10,040,800 |
| Earle M. Jorgensen Co. sec. notes | | | | |
| 9 3/4s, 2012 | | 11,456,000 | | 12,200,640 |
| Graham Packaging Co., Inc. | | | | |
| company guaranty 8 1/2s, 2012 | | 2,010,000 | | 1,944,675 |
| Graham Packaging Co., Inc. | | | | |
| sub. notes 9 7/8s, 2014 | | 6,645,000 | | 6,395,813 |
| Greenbrier Cos., Inc. company | | | | |
| guaranty 8 3/8s, 2015 | | 4,730,000 | | 4,765,475 |
| K&F Acquisitions, Inc. company | | | | |
| guaranty 7 3/4s, 2014 | | 5,905,000 | | 5,875,475 |
| L-3 Communications Corp. company | | | | |
| guaranty 6 1/8s, 2013 | | 4,510,000 | | 4,340,875 |
| L-3 Communications Corp. sr. sub. | | | | |
| notes Class B, 6 3/8s, 2015 | | 6,510,000 | | 6,265,875 |
| Legrand SA debs. 8 1/2s, 2025 (France) | | 11,095,000 | | 12,648,300 |
| Manitowoc Co., Inc. (The) company | | | | |
| guaranty 10 1/2s, 2012 | | 5,086,000 | | 5,486,523 |
| Manitowoc Co., Inc. (The) sr. notes | | | | |
| 7 1/8s, 2013 | | 2,340,000 | | 2,304,900 |
| Milacron Escrow Corp. sec. notes | | | | |
| 11 1/2s, 2011 | | 4,896,000 | | 4,675,680 |
| Owens Brockway Glass Container, Inc. | | | | |
| company guaranty 6 3/4s, 2014 | EUR | 5,765,000 | | 7,223,672 |
| Owens-Brockway Glass company | | | | |
| guaranty 8 1/4s, 2013 | $ | 4,330,000 | | 4,384,125 |
| Owens-Brockway Glass company | | | | |
| guaranty 7 3/4s, 2011 | | 1,000,000 | | 1,022,500 |
| Owens-Brockway Glass sr. sec. notes | | | | |
| 8 3/4s, 2012 | | 5,713,000 | | 6,070,063 |
| Owens-Illinois, Inc. debs. 7 1/2s, 2010 | | 1,685,000 | | 1,668,150 |
| Ray Acquisition SCA sr. notes 9 3/8s, | | | | |
| 2015 (France) | EUR | 6,050,000 | | 8,498,376 |
| RBS Global, Inc. and Rexnord Corp. | | | | |
| 144A company guaranty 9 1/2s, 2014 | $ | 9,285,000 | | 9,331,425 |
| RBS Global, Inc. and Rexnord Corp. | | | | |
| 144A sr. sub. notes 11 3/4s, 2016 | | 1,030,000 | | 1,060,900 |
| CORPORATE BONDS AND NOTES (86.6%)* continued | | |
|
| | | Principal amount | | Value |
|
| Capital Goods continued | | | | |
| Solo Cup Co. sr. sub. notes | | | | |
| 8 1/2s, 2014 | $ | 7,300,000 | $ | 6,351,000 |
| TD Funding Corp. 144A sr. sub. | | | | |
| notes 7 3/4s, 2014 | | 1,325,000 | | 1,315,063 |
| Tekni-Plex, Inc. 144A sec. notes | | | | |
| 10 7/8s, 2012 | | 5,190,000 | | 5,760,900 |
| Terex Corp. company guaranty | | | | |
| 9 1/4s, 2011 | | 1,540,000 | | 1,622,775 |
| WCA Waste Corp. 144A sr. notes | | | | |
| 9 1/4s, 2014 | | 2,600,000 | | 2,658,500 |
| | | | | 192,018,419 |
|
| |
| Commercial and Consumer Services (0.1%) | | |
| iPayment, Inc. 144A sr. sub. notes | | | | |
| 9 3/4s, 2014 | | 2,015,000 | | 2,040,188 |
|
| |
| Communication Services (6.9%) | | | | |
| American Cellular Corp. company | | | | |
| guaranty 9 1/2s, 2009 | | 1,807,000 | | 1,849,916 |
| American Cellular Corp. sr. notes | | | | |
| Ser. B, 10s, 2011 | | 3,725,000 | | 3,874,000 |
| American Tower Corp. sr. notes | | | | |
| 7 1/2s, 2012 | | 3,360,000 | | 3,418,800 |
| American Towers, Inc. company | | | | |
| guaranty 7 1/4s, 2011 | | 2,210,000 | | 2,270,775 |
| Centennial Cellular Operating Co., | | | | |
| LLC company guaranty 10 1/8s, 2013 | 3,070,000 | | 3,238,850 |
| Centennial Cellular Operating Co., | | | | |
| LLC sr. sub. notes 10 3/4s, 2008 | | 756,000 | | 763,560 |
| Centennial Communications Corp. | | | |
| sr. notes 10s, 2013 | | 2,755,000 | | 2,748,113 |
| Centennial Communications Corp. | | | |
| sr. notes FRN 11.258s, 2013 | | 1,125,000 | | 1,161,563 |
| Cincinnati Bell Telephone company | | | | |
| guaranty 6.3s, 2028 | | 1,335,000 | | 1,141,425 |
| Cincinnati Bell, Inc. company | | | | |
| guaranty 7s, 2015 | | 2,210,000 | | 2,154,750 |
| Citizens Communications Co. notes | | | |
| 9 1/4s, 2011 | | 7,860,000 | | 8,596,875 |
| Citizens Communications Co. | | | | |
| sr. notes 6 1/4s, 2013 | | 3,290,000 | | 3,178,963 |
| Digicel, Ltd. 144A sr. notes 9 1/4s, | | | | |
| 2012 (Jamaica) | | 5,715,000 | | 5,957,888 |
| Dobson Cellular Systems sec. notes | | | |
| 9 7/8s, 2012 | | 4,360,000 | | 4,654,300 |
| Dobson Communications Corp. | | | | |
| sr. notes FRN 9.757s, 2012 | | 2,295,000 | | 2,323,688 |
| Horizon PCS, Inc. company guaranty | | | |
| 11 3/8s, 2012 | | 1,065,000 | | 1,200,788 |
| Inmarsat Finance PLC company | | | | |
| guaranty 7 5/8s, 2012 (United Kingdom) | 3,022,000 | | 3,097,550 |
| Inmarsat Finance PLC company | | | | |
| guaranty stepped-coupon zero % | | | | |
| (10 3/8s, 11/15/08), 2012 | | | | |
| (United Kingdom) †† | | 8,984,000 | | 7,838,540 |
| Intelsat Bermuda, Ltd. 144A sr. notes | | | |
| 11 1/4s, 2016 (Bermuda) | | 10,365,000 | | 10,740,731 |
25
| CORPORATE BONDS AND NOTES (86.6%)* continued | | |
|
| | | Principal amount | | Value |
|
| Communication Services continued | | | | |
| Intelsat Subsidiary Holding Co., Ltd. | | | | |
| company guaranty stepped-coupon | | | | |
| 8 7/8s (8 5/8s, 1/15/15), 2015 | | | | |
| (Bermuda) †† | $ | 360,000 | $ | 363,600 |
| Intelsat Subsidiary Holding Co., Ltd. | | | | |
| sr. notes stepped-coupon 8 1/2s | | | | |
| (8 1/4s, 1/15/31), 2013 (Bermuda) †† | | 3,220,000 | | 3,211,950 |
| iPCS, Inc. sr. notes 11 1/2s, 2012 | | 2,565,000 | | 2,885,625 |
| IWO Holdings, Inc. sec. FRN | | | | |
| 9.257s, 2012 | | 835,000 | | 862,138 |
| Level 3 Financing, Inc. company | | | | |
| guaranty 10 3/4s, 2011 | | 835,000 | | 869,444 |
| Level 3 Financing, Inc. 144A sr. notes | | | | |
| FRN 11.424s, 2011 | | 2,680,000 | | 2,803,950 |
| Nordic Telephone Co. Holdings ApS | | | | |
| 144A sr. notes 8 7/8s, 2016 (Denmark) | | 1,035,000 | | 1,076,400 |
| PanAmSat Corp. company guaranty | | | | |
| 9s, 2014 | | 2,740,000 | | 2,787,950 |
| PanAmSat Corp. notes 6 3/8s, 2008 | | 699,000 | | 695,505 |
| Qwest Communications International, | | | | |
| Inc. company guaranty 7 1/2s, 2014 (S) | | 13,480,000 | | 13,362,050 |
| Qwest Corp. debs. 7 1/4s, 2025 | | 2,820,000 | | 2,696,625 |
| Qwest Corp. notes 8 7/8s, 2012 | | 14,295,000 | | 15,474,338 |
| Qwest Corp. sr. notes 7 5/8s, 2015 | | 4,590,000 | | 4,710,488 |
| Rogers Cantel, Inc. debs. 9 3/4s, | | | | |
| 2016 (Canada) | | 2,435,000 | | 2,934,175 |
| Rogers Wireless, Inc. sec. notes | | | | |
| 9 5/8s, 2011 (Canada) | | 1,312,000 | | 1,469,440 |
| Rogers Wireless, Inc. sec. notes | | | | |
| 7 1/2s, 2015 (Canada) | | 2,685,000 | | 2,805,825 |
| Rogers Wireless, Inc. sr. sub. notes | | | | |
| 8s, 2012 (Canada) | | 3,355,000 | | 3,505,975 |
| Rural Cellular Corp. sr. notes | | | | |
| 9 7/8s, 2010 | | 1,985,000 | | 2,049,513 |
| Rural Cellular Corp. sr. sub. FRN | | | | |
| 11.239s, 2012 | | 1,410,000 | | 1,452,300 |
| Rural Cellular Corp. sr. sub. notes | | | | |
| 9 3/4s, 2010 | | 2,195,000 | | 2,184,025 |
| Syniverse Technologies, Inc. sr. sub. | | | | |
| notes Ser. B, 7 3/4s, 2013 | | 3,565,000 | | 3,466,963 |
| Time Warner Telecom, Inc. company | | | | |
| guaranty 9 1/4s, 2014 | | 3,170,000 | | 3,296,800 |
| Windstream Corp. 144A sr. notes | | | | |
| 8 5/8s, 2016 | | 7,875,000 | | 8,327,813 |
| Windstream Corp. 144A sr. notes | | | | |
| 8 1/8s, 2013 | | 4,140,000 | | 4,367,700 |
| | | | | 157,871,667 |
|
| |
| Consumer (0.9%) | | | | |
| Jostens IH Corp. company guaranty | | | | |
| 7 5/8s, 2012 | | 11,165,000 | | 10,941,700 |
| Samsonite Corp. sr. sub. notes | | | | |
| 8 7/8s, 2011 | | 9,530,000 | | 9,792,075 |
| | | | | 20,733,775 |
| CORPORATE BONDS AND NOTES (86.6%)* continued | | |
|
| | | Principal amount | | Value |
|
| Consumer Goods (2.1%) | | | | |
| Church & Dwight Co., Inc. company | | | | |
| guaranty 6s, 2012 | $ | 4,430,000 | $ | 4,164,200 |
| Elizabeth Arden, Inc. company | | | | |
| guaranty 7 3/4s, 2014 | | 5,670,000 | | 5,457,375 |
| Playtex Products, Inc. company | | | | |
| guaranty 9 3/8s, 2011 | | 4,924,000 | | 5,145,580 |
| Playtex Products, Inc. sec. notes | | | | |
| 8s, 2011 | | 9,010,000 | | 9,370,400 |
| Prestige Brands, Inc. sr. sub. notes | | | | |
| 9 1/4s, 2012 | | 6,045,000 | | 6,014,775 |
| Remington Arms Co., Inc. company | | | | |
| guaranty 10 1/2s, 2011 | | 4,755,000 | | 4,136,850 |
| Scotts Co. (The) sr. sub. notes | | | | |
| 6 5/8s, 2013 | | 2,335,000 | | 2,253,275 |
| Spectrum Brands, Inc. company | | | | |
| guaranty 7 3/8s, 2015 | | 12,535,000 | | 9,714,625 |
| Spectrum Brands, Inc. sr. sub. notes | | | | |
| 8 1/2s, 2013 | | 2,460,000 | | 2,044,875 |
| | | | | 48,301,955 |
|
| |
| Consumer Services (0.8%) | | | | |
| Brand Services, Inc. company guaranty | | | | |
| 12s, 2012 | | 7,325,000 | | 8,213,156 |
| United Rentals NA, Inc. company | | | | |
| guaranty 6 1/2s, 2012 | | 2,775,000 | | 2,629,313 |
| United Rentals NA, Inc. sr. sub. notes | | | | |
| 7 3/4s, 2013 | | 219,000 | | 209,693 |
| United Rentals NA, Inc. sr. sub. notes | | | | |
| 7s, 2014 | | 8,105,000 | | 7,436,338 |
| | | | | 18,488,500 |
|
| |
| Energy (9.2%) | | | | |
| Arch Western Finance, LLC sr. notes | | | | |
| 6 3/4s, 2013 | | 12,155,000 | | 11,729,575 |
| Bluewater Finance, Ltd. company | | | | |
| guaranty 10 1/4s, 2012 | | | | |
| (Cayman Islands) | | 4,361,000 | | 4,377,354 |
| Chaparral Energy, Inc. company | | | | |
| guaranty 8 1/2s, 2015 | | 4,015,000 | | 4,045,113 |
| CHC Helicopter Corp. sr. sub. notes | | | | |
| 7 3/8s, 2014 (Canada) | | 8,380,000 | | 7,877,200 |
| Chesapeake Energy Corp. company | | | | |
| guaranty 7 3/4s, 2015 | | 3,742,000 | | 3,816,840 |
| Chesapeake Energy Corp. sr. notes | | | | |
| 7 1/2s, 2013 | | 6,425,000 | | 6,489,250 |
| Chesapeake Energy Corp. sr. notes | | | | |
| 7s, 2014 | | 2,715,000 | | 2,687,850 |
| Compton Petroleum Corp. company | | | | |
| guaranty 7 5/8s, 2013 (Canada) | | 5,360,000 | | 5,212,600 |
| Comstock Resources, Inc. sr. notes | | | | |
| 6 7/8s, 2012 | | 4,485,000 | | 4,299,994 |
| Denbury Resources, Inc. sr. sub. notes | | | | |
| 7 1/2s, 2015 | | 2,815,000 | | 2,843,150 |
| Dresser, Inc. company guaranty | | | | |
| 10 1/8s, 2011 ‡‡ | | 5,444,000 | | 5,552,880 |
| Dresser-Rand Group, Inc. company | | | | |
| guaranty 7 3/8s, 2014 | | 2,687,000 | | 2,586,238 |
| Encore Acquisition Co. sr. sub. notes | | | | |
| 6 1/4s, 2014 | | 2,220,000 | | 2,086,800 |
26
| CORPORATE BONDS AND NOTES (86.6%)* continued | | |
|
| | | Principal amount | | Value |
|
| Energy continued | | | | |
| Encore Acquisition Co. sr. sub. notes | | | | |
| 6s, 2015 | $ | 7,492,000 | $ | 6,948,830 |
| EXCO Resources, Inc. company | | | | |
| guaranty 7 1/4s, 2011 | | 8,425,000 | | 8,193,313 |
| Forest Oil Corp. sr. notes 8s, 2011 | | 4,174,000 | | 4,309,655 |
| Forest Oil Corp. sr. notes 8s, 2008 | | 2,507,000 | | 2,563,408 |
| Hanover Compressor Co. sr. notes | | | | |
| 9s, 2014 | | 3,175,000 | | 3,365,500 |
| Hanover Equipment Trust sec. notes | | | | |
| Ser. B, 8 3/4s, 2011 | | 1,630,000 | | 1,695,200 |
| Harvest Operations Corp. sr. notes | | | | |
| 7 7/8s, 2011 (Canada) | | 5,755,000 | | 5,539,188 |
| Hilcorp Energy I LP/Hilcorp Finance Co. | | | | |
| 144A sr. notes 9s, 2016 | | 2,085,000 | | 2,163,188 |
| Hornbeck Offshore Services, Inc. | | | | |
| sr. notes Ser. B, 6 1/8s, 2014 | | 2,350,000 | | 2,191,375 |
| Inergy LP/Inergy Finance Corp. | | | | |
| sr. notes 6 7/8s, 2014 | | 9,545,000 | | 9,043,888 |
| Massey Energy Co. sr. notes | | | | |
| 6 5/8s, 2010 | | 7,265,000 | | 7,156,025 |
| Newfield Exploration Co. sr. notes | | | | |
| 7 5/8s, 2011 | | 6,220,000 | | 6,391,050 |
| Newfield Exploration Co. sr. sub. | | | | |
| notes 6 5/8s, 2014 | | 6,605,000 | | 6,456,388 |
| Offshore Logistics, Inc. company | | | | |
| guaranty 6 1/8s, 2013 | | 6,055,000 | | 5,661,425 |
| Oslo Seismic Services, Inc. | | | | |
| 1st mtge. 8.28s, 2011 | | 4,103,541 | | 4,200,582 |
| Pacific Energy Partners/Pacific Energy | | | | |
| Finance Corp. sr. notes 7 1/8s, 2014 | | 3,260,000 | | 3,292,600 |
| Peabody Energy Corp. sr. notes | | | | |
| 5 7/8s, 2016 | | 6,615,000 | | 6,027,919 |
| PetroHawk Energy Corp. 144A | | | | |
| sr. notes 9 1/8s, 2013 | | 11,920,000 | | 12,128,600 |
| Plains Exploration & Production Co. | | | | |
| sr. notes 7 1/8s, 2014 | | 6,695,000 | | 6,862,375 |
| Plains Exploration & Production Co. | | | | |
| sr. sub. notes 8 3/4s, 2012 | | 7,395,000 | | 7,764,750 |
| Pogo Producing Co. sr. sub. notes | | | | |
| 6 7/8s, 2017 | | 5,465,000 | | 5,205,413 |
| Pogo Producing Co. 144A sr. sub. | | | | |
| notes 7 7/8s, 2013 | | 2,615,000 | | 2,667,300 |
| Pride International, Inc. sr. notes | | | | |
| 7 3/8s, 2014 | | 5,600,000 | | 5,698,000 |
| Quicksilver Resources, Inc. company | | | | |
| guaranty 7 1/8s, 2016 | | 3,675,000 | | 3,509,625 |
| Seabulk International, Inc. company | | | | |
| guaranty 9 1/2s, 2013 | | 3,450,000 | | 3,760,500 |
| Stone Energy Corp. sr. sub. notes | | | | |
| 6 3/4s, 2014 | | 1,925,000 | | 1,857,625 |
| Targa Resources, Inc. 144A company | | | | |
| guaranty 8 1/2s, 2013 | | 4,025,000 | | 4,014,938 |
| Whiting Petroleum Corp. company | | | | |
| guaranty 7s, 2014 | | 6,665,000 | | 6,565,025 |
| | | | | 208,838,529 |
| CORPORATE BONDS AND NOTES (86.6%)* continued | | |
|
| | | Principal amount | | Value |
|
| Entertainment (1.6%) | | | | |
| AMC Entertainment, Inc. company | | | | |
| guaranty 11s, 2016 | $ | 3,495,000 | $ | 3,796,444 |
| AMC Entertainment, Inc. sr. sub. | | | | |
| notes 8s, 2014 | | 2,100,000 | | 1,963,500 |
| Avis Budget Care Rental, LLC 144A | | | | |
| sr. notes 7 3/4s, 2016 | | 4,050,000 | | 3,829,680 |
| Cinemark USA, Inc. sr. sub. notes | | | | |
| 9s, 2013 | | 1,510,000 | | 1,562,850 |
| Cinemark, Inc. sr. disc. notes | | | | |
| stepped-coupon zero % | | | | |
| (9 3/4s, 3/15/09), 2014 †† | | 9,535,000 | | 7,437,300 |
| Hertz Corp. 144A sr. notes | | | | |
| 8 7/8s, 2014 | | 5,190,000 | | 5,384,625 |
| Marquee Holdings, Inc. sr. disc. | | | | |
| notes stepped-coupon zero % | | | | |
| (12s, 8/15/09), 2014 †† | | 5,060,000 | | 3,858,250 |
| Six Flags, Inc. sr. notes 9 5/8s, 2014 | | 4,040,000 | | 3,605,700 |
| Universal City Florida Holding Co. | | | | |
| sr. notes 8 3/8s, 2010 | | 2,340,000 | | 2,354,625 |
| Universal City Florida Holding Co. | | | | |
| sr. notes FRN 10.239s, 2010 | | 3,321,000 | | 3,395,723 |
| | | | | 37,188,697 |
|
| |
| Financial (0.7%) | | | | |
| BCM Ireland Finance Ltd. 144A FRN | | | | |
| 8.215s, 2016 (Cayman Islands) | EUR | 1,715,000 | | 2,266,796 |
| Crescent Real Estate Equities LP | | | | |
| notes 7 1/2s, 2007 (R) | $ | 2,640,000 | | 2,653,200 |
| E*Trade Finance Corp. sr. notes | | | | |
| 8s, 2011 | | 8,100,000 | | 8,403,750 |
| Finova Group, Inc. notes 7 1/2s, 2009 | | 9,197,850 | | 2,667,377 |
| | | | | 15,991,123 |
|
| |
| Food (1.8%) | | | | |
| Archibald Candy Corp. company | | | | |
| guaranty 10s, 2007 (In default) (F) † | | 861,992 | | 45,041 |
| Chiquita Brands International, Inc. | | | | |
| sr. notes 8 7/8s, 2015 | | 800,000 | | 746,000 |
| Chiquita Brands International, Inc. | | | | |
| sr. notes 7 1/2s, 2014 | | 4,570,000 | | 4,021,600 |
| Dean Foods Co. company guaranty | | | | |
| 7s, 2016 | | 6,495,000 | | 6,430,050 |
| Dean Foods Co. sr. notes 6 5/8s, 2009 | | 2,990,000 | | 2,997,475 |
| Del Monte Corp. company guaranty | | | | |
| 6 3/4s, 2015 | | 3,360,000 | | 3,192,000 |
| Del Monte Corp. sr. sub. notes | | | | |
| 8 5/8s, 2012 | | 6,185,000 | | 6,471,056 |
| Nutro Products, Inc. 144A sr. notes | | | | |
| FRN 9.23s, 2013 | | 2,150,000 | | 2,214,500 |
| Pinnacle Foods Holding Corp. sr. sub. | | | | |
| notes 8 1/4s, 2013 | | 8,615,000 | | 8,464,238 |
| Swift & Co. company guaranty | | | | |
| 10 1/8s, 2009 | | 3,630,000 | | 3,666,300 |
| United Biscuits Finance company | | | | |
| guaranty 10 5/8s, 2011 | | | | |
| (United Kingdom) | EUR | 2,090,000 | | 2,824,791 |
| | | | | 41,073,051 |
27
| CORPORATE BONDS AND NOTES (86.6%)* continued | | |
|
| | | Principal amount | | Value |
|
| Gaming & Lottery (3.3%) | | | | |
| Boyd Gaming Corp. sr. sub. notes | | | | |
| 8 3/4s, 2012 | $ | 1,614,000 | $ | 1,690,665 |
| Boyd Gaming Corp. sr. sub. notes 7 | | | | |
| 3/4s, 2012 | | 3,315,000 | | 3,323,288 |
| Boyd Gaming Corp. sr. sub. notes | | | | |
| 7 1/8s, 2016 | | 5,310,000 | | 5,051,138 |
| Boyd Gaming Corp. sr. sub. notes | | | | |
| 6 3/4s, 2014 | | 730,000 | | 688,025 |
| MGM Mirage, Inc. company guaranty | | | | |
| 8 1/2s, 2010 | | 3,257,000 | | 3,427,993 |
| MGM Mirage, Inc. company guaranty | | | | |
| 6s, 2009 | | 7,002,000 | | 6,844,455 |
| MGM Mirage, Inc. sr. notes | | | | |
| 6 3/4s, 2012 | | 2,000 | | 1,945 |
| Mirage Resorts, Inc. debs. 7 1/4s, 2017 | | 875,000 | | 842,188 |
| Park Place Entertainment Corp. | | | | |
| sr. notes 8 1/2s, 2006 | | 1,465,000 | | 1,472,133 |
| Park Place Entertainment Corp. | | | | |
| sr. notes 7s, 2013 | | 4,000,000 | | 4,128,956 |
| Park Place Entertainment Corp. | | | | |
| sr. sub. notes 7 7/8s, 2010 | | 2,834,000 | | 2,954,445 |
| Pinnacle Entertainment, Inc. sr. sub. | | | | |
| notes 8 1/4s, 2012 | | 6,610,000 | | 6,643,050 |
| Resorts International Hotel and | | | | |
| Casino, Inc. company guaranty | | | | |
| 11 1/2s, 2009 | | 4,943,000 | | 5,171,614 |
| Scientific Games Corp. company | | | | |
| guaranty 6 1/4s, 2012 | | 6,115,000 | | 5,793,963 |
| Station Casinos, Inc. sr. notes 6s, 2012 | | 9,695,000 | | 9,270,844 |
| Station Casinos, Inc. sr. sub. notes | | | | |
| 6 7/8s, 2016 | | 2,405,000 | | 2,227,631 |
| Trump Entertainment Resorts, Inc. | | | | |
| sec. notes 8 1/2s, 2015 | | 10,375,000 | | 10,037,813 |
| Wynn Las Vegas, LLC/Wynn Las Vegas | | | | |
| Capital Corp. 1st mtge. 6 5/8s, 2014 | | 5,695,000 | | 5,438,725 |
| | | | | 75,008,871 |
|
| |
| Health Care (5.8%) | | | | |
| Alderwoods Group, Inc. company | | | | |
| guaranty 7 3/4s, 2012 | | 3,495,000 | | 3,704,700 |
| AMR Holding Co., Inc./EmCare | | | | |
| Holding Co., Inc. sr. sub. notes | | | | |
| 10s, 2015 | | 95,000 | | 101,175 |
| Athena Neurosciences Finance, | | | | |
| LLC company guaranty 7 1/4s, 2008 | | 1,230,000 | | 1,220,775 |
| Community Health Systems, Inc. | | | | |
| sr. sub. notes 6 1/2s, 2012 | | 5,596,000 | | 5,232,260 |
| DaVita, Inc. company guaranty | | | | |
| 6 5/8s, 2013 | | 4,326,000 | | 4,217,850 |
| Elan Finance PLC/Elan Finance Corp. | | | | |
| company guaranty 7 3/4s, | | | | |
| 2011 (Ireland) | | 3,010,000 | | 2,904,650 |
| Extendicare Health Services, Inc. | | | | |
| sr. sub. notes 6 7/8s, 2014 | | 2,665,000 | | 2,784,925 |
| Fresenius Finance BV 144A company | | | | |
| guaranty 5 1/2s, 2016 (Netherlands) | EUR | 1,685,000 | | 2,160,945 |
| HCA, Inc. debs. 7.19s, 2015 | $ | 1,745,000 | | 1,410,948 |
| HCA, Inc. notes 8.36s, 2024 | | 3,150,000 | | 2,533,180 |
| CORPORATE BONDS AND NOTES (86.6%)* continued | | |
|
| | | Principal amount | | Value |
|
| Health Care continued | | | | |
| HCA, Inc. notes 6 3/8s, 2015 | $ | 2,195,000 | $ | 1,745,025 |
| HCA, Inc. notes 5 3/4s, 2014 | | 2,385,000 | | 1,854,338 |
| HCA, Inc. sr. notes 7 7/8s, 2011 | | 116,000 | | 110,490 |
| IASIS Healthcare/IASIS Capital Corp. | | | | |
| sr. sub. notes 8 3/4s, 2014 | | 2,815,000 | | 2,681,288 |
| MedQuest, Inc. company guaranty | | | | |
| Ser. B, 11 7/8s, 2012 | | 5,596,000 | | 5,176,300 |
| Omnicare, Inc. sr. sub. notes | | | | |
| 6 7/8s, 2015 | | 2,660,000 | | 2,543,625 |
| Omnicare, Inc. sr. sub. notes | | | | |
| 6 1/8s, 2013 | | 6,090,000 | | 5,678,925 |
| Psychiatric Solutions, Inc. company | | | | |
| guaranty 7 3/4s, 2015 | | 5,435,000 | | 5,244,775 |
| Select Medical Corp. company | | | | |
| guaranty 7 5/8s, 2015 | | 5,375,000 | | 4,649,375 |
| Service Corp. International notes | | | | |
| 6 1/2s, 2008 | | 1,006,000 | | 1,006,000 |
| Service Corp. International 144A | | | | |
| sr. notes 8s, 2017 (S) | | 1,920,000 | | 1,838,400 |
| Service Corporation International | | | | |
| debs. 7 7/8s, 2013 | | 3,857,000 | | 3,943,783 |
| Service Corporation International | | | | |
| notes Ser. *, 7.7s, 2009 | | 2,281,000 | | 2,332,323 |
| Service Corporation International | | | | |
| sr. notes 6 3/4s, 2016 | | 6,680,000 | | 6,346,000 |
| Stewart Enterprises, Inc. sr. notes | | | | |
| 6 1/4s, 2013 | | 7,880,000 | | 6,973,800 |
| Tenet Healthcare Corp. notes | | | | |
| 7 3/8s, 2013 | | 8,065,000 | | 7,177,850 |
| Tenet Healthcare Corp. sr. notes | | | | |
| 9 7/8s, 2014 (S) | | 6,775,000 | | 6,605,625 |
| Triad Hospitals, Inc. sr. notes 7s, 2012 | | 6,370,000 | | 6,258,525 |
| Triad Hospitals, Inc. sr. sub. notes | | | | |
| 7s, 2013 | | 9,369,000 | | 8,947,395 |
| US Oncology, Inc. company guaranty | | | | |
| 9s, 2012 | | 4,090,000 | | 4,233,150 |
| Vanguard Health Holding Co. II, LLC | | | | |
| sr. sub. notes 9s, 2014 | | 7,999,000 | | 7,759,030 |
| Ventas Realty LP/Capital Corp. | | | | |
| company guaranty 9s, 2012 (R) | | 6,360,000 | | 7,083,450 |
| Ventas Realty LP/Capital Corp. | | | | |
| company guaranty 6 3/4s, 2010 (R) | | 2,200,000 | | 2,241,250 |
| Ventas Realty LP/Capital Corp. | | | | |
| sr. notes 6 5/8s, 2014 (R) | | 1,690,000 | | 1,706,900 |
| Ventas Realty LP/Capital Corp. | | | | |
| sr. notes 6 1/2s, 2016 (R) | | 2,250,000 | | 2,216,250 |
| | | | | 132,625,280 |
|
| |
| Homebuilding (0.7%) | | | | |
| Ashton Woods USA, LLC/Ashton | | | | |
| Woods Finance Co. sr. sub. notes | | | | |
| 9 1/2s, 2015 | | 2,835,000 | | 2,459,363 |
| D.R. Horton, Inc. sr. notes 7 7/8s, 2011 | | 4,000 | | 4,254 |
| K. Hovnanian Enterprises, Inc. | | | | |
| company guaranty 8 7/8s, 2012 | | 2,065,000 | | 1,992,725 |
| K. Hovnanian Enterprises, Inc. | | | | |
| company guaranty 7 3/4s, 2013 | | 4,050,000 | | 3,726,000 |
28
| CORPORATE BONDS AND NOTES (86.6%)* continued | | |
|
| | | Principal amount | | Value |
|
| Homebuilding continued | | | | |
| K. Hovnanian Enterprises, Inc. | | | | |
| sr. notes 6 1/2s, 2014 | $ | 2,000 | $ | 1,805 |
| Meritage Homes Corp. company | | | | |
| guaranty 6 1/4s, 2015 | | 2,450,000 | | 2,091,688 |
| Standard Pacific Corp. sr. notes | | | | |
| 7 3/4s, 2013 | | 4,490,000 | | 4,175,700 |
| Standard Pacific Corp. sr. notes | | | | |
| 7s, 2015 | | 825,000 | | 723,938 |
| | | | | 15,175,473 |
|
| |
| Household Furniture and Appliances (0.4%) | | | |
| Sealy Mattress Co. sr. sub. notes | | | | |
| 8 1/4s, 2014 (S) | | 9,510,000 | | 9,605,100 |
|
| |
| Lodging/Tourism (0.9%) | | | | |
| FelCor Lodging LP company guaranty | | | |
| 8 1/2s, 2008 (R) | | 2,630,000 | | 2,781,225 |
| Host Marriott LP sr. notes Ser. M, | | | | |
| 7s, 2012 (R) | | 9,135,000 | | 9,203,513 |
| Starwood Hotels & Resorts | | | | |
| Worldwide, Inc. company guaranty | | | |
| 7 7/8s, 2012 | | 3,670,000 | | 3,972,775 |
| Starwood Hotels & Resorts | | | | |
| Worldwide, Inc. debs. 7 3/8s, 2015 | 4,600,000 | | 4,899,000 |
| | | | | 20,856,513 |
|
| |
| Media (1.0%) | | | | |
| Affinion Group, Inc. 144A bonds | | | | |
| 11 1/2s, 2015 | | 3,680,000 | | 3,716,800 |
| Affinion Group, Inc. 144A company | | | |
| guaranty 10 1/8s, 2013 | | 6,330,000 | | 6,567,375 |
| Affinity Group, Inc. sr. sub. notes | | | | |
| 9s, 2012 | | 5,935,000 | | 5,935,000 |
| Interpublic Group of Companies, Inc. | | | |
| notes 6 1/4s, 2014 (S) | | 1,235,000 | | 1,032,769 |
| Nielsen Finance LLC/Nielsen Finance | | | |
| Co. 144A sr. notes 10s, 2014 | | 4,495,000 | | 4,539,950 |
| | | | | 21,791,894 |
|
| |
| Publishing (3.4%) | | | | |
| American Media, Inc. company | | | | |
| guaranty Ser. B, 10 1/4s, 2009 | | 6,355,000 | | 5,878,375 |
| CanWest Media, Inc. company | | | | |
| guaranty 8s, 2012 (Canada) | | 4,625,213 | | 4,474,894 |
| Cenveo Corp., sr. sub. notes | | | | |
| 7 7/8s, 2013 | | 1,877,000 | | 1,773,765 |
| Dex Media West, LLC/Dex Media | | | | |
| Finance Co. sr. notes Ser. B, 8 1/2s, 2010 | 6,095,000 | | 6,247,375 |
| Dex Media, Inc. disc. notes | | | | |
| stepped-coupon zero % | | | | |
| (9s, 11/15/08), 2013 †† | | 4,720,000 | | 3,929,400 |
| Dex Media, Inc. notes 8s, 2013 | | 2,395,000 | | 2,383,025 |
| Houghton Mifflin Co. sr. sub. notes | | | | |
| 9 7/8s, 2013 | | 7,690,000 | | 7,959,150 |
| PRIMEDIA, Inc. company guaranty | | | | |
| 8 7/8s, 2011 | | 5,107,000 | | 4,953,790 |
| PRIMEDIA, Inc. sr. notes 8s, 2013 | | 9,200,000 | | 8,211,000 |
| R.H. Donnelley Corp. sr. disc. notes | | | |
| Ser. A-1, 6 7/8s, 2013 | | 1,925,000 | | 1,727,688 |
| CORPORATE BONDS AND NOTES (86.6%)* continued | | |
|
| | | Principal amount | | Value |
|
| Publishing continued | | | | |
| R.H. Donnelley Corp. sr. disc. notes | | | | |
| Ser. A-2, 6 7/8s, 2013 | $ | 4,100,000 | $ | 3,679,750 |
| R.H. Donnelley Corp. sr. notes | | | | |
| 6 7/8s, 2013 | | 2,710,000 | | 2,432,225 |
| R.H. Donnelley Corp. sr. notes | | | | |
| Ser. A-3, 8 7/8s, 2016 | | 5,350,000 | | 5,269,750 |
| Reader’s Digest Association, Inc. | | | | |
| (The) sr. notes 6 1/2s, 2011 | | 3,485,000 | | 3,336,888 |
| Vertis, Inc. company guaranty Ser. B, | | | | |
| 10 7/8s, 2009 | | 10,428,000 | | 10,584,420 |
| Vertis, Inc. 144A sub. notes | | | | |
| 13 1/2s, 2009 | | 3,920,000 | | 3,626,000 |
| | | | | 76,467,495 |
|
| |
| Restaurants (0.3%) | | | | |
| Sbarro, Inc. company guaranty | | | | |
| 11s, 2009 | | 7,558,000 | | 7,652,475 |
|
| |
| Retail (2.2%) | | | | |
| Asbury Automotive Group, Inc. | | | | |
| sr. sub. notes 8s, 2014 | | 3,430,000 | | 3,344,250 |
| Autonation, Inc. 144A company | | | | |
| guaranty 7s, 2014 | | 1,060,000 | | 1,045,425 |
| Autonation, Inc. 144A company | | | | |
| guaranty FRN 7.507s, 2013 | | 1,605,000 | | 1,613,025 |
| Bon-Ton Stores Inc. (The) company | | | | |
| guaranty 10 1/4s, 2014 | | 7,680,000 | | 7,228,800 |
| Burlington Coat Factory Warehouse | | | | |
| Corp. 144A sr. notes 11 1/8s, 2014 | | 5,335,000 | | 5,048,244 |
| Harry & David Holdings, Inc. | | | | |
| company guaranty 9s, 2013 | | 2,460,000 | | 2,250,900 |
| Jean Coutu Group, Inc. sr. notes | | | | |
| 7 5/8s, 2012 (Canada) (S) | | 5,010,000 | | 5,260,500 |
| Movie Gallery, Inc. sr. unsecd. notes | | | | |
| 11s, 2012 | | 2,140,000 | | 1,428,450 |
| Neiman-Marcus Group, Inc. | | | | |
| company guaranty 9s, 2015 | | 9,440,000 | | 10,030,000 |
| Rite Aid Corp. company guaranty | | | | |
| 7 1/2s, 2015 | | 3,340,000 | | 3,189,700 |
| Rite Aid Corp. sec. notes 8 1/8s, 2010 | | 4,455,000 | | 4,471,706 |
| United Auto Group, Inc. company | | | | |
| guaranty 9 5/8s, 2012 | | 3,759,000 | | 3,956,348 |
| Victoria ACQ II 144A sr. unsecd. notes | | | | |
| 11.217s, 2015 (Netherlands) ‡‡ | EUR | 1,285,000 | | 1,662,434 |
| | | | | 50,529,782 |
|
| |
| Technology (4.3%) | | | | |
| Advanced Micro Devices, Inc. | | | | |
| sr. notes 7 3/4s, 2012 | $ | 5,426,000 | | 5,446,348 |
| Amkor Technologies, Inc. | | | | |
| sr. notes 7 3/4s, 2013 | | 5,119,000 | | 4,811,860 |
| Amkor Technologies, Inc. | | | | |
| sr. unsecd. notes 9 1/4s, 2016 | | 2,620,000 | | 2,495,550 |
| Avago Technologies Finance 144A | | | | |
| sr. notes 10 1/8s, 2013 (Singapore) | | 1,085,000 | | 1,133,825 |
| Avago Technologies Finance 144A | | | | |
| sr. notes FRN 10.9s, 2013 (Singapore) | | 90,000 | | 93,938 |
| Celestica, Inc. sr. sub. notes | | | | |
| 7 7/8s, 2011 (Canada) | | 1,810,000 | | 1,805,475 |
29
| CORPORATE BONDS AND NOTES (86.6%)* continued | | |
|
| | | Principal amount | | Value |
|
| Technology continued | | | | |
| Freescale Semiconductor, Inc. | | | | |
| sr. notes Ser. B, 7 1/8s, 2014 | $ | 6,810,000 | $ | 7,014,300 |
| Iron Mountain, Inc. company | | | | |
| guaranty 8 3/4s, 2018 | | 1,805,000 | | 1,845,613 |
| Iron Mountain, Inc. company | | | | |
| guaranty 8 5/8s, 2013 | | 8,626,000 | | 8,798,520 |
| Lucent Technologies, Inc. | | | | |
| debs. 6 1/2s, 2028 | | 350,000 | | 294,875 |
| Lucent Technologies, Inc. | | | | |
| debs. 6.45s, 2029 | | 7,394,000 | | 6,303,385 |
| Lucent Technologies, Inc. | | | | |
| notes 5 1/2s, 2008 | | 1,395,000 | | 1,368,844 |
| New ASAT Finance, Ltd. company | | | | |
| guaranty 9 1/4s, 2011 (Cayman Islands) | | 2,990,000 | | 2,377,050 |
| Nortel Networks, Ltd. 144A company | | | | |
| guaranty 10 3/4s, 2016 (Canada) | | 1,550,000 | | 1,604,250 |
| Nortel Networks, Ltd. 144A company | | | | |
| guaranty FRN 9.73s, 2011 (Canada) | | 4,785,000 | | 4,832,850 |
| Seagate Technology Hdd Holdings | | | | |
| company guaranty 8s, 2009 | | | | |
| (Cayman Islands) | | 1,135,000 | | 1,169,050 |
| Sensata Technologies BV 144A | | | | |
| sr. notes 8s, 2014 (Netherlands) | | 2,625,000 | | 2,572,500 |
| Serena Software, Inc. 144A | | | | |
| sr. sub. notes 10 3/8s, 2016 | | 1,060,000 | | 1,081,200 |
| Solectron Global Finance Corp. | | | | |
| company guaranty 8s, 2016 | | | | |
| (Cayman Islands) | | 3,185,000 | | 3,089,450 |
| SunGard Data Systems, Inc. | | | | |
| company guaranty 10 1/4s, 2015 | | 7,830,000 | | 7,996,388 |
| SunGard Data Systems, Inc. | | | | |
| company guaranty 9 1/8s, 2013 | | 9,007,000 | | 9,299,728 |
| UGS Capital Corp. II 144A | | | | |
| sr. notes 10.38s, 2011 | | 2,140,000 | | 2,156,050 |
| UGS Corp. company guaranty | | | | |
| 10s, 2012 | | 4,395,000 | | 4,724,625 |
| Unisys Corp. sr. notes 8s, 2012 | | 3,745,000 | | 3,468,806 |
| Xerox Capital Trust I company | | | | |
| guaranty 8s, 2027 | | 4,340,000 | | 4,453,925 |
| Xerox Corp. company guaranty | | | | |
| 9 3/4s, 2009 | | 4,000 | | 4,320 |
| Xerox Corp. sr. notes 7 5/8s, 2013 | | 3,057,000 | | 3,160,174 |
| Xerox Corp. sr. notes 6 7/8s, 2011 | | 1,345,000 | | 1,376,944 |
| Xerox Corp. sr. unsec. sr. notes | | | | |
| 6 3/4s, 2017 | | 3,195,000 | | 3,202,988 |
| | | | | 97,982,831 |
|
| |
| Textiles (0.7%) | | | | |
| Levi Strauss & Co. sr. notes | | | | |
| 9 3/4s, 2015 | | 7,798,000 | | 8,070,930 |
| Levi Strauss & Co. sr. notes | | | | |
| 8 7/8s, 2016 | | 4,005,000 | | 3,914,888 |
| Oxford Industries, Inc. sr. notes | | | | |
| 8 7/8s, 2011 | | 4,250,000 | | 4,292,500 |
| | | | | 16,278,318 |
| CORPORATE BONDS AND NOTES (86.6%)* continued | | |
|
| | | Principal amount | | Value |
|
| Tire & Rubber (0.5%) | | | | |
| Goodyear Tire & Rubber Co. (The) | | | |
| sr. notes 9s, 2015 (S) | $ | 10,395,000 | $ | 10,420,988 |
|
| |
| Transportation (0.7%) | | | | |
| CalAir, LLC/CalAir Capital Corp. | | | | |
| company guaranty 8 1/8s, 2008 | | 7,906,000 | | 7,649,055 |
| Kansas City Southern Railway Co. | | | | |
| company guaranty 9 1/2s, 2008 | | 8,753,000 | | 9,125,003 |
| | | | | 16,774,058 |
|
| |
| Utilities & Power (7.6%) | | | | |
| AES Corp. (The) sr. notes 8 7/8s, 2011 | 795,000 | | 846,675 |
| AES Corp. (The) 144A sec. notes | | | | |
| 9s, 2015 | | 7,235,000 | | 7,813,800 |
| AES Corp. (The) 144A sec. notes | | | | |
| 8 3/4s, 2013 | | 7,390,000 | | 7,907,300 |
| ANR Pipeline Co. debs. 9 5/8s, 2021 | 2,385,000 | | 2,880,935 |
| Cleveland Electric Illuminating Co. (The) | | | |
| 144A sr. notes Ser. D, 7.88s, 2017 | | 10,000 | | 11,590 |
| CMS Energy Corp. sr. notes | | | | |
| 9 7/8s, 2007 | | 175,000 | | 182,219 |
| CMS Energy Corp. sr. notes | | | | |
| 8.9s, 2008 | | 2,199,000 | | 2,297,955 |
| CMS Energy Corp. sr. notes | | | | |
| 8 1/2s, 2011 | | 1,254,000 | | 1,344,915 |
| CMS Energy Corp. sr. notes | | | | |
| 7 3/4s, 2010 | | 1,730,000 | | 1,803,525 |
| Colorado Interstate Gas Co. | | | | |
| debs. 6.85s, 2037 | | 3,535,000 | | 3,555,362 |
| Colorado Interstate Gas Co. | | | | |
| sr. notes 5.95s, 2015 | | 1,000,000 | | 940,678 |
| Dynegy-Roseton Danskamme | | | | |
| company guaranty Ser. A, | | | | |
| 7.27s, 2010 | | 3,500,000 | | 3,473,750 |
| Dynegy-Roseton Danskamme | | | | |
| company guaranty Ser. B, 7.67s, 2016 | 5,330,000 | | 5,270,038 |
| Edison Mission Energy 144A | | | | |
| sr. notes 7 3/4s, 2016 | | 2,020,000 | | 2,020,000 |
| Edison Mission Energy 144A | | | | |
| sr. notes 7 1/2s, 2013 | | 2,425,000 | | 2,425,000 |
| El Paso Corp. notes 7 3/4s, 2010 | | 1,800,000 | | 1,854,000 |
| El Paso Corp. sr. notes 8.05s, 2030 (S) | 5,000,000 | | 5,125,000 |
| El Paso Corp. sr. notes 7 3/8s, 2012 (S) | 3,630,000 | | 3,661,763 |
| El Paso Corp. sr. notes Ser. MTN, | | | | |
| 7.8s, 2031 | | 3,470,000 | | 3,478,675 |
| El Paso Natural Gas Co. | | | | |
| debs. 8 5/8s, 2022 | | 1,745,000 | | 1,968,660 |
| El Paso Production Holding Co. | | | | |
| company guaranty 7 3/4s, 2013 | | 11,125,000 | | 11,291,875 |
| Ferrellgas LP/Finance sr. notes | | | | |
| 6 3/4s, 2014 | | 5,460,000 | | 5,255,250 |
| Midwest Generation, LLC | | | | |
| sec. sr. notes 8 3/4s, 2034 | | 10,955,000 | | 11,667,075 |
| Mirant North America, LLC | | | | |
| company guaranty 7 3/8s, 2013 | | 6,380,000 | | 6,316,200 |
| Mission Energy Holding Co. | | | | |
| sec. notes 13 1/2s, 2008 | | 6,998,000 | | 7,829,013 |
| Monongahela Power Co. | | | | |
| 1st mtge. 6.7s, 2014 | | 3,190,000 | | 3,380,843 |
30
| CORPORATE BONDS AND NOTES (86.6%)* continued | | |
|
| | | Principal amount | | Value |
|
| Utilities & Power continued | | | | |
| Nevada Power Co. 2nd mtge. 9s, 2013 | $ | 3,163,000 | $ | 3,447,917 |
| Northwestern Corp. sec. notes | | | | |
| 5 7/8s, 2014 | | 6,090,000 | | 6,048,265 |
| NRG Energy, Inc. sr. notes 7 3/8s, 2016 | | 13,275,000 | | 13,075,875 |
| Orion Power Holdings, Inc. sr. notes | | | | |
| 12s, 2010 | | 6,000,000 | | 6,810,000 |
| SEMCO Energy, Inc. sr. notes | | | | |
| 7 3/4s, 2013 | | 4,840,000 | | 4,831,438 |
| SEMCO Energy, Inc. 144A sr. notes | | | | |
| 7 3/4s, 2013 | | 28,000 | | 27,860 |
| Sierra Pacific Power Co. general ref. | | | | |
| mtge. 6 1/4s, 2012 | | 1,213,000 | | 1,228,719 |
| Sierra Pacific Resources sr. notes | | | | |
| 8 5/8s, 2014 | | 3,415,000 | | 3,670,814 |
| Teco Energy, Inc. notes 7.2s, 2011 | | 1,645,000 | | 1,698,463 |
| Teco Energy, Inc. notes 7s, 2012 | | 2,730,000 | | 2,808,446 |
| Teco Energy, Inc. sr. notes 6 3/4s, 2015 | | 360,000 | | 358,650 |
| Tennessee Gas Pipeline Co. | | | | |
| debs. 7s, 2028 | | 695,000 | | 677,565 |
| Tennessee Gas Pipeline Co. | | | | |
| unsecd. notes 7 1/2s, 2017 | | 1,465,000 | | 1,515,532 |
| Transcontinental Gas Pipeline Corp. | | | | |
| debs. 7 1/4s, 2026 | | 5,100,000 | | 5,151,000 |
| Utilicorp Canada Finance Corp. | | | | |
| company guaranty 7 3/4s, | | | | |
| 2011 (Canada) | | 6,710,000 | | 7,028,725 |
| Utilicorp United, Inc. sr. notes | | | | |
| 9.95s, 2011 | | 169,000 | | 186,879 |
| Williams Cos., Inc. (The) notes | | | | |
| 8 3/4s, 2032 | | 1,330,000 | | 1,433,075 |
| Williams Cos., Inc. (The) notes | | | | |
| 7 5/8s, 2019 | | 5,210,000 | | 5,288,150 |
| Williams Cos., Inc. (The) 144A | | | | |
| notes 6 3/8s, 2010 | | 1,870,000 | | 1,839,613 |
| York Power Funding 144A notes | | | | |
| 12s, 2007 (Cayman Islands) | | | | |
| (In default) (F) † | | 3,107,974 | | 259,205 |
| | | | | 171,988,287 |
|
| |
| Total corporate bonds and notes | | | | |
| (cost $1,994,464,171) | | | $1,971,717,905 |
|
| |
| |
| SENIOR LOANS (2.1%)* (c) | | | | |
|
| | | Principal amount | | Value |
|
| AGCO Corp. bank term loan | | | | |
| FRN 7.249s, 2008 | $ | 812,850 | $ | 812,850 |
| Burlington Coat Factory Warehouse | | | | |
| Corp. bank term loan FRN Ser. B, | | | | |
| 7.53s, 2013 | | 1,243,750 | | 1,206,632 |
| Century Cable Holdings bank term | | | | |
| loan FRN 10 1/4s, 2009 | | 5,320,000 | | 5,156,602 |
| Charter Communications bank term | | | | |
| loan FRN Ser. B, 8 1/8s, 2013 | | 863,526 | | 865,386 |
| Community Health Systems, Inc. | | | | |
| bank term loan FRN Ser. B, 6.97s, 2011 | | 432,300 | | 431,895 |
| Dana Corporation bank term loan | | | | |
| FRN 7.45s, 2008 | | 1,300,000 | | 1,300,325 |
| SENIOR LOANS (2.1%)* (c) continued | | | | |
|
| | | Principal amount | | Value |
|
| Dex Media West, LLC/Dex Media | | | | |
| Finance Co. bank term loan | | | | |
| FRN Ser. B, 6.859s, 2010 | $ | 679,041 | $ | 675,491 |
| Dresser, Inc. bank term loan | | | | |
| FRN 8.94s, 2010 | | 160,000 | | 162,400 |
| Federal Mogul Corp. bank term loan | | | | |
| FRN Ser. A, 7.65s, 2007 | | 2,735,000 | | 2,642,694 |
| Federal Mogul Corp. bank term loan | | | | |
| FRN Ser. B, 7.9s, 2007 | | 6,365,000 | | 6,158,138 |
| Frontier Vision bank term loan FRN | | | | |
| Ser. B, 9.775s, 2006 | | 440,000 | | 433,636 |
| Graphic Packaging Corp. bank term | | | | |
| loan FRN Ser. C, 7.922s, 2010 | | 655,469 | | 660,853 |
| Healthsouth Corp. bank term loan | | | | |
| FRN Ser. B, 8.52s, 2013 | | 6,000,000 | | 6,019,164 |
| Insight Midwest, LP/Insight Capital, | | | | |
| Inc. bank term loan FRN 7.438s, 2009 | | 2,875,000 | | 2,887,578 |
| Iron Mountain, Inc. bank term loan | | | | |
| FRN 7.099s, 2011 | | 982,500 | | 983,728 |
| Leap Wireless International, Inc. bank | | | | |
| term loan FRN Ser. B, 8.249s, 2013 | | 500,000 | | 503,500 |
| Mediacom Communications Corp. | | | | |
| bank term loan FRN Ser. C, | | | | |
| 7.222s, 2015 | | 987,500 | | 982,563 |
| Neiman Marcus Group, Inc. bank | | | | |
| term loan FRN Ser. B, 7.77s, 2013 | | 2,895,570 | | 2,916,322 |
| NRG Energy, Inc. bank term loan | | | | |
| FRN Ser. B, 7.231s, 2013 | | 2,453,850 | | 2,462,286 |
| Olympus Cable Holdings, LLC bank | | | | |
| term loan FRN Ser. B, 10 1/4s, 2010 | | 5,053,836 | | 4,880,110 |
| Pinnacle Foods Holding Corp. bank | | | | |
| term loan FRN 8.661s, 2010 | | 880,940 | | 903,574 |
| Six Flags, Inc. bank term loan FRN | | | | |
| Ser. B, 8.48s, 2009 | | 1,446,469 | | 1,466,358 |
| Solo Cup Co. bank term loan FRN | | | | |
| 9.66s, 2012 | | 500,000 | | 502,500 |
| St. Mary’s Cement Corp. bank term | | | | |
| loan FRN 7.499s, 2009 | | 585,000 | | 585,000 |
| Trump Hotel & Casino Resort, Inc. | | | | |
| bank term loan FRN Ser. B-1, | | | | |
| 8.03s, 2012 | | 577,500 | | 580,568 |
| Trump Hotel & Casino Resort, Inc. | | | | |
| bank term loan FRN Ser. DD, | | | | |
| 5.62s, 2012 | | 577,500 | | 580,568 |
| TRW Automotive, Inc. bank term | | | | |
| loan FRN Ser. B, 7.188s, 2010 | | 368,144 | | 367,428 |
| United Airlines bank term loan | | | | |
| FRN Ser. B, 9 1/4s, 2012 | | 1,001,219 | | 1,014,151 |
| United Airlines bank term loan | | | | |
| FRN Ser. DD, 9.188s, 2012 | | 143,031 | | 144,879 |
| VWR International, Inc. bank term | | | | |
| loan FRN Ser. B, 7.77s, 2011 | | 184,780 | | 185,011 |
| Young Broadcasting, Inc. bank term | | | | |
| loan FRN Ser. B, 7.999s, 2012 | | 298,492 | | 296,720 |
|
| Total senior loans (cost $48,342,001) | | | $ | 48,768,910 |
31
| CONVERTIBLE PREFERRED STOCKS (1.5%)* | | |
|
| | Shares | | Value |
|
| Chesapeake Energy Corp. 6.25% cv. pfd. | 11,562 | $ | 3,117,404 |
| Citigroup Funding, Inc. Ser. GNW, | | | |
| 5.02% cv. pfd. | 201,380 | | 6,518,671 |
| Crown Castle International Corp. | | | |
| $3.125 cum. cv. pfd. | 83,650 | | 4,642,575 |
| Emmis Communications Corp. | | | |
| Ser. A, $3.125 cum. cv. pfd. | 80,527 | | 3,251,278 |
| Freeport-McMoRan Copper & Gold, | | | |
| Inc. 5.50% cv. pfd. | 2,432 | | 3,185,312 |
| Huntsman Corp. $2.50 cv. pfd. | 59,300 | | 2,357,175 |
| Interpublic Group of Companies, Inc. | | | |
| 144A Ser. B, 5.25% cum. cv. pfd | 4,757 | | 4,305,085 |
| Ion Media Networks, Inc. 144A 9.75% | 246 | | 1,722,000 |
| Northrop Grumman Corp. Ser. B, | | | |
| $7.00 cum. cv. pfd. | 34,720 | | 4,548,320 |
|
| Total convertible preferred stocks | | | |
| (cost $32,322,890) | | $ | 33,647,820 |
|
| |
| |
| CONVERTIBLE BONDS AND NOTES (1.2%)* | | |
|
| | Principal amount | | Value |
|
| DRS Technologies, Inc. 144A cv. | | | |
| unsec. notes 2s, 2026 | $8,400,000 | $ | 7,980,000 |
| Intel Corp. cv. sub. bonds | | | |
| 2.95s, 2035 (S) | 4,275,000 | | 3,745,969 |
| L-3 Communications Corp. 144A | | | |
| cv. bonds 3s, 2035 | 4,990,000 | | 5,021,188 |
| LIN Television Corp. cv. sr. sub. notes | | | |
| 2 1/2s, 2033 | 1,720,000 | | 1,569,500 |
| Manor Care, Inc. 144A cv. sr. notes | | | |
| 2 1/8s, 2035 | 930,000 | | 1,136,925 |
| Sinclair Broadcast Group, Inc. cv. | | | |
| sr. sub. notes stepped-coupon | | | |
| 4 7/8s (2s, 1/15/11) 2018 †† | 2,840,000 | | 2,545,350 |
| Trinity Industries, Inc. cv. sub. | | | |
| notes 3 7/8s, 2036 | 2,370,000 | | 2,328,525 |
| Wabash National Corp. cv. sr. | | | |
| notes 3 1/4s, 2008 | 2,275,000 | | 2,249,406 |
|
| Total convertible bonds and notes | | | |
| (cost $26,630,636) | | $ | 26,576,863 |
|
| |
| |
| COMMON STOCKS (0.8%)* | | | |
|
| | Shares | | Value |
|
| Blount International, Inc. † (S) | 271,114 | $ | 2,453,582 |
| Boyd Gaming Corp. | 91,933 | | 3,324,297 |
| Compass Minerals International, Inc. | 4,728 | | 126,379 |
| Contifinancial Corp. Liquidating Trust | | | |
| Units (F) | 31,440,192 | | 3,144 |
| Decrane Aircraft Holdings, Inc. † § (F) | 29,311 | | 29 |
| DigitalGlobe, Inc. 144A † § | 645,566 | | 641,531 |
| Knology, Inc. † | 1,894 | | 19,319 |
| Owens Corning (Rights) (F) | 372,616 | | 4 |
| Playtex Products, Inc. † | 108,000 | | 1,420,200 |
| Pride International, Inc. † | 131,750 | | 3,416,278 |
| Samsonite Corp. † | 615,000 | | 541,200 |
| Sterling Chemicals, Inc. † | 4,358 | | 54,475 |
| COMMON STOCKS (0.8%)* continued | | | |
|
| | Shares | | Value |
|
| Sun Healthcare Group, Inc. † | 9,048 | $ | 95,637 |
| USA Mobility, Inc. | 1,733 | | 39,599 |
| VFB LLC (acquired 5/15/02, | | | |
| cost $9,558,415) † ‡ § (F) | 12,695,838 | | 269,787 |
| VS Holdings, Inc. (F) | 327,451 | | 1 |
| Wayland Investment Fund II | | | |
| (acquired 2/2/01, cost $0) (F) ‡ | 33,000 | | 356,928 |
| WHX Corp. † | 163,145 | | 1,305,160 |
| Williams Cos., Inc. (The) | 156,035 | | 3,843,142 |
|
| Total common stocks (cost $74,475,279) | | $ | 17,910,692 |
|
| |
| |
| COLLATERALIZED MORTGAGE OBLIGATIONS (0.6%)* | | |
|
| Principal amount | | Value |
|
| DLJ Commercial Mortgage Corp. | | | |
| Ser. 98-CF2, Class B4, 6.04s, 2031 | $1,190,771 | $ | 1,200,252 |
| Ser. 98-CF2, Class B5, 5.95s, 2031 | 3,816,434 | | 3,510,844 |
| GE Capital Commercial Mortgage | | | |
| Corp. 144A | | | |
| Ser. 00-1, Class F, 7.787s, 2033 | 583,000 | | 620,411 |
| Ser. 00-1, Class G, 6.131s, 2033 | 2,470,000 | | 2,187,115 |
| GMAC Commercial Mortgage | | | |
| Securities, Inc. 144A | | | |
| Ser. 99-C3, Class G, 6.974s, 2036 | 2,202,750 | | 2,215,178 |
| LB Commercial Conduit Mortgage | | | |
| Trust 144A | | | |
| Ser. 99-C1, Class G, 6.41s, 2031 | 1,054,300 | | 985,360 |
| Mach One Commercial Mortgage | | | |
| Trust 144A | | | |
| Ser. 04-1A, Class J, 5.45s, 2040 | 2,435,000 | | 1,995,441 |
| Ser. 04-1A, Class K, 5.45s, 2040 | 880,000 | | 702,523 |
| Ser. 04-1A, Class L, 5.45s, 2040 | 400,000 | | 292,767 |
|
| Total collateralized mortgage obligations | | | |
| (cost $11,560,740) | | $ | 13,709,891 |
|
| |
| |
| PREFERRED STOCKS (0.5%)* | | | |
|
| | Shares | | Value |
|
| Decrane Aircraft Holdings, Inc. | | | |
| $16.00 pfd. ‡‡ | 21,000 | $ | 147,000 |
| First Republic Capital Corp. | | | |
| 144A 10.50% pfd. | 6,670 | | 7,103,550 |
| Ion Media Networks, Inc. | | | |
| 14.25% cum. pfd. ‡‡ | 148 | | 1,272,800 |
| Rural Cellular Corp. Ser. B, | | | |
| 11.375% cum. pfd. | 3,026 | | 3,653,895 |
|
| Total preferred stocks (cost $10,331,036) | | $ | 12,177,245 |
|
| |
| |
| UNITS (0.3%)* (cost $12,955,329) | | | |
|
| | Units | | Value |
|
| XCL, Ltd. Equity Units § (F) | 3,453 | $ | 6,812,039 |
32
| FOREIGN GOVERNMENT BONDS AND NOTES (0.2%)* | | |
|
| (cost $4,283,012) | | | | | |
|
| | | | Principal amount | | Value |
|
| Argentina (Republic of ) FRB | | | | |
| 5.59s, 2012 | | | $4,642,500 | $ | 4,308,830 |
|
| |
| |
| ASSET-BACKED SECURITIES (—%)* (cost $416,296) | | |
|
| | | | Principal amount | | Value |
|
| Asset Backed Securities Corp. | | | | |
| Home Equity Loan Trust | | | | |
| 144A FRB Ser. 06-HE2, | | | | |
| Class M11, 7.824s, 2036 | | $545,000 | $ | 441,236 |
|
| |
| |
| WARRANTS (—%)* † | | | | | |
|
| | Expiration | Strike | | | |
| | date | price | Warrants | | Value |
|
| Dayton Superior | | | | | |
| Corp. 144A | 6/15/09 | $.01 | 8,414 | $ | 84 |
| Decrane Aircraft | | | | | |
| Holdings Co. Class B | 6/30/10 | 116.00 | 1 | | 1 |
| Decrane Aircraft | | | | | |
| Holdings Co. Class B | 6/30/10 | 116.00 | 1 | | 1 |
| MDP Acquisitions | | | | | |
| PLC 144A (Ireland) | 10/01/13 EUR .001 | 4,510 | | 126,280 |
| Ubiquitel, Inc. 144A | 4/15/10 | $22.74 | 15,004 | | 150 |
| ZSC Specialty | | | | | |
| Chemicals PLC 144A | | | | | |
| (United Kingdom) | 7/01/10 | GBP .01 | 300,000 | | 3,000 |
| ZSC Specialty | | | | | |
| Chemicals PLC | | | | | |
| (Preferred) 144A | | | | | |
| (United Kingdom) | 7/01/10 | GBP .01 | 300,000 | | 3,000 |
|
| |
| Total warrants (cost $1,398,843) | | | $ | 132,516 |
| EQUITY VALUE CERTIFICATES (—%)* (cost $20,766) | | |
|
| Maturity date | Certificates | | Value |
|
| ONO Finance PLC | | | |
| 144A (United Kingdom) 2/15/11 | 186 | $ | 2 |
|
| |
| SHORT-TERM INVESTMENTS (6.5%)* | | | |
|
| Principal amount/shares | | Value |
|
| Short-term investments held | | | |
| as collateral for loaned securities | | | |
| with yields ranging from 5.22% to | | | |
| 5.44% and due dates ranging from | | | |
| September 1, 2006 to October 6, | | | |
| 2006 (d) | $61,654,406 | $ | 61,549,100 |
| Putnam Prime Money | | | |
| Market Fund (e) | 86,938,278 | | 86,938,278 |
|
| Total short-term investments | | | |
| (cost $148,487,378) | | $ | 148,487,378 |
|
| |
| TOTAL INVESTMENTS | | | |
|
| Total investments (cost $2,365,688,377) | | $2,284,691,327 |
* Percentages indicated are based on net assets of $2,276,736,420.
**** Security is in default of principal and interest.
† Non-income-producing security.
(S) Securities on loan, in part or in entirety, at August 31, 2006.
† † The interest rate and date shown parenthetically represent the new interest rate to be paid and the date the fund will begin accruing interest at this rate.
‡ Restricted, excluding 144A securities, as to public resale. The total market value of restricted securities held at August 31, 2006 was $10,667,515 or 0.5% of net assets.
‡‡ Income may be received in cash or additional securities at the discretion of the issuer.
§ Affiliated Companies (Note 7).
(R) Real Estate Investment Trust.
(c) Senior loans are exempt from registration under the Security Act of 1933, as amended, but contain certain restrictions on resale and cannot be sold publicly. These loans pay interest at rates which adjust periodically. The interest rates shown for senior loans are the current interest rates at August 31, 2006. Senior loans are also subject to mandatory and/or optional prepayment which cannot be predicted. As a result, the remaining maturity may be substantially less than the stated maturity shown (Notes 1 and 6).
(d) See Note 1 to the financial statements.
(e) See Note 5 to the financial statements regarding investments in Putnam Prime Money Market Fund.
(F) Security is valued at fair value following procedures approved by the Trustees.
At August 31, 2006, liquid assets totaling $88,396,590 have been designated as collateral for open swap contracts and forward contracts.
144A after the name of an issuer represents securities exempt from registration under Rule 144A of the Securities Act of 1933. These securities may be resold in transactions exempt from registration, normally to qualified institutional buyers.
The rates shown on Floating Rate Bonds (FRB) and Floating Rate Notes (FRN) are the current interest rates at August 31, 2006.
The dates shown on debt obligations are the original maturity dates.
33
| FORWARD CURRENCY CONTRACTS TO BUY at 8/31/06 | | | | |
|
| | | Aggregate | Delivery | Unrealized |
| | Value | face value | date | depreciation |
|
| Euro Dollar | $971,827 | $987,880 | 9/20/06 | $(16,053) |
|
| |
| FORWARD CURRENCY CONTRACTS TO SELL at 8/31/06 | | | | |
|
| | | Aggregate | Delivery | Unrealized |
| | Value | face value | date | appreciation |
|
| Euro Dollar | $59,147,976 | $59,881,697 | 9/20/06 | $733,721 |
| CREDIT DEFAULT CONTRACTS OUTSTANDING at 8/31/06 | | | | |
|
| | Upfront | | | Fixed payments | Unrealized |
| Swap counterparty / | premium | Notional | Termination | received (paid) by | appreciation/ |
| Referenced debt* | received (paid)** | amount | date | fund per annum | (depreciation) |
|
| Bank of America, N.A. | | | | | |
| Abitibi-Consolidated, Inc., 8.375%, 4/1/15 | $— | $2,755,000 | 6/20/11 | 365 bp | $ (85,565) |
|
| L-3 Communications Corp. 7 5/8%, 6/15/12 | — | 1,775,000 | 6/20/11 | (90 bp) | 2,814 |
|
| Citibank, N.A. | | | | | |
| Celestica, 7 5/8%, 7/1/11 | — | 2,585,000 | 9/20/11 | 285 bp | 12,674 |
|
| Ford Motor Co., 7.45%, 7/16/31 | — | 2,130,000 | 6/20/07 | 620 bp | 87,867 |
|
| Visteon Corp., 7%, 3/10/14 | — | 2,750,000 | 6/20/09 | 605 bp | 232,747 |
|
| CreditSuisse First Boston International | | | | | |
| Ford Motor Co., 7.45%, 7/16/31 | — | 4,580,000 | 9/20/07 | (487.5 bp) | (127,076) |
|
| Ford Motor Co., 7.45%, 7/16/31 | — | 5,555,000 | 9/20/08 | 725 bp | 293,319 |
|
| Ford Motor Co., 7.45%, 7/16/31 | — | 975,000 | 9/20/07 | (485 bp) | (26,782) |
|
| Deutsche Bank AG | | | | | |
| Ford Motor Co., 7.45%, 7/16/31 | — | 2,982,000 | 6/20/07 | 595 bp | 115,658 |
|
| Lear Corp., 8.11%, 5/15/09 | — | 2,450,000 | 6/20/08 | 860 bp | 251,833 |
|
| Visteon Corp., 7%, 3/10/14 | — | 1,030,000 | 6/20/09 | 535 bp | 61,799 |
|
| Goldman Sachs Capital Markets, L.P. | | | | | |
| Ford Motor Co., 7.45%, 7/16/31 | — | 2,130,000 | 6/20/07 | 630 bp | 89,961 |
|
| Goldman Sachs International | | | | | |
| General Motors Corp., 7 1/8%, 7/15/13 | — | 4,580,000 | 9/20/08 | 620 bp | 182,122 |
|
| General Motors Corp., 7 1/8%, 7/15/13 | — | 4,580,000 | 9/20/07 | (427.5 bp) | (96,466) |
|
| General Motors Corp., 7 1/8%, 7/15/13 | — | 975,000 | 9/20/07 | (425 bp) | (20,257) |
|
| General Motors Corp., 7 1/8%, 7/15/13 | — | 975,000 | 9/20/08 | 620 bp | 38,780 |
|
| L-3 Communications Corp. 7 5/8%, 6/15/12 | — | 1,085,000 | 9/20/11 | (108 bp) | (3,787) |
|
| Any one of the underlying securities in the | | | | | |
| basket of BB CMBS securities | — | 3,563,000 | (a) | 2.461% | 209,473 |
|
| Standard Pacific Corp., 6 7/8%, 5/15/11 | — | 3,060,000 | 9/20/11 | (353 bp) | (20,341) |
|
| JPMorgan Chase Bank, N.A. | | | | | |
| Abitibi-Consolidated, Inc., 8.375%, 4/1/15 | — | 1,653,000 | 6/20/11 | 365 bp | (59,043) |
|
| Ford Motor Co., 7.45%, 7/16/31 | — | 2,130,000 | 6/20/07 | 635 bp | 91,008 |
|
| Ford Motor Co., 7.45%, 7/16/31 | — | 2,755,000 | 6/20/07 | 665 bp | 125,833 |
|
| Ford Motor Co., 7.45%, 7/16/31 | — | 790,000 | 9/20/08 | 550 bp | 12,941 |
|
| Ford Motor Co., 7.45%, 7/16/31 | — | 790,000 | 9/20/07 | (345 bp) | (3,451) |
|
| General Motors Corp., 7 1/8%, 7/15/13 | — | 790,000 | 9/20/07 | (350 bp) | (8,563) |
|
| General Motors Corp., 7 1/8%, 7/15/13 | — | 790,000 | 9/20/08 | 500 bp | 11,246 |
|
| Lehman Brothers Special Financing, Inc. | | | | | |
| General Motors Corp., 7 1/8%, 7/15/13 | — | 5,495,000 | 12/20/06 | 750 bp | 187,041 |
|
| Merrill Lynch Capital Services, Inc. | | | | | |
| Ford Motor Co., 7.45%, 7/16/31 | — | 2,310,000 | 9/20/07 | (345 bp) | (6,501) |
|
| Ford Motor Co., 7.45%, 7/16/31 | — | 2,310,000 | 9/20/08 | 570 bp | 46,601 |
|
| General Motors Corp., 7 1/8%, 7/15/13 | — | 3,235,000 | 9/20/07 | (335 bp) | (11,503) |
|
| General Motors Corp., 7 1/8%, 7/15/13 | — | 3,235,000 | 9/20/08 | 500 bp | 27,550 |
|
34
| CREDIT DEFAULT CONTRACTS OUTSTANDING at 8/31/06 continued | | | |
|
| | Upfront | | | Fixed payments | Unrealized |
| Swap counterparty / | premium | Notional | Termination | received (paid) by | appreciation/ |
| Referenced debt* | received (paid)** | amount | date | fund per annum | (depreciation) |
|
| Morgan Stanley Capital Services, Inc. | | | | | |
| Bombardier, Inc, 6 3/4%, 5/1/12 | — | $2,910,000 | 3/20/11 | 355 bp | $ 133,478 |
|
| Ford Motor Co., 7.45%, 7/16/31 | — | 810,000 | 9/20/07 | (345 bp) | (8,342) |
|
| Ford Motor Co., 7.45%, 7/16/31 | — | 810,000 | 9/20/08 | 560 bp | 14,801 |
|
| General Motors Corp., 7 1/8%, 7/15/13 | — | 810,000 | 9/20/07 | (335 bp) | (7,474) |
|
| General Motors Corp., 7 1/8%, 7/15/13 | — | 810,000 | 9/20/08 | 500 bp | 11,531 |
|
| Lear Corp., 8.11%, 5/15/09 | — | 2,925,000 | 6/20/08 | 660 bp | 193,323 |
|
| Visteon Corp., 7%, 3/10/14 | — | 1,755,972 | 6/20/09 | 535 bp | 105,356 |
|
| Total | | | | | $2,054,605 |
* Payments related to the referenced debt are made upon a credit default event.
** Upfront premium is based on the difference between the original spread on issue and the market spread on day of execution.
(a) Terminating on the date on which the notional amount is reduced to zero or the date on which the assets securing the reference entity are liquidated.
The accompanying notes are an integral part of these financial statements.
35
| Statement of assets and liabilities 8/31/06 | |
|
| |
| ASSETS | |
|
| Investment in securities, at value, including $60,059,109 of securities on loan (Note 1): | |
| Unaffiliated issuers (identified cost $2,256,174,477) | $ 2,190,029,663 |
| Affiliated issuers (identified cost $109,513,900) (Notes 5 and 7) | 94,661,664 |
|
| Cash | 4,566,027 |
|
| Dividends, interest and other receivables | 42,505,631 |
|
| Receivable for shares of the fund sold | 748,456 |
|
| Receivable for securities sold | 27,154,278 |
|
| Receivable for open forward currency contracts (Note 1) | 733,721 |
|
| Receivable for closed forward currency contracts (Note 1) | 312,814 |
|
| Unrealized appreciation on swap contracts (Note 1) | 2,539,756 |
|
| Receivable for closed swap contracts (Note 1) | 428,804 |
|
| Total assets | 2,363,680,814 |
|
| |
| LIABILITIES | |
|
| Payable for securities purchased | 16,298,424 |
|
| Payable to subcustodian (Note 2) | 762 |
|
| Payable for shares of the fund repurchased | 3,277,421 |
|
| Payable for compensation of Manager (Notes 2 and 5) | 3,292,918 |
|
| Payable for investor servicing and custodian fees (Note 2) | 250,003 |
|
| Payable for Trustee compensation and expenses (Note 2) | 363,480 |
|
| Payable for administrative services (Note 2) | 2,695 |
|
| Payable for distribution fees (Note 2) | 1,058,668 |
|
| Payable for open forward currency contracts (Note 1) | 16,053 |
|
| Payable for closed forward currency contracts (Note 1) | 17,812 |
|
| Unrealized depreciation on swap contracts (Note 1) | 485,151 |
|
| Collateral on securities loaned, at value (Note 1) | 61,549,100 |
|
| Other accrued expenses | 331,907 |
|
| Total liabilities | 86,944,394 |
|
| Net assets | $ 2,276,736,420 |
|
| |
| REPRESENTED BY | |
|
| Paid-in capital (Unlimited shares authorized) (Notes 1 and 4) | $ 4,107,716,825 |
|
| Undistributed net investment income (Note 1) | 289,627 |
|
| Accumulated net realized loss on investments and foreign currency transactions (Note 1) | (1,753,029,207) |
|
| Net unrealized depreciation of investments and assets and liabilities in foreign currencies | (78,240,825) |
|
| Total — Representing net assets applicable to capital shares outstanding | $ 2,276,736,420 |
| |
| (Continued on next page) | |
36
| Statement of assets and liabilities (Continued) | |
|
| |
| COMPUTATION OF NET ASSET VALUE AND OFFERING PRICE | |
|
| Net asset value and redemption price per class A share ($1,657,356,777 divided by 210,462,810 shares) | $7.87 |
|
| Offering price per class A share (100/96.25 of $7.87)* | $8.18 |
|
| Net asset value and offering price per class B share ($342,227,378 divided by 43,655,171 shares)** | $7.84 |
|
| Net asset value and offering price per class C share ($63,687,130 divided by 8,126,461 shares)** | $7.84 |
|
| Net asset value and redemption price per class M share ($19,785,045 divided by 2,509,512 shares) | $7.88 |
|
| Offering price per class M share (100/96.75 of $7.88)*** | $8.14 |
|
| Net asset value, offering price and redemption price per class R share ($390,188 divided by 49,723 shares) | $7.85 |
|
| Net asset value, offering price and redemption price per class Y share ($193,289,902 divided by 24,697,020 shares) | $7.83 |
* On single retail sales of less than $100,000. On sales of $100,000 or more and on group sales, the offering price is reduced.
** Redemption price per share is equal to net asset value less any applicable contingent deferred sales charge.
*** On single retail sales of less than $50,000. On sales of $50,000 or more and on group sales, the offering price is reduced.
The accompanying notes are an integral part of these financial statements.
37
| Statement of operations Year ended 8/31/06 | |
|
| |
| INVESTMENT INCOME | |
|
| Interest (including interest income of $3,251,180 from investments in affiliated issuers) (Note 5) | $195,097,237 |
|
| Dividends (net of foreign tax of $8,538)(including dividends of $769,681 from investments in affiliated issuers) (Note 7) | 4,840,334 |
|
| Securities lending | 54,307 |
|
| Total investment income | 199,991,878 |
|
| |
| EXPENSES | |
|
| Compensation of Manager (Note 2) | 13,870,590 |
|
| Investor servicing fees (Note 2) | 3,593,375 |
|
| Custodian fees (Note 2) | 247,504 |
|
| Trustee compensation and expenses (Note 2) | 117,069 |
|
| Administrative services (Note 2) | 48,680 |
|
| Distribution fees — Class A (Note 2) | 4,251,856 |
|
| Distribution fees — Class B (Note 2) | 4,410,219 |
|
| Distribution fees — Class C (Note 2) | 639,040 |
|
| Distribution fees — Class M (Note 2) | 101,665 |
|
| Distribution fees — Class R (Note 2) | 1,827 |
|
| Other | 749,884 |
|
| Non-recurring costs (Notes 2 and 8) | 28,580 |
|
| Costs assumed by Manager (Notes 2 and 8) | (28,580) |
|
| Fees waived and reimbursed by Manager or affiliate (Notes 5 and 8) | (213,514) |
|
| Total expenses | 27,818,195 |
|
| Expense reduction (Note 2) | (357,590) |
|
| Net expenses | 27,460,605 |
|
| Net investment income | 172,531,273 |
|
| Net realized loss on investments (Notes 1 and 3) | (11,448,567) |
|
| Net realized gain on swap contracts (Note 1) | 2,251,378 |
|
| Net realized loss on foreign currency transactions (Note 1) | (1,661,511) |
|
| Net unrealized appreciation of assets and liabilities in foreign currencies during the year | 905,246 |
|
| Net unrealized depreciation of investments and swap contracts during the year | (58,712,409) |
|
| Net loss on investments | (68,665,863) |
|
| Net increase in net assets resulting from operations | $103,865,410 |
The accompanying notes are an integral part of these financial statements.
38
| Statement of changes in net assets | | |
|
| |
| DECREASE IN NET ASSETS | | |
|
| | Year ended | Year ended |
| | 8/31/06 | 8/31/05 |
|
| Operations: | | |
| Net investment income | $ 172,531,273 | $ 193,336,600 |
|
| Net realized loss on investments and foreign currency transactions | (10,858,700) | (14,019,158) |
|
| Net unrealized appreciation (depreciation) of investments | (57,807,163) | 68,197,018 |
|
| Net increase in net assets resulting from operations | 103,865,410 | 247,514,460 |
|
| Distributions to shareholders: (Note 1) | | |
|
| From net investment income | | |
|
| Class A | (125,685,964) | (141,696,417) |
|
| Class B | (29,512,327) | (41,020,973) |
|
| Class C | (4,259,739) | (4,883,365) |
|
| Class M | (1,441,939) | (1,822,697) |
|
| Class R | (27,131) | (22,583) |
|
| Class Y | (15,394,349) | (16,596,564) |
|
| Redemption fees (Note 1) | 161,964 | 135,909 |
|
| Decrease from capital share transactions (Note 4) | (367,759,383) | (255,484,666) |
|
| Total decrease in net assets | (440,053,458) | (213,876,896) |
|
| |
| NET ASSETS | | |
|
| Beginning of year | 2,716,789,878 | 2,930,666,774 |
|
| End of year (including undistributed net investment income and distributions in excess | | |
| of net investment income of $289,627 and $6,258,021, respectively) | $2,276,736,420 | $2,716,789,878 |
The accompanying notes are an integral part of these financial statements.
39
| Financial highlights (For a common share outstanding throughout the period) | | | | | | | | | | |
|
| |
| |
| INVESTMENT OPERATIONS: | | | | | LESS DISTRIBUTIONS: | | | | | | RATIOS AND SUPPLEMENTAL DATA: | |
| | | | Net | | | | | | | Total | | | Ratio of net | |
| | Net asset | | realized and | Total | From | | | | Net asset | return | Net | Ratio of | investment | |
| | value, | Net | unrealized | from | net | From | | | value, | at net | assets, | expenses to | income | Portfolio |
| | beginning | investment | gain (loss) on | investment | investment | return of | Total | Redemption | end | asset | end of period | average net | to average | turnover |
| Period ended | of period | income(a) | investments | operations | income | capital | distributions | fees | of period | value (%)(b) | (in thousands) | assets (%)(c) | net assets (%) | (%) |
|
| CLASS A | | | | | | | | | | | | | | |
| August 31, 2006 | $8.10 | .58(d,e) | (.22) | .36 | (.59) | — | (.59) | —(f) | $7.87 | 4.64(e) | $1,657,357 | 1.01(d,e) | 7.26(d,e) | 45.50 |
| August 31, 2005 | 7.98 | .56(d) | .16 | .72 | (.60) | — | (.60) | —(f) | 8.10 | 9.28 | 1,851,371 | .97(d) | 6.94(d) | 41.21 |
| August 31, 2004 | 7.55 | .59(d) | .43 | 1.02 | (.59) | — | (.59) | —(f) | 7.98 | 13.95 | 1,924,073 | .99(d) | 7.55(d) | 61.68 |
| August 31, 2003 | 6.86 | .67 | .71 | 1.38 | (.69) | — | (.69) | — | 7.55 | 21.27 | 2,271,756 | .98 | 9.41 | 75.18 |
| August 31, 2002 | 8.10 | .77 | (1.15) | (.38) | (.81) | (.05) | (.86) | — | 6.86 | (5.10) | 1,814,979 | 1.01 | 10.37 | 74.29(g) |
|
| |
| CLASS B | | | | | | | | | | | | | | |
| August 31, 2006 | $8.06 | .51(d,e) | (.20) | .31 | (.53) | — | (.53) | —(f) | $7.84 | 3.99(e) | $342,227 | 1.76(d,e) | 6.52(d,e) | 45.50 |
| August 31, 2005 | 7.94 | .50(d) | .16 | .66 | (.54) | — | (.54) | —(f) | 8.06 | 8.49 | 543,515 | 1.72(d) | 6.19(d) | 41.21 |
| August 31, 2004 | 7.52 | .53(d) | .42 | .95 | (.53) | — | (.53) | —(f) | 7.94 | 13.01 | 672,232 | 1.74(d) | 6.80(d) | 61.68 |
| August 31, 2003 | 6.84 | .62 | .70 | 1.32 | (.64) | — | (.64) | — | 7.52 | 20.31 | 879,566 | 1.73 | 8.67 | 75.18 |
| August 31, 2002 | 8.07 | .71 | (1.14) | (.43) | (.76) | (.04) | (.80) | — | 6.84 | (5.69) | 793,713 | 1.76 | 9.40 | 74.29(g) |
|
| |
| CLASS C | | | | | | | | | | | | | | |
| August 31, 2006 | $8.06 | .51(d,e) | (.20) | .31 | (.53) | — | (.53) | —(f) | $7.84 | 4.02(e) | $63,687 | 1.76(d,e) | 6.50(d,e) | 45.50 |
| August 31, 2005 | 7.95 | .50(d) | .15 | .65 | (.54) | — | (.54) | —(f) | 8.06 | 8.39 | 75,498 | 1.72(d) | 6.18(d) | 41.21 |
| August 31, 2004 | 7.52 | .54(d) | .42 | .96 | (.53) | — | (.53) | —(f) | 7.95 | 13.15 | 63,866 | 1.74(d) | 6.80(d) | 61.68 |
| August 31, 2003 | 6.85 | .62 | .68 | 1.30 | (.63) | — | (.63) | — | 7.52 | 20.08 | 87,008 | 1.73 | 8.49 | 75.18 |
| August 31, 2002 † | 7.60 | .29 | (.74) | (.45) | (.28) | (.02) | (.30) | — | 6.85 | (6.03)* | 48,587 | .80* | 4.17* | 74.29(g) |
|
| |
| CLASS M | | | | | | | | | | | | | | |
| August 31, 2006 | $8.10 | .56(d,e) | (.22) | .34 | (.56) | — | (.56) | —(f) | $7.88 | 4.46(e) | $19,785 | 1.26(d,e) | 7.00(d,e) | 45.50 |
| August 31, 2005 | 7.98 | .54(d) | .15 | .69 | (.57) | — | (.57) | —(f) | 8.10 | 8.95 | 23,265 | 1.22(d) | 6.69(d) | 41.21 |
| August 31, 2004 | 7.55 | .57(d) | .43 | 1.00 | (.57) | — | (.57) | —(f) | 7.98 | 13.64 | 26,295 | 1.24(d) | 7.28(d) | 61.68 |
| August 31, 2003 | 6.87 | .65 | .70 | 1.35 | (.67) | — | (.67) | — | 7.55 | 20.80 | 45,017 | 1.23 | 9.12 | 75.18 |
| August 31, 2002 | 8.10 | .75 | (1.15) | (.40) | (.79) | (.04) | (.83) | — | 6.87 | (5.23) | 34,917 | 1.26 | 9.79 | 74.29(g) |
|
| |
| CLASS R | | | | | | | | | | | | | | |
| August 31, 2006 | $8.08 | .55(d,e) | (.21) | .34 | (.57) | — | (.57) | —(f) | $7.85 | 4.37(e) | $390 | 1.26(d,e) | 7.00(d,e) | 45.50 |
| August 31, 2005 | 7.98 | .53(d) | .15 | .68 | (.58) | — | (.58) | —(f) | 8.08 | 8.79 | 905 | 1.22(d) | 6.60(d) | 41.21 |
| August 31, 2004 | 7.55 | .58(d) | .42 | 1.00 | (.57) | — | (.57) | —(f) | 7.98 | 13.64 | 70 | 1.24(d) | 7.29(d) | 61.68 |
| August 31, 2003 †† | 6.99 | .40 | .54 | .94 | (.38) | — | (.38) | — | 7.55 | 13.76* | 46 | .75* | 5.59* | 75.18 |
|
| |
| CLASS Y | | | | | | | | | | | | | | |
| August 31, 2006 | $8.06 | .59(d,e) | (.21) | .38 | (.61) | — | (.61) | —(f) | $7.83 | 4.99(e) | $193,290 | .76(d,e) | 7.51(d,e) | 45.50 |
| August 31, 2005 | 7.96 | .58(d) | .14 | .72 | (.62) | — | (.62) | —(f) | 8.06 | 9.37 | 222,236 | .72(d) | 7.19(d) | 41.21 |
| August 31, 2004 | 7.53 | .61(d) | .44 | 1.05 | (.62) | — | (.62) | —(f) | 7.96 | 14.34 | 244,131 | .74(d) | 7.81(d) | 61.68 |
| August 31, 2003 | 6.85 | .68 | .71 | 1.39 | (.71) | — | (.71) | — | 7.53 | 21.45 | 220,883 | .73 | 9.57 | 75.18 |
| August 31, 2002 | 8.09 | .77 | (1.13) | (.36) | (.83) | (.05) | (.88) | — | 6.85 | (4.84) | 132,382 | .76 | 10.05 | 74.29(g) |
|
| |
| |
| See notes to financial highlights at the end of this section. | | | | | | | | | | | | |
The accompanying notes are an integral part of these financial statements.
40 41
Financial highlights (Continued)
* Not annualized.
† For the period March 19, 2002 (commencement of operations) to August 31, 2002.
††For the period January 21, 2003 (commencement of operations) to August 31, 2003.
(a) Per share net investment income (loss) has been determined on the basis of the weighted average number of shares outstanding during the period.
(b) Total return assumes dividend reinvestment and does not reflect the effect of sales charges.
(c) Includes amounts paid through expense offset and brokerage service arrangements (Note 2).
(d) Reflects waivers of certain fund expenses in connection with investments in Putnam Prime Market Fund during the period. As a result of such waivers, the expenses of each class, as a percentage of its net assets, reflect a reduction of the following amounts (Note 5):
| | 8/31/06 | 8/31/05 | 8/31/04 |
|
| Class A | <0.01% | <0.01% | <0.01% |
|
| Class B | <0.01 | <0.01 | <0.01 |
|
| Class C | <0.01 | <0.01 | <0.01 |
|
| Class M | <0.01 | <0.01 | <0.01 |
|
| Class R | <0.01 | <0.01 | <0.01 |
|
| Class Y | <0.01 | <0.01 | <0.01 |
|
(e) Reflects a non-recurring reimbursement from Putnam Investments relating to the calculation of certain amounts paid by the fund to Putnam in previous years for transfer agent services, which amounted to the following amounts for the period ended August 31, 2006 (Note 8):
| | | Percentage of |
| | Per share | net assets |
|
| Class A | <$0.01 | 0.01% |
|
| Class B | <0.01 | 0.01 |
|
| Class C | <0.01 | 0.01 |
|
| Class M | <0.01 | 0.01 |
|
| Class R | <0.01 | <0.01 |
|
| Class Y | <0.01 | 0.01 |
|
(f) Amount represents less than $0.01 per share.
(g) Portfolio turnover excludes the impact of assets received from the acquisition of Putnam High Yield Trust II.
The accompanying notes are an integral part of these financial statements.
42
Notes to financial statements 8/31/06
Note 1: Significant accounting policies
Putnam High Yield Trust (the “fund”), a Massachusetts business trust, is registered under the Investment Company Act of 1940, as amended, as a diversified, open-end management investment company. The fund seeks high current income by investing primarily in high-yielding, lower-rated fixed-income securities. These securities may have a higher rate of default. Capital growth is a secondary goal when consistent with achieving high current income.
The fund offers class A, class B, class C, class M, class R and class Y shares. Class A and class M shares are sold with a maximum front-end sales charge of 3.75% and 3.25%, respectively, and generally do not pay a contingent deferred sales charge. Class B shares, which convert to class A shares after approximately eight years, do not pay a front-end sales charge and are subject to a contingent deferred sales charge, if those shares are redeemed within six years of purchase. Class C shares have a one-year 1.00% contingent deferred sales charge and do not convert to class A shares. Class R shares, which are offered to qualified employee-benefit plans, are sold without a front-end sales charge or a contingent deferred sales charge. The expenses for class A, class B, class C, class M and class R shares may differ based on the distribution fee of each class, which is identified in Note 2. Class Y shares, which are sold at net asset value, are generally subject to the sa me expenses as class A, class B, class C, class M and class R shares, but do not bear a distribution fee. Class Y shares are sold to certain eligible purchasers including certain defined contribution plans (including corporate IRAs), bank trust departments, trust companies and certain college savings plans.
A 2.00% redemption fee may apply to any shares that are redeemed (either by selling or exchanging into another fund) within 5 days of purchase. A 1.00% redemption fee would apply to any shares that are redeemed (either by selling or exchanging into another fund) within 6-90 days of purchase. The redemption fee is accounted for as an addition to paid-in-capital.
The redemption fees discussed above will be replaced, effective October 2, 2006, by a 1.00% redemption fee on any shares purchased on or after such date that are redeemed (either by selling or exchanging into another fund) within 90 days of purchase.
Investment income, realized and unrealized gains and losses and expenses of the fund are borne pro-rata based on the relative net assets of each class to the total net assets of the fund, except that each class bears expenses unique to that class (including the distribution fees applicable to such classes). Each class votes as a class only with respect to its own distribution plan or other matters on which a class vote is required by law or determined by the Trustees. Shares of each class would receive their pro-rata share of the net assets of the fund, if the fund were liquidated. In addition, the Trustees declare separate dividends on each class of shares.
In the normal course of business, the fund enters into contracts that may include agreements to indemnify another party under given circumstances. The fund’s maximum exposure under these arrangements is unknown as this would involve future claims that may be, but have not yet been, made against the fund. However, the fund expects the risk of material loss to be remote.
The following is a summary of significant accounting policies consistently followed by the fund in the preparation of its financial statements. The preparation of financial statements is inconformity with accounting principles generally accepted in the United States of America and requires management to make estimates and assumptions that affect the reported amounts of assets and liabilities in the financial statements and the reported amounts of increases and decreases in net assets from operations during the reporting period. Actual results could differ from those estimates.
A) Security valuation Investments for which market quotations are readily available are valued at the last reported sales price on their principal exchange, or official closing price for certain markets. If no sales are reported — as in the case of some securities traded over-the-counter — a security is valued at its last reported bid price. Market quotations are not considered to be readily available for certain debt obligations; such investments are valued on the basis of valuations furnished by an independent pricing service approved by the Trustees or dealers selected by Putnam Investment Management, LLC (“Putnam Management”), the fund’s manager, an indirect wholly-owned subsidiary of Putnam, LLC. Such services or dealers determine valuations for normal institutional-size trading units of such securities using methods based on market transactions for comparable securities and various relationships, gen erally recognized by institutional traders, between securities. Many securities markets and exchanges outside the U.S. close prior to the close of the New York Stock Exchange and therefore the closing prices for securities in such markets or on such exchanges may not fully reflect events that occur after such close but before the close of the New York Stock Exchange. Accordingly, on certain days, the fund will fair value foreign equity securities taking into account multiple factors, including movements in the U.S. securities markets. The number of days on which fair value prices will be used will depend on market activity and it is possible that fair value prices will be used by the fund to a significant extent. Securities quoted in foreign currencies, if any, are translated into U.S. dollars at the current exchange rate. Certain investments, including certain restricted securities, are valued at fair value following procedures approved by the Trustees. Such valuations and procedures are reviewed periodical ly by the Trustees. The fair value of securities is generally determined as the amount that the fund could reasonably expect to realize from an orderly disposition of such securities over a reasonable period of time. By its nature, a fair value price is a good faith estimate of the value of a security at a given point in time and does not reflect an actual market price, which may be different by a material amount.
B) Joint trading account Pursuant to an exemptive order from the Securities and Exchange Commission, the fund may transfer uninvested cash balances, including cash collateral received under security lending arrangements, into a joint trading account along with the cash of other registered investment companies and certain other accounts managed by Putnam Investment Management, LLC (“Putnam Management”), the fund’s manager, an indirect wholly-owned subsidiary of Putnam, LLC. These balances may be invested in issues of high-grade short-term investments having maturities of up to 397 days for collateral received under security lending arrangements and up to 90 days for other cash investments.
C) Repurchase agreements The fund, or any joint trading account, through its custodian, receives delivery of the underlying securities, the market value of which at the time of purchase is required to be in an amount at least equal to the resale price, including accrued interest. Collateral for certain tri-party repurchase agreements is held at the coun-terparty’s custodian in a segregated account for the benefit of the fund and the counterparty. Putnam Management is responsible for determining that the value of these underlying securities is at all times at least equal to the resale price, including accrued interest.
43
D) Security transactions and related investment income Security transactions are recorded on the trade date (the date the order to buy or sell is executed). Gains or losses on securities sold are determined on the identified cost basis.
Interest income is recorded on the accrual basis. Dividend income, net of applicable withholding taxes, is recognized on the ex-dividend date except that certain dividends from foreign securities, if any, are recognized as soon as the fund is informed of the ex-dividend date. Non-cash dividends, if any, are recorded at the fair market value of the securities received. Dividends representing a return of capital or capital gains, if any, are reflected as a reduction of cost and/or as a realized gain when the amounts are conclusively determined. All premiums/discounts are amortized/accreted on a yield-to-maturity basis.
The fund earned certain fees in connection with its senior loan purchasing activities. These fees are treated as market discount and are recorded as income in the statement of operations.
E) Foreign currency translation The accounting records of the fund are maintained in U.S. dollars. The market value of foreign securities, currency holdings, and other assets and liabilities are recorded in the books and records of the fund after translation to U.S. dollars based on the exchange rates on that day. The cost of each security is determined using historical exchange rates. Income and withholding taxes are translated at prevailing exchange rates when earned or incurred. The fund does not isolate that portion of realized or unrealized gains or losses resulting from changes in the foreign exchange rate on investments from fluctuations arising from changes in the market prices of the securities. Such gains and losses are included with the net realized and unrealized gain or loss on investments. Net realized gains and losses on foreign currency transactions represent net realized exchange gains or losses on closed forward currency contracts, disposition of foreign currencies, currency gains and losses realized between the trade and settlement dates on securities transactions and the difference between the amount of investment income and foreign withholding taxes recorded on the fund’s books and the U.S. dollar equivalent amounts actually received or paid. Net unrealized appreciation and depreciation of assets and liabilities in foreign currencies arise from changes in the value of open forward currency contracts and assets and liabilities other than investments at the period end, resulting from changes in the exchange rate. Investments in foreign securities involve certain risks, including those related to economic instability, unfavorable political developments, and currency fluctuations, not present with domestic investments.
F) Forward currency contracts The fund may buy and sell forward currency contracts, which are agreements between two parties to buy and sell currencies at a set price on a future date. These contracts are used to protect against a decline in value relative to the U.S. dollar of the currencies in which its portfolio securities are denominated or quoted (or an increase in the value of a currency in which securities a fund intends to buy are denominated, when a fund holds cash reserves and short term investments), or for other investment purposes. The U.S. dollar value of forward currency contracts is determined using current forward currency exchange rates supplied by a quotation service. The market value of the contract will fluctuate with changes in currency exchange rates. The contract is marked to market daily and the change in market value is recorded as an unrealized gain or loss. When the contract is closed, the fund records a realized gain or loss equal to the difference between the value of the contract at the time it was opened and the value at the time it was closed. The fund could be exposed to risk if the value of the currency changes unfavorably, if the counterparties to the contracts are unable to meet the terms of their contracts or if the fund is unable to enter into a closing position. Risks may exceed amounts recognized on the statement of assets and liabilities. Forward currency contracts outstanding at period end, if any, are listed after the fund’s portfolio.
G) Total return swap contracts The fund may enter into total return swap contracts, which are arrangements to exchange a market linked return for a periodic payment, both based on a notional principal amount. To the extent that the total return of the security, index or other financial measure underlying the transaction exceeds or falls short of the offsetting interest rate obligation, the fund will receive a payment from or make a payment to the counterparty. Total return swap contracts are marked to market daily based upon quotations from market makers and the change, if any, is recorded as unrealized gain or loss. Payments received or made are recorded as realized gains or loss. Certain total return swap contracts may include extended effective dates. Income related to these swap contracts is accrued based on the terms of the contract. The fund could be exposed to credit or market risk due to unfavorable changes in the fluctuat ion of interest rates or in the price of the underlying security or index, the possibility that there is no liquid market for these agreements or that the counterparty may default on its obligation to perform. Risk of loss may exceed amounts recognized on the statement of assets and liabilities. Total return swap contracts outstanding at period end, if any, are listed after the fund’s portfolio.
H) Credit default contracts The fund may enter into credit default contracts where one party, the protection buyer, makes an upfront or periodic payment to a counter party, the protection seller, in exchange for the right to receive a contingent payment. The maximum amount of the payment may equal the notional amount, at par, of the underlying index or security as a result of a related credit event. An upfront payment received by the fund, as the protection seller, is recorded as a liability on the fund’s books. An upfront payment made by the fund, as the protection buyer, is recorded as an asset on the fund’s books. Periodic payments received or paid by the fund are recorded as realized gains or losses. The credit default contracts are marked to market daily based upon quotations from an independent pricing service or market makers and the change, if any, is recorded as unrealized gain or loss. Payments received or made as a result of a credit event or termination of the contract are recognized, net of a proportional amount of the upfront payment, as realized gains or losses. In addition to bearing the risk that the credit event will occur, the fund could be exposed to market risk due to unfavorable changes in interest rates or in the price of the underlying security or index, the possibility that the fund may be unable to close out its position at the same time or at the same price as if it had purchased comparable publicly traded securities or that the counterparty may default on its obligation to perform. Risks of loss may exceed amounts recognized on the statement of assets and liabilities. Credit default contracts outstanding at period end, if any, are listed after the fund’s portfolio.
I) Security lending The fund may lend securities, through its agents, to qualified borrowers in order to earn additional income. The loans are collateralized by cash and/or securities in an amount at least equal to the market value of the securities loaned. The market value of securities loaned is determined daily and any additional required collateral is allocated to the fund on the next business day. The risk of borrower default will be borne by the fund’s agents; the fund will bear the risk of loss with
44
respect to the investment of the cash collateral. Income from securities lending is included in investment income on the statement of operations. At August 31, 2006, the value of securities loaned amounted to $60,059,109. The fund received cash collateral of $61,549,100 which is pooled with collateral of other Putnam funds into 42 issues of high grade short-term investments.
J) Federal taxes It is the policy of the fund to distribute all of its taxable income within the prescribed time and otherwise comply with the provisions of the Internal Revenue Code of 1986 (the “Code”) applicable to regulated investment companies. It is also the intention of the fund to distribute an amount sufficient to avoid imposition of any excise tax under Section 4982 of the Code, as amended. Therefore, no provision has been made for federal taxes on income, capital gains or unrealized appreciation on securities held nor for excise tax on income and capital gains.
At August 31, 2006, the fund had a capital loss carryover of $1,727,813,678 available to the extent allowed by the Code to offset future net capital gain, if any. The amount of the carryover and the expiration dates are:
| Loss Carryover | Expiration |
| $135,892,331 | August 31, 2007 |
|
| 339,129,540 | August 31. 2008 |
|
| 305,968,663 | August 31, 2009 |
|
| 298,606,980 | August 31, 2010 |
|
| 498,097,278 | August 31, 2011 |
|
| 60,420,545 | August 31, 2012 |
|
| 76,026,159 | August 31, 2013 |
|
| 13,672,182 | August 31, 2014 |
|
Pursuant to federal income tax regulations applicable to regulated investment companies, the fund has elected to defer to its fiscal year ending August 31, 2007 $23,250,705 of losses recognized during the period November 1, 2005 to August 31, 2006.
K) Distributions to shareholders Distributions to shareholders from net investment income are recorded by the fund on the ex-dividend date. Distributions from capital gains, if any, are recorded on the ex-dividend date and paid at least annually. The amount and character of income and gains to be distributed are determined in accordance with income tax regulations, which may differ from generally accepted accounting principles.
These differences include temporary and permanent differences of losses on wash sale transactions, foreign currency gains and losses, the expiration of a capital loss carryover, income on swap contract, amortization and accretion and partnerships. Reclassifications are made to the fund’s capital accounts to reflect income and gains available for distribution (or available capital loss carryovers) under income tax regulations. For the year ended August 31, 2006, the fund reclassified $10,337,824 to increase undistributed net investment income and $13,856,531 to decrease paid-in-capital, with an decrease to accumulated net realized losses of $3,518,707.
The tax basis components of distributable earnings and the federal tax cost as of August 31, 2006 were as follows:
| Unrealized appreciation | $ 47,070,350 |
| Unrealized depreciation | (133,243,030) |
| | ——————————————— |
| Net unrealized depreciation | (86,172,680) |
| Undistributed ordinary income | 7,329,421 |
| Capital loss carryforward | (1,727,813,678) |
| Post-October loss | (23,250,705) |
| Cost for federal income tax purposes | $ 2,370,864,007 |
Note 2: Management fee, administrative services and other transactions
Putnam Management is paid for management and investment advisory services quarterly based on the average net assets of the fund. Such fee is based on the following annual rates: 0.70% of the first $500 million of average net assets, 0.60% of the next $500 million, 0.55% of the next $500 million, 0.50% of the next $5 billion, 0.475% of the next $5 billion, 0.455% of the next $5 billion, 0.44% of the next $5 billion, and 0.43% thereafter.
Putnam Management has agreed to waive fees and reimburse expenses of the fund through August 31, 2007 to the extent necessary to ensure that the fund’s expenses do not exceed the simple average of the expenses of all front-end load funds viewed by Lipper Inc. as having the same investment classification or objective as the fund. The expense reimbursement is based on a comparison of the fund’s expenses with the average annualized operating expenses of the funds in its Lipper peer group for each calendar quarter during the fund’s last fiscal year, excluding 12b-1 fees and without giving effect to any expense offset and brokerage service arrangements that may reduce fund expenses. For the year ended August 31, 2006, Putnam Management did not waive any of its management fee from the fund.
For the year ended August 31, 2006, Putnam Management has assumed $28,580 of legal, shareholder servicing and communication, audit and Trustee fees incurred by the fund in connection with certain legal and regulatory matters (including those described in Note 8).
Putnam Investments Limited (“PIL”), an affiliate of Putnam Management, is authorized by the Trustees to manage a separate portion of the assets of the fund as determined by Putnam Management from time to time. Putnam Management pays a quarterly sub-management fee to PIL for its services at an annual rate of 0.40% of the average net assets of the portion of the fund managed by PIL.
The fund reimburses Putnam Management an allocated amount for the compensation and related expenses of certain officers of the fund and their staff who provide administrative services to the fund. The aggregate amount of all such reimbursements is determined annually by the Trustees.
Custodial functions for the fund’s assets are provided by Putnam Fiduciary Trust Company (“PFTC”), a subsidiary of Putnam, LLC. PFTC receives fees for custody services based on the fund’s asset level, the number of its security holdings and transaction volumes. Putnam Investor Services, a division of PFTC, provides investor servicing agent functions to the fund. Putnam Investor Services receives fees for investor servicing based on the number of shareholder accounts in the fund and the level of defined contribution plan assets in the fund. During the year ended August 31, 2006, the fund incurred $3,840,879 for these services.
Under the subcustodian contract between the subcustodian bank and PFTC, the subcustodian bank has a lien on the securities of the fund to the extent permitted by the fund’s investment restrictions to cover any advances made by the subcustodian bank for the settlement of securities
45
purchased by the fund. At August 31, 2006, the payable to the subcusto-dian bank represents the amount due for cash advanced for the settlement of securities purchased.
The fund has entered into an arrangement with PFTC whereby credits realized as a result of uninvested cash balances are used to reduce a portion of the fund’s expenses. For the year ended August 31, 2006, the fund’s expenses were reduced by $357,590 under these arrangements.
Each independent Trustee of the fund receives an annual Trustee fee, of which $706, as a quarterly retainer, has been allocated to the fund, and an additional fee for each Trustees meeting attended. Trustees receive additional fees for attendance at certain committee meetings, industry seminars and for certain compliance-related matters. Trustees also are reimbursed for expenses they incur relating to their services as Trustees. George Putnam, III, who is not an independent Trustee, also receives the foregoing fees for his services as Trustee.
The fund has adopted a Trustee Fee Deferral Plan (the “Deferral Plan”) which allows the Trustees to defer the receipt of all or a portion of Trustees fees payable on or after July 1, 1995. The deferred fees remain invested in certain Putnam funds until distribution in accordance with the Deferral Plan.
The fund has adopted an unfunded noncontributory defined benefit pension plan (the “Pension Plan”) covering all Trustees of the fund who have served as a Trustee for at least five years and were first elected prior to 2004. Benefits under the Pension Plan are equal to 50% of the Trustee’s average annual attendance and retainer fees for the three years ended December 31, 2005. Pension expense for the fund is included in Trustee compensation and expenses in the statement of operations. Accrued pension liability is included in Payable for Trustee compensation and expenses in the statement of assets and liabilities. The Trustees have terminated the Pension Plan with respect to any Trustee first elected after 2003.
The fund has adopted distribution plans (the “Plans”) with respect to its class A, class B, class C, class M and class R shares pursuant to Rule 12b-1 under the Investment Company Act of 1940. The purpose of the Plans is to compensate Putnam Retail Management, a wholly-owned subsidiary of Putnam, LLC and Putnam Retail Management GP, Inc., for services provided and expenses incurred in distributing shares of the fund. The Plans provide for payments by the fund to Putnam Retail Management at an annual rate of up to 0.35%, 1.00%, 1.00% , 1.00% and 1.00% of the average net assets attributable to class A, class B, class C, class M and class R shares, respectively. The Trustees have approved payment by the fund at an annual rate of 0.25%, 1.00%, 1.00%, 0.50% and 0.50% of the average net assets attributable to class A, class B, class C, class M and class R shares, respectively.
For the year ended August 31, 2006, Putnam Retail Management, acting as underwriter, received net commissions of $102,171 and $1,023 from the sale of class A and class M shares, respectively, and received $519,601 and $9,205 in contingent deferred sales charges from redemptions of class B and class C shares, respectively.
A deferred sales charge of up to 1.00% and 0.40% is assessed on certain redemptions of class A and class M shares, respectively. For the year ended August 31, 2006, Putnam Retail Management, acting as underwriter, received $4,366 and no monies on class A and class M redemptions, respectively.
Note 3: Purchases and sales of securities
During the year ended August 31, 2006, cost of purchases and proceeds from sales of investment securities other than short-term investments aggregated $1,053,133,902 and $1,457,805,631, respectively. There were no purchases or sales of U.S. government securities.
Note 4: Capital shares
At August 31, 2006, there was an unlimited number of shares of beneficial interest authorized. Transactions in capital shares were as follows:
| CLASS A | Shares | Amount |
|
| Year ended 8/31/06: | | |
| Shares sold | 32,882,015 | $ 260,320,912 |
|
| Shares issued in connection with | | |
| reinvestment of distributions | 10,772,141 | 85,099,714 |
|
| | 43,654,156 | 345,420,626 |
|
| Shares repurchased | (61,729,443) | (489,662,809) |
|
| Net decrease | (18,075,287) | $(144,242,183) |
| |
| Year ended 8/31/05: | | |
| Shares sold | 34,129,759 | $ 276,210,409 |
|
| Shares issued in connection with | | |
| reinvestment of distributions | 11,676,779 | 94,204,035 |
|
| | 45,806,538 | 370,414,444 |
|
| Shares repurchased | (58,276,775) | (470,672,448) |
|
| Net decrease | (12,470,237) | $ (100,258,004) |
|
| |
| CLASS B | Shares | Amount |
|
| Year ended 8/31/06: | | |
| Shares sold | 5,991,939 | $ 47,093,805 |
|
| Shares issued in connection with | | |
| reinvestment of distributions | 2,244,383 | 17,662,560 |
|
| | 8,236,322 | 64,756,365 |
|
| Shares repurchased | (32,002,007) | (252,477,971) |
|
| Net decrease | (23,765,685) | $(187,721,606) |
| |
| Year ended 8/31/05: | | |
| Shares sold | 9,250,146 | $ 74,436,761 |
|
| Shares issued in connection with | | |
| reinvestment of distributions | 3,076,346 | 24,717,765 |
|
| | 12,326,492 | 99,154,526 |
|
| Shares repurchased | (29,525,955) | (237,581,625) |
|
| Net decrease | (17,199,463) | $(138,427,099) |
46
| CLASS C | Shares | Amount |
|
| Year ended 8/31/06: | | |
| Shares sold | 4,684,738 | $ 36,726,008 |
|
| Shares issued in connection with | | |
| reinvestment of distributions | 366,126 | 2,882,270 |
|
| | 5,050,864 | 39,608,278 |
|
| Shares repurchased | (6,286,019) | (49,728,415) |
|
| Net decrease | (1,235,155) | $(10,120,137) |
| |
| Year ended 8/31/05: | | |
| Shares sold | 5,983,875 | $ 48,108,078 |
|
| Shares issued in connection with | | |
| reinvestment of distributions | 402,757 | 3,242,423 |
|
| | 6,386,632 | 51,350,501 |
|
| Shares repurchased | (5,057,627) | (40,645,327) |
|
| Net increase | 1,329,005 | $ 10,705,174 |
|
| |
| CLASS M | Shares | Amount |
|
| Year ended 8/31/06: | | |
| Shares sold | 626,136 | $ 4,943,215 |
|
| Shares issued in connection with | | |
| reinvestment of distributions | 120,692 | 954,586 |
|
| | 746,828 | 5,897,801 |
|
| Shares repurchased | (1,108,089) | (8,811,632) |
|
| Net decrease | (361,261) | $ (2,913,831) |
| |
| Year ended 8/31/05: | | |
| Shares sold | 769,127 | $ 6,306,819 |
|
| Shares issued in connection with | | |
| reinvestment of distributions | 152,563 | 1,131,548 |
|
| | 921,690 | 7,438,367 |
|
| Shares repurchased | (1,344,815) | (10,885,302) |
|
| Net decrease | (423,125) | $ (3,446,935) |
|
| |
| CLASS R | Shares | Amount |
|
| Year ended 8/31/06: | | |
| Shares sold | 34,612 | $ 273,915 |
|
| Shares issued in connection with | | |
| reinvestment of distributions | 3,435 | 27,111 |
|
| | 38,047 | 301,026 |
|
| Shares repurchased | (100,345) | (799,441) |
|
| Net decrease | (62,298) | $(498,415) |
| |
| Year ended 8/31/05: | | |
| Shares sold | 119,750 | $ 952,653 |
|
| Shares issued in connection with | | |
| reinvestment of distributions | 2,812 | 22,583 |
|
| | 122,562 | 975,236 |
|
| Shares repurchased | (19,293) | (155,450) |
|
| Net increase | 103,269 | $ 819,786 |
| CLASS Y | Shares | Amount |
|
| Year ended 8/31/06: | | |
| Shares sold | 5,417,658 | $ 42,809,889 |
|
| Shares issued in connection with | | |
| reinvestment of distributions | 1,955,308 | 15,360,483 |
|
| | 7,372,966 | 58,170,372 |
|
| Shares repurchased | (10,239,361) | (80,433,583) |
|
| Net decrease | (2,866,395) | $(22,263,211) |
| |
| Year ended 8/31/05: | | |
| Shares sold | 7,058,372 | $ 55,875,236 |
|
| Shares issued in connection | | |
| with reinvestment of distributions | 1,916,346 | 16,596,564 |
|
| | 8,974,718 | 72,471,800 |
|
| Shares repurchased | (12,100,146) | (97,349,388) |
|
| Net decrease | (3,125,428) | $(24,877,588) |
Note 5: Investment in Putnam Prime Money Market Fund
The fund invests in Putnam Prime Money Market Fund, an open-end management investment company managed by Putnam Management. Management fees paid by the fund are reduced by an amount equal to the management and administrative services fees paid by Putnam Prime Money Market Fund with respect to assets invested by the fund in Putnam Prime Money Market Fund. For the period ended August 31, 2006, management fees paid were reduced by $86,462 relating to the fund’s investment in Putnam Prime Money Market Fund. Income distributions earned by the fund are recorded as income in the statement of operations and totaled $3,251,180 for the year ended August 31, 2006. During the year ended August 31, 2006, cost of purchases and cost of sales of investments in Putnam Prime Money Market Fund aggregated $785,373,029 and $776,817,839, respectively.
Note 6: Senior loan commitments
Senior loans are purchased or sold on a when-issued or delayed delivery basis and may be settled a month or more after the trade date, which from time to time can delay the actual investment of available cash balances; interest income is accrued based on the terms of the securities. Senior loans can be acquired through an agent, by assignment from another holder of the loan, or as a participation interest in another holder’s portion of the loan. When the fund invests in a loan or participation, the fund is subject to the risk that an intermediate participant between the fund and the borrower will fail to meet its obligations to the fund, in addition to the risk that the borrower under the loan may default on its obligations.
47
Note 7: Transactions with affiliated issuers
Transactions during the year with companies in which the fund owned at least 5% of the voting securities were as follows:
| Affiliates | Purchase Cost | Sales Proceeds | Dividend Income | Market Value |
|
| Decrane Aircraft Holdings, Inc. | $— | $— | $— | $ 29 |
|
| DigitalGlobe, Inc. 144A | — | — | — | 641,531 |
|
| VFB LLC | — | — | — | 269,787 |
|
| XCL, Ltd. Equity Units | — | — | 769,681 | 6,812,039 |
|
| Total | $— | $— | $769,681 | $7,723,386 |
Market values are shown for those securities affiliated at period end.
Note 8: Regulatory matters and litigation
Putnam Management has entered into agreements with the Securities and Exchange Commission and the Massachusetts Securities Division settling charges connected with excessive short-term trading by Putnam employees and, in the case of the charges brought by the Massachusetts Securities Division, by participants in some Putnam-administered 401(k) plans. Pursuant to these settlement agreements, Putnam Management will pay a total of $193.5 million in penalties and restitution, with $153.5 million being paid to certain open-end funds and their shareholders. The amount will be allocated to shareholders and funds pursuant to a plan developed by an independent consultant, and will be paid following approval of the plan by the SEC and the Massachusetts Securities Division.
The Securities and Exchange Commission’s and Massachusetts Securities Division’s allegations and related matters also serve as the general basis for numerous lawsuits, including purported class action lawsuits filed against Putnam Management and certain related parties, including certain Putnam funds. Putnam Management will bear any costs incurred by Putnam funds in connection with these lawsuits. Putnam Management believes that the likelihood that the pending private lawsuits and purported class action lawsuits will have a material adverse financial impact on the fund is remote, and the pending actions are not likely to materially affect its ability to provide investment management services to its clients, including the Putnam funds.
In connection with a settlement between Putnam and the fund’s Trustees the fund received $127,052, during the period, from Putnam to address issues relating to the calculation of certain amounts paid by the Putnam mutual funds to Putnam for transfer agent services. This amount is included in Fees waived and reimbursed by Manager or affiliate on the Statement of operations.
Putnam Management and Putnam Retail Management are named as defendants in a civil suit in which the plaintiffs allege that the management and distribution fees paid by certain Putnam funds were excessive and seek recovery under the Investment Company Act of 1940. Putnam Management and Putnam Retail Management have contested the plaintiffs’ claims and the matter is currently pending in the U.S. District Court for the District of Massachusetts. Based on currently available information, Putnam Management believes that this action is without merit and that it is unlikely to have a material effect on Putnam Management’s and Putnam Retail Management’s ability to provide services to their clients, including the fund.
Note 9: New accounting pronouncement
In June 2006, FASB issued Interpretation No. 48, Accounting for Uncertainty in Income Taxes (the “Interpretation”). The Interpretation prescribes a minimum threshold for financial statement recognition of the benefit of a tax position taken or expected to be taken by a filer in the filer’s tax return. The Interpretation will become effective for fiscal years beginning after December 15, 2006 but will also apply to tax positions reflected in the fund’s financial statements as of that date. No determination has been made whether the adoption of the Interpretation will require the fund to make any adjustments to its net assets or have any other effect on the fund’s financial statements.
48
About the Trustees
Jameson A. Baxter (Born 1943), Trustee since 1994, Vice Chairman since 2005
Ms. Baxter is the President of Baxter Associates, Inc., a private investment firm that she founded in 1986.
Ms. Baxter serves as a Director of ASHTA Chemicals, Inc., Banta Corporation (a printing and digital imaging firm), Ryerson Tull, Inc. (a steel service corporation), the Mutual Fund Directors Forum, Advocate Health Care and BoardSource, formerly the National Center for Nonprofit Boards. She is Chairman Emeritus of the Board of Trustees, Mount Holyoke College, having served as Chairman for five years and as a board member for thirteen years. Until 2002, Ms. Baxter was a Director of Intermatic Corporation (a manufacturer of energy control products).
Ms. Baxter has held various positions in investment banking and corporate finance, including Vice President and Principal of the Regency Group, and Vice President of and Consultant to First Boston Corporation. She is a graduate of Mount Holyoke College.
Charles B. Curtis (Born 1940), Trustee since 2001
Mr. Curtis is President and Chief Operating Officer of the Nuclear Threat Initiative (a private foundation dealing with national security issues) and serves as Senior Advisor to the United Nations Foundation.
Mr. Curtis is a member of the Council on Foreign Relations and the Trustee Advisory Council of the Applied Physics Laboratory, Johns Hopkins University. Until 2003, Mr. Curtis was a member of the Electric Power Research Institute Advisory Council and the University of Chicago Board of Governors for Argonne National Laboratory. Prior to 2002, Mr. Curtis was a Member of the Board of Directors of the Gas Technology Institute and the Board of Directors of the Environment and Natural Resources Program Steering Committee, John F. Kennedy School of Government, Harvard University. Until 2001, Mr. Curtis was a member of the Department of Defense Policy Board and Director of EG&G Technical Services, Inc. (a fossil energy research and development support company).
From August 1997 to December 1999, Mr. Curtis was a Partner at Hogan & Hartson L.L.P., a Washington, D.C. law firm. Prior to May 1997, Mr. Curtis was Deputy Secretary of Energy and Under Secretary of the U.S. Department of Energy. He served as Chairman of the Federal Energy Regulatory Commission from 1977 to 1981 and has held positions on the staff of the U.S. House of Representatives, the U.S. Treasury Department, and the SEC.
Myra R. Drucker (Born 1948), Trustee since 2004
Ms. Drucker is Chair of the Board of Trustees of Commonfund (a not-for-profit firm specializing in asset management for educational endowments and foundations), Vice Chair of the Board of Trustees of Sarah Lawrence College, and a member of the Investment Committee of the Kresge Foundation (a charitable trust). She is also a director of New York Stock Exchange LLC, a wholly-owned subsidiary of the publicly-traded NYSE Group, Inc. She is an advisor to Hamilton Lane LLC and RCM Capital Management (investment management firms).
Ms. Drucker is an ex-officio member of the New York Stock Exchange (NYSE) Pension Managers Advisory Committee, having served as Chair for seven years and a member of the Executive Committee of the Committee on Investment of Employee Benefit Assets.
Until August 31, 2004, Ms. Drucker was Managing Director and a member of the Board of Directors of General Motors Asset Management and Chief Investment Officer of General Motors Trust Bank. Ms. Drucker also served as a member of the NYSE Corporate Accountability and Listing Standards Committee and the NYSE/NASD IPO Advisory Committee.
Prior to joining General Motors Asset Management in 2001, Ms. Drucker held various executive positions in the investment management industry. Ms. Drucker served as Chief Investment Officer of Xerox Corporation (a technology and service company in the document industry), where she was responsible for the investment of the company’s pension assets. Ms. Drucker was also Staff Vice President and Director of Trust Investments for International Paper (a paper, paper distribution, packaging and forest products company) and previously served as Manager of Trust Investments for Xerox Corporation. Ms. Drucker received a B.A. degree in Literature and Psychology from Sarah Lawrence College and pursued graduate studies in economics, statistics and portfolio theory at Temple University.
John A. Hill (Born 1942), Trustee since 1985 and Chairman since 2000
Mr. Hill is Vice Chairman of First Reserve Corporation, a private equity buyout firm that specializes in energy investments in the diversified worldwide energy industry.
Mr. Hill is a Director of Devon Energy Corporation, TransMontaigne Oil Company and various private companies controlled by First Reserve Corporation, as well as Chairman of TH Lee, Putnam Investment Trust (a closed-end investment company advised by an affiliate of Putnam Management). He is also a Trustee of Sarah Lawrence College. Until 2005, he was a Director of Continuum Health Partners of New York.
49
Prior to acquiring First Reserve Corporation in 1983, Mr. Hill held executive positions in investment banking and investment management with several firms and with the federal government, including Deputy Associate Director of the Office of Management and Budget and Deputy Director of the Federal Energy Administration. He is active in various business associations, including the Economic Club of New York, and lectures on energy issues in the United States and Europe. Mr. Hill holds a B.A. degree in Economics from Southern Methodist University and pursued graduate studies there as a Woodrow Wilson Fellow.
Paul L. Joskow (Born 1947), Trustee since 1997
Dr. Joskow is the Elizabeth and James Killian Professor of Economics and Management, and Director of the Center for Energy and Environmental Policy Research at the Massachusetts Institute of Technology.
Dr. Joskow serves as a Director of National Grid plc (a UK-based holding company with interests in electric and gas transmission and distribution and telecommunications infrastructure) and TransCanada Corporation (an energy company focused on natural gas transmission and power services). He also serves on the Board of Overseers of the Boston Symphony Orchestra. Prior to February 2005, he served on the board of the Whitehead Institute for Biomedical Research (a non-profit research institution) and has been President of the Yale University Council since 1993. Prior to February 2002, he was a Director of State Farm Indemnity Company (an automobile insurance company), and, prior to March 2000, he was a Director of New England Electric System (a public utility holding company).
Dr. Joskow has published five books and numerous articles on topics in industrial organization, government regulation of industry, and competition policy. He is active in industry restructuring, environmental, energy, competition and privatization policies — serving as an advisor to governments and corporations worldwide. Dr. Joskow holds a Ph.D. and M. Phil from Yale University and a B.A. from Cornell University.
Elizabeth T. Kennan (Born 1938), Trustee since 1992
Dr. Kennan is a Partner of Cambus-Kenneth Farm (thoroughbred horse and cattle breeding). She is President Emeritus of Mount Holyoke College.
Dr. Kennan served as Chairman and is now Lead Director of Northeast Utilities. Until 2005, she was a Director of Talbots, Inc. She has served as Director on a number of other boards, including Bell Atlantic, Chastain Real Estate, Shawmut Bank, Berkshire Life Insurance and Kentucky Home Life Insurance. She is a Trustee of the National Trust for Historic Preservation, of Centre College and of Midway College in Midway, Kentucky. Until 2006, she was a member of The Trustees of Reservations. Dr. Kennan has served on the oversight committee of the Folger Shakespeare Library, as President of Five Colleges Incorporated, as a Trustee of Notre Dame University and is active in various educational and civic associations.
As a member of the faculty of Catholic University for twelve years, until 1978, Dr. Kennan directed the post-doctoral program in Patristic and Medieval Studies, taught history and published numerous articles. Dr. Kennan holds a Ph.D. from the University of Washington in Seattle, an M.S. from St. Hilda’s College at Oxford University and an A.B. from Mount Holyoke College. She holds several honorary doctorates.
Robert E. Patterson (Born 1945), Trustee since 1984
Mr. Patterson is Senior Partner of Cabot Properties, L.P. and Chairman of Cabot Properties, Inc. (a private equity firm investing in commercial real estate).
Mr. Patterson serves as Chairman Emeritus and Trustee of the Joslin Diabetes Center and as a Director of Brandywine Trust Group, LLC. Prior to June 2003, he was a Trustee of Sea Education Association. Prior to December 2001, he was President and Trustee of Cabot Industrial Trust (a publicly traded real estate investment trust). Prior to February 1998, he was Executive Vice President and Director of Acquisitions of Cabot Partners Limited Partnership (a registered investment adviser involved in institutional real estate investments). Prior to 1990, he served as Executive Vice President of Cabot, Cabot & Forbes Realty Advisors, Inc. (the predecessor company of Cabot Partners).
Mr. Patterson practiced law and held various positions in state government and was the founding Executive Director of the Massachusetts Industrial Finance Agency. Mr. Patterson is a graduate of Harvard College and Harvard Law School.
W. Thomas Stephens (Born 1942), Trustee since 1997
Mr. Stephens is Chairman and Chief Executive Officer of Boise Cascade, L.L.C. (a paper, forest products and timberland assets company).
50
Until 2005, Mr. Stephens was a director of TransCanadaPipelines, Ltd. Until 2004, Mr. Stephens was a Director of Xcel Energy Incorporated (a public utility company), Qwest Communications, and Norske Canada, Inc. (a paper manufacturer). Until 2003, Mr. Stephens was a Director of Mail-Well, Inc. (a diversified printing company). He served as Chairman of Mail-Well until 2001 and as CEO of MacMillan-Bloedel, Ltd. (a forest products company) until 1999.
Prior to 1996, Mr. Stephens was Chairman and Chief Executive Officer of Johns Manville Corporation. He holds B.S. and M.S. degrees from the University of Arkansas.
Richard B. Worley (Born 1945), Trustee since 2004
Mr. Worley is Managing Partner of Permit Capital LLC, an investment management firm.
Mr. Worley serves on the Executive Committee of the University of Pennsylvania Medical Center, is a Trustee of The Robert Wood Johnson Foundation (a philanthropic organization devoted to health care issues) and is a Director of The Colonial Williamsburg Foundation (a historical preservation organization). Mr. Worley also serves on the investment committees of Mount Holyoke College and World Wildlife Fund (a wildlife conservation organization).
Prior to joining Permit Capital LLC in 2002, Mr. Worley served as Chief Strategic Officer of Morgan Stanley Investment Management. He previously served as President, Chief Executive Officer and Chief Investment Officer of Morgan Stanley Dean Witter Investment Management and as a Managing Director of Morgan Stanley, a financial services firm. Mr. Worley also was the Chairman of Miller Anderson & Sherrerd, an investment management firm.
Mr. Worley holds a B.S. degree from University of Tennessee and pursued graduate studies in economics at the University of Texas.
Charles E. Haldeman, Jr.* (Born 1948), Trustee since 2004
Mr. Haldeman is President and Chief Executive Officer of Putnam, LLC (“Putnam Investments”). He is a member of Putnam Investments’ Executive Board of Directors and Advisory Council. Prior to November 2003, Mr. Haldeman served as Co-Head of Putnam Investments’ Investment Division.
Prior to joining Putnam Investments in 2002, Mr. Haldeman held executive positions in the investment management industry. He previously served as Chief Executive Officer of Delaware Investments and President & Chief Operating Officer of United Asset Management. Mr. Haldeman was also a partner and director of Cooke & Bieler, Inc. (an investment management firm).
Mr. Haldeman currently serves on the Board of Governors of the Investment Company Institute and as a Trustee of Dartmouth College, and he is a member of the Partners HealthCare Systems Investment Committee. He is a graduate of Dartmouth College, Harvard Law School and Harvard Business School. Mr. Haldeman is also a Chartered Financial Analyst (CFA) charterholder.
George Putnam, III* (Born 1951), Trustee since 1984 and President since 2000
Mr. Putnam is President of New Generation Research, Inc. (a publisher of financial advisory and other research services), and of New Generation Advisers, Inc. (a registered investment advisor to private funds). Mr. Putnam founded the New Generation companies in 1986.
Mr. Putnam is a Director of The Boston Family Office, LLC (a registered investment adviser). He is a Trustee of St. Mark’s School and Shore Country Day School, and until 2002 was a Trustee of the Sea Education Association.
Mr. Putnam previously worked as an attorney with the law firm of Dechert LLP (formerly known as Dechert Price & Rhoads) in Philadelphia. He is a graduate of Harvard College, Harvard Business School and Harvard Law School.
| The address of each Trustee is One Post Office Square, Boston, MA 02109. |
| |
| As of August 31, 2006, there were 108 Putnam Funds. All Trustees serve as Trustees of all Putnam funds. |
| �� |
| Each Trustee serves for an indefinite term, until his or her resignation, retirement at age 72, death, or removal. |
| |
| * Trustees who are or may be deemed to be “interested persons” (as defined in the Investment Company Act of 1940) of the fund, Putnam Management, Putnam Retail Management, or Marsh & McLennan Companies, Inc., the parent company of Putnam, LLC and its affiliated companies. Messrs. Haldeman and Putnam, III are deemed “interested persons” by virtue of their positions as officers of the fund, Putnam Management or Putnam Retail Management and as shareholders of Marsh & McLennan Companies, Inc. Mr. Putnam, III is the President of your fund and each of the other Putnam funds. Mr. Haldeman is President and Chief Executive Officer of Putnam Investments. |
| |
51
Officers
In addition to George Putnam, III, the other officers of the fund are shown below:
Charles E. Porter (Born 1938)
Executive Vice President, Associate Treasurer,
Compliance Liaison and Principal Executive Officer
Since 1989
Jonathan S. Horwitz (Born 1955)
Senior Vice President and Treasurer
Since 2004
Prior to 2004, Managing Director,
Putnam Investments
Steven D. Krichmar (Born 1958)
Vice President and Principal Financial Officer
Since 2002
Senior Managing Director, Putnam Investments.
Prior to July 2001, Partner, PricewaterhouseCoopers LLP
Michael T. Healy (Born 1958)
Assistant Treasurer and Principal Accounting Officer
Since 2000
Managing Director, Putnam Investments
Beth S. Mazor (Born 1958)
Vice President
Since 2002
Managing Director, Putnam Investments
James P. Pappas (Born 1953)
Vice President
Since 2004
Managing Director, Putnam Investments and Putnam Management.
During 2002, Chief Operating Officer, Atalanta/Sosnoff Management
Corporation; prior to 2001, President and Chief Executive Officer,
UAM Investment Services, Inc.
Richard S. Robie, III (Born 1960)
Vice President
Since 2004
Senior Managing Director, Putnam Investments, Putnam Management
and Putnam Retail Management. Prior to 2003, Senior Vice President,
United Asset Management Corporation
Francis J. McNamara, III (Born 1955)
Vice President and Chief Legal Officer
Since 2004
Senior Managing Director, Putnam Investments, Putnam Management
and Putnam Retail Management. Prior to 2004, General Counsel,
State Street Research & Management Company
Charles A. Ruys de Perez (Born 1957)
Vice President and Chief Compliance Officer
Since 2004
Managing Director, Putnam Investments
Mark C. Trenchard (Born 1962)
Vice President and BSA Compliance Officer
Since 2002
Managing Director, Putnam Investments
Judith Cohen (Born 1945)
Vice President, Clerk and Assistant Treasurer
Since 1993
Wanda M. McManus (Born 1947)
Vice President, Senior Associate Treasurer and Assistant Clerk
Since 2005
Nancy E. Florek (Born 1957)
Vice President, Assistant Clerk, Assistant Treasurer
and Proxy Manager
Since 2005
The address of each Officer is One Post Office Square, Boston, MA 02109.
52
Fund information
Founded over 65 years ago, Putnam Investments was built around the concept that a balance between risk and reward is the hallmark of a well-rounded financial program. We manage over 100 mutual funds in growth, value, blend, fixed income, and international.
| Investment Manager | Officers | Wanda M. McManus |
| Putnam Investment | George Putnam, III | Vice President, Senior Associate Treasurer |
| Management, LLC | President | and Assistant Clerk |
| One Post Office Square | | |
| Boston, MA 02109 | Charles E. Porter | Nancy E. Florek |
| Executive Vice President, Associate | Vice President, Assistant Clerk, |
| Investment Sub-Manager | Treasurer, Compliance Liaison and | Assistant Treasurer and Proxy Manager |
| Putnam Investments Limited | Principal Executive Officer | |
| 57-59 St. James Street | | |
| London, England SW1A 1LD | Jonathan S. Horwitz | |
| Senior Vice President and Treasurer | |
| Marketing Services | | |
| Putnam Retail Management | Steven D. Krichmar | |
| One Post Office Square | Vice President and Principal Financial Officer | |
| Boston, MA 02109 | | |
| | Michael T. Healy | |
| Custodian | Assistant Treasurer and | |
| Putnam Fiduciary Trust Company | Principal Accounting Officer | |
| | | |
| Legal Counsel | Beth S. Mazor | |
| Ropes & Gray LLP | Vice President | |
| | | |
| Independent Registered Public | James P. Pappas | |
| Accounting Firm | Vice President | |
| KPMG LLP | | |
| Richard S. Robie, III | |
| Vice President | |
| Trustees | | |
| John A. Hill, Chairman | Francis J. McNamara, III | |
| Jameson Adkins Baxter, Vice Chairman | Vice President and Chief Legal Officer | |
| Charles B. Curtis | | |
| Myra R. Drucker | Charles A. Ruys de Perez | |
| Charles E. Haldeman, Jr. | Vice President and Chief Compliance Officer | |
| Paul L. Joskow | | |
| Elizabeth T. Kennan | Mark C. Trenchard | |
| Robert E. Patterson | Vice President and BSA Compliance Officer | |
| George Putnam, III | | |
| W. Thomas Stephens | Judith Cohen | |
| Richard B. Worley | Vice President, Clerk and Assistant Treasurer | |
This report is for the information of shareholders of Putnam High Yield Trust. It may also be used as sales literature when preceded or accompanied by the current prospectus, the most recent copy of Putnam’s Quarterly Performance Summary, and Putnam’s Quarterly Ranking Summary. For more recent performance, please visit www.putnam.com. Investors should carefully consider the investment objective, risks, charges, and expenses of a fund, which are described in its prospectus. For this and other information or to request a prospectus, call 1-800-225-1581 toll free. Please read the prospectus carefully before investing. The fund’s Statement of Additional Information contains additional information about the fund’s Trustees and is available without charge upon request by calling 1-800-225-1581.

Item 2. Code of Ethics:
(a) The fund’s principal executive, financial and accounting officers are employees of Putnam Investment Management, LLC, the Fund's investment manager. As such they are subject to a comprehensive Code of Ethics adopted and administered by Putnam Investments which is designed to protect the interests of the firm and its clients. The Fund has adopted a Code of Ethics which incorporates the Code of Ethics of Putnam Investments with respect to all of its officers and Trustees who are employees of Putnam Investment Management, LLC. For this reason, the Fund has not adopted a separate code of ethics governing its principal executive, financial and accounting officers.
(c) None
Item 3. Audit Committee Financial Expert:
The Funds' Audit and Compliance Committee is comprised solely of Trustees who are "independent" (as such term has been defined by the Securities and Exchange Commission ("SEC") in regulations implementing Section 407 of the Sarbanes-Oxley Act (the "Regulations")). The Trustees believe that each of the members of the Audit and Compliance Committee also possess a combination of knowledge and experience with respect to financial accounting matters, as well as other attributes, that qualify them for service on the Committee. In addition, the Trustees have determined that each of Mr. Patterson, Mr. Stephens and Mr. Hill meets the financial literacy requirements of the New York Stock Exchange's rules and qualifies as an "audit committee financial expert" (as such term has been defined by the Regulations) based on their review of his pertinent experience and education. Certain other Trustees, although not on the Audit and Compliance Committee, would also qualify as "audit committee financial experts." The SEC has stated that the designation or identification of a person as an audit committee financial expert pursuant to this Item 3 of Form N-CSR does not impose on such person any duties, obligations or liability that are greater than the duties, obligations and liability imposed on such person as a member of the Audit and Compliance Committee and the Board of Trustees in the absence of such designation or identification.
Item 4. Principal Accountant Fees and Services:
The following table presents fees billed in each of the last two fiscal years for services rendered to the fund by the fund’s independent auditor:
| Fiscal | | Audit- | | |
| year | Audit | Related | Tax | All Other |
| ended | Fees | Fees | Fees | Fees |
| |
| August 31, 2006 | $75,177* | $-- | $4,680 | $1,550 |
| August 31, 2005 | $51,192 | $-- | $4,192 | $-- |
* Includes fees of $22,597 billed by the fund’s independent auditor to the fund for audit procedures necessitated by regulatory and litigation matters for the fiscal year ended August 31, 2006 . These fees were reimbursed to the fund by Putnam Investment Management, LLC (“Putnam Management”).
For the fiscal years ended August 31, 2006 and August 31, 2005, the fund’s independent auditor billed aggregate non-audit fees in the amounts of $6,230 and $4,192 respectively, to the fund, Putnam Management and any entity controlling, controlled by or under common control with Putnam Management that provides ongoing services to the fund.
Audit Fees represent fees billed for the fund’s last two fiscal years.
Audit-Related Fees represent fees billed in the fund’s last two fiscal years for services traditionally performed by the fund’s auditor, including accounting consultation for proposed transactions or concerning financial accounting and reporting standards and other audit or attest services not required by statute or regulation.
Tax Fees represent fees billed in the fund’s last two fiscal years for tax compliance, tax planning and tax advice services. Tax planning and tax advice services include assistance with tax audits, employee benefit plans and requests for rulings or technical advice from taxing authorities.
All Other Fees represent fees billed for services relating to the review of expense allocation methodology.
Pre-Approval Policies of the Audit and Compliance Committee. The Audit and Compliance Committee of the Putnam funds has determined that, as a matter of policy, all work performed for the funds by the funds’ independent auditors will be pre-approved by the Committee itself and thus will generally not be subject to pre-approval procedures.
The Audit and Compliance Committee also has adopted a policy to pre-approve the engagement by Putnam Management and certain of its affiliates of the funds’ independent auditors, even in circumstances where pre-approval is not required by applicable law. Any such requests by Putnam Management or certain of its affiliates are typically submitted in writing to the Committee and explain, among other things, the nature of the proposed engagement, the estimated fees, and why this work should be performed by that particular audit firm as opposed to another one.
The following table presents fees billed by the fund’s independent auditor for services required to be approved pursuant to paragraph (c)(7)(ii) of Rule 2-01 of Regulation S-X.
| Fiscal | Audit- | | All | Total |
| year | Related | Tax | Other | Non-Audit |
| ended | Fees | Fees | Fees | Fees |
| | | | | |
| August 31, | | | | |
| 2006 | $ - | $ - | $ - | $ - |
| August | | | | |
| 31, 2005 | $ - | $ - | $ - | $ - |
Item 5. Audit Committee of Listed Registrants
Not applicable
Item 6. Schedule of Investments:
The registrant’s schedule of investments in unaffiliated issuers is included in the report to shareholders in Item 1 above.
Item 7. Disclosure of Proxy Voting Policies and Procedures For Closed-End Management
Investment Companies:
Not applicable
Item 8. Portfolio Managers of Closed-End Investment Companies
Not Applicable
Item 9. Purchases of Equity Securities by Closed-End Management Investment Companies and
Affiliated Purchasers:
Not applicable
Item 10. Submission of Matters to a Vote of Security Holders:
Not applicable
Item 11. Controls and Procedures:
(a) The registrant's principal executive officer and principal financial officer have concluded, based on their evaluation of the effectiveness of the design and operation of the registrant's disclosure controls and procedures as of a date within 90 days of the filing date of this report, that the design and operation of such procedures are generally effective to provide reasonable assurance that information required to be disclosed by the registrant in this report is recorded, processed, summarized and reported within the time periods specified in the Commission's rules and forms.
(b) Changes in internal control over financial reporting: Not applicable
Item 12. Exhibits:
(a)(1) The Code of Ethics of The Putnam Funds, which incorporates the Code of Ethics of Putnam Investments, is filed herewith.
(a)(2) Separate certifications for the principal executive officer and principal financial officer of the registrant as required by Rule 30a-2(a) under the Investment Company Act of 1940, as amended, are filed herewith.
(b) The certifications required by Rule 30a-2(b) under the Investment Company Act of 1940, as amended, are filed herewith.
SIGNATURES
Pursuant to the requirements of the Securities Exchange Act of 1934 and the Investment Company Act of 1940, the registrant has duly caused this report to be signed on its behalf by the undersigned, thereunto duly authorized.
Putnam High Yield Trust
By (Signature and Title):
/s/Michael T. Healy
Michael T. Healy
Principal Accounting Officer
Date: October 26, 2006
Pursuant to the requirements of the Securities Exchange Act of 1934 and the Investment Company Act of 1940, this report has been signed below by the following persons on behalf of the registrant and in the capacities and on the dates indicated.
By (Signature and Title):
/s/Charles E. Porter
Charles E. Porter
Principal Executive Officer
Date: October 26, 2006
By (Signature and Title):
/s/Steven D. Krichmar
Steven D. Krichmar
Principal Financial Officer
Date: October 26, 2006