| | |
| |
| UNITED STATES |
| SECURITIES AND EXCHANGE COMMISSION |
| Washington, D.C. 20549 |
|
| FORM N-CSR |
| |
| CERTIFIED SHAREHOLDER REPORT OF REGISTERED |
| MANAGEMENT INVESTMENT COMPANIES |
|
| Investment Company Act file number: (811- 02796) | |
| | |
| Exact name of registrant as specified in charter: | Putnam High Yield Trust |
| | |
| Address of principal executive offices: One Post Office Square, Boston, Massachusetts 02109 |
| |
| Name and address of agent for service: | Beth S. Mazor, Vice President |
| | One Post Office Square |
| | Boston, Massachusetts 02109 |
| | |
| Copy to: | John W. Gerstmayr, Esq. |
| | Ropes & Gray LLP |
| | One International Place |
| | Boston, Massachusetts 02110 |
| | |
| Registrant’s telephone number, including area code: | (617) 292-1000 | |
| | | |
| Date of fiscal year end: August 31, 2010 | |
| | |
| Date of reporting period: September 1, 2009 — February 28, 2010 |
Item 1. Report to Stockholders:
The following is a copy of the report transmitted to stockholders pursuant to Rule 30e-1 under the Investment Company Act of 1940:


A BALANCED APPROACH
Since 1937, when George Putnam created a diverse mix of stocks and bonds in a single, professionally managed portfolio, Putnam has championed the balanced approach.
A WORLD OF INVESTING
Today, we offer investors a world of equity, fixed-income, multi-asset, and absolute-return portfolios to suit a range of financial goals.
A COMMITMENT TO EXCELLENCE
Our portfolio managers seek superior results over time, backed by original, fundamental research on a global scale. We believe in the value of experienced financial advice, in providing exemplary service, and in putting clients first in all we do.

Putnam
High Yield
Trust
Semiannual report
2 | 28 | 10
| |
| Message from the Trustees | 2 |
|
| About the fund | 4 |
|
| Performance snapshot | 6 |
|
| Interview with your fund’s portfolio manager | 7 |
|
| Your fund’s performance | 11 |
|
| Your fund’s expenses | 13 |
|
| Terms and definitions | 15 |
|
| Trustee approval of management contract | 16 |
|
| Other information for shareholders | 26 |
|
| Financial statements | 27 |
|
| Shareholder meeting results | 67 |
|
Message from the Trustees
Dear Fellow Shareholder:
What a difference a year makes. The rebound that followed the market lows in early March 2009 turned out to be one of the strongest in generations. After a slow start, the markets have continued to rise during the first few months of 2010.
It is unlikely that this year will be a repeat performance of 2009. Still, based on an encouraging earnings outlook and evidence of an improving but fragile global economic recovery, today’s markets offer opportunities for active money management, which is Putnam’s core strength.
If there is any lesson to be learned from the extraordinary volatility of the past two years, it is the importance of positioning one’s portfolio to limit downside risk. It is our belief that the best way to achieve this is by diversifying across all asset classes and investment strategies, and by adhering to your plan in every type of market environment.
Diversification and downside protection are worthwhile endeavors — and not just from a psychological standpoint. A portfolio diversified across all asset classes has been shown in the past to conserve wealth better during downturns and to benefit in a rising market environment.
2
Lastly, we would like to thank all shareholders who took the time to vote by proxy on a number of issues, including shareholder-friendly management fee changes, which went into effect earlier this year. We would also like to welcome new shareholders to the fund and thank all of our investors for your continued confidence in Putnam.

About the fund
A disciplined approach to seeking high current income and capital growth
Unlike most types of fixed-income investments, high-yield bonds are more influenced by the performance of issuing companies than by interest rates. For this reason, distinguishing between opportunities and pitfalls in the high-yield bond market requires a rigorous selection process. With Putnam High Yield Trust, this process is highlighted by exhaustive research, investment diversification, and timely portfolio adjustments.
Because of the risks of high-yield bond investing, in-depth credit research is essential. The fund’s research team — more than 20 professionals, including analysts who specialize in different industry sectors — visits with the management of issuing companies and analyzes each company’s profitability and capital structure. The team then considers this information in the context of the bond’s total return profile before deciding whether it is an appropriate investment for the fund.
The fund’s portfolio typically consists of bonds issued by a broad range of companies. Holdings are diversified across industry sectors and among bonds with different credit ratings. While the fund invests primarily in the bonds of U.S. companies, its diversified approach allows it to include foreign bonds as well. Among these securities, investments in emerging-market bonds can enhance the fund’s appreciation potential. The fund also invests in convertible securities as well as bank loans. Although diversification does not ensure a profit or protect against a loss and it is possible to lose money in a diversified portfolio, the fund’s diversification can help reduce the volatility that typically comes with higher-risk investments.
As the bond markets shift over time, the fund’s portfolio managers look for ways to capitalize on developments that affect fixed-income securities in general and high-yield bonds in particular. For example, if credit spreads widen and prices of lower-rated securities decline, the managers may look to take advantage of the improved valuation of higher-risk securities. Conversely, if the portfolio managers believe that credit risk is likely to pick up or volatility is likely to increase, they may look to reduce risk in the portfolio.
Consider these risks before investing: Lower-rated bonds may offer higher yields in return for more risk. Mutual funds that invest in bonds are subject to certain risks, including interest-rate risk, credit risk, and inflation risk. As interest rates rise, the prices of bonds fall. Long-term bonds are more exposed to interest-rate risk than short-term bonds. Unlike bonds, bond funds have ongoing fees and expenses. The use of derivatives involves special risks and may result in losses.
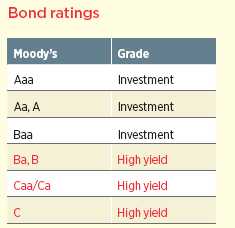
What makes a bond “high yield”?
High-yield bonds are fixed-income investments typically issued by companies that lack an established earnings track record or a solid credit history. In general, high-yield bonds offer higher interest rates than investment-grade bonds to compensate for their increased risk. Because of this added risk, these bonds are typically rated below investment grade by an independent rating agency (for example, the lowest Moody’s Investors Service rating of investment-grade bonds is Baa). The lower the rating, the greater the possibility that a bond’s issuer will be unable to make interest payments or repay the principal.
High-yield bonds can offer greater income potential than
other types of bonds.

Over time, the fund has delivered income for
investors. It invests in high-yield bonds, which
generally offer higher income than do other
types of bonds in exchange for greater credit
risk. See pages 11–13 for complete perfor-
mance information. Past performance is not
indicative of future results.
* Through 2/28/10.
Chart based on net asset value (NAV).
Performance
snapshot
Annualized total return (%) comparison as of 2/28/10
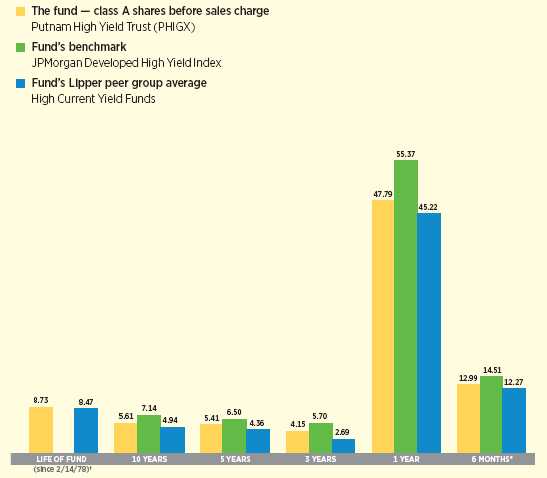
Current performance may be lower or higher than the quoted past performance, which cannot guarantee future results. Share price, principal value, and return will fluctuate, and you may have a gain or a loss when you sell your shares. Performance of class A shares assumes reinvestment of distributions and does not account for taxes. Fund returns in the bar chart do not reflect a sales charge of 4.00%; had they, returns would have been lower. See pages 7 and 11–13 for additional performance information. For a portion of the periods, this fund may have limited expenses, without which returns would have been lower. A 1% short-term trading fee may apply. To obtain the most recent month-end performance, visit putnam.com.
* Returns for the six-month period are not annualized, but cumulative.
† The fund’s benchmark, the JPMorgan Developed High Yield Index, was introduced on 12/31/94, which post-dates the inception date of the fund’s class A shares.
6
Interview with your
fund’s portfolio manager
Paul Scanlon
Paul, how did Putnam High Yield Trust
perform for the period?
For the six months ended February 28, 2010, the fund’s class A shares returned 12.99%, lagging its primary benchmark, the JPMorgan Developed High Yield Index, which returned 14.51%, but topping the average for its Lipper peer group, High Current Yield Funds, which posted a 12.27% return.
What has the backdrop been like for the
high-yield market over the past six months?
High-yield bonds enjoyed a very positive environment during the period. The six-month time frame includes the last four months of 2009, which was the best year for the high-yield market on record. The market bounced back from the severely oversold levels it had suffered in the aftermath of financial market dislocations in 2008 and early 2009. Investors flocked back to the asset class, heartened by the stabilizing economy and improving corporate business fundamentals.
Another major positive factor behind the strong performance was a raft of new issuance. After evaporating during the financial meltdown of 2008, new-issue supply resumed in the second quarter of 2009 and continued through the end of the period. In 2009, more than $180 billion of high-yield debt was brought to market, about three quarters of which was used by high-yield companies to refinance debt. The firms issued the new bonds at lower prevailing rates, to enhance liquidity and extend their maturities.

This comparison shows your fund’s performance in the context of broad market indexes for the six months ended 2/28/10. See pages 6 and 11–13 for additional fund performance information. Index descriptions can be found on page 15.
7
How did you position the fund during
the semiannual period, and how did that
structure influence results?
One of the main reasons we trailed our benchmark index was our decision to underweight financials. Typically, the business model for financial issuers is to borrow at a low rate and lend at a higher rate. Since these companies have been downgraded into the high-yield universe, their cost of borrowing has increased, and the issuers may now be at a competitive disadvantage versus their investment-grade counterparts. It’s important to note that the high-yield fund peer group average trailed the index as well. This was mainly because many bonds from the financials group entered the high-yield universe at what some considered to be artificially low valuations, only to rebound sharply in price as the economy continued to stabilize. The fund’s defensive positioning at the beginning of the year also hurt its relative performance, as the lower-rated tiers of the market outperformed during the first half of its fisca l year.
We have added more cyclical exposure to the portfolio. We are overweight to the consumer products, housing, information technology, and metals/minerals sectors. In similar fashion, we took profits and reduced holdings in the less economically sensitive health-care industry. Nevertheless, we maintained an overweight to health care, as well as to energy, utilities, and wireline telecommunication companies. Areas we underweighted included financials, aerospace, forest products, and services. We also reduced our stake in floating-rate bank loans issued by high-yield companies. This allocation to an asset class that rebounded smartly from oversold levels buoyed the performance of the fund during the period.
Top 10 holdings
| | |
| | COUPON (%) AND | |
| HOLDING (percentage of fund’s net assets) | MATURITY DATE | SECTOR/INDUSTRY |
|
| NRG Energy, Inc. (1.0%) | 7.375%, 2016 | Utilities and power/ |
| | | Power producers |
| Freeport-McMoRan Copper & Gold, Inc. | 8.375%, 2017 | Basic materials/Metals |
| (0.9%) | | |
| HCA, Inc. (0.8%) | 9.125%, 2014 | Health care/Health care |
| Legrand SA (France) (0.7%) | 8.5%, 2025 | Capital goods/Manufacturing |
| Intelsat Jackson Holding Co. | 11.25%, 2016 | Communication services/ |
| (Bermuda) (0.6%) | | Telecommunications |
| CIT Group, Inc. (0.6%) | 7%, 2013 | Financials/Financial |
| Owens Corning, Inc. (0.6%) | 9%, 2019 | Consumer cyclicals/ |
| | | Building materials |
| Ventas Realty LP/Capital Corp. (0.6%) | 9%, 2012 | Health care/Medical services |
| Intelsat Bermuda, Ltd. (Bermuda) (0.6%) | 11.25%, 2017 | Communication services/ |
| | | Telecommunications |
| SunGard Data Systems, Inc. (0.6%) | 9.125%, 2013 | Technology/Computers |
This table shows the fund’s top 10 holdings and the percentage of the fund’s net assets that each represented as of 2/28/10. Short-term holdings are excluded. Holdings will vary over time.
8
“As the market returns to normal,
credit research and analysis will
become particularly influential in
determining relative performance.”
Paul Scanlon
Which holdings contributed the most to
performance relative to the index?
Our holdings of cable TV and Internet services provider Charter Communications proved helpful. Even though the firm filed for bankruptcy, our holdings were protected because they were focused on the top part of the company’s capital structure. Part of our investment process is deciding which parts of a corporation’s capital structure offer the best risk/return characteristic. In this case, our analysis paid off. We also profited from overweighting luxury retailer Neiman Marcus. These bonds showed nice performance as the economy stabilized and consumer spending improved.
Which investments were the main detractors?
Three of the primary detractors were
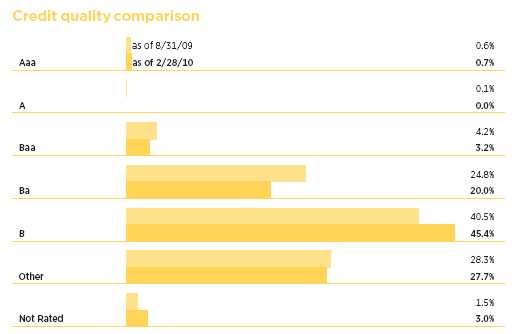
This chart shows how the fund’s credit quality has changed over the past six months. Credit qualities are shown as a percentage of net assets. A bond rated Baa or higher (Prime-3 or higher, for short-term debt) is considered investment grade. The chart reflects Moody’s ratings; percentages may include bonds not rated by Moody’s but considered by Putnam Management to be of comparable quality. Ratings will vary over time.
The calculation of portfolio credit quality is performed by Putnam, using the highest security rating provided by one or more of Standard & Poor’s, Moody’s, and Fitch. Portfolio quality figures include cash bonds and cash, and represent only the fixed-income portion of the portfolio. Securities which do not have agency ratings are assigned the lowest rating. Derivative instruments, including currency forwards, are only included in the calculation to the extent of any unrealized gain or loss on such instruments, which is added to, or subtracted from, the rating totals for the highest rating category. Ratings and portfolio credit quality may change over time. The fund itself has not been rated by an independent rating agency.
9
IN THE NEWS
After two straight years of stagnation, the global economy is recovering faster than previously thought. In its World Economic Outlook, the International Monetary Fund (IMF) upgraded its view on global growth —predicting that world economies will expand 3.9% in 2010, up from –0.8% last year. The recovery, according to the IMF, will not be consistent across the board, with emerging markets leading more advanced economies, which continue to remain dependent on government stimulus for growth. Asia, in particular, is expected to lead the pack, with strong growth coming from China and India. Meanwhile, the United States is already showing signs of growth, with gross domestic product (GDP) increasing by 5.6% in the fourth quarter of 2009, up from 2.2% in the third quarter.
benchmark components that we didn’t own or were underweight. These bonds included Residential Capital (ResCap), the residential mortgage subsidiary of GMAC Financial Services. These bonds had been hurt by the crisis in subprime mortgages, but were then buoyed by a massive cash infusion from the federal government. Sallie Mae, or SLM Corp., which provides educational loans, and Washington Mutual, or WAMU, a bank that suffered the worst failure in U.S. history due to its bad loans before being taken over by JPMorgan Chase, were benchmark constituents that rebounded strongly from distressed levels. Our holdings in Washington Mutual were sold prior to period-end.
What’s your outlook?
High-yield bonds remain attractively priced based on historical averages, even after enjoying a strong run. We also have a positive outlook for business fundamentals for high-yield companies, as we believe there will be ample demand for high-yield bonds, but think there will be correspondingly high levels of issuance.
Going forward, we’ll continue to maintain a diversified portfolio, with investments chosen for issuer-specific reasons, targeting the areas of a company’s capital structure for the best balance between risk and return. As the market returns to normal, credit research and analysis will become particularly influential in determining relative performance.
Thanks for speaking with us today, Paul.
The views expressed in this report are exclusively those of Putnam Management. They are not meant as investment advice.
Please note that the holdings discussed in this report may not have been held by the fund for the entire period. Portfolio composition is subject to review in accordance with the fund’s investment strategy and may vary in the future. Current and future portfolio holdings are subject to risk.

Portfolio Manager Paul Scanlon is Team Leader of U.S. High Yield at Putnam. He has an M.B.A. from The University of Chicago Booth School of Business and a B.A. from Colgate University. A CFA charterholder, Paul joined Putnam in 1999 and has been in the investment industry since 1986. In addition to Paul, your fund’s portfolio managers are Norman Boucher and Robert Salvin.
10
Your fund’s performance
This section shows your fund’s performance, price, and distribution information for periods ended February 28, 2010, the end of the first half of its current fiscal year. In accordance with regulatory requirements for mutual funds, we also include performance as of the most recent calendar quarter-end and expense information taken from the fund’s current prospectus. Performance should always be considered in light of a fund’s investment strategy. Data represents past performance. Past performance does not guarantee future results. More recent returns may be less or more than those shown. Investment return and principal value will fluctuate, and you may have a gain or a loss when you sell your shares. Performance information does not reflect any deduction for taxes a shareholder may owe on fund distributions or on the redemption of fund shares. For the most recent month-end performance, please visit the Individual Investors section at put nam.com or call Putnam at 1-800-225-1581. Class Y shares are generally only available to corporate and institutional clients and clients in other approved programs. See the Terms and Definitions section in this report for definitions of the share classes offered by your fund.
Fund performance Total return for periods ended 2/28/10
| | | | | | | | | | |
| | Class A | Class B | Class C | Class M | Class R | Class Y |
| (inception dates) | (2/14/78) | (3/1/93) | (3/19/02) | (7/3/95) | (1/21/03) | (12/31/98) |
|
| | NAV | POP | NAV | CDSC | NAV | CDSC | NAV | POP | NAV | NAV |
|
| Annual average | | | | | | | | | | |
| (life of fund) | 8.73% | 8.59% | 7.83% | 7.83% | 7.90% | 7.90% | 8.35% | 8.24% | 8.43% | 8.80% |
|
| 10 years | 72.63 | 65.68 | 60.87 | 60.87 | 59.79 | 59.79 | 68.06 | 62.67 | 66.90 | 75.99 |
| Annual average | 5.61 | 5.18 | 4.87 | 4.87 | 4.80 | 4.80 | 5.33 | 4.99 | 5.26 | 5.82 |
|
| 5 years | 30.12 | 24.98 | 25.77 | 24.00 | 25.47 | 25.47 | 28.40 | 24.19 | 27.61 | 31.37 |
| Annual average | 5.41 | 4.56 | 4.69 | 4.40 | 4.64 | 4.64 | 5.13 | 4.43 | 5.00 | 5.61 |
|
| 3 years | 12.98 | 8.48 | 10.68 | 8.02 | 10.48 | 10.48 | 11.89 | 8.21 | 11.56 | 13.42 |
| Annual average | 4.15 | 2.75 | 3.44 | 2.60 | 3.38 | 3.38 | 3.82 | 2.67 | 3.71 | 4.29 |
|
| 1 year | 47.79 | 41.95 | 47.04 | 42.04 | 46.79 | 45.79 | 47.35 | 42.55 | 47.16 | 48.09 |
|
| 6 months | 12.99 | 8.45 | 12.56 | 7.56 | 12.48 | 11.48 | 12.82 | 9.22 | 12.72 | 12.97 |
|
Current performance may be lower or higher than the quoted past performance, which cannot guarantee future results. After-sales-charge returns (public offering price, or POP) for class A and M shares reflect a maximum 4.00% and 3.25% load, respectively. Class B share returns reflect the applicable contingent deferred sales charge (CDSC), which is 5% in the first year, declining to 1% in the sixth year, and is eliminated thereafter. Class C shares reflect a 1% CDSC for the first year that is eliminated thereafter. Class R and Y shares have no initial sales charge or CDSC. Performance for class B, C, M, R, and Y shares before their inception is derived from the historical performance of class A shares, adjusted for the applicable sales charge (or CDSC) and, except for class Y shares, the higher operating expenses for such shares.
For a portion of the periods, this fund may have limited expenses, without which returns would have been lower.
A 1% short-term trading fee may be applied to shares exchanged or sold within 90 days of purchase.
11
Comparative index returns For periods ended 2/28/10
| | |
| | JPMorgan Developed | Lipper High Current Yield Funds |
| | High Yield Index | category average* |
|
| Annual average (life of fund) | —† | 8.47% |
|
| 10 years | 99.23% | 65.64 |
| Annual average | 7.14 | 4.94 |
|
| 5 years | 37.00 | 24.74 |
| Annual average | 6.50 | 4.36 |
|
| 3 years | 18.10 | 8.96 |
| Annual average | 5.70 | 2.69 |
|
| 1 year | 55.37 | 45.22 |
|
| 6 months | 14.51 | 12.27 |
|
Index and Lipper results should be compared to fund performance at net asset value.
* Over the 6-month, 1-year, 3-year, 5-year, 10-year, and life-of-fund periods ended 2/28/10, there were 481, 458, 392, 341, 217, and 10 funds, respectively, in this Lipper category.
† The fund’s benchmark, the JPMorgan Developed High Yield Index, was introduced on 12/31/94, which post-dates the inception date of the fund’s class A shares.
Fund price and distribution information For the six-month period ended 2/28/10
| | | | | | | | |
| Distributions | Class A | Class B | Class C | Class M | Class R | Class Y |
|
| Number | 6 | 6 | 6 | 6 | 6 | 6 |
|
| Income | $0.270 | $0.241 | $0.243 | $0.260 | $0.263 | $0.279 |
|
| Capital gains | — | — | — | — | — | — |
|
| Total | $0.270 | $0.241 | $0.243 | $0.260 | $0.263 | $0.279 |
|
| Share value | NAV | POP | NAV | NAV | NAV | POP | NAV | NAV |
|
| 8/31/09 | $6.68 | $6.96 | $6.67 | $6.65 | $6.69 | $6.91 | $6.61 | $6.61 |
|
| 2/28/10 | 7.27 | 7.57 | 7.26 | 7.23 | 7.28 | 7.52 | 7.18 | 7.18 |
|
| Current yield (end of period) | NAV | POP | NAV | NAV | NAV | POP | NAV | NAV |
|
| Current dividend rate 1 | 7.43% | 7.13% | 6.61% | 6.64% | 6.92% | 6.70% | 7.35% | 7.86% |
|
| Current 30-day SEC yield 2,3 | N/A | 7.08 | 6.60 | 6.60 | N/A | 6.85 | 7.12 | 7.63 |
|
The classification of distributions, if any, is an estimate. Final distribution information will appear on your year-end tax forms.
1 Most recent distribution, excluding capital gains, annualized and divided by NAV or POP at end of period.
2 For a portion of the period, this fund may have limited expenses, without which yields would have been lower.
3 Based only on investment income and calculated using the maximum offering price for each share class, in accordance with SEC guidelines.
12
Fund performance as of most recent calendar quarter
Total return for periods ended 3/31/10
| | | | | | | | | | |
| | Class A | Class B | Class C | Class M | Class R | Class Y |
| (inception dates) | (2/14/78) | (3/1/93) | (3/19/02) | (7/3/95) | (1/21/03) | (12/31/98) |
|
| | NAV | POP | NAV | CDSC | NAV | CDSC | NAV | POP | NAV | NAV |
|
| Annual average | | | | | | | | | | |
| (life of fund) | 8.81% | 8.67% | 7.90% | 7.90% | 7.98% | 7.98% | 8.43% | 8.32% | 8.50% | 8.88% |
|
| 10 years | 79.56 | 72.37 | 67.12 | 67.12 | 66.04 | 66.04 | 74.82 | 69.11 | 73.40 | 83.11 |
|
| Annual average | 6.03 | 5.60 | 5.27 | 5.27 | 5.20 | 5.20 | 5.74 | 5.39 | 5.66 | 6.24 |
|
| 5 years | 38.20 | 32.71 | 33.43 | 31.56 | 32.98 | 32.98 | 36.38 | 31.92 | 35.43 | 39.58 |
|
| Annual average | 6.68 | 5.82 | 5.94 | 5.64 | 5.87 | 5.87 | 6.40 | 5.70 | 6.25 | 6.90 |
|
| 3 years | 15.92 | 11.31 | 13.57 | 10.83 | 13.24 | 13.24 | 14.95 | 11.16 | 14.37 | 16.55 |
|
| Annual average | 5.05 | 3.64 | 4.33 | 3.49 | 4.23 | 4.23 | 4.75 | 3.59 | 4.58 | 5.24 |
|
| 1 year | 49.69 | 43.82 | 48.45 | 43.45 | 48.49 | 47.49 | 49.24 | 44.43 | 48.89 | 49.73 |
|
| 6 months | 10.46 | 6.06 | 10.06 | 5.06 | 9.98 | 8.98 | 10.30 | 6.65 | 10.18 | 10.56 |
|
Your fund’s expenses
As a mutual fund investor, you pay ongoing expenses, such as management fees, distribution fees (12b-1 fees), and other expenses. In the most recent six-month period, your fund limited these expenses; had it not done so, expenses would have been higher. Using the following information, you can estimate how these expenses affect your investment and compare them with the expenses of other funds. You may also pay one-time transaction expenses, including sales charges (loads) and redemption fees, which are not shown in this section and would have resulted in higher total expenses. For more information, see your fund’s prospectus or talk to your financial representative.
Expense ratios
| | | | | | |
| | Class A | Class B | Class C | Class M | Class R | Class Y |
|
| Net expenses for the fiscal year ended 8/31/09*† | 1.08% | 1.83% | 1.83% | 1.33% | 1.33% | 0.83% |
|
| Total annual operating expenses for the fiscal year | | | | | | |
| ended 8/31/09† | 1.12% | 1.87% | 1.87% | 1.37% | 1.37% | 0.87% |
|
| Annualized expense ratio for the six-month period | | | | | | |
| ended 2/28/10 | 1.07% | 1.82% | 1.82% | 1.32% | 1.32% | 0.82% |
|
Fiscal-year expense information in this table is taken from the most recent prospectus, is subject to change, and may differ from that shown for the annualized expense ratio and in the financial highlights of this report. Expenses are shown as a percentage of average net assets.
* Reflects Putnam Management’s decision to contractually limit expenses through 12/30/10.
† Reflects projected expenses based on a new expense agreement.
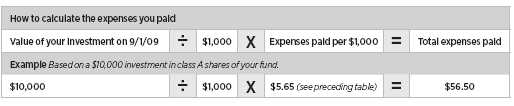
Expenses per $1,000
The following table shows the expenses you would have paid on a $1,000 investment in Putnam High Yield Trust from September 1, 2009, to February 28, 2010. It also shows how much a $1,000 investment would be worth at the close of the period, assuming actual returns and expenses.
13
| | | | | | |
| | Class A | Class B | Class C | Class M | Class R | Class Y |
|
| Expenses paid per $1,000*† | $5.65 | $9.59 | $9.59 | $6.97 | $6.96 | $4.33 |
|
| Ending value (after expenses) | $1,129.90 | $1,125.60 | $1,124.80 | $1,128.20 | $1,127.20 | $1,129.70 |
|
* Expenses for each share class are calculated using the fund’s annualized expense ratio for each class, which represents the ongoing expenses as a percentage of average net assets for the six months ended 2/28/10. The expense ratio may differ for each share class.
†Expenses are calculated by multiplying the expense ratio by the average account value for the period; then multiplying the result by the number of days in the period; and then dividing that result by the number of days in the year.
Estimate the expenses you paid
To estimate the ongoing expenses you paid for the six months ended February 28, 2010, use the following calculation method. To find the value of your investment on September 1, 2009, call Putnam at 1-800-225-1581
Compare expenses using the SEC’s method
The Securities and Exchange Commission (SEC) has established guidelines to help investors assess fund expenses. Per these guidelines, the following table shows your fund’s expenses based on a $1,000 investment, assuming a hypothetical 5% annualized return. You can use this information to compare the ongoing expenses (but not transaction expenses or total costs) of investing in the fund with those of other funds. All mutual fund shareholder reports will provide this information to help you make this comparison. Please note that you cannot use this information to estimate your actual ending account balance and expenses paid during the period.
| | | | | | |
| | Class A | Class B | Class C | Class M | Class R | Class Y |
|
| Expenses paid per $1,000*† | $5.36 | $9.10 | $9.10 | $6.61 | $6.61 | $4.11 |
|
| Ending value (after expenses) | $1,019.49 | $1,015.77 | $1,015.77 | $1,018.25 | $1,018.25 | $1,020.73 |
|
* Expenses for each share class are calculated using the fund’s annualized expense ratio for each class, which represents the ongoing expenses as a percentage of average net assets for the six months ended 2/28/10. The expense ratio may differ for each share class.
†Expenses are calculated by multiplying the expense ratio by the average account value for the period; then multiplying the result by the number of days in the period; and then dividing that result by the number of days in the year.
14
Terms and definitions
Important terms
Total return shows how the value of the fund’s shares changed over time, assuming you held the shares through the entire period and reinvested all distributions in the fund.
Net asset value (NAV) is the price, or value, of one share of a mutual fund, without a sales charge. NAVs fluctuate with market conditions. NAV is calculated by dividing the net assets of each class of shares by the number of outstanding shares in the class.
Public offering price (POP) is the price of a mutual fund share plus the maximum sales charge levied at the time of purchase. POP performance figures shown here assume the 4.00% maximum sales charge for class A shares and 3.25% for class M shares.
Contingent deferred sales charge (CDSC) is generally a charge applied at the time of the redemption of class B or C shares and assumes redemption at the end of the period. Your fund’s class B CDSC declines from a 5% maximum during the first year to 1% during the sixth year. After the sixth year, the CDSC no longer applies. The CDSC for class C shares is 1% for one year after purchase.
Current yield is the annual rate of return earned from dividends or interest of an investment. Current yield is expressed as a percentage of the price of a security, fund share, or principal investment.
Share classes
Class A shares are generally subject to an initial sales charge and no CDSC (except on certain redemptions of shares bought without an initial sales charge).
Class B shares are not subject to an initial sales charge. They may be subject to a CDSC.
Class C shares are not subject to an initial sales charge and are subject to a CDSC only if the shares are redeemed during the first year.
Class M shares have a lower initial sales charge and a higher 12b-1 fee than class A shares and no CDSC (except on certain redemptions of shares bought without an initial sales charge).
Class R shares are not subject to an initial sales charge or CDSC and are available only to certain defined contribution plans.
Class Y shares are not subject to an initial sales charge or CDSC, and carry no 12b-1 fee. They are generally only available to corporate and institutional clients and clients in other approved programs.
Comparative indexes
Barclays Capital Aggregate Bond Index is an unmanaged index of U.S. investment-grade fixed-income securities.
BofA Merrill Lynch U.S. 3-Month Treasury Bill Index is an unmanaged index that seeks to measure the performance of U.S. Treasury bills available in the marketplace.
JPMorgan Developed High Yield Index is an unmanaged index of high-yield fixed-income securities issued in developed countries.
S&P 500 Index is an unmanaged index of common stock performance.
Indexes assume reinvestment of all distributions and do not account for fees. Securities and performance of a fund and an index will differ. You cannot invest directly in an index.
Lipper is a third-party industry-ranking entity that ranks mutual funds. Its rankings do not reflect sales charges. Lipper rankings are based on total return at net asset value relative to other funds that have similar current investment styles or objectives as determined by Lipper. Lipper may change a fund’s category assignment at its discretion. Lipper category averages reflect performance trends for funds within a category.
15
Trustee approval of management contract
General conclusions
The Board of Trustees of the Putnam funds oversees the management of each fund and, as required by law, determines annually whether to approve the continuance of your fund’s management contract with Putnam Investment Management (“Putnam Management”) and the sub-management contract, with respect to your fund, between Putnam Management and its affiliate, Putnam Investments Limited (“PIL”).
In this regard, the Board of Trustees, with the assistance of its Contract Committee consisting solely of Trustees who are not “interested persons” (as such term is defined in the Investment Company Act of 1940, as amended) of the Putnam funds (the “Independent Trustees”), requests and evaluates all information it deems reasonably necessary under the circumstances. Over the course of several months ending in June 2009, the Contract Committee met several times to consider the information provided by Putnam Management and other information developed with the assistance of the Board’s independent counsel and independent staff. The Contract Committee reviewed and discussed key aspects of this information with all of the Independent Trustees. At the Trustees’ June 12, 2009 meeting, the Contract Committee recommended, and the Independent Trustees approved, the continuance of your fund’s management and sub-management co ntracts, effective July 1, 2009. (Because PIL is an affiliate of Putnam Management and Putnam Management remains fully responsible for all services provided by PIL, the Trustees have not evaluated PIL as a separate entity, and all subsequent references to Putnam Management below should be deemed to include reference to PIL as necessary or appropriate in the context.)
The Independent Trustees’ approval was based on the following conclusions:
• That the fee schedule in effect for your fund represented reasonable compensation in light of the nature and quality of the services being provided to the fund, the fees paid by competitive funds and the costs incurred by Putnam Management in providing such services, and
• That such fee schedule represented an appropriate sharing between fund shareholders and Putnam Management of such economies of scale as may exist in the management of the fund at current asset levels.
These conclusions were based on a comprehensive consideration of all information provided to the Trustees, were subject to the continued application of certain expense reductions and waivers pending other considerations noted below, and were not the result of any single factor. Some of the factors that figured particularly in the Trustees’ deliberations and how the Trustees considered these factors are described below, although individual Trustees may have evaluated the information presented differently, giving different weights to various factors. It is also important to recognize that the fee arrangements for your fund and the other Putnam funds are the result of many years of review and discussion between the Independent Trustees and Putnam Management, that certain aspects of the arrangements may receive greater scrutiny in some years than others, and that the Trustees’ conclusions may be based, in part, on their consideration of these sam e arrangements in prior years.
Consideration of strategic
pricing proposal
The Trustees considered that the Contract Committee had been engaged in a detailed review of Putnam Management’s strategic pricing proposal that was first presented
16
to the Committee at its May 2009 meeting. The proposal included proposed changes to the basic structure of the management fees in place for all open-end funds (except the Putnam RetirementReady® Funds and Putnam Money Market Liquidity Fund), including implementation of a breakpoint structure based on the aggregate net assets of all such funds in lieu of the individual breakpoint structures in place for each fund, as well as implementation of performance fees for certain funds. In addition, the proposal recommended substituting separate expense limitations on investor servicing fees and on other expenses as a group in lieu of the total expense limitations in place for many funds.
While the Contract Committee noted the likelihood that the Trustees and Putnam Management would reach agreement on the strategic pricing matters in later months, the terms of the management contracts required that the Trustees approve the continuance of the contracts in order to prevent their expiration at June 30, 2009. The Contract Committee’s recommendations in June reflect its conclusion that the terms of the contractual arrangements for your fund continued to be appropriate for the upcoming term, absent any possible agreement with respect to the matters addressed in Putnam Management’s proposal.
The Trustees were mindful of the significant changes that had occurred at Putnam Management in the past two years, including a change of ownership, the installation of a new senior management team at Putnam Management, the substantial decline in assets under management resulting from extraordinary market forces as well as continued net redemptions in many funds, the introduction of new fund products representing novel investment strategies and the introduction of performance fees for certain new funds. The Trustees were also mindful that many other leading firms in the industry had also been experiencing significant challenges due to the changing financial and competitive environment. For these reasons, even though the Trustees believed that the current contractual arrangements in place between the funds and Putnam Management and its affiliates have served shareholders well and continued to be appropriate for the nea r term, the Trustees believed that it was an appropriate time to reconsider the current structure of the funds’ contractual arrangements with Putnam Management with a view to possible changes that might better serve the interests of shareholders in this new environment. The Trustees concluded their review of Putnam Management’s strategic pricing proposal in July 2009, and their considerations regarding the proposal are discussed below under the heading “Subsequent approval of strategic pricing proposal.” With the exception of the discussion under this heading, the following discussion generally addresses only the Trustees’ reasons for recommending the continuance of the current contractual arrangements as, at the time the Trustees determined to make this recommendation, the Trustees had not yet reached any conclusions with respect to the strategic pricing proposal.
Management fee schedules and
categories; total expenses
The Trustees reviewed the management fee schedules in effect for all Putnam funds, including fee levels and breakpoints, and the assignment of funds to particular fee categories. The general fee structure has been carefully developed over the years and re-examined on many occasions and adjusted where appropriate. In this regard, the Trustees noted that shareholders of all funds voted by overwhelming majorities in 2007 to approve new management contracts containing identical fee schedules.
In reviewing fees and expenses, the Trustees generally focused their attention on material changes in circumstances — for example,
17
changes in a fund’s size or investment style, changes in Putnam Management’s operating costs, or changes in competitive practices in the mutual fund industry — that suggest that consideration of fee changes might be warranted. The Trustees concluded that the circumstances did not warrant changes to the management fee structure of your fund at that time but, as indicated above, based on their detailed review of the current fee structure, were prepared to consider possible changes to this arrangement that might better serve the interests of shareholders in the future. The Trustees focused on two areas of particular interest, as discussed further below:
• Competitiveness. The Trustees reviewed comparative fee and expense information for competitive funds, which indicated that, in a custom peer group of competitive funds selected by Lipper Inc., your fund ranked in the 66th percentile in management fees and in the 41st percentile in total expenses (less any applicable 12b-1 fees) as of December 31, 2008 (the first percentile being the least expensive funds and the 100th percentile being the most expensive funds).
The Trustees noted that expense ratios for a number of Putnam funds, which show the percentage of fund assets used to pay for management and administrative services, distribution (12b-1) fees (as applicable) and other expenses, had been increasing recently as a result of declining net assets and the natural operation of fee breakpoints. The Trustees expressed their intention to monitor the funds’ percentile rankings in management fees and in total expenses to ensure that fees and expenses of the funds continue to meet evolving competitive standards.
The Trustees noted that the expense ratio increases described above were being controlled by expense limitations initially implemented in January 2004. These expense limitations give effect to a commitment by Putnam Management that the expense ratio of each open-end fund would be no higher than the average expense ratio of the competitive funds included in the fund’s relevant Lipper universe (exclusive of any applicable 12b-1 charges in each case). The Trustees observed that this commitment to limit fund expenses has served shareholders well since its inception and, while the Contract Committee was reviewing proposed alternative expense limitation arrangements as noted above, the Trustees received a commitment from Putnam Management and its parent company to continue this program through at least June 30, 2010, or such earlier time as the Trustees and Putnam Management reach agreement on alternative arrange ments.
In order to ensure that the expenses of the Putnam funds continue to meet evolving competitive standards, the Trustees requested, and Putnam Management agreed, to extend for the twelve months beginning July 1, 2009, or until such earlier time as the Trustees and Putnam Management reach agreement on alternative expense limitation arrangements, an additional expense limitation for certain funds at an amount equal to the average expense ratio (exclusive of 12b-1 charges) of a custom peer group of competitive funds selected by Lipper to correspond to the size of the fund. This additional expense limitation is applicable to those open-end funds that had above-average expense ratios (exclusive of 12b-1 charges) based on the custom peer group data for the period ended December 31, 2007. This additional expense limitation was not applied to your fund because it had a below-average expense ratio relative to its custom peer group.
• Economies of scale. Your fund currently has the benefit of breakpoints in its management fee that provide shareholders with significant economies of scale, which means that the effective management fee rate of the fund (as
18
a percentage of fund assets) declines as the fund grows in size and crosses specified asset thresholds. Conversely, as the fund shrinks in size — as has been the case for many Putnam funds in recent years — these breakpoints result in increasing fee levels. In recent years, the Trustees have examined the operation of the existing breakpoint structure during periods of both growth and decline in asset levels. The Trustees concluded that the fee schedule in effect for your fund represented an appropriate sharing of economies of scale at that time but, as noted above, were in the process of reviewing a proposal to eliminate individual fund breakpoints for all of the open-end funds (except for the Putnam RetirementReady® Funds and Putnam Money Market Liquidity Fund) in favor of a breakpoint structure based on the aggregate net assets of all such funds.
In connection with their review of the management fees and total expenses of the Putnam funds, the Trustees also reviewed the costs of the services provided and profits realized by Putnam Management and its affiliates from their contractual relationships with the funds. This information included trends in revenues, expenses and profitability of Putnam Management and its affiliates relating to the investment management and distribution services provided to the funds. In this regard, the Trustees also reviewed an analysis of Putnam Management’s revenues, expenses and profitability with respect to the funds’ management contracts, allocated on a fund-by-fund basis.
Investment performance
The quality of the investment process provided by Putnam Management represented a major factor in the Trustees’ evaluation of the quality of services provided by Putnam Management under your fund’s management contract. The Trustees were assisted in their review of the Putnam funds’ investment process and performance by the work of the Investment Oversight Coordinating Committee of the Trustees and the Investment Oversight Committees of the Trustees, which had met on a regular monthly basis with the funds’ portfolio teams throughout the year. The Trustees concluded that Putnam Management generally provides a high-quality investment process — as measured by the experience and skills of the individuals assigned to the management of fund portfolios, the resources made available to such personnel, and in general the ability of Putnam Management to attract and retain high-quality personnel &# 151; but also recognized that this does not guarantee favorable investment results for every fund in every time period. The Trustees considered the investment performance of each fund over multiple time periods and considered information comparing each fund’s performance with various benchmarks and with the performance of competitive funds.
The Trustees noted the disappointing investment performance of many of the funds for periods ended March 31, 2009. They discussed with senior management of Putnam Management the factors contributing to such underperformance and the actions being taken to improve performance. The Trustees recognized that, in recent years, Putnam Management has taken steps to strengthen its investment personnel and processes to address areas of underperformance, including Putnam Management’s continuing efforts to strengthen the equity research function, recent changes in portfolio managers including increased accountability of individual managers rather than teams, recent changes in Putnam Management’s approach to incentive compensation, including emphasis on top quartile performance over a rolling three-year period, and the recent arrival of a new chief investment officer. The Trustees also recognized the substantial improvement in performance of many funds si nce the implementation of those changes. The
19
Trustees indicated their intention to continue to monitor performance trends to assess the effectiveness of these efforts and to evaluate whether additional changes to address areas of underperformance are warranted.
In the case of your fund, the Trustees considered that your fund’s class A share cumulative total return performance at net asset value was in the following percentiles of its Lipper Inc. peer group (Lipper High Current Yield Funds) for the one-year, three-year and five-year periods ended March 31, 2009 (the first percentile being the best-performing funds and the 100th percentile being the worst-performing funds):
| | | |
| One-year period | 56th | | |
| | |
| Three-year period | 50th | | |
| | |
| Five-year period | 40th | | |
| | |
Over the one-year, three-year and five-year periods ended March 31, 2009, there were 460, 389 and 335 funds, respectively, in your fund’s Lipper peer group. Past performance is no guarantee of future results.
As a general matter, the Trustees believe that cooperative efforts between the Trustees and Putnam Management represent the most effective way to address investment performance problems. The Trustees noted that investors in the Putnam funds have, in effect, placed their trust in the Putnam organization, under the oversight of the funds’ Trustees, to make appropriate decisions regarding the management of the funds. Based on the responsiveness of Putnam Management in the recent past to Trustee concerns about investment performance, the Trustees concluded that it is preferable to seek change within Putnam Management to address performance shortcomings. In the Trustees’ view, the alternative of engaging a new investment adviser for an underperforming fund would entail significant disruptions and would not provide any greater assurance of improved investment performance.
Brokerage and soft-dollar allocations;
other benefits
The Trustees considered various potential benefits that Putnam Management may receive in connection with the services it provides under the management contract with your fund. These include benefits related to brokerage and soft-dollar allocations, whereby a portion of the commissions paid by a fund for brokerage may be used to acquire research services that may be useful to Putnam Management in managing the assets of the fund and of other clients. The Trustees considered a change made, at Putnam Management’s request, to the Putnam funds’ brokerage allocation policy commencing in 2009, which increased the permitted soft dollar allocation to third-party services over what had been authorized in previous years. The Trustees noted that a portion of available soft dollars continue to be allocated to the payment of fund expenses, although the amount allocated for this purpose has declined in recent years. The Trustees indicated their continued int ent to monitor regulatory developments in this area with the assistance of their Brokerage Committee and also indicated their continued intent to monitor the potential benefits associated with the allocation of fund brokerage and trends in industry practice to ensure that the principle of seeking best price and execution remains paramount in the portfolio trading process.
The Trustees’ annual review of your fund’s management contract also included the review of the investor servicing agreement with Putnam Investor Services, Inc. (“PSERV”), which agreement provides benefits to an affiliate of Putnam Management. The Trustees considered that effective January 1, 2009, the Trustees, PSERV and Putnam Management entered into a new fee schedule that includes for the open-end funds (other than funds of Putnam Variable Trust and Putnam Money Market Liquidity Fund) an expense limitation
20
but, as noted above, also considered that this expense limitation is subject to review as part of the Trustees’ pending review of Putnam’s strategic pricing proposal.
In the case of your fund, the Trustees’ annual review of the fund’s management contract also included the review of the fund’s distributor’s contract and distribution plans with Putnam Retail Management Limited Partnership, which contract and plans also provide benefits to an affiliate of Putnam Management.
Comparison of retail and institutional
fee schedules
The information examined by the Trustees as part of their annual contract review has included for many years information regarding fees charged by Putnam Management and its affiliates to institutional clients such as defined benefit pension plans, college endowments, etc. This information included comparisons of such fees with fees charged to the funds, as well as a detailed assessment of the differences in the services provided to these two types of clients. The Trustees observed, in this regard, that the differences in fee rates between institutional clients and mutual funds are by no means uniform when examined by individual asset sectors, suggesting that differences in the pricing of investment management services to these types of clients reflect to a substantial degree historical competitive forces operating in separate market places. The Trustees considered the fact that fee rates across different asset classes are typically higher on average fo r mutual funds than for institutional clients, as well as the differences between the services that Putnam Management provides to the Putnam funds and those that it provides to institutional clients of the firm, but did not rely on such comparisons to any significant extent in concluding that the management fees paid by your fund are reasonable.
Subsequent approval of strategic
pricing proposal
As mentioned above, at a series of meetings beginning in May 2009 and ending on July 10, 2009, the Contract Committee and the Trustees engaged in a detailed review of Putnam Management’s strategic pricing proposal. Following this review, the Trustees of each fund, including all of the Independent Trustees, voted unanimously on July 10, 2009 to approve proposed management contracts reflecting the proposal, as modified based on discussions between the Independent Trustees and Putnam Management, for each fund. In considering the proposed contracts, the Independent Trustees focused largely on the specific proposed changes described below relating to management fees. They also took into account the factors that they considered in connection with their most recent annual approval on June 12, 2009 of the continuance of the funds’ current management contracts and the extensive materials that they had reviewed in connection with that approval process, as described above.
At a meeting held on November 19, 2009, shareholders approved the proposed management contract for your fund. The new management contract was implemented on January 1, 2010.
• Considerations relating to Fund Family fee rate calculations. The Independent Trustees considered that the proposed management contracts would change the manner in which fund shareholders share in potential economies of scale associated with the management of the funds. Under the current management contracts, shareholders of a fund (other than Putnam Money Market Liquidity Fund and the Putnam RetirementReady® Funds, which do not pay management fees to Putnam Management) benefit from increased fund size through reductions in the effective management fee paid to Putnam Management once the fund’s net assets exceed the first breakpoint in the fund’s fee schedule ($500 million for most
21
funds). Conversely, in the case of funds with net assets above the level of the first breakpoint, the effective management fee increases as the fund’s average net assets decline below a breakpoint. These breakpoints are measured solely by the net assets of each individual fund and are not affected by possible growth (or decline) of net assets of other funds in the Fund Family. (“Fund Family” for purposes of this discussion refers to all open-end mutual funds sponsored by Putnam Management, except for the Putnam RetirementReady® Funds and Putnam Money Market Liquidity Fund.) Under the proposed management contracts, potential economies of scale would be shared ratably among shareholders of all funds, regardless of their size. The management fees paid by a fund (and indirectly by shareholders) would no longer be affected by the growth (or decline) of assets of the particular fund, but rather would be affected solely by the growth (or decline) of the aggregate net assets of all funds in the Fund Family, regardless of whether the net assets of the particular fund are growing or declining.
The table below shows the proposed effective management fee rate for your fund, based on June 30, 2009 net assets of the Fund Family ($52.3 billion). This table also shows the effective management fee rate payable by your fund under its current management contract, based on the net assets of the fund as of June 30, 2009. Finally, this table shows the difference in the effective management fees, based on net assets as of June 30, 2009, between the proposed management contract and the current contract.
| | | |
| | Proposed Effective | Current Effective | |
| Name of Fund | Contractual Rate | Contractual Rate | Difference |
|
| |
| Putnam High Yield Trust | 0.582% | 0.636% | (0.053)% |
As shown in the foregoing table, based on June 30, 2009 net asset levels, the proposed management contract would provide for payment of a management fee rate that is lower for your fund than the management fee rate payable under the current management contract. For a small number of funds (although not your fund), the management fee rate would be slightly higher under the proposed contract at these asset levels, but by only immaterial amounts. In the aggregate, the financial impact on Putnam Management of implementing this proposed change for all funds at June 30, 2009 net asset levels is a reduction in annual management fee revenue of approximately $24.0 million. (Putnam Management has already incurred a significant portion of this revenue reduction through the waiver of a portion of its current management fees for certain funds pending shareholder consideration of the proposed management contracts. Putnam is not obliged to continue such waivers beyond July 31, 2010 in the event that the proposed contracts are not approved by shareholders.) The Independent Trustees carefully considered the implications of this proposed change under a variety of economic circumstances. They considered the fact that at current asset levels the management fees paid by the funds under the proposed contract would be lower for almost all funds, and would not be materially higher for any fund. They considered the possibility that under some circumstances, the current management contract could result in a lower fee for a particular fund than the proposed management contract. Such circumstances might occur, for example, if the aggregate net assets of the Fund Family remain largely unchanged and the net assets of an individual fund grew substantially, or if the net assets of an individual fund remain largely unchanged and the aggregate net assets of the Fund Family declined substantially.
22
The Independent Trustees noted that future changes in the net assets of individual funds are inherently unpredictable and that experience has shown that funds often grow in size and decline in size over time depending on market conditions and the changing popularity of particular investment styles and asset classes. They noted that, while the aggregate net assets of the Fund Family have changed substantially over time, basing a management fee on the aggregate level of assets of the Fund Family would likely reduce fluctuations in costs paid by individual funds and lead to greater stability and predictability of fund operating costs over time.
The Independent Trustees considered that the proposed management contract would likely be advantageous for newly organized funds that have yet to attract significant assets and for funds in specialty asset classes that are unlikely to grow to a significant size. In each case, such funds would participate in the benefits of scale made possible by the aggregate size of the Fund Family to an extent that would not be possible based solely on their individual size.
The Independent Trustees also considered that for funds that have achieved or are likely to achieve considerable scale on their own, the proposed management contract could result in sharing of economies which might lead to slightly higher costs under some circumstances, but they noted that any such increases are immaterial at current asset levels and that over time such funds are likely to realize offsetting benefits from their opportunity to participate, both through the exchange privilege and through the Fund Family breakpoint fee structure, in the improved growth prospects of a diversified Fund Family able to offer competitively priced products.
The Independent Trustees noted that the implementation of the proposed management contracts would result in a reduction in aggregate fee revenues for Putnam Management at current asset levels. They also noted that applying various projections of growth equally to the aggregate net assets of the Fund Family and to the net assets of individual funds also showed revenue reductions for Putnam Management. They recognized, however, the possibility that under some scenarios Putnam Management might realize greater future revenues, with respect to certain funds, under the proposed contracts than under the current contracts, but considered such circumstances to be both less likely and inherently unpredictable.
The Independent Trustees considered the extent to which Putnam Management may realize economies of scale in connection with the management of the funds. In this regard, they considered the possibility that such economies of scale as may exist in the management of mutual funds may be associated more closely with the size of the aggregate assets of the mutual fund complex than with the size of any individual fund. In this regard the Independent Trustees considered the financial information provided to them by Putnam Management over a period of many years regarding the allocation of costs involved in calculating the profitability of its mutual fund business as a whole and the profitability of individual funds. The Independent Trustees noted that the methodologies for such cost allocations had been reviewed on a number of occasions in the past by independent financial consultants engaged by the Independent Trustees. The Independent Trustees noted that thes e methodologies support Putnam Management’s assertion that many of its operating costs and any associated economies of scale are related more to the aggregate net assets under management in various sectors of its business than to the size of individual funds. They noted that on a number of occasions in the past the Independent Trustees had separately considered the possibility of
23
calculating management fees in whole or in part based on aggregate net assets of the Putnam funds.
The Independent Trustees considered the fact that the proposed contracts would result in a sharing among the affected funds of economies of scale that for the most part are now enjoyed by the larger funds, without materially increasing the current costs of any of the larger funds. They concluded that this sharing of economies among funds was appropriate in light of the diverse investment opportunities available to shareholders of all funds through the existence of the exchange privilege. They also considered that the proposed change in management fee structure would allow Putnam Management to introduce new investment products at more attractive pricing levels than may currently be the case.
After considering all of the foregoing, the Independent Trustees concluded that the proposed calculation of management fees based on the aggregate net assets of the Fund Family represented a fair and reasonable means of sharing possible economies of scale among the shareholders of all funds.
• Considerations relating to addition of fee rate adjustments based on investment performance for certain funds. The Independent Trustees considered that Putnam’s proposal to add fee rate adjustments based on investment performance to the management contracts of certain funds reflected a desire by Putnam Management to align its fee revenues more closely with investment performance in the case of certain funds. They noted that Putnam Management already has a significant financial interest in achieving good performance results for the funds it manages. Putnam Management’s fees are based on the assets under its management (whether calculated on an individual fund or complex-wide basis). Good performance results in higher asset levels and therefore higher revenues to Putnam Management. Moreove r, good performance also tends to attract additional investors to particular funds or the complex generally, also resulting in higher revenues. Nevertheless, the Independent Trustees concluded that adjusting management fees based on performance for certain selected funds could provide additional benefits to shareholders.
The Independent Trustees noted that Putnam Management proposed the addition of performance adjustments only for certain of the funds (performance adjustments were not proposed for your fund) and considered whether similar adjustments might be appropriate for other funds. In this regard, they considered Putnam Management’s belief that the addition of performance adjustments would be most appropriate for shareholders of U.S. growth funds, international equity funds and Putnam Global Equity Fund. They also considered Putnam Management’s view that it would continue to monitor whether performance fees would be appropriate for other funds. Accordingly, the Independent Trustees concluded that it would be desirable to gain further experience with the operation of performance adjustments for certain funds and the market’s receptivity to such fee structures before giving further consideration to whether similar performance adjustments would be app ropriate for other funds as well.
• Considerations relating to standardization of payment terms. The proposed management contracts for all funds provide that management fees will be computed and paid monthly within 15 days after the end of each month. The current contracts of the funds contain quarterly computation and payment terms in some cases. These differences largely reflect practices in place at earlier times when many of the funds were first organized. Under the proposed contract, certain funds would make payments to Putnam Management earlier than they do under their current contract. This would
24
reduce a fund’s opportunity to earn income on accrued but unpaid management fees by a small amount, but would not have a material effect on a fund’s operating costs.
The Independent Trustees considered the fact that standardizing the payment terms for all funds would involve an acceleration in the timing of payments to Putnam Management for some funds and a corresponding loss of a potential opportunity for such funds to earn income on accrued but unpaid management fees. The Independent Trustees did not view this change as having a material impact on shareholders of any fund. In this regard, the Independent Trustees noted that the proposed contracts conform to the payment terms included in management contracts for all Putnam funds organized in recent years and that standardizing payment terms across all funds would reduce administrative burdens for both the funds and Putnam Management.
• Considerations relating to comparisons with management fees and total expenses of competitive funds. As part of their evaluation of the proposed management contracts, the Independent Trustees also reviewed the general approach taken by Putnam Management and the Independent Trustees in recent years in imposing appropriate limits on total fund expenses. As part of the annual contract review process in recent years, Putnam Management agreed to waive fees as needed to limit total fund expenses to a maximum level equal to the average total expenses of comparable competitive funds in the mutual fund industry. In connection with its proposal to implement new management contracts, Putnam Management also proposed, and the Independent Trustees approved, certain changes in this approach that shift the focus from controlling total expenses to imposing separate limits on certain c ategories of expenses, as required. As a general matter, Putnam Management and the Independent Trustees concluded that management fees for the Putnam funds are competitive with the fees charged by comparable funds in the industry. Nevertheless, the Independent Trustees considered specific management fee waivers proposed to be implemented as of August 1, 2009 by Putnam Management with respect to the current management fees of certain funds, as well as projected reductions in management fees for almost all funds that would result under the proposed contracts. Putnam Management and the Independent Trustees also agreed to impose separate expense limitations of 37.5 basis points on the general category of shareholder servicing expenses and 20 basis points on the general category of other ordinary operating expenses. These new expense limitations, as well as the fee waivers, were implemented for all funds effective as of August 1, 2009, replacing the expense limitation referred to above.
These changes resulted in lower total expenses for many funds, but in the case of some funds total expenses increased after application of the new waivers and expense limitations (as compared with the results obtained using the expense limitation method previously in place). In this regard, the Independent Trustees considered the likelihood that total expenses for most of these funds would have increased in any event in the normal course under the previous expense limitation arrangement, as the reported total expense levels of many competitive funds increased in response to the major decline in asset values that began in September 2008. These new waivers and expense limitations will continue in effect until at least July 31, 2010 and will be re-evaluated by the Independent Trustees as part of the annual contract review process prior to their scheduled expiration. However, the management fee waivers referred to above would largely become permanent reduc tions in fees as a result of the implementation of the proposed management contracts.
25
Under these new expense limitation arrangements effective August 1, 2009, the fixed income funds, including your fund, and asset allocation funds were subject to management fee waivers that reduced these funds’ management fees pending implementation of the proposed management contracts, and in any event, through July 31, 2010. In addition, your fund is subject to expense limitations of 37.5 basis points on the category of shareholder servicing fees and 20 basis points on the general category of other ordinary operating expenses.
Other information for shareholders
Important notice regarding delivery
of shareholder documents
In accordance with SEC regulations, Putnam sends a single copy of annual and semiannual shareholder reports, prospectuses, and proxy statements to Putnam shareholders who share the same address, unless a shareholder requests otherwise. If you prefer to receive your own copy of these documents, please call Putnam at 1-800-225-1581, and Putnam will begin sending individual copies within 30 days.
Proxy voting
Putnam is committed to managing our mutual funds in the best interests of our shareholders. The Putnam funds’ proxy voting guidelines and procedures, as well as information regarding how your fund voted proxies relating to portfolio securities during the 12-month period ended June 30, 2009, are available in the Individual Investors section of putnam.com, and on the SEC’s Web site, www.sec.gov. If you have questions about finding forms on the SEC’s Web site, you may call the SEC at 1-800-SEC-0330. You may also obtain the Putnam funds’ proxy voting guidelines and procedures at no charge by calling Putnam’s Shareholder Services at 1-800-225-1581.
Fund portfolio holdings
The fund will file a complete schedule of its portfolio holdings with the SEC for the first and third quarters of each fiscal year on Form N-Q. Shareholders may obtain the fund’s Forms N-Q on the SEC’s Web site at www.sec.gov. In addition, the fund’s Forms N-Q may be reviewed and copied at the SEC’s Public Reference Room in Washington, D.C. You may call the SEC at 1-800-SEC-0330 for information about the SEC’s Web site or the operation of the Public Reference Room.
Trustee and employee
fund ownership
Putnam employees and members of the Board of Trustees place their faith, confidence, and, most importantly, investment dollars in Putnam mutual funds. As of February 28, 2010, Putnam employees had approximately $323,000,000 and the Trustees had approximately $46,000,000 invested in Putnam mutual funds. These amounts include investments by the Trustees’ and employees’ immediate family members as well as investments through retirement and deferred compensation plans.
26
Financial statements
A guide to financial statements
These sections of the report, as well as the accompanying Notes, constitute the fund’s financial statements.
The fund’s portfolio lists all the fund’s investments and their values as of the last day of the reporting period. Holdings are organized by asset type and industry sector, country, or state to show areas of concentration and diversification.
Statement of assets and liabilities shows how the fund’s net assets and share price are determined. All investment and noninvestment assets are added together. Any unpaid expenses and other liabilities are subtracted from this total. The result is divided by the number of shares to determine the net asset value per share, which is calculated separately for each class of shares. (For funds with preferred shares, the amount subtracted from total assets includes the liquidation preference of preferred shares.)
Statement of operations shows the fund’s net investment gain or loss. This is done by first adding up all the fund’s earnings — from dividends and interest income — and subtracting its operating expenses to determine net investment income (or loss). Then, any net gain or loss the fund realized on the sales of its holdings — as well as any unrealized gains or losses over the period — is added to or subtracted from the net investment result to determine the fund’s net gain or loss for the fiscal period.
Statement of changes in net assets shows how the fund’s net assets were affected by the fund’s net investment gain or loss, by distributions to shareholders, and by changes in the number of the fund’s shares. It lists distributions and their sources (net investment income or realized capital gains) over the current reporting period and the most recent fiscal year-end. The distributions listed here may not match the sources listed in the Statement of operations because the distributions are determined on a tax basis and may be paid in a different period from the one in which they were earned. Dividend sources are estimated at the time of declaration. Actual results may vary. Any non-taxable return of capital cannot be determined until final tax calculations are completed after the end of the fund’s fiscal year.
Financial highlights provide an overview of the fund’s investment results, per-share distributions, expense ratios, net investment income ratios, and portfolio turnover in one summary table, reflecting the five most recent reporting periods. In a semiannual report, the highlights table also includes the current reporting period.
27
The fund’s portfolio 2/28/10 (Unaudited)
| | | |
| CORPORATE BONDS AND NOTES (84.3%)* | Principal amount | Value |
|
| Advertising and marketing services (0.1%) | | | |
| Lamar Media Corp. company guaranty 7 1/4s, 2013 | | $1,243,000 | $1,243,000 |
|
| | | | 1,243,000 |
| Automotive (2.7%) | | | |
| Affinia Group, Inc. 144A sr. notes 10 3/4s, 2016 | | 1,150,000 | 1,247,750 |
|
| Allison Transmission, Inc. 144A company | | | |
| guaranty sr. unsec. notes 11 1/4s, 2015 ‡‡ | | 6,663,000 | 6,896,205 |
|
| American Axle & Manufacturing, Inc. company | | | |
| guaranty sr. unsec. unsub. notes 7 7/8s, 2017 | | 875,000 | 761,250 |
|
| Dana Corp. escrow sr. notes 5.85s, 2015 (In default) F † | | 5,483,000 | 5 |
|
| Ford Motor Credit Co., LLC sr. notes 9 7/8s, 2011 | | 202,000 | 211,595 |
|
| Ford Motor Credit Co., LLC sr. notes 7 1/4s, 2011 | | 6,240,000 | 6,325,713 |
|
| Ford Motor Credit Co., LLC sr. unsec. notes 8 1/8s, 2020 | | 3,190,000 | 3,174,050 |
|
| Ford Motor Credit Co., LLC sr. unsec. | | | |
| unsub. notes 7 1/2s, 2012 | | 2,275,000 | 2,284,535 |
|
| General Motors Corp. sr. unsec. notes 8 1/4s, 2023 | | 4,765,000 | 1,417,588 |
|
| General Motors Corp. sr. unsec. unsub. notes 8 3/8s, 2033 | | 4,765,000 | 1,441,413 |
|
| Navistar International Corp. sr. notes 8 1/4s, 2021 | | 5,570,000 | 5,667,475 |
|
| Oshkosh Corp. 144A company guaranty sr. unsec. | | | |
| notes 8 1/2s, 2020 | | 830,000 | 830,000 |
|
| TRW Automotive, Inc. company guaranty sr. unsec. | | | |
| unsub. notes Ser. REGS, 6 3/8s, 2014 | EUR | 3,040,000 | 3,813,723 |
|
| | | | 34,071,302 |
| Basic materials (8.0%) | | | |
| Aleris International, Inc. company guaranty sr. unsec. | | | |
| notes 9s, 2014 (In default) † ‡‡ | | 4,534,000 | 34,458 |
|
| Aleris International, Inc. company guaranty sr. unsec. | | | |
| sub. notes 10s, 2016 (In default) † | | 396,000 | 8,415 |
|
| AMH Holdings, Inc. sr. disc. unsec. notes 11 1/4s, 2014 | | 1,140,000 | 1,128,600 |
|
| Associated Materials, LLC/Associated Materials | | | |
| Finance, Inc. company guaranty sr. notes 9 7/8s, 2016 | | 3,140,000 | 3,328,400 |
|
| Builders FirstSource, Inc. 144A company | | | |
| guaranty sr. notes FRN 13s, 2016 | | 2,685,000 | 2,725,275 |
|
| Catalyst Paper Corp. company guaranty sr. unsec. | | | |
| unsub. notes 7 3/8s, 2014 (Canada) | | 1,321,000 | 845,440 |
|
| Clondalkin Acquisition BV 144A company | | | |
| guaranty sr. notes FRN 2.254s, 2013 (Netherlands) | | 3,107,000 | 2,772,998 |
|
| Compass Minerals International, Inc. 144A | | | |
| sr. notes 8s, 2019 | | 3,295,000 | 3,418,563 |
|
| FMG Finance Pty Ltd. 144A sr. sec. notes 10 5/8s, | | | |
| 2016 (Australia) | | 4,430,000 | 4,939,450 |
|
| Freeport-McMoRan Copper & Gold, Inc. sr. unsec. | | | |
| notes 8 3/8s, 2017 | | 10,546,000 | 11,416,045 |
|
| Georgia-Pacific, LLC 144A company | | | |
| guaranty sr. unsec. notes 7s, 2015 | | 2,630,000 | 2,666,163 |
|
| HeidelbergCement AG company guaranty sr. unsec. | | | |
| unsub. notes 8s, 2017 (Germany) | EUR | 755,000 | 1,057,292 |
|
| HeidelbergCement AG company guaranty sr. unsec. | | | |
| unsub. notes 7 1/2s, 2014 (Germany) | EUR | 505,000 | 711,033 |
|
28
| | | |
| CORPORATE BONDS AND NOTES (84.3%)* cont. | Principal amount | Value |
|
| Basic materials cont. | | | |
| HeidelbergCement AG company guaranty unsec. | | | |
| unsub. notes 8 1/2s, 2019 (Germany) | EUR | 505,000 | $713,042 |
|
| Hexion Finance Escrow LLC/Hexion Escrow Corp. 144A | | | |
| sr. notes 8 7/8s, 2018 | | $1,180,000 | 1,103,300 |
|
| Hexion U.S. Finance Corp./Hexion Nova Scotia | | | |
| Finance, ULC company guaranty 9 3/4s, 2014 | | 2,213,000 | 2,091,285 |
|
| Huntsman International, LLC company | | | |
| guaranty sr. unsec. sub. notes Ser. REGS, 6 7/8s, 2013 | EUR | 3,115,000 | 3,945,356 |
|
| Jefferson Smurfit Corp. company guaranty 8 1/4s, | | | |
| 2012 (In default) † | | $1,217,000 | 1,004,025 |
|
| Kerling PLC 144A sr. notes 10 5/8s, 2017 | | | |
| (United Kingdom) | EUR | 1,075,000 | 1,486,150 |
|
| Metals USA, Inc. company guaranty sr. unsec. | | | |
| notes 11 1/8s, 2015 | | $2,128,000 | 2,149,280 |
|
| Momentive Performance Materials, Inc. company | | | |
| guaranty sr. unsec. notes 9 3/4s, 2014 | | 2,738,000 | 2,580,565 |
|
| NewPage Corp. company guaranty sr. notes 11 3/8s, 2014 | | 2,760,000 | 2,635,800 |
|
| NewPage Holding Corp. sr. unsec. unsub. notes FRN | | | |
| 7.564s, 2013 ‡‡ | | 1,725,631 | 258,845 |
|
| Novelis, Inc. company guaranty sr. unsec. notes 11 1/2s, 2015 | | 1,990,000 | 2,114,375 |
|
| Novelis, Inc. company guaranty sr. unsec. notes 7 1/4s, 2015 | | 4,589,000 | 4,256,298 |
|
| PE Paper Escrow GmbH sr. notes Ser. REGS, 11 3/4s, | | | |
| 2014 (Austria) | EUR | 875,000 | 1,295,278 |
|
| PE Paper Escrow GmbH 144A sr. notes 12s, 2014 (Austria) | | $3,425,000 | 3,716,125 |
|
| Rhodia SA sr. unsec. notes FRN Ser. REGS, 3.434s, | | | |
| 2013 (France) | EUR | 4,145,000 | 5,264,033 |
|
| Rockwood Specialties Group, Inc. company | | | |
| guaranty sr. unsec. sub. notes 7 5/8s, 2014 | EUR | 950,000 | 1,286,806 |
|
| Smurfit Kappa Acquisition 144A company | | | |
| guaranty sr. notes 7 3/4s, 2019 (Ireland) | EUR | 735,000 | 1,025,181 |
|
| Smurfit Kappa Funding PLC sr. unsec. | | | |
| sub. notes 7 3/4s, 2015 (Ireland) | | $4,392,000 | 4,260,240 |
|
| Smurfit-Stone Container Corp. sr. notes unsec. | | | |
| unsub. notes 8 3/8s, 2012 (In default) † | | 2,163,000 | 1,789,883 |
|
| Solutia, Inc. company guaranty sr. unsec. | | | |
| notes 8 3/4s, 2017 | | 865,000 | 903,925 |
|
| Steel Dynamics, Inc. company guaranty sr. unsec. | | | |
| unsub. notes 7 3/8s, 2012 | | 3,400,000 | 3,459,500 |
|
| Steel Dynamics, Inc. company guaranty sr. unsec. | | | |
| unsub. notes 6 3/4s, 2015 | | 1,340,000 | 1,293,100 |
|
| Steel Dynamics, Inc. sr. unsec. unsub. notes 7 3/4s, 2016 | | 2,625,000 | 2,631,563 |
|
| Teck Resources, Ltd. sr. notes 10 3/4s, 2019 (Canada) | | 1,615,000 | 1,986,450 |
|
| Teck Resources, Ltd. sr. notes 10 1/4s, 2016 (Canada) | | 3,935,000 | 4,692,488 |
|
| Teck Resources, Ltd. sr. unsec. notes 6 1/8s, 2035 (Canada) | | 1,520,000 | 1,368,000 |
|
| Terra Capital, Inc. 144A sr. notes 7 3/4s, 2019 | | 2,000,000 | 2,230,000 |
|
| Verso Paper Holdings, LLC/Verso Paper, Inc. company | | | |
| guaranty sr. sec. notes FRN Ser. B, 3.999s, 2014 | | 2,960,000 | 2,390,200 |
|
| Verso Paper Holdings, LLC/Verso Paper, Inc. 144A | | | |
| sr. notes 11 1/2s, 2014 | | 3,215,000 | 3,375,750 |
|
| | | | 102,358,975 |
29
| | |
| CORPORATE BONDS AND NOTES (84.3%)* cont. | Principal amount | Value |
|
| Broadcasting (2.0%) | | |
| Clear Channel Communications, Inc. company | | |
| guaranty unsec. unsub. notes 10 3/4s, 2016 | $1,440,000 | $1,101,600 |
|
| Clear Channel Communications, Inc. sr. unsec. | | |
| notes 7.65s, 2010 | 882,000 | 868,770 |
|
| Clear Channel Communications, Inc. sr. unsec. | | |
| notes 5 1/2s, 2014 | 680,000 | 404,600 |
|
| Clear Channel Worldwide Holdings, Inc. 144A company | | |
| guaranty sr. unsec. unsub. notes, Ser. B, 9 1/4s, 2017 | 3,600,000 | 3,699,000 |
|
| Clear Channel Worldwide Holdings, Inc. 144A company | | |
| guaranty sr. unsec. unsub. notes Ser. A, 9 1/4s, 2017 | 1,085,000 | 1,106,700 |
|
| DIRECTV Holdings, LLC company guaranty sr. unsec. | | |
| notes 7 5/8s, 2016 | 3,000 | 3,289 |
|
| DIRECTV Holdings, LLC company guaranty sr. unsec. | | |
| notes 6 3/8s, 2015 | 3,675,000 | 3,799,031 |
|
| DISH DBS Corp. company guaranty sr. unsec. | | |
| notes 7 7/8s, 2019 | 3,050,000 | 3,141,500 |
|
| Echostar DBS Corp. company guaranty 7 1/8s, 2016 | 2,532,000 | 2,538,330 |
|
| Sirius XM Radio, Inc. 144A sr. notes 9 3/4s, 2015 | 1,315,000 | 1,374,175 |
|
| Umbrella Acquisition, Inc. 144A company | | |
| guaranty sr. unsec. unsub. notes 9 3/4s, 2015 ‡‡ | 3,724,797 | 3,296,445 |
|
| Univision Communications, Inc. 144A sr. sec. | | |
| notes 12s, 2014 | 635,000 | 687,388 |
|
| XM Satellite Radio, Inc. 144A company | | |
| guaranty sr. unsec. notes 13s, 2013 | 2,715,000 | 2,972,925 |
|
| XM Satellite Radio, Inc. 144A sr. notes 11 1/4s, 2013 | 675,000 | 718,875 |
|
| Young Broadcasting, Inc. company | | |
| guaranty sr. sub. notes 8 3/4s, 2014 (In default) † | 1,025,000 | 5,125 |
|
| Young Broadcasting, Inc. company guaranty sr. unsec. | | |
| sub. notes 10s, 2011 (In default) † | 3,903,000 | 27,321 |
|
| | | 25,745,074 |
| Building materials (1.9%) | | |
| Building Materials Corp. company guaranty notes 7 3/4s, 2014 | 3,940,000 | 4,097,600 |
|
| Building Materials Corp. 144A sr. notes 7s, 2020 | 3,850,000 | 3,850,000 |
|
| Goodman Global Group, Inc. 144A sr. disc. | | |
| notes zero %, 2014 | 3,200,000 | 1,856,000 |
|
| Goodman Global, Inc. company guaranty sr. unsec. | | |
| sub. notes 13 1/2s, 2016 | 3,555,000 | 3,910,500 |
|
| Owens Corning, Inc. company guaranty unsec. | | |
| unsub. notes 9s, 2019 | 6,815,000 | 7,786,138 |
|
| THL Buildco, Inc. (Nortek Holdings, Inc.) | | |
| sr. notes 11s, 2013 | 2,079,199 | 2,183,159 |
|
| | | 23,683,397 |
| Capital goods (4.1%) | | |
| ACCO Brands Corp. 144A company guaranty sr. sec. | | |
| notes 10 5/8s, 2015 | 1,755,000 | 1,907,685 |
|
| Alliant Techsystems, Inc. sr. sub. notes 6 3/4s, 2016 | 2,000 | 1,970 |
|
| Altra Holdings, Inc. 144A sr. notes 8 1/8s, 2016 | 3,080,000 | 3,157,000 |
|
| BBC Holding Corp. sr. notes 8 7/8s, 2014 | 3,780,000 | 3,638,250 |
|
| BE Aerospace, Inc. sr. unsec. unsub. notes 8 1/2s, 2018 | 765,000 | 801,338 |
|
| Berry Plastics Corp. company guaranty sr. notes FRN | | |
| 5.001s, 2015 | 1,455,000 | 1,360,425 |
|
30
| | | |
| CORPORATE BONDS AND NOTES (84.3%)* cont. | Principal amount | Value |
|
| Capital goods cont. | | | |
| Bombardier, Inc. 144A sr. unsec. notes FRN 4.406s, | | | |
| 2013 (Canada) | EUR | 2,000 | $2,719 |
|
| Crosstex Energy/Crosstex Energy Finance Corp. 144A | | | |
| sr. notes 8 7/8s, 2018 | | $2,960,000 | 3,004,400 |
|
| Crown European Holdings SA company guaranty sr. sec. | | | |
| notes 6 1/4s, 2011 (France) | EUR | 1,150,000 | 1,617,086 |
|
| General Cable Corp. company guaranty sr. unsec. | | | |
| unsub. notes FRN 2.626s, 2015 | | $3,918,000 | 3,418,455 |
|
| L-3 Communications Corp. company guaranty Ser. B, | | | |
| 6 3/8s, 2015 | | 3,055,000 | 3,104,644 |
|
| Legrand SA unsec. unsub. debs. 8 1/2s, 2025 (France) | | 7,826,000 | 9,102,413 |
|
| Mueller Water Products, Inc. company | | | |
| guaranty sr. unsec. notes 7 3/8s, 2017 | | 2,800,000 | 2,492,000 |
|
| Owens-Brockway Glass Container, Inc. company | | | |
| guaranty 6 3/4s, 2014 | EUR | 652,000 | 887,959 |
|
| RBS Global, Inc./Rexnord Corp. company | | | |
| guaranty sr. unsec. unsub. notes 9 1/2s, 2014 | | $3,990,000 | 4,039,875 |
|
| Reddy Ice Corp. 144A sr. notes 11 1/4s, 2015 | | 2,000,000 | 2,000,000 |
|
| Ryerson Holding Corp. 144A sr. disc. notes zero %, 2015 | | 3,890,000 | 1,750,500 |
|
| Ryerson Tull, Inc. company guaranty sr. sec. notes 12s, 2015 | | 4,718,000 | 4,847,745 |
|
| TD Funding Corp. 144A company | | | |
| guaranty sr. sub. notes 7 3/4s, 2014 | | 735,000 | 735,000 |
|
| Tenneco, Inc. company guaranty sr. unsec. | | | |
| notes 8 1/8s, 2015 | | 1,845,000 | 1,826,550 |
|
| Transdigm, Inc. company guaranty sr. unsec. | | | |
| sub. notes 7 3/4s, 2014 | | 1,591,000 | 1,587,023 |
|
| Triumph Group, Inc. 144A sr. sub. notes 8s, 2017 | | 1,510,000 | 1,521,325 |
|
| | | | 52,804,362 |
| Coal (1.1%) | | | |
| Arch Western Finance, LLC company | | | |
| guaranty sr. notes 6 3/4s, 2013 | | 7,165,000 | 7,182,913 |
|
| Peabody Energy Corp. company guaranty 7 3/8s, 2016 | | 6,021,000 | 6,367,208 |
|
| | | | 13,550,121 |
| Commercial and consumer services (1.4%) | | | |
| Aramark Corp. company guaranty 8 1/2s, 2015 | | 3,589,000 | 3,624,890 |
|
| Corrections Corporation of America company | | | |
| guaranty sr. notes 7 3/4s, 2017 | | 3,640,000 | 3,749,200 |
|
| Lender Processing Services, Inc. company | | | |
| guaranty sr. unsec. unsub. notes 8 1/8s, 2016 | | 1,757,000 | 1,875,598 |
|
| National Money Mart Co. 144A company | | | |
| guaranty sr. notes 10 3/8s, 2016 (Canada) | | 2,165,000 | 2,262,425 |
|
| Sabre Holdings Corp. sr. unsec. unsub. notes 8.35s, 2016 | | 3,155,000 | 2,894,713 |
|
| Travelport LLC company guaranty 11 7/8s, 2016 | | 1,759,000 | 1,833,758 |
|
| Travelport LLC company guaranty 9 7/8s, 2014 | | 1,028,000 | 1,051,130 |
|
| | | | 17,291,714 |
| Communication services (10.0%) | | | |
| Adelphia Communications Corp. escrow bonds zero %, 2011 | | 81,000 | 1,021 |
|
| Adelphia Communications Corp. escrow bonds zero %, 2010 | | 4,000 | 50 |
|
| Adelphia Communications Corp. escrow bonds zero %, 2010 | | 4,000 | 50 |
|
| Adelphia Communications Corp. escrow bonds zero %, 2011 | | 2,223,000 | 28,010 |
|
| Adelphia Communications Corp. escrow bonds zero %, 2010 | | 2,906,000 | 36,616 |
|
31
| | |
| CORPORATE BONDS AND NOTES (84.3%)* cont. | Principal amount | Value |
|
| Communication services cont. | | |
| Atlantic Broadband Finance, LLC company | | |
| guaranty 9 3/8s, 2014 | $1,781,000 | $1,803,263 |
|
| Cablevision Systems Corp. sr. unsec. notes Ser. B, 8s, 2012 | 1,020,000 | 1,074,825 |
|
| Cablevision Systems Corp. 144A sr. notes 8 5/8s, 2017 | 2,795,000 | 2,878,850 |
|
| CC Holdings GS V, LLC/Crown Castle GS III Corp. 144A | | |
| sr. sec. notes 7 3/4s, 2017 | 1,095,000 | 1,185,338 |
|
| CCH II, LLC sr. notes 13 1/2s, 2016 | 5,538,928 | 6,542,859 |
|
| CCO Holdings LLC/CCO Holdings Capital Corp. | | |
| sr. unsec. notes 8 3/4s, 2013 | 1,530,000 | 1,552,950 |
|
| Cequel Communications Holdings I LLC/Cequel | | |
| Capital Corp.Capital Corp. 144A sr. notes 8 5/8s, 2017 | 2,795,000 | 2,795,000 |
|
| Cincinnati Bell, Inc. company guaranty sr. unsec. | | |
| notes 7s, 2015 | 1,988,000 | 1,908,480 |
|
| Clearwire Communications, LLC/Clearwire | | |
| Finance, Inc. 144A company guaranty sr. notes 12s, 2015 | 3,545,000 | 3,465,238 |
|
| Clearwire Communications, LLC/Clearwire | | |
| Finance, Inc. 144A company guaranty sr. notes 12s, 2015 | 2,640,000 | 2,580,600 |
|
| Cricket Communications, Inc. company | | |
| guaranty 9 3/8s, 2014 | 3,612,000 | 3,593,940 |
|
| Cricket Communications, Inc. company | | |
| guaranty sr. unsub. notes 7 3/4s, 2016 | 1,855,000 | 1,885,144 |
|
| CSC Holdings, Inc. 144A sr. unsec. notes 8 1/2s, 2014 | 117,000 | 122,996 |
|
| Digicel Group, Ltd. 144A sr. notes 8 1/4s, 2017 (Jamaica) | 2,540,000 | 2,413,000 |
|
| Digicel Group, Ltd. 144A sr. unsec. notes 8 7/8s, | | |
| 2015 (Jamaica) | 2,104,000 | 2,009,320 |
|
| Equinix, Inc. sr. notes 8 1/8s, 2018 | 1,435,000 | 1,435,000 |
|
| Frontier Communications Corp. sr. unsec. | | |
| notes 8 1/4s, 2014 | 15,000 | 15,413 |
|
| Frontier Communications Corp. sr. unsec. | | |
| notes 8 1/8s, 2018 | 4,225,000 | 4,203,875 |
|
| Global Crossing, Ltd. 144A sr. sec. notes 12s, 2015 | | |
| (United Kingdom) | 305,000 | 331,688 |
|
| Inmarsat Finance PLC 144A company | | |
| guaranty sr. notes 7 3/8s, 2017 (United Kingdom) | 1,295,000 | 1,327,375 |
|
| Intelsat Bermuda, Ltd. company guaranty sr. unsec. | | |
| notes 11 1/4s, 2017 (Bermuda) | 7,185,000 | 7,283,794 |
|
| Intelsat Intermediate Holding Co., Ltd. company | | |
| guaranty sr. unsec. notes 9 1/4s, 2015 (Bermuda) | 2,118,000 | 2,155,065 |
|
| Intelsat Intermediate Holding Co., Ltd. company | | |
| guaranty sr. unsec. notes 9 1/2s, 2015 (Bermuda) | 765,000 | 789,863 |
|
| Intelsat Jackson Holding Co. company | | |
| guaranty sr. unsec. notes 11 1/4s, 2016 (Bermuda) | 7,644,000 | 8,179,080 |
|
| Intelsat Subsidiary Holding Co., Ltd. company | | |
| guaranty sr. unsec. notes 8 7/8s, 2015 (Bermuda) | 1,825,000 | 1,861,500 |
|
| Intelsat Subsidiary Holding Co., Ltd. company | | |
| guaranty sr. unsec. notes 8 1/2s, 2013 (Bermuda) | 557,000 | 562,570 |
|
| Level 3 Financing, Inc. company guaranty 9 1/4s, 2014 | 4,142,000 | 3,924,545 |
|
| Level 3 Financing, Inc. company guaranty 8 3/4s, 2017 | 1,088,000 | 968,320 |
|
| Mediacom LLC/Mediacom Capital Corp. 144A | | |
| sr. notes 9 1/8s, 2019 | 1,165,000 | 1,170,825 |
|
32
| | | |
| CORPORATE BONDS AND NOTES (84.3%)* cont. | Principal amount | Value |
|
| Communication services cont. | | | |
| MetroPCS Wireless, Inc. company guaranty sr. unsec. | | | |
| notes 9 1/4s, 2014 | | $6,625,000 | $6,608,438 |
|
| Nextel Communications, Inc. company | | | |
| guaranty sr. unsec. notes Ser. D, 7 3/8s, 2015 | | 6,135,000 | 5,659,538 |
|
| NII Capital Corp. 144A company | | | |
| guaranty sr. notes 10s, 2016 | | 4,930,000 | 5,349,050 |
|
| Nordic Telephone Co. Holdings ApS 144A sr. sec. bond | | | |
| 8 7/8s, 2016 (Denmark) | | 931,000 | 996,170 |
|
| PAETEC Holding Corp. company guaranty sr. unsec. | | | |
| unsub. notes 9 1/2s, 2015 | | 1,371,000 | 1,333,298 |
|
| PAETEC Holding Corp. 144A company | | | |
| guaranty sr. notes 8 7/8s, 2017 | | 1,420,000 | 1,430,650 |
|
| Qwest Communications International, Inc. company | | | |
| guaranty 7 1/2s, 2014 | | 902,000 | 911,020 |
|
| Qwest Corp. sr. unsec. unsub. notes 8 7/8s, 2012 | | 4,660,000 | 5,050,275 |
|
| Qwest Corp. sr. unsec. unsub. notes 8 3/8s, 2016 | | 750,000 | 821,250 |
|
| Qwest Corp. sr. unsec. unsub. notes 7 1/4s, 2025 | | 2,586,000 | 2,469,630 |
|
| SBA Telecommunications, Inc. 144A company | | | |
| guaranty sr. notes 8 1/4s, 2019 | | 1,175,000 | 1,233,750 |
|
| SBA Telecommunications, Inc. 144A company | | | |
| guaranty sr. notes 8s, 2016 | | 2,360,000 | 2,454,400 |
|
| Sprint Capital Corp. company guaranty 6 7/8s, 2028 | | 6,828,000 | 5,172,210 |
|
| Sprint Nextel Corp. sr. notes 8 3/8s, 2017 | | 315,000 | 304,763 |
|
| Time Warner Telecom, Inc. company guaranty 9 1/4s, 2014 | | 872,000 | 898,160 |
|
| West Corp. company guaranty 9 1/2s, 2014 | | 5,083,000 | 5,044,878 |
|
| Wind Acquisition Finance SA 144A sr. notes 11 3/4s, | | | |
| 2017 (Netherlands) | | 2,900,000 | 3,103,000 |
|
| Wind Acquisition Finance SA 144A sr. notes 11 3/4s, | | | |
| 2017 (Netherlands) | EUR | 400,000 | 587,556 |
|
| Windstream Corp. company guaranty 8 5/8s, 2016 | | $5,977,000 | 6,081,598 |
|
| Windstream Corp. company guaranty 8 1/8s, 2013 | | 1,975,000 | 2,054,000 |
|
| | | | 127,650,097 |
| Consumer (1.2%) | | | |
| Jarden Corp. company guaranty sr. sub. notes Ser. 1, | | | |
| 7 1/2s, 2020 | EUR | 410,000 | 569,759 |
|
| Jarden Corp. company guaranty sr. unsec. notes 8s, 2016 | | $1,120,000 | 1,170,400 |
|
| Jarden Corp. company guaranty sr. unsec. | | | |
| sub. notes 7 1/2s, 2020 | | 590,000 | 592,950 |
|
| Jarden Corp. company guaranty sr. unsec. | | | |
| sub. notes 7 1/2s, 2017 | | 3,756,000 | 3,774,780 |
|
| Scotts Miracle-Gro Co. (The) company | | | |
| guaranty sr. unsec. notes 7 1/4s, 2018 | | 770,000 | 779,625 |
|
| Visant Corp. company guaranty sr. unsec. | | | |
| sub. notes 7 5/8s, 2012 | | 3,982,000 | 4,001,910 |
|
| Yankee Acquisition Corp. company | | | |
| guaranty sr. notes Ser. B, 8 1/2s, 2015 | | 5,087,000 | 5,087,000 |
|
| | | | 15,976,424 |
33
| | |
| CORPORATE BONDS AND NOTES (84.3%)* cont. | Principal amount | Value |
|
| Consumer staples (4.4%) | | |
| Archibald Candy Corp. company guaranty 10s, | | |
| 2010 (In default) F † | $774,063 | $11,954 |
|
| Avis Budget Car Rental, LLC company | | |
| guaranty sr. unsec. unsub. notes 7 3/4s, 2016 | 3,742,000 | 3,377,155 |
|
| Avis Budget Car Rental, LLC company | | |
| guaranty sr. unsec. unsub. notes 7 5/8s, 2014 | 2,447,000 | 2,281,828 |
|
| Central Garden & Pet Co. sr. sub. notes 8 1/4s, 2018 ## | 2,840,000 | 2,868,400 |
|
| Chiquita Brands International, Inc. sr. notes 7 1/2s, 2014 | 3,144,000 | 3,096,840 |
|
| Chiquita Brands International, Inc. sr. unsec. | | |
| unsub. notes 8 7/8s, 2015 | 738,000 | 749,070 |
|
| Constellation Brands, Inc. company | | |
| guaranty sr. unsec. unsub. notes 7 1/4s, 2016 | 3,323,000 | 3,360,384 |
|
| Dole Food Co. 144A sr. sec. notes 8s, 2016 | 1,405,000 | 1,429,588 |
|
| Dole Food Co. 144A sr. unsec. notes 13 7/8s, 2014 | 1,372,000 | 1,636,110 |
|
| Elizabeth Arden, Inc. company guaranty 7 3/4s, 2014 | 3,418,000 | 3,418,000 |
|
| Great Atlantic & Pacific Tea Co. 144A sr. notes 11 3/8s, 2015 | 1,762,000 | 1,691,520 |
|
| JBS USA LLC/JBS USA Finance, Inc. 144A | | |
| sr. notes 11 5/8s, 2014 | 1,050,000 | 1,186,500 |
|
| Libbey Glass, Inc. 144A sr. notes 10s, 2015 | 1,180,000 | 1,221,300 |
|
| Pinnacle Foods Finance LLC sr. notes 9 1/4s, 2015 | 1,450,000 | 1,471,750 |
|
| Pinnacle Foods Finance LLC 144A sr. unsec. | | |
| notes 9 1/4s, 2015 | 1,045,000 | 1,060,675 |
|
| Prestige Brands, Inc. sr. sub. notes 9 1/4s, 2012 | 650,000 | 652,438 |
|
| Revlon Consumer Products 144A company | | |
| guaranty sr. notes 9 3/4s, 2015 | 1,420,000 | 1,459,050 |
|
| Rite Aid Corp. company guaranty sr. notes 10 1/4s, 2019 | 880,000 | 930,600 |
|
| Rite Aid Corp. company guaranty sr. notes 7 1/2s, 2017 | 886,000 | 821,765 |
|
| Rite Aid Corp. company guaranty sr. unsec. | | |
| unsub. notes 9 1/2s, 2017 | 3,472,000 | 2,873,080 |
|
| RSC Equipment Rental, Inc. 144A sr. sec. notes 10s, 2017 | 2,260,000 | 2,418,200 |
|
| Smithfield Foods, Inc. sr. unsec. notes 7s, 2011 | 775,000 | 775,000 |
|
| Smithfield Foods, Inc. sr. unsec. notes Ser. B, 7 3/4s, 2013 | 2,640,000 | 2,574,000 |
|
| Smithfield Foods, Inc. 144A sr. sec. notes 10s, 2014 | 1,660,000 | 1,796,950 |
|
| Spectrum Brands, Inc. sr. unsec. sub. bonds 12s, 2019 ‡‡ | 1,749,139 | 1,775,376 |
|
| Supervalu, Inc. sr. unsec. notes 8s, 2016 | 1,865,000 | 1,878,988 |
|
| TreeHouse Foods, Inc. sr. unsec. notes 7 3/4s, 2018 | 700,000 | 718,375 |
|
| Tyson Foods, Inc. sr. unsec. unsub. notes 10 1/2s, 2014 | 2,508,000 | 2,915,550 |
|
| Wendy’s/Arby’s Restaurants LLC company | | |
| guaranty sr. unsec. unsub. notes 10s, 2016 | 4,985,000 | 5,346,413 |
|
| | | 55,796,859 |
| Energy (oil field) (2.3%) | | |
| Complete Production Services, Inc. company | | |
| guaranty 8s, 2016 | 2,055,000 | 1,998,488 |
|
| Expro Finance Luxemburg 144A sr. notes 8 1/2s, | | |
| 2016 (Luxembourg) | 2,730,000 | 2,716,350 |
|
| Helix Energy Solutions Group, Inc. 144A sr. unsec. | | |
| notes 9 1/2s, 2016 | 6,787,000 | 6,854,870 |
|
| Hercules Offshore, Inc. 144A sr. notes 10 1/2s, 2017 | 1,350,000 | 1,343,250 |
|
34
| | |
| CORPORATE BONDS AND NOTES (84.3%)* cont. | Principal amount | Value |
|
| Energy (oil field) cont. | | |
| Hornbeck Offshore Services, Inc. sr. notes Ser. B, | | |
| 6 1/8s, 2014 | $2,114,000 | $1,966,020 |
|
| Key Energy Services, Inc. company | | |
| guaranty sr. unsec. unsub. notes 8 3/8s, 2014 | 4,200,000 | 4,158,000 |
|
| Oslo Seismic Services, Inc. 1st mtge. 8.28s, 2011 | 1,523,597 | 1,532,924 |
|
| Pride International, Inc. sr. unsec. notes 7 3/8s, 2014 | 2,793,000 | 2,869,808 |
|
| Stallion Oilfield Holdings Ltd. 144A | | |
| sr. notes 10 1/2s, 2015 | 2,960,000 | 2,886,000 |
|
| Stallion Oilfield Services/Stallion Oilfield Finance Corp. 144A | | |
| sr. unsec. notes 9 3/4s, 2015 (In default) † | 2,837,000 | 1,744,755 |
|
| Trico Shipping AS 144A sr. notes 11 7/8s, 2014 (Norway) | 1,735,000 | 1,680,781 |
|
| | | 29,751,246 |
| Entertainment (0.9%) | | |
| Cinemark, Inc. company guaranty sr. unsec. notes 8 5/8s, 2019 | 1,125,000 | 1,170,000 |
|
| Hertz Corp. company guaranty 8 7/8s, 2014 | 4,725,000 | 4,795,875 |
|
| Marquee Holdings, Inc. sr. disc. notes 12s, 2014 | 4,678,000 | 3,941,215 |
|
| Universal City Development Partners, Ltd. 144A | | |
| sr. notes 8 7/8s, 2015 | 1,075,000 | 1,083,063 |
|
| Universal City Development Partners, Ltd. 144A | | |
| sr. sub. notes 10 7/8s, 2016 | 715,000 | 740,025 |
|
| | | 11,730,178 |
| Financials (6.0%) | | |
| American General Finance Corp. sr. unsec. | | |
| notes Ser. J, MTN, 5 5/8s, 2011 | 2,916,000 | 2,771,477 |
|
| American General Finance Corp. sr. unsec. | | |
| notes Ser. MTN, 6.9s, 2017 | 3,615,000 | 2,592,862 |
|
| American General Finance Corp. sr. unsec. | | |
| notes Ser. MTNI, 4 7/8s, 2012 | 3,035,000 | 2,582,205 |
|
| BAC Capital Trust VI bank guaranty jr. unsec. | | |
| sub. notes 5 5/8s, 2035 | 985,000 | 785,215 |
|
| BAC Capital Trust XI bank guaranty jr. unsec. | | |
| sub. notes 6 5/8s, 2036 | 1,695,000 | 1,509,969 |
|
| CB Richard Ellis Services, Inc. company | | |
| guaranty sr. unsec. sub. notes 11 5/8s, 2017 | 1,240,000 | 1,367,100 |
|
| CIT Group, Inc. sr. bond 7s, 2017 | 1,264,311 | 1,117,335 |
|
| CIT Group, Inc. sr. bond 7s, 2016 | 903,079 | 799,225 |
|
| CIT Group, Inc. sr. bond 7s, 2015 | 1,706,848 | 1,548,965 |
|
| CIT Group, Inc. sr. bond 7s, 2014 | 541,848 | 495,791 |
|
| CIT Group, Inc. sr. bond 7s, 2013 | 8,606,231 | 8,132,888 |
|
| E*Trade Financial Corp. sr. unsec. notes 7 3/8s, 2013 | 1,695,000 | 1,610,250 |
|
| E*Trade Financial Corp. sr. unsec. unsub. notes 12 1/2s, 2017 ‡‡ | 2,369,000 | 2,742,118 |
|
| FelCor Lodging LP 144A sr. sec. notes 10s, 2014 R | 3,480,000 | 3,384,300 |
|
| GMAC, LLC company guaranty sr. unsec. notes 7s, 2012 | 2,455,000 | 2,442,725 |
|
| GMAC, LLC company guaranty sr. unsec. notes 6 7/8s, 2012 | 4,210,000 | 4,167,900 |
|
| GMAC, LLC company guaranty sr. unsec. notes 6 5/8s, 2012 | 1,291,000 | 1,274,863 |
|
| GMAC, LLC company guaranty sr. unsec. notes Ser. 8, | | |
| 6 3/4s, 2014 | 4,734,000 | 4,520,970 |
|
35
| | |
| CORPORATE BONDS AND NOTES (84.3%)* cont. | Principal amount | Value |
|
| Financials cont. | | |
| GMAC, LLC company guaranty sr. unsec. | | |
| unsub. notes 6 7/8s, 2011 | $965,000 | $965,000 |
|
| GMAC, LLC company guaranty sr. unsec. | | |
| unsub. notes FRN 2.452s, 2014 | 624,000 | 533,830 |
|
| GMAC, LLC sr. unsec. unsub. notes 6 3/4s, 2014 | 1,442,000 | 1,387,921 |
|
| GMAC, LLC 144A company guaranty sr. unsec. | | |
| notes 8.3s, 2015 | 1,485,000 | 1,497,994 |
|
| HUB International Holdings, Inc. 144A | | |
| sr. sub. notes 10 1/4s, 2015 | 1,156,000 | 1,072,190 |
|
| Icahn Enterprises LP/Ichan Enterprises Finance Corp. | | |
| 144A sr. notes 8s, 2018 | 5,295,000 | 4,977,300 |
|
| iStar Financial, Inc. sr. unsec. unsub. notes FRN | | |
| 0.607s, 2010 R | 680,000 | 673,846 |
|
| Leucadia National Corp. sr. unsec. notes 8 1/8s, 2015 | 1,345,000 | 1,365,175 |
|
| Leucadia National Corp. sr. unsec. notes 7 1/8s, 2017 | 1,824,000 | 1,773,840 |
|
| NB Capital Trust IV jr. unsec. sub. notes 8 1/4s, 2027 | 680,000 | 659,600 |
|
| Nuveen Investments, Inc. company guaranty sr. unsec. | | |
| unsub. notes 10 1/2s, 2015 | 2,492,000 | 2,255,260 |
|
| Residential Capital LLC company guaranty jr. | | |
| notes 9 5/8s, 2015 | 6,165,000 | 5,964,638 |
|
| Reynolds Group DL Escrow, Inc./Reynolds Group | | |
| Escrow, LLC 144A sr. sec. notes 7 3/4s, 2016 | | |
| (Luxembourg) | 2,525,000 | 2,556,563 |
|
| Royal Bank of Scotland Group PLC jr. sub. notes FRN | | |
| Ser. MTN, 7.64s, 2049 (United Kingdom) | 1,600,000 | 992,000 |
|
| SLM Corp. sr. unsec. unsub. notes Ser. MTNA, 5s, 2013 | 6,590,000 | 6,172,260 |
|
| USI Holdings Corp. 144A company guaranty sr. unsec. | | |
| notes FRN 4 1/8s, 2014 | 756,000 | 625,590 |
|
| | | 77,319,165 |
| Gaming and lottery (2.8%) | | |
| American Casino & Entertainment Properties LLC | | |
| sr. notes 11s, 2014 | 2,560,000 | 2,176,000 |
|
| Boyd Gaming Corp. sr. sub. notes 7 1/8s, 2016 | 3,072,000 | 2,419,200 |
|
| Boyd Gaming Corp. sr. sub. notes 6 3/4s, 2014 | 945,000 | 804,431 |
|
| Harrah’s Operating Co., Inc. company | | |
| guaranty sr. notes 10s, 2018 | 5,856,000 | 4,421,280 |
|
| Harrah’s Operating Co., Inc. sr. notes 11 1/4s, 2017 | 4,810,000 | 4,990,375 |
|
| Mashantucket Western Pequot Tribe 144A bonds 8 1/2s, | | |
| 2015 (In default) † | 4,615,000 | 1,199,900 |
|
| MGM Mirage, Inc. company guaranty sr. unsec. | | |
| notes 7 5/8s, 2017 | 1,565,000 | 1,244,175 |
|
| MGM Mirage, Inc. company guaranty sr. unsec. | | |
| notes 6 5/8s, 2015 | 1,160,000 | 916,400 |
|
| MGM Mirage, Inc. sr. notes 6 3/4s, 2012 | 2,000 | 1,850 |
|
| MGM Mirage, Inc. 144A sr. sec. notes 10 3/8s, 2014 | 485,000 | 514,100 |
|
| MTR Gaming Group, Inc. 144A company | | |
| guaranty sr. notes 12 5/8s, 2014 | 2,805,000 | 2,706,825 |
|
| Penn National Gaming, Inc. 144A sr. unsec. | | |
| sub. notes 8 3/4s, 2019 | 675,000 | 668,250 |
|
36
| | |
| CORPORATE BONDS AND NOTES (84.3%)* cont. | Principal amount | Value |
|
| Gaming and lottery cont. | | |
| Pinnacle Entertainment, Inc. company | | |
| guaranty sr. unsec. sub. notes 7 1/2s, 2015 | $495,000 | $409,613 |
|
| Pinnacle Entertainment, Inc. sr. sub. notes 8 1/4s, 2012 | 5,139,000 | 5,061,915 |
|
| Pinnacle Entertainment, Inc. 144A sr. notes 8 5/8s, 2017 | 725,000 | 688,750 |
|
| Station Casinos, Inc. sr. notes 6s, | | |
| 2012 (In default) † | 3,504,000 | 508,080 |
|
| Trump Entertainment Resorts, Inc. sec. notes 8 1/2s, | | |
| 2015 (In default) † | 8,703,000 | 174,060 |
|
| Wynn Las Vegas, LLC/Wynn Las Vegas Capital Corp. 1st | | |
| mtge. Ser. EXCH, 6 5/8s, 2014 | 2,215,000 | 2,143,013 |
|
| Yonkers Racing Corp. 144A sr. notes 11 3/8s, 2016 | 4,580,000 | 4,831,900 |
|
| | | 35,880,117 |
| Health care (7.6%) | | |
| Biomet, Inc. company guaranty sr. unsec. bond 10s, 2017 | 4,425,000 | 4,834,313 |
|
| Community Health Systems, Inc. company | | |
| guaranty 8 7/8s, 2015 | 2,189,000 | 2,265,615 |
|
| DaVita, Inc. company guaranty 6 5/8s, 2013 | 4,021,000 | 4,031,053 |
|
| Elan Finance PLC/Elan Finance Corp. 144A company | | |
| guaranty sr. notes 8 3/4s, 2016 (Ireland) | 3,550,000 | 3,408,000 |
|
| HCA, Inc. company guaranty sr. notes 9 5/8s, 2016 ‡‡ | 4,305,000 | 4,606,350 |
|
| HCA, Inc. sr. sec. notes 9 1/4s, 2016 | 4,830,000 | 5,125,838 |
|
| HCA, Inc. sr. sec. notes 9 1/8s, 2014 | 9,207,000 | 9,678,859 |
|
| HCA, Inc. 144A sr. sec. notes 8 1/2s, 2019 | 2,980,000 | 3,196,050 |
|
| Health Management Associates, Inc. sr. notes 6 1/8s, 2016 | 3,165,000 | 2,951,363 |
|
| IASIS Healthcare/IASIS Capital Corp. | | |
| sr. sub. notes 8 3/4s, 2014 | 360,000 | 363,600 |
|
| Omnicare, Inc. company guaranty 6 3/4s, 2013 | 391,000 | 385,624 |
|
| Psychiatric Solutions, Inc. company guaranty 7 3/4s, 2015 | 4,455,000 | 4,276,800 |
|
| Psychiatric Solutions, Inc. 144A | | |
| sr. sub. notes 7 3/4s, 2015 | 935,000 | 878,900 |
|
| Quintiles Transnational Corp. 144A sr. notes 9 1/2s, 2014 ‡‡ | 1,055,000 | 1,065,550 |
|
| Select Medical Corp. company guaranty 7 5/8s, 2015 | 4,887,000 | 4,593,780 |
|
| Service Corporation International debs. 7 7/8s, 2013 | 3,506,000 | 3,506,000 |
|
| Service Corporation International sr. unsec. | | |
| unsub. notes 6 3/4s, 2016 | 715,000 | 700,700 |
|
| Stewart Enterprises, Inc. sr. notes 6 1/4s, 2013 | 6,211,000 | 6,117,835 |
|
| Sun Healthcare Group, Inc. company | | |
| guaranty sr. unsec. unsub. notes 9 1/8s, 2015 | 1,632,000 | 1,656,480 |
|
| Surgical Care Affiliates, Inc. 144A | | |
| sr. sub. notes 10s, 2017 | 3,850,000 | 3,792,250 |
|
| Surgical Care Affiliates, Inc. 144A sr. unsec. | | |
| notes 8 7/8s, 2015 ‡‡ | 2,717,852 | 2,663,495 |
|
| Talecris Biotherapeutics Holdings Corp. 144A | | |
| sr. unsec. notes 7 3/4s, 2016 | 2,775,000 | 2,788,875 |
|
| Tenet Healthcare Corp. 144A company | | |
| guaranty sr. sec. notes 10s, 2018 | 1,340,000 | 1,474,000 |
|
| Tenet Healthcare Corp. 144A company | | |
| guaranty sr. sec. notes 9s, 2015 | 5,394,000 | 5,650,215 |
|
37
| | |
| CORPORATE BONDS AND NOTES (84.3%)* cont. | Principal amount | Value |
|
| Health care cont. | | |
| United Surgical Partners International, Inc. company | | |
| guaranty sr. unsec. sub. notes 8 7/8s, 2017 | $1,000,000 | $1,022,500 |
|
| US Oncology Holdings, Inc. sr. unsec. notes FRN | | |
| 6.428s, 2012 ‡‡ | 3,910,000 | 3,694,950 |
|
| US Oncology, Inc. company guaranty sr. unsec. | | |
| sub. notes 10 3/4s, 2014 | 1,487,000 | 1,546,480 |
|
| Vanguard Health Holding Co. II, LLC 144A company | | |
| guaranty sr. notes 8s, 2018 | 2,055,000 | 2,019,038 |
|
| Ventas Realty LP/Capital Corp. company guaranty 9s, 2012 R | 6,916,000 | 7,296,380 |
|
| Ventas Realty LP/Capital Corp. sr. notes 6 5/8s, 2014 R | 1,556,000 | 1,581,285 |
|
| | | 97,172,178 |
| Homebuilding (1.5%) | | |
| Beazer Homes USA, Inc. company guaranty sr. unsec. | | |
| notes 8 3/8s, 2012 | 5,820,000 | 5,703,600 |
|
| Beazer Homes USA, Inc. company guaranty sr. unsec. | | |
| notes 6 1/2s, 2013 | 915,000 | 828,075 |
|
| K. Hovnanian Enterprises, Inc. company | | |
| guaranty sr. notes 10 5/8s, 2016 | 1,790,000 | 1,870,550 |
|
| Realogy Corp. company guaranty sr. notes 11s, 2014 ‡‡ | 746,418 | 612,063 |
|
| Realogy Corp. company guaranty sr. unsec. | | |
| notes 10 1/2s, 2014 | 5,650,000 | 4,717,750 |
|
| Standard Pacific Corp. company | | |
| guaranty sr. notes 10 3/4s, 2016 | 1,940,000 | 2,022,450 |
|
| Standard Pacific Corp. company guaranty sr. unsec. | | |
| notes 7 3/4s, 2013 | 720,000 | 684,000 |
|
| Standard Pacific Corp. company guaranty sr. unsec. | | |
| unsub. notes 7s, 2015 | 1,690,000 | 1,521,000 |
|
| Standard Pacific Corp. company guaranty sr. unsec. | | |
| unsub. notes 6 1/4s, 2014 | 1,135,000 | 1,021,500 |
|
| | | 18,980,988 |
| Household furniture and appliances (0.2%) | | |
| Sealy Mattress Co. 144A company guaranty sr. sec. | | |
| notes 10 7/8s, 2016 | 2,590,000 | 2,829,575 |
|
| | | 2,829,575 |
| Lodging/Tourism (0.2%) | | |
| Host Marriott LP company guaranty Ser. Q, 6 3/4s, 2016 R | 117,000 | 115,245 |
|
| Host Marriott LP sr. notes 7 1/8s, 2013 R | 90,000 | 91,013 |
|
| Seminole Hard Rock Entertainment, Inc. 144A | | |
| sr. notes FRN 2.754s, 2014 | 2,901,000 | 2,538,375 |
|
| | | 2,744,633 |
| Media (2.0%) | | |
| Affinion Group, Inc. company guaranty 11 1/2s, 2015 | 1,766,000 | 1,801,320 |
|
| Affinion Group, Inc. company guaranty 10 1/8s, 2013 | 1,340,000 | 1,353,400 |
|
| Affinity Group, Inc. sr. sub. notes 9s, 2012 | 4,466,000 | 3,126,200 |
|
| Interpublic Group of Companies, Inc. (The) | | |
| sr. unsec. notes 10s, 2017 | 650,000 | 706,875 |
|
| Liberty Media, LLC sr. notes 5.7s, 2013 | 2,925,000 | 2,866,500 |
|
| Nielsen Finance LLC/Nielsen Finance Co. company | | |
| guaranty 10s, 2014 | 2,866,000 | 2,973,475 |
|
| Nielsen Finance LLC/Nielsen Finance Co. company | | |
| guaranty sr. unsec. sub. disc. notes stepped-coupon | | |
| zero % (12 1/2s, 8/1/11), 2016 †† | 4,160,000 | 3,764,800 |
|
38
| | | |
| CORPORATE BONDS AND NOTES (84.3%)* cont. | Principal amount | Value |
|
| Media cont. | | | |
| NTL Cable PLC sr. notes 9 1/8s, 2016 (United Kingdom) | | $1,979,000 | $2,043,318 |
|
| QVC Inc. 144A sr. sec. notes 7 1/2s, 2019 | | 710,000 | 718,875 |
|
| Virgin Media Finance PLC company | | | |
| guaranty sr. notes 8 3/8s, 2019 (United Kingdom) | | 395,000 | 397,963 |
|
| Virgin Media Finance PLC company | | | |
| guaranty sr. notes Ser. 1, 9 1/2s, 2016 | | | |
| (United Kingdom) | | 1,030,000 | 1,091,800 |
|
| Virgin Media Finance PLC company guaranty sr. unsec. | | | |
| unsub. notes 9 1/2s, 2016 (United Kingdom) | EUR�� | 255,000 | 378,540 |
|
| WMG Acquisition Corp. company | | | |
| guaranty sr. sub. notes 7 3/8s, 2014 | | $1,265,000 | 1,208,075 |
|
| WMG Acquisition Corp. 144A sr. sec. notes 9 1/2s, 2016 | | 2,280,000 | 2,394,000 |
|
| WMG Holdings Corp. company guaranty sr. unsec. disc. | | | |
| notes 9 1/2s, 2014 | | 655,000 | 655,000 |
|
| | | | 25,480,141 |
| Oil and gas (8.3%) | | | |
| Chaparral Energy, Inc. company guaranty sr. unsec. | | | |
| notes 8 7/8s, 2017 | | 4,203,000 | 3,435,953 |
|
| Chesapeake Energy Corp. company guaranty sr. unsec. | | | |
| notes 9 1/2s, 2015 | | 790,000 | 859,125 |
|
| Chesapeake Energy Corp. sr. notes 7 1/2s, 2013 | | 4,622,000 | 4,691,330 |
|
| Compton Petroleum Corp. company guaranty 7 5/8s, | | | |
| 2013 (Canada) | | 5,369,000 | 4,322,045 |
|
| Comstock Resources, Inc. company | | | |
| guaranty sr. unsub. notes 8 3/8s, 2017 | | 2,645,000 | 2,691,288 |
|
| Comstock Resources, Inc. sr. notes 6 7/8s, 2012 | | 4,120,000 | 4,109,700 |
|
| Connacher Oil and Gas, Ltd. 144A sec. notes 10 1/4s, | | | |
| 2015 (Canada) | | 4,277,000 | 4,121,959 |
|
| Connacher Oil and Gas, Ltd. 144A sr. sec. | | | |
| notes 11 3/4s, 2014 (Canada) | | 2,435,000 | 2,678,500 |
|
| Denbury Resources, Inc. company | | | |
| guaranty sr. sub. notes 9 3/4s, 2016 | | 475,000 | 511,813 |
|
| Denbury Resources, Inc. company guaranty sr. unsec. | | | |
| sub. notes 8 1/4s, 2020 | | 2,070,000 | 2,145,038 |
|
| Denbury Resources, Inc. sr. sub. notes 7 1/2s, 2015 | | 4,012,000 | 4,052,120 |
|
| Encore Acquisition Co. sr. sub. notes 6s, 2015 | | 4,513,000 | 4,546,848 |
|
| Ferrellgas LP/Finance sr. notes 8 3/4s, 2012 | | 195,000 | 195,244 |
|
| Ferrellgas LP/Finance sr. notes 6 3/4s, 2014 | | 5,849,000 | 5,702,775 |
|
| Ferrellgas Partners LP sr. unsec. notes Ser. UNRE, | | | |
| 6 3/4s, 2014 | | 374,000 | 364,650 |
|
| Forest Oil Corp. sr. notes 8s, 2011 | | 4,280,000 | 4,483,300 |
|
| Hilcorp Energy I LP/Hilcorp Finance Co. 144A | | | |
| sr. unsec. notes 7 3/4s, 2015 | | 2,100,000 | 2,042,250 |
|
| Inergy LP/Inergy Finance Corp. sr. unsec. | | | |
| notes 6 7/8s, 2014 | | 6,319,000 | 6,161,025 |
|
| Newfield Exploration Co. sr. unsec. | | | |
| sub. notes 7 1/8s, 2018 | | 490,000 | 490,000 |
|
| Newfield Exploration Co. sr. unsec. | | | |
| sub. notes 6 5/8s, 2014 | | 6,054,000 | 6,144,810 |
|
39
| | |
| CORPORATE BONDS AND NOTES (84.3%)* cont. | Principal amount | Value |
|
| Oil and gas cont. | | |
| OPTI Canada, Inc. company guaranty sr. sec. | | |
| notes 8 1/4s, 2014 (Canada) | $2,275,000 | $2,024,750 |
|
| OPTI Canada, Inc. company guaranty sr. sec. | | |
| notes 7 7/8s, 2014 (Canada) | 5,540,000 | 4,875,200 |
|
| PetroHawk Energy Corp. company guaranty 9 1/8s, 2013 | 4,421,000 | 4,597,840 |
|
| PetroHawk Energy Corp. company guaranty sr. unsec. | | |
| notes 10 1/2s, 2014 | 585,000 | 634,725 |
|
| Petroleum Development Corp. company | | |
| guaranty sr. unsec. notes 12s, 2018 | 3,245,000 | 3,407,250 |
|
| Plains Exploration & Production Co. company | | |
| guaranty 7 3/4s, 2015 | 787,000 | 793,886 |
|
| Plains Exploration & Production Co. company | | |
| guaranty 7s, 2017 | 4,966,000 | 4,854,265 |
|
| Quicksilver Resources, Inc. company guaranty 7 1/8s, 2016 | 1,017,000 | 945,810 |
|
| Quicksilver Resources, Inc. company | | |
| guaranty sr. unsec. notes 8 1/4s, 2015 | 1,223,000 | 1,235,230 |
|
| Quicksilver Resources, Inc. sr. notes 11 3/4s, 2016 | 1,585,000 | 1,798,975 |
|
| Range Resources Corp. company guaranty sr. unsec. | | |
| sub. notes 7 1/2s, 2017 | 790,000 | 807,775 |
|
| Sabine Pass LNG LP sec. notes 7 1/2s, 2016 | 4,446,000 | 3,901,365 |
|
| Sabine Pass LNG LP sr. sec. notes 7 1/4s, 2013 | 745,000 | 695,644 |
|
| SandRidge Energy, Inc. company guaranty sr. unsec. | | |
| unsub. FRN 3.876s, 2014 | 1,768,000 | 1,564,774 |
|
| SandRidge Energy, Inc. 144A company | | |
| guaranty sr. unsec. unsub. notes 8s, 2018 | 5,452,000 | 5,220,290 |
|
| Whiting Petroleum Corp. company guaranty 7s, 2014 | 2,107,000 | 2,128,070 |
|
| Williams Cos., Inc. (The) notes 7 3/4s, 2031 | 474,000 | 545,933 |
|
| Williams Cos., Inc. (The) sr. unsec. notes 7 7/8s, 2021 | 1,033,000 | 1,265,509 |
|
| Williams Cos., Inc. (The) 144A notes 6 3/8s, 2010 | 1,915,000 | 1,959,870 |
|
| | | 107,006,934 |
| Publishing (0.8%) | | |
| American Media Operations, Inc. 144A | | |
| sr. sub. notes 14s, 2013 ‡‡ | 3,730,636 | 2,387,607 |
|
| American Media Operations, Inc. 144A sr. unsec. | | |
| notes 9s, 2013 ‡‡ | 304,866 | 195,114 |
|
| Belo Corp. sr. unsec. unsub. notes 8s, 2016 | 695,000 | 721,063 |
|
| Cenveo Corp. 144A company guaranty sr. notes 8 7/8s, 2018 | 2,080,000 | 2,059,200 |
|
| Cenveo Corp. 144A company guaranty sr. unsec. | | |
| notes 10 1/2s, 2016 | 769,000 | 765,155 |
|
| McClatchy Co. (The) 144A company | | |
| guaranty sr. notes 11 1/2s, 2017 | 2,365,000 | 2,305,875 |
|
| Quebecor Media, Inc. sr. unsec. notes 7 3/4s, 2016 (Canada) | 918,000 | 920,295 |
|
| Vertis, Inc. company guaranty sr. notes 13 1/2s, 2014 ‡‡ | 2,960,700 | 1,139,870 |
|
| | | 10,494,179 |
| Retail (2.8%) | | |
| Blockbuster, Inc. 144A company | | |
| guaranty sr. notes 11 3/4s, 2014 | 1,875,000 | 1,350,000 |
|
| Bon-Ton Stores, Inc. (The) company guaranty 10 1/4s, 2014 | 3,336,000 | 2,994,060 |
|
| Burlington Coat Factory Warehouse Corp. company | | |
| guaranty sr. unsec. notes 11 1/8s, 2014 | 3,121,000 | 3,175,618 |
|
40
| | |
| CORPORATE BONDS AND NOTES (84.3%)* cont. | Principal amount | Value |
|
| Retail cont. | | |
| Dollar General Corp. company guaranty sr. unsec. | | |
| notes 10 5/8s, 2015 | $2,028,000 | $2,220,660 |
|
| Harry & David Operations Corp. company | | |
| guaranty sr. unsec. notes 9s, 2013 | 3,279,000 | 2,221,523 |
|
| Harry & David Operations Corp. company | | |
| guaranty sr. unsec. notes FRN 5.252s, 2012 | 1,012,000 | 647,680 |
|
| Michaels Stores, Inc. company guaranty 11 3/8s, 2016 | 4,555,000 | 4,577,775 |
|
| Neiman-Marcus Group, Inc. company | | |
| guaranty sr. unsec. notes 9s, 2015 ‡‡ | 6,290,434 | 6,196,077 |
|
| Neiman-Marcus Group, Inc. company | | |
| guaranty sr. unsec. sub. notes 10 3/8s, 2015 | 1,415,000 | 1,407,925 |
|
| Toys R Us Property Co., LLC 144A company | | |
| guaranty sr. unsec. notes 10 3/4s, 2017 | 4,475,000 | 4,911,313 |
|
| Toys R Us Property Co., LLC 144A sr. notes 8 1/2s, 2017 | 2,400,000 | 2,424,000 |
|
| United Auto Group, Inc. company guaranty 7 3/4s, 2016 | 4,421,000 | 4,216,529 |
|
| | | 36,343,160 |
| Technology (5.0%) | | |
| Advanced Micro Devices, Inc. 144A sr. unsec. | | |
| notes 8 1/8s, 2017 | 1,485,000 | 1,503,563 |
|
| Amkor Technologies, Inc. sr. notes 7 3/4s, 2013 | 965,000 | 977,063 |
|
| Brocade Communications Systems, Inc. 144A | | |
| sr. notes 6 7/8s, 2020 | 330,000 | 334,950 |
|
| Brocade Communications Systems, Inc. 144A | | |
| sr. notes 6 5/8s, 2018 | 255,000 | 256,275 |
|
| Ceridian Corp. company guaranty sr. unsec. | | |
| notes 12 1/4s, 2015 ‡‡ | 2,751,850 | 2,628,017 |
|
| Ceridian Corp. sr. unsec. notes 11 1/4s, 2015 | 3,360,000 | 3,217,200 |
|
| Compucom Systems, Inc. 144A sr. sub. notes 12 1/2s, 2015 | 1,462,000 | 1,520,480 |
|
| First Data Corp. company guaranty sr. unsec. | | |
| notes 9 7/8s, 2015 | 4,810,000 | 4,160,650 |
|
| First Data Corp. company guaranty sr. unsec. | | |
| sub. notes 11 1/4s, 2016 | 3,375,000 | 2,767,500 |
|
| First Data Corp. company guaranty sr. unsec. | | |
| notes 10.55s, 2015 ‡‡ | 6,684,340 | 5,798,665 |
|
| Freescale Semiconductor, Inc. company | | |
| guaranty sr. unsec. notes 9 1/8s, 2014 ‡‡ | 2,325,424 | 2,005,678 |
|
| Freescale Semiconductor, Inc. company | | |
| guaranty sr. unsec. notes 8 7/8s, 2014 | 2,061,000 | 1,829,138 |
|
| Freescale Semiconductor, Inc. company | | |
| guaranty sr. unsec. sub. notes 10 1/8s, 2016 | 3,728,000 | 2,907,840 |
|
| Freescale Semiconductor, Inc. 144A company | | |
| guaranty sr. notes 10 1/8s, 2018 | 1,495,000 | 1,524,900 |
|
| Iron Mountain, Inc. company guaranty 8 3/4s, 2018 | 698,000 | 727,665 |
|
| Iron Mountain, Inc. company guaranty 7 3/4s, 2015 | 112,000 | 112,840 |
|
| Iron Mountain, Inc. company guaranty 6 5/8s, 2016 | 211,000 | 207,835 |
|
| Iron Mountain, Inc. company guaranty sr. unsec. | | |
| sub. notes 8s, 2020 | 533,000 | 535,665 |
|
| Iron Mountain, Inc. sr. sub. notes 8 3/8s, 2021 | 1,730,000 | 1,775,413 |
|
| Lucent Technologies, Inc. unsec. debs. 6.45s, 2029 | 529,000 | 375,590 |
|
41
| | |
| CORPORATE BONDS AND NOTES (84.3%)* cont. | Principal amount | Value |
| Technology cont. | | |
| New ASAT Finance, Ltd. company guaranty 9 1/4s, 2011 | | |
| (Cayman Islands) (In default) F † | $2,748,000 | $239,351 |
|
| NXP BV/NXP Funding, LLC company guaranty Ser. EXCH, | | |
| 9 1/2s, 2015 (Netherlands) | 2,275,000 | 1,979,250 |
|
| NXP BV/NXP Funding, LLC sec. notes Ser. EXCH, | | |
| 7 7/8s, 2014 (Netherlands) | 3,455,000 | 3,195,875 |
|
| Sanmina Corp. company guaranty sr. unsec. | | |
| sub. notes 6 3/4s, 2013 | 215,000 | 214,463 |
|
| Sanmina Corp. sr. unsec. sub. notes 8 1/8s, 2016 | 410,000 | 403,850 |
|
| Seagate Technology International 144A company | | |
| guaranty sr. sec. notes 10s, 2014 (Cayman Islands) | 1,085,000 | 1,232,831 |
|
| SunGard Data Systems, Inc. company guaranty 10 1/4s, 2015 | 3,027,000 | 3,140,513 |
|
| SunGard Data Systems, Inc. company guaranty 9 1/8s, 2013 | 7,034,000 | 7,201,058 |
|
| SunGard Data Systems, Inc. company | | |
| guaranty sr. unsec. unsub. notes 10 5/8s, 2015 | 589,000 | 636,120 |
|
| Syniverse Technologies, Inc. sr. sub. notes Ser. B, | | |
| 7 3/4s, 2013 | 3,058,000 | 3,073,290 |
|
| Unisys Corp. sr. unsec. unsub. notes 12 1/2s, 2016 | 835,000 | 905,975 |
|
| Unisys Corp. 144A company | | |
| guaranty sr. sub. notes 14 1/4s, 2015 | 4,285,000 | 5,056,300 |
|
| Xerox Capital Trust I company guaranty 8s, 2027 | 1,647,000 | 1,626,413 |
|
| | | 64,072,216 |
| Textiles (0.6%) | | |
| Hanesbrands, Inc. company guaranty sr. unsec. | | |
| notes FRN Ser. B, 3.831s, 2014 | 4,965,000 | 4,654,688 |
|
| Hanesbrands, Inc. sr. unsec. notes 8s, 2016 | 1,640,000 | 1,672,800 |
|
| Levi Strauss & Co. sr. unsec. notes 8 7/8s, 2016 | 972,000 | 1,008,450 |
|
| | | 7,335,938 |
| Tire and rubber (0.3%) | | |
| Goodyear Tire & Rubber Co. (The) sr. unsec. | | |
| notes 10 1/2s, 2016 | 3,600,000 | 3,879,000 |
|
| | | 3,879,000 |
| Transportation (0.4%) | | |
| Offshore Logistics, Inc. company guaranty 6 1/8s, 2013 | 3,652,000 | 3,578,960 |
|
| RailAmerica, Inc. company guaranty sr. notes 9 1/4s, 2017 | 2,046,000 | 2,145,743 |
|
| | | 5,724,703 |
| Utilities and power (5.7%) | | |
| AES Corp. (The) sr. unsec. notes 8s, 2020 | 1,291,000 | 1,266,794 |
|
| AES Corp. (The) sr. unsec. unsub. notes 8s, 2017 | 1,655,000 | 1,644,656 |
|
| AES Corp. (The) 144A sec. notes 8 3/4s, 2013 | 2,950,000 | 3,001,625 |
|
| AES Corp. (The) 144A sr. notes 9 3/4s, 2016 | 270,000 | 288,225 |
|
| Calpine Corp. 144A sr. sec. notes 7 1/4s, 2017 | 4,228,000 | 4,069,450 |
|
| CMS Energy Corp. sr. notes 8 1/2s, 2011 | 1,164,000 | 1,222,200 |
|
| Colorado Interstate Gas Co. debs. 6.85s, 2037 (Canada) | 3,247,000 | 3,336,120 |
|
| Dynegy Holdings, Inc. sr. unsec. notes 7 3/4s, 2019 | 2,320,000 | 1,821,200 |
|
| Dynegy-Roseton Danskamme company guaranty Ser. B, | | |
| 7.67s, 2016 | 4,885,000 | 4,695,706 |
|
| Edison Mission Energy sr. unsec. notes 7 3/4s, 2016 | 1,916,000 | 1,532,800 |
|
| Edison Mission Energy sr. unsec. notes 7 1/2s, 2013 | 435,000 | 402,375 |
|
| Edison Mission Energy sr. unsec. notes 7.2s, 2019 | 1,900,000 | 1,334,750 |
|
42
| | |
| CORPORATE BONDS AND NOTES (84.3%)* cont. | Principal amount | Value |
|
| Utilities and power cont. | | |
| Edison Mission Energy sr. unsec. notes 7s, 2017 | $60,000 | $43,950 |
|
| El Paso Corp. sr. unsec. notes 12s, 2013 | 1,005,000 | 1,168,313 |
|
| El Paso Corp. sr. unsec. notes Ser. GMTN, 7.8s, 2031 | 121,000 | 117,673 |
|
| El Paso Natural Gas Co. debs. 8 5/8s, 2022 | 1,597,000 | 1,965,525 |
|
| Energy Future Holdings Corp. company | | |
| guaranty sr. unsec. notes 11 1/4s, 2017 ‡‡ | 2,715,000 | 1,900,500 |
|
| Energy Future Holdings Corp. sr. notes 9 3/4s, 2019 | 1,646,000 | 1,629,540 |
|
| Energy Future Intermediate Holdings Co., LLC | | |
| sr. notes 9 3/4s, 2019 | 1,818,000 | 1,804,365 |
|
| Ipalco Enterprises, Inc. sr. sec. notes 8 5/8s, 2011 | 1,754,000 | 1,819,775 |
|
| Ipalco Enterprises, Inc. 144A sr. sec. notes 7 1/4s, 2016 | 562,000 | 567,620 |
|
| Mirant Americas Generation, Inc. sr. unsec. | | |
| notes 9 1/8s, 2031 | 2,070,000 | 1,857,825 |
|
| Mirant Americas Generation, Inc. sr. unsec. | | |
| notes 8.3s, 2011 | 1,866,000 | 1,903,320 |
|
| Mirant North America, LLC company guaranty 7 3/8s, 2013 | 4,782,000 | 4,764,068 |
|
| NRG Energy, Inc. company guaranty 7 3/8s, 2017 | 2,440,000 | 2,409,500 |
|
| NRG Energy, Inc. sr. notes 7 3/8s, 2016 | 13,325,000 | 13,141,781 |
|
| Orion Power Holdings, Inc. sr. unsec. notes 12s, 2010 | 4,255,000 | 4,281,594 |
|
| Sierra Pacific Resources sr. unsec. notes 8 5/8s, 2014 | 2,367,000 | 2,411,381 |
|
| Tennessee Gas Pipeline Co. sr. unsec. unsub. debs. 7s, 2028 | 639,000 | 681,746 |
|
| Texas Competitive Electric Holdings Co., LLC company | | |
| guaranty sr. unsec. notes 10 1/2s, 2016 (United Kingdom) ‡‡ | 3,445,000 | 2,445,950 |
|
| Texas Competitive Electric Holdings Co., LLC company | | |
| guaranty sr. unsec. notes Ser. B, 10 1/4s, 2015 | | |
| (United Kingdom) | 4,025,000 | 3,008,688 |
|
| Texas-New Mexico Power Co. 144A 1st mtge. sec. | | |
| 9 1/2s, 2019 | 785,000 | 969,321 |
|
| Utilicorp United, Inc. sr. unsec. notes 7.95s, 2011 | 156,000 | 163,720 |
|
| | | 73,672,056 |
| Total corporate bonds and notes (cost $1,081,432,594) | | $1,080,587,732 |
|
| |
| SENIOR LOANS (6.4%)* c | Principal amount | Value |
|
| Automotive (—%) | | |
| Allison Transmission, Inc. bank term loan FRN | | |
| Ser. B, 2.994s, 2014 | $11,342 | $10,387 |
|
| | | 10,387 |
| Basic materials (0.2%) | | |
| Lyondell Chemical Co. bank term loan FRN 13s, 2010 U | 490,000 | 509,968 |
|
| Rockwood Specialties Group, Inc. bank term loan FRN | | |
| Ser. H, 6s, 2014 | 515,714 | 515,585 |
|
| Smurfit-Stone Container Enterprises, Inc. bank term | | |
| loan FRN 6 3/4s, 2016 | 1,880,000 | 1,865,101 |
|
| | | 2,890,654 |
| Broadcasting (0.2%) | | |
| Clear Channel Communications, Inc. bank term loan | | |
| FRN Ser. B, 3.881s, 2016 | 1,499,026 | 1,177,004 |
|
| Univision Communications, Inc. bank term loan FRN | | |
| Ser. B, 2.501s, 2014 | 2,327,282 | 2,000,737 |
|
| | | 3,177,741 |
43
| | |
| SENIOR LOANS (6.4%)* c cont. | Principal amount | Value |
|
| Capital goods (0.2%) | | |
| Hawker Beechcraft Acquisition Co., LLC bank term | | |
| loan FRN 2.251s, 2014 | $56,759 | $41,771 |
|
| Hawker Beechcraft Acquisition Co., LLC bank term | | |
| loan FRN Ser. B, 2.236s, 2014 | 1,155,627 | 850,470 |
|
| Hexcel Corp. bank term loan FRN 6 1/2s, 2014 | 398,357 | 399,353 |
|
| Manitowoc Co., Inc. (The) bank term loan FRN Ser. A, | | |
| 4.813s, 2013 | 2,058,601 | 1,991,697 |
|
| | | 3,283,291 |
| Communication services (0.3%) | | |
| Cebridge Connections, Inc. bank term loan FRN 4.749s, 2014 | 1,210,000 | 1,178,661 |
|
| Charter Communications, Inc. bank term loan FRN 2.756s, 2014 | 2,430,000 | 2,185,481 |
|
| Level 3 Financing, Inc. bank term loan FRN Ser. B, | | |
| 11 1/2s, 2014 | 235,000 | 253,947 |
|
| Towerco, LLC bank term loan FRN 6s, 2014 | 755,000 | 759,719 |
|
| | | 4,377,808 |
| Consumer cyclicals (2.5%) | | |
| CCM Merger, Inc. bank term loan FRN Ser. B, 8 1/2s, 2012 | 3,425,663 | 3,375,707 |
|
| Chester Down & Marina, LLC bank term loan FRN 12 3/8s, 2016 | 1,771,156 | 1,780,012 |
|
| Dex Media West, LLC bank term loan FRN Ser. A, 7 1/2s, 2014 | 753,818 | 718,765 |
|
| GateHouse Media, Inc. bank term loan FRN Ser. B, 2.24s, 2014 | 2,399,620 | 1,114,623 |
|
| GateHouse Media, Inc. bank term loan FRN Ser. DD, 2.231s, 2014 | 895,380 | 415,904 |
|
| QVC, Inc. bank term loan FRN 5.749s, 2014 | 342,265 | 342,586 |
|
| Reynolds Consumer Products, Inc. bank term loan FRN | | |
| Ser. B, 6 1/4s, 2015 | 1,530,000 | 1,539,563 |
|
| Six Flags Theme Parks bank term loan FRN 2.48s, 2015 | 5,086,585 | 5,016,645 |
|
| Six Flags Theme Parks bank term loan FRN Ser. B, | | |
| 5 3/4s, 2016 | 5,015,000 | 4,968,611 |
|
| Thomas Learning bank term loan FRN Ser. B, 2 3/4s, 2014 | 5,390,094 | 4,674,408 |
|
| Travelport, LLC bank term loan FRN Ser. C, 10 1/2s, 2013 | 507,450 | 508,930 |
|
| Tribune Co. bank term loan FRN Ser. B, 5 1/4s, | | |
| 2014 (In default) † | 8,650,500 | 5,255,179 |
|
| United Components, Inc. bank term loan FRN Ser. D, | | |
| 2.249s, 2012 | 527,778 | 488,194 |
|
| Visteon Corp. bank term loan FRN Ser. B, 5 1/4s, 2013 | 1,860,000 | 2,052,045 |
|
| | | 32,251,172 |
| Consumer staples (0.7%) | | |
| Claire’s Stores, Inc. bank term loan FRN 3.001s, 2014 | 3,195,689 | 2,641,010 |
|
| Pinnacle Foods Holding Corp. bank term loan FRN | | |
| Ser. B, 2.979s, 2014 | 2,563,618 | 2,406,240 |
|
| Revlon Consumer Products bank term loan FRN Ser. B, | | |
| 4.257s, 2012 | 1,470,000 | 1,446,573 |
|
| Rite-Aid Corp. bank term loan FRN 9 1/2s, 2015 | 2,065,000 | 2,139,340 |
|
| Rite-Aid Corp. bank term loan FRN Ser. B, 1.983s, 2014 | 329,138 | 292,452 |
|
| | | 8,925,615 |
| Energy (—%) | | |
| MEG Energy Corp. bank term loan FRN 6s, 2016 (Canada) | 768,075 | 754,154 |
|
| | | 754,154 |
| Entertainment (0.3%) | | |
| Universal City Development Partners, Ltd. bank term | | |
| loan FRN Ser. B, 6 1/2s, 2014 | 3,200,000 | 3,218,000 |
|
| | | 3,218,000 |
44
| | |
| SENIOR LOANS (6.4%)* c cont. | Principal amount | Value |
|
| Financials (0.3%) | | |
| CB Richard Ellis Services, Inc. bank term loan FRN | | |
| Ser. B, 6s, 2013 | $1,193,005 | $1,174,364 |
|
| HUB International Holdings, Inc. bank term loan FRN | | |
| 6 3/4s, 2014 | 1,381,538 | 1,358,656 |
|
| Nuveen Investments, Inc. bank term loan FRN Ser. B, | | |
| 3.291s, 2014 | 1,145,028 | 996,174 |
|
| | | 3,529,194 |
| Gaming and lottery (0.1%) | | |
| Harrah’s Operating Co., Inc. bank term loan FRN | | |
| Ser. B, 9 1/2s, 2016 | 860,000 | 857,611 |
|
| | | 857,611 |
| Health care (0.6%) | | |
| Fenwal, Inc. bank term loan FRN 5.506s, 2014 | 500,000 | 423,750 |
|
| IASIS Healthcare, LLC/IASIS Capital Corp. bank term | | |
| loan FRN 5.499s, 2014 | 7,063,605 | 6,445,539 |
|
| Select Medical Corp. bank term loan FRN Ser. B, | | |
| 2.251s, 2012 | 434,398 | 416,479 |
|
| | | 7,285,768 |
| Homebuilding (0.1%) | | |
| Realogy Corp. bank term loan FRN 0.081s, 2013 | 232,586 | 205,099 |
|
| Realogy Corp. bank term loan FRN Ser. B, 3.251s, 2013 | 863,891 | 761,795 |
|
| | | 966,894 |
| Technology (0.1%) | | |
| Compucom Systems, Inc. bank term loan FRN 3.74s, 2014 | 1,085,150 | 1,025,466 |
|
| Freescale Semiconductor, Inc. bank term loan FRN | | |
| 12 1/2s, 2014 | 234,245 | 240,492 |
|
| | | 1,265,958 |
| Transportation (0.4%) | | |
| Swift Transportation Co., Inc. bank term loan FRN | | |
| 8 1/4s, 2014 | 5,576,731 | 5,160,221 |
|
| | | 5,160,221 |
| Utilities and power (0.4%) | | |
| TXU Energy Corp. bank term loan FRN Ser. B2, 3.729s, 2014 | 188,374 | 151,476 |
|
| TXU Energy Corp. bank term loan FRN Ser. B3, 3.729s, 2014 | 5,682,066 | 4,545,653 |
|
| | | 4,697,129 |
| Total senior loans (cost $87,270,118) | | $82,651,597 |
|
| |
| CONVERTIBLE BONDS AND NOTES (3.1%)* | Principal amount | Value |
|
| Acquicor Technology, Inc. 144A cv. notes 8s, 2011 | $2,120,000 | $1,966,300 |
|
| Advanced Micro Devices, Inc. cv. sr. unsec. | | |
| notes 6s, 2015 | 1,980,000 | 1,829,025 |
|
| Alexandria Real Estate Equities, Inc. | | |
| 144A cv. company guaranty sr. unsec. notes 3.7s, 2027 R | 2,145,000 | 2,045,794 |
|
| Alliant Techsystems, Inc. cv. company guaranty | | |
| sr. sub. notes 3s, 2024 | 2,170,000 | 2,492,788 |
|
| Digital Realty Trust LP 144A cv. sr. unsec. | | |
| notes 5 1/2s, 2029 R | 1,665,000 | 2,200,922 |
|
| Ford Motor Co. cv. sr. unsec. notes 4 1/4s, 2016 | 1,173,000 | 1,664,018 |
|
| General Cable Corp. cv. unsec. sub. notes stepped-coupon | | |
| 4 1/2s (2 1/4s, 11/15/19) 2029 †† | 1,664,000 | 1,489,280 |
|
| L-3 Communications Holdings, Inc. cv. company | | |
| sr. unsec. bonds 3s, 2035 | 505,000 | 527,094 |
|
45
| | |
| CONVERTIBLE BONDS AND NOTES (3.1%)* cont. | Principal amount | Value |
|
| L-3 Communications Holdings, Inc. 144A cv. company | | |
| guaranty sr. unsec. bonds 3s, 2035 | $2,016,000 | $2,104,200 |
|
| Leap Wireless International, Inc. cv. sr. unsec. | | |
| notes 4 1/2s, 2014 | 1,575,000 | 1,356,548 |
|
| Level 3 Communications, Inc. cv. sr. unsec. | | |
| unsub. notes 5 1/4s, 2011 | 800,000 | 762,000 |
|
| Level 3 Communications, Inc. cv. sr. unsec. | | |
| unsub. notes 3 1/2s, 2012 | 1,880,000 | 1,706,100 |
|
| Massey Energy Co. cv. company | | |
| guaranty sr. unsub. notes 3 1/4s, 2015 | 6,564,000 | 5,907,600 |
|
| Pantry, Inc. (The) cv. company guaranty sr. unsec. | | |
| sub. notes 3s, 2012 | 4,669,000 | 4,167,083 |
|
| Safeguard Scientifics, Inc. cv. sr. unsec. | | |
| notes 2 5/8s, 2024 | 382,000 | 371,973 |
|
| Sirius Satellite Radio, Inc. cv. sr. unsec. | | |
| notes 3 1/4s, 2011 | 830,000 | 771,900 |
|
| Steel Dynamics, Inc. cv. sr. notes 5 1/8s, 2014 | 930,000 | 1,104,375 |
|
| Titan International, Inc. | | |
| 144A cv. sr. sub. notes 5 5/8s, 2017 | 1,605,000 | 1,657,805 |
|
| Trinity Industries, Inc. cv. unsec. | | |
| sub. notes 3 7/8s, 2036 | 2,429,000 | 1,791,388 |
|
| Virgin Media, Inc. cv. sr. unsec. notes 6 1/2s, 2016 | 1,625,000 | 1,905,313 |
|
| XM Satellite Radio Holdings, Inc. | | |
| 144A cv. sr. unsec. sub. notes 7s, 2014 | 1,532,000 | 1,481,444 |
|
| Total convertible bonds and notes (cost $33,839,084) | | $39,302,950 |
| |
| |
| COMMON STOCKS (2.5%)* | Shares | Value |
|
| AboveNet, Inc. † | 5,060 | $309,267 |
|
| AES Corp. (The) † | 144,010 | 1,683,477 |
|
| Alliance Imaging, Inc. † | 340,211 | 1,697,653 |
|
| American Media, Inc. 144A F | 63,915 | 6 |
|
| Avis Budget Group, Inc. † | 70,380 | 740,398 |
|
| Bohai Bay Litigation, LLC (Escrow) F § | 3,899 | 12,165 |
|
| Charter Communications, Inc. Class A | 36,231 | 1,077,872 |
|
| CIT Group, Inc. † | 31,093 | 1,132,718 |
|
| Dana Holding Corp. † | 120,744 | 1,372,859 |
|
| Decrane Aircraft Holdings, Inc. F | 29,311 | 29 |
|
| El Paso Corp. | 120,275 | 1,259,279 |
|
| FelCor Lodging Trust, Inc. † R | 152,730 | 575,792 |
|
| Interpublic Group of Companies, Inc. (The) † | 132,405 | 993,038 |
|
| Louisiana-Pacific Corp. † | 199,010 | 1,514,466 |
|
| M/I Schottenstein Homes, Inc. † | 9,705 | 124,709 |
|
| Nortek, Inc. † | 148,951 | 5,511,187 |
|
| PetroHawk Energy Corp. † | 78,940 | 1,689,316 |
|
| Public Service Enterprise Group, Inc. | 58,200 | 1,729,704 |
|
| Qwest Communications International, Inc. | 322,791 | 1,471,927 |
|
| Sealy Corp. † | 565,495 | 1,956,613 |
|
| Service Corporation International | 240,756 | 1,940,493 |
|
| Spectrum Brands, Inc. † | 107,030 | 2,515,205 |
|
46
| | | | |
| COMMON STOCKS (2.5%)* cont. | | | Shares | Value |
|
| Talecris Biotherapeutics Holdings Corp. † | | | 62,655 | $1,342,070 |
|
| TRW Automotive Holdings Corp. † | | | 57,675 | 1,549,727 |
|
| Vertis Holdings, Inc. F † | | | 135,886 | 136 |
|
| Total common stocks (cost $33,984,514) | | | | $32,200,106 |
| |
| |
| CONVERTIBLE PREFERRED STOCKS (0.5%)* | | | Shares | Value |
|
| Crown Castle International Corp. $3.125 cum. cv. pfd. | | | 34,320 | $1,975,545 |
|
| Dole Food Automatic Exchange 144A 7.00% cv. pfd. | | | 103,165 | 1,205,999 |
|
| Freeport-McMoRan Copper & Gold, Inc. $6.75 cv. pfd. | | | 23,535 | 2,530,013 |
|
| Great Plains Energy, Inc. $6.00 cv. pfd. | | | 20,030 | 1,227,238 |
|
| Lehman Brothers Holdings, Inc. Ser. P, | | | | |
| 7.25% cv. pfd. (In default) † | | | 4,338 | 18,653 |
|
| Total convertible preferred stocks (cost $10,021,203) | | | | $6,957,448 |
| |
| |
| PREFERRED STOCKS (0.2%)* | | | Shares | Value |
|
| Decrane Aircraft Holdings, Inc. $16.00 pfd. ‡‡ | | | 21,000 | $147,000 |
|
| GMAC, Inc. 144A Ser. G, 7.00% pfd. | | | 4,142 | 2,931,630 |
|
| Total preferred stocks (cost $1,609,154) | | | | $3,078,630 |
|
| |
| FOREIGN GOVERNMENT BONDS AND NOTES (0.2%)* | | Principal amount | Value |
|
| Argentina (Republic of) sr. unsec. bonds FRB 0.578s, 2013 | $4,885,000 | $2,022,390 |
|
| Total foreign government bonds and notes (cost $2,072,465) | | | $2,022,390 |
| |
| |
| WARRANTS (—%)* † | Expiration | Strike | | |
| | date | Price | Warrants | Value |
|
| AboveNet, Inc. | 9/08/10 | $24.00 | 977 | $96,723 |
|
| Charter Communication Class A | 11/30/14 | 46.86 | 420 | 2,205 |
|
| Decrane Aircraft Holdings Co. Class B | 6/30/10 | 116.00 | 1 | — |
|
| Decrane Aircraft Holdings Co. Class B | 6/30/10 | 116.00 | 1 | — |
|
| New ASAT (Finance), Ltd. (Cayman Islands) F | 2/01/11 | 0.01 | 714,514 | — |
|
| Smurfit Kappa Group PLC 144A (Ireland) | 10/01/13 | EUR .001 | 4,137 | 177,276 |
|
| Vertis Holdings, Inc. F | 10/18/15 | $0.01 | 9,578 | 1 |
|
| ZSC Specialty Chemicals PLC 144A (United Kingdom) | 6/30/11 | 0.01 | 269,866 | 2,699 |
|
| ZSC Specialty Chemicals PLC (Preferred) 144A | | | | |
| (United Kingdom) | 6/30/11 | 0.01 | 269,866 | 2,699 |
|
| Total warrants (cost $555,683) | | | | $281,603 |
| |
| |
| MORTGAGE-BACKED SECURITIES (—%)* | | Principal amount | Value |
|
| Mach One Commercial Mortgage Trust 144A | | | | |
| Ser. 04-1A, Class J, 5.45s, 2040 F | | $2,190,000 | $131,386 |
| Ser. 04-1A, Class K, 5.45s, 2040 F | | | 880,000 | 44,007 |
| Ser. 04-1A, Class L, 5.45s, 2040 F | | | 400,000 | 16,001 |
|
| Total mortgage-backed securities (cost $2,829,532) | | | | $191,394 |
| |
| |
| U.S. TREASURY OBLIGATIONS (—%)* | | Principal amount | Value |
|
| U.S. Treasury Notes 1 1/4s, November 30, 2010 i | | | $62,000 | $62,641 |
| U.S. Treasury Inflation Index Notes 0.875s, April 15, 2010 i | | 110,605 | 111,477 |
|
| Total U.S. treasury obligations (cost $174,118) | | | | $174,118 |
47
| | |
| SHORT-TERM INVESTMENTS (1.3%)* | Principal amount/shares | Value |
|
| Putnam Money Market Liquidity Fund e | 15,868,697 | $15,868,697 |
|
| SSgA Prime Money Market Fund i | $140,000 | 140,000 |
|
| U.S. Treasury Bills for an effective yield of 0.30%, | | |
| November 18, 2010 | 250,000 | 249,278 |
|
| Total short-term investments (cost $16,258,157) | | $16,257,975 |
|
| |
| TOTAL INVESTMENTS | | |
|
| Total investments (cost $1,270,046,622) | | $1,263,705,943 |
Key to holding’s currency abbreviations
| |
| Key to holding’s abbreviations |
| |
| FRB | Floating Rate Bonds |
| FRN | Floating Rate Notes |
| GMTN | Global Medium Term Notes |
| MTN | Medium Term Notes |
| MTNA | Medium Term Notes Class A |
| MTNI | Medium Term Notes Class I |
* Percentages indicated are based on net assets of $1,282,539,330.
† Non-income-producing security.
†† The interest rate and date shown parenthetically represent the new interest rate to be paid and the date the fund will begin accruing interest at this rate.
‡‡ Income may be received in cash or additional securities at the discretion of the issuer.
§ Affilated Companies (Note 9).
## Forward commitments, in part or in entirety (Note 1).
c Senior loans are exempt from registration under the Securities Act of 1933, as amended, but contain certain restrictions on resale and cannot be sold publicly. These loans pay interest at rates which adjust periodically. The interest rates shown for senior loans are the current interest rates at February 28, 2010. Senior loans are also subject to mandatory and/or optional prepayment which cannot be predicted. As a result, the remaining maturity may be substantially less than the stated maturity shown (Notes 1 and 7).
e See Note 6 to the financial statements regarding investments in Putnam Money Market Liquidity Fund.
F Is valued at fair value following procedures approved by the Trustees. Securities may be classified as Level 2 or Level 3 for Accounting Standards Codification ASC 820 Fair Value Measurements and Disclosures (“ASC 820”) based on the securities valuation inputs.
i Securities purchased with cash or securities received, that were pledged to the fund for collateral on certain derivative contracts (Note 1).
R Real Estate Investment Trust.
U This security, in part or in entirety, represents unfunded loan commitments (Note 8).
At February 28, 2010, liquid assets totaling $4,285,000 have been segregated to cover certain derivatives contracts. Debt obligations are considered secured unless otherwise indicated.
144A after the name of an issuer represents securities exempt from registration under Rule 144A under the Securities Act of 1933, as amended. These securities may be resold in transactions exempt from registration, normally to qualified institutional buyers.
The rates shown on FRB and FRN are the current interest rates at February 28, 2010.
The dates shown on debt obligations are the original maturity dates.
48
| | | | | |
| FORWARD CURRENCY CONTRACTS TO SELL at 2/28/10 (Unaudited) | | | |
|
| | | Aggregate | | Delivery | Unrealized |
| | Value | face value | | date | appreciation |
|
| Euro | $24,771,552 | $25,311,565 | | 3/17/10 | $540,013 |
|
| Total | | | | | $540,013 |
| | | | | | | |
| CREDIT DEFAULT CONTRACTS OUTSTANDING at 2/28/10 (Unaudited) | | |
|
| | | Upfront | | | | Fixed payments | |
| | | premium | | | Termi- | received | Unrealized |
| Swap counterparty / | | received | Notional | | nation | (paid) by fund | appreciation/ |
| Referenced debt* | Rating*** | (paid)** | amount | | date | per annum | (depreciation) |
|
| JPMorgan Chase Bank, N.A. | | | | | | |
| Claire’s Stores, | | | | | | | |
| 9 5/8%, 6/1/15 | Ca | $— | $730,000 | | 6/20/12 | 230 bp | $(57,967) |
|
| Sanmina-SCI Corp., | | | | | | | |
| 8 1/8%, 3/1/16 | B2 | — | 715,000 | | 6/20/13 | 595 bp | 32,561 |
|
| Total | | | | | | | $(25,406) |
* Payments related to the referenced debt are made upon a credit default event.
** Upfront premium is based on the difference between the original spread on issue and the market spread on day of execution.
*** Ratings are presented for credit default contracts in which the fund has sold protection on the underlying referenced debt. Ratings for an underlying index represent the average of the ratings of all the securities included in that index. The Moody’s, Standard & Poor’s or Fitch ratings are believed to be the most recent ratings available at February 28, 2010.
49
ASC 820 establishes a three-level hierarchy for disclosure of fair value measurements. The valuation hierarchy is based upon the transparency of inputs to the valuation of the fund’s investments. The three levels are defined as follows:
Level 1 — Valuations based on quoted prices for identical securities in active markets.
Level 2 — Valuations based on quoted prices in markets that are not active or for which all significant inputs are observable, either directly or indirectly.
Level 3 — Valuations based on inputs that are unobservable and significant to the fair value measurement.
The following is a summary of the inputs used to value the fund’s net assets as of February 28, 2010:
| | | |
| | | Valuation inputs |
|
| Investments in securities: | Level 1 | Level 2 | Level 3 |
|
| Common stocks: | | | |
|
| Basic materials | $1,514,466 | $— | $— |
|
| Capital goods | — | — | 29 |
|
| Communication services | 2,859,066 | — | — |
|
| Conglomerates | — | — | 12,165 |
|
| Consumer cyclicals | 5,996,946 | 5,511,187 | 142 |
|
| Consumer staples | 5,196,096 | — | — |
|
| Energy | 1,689,316 | — | — |
|
| Financials | 1,708,510 | — | — |
|
| Health care | 3,039,723 | — | — |
|
| Utilities and power | 4,672,460 | — | — |
|
| Total common stocks | 26,676,583 | 5,511,187 | 12,336 |
| | | | |
| Convertible bonds and notes | — | 39,302,950 | — |
|
| Convertible preferred stocks | — | 6,957,448 | — |
|
| Corporate bonds and notes | — | 1,080,336,422 | 251,310 |
|
| Foreign government bonds and notes | — | 2,022,390 | — |
|
| Mortgage-backed securities | — | 191,394 | — |
|
| Preferred stocks | — | 3,078,630 | — |
|
| Senior loans | — | 82,651,597 | — |
|
| U.S. treasury obligations | — | 174,118 | — |
|
| Warrants | 96,723 | 184,879 | 1 |
|
| Short-term investments | 16,008,697 | 249,278 | — |
|
| Totals by level | $42,782,003 | $1,220,660,293 | $263,647 |
| | | | |
| | Level 1 | Level 2 | Level 3 |
|
| Other financial instruments: | $— | $514,607 | $2,909,420 |
|
Other financial instruments include swaps, forward currency contracts and receivable purchase agreements.
The following is a reconciliation of Level 3 assets as of February 28, 2010:
| | | | | | | |
| | | | | Change in net | | | |
| | Balance as | Accrued | Realized | unrealized | Net | Net transfers | Balance as of |
| Investments | of August 31, | discounts/ | gain/ | appreciation/ | purchases/ | in and/or out | February 28, |
| in securities: | 2009 | premiums | (loss) | (depreciation)† | sales | of Level 3 | 2010 |
|
| Common | | | | | | | |
| stocks: | | | | | | | |
|
| Capital | | | | | | | |
| goods | $29 | — | — | — | — | — | $29 |
|
| Communi- | | | | | | | |
| cation | | | | | | | |
| services | $2,201,506 | — | — | (2,139,628) | — | (61,878) | — |
|
| Conglom- | | | | | | | |
| erates | $12,165 | — | — | — | — | — | 12,165 |
|
| Consumer | | | | | | | |
| cyclicals | $142 | — | — | — | — | — | 142 |
|
| Total | | | | | | | |
| common | | | | | | | |
| stocks | $2,213,842 | — | — | (2,139,628) | — | (61,878) | $12,336 |
|
| Corporate | | | | | | | |
| bonds and | | | | | | | |
| notes | $12,502 | — | — | (543) | — | 239,351 | $251,310 |
|
| Warrants | $1 | — | — | — | — | — | $1 |
|
| Totals: | $2,226,345 | $— | $— | $(2,140,171) | $— | $177,473 | $263,647 |
|
† Includes $(543) related to Level 3 securities still held at period end. Total change in unrealized appreciation/ (depreciation) for securities (including Level 1 and Level 2) can be found in the Statement of operations.
| | | | | | | |
| | | | | Change in net | | | |
| | Balance as | Accrued | Realized | unrealized | Net | Net transfers | Balance as of |
| | of August 31, | discounts/ | gain/ | appreciation/ | purchases/ | in and/or out | February 28, |
| | 2009†† | premiums | (loss) | (depreciation)† | sales | of Level 3 | 2010†† |
|
| Other | | | | | | | |
| financial | | | | | | | |
| instruments: | $2,993,534 | $— | $— | $(84,114) | $— | $— | $2,909,420 |
|
† Includes $(84,114) related to Level 3 securities still held at period end. Total change in unrealized appreciation/ (depreciation) for securities (including Level 1 and Level 2) can be found in the Statement of operations.
†† Includes amount receivable under receivable purchase agreement.
The accompanying notes are an integral part of these financial statements.
51
Statement of assets and liabilities 2/28/10 (Unaudited)
| |
| ASSETS | |
|
| Investment in securities, at value, (Note 1): | |
| Unaffiliated issuers (identified cost $1,254,177,925) | $1,247,825,081 |
| Affiliated issuers (identified cost $15,868,697) (Notes 6 and 9) | 15,880,862 |
|
| Cash | 12,350,665 |
|
| Dividends, interest and other receivables | 23,619,689 |
|
| Receivable for shares of the fund sold | 1,105,526 |
|
| Receivable for investments sold | 7,966,872 |
|
| Unrealized appreciation on forward currency contracts (Note 1) | 540,013 |
|
| Unrealized appreciation on swap contracts (Note 1) | 32,561 |
|
| Receivable for receivable purchase agreement (Note 2) | 2,909,420 |
|
| Total assets | 1,312,230,689 |
| |
| LIABILITIES | |
|
| Payable for investments purchased | 22,738,800 |
|
| Payable for purchases of delayed delivery securities (Notes 1, 7 and 8) | 3,021,411 |
|
| Payable for shares of the fund repurchased | 1,446,250 |
|
| Payable for compensation of Manager (Note 2) | 569,604 |
|
| Payable for investor servicing fees (Note 2) | 325,619 |
|
| Payable for custodian fees (Note 2) | 12,621 |
|
| Payable for Trustee compensation and expenses (Note 2) | 361,977 |
|
| Payable for administrative services (Note 2) | 19,906 |
|
| Payable for distribution fees (Note 2) | 542,616 |
|
| Unrealized depreciation on swap contracts (Note 1) | 57,967 |
|
| Collateral on certain derivative contracts, at value (Note 1) | 314,118 |
|
| Other accrued expenses | 280,470 |
|
| Total liabilities | 29,691,359 |
| |
| Net assets | $1,282,539,330 |
|
| REPRESENTED BY | |
|
| Paid-in capital (Unlimited shares authorized) (Notes 1 and 4) | $2,522,091,671 |
|
| Undistributed net investment income (Note 1) | 1,884,882 |
|
| Accumulated net realized loss on investments and foreign currency transactions (Note 1) | (1,238,491,418) |
|
| Net unrealized depreciation of investments and assets and liabilities in foreign currencies | (2,945,805) |
|
| Total — Representing net assets applicable to capital shares outstanding | $1,282,539,330 |
(Continued on next page)
52
| |
| Statement of assets and liabilities (Continued) | |
| |
| COMPUTATION OF NET ASSET VALUE AND OFFERING PRICE | |
|
| Net asset value and redemption price per class A share | |
| ($1,128,174,470 divided by 155,151,438 shares) | $7.27 |
|
| Offering price per class A share (100/96.00 of $7.27)* | $7.57 |
|
| Net asset value and offering price per class B share ($52,776,731 divided by 7,272,837 shares)** | $7.26 |
|
| Net asset value and offering price per class C share ($35,724,134 divided by 4,943,248 shares)** | $7.23 |
|
| Net asset value and redemption price per class M share ($10,768,301 divided by 1,478,558 shares) | $7.28 |
|
| Offering price per class M share (100/96.75 of $7.28)*** | $7.52 |
|
| Net asset value, offering price and redemption price per class R share | |
| ($3,727,617 divided by 519,093 shares) | $7.18 |
|
| Net asset value, offering price and redemption price per class Y share | |
| ($51,368,077 divided by 7,151,082 shares) | $7.18 |
|
* On single retail sales of less than $100,000. On sales of $100,000 or more the offering price is reduced.
** Redemption price per share is equal to net asset value less any applicable contingent deferred sales charge.
*** On single retail sales of less than $50,000. On sales of $50,000 or more the offering price is reduced.
The accompanying notes are an integral part of these financial statements.
53
Statement of operations Six months ended 2/28/10 (Unaudited)
| |
| INVESTMENT INCOME | |
|
| Interest (including interest income of $7,272 from | |
| investments in affiliated issuers) (Note 6) | $57,118,533 |
|
| Dividends | 517,145 |
|
| Total investment income | 57,635,678 |
|
| |
| EXPENSES | |
|
| Compensation of Manager (Note 2) | 3,933,165 |
|
| Investor servicing fees (Note 2) | 1,016,562 |
|
| Custodian fees (Note 2) | 24,653 |
|
| Trustee compensation and expenses (Note 2) | 47,517 |
|
| Administrative services (Note 2) | 36,247 |
|
| Distribution fees — Class A (Note 2) | 1,405,107 |
|
| Distribution fees — Class B (Note 2) | 309,455 |
|
| Distribution fees — Class C (Note 2) | 181,812 |
|
| Distribution fees — Class M (Note 2) | 43,377 |
|
| Distribution fees — Class R (Note 2) | 7,561 |
|
| Other | 364,523 |
|
| Fees waived and reimbursed by Manager (Note 2) | (118,165) |
|
| Total expenses | 7,251,814 |
| | |
| Expense reduction (Note 2) | (5,802) |
|
| Net expenses | 7,246,012 |
| |
| Net investment income | 50,389,666 |
|
| Net realized gain on investments (Notes 1 and 3) | 19,359,801 |
|
| Net realized gain on swap contracts (Note 1) | 10,548 |
|
| Net realized gain on foreign currency transactions (Note 1) | 1,204,029 |
|
| Net unrealized appreciation of assets and liabilities in | |
| foreign currencies during the period | 466,286 |
|
| Net unrealized appreciation of investments, swap contracts | |
| and receivable purchase agreements during the period | 84,362,103 |
|
| Net gain on investments | 105,402,767 |
| |
| Net increase in net assets resulting from operations | $155,792,433 |
|
The accompanying notes are an integral part of these financial statements.
54
Statement of changes in net assets
| | |
| INCREASE (DECREASE) IN NET ASSETS | Six months ended 2/28/10* | Year ended 8/31/09 |
|
| Operations: | | |
| Net investment income | $50,389,666 | $97,790,248 |
|
| Net realized gain (loss) on investments and foreign | | |
| currency transactions | 20,574,378 | (268,199,862) |
|
| Net unrealized appreciation of investments and assets and | | |
| liabilities in foreign currencies | 84,828,389 | 92,854,212 |
|
| Net increase (decrease) in net assets resulting from operations | 155,792,433 | (77,555,402) |
|
| Distributions to shareholders (Note 1): | | |
| From ordinary income | | |
| Net investment income | | |
|
| Class A | (42,670,212) | (89,005,603) |
|
| Class B | (2,068,356) | (5,979,813) |
|
| Class C | (1,248,210) | (2,515,249) |
|
| Class M | (618,308) | (1,230,461) |
|
| Class R | (115,027) | (158,987) |
|
| Class Y | (1,881,064) | (6,935,943) |
|
| Increase in capital from settlement payments | — | 76,316 |
|
| Redemption fees (Note 1) | 39,635 | 153,902 |
|
| Decrease from capital share transactions (Note 4) | (57,499,850) | (267,281,965) |
|
| Total increase (decrease) in net assets | 49,731,041 | (450,433,205) |
| |
| NET ASSETS | | |
|
| Beginning of period | 1,232,808,289 | 1,683,241,494 |
|
| End of period (including undistributed net investment | | |
| income of $1,884,882 and $96,393, respectively) | $1,282,539,330 | $1,232,808,289 |
|
* Unaudited
The accompanying notes are an integral part of these financial statements.
55
Financial highlights (For a common share outstanding throughout the period)
| | | | | | | | | | | | | | |
| INVESTMENT OPERATIONS: | | | | LESS DISTRIBUTIONS: | | | | | RATIOS AND SUPPLEMENTAL DATA: | |
|
| | | | | | | | | | | | | | Ratio of net | |
| | | | Net realized | | | | | | | | | Ratio of | investment | |
| | Net asset value, | | and unrealized | Total from | From net | | | | Net asset | Total return | Net assets, | expenses to | income (loss) | |
| | beginning | Net investment | gain (loss) on | investment | investment | Total | Redemption | Non-recurring | value, end of | at net asset | end of period | average net | to average | Portfolio |
| Period ended | of period | income (loss) a | investments | operations | income | distributions | fees b | reimbursements | period | value (%) c | (in thousands) | assets (%) d,e | net assets (%) d | turnover (%) |
|
| Class A | | | | | | | | | | | | | | |
| February 28, 2010 ** | $6.68 | .28 | .58 | .86 | (.27) | (.27) | — | — | $7.27 | 12.99 * | $1,128,174 | .53 * | 3.90 * | 36.12 * |
| August 31, 2009 | 7.21 | .49 | (.48) | .01 | (.54) | (.54) | — | — b,g,h | 6.68 | 1.73 | 1,070,781 | 1.13 | 8.37 | 44.15 |
| August 31, 2008 | 7.82 | .57 | (.60) | (.03) | (.58) | (.58) | — | — | 7.21 | (.50) | 1,298,019 | 1.07 | 7.51 | 27.59 |
| August 31, 2007 | 7.87 | .58 | (.04) | .54 | (.59) | (.59) | — | — | 7.82 | 6.87 | 1,570,488 | 1.03 | 7.17 | 57.18 |
| August 31, 2006 | 8.10 | .58 f | (.22) | .36 | (.59) | (.59) | — | — | 7.87 | 4.64 f | 1,657,357 | 1.01 f | 7.26 f | 45.50 |
| August 31, 2005 | 7.98 | .56 | .16 | .72 | (.60) | (.60) | — | — | 8.10 | 9.28 | 1,851,371 | .97 | 6.94 | 41.21 |
|
| Class B | | | | | | | | | | | | | | |
| February 28, 2010 ** | $6.67 | .25 | .58 | .83 | (.24) | (.24) | — | — | $7.26 | 12.56 * | $52,777 | .90 * | 3.52 * | 36.12 * |
| August 31, 2009 | 7.19 | .45 | (.47) | (.02) | (.50) | (.50) | — | — b,g,h | 6.67 | 1.12 | 65,487 | 1.88 | 7.75 | 44.15 |
| August 31, 2008 | 7.79 | .51 | (.59) | (.08) | (.52) | (.52) | — | — | 7.19 | (1.14) | 113,832 | 1.82 | 6.79 | 27.59 |
| August 31, 2007 | 7.84 | .51 | (.04) | .47 | (.52) | (.52) | — | — | 7.79 | 6.05 | 197,581 | 1.78 | 6.42 | 57.18 |
| August 31, 2006 | 8.06 | .51 f | (.20) | .31 | (.53) | (.53) | — | — | 7.84 | 3.99 f | 342,227 | 1.76 f | 6.52 f | 45.50 |
| August 31, 2005 | 7.94 | .50 | .16 | .66 | (.54) | (.54) | — | — | 8.06 | 8.49 | 543,515 | 1.72 | 6.19 | 41.21 |
|
| Class C | | | | | | | | | | | | | | |
| February 28, 2010 ** | $6.65 | .25 | .57 | .82 | (.24) | (.24) | — | — | $7.23 | 12.48 * | $35,724 | .90 * | 3.53 * | 36.12 * |
| August 31, 2009 | 7.17 | .45 | (.47) | (.02) | (.50) | (.50) | — | — b,g,h | 6.65 | 1.14 | 34,786 | 1.88 | 7.58 | 44.15 |
| August 31, 2008 | 7.78 | .51 | (.60) | (.09) | (.52) | (.52) | — | — | 7.17 | (1.28) | 39,507 | 1.82 | 6.75 | 27.59 |
| August 31, 2007 | 7.84 | .52 | (.05) | .47 | (.53) | (.53) | — | — | 7.78 | 5.95 | 46,276 | 1.78 | 6.42 | 57.18 |
| August 31, 2006 | 8.06 | .51 f | (.20) | .31 | (.53) | (.53) | — | — | 7.84 | 4.02 f | 63,687 | 1.76 f | 6.50 f | 45.50 |
| August 31, 2005 | 7.95 | .50 | .15 | .65 | (.54) | (.54) | — | — | 8.06 | 8.39 | 75,498 | 1.72 | 6.18 | 41.21 |
|
| Class M | | | | | | | | | | | | | | |
| February 28, 2010 ** | $6.69 | .27 | .58 | .85 | (.26) | (.26) | — | — | $7.28 | 12.82 * | $10,768 | .66 * | 3.77 * | 36.12 * |
| August 31, 2009 | 7.23 | .47 | (.48) | (.01) | (.53) | (.53) | — | — b,g,h | 6.69 | 1.36 | 17,087 | 1.38 | 8.03 | 44.15 |
| August 31, 2008 | 7.83 | .55 | (.60) | (.05) | (.55) | (.55) | — | — | 7.23 | (.67) | 13,273 | 1.32 | 7.25 | 27.59 |
| August 31, 2007 | 7.88 | .56 | (.05) | .51 | (.56) | (.56) | — | — | 7.83 | 6.54 | 16,162 | 1.28 | 6.92 | 57.18 |
| August 31, 2006 | 8.10 | .56 f | (.22) | .34 | (.56) | (.56) | — | — | 7.88 | 4.46 f | 19,785 | 1.26 f | 7.00 f | 45.50 |
| August 31, 2005 | 7.98 | .54 | .15 | .69 | (.57) | (.57) | — | — | 8.10 | 8.95 | 23,265 | 1.22 | 6.69 | 41.21 |
|
| Class R | | | | | | | | | | | | | | |
| February 28, 2010 ** | $6.61 | .27 | .56 | .83 | (.26) | (.26) | — | — | $7.18 | 12.72 * | $3,728 | .66 * | 3.80 * | 36.12 * |
| August 31, 2009 | 7.16 | .46 | (.48) | (.02) | (.53) | (.53) | — | — b,g,h | 6.61 | 1.23 | 2,296 | 1.38 | 7.93 | 44.15 |
| August 31, 2008 | 7.77 | .54 | (.59) | (.05) | (.56) | (.56) | — | — | 7.16 | (.75) | 1,446 | 1.32 | 7.22 | 27.59 |
| August 31, 2007 | 7.85 | .56 | (.07) | .49 | (.57) | (.57) | — | — | 7.77 | 6.24 | 1,096 | 1.28 | 6.92 | 57.18 |
| August 31, 2006 | 8.08 | .55 f | (.21) | .34 | (.57) | (.57) | — | — | 7.85 | 4.37 f | 390 | 1.26 f | 7.00 f | 45.50 |
| August 31, 2005 | 7.98 | .53 | .15 | .68 | (.58) | (.58) | — | — | 8.08 | 8.79 | 905 | 1.22 | 6.60 | 41.21 |
|
| Class Y | | | | | | | | | | | | | | |
| February 28, 2010 ** | $6.61 | .28 | .57 | .85 | (.28) | (.28) | — | — | $7.18 | 12.97 * | $51,368 | .41 * | 4.03 * | 36.12 * |
| August 31, 2009 | 7.14 | .54 | (.52) | .02 | (.55) | (.55) | — | — b,g,h | 6.61 | 1.98 | 42,372 | .88 | 9.11 | 44.15 |
| August 31, 2008 | 7.76 | .58 | (.60) | (.02) | (.60) | (.60) | — | — | 7.14 | (.35) | 217,165 | .82 | 7.73 | 27.59 |
| August 31, 2007 | 7.83 | .60 | (.06) | .54 | (.61) | (.61) | — | — | 7.76 | 6.96 | 225,031 | .78 | 7.42 | 57.18 |
| August 31, 2006 | 8.06 | .59 f | (.21) | .38 | (.61) | (.61) | — | — | 7.83 | 4.99 f | 193,290 | .76 f | 7.51 f | 45.50 |
| August 31, 2005 | 7.96 | .58 | .14 | .72 | (.62) | (.62) | — | — | 8.06 | 9.37 | 222,236 | .72 | 7.19 | 41.21 |
|
See notes to financial highlights at the end of this section.
The accompanying notes are an integral part of these financial statements.
Financial highlights (Continued)
* Not annualized.
** Unaudited.
a Per share net investment income (loss) has been determined on the basis of the weighted average number of shares outstanding during the period.
b Amount represents less than $0.01 per share.
c Total return assumes dividend reinvestment and does not reflect the effect of sales charges.
d Reflects an involuntary contractual expense limitation in effect during the period. For periods prior to February 28, 2010, certain fund expenses were waived in connection with the fund’s investment in Putnam Prime Money Market Fund. As a result of such limitation and/or waivers, the expenses of each class reflect a reduction of the following amounts (Note 2):
| |
| | Percentage of |
| | average net assets |
|
| February 28, 2010 | 0.01% |
|
| August 31, 2009 | 0.04 |
|
| August 31, 2008 | <0.01 |
|
| August 31, 2007 | <0.01 |
|
| August 31, 2006 | <0.01 |
|
| August 31, 2005 | <0.01 |
|
e Includes amounts paid through expense offset arrangements (Note 2).
f Reflects a non-recurring reimbursement from Putnam Investments relating to the calculation of certain amounts paid by the fund to Putnam in previous years for transfer agent services, which amounted to less than $0.01 per share and 0.01% of average net assets for the period ended August 31, 2006.
g Reflects non-recurring reimbursement pursuant to a settlement between the Securities and Exchange Commission (the “SEC”) and Bear Stearns & Co., Inc. and Bear Stearns Securities Corp., which amounted to less than $0.01 per share outstanding as of May 21, 2009.
h Reflects non-recurring reimbursement pursuant to a settlement between the SEC and Millennium Partners, L.P., Millennium Management, L.L.C and Millennium International Management, LLC, which amounted to less than $0.01 per share outstanding as of June 23, 2009.
The accompanying notes are an integral part of these financial statements.
58
Notes to financial statements 2/28/10 (Unaudited)
Note 1: Significant accounting policies
Putnam High Yield Trust (the “fund”), a Massachusetts business trust, is registered under the Investment Company Act of 1940, as amended, as a diversified, open-end management investment company. The fund seeks high current income by investing primarily in high-yielding, lower-rated fixed-income securities. These securities may have a higher rate of default. Capital growth is a secondary goal when consistent with achieving high current income.
The fund offers class A, class B, class C, class M, class R and class Y shares. Class A and class M shares are sold with a maximum front-end sales charge of 4.00% and 3.25%, respectively, and generally do not pay a contingent deferred sales charge. Class B shares, which convert to class A shares after approximately eight years, do not pay a front-end sales charge and are subject to a contingent deferred sales charge, if those shares are redeemed within six years of purchase. Class C shares have a one-year 1.00% contingent deferred sales charge and do not convert to class A shares. Class R shares, which are offered to qualified employee-benefit plans, are sold at net asset value. The expenses for class A, class B, class C, class M and class R shares may differ based on the distribution fee of each class, which is identified in Note 2. Class Y shares, which are sold at net asset value, are generally subject to the same expenses as class A, clas s B, class C, class M and class R shares, but do not bear a distribution fee. Class Y shares are generally only available to corporate and institutional clients and clients in other approved programs.
A 1.00% redemption fee may apply on any shares that are redeemed (either by selling or exchanging into another fund) within 90 days of purchase. The redemption fee is accounted for as an addition to paid-in-capital.
Investment income, realized and unrealized gains and losses and expenses of the fund are borne pro-rata based on the relative net assets of each class to the total net assets of the fund, except that each class bears expenses unique to that class (including the distribution fees applicable to such classes). Each class votes as a class only with respect to its own distribution plan or other matters on which a class vote is required by law or determined by the Trustees. If the fund were liquidated, shares of each class would receive their pro-rata share of the net assets of the fund. In addition, the Trustees declare separate dividends on each class of shares.
In the normal course of business, the fund enters into contracts that may include agreements to indemnify another party under given circumstances. The fund’s maximum exposure under these arrangements is unknown as this would involve future claims that may be, but have not yet been, made against the fund. However, the fund’s management team expects the risk of material loss to be remote.
The following is a summary of significant accounting policies consistently followed by the fund in the preparation of its financial statements. The preparation of financial statements is in conformity with accounting principles generally accepted in the United States of America and requires management to make estimates and assumptions that affect the reported amounts of assets and liabilities in the financial statements and the reported amounts of increases and decreases in net assets from operations during the reporting period. Actual results could differ from those estimates. Subsequent events after the Statement of assets and liabilities date through the date that the financial statements were issued, April 14, 2010, have been evaluated in the preparation of the financial statements.
A) Security valuation Investments for which market quotations are readily available are valued at the last reported sales price on their principal exchange, or official closing price for certain markets. If no sales are reported — as in the case of some securities traded over-the-counter — a security is valued at its last reported bid price. Market quotations are not considered to be readily available for certain debt obligations; such investments are valued on the basis of valuations furnished by an independent pricing service approved by the Trustees or dealers selected by Putnam Investment Management, LLC (“Putnam Management”), the fund’s manager, an indirect wholly-owned subsidiary of Putnam Investments, LLC. Such services or dealers determine valuations for normal institutional-size trading units of such securities using methods based on market transactions for comparable securiti es and various relationships, generally recognized by institutional traders, between securities (which considers such factors as security prices, yields, maturities and ratings). Many securities markets and exchanges outside the U.S. close prior to the close of the New York Stock Exchange and therefore the closing prices for securities in such markets or on such exchanges may not fully reflect events that occur after such close but before the close of the New York Stock Exchange. Accordingly, on certain days, the fund will fair value foreign equity securities taking into account multiple factors, including movements in the U.S. securities markets. The number of days on which fair value prices will be used will depend on market activity and it is possible that fair value prices will be used by the fund to a significant extent. Securities quoted in foreign currencies, if any, are translated into U.S. dollars at the current exchange rate. To the extent a pricing service or
59
dealer is unable to value a security or provides a valuation that Putnam Management does not believe accurately reflects the security’s fair value, the security will be valued at fair value by Putnam Management. Certain investments, including certain restricted and illiquid securities and derivatives, are also valued at fair value following procedures approved by the Trustees. Such valuations and procedures are reviewed periodically by the Trustees. Certain securities may be valued on the basis of a price provided by a single source. The fair value of securities is generally determined as the amount that the fund could reasonably expect to realize from an orderly disposition of such securities over a reasonable period of time. By its nature, a fair value price is a good faith estimate of the value of a security in a current sale and does not reflect an actual market price, which may be different by a material amount.
B) Security transactions and related investment income Security transactions are recorded on the trade date (the date the order to buy or sell is executed). Gains or losses on securities sold are determined on the identified cost basis. Interest income is recorded on the accrual basis. Dividend income, net of applicable withholding taxes, is recognized on the ex-dividend date except that certain dividends from foreign securities, if any, are recognized as soon as the fund is informed of the ex-dividend date. Non-cash dividends, if any, are recorded at the fair market value of the securities received. Dividends representing a return of capital or capital gains, if any, are reflected as a reduction of cost and/or as a realized gain. All premiums/discounts are amortized/accreted on a yield-to-maturity basis.
Securities purchased or sold on a forward commitment or delayed delivery basis may be settled a month or more after the trade date; interest income is accrued based on the terms of the securities. Losses may arise due to changes in the market value of the underlying securities or if the counterparty does not perform under the contract.
The fund earned certain fees in connection with its senior loan purchasing activities. These fees are treated as market discount and are recorded as income in the Statement of operations.
C) Foreign currency translation The accounting records of the fund are maintained in U.S. dollars. The market value of foreign securities, currency holdings, and other assets and liabilities is recorded in the books and records of the fund after translation to U.S. dollars based on the exchange rates on that day. The cost of each security is determined using historical exchange rates. Income and withholding taxes are translated at prevailing exchange rates when earned or incurred. The fund does not isolate that portion of realized or unrealized gains or losses resulting from changes in the foreign exchange rate on investments from fluctuations arising from changes in the market prices of the securities. Such gains and losses are included with the net realized and unrealized gain or loss on investments. Net realized gains and losses on foreign currency transactions represent net realized exchange gains or losses on closed forward currency contracts, disposition of foreign currencies, currency gains and losses realized between the trade and settlement dates on securities transactions and the difference between the amount of investment income and foreign withholding taxes recorded on the fund’s books and the U.S. dollar equivalent amounts actually received or paid. Net unrealized appreciation and depreciation of assets and liabilities in foreign currencies arise from changes in the value of open forward currency contracts and assets and liabilities other than investments at the period end, resulting from changes in the exchange rate. Investments in foreign securities involve certain risks, including those related to economic instability, unfavorable political developments, and currency fluctuations, not present with domestic investments.
D) Forward currency contracts The fund may buy and sell forward currency contracts, which are agreements between two parties to buy and sell currencies at a set price on a future date. These contracts are used to protect against a decline in value relative to the U.S. dollar of the currencies in which its portfolio securities are denominated or quoted (or an increase in the value of a currency in which securities a fund intends to buy are denominated, when a fund holds cash reserves and short term investments), or for other investment purposes. The U.S. dollar value of forward currency contracts is determined using current forward currency exchange rates supplied by a quotation service. The market value of the contract will fluctuate with changes in currency exchange rates. The contract is marked to market daily and the change in market value is recorded as an unrealized gain or loss. When the contract is clos ed, the fund records a realized gain or loss equal to the difference between the value of the contract at the time it was opened and the value at the time it was closed. The fund could be exposed to risk if the value of the currency changes unfavorably, if the counterparties to the contracts are unable to meet the terms of their contracts or if the fund is unable to enter into a closing position. Risks may exceed amounts recognized on the Statement of assets and liabilities. Forward currency contracts outstanding at period end, if any, are listed after the fund’s portfolio. The fund had an average contract amount of approximately $21,000,000 on Forward currency contracts for the period ended February 28, 2010.
E) Credit default contracts The fund may enter into credit default contracts to provide a measure of protection against risk of loss following a default, or other credit event in respect of issuers within an underlying
60
index or a single issuer, or to gain credit exposure to an underlying index or issuer. In a credit default contract, the protection buyer typically makes an up front payment and a periodic stream of payments to a counterparty, the protection seller, in exchange for the right to receive a contingent payment upon the occurrence of a credit event on the reference obligation or all other equally ranked obligations of the reference entity. Credit events are contract specific but may include bankruptcy, failure to pay, restructuring and obligation acceleration. An upfront payment received by the fund, as the protection seller, is recorded as a liability on the fund’s books. An upfront payment made by the fund, as the protection buyer, is recorded as an asset on the fund’s books. Periodic payments received or paid by the fund are recorded as realized gains or losses. The credit default contracts are marked to market daily based upon quotations from an independent pricing service or market makers and the change, if any, is recorded as an unrealized gain or loss. Upon the occurrence of a credit event, the difference between the par value and market value of the reference obligation, net of any proportional amount of the upfront payment, is recorded as a realized gain or loss.
In addition to bearing the risk that the credit event will occur, the fund could be exposed to market risk due to unfavorable changes in interest rates or in the price of the underlying security or index or the possibility that the fund may be unable to close out its position at the same time or at the same price as if it had purchased the underlying reference obligations. In certain circumstances, the fund may enter into offsetting credit default contracts which would mitigate its risk of loss. Risks of loss may exceed amounts recognized on the Statement of assets and liabilities. The fund’s maximum risk of loss from counterparty risk, either as the protection seller or as the protection buyer, is the fair value of the contract. This risk may be mitigated by having a master netting arrangement between the fund and the counterparty. Where the fund is a seller of protection, the maximum potential amount of future payments the fund may be required t o make is equal to the notional amount of the relevant credit default contract. Credit default contracts outstanding, including their respective notional amounts at period end, if any, are listed after the fund’s portfolio. The fund had an average notional amount of approximately $4,000,000 on Credit default swap contracts for the period ended February 28, 2010.
F) Master agreements The fund is a party to ISDA (International Swap and Derivatives Association, Inc.) Master Agreements (“Master Agreements”) with certain counterparties that govern over-the-counter derivative and foreign exchange contracts entered into from time to time. The Master Agreements may contain provisions regarding, among other things, the parties’ general obligations, representations, agreements, collateral requirements, events of default and early termination. With respect to certain counterparties, in accordance with the terms of the Master Agreements, collateral posted to the fund is held in a segregated account by the fund’s custodian and with respect to those amounts which can be sold or repledged, are presented in the fund’s portfolio. Collateral posted to the fund which can not be sold or repledged totaled $242,533 at February 28 , 2010. Collateral pledged by the fund is segregated by the fund’s custodian and identified in the fund’s portfolio. Collateral can be in the form of cash or debt securities issued by the U.S. Government or related agencies or other securities as agreed to by the fund and the applicable counterparty. Collateral requirements are determined based on the fund’s net position with each counterparty. Termination events applicable to the fund may occur upon a decline in the fund’s net assets below a specified threshold over a certain period of time. Termination events applicable to counterparties may occur upon a decline in the counterparty’s long-term and short-term credit ratings below a specified level. In each case, upon occurrence, the other party may elect to terminate early and cause settlement of all derivative and foreign exchange contracts outstanding, including the payment of any losses and costs resulting from such early termination, as reasonably determined by the terminating p arty. Any decision by one or more of the fund’s counterparties to elect early termination could impact the fund’s future derivative activity.
At February 28, 2010, the fund did not have a net liability position on derivative contracts subject to the Master Agreements. There was no collateral posted by the fund.
G) Federal taxes It is the policy of the fund to distribute all of its taxable income within the prescribed time and otherwise comply with the provisions of the Internal Revenue Code of 1986, as amended (the “Code”), applicable to regulated investment companies. It is also the intention of the fund to distribute an amount sufficient to avoid imposition of any excise tax under Section 4982 of the Code. The fund is subject to the provisions of Accounting Standards Codification ASC 740 Income Taxes (“ASC 740”). ASC 740 sets forth a minimum threshold for financial statement recognition of the benefit of a tax position taken or expected to be taken in a tax return. The fund did not have any unrecognized tax benefits in the accompanying financial statements. No provision has been made for federal taxes on income, capit al gains or unrealized appreciation on securities held nor for excise tax on income and capital gains. Each of the fund’s federal tax returns for the prior three fiscal
61
years remains subject to examination by the Internal Revenue Service and state departments of revenue.
At August 31, 2009 the fund had a capital loss carryover of $1,073,746,335 available to the extent allowed by the Code to offset future net capital gain, if any. The amounts of the carryovers and the expiration dates are:
| | | |
| Loss Carryover | Expiration | | |
| | |
| $302,150,418 | August 31, 2010 | | |
| | |
| 499,955,886 | August 31, 2011 | | |
| | |
| 61,743,291 | August 31, 2012 | | |
| | |
| 76,944,480 | August 31, 2013 | | |
| | |
| 14,070,646 | August 31, 2014 | | |
| | |
| 2,600,677 | August 31, 2015 | | |
| | |
| 20,028,690 | August 31, 2016 | | |
| | |
| 96,252,247 | August 31, 2017 | | |
| | |
Pursuant to federal income tax regulations applicable to regulated investment companies, the fund has elected to defer to its fiscal year ending August 31, 2010 approximately $171,564,975 of losses recognized during the period November 1, 2008 to August 31, 2009.
The aggregate identified cost on a tax basis is $1,273,632,691, resulting in gross unrealized appreciation and depreciation of $66,337,525 and $76,264,273, respectively, or net unrealized depreciation of $9,926,748.
H) Distributions to shareholders Distributions to shareholders from net investment income are recorded by the fund on the ex-dividend date. Distributions from capital gains, if any, are recorded on the ex-dividend date and paid at least annually. The amount and character of income and gains to be distributed are determined in accordance with income tax regulations, which may differ from generally accepted accounting principles. Dividend sources are estimated at the time of declaration. Actual results may vary. Any non-taxable return of capital cannot be determined until final tax calculations are completed after the end of the fund’s fiscal year. Reclassifications are made to the fund’s capital accounts to reflect income and gains available for distribution (or available capital loss carryovers) under income tax regulations.
Note 2: Management fee, administrative
services and other transactions
Effective January 1, 2010, the fund pays Putnam Management a management fee (based on the fund’s average net assets and computed and paid monthly) at annual rates that may vary based on the average of the aggregate net assets of most open-end funds, as defined in the fund’s management contract, sponsored by Putnam Management. Such annual rates may vary as follows: 0.72% of the first $5 billion, 0.67% of the next $5 billion, 0.62% of the next $10 billion, 0.57% of the next $10 billion, 0.52% of the next $50 billion, 0.50% of the next $50 billion, 0.49% of the next $100 billion and 0.485% thereafter.
Prior to January 1, 2010, the fund paid Putnam Management for management and investment advisory services quarterly based on the average net assets of the fund. Such fee was based on the following annual rates: 0.70% of the first $500 million of average net assets, 0.60% of the next $500 million, 0.55% of the next $500 million, 0.50% of the next $5 billion, 0.475% of the next $5 billion, 0.455% of the next $5 billion, 0.44% of the next $5 billion, and 0.43% thereafter.
Effective August 1, 2009 through July 31, 2010, Putnam Management has contractually agreed to reimburse the fund’s expenses to the extent necessary to limit the cumulative expenses of the fund, exclusive of brokerage, interest, taxes, investment-related expenses, extraordinary expenses and payments under the fund’s investor servicing contract, investment management contract and distribution plans, on a fiscal year-to-date basis (or from August 1, 2009 through the fund’s next fiscal year end, as applicable), to an annual rate of 0.20% of the fund’s average net assets over such fiscal year-to-date period (or since August 1, 2009, as applicable). During the period ended February 28, 2010, the fund’s expenses were not reduced as a result of this limit.
Putnam Management has also contractually agreed, from August 1, 2009 through December 30, 2010, to limit the management fee for the fund to an annual rate of 0.60% of the fund’s average net assets. During the period ended February 28, 2010, the fund’s expenses were reduced by $118,165 as a result of this limit.
Putnam Investments Limited (“PIL”), an affiliate of Putnam Management, is authorized by the Trustees to manage a separate portion of the assets of the fund as determined by Putnam Management from time to time. Putnam Management pays a quarterly sub-management fee to PIL for its services at an annual rate of 0.40% of the average net assets of the portion of the fund managed by PIL.
On September 15, 2008, the fund terminated its outstanding derivatives contracts with Lehman Brothers Special Financing, Inc. (“LBSF”) in connection with the bankruptcy filing of LBSF’s parent company, Lehman Brothers Holdings, Inc. On September 26, 2008, the fund entered into receivable purchase agreements (“Agreements”) with other registered investment companies (each a “Purchaser”) managed by Putnam Management. Under the Agreements, the fund sold to the Purchasers the fund’s right to receive, in the aggregate, $11,983,721 in net payments from LBSF in connection with certain terminated derivatives
62
transactions (the “Receivable”), in each case in exchange for an initial payment plus (or minus) additional amounts based on the applicable Purchaser’s ultimate realized gain (or loss) on the Receivable. The Agreements, which are included in the Statement of assets and liabilities, are valued at fair value following procedures approved by the Trustees. All remaining payments under the agreement will be recorded as realized gain or loss.
The fund reimburses Putnam Management an allocated amount for the compensation and related expenses of certain officers of the fund and their staff who provide administrative services to the fund. The aggregate amount of all such reimbursements is determined annually by the Trustees.
Custodial functions for the fund’s assets are provided by State Street Bank and Trust Company (“State Street”). Custody fees are based on the fund’s asset level, the number of its security holdings and transaction volumes.
Putnam Investor Services, Inc., an affiliate of Putnam Management, provided investor servicing agent functions to the fund. Putnam Investor Services, Inc. received fees for investor servicing, subject to certain limitations, based on the fund’s retail asset level, the number of shareholder accounts in the fund and the level of defined contribution plan assets in the fund. The amounts incurred for investor servicing agent functions during the period ended February 28, 2010 are included in Investor servicing fees in the Statement of operations.
The fund has entered into expense offset arrangements with Putnam Investor Services, Inc. and State Street whereby Putnam Investor Services, Inc.’s and State Street’s fees are reduced by credits allowed on cash balances. For the period ended February 28, 2010, the fund’s expenses were reduced by $5,802 under the expense offset arrangements.
Each independent Trustee of the fund receives an annual Trustee fee, of which $959, as a quarterly retainer, has been allocated to the fund, and an additional fee for each Trustees meeting attended. Trustees receive additional fees for attendance at certain committee meetings and industry seminars and for certain compliance-related matters. Trustees also are reimbursed for expenses they incur relating to their services as Trustees.
The fund has adopted a Trustee Fee Deferral Plan (the “Deferral Plan”) which allows the Trustees to defer the receipt of all or a portion of Trustees fees payable on or after July 1, 1995. The deferred fees remain invested in certain Putnam funds until distribution in accordance with the Deferral Plan.
The fund has adopted an unfunded noncontributory defined benefit pension plan (the “Pension Plan”) covering all Trustees of the fund who have served as a Trustee for at least five years and were first elected prior to 2004. Benefits under the Pension Plan are equal to 50% of the Trustee’s average annual attendance and retainer fees for the three years ended December 31, 2005. The retirement benefit is payable during a Trustee’s lifetime, beginning the year following retirement, for the number of years of service through December 31, 2006. Pension expense for the fund is included in Trustee compensation and expenses in the Statement of operations. Accrued pension liability is included in Payable for Trustee compensation and expenses in the Statement of assets and liabilities. The Trustees have terminated the Pension Plan with respect to any Trustee first elected after 2003.
The fund has adopted distribution plans (the “Plans”) with respect to its class A, class B, class C, class M and class R shares pursuant to Rule 12b-1 under the Investment Company Act of 1940. The purpose of the Plans is to compensate Putnam Retail Management Limited Partnership, a wholly-owned subsidiary of Putnam Investments, LLC and Putnam Retail Management GP, Inc., for services provided and expenses incurred in distributing shares of the fund. The Plans provide for payments by the fund to Putnam Retail Management Limited Partnership at an annual rate of up to 0.35%, 1.00%, 1.00%, 1.00% and 1.00% of the average net assets attributable to class A, class B, class C, class M and class R shares, respectively. The Trustees have approved payment by the fund at an annual rate of 0.25%, 1.00%, 1.00%, 0.50% and 0.50% of the average net assets attributable to class A, class B, class C, class M and class R shares, respectively.
For the period ended February 28, 2010, Putnam Retail Management Limited Partnership, acting as underwriter, received net commissions of $41,805 and $640 from the sale of class A and class M shares, respectively, and received $15,481 and $1,591 in contingent deferred sales charges from redemptions of class B and class C shares, respectively.
A deferred sales charge of up to 1.00% and 0.40% is assessed on certain redemptions of class A and class M shares, respectively. For the period ended February 28, 2010, Putnam Retail Management Limited Partnership, acting as underwriter, received no monies on class A and class M redemptions.
Note 3: Purchases and sales of securities
During the period ended February 28, 2010, cost of purchases and proceeds from sales of investment securities other than short-term investments aggregated $453,302,361 and $514,163,676, respectively. There were no purchases or sales of U.S. government securities.
63
Note 4: Capital shares
At February 28, 2010, there was an unlimited number of shares of beneficial interest authorized. In certain circumstances shares may be purchased or redeemed through the delivery to the fund or receipt by the shareholders, respectively, of securities, the fair value of which is used to determine the number of shares issued or redeemed. Transactions in capital shares were as follows:
| | | | |
| | Six months ended 2/28/10 | Year ended 8/31/09 |
|
| Class A | Shares | Amount | Shares | Amount |
|
| Shares sold | 7,615,757 | $54,553,295 | 21,917,836 | $125,754,089 |
|
| Shares issued in connection with | | | | |
| reinvestment of distributions | 4,007,793 | 28,743,794 | 10,571,135 | 60,813,179 |
|
| | 11,623,550 | 83,297,089 | 32,488,971 | 186,567,268 |
|
| Shares repurchased | (16,656,660) | (119,191,346) | (52,345,832) | (302,414,789) |
|
| Net decrease | (5,033,110) | $(35,894,257) | (19,856,861) | $(115,847,521) |
|
| |
| | Six months ended 2/28/10 | Year ended 8/31/09 |
|
| Class B | Shares | Amount | Shares | Amount |
|
| Shares sold | 314,559 | $2,251,747 | 2,189,386 | $11,903,293 |
|
| Shares issued in connection with | | | | |
| reinvestment of distributions | 179,570 | 1,284,426 | 635,042 | 3,627,559 |
|
| | 494,129 | 3,536,173 | 2,824,428 | 15,530,852 |
|
| Shares repurchased | (3,041,005) | (21,771,351) | (8,840,717) | (51,042,369) |
|
| Net decrease | (2,546,876) | $(18,235,178) | (6,016,289) | $(35,511,517) |
|
| |
| | Six months ended 2/28/10 | Year ended 8/31/09 |
|
| Class C | Shares | Amount | Shares | Amount |
|
| Shares sold | 424,575 | $3,022,009 | 1,617,420 | $9,098,752 |
|
| Shares issued in connection with | | | | |
| reinvestment of distributions | 110,696 | 789,367 | 277,682 | 1,593,866 |
|
| | 535,271 | 3,811,376 | 1,895,102 | 10,692,618 |
|
| Shares repurchased | (826,597) | (5,881,345) | (2,168,535) | (12,449,199) |
|
| Net decrease | (291,326) | $(2,069,969) | (273,433) | $(1,756,581) |
|
| |
| | Six months ended 2/28/10 | Year ended 8/31/09 |
|
| Class M | Shares | Amount | Shares | Amount |
|
| Shares sold | 111,930 | $804,778 | 1,326,688 | $7,256,380 |
|
| Shares issued in connection with | | | | |
| reinvestment of distributions | 67,831 | 486,942 | 163,850 | 946,039 |
|
| | 179,761 | 1,291,720 | 1,490,538 | 8,202,419 |
|
| Shares repurchased | (1,253,487) | (9,070,561) | (775,223) | (4,413,948) |
|
| Net increase (decrease) | (1,073,726) | $(7,778,841) | 715,315 | $3,788,471 |
|
| |
| | Six months ended 2/28/10 | Year ended 8/31/09 |
|
| Class R | Shares | Amount | Shares | Amount |
|
| Shares sold | 275,363 | $1,946,825 | 381,094 | $2,157,017 |
|
| Shares issued in connection with | | | | |
| reinvestment of distributions | 14,918 | 105,903 | 26,047 | 149,058 |
|
| | 290,281 | 2,052,728 | 407,141 | 2,306,075 |
|
| Shares repurchased | (118,497) | (838,468) | (261,888) | (1,547,098) |
|
| Net increase | 171,784 | $1,214,260 | 145,253 | $758,977 |
|
64
| | | | |
| | Six months ended 2/28/10 | Year ended 8/31/09 |
|
| Class Y | Shares | Amount | Shares | Amount |
|
| Shares sold | 1,330,511 | $9,437,371 | 4,066,190 | $23,419,266 |
|
| Shares issued in connection with | | | | |
| reinvestment of distributions | 232,002 | 1,645,422 | 1,223,124 | 6,935,943 |
|
| | 1,562,513 | 11,082,793 | 5,289,314 | 30,355,209 |
|
| Shares repurchased | (820,705) | (5,818,658) | (6,952,263) | (39,565,080) |
|
| Redemption in kind | — | — | (22,323,593) | (109,503,923) |
|
| Net increase (decrease) | 741,808 | $5,264,135 | (23,986,542) | $(118,713,794) |
|
Note 5: Summary of derivative activity
The following is a summary of the market values of derivative instruments as of February 28, 2010:
Market values of derivative instruments as of February 28, 2010
| | | | |
| | Asset derivatives | Liability derivatives |
|
| Derivatives not | | | | |
| accounted for as | Statement of | | Statement of | |
| hedging instruments | assets and | | assets and | |
| under ASC 815 | liabilities location | Market value | liabilities location | Market value |
|
| Credit contracts | Receivables | $32,561 | Payables | $57,967 |
|
| Foreign exchange | | | | |
| contracts | Receivables | 540,013 | Payables | — |
|
| Total | | $572,574 | | $57,967 |
|
The following is a summary of realized and change in unrealized gains or losses of derivative instruments on the Statement of operations for the period ended February 28, 2010 (see Note 1):
Change in unrealized appreciation or (depreciation) on derivatives recognized in net gain or (loss) on investments
| | | |
| Derivatives not accounted for as hedging | Forward currency | | |
| instruments under ASC 815 | contracts | Swaps | Total |
|
| Credit contracts | $— | $482,826 | $482,826 |
|
| Foreign exchange contracts | 498,741 | — | 498,741 |
|
| Total | $498,741 | $482,826 | $981,567 |
|
Amount of realized gain or (loss) on derivatives recognized in net gain or (loss) on investments
| | | |
| Derivatives not accounted for as hedging | Forward currency | | |
| instruments under ASC 815 | contracts | Swaps | Total |
|
| Credit contracts | $— | $10,548 | $10,548 |
|
| Foreign exchange contracts | 1,202,424 | — | $1,202,424 |
|
| Total | $1,202,424 | $10,548 | $1,212,972 |
|
Note 6: Investment in Putnam Money Market
Liquidity Fund
The fund invested in Putnam Money Market Liquidity Fund, an open-end management investment company managed by Putnam Management. Investments in Putnam Money Market Liquidity Fund are valued at its closing net asset value each business day. Income distributions earned by the fund are recorded as interest income in the Statement of operations and totaled $7,272 for the period ended February 28, 2010. During the period ended February 28, 2010, cost of purchases and proceeds of sales of investments in Putnam Money Market Liquidity Fund aggregated $190,962,658 and $180,263,485, respectively. Management fees charged to Putnam Money Market Liquidity Fund have been waived by Putnam Management.
65
Note 7: Senior loan commitments
Senior loans are purchased or sold on a when-issued or delayed delivery basis and may be settled a month or more after the trade date, which from time to time can delay the actual investment of available cash balances; interest income is accrued based on the terms of the securities. Senior loans can be acquired through an agent, by assignment from another holder of the loan, or as a participation interest in another holder’s portion of the loan. When the fund invests in a loan or participation, the fund is subject to the risk that an intermediate participant between the fund and the borrower will fail to meet its obligations to the fund, in addition to the risk that the borrower under the loan may default on its obligations.
Note 8: Unfunded loan commitments
As of February 28, 2010, the fund had unfunded loan commitments of $163,283, which could be extended at the option of the borrower, pursuant to the following loan agreements with the following borrowers:
| | | |
| Borrower | Unfunded Commitments | | |
| | |
| Lyondell Chemical Co. | $163,283 | | |
| | |
Note 9: Transactions with affiliated issuers
Transactions during the period with companies in which the fund owned at least 5% of the voting securities were as follows:
| | | | |
| | Purchase | Sales | Dividends | Market |
| Affiliates | cost | proceeds | Income | Value |
|
| Bohai Bay Litigation, | | | | |
| LLC Escrow | $— | $— | $— | $12,165 |
|
| Totals | $— | $— | $— | $12,165 |
|
Market values are shown for those securities affiliated at period end.
Note 10: Regulatory matters and litigation
In late 2003 and 2004, Putnam Management settled charges brought by the SEC and the Massachusetts Securities Division in connection with excessive short-term trading in Putnam funds. Distribution of payments from Putnam Management to certain open-end Putnam funds and their shareholders is expected to be completed in the next several months. These allegations and related matters have served as the general basis for certain lawsuits, including purported class action lawsuits against Putnam Management and, in a limited number of cases, some Putnam funds. Putnam Management believes that these lawsuits will have no material adverse effect on the funds or on Putnam Management’s ability to provide investment management services. In addition, Putnam Management has agreed to bear any costs incurred by the Putnam funds as a result of these matters.
Note 11: Market and credit risk
In the normal course of business, the fund trades finan-cial instruments and enters into financial transactions where risk of potential loss exists due to changes in the market (market risk) or failure of the contracting party to the transaction to perform (credit risk). The fund may be exposed to additional credit risk that an institution or other entity with which the fund has unsettled or open transactions will default.
66
Shareholder meeting results (Unaudited)
November 19, 2009 meeting
At the meeting, each of the nominees for Trustees was elected, as follows:
| | |
| | Votes for | Votes withheld |
|
| Ravi Akhoury | 153,041,211 | 5,337,719 |
|
| Jameson A. Baxter | 153,097,852 | 5,281,078 |
|
| Charles B. Curtis | 152,999,187 | 5,379,743 |
|
| Robert J. Darretta | 153,241,736 | 5,137,194 |
|
| Myra R. Drucker | 153,182,801 | 5,196,129 |
|
| John A. Hill | 153,198,202 | 5,180,728 |
|
| Paul L. Joskow | 153,133,201 | 5,245,729 |
|
| Elizabeth T. Kennan | 152,922,642 | 5,456,288 |
|
| Kenneth R. Leibler | 153,213,469 | 5,165,461 |
|
| Robert E. Patterson | 153,063,862 | 5,315,068 |
|
| George Putnam, III | 153,062,814 | 5,316,116 |
|
| Robert L. Reynolds | 153,268,841 | 5,110,089 |
|
| W. Thomas Stephens | 153,049,696 | 5,329,234 |
|
| Richard B. Worley | 153,184,678 | 5,194,252 |
|
A proposal to approve a new management contract between the fund and Putnam Management was approved
as follows:
| | | |
| Votes | Votes | | Broker |
| for | withheld | Abstentions | non-votes |
|
| 103,769,560 | 3,475,056 | 3,830,017 | 47,304,297 |
|
All tabulations are rounded to the nearest whole number.
67
Services for shareholders
Investor services
Systematic investment plan Tell us how much you wish to invest regularly — weekly, semimonthly, or monthly — and the amount you choose will be transferred automatically from your checking or savings account. There’s no additional fee for this service, and you can suspend it at any time. This plan may be a great way to save for college expenses or to plan for your retirement.
Please note that regular investing does not guarantee a profit or protect against loss in a declining market. Before arranging a systematic investment plan, consider your financial ability to continue making purchases in periods when prices are low.
Systematic exchange You can make regular transfers from one Putnam fund to another Putnam fund. There are no additional fees for this service, and you can cancel or change your options at any time.
Dividends PLUS You can choose to have the dividend distributions from one of your Putnam funds automatically reinvested in another Putnam fund at no additional charge.
Free exchange privilege You can exchange money between Putnam funds free of charge, as long as they are the same class of shares. A signature guarantee is required if you are exchanging more than $500,000.
Reinstatement privilege If you’ve sold Putnam shares or received a check for a dividend or capital gain, you may reinvest the proceeds with Putnam within 90 days of the transaction and they will be reinvested at the fund’s current net asset value — with no sales charge. However, reinstatement of class B shares may have special tax consequences. Ask your financial or tax representative for details.
Check-writing service You have ready access to many Putnam accounts. It’s as simple as writing a check, and there are no special fees or service charges. For more information about the check-writing service, call Putnam or visit our Web site.
Dollar cost averaging When you’re investing for long-term goals, it’s time, not timing, that counts. Investing on a systematic basis is a better strategy than trying to figure out when the markets will go up or down. This means investing the same amount of money regularly over a long period. This method of investing is called dollar cost averaging. When a fund’s share price declines, your investment dollars buy more shares at lower prices. When it increases, they buy fewer shares. Over time, you will pay a lower average price per share.
For more information
Visit the Individual Investors section at putnam.com A secure section of our Web site contains complete information on your account, including balances and transactions, updated daily. You may also conduct transactions, such as exchanges, additional investments, and address changes. Log on today to get your password.
Call us toll free at 1-800-225-1581 Ask a helpful Putnam representative or your financial advisor for details about any of these or other services, or see your prospectus.
68
Fund information
Founded over 70 years ago, Putnam Investments was built around the concept that a balance between risk and reward is the hallmark of a well-rounded financial program. We manage over 100 funds across income, value, blend, growth, asset allocation, absolute return, and global sector categories.
| | |
| Investment Manager | Robert E. Patterson | James P. Pappas |
| Putnam Investment | George Putnam, III | Vice President |
| Management, LLC | Robert L. Reynolds | |
| One Post Office Square | W. Thomas Stephens | Francis J. McNamara, III |
| Boston, MA 02109 | Richard B. Worley | Vice President and |
| | | Chief Legal Officer |
| Investment Sub-Manager | Officers | |
| Putnam Investments Limited | Robert L. Reynolds | Robert R. Leveille |
| 57–59 St James’s Street | President | Vice President and |
| London, England SW1A 1LD | | Chief Compliance Officer |
| | Jonathan S. Horwitz | |
| Marketing Services | Executive Vice President, | Mark C. Trenchard |
| Putnam Retail Management | Principal Executive | Vice President and |
| One Post Office Square | Officer, Treasurer and | BSA Compliance Officer |
| Boston, MA 02109 | Compliance Liaison | |
| | Judith Cohen |
| Custodian | Charles E. Porter | Vice President, Clerk and |
| State Street Bank | Senior Advisor to the Trustees | Assistant Treasurer |
| and Trust Company | | |
| | Steven D. Krichmar | Wanda M. McManus |
| Legal Counsel | Vice President and | Vice President, Senior Associate |
| Ropes & Gray LLP | Principal Financial Officer | Treasurer and Assistant Clerk |
| |
| Trustees | Janet C. Smith | Nancy E. Florek |
| John A. Hill, Chairman | Vice President, Principal | Vice President, Assistant Clerk, |
| Jameson A. Baxter, | Accounting Officer and | Assistant Treasurer and |
| Vice Chairman | Assistant Treasurer | Proxy Manager |
| Ravi Akhoury | | |
| Charles B. Curtis | Susan G. Malloy | |
| Robert J. Darretta | Vice President and | |
| Myra R. Drucker | Assistant Treasurer | |
| Paul L. Joskow | | |
| Elizabeth T. Kennan | Beth S. Mazor | |
| Kenneth R. Leibler | Vice President | |
| | |
This report is for the information of shareholders of Putnam High Yield Trust. It may also be used as sales literature when preceded or accompanied by the current prospectus, the most recent copy of Putnam’s Quarterly Performance Summary, and Putnam’s Quarterly Ranking Summary. For more recent performance, please visit putnam.com. Investors should carefully consider the investment objective, risks, charges, and expenses of a fund, which are described in its prospectus. For this and other information or to request a prospectus, or a summary prospectus if available, call 1-800-225-1581 toll free. Please read the prospectus carefully before investing. The fund’s Statement of Additional Information contains additional information about the fund’s Trustees and is available without charge upon request by calling 1-800-225-1581.

Item 2. Code of Ethics:
Not applicable
Item 3. Audit Committee Financial Expert:
Not applicable
Item 4. Principal Accountant Fees and Services:
Not applicable
Item 5. Audit Committee of Listed Registrants
Not applicable
Item 6. Schedule of Investments:
The registrant’s schedule of investments in unaffiliated issuers is included in the report to shareholders in Item 1 above.
Item 7. Disclosure of Proxy Voting Policies and Procedures For Closed- End Management Investment Companies:
Not applicable
Item 8. Portfolio Managers of Closed- End Investment Companies
Not Applicable
Item 9. Purchases of Equity Securities by Closed-End Management Investment Companies and Affiliated Purchasers:
Not applicable
Item 10. Submission of Matters to a Vote of Security Holders:
Not applicable
Item 11. Controls and Procedures:
(a) The registrant's principal executive officer and principal financial officer have concluded, based on their evaluation of the effectiveness of the design and operation of the registrant's disclosure controls and procedures as of a date within 90 days of the filing date of this report, that the design and operation of such procedures are generally effective to provide reasonable assurance that information required to be disclosed by the registrant in this report is recorded, processed, summarized and reported within the time periods specified in the Commission's rules and forms.
(b) Changes in internal control over financial reporting: Not applicable
Item 12. Exhibits:
(a)(1) Not applicable
(a)(2) Separate certifications for the principal executive officer and principal financial officer of the registrant as required by Rule 30a-2(a) under the Investment Company Act of 1940, as amended, are filed herewith.
(b) The certifications required by Rule 30a-2(b) under the Investment Company Act of 1940, as amended, are filed herewith.
Putnam High Yield Trust
By (Signature and Title):
/s/Janet C. Smith
Janet C. Smith
Principal Accounting Officer
Date: April 28, 2010
Pursuant to the requirements of the Securities Exchange Act of 1934 and the Investment Company Act of 1940, this report has been signed below by the following persons on behalf of the registrant and in the capacities and on the dates indicated.
By (Signature and Title):
/s/Jonathan S. Horwitz
Jonathan S. Horwitz
Principal Executive Officer
Date: April 28, 2010
By (Signature and Title):
/s/Steven D. Krichmar
Steven D. Krichmar
Principal Financial Officer
Date: April 28, 2010