UNITED STATES
SECURITIES AND EXCHANGE COMMISSION
Washington, DC 20549
FORM N-CSR
CERTIFIED SHAREHOLDER REPORT OF REGISTERED MANAGEMENT INVESTMENT COMPANIES
Investment Company Act file number 811-02781
Templeton Funds
(Exact name of registrant as specified in charter)
300 S.E. 2nd Street, Fort Lauderdale, FL 33301-1923
(Address of principal executive offices) (Zip code)
Craig S. Tyle, One Franklin Parkway, San Mateo, CA 94403-1906
(Name and address of agent for service)
Registrant's telephone number, including area code: (954) 527-7500_
Date of fiscal year end: _8/31__
Date of reporting period: 8/31/15_
Item 1. Reports to Stockholders.
Annual Report
and Shareholder Letter
August 31, 2015
Templeton Foreign Fund
A SERIES OF TEMPLETON FUNDS

Sign up for electronic delivery at franklintempleton.com/edelivery
Franklin Templeton Investments
Gain From Our Perspective®
At Franklin Templeton Investments, we’re dedicated to one goal: delivering exceptional asset management for our clients. By bringing together multiple, world-class investment teams in a single firm, we’re able to offer specialized expertise across styles and asset classes, all supported by the strength and resources of one of the world’s largest asset managers. This has helped us to become a trusted partner to individual and institutional investors across the globe.
Focus on Investment Excellence
At the core of our firm, you’ll find multiple independent investment teams—each with a focused area of expertise—from traditional to alternative strategies and multi-asset solutions. And because our portfolio groups operate autonomously, their strategies can be combined to deliver true style and asset class diversification.
All of our investment teams share a common commitment to excellence grounded in rigorous, fundamental research and robust, disciplined risk management. Decade after decade, our consistent, research-driven processes have helped Franklin Templeton earn an impressive record of strong, long-term results.
Global Perspective Shaped by Local Expertise
In today’s complex and interconnected world, smart investing demands a global perspective. Franklin Templeton pioneered international investing over 60 years ago, and our expertise in emerging markets spans more than a quarter of a century. Today, our investment professionals are on the ground across the globe, spotting investment ideas and potential risks firsthand. These locally based teams bring in-depth understanding of local companies, economies and cultural nuances, and share their best thinking across our global research network.
Strength and Experience
Franklin Templeton is a global leader in asset management serving clients in over 150 countries.1 We run our business with the same prudence we apply to asset management, staying focused on delivering relevant investment solutions, strong long-term results and reliable, personal service. This approach, focused on putting clients first, has helped us to become one of the most trusted names in financial services.
1. As of 12/31/14. Clients are represented by the total number of shareholder accounts.
Not FDIC Insured | May Lose Value | No Bank Guarantee
| |
| Contents | |
| |
| Shareholder Letter | 1 |
| Annual Report | |
| Templeton Foreign Fund | 3 |
| Performance Summary | 9 |
| Your Fund’s Expenses | 14 |
| Financial Highlights and | |
| Statement of Investments | 16 |
| Financial Statements | 25 |
| Notes to Financial Statements | 29 |
| Report of Independent Registered | |
| Public Accounting Firm | 38 |
| Tax Information | 39 |
| Board Members and Officers | 40 |
| Shareholder Information | 45 |
| | | | | | |
| | Not FDIC Insured | | | May Lose Value | | No Bank Guarantee | | |
| franklintempleton.com | | | | Not part of the annual report | | | 1 |
Annual Report
Templeton Foreign Fund
This annual report for Templeton Foreign Fund covers the fiscal year ended August 31, 2015.
Your Fund’s Goal and Main Investments
The Fund seeks long-term capital growth. Under normal market conditions, the Fund invests primarily in equity securities of companies located outside the U.S., including developing markets. The Fund will invest, under normal market circumstances, at least 80% of its net assets in “foreign securities,” as defined in the prospectus.
Performance Overview
The Fund’s Class A shares had a -16.46% cumulative total return for the 12 months under review. In comparison, the MSCI Europe, Australasia, Far East (EAFE) Index, which measures global equity performance in developed countries excluding the U.S. and Canada, had a -7.08% total return.1 The Fund’s long-term relative results are shown in the Performance Summary beginning on page 9. For the 10-year period ended August 31, 2015, The Fund’s Class A shares delivered a +47.93% cumulative total return, compared with the MSCI EAFE Index’s +54.30% cumulative total return for the same period.1 Please note index performance information is provided for reference and we do not attempt to track the index but rather undertake investments on the basis of fundamental research. You can find more performance data in the Performance Summary.
Performance data represent past performance, which does not guarantee future results. Investment return and principal value will fluctuate, and you may have a gain or loss when you sell your shares. Current performance may differ from figures shown. Please visit franklintempleton.com or call (800) 342-5236 for most recent month-end performance.
Economic and Market Overview
The global economy expanded moderately during the 12 months under review despite slowing growth in some countries. As measured by the MSCI World Index, stocks in global developed markets overall declined during the period, although a generally accommodative monetary policy environment and signs of
economic improvement in Europe provided some support. However, weighing on global stocks near period-end was a rapid sell-off in China’s equity markets, despite the government’s monetary easing effort. Over the reporting period, oil prices declined sharply owing largely to strong global supply, and gold and other commodity prices also fell. The U.S. dollar appreciated against most currencies during the period, which reduced returns of many foreign assets in U.S. dollar terms.
U.S. economic growth was mixed during the 12 months under review. In 2014’s fourth quarter, growth expanded due to increased consumer spending, business investment, exports, and state and local government spending. Growth slowed in 2015’s first quarter as the U.S. dollar strengthened, energy prices fell, and a West Coast ports labor dispute led to decreased exports. However, growth rebounded in the second quarter due to increases in consumer spending, net exports, state and local government spending, and investments for businesses, homes and inventory. The U.S. Federal Reserve (Fed) ended its bond buying program in October 2014 and kept its target interest rate at 0%–0.25% while considering when to begin increasing it toward normal levels. During its July meeting, the Fed stated that although labor market and economic conditions had improved, committee members would like more confidence that inflation was moving toward their goal before
1. Source: Morningstar. As of 8/31/15, the Fund’s Class A 10-year average annual total return not including the maximum sales charge was +3.99%, compared with the MSCI EAFE Index’s 10-year average annual total return of +4.43%.
The index is unmanaged and includes reinvested dividends. One cannot invest directly in an index, and an index is not representative of the Fund’s portfolio.
The dollar value, number of shares or principal amount, and names of all portfolio holdings are listed in the Fund’s Statement of Investments (SOI).
The SOI begins on page 21.
franklintempleton.com
Annual Report
| 3
TEMPLETON FOREIGN FUND
raising the federal funds target rate. Furthermore, it regarded international developments, particularly moderating growth in China and other emerging markets and China’s unexpected currency devaluation, as well as a strengthening U.S. dollar, as potential risks to U.S. economic growth.
Outside the U.S., the U.K. economy grew in 2015’s second quarter supported by services and industrial production. Eurozone economic growth generally improved during the period. France’s economy stagnated due to lower consumer spending and business investment, which was partially offset by higher exports, while Italy expanded but at a slower pace. In contrast, Greece’s economy grew despite the country’s liquidity crisis. Germany’s economic growth rose slightly compared with the previous quarter largely due to strong exports, although at a lower-than-expected rate as weak inventories and investments weighed on the economy. The eurozone’s annual inflation rate rose beginning in May as services and food prices increased. In late 2014, the European Central Bank (ECB) reduced its interest rates, and in early 2015, it expanded asset purchases to avoid deflation and potentially boost the economy. Despite Greece’s debt issues and geopolitical tension in Ukraine, the region generally benefited from lower oil prices, a weaker euro that helped exports, the ECB’s accommodative policy and an improved 2015 eurozone growth forecast.
The Bank of Japan (BOJ) broadened its stimulus measures amid weak domestic demand and lower inflation. In December, Japan’s ruling coalition was reelected and announced a new stimulus package to revive economic growth. The country exited recession in the fourth quarter, supported largely by exports. Japan’s economy continued to grow in 2015’s first quarter, driven by increasing private demand as business investment and private consumption rose. However, growth contracted in the second quarter due to decreases in net exports, consumer spending and business investment. The BOJ lowered its economic growth and inflation forecasts twice during the period.
In emerging markets, economic growth generally moderated. In early 2015, a temporary solution to Greece’s dispute with the country’s international creditors and a Russia-Ukraine ceasefire agreement bolstered emerging market stocks. Later in the period, investors remained concerned about Greece’s economy, even though the country and its international creditors agreed on a third bailout package. In China, the government sought to cool domestic stock market speculation, but its intervention led to severe market volatility in June and July. Emerging market stocks, especially Chinese equities, slumped in August after China devalued the renminbi. This move sparked concerns among investors about China’s moderating economy and a
possible currency war. Toward period-end, China’s reluctance to implement widely anticipated monetary policy easing measures triggered a fresh sell-off in the domestic equity market, forcing China’s central bank to reduce the benchmark interest rate and the reserve ratio requirement. In the recent global environment, emerging market stocks, as measured by the MSCI Emerging Markets Index, fell for the 12-month period.
Investment Strategy
Our investment strategy employs a bottom-up, value-oriented, long-term approach. We focus on the market price of a company’s securities relative to our evaluation of the company’s long-term earnings, asset value and cash flow potential. As we look internationally, we consider specific companies, rather than sectors or countries, while doing in-depth research to construct a bargain list from which we buy. Before we make a purchase, we look at the company’s price/earnings ratio, price/cash flow ratio, profit margins and liquidation value.
Manager’s Discussion
The 12 months under review brought renewed volatility to international equity markets, and renewed headwinds for our patient, bottom-up value investment approach. The years since the onset of the global financial crisis have come to represent one of the most challenging periods of our investment career. The problem has not been absolute returns as the Fund has generated significant gains since the depths of the global financial crisis, outperforming its benchmark. We believe the problem has been an unusually hostile market for value investors. In fact, value as a style is on track to underperform growth for its ninth consecutive year, the longest stretch on record.
In our opinion, this trend was an anomaly. Historically, value-oriented stocks have outperformed the broader market more often than not. Yet, this recent period has been different for a few reasons. First, global economic growth has been persistently low, affording a scarcity premium to companies that have been able to exhibit above-average revenue growth. Second, central bank policy rates have fallen to historical lows. As interest rates declined, so too did equity earnings yields. Because earnings yields are simply the inverse of price-to-earnings ratios, equity valuations tend to expand in falling rate environments, further improving the backdrop for growth stocks.
Other aspects of this environment have been equally challenging. To begin with, this has not been a typical monetary loosening cycle. Central banks have not just lowered interest rates, they have acquired vast portfolios of debt securities in an effort to boost lending and stimulate the economy. As a result of such quantitative easing, the balance sheet of the U.S. Fed
4 | Annual Report
franklintempleton.com
TEMPLETON FOREIGN FUND
has quadrupled to nearly US$4.5 trillion, or around 25% of gross domestic product (GDP). Furthermore, the Bank of Japan’s balance sheet has ballooned to 65% of GDP. In Europe, the ECB and the Bank of England embarked on their own quantitative easing programs. The People’s Bank of China responded to the global financial crisis with what was, by some measures, the largest stimulus in history. The result of all this stimulus has been a wave of what we believe to be indiscriminate support for financial assets in general, and risk assets like equities in particular. Given the extent to which central bank actions have influenced financial markets, investors recently seemed to us more focused on analyzing economic and policy trends than on distinguishing fundamental values at the individual security level. This scenario has led to high degrees of correlation between individual equities, which have put at a disadvantage fundamentally oriented, bottom-up stock-pickers like us. Although such conditions have been frustrating, we nevertheless remain confident in the long-term merit of our time-tested investment approach. We believe recent market trends cannot persist indefinitely; price has eventually converged with fundamental value over time.
This convergence has certainly not yet occurred in the energy sector, a major Fund overweighting and a large detractor during the 12 months under review.2 Global energy stocks tumbled during the period, and the price of oil fell to a six-and-half-year low as modest economic growth raised concerns about energy demand and the Organization of the Petroleum Exporting Countries’ (OPEC’s) decision not to cut production compounded a global supply glut. Four of the Fund’s 10 worst detractors during the period were energy stocks, led by Canadian pressure pumping firm Trican Well Service.3 Trican shares declined amid concerns about the firm’s strained balance sheet as low oil prices persisted. As of period-end, Trican was in the process of renegotiating debt covenants, and management was optimistic about its ability to reach an agreement with its creditors and address balance sheet concerns. In our analysis, the company’s recent woes significantly depressed valuations, creating a compelling opportunity to invest in a well-regarded, market-leading pressure pumping firm that appeared positioned to replicate its historical domestic market success in the U.S.
More broadly, despite the near-term supply and demand imbalances currently depressing oil prices, we believed longer term conditions remained supportive of higher prices. The reserve life of U.S. shale deposits, a major source of recent supply growth, is a fraction of the life of traditional deposits, meaning
| | |
| Top 10 Sectors/Industries | | |
| 8/31/15 | | |
| | % of Total | |
| | Net Assets | |
| Banks | 13.2 | % |
| Pharmaceuticals | 9.8 | % |
| Energy Equipment & Services | 9.2 | % |
| Oil, Gas & Consumable Fuels | 6.4 | % |
| Insurance | 5.6 | % |
| Technology Hardware, Storage & Peripherals | 4.8 | % |
| Capital Markets | 4.4 | % |
| Metals & Mining | 3.9 | % |
| Life Sciences Tools & Services | 3.5 | % |
| Automobiles | 3.3 | % |
shale deposits’ productive capacity should fade relatively quickly. In the meantime, low prices were beginning to have their expected effect as higher cost North American oil production began to decline. In fact, the International Energy Agency recently predicted that non-OPEC production will decrease the most in 20 years in 2016. In short, the shale boom is aging and does not appear to represent a permanent impediment to balanced oil markets. To us, a balanced market is one where price levels encourage the production of the all-important marginal barrel of supply, or the last barrel needed to satisfy demand. At period-end, the marginal cost of production in global oil markets was roughly US$70–US$80, and we believe prices are likely to recover to these levels over our investment horizon.
Stock selection in information technology also detracted from relative performance, pressured by Chinese polysilicon manufacturer GCL-Poly Energy Holdings and South Korean semiconductor and consumer electronics firm Samsung Electronics.3,4 GCL suffered from weak pricing as the polysili-con market became oversupplied. However, demand remained robust and the supply surplus appeared temporary, based on our analysis. As the world’s low-cost polysilicon producer, GCL was still profitable and highly cash generative even at recent weak pricing levels, and we continued to believe that the stock’s depressed valuation significantly understated its long-term earnings potential. Turning to Samsung, shares declined during the period amid cyclical weakness in the firm’s memory division, slowing growth in its highly successful smartphone business, and investor disappointment in the company’s decision not to issue a special dividend this year. We think that Samsung, with a cash hoard equal to one-third of its market
2. The energy sector comprises energy equipment and services; and oil, gas and consumable fuels in the SOI. 3. Not part of the index.
4. The information technology sector comprises electronic equipment, instruments and components; semiconductors and semiconductor equipment; and technology hardware, storage and peripherals in the SOI.
franklintempleton.com
Annual Report
| 5
| | |
| TEMPLETON FOREIGN FUND | | |
| |
| |
| |
| Top 10 Holdings | | |
| 8/31/15 | | |
| Company | % of Total | |
| Sector/Industry, Country | Net Assets | |
| Samsung Electronics Co. Ltd. | 3.7 | % |
| Technology Hardware, Storage & Peripherals, South Korea | |
| BNP Paribas SA | 2.5 | % |
| Banks, France | | |
| Credit Suisse Group AG | 2.3 | % |
| Capital Markets, Switzerland | | |
| Roche Holding AG | 2.1 | % |
| Pharmaceuticals, Switzerland | | |
| Hana Financial Group Inc. | 2.0 | % |
| Banks, South Korea | | |
| Teva Pharmaceutical Industries Ltd., ADR | 2.0 | % |
| Pharmaceuticals, Israel | | |
| KB Financial Group Inc. | 1.8 | % |
| Banks, South Korea | | |
| AXA SA | 1.7 | % |
| Insurance, France | | |
| Nissan Motor Co. Ltd. | 1.7 | % |
| Automobiles, Japan | | |
| Marks & Spencer Group PLC | 1.7 | % |
| Multiline Retail, U.K. | | |
capitalization, and trading near all-time lows on a number of meaningful valuation metrics, can weather current weakness and enjoy continued appreciation over our long-term investment horizon. Even after its recent decline, the stock was up roughly 500% from when it was first recommended for our bargain list, and we see continued potential for price appreciation over the long term given our view of Samsung’s modest valuation and impressive market position across a range of lucrative technology products.
Other relative detractors during the period included an underweighted allocation and stock selection in consumer discretionary and stock selection in industrials and financials.5 Of these, the financials sector accounted for the most stock-level detractors. South Korean lenders Hana Financial Group and KB Financial Group finished among the 10 worst detractors during the year in review as turmoil in emerging markets escalated.3 We remained favorable toward both stocks, which we believe should benefit over our investment horizon as interest rates rise from historically low levels. The low interest rate environment negatively affected the profitability of South
Korean banks in general given their reliance on interest income to drive earnings, creating what we think was an attractive opportunity for investors to buy industry leaders like Hana and KB at a discount. In our analysis, Hana should get an additional boost from cost savings associated with a recent acquisition, while KB stood to potentially benefit from a recovery in its well-positioned retail bank franchise. These companies traded at what we considered major discounts to tangible book value, valuations levels that to us have historically represented attractive entry points into bank stocks. Conversely, a number of financials firms finished among the Fund’s top contributors, including German exchange operator Deutsche Boerse, Chinese insurer China Life Insurance3 and Dutch financial services firm ING Groep.
Although stock selection in the materials sector detracted from relative performance, the Fund’s underweighted position in the weak performing sector contributed to relative results.6 Irish cement manufacturer CRH rose to an eight-year high as firmer demand in key markets like the U.S. and Europe improved the firm’s earnings outlook. We believed restructuring and cost-saving initiatives have been well executed thus far, and CRH also stood to potentially benefit from an acquisition of assets divested as a regulatory requirement of a merger between competitors. In contrast, however, South Korean steel-maker POSCO detracted from relative performance.3 POSCO shares fell to a nine-year low after the company reported weaker earnings and failed to impress investors with its turnaround plan. The oversupplied and fiercely competitive steel market has been very challenging, and POSCO’s former management team appeared to us to be too often distracted by an ill-advised diversification strategy into non-core businesses. With POSCO’s new management in place and a renewed focus on profitability and market share in the firm’s core steel-making operations, we believe POSCO should be well positioned to potentially benefit from eventual supply rationalization in global steel markets over our long-term horizon. The stock’s historically low valuation multiple created significant scope for future appreciation based on our analysis.
The Fund’s overweighting in the health care sector aided performance relative to the benchmark, led by Israeli generic drugmaker Teva Pharmaceutical Industries.3,7 Teva shares surged after the company agreed to buy the generic drug
5. The consumer discretionary sector comprises auto components, automobiles, multiline retail and specialty retail in the SOI. The industrials sector comprises aerospace and defense, airlines, building products, commercial services and supplies, construction and engineering, electrical equipment, industrial conglomerates, machinery, and trading companies and distributors in the SOI. The financials sector comprises banks, capital markets, diversified financial services, insurance, and thrifts and mortgage finance in the SOI.
6. The materials sector comprises construction materials, and metals and mining in the SOI.
7. The health care sector comprises biotechnology, health care equipment and supplies, health care providers and services, life sciences tools and services and pharmaceuticals in the SOI.
See www.franklintempletondatasources.com for additional data provider information.
6 | Annual Report
franklintempleton.com
TEMPLETON FOREIGN FUND
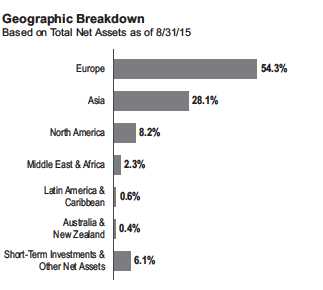
| | |
| Top 10 Countries | | |
| 8/31/15 | | |
| | % of Total | |
| | Net Assets | |
| U.K. | 16.8 | % |
| South Korea | 11.4 | % |
| France | 10.8 | % |
| Germany | 7.7 | % |
| Switzerland | 7.7 | % |
| China | 7.6 | % |
| Japan | 6.2 | % |
| Canada | 5.8 | % |
| Netherlands | 4.6 | % |
| Italy | 2.6 | % |
business of Dublin-based pharmaceuticals firm Allergan. We believe the takeover should bolster Teva’s position as the world’s largest generic drugmaker and give it greater negotiating power with governments and health insurers. We viewed this deal as much more favorable than Teva’s recently abandoned takeover attempt of U.S. generics firm Mylan. By comparison, we believed the Allergan deal avoided the uncertainty of a hostile takeover, ensured a quicker closing, represented a better asset acquisition and should be easier to integrate given management synergies. More generally, health care stocks have remained strong, benefiting from investors’ defensive bias, as well as solid earnings growth and robust mergers and acquisition activity. Shares have appreciated as the value cycle progressed, and the industry traded at a slight premium to the broader market, making continued pipeline development essential to future return prospects. Although we could not identify any additional new bargains among major pharmaceutical firms in recent quarters, some of our mature undervalued holdings continued to generate strong cash flows to support healthy dividend yields and self-fund continued research and development. Select biotechnology and medical technology companies also looked interesting to us.
Turning to regions, although an overweighting in Asia contributed to relative performance, stock selection detracted from relative results. In particular, the Fund’s exposure to South Korea notably detracted.3 South Korean stocks encountered significant headwinds as the period progressed due to a strengthening won (which impinged on export profitability), corporate governance concerns at some of the country’s bellwether conglomerates and a flu-like viral outbreak that
dampened economic activity. However, in our opinion, valuations in the market remained unusually cheap, particularly for larger capitalization stocks, and we were encouraged by recent government-sponsored corporate reform measures that we believe should benefit minority shareholders over the long-term. Stock selection in Europe detracted, though we continued to see what we considered compelling bottom-up values in the region. In our analysis, European stocks at period-end traded at major discounts to their U.S. peers on most cycle-adjusted valuation metrics. We saw little justification for this discount; given the different stages of economic, earnings and policy cycles, we think European equities should trade at a premium. Corporate earnings have improved significantly since the spring, leading economic indicators have been encouraging, and improving credit conditions have been helping to underpin a sustainable recovery. Overall, we believe Europe continued to manage its unique policy and political challenges well, and featured reasonably valued companies with strong operating leverage that were positioned to potentially benefit from an improving growth environment.
It is important to recognize the effect of currency movements on the Fund’s performance. In general, if the value of the U.S. dollar goes up compared with a foreign currency, an investment traded in that foreign currency will go down in value because it will be worth fewer U.S. dollars. This can have a negative effect on Fund performance. Conversely, when the U.S. dollar weakens in relation to a foreign currency, an investment traded in that foreign currency will increase in value, which can contribute to Fund performance. For the 12 months ended August 31, 2015, the U.S. dollar rose in value relative to most currencies. As a result, the Fund’s performance was negatively affected by the portfolio’s investment predominantly in securities with non-U.S. currency exposure.
During challenging times, we often turn for perspective to the words of our firm’s founder, Sir John Templeton. In 1995, he wrote, “In almost every activity of normal life people try to go where the outlook is best. ... You look for a job in an industry with a good future, or build a factory where the prospects are best. But my contention is if you’re selecting publicly traded investments, you have to do the opposite. You’re trying to buy a share at the lowest possible price in relation to what that corporation is worth. And there’s only one reason a share goes to a bargain price — because other people are selling. There is no other reason. To get a bargain price, you’ve got to look for where the public is most frightened and pessimistic.” As valuations have risen with equity markets since the recovery from the global financial crisis, we have continued to search pockets
franklintempleton.com
Annual Report
| 7
TEMPLETON FOREIGN FUND
of fear and pessimism where we believe we can still find long-term value for our clients. Although the market has not favored this style of value investing in recent years, we have maintained our disciplined process and continue to believe it will pay off over the long term. Central banks cannot support global financial markets with extraordinary stimulus indefinitely. Historically, when policymakers have raised interest rates (as we believe the Fed is likely preparing to do), value investing has outperformed. As central banks begin the delicate process of withdrawing stimulus, and global economies find their footing in a market-based (as opposed to policy-driven) system, we believe the ensuing normalization of interest rate and economic conditions will support the process of value recognition at the individual stock level. We believe the Fund is well positioned to take advantage of this eventual normalization and add to its long-term performance.
Thank you for your continued participation in Templeton Foreign Fund. We look forward to serving your future investment needs.
The foregoing information reflects our analysis, opinions and portfolio holdings as of August 31, 2015, the end of the reporting period. The way we implement our main investment strategies and the resulting portfolio holdings may change depending on factors such as market and economic conditions. These opinions may not be relied upon as investment advice or an offer for a particular security. The information is not a complete analysis of every aspect of any market, country, industry, security or the Fund. Statements of fact are from sources considered reliable, but the investment manager makes no representation or warranty as to their completeness or accuracy. Although historical performance is no guarantee of future results, these insights may help you understand our investment management philosophy.
8 | Annual Report
franklintempleton.com
TEMPLETON FOREIGN FUND
Performance Summary as of August 31, 2015
Your dividend income will vary depending on dividends or interest paid by securities in the Fund’s portfolio, adjusted for operating expenses of each class. Capital gain distributions are net profits realized from the sale of portfolio securities. The performance table and graphs do not reflect any taxes that a shareholder would pay on Fund dividends, capital gain distributions, if any, or any realized gains on the sale of Fund shares. Total return reflects reinvestment of the Fund’s dividends and capital gain distributions, if any, and any unrealized gains or losses.
| | | | | | | | |
| Net Asset Value | | | | | | | | |
| Share Class (Symbol) | | 8/31/15 | | 8/31/14 | | Change | | |
| A (TEMFX) | $ | 6.74 | $ | 8.58 | -$ | 1.84 | | |
| C (TEFTX) | $ | 6.56 | $ | 8.35 | -$ | 1.79 | | |
| R (TEFRX) | $ | 6.61 | $ | 8.42 | -$ | 1.81 | | |
| R6 (FTFGX) | $ | 6.66 | $ | 8.49 | -$ | 1.83 | | |
| Advisor (TFFAX) | $ | 6.66 | $ | 8.49 | -$ | 1.83 | | |
| |
| |
| Distributions1 (9/1/14–8/31/15) | | | | | | | | |
| | | Dividend | | Short-Term | | Long-Term | | |
| Share Class | | Income | | Capital Gain | | Capital Gain | | Total |
| A | $ | 0.2110 | $ | 0.0635 | $ | 0.1680 | $ | 0.4425 |
| C | $ | 0.1506 | $ | 0.0635 | $ | 0.1680 | $ | 0.3821 |
| R | $ | 0.1934 | $ | 0.0635 | $ | 0.1680 | $ | 0.4249 |
| R6 | $ | 0.2483 | $ | 0.0635 | $ | 0.1680 | $ | 0.4798 |
| Advisor | $ | 0.2334 | $ | 0.0635 | $ | 0.1680 | $ | 0.4649 |
franklintempleton.com
Annual Report
| 9
|
| TEMPLETON FOREIGN FUND |
| PERFORMANCE SUMMARY |
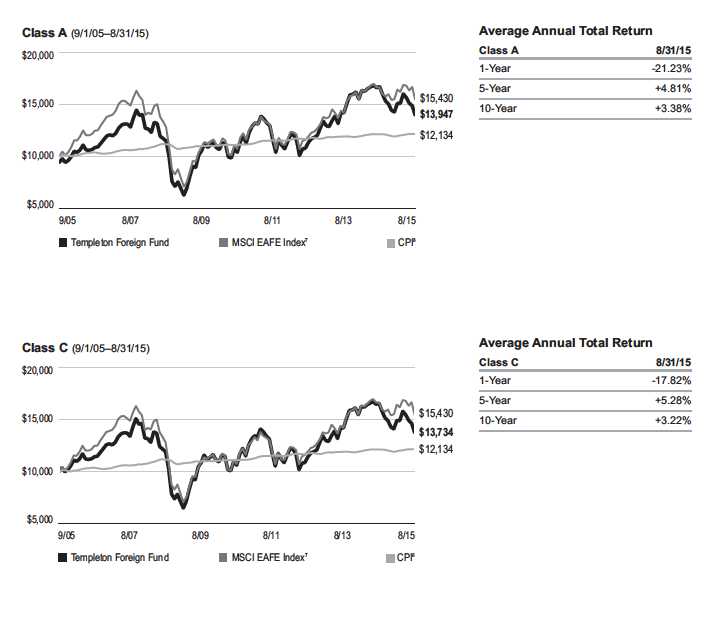
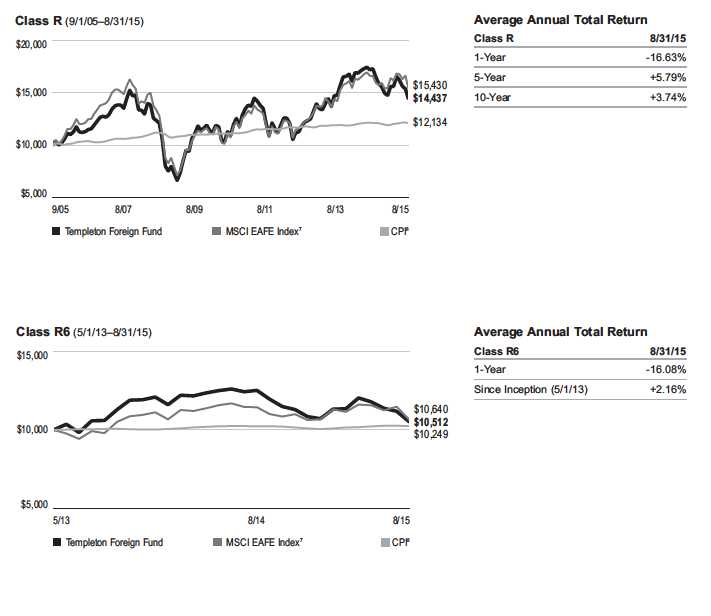
Performance as of 8/31/15
Cumulative total return excludes sales charges. Average annual total returns and value of $10,000 investment include maximum sales charges. Class A: 5.75% maximum initial sales charge; Class C: 1% contingent deferred sales charge in first year only;
Class R/R6/Advisor Class: no sales charges.
| | | | | | | | | | |
| | | | | | | | Average Annual | | | |
| | Cumulative | | Average Annual | | | Value of $10,000 | Total Return | | Total Annual | |
| Share Class | Total Return2 | | Total Return3 | | | Investment4 | (9/30/15 | )5 | Operating Expenses6 | |
| A | | | | | | | | | 1.16 | % |
| 1-Year | -16.46 | % | -21.23 | % | $ | 7,877 | -22.01 | % | | |
| 5-Year | +34.23 | % | +4.81 | % | $ | 12,645 | +1.79 | % | | |
| 10-Year | +47.93 | % | +3.38 | % | $ | 13,947 | +2.43 | % | | |
| C | | | | | | | | | 1.91 | % |
| 1-Year | -17.04 | % | -17.82 | % | $ | 8,218 | -18.63 | % | | |
| 5-Year | +29.34 | % | +5.28 | % | $ | 12,934 | +2.18 | % | | |
| 10-Year | +37.34 | % | +3.22 | % | $ | 13,734 | +2.26 | % | | |
| R | | | | | | | | | 1.41 | % |
| 1-Year | -16.63 | % | -16.63 | % | $ | 8,337 | -17.44 | % | | |
| 5-Year | +32.49 | % | +5.79 | % | $ | 13,249 | +2.70 | % | | |
| 10-Year | +44.37 | % | +3.74 | % | $ | 14,437 | +2.77 | % | | |
| R6 | | | | | | | | | 0.72 | % |
| 1-Year | -16.08 | % | -16.08 | % | $ | 8,392 | -16.89 | % | | |
| Since Inception (5/1/13) | +5.12 | % | +2.16 | % | $ | 10,512 | -0.23 | % | | |
| Advisor | | | | | | | | | 0.91 | % |
| 1-Year | -16.25 | % | -16.25 | % | $ | 8,375 | -17.06 | % | | |
| 5-Year | +36.07 | % | +6.35 | % | $ | 13,607 | +3.24 | % | | |
| 10-Year | +51.65 | % | +4.25 | % | $ | 15,165 | +3.29 | % | | |
Performance data represent past performance, which does not guarantee future results. Investment return and principal value will fluctuate, and you may have a gain or loss when you sell your shares. Current performance may differ from figures shown.
For most recent month-end performance, go to franklintempleton.com or call (800) 342-5236.
10 | Annual Report
franklintempleton.com
TEMPLETON FOREIGN FUND
PERFORMANCE SUMMARY
Total Return Index Comparison for a Hypothetical $10,000 Investment
Total return represents the change in value of an investment over the periods shown. It includes any applicable maximum sales charge, Fund expenses, account fees and reinvested distributions. The unmanaged index includes reinvestment of any income or distributions. It differs from the Fund in composition and does not pay management fees or expenses. One cannot invest directly in an index.
franklintempleton.com
Annual Report
| 11
TEMPLETON FOREIGN FUND
PERFORMANCE SUMMARY
Total Return Index Comparison for a Hypothetical $10,000 Investment (continued)
12 | Annual Report
franklintempleton.com
TEMPLETON FOREIGN FUND
PERFORMANCE SUMMARY
Total Return Index Comparison for a Hypothetical $10,000 Investment (continued)

All investments involve risks, including possible loss of principal. Special risks are associated with foreign investing, including currency fluctuations, economic instability and political developments; investments in emerging markets involve heightened risks related to the same factors. In addition, smaller company stocks have historically experienced more price volatility than larger company stocks, especially over the short term. To the extent the Fund focuses on particular countries, regions, industries, sectors or types of investment from time to time, it may be subject to greater risks of adverse developments in such areas of focus than a fund that invests in a wider variety of countries, regions, industries, sectors or investments. The Fund is actively managed but there is no guarantee that the manager's investment decisions will produce the desired results. The Fund’s prospectus also includes a description of the main investment risks.
Class C: These shares have higher annual fees and expenses than Class A shares.
Class R: Shares are available to certain eligible investors as described in the prospectus. These shares have higher annual fees and expenses than Class A shares.
Class R6: Shares are available to certain eligible investors as described in the prospectus.
Advisor Class: Shares are available to certain eligible investors as described in the prospectus.
1. The distribution amount is the sum of the dividend payments to shareholders for the period shown and includes only estimated tax-basis net investment income and
capital gain.
2. Cumulative total return represents the change in value of an investment over the periods indicated.
3. Average annual total return represents the average annual change in value of an investment over the periods indicated.
4. These figures represent the value of a hypothetical $10,000 investment in the Fund over the periods indicated.
5. In accordance with SEC rules, we provide standardized average annual total return information through the latest calendar quarter.
6. Figures are as stated in the Fund’s current prospectus. In periods of market volatility, assets may decline significantly, causing total annual Fund operating expenses to
become higher than the figures shown.
7. Source: Morningstar. The MSCI EAFE Index is a free float-adjusted, market capitalization-weighted index designed to measure equity market performance in global
developed markets excluding the U.S. and Canada.
8. Source: Bureau of Labor Statistics, bls.gov/cpi. The Consumer Price Index (CPI) is a commonly used measure of the inflation rate.
See www.franklintempletondatasources.com for additional data provider information.
franklintempleton.com
Annual Report
| 13
TEMPLETON FOREIGN FUND
Your Fund’s Expenses
As a Fund shareholder, you can incur two types of costs:
- Transaction costs, including sales charges (loads) on Fund purchases; and
- Ongoing Fund costs, including management fees, distribution and service (12b-1) fees, and other Fund expenses. All mutual funds have ongoing costs, sometimes referred to as operating expenses.
The following table shows ongoing costs of investing in the Fund and can help you understand these costs and compare them with those of other mutual funds. The table assumes a $1,000 investment held for the six months indicated.
Actual Fund Expenses
The first line (Actual) for each share class listed in the table provides actual account values and expenses. The “Ending Account Value” is derived from the Fund’s actual return, which includes the effect of Fund expenses.
You can estimate the expenses you paid during the period by following these steps. Of course, your account value and expenses will differ from those in this illustration:
| 1. | Divide your account value by $1,000. |
| | If an account had an $8,600 value, then $8,600 ÷ $1,000 = 8.6. |
| 2. | Multiply the result by the number under the heading “Expenses Paid During Period.” |
| | If Expenses Paid During Period were $7.50, then 8.6 x $7.50 = $64.50. |
In this illustration, the estimated expenses paid this period are $64.50.
Hypothetical Example for Comparison with Other Funds
Information in the second line (Hypothetical) for each class in the table can help you compare ongoing costs of investing in the Fund with those of other mutual funds. This information may not be used to estimate the actual ending account balance or expenses you paid during the period. The hypothetical “Ending Account Value” is based on the actual expense ratio for each class and an assumed 5% annual rate of return before expenses, which does not represent the Fund’s actual return. The figure under the heading “Expenses Paid During Period” shows the hypothetical expenses your account would have incurred under this scenario. You can compare this figure with the 5% hypothetical examples that appear in shareholder reports of other funds.
Please note that expenses shown in the table are meant to highlight ongoing costs and do not reflect any transaction costs, such as sales charges. Therefore, the second line for each class is useful in comparing ongoing costs only, and will not help you compare total costs of owning different funds. In addition, if transaction costs were included, your total costs would have been higher. Please refer to the Fund prospectus for additional information on operating expenses.
14 | Annual Report
franklintempleton.com
TEMPLETON FOREIGN FUND
YOUR FUND’S EXPENSES
| | | | | | |
| | | Beginning Account | | Ending Account | | Expenses Paid During |
| Share Class | | Value 3/1/15 | | Value 8/31/15 | | Period* 3/1/15–8/31/15 |
| A | | | | | | |
| Actual | $ | 1,000 | $ | 924.60 | $ | 5.82 |
| Hypothetical (5% return before expenses) | $ | 1,000 | $ | 1,019.16 | $ | 6.11 |
| C | | | | | | |
| Actual | $ | 1,000 | $ | 921.30 | $ | 9.44 |
| Hypothetical (5% return before expenses) | $ | 1,000 | $ | 1,015.38 | $ | 9.91 |
| R | | | | | | |
| Actual | $ | 1,000 | $ | 924.50 | $ | 7.03 |
| Hypothetical (5% return before expenses) | $ | 1,000 | $ | 1,017.90 | $ | 7.37 |
| R6 | | | | | | |
| Actual | $ | 1,000 | $ | 927.60 | $ | 3.55 |
| Hypothetical (5% return before expenses) | $ | 1,000 | $ | 1,021.53 | $ | 3.72 |
| Advisor | | | | | | |
| Actual | $ | 1,000 | $ | 926.30 | $ | 4.61 |
| Hypothetical (5% return before expenses) | $ | 1,000 | $ | 1,020.42 | $ | 4.84 |
*Expenses are calculated using the most recent six-month expense ratio, annualized for each class (A: 1.20%; C: 1.95%; R: 1.45%; R6: 0.73%; and Advisor: 0.95%), multiplied by the average account value over the period, multiplied by 184/365 to reflect the one-half year period.
franklintempleton.com
Annual Report
| 15
TEMPLETON FOREIGN FUND
| | | | | | | | | | | | | | | |
| Financial Highlights | | | | | | | | | | | | | | | |
| | | | | | Year Ended August 31, | | | | |
| | | 2015 | | | 2014 | | | 2013 | | | 2012 | | | 2011 | |
| Class A | | | | | | | | | | | | | | | |
| Per share operating performance | | | | | | | | | | | | | | | |
| (for a share outstanding throughout the year) | | | | | | | | | | | | | | | |
| Net asset value, beginning of year | $ | 8.58 | | $ | 7.67 | | $ | 6.26 | | $ | 6.57 | | $ | 6.01 | |
| Income from investment operationsa: | | | | | | | | | | | | | | | |
| Net investment incomeb | | 0.12 | | | 0.20 | c | | 0.12 | | | 0.14 | | | 0.14 | |
| Net realized and unrealized gains (losses) | | (1.52 | ) | | 1.12 | | | 1.44 | | | (0.28 | ) | | 0.54 | |
| Total from investment operations | | (1.40 | ) | | 1.32 | | | 1.56 | | | (0.14 | ) | | 0.68 | |
| Less distributions from: | | | | | | | | | | | | | | | |
| Net investment income | | (0.21 | ) | | (0.11 | ) | | (0.15 | ) | | (0.17 | ) | | (0.12 | ) |
| Net realized gains | | (0.23 | ) | | (0.30 | ) | | — | | | — | | | — | |
| Total distributions | | (0.44 | ) | | (0.41 | ) | | (0.15 | ) | | (0.17 | ) | | (0.12 | ) |
| Net asset value, end of year | $ | 6.74 | | $ | 8.58 | | $ | 7.67 | | $ | 6.26 | | $ | 6.57 | |
| |
| Total returnd | | (16.46 | )% | | 17.61 | % | | 25.17 | % | | (1.94 | )% | | 11.30 | % |
| |
| Ratios to average net assets | | | | | | | | | | | | | | | |
| Expenses | | 1.18 | %e | | 1.16 | % | | 1.19 | %f | | 1.21 | %f | | 1.17 | %f |
| Net investment income | | 1.54 | % | | 2.39 | %c | | 1.72 | % | | 2.29 | % | | 1.97 | % |
| |
| Supplemental data | | | | | | | | | | | | | | | |
| Net assets, end of year (000’s) | $ | 4,165,454 | | $ | 4,524,854 | | $ | 3,904,719 | | $ | 3,418,240 | | $ | 3,775,303 | |
| Portfolio turnover rate | | 29.12 | % | | 30.82 | % | | 32.05 | % | | 20.17 | % | | 34.97 | % |
aThe amount shown for a share outstanding throughout the period may not correlate with the Statement of Operations for the period due to the timing of sales and
repurchases of the Fund’s shares in relation to income earned and/or fluctuating fair value of the investments of the Fund.
bBased on average daily shares outstanding.
cNet investment income per share includes approximately $0.07 per share received in the form of a special dividend paid in connection with certain Fund’s holdings.
Excluding this amount, the ratio of net investment income to average net assets would have been 1.57%.
dTotal return does not reflect sales commissions or contingent deferred sales charges, if applicable.
eBenefit of waiver and payments by affiliates rounds to less than 0.01%.
f Benefit of expense reduction and reimbursement rounds to less than 0.01%.
16 | Annual Report | The accompanying notes are an integral part of these financial statements.
franklintempleton.com
| | | | | | | | | | | | | | | |
| | | | | | | | | TEMPLETON FOREIGN FUND | |
| | | | | | | | | FINANCIAL HIGHLIGHTS | |
| |
| |
| |
| |
| | | | | | Year Ended August 31, | | | | |
| | | 2015 | | | 2014 | | | 2013 | | | 2012 | | | 2011 | |
| Class C | | | | | | | | | | | | | | | |
| Per share operating performance | | | | | | | | | | | | | | | |
| (for a share outstanding throughout the year) | | | | | | | | | | | | | | | |
| Net asset value, beginning of year | $ | 8.35 | | $ | 7.48 | | $ | 6.11 | | $ | 6.40 | | $ | 5.86 | |
| Income from investment operationsa: | | | | | | | | | | | | | | | |
| Net investment incomeb | | 0.05 | | | 0.13 | c | | 0.07 | | | 0.09 | | | 0.08 | |
| Net realized and unrealized gains (losses) | | (1.46 | ) | | 1.10 | | | 1.40 | | | (0.27 | ) | | 0.53 | |
| Total from investment operations | | (1.41 | ) | | 1.23 | | | 1.47 | | | (0.18 | ) | | 0.61 | |
| Less distributions from: | | | | | | | | | | | | | | | |
| Net investment income | | (0.15 | ) | | (0.06 | ) | | (0.10 | ) | | (0.11 | ) | | (0.07 | ) |
| Net realized gains | | (0.23 | ) | | (0.30 | ) | | — | | | — | | | — | |
| Total distributions | | (0.38 | ) | | (0.36 | ) | | (0.10 | ) | | (0.11 | ) | | (0.07 | ) |
| Net asset value, end of year | $ | 6.56 | | $ | 8.35 | | $ | 7.48 | | $ | 6.11 | | $ | 6.40 | |
| |
| Total returnd | | (17.04 | )% | | 16.72 | % | | 24.21 | % | | (2.62 | )% | | 10.42 | % |
| |
| Ratios to average net assets | | | | | | | | | | | | | | | |
| Expenses | | 1.93 | %e | | 1.91 | % | | 1.94 | %f | | 1.96 | %f | | 1.92 | %f |
| Net investment income | | 0.79 | % | | 1.64 | %c | | 0.97 | % | | 1.54 | % | | 1.22 | % |
| |
| Supplemental data | | | | | | | | | | | | | | | |
| Net assets, end of year (000’s) | $ | 468,128 | | $ | 617,421 | | $ | 517,468 | | $ | 459,838 | | $ | 555,999 | |
| Portfolio turnover rate | | 29.12 | % | | 30.82 | % | | 32.05 | % | | 20.17 | % | | 34.97 | % |
aThe amount shown for a share outstanding throughout the period may not correlate with the Statement of Operations for the period due to the timing of sales and
repurchases of the Fund’s shares in relation to income earned and/or fluctuating fair value of the investments of the Fund.
bBased on average daily shares outstanding.
cNet investment income per share includes approximately $0.07 per share received in the form of a special dividend paid in connection with certain Fund’s holdings.
Excluding this amount, the ratio of net investment income to average net a ssets would have been (0.82)%.
dTotal return does not reflect sales commissions or contingent deferred sales charges, if applicable.
eBenefit of waiver and payments by affiliates rounds to less than 0.01%.
f Benefit of expense reduction and reimbursement rounds to less than 0.01%.
franklintempleton.com
The accompanying notes are an integral part of these financial statements. | Annual Report | 17
|
| TEMPLETON FOREIGN FUND |
| FINANCIAL HIGHLIGHTS |
| | | | | | | | | | | | | | | |
| | | | | | Year Ended August 31, | | | | |
| | | 2015 | | | 2014 | | | 2013 | | | 2012 | | | 2011 | |
| Class R | | | | | | | | | | | | | | | |
| Per share operating performance | | | | | | | | | | | | | | | |
| (for a share outstanding throughout the year) | | | | | | | | | | | | | | | |
| Net asset value, beginning of year | $ | 8.42 | | $ | 7.54 | | $ | 6.16 | | $ | 6.46 | | $ | 5.92 | |
| Income from investment operationsa: | | | | | | | | | | | | | | | |
| Net investment incomeb | | 0.09 | | | 0.18 | c | | 0.10 | | | 0.13 | | | 0.12 | |
| Net realized and unrealized gains (losses) | | (1.48 | ) | | 1.09 | | | 1.41 | | | (0.28 | ) | | 0.53 | |
| Total from investment operations | | (1.39 | ) | | 1.27 | | | 1.51 | | | (0.15 | ) | | 0.65 | |
| Less distributions from: | | | | | | | | | | | | | | | |
| Net investment income | | (0.19 | ) | | (0.09 | ) | | (0.13 | ) | | (0.15 | ) | | (0.11 | ) |
| Net realized gains | | (0.23 | ) | | (0.30 | ) | | — | | | — | | | — | |
| Total distributions | | (0.42 | ) | | (0.39 | ) | | (0.13 | ) | | (0.15 | ) | | (0.11 | ) |
| Net asset value, end of year | $ | 6.61 | | $ | 8.42 | | $ | 7.54 | | $ | 6.16 | | $ | 6.46 | |
| |
| Total return | | (16.63 | )% | | 17.22 | % | | 24.81 | % | | (2.07 | )% | | 10.91 | % |
| |
| Ratios to average net assets | | | | | | | | | | | | | | | |
| Expenses | | 1.43 | %d | | 1.41 | % | | 1.44 | %e | | 1.46 | %e | | 1.42 | %e |
| Net investment income | | 1.29 | % | | 2.14 | %c | | 1.47 | % | | 2.04 | % | | 1.72 | % |
| |
| Supplemental data | | | | | | | | | | | | | | | |
| Net assets, end of year (000’s) | $ | 174,865 | | $ | 207,738 | | $ | 172,393 | | $ | 149,061 | | $ | 139,600 | |
| Portfolio turnover rate | | 29.12 | % | | 30.82 | % | | 32.05 | % | | 20.17 | % | | 34.97 | % |
aThe amount shown for a share outstanding throughout the period may not correlate with the Statement of Operations for the period due to the timing of sales and
repurchases of the Fund’s shares in relation to income earned and/or fluctuating fair value of the investments of the Fund.
bBased on average daily shares outstanding.
cNet investment income per share includes approximately $0.07 per share received in the form of a special dividend paid in connection with certain Fund’s holdings.
Excluding this amount, the ratio of net investment income to average net assets would have been 1.32%.
dBenefit of waiver and payments by affiliates rounds to less than 0.01%.
eBenefit of expense reduction and reimbursement rounds to less than 0.01%.
18 | Annual Report | The accompanying notes are an integral part of these financial statements.
franklintempleton.com
TEMPLETON FOREIGN FUND
FINANCIAL HIGHLIGHTS
| | | | | | | | | |
| | | Year Ended August 31, | |
| | | 2015 | | | 2014 | | | 2013 | a |
| Class R6 | | | | | | | | | |
| Per share operating performance | | | | | | | | | |
| (for a share outstanding throughout the year) | | | | | | | | | |
| Net asset value, beginning of year | $ | 8.49 | | $ | 7.59 | | $ | 7.16 | |
| Income from investment operationsb: | | | | | | | | | |
| Net investment incomec | | 0.15 | | | 0.25 | d | | 0.08 | |
| Net realized and unrealized gains (losses) | | (1.50 | ) | | 1.10 | | | 0.35 | |
| Total from investment operations | | (1.35 | ) | | 1.35 | | | 0.43 | |
| Less distributions from: | | | | | | | | | |
| Net investment income | | (0.25 | ) | | (0.15 | ) | | — | |
| Net realized gains | | (0.23 | ) | | (0.30 | ) | | — | |
| Total distributions | | (0.48 | ) | | (0.45 | ) | | — | |
| Net asset value, end of year | $ | 6.66 | | $ | 8.49 | | $ | 7.59 | |
| |
| Total returne | | (16.08 | )% | | 18.16 | % | | 6.01 | % |
| |
| Ratios to average net assetsf | | | | | | | | | |
| Expenses | | 0.72 | %g | | 0.72 | % | | 0.74 | % |
| Net investment income | | 2.00 | % | | 2.83 | %d | | 2.17 | % |
| |
| Supplemental data | | | | | | | | | |
| Net assets, end of year (000’s) | $ | 816,746 | | $ | 666,249 | | $ | 366,042 | |
| Portfolio turnover rate | | 29.12 | % | | 30.82 | % | | 32.05 | % |
aFor the period May 1, 2013 (effective date) to August 31, 2013.
bThe amount shown for a share outstanding throughout the period may not correlate with the Statement of Operations for the period due to the timing of sales and
repurchases of the Fund’s shares in relation to income earned and/or fluctuating fair value of the investments of the Fund.
cBased on average daily shares outstanding.
dNet investment income per share includes approximately $0.07 per share received in the form of a special dividend paid in connection with certain Fund’s holdings.
Excluding this amount, the ratio of net investment income to average net assets would have been 2.01%.
eTotal return is not annualized for periods less than one year.
f Ratios are annualized for periods less than one year.
gBenefit of waiver and payments by affiliates rounds to less than 0.01%.
franklintempleton.com
The accompanying notes are an integral part of these financial statements. | Annual Report | 19
|
| TEMPLETON FOREIGN FUND |
| FINANCIAL HIGHLIGHTS |
| | | | | | | | | | | | | | | |
| | | | | | Year Ended August 31, | | | | |
| | | 2015 | | | 2014 | | | 2013 | | | 2012 | | | 2011 | |
| Advisor Class | | | | | | | | | | | | | | | |
| Per share operating performance | | | | | | | | | | | | | | | |
| (for a share outstanding throughout the year) | | | | | | | | | | | | | | | |
| Net asset value, beginning of year | $ | 8.49 | | $ | 7.59 | | $ | 6.20 | | $ | 6.51 | | $ | 5.95 | |
| Income from investment operationsa: | | | | | | | | | | | | | | | |
| Net investment incomeb | | 0.13 | | | 0.22 | c | | 0.13 | | | 0.16 | | | 0.16 | |
| Net realized and unrealized gains (losses) | | (1.50 | ) | | 1.11 | | | 1.43 | | | (0.28 | ) | | 0.54 | |
| Total from investment operations | | (1.37 | ) | | 1.33 | | | 1.56 | | | (0.12 | ) | | 0.70 | |
| Less distributions from: | | | | | | | | | | | | | | | |
| Net investment income | | (0.23 | ) | | (0.13 | ) | | (0.17 | ) | | (0.19 | ) | | (0.14 | ) |
| Net realized gains | | (0.23 | ) | | (0.30 | ) | | — | | | — | | | — | |
| Total distributions | | (0.46 | ) | | (0.43 | ) | | (0.17 | ) | | (0.19 | ) | | (0.14 | ) |
| Net asset value, end of year | $ | 6.66 | | $ | 8.49 | | $ | 7.59 | | $ | 6.20 | | $ | 6.51 | |
| |
| Total return | | (16.25 | )% | | 17.93 | % | | 25.39 | % | | (1.49 | )% | | 11.53 | % |
| |
| Ratios to average net assets | | | | | | | | | | | | | | | |
| Expenses | | 0.93 | %d | | 0.91 | % | | 0.94 | %e | | 0.96 | %e | | 0.92 | %e |
| Net investment income | | 1.79 | % | | 2.64 | %c | | 1.97 | % | | 2.54 | % | | 2.22 | % |
| |
| Supplemental data | | | | | | | | | | | | | | | |
| Net assets, end of year (000’s) | $ | 1,206,146 | | $ | 1,727,057 | | $ | 1,340,444 | | $ | 1,430,480 | | $ | 1,169,727 | |
| Portfolio turnover rate | | 29.12 | % | | 30.82 | % | | 32.05 | % | | 20.17 | % | | 34.97 | % |
aThe amount shown for a share outstanding throughout the period may not correlate with the Statement of Operations for the period due to the timing of sales and
repurchases of the Fund’s shares in relation to income earned and/or fluctuating fair value of the investments of the Fund.
bBased on average daily shares outstanding.
cNet investment income per share includes approximately $0.07 per share received in the form of a special dividend paid in connection with certain Fund’s holdings.
Excluding this amount, the ratio of net investment income to average net assets would have been 1.82%.
dBenefit of waiver and payments by affiliates rounds to less than 0.01%.
eBenefit of expense reduction and reimbursement rounds to less than 0.01%.
20 | Annual Report | The accompanying notes are an integral part of these financial statements.
franklintempleton.com
| | | | |
| | | TEMPLETON FOREIGN FUND |
| |
| |
| |
| |
| Statement of Investments, August 31, 2015 | | | |
| | Industry | Shares | | Value |
| |
| Common Stocks 93.9% | | | | |
| Australia 0.4% | | | | |
| WorleyParsons Ltd. | Energy Equipment & Services | 5,134,780 | $ | 27,452,428 |
| Belgium 0.6% | | | | |
| UCB SA | Pharmaceuticals | 529,800 | | 40,130,287 |
| Brazil 0.6% | | | | |
| BM&F BOVESPA SA | Diversified Financial Services | 12,758,560 | | 37,927,716 |
| Canada 5.8% | | | | |
| Barrick Gold Corp. | Metals & Mining | 4,169,350 | | 28,976,982 |
| Cenovus Energy Inc. | Oil, Gas & Consumable Fuels | 4,143,470 | | 60,081,339 |
| Ensign Energy Services Inc. | Energy Equipment & Services | 4,529,930 | | 36,235,307 |
| HudBay Minerals Inc. | Metals & Mining | 7,882,080 | | 39,495,804 |
| Precision Drilling Corp. | Energy Equipment & Services | 13,244,530 | | 63,848,474 |
| Silver Wheaton Corp. | Metals & Mining | 5,876,610 | | 72,075,215 |
| Suncor Energy Inc. | Oil, Gas & Consumable Fuels | 2,971,420 | | 84,184,397 |
| Trican Well Service Ltd. | Energy Equipment & Services | 7,331,010 | | 10,256,669 |
| | | | | 395,154,187 |
| China 7.6% | | | | |
| China Life Insurance Co. Ltd., H | Insurance | 12,083,260 | | 41,706,736 |
| China Mobile Ltd. | Wireless Telecommunication Services | 3,687,720 | | 45,466,019 |
| China Telecom Corp. Ltd., H | Diversified Telecommunication Services | 146,265,732 | | 76,624,371 |
| Digital China Holdings Ltd. | Electronic Equipment, Instruments & Components | 24,925,250 | | 21,934,220 |
| a GCL-Poly Energy Holdings Ltd. | Semiconductors & Semiconductor Equipment | 455,645,580 | | 74,079,155 |
| Kunlun Energy Co. Ltd. | Oil, Gas & Consumable Fuels | 24,986,930 | | 17,732,660 |
| Shanghai Pharmaceuticals Holding Co. Ltd., H | Health Care Providers & Services | 21,370,600 | | 44,561,148 |
| Sinopec Engineering Group Co. Ltd. | Construction & Engineering | 65,387,530 | | 55,853,606 |
| Sinopharm Group Co. | Health Care Providers & Services | 16,074,000 | | 60,873,793 |
| Springland International Holdings Ltd. | Multiline Retail | 18,444,100 | | 4,926,360 |
| a,b Trina Solar Ltd., ADR | Semiconductors & Semiconductor Equipment | 8,757,119 | | 77,938,359 |
| | | | | 521,696,427 |
| France 10.8% | | | | |
| AXA SA | Insurance | 4,701,482 | | 118,504,197 |
| BNP Paribas SA | Banks | 2,664,643 | | 168,157,097 |
| Cie Generale des Etablissements Michelin, B | Auto Components | 881,330 | | 85,290,032 |
| Compagnie de Saint-Gobain | Building Products | 1,528,680 | | 70,230,991 |
| Sanofi | Pharmaceuticals | 1,044,725 | | 103,305,176 |
| Societe Generale SA | Banks | 687,386 | | 33,499,605 |
| Technip SA | Energy Equipment & Services | 1,813,490 | | 98,762,733 |
| Total SA, B | Oil, Gas & Consumable Fuels | 1,332,660 | | 60,986,260 |
| | | | | 738,736,091 |
| Germany 7.7% | | | | |
| Bayer AG | Pharmaceuticals | 625,790 | | 84,885,546 |
| Deutsche Boerse AG | Diversified Financial Services | 942,340 | | 84,324,805 |
| a Deutsche Lufthansa AG | Airlines | 3,760,140 | | 45,775,500 |
| Gerresheimer AG | Life Sciences Tools & Services | 760,130 | | 55,096,154 |
| Kloeckner & Co. SE | Trading Companies & Distributors | 1,695,140 | | 15,368,488 |
| Merck KGaA | Pharmaceuticals | 595,614 | | 56,958,746 |
| Metro AG | Food & Staples Retailing | 1,351,254 | | 39,446,676 |
| a MorphoSys AG | Life Sciences Tools & Services | 622,120 | | 43,976,506 |
| Muenchener Rueckversicherungs- | | | | |
| Gesellschaft AG | Insurance | 169,192 | | 31,080,856 |
| Siemens AG | Industrial Conglomerates | 695,382 | | 68,987,377 |
| | | | | 525,900,654 |
| |
| franklintempleton.com | | Annual Report | 21 |
TEMPLETON FOREIGN FUND
STATEMENT OF INVESTMENTS
| | | | |
| | Industry | Shares | | Value |
| Common Stocks (continued) | | | | |
| Hong Kong 0.7% | | | | |
| First Pacific Co. Ltd. | Diversified Financial Services | 18,261,500 | $ | 11,852,302 |
| Kingboard Chemical Holdings Ltd. | Electronic Equipment, Instruments & Components | 27,361,904 | | 35,517,517 |
| | | | | 47,369,819 |
| India 0.9% | | | | |
| Hero Motocorp Ltd. | Automobiles | 626,590 | | 22,641,288 |
| Jain Irrigation Systems Ltd. | Machinery | 12,128,940 | | 10,686,138 |
| LIC Housing Finance Ltd. | Thrifts & Mortgage Finance | 4,173,484 | | 27,868,647 |
| | | | | 61,196,073 |
| Ireland 1.0% | | | | |
| CRH PLC (EUR Traded) | Construction Materials | 1,802,670 | | 53,959,021 |
| CRH PLC (GBP Traded) | Construction Materials | 584,740 | | 17,246,352 |
| | | | | 71,205,373 |
| Israel 2.0% | | | | |
| Teva Pharmaceutical Industries Ltd., ADR | Pharmaceuticals | 2,148,400 | | 138,378,444 |
| Italy 2.6% | | | | |
| Eni SpA | Oil, Gas & Consumable Fuels | 4,133,610 | | 67,822,389 |
| UniCredit SpA | Banks | 16,614,987 | | 108,634,511 |
| | | | | 176,456,900 |
| Japan 6.2% | | | | |
| CANON Inc. | Technology Hardware, Storage & Peripherals | 1,568,100 | | 47,945,783 |
| ITOCHU Corp. | Trading Companies & Distributors | 6,693,750 | | 80,359,231 |
| Konica Minolta Inc. | Technology Hardware, Storage & Peripherals | 2,681,700 | | 29,462,425 |
| Nissan Motor Co. Ltd. | Automobiles | 12,948,070 | | 117,156,324 |
| SoftBank Group Corp. | Wireless Telecommunication Services | 1,752,560 | | 102,097,751 |
| Toyota Motor Corp. | Automobiles | 814,710 | | 48,328,887 |
| | | | | 425,350,401 |
| Netherlands 4.6% | | | | |
| Aegon NV | Insurance | 13,824,105 | | 85,053,479 |
| ING Groep NV, IDR | Banks | 2,540,558 | | 38,877,820 |
| a QIAGEN NV | Life Sciences Tools & Services | 3,281,620 | | 86,727,133 |
| a SBM Offshore NV | Energy Equipment & Services | 8,608,424 | | 102,818,795 |
| | | | | 313,477,227 |
| Norway 0.2% | | | | |
| Telenor ASA | Diversified Telecommunication Services | 619,556 | | 12,355,945 |
| Russia 0.3% | | | | |
| LUKOIL PJSC, ADR (London Stock Exchange) | Oil, Gas & Consumable Fuels | 557,810 | | 21,040,593 |
| Singapore 0.7% | | | | |
| United Overseas Bank Ltd. | Banks | 3,335,570 | | 45,817,100 |
| South Africa 0.3% | | | | |
| a Petra Diamonds Ltd. | Metals & Mining | 11,389,110 | | 21,846,450 |
| South Korea 11.4% | | | | |
| Daewoo International Corp. | Trading Companies & Distributors | 1,464,240 | | 26,992,653 |
| Hana Financial Group Inc. | Banks | 6,070,700 | | 139,631,850 |
| Hyundai Mobis Co. Ltd. | Auto Components | 362,930 | | 63,375,258 |
| Hyundai Motor Co. | Automobiles | 276,890 | | 34,887,541 |
| KB Financial Group Inc. | Banks | 4,069,207 | | 123,188,346 |
| |
| |
| 22 | Annual Report | | franklintempleton.com |
TEMPLETON FOREIGN FUND
STATEMENT OF INVESTMENTS
| | | | |
| | Industry | Shares | | Value |
| Common Stocks (continued) | | | | |
| South Korea (continued) | | | | |
| KIWOOM Securities Co. Ltd. | Capital Markets | 523,100 | $ | 25,213,689 |
| Korea Investment Holdings Co. Ltd. | Capital Markets | 995,620 | | 58,765,962 |
| POSCO | Metals & Mining | 364,570 | | 58,574,871 |
| Samsung Electronics Co. Ltd. | Technology Hardware, Storage & Peripherals | 273,554 | | 251,911,367 |
| | | | | 782,541,537 |
| Spain 1.2% | | | | |
| Telefonica SA | Diversified Telecommunication Services | 5,685,719 | | 80,280,557 |
| Sweden 0.8% | | | | |
| Getinge AB, B | Health Care Equipment & Supplies | 2,431,635 | | 54,080,714 |
| Switzerland 7.7% | | | | |
| ABB Ltd. | Electrical Equipment | 2,638,020 | | 50,945,781 |
| a Basilea Pharmaceutica AG | Biotechnology | 227,050 | | 23,673,794 |
| Credit Suisse Group AG | Capital Markets | 5,912,129 | | 158,696,403 |
| GAM Holding Ltd. | Capital Markets | 1,909,580 | | 35,258,343 |
| Glencore PLC | Metals & Mining | 10,714,210 | | 24,382,732 |
| Lonza Group AG | Life Sciences Tools & Services | 394,580 | | 54,120,825 |
| Roche Holding AG | Pharmaceuticals | 525,150 | | 143,407,913 |
| Swiss Re AG | Insurance | 398,773 | | 34,257,148 |
| | | | | 524,742,939 |
| Thailand 0.6% | | | | |
| Bangkok Bank PCL, fgn. | Banks | 9,138,200 | | 41,966,329 |
| United Kingdom 16.8% | | | | |
| Aberdeen Asset Management PLC | Capital Markets | 4,709,750 | | 23,048,010 |
| Aviva PLC | Insurance | 9,822,284 | | 72,922,142 |
| BAE Systems PLC | Aerospace & Defense | 10,465,340 | | 72,621,459 |
| Barclays PLC | Banks | 16,412,680 | | 65,849,005 |
| BP PLC | Oil, Gas & Consumable Fuels | 12,055,590 | | 66,692,164 |
| Carillion PLC | Construction & Engineering | 10,602,120 | | 55,527,749 |
| GlaxoSmithKline PLC | Pharmaceuticals | 4,872,004 | | 100,220,260 |
| HSBC Holdings PLC | Banks | 10,572,730 | | 84,155,879 |
| Kingfisher PLC | Specialty Retail | 10,368,844 | | 56,676,800 |
| Marks & Spencer Group PLC | Multiline Retail | 14,125,645 | | 113,042,998 |
| Petrofac Ltd. | Energy Equipment & Services | 8,198,810 | | 112,226,843 |
| Royal Dutch Shell PLC, B | Oil, Gas & Consumable Fuels | 2,309,270 | | 60,473,078 |
| Serco Group PLC | Commercial Services & Supplies | 7,296,744 | | 12,652,858 |
| Standard Chartered PLC | Banks | 4,535,670 | | 53,245,628 |
| a Subsea 7 SA | Energy Equipment & Services | 4,180,378 | | 35,549,751 |
| Tesco PLC | Food & Staples Retailing | 37,378,280 | | 109,756,146 |
| Vodafone Group PLC | Wireless Telecommunication Services | 15,369,735 | | 53,468,619 |
| | | | | 1,148,129,389 |
| United States 2.4% | | | | |
| Halliburton Co. | Energy Equipment & Services | 2,274,310 | | 89,494,098 |
| Noble Corp. PLC | Energy Equipment & Services | 3,747,957 | | 48,798,400 |
| a Stillwater Mining Co. | Metals & Mining | 2,376,050 | | 22,691,278 |
| | | | | 160,983,776 |
| Total Common Stocks | | | | |
| (Cost $6,958,779,357) | | | | 6,414,217,356 |
| |
| |
| |
| franklintempleton.com | | Annual Report | 23 |
TEMPLETON FOREIGN FUND
STATEMENT OF INVESTMENTS
| | | |
| | Principal Amount* | | Value |
| Short Term Investments 5.4% | | | |
| Time Deposits 5.4% | | | |
| United States 5.4% | | | |
| Bank of Montreal, 0.05%, 9/01/15 | 125,000,000 | $ | 125,000,000 |
| Royal Bank of Canada, 0.05%, 9/01/15 | 240,700,000 | | 240,700,000 |
| Total Time Deposits | | | |
| (Cost $365,700,000) | | | 365,700,000 |
| Total Investments before Money | | | |
| Market Funds | | | |
| (Cost $7,324,479,357) | | | 6,779,917,356 |
| |
| | Shares | | |
| cInvestments from Cash Collateral | | | |
| Received for Loaned Securities | | | |
| (Cost $453,250) 0.0%† | | | |
| Money Market Funds 0.0%† | | | |
| United States 0.0%† | | | |
| a,dInstitutional Fiduciary Trust Money Market | | | |
| Portfolio | 453,250 | | 453,250 |
| Total Investments | | | |
| (Cost $7,324,932,607) 99.3% | | | 6,780,370,606 |
| Other Assets, less Liabilities 0.7% | | | 50,967,901 |
| Net Assets 100.0% | | $ | 6,831,338,507 |
See Abbreviations on page 37.
†Rounds to less than 0.1% of net assets.
*The principal amount is stated in U.S. dollars unless otherwise indicated.
aNon-income producing.
bA portion or all of the security is on loan at August 31, 2015. See Note 1(d).
cSee Note 1(d) regarding securities on loan.
dSee Note 3(f) regarding investments in Institutional Fiduciary Trust Money Market Portfolio.
24 | Annual Report | The accompanying notes are an integral part of these financial statements.
franklintempleton.com
TEMPLETON FOREIGN FUND
Financial Statements
Statement of Assets and Liabilities
August 31, 2015
| | | |
| Assets: | | | |
| Investments in securities: | | | |
| Cost - Unaffiliated issuers | $ | 7,324,479,357 | |
| Cost - Sweep Money Fund (Note 3f) | | 453,250 | |
| Total cost of investments | $ | 7,324,932,607 | |
| Value - Unaffiliated issuers | $ | 6,779,917,356 | |
| Value - Sweep Money Fund (Note 3f) | | 453,250 | |
| Total value of investments (includes securities loaned in the amount of $436,100) | | 6,780,370,606 | |
| Cash | | 35,262,341 | |
| Receivables: | | | |
| Capital shares sold | | 6,178,513 | |
| Dividends and interest | | 16,942,696 | |
| Other assets | | 13,569,331 | |
| Total assets | | 6,852,323,487 | |
| Liabilities: | | | |
| Payables: | | | |
| Capital shares redeemed | | 11,718,717 | |
| Management fees | | 4,129,964 | |
| Distribution fees | | 1,405,944 | |
| Transfer agent fees | | 2,515,381 | |
| Payable upon return of securities loaned | | 453,250 | |
| Accrued expenses and other liabilities | | 761,724 | |
| Total liabilities | | 20,984,980 | |
| Net assets, at value | $ | 6,831,338,507 | |
| Net assets consist of: | | | |
| Paid-in capital | $ | 7,354,711,547 | |
| Undistributed net investment income | | 83,119,483 | |
| Net unrealized appreciation (depreciation) | | (545,136,340 | ) |
| Accumulated net realized gain (loss) | | (61,356,183 | ) |
| Net assets, at value | $ | 6,831,338,507 | |
franklintempleton.com
The accompanying notes are an integral part of these financial statements. | Annual Report | 25
TEMPLETON FOREIGN FUND
FINANCIAL STATEMENTS
| | |
| Statement of Assets and Liabilities (continued) | | |
| August 31, 2015 | | |
| |
| Class A: | | |
| Net assets, at value | $ | 4,165,453,628 |
| Shares outstanding | | 617,677,791 |
| Net asset value per sharea | $ | 6.74 |
| Maximum offering price per share (net asset value per share ÷ 94.25%) | $ | 7.15 |
| Class C: | | |
| Net assets, at value | $ | 468,127,590 |
| Shares outstanding | | 71,330,937 |
| Net asset value and maximum offering price per sharea | $ | 6.56 |
| Class R: | | |
| Net assets, at value | $ | 174,864,736 |
| Shares outstanding | | 26,443,146 |
| Net asset value and maximum offering price per share | $ | 6.61 |
| Class R6: | | |
| Net assets, at value | $ | 816,746,472 |
| Shares outstanding | | 122,552,797 |
| Net asset value and maximum offering price per share | $ | 6.66 |
| Advisor Class: | | |
| Net assets, at value | $ | 1,206,146,081 |
| Shares outstanding | | 181,070,608 |
| Net asset value and maximum offering price per share | $ | 6.66 |
| |
| aRedemption price is equal to net asset value less contingent deferred sales charges, if applicable. | |
| 26 | Annual Report | The accompanying notes are an integral part of these financial statements. | franklintempleton.com |
|
| TEMPLETON FOREIGN FUND |
| FINANCIAL STATEMENTS |
Statement of Operations
for the year ended August 31, 2015
| | | |
| Investment income: | | | |
| Dividends (net of foreign taxes of $17,422,511) | $ | 183,800,642 | |
| Interest | | 213,218 | |
| Income from securities loaned | | 293,489 | |
| Other income (Note 1e) | | 13,466,678 | |
| Total investment income | | 197,774,027 | |
| Expenses: | | | |
| Management fees (Note 3a) | | 49,887,981 | |
| Distribution fees: (Note 3c) | | | |
| Class A | | 10,963,291 | |
| Class C | | 5,329,333 | |
| Class R | | 946,005 | |
| Transfer agent fees: (Note 3e) | | | |
| Class A | | 9,338,858 | |
| Class C | | 1,135,065 | |
| Class R | | 402,923 | |
| Class R6 | | 4,542 | |
| Advisor Class | | 3,013,277 | |
| Custodian fees (Note 4) | | 951,527 | |
| Reports to shareholders | | 621,715 | |
| Registration and filing fees | | 310,580 | |
| Professional fees | | 177,735 | |
| Trustees’ fees and expenses | | 143,932 | |
| Other | | 306,250 | |
| Total expenses | | 83,533,014 | |
| Expenses waived/paid by affiliates (Note 3f) | | (2,904 | ) |
| Net expenses | | 83,530,110 | |
| Net investment income | | 114,243,917 | |
| Realized and unrealized gains (losses): | | | |
| Net realized gain (loss) from: | | | |
| Investments (net of foreign taxes of $395,223) | | 76,132,372 | |
| Foreign currency transactions | | (3,378,344 | ) |
| Net realized gain (loss) | | 72,754,028 | |
| Net change in unrealized appreciation (depreciation) on: | | | |
| Investments | | (1,451,865,638 | ) |
| Translation of other assets and liabilities denominated in foreign currencies | | (395,154 | ) |
| Change in deferred taxes on unrealized appreciation | | 1,451,426 | |
| Net change in unrealized appreciation (depreciation) | | (1,450,809,366 | ) |
| Net realized and unrealized gain (loss) | | (1,378,055,338 | ) |
| Net increase (decrease) in net assets resulting from operations | $ | (1,263,811,421 | ) |
franklintempleton.com
The accompanying notes are an integral part of these financial statements. | Annual Report | 27
| | | | | | |
| TEMPLETON FOREIGN FUND | | | | | | |
| FINANCIAL STATEMENTS | | | | | | |
| |
| |
| Statements of Changes in Net Assets | | | | | | |
| |
| |
| | | Year Ended August 31, | |
| | | 2015 | | | 2014 | |
| Increase (decrease) in net assets: | | | | | | |
| Operations: | | | | | | |
| Net investment income | $ | 114,243,917 | | $ | 177,064,516 | |
| Net realized gain (loss) | | 72,754,028 | | | 139,539,284 | |
| Net change in unrealized appreciation (depreciation) | | (1,450,809,366 | ) | | 810,538,733 | |
| Net increase (decrease) in net assets resulting from operations | | (1,263,811,421 | ) | | 1,127,142,533 | |
| Distributions to shareholders from: | | | | | | |
| Net investment income: | | | | | | |
| Class A | | (108,979,296 | ) | | (58,100,684 | ) |
| Class C | | (10,871,816 | ) | | (4,210,159 | ) |
| Class R | | (4,775,729 | ) | | (2,101,235 | ) |
| Class R6 | | (20,887,052 | ) | | (8,190,270 | ) |
| Advisor Class | | (45,477,971 | ) | | (23,941,969 | ) |
| Net realized gains: | | | | | | |
| Class A | | (119,528,717 | ) | | (154,490,972 | ) |
| Class C | | (16,706,757 | ) | | (21,424,495 | ) |
| Class R | | (5,716,552 | ) | | (6,760,690 | ) |
| Class R6 | | (19,473,832 | ) | | (16,701,511 | ) |
| Advisor Class | | (45,105,781 | ) | | (54,864,648 | ) |
| Total distributions to shareholders | | (397,523,503 | ) | | (350,786,633 | ) |
| Capital share transactions: (Note 2) | | | | | | |
| Class A | | 601,431,832 | | | 142,886,859 | |
| Class C | | (19,450,312 | ) | | 38,140,900 | |
| Class R | | 12,386,157 | | | 14,559,151 | |
| Class R6 | | 318,106,096 | | | 248,921,451 | |
| Advisor Class | | (163,119,352 | ) | | 221,388,008 | |
| Total capital share transactions | | 749,354,421 | | | 665,896,369 | |
| Net increase (decrease) in net assets | | (911,980,503 | ) | | 1,442,252,269 | |
| Net assets: | | | | | | |
| Beginning of year | | 7,743,319,010 | | | 6,301,066,741 | |
| End of year | $ | 6,831,338,507 | | $ | 7,743,319,010 | |
| Undistributed net investment income included in net assets: | | | | | | |
| End of year | $ | 83,119,483 | | $ | 166,306,751 | |
28 | Annual Report | The accompanying notes are an integral part of these financial statements.
franklintempleton.com
TEMPLETON FOREIGN FUND
Notes to Financial Statements
1. Organization and Significant Accounting Policies
Templeton Funds (Trust) is registered under the Investment Company Act of 1940 (1940 Act) as an open-end management investment company, consisting of two separate funds and applies the specialized accounting and reporting guidance in U.S. Generally Accepted Accounting Principles (U.S. GAAP). Templeton Foreign Fund (Fund) is included in this report. The financial statements of the remaining fund in the Trust are presented separately. The Fund offers five classes of shares: Class A, Class C, Class R, Class R6, and Advisor Class. Each class of shares differs by its initial sales load, contingent deferred sales charges, voting rights on matters affecting a single class, its exchange privilege and fees primarily due to differing arrangements for distribution and transfer agent fees.
The following summarizes the Fund’s significant accounting policies.
a. Financial Instrument Valuation
The Fund’s investments in financial instruments are carried at fair value daily. Fair value is the price that would be received to sell an asset or paid to transfer a liability in an orderly transaction between market participants on the measurement date. The Fund calculates the net asset value (NAV) per share at the close of the New York Stock Exchange (NYSE), generally at 4 p.m. Eastern time (NYSE close) on each day the NYSE is open for trading. Under compliance policies and procedures approved by the Trust’s Board of Trustees (the Board), the Fund’s administrator has responsibility for oversight of valuation, including leading the cross-functional Valuation and Liquidity Oversight Committee (VLOC). The VLOC provides administration and oversight of the Fund’s valuation policies and procedures, which are approved annually by the Board. Among other things, these procedures allow the Fund to utilize independent pricing services, quotations from securities and financial instrument dealers, and other market sources to determine fair value.
Equity securities and derivative financial instruments (derivatives) listed on an exchange or on the NASDAQ National Market System are valued at the last quoted sale price or the official closing price of the day, respectively. Foreign equity securities are valued as of the close of trading on the foreign stock exchange on which the security is primarily traded or as of the NYSE close, whichever is earlier. The value is then converted into its U.S. dollar equivalent at the foreign exchange rate in effect at the NYSE close on the day that the value of the security is determined. Over-the-counter (OTC) securities are valued within the range of the most recent quoted bid and ask prices. Securities that trade in multiple markets or on multiple exchanges are valued according to the broadest and most representative market. Certain equity securities are valued based upon fundamental characteristics or relationships to similar securities.
Debt securities generally trade in the OTC market rather than on a securities exchange. The Fund’s pricing services use multiple valuation techniques to determine fair value. In instances where sufficient market activity exists, the pricing services may utilize a market-based approach through which quotes from market makers are used to determine fair value. In instances where sufficient market activity may not exist or is limited, the pricing services also utilize proprietary valuation models which may consider market characteristics such as benchmark yield curves, credit spreads, estimated default rates, anticipated market interest rate volatility, coupon rates, anticipated timing of principal repayments, underlying collateral, and other unique security features in order to estimate the relevant cash flows, which are then discounted to calculate the fair value.
Investments in open-end mutual funds are valued at the closing NAV. Time deposits are valued at cost, which approximates fair value.
The Fund has procedures to determine the fair value of financial instruments for which market prices are not reliable or readily available. Under these procedures, the VLOC convenes on a regular basis to review such financial instruments and considers a number of factors, including significant unobservable valuation inputs, when arriving at fair value. The VLOC primarily employs a market-based approach which may use related or comparable assets or liabilities, recent transactions, market multiples, book values, and other relevant information for the investment to determine the fair value of the investment. An income-based valuation approach may also be used in which the anticipated future cash flows of the investment are discounted to calculate fair value. Discounts may also be applied due to the nature or duration of any restrictions on the disposition of the investments. Due to the inherent uncertainty of valuations of such investments, the fair values may differ significantly from the values that would have been used had an active market existed. The VLOC employs various methods for calibrating these valuation approaches including a regular review of key inputs and assumptions, transactional back-testing or disposition analysis, and reviews of any related market activity.
franklintempleton.com
Annual Report
| 29
TEMPLETON FOREIGN FUND
NOTES TO FINANCIAL STATEMENTS
1. Organization and Significant Accounting
Policies (continued)
a. Financial Instrument Valuation (continued)
Trading in securities on foreign securities stock exchanges and OTC markets may be completed before the daily NYSE close. In addition, trading in certain foreign markets may not take place on every NYSE business day. Occasionally, events occur between the time at which trading in a foreign security is completed and the close of the NYSE that might call into question the reliability of the value of a portfolio security held by the Fund. As a result, differences may arise between the value of the Fund’s portfolio securities as determined at the foreign market close and the latest indications of value at the close of the NYSE. In order to minimize the potential for these differences, the VLOC monitors price movements following the close of trading in foreign stock markets through a series of country specific market proxies (such as baskets of American Depositary Receipts, futures contracts and exchange traded funds). These price movements are measured against established trigger thresholds for each specific market proxy to assist in determining if an event has occurred that may call into question the reliability of the values of the foreign securities held by the Fund. If such an event occurs, the securities may be valued using fair value procedures, which may include the use of independent pricing services.
When the last day of the reporting period is a non-business day, certain foreign markets may be open on those days that the NYSE is closed, which could result in differences between the value of the Fund’s portfolio securities on the last business day and the last calendar day of the reporting period. Any significant security valuation changes due to an open foreign market are adjusted and reflected by the Fund for financial reporting purposes.
b. Foreign Currency Translation
Portfolio securities and other assets and liabilities denominated in foreign currencies are translated into U.S. dollars based on the exchange rate of such currencies against U.S. dollars on the date of valuation. The Fund may enter into foreign currency exchange contracts to facilitate transactions denominated in a foreign currency. Purchases and sales of securities, income and expense items denominated in foreign currencies are translated into U.S. dollars at the exchange rate in effect on the transaction date. Portfolio securities and assets and liabilities denominated in foreign currencies contain risks that those currencies will decline in value relative to the U.S. dollar. Occasionally, events may impact the availability or reliability of foreign exchange rates used to convert the U.S. dollar equivalent value. If such an event occurs, the foreign exchange rate will be valued at fair value using procedures established and approved by the Board.
The Fund does not separately report the effect of changes in foreign exchange rates from changes in market prices on securities held. Such changes are included in net realized and unrealized gain or loss from investments in the Statement of Operations.
Realized foreign exchange gains or losses arise from sales of foreign currencies, currency gains or losses realized between the trade and settlement dates on securities transactions and the difference between the recorded amounts of dividends, interest, and foreign withholding taxes and the U.S. dollar equivalent of the amounts actually received or paid. Net unrealized foreign exchange gains and losses arise from changes in foreign exchange rates on foreign denominated assets and liabilities other than investments in securities held at the end of the reporting period.
c. Derivative Financial Instruments
The Fund invested in derivatives in order to manage risk or gain exposure to various other investments or markets. Derivatives are financial contracts based on an underlying or notional amount, require no initial investment or an initial net investment that is smaller than would normally be required to have a similar response to changes in market factors, and require or permit net settlement. Derivatives contain various risks including the potential inability of the counterparty to fulfill their obligations under the terms of the contract, the potential for an illiquid secondary market, and/or the potential for market movements which expose the Fund to gains or losses in excess of the amounts shown in the Statement of Assets and Liabilities. Realized gain and loss and unrealized appreciation and depreciation on these contracts for the period are included in the Statement of Operations.
Collateral requirements differ by type of derivative. Collateral or initial margin requirements are set by the broker or exchange clearing house for exchange traded and centrally cleared derivatives. Initial margin deposited is held at the exchange and can be in the form of cash and/or securities.
The Fund purchased or wrote OTC option contracts primarily to manage and/or gain exposure to equity price risk. An option is a contract entitling the holder to purchase or sell a specific amount of shares or units of an asset or notional amount of
30 | Annual Report
franklintempleton.com
TEMPLETON FOREIGN FUND
NOTES TO FINANCIAL STATEMENTS
a swap (swaption), at a specified price. When an option is purchased or written, an amount equal to the premium paid or received is recorded as an asset or liability, respectively. Upon exercise of an option, the acquisition cost or sales proceeds of the underlying investment is adjusted by any premium received or paid. Upon expiration of an option, any premium received or paid is recorded as a realized gain or loss. Upon closing an option other than through expiration or exercise, the difference between the premium received or paid and the cost to close the position is recorded as a realized gain or loss.
See Note 6 regarding investment transactions.
d. Securities Lending
The Fund participates in an agency based securities lending program to earn additional income. The Fund receives cash collateral against the loaned securities in an amount equal to at least 102% of the fair value of the loaned securities. Collateral is maintained over the life of the loan in an amount not less than 100% of the fair value of loaned securities, as determined at the close of Fund business each day; any additional collateral required due to changes in security values is delivered to the Fund on the next business day. The collateral is deposited into a joint cash account with other funds and is used to invest in a money market fund managed by Franklin Advisers, Inc., an affiliate of the Fund. The total cash collateral received at year end was $453,250. The Fund may receive income from the investment of cash collateral, in addition to lending fees and rebates paid by the borrower. Income from securities loaned is reported separately in the Statement of Operations. The Fund bears the market risk with respect to the collateral investment, securities loaned, and the risk that the agent may default on its obligations to the Fund. If the borrower defaults on its obligation to return the securities loaned, the Fund has the right to repurchase the securities in the open market using the collateral received. The securities lending agent has agreed to indemnify the Fund in the event of default by a third party borrower.
e. Income and Deferred Taxes
It is the Fund’s policy to qualify as a regulated investment company under the Internal Revenue Code. The Fund intends to distribute to shareholders substantially all of its taxable income and net realized gains to relieve it from federal income and if applicable, excise taxes. As a result, no provision for U.S. federal income taxes is required.
The Fund may be subject to foreign taxation related to income received, capital gains on the sale of securities and certain foreign currency transactions in the foreign jurisdictions in which it invests. Foreign taxes, if any, are recorded based on the tax regulations and rates that exist in the foreign markets in which the Fund invests. When a capital gain tax is determined to apply, the Fund records an estimated deferred tax liability in an amount that would be payable if the securities were disposed of on the valuation date. As a result of several court cases, in certain countries across the European Union, the Fund has filed additional tax reclaims for previously withheld taxes on dividends earned in those countries. These additional filings are subject to various administrative proceedings by the local jurisdictions’ tax authorities within the European Union, as well as a number of related judicial proceedings. During the year ended August 31, 2015, the Fund recognized approximately $13,567,157 from Finland and Sweden for previously withheld foreign taxes and interest on such taxes. These amounts are reflected as other income and interest in the Statement of Operations. In regards to filings in other European Union countries, uncertainty exists as to the ultimate resolution of these proceedings, the likelihood of receipt of these reclaims, and the potential timing of payment, and accordingly, no amounts are reflected in the financial statements.
The Fund recognizes the tax benefits of uncertain tax positions only when the position is “more likely than not” to be sustained upon examination by the tax authorities based on the technical merits of the tax position. As of August 31, 2015, and for all open tax years, the Fund has determined that no liability for unrecognized tax benefits is required in the Fund’s financial statements related to uncertain tax positions taken on a tax return (or expected to be taken on future tax returns). Open tax years are those that remain subject to examination and are based on each tax jurisdiction’s statute of limitation.
f. Security Transactions, Investment Income, Expenses and Distributions
Security transactions are accounted for on trade date. Realized gains and losses on security transactions are determined on a specific identification basis. Interest income and estimated expenses are accrued daily. Amortization of premium and accretion of discount on debt securities are included in interest income. Dividend income is recorded on the ex-dividend date except for certain dividends from foreign securities where the dividend rate is not available. In such cases, the dividend is recorded as soon as the information is received by the Fund.
franklintempleton.com
Annual Report
| 31
TEMPLETON FOREIGN FUND
NOTES TO FINANCIAL STATEMENTS
1. Organization and Significant Accounting
Policies (continued)
f. Security Transactions, Investment Income, Expenses and Distributions (continued)
Distributions to shareholders are recorded on the ex-dividend date and are determined according to income tax regulations (tax basis). Distributable earnings determined on a tax basis may differ from earnings recorded in accordance with U.S. GAAP. These differences may be permanent or temporary. Permanent differences are reclassified among capital accounts to reflect their tax character. These reclassifications have no impact on net assets or the results of operations. Temporary differences are not reclassified, as they may reverse in subsequent periods.
Common expenses incurred by the Trust are allocated among the Funds based on the ratio of net assets of each Fund to the combined net assets of the Trust. Fund specific expenses are charged directly to the fund that incurred the expense.
Realized and unrealized gains and losses and net investment income, not including class specific expenses, are allocated daily to each class of shares based upon the relative proportion of net assets of each class. Differences in per share distributions, by class, are generally due to differences in class specific expenses.
g. Accounting Estimates
The preparation of financial statements in accordance with U.S. GAAP requires management to make estimates and assumptions that affect the reported amounts of assets and liabilities at the date of the financial statements and the amounts of income and expenses during the reporting period. Actual results could differ from those estimates.
h. Guarantees and Indemnifications
Under the Trust’s organizational documents, its officers and trustees are indemnified by the Trust against certain liabilities arising out of the performance of their duties to the Trust. Additionally, in the normal course of business, the Trust, on behalf of the Fund, enters into contracts with service providers that contain general indemnification clauses. The Trust’s maximum exposure under these arrangements is unknown as this would involve future claims that may be made against the Trust that have not yet occurred. Currently, the Trust expects the risk of loss to be remote.
2. Shares of Beneficial Interest
At August 31, 2015, there were an unlimited number of shares authorized (without par value). Transactions in the Fund’s shares were as follows:
| | | | | | | | | | |
| | | | | Year Ended August 31, | | | | |
| | | | | 2015 | | | | | 2014 | |
| | Shares | | | Amount | | Shares | | | Amount | |
| Class A Shares: | | | | | | | | | | |
| Shares sold | 197,495,629 | | $ | 1,407,746,061 | | 107,425,703 | | $ | 899,780,054 | |
| Shares issued in reinvestment of distributions | 29,695,505 | | | 206,977,376 | | 23,668,938 | | | 191,481,652 | |
| Shares redeemed | (137,022,573 | ) | | (1,013,291,605 | ) | (112,750,122 | ) | | (948,374,847 | ) |
| Net increase (decrease) | 90,168,561 | | $ | 601,431,832 | | 18,344,519 | | $ | 142,886,859 | |
| Class C Shares: | | | | | | | | | | |
| Shares sold | 9,195,016 | | $ | 66,737,206 | | 12,331,670 | | $ | 100,675,640 | |
| Shares issued in reinvestment of distributions | 3,442,606 | | | 23,478,576 | | 2,765,434 | | | 21,902,241 | |
| Shares redeemed | (15,238,231 | ) | | (109,666,094 | ) | (10,333,548 | ) | | (84,436,981 | ) |
| Net increase (decrease) | (2,600,609 | ) | $ | (19,450,312 | ) | 4,763,556 | | $ | 38,140,900 | |
| Class R Shares: | | | | | | | | | | |
| Shares sold | 8,121,277 | | $ | 58,962,421 | | 7,010,920 | | $ | 57,696,222 | |
| Shares issued in reinvestment of distributions | 1,435,562 | | | 9,833,597 | | 1,040,997 | | | 8,286,336 | |
| Shares redeemed | (7,783,141 | ) | | (56,409,861 | ) | (6,259,421 | ) | | (51,423,407 | ) |
| Net increase (decrease) | 1,773,698 | | $ | 12,386,157 | | 1,792,496 | | $ | 14,559,151 | |
32 | Annual Report
franklintempleton.com
| | | | | | | | | | |
| | | | | | | TEMPLETON FOREIGN FUND | |
| | | | | NOTES TO FINANCIAL STATEMENTS | |
| |
| |
| |
| |
| | | | | Year Ended August 31, | | | | |
| | | | | 2015 | | | | | 2014 | |
| | Shares | | | Amount | | Shares | | | Amount | |
| Class R6 Shares: | | | | | | | | | | |
| Shares sold | 54,706,727 | | $ | 399,463,456 | | 30,906,509 | | $ | 254,985,482 | |
| Shares issued in reinvestment of distributions | 5,874,947 | | | 40,360,883 | | 3,119,271 | | | 24,891,780 | |
| Shares redeemed | (16,503,763 | ) | | (121,718,243 | ) | (3,756,040 | ) | | (30,955,811 | ) |
| Net increase (decrease) | 44,077,911 | | $ | 318,106,096 | | 30,269,740 | | $ | 248,921,451 | |
| Advisor Class Shares: | | | | | | | | | | |
| Shares sold | 58,090,549 | | $ | 425,813,328 | | 81,784,917 | | $ | 679,248,228 | |
| Shares issued in reinvestment of distributions | 11,318,646 | | | 77,759,100 | | 8,541,417 | | | 68,245,926 | |
| Shares redeemed | (91,872,521 | ) | | (666,691,780 | ) | (63,441,380 | ) | | (526,106,146 | ) |
| Net increase (decrease) | (22,463,326 | ) | $ | (163,119,352 | ) | 26,884,954 | | $ | 221,388,008 | |
3. Transactions with Affiliates
Franklin Resources, Inc. is the holding company for various subsidiaries that together are referred to as Franklin Templeton Investments. Certain officers and trustees of the Trust are also officers and/or directors of the following subsidiaries:
| |
| Subsidiary | Affiliation |
| Templeton Global Advisors Limited (TGAL) | Investment manager |
| Franklin Templeton Services, LLC (FT Services) | Administrative manager |
| Franklin Templeton Distributors, Inc. (Distributors) | Principal underwriter |
| Franklin Templeton Investor Services, LLC (Investor Services) | Transfer agent |
a. Management Fees
The Fund pays an investment management fee to TGAL based on the average daily net assets of the Fund as follows:
| | |
| Annualized Fee Rate | | Net Assets |
| 0.705 | % | Up to and including $1 billion |
| 0.690 | % | Over $1 billion, up to and including $5 billion |
| 0.675 | % | Over $5 billion, up to and including $10 billion |
| 0.655 | % | Over $10 billion, up to and including $15 billion |
| 0.635 | % | Over $15 billion, up to and including $20 billion |
| 0.615 | % | Over $20 billion, up to and including $25 billion |
| 0.605 | % | Over $25 billion, up to and including $30 billion |
| 0.595 | % | Over $30 billion, up to and including $35 billion |
| 0.585 | % | In excess of $35 billion |
b. Administrative Fees
Under an agreement with TGAL, FT Services provides administrative services to the Fund. The fee is paid by TGAL based on the Fund’s average daily net assets, and is not an additional expense of the Fund.
franklintempleton.com
Annual Report
| 33
TEMPLETON FOREIGN FUND
NOTES TO FINANCIAL STATEMENTS
3. Transactions with Affiliates (continued)
c. Distribution Fees
The Board has adopted distribution plans for each share class, with the exception of Class R6 and Advisor Class shares, pursuant to Rule 12b-1 under the 1940 Act. Distribution fees are not charged on shares held by affiliates. Under the Fund’s Class A reimbursement distribution plan, the Fund reimburses Distributors for costs incurred in connection with the servicing, sale and distribution of the Fund’s shares up to the maximum annual plan rate. Under the Class A reimbursement distribution plan, costs exceeding the maximum for the current plan year cannot be reimbursed in subsequent periods. In addition, under the Fund’s Class C and R compensation distribution plans, the Fund pays Distributors for costs incurred in connection with the servicing, sale and distribution of the Fund’s shares up to the maximum annual plan rate for each class. The plan year, for purposes of monitoring compliance with the maximum annual plan rates, is February 1 through January 31.
The maximum annual plan rates, based on the average daily net assets, for each class, are as follows:
| | |
| Class A | 0.25 | % |
| Class C | 1.00 | % |
| Class R | 0.50 | % |
d. Sales Charges/Underwriting Agreements
Front-end sales charges and contingent deferred sales charges (CDSC) do not represent expenses of the Fund. These charges are deducted from the proceeds of sales of Fund shares prior to investment or from redemption proceeds prior to remittance, as applicable. Distributors has advised the Fund of the following commission transactions related to the sales and redemptions of the Fund’s shares for the year:
| | |
| Sales charges retained net of commissions paid to unaffiliated broker/dealers | $ | 1,030,002 |
| CDSC retained | $ | 77,548 |
e. Transfer Agent Fees
Each class of shares, except for Class R6, pays transfer agent fees to Investor Services for its performance of shareholder servicing obligations and reimburses Investor Services for out of pocket expenses incurred, including shareholding servicing fees paid to third parties. These fees are allocated daily based upon their relative proportion of such classes’ aggregate net assets. Class R6 pays Investor Services transfer agent fees specific to that class.
For the year ended August 31, 2015, the Fund paid transfer agent fees of $13,894,665, of which $5,823,105 was retained by Investor Services.
f. Investments in Institutional Fiduciary Trust Money Market Portfolio
The Fund invests in Institutional Fiduciary Trust Money Market Portfolio (Sweep Money Fund), an affiliated open-end management investment company. Management fees paid by the Fund are waived on assets invested in the Sweep Money Fund, as noted in the Statement of Operations, in an amount not to exceed the management and administrative fees paid directly or indirectly by the Sweep Money Fund.
g. Waiver and Expense Reimbursements
Investor Services has contractually agreed in advance to waive or limit its fees so that the Class R6 transfer agent fees do not exceed 0.01% until December 31, 2015. There were no Class R6 transfer agent fees waived during the year ended August 31, 2015.
34 | Annual Report
franklintempleton.com
TEMPLETON FOREIGN FUND
NOTES TO FINANCIAL STATEMENTS
4. Expense Offset Arrangement
The Fund has entered into an arrangement with its custodian whereby credits realized as a result of uninvested cash balances are used to reduce a portion of the Fund’s custodian expenses. During the year ended August 31, 2015, there were no credits earned.
5. Income Taxes
For tax purposes, the Fund may elect to defer any portion of a post-October capital loss to the first day of the following fiscal year. At August 31, 2015, the Fund deferred post-October capital losses of $45,361,961.
The tax character of distributions paid during the years ended August 31, 2015 and 2014, was as follows:
| | | | |
| | | 2015 | | 2014 |
| Distributions paid from: | | | | |
| Ordinary income | $ | 247,625,321 | $ | 224,844,863 |
| Long term capital gain | | 149,898,182 | | 125,941,770 |
| | $ | 397,523,503 | $ | 350,786,633 |
At August 31, 2015, the cost of investments, net unrealized appreciation (depreciation), and undistributed ordinary income for income tax purposes were as follows:
| | | |
| Cost of investments | $ | 7,357,513,283 | |
| |
| Unrealized appreciation | $ | 558,098,045 | |
| Unrealized depreciation | | (1,135,240,722 | ) |
| Net unrealized appreciation (depreciation) | $ | (577,142,677 | ) |
| |
| Distributable earnings - undistributed ordinary income | $ | 86,321,573 | |
Differences between income and/or capital gains as determined on a book basis and a tax basis are primarily due to differing treatments of passive foreign investment company shares, wash sales, and foreign tax reclaims.
6. Investment Transactions
Purchases and sales of investments (excluding short term securities) for the year ended August 31, 2015, aggregated $2,353,170,567 and $2,043,985,545, respectively.
Transactions in options written during the year ended August 31, 2015, were as follows:
| | | | | |
| | Number of | | | Premiums | |
| | Contracts | | | Received | |
| Options outstanding at August 31, 2014 | — | | $ | — | |
| Options written | 2,694,230 | | | 1,023,335 | |
| Options expired | — | | | — | |
| Options exercised | (2,694,230 | ) | | (1,023,335 | ) |
| Options closed | — | | | — | |
| Options outstanding at August 31, 2015 | — | | $ | — | |
| |
| |
| See Note 1(c) regarding derivative financial instruments. | | | | | |
franklintempleton.com
Annual Report
| 35
TEMPLETON FOREIGN FUND
NOTES TO FINANCIAL STATEMENTS
7. Concentration of Risk
Investing in foreign securities may include certain risks and considerations not typically associated with investing in U.S. securities, such as fluctuating currency values and changing local and regional economic, political and social conditions, which may result in greater market volatility. In addition, certain foreign securities may not be as liquid as U.S. securities.
8. Credit Facility
The Fund, together with other U.S. registered and foreign investment funds (collectively, Borrowers), managed by Franklin Templeton Investments, are borrowers in a joint syndicated senior unsecured credit facility totaling $2 billion (Global Credit Facility) which matures on February 12, 2016. This Global Credit Facility provides a source of funds to the Borrowers for temporary and emergency purposes, including the ability to meet future unanticipated or unusually large redemption requests.
Under the terms of the Global Credit Facility, the Fund shall, in addition to interest charged on any borrowings made by the Fund and other costs incurred by the Fund, pay its share of fees and expenses incurred in connection with the implementation and maintenance of the Global Credit Facility, based upon its relative share of the aggregate net assets of all of the Borrowers, including an annual commitment fee of 0.07% based upon the unused portion of the Global Credit Facility. These fees are reflected in other expenses in the Statement of Operations. During the year ended August 31, 2015, the Fund did not use the Global Credit Facility.
9. Fair Value Measurements
The Fund follows a fair value hierarchy that distinguishes between market data obtained from independent sources (observable inputs) and the Fund’s own market assumptions (unobservable inputs). These inputs are used in determining the value of the Fund’s financial instruments and are summarized in the following fair value hierarchy:
- Level 1 – quoted prices in active markets for identical financial instruments
- Level 2 – other significant observable inputs (including quoted prices for similar financial instruments, interest rates, prepayment speed, credit risk, etc.)
- Level 3 – significant unobservable inputs (including the Fund’s own assumptions in determining the fair value of financial instruments)
The input levels are not necessarily an indication of the risk or liquidity associated with financial instruments at that level.
For movements between the levels within the fair value hierarchy, the Fund has adopted a policy of recognizing the transfers as of the date of the underlying event which caused the movement.
A summary of inputs used as of August 31, 2015, in valuing the Fund’s assets carried at fair value, is as follows:
| | | | | | | | |
| | | Level 1 | | Level 2 | | Level 3 | | Total |
| Assets: | | | | | | | | |
| Investments in Securities | | | | | | | | |
| Equity Investmentsa,b | $ | 6,414,217,356 | $ | — | $ | — | $ | 6,414,217,356 |
| Short Term Investments | | 453,250 | | 365,700,000 | | — | | 366,153,250 |
| Total Investments in Securities | $ | 6,414,670,606 | $ | 365,700,000 | $ | — | $ | 6,780,370,606 |
| |
| aIncludes common stocks as well as other equity investments. | | | | | | | | |
| bFor detailed categories, see the accompanying Statement of Investments. | | | | | | | | |
36 | Annual Report
franklintempleton.com
TEMPLETON FOREIGN FUND
NOTES TO FINANCIAL STATEMENTS
10. New Accounting Pronouncements
In June 2014, the Financial Accounting Standards Board issued Accounting Standards Update (ASU) No. 2014-11, Transfers and Servicing (Topic 860), Repurchase-to-Maturity Transactions, Repurchase Financings, and Disclosures. The ASU changes the accounting for certain repurchase agreements and expands disclosure requirements related to repurchase agreements, securities lending, repurchase-to-maturity and similar transactions. The ASU is effective for certain transactions accounted for as a sale for interim and annual reporting periods beginning after December 15, 2014 and transactions accounted for as secured borrowings for annual periods beginning after December 15, 2014, and for interim periods beginning after March 15, 2015. Management has reviewed the requirements and believes the adoption of this ASU will not have a material impact on the financial statements.
11. Subsequent Events
The Fund has evaluated subsequent events through the issuance of the financial statements and determined that no events have occurred that require disclosure.
| | | |
| Abbreviations | | |
| Currency | Selected Portfolio |
| EUR | Euro | ADR | American Depositary Receipt |
| GBP | British Pound | IDR | International Depositary Receipt |
franklintempleton.com
Annual Report
| 37
TEMPLETON FOREIGN FUND
Report of Independent Registered Public Accounting Firm
To the Board of Trustees of Templeton Funds and Shareholders of Templeton Foreign Fund
In our opinion, the accompanying statement of assets and liabilities, including the statement of investments, and the related statements of operations and of changes in net assets and the financial highlights present fairly, in all material respects, the financial position of Templeton Foreign Fund (the “Fund”) at August 31, 2015, the results of its operations for the year then ended, the changes in its net assets for each of the two years in the period then ended and the financial highlights for each of the periods presented, in conformity with accounting principles generally accepted in the United States of America. These financial statements and financial highlights (hereafter referred to as “financial statements”) are the responsibility of the Fund’s management. Our responsibility is to express an opinion on these financial statements based on our audits. We conducted our audits of these financial statements in accordance with the standards of the Public Company Accounting Oversight Board (United States). Those standards require that we plan and perform the audit to obtain reasonable assurance about whether the financial statements are free of material misstatement. An audit includes examining, on a test basis, evidence supporting the amounts and disclosures in the financial statements, assessing the accounting principles used and significant estimates made by management, and evaluating the overall financial statement presentation. We believe that our audits, which included confirmation of securities at August 31, 2015 by correspondence with the custodian, transfer agent and brokers, provide a reasonable basis for our opinion.
PricewaterhouseCoopers LLP
San Francisco, California
October 20, 2015
38 | Annual Report
franklintempleton.com
TEMPLETON FOREIGN FUND
Tax Information (unaudited)
Under Section 852(b)(3)(C) of the Internal Revenue Code (Code), the Fund hereby reports the maximum amount allowable but no less than $149,898,182 as a long term capital gain dividend for the fiscal year ended August 31, 2015.
Under Section 871(k)(2)(C) of the Code, the Fund hereby reports the maximum amount allowable but no less than $56,633,457 as a short term capital gain dividend for purposes of the tax imposed under Section 871(a)(1)(A) of the Code for the fiscal year ended August 31, 2015.
Under Section 854(b)(1)(B) of the Code, the Fund hereby reports the maximum amount allowable but no less than $152,322,404 as qualified dividends for purposes of the maximum rate under Section 1(h)(11) of the Code for the fiscal year ended August 31, 2015. Distributions, including qualified dividend income, paid during calendar year 2015 will be reported to shareholders on Form 1099-DIV by mid-February 2016. Shareholders are advised to check with their tax advisors for information on the treatment of these amounts on their individual income tax returns.
At August 31, 2014, more than 50% of the Fund’s total assets were invested in securities of foreign issuers. In most instances, foreign taxes were withheld from income paid to the Fund on these investments. As shown in the table below, the Fund hereby reports to shareholders the foreign source income and foreign taxes paid, pursuant to Section 853 of the Code. This written statement will allow shareholders of record on December 18, 2014, to treat their proportionate share of foreign taxes paid by the Fund as having been paid directly by them. The shareholder shall consider these amounts as foreign taxes paid in the tax year in which they receive the Fund distribution.
The following table provides a detailed analysis of foreign tax paid, foreign source income, and foreign source qualified dividends as reported by the Fund, to Class A, Class C, Class R, and Class R6 and Advisor Class shareholders of record.
| | | | | | |
| | | Foreign Tax Paid | | Foreign Source | | Foreign Source Qualified |
| Class | | Per Share | | Income Per Share | | Dividends Per Share |
| Class A | $ | 0.0221 | $ | 0.2033 | $ | 0.1723 |
| Class C | $ | 0.0221 | $ | 0.1660 | $ | 0.1409 |
| Class R | $ | 0.0221 | $ | 0.1926 | $ | 0.1635 |
| Class R6 | $ | 0.0221 | $ | 0.2268 | $ | 0.1923 |
| Advisor Class | $ | 0.0221 | $ | 0.2176 | $ | 0.1844 |
Foreign Tax Paid Per Share (Column 1) is the amount per share available to you, as a tax credit (assuming you held your shares in the Fund for a minimum of 16 days during the 31-day period beginning 15 days before the ex-dividend date of the Fund’s distribution to which the foreign taxes relate), or, as a tax deduction.
Foreign Source Income Per Share (Column 2) is the amount per share of income dividends attributable to foreign securities held by the Fund, plus any foreign taxes withheld on these dividends. The amounts reported include foreign source qualified dividends that have not been adjusted for the rate differential applicable to such dividend income.1
Foreign Source Qualified Dividends Per Share (Column 3) is the amount per share of foreign source qualified dividends, plus any foreign taxes withheld on these dividends. These amounts represent the portion of the Foreign Source Income reported to you in column 2 that were derived from qualified foreign securities held by the Fund.1
By mid-February 2015, shareholders received Form 1099-DIV which included their share of taxes paid and foreign source income distributed during the calendar year 2014. The Foreign Source Income reported on Form 1099-DIV has not been adjusted for the rate differential on foreign source qualified dividend income. Shareholders are advised to check with their tax advisors for information on the treatment of these amounts on their 2014 individual income tax returns.
1Qualified dividends are taxed at reduced long term capital gains tax rates. In determining the amount of foreign tax credit that may be applied against the U.S. tax liability of individuals receiving foreign source qualified dividends, adjustments may be required to the foreign tax credit limitation calculation to reflect the rate differential applicable to such dividend income. The rules however permit certain individuals to elect not to apply the rate differential adjustments for capital gains and/or dividends for any taxable year. Please consult your tax advisor and the instructions to Form 1116 for more information.
franklintempleton.com
Annual Report
| 39
TEMPLETON FOREIGN FUND
Board Members and Officers
The name, year of birth and address of the officers and board members, as well as their affiliations, positions held with the Trust, principal occupations during at least the past five years and number of portfolios overseen in the Franklin Templeton Investments fund complex, are shown below. Generally, each board member serves until that person’s successor is elected and qualified.
| | | | |
| Independent Board Members | | | |
| |
| | | | Number of Portfolios in | |
| Name, Year of Birth | | Length of | Fund Complex Overseen | Other Directorships Held |
| and Address | Position | Time Served | by Board Member* | During at Least the Past 5 Years |
| |
| Harris J. Ashton (1932) | Trustee | Since 1992 | 144 | Bar-S Foods (meat packing company) |
| 300 S.E. 2nd Street | | | | (1981-2010). |
| Fort Lauderdale, FL 33301-1923 | | | | |
| |
| Principal Occupation During at Least the Past 5 Years: | | |
| Director of various companies; and formerly, Director, RBC Holdings, Inc. (bank holding company) (until 2002); and President, Chief Executive |
| Officer and Chairman of the Board, General Host Corporation (nursery and craft centers) (until 1998). | |
| |
| Ann Torre Bates (1958) | Trustee | Since 2008 | 42 | Navient Corporation (loan manage- |
| 300 S.E. 2nd Street | | | | ment, servicing and asset recovery) |
| Fort Lauderdale, FL 33301-1923 | | | | (2014-present), Ares Capital |
| | | | | Corporation (specialty finance |
| | | | | company) (2010-present), United |
| | | | | Natural Foods, Inc. (distributor of |
| | | | | natural, organic and specialty foods) |
| | | | | (2013-present), Allied Capital |
| | | | | Corporation (financial services) |
| | | | | (2003-2010) and SLM Corporation |
| | | | | (Sallie Mae) (1997-2014). |
| Principal Occupation During at Least the Past 5 Years: | | |
| Director of various companies; and formerly, Executive Vice President and Chief Financial Officer, NHP Incorporated (manager of multifamily |
| housing) (1995-1997); and Vice President and Treasurer, US Airways, Inc. (until 1995). | |
| |
| Frank J. Crothers (1944) | Trustee | Since 2003 | 25 | Fortis, Inc. (utility holding company) |
| 300 S.E. 2nd Street | | | | (2007-present) and AML Foods |
| Fort Lauderdale, FL 33301-1923 | | | | Limited (retail distributors) |
| | | | | (1989-present). |
| |
| Principal Occupation During at Least the Past 5 Years: | | |
| Director and Vice Chairman, Caribbean Utilities Company, Ltd.; director of various other private business and nonprofit organizations; and |
| formerly, Chairman, Atlantic Equipment and Power Ltd. (1977-2003). | | |
| |
| Edith E. Holiday (1952) | Lead | Trustee since 2003 144 | Hess Corporation (exploration and |
| 300 S.E. 2nd Street | Independent | and Lead | | refining of oil and gas) (1993-present), |
| Fort Lauderdale, FL 33301-1923 | Trustee | Independent | | RTI International Metals, Inc. (manu- |
| | | Trustee since 2007 | | facture and distribution of titanium) |
| | | | | (1999-present), Canadian National |
| | | | | Railway (railroad) (2001-present), |
| | | | | White Mountains Insurance Group, |
| | | | | Ltd. (holding company) (2004-present) |
| | | | | and H.J. Heinz Company (processed |
| | | | | foods and allied products) |
| | | | | (1994-2013). |
| |
| Principal Occupation During at Least the Past 5 Years: | | |
| Director or Trustee of various companies and trusts; and formerly, Assistant to the President of the United States and Secretary of the |
| Cabinet (1990-1993); General Counsel to the United States Treasury Department (1989-1990); and Counselor to the Secretary and Assistant |
| Secretary for Public Affairs and Public Liaison – United States Treasury Department (1988-1989). | |
40 | Annual Report
franklintempleton.com
TEMPLETON FOREIGN FUND
| | | | |
| Independent Board Members (continued) | | |
| |
| | | | Number of Portfolios in | |
| Name, Year of Birth | | Length of | Fund Complex Overseen | Other Directorships Held |
| and Address | Position | Time Served | by Board Member* | During at Least the Past 5 Years |
| |
| J. Michael Luttig (1954) | Trustee | Since 2009 | 144 | Boeing Capital Corporation |
| 300 S.E. 2nd Street | | | | (aircraft financing) (2006-2013). |
| Fort Lauderdale, FL 33301-1923 | | | | |
| |
| Principal Occupation During at Least the Past 5 Years: | | |
| Executive Vice President, General Counsel and member of the Executive Council, The Boeing Company (aerospace company); and formerly, |
| Federal Appeals Court Judge, U.S. Court of Appeals for the Fourth Circuit (1991-2006). | |
| |
| David W. Niemiec (1949) | Trustee | Since 2005 | 42 | Emeritus Corporation (assisted living) |
| 300 S.E. 2nd Street | | | | (1999-2010) and OSI Pharmaceuticals, |
| Fort Lauderdale, FL 33301-1923 | | | | Inc. (pharmaceutical products) |
| | | | | (2006-2010). |
| |
| Principal Occupation During at Least the Past 5 Years: | | |
| Advisor, Saratoga Partners (private equity fund); and formerly, Managing Director, Saratoga Partners (1998-2001) and SBC Warburg Dillon |
| Read (investment banking) (1997-1998); Vice Chairman, Dillon, Read & Co. Inc. (investment banking) (1991-1997); and Chief Financial |
| Officer, Dillon, Read & Co. Inc. (1982-1997). | | | |
| |
| Frank A. Olson (1932) | Trustee | Since 2003 | 144 | Hess Corporation (exploration and |
| 300 S.E. 2nd Street | | | | refining of oil and gas) (1998-2013). |
| Fort Lauderdale, FL 33301-1923 | | | | |
| |
| Principal Occupation During at Least the Past 5 Years: | | |
| Director of various companies; and formerly, Chairman of the Board, The Hertz Corporation (car rental) (1980-2000) and Chief Executive |
| Officer (1977-1999); and Chairman of the Board, President and Chief Executive Officer, UAL Corporation (airlines) (June-December 1987). |
| |
| Larry D. Thompson (1945) | Trustee | Since 2005 | 144 | Cbeyond, Inc. (business communi- |
| 300 S.E. 2nd Street | | | | cations provider) (2010-2012), The |
| Fort Lauderdale, FL 33301-1923 | | | | Southern Company (energy company) |
| | | | | (2014-present; previously 2010-2012) |
| | | | | and Graham Holdings Company |
| | | | | (education and media organization) |
| | | | | (2011-present). |
| Principal Occupation During at Least the Past 5 Years: | | |
| Director of various companies; John A. Sibley Professor of Corporate and Business Law, University of Georgia School of Law (January 2015; |
| previously 2011-2012); and formerly, Executive Vice President – Government Affairs, General Counsel and Corporate Secretary, PepsiCo, |
| Inc. (consumer products) (2012-2014); Senior Vice President – Government Affairs, General Counsel and Secretary, PepsiCo, Inc. |
| (2004-2011); Senior Fellow of The Brookings Institution (2003-2004); Visiting Professor, University of Georgia School of Law (2004); and |
| Deputy Attorney General, U.S. Department of Justice (2001-2003). | | |
| |
| Constantine D. Tseretopoulos Trustee | Since 2003 | 25 | None |
| (1954) | | | | |
| 300 S.E. 2nd Street | | | | |
| Fort Lauderdale, FL 33301-1923 | | | | |
| Principal Occupation During at Least the Past 5 Years: | | |
| Physician, Chief of Staff, owner and operator of the Lyford Cay Hospital (1987-present); director of various nonprofit organizations; and |
| formerly, Cardiology Fellow, University of Maryland (1985-1987); and Internal Medicine Resident, Greater Baltimore Medical Center |
| (1982-1985). | | | | |
| |
| Robert E. Wade (1946) | Trustee | Since 2006 | 42 | El Oro Ltd (investments) |
| 300 S.E. 2nd Street | | | | (2003-present). |
| Fort Lauderdale, FL 33301-1923 | | | | |
| |
| Principal Occupation During at Least the Past 5 Years: | | |
| Attorney at law engaged in private practice (1972-2008) and member of various boards. | |
| |
| |
| |
| franklintempleton.com | | | | Annual Report | 41 |
| | | | |
| TEMPLETON FOREIGN FUND | | | |
| |
| |
| |
| |
| Interested Board Members and Officers | | |
| |
| | | | Number of Portfolios in | |
| Name, Year of Birth | | Length of | Fund Complex Overseen | Other Directorships Held |
| and Address | Position | Time Served | by Board Member* | During at Least the Past 5 Years |
| |
| **Gregory E. Johnson (1961) | Trustee | Since 2013 | 161 | None |
| One Franklin Parkway | | | | |
| San Mateo, CA 94403-1906 | | | | |
| Principal Occupation During at Least the Past 5 Years: | | |
| Chairman of the Board, Member – Office of the Chairman, Director and Chief Executive Officer, Franklin Resources, Inc.; officer and/or |
| director or trustee, as the case may be, of some of the other subsidiaries of Franklin Resources, Inc. and of 45 of the investment companies |
| in Franklin Templeton Investments; Vice Chairman, Investment Company Institute; and formerly, President, Franklin Resources, Inc. |
| (1994-2015). | | | | |
| |
| **Rupert H. Johnson, Jr. (1940) Chairman of | Chairman of the | 144 | None |
| One Franklin Parkway | the Board and | Board since 2013, | | |
| San Mateo, CA 94403-1906 | Trustee and | Trustee since 1992 | | |
| | Vice President | and Vice President | | |
| | | since 1996 | | |
| |
| Principal Occupation During at Least the Past 5 Years: | | |
| Vice Chairman, Member – Office of the Chairman and Director, Franklin Resources, Inc.; Director, Franklin Advisers, Inc.; Senior Vice |
| President, Franklin Advisory Services, LLC; and officer and/or director or trustee, as the case may be, of some of the other subsidiaries of |
| Franklin Resources, Inc. and of 43 of the investment companies in Franklin Templeton Investments. | |
| |
| Alison E. Baur (1964) | Vice President | Since 2012 | Not Applicable | Not Applicable |
| One Franklin Parkway | | | | |
| San Mateo, CA 94403-1906 | | | | |
| Principal Occupation During at Least the Past 5 Years: | | |
| Deputy General Counsel, Franklin Templeton Investments; and officer of some of the other subsidiaries of Franklin Resources, Inc. and of 45 |
| of the investment companies in Franklin Templeton Investments. | | |
| |
| Norman J. Boersma (1957) | President and | Since 2012 | Not Applicable | Not Applicable |
| Lyford Cay | Chief Executive | | | |
| Nassau, Bahamas | Officer – | | | |
| | Investment | | | |
| | Management | | | |
| Principal Occupation During at Least the Past 5 Years: | | |
| Director, President and Chief Executive Officer, Templeton Global Advisors Ltd.; Chief Investment Officer of Templeton Global Equity Group; |
| officer of six of the investment companies in Franklin Templeton Investments; and formerly, Executive Vice President, Franklin Templeton |
| Investments Corp. (1993-2014). | | | | |
| |
| Laura F. Fergerson (1962) | Chief Executive Since 2009 | Not Applicable | Not Applicable |
| One Franklin Parkway | Officer – | | | |
| San Mateo, CA 94403-1906 | Finance and | | | |
| | Administration | | | |
| |
| Principal Occupation During at Least the Past 5 Years: | | |
| Senior Vice President, Franklin Templeton Services, LLC; Vice President, Franklin Advisers, Inc. and Franklin Templeton Institutional, LLC; |
| and officer of 45 of the investment companies in Franklin Templeton Investments. | |
| |
| Aliya S. Gordon (1973) | Vice President | Since 2009 | Not Applicable | Not Applicable |
| One Franklin Parkway | | | | |
| San Mateo, CA 94403-1906 | | | | |
| |
| Principal Occupation During at Least the Past 5 Years: | | |
| Senior Associate General Counsel, Franklin Templeton Investments; and officer of 45 of the investment companies in Franklin Templeton |
| Investments. | | | | |
42 | Annual Report
franklintempleton.com
TEMPLETON FOREIGN FUND
| | | | |
| Interested Board Members and Officers (continued) | |
| |
| | | | Number of Portfolios in | |
| Name, Year of Birth | | Length of | Fund Complex Overseen | Other Directorships Held |
| and Address | Position | Time Served | by Board Member* | During at Least the Past 5 Years |
| |
| Steven J. Gray (1955) | Vice President | Since 2009 | Not Applicable | Not Applicable |
| One Franklin Parkway | | | | |
| San Mateo, CA 94403-1906 | | | | |
| |
| Principal Occupation During at Least the Past 5 Years: | | |
| Senior Associate General Counsel, Franklin Templeton Investments; Vice President, Franklin Templeton Distributors, Inc. and Franklin |
| Alternative Strategies Advisers, LLC; and officer of 45 of the investment companies in Franklin Templeton Investments. |
| |
| Selena L. Holmes (1965) | Vice President | Since 2012 | Not Applicable | Not Applicable |
| 100 Fountain Parkway | – AML | | | |
| St. Petersburg, FL 33716-1205 | Compliance | | | |
| |
| Principal Occupation During at Least the Past 5 Years: | | |
| Director, Global Compliance Monitoring; Chief Compliance Officer, Franklin Alternative Strategies Advisers, LLC; Vice President, Franklin |
| Templeton Companies, LLC; and officer of 45 of the investment companies in Franklin Templeton Investments. |
| |
| Kimberly H. Novotny (1972) | Vice President | Since 2013 | Not Applicable | Not Applicable |
| 300 S.E. 2nd Street | | | | |
| Fort Lauderdale, FL 33301-1923 | | | | |
| |
| Principal Occupation During at Least the Past 5 Years: | | |
| Associate General Counsel, Franklin Templeton Investments; Vice President, Fiduciary Trust International of the South; Vice President, |
| Templeton Investment Counsel, LLC; Assistant Secretary, Franklin Resources, Inc.; and officer of 45 of the investment companies in |
| Franklin Templeton Investments. | | | | |
| |
| Mark H. Otani (1968) | Treasurer, | Since 2009 | Not Applicable | Not Applicable |
| One Franklin Parkway | Chief Financial | | | |
| San Mateo, CA 94403-1906 | Officer and | | | |
| | Chief | | | |
| | Accounting | | | |
| | Officer | | | |
| |
| Principal Occupation During at Least the Past 5 Years: | | |
| Treasurer, U.S. Fund Administration & Reporting, Franklin Templeton Investments; and officer of 14 of the investment companies in |
| Franklin Templeton Investments. | | | | |
| |
| Robert C. Rosselot (1960) | Chief | Since 2013 | Not Applicable | Not Applicable |
| 300 S.E. 2nd Street | Compliance | | | |
| Fort Lauderdale, FL 33301-1923 | Officer | | | |
| |
| Principal Occupation During at Least the Past 5 Years: | | |
| Director, Global Compliance, Franklin Templeton Investments; Vice President, Franklin Templeton Companies, LLC; officer of 45 of the |
| investment companies in Franklin Templeton Investments; and formerly, Senior Associate General Counsel, Franklin Templeton Investments |
| (2007-2013); and Secretary and Vice President, Templeton Group of Funds (2004-2013). | |
| |
| Karen L. Skidmore (1952) | Vice President | Since 2009 | Not Applicable | Not Applicable |
| One Franklin Parkway | | | | |
| San Mateo, CA 94403-1906 | | | | |
| |
| Principal Occupation During at Least the Past 5 Years: | | |
| Senior Associate General Counsel, Franklin Templeton Investments; and officer of 45 of the investment companies in Franklin Templeton |
| Investments. | | | | |
franklintempleton.com
Annual Report
| 43
TEMPLETON FOREIGN FUND
| | | | |
| Independent Board Members (continued) | | |
| |
| | | | Number of Portfolios in | |
| Name, Year of Birth | | Length of | Fund Complex Overseen | Other Directorships Held |
| and Address | Position | Time Served | by Board Member* | During at Least the Past 5 Years |
| |
| Craig S. Tyle (1960) | Vice President | Since 2005 | Not Applicable | Not Applicable |
| One Franklin Parkway | | | | |
| San Mateo, CA 94403-1906 | | | | |
| |
| Principal Occupation During at Least the Past 5 Years: | | |
| General Counsel and Executive Vice President, Franklin Resources, Inc.; and officer of some of the other subsidiaries of Franklin Resources, |
| Inc. and of 45 of the investment companies in Franklin Templeton Investments. | |
| |
| Lori A. Weber (1964) | Secretary and | Secretary since | Not Applicable | Not Applicable |
| 300 S.E. 2nd Street | Vice President | 2013 and Vice | | |
| Fort Lauderdale, FL 33301-1923 | | President since | | |
| | | 2011 | | |
| |
| Principal Occupation During at Least the Past 5 Years: | | |
| Senior Associate General Counsel, Franklin Templeton Investments; Assistant Secretary, Franklin Resources, Inc.; Vice President and |
| Secretary, Templeton Investment Counsel, LLC; and officer of 45 of the investment companies in Franklin Templeton Investments. |
*We base the number of portfolios on each separate series of the U.S. registered investment companies within the Franklin Templeton Investments fund complex.
These portfolios have a common investment manager or affiliated investment managers.
**Gregory E. Johnson is considered to be an interested person of the Fund under the federal securities laws due to his position as an officer and director of Franklin
Resources, Inc. (Resources), which is the parent company of the Fund’s investment manager and distributor. Rupert H. Johnson, Jr. is considered to be an interested
person of the Fund under the federal securities laws due to his position as officer and director and major shareholder of Resources.
Note 1: Rupert H. Johnson, Jr. is the uncle of Gregory E. Johnson.
Note 2: Officer information is current as of the date of this report. It is possible that after this date, information about officers may change.
The Sarbanes-Oxley Act of 2002 and Rules adopted by the U.S. Securities and Exchange Commission require the Fund to disclose whether the Fund’s Audit
Committee includes at least one member who is an audit committee financial expert within the meaning of such Act and Rules. The Fund’s Board has deter-
mined that there is at least one such financial expert on the Audit Committee and has designated each of Ann Torre Bates and David W. Niemiec as an audit
committee financial expert. The Board believes that Ms. Bates and Mr. Niemiec qualify as such an expert in view of their extensive business background
and experience. Ms. Bates has served as a member of the Fund Audit Committee since 2008. She currently serves as a director of Navient Corporation
(2014-present), Ares Capital Corporation (2010-present) and United Natural Foods, Inc. (2013-present) and was formerly a director of SLM Corporation from
1997 to 2014 and Allied Capital Corporation from 2003 to 2010, Executive Vice President and Chief Financial Officer of NHP Incorporated from 1995 to 1997 and
Vice President and Treasurer of US Airways, Inc. until 1995. Mr. Niemiec has served as a member of the Fund Audit Committee since 2005, currently serves as
an Advisor to Saratoga Partners and was formerly its Managing Director from 1998 to 2001. Mr. Niemiec was formerly a director of Emeritus Corporation from
1999 to 2010 and OSI Pharmaceuticals, Inc. from 2006 to 2010, Managing Director of SBC Warburg Dillon Read from 1997 to 1998, and was Vice Chairman from
1991 to 1997 and Chief Financial Officer from 1982 to 1997 of Dillon, Read & Co. Inc. As a result of such background and experience, the Board believes that
Ms. Bates and Mr. Niemiec have each acquired an understanding of generally accepted accounting principles and financial statements, the general applica-
tion of such principles in connection with the accounting estimates, accruals and reserves, and analyzing and evaluating financial statements that present a
breadth and level of complexity of accounting issues generally comparable to those of the Fund, as well as an understanding of internal controls and proce-
dures for financial reporting and an understanding of audit committee functions. Ms. Bates and Mr. Niemiec are independent Board members as that term is
defined under the applicable U.S. Securities and Exchange Commission Rules and Releases.
The Statement of Additional Information (SAI) includes additional information about the board members and is available, without charge, upon request.
Shareholders may call (800) DIAL BEN/342-5236 to request the SAI.
44 | Annual Report
franklintempleton.com
TEMPLETON FOREIGN FUND
Shareholder Information
Board Review of Investment Management Agreement
At a meeting held May 19, 2015, the Board of Trustees (Board), including a majority of non-interested or independent Trustees, approved renewal of the investment management agreement for each of the two separate funds in Templeton Funds, including Templeton Foreign Fund (Fund(s)). In reaching this decision, the Board took into account information furnished throughout the year at regular Board meetings, as well as information prepared specifically in connection with the annual renewal review process. Information furnished and discussed throughout the year included investment performance reports and related financial information for the Funds, along with periodic reports on expenses, shareholder services, legal and compliance matters, pricing, brokerage commissions and execution and other services provided by the Investment Manager (Manager) and its affiliates, as well as marketing support payments made to financial intermediaries. Information furnished specifically in connection with the renewal process included a report for the Fund prepared by Lipper, Inc. (Lipper), an independent organization, as well as additional material, including a Fund profitability analysis prepared by management. The Lipper report compared the Funds’ investment performance and expenses with those of other mutual funds deemed comparable to the Funds as selected by Lipper. The Fund profitability analysis discussed the profitability to Franklin Templeton Investments (FTI) from its overall U.S. fund operations, as well as on an individual fund-by-fund basis. Additional material accompanying such profitability analysis report included information on a fund-by-fund basis listing portfolio managers and other accounts they manage, as well as information on management fees charged by the Manager and its affiliates to U.S. mutual funds and other accounts, including management’s explanation of differences where relevant. Such material also included a memorandum prepared by management describing project initiatives and capital investments relating to the services provided to the Funds by the FTI organization, as well as a memorandum relating to economies of scale and an analysis concerning transfer agent fees charged by an affiliate of the Manager. The Board also noted that at the February meetings each year, it receives an annual report on all marketing support payments made by FTI to financial intermediaries.
In considering such materials, the independent Trustees received assistance and advice from and met separately with independent counsel. In approving continuance of the investment management agreements for the Funds, the Board, including a majority of independent Trustees, determined that the existing management
fee structure was fair and reasonable and that continuance of the investment management agreements was in the best interests of the Funds and their shareholders. While attention was given to all information furnished, the following discusses some primary factors relevant to the Board’s decision.
NATURE, EXTENT AND QUALITY OF SERVICES.
The Board was satisfied with the nature and quality of the overall services provided by the Manager and its affiliates to the Fund and its shareholders. In addition to investment performance and expenses discussed later, the Board’s opinion was based, in part, upon periodic reports furnished showing that the investment policies and restrictions for the Fund were consistently complied with as well as other reports periodically furnished to the Board covering matters such as the compliance of portfolio managers and other management personnel with the code of ethics adopted throughout the Franklin Templeton fund complex, the adherence to fair value pricing procedures established by the Board, and the accuracy of net asset value calculations. The Board also noted the extent of benefits provided to Fund shareholders from being part of the Franklin Templeton family of funds, including the right to exchange investments between the same class of shares of different funds without a sales charge, the ability to reinvest Fund dividends into other funds and the right to combine holdings in other funds to obtain a reduced sales charge. Favorable consideration was given to management’s continual efforts and expenditures in establishing effective business continuity plans and developing strategies to address cybersecurity threats. Among other factors taken into account by the Board were the Manager’s best execution trading policies, including a favorable report by an independent portfolio trading analytical firm that also covered global foreign exchange transactions. Consideration was also given to the experience of the Fund’s portfolio management team, the number of accounts managed and general method of compensation. In this latter respect, the Board noted that a primary factor in management’s determination of a portfolio manager’s bonus compensation was the relative investment performance of the funds he or she managed and that a portion of such bonus was required to be invested in a predesignated list of funds within such person’s fund management area so as to be aligned with the interests of shareholders. The Board also took into account the quality of transfer agent and shareholder services provided to Fund shareholders by an affiliate of the Manager, noting the changes taking place in the nature of transfer agency services throughout the industry and regulatory initiatives in this area, and the continual enhancements to the Franklin Templeton website. Particular attention was given to
franklintempleton.com
Annual Report
| 45
TEMPLETON FOREIGN FUND
SHAREHOLDER INFORMATION
Board Review of Investment Management
Agreement (continued) management’s conservative approach and diligent risk management procedures, including continual monitoring of counterparty credit risk and attention given to derivatives and other complex instruments including expanded collateralization requirements, as applicable. The Board also took into account, among other things, management’s efforts in establishing a global credit facility for the benefit of the Fund and other accounts managed by FTI to provide a source of cash for temporary and emergency purposes or to meet unusual redemption requests as well as the strong financial position of the Manager’s parent company and its commitment to the mutual fund business as evidenced by its continued subsidization of money market funds.
INVESTMENT PERFORMANCE. The Board placed significant emphasis on the investment performance of the Fund in view of its importance to shareholders. While consideration was given to performance reports and discussions with portfolio managers at Board meetings during the year, particular attention in assessing performance was given to the Lipper reports furnished for the agreement renewal. The Lipper reports prepared for the Fund showed the investment performance of its Class A shares for the one-year period ended February 28, 2015, and the previous 10 years ended such date in comparison with a performance universe selected by Lipper. The Lipper performance universe for the Fund consisted of the Fund and all retail and institutional international multi-cap value funds as selected by Lipper. On a comparative basis, the Lipper report for the Fund showed its total return to be in the lowest or worst performing quintile of such universe for the one-year period, and on an annualized basis to also be in the middle performing quintile of such universe for each of the previous three- and five-year periods, and in the highest or best performing quintile of such universe for the previous 10-year period. The Board found the Fund’s comparative performance as set forth in the Lipper report to be acceptable, noting that the Fund’s one-year performance had negatively impacted its shorter term returns but that the Fund’s annualized total return was above the median for the previous four-, five- and 10-year periods. The Board acknowledged that management was appropriately focused on the Fund, noting the portfolio manager change in 2013.
COMPARATIVE EXPENSES. Consideration was given to a comparative analysis of the management fees and total expense ratio of the Fund compared with those of a group of other funds selected by Lipper as constituting its appropriate Lipper expense group. Lipper expense data is based upon information taken from each fund’s most recent annual report, which reflects historical asset levels that may be quite different from those currently existing, particularly in a period of market volatility. While recognizing such inherent limitation and the fact that expense ratios generally increase as assets decline and decrease as assets grow, the Board believed the independent analysis conducted by Lipper to be an appropriate measure of comparative expenses. In reviewing comparative costs, Lipper provides information on the Fund’s contractual investment management fee in comparison with the contractual investment management fee that would have been charged by other funds within its Lipper expense group assuming they were similar in size to the Fund, as well as the actual total expenses of the Fund in comparison with those of its Lipper expense group. The Lipper contractual investment management fee analysis included administrative charges as being part of the management fee, and actual total expenses, for comparative consistency, are shown by Lipper for Fund Class A shares. The results of such expense comparisons showed the contractual investment management fee rate and actual total expense ratio of the Fund to be in the least expensive quintile of its Lipper expense group. The Board was satisfied with the comparative expenses of the Fund as set forth in the Lipper reports.
MANAGEMENT PROFITABILITY. The Board also considered the level of profits realized by the Manager and its affiliates in connection with the operation of the Fund. In this respect, the Board reviewed the Fund profitability analysis that addresses the overall profitability of Franklin Templeton’s U.S. fund business, as well as its profits in providing management and other services to each of the individual funds during the 12-month period ended September 30, 2014, being the most recent fiscal year-end for Franklin Resources, Inc., the Manager’s parent. In reviewing the analysis, the Board recognized that allocation methodologies are inherently subjective and various allocation methodologies may be reasonable while producing different results. In this respect, the Board noted that while management continually makes refinements to its methodologies in response to organizational and product related changes, the overall approach as defined by the primary drivers and activity measurements has remained consistent with that used in the Fund’s profitability report presentations from prior years. Additionally, the Fund’s independent registered public accounting firm had been engaged by the Manager to periodically review the reasonableness of the allocation methodologies to be used solely by the Fund’s Board in reference to the profitability analysis. In reviewing and discussing such analysis,
46 | Annual Report
franklintempleton.com
TEMPLETON FOREIGN FUND
SHAREHOLDER INFORMATION
management discussed with the Board its belief that costs incurred in establishing the infrastructure necessary for the type of mutual fund operations conducted by the Manager and its affiliates may not be fully reflected in the expenses allocated to the Fund in determining its profitability, as well as the fact that the level of profits, to a certain extent, reflected operational cost savings and efficiencies initiated by management. The Board also took into account management’s expenditures in improving shareholder services provided to the Fund, as well as the need to implement systems and meet additional regulatory and compliance requirements resulting from statutes such as the Sarbanes-Oxley and Dodd-Frank Acts and recent SEC and other regulatory requirements. In addition, the Board considered a third-party study comparing the profitability of the Manager’s parent on an overall basis to other publicly held managers broken down to show profitability from management operations exclusive of distribution expenses, as well as profitability including distribution expenses. The Board also considered the extent to which the Manager and its affiliates might derive ancillary benefits from fund operations, including revenues generated from transfer agent services, and potential benefits resulting from personnel and systems enhancements necessitated by fund growth, increased leverage with the service providers and counterparties, allocation of fund brokerage and the use of commission dollars to pay for research. Based upon its consideration of all these factors, the Board determined that the level of profits realized by the Manager and its affiliates from providing services to the Fund was not excessive in view of the nature, quality and extent of services provided.
ECONOMIES OF SCALE. The Board also considered whether economies of scale are realized by the Manager as the Fund grows larger and the extent to which this is reflected in the level of management fees charged. While recognizing that any precise determination is inherently subjective, the Board noted that based upon the Fund profitability analysis, it appears that as some funds get larger, at some point economies of scale do result in the Manager realizing a larger profit margin on management services provided to such a fund. The Board also noted that economies of scale are shared with a fund and its shareholders through management fee breakpoints so that as a fund grows in size, its effective management fee rate declines. The Fund’s investment management agreement provides a fee at the rate of 0.705% on the first $1 billion of net assets; 0.690% on the next $4 billion of net assets; 0.675% on the next $5 billion of net assets; 0.655% on the next $5 billion of net assets; 0.635% on the next $5 billion of net assets; and 0.615% on net assets in excess of $20 billion, with additional breakpoints continuing thereafter up to the $35 billion asset level. At the end of 2014, the net assets of the Fund were approximately $6.51 billion. The Board believed that to the extent economies of scale may be realized by the Manager and its affiliates, the schedule of fees under the investment management agreement for the Fund provides a sharing of benefits with the Fund and its shareholders.
Proxy Voting Policies and Procedures
The Trust’s investment manager has established Proxy Voting Policies and Procedures (Policies) that the Trust uses to determine how to vote proxies relating to portfolio securities. Shareholders may view the Trust’s complete Policies online at franklintempleton.com. Alternatively, shareholders may request copies of the Policies free of charge by calling the Proxy Group collect at (954) 527-7678 or by sending a written request to: Franklin Templeton Companies, LLC, 300 S.E. 2nd Street, Fort Lauderdale, FL 33301, Attention: Proxy Group. Copies of the Fund’s proxy voting records are also made available online at franklintempleton.com and posted on the U.S. Securities and Exchange Commission’s website at sec.gov and reflect the most recent 12-month period ended June 30.
Quarterly Statement of Investments
The Trust files a complete statement of investments with the U.S. Securities and Exchange Commission for the first and third quarters for each fiscal year on Form N-Q. Shareholders may view the filed Form N-Q by visiting the Commission’s website at sec.gov. The filed form may also be viewed and copied at the Commission’s Public Reference Room in Washington, DC. Information regarding the operations of the Public Reference Room may be obtained by calling (800) SEC-0330.
Householding of Reports and Prospectuses
You will receive the Fund’s financial reports every six months as well as an annual updated summary prospectus (prospectus available upon request). To reduce Fund expenses, we try to identify related shareholders in a household and send only one copy of the financial reports and summary prospectus. This process, called “householding,” will continue indefinitely unless you instruct us otherwise. If you prefer not to have these documents householded, please call us at (800) 632-2301. At any time you may view current prospectuses/summary prospectuses and financial reports on our website. If you choose, you may receive these documents through electronic delivery.
franklintempleton.com
Annual Report
| 47
This page intentionally left blank.
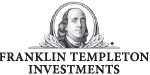
Annual Report and Shareholder Letter
Templeton Foreign Fund
Investment Manager
Templeton Global Advisors Limited
Distributor
Franklin Templeton Distributors, Inc.
(800) DIAL BEN® / 342-5236
franklintempleton.com
Shareholder Services
(800) 632-2301
Authorized for distribution only when accompanied or preceded by a summary prospectus and/or prospectus. Investors should carefully consider a fund’s investment goals, risks, charges and expenses before investing. A prospectus contains this and other information; please read it carefully before investing.
To help ensure we provide you with quality service, all calls to and from our service areas are monitored and/or recorded.
| |
| © 2015 Franklin Templeton Investments. All rights reserved. | 104 A 10/15 |
Annual Report
and Shareholder Letter
August 31, 2015
Templeton World Fund
A SERIES OF TEMPLETON FUNDS

Sign up for electronic delivery at franklintempleton.com/edelivery
Franklin Templeton Investments
Gain From Our Perspective®
At Franklin Templeton Investments, we’re dedicated to one goal: delivering exceptional asset management for our clients. By bringing together multiple, world-class investment teams in a single firm, we’re able to offer specialized expertise across styles and asset classes, all supported by the strength and resources of one of the world’s largest asset managers. This has helped us to become a trusted partner to individual and institutional investors across the globe.
Focus on Investment Excellence
At the core of our firm, you’ll find multiple independent investment teams—each with a focused area of expertise—from traditional to alternative strategies and multi-asset solutions. And because our portfolio groups operate autonomously, their strategies can be combined to deliver true style and asset class diversification.
All of our investment teams share a common commitment to excellence grounded in rigorous, fundamental research and robust, disciplined risk management. Decade after decade, our consistent, research-driven processes have helped Franklin Templeton earn an impressive record of strong, long-term results.
Global Perspective Shaped by Local Expertise
In today’s complex and interconnected world, smart investing demands a global perspective. Franklin Templeton pioneered international investing over 60 years ago, and our expertise in emerging markets spans more than a quarter of a century. Today, our investment professionals are on the ground across the globe, spotting investment ideas and potential risks firsthand. These locally based teams bring in-depth understanding of local companies, economies and cultural nuances, and share their best thinking across our global research network.
Strength and Experience
Franklin Templeton is a global leader in asset management serving clients in over 150 countries.1 We run our business with the same prudence we apply to asset management, staying focused on delivering relevant investment solutions, strong long-term results and reliable, personal service. This approach, focused on putting clients first, has helped us to become one of the most trusted names in financial services.
1. As of 12/31/14. Clients are represented by the total number of shareholder accounts.
Not FDIC Insured | May Lose Value | No Bank Guarantee
| |
| Contents | |
| |
| Shareholder Letter | 1 |
| Annual Report | |
| Templeton World Fund | 3 |
| Performance Summary | 9 |
| Your Fund’s Expenses | 14 |
| Financial Highlights and | |
| Statement of Investments | 16 |
| Financial Statements | 25 |
| Notes to Financial Statements | 29 |
| Report of Independent Registered | |
| Public Accounting Firm | 38 |
| Tax Information | 39 |
| Board Members and Officers | 40 |
| Shareholder Information | 45 |
| | | | | | |
| | Not FDIC Insured | | | May Lose Value | | No Bank Guarantee | | |
| franklintempleton.com | | | | Not part of the annual report | | | 1 |
Annual Report
Templeton World Fund
This annual report for Templeton World Fund covers the fiscal year ended August 31, 2015.
Your Fund’s Goal and Main Investments
The Fund seeks long-term capital growth. Under normal market conditions, the Fund invests primarily in equity securities of companies located anywhere in the world, including developing markets. Under normal circumstances, the Fund will invest in issuers located in at least three different countries (including the U.S.).
Performance Overview
The Fund’s Class A shares had a -10.59% cumulative total return for the 12 months under review. In comparison, the MSCI World Index, which measures stock market performance in global developed markets, had a -3.61% total return.1 The Fund’s long-term relative results are shown in the Performance Summary beginning on page 9. For the 10-year period ended August 31, 2015, the Fund’s Class A shares delivered a +62.15% cumulative total return, compared with the MSCI World Index’s +78.74% cumulative total return for the same period.1 Please note index performance information is provided for reference and we do not attempt to track the index but rather undertake investments on the basis of fundamental research. You can find more performance data in the Performance Summary.
Performance data represent past performance, which does not guarantee future results. Investment return and principal value will fluctuate, and you may have a gain or loss when you sell your shares. Current performance may differ from figures shown. Please visit franklintempleton.com or call (800) 342-5236 for most recent month-end performance.
Economic and Market Overview
The global economy expanded moderately during the 12 months under review despite slowing growth in some countries. As measured by the MSCI World Index, stocks in global developed markets overall declined during the period, although a generally accommodative monetary policy environment and
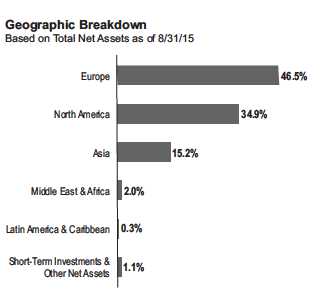
signs of economic improvement in Europe provided some support. However, weighing on global stocks near period-end was a rapid sell-off in China’s equity markets, despite the government’s monetary easing effort. Over the reporting period, oil prices declined sharply owing largely to strong global supply, and gold and other commodity prices also fell. The U.S. dollar appreciated against most currencies during the period, which reduced returns of many foreign assets in U.S. dollar terms.
U.S. economic growth was mixed during the 12 months under review. In 2014’s fourth quarter, growth expanded due to increased consumer spending, business investment, exports, and state and local government spending. Growth slowed in 2015’s first quarter as the U.S. dollar strengthened, energy prices fell, and a West Coast ports labor dispute led to decreased exports. However, growth rebounded in the second quarter due to increases in consumer spending, net exports, state and local government spending, and investments for businesses, homes and inventory. The U.S. Federal Reserve (Fed) ended its bond buying program in October 2014 and kept its target interest rate at 0%–0.25% while considering when to begin increasing it toward normal levels. During its July meeting, the Fed stated that although labor market and economic
1. Source: Morningstar. As of 8/31/15, the Fund’s Class A 10-year average annual total return not including the maximum sales charge was +4.95%, compared with the MSCI World Index’s 10-year average annual total return of +5.98%.
The index is unmanaged and includes reinvested dividends. One cannot invest directly in an index, and an index is not representative of the Fund’s portfolio.
The dollar value, number of shares or principal amount, and names of all portfolio holdings are listed in the Fund’s Statement of Investments (SOI).
The SOI begins on page 20.
franklintempleton.com
Annual Report
| 3
TEMPLETON WORLD FUND
conditions had improved, committee members would like more confidence that inflation was moving toward their goal before raising the federal funds target rate. Furthermore, it regarded international developments, particularly moderating growth in China and other emerging markets and China’s unexpected currency devaluation, as well as a strengthening U.S. dollar, as potential risks to U.S. economic growth.
Outside the U.S., the U.K. economy grew in 2015’s second quarter supported by services and industrial production. Eurozone economic growth generally improved during the period. France’s economy stagnated due to lower consumer spending and business investment, which was partially offset by higher exports, while Italy expanded but at a slower pace. In contrast, Greece’s economy grew despite the country’s liquidity crisis. Germany’s economic growth rose slightly compared with the previous quarter largely due to strong exports, although at a lower-than-expected rate as weak inventories and investments weighed on the economy. The eurozone’s annual inflation rate rose beginning in May as services and food prices increased. In late 2014, the European Central Bank (ECB) reduced its interest rates, and in early 2015, it expanded asset purchases to avoid deflation and potentially boost the economy. Despite Greece’s debt issues and geopolitical tension in Ukraine, the region generally benefited from lower oil prices, a weaker euro that helped exports, the ECB’s accommodative policy and an improved 2015 eurozone growth forecast.
The Bank of Japan (BOJ) broadened its stimulus measures amid weak domestic demand and lower inflation. In December, Japan’s ruling coalition was reelected and announced a new stimulus package to revive economic growth. The country exited recession in the fourth quarter, supported largely by exports. Japan’s economy continued to grow in 2015’s first quarter, driven by increasing private demand as business investment and private consumption rose. However, growth contracted in the second quarter due to decreases in net exports, consumer spending and business investment. The BOJ lowered its economic growth and inflation forecasts twice during the period.
In emerging markets, economic growth generally moderated. In early 2015, a temporary solution to Greece’s dispute with the country’s international creditors and a Russia-Ukraine cease-fire agreement bolstered emerging market stocks. Later in the period, investors remained concerned about Greece’s economy, even though the country and its international creditors agreed on a third bailout package. In China, the government sought to cool domestic stock market speculation, but its intervention led to severe market volatility in June and July. Emerging market stocks, especially Chinese equities, slumped in August after China devalued the renminbi. This move sparked concerns among investors about China’s moderating economy and a possible currency war. Toward period-end, China’s reluctance to implement widely anticipated monetary policy easing measures triggered a fresh sell-off in the domestic equity market, forcing China’s central bank to reduce the benchmark interest rate and the reserve ratio requirement. In the recent global environment, emerging market stocks, as measured by the MSCI Emerging Markets Index, fell for the 12-month period.
Investment Strategy
Our investment strategy employs a bottom-up, value-oriented, long-term approach. We focus on the market price of a company’s securities relative to our evaluation of the company’s long-term earnings, asset value and cash flow potential. As we look worldwide, we consider specific companies, rather than sectors or countries, while doing in-depth research to construct a bargain list from which we buy. Before we make a purchase, we look at the company’s price/earnings ratio, price/cash flow ratio, profit margins and liquidation value.
Manager’s Discussion
The 12 months under review brought renewed volatility to global equity markets, and renewed headwinds for our patient, bottom-up value investment approach. The years since the onset of the global financial crisis have come to represent one of the most challenging periods of our investment career. The problem has not been absolute returns as the Fund has generated significant gains since the depths of the global financial crisis. We believe the problem has been an unusually hostile market for value investors. In fact, value as a style is on track to underperform growth for its ninth consecutive year, the longest stretch on record. Although the Fund has weathered deeper periods of underperformance in the past, this latest episode of relative weakness has been notable for being the longest on record.
In our opinion, recent performance was an anomaly. Historically, value-oriented stocks have outperformed the broader market more often than not. Since its inception, even taking into account recent weakness, the Fund has outperformed the benchmark index. Yet, this recent period has been different for a few reasons. First, global economic growth has been persistently low, affording a scarcity premium to companies that have been able to exhibit above-average revenue growth. Second, central bank policy rates have fallen to historical lows. As interest rates declined, so too did equity earnings yields. Because earnings yields are simply the inverse of price-to-earnings ratios, equity valuations tend to expand in falling rate environments, further improving the backdrop for growth stocks.
4 | Annual Report
franklintempleton.com
TEMPLETON WORLD FUND
Other aspects of this environment have been equally challenging. To begin with, this has not been a typical monetary loosening cycle. Central banks have not just lowered interest rates, they have acquired vast portfolios of debt securities in an effort to boost lending and stimulate the economy. As a result of such quantitative easing, the balance sheet of the U.S. Fed has quadrupled to nearly US$4.5 trillion, or around 25% of gross domestic product (GDP). Furthermore, the Bank of Japan’s balance sheet has ballooned to 65% of GDP. In Europe, the ECB and the Bank of England embarked on their own quantitative easing programs. The result of all this stimulus has been a wave of what we believe to be indiscriminate support for financial assets in general, and risk assets like equities in particular. Given the extent to which central bank actions have influenced financial markets, investors recently seemed to us more intently focused on analyzing economic and policy trends than on distinguishing fundamental values at the individual security level. This scenario has led to high degrees of correlation between individual equities, which have put at a disadvantage fundamentally oriented, bottom-up stock-pickers like us. Although such conditions have been frustrating, we nevertheless remain confident in the long-term value of our time-tested investment approach. We believe recent market trends cannot persist indefinitely; it has been our experience that price has eventually converged with value.
This convergence has certainly not yet occurred in the energy sector, a major Fund overweighting and the Fund’s biggest detractor during the 12 months under review.2 Global energy stocks tumbled during the period and the price of oil fell to a six-and-half-year low as modest economic growth raised concerns about energy demand and the Organization of the Petroleum Exporting Countries’ (OPEC’s) decision not to cut production compounded a global supply glut. Half of the Fund’s worst 10 detractors during the period were energy stocks, led by Brazilian oil major Petroleo Brazileiro (Petrobras).3 Petrobras remained a higher risk holding given ongoing uncertainty around legal issues, government interference and strategic execution. However, we believe many of these risks were discounted in the firm’s depressed share price, which seemed to us more reflective of the company’s ancillary problems than its core value proposition as owner of perhaps the world’s most promising long-term production portfolio.
More broadly, despite the near-term supply and demand imbalances currently depressing oil prices, we believed longer term conditions remained supportive of higher prices. The reserve
| | |
| Top 10 Sectors/Industries | | |
| 8/31/15 | | |
| | % of Total | |
| | Net Assets | |
| Banks | 17.3 | % |
| Pharmaceuticals | 11.8 | % |
| Oil, Gas & Consumable Fuels | 8.2 | % |
| Insurance | 6.2 | % |
| Technology Hardware, Storage & Peripherals | 4.1 | % |
| Automobiles | 3.9 | % |
| Energy Equipment & Services | 3.8 | % |
| Media | 3.7 | % |
| Capital Markets | 3.6 | % |
| Diversified Telecommunication Services | 3.5 | % |
life of U.S. shale deposits, a major source of recent supply growth, is a fraction of the life of traditional deposits, meaning shale deposits’ productive capacity should fade relatively quickly. In the meantime, low prices were beginning to have their expected effect as higher cost North American oil production began to decline. In fact, the International Energy Agency recently predicted that non-OPEC production will decrease the most in 20 years in 2016. In short, the shale boom is aging and does not appear to represent a permanent impediment to balanced oil markets. To us, a balanced market is one where price levels encourage the production of the all-important marginal barrel of supply, or the last barrel needed to satisfy demand. At period-end, the marginal cost of production in global oil markets was roughly US$70–US$80, and we believe prices are likely to recover to these levels over our investment horizon.
The Fund’s underweighted allocation and stock selection in information technology also detracted, pressured by South Korean semiconductor and consumer electronics firm Samsung Electronics.3,4 Samsung shares declined amid cyclical weakness in the firm’s memory division, slowing growth in its highly successful smartphone business, and disappointment in the company’s decision not to issue a special dividend this year. We think that Samsung, with a cash hoard equal to one-third of its market capitalization, and trading near all-time lows on a number of meaningful valuation metrics, can weather current weakness and enjoy continued appreciation over our long-term investment horizon. Even after its recent decline, the stock was up roughly 500% from when it was first recommended for our
2. The energy sector comprises energy equipment and services; and oil, gas and consumable fuels in the SOI. 3. Not part of the index.
4. The information technology sector comprises communications equipment; electronic equipment, instruments and components; Internet software and services; IT services; semiconductors and semiconductor equipment; software; and technology hardware, storage and peripherals in the SOI.
franklintempleton.com
Annual Report
| 5
| | |
| TEMPLETON WORLD FUND | | |
| |
| |
| |
| Top 10 Holdings | | |
| 8/31/15 | | |
| Company | % of Total | |
| Sector/Industry, Country | Net Assets | |
| Samsung Electronics Co. Ltd. | 2.8 | % |
| Technology Hardware, Storage & Peripherals, South Korea | |
| Amgen Inc. | 2.6 | % |
| Biotechnology, U.S. | | |
| Citigroup Inc. | 2.6 | % |
| Banks, U.S. | | |
| Microsoft Corp. | 2.5 | % |
| Software, U.S. | | |
| BNP Paribas SA | 2.5 | % |
| Banks, France | | |
| Roche Holding AG | 2.3 | % |
| Pharmaceuticals, Switzerland | | |
| Credit Suisse Group AG | 2.1 | % |
| Capital Markets, Switzerland | | |
| Medtronic PLC | 2.1 | % |
| Health Care Equipment & Supplies, U.S. | | |
| Teva Pharmaceutical Industries Ltd., ADR | 2.0 | % |
| Pharmaceuticals, Israel | | |
| JPMorgan Chase & Co. | 2.0 | % |
| Banks, U.S. | | |
bargain list, and we see continued potential for price appreciation over the long term given our view of Samsung’s modest valuation and impressive market position across a range of lucrative technology products.
The Fund’s consumer holdings lagged during the period. From the consumer discretionary sector, shares of South Korean auto-maker Hyundai Motor declined as weaker demand from China and a stronger won negatively impacted sales.3,5 However, Hyundai moved to address China weakness by reducing prices to clear older inventory and make way for popular new models, which should improve capacity utilization in this important market. In our analysis, the stock became too cheap to ignore, trading near its financial crisis lows on several valuation metrics. Despite its depressed valuations, we do not believe Hyundai is a broken company. With an expanded product lineup of new vehicles slated for imminent delivery, Hyundai has done an excellent job improving the quality and diversification of its range. New plant openings outside of South Korea should help reduce sensitivity to the won, and the company continues to realize cost savings due to manufacturing efficiencies, particularly in its new products. We believed the stock remained a compelling long-term bargain for patient value investors.
Elsewhere in the consumer universe, despite generating positive absolute gains, consumer staples detracted from relative performance due to our underweighting in this defensive sector.6 Notably, however, U.S. pharmacy and benefits manager CVS Health finished among the Fund’s top contributors. The hybrid retail and health care business model pioneered by CVS has been remarkably successful and investors approved of the firm’s recent announcement of major acquisitions intended to galvanize further market share gains. More broadly, however, what we consider bargain opportunities among consumer staples stocks have become increasingly scarce as investors have been willing to pay a premium for the sector’s perceived combination of defensive revenue streams and emerging market growth exposure.
Despite the aforementioned challenges for value investors, the year in review did bring some encouraging results. Stock selection and an underweighted allocation in materials contributed to relative performance.7 Irish cement manufacturer CRH rose to an eight-year high as firmer demand in key markets like the U.S. and Europe improved the firm’s earnings outlook. We believed restructuring and cost-saving initiatives have been well executed thus far, and CRH also stood to potentially benefit from an acquisition of assets divested as a regulatory requirement of a merger between competitors. In contrast, however, South Korean steel-maker POSCO detracted from relative performance.3 POSCO shares fell to a nine-year low after the company reported weaker earnings and failed to impress investors with its turnaround plan. The oversupplied and fiercely competitive steel market has been very challenging, and POSCO’s former management team appeared to us to be too often distracted by an ill-advised diversification strategy into non-core businesses. With POSCO’s new management in place and a renewed focus on profitability and market share in the firm’s core steel-making operations, we believe POSCO should be positioned to potentially benefit from eventual supply rationalization in global steel markets over our long-term horizon. The stock’s historically low valuation multiple created significant scope for future appreciation based on our analysis.
Stock selection in the financials sector contributed to relative performance as our value thesis in the sector continued to mature.8 We went into the global financial crisis underweighted in banking stocks but soon thereafter began increasing exposure as many stocks traded at what we considered significant
5. The consumer discretionary sector comprises automobiles; media; specialty retail; and textiles, apparel and luxury goods in the SOI. 6. The consumer staples sector comprises food and staples retailing in the SOI.
7. The materials sector comprises chemicals, construction materials, and metals and mining in the SOI.
8. The financials sector comprises banks, capital markets, consumer finance, diversified financial services, insurance, and real estate management and development in the SOI.
6 | Annual Report
franklintempleton.com
TEMPLETON WORLD FUND
discounts to tangible book value, historically an attractive entry point for long-term investors. Six years later the industry has largely restructured, recapitalized and refocused on core earnings drivers. Dutch lender ING Groep, one of the Fund’s top contributors during the period, is an excellent example of the progress that has been made at the corporate level in the banking industry. After years of drastic restructuring following a state-sponsored bailout, ING has divested non-core businesses and repaid in full the Dutch government’s crisis-era rescue loan. The firm comfortably passed the ECB’s stress tests earlier this year and once again began to grow its loan book, subsequently generating higher profitability levels and a strong share price rally.
The Fund’s overweighted allocation in health care contributed to relative performance, but stock selection in the sector detracted from relative results.9 We increased our allocation throughout the 2000s as consensus fears about an impending patent cliff and waning research and development productivity led to valuations we considered attractive. The industry largely survived the patent cliff, and companies implemented successful strategies designed to rein in bloated cost structures and refocus investment on new drug development. We found value across the sector, including in major pharmaceuticals companies like Pfizer (U.S.), innovative biotechnology companies like Amgen (U.S.), growth-oriented devices firms like Medtronic (U.S.), and specialty pharmaceuticals firms like Teva Pharmaceutical Industries3 (Israel), each of which finished among the Fund’s top 10 contributors during the year in review.
Turning to regions, relative weakness was primarily attributable to an overweighted allocation and stock selection in Europe as well as stock selection in Asia. In our analysis, European stocks at period-end traded at major discounts to their U.S. peers on most cycle-adjusted valuation metrics. We saw little justification for this discount; given the different stages of eco nomic, earnings and policy cycles, we think European equities should trade at a premium. Corporate earnings have improved significantly since the spring, leading economic indicators have been encouraging, and improving credit conditions were helping to underpin a sustainable recovery. Overall, we believe Europe continued to manage its unique policy and political challenges well, and featured reasonably valued companies with strong operating leverage that were positioned to potentially benefit from an improving growth environment. Asian
| | |
| Top 10 Countries | | |
| 8/31/15 | | |
| | % of Total | |
| | Net Assets | |
| U.S. | 34.1 | % |
| U.K. | 16.5 | % |
| France | 7.6 | % |
| South Korea | 6.7 | % |
| Switzerland | 6.1 | % |
| Germany | 4.4 | % |
| Japan | 3.9 | % |
| Netherlands | 3.2 | % |
| Italy | 2.6 | % |
| Singapore | 2.1 | % |
weakness was primarily attributable to investments in South Korea3 such as the aforementioned Samsung, Hyundai and POSCO. South Korean stocks encountered significant head-winds as the period progressed due to a strengthening won (which impinged export profitability), corporate governance concerns at some of the country’s bellwether conglomerates and a flu-like viral outbreak that dampened economic activity. However, in our opinion, valuations in the market remained unusually cheap, particularly for larger capitalization stocks, and we were encouraged by recent government-sponsored corporate reform measures that we think should benefit minority shareholders over the long term. Elsewhere, the Fund’s underweighted allocation and stock selection in the U.S. detracted from relative performance given the country’s continued strong performance. However, the Fund’s allocation to the U.S. remained meaningful. Although we continued to find attractive values at the bottom-up level, the U.S. was still among the world’s most expensive markets and corporate profit margins remained near record levels, making it difficult for us to find sufficient bargains to even approach the global benchmark’s comparatively large U.S. allocation.
It is important to recognize the effect of currency movements on the Fund’s performance. In general, if the value of the U.S. dollar goes up compared with a foreign currency, an investment traded in that foreign currency will go down in value because it will be worth fewer U.S. dollars. This can have a negative effect on Fund performance. Conversely, when the U.S. dollar weakens in relation to a foreign currency, an investment traded
9. The health care sector comprises biotechnology, health care equipment and supplies, life sciences tools and services, and pharmaceuticals in the SOI.
See www.franklintempletondatasources.com for additional data provider information.
franklintempleton.com Annual Report | 7
TEMPLETON WORLD FUND
in that foreign currency will increase in value, which can contribute to Fund performance. For the 12 months ended August 31, 2015, the U.S. dollar rose in value relative to most currencies. As a result, the Fund’s performance was negatively affected by the portfolio’s substantial investment in securities with non-U.S. currency exposure.
During challenging times, we often turn for perspective to the words of our firm’s founder, Sir John Templeton. In 1995, he wrote, “In almost every activity of normal life people try to go where the outlook is best. ... You look for a job in an industry with a good future, or build a factory where the prospects are best. But my contention is if you’re selecting publicly traded investments, you have to do the opposite. You’re trying to buy a share at the lowest possible price in relation to what that corporation is worth. And there’s only one reason a share goes to a bargain price — because other people are selling. There is no other reason. To get a bargain price, you’ve got to look for where the public is most frightened and pessimistic.” As valuations have risen with equity markets since the recovery from the global financial crisis, we have continued to search pockets of fear and pessimism where we believe we can still find long-term value for our clients. Although the market has not favored this style of value investing in recent years, we have maintained our disciplined process and continue to believe it will pay off over the long term. Central banks cannot support global financial markets with extraordinary stimulus indefinitely. Historically, when policymakers have raised interest rates (as we believe the Fed is likely preparing to do), value investing has outperformed. As central banks begin the delicate process of withdrawing stimulus, and global economies find their footing in a market-based (as opposed to policy-driven) system, we believe the ensuing normalization of interest rate and economic conditions will support the process of value recognition at the individual stock level. We believe the Fund is well positioned to take advantage of this eventual normalization and add to its long-term performance.
Thank you for your continued participation in Templeton World Fund. We look forward to serving your future investment needs.
The foregoing information reflects our analysis, opinions and portfolio holdings as of August 31, 2015, the end of the reporting period. The way we implement our main investment strategies and the resulting portfolio holdings may change depending on factors such as market and economic conditions. These opinions may not be relied upon as investment advice or an offer for a particular security. The information is not a complete analysis of every aspect of any market, country, industry, security or the Fund. Statements of fact are from sources considered reliable, but the investment manager makes no representation or warranty as to their completeness or accuracy. Although historical performance is no guarantee of future results, these insights may help you understand our investment management philosophy.
8 | Annual Report
franklintempleton.com
TEMPLETON WORLD FUND
Performance Summary as of August 31, 2015
Your dividend income will vary depending on dividends or interest paid by securities in the Fund’s portfolio, adjusted for operating expenses of each class. Capital gain distributions are net profits realized from the sale of portfolio securities. The performance table and graphs do not reflect any taxes that a shareholder would pay on Fund dividends, capital gain distributions, if any, or any realized gains on the sale of Fund shares. Total return reflects reinvestment of the Fund’s dividends and capital gain distributions, if any, and any unrealized gains or losses.
| | | | | | | | |
| Net Asset Value | | | | | | | | |
| Share Class (Symbol) | | 8/31/15 | | 8/31/14 | | Change | | |
| A (TEMWX) | $ | 16.51 | $ | 20.18 | -$ | 3.67 | | |
| C (TEWTX) | $ | 15.86 | $ | 19.44 | -$ | 3.58 | | |
| R6 (FTWRX) | $ | 16.50 | $ | 20.18 | -$ | 3.68 | | |
| Advisor (TWDAX) | $ | 16.50 | $ | 20.18 | -$ | 3.68 | | |
| |
| |
| Distributions1 (9/1/14–8/31/15) | | | | | | | | |
| | | Dividend | | Short-Term | | Long-Term | | |
| Share Class | | Income | | Capital Gain | | Capital Gain | | Total |
| A | $ | 0.5185 | $ | 0.1367 | $ | 0.9487 | $ | 1.6039 |
| C | $ | 0.3761 | $ | 0.1367 | $ | 0.9487 | $ | 1.4615 |
| R6 | $ | 0.5860 | $ | 0.1367 | $ | 0.9487 | $ | 1.6714 |
| Advisor | $ | 0.5703 | $ | 0.1367 | $ | 0.9487 | $ | 1.6557 |
franklintempleton.com
Annual Report
| 9
TEMPLETON WORLD FUND
PERFORMANCE SUMMARY
Performance as of 8/31/15
Cumulative total return excludes sales charges. Average annual total returns and value of $10,000 investment include maximum sales charges. Class A: 5.75% maximum initial sales charge; Class C: 1% contingent deferred sales charge in first year only;
Class R6/Advisor Class: no sales charges.
| | | | | | | | | | |
| | | | | | | | Average Annual | | | |
| | Cumulative | | Average Annual | | | Value of $10,000 | Total Return | | Total Annual | |
| Share Class | Total Return2 | | Total Return3 | | | Investment4 | (9/30/15 | )5 | Operating Expenses6 | |
| A | | | | | | | | | 1.05 | % |
| 1-Year | -10.59 | % | -15.72 | % | $ | 8,428 | -17.07 | % | | |
| 5-Year | +61.44 | % | +8.75 | % | $ | 15,212 | +5.66 | % | | |
| 10-Year | +62.15 | % | +4.33 | % | $ | 15,286 | +3.48 | % | | |
| C | | | | | | | | | 1.80 | % |
| 1-Year | -11.27 | % | -12.08 | % | $ | 8,792 | -13.51 | % | | |
| 5-Year | +55.36 | % | +9.21 | % | $ | 15,536 | +6.09 | % | | |
| 10-Year | +50.33 | % | +4.16 | % | $ | 15,033 | +3.31 | % | | |
| R6 | | | | | | | | | 0.72 | % |
| 1-Year | -10.30 | % | -10.30 | % | $ | 8,970 | -11.72 | % | | |
| Since Inception (5/1/13) | +11.40 | % | +4.73 | % | $ | 11,140 | +2.33 | % | | |
| Advisor7 | | | | | | | | | 0.80 | % |
| 1-Year | -10.38 | % | -10.38 | % | $ | 8,962 | -11.79 | % | | |
| 5-Year | +63.35 | % | +10.31 | % | $ | 16,335 | +7.17 | % | | |
| 10-Year | +65.92 | % | +5.19 | % | $ | 16,592 | +4.33 | % | | |
Performance data represent past performance, which does not guarantee future results. Investment return and principal value will fluctuate, and you may have a gain or loss when you sell your shares. Current performance may differ from figures shown. For most recent month-end performance, go to franklintempleton.com or call (800) 342-5236.
10 | Annual Report
franklintempleton.com
TEMPLETON WORLD FUND
PERFORMANCE SUMMARY
Total Return Index Comparison for a Hypothetical $10,000 Investment
Total return represents the change in value of an investment over the periods shown. It includes any applicable maximum sales charge, Fund expenses, account fees and reinvested distributions. The unmanaged index includes reinvestment of any income or distributions. It differs from the Fund in composition and does not pay management fees or expenses. One cannot invest directly in an index.
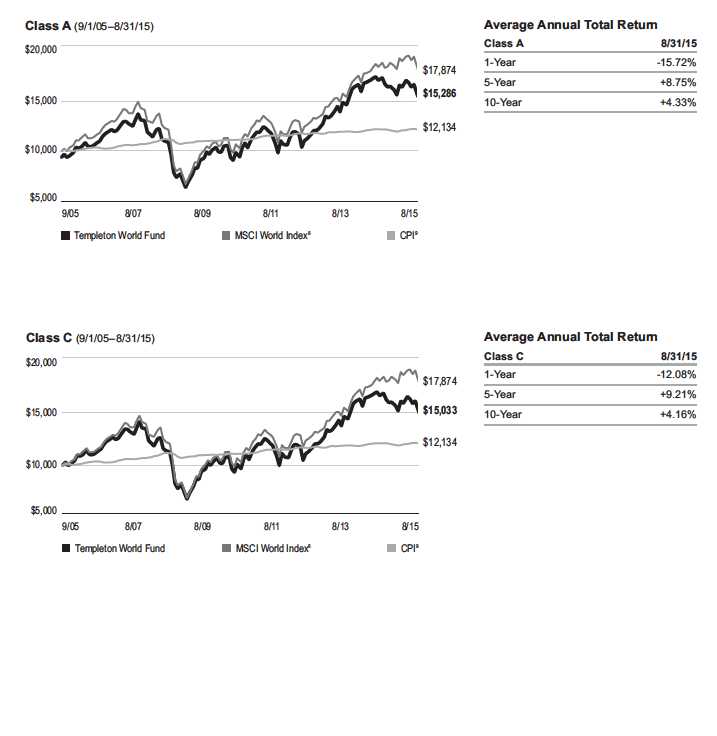
franklintempleton.com Annual Report | 11
TEMPLETON WORLD FUND
PERFORMANCE SUMMARY
Total Return Index Comparison for a Hypothetical $10,000 Investment (continued)
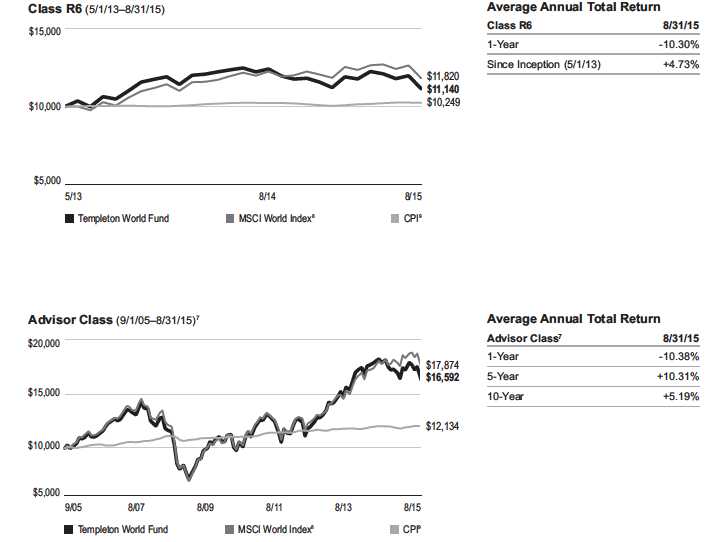
12 | Annual Report
franklintempleton.com
TEMPLETON WORLD FUND
PERFORMANCE SUMMARY
All investments involve risks, including possible loss of principal. Special risks are associated with foreign investing, including currency fluctuations, economic instability and political developments; investments in emerging markets involve heightened risks related to the same factors. In addition, smaller company stocks have historically experienced more price volatility than larger company stocks, especially over the short term. To the extent the Fund focuses on particular countries, regions, industries, sectors or types of investment from time to time, it may be subject to greater risks of adverse developments in such areas of focus than a fund that invests in a wider variety of countries, regions, industries, sectors or investments. The Fund is actively managed but there is no guarantee that the manager’s investment decisions will produce the desired results. The Fund’s prospectus also includes a description of the main investment risks.
Class C: These shares have higher annual fees and expenses than Class A shares.
Class R6: Shares are available to certain eligible investors as described in the prospectus.
Advisor Class: Shares are available to certain eligible investors as described in the prospectus.
1. The distribution amount is the sum of the dividend payments to shareholders for the period shown and includes only estimated tax-basis net investment income and
capital gain.
2. Cumulative total return represents the change in value of an investment over the periods indicated.
3. Average annual total return represents the average annual change in value of an investment over the periods indicated.
4. These figures represent the value of a hypothetical $10,000 investment in the Fund over the periods indicated.
5. In accordance with SEC rules, we provide standardized average annual total return information through the latest calendar quarter.
6. Figures are as stated in the Fund’s current prospectus. In periods of market volatility, assets may decline significantly, causing total annual Fund operating expenses to
become higher than the figures shown.
7. Effective 5/15/06, the Fund began offering Advisor Class shares, which do not have sales charges or a Rule 12b-1 plan. Performance quotations for this class reflect the
following methods of calculation: (a) For periods prior to 5/15/06, a restated figure is used based upon the Fund’s Class A performance, excluding the effect of Class A’s
maximum initial sales charge, but reflecting the effect of the Class A Rule 12b-1 fees; and (b) for periods after 5/15/06, actual Advisor Class performance is used reflecting
all charges and fees applicable to that class. Since 5/15/06 (commencement of sales), the cumulative and average annual total returns of Advisor Class shares were
+44.98% and +4.08%.
8. Source: Morningstar. The MSCI World Index is a free float-adjusted, market capitalization-weighted index designed to measure equity market performance in global
developed markets.
9. Source: Bureau of Labor Statistics, bls.gov/cpi. The Consumer Price Index (CPI) is a commonly used measure of the inflation rate.
See www.franklintempletondatasources.com for additional data provider information.
franklintempleton.com
Annual Report
| 13
TEMPLETON WORLD FUND
Your Fund’s Expenses
As a Fund shareholder, you can incur two types of costs:
- Transaction costs, including sales charges (loads) on Fund purchases; and
- Ongoing Fund costs, including management fees, distribu- tion and service (12b-1) fees, and other Fund expenses. All mutual funds have ongoing costs, sometimes referred to as operating expenses.
The following table shows ongoing costs of investing in the Fund and can help you understand these costs and compare them with those of other mutual funds. The table assumes a $1,000 investment held for the six months indicated.
Actual Fund Expenses
The first line (Actual) for each share class listed in the table provides actual account values and expenses. The “Ending Account Value” is derived from the Fund’s actual return, which includes the effect of Fund expenses.
You can estimate the expenses you paid during the period by following these steps. Of course, your account value and expenses will differ from those in this illustration:
| 1. | Divide your account value by $1,000. |
| | If an account had an $8,600 value, then $8,600 ÷ $1,000 = 8.6. |
| 2. | Multiply the result by the number under the heading “Expenses Paid During Period.” |
| | If Expenses Paid During Period were $7.50, then 8.6 x $7.50 = $64.50. |
In this illustration, the estimated expenses paid this period are $64.50.
Hypothetical Example for Comparison with Other Funds
Information in the second line (Hypothetical) for each class in the table can help you compare ongoing costs of investing in the Fund with those of other mutual funds. This information may not be used to estimate the actual ending account balance or expenses you paid during the period. The hypothetical “Ending Account Value” is based on the actual expense ratio for each class and an assumed 5% annual rate of return before expenses, which does not represent the Fund’s actual return. The figure under the heading “Expenses Paid During Period” shows the hypothetical expenses your account would have incurred under this scenario. You can compare this figure with the 5% hypothetical examples that appear in shareholder reports of other funds.
Please note that expenses shown in the table are meant to highlight ongoing costs and do not reflect any transaction costs, such as sales charges. Therefore, the second line for each class is useful in comparing ongoing costs only, and will not help you compare total costs of owning different funds. In addition, if transaction costs were included, your total costs would have been higher. Please refer to the Fund prospectus for additional information on operating expenses.
14 | Annual Report
franklintempleton.com
TEMPLETON WORLD FUND
YOUR FUND’S EXPENSES
| | | | | | |
| | | Beginning Account | | Ending Account | | Expenses Paid During |
| Share Class | | Value 3/1/15 | | Value 8/31/15 | | Period* 3/1/15–8/31/15 |
| A | | | | | | |
| Actual | $ | 1,000 | $ | 933.30 | $ | 5.17 |
| Hypothetical (5% return before expenses) | $ | 1,000 | $ | 1,019.86 | $ | 5.40 |
| C | | | | | | |
| Actual | $ | 1,000 | $ | 929.70 | $ | 8.80 |
| Hypothetical (5% return before expenses) | $ | 1,000 | $ | 1,016.08 | $ | 9.20 |
| R6 | | | | | | |
| Actual | $ | 1,000 | $ | 934.80 | $ | 3.51 |
| Hypothetical (5% return before expenses) | $ | 1,000 | $ | 1,021.58 | $ | 3.67 |
| Advisor | | | | | | |
| Actual | $ | 1,000 | $ | 934.30 | $ | 3.95 |
| Hypothetical (5% return before expenses) | $ | 1,000 | $ | 1,021.12 | $ | 4.13 |
*Expenses are calculated using the most recent six-month expense ratio, annualized for each class (A: 1.06%; C: 1.81%; R6: 0.72%; and Advisor: 0.81%), multiplied by the average account value over the period, multiplied by 184/365, to reflect the one-half year period.
franklintempleton.com
Annual Report
| 15
TEMPLETON WORLD FUND
| | | | | | | | | | | | | | | |
| Financial Highlights | | | | | | | | | | | | | | | |
| | | | | | Year Ended August 31, | | | | |
| | | 2015 | | | 2014 | | | 2013 | | | 2012 | | | 2011 | |
| Class A | | | | | | | | | | | | | | | |
| Per share operating performance | | | | | | | | | | | | | | | |
| (for a share outstanding throughout the year) | | | | | | | | | | | | | | | |
| Net asset value, beginning of year | $ | 20.18 | | $ | 18.02 | | $ | 15.06 | | $ | 14.21 | | $ | 12.74 | |
| Income from investment operationsa: | | | | | | | | | | | | | | | |
| Net investment incomeb | | 0.29 | | | 0.43 | c | | 0.25 | | | 0.29 | | | 0.24 | |
| Net realized and unrealized gains (losses) | | (2.35 | ) | | 2.75 | | | 3.38 | | | 0.84 | | | 1.47 | |
| Total from investment operations | | (2.06 | ) | | 3.18 | | | 3.63 | | | 1.13 | | | 1.71 | |
| Less distributions from: | | | | | | | | | | | | | | | |
| Net investment income | | (0.52 | ) | | (0.19 | ) | | (0.42 | ) | | (0.28 | ) | | (0.24 | ) |
| Net realized gains | | (1.09 | ) | | (0.83 | ) | | (0.25 | ) | | — | | | — | |
| Total distributions | | (1.61 | ) | | (1.02 | ) | | (0.67 | ) | | (0.28 | ) | | (0.24 | ) |
| Net asset value, end of year | $ | 16.51 | | $ | 20.18 | | $ | 18.02 | | $ | 15.06 | | $ | 14.21 | |
| |
| Total returnd | | (10.59 | )% | | 17.96 | % | | 24.71 | % | | 8.18 | % | | 13.45 | % |
| |
| Ratios to average net assets | | | | | | | | | | | | | | | |
| Expenses | | 1.06 | %e | | 1.05 | % | | 1.05 | %f | | 1.09 | % | | 1.07 | %f |
| Net investment income | | 1.61 | % | | 2.20 | %c | | 1.49 | % | | 1.99 | % | | 1.62 | % |
| |
| Supplemental data | | | | | | | | | | | | | | | |
| Net assets, end of year (000’s) | $ | 4,791,792 | | $ | 5,917,398 | | $ | 5,278,292 | | $ | 4,857,469 | | $ | 5,067,228 | |
| Portfolio turnover rate | | 15.73 | % | | 18.56 | % | | 17.57 | % | | 18.77 | % | | 16.11 | % |
aThe amount shown for a share outstanding throughout the period may not correlate with the Statement of Operations for the period due to the timing of sales and
repurchases of the Fund’s shares in relation to income earned and/or fluctuating fair value of the investments of the Fund.
bBased on average daily shares outstanding.
cNet investment income per share includes approximately $0.18 per share received in the form of a special dividend paid in connection with certain Fund’s holdings.
Excluding this amount, the ratio of net investment income to average net assets would have been 1.30%.
dTotal return does not reflect sales commissions or contingent deferred sales charges, if applicable.
eBenefit of waiver and payments by affiliates rounds to less than 0.01%.
fBenefit of expense reduction rounds to less than 0.01%.
16 | Annual Report | The accompanying notes are an integral part of these financial statements.
franklintempleton.com
| | | | | | | | | | | | | | | |
| | | | | | | | | TEMPLETON WORLD FUND | |
| | | | | | | | | FINANCIAL HIGHLIGHTS | |
| |
| |
| |
| |
| | | | | | Year Ended August 31, | | | | |
| | | 2015 | | | 2014 | | | 2013 | | | 2012 | | | 2011 | |
| Class C | | | | | | | | | | | | | | | |
| Per share operating performance | | | | | | | | | | | | | | | |
| (for a share outstanding throughout the year) | | | | | | | | | | | | | | | |
| Net asset value, beginning of year | $ | 19.44 | | $ | 17.40 | | $ | 14.53 | | $ | 13.69 | | $ | 12.28 | |
| Income from investment operationsa: | | | | | | | | | | | | | | | |
| Net investment incomeb | | 0.15 | | | 0.27 | c | | 0.12 | | | 0.17 | | | 0.13 | |
| Net realized and unrealized gains (losses) | | (2.26 | ) | | 2.66 | | | 3.26 | | | 0.83 | | | 1.41 | |
| Total from investment operations | | (2.11 | ) | | 2.93 | | | 3.38 | | | 1.00 | | | 1.54 | |
| Less distributions from: | | | | | | | | | | | | | | | |
| Net investment income | | (0.38 | ) | | (0.06 | ) | | (0.26 | ) | | (0.16 | ) | | (0.13 | ) |
| Net realized gains | | (1.09 | ) | | (0.83 | ) | | (0.25 | ) | | — | | | — | |
| Total distributions | | (1.47 | ) | | (0.89 | ) | | (0.51 | ) | | (0.16 | ) | | (0.13 | ) |
| Net asset value, end of year | $ | 15.86 | | $ | 19.44 | | $ | 17.40 | | $ | 14.53 | | $ | 13.69 | |
| |
| Total returnd | | (11.27 | )% | | 17.08 | % | | 23.76 | % | | 7.41 | % | | 12.50 | % |
| |
| Ratios to average net assets | | | | | | | | | | | | | | | |
| Expenses | | 1.81 | %e | | 1.80 | % | | 1.81 | %f | | 1.84 | % | | 1.82 | %f |
| Net investment income | | 0.86 | % | | 1.45 | %c | | 0.73 | % | | 1.24 | % | | 0.87 | % |
| |
| Supplemental data | | | | | | | | | | | | | | | |
| Net assets, end of year (000’s) | $ | 193,309 | | $ | 241,635 | | $ | 210,256 | | $ | 186,483 | | $ | 201,956 | |
| Portfolio turnover rate | | 15.73 | % | | 18.56 | % | | 17.57 | % | | 18.77 | % | | 16.11 | % |
aThe amount shown for a share outstanding throughout the period may not correlate with the Statement of Operations for the period due to the timing of sales and
repurchases of the Fund’s shares in relation to income earned and/or fluctuating fair value of the investments of the Fund.
bBased on average daily shares outstanding.
cNet investment income per share includes approximately $0.18 per share received in the form of a special dividend paid in connection with certain Fund’s holdings.
Excluding this amount, the ratio of net investment income to average net assets would have been 0.55%.
dTotal return does not reflect sales commissions or contingent deferred sales charges, if applicable.
eBenefit of waiver and payments by affiliates rounds to less than 0.01%.
fBenefit of expense reduction rounds to less than 0.01%.
franklintempleton.com
The accompanying notes are an integral part of these financial statements. | Annual Report | 17
|
| TEMPLETON WORLD FUND |
| FINANCIAL HIGHLIGHTS |
| | | | | | | | | |
| | | Year Ended August 31, | |
| | | 2015 | | | 2014 | | | 2013 | a |
| Class R6 | | | | | | | | | |
| Per share operating performance | | | | | | | | | |
| (for a share outstanding throughout the year) | | | | | | | | | |
| Net asset value, beginning of year | $ | 20.18 | | $ | 18.02 | | $ | 17.17 | |
| Income from investment operationsb: | | | | | | | | | |
| Net investment incomec | | 0.35 | | | 0.57 | d | | 0.12 | |
| Net realized and unrealized gains (losses) | | (2.35 | ) | | 2.67 | | | 0.73 | |
| Total from investment operations | | (2.00 | ) | | 3.24 | | | 0.85 | |
| Less distributions from: | | | | | | | | | |
| Net investment income | | (0.59 | ) | | (0.25 | ) | | — | |
| Net realized gains | | (1.09 | ) | | (0.83 | ) | | — | |
| Total distributions | | (1.68 | ) | | (1.08 | ) | | — | |
| Net asset value, end of year | $ | 16.50 | | $ | 20.18 | | $ | 18.02 | |
| |
| Total returne | | (10.30 | )% | | 18.40 | % | | 4.95 | % |
| |
| Ratios to average net assetsf | | | | | | | | | |
| Expenses | | 0.72 | %g | | 0.72 | % | | 0.72 | %h |
| Net investment income | | 1.95 | % | | 2.53 | %d | | 1.82 | % |
| |
| Supplemental data | | | | | | | | | |
| Net assets, end of year (000’s) | $ | 51,733 | | $ | 55,175 | | $ | 24,306 | |
| Portfolio turnover rate | | 15.73 | % | | 18.56 | % | | 17.57 | % |
aFor the period May 1, 2013 (effective date) to August 31, 2013.
bThe amount shown for a share outstanding throughout the period may not correlate with the Statement of Operations for the period due to the timing of sales and
repurchases of the Fund’s shares in relation to income earned and/or fluctuating fair value of the investments of the Fund.
cBased on average daily shares outstanding.
dNet investment income per share includes approximately $0.18 per share received in the form of a special dividend paid in connection with certain Fund’s holdings.
Excluding this amount, the ratio of net investment income to average net assets would have been 1.63%.
eTotal return is not annualized for periods less than one year.
fRatios are annualized for periods less than one year.
gBenefit of waiver and payments by affiliates rounds to less than 0.01%.
hBenefit of expense reduction rounds to less than 0.01%.
18 | Annual Report | The accompanying notes are an integral part of these financial statements.
franklintempleton.com
| | | | | | | | | | | | | | | |
| | | | | | | | | TEMPLETON WORLD FUND | |
| | | | | | | | | FINANCIAL HIGHLIGHTS | |
| |
| |
| |
| |
| | | | | | Year Ended August 31, | | | | |
| | | 2015 | | | 2014 | | | 2013 | | | 2012 | | | 2011 | |
| Advisor Class | | | | | | | | | | | | | | | |
| Per share operating performance | | | | | | | | | | | | | | | |
| (for a share outstanding throughout the year) | | | | | | | | | | | | | | | |
| Net asset value, beginning of year | $ | 20.18 | | $ | 18.01 | | $ | 15.07 | | $ | 14.22 | | $ | 12.75 | |
| Income from investment operationsa: | | | | | | | | | | | | | | | |
| Net investment incomeb | | 0.33 | | | 0.48 | c | | 0.30 | | | 0.33 | | | 0.29 | |
| Net realized and unrealized gains (losses) | | (2.35 | ) | | 2.75 | | | 3.36 | | | 0.84 | | | 1.46 | |
| Total from investment operations | | (2.02 | ) | | 3.23 | | | 3.66 | | | 1.17 | | | 1.75 | |
| Less distributions from: | | | | | | | | | | | | | | | |
| Net investment income | | (0.57 | ) | | (0.23 | ) | | (0.47 | ) | | (0.32 | ) | | (0.28 | ) |
| Net realized gains | | (1.09 | ) | | (0.83 | ) | | (0.25 | ) | | — | | | — | |
| Total distributions | | (1.66 | ) | | (1.06 | ) | | (0.72 | ) | | (0.32 | ) | | (0.28 | ) |
| Net asset value, end of year | $ | 16.50 | | $ | 20.18 | | $ | 18.01 | | $ | 15.07 | | $ | 14.22 | |
| |
| Total return | | (10.38 | )% | | 18.29 | % | | 24.97 | % | | 8.51 | % | | 13.63 | % |
| |
| Ratios to average net assets | | | | | | | | | | | | | | | |
| Expenses | | 0.81 | %d | | 0.80 | % | | 0.81 | %e | | 0.84 | % | | 0.82 | %e |
| Net investment income | | 1.86 | % | | 2.45 | %c | | 1.73 | % | | 2.24 | % | | 1.87 | % |
| |
| Supplemental data | | | | | | | | | | | | | | | |
| Net assets, end of year (000’s) | $ | 181,661 | | $ | 273,478 | | $ | 216,767 | | $ | 232,104 | | $ | 191,488 | |
| Portfolio turnover rate | | 15.73 | % | | 18.56 | % | | 17.57 | % | | 18.77 | % | | 16.11 | % |
aThe amount shown for a share outstanding throughout the period may not correlate with the Statement of Operations for the period due to the timing of sales and
repurchases of the Fund’s shares in relation to income earned and/or fluctuating fair value of the investments of the Fund.
bBased on average daily shares outstanding.
cNet investment income per share includes approximately $0.18 per share received in the form of a special dividend paid in connection with certain Fund’s holdings.
Excluding this amount, the ratio of net investment income to average net assets would have been 1.55%.
dBenefit of waiver and payments by affiliates rounds to less than 0.01%.
eBenefit of expense reduction rounds to less than 0.01%.
franklintempleton.com
The accompanying notes are an integral part of these financial statements. | Annual Report | 19
TEMPLETON WORLD FUND
| | | | |
| Statement of Investments, August 31, 2015 | | | | |
| | Industry | Shares | | Value |
| Common Stocks 98.6% | | | | |
| Austria 0.3% | | | | |
| UNIQA Insurance Group AG | Insurance | 309,458 | $ | 2,585,229 |
| aUNIQA Insurance Group AG, 144A | Insurance | 1,891,099 | | 15,798,341 |
| | | | | 18,383,570 |
| Belgium 0.3% | | | | |
| UCB SA | Pharmaceuticals | 198,590 | | 15,042,419 |
| Canada 0.8% | | | | |
| Suncor Energy Inc. | Oil, Gas & Consumable Fuels | 1,494,077 | | 42,329,247 |
| Trican Well Service Ltd. | Energy Equipment & Services | 869,300 | | 1,216,220 |
| | | | | 43,545,467 |
| China 1.0% | | | | |
| bGCL-Poly Energy Holdings Ltd. | Semiconductors & | | | |
| | Semiconductor Equipment | 115,922,000 | | 18,846,674 |
| Kunlun Energy Co. Ltd. | Oil, Gas & Consumable Fuels | 34,333,100 | | 24,365,426 |
| Weichai Power Co. Ltd., H | Machinery | 6,584,000 | | 7,068,243 |
| | | | | 50,280,343 |
| France 7.6% | | | | |
| AXA SA | Insurance | 2,231,490 | | 56,246,292 |
| BNP Paribas SA | Banks | 2,071,960 | | 130,754,769 |
| Compagnie de Saint-Gobain | Building Products | 130,095 | | 5,976,856 |
| Sanofi | Pharmaceuticals | 1,026,720 | | 101,524,794 |
| Technip SA | Energy Equipment & Services | 445,020 | | 24,235,806 |
| Total SA, B | Oil, Gas & Consumable Fuels | 1,704,440 | | 77,999,955 |
| | | | | 396,738,472 |
| Germany 4.4% | | | | |
| Deutsche Boerse AG | Diversified Financial Services | 461,140 | | 41,264,873 |
| bDeutsche Lufthansa AG | Airlines | 3,199,050 | | 38,944,857 |
| Merck KGaA | Pharmaceuticals | 523,150 | | 50,028,991 |
| Metro AG | Food & Staples Retailing | 981,551 | | 28,654,068 |
| SAP SE | Software | 240,384 | | 16,172,743 |
| Siemens AG | Industrial Conglomerates | 546,680 | | 54,234,966 |
| | | | | 229,300,498 |
| Hong Kong 0.5% | | | | |
| bCheung Kong Property Holdings Ltd. | Real Estate Management | | | |
| | & Development | 570,170 | | 3,994,869 |
| CK Hutchison Holdings Ltd. | Industrial Conglomerates | 570,170 | | 7,592,457 |
| Noble Group Ltd. | Trading Companies & Distributors | 37,017,100 | | 14,298,901 |
| | | | | 25,886,227 |
| India 0.3% | | | | |
| Reliance Industries Ltd. | Oil, Gas & Consumable Fuels | 1,171,931 | | 15,119,536 |
| Ireland 1.7% | | | | |
| CRH PLC | Construction Materials | 2,899,454 | | 86,788,873 |
| aCRH PLC, 144A | Construction Materials | 20,100 | | 601,650 |
| | | | | 87,390,523 |
| Israel 2.0% | | | | |
| Teva Pharmaceutical Industries Ltd., ADR | Pharmaceuticals | 1,615,064 | | 104,026,272 |
20 | Annual Report
franklintempleton.com
TEMPLETON WORLD FUND
STATEMENT OF INVESTMENTS
| | | | |
| | Industry | Shares | | Value |
| Common Stocks (continued) | | | | |
| Italy 2.6% | | | | |
| Eni SpA | Oil, Gas & Consumable Fuels | 3,695,594 | $ | 60,635,621 |
| UniCredit SpA | Banks | 11,423,784 | | 74,692,637 |
| | | | | 135,328,258 |
| Japan 3.9% | | | | |
| ITOCHU Corp. | Trading Companies & Distributors | 2,620,370 | | 31,457,840 |
| Nissan Motor Co. Ltd. | Automobiles | 10,249,400 | | 92,738,303 |
| SoftBank Group Corp. | Wireless Telecommunication | | | |
| | Services | 987,100 | | 57,504,844 |
| Toyota Motor Corp. | Automobiles | 401,450 | | 23,814,157 |
| | | | | 205,515,144 |
| Netherlands 3.2% | | | | |
| Aegon NV | Insurance | 4,593,720 | | 28,263,086 |
| Akzo Nobel NV | Chemicals | 389,120 | | 26,332,259 |
| ING Groep NV, IDR | Banks | 4,298,662 | | 65,781,851 |
| bQIAGEN NV | Life Sciences Tools & Services | 1,170,061 | | 30,922,543 |
| bSBM Offshore NV | Energy Equipment & Services | 1,306,962 | | 15,610,321 |
| | | | | 166,910,060 |
| Norway 1.1% | | | | |
| Telenor ASA | Diversified Telecommunication | | | |
| | Services | 2,856,120 | | 56,960,248 |
| Portugal 0.7% | | | | |
| Galp Energia SGPS SA, B | Oil, Gas & Consumable Fuels | 3,335,170 | | 35,148,473 |
| Russia 0.4% | | | | |
| LUKOIL PJSC, ADR (London Stock Exchange) | Oil, Gas & Consumable Fuels | 61,774 | | 2,330,116 |
| Mining and Metallurgical Co. Norilsk Nickel OJSC, ADR | Metals & Mining | 1,170,362 | | 18,532,682 |
| | | | | 20,862,798 |
| Singapore 2.1% | | | | |
| DBS Group Holdings Ltd. | Banks | 3,301,396 | | 41,557,015 |
| bFlextronics International Ltd. | Electronic Equipment, Instruments | | | |
| | & Components | 2,477,274 | | 26,036,150 |
| Singapore Telecommunications Ltd. | Diversified Telecommunication | | | |
| | Services | 15,862,261 | | 42,047,527 |
| | | | | 109,640,692 |
| South Korea 6.7% | | | | |
| Hana Financial Group Inc. | Banks | 1,746,727 | | 40,176,375 |
| Hyundai Motor Co. | Automobiles | 446,466 | | 56,253,750 |
| KB Financial Group Inc. | Banks | 1,876,166 | | 56,797,746 |
| POSCO | Metals & Mining | 293,882 | | 47,217,545 |
| Samsung Electronics Co. Ltd. | Technology Hardware, Storage | | | |
| | & Peripherals | 160,895 | | 148,165,552 |
| | | | | 348,610,968 |
| Spain 1.3% | | | | |
| Telefonica SA | Diversified Telecommunication | | | |
| | Services | 4,853,814 | | 68,534,321 |
franklintempleton.com
Annual Report
| 21
TEMPLETON WORLD FUND
STATEMENT OF INVESTMENTS
| | | | |
| | Industry | Shares | | Value |
| Common Stocks (continued) | | | | |
| Switzerland 6.1% | | | | |
| ABB Ltd. | Electrical Equipment | 1,244,840 | $ | 24,040,510 |
| Credit Suisse Group AG | Capital Markets | 4,136,425 | | 111,032,044 |
| Roche Holding AG | Pharmaceuticals | 438,202 | | 119,664,161 |
| Swiss Re AG | Insurance | 711,990 | | 61,164,489 |
| | | | | 315,901,204 |
| Taiwan 0.7% | | | | |
| Taiwan Semiconductor Manufacturing Co. Ltd. | Semiconductors & | | | |
| | Semiconductor Equipment | 2,423,578 | | 9,623,886 |
| Tripod Technology Corp. | Electronic Equipment, Instruments | | | |
| | & Components | 20,588,000 | | 28,898,997 |
| | | | | 38,522,883 |
| Turkey 0.3% | | | | |
| Turkcell Iletisim Hizmetleri AS | Wireless Telecommunication | | | |
| | Services | 4,097,336 | | 16,044,252 |
| United Kingdom 16.5% | | | | |
| Aviva PLC | Insurance | 8,118,486 | | 60,272,885 |
| BAE Systems PLC | Aerospace & Defense | 8,935,010 | | 62,002,138 |
| Barclays PLC | Banks | 12,202,417 | | 48,957,088 |
| BP PLC | Oil, Gas & Consumable Fuels | 7,507,191 | | 41,530,179 |
| Carillion PLC | Construction & Engineering | 7,084,170 | | 37,102,770 |
| GlaxoSmithKline PLC | Pharmaceuticals | 4,688,107 | | 96,437,380 |
| HSBC Holdings PLC | Banks | 8,684,100 | | 69,122,929 |
| bInternational Consolidated Airlines Group SA | Airlines | 3,758,230 | | 31,085,166 |
| Kingfisher PLC | Specialty Retail | 14,053,529 | | 76,817,537 |
| Lloyds Banking Group PLC | Banks | 31,861,170 | | 37,833,064 |
| Petrofac Ltd. | Energy Equipment & Services | 2,175,180 | | 29,774,270 |
| Royal Dutch Shell PLC, A | Oil, Gas & Consumable Fuels | 20,098 | | 522,761 |
| Royal Dutch Shell PLC, B | Oil, Gas & Consumable Fuels | 1,724,362 | | 45,156,035 |
| Serco Group PLC | Commercial Services & Supplies | 9,372,468 | | 16,252,249 |
| Sky PLC | Media | 2,530,523 | | 40,501,925 |
| Standard Chartered PLC | Banks | 2,029,110 | | 23,820,348 |
| bSubsea 7 SA | Energy Equipment & Services | 2,186,940 | | 18,597,642 |
| Tesco PLC | Food & Staples Retailing | 21,928,742 | | 64,390,716 |
| Vodafone Group PLC | Wireless Telecommunication | | | |
| | Services | 18,176,089 | | 63,231,434 |
| | | | | 863,408,516 |
| United States 34.1% | | | | |
| Accenture PLC, A | IT Services | 63,681 | | 6,003,208 |
| bAlly Financial Inc. | Consumer Finance | 519,640 | | 11,359,330 |
| American International Group Inc. | Insurance | 1,366,615 | | 82,461,549 |
| Amgen Inc. | Biotechnology | 902,610 | | 136,998,146 |
| Apache Corp. | Oil, Gas & Consumable Fuels | 428,590 | | 19,389,412 |
| Baker Hughes Inc. | Energy Equipment & Services | 652,168 | | 36,521,408 |
| Best Buy Co. Inc. | Specialty Retail | 456,800 | | 16,782,832 |
| Capital One Financial Corp. | Consumer Finance | 125,730 | | 9,775,508 |
| Chesapeake Energy Corp. | Oil, Gas & Consumable Fuels | 2,695,560 | | 21,052,324 |
| Chevron Corp. | Oil, Gas & Consumable Fuels | 154,346 | | 12,500,483 |
| Cisco Systems Inc. | Communications Equipment | 1,103,882 | | 28,568,466 |
| Citigroup Inc. | Banks | 2,560,790 | | 136,951,049 |
| |
| |
| 22 | Annual Report | | franklintempleton.com |
TEMPLETON WORLD FUND
STATEMENT OF INVESTMENTS
| | | | |
| | Industry | Shares | | Value |
| Common Stocks (continued) | | | | |
| United States (continued) | | | | |
| Comcast Corp., Special A | Media | 1,492,119 | $ | 85,408,892 |
| CVS Health Corp. | Food & Staples Retailing | 567,690 | | 58,131,456 |
| Devon Energy Corp. | Oil, Gas & Consumable Fuels | 437,230 | | 18,652,232 |
| Eli Lilly & Co. | Pharmaceuticals | 131,540 | | 10,832,319 |
| Foot Locker Inc. | Specialty Retail | 443,820 | | 31,418,018 |
| General Motors Co. | Automobiles | 1,099,700 | | 32,375,168 |
| Gilead Sciences Inc. | Biotechnology | 319,790 | | 33,600,335 |
| bGoogle Inc., A | Internet Software & Services | 58,590 | | 37,955,774 |
| Halliburton Co. | Energy Equipment & Services | 966,980 | | 38,050,663 |
| The Hartford Financial Services Group Inc. | Insurance | 323,710 | | 14,874,474 |
| Hewlett-Packard Co. | Technology Hardware, Storage | | | |
| | & Peripherals | 2,312,330 | | 64,883,980 |
| JPMorgan Chase & Co. | Banks | 1,605,584 | | 102,917,934 |
| b,cKnowles Corp. | Electronic Equipment, Instruments | | | |
| | & Components | 2,471,730 | | 40,239,764 |
| Medtronic PLC | Health Care Equipment & Supplies | 1,495,120 | | 108,082,225 |
| Merck & Co. Inc. | Pharmaceuticals | 559,434 | | 30,125,521 |
| bMichael Kors Holdings Ltd. | Textiles, Apparel & Luxury Goods | 587,490 | | 25,532,315 |
| Microsoft Corp. | Software | 3,054,370 | | 132,926,182 |
| Morgan Stanley | Capital Markets | 2,245,660 | | 77,362,987 |
| bNavistar International Corp. | Machinery | 1,144,790 | | 20,423,054 |
| bNews Corp., A | Media | 2,101,623 | | 28,645,121 |
| Noble Corp. PLC | Energy Equipment & Services | 2,416,734 | | 31,465,877 |
| Oracle Corp. | Software | 205,161 | | 7,609,421 |
| Pfizer Inc. | Pharmaceuticals | 2,700,740 | | 87,017,843 |
| SunTrust Banks Inc. | Banks | 1,763,570 | | 71,195,321 |
| Twenty-First Century Fox Inc., A | Media | 1,411,332 | | 38,656,383 |
| United Parcel Service Inc., B | Air Freight & Logistics | 166,479 | | 16,256,674 |
| Verizon Communications Inc. | Diversified Telecommunication | | | |
| | Services | 328,562 | | 15,117,138 |
| | | | | 1,778,120,786 |
| Total Common Stocks (Cost $4,554,004,812) | | | | 5,145,221,930 |
| Preferred Stocks 0.3% | | | | |
| Brazil 0.3% | | | | |
| bPetroleo Brasileiro SA, ADR, pfd. | Oil, Gas & Consumable Fuels | 2,589,090 | | 13,049,013 |
| Vale SA, ADR, pfd., A | Metals & Mining | 509,366 | | 1,976,340 |
| Total Preferred Stocks (Cost $42,439,679) | | | | 15,025,353 |
| |
| | | Principal | | |
| | | Amount* | | |
| |
| Mortgage-Backed Securities (Cost $1,203,942) | | | | |
| 0.0%† | | | | |
| United States 0.0%† | | | | |
| FHLMC, 5.50%, 12/01/35 | | 1,221,501 | | 1,360,341 |
| Total Investments before Short Term | | | | |
| Investments (Cost $4,597,648,433) | | | | 5,161,607,624 |
franklintempleton.com
Annual Report
| 23
TEMPLETON WORLD FUND
STATEMENT OF INVESTMENTS
| | | | | |
| | | Principal | | | |
| | | Amount* | | Value | |
| Short Term Investments 1.1% | | | | | |
| Time Deposits (Cost $38,300,000) 0.7% | | | | | |
| United States 0.7% | | | | | |
| Royal Bank of Canada, 0.05%, 9/01/15 | | 38,300,000 | $ | 38,300,000 | |
| Total Investments before Money Market Funds | | | | | |
| (Cost $4,635,948,433) | | | | 5,199,907,624 | |
| |
| | | Shares | | | |
| dInvestments from Cash Collateral Received for | | | | | |
| Loaned Securities (Cost $20,698,360) 0.4% | | | | | |
| Money Market Funds 0.4% | | | | | |
| United States 0.4% | | | | | |
| b,eInstitutional Fiduciary Trust Money Market Portfolio | | 20,698,360 | | 20,698,360 | |
| Total Investments (Cost $4,656,646,793) | | | | | |
| 100.0% | | | | 5,220,605,984 | |
| Other Assets, less Liabilities (0.0)%† | | | | (2,111,393 | ) |
| Net Assets 100.0% | | | $ | 5,218,494,591 | |
See Abbreviations on page 37.
†Rounds to less than 0.1% of net assets.
*The principal amount is stated in U.S. dollars unless otherwise indicated.
aSecurity was purchased pursuant to Rule 144A under the Securities Act of 1933 and may be sold in transactions exempt from registration only to qualified institutional buyers
or in a public offering registered under the Securities Act of 1933. These securities have been deemed liquid under guidelines approved by the Trust’s Board of Trustees. At
August 31, 2015, the aggregate value of these securities was $16,399,991, representing 0.31% of net assets.
bNon-income producing.
cA portion or all of the security is on loan at August 31, 2015. See Note 1(d).
dSee Note 1(d) regarding securities on loan.
eSee Note 3(f) regarding investments in Institutional Fiduciary Trust Money Market Portfolio.
24 | Annual Report | The accompanying notes are an integral part of these financial statements.
franklintempleton.com
TEMPLETON WORLD FUND
Financial Statements
Statement of Assets and Liabilities
August 31, 2015
| | |
| Assets: | | |
| Investments in securities: | | |
| Cost - Unaffiliated issuers | $ | 4,635,948,433 |
| Cost - Sweep Money Fund (Note 3f) | | 20,698,360 |
| Total cost of investments | $ | 4,656,646,793 |
| Value - Unaffiliated issuers | $ | 5,199,907,624 |
| Value - Sweep Money Fund (Note 3f) | | 20,698,360 |
| Total value of investments (includes securities loaned in the amount of $20,117,570) | | 5,220,605,984 |
| Cash | | 10,230,277 |
| Receivables: | | |
| Capital shares sold | | 1,666,807 |
| Dividends and interest | | 13,910,991 |
| Other assets | | 4,035,905 |
| Total assets | | 5,250,449,964 |
| Liabilities: | | |
| Payables: | | |
| Capital shares redeemed | | 5,507,601 |
| Management fees | | 3,196,929 |
| Distribution fees | | 1,233,139 |
| Transfer agent fees | | 887,064 |
| Payable upon return of securities loaned | | 20,698,360 |
| Accrued expenses and other liabilities | | 432,280 |
| Total liabilities | | 31,955,373 |
| Net assets, at value | $ | 5,218,494,591 |
| Net assets consist of: | | |
| Paid-in capital | $ | 4,359,105,953 |
| Undistributed net investment income | | 72,248,815 |
| Net unrealized appreciation (depreciation) | | 563,663,579 |
| Accumulated net realized gain (loss) | | 223,476,244 |
| Net assets, at value | $ | 5,218,494,591 |
franklintempleton.com
The accompanying notes are an integral part of these financial statements. | Annual Report | 25
| | |
| TEMPLETON WORLD FUND | | |
| FINANCIAL STATEMENTS | | |
| |
| |
| Statement of Assets and Liabilities (continued) | | |
| August 31, 2015 | | |
| |
| Class A: | | |
| Net assets, at value | $ | 4,791,792,324 |
| Shares outstanding | | 290,266,531 |
| Net asset value per sharea | $ | 16.51 |
| Maximum offering price per share (net asset value per share ÷ 94.25%) | $ | 17.52 |
| Class C: | | |
| Net assets, at value | $ | 193,308,672 |
| Shares outstanding | | 12,185,604 |
| Net asset value and maximum offering price per sharea | $ | 15.86 |
| Class R6: | | |
| Net assets, at value | $ | 51,732,921 |
| Shares outstanding | | 3,135,373 |
| Net asset value and maximum offering price per share | $ | 16.50 |
| Advisor Class: | | |
| Net assets, at value | $ | 181,660,674 |
| Shares outstanding | | 11,009,564 |
| Net asset value and maximum offering price per share | $ | 16.50 |
| |
| aRedemption price is equal to net asset value less contingent deferred sales charges, if applicable. | |
| 26 | Annual Report | The accompanying notes are an integral part of these financial statements. | franklintempleton.com |
|
| TEMPLETON WORLD FUND |
| FINANCIAL STATEMENTS |
Statement of Operations
for the year ended August 31, 2015
| | | |
| Investment income: | | | |
| Dividends (net of foreign taxes of $10,145,285) | $ | 151,664,488 | |
| Interest | | 145,610 | |
| Income from securities loaned | | 471,265 | |
| Paydown gain | | 9,721 | |
| Other income (Note 1e) | | 3,924,954 | |
| Total investment income | | 156,216,038 | |
| Expenses: | | | |
| Management fees (Note 3a) | | 40,463,026 | |
| Distribution fees: (Note 3c) | | | |
| Class A | | 13,427,680 | |
| Class C | | 2,165,638 | |
| Transfer agent fees: (Note 3e) | | | |
| Class A | | 4,706,837 | |
| Class C | | 190,435 | |
| Class R6 | | 596 | |
| Advisor Class | | 209,031 | |
| Custodian fees (Note 4) | | 522,026 | |
| Reports to shareholders | | 278,844 | |
| Registration and filing fees | | 187,796 | |
| Professional fees | | 111,278 | |
| Trustees’ fees and expenses | | 117,828 | |
| Other | | 210,729 | |
| Total expenses | | 62,591,744 | |
| Expenses waived/paid by affiliates (Note 3f) | | (10,051 | ) |
| Net expenses | | 62,581,693 | |
| Net investment income | | 93,634,345 | |
| Realized and unrealized gains (losses): | | | |
| Net realized gain (loss) from: | | | |
| Investments | | 285,057,869 | |
| Foreign currency transactions | | 181,268 | |
| Net realized gain (loss) | | 285,239,137 | |
| Net change in unrealized appreciation (depreciation) on: | | | |
| Investments | | (1,031,906,441 | ) |
| Translation of other assets and liabilities denominated in foreign currencies | | (243,476 | ) |
| Net change in unrealized appreciation (depreciation) | | (1,032,149,917 | ) |
| Net realized and unrealized gain (loss) | | (746,910,780 | ) |
| Net increase (decrease) in net assets resulting from operations | $ | (653,276,435 | ) |
franklintempleton.com
The accompanying notes are an integral part of these financial statements. | Annual Report | 27
| | | | | | |
| TEMPLETON WORLD FUND | | | | | | |
| FINANCIAL STATEMENTS | | | | | | |
| |
| |
| Statements of Changes in Net Assets | | | | | | |
| |
| |
| | | Year Ended August 31, | |
| | | 2015 | | | 2014 | |
| Increase (decrease) in net assets: | | | | | | |
| Operations: | | | | | | |
| Net investment income | $ | 93,634,345 | | $ | 138,803,204 | |
| Net realized gain (loss) | | 285,239,137 | | | 303,926,646 | |
| Net change in unrealized appreciation (depreciation) | | (1,032,149,917 | ) | | 575,658,222 | |
| Net increase (decrease) in net assets resulting from operations | | (653,276,435 | ) | | 1,018,388,072 | |
| Distributions to shareholders from: | | | | | | |
| Net investment income: | | | | | | |
| Class A | | (148,302,524 | ) | | (53,926,129 | ) |
| Class C | | (4,547,565 | ) | | (671,517 | ) |
| Class R6 | | (1,601,276 | ) | | (321,643 | ) |
| Advisor Class | | (7,396,095 | ) | | (2,783,214 | ) |
| Net realized gains: | | | | | | |
| Class A | | (310,296,789 | ) | | (239,843,544 | ) |
| Class C | | (13,123,838 | ) | | (9,992,724 | ) |
| Class R6 | | (2,965,913 | ) | | (1,076,002 | ) |
| Advisor Class | | (14,074,841 | ) | | (10,037,283 | ) |
| Total distributions to shareholders | | (502,308,841 | ) | | (318,652,056 | ) |
| Capital share transactions: (Note 2) | | | | | | |
| Class A | | (69,471,771 | ) | | (4,029,796 | ) |
| Class C | | (4,668,310 | ) | | 6,267,896 | |
| Class R6 | | 6,893,427 | | | 26,596,767 | |
| Advisor Class | | (46,359,007 | ) | | 29,494,496 | |
| Total capital share transactions | | (113,605,661 | ) | | 58,329,363 | |
| Net increase (decrease) in net assets | | (1,269,190,937 | ) | | 758,065,379 | |
| Net assets: | | | | | | |
| Beginning of year | | 6,487,685,528 | | | 5,729,620,149 | |
| End of year | $ | 5,218,494,591 | | $ | 6,487,685,528 | |
| Undistributed net investment income included in net assets: | | | | | | |
| End of year | $ | 72,248,815 | | $ | 140,281,974 | |
28 | Annual Report | The accompanying notes are an integral part of these financial statements.
franklintempleton.com
TEMPLETON WORLD FUND
Notes to Financial Statements
1. Organization and Significant Accounting Policies
Templeton Funds (Trust) is registered under the Investment Company Act of 1940 (1940 Act) as an open-end management investment company, consisting of two separate funds and applies the specialized accounting and reporting guidance in U.S. Generally Accepted Accounting Principles (U.S. GAAP). Templeton World Fund (Fund) is included in this report. The financial statements of the remaining fund in the Trust are presented separately. The Fund offers four classes of shares: Class A, Class C, Class R6, and Advisor Class. Each class of shares differs by its initial sales load, contingent deferred sales charges, voting rights on matters affecting a single class, its exchange privilege and fees primarily due to differing arrangements for distribution and transfer agent fees.
The following summarizes the Fund’s significant accounting policies.
a. Financial Instrument Valuation
The Fund’s investments in financial instruments are carried at fair value daily. Fair value is the price that would be received to sell an asset or paid to transfer a liability in an orderly transaction between market participants on the measurement date. The Fund calculates the net asset value per share (NAV) at the close of the New York Stock Exchange (NYSE), generally at 4 p.m. Eastern time (NYSE close) on each day the NYSE is open for trading. Under compliance policies and procedures approved by the Trust’s Board of Trustees (the Board), the Fund’s administrator has responsibility for oversight of valuation, including leading the cross-functional Valuation and Liquidity Oversight Committee (VLOC). The VLOC provides administration and oversight of the Fund’s valuation policies and procedures, which are approved annually by the Board. Among other things, these procedures allow the Fund to utilize independent pricing services, quotations from securities and financial instrument dealers, and other market sources to determine fair value.
Equity securities listed on an exchange or on the NASDAQ National Market System are valued at the last quoted sale price or the official closing price of the day, respectively. Foreign equity securities are valued as of the close of trading on the foreign stock exchange on which the security is primarily traded or as of the NYSE close, whichever is earlier. The value is then converted into its U.S. dollar equivalent at the foreign exchange rate in effect at the NYSE close on the day that the value of the security is determined. Over-the-counter (OTC) securities are valued within the range of the most recent quoted bid and ask prices. Securities that trade in multiple markets or on multiple exchanges are valued according to the broadest and most representative market. Certain equity securities are valued based upon fundamental characteristics or relationships to similar securities.
Debt securities generally trade in the OTC market rather than on a securities exchange. The Fund’s pricing services use multiple valuation techniques to determine fair value. In instances where sufficient market activity exists, the pricing services may utilize a market-based approach through which quotes from market makers are used to determine fair value. In instances where sufficient market activity may not exist or is limited, the pricing services also utilize proprietary valuation models which may consider market characteristics such as benchmark yield curves, credit spreads, estimated default rates, anticipated market interest rate volatility, coupon rates, anticipated timing of principal repayments, underlying collateral, and other unique security features in order to estimate the relevant cash flows, which are then discounted to calculate the fair value.
Investments in open-end mutual funds are valued at the closing NAV. Time deposits are valued at cost, which approximates fair value.
The Fund has procedures to determine the fair value of financial instruments for which market prices are not reliable or readily available. Under these procedures, the VLOC convenes on a regular basis to review such financial instruments and considers a number of factors, including significant unobservable valuation inputs, when arriving at fair value. The VLOC primarily employs a market-based approach which may use related or comparable assets or liabilities, recent transactions, market multiples, book values, and other relevant information for the investment to determine the fair value of the investment. An income-based valuation approach may also be used in which the anticipated future cash flows of the investment are discounted to calculate fair value. Discounts may also be applied due to the nature or duration of any restrictions on the disposition of the investments. Due to the inherent uncertainty of valuations of such investments, the fair values may differ significantly from the values that would have been used had an active market existed. The VLOC employs various methods for calibrating these valuation approaches including a regular review of key inputs and assumptions, transactional back-testing or disposition analysis, and reviews of any related market activity.
franklintempleton.com
Annual Report
| 29
TEMPLETON WORLD FUND
NOTES TO FINANCIAL STATEMENTS
1. Organization and Significant Accounting
Policies (continued)
a. Financial Instrument Valuation (continued)
Trading in securities on foreign securities stock exchanges and OTC markets may be completed before the daily NYSE close. In addition, trading in certain foreign markets may not take place on every NYSE business day. Occasionally, events occur between the time at which trading in a foreign security is completed and the close of the NYSE that might call into question the reliability of the value of a portfolio security held by the Fund. As a result, differences may arise between the value of the Fund’s portfolio securities as determined at the foreign market close and the latest indications of value at the close of the NYSE. In order to minimize the potential for these differences, the VLOC monitors price movements following the close of trading in foreign stock markets through a series of country specific market proxies (such as baskets of American Depositary Receipts, futures contracts and exchange traded funds). These price movements are measured against established trigger thresholds for each specific market proxy to assist in determining if an event has occurred that may call into question the reliability of the values of the foreign securities held by the Fund. If such an event occurs, the securities may be valued using fair value procedures, which may include the use of independent pricing services.
When the last day of the reporting period is a non-business day, certain foreign markets may be open on those days that the NYSE is closed, which could result in differences between the value of the Fund’s portfolio securities on the last business day and the last calendar day of the reporting period. Any significant security valuation changes due to an open foreign market are adjusted and reflected by the Fund for financial reporting purposes.
b. Foreign Currency Translation
Portfolio securities and other assets and liabilities denominated in foreign currencies are translated into U.S. dollars based on the exchange rate of such currencies against U.S. dollars on the date of valuation. The Fund may enter into foreign currency exchange contracts to facilitate transactions denominated in a foreign currency. Purchases and sales of securities, income and expense items denominated in foreign currencies are translated into U.S. dollars at the exchange rate in effect on the transaction date. Portfolio securities and assets and liabilities denominated in foreign currencies contain risks that those currencies will decline in value relative to the U.S. dollar.
Occasionally, events may impact the availability or reliability of foreign exchange rates used to convert the U.S. dollar equivalent value. If such an event occurs, the foreign exchange rate will be valued at fair value using procedures established and approved by the Board.
The Fund does not separately report the effect of changes in foreign exchange rates from changes in market prices on securities held. Such changes are included in net realized and unrealized gain or loss from investments in the Statement of Operations.
Realized foreign exchange gains or losses arise from sales of foreign currencies, currency gains or losses realized between the trade and settlement dates on securities transactions and the difference between the recorded amounts of dividends, interest, and foreign withholding taxes and the U.S. dollar equivalent of the amounts actually received or paid. Net unrealized foreign exchange gains and losses arise from changes in foreign exchange rates on foreign denominated assets and liabilities other than investments in securities held at the end of the reporting period.
c. Derivative Financial Instruments
The Fund invested in derivatives in order to manage risk or gain exposure to various other investments or markets. Derivatives are financial contracts based on an underlying or notional amount, require no initial investment or an initial net investment that is smaller than would normally be required to have a similar response to changes in market factors, and require or permit net settlement. Derivatives contain various risks including the potential inability of the counterparty to fulfill their obligations under the terms of the contract, the potential for an illiquid secondary market, and/or the potential for market movements which expose the Fund to gains or losses in excess of the amounts shown in the Statement of Assets and Liabilities. Realized gain and loss and unrealized appreciation and depreciation on these contracts for the period are included in the Statement of Operations.
Collateral requirements differ by type of derivative. Collateral or initial margin requirements are set by the broker or exchange clearing house for exchange traded and centrally cleared derivatives. Initial margin deposited is held at the exchange and can be in the form of cash and/or securities.
The Fund purchased or wrote OTC option contracts primarily to manage and/or gain exposure to equity price risk. An option is a contract entitling the holder to purchase or sell a specific
30 | Annual Report
franklintempleton.com
TEMPLETON WORLD FUND
NOTES TO FINANCIAL STATEMENTS
amount of shares or units of an asset or notional amount of a swap (swaption), at a specified price. When an option is purchased or written, an amount equal to the premium paid or received is recorded as an asset or liability, respectively. Upon exercise of an option, the acquisition cost or sales proceeds of the underlying investment is adjusted by any premium received or paid. Upon expiration of an option, any premium received or paid is recorded as a realized gain or loss. Upon closing an option other than through expiration or exercise, the difference between the premium received or paid and the cost to close the position is recorded as a realized gain or loss.
See Note 6 regarding investment transactions.
d. Securities Lending
The Fund participates in an agency based securities lending program to earn additional income. The Fund receives cash collateral against the loaned securities in an amount equal to at least 102% of the fair value of the loaned securities. Collateral is maintained over the life of the loan in an amount not less than 100% of the fair value of loaned securities, as determined at the close of Fund business each day; any additional collateral required due to changes in security values is delivered to the Fund on the next business day. The collateral is deposited into a joint cash account with other funds and is used to invest in a money market fund managed by Franklin Advisers, Inc., an affiliate of the Fund. The total cash collateral received at year end was $ 20,698,360. The Fund may receive income from the investment of cash collateral, in addition to lending fees and rebates paid by the borrower. Income from securities loaned is reported separately in the Statement of Operations. The Fund bears the market risk with respect to the collateral investment, securities loaned, and the risk that the agent may default on its obligations to the Fund. If the borrower defaults on its obligation to return the securities loaned, the Fund has the right to repurchase the securities in the open market using the collateral received. The securities lending agent has agreed to indemnify the Fund in the event of default by a third party borrower.
e. Income and Deferred Taxes
It is the Fund’s policy to qualify as a regulated investment company under the Internal Revenue Code. The Fund intends to distribute to shareholders substantially all of its taxable income and net realized gains to relieve it from federal income and excise taxes. As a result, no provision for U.S. federal income taxes is required.
The Fund may be subject to foreign taxation related to income received, capital gains on the sale of securities and certain foreign currency transactions in the foreign jurisdictions in which it invests. Foreign taxes, if any, are recorded based on the tax regulations and rates that exist in the foreign markets in which the Fund invests. When a capital gain tax is determined to apply, the Fund records an estimated deferred tax liability in an amount that would be payable if the securities were disposed of on the valuation date. As a result of several court cases, in certain countries across the European Union, the Fund has filed additional tax reclaims for previously withheld taxes on dividends earned in those countries. These additional filings are subject to various administrative proceedings by the local jurisdictions’ tax authorities within the European Union, as well as a number of related judicial proceedings. During the year ended August 31, 2015, the Fund recognized approximately $3,945,872 from Finland and Sweden for previously withheld foreign taxes and interest on such taxes. These amounts are reflected as other income and interest in the Statement of Operations. In regards to filings in other European Union countries, uncertainty exists as to the ultimate resolution of these proceedings, the likelihood of receipt of these reclaims, and the potential timing of payment, and accordingly, no amounts are reflected in the financial statements.
The Fund recognizes the tax benefits of uncertain tax positions only when the position is “more likely than not” to be sustained upon examination by the tax authorities based on the technical merits of the tax position. As of August 31, 2015, and for all open tax years, the Fund has determined that no liability for unrecognized tax benefits is required in the Fund’s financial statements related to uncertain tax positions taken on a tax return (or expected to be taken on future tax returns). Open tax years are those that remain subject to examination and are based on each tax jurisdiction’s statute of limitation.
f. Security Transactions, Investment Income, Expenses and Distributions
Security transactions are accounted for on trade date. Realized gains and losses on security transactions are determined on a specific identification basis. Interest income and estimated expenses are accrued daily. Amortization of premium and accretion of discount on debt securities are included in interest income. Paydown gains and losses are recorded separately in the Statement of Operations. Dividend income is recorded on the ex-dividend date except for certain dividends from foreign
franklintempleton.com
Annual Report
| 31
TEMPLETON WORLD FUND
NOTES TO FINANCIAL STATEMENTS
1. Organization and Significant Accounting
Policies (continued)
f. Security Transactions, Investment Income, Expenses and Distributions (continued)
securities where the dividend rate is not available. In such cases, the dividend is recorded as soon as the information is received by the Fund. Distributions to shareholders are recorded on the ex-dividend date and are determined according to income tax regulations (tax basis). Distributable earnings determined on a tax basis may differ from earnings recorded in accordance with U.S. GAAP. These differences may be permanent or temporary. Permanent differences are reclassified among capital accounts to reflect their tax character. These reclassifications have no impact on net assets or the results of operations. Temporary differences are not reclassified, as they may reverse in subsequent periods.
Common expenses incurred by the Trust are allocated among the Funds based on the ratio of net assets of each Fund to the combined net assets of the Trust. Fund specific expenses are charged directly to the fund that incurred the expense.
Realized and unrealized gains and losses and net investment income, not including class specific expenses, are allocated daily to each class of shares based upon the relative proportion of net assets of each class. Differences in per share distributions, by class, are generally due to differences in class specific expenses.
g. Accounting Estimates
The preparation of financial statements in accordance with U.S. GAAP requires management to make estimates and assumptions that affect the reported amounts of assets and liabilities at the date of the financial statements and the amounts of income and expenses during the reporting period. Actual results could differ from those estimates.
h. Guarantees and Indemnifications
Under the Trust’s organizational documents, its officers and trustees are indemnified by the Trust against certain liabilities arising out of the performance of their duties to the Trust. Additionally, in the normal course of business, the Trust, on behalf of the Fund, enters into contracts with service providers that contain general indemnification clauses. The Trust’s maximum exposure under these arrangements is unknown as this would involve future claims that may be made against the Trust that have not yet occurred. Currently, the Trust expects the risk of loss to be remote.
2. Shares of Beneficial Interest
At August 31, 2015, there were an unlimited number of shares authorized (without par value). Transactions in the Fund’s shares were as follows:
| | | | | | | | | | | |
| | | | | Year Ended August 31, | | | | | |
| | | | | 2015 | | | | | 2014 | |
| | Shares | | | Amount | | Shares | | | | Amount | |
| |
| Class A Shares: | | | | | | | | | | | |
| Shares sold | 21,109,474 | | $ | 378,685,269 | | 26,102,399 | | $ | 510,657,491 | |
| Shares issued in reinvestment of distributions | 24,336,255 | | | 420,286,959 | | 14,121,577 | | | | 268,451,277 | |
| Shares redeemed | (48,417,724 | ) | | (868,443,999 | ) | (39,928,591 | ) | | | (783,138,564 | ) |
| Net increase (decrease) | (2,971,995 | ) | $ | (69,471,771 | ) | 295,385 | | | $ | (4,029,796 | ) |
| Class C Shares: | | | | | | | | | | | |
| Shares sold | 1,011,688 | | $ | 17,428,571 | | 1,256,460 | | | $ | 23,747,361 | |
| Shares issued in reinvestment of distributions | 925,142 | | | 15,431,374 | | 506,107 | | | | 9,317,434 | |
| Shares redeemed | (2,179,024 | ) | | (37,528,255 | ) | (1,417,063 | ) | | | (26,796,899 | ) |
| Net increase (decrease) | (242,194 | ) | $ | (4,668,310 | ) | 345,504 | | | $ | 6,267,896 | |
| Class R6 Shares: | | | | | | | | | | | |
| Shares sold | 786,312 | | $ | 13,902,625 | | 1,630,392 | | | $ | 31,476,300 | |
| Shares issued in reinvestment of distributions | 133,109 | | | 2,292,144 | | 73,699 | | | | 1,397,332 | |
| Shares redeemed | (518,439 | ) | | (9,301,342 | ) | (318,920 | ) | | | (6,276,865 | ) |
| Net increase (decrease) | 400,982 | | $ | 6,893,427 | | 1,385,171 | | | $ | 26,596,767 | |
| |
| |
| 32 | Annual Report | | | | | | franklintempleton.com | |
| | | | | | | | | | |
| | | | | | | TEMPLETON WORLD FUND | |
| | | | | NOTES TO FINANCIAL STATEMENTS | |
| |
| |
| |
| |
| | | | | Year Ended August 31, | | | | |
| | | | | 2015 | | | | 2014 | |
| | Shares | | | Amount | | Shares | | | Amount | |
| Advisor Class Shares: | | | | | | | | | | |
| Shares sold | 3,463,742 | | $ | 62,050,624 | | 4,516,353 | | $ | 88,130,065 | |
| Shares issued in reinvestment of distributions | 1,079,933 | | | 18,607,249 | | 593,105 | | | 11,251,196 | |
| Shares redeemed | (7,087,137 | ) | | (127,016,880 | ) | (3,590,160 | ) | | (69,886,765 | ) |
| Net increase (decrease) | (2,543,462 | ) | $ | (46,359,007 | ) | 1,519,298 | | $ | 29,494,496 | |
3. Transactions with Affiliates
Franklin Resources, Inc. is the holding company for various subsidiaries that together are referred to as Franklin Templeton Investments. Certain officers and trustees of the Trust are also officers and/or directors of the following subsidiaries:
| |
| Subsidiary | Affiliation |
| Templeton Global Advisors Limited (TGAL) | Investment manager |
| Franklin Templeton Services, LLC (FT Services) | Administrative manager |
| Franklin Templeton Distributors, Inc. (Distributors) | Principal underwriter |
| Franklin Templeton Investor Services, LLC (Investor Services) | Transfer agent |
a. Management Fees
The Fund pays an investment management fee to TGAL based on the average daily net assets of the Fund as follows:
| | |
| Annualized Fee Rate | | Net Assets |
| 0.705 | % | Up to and including $1 billion |
| 0.690 | % | Over $1 billion, up to and including $5 billion |
| 0.675 | % | Over $5 billion, up to and including $10 billion |
| 0.655 | % | Over $10 billion, up to and including $15 billion |
| 0.635 | % | Over $15 billion, up to and including $20 billion |
| 0.615 | % | In excess of $20 billion |
b. Administrative Fees
Under an agreement with TGAL, FT Services provides administrative services to the Fund. The fee is paid by TGAL based on the Fund’s average daily net assets, and is not an additional expense of the Fund.
c. Distribution Fees
The Board has adopted distribution plans for each share class, with the exception of Class R6 and Advisor Class shares, pursuant to Rule 12b-1 under the 1940 Act. Distribution fees are not charged on shares held by affiliates. Under the Fund’s Class A reimbursement distribution plan, the Fund reimburses Distributors for costs incurred in connection with the servicing, sale and distribution of the Fund’s shares up to the maximum annual plan rate. Under the Class A reimbursement distribution plan, costs exceeding the maximum for the current plan year cannot be reimbursed in subsequent periods. In addition, under the Fund’s Class C compensation distribution plan, the Fund pays Distributors for costs incurred in connection with the servicing, sale and distribution of the Fund’s shares up to the maximum annual plan rate for each class. The plan year, for purposes of monitoring compliance with the maximum annual plan rates, is February 1 through January 31.
franklintempleton.com
Annual Report
| 33
TEMPLETON WORLD FUND
NOTES TO FINANCIAL STATEMENTS
3. Transactions with Affiliates (continued)
c. Distribution Fees (continued)
The maximum annual plan rates, based on the average daily net assets, for each class, are as follows:
d. Sales Charges/Underwriting Agreements
Front-end sales charges and contingent deferred sales charges (CDSC) do not represent expenses of the Fund. These charges are deducted from the proceeds of sales of Fund shares prior to investment or from redemption proceeds prior to remittance, as applicable. Distributors has advised the Fund of the following commission transactions related to the sales and redemptions of the Fund’s shares for the year:
| | |
| Sales charges retained net of commissions paid to unaffiliated broker/dealers | $ | 367,305 |
| CDSC retained | $ | 21,137 |
e. Transfer Agent Fees
Each class of shares, except for Class R6, pays transfer agent fees to Investor Services for its performance of shareholder servicing obligations and reimburses Investor Services for out of pocket expenses incurred, including shareholding servicing fees paid to third parties. These fees are allocated daily based upon their relative proportion of such classes’ aggregate net assets. Class R6 pays Investor Services transfer agent fees specific to that class.
For the year ended August 31, 2015, the Fund paid transfer agent fees of $5,106,899, of which $2,480,742 was retained by Investor Services.
f. Investments in Institutional Fiduciary Trust Money Market Portfolio
The Fund invests in Institutional Fiduciary Trust Money Market Portfolio (Sweep Money Fund), an affiliated open-end management investment company. Management fees paid by the Fund are waived on assets invested in the Sweep Money Fund, as noted in the Statement of Operations, in an amount not to exceed the management and administrative fees paid directly or indirectly by the Sweep Money Fund.
g. Waiver and Expense Reimbursements
Investor Services has contractually agreed in advance to waive or limit its fees so that the Class R6 transfer agent fees do not exceed 0.01% until December 31, 2015. There were no Class R6 transfer agent fees waived during the year ended August 31, 2015.
4. Expense Offset Arrangement
The Fund has entered into an arrangement with its custodian whereby credits realized as a result of uninvested cash balances are used to reduce a portion of the Fund’s custodian expenses. During the year ended August 31, 2015, there were no credits earned.
5. Income Taxes
For tax purposes, capital losses may be carried over to offset future capital gains. Capital loss carryforwards with no expiration, if any, must be fully utilized before those losses with expiration dates.
34 | Annual Report
franklintempleton.com
TEMPLETON WORLD FUND
NOTES TO FINANCIAL STATEMENTS
| | | |
| At August 31, 2015, capital loss carryforwards were as follows: | | | |
| |
| Capital loss carryforwards subject to expiration: | | | |
| 2016 | $ | 824,239 | |
| 2017 | | 2,023,740 | |
| Total capital loss carryforwards | $ | 2,847,979 | a |
aCapital loss carryforwards were from merged Templeton Global Long-Short Fund, which may be carried over to offset future gains, subject to limitations.
During the year ended August 31, 2015, the Fund utilized $2,023,740 of capital loss carryforwards.
The tax character of distributions paid during the years ended August 31, 2015 and 2014, was as follows:
| | | | |
| | | 2015 | | 2014 |
| Distributions paid from: | | | | |
| Ordinary income | $ | 204,715,113 | $ | 100,947,014 |
| Long term capital gain | | 297,593,728 | | 217,705,042 |
| | $ | 502,308,841 | $ | 318,652,056 |
At August 31, 2015, the cost of investments, net unrealized appreciation (depreciation), undistributed ordinary income and undistributed long term capital gains for income tax purposes were as follows:
| | | |
| Cost of investments | $ | 4,664,807,746 | |
| |
| Unrealized appreciation | $ | 1,230,493,524 | |
| Unrealized depreciation | | (674,695,286 | ) |
| Net unrealized appreciation (depreciation) | $ | 555,798,238 | |
| |
| Undistributed ordinary income | $ | 68,425,542 | |
| Undistributed long term capital gains | | 234,485,176 | |
| Distributable earnings | $ | 302,910,718 | |
Differences between income and/or capital gains as determined on a book basis and a tax basis are primarily due to differing treatment of wash sales and foreign tax reclaims.
6. Investment Transactions
Purchases and sales of investments (excluding short term securities) for the year ended August 31, 2015, aggregated $907,978,265 and $1,288,410,545, respectively.
Transactions in options written during the year ended August 31, 2015, were as follows:
| | | | | |
| | Number of | | | Premiums | |
| | Contracts | | | Received | |
| Options outstanding at August 31, 2014 | — | | $ | — | |
| Options written | 138,958 | | | 52,207 | |
| Options expired | — | | | — | |
| Options exercised | (138,958 | ) | | (52,207 | ) |
| Options closed | — | | | — | |
| Options outstanding at August 31, 2015 | — | | $ | — | |
| |
| See Note 1(c) regarding derivative financial instruments. | | | | | |
franklintempleton.com
Annual Report
| 35
TEMPLETON WORLD FUND
NOTES TO FINANCIAL STATEMENTS
7. Concentration of Risk
Investing in foreign securities may include certain risks and considerations not typically associated with investing in U.S. securities, such as fluctuating currency values and changing local and regional economic, political and social conditions, which may result in greater market volatility. In addition, certain foreign securities may not be as liquid as U.S. securities.
8. Credit Facility
The Fund, together with other U.S. registered and foreign investment funds (collectively, Borrowers), managed by Franklin Templeton Investments, are borrowers in a joint syndicated senior unsecured credit facility totaling $2 billion (Global Credit Facility) which matures on February 12, 2016. This Global Credit Facility provides a source of funds to the Borrowers for temporary and emergency purposes, including the ability to meet future unanticipated or unusually large redemption requests.
Under the terms of the Global Credit Facility, the Fund shall, in addition to interest charged on any borrowings made by the Fund and other costs incurred by the Fund, pay its share of fees and expenses incurred in connection with the implementation and maintenance of the Global Credit Facility, based upon its relative share of the aggregate net assets of all of the Borrowers, including an annual commitment fee of 0.07% based upon the unused portion of the Global Credit Facility. These fees are reflected in other expenses in the Statement of Operations. During the year ended August 31, 2015, the Fund did not use the Global Credit Facility.
9. Fair Value Measurements
The Fund follows a fair value hierarchy that distinguishes between market data obtained from independent sources (observable inputs) and the Fund’s own market assumptions (unobservable inputs). These inputs are used in determining the value of the Fund’s financial instruments and are summarized in the following fair value hierarchy:
- Level 1 – quoted prices in active markets for identical financial instruments
- Level 2 – other significant observable inputs (including quoted prices for similar financial instruments, interest rates, prepayment speed, credit risk, etc.)
- Level 3 – significant unobservable inputs (including the Fund’s own assumptions in determining the fair value of financial instruments)
The input levels are not necessarily an indication of the risk or liquidity associated with financial instruments at that level.
For movements between the levels within the fair value hierarchy, the Fund has adopted a policy of recognizing the transfers as of the date of the underlying event which caused the movement.
A summary of inputs used as of August 31, 2015, in valuing the Fund’s assets carried at fair value, is as follows:
| | | | | | | | |
| | | Level 1 | | Level 2 | | Level 3 | | Total |
| Assets: | | | | | | | | |
| Investments in Securities: | | | | | | | | |
| Equity Investments:a,b | $ | 5,160,247,283 | $ | — | $ | — | $ | 5,160,247,283 |
| Mortgage-Backed Securities | | — | | 1,360,341 | | — | | 1,360,341 |
| Short Term Investments | | 20,698,360 | | 38,300,000 | | — | | 58,998,360 |
| Total Investments in Securities | $ | 5,180,945,643 | $ | 39,660,341 | $ | — | $ | 5,220,605,984 |
| aIncludes common and preferred stocks. | | | | | | | | |
| bFor detailed categories, see the accompanying Statement of Investments. | | | | | | | | |
36 | Annual Report
franklintempleton.com
TEMPLETON WORLD FUND
NOTES TO FINANCIAL STATEMENTS
10. New Accounting Pronouncements
In June 2014, the Financial Accounting Standards Board issued Accounting Standards Update (ASU) No. 2014-11, Transfers and Servicing (Topic 860), Repurchase-to-Maturity Transactions, Repurchase Financings, and Disclosures. The ASU changes the accounting for certain repurchase agreements and expands disclosure requirements related to repurchase agreements, securities lending, repurchase-to-maturity and similar transactions. The ASU is effective for certain transactions accounted for as a sale for interim and annual reporting periods beginning after December 15, 2014 and transactions accounted for as secured borrowings for annual periods beginning after December 15, 2014, and for interim periods beginning after March 15, 2015. Management has reviewed the requirements and believes the adoption of this ASU will not have a material impact on the financial statements.
11. Subsequent Events
The Fund has evaluated subsequent events through the issuance of the financial statements and determined that no events have occurred that require disclosure.
|
| Abbreviations |
| Selected Portfolio |
| |
ADR FHLMC IDR | American Depositary Receipt Federal Home Loan Mortgage Corp. International Depositary Receipt |
franklintempleton.com
Annual Report
| 37
TEMPLETON WORLD FUND
Report of Independent Registered Public Accounting Firm
To the Board of Trustees of Templeton Funds and Shareholders of Templeton World Fund
In our opinion, the accompanying statement of assets and liabilities, including the statement of investments, and the related statements of operations and of changes in net assets and the financial highlights present fairly, in all material respects, the financial position of Templeton World Fund (the “Fund”) at August 31, 2015, the results of its operations for the year then ended, the changes in its net assets for each of the two years in the period then ended and the financial highlights for each of the periods presented then ended, in conformity with accounting principles generally accepted in the United States of America. These financial statements and financial highlights (hereafter referred to as “financial statements”) are the responsibility of the Fund’s management. Our responsibility is to express an opinion on these financial statements based on our audits. We conducted our audits of these financial statements in accordance with the standards of the Public Company Accounting Oversight Board (United States). Those standards require that we plan and perform the audit to obtain reasonable assurance about whether the financial statements are free of material misstatement. An audit includes examining, on a test basis, evidence supporting the amounts and disclosures in the financial statements, assessing the accounting principles used and significant estimates made by management, and evaluating the overall financial statement presentation. We believe that our audits, which included confirmation of securities at August 31, 2015 by correspondence with the custodian, transfer agent and brokers, provides a reasonable basis for our opinion.
PricewaterhouseCoopers LLP
San Francisco, California
October 20, 2015
38 | Annual Report
franklintempleton.com
TEMPLETON WORLD FUND
Tax Information (unaudited)
Under Section 852(b)(3)(C) of the Internal Revenue Code (Code), the Fund hereby reports the maximum amount allowable but no less than $297,593,728 as a long term capital gain dividend for the fiscal year ended August 31, 2015.
Under Section 871(k)(2)(C) of the Code, the Fund hereby reports the maximum amount allowable but no less than $42,867,653 as a short term capital gain dividend for purposes of the tax imposed under Section 871(a)(1)(A) of the Code for the fiscal year ended August 31, 2015.
Under Section 854(b)(1)(A) of the Code, the Fund hereby reports 16.46% of the ordinary income dividends as income qualifying for the dividends received deduction for the fiscal year ended August 31, 2015.
Under Section 854(b)(1)(B) of the Code, the Fund hereby reports the maximum amount allowable but no less than $133,664,854 as qualified dividends for purposes of the maximum rate under Section 1(h)(11) of the Code for the fiscal year ended August 31, 2015. Distributions, including qualified dividend income, paid during calendar year 2015 will be reported to shareholders on Form 1099-DIV by mid-February 2016. Shareholders are advised to check with their tax advisors for information on the treatment of these amounts on their individual income tax returns.
At August 31, 2014, more than 50% of the Fund’s total assets were invested in securities of foreign issuers. In most instances, foreign taxes were withheld from income paid to the Fund on these investments. As shown in the table below, the Fund hereby reports to shareholders the foreign source income and foreign taxes paid, pursuant to Section 853 of the Code. This written statement will allow shareholders of record on December 18, 2014, to treat their proportionate share of foreign taxes paid by the Fund as having been paid directly by them. The shareholder shall consider these amounts as foreign taxes paid in the tax year in which they receive the Fund distribution.
The following table provides a detailed analysis of foreign tax paid, foreign source income, and foreign source qualified dividends as reported by the Fund, to Class A, Class C, Class R6, and Advisor Class shareholders of record.
| | | | | | |
| | | Foreign Tax Paid | | Foreign Source | | Foreign Source Qualified |
| Class | | Per Share | | Income Per Share | | Dividends Per Share |
| Class A | $ | 0.0325 | $ | 0.3458 | $ | 0.2834 |
| Class C | $ | 0.0325 | $ | 0.2662 | $ | 0.2183 |
| Class R6 | $ | 0.0325 | $ | 0.3834 | $ | 0.3141 |
| Advisor Class | $ | 0.0325 | $ | 0.3748 | $ | 0.3071 |
Foreign Tax Paid Per Share (Column 1) is the amount per share available to you, as a tax credit (assuming you held your shares in the Fund for a minimum of 16 days during the 31-day period beginning 15 days before the ex-dividend date of the Fund’s distribution to which the foreign taxes relate), or, as a tax deduction.
Foreign Source Income Per Share (Column 2) is the amount per share of income dividends attributable to foreign securities held by the Fund, plus any foreign taxes withheld on these dividends. The amounts reported include foreign source qualified dividends that have not been adjusted for the rate differential applicable to such dividend income.1
Foreign Source Qualified Dividends Per Share (Column 3) is the amount per share of foreign source qualified dividends, plus any foreign taxes withheld on these dividends. These amounts represent the portion of the Foreign Source Income reported to you in column 2 that were derived from qualified foreign securities held by the Fund.1
By mid-February 2015, shareholders received Form 1099-DIV which included their share of taxes paid and foreign source income distributed during the calendar year 2014. The Foreign Source Income reported on Form 1099-DIV has not been adjusted for the rate differential on foreign source qualified dividend income. Shareholders are advised to check with their tax advisors for information on the treatment of these amounts on their 2014 individual income tax returns.
1Qualified dividends are taxed at reduced long term capital gains tax rates. In determining the amount of foreign tax credit that may be applied against the U.S. tax liability of individuals receiving foreign source qualified dividends, adjustments may be required to the foreign tax credit limitation calculation to reflect the rate differential applicable to such dividend income. The rules however permit certain individuals to elect not to apply the rate differential adjustments for capital gains and/or dividends for any taxable year. Please consult your tax advisor and the instructions to Form 1116 for more information.
franklintempleton.com
Annual Report
| 39
TEMPLETON WORLD FUND
Board Members and Officers
The name, year of birth and address of the officers and board members, as well as their affiliations, positions held with the Trust, principal occupations during at least the past five years and number of portfolios overseen in the Franklin Templeton Investments fund complex, are shown below. Generally, each board member serves until that person’s successor is elected and qualified.
| | | | |
| Independent Board Members | | | |
| |
| | | | Number of Portfolios in | |
| Name, Year of Birth | | Length of | Fund Complex Overseen | Other Directorships Held |
| and Address | Position | Time Served | by Board Member* | During at Least the Past 5 Years |
| |
| Harris J. Ashton (1932) | Trustee | Since 1992 | 144 | Bar-S Foods (meat packing company) |
| 300 S.E. 2nd Street | | | | (1981-2010). |
| Fort Lauderdale, FL 33301-1923 | | | | |
| |
| Principal Occupation During at Least the Past 5 Years: | | |
| Director of various companies; and formerly, Director, RBC Holdings, Inc. (bank holding company) (until 2002); and President, Chief Executive |
| Officer and Chairman of the Board, General Host Corporation (nursery and craft centers) (until 1998). | |
| |
| Ann Torre Bates (1958) | Trustee | Since 2008 | 42 | Navient Corporation (loan manage- |
| 300 S.E. 2nd Street | | | | ment, servicing and asset recovery) |
| Fort Lauderdale, FL 33301-1923 | | | | (2014-present), Ares Capital |
| | | | | Corporation (specialty finance |
| | | | | company) (2010-present), United |
| | | | | Natural Foods, Inc. (distributor of |
| | | | | natural, organic and specialty foods) |
| | | | | (2013-present), Allied Capital |
| | | | | Corporation (financial services) |
| | | | | (2003-2010) and SLM Corporation |
| | | | | (Sallie Mae) (1997-2014). |
| Principal Occupation During at Least the Past 5 Years: | | |
| Director of various companies; and formerly, Executive Vice President and Chief Financial Officer, NHP Incorporated (manager of multifamily |
| housing) (1995-1997); and Vice President and Treasurer, US Airways, Inc. (until 1995). | |
| |
| Frank J. Crothers (1944) | Trustee | Since 2003 | 25 | Fortis, Inc. (utility holding company) |
| 300 S.E. 2nd Street | | | | (2007-present) and AML Foods |
| Fort Lauderdale, FL 33301-1923 | | | | Limited (retail distributors) |
| | | | | (1989-present). |
| |
| Principal Occupation During at Least the Past 5 Years: | | |
| Director and Vice Chairman, Caribbean Utilities Company, Ltd.; director of various other private business and nonprofit organizations; and |
| formerly, Chairman, Atlantic Equipment and Power Ltd. (1977-2003). | | |
| |
| Edith E. Holiday (1952) | Lead | Trustee since 2003 144 | Hess Corporation (exploration and |
| 300 S.E. 2nd Street | Independent | and Lead | | refining of oil and gas) (1993-present), |
| Fort Lauderdale, FL 33301-1923 | Trustee | Independent | | RTI International Metals, Inc. (manu- |
| | | Trustee since 2007 | | facture and distribution of titanium) |
| | | | | (1999-present), Canadian National |
| | | | | Railway (railroad) (2001-present), |
| | | | | White Mountains Insurance Group, |
| | | | | Ltd. (holding company) (2004-present) |
| | | | | and H.J. Heinz Company (processed |
| | | | | foods and allied products) |
| | | | | (1994-2013). |
| |
| Principal Occupation During at Least the Past 5 Years: | | |
| Director or Trustee of various companies and trusts; and formerly, Assistant to the President of the United States and Secretary of the |
| Cabinet (1990-1993); General Counsel to the United States Treasury Department (1989-1990); and Counselor to the Secretary and Assistant |
| Secretary for Public Affairs and Public Liaison – United States Treasury Department (1988-1989). | |
40 | Annual Report
franklintempleton.com
TEMPLETON WORLD FUND
| | | | |
| Independent Board Members (continued) | | |
| |
| | | | Number of Portfolios in | |
| Name, Year of Birth | | Length of | Fund Complex Overseen | Other Directorships Held |
| and Address | Position | Time Served | by Board Member* | During at Least the Past 5 Years |
| |
| J. Michael Luttig (1954) | Trustee | Since 2009 | 144 | Boeing Capital Corporation |
| 300 S.E. 2nd Street | | | | (aircraft financing) (2006-2013). |
| Fort Lauderdale, FL 33301-1923 | | | | |
| |
| Principal Occupation During at Least the Past 5 Years: | | |
| Executive Vice President, General Counsel and member of the Executive Council, The Boeing Company (aerospace company); and formerly, |
| Federal Appeals Court Judge, U.S. Court of Appeals for the Fourth Circuit (1991-2006). | |
| |
| David W. Niemiec (1949) | Trustee | Since 2005 | 42 | Emeritus Corporation (assisted living) |
| 300 S.E. 2nd Street | | | | (1999-2010) and OSI Pharmaceuticals, |
| Fort Lauderdale, FL 33301-1923 | | | | Inc. (pharmaceutical products) |
| | | | | (2006-2010). |
| |
| Principal Occupation During at Least the Past 5 Years: | | |
| Advisor, Saratoga Partners (private equity fund); and formerly, Managing Director, Saratoga Partners (1998-2001) and SBC Warburg Dillon |
| Read (investment banking) (1997-1998); Vice Chairman, Dillon, Read & Co. Inc. (investment banking) (1991-1997); and Chief Financial |
| Officer, Dillon, Read & Co. Inc. (1982-1997). | | | |
| |
| Frank A. Olson (1932) | Trustee | Since 2003 | 144 | Hess Corporation (exploration and |
| 300 S.E. 2nd Street | | | | refining of oil and gas) (1998-2013). |
| Fort Lauderdale, FL 33301-1923 | | | | |
| |
| Principal Occupation During at Least the Past 5 Years: | | |
| Director of various companies; and formerly, Chairman of the Board, The Hertz Corporation (car rental) (1980-2000) and Chief Executive |
| Officer (1977-1999); and Chairman of the Board, President and Chief Executive Officer, UAL Corporation (airlines) (June-December 1987). |
| |
| Larry D. Thompson (1945) | Trustee | Since 2005 | 144 | Cbeyond, Inc. (business communi- |
| 300 S.E. 2nd Street | | | | cations provider) (2010-2012), The |
| Fort Lauderdale, FL 33301-1923 | | | | Southern Company (energy company) |
| | | | | (2014-present; previously 2010-2012) |
| | | | | and Graham Holdings Company |
| | | | | (education and media organization) |
| | | | | (2011-present). |
| Principal Occupation During at Least the Past 5 Years: | | |
| Director of various companies; John A. Sibley Professor of Corporate and Business Law, University of Georgia School of Law (January 2015; |
| previously 2011-2012); and formerly, Executive Vice President – Government Affairs, General Counsel and Corporate Secretary, PepsiCo, |
| Inc. (consumer products) (2012-2014); Senior Vice President – Government Affairs, General Counsel and Secretary, PepsiCo, Inc. |
| (2004-2011); Senior Fellow of The Brookings Institution (2003-2004); Visiting Professor, University of Georgia School of Law (2004); and |
| Deputy Attorney General, U.S. Department of Justice (2001-2003). | | |
| |
| Constantine D. Tseretopoulos Trustee | Since 2003 | 25 | None |
| (1954) | | | | |
| 300 S.E. 2nd Street | | | | |
| Fort Lauderdale, FL 33301-1923 | | | | |
| Principal Occupation During at Least the Past 5 Years: | | |
| Physician, Chief of Staff, owner and operator of the Lyford Cay Hospital (1987-present); director of various nonprofit organizations; and |
| formerly, Cardiology Fellow, University of Maryland (1985-1987); and Internal Medicine Resident, Greater Baltimore Medical Center |
| (1982-1985). | | | | |
| |
| Robert E. Wade (1946) | Trustee | Since 2006 | 42 | El Oro Ltd (investments) |
| 300 S.E. 2nd Street | | | | (2003-present). |
| Fort Lauderdale, FL 33301-1923 | | | | |
| |
| Principal Occupation During at Least the Past 5 Years: | | |
| Attorney at law engaged in private practice (1972-2008) and member of various boards. | |
| |
| |
| |
| franklintempleton.com | | | | Annual Report | 41 |
| | | | |
| TEMPLETON WORLD FUND | | | |
| |
| |
| |
| |
| Interested Board Members and Officers | | |
| |
| | | | Number of Portfolios in | |
| Name, Year of Birth | | Length of | Fund Complex Overseen | Other Directorships Held |
| and Address | Position | Time Served | by Board Member* | During at Least the Past 5 Years |
| |
| **Gregory E. Johnson (1961) | Trustee | Since 2013 | 161 | None |
| One Franklin Parkway | | | | |
| San Mateo, CA 94403-1906 | | | | |
| Principal Occupation During at Least the Past 5 Years: | | |
| Chairman of the Board, Member – Office of the Chairman, Director and Chief Executive Officer, Franklin Resources, Inc.; officer and/or |
| director or trustee, as the case may be, of some of the other subsidiaries of Franklin Resources, Inc. and of 45 of the investment companies |
| in Franklin Templeton Investments; Vice Chairman, Investment Company Institute; and formerly, President, Franklin Resources, Inc. |
| (1994-2015). | | | | |
| |
| **Rupert H. Johnson, Jr. (1940) Chairman of | Chairman of the | 144 | None |
| One Franklin Parkway | the Board and | Board since 2013, | | |
| San Mateo, CA 94403-1906 | Trustee and | Trustee since 1992 | | |
| | Vice President | and Vice President | | |
| | | since 1996 | | |
| |
| Principal Occupation During at Least the Past 5 Years: | | |
| Vice Chairman, Member – Office of the Chairman and Director, Franklin Resources, Inc.; Director, Franklin Advisers, Inc.; Senior Vice |
| President, Franklin Advisory Services, LLC; and officer and/or director or trustee, as the case may be, of some of the other subsidiaries of |
| Franklin Resources, Inc. and of 43 of the investment companies in Franklin Templeton Investments. | |
| |
| Alison E. Baur (1964) | Vice President | Since 2012 | Not Applicable | Not Applicable |
| One Franklin Parkway | | | | |
| San Mateo, CA 94403-1906 | | | | |
| Principal Occupation During at Least the Past 5 Years: | | |
| Deputy General Counsel, Franklin Templeton Investments; and officer of some of the other subsidiaries of Franklin Resources, Inc. and of 45 |
| of the investment companies in Franklin Templeton Investments. | | |
| |
| Norman J. Boersma (1957) | President and | Since 2012 | Not Applicable | Not Applicable |
| Lyford Cay | Chief Executive | | | |
| Nassau, Bahamas | Officer – | | | |
| | Investment | | | |
| | Management | | | |
| Principal Occupation During at Least the Past 5 Years: | | |
| Director, President and Chief Executive Officer, Templeton Global Advisors Ltd.; Chief Investment Officer of Templeton Global Equity Group; |
| officer of six of the investment companies in Franklin Templeton Investments; and formerly, Executive Vice President, Franklin Templeton |
| Investments Corp. (1993-2014). | | | | |
| |
| Laura F. Fergerson (1962) | Chief Executive Since 2009 | Not Applicable | Not Applicable |
| One Franklin Parkway | Officer – | | | |
| San Mateo, CA 94403-1906 | Finance and | | | |
| | Administration | | | |
| |
| Principal Occupation During at Least the Past 5 Years: | | |
| Senior Vice President, Franklin Templeton Services, LLC; Vice President, Franklin Advisers, Inc. and Franklin Templeton Institutional, LLC; |
| and officer of 45 of the investment companies in Franklin Templeton Investments. | |
| |
| Aliya S. Gordon (1973) | Vice President | Since 2009 | Not Applicable | Not Applicable |
| One Franklin Parkway | | | | |
| San Mateo, CA 94403-1906 | | | | |
| |
| Principal Occupation During at Least the Past 5 Years: | | |
| Senior Associate General Counsel, Franklin Templeton Investments; and officer of 45 of the investment companies in Franklin Templeton |
| Investments. | | | | |
42 | Annual Report
franklintempleton.com
TEMPLETON WORLD FUND
| | | | |
| Interested Board Members and Officers (continued) | |
| |
| | | | Number of Portfolios in | |
| Name, Year of Birth | | Length of | Fund Complex Overseen | Other Directorships Held |
| and Address | Position | Time Served | by Board Member* | During at Least the Past 5 Years |
| |
| Steven J. Gray (1955) | Vice President | Since 2009 | Not Applicable | Not Applicable |
| One Franklin Parkway | | | | |
| San Mateo, CA 94403-1906 | | | | |
| |
| Principal Occupation During at Least the Past 5 Years: | | |
| Senior Associate General Counsel, Franklin Templeton Investments; Vice President, Franklin Templeton Distributors, Inc. and Franklin |
| Alternative Strategies Advisers, LLC; and officer of 45 of the investment companies in Franklin Templeton Investments. |
| |
| Selena L. Holmes (1965) | Vice President | Since 2012 | Not Applicable | Not Applicable |
| 100 Fountain Parkway | – AML | | | |
| St. Petersburg, FL 33716-1205 | Compliance | | | |
| |
| Principal Occupation During at Least the Past 5 Years: | | |
| Director, Global Compliance Monitoring; Chief Compliance Officer, Franklin Alternative Strategies Advisers, LLC; Vice President, Franklin |
| Templeton Companies, LLC; and officer of 45 of the investment companies in Franklin Templeton Investments. |
| |
| Kimberly H. Novotny (1972) | Vice President | Since 2013 | Not Applicable | Not Applicable |
| 300 S.E. 2nd Street | | | | |
| Fort Lauderdale, FL 33301-1923 | | | | |
| |
| Principal Occupation During at Least the Past 5 Years: | | |
| Associate General Counsel, Franklin Templeton Investments; Vice President, Fiduciary Trust International of the South; Vice President, |
| Templeton Investment Counsel, LLC; Assistant Secretary, Franklin Resources, Inc.; and officer of 45 of the investment companies in |
| Franklin Templeton Investments. | | | | |
| |
| Mark H. Otani (1968) | Treasurer, | Since 2009 | Not Applicable | Not Applicable |
| One Franklin Parkway | Chief Financial | | | |
| San Mateo, CA 94403-1906 | Officer and | | | |
| | Chief | | | |
| | Accounting | | | |
| | Officer | | | |
| |
| Principal Occupation During at Least the Past 5 Years: | | |
| Treasurer, U.S. Fund Administration & Reporting, Franklin Templeton Investments; and officer of 14 of the investment companies in |
| Franklin Templeton Investments. | | | | |
| |
| Robert C. Rosselot (1960) | Chief | Since 2013 | Not Applicable | Not Applicable |
| 300 S.E. 2nd Street | Compliance | | | |
| Fort Lauderdale, FL 33301-1923 | Officer | | | |
| |
| Principal Occupation During at Least the Past 5 Years: | | |
| Director, Global Compliance, Franklin Templeton Investments; Vice President, Franklin Templeton Companies, LLC; officer of 45 of the |
| investment companies in Franklin Templeton Investments; and formerly, Senior Associate General Counsel, Franklin Templeton Investments |
| (2007-2013); and Secretary and Vice President, Templeton Group of Funds (2004-2013). | |
| |
| Karen L. Skidmore (1952) | Vice President | Since 2009 | Not Applicable | Not Applicable |
| One Franklin Parkway | | | | |
| San Mateo, CA 94403-1906 | | | | |
| |
| Principal Occupation During at Least the Past 5 Years: | | |
| Senior Associate General Counsel, Franklin Templeton Investments; and officer of 45 of the investment companies in Franklin Templeton |
| Investments. | | | | |
franklintempleton.com
Annual Report
| 43
TEMPLETON WORLD FUND
| | | | |
| Interested Board Members and Officers (continued) | |
| |
| | | | Number of Portfolios in | |
| Name, Year of Birth | | Length of | Fund Complex Overseen | Other Directorships Held |
| and Address | Position | Time Served | by Board Member* | During at Least the Past 5 Years |
| |
| Craig S. Tyle (1960) | Vice President | Since 2005 | Not Applicable | Not Applicable |
| One Franklin Parkway | | | | |
| San Mateo, CA 94403-1906 | | | | |
| |
| Principal Occupation During at Least the Past 5 Years: | | |
| General Counsel and Executive Vice President, Franklin Resources, Inc.; and officer of some of the other subsidiaries of Franklin Resources, |
| Inc. and of 45 of the investment companies in Franklin Templeton Investments. | |
| |
| Lori A. Weber (1964) | Secretary and | Secretary since | Not Applicable | Not Applicable |
| 300 S.E. 2nd Street | Vice President | 2013 and Vice | | |
| Fort Lauderdale, FL 33301-1923 | | President since | | |
| | | 2011 | | |
| |
| Principal Occupation During at Least the Past 5 Years: | | |
| Senior Associate General Counsel, Franklin Templeton Investments; Assistant Secretary, Franklin Resources, Inc.; Vice President and |
| Secretary, Templeton Investment Counsel, LLC; and officer of 45 of the investment companies in Franklin Templeton Investments. |
*We base the number of portfolios on each separate series of the U.S. registered investment companies within the Franklin Templeton Investments fund complex.
These portfolios have a common investment manager or affiliated investment managers.
**Gregory E. Johnson is considered to be an interested person of the Fund under the federal securities laws due to his position as an officer and director of Franklin
Resources, Inc. (Resources), which is the parent company of the Fund’s investment manager and distributor. Rupert H. Johnson, Jr. is considered to be an interested
person of the Fund under the federal securities laws due to his position as officer and director and major shareholder of Resources.
Note 1: Rupert H. Johnson, Jr. is the uncle of Gregory E. Johnson.
Note 2: Officer information is current as of the date of this report. It is possible that after this date, information about officers may change.
The Sarbanes-Oxley Act of 2002 and Rules adopted by the U.S. Securities and Exchange Commission require the Fund to disclose whether the Fund’s Audit
Committee includes at least one member who is an audit committee financial expert within the meaning of such Act and Rules. The Fund’s Board has deter-
mined that there is at least one such financial expert on the Audit Committee and has designated each of Ann Torre Bates and David W. Niemiec as an audit
committee financial expert. The Board believes that Ms. Bates and Mr. Niemiec qualify as such an expert in view of their extensive business background
and experience. Ms. Bates has served as a member of the Fund Audit Committee since 2008. She currently serves as a director of Navient Corporation
(2014-present), Ares Capital Corporation (2010-present) and United Natural Foods, Inc. (2013-present) and was formerly a director of SLM Corporation from
1997 to 2014 and Allied Capital Corporation from 2003 to 2010, Executive Vice President and Chief Financial Officer of NHP Incorporated from 1995 to 1997 and
Vice President and Treasurer of US Airways, Inc. until 1995. Mr. Niemiec has served as a member of the Fund Audit Committee since 2005, currently serves as
an Advisor to Saratoga Partners and was formerly its Managing Director from 1998 to 2001. Mr. Niemiec was formerly a director of Emeritus Corporation from
1999 to 2010 and OSI Pharmaceuticals, Inc. from 2006 to 2010, Managing Director of SBC Warburg Dillon Read from 1997 to 1998, and was Vice Chairman from
1991 to 1997 and Chief Financial Officer from 1982 to 1997 of Dillon, Read & Co. Inc. As a result of such background and experience, the Board believes that
Ms. Bates and Mr. Niemiec have each acquired an understanding of generally accepted accounting principles and financial statements, the general applica-
tion of such principles in connection with the accounting estimates, accruals and reserves, and analyzing and evaluating financial statements that present a
breadth and level of complexity of accounting issues generally comparable to those of the Fund, as well as an understanding of internal controls and proce-
dures for financial reporting and an understanding of audit committee functions. Ms. Bates and Mr. Niemiec are independent Board members as that term is
defined under the applicable U.S. Securities and Exchange Commission Rules and Releases.
The Statement of Additional Information (SAI) includes additional information about the board members and is available, without charge, upon request.
Shareholders may call (800) DIAL BEN/342-5236 to request the SAI.
44 | Annual Report
franklintempleton.com
TEMPLETON WORLD FUND
Shareholder Information
Board Review of Investment Management Agreement
At a meeting held May 19, 2015, the Board of Trustees (Board), including a majority of non-interested or independent Trustees, approved renewal of the investment management agreement for each of the two separate funds in Templeton Funds, including Templeton World Fund (Fund(s)). In reaching this decision, the Board took into account information furnished throughout the year at regular Board meetings, as well as information prepared specifically in connection with the annual renewal review process. Information furnished and discussed throughout the year included investment performance reports and related financial information for the Funds, along with periodic reports on expenses, shareholder services, legal and compliance matters, pricing, brokerage commissions and execution and other services provided by the Investment Manager (Manager) and its affiliates, as well as marketing support payments made to financial intermediaries. Information furnished specifically in connection with the renewal process included a report for the Fund prepared by Lipper, Inc. (Lipper), an independent organization, as well as additional material, including a Fund profitability analysis prepared by management. The Lipper report compared the Funds’ investment performance and expenses with those of other mutual funds deemed comparable to the Funds as selected by Lipper. The Fund profitability analysis discussed the profitability to Franklin Templeton Investments (FTI) from its overall U.S. fund operations, as well as on an individual fund-by-fund basis. Additional material accompanying such profitability analysis report included information on a fund-by-fund basis listing portfolio managers and other accounts they manage, as well as information on management fees charged by the Manager and its affiliates to U.S. mutual funds and other accounts, including management’s explanation of differences where relevant. Such material also included a memorandum prepared by management describing project initiatives and capital investments relating to the services provided to the Funds by the FTI organization, as well as a memorandum relating to economies of scale and an analysis concerning transfer agent fees charged by an affiliate of the Manager. The Board also noted that at the February meetings each year, it receives an annual report on all marketing support payments made by FTI to financial intermediaries.
In considering such materials, the independent Trustees received assistance and advice from and met separately with independent counsel. In approving continuance of the investment management agreements for the Funds, the Board, including a majority
of independent Trustees, determined that the existing management fee structure was fair and reasonable and that continuance of the investment management agreements was in the best interests of the Funds and their shareholders. While attention was given to all information furnished, the following discusses some primary factors relevant to the Board’s decision.
NATURE, EXTENT AND QUALITY OF SERVICES. The Board was satisfied with the nature and quality of the overall services provided by the Manager and its affiliates to the Fund and its shareholders. In addition to investment performance and expenses discussed later, the Board’s opinion was based, in part, upon periodic reports furnished showing that the investment policies and restrictions for the Fund were consistently complied with as well as other reports periodically furnished to the Board covering matters such as the compliance of portfolio managers and other management personnel with the code of ethics adopted throughout the Franklin Templeton fund complex, the adherence to fair value pricing procedures established by the Board, and the accuracy of net asset value calculations. The Board also noted the extent of benefits provided to Fund shareholders from being part of the Franklin Templeton family of funds, including the right to exchange investments between the same class of shares of different funds without a sales charge, the ability to reinvest Fund dividends into other funds and the right to combine holdings in other funds to obtain a reduced sales charge. Favorable consideration was given to management’s continual efforts and expenditures in establishing effective business continuity plans and developing strategies to address cybersecurity threats. Among other factors taken into account by the Board were the Manager’s best execution trading policies, including a favorable report by an independent portfolio trading analytical firm that also covered global foreign exchange transactions. Consideration was also given to the experience of the Fund’s portfolio management team, the number of accounts managed and general method of compensation. In this latter respect, the Board noted that a primary factor in management’s determination of a portfolio manager’s bonus compensation was the relative investment performance of the funds he or she managed and that a portion of such bonus was required to be invested in a predesignated list of funds within such person’s fund management area so as to be aligned with the interests of shareholders. The Board also took into account the quality of transfer agent and shareholder services provided to Fund shareholders by an affiliate of the Manager, noting the changes taking place in the nature of transfer agency services throughout the industry and regulatory initiatives in this area, and the continual enhancements to the Franklin Templeton
franklintempleton.com
Annual Report
| 45
TEMPLETON WORLD FUND
SHAREHOLDER INFORMATION
Board Review of Investment Management
Agreement (continued) website. Particular attention was given to management’s conservative approach and diligent risk management procedures, including continual monitoring of counterparty credit risk and attention given to derivatives and other complex instruments including expanded collateralization requirements, as applicable. The Board also took into account, among other things, management’s efforts in establishing a global credit facility for the benefit of the Fund and other accounts managed by FTI to provide a source of cash for temporary and emergency purposes or to meet unusual redemption requests as well as the strong financial position of the Manager’s parent company and its commitment to the mutual fund business as evidenced by its continued subsidization of money market funds.
INVESTMENT PERFORMANCE. The Board placed significant emphasis on the investment performance of the Fund in view of its importance to shareholders. While consideration was given to performance reports and discussions with portfolio managers at Board meetings during the year, particular attention in assessing performance was given to the Lipper reports furnished for the agreement renewal. The Lipper reports prepared for the Fund showed the investment performance of its Class A shares for the one-year period ended February 28, 2015, and the previous 10 years ended such date in comparison with a performance universe selected by Lipper. The Lipper performance universe for the Fund consisted of the Fund and all retail and institutional global large-cap value funds as selected by Lipper. On a comparative basis, the Lipper report showed the Fund’s total return to be in the lowest or worst quintile of such performance universe for the one-year period, and on an annualized basis to be in the lowest performing quintile of such universe for the previous three-year period, in the second-lowest performing quintile for the previous five-year period, and in the middle performing quintile for the previous 10-year period. The Board found the Fund’s comparative performance as set forth in the Lipper report to be acceptable, taking into consideration that the Fund’s total return was within nine basis points of the median for the annualized 10-year period.
COMPARATIVE EXPENSES. Consideration was given to a comparative analysis of the management fees and total expense ratio of the Fund compared with those of a group of other funds selected by Lipper as constituting its appropriate Lipper expense group. Lipper expense data is based upon information taken from each fund’s most recent annual report, which reflects historical asset levels that may be quite different from those currently existing, particularly in a period of market volatility. While recognizing such inherent limitation and the fact that expense ratios generally increase as assets decline and decrease as assets grow, the Board believed the independent analysis conducted by Lipper to be an appropriate measure of comparative expenses. In reviewing comparative costs, Lipper provides information on the Fund’s contractual investment management fee in comparison with the contractual investment management fee that would have been charged by other funds within its Lipper expense group assuming they were similar in size to the Fund, as well as the actual total expenses of the Fund in comparison with those of its Lipper expense group. The Lipper contractual investment management fee analysis included administrative charges as being part of the management fee, and actual total expenses, for comparative consistency, are shown by Lipper for Fund Class A shares. The results of such expense comparisons showed the contractual investment management fee rate and actual total expense ratio of the Fund to be in the second least expensive quintile of its Lipper expense group. The Board was satisfied with the comparative expenses of the Fund as set forth in the Lipper reports.
MANAGEMENT PROFITABILITY. The Board also considered the level of profits realized by the Manager and its affiliates in connection with the operation of the Fund. In this respect, the Board reviewed the Fund profitability analysis that addresses the overall profitability of Franklin Templeton’s U.S. fund business, as well as its profits in providing management and other services to each of the individual funds during the 12-month period ended September 30, 2014, being the most recent fiscal year-end for Franklin Resources, Inc., the Manager’s parent. In reviewing the analysis, the Board recognized that allocation methodologies are inherently subjective and various allocation methodologies may be reasonable while producing different results. In this respect, the Board noted that while management continually makes refinements to its methodologies in response to organizational and product related changes, the overall approach as defined by the primary drivers and activity measurements has remained consistent with that used in the Fund’s profitability report presentations from prior years. Additionally, the Fund’s independent registered public accounting firm had been engaged by the Manager to periodically review the reasonableness of the allocation methodologies to be used solely by the Fund’s Board in reference to the profitability analysis. In reviewing and discussing such analysis, management discussed with the Board its belief that costs incurred in establishing the infrastructure necessary for the type
46 | Annual Report
franklintempleton.com
TEMPLETON WORLD FUND
SHAREHOLDER INFORMATION
of mutual fund operations conducted by the Manager and its affiliates may not be fully reflected in the expenses allocated to the Fund in determining its profitability, as well as the fact that the level of profits, to a certain extent, reflected operational cost savings and efficiencies initiated by management. The Board also took into account management’s expenditures in improving shareholder services provided to the Fund, as well as the need to implement systems and meet additional regulatory and compliance requirements resulting from statutes such as the Sarbanes-Oxley and Dodd-Frank Acts and recent SEC and other regulatory requirements. In addition, the Board considered a third-party study comparing the profitability of the Manager’s parent on an overall basis to other publicly held managers broken down to show profitability from management operations exclusive of distribution expenses, as well as profitability including distribution expenses. The Board also considered the extent to which the Manager and its affiliates might derive ancillary benefits from fund operations, including revenues generated from transfer agent services, and potential benefits resulting from personnel and systems enhancements necessitated by fund growth, increased leverage with the service providers and counterparties, allocation of fund brokerage and the use of commission dollars to pay for research. Based upon its consideration of all these factors, the Board determined that the level of profits realized by the Manager and its affiliates from providing services to the Fund was not excessive in view of the nature, quality and extent of services provided.
ECONOMIES OF SCALE. The Board also considered whether economies of scale are realized by the Manager as the Fund grows larger and the extent to which this is reflected in the level of management fees charged. While recognizing that any precise determination is inherently subjective, the Board noted that based upon the Fund profitability analysis, it appears that as some funds get larger, at some point economies of scale do result in the Manager realizing a larger profit margin on management services provided to such a fund. The Board also noted that economies of scale are shared with a fund and its shareholders through management fee breakpoints so that as a fund grows in size, its effective management fee rate declines. The Fund’s investment management agreement provides a fee at the rate of 0.705% on the first $1 billion of net assets; 0.690% on the next $4 billion of net assets; 0.675% on the next $5 billion of net assets; 0.655% on the next $5 billion of net assets; 0.635% on the next $5 billion of net assets; and 0.615% on net assets in excess of $20 billion. At the end of 2014, the net assets of the Fund were approximately $5.83 billion. The Board believed that to the extent economies of scale may be realized by the Manager and its affiliates, the schedule of fees under the investment management agreement for the Fund provides a sharing of benefits with the Fund and its shareholders.
Proxy Voting Policies and Procedures
The Trust’s investment manager has established Proxy Voting Policies and Procedures (Policies) that the Trust uses to determine how to vote proxies relating to portfolio securities. Shareholders may view the Trust’s complete Policies online at franklintempleton.com. Alternatively, shareholders may request copies of the Policies free of charge by calling the Proxy Group collect at (954) 527-7678 or by sending a written request to: Franklin Templeton Companies, LLC, 300 S.E. 2nd Street, Fort Lauderdale, FL 33301, Attention: Proxy Group. Copies of the Trust’s proxy voting records are also made available online at franklintempleton.com and posted on the U.S. Securities and Exchange Commission’s website at sec.gov and reflect the most recent 12-month period ended June 30.
Quarterly Statement of Investments
The Trust files a complete statement of investments with the U.S. Securities and Exchange Commission for the first and third quarters for each fiscal year on Form N-Q. Shareholders may view the filed Form N-Q by visiting the Commission’s website at sec.gov. The filed form may also be viewed and copied at the Commission’s Public Reference Room in Washington, DC. Information regarding the operations of the Public Reference Room may be obtained by calling (800) SEC-0330.
Householding of Reports and Prospectuses
You will receive the Fund’s financial reports every six months as well as an annual updated summary prospectus (prospectus available upon request). To reduce Fund expenses, we try to identify related shareholders in a household and send only one copy of the financial reports and summary prospectus. This process, called “householding,” will continue indefinitely unless you instruct us otherwise. If you prefer not to have these documents householded, please call us at (800) 632-2301. At any time you may view current prospectuses/summary prospectuses and financial reports on our website. If you choose, you may receive these documents through electronic delivery.
franklintempleton.com
Annual Report
| 47
This page intentionally left blank.

Annual Report and Shareholder Letter
Templeton World Fund
Investment Manager
Templeton Global Advisors Limited
Distributor
Franklin Templeton Distributors, Inc.
(800) DIAL BEN® / 342-5236
franklintempleton.com
Shareholder Services
(800) 632-2301
Authorized for distribution only when accompanied or preceded by a summary prospectus and/or prospectus. Investors should carefully consider a fund’s investment goals, risks, charges and expenses before investing. A prospectus contains this and other information; please read it carefully before investing.
To help ensure we provide you with quality service, all calls to and from our service areas are monitored and/or recorded.
| |
| © 2015 Franklin Templeton Investments. All rights reserved. | 102 A 10/15 |
Item 2. Code of Ethics.
(a) The Registrant has adopted a code of ethics that applies to its principal executive officers and principal financial and accounting officer.
(c) N/A
(d) N/A
(f) Pursuant to Item 12(a)(1), the Registrant is attaching as an exhibit a copy of its code of ethics that applies to its principal executive officers and principal financial and accounting officer.
Item 3. Audit Committee Financial Expert.
(a)(1) The Registrant has an audit committee financial expert serving on its audit committee.
(2) The audit committee financial expert is David W. Niemiec and he is "independent" as defined under the relevant Securities and Exchange Commission Rules and Releases.
Item 4. Principal Accountant Fees and Services.
(a) Audit Fees
The aggregate fees paid to the principal accountant for professional services rendered by the principal accountant for the audit of the registrant’s annual financial statements or for services that are normally provided by the principal accountant in connection with statutory and regulatory filings or engagements were $112,997 for the fiscal year ended August 31, 2015 and $115,983 for the fiscal year ended August 31, 2014.
(b) Audit-Related Fees
The aggregate fees paid to the principal accountant for assurance and related services rendered by the principal accountant to the registrant that are reasonably related to the performance of the audit of the registrant's financial statements and are not reported under paragraph (a) of Item 4 were $5,904 for the fiscal year ended August 31, 2015 and $5,788 for the fiscal year ended August 31, 2014. The services for which these fees were paid included attestation services.
There were no fees paid to the principal accountant for assurance and related services rendered by the principal accountant to the registrant's investment adviser and any entity controlling, controlled by or under common control with the investment adviser that provides ongoing services to the registrant that are reasonably related to the performance of the audit of their financial statements.
(c) Tax Fees
There were no fees paid to the principal accountant for professional services rendered by the principal accountant to the registrant for tax compliance, tax advice and tax planning.
The aggregate fees paid to the principal accountant for professional services rendered by the principal accountant to the registrant’s investment adviser and any entity controlling, controlled by or under common control with the investment adviser that provides ongoing services to the registrant for tax compliance, tax advice and tax planning were $0 for the fiscal year ended August 31, 2015 and $3,830 for the fiscal year ended August 31, 2014. The services for which these fees were paid included technical tax consultation for withholding tax reporting for foreign governments and requirements on local country’s self-certification forms.
(d) All Other Fees
The aggregate fees paid to the principal accountant for products and services rendered by the principal accountant to the registrant, other than the services reported in paragraphs (a)-(c) of Item 4 were $0 for the fiscal year ended August 31, 2015 and $4,156 for the fiscal year ended August 31, 2014. The services for which these fees were paid included review of materials provided to the fund Board in connection with the investment management contract renewal process.
The aggregate fees paid to the principal accountant for products and services rendered by the principal accountant to the registrant’s investment adviser and any entity controlling, controlled by or under common control with the investment adviser that provides ongoing services to the registrant, other than the services reported in paragraphs (a)-(c) of Item 4 were $9,000 for the fiscal year ended August 31, 2015 and $159,080 for the fiscal year ended August 31, 2014. The services for which these fees were paid included preparation and review of materials provided to the fund Board in connection with the investment management contract renewal process and certifying assets under management.
(e) (1) The registrant’s audit committee is directly responsible for approving the services to be provided by the auditors, including:
(i) pre-approval of all audit and audit related services;
(ii) pre-approval of all non-audit related services to be provided to the Fund by the auditors;
(iii) pre-approval of all non-audit related services to be provided to the registrant by the auditors to the registrant’s investment adviser or to any entity that controls, is controlled by or is under common control with the registrant’s investment adviser and that provides ongoing services to the registrant where the non-audit services relate directly to the operations or financial reporting of the registrant; and
(iv) establishment by the audit committee, if deemed necessary or appropriate, as an alternative to committee pre-approval of services to be provided by the auditors, as required by paragraphs (ii) and (iii) above, of policies and procedures to permit such services to be pre-approved by other means, such as through establishment of guidelines or by action of a designated member or members of the committee; provided the policies and procedures are detailed as to the particular service and the committee is informed of each service and such policies and procedures do not include delegation of audit committee responsibilities, as contemplated under the Securities Exchange Act of 1934, to management; subject, in the case of (ii) through (iv), to any waivers, exceptions or exemptions that may be available under applicable law or rules.
(e) (2) None of the services provided to the registrant described in paragraphs (b)-(d) of Item 4 were approved by the audit committee pursuant to paragraph (c)(7)(i)(C) of Rule 2-01 of regulation S-X.
(f) No disclosures are required by this Item 4(f).
(g) The aggregate non-audit fees paid to the principal accountant for services rendered by the principal accountant to the registrant and the registrant’s investment adviser and any entity controlling, controlled by or under common control with the investment adviser that provides ongoing services to the registrant were $14,904 for the fiscal year ended August 31, 2015 and $172,854 for the fiscal year ended August 31, 2014.
(h) The registrant’s audit committee of the board has considered whether the provision of non-audit services that were rendered to the registrant’s investment adviser (not including any sub-adviser whose role is primarily portfolio management and is subcontracted with or overseen by another investment adviser), and any entity controlling, controlled by, or under common control with the investment adviser that provides ongoing services to the registrant that were not pre-approved pursuant to paragraph (c)(7)(ii) of Rule 2-01 of Regulation S-X is compatible with maintaining the principal accountant’s independence.
Item 5. Audit Committee of Listed Registrants. N/A
Item 6. Schedule of Investments. N/A
Item 7. Disclosure of Proxy Voting Policies and Procedures for Closed-End Management Investment Companies. N/A
Item 8. Portfolio Managers of Closed-End Management Investment Companies. N/A
Item 9. Purchases of Equity Securities by Closed-End Management Investment Company and Affiliated Purchasers. N/A
Item 10. Submission of Matters to a Vote of Security Holders.
There have been no changes to the procedures by which shareholders may recommend nominees to the Registrant's Board of Trustees that would require disclosure herein.
Item 11. Controls and Procedures.
(a) Evaluation of Disclosure Controls and Procedures. The Registrant maintains disclosure controls and procedures that are designed to ensure that information required to be disclosed in the Registrant’s filings under the Securities Exchange Act of 1934 and the Investment Company Act of 1940 is recorded, processed, summarized and reported within the periods specified in the rules and forms of the Securities and Exchange Commission. Such information is accumulated and communicated to the Registrant’s management, including its principal executive officer and principal financial officer, as appropriate, to allow timely decisions regarding required disclosure. The Registrant’s management, including the principal executive officer and the principal financial officer, recognizes that any set of controls and procedures, no matter how well designed and operated, can provide only reasonable assurance of achieving the desired control objectives.
Within 90 days prior to the filing date of this Shareholder Report on Form N-CSR, the Registrant had carried out an evaluation, under the supervision and with the participation of the Registrant’s management, including the Registrant’s principal executive officer and the Registrant’s principal financial officer, of the effectiveness of the design and operation of the Registrant’s disclosure controls and procedures. Based on such evaluation, the Registrant’s principal executive officer and principal financial officer concluded that the Registrant’s disclosure controls and procedures are effective.
(b) Changes in Internal Controls. There have been no changes in the Registrant’s internal controls or in other factors that could materially affect the internal controls over financial reporting subsequent to the date of their evaluation in connection with the preparation of this Shareholder Report on Form N-CSR.
Item 12. Exhibits.
(a)(1) Code of Ethics
(a)(2) Certifications pursuant to Section 302 of the Sarbanes-Oxley Act of 2002 of Laura F. Fergerson, Chief Executive Officer - Finance and Administration, and Mark H. Otani, Chief Financial Officer and Chief Accounting Officer
(b) Certifications pursuant to Section 906 of the Sarbanes-Oxley Act of 2002 of Laura F. Fergerson, Chief Executive Officer - Finance and Administration, and Mark H. Otani, Chief Financial Officer and Chief Accounting Officer
SIGNATURES
Pursuant to the requirements of the Securities Exchange Act of 1934 and the Investment Company Act of 1940, the registrant has duly caused this report to be signed on its behalf by the undersigned, thereunto duly authorized.
TEMPLETON FUNDS
By /s/LAURA F. FERGERSON
Laura F. Fergerson
Chief Executive Officer - Finance and
Administration
Date: October 26, 2015
Pursuant to the requirements of the Securities Exchange Act of 1934 and the Investment Company Act of 1940, this report has been signed below by the following persons on behalf of the registrant and in the capacities and on the dates indicated.
By /s/LAURA F. FERGERSON
Laura F. Fergerson
Chief Executive Officer - Finance and
Administration
Date: October 26, 2015
By /s/MARK H. OTANI
Mark H. Otani
Chief Financial Officer and
Chief Accounting Officer
Date: October 26, 2015