UNITED STATES
SECURITIES AND EXCHANGE COMMISSION
Washington, DC 20549
FORM N-CSR/A
CERTIFIED SHAREHOLDER REPORT OF REGISTERED MANAGEMENT INVESTMENT COMPANIES
Investment Company Act file number 811-02781
Templeton Funds
(Exact name of registrant as specified in charter)
300 S.E. 2nd Street, Fort Lauderdale, FL 33301-1923
(Address of principal executive offices) (Zip code)
Craig S. Tyle, One Franklin Parkway, San Mateo, CA 94403-1906
(Name and address of agent for service)
Registrant's telephone number, including area code: (954) 527-7500_
Date of fiscal year end: _8/31__
Date of reporting period: 8/31/16_
Item 1. Reports to Stockholders.
| |
| Contents | |
| |
| Annual Report | |
| Templeton Foreign Fund. | 3 |
| Performance Summary | 9 |
| Your Fund’s Expenses | 14 |
| Financial Highlights and Statement of Investments | 16 |
| FinancialStatements | 25 |
| Notes to Financial Statements | 29 |
| Report of Independent Registered | |
| Public Accounting Firm. | 38 |
| Tax Information. | 39 |
| Board Members and Officers | 40 |
| Shareholder Information | 45 |
Visit franklintempleton.com for fund updates, to access your account, or to find helpful financial planning tools.
2 Annual Report
franklintempleton.com
Annual Report
Templeton Foreign Fund
We are pleased to bring you Templeton Foreign Fund’s annual report for the fiscal year ended August 31, 2016.
Your Fund’s Goal and Main Investments
The Fund seeks long-term capital growth. Under normal market conditions, the Fund invests at least 80% of its net assets in "foreign securities," as described in the prospectus. These securities are predominantly equity securities of companies located outside the U.S., including developing markets.
Performance Overview
The Fund’s Class A shares delivered a +3.46% cumulative total return for the 12 months under review. In comparison, the Fund’s new benchmark, the MSCI All Country World Index (ACWI) ex USA, which measures stock performance in global developed and emerging markets excluding the U.S., generated a +3.43% total return, while the Fund’s old benchmark, the MSCI Europe, Australasia, Far East (EAFE) Index, which measures global equity performance in developed countries excluding the U.S. and Canada, posted a +0.38% total return.1 The Fund’s long-term results are shown in the Performance Summary beginning on page 9. For the 10-year period ended August 31, 2016, the Fund’s Class A shares generated a +33.00% cumulative total return, compared with the MSCI ACWI ex USA’s +28.06% cumulative total return for the same period.1 Please note index performance information is provided for reference and we do not attempt to track the index but rather undertake investments on the basis of fundamental research. You can find more performance data in the Performance Summary.
Performance data represent past performance, which does not guarantee future results. Investment return and principal value will fluctuate, and you may have a gain or loss when you sell your shares. Current performance may differ from figures shown. For most recent month-end performance, go to franklintempleton.com or call (800) 342-5236.

Economic and Market Overview
The global economy expanded moderately during the 12 months under review despite slower growth in some countries. In this environment, global developed and emerging market stocks, as measured by the MSCI ACWI, rose. Moreover, global markets were assisted by accommodative monetary policies of various global central banks, an improvement in commodity prices that included a rally in crude oil prices during the second half of the review period, finalization of Greece’s new debt deal and encouraging economic data toward period-end. However, the impact of these factors was partially offset by worries of a slowdown in the Chinese economy, declining commodity prices during the first half of the review period, geopolitical tensions in certain regions and uncertainty about the U.S. Federal Reserve’s (Fed’s) timing for raising interest rates. In addition, global economic concerns and the U.K.’s historic referendum to leave the European Union (also known as the “Brexit”) contributed to volatility in global stock markets.
1. Source: Morningstar. As of 8/31/16, the Fund’s Class A 10-year average annual total return not including the maximum sales charge was +2.89%, compared with the MSCI
ACWI ex USA’s 10-year average annual total return of +2.50%.
The indexes are unmanaged and include reinvestment of any income or distributions. They do not reflect any fees, expenses or sales charges. One cannot invest directly in an
index, and an index is not representative of the Fund’s portfolio.
The dollar value, number of shares or principal amount, and names of all portfolio holdings are listed in the Fund’s Statement of Investments (SOI).
The SOI begins on page 21.
franklintempleton.com
Annual Report
3
| | |
| TEMPLETON FOREIGN FUND | | |
| |
| |
| |
| Top 10 Sectors/Industries | | |
| 8/31/16 | | |
| | % of Total | |
| | Net Assets | |
| Banks | 15.4 | % |
| Oil, Gas & Consumable Fuels | 9.9 | % |
| Energy Equipment & Services | 9.8 | % |
| Pharmaceuticals | 8.1 | % |
| Technology Hardware, Storage & Peripherals | 7.2 | % |
| Metals & Mining | 6.8 | % |
| Insurance | 4.8 | % |
| Automobiles | 4.0 | % |
| Wireless Telecommunication Services | 3.6 | % |
| Auto Components | 3.1 | % |
The U.S. economy grew modestly during the 12-month period despite a general decline in private inventory and nonresidential fixed investments. However, personal consumption expenditure remained strong during the period. Sentiment in the manufacturing sector remained volatile, contracting during the initial months, expanding during the second half and finally contracting again toward period-end. Similarly, the services sector was also volatile but remained in expansionary territory throughout. Growth in services contributed to new jobs and helped the unemployment rate decrease from 5.1% in August 2015 to 4.9% at period-end. Retail sales generally rose, as did home sales and prices amid declining mortgage rates. The Fed raised its federal funds target range to 0.25%–0.50% in December 2015, and maintained it through period-end. Following encouraging U.S. employment data in June and July 2016, the Fed Chair signaled a possible increase in interest rates in the near term. However, weak job additions for August dampened expectations of an increase in interest rates in September.
In Europe, economic growth in the U.K. slowed in the first quarter of 2016, and rebounded marginally in the second quarter, supported by industrial production and services. Immediate effects of the Brexit vote in June materialized as U.K. stocks declined significantly, the pound sterling hit a three-decade low amid intensified selling and the U.K.’s credit rating was downgraded. The eurozone grew slightly during the period, benefiting from lower oil prices, a weaker euro that supported exports and the European Central Bank’s (ECB) accommodative policy. However, growth moderated during the second quarter of 2016. After reducing the bank deposit rate in December 2015, the ECB cut its benchmark interest rate and expanded its massive bond-buying program in March and August 2016 to boost the region’s slowing growth.
In Asia, Japan’s gross domestic product (GDP) contracted in the fourth quarter of 2015 as private consumption and residential investments declined. After growing more than expected during the first quarter of 2016, led by increases in private consumption, government spending and exports, Japan’s economic growth slowed significantly in the second quarter. In January 2016, the Bank of Japan (BOJ) introduced negative interest rates on excess reserves kept by financial institutions with the central bank to boost lending and help achieve its inflation target. In July 2016, Japan’s Prime Minister Shinzo Abe announced a higher-than-expected fiscal stimulus to revive the economy. Toward period-end, BOJ governor Haruhiko Kuroda indicated that the central bank would not hesitate to introduce further monetary stimulus measures, including lower negative interest rates, boosting domestic equity market sentiment.
In emerging markets, growth generally moderated during the review period. Brazil witnessed its longest recession since the 1930s amid political and economic turmoil. Brazil’s economy continued to contract during the period although the pace of contraction slowed in 2016’s first half, as business sentiment grew near period-end with the likely impeachment of President Dilma Rousseff. Russia’s GDP showed signs of stabilization in the first half of 2016 following a rebound in oil prices and an improvement in industrial production. The Bank of Russia reduced its key interest rate in June 2016 to revive its economy. China’s economy grew at a less robust pace during the period under review. However, China’s economy appeared to stabilize in 2016’s first half and remained within the government’s targeted range. The People’s Bank of China cut its benchmark interest rate once during the review period. Additionally, the bank also employed other monetary easing measures that included cutting the cash reserve requirement ratio for the country’s banks and effectively devaluing the Chinese currency against the U.S. dollar. Overall, emerging market stocks, as measured by the MSCI Emerging Markets Index, rose during the period.
Investment Strategy
Our investment strategy employs a bottom-up, value-oriented, long-term approach. We focus on the market price of a company’s securities relative to our evaluation of the company’s long-term earnings, asset value and cash flow potential. As we look internationally, we consider specific companies, rather than sectors or countries, while doing in-depth research to construct a bargain list from which we buy. Before we make a purchase, we look at the company’s price/earnings ratio, price/cash flow ratio, profit margins and liquidation value.
4 Annual Report
franklintempleton.com
TEMPLETON FOREIGN FUND
Manager’s Discussion
During the 12-month period under review, the Fund performed in line with its benchmark, the MSCI ACWI ex USA. Challenging conditions persisted during the first half of the review period, with concerns about debt, deflation and growth supporting expensive defensive sectors (which we have largely avoided) and punishing cheaper cyclical sectors (where we have been finding better opportunities). Low-to-negative interest rates perpetuated these trends, with financials suffering as net interest margins tightened, while “bond proxies,” such as consumer staples, rallied. However, performance during the period improved as the period progressed, with the Fund hitting its highest levels for the fiscal year during the month of August.
Conditions improved in the latter half of the period. Popular consumer staples holdings retreated from lofty valuation levels near period-end, rewarding the Fund’s underweighted allocation to this sector as the period progressed.2 Conversely, improving Chinese economic data, a flagging U.S. dollar and talk of an output freeze by major oil producing nations contributed to stabilizing commodity prices in the final six months of the period. We believe this allowed downtrodden energy and materials firms to subsequently restructure and refinance. Moreover, financials stocks experienced a late recovery as benign stress test results from the European banking sector and better-than-expected earnings helped reverse effects of the U.K.’s historic Brexit referendum.
The Fund’s positive performance during the period was largely attributable to our contrarian investments in beaten-down resource sectors. In particular, the Fund’s stock selection and overweighted allocation in the materials sector and overweighted allocation in the energy sector aided the Fund’s relative returns.3 Within the materials sector, Canadian precious metals firms Barrick Gold and Silver Wheaton and Swiss miner and commodities trader Glencore were some of the largest contributors. Shares of Barrick, the world’s largest gold miner, and Silver Wheaton, the world’s largest gold and silver streaming company (streamers provide financing to primary miners in exchange for a proportion of metal production), both increased as precious metals prices soared to multi-year highs toward period-end. In our opinion, both companies represented compelling value propositions in recent quarters. Uncertainty surrounding major restructuring initiatives at Barrick offered investors a chance to gain exposure to what we consider to be the world’s best gold production portfolio at severely
| | |
| Top 10 Holdings | | |
| 8/31/16 | | |
| Company | % of Total | |
| Sector/Industry, Country | Net Assets | |
| Samsung Electronics Co. Ltd. | 4.9 | % |
| Technology Hardware, Storage & Peripherals, | | |
| South Korea | | |
| Hana Financial Group Inc. | 2.5 | % |
| Banks, South Korea | | |
| BP PLC | 2.2 | % |
| Oil, Gas & Consumable Fuels, U.K. | | |
| KB Financial Group Inc. | 2.2 | % |
| Banks, South Korea | | |
| SoftBank Group Corp. | 2.2 | % |
| Wireless Telecommunication Services, Japan | | |
| BNP Paribas SA | 2.1 | % |
| Banks, France | | |
| Royal Dutch Shell PLC | 2.0 | % |
| Oil, Gas & Consumable Fuels, U.K. | | |
| Nissan Motor Co. Ltd. | 2.0 | % |
| Automobiles, Japan | | |
| SBM Offshore NV | 2.0 | % |
| Energy Equipment & Services, Netherlands | | |
| Silver Wheaton Corp. | 1.9 | % |
| Metals & Mining, Canada | | |
discounted valuation levels, while a general misunderstanding of Silver Wheaton’s business model allowed investors to similarly buy a robust and recurring stream of cash flows without bearing the capital and political risks associated with traditional mining, all at what we believe to be a value price. More generally, we deliberately increased the Fund’s exposure to what we viewed as undervalued precious metals companies during the review period because of these metals’ traditional role as monetary assets. Aggressive global monetary policy has led to the proliferation of negative real interest rates, which has erased the opportunity cost of holding precious metals as a store of value.
The Fund began acquiring shares of Glencore in the second half of 2015 as concerns about the firm’s high debt levels, opaque trading business and exposure to China-dependent commodities, such as coal and copper, drove share prices significantly lower. With Glencore’s bonds trading at significant lows, analysts predicting that equity could go to zero, and additional news sources expressing concerns over Glencore filing for Chapter 11 bankruptcy, we undertook a calm analysis of the facts. Specifically, we assessed that
2. The consumer staples sector comprises food and staples retailing in the SOI.
3. The materials sector comprises chemicals and metals and mining in the SOI. The energy sector comprises energy equipment and services and oil, gas and consumable fuels
in the SOI.
franklintempleton.com
Annual Report
5
TEMPLETON FOREIGN FUND
Glencore’s commodity mix, with the notable absence of iron ore, was less exposed to China than its diversified peers, its trading business was an asset and not a liability, and company management has the ability to deleverage its balance sheet by selling assets, reigning in working capital and cutting costs. We felt the situation was manageable and that the market’s overreaction amounted to what Sir John Templeton famously identified as the best buying opportunity: the moment of maximum pessimism. Financial results have supported our thesis thus far, with the trading division reliably hitting profit targets and asset sales proceeding smoothly. Glencore continues to progress with balance sheet restructuring and portfolio optimization, while also benefiting from a rally in the price of key commodities, such as zinc, nickel and gold. We maintained our holding in anticipation of further improvements.
Within the energy sector, oilfield services firms Halliburton (U.S.) and WorleyParsons (Australia) both aided the Fund’s relative returns. Halliburton weathered a failed merger with U.S. rival Baker Hughes and posted strong gains for the review period. However, this highly cyclical stock is no longer what we would consider a bargain as shares have begun to price in an eventual earnings recovery. Shares of WorleyParsons also began anticipating a better environment as improving oil prices and significant cost-cutting progress offset concerns about the still-subdued outlook for oil and gas capital expenditure (capex). Following the appreciation of the oilfield services stocks, we generally found relatively more attractive value among integrated oil producers and exploration and production companies. More broadly, the long-term drivers underpinning oil markets and energy producers remain intact, and we expect the market to come into balance over the next year as low investment hampers supply and low oil prices buoy demand. Marginal supply continues to leave the market, with U.S. shale production on track to fall below last year’s levels. Add to this production disruptions in Venezuela, where the oil sector cannot pay its debts, and Nigeria, where rebel attacks on the Niger Delta have cut output in half, and the result is six consecutive quarters of supply contraction and a clearly tightening market. At the stock level, we are seeing earnings recover from trough levels as companies slash capex and focus on harvesting growth from the previous investment cycle. More importantly, we believe the improving returns and cash flows resulting from these better fundamentals are more likely to be used to reward shareholders than to chase economically dubious volume growth.
The Fund’s stock selection and overweighted allocation in the information technology (IT) sector also helped the Fund’s relative returns.4 Within IT, shares of South Korean semiconductor and consumer electronics manufacturer Samsung Electronics delivered solid returns throughout the review period as an intergenerational leadership transition in the founding Lee family paved the way for value-added deployment of the firm’s substantial cash hoard. With improving cash flow dynamics, generous shareholder returns, industry-leading technology, and solid market share, profitability and research and development (R&D) capabilities, we believe Samsung remains an attractive investment over our long-term horizon. More generally, every major tier in the tech “stack”—computer, storage, networking, database, apps—is being disrupted by a new set of technologies and our approach is to identify both mature tech companies that offer value in their ability to adapt to change as well as new tech entrants we believe are likely to succeed.
It is important to recognize the effect of currency movements on the Fund’s performance. In general, if the value of the U.S. dollar goes up compared with a foreign currency, an investment traded in that foreign currency will go down in value because it will be worth fewer U.S. dollars. This can have a negative effect on Fund performance. Conversely, when the U.S. dollar weakens in relation to a foreign currency, an investment traded in that foreign currency will increase in value, which can contribute to Fund performance. For the 12 months ended August 31, 2016, the U.S. dollar declined in value relative to many currencies in which the Fund’s investments were traded. As a result, the Fund’s performance was positively affected by the portfolio’s investment predominantly in securities with non-U.S. currency exposure. However, one cannot expect the same result in future periods.
Turning to detractors, stock selection and an overweighting in the financials sector and stock selection and an underweighting in the consumer staples sector detracted from the Fund’s relative returns.5 The financials sector contained some of the Fund’s largest relative detractors, primarily in European banks. Swiss financial services firm Credit Suisse Group declined amid lower capital markets activity, elevated restructuring and litigation charges, and capital adequacy concerns. However, management laid out what we consider a sensible plan to alleviate cost and capital concerns through a multi-year restructuring program, while also repositioning ancillary businesses to maximize profitability. Consequently, we believe
4. The IT sector comprises Internet software and services; semiconductors and semiconductor equipment; and technology hardware, storage and peripherals in the SOI.
5. The financials sector comprises banks, insurance, and thrifts and mortgage finance in the SOI.
6 Annual Report
franklintempleton.com
TEMPLETON FOREIGN FUND
Top 10 Countries
8/31/16
| | |
| | % of Total | |
| | Net Assets | |
| U.K. | 15.3 | % |
| South Korea | 13.0 | % |
| China | 10.4 | % |
| France | 8.2 | % |
| Canada | 7.1 | % |
| Switzerland | 6.9 | % |
| Germany | 6.3 | % |
| Japan | 6.0 | % |
| Netherlands | 5.4 | % |
| U.S. | 4.1 | % |
shares of the company were trading below their value based on our analysis. Italian lender UniCredit was also a major detractor as the stock was negatively affected by a chief executive officer transition, capital concerns following a period of strong loan growth and general Brexit-related fears. Nevertheless, the company has made solid progress bolstering capital and improving income from interest and fees, leading to solid operational performance. In addition, concerns about the challenging banking environment in Italy and Europe have made UniCredit shares cheap, in our analysis. We believe improvements in non-performing loans contradict such pessimistic valuations and should ultimately lead to lower loan-loss provisions and improving returns over the Fund’s investment horizon.
More broadly across the European banking sector, we were encouraged by the stronger-than-expected second quarter results reported at period end, which were characterized by improving capital ratios and positive earnings-per-share revisions (excluding the U.K.). Even within the U.K., results were better than expected, and credit quality did not significantly deteriorate. Among our broader European bank holdings, we forecast a gradual improvement in returns as lower loan losses, falling litigation and regulatory costs, increasing fee- and commission-based revenues and improvements in investment banking lines following restructurings offset the margin compression attributable to low or negative interest rates. We believe even a modest improvement in returns against a backdrop of relative stability should be sufficient to increase valuations from recent depressed levels, keeping us constructive on the sector.
We also remained constructive on the health care sector.6 However, the Fund’s overweighted allocation detracted from the Fund’s relative returns as political rhetoric from the U.S. presidential campaign trail contributed to the stalling out of a multi-year pharmaceuticals rally. Shares of Israeli pharmaceuticals firm Teva Pharmaceutical Industries was one of the Fund’s biggest relative detractors, falling after a U.S. regulatory agency invalidated two of the patents protecting Copaxone, a multiple sclerosis drug that generates a portion of the company’s revenue. The market quickly priced in a worst-case scenario, seemingly ignoring the fact that the invalidated patents will remain in effect until the completion of the appeals process, and that Copaxone has two more patents to deploy defensively in the meantime. We think the hit to revenues will be milder and come later than the market expects, though we nevertheless expect that a large chunk of Copaxone sales may disappear in the near future. Even with these conservative assumptions, shares of the company remained attractive, in our analysis, with solid operational progress, improving fundamentals and significant value to be realized from the recently completed acquisition of the generics business of U.S. biotechnology firm Allergan.
After reducing the Fund’s allocation to the health care sector to realize profits throughout 2015, select opportunities have begun to resurface in the sector more generally in 2016 amid concerns about political interference with drug pricing and corporate tax strategy. We believe such fears are generally overstated, but nonetheless have attempted to address these concerns within the portfolio by focusing our investments on well-run, highly innovative companies capable of dealing with pricing and competitive pressures on a case-by-case basis. Within health care, we continue to favor companies with sound business models, solid product portfolios, attractive R&D pipelines, and the ability to grow revenues, increase cash flows and generate high capital returns for shareholders through dividends and share buybacks. We see little direct threat to our pharmaceuticals holdings from Brexit and will continue using volatility to selectively increase exposure where we believe warranted.
In contrast to our efforts in financials and health care, bargain hunting in consumer staples was relatively fruitless. The consumer staples sector globally appeared overbought during
6. The health care sector comprises biotechnology, health care equipment and supplies, health care providers and services, life sciences tool and services, and pharmaceu-
ticals in the SOI.
See www.franklintempletondatasources.com for additional data provider information.
franklintempleton.com
Annual Report
7
TEMPLETON FOREIGN FUND
the review period and relative price/earnings ratios were expensive, a perilous position for a sector that has historically shown the greatest inverse sensitivity to interest rate moves of any of its peers. We believe the search for safety and yield in a low growth environment has left consumer staples vulnerable to a significant correction should we get any normalization in financial conditions over our investment horizon. Although the sector’s late pullback helped the Fund recoup some relative performance from its underweighting in consumer staples, it was insufficient to offset earlier sector strength. Stock selection in the sector also hampered relative performance.
From a regional standpoint, stock selection and an overweighted allocation in Europe detracted from the Fund’s relative returns. Although the Fund’s underweighted allocation in Asia hurt relative returns, stock selection led to an overall contribution to relative returns for the region. In particular, South Korea and Japan were strong performers. We continue to find compelling opportunities in Europe, where many high-quality multinationals with solid fundamentals and diverse revenue streams trade at excessively cheap valuations. Following the results of the Brexit referendum, we will continue to monitor the risk of European Union disintegration closely, though we currently view this as a low-probability event given any rational cost-benefit analysis for the remaining members of the union. Asia has also offered a number of compelling bargains recently, primarily concentrated in South Korea and China, where sentiment is poor, corporate fundamentals have scope for improvement and valuations look attractive to us.
Thank you for your continued participation in Templeton Foreign Fund. We look forward to serving your future investment needs.
The foregoing information reflects our analysis, opinions and portfolio holdings as of August 31, 2016, the end of the reporting period. The way we implement our main investment strategies and the resulting portfolio holdings may change depending on factors such as market and economic conditions. These opinions may not be relied upon as investment advice or an offer for a particular security. The information is not a complete analysis of every aspect of any market, country, industry, security or the Fund. Statements of fact are from sources considered reliable, but the investment manager makes no representation or warranty as to their completeness or accuracy. Although historical performance is no guarantee of future results, these insights may help you understand our investment management philosophy.
8 Annual Report
franklintempleton.com
TEMPLETON FOREIGN FUND
Performance Summary as of August 31, 2016
Your dividend income will vary depending on dividends or interest paid by securities in the Fund’s portfolio, adjusted for operating expenses of each class. Capital gain distributions are net profits realized from the sale of portfolio securities. The performance table and graphs do not reflect any taxes that a shareholder would pay on Fund dividends, capital gain distributions, if any, or any realized gains on the sale of Fund shares. Total return reflects reinvestment of the Fund’s dividends and capital gain distributions, if any, and any unrealized gains or losses.
| | | | | | |
| Net Asset Value | | | | | | |
| Share Class (Symbol) | | 8/31/16 | | 8/31/15 | | Change |
| A (TEMFX) | $ | 6.87 | $ | 6.74 | +$ | 0.13 |
| C (TEFTX) | $ | 6.69 | $ | 6.56 | +$ | 0.13 |
| R (TEFRX) | $ | 6.73 | $ | 6.61 | +$ | 0.12 |
| R6 (FTFGX) | $ | 6.78 | $ | 6.66 | +$ | 0.12 |
| Advisor (TFFAX) | $ | 6.78 | $ | 6.66 | +$ | 0.12 |
| |
| |
| Distributions1 (9/1/15–8/31/16) | | | | | | |
| | | Dividend | | Short-Term | | |
| Share Class | | Income | | Capital Gain | | Total |
| A | $ | 0.0913 | $ | 0.0034 | $ | 0.0947 |
| C | $ | 0.0364 | $ | 0.0034 | $ | 0.0398 |
| R | $ | 0.0749 | $ | 0.0034 | $ | 0.0783 |
| R6 | $ | 0.1255 | $ | 0.0034 | $ | 0.1289 |
| Advisor | $ | 0.1091 | $ | 0.0034 | $ | 0.1125 |
See page 13 for Performance Summary footnotes.
franklintempleton.com
Annual Report
9
TEMPLETON FOREIGN FUND
PERFORMANCE SUMMARY
Performance as of 8/31/162
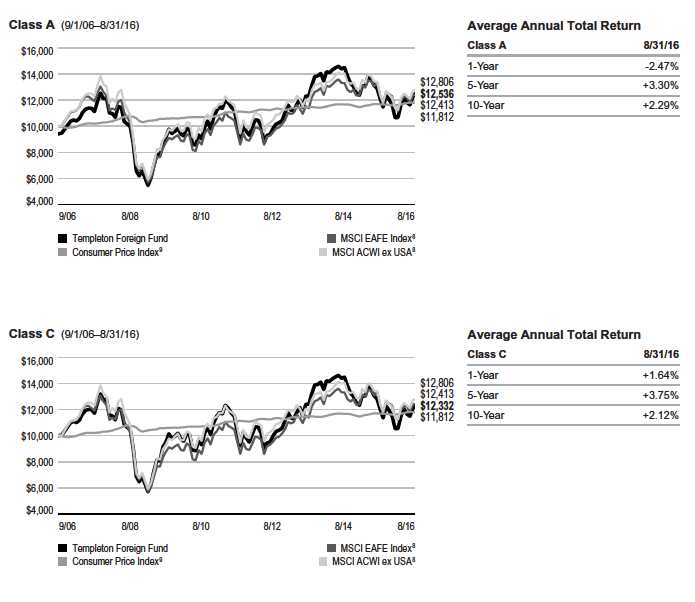
Cumulative total return excludes sales charges. Average annual total returns and value of $10,000 investment include maximum sales charges. Class A: 5.75% maximum initial sales charge; Class C: 1% contingent deferred sales charge in first year only;
Class R/R6/Advisor Class: no sales charges.
| | | | | | | | | | |
| | Cumulative | | Average Annual | | | Value of | Average Annual | | Total Annual | |
| Share Class | Total Return3 | | Total Return4 | | $ | 10,000 Investment5 | Total Return (9/30/16)6 | | Operating Expenses7 | |
| A | | | | | | | | | 1.18 | % |
| 1-Year | +3.46 | % | -2.47 | % | $ | 9,753 | +3.60 | % | | |
| 5-Year | +24.78 | % | +3.30 | % | $ | 11,761 | +5.66 | % | | |
| 10-Year | +33.00 | % | +2.29 | % | $ | 12,536 | +2.28 | % | | |
| C | | | | | | | | | 1.93 | % |
| 1-Year | +2.64 | % | +1.64 | % | $ | 10,164 | +8.25 | % | | |
| 5-Year | +20.22 | % | +3.75 | % | $ | 12,022 | +6.12 | % | | |
| 10-Year | +23.32 | % | +2.12 | % | $ | 12,332 | +2.13 | % | | |
| R | | | | | | | | | 1.43 | % |
| 1-Year | +3.10 | % | +3.10 | % | $ | 10,310 | +9.85 | % | | |
| 5-Year | +23.17 | % | +4.26 | % | $ | 12,317 | +6.65 | % | | |
| 10-Year | +29.57 | % | +2.62 | % | $ | 12,957 | +2.65 | % | | |
| R6 | | | | | | | | | 0.72 | % |
| 1-Year | +3.92 | % | +3.92 | % | $ | 10,392 | +10.67 | % | | |
| 3-Year | +3.05 | % | +1.01 | % | $ | 10,305 | -0.88 | % | | |
| Since Inception (5/1/13) | +9.24 | % | +2.69 | % | $ | 10,924 | +2.84 | % | | |
| Advisor | | | | | | | | | 0.93 | % |
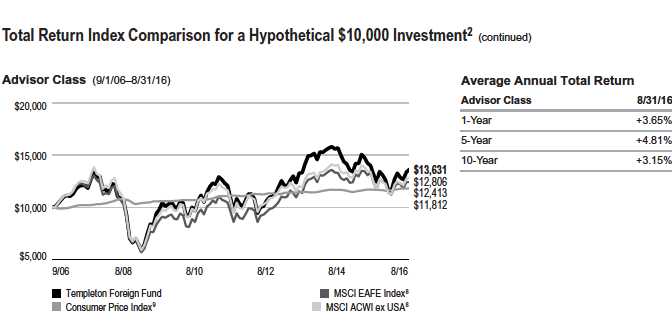
| 1-Year | +3.65 | % | +3.65 | % | $ | 10,365 | +10.38 | % | | |
| 5-Year | +26.45 | % | +4.81 | % | $ | 12,645 | +7.19 | % | | |
| 10-Year | +36.31 | % | +3.15 | % | $ | 13,631 | +3.16 | % | | |
Performance data represent past performance, which does not guarantee future results. Investment return and principal value will
fluctuate, and you may have a gain or loss when you sell your shares. Current performance may differ from figures shown. For most
recent month-end performance, go to franklintempleton.com or call (800) 342-5236.
See page 13 for Performance Summary footnotes.
10 Annual Report
franklintempleton.com
TEMPLETON FOREIGN FUND
PERFORMANCE SUMMARY
Total Return Index Comparison for a Hypothetical $10,000 Investment2
Total return represents the change in value of an investment over the periods shown. It includes any applicable maximum sales charge, Fund expenses, account fees and reinvested distributions. The unmanaged indexes include reinvestment of any income or distributions. They differ from the Fund in composition and do not pay management fees or expenses. One cannot invest directly in an index.
See page 13 for Performance Summary footnotes.
franklintempleton.com
Annual Report
11
TEMPLETON FOREIGN FUND PERFORMANCE SUMMARY
Total Return Index Comparison for a Hypothetical $10,000 Investment2 (continued)
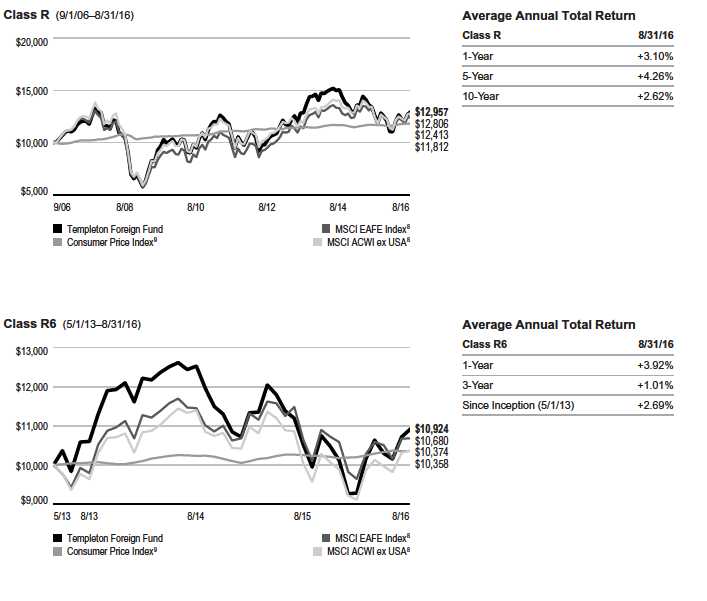
See page 13 for Performance Summary footnotes.
12 Annual Report
franklintempleton.com
TEMPLETON FOREIGN FUND
PERFORMANCE SUMMARY
All investments involve risks, including possible loss of principal. Special risks are associated with foreign investing, including currency fluctuations, economic instability and political developments; investments in emerging markets involve heightened risks related to the same factors. In addition, smaller company stocks have historically experienced more price volatility than larger company stocks, especially over the short term. To the extent the Fund focuses on particular countries, regions, industries, sectors or types of investment from time to time, it may be subject to greater risks of adverse developments in such areas of focus than a fund that invests in a wider variety of countries, regions, industries, sectors or investments. Derivatives, including currency management strategies, involve costs and can create economic leverage in the portfolio, which may result in significant volatility and cause the Fund to participate in losses (as well as enable gains) on an amount that exceeds the Fund’s initial investment. The Fund is actively managed but there is no guarantee that the manager’s investment decisions will produce the desired results. The Fund’s prospectus also includes a description of the main investment risks.
Class C: These shares have higher annual fees and expenses than Class A shares.
Class R: Shares are available to certain eligible investors as described in the prospectus. These shares have higher annual fees and expenses than Class A shares.
Class R6: Shares are available to certain eligible investors as described in the prospectus.
Advisor Class: Shares are available to certain eligible investors as described in the prospectus.
1. The distribution amount is the sum of the dividend payments to shareholders for the period shown and includes only estimated tax-basis net investment income and capital
gain.
2. The Fund has a fee waiver associated with any investment it makes in a Franklin Templeton money fund and/or other Franklin Templeton fund, contractually guaranteed
through its current fiscal year-end. Fund investment results reflect the fee waiver; without this waiver, the results would have been lower.
3. Cumulative total return represents the change in value of an investment over the periods indicated.
4. Average annual total return represents the average annual change in value of an investment over the periods indicated. Return for less than one year, ifany,hasnotbeen
annualized.
5. These figures represent the value of a hypothetical $10,000 investment in the Fund over the periods indicated.
6. In accordance with SEC rules, we provide standardized average annual total return information through the latest calendar quarter.
7. Figures are as stated in the Fund’s current prospectus and may differ from the expense ratios disclosed in the Financial Highlights in this report. In periods of market volatility,
assets may decline significantly, causing total annual Fund operating expenses to become higher than the figures shown.
8. Source: Morningstar. The MSCI ACWI ex USA is a free float-adjusted, market capitalization-weighted index designed to measure equity market performance in global
developed and emerging markets, excluding the U.S. The MSCI EAFE Index is a free float-adjusted, market capitalization-weighted index designed to measure equity market
performance in global developed markets excluding the U.S. and Canada.
9. Source: Bureau of Labor Statistics, bls.gov/cpi. The Consumer Price Index is a commonly used measure of the inflation rate.
See www.franklintempletondatasources.com for additional data provider information.
franklintempleton.com
Annual Report
13
TEMPLETON FOREIGN FUND
Your Fund’s Expenses
As a Fund shareholder, you can incur two types of costs:
- Transaction costs, including sales charges (loads) on Fund purchases; and
- Ongoing Fund costs, including management fees, distribution and service (12b-1) fees, and other Fund expenses. All mutual funds have ongoing costs, sometimes referred to as operating expenses.
The following table shows ongoing costs of investing in the Fund and can help you understand these costs and compare them with those of other mutual funds. The table assumes a $1,000 investment held for the six months indicated.
Actual Fund Expenses
The first line (Actual) for each share class listed in the table provides actual account values and expenses. The “Ending Account Value” is derived from the Fund’s actual return, which includes the effect of Fund expenses.
You can estimate the expenses you paid during the period by following these steps. Of course, your account value and expenses will differ from those in this illustration:
| 1. | Divide your account value by $1,000. |
| | If an account had an $8,600 value, then $8,600 ÷ $1,000 = 8.6. |
| 2. | Multiply the result by the number under the heading “Expenses Paid During Period.” |
| | If Expenses Paid During Period were $7.50, then 8.6 x $7.50 = $64.50. |
In this illustration, the estimated expenses paid this period are $64.50.
Hypothetical Example for Comparison with Other Funds
Information in the second line (Hypothetical) for each class in the table can help you compare ongoing costs of investing in the Fund with those of other mutual funds. This information may not be used to estimate the actual ending account balance or expenses you paid during the period. The hypothetical “Ending Account Value” is based on the actual expense ratio for each class and an assumed 5% annual rate of return before expenses, which does not represent the Fund’s actual return. The figure under the heading “Expenses Paid During Period” shows the hypothetical expenses your account would have incurred under this scenario. You can compare this figure with the 5% hypothetical examples that appear in shareholder reports of other funds.
Please note that expenses shown in the table are meant to highlight ongoing costs and do not reflect any transaction costs, such as sales charges. Therefore, the second line for each class is useful in comparing ongoing costs only, and will not help you compare total costs of owning different funds. In addition, if transaction costs were included, your total costs would have been higher. Please refer to the Fund prospectus for additional information on operating expenses.
14 Annual Report
franklintempleton.com
TEMPLETON FOREIGN FUND
YOUR FUND’S EXPENSES
| | | | | | |
| | | Beginning Account | | Ending Account | | Expenses Paid During |
| Share Class | | Value 3/1/16 | | Value 8/31/16 | | Period* 3/1/16–8/31/16 |
| A | | | | | | |
| Actual | $ | 1,000 | $ | 1,174.40 | $ | 6.72 |
| Hypothetical (5% return before expenses) | $ | 1,000 | $ | 1,018.95 | $ | 6.24 |
| C | | | | | | |
| Actual | $ | 1,000 | $ | 1,169.60 | $ | 10.80 |
| Hypothetical (5% return before expenses) | $ | 1,000 | $ | 1,015.18 | $ | 10.03 |
| R | | | | | | |
| Actual | $ | 1,000 | $ | 1,172.50 | $ | 8.08 |
| Hypothetical (5% return before expenses) | $ | 1,000 | $ | 1,017.70 | $ | 7.51 |
| R6 | | | | | | |
| Actual | $ | 1,000 | $ | 1,177.10 | $ | 3.94 |
| Hypothetical (5% return before expenses) | $ | 1,000 | $ | 1,021.52 | $ | 3.66 |
| Advisor | | | | | | |
| Actual | $ | 1,000 | $ | 1,175.00 | $ | 5.36 |
| Hypothetical (5% return before expenses) | $ | 1,000 | $ | 1,020.21 | $ | 4.98 |
*Expenses are calculated using the most recent six-month expense ratio, net of expense waivers, annualized for each class (A: 1.23%;
C: 1.98%; R: 1.48%; R6: 0.72%; and Advisor: 0.98%), multiplied by the average account value over the period, multiplied by 184/366 to reflect
the one-half year period.
franklintempleton.com
Annual Report
15
TEMPLETON FOREIGN FUND
| | | | | | | | | | | | | | | |
| Financial Highlights | | | | | | | | | | | | | | | |
| | | | | | Year Ended August 31, | | | | |
| | | 2016 | | | 2015 | | | 2014 | | | 2013 | | | 2012 | |
| Class A | | | | | | | | | | | | | | | |
| Per share operating performance | | | | | | | | | | | | | | | |
| (for a share outstanding throughout the year) | | | | | | | | | | | | | | | |
| Net asset value, beginning of year | $ | 6.74 | | $ | 8.58 | | $ | 7.67 | | $ | 6.26 | | $ | 6.57 | |
| Income from investment operationsa: | | | | | | | | | | | | | | | |
| Net investment incomeb | | 0.11 | | | 0.12 | | | 0.20 | c | | 0.12 | | | 0.14 | |
| Net realized and unrealized gains (losses) | | 0.11 | | | (1.52 | ) | | 1.12 | | | 1.44 | | | (0.28 | ) |
| Total from investment operations | | 0.22 | | | (1.40 | ) | | 1.32 | | | 1.56 | | | (0.14 | ) |
| Less distributions from: | | | | | | | | | | | | | | | |
| Net investment income | | (0.09 | ) | | (0.21 | ) | | (0.11 | ) | | (0.15 | ) | | (0.17 | ) |
| Net realized gains | | (—)d | | | (0.23 | ) | | (0.30 | ) | | — | | | — | |
| Total distributions | | (0.09 | ) | | (0.44 | ) | | (0.41 | ) | | (0.15 | ) | | (0.17 | ) |
| Net asset value, end of year. | $ | 6.87 | | $ | 6.74 | | $ | 8.58 | | $ | 7.67 | | $ | 6.26 | |
| |
| Total returne | | 3.46 | % | | (16.46 | )% | | 17.61 | % | | 25.17 | % | | (1.94 | )% |
| |
| Ratios to average net assets | | | | | | | | | | | | | | | |
| Expenses | | 1.22 | %f,g | | 1.18 | %f | | 1.16 | % | | 1.19 | %g | | 1.21 | %g |
| Net investment income | | 1.66 | % | | 1.54 | % | | 2.39 | %c | | 1.72 | % | | 2.29 | % |
| |
| Supplemental data | | | | | | | | | | | | | | | |
| Net assets, end of year (000’s) | $ | 3,644,336 | | $ | 4,165,454 | | $ | 4,524,854 | | $ | 3,904,719 | | $ | 3,418,240 | |
| Portfolio turnover rate | | 22.89 | % | | 29.12 | % | | 30.82 | % | | 32.05 | % | | 20.17 | % |
aThe amount shown for a share outstanding throughout the period may not correlate with the Statement of Operations for the period due to the timing of sales and
repurchases of the Fund’s shares in relation to income earned and/or fluctuating fair value of the investments of the Fund.
bBased on average daily shares outstanding.
cNet investment income per share includes approximately $0.07 per share related to income received in the form of special dividends in connection with certain Fund
holdings. Excluding this amount, the ratio of net investment income to average net assets would have been 1.57%.
dAmount rounds to less than $0.01 per share.
eTotal return does not reflect sales commissions or contingent deferred sales charges, if applicable.
fBenefit of waiver and payments by affiliates rounds to less than 0.01%.
gBenefit of expense reduction and reimbursement rounds to less than 0.01%.
16 Annual Report | The accompanying notes are an integral part of these financial statements.
franklintempleton.com
TEMPLETON FOREIGN FUND
FINANCIAL HIGHLIGHTS
| | | | | | | | | | | | | | | |
| | | | | | Year Ended August 31, | | | | |
| | | 2016 | | | 2015 | | | 2014 | | | 2013 | | | 2012 | |
| Class C | | | | | | | | | | | | | | | |
| Per share operating performance | | | | | | | | | | | | | | | |
| (for a share outstanding throughout the year) | | | | | | | | | | | | | | | |
| Net asset value, beginning of year | $ | 6.56 | | $ | 8.35 | | $ | 7.48 | | $ | 6.11 | | $ | 6.40 | |
| Income from investment operationsa: | | | | | | | | | | | | | | | |
| Net investment incomeb | | 0.06 | | | 0.05 | | | 0.13 | c | | 0.07 | | | 0.09 | |
| Net realized and unrealized gains (losses) | | 0.11 | | | (1.46 | ) | | 1.10 | | | 1.40 | | | (0.27 | ) |
| Total from investment operations | | 0.17 | | | (1.41 | ) | | 1.23 | | | 1.47 | | | (0.18 | ) |
| Less distributions from: | | | | | | | | | | | | | | | |
| Net investment income | | (0.04 | ) | | (0.15 | ) | | (0.06 | ) | | (0.10 | ) | | (0.11 | ) |
| Net realized gains | | (—)d | | | (0.23 | ) | | (0.30 | ) | | — | | | — | |
| Total distributions | | (0.04 | ) | | (0.38 | ) | | (0.36 | ) | | (0.10 | ) | | (0.11 | ) |
| Net asset value, end of year. | $ | 6.69 | | $ | 6.56 | | $ | 8.35 | | $ | 7.48 | | $ | 6.11 | |
| |
| Total returne | | 2.64 | % | | (17.04 | )% | | 16.72 | % | | 24.21 | % | | (2.62 | )% |
| |
| Ratios to average net assets | | | | | | | | | | | | | | | |
| Expenses | | 1.97 | %f,g | | 1.93 | %f | | 1.91 | % | | 1.94 | %g | | 1.96 | %g |
| Net investment income | | 0.91 | % | | 0.79 | % | | 1.64 | %c | | 0.97 | % | | 1.54 | % |
| |
| Supplemental data | | | | | | | | | | | | | | | |
| Net assets, end of year (000’s) | $ | 397,512 | | $ | 468,128 | | $ | 617,421 | | $ | 517,468 | | $ | 459,838 | |
| Portfolio turnover rate | | 22.89 | % | | 29.12 | % | | 30.82 | % | | 32.05 | % | | 20.17 | % |
aThe amount shown for a share outstanding throughout the period may not correlate with the Statement of Operations for the period due to the timing of sales and
repurchases of the Fund’s shares in relation to income earned and/or fluctuating fair value of the investments of the Fund.
bBased on average daily shares outstanding.
cNet investment income per share includes approximately $0.07 per share related to income received in the form of special dividends in connection with certain Fund
holdings. Excluding this amount, the ratio of net investment income to average net assets would have been (0.82)%.
dAmount rounds to less than $0.01 per share.
eTotal return does not reflect sales commissions or contingent deferred sales charges, if applicable.
fBenefit of waiver and payments by affiliates rounds to less than 0.01%.
gBenefit of expense reduction and reimbursement rounds to less than 0.01%.
franklintempleton.com
The accompanying notes are an integral part of these financial statements. | Annual Report 17
TEMPLETON FOREIGN FUND
FINANCIAL HIGHLIGHTS
| | | | | | | | | | | | | | | |
| | | | | | Year Ended August 31, | | | | |
| | | 2016 | | | 2015 | | | 2014 | | | 2013 | | | 2012 | |
| Class R | | | | | | | | | | | | | | | |
| Per share operating performance | | | | | | | | | | | | | | | |
| (for a share outstanding throughout the year) | | | | | | | | | | | | | | | |
| Net asset value, beginning of year | $ | 6.61 | | $ | 8.42 | | $ | 7.54 | | $ | 6.16 | | $ | 6.46 | |
| Income from investment operationsa: | | | | | | | | | | | | | | | |
| Net investment incomeb | | 0.09 | | | 0.09 | | | 0.18 | c | | 0.10 | | | 0.13 | |
| Net realized and unrealized gains (losses) | | 0.10 | | | (1.48 | ) | | 1.09 | | | 1.41 | | | (0.28 | ) |
| Total from investment operations | | 0.19 | | | (1.39 | ) | | 1.27 | | | 1.51 | | | (0.15 | ) |
| Less distributions from: | | | | | | | | | | | | | | | |
| Net investment income | | (0.07 | ) | | (0.19 | ) | | (0.09 | ) | | (0.13 | ) | | (0.15 | ) |
| Net realized gains | | (—)d | | | (0.23 | ) | | (0.30 | ) | | — | | | — | |
| Total distributions | | (0.07 | ) | | (0.42 | ) | | (0.39 | ) | | (0.13 | ) | | (0.15 | ) |
| Net asset value, end of year. | $ | 6.73 | | $ | 6.61 | | $ | 8.42 | | $ | 7.54 | | $ | 6.16 | |
| |
| Total return | | 3.10 | % | | (16.63 | )% | | 17.22 | % | | 24.81 | % | | (2.07 | )% |
| |
| Ratios to average net assets | | | | | | | | | | | | | | | |
| Expenses | | 1.47 | %e,f | | 1.43 | %e | | 1.41 | % | | 1.44 | %f | | 1.46 | %f |
| Net investment income | | 1.41 | % | | 1.29 | % | | 2.14 | %c | | 1.47 | % | | 2.04 | % |
| |
| Supplemental data | | | | | | | | | | | | | | | |
| Net assets, end of year (000’s) | $ | 159,802 | | $ | 174,865 | | $ | 207,738 | | $ | 172,393 | | $ | 149,061 | |
| Portfolio turnover rate | | 22.89 | % | | 29.12 | % | | 30.82 | % | | 32.05 | % | | 20.17 | % |
aThe amount shown for a share outstanding throughout the period may not correlate with the Statement of Operations for the period due to the timing of sales and
repurchases of the Fund’s shares in relation to income earned and/or fluctuating fair value of the investments of the Fund.
bBased on average daily shares outstanding.
cNet investment income per share includes approximately $0.07 per share related to income received in the form of special dividends in connection with certain Fund
holdings. Excluding this amount, the ratio of net investment income to average net assets would have been 1.32%.
dAmount rounds to less than $0.01 per share.
eBenefit of waiver and payments by affiliates rounds to less than 0.01%.
fBenefit of expense reduction and reimbursement rounds to less than 0.01%.
18 Annual Report | The accompanying notes are an integral part of these financial statements.
franklintempleton.com
TEMPLETON FOREIGN FUND
FINANCIAL HIGHLIGHTS
| | | | | | | | | | | | |
| | | | | | Year Ended August 31, | | | | |
| | | 2016 | | | 2015 | | | 2014 | | | 2013 | a |
| Class R6 | | | | | | | | | | | | |
| Per share operating performance | | | | | | | | | | | | |
| (for a share outstanding throughout the year) | | | | | | | | | | | | |
| Net asset value, beginning of year | $ | 6.66 | | $ | 8.49 | | $ | 7.59 | | $ | 7.16 | |
| Income from investment operationsb: | | | | | | | | | | | | |
| Net investment incomec | | 0.14 | | | 0.15 | | | 0.25 | d | | 0.08 | |
| Net realized and unrealized gains (losses) | | 0.11 | | | (1.50 | ) | | 1.10 | | | 0.35 | |
| Total from investment operations | | 0.25 | | | (1.35 | ) | | 1.35 | | | 0.43 | |
| Less distributions from: | | | | | | | | | | | | |
| Net investment income. | | (0.13 | ) | | (0.25 | ) | | (0.15 | ) | | — | |
| Net realized gains | | (—)e | | | (0.23 | ) | | (0.30 | ) | | — | |
| Total distributions | | (0.13 | ) | | (0.48 | ) | | (0.45 | ) | | — | |
| Net asset value, end of year | $ | 6.78 | | $ | 6.66 | | $ | 8.49 | | $ | 7.59 | |
| |
| Total returnf | | 3.92 | % | | (16.08 | )% | | 18.16 | % | | 6.01 | % |
| |
| Ratios to average net assetsg | | | | | | | | | | | | |
| Expenses | | 0.72 | %h | | 0.72 | %h | | 0.72 | % | | 0.74 | % |
| Net investment income | | 2.16 | % | | 2.00 | % | | 2.83 | %d | | 2.17 | % |
| |
| Supplemental data | | | | | | | | | | | | |
| Net assets, end of year (000’s) | $ | 880,092 | | $ | 816,746 | | $ | 666,249 | | $ | 366,042 | |
| Portfolio turnover rate | | 22.89 | % | | 29.12 | % | | 30.82 | % | | 32.05 | % |
aFor the period May 1, 2013 (effective date) to August 31, 2013.
bThe amount shown for a share outstanding throughout the period may not correlate with the Statement of Operations for the period due to the timing of sales and
repurchases of the Fund’s shares in relation to income earned and/or fluctuating fair value of the investments of the Fund.
cBased on average daily shares outstanding.
dNet investment income per share includes approximately $0.07 per share related to income received in the form of special dividends in connection with certain Fund
holdings. Excluding this amount, the ratio of net investment income to average net assets would have been 2.01%.
eAmount rounds to less than $0.01 per share.
fTotal return is not annualized for periods less than one year.
gRatios are annualized for periods less than one year.
hBenefit of waiver and payments by affiliates rounds to less than 0.01%.
franklintempleton.com
The accompanying notes are an integral part of these financial statements. | Annual Report 19
TEMPLETON FOREIGN FUND
FINANCIAL HIGHLIGHTS
| | | | | | | | | | | | | | | |
| | | | | | Year Ended August 31, | | | | |
| | | 2016 | | | 2015 | | | 2014 | | | 2013 | | | 2012 | |
| Advisor Class | | | | | | | | | | | | | | | |
| Per share operating performance | | | | | | | | | | | | | | | |
| (for a share outstanding throughout the year) | | | | | | | | | | | | | | | |
| Net asset value, beginning of year | $ | 6.66 | | $ | 8.49 | | $ | 7.59 | | $ | 6.20 | | $ | 6.51 | |
| Income from investment operationsa: | | | | | | | | | | | | | | | |
| Net investment incomeb | | 0.12 | | | 0.13 | | | 0.22 | c | | 0.13 | | | 0.16 | |
| Net realized and unrealized gains (losses) | | 0.11 | | | (1.50 | ) | | 1.11 | | | 1.43 | | | (0.28 | ) |
| Total from investment operations | | 0.23 | | | (1.37 | ) | | 1.33 | | | 1.56 | | | (0.12 | ) |
| Less distributions from: | | | | | | | | | | | | | | | |
| Net investment income | | (0.11 | ) | | (0.23 | ) | | (0.13 | ) | | (0.17 | ) | | (0.19 | ) |
| Net realized gains | | (—)d | | | (0.23 | ) | | (0.30 | ) | | — | | | — | |
| Total distributions | | (0.11 | ) | | (0.46 | ) | | (0.43 | ) | | (0.17 | ) | | (0.19 | ) |
| Net asset value, end of year. | $ | 6.78 | | $ | 6.66 | | $ | 8.49 | | $ | 7.59 | | $ | 6.20 | |
| |
| Total return | | 3.65 | % | | (16.25 | )% | | 17.93 | % | | 25.39 | % | | (1.49 | )% |
| |
| Ratios to average net assets | | | | | | | | | | | | | | | |
| Expenses | | 0.97 | %e,f | | 0.93 | %e | | 0.91 | % | | 0.94 | %f | | 0.96 | %f |
| Net investment income | | 1.91 | % | | 1.79 | % | | 2.64 | %c | | 1.97 | % | | 2.54 | % |
| |
| Supplemental data | | | | | | | | | | | | | | | |
| Net assets, end of year (000’s) | $ | 1,125,431 | | $ | 1,206,146 | | $ | 1,727,057 | | $ | 1,340,444 | | $ | 1,430,480 | |
| Portfolio turnover rate | | 22.89 | % | | 29.12 | % | | 30.82 | % | | 32.05 | % | | 20.17 | % |
aThe amount shown for a share outstanding throughout the period may not correlate with the Statement of Operations for the period due to the timing of sales and
repurchases of the Fund’s shares in relation to income earned and/or fluctuating fair value of the investments of the Fund.
bBased on average daily shares outstanding.
cNet investment income per share includes approximately $0.07 per share related to income received in the form of special dividends in connection with certain Fund
holdings. Excluding this amount, the ratio of net investment income to average net assets would have been 1.82%.
dAmount rounds to less than $0.01 per share.
eBenefit of waiver and payments by affiliates rounds to less than 0.01%.
fBenefit of expense reduction and reimbursement rounds to less than 0.01%.
20 Annual Report | The accompanying notes are an integral part of these financial statements.
franklintempleton.com
TEMPLETON FOREIGN FUND
| | | | |
| Statement of Investments, August 31, 2016 | | | |
| | Industry | Shares | | Value |
| |
| Common Stocks 97.3% | | | | |
| Australia 1.9% | | | | |
| Origin Energy Ltd | Oil, Gas & Consumable Fuels | 11,708,710 | $ | 46,277,083 |
| a WorleyParsons Ltd | Energy Equipment & Services | 11,069,580 | | 67,872,288 |
| | | | | 114,149,371 |
| Belgium 0.7% | | | | |
| UCB SA | Pharmaceuticals | 510,760 | | 41,933,865 |
| Canada 7.1% | | | | |
| Barrick Gold Corp | Metals & Mining | 4,632,000 | | 78,790,320 |
| Cenovus Energy Inc | Oil, Gas & Consumable Fuels | 3,994,550 | | 57,737,479 |
| Ensign Energy Services Inc | Energy Equipment & Services | 4,367,130 | | 25,715,452 |
| HudBay Minerals Inc | Metals & Mining | 7,330,280 | | 29,744,929 |
| b Precision Drilling Corp | Energy Equipment & Services | 16,116,920 | | 66,260,020 |
| Silver Wheaton Corp | Metals & Mining | 4,767,020 | | 120,861,710 |
| Suncor Energy Inc | Oil, Gas & Consumable Fuels | 2,178,450 | | 59,086,749 |
| | | | | 438,196,659 |
| China 10.4% | | | | |
| c Baidu Inc., ADR | Internet Software & Services | 398,390 | | 68,152,577 |
| China Life Insurance Co. Ltd., H | Insurance | 16,563,800 | | 39,585,809 |
| China Mobile Ltd | Wireless Telecommunication Services | 3,555,180 | | 43,903,275 |
| China Telecom Corp. Ltd., H | Diversified Telecommunication Services | 141,009,292 | | 72,888,989 |
| GCL-Poly Energy Holdings Ltd | Semiconductors & Semiconductor Equipment | 439,270,790 | | 62,286,630 |
| Haier Electronics Group Co. Ltd | Household Durables | 18,014,350 | | 30,141,378 |
| Kunlun Energy Co. Ltd | Oil, Gas & Consumable Fuels | 37,947,050 | | 27,930,837 |
| Shanghai Pharmaceuticals Holding Co. Ltd., H | Health Care Providers & Services | 20,602,590 | | 56,568,055 |
| Sinopec Engineering Group Co. Ltd | Construction & Engineering | 63,037,660 | | 52,249,348 |
| Sinopharm Group Co. Ltd | Health Care Providers & Services | 15,496,330 | | 79,402,798 |
| c Trina Solar Ltd., ADR | Semiconductors & Semiconductor Equipment | 10,563,229 | | 111,019,537 |
| | | | | 644,129,233 |
| France 8.2% | | | | |
| AXA SA | Insurance | 3,399,272 | | 71,353,738 |
| BNP Paribas SA | Banks | 2,568,873 | | 130,667,111 |
| Cie Generale des Etablissements Michelin, B | Auto Components | 849,660 | | 90,312,792 |
| Sanofi | Pharmaceuticals | 1,216,115 | | 93,686,130 |
| Societe Generale SA | Banks | 662,686 | | 24,128,797 |
| Technip SA | Energy Equipment & Services | 632,630 | | 37,375,839 |
| Total SA, B | Oil, Gas & Consumable Fuels | 1,284,760 | | 61,258,918 |
| | | | | 508,783,325 |
| Germany 6.3% | | | | |
| Bayer AG | Pharmaceuticals | 603,300 | | 64,577,320 |
| Deutsche Lufthansa AG | Airlines | 2,663,630 | | 31,030,840 |
| Gerresheimer AG | Life Sciences Tools & Services | 732,810 | | 60,850,939 |
| Merck KGaA | Pharmaceuticals | 574,214 | | 60,420,017 |
| Metro AG | Food & Staples Retailing | 1,302,694 | | 38,648,731 |
| c MorphoSys AG | Life Sciences Tools & Services | 599,760 | | 25,580,356 |
| Muenchener Rueckversicherungs-Gesellschaft | | | | |
| Aktiengesellschaft in Muenchen | Insurance | 163,112 | | 29,481,267 |
| Siemens AG | Industrial Conglomerates | 670,392 | | 80,043,614 |
| | | | | 390,633,084 |
franklintempleton.com
Annual Report
21
TEMPLETON FOREIGN FUND
STATEMENT OF INVESTMENTS
| | | | |
| | Industry | Shares | | Value |
| |
| Common Stocks (continued) | | | | |
| India 1.3% | | | | |
| Hero Motocorp Ltd | Automobiles | 604,070 | $ | 31,940,195 |
| Jain Irrigation Systems Ltd | Machinery | 11,693,050 | | 14,700,135 |
| LIC Housing Finance Ltd | Thrifts & Mortgage Finance | 4,023,494 | | 34,425,267 |
| | | | | 81,065,597 |
| Israel 1.8% | | | | |
| Teva Pharmaceutical Industries Ltd., ADR | Pharmaceuticals | 2,221,520 | | 111,942,393 |
| Italy 2.9% | | | | |
| Eni SpA | Oil, Gas & Consumable Fuels | 5,061,480 | | 76,437,660 |
| Tenaris SA | Energy Equipment & Services | 3,915,640 | | 53,805,251 |
| UniCredit SpA | Banks | 19,930,207 | | 51,260,437 |
| | | | | 181,503,348 |
| Japan 6.0% | | | | |
| ITOCHU Corp | Trading Companies & Distributors | 2,042,070 | | 24,098,656 |
| Konica Minolta Inc | Technology Hardware, Storage & Peripherals | 2,585,320 | | 23,288,245 |
| Nissan Motor Co. Ltd | Automobiles | 12,482,750 | | 122,456,785 |
| SoftBank Group Corp | Wireless Telecommunication Services | 2,054,180 | | 134,132,703 |
| Sumitomo Metal Mining Co. Ltd | Metals & Mining | 58,400 | | 740,548 |
| Sumitomo Rubber Industries Ltd | Auto Components | 1,416,880 | | 21,007,045 |
| Toyota Motor Corp | Automobiles | 785,430 | | 47,354,297 |
| | | | | 373,078,279 |
| Mexico 0.5% | | | | |
| Industrias Penoles SA | Metals & Mining | 1,421,722 | | 32,870,542 |
| Netherlands 5.4% | | | | |
| Aegon NV | Insurance | 16,995,915 | | 69,645,794 |
| ING Groep NV | Banks | 4,785,728 | | 59,889,690 |
| c QIAGEN NV | Life Sciences Tools & Services | 3,163,680 | | 83,769,218 |
| SBM Offshore NV | Energy Equipment & Services | 8,299,044 | | 121,535,734 |
| | | | | 334,840,436 |
| Norway 0.9% | | | | |
| Telenor ASA | Diversified Telecommunication Services | 3,325,406 | | 58,039,882 |
| Singapore 0.9% | | | | |
| United Overseas Bank Ltd | Banks | 4,349,430 | | 57,485,953 |
| South Africa 0.3% | | | | |
| Petra Diamonds Ltd | Metals & Mining | 13,821,880 | | 20,596,558 |
| South Korea 13.0% | | | | |
| Hana Financial Group Inc | Banks | 5,852,530 | | 153,603,519 |
| Hyundai Mobis Co. Ltd | Auto Components | 349,890 | | 81,644,918 |
| Hyundai Motor Co | Automobiles | 373,420 | | 44,487,614 |
| KB Financial Group Inc | Banks | 3,922,967 | | 136,695,480 |
| Korea Investment Holdings Co. Ltd | Capital Markets | 959,840 | | 34,477,289 |
| Posco Daewoo Corp | Trading Companies & Distributors | 2,450,900 | | 50,274,872 |
| Samsung Electronics Co. Ltd | Technology Hardware, Storage & Peripherals | 211,464 | | 306,860,759 |
| | | | | 808,044,451 |
| Spain 0.5% | | | | |
| a Tecnicas Reunidas SA | Energy Equipment & Services | 923,230 | | 33,177,728 |
| Sweden 0.7% | | | | |
| Getinge AB, B | Health Care Equipment & Supplies | 2,344,245 | | 45,729,344 |
22 Annual Report
franklintempleton.com
TEMPLETON FOREIGN FUND
STATEMENT OF INVESTMENTS
| | | | | |
| | Industry | | Shares | | Value |
| |
| Common Stocks (continued) | | | | | |
| Switzerland 6.9% | | | | | |
| ABB Ltd | Electrical Equipment | | 3,463,220 | $ | 75,027,925 |
| c Basilea Pharmaceutica AG | Biotechnology | | 218,890 | | 15,443,467 |
| Credit Suisse Group AG | Capital Markets | | 3,554,739 | | 46,293,099 |
| GAM Holding AG. | Capital Markets | | 1,840,950 | | 17,873,301 |
| Glencore PLC | Metals & Mining | | 38,868,270 | | 88,817,983 |
| Roche Holding AG. | Pharmaceuticals | | 396,760 | | 96,724,493 |
| Swiss Re AG | Insurance | | 384,443 | | 32,439,149 |
| UBS Group AG | Capital Markets | | 3,731,690 | | 53,946,659 |
| | | | | | 426,566,076 |
| Taiwan 1.1% | | | | | |
| Catcher Technology Co. Ltd | Technology Hardware, Storage & Peripherals | | 4,497,350 | | 32,296,948 |
| Quanta Computer Inc | Technology Hardware, Storage & Peripherals | | 19,250,680 | | 35,592,142 |
| | | | | | 67,889,090 |
| Thailand 1.1% | | | | | |
| Bangkok Bank PCL, NVDR. | Banks | | 8,809,790 | | 43,132,854 |
| PTT Exploration and Production PCL, fgn | Oil, Gas & Consumable Fuels | | 10,708,510 | | 25,131,902 |
| | | | | | 68,264,756 |
| United Kingdom 15.3% | | | | | |
| Aberdeen Asset Management PLC | Capital Markets | | 4,540,490 | | 19,111,638 |
| Aviva PLC. | Insurance | | 9,469,294 | | 53,259,702 |
| BAE Systems PLC. | Aerospace & Defense | | 10,089,230 | | 71,330,521 |
| Barclays PLC | Banks | | 30,810,410 | | 69,676,829 |
| BP PLC | Oil, Gas & Consumable Fuels | | 24,559,940 | | 137,975,271 |
| Carillion PLC. | Construction & Engineering | | 10,221,100 | | 34,916,974 |
| HSBC Holdings PLC | Banks | | 12,457,080 | | 92,290,706 |
| Johnson Matthey PLC | Chemicals | | 1,155,686 | | 50,647,481 |
| Kingfisher PLC | Specialty Retail | | 6,644,184 | | 32,371,608 |
| Petrofac Ltd | Energy Equipment & Services | | 7,904,160 | | 86,287,849 |
| Royal Dutch Shell PLC, B | Oil, Gas & Consumable Fuels | | 4,839,820 | | 123,398,563 |
| c Standard Chartered PLC | Banks | | 11,423,265 | | 96,284,626 |
| c Subsea 7 SA | Energy Equipment & Services | | 3,345,878 | | 36,362,786 |
| Vodafone Group PLC | Wireless Telecommunication Services | | 14,817,375 | | 44,714,404 |
| | | | | | 948,628,958 |
| United States 4.1% | | | | | |
| Apple Inc | Technology Hardware, Storage & Peripherals | | 487,420 | | 51,715,262 |
| Citigroup Inc | Banks | | 907,160 | | 43,307,818 |
| Eli Lilly & Co | Pharmaceuticals | | 407,130 | | 31,654,358 |
| Halliburton Co | Energy Equipment & Services | | 1,815,740 | | 78,094,978 |
| c Stillwater Mining Co | Metals & Mining | | 3,879,679 | | 49,077,939 |
| | | | | | 253,850,355 |
| Total Common Stocks | | | | | |
| (Cost $6,083,768,512) | | | | | 6,041,399,283 |
| |
| |
| | | | Principal | | |
| | | | Amount* | | |
| |
| Short Term Investments 2.4% | | | | | |
| Time Deposits 2.0% | | | | | |
| Australia 0.3% | | | | | |
| National Australia Bank, 0.26%, 9/01/16. | | $ | 16,000,000 | | 16,000,000 |
franklintempleton.com
Annual Report
23
TEMPLETON FOREIGN FUND
STATEMENT OF INVESTMENTS
| | | | | |
| | | | Principal | | |
| | | | Amount* | | Value |
| Time Deposits (continued) | | | | | |
| United States 1.7% | | | | | |
| Bank of Montreal, 0.25%, 9/01/16 | | $ | 31,000,000 | $ | 31,000,000 |
| Royal Bank of Canada, 0.30%, 9/01/16 | | | 75,000,000 | | 75,000,000 |
| | | | | | 106,000,000 |
| Total Time Deposits (Cost $122,000,000) | | | | | 122,000,000 |
| |
| |
| | | | Shares | | |
| d Investments from Cash Collateral | | | | | |
| Received for Loaned Securities | | | | | |
| (Cost $22,955,688) 0.4% | | | | | |
| Money Market Funds 0.4% | | | | | |
| United States 0.4% | | | | | |
| c,e Institutional Fiduciary Trust Money Market Portfolio | | | 22,955,688 | | 22,955,688 |
| Total Investments (Cost $6,228,724,200) | | | | | |
| 99.7% | | | | | 6,186,354,971 |
| Other Assets, less Liabilities 0.3% | | | | | 20,818,024 |
| Net Assets 100.0% | | | | $ | 6,207,172,995 |
See Abbreviations on page 37.
*The principal amount is stated in U.S. dollars unless otherwise indicated.
aA portion or all of the security is on loan at August 31, 2016. See Note 1(d).
bSee Note 8 regarding holdings of 5% voting securities.
cNon-income producing.
dSee Note 6 regarding securities on loan.
eSee Note 3(f) regarding investments in affiliated management investment companies.
24 Annual Report | The accompanying notes are an integral part of these financial statements.
franklintempleton.com
TEMPLETON FOREIGN FUND
Financial Statements
Statement of Assets and Liabilities
August 31, 2016
| | | |
| Assets: | | | |
| Investments in securities: | | | |
| Cost - Unaffiliated issuers | $ | 6,111,774,531 | |
| Cost - Non-controlled affiliates (Notes 3f and 8) | | 116,949,669 | |
| Total cost of investments | $ | 6,228,724,200 | |
| Value - Unaffiliated issuers | $ | 6,097,139,263 | |
| Value - Non-controlled affiliates (Notes 3f and 8) | | 89,215,708 | |
| Total value of investments (includes securities loaned in the amount of $21,850,510) | | 6,186,354,971 | |
| Cash. | | 7,495,154 | |
| Foreign currency, at value (cost $2,196,243) | | 2,196,243 | |
| Receivables: | | | |
| Investment securities sold | | 92,564,168 | |
| Capital shares sold | | 13,181,518 | |
| Dividends. | | 17,700,154 | |
| European Union tax reclaims | | 6,047,275 | |
| Other assets | | 1,980 | |
| Total assets | | 6,325,541,463 | |
| Liabilities: | | | |
| Payables: | | | |
| Investment securities purchased | | 7,774,523 | |
| Capital shares redeemed | | 79,661,469 | |
| Management fees | | 3,772,113 | |
| Distribution fees | | 1,227,610 | |
| Transfer agent fees | | 2,327,714 | |
| Payable upon return of securities loaned | | 22,955,688 | |
| Accrued expenses and other liabilities. | | 649,351 | |
| Total liabilities | | 118,368,468 | |
| Net assets, at value | $ | 6,207,172,995 | |
| Net assets consist of: | | | |
| Paid-in capital | $ | 6,632,308,866 | |
| Undistributed net investment income | | 94,500,204 | |
| Net unrealized appreciation (depreciation) | | (42,832,655) | |
| Accumulated net realized gain (loss) | | (476,803,420) | |
| Net assets, at value | $ | 6,207,172,995 | |
franklintempleton.com
The accompanying notes are an integral part of these financial statements. | Annual Report 25
TEMPLETON FOREIGN FUND
FINANCIAL STATEMENTS
| | |
| Statement of Assets and Liabilities (continued) | | |
| August 31, 2016 | | |
| |
| Class A: | | |
| Net assets, at value | $ | 3,644,336,483 |
| Shares outstanding. | | 530,841,488 |
| Net asset value per sharea | $ | 6.87 |
| Maximum offering price per share (net asset value per share ÷ 94.25%) | $ | 7.29 |
| Class C: | | |
| Net assets, at value | $ | 397,512,227 |
| Shares outstanding. | | 59,440,547 |
| Net asset value and maximum offering price per sharea | $ | 6.69 |
| Class R: | | |
| Net assets, at value | $ | 159,801,545 |
| Shares outstanding. | | 23,741,216 |
| Net asset value and maximum offering price per share | $ | 6.73 |
| Class R6: | | |
| Net assets, at value | $ | 880,091,656 |
| Shares outstanding. | | 129,813,040 |
| Net asset value and maximum offering price per share | $ | 6.78 |
| Advisor Class: | | |
| Net assets, at value | $ | 1,125,431,084 |
| Shares outstanding. | | 166,046,123 |
| Net asset value and maximum offering price per share | $ | 6.78 |
aRedemption price is equal to net asset value less contingent deferred sales charges, if applicable.
26 Annual Report | The accompanying notes are an integral part of these financial statements.
franklintempleton.com
TEMPLETON FOREIGN FUND
FINANCIAL STATEMENTS
| | | |
| Statement of Operations | | | |
| for the year ended August 31, 2016 | | | |
| |
| Investment income: | | | |
| Dividends: (net of foreign taxes of $16,704,102) | | | |
| Unaffiliated issuers | $ | 180,456,831 | |
| Non-controlled affiliates | | 886,661 | |
| Interest | | 845,401 | |
| Income from securities loaned (net of fees and rebates) | | 272,291 | |
| Other income (Note 1d) | | 117,560 | |
| Total investment income | | 182,578,744 | |
| Expenses: | | | |
| Management fees (Note 3a) | | 43,682,409 | |
| Distribution fees: (Note 3c) | | | |
| Class A | | 9,629,567 | |
| Class C | | 4,121,093 | |
| Class R | | 810,830 | |
| Transfer agent fees: (Note 3e) | | | |
| Class A | | 9,452,815 | |
| Class C | | 1,011,386 | |
| Class R | | 398,054 | |
| Class R6 | | 6,399 | |
| Advisor Class | | 2,744,073 | |
| Custodian fees (Note 4) | | 867,710 | |
| Reports to shareholders | | 717,937 | |
| Registration and filing fees. | | 164,633 | |
| Professional fees | | 171,785 | |
| Trustees’ fees and expenses | | 154,803 | |
| Other | | 118,211 | |
| Total expenses | | 74,051,705 | |
| Expense reductions (Note 4) | | (3,397 | ) |
| Expenses waived/paid by affiliates (Note 3f) | | (29,268 | ) |
| Net expenses | | 74,019,040 | |
| Net investment income. | | 108,559,704 | |
| Realized and unrealized gains (losses): | | | |
| Net realized gain (loss) from: | | | |
| Investments: | | | |
| Unaffiliated issuers | | (408,027,053 | ) |
| Non-controlled affiliates (Note 8) | | (4,015,298 | ) |
| Foreign currency transactions. | | (797,271 | ) |
| Net realized gain (loss) | | (412,839,622 | ) |
| Net change in unrealized appreciation (depreciation) on: | | | |
| Investments | | 502,192,772 | |
| Translation of other assets and liabilities | | | |
| denominated in foreign currencies | | 110,913 | |
| Net change in unrealized appreciation (depreciation) | | 502,303,685 | |
| Net realized and unrealized gain (loss) | | 89,464,063 | |
| Net increase (decrease) in net assets resulting from operations | $ | 198,023,767 | |
franklintempleton.com
The accompanying notes are an integral part of these financial statements. | Annual Report 27
TEMPLETON FOREIGN FUND
FINANCIAL STATEMENTS
| | | | | | |
| Statements of Changes in Net Assets | | | | | | |
| |
| | | Year Ended August 31, | |
| | | 2016 | | | 2015 | |
| Increase (decrease) in net assets: | | | | | | |
| Operations: | | | | | | |
| Net investment income | $ | 108,559,704 | | $ | 114,243,917 | |
| Net realized gain (loss) | | (412,839,622 | ) | | 72,754,028 | |
| Net change in unrealized appreciation (depreciation) | | 502,303,685 | | | (1,450,809,366 | ) |
| Net increase (decrease) in net assets resulting from operations | | 198,023,767 | | | (1,263,811,421 | ) |
| Distributions to shareholders from: | | | | | | |
| Net investment income: | | | | | | |
| Class A | | (55,196,460 | ) | | (108,979,296 | ) |
| Class C | | (2,480,964 | ) | | (10,871,816 | ) |
| Class R | | (1,966,945 | ) | | (4,775,729 | ) |
| Class R6 | | (15,445,834 | ) | | (20,887,052 | ) |
| Advisor Class | | (19,299,962 | ) | | (45,477,971 | ) |
| Net realized gains: | | | | | | |
| Class A | | (2,055,521 | ) | | (119,528,717 | ) |
| Class C | | (231,738 | ) | | (16,706,757 | ) |
| Class R | | (89,287 | ) | | (5,716,552 | ) |
| Class R6 | | (418,453 | ) | | (19,473,832 | ) |
| Advisor Class | | (601,465 | ) | | (45,105,781 | ) |
| Total distributions to shareholders | | (97,786,629 | ) | | (397,523,503 | ) |
| Capital share transactions: (Note 2) | | | | | | |
| Class A | | (578,271,720 | ) | | 601,431,832 | |
| Class C | | (74,336,175 | ) | | (19,450,312 | ) |
| Class R | | (17,573,822 | ) | | 12,386,157 | |
| Class R6 | | 44,144,990 | | | 318,106,096 | |
| Advisor Class | | (98,365,923 | ) | | (163,119,352 | ) |
| Total capital share transactions | | (724,402,650 | ) | | 749,354,421 | |
| Net increase (decrease) in net assets | | (624,165,512 | ) | | (911,980,503 | ) |
| Net assets: | | | | | | |
| Beginning of year. | | 6,831,338,507 | | | 7,743,319,010 | |
| End of year | $ | 6,207,172,995 | | $ | 6,831,338,507 | |
| Undistributed net investment income included in net assets: | | | | | | |
| End of year | $ | 94,500,204 | | $ | 83,119,483 | |
28 Annual Report | The accompanying notes are an integral part of these financial statements.
franklintempleton.com
TEMPLETON FOREIGN FUND
Notes to Financial Statements
1. Organization and Significant Accounting Policies
Templeton Funds (Trust) is registered under the Investment Company Act of 1940 (1940 Act) as an open-end management investment company, consisting of two separate funds and applies the specialized accounting and reporting guidance in U.S. Generally Accepted Accounting Principles (U.S. GAAP). Templeton Foreign Fund (Fund) is included in this report. The financial statements of the remaining funds in the Trust are presented separately. The Fund offers five classes of shares: Class A, Class C, Class R, Class R6 and Advisor Class. Each class of shares differs by its initial sales load, contingent deferred sales charges, voting rights on matters affecting a single class, its exchange privilege and fees primarily due to differing arrangements for distribution and transfer agent fees.
The following summarizes the Fund’s significant accounting policies.
a. Financial Instrument Valuation
The Fund’s investments in financial instruments are carried at fair value daily. Fair value is the price that would be received to sell an asset or paid to transfer a liability in an orderly transaction between market participants on the measurement date. The Fund calculates the net asset value (NAV) per share as of 4 p.m. Eastern time each day the New York Stock Exchange (NYSE) is open for trading. Under compliance policies and procedures approved by the Trust’s Board of Trustees (the Board), the Fund’s administrator has responsibility for oversight of valuation, including leading the cross-functional Valuation Committee (VC). The VC provides administration and oversight of the Fund’s valuation policies and procedures, which are approved annually by the Board. Among other things, these procedures allow the Fund to utilize independent pricing services, quotations from securities and financial instrument dealers, and other market sources to determine fair value.
Equity securities listed on an exchange or on the NASDAQ National Market System are valued at the last quoted sale price or the official closing price of the day, respectively. Foreign equity securities are valued as of the close of trading on the foreign stock exchange on which the security is primarily traded. The value is then converted into its U.S. dollar equivalent at the foreign exchange rate in effect on the day that the value of the security is determined. Over-the-counter (OTC) securities are valued within the range of the most recent quoted bid and ask prices. Securities that trade in multiple markets or on multiple exchanges are valued according to the broadest and most representative market. Certain equity securities are valued based upon fundamental characteristics or relationships to similar securities.
Debt securities generally trade in the OTC market rather than on a securities exchange. The Fund’s pricing services use multiple valuation techniques to determine fair value. In instances where sufficient market activity exists, the pricing services may utilize a market-based approach through which quotes from market makers are used to determine fair value. In instances where sufficient market activity may not exist or is limited, the pricing services also utilize proprietary valuation models which may consider market characteristics such as benchmark yield curves, credit spreads, estimated default rates, anticipated market interest rate volatility, coupon rates, anticipated timing of principal repayments, underlying collateral, and other unique security features in order to estimate the relevant cash flows, which are then discounted to calculate the fair value.
Investments in open-end mutual funds are valued at the closing NAV. Time deposits are valued at cost, which approximates fair value.
The Fund has procedures to determine the fair value of financial instruments for which market prices are not reliable or readily available. Under these procedures, the VC convenes on a regular basis to review such financial instruments and considers a number of factors, including significant unobservable valuation inputs, when arriving at fair value. The VC primarily employs a market-based approach which may use related or comparable assets or liabilities, recent transactions, market multiples, book values, and other relevant information for the investment to determine the fair value of the investment. An income-based valuation approach may also be used in which the anticipated future cash flows of the investment are discounted to calculate fair value. Discounts may also be applied due to the nature or duration of any restrictions on the disposition of the investments. Due to the inherent uncertainty of valuations of such investments, the fair values may differ significantly from the values that would have been used had an active market existed. The VC employs various methods for calibrating these valuation approaches including a regular review of key inputs and assumptions, transactional back-testing or disposition analysis, and reviews of any related market activity.
franklintempleton.com
Annual Report
29
TEMPLETON FOREIGN FUND
NOTES TO FINANCIAL STATEMENTS
1. Organization and Significant Accounting
Policies (continued)
a. Financial Instrument Valuation (continued)
Trading in securities on foreign securities stock exchanges and OTC markets may be completed before 4 p.m. Eastern time. In addition, trading in certain foreign markets may not take place on every NYSE business day. Occasionally, events occur between the time at which trading in a foreign security is completed and the close of the NYSE that might call into question the reliability of the value of a portfolio security held by the Fund. As a result, differences may arise between the value of the Fund’s portfolio securities as determined at the foreign market close and the latest indications of value at the close of the NYSE. In order to minimize the potential for these differences, the VC monitors price movements following the close of trading in foreign stock markets through a series of country specific market proxies (such as baskets of American Depositary Receipts, futures contracts and exchange traded funds). These price movements are measured against established trigger thresholds for each specific market proxy to assist in determining if an event has occurred that may call into question the reliability of the values of the foreign securities held by the Fund. If such an event occurs, the securities may be valued using fair value procedures, which may include the use of independent pricing services.
When the last day of the reporting period is a non-business day, certain foreign markets may be open on those days that the NYSE is closed, which could result in differences between the value of the Fund’s portfolio securities on the last business day and the last calendar day of the reporting period. Any significant security valuation changes due to an open foreign market are adjusted and reflected by the Fund for financial reporting purposes.
b. Foreign Currency Translation
Portfolio securities and other assets and liabilities denominated in foreign currencies are translated into U.S. dollars based on the exchange rate of such currencies against U.S. dollars on the date of valuation. The Fund may enter into foreign currency exchange contracts to facilitate transactions denominated in a foreign currency. Purchases and sales of securities, income and expense items denominated in foreign currencies are translated into U.S. dollars at the exchange rate in effect on the transaction date. Portfolio securities and assets and liabilities denominated in foreign currencies contain risks that those currencies will decline in value relative to the U.S. dollar. Occasionally, events may impact the availability or reliability of foreign exchange rates used to convert the U.S. dollar equivalent value. If such an event occurs, the foreign exchange rate will be valued at fair value using procedures established and approved by the Board.
The Fund does not separately report the effect of changes in foreign exchange rates from changes in market prices on securities held. Such changes are included in net realized and unrealized gain or loss from investments in the Statement of Operations.
Realized foreign exchange gains or losses arise from sales of foreign currencies, currency gains or losses realized between the trade and settlement dates on securities transactions and the difference between the recorded amounts of dividends, interest, and foreign withholding taxes and the U.S. dollar equivalent of the amounts actually received or paid. Net unrealized foreign exchange gains and losses arise from changes in foreign exchange rates on foreign denominated assets and liabilities other than investments in securities held at the end of the reporting period.
c. Securities Lending
The Fund participates in an agency based securities lending program to earn additional income. The Fund receives cash collateral against the loaned securities in an amount equal to at least 102% of the fair value of the loaned securities. Collateral is maintained over the life of the loan in an amount not less than 100% of the fair value of loaned securities, as determined at the close of Fund business each day; any additional collateral required due to changes in security values is delivered to the Fund on the next business day. The collateral is deposited into a joint cash account with other funds and is used to invest in a money market fund managed by Franklin Advisers, Inc., an affiliate of the Fund. The Fund may receive income from the investment of cash collateral, in addition to lending fees and rebates paid by the borrower. Income from securities loaned is reported separately in the Statement of Operations. The Fund bears the market risk with respect to the collateral investment, securities loaned, and the risk that the agent may default on its obligations to the Fund. If the borrower defaults on its obligation to return the securities loaned, the Fund has the right to repurchase the securities in the open market using the collateral received. The securities lending agent has agreed to indemnify the Fund in the event of default by a third party borrower.
30 Annual Report
franklintempleton.com
TEMPLETON FOREIGN FUND
NOTES TO FINANCIAL STATEMENTS
d. Income and Deferred Taxes
It is the Fund’s policy to qualify as a regulated investment company under the Internal Revenue Code. The Fund intends to distribute to shareholders substantially all of its taxable income and net realized gains to relieve it from federal income and excise taxes. As a result, no provision for U.S. federal income taxes is required.
The Fund may be subject to foreign taxation related to income received, capital gains on the sale of securities and certain foreign currency transactions in the foreign jurisdictions in which it invests. Foreign taxes, if any, are recorded based on the tax regulations and rates that exist in the foreign markets in which the Fund invests. When a capital gain tax is determined to apply, the Fund records an estimated deferred tax liability in an amount that would be payable if the securities were disposed of on the valuation date. As a result of several court cases, in certain countries across the European Union, the Fund filed additional tax reclaims for previously withheld taxes on dividends earned in those countries (EU reclaims). These additional filings are subject to various administrative proceedings by the local jurisdictions’ tax authorities within the European Union, as well as a number of related judicial proceedings. Income recognized, if any, for EU reclaims is reflected as other income in the Statement of Operations and any related receivable, if any, is reflected as European Union tax reclaims in the Statement of Assets and Liabilities. When uncertainty exists as to the ultimate resolution of these proceedings, the likelihood of receipt of these EU reclaims, and the potential timing of payment, no amounts are reflected in the financial statements.
The Fund may recognize an income tax liability related to its uncertain tax positions under U.S. GAAP when the uncertain tax position has a less than 50% probability that it will be sustained upon examination by the tax authorities based on its technical merits. As of August 31, 2016, the Fund has determined that no tax liability is required in its financial statements related to uncertain tax positions for any open tax years (or expected to be taken in future tax years). Open tax years are those that remain subject to examination and are based on each tax jurisdiction’s statute of limitation.
e. Security Transactions, Investment Income, Expenses and Distributions
Security transactions are accounted for on trade date. Realized gains and losses on security transactions are determined on a specific identification basis. Interest income and estimated expenses are accrued daily. Amortization of premium and accretion of discount on debt securities are included in interest income. Dividend income is recorded on the ex-dividend date except for certain dividends from foreign securities where the dividend rate is not available. In such cases, the dividend is recorded as soon as the information is received by the Fund. Distributions to shareholders are recorded on the ex-dividend date and are determined according to income tax regulations (tax basis). Distributable earnings determined on a tax basis may differ from earnings recorded in accordance with U.S. GAAP. These differences may be permanent or temporary. Permanent differences are reclassified among capital accounts to reflect their tax character. These reclassifications have no impact on net assets or the results of operations. Temporary differences are not reclassified, as they may reverse in subsequent periods.
Common expenses incurred by the Trust are allocated among the Funds based on the ratio of net assets of each Fund to the combined net assets of the Trust. Fund specific expenses are charged directly to the Fund that incurred the expense.
Realized and unrealized gains and losses and net investment income, not including class specific expenses, are allocated daily to each class of shares based upon the relative proportion of net assets of each class. Differences in per share distributions, by class, are generally due to differences in class specific expenses.
f. Accounting Estimates
The preparation of financial statements in accordance with U.S. GAAP requires management to make estimates and assumptions that affect the reported amounts of assets and liabilities at the date of the financial statements and the amounts of income and expenses during the reporting period. Actual results could differ from those estimates.
g. Guarantees and Indemnifications
Under the Trust’s organizational documents, its officers and trustees are indemnified by the Trust against certain liabilities arising out of the performance of their duties to the Trust. Additionally, in the normal course of business, the Trust, on
franklintempleton.com
Annual Report
31
TEMPLETON FOREIGN FUND
NOTES TO FINANCIAL STATEMENTS
1. Organization and Significant Accounting
Policies (continued)
g. Guarantees and Indemnifications (continued)
behalf of the Fund, enters into contracts with service providers that contain general indemnification clauses. The Trust’s maximum exposure under these arrangements is unknown as this would involve future claims that may be made against the Trust that have not yet occurred. Currently, the Trust expects the risk of loss to be remote.
2. Shares of Beneficial Interest
At August 31, 2016, there were an unlimited number of shares authorized (without par value). Transactions in the Fund’s shares were as follows:
| | | | | | | | | | |
| | | | | Year Ended August 31, | | | | |
| | | | | 2016 | | | | | 2015 | |
| | Shares | | | Amount | | Shares | | | Amount | |
| Class A Shares: | | | | | | | | | | |
| Shares sold | 87,045,428 | | $ | 557,157,941 | | 197,495,629 | | $ | 1,407,746,061 | |
| Shares issued in reinvestment of distributions | 8,362,892 | | | 52,686,218 | | 29,695,505 | | | 206,977,376 | |
| Shares redeemed | (182,244,623 | ) | | (1,188,115,879 | ) | (137,022,573 | ) | | (1,013,291,605 | ) |
| Net increase (decrease) | (86,836,303 | ) | $ | (578,271,720 | ) | 90,168,561 | | $ | 601,431,832 | |
| Class C Shares: | | | | | | | | | | |
| Shares sold | 5,000,404 | | $ | 31,324,355 | | 9,195,016 | | $ | 66,737,206 | |
| Shares issued in reinvestment of distributions | 376,527 | | | 2,323,173 | | 3,442,606 | | | 23,478,576 | |
| Shares redeemed | (17,267,321 | ) | | (107,983,703 | ) | (15,238,231 | ) | | (109,666,094 | ) |
| Net increase (decrease) | (11,890,390 | ) | $ | (74,336,175 | ) | (2,600,609 | ) | $ | (19,450,312 | ) |
| Class R Shares: | | | | | | | | | | |
| Shares sold | 6,508,159 | | $ | 41,010,434 | | 8,121,277 | | $ | 58,962,421 | |
| Shares issued in reinvestment of distributions | 308,972 | | | 1,912,536 | | 1,435,562 | | | 9,833,597 | |
| Shares redeemed | (9,519,061 | ) | | (60,496,792 | ) | (7,783,141 | ) | | (56,409,861 | ) |
| Net increase (decrease) | (2,701,930 | ) | $ | (17,573,822 | ) | 1,773,698 | | $ | 12,386,157 | |
| Class R6 Shares: | | | | | | | | | | |
| Shares sold | 25,537,718 | | $ | 161,908,346 | | 54,706,727 | | $ | 399,463,456 | |
| Shares issued in reinvestment of distributions | 2,475,067 | | | 15,345,418 | | 5,874,947 | | | 40,360,883 | |
| Shares redeemed | (20,752,542 | ) | | (133,108,774 | ) | (16,503,763 | ) | | (121,718,243 | ) |
| Net increase (decrease) | 7,260,243 | | $ | 44,144,990 | | 44,077,911 | | $ | 318,106,096 | |
| Advisor Class Shares: | | | | | | | | | | |
| Shares sold | 46,887,869 | | $ | 295,945,472 | | 58,090,549 | | $ | 425,813,328 | |
| Shares issued in reinvestment of distributions | 2,731,853 | | | 16,964,805 | | 11,318,646 | | | 77,759,100 | |
| Shares redeemed | (64,644,207 | ) | | (411,276,200 | ) | (91,872,521 | ) | | (666,691,780 | ) |
| Net increase (decrease) | (15,024,485 | ) | $ | (98,365,923 | ) | (22,463,326 | ) | $ | (163,119,352 | ) |
32 Annual Report
franklintempleton.com
TEMPLETON FOREIGN FUND
NOTES TO FINANCIAL STATEMENTS
3. Transactions with Affiliates
Franklin Resources, Inc. is the holding company for various subsidiaries that together are referred to as Franklin Templeton Investments. Certain officers and trustees of the Trust are also officers and/or directors of the following subsidiaries:
Subsidiary Affiliation
Templeton Global Advisors Limited (TGAL) Investment manager Franklin Templeton Services, LLC (FT Services) Administrative manager Franklin Templeton Distributors, Inc. (Distributors) Principal underwriter Franklin Templeton Investor Services, LLC (Investor Services) Transfer agent
a. Management Fees
The Fund pays an investment management fee to TGAL based on the average daily net assets of the Fund as follows:
| | |
| Annualized Fee Rate | | Net Assets |
| 0.705% | | Up to and including $1 billion |
| 0.690% | | Over $1 billion, up to and including $5 billion |
| 0.675% | | Over $5 billion, up to and including $10 billion |
| 0.655% | | Over $10 billion, up to and including $15 billion |
| 0.635% | | Over $15 billion, up to and including $20 billion |
| 0.615% | | Over $20 billion, up to and including $25 billion |
| 0.605% | | Over $25 billion, up to and including $30 billion |
| 0.595% | | Over $30 billion, up to and including $35 billion |
| 0.585% | | In excess of $35 billion |
For the year ended August 31, 2016, the annualized effective investment management fee rate was 0.689% of the Fund’s average daily net assets.
b. Administrative Fees
Under an agreement with TGAL, FT Services provides administrative services to the Fund. The fee is paid by TGAL based on the Fund’s average daily net assets, and is not an additional expense of the Fund.
c. Distribution Fees
The Board has adopted distribution plans for each share class, with the exception of Class R6 and Advisor Class shares, pursuant to Rule 12b-1 under the 1940 Act. Under the Fund’s Class A reimbursement distribution plan, the Fund reimburses Distributors for costs incurred in connection with the servicing, sale and distribution of the Fund’s shares up to the maximum annual plan rate. Under the Class A reimbursement distribution plan, costs exceeding the maximum for the current plan year cannot be reimbursed in subsequent periods. In addition, under the Fund’s Class C and R compensation distribution plans, the Fund pays Distributors for costs incurred in connection with the servicing, sale and distribution of the Fund’s shares up to the maximum annual plan rate for each class. The plan year, for purposes of monitoring compliance with the maximum annual plan rates, is February 1 through January 31.
The maximum annual plan rates, based on the average daily net assets, for each class, are as follows:
| | |
| Class A | 0.25% | |
| Class C | 1.00% | |
| Class R | 0.50% | |
franklintempleton.com
Annual Report
33
TEMPLETON FOREIGN FUND
NOTES TO FINANCIAL STATEMENTS
3. Transactions with Affiliates (continued)
d. Sales Charges/Underwriting Agreements
Front-end sales charges and contingent deferred sales charges (CDSC) do not represent expenses of the Fund. These charges are deducted from the proceeds of sales of Fund shares prior to investment or from redemption proceeds prior to remittance, as applicable. Distributors has advised the Fund of the following commission transactions related to the sales and redemptions of the Fund’s shares for the year:
| | |
| Sales charges retained net of commissions paid to | | |
| unaffiliated brokers/dealers | $ | 652,293 |
| CDSC retained | $ | 49,325 |
e. Transfer Agent Fees
Each class of shares, except for Class R6, pays transfer agent fees to Investor Services for its performance of shareholder servicing obligations and reimburses Investor Services for out of pocket expenses incurred, including shareholder servicing fees paid to third parties. These fees are allocated daily based upon their relative proportion of such classes’ aggregate net assets. Class R6 pays Investor Services transfer agent fees specific to that class.
For the year ended August 31, 2016, the Fund paid transfer agent fees of $13,612,727, of which $6,244,922 was retained by Investor Services.
f. Investments in Affiliated Management Investment Companies
The Fund invests in one or more affiliated management investment companies for purposes other than exercising a controlling influence over the management or policies. Management fees paid by the Fund are waived on assets invested in the affiliated management investment companies, as noted in the Statement of Operations, in an amount not to exceed the management and administrative fees paid directly or indirectly by each affiliate. Prior to August 31, 2013, the waiver was accounted for as a reduction to management fees. During the year ended August 31, 2016, the Fund held investments in affiliated management investment companies as follows:
| | | | | | | | | | | |
| | | | | | | | | | | % of | |
| | | | | | | | | | | Affiliated | |
| | Number of | | | | Number of | | | | | Fund Shares | |
| | Shares Held | | | | Shares | | Value | | | Outstanding | |
| | at Beginning | Gross | Gross | | Held at End | | at End | Investment | Realized | Held at End | |
| | of Year | Additions | Reductions | | of Year | | of Year | Income | Gain (Loss) | of Year | |
| |
| Non-Controlled Affiliates | | | | | | | | | | | |
| Institutional Fiduciary Trust Money | | | | | | | | | | | |
| Market Portfolio | 453,250 | 347,041,133 | (324,538,695 | ) | 22,955,688 | $ | 22,955,688 | $— | $— | 0.1 | % |
g. Waiver and Expense Reimbursements
Investor Services has contractually agreed in advance to waive or limit its fees so that the Class R6 transfer agent fees do not exceed 0.01% until December 31, 2016. There were no Class R6 transfer agent fees waived during the year ended August 31, 2016.
4. Expense Offset Arrangement
The Fund has entered into an arrangement with its custodian whereby credits realized as a result of uninvested cash balances are used to reduce a portion of the Fund’s custodian expenses. During the year ended August 31, 2016, the custodian fees were reduced as noted in the the Statement of Operations.
34 Annual Report
franklintempleton.com
TEMPLETON FOREIGN FUND
NOTES TO FINANCIAL STATEMENTS
5. Income Taxes
For tax purposes, capital losses may be carried over to offset future capital gains, if any. At August 31, 2016, the Fund had long-term capital loss carryforwards of $454,108,633.
The tax character of distributions paid during the years ended August 31, 2016 and 2015, was as follows:
| | | | |
| | | 2016 | | 2015 |
| Distributions paid from: | | | | |
| Ordinary income | $ | 97,786,629 | $ | 247,625,321 |
| Long term capital gain | | — | | 149,898,182 |
| | $ | 97,786,629 | $ | 397,523,503 |
At August 31, 2016, the cost of investments, net unrealized appreciation (depreciation) and undistributed ordinary income for income tax purposes were as follows:
| | | |
| Cost of investments. | $ | 6,273,609,179 | |
| |
| Unrealized appreciation | $ | 757,497,082 | |
| Unrealized depreciation | | (844,751,290 | ) |
| Net unrealized appreciation (depreciation) | $ | (87,254,208 | ) |
| Distributable earnings - undistributed ordinary | | | |
| income | $ | 110,458,807 | |
Differences between income and/or capital gains as determined on a book basis and a tax basis are primarily due to differing treatments of EU reclaims and passive foreign investment company shares.
6. Investment Transactions
Purchases and sales of investments (excluding short term securities) for the year ended August 31, 2016, aggregated $1,415,458,266 and $1,881,578,575, respectively.
At August 31, 2016, in connection with securities lending transactions, the Fund loaned equity investments and received $22,955,688 of cash collateral. The gross amount of recognized liability for such transactions is included in payable upon return of securities loaned in the Statement of Assets and Liabilities. The agreements can be terminated at any time.
7. Concentration of Risk
Investing in foreign securities may include certain risks and considerations not typically associated with investing in U.S. securities, such as fluctuating currency values and changing local and regional economic, political and social conditions, which may result in greater market volatility. In addition, certain foreign securities may not be as liquid as U.S. securities.
franklintempleton.com
Annual Report
35
TEMPLETON FOREIGN FUND
NOTES TO FINANCIAL STATEMENTS
8. Holdings of 5% Voting Securities of Portfolio Companies
The 1940 Act defines "affiliated companies" to include investments in portfolio companies in which a fund owns 5% or more of the outstanding voting securities. During the year ended August 31, 2016, the Fund held investments in “affiliated companies” as follows:
| | | | | | | | | | | | |
| | Number of | | | | Number of | | | | | | | |
| | Shares Held | | | | Shares | | | | | | Realized | |
| | at Beginning | Gross | Gross | | Held at End | | Value at | | Investment | | Capital | |
| Name of Issuer | of Year | Additions | Reductions | | of Year | | End of Year | | Income | | Gain (Loss) | |
| Non-Controlled Affiliates | | | | | | | | | | | | |
| Precision Drilling Corp | 13,244,530 | 3,473,190 | (600,800 | ) | 16,116,920 | $ | 66,260,020 | $ | 886,661 | $ | (1,640,383 | ) |
| WorleyParsons Ltd | 5,134,780 | 7,330,690 | (1,395,890 | ) | 11,069,580 | | —a | | — | | (2,374,915 | ) |
| Total Affiliated Securities (Value is 1.1% of Net Assets) | | | | $ | 66,260,020 | $ | 886,661 | $ | (4,015,298 | ) |
| |
| aAs of August 31, 2016, no longer an affiliate. | | | | | | | | | | | | |
9. Credit Facility
The Fund, together with other U.S. registered and foreign investment funds (collectively, Borrowers), managed by Franklin Templeton Investments, are borrowers in a joint syndicated senior unsecured credit facility totaling $2 billion (Global Credit Facility) which matures on February 10, 2017. This Global Credit Facility provides a source of funds to the Borrowers for temporary and emergency purposes, including the ability to meet future unanticipated or unusually large redemption requests.
Under the terms of the Global Credit Facility, the Fund shall, in addition to interest charged on any borrowings made by the Fund and other costs incurred by the Fund, pay its share of fees and expenses incurred in connection with the implementation and maintenance of the Global Credit Facility, based upon its relative share of the aggregate net assets of all of the Borrowers, including an annual commitment fee of 0.07% based upon the unused portion of the Global Credit Facility. Effective February 12, 2016, the annual commitment fee is 0.15%. These fees are reflected in other expenses in the Statement of Operations. During the year ended August 31, 2016, the Fund did not use the Global Credit Facility.
10. Fair Value Measurements
The Fund follows a fair value hierarchy that distinguishes between market data obtained from The independent sources (observable inputs) and the Fund’s own market assumptions (unobservable inputs). These inputs are used in determining the value of the Fund’s financial instruments and are summarized in the following fair value hierarchy:
- Level 1 – quoted prices in active markets for identical financial instruments
- Level 2 – other significant observable inputs (including quoted prices for similar financial instruments, interest rates, prepayment speed, credit risk, etc.)
- Level 3 – significant unobservable inputs (including the Fund’s own assumptions in determining the fair value of financial instruments)
The input levels are not necessarily an indication of the risk or liquidity associated with financial instruments at that level.
For movements between the levels within the fair value hierarchy, the Fund has adopted a policy of recognizing the transfers as of the date of the underlying event which caused the movement.
36 Annual Report
franklintempleton.com
TEMPLETON FOREIGN FUND
NOTES TO FINANCIAL STATEMENTS
A summary of inputs used as of August 31, 2016, in valuing the Fund’s assets carried at fair value, is as follows:
| | | | | | | | |
| | | Level 1 | | Level 2 | | Level 3 | | Total |
| Assets: | | | | | | | | |
| Investments in Securities: | | | | | | | | |
| Equity Investmentsa,b | $ | 6,041,399,283 | $ | — | $ | — | $ | 6,041,399,283 |
| Short Term Investments | | 22,955,688 | | 122,000,000 | | — | | 144,955,688 |
| Total Investments in Securities | $ | 6,064,354,971 | $ | 122,000,000 | $ | — | $ | 6,186,354,971 |
aIncludes common stocks.
bFor detailed categories, see the accompanying Statement of Investments.
11. Subsequent Events
The Fund has evaluated subsequent events through the issuance of the financial statements and determined that no events have occurred that require disclosure.
franklintempleton.com
Annual Report
37
TEMPLETON FUNDS
Report of Independent Registered Public Accounting Firm
To the Board of Trustees of Templeton Funds and Shareholders of Templeton Foreign Fund
In our opinion, the accompanying statement of assets and liabilities, including the statement of investments, and the related statements of operations and of changes in net assets and the financial highlights present fairly, in all material respects, the financial position of Templeton Foreign Fund (the "Fund") at August 31, 2016, the results of its operations for the year then ended, the changes in its net assets for each of the two years in the period then ended and the financial highlights for the periods presented, in conformity with accounting principles generally accepted in the United States of America. These financial statements and financial highlights (hereafter referred to as "financial statements") are the responsibility of the Fund’s management. Our responsibility is to express an opinion on these financial statements based on our audits. We conducted our audits of these financial statements in accordance with the standards of the Public Company Accounting Oversight Board (United States). Those standards require that we plan and perform the audit to obtain reasonable assurance about whether the financial statements are free of material misstatement. An audit includes examining, on a test basis, evidence supporting the amounts and disclosures in the financial statements, assessing the accounting principles used and significant estimates made by management, and evaluating the overall financial statement presentation. We believe that our audits, which included confirmation of securities at August 31, 2016 by correspondence with the custodian, transfer agent and brokers, provides a reasonable basis for our opinion.
PricewaterhouseCoopers LLP
San Francisco, California October 19, 2016
38 Annual Report
franklintempleton.com
TEMPLETON FUNDS
Tax Information (unaudited)
Templeton Foreign Fund
Under Section 871(k)(2)(C) of the Internal Revenue Code (Code), the Fund hereby reports the maximum amount allowable but no less than $3,305,219 as a short term capital gain dividend for purposes of the tax imposed under Section 871(a)(1)(A) of the Code for the fiscal year ended August 31, 2016.
Under Section 854(b)(1)(B) of the Code, the Fund hereby reports the maximum amount allowable but no less than $132,350,656 as qualified dividends for purposes of the maximum rate under Section 1(h)(11) of the Code for the fiscal year ended August 31, 2016. Distributions, including qualified dividend income, paid during calendar year 2016 will be reported to shareholders on Form 1099-DIV by mid-February 2017. Shareholders are advised to check with their tax advisors for information on the treatment of these amounts on their individual income tax returns.
At August 31, 2015, more than 50% of the Fund’s total assets were invested in securities of foreign issuers. In most instances, foreign taxes were withheld from income paid to the Fund on these investments. As shown in the table below, the Fund hereby reports to shareholders the foreign source income and foreign taxes paid, pursuant to Section 853 of the Code. This written statement will allow shareholders of record on December 17, 2015, to treat their proportionate share of foreign taxes paid by the Fund as having been paid directly by them. The shareholder shall consider these amounts as foreign taxes paid in the tax year in which they receive the Fund distribution.
The following table provides a detailed analysis of foreign tax paid, foreign source income, and foreign source qualified dividends as reported by the Fund, to Class A, Class C, Class R, and Class R6 and Advisor Class shareholders of record.
| | | | | | |
| | | Foreign Tax Paid | | Foreign Source | | Foreign Source Qualified |
| Class | | Per Share | | Income Per Share | | Dividends Per Share |
| |
| Class A | $ | 0.0185 | $ | 0.1231 | $ | 0.0936 |
| Class C | $ | 0.0185 | $ | 0.0695 | $ | 0.0528 |
| Class R | $ | 0.0185 | $ | 0.1075 | $ | 0.0820 |
| Class R6 | $ | 0.0185 | $ | 0.1526 | $ | 0.1161 |
| Advisor Class | $ | 0.0185 | $ | 0.1377 | $ | 0.1046 |
Foreign Tax Paid Per Share (Column 1) is the amount per share available to you, as a tax credit (assuming you held your shares in the Fund for a minimum of 16 days during the 31-day period beginning 15 days before the ex-dividend date of the Fund’s distribution to which the foreign taxes relate), or, as a tax deduction.
Foreign Source Income Per Share (Column 2) is the amount per share of income dividends attributable to foreign securities held by the Fund, plus any foreign taxes withheld on these dividends. The amounts reported include foreign source qualified dividends that have not been adjusted for the rate differential applicable to such dividend income.1
Foreign Source Qualified Dividends Per Share (Column 3) is the amount per share of foreign source qualified dividends, plus any foreign taxes withheld on these dividends. These amounts represent the portion of the Foreign Source Income reported to you in column 2 that were derived from qualified foreign securities held by the Fund.1
By mid-February 2016, shareholders received Form 1099-DIV which included their share of taxes paid and foreign source income distributed during the calendar year 2015. The Foreign Source Income reported on Form 1099-DIV has not been adjusted for the rate differential on foreign source qualified dividend income. Shareholders are advised to check with their tax advisors for information on the treatment of these amounts on their 2015 individual income tax returns.
franklintempleton.com
Annual Report
39
1Qualified dividends are taxed at reduced long term capital gains tax rates. In determining the amount of foreign tax credit that may be applied against the U.S. tax liability of
individuals receiving foreign source qualified dividends, adjustments may be required to the foreign tax credit limitation calculation to reflect the rate differential applicable to
such dividend income. The rules however permit certain individuals to elect not to apply the rate differential adjustments for capital gains and/or dividends for any taxable
year. Please consult your tax advisor and the instructions to Form 1116 for more information.
TEMPLETON FUNDS
| | | | |
| Board Members and Officers | | |
| |
| |
| The name, year of birth and address of the officers and board members, as well as their affiliations, positions held with the Trust, |
| principal occupations during at least the past five years and number of U.S. registered portfolios overseen in the Franklin Templeton |
| Investments fund complex, are shown below. Generally, each board member serves until that person’s successor is elected and |
| qualified. | | | | |
| |
| |
| Independent Board Members | | | |
| |
| | | | Number of Portfolios in | |
| Name, Year of Birth | | Length of | Fund Complex Overseen | Other Directorships Held |
| and Address | Position | Time Served | by Board Member* | During at Least the Past 5 Years |
| |
| Harris J. Ashton (1932) | Trustee | Since 1992 | 145 | Bar-S Foods (meat packing company) |
| 300 S.E. 2nd Street | | | | (1981-2010). |
| Fort Lauderdale, FL 33301-1923 | | | | |
| Principal Occupation During at Least the Past 5 Years: | | |
| Director of various companies; and formerly, Director, RBC Holdings, Inc. (bank holding company) (until 2002); and President, Chief Executive |
| Officer and Chairman of the Board, General Host Corporation (nursery and craft centers) (until 1998). | |
| |
| Ann Torre Bates (1958) | Trustee | Since 2008 | 42 | Ares Capital Corporation (specialty |
| 300 S.E. 2nd Street | | | | finance company) (2010-present), |
| Fort Lauderdale, FL 33301-1923 | | | | United Natural Foods, Inc. (distributor |
| | | | | of natural, organic and specialty foods) |
| | | | | (2013-present), Allied Capital |
| | | | | Corporation (financial services) |
| | | | | (2003-2010), SLM Corporation (Sallie |
| | | | | Mae) (1997-2014) and Navient |
| | | | | Corporation (loan management, |
| | | | | servicing and asset recovery) |
| | | | | (2014-2016). |
| Principal Occupation During at Least the Past 5 Years: | | |
| Director of various companies; and formerly, Executive Vice President and Chief Financial Officer, NHP Incorporated (manager of multifamily |
| housing) (1995-1997); and Vice President and Treasurer, US Airways, Inc. (until 1995). | |
| |
| Edith E. Holiday (1952) | Lead | Trustee since 2003 | 145 | Hess Corporation (exploration and |
| 300 S.E. 2nd Street | Independent | and Lead | | refining of oil and gas) (1993-present), |
| Fort Lauderdale, FL 33301-1923 | Trustee | Independent | | Canadian National Railway (railroad) |
| | | Trustee since 2007 | | (2001-present), White Mountains |
| | | | | Insurance Group, Ltd. (holding |
| | | | | company) (2004-present), RTI |
| | | | | International Metals, Inc. (manufacture |
| | | | | and distribution of titanium) |
| | | | | (1999-2015) and H.J. Heinz Company |
| | | | | (processed foods and allied products) |
| | | | | (1994-2013). |
| Principal Occupation During at Least the Past 5 Years: | | |
| Director or Trustee of various companies and trusts; and formerly, Assistant to the President of the United States and Secretary of the |
| Cabinet (1990-1993); General Counsel to the United States Treasury Department (1989-1990); and Counselor to the Secretary and Assistant |
| Secretary for Public Affairs and Public Liaison – United States Treasury Department (1988-1989). | |
| |
| J. Michael Luttig (1954) | Trustee | Since 2009 | 145 | Boeing Capital Corporation (aircraft |
| 300 S.E. 2nd Street | | | | financing) (2006-2013). |
| Fort Lauderdale, FL 33301-1923 | | | | |
| Principal Occupation During at Least the Past 5 Years: | | |
| Executive Vice President, General Counsel and member of the Executive Council, The Boeing Company (aerospace company) (2006-present); |
| and formerly, Federal Appeals Court Judge, U.S. Court of Appeals for the Fourth Circuit (1991-2006). | |
| |
| David W. Niemiec (1949) | Trustee | Since 2005 | 42 | Emeritus Corporation (assisted living) |
| 300 S.E. 2nd Street | | | | (1999-2010) and OSI Pharmaceuticals, |
| Fort Lauderdale, FL 33301-1923 | | | | Inc. (pharmaceutical products) |
| | | | | (2006-2010). |
| Principal Occupation During at Least the Past 5 Years: | | |
| Advisor, Saratoga Partners (private equity fund); and formerly, Managing Director, Saratoga Partners (1998-2001) and SBC Warburg Dillon |
| Read (investment banking) (1997-1998); Vice Chairman, Dillon, Read & Co. Inc. (investment banking) (1991-1997); and Chief Financial Officer, |
| Dillon, Read & Co. Inc. (1982-1997). | | | |
40 Annual Report
franklintempleton.com
TEMPLETON FUNDS
| | | | | |
| Independent Board Members (continued) | | |
| |
| |
| |
| | | | | Number of Portfolios in | |
| Name, Year of Birth | | | Length of | Fund Complex Overseen | Other Directorships Held |
| and Address | | Position | Time Served | by Board Member* | During at Least the Past 5 Years |
| |
| Frank A. Olson (1932) | | Trustee | Since 2003 | 145 | Hess Corporation (exploration and |
| 300 S.E. 2nd Street | | | | | refining of oil and gas) (1998-2013). |
| Fort Lauderdale, FL 33301-1923 | | | | | |
| Principal Occupation During at Least the Past 5 Years: | | |
| Director of various companies; and formerly, Chairman of the Board, The Hertz Corporation (car rental) (1980-2000) and Chief Executive |
| Officer (1977-1999); and Chairman of the Board, President and Chief Executive Officer, UAL Corporation (airlines) (June-December 1987). |
| |
| Larry D. Thompson (1945) | | Trustee | Since 2005 | 145 | The Southern Company (energy |
| 300 S.E. 2nd Street | | | | | company) (2014-present; previously |
| Fort Lauderdale, FL 33301-1923 | | | | | 2010-2012), Graham Holdings |
| | | | | | Company (education and media |
| | | | | | organization) (2011-present) and |
| | | | | | Cbeyond, Inc. (business |
| | | | | | communications provider) |
| | | | | | (2010-2012). |
| Principal Occupation During at Least the Past 5 Years: | | |
| Director of various companies; John A. Sibley Professor of Corporate and Business Law, University of Georgia School of Law (2015-present; |
| previously 2011-2012); and formerly, Executive Vice President – Government Affairs, General Counsel and Corporate Secretary, PepsiCo, |
| Inc. (consumer products) (2012-2014); Senior Vice President – Government Affairs, General Counsel and Secretary, PepsiCo, Inc. |
| (2004-2011); Senior Fellow of The Brookings Institution (2003-2004); Visiting Professor, University of Georgia School of Law (2004); and |
| Deputy Attorney General, U.S. Department of Justice (2001-2003). | | |
| |
| Constantine D. Tseretopoulos | | Trustee | Since 2003 | 26 | None |
| (1954) | | | | | |
| 300 S.E. 2nd Street | | | | | |
| Fort Lauderdale, FL 33301-1923 | | | | | |
| Principal Occupation During at Least the Past 5 Years: | | |
| Physician, Chief of Staff, owner and operator of the Lyford Cay Hospital (1987-present); director of various nonprofit organizations; and |
| formerly, Cardiology Fellow, University of Maryland (1985-1987); and Internal Medicine Resident, Greater Baltimore Medical Center |
| (1982-1985). | | | | | |
| |
| Robert E. Wade (1946) | | Trustee | Since 2006 | 42 | El Oro Ltd (investments) |
| 300 S.E. 2nd Street | | | | | (2003-present). |
| Fort Lauderdale, FL 33301-1923 | | | | | |
| Principal Occupation During at Least the Past 5 Years: | | |
| Attorney at law engaged in private practice (1972-2008) and member of various boards. | |
| |
| |
| Interested Board Members and Officers | | |
| |
| | | | | Number of Portfolios in | |
| Name, Year of Birth | | | Length of | Fund Complex Overseen | Other Directorships Held |
| and Address | | Position | Time Served | by Board Member* | During at Least the Past 5 Years |
| |
| **Gregory E. Johnson (1961) | | Trustee | Since 2013 | 161 | None |
| One Franklin Parkway | | | | | |
| San Mateo, CA 94403-1906 | | | | | |
| Principal Occupation During at Least the Past 5 Years: | | |
| Chairman of the Board, Member – Office of the Chairman, Director and Chief Executive Officer, Franklin Resources, Inc.; officer and/or |
| director or trustee, as the case may be, of some of the other subsidiaries of Franklin Resources, Inc. and of 44 of the investment companies in |
| Franklin Templeton Investments; Vice Chairman, Investment Company Institute; and formerly, President, Franklin Resources, Inc. |
| (1994-2015). | | | | | |
franklintempleton.com
Annual Report
41
TEMPLETON FUNDS
| | | | |
| Interested Board Members and Officers (continued) | |
| |
| |
| |
| | | | Number of Portfolios in | |
| Name, Year of Birth | | Length of | Fund Complex Overseen | Other Directorships Held |
| and Address | Position | Time Served | by Board Member* | During at Least the Past 5 Years |
| |
| **Rupert H. Johnson, Jr. (1940) | Chairman of | Chairman of the | 145 | None |
| One Franklin Parkway | the Board, | Board since 2013, | | |
| San Mateo, CA 94403-1906 | Trustee and | Trustee since 1992 | | |
| | Vice President | and Vice President | | |
| | | since 1996 | | |
| Principal Occupation During at Least the Past 5 Years: | | |
| Vice Chairman, Member – Office of the Chairman and Director, Franklin Resources, Inc.; Director, Franklin Advisers, Inc.; Senior Vice |
| President, Franklin Advisory Services, LLC; and officer and/or director or trustee, as the case may be, of some of the other subsidiaries of |
| Franklin Resources, Inc. and of 42 of the investment companies in Franklin Templeton Investments. | |
| |
| Alison E. Baur (1964) | Vice President | Since 2012 | Not Applicable | Not Applicable |
| One Franklin Parkway | | | | |
| San Mateo, CA 94403-1906 | | | | |
| Principal Occupation During at Least the Past 5 Years: | | |
| Deputy General Counsel, Franklin Templeton Investments; and officer of some of the other subsidiaries of Franklin Resources, Inc. and of 45 |
| of the investment companies in Franklin Templeton Investments. | | |
| |
| Norman J. Boersma (1957) | President and | Since 2012 | Not Applicable | Not Applicable |
| Lyford Cay | Chief Executive | | | |
| Nassau, Bahamas | Officer – | | | |
| | Investment | | | |
| | Management | | | |
| Principal Occupation During at Least the Past 5 Years: | | |
| Director, President and Chief Executive Officer, Templeton Global Advisors Ltd.; Chief Investment Officer of Templeton Global Equity Group; |
| officer of six of the investment companies in Franklin Templeton Investments; and formerly, Executive Vice President, Franklin Templeton |
| Investments Corp. (1993-2014). | | | | |
| |
| Laura F. Fergerson (1962) | Chief Executive Since 2009 | Not Applicable | Not Applicable |
| One Franklin Parkway | Officer – | | | |
| San Mateo, CA 94403-1906 | Finance and | | | |
| | Administration | | | |
| Principal Occupation During at Least the Past 5 Years: | | |
| Senior Vice President, Franklin Templeton Services, LLC; Vice President, Franklin Advisers, Inc. and Franklin Templeton Institutional, LLC; and |
| officer of 45 of the investment companies in Franklin Templeton Investments. | |
| |
| Aliya S. Gordon (1973) | Vice President | Since 2009 | Not Applicable | Not Applicable |
| One Franklin Parkway | | | | |
| San Mateo, CA 94403-1906 | | | | |
| Principal Occupation During at Least the Past 5 Years: | | |
| Senior Associate General Counsel, Franklin Templeton Investments; and officer of 45 of the investment companies in Franklin Templeton |
| Investments. | | | | |
| |
| Steven J. Gray (1955) | Vice President | Since 2009 | Not Applicable | Not Applicable |
| One Franklin Parkway | | | | |
| San Mateo, CA 94403-1906 | | | | |
| Principal Occupation During at Least the Past 5 Years: | | |
| Senior Associate General Counsel, Franklin Templeton Investments; Vice President, Franklin Templeton Distributors, Inc. and Franklin |
| Alternative Strategies Advisers, LLC; and officer of 45 of the investment companies in Franklin Templeton Investments. |
| |
| Robert Lim (1948) | Vice President | Since May 2016 | Not Applicable | Not Applicable |
| One Franklin Parkway | – AML | | | |
| San Mateo, CA 94403-1906 | Compliance | | | |
| Principal Occupation During at Least the Past 5 Years: | | |
| Vice President, Franklin Templeton Companies, LLC; Chief Compliance Officer, Franklin Templeton Distributors, Inc. and Franklin Templeton |
| Investor Services, LLC; and officer of 45 of the investment companies in Franklin Templeton Investments. |
42 Annual Report
franklintempleton.com
TEMPLETON FUNDS
| | | | |
| Interested Board Members and Officers (continued) | |
| |
| |
| |
| | | | Number of Portfolios in | |
| Name, Year of Birth | | Length of | Fund Complex Overseen | Other Directorships Held |
| and Address | Position | Time Served | by Board Member* | During at Least the Past 5 Years |
| |
| Kimberly H. Novotny (1972) | Vice President | Since 2013 | Not Applicable | Not Applicable |
| 300 S.E. 2nd Street | | | | |
| Fort Lauderdale, FL 33301-1923 | | | | |
| Principal Occupation During at Least the Past 5 Years: | | |
| Associate General Counsel, Franklin Templeton Investments; Vice President and Corporate Secretary, Fiduciary Trust International of the |
| South; Vice President, Templeton Investment Counsel, LLC; Assistant Secretary, Franklin Resources, Inc.; and officer of 45 of the investment |
| companies in Franklin Templeton Investments. | | | |
| |
| Mark H. Otani (1968) | Treasurer, Chief Since 2009 | Not Applicable | Not Applicable |
| One Franklin Parkway | Financial | | | |
| San Mateo, CA 94403-1906 | Officer | | | |
| | and Chief | | | |
| | Accounting | | | |
| | Officer | | | |
| Principal Occupation During at Least the Past 5 Years: | | |
| Treasurer, U.S. Fund Administration & Reporting, Franklin Templeton Investments; and officer of 14 of the investment companies in Franklin |
| Templeton Investments. | | | | |
| |
| Robert C. Rosselot (1960) | Chief | Since 2013 | Not Applicable | Not Applicable |
| 300 S.E. 2nd Street | Compliance | | | |
| Fort Lauderdale, FL 33301-1923 | Officer | | | |
| Principal Occupation During at Least the Past 5 Years: | | |
| Director, Global Compliance, Franklin Templeton Investments; Vice President, Franklin Templeton Companies, LLC; officer of 45 of the |
| investment companies in Franklin Templeton Investments; and formerly, Senior Associate General Counsel, Franklin Templeton Investments |
| (2007-2013); and Secretary and Vice President, Templeton Group of Funds (2004-2013). | |
| |
| Karen L. Skidmore (1952) | Vice President | Since 2009 | Not Applicable | Not Applicable |
| One Franklin Parkway | | | | |
| San Mateo, CA 94403-1906 | | | | |
| Principal Occupation During at Least the Past 5 Years: | | |
| Senior Associate General Counsel, Franklin Templeton Investments; and officer of 45 of the investment companies in Franklin Templeton |
| Investments. | | | | |
| |
| Navid J. Tofigh (1972) | Vice President | Since November | Not Applicable | Not Applicable |
| One Franklin Parkway | | 2015 | | |
| San Mateo, CA 94403-1906 | | | | |
| Principal Occupation During at Least the Past 5 Years: | | |
| Associate General Counsel, Franklin Templeton Investments; and officer of 45 of the investment companies in Franklin Templeton Investments. |
| |
| Craig S. Tyle (1960) | Vice President | Since 2011 | Not Applicable | Not Applicable |
| One Franklin Parkway | | | | |
| San Mateo, CA 94403-1906 | | | | |
| Principal Occupation During at Least the Past 5 Years: | | |
| General Counsel and Executive Vice President, Franklin Resources, Inc.; and officer of some of the other subsidiaries of Franklin Resources, |
| Inc. and of 45 of the investment companies in Franklin Templeton Investments. | |
| |
| Lori A. Weber (1964) | Secretary and | Secretary since | Not Applicable | Not Applicable |
| 300 S.E. 2nd Street | Vice President | 2013 and Vice | | |
| Fort Lauderdale, FL 33301-1923 | | President since | | |
| | | 2011 | | |
| Principal Occupation During at Least the Past 5 Years: | | |
| Senior Associate General Counsel, Franklin Templeton Investments; Assistant Secretary, Franklin Resources, Inc.; Vice President and |
| Secretary, Templeton Investment Counsel, LLC; and officer of 45 of the investment companies in Franklin Templeton Investments. |
franklintempleton.com
Annual Report
43
*We base the number of portfolios on each separate series of the U.S. registered investment companies within the Franklin Templeton Investments fund complex. These
portfolios have a common investment manager or affiliated investment managers.
TEMPLETON FUNDS
Interested Board Members and Officers (continued)
**Gregory E. Johnson is considered to be an interested person of the Fund under the federal securities laws due to his position as an officer and director ofFranklin Resources, Inc. (Resources), which is the parent company of the Fund’s investment manager and distributor. Rupert H. Johnson, Jr. is considered to be an interested person of the Fund under the federal securities laws due to his position as officer and director and major shareholder of Resources.
Note 1: Rupert H. Johnson, Jr. is the uncle of Gregory E. Johnson.
Note 2: Officer information is current as of the date of this report. It is possible that after this date, information about officers may change. Note 3: Effective May 13, 2016, Frank J. Crothers ceased to be a trustee of the Trust.
The Sarbanes-Oxley Act of 2002 and Rules adopted by the U.S. Securities and Exchange Commission require the Fund to disclose whether the Fund’s Audit Committee includes at least one member who is an audit committee financial expert within the meaning of such Act and Rules. The Fund’s Board has determined that there is at least one such financial expert on the Audit Committee and has designated each of Ann Torre Bates and David W. Niemiec as an audit committee financial expert. The Board believes that Ms. Bates and Mr. Niemiec qualify as such an expert in view of their extensive business background and experience. Ms. Bates has served as a member of the Fund Audit Committee since 2008. She currently serves as a director of Ares Capital Corporation (2010-present) and United Natural Foods, Inc. (2013-present) and was formerly a director of Navient Corporation from 2014 to 2016, SLM Corporation from 1997 to 2014 and Allied Capital Corporation from 2003 to 2010, Executive Vice President and Chief Financial Officer of NHP Incorporated from 1995 to 1997 and Vice President and Treasurer of US Airways, Inc. until 1995. Mr. Niemiec has served as a member of the Fund Audit Committee since 2005, currently serves as an Advisor to Saratoga Partners and was formerly its Managing Director from 1998 to 2001. Mr. Niemiec was formerly a director of Emeritus Corporation from 1999 to 2010 and OSI Pharmaceuticals, Inc. from 2006 to 2010, Managing Director of SBC Warburg Dillon Read from 1997 to 1998, and was Vice Chairman from 1991 to 1997 and Chief Financial Officer from 1982 to 1997 of Dillon, Read & Co. Inc. As a result of such background and experience, the Board believes that Ms. Bates and Mr. Niemiec have each acquired an understanding of generally accepted accounting principles and financial statements, the general application of such principles in connection with the accounting estimates, accruals and reserves, and analyzing and evaluating financial statements that present a breadth and level of complexity of accounting issues generally comparable to those of the Fund, as well as an understanding of internal controls and procedures for financial reporting and an understanding of audit committee functions. Ms. Bates and Mr. Niemiec are independent Board members as that term is defined under the applicable U.S. Securities and Exchange Commission Rules and Releases.
The Statement of Additional Information (SAI) includes additional information about the board members and is available, without charge, upon request.
Shareholders may call (800) DIAL BEN/342-5236 to request the SAI.
44 Annual Report
franklintempleton.com
TEMPLETON FUNDS
TEMPLETON FOREIGN FUND
Shareholder Information
Board Review of Investment Management Agreement
At a meeting held May 17, 2016, the Board of Trustees (Board), including a majority of trustees that are not “interested persons” as such term is defined in section 2(a)(19) of the Investment Company Act of 1940 (hereinafter referred to as “non-interested Trustees” or “independent Trustees”), approved renewal of the investment management agreement for each of the two separate funds comprising the Templeton Funds (Fund(s)). In reaching this decision, the Board took into account information furnished throughout the year at regular Board meetings, as well as information prepared specifically in connection with the annual renewal review process. Information furnished and discussed throughout the year included investment performance reports and related financial information for the Funds, along with periodic reports on expenses, shareholder services, legal and compliance matters, pricing, brokerage commissions and execution and other services provided by the Investment Manager (Manager) and its affiliates, as well as marketing support payments made to financial intermediaries. Information furnished specifically in connection with the renewal process included a report for the Fund prepared by Broadridge Financial Solutions, Inc. (Broadridge), an independent organization, as well as additional material, including a Fund profitability analysis prepared by management. The Broadridge report, which utilized data from Lipper Inc. (Lipper) compared the Funds’ investment performance and expenses with those of other mutual funds deemed comparable to the Funds as selected by Lipper. The Fund profitability analysis discussed the profitability to Franklin Templeton Investments (FTI) from its overall U.S. fund operations, as well as on an individual fund-by-fund basis. Additional material accompanying such profitability analysis report included information on a fund-by-fund basis listing portfolio managers and other accounts they manage, as well as information on management fees charged by the Manager and its affiliates to U.S. mutual funds and other accounts, including management’s explanation of differences where relevant. Such material also included a memorandum prepared by management describing project initiatives and capital investments relating to the services provided to the Funds by the FTI organization, as well as a memorandum relating to economies of scale and an analysis concerning transfer agent fees charged by an affiliate of the Manager. The Board also received a report on all marketing support payments made by FTI to financial intermediaries during the past year, as well as a memorandum relating to third-party servicing arrangements in response to a Guidance Update from the U.S. Securities and Exchange Commission (SEC) relating to mutual fund distribution and sub-accounting fees.
In considering such materials, the independent Trustees received assistance and advice from and met separately with independent counsel. In approving continuance of the investment management agreements for the Funds, the Board, including a majority of independent Trustees, determined that the existing management fee structure was fair and reasonable and that continuance of the investment management agreement was in the best interests of such Funds and its shareholders. While attention was given to all information furnished, the following discusses some primary factors relevant to the Board’s decision.
NATURE, EXTENT AND QUALITY OF SERVICES. The Board was satisfied with the nature and quality of the overall services provided by the Manager and its affiliates to the Funds and their shareholders. In addition to investment performance and expenses discussed later, the Board’s opinion was based, in part, upon periodic reports furnished showing that the investment policies and restrictions for the Funds were consistently complied with as well as other reports periodically furnished to the Board covering matters such as the compliance of portfolio managers and other management personnel with the code of ethics adopted throughout the Franklin Templeton fund complex, the adherence to fair value pricing procedures established by the Board, and the accuracy of net asset value calculations. The Board also noted the extent of benefits provided to Fund shareholders from being part of the Franklin Templeton family of funds, including the right to exchange investments between the same class of shares of different funds without a sales charge, the ability to reinvest Fund dividends into other funds and the right to combine holdings in other funds to obtain a reduced sales charge. Favorable consideration was given to management’s continual efforts and expenditures in establishing effective business continuity plans and developing strategies to address cybersecurity threats. Among other factors taken into account by the Board were the Manager’s best execution trading policies, including a favorable report by an independent portfolio trading analytical firm that also covered global foreign exchange transactions. Consideration was also given to the experience of the Funds’ portfolio management teams, the number of accounts managed and general method of compensation. In this latter respect, the Board noted that a primary factor in management’s determination of a portfolio manager’s bonus compensation was the relative investment performance of the funds he or she
franklintempleton.com
Annual Report
45
TEMPLETON FUNDS TEMPLETON FOREIGN FUND SHAREHOLDER INFORMATION
managed and that a portion of such bonus was required to be invested in a pre-designated list of funds within such person’s fund management area so as to be aligned with the interests of shareholders. The Board also took into account the quality of transfer agent and shareholder services provided to Fund shareholders by an affiliate of the Manager and steps taken by FTI to enhance analytical support to the investment management groups and provide additional oversight of liquidity risk and complex securities. The Board also took into account, among other things, management’s efforts in establishing a global credit facility for the benefit of the Fund and other accounts managed by FTI to provide a source of cash for temporary and emergency purposes or to meet unusual redemption requests as well as the strong financial position of the Manager’s parent company and its commitment to the mutual fund business as evidenced by its continued introduction of new funds and reassessment of the fund offerings in response to the market environment.
INVESTMENT PERFORMANCE. The Board placed significant emphasis on the investment performance of the Fund in view of its importance to shareholders. While consideration was given to performance reports and discussions with portfolio managers at Board meetings during the year, particular attention in assessing performance was given to the Broadridge report furnished for the agreement renewals. The Broadridge report prepared for the Fund showed the investment performance of its Class A shares for the one-year period ended February 29, 2016, and the previous 10 years ended such date in comparison with a performance universe selected by Lipper. The following summarizes the performance results for the Fund.
The Lipper performance universe for this Fund consisted of the Fund and all retail and institutional international multi-cap value funds as selected by Lipper. On a comparative basis, the Broadridge report for the Fund showed its total return to be in the second-lowest performing quintile of such universe for the one-year period, and on an annualized basis to also be in the second-lowest performing quintile of such universe for each of the previous three- and five-year periods, and in the highest or best performing quintile of such universe for the previous 10-year period. The Board found the Fund’s comparative performance as set forth in the Broadridge report to be acceptable, noting that the Fund’s performance over the last two years had negatively impacted its shorter term returns but that the Fund’s total return was above the median for six of the previous 10 one-year periods.
COMPARATIVE EXPENSES. Consideration was given to a Broadridge report analysis of the management fees and total expense ratios of the Fund compared with those of a group of other funds selected by Lipper as constituting its appropriate Lipper expense group. Lipper expense data is based upon information taken from the Fund’s most recent annual report which reflects historical asset levels that may be quite different from those currently existing, particularly in a period of market volatility. While recognizing such inherent limitation and the fact that expense ratios generally increase as assets decline and decrease as assets grow, the Board believed the independent analysis conducted by Lipper to be an appropriate measure of comparative expenses. In reviewing comparative costs, Lipper provides information on the Fund’s contractual investment management fee in comparison with the contractual investment management fee that would have been charged by other funds within its Lipper expense group assuming they were similar in size to the Fund, as well as the actual total expenses of the Fund in comparison with those of its Lipper expense group. The Lipper contractual investment management fee analysis included administrative charges as being part of the management fee and actual total expenses for comparative consistency are shown by Lipper for Fund Class A shares. The results of such expense comparisons showed the contractual and actual investment management fee rates of Templeton Foreign Fund to be in the second least expensive quintile of its Lipper expense group. The Board was satisfied with the comparative expenses of the Fund as set forth in the Broadridge report.
MANAGEMENT PROFITABILITY. The Board also considered the level of profits realized by the Manager and its affiliates in connection with the operation of the Fund. In this respect, the Board reviewed the Fund profitability analysis that addresses the overall profitability of Franklin Templeton’s U.S. fund business, as well as its profits in providing management and other services to each of the individual funds during the 12-month period ended September 30, 2015, being the most recent fiscal year end for Franklin Resources, Inc., the Manager’s parent. In reviewing the analysis, the Board recognized that allocation methodologies are inherently subjective and various allocation methodologies may be reasonable while producing different results. In this respect, the Board noted that while management continually makes refinements to its methodologies in response to organizational and product related changes, the overall approach as defined by the primary drivers and activity measurements has remained consistent with that used in the Fund’s profitability report presentations from prior years. Additionally, the Fund’s
46 Annual Report
franklintempleton.com
TEMPLETON FUNDS
TEMPLETON FOREIGN FUND
SHAREHOLDER INFORMATION
independent registered public accounting firm had been engaged by the Manager to periodically review the reasonableness of the allocation methodologies to be used solely by the Fund’s Board in reference to the profitability analysis. In reviewing and discussing such analysis, management discussed with the Board its belief that costs incurred in establishing the infrastructure necessary for the type of mutual fund operations conducted by the Manager and its affiliates may not be fully reflected in the expenses allocated to the Funds in determining its profitability, as well as the fact that the level of profits, to a certain extent, reflected operational cost savings and efficiencies initiated by management. The Board also took into account management’s expenditures in improving shareholder services provided to the Fund, as well as the need to implement systems and meet additional regulatory and compliance requirements resulting from statutes such as the Sarbanes-Oxley Act of 2002 and Dodd-Frank Wall Street Reform and Consumer Protection Act and recent SEC and other regulatory requirements. In addition, the Board considered a third-party study comparing the profitability of the Manager’s parent on an overall basis to other publicly held managers broken down to show profitability from management operations exclusive of distribution expenses, as well as profitability including distribution expenses. The Board also considered the extent to which the Manager and its affiliates might derive ancillary benefits from fund operations, including revenues generated from transfer agent services, and potential benefits resulting from personnel and systems enhancements necessitated by fund growth, increased leverage with the service providers and counterparties, allocation of fund brokerage and the use of commission dollars to pay for research. Based upon its consideration of all these factors, the Board determined that the level of profits realized by the Manager and its affiliates from providing services to the Fund was not excessive in view of the nature, quality and extent of services provided.
ECONOMIES OF SCALE. The Board also considered whether economies of scale are realized by the Manager as a fund grows larger and the extent to which this is reflected in the level of management fees charged. While recognizing that any precise determination is inherently subjective, the Board noted that based upon the Fund profitability analysis, it appears that as some funds get larger, at some point economies of scale do result in the Manager realizing a larger profit margin on management services provided to such a fund. The Board also noted that economies of scale are shared with the Fund and its shareholders through management fee breakpoints so that as the Fund grows in size, its effective management fee rate declines.
The Fund’s investment management agreement provides a fee at the rate of 0.705% on the first $1 billion of net assets; 0.690% on the next $4 billion of net assets; 0.675% on the next $5 billion of net assets; 0.655% on the next $5 billion of net assets; 0.635% on the next $5 billion of net assets; and 0.615% on net assets in excess of $20 billion, with additional breakpoints for Templeton Foreign Fund continuing thereafter up to the $35 billion asset level. At the end of 2015, the net assets of Templeton Foreign Fund were approximately $6.38 billion. The Board believed that to the extent economies of scale may be realized by the Manager, the schedule of fees under the investment management agreement for the Fund provides a sharing of benefits with the Fund and its shareholders.
Proxy Voting Policies and Procedures
The Fund’s investment manager has established Proxy Voting Policies and Procedures (Policies) that the Fund uses to determine how to vote proxies relating to portfolio securities. Shareholders may view the Fund’s complete Policies online at franklintempleton.com. Alternatively, shareholders may request copies of the Policies free of charge by calling the Proxy Group collect at (954) 527-7678 or by sending a written request to: Franklin Templeton Companies, LLC, 300 S.E. 2nd Street, Fort Lauderdale, FL 33301, Attention: Proxy Group. Copies of the Fund’s proxy voting records are also made available online at franklintempleton.com and posted on the U.S. Securities and Exchange Commission’s website at sec.gov and reflect the most recent 12-month period ended June 30.
Quarterly Statement of Investments
The Trust, on behalf of the Fund, files a complete statement of investments with the U.S. Securities and Exchange Commission for the first and third quarters for each fiscal year on Form N-Q. Shareholders may view the filed Form N-Q by visiting the Commission’s website at sec.gov. The filed form may also be viewed and copied at the Commission’s Public Reference Room in Washington, DC. Information regarding the operations of the Public Reference Room may be obtained by calling (800) SEC-0330.
Householding of Reports and Prospectuses
You will receive the Fund’s financial reports every six months as well as an annual updated summary prospectus (prospectus available upon request). To reduce Fund expenses, we try to identify related shareholders in a household and send only one copy of the financial reports and summary prospectus. This process, called “householding,” will continue indefinitely
franklintempleton.com
Annual Report
47
TEMPLETON FUNDS TEMPLETON FOREIGN FUND SHAREHOLDER INFORMATION
unless you instruct us otherwise. If you prefer not to have these documents householded, please call us at (800) 632-2301. At any time you may view current prospectuses/summary prospectuses and financial reports on our website. If you choose, you may receive these documents through electronic delivery.
48 Annual Report
franklintempleton.com
Authorized for distribution only when accompanied or preceded by a summary prospectus and/or prospectus. Investors should carefully consider a fund’s investment goals, risks, charges and expenses before investing. A prospectus contains this and other information; please read it carefully before investing.
To help ensure we provide you with quality service, all calls to and from our service areas are monitored and/or recorded.
| |
| © 2016 Franklin Templeton Investments. All rights reserved. | 104 A 10/16 |
Item 2. Code of Ethics.
(a) The Registrant has adopted a code of ethics that applies to its principal executive officers and principal financial and accounting officer.
(c) N/A
(d) N/A
(f) Pursuant to Item 12(a)(1), the Registrant is attaching as an exhibit a copy of its code of ethics that applies to its principal executive officers and principal financial and accounting officer.
Item 3. Audit Committee Financial Expert.
(a)(1) The Registrant has an audit committee financial expert serving on its audit committee.
(2) The audit committee financial expert is David W. Niemiec and he is "independent" as defined under the relevant Securities and Exchange Commission Rules and Releases.
Item 4. Principal Accountant Fees and Services.
(a) Audit Fees
The aggregate fees paid to the principal accountant for professional services rendered by the principal accountant for the audit of the registrant’s annual financial statements or for services that are normally provided by the principal accountant in connection with statutory and regulatory filings or engagements were $115,793 for the fiscal year ended August 31, 2016 and $120,010 for the fiscal year ended August 31, 2015.
(b) Audit-Related Fees
The aggregate fees paid to the principal accountant for assurance and related services rendered by the principal accountant to the registrant that are reasonably related to the performance of the audit of the registrant's financial statements and are not reported under paragraph (a) of Item 4 were $6,022 for the fiscal year ended August 31, 2016 and $5,904 for the fiscal year ended August 31, 2015. The services for which these fees were paid included attestation services.
There were no fees paid to the principal accountant for assurance and related services rendered by the principal accountant to the registrant's investment adviser and any entity controlling, controlled by or under common control with the investment adviser that provides ongoing services to the registrant that are reasonably related to the performance of the audit of their financial statements.
(c) Tax Fees
There were no fees paid to the principal accountant for professional services rendered by the principal accountant to the registrant for tax compliance, tax advice and tax planning.
There were no fees paid to the principal accountant for professional services rendered by the principal accountant to the registrant’s investment adviser and any entity controlling, controlled by or under common control with the investment adviser that provides ongoing services to the registrant for tax compliance, tax advice and tax planning.
(d) All Other Fees
The aggregate fees paid to the principal accountant for products and services rendered by the principal accountant to the registrant, other than the services reported in paragraphs (a)-(c) of Item 4 were $0 for the fiscal year ended August 31, 2016 and $3,713 for the fiscal year ended August 31, 2015. The services for which these fees were paid included review of materials provided to the fund Board in connection with the investment management contract renewal process.
The aggregate fees paid to the principal accountant for products and services rendered by the principal accountant to the registrant’s investment adviser and any entity controlling, controlled by or under common control with the investment adviser that provides ongoing services to the registrant, other than the services reported in paragraphs (a)-(c) of Item 4 were $0 for the fiscal year ended August 31, 2016 and $9,000 for the fiscal year ended August 31, 2015. The services for which these fees were paid included preparation and review of materials provided to the fund Board in connection with the investment management contract renewal process and certifying assets under management.
(e) (1) The registrant’s audit committee is directly responsible for approving the services to be provided by the auditors, including:
(i) pre-approval of all audit and audit related services;
(ii) pre-approval of all non-audit related services to be provided to the Fund by the auditors;
(iii) pre-approval of all non-audit related services to be provided to the registrant by the auditors to the registrant’s investment adviser or to any entity that controls, is controlled by or is under common control with the registrant’s investment adviser and that provides ongoing services to the registrant where the non-audit services relate directly to the operations or financial reporting of the registrant; and
(iv) establishment by the audit committee, if deemed necessary or appropriate, as an alternative to committee pre-approval of services to be provided by the auditors, as required by paragraphs (ii) and (iii) above, of policies and procedures to permit such services to be pre-approved by other means, such as through establishment of guidelines or by action of a designated member or members of the committee; provided the policies and procedures are detailed as to the particular service and the committee is informed of each service and such policies and procedures do not include delegation of audit committee responsibilities, as contemplated under the Securities Exchange Act of 1934, to management; subject, in the case of (ii) through (iv), to any waivers, exceptions or exemptions that may be available under applicable law or rules.
(e) (2) None of the services provided to the registrant described in paragraphs (b)-(d) of Item 4 were approved by the audit committee pursuant to paragraph (c)(7)(i)(C) of Rule 2-01 of regulation S-X.
(f) No disclosures are required by this Item 4(f).
(g) The aggregate non-audit fees paid to the principal accountant for services rendered by the principal accountant to the registrant and the registrant’s investment adviser and any entity controlling, controlled by or under common control with the investment adviser that provides ongoing services to the registrant were $6,022 for the fiscal year ended August 31, 2016 and $18,617 for the fiscal year ended August 31, 2015.
(h) The registrant’s audit committee of the board has considered whether the provision of non-audit services that were rendered to the registrant’s investment adviser (not including any sub-adviser whose role is primarily portfolio management and is subcontracted with or overseen by another investment adviser), and any entity controlling, controlled by, or under common control with the investment adviser that provides ongoing services to the registrant that were not pre-approved pursuant to paragraph (c)(7)(ii) of Rule 2-01 of Regulation S-X is compatible with maintaining the principal accountant’s independence.
Item 5. Audit Committee of Listed Registrants. N/A
Item 6. Schedule of Investments. N/A
Item 7. Disclosure of Proxy Voting Policies and Procedures for Closed-End Management Investment Companies. N/A
Item 8. Portfolio Managers of Closed-End Management Investment Companies. N/A
Item 9. Purchases of Equity Securities by Closed-End Management Investment Company and Affiliated Purchasers. N/A
Item 10. Submission of Matters to a Vote of Security Holders.
There have been no changes to the procedures by which shareholders may recommend nominees to the Registrant's Board of Trustees that would require disclosure herein.
Item 11. Controls and Procedures.
(a) Evaluation of Disclosure Controls and Procedures. The Registrant maintains disclosure controls and procedures that are designed to ensure that information required to be disclosed in the Registrant’s filings under the Securities Exchange Act of 1934 and the Investment Company Act of 1940 is recorded, processed, summarized and reported within the periods specified in the rules and forms of the Securities and Exchange Commission. Such information is accumulated and communicated to the Registrant’s management, including its principal executive officer and principal financial officer, as appropriate, to allow timely decisions regarding required disclosure. The Registrant’s management, including the principal executive officer and the principal financial officer, recognizes that any set of controls and procedures, no matter how well designed and operated, can provide only reasonable assurance of achieving the desired control objectives.
Within 90 days prior to the filing date of this Shareholder Report on Form N-CSR, the Registrant had carried out an evaluation, under the supervision and with the participation of the Registrant’s management, including the Registrant’s principal executive officer and the Registrant’s principal financial officer, of the effectiveness of the design and operation of the Registrant’s disclosure controls and procedures. Based on such evaluation, the Registrant’s principal executive officer and principal financial officer concluded that the Registrant’s disclosure controls and procedures are effective.
(b) Changes in Internal Controls. There have been no changes in the Registrant’s internal controls or in other factors that could materially affect the internal controls over financial reporting subsequent to the date of their evaluation in connection with the preparation of this Shareholder Report on Form N-CSR.
Item 12. Exhibits.
(a)(1) Code of Ethics
(a)(2) Certifications pursuant to Section 302 of the Sarbanes-Oxley Act of 2002 of Laura F. Fergerson, Chief Executive Officer - Finance and Administration, and Mark H. Otani, Chief Financial Officer and Chief Accounting Officer
(b) Certifications pursuant to Section 906 of the Sarbanes-Oxley Act of 2002 of Laura F. Fergerson, Chief Executive Officer - Finance and Administration, and Mark H. Otani, Chief Financial Officer and Chief Accounting Officer
SIGNATURES
Pursuant to the requirements of the Securities Exchange Act of 1934 and the Investment Company Act of 1940, the registrant has duly caused this report to be signed on its behalf by the undersigned, thereunto duly authorized.
TEMPLETON FUNDS
By /s/Laura F. Fergerson
Laura F. Fergerson
Chief Executive Officer –
Finance and Administration
Date: January 4, 2017
Pursuant to the requirements of the Securities Exchange Act of 1934 and the Investment Company Act of 1940, this report has been signed below by the following persons on behalf of the registrant and in the capacities and on the dates indicated.
By /s/Laura F. Fergerson
Laura F. Fergerson
Chief Executive Officer –
Finance and Administration
Date: January 4, 2017
By /s/Mark H. Otani
Mark H. Otani
Chief Financial Officer and
Chief Accounting Officer
Date: January 4, 2017