UNITED STATES
SECURITIES AND EXCHANGE COMMISSION
Washington, DC 20549
FORM N-CSR
CERTIFIED SHAREHOLDER REPORT OF REGISTERED
MANAGEMENT INVESTMENT COMPANIES
Investment Company Act file number 811-02781
Templeton Funds
(Exact name of registrant as specified in charter)
300 S.E. 2nd Street, Fort Lauderdale, FL 33301-1923
(Address of principal executive offices) (Zip code)
Craig S. Tyle, One Franklin Parkway, San Mateo, CA 94403-1906
(Name and address of agent for service)
Registrant’s telephone number, including area code: (954) 527-7500
Date of fiscal year end: 8/31
Date of reporting period: 8/31/18
| Item 1. | Reports to Stockholders. |
| | |

| | Annual Report and Shareholder Letter August 31, 2018 |
Sign up for electronic delivery at franklintempleton.com/edelivery
Franklin Templeton Investments
Why choose Franklin Templeton Investments?
Successful investing begins with ambition. And achievement only comes when you reach for it. That’s why we continually strive to deliver better outcomes for investors. No matter what your goals are, our deep, global investment expertise allows us to offer solutions that can help.
During our more than 70 years of experience, we’ve managed through all kinds of markets—up, down and those in between. We’re always preparing for what may come next. It’s because of this, combined with our strength as one of the world’s largest asset managers that we’ve earned the trust of millions of investors around the world.
Dear Shareholder:
During the 12 months ended August 31, 2018, global markets reflected investor optimism about global economic growth amid higher crude oil prices, continued monetary easing by the European Central Bank and U.S. tax reform. Corporate earnings also increased throughout the period, with many companies exceeding their earnings guidance and reporting increased sales and better operating profit margins. However, investor sentiment was dampened at times by Korean peninsula tensions, U.S. and global trade uncertainties, and worries that central banks could raise interest rates due to strong economic growth and rising inflation in the U.S. and other countries. In this environment, stocks in global developed and emerging markets excluding the U.S. generated positive returns, as measured by the MSCI All Country World Index ex USA Index.
We are committed to our long-term perspective and disciplined investment approach as we conduct a rigorous, fundamental analysis of securities with a regular emphasis on investment risk management.
Historically, patient investors have achieved rewarding results by evaluating their goals, diversifying their assets globally and maintaining a disciplined investment program, all hallmarks of the Templeton investment philosophy developed more than 60 years ago. We continue to recommend investors consult their financial advisors and review their portfolios to design a
long-term strategy and portfolio allocation that meet their individual needs, goals and risk tolerance.
Templeton Foreign Fund’s annual report includes more detail about prevailing conditions and a discussion about investment decisions during the period. Please remember all securities markets fluctuate, as do mutual fund share prices.
We thank you for investing with Franklin Templeton, welcome your questions and comments, and look forward to serving your investment needs in the years ahead.
Sincerely,

Norman J. Boersma, CFA
President and Chief Executive Officer –
Investment Management
Templeton Funds
This letter reflects our analysis and opinions as of August 31, 2018, unless otherwise indicated. The information is not a complete analysis of every aspect of any market, country, industry, security or fund. Statements of fact are from sources considered reliable.
CFA® is a trademark owned by CFA Institute.
|
Not FDIC Insured | May Lose Value | No Bank Guarantee |
| | | | |
| | | |
| franklintempleton.com | | Not part of the annual report | | 1 |
Visit franklintempleton.com for fund updates, to access your account, or to find helpful financial planning tools.
| | | | |
| | | |
2 | | Annual Report | | franklintempleton.com |
Annual Report
Templeton Foreign Fund
This annual report for Templeton Foreign Fund covers the fiscal year ended August 31, 2018.
Your Fund’s Goal and Main Investments
The Fund seeks long-term capital growth. Under normal market conditions, the Fund invests at least 80% of its net assets in “foreign securities,” as described in the prospectus. These securities are predominantly equity securities of companies located outside the U.S., including developing markets.
Performance Overview
The Fund’s Class A shares had a -0.15% cumulative total return for the 12 months under review. In comparison, the Fund’s benchmark, the MSCI All Country World Index (ACWI) ex USA Index, which measures stock performance in global developed and emerging markets excluding the U.S., generated a +3.68% total return.1 For the 10-year period ended August 31, 2018, the Fund’s Class A shares generated a +45.46% cumulative total return, compared with the MSCI ACWI ex USA Index’s +46.77% cumulative total return for the same period.1 Please note index performance information is provided for reference and we do not attempt to track the index but rather undertake investments on the basis of fundamental research. You can find more performance data in the Performance Summary beginning on page 8.
Performance data represent past performance, which does not guarantee future results. Investment return and principal value will fluctuate, and you may have a gain or loss when you sell your shares. Current performance may differ from figures shown. For most recent month-end performance, go to franklintempleton.com or call (800) 342-5236.
Economic and Market Overview
The global economy expanded during the 12-month period under review amid generally upbeat economic data across regions. In this environment, the MSCI ACWI, which measures performance of global developed and emerging market stocks, reached a new all-time high in January 2018 and generated a
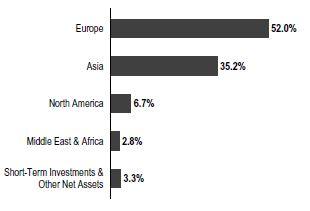
Geographic Composition
Based on Total Net Assets as of 8/31/18
+11.99% total return for the 12 months ended August 31, 2018.1 Global markets were aided by higher crude oil prices, the European Central Bank’s (ECB’s) extension of its monetary easing program, the passage of the U.S. tax reform bill and encouraging corporate earnings reports.
However, global markets reflected investor concerns about tensions in the Korean peninsula at certain times during the period and political uncertainties in the U.S. and the European Union (EU), as well as worries that strong economic growth and rising inflation in the U.S. and other countries would lead central banks to increase interest rates sooner than expected. Markets were further pressured by the Trump administration’s protectionist trade policies, U.S. trade disputes with its allies and China, and fears of tighter regulation in the information technology (IT) sector. A sudden decrease in the Turkish lira’s value in August also hurt investor confidence, particularly in emerging markets. But investors were encouraged by an overall easing of tensions in the Korean peninsula in the latter part of the period, a U.S.-EU agreement to try to reduce trade barriers, and a trade deal between the U.S. and Mexico near period-end.
The U.S. economy grew during the 12 months under review. After moderating for three consecutive quarters, the economy grew faster in 2018’s second quarter, driven by consumer
1. Source: Morningstar. As of 8/31/18, the Fund’s Class A 10-year average annual total return not including the maximum sales charge was +3.82%, compared with the MSCI ACWI ex USA Index’s 10-year average annual total return of +3.91%.
The index is unmanaged and includes reinvestment of any income or distributions. It does not reflect any fees, expenses or sales charges. One cannot invest directly in an index, and an index is not representative of the Fund’s portfolio.
The dollar value, number of shares or principal amount, and names of all portfolio holdings are listed in the Fund’s Statement of Investments (SOI).
The SOI begins on page 17.
| | | | |
| | | |
| franklintempleton.com | | Annual Report | | 3 |
TEMPLETON FOREIGN FUND
spending, business investment, exports and government spending. The unemployment rate declined from 4.4% in August 2017, as reported at the beginning of the 12-month period, to 3.9% at period-end.2 Annual inflation, as measured by the Consumer Price Index, increased from 1.9% in August 2017, as reported at the beginning of the period, to 2.7% at period-end.2 The U.S. Federal Reserve (Fed) began reducing its balance sheet in October 2017 and raised its target range for the federal funds rate three times during the period to 1.75%–2.00%. In August 2018, Fed Chair Jerome Powell reiterated the Fed’s intention to gradually raise interest rates.
In Europe, the U.K.’s quarterly economic growth moderated in 2018’s first quarter but accelerated in the second quarter. The Bank of England raised its key policy rate twice during the period. The eurozone’s quarterly growth moderated in 2018’s first quarter and remained stable in the second quarter. The bloc’s annual inflation rate ended the period higher than in August 2017. The ECB kept its benchmark interest rate unchanged during the period. However, at its October 2017 meeting, the ECB extended the time frame for its bond-buying program from December 2017 to at least September 2018, while reducing the amount of monthly bond purchases in half beginning in January 2018. In June, the ECB announced it would further reduce its monthly bond purchases beginning in October 2018, and indicated it would conclude the program at the end of 2018, while keeping interest rates unchanged through at least the summer of 2019.
In Asia, Japan’s quarterly gross domestic product (GDP) contracted in 2018’s first quarter but expanded in the second quarter. The Bank of Japan left its benchmark interest rate unchanged during the period and continued its monetary stimulus measures.
In emerging markets, Brazil’s quarterly GDP growth accelerated in 2018’s first and second quarters. The country’s central bank cut its benchmark interest rate several times during the period to spur economic growth. Russia’s annual GDP growth rate slowed in 2017’s fourth quarter but accelerated in 2018’s first and second quarters, amid the Bank of Russia’s continued policy support. China’s annual GDP moderated in 2018’s second quarter, after growing at a stable rate in the previous two quarters. The People’s Bank of China left its benchmark interest rate unchanged during the period, but it took measures to improve financial liquidity to mitigate the
Top 10 Sectors/Industries
8/31/18
| | |
| | | % of Total
Net Assets |
Banks | | 14.0% |
Oil, Gas & Consumable Fuels | | 11.8% |
Pharmaceuticals | | 11.2% |
Technology Hardware, Storage & Peripherals | | 4.9% |
Insurance | | 4.1% |
Diversified Telecommunication Services | | 3.9% |
Metals & Mining | | 3.7% |
Wireless Telecommunication Services | | 3.1% |
Life Sciences Tools & Services | | 2.9% |
Industrial Conglomerates | | 2.6% |
negative effects of the U.S.-China trade dispute and support economic growth. Overall, emerging market stocks, as measured by the MSCI Emerging Markets Index, declined during the period.
Investment Strategy
Our investment strategy employs a bottom-up, value-oriented, long-term approach. We focus on the market price of a company’s securities relative to our evaluation of the company’s long-term earnings, asset value and cash flow potential. We also consider the company’s price/earnings ratio, price/cash flow ratio, profit margins and liquidation value.
Manager’s Discussion
International equities advanced modestly during the 12 months under review, a period when global economic growth and tailwinds from U.S. tax reform ultimately gave way to concerns about rising trade tensions and less accommodative monetary policy.
The Fund underperformed its benchmark, the MSCI ACWI ex USA Index, during the period. The bulk of relative weakness was attributable to stock selection in two sectors: industrials and materials.3 With industrials accounting for about 8% and materials accounting for about 7% of the portfolio at period-end, neither sector offers a high concentration of value or represents a high conviction industry theme. The problem here was not how much (or how little) exposure we had to these sectors, it was what we owned within them. The industrials sector delivered the Fund’s biggest single stock detractor. U.K.-based professional services firm Capita
2. Source: U.S. Bureau of Labor Statistics.
3. The industrials sector comprises aerospace and defense, construction and engineering, electrical equipment, industrial conglomerates, machinery, marine, and trading companies and distributors in the SOI. The materials sector comprises chemicals, construction materials, and metals and mining in the SOI.
| | | | |
| | | |
4 | | Annual Report | | franklintempleton.com |
TEMPLETON FOREIGN FUND
declined sharply during the period after management announced plans to halt dividends and sell shares to raise capital. The recent bankruptcy of Carillion (not a Fund holding), a competing U.K. outsourcing firm, further compounded investor concerns about the magnitude of Capita’s woes. The emergence of new information required a reassessment of the investment thesis, and our analysis suggested that the risk profile of Capita had increased materially. The combination of a significantly dilutive equity issuance and new guidance for negative free cash flows in 2018 suggested to us that the firm’s finances are more impaired than initially portrayed by outgoing management. With fundamentals deteriorating, valuations no longer appeared supportive and we liquidated the position. Meanwhile, materials holdings were led lower by Canadian precious metals firms Alamos Gold,4 Barrick Gold4 and Wheaton Precious Metals. After rallying at the beginning of the period to the highest levels in more than a year, the price of gold declined steadily during the period’s latter half as the U.S. dollar strengthened, interest rates rose, and physical demand from major consumers such as India disappointed. History suggests that a modest exposure to gold and silver miners can help optimize risk-adjusted returns over time, and we view these investments as attractive portfolio hedges at a time when global debt has reached an all-time high and economic and market cycles look increasingly mature. With valuations across the precious metals industry becoming increasingly depressed, in our analysis, we have maintained select investments in a handful of companies with resilient balance sheets, low cost positions and identifiable value catalysts.
Stock selection in the financials sector also detracted from relative results.5 French lender BNP Paribas and Chinese insurer China Life Insurance finished among the biggest detractors. BNP was pressured primarily by concerns about its exposure to Italian sovereign debt during a period when political parties outside the Italian mainstream won the election and struggled to form a coalition government. Despite concerns about an Italian exit from the EU, it is worth noting that neither of the coalition parties ran on a “leave” campaign, popular opinion favors staying in the union, and in all likelihood an EU disintegration would devastate the Italian economy and banking system. More specifically, we view BNP Paribas as a highly diversified bank with a solid track record of profitability that continues to strengthen its capital ratios. We believe BNP should continue to generate a satisfactory return on
Top 10 Holdings
8/31/18
| | | | |
| |
Company Sector/Industry, Country | | % of Total Net Assets | |
| |
Samsung Electronics Co. Ltd. Technology Hardware, Storage & Peripherals, South Korea | | | 4.3% | |
| |
BP PLC Oil, Gas & Consumable Fuels, U.K. | | | 3.2% | |
| |
Royal Dutch Shell PLC Oil, Gas & Consumable Fuels, U.K. | | | 2.8% | |
| |
Teva Pharmaceutical Industries Ltd. Pharmaceuticals, Israel | | | 2.8% | |
| |
Roche Holding AG Pharmaceuticals, Switzerland | | | 2.3% | |
| |
Eni SpA Oil, Gas & Consumable Fuels, Italy | | | 2.2% | |
| |
Sanofi Pharmaceuticals, France | | | 2.1% | |
| |
Standard Chartered PLC Banks, U.K. | | | 2.1% | |
| |
BNP Paribas SA Banks, France | | | 2.0% | |
| |
Baidu Inc. Internet Software & Services, China | | | 1.9% | |
capital—much of which will be returned to shareholders—given the positive business trends across many of its territories. China Life’s earnings have been disappointing in recent years due to an increase in reserves attributable to lower interest rates. We recently reassessed this investment amid share price weakness. Although this is not a simple story and we have revisited a number of our assumptions to better reflect the realities of the business, our view on the excellent long-term demographic opportunity has not changed, and we believe China Life offers inexpensive exposure to that attractive structural growth theme.
Turning to contributors, stock selection and an overweighted allocation in the energy sector notably contributed to relative performance.6 U.K.-based integrated energy firm BP was the sector’s leading contributor. We continue to believe BP is capable of generating substantial free cash flow that will likely be returned to shareholders through improved dividends and share repurchases. Within the energy sector more broadly, oil markets have moved into a supply deficit amid production cuts by the Organization of the Oil Exporting Countries, politically driven curtailments in Venezuela and Iran, and continued
4. Not part of the index.
5. The financials sector comprises banks, capital markets and insurance in the SOI.
6. The energy sector comprises energy equipment and services and oil, gas and consumable fuels in the SOI.
| | | | |
| | | |
| franklintempleton.com | | Annual Report | | 5 |
TEMPLETON FOREIGN FUND
strong demand growth that is drawing down inventories. With market sentiment improving and crude oil now trading above the marginal cost of production, we have been taking profits on the higher-volatility, oil price-sensitive energy stocks that performed well. Within the energy sector more broadly, we are finding what we consider more attractive risk-reward characteristics among the large integrated companies whose stocks, in our analysis, are not fully discounting likely sustained higher oil prices, and which may prove more defensive if crude oil prices retreat. Encouragingly, management at these companies are exhibiting strategic focus and cost discipline, as evidenced by the fact that the sector in aggregate should generate higher free cash flows this year than it did when oil traded at $100 per barrel. As these cash flows materialize, reassuring investors that the sector’s high dividend payouts can be fully covered, we expect additional upside potential for our select energy holdings.
We were also encouraged by the outperformance of the Fund’s high-conviction health care overweighting.7 The sector accounted for two of the Fund’s top three relative contributors during the period: Israeli generic drug manufacturer Teva Pharmaceutical Industries and German biotechnology firm MorphoSys4. Teva’s new chief executive officer is making progress with a restructuring plan that seeks to refinance and pay down debt, renew the focus on profitability and deliver a significant amount of savings by 2019. The stock also found additional support following a major vote of confidence from Warren Buffett’s Berkshire Hathaway (not a Fund holding), which acquired a stake in the firm during the period. MorphoSys specializes in therapeutic antibodies and has a proven approach to drug discovery that involves partnering with larger firms in pharmaceuticals development. More recently, the firm has also begun to develop proprietary, wholly-owned drugs. This business mix gives MorphoSys a diverse portfolio of lower-risk/lower-return partnered products (which typically generate a royalty) as well as higher risk/reward proprietary drugs. We believe that with a well-capitalized balance sheet, attractive positioning as a potential takeout candidate for big pharmaceuticals firms, and significant newsflow expected in coming years as key drugs reach critical stages of development, MorphoSys remains an undervalued innovator with significant upside potential. In general, we were encouraged to see the health care sector begin to recover during the review period as investors set aside
Top 10 Countries
8/31/18
| | | | |
| | | % of Total
Net Assets | |
U.K. | | | 19.2% | |
China | | | 10.1% | |
Japan | | | 10.0% | |
France | | | 7.6% | |
South Korea | | | 7.4% | |
Germany | | | 7.3% | |
Netherlands | | | 6.2% | |
Canada | | | 4.9% | |
Switzerland | | | 4.3% | |
Israel | | | 2.8% | |
concerns about generic competition, regulatory scrutiny and a consolidating payer industry, and instead reassessed the sector’s cheap valuations and attractive defensive characteristics. Major pharmaceuticals stocks have been trading at valuations that discount single-digit percentage earnings growth despite generating free cash flow yields in excess of the IT sector and delivering double-digit percentage returns on equity. Furthermore, we believe the sector may prove relatively immune to escalating trade wars given largely domestic supply chains and government incentives to keep costs down.
Another notable sector contributor included consumer staples, due to stock selection and an underweighted allocation.8
It is important to recognize the effect of currency movements on the Fund’s performance. In general, if the value of the U.S. dollar goes up compared with a foreign currency, an investment traded in that foreign currency will go down in value because it will be worth fewer U.S. dollars. This can have a negative effect on Fund performance. Conversely, when the U.S. dollar weakens in relation to a foreign currency, an investment traded in that foreign currency will increase in value, which can contribute to Fund performance. For the 12 months ended August 31, 2018, the U.S. dollar rose in value relative to most currencies. As a result, the Fund’s performance was negatively affected by the portfolio’s investment predominantly in securities with non-U.S. currency exposure.
From a regional standpoint, stock selection in Canada and the U.K., as well as stock selection and an underweighting in Japan, detracted notably from relative performance.
7. The health care sector comprises biotechnology, health care equipment and supplies, health care providers and services, life sciences tools and services, and pharmaceuticals in the SOI.
8. The consumer staples sector comprises beverages, food and staples retailing, and food products in the SOI.
See www.franklintempletondatasources.com for additional data provider information.
| | | | |
| | | |
6 | | Annual Report | | franklintempleton.com |
TEMPLETON FOREIGN FUND
Conversely, overweighted allocations in Israel and Thailand, as well as stock selection in Italy, notably contributed. We remain constructive on international equities in general. Europe’s overall trailing 12-month price-to-earnings ratio has halved in just the past two years, and the region trades at the steepest discount to the U.S. based on price-to-book ratios in decades, in our analysis. Despite some softening thus far in 2018, we believe the economic backdrop in the eurozone remains broadly expansionary. In our view, an environment of balanced budgets, easier fiscal policy, still-accommodative monetary policy, and accelerating investment supported by high-capacity utilization remains auspicious. In Asia, we believe the best opportunities in the region are those based on the long-term wealth accumulation and demand potential of the region’s consumers. We are finding many such opportunities among providers of the critical services and infrastructure—utilities, telecommunication services and insurers—required to facilitate the rise of a middle class. Emerging markets more generally have been buffeted by a series of headwinds originating in the U.S., including a stronger U.S. dollar and diminished liquidity resulting from the Fed’s quantitative tightening, as well as the uncertainty surrounding trade. We believe those threats are at least partially reflected in emerging market equity valuations hovering near three-year lows, and we continue to find select opportunities among emerging market stocks we consider to be cheaply valued and have unique value catalysts.
We continue to believe circumstances are poised to improve for value investors as the anomalous conditions dominating this growth-oriented cycle begin to normalize. Keep in mind that value globally has only been cheaper a small percentage of the time in the past 30 years, creating an attractive opportunity for contrarian investors. Yet, despite our conviction on value’s long-term prospects, we are not sitting idly by waiting for the cycle to turn. We have worked hard to continuously refine and improve our process, with recent initiatives including improved risk management strategies and the integration of ESG (environmental, social and governance) analysis into our investment framework. The goal in these efforts is to ensure that our investment process remains true to Templeton’s time-tested fundamental value approach, while also evolving to best address client goals and market conditions.
Thank you for your continued participation in Templeton Foreign Fund. We look forward to serving your future investment needs.
| | |
 | | 
Tucker Scott, CFA |
| |
 | | 
Norman J. Boersma, CFA James Harper, CFA Heather Arnold, CFA Christopher James Peel, CFA Herbert J. Arnett, Jr. Portfolio Management Team |
The foregoing information reflects our analysis, opinions and portfolio holdings as of August 31, 2018, the end of the reporting period. The way we implement our main investment strategies and the resulting portfolio holdings may change depending on factors such as market and economic conditions. These opinions may not be relied upon as investment advice or an offer for a particular security. The information is not a complete analysis of every aspect of any market, country, industry, security or the Fund. Statements of fact are from sources considered reliable, but the investment manager makes no representation or warranty as to their completeness or accuracy. Although historical performance is no guarantee of future results, these insights may help you understand our investment management philosophy.
| | | | |
| | | |
| franklintempleton.com | | Annual Report | | 7 |
TEMPLETON FOREIGN FUND
Performance Summary as of August 31, 2018
The performance table and graphs do not reflect any taxes that a shareholder would pay on Fund dividends, capital gain distributions, if any, or any realized gains on the sale of Fund shares. Total return reflects reinvestment of the Fund’s dividends and capital gain distributions, if any, and any unrealized gains or losses. Your dividend income will vary depending on dividends or interest paid by securities in the Fund’s portfolio, adjusted for operating expenses of each class. Capital gain distributions are net profits realized from the sale of portfolio securities.
Performance as of 8/31/181
Cumulative total return excludes sales charges. Average annual total return includes maximum sales charges. Sales charges will vary depending on the size of the investment and the class of share purchased. The maximum is 5.75% and the minimum is 0%. Class A: 5.75% maximum initial sales charge; Advisor Class: no sales charges. For other share classes, visit franklintempleton.com.
| | | | | | | | |
| Share Class | | Cumulative
Total Return2 | | | Average Annual
Total Return3 | |
| | |
A | | | | | | | | |
| | |
1-Year | | | -0.15% | | | | -5.93% | |
| | |
5-Year | | | +17.57% | | | | +2.07% | |
| | |
10-Year | | | +45.46% | | | | +3.21% | |
| | |
Advisor | | | | | | | | |
| | |
1-Year | | | +0.16% | | | | +0.16% | |
| | |
5-Year | | | +19.04% | | | | +3.55% | |
| | |
10-Year | | | +49.09% | | | | +4.07% | |
Performance data represent past performance, which does not guarantee future results. Investment return and principal value will fluctuate, and you may have a gain or loss when you sell your shares. Current performance may differ from figures shown. For most recent month-end performance, go to franklintempleton.com or call (800) 342-5236.
See page 10 for Performance Summary footnotes.
| | | | |
| | | |
8 | | Annual Report | | franklintempleton.com |
TEMPLETON FOREIGN FUND
PERFORMANCE SUMMARY
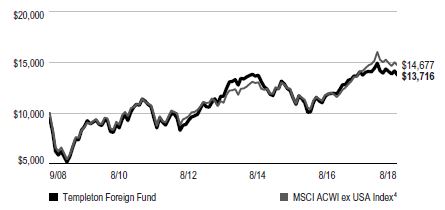
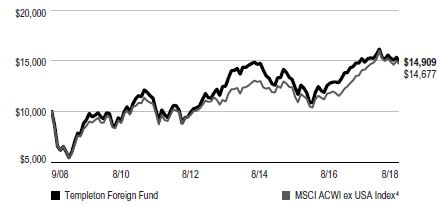
Total Return Index Comparison for a Hypothetical $10,000 Investment1
Total return represents the change in value of an investment over the periods shown. It includes any applicable maximum sales charge,
Fund expenses, account fees and reinvested distributions. The unmanaged index includes reinvestment of any income or distributions. It differs from the Fund in composition and does not pay management fees or expenses. One cannot invest directly in an index.
Class A (9/1/08–8/31/18)
Advisor Class (9/1/08–8/31/18)
See page 10 for Performance Summary footnotes.
| | | | |
| | | |
| franklintempleton.com | | Annual Report | | 9 |
TEMPLETON FOREIGN FUND
PERFORMANCE SUMMARY
Distributions (9/1/17–8/31/18)
| | | | |
| Share Class | | Net Investment Income | |
| |
A | | | $0.1125 | |
| |
C | | | $0.0524 | |
| |
R | | | $0.0993 | |
| |
R6 | | | $0.1534 | |
| |
Advisor | | | $0.1374 | |
Total Annual Operating Expenses5
| | | | | | | | |
| Share Class | | With Waiver | | | Without Waiver | |
A | | | 1.10% | | | | 1.19% | |
| Advisor | | | 0.85% | | | | 0.94% | |
Each class of shares is available to certain eligible investors and has different annual fees and expenses, as described in the prospectus.
All investments involve risks, including possible loss of principal. Special risks are associated with foreign investing, including currency fluctuations, economic instability and political developments; investments in developing markets involve heightened risks related to the same factors. Currency rates may fluctuate significantly over short periods of time, and can reduce returns. Because the Fund may invest its assets in companies in a specific region, including Europe, it is subject to greater risks of adverse developments in that region and/or the surrounding regions than a fund that is more broadly diversified geographically. Current political and financial uncertainty surrounding the European Union may increase market volatility and the economic risk of investing in companies in Europe. Derivatives, including currency management strategies, involve costs and can create economic leverage in the portfolio which may result in significant volatility and cause the Fund to participate in losses (as well as enable gains) on an amount that exceeds the Fund’s initial investment. The Fund may not achieve the anticipated benefits, and may realize losses when a counterparty fails to perform as promised. The Fund is actively managed but there is no guarantee that the manager’s investment decisions will produce the desired results. The Fund’s prospectus also includes a description of the main investment risks.
1. The Fund has an expense reduction and a fee waiver associated with any investments it makes in a Franklin Templeton money fund and/or other Franklin Templeton fund, contractually guaranteed through 12/31/19. Fund investment results reflect the expense reduction and fee waiver; without these reductions, the results would have been lower.
2. Cumulative total return represents the change in value of an investment over the periods indicated.
3. Average annual total return represents the average annual change in value of an investment over the periods indicated. Return for less than one year, if any, has not been annualized.
4. Source: Morningstar. The MSCI ACWI ex USA Index is a free float-adjusted, market capitalization-weighted index designed to measure equity market performance in global developed and emerging markets, excluding the U.S.
5. Figures are as stated in the Fund’s current prospectus and may differ from the expense ratios disclosed in the Your Fund’s Expenses and Financial Highlights sections in this report. In periods of market volatility, assets may decline significantly, causing total annual Fund operating expenses to become higher than the figures shown.
See www.franklintempletondatasources.com for additional data provider information.
| | | | |
| | | |
10 | | Annual Report | | franklintempleton.com |
TEMPLETON FOREIGN FUND
Your Fund’s Expenses
As a Fund shareholder, you can incur two types of costs: (1) transaction costs, including sales charges (loads) on Fund purchases and redemptions; and (2) ongoing Fund costs, including management fees, distribution and service (12b-1) fees, and other Fund expenses. All mutual funds have ongoing costs, sometimes referred to as operating expenses. The table below shows ongoing costs of investing in the Fund and can help you understand these costs and compare them with those of other mutual funds. The table assumes a $1,000 investment held for the six months indicated.
Actual Fund Expenses
The table below provides information about actual account values and actual expenses in the columns under the heading “Actual.” In these columns the Fund’s actual return, which includes the effect of Fund expenses, is used to calculate the “Ending Account Value” for each class of shares. You can estimate the expenses you paid during the period by following these steps (of course, your account value and expenses will differ from those in this illustration): Divide your account value by $1,000 (if your account had an $8,600 value, then $8,600 ÷ $1,000 = 8.6). Then multiply the result by the number in the row for your class of shares under the headings “Actual” and “Expenses Paid During Period” (if Actual Expenses Paid During Period were $7.50, then 8.6 x $7.50 = $64.50). In this illustration, the actual expenses paid this period are $64.50.
Hypothetical Example for Comparison with Other Funds
Under the heading “Hypothetical” in the table, information is provided about hypothetical account values and hypothetical expenses based on the Fund’s actual expense ratio and an assumed rate of return of 5% per year before expenses, which is not the Fund’s actual return. This information may not be used to estimate the actual ending account balance or expenses you paid for the period, but it can help you compare ongoing costs of investing in the Fund with those of other funds. To do so, compare this 5% hypothetical example for the class of shares you hold with the 5% hypothetical examples that appear in the shareholder reports of other funds.
Please note that expenses shown in the table are meant to highlight ongoing costs and do not reflect any transactional costs. Therefore, information under the heading “Hypothetical” is useful in comparing ongoing costs only, and will not help you compare total costs of owning different funds. In addition, if transactional costs were included, your total costs would have been higher.
| | | | | | | | | | | | |
| | | | | Actual (actual return after expenses) | | Hypothetical (5% annual return before expenses) | | |
| | | | | | | | |
Share Class | | Beginning
Account Value 3/1/18 | | Ending
Account
Value 8/31/18 | | Expenses Paid During Period 3/1/18–8/31/181,2 | | Ending
Account
Value 8/31/18 | | Expenses Paid During Period 3/1/18–8/31/181,2 | | Net Annualized Expense Ratio2 |
| | | | | | |
A | | $1,000 | | $968.50 | | $5.16 | | $1,019.96 | | $5.30 | | 1.04% |
C | | $1,000 | | $965.20 | | $8.87 | | $1,016.18 | | $9.10 | | 1.79% |
R | | $1,000 | | $967.90 | | $6.40 | | $1,018.70 | | $6.56 | | 1.29% |
R6 | | $1,000 | | $970.60 | | $3.28 | | $1,021.88 | | $3.36 | | 0.66% |
Advisor | | $1,000 | | $969.30 | | $3.92 | | $1,021.22 | | $4.02 | | 0.79% |
1. Expenses are equal to the annualized expense ratio for the six-month period as indicated above—in the far right column—multiplied by the simple average account value over the period indicated, and then multiplied by 184/365 to reflect the one-half year period.
2. Reflects expenses after fee waivers and expense reimbursements. Does not include acquired fund fees and expenses.
| | | | |
| | | |
| franklintempleton.com | | Annual Report | | 11 |
TEMPLETON FUNDS
Financial Highlights
Templeton Foreign Fund
| | | | | | | | | | | | | | | | | | |
| | | | | | Year Ended August 31, | | | |
| | | 2018 | | | 2017 | | | 2016 | | | 2015 | | | 2014 |
| | | | | |
Class A | | | | | | | | | | | | | | | | | | |
Per share operating performance | | | | | | | | | | | | | | | | | | |
(for a share outstanding throughout the year) | | | | | | | | | | | | | | | | | | |
| | | | | |
Net asset value, beginning of year | | | $ 7.81 | | | | $ 6.87 | | | | $ 6.74 | | | | $ 8.58 | | | $ 7.67 |
| | | | | |
Income from investment operationsa: | | | | | | | | | | | | | | | | | | |
Net investment incomeb | | | 0.12 | | | | 0.11 | | | | 0.11 | | | | 0.12 | | | 0.20c |
Net realized and unrealized gains (losses) | | | (0.13 | ) | | | 0.96 | | | | 0.11 | | | | (1.52 | ) | | 1.12 |
| | | | | |
Total from investment operations | | | (0.01 | ) | | | 1.07 | | | | 0.22 | | | | (1.40 | ) | | 1.32 |
| | | | | |
Less distributions from: | | | | | | | | | | | | | | | | | | |
Net investment income | | | (0.11 | ) | | | (0.13 | ) | | | (0.09 | ) | | | (0.21 | ) | | (0.11) |
Net realized gains | | | — | | | | — | | | | (— | )d | | | (0.23 | ) | | (0.30) |
| | | | | |
Total distributions | | | (0.11 | ) | | | (0.13 | ) | | | (0.09 | ) | | | (0.44 | ) | | (0.41) |
| | | | | |
Net asset value, end of year | | | $ 7.69 | | | | $ 7.81 | | | | $ 6.87 | | | | $ 6.74 | | | $ 8.58 |
| | | | | |
Total returne | | | (0.15)% | | | | 15.83% | | | | 3.46% | | | | (16.46)% | | | 17.61% |
| | | | | |
Ratios to average net assets | | | | | | | | | | | | | | | | | | |
Expenses before waiver and payments by affiliates | | | 1.16% | | | | 1.21% | | | | 1.22% | | | | 1.18% | | | 1.16% |
Expenses net of waiver and payments by affiliates | | | 1.11% | f | | | 1.21% | f,g | | | 1.22% | f,g | | | 1.18% | g | | 1.16% |
Net investment income | | | 1.54% | | | | 1.55% | | | | 1.66% | | | | 1.54% | | | 2.39%c |
| | | | | |
Supplemental data | | | | | | | | | | | | | | | | | | |
Net assets, end of year (000’s) | | | $2,929,181 | | | | $3,287,394 | | | | $3,644,336 | | | | $4,165,454 | | | $4,524,854 |
Portfolio turnover rate | | | 23.01% | | | | 42.56% | | | | 22.89% | | | | 29.12% | | | 30.82% |
aThe amount shown for a share outstanding throughout the period may not correlate with the Statement of Operations for the period due to the timing of sales and repurchases of the Fund’s shares in relation to income earned and/or fluctuating fair value of the investments of the Fund.
bBased on average daily shares outstanding.
cNet investment income per share includes approximately $0.07 per share related to income received in the form of special dividends in connection with certain Fund holdings. Excluding this amount, the ratio of net investment income to average net assets would have been 1.57%.
dAmount rounds to less than $0.01 per share.
eTotal return does not reflect sales commissions or contingent deferred sales charges, if applicable.
fBenefit of expense reduction rounds to less than 0.01%.
gBenefit of waiver and payments by affiliates rounds to less than 0.01%.
| | | | |
| | | |
12 | | Annual Report | The accompanying notes are an integral part of these financial statements. | | franklintempleton.com |
TEMPLETON FUNDS
FINANCIAL HIGHLIGHTS
Templeton Foreign Fund (continued)
| | | | | | | | | | | | | | | | | | |
| | | | | | Year Ended August 31, | | | |
| | | 2018 | | | 2017 | | | 2016 | | | 2015 | | | 2014 |
| | | | | |
Class C | | | | | | | | | | | | | | | | | | |
| | | | | |
Per share operating performance | | | | | | | | | | | | | | | | | | |
(for a share outstanding throughout the year) | | | | | | | | | | | | | | | | | | |
| | | | | |
Net asset value, beginning of year | | | $ 7.60 | | | | $ 6.69 | | | | $ 6.56 | | | | $ 8.35 | | | $ 7.48 |
| | | | | |
Income from investment operationsa: | | | | | | | | | | | | | | | | | | |
Net investment incomeb | | | 0.06 | | | | 0.05 | | | | 0.06 | | | | 0.05 | | | 0.13c |
Net realized and unrealized gains (losses) | | | (0.12 | ) | | | 0.94 | | | | 0.11 | | | | (1.46 | ) | | 1.10 |
| | | | | |
Total from investment operations | | | (0.06 | ) | | | 0.99 | | | | 0.17 | | | | (1.41 | ) | | 1.23 |
| | | | | |
Less distributions from: | | | | | | | | | | | | | | | | | | |
Net investment income | | | (0.05 | ) | | | (0.08 | ) | | | (0.04 | ) | | | (0.15 | ) | | (0.06) |
Net realized gains | | | — | | | | — | | | | (— | )d | | | (0.23 | ) | | (0.30) |
| | | | | |
Total distributions | | | (0.05 | ) | | | (0.08 | ) | | | (0.04 | ) | | | (0.38 | ) | | (0.36) |
| | | | | |
Net asset value, end of year | | | $ 7.49 | | | | $ 7.60 | | | | $ 6.69 | | | | $ 6.56 | | | $ 8.35 |
| | | | | |
Total returne | | | (0.79 | )% | | | 14.92% | | | | 2.64% | | | | (17.04 | )% | | 16.72% |
| | | | | |
Ratios to average net assets | | | | | | | | | | | | | | | | | | |
| | | | | |
Expenses before waiver and payments by affiliates | | | 1.91% | | | | 1.96% | | | | 1.97% | | | | 1.93% | | | 1.91% |
Expenses net of waiver and payments by affiliates | | | 1.86% | f | | | 1.96% | f,g | | | 1.97% | f,g | | | 1.93% | g | | 1.91% |
Net investment income | | | 0.79% | | | | 0.80% | | | | 0.91% | | | | 0.79% | | | 1.64%c |
| | | | | |
Supplemental data | | | | | | | | | | | | | | | | | | |
| | | | | |
Net assets, end of year (000’s) | | | $281,640 | | | | $346,032 | | | | $397,512 | | | | $468,128 | | | $617,421 |
Portfolio turnover rate | | | 23.01% | | | | 42.56% | | | | 22.89% | | | | 29.12% | | | 30.82% |
aThe amount shown for a share outstanding throughout the period may not correlate with the Statement of Operations for the period due to the timing of sales and repurchases of the Fund’s shares in relation to income earned and/or fluctuating fair value of the investments of the Fund.
bBased on average daily shares outstanding.
cNet investment income per share includes approximately $0.07 per share related to income received in the form of special dividends in connection with certain Fund holdings. Excluding this amount, the ratio of net investment income to average net assets would have been (0.82)%.
dAmount rounds to less than $0.01 per share.
eTotal return does not reflect sales commissions or contingent deferred sales charges, if applicable.
fBenefit of expense reduction rounds to less than 0.01%.
gBenefit of waiver and payments by affiliates rounds to less than 0.01%.
| | | | |
| | | |
| franklintempleton.com | | The accompanying notes are an integral part of these financial statements. | Annual Report | | 13 |
TEMPLETON FUNDS
FINANCIAL HIGHLIGHTS
Templeton Foreign Fund (continued)
| | | | | | | | | | | | | | | | | | |
| | | | | | Year Ended August 31, | | | |
| | | 2018 | | | 2017 | | | 2016 | | | 2015 | | | 2014 |
| | | | | |
Class R | | | | | | | | | | | | | | | | | | |
| | | | | |
Per share operating performance | | | | | | | | | | | | | | | | | | |
(for a share outstanding throughout the year) | | | | | | | | | | | | | | | | | | |
Net asset value, beginning of year | | | $ 7.65 | | | | $ 6.73 | | | | $ 6.61 | | | | $ 8.42 | | | $ 7.54 |
| | | | | |
Income from investment operationsa: | | | | | | | | | | | | | | | | | | |
Net investment incomeb | | | 0.10 | | | | 0.09 | | | | 0.09 | | | | 0.09 | | | 0.18c |
Net realized and unrealized gains (losses) | | | (0.12 | ) | | | 0.94 | | | | 0.10 | | | | (1.48 | ) | | 1.09 |
| | | | | |
Total from investment operations | | | (0.02 | ) | | | 1.03 | | | | 0.19 | | | | (1.39 | ) | | 1.27 |
| | | | | |
Less distributions from: | | | | | | | | | | | | | | | | | | |
Net investment income | | | (0.10 | ) | | | (0.11 | ) | | | (0.07 | ) | | | (0.19 | ) | | (0.09) |
Net realized gains | | | — | | | | — | | | | (— | )d | | | (0.23 | ) | | (0.30) |
| | | | | |
Total distributions | | | (0.10 | ) | | | (0.11 | ) | | | (0.07 | ) | | | (0.42 | ) | | (0.39) |
| | | | | |
Net asset value, end of year | | | $ 7.53 | | | | $ 7.65 | | | | $ 6.73 | | | | $ 6.61 | | | $ 8.42 |
| | | | | |
Total return | | | (0.32 | )% | | | 15.57% | | | | 3.10% | | | | (16.63 | )% | | 17.22% |
| | | | | |
Ratios to average net assets | | | | | | | | | | | | | | | | | | |
| | | | | |
Expenses before waiver and payments by affiliates | | | 1.41% | | | | 1.46% | | | | 1.47% | | | | 1.43% | | | 1.41% |
Expenses net of waiver and payments by affiliates | | | 1.36% | e | | | 1.46% | e,f | | | 1.47% | e,f | | | 1.43% | f | | 1.41% |
Net investment income | | | 1.29% | | | | 1.30% | | | | 1.41% | | | | 1.29% | | | 2.14%c |
| | | | | |
Supplemental data | | | | | | | | | | | | | | | | | | |
| | | | | |
Net assets, end of year (000’s) | | | $148,638 | | | | $153,516 | | | | $159,802 | | | | $174,865 | | | $207,738 |
Portfolio turnover rate | | | 23.01% | | | | 42.56% | | | | 22.89% | | | | 29.12% | | | 30.82% |
aThe amount shown for a share outstanding throughout the period may not correlate with the Statement of Operations for the period due to the timing of sales and repurchases of the Fund’s shares in relation to income earned and/or fluctuating fair value of the investments of the Fund.
bBased on average daily shares outstanding.
cNet investment income per share includes approximately $0.07 per share related to income received in the form of special dividends in connection with certain Fund holdings. Excluding this amount, the ratio of net investment income to average net assets would have been 1.32%.
dAmount rounds to less than $0.01 per share.
eBenefit of expense reduction rounds to less than 0.01%.
fBenefit of waiver and payments by affiliates rounds to less than 0.01%.
| | | | |
| | | |
14 | | Annual Report | The accompanying notes are an integral part of these financial statements. | | franklintempleton.com |
TEMPLETON FUNDS
FINANCIAL HIGHLIGHTS
Templeton Foreign Fund (continued)
| | | | | | | | | | | | | | | | | | |
| | | | | | Year Ended August 31, | | | |
| | | 2018 | | | 2017 | | | 2016 | | | 2015 | | | 2014 |
| | | | | |
Class R6 | | | | | | | | | | | | | | | | | | |
| | | | | |
Per share operating performance | | | | | | | | | | | | | | | | | | |
(for a share outstanding throughout the year) | | | | | | | | | | | | | | | | | | |
| | | | | |
Net asset value, beginning of year | | | $ 7.70 | | | | $ 6.78 | | | | $ 6.66 | | | | $ 8.49 | | | $ 7.59 |
| | | | | |
Income from investment operationsa: | | | | | | | | | | | | | | | | | | |
Net investment incomeb | | | 0.15 | | | | 0.16 | | | | 0.14 | | | | 0.15 | | | 0.25c |
Net realized and unrealized gains (losses) | | | (0.12 | ) | | | 0.93 | | | | 0.11 | | | | (1.50 | ) | | 1.10 |
| | | | | |
Total from investment operations | | | 0.03 | | | | 1.09 | | | | 0.25 | | | | (1.35 | ) | | 1.35 |
| | | | | |
Less distributions from: | | | | | | | | | | | | | | | | | | |
Net investment income | | | (0.15 | ) | | | (0.17 | ) | | | (0.13 | ) | | | (0.25 | ) | | (0.15) |
Net realized gains | | | — | | | | — | | | | (— | )d | | | (0.23 | ) | | (0.30) |
| | | | | |
Total distributions | | | (0.15 | ) | | | (0.17 | ) | | | (0.13 | ) | | | (0.48 | ) | | (0.45) |
| | | | | |
Net asset value, end of year | | | $ 7.58 | | | | $ 7.70 | | | | $ 6.78 | | | | $ 6.66 | | | $ 8.49 |
| | | | | |
Total return | | | 0.24% | | | | 16.52% | | | | 3.92% | | | | (16.08 | )% | | 18.16% |
| | | | | |
Ratios to average net assets | | | | | | | | | | | | | | | | | | |
| | | | | |
Expenses before waiver and payments by affiliates | | | 0.73% | | | | 0.74% | | | | 0.72% | | | | 0.72% | | | 0.72% |
Expenses net of waiver and payments by affiliates | | | 0.68% | e | | | 0.73% | e | | | 0.72% | e,f | | | 0.72% | f | | 0.72% |
Net investment income | | | 1.97% | | | | 2.03% | | | | 2.16% | | | | 2.00% | | | 2.83%c |
| | | | | |
Supplemental data | | | | | | | | | | | | | | | | | | |
| | | | | |
Net assets, end of year (000’s) | | | $1,496,328 | | | | $1,757,902 | | | | $880,092 | | | | $816,746 | | | $666,249 |
Portfolio turnover rate | | | 23.01% | | | | 42.56% | | | | 22.89% | | | | 29.12% | | | 30.82% |
aThe amount shown for a share outstanding throughout the period may not correlate with the Statement of Operations for the period due to the timing of sales and repurchases of the Fund’s shares in relation to income earned and/or fluctuating fair value of the investments of the Fund.
bBased on average daily shares outstanding.
cNet investment income per share includes approximately $0.07 per share related to income received in the form of special dividends in connection with certain Fund holdings. Excluding this amount, the ratio of net investment income to average net assets would have been 2.01%.
dAmount rounds to less than $0.01 per share.
eBenefit of expense reduction rounds to less than 0.01%.
fBenefit of waiver and payments by affiliates rounds to less than 0.01%.
| | | | |
| | | |
| franklintempleton.com | | The accompanying notes are an integral part of these financial statements. | Annual Report | | 15 |
TEMPLETON FUNDS
FINANCIAL HIGHLIGHTS
Templeton Foreign Fund (continued)
| | | | | | | | | | | | | | | | | | |
| | | | | | Year Ended August 31, | | | |
| | | 2018 | | | 2017 | | | 2016 | | | 2015 | | | 2014 |
| | | | | |
Advisor Class | | | | | | | | | | | | | | | | | | |
| | | | | |
Per share operating performance | | | | | | | | | | | | | | | | | | |
(for a share outstanding throughout the year) | | | | | | | | | | | | | | | | | | |
| | | | | |
Net asset value, beginning of year | | | $ 7.70 | | | | $ 6.78 | | | | $ 6.66 | | | | $ 8.49 | | | $ 7.59 |
| | | | | |
Income from investment operationsa: | | | | | | | | | | | | | | | | | | |
Net investment incomeb | | | 0.14 | | | | 0.13 | | | | 0.12 | | | | 0.13 | | | 0.22c |
Net realized and unrealized gains (losses) | | | (0.12 | ) | | | 0.94 | | | | 0.11 | | | | (1.50 | ) | | 1.11 |
| | | | | |
Total from investment operations | | | 0.02 | | | | 1.07 | | | | 0.23 | | | | (1.37 | ) | | 1.33 |
| | | | | |
Less distributions from: | | | | | | | | | | | | | | | | | | |
Net investment income | | | (0.14 | ) | | | (0.15 | ) | | | (0.11 | ) | | | (0.23 | ) | | (0.13) |
Net realized gains | | | — | | | | — | | | | (— | )d | | | (0.23 | ) | | (0.30) |
| | | | | |
Total distributions | | | (0.14 | ) | | | (0.15 | ) | | | (0.11 | ) | | | (0.46 | ) | | (0.43) |
| | | | | |
Net asset value, end of year | | | $ 7.58 | | | | $ 7.70 | | | | $ 6.78 | | | | $ 6.66 | | | $ 8.49 |
| | | | | |
Total return | | | 0.16% | | | | 16.10% | | | | 3.65% | | | | (16.25)% | | | 17.93% |
| | | | | |
Ratios to average net assets | | | | | | | | | | | | | | | | | | |
| | | | | |
Expenses before waiver and payments by affiliates | | | 0.91% | | | | 0.96% | | | | 0.97% | | | | 0.93% | | | 0.91% |
Expenses net of waiver and payments by affiliates | | | 0.86% | e | | | 0.96% | e,f | | | 0.97% | e,f | | | 0.93% | f | | 0.91% |
Net investment income | | | 1.79% | | | | 1.80% | | | | 1.91% | | | | 1.79% | | | 2.64%c |
| | | | | |
Supplemental data | | | | | | | | | | | | | | | | | | |
| | | | | |
Net assets, end of year (000’s) | | | $1,627,827 | | | | $1,717,937 | | | | $1,125,431 | | | | $1,206,146 | | | $1,727,057 |
Portfolio turnover rate | | | 23.01% | | | | 42.56% | | | | 22.89% | | | | 29.12% | | | 30.82% |
aThe amount shown for a share outstanding throughout the period may not correlate with the Statement of Operations for the period due to the timing of sales and repurchases of the Fund’s shares in relation to income earned and/or fluctuating fair value of the investments of the Fund.
bBased on average daily shares outstanding.
cNet investment income per share includes approximately $0.07 per share related to income received in the form of special dividends in connection with certain Fund holdings. Excluding this amount, the ratio of net investment income to average net assets would have been 1.82%.
dAmount rounds to less than $0.01 per share.
eBenefit of expense reduction rounds to less than 0.01%.
fBenefit of waiver and payments by affiliates rounds to less than 0.01%.
| | | | |
| | | |
16 | | Annual Report | The accompanying notes are an integral part of these financial statements. | | franklintempleton.com |
TEMPLETON FUNDS
Statement of Investments, August 31, 2018
Templeton Foreign Fund
| | | | | | | | | | | | |
| | | Industry | | | Shares | | | Value | |
Common Stocks 96.7% | | | | | | | | | | | | |
Canada 4.9% | | | | | | | | | | | | |
Alamos Gold Inc., A | | | Metals & Mining | | | | 13,968,340 | | | $ | 61,321,012 | |
Barrick Gold Corp. | | | Metals & Mining | | | | 3,818,380 | | | | 39,787,520 | |
Cenovus Energy Inc. | | | Oil, Gas & Consumable Fuels | | | | 4,940,372 | | | | 45,798,507 | |
Husky Energy Inc. | | | Oil, Gas & Consumable Fuels | | | | 3,829,620 | | | | 63,315,993 | |
Wheaton Precious Metals Corp. | | | Metals & Mining | | | | 6,265,170 | | | | 107,327,486 | |
| | | |
| | | | | | | | | | | 317,550,518 | |
China 10.1% | | | | | | | | | | | | |
aBaidu Inc., ADR | | | Internet Software & Services | | | | 550,380 | | | | 124,650,062 | |
China Life Insurance Co. Ltd., H | | | Insurance | | | | 27,589,800 | | | | 62,355,788 | |
China Mobile Ltd. | | | Wireless Telecommunication Services | | | | 8,683,180 | | | | 81,641,273 | |
China Telecom Corp. Ltd., H | | | Diversified Telecommunication Services | | | | 219,339,292 | | | | 103,113,946 | |
Kunlun Energy Co. Ltd. | | | Oil, Gas & Consumable Fuels | | | | 40,057,050 | | | | 41,847,298 | |
NetEase Inc., ADR | | | Internet Software & Services | | | | 209,470 | | | | 41,414,314 | |
Shanghai Pharmaceuticals Holding Co. Ltd., H | | | Health Care Providers & Services | | | | 22,098,290 | | | | 57,996,327 | |
Sinopec Engineering Group Co. Ltd. | | | Construction & Engineering | | | | 61,868,670 | | | | 64,476,089 | |
Sinopharm Group Co. Ltd., H | | | Health Care Providers & Services | | | | 15,295,130 | | | | 76,093,720 | |
| | | |
| | | | | | | | | | | 653,588,817 | |
Denmark 1.3% | | | | | | | | | | | | |
A.P. Moeller-Maersk AS, B | | | Marine | | | | 22,510 | | | | 34,732,117 | |
Vestas Wind Systems AS | | | Electrical Equipment | | | | 731,000 | | | | 50,921,933 | |
| | | |
| | | | | | | | | | | 85,654,050 | |
France 7.6% | | | | | | | | | | | | |
AXA SA | | | Insurance | | | | 3,085,182 | | | | 77,851,435 | |
BNP Paribas SA | | | Banks | | | | 2,216,723 | | | | 130,111,796 | |
Cie Generale des Etablissements Michelin SCA | | | Auto Components | | | | 432,490 | | | | 51,166,972 | |
Sanofi | | | Pharmaceuticals | | | | 1,594,645 | | | | 136,363,767 | |
Total SA | | | Oil, Gas & Consumable Fuels | | | | 639,230 | | | | 39,960,466 | |
Veolia Environnement SA | | | Multi-Utilities | | | | 2,861,260 | | | | 60,297,539 | |
| | | |
| | | | | | | | | | | 495,751,975 | |
Germany 7.3% | | | | | | | | | | | | |
Bayer AG | | | Pharmaceuticals | | | | 920,815 | | | | 85,890,831 | |
E.ON SE | | | Multi-Utilities | | | | 6,484,180 | | | | 69,075,520 | |
Gerresheimer AG | | | Life Sciences Tools & Services | | | | 769,760 | | | | 64,315,294 | |
Merck KGaA | | | Pharmaceuticals | | | | 650,094 | | | | 68,258,253 | |
aMorphoSys AG | | | Life Sciences Tools & Services | | | | 455,050 | | | | 53,703,982 | |
Siemens AG | | | Industrial Conglomerates | | | | 531,282 | | | | 69,038,601 | |
Telefonica Deutschland Holding AG | | | Diversified Telecommunication Services | | | | 15,114,490 | | | | 62,844,420 | |
| | | |
| | | | | | | | | | | 473,126,901 | |
Hong Kong 1.8% | | | | | | | | | | | | |
CK Hutchison Holdings Ltd. | | | Industrial Conglomerates | | | | 8,707,000 | | | | 100,334,830 | |
Value Partners Group Ltd. | | | Capital Markets | | | | 26,572,000 | | | | 18,111,425 | |
| | | |
| | | | | | | | | | | 118,446,255 | |
India 0.7% | | | | | | | | | | | | |
Hero Motocorp Ltd. | | | Automobiles | | | | 634,530 | | | | 29,077,300 | |
Jain Irrigation Systems Ltd. | | | Machinery | | | | 11,859,610 | | | | 14,238,881 | |
| | | |
| | | | | | | | | | | 43,316,181 | |
| | | | |
| | | |
| franklintempleton.com | | Annual Report | | 17 |
TEMPLETON FUNDS
STATEMENT OF INVESTMENTS
| | | | | | | | | | | | |
| Templeton Foreign Fund (continued) | |
| | | Industry | | | Shares | | | Value | |
| | | |
Common Stocks (continued) | | | | | | | | | | | | |
Ireland 1.9% | | | | | | | | | | | | |
| | | |
Bank of Ireland Group PLC | | | Banks | | | | 9,966,410 | | | $ | 81,421,262 | |
CRH PLC | | | Construction Materials | | | | 1,273,950 | | | | 42,295,743 | |
| | | |
| | | | | | | | | | | 123,717,005 | |
Israel 2.8% | | | | | | | | | | | | |
| | | |
Teva Pharmaceutical Industries Ltd., ADR | | | Pharmaceuticals | | | | 7,864,800 | | | | 180,182,568 | |
Italy 2.2% | | | | | | | | | | | | |
| | | |
Eni SpA | | | Oil, Gas & Consumable Fuels | | | | 7,552,934 | | | | 140,061,536 | |
Japan 10.0% | | | | | | | | | | | | |
| | | |
Astellas Pharma Inc. | | | Pharmaceuticals | | | | 6,345,940 | | | | 107,493,444 | |
Ezaki Glico Co. Ltd. | | | Food Products | | | | 796,300 | | | | 40,064,056 | |
INPEX Corp. | | | Oil, Gas & Consumable Fuels | | | | 3,935,570 | | | | 43,037,825 | |
Kirin Holdings Co. Ltd. | | | Beverages | | | | 304,450 | | | | 7,528,701 | |
Mitsui Fudosan Co. Ltd. | | | Real Estate Management & Development | | | | 1,108,100 | | | | 25,377,440 | |
Panasonic Corp. | | | Household Durables | | | | 6,608,300 | | | | 78,897,529 | |
Seven & i Holdings Co. Ltd. | | | Food & Staples Retailing | | | | 1,388,400 | | | | 56,545,700 | |
SoftBank Group Corp. | | | Wireless Telecommunication Services | | | | 898,120 | | | | 83,260,303 | |
Sumitomo Metal Mining Co. Ltd. | | | Metals & Mining | | | | 1,074,540 | | | | 34,720,297 | |
Sumitomo Rubber Industries Ltd. | | | Auto Components | | | | 3,966,520 | | | | 58,834,661 | |
Suntory Beverage & Food Ltd. | | | Beverages | | | | 1,415,900 | | | | 58,048,013 | |
Taiheiyo Cement Corp. | | | Construction Materials | | | | 1,876,841 | | | | 56,758,794 | |
| | | |
| | | | | | | | | | | 650,566,763 | |
Luxembourg 1.4% | | | | | | | | | | | | |
| | | |
SES SA, IDR | | | Media | | | | 4,488,607 | | | | 90,008,130 | |
Netherlands 6.2% | | | | | | | | | | | | |
Aegon NV | | | Insurance | | | | 12,764,355 | | | | 76,520,834 | |
Flow Traders | | | Capital Markets | | | | 1,703,977 | | | | 49,750,882 | |
ING Groep NV | | | Banks | | | | 4,642,358 | | | | 62,976,651 | |
aNXP Semiconductors NV | | | Semiconductors & Semiconductor Equipment | | | | 705,600 | | | | 65,719,584 | |
aQIAGEN NV | | | Life Sciences Tools & Services | | | | 1,912,321 | | | | 74,008,747 | |
SBM Offshore NV | | | Energy Equipment & Services | | | | 4,498,636 | | | | 72,694,654 | |
| | | |
| | | | | | | | | | | 401,671,352 | |
Singapore 1.3% | | | | | | | | | | | | |
| | | |
Singapore Telecommunications Ltd. | | | Diversified Telecommunication Services | | | | 36,484,140 | | | | 85,838,782 | |
Singapore Telecommunications Ltd., ADR | | | Diversified Telecommunication Services | | | | 33,000 | | | | 772,860 | |
| | | |
| | | | | | | | | | | 86,611,642 | |
South Korea 7.4% | | | | | | | | | | | | |
| | | |
Hana Financial Group Inc. | | | Banks | | | | 2,203,300 | | | | 84,332,117 | |
KB Financial Group Inc. | | | Banks | | | | 1,968,477 | | | | 91,224,687 | |
Lotte Chemical Corp. | | | Chemicals | | | | 68,800 | | | | 19,487,989 | |
Samsung Electronics Co. Ltd. | | | Technology Hardware, Storage & Peripherals | | | | 6,496,440 | | | | 282,137,431 | |
| | | |
| | | | | | | | | | | 477,182,224 | |
Sweden 0.6% | | | | | | | | | | | | |
| | | |
Getinge AB, B | | | Health Care Equipment & Supplies | | | | 3,489,111 | | | | 41,574,951 | |
| | | | |
| | | |
18 | | Annual Report | | franklintempleton.com |
TEMPLETON FUNDS
STATEMENT OF INVESTMENTS
Templeton Foreign Fund (continued)
| | | | | | | | | | | | |
| | | Industry | | | Shares | | | Value | |
| | | |
Common Stocks (continued) | | | | | | | | | | | | |
Switzerland 4.3% | | | | | | | | | | | | |
| | | |
Landis+Gyr Group AG | | | Electronic Equipment, Instruments & Components | | | | 526,150 | | | $ | 37,173,199 | |
Roche Holding AG | | | Pharmaceuticals | | | | 615,590 | | | | 152,889,559 | |
UBS Group AG | | | Capital Markets | | | | 5,530,030 | | | | 86,325,619 | |
| | | |
| | | | | | | | | | | 276,388,377 | |
Taiwan 2.0% | | | | | | | | | | | | |
| | | |
Quanta Computer Inc. | | | Technology Hardware, Storage & Peripherals | | | | 20,220,680 | | | | 34,816,628 | |
Taiwan Semiconductor Manufacturing Co. Ltd. | | | Semiconductors & Semiconductor Equipment | | | | 11,405,710 | | | | 95,218,059 | |
| | | |
| | | | | | | | | | | 130,034,687 | |
Thailand 1.9% | | | | | | | | | | | | |
| | | |
Bangkok Bank PCL, fgn | | | Banks | | | | 4,671,600 | | | | 29,651,901 | |
Bangkok Bank PCL, NVDR | | | Banks | | | | 9,123,830 | | | | 57,076,141 | |
Kasikornbank PCL, fgn | | | Banks | | | | 1,695,300 | | | | 10,967,458 | |
Kasikornbank PCL, NVDR | | | Banks | | | | 4,442,200 | | | | 28,602,509 | |
| | | |
| | | | | | | | | | | 126,298,009 | |
United Kingdom 19.2% | | | | | | | | | | | | |
| | | |
Aviva PLC | | | Insurance | | | | 7,557,114 | | | | 47,499,164 | |
BAE Systems PLC | | | Aerospace & Defense | | | | 8,038,450 | | | | 63,129,623 | |
Barclays PLC | | | Banks | | | | 35,871,430 | | | | 81,678,678 | |
BP PLC | | | Oil, Gas & Consumable Fuels | | | | 28,917,960 | | | | 205,107,410 | |
aCobham PLC | | | Aerospace & Defense | | | | 22,941,809 | | | | 36,985,909 | |
HSBC Holdings PLC (GBP Traded) | | | Banks | | | | 11,683,650 | | | | 101,281,001 | |
HSBC Holdings PLC (HKD Traded) | | | Banks | | | | 989,600 | | | | 8,680,370 | |
Johnson Matthey PLC | | | Chemicals | | | | 2,214,526 | | | | 100,332,228 | |
Kingfisher PLC | | | Specialty Retail | | | | 23,879,104 | | | | 84,637,652 | |
Royal Dutch Shell PLC, B | | | Oil, Gas & Consumable Fuels | | | | 5,550,600 | | | | 182,745,790 | |
Shire PLC | | | Biotechnology | | | | 1,367,760 | | | | 79,738,098 | |
SIG PLC | | | Trading Companies & Distributors | | | | 26,088,083 | | | | 43,951,507 | |
Standard Chartered PLC | | | Banks | | | | 16,424,505 | | | | 133,480,352 | |
Travis Perkins PLC | | | Trading Companies & Distributors | | | | 2,675,920 | | | | 39,897,713 | |
Vodafone Group PLC | | | Wireless Telecommunication Services | | | | 16,907,095 | | | | 36,043,184 | |
| | | |
| | | | | | | | | | | 1,245,188,679 | |
United States 1.8% | | | | | | | | | | | | |
| | | |
Oracle Corp. | | | Software | | | | 2,352,910 | | | | 114,304,368 | |
| | | |
Total Common Stocks
(Cost $5,752,692,887) | | | | | | | | | | | 6,271,224,988 | |
| | | | |
| | | |
| franklintempleton.com | | Annual Report | | 19 |
TEMPLETON FUNDS
STATEMENT OF INVESTMENTS
Templeton Foreign Fund (continued)
| | | | | | | | |
| | | Principal
Amount | | | Value | |
Short Term Investments 1.4% | | | | | | | | |
| | |
Time Deposits 1.4% | | | | | | | | |
| | |
United States 1.4% | | | | | | | | |
National Bank of Canada, 1.85%, 9/04/18 | | $ | 60,000,000 | | | $ | 60,000,000 | |
Royal Bank of Canada, 1.85%, 9/04/18 | | | 27,000,000 | | | | 27,000,000 | |
| | | | | | | | |
| | |
Total Time Deposits (Cost $87,000,000) | | | | | | | 87,000,000 | |
| | | | | | | | |
| | |
Total Investments (Cost $5,839,692,887) 98.1% | | | | | | | 6,358,224,988 | |
Other Assets, less Liabilities 1.9% | | | | | | | 125,388,584 | |
| | | | | | | | |
| | |
Net Assets 100.0% | | | | | | | $6,483,613,572 | |
| | | | | | | | |
See Abbreviations on page 33.
aNon-income producing.
| | | | |
| | | |
20 | | Annual Report | The accompanying notes are an integral part of these financial statements. | | franklintempleton.com |
TEMPLETON FUNDS
Financial Statements
Statement of Assets and Liabilities
August 31, 2018
Templeton Foreign Fund
| | | | |
Assets: | | | | |
Investments in securities: | | | | |
Cost - Unaffiliated issuers | | | $5,839,692,887 | |
| | | | |
| |
Value - Unaffiliated issuers | | | $6,358,224,988 | |
Cash | | | 496,768 | |
Foreign currency, at value (cost $40,071,161) | | | 39,987,266 | |
Receivables: | | | | |
Investment securities sold | | | 128,025,543 | |
Capital shares sold | | | 8,050,553 | |
Dividends | | | 26,958,199 | |
European Union tax reclaims | | | 5,874,286 | |
Other assets | | | 3,575 | |
| | | | |
| |
Total assets | | | 6,567,621,178 | |
| | | | |
| |
Liabilities: | | | | |
Payables: | | | | |
Investment securities purchased | | | 67,351,804 | |
Capital shares redeemed | | | 9,803,171 | |
Management fees | | | 3,461,553 | |
Distribution fees | | | 937,113 | |
Transfer agent fees | | | 1,824,581 | |
Accrued expenses and other liabilities | | | 629,384 | |
| | | | |
| |
Total liabilities | | | 84,007,606 | |
| | | | |
| |
Net assets, at value | | | $6,483,613,572 | |
| | | | |
Net assets consist of: | | | | |
Paid-in capital | | | $6,162,620,351 | |
Undistributed net investment income | | | 103,368,680 | |
Net unrealized appreciation (depreciation) | | | 518,035,369 | |
Accumulated net realized gain (loss) | | | (300,410,828 | ) |
| | | | |
| |
Net assets, at value | | | $6,483,613,572 | |
| | | | |
| | | | |
| | | |
| franklintempleton.com | | The accompanying notes are an integral part of these financial statements. | Annual Report | | 21 |
TEMPLETON FUNDS
FINANCIAL STATEMENTS
Statement of Assets and Liabilities (continued)
August 31, 2018
Templeton Foreign Fund
| | | | |
Class A: | | | | |
Net assets, at value | | | $2,929,180,778 | |
| | | | |
Shares outstanding | | | 380,823,508 | |
| | | | |
Net asset value per sharea | | | $7.69 | |
| | | | |
Maximum offering price per share (net asset value per share ÷ 94.25%) | | | $8.16 | |
| | | | |
Class C: | | | | |
Net assets, at value | | | $ 281,639,711 | |
| | | | |
Shares outstanding | | | 37,607,409 | |
| | | | |
Net asset value and maximum offering price per sharea | | | $7.49 | |
| | | | |
Class R: | | | | |
Net assets, at value | | | $ 148,637,871 | |
| | | | |
Shares outstanding | | | 19,739,188 | |
| | | | |
Net asset value and maximum offering price per share | | | $7.53 | |
| | | | |
Class R6: | | | | |
Net assets, at value | | | $1,496,328,383 | |
| | | | |
Shares outstanding | | | 197,383,027 | |
| | | | |
Net asset value and maximum offering price per share | | | $7.58 | |
| | | | |
Advisor Class: | | | | |
Net assets, at value | | | $1,627,826,829 | |
| | | | |
Shares outstanding | | | 214,699,507 | |
| | | | |
Net asset value and maximum offering price per share | | | $7.58 | |
| | | | |
aRedemption price is equal to net asset value less contingent deferred sales charges, if applicable.
| | | | |
| | | |
22 | | Annual Report | The accompanying notes are an integral part of these financial statements. | | franklintempleton.com |
TEMPLETON FUNDS
FINANCIAL STATEMENTS
Statement of Operations
for the year ended August 31, 2018
Templeton Foreign Fund
| | | | |
Investment income: | | | | |
Dividends: (net of foreign taxes)* | | | | |
Unaffiliated issuers | | | $ 186,318,127 | |
Interest: | | | | |
Unaffiliated issuers | | | 2,358,284 | |
Income from securities loaned (net of fees and rebates) | | | 263 | |
Other income (Note 1d) | | | 123,845 | |
| | | | |
| |
Total investment income | | | 188,800,519 | |
| | | | |
| |
Expenses: | | | | |
Management fees (Note 3a) | | | 49,131,284 | |
Distribution fees: (Note 3c) | | | | |
Class A | | | 8,064,866 | |
Class C | | | 3,328,473 | |
Class R | | | 777,199 | |
Transfer agent fees: (Note 3e) | | | | |
Class A | | | 6,150,788 | |
Class C | | | 634,332 | |
Class R | | | 297,591 | |
Class R6 | | | 257,315 | |
Advisor Class | | | 3,178,943 | |
Custodian fees (Note 4) | | | 827,059 | |
Reports to shareholders | | | 487,395 | |
Registration and filing fees | | | 164,414 | |
Professional fees | | | 202,392 | |
Trustees’ fees and expenses | | | 217,005 | |
Other | | | 131,235 | |
| | | | |
| |
Total expenses | | | 73,850,291 | |
| |
Expense reductions (Note 4) | | | (8,785 | ) |
Expenses waived/paid by affiliates (Note 3f and 3g) | | | (3,466,701 | ) |
| | | | |
| |
Net expenses | | | 70,374,805 | |
| | | | |
| |
Net investment income | | | 118,425,714 | |
| | | | |
Realized and unrealized gains (losses): | | | | |
Net realized gain (loss) from: | | | | |
Investments: | | | | |
Unaffiliated issuers | | | 179,482,800 | |
Foreign currency transactions | | | (1,564,480 | ) |
| | | | |
| |
Net realized gain (loss) | | | 177,918,320 | |
| | | | |
| |
Net change in unrealized appreciation (depreciation) on: | | | | |
Investments: | | | | |
Unaffiliated issuers | | | (264,984,997 | ) |
Translation of other assets and liabilities denominated in foreign currencies | | | (981,446 | ) |
Change in deferred taxes on unrealized appreciation | | | 18,640 | |
| | | | |
| |
Net change in unrealized appreciation (depreciation) | | | (265,947,803 | ) |
| | | | |
| |
Net realized and unrealized gain (loss) | | | (88,029,483 | ) |
| | | | |
| |
Net increase (decrease) in net assets resulting from operations | | $ | 30,396,231 | |
| | | | |
| |
*Foreign taxes withheld on dividends | | $ | 19,581,902 | |
| | | | |
| | | |
| franklintempleton.com | | The accompanying notes are an integral part of these financial statements. | Annual Report | | 23 |
TEMPLETON FUNDS
FINANCIAL STATEMENTS
Statements of Changes in Net Assets
Templeton Foreign Fund
| | | | | | | | |
| | | Year Ended August 31, | |
| | | 2018 | | | 2017 | |
Increase (decrease) in net assets: | | | | | | | | |
Operations: | | | | | | | | |
Net investment income | | | $ 118,425,714 | | | | $ 108,202,782 | |
Net realized gain (loss) | | | 177,918,320 | | | | 14,297,012 | |
Net change in unrealized appreciation (depreciation) | | | (265,947,803 | ) | | | 826,815,827 | |
| | | | |
| | |
Net increase (decrease) in net assets resulting from operations | | | 30,396,231 | | | | 949,315,621 | |
| | | | |
| | |
Distributions to shareholders from: | | | | | | | | |
Net investment income: | | | | | | | | |
Class A | | | (45,938,794 | ) | | | (64,763,171 | ) |
Class C | | | (2,307,223 | ) | | | (4,271,133 | ) |
Class R | | | (2,044,262 | ) | | | (2,485,682 | ) |
Class R6 | | | (38,039,633 | ) | | | (18,746,684 | ) |
Advisor Class | | | (28,775,654 | ) | | | (26,220,193 | ) |
| | | | |
| | |
Total distributions to shareholders | | | (117,105,566 | ) | | | (116,486,863 | ) |
| | | | |
| | |
Capital share transactions: (Note 2) | | | | | | | | |
Class A | | | (318,451,833 | ) | | | (815,372,950 | ) |
Class C | | | (60,908,186 | ) | | | (100,355,661 | ) |
Class R | | | (2,801,703 | ) | | | (26,136,626 | ) |
Class R6 | | | (241,696,462 | ) | | | 740,372,787 | |
Advisor Class | | | (68,600,065 | ) | | | 424,271,853 | |
| | | | |
| | |
Total capital share transactions | | | (692,458,249 | ) | | | 222,779,403 | |
| | | | |
| | |
Net increase (decrease) in net assets | | | (779,167,584 | ) | | | 1,055,608,161 | |
Net assets: | | | | | | | | |
Beginning of year | | | 7,262,781,156 | | | | 6,207,172,995 | |
| | | | |
| | |
End of year | | | $6,483,613,572 | | | | $7,262,781,156 | |
| | | | |
| | |
Undistributed net investment income included in net assets: | | | | | | | | |
End of year | | | $ 103,368,680 | | | | $ 95,124,828 | |
| | | | |
| | | | |
| | | |
24 | | Annual Report | The accompanying notes are an integral part of these financial statements. | | franklintempleton.com |
TEMPLETON FUNDS
Notes to Financial Statements
Templeton Foreign Fund
1. Organization and Significant Accounting Policies
Templeton Funds (Trust) is registered under the Investment Company Act of 1940 (1940 Act) as an open-end management investment company, consisting of three separate funds and applies the specialized accounting and reporting guidance in U.S. Generally Accepted Accounting Principles (U.S. GAAP). Templeton Foreign Fund (Fund) is included in this report. The Fund offers five classes of shares: Class A, Class C, Class R, Class R6 and Advisor Class. Each class of shares may differ by its initial sales load, contingent deferred sales charges, voting rights on matters affecting a single class, its exchange privilege and fees due to differing arrangements for distribution and transfer agent fees.
The following summarizes the Fund’s significant accounting policies.
a. Financial Instrument Valuation
The Fund’s investments in financial instruments are carried at fair value daily. Fair value is the price that would be received to sell an asset or paid to transfer a liability in an orderly transaction between market participants on the measurement date. The Fund calculates the net asset value (NAV) per share each business day as of 4 p.m. Eastern time or the regularly scheduled close of the New York Stock Exchange (NYSE), whichever is earlier. Under compliance policies and procedures approved by the Trust’s Board of Trustees (the Board), the Fund’s administrator has responsibility for oversight of valuation, including leading the cross-functional Valuation Committee (VC). The VC provides administration and oversight of the Fund’s valuation policies and procedures, which are approved annually by the Board. Among other things, these procedures allow the Fund to utilize independent pricing services, quotations from securities and financial instrument dealers, and other market sources to determine fair value.
Equity securities listed on an exchange or on the NASDAQ National Market System are valued at the last quoted sale price or the official closing price of the day, respectively. Foreign equity securities are valued as of the close of trading on the foreign stock exchange on which the security is primarily traded, or as of 4 p.m. Eastern time. The value is then converted into its U.S. dollar equivalent at the foreign exchange rate in effect at 4 p.m. Eastern time on the day that the value of the security is determined. Over-the-counter (OTC) securities are valued within the range of the most recent quoted bid and ask
prices. Securities that trade in multiple markets or on multiple exchanges are valued according to the broadest and most representative market. Certain equity securities are valued based upon fundamental characteristics or relationships to similar securities.
Investments in open-end mutual funds are valued at the closing NAV. Investments in time deposits are valued at cost, which approximates fair value.
The Fund has procedures to determine the fair value of financial instruments for which market prices are not reliable or readily available. Under these procedures, the VC convenes on a regular basis to review such financial instruments and considers a number of factors, including significant unobservable valuation inputs, when arriving at fair value. The VC primarily employs a market-based approach which may use related or comparable assets or liabilities, recent transactions, market multiples, book values, and other relevant information for the investment to determine the fair value of the investment. An income-based valuation approach may also be used in which the anticipated future cash flows of the investment are discounted to calculate fair value. Discounts may also be applied due to the nature or duration of any restrictions on the disposition of the investments. Due to the inherent uncertainty of valuations of such investments, the fair values may differ significantly from the values that would have been used had an active market existed. The VC employs various methods for calibrating these valuation approaches including a regular review of key inputs and assumptions, transactional back-testing or disposition analysis, and reviews of any related market activity.
Trading in securities on foreign securities stock exchanges and OTC markets may be completed before 4 p.m. Eastern time. In addition, trading in certain foreign markets may not take place on every Fund’s business day. Occasionally, events occur between the time at which trading in a foreign security is completed and 4 p.m. Eastern time that might call into question the reliability of the value of a portfolio security held by the Fund. As a result, differences may arise between the value of the Fund’s portfolio securities as determined at the foreign market close and the latest indications of value at 4 p.m. Eastern time. In order to minimize the potential for these differences, the VC monitors price movements following the close of trading in foreign stock markets through a series of country specific market proxies (such as baskets of American Depositary Receipts, futures contracts and exchange traded funds). These price movements are measured against
| | | | |
| | | |
| franklintempleton.com | | Annual Report | | 25 |
TEMPLETON FUNDS
NOTES TO FINANCIAL STATEMENTS
Templeton Foreign Fund (continued)
1. Organization and Significant Accounting Policies (continued)
a. Financial Instrument Valuation (continued)
established trigger thresholds for each specific market proxy to assist in determining if an event has occurred that may call into question the reliability of the values of the foreign securities held by the Fund. If such an event occurs, the securities may be valued using fair value procedures, which may include the use of independent pricing services.
When the last day of the reporting period is a non-business day, certain foreign markets may be open on those days that the Fund’s NAV is not calculated, which could result in differences between the value of the Fund’s portfolio securities on the last business day and the last calendar day of the reporting period. Any significant security valuation changes due to an open foreign market are adjusted and reflected by the Fund for financial reporting purposes.
b. Foreign Currency Translation
Portfolio securities and other assets and liabilities denominated in foreign currencies are translated into U.S. dollars based on the exchange rate of such currencies against U.S. dollars on the date of valuation. The Fund may enter into foreign currency exchange contracts to facilitate transactions denominated in a foreign currency. Purchases and sales of securities, income and expense items denominated in foreign currencies are translated into U.S. dollars at the exchange rate in effect on the transaction date. Portfolio securities and assets and liabilities denominated in foreign currencies contain risks that those currencies will decline in value relative to the U.S. dollar. Occasionally, events may impact the availability or reliability of foreign exchange rates used to convert the U.S. dollar equivalent value. If such an event occurs, the foreign exchange rate will be valued at fair value using procedures established and approved by the Board.
The Fund does not separately report the effect of changes in foreign exchange rates from changes in market prices on securities held. Such changes are included in net realized and unrealized gain or loss from investments in the Statement of Operations.
Realized foreign exchange gains or losses arise from sales of foreign currencies, currency gains or losses realized between the trade and settlement dates on securities transactions and the difference between the recorded amounts of dividends, interest, and foreign withholding taxes and the U.S. dollar equivalent of
the amounts actually received or paid. Net unrealized foreign exchange gains and losses arise from changes in foreign exchange rates on foreign denominated assets and liabilities other than investments in securities held at the end of the reporting period.
c. Securities Lending
The Fund participates in an agency based securities lending program to earn additional income. The Fund receives cash collateral against the loaned securities in an amount equal to at least 102% of the fair value of the loaned securities. Collateral is maintained over the life of the loan in an amount not less than 100% of the fair value of loaned securities, as determined at the close of Fund business each day; any additional collateral required due to changes in security values is delivered to the Fund on the next business day. The collateral is deposited into a joint cash account with other funds and is used to invest in a money market fund managed by Franklin Advisers, Inc., an affiliate of the Fund. The Fund may receive income from the investment of cash collateral, in addition to lending fees and rebates paid by the borrower. Income from securities loaned is reported separately in the Statement of Operations. The Fund bears the market risk with respect to the collateral investment, securities loaned, and the risk that the agent may default on its obligations to the Fund. If the borrower defaults on its obligation to return the securities loaned, the Fund has the right to repurchase the securities in the open market using the collateral received. The securities lending agent has agreed to indemnify the Fund in the event of default by a third party borrower. At August 31, 2018, the Fund had no securities on loan.
d. Income and Deferred Taxes
It is the Fund’s policy to qualify as a regulated investment company under the Internal Revenue Code. The Fund intends to distribute to shareholders substantially all of its taxable income and net realized gains to relieve it from federal income and excise taxes. As a result, no provision for U.S. federal income taxes is required.
The Fund may be subject to foreign taxation related to income received, capital gains on the sale of securities and certain foreign currency transactions in the foreign jurisdictions in which it invests. Foreign taxes, if any, are recorded based on the tax regulations and rates that exist in the foreign markets in which the Fund invests. When a capital gain tax is determined
| | | | |
| | | |
26 | | Annual Report | | franklintempleton.com |
TEMPLETON FUNDS
NOTES TO FINANCIAL STATEMENTS
Templeton Foreign Fund (continued)
to apply, the Fund records an estimated deferred tax liability in an amount that would be payable if the securities were disposed of on the valuation date.
As a result of several court cases, in certain countries across the European Union, the Fund filed additional tax reclaims for previously withheld taxes on dividends earned in those countries (EU reclaims). These additional filings are subject to various administrative proceedings by the local jurisdictions’ tax authorities within the European Union, as well as a number of related judicial proceedings. Income recognized, if any, for EU reclaims is reflected as other income in the Statement of Operations and any related receivable, if any, is reflected as European Union tax reclaims in the Statement of Assets and Liabilities. When uncertainty exists as to the ultimate resolution of these proceedings, the likelihood of receipt of these EU reclaims, and the potential timing of payment, no amounts are reflected in the financial statements. For U.S. income tax purposes, EU reclaims received by the Fund, if any, reduce the amounts of foreign taxes Fund shareholders can use as tax credits in their individual income tax returns.
The Fund may recognize an income tax liability related to its uncertain tax positions under U.S. GAAP when the uncertain tax position has a less than 50% probability that it will be sustained upon examination by the tax authorities based on its technical merits. As of August 31, 2018, the Fund has determined that no tax liability is required in its financial statements related to uncertain tax positions for any open tax years (or expected to be taken in future tax years). Open tax years are those that remain subject to examination and are based on the statute of limitations in each jurisdiction in which the Fund invests.
e. Security Transactions, Investment Income, Expenses and Distributions
Security transactions are accounted for on trade date. Realized gains and losses on security transactions are determined on a specific identification basis. Interest income and estimated expenses are accrued daily. Dividend income is recorded on the ex-dividend date except for certain dividends from securities where the dividend rate is not available. In such cases, the dividend is recorded as soon as the information is received by
the Fund. Distributions to shareholders are recorded on the ex-dividend date. Distributable earnings are determined according to income tax regulations (tax basis) and may differ from earnings recorded in accordance with U.S. GAAP. These differences may be permanent or temporary. Permanent differences are reclassified among capital accounts to reflect their tax character. These reclassifications have no impact on net assets or the results of operations. Temporary differences are not reclassified, as they may reverse in subsequent periods.
Common expenses incurred by the Trust are allocated among the Funds based on the ratio of net assets of each Fund to the combined net assets of the Trust or based on the ratio of number of shareholders of each Fund to the combined number of shareholders of the Trust. Fund specific expenses are charged directly to the Fund that incurred the expense.
Realized and unrealized gains and losses and net investment income, excluding class specific expenses, are allocated daily to each class of shares based upon the relative proportion of net assets of each class. Differences in per share distributions by class are generally due to differences in class specific expenses.
f. Accounting Estimates
The preparation of financial statements in accordance with U.S. GAAP requires management to make estimates and assumptions that affect the reported amounts of assets and liabilities at the date of the financial statements and the amounts of income and expenses during the reporting period. Actual results could differ from those estimates.
g. Guarantees and Indemnifications
Under the Trust’s organizational documents, its officers and trustees are indemnified by the Trust against certain liabilities arising out of the performance of their duties to the Trust. Additionally, in the normal course of business, the Trust, on behalf of the Fund, enters into contracts with service providers that contain general indemnification clauses. The Trust’s maximum exposure under these arrangements is unknown as this would involve future claims that may be made against the Trust that have not yet occurred. Currently, the Trust expects the risk of loss to be remote.
| | | | |
| | | |
| franklintempleton.com | | Annual Report | | 27 |
TEMPLETON FUNDS
NOTES TO FINANCIAL STATEMENTS
Templeton Foreign Fund (continued)
2. Shares of Beneficial Interest
At August 31, 2018, there were an unlimited number of shares authorized (without par value). Transactions in the Fund’s shares were as follows:
| | | | | | | | | | | | | | | | |
| | | Year Ended August 31, | |
| | | 2018 | | | 2017 | |
| | | Shares | | | Amount | | | Shares | | | Amount | |
| | | | |
Class A Shares: | | | | | | | | | | | | | | | | |
Shares sold | | | 60,288,358 | | | $ | 481,363,237 | | | | 69,944,632 | | | $ | 518,364,798 | |
Shares issued in reinvestment of distributions | | | 5,091,690 | | | | 40,682,600 | | | | 8,520,627 | | | | 59,218,357 | |
Shares redeemed | | | (105,562,715) | | | | (840,497,670) | | | | (188,300,572) | | | | (1,392,956,105) | |
| | | | |
Net increase (decrease) | | | (40,182,667) | | | $ | (318,451,833) | | | | (109,835,313) | | | $ | (815,372,950) | |
| | | | |
Class C Shares: | | | | | | | | | | | | | | | | |
Shares sold | | | 3,827,342 | | | $ | 29,864,007 | | | | 3,960,939 | | | $ | 28,641,978 | |
Shares issued in reinvestment of distributions | | | 285,470 | | | | 2,232,372 | | | | 554,617 | | | | 3,771,397 | |
Shares redeemed | | | (12,010,993) | | | | (93,004,565) | | | | (18,450,513) | | | | (132,769,036) | |
| | | | |
Net increase (decrease) | | | (7,898,181) | | | $ | (60,908,186) | | | | (13,934,957) | | | $ | (100,355,661) | |
| | | | |
Class R Shares: | | | | | | | | | | | | | | | | |
Shares sold | | | 6,707,134 | | | $ | 52,353,029 | | | | 5,244,477 | | | $ | 38,061,455 | |
Shares issued in reinvestment of distributions | | | 239,779 | | | | 1,879,867 | | | | 333,980 | | | | 2,277,746 | |
Shares redeemed | | | (7,267,977) | | | | (57,034,599) | | | | (9,259,421) | | | | (66,475,827) | |
| | | | |
Net increase (decrease) | | | (321,064) | | | $ | (2,801,703) | | | | (3,680,964) | | | $ | (26,136,626) | |
| | | | |
Class R6 Shares: | | | | | | | | | | | | | | | | |
Shares sold | | | 63,036,598 | | | $ | 498,171,947 | | | | 150,845,920 | | | $ | 1,114,127,521 | |
Shares issued in reinvestment of distributions | | | 4,723,492 | | | | 37,079,411 | | | | 2,617,825 | | | | 17,905,922 | |
Shares redeemed | | | (98,535,316) | | | | (776,947,820) | | | | (55,118,532) | | | | (391,660,656) | |
| | | | |
Net increase (decrease) | | | (30,775,226) | | | $ | (241,696,462) | | | | 98,345,213 | | | $ | 740,372,787 | |
| | | | |
Advisor Class Shares: | | | | | | | | | | | | | | | | |
Shares sold | | | 63,095,318 | | | $ | 494,556,825 | | | | 132,077,858 | | | $ | 979,961,944 | |
Shares issued in reinvestment of distributions | | | 3,269,695 | | | | 25,699,807 | | | | 3,306,454 | | | | 22,649,209 | |
Shares redeemed | | | (74,661,946) | | | | (588,856,697) | | | | (78,433,995) | | | | (578,339,300) | |
| | | | |
Net increase (decrease) | | | (8,296,933) | | | $ | (68,600,065) | | | | 56,950,317 | | | $ | 424,271,853 | |
3. Transactions with Affiliates
Franklin Resources, Inc. is the holding company for various subsidiaries that together are referred to as Franklin Templeton Investments. Certain officers and trustees of the Trust are also officers and/or directors of the following subsidiaries:
| | |
| Subsidiary | | Affiliation |
Templeton Global Advisors Limited (TGAL) | | Investment manager |
Franklin Templeton Services, LLC (FT Services) | | Administrative manager |
Franklin Templeton Distributors, Inc. (Distributors) | | Principal underwriter |
Franklin Templeton Investor Services, LLC (Investor Services) | | Transfer agent |
| | | | |
| | | |
28 | | Annual Report | | franklintempleton.com |
TEMPLETON FUNDS
NOTES TO FINANCIAL STATEMENTS
Templeton Foreign Fund (continued)
a. Management Fees
The Fund pays an investment management fee to TGAL based on the average daily net assets of the Fund as follows:
| | |
| Annualized Fee Rate | | Net Assets |
0.705% | | Up to and including $1 billion |
0.690% | | Over $1 billion, up to and including $5 billion |
0.675% | | Over $5 billion, up to and including $10 billion |
0.655% | | Over $10 billion, up to and including $15 billion |
0.635% | | Over $15 billion, up to and including $20 billion |
0.615% | | Over $20 billion, up to and including $25 billion |
0.605% | | Over $25 billion, up to and including $30 billion |
0.595% | | Over $30 billion, up to and including $35 billion |
0.585% | | In excess of $35 billion |
For the year ended August 31, 2018, the gross effective investment management fee rate was 0.688% of the Fund’s average daily net assets.
b. Administrative Fees
Under an agreement with TGAL, FT Services provides administrative services to the Fund. The fee is paid by TGAL based on the Fund’s average daily net assets, and is not an additional expense of the Fund.
c. Distribution Fees
The Board has adopted distribution plans for each share class, with the exception of Class R6 and Advisor Class shares, pursuant to Rule 12b-1 under the 1940 Act. Under the Fund’s Class A reimbursement distribution plan, the Fund reimburses Distributors for costs incurred in connection with the servicing, sale and distribution of the Fund’s shares up to the maximum annual plan rate. Under the Class A reimbursement distribution plan, costs exceeding the maximum for the current plan year cannot be reimbursed in subsequent periods. In addition, under the Fund’s Class C and R compensation distribution plans, the Fund pays Distributors for costs incurred in connection with the servicing, sale and distribution of the Fund’s shares up to the maximum annual plan rate for each class. The plan year, for purposes of monitoring compliance with the maximum annual plan rates, is February 1 through January 31.
The maximum annual plan rates, based on the average daily net assets, for each class, are as follows:
| | | | |
Class A | | | 0.25 | % |
Class C | | | 1.00 | % |
Class R | | | 0.50 | % |
d. Sales Charges/Underwriting Agreements
Front-end sales charges and contingent deferred sales charges (CDSC) do not represent expenses of the Fund. These charges are deducted from the proceeds of sales of Fund shares prior to investment or from redemption proceeds prior to remittance, as applicable. Distributors has advised the Fund of the following commission transactions related to the sales and redemptions of the Fund’s shares for the year:
| | | | |
Sales charges retained net of commissions paid to unaffiliated brokers/dealers | | $ | 390,428 | |
CDSC retained | | $ | 16,278 | |
| | | | |
| | | |
| franklintempleton.com | | Annual Report | | 29 |
TEMPLETON FUNDS
NOTES TO FINANCIAL STATEMENTS
Templeton Foreign Fund (continued)
3. Transactions with Affiliates (continued)
e. Transfer Agent Fees
Each class of shares pays transfer agent fees to Investor Services for its performance of shareholder servicing obligations. Effective November 1, 2017, the fees are based on an annualized asset based fee of 0.02% plus a transaction based fee. Prior to November 1, 2017, the fees were account based fees that varied based on fund or account type. In addition, each class reimburses Investor Services for out of pocket expenses incurred and, except for Class R6, reimburses shareholder servicing fees paid to third parties. These fees are allocated daily based upon their relative proportion of such classes’ aggregate net assets. Class R6 pays Investor Services transfer agent fees specific to that class.
For the year ended August 31, 2018, the Fund paid transfer agent fees of $10,518,969, of which $3,521,872 was retained by Investor Services.
f. Investments in Affiliated Management Investment Companies
The Fund invests in one or more affiliated management investment companies for purposes other than exercising a controlling influence over the management or policies. Management fees paid by the Fund are waived on assets invested in the affiliated management investment companies, as noted in the Statement of Operations, in an amount not to exceed the management and administrative fees paid directly or indirectly by each affiliate. During the year ended August 31, 2018, the Fund held investments in affiliated management investment companies as follows:
| | | | | | | | | | | | | | | | | | | | | | | | | | | | | | | | |
| | | Number of Shares Held at Beginning of Year | | | Gross
Additions | | | Gross
Reductions | | | Number of Shares
Held at End of Year | | | Value
at End
of
Year | | | Dividend
Income | | | Realized
Gain
(Loss) | | | Net Change in
Unrealized
Appreciation
(Depreciation) | |
| | | | | | | | |
Non-Controlled Affiliates | | | | | | | | | | | | | | | | | | | | | | | | | | | | | | | | |
Institutional Fiduciary Trust Money Market Portfolio, 1.64% | | | — | | | | 10,489,760 | | | | (10,489,760 | ) | | | — | | | | $ — | | | | $ — | | | | $ — | | | | $ — | |
g. Waiver and Expense Reimbursements
Effective February 1, 2018, TGAL has contractually agreed in advance to waive or limit its fees and to assume as its own expense certain expenses otherwise payable by the Fund so that the expenses (excluding distribution fees, acquired fund fees and expenses, and certain non-routine expenses or costs, including those relating to litigation, indemnification, reorganizations, and liquidations) for Class A, Class C, Class R and Advisor Class of the Fund do not exceed 0.85%, and for Class R6 do not exceed 0.65%, based on the average net assets of each class until December 31, 2019. Total expenses waived or paid are not subject to recapture subsequent to the Fund’s fiscal year end.
4. Expense Offset Arrangement
The Fund has entered into an arrangement with its custodian whereby credits realized as a result of uninvested cash balances are used to reduce a portion of the Fund’s custodian expenses. During the year ended August 31, 2018, the custodian fees were reduced as noted in the Statement of Operations.
5. Income Taxes
For tax purposes, capital losses may be carried over to offset future capital gains.
| | | | |
| | | |
30 | | Annual Report | | franklintempleton.com |
TEMPLETON FUNDS
NOTES TO FINANCIAL STATEMENTS
Templeton Foreign Fund (continued)
At August 31, 2018, the capital loss carryforwards were as follows:
| | | | |
Capital loss carryforwards not subject to expiration: | | | | |
Short Term | | $ | 16,856,215 | |
Long Term | | | 272,919,490 | |
| | | | |
Total capital loss carryforwards | | $ | 289,775,705 | |
| | | | |
During the year ended August 31, 2018, the Fund utilized $165,346,505 of capital loss carryforwards.
The tax character of distributions paid during the years ended August 31, 2018 and 2017, was as follows:
| | | | | | | | |
| | | 2018 | | | 2017 | |
| | |
Distributions paid from ordinary income | | $ | 117,105,566 | | | $ | 116,486,863 | |
At August 31, 2018, the cost of investments, net unrealized appreciation (depreciation) and undistributed ordinary income for income tax purposes were as follows:
| | | | |
Cost of investments | | $ | 5,861,042,521 | |
| | | | |
| |
Unrealized appreciation | | $ | 954,063,181 | |
Unrealized depreciation | | | (456,880,714) | |
| | | | |
| |
Net unrealized appreciation (depreciation) | | $ | 497,182,467 | |
| | | | |
| |
Distributable earnings: | | | | |
Undistributed ordinary income | | $ | 107,723,547 | |
| | | | |
Differences between income and/or capital gains as determined on a book basis and a tax basis are primarily due to differing treatment of passive foreign investment company shares.
6. Investment Transactions
Purchases and sales of investments (excluding short term securities) for the year ended August 31, 2018, aggregated $1,594,887,826 and $2,271,822,926, respectively.
7. Concentration of Risk
Investing in foreign securities may include certain risks and considerations not typically associated with investing in U.S. securities, such as fluctuating currency values and changing local and regional economic, political and social conditions, which may result in greater market volatility. In addition, certain foreign securities may not be as liquid as U.S. securities.
8. Credit Facility
The Fund, together with other U.S. registered and foreign investment funds (collectively, Borrowers), managed by Franklin Templeton Investments, are borrowers in a joint syndicated senior unsecured credit facility totaling $2 billion (Global Credit Facility) which matures on February 8, 2019. This Global Credit Facility provides a source of funds to the Borrowers for temporary and emergency purposes, including the ability to meet future unanticipated or unusually large redemption requests.
| | | | |
| | | |
| franklintempleton.com | | Annual Report | | 31 |
TEMPLETON FUNDS
NOTES TO FINANCIAL STATEMENTS
Templeton Foreign Fund (continued)
8. Credit Facility (continued)
Under the terms of the Global Credit Facility, the Fund shall, in addition to interest charged on any borrowings made by the Fund and other costs incurred by the Fund, pay its share of fees and expenses incurred in connection with the implementation and maintenance of the Global Credit Facility, based upon its relative share of the aggregate net assets of all of the Borrowers, including an annual commitment fee of 0.15% based upon the unused portion of the Global Credit Facility. These fees are reflected in other expenses in the Statement of Operations. During the year ended August 31, 2018, the Fund did not use the Global Credit Facility.
9. Fair Value Measurements
The Fund follows a fair value hierarchy that distinguishes between market data obtained from independent sources (observable inputs) and the Fund’s own market assumptions (unobservable inputs). These inputs are used in determining the value of the Fund’s financial instruments and are summarized in the following fair value hierarchy:
| | • | | Level 1 – quoted prices in active markets for identical financial instruments |
| | • | | Level 2 – other significant observable inputs (including quoted prices for similar financial instruments, interest rates, prepayment speed, credit risk, etc.) |
| | • | | Level 3 – significant unobservable inputs (including the Fund’s own assumptions in determining the fair value of financial instruments) |
The input levels are not necessarily an indication of the risk or liquidity associated with financial instruments at that level.
For movements between the levels within the fair value hierarchy, the Fund has adopted a policy of recognizing the transfers as of the date of the underlying event which caused the movement.
A summary of inputs used as of August 31, 2018, in valuing the Fund’s assets carried at fair value, is as follows:
| | | | | | | | | | | | | | | | |
| | | Level 1 | | | Level 2 | | | Level 3 | | | Total | |
Assets: | | | | | | | | | | | | | | | | |
Investments in Securities:a | | | | | | | | | | | | | | | | |
Equity Investments | | $ | 6,271,224,988 | | | $ | — | | | $ | — | | | $ | 6,271,224,988 | |
Short Term Investments | | | — | | | | 87,000,000 | | | | — | | | | 87,000,000 | |
| | | | |
Total Investments in Securities | | $ | 6,271,224,988 | | | $ | 87,000,000 | | | $ | — | | | $ | 6,358,224,988 | |
| | | | |
aFor detailed categories, see the accompanying Statement of Investments.
10. New Accounting Pronouncements
In August 2018, the Financial Accounting Standards Board issued Accounting Standards Update (ASU) No. 2018-13, Fair Value Measurement (Topic 820): Disclosure Framework—Changes to the Disclosure Requirements for Fair Value Measurements. The amendments in the ASU modify the disclosure requirements on fair value measurements in Topic 820. The ASU is effective for interim and annual reporting periods beginning after December 15, 2019. Management is currently evaluating the impact, if any, of applying this provision.
| | | | |
| | | |
32 | | Annual Report | | franklintempleton.com |
TEMPLETON FUNDS
NOTES TO FINANCIAL STATEMENTS
Templeton Foreign Fund (continued)
11. Subsequent Events
The Fund has evaluated subsequent events through the issuance of the financial statements and determined that no events have occurred that require disclosure, except for the following:
On February 27, 2018, the Board approved an automatic conversion feature for Class C that will convert shareholders’ Class C shares into Class A shares after they have been held for 10 years. The conversion feature will become effective on or about October 5, 2018. Further details are disclosed in the Fund’s Prospectus.
On May 18, 2018, the Board approved changes to certain front-end sales charges and dealer commissions on Class A shares. The changes will become effective on or about September 10, 2018. Further details are disclosed in the Fund’s Prospectus.
Abbreviations
| | | | | | |
Currency | | Selected Portfolio |
| | | |
GBP | | British Pound | | ADR | | American Depositary Receipt |
HKD | | Hong Kong Dollar | | IDR | | International Depositary Receipt |
| | | | NVDR | | Non-Voting Depositary Receipt |
| | | | |
| | | |
| franklintempleton.com | | Annual Report | | 33 |
TEMPLETON FUNDS
Report of Independent Registered Public Accounting Firm
To the Board of Trustees of Templeton Funds and Shareholders of Templeton Foreign Fund
Opinion on the Financial Statements
We have audited the accompanying statement of assets and liabilities, including the statement of investments, of Templeton Foreign Fund (the “Fund”) as of August 31, 2018, the related statement of operations for the year ended August 31, 2018, the statement of changes in net assets for each of the two years in the period ended August 31, 2018, including the related notes, and the financial highlights for each of the five years in the period ended August 31, 2018 (collectively referred to as the “financial statements”). In our opinion, the financial statements present fairly, in all material respects, the financial position of the Fund as of August 31, 2018, the results of its operations for the year then ended, the changes in its net assets for each of the two years in the period ended August 31, 2018 and the financial highlights for each of the five years in the period ended August 31, 2018 in conformity with accounting principles generally accepted in the United States of America.
Basis for Opinion
These financial statements are the responsibility of the Fund’s management. Our responsibility is to express an opinion on the Fund’s financial statements based on our audits. We are a public accounting firm registered with the Public Company Accounting Oversight Board (United States) (“PCAOB”) and are required to be independent with respect to the Fund in accordance with the U.S. federal securities laws and the applicable rules and regulations of the Securities and Exchange Commission and the PCAOB.
We conducted our audits of these financial statements in accordance with the standards of the PCAOB. Those standards require that we plan and perform the audit to obtain reasonable assurance about whether the financial statements are free of material misstatement, whether due to error or fraud.
Our audits included performing procedures to assess the risks of material misstatement of the financial statements, whether due to error or fraud, and performing procedures that respond to those risks. Such procedures included examining, on a test basis, evidence regarding the amounts and disclosures in the financial statements. Our audits also included evaluating the accounting principles used and significant estimates made by management, as well as evaluating the overall presentation of the financial statements. Our procedures included confirmation of securities owned as of August 31, 2018 by correspondence with the custodian and brokers; when replies were not received from brokers, we performed other auditing procedures. We believe that our audits provide a reasonable basis for our opinion.
PricewaterhouseCoopers LLP
San Francisco, California
October 16, 2018
We have served as the auditor of one or more investment companies in the Franklin Templeton funds since 1948.
| | | | |
| | | |
34 | | Annual Report | | franklintempleton.com |
TEMPLETON FUNDS
Tax Information (unaudited)
Templeton Foreign Fund
Under Section 854(b)(1)(B) of the Internal Revenue Code, the Fund hereby reports the maximum amount allowable but no less than $150,950,416 as qualified dividends for purposes of the maximum rate under Section 1(h)(11) of the Internal Revenue Code for the fiscal year ended August 31, 2018. Distributions, including qualified dividend income, paid during calendar year 2018 will be reported to shareholders on Form 1099-DIV by mid-February 2019. Shareholders are advised to check with their tax advisors for information on the treatment of these amounts on their individual income tax returns.
At August 31, 2017, more than 50% of the Fund’s total assets were invested in securities of foreign issuers. In most instances, foreign taxes were withheld from income paid to the Fund on these investments. As shown in the table below, the Fund hereby reports to shareholders the foreign source income and foreign taxes paid, pursuant to Section 853 of the Code. This written statement will allow shareholders of record on December 21, 2017, to treat their proportionate share of foreign taxes paid by the Fund as having been paid directly by them. The shareholder shall consider these amounts as foreign taxes paid in the tax year in which they receive the Fund distribution.
The following table provides a detailed analysis of foreign tax paid, foreign source income and foreign source qualified dividends as reported by the Fund, to Class A, Class C, Class R, and Class R6 and Advisor Class shareholders of record.
| | | | | | | | | | | | |
| Class | | Foreign Tax Paid
Per Share | | | Foreign Source
Income Per Share | | | Foreign Source Qualified
Dividends Per Share | |
| | | |
Class A | | | $ 0.0174 | | | | $ 0.1116 | | | | $ 0.0793 | |
Class C | | | $ 0.0174 | | | | $ 0.0470 | | | | $ 0.0333 | |
Class R | | | $ 0.0174 | | | | $ 0.0988 | | | | $ 0.0700 | |
Class R6 | | | $ 0.0174 | | | | $ 0.1555 | | | | $ 0.1108 | |
Advisor Class | | | $ 0.0174 | | | | $ 0.1403 | | | | $ 0.0999 | |
Foreign Tax Paid Per Share (Column 1) is the amount per share available to you, as a tax credit (assuming you held your shares in the Fund for a minimum of 16 days during the 31-day period beginning 15 days before the ex-dividend date of the Fund’s distribution to which the foreign taxes relate), or, as a tax deduction.
Foreign Source Income Per Share (Column 2) is the amount per share of income dividends attributable to foreign securities held by the Fund, plus any foreign taxes withheld on these dividends. The amounts reported include foreign source qualified dividends that have not been adjusted for the rate differential applicable to such dividend income.1
Foreign Source Qualified Dividends Per Share (Column 3) is the amount per share of foreign source qualified dividends, plus any foreign taxes withheld on these dividends. These amounts represent the portion of the Foreign Source Income reported to you in column 2 that were derived from qualified foreign securities held by the Fund.1
In February 2018, shareholders received Form 1099-DIV which included their share of taxes paid and foreign source income distributed during the calendar year 2017. The Foreign Source Income reported on Form 1099-DIV was not adjusted for the rate differential on foreign source qualified dividend income. Shareholders are advised to check with their tax advisors for information on the treatment of these amounts on their 2017 individual income tax returns.
1Qualified dividends are taxed at reduced long term capital gains tax rates. In determining the amount of foreign tax credit that may be applied against the U.S. tax liability of individuals receiving foreign source qualified dividends, adjustments may be required to the foreign tax credit limitation calculation to reflect the rate differential applicable to such dividend income. The rules however permit certain individuals to elect not to apply the rate differential adjustments for capital gains and/or dividends for any taxable year. Please consult your tax advisor and the instructions to Form 1116 for more information.
| | | | |
| | | |
| franklintempleton.com | | Annual Report | | 35 |
TEMPLETON FUNDS
TEMPLETON FOREIGN FUND
Special Meeting of Shareholders
MEETING OF SHAREHOLDERS: OCTOBER 30, 2017 AND RECONVENED ON DECEMBER 15, 2017
(UNAUDITED)
A Special Meeting of Shareholders of Templeton Funds was held at the offices of Franklin Templeton Investments, One Franklin Parkway, San Mateo, California on October 30, 2017 and reconvened on December 15, 2017. The purpose of the meeting was to elect Trustees of Templeton Funds and to vote on the following proposals: to approve the use of a “manager of managers” structure whereby the Fund’s investment manager would be able to hire and replace subadvisers without shareholder approval; and to approve an amended fundamental investment restriction regarding investments in commodities for the Fund. At the meeting, (i) the following persons were elected by the shareholders to serve as Trustees of Templeton Funds: Harris J. Ashton, Ann Torre Bates, Mary C. Choksi, Edith E. Holiday, Gregory E. Johnson, Rupert H. Johnson, Jr., J. Michael Luttig, David W. Niemiec, Larry D. Thompson, Constantine D. Tseretopoulos and Robert E. Wade; and (ii) the proposals to use a “manager of managers” structure and to approve the amended fundamental investment restriction regarding investments in commodities were approved by shareholders of the Fund. No other business was transacted at the meeting.
In connection with the meeting, management is aware that some shareholders received from the proxy solicitor numerous calls and mailings that may have been distracting. Management is taking steps to ensure that, in the future, for any new shareholder meeting solicitations that occur, such activity is not repeated. Management apologizes for any inconvenience that may have been caused as a result of such calls and mailings.
The results of the voting at the meeting are as follows:
| Proposal 1. | To elect a Board of Trustees: |
| | | | | | | | |
| Name | | For | | | Withheld | |
| | |
Harris J. Ashton | | | 654,630,558 | | | | 25,820,888 | |
| | |
Ann Torre Bates | | | 655,508,550 | | | | 24,942,896 | |
| | |
Mary C. Choksi | | | 655,587,180 | | | | 24,864,266 | |
| | |
Edith E. Holiday | | | 655,452,139 | | | | 24,999,307 | |
| | |
Gregory E. Johnson | | | 655,319,916 | | | | 25,131,529 | |
| | |
Rupert H. Johnson, Jr. | | | 654,824,311 | | | | 25,627,134 | |
| | |
J. Michael Luttig | | | 655,213,382 | | | | 25,238,064 | |
| | |
David W. Niemiec | | | 655,019,957 | | | | 25,431,488 | |
| | |
Larry D. Thompson | | | 655,060,509 | | | | 25,390,936 | |
| | |
Constantine D. Tseretopoulos | | | 655,237,345 | | | | 25,214,100 | |
| | |
Robert E. Wade | | | 655,537,220 | | | | 24,914,227 | |
Total Trust Shares Outstanding*: 1,210,818,878
*As of the record date.
| | | | |
| | | |
36 | | Annual Report | | franklintempleton.com |
TEMPLETON FUNDS
TEMPLETON FOREIGN FUND
SPECIAL MEETING OF SHAREHOLDERS
| Proposal 2. | To approve the use of a “manager of managers” structure whereby the Fund’s investment manager would be able to hire and replace subadvisers without shareholder approval: |
| | | | |
| | | Shares | |
| |
For | | | 354,091,655 | |
| |
Against | | | 18,313,953 | |
| |
Abstain | | | 12,794,642 | |
| |
Broker Non-Votes | | | 114,259,004 | |
| |
Total Fund Shares Voted | | | 499,459,255 | |
| |
Total Fund Shares Outstanding* | | | 938,738,937 | |
| Proposal 3. | To approve an amended fundamental investment restriction regarding investments in commodities: |
| | | | |
| | | Shares | |
| |
For | | | 353,659,752 | |
| |
Against | | | 16,270,717 | |
| |
Abstain | | | 15,269,779 | |
| |
Broker Non-Votes | | | 114,259,004 | |
| |
Total Fund Shares Voted | | | 499,459,255 | |
| |
Total Fund Shares Outstanding* | | | 938,738,937 | |
| | | | |
| | | |
| franklintempleton.com | | Annual Report | | 37 |
TEMPLETON FUNDS
Board Members and Officers
The name, year of birth and address of the officers and board members, as well as their affiliations, positions held with the Trust, principal occupations during at least the past five years and number of U.S. registered portfolios overseen in the Franklin Templeton Investments fund complex, are shown below. Generally, each board member serves until that person’s successor is elected and qualified.
Independent Board Members
| | | | | | | | |
Name, Year of Birth and Address | | Position | | Length of
Time Served | | Number of Portfolios in
Fund Complex Overseen
by Board Member* | | Other Directorships Held
During at Least the Past 5 Years |
| | | | |
Harris J. Ashton (1932) 300 S.E. 2nd Street | | Trustee | | Since 1992 | | 136 | | Bar-S Foods (meat packing company) (1981-2010). |
Fort Lauderdale, FL 33301-1923 | | | | | | |
| | |
Principal Occupation During at Least the Past 5 Years: | | | | |
Director of various companies; and formerly, Director, RBC Holdings, Inc. (bank holding company) (until 2002); and President, Chief Executive Officer and Chairman of the Board, General Host Corporation (nursery and craft centers) (until 1998). |
| | | | |
Ann Torre Bates (1958) 300 S.E. 2nd Street Fort Lauderdale, FL 33301-1923 | | Trustee | | Since 2008 | | 38 | | Ares Capital Corporation (specialty finance company) (2010-present), United Natural Foods, Inc. (distributor of natural, organic and specialty foods) (2013-present), Allied Capital Corporation (financial services) (2003-2010), SLM Corporation (Sallie Mae) (1997-2014) and Navient Corporation (loan management, servicing and asset recovery) (2014-2016). |
| | |
Principal Occupation During at Least the Past 5 Years: | | | | |
Director of various companies; and formerly, Executive Vice President and Chief Financial Officer, NHP Incorporated (manager of multifamily housing) (1995-1997); and Vice President and Treasurer, US Airways, Inc. (until 1995). |
| | | | |
Mary C. Choksi (1950) 300 S.E. 2nd Street Fort Lauderdale, FL 33301-1923 | | Trustee | | Since 2016 | | 136 | | Avis Budget Group Inc. (car rental) (2007-present), Omnicom Group Inc. (advertising and marketing communications services) (2011-present) and White Mountains Insurance Group, Ltd. (holding company) (2017-present). |
|
Principal Occupation During at Least the Past 5 Years: Director of various companies; and formerly, Founder and Senior Advisor, Strategic Investment Group (investment management group) (2015-2017); Founding Partner and Senior Managing Director, Strategic Investment Group (1987–2015); Founding Partner and Managing Director, Emerging Markets Management LLC (investment management firm) (1987-2011); and Loan Officer/Senior Loan Officer/Senior Pension Investment Officer, World Bank Group (international financial institution) (1977-1987). |
| | | | |
Edith E. Holiday (1952) 300 S.E. 2nd Street Fort Lauderdale, FL 33301-1923 | | Lead Independent Trustee | | Trustee since 2003 and Lead Independent Trustee since 2007 | | 136 | | Hess Corporation (exploration of oil and gas) (1993-present), Canadian National Railway (railroad) (2001-present), White Mountains Insurance Group, Ltd. (holding company) (2004-present), Santander Consumer USA Holdings, Inc. (consumer finance) (2016-present), RTI International Metals, Inc. (manufacture and distribution of titanium) (1999-2015) and H.J. Heinz Company (processed foods and allied products) (1994-2013). |
|
Principal Occupation During at Least the Past 5 Years: Director or Trustee of various companies and trusts; and formerly, Assistant to the President of the United States and Secretary of the Cabinet (1990-1993); General Counsel to the United States Treasury Department (1989-1990); and Counselor to the Secretary and Assistant Secretary for Public Affairs and Public Liaison–United States Treasury Department (1988-1989). |
| | | | |
| | | |
38 | | Annual Report | | franklintempleton.com |
TEMPLETON FUNDS
Independent Board Members (continued)
| | | | | | | | |
Name, Year of Birth and Address | | Position | | Length of
Time Served | | Number of Portfolios in
Fund Complex Overseen by Board Member* | | Other Directorships Held During at Least the Past 5 Years |
| | | | |
J. Michael Luttig (1954) 300 S.E. 2nd Street Fort Lauderdale, FL 33301-1923 | | Trustee | | Since 2009 | | 136 | | Boeing Capital Corporation (aircraft financing) (2006-2013). |
|
Principal Occupation During at Least the Past 5 Years: |
Executive Vice President, General Counsel and member of the Executive Council, The Boeing Company (aerospace company) (2006-present); and formerly, Federal Appeals Court Judge, U.S. Court of Appeals for the Fourth Circuit (1991-2006). |
| | | | |
David W. Niemiec (1949) 300 S.E. 2nd Street Fort Lauderdale, FL 33301-1923 | | Trustee | | Since 2005 | | 38 | | Hess Midstream Partners LP (oil and gas midstream infrastructure) (2017-present). |
| |
Principal Occupation During at Least the Past 5 Years: | | |
Advisor, Saratoga Partners (private equity fund); and formerly, Managing Director, Saratoga Partners (1998-2001) and SBC Warburg Dillon Read (investment banking) (1997-1998); Vice Chairman, Dillon, Read & Co. Inc. (investment banking) (1991-1997); and Chief Financial Officer, Dillon, Read & Co. Inc. (1982-1997). |
| | | | |
Larry D. Thompson (1945) 300 S.E. 2nd Street Fort Lauderdale, FL 33301-1923 | | Trustee | | Since 2005 | | 136 | | The Southern Company (energy company) (2014-present; previously 2010-2012), Graham Holdings Company (education and media organization) (2011-present) and Cbeyond, Inc. (business communications provider) (2010-2012). |
|
Principal Occupation During at Least the Past 5 Years: Director of various companies; Counsel, Finch McCranie, LLP (law firm) (2015-present); Independent Compliance Monitor and Auditor, Volkswagen AG (manufacturer of automobiles and commercial vehicles) (2017 – present); John A. Sibley Professor of Corporate and Business Law, University of Georgia School of Law (2015-present; previously 2011-2012); and formerly, Executive Vice President – Government Affairs, General Counsel and Corporate Secretary, PepsiCo, Inc. (consumer products) (2012-2014); Senior Vice President – Government Affairs, General Counsel and Secretary, PepsiCo, Inc. (2004-2011); Senior Fellow of The Brookings Institution (2003-2004); Visiting Professor, University of Georgia School of Law (2004); and Deputy Attorney General, U.S. Department of Justice (2001-2003). |
| | | | |
Constantine D. Tseretopoulos (1954) 300 S.E. 2nd Street Fort Lauderdale, FL 33301-1923 | | Trustee | | Since 2003 | | 24 | | None |
|
Principal Occupation During at Least the Past 5 Years: Physician, Chief of Staff, owner and operator of the Lyford Cay Hospital (1987-present); director of various nonprofit organizations; and formerly, Cardiology Fellow, University of Maryland (1985-1987); and Internal Medicine Resident, Greater Baltimore Medical Center (1982-1985). |
| | | | |
Robert E. Wade (1946) 300 S.E. 2nd Street Fort Lauderdale, FL 33301-1923 | | Trustee | | Since 2006 | | 38 | | El Oro Ltd (investments) (2003-present). |
|
Principal Occupation During at Least the Past 5 Years: |
Attorney at law engaged in private practice as a sole practitioner (1972-2008) and member of various boards. |
| | | | |
| | | |
| franklintempleton.com | | Annual Report | | 39 |
TEMPLETON FUNDS
Interested Board Members and Officers
| | | | | | | | |
Name, Year of Birth and Address | | Position | | Length of Time Served | | Number of Portfolios in
Fund Complex Overseen
by Board Member* | | Other Directorships Held During at Least the Past 5 Years |
| | | | |
**Gregory E. Johnson (1961) One Franklin Parkway San Mateo, CA 94403-1906 | | Trustee | | Since 2013 | | 150 | | None |
|
Principal Occupation During at Least the Past 5 Years: Chairman of the Board, Member – Office of the Chairman, Director and Chief Executive Officer, Franklin Resources, Inc.; officer and/or director or trustee, as the case may be, of some of the other subsidiaries of Franklin Resources, Inc. and of 42 of the investment companies in Franklin Templeton Investments; Vice Chairman, Investment Company Institute; and formerly, President, Franklin Resources, Inc. (1994-2015). |
| | | | |
**Rupert H. Johnson, Jr. (1940) One Franklin Parkway San Mateo, CA 94403-1906 | | Chairman of the Board, Trustee and Vice President | | Chairman of the Board since 2013, Trustee since 1992 and Vice President since 1996 | | 136 | | None |
|
Principal Occupation During at Least the Past 5 Years: Vice Chairman, Member – Office of the Chairman and Director, Franklin Resources, Inc.; Director, Franklin Advisers, Inc.; Senior Vice President, Franklin Advisory Services, LLC; and officer and/or director or trustee, as the case may be, of some of the other subsidiaries of Franklin Resources, Inc. and of 40 of the investment companies in Franklin Templeton Investments. |
| | | | |
Alison E. Baur (1964) One Franklin Parkway San Mateo, CA 94403-1906 | | Vice President | | Since 2012 | | Not Applicable | | Not Applicable |
|
Principal Occupation During at Least the Past 5 Years: Deputy General Counsel, Franklin Templeton Investments; and officer of some of the other subsidiaries of Franklin Resources, Inc. and of 44 of the investment companies in Franklin Templeton Investments. |
| | | | |
Norman J. Boersma (1957) Lyford Cay Nassau, Bahamas | | President and Chief Executive Officer – Investment Management | | Since 2012 | | Not Applicable | | Not Applicable |
|
Principal Occupation During at Least the Past 5 Years: Chairman of the Board, President and Chief Executive Officer, Templeton Global Advisors Ltd.; Chief Investment Officer of Templeton Global Equity Group; officer of five of the investment companies in Franklin Templeton Investments; and formerly, Executive Vice President, Franklin Templeton Investments Corp. (1993-2014). |
| | | | |
Aliya S. Gordon (1973) One Franklin Parkway San Mateo, CA 94403-1906 | | Vice President | | Since 2009 | | Not Applicable | | Not Applicable |
|
Principal Occupation During at Least the Past 5 Years: Senior Associate General Counsel, Franklin Templeton Investments; and officer of 44 of the investment companies in Franklin Templeton Investments. |
| | | | |
Steven J. Gray (1955) One Franklin Parkway San Mateo, CA 94403-1906 | | Vice President | | Since 2009 | | Not Applicable | | Not Applicable |
|
Principal Occupation During at Least the Past 5 Years: Senior Associate General Counsel, Franklin Templeton Investments; Vice President, Franklin Templeton Distributors, Inc. and FASA, LLC; and officer of 44 of the investment companies in Franklin Templeton Investments. |
| | | | |
Matthew T. Hinkle (1971) One Franklin Parkway San Mateo, CA 94403-1906 | | Chief Executive Officer – Finance and Administration | | Since 2017 | | Not Applicable | | Not Applicable |
|
Principal Occupation During at Least the Past 5 Years: Senior Vice President, Franklin Templeton Services, LLC; officer of 44 of the investment companies in Franklin Templeton Investments; and formerly, Vice President, Global Tax (2012-April 2017) and Treasurer/Assistant Treasurer, Franklin Templeton Investments (2009-2017). |
| | | | |
| | | |
40 | | Annual Report | | franklintempleton.com |
TEMPLETON FUNDS
Interested Board Members and Officers (continued)
| | | | | | | | |
Name, Year of Birth and Address | | Position | | Length of Time Served | | Number of Portfolios in Fund Complex Overseen by Board Member* | | Other Directorships Held During at Least the Past 5 Years |
| | | | |
Robert G. Kubilis (1973) 300 S.E. 2nd Street Fort Lauderdale, FL 33301-1923 | | Chief Financial Officer, Chief Accounting Officer and Treasurer | | Since 2017 | | Not Applicable | | Not Applicable |
| | |
| Principal Occupation During at Least the Past 5 Years: | | | | |
Treasurer, U.S. Fund Administration & Reporting, Franklin Templeton Investments; and officer of 16 of the investment companies in Franklin Templeton Investments. |
| | | | |
Robert Lim (1948) One Franklin Parkway San Mateo, CA 94403-1906 | | Vice President – AML Compliance | | Since 2016 | | Not Applicable | | Not Applicable |
| | |
| Principal Occupation During at Least the Past 5 Years: | | | | |
Vice President, Franklin Templeton Companies, LLC; Chief Compliance Officer, Franklin Templeton Distributors, Inc. and Franklin Templeton Investor Services, LLC; and officer of 44 of the investment companies in Franklin Templeton Investments. |
| | | | |
Kimberly H. Novotny (1972) 300 S.E. 2nd Street Fort Lauderdale, FL 33301-1923 | | Vice President | | Since 2013 | | Not Applicable | | Not Applicable |
| | |
| Principal Occupation During at Least the Past 5 Years: | | | | |
Associate General Counsel, Franklin Templeton Investments; Vice President and Corporate Secretary, Fiduciary Trust International of the South; Vice President, Templeton Investment Counsel, LLC; Assistant Secretary, Franklin Resources, Inc.; and officer of 44 of the investment companies in Franklin Templeton Investments. |
| | | | |
Robert C. Rosselot (1960) 300 S.E. 2nd Street Fort Lauderdale, FL 33301-1923 | | Chief Compliance Officer | | Since 2013 | | Not Applicable | | Not Applicable |
| | |
| Principal Occupation During at Least the Past 5 Years: | | | | |
Director, Global Compliance, Franklin Templeton Investments; Vice President, Franklin Templeton Companies, LLC; officer of 44 of the investment companies in Franklin Templeton Investments; and formerly, Senior Associate General Counsel, Franklin Templeton Investments (2007-2013); and Secretary and Vice President, Templeton Group of Funds (2004-2013). |
| | | | |
Karen L. Skidmore (1952) One Franklin Parkway San Mateo, CA 94403-1906 | | Vice President | | Since 2009 | | Not Applicable | | Not Applicable |
| | |
| Principal Occupation During at Least the Past 5 Years: | | | | |
Senior Associate General Counsel, Franklin Templeton Investments; and officer of 44 of the investment companies in Franklin Templeton Investments. |
| | | | |
Navid J. Tofigh (1972) One Franklin Parkway San Mateo, CA 94403-1906 | | Vice President | | Since 2015 | | Not Applicable | | Not Applicable |
| | |
| Principal Occupation During at Least the Past 5 Years: | | | | |
Associate General Counsel, Franklin Templeton Investments; and officer of 44 of the investment companies in Franklin Templeton Investments. |
| | | | |
Craig S. Tyle (1960) One Franklin Parkway San Mateo, CA 94403-1906 | | Vice President | | Since 2005 | | Not Applicable | | Not Applicable |
| | |
| Principal Occupation During at Least the Past 5 Years: | | | | |
General Counsel and Executive Vice President, Franklin Resources, Inc.; and officer of some of the other subsidiaries of Franklin Resources, Inc. and of 44 of the investment companies in Franklin Templeton Investments. |
| | | | |
| | | |
| franklintempleton.com | | Annual Report | | 41 |
TEMPLETON FUNDS
Interested Board Members and Officers (continued)
| | | | | | | | |
Name, Year of Birth and Address | | Position | | Length of Time Served | | Number of Portfolios in Fund Complex Overseen by Board Member* | | Other Directorships Held During at Least the Past 5 Years |
| | | | |
Lori A. Weber (1964) 300 S.E. 2nd Street Fort Lauderdale, FL 33301-1923 | | Vice President and Secretary | | Vice President since 2011 and Secretary since 2013 | | Not Applicable | | Not Applicable |
| | |
| Principal Occupation During at Least the Past 5 Years: | | | | |
Senior Associate General Counsel, Franklin Templeton Investments; Assistant Secretary, Franklin Resources, Inc.; Vice President and Secretary, Templeton Investment Counsel, LLC; and officer of 44 of the investment companies in Franklin Templeton Investments. |
*We base the number of portfolios on each separate series of the U.S. registered investment companies within the Franklin Templeton Investments fund complex. These portfolios have a common investment manager or affiliated investment managers.
**Gregory E. Johnson is considered to be an interested person of the Fund under the federal securities laws due to his position as an officer and director of Franklin Resources, Inc. (Resources), which is the parent company of the Fund’s investment manager and distributor. Rupert H. Johnson, Jr. is considered to be an interested person of the Fund under the federal securities laws due to his position as an officer and director and major shareholder of Resources.
Note 1: Rupert H. Johnson, Jr. is the uncle of Gregory E. Johnson.
Note 2: Officer information is current as of the date of this report. It is possible that after this date, information about officers may change.
The Sarbanes-Oxley Act of 2002 and Rules adopted by the U.S. Securities and Exchange Commission require the Fund to disclose whether the Fund’s Audit Committee includes at least one member who is an audit committee financial expert within the meaning of such Act and Rules. The Fund’s Board has determined that there is at least one such financial expert on the Audit Committee and has designated each of Ann Torre Bates and David W. Niemiec as an audit committee financial expert. The Board believes that Ms. Bates and Mr. Niemiec qualify as such an expert in view of their extensive business background and experience. Ms. Bates has served as a member of the Fund Audit Committee since 2008. She currently serves as a director of Ares Capital Corporation (2010-present) and United Natural Foods, Inc. (2013-present) and was formerly a director of Navient Corporation from 2014 to 2016, SLM Corporation from 1997 to 2014 and Allied Capital Corporation from 2003 to 2010, Executive Vice President and Chief Financial Officer of NHP Incorporated from 1995 to 1997 and Vice President and Treasurer of US Airways, Inc. until 1995. Mr. Niemiec has served as a member of the Fund Audit Committee since 2005, currently serves as an Advisor to Saratoga Partners and was formerly its Managing Director from 1998 to 2001 and serves as a director of Hess Midstream Partners LP (2017-present). Mr. Niemiec was formerly a director of Emeritus Corporation from 1999 to 2010 and OSI Pharmaceuticals, Inc. from 2006 to 2010, Managing Director of SBC Warburg Dillon Read from 1997 to 1998, and was Vice Chairman from 1991 to 1997 and Chief Financial Officer from 1982 to 1997 of Dillon, Read & Co. Inc. As a result of such background and experience, the Board believes that Ms. Bates and Mr. Niemiec have each acquired an understanding of generally accepted accounting principles and financial statements, the general application of such principles in connection with the accounting estimates, accruals and reserves, and analyzing and evaluating financial statements that present a breadth and level of complexity of accounting issues generally comparable to those of the Fund, as well as an understanding of internal controls and procedures for financial reporting and an understanding of audit committee functions. Ms. Bates and Mr. Niemiec are independent Board members as that term is defined under the applicable U.S. Securities and Exchange Commission Rules and Releases.
The Statement of Additional Information (SAI) includes additional information about the board members and is available, without charge, upon request. Shareholders may call (800) DIAL BEN/342-5236 to request the SAI.
| | | | |
| | | |
42 | | Annual Report | | franklintempleton.com |
TEMPLETON FUNDS
TEMPLETON FOREIGN FUND
Shareholder Information
Board Approval of Investment Management Agreements
TEMPLETON FUNDS
Templeton Foreign Fund
(Fund)
At an in-person meeting held on May 18, 2018 (Meeting), the Board of Trustees (Board) of Templeton Funds (Trust), including a majority of the trustees who are not “interested persons” as defined in the Investment Company Act of 1940 (Independent Trustees), reviewed and approved the continuance of the investment management agreement between Templeton Global Advisors Limited (Manager) and the Trust, on behalf of the Fund (Management Agreement) for an additional one-year period. The Independent Trustees received advice from and met separately with Independent Trustee counsel in considering whether to approve the continuation of the Management Agreement.
In considering the continuation of the Management Agreement, the Board reviewed and considered information provided by the Manager at the Meeting and throughout the year at meetings of the Board and its committees. The Board also reviewed and considered information provided in response to a detailed set of requests for information submitted to the Manager by Independent Trustee counsel on behalf of the Independent Trustees in connection with the annual contract renewal process. In addition, prior to the Meeting, the Independent Trustees held a telephonic contract renewal meeting at which the Independent Trustees conferred amongst themselves and Independent Trustee counsel about contract renewal matters. The Board reviewed and considered all of the factors it deemed relevant in approving the continuance of the Management Agreement, including, but not limited to: (i) the nature, extent and quality of the services provided by the Manager; (ii) the investment performance of the Fund; (iii) the costs of the services provided and profits realized by the Manager and its affiliates from the relationship with the Fund; (iv) the extent to which economies of scale are realized as the Fund grows; and (v) whether fee levels reflect these economies of scale for the benefit of Fund investors.
In approving the continuance of the Management Agreement, the Board, including a majority of the Independent Trustees, determined that the terms of the Management Agreement are fair and reasonable and that the continuance of such Management Agreement is in the interests of the Fund and its shareholders. While attention was given to all information
furnished, the following discusses some primary factors relevant to the Board’s determination.
Nature, Extent and Quality of Services
The Board reviewed and considered information regarding the nature, extent and quality of investment management services provided by the Manager and its affiliates to the Fund and its shareholders. This information included, among other things, the qualifications, background and experience of the senior management and investment personnel of the Manager; the structure of investment personnel compensation; oversight of third-party service providers; investment performance reports and related financial information for the Fund; reports on expenses, shareholder services, marketing support payments made to financial intermediaries and third party servicing arrangements; legal and compliance matters; risk controls; pricing and other services provided by the Manager and its affiliates; and management fees charged by the Manager and its affiliates to U.S. funds and other accounts, including management’s explanation of differences among accounts where relevant. The Board also reviewed and considered an annual report on payments made by Franklin Templeton Investments (FTI) or the Fund to financial intermediaries, as well as a memorandum relating to third-party servicing arrangements in response to a guidance update in 2016 from the U.S. Securities and Exchange Commission (SEC) relating to mutual fund distribution and sub-accounting fees. The Board noted management’s continuing efforts and expenditures in establishing effective business continuity plans and developing strategies to address areas of heightened concern in the mutual fund industry, such as cybersecurity and liquidity risk management. The Board also recognized management’s commitment to facilitating Board oversight of particular areas, including derivatives and payments to intermediaries, by enhanced reporting.
The Board also reviewed and considered the benefits provided to Fund shareholders of investing in a fund that is part of the Franklin Templeton family of funds. The Board noted the financial position of Franklin Resources, Inc. (FRI), the Manager’s parent, and its commitment to the mutual fund business as evidenced by its continued introduction of new funds, reassessment of the fund offerings in response to the market environment and project initiatives and capital investments relating to the services provided to the Fund by the FTI organization.
Following consideration of such information, the Board was satisfied with the nature, extent and quality of services provided
| | | | |
| | | |
| franklintempleton.com | | Annual Report | | 43 |
TEMPLETON FUNDS
TEMPLETON FOREIGN FUND
SHAREHOLDER INFORMATION
by the Manager and its affiliates to the Fund and its shareholders.
Fund Performance
The Board reviewed and considered the performance results of the Fund over various time periods ended February 28, 2018. The Board considered the performance returns for the Fund in comparison to the performance returns of mutual funds deemed comparable to the Fund included in a universe (Performance Universe) selected by Broadridge Financial Solutions, Inc. (Broadridge), an independent provider of investment company data. The Board received a description of the methodology used by Broadridge to select the mutual funds included in a Performance Universe. The Board also reviewed and considered Fund performance reports provided and discussions that occurred with portfolio managers at Board meetings throughout the year. A summary of the Fund’s performance results is below.
The Performance Universe for the Fund included the Fund and all retail and institutional international multi-cap value funds. The Board noted that the Fund’s annualized total return for the one-, three- and five-year periods was below the median of its Performance Universe, but for the 10-year period was above the median and in the first quintile (the best) of its Performance Universe. The Board concluded that the Fund’s performance was acceptable, noting the Fund’s favorable long term performance and that the Fund’s annualized total return for the one-year period, while below the median, exceeded 10.7%. The Board also noted management’s expectation of some reversal in several sectors and specific stocks that contributed to underperfomance in the 14-month period ending February 28, 2018. Management further explained that it continues to review the Fund’s holdings and that a number of trades were made to reduce volatility in the Fund’s portfolio.
Comparative Fees and Expenses
The Board reviewed and considered information regarding the Fund’s actual total expense ratio and its various components, including, as applicable, management fees; transfer agent expenses; underlying fund expenses; Rule 12b-1 and non-Rule 12b-1 service fees; and other non-management fees. The Board also noted the quarterly and annual reports it receives on all marketing support payments made by FTI to financial intermediaries. The Board considered the actual total expense ratio and, separately, the contractual management fee rate, without the effect of fee waivers (Management Rate), if any, of the Fund in comparison to the median expense ratio and median Management Rate, respectively, of other mutual funds
deemed comparable to and with a similar expense structure as the Fund selected by Broadridge (Expense Group). Broadridge fee and expense data is based upon information taken from each fund’s most recent annual report, which reflects historical asset levels that may be quite different from those currently existing, particularly in a period of market volatility. While recognizing such inherent limitation and the fact that expense ratios and Management Rates generally increase as assets decline and decrease as assets grow, the Board believed the independent analysis conducted by Broadridge to be an appropriate measure of comparative fees and expenses. The Broadridge Management Rate includes administrative charges, and the actual total expense ratio, for comparative consistency, was shown for Class A shares for funds with multiple classes of shares. The Board received a description of the methodology used by Broadridge to select the mutual funds included in an Expense Group.
The Expense Group for the Fund included the Fund, six international multi-cap growth funds and three international multi-cap core funds. The Board noted that the Management Rate for the Fund was below the median of its Expense Group, but its actual total expense ratio was slightly above the median of its Expense Group. The Board concluded that the Management Rate charged to the Fund is reasonable. In doing so, the Board noted that management agreed to cap the Fund’s operating expenses at 0.85%, effective February 1, 2018.
Profitability
The Board reviewed and considered information regarding the profits realized by the Manager and its affiliates in connection with the operation of the Fund. In this respect, the Board considered the Fund profitability analysis provided by the Manager that addresses the overall profitability of FTI’s U.S. fund business, as well as its profits in providing investment management and other services to each of the individual funds during the 12-month period ended September 30, 2017, being the most recent fiscal year-end for FRI. The Board noted that although management continually makes refinements to its methodologies used in calculating profitability in response to organizational and product-related changes, the overall methodology has remained consistent with that used in the Fund’s profitability report presentations from prior years. Additionally, PricewaterhouseCoopers LLP, auditor to Franklin Resources, Inc. and certain Franklin Templeton funds, has been engaged by the Manager to periodically review and assess the allocation methodologies to be used solely by the Fund’s Board with respect to the profitability analysis.
| | | | |
| | | |
44 | | Annual Report | | franklintempleton.com |
TEMPLETON FUNDS
TEMPLETON FOREIGN FUND
SHAREHOLDER INFORMATION
The Board noted management’s belief that costs incurred in establishing the infrastructure necessary for the type of mutual fund operations conducted by the Manager and its affiliates may not be fully reflected in the expenses allocated to the Fund in determining its profitability, as well as the fact that the level of profits, to a certain extent, reflected operational cost savings and efficiencies initiated by management. The Board also noted management’s expenditures in improving shareholder services provided to the Fund, as well as the need to implement systems and meet additional regulatory and compliance requirements resulting from recent SEC and other regulatory requirements.
The Board also considered the extent to which the Manager and its affiliates might derive ancillary benefits from fund operations, including revenues generated from transfer agent services, potential benefits resulting from personnel and systems enhancements necessitated by fund growth, as well as increased leverage with service providers and counterparties. Based upon its consideration of all these factors, the Board concluded that the level of profits realized by the Manager and its affiliates from providing services to the Fund was not excessive in view of the nature, extent and quality of services provided to the Fund.
Economies of Scale
The Board reviewed and considered the extent to which the Manager may realize economies of scale, if any, as the Fund grows larger and whether the Fund’s management fee structure reflects any economies of scale for the benefit of shareholders. With respect to possible economies of scale, the Board noted the existence of management fee breakpoints, which operate generally to share any economies of scale with a Fund’s shareholders by reducing the Fund’s effective management fees as the Fund grows in size. The Board considered the Manager’s view that any analyses of potential economies of scale in managing a particular fund are inherently limited in light of the joint and common costs and investments the Manager incurs across the Franklin Templeton family of funds as a whole. The Board concluded that to the extent economies of scale may be realized by the Manager and its affiliates, the Fund’s management fee structure provided a sharing of benefits with the Fund and its shareholders as the Fund grows.
Conclusion
Based on its review, consideration and evaluation of all factors it believed relevant, including the above-described factors and conclusions, the Board unanimously approved the continuation of the Management Agreement for an additional one-year period.
Proxy Voting Policies and Procedures
The Fund’s investment manager has established Proxy Voting Policies and Procedures (Policies) that the Fund uses to determine how to vote proxies relating to portfolio securities. Shareholders may view the Fund’s complete Policies online at franklintempleton.com. Alternatively, shareholders may request copies of the Policies free of charge by calling the Proxy Group collect at (954) 527-7678 or by sending a written request to: Franklin Templeton Companies, LLC, 300 S.E. 2nd Street, Fort Lauderdale, FL 33301, Attention: Proxy Group. Copies of the Fund’s proxy voting records are also made available online at franklintempleton.com and posted on the U.S. Securities and Exchange Commission’s website at sec.gov and reflect the most recent 12-month period ended June 30.
Quarterly Statement of Investments
The Trust, on behalf of the Fund, files a complete statement of investments with the U.S. Securities and Exchange Commission for the first and third quarters for each fiscal year on Form N-Q. Shareholders may view the filed Form N-Q by visiting the Commission’s website at sec.gov. The filed form may also be viewed and copied at the Commission’s Public Reference Room in Washington, DC. Information regarding the operations of the Public Reference Room may be obtained by calling (800) SEC-0330.
Householding of Reports and Prospectuses
You will receive the Fund’s financial reports every six months as well as an annual updated summary prospectus (prospectus available upon request). To reduce Fund expenses, we try to identify related shareholders in a household and send only one copy of the financial reports and summary prospectus. This process, called “householding,” will continue indefinitely unless you instruct us otherwise. If you prefer not to have these documents householded, please call us at (800) 632-2301. At any time you may view current prospectuses/summary prospectuses and financial reports on our website. If you choose, you may receive these documents through electronic delivery.
| | | | |
| | | |
| franklintempleton.com | | Annual Report | | 45 |
This page intentionally left blank.
This page intentionally left blank.
This page intentionally left blank.
| | |
 | | Annual Report and Shareholder Letter |
| | Templeton Foreign Fund |
| | Investment Manager |
| | Templeton Global Advisors Limited |
| | Distributor |
| | Franklin Templeton Distributors, Inc. |
| | (800) DIAL BEN® / 342-5236 franklintempleton.com |
| | Shareholder Services |
| | (800) 632-2301 |
Authorized for distribution only when accompanied or preceded by a summary prospectus and/or prospectus. Investors should carefully consider a fund’s investment goals, risks, charges and expenses before investing. A prospectus contains this and other information; please read it carefully before investing.
To help ensure we provide you with quality service, all calls to and from our service areas are monitored and/or recorded.
| | |
© 2018 Franklin Templeton Investments. All rights reserved. | | 104 A 10/18 |
| | |
| | Annual Report
and Shareholder Letter August 31, 2018 |
Sign up for electronic delivery at franklintempleton.com/edelivery
Franklin Templeton Investments
Why choose Franklin Templeton Investments?
Successful investing begins with ambition. And achievement only comes when you reach for it. That’s why we continually strive to deliver better outcomes for investors. No matter what your goals are, our deep, global investment expertise allows us to offer solutions that can help.
During our more than 70 years of experience, we’ve managed through all kinds of markets—up, down and those in between. We’re always preparing for what may come next. It’s because of this, combined with our strength as one of the world’s largest asset managers that we’ve earned the trust of millions of investors around the world.
Dear Shareholder:
During the 12 months ended August 31, 2018, global markets reflected investor optimism about global economic growth amid higher crude oil prices, continued monetary easing by the European Central Bank and U.S. tax reform. Corporate earnings also increased throughout the period, with many companies exceeding their earnings guidance and reporting increased sales and better operating profit margins. However, investor sentiment was dampened at times by Korean peninsula tensions, U.S. and global trade uncertainties, and worries that central banks could raise interest rates due to strong economic growth and rising inflation in the U.S. and other countries. In this environment, global developed and emerging market stocks generated strong returns, as measured by the MSCI All Country World Index.
We are committed to our long-term perspective and disciplined investment approach as we conduct a rigorous, fundamental analysis of securities with a regular emphasis on investment risk management.
Historically, patient investors have achieved rewarding results by evaluating their goals, diversifying their assets globally and maintaining a disciplined investment program, all hallmarks of the Templeton investment philosophy developed more than 60 years ago. We continue to recommend investors consult their financial advisors and review their portfolios to design a long-term strategy and portfolio allocation that meet their individual needs, goals and risk tolerance.
Templeton World Fund’s annual report includes more detail about prevailing conditions and a discussion about investment decisions during the period. Please remember all securities markets fluctuate, as do mutual fund share prices.
We thank you for investing with Franklin Templeton, welcome your questions and comments, and look forward to serving your investment needs in the years ahead.
Sincerely,

Norman J. Boersma, CFA
President and Chief Executive Officer –
Investment Management
Templeton Funds
This letter reflects our analysis and opinions as of August 31, 2018, unless otherwise indicated. The information is not a complete analysis of every aspect of any market, country, industry, security or fund. Statements of fact are from sources considered reliable.
CFA® is a trademark owned by CFA Institute.
|
Not FDIC Insured | May Lose Value | No Bank Guarantee |
| | | | |
| | | |
| franklintempleton.com | | Not part of the annual report | | 1 |
Visit franklintempleton.com for fund updates, to access your account, or to find helpful financial planning tools.
| | | | |
| | | |
2 | | Annual Report | | franklintempleton.com |
Annual Report
Templeton World Fund
This annual report for Templeton World Fund covers the fiscal year ended August 31, 2018.
Your Fund’s Goal and Main Investments
The Fund seeks long-term capital growth. Under normal market conditions, the Fund invests primarily in equity securities of companies located anywhere in the world, including developing markets. Under normal circumstances, the Fund will invest in issuers located in at least three different countries (including the U.S.). The Fund regularly uses certain derivative instruments to seek to hedge against currency risks.
Performance Overview
The Fund’s Class A shares delivered a +7.81% cumulative total return for the 12 months under review. In comparison, the Fund’s benchmark, the MSCI All Country World Index (ACWI) 100% Hedged to USD, which measures stock performance in global developed and emerging markets, generated a +14.07% total return.1 Also in comparison, the Fund’s second benchmark, the MSCI ACWI, posted a +11.99% total return,2 and the Fund’s third benchmark, the Linked MSCI ACWI 100% Hedged to USD/World, posted a +14.07% total return.3 For the 10-year period ended August 31, 2018, the Fund’s Class A shares generated a +77.98% cumulative total return, compared with the Linked MSCI ACWI 100% Hedged to USD/World’s +113.04% cumulative total return for the same period.3 Please note index performance information is provided for reference and we do not attempt to track the index but rather undertake investments on the basis of fundamental research. You can find more performance data in the Performance Summary beginning on page 8.
Performance data represent past performance, which does not guarantee future results. Investment return and principal value will fluctuate, and you may have a gain or loss when you sell your shares. Current performance may differ from figures
Geographic Composition*
Based on Total Net Assets as of 8/31/18
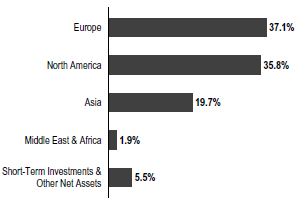
*Figures reflect certain derivatives held in the portfolio (or their underlying reference assets) and may not total 100% or may be negative due to rounding, use of any derivatives, unsettled trades or other factors.
shown. For most recent month-end performance, go to franklintempleton.com or call (800) 342-5236.
Economic and Market Overview
The global economy expanded during the 12-month period under review amid generally upbeat economic data across regions. In this environment, the MSCI ACWI, which measures performance of global developed and emerging market stocks, reached a new all-time high in January 2018 and generated a +11.99% total return for the 12 months ended August 31, 2018.2 Global markets were aided by higher crude oil prices, the European Central Bank’s (ECB’s) extension of its monetary easing program, the passage of the U.S. tax reform bill and encouraging corporate earnings reports.
However, global markets reflected investor concerns about tensions in the Korean peninsula at certain times during the period and political uncertainties in the U.S. and the European Union (EU), as well as worries that strong economic growth and rising inflation in the U.S. and other countries would lead
1. Source: FactSet.
2. Source: Morningstar.
3. Source: FactSet. The Linked MSCI ACWI 100% Hedged to USD/World reflects performance of the MSCI World Index through 6/29/2016 and performance of the MSCI ACWI 100% Hedged to USD thereafter. As of 8/31/18, the Fund’s Class A 10-year average annual total return not including the maximum sales charge was +5.93%, compared with the Linked MSCI ACWI 100% Hedged to USD/World’s 10-year average annual total return of +7.86%.
The indexes are unmanaged and include reinvestment of any income or distributions. They do not reflect any fees, expenses or sales charges. One cannot invest directly in an index, and an index is not representative of the Fund’s portfolio.
The dollar value, number of shares or principal amount, and names of all portfolio holdings are listed in the Fund’s Statement of Investments (SOI).
The SOI begins on page 16.
| | | | |
| | | |
| franklintempleton.com | | Annual Report | | 3 |
TEMPLETON WORLD FUND
central banks to increase interest rates sooner than expected. Markets were further pressured by the Trump administration’s protectionist trade policies, U.S. trade disputes with its allies and China, and fears of tighter regulation in the information technology (IT) sector. A sudden decrease in the Turkish lira’s value in August also hurt investor confidence, particularly in emerging markets. But investors were encouraged by an overall easing of tensions in the Korean peninsula in the latter part of the period , a U.S.-EU agreement to try to reduce trade barriers, and a trade deal between the U.S. and Mexico near period-end.
The U.S. economy grew during the 12 months under review. After moderating for three consecutive quarters, the economy grew faster in 2018’s second quarter, driven by consumer spending, business investment, exports and government spending. The unemployment rate declined from 4.4% in August 2017, as reported at the beginning of the 12-month period, to 3.9% at period-end.4 Annual inflation, as measured by the Consumer Price Index, increased from 1.9% in August 2017, as reported at the beginning of the period, to 2.7% at period-end.4 The U.S. Federal Reserve (Fed) began reducing its balance sheet in October 2017 and raised its target range for the federal funds rate three times during the period to 1.75%–2.00%. In August 2018, Fed Chair Jerome Powell reiterated the Fed’s intention to gradually raise interest rates.
In Europe, the U.K.’s quarterly economic growth moderated in 2018’s first quarter but accelerated in the second quarter. The Bank of England raised its key policy rate twice during the period. The eurozone’s quarterly growth moderated in 2018’s first quarter and remained stable in the second quarter. The bloc’s annual inflation rate ended the period higher than in August 2017. The ECB kept its benchmark interest rate unchanged during the period. However, at its October 2017 meeting, the ECB extended the time frame for its bond-buying program from December 2017 to at least September 2018, while reducing the amount of monthly bond purchases in half beginning in January 2018. In June, the ECB announced it would further reduce its monthly bond purchases beginning in October 2018, and indicated it would conclude the program at the end of 2018, while keeping interest rates unchanged through at least the summer of 2019.
In Asia, Japan’s quarterly gross domestic product (GDP) contracted in 2018’s first quarter but expanded in the second quarter. The Bank of Japan left its benchmark interest rate unchanged during the period and continued its monetary stimulus measures.
Top 10 Sectors/Industries
8/31/18
| | |
| | | % of Total Net Assets |
Banks | | 13.5% |
Pharmaceuticals | | 13.1% |
Oil, Gas & Consumable Fuels | | 11.8% |
Media | | 3.8% |
Wireless Telecommunication Services | | 3.4% |
Insurance | | 3.2% |
Internet Software & Services | | 3.0% |
Diversified Telecommunication Services | | 3.0% |
Industrial Conglomerates | | 2.8% |
Multi-Utilities | | 2.6% |
In emerging markets, Brazil’s quarterly GDP growth accelerated in 2018’s first and second quarters. The country’s central bank cut its benchmark interest rate several times during the period to spur economic growth. Russia’s annual GDP growth rate slowed in 2017’s fourth quarter but accelerated in 2018’s first and second quarters, amid the Bank of Russia’s continued policy support. China’s annual GDP moderated in 2018’s second quarter, after growing at a stable rate in the previous two quarters. The People’s Bank of China left its benchmark interest rate unchanged during the period, but it took measures to improve financial liquidity to mitigate the negative effects of the U.S.-China trade dispute and support economic growth. Overall, emerging market stocks, as measured by the MSCI Emerging Markets Index, declined during the period.
Investment Strategy
Our investment strategy employs a bottom-up, value-oriented, long-term approach. We focus on the market price of a company’s securities relative to our evaluation of the company’s long-term earnings, asset value and cash flow potential. We also consider the company’s price/earnings ratio, price/cash flow ratio, profit margins and liquidation value.
Manager’s Discussion
Global equities advanced during the 12 months under review, a period when global economic growth and tailwinds from U.S. tax reform ultimately gave way to concerns about rising trade tensions and less accommodative monetary policy.
The Fund delivered absolute gains during the period but underperformed its benchmark, the MSCI ACWI 100%
4. Source: U.S. Bureau of Labor Statistics.
| | | | |
| | | |
4 | | Annual Report | | franklintempleton.com |
TEMPLETON WORLD FUND
Hedged to USD, in large part due to our underweighted exposures to growth stocks (not least of all those in the U.S. and the IT sector, as well as technology-related stocks in other sectors, such as consumer discretionary).5 Among IT and technology-related stocks, not owning Amazon.com significantly detracted from the Fund’s relative performance during the 12-month period. Amazon.com, a leading e-commerce and internet platform company powered by technological innovation, is a U.S. company with an impressive growth profile, but with an extremely high price relative to next year’s projected earnings, a very low net profit margin and 0% dividend payout, it does not look like a great investment at these levels, in our view. Indeed, for the same market capitalization as Amazon.com at period-end, investors could own the Fund’s top seven holdings, and get roughly four times the revenues, 25 times the earnings and eight times the free cash flow, as well as a single-digit percentage dividend yield. Even assuming an incredible double-digit percentage annualized sales growth rate through the next decade (as the market consensus assumes), Amazon.com’s potential downside could be substantial once it eventually attains a more mature valuation and profit margin profile like, for instance, Walmart (not a Fund holding). Historically, we have done best in the IT sector by avoiding stocks that we believe are pricing in exuberant growth expectations and by focusing instead on market leaders with what we consider reliable cash-generating potential that can be acquired cheaply due to temporary setbacks or concerns about future growth. Examples include U.S. hardware giant Apple and U.S. software leader Microsoft, both of which we liquidated during the period as we used recent share price strength as a profit-taking opportunity, as well as another U.S. software leader, Oracle. We are confident this disciplined approach would again be rewarded as share prices eventually converge with fundamentals in the IT sector over time.
Other sectors that notably detracted from relative performance included health care, due to stock selection, and financials, due to stock selection and an overweighted allocation.6 In health care, shares of U.S. biotechnology firm Allergan remained under pressure. The company has suffered a number of setbacks in recent years, including a failed merger and the loss of patent exclusivity on a key drug. Yet, even adjusting for the patent loss, Allergan shares still trade at valuations significantly below their long-term historical average. We believe that seems
Top 10 Holdings
8/31/18
| | |
| |
Company Sector/Industry, Country | | % of Total Net Assets |
| |
SES SA Media, Luxembourg | | 2.5% |
| |
Royal Dutch Shell PLC Oil, Gas & Consumable Fuels, U.K. | | 2.4% |
| |
Citigroup Inc. Banks, U.S. | | 2.3% |
| |
Eni SpA Oil, Gas & Consumable Fuels, Italy | | 2.3% |
| |
Allergan PLC Pharmaceuticals, U.S. | | 2.1% |
| |
Roche Holding AG Pharmaceuticals, Switzerland | | 2.1% |
| |
BP PLC Oil, Gas & Consumable Fuels, U.K. | | 2.1% |
| |
Oracle Corp. Software, U.S. | | 2.0% |
| |
Singapore Telecommunications Ltd. Diversified Telecommunication Services, Singapore | | 1.9% |
| |
Teva Pharmaceutical Industries Ltd. Pharmaceuticals, Israel | | 1.9% |
very pessimistic for a company with healthy cash generation that should grow revenues at a mid-single digit percentage rate and earnings at an even faster rate thanks to an improving business mix that sees a higher proportion of future cash flows coming from highly profitable, long-duration franchises. Despite isolated stock-specific weakness, we were encouraged to see health care stocks more broadly begin to recover during the review period as investors set aside concerns about generic competition, regulatory scrutiny and a consolidating payer industry, and instead reassessed the sector’s cheap valuations and attractive defensive characteristics. Major pharmaceuticals stocks have been trading at valuations that discount single-digit percentage earnings growth despite generating free cash flow yields in excess of the IT sector and delivering double-digit percentage returns on equity. Furthermore, we believe the sector may prove relatively immune to escalating trade wars given largely domestic supply chains and government incentives to keep costs down.
In financials, French lender BNP Paribas and U.K.-based emerging markets bank Standard Chartered led the sector lower. BNP was pressured primarily by concerns about its
5. The IT sector comprises communications equipment; electronic equipment, instruments and components; internet software and services; software; and technology hardware, storage and peripherals in the SOI. The consumer discretionary sector comprises automobiles, household durables, leisure products, media and specialty retail in the SOI.
6. The health care sector comprises biotechnology, health care providers and services, life sciences tools and services, and pharmaceuticals in the SOI. The financials sector comprises banks, capital markets, consumer finance, diversified financial services and insurance in the SOI.
| | | | |
| | | |
| franklintempleton.com | | Annual Report | | 5 |
TEMPLETON WORLD FUND
exposure to Italian sovereign debt during a period when non-traditionalist political parties struggled to form a coalition government. Despite concerns about an Italian exit from the EU, it is worth noting that neither of the coalition parties ran on a “leave” campaign, popular opinion favors staying in the union, and in all likelihood an EU disintegration would devastate the Italian economy and banking system. More specifically, we view BNP Paribas as a highly diversified bank with a solid track record of profitability that continues to strengthen its capital ratios. We believe BNP should continue to generate a satisfactory return on capital—much of which will be rewarded to shareholders—given the positive business trends across many of its territories. Standard Chartered’s stock declined amid increasing emerging market turmoil and investor impatience about the timing of an eventual earnings recovery. We also revisited this stock during the period, and we concluded that recent weakness represents an additional buying opportunity. Company management has successfully executed on its planned strategic actions to reduce risk, control costs and strengthen the balance sheet. Its focus going forward will be on growing revenues and profitability, which we believe is possible given Standard Chartered’s strong brand and positioning in high GDP growth markets across Asia, the Middle East and Africa. The firm’s restored balance sheet provides ample liquidity and excess capital to finance the growth in these markets, in our assessment, and we expect a meaningful expansion in Standard Chartered’s very low price-to-tangible book value ratio as that growth comes through.
Turning to contributors, stock selection and an overweighted allocation in the energy sector contributed to relative performance.7 U.S.-based oil exploration and production firm ConocoPhillips was among the sector’s top contributors, rallying as higher oil prices led management to boost the dividend and buy back shares. Our thesis on ConocoPhillips was largely predicated on its capital return prospects; encouragingly, despite higher oil prices, company management has focused more on returning excess cash to shareholders than investing in growth. The market has rewarded that discipline, sending shares to multi-year highs during the review period. With valuations approaching levels we consider fair value, we used recent stock price strength as a profit-taking opportunity and liquidated the Fund’s stake in ConocoPhillips. We have been taking profits on higher-volatility, oil price-sensitive
Top 10 Countries
8/31/18
| | |
| | | % of Total Net Assets |
| |
U.S. | | 33.9% |
| |
U.K. | | 10.5% |
| |
France | | 6.7% |
| |
Germany | | 5.5% |
| |
China | | 5.4% |
| |
Japan | | 4.6% |
| |
Switzerland | | 3.7% |
| |
South Korea | | 3.7% |
| |
Netherlands | | 3.0% |
| |
Italy | | 2.7% |
energy stocks more generally amid improving market sentiment and oil prices hovering above the marginal cost of production. Within the energy sector more broadly, we are finding what we consider the most attractive risk-reward characteristics among large integrated companies whose stocks, in our analysis, are not fully discounting likely sustained higher oil prices, and which may prove more defensive if crude oil prices retreat. Encouragingly, management at these companies are also exhibiting strategic focus and cost discipline, as evidenced by the fact that the sector in aggregate should generate higher free cash flows this year than it did when oil traded at $100 per barrel. As these cash flows materialize, reassuring investors that the sector’s high dividend payouts can be fully covered, we expect additional upside potential for our select energy holdings.
Other sectors that contributed to relative performance included industrials, due to stock selection and an underweighted allocation, and real estate, due to an underweighted allocation.8
The Fund’s currency hedges had a positive effect on Fund performance during the 12 months under review. However, one cannot expect the same results for future periods.
From a regional standpoint, stock selection and an unfavorable underweighting in the U.S. detracted significantly from the Fund’s relative performance. The U.S. continues to look expensive and generally late in the cycle, in our view. Indeed, the U.S. economic expansion is the second longest (and, by some measures, the weakest) on record, corporate profits appear to be near peak levels, and U.S. stocks are approaching
7. The energy sector comprises energy equipment and services and oil, gas and consumable fuels in the SOI.
8. The industrials sector comprises aerospace and defense, air freight and logistics, building products, electrical equipment, industrial conglomerates, machinery, and marine in the SOI. The real estate sector comprises real estate management and development in the SOI.
See www.franklintempletondatasources.com for additional data provider information.
| | | | |
| | | |
6 | | Annual Report | | franklintempleton.com |
TEMPLETON WORLD FUND
the most expensive levels in history based on the metrics most correlated to long-term returns. Tax reform has contributed to near-term corporate earnings, but that is largely reflected in stock valuations, in our analysis. We believe that unlike Europe, where the risk premium is high and has room to recede, risk appears under-discounted in the U.S., where valuations may inadequately reflect tightening monetary policy, a mature profit cycle and rising trade tensions.
An overweighted allocation in Europe, as well as stock selection and an overweighted allocation in Asia, also hindered relative performance. Europe’s overall trailing 12-month price-to-earnings ratio has halved in just the past two years, and the region trades at the steepest discount to the U.S. based on price-to-book ratios in decades, in our analysis. Despite some softening thus far in 2018, we believe the economic backdrop in the eurozone remains broadly expansionary. In our view, an environment of balanced budgets, easier fiscal policy, still-accommodative monetary policy, and accelerating investment supported by high-capacity utilization remains auspicious. In Asia, we believe the best opportunities in the region are those based on the long-term wealth accumulation and demand potential of the region’s consumers. We are finding many such opportunities among providers of the critical services and infrastructure—utilities, telecommunication services and insurers—required to facilitate the rise of a middle class. Emerging markets more generally have been buffeted by a series of headwinds originating in the U.S., including a stronger U.S. dollar and diminished liquidity resulting from the Fed’s quantitative tightening, as well as the uncertainty surrounding trade. We believe those threats are at least partially reflected in emerging market equity valuations hovering near three-year lows, and we continue to find select opportunities among emerging market stocks we consider to be cheaply valued and have unique value catalysts.
We continue to believe circumstances are poised to improve for value investors as the anomalous conditions dominating this growth-oriented market begin to normalize. Keep in mind that value globally has only been cheaper a small percentage of the time in the past 30 years, creating an attractive opportunity for contrarian investors. Yet, despite our conviction on value’s long-term prospects, we are not sitting idly by waiting for the cycle to turn. We have worked hard to continuously refine and improve our process, with recent initiatives including improved risk management strategies and the integration of ESG (environmental, social and governance) analysis into our investment framework. The goal in these efforts is to ensure that our investment process remains true to Templeton’s
time-tested fundamental value approach, while also evolving to best address client goals and market conditions.
Thank you for your continued participation in Templeton World Fund. We look forward to serving your future investment needs.
| | |
 | | 
Norman J. Boersma, CFA Tucker Scott, CFA James Harper, CFA Heather Arnold, CFA Christopher James Peel, CFA Herbert J. Arnett, Jr. Portfolio Management Team |
The foregoing information reflects our analysis, opinions and portfolio holdings as of August 31, 2018, the end of the reporting period. The way we implement our main investment strategies and the resulting portfolio holdings may change depending on factors such as market and economic conditions. These opinions may not be relied upon as investment advice or an offer for a particular security. The information is not a complete analysis of every aspect of any market, country, industry, security or the Fund. Statements of fact are from sources considered reliable, but the investment manager makes no representation or warranty as to their completeness or accuracy. Although historical performance is no guarantee of future results, these insights may help you understand our investment management philosophy.
| | | | |
| | | |
| franklintempleton.com | | Annual Report | | 7 |
TEMPLETON WORLD FUND
Performance Summary as of August 31, 2018
The performance table and graphs do not reflect any taxes that a shareholder would pay on Fund dividends, capital gain distributions, if any, or any realized gains on the sale of Fund shares. Total return reflects reinvestment of the Fund’s dividends and capital gain distributions, if any, and any unrealized gains or losses. Your dividend income will vary depending on dividends or interest paid by securities in the Fund’s portfolio, adjusted for operating expenses of each class. Capital gain distributions are net profits realized from the sale of portfolio securities.
Performance as of 8/31/18
Cumulative total return excludes sales charges. Average annual total return includes maximum sales charges. Sales charges will vary depending on the size of the investment and the class of share purchased. The maximum is 5.75% and the minimum is 0%. Class A: 5.75% maximum initial sales charge; Advisor Class: no sales charges. For other share classes, visit franklintempleton.com.
| | | | | | | | |
| Share Class | | Cumulative Total Return1 | | | Average Annual Total Return2 | |
| | |
A | | | | | | | | |
| | |
1-Year | | | +7.81% | | | | +1.63% | |
| | |
5-Year | | | +33.51% | | | | +4.70% | |
| | |
10-Year | | | +77.98% | | | | +5.31% | |
| | |
Advisor | | | | | | | | |
| | |
1-Year | | | +8.09% | | | | +8.09% | |
| | |
5-Year | | | +35.26% | | | | +6.23% | |
| | |
10-Year | | | +82.57% | | | | +6.20% | |
Performance data represent past performance, which does not guarantee future results. Investment return and principal value will fluctuate, and you may have a gain or loss when you sell your shares. Current performance may differ from figures shown. For most recent month-end performance, go to franklintempleton.com or call (800) 342-5236.
See page 10 for Performance Summary footnotes.
| | | | |
| | | |
8 | | Annual Report | | franklintempleton.com |
TEMPLETON WORLD FUND
PERFORMANCE SUMMARY
Total Return Index Comparison for a Hypothetical $10,000 Investment
Total return represents the change in value of an investment over the periods shown. It includes any applicable maximum sales charge, Fund expenses, account fees and reinvested distributions. The unmanaged indexes include reinvestment of any income or distributions. They differ from the Fund in composition and do not pay management fees or expenses. One cannot invest directly in an index.
Class A (9/1/08–8/31/18)
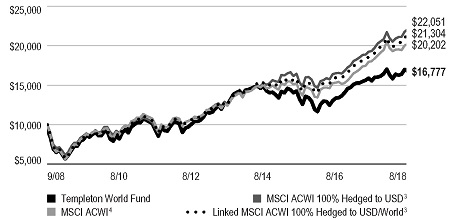
Advisor Class (9/1/08–8/31/18)
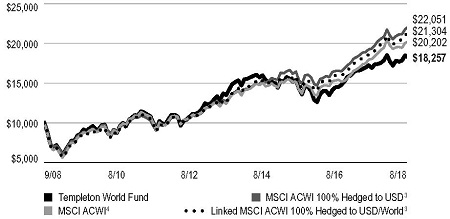
See page 10 for Performance Summary footnotes.
| | | | |
| | | |
| franklintempleton.com | | Annual Report | | 9 |
TEMPLETON WORLD FUND
PERFORMANCE SUMMARY
Distributions (9/1/17–8/31/18)
| | | | | | | | | | | | | | | | |
Share Class | | Net Investment Income | | | Short-Term Capital Gain | | | Long-Term Capital Gain | | | Total | |
| | | | |
A | | | $0.0204 | | | | $0.1551 | | | | $0.8321 | | | | $1.0076 | |
| | | | |
C | | | $ — | | | | $0.1551 | | | | $0.8321 | | | | $0.9872 | |
| | | | |
R6 | | | $0.0807 | | | | $0.1551 | | | | $0.8321 | | | | $1.0679 | |
| | | | |
Advisor | | | $0.0638 | | | | $0.1551 | | | | $0.8321 | | | | $1.0510 | |
Total Annual Operating Expenses5
| | | | |
| Share Class | | | |
| |
| A | | | 1.05% | |
| |
| Advisor | | | 0.80% | |
Each class of shares is available to certain eligible investors and has different annual fees and expenses, as described in the prospectus.
All investments involve risks, including possible loss of principal. Special risks are associated with foreign investing, including currency fluctuations, economic instability and political developments; investments in developing markets involve heightened risks related to the same factors. Currency rates may fluctuate significantly over short periods of time, and can reduce returns. Because the Fund may invest its assets in companies in a specific region, including Europe, it is subject to greater risks of adverse developments in that region and/or the surrounding regions than a fund that is more broadly diversified geographically. Current political and financial uncertainty surrounding the European Union may increase market volatility and the economic risk of investing in companies in Europe. Derivatives, including currency management strategies, involve costs and can create economic leverage in the portfolio which may result in significant volatility and cause the Fund to participate in losses (as well as enable gains) on an amount that exceeds the Fund’s initial investment. The Fund may not achieve the anticipated benefits, and may realize losses when a counterparty fails to perform as promised. The Fund is actively managed but there is no guarantee that the manager’s investment decisions will produce the desired results. The Fund’s prospectus also includes a description of the main investment risks.
1. Cumulative total return represents the change in value of an investment over the periods indicated.
2. Average annual total return represents the average annual change in value of an investment over the periods indicated. Return for less than one year, if any, has not been annualized.
3. Source: FactSet. The MSCI ACWI 100% Hedged to USD represents a close estimation of the performance that can be achieved by hedging the currency exposures of its parent index, the MSCI ACWI, to the USD, the “home” currency for the hedged index. The Linked MSCI ACWI 100% Hedged to USD/World reflects performance of the MSCI World Index through 6/29/2016 and performance of the MSCI ACWI 100% Hedged to USD thereafter.
4. Source: Morningstar. The MSCI ACWI is a free float-adjusted, market capitalization-weighted index designed to measure equity market performance in global developed and emerging markets.
5. Figures are as stated in the Fund’s current prospectus and may differ from the expense ratios disclosed in the Your Fund’s Expenses and Financial Highlights sections in this report. In periods of market volatility, assets may decline significantly, causing total annual Fund operating expenses to become higher than the figures shown.
See www.franklintempletondatasources.com for additional data provider information.
| | | | |
| | | |
10 | | Annual Report | | franklintempleton.com |
TEMPLETON WORLD FUND
Your Fund’s Expenses
As a Fund shareholder, you can incur two types of costs: (1) transaction costs, including sales charges (loads) on Fund purchases and redemptions; and (2) ongoing Fund costs, including management fees, distribution and service (12b-1) fees, and other Fund expenses. All mutual funds have ongoing costs, sometimes referred to as operating expenses. The table below shows ongoing costs of investing in the Fund and can help you understand these costs and compare them with those of other mutual funds. The table assumes a $1,000 investment held for the six months indicated.
Actual Fund Expenses
The table below provides information about actual account values and actual expenses in the columns under the heading “Actual.” In these columns the Fund’s actual return, which includes the effect of Fund expenses, is used to calculate the “Ending Account Value” for each class of shares. You can estimate the expenses you paid during the period by following these steps (of course, your account value and expenses will differ from those in this illustration): Divide your account value by $1,000 (if your account had an $8,600 value, then $8,600 ÷ $1,000 = 8.6). Then multiply the result by the number in the row for your class of shares under the headings “Actual” and “Expenses Paid During Period” (if Actual Expenses Paid During Period were $7.50, then 8.6 x $7.50 = $64.50). In this illustration, the actual expenses paid this period are $64.50.
Hypothetical Example for Comparison with Other Funds
Under the heading “Hypothetical” in the table, information is provided about hypothetical account values and hypothetical expenses based on the Fund’s actual expense ratio and an assumed rate of return of 5% per year before expenses, which is not the Fund’s actual return. This information may not be used to estimate the actual ending account balance or expenses you paid for the period, but it can help you compare ongoing costs of investing in the Fund with those of other funds. To do so, compare this 5% hypothetical example for the class of shares you hold with the 5% hypothetical examples that appear in the shareholder reports of other funds.
Please note that expenses shown in the table are meant to highlight ongoing costs and do not reflect any transactional costs. Therefore, information under the heading “Hypothetical” is useful in comparing ongoing costs only, and will not help you compare total costs of owning different funds. In addition, if transactional costs were included, your total costs would have been higher.
| | | | | | | | | | | | |
| | | | | Actual (actual return after expenses) | | Hypothetical (5% annual return before expenses) | | |
| | | | | | | | |
Share Class | | Beginning
Account Value 3/1/18 | | Ending
Account
Value 8/31/18 | | Expenses Paid During Period 3/1/18–8/31/181,2 | | Ending
Account
Value 8/31/18 | | Expenses Paid During Period 3/1/18–8/31/181,2 | | Net Annualized Expense Ratio2 |
| | | | | | |
A | | $ 1,000 | | $ 1,028.00 | | $5.16 | | $1,020.11 | | $ 5.14 | | 1.01% |
C | | $ 1,000 | | $ 1,024.40 | | $9.03 | | $1,016.28 | | $ 9.00 | | 1.77% |
R6 | | $ 1,000 | | $ 1,029.30 | | $3.73 | | $1,021.53 | | $ 3.72 | | 0.73% |
Advisor | | $ 1,000 | | $ 1,029.90 | | $3.94 | | $1,021.32 | | $ 3.92 | | 0.77% |
1. Expenses are equal to the annualized expense ratio for the six-month period as indicated above—in the far right column—multiplied by the simple average account value over the period indicated, and then multiplied by 184/365 to reflect the one-half year period.
2. Reflects expenses after fee waivers and expense reimbursements, for Class R6.
| | | | |
| | | |
| franklintempleton.com | | Annual Report | | 11 |
TEMPLETON FUNDS
Financial Highlights
Templeton World Fund
| | | | | | | | | | | | | | | | | | |
| | | | | | Year Ended August 31, | | | |
| | | 2018 | | | 2017 | | | 2016 | | | 2015 | | | 2014 |
| | | | | |
Class A | | | | | | | | | | | | | | | | | | |
| | | | | |
Per share operating performance | | | | | | | | | | | | | | | | | | |
(for a share outstanding throughout the year) | | | | | | | | | | | | | | | | | | |
| | | | | |
Net asset value, beginning of year | | | $16.94 | | | | $15.47 | | | | $16.51 | | | | $20.18 | | | $18.02 |
| | | | | |
Income from investment operationsa: | | | | | | | | | | | | | | | | | | |
Net investment incomeb | | | 0.28 | | | | 0.27 | | | | 0.26 | | | | 0.29 | | | 0.43c |
Net realized and unrealized gains (losses) | | | 1.03 | | | | 2.21 | | | | (0.17 | ) | | | (2.35 | ) | | 2.75 |
| | | | | |
Total from investment operations | | | 1.31 | | | | 2.48 | | | | 0.09 | | | | (2.06 | ) | | 3.18 |
| | | | | |
Less distributions from: | | | | | | | | | | | | | | | | | | |
Net investment income | | | (0.02 | ) | | | (0.57 | ) | | | (0.28 | ) | | | (0.52 | ) | | (0.19) |
Net realized gains | | | (0.99 | ) | | | (0.44 | ) | | | (0.85 | ) | | | (1.09 | ) | | (0.83) |
| | | | | |
Total distributions | | | (1.01 | ) | | | (1.01 | ) | | | (1.13 | ) | | | (1.61 | ) | | (1.02) |
| | | | | |
Net asset value, end of year | | | $17.24 | | | | $16.94 | | | | $15.47 | | | | $16.51 | | | $20.18 |
| | | | | |
Total returnd | | | 7.81% | | | | 16.45% | | | | 0.84% | | | | (10.59)% | | | 17.96% |
| | | | | |
Ratios to average net assets | | | | | | | | | | | | | | | | | | |
Expenses | | | 1.04% | e | | | 1.06% | e,f | | | 1.07% | f | | | 1.06% | f | | 1.05% |
Net investment income | | | 1.64% | | | | 1.63% | | | | 1.73% | | | | 1.61% | | | 2.20%c |
| | | | | |
Supplemental data | | | | | | | | | | | | | | | | | | |
Net assets, end of year (000’s) | | | $3,973,648 | | | | $4,240,117 | | | | $4,195,518 | | | | $4,791,792 | | | $5,917,398 |
Portfolio turnover rate | | | 28.39% | | | | 31.46% | | | | 21.62% | | | | 15.73% | | | 18.56% |
aThe amount shown for a share outstanding throughout the period may not correlate with the Statement of Operations for the period due to the timing of sales and repurchases of the Fund’s shares in relation to income earned and/or fluctuating fair value of the investments of the Fund.
bBased on average daily shares outstanding.
cNet investment income per share includes approximately $0.18 per share related to income received in the form of special dividends in connection with certain Fund holdings. Excluding this amount, the ratio of net investment income to average net assets would have been 1.30%.
dTotal return does not reflect sales commissions or contingent deferred sales charges, if applicable.
eBenefit of expense reduction rounds to less than 0.01%.
fBenefit of waiver and payments by affiliates rounds to less than 0.01%.
| | | | |
| | | |
12 | | Annual Report | The accompanying notes are an integral part of these financial statements. | | franklintempleton.com |
TEMPLETON FUNDS
FINANCIAL HIGHLIGHTS
Templeton World Fund (continued)
| | | | | | | | | | | | | | | | | | |
| | | | | | Year Ended August 31, | | | |
| | | 2018 | | | 2017 | | | 2016 | | | 2015 | | | 2014 |
| | | | | |
Class C | | | | | | | | | | | | | | | | | | |
| | | | | |
Per share operating performance | | | | | | | | | | | | | | | | | | |
(for a share outstanding throughout the year) | | | | | | | | | | | | | | | | | | |
| | | | | |
Net asset value, beginning of year | | | $16.21 | | | | $14.84 | | | | $15.86 | | | | $19.44 | | | $17.40 |
| | | | | |
Income from investment operationsa: | | | | | | | | | | | | | | | | | | |
Net investment incomeb | | | 0.14 | | | | 0.14 | | | | 0.14 | | | | 0.15 | | | 0.27c |
Net realized and unrealized gains (losses) | | | 0.99 | | | | 2.12 | | | | (0.16 | ) | | | (2.26 | ) | | 2.66 |
| | | | | |
Total from investment operations | | | 1.13 | | | | 2.26 | | | | (0.02 | ) | | | (2.11 | ) | | 2.93 |
| | | | | |
Less distributions from: | | | | | | | | | | | | | | | | | | |
Net investment income | | | — | | | | (0.45 | ) | | | (0.15 | ) | | | (0.38 | ) | | (0.06) |
Net realized gains | | | (0.99 | ) | | | (0.44 | ) | | | (0.85 | ) | | | (1.09 | ) | | (0.83) |
| | | | | |
Total distributions | | | (0.99 | ) | | | (0.89 | ) | | | (1.00 | ) | | | (1.47 | ) | | (0.89) |
| | | | | |
Net asset value, end of year | | | $16.35 | | | | $16.21 | | | | $14.84 | | | | $15.86 | | | $19.44 |
| | | | | |
Total returnd | | | 7.01% | | | | 15.59% | | | | 0.11% | | | | (11.27)% | | | 17.08% |
| | | | | |
Ratios to average net assets | | | | | | | | | | | | | | | | | | |
| | | | | |
Expenses | | | 1.80% | e | | | 1.81% | e,f | | | 1.82% | f | | | 1.81% | f | | 1.80% |
Net investment income | | | 0.88% | | | | 0.88% | | | | 0.98% | | | | 0.86% | | | 1.45%c |
| | | | | |
Supplemental data | | | | | | | | | | | | | | | | | | |
Net assets, end of year (000’s) | | | $117,879 | | | | $138,534 | | | | $158,126 | | | | $193,309 | | | $241,635 |
Portfolio turnover rate | | | 28.39% | | | | 31.46% | | | | 21.62% | | | | 15.73% | | | 18.56% |
aThe amount shown for a share outstanding throughout the period may not correlate with the Statement of Operations for the period due to the timing of sales and repurchases of the Fund’s shares in relation to income earned and/or fluctuating fair value of the investments of the Fund.
bBased on average daily shares outstanding.
cNet investment income per share includes approximately $0.18 per share related to income received in the form of special dividends in connection with certain Fund holdings. Excluding this amount, the ratio of net investment income to average net assets would have been 0.55%.
dTotal return does not reflect sales commissions or contingent deferred sales charges, if applicable.
eBenefit of expense reduction rounds to less than 0.01%.
fBenefit of waiver and payments by affiliates rounds to less than 0.01%.
| | | | |
| | | |
| franklintempleton.com | | The accompanying notes are an integral part of these financial statements. | Annual Report | | 13 |
TEMPLETON FUNDS
FINANCIAL HIGHLIGHTS
Templeton World Fund (continued)
| | | | | | | | | | | | | | | | | | |
| | | | | | Year Ended August 31, | | | |
| | | 2018 | | | 2017 | | | 2016 | | | 2015 | | | 2014 |
| | | | | |
Class R6 | | | | | | | | | | | | | | | | | | |
| | | | | |
Per share operating performance | | | | | | | | | | | | | | | | | | |
(for a share outstanding throughout the year) | | | | | | | | | | | | | | | | | | |
Net asset value, beginning of year | | | $16.92 | | | | $15.45 | | | | $16.50 | | | | $20.18 | | | $18.02 |
| | | | | |
Income from investment operationsa: | | | | | | | | | | | | | | | | | | |
Net investment incomeb | | | 0.33 | | | | 0.32 | | | | 0.32 | | | | 0.35 | | | 0.57c |
Net realized and unrealized gains (losses) | | | 1.03 | | | | 2.22 | | | | (0.18 | ) | | | (2.35 | ) | | 2.67 |
| | | | | |
Total from investment operations | | | 1.36 | | | | 2.54 | | | | 0.14 | | | | (2.00 | ) | | 3.24 |
| | | | | |
Less distributions from: | | | | | | | | | | | | | | | | | | |
Net investment income | | | (0.08 | ) | | | (0.63 | ) | | | (0.34 | ) | | | (0.59 | ) | | (0.25) |
Net realized gains | | | (0.99 | ) | | | (0.44 | ) | | | (0.85 | ) | | | (1.09 | ) | | (0.83) |
| | | | | |
Total distributions | | | (1.07 | ) | | | (1.07 | ) | | | (1.19 | ) | | | (1.68 | ) | | (1.08) |
| | | | | |
Net asset value, end of year | | | $17.21 | | | | $16.92 | | | | $15.45 | | | | $16.50 | | | $20.18 |
| | | | | |
Total return | | | 8.13% | | | | 16.87% | | | | 1.18% | | | | (10.30 | )% | | 18.40% |
| | | | | |
Ratios to average net assets | | | | | | | | | | | | | | | | | | |
| | | | | |
Expenses before waiver and payments by affiliates and expense reduction | | | 0.74% | | | | 0.73% | | | | 0.72% | | | | 0.72% | | | 0.72% |
Expenses net of waiver and payments by affiliates and expense reduction | | | 0.72% | d | | | 0.73% | d,e | | | 0.72% | e | | | 0.72% | e | | 0.72% |
Net investment income | | | 1.96% | | | | 1.96% | | | | 2.08% | | | | 1.95% | | | 2.53%c |
| | | | | |
Supplemental data | | | | | | | | | | | | | | | | | | |
| | | | | |
Net assets, end of year (000’s) | | | $51,431 | | | | $55,504 | | | | $50,487 | | | | $51,733 | | | $55,175 |
Portfolio turnover rate | | | 28.39% | | | | 31.46% | | | | 21.62% | | | | 15.73% | | | 18.56% |
aThe amount shown for a share outstanding throughout the period may not correlate with the Statement of Operations for the period due to the timing of sales and repurchases of the Fund’s shares in relation to income earned and/or fluctuating fair value of the investments of the Fund.
bBased on average daily shares outstanding.
cNet investment income per share includes approximately $0.18 per share related to income received in the form of special dividends in connection with certain Fund holdings. Excluding this amount, the ratio of net investment income to average net assets would have been 1.63%.
dBenefit of expense reduction rounds to less than 0.01%.
eBenefit of waiver and payments by affiliates rounds to less than 0.01%.
| | | | |
| | | |
14 | | Annual Report | The accompanying notes are an integral part of these financial statements. | | franklintempleton.com |
TEMPLETON FUNDS
FINANCIAL HIGHLIGHTS
Templeton World Fund (continued)
| | | | | | | | | | | | | | | | | | |
| | | | | | Year Ended August 31, | | | |
| | | 2018 | | | 2017 | | | 2016 | | | 2015 | | | 2014 |
| | | | | |
Advisor Class | | | | | | | | | | | | | | | | | | |
| | | | | |
Per share operating performance | | | | | | | | | | | | | | | | | | |
(for a share outstanding throughout the year) | | | | | | | | | | | | | | | | | | |
| | | | | |
Net asset value, beginning of year | | | $16.93 | | | | $15.46 | | | | $16.50 | | | | $20.18 | | | $18.01 |
| | | | | |
Income from investment operationsa: | | | | | | | | | | | | | | | | | | |
Net investment incomeb | | | 0.32 | | | | 0.32 | | | | 0.30 | | | | 0.33 | | | 0.48c |
Net realized and unrealized gains (losses) | | | 1.03 | | | | 2.20 | | | | (0.17 | ) | | | (2.35 | ) | | 2.75 |
| | | | | |
Total from investment operations | | | 1.35 | | | | 2.52 | | | | 0.13 | | | | (2.02 | ) | | 3.23 |
| | | | | |
Less distributions from: | | | | | | | | | | | | | | | | | | |
Net investment income | | | (0.06 | ) | | | (0.61 | ) | | | (0.32 | ) | | | (0.57 | ) | | (0.23) |
Net realized gains | | | (0.99 | ) | | | (0.44 | ) | | | (0.85 | ) | | | (1.09 | ) | | (0.83) |
| | | | | |
Total distributions | | | (1.05 | ) | | | (1.05 | ) | | | (1.17 | ) | | | (1.66 | ) | | (1.06) |
| | | | | |
Net asset value, end of year | | | $17.23 | | | | $16.93 | | | | $15.46 | | | | $16.50 | | | $20.18 |
| | | | | |
Total return | | | 8.09% | | | | 16.74% | | | | 1.12% | | | | (10.38)% | | | 18.29% |
| | | | | |
Ratios to average net assets | | | | | | | | | | | | | | | | | | |
| | | | | |
Expenses | | | 0.80% | d | | | 0.81% | d,e | | | 0.82% | e | | | 0.81% | e | | 0.80% |
Net investment income | | | 1.88% | | | | 1.88% | | | | 1.98% | | | | 1.86% | | | 2.45%c |
| | | | | |
Supplemental data | | | | | | | | | | | | | | | | | | |
Net assets, end of year (000’s) | | | $146,883 | | | | $157,237 | | | | $113,455 | | | | $181,661 | | | $273,478 |
| | | | | |
Portfolio turnover rate | | | 28.39% | | | | 31.46% | | | | 21.62% | | | | 15.73% | | | 18.56% |
aThe amount shown for a share outstanding throughout the period may not correlate with the Statement of Operations for the period due to the timing of sales and repurchases of the Fund’s shares in relation to income earned and/or fluctuating fair value of the investments of the Fund.
bBased on average daily shares outstanding.
cNet investment income per share includes approximately $0.18 per share related to income received in the form of special dividends in connection with certain Fund holdings. Excluding this amount, the ratio of net investment income to average net assets would have been 1.55%.
dBenefit of expense reduction rounds to less than 0.01%.
eBenefit of waiver and payments by affiliates rounds to less than 0.01%.
| | | | |
| | | |
| franklintempleton.com | | The accompanying notes are an integral part of these financial statements. | Annual Report | | 15 |
TEMPLETON FUNDS
Statement of Investments, August 31, 2018
Templeton World Fund
| | | | | | | | | | | | |
| | | Industry | | | Shares | | | Value | |
Common Stocks 94.0% | | | | | | | | | | | | |
Canada 1.9% | | | | | | | | | | | | |
Husky Energy Inc. | | | Oil, Gas & Consumable Fuels | | | | 2,394,910 | | | $ | 39,595,601 | |
Wheaton Precious Metals Corp. | | | Metals & Mining | | | | 2,305,185 | | | | 39,489,704 | |
| | | | | | | | | | | | |
| | | | | | | | | | | 79,085,305 | |
| | | | | | | | | | | | |
China 5.4% | | | | | | | | | | | | |
aBaidu Inc., ADR | | | Internet Software & Services | | | | 299,800 | | | | 67,898,704 | |
China Life Insurance Co. Ltd., H | | | Insurance | | | | 11,080,000 | | | | 25,041,941 | |
China Mobile Ltd. | | | Wireless Telecommunication Services | | | | 4,684,500 | | | | 44,044,756 | |
China Telecom Corp. Ltd., H | | | Diversified Telecommunication Services | | | | 96,917,800 | | | | 45,562,182 | |
Kunlun Energy Co. Ltd. | | | Oil, Gas & Consumable Fuels | | | | 46,951,930 | | | | 49,050,327 | |
| | | | | | | | | | | | |
| | | | | | | | | | | 231,597,910 | |
| | | | | | | | | | | | |
Denmark 2.0% | | | | | | | | | | | | |
A.P. Moeller-Maersk AS, B | | | Marine | | | | 25,140 | | | | 38,790,112 | |
Vestas Wind Systems AS | | | Electrical Equipment | | | | 663,460 | | | | 46,217,053 | |
| | | | | | | | | | | | |
| | | | | | | | | | | 85,007,165 | |
| | | | | | | | | | | | |
France 6.7% | | | | | | | | | | | | |
AXA SA | | | Insurance | | | | 2,409,270 | | | | 60,795,482 | |
BNP Paribas SA | | | Banks | | | | 1,003,370 | | | | 58,893,363 | |
Compagnie de Saint-Gobain | | | Building Products | | | | 634,910 | | | | 27,308,798 | |
Credit Agricole SA. | | | Banks | | | | 1,616,380 | | | | 22,118,586 | |
Sanofi | | | Pharmaceuticals | | | | 762,310 | | | | 65,187,840 | |
Veolia Environnement SA | | | Multi-Utilities | | | | 2,521,590 | | | | 53,139,411 | |
| | | | | | | | | | | | |
| | | | | | | | | | | 287,443,480 | |
| | | | | | | | | | | | |
Germany 5.5% | | | | | | | | | | | | |
Bayer AG | | | Pharmaceuticals | | | | 578,800 | | | | 53,988,709 | |
E.ON SE | | | Multi-Utilities | | | | 4,004,370 | | | | 42,658,276 | |
aInnogy SE | | | Multi-Utilities | | | | 381,030 | | | | 16,514,909 | |
Merck KGaA | | | Pharmaceuticals | | | | 544,180 | | | | 57,137,546 | |
Siemens AG | | | Industrial Conglomerates | | | | 503,480 | | | | 65,425,810 | |
| | | |
| | | | | | | | | | | 235,725,250 | |
Hong Kong 1.3% | | | | | | | | | | | | |
CK Hutchison Holdings Ltd. | | | Industrial Conglomerates | | | | 4,827,560 | | | | 55,630,230 | |
| | | | | | | | | | | | |
India 1.5% | | | | | | | | | | | | |
Bharti Airtel Ltd. | | | Wireless Telecommunication Services | | | | 6,275,840 | | | | 33,926,923 | |
Hero Motocorp Ltd. | | | Automobiles | | | | 676,490 | | | | 31,000,115 | |
| | | | | | | | | | | | |
| | | | | | | | | | | 64,927,038 | |
| | | | | | | | | | | | |
Ireland 0.5% | | | | | | | | | | | | |
Bank of Ireland Group PLC | | | Banks | | | | 2,683,980 | | | | 21,926,956 | |
Israel 1.9% | | | | | | | | | | | | |
| | | |
Teva Pharmaceutical Industries Ltd., ADR | | | Pharmaceuticals | | | | 3,487,534 | | | | 79,899,404 | |
| | | | | | | | | | | | |
| | | |
Italy 2.7% | | | | | | | | | | | | |
Eni SpA | | | Oil, Gas & Consumable Fuels | | | | 5,225,004 | | | | 96,892,424 | |
UniCredit SpA | | | Banks | | | | 1,284,510 | | | | 18,534,240 | |
| | | | | | | | | | | | |
| | | | | | | | | | | 115,426,664 | |
| | | | | | | | | | | | |
Japan 4.6% | | | | | | | | | | | | |
Mitsui Fudosan Co. Ltd. | | | Real Estate Management & Development | | | | 1,763,640 | | | | 40,390,459 | |
Panasonic Corp. | | | Household Durables | | | | 4,532,240 | | | | 54,111,123 | |
Seven & i Holdings Co. Ltd. | | | Food & Staples Retailing | | | | 719,900 | | | | 29,319,540 | |
SoftBank Group Corp. | | | Wireless Telecommunication Services | | | | 254,840 | | | | 23,624,968 | |
| | | | |
| | | |
16 | | Annual Report | | franklintempleton.com |
TEMPLETON FUNDS
STATEMENT OF INVESTMENTS
Templeton World Fund (continued)
| | | | | | | | | | | | |
| | | Industry | | | Shares | | | Value | |
| | | |
Common Stocks (continued) | | | | | | | | | | | | |
Japan (continued) | | | | | | | | | | | | |
Suntory Beverage & Food Ltd. | | | Beverages | | | | 774,410 | | | $ | 31,748,684 | |
Taiheiyo Cement Corp. | | | Construction Materials | | | | 637,000 | | | | 19,263,940 | |
| | | | | | | | | | | | |
| | | | | | | | | | | 198,458,714 | |
| | | | | | | | | | | | |
Luxembourg 2.5% | | | | | | | | | | | | |
SES SA, IDR | | | Media | | | | 5,305,960 | | | | 106,398,163 | |
| | | | | | | | | | | | |
Netherlands 3.0% | | | | | | | | | | | | |
Aegon NV | | | Insurance | | | | 8,719,752 | | | | 52,273,906 | |
Akzo Nobel NV | | | Chemicals | | | | 166,603 | | | | 15,567,289 | |
ING Groep NV | | | Banks | | | | 3,700,392 | | | | 50,198,260 | |
aQIAGEN NV | | | Life Sciences Tools & Services | | | | 302,445 | | | | 11,704,926 | |
| | | | | | | | | | | | |
| | | | | | | | | | | 129,744,381 | |
| | | | | | | | | | | | |
Singapore 1.9% | | | | | | | | | | | | |
Singapore Telecommunications Ltd. | | | Diversified Telecommunication Services | | | | 35,154,451 | | | | 82,710,330 | |
| | | | | | | | | | | | |
South Korea 3.7% | | | | | | | | | | | | |
Hana Financial Group Inc. | | | Banks | | | | 774,787 | | | | 29,655,257 | |
KB Financial Group Inc. | | | Banks | | | | 1,099,016 | | | | 50,931,452 | |
Samsung Electronics Co. Ltd. | | | Technology Hardware, Storage & Peripherals | | | | 1,816,610 | | | | 78,894,545 | |
| | | | | | | | | | | | |
| | | | | | | | | | | 159,481,254 | |
| | | | | | | | | | | | |
Switzerland 3.7% | | | | | | | | | | | | |
Novartis AG | | | Pharmaceuticals | | | | 142,820 | | | | 11,840,412 | |
Roche Holding AG | | | Pharmaceuticals | | | | 370,492 | | | | 92,016,372 | |
UBS Group AG | | | Capital Markets | | | | 3,625,320 | | | | 56,592,459 | |
| | | | | | | | | | | | |
| | | | | | | | | | | 160,449,243 | |
| | | | | | | | | | | | |
Thailand 1.3% | | | | | | | | | | | | |
Bangkok Bank PCL, fgn | | | Banks | | | | 8,609,670 | | | | 54,647,890 | |
| | | | | | | | | | | | |
United Kingdom 10.5% | | | | | | | | | | | | |
BAE Systems PLC | | | Aerospace & Defense | | | | 2,600,339 | | | | 20,421,651 | |
Barclays PLC | | | Banks | | | | 9,035,622 | | | | 20,573,968 | |
BP PLC | | | Oil, Gas & Consumable Fuels | | | | 12,943,416 | | | | 91,804,212 | |
HSBC Holdings PLC | | | Banks | | | | 5,903,390 | | | | 51,174,183 | |
Kingfisher PLC | | | Specialty Retail | | | | 14,082,618 | | | | 49,914,759 | |
Man Group PLC | | | Capital Markets | | | | 7,928,861 | | | | 17,653,150 | |
Royal Dutch Shell PLC, B | | | Oil, Gas & Consumable Fuels | | | | 3,065,477 | | | | 100,926,570 | |
Standard Chartered PLC | | | Banks | | | | 6,246,036 | | | | 50,760,926 | |
Vodafone Group PLC | | | Wireless Telecommunication Services | | | | 21,136,365 | | | | 45,059,301 | |
| | | | | | | | | | | | |
| | | | | | | | | | | 448,288,720 | |
| | | | | | | | | | | | |
United States 33.4% | | | | | | | | | | | | |
Advance Auto Parts Inc. | | | Specialty Retail | | | | 329,690 | | | | 54,079,051 | |
Allergan PLC | | | Pharmaceuticals | | | | 480,810 | | | | 92,176,085 | |
Ally Financial Inc. | | | Consumer Finance | | | | 1,337,590 | | | | 35,954,419 | |
aAlphabet Inc., A | | | Internet Software & Services | | | | 50,460 | | | | 62,156,628 | |
AmerisourceBergen Corp. | | | Health Care Providers & Services | | | | 561,740 | | | | 50,539,748 | |
Amgen Inc. | | | Biotechnology | | | | 74,211 | | | | 14,828,100 | |
Apache Corp. | | | Oil, Gas & Consumable Fuels | | | | 1,395,970 | | | | 61,185,365 | |
Capital One Financial Corp. | | | Consumer Finance | | | | 626,450 | | | | 62,074,931 | |
Cardinal Health Inc. | | | Health Care Providers & Services | | | | 690,340 | | | | 36,028,845 | |
aCelgene Corp. | | | Biotechnology | | | | 201,150 | | | | 18,998,618 | |
Citigroup Inc. | | | Banks | | | | 1,402,610 | | | | 99,921,936 | |
Comcast Corp., A | | | Media | | | | 1,514,448 | | | | 56,019,432 | |
| | | | |
| | | |
| franklintempleton.com | | Annual Report | | 17 |
TEMPLETON FUNDS
STATEMENT OF INVESTMENTS
Templeton World Fund (continued)
| | | | | | | | | | | | |
| | | Industry | | | Shares | | | Value | |
| | | |
Common Stocks (continued) | | | | | | | | | | | | |
United States (continued) | | | | | | | | | | | | |
| | | |
aCommScope Holding Co. Inc. | | | Communications Equipment | | | | 1,022,110 | | | $ | 32,390,666 | |
Coty Inc., A | | | Personal Products | | | | 5,290,970 | | | | 65,396,389 | |
Eli Lilly & Co. | | | Pharmaceuticals | | | | 549,680 | | | | 58,073,692 | |
Exxon Mobil Corp. | | | Oil, Gas & Consumable Fuels | | | | 529,890 | | | | 42,481,281 | |
Gilead Sciences Inc. | | | Biotechnology | | | | 955,550 | | | | 72,363,801 | |
Helmerich & Payne Inc. | | | Energy Equipment & Services | | | | 206,100 | | | | 13,513,977 | |
JPMorgan Chase & Co. | | | Banks | | | | 413,914 | | | | 47,426,266 | |
Kellogg Co. | | | Food Products | | | | 401,200 | | | | 28,802,148 | |
aKnowles Corp. | | | Electronic Equipment, Instruments & Components | | | | 2,785,470 | | | | 50,500,571 | |
The Kroger Co. | | | Food & Staples Retailing | | | | 153,200 | | | | 4,825,800 | |
aMattel Inc. | | | Leisure Products | | | | 2,811,910 | | | | 43,387,771 | |
a,bNavistar International Corp. | | | Machinery | | | | 1,114,980 | | | | 48,579,679 | |
aNetScout Systems Inc. | | | Communications Equipment | | | | 283,574 | | | | 7,089,350 | |
Oracle Corp. | | | Software | | | | 1,724,141 | | | | 83,758,770 | |
Perrigo Co. PLC | | | Pharmaceuticals | | | | 645,040 | | | | 49,352,010 | |
United Parcel Service Inc., B | | | Air Freight & Logistics | | | | 424,560 | | | | 52,169,933 | |
Voya Financial Inc. | | | Diversified Financial Services | | | | 526,386 | | | | 26,356,147 | |
Walgreens Boots Alliance Inc. | | | Food & Staples Retailing | | | | 930,970 | | | | 63,827,303 | |
| | | | | | | | | | | | |
| | | | | | | | | | | 1,434,258,712 | |
| | | | | | | | | | | | |
Total Common Stocks
(Cost $3,570,421,154) | | | | | | | | | | | 4,031,106,809 | |
| | | | | | | | | | | | |
| | | |
| | | | | | Principal
Amount | | | | |
Corporate Bonds (Cost $21,116,477) 0.5% | | | | | | | | | |
United States 0.5% | | | | | | | | | |
cChesapeake Energy Corp., secured note, second lien, 144A, 8.00%, 12/15/22 | | | Oil, Gas & Consumable Fuels | | | $ | 22,493,000 | | | | 23,673,883 | |
| | | | | | | | | | | | |
| | |
Mortgage-Backed Securities
(Cost $407,265) 0.0%† | | | | | | | | | |
United States 0.0%† | | | | | | | | | | | | |
FHLMC, 5.50%, 12/01/35 | | | | | | | 413,205 | | | | 448,559 | |
| | | | | | | | | | | | |
| | |
Total Investments before Short Term
Investments (Cost $3,591,944,896) | | | | | | | | 4,055,229,251 | |
| | | | | | | | | | | | |
| | |
Short Term Investments 4.7% | | | | | | | | | |
| | | |
Time Deposits 4.7% | | | | | | | | | | | | |
United States 4.7% | | | | | | | | | | | | |
Bank of Montreal, 1.80%, 9/04/18 | | | | 20,000,000 | | | | 20,000,000 | |
National Australia Bank Ltd., 1.83%, 9/04/18 | | | | 19,000,000 | | | | 19,000,000 | |
National Bank of Canada, 1.85%, 9/04/18 | | | | 50,000,000 | | | | 50,000,000 | |
| | | | |
| | | |
18 | | Annual Report | | franklintempleton.com |
TEMPLETON FUNDS
STATEMENT OF INVESTMENTS
Templeton World Fund (continued)
| | | | | | | | | | |
| | | | | | Principal
Amount | | Value | |
Short Term Investments (continued) | | | | | | | | | | |
| | | |
Time Deposits (continued) | | | | | | | | | | |
United States (continued) | | | | | | | | | | |
Royal Bank of Canada, 1.85%, 9/04/18 | | | | | | $110,000,000 | | $ | 110,000,000 | |
| | | | | | | | | | |
Total Time Deposits (Cost $199,000,000) | | | | | | | | | 199,000,000 | |
| | | | | | | | | | |
Total Investments (Cost $3,790,944,896) 99.2% | | | | | | | | | 4,254,229,251 | |
Options Written (0.0)%† | | | | | | | | | (293,475 | ) |
Other Assets, less Liabilities 0.8% | | | | | | | | | 35,905,120 | |
| | | | | | | | | | |
Net Assets 100.0% | | | | | | | | | $4,289,840,896 | |
| | | |
| | | Number of
Contracts | | | Notional
Amount | | | |
dOptions Written (0.0)%† | | | | | | | | | | |
Calls - Exchange-Traded | | | | | | | | | | |
Navistar International Corp., January Strike Price $43.01, Expires 1/18/19 | | | 455 | | | 45,500 | | | (182,000 | ) |
Navistar International Corp., October Strike Price $43.01, Expires 10/19/18 | | | 455 | | | 45,500 | | | (111,475 | ) |
| | | | | | | | | | |
Total Options Written (Premium Received $291,648) | | | | | | | | $ | (293,475 | ) |
| | | | | | | | | | |
†Rounds to less than 0.1% of net assets.
aNon-income producing.
bA portion or all of the security is held in connection with written option contracts open at year end.
cSecurity was purchased pursuant to Rule 144A under the Securities Act of 1933 and may be sold in transactions exempt from registration only to qualified institutional buyers or in a public offering registered under the Securities Act of 1933. This security has been deemed liquid under guidelines approved by the Trust’s Board of Trustees.
dSee Note 1(c) regarding written options.
| | | | |
| | | |
| franklintempleton.com | | Annual Report | | 19 |
TEMPLETON FUNDS
STATEMENT OF INVESTMENTS
Templeton World Fund (continued)
At August 31, 2018, the Fund had the following forward exchange contracts outstanding. See Note 1(c).
Forward Exchange Contracts
| | | | | | | | | | | | | | | | | | | | | | | | | | | | |
| Currency | | Counterpartya | | | Type | | | Quantity | | | Contract
Amount | | | Settlement
Date | | | Unrealized
Appreciation | | | Unrealized
Depreciation | |
| |
OTC Forward Exchange Contracts | | | | | | | | | | | | | | | | | | | | | | | | | | | | |
British Pound | | | BOFA | | | | Buy | | | | 2,392,572 | | | $ | 3,044,962 | | | | 10/11/18 | | | $ | 61,053 | | | $ | — | |
British Pound | | | BOFA | | | | Buy | | | | 2,739,588 | | | | 3,607,640 | | | | 10/11/18 | | | | — | | | | (51,132 | ) |
British Pound | | | BOFA | | | | Sell | | | | 74,848,916 | | | | 99,700,253 | | | | 10/11/18 | | | | 2,532,083 | | | | — | |
British Pound | | | GSCO | | | | Buy | | | | 2,392,572 | | | | 3,044,593 | | | | 10/11/18 | | | | 61,421 | | | | — | |
British Pound | | | GSCO | | | | Buy | | | | 2,739,588 | | | | 3,607,158 | | | | 10/11/18 | | | | — | | | | (50,650 | ) |
British Pound | | | GSCO | | | | Sell | | | | 74,837,927 | | | | 99,694,222 | | | | 10/11/18 | | | | 2,540,318 | | | | — | |
British Pound | | | HSBK | | | | Buy | | | | 2,392,572 | | | | 3,045,005 | | | | 10/11/18 | | | | 61,010 | | | | — | |
British Pound | | | HSBK | | | | Buy | | | | 2,739,588 | | | | 3,607,306 | | | | 10/11/18 | | | | — | | | | (50,798 | ) |
British Pound | | | HSBK | | | | Sell | | | | 74,845,350 | | | | 99,679,711 | | | | 10/11/18 | | | | 2,516,170 | | | | — | |
British Pound | | | MSCO | | | | Buy | | | | 2,392,572 | | | | 3,044,579 | | | | 10/11/18 | | | | 61,436 | | | | — | |
British Pound | | | MSCO | | | | Buy | | | | 2,739,588 | | | | 3,607,314 | | | | 10/11/18 | | | | — | | | | (50,806 | ) |
British Pound | | | MSCO | | | | Sell | | | | 74,847,141 | | | | 99,706,122 | | | | 10/11/18 | | | | 2,540,256 | | | | — | |
British Pound | | | UBSW | | | | Buy | | | | 2,392,572 | | | | 3,044,471 | | | | 10/11/18 | | | | 61,544 | | | | — | |
British Pound | | | UBSW | | | | Buy | | | | 2,739,588 | | | | 3,607,092 | | | | 10/11/18 | | | | — | | | | (50,584 | ) |
British Pound | | | UBSW | | | | Sell | | | | 74,845,117 | | | | 99,716,898 | | | | 10/11/18 | | | | 2,553,660 | | | | — | |
Canadian Dollar | | | BOFA | | | | Buy | | | | 1,240,262 | | | | 944,525 | | | | 10/11/18 | | | | 6,451 | | | | — | |
Canadian Dollar | | | BOFA | | | | Sell | | | | 22,211,366 | | | | 16,941,533 | | | | 10/11/18 | | | | — | | | | (89,118 | ) |
Canadian Dollar | | | GSCO | | | | Buy | | | | 1,240,262 | | | | 944,477 | | | | 10/11/18 | | | | 6,498 | | | | — | |
Canadian Dollar | | | GSCO | | | | Sell | | | | 22,212,628 | | | | 16,945,727 | | | | 10/11/18 | | | | — | | | | (85,892 | ) |
Canadian Dollar | | | HSBK | | | | Buy | | | | 1,240,262 | | | | 944,458 | | | | 10/11/18 | | | | 6,518 | | | | — | |
Canadian Dollar | | | HSBK | | | | Sell | | | | 22,211,959 | | | | 16,943,885 | | | | 10/11/18 | | | | — | | | | (87,221 | ) |
Canadian Dollar | | | MSCO | | | | Buy | | | | 1,240,262 | | | | 944,527 | | | | 10/11/18 | | | | 6,449 | | | | — | |
Canadian Dollar | | | MSCO | | | | Sell | | | | 22,211,067 | | | | 16,944,536 | | | | 10/11/18 | | | | — | | | | (85,886 | ) |
Canadian Dollar | | | UBSW | | | | Buy | | | | 1,240,262 | | | | 944,460 | | | | 10/11/18 | | | | 6,516 | | | | — | |
Canadian Dollar | | | UBSW | | | | Sell | | | | 22,209,237 | | | | 16,943,010 | | | | 10/11/18 | | | | — | | | | (86,008 | ) |
Danish Krone | | | BOFA | | | | Sell | | | | 8,332,224 | | | | 1,301,249 | | | | 10/11/18 | | | | — | | | | (147 | ) |
Danish Krone | | | BOFA | | | | Sell | | | | 87,532,014 | | | | 13,849,070 | | | | 10/11/18 | | | | 177,595 | | | | — | |
Danish Krone | | | GSCO | | | | Sell | | | | 8,332,268 | | | | 1,301,249 | | | | 10/11/18 | | | | — | | | | (154 | ) |
Danish Krone | | | GSCO | | | | Sell | | | | 87,498,136 | | | | 13,843,922 | | | | 10/11/18 | | | | 177,737 | | | | — | |
Danish Krone | | | HSBK | | | | Sell | | | | 8,332,678 | | | | 1,301,249 | | | | 10/11/18 | | | | — | | | | (218 | ) |
Danish Krone | | | HSBK | | | | Sell | | | | 87,504,340 | | | | 13,844,945 | | | | 10/11/18 | | | | 177,792 | | | | — | |
Danish Krone | | | MSCO | | | | Sell | | | | 8,332,372 | | | | 1,301,249 | | | | 10/11/18 | | | | — | | | | (170 | ) |
Danish Krone | | | MSCO | | | | Sell | | | | 87,506,247 | | | | 13,844,766 | | | | 10/11/18 | | | | 177,315 | | | | — | |
Danish Krone | | | UBSW | | | | Sell | | | | 8,332,065 | | | | 1,301,249 | | | | 10/11/18 | | | | — | | | | (122 | ) |
Danish Krone | | | UBSW | | | | Sell | | | | 87,548,604 | | | | 13,850,969 | | | | 10/11/18 | | | | 176,903 | | | | — | |
Euro | | | BOFA | | | | Sell | | | | 150,084,268 | | | | 177,437,734 | | | | 10/11/18 | | | | 2,725,039 | | | | — | |
Euro | | | GSCO | | | | Sell | | | | 150,094,238 | | | | 177,450,632 | | | | 10/11/18 | | | | 2,726,332 | | | | — | |
Euro | | | HSBK | | | | Sell | | | | 150,077,092 | | | | 177,427,478 | | | | 10/11/18 | | | | 2,723,136 | | | | — | |
Euro | | | MSCO | | | | Sell | | | | 150,071,636 | | | | 177,435,396 | | | | 10/11/18 | | | | 2,737,406 | | | | — | |
Euro | | | UBSW | | | | Sell | | | | 150,072,889 | | | | 177,419,153 | | | | 10/11/18 | | | | 2,719,706 | | | | — | |
Hong Kong Dollar | | | BOFA | | | | Sell | | | | 332,618,336 | | | | 42,448,485 | | | | 10/11/18 | | | | 41,904 | | | | — | |
Hong Kong Dollar | | | GSCO | | | | Sell | | | | 332,611,303 | | | | 42,445,295 | | | | 10/11/18 | | | | 39,610 | | | | — | |
Hong Kong Dollar | | | HSBK | | | | Sell | | | | 332,604,111 | | | | 42,446,761 | | | | 10/11/18 | | | | 41,994 | | | | — | |
Hong Kong Dollar | | | MSCO | | | | Sell | | | | 332,626,110 | | | | 42,453,057 | | | | 10/11/18 | | | | 45,484 | | | | — | |
Hong Kong Dollar | | | UBSW | | | | Sell | | | | 332,607,105 | | | | 42,449,779 | | | | 10/11/18 | | | | 44,631 | | | | — | |
Japanese Yen | | | BOFA | | | | Buy | | | | 135,163,482 | | | | 1,226,877 | | | | 10/11/18 | | | | — | | | | (6,764 | ) |
Japanese Yen | | | BOFA | | | | Buy | | | | 230,600,167 | | | | 2,081,253 | | | | 10/11/18 | | | | 361 | | | | — | |
Japanese Yen | | | BOFA | | | | Sell | | | | 4,694,229,413 | | | | 42,748,651 | | | | 10/11/18 | | | | 374,105 | | | | — | |
| | | | |
| | | |
20 | | Annual Report | | franklintempleton.com |
TEMPLETON FUNDS
STATEMENT OF INVESTMENTS
Templeton World Fund (continued)
Forward Exchange Contracts (continued)
| | | | | | | | | | | | | | | | | | | | | | | | | | | | |
Currency | | Counterpartya | | | Type | | | Quantity | | | Contract
Amount | | | Settlement
Date | | | Unrealized
Appreciation | | | Unrealized
Depreciation | |
| |
OTC Forward Exchange Contracts (continued) | |
Japanese Yen | | | GSCO | | | | Buy | | | | 135,163,482 | | | $ | 1,226,687 | | | | 10/11/18 | | | $ | — | | | $ | (6,574 | ) |
Japanese Yen | | | GSCO | | | | Buy | | | | 230,600,167 | | | | 2,081,199 | | | | 10/11/18 | | | | 416 | | | | — | |
Japanese Yen | | | GSCO | | | | Sell | | | | 4,694,403,662 | | | | 42,759,973 | | | | 10/11/18 | | | | 383,853 | | | | — | |
Japanese Yen | | | HSBK | | | | Buy | | | | 135,163,482 | | | | 1,226,661 | | | | 10/11/18 | | | | — | | | | (6,548 | ) |
Japanese Yen | | | HSBK | | | | Buy | | | | 230,600,167 | | | | 2,081,165 | | | | 10/11/18 | | | | 450 | | | | — | |
Japanese Yen | | | HSBK | | | | Sell | | | | 4,694,036,885 | | | | 42,750,791 | | | | 10/11/18 | | | | 377,982 | | | | — | |
Japanese Yen | | | MSCO | | | | Buy | | | | 135,163,482 | | | | 1,226,689 | | | | 10/11/18 | | | | — | | | | (6,576 | ) |
Japanese Yen | | | MSCO | | | | Buy | | | | 230,600,167 | | | | 2,081,195 | | | | 10/11/18 | | | | 420 | | | | — | |
Japanese Yen | | | MSCO | | | | Sell | | | | 4,693,879,063 | | | | 42,750,880 | | | | 10/11/18 | | | | 379,496 | | | | — | |
Japanese Yen | | | UBSW | | | | Buy | | | | 135,163,482 | | | | 1,226,647 | | | | 10/11/18 | | | | — | | | | (6,534 | ) |
Japanese Yen | | | UBSW | | | | Buy | | | | 230,600,167 | | | | 2,081,122 | | | | 10/11/18 | | | | 493 | | | | — | |
Japanese Yen | | | UBSW | | | | Sell | | | | 4,693,722,484 | | | | 42,750,459 | | | | 10/11/18 | | | | 380,488 | | | | — | |
Singapore Dollar | | | BOFA | | | | Buy | | | | 694,414 | | | | 504,906 | | | | 10/11/18 | | | | 1,245 | | | | — | |
Singapore Dollar | | | BOFA | | | | Sell | | | | 22,302,516 | | | | 16,436,166 | | | | 10/11/18 | | | | 180,074 | | | | — | |
Singapore Dollar | | | GSCO | | | | Buy | | | | 694,414 | | | | 504,908 | | | | 10/11/18 | | | | 1,243 | | | | — | |
Singapore Dollar | | | GSCO | | | | Sell | | | | 22,306,336 | | | | 16,443,826 | | | | 10/11/18 | | | | 184,949 | | | | — | |
Singapore Dollar | | | HSBK | | | | Buy | | | | 694,414 | | | | 504,872 | | | | 10/11/18 | | | | 1,280 | | | | — | |
Singapore Dollar | | | HSBK | | | | Sell | | | | 22,299,277 | | | | 16,439,294 | | | | 10/11/18 | | | | 185,563 | | | | — | |
Singapore Dollar | | | MSCO | | | | Buy | | | | 694,414 | | | | 504,932 | | | | 10/11/18 | | | | 1,220 | | | | — | |
Singapore Dollar | | | MSCO | | | | Sell | | | | 22,304,024 | | | | 16,442,061 | | | | 10/11/18 | | | | 184,871 | | | | — | |
Singapore Dollar | | | UBSW | | | | Buy | | | | 694,414 | | | | 504,910 | | | | 10/11/18 | | | | 1,242 | | | | — | |
Singapore Dollar | | | UBSW | | | | Sell | | | | 22,302,467 | | | | 16,438,335 | | | | 10/11/18 | | | | 182,278 | | | | — | |
South Korean Won | | | BOFA | | | | Buy | | | | 1,071,759,048 | | | | 950,731 | | | | 10/11/18 | | | | 10,875 | | | | — | |
South Korean Won | | | BOFA | | | | Sell | | | | 44,731,795,769 | | | | 40,136,201 | | | | 10/11/18 | | | | 1,849 | | | | — | |
South Korean Won | | | GSCO | | | | Buy | | | | 1,071,759,048 | | | | 950,849 | | | | 10/11/18 | | | | 10,757 | | | | — | |
South Korean Won | | | GSCO | | | | Sell | | | | 36,419,591,542 | | | | 32,692,631 | | | | 10/11/18 | | | | 16,172 | | | | — | |
South Korean Won | | | HSBK | | | | Buy | | | | 1,071,759,048 | | | | 950,984 | | | | 10/11/18 | | | | 10,622 | | | | — | |
South Korean Won | | | HSBK | | | | Sell | | | | 34,196,185,446 | | | | 30,681,883 | | | | 10/11/18 | | | | 312 | | | | — | |
South Korean Won | | | MSCO | | | | Buy | | | | 1,071,759,048 | | | | 950,833 | | | | 10/11/18 | | | | 10,773 | | | | — | |
South Korean Won | | | MSCO | | | | Sell | | | | 28,717,075,890 | | | | 25,785,289 | | | | 10/11/18 | | | | 19,696 | | | | — | |
South Korean Won | | | UBSW | | | | Buy | | | | 1,071,759,048 | | | | 951,133 | | | | 10/11/18 | | | | 10,473 | | | | — | |
South Korean Won | | | UBSW | | | | Sell | | | | 28,745,866,699 | | | | 25,820,414 | | | | 10/11/18 | | | | 28,989 | | | | — | |
Swedish Krona | | | BOFA | | | | Buy | | | | 51,124,938 | | | | 5,810,121 | | | | 10/11/18 | | | | — | | | | (203,039 | ) |
Swedish Krona | | | BOFA | | | | Sell | | | | 51,124,938 | | | | 5,889,753 | | | | 10/11/18 | | | | 282,669 | | | | — | |
Swedish Krona | | | GSCO | | | | Buy | | | | 51,124,308 | | | | 5,810,106 | | | | 10/11/18 | | | | — | | | | (203,091 | ) |
Swedish Krona | | | GSCO | | | | Sell | | | | 51,124,308 | | | | 5,887,067 | | | | 10/11/18 | | | | 280,053 | | | | — | |
Swedish Krona | | | HSBK | | | | Buy | | | | 51,231,935 | | | | 5,822,044 | | | | 10/11/18 | | | | — | | | | (203,227 | ) |
Swedish Krona | | | HSBK | | | | Sell | | | | 51,231,935 | | | | 5,903,113 | | | | 10/11/18 | | | | 284,295 | | | | — | |
Swedish Krona | | | MSCO | | | | Buy | | | | 37,290,123 | | | | 4,229,421 | | | | 10/11/18 | | | | — | | | | (139,657 | ) |
Swedish Krona | | | MSCO | | | | Sell | | | | 37,290,123 | | | | 4,293,674 | | | | 10/11/18 | | | | 203,912 | | | | — | |
Swedish Krona | | | UBSW | | | | Buy | | | | 32,112,761 | | | | 3,641,150 | | | | 10/11/18 | | | | — | | | | (119,211 | ) |
Swedish Krona | | | UBSW | | | | Sell | | | | 32,112,761 | | | | 3,697,152 | | | | 10/11/18 | | | | 175,213 | | | | — | |
Swiss Franc | | | BOFA | | | | Sell | | | | 31,062,723 | | | | 31,607,502 | | | | 10/11/18 | | | | — | | | | (545,997 | ) |
Swiss Franc | | | GSCO | | | | Sell | | | | 31,079,895 | | | | 31,630,456 | | | | 10/11/18 | | | | — | | | | (540,817 | ) |
Swiss Franc | | | HSBK | | | | Sell | | | | 31,056,666 | | | | 31,604,426 | | | | 10/11/18 | | | | — | | | | (542,804 | ) |
Swiss Franc | | | MSCO | | | | Sell | | | | 31,055,821 | | | | 31,604,827 | | | | 10/11/18 | | | | — | | | | (541,529 | ) |
Swiss Franc | | | UBSW | | | | Sell | | | | 31,061,695 | | | | 31,609,559 | | | | 10/11/18 | | | | — | | | | (542,877 | ) |
Thailand Baht | | | BOFA | | | | Buy | | | | 12,176,100 | | | | 367,015 | | | | 10/11/18 | | | | 4,979 | | | | — | |
Thailand Baht | | | BOFA | | | | Sell | | | | 360,776,241 | | | | 10,876,894 | | | | 10/11/18 | | | | — | | | | (145,260 | ) |
| | | | |
| | | |
| franklintempleton.com | | Annual Report | | 21 |
TEMPLETON FUNDS
STATEMENT OF INVESTMENTS
Templeton World Fund (continued)
Forward Exchange Contracts (continued)
| | | | | | | | | | | | | | | | | | | | | | | | | | | | |
| Currency | | Counterpartya | | | Type | | | Quantity | | | Contract
Amount | | | Settlement
Date | | | Unrealized
Appreciation | | | Unrealized
Depreciation | |
| |
OTC Forward Exchange Contracts (continued) | |
Thailand Baht | | | GSCO | | | | Buy | | | | 12,176,100 | | | $ | 367,170 | | | | 10/11/18 | | | $ | 4,824 | | | $ | — | |
Thailand Baht | | | GSCO | | | | Sell | | | | 360,892,882 | | | | 10,884,301 | | | | 10/11/18 | | | | — | | | | (141,417 | ) |
Thailand Baht | | | HSBK | | | | Buy | | | | 12,176,100 | | | | 367,047 | | | | 10/11/18 | | | | 4,947 | | | | — | |
Thailand Baht | | | HSBK | | | | Sell | | | | 360,792,607 | | | | 10,882,622 | | | | 10/11/18 | | | | — | | | | (140,032 | ) |
Thailand Baht | | | MSCO | | | | Buy | | | | 12,176,100 | | | | 367,119 | | | | 10/11/18 | | | | 4,876 | | | | — | |
Thailand Baht | | | MSCO | | | | Sell | | | | 360,721,881 | | | | 10,881,235 | | | | 10/11/18 | | | | — | | | | (139,259 | ) |
Thailand Baht | | | UBSW | | | | Buy | | | | 12,176,100 | | | | 366,971 | | | | 10/11/18 | | | | 5,024 | | | | — | |
Thailand Baht | | | UBSW | | | | Sell | | | | 360,803,831 | | | | 10,883,060 | | | | 10/11/18 | | | | — | | | | (139,937 | ) |
| | | | | | | | | | | | | | | | | | | | | | | | |
Total Forward Exchange Contracts | | | | | | | | | | | | | | | | | | | | | | $ | 31,947,306 | | | $ | (5,010,056 | ) |
| | | | | | | | | | | | | | | | | | | | | | | | |
Net unrealized appreciation (depreciation) | | | | | | | | | | | | | | | | | | | $ | 26,937,250 | | | | | |
aMay be comprised of multiple contracts with the same counterparty, currency and settlement date.
See Note 8 regarding other derivative information.
See Abbreviations on page 38.
| | | | |
| | | |
22 | | Annual Report | The accompanying notes are an integral part of these financial statements. | | franklintempleton.com |
TEMPLETON FUNDS
Financial Statements
Statement of Assets and Liabilities
August 31, 2018
Templeton World Fund
| | | | |
Assets: | | | | |
Investments in securities: | | | | |
Cost - Unaffiliated issuers | | | $3,790,944,896 | |
| | | | |
| |
Value - Unaffiliated issuers | | | $4,254,229,251 | |
Cash | | | 696,662 | |
Restricted cash for OTC derivative contracts (Note 1d) | | | 7,390,000 | |
Foreign currency, at value (cost $2,835,094) | | | 2,832,450 | |
Receivables: | | | | |
Investment securities sold | | | 6,902,867 | |
Capital shares sold | | | 929,815 | |
Dividends and interest | | | 15,501,518 | |
European Union tax reclaims | | | 241,104 | |
Unrealized appreciation on OTC forward exchange contracts | | | 31,947,306 | |
Other assets | | | 2,196 | |
| | | | |
Total assets | | | 4,320,673,169 | |
| | | | |
| |
Liabilities: | | | | |
Payables: | | | | |
Investment securities purchased | | | 10,566,590 | |
Capital shares redeemed | | | 3,241,493 | |
Management fees | | | 2,541,693 | |
Distribution fees | | | 939,065 | |
Transfer agent fees | | | 495,511 | |
Deposits from brokers for: | | | | |
OTC derivative contracts | | | 7,390,000 | |
Options written, at value (premiums received $291,648) | | | 293,475 | |
Unrealized depreciation on OTC forward exchange contracts | | | 5,010,056 | |
Accrued expenses and other liabilities | | | 354,390 | |
| | | | |
Total liabilities | | | 30,832,273 | |
| | | | |
Net assets, at value | | | $4,289,840,896 | |
| | | | |
| |
Net assets consist of: | | | | |
Paid-in capital | | | $3,291,922,360 | |
Undistributed net investment income | | | 70,503,712 | |
Net unrealized appreciation (depreciation) | | | 490,247,669 | |
Accumulated net realized gain (loss) | | | 437,167,155 | |
| | | | |
Net assets, at value | | | $4,289,840,896 | |
| | | | |
| | | | |
| | | |
| franklintempleton.com | | The accompanying notes are an integral part of these financial statements. | Annual Report | | 23 |
TEMPLETON FUNDS
FINANCIAL STATEMENTS
Statement of Assets and Liabilities (continued)
August 31, 2018
Templeton World Fund
| | | | |
Class A: | | | | |
Net assets, at value | | | $3,973,648,376 | |
Shares outstanding | | | 230,456,436 | |
Net asset value per sharea | | | $17.24 | |
Maximum offering price per share (net asset value per share ÷ 94.25%) | | | $18.29 | |
Class C: | | | | |
Net assets, at value | | | $ 117,879,137 | |
Shares outstanding | | | 7,210,501 | |
Net asset value and maximum offering price per sharea | | | $16.35 | |
Class R6: | | | | |
Net assets, at value | | | $ 51,430,610 | |
Shares outstanding | | | 2,987,950 | |
Net asset value and maximum offering price per share | | | $17.21 | |
Advisor Class: | | | | |
Net assets, at value | | | $ 146,882,773 | |
Shares outstanding | | | 8,526,091 | |
Net asset value and maximum offering price per share | | | $17.23 | |
aRedemption price is equal to net asset value less contingent deferred sales charges, if applicable.
| | | | |
| | | |
24 | | Annual Report | The accompanying notes are an integral part of these financial statements. | | franklintempleton.com |
TEMPLETON FUNDS
FINANCIAL STATEMENTS
Statement of Operations
for the year ended August 31, 2018
Templeton World Fund
| | | | |
Investment income: | | | | |
Dividends: (net of foreign taxes)* | | | | |
Unaffiliated issuers | | | $ 116,706,517 | |
Interest: | | | | |
Unaffiliated issuers | | | 3,990,784 | |
Income from securities loaned (net of fees and rebates) | | | 83 | |
Total investment income | | | 120,697,384 | |
Expenses: | | | | |
Management fees (Note 3a) | | | 31,167,043 | |
Distribution fees: (Note 3c) | | | | |
Class A | | | 10,131,892 | |
Class C | | | 1,315,277 | |
Transfer agent fees: (Note 3e) | | | | |
Class A | | | 3,546,945 | |
Class C | | | 111,945 | |
Class R6 | | | 18,855 | |
Advisor Class | | | 121,171 | |
Custodian fees (Note 4) | | | 375,391 | |
Reports to shareholders | | | 183,851 | |
Registration and filing fees | | | 112,987 | |
Professional fees | | | 147,873 | |
Trustees’ fees and expenses | | | 136,077 | |
Other | | | 88,361 | |
Total expenses | | | 47,457,668 | |
Expense reductions (Note 4) | | | (233,522 | ) |
Expenses waived/paid by affiliates (Note 3f) | | | (8,554 | ) |
Net expenses | | | 47,215,592 | |
Net investment income | | | 73,481,792 | |
Realized and unrealized gains (losses): | | | | |
Net realized gain (loss) from: | | | | |
Investments:# | | | | |
Unaffiliated issuers | | | 503,951,829 | |
Written options | | | 88,798 | |
Foreign currency transactions | | | (694,560 | ) |
Forward exchange contracts | | | (20,682,298 | ) |
Net realized gain (loss) | | | 482,663,769 | |
Net change in unrealized appreciation (depreciation) on: | | | | |
Investments: | | | | |
Unaffiliated issuers | | | (299,006,829 | ) |
Translation of other assets and liabilities denominated in foreign currencies | | | (118,905 | ) |
Forward exchange contracts | | | 82,681,073 | |
Written options | | | (1,827 | ) |
Change in deferred taxes on unrealized appreciation | | | 1,046,242 | |
Net change in unrealized appreciation (depreciation) | | | (215,400,246 | ) |
Net realized and unrealized gain (loss) | | | 267,263,523 | |
Net increase (decrease) in net assets resulting from operations | | | $ 340,745,315 | |
| |
*Foreign taxes withheld on dividends | | $ | 9,374,349 | |
#Net of foreign taxes | | $ | 6,590 | |
| | | | |
| | | |
| franklintempleton.com | | The accompanying notes are an integral part of these financial statements. | Annual Report | | 25 |
TEMPLETON FUNDS
FINANCIAL STATEMENTS
Statements of Changes in Net Assets
Templeton World Fund
| | | | | | | | |
| | | Year Ended August 31, | |
| | | 2018 | | | 2017 | |
Increase (decrease) in net assets: | | | | | | | | |
Operations: | | | | | | | | |
Net investment income | | | $ 73,481,792 | | | | $ 74,979,159 | |
Net realized gain (loss) | | | 482,663,769 | | | | 322,365,433 | |
Net change in unrealized appreciation (depreciation) | | | (215,400,246 | ) | | | 307,952,182 | |
| | | | |
Net increase (decrease) in net assets resulting from operations | | | 340,745,315 | | | | 705,296,774 | |
| | | | |
Distributions to shareholders from: | | | | | | | | |
Net investment income: | | | | | | | | |
Class A | | | (4,937,007 | ) | | | (147,912,009 | ) |
Class C | | | — | | | | (4,531,267 | ) |
Class R6 | | | (243,447 | ) | | | (2,005,405 | ) |
Advisor Class | | | (502,930 | ) | | | (4,323,569 | ) |
Net realized gains: | | | | | | | | |
Class A | | | (238,907,033 | ) | | | (113,474,378 | ) |
Class C | | | (7,980,686 | ) | | | (4,385,709 | ) |
Class R6 | | | (2,978,075 | ) | | | (1,402,508 | ) |
Advisor Class | | | (7,782,016 | ) | | | (3,107,234 | ) |
| | | | |
Total distributions to shareholders | | | (263,331,194 | ) | | | (281,142,079 | ) |
| | | | |
Capital share transactions: (Note 2) | | | | | | | | |
Class A | | | (338,750,270 | ) | | | (349,046,846 | ) |
Class C | | | (21,767,393 | ) | | | (33,687,471 | ) |
Class R6 | | | (5,089,145 | ) | | | 234,305 | |
Advisor Class | | | (13,357,466 | ) | | | 32,150,701 | |
| | | | |
Total capital share transactions | | | (378,964,274 | ) | | | (350,349,311 | ) |
| | | | |
Net increase (decrease) in net assets | | | (301,550,153 | ) | | | 73,805,384 | |
Net assets: | | | | | | | | |
Beginning of year | | | 4,591,391,049 | | | | 4,517,585,665 | |
| | | | |
End of year | | | $4,289,840,896 | | | | $4,591,391,049 | |
| | | | |
Undistributed net investment income included in net assets: | | | | | | | | |
End of year | | | $ 70,503,712 | | | | $ 24,088,752 | |
| | | | |
| | | | |
| | | |
26 | | Annual Report | The accompanying notes are an integral part of these financial statements. | | franklintempleton.com |
TEMPLETON FUNDS
Notes to Financial Statements
Templeton World Fund
1. Organization and Significant Accounting Policies
Templeton Funds (Trust) is registered under the Investment Company Act of 1940 (1940 Act) as an open-end management investment company, consisting of three separate funds and applies the specialized accounting and reporting guidance in U.S. Generally Accepted Accounting Principles (U.S. GAAP). Templeton World Fund (Fund) is included in this report. The Fund offers four classes of shares: Class A, Class C, Class R6, and Advisor Class. Each class of shares may differ by its initial sales load, contingent deferred sales charges, voting rights on matters affecting a single class, its exchange privilege and fees due to differing arrangements for distribution and transfer agent fees.
The following summarizes the Fund’s significant accounting policies.
a. Financial Instrument Valuation
The Fund’s investments in financial instruments are carried at fair value daily. Fair value is the price that would be received to sell an asset or paid to transfer a liability in an orderly transaction between market participants on the measurement date. The Fund calculates the net asset value (NAV) per share each business day as of 4 p.m. Eastern time or the regularly scheduled close of the New York Stock Exchange (NYSE), whichever is earlier. Under compliance policies and procedures approved by the Trust’s Board of Trustees (the Board), the Fund’s administrator has responsibility for oversight of valuation, including leading the cross-functional Valuation Committee (VC). The VC provides administration and oversight of the Fund’s valuation policies and procedures, which are approved annually by the Board. Among other things, these procedures allow the Fund to utilize independent pricing services, quotations from securities and financial instrument dealers, and other market sources to determine fair value.
Equity securities and derivative financial instruments listed on an exchange or on the NASDAQ National Market System are valued at the last quoted sale price or the official closing price of the day, respectively. Foreign equity securities are valued as of the close of trading on the foreign stock exchange on which the security is primarily traded, or as of 4 p.m. Eastern time. The value is then converted into its U.S. dollar equivalent at the foreign exchange rate in effect at 4 p.m. Eastern time on the day that the value of the security is determined. Over-the-counter (OTC) securities are valued within the range of the most recent
quoted bid and ask prices. Securities that trade in multiple markets or on multiple exchanges are valued according to the broadest and most representative market. Certain equity securities are valued based upon fundamental characteristics or relationships to similar securities.
Debt securities generally trade in the OTC market rather than on a securities exchange. The Fund’s pricing services use multiple valuation techniques to determine fair value. In instances where sufficient market activity exists, the pricing services may utilize a market-based approach through which quotes from market makers are used to determine fair value. In instances where sufficient market activity may not exist or is limited, the pricing services also utilize proprietary valuation models which may consider market characteristics such as benchmark yield curves, credit spreads, estimated default rates, anticipated market interest rate volatility, coupon rates, anticipated timing of principal repayments, underlying collateral, and other unique security features in order to estimate the relevant cash flows, which are then discounted to calculate the fair value.
Investments in time deposits are valued at cost, which approximates fair value.
Certain derivative financial instruments trade in the OTC market. The Fund’s pricing services use various techniques including industry standard option pricing models and proprietary discounted cash flow models to determine the fair value of those instruments. The Fund’s net benefit or obligation under the derivative contract, as measured by the fair value of the contract, is included in net assets.
The Fund has procedures to determine the fair value of financial instruments for which market prices are not reliable or readily available. Under these procedures, the VC convenes on a regular basis to review such financial instruments and considers a number of factors, including significant unobservable valuation inputs, when arriving at fair value. The VC primarily employs a market-based approach which may use related or comparable assets or liabilities, recent transactions, market multiples, book values, and other relevant information for the investment to determine the fair value of the investment. An income-based valuation approach may also be used in which the anticipated future cash flows of the investment are discounted to calculate fair value. Discounts may also be applied due to the nature or duration of any restrictions on the disposition of the investments. Due to the inherent uncertainty of valuations of such investments, the fair values may differ significantly from
| | | | |
| | | |
| franklintempleton.com | | Annual Report | | 27 |
TEMPLETON FUNDS
NOTES TO FINANCIAL STATEMENTS
Templeton World Fund (continued)
1. Organization and Significant Accounting Policies (continued)
a. Financial Instrument Valuation (continued)
the values that would have been used had an active market existed. The VC employs various methods for calibrating these valuation approaches including a regular review of key inputs and assumptions, transactional back-testing or disposition analysis, and reviews of any related market activity.
Trading in securities on foreign securities stock exchanges and OTC markets may be completed before 4 p.m. Eastern time. In addition, trading in certain foreign markets may not take place on every Fund’s business day. Occasionally, events occur between the time at which trading in a foreign security is completed and 4 p.m. Eastern time that might call into question the reliability of the value of a portfolio security held by the Fund. As a result, differences may arise between the value of the Fund’s portfolio securities as determined at the foreign market close and the latest indications of value at 4 p.m. Eastern time. In order to minimize the potential for these differences, the VC monitors price movements following the close of trading in foreign stock markets through a series of country specific market proxies (such as baskets of American Depositary Receipts, futures contracts and exchange traded funds). These price movements are measured against established trigger thresholds for each specific market proxy to assist in determining if an event has occurred that may call into question the reliability of the values of the foreign securities held by the Fund. If such an event occurs, the securities may be valued using fair value procedures, which may include the use of independent pricing services.
When the last day of the reporting period is a non-business day, certain foreign markets may be open on those days that the Fund’s NAV is not calculated, which could result in differences between the value of the Fund’s portfolio securities on the last business day and the last calendar day of the reporting period. Any significant security valuation changes due to an open foreign market are adjusted and reflected by the Fund for financial reporting purposes.
b. Foreign Currency Translation
Portfolio securities and other assets and liabilities denominated in foreign currencies are translated into U.S. dollars based on the exchange rate of such currencies against U.S. dollars on the date of valuation. The Fund may enter into foreign currency
exchange contracts to facilitate transactions denominated in a foreign currency. Purchases and sales of securities, income and expense items denominated in foreign currencies are translated into U.S. dollars at the exchange rate in effect on the transaction date. Portfolio securities and assets and liabilities denominated in foreign currencies contain risks that those currencies will decline in value relative to the U.S. dollar. Occasionally, events may impact the availability or reliability of foreign exchange rates used to convert the U.S. dollar equivalent value. If such an event occurs, the foreign exchange rate will be valued at fair value using procedures established and approved by the Board.
The Fund does not separately report the effect of changes in foreign exchange rates from changes in market prices on securities held. Such changes are included in net realized and unrealized gain or loss from investments in the Statement of Operations.
Realized foreign exchange gains or losses arise from sales of foreign currencies, currency gains or losses realized between the trade and settlement dates on securities transactions and the difference between the recorded amounts of dividends, interest, and foreign withholding taxes and the U.S. dollar equivalent of the amounts actually received or paid. Net unrealized foreign exchange gains and losses arise from changes in foreign exchange rates on foreign denominated assets and liabilities other than investments in securities held at the end of the reporting period.
c. Derivative Financial Instruments
The Fund invested in derivative financial instruments in order to manage risk or gain exposure to various other investments or markets. Derivatives are financial contracts based on an underlying or notional amount, require no initial investment or an initial net investment that is smaller than would normally be required to have a similar response to changes in market factors, and require or permit net settlement. Derivatives contain various risks including the potential inability of the counterparty to fulfill their obligations under the terms of the contract, the potential for an illiquid secondary market, and/or the potential for market movements which expose the Fund to gains or losses in excess of the amounts shown in the Statement of Assets and Liabilities. Realized gain and loss and unrealized appreciation and depreciation on these contracts for the period are included in the Statement of Operations.
| | | | |
| | | |
28 | | Annual Report | | franklintempleton.com |
TEMPLETON FUNDS
NOTES TO FINANCIAL STATEMENTS
Templeton World Fund (continued)
Derivative counterparty credit risk is managed through a formal evaluation of the creditworthiness of all potential counter-parties. The Fund attempts to reduce its exposure to counterparty credit risk on OTC derivatives, whenever possible, by entering into International Swaps and Derivatives Association (ISDA) master agreements with certain counterparties. These agreements contain various provisions, including but not limited to collateral requirements, events of default, or early termination. Termination events applicable to the counterparty include certain deteriorations in the credit quality of the counterparty. Termination events applicable to the Fund include failure of the Fund to maintain certain net asset levels and/or limit the decline in net assets over various periods of time. In the event of default or early termination, the ISDA master agreement gives the non-defaulting party the right to net and close-out all transactions traded, whether or not arising under the ISDA agreement, to one net amount payable by one counterparty to the other. However, absent an event of default or early termination, OTC derivative assets and liabilities are presented gross and not offset in the Statement of Assets and Liabilities. Early termination by the counterparty may result in an immediate payment by the Fund of any net liability owed to that counterparty under the ISDA agreement.
Collateral requirements differ by type of derivative. Collateral or initial margin requirements are set by the broker or exchange clearing house for exchange traded and centrally cleared derivatives. Initial margin deposited is held at the exchange and can be in the form of cash and/or securities. For OTC derivatives traded under an ISDA master agreement, posting of collateral is required by either the Fund or the applicable counterparty if the total net exposure of all OTC derivatives with the applicable counterparty exceeds the minimum transfer amount, which typically ranges from $100,000 to $250,000, and can vary depending on the counterparty and the type of the agreement. Generally, collateral is determined at the close of Fund business each day and any additional collateral required due to changes in derivative values may be delivered by the Fund or the counterparty the next business day, or within a few business days. Collateral pledged and/or received by the Fund for OTC derivatives, if any, is held in segregated accounts with the Fund’s custodian/counterparty broker and can be in the form of cash and/or securities. Unrestricted cash may be invested according to the Fund’s investment objectives. To the extent that the amounts due to the Fund from its counterparties are not subject to collateralization or are not fully collateralized, the Fund bears the risk of loss from counterparty non-performance.
The Fund entered into OTC forward exchange contracts primarily to manage and/or gain exposure to certain foreign currencies. A forward exchange contract is an agreement between the Fund and a counterparty to buy or sell a foreign currency at a specific exchange rate on a future date.
The Fund purchased or wrote exchange traded option contracts primarily to manage exposure to equity price risk. An option is a contract entitling the holder to purchase or sell a specific amount of shares or units of an asset or notional amount of a swap (swaption), at a specified price. When an option is purchased or written, an amount equal to the premium paid or received is recorded as an asset or liability, respectively. Upon exercise of an option, the acquisition cost or sales proceeds of the underlying investment is adjusted by any premium received or paid. Upon expiration of an option, any premium received or paid is recorded as a realized gain or loss. Upon closing an option other than through expiration or exercise, the difference between the premium received or paid and the cost to close the position is recorded as a realized gain or loss.
See Note 8 regarding other derivative information.
d. Restricted Cash
At August 31, 2018, the Fund held restricted cash in connection with investments in certain derivative securities. Restricted cash is held in a segregated account with the Fund’s custodian and is reflected in the Statement of Assets and Liabilities.
e. Securities Lending
The Fund participates in an agency based securities lending program to earn additional income. The Fund receives cash collateral against the loaned securities in an amount equal to at least 102% of the fair value of the loaned securities. Collateral is maintained over the life of the loan in an amount not less than 100% of the fair value of loaned securities, as determined at the close of Fund business each day; any additional collateral required due to changes in security values is delivered to the Fund on the next business day. The collateral is deposited into a joint cash account with other funds and is used to invest in a money market fund managed by Franklin Advisers, Inc., an affiliate of the Fund. The Fund may receive income from the investment of cash collateral, in addition to lending fees and rebates paid by the borrower. Income from securities loaned, net of fees paid to the securities lending agent and/or third-party vendor, is reported separately in the Statement of Operations. The Fund bears the market risk with respect to the collateral
| | | | |
| | | |
| franklintempleton.com | | Annual Report | | 29 |
TEMPLETON FUNDS
NOTES TO FINANCIAL STATEMENTS
Templeton World Fund (continued)
1. Organization and Significant Accounting Policies (continued)
e. Securities Lending (continued)
investment, securities loaned, and the risk that the agent may default on its obligations to the Fund. If the borrower defaults on its obligation to return the securities loaned, the Fund has the right to repurchase the securities in the open market using the collateral received. The securities lending agent has agreed to indemnify the Fund in the event of default by a third party borrower. At August 31, 2018, the Fund had no securities on loan.
f. Income and Deferred Taxes
It is the Fund’s policy to qualify as a regulated investment company under the Internal Revenue Code. The Fund intends to distribute to shareholders substantially all of its taxable income and net realized gains to relieve it from federal income and excise taxes. As a result, no provision for U.S. federal income taxes is required.
The Fund may be subject to foreign taxation related to income received, capital gains on the sale of securities and certain foreign currency transactions in the foreign jurisdictions in which it invests. Foreign taxes, if any, are recorded based on the tax regulations and rates that exist in the foreign markets in which the Fund invests. When a capital gain tax is determined to apply, the Fund records an estimated deferred tax liability in an amount that would be payable if the securities were disposed of on the valuation date.
As a result of several court cases, in certain countries across the European Union, the Fund filed additional tax reclaims for previously withheld taxes on dividends earned in those countries (EU reclaims). These additional filings are subject to various administrative proceedings by the local jurisdictions’ tax authorities within the European Union, as well as a number of related judicial proceedings. Income recognized, if any, for EU reclaims is reflected as other income in the Statement of Operations and any related receivable, if any, is reflected as European Union tax reclaims in the Statement of Assets and Liabilities. When uncertainty exists as to the ultimate resolution of these proceedings, the likelihood of receipt of these EU reclaims, and the potential timing of payment, no amounts are reflected in the financial statements. For U.S. income tax
purposes, EU reclaims received by the Fund, if any, reduce the amounts of foreign taxes Fund shareholders can use as tax credits in their individual income tax returns.
The Fund may recognize an income tax liability related to its uncertain tax positions under U.S. GAAP when the uncertain tax position has a less than 50% probability that it will be sustained upon examination by the tax authorities based on its technical merits. As of August 31, 2018, the Fund has determined that no tax liability is required in its financial statements related to uncertain tax positions for any open tax years (or expected to be taken in future tax years). Open tax years are those that remain subject to examination and are based on the statute of limitations in each jurisdiction in which the Fund invests.
g. Security Transactions, Investment Income, Expenses and Distributions
Security transactions are accounted for on trade date. Realized gains and losses on security transactions are determined on a specific identification basis. Interest income and estimated expenses are accrued daily. Amortization of premium and accretion of discount on debt securities are included in interest income. Paydown gains and losses are recorded as an adjustment to interest income. Dividend income is recorded on the ex-dividend date except for certain dividends from securities where the dividend rate is not available. In such cases, the dividend is recorded as soon as the information is received by the Fund. Distributions to shareholders are recorded on the ex-dividend date. Distributable earnings are determined according to income tax regulations (tax basis) and may differ from earnings recorded in accordance with U.S. GAAP. These differences may be permanent or temporary. Permanent differences are reclassified among capital accounts to reflect their tax character. These reclassifications have no impact on net assets or the results of operations. Temporary differences are not reclassified, as they may reverse in subsequent periods.
Common expenses incurred by the Trust are allocated among the Funds based on the ratio of net assets of each Fund to the combined net assets of the Trust or based on the ratio of number of shareholders of each Fund to the combined number of shareholders of the Trust. Fund specific expenses are charged directly to the Fund that incurred the expense.
| | | | |
| | | |
30 | | Annual Report | | franklintempleton.com |
TEMPLETON FUNDS
NOTES TO FINANCIAL STATEMENTS
Templeton World Fund (continued)
Realized and unrealized gains and losses and net investment income, excluding class specific expenses, are allocated daily to each class of shares based upon the relative proportion of net assets of each class. Differences in per share distributions by class are generally due to differences in class specific expenses.
h. Accounting Estimates
The preparation of financial statements in accordance with U.S. GAAP requires management to make estimates and assumptions that affect the reported amounts of assets and liabilities at the date of the financial statements and the amounts of income and expenses during the reporting period. Actual results could differ from those estimates.
i. Guarantees and Indemnifications
Under the Trust’s organizational documents, its officers and trustees are indemnified by the Trust against certain liabilities arising out of the performance of their duties to the Trust. Additionally, in the normal course of business, the Trust, on behalf of the Fund, enters into contracts with service providers that contain general indemnification clauses. The Trust’s maximum exposure under these arrangements is unknown as this would involve future claims that may be made against the Trust that have not yet occurred. Currently, the Trust expects the risk of loss to be remote.
2. Shares of Beneficial Interest
At August 31, 2018, there were an unlimited number of shares authorized (without par value). Transactions in the Fund’s shares were as follows:
| | | | | | | | | | | | | | | | |
| | | | | | Year Ended August 31, | | | | |
| | | 2018 | | | 2017 | |
| | | Shares | | | Amount | | | Shares | | | Amount | |
Class A Shares: | | | | | | | | | | | | | | | | |
Shares sold | | | 10,715,421 | | | $ | 183,525,967 | | | | 13,622,420 | | | $ | 224,118,415 | |
Shares issued in reinvestment of distributions | | | 13,445,122 | | | | 228,298,168 | | | | 15,184,290 | | | | 242,644,949 | |
Shares redeemed | | | (43,934,274 | ) | | | (750,574,405 | ) | | | (49,762,301 | ) | | | (815,810,210 | ) |
| | | | |
Net increase (decrease) | | | (19,773,731 | ) | | $ | (338,750,270 | ) | | | (20,955,591 | ) | | $ | (349,046,846 | ) |
| | | | |
Class C Shares: | | | | | | | | | | | | | | | | |
Shares sold | | | 353,066 | | | $ | 5,773,148 | | | | 517,008 | | | $ | 8,138,998 | |
Shares issued in reinvestment of distributions | | | 477,955 | | | | 7,738,087 | | | | 511,414 | | | | 7,860,438 | |
Shares redeemed | | | (2,165,072 | ) | | | (35,278,628 | ) | | | (3,138,493 | ) | | | (49,686,907 | ) |
| | | | |
Net increase (decrease) | | | (1,334,051 | ) | | $ | (21,767,393 | ) | | | (2,110,071 | ) | | $ | (33,687,471 | ) |
| | | | |
Class R6 Shares: | | | | | | | | | | | | | | | | |
Shares sold | | | 1,911,395 | | | $ | 33,094,112 | | | | 516,394 | | | $ | 8,474,649 | |
Shares issued in reinvestment of distributions | | | 98,261 | | | | 1,662,581 | | | | 125,473 | | | | 1,997,530 | |
Shares redeemed | | | (2,301,480 | ) | | | (39,845,838 | ) | | | (629,113 | ) | | | (10,237,874 | ) |
| | | | |
Net increase (decrease) | | | (291,824 | ) | | $ | (5,089,145 | ) | | | 12,754 | | | $ | 234,305 | |
| | | | |
Advisor Class Shares: | | | | | | | | | | | | | | | | |
Shares sold | | | 3,275,702 | | | $ | 56,104,176 | | | | 6,939,523 | | | $ | 113,683,529 | |
Shares issued in reinvestment of distributions | | | 401,452 | | | | 6,800,595 | | | | 368,053 | | | | 5,866,759 | |
Shares redeemed | | | (4,437,189 | ) | | | (76,262,237 | ) | | | (5,360,483 | ) | | | (87,399,587 | ) |
| | | | |
Net increase (decrease) | | | (760,035 | ) | | $ | (13,357,466 | ) | | | 1,947,093 | | | $ | 32,150,701 | |
| | | | |
| | | |
| franklintempleton.com | | Annual Report | | 31 |
TEMPLETON FUNDS
NOTES TO FINANCIAL STATEMENTS
Templeton World Fund (continued)
3. Transactions with Affiliates
Franklin Resources, Inc. is the holding company for various subsidiaries that together are referred to as Franklin Templeton Investments. Certain officers and trustees of the Trust are also officers and/or directors of the following subsidiaries:
| | |
| Subsidiary | | Affiliation |
Templeton Global Advisors Limited (TGAL) | | Investment manager |
Franklin Templeton Services, LLC (FT Services) | | Administrative manager |
Franklin Templeton Distributors, Inc. (Distributors) | | Principal underwriter |
Franklin Templeton Investor Services, LLC (Investor Services) | | Transfer agent |
a. Management Fees
The Fund pays an investment management fee to TGAL based on the average daily net assets of the Fund as follows:
| | |
| Annualized Fee Rate | | Net Assets |
0.705% | | Up to and including $1 billion |
0.690% | | Over $1 billion, up to and including $5 billion |
0.675% | | Over $5 billion, up to and including $10 billion |
0.655% | | Over $10 billion, up to and including $15 billion |
0.635% | | Over $15 billion, up to and including $20 billion |
0.615% | | In excess of $20 billion |
For the year ended August 31, 2018, the gross effective investment management fee rate was 0.693% of the Fund’s average daily net assets.
b. Administrative Fees
Under an agreement with TGAL, FT Services provides administrative services to the Fund. The fee is paid by TGAL based on the Fund’s average daily net assets, and is not an additional expense of the Fund.
c. Distribution Fees
The Board has adopted distribution plans for each share class, with the exception of Class R6 and Advisor Class shares, pursuant to Rule 12b-1 under the 1940 Act. Under the Fund’s Class A reimbursement distribution plan, the Fund reimburses Distributors for costs incurred in connection with the servicing, sale and distribution of the Fund’s shares up to the maximum annual plan rate. Under the Class A reimbursement distribution plan, costs exceeding the maximum for the current plan year cannot be reimbursed in subsequent periods. In addition, under the Fund’s Class C compensation distribution plan, the Fund pays Distributors for costs incurred in connection with the servicing, sale and distribution of the Fund’s shares up to the maximum annual plan rate. The plan year, for purposes of monitoring compliance with the maximum annual plan rates, is February 1 through January 31.
The maximum annual plan rates, based on the average daily net assets, for each class, are as follows:
| | | | |
Class A | | | 0.25 | % |
Class C | | | 1.00 | % |
| | | | |
| | | |
32 | | Annual Report | | franklintempleton.com |
TEMPLETON FUNDS
NOTES TO FINANCIAL STATEMENTS
Templeton World Fund (continued)
d. Sales Charges/Underwriting Agreements
Front-end sales charges and contingent deferred sales charges (CDSC) do not represent expenses of the Fund. These charges are deducted from the proceeds of sales of Fund shares prior to investment or from redemption proceeds prior to remittance, as applicable. Distributors has advised the Fund of the following commission transactions related to the sales and redemptions of the Fund’s shares for the year:
| | | | |
Sales charges retained net of commissions paid to unaffiliated brokers/dealers | | $ | 115,042 | |
CDSC retained | | $ | 3,749 | |
e. Transfer Agent Fees
Each class of shares pays transfer agent fees to Investor Services for its performance of shareholder servicing obligations. Effective November 1, 2017, the fees are based on an annualized asset based fee of 0.02% plus a transaction based fee. Prior to November 1, 2017, the fees were account based fees that varied based on fund or account type. In addition, each class reimburses Investor Services for out of pocket expenses incurred and, except for Class R6, reimburses shareholder servicing fees paid to third parties. These fees are allocated daily based upon their relative proportion of such classes’ aggregate net assets. Class R6 pays Investor Services transfer agent fees specific to that class.
For the year ended August 31, 2018, the Fund paid transfer agent fees of $3,798,916 of which $1,752,020 was retained by Investor Services.
f. Waiver and Expense Reimbursements
Investor Services has voluntarily agreed in advance to waive or limit its fees so that the Class R6 transfer agent fees do not exceed 0.02% based on the average net assets of the class. Investor Services may discontinue this waiver in the future.
4. Expense Offset Arrangement
The Fund has entered into an arrangement with its custodian whereby credits realized as a result of uninvested cash balances are used to reduce a portion of the Fund’s custodian expenses. During the year ended August 31, 2018, the custodian fees were reduced as noted in the Statement of Operations.
5. Income Taxes
The tax character of distributions paid during the years ended August 31, 2018 and 2017, was as follows:
| | | | | | | | |
| | | 2018 | | | 2017 | |
Distributions paid from: | | | | | | | | |
Ordinary income | | $ | 46,162,583 | | | $ | 169,593,058 | |
Long term capital gain | | | 217,168,611 | | | | 111,549,021 | |
| | | | |
| | $ | 263,331,194 | | | $ | 281,142,079 | |
| | | | |
| | | | |
| | | |
| franklintempleton.com | | Annual Report | | 33 |
TEMPLETON FUNDS
NOTES TO FINANCIAL STATEMENTS
Templeton World Fund (continued)
5. Income Taxes (continued)
At August 31, 2018, the cost of investments, net unrealized appreciation (depreciation), undistributed ordinary income and undistributed long term capital gains for income tax purposes were as follows:
| | | | |
Cost of investments | | $ | 3,823,802,844 | |
| | | | |
| |
Unrealized appreciation | | $ | 742,074,193 | |
Unrealized depreciation | | | (285,004,011) | |
| | | | |
| |
Net unrealized appreciation (depreciation) | | $ | 457,070,182 | |
| | | | |
| |
Distributable earnings: | | | | |
Undistributed ordinary income | | $ | 152,085,297 | |
Undistributed long term capital gains | | | 388,530,224 | |
| | | | |
| |
Total distributable earnings | | $ | 540,615,521 | |
| | | | |
Differences between income and/or capital gains as determined on a book basis and a tax basis are primarily due to differing treatment of foreign currency transactions.
The Fund utilized a tax accounting practice to treat a portion of the proceeds from capital shares redeemed as a distribution from realized capital gains.
6. Investment Transactions
Purchases and sales of investments (excluding short term securities) for the year ended August 31, 2018, aggregated $1,233,949,404 and $1,758,289,079, respectively.
7. Concentration of Risk
Investing in foreign securities may include certain risks and considerations not typically associated with investing in U.S. securities, such as fluctuating currency values and changing local and regional economic, political and social conditions, which may result in greater market volatility. In addition, certain foreign securities may not be as liquid as U.S. securities.
8. Other Derivative Information
At August 31, 2018, the Fund’s investments in derivative contracts are reflected in the Statement of Assets and Liabilities as follows:
| | | | | | | | | | | | |
| | | Asset Derivatives | | | Liability Derivatives | |
Derivative Contracts Not Accounted for as Hedging Instruments | | Statement of Assets and Liabilities Location | | Fair Value | | | Statement of Assets and Liabilities Location | | Fair Value | |
Foreign exchange contracts | | Unrealized appreciation on OTC forward exchange contracts | | | $31,947,306 | | | Unrealized depreciation on OTC forward exchange contracts | | | $5,010,056 | |
Equity contracts | | Investments in securities, at value | | | — | | | Options written, at value | | | 293,475 | |
| | | | | | | | | | | | |
Totals | | | | | $31,947,306 | | | | | | $5,303,531 | |
| | | | | | | | | | | | |
| | | | |
| | | |
34 | | Annual Report | | franklintempleton.com |
TEMPLETON FUNDS
NOTES TO FINANCIAL STATEMENTS
Templeton World Fund (continued)
For the year ended August 31, 2018, the effect of derivative contracts in the Fund’s Statement of Operations was as follows:
| | | | | | | | | | |
Derivative Contracts Not Accounted for as
Hedging Instruments | | Statement of
Operations Location | | Net Realized Gain (Loss) for the Year | | | Statement of Operations Location | | Net Change in Unrealized Appreciation (Depreciation) for the Year |
| | Net realized gain (loss) from: | | | | | | Net change in unrealized appreciation (depreciation) on: | | |
Foreign exchange contracts | | Forward exchange contracts | | | $(20,682,298) | | | Forward exchange contracts | | $82,681,073 |
Equity contracts | | Written options | | | 88,798 | | | Written options | | (1,827) |
| | | | | | | | | | |
Totals | | | | | $(20,593,500) | | | | | $82,679,246 |
| | | | | | | | | | |
For the year ended August 31, 2018, the average month end notional amount of options contracts represented 69,792 shares. The average month end contract value of forward exchange contracts was $2,718,581,145.
At August 31, 2018, the Fund’s OTC derivative assets and liabilities are as follows:
| | | | | | | | |
| | | Gross Amounts of
Assets and Liabilities Presented
in the Statement of Assets and Liabilities | |
| | | Assetsa | | | Liabilitiesa | |
Derivatives | | | | | | | | |
Forward exchange contracts | | | $31,947,306 | | | | $5,010,056 | |
| | | | |
aAbsent an event of default or early termination, OTC derivative assets and liabilities are presented gross and not offset in the Statement of Assets and Liabilities.
At August 31, 2018, the Fund’s OTC derivative assets, which may be offset against the Fund’s OTC derivative liabilities and collateral received from the counterparty, are as follows:
| | | | | | | | | | | | | | | | | | | | |
| | | | | | Amounts Not Offset in the
Statement of Assets and Liabilities | | | |
| | | Gross Amounts of Assets Presented in the Statement of Assets and Liabilities | | | Financial Instruments Available for Offset | | | Financial Instruments Collateral Received | | | Cash Collateral Received | | | Net Amount (Not less than zero) |
Counterparty | | | | | | | | | | | | | | | | | | | | |
BOFA | | | $ 6,400,282 | | | $ | (1,041,457 | ) | | $ | (3,688,122 | ) | | $ | — | | | | $1,670,703 | |
GSCO | | | 6,434,183 | | | | (1,028,595 | ) | | | — | | | | (3,690,000 | ) | | | 1,715,588 | |
HSBK | | | 6,392,071 | | | | (1,030,848 | ) | | | (3,430,784 | ) | | | — | | | | 1,930,439 | |
MSCO | | | 6,373,610 | | | | (963,883 | ) | | | — | | | | (3,700,000 | ) | | | 1,709,727 | |
UBSW | | | 6,347,160 | | | | (945,273 | ) | | | (3,732,266 | ) | | | — | | | | 1,669,621 | |
| | | | |
Total | | | $31,947,306 | | | $ | (5,010,056 | ) | | $ | (10,851,172 | ) | | $ | (7,390,000 | ) | | | $8,696,078 | |
| | | | |
| | | | |
| | | |
| franklintempleton.com | | Annual Report | | 35 |
TEMPLETON FUNDS
NOTES TO FINANCIAL STATEMENTS
Templeton World Fund (continued)
8. Other Derivative Information (continued)
At August 31, 2018, the Fund’s OTC derivative liabilities, which may be offset against the Fund’s OTC derivative assets and collateral pledged to the counterparty, are as follows:
| | | | | | | | | | | | | | | | | | | | |
| | | | | | Amounts Not Offset in the
Statement of Assets and Liabilities | | | | |
| | | Gross Amounts of
Liabilities Presented in the Statement of Assets and Liabilities | | | Financial Instruments Available for Offset | | | Financial Instruments Collateral Pledged | | | Cash Collateral Pledged | | | Net Amount (Not less than zero) | |
Counterparty | | | | | | | | | | | | | | | | | | | | |
BOFA | | | $1,041,457 | | | | $(1,041,457 | ) | | | $ — | | | | $ — | | | | $ — | |
GSCO | | | 1,028,595 | | | | (1,028,595 | ) | | | — | | | | — | | | | — | |
HSBK | | | 1,030,848 | | | | (1,030,848 | ) | | | — | | | | — | | | | — | |
MSCO | | | 963,883 | | | | (963,883 | ) | | | — | | | | — | | | | — | |
UBSW | | | 945,273 | | | | (945,273 | ) | | | — | | | | — | | | | — | |
Total | | | $5,010,056 | | | | $(5,010,056 | ) | | | $ — | | | | $ — | | | | $ — | |
See Note 1(c) regarding derivative financial instruments.
See Abbreviations on page 38.
9. Credit Facility
The Fund, together with other U.S. registered and foreign investment funds (collectively, Borrowers), managed by Franklin Templeton Investments, are borrowers in a joint syndicated senior unsecured credit facility totaling $2 billion (Global Credit Facility) which matures on February 8, 2019. This Global Credit Facility provides a source of funds to the Borrowers for temporary and emergency purposes, including the ability to meet future unanticipated or unusually large redemption requests.
Under the terms of the Global Credit Facility, the Fund shall, in addition to interest charged on any borrowings made by the Fund and other costs incurred by the Fund, pay its share of fees and expenses incurred in connection with the implementation and maintenance of the Global Credit Facility, based upon its relative share of the aggregate net assets of all of the Borrowers, including an annual commitment fee of 0.15% based upon the unused portion of the Global Credit Facility. These fees are reflected in other expenses in the Statement of Operations. During the year ended August 31, 2018, the Fund did not use the Global Credit Facility.
10. Fair Value Measurements
The Fund follows a fair value hierarchy that distinguishes between market data obtained from independent sources (observable inputs) and the Fund’s own market assumptions (unobservable inputs). These inputs are used in determining the value of the Fund’s financial instruments and are summarized in the following fair value hierarchy:
| | • | | Level 1 – quoted prices in active markets for identical financial instruments |
| | • | | Level 2 – other significant observable inputs (including quoted prices for similar financial instruments, interest rates, prepayment speed, credit risk, etc.) |
| | • | | Level 3 – significant unobservable inputs (including the Fund’s own assumptions in determining the fair value of financial instruments) |
The input levels are not necessarily an indication of the risk or liquidity associated with financial instruments at that level.
| | | | |
| | | |
36 | | Annual Report | | franklintempleton.com |
TEMPLETON FUNDS
NOTES TO FINANCIAL STATEMENTS
Templeton World Fund (continued)
For movements between the levels within the fair value hierarchy, the Fund has adopted a policy of recognizing the transfers as of the date of the underlying event which caused the movement.
A summary of inputs used as of August 31, 2018, in valuing the Fund’s assets and liabilities carried at fair value, is as follows:
| | | | | | | | | | | | | | | | |
| | | Level 1 | | | Level 2 | | | Level 3 | | | Total | |
Assets: | | | | | | | | | | | | | | | | |
Investments in Securities:a | | | | | | | | | | | | | | | | |
Equity Investments | | $ | 4,031,106,809 | | | $ | — | | | $ | — | | | $ | 4,031,106,809 | |
Corporate Bonds | | | — | | | | 23,673,883 | | | | — | | | | 23,673,883 | |
Mortgage-Backed Securities | | | — | | | | 448,559 | | | | — | | | | 448,559 | |
Short Term Investments | | | — | | | | 199,000,000 | | | | — | | | | 199,000,000 | |
Total Investments in Securities | | $ | 4,031,106,809 | | | $ | 223,122,442 | | | $ | — | | | $ | 4,254,229,251 | |
| | | | |
Other Financial Instruments: | | | | | | | | | | | | | | | | |
Forward Exchange Contracts | | $ | — | | | $ | 31,947,306 | | | $ | — | | | $ | 31,947,306 | |
| | | | |
Liabilities: | | | | | | | | | | | | | | | | |
Other Financial Instruments: | | | | | | | | | | | | | | | | |
Options Written | | $ | — | | | $ | 293,475 | | | $ | — | | | $ | 293,475 | |
Forward Exchange Contracts | | | — | | | | 5,010,056 | | | | — | | | | 5,010,056 | |
Total Other Financial Instruments | | $ | — | | | $ | 5,303,531 | | | $ | — | | | $ | 5,303,531 | |
aFor detailed categories, see the accompanying Statement of Investments.
11. New Accounting Pronouncements
In August 2018, the Financial Accounting Standards Board issued Accounting Standards Update (ASU) No. 2018-13, Fair Value Measurement (Topic 820): Disclosure Framework—Changes to the Disclosure Requirements for Fair Value Measurements. The amendments in the ASU modify the disclosure requirements on fair value measurements in Topic 820. The ASU is effective for interim and annual reporting periods beginning after December 15, 2019. Management is currently evaluating the impact, if any, of applying this provision.
12. Subsequent Events
The Fund has evaluated subsequent events through the issuance of the financial statements and determined that no events have occurred that require disclosure, except for the following:
On February 27, 2018, the Board approved an automatic conversion feature for Class C that will convert shareholders’ Class C shares into Class A shares after they have been held for 10 years. The conversion feature will become effective on or about October 5, 2018. Further details are disclosed in the Fund’s Prospectus.
On May 18, 2018, the Board approved changes to certain front-end sales charges and dealer commissions on Class A shares. The changes will become effective on or about September 10, 2018. Further details are disclosed in the Fund’s Prospectus.
| | | | |
| | | |
| franklintempleton.com | | Annual Report | | 37 |
TEMPLETON FUNDS
NOTES TO FINANCIAL STATEMENTS
Templeton World Fund (continued)
Abbreviations
| | | | | | | | |
| Counterparty | | Selected Portfolio | | |
BOFA | | Bank of America Corp. | | ADR | | American Depositary Receipt | | |
GSCO | | The Goldman Sachs Group, Inc. | | FHLMC | | Federal Home Loan Mortgage Corp. | | |
HSBK | | HSBC Bank PLC | | IDR | | International Depositary Receipt | | |
MSCO | | Morgan Stanley | | | | | | |
UBSW | | UBS AG | | | | | | |
| | | | |
| | | |
38 | | Annual Report | | franklintempleton.com |
TEMPLETON FUNDS
Report of Independent Registered Public Accounting Firm
To the Board of Trustees of Templeton Funds and Shareholders of Templeton World Fund
Opinion on the Financial Statements
We have audited the accompanying statement of assets and liabilities, including the statement of investments, of Templeton World Fund (the “Fund”) as of August 31, 2018, the related statement of operations for the year ended August 31, 2018, the statement of changes in net assets for each of the two years in the period ended August 31, 2018, including the related notes, and the financial highlights for each of the five years in the period ended August 31, 2018 (collectively referred to as the “financial statements”). In our opinion, the financial statements present fairly, in all material respects, the financial position of the Fund as of August 31, 2018, the results of its operations for the year then ended, the changes in its net assets for each of the two years in the period ended August 31, 2018 and the financial highlights for each of the five years in the period ended August 31, 2018 in conformity with accounting principles generally accepted in the United States of America.
Basis for Opinion
These financial statements are the responsibility of the Fund’s management. Our responsibility is to express an opinion on the Fund’s financial statements based on our audits. We are a public accounting firm registered with the Public Company Accounting Oversight Board (United States) (“PCAOB”) and are required to be independent with respect to the Fund in accordance with the U.S. federal securities laws and the applicable rules and regulations of the Securities and Exchange Commission and the PCAOB.
We conducted our audits of these financial statements in accordance with the standards of the PCAOB. Those standards require that we plan and perform the audit to obtain reasonable assurance about whether the financial statements are free of material misstatement, whether due to error or fraud.
Our audits included performing procedures to assess the risks of material misstatement of the financial statements, whether due to error or fraud, and performing procedures that respond to those risks. Such procedures included examining, on a test basis, evidence regarding the amounts and disclosures in the financial statements. Our audits also included evaluating the accounting principles used and significant estimates made by management, as well as evaluating the overall presentation of the financial statements. Our procedures included confirmation of securities owned as of August 31, 2018 by correspondence with the custodian and brokers; when replies were not received from brokers, we performed other auditing procedures. We believe that our audits provide a reasonable basis for our opinion.
PricewaterhouseCoopers LLP
San Francisco, California
October 16, 2018
We have served as the auditor of one or more investment companies in the Franklin Templeton funds since 1948.
| | | | |
| | | |
| franklintempleton.com | | Annual Report | | 39 |
TEMPLETON FUNDS
Tax Information (unaudited)
Under Section 852(b)(3)(C) of the Internal Revenue Code, the Fund hereby reports the maximum amount allowable but no less than $241,931,009 as a long term capital gain dividend for the fiscal year ended August 31, 2018.
Under Section 871(k)(2)(C) of the Internal Revenue Code, the Fund hereby reports the maximum amount allowable but no less than $40,479,198 as a short term capital gain dividend for purposes of the tax imposed under Section 871(a)(1)(A) of the Internal Revenue Code for the fiscal year ended August 31, 2018.
Under Section 854(b)(1)(A) of the Internal Revenue Code, the Fund hereby reports 52.96% of the ordinary income dividends as income qualifying for the dividends received deduction for the fiscal year ended August 31, 2018.
Under Section 854(b)(1)(B) of the Internal Revenue Code, the Fund hereby reports the maximum amount allowable but no less than $106,062,004 as qualified dividends for purposes of the maximum rate under Section 1(h)(11) of the Internal Revenue Code for the fiscal year ended August 31, 2018. Distributions, including qualified dividend income, paid during calendar year 2018 will be reported to shareholders on Form 1099-DIV by mid-February 2019. Shareholders are advised to check with their tax advisors for information on the treatment of these amounts on their individual income tax returns.
At August 31, 2017, more than 50% of the Fund’s total assets were invested in securities of foreign issuers. In most instances, foreign taxes were withheld from income paid to the Fund on these investments. As shown in the table below, the Fund hereby reports to shareholders the foreign source income and foreign taxes paid, pursuant to Section 853 of the Internal Revenue Code. This written statement will allow shareholders of record on December 21, 2017 to treat their proportionate share of foreign taxes paid by the Fund as having been paid directly by them. The shareholder shall consider these amounts as foreign taxes paid in the tax year in which they receive the Fund distribution.
The following table provides a detailed analysis of foreign tax paid, foreign source income and foreign source qualified dividends as reported by the Fund, to Class A, Class C, Class R6, and Advisor Class shareholders of record.
| | | | | | | | | | | | |
| Class | | Foreign Tax Paid Per Share | | | Foreign Source
Income Per Share | | | Foreign Source Qualified
Dividends Per Share | |
| | | |
Class A | | | $0.0302 | | | | $0.2924 | | | | $0.2232 | |
Class C | | | $0.0302 | | | | $0.2120 | | | | $0.1618 | |
Class R6 | | | $0.0302 | | | | $0.3256 | | | | $0.2486 | |
Advisor Class | | | $0.0302 | | | | $0.3173 | | | | $0.2423 | |
Foreign Tax Paid Per Share (Column 1) is the amount per share available to you, as a tax credit (assuming you held your shares in the Fund for a minimum of 16 days during the 31-day period beginning 15 days before the ex-dividend date of the Fund’s distribution to which the foreign taxes relate), or, as a tax deduction.
Foreign Source Income Per Share (Column 2) is the amount per share of income dividends attributable to foreign securities held by the Fund, plus any foreign taxes withheld on these dividends. The amounts reported include foreign source qualified dividends that have not been adjusted for the rate differential applicable to such dividend income.1
Foreign Source Qualified Dividends Per Share (Column 3) is the amount per share of foreign source qualified dividends, plus any foreign taxes withheld on these dividends. These amounts represent the portion of the Foreign Source Income reported to you in column 2 that were derived from qualified foreign securities held by the Fund.1
In February 2018, shareholders received Form 1099-DIV which included their share of taxes paid and foreign source income distributed during the calendar year 2017. The Foreign Source Income reported on Form 1099-DIV was not adjusted for the rate differential on foreign source qualified dividend income. Shareholders are advised to check with their tax advisors for information on the treatment of these amounts on their 2017 individual income tax returns.
1Qualified dividends are taxed at reduced long term capital gains tax rates. In determining the amount of foreign tax credit that may be applied against the U.S. tax liability of individuals receiving foreign source qualified dividends, adjustments may be required to the foreign tax credit limitation calculation to reflect the rate differential applicable to such dividend income. The rules however permit certain individuals to elect not to apply the rate differential adjustments for capital gains and/or dividends for any taxable year. Please consult your tax advisor and the instructions to Form 1116 for more information.
| | | | |
| | | |
40 | | Annual Report | | franklintempleton.com |
TEMPLETON FUNDS
TEMPLETON WORLD FUND
Special Meeting of Shareholders
MEETING OF SHAREHOLDERS: OCTOBER 30, 2017 AND RECONVENED ON DECEMBER 15, 2017
(UNAUDITED)
A Special Meeting of Shareholders of Templeton Funds was held at the offices of Franklin Templeton Investments, One Franklin Parkway, San Mateo, California on October 30, 2017 and reconvened on December 15, 2017. The purpose of the meeting was to elect Trustees of Templeton Funds and to vote on the following proposals: to approve the use of a “manager of managers” structure whereby the Fund’s investment manager would be able to hire and replace subadvisers without shareholder approval; and to approve an amended fundamental investment restriction regarding investments in commodities for the Fund. At the meeting, (i) the following persons were elected by the shareholders to serve as Trustees of Templeton Funds: Harris J. Ashton, Ann Torre Bates, Mary C. Choksi, Edith E. Holiday, Gregory E. Johnson, Rupert H. Johnson, Jr., J. Michael Luttig, David W. Niemiec, Larry D. Thompson, Constantine D. Tseretopoulos and Robert E. Wade; and (ii) the proposals to use a “manager of managers” structure and to approve the amended fundamental investment restriction regarding investments in commodities were approved by shareholders of the Fund. No other business was transacted at the meeting.
In connection with the meeting, management is aware that some shareholders received from the proxy solicitor numerous calls and mailings that may have been distracting. Management is taking steps to ensure that, in the future, for any new shareholder meeting solicitations that occur, such activity is not repeated. Management apologizes for any inconvenience that may have been caused as a result of such calls and mailings.
The results of the voting at the meeting are as follows:
| Proposal 1. | To elect a Board of Trustees: |
| | | | | | | | |
| Name | | For | | | Withheld | |
| | |
Harris J. Ashton | | | 654,630,558 | | | | 25,820,888 | |
| | |
Ann Torre Bates | | | 655,508,550 | | | | 24,942,896 | |
| | |
Mary C. Choksi | | | 655,587,180 | | | | 24,864,266 | |
| | |
Edith E. Holiday | | | 655,452,139 | | | | 24,999,307 | |
| | |
Gregory E. Johnson | | | 655,319,916 | | | | 25,131,529 | |
| | |
Rupert H. Johnson, Jr. | | | 654,824,311 | | | | 25,627,134 | |
| | |
J. Michael Luttig | | | 655,213,382 | | | | 25,238,064 | |
| | |
David W. Niemiec | | | 655,019,957 | | | | 25,431,488 | |
| | |
Larry D. Thompson | | | 655,060,509 | | | | 25,390,936 | |
| | |
Constantine D. Tseretopoulos | | | 655,237,345 | | | | 25,214,100 | |
| | |
Robert E. Wade | | | 655,537,220 | | | | 24,914,227 | |
Total Trust Shares Outstanding*: 1,210,818,878
*As of the record date.
| | | | |
| | | |
| franklintempleton.com | | Annual Report | | 41 |
TEMPLETON FUNDS
TEMPLETON WORLD FUND
SPECIAL MEETING OF SHAREHOLDERS
| Proposal 2. | To approve the use of a “manager of managers” structure whereby the Fund’s investment manager would be able to hire and replace subadvisers without shareholder approval: |
| | | | |
| | | Shares | |
| |
For | | | 137,115,445 | |
| |
Against | | | 9,467,602 | |
| |
Abstain | | | 5,046,996 | |
| |
Broker Non-Votes | | | 29,362,147 | |
| |
Total Fund Shares Voted | | | 180,992,190 | |
| |
Total Fund Shares Outstanding* | | | 272,079,941 | |
| Proposal 3. | To approve an amended fundamental investment restriction regarding investments in commodities: |
| | | | |
| | | Shares | |
| |
For | | | 135,223,792 | |
| |
Against | | | 9,542,689 | |
| |
Abstain | | | 6,863,562 | |
| |
Broker Non-Votes | | | 29,362,147 | |
| |
Total Fund Shares Voted | | | 180,992,190 | |
| |
Total Fund Shares Outstanding* | | | 272,079,941 | |
| | | | |
| | | |
42 | | Annual Report | | franklintempleton.com |
TEMPLETON FUNDS
Board Members and Officers
The name, year of birth and address of the officers and board members, as well as their affiliations, positions held with the Trust, principal occupations during at least the past five years and number of U.S. registered portfolios overseen in the Franklin Templeton Investments fund complex, are shown below. Generally, each board member serves until that person’s successor is elected and qualified.
Independent Board Members
| | | | | | | | |
Name, Year of Birth and Address | | Position | | Length of
Time Served | | Number of Portfolios in
Fund Complex Overseen
by Board Member* | | Other Directorships Held
During at Least the Past 5 Years |
| | | | |
Harris J. Ashton (1932) 300 S.E. 2nd Street | | Trustee | | Since 1992 | | 136 | | Bar-S Foods (meat packing company) (1981-2010). |
| Fort Lauderdale, FL 33301-1923 | | | | | | |
|
| Principal Occupation During at Least the Past 5 Years: |
Director of various companies; and formerly, Director, RBC Holdings, Inc. (bank holding company) (until 2002); and President, Chief Executive Officer and Chairman of the Board, General Host Corporation (nursery and craft centers) (until 1998). |
| | | | |
Ann Torre Bates (1958) 300 S.E. 2nd Street Fort Lauderdale, FL 33301-1923 | | Trustee | | Since 2008 | | 38 | | Ares Capital Corporation (specialty finance company) (2010-present), United Natural Foods, Inc. (distributor of natural, organic and specialty foods) (2013-present), Allied Capital Corporation (financial services) (2003-2010), SLM Corporation (Sallie Mae) (1997-2014) and Navient Corporation (loan management, servicing and asset recovery) (2014-2016). |
|
| Principal Occupation During at Least the Past 5 Years: |
Director of various companies; and formerly, Executive Vice President and Chief Financial Officer, NHP Incorporated (manager of multifamily housing) (1995-1997); and Vice President and Treasurer, US Airways, Inc. (until 1995). |
| | | | |
Mary C. Choksi (1950) 300 S.E. 2nd Street Fort Lauderdale, FL 33301-1923 | | Trustee | | Since 2016 | | 136 | | Avis Budget Group Inc. (car rental) (2007-present), Omnicom Group Inc. (advertising and marketing communications services) (2011-present) and White Mountains Insurance Group, Ltd. (holding company) (2017-present). |
| | |
| Principal Occupation During at Least the Past 5 Years: | | | | |
Director of various companies; and formerly, Founder and Senior Advisor, Strategic Investment Group (investment management group) (2015-2017); Founding Partner and Senior Managing Director, Strategic Investment Group (1987–2015); Founding Partner and Managing Director, Emerging Markets Management LLC (investment management firm) (1987-2011); and Loan Officer/Senior Loan Officer/Senior Pension Investment Officer, World Bank Group (international financial institution) (1977-1987). |
| | | | |
Edith E. Holiday (1952) 300 S.E. 2nd Street Fort Lauderdale, FL 33301-1923 | | Lead Independent Trustee | | Trustee since 2003 and Lead Independent Trustee since 2007 | | 136 | | Hess Corporation (exploration of oil and gas) (1993-present), Canadian National Railway (railroad) (2001-present), White Mountains Insurance Group, Ltd. (holding company) (2004-present), Santander Consumer USA Holdings, Inc. (consumer finance) (2016-present), RTI International Metals, Inc. (manufacture and distribution of titanium) (1999-2015) and H.J. Heinz Company (processed foods and allied products) (1994-2013). |
|
| Principal Occupation During at Least the Past 5 Years: |
Director or Trustee of various companies and trusts; and formerly, Assistant to the President of the United States and Secretary of the Cabinet (1990-1993); General Counsel to the United States Treasury Department (1989-1990); and Counselor to the Secretary and Assistant Secretary for Public Affairs and Public Liaison–United States Treasury Department (1988-1989). |
| | | | |
| | | |
| franklintempleton.com | | Annual Report | | 43 |
TEMPLETON FUNDS
Independent Board Members (continued)
| | | | | | | | |
Name, Year of Birth and Address | | Position | | Length of
Time Served | | Number of Portfolios in
Fund Complex Overseen
by Board Member* | | Other Directorships Held During at Least the Past 5 Years |
| | | | |
J. Michael Luttig (1954) 300 S.E. 2nd Street Fort Lauderdale, FL 33301-1923 | | Trustee | | Since 2009 | | 136 | | Boeing Capital Corporation (aircraft financing) (2006-2013). |
|
| Principal Occupation During at Least the Past 5 Years: |
Executive Vice President, General Counsel and member of the Executive Council, The Boeing Company (aerospace company) (2006-present); and formerly, Federal Appeals Court Judge, U.S. Court of Appeals for the Fourth Circuit (1991-2006). |
| | | | |
David W. Niemiec (1949) 300 S.E. 2nd Street Fort Lauderdale, FL 33301-1923 | | Trustee | | Since 2005 | | 38 | | Hess Midstream Partners LP (oil and gas midstream infrastructure) (2017-present). |
|
| Principal Occupation During at Least the Past 5 Years: |
Advisor, Saratoga Partners (private equity fund); and formerly, Managing Director, Saratoga Partners (1998-2001) and SBC Warburg Dillon Read (investment banking) (1997-1998); Vice Chairman, Dillon, Read & Co. Inc. (investment banking) (1991-1997); and Chief Financial Officer, Dillon, Read & Co. Inc. (1982-1997). |
| | | | |
Larry D. Thompson (1945) 300 S.E. 2nd Street Fort Lauderdale, FL 33301-1923 | | Trustee | | Since 2005 | | 136 | | The Southern Company (energy company) (2014-present; previously 2010-2012), Graham Holdings Company (education and media organization) (2011-present) and Cbeyond, Inc. (business communications provider) (2010-2012). |
| | |
| Principal Occupation During at Least the Past 5 Years: | | | | |
Director of various companies; Counsel, Finch McCranie, LLP (law firm) (2015-present); Independent Compliance Monitor and Auditor, Volkswagen AG (manufacturer of automobiles and commercial vehicles) (2017 – present); John A. Sibley Professor of Corporate and Business Law, University of Georgia School of Law (2015-present; previously 2011-2012); and formerly, Executive Vice President – Government Affairs, General Counsel and Corporate Secretary, PepsiCo, Inc. (consumer products) (2012-2014); Senior Vice President – Government Affairs, General Counsel and Secretary, PepsiCo, Inc. (2004-2011); Senior Fellow of The Brookings Institution (2003-2004); Visiting Professor, University of Georgia School of Law (2004); and Deputy Attorney General, U.S. Department of Justice (2001-2003). |
| | | | |
Constantine D. Tseretopoulos (1954) 300 S.E. 2nd Street Fort Lauderdale, FL 33301-1923 | | Trustee | | Since 2003 | | 24 | | None |
| | |
| Principal Occupation During at Least the Past 5 Years: | | | | |
Physician, Chief of Staff, owner and operator of the Lyford Cay Hospital (1987-present); director of various nonprofit organizations; and formerly, Cardiology Fellow, University of Maryland (1985-1987); and Internal Medicine Resident, Greater Baltimore Medical Center (1982-1985). |
| | | | |
Robert E. Wade (1946) 300 S.E. 2nd Street Fort Lauderdale, FL 33301-1923 | | Trustee | | Since 2006 | | 38 | | El Oro Ltd (investments) (2003-present). |
| | |
| Principal Occupation During at Least the Past 5 Years: | | | | |
Attorney at law engaged in private practice as a sole practitioner (1972-2008) and member of various boards. |
| | | | |
| | | |
44 | | Annual Report | | franklintempleton.com |
TEMPLETON FUNDS
Interested Board Members and Officers
| | | | | | | | |
Name, Year of Birth and Address | | Position | | Length of Time Served | | Number of Portfolios in
Fund Complex Overseen
by Board Member* | | Other Directorships Held
During at Least the Past 5 Years |
| | | | |
**Gregory E. Johnson (1961) One Franklin Parkway San Mateo, CA 94403-1906 | | Trustee | | Since 2013 | | 150 | | None |
| | |
| Principal Occupation During at Least the Past 5 Years: | | | | |
Chairman of the Board, Member – Office of the Chairman, Director and Chief Executive Officer, Franklin Resources, Inc.; officer and/or director or trustee, as the case may be, of some of the other subsidiaries of Franklin Resources, Inc. and of 42 of the investment companies in Franklin Templeton Investments; Vice Chairman, Investment Company Institute; and formerly, President, Franklin Resources, Inc. (1994-2015). |
| | | | |
**Rupert H. Johnson, Jr. (1940) One Franklin Parkway San Mateo, CA 94403-1906 | | Chairman of the Board, Trustee and Vice President | | Chairman of the Board since 2013, Trustee since 1992 and Vice President since 1996 | | 136 | | None |
| | |
| Principal Occupation During at Least the Past 5 Years: | | | | |
Vice Chairman, Member – Office of the Chairman and Director, Franklin Resources, Inc.; Director, Franklin Advisers, Inc.; Senior Vice President, Franklin Advisory Services, LLC; and officer and/or director or trustee, as the case may be, of some of the other subsidiaries of Franklin Resources, Inc. and of 40 of the investment companies in Franklin Templeton Investments. |
| | | | |
Alison E. Baur (1964) One Franklin Parkway San Mateo, CA 94403-1906 | | Vice President | | Since 2012 | | Not Applicable | | Not Applicable |
| | |
| Principal Occupation During at Least the Past 5 Years: | | | | |
Deputy General Counsel, Franklin Templeton Investments; and officer of some of the other subsidiaries of Franklin Resources, Inc. and of 44 of the investment companies in Franklin Templeton Investments. |
| | | | |
Norman J. Boersma (1957) Lyford Cay Nassau, Bahamas | | President and Chief Executive Officer – Investment Management | | Since 2012 | | Not Applicable | | Not Applicable |
| | |
| Principal Occupation During at Least the Past 5 Years: | | | | |
Chairman of the Board, President and Chief Executive Officer, Templeton Global Advisors Ltd.; Chief Investment Officer of Templeton Global Equity Group; officer of five of the investment companies in Franklin Templeton Investments; and formerly, Executive Vice President, Franklin Templeton Investments Corp. (1993-2014). |
| | | | |
Aliya S. Gordon (1973) One Franklin Parkway San Mateo, CA 94403-1906 | | Vice President | | Since 2009 | | Not Applicable | | Not Applicable |
| | |
| Principal Occupation During at Least the Past 5 Years: | | | | |
Senior Associate General Counsel, Franklin Templeton Investments; and officer of 44 of the investment companies in Franklin Templeton Investments. |
| | | | |
Steven J. Gray (1955) One Franklin Parkway San Mateo, CA 94403-1906 | | Vice President | | Since 2009 | | Not Applicable | | Not Applicable |
| | |
| Principal Occupation During at Least the Past 5 Years: | | | | |
Senior Associate General Counsel, Franklin Templeton Investments; Vice President, Franklin Templeton Distributors, Inc. and FASA, LLC; and officer of 44 of the investment companies in Franklin Templeton Investments. |
| | | | |
Matthew T. Hinkle (1971) One Franklin Parkway San Mateo, CA 94403-1906 | | Chief Executive Officer – Finance and Administration | | Since 2017 | | Not Applicable | | Not Applicable |
|
| Principal Occupation During at Least the Past 5 Years: |
Senior Vice President, Franklin Templeton Services, LLC; officer of 44 of the investment companies in Franklin Templeton Investments; and formerly, Vice President, Global Tax (2012-April 2017) and Treasurer/Assistant Treasurer, Franklin Templeton Investments (2009-2017). |
| | | | |
| | | |
| franklintempleton.com | | Annual Report | | 45 |
TEMPLETON FUNDS
Interested Board Members and Officers (continued)
| | | | | | | | |
Name, Year of Birth and Address | | Position | | Length of
Time Served | | Number of Portfolios in
Fund Complex Overseen
by Board Member* | | Other Directorships Held During at Least the Past 5 Years |
Robert G. Kubilis (1973) 300 S.E. 2nd Street Fort Lauderdale, FL 33301-1923 | | Chief Financial Officer, Chief Accounting Officer and Treasurer | | Since 2017 | | Not Applicable | | Not Applicable |
| | |
| Principal Occupation During at Least the Past 5 Years: | | | | |
Treasurer, U.S. Fund Administration & Reporting, Franklin Templeton Investments; and officer of 16 of the investment companies in Franklin Templeton Investments. |
Robert Lim (1948) One Franklin Parkway San Mateo, CA 94403-1906 | | Vice President – AML Compliance | | Since 2016 | | Not Applicable | | Not Applicable |
| | |
| Principal Occupation During at Least the Past 5 Years: | | | | |
Vice President, Franklin Templeton Companies, LLC; Chief Compliance Officer, Franklin Templeton Distributors, Inc. and Franklin Templeton Investor Services, LLC; and officer of 44 of the investment companies in Franklin Templeton Investments. |
Kimberly H. Novotny (1972) 300 S.E. 2nd Street Fort Lauderdale, FL 33301-1923 | | Vice President | | Since 2013 | | Not Applicable | | Not Applicable |
| | |
| Principal Occupation During at Least the Past 5 Years: | | | | |
Associate General Counsel, Franklin Templeton Investments; Vice President and Corporate Secretary, Fiduciary Trust International of the South; Vice President, Templeton Investment Counsel, LLC; Assistant Secretary, Franklin Resources, Inc.; and officer of 44 of the investment companies in Franklin Templeton Investments. |
Robert C. Rosselot (1960) 300 S.E. 2nd Street Fort Lauderdale, FL 33301-1923 | | Chief Compliance Officer | | Since 2013 | | Not Applicable | | Not Applicable |
| | |
| Principal Occupation During at Least the Past 5 Years: | | | | |
Director, Global Compliance, Franklin Templeton Investments; Vice President, Franklin Templeton Companies, LLC; officer of 44 of the investment companies in Franklin Templeton Investments; and formerly, Senior Associate General Counsel, Franklin Templeton Investments (2007-2013); and Secretary and Vice President, Templeton Group of Funds (2004-2013). |
Karen L. Skidmore (1952) One Franklin Parkway San Mateo, CA 94403-1906 | | Vice President | | Since 2009 | | Not Applicable | | Not Applicable |
| | |
| Principal Occupation During at Least the Past 5 Years: | | | | |
Senior Associate General Counsel, Franklin Templeton Investments; and officer of 44 of the investment companies in Franklin Templeton Investments. |
Navid J. Tofigh (1972) One Franklin Parkway San Mateo, CA 94403-1906 | | Vice President | | Since 2015 | | Not Applicable | | Not Applicable |
| | |
| Principal Occupation During at Least the Past 5 Years: | | | | |
Associate General Counsel, Franklin Templeton Investments; and officer of 44 of the investment companies in Franklin Templeton Investments. |
Craig S. Tyle (1960) One Franklin Parkway San Mateo, CA 94403-1906 | | Vice President | | Since 2005 | | Not Applicable | | Not Applicable |
|
| Principal Occupation During at Least the Past 5 Years: |
General Counsel and Executive Vice President, Franklin Resources, Inc.; and officer of some of the other subsidiaries of Franklin Resources, Inc. and of 44 of the investment companies in Franklin Templeton Investments. |
| | | | |
| | | |
46 | | Annual Report | | franklintempleton.com |
TEMPLETON FUNDS
Interested Board Members and Officers (continued)
| | | | | | | | |
Name, Year of Birth and Address | | Position | | Length of Time Served | | Number of Portfolios in
Fund Complex Overseen
by Board Member* | | Other Directorships Held
During at Least the Past 5 Years |
Lori A. Weber (1964) 300 S.E. 2nd Street Fort Lauderdale, FL 33301-1923 | | Vice President and Secretary | | Vice President since 2011 and Secretary since 2013 | | Not Applicable | | Not Applicable |
|
Principal Occupation During at Least the Past 5 Years: Senior Associate General Counsel, Franklin Templeton Investments; Assistant Secretary, Franklin Resources, Inc.; Vice President and Secretary, Templeton Investment Counsel, LLC; and officer of 44 of the investment companies in Franklin Templeton Investments. |
*We base the number of portfolios on each separate series of the U.S. registered investment companies within the Franklin Templeton Investments fund complex. These portfolios have a common investment manager or affiliated investment managers.
**Gregory E. Johnson is considered to be an interested person of the Fund under the federal securities laws due to his position as an officer and director of Franklin Resources, Inc. (Resources), which is the parent company of the Fund’s investment manager and distributor. Rupert H. Johnson, Jr. is considered to be an interested person of the Fund under the federal securities laws due to his position as an officer and director and major shareholder of Resources.
Note 1: Rupert H. Johnson, Jr. is the uncle of Gregory E. Johnson.
Note 2: Officer information is current as of the date of this report. It is possible that after this date, information about officers may change.
The Sarbanes-Oxley Act of 2002 and Rules adopted by the U.S. Securities and Exchange Commission require the Fund to disclose whether the Fund’s Audit Committee includes at least one member who is an audit committee financial expert within the meaning of such Act and Rules. The Fund’s Board has determined that there is at least one such financial expert on the Audit Committee and has designated each of Ann Torre Bates and David W. Niemiec as an audit committee financial expert. The Board believes that Ms. Bates and Mr. Niemiec qualify as such an expert in view of their extensive business background and experience. Ms. Bates has served as a member of the Fund Audit Committee since 2008. She currently serves as a director of Ares Capital Corporation (2010-present) and United Natural Foods, Inc. (2013-present) and was formerly a director of Navient Corporation from 2014 to 2016, SLM Corporation from 1997 to 2014 and Allied Capital Corporation from 2003 to 2010, Executive Vice President and Chief Financial Officer of NHP Incorporated from 1995 to 1997 and Vice President and Treasurer of US Airways, Inc. until 1995. Mr. Niemiec has served as a member of the Fund Audit Committee since 2005, currently serves as an Advisor to Saratoga Partners and was formerly its Managing Director from 1998 to 2001 and serves as a director of Hess Midstream Partners LP (2017-present). Mr. Niemiec was formerly a director of Emeritus Corporation from 1999 to 2010 and OSI Pharmaceuticals, Inc. from 2006 to 2010, Managing Director of SBC Warburg Dillon Read from 1997 to 1998, and was Vice Chairman from 1991 to 1997 and Chief Financial Officer from 1982 to 1997 of Dillon, Read & Co. Inc. As a result of such background and experience, the Board believes that Ms. Bates and Mr. Niemiec have each acquired an understanding of generally accepted accounting principles and financial statements, the general application of such principles in connection with the accounting estimates, accruals and reserves, and analyzing and evaluating financial statements that present a breadth and level of complexity of accounting issues generally comparable to those of the Fund, as well as an understanding of internal controls and procedures for financial reporting and an understanding of audit committee functions. Ms. Bates and Mr. Niemiec are independent Board members as that term is defined under the applicable U.S. Securities and Exchange Commission Rules and Releases.
The Statement of Additional Information (SAI) includes additional information about the board members and is available, without charge, upon request. Shareholders may call (800) DIAL BEN/342-5236 to request the SAI.
| | | | |
| | | |
| franklintempleton.com | | Annual Report | | 47 |
TEMPLETON FUNDS
TEMPLETON WORLD FUND
Shareholder Information
Board Approval of Investment Management Agreements
TEMPLETON FUNDS
Templeton World Fund
(Fund)
At an in-person meeting held on May 18, 2018 (Meeting), the Board of Trustees (Board) of Templeton Funds (Trust), including a majority of the trustees who are not “interested persons” as defined in the Investment Company Act of 1940 (Independent Trustees), reviewed and approved the continuance of the investment management agreement between Templeton Global Advisors Limited (Manager) and the Trust, on behalf of the Fund (Management Agreement) for an additional one-year period. The Independent Trustees received advice from and met separately with Independent Trustee counsel in considering whether to approve the continuation of the Management Agreement.
In considering the continuation of the Management Agreement, the Board reviewed and considered information provided by the Manager at the Meeting and throughout the year at meetings of the Board and its committees. The Board also reviewed and considered information provided in response to a detailed set of requests for information submitted to the Manager by Independent Trustee counsel on behalf of the Independent Trustees in connection with the annual contract renewal process. In addition, prior to the Meeting, the Independent Trustees held a telephonic contract renewal meeting at which the Independent Trustees conferred amongst themselves and Independent Trustee counsel about contract renewal matters. The Board reviewed and considered all of the factors it deemed relevant in approving the continuance of the Management Agreement, including, but not limited to: (i) the nature, extent and quality of the services provided by the Manager; (ii) the investment performance of the Fund; (iii) the costs of the services provided and profits realized by the Manager and its affiliates from the relationship with the Fund; (iv) the extent to which economies of scale are realized as the Fund grows; and (v) whether fee levels reflect these economies of scale for the benefit of Fund investors.
In approving the continuance of the Management Agreement, the Board, including a majority of the Independent Trustees, determined that the terms of the Management Agreement are fair and reasonable and that the continuance of such Management Agreement is in the interests of the Fund and its shareholders. While attention was given to all information
furnished, the following discusses some primary factors relevant to the Board’s determination.
Nature, Extent and Quality of Services
The Board reviewed and considered information regarding the nature, extent and quality of investment management services provided by the Manager and its affiliates to the Fund and its shareholders. This information included, among other things, the qualifications, background and experience of the senior management and investment personnel of the Manager; the structure of investment personnel compensation; oversight of third-party service providers; investment performance reports and related financial information for the Fund; reports on expenses, shareholder services, marketing support payments made to financial intermediaries and third party servicing arrangements; legal and compliance matters; risk controls; pricing and other services provided by the Manager and its affiliates; and management fees charged by the Manager and its affiliates to U.S. funds and other accounts, including management’s explanation of differences among accounts where relevant. The Board also reviewed and considered an annual report on payments made by Franklin Templeton Investments (FTI) or the Fund to financial intermediaries, as well as a memorandum relating to third-party servicing arrangements in response to a guidance update in 2016 from the U.S. Securities and Exchange Commission (SEC) relating to mutual fund distribution and sub-accounting fees. The Board noted management’s continuing efforts and expenditures in establishing effective business continuity plans and developing strategies to address areas of heightened concern in the mutual fund industry, such as cybersecurity and liquidity risk management. The Board also recognized management’s commitment to facilitating Board oversight of particular areas, including derivatives and payments to intermediaries, by enhanced reporting.
The Board also reviewed and considered the benefits provided to Fund shareholders of investing in a fund that is part of the Franklin Templeton family of funds. The Board noted the financial position of Franklin Resources, Inc. (FRI), the Manager’s parent, and its commitment to the mutual fund business as evidenced by its continued introduction of new funds, reassessment of the fund offerings in response to the market environment and project initiatives and capital investments relating to the services provided to the Fund by the FTI organization.
Following consideration of such information, the Board was satisfied with the nature, extent and quality of services provided
| | | | |
| | | |
48 | | Annual Report | | franklintempleton.com |
TEMPLETON FUNDS
TEMPLETON WORLD FUND
SHAREHOLDER INFORMATION
by the Manager and its affiliates to the Fund and its shareholders.
Fund Performance
The Board reviewed and considered the performance results of the Fund over various time periods ended February 28, 2018. The Board considered the performance returns for the Fund in comparison to the performance returns of mutual funds deemed comparable to the Fund included in a universe (Performance Universe) selected by Broadridge Financial Solutions, Inc. (Broadridge), an independent provider of investment company data. The Board received a description of the methodology used by Broadridge to select the mutual funds included in a Performance Universe. The Board also reviewed and considered Fund performance reports provided and discussions that occurred with portfolio managers at Board meetings throughout the year. A summary of the Fund’s performance results is below.
The Performance Universe for the Fund included the Fund and all retail and institutional global large-cap value funds. The Board noted that the Fund’s annualized total return for the one-, five-, and 10-year periods was below the median of its Performance Universe, but for the three-year period was above the median of its Performance Universe. The Board discussed the Fund’s performance with management and management explained that overweight health care holdings, an underweight position in the technology sector, and underweight positions in U.S. securities detracted from the Fund’s performance over the one-, three- and five-year periods. Management further explained that while the sector positioning was generally consistent with its long-term value orientation, management has recently made enhancements to the investment process for the Fund. Based on its discussion with management and the fact that the Fund’s annualized total return for the one-year period, while below the median, exceeded 8%, the Board concluded that the Fund’s performance was acceptable.
Comparative Fees and Expenses
The Board reviewed and considered information regarding the Fund’s actual total expense ratio and its various components, including, as applicable, management fees; transfer agent expenses; underlying fund expenses; Rule 12b-1 and non-Rule 12b-1 service fees; and other non-management fees. The Board also noted the quarterly and annual reports it receives on all marketing support payments made by FTI to financial intermediaries. The Board considered the actual total expense ratio and, separately, the contractual management fee rate, without the effect of fee waivers (Management Rate), if
any, of the Fund in comparison to the median expense ratio and median Management Rate, respectively, of other mutual funds deemed comparable to and with a similar expense structure as the Fund selected by Broadridge (Expense Group). Broadridge fee and expense data is based upon information taken from each fund’s most recent annual report, which reflects historical asset levels that may be quite different from those currently existing, particularly in a period of market volatility. While recognizing such inherent limitation and the fact that expense ratios and Management Rates generally increase as assets decline and decrease as assets grow, the Board believed the independent analysis conducted by Broadridge to be an appropriate measure of comparative fees and expenses. The Broadridge Management Rate includes administrative charges, and the actual total expense ratio, for comparative consistency, was shown for Class A shares for funds with multiple classes of shares. The Board received a description of the methodology used by Broadridge to select the mutual funds included in an Expense Group.
The Expense Group for the Fund included the Fund, three other global large-cap value funds and three global multi-cap value funds. The Board noted that the Management Rate and actual total expense ratio for the Fund were below the medians of its Expense Group. The Board concluded that the Management Rate charged to the Fund is reasonable.
Profitability
The Board reviewed and considered information regarding the profits realized by the Manager and its affiliates in connection with the operation of the Fund. In this respect, the Board considered the Fund profitability analysis provided by the Manager that addresses the overall profitability of FTI’s U.S. fund business, as well as its profits in providing investment management and other services to each of the individual funds during the 12-month period ended September 30, 2017, being the most recent fiscal year-end for FRI. The Board noted that although management continually makes refinements to its methodologies used in calculating profitability in response to organizational and product-related changes, the overall methodology has remained consistent with that used in the Fund’s profitability report presentations from prior years. Additionally, PricewaterhouseCoopers LLP, auditor to Franklin Resources, Inc. and certain Franklin Templeton funds, has been engaged by the Manager to periodically review and assess the allocation methodologies to be used solely by the Fund’s Board with respect to the profitability analysis.
| | | | |
| | | |
| franklintempleton.com | | Annual Report | | 49 |
TEMPLETON FUNDS
TEMPLETON WORLD FUND
SHAREHOLDER INFORMATION
The Board noted management’s belief that costs incurred in establishing the infrastructure necessary for the type of mutual fund operations conducted by the Manager and its affiliates may not be fully reflected in the expenses allocated to the Fund in determining its profitability, as well as the fact that the level of profits, to a certain extent, reflected operational cost savings and efficiencies initiated by management. The Board also noted management’s expenditures in improving shareholder services provided to the Fund, as well as the need to implement systems and meet additional regulatory and compliance requirements resulting from recent SEC and other regulatory requirements.
The Board also considered the extent to which the Manager and its affiliates might derive ancillary benefits from fund operations, including revenues generated from transfer agent services, potential benefits resulting from personnel and systems enhancements necessitated by fund growth, as well as increased leverage with service providers and counterparties. Based upon its consideration of all these factors, the Board concluded that the level of profits realized by the Manager and its affiliates from providing services to the Fund was not excessive in view of the nature, extent and quality of services provided to the Fund.
Economies of Scale
The Board reviewed and considered the extent to which the Manager may realize economies of scale, if any, as the Fund grows larger and whether the Fund’s management fee structure reflects any economies of scale for the benefit of shareholders. With respect to possible economies of scale, the Board noted the existence of management fee breakpoints, which operate generally to share any economies of scale with a Fund’s shareholders by reducing the Fund’s effective management fees as the Fund grows in size. The Board considered the Manager’s view that any analyses of potential economies of scale in managing a particular fund are inherently limited in light of the joint and common costs and investments the Manager incurs across the Franklin Templeton family of funds as a whole. The Board concluded that given the Fund’s decline in assets over the past three calendar years, the Fund is not expected to experience additional economies of scale in the foreseeable future.
Conclusion
Based on its review, consideration and evaluation of all factors it believed relevant, including the above-described factors and conclusions, the Board unanimously approved the continuation of the Management Agreement for an additional one-year period.
Proxy Voting Policies and Procedures
The Fund’s investment manager has established Proxy Voting Policies and Procedures (Policies) that the Fund uses to determine how to vote proxies relating to portfolio securities. Shareholders may view the Fund’s complete Policies online at franklintempleton.com. Alternatively, shareholders may request copies of the Policies free of charge by calling the Proxy Group collect at (954) 527-7678 or by sending a written request to: Franklin Templeton Companies, LLC, 300 S.E. 2nd Street, Fort Lauderdale, FL 33301, Attention: Proxy Group. Copies of the Fund’s proxy voting records are also made available online at franklintempleton.com and posted on the U.S. Securities and Exchange Commission’s website at sec.gov and reflect the most recent 12-month period ended June 30.
Quarterly Statement of Investments
The Trust, on behalf of the Fund, files a complete statement of investments with the U.S. Securities and Exchange Commission for the first and third quarters for each fiscal year on Form N-Q. Shareholders may view the filed Form N-Q by visiting the Commission’s website at sec.gov. The filed form may also be viewed and copied at the Commission’s Public Reference Room in Washington, DC. Information regarding the operations of the Public Reference Room may be obtained by calling (800) SEC-0330.
Householding of Reports and Prospectuses
You will receive each Fund’s financial reports every six months as well as an annual updated summary prospectus (prospectus available upon request). To reduce Fund expenses, we try to identify related shareholders in a household and send only one copy of the financial reports and summary prospectus. This process, called “householding,” will continue indefinitely unless you instruct us otherwise. If you prefer not to have these documents householded, please call us at (800) 632-2301. At any time you may view current prospectuses/summary prospectuses and financial reports on our website. If you choose, you may receive these documents through electronic delivery.
| | | | |
| | | |
50 | | Annual Report | | franklintempleton.com |
This page intentionally left blank.
This page intentionally left blank.
| | | | |
| | |  | | Annual Report and Shareholder Letter Templeton World Fund Investment Manager Templeton Global Advisors Limited Distributor Franklin Templeton Distributors, Inc. (800) DIAL BEN® / 342-5236 franklintempleton.com Shareholder Services (800) 632-2301 |
| | Authorized for distribution only when accompanied or preceded by a summary prospectus and/or prospectus. Investors should carefully consider a fund’s investment goals, risks, charges and expenses before investing. A prospectus contains this and other information; please read it carefully before investing. To help ensure we provide you with quality service, all calls to and from our service areas are monitored and/or recorded. |
| | |
| | © 2018 Franklin Templeton Investments. All rights reserved. | | 102 A 10/18 |
Annual Report
Templeton International Climate Change Fund
This annual report for Templeton International Climate Change Fund covers the period since the Fund’s inception on June 1, 2018, through August 31, 2018.
Your Fund’s Goal and Main Investments
The Fund seeks total return over the longer term. Under normal market conditions, the Fund invests at least 80% of its net assets in “non-U.S. securities,” as defined in the prospectus. These securities are predominantly equity securities of companies located outside the U.S., including developing markets.
Performance Overview
The Fund’s Advisor Class shares had a -3.60% cumulative total return for the period since the Fund’s inception on June 1, 2018, through August 31, 2018. In comparison, the Fund’s benchmark, the MSCI All Country World Index (ACWI) ex USA Index, which measures stock performance in global developed and emerging markets excluding the U.S., had a -1.97% total return for the same period.1 Please note index performance information is provided for reference and we do not attempt to track the index but rather undertake investments on the basis of fundamental research. You can find more performance data in the Performance Summary beginning on page 6.
Performance data represent past performance, which does not guarantee future results. Investment return and principal value will fluctuate, and you may have a gain or loss when you sell your shares. Current performance may differ from figures shown.
Economic and Market Overview
The global economy expanded during the period under review. In this environment, global developed and emerging market stocks rose, as measured by the MSCI ACWI. Global markets were aided by higher crude oil prices, the European Central
Geographic Composition
Based on Total Net Assets as of 8/31/18
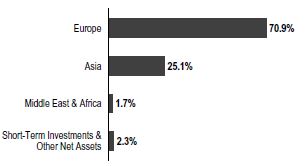
Bank’s (ECB’s) monetary easing program, the effects of the U.S. tax reform bill and encouraging corporate earnings reports.
However, global markets reflected investor concerns about political uncertainties in the U.S. and the European Union (EU), as well as worries that strong economic growth and rising inflation in the U.S. and other countries would lead central banks to increase interest rates sooner than expected. Markets were further pressured by the Trump administration’s protectionist trade policies, U.S. trade disputes with its allies and China, and fears of tighter regulation in the information technology (IT) sector. A sudden decrease in the Turkish lira’s value in August also hurt investor confidence, particularly in emerging markets. But investors were encouraged by a U.S.-EU agreement to try to reduce trade barriers, and a trade deal between the U.S. and Mexico near period-end.
The U.S. economy grew during the period. After moderating for three consecutive quarters, the economy grew faster in 2018’s second quarter, driven by consumer spending, business investment, exports and government spending. The unemployment rate ended the period at 3.9%.2 Annual inflation, as measured by the Consumer Price Index, was 2.7% at period-end.2 The U.S. Federal Reserve (Fed) continued reducing its balance sheet during the period and raised its target range for the federal funds rate in June 2018 to 1.75%–2.00%.
1. Source: FactSet.
The index is unmanaged and includes reinvestment of any income or distributions. It does not reflect any fees, expenses or sales charges. One cannot invest directly in an index, and an index is not representative of the Fund’s portfolio.
2. Source: U.S. Bureau of Labor Statistics.
TEMPLETON INTERNATIONAL CLIMATE CHANGE FUND
In August, Fed Chair Jerome Powell reiterated the Fed’s intention to gradually raise interest rates.
In Europe, the U.K.’s quarterly economic growth accelerated in 2018’s second quarter. The Bank of England raised its key policy rate in August. The eurozone’s quarterly growth remained stable in the second quarter. The ECB kept its benchmark interest rate unchanged during the period. In June, the ECB announced it would further reduce its monthly bond purchases beginning in October 2018, and indicated it would conclude the program at the end of 2018, while keeping interest rates unchanged through at least the summer of 2019.
In Asia, Japan’s quarterly gross domestic product (GDP) expanded in 2018’s second quarter, following a contraction in the first quarter. The Bank of Japan left its benchmark interest rate unchanged during the period and continued its monetary stimulus measures.
In emerging markets, Brazil’s quarterly GDP growth accelerated in 2018’s second quarter. The country’s central bank left its benchmark interest rate unchanged during the period. Russia’s annual GDP growth rate accelerated in 2018’s second quarter, as the Bank of Russia left its key rate unchanged during the period. China’s annual GDP moderated in 2018’s second quarter, after growing at a stable rate in the previous two quarters. The People’s Bank of China left its benchmark interest rate unchanged during the period, but it took measures to improve financial liquidity to mitigate the negative effects of the U.S.-China trade dispute and support economic growth. Overall, emerging market stocks, as measured by the MSCI Emerging Markets Index, declined during the period.
Investment Strategy
Our investment strategy employs a bottom-up, value-oriented, long-term approach to select attractively valued companies preparing for a transition to a lower carbon economy and that meet our climate change criteria. We focus on the market price of the company’s securities relative to our evaluation of the company’s long-term earnings, asset value and cash flow potential. We also consider a company’s price/earnings ratio, price/cash flow ratio, profit margins and liquidation value.
Top 10 Sectors/Industries
8/31/18
| | |
| | | % of Total
Net Assets |
| |
Electrical Equipment | | 14.2% |
| |
Banks | | 8.2% |
| |
Pharmaceuticals | | 7.7% |
| |
Electronic Equipment, Instruments & Components | | 6.4% |
| |
Chemicals | | 5.8% |
| |
Wireless Telecommunication Services | | 5.3% |
| |
Multi-Utilities | | 4.9% |
| |
Semiconductors & Semiconductor Equipment | | 4.7% |
| |
Independent Power & Renewable Electricity Producers | | 3.4% |
| |
Industrial Conglomerates | | 3.1% |
Manager’s Discussion
The Fund underperformed its benchmark, the MSCI ACWI ex USA Index, during the period since inception through August 31, 2018. Underperformance during the period was largely attributable to the Fund’s lack of exposure to the energy sector during a period when oil advanced and energy finished as the second-strongest sector. Consistent with our belief that the global economy needs to transition to a lower carbon footprint in line with the COP21 (Conference of the Parties) climate initiatives, the Fund has no exposure to fossil fuel producers and the total carbon intensity (carbon emissions relative to the intensity of a specific activity or an industrial process) of the companies it holds is less than half of the total carbon intensity of the companies in the MSCI ACWI.
Stock selection in the industrials sector also detracted from relative performance, pressured by U.K.-based building-products supplier Travis Perkins, which said that weaker-than-expected earnings results had prompted it to begin a comprehensive review of its businesses.3 We reassessed our investment thesis during the period and concluded that the stock remains a compelling bargain. While patience is required given ongoing uncertainties and associated pressures on the U.K. economy due to concerns about the U.K.’s exit from the EU, in our analysis, Travis remains a lowly valued, well-run, shareholder-friendly company that is actively addressing challenges in a difficult, but transitory, macro environment.
The financials and consumer discretionary sectors also detracted from relative performance due to stock selection.4 In financials, shares of U.K.-based emerging markets lender
3. The industrials sector comprises construction and engineering, electrical equipment, industrial conglomerates, and trading companies and distributors in the SOI.
4. The financials sector comprises banks, capital markets and insurance in the SOI. The consumer discretionary sector comprises auto components; hotels, restaurants and leisure; household durables; specialty retail; and textiles, apparel and luxury goods in the SOI.
TEMPLETON INTERNATIONAL CLIMATE CHANGE FUND
Standard Chartered declined amid increasing emerging market turmoil and investor impatience about the timing of an eventual earnings recovery. We believe recent weakness represents an additional buying opportunity. Company management has successfully executed on its planned strategic actions to reduce risk and control costs. In our view, the firm’s restored balance sheet provides ample liquidity and excess capital to finance the growth in its high GDP markets, and we expect a meaningful expansion in Standard Chartered’s very low price-to-tangible book value ratio as that growth comes through.
Top 10 Holdings
8/31/18
| | | | |
Company Sector/Industry, Country | | % of Total
Net Assets | |
| |
Vestas Wind Systems AS Electrical Equipment, Denmark | | | 3.6% | |
| |
Signify NV Electrical Equipment, Netherlands | | | 3.5% | |
| |
Prysmian SpA Electrical Equipment, Italy | | | 3.3% | |
| |
Siemens AG Industrial Conglomerates, Germany | | | 3.1% | |
| |
Landis+Gyr Group AG Electronic Equipment, Instruments & Components, Switzerland | | | 3.0% | |
| |
Orsted AS Electric Utilities, Denmark | | | 3.0% | |
| |
Johnson Matthey PLC Chemicals, U.K. | | | 3.0% | |
| |
E.ON SE Multi-Utilities, Germany | | | 2.9% | |
| |
BNP Paribas SA Banks, France | | | 2.9% | |
| |
Siemens Gamesa Renewable Energy SA Electrical Equipment, Spain | | | 2.7% | |
From the consumer discretionary sector, shares of German auto parts maker ElringKlinger declined after disappointing quarterly earnings cast doubts over the firm’s ability to meet full-year guidance.5 The global push for lower emissions also represents a compelling long-term growth driver for ElringKlinger, whose products are centered on energy efficiency and emissions reduction. However, concerns about the auto cycle, raw materials costs and trade disputes raise the
risk of further deterioration in fundamentals, and we continue to closely monitor developments with the stock.
Top 10 Countries
8/31/18
| | |
| | | % of Total Net Assets |
| |
U.K. | | 15.0% |
| |
France | | 14.7% |
| |
Japan | | 12.4% |
| |
Germany | | 10.7% |
| |
Netherlands | | 8.7% |
| |
Denmark | | 8.3% |
| |
Switzerland | | 6.3% |
| |
Italy | | 3.3% |
| |
Spain | | 2.7% |
| |
Taiwan | | 2.7% |
Turning to contributors, stock selection and an overweighted allocation in the utilities sector contributed to the Fund’s relative performance.6 Philippines-based geothermal energy firm Energy Development was among the Fund’s top contributors, with its share price surging the most in 11 years after management announced a tender offer to take the firm private at a significant premium to the then-current share price.5
Stock selection and overweighted allocations in the health care and telecommunications services sectors also contributed, as did stock selection in the IT sector.7 Top contributors from the health care sector included pharmaceuticals firms Astellas Pharma (Japan), Sanofi (France) and Teva Pharmaceutical Industries (Israel), as well as biotechnology firm Shire (U.K.). In telecommunication services, Japanese telecommunication services conglomerate Softbank Group benefited performance. Key contributors in the IT sector included Taiwanese chip maker Taiwan Semiconductor Manufacturing, Japanese electronics firm Murata Manufacturing and Swiss energy metering firm Landis+Gyr Group5.
From a regional standpoint, the benefits of stock selection and an underweighted allocation in Asia were largely offset by stock selection in Europe, most notably in the U.K.
5. Not part of the index.
6. The utilities sector comprises electric utilities, independent power and renewable electricity producers, and multi-utilities in the SOI.
7. The health care sector comprises biotechnology and pharmaceuticals in the SOI. The telecommunication services sector comprises diversified telecommunication services and wireless telecommunication services in the SOI. The IT sector comprises electronic equipment, instruments and components; semiconductors and semiconductor equipment; and technology hardware, storage and peripherals in the SOI.
See www.franklintempletondatasources.com for additional data provider information.
TEMPLETON INTERNATIONAL CLIMATE CHANGE FUND
It is important to recognize the effect of currency movements on the Fund’s performance. In general, if the value of the U.S. dollar goes up compared with a foreign currency, an investment traded in that foreign currency will go down in value because it will be worth fewer U.S. dollars. This can have a negative effect on Fund performance. Conversely, when the U.S. dollar weakens in relation to a foreign currency, an investment traded in that foreign currency will increase in value, which can contribute to Fund performance. For the period since the Fund’s inception on June 1, 2018, through August 31, 2018, the U.S. dollar rose in value relative to most currencies. As a result, the Fund’s performance was negatively affected by the portfolio’s investment predominantly in securities with non-U.S. currency exposure.
At period-end, we continued to find what we consider attractive opportunities at the intersection of climate solutions and value investing. In our view, lowly valued companies prepared for the transition to a low-carbon future are well positioned for both resilience and growth over a long-term investment horizon.
Thank you for your participation in Templeton International Climate Change Fund. We look forward to serving your future investment needs.
Maarten Bloemen
Portfolio Manager
The foregoing information reflects our analysis, opinions and portfolio holdings as of August 31, 2018, the end of the reporting period. The way we implement our main investment strategies and the resulting portfolio holdings may change depending on factors such as market and economic conditions. These opinions may not be relied upon as investment advice or an offer for a particular security. The information is not a complete analysis of every aspect of any market, country, industry, security or the Fund. Statements of fact are from sources considered reliable, but the investment manager makes no representation or warranty as to their completeness or accuracy. Although historical performance is no guarantee of future results, these insights may help you understand our investment management philosophy.
|
Maarten Bloemen has more than 31 years of investment experience, with the last 16 years at Franklin Templeton as a senior analyst and portfolio manager. He is a member of the energy sector team, having covered the sector for many years and currently shares joint global research responsibilities for renewable energy. Mr. Bloemen is also leading the Sustainable Investing (ESG) efforts within Templeton’s Global Equity Group. Over the past 16 years at Templeton, he has covered a variety of sectors including: energy, metals and mining and renewables. He also manages several institutional separate global and international portfolios. Prior to joining Franklin Templeton in 2001, Mr. Bloemen was a senior portfolio manager with ABN AMRO Bank in the Netherlands, where he managed several global equity portfolios for retail and institutional investors. Previously, he was a vice president, marketing and sales, for ABN AMRO’s Canadian operations. He entered the financial services industry in 1986. Mr. Bloemen earned a B.E.S. in environmental studies from the University of Waterloo and an M.E.S. in environmental studies from York University. |
TEMPLETON INTERNATIONAL CLIMATE CHANGE FUND
Performance Summary as of August 31, 2018
The performance table does not reflect any taxes that a shareholder would pay on Fund dividends, capital gain distributions, if any, or any realized gains on the sale of Fund shares. Total return reflects reinvestment of the Fund’s dividends and capital gain distributions, if any, and any unrealized gains or losses. Your dividend income will vary depending on dividends or interest paid by securities in the Fund’s portfolio, adjusted for operating expenses. Capital gain distributions are net profits realized from the sale of portfolio securities.
Performance as of 8/31/181
Cumulative total return excludes sales charges. Average annual total return includes maximum sales charges. Sales charges will vary depending on the size of the investment and the class of share purchased. Advisor Class shares are offered without sales charges.
| | | | | | | | |
| Share Class | | Cumulative
Total Return2 | | | Average Annual
Total Return3 | |
| | |
Advisor | | | | | | | | |
| | |
Since Inception (6/1/18) | | | -3.60% | | | | -3.60% | |
Performance data represent past performance, which does not guarantee future results. Investment return and principal value will fluctuate, and you may have a gain or loss when you sell your shares. Current performance may differ from figures shown.
See page 7 for Performance Summary footnotes.
TEMPLETON INTERNATIONAL CLIMATE CHANGE FUND
PERFORMANCE SUMMARY
Total Annual Operating Expenses4
| | | | |
Share Class | | With Waiver | | Without Waiver |
Advisor | | 0.97% | | 8.24% |
All investments involve risks, including possible loss of principal. Special risks are associated with foreign investing, including currency fluctuations, economic instability and political developments; investments in developing markets involve heightened risks related to the same factors. Currency rates may fluctuate significantly over short periods of time, and can reduce returns. Because the Fund may invest its assets in companies in a specific region, including Europe, it is subject to greater risks of adverse developments in that region and/or the surrounding regions than a fund that is more broadly diversified geographically. Current political and financial uncertainty surrounding the European Union may increase market volatility and the economic risk of investing in companies in Europe. Derivatives, including currency management strategies, involve costs and can create economic leverage in the portfolio, which may result in significant volatility and cause the Fund to participate in losses (as well as enable gains) on an amount that exceeds the Fund’s initial investment. The Fund may not achieve the anticipated benefits, and may realize losses when a counterparty fails to perform as promised. The Fund is actively managed but there is no guarantee that the manager’s investment decisions will produce the desired results. The Fund’s prospectus also includes a description of the main investment risks.
1. The Fund has an expense reduction contractually guaranteed through 5/31/19. Fund investment results reflect the expense reduction; without this reduction, the results would have been lower.
2. Cumulative total return represents the change in value of an investment over the period indicated.
3. Average annual total return represents the average annual change in value of an investment over the period indicated. Return for less than one year, if any, has not been annualized.
4. Figures are as stated in the Fund’s current prospectus and may differ from the expense ratios disclosed in the Your Fund’s Expenses and Financial Highlights sections in this report. In periods of market volatility, assets may decline significantly, causing total annual Fund operating expenses to become higher than the figures shown.
TEMPLETON INTERNATIONAL CLIMATE CHANGE FUND
Your Fund’s Expenses
As a Fund shareholder, you can incur two types of costs: (1) transaction costs, including sales charges (loads) on Fund purchases and redemptions; and (2) ongoing Fund costs, including management fees, distribution and service (12b-1) fees, and other Fund expenses. All mutual funds have ongoing costs, sometimes referred to as operating expenses. The table below shows ongoing costs of investing in the Fund and can help you understand these costs and compare them with those of other mutual funds. The table assumes a $1,000 investment held for the six months indicated.
Actual Fund Expenses
The table below provides information about actual account values and actual expenses in the columns under the heading “Actual.” In these columns the Fund’s actual return, which includes the effect of Fund expenses, is used to calculate the “Ending Account Value.” You can estimate the expenses you paid during the period by following these steps (of course, your account value and expenses will differ from those in this illustration): Divide your account value by $1,000 (if your account had an $8,600 value, then $8,600 ÷ $1,000 = 8.6). Then multiply the result by the number in the row for your class of shares under the headings “Actual” and “Expenses Paid During Period” (if Actual Expenses Paid During Period were $7.50, then 8.6 x $7.50 = $64.50). In this illustration, the actual expenses paid this period are $64.50.
Hypothetical Example for Comparison with Other Funds
Under the heading “Hypothetical” in the table, information is provided about hypothetical account values and hypothetical expenses based on the Fund’s actual expense ratio and an assumed rate of return of 5% per year before expenses, which is not the Fund’s actual return. This information may not be used to estimate the actual ending account balance or expenses you paid for the period, but it can help you compare ongoing costs of investing in the Fund with those of other funds. To do so, compare this 5% hypothetical example for the class of shares you hold with the 5% hypothetical examples that appear in the shareholder reports of other funds.
Please note that expenses shown in the table are meant to highlight ongoing costs and do not reflect any transactional costs. Therefore, information under the heading “Hypothetical” is useful in comparing ongoing costs only, and will not help you compare total costs of owning different funds. In addition, if transactional costs were included, your total costs would have been higher.
| | | | | | | | | | | | |
| | | | | Actual (actual return after expenses) | | Hypothetical (5% annual return before expenses) | | |
| | | | | | | | |
Share Class | | Beginning Account Value1 | | Ending Account Value 8/31/18 | | Expenses Paid During Period 6/1/18–8/31/182,3 | | Ending Account Value 8/31/18 | | Expenses Paid During Period 3/1/18–8/31/182,3 | | Net Annualized Expense Ratio3 |
| | | | | | |
Advisor | | $1,000 | | $964.00 | | $2.35 | | $1,020.32 | | $4.94 | | 0.97% |
1. June 1, 2018 for Actual; March 1, 2018 for Hypothetical.
2. Expenses are equal to the annualized expense ratio for the six-month period as indicated above—in the far right column—multiplied by the simple average account value over the period indicated, and then multiplied by 184/365 to reflect the one-half year period for Hypothetical expenses. For Actual expenses, the multiplier is 90/365 to reflect the number of days since commencement of operations.
3. Reflects expenses after fee waivers and expense reimbursements. Does not include acquired fund fees and expenses.
TEMPLETON FUNDS
Financial Highlights
Templeton International Climate Change Fund
| | | | |
| | | Year Ended August 31, 2018a | |
| |
Advisor Class | | | | |
Per share operating performance | | | | |
(for a share outstanding throughout the year) | | | | |
| |
Net asset value, beginning of year | | | $10.00 | |
| |
Income from investment operationsb: | | | | |
Net investment incomec | | | 0.04 | |
Net realized and unrealized gains (losses) | | | (0.40 | ) |
| |
Total from investment operations | | | (0.36 | ) |
| |
Net asset value, end of year | | | $ 9.64 | |
| |
Total returnd | | | (3.60)% | |
| |
Ratios to average net assetse | | | | |
| |
Expenses before waiver and payments by affiliates | | | 13.30% | |
| |
Expenses net of waiver and payments by affiliates | | | 0.97% | |
| |
Net investment income | | | 1.51% | |
| |
Supplemental data | | | | |
Net assets, end of year (000’s) | | | $1,929 | |
Portfolio turnover rate | | | 7.95% | |
aFor the period June 1, 2018 (commencement of operations) to August 31, 2018.
bThe amount shown for a share outstanding throughout the period may not correlate with the Statement of Operations for the period due to the timing of sales and repurchases of the Fund’s shares in relation to income earned and/or fluctuating fair value of the investments of the Fund.
cBased on average daily shares outstanding.
dTotal return is not annualized for periods less than one year.
eRatios are annualized for periods less than one year, except for non-recurring expenses, if any.
| | | | |
| | | |
9 | | Annual Report | The accompanying notes are an integral part of these financial statements. | | |
TEMPLETON FUNDS
Statement of Investments, August 31, 2018
Templeton International Climate Change Fund
| | | | | | | | | | | | |
| | | Industry | | | Shares | | | Value | |
| | | |
Common Stocks 97.7% | | | | | | | | | | | | |
China 2.4% | | | | | | | | | | | | |
China Mobile Ltd. | | | Wireless Telecommunication Services | | | | 5,000 | | | | $ 47,011 | |
| | | |
Denmark 8.3% | | | | | | | | | | | | |
Novozymes AS | | | Chemicals | | | | 589 | | | | 32,274 | |
Orsted AS | | | Electric Utilities | | | | 920 | | | | 58,145 | |
Vestas Wind Systems AS | | | Electrical Equipment | | | | 993 | | | | 69,173 | |
| | | |
| | | | | | | | | | | 159,592 | |
France 14.7% | | | | | | | | | | | | |
AXA SA | | | Insurance | | | | 1,608 | | | | 40,576 | |
BNP Paribas SA | | | Banks | | | | 950 | | | | 55,761 | |
Cie Generale des Etablissements Michelin SCA | | | Auto Components | | | | 348 | | | | 41,171 | |
Compagnie de Saint-Gobain | | | Building Products | | | | 755 | | | | 32,474 | |
Sanofi | | | Pharmaceuticals | | | | 587 | | | | 50,197 | |
Sodexo SA | | | Hotels, Restaurants & Leisure | | | | 253 | | | | 26,341 | |
Veolia Environnement SA | | | Multi-Utilities | | | | 1,721 | | | | 36,268 | |
| | | |
| | | | | | | | | | | 282,788 | |
Germany 10.7% | | | | | | | | | | | | |
E.ON SE | | | Multi-Utilities | | | | 5,309 | | | | 56,556 | |
ElringKlinger AG | | | Auto Components | | | | 1,457 | | | | 17,702 | |
Infineon Technologies AG | | | Semiconductors & Semiconductor Equipment | | | | 1,493 | | | | 37,978 | |
Merck KGaA | | | Pharmaceuticals | | | | 318 | | | | 33,389 | |
Siemens AG | | | Industrial Conglomerates | | | | 461 | | | | 59,906 | |
| | | |
| | | | | | | | | | | 205,531 | |
India 1.0% | | | | | | | | | | | | |
aAzure Power Global Ltd. | |
| Independent Power & Renewable
Electricity Producers |
| | | 1,200 | | | | 18,732 | |
| | | |
Israel 1.7% | | | | | | | | | | | | |
Teva Pharmaceutical Industries Ltd., ADR | | | Pharmaceuticals | | | | 1,400 | | | | 32,074 | |
| | | |
Italy 3.3% | | | | | | | | | | | | |
Prysmian SpA | | | Electrical Equipment | | | | 2,496 | | | | 64,360 | |
Japan 12.4% | | | | | | | | | | | | |
Ajinomoto Co. Inc. | | | Food Products | | | | 1,500 | | | | 25,463 | |
Asics Corp. | | | Textiles, Apparel & Luxury Goods | | | | 1,800 | | | | 26,926 | |
Astellas Pharma Inc. | | | Pharmaceuticals | | | | 2,000 | | | | 33,878 | |
Murata Manufacturing Co. Ltd. | |
| Electronic Equipment, Instruments
& Components |
| | | 200 | | | | 34,535 | |
Omron Corp. | |
| Electronic Equipment, Instruments
& Components |
| | | 700 | | | | 31,344 | |
Panasonic Corp. | | | Household Durables | | | | 3,700 | | | | 44,175 | |
SoftBank Group Corp. | | | Wireless Telecommunication Services | | | | 200 | | | | 18,541 | |
Suntory Beverage & Food Ltd. | | | Beverages | | | | 600 | | | | 24,598 | |
| | | |
| | | | | | | | | | | 239,460 | |
Netherlands 8.7% | | | | | | | | | | | | |
Akzo Nobel NV | | | Chemicals | | | | 228 | | | | 21,304 | |
Arcadis NV | | | Construction & Engineering | | | | 2,227 | | | | 39,489 | |
ING Groep NV | | | Banks | | | | 2,953 | | | | 40,059 | |
Signify NV | | | Electrical Equipment | | | | 2,407 | | | | 67,707 | |
| | | |
| | | | | | | | | | | 168,559 | |
TEMPLETON FUNDS
STATEMENT OF INVESTMENTS
Templeton International Climate Change Fund (continued)
| | | | | | | | | | | | |
| | | Industry | | | Shares | | | Value | |
Common Stocks (continued) | | | | | | | | | | | | |
Philippines 2.4% | | | | | | | | | | | | |
| | | |
aEnergy Development Corp. | |
| Independent Power & Renewable
Electricity Producers |
| | | 348,500 | | | | $ 45,869 | |
Singapore 2.0% | | | | | | | | | | | | |
| | | |
Singapore Telecommunications Ltd. | | | Diversified Telecommunication Services | | | | 16,300 | | | | 38,350 | |
| | | |
South Korea 2.2% | | | | | | | | | | | | |
| | | |
bSamsung Electronics Co. Ltd., GDR, 144A | | | Technology Hardware, Storage & Peripherals | | | | 40 | | | | 42,720 | |
| | | |
Spain 2.7% | | | | | | | | | | | | |
| | | |
aSiemens Gamesa Renewable Energy SA | | | Electrical Equipment | | | | 3,547 | | | | 52,913 | |
| | | |
Sweden 1.2% | | | | | | | | | | | | |
| | | |
Billerudkorsnas AB | | | Containers & Packaging | | | | 1,978 | | | | 23,353 | |
| | | |
Switzerland 6.3% | | | | | | | | | | | | |
| | | |
ABB Ltd. | | | Electrical Equipment | | | | 886 | | | | 20,881 | |
Landis+Gyr Group AG | | | Electronic Equipment, Instruments & Components | | | | 823 | | | | 58,146 | |
UBS Group AG | | | Capital Markets | | | | 2,661 | | | | 41,539 | |
| | | |
| | | | | | | | | | | 120,566 | |
Taiwan 2.7% | | | | | | | | | | | | |
Taiwan Semiconductor Manufacturing Co. Ltd., ADR | | | Semiconductors & Semiconductor Equipment | | | | 1,200 | | | | 52,320 | |
United Kingdom 15.0% | | | | | | | | | | | | |
HSBC Holdings PLC | | | Banks | | | | 3,200 | | | | 28,069 | |
Johnson Matthey PLC | | | Chemicals | | | | 1,281 | | | | 58,037 | |
Kingfisher PLC | | | Specialty Retail | | | | 12,291 | | | | 43,565 | |
Shire PLC | | | Biotechnology | | | | 586 | | | | 34,163 | |
SIG PLC | | | Trading Companies & Distributors | | | | 14,028 | | | | 23,633 | |
Standard Chartered PLC | | | Banks | | | | 3,976 | | | | 32,313 | |
Travis Perkins PLC | | | Trading Companies & Distributors | | | | 2,121 | | | | 31,624 | |
Vodafone Group PLC | | | Wireless Telecommunication Services | | | | 17,669 | | | | 37,667 | |
| | | |
| | | | | | | | | | | 289,071 | |
| | | |
Total Common Stocks (Cost $1,957,229) | | | | | | | | | | | 1,883,269 | |
| | | |
Short Term Investments (Cost $41) 0.0%† | | | | | | | | | | | | |
| | | |
Money Market Funds 0.0%† | | | | | | | | | | | | |
| | | |
United States 0.0%† | | | | | | | | | | | | |
| c,dInstitutional Fiduciary Trust Money Market Portfolio, 1.64% | | | | | | | 41 | | | | 41 | |
Total Investments (Cost $1,957,270) 97.7% | | | | | | | | | | | 1,883,310 | |
Other Assets, less Liabilities 2.3% | | | | | | | | | | | 45,214 | |
Net Assets 100.0% | | | | | | | | | | | $1,928,524 | |
TEMPLETON FUNDS
STATEMENT OF INVESTMENTS
Templeton International Climate Change Fund (continued)
See Abbreviations on page 22.
†Rounds to less than 0.1% of net assets.
aNon-income producing.
bSecurity was purchased pursuant to Rule 144A under the Securities Act of 1933 and may be sold in transactions exempt from registration only to qualified institutional buyers or in a public offering registered under the Securities Act of 1933. This security has been deemed liquid under guidelines approved by the Trust’s Board of Trustees.
cSee Note 3(e) regarding investments in affiliated management investment companies.
dThe rate shown is the annualized seven-day effective yield at period end.
| | | | |
| | | |
| | The accompanying notes are an integral part of these financial statements. | Annual Report | | 12 |
TEMPLETON FUNDS
Financial Statements
Statement of Assets and Liabilities
August 31, 2018
Templeton International Climate Change Fund
| | | | |
Assets: | | | | |
Investments in securities: | | | | |
Cost - Unaffiliated issuers | | | $1,957,229 | |
Cost - Non-controlled affiliates (Note 3e) | | | 41 | |
| |
Value - Unaffiliated issuers | | | $1,883,269 | |
Value - Non-controlled affiliates (Note 3e) | | | 41 | |
Cash | | | 12,536 | |
Receivables: | | | | |
Dividends | | | 2,851 | |
Affiliates | | | 50,262 | |
Offering costs | | | 31,881 | |
| |
Total assets | | | 1,980,840 | |
| |
Liabilities: | | | | |
Payables: | | | | |
Transfer agent fees | | | 28 | |
Professional fees | | | 49,769 | |
Accrued expenses and other liabilities | | | 2,519 | |
| |
Total liabilities | | | 52,316 | |
| |
Net assets, at value | | | $1,928,524 | |
| |
Net assets consist of: | | | | |
Paid-in capital | | | $1,998,856 | |
Undistributed net investment income | | | 6,370 | |
Net unrealized appreciation (depreciation) | | | (73,960) | |
Accumulated net realized gain (loss) | | | (2,742) | |
| |
Net assets, at value | | | $1,928,524 | |
| |
Shares outstanding | | | 200,000 | |
Net asset value per share | | | $9.64 | |
| | | | |
| | | |
13 | | Annual Report | The accompanying notes are an integral part of these financial statements. | | |
TEMPLETON FUNDS
FINANCIAL STATEMENTS
Statement of Operations
for the year ended August 31, 2018a
Templeton International Climate Change Fund
| | | | |
Investment income: | | | | |
Dividends: (net of foreign taxes)* | | | | |
Unaffiliated issuers | | | $ 11,795 | |
Non-controlled affiliates (Note 3e) | | | 160 | |
| | | | |
| |
Total investment income | | | 11,955 | |
| | | | |
| |
Expenses: | | | | |
Management fees (Note 3a) | | | 3,401 | |
Transfer agent fees (Note 3d) | | | 158 | |
Custodian fees (Note 4) | | | 260 | |
Reports to shareholders | | | 2,125 | |
Registration and filing fees | | | 204 | |
Professional fees | | | 50,036 | |
Amortization of offering costs (Note 1e) | | | 21,254 | |
Other | | | 2,637 | |
| | | | |
| |
Total expenses | | | 80,075 | |
Expenses waived/paid by affiliates (Note 3f) | | | (75,397 | ) |
| | | | |
| |
Net expenses | | | 4,678 | |
| | | | |
| |
Net investment income | | | 7,277 | |
| | | | |
| |
Realized and unrealized gains (losses): | | | | |
Net realized gain (loss) from: | | | | |
Investments: | | | | |
Unaffiliated issuers | | | (2,742 | ) |
Foreign currency transactions | | | (2,051 | ) |
| | | | |
| |
Net realized gain (loss) | | | (4,793 | ) |
| | | | |
Net change in unrealized appreciation (depreciation) on: | | | | |
Investments: | | | | |
Unaffiliated issuers | | | (73,960 | ) |
| | | | |
| |
Net realized and unrealized gain (loss) | | | (78,753 | ) |
| | | | |
| |
Net increase (decrease) in net assets resulting from operations | | | $(71,476 | ) |
| | | | |
*Foreign taxes withheld on dividends | $ 738 |
aFor the period June 1, 2018 (commencement of operations) to August 31, 2018.
| | | | |
| | | |
| | The accompanying notes are an integral part of these financial statements. | Annual Report | | 14 |
TEMPLETON FUNDS
FINANCIAL STATEMENTS
Statement of Changes in Net Assets
Templeton International Climate Change Fund
| | | | |
| | | Year Ended
August 31, 2018a | |
Increase (decrease) in net assets: | | | | |
Operations: | | | | |
Net investment income | | | $ 7,277 | |
Net realized gain (loss) | | | (4,793 | ) |
Net change in unrealized appreciation (depreciation) | | | (73,960 | ) |
| | | | |
| |
Net increase (decrease) in net assets resulting from operations | | | (71,476 | ) |
| | | | |
| |
Capital share transactions (Note 2) | | | 2,000,000 | |
| | | | |
| |
Net increase (decrease) in net assets | | | 1,928,524 | |
Net assets: | | | | |
End of year | | | $1,928,524 | |
| | | | |
| |
Undistributed net investment income included in net assets: | | | | |
End of year | | | $ 6,370 | |
| | | | |
aFor the period June 1, 2018 (commencement of operations) to August 31, 2018.
| | | | |
| | | |
15 | | Annual Report | The accompanying notes are an integral part of these financial statements. | | |
TEMPLETON FUNDS
Notes to Financial Statements
Templeton International Climate Change Fund
1. Organization and Significant Accounting Policies
Templeton Funds (Trust) is registered under the Investment Company Act of 1940 (1940 Act) as an open-end management investment company, consisting of three separate funds and applies the specialized accounting and reporting guidance in U.S. Generally Accepted Accounting Principles (U.S. GAAP). Templeton International Climate Change Fund (Fund) is included in this report. The Fund has five classes of shares: Class A, Class C, Class R, Class R6 and Advisor Class. Each class of shares may differ by its initial sales load, contingent deferred sales charges, voting rights on matters affecting a single class, its exchange privilege and fees due to differing arrangements for distribution and transfer agent fees.
The Fund commenced operations effective June 1, 2018, with one class of shares, Advisor Class.
The following summarizes the Fund’s significant accounting policies.
a. Financial Instrument Valuation
The Fund’s investments in financial instruments are carried at fair value daily. Fair value is the price that would be received to sell an asset or paid to transfer a liability in an orderly transaction between market participants on the measurement date. The Fund calculates the net asset value (NAV) per share each business day as of 4 p.m. Eastern time or the regularly scheduled close of the New York Stock Exchange (NYSE), whichever is earlier. Under compliance policies and procedures approved by the Trust’s Board of Trustees (the Board), the Fund’s administrator has responsibility for oversight of valuation, including leading the cross-functional Valuation Committee (VC). The VC provides administration and oversight of the Fund’s valuation policies and procedures, which are approved annually by the Board. Among other things, these procedures allow the Fund to utilize independent pricing services, quotations from securities and financial instrument dealers, and other market sources to determine fair value.
Equity securities listed on an exchange or on the NASDAQ National Market System are valued at the last quoted sale price or the official closing price of the day, respectively. Foreign equity securities are valued as of the close of trading on the foreign stock exchange on which the security is primarily traded, or as of 4 p.m. Eastern time. The value is then converted into its U.S. dollar equivalent at the foreign exchange rate in
effect at 4 p.m. Eastern time on the day that the value of the security is determined. Over-the-counter (OTC) securities are valued within the range of the most recent quoted bid and ask prices. Securities that trade in multiple markets or on multiple exchanges are valued according to the broadest and most representative market. Certain equity securities are valued based upon fundamental characteristics or relationships to similar securities.
Investments in open-end mutual funds are valued at the closing NAV.
The Fund has procedures to determine the fair value of financial instruments for which market prices are not reliable or readily available. Under these procedures, the VC convenes on a regular basis to review such financial instruments and considers a number of factors, including significant unobservable valuation inputs, when arriving at fair value. The VC primarily employs a market-based approach which may use related or comparable assets or liabilities, recent transactions, market multiples, book values, and other relevant information for the investment to determine the fair value of the investment. An income-based valuation approach may also be used in which the anticipated future cash flows of the investment are discounted to calculate fair value. Discounts may also be applied due to the nature or duration of any restrictions on the disposition of the investments. Due to the inherent uncertainty of valuations of such investments, the fair values may differ significantly from the values that would have been used had an active market existed. The VC employs various methods for calibrating these valuation approaches including a regular review of key inputs and assumptions, transactional back-testing or disposition analysis, and reviews of any related market activity.
Trading in securities on foreign securities stock exchanges and OTC markets may be completed before 4 p.m. Eastern time. In addition, trading in certain foreign markets may not take place on every Fund’s business day. Occasionally, events occur between the time at which trading in a foreign security is completed and 4 p.m. Eastern time that might call into question the reliability of the value of a portfolio security held by the Fund. As a result, differences may arise between the value of the Fund’s portfolio securities as determined at the foreign market close and the latest indications of value at 4 p.m. Eastern time. In order to minimize the potential for these differences, the VC monitors price movements following the close of trading in foreign stock markets through a series of country specific market proxies (such as baskets of American
TEMPLETON FUNDS
NOTES TO FINANCIAL STATEMENTS
Templeton International Climate Change Fund (continued)
1. Organization and Significant Accounting Policies (continued)
a. Financial Instrument Valuation (continued)
Depositary Receipts, futures contracts and exchange traded funds). These price movements are measured against established trigger thresholds for each specific market proxy to assist in determining if an event has occurred that may call into question the reliability of the values of the foreign securities held by the Fund. If such an event occurs, the securities may be valued using fair value procedures, which may include the use of independent pricing services.
When the last day of the reporting period is a non-business day, certain foreign markets may be open on those days that the Fund’s NAV is not calculated, which could result in differences between the value of the Fund’s portfolio securities on the last business day and the last calendar day of the reporting period. Any significant security valuation changes due to an open foreign market are adjusted and reflected by the Fund for financial reporting purposes.
b. Foreign Currency Translation
Portfolio securities and other assets and liabilities denominated in foreign currencies are translated into U.S. dollars based on the exchange rate of such currencies against U.S. dollars on the date of valuation. The Fund may enter into foreign currency exchange contracts to facilitate transactions denominated in a foreign currency. Purchases and sales of securities, income and expense items denominated in foreign currencies are translated into U.S. dollars at the exchange rate in effect on the transaction date. Portfolio securities and assets and liabilities denominated in foreign currencies contain risks that those currencies will decline in value relative to the U.S. dollar. Occasionally, events may impact the availability or reliability of foreign exchange rates used to convert the U.S. dollar equivalent value. If such an event occurs, the foreign exchange rate will be valued at fair value using procedures established and approved by the Board.
The Fund does not separately report the effect of changes in foreign exchange rates from changes in market prices on securities held. Such changes are included in net realized and unrealized gain or loss from investments in the Statement of Operations.
Realized foreign exchange gains or losses arise from sales of foreign currencies, currency gains or losses realized between the trade and settlement dates on securities transactions and the
difference between the recorded amounts of dividends, interest, and foreign withholding taxes and the U.S. dollar equivalent of the amounts actually received or paid. Net unrealized foreign exchange gains and losses arise from changes in foreign exchange rates on foreign denominated assets and liabilities other than investments in securities held at the end of the reporting period.
c. Income and Deferred Taxes
It is the Fund’s policy to qualify as a regulated investment company under the Internal Revenue Code. The Fund intends to distribute to shareholders substantially all of its taxable income and net realized gains to relieve it from federal income and excise taxes. As a result, no provision for U.S. federal income taxes is required.
The Fund may be subject to foreign taxation related to income received, capital gains on the sale of securities and certain foreign currency transactions in the foreign jurisdictions in which it invests. Foreign taxes, if any, are recorded based on the tax regulations and rates that exist in the foreign markets in which the Fund invests. When a capital gain tax is determined to apply, the Fund records an estimated deferred tax liability in an amount that would be payable if the securities were disposed of on the valuation date.
The Fund may recognize an income tax liability related to its uncertain tax positions under U.S. GAAP when the uncertain tax position has a less than 50% probability that it will be sustained upon examination by the tax authorities based on its technical merits. As of August 31, 2018, the Fund has determined that no tax liability is required in its financial statements related to uncertain tax positions (or expected to be taken in future tax years).
d. Security Transactions, Investment Income, Expenses and Distributions
Security transactions are accounted for on trade date. Realized gains and losses on security transactions are determined on a specific identification basis. Estimated expenses are accrued daily. Dividend income is recorded on the ex-dividend date except for certain dividends from securities where the dividend rate is not available. In such cases, the dividend is recorded as soon as the information is received by the Fund. Distributions to shareholders are recorded on the ex-dividend date. Distributable earnings are determined according to income tax regulations (tax basis) and may differ from earnings recorded in accordance
TEMPLETON FUNDS
NOTES TO FINANCIAL STATEMENTS
Templeton International Climate Change Fund (continued)
with U.S. GAAP. These differences may be permanent or temporary. Permanent differences are reclassified among capital accounts to reflect their tax character. These reclassifications have no impact on net assets or the results of operations. Temporary differences are not reclassified, as they may reverse in subsequent periods.
Common expenses incurred by the Trust are allocated among the Funds based on the ratio of net assets of each Fund to the combined net assets of the Trust or based on the ratio of number of shareholders of each Fund to the combined number of shareholders of the Trust. Fund specific expenses are charged directly to the Fund that incurred the expense.
Realized and unrealized gains and losses and net investment income, excluding class specific expenses, are allocated daily to each class of shares based upon the relative proportion of net assets of each class. Differences in per share distributions by class are generally due to differences in class specific expenses.
e. Offering Costs
Offering costs are amortized on a straight line basis over the first twelve months of operations.
f. Accounting Estimates
The preparation of financial statements in accordance with U.S. GAAP requires management to make estimates and assumptions that affect the reported amounts of assets and liabilities at the date of the financial statements and the amounts of income and expenses during the reporting period. Actual results could differ from those estimates.
g. Guarantees and Indemnifications
Under the Trust’s organizational documents, its officers and trustees are indemnified by the Trust against certain liabilities arising out of the performance of their duties to the Trust. Additionally, in the normal course of business, the Trust, on behalf of the Fund, enters into contracts with service providers that contain general indemnification clauses. The Trust’s maximum exposure under these arrangements is unknown as this would involve future claims that may be made against the Trust that have not yet occurred. Currently, the Trust expects the risk of loss to be remote.
2. Shares of Beneficial Interest
At August 31, 2018, there were an unlimited number of shares authorized (without par value). Transactions in the Fund’s shares were as follows:
| | | | | | | | |
| | | Year Ended August 31, 2018* | |
| | Shares | | | Amount | |
Shares sold | | | 200,001 | | | | $2,000,010 | |
Shares redeemed | | | (1 | ) | | | (10 | ) |
| | |
Net increase (decrease) | | | 200,000 | | | | $2,000,000 | |
| | |
*For the period June 1, 2018 (commencement of operations) to August 31, 2018. | | | | | | | | |
3. Transactions with Affiliates
Franklin Resources, Inc. is the holding company for various subsidiaries that together are referred to as Franklin Templeton Investments. Certain officers and trustees of the Fund are also officers and/or directors of the following subsidiaries:
| | |
| Subsidiary | | Affiliation |
Franklin Templeton Investment Corporation (FTIC) | | Investment manager |
Franklin Templeton Services, LLC (FT Services) | | Administrative manager |
Franklin Templeton Distributors, Inc. (Distributors) | | Principal underwriter |
Franklin Templeton Investor Services, LLC (Investor Services) | | Transfer agent |
TEMPLETON FUNDS
NOTES TO FINANCIAL STATEMENTS
Templeton International Climate Change Fund (continued)
3. Transactions with Affiliates (continued)
a. Management Fees
The Fund pays an investment management fee to FTIC based on the average daily net assets of the Fund as follows:
| | |
| Annualized Fee Rate | | Net Assets |
0.705% | | Up to and including $1 billion |
0.690% | | Over $1 billion, up to and including $5 billion |
0.675% | | Over $5 billion, up to and including $10 billion |
0.655% | | Over $10 billion, up to and including $15 billion |
0.635% | | Over $15 billion, up to and including $20 billion |
0.615% | | Over $20 billion, up to and including $25 billion |
0.605% | | Over $25 billion, up to and including $30 billion |
0.595% | | Over $30 billion, up to and including $35 billion |
0.585% | | In excess of $35 billion |
For the year ended August 31, 2018, the gross annualized effective investment management fee rate was 0.705% of the Fund’s average daily net assets.
b. Administrative Fees
Under an agreement with FTIC, FT Services provides administrative services to the Fund. The fee is paid by FTIC based on the Fund’s average daily net assets, and is not an additional expense of the Fund.
c. Distribution Fees
The Board has adopted distribution plans for each share class, with the exception of Class R6 and Advisor Class shares, pursuant to Rule 12b-1 under the 1940 Act. Under the Fund’s Class A reimbursement distribution plan, the Fund reimburses Distributors for costs incurred in connection with the servicing, sale and distribution of the Fund’s shares up to the maximum annual plan rate. Under the Class A reimbursement distribution plan, costs exceeding the maximum for the current plan year cannot be reimbursed in subsequent periods. In addition, under the Fund’s Class C and R compensation distribution plans, the Fund pays Distributors for costs incurred in connection with the servicing, sale and distribution of the Fund’s shares up to the maximum annual plan rate for each class. The plan year, for purposes of monitoring compliance with the maximum annual plan rates, is February 1 through January 31.
The maximum annual plan rates, based on the average daily net assets, for each class, are as follows:
| | | | |
Class A | | | 0.25 | % |
Class C | | | 1.00 | % |
Class R | | | 0.50 | % |
d. Transfer Agent Fees
Each class of shares pays transfer agent fees to Investor Services for its performance of shareholder servicing obligations. The fees are based on an annualized asset based fee of 0.02% plus a transaction based fee. In addition, each class reimburses Investor Services for out of pocket expenses incurred and, except for Class R6, reimburses shareholder servicing fees paid to third parties. These fees are allocated daily based upon their relative proportion of such classes’ aggregate net assets. Class R6 pays Investor Services transfer agent fees specific to that class.
For the year ended August 31, 2018, the Fund paid transfer agent fees of $158, which were retained by Investor Services.
TEMPLETON FUNDS
NOTES TO FINANCIAL STATEMENTS
Templeton International Climate Change Fund (continued)
e. Investments in Affiliated Management Investment Companies
The Fund invests in one or more affiliated management investment companies for purposes other than exercising a controlling influence over the management or policies. Management fees paid by the Fund are waived on assets invested in the affiliated management investment companies, as noted in the Statement of Operations, in an amount not to exceed the management and administrative fees paid directly or indirectly by each affiliate. During the year ended August 31, 2018, the Fund held investments in affiliated management investment companies as follows:
| | | | | | | | | | | | | | | | | | | | | | | | | | | | | | | | |
| | | Number of Shares Held at Beginning of Year | | | Gross Additions | | | Gross Reductions | | | Number of Shares Held at End of Year | | | Value at End of Year | | | Dividend
Income | | | Realized
Gain
(Loss) | | | Net Change in
Unrealized
Appreciation
(Depreciation) | |
| | | | | | | | |
Non-Controlled Affiliates | | | | | | | | | | | | | | | | | | | | | | | | | | | | | | | | |
Institutional Fiduciary Trust Money Market Portfolio, 1.64% | | | — | | | | 145,214 | | | | (145,173 | ) | | | 41 | | | | $41 | | | | $160 | | | | $ — | | | | $ — | |
f. Waiver and Expense Reimbursements
FTIC has contractually agreed in advance to waive or limit its fees and to assume as its own expense certain expenses otherwise payable by the Fund so that the expenses (excluding distribution fees and acquired fund fees and expenses and certain non-routine expenses or costs including those relating to litigation, indemnification, reorganizations, and liquidations) of the Fund does not exceed 0.97%, based on the average net assets of each class until May 31, 2019. Total expenses waived or paid are not subject to recapture subsequent to the Fund’s fiscal year end.
g. Other Affiliated Transactions
At August 31, 2018, Franklin Resources, Inc., owned 100% of the Fund’s outstanding shares. Investment activities of this shareholder could have a material impact on the Fund.
4. Expense Offset Arrangement
The Fund has entered into an arrangement with its custodian whereby credits realized as a result of uninvested cash balances are used to reduce a portion of the Fund’s custodian expenses. During the year ended August 31, 2018, there were no credits earned.
5. Income Taxes
For tax purposes, capital losses may be carried over to offset future capital gains.
At August 31, 2018, the capital loss carryforwards were as follows:
| | | | |
Capital loss carryforwards not subject to expiration: | | | | |
Short Term | | $ | 2,742 | |
At August 31, 2018, the cost of investments, net unrealized appreciation (depreciation) and undistributed ordinary income for income tax purposes were as follows:
| | | | |
Cost of investments | | $ | 1,957,270 | |
| | | | |
| |
Unrealized appreciation | | $ | 49,106 | |
Unrealized depreciation | | | (123,066 | ) |
| | | | |
| |
Net unrealized appreciation (depreciation) | | $ | (73,960 | ) |
| | | | |
| |
Distributable earnings: | | | | |
Undistributed ordinary income | | $ | 6,370 | |
| | | | |
TEMPLETON FUNDS
NOTES TO FINANCIAL STATEMENTS
Templeton International Climate Change Fund (continued)
5. Income Taxes (continued)
Differences between income and/or capital gains as determined on a book basis and a tax basis are primarily due to differing treatments of foreign currency transactions and offering costs.
6. Investment Transactions
Purchases and sales of investments (excluding short term securities) for the year ended August 31, 2018, aggregated $2,074,046 and $114,074, respectively.
7. Concentration of Risk
Investing in foreign securities may include certain risks and considerations not typically associated with investing in U.S. securities, such as fluctuating currency values and changing local and regional economic, political and social conditions, which may result in greater market volatility. In addition, certain foreign securities may not be as liquid as U.S. securities.
8. Fair Value Measurements
The Fund follows a fair value hierarchy that distinguishes between market data obtained from independent sources (observable inputs) and the Fund’s own market assumptions (unobservable inputs). These inputs are used in determining the value of the Fund’s financial instruments and are summarized in the following fair value hierarchy:
| | • | | Level 1 – quoted prices in active markets for identical financial instruments |
| | • | | Level 2 – other significant observable inputs (including quoted prices for similar financial instruments, interest rates, prepayment speed, credit risk, etc.) |
| | • | | Level 3 – significant unobservable inputs (including the Fund’s own assumptions in determining the fair value of financial instruments) |
The input levels are not necessarily an indication of the risk or liquidity associated with financial instruments at that level.
For movements between the levels within the fair value hierarchy, the Fund has adopted a policy of recognizing the transfers as of the date of the underlying event which caused the movement.
At August 31, 2018, all of the Fund’s investments in financial instruments carried at fair value were valued using Level 1 inputs. For detailed categories, see the accompanying Statement of Investments.
9. New Accounting Pronouncements
In August 2018, the Financial Accounting Standards Board issued Accounting Standards Update (ASU) No. 2018-13, Fair Value Measurement (Topic 820): Disclosure Framework—Changes to the Disclosure Requirements for Fair Value Measurements. The amendments in the ASU modify the disclosure requirements on fair value measurements in Topic 820. The ASU is effective for interim and annual reporting periods beginning after December 15, 2019. Management is currently evaluating the impact, if any, of applying this provision.
10. Subsequent Events
The Fund has evaluated subsequent events through the issuance of the financial statements and determined that no events have occurred that require disclosure.
TEMPLETON FUNDS
NOTES TO FINANCIAL STATEMENTS
Templeton International Climate Change Fund (continued)
Abbreviations
| | |
Selected Portfolio |
| |
ADR | | American Depositary Receipt |
GDR | | Global Depositary Receipt |
TEMPLETON FUNDS
Report of Independent Registered Public Accounting Firm
To the Board of Trustees of Templeton Funds and Shareholders of Templeton International Climate Change Fund
Opinion on the Financial Statements
We have audited the accompanying statement of assets and liabilities, including the statement of investments, of Templeton International Climate Change Fund (the “Fund”) as of August 31, 2018, and the related statement of operations and changes in net assets, including the related notes, and the financial highlights for the period June 1, 2018 (commencement of operations) through August 31, 2018 (collectively referred to as the “financial statements”). In our opinion, the financial statements present fairly, in all material respects, the financial position of the Fund as of August 31, 2018, and the results of its operations, changes in its net assets, and the financial highlights for the period June 1, 2018 (commencement of operations) through August 31, 2018 in conformity with accounting principles generally accepted in the United States of America.
Basis for Opinion
These financial statements are the responsibility of the Fund’s management. Our responsibility is to express an opinion on the Fund’s financial statements based on our audit. We are a public accounting firm registered with the Public Company Accounting Oversight Board (United States) (“PCAOB”) and are required to be independent with respect to the Fund in accordance with the U.S. federal securities laws and the applicable rules and regulations of the Securities and Exchange Commission and the PCAOB.
We conducted our audit of these financial statements in accordance with the standards of the PCAOB. Those standards require that we plan and perform the audit to obtain reasonable assurance about whether the financial statements are free of material misstatement, whether due to error or fraud.
Our audit included performing procedures to assess the risks of material misstatement of the financial statements, whether due to error or fraud, and performing procedures that respond to those risks. Such procedures included examining, on a test basis, evidence regarding the amounts and disclosures in the financial statements. Our audit also included evaluating the accounting principles used and significant estimates made by management, as well as evaluating the overall presentation of the financial statements. Our procedures included confirmation of securities owned as of August 31, 2018 by correspondence with the custodian, and transfer agent. We believe that our audit provides a reasonable basis for our opinion.
PricewaterhouseCoopers LLP
San Francisco, California
October 16, 2018
We have served as the auditor of one or more investment companies in the Franklin Templeton funds since 1948.
TEMPLETON FUNDS
Tax Information (unaudited)
Templeton International Climate Change Fund
Under Section 854(b)(1)(B) of the Internal Revenue Code, the Fund hereby reports the maximum amount allowable but no less than $9,747 as qualified dividends for purposes of the maximum rate under Section 1(h)(11) of the Internal Revenue Code for the fiscal year ended August 31, 2018. Distributions, including qualified dividend income, paid during calendar year 2018 will be reported to shareholders on Form 1099-DIV by mid-February 2019. Shareholders are advised to check with their tax advisors for information on the treatment of these amounts on their individual income tax returns.
At August 31, 2018, more than 50% of the Fund’s total assets were invested in securities of foreign issuers. In most instances, foreign taxes were withheld from income paid to the Fund on these investments. The Fund elects to treat foreign taxes paid as allowed under Section 853 of the Internal Revenue Code. This election will allow shareholders of record as of the 2018 distribution date, to treat their proportionate share of foreign taxes paid by the Fund as having been paid directly by them. The shareholder shall consider these amounts as foreign taxes paid in the tax year in which they receive the Fund distribution.
TEMPLETON FUNDS
Board Members and Officers
The name, year of birth and address of the officers and board members, as well as their affiliations, positions held with the Trust, principal occupations during at least the past five years and number of U.S. registered portfolios overseen in the Franklin Templeton Investments fund complex, are shown below. Generally, each board member serves until that person’s successor is elected and qualified.
Independent Board Members
| | | | | | | | |
Name, Year of Birth and Address | | Position | | Length of
Time Served | | Number of Portfolios in
Fund Complex Overseen
by Board Member* | | Other Directorships Held During at Least the Past 5 Years |
| | | | |
Harris J. Ashton (1932) 300 S.E. 2nd Street | | Trustee | | Since 1992 | | 136 | | Bar-S Foods (meat packing company) (1981-2010). |
| Fort Lauderdale, FL 33301-1923 | | | | | | | | |
|
Principal Occupation During at Least the Past 5 Years: Director of various companies; and formerly, Director, RBC Holdings, Inc. (bank holding company) (until 2002); and President, Chief Executive Officer and Chairman of the Board, General Host Corporation (nursery and craft centers) (until 1998). |
| | | | |
Ann Torre Bates (1958) 300 S.E. 2nd Street Fort Lauderdale, FL 33301-1923 | | Trustee | | Since 2008 | | 38 | | Ares Capital Corporation (specialty finance company) (2010-present), United Natural Foods, Inc. (distributor of natural, organic and specialty foods) (2013-present), Allied Capital Corporation (financial services) (2003-2010), SLM Corporation (Sallie Mae) (1997-2014) and Navient Corporation (loan management, servicing and asset recovery) (2014-2016). |
|
Principal Occupation During at Least the Past 5 Years: Director of various companies; and formerly, Executive Vice President and Chief Financial Officer, NHP Incorporated (manager of multifamily housing) (1995-1997); and Vice President and Treasurer, US Airways, Inc. (until 1995). |
| | | | |
Mary C. Choksi (1950) 300 S.E. 2nd Street Fort Lauderdale, FL 33301-1923 | | Trustee | | Since 2016 | | 136 | | Avis Budget Group Inc. (car rental) (2007-present), Omnicom Group Inc. (advertising and marketing communications services) (2011-present) and White Mountains Insurance Group, Ltd. (holding company) (2017-present). |
|
Principal Occupation During at Least the Past 5 Years: Director of various companies; and formerly, Founder and Senior Advisor, Strategic Investment Group (investment management group) (2015-2017); Founding Partner and Senior Managing Director, Strategic Investment Group (1987–2015); Founding Partner and Managing Director, Emerging Markets Management LLC (investment management firm) (1987-2011); and Loan Officer/Senior Loan Officer/Senior Pension Investment Officer, World Bank Group (international financial institution) (1977-1987). |
| | | | |
Edith E. Holiday (1952) 300 S.E. 2nd Street Fort Lauderdale, FL 33301-1923 | | Lead Independent Trustee | | Trustee since 2003 and Lead Independent Trustee since 2007 | | 136 | | Hess Corporation (exploration of oil and gas) (1993-present), Canadian National Railway (railroad) (2001-present), White Mountains Insurance Group, Ltd. (holding company) (2004-present), Santander Consumer USA Holdings, Inc. (consumer finance) (2016-present), RTI International Metals, Inc. (manufacture and distribution of titanium) (1999-2015) and H.J. Heinz Company (processed foods and allied products) (1994-2013). |
|
Principal Occupation During at Least the Past 5 Years: Director or Trustee of various companies and trusts; and formerly, Assistant to the President of the United States and Secretary of the Cabinet (1990-1993); General Counsel to the United States Treasury Department (1989-1990); and Counselor to the Secretary and Assistant Secretary for Public Affairs and Public Liaison–United States Treasury Department (1988-1989). |
TEMPLETON FUNDS
Independent Board Members (continued)
| | | | | | | | |
Name, Year of Birth and Address | | Position | | Length of
Time Served | | Number of Portfolios in
Fund Complex Overseen
by Board Member* | | Other Directorships Held During at Least the Past 5 Years |
| | | | |
J. Michael Luttig (1954) 300 S.E. 2nd Street Fort Lauderdale, FL 33301-1923 | | Trustee | | Since 2009 | | 136 | | Boeing Capital Corporation (aircraft financing) (2006-2013). |
|
Principal Occupation During at Least the Past 5 Years: Executive Vice President, General Counsel and member of the Executive Council, The Boeing Company (aerospace company) (2006-present); and formerly, Federal Appeals Court Judge, U.S. Court of Appeals for the Fourth Circuit (1991-2006). |
| | | | |
David W. Niemiec (1949) 300 S.E. 2nd Street Fort Lauderdale, FL 33301-1923 | | Trustee | | Since 2005 | | 38 | | Hess Midstream Partners LP (oil and gas midstream infrastructure) (2017-present). |
|
Principal Occupation During at Least the Past 5 Years: Advisor, Saratoga Partners (private equity fund); and formerly, Managing Director, Saratoga Partners (1998-2001) and SBC Warburg Dillon Read (investment banking) (1997-1998); Vice Chairman, Dillon, Read & Co. Inc. (investment banking) (1991-1997); and Chief Financial Officer, Dillon, Read & Co. Inc. (1982-1997). |
| | | | |
Larry D. Thompson (1945) 300 S.E. 2nd Street Fort Lauderdale, FL 33301-1923 | | Trustee | | Since 2005 | | 136 | | The Southern Company (energy company) (2014-present; previously 2010-2012), Graham Holdings Company (education and media organization) (2011-present) and Cbeyond, Inc. (business communications provider) (2010-2012). |
|
Principal Occupation During at Least the Past 5 Years: Director of various companies; Counsel, Finch McCranie, LLP (law firm) (2015-present); Independent Compliance Monitor and Auditor, Volkswagen AG (manufacturer of automobiles and commercial vehicles) (2017 – present); John A. Sibley Professor of Corporate and Business Law, University of Georgia School of Law (2015-present; previously 2011-2012); and formerly, Executive Vice President – Government Affairs, General Counsel and Corporate Secretary, PepsiCo, Inc. (consumer products) (2012-2014); Senior Vice President – Government Affairs, General Counsel and Secretary, PepsiCo, Inc. (2004-2011); Senior Fellow of The Brookings Institution (2003-2004); Visiting Professor, University of Georgia School of Law (2004); and Deputy Attorney General, U.S. Department of Justice (2001-2003). |
| | | | |
Constantine D. Tseretopoulos (1954) 300 S.E. 2nd Street | | Trustee | | Since 2003 | | 24 | | None |
| Fort Lauderdale, FL 33301-1923 | | | | | | | | |
|
Principal Occupation During at Least the Past 5 Years: Physician, Chief of Staff, owner and operator of the Lyford Cay Hospital (1987-present); director of various nonprofit organizations; and formerly, Cardiology Fellow, University of Maryland (1985-1987); and Internal Medicine Resident, Greater Baltimore Medical Center (1982-1985). |
| | | | |
Robert E. Wade (1946) 300 S.E. 2nd Street | | Trustee | | Since 2006 | | 38 | | El Oro Ltd (investments) (2003-present). |
| Fort Lauderdale, FL 33301-1923 | | | | | | | | |
|
Principal Occupation During at Least the Past 5 Years: Attorney at law engaged in private practice as a sole practitioner (1972-2008) and member of various boards. |
TEMPLETON FUNDS
Interested Board Members and Officers
| | | | | | | | |
Name, Year of Birth and Address | | Position | | Length of Time Served | | Number of Portfolios in Fund Complex Overseen by Board Member* | | Other Directorships Held During at Least the Past 5 Years |
| | | | |
**Gregory E. Johnson (1961) One Franklin Parkway San Mateo, CA 94403-1906 | | Trustee | | Since 2013 | | 150 | | None |
|
Principal Occupation During at Least the Past 5 Years: Chairman of the Board, Member – Office of the Chairman, Director and Chief Executive Officer, Franklin Resources, Inc.; officer and/or director or trustee, as the case may be, of some of the other subsidiaries of Franklin Resources, Inc. and of 42 of the investment companies in Franklin Templeton Investments; Vice Chairman, Investment Company Institute; and formerly, President, Franklin Resources, Inc. (1994-2015). |
| | | | |
**Rupert H. Johnson, Jr. (1940) One Franklin Parkway San Mateo, CA 94403-1906 | | Chairman of the Board, Trustee and Vice President | | Chairman of the Board since 2013, Trustee since 1992 and Vice President since 1996 | | 136 | | None |
|
Principal Occupation During at Least the Past 5 Years: Vice Chairman, Member – Office of the Chairman and Director, Franklin Resources, Inc.; Director, Franklin Advisers, Inc.; Senior Vice President, Franklin Advisory Services, LLC; and officer and/or director or trustee, as the case may be, of some of the other subsidiaries of Franklin Resources, Inc. and of 40 of the investment companies in Franklin Templeton Investments. |
| | | | |
Alison E. Baur (1964) One Franklin Parkway San Mateo, CA 94403-1906 | | Vice President | | Since 2012 | | Not Applicable | | Not Applicable |
|
Principal Occupation During at Least the Past 5 Years: Deputy General Counsel, Franklin Templeton Investments; and officer of some of the other subsidiaries of Franklin Resources, Inc. and of 44 of the investment companies in Franklin Templeton Investments. |
| | | | |
Norman J. Boersma (1957) Lyford Cay Nassau, Bahamas | | President and Chief Executive Officer – Investment Management | | Since 2012 | | Not Applicable | | Not Applicable |
|
Principal Occupation During at Least the Past 5 Years: Chairman of the Board, President and Chief Executive Officer, Templeton Global Advisors Ltd.; Chief Investment Officer of Templeton Global Equity Group; officer of five of the investment companies in Franklin Templeton Investments; and formerly, Executive Vice President, Franklin Templeton Investments Corp. (1993-2014). |
| | | | |
Aliya S. Gordon (1973) One Franklin Parkway San Mateo, CA 94403-1906 | | Vice President | | Since 2009 | | Not Applicable | | Not Applicable |
|
Principal Occupation During at Least the Past 5 Years: Senior Associate General Counsel, Franklin Templeton Investments; and officer of 44 of the investment companies in Franklin Templeton Investments. |
| | | | |
Steven J. Gray (1955) One Franklin Parkway San Mateo, CA 94403-1906 | | Vice President | | Since 2009 | | Not Applicable | | Not Applicable |
|
Principal Occupation During at Least the Past 5 Years: Senior Associate General Counsel, Franklin Templeton Investments; Vice President, Franklin Templeton Distributors, Inc. and FASA, LLC; and officer of 44 of the investment companies in Franklin Templeton Investments. |
| | | | |
Matthew T. Hinkle (1971) One Franklin Parkway San Mateo, CA 94403-1906 | | Chief Executive Officer – Finance and Administration | | Since 2017 | | Not Applicable | | Not Applicable |
| | | | | | | | |
|
Principal Occupation During at Least the Past 5 Years: Senior Vice President, Franklin Templeton Services, LLC; officer of 44 of the investment companies in Franklin Templeton Investments; and formerly, Vice President, Global Tax (2012-April 2017) and Treasurer/Assistant Treasurer, Franklin Templeton Investments (2009-2017). |
TEMPLETON FUNDS
Interested Board Members and Officers (continued)
| | | | | | | | |
Name, Year of Birth and Address | | Position | | Length of Time Served | | Number of Portfolios in Fund Complex Overseen by Board Member* | | Other Directorships Held During at Least the Past 5 Years |
| | | | |
Robert G. Kubilis (1973) 300 S.E. 2nd Street Fort Lauderdale, FL 33301-1923 | | Chief Financial Officer, Chief Accounting Officer and Treasurer | | Since 2017 | | Not Applicable | | Not Applicable |
|
Principal Occupation During at Least the Past 5 Years: Treasurer, U.S. Fund Administration & Reporting, Franklin Templeton Investments; and officer of 16 of the investment companies in Franklin Templeton Investments. |
| | | | |
Robert Lim (1948) One Franklin Parkway San Mateo, CA 94403-1906 | | Vice President – AML Compliance | | Since 2016 | | Not Applicable | | Not Applicable |
|
Principal Occupation During at Least the Past 5 Years: Vice President, Franklin Templeton Companies, LLC; Chief Compliance Officer, Franklin Templeton Distributors, Inc. and Franklin Templeton Investor Services, LLC; and officer of 44 of the investment companies in Franklin Templeton Investments. |
| | | | |
Kimberly H. Novotny (1972) 300 S.E. 2nd Street Fort Lauderdale, FL 33301-1923 | | Vice President | | Since 2013 | | Not Applicable | | Not Applicable |
|
Principal Occupation During at Least the Past 5 Years: Associate General Counsel, Franklin Templeton Investments; Vice President and Corporate Secretary, Fiduciary Trust International of the South; Vice President, Templeton Investment Counsel, LLC; Assistant Secretary, Franklin Resources, Inc.; and officer of 44 of the investment companies in Franklin Templeton Investments. |
| | | | |
Robert C. Rosselot (1960) 300 S.E. 2nd Street Fort Lauderdale, FL 33301-1923 | | Chief Compliance Officer | | Since 2013 | | Not Applicable | | Not Applicable |
|
Principal Occupation During at Least the Past 5 Years: Director, Global Compliance, Franklin Templeton Investments; Vice President, Franklin Templeton Companies, LLC; officer of 44 of the investment companies in Franklin Templeton Investments; and formerly, Senior Associate General Counsel, Franklin Templeton Investments (2007-2013); and Secretary and Vice President, Templeton Group of Funds (2004-2013). |
| | | | |
Karen L. Skidmore (1952) One Franklin Parkway San Mateo, CA 94403-1906 | | Vice President | | Since 2009 | | Not Applicable | | Not Applicable |
|
Principal Occupation During at Least the Past 5 Years: Senior Associate General Counsel, Franklin Templeton Investments; and officer of 44 of the investment companies in Franklin Templeton Investments. |
| | | | |
Navid J. Tofigh (1972) One Franklin Parkway San Mateo, CA 94403-1906 | | Vice President | | Since 2015 | | Not Applicable | | Not Applicable |
|
Principal Occupation During at Least the Past 5 Years: Associate General Counsel, Franklin Templeton Investments; and officer of 44 of the investment companies in Franklin Templeton Investments. |
| | | | |
Craig S. Tyle (1960) One Franklin Parkway San Mateo, CA 94403-1906 | | Vice President | | Since 2005 | | Not Applicable | | Not Applicable |
|
Principal Occupation During at Least the Past 5 Years: General Counsel and Executive Vice President, Franklin Resources, Inc.; and officer of some of the other subsidiaries of Franklin Resources, Inc. and of 44 of the investment companies in Franklin Templeton Investments. |
TEMPLETON FUNDS
Interested Board Members and Officers (continued)
| | | | | | | | |
Name, Year of Birth and Address | | Position | | Length of Time Served | | Number of Portfolios in Fund Complex Overseen by Board Member* | | Other Directorships Held During at Least the Past 5 Years |
| | | | |
Lori A. Weber (1964) 300 S.E. 2nd Street Fort Lauderdale, FL 33301-1923 | | Vice President and Secretary | | Vice President since 2011 and Secretary since 2013 | | Not Applicable | | Not Applicable |
|
Principal Occupation During at Least the Past 5 Years: Senior Associate General Counsel, Franklin Templeton Investments; Assistant Secretary, Franklin Resources, Inc.; Vice President and Secretary, Templeton Investment Counsel, LLC; and officer of 44 of the investment companies in Franklin Templeton Investments. |
*We base the number of portfolios on each separate series of the U.S. registered investment companies within the Franklin Templeton Investments fund complex. These portfolios have a common investment manager or affiliated investment managers.
**Gregory E. Johnson is considered to be an interested person of the Fund under the federal securities laws due to his position as an officer and director of Franklin Resources, Inc. (Resources), which is the parent company of the Fund’s investment manager and distributor. Rupert H. Johnson, Jr. is considered to be an interested person of the Fund under the federal securities laws due to his position as an officer and director and major shareholder of Resources.
Note 1: Rupert H. Johnson, Jr. is the uncle of Gregory E. Johnson.
Note 2: Officer information is current as of the date of this report. It is possible that after this date, information about officers may change.
The Sarbanes-Oxley Act of 2002 and Rules adopted by the U.S. Securities and Exchange Commission require the Fund to disclose whether the Fund’s Audit Committee includes at least one member who is an audit committee financial expert within the meaning of such Act and Rules. The Fund’s Board has determined that there is at least one such financial expert on the Audit Committee and has designated each of Ann Torre Bates and David W. Niemiec as an audit committee financial expert. The Board believes that Ms. Bates and Mr. Niemiec qualify as such an expert in view of their extensive business background and experience. Ms. Bates has served as a member of the Fund Audit Committee since 2008. She currently serves as a director of Ares Capital Corporation (2010-present) and United Natural Foods, Inc. (2013-present) and was formerly a director of Navient Corporation from 2014 to 2016, SLM Corporation from 1997 to 2014 and Allied Capital Corporation from 2003 to 2010, Executive Vice President and Chief Financial Officer of NHP Incorporated from 1995 to 1997 and Vice President and Treasurer of US Airways, Inc. until 1995. Mr. Niemiec has served as a member of the Fund Audit Committee since 2005, currently serves as an Advisor to Saratoga Partners and was formerly its Managing Director from 1998 to 2001 and serves as a director of Hess Midstream Partners LP (2017-present). Mr. Niemiec was formerly a director of Emeritus Corporation from 1999 to 2010 and OSI Pharmaceuticals, Inc. from 2006 to 2010, Managing Director of SBC Warburg Dillon Read from 1997 to 1998, and was Vice Chairman from 1991 to 1997 and Chief Financial Officer from 1982 to 1997 of Dillon, Read & Co. Inc. As a result of such background and experience, the Board believes that Ms. Bates and Mr. Niemiec have each acquired an understanding of generally accepted accounting principles and financial statements, the general application of such principles in connection with the accounting estimates, accruals and reserves, and analyzing and evaluating financial statements that present a breadth and level of complexity of accounting issues generally comparable to those of the Fund, as well as an understanding of internal controls and procedures for financial reporting and an understanding of audit committee functions. Ms. Bates and Mr. Niemiec are independent Board members as that term is defined under the applicable U.S. Securities and Exchange Commission Rules and Releases.
The Statement of Additional Information (SAI) includes additional information about the board members and is available, without charge, upon request. Shareholders may call (800) DIAL BEN/342-5236 to request the SAI.
TEMPLETON FUNDS
TEMPLETON INTERNATIONAL CLIMATE CHANGE FUND
Shareholder Information
Board Approval of Investment Management Agreements
TEMPLETON FUNDS
Templeton International Climate Change Fund
(Fund)
At an in-person meeting held on February 27, 2018 (Meeting), the Board of Trustees (Board) of Templeton Funds (Trust), including a majority of the trustees who are not “interested persons” as defined in the Investment Company Act of 1940 (Independent Trustees), reviewed and approved an investment management agreement between Franklin Templeton Investments Corp. (Manager) and the Trust, on behalf of the Fund (Management Agreement) for an initial two-year period. The Independent Trustees received advice from and met separately with Independent Trustee counsel in considering whether to approve the Management Agreement.
In considering the approval of the Management Agreement, the Board reviewed and considered information provided by the Manager in connection with the Meeting and throughout the year at meetings of the Board and its committees. The Board reviewed and considered all of the factors it deemed relevant in approving the Management Agreement, including, but not limited to: (1) the nature, extent and quality of the services to be provided by the Manager; (ii) the costs of the services to be provided by the Manager; and (iii) the extent to which economies of scale may be realized as the Fund grows. The Board also reviewed and considered the form of Management Agreement and the terms of the Management Agreement which were discussed at the Meeting, noting that the form of Management Agreement was substantially the same as the standard forms of investment management agreement (that include administration services) for the other funds in the Franklin Templeton family of funds, including the other series of the Trust.
In approving the Management Agreement, the Board, including a majority of the Independent Trustees, determined that the terms of the proposed Management Agreement are fair and reasonable and that the approval of such Management Agreement is in the interests of the Fund and its shareholders. While attention was given to all information furnished, the following discusses some primary factors relevant to the Board’s determination.
Nature, Extent and Quality of Services
The Board reviewed and considered information regarding the nature, extent and quality of investment management services
to be provided by the Manager and its affiliates to the Fund and its shareholders. This information included, among other things, the Fund’s proposed investment strategies and the ability of the Manager to implement such investment strategies, in particular, its intention to invest primarily in companies that the Manager believes exhibit superior practices in identifying, adapting and providing solutions to the consequences of climate change; the qualifications, background and experience of the investment personnel that will be responsible for the day-to-day portfolio management of the Fund; the Manager’s experience as the manager of other funds and accounts, including other series of the Trust and other funds in the Franklin Templeton family of funds; the Manager’s strength and reputation within the industry; the personnel, operations, financial condition, and investment management capabilities, methodologies and resources of the Manager; and the Manager’s compliance capabilities, as demonstrated by, among other things, its policies and procedures reasonably designed to prevent violations of the Federal Securities Laws (as defined in Rule 38a-1 of the Investment Company Act of 1940). Following consideration of such information, the Board was satisfied with the nature, extent and quality of services to be provided by the Manager and its affiliates to the Fund and its shareholders.
Fund Performance
The Board noted that, as the Fund had not yet commenced investment operations, there was no investment performance for the Fund. The Board considered the proposed performance benchmark for the Fund and how such benchmark would be utilized to measure performance of the Manager.
Comparative Fees and Expenses
The Board reviewed and considered information regarding the proposed investment management fee to be charged to the Fund by the Manager. In particular, the Board considered information relating to the proposed contractual management fee rate, without the effect of fee waivers (Management Rate), if any, and, separately, the estimated total expense ratio for the Fund, including comparative data provided by Broadridge Financial Solutions, Inc. (“Broadridge”), an independent organization, which compared the Fund’s proposed Management Rate and estimated total expense ratio with those of other funds deemed comparable to the Fund as selected by Broadridge (“Comparable Funds”). The Broadridge Management Rate includes administrative charges, and the estimated total expense ratio, for comparative consistency, was shown for Advisor Class shares for the Fund and Class I, Institutional Class, Class A and Class P shares for the funds
TEMPLETON FUNDS
TEMPLETON INTERNATIONAL CLIMATE CHANGE FUND
SHAREHOLDER INFORMATION
with multiple classes of shares. The Board noted that the Management Rate and estimated total expense ratio for the Fund would be below the medians of the Comparable Funds. The Board concluded that the proposed Management Rate for the Fund is reasonable.
Profitability
The Board then noted that the Manager (and its affiliates) could not report any financial results from their relationships with the Fund because the Fund had not yet commenced investment operations, and thus, the Board could not evaluate the Manager’s (or its affiliates’) profitability with respect to the Fund.
Economies of Scale
The Board reviewed and considered the extent to which the Manager may realize economies of scale, if any, as the Fund grows larger and whether the Fund’s management fee structure reflects any economies of scale for the benefit of shareholders. In connection with this review, the Trustees noted that management anticipates that the parent of the Manager or an affiliate will be the sole shareholder of the Fund for a period of time after which the Manager will consider whether to offer the Fund for sale to the public. With respect to possible economies of scale in the future, the Board noted the existence of management fee breakpoints, which operate generally to share any economies of scale with the Fund’s shareholders by reducing the Fund’s effective management fees as the Fund grows in size, though it is not anticipated that the Fund will generate significant, if any, profit for the Manager and/or its affiliates for some time.
Conclusion
Based on its review, consideration and evaluation of all factors it believed relevant, including the above-described factors and conclusions, the Board, including a majority of the Independent Trustees, approved the Management Agreement for the Fund for an initial two-year period.
Proxy Voting Policies and Procedures
The Fund’s investment manager has established Proxy Voting Policies and Procedures (Policies) that the Fund uses to determine how to vote proxies relating to portfolio securities. Shareholders may view the Fund’s complete Policies online at franklintempleton.com. Alternatively, shareholders may request copies of the Policies free of charge by calling the Proxy Group collect at (954) 527-7678 or by sending a written request to: Franklin Templeton Companies, LLC, 300 S.E. 2nd Street, Fort Lauderdale, FL 33301, Attention: Proxy Group. Copies of
the Fund’s proxy voting records are also made available online at franklintempleton.com and posted on the U.S. Securities and Exchange Commission’s website at sec.gov and reflect the most recent 12-month period ended June 30.
Quarterly Statement of Investments
The Trust, on behalf of the Fund, files a complete statement of investments with the U.S. Securities and Exchange Commission for the first and third quarters for each fiscal year on Form N-Q. Shareholders may view the filed Form N-Q by visiting the Commission’s website at sec.gov. The filed form may also be viewed and copied at the Commission’s Public Reference Room in Washington, DC. Information regarding the operations of the Public Reference Room may be obtained by calling (800) SEC-0330.
| (a) | The Registrant has adopted a code of ethics that applies to its principal executive officers and principal financial and accounting officer. |
| (f) | Pursuant to Item 12(a)(1), the Registrant is attaching as an exhibit a copy of its code of ethics that applies to its principal executive officers and principal financial and accounting officer. |
| Item 3. | Audit Committee Financial Expert. |
| (a) (1) | The Registrant has an audit committee financial expert serving on its audit committee. |
| | (2) | The audit committee financial expert is David W. Niemiec and he is “independent” as defined under the relevant Securities and Exchange Commission Rules and Releases. |
| Item 4. | Principal Accountant Fees and Services. |
(a) Audit Fees
The aggregate fees paid to the principal accountant for professional services rendered by the principal accountant for the audit of the registrant’s annual financial statements or for services that are normally provided by the principal accountant in connection with statutory and regulatory filings or engagements were $174,642 for the fiscal year ended August 31, 2018 and $132,699 for the fiscal year ended August 31, 2017.
(b) Audit-Related Fees
The aggregate fees paid to the principal accountant for assurance and related services rendered by the principal accountant to the registrant that are reasonably related to the performance of the audit of the registrant’s financial statements and are not reported under paragraph (a) of Item 4 were $6,204 for the fiscal year ended August 31, 2018 and $6,142 for the fiscal year ended August 31, 2017. The services for which these fees were paid included attestation services.
There were no fees paid to the principal accountant for assurance and related services rendered by the principal accountant to the registrant’s investment adviser and any entity controlling, controlled by or under common control with the investment adviser that provides ongoing services to the registrant that are reasonably related to the performance of the audit of their financial statements.
(c) Tax Fees
There were no fees paid to the principal accountant for professional services rendered by the principal accountant to the registrant for tax compliance, tax advice and tax planning.
There were no fees paid to the principal accountant for professional services rendered by the principal accountant to the registrant’s investment adviser and any entity controlling, controlled by or under common control with the investment adviser that provides ongoing services to the registrant for tax compliance, tax advice and tax planning.
(d) All Other Fees
The aggregate fees paid to the principal accountant for products and services rendered by the principal accountant to the registrant, other than the services reported in paragraphs (a)-(c) of Item 4 were $4,247 for the fiscal year ended August 31, 2018 and $0 for the fiscal year ended August 31, 2017. The services for which these fees were paid included review of materials provided to the fund Board in connection with the investment management contract renewal process.
The aggregate fees paid to the principal accountant for products and services rendered by the principal accountant to the registrant’s investment adviser and any entity controlling, controlled by or under common control with the investment adviser that provides ongoing services to the registrant, other than the services reported in paragraphs (a)-(c) of Item 4 were $0 for the fiscal year ended August 31, 2018 and $14,000 for the fiscal year ended August 31, 2017. The services for which these fees were paid included benchmarking services in connection with the 2015 ICI Transfer Agent Survey.
(e) (1) The registrant’s audit committee is directly responsible for approving the services to be provided by the auditors, including:
(i) pre-approval of all audit and audit related services;
(ii) pre-approval of all non-audit related services to be provided to the Fund by the auditors;
(iii) pre-approval of all non-audit related services to be provided to the registrant by the auditors to the registrant’s investment adviser or to any entity that controls, is controlled by or is under common control with the registrant’s investment adviser and that provides ongoing services to the registrant where the non-audit services relate directly to the operations or financial reporting of the registrant; and
(iv) establishment by the audit committee, if deemed necessary or appropriate, as an alternative to committee pre-approval of services to be provided by the auditors, as required by paragraphs (ii) and (iii) above, of policies and procedures to permit such services to be pre-approved by other means, such as through establishment of guidelines or by action of a designated member or members of the committee; provided the policies and procedures are detailed as to the particular service and the committee is informed of each service and such policies and procedures do not include delegation of audit committee responsibilities, as contemplated under the Securities Exchange Act of 1934, to management; subject, in the case of (ii) through (iv), to any waivers, exceptions or exemptions that may be available under applicable law or rules.
(e) (2) None of the services provided to the registrant described in paragraphs (b)-(d) of Item 4 were approved by the audit committee pursuant to paragraph (c)(7)(i)(C) of Rule 2-01 of regulation S-X.
(f) No disclosures are required by this Item 4(f).
(g) The aggregate non-audit fees paid to the principal accountant for services rendered by the principal accountant to the registrant and the registrant’s investment adviser and any entity controlling, controlled by or under common control with the investment adviser that provides ongoing services to the registrant were $10,451 for the fiscal year ended August 31, 2018 and $20,142 for the fiscal year ended August 31, 2017.
(h) The registrant’s audit committee of the board has considered whether the provision of non-audit services that were rendered to the registrant’s investment adviser (not including any sub-adviser whose role is primarily portfolio management and is subcontracted with or overseen by another investment adviser), and any entity controlling, controlled by, or under common control with the investment adviser that provides ongoing services to the registrant that were not pre-approved pursuant to paragraph (c)(7)(ii) of Rule 2-01 of Regulation S-X is compatible with maintaining the principal accountant’s independence.
| Item 5. | Audit Committee of Listed Registrants. N/A |
| Item 6. | Schedule of Investments. N/A |
Item 7. Disclosure of Proxy Voting Policies and Procedures for Closed-End Management Investment Companies. N/A
| Item 8. | Portfolio Managers of Closed-End Management Investment Companies. N/A |
Item 9. Purchases of Equity Securities by Closed-End Management Investment Company and Affiliated Purchasers. N/A
| Item 10. | Submission of Matters to a Vote of Security Holders. |
There have been no changes to the procedures by which shareholders may recommend nominees to the Registrant’s Board of Trustees that would require disclosure herein.
| Item 11. | Controls and Procedures. |
(a) Evaluation of Disclosure Controls and Procedures. The Registrant maintains disclosure controls and procedures that are designed to ensure that information required to be disclosed in the Registrant’s filings under the Securities Exchange Act of 1934 and the Investment Company Act of 1940 is recorded, processed, summarized and reported within the periods specified in the rules and forms of the Securities and Exchange Commission. Such information is accumulated and communicated to the Registrant’s management, including its principal executive officer and principal financial officer, as appropriate, to allow timely decisions regarding required disclosure. The Registrant’s management, including the principal executive officer and the principal financial officer, recognizes that any set of controls and procedures, no matter how well designed and operated, can provide only reasonable assurance of
achieving the desired control objectives.
Within 90 days prior to the filing date of this Shareholder Report on Form N-CSR, the Registrant had carried out an evaluation, under the supervision and with the participation of the Registrant’s management, including the Registrant’s principal executive officer and the Registrant’s principal financial officer, of the effectiveness of the design and operation of the Registrant’s disclosure controls and procedures. Based on such evaluation, the Registrant’s principal executive officer and principal financial officer concluded that the Registrant’s disclosure controls and procedures are effective.
(b) Changes in Internal Controls. There have been no changes in the Registrant’s internal controls or in other factors that could materially affect the internal controls over financial reporting subsequent to the date of their evaluation in connection with the preparation of this Shareholder Report on Form N-CSR.
Item 12. Disclosure of Securities Lending Activities for Closed-End Management Investment Company. N/A
(a)(1) Code of Ethics
(a)(2) Certifications pursuant to Section 302 of the Sarbanes-Oxley Act of 2002 of Matthew T. Hinkle, Chief Executive Officer - Finance and Administration, and Robert G. Kubilis, Chief Financial Officer and Chief Accounting Officer
(b) Certifications pursuant to Section 906 of the Sarbanes-Oxley Act of 2002 of Matthew T. Hinkle, Chief Executive Officer - Finance and Administration, and Robert G. Kubilis, Chief Financial Officer and Chief Accounting Officer
SIGNATURES
Pursuant to the requirements of the Securities Exchange Act of 1934 and the Investment Company Act of 1940, the registrant has duly caused this report to be signed on its behalf by the undersigned, thereunto duly authorized.
TEMPLETON FUNDS
| | |
| By | | /s/ MATTHEW T. HINKLE |
| | Matthew T. Hinkle |
| | Chief Executive Officer – |
| | Finance and Administration |
| Date: | | October 25, 2018 |
Pursuant to the requirements of the Securities Exchange Act of 1934 and the Investment Company Act of 1940, this report has been signed below by the following persons on behalf of the registrant and in the capacities and on the dates indicated.
| | |
| By | | /s/ MATTHEW T. HINKLE |
| | Matthew T. Hinkle |
| | Chief Executive Officer – |
| | Finance and Administration |
| Date: | | October 25, 2018 |
| |
| By | | /s/ ROBERT G. KUBILIS |
| | Robert G. Kubilis |
| | Chief Financial Officer and |
| | Chief Accounting Officer |
| Date: | | October 25, 2018 |