UNITED STATES
SECURITIES AND EXCHANGE COMMISSION
Washington, D.C. 20549
FORM N-CSR
CERTIFIED SHAREHOLDER REPORT
OF
REGISTERED MANAGEMENT INVESTMENT COMPANIES
Investment Company Act file number: 811-2687
Name of Registrant: Vanguard Municipal Bond Funds
Address of Registrant: | P.O. Box 2600 |
| Valley Forge, PA 19482 |
Name and address of agent for service: | Heidi Stam, Esquire |
| P.O. Box 876 |
| Valley Forge, PA 19482 |
Registrant’s telephone number, including area code: (610) 669-1000
Date of fiscal year end: October 1
Date of reporting period: November 1, 2006–October 31, 2007
Item 1: Reports to Shareholders |

> | For the fiscal year ended October 31, 2007, the Vanguard Municipal Bond Funds |
| posted returns ranging from 1.9% for the Investor Shares of Vanguard High-Yield |
| Tax-Exempt Fund to 3.8% for the Admiral Shares of Vanguard Short-Term |
| Tax-Exempt Fund. |
| |
| |
> | All seven Vanguard Municipal Bond Funds posted returns that bested the |
| average returns of their peers. |
| |
| |
> | In two separate rate cuts, the Federal Reserve Board lowered the target for |
| short-term interest rates to 4.50%, the first cut in September and the second |
| in late October, dampening U.S. Treasury yields, particularly at the short end |
| of the maturity spectrum. |
Contents | |
| |
Your Fund’s Total Returns | 1 |
Chairman’s Letter | 2 |
Advisor’s Report | 8 |
Vanguard Tax-Exempt Money Market Fund | 10 |
Vanguard Short-Term Tax-Exempt Fund | 17 |
Vanguard Limited-Term Tax-Exempt Fund | 27 |
Vanguard Intermediate-Term Tax-Exempt Fund | 37 |
Vanguard Insured Long-Term Tax-Exempt Fund | 47 |
Vanguard Long-Term Tax-Exempt Fund | 57 |
Vanguard High-Yield Tax-Exempt Fund | 67 |
About Your Fund’s Expenses | 78 |
Glossary | 81 |
Please note: The opinions expressed in this report are just that—informed opinions. They should not be considered promises or advice. Also, please keep in mind that the information and opinions cover the period through the date on the cover of this report. Of course, the risks of investing in your fund are spelled out in the prospectus.
Your Fund’s Total Returns
Fiscal Year Ended October 31, 2007 | | | | | |
| | | | | SEC | Taxable- |
| Ticker | Total | Income | Capital | Annualized | Equivalent |
Vanguard Tax-Exempt Fund | Symbol | Return | Return | Return | Yield1 | Yield2 |
Money Market3 | VMSXX | 3.6% | 3.6% | 0.0% | 3.41% | 5.25% |
Short-Term | | | | | | |
Investor Shares | VWSTX | 3.7 | 3.4 | 0.3 | 3.44 | 5.29 |
Admiral™ Shares4 | VWSUX | 3.8 | 3.5 | 0.3 | 3.52 | 5.42 |
Limited-Term | | | | | | |
Investor Shares | VMLTX | 3.6 | 3.5 | 0.1 | 3.57 | 5.49 |
Admiral Shares | VMLUX | 3.7 | 3.6 | 0.1 | 3.65 | 5.62 |
Intermediate-Term | | | | | | |
Investor Shares | VWITX | 2.7 | 4.1 | –1.4 | 3.82 | 5.88 |
Admiral Shares | VWIUX | 2.8 | 4.2 | –1.4 | 3.90 | 6.00 |
Insured Long-Term | | | | | | |
Investor Shares | VILPX | 2.3 | 4.5 | –2.2 | 4.09 | 6.29 |
Admiral Shares | VILQX | 2.4 | 4.6 | –2.2 | 4.17 | 6.42 |
Long-Term | | | | | | |
Investor Shares | VWLTX | 2.4 | 4.6 | –2.2 | 4.06 | 6.25 |
Admiral Shares | VWLUX | 2.4 | 4.6 | –2.2 | 4.14 | 6.37 |
High-Yield | | | | | | |
Investor Shares | VWAHX | 1.9 | 4.6 | –2.7 | 4.34 | 6.68 |
Admiral Shares | VWALX | 2.0 | 4.7 | –2.7 | 4.42 | 6.80 |
1 Seven-day yield for the Tax-Exempt Money Market Fund; 30-day yield for the other funds.
2 This calculation, which assumes a typical itemized tax return, is based on the maximum federal income tax rate of 35%. State and local taxes were not considered. Please see the prospectus for a detailed explanation of the calculation.
3 An investment in a money market fund is not insured or guaranteed by the Federal Deposit Insurance Corporation or any other government agency. Although the fund seeks to preserve the value of your investment at $1 per share, it is possible to lose money by investing in the fund.
4 A lower-cost class of shares available to many longtime shareholders and to those with significant investments in the fund.
1

Chairman’s Letter
Dear Shareholder,
The 2007 fiscal year was a challenging one for fixed income investors. For the 12-month period, all of the Vanguard Municipal Bond Funds posted modestly positive returns. Among the seven funds, the High-Yield Tax-Exempt Fund had the lowest return (its Investor Shares returned 1.9%), and the Short-Term Tax-Exempt Fund had the highest (3.8% for its Admiral Shares).
As of October 31, the Money Market Tax-Exempt Fund had a yield of 3.41%. At the other end of the maturity spectrum, the Long-Term Tax-Exempt Fund’s Admiral Shares had a yield of 4.14%. The yields of these two funds were equivalent to taxable-bond yields of 5.25% and 6.37%, respectively, for investors in the highest federal income tax bracket.
For all of the funds, the taxable equivalent yields are listed in the table on page 1.
Bond investors converged on high-quality issues
As troubles in the subprime credit markets rippled across the financial markets, bond investors sought the relative safety of U.S. Treasury bonds. This “flight to quality” drove prices for Treasuries higher and yields lower, and widened the spread between Treasury yields and the yields of riskier bonds. Declines in Treasury yields were steepest at the short end of the maturity spectrum, aided by the actions of the Federal Reserve Board. The central bank lowered the target for
2
short-term interest rates to 4.50% in two separate rate cuts (a half-percentage-point in September and a quarter-point on October 31). The yield of the 3-month Treasury bill finished the fiscal period at 3.92%, after spending much of the year near 5%; the 10-year Treasury note ended at 4.47%.
For the year, the broad taxable bond market returned 5.4%. Returns from tax-exempt bonds were lower, as these issues did not benefit from the late-summer rally in Treasuries.
Stocks rode a bumpy path to impressive results
Despite some volatility, the U.S. stock market produced strong results during the fund’s fiscal year. Ongoing problems with low-quality mortgage loans (an unpleasant postscript to the housing downturn) rattled financial markets in the spring and summer, and continued to make investors skittish through the close of the fiscal period. At the end of October, crude oil prices touched historic highs, while the U.S. dollar dipped to record lows versus other major currencies.
Still, the broad U.S. stock market returned an impressive 15.3%. Large-capitalization stocks outperformed small-caps, and growth stocks outperformed value stocks—both continuing recent months’ reversals of longer-term trends.
International companies performed even better than domestic issues. Stocks in emerging markets fared particularly well,
Market Barometer | | | |
| Average Annual Total Returns |
| Periods Ended October 31, 2007 |
| One Year | Three Years | Five Years |
Bonds | | | |
Lehman U.S. Aggregate Bond Index (Broad taxable market) | 5.4% | 3.9% | 4.4% |
Lehman Municipal Bond Index | 2.9 | 3.7 | 4.5 |
Citigroup 3-Month Treasury Bill Index | 5.0 | 4.1 | 2.9 |
| | | |
| | | |
Stocks | | | |
Russell 1000 Index (Large-caps) | 15.0% | 13.8% | 14.5% |
Russell 2000 Index (Small-caps) | 9.3 | 13.7 | 18.7 |
Dow Jones Wilshire 5000 Index (Entire market) | 15.3 | 14.2 | 15.3 |
MSCI All Country World Index ex USA (International) | 33.0 | 27.4 | 26.4 |
| | | |
| | | |
CPI | | | |
Consumer Price Index | 3.5% | 3.1% | 2.9% |
| | | | | |
3
followed by European and Pacific region stocks (Japan was a notable laggard). The weak U.S. dollar boosted foreign stock returns for U.S.-based investors.
The funds persevered in a difficult environment
Despite widespread concern regarding the larger economic impact of subprime lending on the financial markets, in 2007 the Vanguard Municipal Bond Funds persevered, delivering a respectable performance. At the fiscal year-end, municipal yields were lower than where they had started for short-term issues, but slightly higher for the longest-term bonds. The pace of new bond issuance increased from a year ago, as states and municipalities took advantage of generally low interest rates.
Over the 12 months, the share prices of the Short- and Limited-Term Municipal Bond Funds rose; at the longer end of the maturity spectrum, the remaining four bond funds experienced slight share-price decreases. The Tax-Exempt Money Market Fund returned 3.6% for the full 12 months. Its share price remained unchanged, maintaining a net asset value of $1, which is expected but not guaranteed.
Late-summer turmoil in the fixed income markets put extra pressure on longer-term bonds. Thus, of the longer-term munis, the Investor Shares of the High-Yield Tax-Exempt Fund had the weakest return, at 1.9% (Admiral Shares, 2.0%), with the Insured Long-Term Fund registering a bit more (2.3% for Investor Shares; 2.4% for Admiral Shares) and the Long-Term Fund
Total Returns | | |
Fiscal Year Ended October 31, 2007 | | |
| | |
| | |
| | Average |
| Vanguard | Competing |
Tax-Exempt Fund Investor Shares | Fund | Fund1 |
Money Market | 3.6% | 3.0% |
Short-Term | 3.7 | 3.6 |
Limited-Term | 3.6 | 2.9 |
Intermediate-Term | 2.7 | 2.4 |
Insured Long-Term | 2.3 | 1.6 |
Long-Term | 2.4 | 1.5 |
High-Yield | 1.9 | 0.2 |
1 Derived from data provided by Lipper Inc.
4
returning 2.4% for both of its share classes. The Intermediate-Term Tax-Exempt Fund returned 2.7% (Admiral Shares, 2.8%). The Short-Term and Limited-Term Tax-Exempt Funds recorded small share-price increases. The Investor Shares of the Short-Term Fund returned 3.7% (3.8% for Admiral Shares), and the Limited-Term Fund returned 3.6% (3.7% for Admiral Shares).
Vanguard Fixed Income Group, the funds’ advisor, continues to focus on generating stable income for bond investors. The group focuses its credit-research and portfolio-management skills on developing strategies to produce portfolios that feature low costs, peer-beating income, and the highest quality—a combination that is highly useful to investors in the fixed income markets.
The funds continued to outpace their peers
Over the short term, the Vanguard Municipal Bond Funds have occasionally lagged the average returns of their peers, but over longer periods the funds continue to assert their advantage. For the past decade, the returns of all seven funds have topped the average returns of their peer groups, a tribute both to the skill of the funds’ advisor and to the power of Vanguard’s low costs.
Total Returns | | |
Ten Years Ended October 31, 2007 | | |
| | Average |
| | Annual Return |
| | Average |
| Vanguard | Competing |
Tax-Exempt Fund Investor Shares | Fund | Fund1 |
Money Market | 2.6% | 2.1% |
Short-Term | 3.2 | 3.0 |
Limited-Term | 3.8 | 3.2 |
Intermediate-Term | 4.5 | 4.1 |
Insured Long-Term | 5.3 | 4.2 |
Long-Term | 5.1 | 4.2 |
High-Yield | 5.1 | 4.3 |
The figures shown represent past performance, which is not a guarantee of future results. (Current |
performance may be lower or higher than the performance data cited. For performance data current to the |
most recent month-end, visit our website at www.vanguard.com/performance.) Note, too, that both |
investment returns and principal value can fluctuate widely, so an investor’s shares, when sold, could be worth |
more or less than their original cost. |
1 Derived from data provided by Lipper Inc.
5
Low costs: One aspect of the Vanguard advantage
One of the keys to Vanguard Municipal Bond Funds’ strong performance when compared with our competitors is our low expenses. Low costs allow our shareholders to keep more of their funds’ returns in their pockets.
The municipal bond market has tens of thousands of issuers—from the largest state governments to the smallest local school districts. The funds’ portfolio managers can focus their research efforts and portfolio management decisions on the higher-quality issues in this investable universe, because low costs mean there’s no need to sacrifice credit quality for higher yields in an effort to provide competitive returns.
For investors in higher tax brackets, we believe the Vanguard Municipal Bond Funds are an excellent way to participate in the tax-exempt bond markets.
Thank you for investing with Vanguard.
Sincerely,

John J. Brennan
Chairman and Chief Executive Officer
November 14, 2007
Expense Ratios1 | | | |
Your fund compared with its peer group | | | |
| | | Peer-Group |
| Investor | Admiral | Expense |
Tax-Exempt Fund | Shares | Shares | Ratio |
Money Market | 0.10% | — | 0.74% |
Short-Term | 0.15 | 0.08% | 0.63 |
Limited-Term | 0.15 | 0.08 | 0.84 |
Intermediate-Term | 0.15 | 0.08 | 0.90 |
Insured Long-Term | 0.15 | 0.08 | 1.15 |
Long-Term | 0.15 | 0.08 | 1.09 |
High-Yield | 0.15 | 0.08 | 1.16 |
1 Fund expense ratios reflect the 12 months ended October 31, 2007. Peer groups are: for the Tax-Exempt Money Market Fund, the Average Tax-Exempt Money Market Fund; for the Short-Term Tax-Exempt Fund, the Average 1–2 Year Municipal Fund; for the Limited-Term Tax-Exempt Fund, the Average 1–5 Year Municipal Fund; for the Intermediate-Term Tax-Exempt Fund, the Average Intermediate Municipal Fund; for the Insured Long-Term Tax-Exempt Fund, the Average Insured Municipal Fund; for the Long-Term Tax-Exempt Fund, the Average General Municipal Fund; and for the High-Yield Tax-Exempt Fund, the Average High-Yield Municipal Fund. Peer-group expense ratios are derived form data provided by Lipper Inc. and capture data through year-end 2006.
6
Your Fund’s Performance at a Glance | | | | |
October 31, 2006–October 31, 2007 | | | | |
| | | Distributions Per Share |
| Starting | Ending | Income | Capital |
Tax-Exempt Fund | Share Price | Share Price | Dividends | Gains |
Money Market | $1.00 | $1.00 | $0.036 | $0.000 |
Short-Term | | | | |
Investor Shares | 15.58 | 15.62 | 0.526 | 0.000 |
Admiral Shares | 15.58 | 15.62 | 0.537 | 0.000 |
Limited-Term | | | | |
Investor Shares | 10.72 | 10.73 | 0.371 | 0.000 |
Admiral Shares | 10.72 | 10.73 | 0.378 | 0.000 |
Intermediate-Term | | | | |
Investor Shares | 13.37 | 13.18 | 0.548 | 0.000 |
Admiral Shares | 13.37 | 13.18 | 0.557 | 0.000 |
Insured Long-Term | | | | |
Investor Shares | 12.68 | 12.38 | 0.569 | 0.019 |
Admiral Shares | 12.68 | 12.38 | 0.578 | 0.019 |
Long-Term | | | | |
Investor Shares | 11.34 | 11.09 | 0.512 | 0.000 |
Admiral Shares | 11.34 | 11.09 | 0.520 | 0.000 |
High-Yield | | | | |
Investor Shares | 10.91 | 10.62 | 0.497 | 0.000 |
Admiral Shares | 10.91 | 10.62 | 0.505 | 0.000 |
7
Advisor’s Report
For the fiscal year ended October 31, 2007, the Vanguard Municipal Bond Funds posted returns ranging from 1.9% for the Investor Shares of Vanguard High-Yield Tax-Exempt Fund to 3.8% for the Admiral Shares of Vanguard Short-Term Tax-Exempt Fund. All seven funds posted returns that bested the average returns of their peers.
The investment environment
Over the past year, the U.S. economy has expanded slightly below its potential long-run growth rate. Through the third quarter of 2007, Commerce Department estimates indicated that real economic output had increased by a bit less than 3% over the previous 12 months. The Commerce Department’s estimate of real gross domestic product (GDP) growth through third-quarter 2007 was 2.6%. Consumer spending, adjusted for inflation, expanded at a respectable clip, thanks to rising incomes and a fairly tight labor market. Consensus growth expectations point to a continued moderation in real GDP growth going forward, as the housing recession continues and the attendant “credit crunch” increases financing costs.
The rate of consumer inflation has stayed somewhat elevated through the course of 2007 as food and energy prices have risen. For the year ended October 31, the Consumer Price Index (CPI) remained at 3.5%. Expectations for core CPI inflation are for a modest and gradual deceleration toward or even below 2% in coming months.
Following its surprise 50-basis-point reduction in the discount rate in August, the Federal Reserve Board lowered its federal funds target rate by 50 basis points, to 4.75% on September 18, and then again to 4.50% on October 31. In its October 31 statement, the Fed commented that the “upside risks to inflation roughly balance the downside risks to growth,” suggesting to some that the Fed was less inclined to reduce interest rates again in the near term. Nevertheless, many financial market participants expect further reductions in the federal funds rate, given expectations for slower growth, stable core inflation rates, and ongoing concerns regarding the availability of credit.
Impact of subprime lending woes
Over the last 12 months, municipal bonds underperformed U.S. Treasuries across the yield curve. These relative performances reflected a global “flight to quality” that produced a rally in U.S. Treasuries, as subprime lending woes continued to reverberate through the credit markets. The net effect was to cheapen tax-exempt bonds to extraordinarily attractive levels on an after-tax basis for high-quality municipals.
For fiscal year 2007, total tax-exempt issuance increased 7.6% to $399.9 billion. Bonds issued to raise new money rose 11.8% to $275.7 billion, while refunding of older high-coupon debt was up slightly (1.1%). By the end of the fiscal year, municipal market issuance appeared to be heading toward a record-breaking volume for calendar-year 2007.
Management of the funds
Turmoil in the fixed income markets in the late summer put extra pressure on longer-term and riskier bonds. Of the
8
longer-term municipals, the Insured Long-Term Tax-Exempt Fund had the weakest return, at 2.3%, just behind the Long-Term Tax-Exempt Fund, at 2.4%. The Limited-Term Fund returned 3.6%, and the Short-Term Fund returned 3.7%.
Recent news about municipal insurance companies has brought into question the durability of “AAA” ratings, given exposure to residential mortgage-backed securities. It is important to remember that the decision to invest in insured bonds and money market instruments is first and foremost dependent upon the quality of the underlying tax-exempt issuer.
As a matter of course, Vanguard always looks carefully beneath the surface, to an evaluation of the underlying credit as the key factor in the purchase of a tax-exempt instrument. Our large and experienced municipal credit group conducts a focused and diligent examination of all holdings, and we believe our shareholders can continue to rely on the rigorous review and oversight process that is consistent with our funds’ objectives.
We expect that our funds’ combination of low costs, prudent management, and bias toward high-quality issues will continue to produce more-than-competitive returns.
Pamela Wisehaupt Tynan, Principal
Reid O. Smith, Principal
Vanguard Fixed Income Group
November 20, 2007
Yields of Municipal Bonds | | |
(AAA-Rated General-Obligation Issues) | | |
| October 31, | October 31, |
Maturity | 2006 | 2007 |
2 years | 3.47% | 3.33% |
5 years | 3.45 | 3.47 |
10 years | 3.64 | 3.81 |
30 years | 4.07 | 4.40 |
Source: Vanguard.
9
Tax-Exempt Money Market Fund
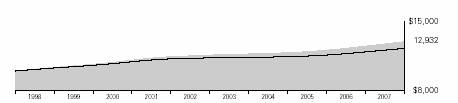
Fund Profile
As of October 31, 2007
Financial Attributes | |
| |
Yield | 3.4% |
Average Weighted Maturity | 30 days |
Average Quality1 | MIG-1 |
Expense Ratio | 0.10% |
Largest State Concentrations2 | |
| |
Texas | 16.9% |
Illinois | 9.0 |
Florida | 5.8 |
Michigan | 4.2 |
North Carolina | 4.0 |
Tennessee | 4.0 |
Colorado | 3.9 |
Georgia | 3.9 |
Washington | 3.0 |
Wisconsin | 2.7 |
Top Ten | 57.4% |
Distribution by Credit Quality3(% of portfolio) | |
| |
MIG-1/SP-1+/F-1+ | 91.2% |
A-1/P-1 | 8.2 |
AAA/AA | 0.6 |
1 Moody’s Investors Service.
2 Percentages of total net assets, excluding any futures contracts.
3 Ratings: Moody’s Investors Service, Standard & Poor’s, Fitch.
See page 81 for a glossary of investment terms.
10
Tax-Exempt Money Market Fund
Performance Summary
Investment returns will fluctuate. All of the returns in this report represent past performance, which is not a guarantee of future results that may be achieved by the fund. (Current performance may be lower or higher than the performance data cited. For performance data current to the most recent month-end, visit our website at www.vanguard.com/performance.) The returns shown do not reflect taxes that a shareholder would pay on fund distributions. An investment in a money market fund is not insured or guaranteed by the Federal Deposit Insurance Corporation or any other government agency. Although the fund seeks to preserve the value of your investment at $1 per share, it is possible to lose money by investing in the fund. The annualized yield shown reflects the current earnings of the fund more closely than do the average annual returns.
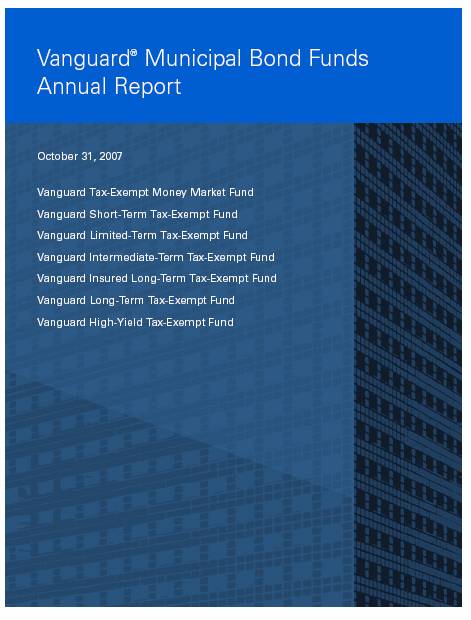
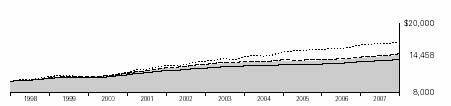
Cumulative Performance: October 31, 1997–October 31, 2007
Initial Investment of $10,000
| | | |
| | | | |
| | Average Annual Total Returns | Final Value |
| | Periods Ended October 31, 2007 | of a $10,000 |
| One Year | Five Years | Ten Years | Investment |
Tax-Exempt Money Market Fund1 | 3.65% | 2.21% | 2.60% | $12,932 |
Average Tax-Exempt Money Market Fund2 | 3.02 | 1.62 | 2.06 | 12,267 |
1 Total returns do not include the account service fee that may be applicable to certain accounts with balances below $10,000.
2 Returns for the Average Tax-Exempt Money Market Fund are derived from data provided by Lipper Inc.
11
Tax-Exempt Money Market Fund
Fiscal-Year Total Returns (%): October 31, 1997–October 31, 2007 | | |
| | Average |
| | Fund1 |
Fiscal | Total | Total |
Year | Return | Return |
1998 | 3.4% | 3.0% |
1999 | 3.1 | 2.6 |
2000 | 3.9 | 3.4 |
2001 | 3.2 | 2.6 |
2002 | 1.5 | 0.9 |
2003 | 1.0 | 0.5 |
2004 | 1.0 | 0.5 |
2005 | 2.1 | 1.5 |
2006 | 3.3 | 2.7 |
2007 | 3.6 | 3.0 |
SEC 7-Day Annualized Yield (10/31/2007): 3.41% | | |
Average Annual Total Returns: Periods Ended September 30, 2007
This table presents average annual total returns through the latest calendar quarter—rather than through the end of the fiscal period. Securities and Exchange Commission rules require that we provide this information.
| | | | | | Ten Years |
| Inception Date | One Year | Five Years | Capital | Income | Total |
Tax-Exempt Money Market2 | 6/10/1980 | 3.64% | 2.17% | 0.00% | 2.60% | 2.60% |
1 Returns for the average tax-exempt money market fund are derived from Lipper Inc.
2 Total returns do not include the account service fee that may be applicable to certain accounts with balances below $10,000.
Note: See Financial Highlights table on page 15 for dividend and capital gains information.
12
Tax-Exempt Money Market Fund
Financial Statements
The Statement of Net Assets—an integral part of the Financial Statements for Vanguard Tax-Exempt Money Market Fund—is included as an insert to this report.
Statement of Operations
| Year Ended |
| October 31, 2007 |
| ($000) |
Investment Income | |
Income | |
Interest1 | 752,408 |
Total Income | 752,408 |
Expenses | |
The Vanguard Group—Note B | |
Investment Advisory Services | 1,661 |
Management and Administrative | 12,602 |
Marketing and Distribution | 5,251 |
Custodian Fees | 105 |
Auditing Fees | 18 |
Shareholders’ Reports | 225 |
Trustees’ Fees and Expenses | 22 |
Total Expenses | 19,884 |
Net Investment Income | 732,524 |
Realized Net Gain (Loss) on Investment Securities Sold | 550 |
Change in Unrealized Appreciation (Depreciation) of Investment Securities | — |
Net Increase (Decrease) in Net Assets Resulting from Operations | 733,074 |
1 Interest income from an affiliated company of the fund was $23,405,000.
13
Tax-Exempt Money Market Fund
Statement of Changes in Net Assets
| Year Ended October 31, |
| 2007 | 2006 |
| ($000) | ($000) |
Increase (Decrease) in Net Assets | | |
Operations | | |
Net Investment Income | 732,524 | 583,431 |
Realized Net Gain (Loss) | 550 | (47) |
Change in Unrealized Appreciation (Depreciation) | — | — |
Net Increase (Decrease) in Net Assets Resulting from Operations | 733,074 | 583,384 |
Distributions | | |
Net Investment Income | (732,524) | (583,431) |
Realized Capital Gain | — | — |
Total Distributions | (732,524) | (583,431) |
Capital Share Transactions (at $1.00) | | |
Issued | 20,617,898 | 18,886,112 |
Issued in Lieu of Cash Distributions | 693,545 | 550,007 |
Redeemed | (18,409,309) | (17,681,611) |
Net Increase (Decrease) from Capital Share Transactions | 2,902,134 | 1,754,508 |
Total Increase (Decrease) | 2,902,684 | 1,754,461 |
Net Assets | | |
Beginning of Period | 19,116,446 | 17,361,985 |
End of Period | 22,019,130 | 19,116,446 |
14
Tax-Exempt Money Market Fund
Financial Highlights
| | | Year Ended October 31, |
For a Share Outstanding Throughout Each Period | 2007 | 2006 | 2005 | 2004 | 2003 |
Net Asset Value, Beginning of Period | $1.00 | $1.00 | $1.00 | $1.00 | $1.00 |
Investment Operations | | | | | |
Net Investment Income | .036 | .032 | .021 | .010 | .010 |
Net Realized and Unrealized Gain (Loss) | | | | | |
on Investments | — | — | — | — | — |
Total from Investment Operations | .036 | .032 | .021 | .010 | .010 |
Distributions | | | | | |
Dividends from Net Investment Income | (.036) | (.032) | (.021) | (.010) | (.010) |
Distributions from Realized Capital Gains | — | — | — | — | — |
Total Distributions | (.036) | (.032) | (.021) | (.010) | (.010) |
Net Asset Value, End of Period | $1.00 | $1.00 | $1.00 | $1.00 | $1.00 |
| | | | | |
| | | | | |
Total Return1 | 3.65% | 3.26% | 2.13% | 1.03% | 0.99% |
| | | | | |
| | | | | |
Ratios/Supplemental Data | | | | | |
Net Assets, End of Period (Millions) | $22,019 | $19,116 | $17,362 | $14,936 | $12,434 |
Ratio of Total Expenses to | | | | | |
Average Net Assets | 0.10% | 0.13% | 0.13% | 0.13% | 0.17% |
Ratio of Net Investment Income to | | | | | |
Average Net Assets | 3.59% | 3.22% | 2.12% | 1.03% | 0.97% |
1 Total returns do not include the account service fee that may be applicable to certain accounts with balances below $10,000.
See accompanying Notes, which are an integral part of the Financial Statements.
15
Tax-Exempt Money Market Fund
Notes to Financial Statements
Vanguard Tax-Exempt Money Market Fund is registered under the Investment Company Act of 1940 as an open-end investment company, or mutual fund. The fund invests in debt instruments of many municipal issuers; the issuers’ abilities to meet their obligations may be affected by economic and political developments in a specific state or region.
A. The following significant accounting policies conform to generally accepted accounting principles for U.S. mutual funds. The fund consistently follows such policies in preparing its financial statements.
1. Security Valuation: Investment securities are valued at amortized cost, which approximates market value. Investments in Vanguard Municipal Cash Management Fund are valued at that fund’s net asset value.
2. Federal Income Taxes: The fund intends to continue to qualify as a regulated investment company and distribute all of its income. Accordingly, no provision for federal income taxes is required in the financial statements.
3. Distributions: Distributions from net investment income are declared daily and paid on the first business day of the following month.
4. Other: Interest income includes income distributions received from Vanguard Municipal Cash Management Fund and is accrued daily. Premiums and discounts on debt securities purchased are amortized and accreted, respectively, to interest income over the lives of the respective securities. Security transactions are accounted for on the date securities are bought or sold. Costs used to determine realized gains (losses) on the sale of investment securities are those of the specific securities sold.
B. The Vanguard Group furnishes at cost investment advisory, corporate management, administrative, marketing, and distribution services. The costs of such services are allocated to the fund under methods approved by the board of trustees. The fund has committed to provide up to 0.40% of its assets in capital contributions to Vanguard. At October 31, 2007, the fund had contributed capital of $1,805,000 to Vanguard (included in Other Assets), representing 0.01% of the fund’s net assets and 1.80% of Vanguard’s capitalization. The fund’s trustees and officers are also directors and officers of Vanguard.
C. In June 2006, the Financial Accounting Standards Board issued Interpretation No. 48 (“FIN 48”), “Accounting for Uncertainty in Income Taxes.” FIN 48 establishes the minimum threshold for recognizing, and a system for measuring, the benefits of tax-return positions in financial statements, and is effective for the fund’s fiscal year beginning November 1, 2007. Management has analyzed the fund’s tax positions taken on federal income tax returns for all open tax years (tax years ended October 31, 2004–2007) for purposes of implementing FIN 48, and has concluded that as of October 31, 2007, no provision for income tax would be required in the fund’s financial statements.
16
Short-Term Tax-Exempt Fund
Fund Profile
As of October 31, 2007
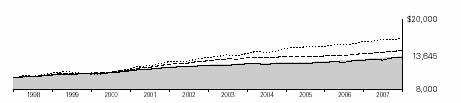
Financial Attributes | | | |
| Comparative | Broad |
| Fund | Index1 | Index2 |
Number of Issues | 450 | 6,086 | 41,655 |
Yield | | — | — |
Investor Shares | 3.4% | | |
Admiral Shares | 3.5% | | |
Yield to Maturity | 3.5%3 | 3.6% | 4.1% |
Average Coupon | 4.6% | 5.2% | 5.0% |
Average Effective Maturity | 1.2 years | 3.0 years | 13.4 years |
Average Quality | AA+ | AAA | AA+ |
Average Duration | 1.7 years | 2.6 years | 7.1 years |
Expense Ratio | | — | — |
Investor Shares | 0.15% | | |
Admiral Shares | 0.08% | | |
Short-Term Reserves | 0.2% | — | — |
| | | | |
Largest State Concentrations4 | |
| |
Texas | 17.8% |
Florida | 9.2 |
New York | 6.3 |
Illinois | 6.1 |
Pennsylvania | 4.9 |
Washington | 4.9 |
Georgia | 3.6 |
California | 3.3 |
Nevada | 3.1 |
Tennessee | 3.1 |
Top Ten | 62.3% |
Volatility Measures5 | |
| Fund Versus | Fund Versus |
| Comparative Index1 | Broad Index2 |
R-Squared | 0.87 | 0.38 |
Beta | 0.44 | 0.13 |
Distribution by Maturity (% of portfolio) | |
| |
Under 1 Year | 47.7% |
1–3 Years | 49.1 |
3–5 Years | 3.1 |
Over 5 Years | 0.1 |
Distribution by Credit Quality (% of portfolio) |
| |
AAA | 65.8% |
AA | 27.6 |
A | 5.8 |
BBB | 0.5 |
Other | 0.3 |
Investment Focus
1 Lehman 3 Year Municipal Bond Index.
2 Lehman Municipal Bond Index.
3 Before expenses.
4 Percentages of total net assets, excluding any futures contracts.
5 For an explanation of R-squared, beta, and other terms used here, see the Glossary on page 81.
17
Short-Term Tax-Exempt Fund
Performance Summary
All of the returns in this report represent past performance, which is not a guarantee of future results that may be achieved by the fund. (Current performance may be lower or higher than the performance data cited. For performance data current to the most recent month-end, visit our website at www.vanguard.com/performance.) Note, too, that both investment returns and principal value can fluctuate widely, so an investor’s shares, when sold, could be worth more or less than their original cost. The returns shown do not reflect taxes that a shareholder would pay on fund distributions or on the sale of fund shares.
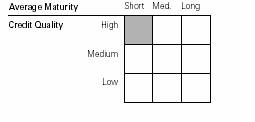
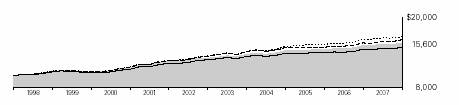
Cumulative Performance: October 31, 1997–October 31, 2007
Initial Investment of $10,000
| | | |
| | | | |
| | Average Annual Total Returns | Final Value |
| | Periods Ended October 31, 2007 | of a $10,000 |
| One Year | Five Years | Ten Years | Investment |
Short-Term Tax-Exempt Fund Investor Shares1 | 3.70% | 2.34% | 3.16% | $13,645 |
Lehman Municipal Bond Index | 2.91 | 4.46 | 5.29 | 16,751 |
Lehman 3 Year Municipal Bond Index | 4.01 | 2.70 | 3.96 | 14,740 |
Average 1–2 Year Municipal Fund2 | 3.59 | 2.15 | 3.04 | 13,485 |
| | | | | |
| | | | Final Value |
| | | Since | of a $100,000 |
| One Year | Five Years | Inception3 | Investment |
Short-Term Tax-Exempt Fund Admiral Shares | 3.77% | 2.41% | 2.73% | $119,840 |
Lehman Municipal Bond Index | 2.91 | 4.46 | 5.05 | 139,177 |
Lehman 3 Year Municipal Bond Index | 4.01 | 2.70 | 3.45 | 125,567 |
1 Total returns do not include the account service fee that may be applicable to certain accounts with balances below $10,000.
2 Derived from data provided by Lipper Inc.
3 Performance for the Admiral Shares and comparative standards is calculated since the inception date for Admiral Shares: February 12, 2001.
18
Short-Term Tax-Exempt Fund
Fiscal-Year Total Returns (%): October 31, 1997–October 31, 2007 | | |
| | | | |
| | Investor Shares | Lehman1 |
Fiscal | Capital | Income | Total | Total |
Year | Return | Return | Return | Return |
1998 | 0.5% | 4.0% | 4.5% | 5.7% |
1999 | –1.0 | 3.7 | 2.7 | 2.2 |
2000 | 0.1 | 4.1 | 4.2 | 4.9 |
2001 | 1.5 | 4.2 | 5.7 | 8.7 |
2002 | –0.1 | 2.9 | 2.8 | 4.8 |
2003 | 0.3 | 2.0 | 2.3 | 3.9 |
2004 | –0.6 | 1.8 | 1.2 | 2.2 |
2005 | –0.9 | 2.2 | 1.3 | 0.3 |
2006 | 0.3 | 2.9 | 3.2 | 3.1 |
2007 | 0.3 | 3.4 | 3.7 | 4.0 |
| | | | | |
Average Annual Total Returns: Periods Ended September 30, 2007
This table presents average annual total returns through the latest calendar quarter—rather than through the end of the fiscal period. Securities and Exchange Commission rules require that we provide this information.
| | | | | | Ten Years |
| Inception Date | One Year | Five Years | Capital | Income | Total |
Investor Shares2 | 9/1/1977 | 3.60% | 2.23% | 0.03% | 3.12% | 3.15% |
Admiral Shares | 2/12/2001 | 3.67 | 2.30 | –0.053 | 2.763 | 2.713 |
1 Lehman 3 Year Municipal Bond Index.
2 Total returns do not include the account service fee that may be applicable to certain accounts with balances below $10,000.
3 Return since inception.
Note: See Financial Highlights tables on pages 22 and 23 for dividend and capital gains information.
19
Short-Term Tax-Exempt Fund
Financial Statements
The Statement of Net Assets—an integral part of the Financial Statements for Vanguard Short-Term Tax-Exempt Fund—is included as an insert to this report.
Statement of Operations
| Year Ended |
| October 31, 2007 |
| ($000) |
Investment Income | |
Income | |
Interest1 | 142,484 |
Total Income | 142,484 |
Expenses | |
The Vanguard Group—Note B | |
Investment Advisory Services | 335 |
Management and Administrative—Investor Shares | 1,150 |
Management and Administrative—Admiral Shares | 1,188 |
Marketing and Distribution—Investor Shares | 284 |
Marketing and Distribution—Admiral Shares | 777 |
Custodian Fees | 65 |
Auditing Fees | 21 |
Shareholders’ Reports—Investor Shares | 43 |
Shareholders’ Reports—Admiral Shares | 14 |
Trustees’ Fees and Expenses | 4 |
Total Expenses | 3,881 |
Expenses Paid Indirectly—Note C | (50) |
Net Expenses | 3,831 |
Net Investment Income | 138,653 |
Realized Net Gain (Loss) | |
Investment Securities Sold | (3,025) |
Futures Contracts | 80 |
Realized Net Gain (Loss) | (2,945) |
Change in Unrealized Appreciation (Depreciation) | |
Investment Securities | 15,485 |
Futures Contracts | — |
Change in Unrealized Appreciation (Depreciation) | 15,485 |
Net Increase (Decrease) in Net Assets Resulting from Operations | 151,193 |
1 Interest income from an affiliated company of the fund was $2,161,000.
20
Short-Term Tax-Exempt Fund
Statement of Changes in Net Assets
| Year Ended October 31, |
| 2007 | 2006 |
| ($000) | ($000) |
Increase (Decrease) in Net Assets | | |
Operations | | |
Net Investment Income | 138,653 | 121,695 |
Realized Net Gain (Loss) | (2,945) | (3,801) |
Change in Unrealized Appreciation (Depreciation) | 15,485 | 14,863 |
Net Increase (Decrease) in Net Assets Resulting from Operations | 151,193 | 132,757 |
Distributions | | |
Net Investment Income | | |
Investor Shares | (36,049) | (35,100) |
Admiral Shares | (102,604) | (86,595) |
Realized Capital Gain | | |
Investor Shares | — | — |
Admiral Shares | — | — |
Total Distributions | (138,653) | (121,695) |
Capital Share Transactions—Note F | | |
Investor Shares | (101,961) | (246,823) |
Admiral Shares | 99,627 | 89,807 |
Net Increase (Decrease) from Capital Share Transactions | (2,334) | (157,016) |
Total Increase (Decrease) | 10,206 | (145,954) |
Net Assets | | |
Beginning of Period | 4,107,377 | 4,253,331 |
End of Period | 4,117,583 | 4,107,377 |
21
Short-Term Tax-Exempt Fund
Financial Highlights
Investor Shares | | | | | |
| | | | | |
| | | | | |
| | | Year Ended October 31, |
For a Share Outstanding Throughout Each Period | 2007 | 2006 | 2005 | 2004 | 2003 |
Net Asset Value, Beginning of Period | $15.58 | $15.53 | $15.67 | $15.77 | $15.73 |
Investment Operations | | | | | |
Net Investment Income | .526 | .443 | .340 | .292 | .317 |
Net Realized and Unrealized Gain (Loss) | | | | | |
on Investments | .040 | .050 | (.140) | (.100) | .040 |
Total from Investment Operations | .566 | .493 | .200 | .192 | .357 |
Distributions | | | | | |
Dividends from Net Investment Income | (.526) | (.443) | (.340) | (.292) | (.317) |
Distributions from Realized Capital Gains | — | — | — | — | — |
Total Distributions | (.526) | (.443) | (.340) | (.292) | (.317) |
Net Asset Value, End of Period | $15.62 | $15.58 | $15.53 | $15.67 | $15.77 |
| | | | | |
| | | | | |
Total Return1 | 3.70% | 3.22% | 1.29% | 1.23% | 2.28% |
| | | | | |
| | | | | |
Ratios/Supplemental Data | | | | | |
Net Assets, End of Period (Millions) | $1,040 | $1,139 | $1,382 | $2,198 | $2,144 |
Ratio of Total Expenses to | | | | | |
Average Net Assets | 0.15% | 0.16% | 0.16% | 0.14% | 0.17% |
Ratio of Net Investment Income to | | | | | |
Average Net Assets | 3.37% | 2.85% | 2.16% | 1.86% | 2.01% |
Portfolio Turnover Rate | 51% | 49% | 30% | 10% | 25% |
| | | | | | | |
1 Total returns do not include the account service fee that may be applicable to certain accounts with balances below $10,000.
22
Short-Term Tax-Exempt Fund
Admiral Shares | | | | | |
| | | | | |
| | | | | |
| | | Year Ended October 31, |
For a Share Outstanding Throughout Each Period | 2007 | 2006 | 2005 | 2004 | 2003 |
Net Asset Value, Beginning of Period | $15.58 | $15.53 | $15.67 | $15.77 | $15.73 |
Investment Operations | | | | | |
Net Investment Income | .537 | .455 | .351 | .300 | .327 |
Net Realized and Unrealized Gain (Loss) | | | | | |
on Investments | .040 | .050 | (.140) | (.100) | .040 |
Total from Investment Operations | .577 | .505 | .211 | .200 | .367 |
Distributions | | | | | |
Dividends from Net Investment Income | (.537) | (.455) | (.351) | (.300) | (.327) |
Distributions from Realized Capital Gains | — | — | — | — | — |
Total Distributions | (.537) | (.455) | (.351) | (.300) | (.327) |
Net Asset Value, End of Period | $15.62 | $15.58 | $15.53 | $15.67 | $15.77 |
| | | | | |
| | | | | |
Total Return | 3.77% | 3.30% | 1.37% | 1.28% | 2.35% |
| | | | | |
| | | | | |
Ratios/Supplemental Data | | | | | |
Net Assets, End of Period (Millions) | $3,078 | $2,969 | $2,871 | $2,433 | $2,428 |
Ratio of Total Expenses to | | | | | |
Average Net Assets | 0.08% | 0.09% | 0.09% | 0.09% | 0.11% |
Ratio of Net Investment Income to | | | | | |
Average Net Assets | 3.44% | 2.92% | 2.26% | 1.91% | 2.05% |
Portfolio Turnover Rate | 51% | 49% | 30% | 10% | 25% |
| | | | | | | |
See accompanying Notes, which are an integral part of the Financial Statements.
23
Short-Term Tax-Exempt Fund
Notes to Financial Statements
Vanguard Short-Term Tax-Exempt Fund is registered under the Investment Company Act of 1940 as an open-end investment company, or mutual fund. The fund invests in debt instruments of many municipal issuers; the issuers’ abilities to meet their obligations may be affected by economic and political developments in a specific state or region. The fund offers two classes of shares, Investor Shares and Admiral Shares. Investor Shares are available to any investor who meets the fund’s minimum purchase requirements. Admiral Shares are designed for investors who meet certain administrative, service, tenure, and account-size criteria.
A. The following significant accounting policies conform to generally accepted accounting principles for U.S. mutual funds. The fund consistently follows such policies in preparing its financial statements.
1. Security Valuation: Bonds, and temporary cash investments acquired over 60 days to maturity, are valued using the latest bid prices or using valuations based on a matrix system (which considers such factors as security prices, yields, maturities, and ratings), both as furnished by independent pricing services. Investments in Vanguard Municipal Cash Management Fund are valued at that fund’s net asset value. Other temporary cash investments are valued at amortized cost, which approximates market value. Securities for which market quotations are not readily available, or whose values have been materially affected by events occurring before the fund’s pricing time but after the close of the securities’ primary markets, are valued by methods deemed by the board of trustees to represent fair value.
2. Futures Contracts: The fund uses futures contracts to invest in fixed income asset classes with greater efficiency and lower cost than is possible through direct investment, to add value when these instruments are attractively priced, or to adjust sensitivity to changes in interest rates. The primary risks associated with the use of futures contracts are imperfect correlation between changes in market values of bonds held by the fund and the prices of futures contracts, and the possibility of an illiquid market.
Futures contracts are valued based upon their quoted daily settlement prices. The aggregate principal amounts of the contracts are not recorded in the Statement of Net Assets. Fluctuations in the value of the contracts are recorded in the Statement of Net Assets as an asset (liability) and in the Statement of Operations as unrealized appreciation (depreciation) until the contracts are closed, when they are recorded as realized futures gains (losses).
3. Federal Income Taxes: The fund intends to continue to qualify as a regulated investment company and distribute all of its income. Accordingly, no provision for federal income taxes is required in the financial statements.
4. Distributions: Distributions from net investment income are declared daily and paid on the first business day of the following month. Annual distributions from realized capital gains, if any, are recorded on the ex-dividend date.
5. Other: Interest income includes income distributions received from Vanguard Municipal Cash Management Fund and is accrued daily. Premiums and discounts on debt securities purchased are amortized and accreted, respectively, to interest income over the lives of the respective securities. Security transactions are accounted for on the date securities are bought or sold. Costs used to determine realized gains (losses) on the sale of investment securities are those of the specific securities sold.
24
Short-Term Tax-Exempt Fund
Each class of shares has equal rights as to assets and earnings, except that each class separately bears certain class-specific expenses related to maintenance of shareholder accounts (included in Management and Administrative expenses) and shareholder reporting. Marketing and distribution expenses are allocated to each class of shares based on a method approved by the board of trustees. Income, other non-class-specific expenses, and gains and losses on investments are allocated to each class of shares based on its relative net assets.
B. The Vanguard Group furnishes at cost investment advisory, corporate management, administrative, marketing, and distribution services. The costs of such services are allocated to the fund under methods approved by the board of trustees. The fund has committed to provide up to 0.40% of its net assets in capital contributions to Vanguard. At October 31, 2007, the fund had contributed capital of $345,000 to Vanguard (included in Other Assets), representing 0.01% of the fund’s net assets and 0.34% of Vanguard’s capitalization. The fund’s trustees and officers are also directors and officers of Vanguard.
C. The fund’s investment advisor may direct new issue purchases, subject to obtaining the best price and execution, to underwriters who have agreed to rebate or credit to the fund part of the underwriting fees generated. Such rebates or credits are used solely to reduce the fund’s management and administrative expenses. The fund’s custodian bank has also agreed to reduce its fees when the fund maintains cash on deposit in the non-interest-bearing custody account. For the year ended October 31, 2007, these arrangements reduced the fund’s management and administrative expenses by $49,000 and custodian fees by $1,000.
D. Capital gain distributions are determined on a tax basis and may differ from realized capital gains for financial reporting purposes. Differences may be permanent or temporary. Permanent differences are reclassified among capital accounts in the financial statements to reflect their tax character. Temporary differences arise when gains or losses are recognized in different periods for financial statement and tax purposes; these differences will reverse at some time in the future.
For tax purposes, at October 31, 2007, the fund had available realized losses of $12,077,000 to offset future net capital gains of $14,000 through October 31, 2008, $127,000 through October 31, 2010, $2,850,000 through October 31, 2011, $59,000 through October 31, 2012, $2,281,000 through October 31, 2013, $3,801,000 through October 31, 2014, and 2,945,000 through October 31, 2015.
At October 31, 2007, the cost of investment securities for tax purposes was $4,123,060,000. Net unrealized appreciation of investment securities for tax purposes was $5,004,000, consisting of unrealized gains of $8,123,000 on securities that had risen in value since their purchase and $3,119,000 in unrealized losses on securities that had fallen in value since their purchase.
25
Short-Term Tax-Exempt Fund
E. During the year ended October 31, 2007, the fund purchased $1,391,808,000 of investment securities and sold $1,375,181,000 of investment securities, other than temporary cash investments.
F. Capital share transactions for each class of shares were:
| | | Year Ended October 31, |
| | 2007 | | 2006 |
| Amount | Shares | Amount | Shares |
| ($000) | (000) | ($000) | (000) |
Investor Shares | | | | |
Issued | 380,978 | 24,462 | 466,121 | 30,018 |
Issued in Lieu of Cash Distributions | 30,545 | 1,961 | 29,246 | 1,883 |
Redeemed | (513,484) | (32,967) | (742,190) | (47,795) |
Net Increase (Decrease)—Investor Shares | (101,961) | (6,544) | (246,823) | (15,894) |
Admiral Shares | | | | |
Issued | 1,130,745 | 72,604 | 1,343,845 | 86,534 |
Issued in Lieu of Cash Distributions | 84,673 | 5,436 | 70,993 | 4,570 |
Redeemed | (1,115,791) | (71,644) | (1,325,031) | (85,327) |
Net Increase (Decrease)—Admiral Shares | 99,627 | 6,396 | 89,807 | 5,777 |
G. In June 2006, the Financial Accounting Standards Board issued Interpretation No. 48 (“FIN 48”), “Accounting for Uncertainty in Income Taxes.” FIN 48 establishes the minimum threshold for recognizing, and a system for measuring, the benefits of tax-return positions in financial statements, and is effective for the fund’s fiscal year beginning November 1, 2007. Management has analyzed the fund’s tax positions taken on federal income tax returns for all open tax years (tax years ended October 31, 2004–2007) for purposes of implementing FIN 48, and has concluded that as of October 31, 2007, no provision for income tax would be required in the fund’s financial statements.
26
Limited-Term Tax-Exempt Fund
Fund Profile
As of October 31, 2007
Financial Attributes | | | |
| Comparative | Broad |
| Fund | Index1 | Index2 |
Number of Issues | 718 | 6,086 | 41,655 |
Yield | | — | — |
Investor Shares | 3.6% | | |
Admiral Shares | 3.7% | | |
Yield to Maturity | 3.6%3 | 3.6% | 4.1% |
Average Coupon | 4.8% | 5.2% | 5.0% |
Average Effective | | | |
Maturity | 3.0 years | 3.0 years | 13.4 years |
Average Quality | AA+ | AAA | AA+ |
Average Duration | 3.0 years | 2.6 years | 7.1 years |
Expense Ratio | | — | — |
Investor Shares | 0.15% | | |
Admiral Shares | 0.08% | | |
Short-Term Reserves | 0% | — | — |
| | | | |
Largest State Concentrations4 | |
| |
New York | 10.1% |
Texas | 9.0 |
California | 8.1 |
Florida | 7.7 |
Washington | 5.5 |
New Jersey | 4.6 |
Massachusetts | 4.4 |
North Carolina | 4.1 |
Illinois | 3.8 |
Ohio | 3.3 |
Top Ten | 60.6% |
Volatility Measures5 | |
| Fund Versus | Fund Versus |
| Comparative Index1 | Broad Index2 |
R-Squared | 0.94 | 0.66 |
Beta | 0.90 | 0.34 |
Distribution by Maturity (% of portfolio) | |
| |
Under 1 Year | 25.4% |
1–3 Years | 27.8 |
3–5 Years | 25.9 |
Over 5 Years | 20.9 |
Distribution by Credit Quality (% of portfolio) |
| |
AAA | 63.2% |
AA | 24.6 |
A | 7.9 |
BBB | 4.0 |
BB | 0.1 |
Other | 0.2 |
Investment Focus
1 | Lehman 3 Year Municipal Bond Index. |
2 | Lehman Municipal Bond Index. |
4 | Percentages of total net assets, excluding any futures contracts. |
5 | For an explanation of R-squared, beta, and other terms used here, see the Glossary on page 81. |
27
Limited-Term Tax-Exempt Fund
Performance Summary
All of the returns in this report represent past performance, which is not a guarantee of future results that may be achieved by the fund. (Current performance may be lower or higher than the performance data cited. For performance data current to the most recent month-end, visit our website at www.vanguard.com/performance.) Note, too, that both investment returns and principal value can fluctuate widely, so an investor’s shares, when sold, could be worth more or less than their original cost. The returns shown do not reflect taxes that a shareholder would pay on fund distributions or on the sale of fund shares.
Cumulative Performance: October 31, 1997–October 31, 2007
Initial Investment of $10,000
| | | |
| | | | |
| | Average Annual Total Returns | Final Value |
| Periods Ended October 31, 2007 | of a $10,000 |
| One Year | Five Years | Ten Years | Investment |
Limited-Term Tax-Exempt Fund Investor Shares1 | 3.62% | 2.69% | 3.76% | $14,458 |
Lehman Municipal Bond Index | 2.91 | 4.46 | 5.29 | 16,751 |
Lehman 3 Year Municipal Bond Index | 4.01 | 2.70 | 3.96 | 14,740 |
Average 1–5 Year Municipal Fund2 | 2.87 | 2.35 | 3.24 | 13,754 |
| | | | | | |
| | | | Final Value |
| | | Since | of a $100,000 |
| One Year | Five Years | Inception3 | Investment |
Limited-Term Tax-Exempt Fund Admiral Shares | 3.69% | 2.76% | 3.31% | $124,454 |
Lehman Municipal Bond Index | 2.91 | 4.46 | 5.02 | 138,986 |
Lehman 3 Year Municipal Bond Index | 4.01 | 2.70 | 3.45 | 125,567 |
1 Total returns do not include the account service fee that may be applicable to certain accounts with balances below $10,000.
2 Derived from data provided by Lipper Inc.
3 Performance for the Admiral Shares and comparative standards is calculated since the inception date for Admiral Shares: February 12, 2001.
28
Limited-Term Tax-Exempt Fund
Fiscal-Year Total Returns (%): October 31, 1997–October 31, 2007 | | |
| | | | |
| | Investor Shares | Lehman1 |
Fiscal | Capital | Income | Total | Total |
Year | Return | Return | Return | Return |
1998 | 1.0% | 4.4% | 5.4% | 5.7% |
1999 | –2.4 | 4.2 | 1.8 | 2.2 |
2000 | 0.5 | 4.5 | 5.0 | 4.9 |
2001 | 3.3 | 4.6 | 7.9 | 8.7 |
2002 | 0.1 | 3.9 | 4.0 | 4.8 |
2003 | 0.7 | 3.3 | 4.0 | 3.9 |
2004 | –1.1 | 2.9 | 1.8 | 2.2 |
2005 | –2.3 | 3.0 | 0.7 | 0.3 |
2006 | 0.1 | 3.3 | 3.4 | 3.1 |
2007 | 0.1 | 3.5 | 3.6 | 4.0 |
| | | | | |
Average Annual Total Returns: Periods Ended September 30, 2007
This table presents average annual total returns through the latest calendar quarter—rather than through the end of the fiscal period. Securities and Exchange Commission rules require that we provide this information.
| | | | | | Ten Years |
| Inception Date | One Year | Five Years | Capital | Income | Total |
Investor Shares2 | 8/31/1987 | 3.60% | 2.45% | –0.01% | 3.77% | 3.76% |
Admiral Shares | 2/12/2001 | 3.67 | 2.52 | –0.203 | 3.513 | 3.313 |
1 Lehman 3 Year Municipal Bond Index.
2 Total returns do not include the account service fee that may be applicable to certain accounts with balances below $10,000.
3 Return since inception.
Note: See Financial Highlights tables on pages 32 and 33 for dividend and capital gains information.
29
Limited-Term Tax-Exempt Fund
Financial Statements
The Statement of Net Assets—an integral part of the Financial Statements for Vanguard Limited-Term Tax-Exempt Fund—is included as an insert to this report.
Statement of Operations
| Year Ended |
| October 31, 2007 |
| ($000) |
Investment Income | |
Income | |
Interest1 | 240,005 |
Total Income | 240,005 |
Expenses | |
The Vanguard Group—Note B | |
Investment Advisory Services | 549 |
Management and Administrative—Investor Shares | 2,036 |
Management and Administrative—Admiral Shares | 1,962 |
Marketing and Distribution—Investor Shares | 497 |
Marketing and Distribution—Admiral Shares | 1,229 |
Custodian Fees | 61 |
Auditing Fees | 23 |
Shareholders’ Reports—Investor Shares | 73 |
Shareholders’ Reports—Admiral Shares | 24 |
Trustees’ Fees and Expenses | 7 |
Total Expenses | 6,461 |
Expenses Paid Indirectly—Note C | (128) |
Net Expenses | 6,333 |
Net Investment Income | 233,672 |
Realized Net Gain (Loss) | |
Investment Securities Sold | (9,192) |
Futures Contracts | (2,464) |
Realized Net Gain (Loss) | (11,656) |
Change in Unrealized Appreciation (Depreciation) | |
Investment Securities | 16,020 |
Futures Contracts | (496) |
Change in Unrealized Appreciation (Depreciation) | 15,524 |
Net Increase (Decrease) in Net Assets Resulting from Operations | 237,540 |
1 Interest income from an affiliated company of the fund was $1,724,000.
30
Limited-Term Tax-Exempt Fund
Statement of Changes in Net Assets
| Year Ended October 31, |
| 2007 | 2006 |
| ($000) | ($000) |
Increase (Decrease) in Net Assets | | |
Operations | | |
Net Investment Income | 233,672 | 218,644 |
Realized Net Gain (Loss) | (11,656) | (15,255) |
Change in Unrealized Appreciation (Depreciation) | 15,524 | 23,643 |
Net Increase (Decrease) in Net Assets Resulting from Operations | 237,540 | 227,032 |
Distributions | | |
Net Investment Income | | |
Investor Shares | (64,936) | (67,728) |
Admiral Shares | (168,736) | (150,916) |
Realized Capital Gain | | |
Investor Shares | — | — |
Admiral Shares | — | — |
Total Distributions | (233,672) | (218,644) |
Capital Share Transactions—Note F | | |
Investor Shares | (185,519) | (369,475) |
Admiral Shares | 228,759 | 194,852 |
Net Increase (Decrease) from Capital Share Transactions | 43,240 | (174,623) |
Total Increase (Decrease) | 47,108 | (166,235) |
Net Assets | | |
Beginning of Period | 6,665,364 | 6,831,599 |
End of Period | 6,712,472 | 6,665,364 |
31
Limited-Term Tax-Exempt Fund
Financial Highlights
Investor Shares | | | | | |
| | | | | |
| | | | | |
| | | Year Ended October 31, |
For a Share Outstanding Throughout Each Period | 2007 | 2006 | 2005 | 2004 | 2003 |
Net Asset Value, Beginning of Period | $10.72 | $10.71 | $10.96 | $11.08 | $11.00 |
Investment Operations | | | | | |
Net Investment Income | .371 | .344 | .326 | .318 | .355 |
Net Realized and Unrealized Gain (Loss) | | | | | |
on Investments | .010 | .010 | (.250) | (.120) | .080 |
Total from Investment Operations | .381 | .354 | .076 | .198 | .435 |
Distributions | | | | | |
Dividends from Net Investment Income | (.371) | (.344) | (.326) | (.318) | (.355) |
Distributions from Realized Capital Gains | — | — | — | — | — |
Total Distributions | (.371) | (.344) | (.326) | (.318) | (.355) |
Net Asset Value, End of Period | $10.73 | $10.72 | $10.71 | $10.96 | $11.08 |
| | | | | |
| | | | | |
Total Return1 | 3.62% | 3.37% | 0.71% | 1.82% | 4.00% |
| | | | | |
| | | | | |
Ratios/Supplemental Data | | | | | |
Net Assets, End of Period (Millions) | $1,798 | $1,983 | $2,351 | $3,553 | $3,148 |
Ratio of Total Expenses to | | | | | |
Average Net Assets | 0.15% | 0.16% | 0.16% | 0.14% | 0.17% |
Ratio of Net Investment Income to | | | | | |
Average Net Assets | 3.46% | 3.23% | 3.01% | 2.89% | 3.19% |
Portfolio Turnover Rate | 32% | 27% | 17% | 8% | 13% |
| | | | | | |
1 Total returns do not include the account service fee that may be applicable to certain accounts with balances below $10,000.
32
Limited-Term Tax-Exempt Fund
Admiral Shares | | | | | |
| | | | | |
| | | | | |
| | | Year Ended October 31, |
For a Share Outstanding Throughout Each Period | 2007 | 2006 | 2005 | 2004 | 2003 |
Net Asset Value, Beginning of Period | $10.72 | $10.71 | $10.96 | $11.08 | $11.00 |
Investment Operations | | | | | |
Net Investment Income | .378 | .352 | .334 | .324 | .362 |
Net Realized and Unrealized Gain (Loss) | | | | | |
on Investments | .010 | .010 | (.250) | (.120) | .080 |
Total from Investment Operations | .388 | .362 | .084 | .204 | .442 |
Distributions | | | | | |
Dividends from Net Investment Income | (.378) | (.352) | (.334) | (.324) | (.362) |
Distributions from Realized Capital Gains | — | — | — | — | — |
Total Distributions | (.378) | (.352) | (.334) | (.324) | (.362) |
Net Asset Value, End of Period | $10.73 | $10.72 | $10.71 | $10.96 | $11.08 |
| | | | | |
| | | | | |
Total Return | 3.69% | 3.45% | 0.78% | 1.87% | 4.06% |
| | | | | |
| | | | | |
Ratios/Supplemental Data | | | | | |
Net Assets, End of Period (Millions) | $4,914 | $4,682 | $4,481 | $3,395 | $3,286 |
Ratio of Total Expenses to | | | | | |
Average Net Assets | 0.08% | 0.09% | 0.09% | 0.09% | 0.11% |
Ratio of Net Investment Income to | | | | | |
Average Net Assets | 3.53% | 3.30% | 3.08% | 2.95% | 3.25% |
Portfolio Turnover Rate | 32% | 27% | 17% | 8% | 13% |
| | | | | | |
See accompanying Notes, which are an integral part of the Financial Statements.
33
Limited-Term Tax-Exempt Fund
Notes to Financial Statements
Vanguard Limited-Term Tax-Exempt Fund is registered under the Investment Company Act of 1940 as an open-end investment company, or mutual fund. The fund invests in debt instruments of many municipal issuers; the issuers’ abilities to meet their obligations may be affected by economic and political developments in a specific state or region. The fund offers two classes of shares, Investor Shares and Admiral Shares. Investor Shares are available to any investor who meets the fund’s minimum purchase requirements. Admiral Shares are designed for investors who meet certain administrative, service, tenure, and account-size criteria.
A. The following significant accounting policies conform to generally accepted accounting principles for U.S. mutual funds. The fund consistently follows such policies in preparing its financial statements.
1. Security Valuation: Bonds, and temporary cash investments acquired over 60 days to maturity, are valued using the latest bid prices or using valuations based on a matrix system (which considers such factors as security prices, yields, maturities, and ratings), both as furnished by independent pricing services. Investments in Vanguard Municipal Cash Management Fund are valued at that fund’s net asset value. Other temporary cash investments are valued at amortized cost, which approximates market value. Securities for which market quotations are not readily available, or whose values have been materially affected by events occurring before the funds’ pricing time but after the close of the securities’ primary markets, are valued by methods deemed by the board of trustees to represent fair value.
2. Futures Contracts: The fund uses futures contracts to invest in fixed income asset classes with greater efficiency and lower cost than is possible through direct investment, to add value when these instruments are attractively priced, or to adjust sensitivity to changes in interest rates. The primary risks associated with the use of futures contracts are imperfect correlation between changes in market values of bonds held by the fund and the prices of futures contracts, and the possibility of an illiquid market.
Futures contracts are valued based upon their quoted daily settlement prices. The aggregate principal amounts of the contracts are not recorded in the Statement of Net Assets. Fluctuations in the value of the contracts are recorded in the Statement of Net Assets as an asset (liability) and in the Statement of Operations as unrealized appreciation (depreciation) until the contracts are closed, when they are recorded as realized futures gains (losses).
3. Federal Income Taxes: The fund intends to continue to qualify as a regulated investment company and distribute all of its income. Accordingly, no provision for federal income taxes is required in the financial statements.
4. Distributions: Distributions from net investment income are declared daily and paid on the first business day of the following month. Annual distributions from realized capital gains, if any, are recorded on the ex-dividend date.
5. Other: Interest income includes income distributions received from Vanguard Municipal Cash Management Fund and is accrued daily. Premiums and discounts on debt securities purchased are amortized and accreted, respectively, to interest income over the lives of the respective securities. Security transactions are accounted for on the date securities are bought or sold. Costs used to determine realized gains (losses) on the sale of investment securities are those of the specific securities sold.
34
Limited-Term Tax-Exempt Fund
Each class of shares has equal rights as to assets and earnings, except that each class separately bears certain class-specific expenses related to maintenance of shareholder accounts (included in Management and Administrative expenses) and shareholder reporting. Marketing and distribution expenses are allocated to each class of shares based on a method approved by the board of trustees. Income, other non-class-specific expenses, and gains and losses on investments are allocated to each class of shares based on its relative net assets.
B. The Vanguard Group furnishes at cost investment advisory, corporate management, administrative, marketing, and distribution services. The costs of such services are allocated to the fund under methods approved by the board of trustees. The fund has committed to provide up to 0.40% of its net assets in capital contributions to Vanguard. At October 31, 2007, the fund had contributed capital of $563,000 to Vanguard (included in Other Assets), representing 0.01% of the fund’s net assets and 0.56% of Vanguard’s capitalization. The fund’s trustees and officers are also directors and officers of Vanguard.
C. The fund’s investment advisor may direct new issue purchases, subject to obtaining the best price and execution, to underwriters who have agreed to rebate or credit to the fund part of the underwriting fees generated. Such rebates or credits are used solely to reduce the fund’s management and administrative expenses. The fund’s custodian bank has also agreed to reduce its fees when the fund maintains cash on deposit in the non-interest-bearing custody account. For the year ended October 31, 2007, these arrangements reduced the fund’s management and administrative expenses by $122,000 and custodian fees by $6,000.
D. Capital gain distributions are determined on a tax basis and may differ from realized capital gains for financial reporting purposes. Differences may be permanent or temporary. Permanent differences are reclassified among capital accounts in the financial statements to reflect their tax character. Temporary differences arise when gains or losses are recognized in different periods for financial statement and tax purposes; these differences will reverse at some time in the future.
For tax purposes, at October 31, 2007, the fund had available realized losses of $85,890,000 to offset future net capital gains of $2,880,000 through October 31, 2008, $815,000 through October 31, 2009, $31,765,000 through October 31, 2011, $1,396,000 through October 31, 2012, $20,383,000 through October 31, 2013, $16,166,000 through October 31, 2014, and $12,485,000 through October 31, 2015.
The fund had realized losses totaling $353,000 through October 31, 2007, which are deferred for tax purposes and reduce the amount of tax-basis unrealized appreciation on investment securities.
At October 31, 2007, cost of investment securities for tax purposes was $6,648,951,000. Net unrealized appreciation of investment securities for tax purposes was $489,000, consisting of unrealized gains of $17,883,000 on securities that had risen in value since their purchase and $17,394,000 in unrealized losses on securities that had fallen in value since their purchase.
E. During the year ended October 31, 2007, the fund purchased $1,878,348,000 of investment securities and sold $2,091,012,000 of investment securities, other than temporary cash investments.
35
Limited-Term Tax-Exempt Fund
F. Capital share transactions for each class of shares were:
| | | Year Ended October 31, |
| | 2007 | | 2006 |
| Amount | Shares | Amount | Shares |
| ($000) | (000) | ($000) | (000) |
Investor Shares | | | | |
Issued | 595,187 | 55,678 | 641,678 | 60,070 |
Issued in Lieu of Cash Distributions | 55,007 | 5,143 | 56,462 | 5,286 |
Redeemed | (835,713) | (78,168) | (1,067,615) | (99,939) |
Net Increase (Decrease)—Investor Shares | (185,519) | (17,347) | (369,475) | (34,583) |
Admiral Shares | | | | |
Issued | 1,508,998 | 141,138 | 1,646,248 | 154,113 |
Issued in Lieu of Cash Distributions | 134,376 | 12,564 | 118,483 | 11,094 |
Redeemed | (1,414,615) | (132,312) | (1,569,879) | (146,989) |
Net Increase (Decrease)—Admiral Shares | 228,759 | 21,390 | 194,852 | 18,218 |
G. In June 2006, the Financial Accounting Standards Board issued Interpretation No. 48 (“FIN 48”), “Accounting for Uncertainty in Income Taxes.” FIN 48 establishes the minimum threshold for recognizing, and a system for measuring, the benefits of tax-return positions in financial statements, and is effective for the fund’s fiscal year beginning November 1, 2007. Management has analyzed the fund’s tax positions taken on federal income tax returns for all open tax years (tax years ended October 31, 2004–2007) for purposes of implementing FIN 48, and has concluded that as of October 31, 2007, no provision for income tax would be required in the fund’s financial statements.
36
Intermediate-Term Tax-Exempt Fund
Fund Profile
As of October 31, 2007
Financial Attributes | | | |
| Comparative | Broad |
| Fund | Index1 | Index2 |
Number of Issues | 1,278 | 4,222 | 41,655 |
Yield | | — | — |
Investor Shares | 3.8% | | |
Admiral Shares | 3.9% | | |
Yield to Maturity | 3.9%3 | 3.7% | 4.1% |
Average Coupon | 5.0% | 5.0% | 5.0% |
Average Effective | | | |
Maturity | 6.7 years | 7.0 years | 13.4 years |
Average Quality | AA+ | AAA | AA+ |
Average Duration | 5.2 years | 5.2 years | 7.1 years |
Expense Ratio | | — | — |
Investor Shares | 0.15% | | |
Admiral Shares | 0.08% | | |
Short-Term Reserves | 2.9% | — | — |
| | | | |
Largest State Concentrations4 | |
| |
California | 10.1% |
Texas | 7.8 |
Massachusetts | 7.4 |
New Jersey | 7.1 |
New York | 6.3 |
Pennsylvania | 4.8 |
Georgia | 4.6 |
Florida | 4.5 |
North Carolina | 3.6 |
Minnesota | 3.5 |
Top Ten | 59.7% |
Volatility Measures5 | |
| Fund Versus | Fund Versus |
| Comparative Index1 | Broad Index2 |
R-Squared | 0.93 | 0.97 |
Beta | 0.92 | 0.92 |
Distribution by Maturity (% of portfolio) | |
| |
Under 1 Year | 9.7% |
1–5 Years | 34.6 |
5–10 Years | 41.5 |
10–20 Years | 11.1 |
20–30 Years | 2.9 |
Greater than 30 Years | 0.2 |
Distribution by Credit Quality (% of portfolio) |
| |
AAA | 68.6% |
AA | 21.5 |
A | 5.0 |
BBB | 4.8 |
Other | 0.1 |
Investment Focus
1 Lehman 7 Year Municipal Bond Index.
2 Lehman Municipal Bond Index.
3 Before expenses.
4 Percentages of total net assets, excluding any futures contracts.
5 For an explanation of R-squared, beta, and other terms used here, see the Glossary on page 81.
37
Intermediate-Term Tax-Exempt Fund
Performance Summary
All of the returns in this report represent past performance, which is not a guarantee of future results that may be achieved by the fund. (Current performance may be lower or higher than the performance data cited. For performance data current to the most recent month-end, visit our website at www.vanguard.com/performance.) Note, too, that both investment returns and principal value can fluctuate widely, so an investor’s shares, when sold, could be worth more or less than their original cost. The returns shown do not reflect taxes that a shareholder would pay on fund distributions or on the sale of fund shares.
Cumulative Performance: October 31, 1997–October 31, 2007
Initial Investment of $10,000
| | | |
| | | | |
| | Average Annual Total Returns | Final Value |
| Periods Ended October 31, 2007 | of a $10,000 |
| One Year | Five Years | Ten Years | Investment |
Intermediate-Term Tax-Exempt Fund | | | | |
Investor Shares1 | 2.74% | 3.68% | 4.55% | $15,600 |
Lehman Municipal Bond Index | 2.91 | 4.46 | 5.29 | 16,751 |
Lehman 7 Year Municipal Bond Index | 3.63 | 3.92 | 4.96 | 16,230 |
Average Intermediate Municipal Fund2 | 2.36 | 3.12 | 4.06 | 14,882 |
| | | | Final Value |
| | | Since | of a $100,000 |
| One Year | Five Years | Inception3 | Investment |
Intermediate-Term Tax-Exempt Fund Admiral Shares | 2.81% | 3.75% | 4.16% | $131,495 |
Lehman Municipal Bond Index | 2.91 | 4.46 | 5.01 | 138,877 |
Lehman 7 Year Municipal Bond Index | 3.63 | 3.92 | 4.59 | 135,206 |
1 Total returns do not include the account service fee that may be applicable to certain accounts with balances below $10,000.
2 Derived from data provided by Lipper Inc.
3 Performance for the Admiral Shares and comparative standards is calculated since the inception date for Admiral Shares: February 12, 2001.
38
Intermediate-Term Tax-Exempt Fund
Fiscal-Year Total Returns (%): October 31, 1997–October 31, 2007 | | |
| | | | |
| | | Investor Shares | Lehman1 |
Fiscal | Capital | Income | Total | Total |
Year | Return | Return | Return | Return |
1998 | 1.7% | 5.1% | 6.8% | 7.4% |
1999 | –5.2 | 4.8 | –0.4 | 0.0 |
2000 | 2.0 | 5.3 | 7.3 | 6.8 |
2001 | 4.3 | 5.1 | 9.4 | 9.9 |
2002 | –0.2 | 4.6 | 4.4 | 6.3 |
2003 | 0.5 | 4.2 | 4.7 | 5.8 |
2004 | 0.7 | 4.1 | 4.8 | 4.6 |
2005 | –3.0 | 4.0 | 1.0 | 0.6 |
2006 | 0.8 | 4.3 | 5.1 | 5.0 |
2007 | –1.4 | 4.1 | 2.7 | 3.6 |
Average Annual Total Returns: Periods Ended September 30, 2007
This table presents average annual total returns through the latest calendar quarter—rather than through the end of the fiscal period. Securities and Exchange Commission rules require that we provide this information.
| | | | Ten Years |
| Inception Date | One Year | Five Years | Capital | Income | Total |
Investor Shares2 | 9/1/1977 | 2.96% | 3.24% | –0.02% | 4.57% | 4.55% |
Admiral Shares | 2/12/2001 | 3.03 | 3.31 | –0.203 | 4.373 | 4.173 |
1 Lehman 7 Year Municipal Bond Index.
2 Total returns do not include the account service fee that may be applicable to certain accounts with balances below $10,000.
3 Return since inception.
Note: See Financial Highlights tables on pages 42 and 43 for dividend and capital gains information.
39
Intermediate-Term Tax-Exempt Fund
Financial Statements
The Statement of Net Assets—an integral part of the Financial Statements for Vanguard Intermiediate-Term Tax-Exempt Fund—is included as an insert to this report.
Statement of Operations
| Year Ended |
| October 31, 2007 |
| ($000) |
Investment Income | |
Income | |
Interest1 | 657,323 |
Total Income | 657,323 |
Expenses | |
The Vanguard Group—Note B | |
Investment Advisory Services | 1,250 |
Management and Administrative—Investor Shares | 5,359 |
Management and Administrative—Admiral Shares | 5,155 |
Marketing and Distribution—Investor Shares | 1,276 |
Marketing and Distribution—Admiral Shares | 2,023 |
Custodian Fees | 114 |
Auditing Fees | 24 |
Shareholders’ Reports—Investor Shares | 200 |
Shareholders’ Reports—Admiral Shares | 71 |
Trustees’ Fees and Expenses | 17 |
Total Expenses | 15,489 |
Expenses Paid Indirectly—Note C | (342) |
Net Expenses | 15,147 |
Net Investment Income | 642,176 |
Realized Net Gain (Loss) | |
Investment Securities Sold | 23,060 |
Futures Contracts | (26,119) |
Realized Net Gain (Loss) | (3,059) |
Change in Unrealized Appreciation (Depreciation) | |
Investment Securities | (206,272) |
Futures Contracts | 40 |
Change in Unrealized Appreciation (Depreciation) | (206,232) |
Net Increase (Decrease) in Net Assets Resulting from Operations | 432,885 |
1 Interest income from an affiliated company of the fund was $18,717,000.
40
Intermediate-Term Tax-Exempt Fund
Statement of Changes in Net Assets
| Year Ended October 31, |
| 2007 | 2006 |
| ($000) | ($000) |
Increase (Decrease) in Net Assets | | |
Operations | | |
Net Investment Income | 642,176 | 563,863 |
Realized Net Gain (Loss) | (3,059) | (23,628) |
Change in Unrealized Appreciation (Depreciation) | (206,232) | 134,100 |
Net Increase (Decrease) in Net Assets Resulting from Operations | 432,885 | 674,335 |
Distributions | | |
Net Investment Income | | |
Investor Shares | (201,124) | (199,408) |
Admiral Shares | (441,052) | (364,455) |
Realized Capital Gain | | |
Investor Shares | — | — |
Admiral Shares | — | — |
Total Distributions | (642,176) | (563,863) |
Capital Share Transactions—Note F | | |
Investor Shares | 24,273 | 113,203 |
Admiral Shares | 2,179,027 | 1,382,111 |
Net Increase (Decrease) from Capital Share Transactions | 2,203,300 | 1,495,314 |
Total Increase (Decrease) | 1,994,009 | 1,605,786 |
Net Assets | | |
Beginning of Period | 14,340,582 | 12,734,796 |
End of Period | 16,334,591 | 14,340,582 |
41
Intermediate-Term Tax-Exempt Fund
Financial Highlights
Investor Shares | | | | | |
| | | | | |
| | | | | |
| | | Year Ended October 31, |
For a Share Outstanding Throughout Each Period | 2007 | 2006 | 2005 | 2004 | 2003 |
Net Asset Value, Beginning of Period | $13.37 | $13.26 | $13.67 | $13.58 | $13.55 |
Investment Operations | | | | | |
Net Investment Income | .548 | .556 | .548 | .551 | .563 |
Net Realized and Unrealized Gain (Loss) | | | | | |
on Investments | (.190) | .110 | (.410) | .090 | .070 |
Total from Investment Operations | .358 | .666 | .138 | .641 | .633 |
Distributions | | | | | |
Dividends from Net Investment Income | (.548) | (.556) | (.548) | (.551) | (.563) |
Distributions from Realized Capital Gains | — | — | — | — | (.040) |
Total Distributions | (.548) | (.556) | (.548) | (.551) | (.603) |
Net Asset Value, End of Period | $13.18 | $13.37 | $13.26 | $13.67 | $13.58 |
| | | | | |
| | | | | |
Total Return1 | 2.74% | 5.14% | 1.02% | 4.82% | 4.74% |
| | | | | |
| | | | | |
Ratios/Supplemental Data | | | | | |
Net Assets, End of Period (Millions) | $4,851 | $4,895 | $4,745 | $6,858 | $6,922 |
Ratio of Total Expenses to | | | | | |
Average Net Assets | 0.15% | 0.17% | 0.16% | 0.14% | 0.17% |
Ratio of Net Investment Income to | | | | | |
Average Net Assets | 4.14% | 4.19% | 4.06% | 4.05% | 4.13% |
Portfolio Turnover Rate | 12% | 8% | 12% | 10% | 19% |
| | | | | | |
1 Total returns do not include the account service fee that may be applicable to certain accounts with balances below $10,000.
42
Intermediate-Term Tax-Exempt Fund
Admiral Shares | | | | | |
| | | | | |
| | | | | |
| | | | Year Ended October 31, |
For a Share Outstanding Throughout Each Period | 2007 | 2006 | 2005 | 2004 | 2003 |
Net Asset Value, Beginning of Period | $13.37 | $13.26 | $13.67 | $13.58 | $13.55 |
Investment Operations | | | | | |
Net Investment Income | .557 | .566 | .558 | .559 | .571 |
Net Realized and Unrealized Gain (Loss) | | | | | |
on Investments | (.190) | .110 | (.410) | .090 | .070 |
Total from Investment Operations | .367 | .676 | .148 | .649 | .641 |
Distributions | | | | | |
Dividends from Net Investment Income | (.557) | (.566) | (.558) | (.559) | (.571) |
Distributions from Realized Capital Gains | — | — | — | — | (.040) |
Total Distributions | (.557) | (.566) | (.558) | (.559) | (.611) |
Net Asset Value, End of Period | $13.18 | $13.37 | $13.26 | $13.67 | $13.58 |
| | | | | |
| | | | | |
Total Return | 2.81% | 5.22% | 1.09% | 4.88% | 4.81% |
| | | | | |
| | | | | |
Ratios/Supplemental Data | | | | | |
Net Assets, End of Period (Millions) | $11,484 | $9,445 | $7,990 | $5,145 | $4,754 |
Ratio of Total Expenses to | | | | | |
Average Net Assets | 0.08% | 0.09% | 0.09% | 0.09% | 0.11% |
Ratio of Net Investment Income to | | | | | |
Average Net Assets | 4.21% | 4.27% | 4.13% | 4.11% | 4.19% |
Portfolio Turnover Rate | 12% | 8% | 12% | 10% | 19% |
See accompanying Notes, which are an integral part of the Financial Statements.
43
Intermediate-Term Tax-Exempt Fund
Notes to Financial Statements
Vanguard Intermediate-Term Tax-Exempt Fund is registered under the Investment Company Act of 1940 as an open-end investment company, or mutual fund. The fund invests in debt instruments of many municipal issuers; the issuers’ abilities to meet their obligations may be affected by economic and political developments in a specific state or region. The fund offers two classes of shares, Investor Shares and Admiral Shares. Investor Shares are available to any investor who meets the fund’s minimum purchase requirements. Admiral Shares are designed for investors who meet certain administrative, service, tenure, and account-size criteria.
A. The following significant accounting policies conform to generally accepted accounting principles for U.S. mutual funds. The fund consistently follows such policies in preparing its financial statements.
1. Security Valuation: Bonds, and temporary cash investments acquired over 60 days to maturity, are valued using the latest bid prices or using valuations based on a matrix system (which considers such factors as security prices, yields, maturities, and ratings), both as furnished by independent pricing services. Investments in Vanguard Municipal Cash Management Fund are valued at that fund’s net asset value. Other temporary cash investments are valued at amortized cost, which approximates market value. Securities for which market quotations are not readily available, or whose values have been materially affected by events occurring before the fund’s pricing time but after the close of the securities’ primary markets, are valued by methods deemed by the board of trustees to represent fair value.
2. Futures Contracts: The fund uses futures contracts to invest in fixed income asset classes with greater efficiency and lower cost than is possible through direct investment, to add value when these instruments are attractively priced, or to adjust sensitivity to changes in interest rates. The primary risks associated with the use of futures contracts are imperfect correlation between changes in market values of bonds held by the fund and the prices of futures contracts, and the possibility of an illiquid market.
Futures contracts are valued based upon their quoted daily settlement prices. The aggregate principal amounts of the contracts are not recorded in the Statement of Net Assets. Fluctuations in the value of the contracts are recorded in the Statement of Net Assets as an asset (liability) and in the Statement of Operations as unrealized appreciation (depreciation) until the contracts are closed, when they are recorded as realized futures gains (losses).
3. Federal Income Taxes: The fund intends to continue to qualify as a regulated investment company and distribute all of its income. Accordingly, no provision for federal income taxes is required in the financial statements.
4. Distributions: Distributions from net investment income are declared daily and paid on the first business day of the following month. Annual distributions from realized capital gains, if any, are recorded on the ex-dividend date.
5. Other: Interest income includes income distributions received from Vanguard Municipal Cash Management Fund and is accrued daily. Premiums and discounts on debt securities purchased are amortized and accreted, respectively, to interest income over the lives of the respective securities. Security transactions are accounted for on the date securities are bought or sold. Costs used to determine realized gains (losses) on the sale of investment securities are those of the specific securities sold.
44
Intermediate-Term Tax-Exempt Fund
Each class of shares has equal rights as to assets and earnings, except that each class separately bears certain class-specific expenses related to maintenance of shareholder accounts (included in Management and Administrative expenses) and shareholder reporting. Marketing and distribution expenses are allocated to each class of shares based on a method approved by the board of trustees. Income, other non-class-specific expenses, and gains and losses on investments are allocated to each class of shares based on its relative net assets.
B. The Vanguard Group furnishes at cost investment advisory, corporate management, administrative, marketing, and distribution services. The costs of such services are allocated to the fund under methods approved by the board of trustees. The fund has committed to provide up to 0.40% of its net assets in capital contributions to Vanguard. At October 31, 2007, the fund had contributed capital of $1,357,000 to Vanguard (included in Other Assets), representing 0.01% of the fund’s net assets and 1.36% of Vanguard’s capitalization. The fund’s trustees and officers are also directors and officers of Vanguard.
C. The fund’s investment advisor may direct new issue purchases, subject to obtaining the best price and execution, to underwriters who have agreed to rebate or credit to the fund part of the underwriting fees generated. Such rebates or credits are used solely to reduce the fund’s management and administrative expenses. The fund’s custodian bank has also agreed to reduce its fees when the fund maintains cash on deposit in the non-interest-bearing custody account. For the year ended October 31, 2007, these arrangements reduced the fund’s management and administrative expenses by $323,000 and custodian fees by $19,000.
D. Capital gain distributions are determined on a tax basis and may differ from realized capital gains for financial reporting purposes. Differences may be permanent or temporary. Permanent differences are reclassified among capital accounts in the financial statements to reflect their tax character. Temporary differences arise when gains or losses are recognized in different periods for financial statement and tax purposes; these differences will reverse at some time in the future.
For tax purposes, at October 31, 2007, the fund had available realized losses of $77,154,000 to offset future net capital gains of $19,291,000 through October 31, 2011, $22,706,000 through October 31, 2013, $32,718,000 through October 31, 2014, and $2,439,000 through October 31, 2015.
The fund had realized losses totaling $30,751,000 through October 31, 2007, which are deferred for tax purposes and reduce the amount of tax-basis unrealized appreciation on investment securities.
At October 31, 2007, the cost of investment securities for tax purposes was $15,959,683,000. Net unrealized appreciation of investment securities for tax purposes was $150,256,000, consisting of unrealized gains of $218,207,000 on securities that had risen in value since their purchase and $67,951,000 in unrealized losses on securities that had fallen in value since their purchase.
E. During the year ended October 31, 2007, the fund purchased $3,411,395,000 of investment securities and sold $1,697,763,000 of investment securities, other than temporary cash investments.
45
Intermediate-Term Tax-Exempt Fund
F. Capital share transactions for each class of shares were:
| | | Year Ended October 31, |
| | 2007 | | 2006 |
| Amount | Shares | Amount | Shares |
| ($000) | (000) | ($000) | (000) |
Investor Shares | | | | |
Issued | 1,633,549 | 123,274 | 1,468,116 | 110,775 |
Issued in Lieu of Cash Distributions | 162,360 | 12,261 | 160,583 | 12,115 |
Redeemed | (1,771,636) | (133,823) | (1,515,496) | (114,402) |
Net Increase (Decrease)—Investor Shares | 24,273 | 1,712 | 113,203 | 8,488 |
Admiral Shares | | | | |
Issued | 3,514,276 | 265,378 | 2,638,973 | 199,137 |
Issued in Lieu of Cash Distributions | 321,955 | 24,326 | 261,192 | 19,704 |
Redeemed | (1,657,204) | (125,324) | (1,518,054) | (114,636) |
Net Increase (Decrease)—Admiral Shares | 2,179,027 | 164,380 | 1,382,111 | 104,205 |
G. In June 2006, the Financial Accounting Standards Board issued Interpretation No. 48 (“FIN 48”), “Accounting for Uncertainty in Income Taxes.” FIN 48 establishes the minimum threshold for recognizing, and a system for measuring, the benefits of tax-return positions in financial statements, and is effective for the fund’s fiscal year beginning November 1, 2007. Management has analyzed the fund’s tax positions taken on federal income tax returns for all open tax years (tax years ended October 31, 2004–2007) for purposes of implementing FIN 48, and has concluded that as of October 31, 2007, no provision for income tax would be required in the fund’s financial statements.
46
Insured Long-Term Tax-Exempt Fund
Fund Profile
As of October 31, 2007
Financial Attributes | | | |
| Comparative | Broad |
| Fund | Index1 | Index2 |
Number of Issues | 296 | 6,958 | 41,655 |
Yield | | — | — |
Investor Shares | 4.1% | | |
Admiral Shares | 4.2% | | |
Yield to Maturity | 4.2%3 | 4.0% | 4.1% |
Average Coupon | 4.4% | 5.0% | 5.0% |
Average Effective | | | |
Maturity | 8.8 years | 9.9 years | 13.4 years |
Average Quality | AAA | AAA | AA+ |
Average Duration | 6.5 years | 6.2 years | 7.1 years |
Expense Ratio | | — | — |
Investor Shares | 0.15% | | |
Admiral Shares | 0.08% | | |
Short-Term Reserves | 0% | — | — |
| | | | |
Largest State Concentrations4 | |
| |
California | 15.2% |
New Jersey | 9.1 |
Texas | 8.6 |
Florida | 7.4 |
New York | 5.7 |
Illinois | 5.6 |
Massachusetts | 5.2 |
Georgia | 4.7 |
Colorado | 4.3 |
Pennsylvania | 3.7 |
Top Ten | 69.5% |
Volatility Measures5 | |
| Fund Versus | Fund Versus |
| Comparative Index1 | Broad Index2 |
R-Squared | 0.94 | 0.98 |
Beta | 1.01 | 1.20 |
Distribution by Maturity (% of portfolio) | |
| |
Under 1 Year | 7.4% |
1–5 Years | 25.4 |
5–10 Years | 42.5 |
10–20 Years | 16.2 |
20–30 Years | 6.2 |
Over 30 Years | 2.3 |
Distribution by Credit Quality (% of portfolio) |
| |
AAA | 87.9% |
AA | 9.3 |
A | 2.8 |
Investment Focus
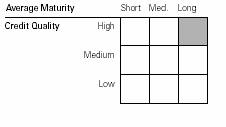
1 Lehman 10 Year Municipal Bond Index.
2 Lehman Municipal Bond Index.
3 Before expenses.
4 Percentages of total net assets, excluding any futures contracts.
5 For an explanation of R-squared, beta, and other terms used here, see the Glossary on page 81.
47
Insured Long-Term Tax-Exempt Fund
Performance Summary
All of the returns in this report represent past performance, which is not a guarantee of future results that may be achieved by the fund. (Current performance may be lower or higher than the performance data cited. For performance data current to the most recent month-end, visit our website at www.vanguard.com/performance.) Note, too, that both investment returns and principal value can fluctuate widely, so an investor’s shares, when sold, could be worth more or less than their original cost. The returns shown do not reflect taxes that a shareholder would pay on fund distributions or on the sale of fund shares.
Cumulative Performance: October 31, 1997–October 31, 2007
Initial Investment of $10,000
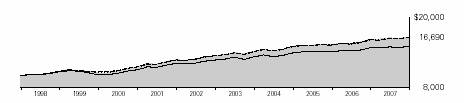
| | | |
| | | | |
| | Average Annual Total Returns | Final Value |
| | Periods Ended October 31, 2007 | of a $10,000 |
| One Year | Five Years | Ten Years | Investment |
Insured Long-Term Tax-Exempt Fund | | | | |
Investor Shares1 | 2.34% | 4.32% | 5.26% | $16,690 |
Lehman Municipal Bond Index | 2.91 | 4.46 | 5.29 | 16,751 |
Lehman 10 Year Municipal Bond Index | 3.19 | 4.31 | 5.28 | 16,732 |
Average Insured Municipal Fund2 | 1.63 | 3.44 | 4.20 | 15,088 |
| | | | | |
| | | | Final Value |
| | | Since | of a $100,000 |
| One Year | Five Years | Inception3 | Investment |
Insured Long-Term Tax-Exempt Fund Admiral Shares | 2.41% | 4.39% | 4.90% | $137,861 |
Lehman Municipal Bond Index | 2.91 | 4.46 | 5.00 | 138,749 |
Lehman 10 Year Municipal Bond Index | 3.19 | 4.31 | 4.90 | 137,922 |
1 Total returns do not include the account service fee that may be applicable to certain accounts with balances below $10,000.
2 Derived from data provided by Lipper Inc.
3 Performance for the Admiral Shares and comparative standards is calculated since the inception date for Admiral Shares: February 12, 2001.
48
Insured Long-Term Tax-Exempt Fund
Fiscal-Year Total Returns (%): October 31, 1997–October 31, 2007 | |
| | | | |
| | | Investor Shares | Lehman1 |
Fiscal | Capital | Income | Total | Total |
Year | Return | Return | Return | Return |
1998 | 2.4% | 5.5% | 7.9% | 8.3% |
1999 | –7.7 | 5.0 | –2.7 | –1.2 |
2000 | 3.8 | 5.9 | 9.7 | 8.2 |
2001 | 5.6 | 5.4 | 11.0 | 10.2 |
2002 | 0.9 | 4.8 | 5.7 | 6.2 |
2003 | 1.0 | 4.6 | 5.6 | 4.9 |
2004 | 1.0 | 4.8 | 5.8 | 6.3 |
2005 | –2.5 | 4.5 | 2.0 | 1.2 |
2006 | 1.3 | 4.7 | 6.0 | 6.0 |
2007 | –2.2 | 4.5 | 2.3 | 3.2 |
Average Annual Total Returns: Periods Ended September 30, 2007
This table presents average annual total returns through the latest calendar quarter—rather than through the end of the fiscal period. Securities and Exchange Commission rules require that we provide this information.
| | | | | | Ten Years |
| Inception Date | One Year | Five Years | Capital | Income | Total |
Investor Shares2 | 9/30/1984 | 2.58% | 3.83% | 0.29% | 4.96% | 5.25% |
Admiral Shares | 2/12/2001 | 2.65 | 3.90 | 0.133 | 4.783 | 4.913 |
1 Lehman 10 Year Municipal Bond Index.
2 Total returns do not include the account service fee that may be applicable to certain accounts with balances below $10,000.
3 Return since inception.
Note: See Financial Highlights tables on pages 52 and 53 for dividend and capital gains information.
49
Insured Long-Term Tax-Exempt Fund
Financial Statements
The Statement of Net Assets—an integral part of the Financial Statements for Vanguard Insured Long-Term Tax-Exempt Fund—is included as an insert to this report.
Statement of Operations
| Year Ended |
| October 31, 2007 |
| ($000) |
Investment Income | |
Income | |
Interest | 153,508 |
Total Income | 153,508 |
Expenses | |
The Vanguard Group—Note B | |
Investment Advisory Services | 269 |
Management and Administrative—Investor Shares | 1,038 |
Management and Administrative—Admiral Shares | 1,175 |
Marketing and Distribution—Investor Shares | 209 |
Marketing and Distribution—Admiral Shares | 370 |
Custodian Fees | 27 |
Auditing Fees | 23 |
Shareholders’ Reports—Investor Shares | 57 |
Shareholders’ Reports—Admiral Shares | 20 |
Trustees’ Fees and Expenses | 4 |
Total Expenses | 3,192 |
Expenses Paid Indirectly—Note C | (188) |
Net Expenses | 3,004 |
Net Investment Income | 150,504 |
Realized Net Gain (Loss) | |
Investment Securities Sold | 18,876 |
Futures Contracts | (16,251) |
Realized Net Gain (Loss) | 2,625 |
Change in Unrealized Appreciation (Depreciation) | |
Investment Securities | (75,935) |
Futures Contracts | 752 |
Change in Unrealized Appreciation (Depreciation) | (75,183) |
Net Increase (Decrease) in Net Assets Resulting from Operations | 77,946 |
50
Insured Long-Term Tax-Exempt Fund
Statement of Changes in Net Assets
| Year Ended October 31, |
| 2007 | 2006 |
| ($000) | ($000) |
Increase (Decrease) in Net Assets | | |
Operations | | |
Net Investment Income | 150,504 | 143,632 |
Realized Net Gain (Loss) | 2,625 | 8,742 |
Change in Unrealized Appreciation (Depreciation) | (75,183) | 29,356 |
Net Increase (Decrease) in Net Assets Resulting from Operations | 77,946 | 181,730 |
Distributions | | |
Net Investment Income | | |
Investor Shares | (42,731) | (45,367) |
Admiral Shares | (107,773) | (98,265) |
Realized Capital Gain1 | | |
Investor Shares | (1,448) | (3,009) |
Admiral Shares | (3,467) | (5,940) |
Total Distributions | (155,419) | (152,581) |
Capital Share Transactions—Note F | | |
Investor Shares | 13,178 | (95,518) |
Admiral Shares | 265,817 | 223,730 |
Net Increase (Decrease) from Capital Share Transactions | 278,995 | 128,212 |
Total Increase (Decrease) | 201,522 | 157,361 |
Net Assets | | |
Beginning of Period | 3,187,674 | 3,030,313 |
End of Period | 3,389,196 | 3,187,674 |
1 Includes fiscal 2007 and 2006 short-term gain distributions totaling $3,471,000 and $2,069,000, respectively. Short-term gain distributions are treated as ordinary income dividends for tax purposes.
51
Insured Long-Term Tax-Exempt Fund
Financial Highlights
Investor Shares | | | | | |
| | | | | |
| | | | | |
| | | Year Ended October 31, |
For a Share Outstanding Throughout Each Period | 2007 | 2006 | 2005 | 2004 | 2003 |
Net Asset Value, Beginning of Period | $12.68 | $12.56 | $12.90 | $12.89 | $12.85 |
Investment Operations | | | | | |
Net Investment Income | .569 | .577 | .578 | .587 | .580 |
Net Realized and Unrealized Gain (Loss) | | | | | |
on Investments | (.281) | .157 | (.321) | .134 | .123 |
Total from Investment Operations | .288 | .734 | .257 | .721 | .703 |
Distributions | | | | | |
Dividends from Net Investment Income | (.569) | (.577) | (.578) | (.587) | (.580) |
Distributions from Realized Capital Gains | (.019) | (.037) | (.019) | (.124) | (.083) |
Total Distributions | (.588) | (.614) | (.597) | (.711) | (.663) |
Net Asset Value, End of Period | $12.38 | $12.68 | $12.56 | $12.90 | $12.89 |
| | | | | |
| | | | | |
Total Return1 | 2.34% | 6.00% | 2.01% | 5.76% | 5.58% |
| | | | | |
| | | | | |
Ratios/Supplemental Data | | | | | |
Net Assets, End of Period (Millions) | $947 | $956 | $1,043 | $1,880 | $1,912 |
Ratio of Total Expenses to | | | | | |
Average Net Assets | 0.15% | 0.16% | 0.16% | 0.15% | 0.17% |
Ratio of Net Investment Income to | | | | | |
Average Net Assets | 4.55% | 4.60% | 4.52% | 4.50% | 4.57% |
Portfolio Turnover Rate | 34% | 19% | 15% | 18% | 17% |
| | | | | | |
1 Total returns do not include the account service fee that may be applicable to certain accounts with balances below $10,000.
52
Insured Long-Term Tax-Exempt Fund
Admiral Shares | | | | | |
| | | | | |
| | | | | |
| | | Year Ended October 31, |
For a Share Outstanding Throughout Each Period | 2007 | 2006 | 2005 | 2004 | 2003 |
Net Asset Value, Beginning of Period | $12.68 | $12.56 | $12.90 | $12.89 | $12.85 |
Investment Operations | | | | | |
Net Investment Income | .578 | .586 | .587 | .594 | .587 |
Net Realized and Unrealized Gain (Loss) | | | | | |
on Investments | (.281) | .157 | (.321) | .134 | .123 |
Total from Investment Operations | .297 | .743 | .266 | .728 | .710 |
Distributions | | | | | |
Dividends from Net Investment Income | (.578) | (.586) | (.587) | (.594) | (.587) |
Distributions from Realized Capital Gains | (.019) | (.037) | (.019) | (.124) | (.083) |
Total Distributions | (.597) | (.623) | (.606) | (.718) | (.670) |
Net Asset Value, End of Period | $12.38 | $12.68 | $12.56 | $12.90 | $12.89 |
| | | | | |
| | | | | |
Total Return | 2.41% | 6.08% | 2.08% | 5.82% | 5.64% |
| | | | | |
| | | | | |
Ratios/Supplemental Data | | | | | |
Net Assets, End of Period (Millions) | $2,442 | $2,232 | $1,987 | $1,076 | $1,008 |
Ratio of Total Expenses to | | | | | |
Average Net Assets | 0.08% | 0.09% | 0.09% | 0.09% | 0.11% |
Ratio of Net Investment Income to | | | | | |
Average Net Assets | 4.62% | 4.67% | 4.58% | 4.56% | 4.63% |
Portfolio Turnover Rate | 34% | 19% | 15% | 18% | 17% |
| | | | | | | |
See accompanying Notes, which are an integral part of the Financial Statements.
53
Insured Long-Term Tax-Exempt Fund
Notes to Financial Statements
Vanguard Insured Long-Term Tax-Exempt Fund is registered under the Investment Company Act of 1940 as an open-end investment company, or mutual fund. The fund invests in debt instruments of many municipal issuers; the issuers’ abilities to meet their obligations may be affected by economic and political developments in a specific state or region. The fund offers two classes of shares, Investor Shares and Admiral Shares. Investor Shares are available to any investor who meets the fund’s minimum purchase requirements. Admiral Shares are designed for investors who meet certain administrative, service, tenure, and account-size criteria.
A. The following significant accounting policies conform to generally accepted accounting principles for U.S. mutual funds. The fund consistently follows such policies in preparing its financial statements.
1. Security Valuation: Bonds, and temporary cash investments acquired over 60 days to maturity, are valued using the latest bid prices or using valuations based on a matrix system (which considers such factors as security prices, yields, maturities, and ratings), both as furnished by independent pricing services. Other temporary cash investments are valued at amortized cost, which approximates market value. Securities for which market quotations are not readily available, or whose values have been materially affected by events occurring before the fund’s pricing time but after the close of the securities’ primary markets, are valued by methods deemed by the board of trustees to represent fair value.
2. Futures Contracts: The fund uses futures contracts to invest in fixed income asset classes with greater efficiency and lower cost than is possible through direct investment, to add value when these instruments are attractively priced, or to adjust sensitivity to changes in interest rates. The primary risks associated with the use of futures contracts are imperfect correlation between changes in market values of bonds held by the fund and the prices of futures contracts, and the possibility of an illiquid market.
Futures contracts are valued based upon their quoted daily settlement prices. The aggregate principal amounts of the contracts are not recorded in the Statement of Net Assets. Fluctuations in the value of the contracts are recorded in the Statement of Net Assets as an asset (liability) and in the Statement of Operations as unrealized appreciation (depreciation) until the contracts are closed, when they are recorded as realized futures gains (losses).
3. Federal Income Taxes: The fund intends to continue to qualify as a regulated investment company and distribute all of its income. Accordingly, no provision for federal income taxes is required in the financial statements.
4. Distributions: Distributions from net investment income are declared daily and paid on the first business day of the following month. Annual distributions from realized capital gains, if any, are recorded on the ex-dividend date.
5. Other: Interest income is accrued daily. Premiums and discounts on debt securities purchased are amortized and accreted, respectively, to interest income over the lives of the respective securities. Security transactions are accounted for on the date securities are bought or sold. Costs used to determine realized gains (losses) on the sale of investment securities are those of the specific securities sold.
Each class of shares has equal rights as to assets and earnings, except that each class separately bears certain class-specific expenses related to maintenance of shareholder accounts (included in Management and Administrative expenses) and shareholder reporting. Marketing and distribution expenses are allocated to each class of shares based on a method approved by the board of trustees. Income, other non-class-specific expenses, and gains and losses on investments are allocated to each class of shares based on its relative net assets.
54
Insured Long-Term Tax-Exempt Fund
B. The Vanguard Group furnishes at cost investment advisory, corporate management, administrative, marketing, and distribution services. The costs of such services are allocated to the fund under methods approved by the board of trustees. The fund has committed to provide up to 0.40% of its net assets in capital contributions to Vanguard. At October 31, 2007, the fund had contributed capital of $283,000 to Vanguard (included in Other Assets), representing 0.01% of the fund’s net assets and 0.29% of Vanguard’s capitalization. The fund’s trustees and officers are also directors and officers of Vanguard.
C. The fund’s investment advisor may direct new issue purchases, subject to obtaining the best price and execution, to underwriters who have agreed to rebate or credit to the fund part of the underwriting fees generated. Such rebates or credits are used solely to reduce the fund’s management and administrative expenses. The fund’s custodian bank has also agreed to reduce its fees when the fund maintains cash on deposit in the non-interest-bearing custody account. For the year ended October 31, 2007, these arrangements reduced the fund’s management and administrative expenses by $184,000 and custodian fees by $4,000. The total expense reduction represented an effective annual rate of 0.01% of the fund’s average net assets.
D. Capital gain distributions are determined on a tax basis and may differ from realized capital gains for financial reporting purposes. Differences may be permanent or temporary. Permanent differences are reclassified among capital accounts in the financial statements to reflect their tax character. Temporary differences arise when gains or losses are recognized in different periods for financial statement and tax purposes; these differences will reverse at some time in the future.
The fund used a tax accounting practice to treat a portion of the price of capital shares redeemed during the year as distributions from realized capital gains. Accordingly, the fund has reclassified $977,000 from accumulated net realized gains to paid-in capital. For tax purposes, at October 31, 2007, the fund had no capital gains available for distribution.
The fund had realized losses totaling $21,283,000 through October 31, 2007, which are deferred for tax purposes and reduce the amount of unrealized appreciation on investment securities for tax purposes.
At October 31, 2007, the cost of investment securities for tax purposes was $3,260,283,000. Net unrealized appreciation of investment securities for tax purposes was $106,286,000, consisting of unrealized gains of $118,073,000 on securities that had risen in value since their purchase and $11,787,000 in unrealized losses on securities that had fallen in value since their purchase.
At October 31, 2007, the aggregate settlement value of open futures contracts expiring in December 2007 and the related unrealized appreciation (depreciation) were:
| | | ($000) |
| Number of | Aggregate | Unrealized |
| Long (Short) | Settlement | Appreciation |
Futures Contracts | Contracts | Value | (Depreciation) |
30-Year U.S. Treasury Bond | (840) | 94,579 | (773) |
Unrealized appreciation (depreciation) on open futures contracts is required to be treated as realized gain (loss) for tax purposes.
55
Insured Long-Term Tax-Exempt Fund
E. During the year ended October 31, 2007, the fund purchased $1,269,289,000 of investment securities and sold $1,060,782,000 of investment securities, other than temporary cash investments.
F. Capital share transactions for each class of shares were:
| | | Year Ended October 31, |
| | 2007 | | 2006 |
| Amount | Shares | Amount | Shares |
| ($000) | (000) | ($000) | (000) |
Investor Shares | | | | |
Issued | 217,636 | 17,436 | 148,919 | 11,865 |
Issued in Lieu of Cash Distributions | 32,379 | 2,592 | 34,523 | 2,749 |
Redeemed | (236,837) | (18,954) | (278,960) | (22,246) |
Net Increase (Decrease)—Investor Shares | 13,178 | 1,074 | (95,518) | (7,632) |
Admiral Shares | | | | |
Issued | 526,842 | 42,330 | 423,044 | 33,700 |
Issued in Lieu of Cash Distributions | 72,061 | 5,769 | 67,671 | 5,389 |
Redeemed | (333,086) | (26,789) | (266,985) | (21,297) |
Net Increase (Decrease)—Admiral Shares | 265,817 | 21,310 | 223,730 | 17,792 |
G. In June 2006, the Financial Accounting Standards Board issued Interpretation No. 48 (“FIN 48”), “Accounting for Uncertainty in Income Taxes.” FIN 48 establishes the minimum threshold for recognizing, and a system for measuring, the benefits of tax-return positions in financial statements, and is effective for the fund’s fiscal year beginning November 1, 2007. Management has analyzed the fund’s tax positions taken on federal income tax returns for all open tax years (tax years ended October 31, 2004–2007) for purposes of implementing FIN 48, and has concluded that as of October 31, 2007, no provision for income tax would be required in the fund’s financial statements.
56
Long-Term Tax-Exempt Fund
Fund Profile
As of October 31, 2007
Financial Attributes | | | |
| Comparative | Broad |
| Fund | Index1 | Index2 |
Number of Issues | 258 | 6,958 | 41,655 |
Yield | | — | — |
Investor Shares | 4.1% | | |
Admiral Shares | 4.1% | | |
Yield to Maturity | 4.0%3 | 4.0% | 4.1% |
Average Coupon | 4.6% | 5.0% | 5.0% |
Average Effective | | | |
Maturity | 8.9 years | 9.9 years | 13.4 years |
Average Quality | AA+ | AAA | AA+ |
Average Duration | 6.4 years | 6.2 years | 7.1 years |
Expense Ratio | | — | — |
Investor Shares | 0.15% | | |
Admiral Shares | 0.08% | | |
Short-Term Reserves | 7.4% | — | — |
| | | | |
Largest State Concentrations4 | |
| |
Texas | 10.7% |
California | 9.1 |
Massachusetts | 8.6 |
New York | 7.2 |
Florida | 4.7 |
Illinois | 4.5 |
Georgia | 4.2 |
New Jersey | 4.1 |
Michigan | 3.6 |
Louisiana | 3.4 |
Top Ten | 60.1% |
Volatility Measures5 | |
| Fund Versus | Fund Versus |
| Comparative Index1 | Broad Index2 |
R-Squared | 0.95 | 0.98 |
Beta | 1.00 | 1.17 |
Distribution by Maturity (% of portfolio) | |
| |
Under 1 Year | 10.4% |
1–5 Years | 24.8 |
5–10 Years | 37.4 |
10–20 Years | 16.6 |
20–30 Years | 9.1 |
Over 30 Years | 1.7 |
Distribution by Credit Quality (% of portfolio) |
| |
AAA | 69.1% |
AA | 16.9 |
A | 8.4 |
BBB | 5.4 |
Other | 0.2 |
Investment Focus
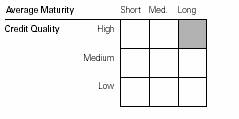
1 | Lehman 10 Year Municipal Bond Index. |
2 | Lehman Municipal Bond Index. |
4 | Percentages of net assets, excluding any futures contracts. |
5 | For an explanation of R-squared, beta, and other terms used here, see the Glossary on page 81. |
57
Long-Term Tax-Exempt Fund
Performance Summary
All of the returns in this report represent past performance, which is not a guarantee of future results that may be achieved by the fund. (Current performance may be lower or higher than the performance data cited. For performance data current to the most recent month-end, visit our website at www.vanguard.com/performance.) Note, too, that both investment returns and principal value can fluctuate widely, so an investor’s shares, when sold, could be worth more or less than their original cost. The returns shown do not reflect taxes that a shareholder would pay on fund distributions or on the sale of fund shares.
Cumulative Performance: October 31, 1997–October 31, 2007
Initial Investment of $10,000
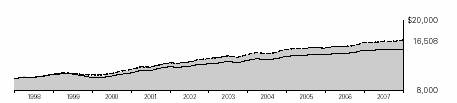
| | | |
| | | | |
| Average Annual Total Returns | Final Value |
| Periods Ended October 31, 2007 | of a $10,000 |
| One Year | Five Years | Ten Years | Investment |
Long-Term Tax-Exempt Fund Investor Shares1 | 2.37% | 4.33% | 5.14% | $16,508 |
Lehman Municipal Bond Index | 2.91 | 4.46 | 5.29 | 16,751 |
Lehman 10 Year Municipal Bond Index | 3.19 | 4.31 | 5.28 | 16,732 |
Average General Municipal Fund2 | 1.47 | 3.75 | 4.23 | 15,131 |
| | | | | | |
| | | | Final Value |
| | | Since | of a $100,000 |
| One Year | Five Years | Inception3 | Investment |
Long-Term Tax-Exempt Fund Admiral Shares | 2.44% | 4.40% | 4.86% | $137,506 |
Lehman Municipal Bond Index | 2.91 | 4.46 | 5.02 | 138,913 |
Lehman 10 Year Municipal Bond Index | 3.19 | 4.31 | 4.90 | 137,922 |
1 Total returns do not include the account service fee that may be applicable to certain accounts with balances below $10,000.
2 Derived from data provided by Lipper Inc.
3 Performance for the Admiral Shares and comparative standards is calculated since the inception date for Admiral Shares: February 12, 2001.
58
Long-Term Tax-Exempt Fund
Fiscal-Year Total Returns (%): October 31, 1997–October 31, 2007 | |
| | | | |
| | | Investor Shares | Lehman1 |
Fiscal | Capital | Income | Total | Total |
Year | Return | Return | Return | Return |
1998 | 2.4% | 5.4% | 7.8% | 8.3% |
1999 | –8.3 | 4.8 | –3.5 | –1.2 |
2000 | 3.8 | 5.8 | 9.6 | 8.2 |
2001 | 6.1 | 5.4 | 11.5 | 10.2 |
2002 | 0.1 | 4.9 | 5.0 | 6.2 |
2003 | 0.7 | 4.7 | 5.4 | 4.9 |
2004 | 1.4 | 4.7 | 6.1 | 6.3 |
2005 | –2.8 | 4.5 | 1.7 | 1.2 |
2006 | 1.4 | 4.7 | 6.1 | 6.0 |
2007 | –2.2 | 4.6 | 2.4 | 3.2 |
Average Annual Total Returns: Periods Ended September 30, 2007
This table presents average annual total returns through the latest calendar quarter—rather than through the end of the fiscal period. Securities and Exchange Commission rules require that we provide this information.
| | | | | | Ten Years |
| Inception Date | One Year | Five Years | Capital | Income | Total |
Investor Shares2 | 9/1/1977 | 2.54% | 3.67% | 0.17% | 4.97% | 5.14% |
Admiral Shares | 2/12/2001 | 2.62 | 3.74 | 0.033 | 4.813 | 4.843 |
1 Lehman 10 Year Municipal Bond Index.
2 Total returns do not include the account service fee that may be applicable to certain accounts with balances below $10,000.
3 Return since inception.
Note: See Financial Highlights tables on pages 62 and 63 for dividend and capital gains information.
59
Long-Term Tax-Exempt Fund
Financial Statements
The Statement of Net Assets—an integral part of the Financial Statements for Vanguard Long-Term Tax-Exempt Fund—is included as an insert to this report.
Statement of Operations
| Year Ended |
| October 31, 2007 |
| ($000) |
Investment Income | |
Income | |
Interest1 | 116,609 |
Total Income | 116,609 |
Expenses | |
The Vanguard Group—Note B | |
Investment Advisory Services | 202 |
Management and Administrative—Investor Shares | 694 |
Management and Administrative—Admiral Shares | 812 |
Marketing and Distribution—Investor Shares | 167 |
Marketing and Distribution—Admiral Shares | 419 |
Custodian Fees | 18 |
Auditing Fees | 22 |
Shareholders’ Reports—Investor Shares | 39 |
Shareholders’ Reports—Admiral Shares | 13 |
Trustees’ Fees and Expenses | 3 |
Total Expenses | 2,389 |
Expenses Paid Indirectly—Note C | (64) |
Net Expenses | 2,325 |
Net Investment Income | 114,284 |
Realized Net Gain (Loss) | |
Investment Securities Sold | 6,973 |
Futures Contracts | (3,364) |
Realized Net Gain (Loss) | 3,609 |
Change in Unrealized Appreciation (Depreciation) | |
Investment Securities | (57,920) |
Futures Contracts | (569) |
Change in Unrealized Appreciation (Depreciation) | (58,489) |
Net Increase (Decrease) in Net Assets Resulting from Operations | 59,404 |
1 Interest income from an affiliated company of the fund was $6,211,000.
60
Long-Term Tax-Exempt Fund
Statement of Changes in Net Assets
| Year Ended October 31, |
| 2007 | 2006 |
| ($000) | ($000) |
Increase (Decrease) in Net Assets | | |
Operations | | |
Net Investment Income | 114,284 | 101,253 |
Realized Net Gain (Loss) | 3,609 | 3,151 |
Change in Unrealized Appreciation (Depreciation) | (58,489) | 27,501 |
Net Increase (Decrease) in Net Assets Resulting from Operations | 59,404 | 131,905 |
Distributions | | |
Net Investment Income | | |
Investor Shares | (29,420) | (29,070) |
Admiral Shares | (84,864) | (72,183) |
Realized Capital Gain | | |
Investor Shares | — | (2,445) |
Admiral Shares | — | (5,569) |
Total Distributions | (114,284) | (109,267) |
Capital Share Transactions—Note F | | |
Investor Shares | 27,242 | (4,778) |
Admiral Shares | 315,533 | 279,942 |
Net Increase (Decrease) from Capital Share Transactions | 342,775 | 275,164 |
Total Increase (Decrease) | 287,895 | 297,802 |
Net Assets | | |
Beginning of Period | 2,327,038 | 2,029,236 |
End of Period | 2,614,933 | 2,327,038 |
61
Long-Term Tax-Exempt Fund
Financial Highlights
Investor Shares | | | | | |
| | | | | |
| | | | | |
| | | Year Ended October 31, |
For a Share Outstanding Throughout Each Period | 2007 | 2006 | 2005 | 2004 | 2003 |
Net Asset Value, Beginning of Period | $11.34 | $11.23 | $11.55 | $11.39 | $11.36 |
Investment Operations | | | | | |
Net Investment Income | .512 | .516 | .513 | .522 | .525 |
Net Realized and Unrealized Gain (Loss) | | | | | |
on Investments | (.250) | .153 | (.320) | .160 | .082 |
Total from Investment Operations | .262 | .669 | .193 | .682 | .607 |
Distributions | | | | | |
Dividends from Net Investment Income | (.512) | (.516) | (.513) | (.522) | (.525) |
Distributions from Realized Capital Gains | — | (.043) | — | — | (.052) |
Total Distributions | (.512) | (.559) | (.513) | (.522) | (.577) |
Net Asset Value, End of Period | $11.09 | $11.34 | $11.23 | $11.55 | $11.39 |
| | | | | |
| | | | | |
Total Return1 | 2.37% | 6.14% | 1.69% | 6.14% | 5.43% |
| | | | | |
| | | | | |
Ratios/Supplemental Data | | | | | |
Net Assets, End of Period (Millions) | $653 | $641 | $640 | $1,122 | $1,131 |
Ratio of Total Expenses to | | | | | |
Average Net Assets | 0.15% | 0.16% | 0.16% | 0.15% | 0.17% |
Ratio of Net Investment Income to | | | | | |
Average Net Assets | 4.57% | 4.61% | 4.49% | 4.57% | 4.59% |
Portfolio Turnover Rate | 13% | 8% | 17% | 11% | 11% |
| | | | | | |
1 Total returns do not include the account service fee that may be applicable to certain accounts with balances below $10,000.
62
Long-Term Tax-Exempt Fund
Admiral Shares | | | | | |
| | | | | |
| | | | | |
| | | Year Ended October 31, |
For a Share Outstanding Throughout Each Period | 2007 | 2006 | 2005 | 2004 | 2003 |
Net Asset Value, Beginning of Period | $11.34 | $11.23 | $11.55 | $11.39 | $11.36 |
Investment Operations | | | | | |
Net Investment Income | .520 | .524 | .521 | .528 | .532 |
Net Realized and Unrealized Gain (Loss) | | | | | |
on Investments | (.250) | .153 | (.320) | .160 | .082 |
Total from Investment Operations | .270 | .677 | .201 | .688 | .614 |
Distributions | | | | | |
Dividends from Net Investment Income | (.520) | (.524) | (.521) | (.528) | (.532) |
Distributions from Realized Capital Gains | — | (.043) | — | — | (.052) |
Total Distributions | (.520) | (.567) | (.521) | (.528) | (.584) |
Net Asset Value, End of Period | $11.09 | $11.34 | $11.23 | $11.55 | $11.39 |
| | | | | |
| | | | | |
Total Return | 2.44% | 6.22% | 1.76% | 6.19% | 5.50% |
| | | | | |
| | | | | |
Ratios/Supplemental Data | | | | | |
Net Assets, End of Period (Millions) | $1,962 | $1,686 | $1,390 | $823 | $799 |
Ratio of Total Expenses to | | | | | |
Average Net Assets | 0.08% | 0.09% | 0.09% | 0.09% | 0.11% |
Ratio of Net Investment Income to | | | | | |
Average Net Assets | 4.64% | 4.68% | 4.55% | 4.62% | 4.65% |
Portfolio Turnover Rate | 13% | 8% | 17% | 11% | 11% |
See accompanying Notes, which are an integral part of the Financial Statements.
63
Long-Term Tax-Exempt Fund
Notes to Financial Statements
Vanguard Long-Term Tax-Exempt Fund is registered under the Investment Company Act of 1940 as an open-end investment company, or mutual fund. The fund invests in debt instruments of many municipal issuers; the issuers’ abilities to meet their obligations may be affected by economic and political developments in a specific state or region. The fund offers two classes of shares, Investor Shares and Admiral Shares. Investor Shares are available to any investor who meets the fund’s minimum purchase requirements. Admiral Shares are designed for investors who meet certain administrative, service, tenure, and account-size criteria.
A. The following significant accounting policies conform to generally accepted accounting principles for U.S. mutual funds. The fund consistently follows such policies in preparing its financial statements.
1. Security Valuation: Bonds, and temporary cash investments acquired over 60 days to maturity, are valued using the latest bid prices or using valuations based on a matrix system (which considers such factors as security prices, yields, maturities, and ratings), both as furnished by independent pricing services. Investments in Vanguard Municipal Cash Management Fund are valued at that fund’s net asset value. Other temporary cash investments are valued at amortized cost, which approximates market value. Securities for which market quotations are not readily available, or whose values have been materially affected by events occurring before the fund’s pricing time but after the close of the securities’ primary markets, are valued by methods deemed by the board of trustees to represent fair value.
2. Futures Contracts: The fund uses futures contracts to invest in fixed income asset classes with greater efficiency and lower cost than is possible through direct investment, to add value when these instruments are attractively priced, or to adjust sensitivity to changes in interest rates. The primary risks associated with the use of futures contracts are imperfect correlation between changes in market values of bonds held by the fund and the prices of futures contracts, and the possibility of an illiquid market.
Futures contracts are valued based upon their quoted daily settlement prices. The aggregate principal amounts of the contracts are not recorded in the Statement of Net Assets. Fluctuations in the value of the contracts are recorded in the Statement of Net Assets as an asset (liability) and in the Statement of Operations as unrealized appreciation (depreciation) until the contracts are closed, when they are recorded as realized futures gains (losses).
3. Federal Income Taxes: The fund intends to continue to qualify as a regulated investment company and distribute all of its income. Accordingly, no provision for federal income taxes is required in the financial statements.
4. Distributions: Distributions from net investment income are declared daily and paid on the first business day of the following month. Annual distributions from realized capital gains, if any, are recorded on the ex-dividend date.
5. Other: Interest income includes income distributions received from Vanguard Municipal Cash Management Fund and is accrued daily. Premiums and discounts on debt securities purchased are amortized and accreted, respectively, to interest income over the lives of the respective securities. Security transactions are accounted for on the date securities are bought or sold. Costs used to determine realized gains (losses) on the sale of investment securities are those of the specific securities sold.
Each class of shares has equal rights as to assets and earnings, except that each class separately bears certain class-specific expenses related to maintenance of shareholder accounts (included in Management and Administrative expenses) and shareholder reporting. Marketing and distribution
64
Long-Term Tax-Exempt Fund
expenses are allocated to each class of shares based on a method approved by the board of trustees. Income, other non-class-specific expenses, and gains and losses on investments are allocated to each class of shares based on its relative net assets.
B. The Vanguard Group furnishes at cost investment advisory, corporate management, administrative, marketing, and distribution services. The costs of such services are allocated to the fund under methods approved by the board of trustees. The fund has committed to provide up to 0.40% of its net assets in capital contributions to Vanguard. At October 31, 2007, the fund had contributed capital of $218,000 to Vanguard (included in Other Assets), representing 0.01% of the fund’s net assets and 0.22% of Vanguard’s capitalization. The fund’s trustees and officers are also directors and officers of Vanguard.
C. The fund’s investment advisor may direct new issue purchases, subject to obtaining the best price and execution, to underwriters who have agreed to rebate or credit to the fund part of the underwriting fees generated. Such rebates or credits are used solely to reduce the fund’s management and administrative expenses. The fund’s custodian bank has also agreed to reduce its fees when the fund maintains cash on deposit in the non-interest-bearing custody account. For the year ended October 31, 2007, these arrangements reduced the fund’s management and administrative expenses by $63,000 and custodian fees by $1,000.
D. Capital gain distributions are determined on a tax basis and may differ from realized capital gains for financial reporting purposes. Differences may be permanent or temporary. Permanent differences are reclassified among capital accounts in the financial statements to reflect their tax character. Temporary differences arise when gains or losses are recognized in different periods for financial statement and tax purposes; these differences will reverse at some time in the future.
The fund used a tax accounting practice to treat a portion of the price of capital shares redeemed during the year as distributions from realized capital gains. Accordingly, the fund has reclassified $47,000 from accumulated net realized gains to paid-in capital.
The fund used a capital loss carryforward of $433,000 to offset taxable capital gains realized during the year ended October 31, 2007, reducing the amount of capital gains that would otherwise be available to distribute to shareholders. For tax purposes, at October 31, 2007, the fund had no capital gains available for distribution.
The fund had realized losses totaling $14,957,000 through October 31, 2007, which are deferred for tax purposes and reduce the amount of tax-basis unrealized appreciation on investment securities.
At October 31, 2007, the cost of investment securities for tax purposes was $2,504,346,000. Net unrealized appreciation of investment securities for tax purposes was $72,936,000, consisting of unrealized gains of $89,339,000 on securities that had risen in value since their purchase and $16,403,000 in unrealized losses on securities that had fallen in value since their purchase.
At October 31, 2007, the aggregate settlement value of open futures contracts expiring in December 2007 and the related unrealized appreciation (depreciation) were:
| | | ($000) |
| Number of | Aggregate | Unrealized |
| Long (Short) | Settlement | Appreciation |
Futures Contracts | Contracts | Value | (Depreciation) |
30-Year U.S. Treasury Bond | (310) | 34,904 | (569) |
65
Long-Term Tax-Exempt Fund
Unrealized appreciation (depreciation) on open futures contracts is required to be treated as realized gain (loss) for tax purposes.
E. During the year ended October 31, 2007, the fund purchased $596,511,000 of investment securities and sold $300,761,000 of investment securities, other than temporary cash investments.
F. Capital share transactions for each class of shares were:
| | | Year Ended October 31, |
| | 2007 | | 2006 |
| Amount | Shares | Amount | Shares |
| ($000) | (000) | ($000) | (000) |
Investor Shares | | | | |
Issued | 189,806 | 16,979 | 150,887 | 13,462 |
Issued in Lieu of Cash Distributions | 22,529 | 2,015 | 23,779 | 2,121 |
Redeemed | (185,093) | (16,577) | (179,444) | (16,024) |
Net Increase (Decrease)—Investor Shares | 27,242 | 2,417 | (4,778) | (441) |
Admiral Shares | | | | |
Issued | 597,314 | 53,513 | 478,388 | 42,678 |
Issued in Lieu of Cash Distributions | 58,823 | 5,263 | 51,595 | 4,604 |
Redeemed | (340,604) | (30,529) | (250,041) | (22,369) |
Net Increase (Decrease)—Admiral Shares | 315,533 | 28,247 | 279,942 | 24,913 |
G. In June 2006, the Financial Accounting Standards Board issued Interpretation No. 48 (“FIN 48”), “Accounting for Uncertainty in Income Taxes.” FIN 48 establishes the minimum threshold for recognizing, and a system for measuring, the benefits of tax-return positions in financial statements, and is effective for the fund’s fiscal year beginning November 1, 2007. Management has analyzed the fund’s tax positions taken on federal income tax returns for all open tax years (tax years ended October 31, 2004–2007) for purposes of implementing FIN 48, and has concluded that as of October 31, 2007, no provision for income tax would be required in the fund’s financial statements.
66
High-Yield Tax-Exempt Fund
Fund Profile
As of October 31, 2007
Financial Attributes | | | |
| Comparative | Broad |
| Fund | Index1 | Index2 |
Number of Issues | 536 | 6,958 | 41,655 |
Yield | | — | — |
Investor Shares | 4.3% | | |
Admiral Shares | 4.4% | | |
Yield to Maturity | 4.5%3 | 4.0% | 4.1% |
Average Coupon | 4.6% | 5.0% | 5.0% |
Average Effective | | | |
Maturity | 9.0 years | 9.9 years | 13.4 years |
Average Quality | A | AAA | AA+ |
Average Duration | 6.4 years | 6.2 years | 7.1 years |
Expense Ratio | | — | — |
Investor Shares | 0.15% | | |
Admiral Shares | 0.08% | | |
Short-Term Reserves | 1.9% | — | — |
| | | | |
Largest State Concentrations4 | |
| |
California | 12.1% |
New York | 7.4 |
New Jersey | 6.6 |
Florida | 5.5 |
Texas | 5.3 |
Tennessee | 4.2 |
Colorado | 3.7 |
Puerto Rico | 3.3 |
South Carolina | 3.3 |
North Carolina | 3.1 |
Top Ten | 54.5% |
Volatility Measures5 | |
| Fund Versus | Fund Versus |
| Comparative Index1 | Broad Index2 |
R-Squared | 0.87 | 0.96 |
Beta | 0.85 | 1.04 |
Distribution by Maturity (% of portfolio) | |
| |
Under 1 Year | 9.2% |
1–5 Years | 23.0 |
5–10 Years | 44.6 |
10–20 Years | 12.0 |
20–30 Years | 8.3 |
Over 30 Years | 2.9 |
Distribution by Credit Quality (% of portfolio) |
| |
AAA | 33.2% |
AA | 22.0 |
A | 19.5 |
BBB | 16.4 |
BB | 0.3 |
B | 2.0 |
Below B/Other | 6.6 |
Investment Focus
1 | Lehman 10 Year Municipal Bond Index. |
2 | Lehman Municipal Bond Index. |
4 | Percentages of total net assets, excluding any futures contracts. |
5 | For an explanation of R-squared, beta, and other terms used here, see the Glossary on page 81. |
67
High-Yield Tax-Exempt Fund
Performance Summary
All of the returns in this report represent past performance, which is not a guarantee of future results that may be achieved by the fund. (Current performance may be lower or higher than the performance data cited. For performance data current to the most recent month-end, visit our website at www.vanguard.com/performance.) Note, too, that both investment returns and principal value can fluctuate widely, so an investor’s shares, when sold, could be worth more or less than their original cost. The returns shown do not reflect taxes that a shareholder would pay on fund distributions or on the sale of fund shares.
Cumulative Performance: October 31, 1997–October 31, 2007
Initial Investment of $10,000
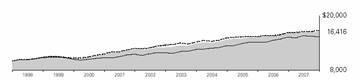
| | | |
| | | | |
| Average Annual Total Returns | Final Value |
| Periods Ended October 31, 2007 | of a $10,000 |
| One Year | Five Years | Ten Years | Investment |
High-Yield Tax-Exempt Fund Investor Shares1 | 1.94% | 4.93% | 5.08% | $16,416 |
Lehman Municipal Bond Index | 2.91 | 4.46 | 5.29 | 16,751 |
Lehman 10 Year Municipal Bond Index | 3.19 | 4.31 | 5.28 | 16,732 |
Average High Yield Municipal Fund2 | 0.20 | 5.34 | 4.34 | 15,296 |
| | | | | | |
| | | | Final Value |
| | | Since | of a $100,000 |
| One Year | Five Years | Inception3 | Investment |
High-Yield Tax-Exempt Fund Admiral Shares | 2.01% | 5.00% | 4.69% | $131,432 |
Lehman Municipal Bond Index | 2.91 | 4.46 | 4.63 | 131,039 |
Lehman 10 Year Municipal Bond Index | 3.19 | 4.31 | 4.64 | 131,050 |
1 Total returns do not include the account service fee that may be applicable to certain accounts with balances below $10,000.
2 Derived from data provided by Lipper Inc.
3 Performance for the Admiral Shares and comparative standards is calculated since the inception date for Admiral Shares: November 12, 2001.
68
High-Yield Tax-Exempt Fund
Fiscal-Year Total Returns (%): October 31, 1997–October 31, 2007 | | |
| | | | |
| | Investor Shares | Lehman1 |
Fiscal | Capital | Income | Total | Total |
Year | Return | Return | Return | Return |
1998 | 2.6% | 5.6% | 8.2% | 8.3% |
1999 | –7.8 | 5.0 | –2.8 | –1.2 |
2000 | 1.8 | 6.0 | 7.8 | 8.2 |
2001 | 4.0 | 5.8 | 9.8 | 10.2 |
2002 | –1.7 | 5.4 | 3.7 | 6.2 |
2003 | 1.4 | 5.1 | 6.5 | 4.9 |
2004 | 1.6 | 4.9 | 6.5 | 6.3 |
2005 | –1.4 | 4.6 | 3.2 | 1.2 |
2006 | 1.9 | 4.7 | 6.6 | 6.0 |
2007 | –2.7 | 4.6 | 1.9 | 3.2 |
Average Annual Total Returns: Periods Ended September 30, 2007
This table presents average annual total returns through the latest calendar quarter—rather than through the end of the fiscal period. Securities and Exchange Commission rules require that we provide this information.
| | | | | | Ten Years |
| Inception Date | One Year | Five Years | Capital | Income | Total |
Investor Shares2 | 12/27/1978 | 2.30% | 4.36% | –0.08% | 5.18% | 5.10% |
Admiral Shares | 11/12/2001 | 2.37 | 4.43 | –0.243 | 4.943 | 4.703 |
1 Lehman 10 Year Municipal Bond Index.
2 Total returns do not include the account service fee that may be applicable to certain accounts with balances below $10,000.
3 Return since inception.
Note: See Financial Highlights tables on pages 72 and 73 for dividend and capital gains information.
69
High-Yield Tax-Exempt Fund
Financial Statements
The Statement of Net Assets—an integral part of the Financial Statements for Vanguard High-Yield Tax-Exempt Fund—is included as an insert to this report.
Statement of Operations
| Year Ended |
| October 31, 2007 |
| ($000) |
Investment Income | |
Income | |
Interest1 | 284,302 |
Total Income | 284,302 |
Expenses | |
The Vanguard Group—Note B | |
Investment Advisory Services | 488 |
Management and Administrative—Investor Shares | 2,074 |
Management and Administrative—Admiral Shares | 1,976 |
Marketing and Distribution—Investor Shares | 501 |
Marketing and Distribution—Admiral Shares | 729 |
Custodian Fees | 42 |
Auditing Fees | 23 |
Shareholders’ Reports—Investor Shares | 108 |
Shareholders’ Reports—Admiral Shares | 33 |
Trustees’ Fees and Expenses | 7 |
Total Expenses | 5,981 |
Expenses Paid Indirectly—Note C | (222) |
Net Expenses | 5,759 |
Net Investment Income | 278,543 |
Realized Net Gain (Loss) | |
Investment Securities Sold | 9,207 |
Futures Contracts | (29,271) |
Realized Net Gain (Loss) | (20,064) |
Change in Unrealized Appreciation (Depreciation) | |
Investment Securities | (144,981) |
Futures Contracts | 4,901 |
Change in Unrealized Appreciation (Depreciation) | (140,080) |
Net Increase (Decrease) in Net Assets Resulting from Operations | 118,399 |
1 Interest income from an affiliated company of the fund was $4,312,000.
70
High-Yield Tax-Exempt Fund
Statement of Changes in Net Assets
| Year Ended October 31, |
| 2007 | 2006 |
| ($000) | ($000) |
Increase (Decrease) in Net Assets | | |
Operations | | |
Net Investment Income | 278,543 | 238,805 |
Realized Net Gain (Loss) | (20,064) | 10,316 |
Change in Unrealized Appreciation (Depreciation) | (140,080) | 85,568 |
Net Increase (Decrease) in Net Assets Resulting from Operations | 118,399 | 334,689 |
Distributions | | |
Net Investment Income | | |
Investor Shares | (88,943) | (80,717) |
Admiral Shares | (189,600) | (158,088) |
Realized Capital Gain | | |
Investor Shares | — | — |
Admiral Shares | — | — |
Total Distributions | (278,543) | (238,805) |
Capital Share Transactions—Note F | | |
Investor Shares | 188,393 | 44,478 |
Admiral Shares | 626,294 | 553,044 |
Net Increase (Decrease) from Capital Share Transactions | 814,687 | 597,522 |
Total Increase (Decrease) | 654,543 | 693,406 |
Net Assets | | |
Beginning of Period | 5,567,058 | 4,873,652 |
End of Period | 6,221,601 | 5,567,058 |
71
High-Yield Tax-Exempt Fund
Financial Highlights
Investor Shares | | | | | |
| | | | | |
| | | | | |
| | | Year Ended October 31, |
For a Share Outstanding Throughout Each Period | 2007 | 2006 | 2005 | 2004 | 2003 |
Net Asset Value, Beginning of Period | $10.91 | $10.71 | $10.86 | $10.69 | $10.54 |
Investment Operations | | | | | |
Net Investment Income | .497 | .491 | .492 | .506 | .526 |
Net Realized and Unrealized Gain (Loss) | | | | | |
on Investments | (.290) | .200 | (.150) | .170 | .150 |
Total from Investment Operations | .207 | .691 | .342 | .676 | .676 |
Distributions | | | | | |
Dividends from Net Investment Income | (.497) | (.491) | (.492) | (.506) | (.526) |
Distributions from Realized Capital Gains | — | — | — | — | — |
Total Distributions | (.497) | (.491) | (.492) | (.506) | (.526) |
Net Asset Value, End of Period | $10.62 | $10.91 | $10.71 | $10.86 | $10.69 |
| | | | | |
| | | | | |
Total Return1 | 1.94% | 6.61% | 3.20% | 6.48% | 6.55% |
| | | | | |
| | | | | |
Ratios/Supplemental Data | | | | | |
Net Assets, End of Period (Millions) | $1,965 | $1,830 | $1,753 | $2,728 | $2,605 |
Ratio of Total Expenses to | | | | | |
Average Net Assets | 0.15% | 0.17% | 0.16% | 0.15% | 0.17% |
Ratio of Net Investment Income to | | | | | |
Average Net Assets | 4.61% | 4.56% | 4.55% | 4.71% | 4.94% |
Portfolio Turnover Rate | 22% | 15% | 15% | 24% | 17% |
| | | | | | |
1 Total returns do not include the account service fee that may be applicable to certain accounts with balances below $10,000.
72
High-Yield Tax-Exempt Fund
Admiral Shares | | | | | |
| | | | | |
| | | | | |
| | Year Ended October 31, |
For a Share Outstanding Throughout Each Period | 2007 | 2006 | 2005 | 2004 | 2003 |
Net Asset Value, Beginning of Period | $10.91 | $10.71 | $10.86 | $10.69 | $10.54 |
Investment Operations | | | | | |
Net Investment Income | .505 | .499 | .500 | .512 | .533 |
Net Realized and Unrealized Gain (Loss) | | | | | |
on Investments | (.290) | .200 | (.150) | .170 | .150 |
Total from Investment Operations | .215 | .699 | .350 | .682 | .683 |
Distributions | | | | | |
Dividends from Net Investment Income | (.505) | (.499) | (.500) | (.512) | (.533) |
Distributions from Realized Capital Gains | — | — | — | — | — |
Total Distributions | (.505) | (.499) | (.500) | (.512) | (.533) |
Net Asset Value, End of Period | $10.62 | $10.91 | $10.71 | $10.86 | $10.69 |
| | | | | |
| | | | | |
Total Return | 2.01% | 6.69% | 3.27% | 6.54% | 6.61% |
| | | | | |
| | | | | |
Ratios/Supplemental Data | | | | | |
Net Assets, End of Period (Millions) | $4,256 | $3,737 | $3,121 | $1,652 | $1,449 |
Ratio of Total Expenses to | | | | | |
Average Net Assets | 0.08% | 0.09% | 0.09% | 0.10% | 0.11% |
Ratio of Net Investment Income to | | | | | |
Average Net Assets | 4.68% | 4.64% | 4.60% | 4.76% | 5.00% |
Portfolio Turnover Rate | 22% | 15% | 15% | 24% | 17% |
| | | | | | |
See accompanying Notes, which are an integral part of the Financial Statements.
73
High-Yield Tax-Exempt Fund
Notes to Financial Statements
Vanguard High-Yield Tax-Exempt Fund is registered under the Investment Company Act of 1940 as an open-end investment company, or mutual fund. The fund invests in debt instruments of many municipal issuers; the issuers’ abilities to meet their obligations may be affected by economic and political developments in a specific state or region. The fund offers two classes of shares, Investor Shares and Admiral Shares. Investor Shares are available to any investor who meets the fund’s minimum purchase requirements. Admiral Shares are designed for investors who meet certain administrative, service, tenure, and account-size criteria.
A. The following significant accounting policies conform to generally accepted accounting principles for U.S. mutual funds. The fund consistently follows such policies in preparing its financial statements.
1. Security Valuation: Bonds, and temporary cash investments acquired over 60 days to maturity, are valued using the latest bid prices or using valuations based on a matrix system (which considers such factors as security prices, yields, maturities, and ratings), both as furnished by independent pricing services. Investments in Vanguard Municipal Cash Management Fund are valued at that fund’s net asset value. Other temporary cash investments are valued at amortized cost, which approximates market value. Securities for which market quotations are not readily available, or whose values have been materially affected by events occurring before the fund’s pricing time but after the close of the securities’ primary markets, are valued by methods deemed by the board of trustees to represent fair value.
2. Futures Contracts: The fund uses futures contracts to invest in fixed income asset classes with greater efficiency and lower cost than is possible through direct investment, to add value when these instruments are attractively priced, or to adjust sensitivity to changes in interest rates. The primary risks associated with the use of futures contracts are imperfect correlation between changes in market values of bonds held by the fund and the prices of futures contracts, and the possibility of an illiquid market.
Futures contracts are valued based upon their quoted daily settlement prices. The aggregate principal amounts of the contracts are not recorded in the Statement of Net Assets. Fluctuations in the value of the contracts are recorded in the Statement of Net Assets as an asset (liability) and in the Statement of Operations as unrealized appreciation (depreciation) until the contracts are closed, when they are recorded as realized futures gains (losses).
3. Federal Income Taxes: The fund intends to continue to qualify as a regulated investment company and distribute all of its income. Accordingly, no provision for federal income taxes is required in the financial statements.
4. Distributions: Distributions from net investment income are declared daily and paid on the first business day of the following month. Annual distributions from realized capital gains, if any, are recorded on the ex-dividend date.
5. Other: Interest income includes income distributions received from Vanguard Municipal Cash Management Fund and is accrued daily. Premiums and discounts on debt securities purchased are amortized and accreted, respectively, to interest income over the lives of the respective securities. Security transactions are accounted for on the date securities are bought or sold. Costs used to determine realized gains (losses) on the sale of investment securities are those of the specific securities sold.
Each class of shares has equal rights as to assets and earnings, except that each class separately bears certain class-specific expenses related to maintenance of shareholder accounts (included in Management and Administrative expenses) and shareholder reporting. Marketing and distribution
74
High-Yield Tax-Exempt Fund
expenses are allocated to each class of shares based on a method approved by the board of trustees. Income, other non-class-specific expenses, and gains and losses on investments are allocated to each class of shares based on its relative net assets.
B. The Vanguard Group furnishes at cost investment advisory, corporate management, administrative, marketing, and distribution services. The costs of such services are allocated to the fund under methods approved by the board of trustees. The fund has committed to provide up to 0.40% of its net assets in capital contributions to Vanguard. At October 31, 2007, the fund had contributed capital of $520,000 to Vanguard (included in Other Assets), representing 0.01% of the fund’s net assets and 0.52% of Vanguard’s capitalization. The fund’s trustees and officers are also directors and officers of Vanguard.
C. The fund’s investment advisor may direct new issue purchases, subject to obtaining the best price and execution, to underwriters who have agreed to rebate or credit to the fund part of the underwriting fees generated. Such rebates or credits are used solely to reduce the fund’s management and administrative expenses. The fund’s custodian bank has also agreed to reduce its fees when the fund maintains cash on deposit in the non-interest-bearing custody account. For the year ended October 31, 2007, these arrangements reduced the fund’s management and administrative expenses by $212,000 and custodian fees by $10,000.
D. Capital gain distributions are determined on a tax basis and may differ from realized capital gains for financial reporting purposes. Differences may be permanent or temporary. Permanent differences are reclassified among capital accounts in the financial statements to reflect their tax character. Temporary differences arise when gains or losses are recognized in different periods for financial statement and tax purposes; these differences will reverse at some time in the future.
For tax purposes, at October 31, 2007, the fund had available realized losses of $71,081,000 to offset future net capital gains of $49,222,000 through October 31, 2011, and $21,859,000 through October 31, 2015.
The fund had realized losses totaling $21,918,000 through October 31, 2007, which are deferred for tax purposes and reduce the amount of unrealized appreciation on investment securities for tax purposes.
At October 31, 2007, the cost of investment securities for tax purposes was $6,098,342,000. Net unrealized appreciation of investment securities for tax purposes was $86,629,000, consisting of unrealized gains of $151,851,000 on securities that had risen in value since their purchase and $65,222,000 in unrealized losses on securities that had fallen in value since their purchase.
At October 31, 2007, the aggregate settlement value of open futures contracts expiring in December 2007 and the related unrealized appreciation (depreciation) were:
| | | ($000) |
| Number of | Aggregate | Unrealized |
| Long (Short) | Settlement | Appreciation |
Futures Contracts | Contracts | Value | (Depreciation) |
30-Year U.S. Treasury Bond | (1,610) | 181,276 | 1,411 |
Unrealized appreciation (depreciation) on open futures contracts is required to be treated as realized gain (loss) for tax purposes.
E. During the year ended October 31, 2007, the fund purchased $1,958,814,000 of investment securities and sold $1,239,629,000 of investment securities, other than temporary cash investments.
75
High-Yield Tax-Exempt Fund
F. Capital share transactions for each class of shares were:
| | Year Ended October 31, |
| | 2007 | | 2006 |
| Amount | Shares | Amount | Shares |
| ($000) | (000) | ($000) | (000) |
Investor Shares | | | | |
Issued | 808,735 | 75,000 | 596,303 | 55,390 |
Issued in Lieu of Cash Distributions | 70,332 | 6,539 | 62,115 | 5,767 |
Redeemed | (690,674) | (64,265) | (613,940) | (57,076) |
Net Increase (Decrease)—Investor Shares | 188,393 | 17,274 | 44,478 | 4,081 |
Admiral Shares | | | | |
Issued | 1,283,561 | 119,306 | 984,890 | 91,485 |
Issued in Lieu of Cash Distributions | 128,605 | 11,958 | 103,557 | 9,613 |
Redeemed | (785,872) | (73,260) | (535,403) | (49,829) |
Net Increase (Decrease)—Admiral Shares | 626,294 | 58,004 | 553,044 | 51,269 |
G. In June 2006, the Financial Accounting Standards Board issued Interpretation No. 48 (“FIN 48”), “Accounting for Uncertainty in Income Taxes.” FIN 48 establishes the minimum threshold for recognizing, and a system for measuring, the benefits of tax-return positions in financial statements, and is effective for the fund’s fiscal year beginning November 1, 2007. Management has analyzed the fund’s tax positions taken on federal income tax returns for all open tax years (tax years ended October 31, 2004–2007) for purposes of implementing FIN 48, and has concluded that as of October 31, 2007, no provision for income tax would be required in the fund’s financial statements.
76
Report of Independent Registered Public Accounting Firm
To the Trustees of Vanguard Municipal Bond Funds and the Shareholders of Vanguard Tax-Exempt Money Market Fund, Vanguard Short-Term Tax-Exempt Fund, Vanguard Limited-Term Tax-Exempt Fund, Vanguard Intermediate-Term Tax-Exempt Fund, Vanguard Insured Long-Term Tax-Exempt Fund, Vanguard Long-Term Tax-Exempt Fund, and Vanguard High-Yield Tax-Exempt Fund:
In our opinion, the statements of net assets appearing in the insert to this Annual Report and the accompanying related statements of operations and of changes in net assets and the financial highlights present fairly, in all material respects, the financial position of Vanguard Tax-Exempt Money Market Fund, Vanguard Short-Term Tax-Exempt Fund, Vanguard Limited-Term Tax-Exempt Fund, Vanguard Intermediate-Term Tax-Exempt Fund, Vanguard Insured Long-Term Tax-Exempt Fund, Vanguard Long-Term Tax-Exempt Fund, and Vanguard High-Yield Tax-Exempt Fund (separate portfolios of Vanguard Municipal Bond Funds, hereafter referred to as the “Funds”) at October 31, 2007, the results of each of their operations for the year then ended, the changes in each of their net assets for each of the two years in the period then ended and the financial highlights for each of the five years in the period then ended, in conformity with accounting principles generally accepted in the United States of America. These financial statements and financial highlights (hereafter referred to as “financial statements”) are the responsibility of the Funds’ management; our responsibility is to express an opinion on these financial statements based on our audits. We conducted our audits of these financial statements in accordance with the standards of the Public Company Accounting Oversight Board (United States). Those standards require that we plan and perform the audit to obtain reasonable assurance about whether the financial statements are free of material misstatement. An audit includes examining, on a test basis, evidence supporting the amounts and disclosures in the financial statements, assessing the accounting principles used and significant estimates made by management, and evaluating the overall financial statement presentation. We believe that our audits, which included confirmation of securities at October 31, 2007 by correspondence with the custodian and broker and by agreement to the underlying ownership records for Vanguard Municipal Cash Management Fund, provide a reasonable basis for our opinion.
PricewaterhouseCoopers LLP
Philadelphia, Pennsylvania
December 6, 2007
Special 2007 tax information (unaudited) for Vanguard Municipal Bond Funds
This information for the fiscal year ended October 31, 2007, is included pursuant to provisions of the Internal Revenue Code.
The Insured Long-Term Tax-Exempt Fund distributed $2,472,000 as capital gain dividends (from net long-term capital gains) to shareholders during the fiscal year.
Each fund designates 100% of its income dividends as exempt-interest dividends.
77
About Your Fund’s Expenses
As a shareholder of the fund, you incur ongoing costs, which include costs for portfolio management, administrative services, and shareholder reports (like this one), among others. Operating expenses, which are deducted from a fund’s gross income, directly reduce the investment return of the fund.
A fund’s expenses are expressed as a percentage of its average net assets. This figure is known as the expense ratio. The following examples are intended to help you understand the ongoing costs (in dollars) of investing in your fund and to compare these costs with those of other mutual funds. The examples are based on an investment of $1,000 made at the beginning of the period shown and held for the entire period.
The tables on pages 79 and 80 illustrate your fund’s costs in two ways:
• Based on actual fund return. The table on page 79 helps you to estimate the actual expenses that you paid over the period. The “Ending Account Value” shown is derived from the fund’s actual return, and the third column shows the dollar amount that would have been paid by an investor who started with $1,000 in the fund. You may use the information in this table, together with the amount you invested, to estimate the expenses that you paid over the period.
To do so, simply divide your account value by $1,000 (for example, an $8,600 account value divided by $1,000 = 8.6), then multiply the result by the number given for your fund under the heading “Expenses Paid During Period.”
• Based on hypothetical 5% yearly return. The table on page 80 is intended to help you compare your fund’s costs with those of other mutual funds. It assumes that the fund had a yearly return of 5% before expenses, but that the expense ratio is unchanged. In this case—because the return used is not the fund’s actual return—the results do not apply to your investment. The example is useful in making comparisons because the Securities and Exchange Commission requires all mutual funds to calculate expenses based on a 5% return. You can assess your fund’s costs by comparing this hypothetical example with the hypothetical examples that appear in shareholder reports of other funds.
Note that the expenses shown in the table are meant to highlight and help you compare ongoing costs only and do not reflect transaction costs incurred by the fund for buying and selling securities. Further, the expenses do not include the account service fee described in the prospectus. If such a fee were applied to your account, your costs would be higher. Your fund does not charge transaction fees, such as purchase or redemption fees, nor does it carry a “sales load.”
The calculations assume no shares were bought or sold during the period. Your actual costs may have been higher or lower, depending on the amount of your investment and the timing of any purchases or redemptions.
You can find more information about the fund’s expenses, including annual expense ratios, in the Financial Statements section of this report. For additional information on operating expenses and other shareholder costs, please refer to your fund’s current prospectus.
78
Six Months Ended October 31, 2007 | | | |
| Beginning | Ending | Expenses |
| Account Value | Account Value | Paid During |
Tax-Exempt Fund | 4/30/2007 | 10/31/2007 | Period1 |
Based on Actual Fund Return | | | |
Money Market | $1,000.00 | $1,018.46 | $0.46 |
Short-Term | | | |
Investor Shares | 1,000.00 | 1,020.78 | 0.76 |
Admiral Shares | 1,000.00 | 1,021.16 | 0.41 |
Limited-Term | | | |
Investor Shares | 1,000.00 | 1,020.67 | 0.76 |
Admiral Shares | 1,000.00 | 1,021.04 | 0.41 |
Intermediate-Term | | | |
Investor Shares | 1,000.00 | 1,011.86 | 0.76 |
Admiral Shares | 1,000.00 | 1,012.23 | 0.41 |
Insured Long-Term | | | |
Investor Shares | 1,000.00 | 1,007.80 | 0.76 |
Admiral Shares | 1,000.00 | 1,008.17 | 0.40 |
Long-Term | | | |
Investor Shares | 1,000.00 | 1,007.93 | 0.76 |
Admiral Shares | 1,000.00 | 1,008.30 | 0.40 |
High-Yield | | | |
Investor Shares | 1,000.00 | 1,002.04 | 0.76 |
Admiral Shares | 1,000.00 | 1,002.41 | 0.40 |
1 The calculations are based on expenses incurred in the most recent six-month period. The fund’s annualized six-month expense ratios for that period are: for the Tax-Exempt Money Market Fund, 0.09%; for the Short-Term Tax-Exempt Fund, 0.15% for Investor Shares and 0.08% for Admiral Shares; for the Limited-Term Tax-Exempt Fund, 0.15% for Investor Shares and 0.08% for Admiral Shares; for the Intermediate-Term Tax-Exempt Fund, 0.15% for Investor Shares and 0.08% for Admiral Shares; for the Insured Long-Term Tax-Exempt Fund, 0.15% for Investor Shares and 0.08% for Admiral Shares; for the Long-Term Tax-Exempt Fund, 0.15% for Investor Shares and 0.08% for Admiral Shares; and for the High-Yield Tax-Exempt Fund, 0.15% for Investor Shares and 0.08% for Admiral Shares. The dollar amounts shown as “Expenses Paid” are equal to the annualized expense ratio multiplied by the average account value over the period, multiplied by the number of days in the most recent six-month period, then divided by the number of days in the most recent 12-month period.
79
Six Months Ended October 31, 2007 | | | |
| Beginning | Ending | Expenses |
| Account Value | Account Value | Paid During |
Tax-Exempt Fund | 4/30/2007 | 10/31/2007 | Period1 |
Based on Hypothetical 5% Yearly Return | | | |
Money Market | $1,000.00 | $1,024.75 | $0.46 |
Short-Term | | | |
Investor Shares | 1,000.00 | 1,024.45 | 0.77 |
Admiral Shares | 1,000.00 | 1,024.80 | 0.41 |
Limited-Term | | | |
Investor Shares | 1,000.00 | 1,024.45 | 0.77 |
Admiral Shares | 1,000.00 | 1,024.80 | 0.41 |
Intermediate-Term | | | |
Investor Shares | 1,000.00 | 1,024.45 | 0.77 |
Admiral Shares | 1,000.00 | 1,024.80 | 0.41 |
Insured Long-Term | | | |
Investor Shares | 1,000.00 | 1,024.45 | 0.77 |
Admiral Shares | 1,000.00 | 1,024.80 | 0.41 |
Long-Term | | | |
Investor Shares | 1,000.00 | 1,024.45 | 0.77 |
Admiral Shares | 1,000.00 | 1,024.80 | 0.41 |
High-Yield | | | |
Investor Shares | 1,000.00 | 1,024.45 | 0.77 |
Admiral Shares | 1,000.00 | 1,024.80 | 0.41 |
1 Amounts in this table are calculated in the manner described in the footnote on page 79.
80
Glossary
Average Coupon. The average interest rate paid on the fixed income securities held by a fund. It is expressed as a percentage of face value.
Average Duration. An estimate of how much the value of the bonds held by a fund will fluctuate in response to a change in interest rates. To see how the value could change, multiply the average duration by the change in rates. If interest rates rise by 1 percentage point, the value of the bonds in a fund with an average duration of five years would decline by about 5%. If rates decrease by a percentage point, the value would rise by 5%.
Average Effective Maturity. The average length of time until fixed income securities held by a fund reach maturity and are repaid, taking into consideration the possibility that the issuer may call the bond before its maturity date. The figure reflects the proportion of fund assets represented by each security; it also reflects any futures contracts held. In general, the longer the average effective maturity, the more a fund’s share price will fluctuate in response to changes in market interest rates.
Average Quality. An indicator of credit risk, this figure is the average of the ratings assigned to a fund’s holdings by credit-rating agencies. The agencies make their judgment after appraising an issuer’s ability to meet its obligations. Quality is graded on a scale, with AAA indicating the most creditworthy bond issuers and MIG-1, A-1+, SP-1+, and F-1+ indicating the most creditworthy issuers of money market securities.
Average Weighted Maturity. The average length of time until fixed income securities held by a fund reach maturity and are repaid. The figure reflects the proportion of fund assets represented by each security.
Beta. A measure of the magnitude of a fund’s past share-price fluctuations in relation to the ups and downs of a given market index. The index is assigned a beta of 1.00. Compared with a given index, a fund with a beta of 1.20 typically would have seen its share price rise or fall by 12% when the index rose or fell by 10%. A fund’s beta should be reviewed in conjunction with its R-squared (see definition below). The lower the R-squared, the less correlation there is between the fund and the index, and the less reliable beta is as an indicator of volatility.
Equity Exposure. A measure that reflects a fund’s investments in stocks and stock futures. Any holdings in short-term reserves are excluded.
Expense Ratio. The percentage of a fund’s average net assets used to pay its annual administrative and advisory expenses. These expenses directly reduce returns to investors.
Inception Date. The date on which the assets of a fund (or one of its share classes) are first invested in accordance with the fund’s investment objective. For funds with a subscription period, the inception date is the day after that period ends. Investment performance is measured from the inception date.
R-Squared. A measure of how much of a fund’s past returns can be explained by the returns from the market in general, as measured by a given index. If a fund’s total returns were precisely synchronized with an index’s returns, its R-squared would be 1.00. If the fund’s returns bore no relationship to the index’s returns, its R-squared would be 0.
Short-Term Reserves. The percentage of a fund invested in highly liquid, short-term securities that can be readily converted to cash.
Yield. A snapshot of a fund’s interest income. The yield, expressed as a percentage of the fund’s net asset value, is based on income earned over the past 30 days (7 days for money market funds) and is annualized, or projected forward for the coming year.
Yield to Maturity. The rate of return an investor would receive if the fixed income securities held by a fund were held to their maturity dates.
81
This page intentionally left blank.
This page intentionally left blank.
The People Who Govern Your Fund
The trustees of your mutual fund are there to see that the fund is operated and managed in your best interests since, as a shareholder, you are a part owner of the fund. Your fund’s trustees also serve on the board of directors of The Vanguard Group, Inc., which is owned by the Vanguard funds and provides services to them on an at-cost basis.
A majority of Vanguard’s board members are independent, meaning that they have no affiliation with Vanguard or the funds they oversee, apart from the sizable personal investments they have made as private individuals.
Our independent board members bring distinguished backgrounds in business, academia, and public service to their task of working with Vanguard officers to establish the policies and oversee the activities of the funds. Among board members’ responsibilities are selecting investment advisors for the funds; monitoring fund operations, performance, and costs; reviewing contracts; nominating and selecting new trustees/directors; and electing Vanguard officers.
Each trustee serves a fund until its termination; or until the trustee’s retirement, resignation, or death; or otherwise as specified in the fund’s organizational documents. Any trustee may be removed at a shareholders’ meeting by a vote representing two-thirds of the net asset value of all shares of the fund together with shares of other Vanguard funds organized within the same trust. The table on these two pages shows information for each trustee and executive officer of the fund. The mailing address of the trustees and officers is P.O. Box 876, Valley Forge, PA 19482.
Chairman of the Board, Chief Executive Officer, and Trustee |
| |
John J. Brennan1 | |
Born 1954 | Principal Occupation(s) During the Past Five Years: Chairman of the Board, |
Trustee since May 1987; | Chief Executive Officer, and Director/Trustee of The Vanguard Group, Inc., and |
Chairman of the Board and | of each of the investment companies served by The Vanguard Group. |
Chief Executive Officer | |
148 Vanguard Funds Overseen | |
| |
Independent Trustees | |
| |
Charles D. Ellis | |
Born 1937 | Principal Occupation(s) During the Past Five Years: Applecore Partners (pro |
Trustee since January 2001 | bono ventures in education); Senior Advisor to Greenwich Associates |
148 Vanguard Funds Overseen | (international business strategy consulting); Successor Trustee of Yale |
| University; Overseer of the Stern School of Business at New York University; |
| Trustee of the Whitehead Institute for Biomedical Research. |
| |
Rajiv L. Gupta | |
Born 1945 | Principal Occupation(s) During the Past Five Years: Chairman, President, and |
Trustee since December 20012 | Chief Executive Officer of Rohm and Haas Co. (chemicals); Board Member of |
148 Vanguard Funds Overseen | the American Chemistry Council; Director of Tyco International, Ltd. (diversified |
| manufacturing and services) since 2005; Trustee of Drexel University and of the |
| Chemical Heritage Foundation. |
| |
Amy Gutmann | |
Born 1949 | Principal Occupation(s) During the Past Five Years: President of the University |
Trustee since June 2006 | of Pennsylvania since 2004; Professor in the School of Arts and Sciences, |
148 Vanguard Funds Overseen | Annenberg School for Communication, and Graduate School of Education of the |
| University of Pennsylvania since 2004; Provost (2001–2004) and Laurance S. |
| Rockefeller Professor of Politics and the University Center for Human Values |
| (1990–2004), Princeton University; Director of Carnegie Corporation of New |
| York since 2005 and of Schuylkill River Development Corporation and Greater |
| Philadelphia Chamber of Commerce since 2004. |
JoAnn Heffernan Heisen | |
Born 1950 | Principal Occupation(s) During the Past Five Years: Corporate Vice President |
Trustee since July 1998 | and Chief Global Diversity Officer since 2006, Vice President and Chief |
148 Vanguard Funds Overseen | Information Officer (1997–2005), and Member of the Executive Committee of |
| Johnson &Johnson (pharmaceuticals/consumer products); Director of the |
| University Medical Center at Princeton and Women’s Research and Education |
| Institute. |
| |
André F. Perold | |
Born 1952 | Principal Occupation(s) During the Past Five Years: George Gund Professor of |
Trustee since December 2004 | Finance and Banking, Harvard Business School; Senior Associate Dean, |
148 Vanguard Funds Overseen | Director of Faculty Recruiting, and Chair of Finance Faculty, Harvard Business |
| School; Director and Chairman of UNX, Inc. (equities trading firm) since 2003; |
| Chair of the Investment Committee of HighVista Strategies LLC (private |
| investment firm) since 2005. |
| |
Alfred M. Rankin, Jr. | |
Born 1941 | Principal Occupation(s) During the Past Five Years: Chairman, President, Chief |
Trustee since January 1993 | Executive Officer, and Director of NACCO Industries, Inc. (forklift |
148 Vanguard Funds Overseen | trucks/housewares/lignite); Director of Goodrich Corporation (industrial |
| products/aircraft systems and services). |
| |
J. Lawrence Wilson | |
Born 1936 | Principal Occupation(s) During the Past Five Years: Retired Chairman and Chief |
Trustee since April 1985 | Executive Officer of Rohm and Haas Co. (chemicals); Director of Cummins Inc. |
148 Vanguard Funds Overseen | (diesel engines) and AmerisourceBergen Corp. (pharmaceutical distribution); |
| Trustee of Vanderbilt University and of Culver Educational Foundation. |
Executive Officers1 | |
| |
Thomas J. Higgins | |
Born 1957 | Principal Occupation(s) During the Past Five Years: Principal of The Vanguard |
Treasurer since July 1998 | Group, Inc.;Treasurer of each of the investment companies served by The |
148 Vanguard Funds Overseen | Vanguard Group. |
| |
| |
Heidi Stam | |
Born 1956 | Principal Occupation(s) During the Past Five Years: Managing Director of The |
Secretary since July 2005 | Vanguard Group, Inc., since 2006; General Counsel of The Vanguard Group |
148 Vanguard Funds Overseen | since 2005; Secretary of The Vanguard Group, and of each of the investment |
| companies served by The Vanguard Group, since 2005; Principal of The |
| Vanguard Group (1997–2006). |
| | |
Vanguard Senior Management Team | | |
| | | |
R. Gregory Barton | Kathleen C. Gubanich | F. William McNabb, III | Ralph K. Packard |
Mortimer J. Buckley | Paul A. Heller | Michael S. Miller | George U. Sauter |
Founder |
|
John C. Bogle |
Chairman and Chief Executive Officer, 1974–1996 |
1 Officers of the funds are “interested persons” as defined in the Investment Company Act of 1940.
2 December 2002 for Vanguard Equity Income Fund, Vanguard Growth Equity Fund, the Vanguard Municipal Bond Funds, and the Vanguard State Tax-Exempt Funds.
More information about the trustees is in the Statement of Additional Information, available from The Vanguard Group.

P.O. Box 2600
Valley Forge, PA 19482-2600
Connect with Vanguard® > www.vanguard.com
Fund Information > 800-662-7447 | Vanguard, Admiral, Connect with Vanguard, and the ship |
�� | logo are trademarks of The Vanguard Group, Inc. |
Direct Investor Account Services > 800-662-2739 | |
| All other marks are the exclusive property of their |
Institutional Investor Services > 800-523-1036 | respective owners. |
| |
| All comparative mutual fund data are from Lipper Inc. |
Text Telephone for People | or Morningstar, Inc., unless otherwise noted. |
With Hearing Impairment > 800-952-3335 | |
| |
| |
| You can obtain a free copy of Vanguard’s proxy voting |
| guidelines by visiting our website, www.vanguard.com, |
This material may be used in conjunction | and searching for “proxy voting guidelines,” or by calling |
with the offering of shares of any Vanguard | Vanguard at 800-662-2739. The guidelines are also |
fund only if preceded or accompanied by | available from the SEC’s website, www.sec.gov. In |
the fund’s current prospectus. | addition, you may obtain a free report on how your fund |
| voted the proxies for securities it owned during the 12 |
| months ended June 30. To get the report, visit either |
| www.vanguard.com or www.sec.gov. |
| |
| You can review and copy information about your fund |
| at the SEC’s Public Reference Room in Washington, |
| D.C.To find out more about this public service, call the |
| SEC at 202-551-8090. Information about your fund is |
| also available on the SEC’s website, and you can receive |
| copies of this information, for a fee, by sending a |
| request in either of two ways: via e-mail addressed to |
| publicinfo@sec.gov or via regular mail addressed to the |
| Public Reference Section, Securities and Exchange |
| Commission, Washington, DC 20549-0102. |
| |
| |
| |
| |
| |
| © 2007 The Vanguard Group, Inc. |
| All rights reserved. |
| Vanguard Marketing Corporation, Distributor. |
| |
| Q950 122007 |
Vanguard® Municipal Bond Funds
Statement of Net Assets
As of October 31, 2007
The Statement of Net Assets should be read in conjunction with each fund’s Statement of Operations,
Statement of Changes in Net Assets, Financial Highlights, and Notes to Financial Statements, all of which appear in the accompanying report.
Each fund provides a complete list of its holdings four times in each fiscal year, at the quarter-ends. For the second and fourth fiscal quarters, the lists appear in the fund’s semiannual and annual reports to shareholders. For the first and third fiscal quarters, the fund files the lists with the Securities and Exchange Commission on Form N-Q. Shareholders can look up the fund’s Forms N-Q on the SEC’s website at www.sec.gov. Forms N-Q may also be reviewed and copied at the SEC’s Public Reference Room (see the back cover of the accompanying report for further information).
Contents | |
| |
Tax-Exempt Money Market Fund | 2 |
Short-Term Tax-Exempt Fund | 44 |
Limited-Term Tax-Exempt Fund | 57 |
Intermediate-Term Tax-Exempt Fund | 77 |
Insured Long-Term Tax-Exempt Fund | 108 |
Long-Term Tax-Exempt Fund | 118 |
High-Yield Tax-Exempt Fund | 127 |
Key to Abbreviations | Back cover |
1
Tax-Exempt Money Market Fund
| | | | | Face | Market |
| | | Maturity | | Amount | Value• |
| | Coupon | Date | | ($000) | ($000) |
Municipal Bonds (96.9%) | | | | | |
Alabama (0.5%) | | | | | |
1 | Alabama Public School & College Auth. TOB VRDO | 3.490% | 11/7/07 | (3) | 5,000 | 5,000 |
1 | Alabama Special Care Fac. Financing Auth. TOB VRDO | 3.510% | 11/7/07 | | 5,000 | 5,000 |
1 | Birmingham AL Medical Center East Special Care Fac. Financing Auth. Rev. TOB PUT | 3.720% | 11/7/07 | (1) | 25,265 | 25,265 |
| Birmingham AL Public Educ. Building Student Housing Rev. (Univ. Alabama Project) VRDO | 3.450% | 11/7/07 | LOC | 18,160 | 18,160 |
1 | Birmingham AL Water & Sewer Works Rev. TOB VRDO | 3.500% | 11/7/07 | (2) | 4,000 | 4,000 |
| Mobile AL IDR (Kimberly-Clark Tissue Co.) VRDO | 3.600% | 11/7/07 | | 33,550 | 33,550 |
1 | Montgomery AL Water Works & Sewer Systems Rev. TOB VRDO | 3.580% | 11/7/07 | (4) | 5,190 | 5,190 |
1 | Univ. of Alabama General Rev. TOB VRDO | 3.520% | 11/7/07 | (1) | 16,910 | 16,910 |
1 | Univ. of South Alabama Univ. Tuition Rev. & Capital Improvement TOB VRDO | 3.580% | 11/7/07 | (3) | 7,850 | 7,850 |
| | | | | | 120,925 |
Alaska (1.1%) | | | | | |
| Alaska GO | 5.000% | 7/15/08 | (4) | 6,605 | 6,661 |
| Alaska Housing Finance Corp. (State Capital) VRDO | 3.440% | 11/7/07 | (1) | 13,175 | 13,175 |
| Alaska Housing Finance Corp. Home Mortgage VRDO | 3.510% | 11/7/07 | (4) | 20,000 | 20,000 |
1 | Alaska Housing Finance Corp. TOB PUT | 3.650% | 9/18/08 | (1) | 5,015 | 5,015 |
1 | Alaska Housing Finance Corp. TOB VRDO | 3.500% | 11/7/07 | (3) | 4,895 | 4,895 |
1 | Alaska Housing Finance Corp. TOB VRDO | 3.510% | 11/7/07 | | 8,615 | 8,615 |
1 | Alaska Housing Finance Corp. TOB VRDO | 3.550% | 11/7/07 | | 4,850 | 4,850 |
1 | Alaska Housing Finance Corp. TOB VRDO | 3.500% | 11/8/07 | | 10,570 | 10,570 |
1 | Alaska Housing Finance Corp. TOB VRDO | 3.520% | 11/8/07 | (1) | 8,530 | 8,530 |
1 | Anchorage AK Water Rev. TOB VRDO | 3.490% | 11/7/07 | (1) | 15,410 | 15,410 |
| Valdez AK Marine Terminal Rev. (BP Pipeline Project) VRDO | 3.580% | 11/1/07 | | 30,525 | 30,525 |
| Valdez AK Marine Terminal Rev. (BP Pipeline Project) VRDO | 3.580% | 11/1/07 | | 120,020 | 120,020 |
| | | | | | 248,266 |
Arizona (1.5%) | | | | | |
| Arizona School Fac. Board Rev. COP | 5.000% | 9/1/08 | (4) | 9,960 | 10,081 |
1 | Arizona School Fac. Board Rev. TOB VRDO | 3.500% | 11/7/07 | | 7,700 | 7,700 |
1 | Arizona State Univ. COP TOB PUT | 3.800% | 3/13/08 | (2) | 5,410 | 5,410 |
1 | Arizona State Univ. COP TOB VRDO | 3.510% | 11/7/07 | (2) | 5,355 | 5,355 |
1 | Arizona Transp. Board Highway Rev. TOB VRDO | 3.500% | 11/7/07 | | 10,330 | 10,330 |
1 | Chandler AZ GO TOB VRDO | 3.500% | 11/7/07 | | 9,280 | 9,280 |
1 | Maricopa County AZ IDA Health Fac. Rev. (Catholic Healthcare West) TOB VRDO | 3.490% | 11/7/07 | LOC | 75,465 | 75,465 |
1 | Maricopa County AZ Public Finance Corp. Lease Rev. TOB VRDO | 3.490% | 11/7/07 | (2) | 6,410 | 6,410 |
| McAllister Academic Village AZ LLC Rev. (Arizona State Univ.) VRDO | 3.250% | 11/7/07 | (2) | 10,900 | 10,900 |
1 | Mesa AZ Util. System Rev. TOB VRDO | 3.490% | 11/7/07 | (4)(Prere.) | 5,205 | 5,205 |
| Nanotechnology Research Arizona Lease Rev. (Arizona State Univ. Project) VRDO | 3.260% | 11/7/07 | (1) | 19,175 | 19,175 |
1 | Phoenix AZ Civic Improvement Corp. Transit Rev. TOB VRDO | 3.490% | 11/7/07 | (3) | 24,215 | 24,215 |
1 | Phoenix AZ Civic Improvement Corp. Transit Rev. TOB VRDO | 3.500% | 11/7/07 | (3) | 4,675 | 4,675 |
2
Tax-Exempt Money Market Fund
| | | | | Face | Market |
| | | Maturity | | Amount | Value• |
| | Coupon | Date | | ($000) | ($000) |
1 | Phoenix AZ Civic Improvement Corp. | | | | | |
| Water System Rev. TOB VRDO | 3.500% | 11/7/07 | (1) | 8,575 | 8,575 |
1 | Phoenix AZ GO TOB VRDO | 3.340% | 11/7/07 | | 8,430 | 8,430 |
1 | Phoenix AZ GO TOB VRDO | 3.490% | 11/7/07 | | 16,640 | 16,640 |
1 | Phoenix AZ GO TOB VRDO | 3.510% | 11/7/07 | | 5,000 | 5,000 |
| Salt River Project Arizona Agricultural Improvement & Power Dist. Rev. CP | 3.620% | 11/13/07 | | 20,500 | 20,500 |
| Salt River Project Arizona Agricultural Improvement & Power Dist. Rev. CP | 3.710% | 11/15/07 | | 11,075 | 11,075 |
1 | Salt River Project Arizona Agricultural Improvement & Power Dist. Rev. TOB VRDO | 3.500% | 11/7/07 | | 14,900 | 14,900 |
1 | Salt River Project Arizona Agricultural Improvement & Power Dist. Rev. TOB VRDO | 3.520% | 11/7/07 | | 16,000 | 16,000 |
| Tempe AZ Transit Excise Tax Rev. VRDO | 3.270% | 11/7/07 | | 14,985 | 14,985 |
1 | Tucson AZ Water System Rev. TOB VRDO | 3.490% | 11/7/07 | (4) | 7,250 | 7,250 |
1 | Tucson AZ Water System Rev. TOB VRDO | 3.510% | 11/7/07 | (4) | 9,480 | 9,480 |
| | | | | | 327,036 |
Arkansas (0.1%) | | | | | |
| Pulaski County AR Health Fac. St. Vincent Infirmary Catholic Health Initiatives) VRDO | 3.260% | 11/7/07 | | 32,900 | 32,900 |
| | | | | | |
California (1.2%) | | | | | |
| Access To Loans For Learning Student Loan Corp. California Rev. Student Loan Program VRDO | 3.600% | 11/1/07 | (2) | 50,000 | 50,000 |
| Access To Loans For Learning Student Loan Corp. California Rev. Student Loan Program VRDO | 3.510% | 11/7/07 | (2) | 25,000 | 25,000 |
| Access To Loans For Learning Student Loan Corp. California Rev. Student Loan Program VRDO | 3.510% | 11/7/07 | (2) | 40,000 | 40,000 |
2 | California RAN | 4.000% | 6/30/08 | | 150,000 | 150,613 |
| | | | | | 265,613 |
Colorado (3.9%) | | | | | |
1 | Board of Governors of the Colorado State University System Rev. TOB PUT | 3.800% | 3/6/08 | (3) | 21,995 | 21,995 |
| Colorado Educ. & Cultural Fac. Auth. Nature Conservancy Project VRDO | 3.420% | 11/7/07 | | 10,023 | 10,023 |
| Colorado General Fund TRAN | 4.250% | 6/27/08 | | 100,000 | 100,345 |
| Colorado Health Fac. Auth. Rev. (Catholic Health Initiatives) VRDO | 3.260% | 11/7/07 | | 38,340 | 38,340 |
1 | Colorado Health Fac. Auth. Rev. (Poudre Valley Medical Center) TOB VRDO | 3.490% | 11/7/07 | LOC | 29,990 | 29,990 |
1 | Colorado Health Fac. Auth. Rev. (Poudre Valley Medical Center) TOB VRDO | 3.490% | 11/7/07 | LOC | 46,000 | 46,000 |
| Colorado Health Fac. Auth. Rev. (Sisters of Charity Health System Inc.) VRDO | 3.230% | 11/7/07 | | 13,600 | 13,600 |
| Colorado Health Fac. Auth. Rev. (Sisters of Charity Leavenworth) VRDO | 3.250% | 11/7/07 | | 40,300 | 40,300 |
| Colorado Housing & Finance Auth. Multi-Family Mortgage Bonds VRDO | 3.230% | 11/7/07 | | 19,825 | 19,825 |
| Colorado Housing & Finance Auth. Multi-Family Mortgage Bonds VRDO | 3.290% | 11/7/07 | | 69,790 | 69,790 |
| Colorado Housing & Finance Auth. Multi-Family Mortgage Bonds VRDO | 3.290% | 11/7/07 | | 20,000 | 20,000 |
| Colorado Housing & Finance Auth. Multi-Family Mortgage Bonds VRDO | 3.290% | 11/7/07 | | 17,145 | 17,145 |
| Colorado Housing & Finance Auth. Single Family Mortgage Bonds VRDO | 3.230% | 11/7/07 | | 10,090 | 10,090 |
3
Tax-Exempt Money Market Fund
| | | | | Face | Market |
| | | Maturity | | Amount | Value• |
| | Coupon | Date | | ($000) | ($000) |
| Colorado Housing & Finance Auth. Single Family Mortgage Bonds VRDO | 3.230% | 11/7/07 | | 20,915 | 20,915 |
| Colorado Housing & Finance Auth. Single Family Mortgage Bonds VRDO | 3.230% | 11/7/07 | | 19,590 | 19,590 |
| Colorado Housing & Finance Auth. Single Family Mortgage Bonds VRDO | 3.230% | 11/7/07 | | 34,500 | 34,500 |
| Colorado Housing & Finance Auth. Single Family Mortgage Bonds VRDO | 3.290% | 11/7/07 | | 24,315 | 24,315 |
| Colorado Housing & Finance Auth. Single Family Mortgage Bonds VRDO | 3.290% | 11/7/07 | | 19,500 | 19,500 |
| Colorado Housing & Finance Auth. Single Family Mortgage Bonds VRDO | 3.290% | 11/7/07 | | 16,800 | 16,800 |
| Colorado Housing & Finance Auth. Single Family Mortgage Bonds VRDO | 3.290% | 11/7/07 | | 16,855 | 16,855 |
| Colorado Housing & Finance Auth. Single Family Mortgage Bonds VRDO | 3.290% | 11/7/07 | | 9,725 | 9,725 |
| Colorado Housing & Finance Auth. Single Family Mortgage Bonds VRDO | 3.290% | 11/7/07 | | 15,000 | 15,000 |
| Colorado Housing & Finance Auth. Single Family Mortgage Bonds VRDO | 3.300% | 11/7/07 | | 50,000 | 50,000 |
1 | Colorado Housing Finance Auth. Single Family Mortgage Rev. TOB VRDO | 3.350% | 11/7/07 | (1) | 6,000 | 6,000 |
| Colorado Student Obligation Bond Auth. VRDO | 3.330% | 11/7/07 | (2) | 11,200 | 11,200 |
| Denver CO City & County (Wellington E. Webb Municipal Office Building) COP VRDO | 3.250% | 11/7/07 | (2) | 39,800 | 39,800 |
1 | Denver CO City & County Airport Rev. TOB VRDO | 3.490% | 11/7/07 | (10) | 10,510 | 10,510 |
1 | Denver CO City & County Airport Rev. TOB VRDO | 3.570% | 11/7/07 | (2) | 6,745 | 6,745 |
1 | Denver CO City & County Airport Rev. TOB VRDO | 3.580% | 11/7/07 | (1) | 21,905 | 21,905 |
1 | Denver CO City & County Airport Rev. TOB VRDO | 3.610% | 11/7/07 | (4) | 1,500 | 1,500 |
| Denver CO City & County Airport Rev. VRDO | 3.370% | 11/7/07 | (11) | 21,700 | 21,700 |
| Denver CO City & County GO (Medical Fac.) | 5.000% | 8/1/08 | | 8,770 | 8,860 |
| Lowry Econ. Redev. Auth. Colorado Rev. VRDO | 3.250% | 11/7/07 | LOC | 3,320 | 3,320 |
1 | Regional Transp. Dist. of Colorado Sales Tax Rev. TOB VRDO | 3.510% | 11/7/07 | (2) | 7,350 | 7,350 |
1 | Regional Transp. Dist. of Colorado Sales Tax Rev. TOB VRDO | 3.510% | 11/7/07 | (2) | 32,550 | 32,550 |
1 | Univ. of Colorado Enterprise System Rev. TOB PUT | 3.800% | 3/6/08 | (1) | 5,580 | 5,580 |
1 | Univ. of Colorado Enterprise System Rev. TOB VRDO | 3.490% | 11/7/07 | (1) | 14,955 | 14,955 |
1 | Univ. of Colorado Enterprise System Rev. TOB VRDO | 3.520% | 11/7/07 | (3) | 4,620 | 4,620 |
| | | | | | 861,238 |
Connecticut (0.2%) | | | | | |
2 | Connecticut State Health & Educ. Fac. Auth. (Masonicare) VRDO | 3.600% | 11/1/07 | LOC | 26,465 | 26,465 |
1 | Connecticut State Housing Finance Auth. TOB VRDO | 3.350% | 11/7/07 | | 9,000 | 9,000 |
1 | Connecticut State Housing Rev. TOB VRDO | 3.350% | 11/7/07 | (2) | 10,975 | 10,975 |
| | | | | | 46,440 |
Delaware (0.5%) | | | | | |
1 | Delaware Housing Auth. Single Family Mortgage Rev. TOB VRDO | 3.360% | 11/7/07 | | 7,000 | 7,000 |
1 | Delaware Housing Auth. Single Family Mortgage Rev. TOB VRDO | 3.550% | 11/7/07 | | 5,130 | 5,130 |
4
Tax-Exempt Money Market Fund
| | | | | Face | Market |
| | | Maturity | | Amount | Value• |
| | Coupon | Date | | ($000) | ($000) |
1 | Delaware Housing Auth. Single Family Mortgage Rev. TOB VRDO | 3.550% | 11/7/07 | | 10,125 | 10,125 |
1 | Delaware Housing Auth. Single Family Mortgage Rev. TOB VRDO | 3.590% | 11/7/07 | | 11,055 | 11,055 |
1 | GS Pool Trust TOB VRDO | 3.530% | 11/7/07 | | 5,041 | 5,041 |
1 | GS Pool Trust TOB VRDO | 3.560% | 11/7/07 | (11) | 22,300 | 22,300 |
| New Castle County DE Airport Fac. Rev. (FlightSafety) VRDO | 3.500% | 11/7/07 | | 22,900 | 22,900 |
| Wilmington DE Rev. (Delaware Art Museum) VRDO | 3.280% | 11/7/07 | LOC | 24,800 | 24,800 |
| | | | | | 108,351 |
District of Columbia (2.5%) | | | | | |
1 | District of Columbia COP TOB PUT | 3.780% | 5/22/08 | (3) | 17,745 | 17,745 |
1 | District of Columbia GO TOB VRDO | 3.340% | 11/7/07 | (2)(Prere.) | 4,485 | 4,485 |
1 | District of Columbia GO TOB VRDO | 3.490% | 11/7/07 | (3) | 4,600 | 4,600 |
1 | District of Columbia GO TOB VRDO | 3.510% | 11/7/07 | (4) | 5,195 | 5,195 |
1 | District of Columbia GO TOB VRDO | 3.520% | 11/7/07 | (3) | 14,100 | 14,100 |
1 | District of Columbia GO TOB VRDO | 3.580% | 11/7/07 | (4) | 5,200 | 5,200 |
1 | District of Columbia GO TOB VRDO | 3.580% | 11/7/07 | (4) | 3,735 | 3,735 |
| District of Columbia Rev. (American College of Cardiology) VRDO | 3.260% | 11/7/07 | LOC | 13,000 | 13,000 |
| District of Columbia Rev. (Council Foreign Relations) VRDO | 3.430% | 11/7/07 | LOC | 62,680 | 62,680 |
| District of Columbia Rev. (Georgetown Day School) VRDO | 3.260% | 11/7/07 | LOC | 18,000 | 18,000 |
| District of Columbia Rev. (Henry J. Kaiser Family Foundation) VRDO | 3.520% | 11/7/07 | | 12,000 | 12,000 |
| District of Columbia Rev. (National Public Radio Inc.) VRDO | 3.260% | 11/7/07 | LOC | 17,930 | 17,930 |
| District of Columbia Univ. Rev. (George Washington Univ.) VRDO | 3.260% | 11/7/07 | (1) | 47,565 | 47,565 |
1 | District of Columbia Water & Sewer Auth. Public Util. Rev. TOB VRDO | 3.490% | 11/7/07 | (4) | 9,920 | 9,920 |
1 | District of Columbia Water & Sewer Auth. Public Util. Rev. TOB VRDO | 3.490% | 11/7/07 | (3) | 12,915 | 12,915 |
1 | District of Columbia Water & Sewer Auth. Public Util. Rev. TOB VRDO | 3.510% | 11/7/07 | (3) | 6,285 | 6,285 |
1 | District of Columbia Water & Sewer Auth. Public Util. Rev. TOB VRDO | 3.510% | 11/7/07 | (4) | 9,505 | 9,505 |
1,2 | Metro. Washington Airports Auth. Airport System Rev. TOB VRDO | 3.380% | 11/7/07 | (2) | 9,000 | 9,000 |
1 | Metro. Washington Airports Auth. Airport System Rev. TOB VRDO | 3.390% | 11/7/07 | (3) | 5,000 | 5,000 |
1 | Metro. Washington Airports Auth. Airport System Rev. TOB VRDO | 3.520% | 11/7/07 | (4) | 11,985 | 11,985 |
1 | Metro. Washington Airports Auth. Airport System Rev. TOB VRDO | 3.530% | 11/7/07 | (3) | 22,033 | 22,033 |
1 | Metro. Washington Airports Auth. Airport System Rev. TOB VRDO | 3.580% | 11/7/07 | (3) | 50,000 | 50,000 |
1 | Metro. Washington Airports Auth. Airport System Rev. TOB VRDO | 3.590% | 11/7/07 | (2) | 15,000 | 15,000 |
1 | Metro. Washington Airports Auth. Airport System Rev. TOB VRDO | 3.590% | 11/7/07 | (3) | 15,635 | 15,635 |
1 | Metro. Washington Airports Auth. Airport System Rev. TOB VRDO | 3.600% | 11/7/07 | (4) | 6,000 | 6,000 |
5
Tax-Exempt Money Market Fund
| | | | | Face | Market |
| | | Maturity | | Amount | Value• |
| | Coupon | Date | | ($000) | ($000) |
1 | Metro. Washington Airports Auth. Airport System Rev. TOB VRDO | 3.600% | 11/7/07 | (1) | 19,000 | 19,000 |
1 | Metro. Washington Airports Auth. Airport System Rev. TOB VRDO | 3.610% | 11/7/07 | (1) | 6,510 | 6,510 |
1 | Washington DC Convention Center Auth. Dedicated Tax Rev. TOB VRDO | 3.500% | 11/7/07 | (2) | 20,095 | 20,095 |
1 | Washington DC Convention Center Auth. TOB VRDO | 3.520% | 11/7/07 | (2) | 41,305 | 41,305 |
| Washington DC Metro. Area Transit Auth. Rev. CP | 3.750% | 11/19/07 | LOC | 28,400 | 28,400 |
| Washington DC Metro. Area Transit Auth. Rev. CP | 3.580% | 12/10/07 | LOC | 33,900 | 33,900 |
| | | | | | 548,723 |
Florida (5.8%) | | | | | |
1 | Brevard County FL School Board COP TOB VRDO | 3.490% | 11/7/07 | (2) | 14,015 | 14,015 |
| Broward County FL GO | 5.000% | 1/1/08 | | 4,000 | 4,008 |
1 | Broward County FL GO (Parks & Land Preservation Project) TOB VRDO | 3.520% | 11/7/07 | (Prere.) | 11,320 | 11,320 |
1 | Broward County FL GO (Parks & Land Preservation Project) TOB VRDO | 3.520% | 11/7/07 | (Prere.) | 6,900 | 6,900 |
1 | Broward County FL School Board COP TOB VRDO | 3.490% | 11/7/07 | (3) | 34,850 | 34,850 |
1 | Broward County FL School Board COP TOB VRDO | 3.580% | 11/7/07 | (4) | 5,245 | 5,245 |
| Charlotte County FL Util. VRDO | 3.450% | 11/7/07 | (4) | 13,915 | 13,915 |
| Citizens Property Insurance Corp. Florida (High Risk Account) | 5.000% | 3/1/08 | (1) | 6,000 | 6,026 |
1 | Citizens Property Insurance Corp. Florida (High Risk) VRDO | 3.500% | 11/7/07 | (1) | 10,820 | 10,820 |
1 | Collier County FL School Board COP TOB VRDO | 3.520% | 11/7/07 | (4) | 11,000 | 11,000 |
1 | Collier County FL School Board COP TOB VRDO | 3.580% | 11/7/07 | (4) | 6,025 | 6,025 |
1 | Collier County FL School Board COP TOB VRDO | 3.580% | 11/7/07 | (4) | 3,945 | 3,945 |
1 | Florida Board of Educ. Capital Outlay TOB VRDO | 3.520% | 11/7/07 | | 7,980 | 7,980 |
| Florida Board of Educ. Public Educ. | 5.000% | 6/1/08 | (4) | 19,600 | 19,745 |
1 | Florida Board of Educ. Public Educ. Capital Outlay TOB VRDO | 3.520% | 11/7/07 | | 15,000 | 15,000 |
1 | Florida Board of Educ. Public Educ. TOB VRDO | 3.490% | 11/7/07 | | 16,910 | 16,910 |
1 | Florida Board of Educ. Public Educ. TOB VRDO | 3.520% | 11/7/07 | (1) | 7,920 | 7,920 |
1 | Florida Board of Educ. Public Educ. TOB VRDO | 3.520% | 11/7/07 | | 29,275 | 29,275 |
1 | Florida Board of Educ. Rev. (Lottery Rev.) TOB VRDO | 3.490% | 11/7/07 | (3) | 11,215 | 11,215 |
1 | Florida Board of Educ. Rev. (Lottery Rev.) TOB VRDO | 3.520% | 11/7/07 | (1) | 28,070 | 28,070 |
1 | Florida Board of Educ. TOB VRDO | 3.510% | 11/7/07 | (1) | 5,960 | 5,960 |
1 | Florida Board of Educ. TOB VRDO | 3.520% | 11/7/07 | | 30,155 | 30,155 |
1 | Florida Correctional Privatization Comm. COP TOB VRDO | 3.510% | 11/7/07 | (2) | 7,925 | 7,925 |
1 | Florida Dept. of Environmental Protection & Preservation Rev. TOB VRDO | 3.490% | 11/7/07 | (2) | 10,995 | 10,995 |
1 | Florida Dept. of Environmental Protection & Preservation Rev. TOB VRDO | 3.500% | 11/7/07 | (2) | 5,310 | 5,310 |
| Florida Dept. of Transp. | 5.250% | 7/1/08 | | 4,670 | 4,725 |
1 | Florida Dept. of Transp. TOB PUT | 3.780% | 11/1/07 | | 34,705 | 34,705 |
1 | Florida Dept. of Transp. TOB VRDO | 3.510% | 11/7/07 | | 7,475 | 7,475 |
1 | Florida Dept. of Transp. TOB VRDO | 3.510% | 11/7/07 | | 14,435 | 14,435 |
1 | Florida Housing Finance Agency Rev. TOB VRDO | 3.350% | 11/7/07 | | 6,300 | 6,300 |
1 | Florida Housing Finance Corp. Rev. TOB VRDO | 3.360% | 11/7/07 | | 11,500 | 11,500 |
1 | Florida Housing Finance Corp. Rev. TOB VRDO | 3.390% | 11/7/07 | | 5,445 | 5,445 |
1 | Florida Housing Finance Corp. Rev. TOB VRDO | 3.590% | 11/7/07 | | 7,500 | 7,500 |
6
Tax-Exempt Money Market Fund
| | | | | Face | Market |
| | | Maturity | | Amount | Value• |
| | Coupon | Date | | ($000) | ($000) |
| Florida Hurricane Catastrophe Fund | | | | | |
| Finance Corp. Rev. | 5.000% | 7/1/08 | | 40,000 | 40,318 |
| Florida Local Govt. Finance Comm. Pooled Loan Program CP | 3.550% | 12/12/07 | LOC | 44,962 | 44,964 |
| Florida Local Govt. Finance Comm. Pooled Loan Program CP | 3.550% | 12/13/07 | LOC | 22,739 | 22,739 |
| Florida Muni. Power Agency Rev. (Stanton Project) VRDO | 3.330% | 11/7/07 | (1) | 1,990 | 1,990 |
1 | Florida Turnpike Auth. Rev. TOB VRDO | 3.490% | 11/7/07 | (3) | 34,595 | 34,595 |
1 | Florida Turnpike Auth. Rev. TOB VRDO | 3.510% | 11/7/07 | (2) | 5,430 | 5,430 |
1 | Florida Turnpike Auth. Rev. TOB VRDO | 3.580% | 11/7/07 | (1) | 4,000 | 4,000 |
| Gainsville FL Util. System Rev. VRDO | 3.270% | 11/7/07 | | 32,500 | 32,500 |
1 | Greater Orlando Aviation Auth. Orlando FL Airport Fac. Rev. TOB VRDO | 3.590% | 11/7/07 | (4) | 5,635 | 5,635 |
| Greater Orlando Aviation Auth. Orlando FL Airport Fac. Rev. TOB VRDO | 3.610% | 11/7/07 | (4) | 5,605 | 5,605 |
| Highlands County FL Health Rev. (Adventist Health System) VRDO | 3.470% | 11/7/07 | (4) | 14,700 | 14,700 |
| Hillsborough County FL Capital Improvement Program CP | 3.600% | 11/8/07 | LOC | 11,355 | 11,355 |
1 | Hillsborough County FL School Board COP TOB VRDO | 3.580% | 11/7/07 | (1) | 5,080 | 5,080 |
1 | Hillsborough County FL School Dist. Sales Tax Rev. TOB VRDO | 3.510% | 11/7/07 | (2) | 7,855 | 7,855 |
1 | Hillsborough County FL Water & Sewer Rev. TOB VRDO | 3.500% | 11/7/07 | (2) | 10,095 | 10,095 |
| Jacksonville FL Econ. Dev. Community Health Care Fac. Rev. VRDO | 3.580% | 11/1/07 | LOC | 10,135 | 10,135 |
| Jacksonville FL Electric Auth. Electric System Rev. VRDO | 3.230% | 11/7/07 | (11) | 30,800 | 30,800 |
1 | Jacksonville FL Electric Auth. Water & Sewer Rev. TOB VRDO | 3.520% | 11/7/07 | (3) | 8,295 | 8,295 |
| Jacksonville FL Health Fac. Auth. Hosp. Rev. VRDO | 3.580% | 11/1/07 | LOC | 30,020 | 30,020 |
1 | Lake County FL Capital Improvement Rev. TOB VRDO | 3.500% | 11/7/07 | (2) | 6,900 | 6,900 |
1 | Lake County FL Capital Improvement Rev. TOB VRDO | 3.500% | 11/7/07 | (2) | 7,055 | 7,055 |
1 | Lee Memorial Health System Florida Hosp. Rev. TOB VRDO | 3.490% | 11/7/07 | (2) | 14,695 | 14,695 |
1 | Miami-Dade County FL Aviation– Miami International Airport TOB VRDO | 3.500% | 11/7/07 | (3) | 17,120 | 17,120 |
1 | Miami-Dade County FL Aviation– Miami International Airport TOB VRDO | 3.550% | 11/7/07 | (1) | 5,295 | 5,295 |
1 | Miami-Dade County FL Aviation– Miami International Airport TOB VRDO | 3.600% | 11/7/07 | (10) | 2,475 | 2,475 |
1 | Miami-Dade County FL Aviation– Miami International Airport TOB VRDO | 3.610% | 11/7/07 | (11) | 3,990 | 3,990 |
1 | Miami-Dade County FL Educ. Fac. Auth. Rev. (Univ.of Miami) TOB VRDO | 3.490% | 11/7/07 | (2) | 15,795 | 15,795 |
1 | Miami-Dade County FL Educ. Fac. Auth. Rev. (Univ.of Miami) TOB VRDO | 3.490% | 11/7/07 | (2) | 5,075 | 5,075 |
1 | Miami-Dade County FL Expressway Auth. Toll System Rev. TOB VRDO | 3.490% | 11/7/07 | (2) | 13,150 | 13,150 |
1 | Miami-Dade County FL Expressway Auth. Toll System Rev. TOB VRDO | 3.520% | 11/7/07 | (2) | 18,500 | 18,500 |
7
Tax-Exempt Money Market Fund
| | | | | Face | Market |
| | | Maturity | | Amount | Value• |
| | Coupon | Date | | ($000) | ($000) |
1 | Miami-Dade County FL Parks Program TOB VRDO | 3.580% | 11/7/07 | (1) | 5,315 | 5,315 |
1 | Miami-Dade County FL School Board COP TOB VRDO | 3.520% | 11/7/07 | (2) | 11,880 | 11,880 |
| Monroe County FL Airport Rev. Var-Key West International Airport VRDO | 3.470% | 11/7/07 | LOC | 30,355 | 30,355 |
| Orange County FL Educ. Fac. Auth. Rev. (Rollins College) VRDO | 3.580% | 11/1/07 | LOC | 12,670 | 12,670 |
1 | Orange County FL Housing Finance Auth. Single Family Mortgage Rev. TOB VRDO | 3.560% | 11/7/07 | | 7,340 | 7,340 |
1 | Orange County FL Housing Finance Auth. Single Family Mortgage Rev. TOB VRDO | 3.610% | 11/7/07 | | 3,140 | 3,140 |
1 | Orange County FL Sales Tax Rev. TOB VRDO | 3.520% | 11/7/07 | (3) | 19,330 | 19,330 |
1 | Orange County FL School Board TOB VRDO | 3.510% | 11/7/07 | (1) | 11,630 | 11,630 |
1 | Orlando & Orange County FL Expressway Auth. TOB VRDO | 3.510% | 11/7/07 | (2) | 4,820 | 4,820 |
| Palm Beach County FL Rev. (Community Foundation Palm Beach Project) VRDO | 3.490% | 11/7/07 | LOC | 5,700 | 5,700 |
| Palm Beach County FL Rev. (Norton Gallery) VRDO | 3.360% | 11/7/07 | LOC | 12,500 | 12,500 |
1 | Palm Beach County FL School Board COP TOB VRDO | 3.520% | 11/7/07 | (2) | 15,725 | 15,725 |
1 | Palm Beach County FL School Board COP TOB VRDO | 3.530% | 11/7/07 | (2) | 11,340 | 11,340 |
| Palm Beach County FL School Dist. Sales Tax Rev. CP | 3.500% | 2/7/08 | LOC | 30,600 | 30,600 |
| Pinellas County FL Health Fac. Auth. Rev. (Bayfront Hosp.) VRDO | 3.580% | 11/1/07 | LOC | 25,550 | 25,550 |
| Pinellas County FL Health Fac. Auth. Rev. (Bayfront Hosp.) VRDO | 3.580% | 11/1/07 | LOC | 17,500 | 17,500 |
1 | Polk County FL Util. System Rev. TOB VRDO | 3.520% | 11/7/07 | (3) | 9,600 | 9,600 |
| Port St. Lucie FL Rev. VRDO | 3.250% | 11/7/07 | (1) | 57,400 | 57,400 |
1 | Reedy Creek FL Improvement Dist. Util. Rev. TOB PUT | 3.800% | 3/6/08 | (2) | 6,385 | 6,385 |
1 | Sarasota County FL Util. System Rev. TOB VRDO | 3.520% | 11/7/07 | (3) | 7,890 | 7,890 |
| Sarasota FL Manatee Airport Auth. Rev. VRDO | 3.580% | 11/1/07 | LOC | 14,640 | 14,640 |
1 | South Florida Water Management Dist. TOB VRDO | 3.520% | 11/7/07 | (2) | 22,980 | 22,980 |
1 | South Miami FL Health Fac. Auth. Hosp. Rev. (Baptist Health South FL Obligated Group) TOB VRDO | 3.490% | 11/7/07 | | 10,400 | 10,400 |
| Sunshine State Florida Govt. Financing Comm. Rev. VRDO | 3.590% | 11/1/07 | (2) | 11,715 | 11,715 |
1 | Tampa Bay FL Water Util. System Rev. TOB VRDO | 3.520% | 11/7/07 | (3)(Prere.) | 2,500 | 2,500 |
1 | Tampa FL Rev. (Univ. of Tampa Project) TOB VRDO | 3.500% | 11/7/07 | (11) | 6,835 | 6,835 |
1 | Volusia County FL Health Facs Auth Rev. TOB PUT | 3.750% | 11/1/07 | (2) | 8,420 | 8,420 |
1 | Volusia County FL Rev. TOB VRDO | 3.490% | 11/7/07 | (4) | 14,390 | 14,390 |
| West Palm Beach FL Util. System Rev. VRDO | 3.250% | 11/7/07 | (3) | 18,250 | 18,250 |
| | | | | | 1,269,575 |
Georgia (3.9%) | | | | | |
| Atlanta GA Airport General Rev. VRDO | 3.430% | 11/7/07 | (1) | 35,300 | 35,300 |
| Atlanta GA Airport General Rev. VRDO | 3.450% | 11/7/07 | (1) | 62,710 | 62,710 |
1 | Atlanta GA Airport Passenger Charge Rev. TOB VRDO | 3.510% | 11/7/07 | (4) | 13,500 | 13,500 |
| Atlanta GA Tax Allocation (Atlantic Station) VRDO | 3.520% | 11/7/07 | LOC | 15,000 | 15,000 |
1 | Atlanta GA Water & Wastewater Rev. TOB VRDO | 3.490% | 11/7/07 | (4) | 25,975 | 25,975 |
1 | Atlanta GA Water & Wastewater Rev. TOB VRDO | 3.500% | 11/7/07 | (4) | 32,900 | 32,900 |
1 | Atlanta GA Water & Wastewater Rev. TOB VRDO | 3.500% | 11/7/07 | (3) | 18,495 | 18,495 |
1 | Atlanta GA Water & Wastewater Rev. TOB VRDO | 3.500% | 11/7/07 | (1) | 9,995 | 9,995 |
8
Tax-Exempt Money Market Fund
| | | | | Face | Market |
| | | Maturity | | Amount | Value• |
| | Coupon | Date | | ($000) | ($000) |
1 | Atlanta GA Water & Wastewater Rev. TOB VRDO | 3.520% | 11/7/07 | (4) | 9,600 | 9,600 |
1 | Atlanta GA Water & Wastewater Rev. TOB VRDO | 3.580% | 11/7/07 | (4) | 5,000 | 5,000 |
| Atlanta GA Water & Wastewater Rev. VRDO | 3.450% | 11/7/07 | (4) | 107,900 | 107,900 |
| Burke County GA Dev. Auth. PCR (Oglethorpe Power Corp.) VRDO | 3.250% | 11/7/07 | (3) | 59,180 | 59,180 |
| Cobb County GA School Dist. TAN | 4.000% | 12/31/07 | | 19,000 | 19,008 |
| Coweta County GA Dev. Auth. Rev. (Metro Atlanta YMCA Project) VRDO | 3.260% | 11/7/07 | LOC | 7,500 | 7,500 |
1 | DeKalb County GA Water & Sewer Rev. TOB VRDO | 3.500% | 11/7/07 | (4) | 12,324 | 12,324 |
1 | DeKalb County GA Water & Sewer Rev. TOB VRDO | 3.500% | 11/7/07 | (4) | 16,552 | 16,552 |
1 | DeKalb County GA Water & Sewer Rev. TOB VRDO | 3.520% | 11/7/07 | | 6,650 | 6,650 |
| Floyd County GA Dev. Auth. Rev. | | | | | |
| (Berry College) VRDO | 3.260% | 11/7/07 | LOC | 8,300 | 8,300 |
| Floyd County GA Dev. Auth. Rev. | | | | | |
| (Berry College) VRDO | 3.440% | 11/7/07 | LOC | 19,650 | 19,650 |
| Fulco GA Hosp. Auth. Rev. (Piedmont Hosp.) VRDO | 3.430% | 11/7/07 | LOC | 12,100 | 12,100 |
| Fulco GA Hosp. Auth. Rev. (Shepherd Center) VRDO | 3.260% | 11/7/07 | LOC | 7,300 | 7,300 |
| Fulton County GA Dev. Auth. | | | | | |
| (Woodward Academy Project) VRDO | 3.260% | 11/7/07 | LOC | 14,570 | 14,570 |
1 | Fulton County GA Fac. Corp. (Fulton County GA | | | | | |
| Public Purpose Project) COP TOB VRDO | 3.520% | 11/7/07 | (2) | 16,695 | 16,695 |
1 | Fulton County GA Water & Sewer Rev. TOB VRDO | 3.520% | 11/7/07 | (3) | 3,300 | 3,300 |
1 | Georgia GO TOB VRDO | 3.490% | 11/7/07 | | 31,285 | 31,285 |
1 | Georgia GO TOB VRDO | 3.500% | 11/7/07 | | 16,690 | 16,690 |
1 | Georgia GO TOB VRDO | 3.500% | 11/7/07 | | 14,665 | 14,665 |
1 | Georgia GO TOB VRDO | 3.500% | 11/7/07 | | 5,005 | 5,005 |
1 | Georgia GO TOB VRDO | 3.500% | 11/7/07 | | 11,325 | 11,325 |
1 | Georgia GO TOB VRDO | 3.510% | 11/7/07 | | 6,130 | 6,130 |
| Georgia Port Auth. Rev. (Garden City | | | | | |
| Terminal Project) VRDO | 3.260% | 11/7/07 | LOC | 11,500 | 11,500 |
| Georgia Road & Tollway Auth. Federal | | | | | |
| Highway Reimbursement Rev. CP | 3.750% | 11/8/07 | LOC | 20,000 | 20,000 |
1 | Georgia Road & Tollway Auth. Rev. TOB VRDO | 3.500% | 11/7/07 | | 21,440 | 21,440 |
1 | Gwinnett County GA Dev. Auth. COP TOB VRDO | 3.510% | 11/7/07 | (1) | 6,735 | 6,735 |
1 | Gwinnett County GA Dev. Auth. COP TOB VRDO | 3.580% | 11/7/07 | (1) | 7,775 | 7,775 |
| Macon-Bibb County GA Hosp. Auth. | | | | | |
| (Medical Center of Cenrtal Georgia) VRDO | 3.250% | 11/7/07 | (2) | 45,000 | 45,000 |
| Macon-Bibb County GA Hosp. Auth. | | | | | |
| (Medical Center of Central Georgia) VRDO | 3.440% | 11/7/07 | LOC | 21,700 | 21,700 |
| Metro. Atlanta GA Rapid Transp. Auth. | | | | | |
| Georgia Sales Tax Rev. CP | 3.630% | 12/6/07 | LOC | 6,000 | 6,000 |
1 | Metro. Atlanta GA Rapid Transp. Auth. | | | | | |
| Georgia Sales Tax Rev. TOB VRDO | 3.490% | 11/7/07 | (3) | 8,000 | 8,000 |
1 | Metro. Atlanta GA Rapid Transp. Auth. | | | | | |
| Georgia Sales Tax Rev. TOB VRDO | 3.500% | 11/7/07 | (3) | 9,435 | 9,435 |
1 | Metro. Atlanta GA Rapid Transp. Auth. | | | | | |
| Georgia Sales Tax Rev. TOB VRDO | 3.500% | 11/7/07 | (4) | 19,400 | 19,400 |
| Metro. Atlanta GA Rapid Transp. Auth. | | | | | |
| Georgia Sales Tax Rev. TOB VRDO | 3.510% | 11/7/07 | (4) | 5,000 | 5,000 |
1 | Metro. Atlanta GA Rapid Transp. Auth. | | | | | |
| Georgia Sales Tax Rev. TOB VRDO | 3.520% | 11/7/07 | (4) | 10,440 | 10,440 |
| Richmond County GA Hosp. Auth. | | | | | |
| (Univ. of Health Services) VRDO | 3.440% | 11/7/07 | LOC | 31,200 | 31,200 |
| | | | | | 848,229 |
9
Tax-Exempt Money Market Fund
| | | | | Face | Market |
| | | Maturity | | Amount | Value• |
| | Coupon | Date | | ($000) | ($000) |
Hawaii (0.4%) | | | | | |
1 | Hawaii GO TOB VRDO | 3.510% | 11/7/07 | (1) | 5,255 | 5,255 |
1 | Hawaii GO TOB VRDO | 3.510% | 11/7/07 | (4) | 14,210 | 14,210 |
1 | Hawaii GO TOB VRDO | 3.510% | 11/7/07 | (1) | 6,305 | 6,305 |
1 | Hawaii GO TOB VRDO | 3.520% | 11/7/07 | (4) | 8,435 | 8,435 |
1 | Hawaii GO TOB VRDO | 3.520% | 11/7/07 | (1) | 6,030 | 6,030 |
1 | Honolulu HI City & County TOB VRDO | 3.510% | 11/7/07 | (1) | 4,565 | 4,565 |
1 | Honolulu HI City & County TOB VRDO | 3.510% | 11/7/07 | (3) | 3,540 | 3,540 |
1 | Honolulu HI City & County TOB VRDO | 3.520% | 11/7/07 | (1) | 12,500 | 12,500 |
1 | Honolulu HI City & County TOB VRDO | 3.580% | 11/7/07 | (1) | 3,630 | 3,630 |
1 | Honolulu HI City & County Waste Water | | | | | |
| GO TOB VRDO | 3.510% | 11/7/07 | (1) | 9,900 | 9,900 |
1 | Univ. of Hawaii Rev. TOB VRDO | 3.500% | 11/7/07 | (1) | 6,850 | 6,850 |
| | | | | | 81,220 |
Idaho (1.3%) | | | | | |
| Idaho Housing & Finance Assn. | | | | | |
| Single Family Mortgage Rev. VRDO | 3.230% | 11/7/07 | | 30,000 | 30,000 |
| Idaho Housing & Finance Assn. | | | | | |
| Single Family Mortgage Rev. VRDO | 3.290% | 11/7/07 | | 7,320 | 7,320 |
| Idaho Housing & Finance Assn. | | | | | |
| Single Family Mortgage Rev. VRDO | 3.290% | 11/7/07 | | 6,085 | 6,085 |
| Idaho Housing & Finance Assn. | | | | | |
| Single Family Mortgage Rev. VRDO | 3.290% | 11/7/07 | | 11,700 | 11,700 |
| Idaho Housing & Finance Assn. | | | | | |
| Single Family Mortgage Rev. VRDO | 3.290% | 11/7/07 | | 9,885 | 9,885 |
| Idaho Housing & Finance Assn. | | | | | |
| Single Family Mortgage Rev. VRDO | 3.290% | 11/7/07 | | 6,185 | 6,185 |
| Idaho Housing & Finance Assn. | | | | | |
| Single Family Mortgage Rev. VRDO | 3.290% | 11/7/07 | | 10,500 | 10,500 |
| Idaho Housing & Finance Assn. | | | | | |
| Single Family Mortgage Rev. VRDO | 3.290% | 11/7/07 | | 9,070 | 9,070 |
| Idaho Housing & Finance Assn. | | | | | |
| Single Family Mortgage Rev. VRDO | 3.290% | 11/7/07 | | 11,305 | 11,305 |
| Idaho Housing & Finance Assn. | | | | | |
| Single Family Mortgage Rev. VRDO | 3.290% | 11/7/07 | | 11,200 | 11,200 |
| Idaho Housing & Finance Assn. | | | | | |
| Single Family Mortgage Rev. VRDO | 3.290% | 11/7/07 | | 11,415 | 11,415 |
| Idaho Housing & Finance Assn. | | | | | |
| Single Family Mortgage Rev. VRDO | 3.290% | 11/7/07 | | 2,330 | 2,330 |
| Idaho Housing & Finance Assn. | | | | | |
| Single Family Mortgage Rev. VRDO | 3.290% | 11/7/07 | | 18,900 | 18,900 |
| Idaho Housing & Finance Assn. | | | | | |
| Single Family Mortgage Rev. VRDO | 3.290% | 11/7/07 | | 5,000 | 5,000 |
| Idaho Housing & Finance Assn. | | | | | |
| Single Family Mortgage Rev. VRDO | 3.290% | 11/7/07 | | 17,500 | 17,500 |
| Idaho Housing & Finance Assn. | | | | | |
| Single Family Mortgage Rev. VRDO | 3.290% | 11/7/07 | | 20,000 | 20,000 |
| Idaho Housing & Finance Assn. | | | | | |
| Single Family Mortgage Rev. VRDO | 3.290% | 11/7/07 | | 5,800 | 5,800 |
| Idaho Housing & Finance Assn. | | | | | |
| Single Family Mortgage Rev. VRDO | 3.290% | 11/7/07 | | 12,020 | 12,020 |
| Idaho Housing & Finance Assn. | | | | | |
| Single Family Mortgage Rev. VRDO | 3.290% | 11/7/07 | | 12,320 | 12,320 |
| Idaho Housing & Finance Assn. | | | | | |
| Single Family Mortgage Rev. VRDO | 3.290% | 11/7/07 | | 9,450 | 9,450 |
10
Tax-Exempt Money Market Fund
| | | | | Face | Market |
| | | Maturity | | Amount | Value• |
| | Coupon | Date | | ($000) | ($000) |
| Idaho Housing & Finance Assn. | | | | | |
| Single Family Mortgage Rev. VRDO | 3.290% | 11/7/07 | | 8,885 | 8,885 |
| Idaho Housing & Finance Assn. | | | | | |
| Single Family Mortgage Rev. VRDO | 3.290% | 11/7/07 | | 20,000 | 20,000 |
| Idaho Housing & Finance Assn. | | | | | |
| Single Family Mortgage Rev. VRDO | 3.290% | 11/7/07 | | 6,750 | 6,750 |
| Idaho Housing & Finance Assn. | | | | | |
| Single Family Mortgage Rev. VRDO | 3.290% | 11/7/07 | | 18,600 | 18,600 |
| | | | | | 282,220 |
Illinois (9.0%) | | | | | |
1 | Aurora Il Single Family Mortage Rev. TOB VRDO | 3.390% | 11/7/07 | | 5,300 | 5,300 |
| Bartlett IL Special Services Area | | | | | |
| (Bluff City LLC) VRDO | 3.340% | 11/7/07 | LOC | 15,680 | 15,680 |
1 | Chicago IL Board of Educ. TOB VRDO | 3.290% | 11/7/07 | (3) | 11,385 | 11,385 |
1 | Chicago IL Board of Educ. TOB VRDO | 3.510% | 11/7/07 | (2) | 12,095 | 12,095 |
1 | Chicago IL Board of Educ. TOB VRDO | 3.510% | 11/7/07 | (1) | 5,225 | 5,225 |
1 | Chicago IL Board of Educ. TOB VRDO | 3.520% | 11/7/07 | (1)(Prere.) | 5,950 | 5,950 |
| Chicago IL Board of Educ. VRDO | 3.640% | 11/1/07 | (11) | 15,450 | 15,450 |
| Chicago IL Board of Educ. VRDO | 3.470% | 11/7/07 | (4) | 20,000 | 20,000 |
1 | Chicago IL GO TOB VRDO | 3.340% | 11/7/07 | (2) | 3,265 | 3,265 |
1 | Chicago IL GO TOB VRDO | 3.340% | 11/7/07 | (4) | 4,040 | 4,040 |
1 | Chicago IL GO TOB VRDO | 3.490% | 11/7/07 | (4) | 17,990 | 17,990 |
1 | Chicago IL GO TOB VRDO | 3.490% | 11/7/07 | (4) | 24,315 | 24,315 |
1 | Chicago IL GO TOB VRDO | 3.490% | 11/7/07 | (2) | 13,800 | 13,800 |
1 | Chicago IL GO TOB VRDO | 3.500% | 11/7/07 | (3) | 7,905 | 7,905 |
1 | Chicago IL GO TOB VRDO | 3.500% | 11/7/07 | (3) | 9,700 | 9,700 |
1 | Chicago IL GO TOB VRDO | 3.500% | 11/7/07 | (2) | 19,995 | 19,995 |
1 | Chicago IL GO TOB VRDO | 3.500% | 11/7/07 | (2) | 7,690 | 7,690 |
1 | Chicago IL GO TOB VRDO | 3.510% | 11/7/07 | (1) | 5,440 | 5,440 |
1 | Chicago IL GO TOB VRDO | 3.510% | 11/7/07 | (1) | 2,515 | 2,515 |
1 | Chicago IL GO TOB VRDO | 3.510% | 11/7/07 | (4) | 5,235 | 5,235 |
1 | Chicago IL GO TOB VRDO | 3.580% | 11/7/07 | (4) | 4,965 | 4,965 |
| Chicago IL GO VRDO | 3.440% | 11/7/07 | (4) | 22,590 | 22,590 |
1 | Chicago IL Metro. Water Reclamation Dist. | | | | | |
| GO TOB VRDO | 3.490% | 11/7/07 | | 11,050 | 11,050 |
1 | Chicago IL Metro. Water Reclamation Dist. | | | | | |
| GO TOB VRDO | 3.510% | 11/7/07 | | 7,190 | 7,190 |
1 | Chicago IL Metro. Water Reclamation Dist. | | | | | |
| GO TOB VRDO | 3.510% | 11/7/07 | | 5,005 | 5,005 |
1 | Chicago IL Metro. Water Reclamation Dist. | | | | | |
| GO TOB VRDO | 3.510% | 11/7/07 | (Prere.) | 5,230 | 5,230 |
1 | Chicago IL Metro. Water Reclamation Dist. | | | | | |
| GO TOB VRDO | 3.520% | 11/7/07 | | 5,210 | 5,210 |
| Chicago IL Midway Airport Rev. CP | 3.800% | 12/14/07 | LOC | 10,536 | 10,536 |
1 | Chicago IL Park Dist. TOB VRDO | 3.500% | 11/7/07 | (3) | 9,990 | 9,990 |
1 | Chicago IL Park Dist. TOB VRDO | 3.510% | 11/7/07 | (3) | 5,190 | 5,190 |
1 | Chicago IL Park Dist. TOB VRDO | 3.510% | 11/7/07 | (3) | 5,555 | 5,555 |
1 | Chicago IL Public Building Comm. | | | | | |
| (Chicago School Reform Board) TOB VRDO | 3.520% | 11/7/07 | (3) | 5,400 | 5,400 |
1 | Chicago IL Sales Tax Rev. TOB VRDO | 3.520% | 11/7/07 | (4) | 5,375 | 5,375 |
| Chicago IL Sales Tax Rev. VRDO | 3.280% | 11/7/07 | (3) | 29,200 | 29,200 |
1 | Chicago IL Single Family Mortgage TOB VRDO | 3.400% | 11/7/07 | | 4,975 | 4,975 |
1 | Chicago IL Transit Auth. Capital Grant Receipts | | | | | |
| Rev. (Federal Transit Administration) TOB VRDO | 3.520% | 11/7/07 | (2) | 18,550 | 18,550 |
| Chicago IL Transit Auth. Rev. | 5.250% | 6/1/08 | (2) | 4,540 | 4,579 |
11
Tax-Exempt Money Market Fund
| | | | | Face | Market |
| | | Maturity | | Amount | Value• |
| | Coupon | Date | | ($000) | ($000) |
1 | Chicago IL Wastewater Transmission Rev. | | | | | |
| TOB VRDO | 3.500% | 11/7/07 | (3) | 10,970 | 10,970 |
1 | Cook County IL GO TOB PUT | 3.750% | 8/28/08 | (1) | 6,850 | 6,850 |
1 | Cook County IL GO TOB VRDO | 3.490% | 11/7/07 | (1) | 8,395 | 8,395 |
1 | Cook County IL GO TOB VRDO | 3.500% | 11/7/07 | (3) | 5,075 | 5,075 |
1 | Cook County IL GO TOB VRDO | 3.500% | 11/7/07 | (1) | 8,230 | 8,230 |
1 | Cook County IL GO TOB VRDO | 3.500% | 11/7/07 | (3) | 11,500 | 11,500 |
1 | Cook County IL GO TOB VRDO | 3.520% | 11/7/07 | (2) | 13,180 | 13,180 |
| Cook County IL GO VRDO | 3.300% | 11/7/07 | | 7,500 | 7,500 |
| Cook County IL GO VRDO | 3.440% | 11/7/07 | | 24,800 | 24,800 |
| Illinois Dev. Finance Auth. Hosp. Rev. | | | | | |
| (Evanston Northwestern Healthcare Corp.) VRDO | 3.470% | 11/7/07 | | 31,440 | 31,440 |
| Illinois Dev. Finance Auth. Rev. (Bradley Univ.) VRDO | 3.450% | 11/7/07 | (10) | 18,900 | 18,900 |
| Illinois Dev. Finance Auth. Rev. | | | | | |
| (Chicago Horticultural Society) VRDO | 3.340% | 11/7/07 | LOC | 20,000 | 20,000 |
| Illinois Dev. Finance Auth. Rev. | | | | | |
| (Loyola Academy) VRDO | 3.340% | 11/7/07 | LOC | 16,245 | 16,245 |
| Illinois Dev. Finance Auth. Rev. | | | | | |
| (McCormick Theological) VRDO | 3.310% | 11/7/07 | LOC | 20,435 | 20,435 |
| Illinois Dev. Finance Auth. Rev. | | | | | |
| (North Shore Senior Center Project) VRDO | 3.340% | 11/7/07 | LOC | 7,000 | 7,000 |
| Illinois Educ. Fac. Auth. Rev. | | | | | |
| (Adler Planetarium) VRDO | 3.360% | 11/7/07 | LOC | 22,300 | 22,300 |
| Illinois Educ. Fac. Auth. Rev. | | | | | |
| (Field Museum of Natural History) VRDO | 3.280% | 11/7/07 | LOC | 26,400 | 26,400 |
1 | Illinois Educ. Fac. Auth. Rev. | | | | | |
| (Northwestern Univ.) TOB VRDO | 3.500% | 11/7/07 | | 7,005 | 7,005 |
1 | Illinois Educ. Fac. Auth. Rev. | | | | | |
| (Northwestern Univ.) TOB VRDO | 3.510% | 11/7/07 | | 5,970 | 5,970 |
1 | Illinois Educ. Fac. Auth. Rev. | | | | | |
| (Univ. of Chicago) TOB VRDO | 3.490% | 11/7/07 | | 10,015 | 10,015 |
1 | Illinois Educ. Fac. Auth. Rev. | | | | | |
| (Univ. of Chicago) TOB VRDO | 3.500% | 11/7/07 | | 5,795 | 5,795 |
1 | Illinois Educ. Fac. Auth. Rev. | | | | | |
| (Univ. of Chicago) TOB VRDO | 3.500% | 11/7/07 | | 4,830 | 4,830 |
1 | Illinois Educ. Fac. Auth. Rev. | | | | | |
| (Univ. of Chicago) TOB VRDO | 3.500% | 11/7/07 | | 3,635 | 3,635 |
| Illinois Educ. Fac. Auth. Rev. | | | | | |
| (Univ. of Chicago) VRDO | 3.430% | 11/7/07 | | 18,200 | 18,200 |
| Illinois Educ. Fac. Auth. Rev. | | | | | |
| (Univ. of Chicago) VRDO | 3.430% | 11/7/07 | | 33,362 | 33,362 |
| Illinois Finance Auth. IDR (Guesto Packing | | | | | |
| Company Inc. Project) Rev. VRDO | 3.550% | 11/7/07 | LOC | 8,000 | 8,000 |
1 | Illinois Finance Auth. Rev. | | | | | |
| (Northwestern Univ.) TOB VRDO | 3.500% | 11/7/07 | | 5,195 | 5,195 |
1 | Illinois Finance Auth. Rev. | | | | | |
| (Northwestern Univ.) TOB VRDO | 3.520% | 11/7/07 | | 8,165 | 8,165 |
1 | Illinois Finance Auth. Rev. | | | | | |
| (Palos Community Hosp.) TOB VRDO | 3.490% | 11/7/07 | (1) | 11,480 | 11,480 |
| Illinois Finance Auth. Rev. | | | | | |
| (Univ. of Chicago) VRDO | 3.430% | 11/7/07 | | 60,482 | 60,482 |
| Illinois GO | 5.000% | 1/1/08 | | 8,100 | 8,116 |
| Illinois GO | 5.250% | 8/1/08 | | 14,500 | 14,669 |
| Illinois GO TAN | 4.250% | 11/9/07 | | 150,000 | 150,016 |
1 | Illinois GO TOB PUT | 3.780% | 6/5/08 | (2) | 14,440 | 14,440 |
1 | Illinois GO TOB VRDO | 3.490% | 11/7/07 | | 4,600 | 4,600 |
12
Tax-Exempt Money Market Fund
| | | | | Face | Market |
| | | Maturity | | Amount | Value• |
| | Coupon | Date | | ($000) | ($000) |
1 | Illinois GO TOB VRDO | 3.490% | 11/7/07 | (3) | 6,300 | 6,300 |
1 | Illinois GO TOB VRDO | 3.490% | 11/7/07 | | 17,380 | 17,380 |
1 | Illinois GO TOB VRDO | 3.490% | 11/7/07 | (1) | 9,150 | 9,150 |
1 | Illinois GO TOB VRDO | 3.490% | 11/7/07 | | 12,990 | 12,990 |
1 | Illinois GO TOB VRDO | 3.500% | 11/7/07 | (3) | 22,000 | 22,000 |
1 | Illinois GO TOB VRDO | 3.500% | 11/7/07 | (4) | 6,013 | 6,013 |
1 | Illinois GO TOB VRDO | 3.500% | 11/7/07 | | 2,845 | 2,845 |
1 | Illinois GO TOB VRDO | 3.500% | 11/7/07 | (2) | 3,105 | 3,105 |
1 | Illinois GO TOB VRDO | 3.500% | 11/7/07 | (2) | 2,500 | 2,500 |
1 | Illinois GO TOB VRDO | 3.500% | 11/7/07 | (2) | 2,940 | 2,940 |
1 | Illinois GO TOB VRDO | 3.500% | 11/7/07 | (3) | 12,730 | 12,730 |
1 | Illinois GO TOB VRDO | 3.510% | 11/7/07 | (4) | 3,525 | 3,525 |
1 | Illinois GO TOB VRDO | 3.510% | 11/7/07 | (1) | 8,325 | 8,325 |
1 | Illinois GO TOB VRDO | 3.520% | 11/7/07 | (4) | 3,995 | 3,995 |
1 | Illinois GO TOB VRDO | 3.520% | 11/7/07 | (1) | 12,480 | 12,480 |
1 | Illinois GO TOB VRDO | 3.520% | 11/7/07 | (2) | 11,455 | 11,455 |
1 | Illinois GO TOB VRDO | 3.520% | 11/7/07 | | 15,240 | 15,240 |
1 | Illinois GO TOB VRDO | 3.520% | 11/7/07 | | 24,025 | 24,025 |
1 | Illinois GO TOB VRDO | 3.580% | 11/7/07 | (1) | 5,220 | 5,220 |
1 | Illinois GO TOB VRDO | 3.580% | 11/7/07 | (1) | 5,075 | 5,075 |
1 | Illinois GO TOB VRDO | 3.580% | 11/7/07 | (4) | 4,960 | 4,960 |
| Illinois GO VRDO | 3.240% | 11/7/07 | | 38,150 | 38,150 |
| Illinois Health Fac. Auth. Rev. | | | | | |
| (Evanston Hosp. Corp.) CP | 3.680% | 12/6/07 | | 50,000 | 50,000 |
| Illinois Health Fac. Auth. Rev. | | | | | |
| (Gottlieb Health Resources Inc. | | | | | |
| Obligated Group) VRDO | 3.450% | 11/7/07 | LOC | 14,100 | 14,100 |
1 | Illinois Housing Dev. Auth. | | | | | |
| Homeowner Mortgage TOB VRDO | 3.360% | 11/7/07 | | 5,505 | 5,505 |
1 | Illinois Housing Dev. Auth. | | | | | |
| Multi Family Rev TOB VRDO | 3.630% | 11/7/07 | | 46,530 | 46,530 |
1 | Illinois Housing Dev. Auth. TOB VRDO | 3.550% | 11/7/07 | | 9,940 | 9,940 |
1 | Illinois Regional Transp. Auth. Rev. TOB VRDO | 3.490% | 11/7/07 | (1) | 5,960 | 5,960 |
1 | Illinois Regional Transp. Auth. Rev. TOB VRDO | 3.500% | 11/7/07 | (1) | 5,195 | 5,195 |
1 | Illinois Regional Transp. Auth. Rev. TOB VRDO | 3.520% | 11/7/07 | (3) | 12,895 | 12,895 |
1 | Illinois Sales Tax Rev. TOB VRDO | 3.500% | 11/7/07 | | 3,500 | 3,500 |
1 | Illinois Sales Tax Rev. TOB VRDO | 3.580% | 11/7/07 | (4) | 5,245 | 5,245 |
1 | Illinois State Tollway Highway Auth. | | | | | |
| Toll Highway Rev. TOB VRDO | 3.510% | 11/7/07 | (4) | 5,190 | 5,190 |
1 | Illinois State Tollway Highway Auth. | | | | | |
| Toll Highway Rev. TOB VRDO | 3.510% | 11/7/07 | (4) | 10,370 | 10,370 |
2 | Illinois State Tollway Highway Auth. | | | | | |
| Toll Highway Rev. VRDO | 3.300% | 11/7/07 | (10) | 75,000 | 75,000 |
1 | Lake County IL Community | | | | | |
| Consolidated School Dist. TOB VRDO | 3.490% | 11/7/07 | (4) | 13,635 | 13,635 |
1 | Lake County IL Community | | | | | |
| High School Dist TOB VRDO | 3.520% | 11/7/07 | | 13,255 | 13,255 |
1 | Metro. Pier & Exposition Auth. | | | | | |
| Illinois Dedicated Sales Tax Rev. TOB VRDO | 3.510% | 11/7/07 | (1) | 31,675 | 31,675 |
1 | Metro. Pier & Exposition Auth. | | | | | |
| Illinois Dedicated Sales Tax Rev. TOB VRDO | 3.510% | 11/7/07 | (3) | 8,795 | 8,795 |
1 | Metro. Pier & Exposition Auth. | | | | | |
| Illinois Dedicated Sales Tax Rev. TOB VRDO | 3.510% | 11/7/07 | (1) | 14,485 | 14,485 |
1 | Metro. Pier & Exposition Auth. | | | | | |
| Illinois Dedicated Sales Tax Rev. TOB VRDO | 3.510% | 11/7/07 | (1) | 5,060 | 5,060 |
1 | Metro. Pier & Exposition Auth. Illinois | | | | | |
| Dedicated Sales Tax Rev. TOB VRDO | 3.520% | 11/7/07 | (1) | 10,000 | 10,000 |
13
Tax-Exempt Money Market Fund
| | | | | Face | Market |
| | | Maturity | | Amount | Value• |
| | Coupon | Date | | ($000) | ($000) |
1 | Metro. Pier & Exposition Auth. Illinois | | | | | |
| Dedicated Sales Tax Rev. TOB VRDO | 3.530% | 11/7/07 | (3) | 6,645 | 6,645 |
1 | Metro. Pier & Exposition Auth. Illinois | | | | | |
| Dedicated Sales Tax Rev. TOB VRDO | 3.580% | 11/7/07 | (1) | 6,145 | 6,145 |
1 | Regional Transp. Auth. Cook, Du Page, | | | | | |
| Kane, Lake, McHenry, and Will Counties | | | | | |
| IL GO TOB VRDO | 3.490% | 11/7/07 | (4) | 66,175 | 66,175 |
1 | Regional Transp. Auth. Cook, Du Page, | | | | | |
| Kane, Lake, McHenry, and Will Counties | | | | | |
| IL GO TOB VRDO | 3.490% | 11/7/07 | (3) | 47,325 | 47,325 |
1 | Regional Transp. Auth. Cook, Du Page, | | | | | |
| Kane, Lake, McHenry, and Will Counties | | | | | |
| IL GO TOB VRDO | 3.500% | 11/7/07 | (3) | 96,515 | 96,515 |
1 | Schaumburg IL GO TOB VRDO | 3.520% | 11/7/07 | (3) | 6,000 | 6,000 |
| Schaumburg IL GO VRDO | 3.460% | 11/7/07 | | 485 | 485 |
| Univ. of Illinois (Util. Infrastructure Project) | | | | | |
| COP VRDO | 3.430% | 11/7/07 | | 114,448 | 114,448 |
1 | Univ. of Illinois Univ. Rev. TOB VRDO | 3.520% | 11/7/07 | (1) | 14,660 | 14,660 |
1 | Will County IL Community School Dist. TOB VRDO | 3.510% | 11/7/07 | (4) | 8,570 | 8,570 |
1 | Will County IL Community School Dist. TOB VRDO | 3.510% | 11/7/07 | (3) | 7,005 | 7,005 |
1 | Will County IL Community School Dist. TOB VRDO | 3.510% | 11/7/07 | (1) | 8,610 | 8,610 |
1 | Will County IL First Preserve Dist. TOB PUT | 3.800% | 3/13/08 | (1) | 12,835 | 12,835 |
| | | | | | 1,978,916 |
Indiana (2.5%) | | | | | |
1 | Franklin IN Community Multi-School Building Corp. | | | | | |
| TOB VRDO | 3.570% | 11/7/07 | (3) | 2,650 | 2,650 |
1 | Franklin Township IN School Building Corp. | | | | | |
| (Marion County) TOB PUT | 3.800% | 3/13/08 | (1) | 5,530 | 5,530 |
| Indiana Bond Bank Advance Funding | | | | | |
| Program Notes | 4.250% | 1/31/08 | LOC | 100,000 | 100,146 |
| Indiana Bond Bank Rev. Midyear Funding | | | | | |
| Program Notes TAN | 4.500% | 5/20/08 | LOC | 100,000 | 100,401 |
1 | Indiana Bond Bank Rev. Revolving Funding | | | | | |
| Program TOB VRDO | 3.500% | 11/7/07 | | 8,255 | 8,255 |
| Indiana Dev. Finance Auth. Rev. | | | | | |
| (Children’s Museum) VRDO | 3.260% | 11/7/07 | | 29,200 | 29,200 |
| Indiana Dev. Finance Auth. Rev. | | | | | |
| (Indianapolis Museum of Art) VRDO | 3.260% | 11/7/07 | LOC | 19,100 | 19,100 |
| Indiana Educ. Fac. Auth. (Wabash College) VRDO | 3.470% | 11/7/07 | LOC | 29,940 | 29,940 |
1 | Indiana Finance Auth. Highway Rev. TOB VRDO | 3.520% | 11/7/07 | (3) | 35,240 | 35,240 |
| Indiana Health Fac. Auth. Finance Auth. Rev. | | | | | |
| (Ascension Health Credit Group) | 5.000% | 11/1/07 | | 5,000 | 5,000 |
1 | Indiana Health Fac. Fin. Auth. Hosp. Rev. | | | | | |
| (Community Hosp. Project) Rev. TOB VRDO | 3.580% | 11/7/07 | (2) | 6,450 | 6,450 |
1 | Indiana Housing & Community Dev. Auth. | | | | | |
| Single Family Mortgage Rev. TOB VRDO | 3.390% | 11/7/07 | | 7,700 | 7,700 |
| Indiana Office Building Comm. Fac. Rev. | | | | | |
| (Indiana Govt. Center South) VRDO | 3.320% | 11/7/07 | | 14,400 | 14,400 |
1 | Indiana Transp. Finance Auth. Highway Rev. | | | | | |
| TOB VRDO | 3.340% | 11/7/07 | (3) | 4,995 | 4,995 |
1 | Indiana Transp. Finance Auth. Highway Rev. | | | | | |
| TOB VRDO | 3.340% | 11/7/07 | (3) | 4,050 | 4,050 |
1 | Indiana Transp. Finance Auth. Highway Rev. | | | | | |
| TOB VRDO | 3.500% | 11/7/07 | (3) | 5,110 | 5,110 |
1 | Indiana Transp. Finance Auth. Highway Rev. | | | | | |
| TOB VRDO | 3.500% | 11/7/07 | (3) | 7,955 | 7,955 |
14
Tax-Exempt Money Market Fund
| | | | | Face | Market |
| | | Maturity | | Amount | Value• |
| | Coupon | Date | | ($000) | ($000) |
1 | Indiana Transp. Finance Auth. Highway Rev. | | | | | |
| TOB VRDO | 3.500% | 11/7/07 | (3) | 4,298 | 4,298 |
| Indianapolis IN Local Public Improvement Rev. | | | | | |
| (Bank-Waterworks Project) VRDO | 3.450% | 11/7/07 | (1) | 95,635 | 95,635 |
1 | Indianapolis IN Local Public Improvement Rev. | | | | | |
| TOB PUT | 3.800% | 3/13/08 | (1) | 7,100 | 7,100 |
1 | Indianapolis IN Local Public Improvement Rev. | | | | | |
| TOB PUT | 3.960% | 3/13/08 | (1) | 6,530 | 6,530 |
1 | Indianapolis IN Local Public Improvement Rev. | | | | | |
| TOB PUT | 3.980% | 3/13/08 | (1) | 5,870 | 5,870 |
1 | Indianapolis IN Local Public Improvement Rev. | | | | | |
| TOB VRDO | 3.500% | 11/7/07 | (1) | 4,240 | 4,240 |
1 | Indianapolis IN Local Public Improvement Rev. | | | | | |
| TOB VRDO | 3.550% | 11/7/07 | (2) | 16,800 | 16,800 |
| Noblesville IN Econ. Dev. Rev. | | | | | |
| (Greystone Apartments Project) VRDO | 3.540% | 11/7/07 | LOC | 6,250 | 6,250 |
1 | Purdue Univ. Indiana Univ. Rev. TOB VRDO | 3.510% | 11/7/07 | (Prere.) | 6,270 | 6,270 |
| Trustee of Indiana Univ. CP | 3.610% | 11/14/07 | | 22,000 | 22,000 |
| | | | | | 561,115 |
Iowa (0.3%) | | | | | |
1 | Des Moines IA Metro. Wastewater Reclamation | | | | | |
| Auth. Sewer. Rev. TOB VRDO | 3.490% | 11/7/07 | (1) | 6,470 | 6,470 |
| Iowa Finance Auth. Hosp. Fac. Rev. | | | | | |
| (Iowa Health System) VRDO | 3.270% | 11/7/07 | (2) | 6,980 | 6,980 |
| Iowa Finance Auth. Single Family Rev. VRDO | 3.500% | 11/7/07 | | 11,500 | 11,500 |
| Iowa Finance Auth. Single Family Rev. VRDO | 3.530% | 11/7/07 | | 12,000 | 12,000 |
| Iowa Higher Educ. Loan Auth. Rev. Private | | | | | |
| College Fac. (Grinnell College Project) VRDO | 3.470% | 11/7/07 | | 37,500 | 37,500 |
| | | | | | 74,450 |
Kansas (0.3%) | | | | | |
1 | Johnson County KS Water Dist. Rev. TOB VRDO | 3.580% | 11/7/07 | | 3,220 | 3,220 |
1 | Kansas Dev. Finance Auth. TOB VRDO | 3.510% | 11/7/07 | | 5,195 | 5,195 |
| Sedgwick County KS Airport Fac. Rev. | | | | | |
| (FlightSafety) VRDO | 3.500% | 11/7/07 | | 34,000 | 34,000 |
| Wichita KS Airport Facs. Rev. VRDO | 3.500% | 11/7/07 | | 7,500 | 7,500 |
1 | Wyandotte County Kansas City KS Unified | | | | | |
| Govt. GO TOB VRDO | 3.520% | 11/7/07 | (2) | 6,000 | 6,000 |
| | | | | | 55,915 |
Kentucky (1.4%) | | | | | |
| Jeffersontown KY Lease Program | | | | | |
| (Kentucky League of Cities Funding) VRDO | 3.420% | 11/7/07 | LOC | 3,600 | 3,600 |
| Kentucky Asset/Liability Comm. | | | | | |
| General Fund Rev. CP | 3.750% | 11/1/07 | | 16,700 | 16,700 |
| Kentucky Asset/Liability Comm. | | | | | |
| General Fund Rev. CP | 3.750% | 11/8/07 | | 12,500 | 12,500 |
1 | Kentucky Asset/Liability Comm. | | | | | |
| General Fund Rev. TOB VRDO | 3.510% | 11/7/07 | (1) | 5,050 | 5,050 |
| Kentucky Inc. Public Energy Auth. | | | | | |
| Gas Supply Rev. VRDO | 3.580% | 11/1/07 | | 111,474 | 111,474 |
1 | Kentucky Property & Building Comm. | | | | | |
| Rev. TOB VRDO | 3.490% | 11/7/07 | (4) | 21,780 | 21,780 |
1 | Kentucky Property & Building Comm. | | | | | |
| Rev. TOB VRDO | 3.520% | 11/7/07 | (1) | 24,835 | 24,835 |
| Kentucky Turnpike Auth. Econ. Dev. Road Rev. | | | | | |
| (Revitalization Project) | 6.500% | 7/1/08 | (2) | 7,000 | 7,126 |
15
Tax-Exempt Money Market Fund
| | | | | Face | Market |
| | | Maturity | | Amount | Value• |
| | Coupon | Date | | ($000) | ($000) |
1 | Louisville & Jefferson County KY Metro. | | | | | |
| Sewer Dist. TOB VRDO | 3.520% | 11/7/07 | (3) | 14,000 | 14,000 |
1 | Louisville & Jefferson County KY TOB VRDO | 3.520% | 11/7/07 | (1) | 17,500 | 17,500 |
| Richmond KY League of Cities Funding | | | | | |
| Lease Program Rev. VRDO | 3.470% | 11/7/07 | LOC | 10,000 | 10,000 |
| Warren County KY Rev. (Western Kentucky | | | | | |
| Univ. Student Life) VRDO | 3.470% | 11/7/07 | LOC | 60,430 | 60,430 |
| Warren County KY Rev. (Western Kentucky | | | | | |
| Univ. Student Life) VRDO | 3.470% | 11/7/07 | LOC | 4,800 | 4,800 |
| | | | | | 309,795 |
Louisiana (0.7%) | | | | | |
| Ascension Parish LA Ind. Dev. Board Rev. | | | | | |
| (Geismar Project) VRDO | 3.260% | 11/7/07 | LOC | 40,000 | 40,000 |
1 | Louisiana Gasoline and Fuel Tax Rev. TOB VRDO | 3.500% | 11/7/07 | (3)(4) | 27,225 | 27,225 |
1 | Louisiana GO TOB VRDO | 3.490% | 11/7/07 | (2) | 22,445 | 22,445 |
1 | Louisiana GO TOB VRDO | 3.500% | 11/7/07 | (3) | 30,000 | 30,000 |
1 | Louisiana GO TOB VRDO | 3.580% | 11/7/07 | (2) | 5,175 | 5,175 |
1 | Louisiana GO TOB VRDO | 3.580% | 11/7/07 | (4) | 7,985 | 7,985 |
1 | Louisiana GO TOB VRDO | 3.580% | 11/7/07 | (4) | 7,985 | 7,985 |
| Louisiana Local Govt. Environment Facilities | | | | | |
| Community Dev. Auth. Rev. VRDO | 3.270% | 11/7/07 | LOC | 12,500 | 12,500 |
| Louisiana Public Fac. Auth. Rev. (International | | | | | |
| Matex Tank Terminals) VRDO | 3.260% | 11/7/07 | LOC | 10,000 | 10,000 |
| | | | | | 163,315 |
Maine (0.3%) | | | | | |
| Maine GO BAN | 4.250% | 6/10/08 | | 9,500 | 9,531 |
1 | Maine Health & Higher Educ. Fac. | | | | | |
| Auth. Rev. TOB VRDO | 3.510% | 11/7/07 | (1) | 11,285 | 11,285 |
1 | Maine Housing Auth. General Rev. TOB VRDO | 3.530% | 11/7/07 | | 3,740 | 3,740 |
1 | Maine Housing Auth. General Rev. TOB VRDO | 3.580% | 11/7/07 | | 4,240 | 4,240 |
1 | Maine Housing Auth. General Rev. TOB VRDO | 3.610% | 11/7/07 | | 150 | 150 |
1 | Maine Housing Auth. General Rev. TOB VRDO | 3.610% | 11/7/07 | | 345 | 345 |
1 | Maine Housing Auth. General Rev. TOB VRDO | 3.610% | 11/7/07 | | 125 | 125 |
| Maine Housing Auth. Mortgage Rev. PUT | 3.820% | 7/18/08 | | 12,000 | 12,000 |
1 | Maine Housing Auth. Mortgage Rev. TOB VRDO | 3.550% | 11/7/07 | | 5,055 | 5,055 |
1 | Maine Housing Auth. Mortgage Rev. TOB VRDO | 3.590% | 11/7/07 | | 7,065 | 7,065 |
| Maine Housing Auth. Mortgage Rev. VRDO | 3.500% | 11/7/07 | | 5,000 | 5,000 |
| Maine Housing Auth. Mortgage Rev. VRDO | 3.500% | 11/7/07 | | 5,000 | 5,000 |
| Maine Housing Auth. Mortgage Rev. VRDO | 3.530% | 11/7/07 | | 5,900 | 5,900 |
| | | | | | 69,436 |
Maryland (0.8%) | | | | | |
| Anne Arundel County MD GO | 5.000% | 3/1/08 | | 7,375 | 7,406 |
| Baltimore MD Consolidated | | | | | |
| Public Improvement CP | 3.600% | 11/7/07 | | 26,075 | 26,075 |
1 | Maryland Dept. of Housing & Community Dev. | | | | | |
| Mortgage Rev. Draw Down TOB VRDO | 3.530% | 11/7/07 | | 4,180 | 4,180 |
1 | Maryland Dept. of Housing & Community Dev. | | | | | |
| Mortgage Rev. Draw Down TOB VRDO | 3.530% | 11/7/07 | | 3,530 | 3,530 |
1 | Maryland Dept. of Housing & Community Dev. | | | | | |
| Mortgage Rev. Draw Down TOB VRDO | 3.560% | 11/7/07 | | 3,170 | 3,170 |
1 | Maryland Dept. of Housing & Community Dev. | | | | | |
| Rev. TOB VRDO | 3.360% | 11/7/07 | | 4,975 | 4,975 |
1 | Maryland Dept. of Housing & Community Dev. | | | | | |
| Rev. TOB VRDO | 3.550% | 11/7/07 | | 2,960 | 2,960 |
1 | Maryland Dept. of Housing & Community Dev. | | | | | |
| Rev. TOB VRDO | 3.550% | 11/7/07 | | 7,995 | 7,995 |
16
Tax-Exempt Money Market Fund
| | | | | Face | Market |
| | | Maturity | | Amount | Value• |
| | Coupon | Date | | ($000) | ($000) |
1 | Maryland Dept. of Housing & Community Dev. | | | | | |
| Rev. TOB VRDO | 3.580% | 11/7/07 | | 20 | 20 |
1 | Maryland Dept. of Housing & Community Dev. | | | | | |
| TOB VRDO | 3.530% | 11/7/07 | | 3,120 | 3,120 |
| Maryland Dept. of Housing & Community Dev. | | | | | |
| VRDO | 3.450% | 11/7/07 | | 16,400 | 16,400 |
| Maryland GO | 5.250% | 2/1/08 | | 5,000 | 5,019 |
| Maryland GO | 5.250% | 3/1/08 | | 24,935 | 25,070 |
1 | Maryland GO TOB VRDO | 3.490% | 11/7/07 | | 7,800 | 7,800 |
| Maryland Health & Higher Educ. Fac. Auth. Rev. | | | | | |
| (Gilman School) VRDO | 3.250% | 11/7/07 | LOC | 8,000 | 8,000 |
| Maryland Health & Higher Educ. Fac. Auth. Rev. | | | | | |
| (Johns Hopkins Univ.) CP | 3.750% | 11/6/07 | | 21,562 | 21,562 |
| Maryland Water Quality Financing Administration | | | | | |
| Revolving Loan Rev. | 5.000% | 9/1/08 | | 5,000 | 5,066 |
1 | Montgomery County MD GO TOB VRDO | 3.490% | 11/7/07 | | 4,885 | 4,885 |
1 | Northeast MD Waste Disposal TOB PUT | 3.770% | 11/1/07 | (2) | 4,995 | 4,995 |
1 | Prince Georges County MD GO TOB VRDO | 3.340% | 11/7/07 | | 6,380 | 6,380 |
| | | | | | 168,608 |
Massachusetts (2.1%) | | | | | |
| Boston MA GO | 5.000% | 2/1/08 | (1) | 5,000 | 5,016 |
1 | Massachusetts Bay Transp. Auth. Rev. | | | | | |
| Sales Tax TOB VRDO | 3.490% | 11/7/07 | | 5,025 | 5,025 |
1 | Massachusetts Bay Transp. Auth. Rev. TOB VRDO | 3.490% | 11/7/07 | | 28,480 | 28,480 |
1 | Massachusetts Bay Transp. Auth. Rev. TOB VRDO | 3.530% | 11/7/07 | | 11,640 | 11,640 |
1 | Massachusetts Bay Transp. Auth. Rev. TOB VRDO | 3.530% | 11/7/07 | | 11,955 | 11,955 |
| Massachusetts GO | 5.500% | 2/1/08 | (1) | 10,000 | 10,047 |
1 | Massachusetts GO TOB PUT | 3.800% | 2/27/08 | (2) | 5,490 | 5,490 |
1 | Massachusetts GO TOB VRDO | 3.290% | 11/7/07 | (2) | 11,150 | 11,150 |
1 | Massachusetts GO TOB VRDO | 3.500% | 11/7/07 | (Prere.) | 5,755 | 5,755 |
| Massachusetts Health & Educ. Fac. Auth. Rev. | | | | | |
| (Baystate Medical Center) VRDO | 3.240% | 11/7/07 | LOC | 22,000 | 22,000 |
| Massachusetts Health & Educ. Fac. Auth. Rev. | | | | | |
| (Harvard Univ.) CP | 3.720% | 11/8/07 | | 7,000 | 7,000 |
| Massachusetts Health & Educ. Fac. Auth. Rev. | | | | | |
| (Harvard Univ.) CP | 3.680% | 12/13/07 | | 26,900 | 26,900 |
| Massachusetts Health & Educ. Fac. Auth. Rev. | | | | | |
| (Harvard Univ.) CP | 3.550% | 2/7/08 | | 40,735 | 40,735 |
| Massachusetts Health & Educ. Fac. Auth. Rev. | | | | | |
| (Harvard Univ.) CP | 3.550% | 2/8/08 | | 12,000 | 12,000 |
1 | Massachusetts Health & Educ. Fac. Auth. Rev. | | | | | |
| (Harvard Univ.) TOB VRDO | 3.290% | 11/7/07 | | 10,580 | 10,580 |
1 | Massachusetts Health & Educ. Fac. Auth. Rev. | | | | | |
| (Harvard Univ.) TOB VRDO | 3.490% | 11/7/07 | | 13,240 | 13,240 |
1 | Massachusetts Health & Educ. Fac. Auth. Rev. | | | | | |
| (Harvard Univ.) TOB VRDO | 3.510% | 11/7/07 | | 15,000 | 15,000 |
1 | Massachusetts Housing Finance Agency | | | | | |
| Housing Rev. TOB VRDO | 3.500% | 11/7/07 | | 10,105 | 10,105 |
1 | Massachusetts School Building Auth. | | | | | |
| Dedicated Sales Tax Rev. TOB VRDO | 3.510% | 11/7/07 | (1) | 9,800 | 9,800 |
1 | Massachusetts School Building Auth. | | | | | |
| Dedicated Sales Tax Rev. TOB VRDO | 3.510% | 11/7/07 | (4) | 8,800 | 8,800 |
1 | Massachusetts School Building Auth. | | | | | |
| Dedicated Sales Tax Rev. TOB VRDO | 3.510% | 11/7/07 | (4) | 7,070 | 7,070 |
1 | Massachusetts School Building Auth. | | | | | |
| Dedicated Sales Tax Rev. TOB VRDO | 3.510% | 11/7/07 | (4) | 31,135 | 31,135 |
17
Tax-Exempt Money Market Fund
| | | | | Face | Market |
| | | Maturity | | Amount | Value• |
| | Coupon | Date | | ($000) | ($000) |
1 | Massachusetts Special Obligation | | | | | |
| Dedicated Tax Rev. TOB VRDO | 3.490% | 11/7/07 | (3) | 19,000 | 19,000 |
1 | Massachusetts Turnpike Auth. Rev. | | | | | |
| (Metro. Highway System) TOB VRDO | 3.490% | 11/7/07 | (2) | 12,977 | 12,977 |
| Massachusetts Water Resources Auth. Rev. CP | 3.700% | 11/14/07 | LOC | 7,500 | 7,500 |
1 | Massachusetts Water Resources Auth. | | | | | |
| Rev. TOB VRDO | 3.490% | 11/7/07 | (4) | 12,635 | 12,635 |
1 | Massachusetts Water Resources Auth. | | | | | |
| Rev. TOB VRDO | 3.490% | 11/7/07 | (4) | 11,385 | 11,385 |
1 | Massachusetts Water Resources Auth. | | | | | |
| Rev. TOB VRDO | 3.500% | 11/7/07 | (4) | 30,545 | 30,545 |
1 | Massachusetts Water Resources Auth. | �� | | | | |
| Rev. TOB VRDO | 3.500% | 11/7/07 | | 10,270 | 10,270 |
1 | Massachusetts Water Resources Auth. | | | | | |
| Rev. TOB VRDO | 3.510% | 11/7/07 | (2) | 7,300 | 7,300 |
1 | Massachusetts Water Resources Auth. | | | | | |
| Rev. TOB VRDO | 3.500% | 11/8/07 | (4) | 39,485 | 39,485 |
| Massachusetts Water Resources Auth. | | | | | |
| Rev. VRDO | 3.240% | 11/7/07 | (2) | 5,260 | 5,260 |
| Massachusetts Water Resources Auth. | | | | | |
| Rev. VRDO | 3.240% | 11/7/07 | (3) | 2,190 | 2,190 |
| | | | | | 467,470 |
Michigan (4.2%) | | | | | |
1 | Detroit MI City School Dist. TOB PUT | 3.800% | 2/28/08 | (3) | 7,585 | 7,585 |
1 | Detroit MI City School Dist. TOB VRDO | 3.520% | 11/7/07 | (3) | 12,375 | 12,375 |
1 | Detroit MI Sewer System Rev. TOB VRDO | 3.500% | 11/7/07 | (3) | 895 | 895 |
1 | Detroit MI Sewer System Rev. TOB VRDO | 3.510% | 11/7/07 | (4) | 22,050 | 22,050 |
1 | Detroit MI Sewer System Rev. TOB VRDO | 3.520% | 11/7/07 | (1) | 20,100 | 20,100 |
1 | Detroit MI Sewer System Rev. TOB VRDO | 3.520% | 11/7/07 | (3) | 19,600 | 19,600 |
| Detroit MI Sewer System Rev. VRDO | 3.580% | 11/1/07 | (4) | 1,000 | 1,000 |
| Detroit MI Sewer System Rev. VRDO | 3.440% | 11/7/07 | (3) | 20,000 | 20,000 |
1 | Detroit MI Water Supply System TOB VRDO | 3.290% | 11/7/07 | (4) | 16,000 | 16,000 |
| Detroit MI Water Supply System VRDO | 3.230% | 11/7/07 | (3) | 8,300 | 8,300 |
1 | Huron Valley MI School Dist. TOB VRDO | 3.510% | 11/7/07 | | 5,040 | 5,040 |
1 | Huron Valley MI School Dist. TOB VRDO | 3.520% | 11/7/07 | | 5,000 | 5,000 |
| Michigan Building Auth. CP | 3.720% | 11/20/07 | LOC | 35,045 | 35,045 |
1 | Michigan Building Auth. Rev. TOB VRDO | 3.340% | 11/7/07 | (1) | 12,175 | 12,175 |
1 | Michigan Building Auth. Rev. TOB VRDO | 3.500% | 11/7/07 | (3) | 12,515 | 12,515 |
1 | Michigan Building Auth. Rev. TOB VRDO | 3.500% | 11/7/07 | | 5,000 | 5,000 |
1 | Michigan Building Auth. Rev. TOB VRDO | 3.500% | 11/7/07 | (4) | 9,635 | 9,635 |
1 | Michigan Building Auth. Rev. TOB VRDO | 3.510% | 11/7/07 | (1) | 4,240 | 4,240 |
1 | Michigan Building Auth. Rev. TOB VRDO | 3.520% | 11/7/07 | (3) | 7,000 | 7,000 |
1 | Michigan Building Auth. Rev. TOB VRDO | 3.580% | 11/7/07 | (Prere.) | 5,080 | 5,080 |
1 | Michigan GO TOB VRDO | 3.510% | 11/7/07 | (4) | 5,230 | 5,230 |
1 | Michigan Hosp. Finance Auth. Rev. | | | | | |
| (Henry Ford Health System) TOB VRDO | 3.510% | 11/7/07 | | 1,670 | 1,670 |
| Michigan Hosp. Finance Auth. Rev. | | | | | |
| (Henry Ford Health System) VRDO | 3.240% | 11/7/07 | LOC | 49,320 | 49,320 |
| Michigan Hosp. Finance Auth. Rev. | | | | | |
| (Holland Community Hosp.) VRDO | 3.460% | 11/7/07 | LOC | 7,000 | 7,000 |
1 | Michigan Hosp. Finance Auth. Rev. TOB VRDO | 3.490% | 11/7/07 | LOC | 14,200 | 14,200 |
1 | Michigan Housing Dev. Auth. Rev. TOB VRDO | 3.530% | 11/7/07 | (4) | 8,125 | 8,125 |
| Michigan Housing Dev. Auth. | | | | | |
| Single Family Mortgage Rev. VRDO | 3.240% | 11/7/07 | | 26,340 | 26,340 |
| Michigan Housing Dev. Auth. | | | | | |
| Single Family Mortgage Rev. VRDO | 3.300% | 11/7/07 | | 14,015 | 14,015 |
18
Tax-Exempt Money Market Fund
| | | | | Face | Market |
| | | Maturity | | Amount | Value• |
| | Coupon | Date | | ($000) | ($000) |
| Michigan Housing Dev. Auth. | | | | | |
| Single Family Mortgage Rev. VRDO | 3.300% | 11/7/07 | | 82,000 | 82,000 |
| Michigan Muni. Bond Auth. Rev. | 4.500% | 8/20/08 | | 50,000 | 50,317 |
| Michigan Muni. Bond Auth. Rev. | 4.500% | 8/20/08 | LOC | 100,000 | 100,635 |
| Michigan Muni. Bond Auth. Rev. | | | | | |
| (Clean Water Revolving Fund) | 5.250% | 10/1/08 | | 11,960 | 12,151 |
1 | Michigan Muni. Bond Auth. Rev. | | | | | |
| (Clean Water Revolving Fund) TOB VRDO | 3.510% | 11/7/07 | | 8,335 | 8,335 |
1 | Michigan Muni. Bond Auth. Rev. | | | | | |
| (Clean Water Revolving Fund) TOB VRDO | 3.580% | 11/7/07 | | 7,580 | 7,580 |
| Michigan Muni. Bond Auth. Rev. | | | | | |
| (School Dist. of Detroit) | 5.000% | 6/1/08 | (4) | 5,000 | 5,036 |
1 | Michigan Muni. Bond Auth. Rev. TOB VRDO | 3.510% | 11/7/07 | | 30,310 | 30,310 |
1 | Michigan Muni. Bond Auth. Rev. TOB VRDO | 3.510% | 11/7/07 | | 6,000 | 6,000 |
1 | Michigan Muni. Bond Auth. Rev. TOB VRDO | 3.520% | 11/7/07 | | 3,845 | 3,845 |
1 | Michigan State Univ. Rev. TOB VRDO | 3.490% | 11/7/07 | (2) | 40,175 | 40,175 |
1 | Michigan Trunk Line Rev. TOB PUT | 3.800% | 3/13/08 | (4) | 24,210 | 24,210 |
| Oakland County MI Econ. Dev. Corp. | | | | | |
| (Cranbrook Educ. Comm.) VRDO | 3.480% | 11/7/07 | | 6,500 | 6,500 |
| Univ. of Michigan Hosp. Rev. VRDO | 3.430% | 11/7/07 | | 59,695 | 59,695 |
| Univ. of Michigan Univ. Rev. VRDO | 3.430% | 11/7/07 | | 82,680 | 82,680 |
1 | Wayne Charter County MI Airport Rev. | | | | | |
| (Detroit Metro. Wayne County) TOB VRDO | 3.550% | 11/7/07 | (1) | 13,615 | 13,615 |
1 | Wayne Charter County MI Airport Rev. | | | | | |
| (Detroit Metro. Wayne County) TOB VRDO | 3.550% | 11/7/07 | (1) | 2,745 | 2,745 |
| Wayne Charter County MI Airport Rev. | | | | | |
| (Detroit Metro. Wayne County) VRDO | 3.310% | 11/7/07 | (2) | 22,690 | 22,690 |
1 | Wayne Charter County MI Airport Rev. TOB VRDO | 3.590% | 11/7/07 | (1) | 4,555 | 4,555 |
| | | | | | 917,609 |
Minnesota (0.8%) | | | | | |
1 | Hennepin County MN Salex Tax Rev. TOB VRDO | 3.500% | 11/7/07 | | 17,730 | 17,730 |
1 | Minneapolis & St. Paul MN Metro. Airport | | | | | |
| TOB VRDO | 3.510% | 11/7/07 | (2) | 6,840 | 6,840 |
1 | Minneapolis & St. Paul MN Metro. Airport | | | | | |
| TOB VRDO | 3.510% | 11/7/07 | (2) | 19,875 | 19,875 |
1 | Minneapolis MN TOB VRDO | 3.500% | 11/7/07 | | 3,945 | 3,945 |
| Minnesota GO | 5.000% | 8/1/08 | | 12,965 | 13,087 |
1 | Minnesota GO TOB VRDO | 3.490% | 11/7/07 | | 4,085 | 4,085 |
1 | Minnesota GO TOB VRDO | 3.490% | 11/7/07 | | 5,280 | 5,280 |
1 | Minnesota GO TOB VRDO | 3.500% | 11/7/07 | | 7,510 | 7,510 |
1 | Minnesota GO TOB VRDO | 3.510% | 11/7/07 | | 3,835 | 3,835 |
1 | Minnesota GO TOB VRDO | 3.510% | 11/7/07 | | 3,615 | 3,615 |
| Minnesota Housing Finance Agency | | | | | |
| Residential Housing Finance Rev. | 3.700% | 3/4/08 | | 16,500 | 16,500 |
1 | Minnesota Housing Finance Agency | | | | | |
| Residential Housing Finance TOB VRDO | 3.360% | 11/7/07 | | 7,000 | 7,000 |
1 | Minnesota Housing Finance Agency | | | | | |
| Residential Housing Finance TOB VRDO | 3.550% | 11/7/07 | | 5,000 | 5,000 |
1 | Minnesota Housing Finance Agency | | | | | |
| Residential Housing Finance TOB VRDO | 3.590% | 11/7/07 | | 7,905 | 7,905 |
| Minnesota Housing Finance Agency | | | | | |
| Residential Housing Finance VRDO | 3.530% | 11/7/07 | | 4,500 | 4,500 |
1 | Minnesota Public Fac. Auth. | | | | | |
| Clean Water Rev. TOB VRDO | 3.500% | 11/7/07 | | 8,450 | 8,450 |
1 | Minnesota State Housing Fin. Agency TOB VRDO | 3.560% | 11/7/07 | | 10,475 | 10,475 |
19
Tax-Exempt Money Market Fund
| | | | | Face | Market |
| | | Maturity | | Amount | Value• |
| | Coupon | Date | | ($000) | ($000) |
| Rochester MN Health Care Fac. Rev. | | | | | |
| (Mayo Foundation) CP | 3.550% | 12/11/07 | | 21,500 | 21,501 |
1 | Rochester MN Health Care Fac. Rev. | | | | | |
| (Mayo Foundation) TOB VRDO | 3.500% | 11/7/07 | | 9,130 | 9,130 |
| | | | | | 176,263 |
Mississippi (0.7%) | | | | | |
1 | Mississippi Dev. Bank GO TOB VRDO | 3.510% | 11/7/07 | (3) | 6,465 | 6,465 |
1 | Mississippi Dev. Bank Special Obligation Rev. PUT | 3.600% | 9/18/08 | (2) | 5,000 | 5,000 |
| Mississippi Dev. Bank Special Obligation Rev. VRDO | 3.450% | 11/7/07 | (3) | 11,215 | 11,215 |
| Mississippi Dev. Bank Special Obligation Rev. VRDO | 3.480% | 11/7/07 | | 45,927 | 45,927 |
1 | Mississippi GO TOB VRDO | 3.500% | 11/7/07 | (4) | 9,200 | 9,200 |
1 | Mississippi GO TOB VRDO | 3.500% | 11/7/07 | | 12,515 | 12,515 |
1 | Mississippi GO TOB VRDO | 3.510% | 11/7/07 | (3)(Prere.) | 3,735 | 3,735 |
| Mississippi GO VRDO | 3.250% | 11/7/07 | | 48,585 | 48,585 |
1 | Mississippi Home Corp. Single Family Rev. | | | | | |
| TOB VRDO | 3.500% | 11/7/07 | (3) | 2,245 | 2,245 |
| | | | | | 144,887 |
Missouri (1.7%) | | | | | |
1 | Bi-State Dev. Agency of the | | | | | |
| Missouri-Illinois Metro. Dist. | | | | | |
| (Metrolink Cross County Project) TOB VRDO | 3.500% | 11/7/07 | (4) | 8,500 | 8,500 |
1 | Bi-State Dev. Agency of the | | | | | |
| Missouri-Illinois Metro. Dist. | | | | | |
| (Metrolink Cross County Project) TOB VRDO | 3.500% | 11/7/07 | (4) | 8,500 | 8,500 |
| Bi-State Dev. Agency of the | | | | | |
| Missouri-Illinois Metro. Dist. | | | | | |
| (St. Clair County Metrolink Extension) VRDO | 3.300% | 11/7/07 | (4) | 18,500 | 18,500 |
1 | Curators of the Univ. of Missouri | | | | | |
| System Fac. Rev. TOB VRDO | 3.490% | 11/7/07 | | 14,640 | 14,640 |
| Curators of the Univ. of Missouri | | | | | |
| System Fac. Rev. VRDO | 3.430% | 11/7/07 | | 69,450 | 69,450 |
1 | Hazelwood MO School Dist. TOB VRDO | 3.340% | 11/7/07 | (4) | 4,365 | 4,365 |
1 | Kansas City MO GO TOB VRDO | 3.500% | 11/7/07 | | 7,265 | 7,265 |
1 | Kansas City MO Muni. Assistance | | | | | |
| Corp. Rev. TOB VRDO | 3.500% | 11/7/07 | (3) | 7,185 | 7,185 |
| Kansas City MO School Dist. Building | | | | | |
| Elementary School Project Leasehold Rev. | 5.000% | 2/1/08 | (3) | 5,940 | 5,959 |
1 | Missouri Board Public Building Special | | | | | |
| Obligation Rev. TOB VRDO | 3.500% | 11/7/07 | | 13,570 | 13,570 |
1 | Missouri Board Public Building Special | | | | | |
| Obligation Rev. TOB VRDO | 3.580% | 11/7/07 | | 5,000 | 5,000 |
1 | Missouri Environmental Improvement & | | | | | |
| Energy Resource Auth. Water PCR | | | | | |
| (Clean Water SRF Program) TOB VRDO | 3.580% | 11/7/07 | | 7,400 | 7,400 |
1 | Missouri Health & Educ. Fac. Auth. | | | | | |
| (Washington Univ.) TOB VRDO | 3.500% | 11/7/07 | | 4,560 | 4,560 |
1 | Missouri Health & Educ. Fac. Auth. | | | | | |
| (Washington Univ.) TOB VRDO | 3.500% | 11/7/07 | | 4,560 | 4,560 |
1 | Missouri Health & Educ. Fac. Auth. Rev. | | | | | |
| (Washington Univ.) TOB VRDO | 3.510% | 11/7/07 | | 9,925 | 9,925 |
1 | Missouri Health & Educ. Fac. Auth. TOB VRDO | 3.520% | 11/7/07 | | 8,000 | 8,000 |
| Missouri Higher Educ. Student Loan Auth. VRDO | 3.480% | 11/7/07 | (1) | 30,200 | 30,200 |
| Missouri Highways & Transp. Comm. Road Rev. | 5.000% | 5/1/08 | | 7,465 | 7,512 |
1 | Missouri Highways & Transp. Comm. | | | | | |
| Road Rev. TOB VRDO | 3.490% | 11/7/07 | | 6,975 | 6,975 |
20
Tax-Exempt Money Market Fund
| | | | | Face | Market |
| | | Maturity | | Amount | Value• |
| | Coupon | Date | | ($000) | ($000) |
1 | Missouri Highways & Transp. Comm. | | | | | |
| Road Rev. TOB VRDO | 3.490% | 11/7/07 | | 5,000 | 5,000 |
1 | Missouri Highways & Transp. Comm. | | | | | |
| Road Rev. TOB VRDO | 3.500% | 11/7/07 | | 6,885 | 6,885 |
1 | Missouri Highways & Transp. Comm. | | | | | |
| Road Rev. TOB VRDO | 3.500% | 11/7/07 | | 5,000 | 5,000 |
1 | Missouri Highways & Transp. Comm. | | | | | |
| Road Rev. TOB VRDO | 3.520% | 11/7/07 | | 36,025 | 36,025 |
| Missouri Highways & Transp. Comm. | | | | | |
| Road Rev. VRDO | 3.250% | 11/7/07 | LOC | 5,085 | 5,085 |
1 | Missouri Housing Dev. Corp. Single Family | | | | | |
| Mortgage Rev. TOB VRDO | 3.350% | 11/7/07 | | 9,600 | 9,600 |
1 | Missouri Housing Dev. Corp. Single Family | | | | | |
| Mortgage Rev. TOB VRDO | 3.400% | 11/7/07 | | 3,575 | 3,575 |
1 | Missouri Housing Dev. Corp. Single Family | | | | | |
| Mortgage Rev. TOB VRDO | 3.550% | 11/7/07 | | 6,775 | 6,775 |
1 | Missouri State Housing Dev. TOB VRDO | 3.350% | 11/7/07 | | 7,975 | 7,975 |
| Missouri Water Pollution Control GO | 5.000% | 10/1/08 | | 11,350 | 11,491 |
1 | St. Louis MO Airport Rev. Airport Dev. | | | | | |
| Program TOB VRDO | 3.490% | 11/7/07 | (1) | 38,630 | 38,630 |
| | | | | | 378,107 |
Nebraska (0.9%) | | | | | |
| American Public Energy Agency Nebraska | | | | | |
| (National Public Gas Agency) VRDO | 3.430% | 11/7/07 | | 35,319 | 35,319 |
1 | Central Plains Energy Project Nebraska | | | | | |
| Gas Project TOB VRDO | 3.500% | 11/7/07 | | 26,080 | 26,080 |
1 | Douglas County NE School Dist. GO TOB VRDO | 3.510% | 11/7/07 | | 7,280 | 7,280 |
1 | Lancaster County NE School Dist. No. 1 | | | | | |
| (Lincoln Public Schools) TOB VRDO | 3.520% | 11/7/07 | | 6,965 | 6,965 |
| Nebraska Investment Finance Auth. | | | | | |
| Single Family Housing Rev. VRDO | 3.290% | 11/7/07 | | 20,965 | 20,965 |
| Nebraska Investment Finance Auth. | | | | | |
| Single Family Housing Rev. VRDO | 3.290% | 11/7/07 | | 20,720 | 20,720 |
| Nebraska Investment Finance Auth. | | | | | |
| Single Family Housing Rev. VRDO | 3.290% | 11/7/07 | | 20,020 | 20,020 |
1 | Nebraska Public Power Dist. Rev. TOB VRDO | 3.500% | 11/7/07 | (4) | 9,950 | 9,950 |
1 | Nebraska Public Power Dist. Rev. TOB VRDO | 3.510% | 11/7/07 | (4) | 8,245 | 8,245 |
1 | Nebraska Public Power Dist. Rev. TOB VRDO | 3.520% | 11/7/07 | (2) | 5,330 | 5,330 |
1 | Nebraska Public Power Dist. Rev. TOB VRDO | 3.520% | 11/7/07 | (2) | 3,200 | 3,200 |
| Omaha NE Public Power Dist. Electric Rev. CP | 3.600% | 11/8/07 | | 12,500 | 12,500 |
| Omaha NE Public Power Dist. Electric Rev. CP | 3.550% | 12/13/07 | | 5,000 | 5,000 |
1 | Omaha NE Public Power Dist. Electric Rev. | | | | | |
| TOB VRDO | 3.510% | 11/7/07 | | 14,695 | 14,695 |
1 | Omaha NE TOB VRDO | 3.520% | 11/7/07 | | 8,000 | 8,000 |
| | | | | | 204,269 |
Nevada (1.8%) | | | | | |
1 | Clark County NV Highway Improvement Rev. | | | | | |
| (Motor Vehicle Fuel Tax) TOB VRDO | 3.520% | 11/7/07 | (2) | 17,165 | 17,165 |
1 | Clark County NV Highway Improvement Rev. | | | | | |
| (Motor Vehicle Fuel Tax) TOB VRDO | 3.520% | 11/7/07 | (2) | 17,880 | 17,880 |
1 | Clark County NV Airport Improvement Rev. | | | | | |
| TOB VRDO | 3.610% | 11/7/07 | (2) | 5,000 | 5,000 |
| Clark County NV Airport Improvement Rev. VRDO | 3.250% | 11/7/07 | (3) | 21,130 | 21,130 |
| Clark County NV Airport Improvement Rev. VRDO | 3.280% | 11/7/07 | (3) | 24,880 | 24,880 |
| Clark County NV Airport Improvement Rev. VRDO | 3.300% | 11/7/07 | (3) | 20,000 | 20,000 |
1 | Clark County NV Airport System Rev. TOB VRDO | 3.500% | 11/7/07 | (3) | 10,095 | 10,095 |
21
Tax-Exempt Money Market Fund
| | | | | Face | Market |
| | | Maturity | | Amount | Value• |
| | Coupon | Date | | ($000) | ($000) |
1 | Clark County NV GO TOB VRDO | 3.500% | 11/7/07 | (2) | 5,695 | 5,695 |
1 | Clark County NV Highway Rev. | | | | | |
| (Motor Vehicle Fuel Tax) TOB VRDO | 3.520% | 11/7/07 | (2) | 5,965 | 5,965 |
| Clark County NV School Dist. GO | 5.000% | 6/1/08 | (3) | 30,735 | 30,960 |
| Clark County NV School Dist. GO | 5.000% | 6/15/08 | (4) | 7,575 | 7,634 |
| Clark County NV School Dist. GO | 5.500% | 6/15/08 | (4) | 19,100 | 19,332 |
1 | Clark County NV School Dist. GO TOB PUT | 3.800% | 2/13/08 | (2) | 35,815 | 35,815 |
1 | Clark County NV School Dist. GO TOB VRDO | 3.490% | 11/7/07 | (4) | 42,585 | 42,585 |
1 | Clark County NV School Dist. GO TOB VRDO | 3.490% | 11/7/07 | (3) | 10,990 | 10,990 |
1 | Clark County NV School Dist. GO TOB VRDO | 3.510% | 11/7/07 | (4) | 5,620 | 5,620 |
1 | Clark County NV School Dist. GO TOB VRDO | 3.510% | 11/7/07 | (3) | 12,970 | 12,970 |
1 | Clark County NV School Dist. GO TOB VRDO | 3.520% | 11/7/07 | (1)(Prere.) | 11,720 | 11,720 |
1 | Clark County NV School Dist. GO TOB VRDO | 3.520% | 11/7/07 | (4) | 10,400 | 10,400 |
| Las Vegas Valley Water Dist. Nevada CP | 3.720% | 11/8/07 | | 5,000 | 5,000 |
1 | Las Vegas Valley Water Dist. Nevada GO | | | | | |
| Water Improvement & Refunding TOB VRDO | 3.490% | 11/7/07 | (3) | 13,370 | 13,370 |
| Las Vegas Valley Water Dist. Nevada GO | | | | | |
| Water Improvement & Refunding VRDO | 3.640% | 11/1/07 | | 3,450 | 3,450 |
1 | Las Vegas Valley Water Dist. Nevada TOB VRDO | 3.490% | 11/7/07 | (4) | 5,480 | 5,480 |
| Nevada GO | 5.250% | 5/15/08 | (Prere.) | 7,625 | 7,691 |
1 | Nevada GO TOB VRDO | 3.500% | 11/7/07 | (4) | 5,175 | 5,175 |
1 | Nevada GO TOB VRDO | 3.500% | 11/7/07 | | 5,125 | 5,125 |
| Nevada Housing Division Multi-Unit | | | | | |
| Housing City Center VRDO | 3.500% | 11/7/07 | LOC | 7,440 | 7,440 |
1 | Nevada Rural Housing Auth. Single | | | | | |
| Family Rev. TOB VRDO | 3.390% | 11/7/07 | | 5,255 | 5,255 |
1 | Washoe County Nevada School Dist. TOB VRDO | 3.520% | 11/7/07 | (4) | 16,860 | 16,860 |
| | | | | | 390,682 |
New Hampshire (0.1%) | | | | | |
| New Hampshire Health & Educ. Fac. Auth. Rev. | | | | | |
| (St. Paul’s School) VRDO | 3.440% | 11/7/07 | | 23,800 | 23,800 |
| | | | | | |
New Jersey (1.9%) | | | | | |
1 | New Jersey COP TOB PUT | 3.770% | 11/8/07 | (2) | 4,835 | 4,835 |
| New Jersey Econ. Dev. Auth. Rev. | | | | | |
| (Chambers Cogeneration Limited | | | | | |
| Partnership) CP | 3.880% | 11/13/07 | LOC | 30,000 | 30,000 |
1 | New Jersey GO TOB VRDO | 3.480% | 11/7/07 | (2) | 28,425 | 28,425 |
1 | New Jersey Housing & Mortgage Finance | | | | | |
| Agency Multi-Family Housing Rev. TOB PUT | 3.760% | 11/8/07 | (7) | 39,290 | 39,290 |
1 | New Jersey State Transp. Trust Fund Auth. | | | | | |
| Cap TOB VRDO | 3.510% | 11/7/07 | (2) | 10,585 | 10,585 |
| New Jersey TRAN | 4.500% | 6/24/08 | | 275,000 | 276,536 |
1 | New Jersey Transp. Trust Fund Auth. Rev. | | | | | |
| TOB VRDO | 3.490% | 11/7/07 | (1) | 10,570 | 10,570 |
1 | New Jersey Transp. Trust Fund Auth. Rev. | | | | | |
| TOB VRDO | 3.510% | 11/7/07 | (3) | 5,400 | 5,400 |
| New Jersey Transportation Trust Fund Auth. | | | | | |
| Transportation System Rev. | 5.000% | 12/15/07 | | 4,870 | 4,877 |
1 | New Jersey Turnpike Auth. Rev. TOB VRDO | 3.490% | 11/7/07 | (2) | 8,535 | 8,535 |
| | | | | | 419,053 |
New Mexico (0.8%) | | | | | |
| Bernalillo County NM TRAN | 4.500% | 6/30/08 | | 30,000 | 30,148 |
| Hurley NM PCR (Kennecott Santa Fe Corp. | | | | | |
| Project British Petroleum) VRDO | 3.580% | 11/1/07 | | 4,200 | 4,200 |
1 | New Mexico Finance Auth. Rev. TOB VRDO | 3.520% | 11/7/07 | (1) | 8,805 | 8,805 |
22
Tax-Exempt Money Market Fund
| | | | | Face | Market |
| | | Maturity | | Amount | Value• |
| | Coupon | Date | | ($000) | ($000) |
1 | New Mexico Finance Auth. Transp. Rev. TOB VRDO | 3.490% | 11/7/07 | (1) | 10,925 | 10,925 |
1 | New Mexico Finance Auth. Transp. Rev. TOB VRDO | 3.490% | 11/7/07 | (1) | 17,620 | 17,620 |
1 | New Mexico Finance Auth. Transp. Rev. TOB VRDO | 3.500% | 11/7/07 | (1) | 5,175 | 5,175 |
1 | New Mexico Finance Auth. Transp. Rev. TOB VRDO | 3.510% | 11/7/07 | (2) | 5,195 | 5,195 |
1 | New Mexico Finance Auth. Transp. Rev. TOB VRDO | 3.510% | 11/7/07 | (1) | 5,170 | 5,170 |
1 | New Mexico Mortgage Finance Auth. Single | | | | | |
| Family Mortgage TOB VRDO | 3.400% | 11/7/07 | | 6,475 | 6,475 |
1 | New Mexico Mortgage Finance Auth. TOB VRDO | 3.550% | 11/7/07 | | 5,715 | 5,715 |
| Univ. of New Mexico Univ. Rev. VRDO | 3.280% | 11/7/07 | | 36,940 | 36,940 |
| Univ. of New Mexico Univ. Rev. VRDO | 3.280% | 11/7/07 | | 12,000 | 12,000 |
| Univ. of New Mexico Univ. Rev. VRDO | 3.340% | 11/7/07 | | 20,185 | 20,185 |
| | | | | | 168,553 |
New York (2.0%) | | | | | |
1 | Metro. New York Transp. Auth. Rev. | | | | | |
| (Dedicated Petroluem Tax) TOB VRDO | 3.510% | 11/7/07 | (1) | 6,015 | 6,015 |
| Metro. New York Transp. Auth. Rev. | | | | | |
| (Transit Rev.) CP | 3.550% | 12/6/07 | LOC | 40,000 | 40,000 |
1 | Metro. New York Transp. Auth. Rev. | | | | | |
| (Transit Rev.) TOB VRDO | 3.490% | 11/7/07 | (3) | 5,360 | 5,360 |
1 | Metro. New York Transp. Auth. Rev. TOB VRDO | 3.490% | 11/7/07 | (2) | 14,700 | 14,700 |
1 | Metro. New York Transp. Auth. Rev. TOB VRDO | 3.510% | 11/7/07 | (2) | 19,050 | 19,050 |
| New York City NY GO | 5.000% | 8/1/08 | | 20,715 | 20,953 |
| New York City NY Muni. Water Finance Auth. | | | | | |
| Water & Sewer System CP | 3.680% | 12/13/07 | | 45,520 | 45,520 |
1 | New York City NY Muni. Water Finance Auth. | | | | | |
| Water & Sewer System Rev. TOB VRDO | 3.500% | 11/7/07 | | 13,055 | 13,055 |
1 | New York City NY Muni. Water Finance Auth. | | | | | |
| Water & Sewer System Rev. TOB VRDO | 3.500% | 11/7/07 | | 10,200 | 10,200 |
1 | New York City NY Muni. Water Finance Auth. | | | | | |
| Water & Sewer System Rev. TOB VRDO | 3.510% | 11/7/07 | (1) | 9,900 | 9,900 |
1 | New York City NY Muni. Water Finance Auth. | | | | | |
| Water & Sewer System Rev. TOB VRDO | 3.510% | 11/7/07 | | 19,600 | 19,600 |
1 | New York City NY Transitional Finance Auth. | | | | | |
| Rev. TOB VRDO | 3.490% | 11/7/07 | (3) | 15,588 | 15,588 |
1 | New York City NY Transitional Finance Auth. | | | | | |
| Rev. TOB VRDO | 3.500% | 11/7/07 | | 13,700 | 13,700 |
1 | New York City NY Transitional Finance Auth. | | | | | |
| Rev. TOB VRDO | 3.510% | 11/7/07 | | 12,475 | 12,475 |
| New York City NY Transitional Finance Auth. | | | | | |
| Rev. VRDO | 3.230% | 11/7/07 | | 33,120 | 33,120 |
1 | New York Metro. Transp. Auth. Rev. TOB VRDO | 3.510% | 11/7/07 | (4) | 9,155 | 9,155 |
1 | New York State Dormitory Auth. Rev. | | | | | |
| (Mental Health Services) TOB VRDO | 3.510% | 11/7/07 | (1) | 5,995 | 5,995 |
1 | New York State Dormitory Auth. Rev. TOB VRDO | 3.490% | 11/7/07 | | 43,560 | 43,560 |
| New York State Thruway Auth. Rev. | | | | | |
| (Service Contract) | 5.000% | 4/1/08 | | 23,480 | 23,611 |
1 | New York State Thruway Auth. Rev. TOB VRDO | 3.480% | 11/7/07 | (4) | 30,130 | 30,130 |
1 | New York State Thruway Auth. Rev. TOB VRDO | 3.490% | 11/7/07 | (3) | 6,830 | 6,830 |
1 | New York State Thruway Auth. Rev. TOB VRDO | 3.500% | 11/7/07 | (3) | 1,800 | 1,800 |
1 | New York State Thruway Auth. Rev. TOB VRDO | 3.510% | 11/7/07 | (4) | 22,630 | 22,630 |
1 | Port Auth. of New York & New Jersey Rev. | | | | | |
| TOB VRDO | 3.480% | 11/7/07 | | 10,000 | 10,000 |
| | | | | | 432,947 |
23
Tax-Exempt Money Market Fund
| | | | | Face | Market |
| | | Maturity | | Amount | Value• |
| | Coupon | Date | | ($000) | ($000) |
North Carolina (4.0%) | | | | | |
| Board of Governors of Univ. of NC Chapel Hill & | | | | | |
| NC State Univ. of Raleigh CP | 3.700% | 11/16/07 | | 12,000 | 12,000 |
| Board of Governors of Univ. of NC Chapel Hill & | | | | | |
| NC State Univ. of Raleigh CP | 3.610% | 11/19/07 | | 20,400 | 20,400 |
1 | Charlotte NC COP TOB VRDO | 3.510% | 11/7/07 | | 5,285 | 5,285 |
| Charlotte NC Water & Sewer System Rev. VRDO | 3.430% | 11/7/07 | | 58,200 | 58,200 |
| Durham NC GO | 5.000% | 2/1/08 | | 5,340 | 5,358 |
| Guilford County NC GO VRDO | 3.410% | 11/7/07 | | 19,250 | 19,250 |
| Mecklenburg County NC GO VRDO | 3.300% | 11/7/07 | | 8,200 | 8,200 |
| Mecklenburg County NC GO VRDO | 3.300% | 11/7/07 | | 8,200 | 8,200 |
| Mecklenburg County NC GO VRDO | 3.300% | 11/7/07 | | 9,000 | 9,000 |
| Mecklenburg County NC GO VRDO | 3.300% | 11/7/07 | | 7,000 | 7,000 |
| Mecklenburg County NC GO VRDO | 3.300% | 11/7/07 | | 13,500 | 13,500 |
| Mecklenburg County NC GO VRDO | 3.300% | 11/7/07 | | 10,000 | 10,000 |
| Mecklenburg County NC GO VRDO | 3.300% | 11/7/07 | | 7,000 | 7,000 |
| Mecklenburg County NC GO VRDO | 3.300% | 11/7/07 | | 7,000 | 7,000 |
| Mecklenburg County NC GO VRDO | 3.300% | 11/7/07 | | 8,200 | 8,200 |
| North Carolina Capital Fac. Finance Agency | | | | | |
| (YMCA of Greater Winston-Salem) VRDO | 3.480% | 11/7/07 | LOC | 11,485 | 11,485 |
| North Carolina Capital Fac. Finance Agency | | | | | |
| Rev. (Duke Univ.) CP | 3.450% | 3/6/08 | | 7,344 | 7,344 |
1 | North Carolina Capital Fac. Finance Agency | | | | | |
| Rev. (Duke Univ.) TOB VRDO | 3.500% | 11/7/07 | | 7,249 | 7,249 |
1 | North Carolina Capital Fac. Finance Agency | | | | | |
| Rev. (Duke Univ.) TOB VRDO | 3.500% | 11/7/07 | | 24,000 | 24,000 |
1 | North Carolina Capital Fac. Finance Agency | | | | | |
| Rev. (Duke Univ.) TOB VRDO | 3.520% | 11/7/07 | | 8,600 | 8,600 |
1 | North Carolina Capital Fac. Finance Agency | | | | | |
| Rev. (Duke Univ.) TOB VRDO | 3.520% | 11/7/07 | | 5,000 | 5,000 |
1 | North Carolina Capital Fac. Finance Agency | | | | | |
| Rev. (Duke Univ.) TOB VRDO | 3.520% | 11/7/07 | | 12,000 | 12,000 |
1 | North Carolina Capital Fac. Finance Agency | | | | | |
| Rev. TOB VRDO | 3.520% | 11/7/07 | | 15,700 | 15,700 |
| North Carolina Eastern Muni. Power Agency Rev. | 7.000% | 1/1/08 | (1) | 9,875 | 9,928 |
1 | North Carolina Eastern Muni. Power Agency | | | | | |
| Rev. TOB VRDO | 3.490% | 11/7/07 | (3) | 4,075 | 4,075 |
| North Carolina GO | 5.000% | 2/1/08 | | 27,585 | 27,677 |
| North Carolina GO | 5.000% | 3/1/08 | | 5,000 | 5,021 |
1 | North Carolina GO TOB VRDO | 3.500% | 11/7/07 | | 18,970 | 18,970 |
| North Carolina GO VRDO | 3.230% | 11/7/07 | | 21,970 | 21,970 |
| North Carolina GO VRDO | 3.250% | 11/7/07 | | 42,785 | 42,785 |
1 | North Carolina Housing Finance Agency TOB VRDO | 3.410% | 11/7/07 | | 2,300 | 2,300 |
1 | North Carolina Infrastructure Financial Corp. | | | | | |
| COP TOB VRDO | 3.340% | 11/7/07 | (4) | 9,950 | 9,950 |
1 | North Carolina Infrastructure Financial Corp. | | | | | |
| COP TOB VRDO | 3.490% | 11/7/07 | (4) | 29,085 | 29,085 |
1 | North Carolina Infrastructure Financial Corp. | | | | | |
| COP TOB VRDO | 3.500% | 11/7/07 | | 2,615 | 2,615 |
1 | North Carolina Medical Care Comm. | | | | | |
| Health Care Fac. (Duke Univ. Health System) | | | | | |
| TOB VRDO | 3.510% | 11/7/07 | | 32,000 | 32,000 |
| North Carolina Medical Care Comm. | | | | | |
| Health Care Fac. (Duke Univ. Health System) | | | | | |
| VRDO | 3.240% | 11/7/07 | | 29,400 | 29,400 |
24
Tax-Exempt Money Market Fund
| | | | | Face | Market |
| | | Maturity | | Amount | Value• |
| | Coupon | Date | | ($000) | ($000) |
| North Carolina Medical Care Comm. | | | | | |
| Health Care Fac. (Univ. Eastern Carolina) VRDO | 3.240% | 11/7/07 | (2) | 45,740 | 45,740 |
| North Carolina Medical Care Comm. | | | | | |
| Health Care Fac. (Univ. Eastern Carolina) VRDO | 3.280% | 11/7/07 | (2) | 36,910 | 36,910 |
1 | North Carolina Medical Care Comm. | | | | | |
| Health Care Fac. TOB VRDO | 3.510% | 11/7/07 | | 7,330 | 7,330 |
| North Carolina Medical Care Comm. Hosp. | | | | | |
| (Moses H. Cone Memorial Hosp.) VRDO | 3.450% | 11/7/07 | | 47,700 | 47,700 |
| Raleigh Durham NC Airport Auth. Rev. VRDO | 3.320% | 11/7/07 | (10) | 12,000 | 12,000 |
| Raleigh NC Downtown Improvement | | | | | |
| Project COP VRDO | 3.240% | 11/7/07 | | 83,225 | 83,225 |
| Raleigh NC Downtown Improvement | | | | | |
| Project COP VRDO | 3.240% | 11/7/07 | | 30,500 | 30,500 |
1 | Sampson County NC TOB PUT | 3.600% | 9/18/08 | (4) | 5,000 | 5,000 |
| Union County NC GO CP | 3.750% | 12/4/07 | | 9,000 | 9,000 |
1 | Univ. of North Carolina Univ. Rev. TOB VRDO | 3.520% | 11/7/07 | | 30,000 | 30,000 |
1 | Univ. of North Carolina Univ. Rev. TOB VRDO | 3.520% | 11/7/07 | | 14,850 | 14,850 |
| Wake County NC Public Improvement GO VRDO | 3.420% | 11/7/07 | | 17,300 | 17,300 |
| Winston-Salem NC Water & Sewer | | | | | |
| System Rev. VRDO | 3.260% | 11/7/07 | | 5,000 | 5,000 |
| Winston-Salem NC Water & Sewer | | | | | |
| System Rev. VRDO | 3.300% | 11/7/07 | | 19,500 | 19,500 |
| | | | | | 889,802 |
North Dakota (0.2%) | | | | | |
| North Dakota State Housing Fin. Agency Rev. | 4.250% | 10/8/08 | | 44,500 | 44,640 |
| | | | | | |
Ohio (2.1%) | | | | | |
| Cleveland OH Airport System Rev. | 5.500% | 1/1/08 | (4) | 8,070 | 8,093 |
| Columbus OH Regional Airport Auth. | | | | | |
| Airport Refunding Rev. (Oasbo Expanded | | | | | |
| Asset Program) VRDO | 3.450% | 11/7/07 | LOC | 45,000 | 45,000 |
| Cuyahoga County OH Hosp. Rev. | | | | | |
| (Cleveland Clinic Foundation) VRDO | 3.580% | 11/1/07 | | 12,000 | 12,000 |
| Fairfield City OH Police Services Project BAN | 4.250% | 11/1/07 | | 7,000 | 7,000 |
| Findlay OH BAN | 4.000% | 11/28/07 | | 4,505 | 4,505 |
1 | Franklin County OH GO TOB VRDO | 3.490% | 11/7/07 | | 17,400 | 17,400 |
| Franklin County OH Hosp. Rev. | | | | | |
| (Trinity Health Credit Group) VRDO | 3.250% | 11/7/07 | (3) | 6,350 | 6,350 |
1 | Hamilton County OH Sewer System Rev. | | | | | |
| TOB VRDO | 3.510% | 11/7/07 | (1) | 7,920 | 7,920 |
| Lorain County OH Sewer System BAN | 4.500% | 11/14/07 | | 2,000 | 2,001 |
1 | Marion County OH Multifamily Housing Rev. | | | | | |
| TOB VRDO | 3.630% | 11/7/07 | | 35 | 35 |
1 | Ohio Building Auth. Rev. (Administration | | | | | |
| Building Fund) TOB VRDO | 3.500% | 11/7/07 | (4) | 4,155 | 4,155 |
1 | Ohio Building Auth. Rev. (Adult Correctional | | | | | |
| Building) TOB PUT | 3.800% | 2/28/08 | | 7,180 | 7,180 |
1 | Ohio Common Schools GO TOB VRDO | 3.470% | 11/7/07 | | 5,515 | 5,515 |
| Ohio Common Schools GO VRDO | 3.250% | 11/7/07 | | 38,470 | 38,470 |
| Ohio Common Schools GO VRDO | 3.250% | 11/7/07 | | 27,880 | 27,880 |
| Ohio GO | 5.000% | 3/15/08 | | 3,000 | 3,014 |
| Ohio GO | 5.000% | 8/1/08 | | 14,800 | 14,943 |
1 | Ohio GO TOB VRDO | 3.470% | 11/7/07 | | 10,360 | 10,360 |
1 | Ohio GO TOB VRDO | 3.500% | 11/7/07 | | 5,770 | 5,770 |
1 | Ohio GO TOB VRDO | 3.510% | 11/7/07 | | 4,085 | 4,085 |
| Ohio GO VRDO | 3.250% | 11/7/07 | | 29,200 | 29,200 |
25
Tax-Exempt Money Market Fund
| | | | | Face | Market |
| | | Maturity | | Amount | Value• |
| | Coupon | Date | | ($000) | ($000) |
| Ohio GO VRDO | 3.310% | 11/7/07 | | 46,360 | 46,360 |
| Ohio Higher Educ. Fac. Comm. Rev. | | | | | |
| (Case Western Reserve Univ.) VRDO | 3.310% | 11/7/07 | | 6,585 | 6,585 |
| Ohio Higher Educ. Fac. Comm. Rev. | | | | | |
| (Kenyon College) VRDO | 3.280% | 11/7/07 | | 8,500 | 8,500 |
| Ohio Higher Educ. Fac. Comm. Rev. | | | | | |
| (Marietta College) VRDO | 3.450% | 11/7/07 | LOC | 7,700 | 7,700 |
| Ohio Higher Educ. Fac. Comm. Rev. VRDO | 3.450% | 11/7/07 | LOC | 14,755 | 14,755 |
1 | Ohio Higher Educ. GO TOB VRDO | 3.520% | 11/7/07 | | 10,000 | 10,000 |
1 | Ohio Housing Finance Agency | | | | | |
| Mortgage Rev. TOB VRDO | 3.550% | 11/7/07 | | 6,840 | 6,840 |
| Ohio Housing Finance Agency | | | | | |
| Mortgage Rev. VRDO | 3.410% | 11/7/07 | | 4,500 | 4,500 |
1 | Ohio Infrastructure Improvement GO TOB VRDO | 3.490% | 11/7/07 | | 5,670 | 5,670 |
| Ohio Infrastructure Improvement GO VRDO | 3.310% | 11/7/07 | | 9,750 | 9,750 |
| Ohio State Univ. CP | 3.550% | 12/13/07 | | 15,000 | 15,000 |
| Ohio Water Dev. Auth. PCR | | | | | |
| (FirstEnergy Nuclear) VRDO | 3.350% | 11/7/07 | LOC | 25,000 | 25,000 |
| Ohio Water Dev. Auth. PCR (FirstEnergy) VRDO | 3.330% | 11/7/07 | LOC | 10,000 | 10,000 |
1 | Ohio Water Dev. Auth. PCR TOB VRDO | 3.510% | 11/7/07 | | 6,935 | 6,935 |
| Summit County OH Rev. (Western | | | | | |
| Reserve Academy) VRDO | 3.460% | 11/7/07 | LOC | 5,000 | 5,000 |
| Toledo OH City Services Special | | | | | |
| Assessment VRDO | 3.430% | 11/7/07 | LOC | 7,200 | 7,200 |
| Univ. of Akron OH General Receipts Rev. VRDO | 3.430% | 11/7/07 | (3) | 11,815 | 11,815 |
| Univ. of Cincinnati OH General Receipts BAN | 4.500% | 1/24/08 | | 10,000 | 10,017 |
| | | | | | 472,503 |
Oklahoma (0.4%) | | | | | |
1 | Oklahoma State Capitol Improvement | | | | | |
| Auth. Fac. Rev. TOB VRDO | 3.340% | 11/7/07 | (2) | 5,100 | 5,100 |
1 | Oklahoma State Capitol Improvement | | | | | |
| Auth. Fac. Rev. TOB VRDO | 3.520% | 11/7/07 | (2) | 8,935 | 8,935 |
| Oklahoma State Capitol Improvement | | | | | |
| Auth. Fac. Rev. VRDO | 3.640% | 11/1/07 | (11) | 7,400 | 7,400 |
| Payne County OK Econ. Dev. Auth. | | | | | |
| Student Housing Rev. VRDO | 3.470% | 11/7/07 | (2) | 35,710 | 35,710 |
| Payne County OK Econ. Dev. Auth. | | | | | |
| Student Housing Rev. VRDO | 3.470% | 11/7/07 | (2) | 16,500 | 16,500 |
| Tulsa County OK Ind. Auth. Rev. | 5.000% | 5/15/08 | | 5,000 | 5,033 |
| | | | | | 78,678 |
Oregon (1.2%) | | | | | |
| Oregon Housing & Community Service Dept. | | | | | |
| Single Family Mortgage Rev. VRDO | 3.310% | 11/7/07 | | 13,500 | 13,500 |
| Oregon Housing & Community Service Dept. | | | | | |
| Single Family Mortgage Rev. VRDO | 3.330% | 11/7/07 | | 5,000 | 5,000 |
1 | Oregon State Dept. Transp. Highway | | | | | |
| Usertax Rev. TOB VRDO | 3.490% | 11/7/07 | | 10,140 | 10,140 |
| Oregon State Dept. Transp. Highway | | | | | |
| Usertax Rev. VRDO | 3.430% | 11/7/07 | | 40,000 | 40,000 |
1 | Oregon State HomeOwner Rev. TOB VRDO | 3.530% | 11/7/07 | | 9,410 | 9,410 |
1 | Oregon State HomeOwner Rev. TOB VRDO | 3.560% | 11/7/07 | | 24,495 | 24,495 |
1 | Oregon State HomeOwner Rev. TOB VRDO | 3.560% | 11/7/07 | | 31,715 | 31,715 |
1 | Oregon State Housing & Community | | | | | |
| Services Dept. Mortgage Rev. TOB VRDO | 3.550% | 11/7/07 | | 7,745 | 7,745 |
| Oregon State Housing & Community | | | | | |
| Services Dept. Mortgage Rev. VRDO | 3.430% | 11/7/07 | | 6,190 | 6,190 |
26
Tax-Exempt Money Market Fund
| | | | | Face | Market |
| | | Maturity | | Amount | Value• |
| | Coupon | Date | | ($000) | ($000) |
| Oregon State Housing & Community | | | | | |
| Services Dept. Mortgage Rev. VRDO | 3.500% | 11/7/07 | | 30,000 | 30,000 |
| Oregon State Housing & Community | | | | | |
| Services Dept. Mortgage Rev. VRDO | 3.500% | 11/7/07 | | 5,000 | 5,000 |
| Oregon State Housing & Community | | | | | |
| Services Dept. Mortgage Rev. VRDO | 3.500% | 11/7/07 | | 18,075 | 18,075 |
| Oregon State Var-Veterans Welfare VRDO | 3.570% | 11/1/07 | | 6,000 | 6,000 |
| Oregon State Veteran Welfare Services VRDO | 3.250% | 11/7/07 | | 10,000 | 10,000 |
1 | Oregon State Veterans Welfare TOB VRDO | 3.500% | 11/7/07 | | 6,820 | 6,820 |
| Portland OR Econ. Dev. (Broadway Project) VRDO | 3.460% | 11/7/07 | (2) | 6,275 | 6,275 |
1 | Portland OR Sewer System Rev. TOB VRDO | 3.490% | 11/7/07 | (4) | 22,945 | 22,945 |
1 | Portland OR Sewer System Rev. TOB VRDO | 3.500% | 11/7/07 | (4) | 3,160 | 3,160 |
| | | | | | 256,470 |
Pennsylvania (1.7%) | | | | | |
1 | Allegheny County PA Hosp. Dev. Auth. Rev. | | | | | |
| (Univ. of Pittsburgh Medical Center) TOB VRDO | 3.490% | 11/7/07 | | 9,995 | 9,995 |
| Pennsylvania GO | 5.000% | 8/1/08 | (Prere.) | 6,210 | 6,330 |
| Pennsylvania Higher Educ. Assistance Agency | | | | | |
| Student Loan Rev. VRDO | 3.400% | 11/7/07 | (2) | 30,800 | 30,800 |
| Pennsylvania Higher Educ. Assistance Agency | | | | | |
| Student Loan Rev. VRDO | 3.400% | 11/7/07 | (2) | 13,500 | 13,500 |
| Pennsylvania Higher Educ. Assistance Agency | | | | | |
| Student Loan Rev. VRDO | 3.500% | 11/7/07 | (4) | 40,300 | 40,300 |
| Pennsylvania Housing Finance Agency Rev. VRDO | 3.250% | 11/7/07 | | 18,335 | 18,335 |
| Pennsylvania Housing Finance Agency Rev. VRDO | 3.250% | 11/7/07 | | 25,165 | 25,165 |
1 | Pennsylvania Turnpike Comm. Oil Franchise | | | | | |
| Tax Rev. TOB VRDO | 3.510% | 11/7/07 | (1) | 2,575 | 2,575 |
| Pennsylvania Turnpike Comm. Rev. VRDO | 3.250% | 11/7/07 | | 19,400 | 19,400 |
| Pennsylvania Turnpike Comm. Rev. VRDO | 3.440% | 11/7/07 | | 3,780 | 3,780 |
1 | Philadelphia PA Airport Rev. TOB VRDO | 3.590% | 11/7/07 | (4) | 5,080 | 5,080 |
1 | Philadelphia PA Airport Rev. TOB VRDO | 3.590% | 11/7/07 | (4) | 6,780 | 6,780 |
| Philadelphia PA Airport Rev. VRDO | 3.330% | 11/7/07 | (1) | 22,500 | 22,500 |
| Red Lion PA School Dist. VRDO | 3.450% | 11/7/07 | (4) | 48,880 | 48,880 |
| Sayre PA Health Care Fac. Auth. Rev. | | | | | |
| (VHA of Pennsylvania, Pooled Capital | | | | | |
| Asset Financial Program) VRDO | 3.290% | 11/7/07 | (2) | 10,800 | 10,800 |
| Sayre PA Health Care Fac. Auth. Rev. | | | | | |
| (VHA of Pennsylvania, Pooled Capital | | | | | |
| Asset Financial Program) VRDO | 3.290% | 11/7/07 | (2) | 6,400 | 6,400 |
| Sayre PA Health Care Fac. Auth. Rev. | | | | | |
| (VHA of Pennsylvania, Pooled Capital | | | | | |
| Asset Financial Program) VRDO | 3.290% | 11/7/07 | (2) | 1,500 | 1,500 |
| Sayre PA Health Care Fac. Auth. Rev. | | | | | |
| (VHA of Pennsylvania, Pooled Capital | | | | | |
| Asset Financial Program) VRDO | 3.290% | 11/7/07 | (2) | 19,300 | 19,300 |
| Sayre PA Health Care Fac. Auth. Rev. | | | | | |
| (VHA of Pennsylvania, Pooled Capital | | | | | |
| Asset Financial Program) VRDO | 3.300% | 11/7/07 | (2) | 7,000 | 7,000 |
| Sayre PA Health Care Fac. Auth. Rev. | | | | | |
| (VHA of Pennsylvania, Pooled Capital | | | | | |
| Asset Financial Program) VRDO | 3.300% | 11/7/07 | (2) | 8,700 | 8,700 |
| Sayre PA Health Care Fac. Auth. Rev. | | | | | |
| (VHA of Pennsylvania, Pooled Capital | | | | | |
| Asset Financial Program) VRDO | 3.300% | 11/7/07 | (2) | 12,000 | 12,000 |
27
Tax-Exempt Money Market Fund
| | | | | Face | Market |
| | | Maturity | | Amount | Value• |
| | Coupon | Date | | ($000) | ($000) |
| Sayre PA Health Care Fac. Auth. Rev. | | | | | |
| (VHA of Pennsylvania, Pooled Capital | | | | | |
| Asset Financial Program) VRDO | 3.300% | 11/7/07 | (2) | 7,000 | 7,000 |
| Univ. of Pittsburgh of the Commonwealth | | | | | |
| System of Higher Educ. Pennsylvania | | | | | |
| (Univ. Capital Project) VRDO | 3.400% | 11/7/07 | | 19,700 | 19,700 |
| Univ. of Pittsburgh of the Commonwealth | | | | | |
| System of Higher Educ. Pennsylvania | | | | | |
| (Univ. Capital Project) VRDO | 3.400% | 11/7/07 | | 13,621 | 13,621 |
| Univ. of Pittsburgh of the Commonwealth | | | | | |
| System of Higher Educ. Pennsylvania | | | | | |
| (Univ. Capital Project) VRDO | 3.400% | 11/7/07 | | 12,500 | 12,500 |
| | | | | | 371,941 |
Rhode Island (0.3%) | | | | | |
1 | Narragansett RI Commission WasteWater | | | | | |
| System Rev. TOB VRDO | 3.490% | 11/7/07 | (1) | 11,985 | 11,985 |
1 | Rhode Island Convention Center Auth. | | | | | |
| Rev. TOB VRDO | 3.580% | 11/7/07 | (4) | 5,900 | 5,900 |
1 | Rhode Island Convention Center Auth. | | | | | |
| Rev. TOB VRDO | 3.580% | 11/7/07 | (4) | 5,370 | 5,370 |
1 | Rhode Island Econ. Dev. Corp. Airport | | | | | |
| Rev. TOB PUT | 3.800% | 3/13/08 | (1) | 6,405 | 6,405 |
1 | Rhode Island Econ. Dev. Corp. Airport | | | | | |
| Rev. TOB VRDO | 3.520% | 11/7/07 | (1) | 4,790 | 4,790 |
1 | Rhode Island Econ. Dev. Corp. Airport | | | | | |
| Rev. TOB VRDO | 3.550% | 11/7/07 | (1) | 1,730 | 1,730 |
1 | Rhode Island Econ. Dev. Corp. Airport | | | | | |
| Rev. TOB VRDO | 3.550% | 11/7/07 | (1) | 4,485 | 4,485 |
1 | Rhode Island Econ. Dev. Corp. Airport | | | | | |
| Rev. TOB VRDO | 3.610% | 11/7/07 | (1) | 3,925 | 3,925 |
| Rhode Island Housing & Mortgage | | | | | |
| Finance Corp. Rev. | 4.000% | 4/1/08 | | 5,000 | 5,002 |
1 | Rhode Island Housing & Mortgage | | | | | |
| Finance Corp. Rev. TOB VRDO | 3.550% | 11/7/07 | (4) | 4,310 | 4,310 |
1 | Rhode Island Housing & Mortgage | | | | | |
| Finance Corp. Rev. TOB VRDO | 3.610% | 11/7/07 | (4) | 5,320 | 5,320 |
| | | | | | 59,222 |
South Carolina (0.9%) | | | | | |
| Charleston SC Waterworks & Sewer Rev. | | | | | |
| Capital Improvement VRDO | 3.430% | 11/7/07 | | 42,175 | 42,175 |
1 | Horry County SC School Dist. GO TOB VRDO | 3.580% | 11/7/07 | (4) | 3,750 | 3,750 |
1 | Scago Educ. Fac. Corp. for Pickens School | | | | | |
| Dist. South Carolina (Pickens County Project) | | | | | |
| TOB VRDO | 3.500% | 11/7/07 | (4) | 26,440 | 26,440 |
1 | South Carolina GO TOB VRDO | 3.490% | 11/7/07 | | 5,645 | 5,645 |
| South Carolina Housing Finance & Dev. Auth. Rev. | 3.870% | 9/2/08 | | 16,600 | 16,600 |
| South Carolina Public Service Auth. Rev. | | | | | |
| (Santee Cooper) CP | 3.600% | 11/1/07 | | 6,935 | 6,935 |
| South Carolina Public Service Auth. Rev. CP | 3.720% | 11/6/07 | | 7,000 | 7,000 |
| South Carolina Public Service Auth. Rev. CP | 3.510% | 11/7/07 | | 6,500 | 6,500 |
1 | South Carolina Public Service Auth. Rev. TOB VRDO | 3.490% | 11/7/07 | (2) | 5,545 | 5,545 |
1 | South Carolina Public Service Auth. Rev. TOB VRDO | 3.500% | 11/7/07 | (1) | 5,670 | 5,670 |
1 | South Carolina Public Service Auth. Rev. TOB VRDO | 3.500% | 11/7/07 | (1) | 9,800 | 9,800 |
1 | South Carolina Public Service Auth. Rev. TOB VRDO | 3.510% | 11/7/07 | (2) | 4,510 | 4,510 |
1 | South Carolina Public Service Auth. Rev. TOB VRDO | 3.520% | 11/7/07 | (2) | 11,000 | 11,000 |
1 | South Carolina Public Service Auth. Rev. TOB VRDO | 3.520% | 11/7/07 | (1) | 23,150 | 23,150 |
28
Tax-Exempt Money Market Fund
| | | | | Face | Market |
| | | Maturity | | Amount | Value• |
| | Coupon | Date | | ($000) | ($000) |
1 | South Carolina Transp. Infrastructure Rev. | | | | | |
| TOB VRDO | 3.500% | 11/7/07 | (2) | 6,390 | 6,390 |
1 | South Carolina Transp. Infrastructure Rev. | | | | | |
| TOB VRDO | 3.520% | 11/7/07 | (2) | 7,760 | 7,760 |
1 | South Carolina Transp. Infrastructure Rev. | | | | | |
| TOB VRDO | 3.520% | 11/7/07 | (2) | 12,650 | 12,650 |
| | | | | | 201,520 |
South Dakota (0.4%) | | | | | |
| South Dakota Health & Educ. Fac. Auth. Rev. | | | | | |
| (Sioux Valley Hosp. & Health System) VRDO | 3.480% | 11/7/07 | LOC | 15,285 | 15,285 |
| South Dakota Health & Educ. Fac. Auth. Rev. | | | | | |
| (Sioux Valley Hosp. & Health System) VRDO | 3.480% | 11/7/07 | LOC | 15,000 | 15,000 |
| South Dakota Housing Dev. Auth. | | | | | |
| Homeownership Mortgage Rev. | 4.250% | 8/15/08 | | 26,000 | 26,090 |
1 | South Dakota Housing Dev. Auth. | | | | | |
| Homeownership Mortgage Rev. TOB VRDO | 3.400% | 11/7/07 | | 7,470 | 7,470 |
1 | South Dakota Housing Dev. Auth. | | | | | |
| Homeownership Mortgage Rev. TOB VRDO | 3.410% | 11/7/07 | | 3,140 | 3,140 |
| South Dakota Housing Dev. Auth. | | | | | |
| Homeownership Mortgage Rev. VRDO | 3.310% | 11/7/07 | | 25,000 | 25,000 |
1 | South Dakota Housing Dev. Auth. TOB VRDO | 3.550% | 11/7/07 | | 3,650 | 3,650 |
| | | | | | 95,635 |
Tennessee (4.0%) | | | | | |
| Clarksville TN Public Building Auth. Rev. | | | | | |
| (Pooled Financing) VRDO | 3.580% | 11/1/07 | LOC | 27,759 | 27,759 |
| Clarksville TN Public Building Auth. Rev. | | | | | |
| (Pooled Financing) VRDO | 3.580% | 11/1/07 | LOC | 30,750 | 30,750 |
| Clarksville TN Public Building Auth. Rev. VRDO | 3.580% | 11/1/07 | LOC | 4,315 | 4,315 |
| Knox County TN GO | 5.000% | 4/1/08 | | 3,115 | 3,131 |
1 | Memphis TN GO TOB PUT | 3.750% | 3/6/08 | (1) | 11,238 | 11,237 |
1 | Memphis TN GO TOB VRDO | 3.500% | 11/7/07 | (3) | 7,465 | 7,465 |
| Metro. Govt. of Nashville & | | | | | |
| Davidson County TN CP | 3.600% | 11/28/07 | | 43,000 | 43,000 |
| Metro. Govt. of Nashville & | | | | | |
| Davidson County TN CP | 3.550% | 12/12/07 | | 70,000 | 70,000 |
| Metro. Govt. of Nashville & | | | | | |
| Davidson County TN GO VRDO | 3.430% | 11/7/07 | | 38,130 | 38,130 |
| Metro. Govt. of Nashville & | | | | | |
| Davidson County TN Health & | | | | | |
| Educ. Fac. (Vanderbilt Univ.) CP | 3.560% | 11/7/07 | | 21,400 | 21,400 |
| Metro. Govt. of Nashville & | | | | | |
| Davidson County TN Ind. Dev. Board | | | | | |
| (Country Music Hall of Fame) VRDO | 3.450% | 11/7/07 | LOC | 12,500 | 12,500 |
| Metro. Govt. of Nashville TN Airport Auth. | | | | | |
| Improvement Refunding VRDO | 3.250% | 11/7/07 | (3)LOC | 25,900 | 25,900 |
| Montgomery County TN Public Building | | | | | |
| Auth. Pooled Financial Rev. (Tennessee | | | | | |
| County Loan Pool) VRDO | 3.580% | 11/1/07 | LOC | 57,870 | 57,870 |
| Montgomery County TN Public Building | | | | | |
| Auth. Pooled Financial Rev. (Tennessee | | | | | |
| County Loan Pool) VRDO | 3.580% | 11/1/07 | LOC | 19,250 | 19,250 |
| Montgomery County TN Public Building | | | | | |
| Auth. Pooled Financial Rev. (Tennessee | | | | | |
| County Loan Pool) VRDO | 3.580% | 11/1/07 | LOC | 71,755 | 71,755 |
| Sevier County TN Public Building Auth. | | | | | |
| (Local Govt. Public Improvement Bonds) VRDO | 3.620% | 11/1/07 | | 23,000 | 23,000 |
29
Tax-Exempt Money Market Fund
| | | | | Face | Market |
| | | Maturity | | Amount | Value• |
| | Coupon | Date | | ($000) | ($000) |
| Sevier County TN Public Building Auth. | | | | | |
| (Local Govt. Public Improvement Bonds) VRDO | 3.470% | 11/7/07 | (2) | 6,160 | 6,160 |
| Sevier County TN Public Building Auth. | | | | | |
| (Local Govt. Public Improvement Bonds) VRDO | 3.470% | 11/7/07 | (2) | 8,000 | 8,000 |
| Shelby County TN GO | 5.000% | 4/1/08 | | 4,550 | 4,573 |
| Shelby County TN GO VRDO | 3.280% | 11/7/07 | | 11,400 | 11,400 |
| Shelby County TN GO VRDO | 3.430% | 11/7/07 | | 76,565 | 76,565 |
| Shelby County TN GO VRDO | 3.430% | 11/7/07 | | 109,090 | 109,090 |
| Shelby County TN GO VRDO | 3.430% | 11/7/07 | | 146,800 | 146,800 |
| Shelby County TN Health Educ. & Housing Fac. | | | | | |
| Board Rev. (BriarCrest) VRDO | 3.260% | 11/7/07 | LOC | 7,800 | 7,800 |
1 | Tennessee Energy Acquisition Corp. Gas Rev. | | | | | |
| TOB VRDO | 3.530% | 11/7/07 | | 15,875 | 15,875 |
1 | Tennessee Energy Acquistion Corp. Gas Rev. | | | | | |
| TOB VRDO | 3.570% | 11/7/07 | | 5,375 | 5,375 |
1 | Tennessee Housing Dev. Agency | | | | | |
| (Homeownership Program) TOB PUT | 3.750% | 2/20/08 | | 14,630 | 14,630 |
1 | Tennessee Housing Dev. Agency | | | | | |
| (Homeownership Program) TOB VRDO | 3.280% | 11/7/07 | | 1,995 | 1,995 |
| Tennessee IAM GO CP | 3.420% | 12/7/07 | | 10,000 | 10,000 |
| | | | | | 885,725 |
Texas (16.9%) | | | | | |
1 | Aldine TX Independent School Dist. TOB VRDO | 3.500% | 11/7/07 | | 4,770 | 4,770 |
1,2 | Aldine TX Independent School Dist. TOB VRDO | 3.510% | 11/7/07 | | 5,220 | 5,220 |
1 | Alvin TX Community College TOB VRDO | 3.580% | 11/7/07 | (1) | 5,205 | 5,205 |
1 | Alvin TX Independent School Dist. GO TOB VRDO | 3.340% | 11/7/07 | (1) | 4,780 | 4,780 |
| Austin TX Combined Util. System Rev. CP | 3.620% | 11/13/07 | LOC | 11,898 | 11,898 |
1 | Austin TX Electric Util. System Rev. TOB VRDO | 3.510% | 11/7/07 | (1) | 4,740 | 4,740 |
1 | Austin TX Electric Util. System Rev. TOB VRDO | 3.510% | 11/7/07 | (4) | 11,370 | 11,370 |
1 | Austin TX Electric Util. System Rev. TOB VRDO | 3.520% | 11/7/07 | (2) | 6,665 | 6,665 |
1 | Austin TX Public Improvement GO TOB VRDO | 3.510% | 11/7/07 | | 6,440 | 6,440 |
1 | Austin TX Public Improvement GO TOB VRDO | 3.580% | 11/7/07 | (3) | 5,735 | 5,735 |
1 | Austin TX Water & Wastewater System Rev. | | | | | |
| TOB PUT | 3.800% | 3/6/08 | (4) | 16,840 | 16,840 |
1 | Austin TX Water & Wastewater System Rev. | | | | | |
| TOB VRDO | 3.510% | 11/7/07 | (4) | 14,150 | 14,150 |
1 | Austin TX Water & Wastewater System Rev. | | | | | |
| TOB VRDO | 3.510% | 11/7/07 | (1) | 13,235 | 13,235 |
1 | Bastrop TX Independent School Dist. TOB VRDO | 3.520% | 11/7/07 | | 14,140 | 14,140 |
| Bexar TX Metro. Water Dist. CP | 3.770% | 11/13/07 | LOC | 10,000 | 10,000 |
| Board of Regents of the Univ. of Texas System | | | | | |
| Permanent Univ. Fund CP | 3.720% | 11/8/07 | | 13,675 | 13,675 |
| Board of Regents of the Univ. of Texas System | | | | | |
| Rev. Financing System CP | 3.600% | 11/1/07 | | 5,491 | 5,491 |
| Board of Regents of the Univ. of Texas System | | | | | |
| Rev. Financing System CP | 3.600% | 11/7/07 | | 15,450 | 15,450 |
| Board of Regents of the Univ. of Texas System | | | | | |
| Rev. Financing System CP | 3.720% | 11/8/07 | | 20,078 | 20,078 |
| Board of Regents of the Univ. of Texas System | | | | | |
| Rev. Financing System CP | 3.730% | 11/8/07 | | 1,500 | 1,500 |
| Board of Regents of the Univ. of Texas System | | | | | |
| Rev. Financing System CP | 3.580% | 12/10/07 | | 23,501 | 23,501 |
| Board of Regents of the Univ. of Texas System | | | | | |
| Rev. Financing System CP | 3.680% | 12/12/07 | | 21,893 | 21,893 |
| Board of Regents of the Univ. of Texas System | | | | | |
| Rev. Financing System CP | 3.770% | 12/13/07 | | 10,000 | 10,000 |
30
Tax-Exempt Money Market Fund
| | | | | Face | Market |
| | | Maturity | | Amount | Value• |
| | Coupon | Date | | ($000) | ($000) |
| Board of Regents of the Univ. of Texas System | | | | | |
| Rev. Financing System CP | 3.410% | 1/7/08 | | 10,000 | 10,000 |
1 | Board of Regents of the Univ. of Texas System | | | | | |
| Rev. Financing System TOB VRDO | 3.500% | 11/7/07 | | 10,215 | 10,215 |
1 | Board of Regents of the Univ. of Texas System | | | | | |
| Rev. TOB VRDO | 3.490% | 11/7/07 | | 20,010 | 20,010 |
1 | Board of Regents of the Univ. of Texas System | | | | | |
| Rev. TOB VRDO | 3.500% | 11/7/07 | | 9,055 | 9,055 |
1 | Bridgeport TX Independent School Dist. TOB VRDO | 3.580% | 11/7/07 | | 6,410 | 6,410 |
1 | Carroll TX Independent School Dist. GO TOB VRDO | 3.580% | 11/7/07 | | 7,245 | 7,245 |
1 | Clear Creek TX Independent School Dist. | | | | | |
| GO TOB PUT | 3.800% | 3/6/08 | | 13,340 | 13,340 |
1 | Clear Creek TX Independent School Dist. | | | | | |
| GO TOB VRDO | 3.500% | 11/7/07 | | 9,825 | 9,825 |
| Conroe TX Independent School Dist. PUT | 5.000% | 8/15/08 | | 14,355 | 14,510 |
1 | Conroe TX Independent School Dist. TOB VRDO | 3.580% | 11/7/07 | (3) | 5,525 | 5,525 |
1 | Corpus Christi TX GO TOB VRDO | 3.500% | 11/7/07 | (4) | 4,370 | 4,370 |
1 | Cypress-Fairbanks TX Independent School Dist. | | | | | |
| TOB VRDO | 3.520% | 11/7/07 | | 5,000 | 5,000 |
1 | Cypress-Fairbanks TX Independent School Dist. | | | | | |
| Unlimited Tax Schoolhouse TOB PUT | 3.800% | 2/28/08 | (Prere.) | 5,010 | 5,010 |
1 | Cypress-Fairbanks TX Independent School Dist. | | | | | |
| Unlimited Tax Schoolhouse TOB VRDO | 3.510% | 11/7/07 | | 6,000 | 6,000 |
1 | Cypress-Fairbanks TX Independent School Dist. | | | | | |
| Unlimited Tax Schoolhouse TOB VRDO | 3.510% | 11/7/07 | | 1,545 | 1,545 |
1 | Dallas County TX Community College Dist. | | | | | |
| TOB VRDO | 3.520% | 11/7/07 | | 8,465 | 8,465 |
1 | Dallas TX Area Rapid Transit TOB VRDO | 3.490% | 11/7/07 | (2) | 13,790 | 13,790 |
1 | Dallas TX Area Rapid Transit TOB VRDO | 3.490% | 11/7/07 | (2) | 12,170 | 12,170 |
1 | Dallas TX Area Rapid Transit TOB VRDO | 3.490% | 11/7/07 | (2) | 9,870 | 9,870 |
1 | Dallas TX Area Rapid Transit TOB VRDO | 3.500% | 11/7/07 | (2) | 6,100 | 6,100 |
1 | Dallas TX Area Rapid Transit TOB VRDO | 3.500% | 11/7/07 | (2) | 30,245 | 30,245 |
1 | Dallas TX Area Rapid Transit TOB VRDO | 3.500% | 11/7/07 | (2) | 4,305 | 4,305 |
1 | Dallas TX Area Rapid Transit TOB VRDO | 3.520% | 11/7/07 | (3)(Prere.) | 5,260 | 5,260 |
1 | Dallas TX Area Rapid Transit TOB VRDO | 3.520% | 11/7/07 | (2) | 9,345 | 9,345 |
| Dallas TX GO | 5.000% | 2/15/08 | | 6,540 | 6,562 |
1 | Dallas TX GO TOB VRDO | 3.490% | 11/7/07 | | 11,680 | 11,680 |
1 | Dallas TX GO TOB VRDO | 3.500% | 11/7/07 | | 8,120 | 8,120 |
1 | Dallas TX GO TOB VRDO | 3.510% | 11/7/07 | | 7,840 | 7,840 |
1 | Dallas TX Independent School Dist. GO TOB VRDO | 3.510% | 11/7/07 | | 6,100 | 6,100 |
1 | Dallas TX Independent School Dist. GO TOB VRDO | 3.580% | 11/7/07 | | 3,670 | 3,670 |
1 | Dallas TX Rapid Transit Tax TOB VRDO | 3.500% | 11/7/07 | (2) | 9,920 | 9,920 |
1 | Dallas TX Waterworks & Sewer System Rev. | | | | | |
| TOB PUT | 3.800% | 2/28/08 | (Prere.) | 17,985 | 17,985 |
1 | Dallas TX Waterworks & Sewer System Rev. | | | | | |
| TOB VRDO | 3.490% | 11/7/07 | | 2,160 | 2,160 |
| Dallas-Fort Worth TX International Airport Rev. | 5.500% | 11/1/07 | (3) | 3,000 | 3,000 |
1 | Dallas-Fort Worth TX International Airport Rev. | | | | | |
| TOB VRDO | 3.550% | 11/7/07 | (4) | 2,160 | 2,160 |
1 | Dallas-Fort Worth TX International Airport Rev. | | | | | |
| TOB VRDO | 3.550% | 11/7/07 | (3) | 4,472 | 4,472 |
1 | Dallas-Fort Worth TX International Airport Rev. | | | | | |
| TOB VRDO | 3.550% | 11/7/07 | (10) | 5,810 | 5,810 |
1 | Dallas-Fort Worth TX International Airport Rev. | | | | | |
| TOB VRDO | 3.550% | 11/7/07 | (1) | 3,990 | 3,990 |
31
Tax-Exempt Money Market Fund
| | | | | Face | Market |
| | | Maturity | | Amount | Value• |
| | Coupon | Date | | ($000) | ($000) |
1 | Dallas-Fort Worth TX International Airport Rev. | | | | | |
| TOB VRDO | 3.590% | 11/7/07 | (4) | 2,525 | 2,525 |
1 | Dallas-Fort Worth TX International Airport Rev. | | | | | |
| TOB VRDO | 3.590% | 11/7/07 | (1) | 16,965 | 16,965 |
1 | Dallas-Fort Worth TX International Airport Rev. | | | | | |
| TOB VRDO | 3.610% | 11/7/07 | (4) | 3,995 | 3,995 |
1 | Dallas-Fort Worth TX International Airport Rev. | | | | | |
| TOB VRDO | 3.610% | 11/7/07 | (1) | 1,745 | 1,745 |
1 | De Soto TX Independent School Dist. TOB VRDO | 3.530% | 11/7/07 | | 13,755 | 13,755 |
| Denton TX Independent School Dist. VRDO | 3.450% | 11/7/07 | | 10,500 | 10,500 |
| Denton TX Independent School Dist. VRDO | 3.470% | 11/7/07 | | 12,500 | 12,500 |
1 | Duncanville TX Independent School Dist. | | | | | |
| TOB VRDO | 3.520% | 11/7/07 | | 8,225 | 8,225 |
1 | El Paso TX GO TOB VRDO | 3.500% | 11/7/07 | (3) | 3,120 | 3,120 |
| El Paso TX Independent School Dist. | | | | | |
| School Building GO VRDO | 3.450% | 11/7/07 | | 32,530 | 32,530 |
1 | Fort Bend County TX GO TOB VRDO | 3.490% | 11/7/07 | (1) | 10,085 | 10,085 |
1 | Frisco TX TOB VRDO | 3.490% | 11/7/07 | (2) | 16,375 | 16,375 |
1 | Frisco TX TOB VRDO | 3.520% | 11/7/07 | (4) | 4,155 | 4,155 |
1 | Frisco TX TOB VRDO | 3.580% | 11/7/07 | (1) | 7,475 | 7,475 |
| Garland TX Independent School Dist. PUT | 3.750% | 6/16/08 | | 23,325 | 23,325 |
1 | Garland TX Independent School Dist. TOB VRDO | 3.580% | 11/7/07 | | 5,235 | 5,235 |
1 | Giddings TX Independent School Dist. TOB VRDO | 3.500% | 11/7/07 | | 6,735 | 6,735 |
1 | Grand Prairie TX Independent School Dist. | | | | | |
| TOB VRDO | 3.510% | 11/7/07 | | 5,270 | 5,270 |
1 | Grand Prairie TX Independent School Dist. | | | | | |
| TOB VRDO | 3.510% | 11/7/07 | | 7,225 | 7,225 |
1 | Greater East Texas Higher Educ. Auth. | | | | | |
| Student Loan Rev. VRDO | 3.510% | 11/7/07 | LOC | 35,000 | 35,000 |
1 | Greater East Texas Higher Educ. Auth. | | | | | |
| Student Loan Rev. VRDO | 3.510% | 11/7/07 | LOC | 46,700 | 46,700 |
1 | Greater East Texas Higher Educ. Auth. | | | | | |
| Student Loan Rev. VRDO | 3.510% | 11/7/07 | LOC | 40,000 | 40,000 |
1 | Greater East Texas Higher Educ. Auth. | | | | | |
| Student Loan Rev. VRDO | 3.510% | 11/7/07 | LOC | 10,000 | 10,000 |
1 | Harris County TX Flood Control Dist. TOB VRDO | 3.490% | 11/7/07 | | 10,375 | 10,375 |
1 | Harris County TX Flood Control Dist. TOB VRDO | 3.500% | 11/7/07 | | 33,300 | 33,300 |
1 | Harris County TX Flood Control Dist. TOB VRDO | 3.580% | 11/7/07 | | 3,100 | 3,100 |
| Harris County TX GO CP | 3.550% | 12/12/07 | | 23,750 | 23,750 |
| Harris County TX GO CP | 3.420% | 1/10/08 | | 9,850 | 9,850 |
| Harris County TX GO CP | 3.450% | 1/16/08 | | 2,850 | 2,850 |
| Harris County TX GO CP | 3.450% | 1/16/08 | | 1,850 | 1,850 |
1 | Harris County TX GO TOB VRDO | 3.490% | 11/7/07 | (1) | 16,955 | 16,955 |
1 | Harris County TX GO TOB VRDO | 3.500% | 11/7/07 | (3) | 4,680 | 4,680 |
1 | Harris County TX GO TOB VRDO | 3.500% | 11/7/07 | (1) | 9,900 | 9,900 |
1 | Harris County TX GO TOB VRDO | 3.510% | 11/7/07 | (4) | 2,895 | 2,895 |
1 | Harris County TX GO TOB VRDO | 3.520% | 11/7/07 | (3) | 5,575 | 5,575 |
1 | Harris County TX GO TOB VRDO | 3.520% | 11/7/07 | | 16,255 | 16,255 |
1 | Harris County TX GO TOB VRDO | 3.520% | 11/7/07 | | 8,115 | 8,115 |
1 | Harris County TX Health Fac. Dev. Corp. Rev. | | | | | |
| (St. Luke’s Episcopal Hosp.) TOB VRDO | 3.500% | 11/7/07 | | 5,500 | 5,500 |
1 | Harris County TX Health Fac. Dev. Corp. Rev. | | | | | |
| (St. Luke’s Episcopal Hosp.) TOB VRDO | 3.580% | 11/7/07 | | 6,775 | 6,775 |
1 | Harris County TX Permanent Improvement & | | | | | |
| Refunding TOB VRDO | 3.580% | 11/7/07 | | 4,150 | 4,150 |
1 | Harris County TX Rev. TOB VRDO | 3.490% | 11/7/07 | (2) | 19,995 | 19,995 |
32
Tax-Exempt Money Market Fund
| | | | | Face | Market |
| | | Maturity | | Amount | Value• |
| | Coupon | Date | | ($000) | ($000) |
| Harris County TX TAN | 4.000% | 2/29/08 | | 25,000 | 25,027 |
1 | Harris County TX Toll Road Rev. TOB VRDO | 3.490% | 11/7/07 | (4) | 3,845 | 3,845 |
1 | Harris County TX Toll Road Rev. TOB VRDO | 3.490% | 11/7/07 | | 9,255 | 9,255 |
1 | Harris County TX Toll Road TOB VRDO | 3.500% | 11/7/07 | | 4,635 | 4,635 |
1 | Houston TX Airport System Rev. TOB VRDO | 3.500% | 11/7/07 | (4) | 3,000 | 3,000 |
1 | Houston TX GO TOB VRDO | 3.510% | 11/7/07 | (2) | 4,125 | 4,125 |
1 | Houston TX GO TOB VRDO | 3.520% | 11/7/07 | (1) | 4,950 | 4,950 |
1 | Houston TX Higher Educ. Finance Corp. | | | | | |
| Rev. TOB PUT | 3.850% | 12/13/07 | | 8,550 | 8,550 |
1 | Houston TX Higher Educ. Finance Corp. | | | | | |
| Rev. TOB VRDO | 3.490% | 11/7/07 | | 9,250 | 9,250 |
1 | Houston TX Higher Educ. Finance Corp. | | | | | |
| Rev. TOB VRDO | 3.500% | 11/7/07 | | 5,000 | 5,000 |
1 | Houston TX Higher Educ. Finance Corp. | | | | | |
| Rev. TOB VRDO | 3.500% | 11/7/07 | | 8,699 | 8,699 |
1 | Houston TX Higher Educ. Finance Corp. | | | | | |
| Rev. TOB VRDO | 3.500% | 11/7/07 | | 5,495 | 5,495 |
1 | Houston TX Housing Finance Corp. TOB VRDO | 3.630% | 11/7/07 | | 20 | 20 |
| Houston TX Independent School Dist. GO | 5.000% | 2/15/08 | | 4,500 | 4,517 |
| Houston TX Independent School Dist. GO PUT | 3.750% | 6/16/08 | | 80,600 | 80,600 |
1 | Houston TX Independent School Dist. GO TOB PUT | 3.800% | 2/28/08 | (4) | 18,615 | 18,615 |
1 | Houston TX Independent School Dist. | | | | | |
| GO TOB VRDO | 3.490% | 11/7/07 | | 5,315 | 5,315 |
1 | Houston TX Independent School Dist. | | | | | |
| GO TOB VRDO | 3.490% | 11/7/07 | | 15,990 | 15,990 |
1 | Houston TX Independent School Dist. | | | | | |
| GO TOB VRDO | 3.500% | 11/7/07 | (4) | 4,500 | 4,500 |
1 | Houston TX Independent School Dist. | | | | | |
| GO TOB VRDO | 3.520% | 11/7/07 | (4) | 9,995 | 9,995 |
1 | Houston TX Independent School Dist. | | | | | |
| GO TOB VRDO | 3.520% | 11/7/07 | | 7,990 | 7,990 |
1 | Houston TX Independent School Dist. | | | | | |
| Limited Tax Refunding GO TOB VRDO | 3.520% | 11/7/07 | | 11,000 | 11,000 |
1 | Houston TX Independent School Dist. TOB VRDO | 3.490% | 11/7/07 | | 5,730 | 5,730 |
1 | Houston TX Util. System Rev. TOB VRDO | 3.340% | 11/7/07 | (1) | 23,150 | 23,150 |
1 | Houston TX Util. System Rev. TOB VRDO | 3.490% | 11/7/07 | (4) | 9,000 | 9,000 |
1 | Houston TX Util. System Rev. TOB VRDO | 3.490% | 11/7/07 | (1) | 6,410 | 6,410 |
1 | Houston TX Util. System Rev. TOB VRDO | 3.490% | 11/7/07 | (1) | 5,000 | 5,000 |
1 | Houston TX Util. System Rev. TOB VRDO | 3.490% | 11/7/07 | (1) | 9,995 | 9,995 |
1 | Houston TX Util. System Rev. TOB VRDO | 3.500% | 11/7/07 | (4) | 3,445 | 3,445 |
1 | Houston TX Util. System Rev. TOB VRDO | 3.500% | 11/7/07 | (3) | 5,380 | 5,380 |
1 | Houston TX Util. System Rev. TOB VRDO | 3.500% | 11/7/07 | (4) | 4,015 | 4,015 |
1 | Houston TX Util. System Rev. TOB VRDO | 3.510% | 11/7/07 | (4) | 10,220 | 10,220 |
1 | Houston TX Util. System Rev. TOB VRDO | 3.520% | 11/7/07 | (1) | 5,315 | 5,315 |
1 | Houston TX Util. System Rev. TOB VRDO | 3.580% | 11/7/07 | (3) | 5,165 | 5,165 |
1 | Houston TX Water & Sewer System Rev. | | | | | |
| TOB VRDO | 3.490% | 11/7/07 | (1) | 9,310 | 9,310 |
1 | Houston TX Water & Sewer System Rev. | | | | | |
| TOB VRDO | 3.500% | 11/7/07 | (4)(Prere.) | 8,795 | 8,795 |
1 | Houston TX Water & Sewer System Rev. | | | | | |
| TOB VRDO | 3.500% | 11/7/07 | (1) | 9,995 | 9,995 |
1 | Houston TX Water & Sewer System Rev. | | | | | |
| TOB VRDO | 3.510% | 11/7/07 | (4) | 27,765 | 27,765 |
1 | Humble TX Independent School Dist. GO | | | | | |
| TOB VRDO | 3.510% | 11/7/07 | | 5,770 | 5,770 |
| Humble TX Independent School Dist. | | | | | |
| School Building VRDO | 3.450% | 11/7/07 | | 52,500 | 52,500 |
33
Tax-Exempt Money Market Fund
| | | | | Face | Market |
| | | Maturity | | Amount | Value• |
| | Coupon | Date | | ($000) | ($000) |
1 | Humble TX Independent School Dist. | | | | | |
| Unlimited Tax School Building GO TOB VRDO | 3.580% | 11/7/07 | | 7,725 | 7,725 |
1 | Irving TX Waterworks & Sewer Rev. TOB VRDO | 3.500% | 11/7/07 | (2) | 2,270 | 2,270 |
1 | Judson TX Independent School Dist. TOB VRDO | 3.510% | 11/7/07 | | 6,165 | 6,165 |
1 | Klein TX Independent School Dist. | | | | | |
| Unlimited Tax Schoolhouse TOB VRDO | 3.580% | 11/7/07 | | 5,495 | 5,495 |
1 | Lamar TX Consolidated Independent | | | | | |
| School Dist. TOB VRDO | 3.490% | 11/7/07 | | 11,485 | 11,485 |
1 | Lamar TX Consolidated Independent | | | | | |
| School Dist. TOB VRDO | 3.510% | 11/7/07 | | 8,165 | 8,165 |
1 | Lamar TX Independent School Dist. TOB VRDO | 3.510% | 11/7/07 | | 5,120 | 5,120 |
1 | Laredo TX Independent School Dist. | | | | | |
| Unlimited Tax School Building & | | | | | |
| Refunding TOB VRDO | 3.500% | 11/7/07 | | 18,905 | 18,905 |
1 | Lewisville TX Independent School Dist. TOB VRDO | 3.510% | 11/7/07 | (3) | 9,705 | 9,705 |
1 | Lewisville TX Independent School Dist. TOB VRDO | 3.580% | 11/7/07 | | 4,140 | 4,140 |
1 | Lower Colorado River Auth. Texas Rev. TOB VRDO | 3.580% | 11/7/07 | (3) | 5,330 | 5,330 |
| Lubbock TX Independent School Dist. VRDO | 3.450% | 11/7/07 | | 12,800 | 12,800 |
1 | Mansfield TX Independent School Dist. TOB VRDO | 3.340% | 11/7/07 | | 9,980 | 9,980 |
1 | Mansfield TX Independent School Dist. TOB VRDO | 3.490% | 11/7/07 | | 22,030 | 22,030 |
1 | Mansfield TX Independent School Dist. TOB VRDO | 3.510% | 11/7/07 | | 3,040 | 3,040 |
1 | McLennan County TX Junior College GO TOB VRDO | 3.520% | 11/7/07 | (4) | 15,500 | 15,500 |
| Mesquite TX Independent School Dist. GO | 4.500% | 8/15/08 | | 3,200 | 3,219 |
| Mesquite TX Independent School Dist. | | | | | |
| School Building VRDO | 3.450% | 11/7/07 | | 5,340 | 5,340 |
1 | Montgomery County TX GO TOB VRDO | 3.510% | 11/7/07 | (4) | 7,725 | 7,725 |
1 | North East TX Independent School Dist. | | | | | |
| GO TOB VRDO | 3.490% | 11/7/07 | | 5,000 | 5,000 |
1 | North East TX Independent School Dist. | | | | | |
| GO TOB VRDO | 3.500% | 11/7/07 | | 4,995 | 4,995 |
1 | North East TX Independent School Dist. | | | | | |
| GO TOB VRDO | 3.500% | 11/7/07 | | 17,870 | 17,870 |
1 | North East TX Independent School Dist. | | | | | |
| GO TOB VRDO | 3.580% | 11/7/07 | | 4,580 | 4,580 |
1 | North East TX Independent School Dist. | | | | | |
| GO TOB VRDO | 3.580% | 11/7/07 | | 7,225 | 7,225 |
1 | North East TX Independent School Dist. | | | | | |
| Unlimited Tax Refunding GO TOB PUT | 3.770% | 3/6/08 | | 12,280 | 12,280 |
1 | North East TX Independent School Dist. | | | | | |
| Unlimited Tax Refunding GO TOB PUT | 3.800% | 3/6/08 | | 5,780 | 5,780 |
| North Texas Higher Educ. Auth. Student | | | | | |
| Loan VRDO | 3.350% | 11/7/07 | LOC | 26,000 | 26,000 |
| North Texas Higher Educ. Auth. Student | | | | | |
| Loan VRDO | 3.350% | 11/7/07 | LOC | 18,000 | 18,000 |
| North Texas Higher Educ. Auth. Student | | | | | |
| Loan VRDO | 3.380% | 11/7/07 | (2) | 7,500 | 7,500 |
| North Texas Higher Educ. Auth. Student | | | | | |
| Loan VRDO | 3.380% | 11/7/07 | LOC | 30,500 | 30,500 |
| North Texas Higher Educ. Auth. Student | | | | | |
| Loan VRDO | 3.380% | 11/7/07 | (2) | 17,500 | 17,500 |
| North Texas Higher Educ. Auth. Student | | | | | |
| Loan VRDO | 3.380% | 11/7/07 | LOC | 31,840 | 31,840 |
| North Texas Higher Educ. Auth. Student | | | | | |
| Loan VRDO | 3.380% | 11/7/07 | (2) | 70,000 | 70,000 |
1 | North Texas Muni. Water Dist. Texas | | | | | |
| Water System Rev. TOB VRDO | 3.500% | 11/7/07 | (1) | 5,070 | 5,070 |
34
Tax-Exempt Money Market Fund
| | | | | Face | Market |
| | | Maturity | | Amount | Value• |
| | Coupon | Date | | ($000) | ($000) |
1 | North Texas Muni. Water Dist. Texas | | | | | |
| Water System Rev. TOB VRDO | 3.510% | 11/7/07 | (1) | 7,315 | 7,315 |
1 | North Texas Tollway Auth. (Dallas North Tollway) | | | | | |
| System Rev. TOB VRDO | 3.580% | 11/7/07 | (4) | 7,220 | 7,220 |
| North Texas Tollway Auth. (Dallas North Tollway) | | | | | |
| System Rev. VRDO | 3.270% | 11/7/07 | (4) | 5,400 | 5,400 |
| North Texas Tollway Auth. (Dallas North Tollway) | | | | | |
| System Rev. VRDO | 3.270% | 11/7/07 | (4) | 16,400 | 16,400 |
| North Texas Tollway Auth. (Dallas North Tollway) | | | | | |
| System Rev. VRDO | 3.270% | 11/7/07 | (4) | 9,000 | 9,000 |
| North Texas Tollway Auth. (Dallas North Tollway) | | | | | |
| System Rev. VRDO | 3.270% | 11/7/07 | (3) | 45,115 | 45,115 |
| North Texas Tollway Auth. CP | 3.560% | 11/1/07 | | 25,000 | 25,000 |
| North Texas Tollway Auth. CP | 3.400% | 11/7/07 | LOC | 10,000 | 10,000 |
1 | Northside TX Independent School Dist. | | | | | |
| GO TOB VRDO | 3.490% | 11/7/07 | | 36,490 | 36,490 |
1 | Northside TX Independent School Dist. | | | | | |
| GO TOB VRDO | 3.490% | 11/7/07 | | 14,585 | 14,585 |
1 | Northside TX Independent School Dist. | | | | | |
| GO TOB VRDO | 3.520% | 11/7/07 | | 8,410 | 8,410 |
1 | Parker County Texas TOB VRDO | 3.580% | 11/7/07 | (2) | 6,545 | 6,545 |
| Pasadena TX Independent School Dist. VRDO | 3.450% | 11/7/07 | (4) | 38,900 | 38,900 |
| Pasadena TX Independent School Dist. VRDO | 3.450% | 11/7/07 | | 20,600 | 20,600 |
1 | Plano TX GO TOB VRDO | 3.500% | 11/7/07 | | 5,830 | 5,830 |
| Plano TX Independent School Dist. Unlimited | | | | | |
| Tax School Building Bonds (Collin County TX) PUT | 3.700% | 2/28/08 | | 28,060 | 28,060 |
| Red River TX Educ. Finance Rev. | | | | | |
| (Texas Christian Univ.) VRDO | 3.270% | 11/7/07 | | 31,000 | 31,000 |
| Richardson TX Independent School Dist. GO VRDO | 3.450% | 11/7/07 | | 6,270 | 6,270 |
1 | SA Energy Acquisition Public Fac. Corp. | | | | | |
| Texas Gas Supply Rev. TOB VRDO | 3.530% | 11/7/07 | | 15,000 | 15,000 |
| San Antonio TX Educ. Facilities Corp. Rev. | | | | | |
| Higher Educ. (Trinity Univ.) VRDO | 3.580% | 11/1/07 | | 9,200 | 9,200 |
| San Antonio TX Electric & Gas Rev. | 5.000% | 2/1/08 | | 14,000 | 14,047 |
| San Antonio TX Electric & Gas Rev. | 5.250% | 2/1/08 | | 44,320 | 44,488 |
1 | San Antonio TX Electric & Gas Rev. TOB VRDO | 3.490% | 11/7/07 | | 10,250 | 10,250 |
1 | San Antonio TX Electric & Gas Rev. TOB VRDO | 3.490% | 11/7/07 | | 6,220 | 6,220 |
1 | San Antonio TX Electric & Gas Rev. TOB VRDO | 3.490% | 11/7/07 | | 26,695 | 26,695 |
1 | San Antonio TX Electric & Gas Rev. TOB VRDO | 3.500% | 11/7/07 | | 6,840 | 6,840 |
1 | San Antonio TX Electric & Gas Rev. TOB VRDO | 3.520% | 11/7/07 | (1) | 10,550 | 10,550 |
1 | San Antonio TX Electric & Gas Rev. TOB VRDO | 3.520% | 11/7/07 | | 12,980 | 12,980 |
| San Antonio TX Electric & Gas Rev. VRDO | 3.240% | 11/7/07 | | 30,000 | 30,000 |
| San Antonio TX Electric & Gas System Rev. CP | 3.620% | 11/13/07 | | 38,000 | 38,000 |
| San Antonio TX Electric & Gas System Rev. CP | 3.680% | 12/13/07 | | 4,200 | 4,200 |
1 | San Antonio TX Independent School Dist. | | | | | |
| GO TOB VRDO | 3.510% | 11/7/07 | | 17,710 | 17,710 |
1 | San Antonio TX Water Rev. TOB VRDO | 3.490% | 11/7/07 | (1) | 11,235 | 11,235 |
1 | San Antonio TX Water Rev. TOB VRDO | 3.490% | 11/7/07 | (3) | 6,160 | 6,160 |
1 | San Antonio TX Water Rev. TOB VRDO | 3.520% | 11/7/07 | (1) | 10,000 | 10,000 |
1 | Sheldon TX Independent School Dist. TOB VRDO | 3.490% | 11/7/07 | | 5,235 | 5,235 |
1 | Socorro TX Independent School Dist. | | | | | |
| GO TOB VRDO | 3.510% | 11/7/07 | | 9,810 | 9,810 |
1 | Socorro TX Independent School Dist. | | | | | |
| GO TOB VRDO | 3.510% | 11/7/07 | | 6,535 | 6,535 |
| Southwest Texas Higher Educ. Auth. Inc. Rev. | | | | | |
| (Southern Methodist Univ.) VRDO | 3.250% | 11/7/07 | LOC | 2,000 | 2,000 |
35
Tax-Exempt Money Market Fund
| | | | | Face | Market |
| | | Maturity | | Amount | Value• |
| | Coupon | Date | | ($000) | ($000) |
| Southwest Texas Higher Educ. Auth. Inc. Rev. | | | | | |
| (Southern Methodist Univ.) VRDO | 3.250% | 11/7/07 | LOC | 2,100 | 2,100 |
| Spring TX Independent School Dist. | | | | | |
| Schoolhouse GO PUT | 5.000% | 8/15/08 | (4) | 10,000 | 10,107 |
1 | Spring TX Independent School Dist. TOB VRDO | 3.520% | 11/7/07 | | 15,000 | 15,000 |
1 | Tarrant County TX Cultural Educ. Fac. Finance Corp. | | | | | |
| Rev. (Texas Health Resources) TOB VRDO | 3.500% | 11/7/07 | | 8,780 | 8,780 |
1 | Tarrant County TX Cultural Educ. Fac. Finance Corp. | | | | | |
| Rev. (Texas Health Resources) TOB VRDO | 3.500% | 11/7/07 | | 8,780 | 8,780 |
1 | Tarrant County TX Cultural Educ. Fac. Finance Corp. | | | | | |
| Rev. (Texas Health Resources) TOB VRDO | 3.500% | 11/7/07 | | 8,780 | 8,780 |
1 | Tarrant County TX Cultural Educ. Fac. Finance Corp. | | | | | |
| Rev. TOB VRDO | 3.500% | 11/7/07 | | 5,830 | 5,830 |
1 | Tarrant County TX Cultural Educ. Fac. Finance Corp. | | | | | |
| Rev. TOB VRDO | 3.500% | 11/7/07 | | 5,830 | 5,830 |
1 | Tarrant County TX Cultural Educ. Fac. Finance Corp. | | | | | |
| Rev. TOB VRDO | 3.500% | 11/7/07 | | 7,425 | 7,425 |
1 | Texas A & M Univ. Permanent Univ. Fund | | | | | |
| TOB VRDO | 3.490% | 11/7/07 | | 3,900 | 3,900 |
| Texas A & M Univ. System CP | 3.720% | 11/8/07 | | 36,800 | 36,800 |
1 | Texas A & M Univ. System Rev. Financing Bonds | | | | | |
| TOB VRDO | 3.510% | 11/7/07 | | 4,920 | 4,920 |
1 | Texas A & M Univ. System Rev. TOB VRDO | 3.500% | 11/7/07 | | 9,070 | 9,070 |
1 | Texas A & M Univ. System Rev. TOB VRDO | 3.500% | 11/7/07 | | 7,175 | 7,175 |
1 | Texas A & M Univ. System Rev. TOB VRDO | 3.510% | 11/7/07 | | 5,000 | 5,000 |
1 | Texas Dept. Housing & Commnunity Affailrs | | | | | |
| Single Family Rev. TOB VRDO | 3.350% | 11/7/07 | (7) | 4,135 | 4,135 |
1 | Texas Dept. of Housing & Community Affairs | | | | | |
| Multifamily Housing Rev. TOB VRDO | 3.550% | 11/7/07 | | 9,795 | 9,795 |
1 | Texas Dept. of Housing & Community Affairs | | | | | |
| Residential Mortgage Rev. TOB VRDO | 3.550% | 11/7/07 | | 10,000 | 10,000 |
1 | Texas Dept. of Housing & Community Affairs | | | | | |
| Single Mortgage Rev. TOB VRDO | 3.350% | 11/7/07 | (4) | 3,900 | 3,900 |
1 | Texas Dept. of Housing & Community Affairs | | | | | |
| Single Mortgage Rev. TOB VRDO | 3.550% | 11/7/07 | | 8,880 | 8,880 |
| Texas Dept. of Housing & Community Affairs | | | | | |
| Single Mortgage Rev. VRDO | 3.500% | 11/7/07 | (4) | 62,945 | 62,945 |
| Texas Dept. of Housing & Community Affairs | | | | | |
| Single Mortgage Rev. VRDO | 3.560% | 11/7/07 | (4) | 5,800 | 5,800 |
1 | Texas GO TOB PUT | 3.770% | 11/8/07 | | 5,335 | 5,335 |
1 | Texas GO TOB VRDO | 3.490% | 11/7/07 | | 8,885 | 8,885 |
1 | Texas GO TOB VRDO | 3.490% | 11/7/07 | | 17,290 | 17,290 |
1 | Texas GO TOB VRDO | 3.490% | 11/7/07 | | 3,335 | 3,335 |
1 | Texas GO TOB VRDO | 3.500% | 11/7/07 | | 5,595 | 5,595 |
1 | Texas GO TOB VRDO | 3.500% | 11/7/07 | | 4,695 | 4,695 |
1 | Texas GO TOB VRDO | 3.510% | 11/7/07 | | 7,595 | 7,595 |
1 | Texas GO TOB VRDO | 3.510% | 11/7/07 | | 4,285 | 4,285 |
1 | Texas GO TOB VRDO | 3.510% | 11/7/07 | | 7,000 | 7,000 |
1 | Texas GO TOB VRDO | 3.520% | 11/7/07 | | 8,825 | 8,825 |
1 | Texas GO TOB VRDO | 3.520% | 11/7/07 | | 28,800 | 28,800 |
1 | Texas GO TOB VRDO | 3.520% | 11/7/07 | | 7,200 | 7,200 |
| Texas GO Veterans Housing Assistance | | | | | |
| Program Fund II VRDO | 3.340% | 11/7/07 | | 4,185 | 4,185 |
| Texas GO Veterans Housing Assistance | | | | | |
| Program Fund II VRDO | 3.380% | 11/7/07 | | 24,800 | 24,800 |
| Texas Public Finance Auth. GO CP | 3.480% | 1/8/08 | | 9,100 | 9,100 |
36
Tax-Exempt Money Market Fund
| | | | | Face | Market |
| | | Maturity | | Amount | Value• |
| | Coupon | Date | | ($000) | ($000) |
| Texas Small Business IDA IDR (Texas Public | | | | | |
| Fac. Capital Access) VRDO | 3.240% | 11/7/07 | LOC | 15,500 | 15,500 |
| Texas State College Student Loan PUT | 3.850% | 7/1/08 | | 25,000 | 25,000 |
| Texas State College Student Loan PUT | 3.850% | 7/1/08 | | 30,000 | 30,000 |
1 | Texas State Transp. Comm. First Tier TOB VRDO | 3.490% | 11/7/07 | | 10,000 | 10,000 |
1 | Texas State Transp. Comm. First Tier TOB VRDO | 3.500% | 11/7/07 | | 8,865 | 8,865 |
1 | Texas State Transp. Comm. First Tier TOB VRDO | 3.520% | 11/7/07 | | 9,995 | 9,995 |
1 | Texas State Transp. Comm. Highway Fund | | | | | |
| First Tier Rev. TOB VRDO | 3.490% | 11/7/07 | | 23,825 | 23,825 |
1 | Texas State Transp. Comm. Highway Fund | | | | | |
| First Tier Rev. TOB VRDO | 3.580% | 11/7/07 | | 5,000 | 5,000 |
1 | Texas State Transp. Comm. State Highway | | | | | |
| Fund TOB VRDO | 3.510% | 11/7/07 | | 10,335 | 10,335 |
1 | Texas State Transp. Comm. TOB VRDO | 3.290% | 11/7/07 | | 7,000 | 7,000 |
1 | Texas State Transp. Comm. TOB VRDO | 3.340% | 11/7/07 | | 5,200 | 5,200 |
1 | Texas State Transp. Comm. TOB VRDO | 3.490% | 11/7/07 | | 45,500 | 45,500 |
1 | Texas State Transp. Comm. TOB VRDO | 3.490% | 11/7/07 | | 41,460 | 41,460 |
1 | Texas State Transp. Comm. TOB VRDO | 3.500% | 11/7/07 | | 17,676 | 17,676 |
1 | Texas State Transp. Comm. TOB VRDO | 3.510% | 11/7/07 | | 6,100 | 6,100 |
1 | Texas State Transp. Comm. TOB VRDO | 3.510% | 11/7/07 | | 10,360 | 10,360 |
1 | Texas State Transp. Comm. TOB VRDO | 3.520% | 11/7/07 | | 9,215 | 9,215 |
1 | Texas State Univ. System TOB VRDO | 3.510% | 11/7/07 | (4) | 11,905 | 11,905 |
| Texas State Veterans Housing VRDO | 3.300% | 11/7/07 | | 31,430 | 31,430 |
| Texas State Veterans Housing VRDO | 3.340% | 11/7/07 | | 23,790 | 23,790 |
| Texas TRAN | 4.500% | 8/28/08 | | 100,000 | 100,621 |
1 | Texas Transp. Comm. Mobility Fund TOB VRDO | 3.490% | 11/7/07 | | 7,600 | 7,600 |
1 | Texas Transp. Comm. Mobility Fund TOB VRDO | 3.500% | 11/7/07 | | 20,780 | 20,780 |
1 | Texas Transp. Comm. Mobility Fund TOB VRDO | 3.500% | 11/7/07 | | 4,140 | 4,140 |
| Texas Turnpike Auth. Central Texas | | | | | |
| Turnpike System Rev. | 5.000% | 6/1/08 | | 109,540 | 110,409 |
1 | Texas Turnpike Auth. Central Texas | | | | | |
| Turnpike System Rev. TOB VRDO | 3.510% | 11/7/07 | (2) | 17,025 | 17,025 |
1 | Texas Turnpike Auth. Central Texas | | | | | |
| Turnpike System Rev. TOB VRDO | 3.520% | 11/7/07 | (2) | 9,900 | 9,900 |
1 | Texas Turnpike Auth. Rev. TOB VRDO | 3.510% | 11/7/07 | (2) | 12,480 | 12,480 |
1 | Trinity River Auth. Texas Tarrant County | | | | | |
| Water Rev. TOB PUT | 3.800% | 3/13/08 | (1) | 6,185 | 6,185 |
1 | Tyler TX Water & Sewer System Rev. TOB VRDO | 3.580% | 11/7/07 | (1) | 5,560 | 5,560 |
1 | Univ. of Houston TX Rev. TOB VRDO | 3.580% | 11/7/07 | (2) | 5,965 | 5,965 |
| Univ. of Houston TX Rev. VRDO | 3.450% | 11/7/07 | | 18,830 | 18,830 |
1 | Univ. of Texas Permanent Univ. Fund Rev. | | | | | |
| TOB VRDO | 3.290% | 11/7/07 | (Prere.) | 12,000 | 12,000 |
1,2 | Univ. of Texas Permanent Univ. Fund Rev. | | | | | |
| TOB VRDO | 3.340% | 11/7/07 | | 3,600 | 3,600 |
1 | Univ. of Texas Permanent Univ. Fund Rev. | | | | | |
| TOB VRDO | 3.490% | 11/7/07 | (Prere.) | 2,550 | 2,550 |
1 | Univ. of Texas Permanent Univ. Fund Rev. | | | | | |
| TOB VRDO | 3.490% | 11/7/07 | | 11,065 | 11,065 |
1 | Univ. of Texas Permanent Univ. Fund Rev. | | | | | |
| TOB VRDO | 3.500% | 11/7/07 | | 11,850 | 11,850 |
1 | Univ. of Texas Permanent Univ. Fund Rev. | | | | | |
| TOB VRDO | 3.510% | 11/7/07 | | 11,955 | 11,955 |
| Univ. of Texas Permanent Univ. Fund Rev. VRDO | 3.250% | 11/7/07 | | 2,770 | 2,770 |
1 | Univ. of Texas Rev. Finance Systems TOB VRDO | 3.490% | 11/7/07 | | 11,100 | 11,100 |
| West Side Calhoun County TX Dev. | | | | | |
| (British Petroleum) VRDO | 3.580% | 11/1/07 | | 6,200 | 6,200 |
| | | | | | 3,714,690 |
37
Tax-Exempt Money Market Fund
| | | | | Face | Market |
| | | Maturity | | Amount | Value• |
| | Coupon | Date | | ($000) | ($000) |
Utah (1.5%) | | | | | |
| Central Utah Water Conservancy Dist. VRDO | 3.310% | 11/7/07 | (2) | 14,700 | 14,700 |
| Central Utah Water Conservancy Dist. VRDO | 3.310% | 11/7/07 | (2) | 18,600 | 18,600 |
| Murray UT Hosp. Rev. (IHC Health Services) VRDO | 3.430% | 11/7/07 | | 20,700 | 20,700 |
| Salt Lake City UT TRAN | 4.000% | 6/30/08 | | 19,000 | 19,030 |
1 | Utah GO TOB VRDO | 3.490% | 11/7/07 | | 14,260 | 14,260 |
1 | Utah Housing Corp. Single Family | | | | | |
| Mortgage Rev. TOB VRDO | 3.390% | 11/7/07 | | 3,235 | 3,235 |
| Utah Housing Corp. Single Family | | | | | |
| Mortgage Rev. VRDO | 3.290% | 11/7/07 | | 12,730 | 12,730 |
| Utah Housing Corp. Single Family | | | | | |
| Mortgage Rev. VRDO | 3.290% | 11/7/07 | | 11,470 | 11,470 |
| Utah Housing Corp. Single Family | | | | | |
| Mortgage Rev. VRDO | 3.290% | 11/7/07 | | 7,730 | 7,730 |
| Utah Housing Corp. Single Family | | | | | |
| Mortgage Rev. VRDO | 3.290% | 11/7/07 | | 10,000 | 10,000 |
| Utah Housing Corp. Single Family | | | | | |
| Mortgage Rev. VRDO | 3.290% | 11/7/07 | | 13,180 | 13,180 |
| Utah Housing Corp. Single Family | | | | | |
| Mortgage Rev. VRDO | 3.290% | 11/7/07 | | 12,260 | 12,260 |
| Utah Housing Corp. Single Family | | | | | |
| Mortgage Rev. VRDO | 3.290% | 11/7/07 | | 10,565 | 10,565 |
| Utah Housing Corp. Single Family | | | | | |
| Mortgage Rev. VRDO | 3.290% | 11/7/07 | | 6,330 | 6,330 |
| Utah Housing Corp. Single Family | | | | | |
| Mortgage Rev. VRDO | 3.290% | 11/7/07 | | 12,320 | 12,320 |
| Utah Housing Corp. Single Family | | | | | |
| Mortgage Rev. VRDO | 3.290% | 11/7/07 | | 10,600 | 10,600 |
| Utah Housing Finance Auth. | | | | | |
| (Single Family Mortgage) VRDO | 3.290% | 11/7/07 | | 5,605 | 5,605 |
| Utah Housing Finance Auth. | | | | | |
| (Single Family Mortgage) VRDO | 3.290% | 11/7/07 | | 8,045 | 8,045 |
| Utah State Board of Regents | | | | | |
| Student Loan Rev. VRDO | 3.380% | 11/7/07 | (2) | 35,000 | 35,000 |
| Utah State Board of Regents | | | | | |
| Student Loan Rev. VRDO | 3.380% | 11/7/07 | (2) | 45,000 | 45,000 |
1 | Utah Transit Auth. Sales Tax Rev. TOB VRDO | 3.490% | 11/7/07 | (4) | 11,525 | 11,525 |
1 | Utah Transit Auth. Sales Tax Rev. TOB VRDO | 3.520% | 11/7/07 | (1) | 7,430 | 7,430 |
1 | Utah Transit Auth. Sales Tax Rev. TOB VRDO | 3.520% | 11/7/07 | (1) | 5,000 | 5,000 |
1 | Utah Transit Auth. Sales Tax Rev. TOB VRDO | 3.580% | 11/7/07 | (4) | 7,950 | 7,950 |
| | | | | | 323,265 |
Vermont (0.3%) | | | | | |
1 | Univ. of Vermont and State Agricultural | | | | | |
| College Rev. TOB VRDO | 3.500% | 11/7/07 | (2) | 7,753 | 7,753 |
1 | Univ. of Vermont and State Agricultural | | | | | |
| College Rev. TOB VRDO | 3.500% | 11/7/07 | (2) | 7,748 | 7,748 |
1 | Univ. of Vermont and State Agricultural | | | | | |
| College Rev. TOB VRDO | 3.580% | 11/7/07 | (1) | 5,580 | 5,580 |
1 | Vermont Educ. & Health Buildings Finance | | | | | |
| Agency Rev. TOB VRDO | 3.500% | 11/7/07 | | 6,857 | 6,857 |
1 | Vermont Housing Finance Agency | | | | | |
| Single Family TOB VRDO | 3.400% | 11/7/07 | (4) | 1,760 | 1,760 |
| Vermont Student Assistance Corp. Rev. VRDO | 3.380% | 11/7/07 | (2) | 40,000 | 40,000 |
| | | | | | 69,698 |
Tax-Exempt Money Market Fund
| | | | | Face | Market |
| | | Maturity | | Amount | Value• |
| | Coupon | Date | | ($000) | ($000) |
Virginia (1.3%) | | | | | |
| Alexandria VA IDA Rev. (Institute for | | | | | |
| Defense Analysis) VRDO | 3.510% | 11/7/07 | (2) | 12,700 | 12,700 |
| Capital Region Airport Comm. VA Passenger | | | | | |
| Fac. Charge Rev. VRDO | 3.460% | 11/7/07 | LOC | 9,590 | 9,590 |
| Capital Region Airport Comm. VA Passenger | | | | | |
| Fac. Charge Rev. VRDO | 3.500% | 11/7/07 | LOC | 16,345 | 16,345 |
1 | Fairfax County VA Public Improvement | | | | | |
| GO TOB VRDO | 3.500% | 11/7/07 | | 8,295 | 8,295 |
| Norfolk VA GO VRDO | 3.520% | 11/7/07 | | 12,365 | 12,365 |
| Peninsula Ports Auth. Virginia Health System Rev. | | | | | |
| (Riverside Health System Project) VRDO | 3.240% | 11/7/07 | | 35,900 | 35,900 |
1 | Richmond VA Public Util. Rev. TOB VRDO | 3.520% | 11/7/07 | (4) | 5,800 | 5,800 |
| Roanoke VA IDA Hosp. Rev. | | | | | |
| (Carilion Health System) VRDO | 3.560% | 11/1/07 | (4) | 8,490 | 8,490 |
1 | Univ. of Virginia TOB VRDO | 3.520% | 11/7/07 | | 12,000 | 12,000 |
1 | Univ. of Virginia TOB VRDO | 3.520% | 11/7/07 | | 3,300 | 3,300 |
1 | Virginia Beach VA Dev. Auth. | | | | | |
| Public Fac. TOB VRDO | 3.510% | 11/7/07 | | 10,090 | 10,090 |
1 | Virginia Beach VA TOB VRDO | 3.510% | 11/7/07 | | 6,660 | 6,660 |
| Virginia Commonwealth Transp. | | | | | |
| Board Federal Highway Rev. | 5.000% | 10/1/08 | | 15,160 | 15,366 |
| Virginia Housing Dev. Auth. Rev. | | | | | |
| Commonwealth Mortgage PUT | 3.500% | 11/29/07 | | 50,000 | 50,000 |
1 | Virginia Housing Dev. Auth. Rev. | | | | | |
| Commonwealth Mortgage TOB VRDO | 3.390% | 11/7/07 | | 18,985 | 18,985 |
1 | Virginia Housing Dev. Auth. Rev. | | | | | |
| Commonwealth Mortgage TOB VRDO | 3.590% | 11/7/07 | | 5,625 | 5,625 |
1 | Virginia Housing Dev. Auth. Rev. TOB VRDO | 3.570% | 11/7/07 | | 28,430 | 28,430 |
1 | Virginia Port Auth. Rev. TOB VRDO | 3.610% | 11/7/07 | (4) | 3,100 | 3,100 |
1 | Virginia Public School Auth. Rev. TOB VRDO | 3.490% | 11/7/07 | (4) | 10,035 | 10,035 |
1 | Virginia Public School Auth. Rev. TOB VRDO | 3.510% | 11/7/07 | | 7,790 | 7,790 |
| | | | | | 280,866 |
Washington (3.0%) | | | | | |
1 | Central Puget Sound WA Regional Transit Auth. | | | | | |
| Sales & Use Tax Rev. TOB VRDO | 3.510% | 11/7/07 | (2) | 7,345 | 7,345 |
1 | Central Puget Sound WA Regional Transit Auth. | | | | | |
| Sales & Use Tax Rev. TOB VRDO | 3.580% | 11/7/07 | (2) | 7,235 | 7,235 |
1 | Energy Northwest Washington Electric | | | | | |
| Refunding Rev. TOB VRDO | 3.520% | 11/7/07 | (1) | 6,380 | 6,380 |
| Everett WA Ind. Dev. Corp. | | | | | |
| (Kimberly-Clark Corp.) VRDO | 3.650% | 11/7/07 | | 6,400 | 6,400 |
1 | Grant County WA Public Util. Dist. | | | | | |
| No. 002 TOB VRDO | 3.520% | 11/7/07 | (4) | 4,000 | 4,000 |
1 | King County WA (Highline Public School) | | | | | |
| TOB VRDO | 3.510% | 11/7/07 | (3) | 5,260 | 5,260 |
1 | King County WA (Snoqualmie Valley School Dist.) | | | | | |
| TOB VRDO | 3.520% | 11/7/07 | (4) | 10,100 | 10,100 |
1 | King County WA GO TOB VRDO | 3.510% | 11/7/07 | (4) | 5,255 | 5,255 |
1 | King County WA GO TOB VRDO | 3.510% | 11/7/07 | (1) | 7,375 | 7,375 |
1 | King County WA School Dist. TOB PUT | 3.800% | 3/13/08 | (4) | 5,470 | 5,470 |
1 | King County WA Sewer Rev. TOB VRDO | 3.490% | 11/7/07 | (4) | 10,005 | 10,005 |
1 | King County WA Sewer Rev. TOB VRDO | 3.490% | 11/7/07 | (4) | 7,655 | 7,655 |
1 | King County WA Sewer Rev. TOB VRDO | 3.520% | 11/7/07 | (1) | 10,890 | 10,890 |
1 | King County WA Sewer Rev. TOB VRDO | 3.520% | 11/7/07 | (4) | 7,645 | 7,645 |
1 | Pierce County WA School Dist. TOB VRDO | 3.490% | 11/7/07 | (4) | 8,290 | 8,290 |
Tax-Exempt Money Market Fund
| | | | | Face | Market |
| | | Maturity | | Amount | Value• |
| | Coupon | Date | | ($000) | ($000) |
1 | Pierce County WA School Dist. TOB VRDO | 3.580% | 11/7/07 | (4) | 6,165 | 6,165 |
| Port Bellingham WA Ind. Dev. Corp. | | | | | |
| Environmental Fac. (BP Amoco | | | | | |
| West Coast LLC) VRDO | 3.640% | 11/1/07 | | 4,600 | 4,600 |
1 | Port of Seattle WA Passenger Fac. | | | | | |
| Charge Rev. TOB VRDO | 3.510% | 11/7/07 | (1) | 3,500 | 3,500 |
1 | Port of Seattle WA Rev. TOB VRDO | 3.290% | 11/7/07 | (3) | 15,000 | 15,000 |
1 | Port of Seattle WA Rev. TOB VRDO | 3.390% | 11/7/07 | (1) | 5,790 | 5,790 |
1 | Port of Seattle WA Rev. TOB VRDO | 3.500% | 11/7/07 | (10) | 4,260 | 4,260 |
1 | Port of Seattle WA Rev. TOB VRDO | 3.500% | 11/7/07 | (1) | 10,000 | 10,000 |
1 | Port of Seattle WA Rev. TOB VRDO | 3.510% | 11/7/07 | (1) | 6,360 | 6,360 |
1 | Port of Seattle WA Rev. TOB VRDO | 3.520% | 11/7/07 | (1) | 8,320 | 8,320 |
1 | Port of Seattle WA Rev. TOB VRDO | 3.550% | 11/7/07 | (3) | 4,430 | 4,430 |
1 | Port of Seattle WA Rev. TOB VRDO | 3.550% | 11/7/07 | (2) | 7,440 | 7,440 |
1 | Port of Seattle WA Rev. TOB VRDO | 3.580% | 11/7/07 | (2) | 12,100 | 12,100 |
1 | Port of Seattle WA Rev. TOB VRDO | 3.580% | 11/7/07 | (1) | 5,245 | 5,245 |
1 | Port of Seattle WA Rev. TOB VRDO | 3.610% | 11/7/07 | (3) | 4,285 | 4,285 |
1 | Port of Seattle WA Rev. TOB VRDO | 3.610% | 11/7/07 | (4) | 2,700 | 2,700 |
1 | Port of Tacoma WA Rev. TOB VRDO | 3.510% | 11/7/07 | (2) | 5,760 | 5,760 |
1 | Port of Tacoma WA Rev. TOB VRDO | 3.550% | 11/7/07 | (3) | 6,255 | 6,255 |
1 | Seattle WA Muni. Light & Power Rev. TOB VRDO | 3.490% | 11/7/07 | (4) | 6,700 | 6,700 |
1 | Seattle WA Muni. Light & Power Rev. TOB VRDO | 3.510% | 11/7/07 | (4) | 6,260 | 6,260 |
1 | Seattle WA Water System Rev. TOB PUT | 3.820% | 6/19/08 | (1) | 12,945 | 12,945 |
1 | Seattle WA Water System Rev. TOB VRDO | 3.510% | 11/7/07 | (1) | 4,920 | 4,920 |
1 | Snohomish County WA Public Util. Dist. TOB VRDO | 3.510% | 11/7/07 | (4) | 5,315 | 5,315 |
1 | Snohomish County WA Public Util. Dist. TOB VRDO | 3.510% | 11/7/07 | (4) | 6,055 | 6,055 |
1 | Snohomish County WA TOB VRDO | 3.290% | 11/7/07 | (1) | 15,210 | 15,210 |
| Spokane WA Regional Solid Waste | | | | | |
| Management System Rev. | 6.500% | 1/1/08 | (2) | 3,500 | 3,515 |
1 | Tacoma WA Electric System Rev. TOB VRDO | 3.520% | 11/7/07 | (3) | 10,355 | 10,355 |
1 | Tacoma WA Sewer TOB VRDO | 3.500% | 11/7/07 | (3) | 10,625 | 10,625 |
| Washington (Motor Vehicle Fuel Tax) GO | 5.000% | 1/1/08 | (Prere.) | 10,000 | 10,020 |
1 | Washington (Motor Vehicle Fuel) GO TOB VRDO | 3.510% | 11/7/07 | (1) | 20,390 | 20,390 |
| Washington GO | 5.750% | 9/1/08 | | 4,000 | 4,074 |
1 | Washington GO TOB PUT | 3.800% | 7/10/08 | (2) | 8,660 | 8,660 |
1,2 | Washington GO TOB VRDO | 3.330% | 11/7/07 | (4) | 7,995 | 7,995 |
1 | Washington GO TOB VRDO | 3.490% | 11/7/07 | (4) | 11,130 | 11,130 |
1 | Washington GO TOB VRDO | 3.490% | 11/7/07 | | 60,960 | 60,960 |
1 | Washington GO TOB VRDO | 3.490% | 11/7/07 | (4) | 4,635 | 4,635 |
1 | Washington GO TOB VRDO | 3.490% | 11/7/07 | | 6,900 | 6,900 |
1 | Washington GO TOB VRDO | 3.490% | 11/7/07 | (4) | 6,675 | 6,675 |
1 | Washington GO TOB VRDO | 3.490% | 11/7/07 | (4) | 11,930 | 11,930 |
1 | Washington GO TOB VRDO | 3.500% | 11/7/07 | (4) | 6,250 | 6,250 |
1 | Washington GO TOB VRDO | 3.500% | 11/7/07 | | 8,025 | 8,025 |
1 | Washington GO TOB VRDO | 3.510% | 11/7/07 | (4) | 4,370 | 4,370 |
1 | Washington GO TOB VRDO | 3.510% | 11/7/07 | (4) | 4,180 | 4,180 |
1 | Washington GO TOB VRDO | 3.510% | 11/7/07 | (4) | 7,760 | 7,760 |
1 | Washington GO TOB VRDO | 3.510% | 11/7/07 | | 12,000 | 12,000 |
1 | Washington GO TOB VRDO | 3.510% | 11/7/07 | (4) | 6,800 | 6,800 |
1 | Washington GO TOB VRDO | 3.510% | 11/7/07 | (2) | 19,155 | 19,155 |
1 | Washington GO TOB VRDO | 3.510% | 11/7/07 | (4) | 5,600 | 5,600 |
1 | Washington GO TOB VRDO | 3.520% | 11/7/07 | (2) | 5,380 | 5,380 |
1 | Washington GO TOB VRDO | 3.520% | 11/7/07 | (3) | 12,700 | 12,700 |
1 | Washington GO TOB VRDO | 3.520% | 11/7/07 | (1) | 10,290 | 10,290 |
| Washington Health Care Fac. Auth. | | | | | |
| (Catholic Health Initiatives) VRDO | 3.260% | 11/7/07 | | 41,130 | 41,130 |
Tax-Exempt Money Market Fund
| | | | | Face | Market |
| | | Maturity | | Amount | Value• |
| | Coupon | Date | | ($000) | ($000) |
1 | Washington Health Care Fac. Auth. | | | | | |
| (Group Health Cooperative of Puget Sound) | | | | | |
| TOB VRDO | 3.290% | 11/7/07 | (1) | 45,235 | 45,235 |
1 | Washington Housing Finance Comm. | | | | | |
| Single Family Mortgage Rev. TOB VRDO | 3.400% | 11/7/07 | | 3,340 | 3,340 |
1 | Washington State GO (Motor Vehicle Fuel Tax) | | | | | |
| TOB VRDO | 3.520% | 11/7/07 | (4) | 5,000 | 5,000 |
1 | Washington State GO TOB VRDO | 3.500% | 11/7/07 | (3) | 5,985 | 5,985 |
1 | Washington State GO TOB VRDO | 3.500% | 11/7/07 | (2) | 5,330 | 5,330 |
| | | | | | 665,314 |
West Virginia (0.1%) | | | | | |
1 | West Virginia Housing Dev. TOB VRDO | 3.340% | 11/7/07 | | 5,470 | 5,470 |
1 | West Virginia Housing Dev. TOB VRDO | 3.570% | 11/7/07 | | 11,640 | 11,640 |
1 | West Virginia State Road TOB VRDO | 3.490% | 11/7/07 | (3) | 3,505 | 3,505 |
1 | West Virginia Univ. Rev. TOB VRDO | 3.510% | 11/7/07 | (3) | 4,655 | 4,655 |
1 | West Virginia Univ. Rev. TOB VRDO | 3.510% | 11/7/07 | (3) | 8,990 | 8,990 |
| | | | | | 34,260 |
Wisconsin (2.7%) | | | | | |
| New Richmond WI School Dist. BAN | 4.125% | 6/6/08 | | 4,500 | 4,502 |
| Univ. of Wisconsin Hosp. & Clinics Auth. Rev. | | | | | |
| (Univ. of Wisconsin Hosp.) VRDO | 3.270% | 11/7/07 | (1) | 16,700 | 16,700 |
| Wisconsin GO CP | 3.600% | 11/1/07 | | 15,755 | 15,755 |
1 | Wisconsin GO TOB VRDO | 3.490% | 11/7/07 | (3) | 7,425 | 7,425 |
1 | Wisconsin GO TOB VRDO | 3.490% | 11/7/07 | (3) | 83,315 | 83,315 |
1 | Wisconsin GO TOB VRDO | 3.500% | 11/7/07 | (1) | 18,995 | 18,995 |
1 | Wisconsin GO TOB VRDO | 3.500% | 11/7/07 | (4) | 20,855 | 20,855 |
1 | Wisconsin GO TOB VRDO | 3.520% | 11/7/07 | (1) | 8,500 | 8,500 |
1 | Wisconsin GO TOB VRDO | 3.520% | 11/7/07 | (1) | 25,700 | 25,700 |
1 | Wisconsin GO TOB VRDO | 3.520% | 11/7/07 | (4) | 17,600 | 17,600 |
1 | Wisconsin GO TOB VRDO | 3.580% | 11/7/07 | (1) | 5,295 | 5,295 |
1 | Wisconsin GO TOB VRDO | 3.580% | 11/7/07 | (1) | 6,675 | 6,675 |
1 | Wisconsin Housing & Econ. Dev. Auth. | | | | | |
| Home Ownership Rev. TOB VRDO | 3.550% | 11/7/07 | | 12,085 | 12,085 |
1 | Wisconsin Housing & Econ. Dev. Auth. | | | | | |
| Home Ownership Rev. TOB VRDO | 3.560% | 11/7/07 | | 2,180 | 2,180 |
1 | Wisconsin Housing & Econ. Dev. Auth. | | | | | |
| Home Ownership Rev. TOB VRDO | 3.570% | 11/7/07 | | 6,540 | 6,540 |
1 | Wisconsin Housing & Econ. Dev. Auth. | | | | | |
| Home Ownership Rev. TOB VRDO | 3.590% | 11/7/07 | | 1,295 | 1,295 |
| Wisconsin Housing & Econ. Dev. Auth. | | | | | |
| Home Ownership Rev. VRDO | 3.270% | 11/7/07 | | 1,775 | 1,775 |
| Wisconsin Housing & Econ. Dev. Auth. | | | | | |
| Home Ownership Rev. VRDO | 3.270% | 11/7/07 | (4) | 5,685 | 5,685 |
| Wisconsin Housing & Econ. Dev. Auth. | | | | | |
| Home Ownership Rev. VRDO | 3.340% | 11/7/07 | | 16,480 | 16,480 |
| Wisconsin Housing & Econ. Dev. Auth. | | | | | |
| Home Ownership Rev. VRDO | 3.340% | 11/7/07 | | 16,220 | 16,220 |
| Wisconsin Housing & Econ. Dev. Auth. | | | | | |
| Home Ownership Rev. VRDO | 3.340% | 11/7/07 | | 24,300 | 24,300 |
| Wisconsin Housing & Econ. Dev. Auth. | | | | | |
| Home Ownership Rev. VRDO | 3.340% | 11/7/07 | | 11,000 | 11,000 |
| Wisconsin Housing & Econ. Dev. Auth. | | | | | |
| Home Ownership Rev. VRDO | 3.340% | 11/7/07 | | 46,805 | 46,805 |
| Wisconsin Housing & Econ. Dev. Auth. | | | | | |
| Home Ownership Rev. VRDO | 3.340% | 11/7/07 | | 3,340 | 3,340 |
Tax-Exempt Money Market Fund
| | | | | Face | Market |
| | | Maturity | | Amount | Value• |
| | Coupon | Date | | ($000) | ($000) |
| Wisconsin Housing & Econ. Dev. Auth. | | | | | |
| Home Ownership Rev. VRDO | 3.340% | 11/7/07 | | 12,555 | 12,555 |
| Wisconsin Housing & Econ. Dev. Auth. | | | | | |
| Home Ownership Rev. VRDO | 3.340% | 11/7/07 | | 57,770 | 57,770 |
| Wisconsin Housing & Econ. Dev. Auth. | | | | | |
| Home Ownership Rev. VRDO | 3.340% | 11/7/07 | (4) | 8,555 | 8,555 |
| Wisconsin Housing & Econ. Dev. Auth. | | | | | |
| Home Ownership Rev. VRDO | 3.500% | 11/7/07 | | 64,890 | 64,890 |
1 | Wisconsin Public Power Inc. Rev. | | | | | |
| (Power Supply System) TOB VRDO | 3.490% | 11/7/07 | (2) | 10,265 | 10,265 |
| Wisconsin School Dist. Cash Flow | | | | | |
| Management Program COP TAN | 4.250% | 11/1/07 | | 19,000 | 19,000 |
1 | Wisconsin State GO TOB VRDO | 3.400% | 11/7/07 | (1) | 1,760 | 1,760 |
| Wisconsin Transp. Rev. | 5.000% | 7/1/08 | | 12,385 | 12,485 |
| Wisconsin Transp. Rev. | 5.000% | 7/1/08 | | 4,530 | 4,567 |
1 | Wisconsin Transp. Rev. TOB VRDO | 3.490% | 11/7/07 | | 9,810 | 9,810 |
1 | Wisconsin Transp. Rev. TOB VRDO | 3.500% | 11/7/07 | (2) | 13,715 | 13,715 |
| | | | | | 594,394 |
Wyoming (0.1%) | | | | | |
1 | Wyoming Community Dev. Auth. | | | | | |
| Housing Rev. TOB VRDO | 3.550% | 11/7/07 | | 8,795 | 8,795 |
1 | Wyoming Community Dev. Auth. | | | | | |
| Housing Rev. TOB VRDO | 3.610% | 11/7/07 | | 5,015 | 5,015 |
| | | | | | 13,810 |
Multiple States (0.6%) | | | | | |
1 | Tax Exempt Multifamily TOB VRDO | 3.630% | 11/7/07 | | 25,300 | 25,300 |
1 | Various States TOB VRDO | 3.650% | 11/7/07 | | 47,355 | 47,355 |
1 | Various States TOB VRDO | 3.650% | 11/7/07 | (1)(2)(3)(4) | 65,760 | 65,760 |
| | | | | | 138,415 |
Total Municipal Bonds (Cost $21,336,774) | | | | | 21,336,774 |
| | | | | |
| | | | | Shares | |
Temporary Cash Investment (3.5%) | | | | | |
3 | Vanguard Municipal Cash Management | | | | | |
| Fund (Cost $769,732) | 3.425% | | | 769,731,782 | 769,732 |
Total Investments (100.4%) (Cost $22,106,506) | | | | | 22,106,506 |
Other Assets and Liabilities (–0.4%) | | | | | |
Other Assets—Note B | | | | | 265,853 |
Liabilities | | | | | (353,229) |
| | | | | | (87,376) |
Net Assets (100%) | | | | | |
Applicable to 22,018,988,377 outstanding | | | | | |
$.001 par value shares of beneficial interest | | | | | |
(unlimited authorization) | | | | | 22,019,130 |
Net Asset Value Per Share | | | | | $1.00 |
Tax-Exempt Money Market Fund
At October 31, 2007, net assets consisted of: | | |
| Amount | Per |
| ($000) | Share |
Paid-in Capital | 22,019,126 | $1.00 |
Undistributed Net Investment Income | — | — |
Accumulated Net Realized Gains | 4 | — |
Unrealized Appreciation | — | — |
Net Assets | 22,019,130 | $1.00 |
• See Note A in Notes to Financial Statements.
1 Security exempt from registration under Rule 144A of the Securities Act of 1933. Such securities may be sold in transactions exempt from registration, normally to qualified institutional buyers. At October 31, 2007, the aggregate value of these securities was $9,580,237,000, representing 43.5% of net assets.
2 Security purchased on a when-issued or delayed delivery basis for which the fund has not taken delivery as of October 31, 2007.
3 Affiliated money market fund available only to Vanguard funds and certain trusts and accounts managed by Vanguard. Rate shown is the 7-day yield.
For key to abbreviations and other references, see back cover.
Short-Term Tax-Exempt Fund
| | | | | Face | Market |
| | | Maturity | | Amount | Value• |
| | Coupon | Date | | ($000) | ($000) |
Municipal Bonds (100.0%) | | | | | |
Alabama (1.9%) | | | | | |
| Huntsville AL Health Care Fac. Auth. PUT | 5.000% | 3/3/08 | LOC | 30,000 | 30,154 |
| Jefferson County AL Sewer Rev. | | | | | |
| (Capital Improvement) | 5.125% | 2/1/09 | (3)(Prere.) | 29,405 | 30,261 |
| Jefferson County AL Sewer Rev. | | | | | |
| (Capital Improvement) | 5.375% | 2/1/09 | (3)(Prere.) | 5,270 | 5,444 |
| Univ. of Alabama General Rev. VRDO | 3.460% | 11/7/07 | (1) | 11,470 | 11,470 |
| | | | | | 77,329 |
Alaska (0.3%) | | | | | |
| Anchorage AK GO | 5.125% | 12/1/09 | (3) | 2,000 | 2,069 |
1 | Anchorage AK Water Rev. TOB VRDO | 3.510% | 11/7/07 | (1) | 11,765 | 11,765 |
| | | | | | 13,834 |
Arizona (1.4%) | | | | | |
| Arizona Health Fac. Auth. Rev. (Banner Health) | 5.000% | 1/1/08 | | 2,410 | 2,415 |
| Arizona Health Fac. Auth. Rev. (Banner Health) | 5.000% | 1/1/09 | | 4,690 | 4,763 |
| Arizona Transp. Board Highway Rev. | 5.000% | 7/1/09 | | 4,000 | 4,103 |
1 | Maricopa County AZ IDA Health Fac. Rev. | | | | | |
| (Catholic Healthcare West) TOB VRDO | 3.490% | 11/7/07 | LOC | 25,000 | 25,000 |
| Phoenix AZ Civic Improvement Corp. Airport Rev. | 5.000% | 7/1/08 | (2) | 5,500 | 5,557 |
| Phoenix AZ Civic Improvement Corp. Airport Rev. | 5.000% | 7/1/09 | (2) | 5,500 | 5,640 |
| Phoenix AZ GO | 7.500% | 7/1/08 | | 11,510 | 11,814 |
| | | | | | 59,292 |
Arkansas (0.1%) | | | | | |
| Fort Smith AR Sales & Use Tax Rev. | 5.000% | 9/1/10 | (3) | 3,000 | 3,124 |
| | | | | | |
California (3.3%) | | | | | |
| California GO | 5.000% | 6/1/08 | | 16,820 | 16,971 |
| California GO | 5.000% | 3/1/09 | | 22,400 | 22,854 |
1 | California GO TOB VRDO | 3.530% | 11/7/07 | | 10,005 | 10,005 |
1,2 | California GO TOB VRDO | 3.530% | 11/7/07 | | 14,430 | 14,430 |
1 | California GO TOB VRDO | 3.530% | 11/7/07 | | 10,095 | 10,095 |
| California Health Fac. Finance Auth. Rev. | | | | | |
| (Cedars-Sinai Medical Center) | 5.000% | 11/15/08 | | 1,065 | 1,080 |
| California Statewide Community Dev. Auth. Rev. | | | | | |
| (Kaiser Permanente) PUT | 2.625% | 5/1/08 | | 11,000 | 10,915 |
| California Statewide Community Dev. Auth. Rev. | | | | | |
| (Kaiser Permanente) PUT | 3.875% | 4/1/10 | | 5,000 | 5,025 |
1 | Golden State Tobacco Securitization Corp. Rev. | | | | | |
| TOB VRDO | 3.510% | 11/7/07 | (4) | 20,390 | 20,390 |
| Kings River Conservation Dist. California COP | 4.000% | 5/1/08 | | 2,020 | 2,020 |
| Los Angeles County CA Public Works | | | | | |
| Financing Auth. Rev. | 5.000% | 12/1/08 | (1) | 6,225 | 6,332 |
| Northern California Power Agency | | | | | |
| (Geothermal Project) | 5.000% | 7/1/08 | (ETM)(Prere.) | 15,000 | 15,216 |
| | | | | | 135,333 |
Colorado (1.1%) | | | | | |
| Colorado Health Fac. Auth. Rev. (Sisters of Charity | | | | | |
| Health System Inc.) VRDO | 3.230% | 11/7/07 | | 15,800 | 15,800 |
1 | E-470 Public Highway Auth. Colorado Rev. TOB VRDO | 3.490% | 11/7/07 | (1) | 14,160 | 14,160 |
1 | E-470 Public Highway Auth. Colorado Rev. TOB VRDO | 3.510% | 11/7/07 | (1) | 6,955 | 6,955 |
1 | E-470 Public Highway Auth. Colorado Rev. TOB VRDO | 3.530% | 11/7/07 | (1) | 1,000 | 1,000 |
1 | Jefferson County CO School Dist. GO TOB VRDO | 3.510% | 11/7/07 | (4) | 4,720 | 4,720 |
| Platte River Power Auth. Colorado Power Rev. | 5.000% | 6/1/10 | | 2,500 | 2,593 |
| | | | | | 45,228 |
Short-Term Tax-Exempt Fund
| | | | | Face | Market |
| | | Maturity | | Amount | Value• |
| | Coupon | Date | | ($000) | ($000) |
Connecticut (0.3%) | | | | | |
| Connecticut Special Tax Obligation Rev. | | | | | |
| (Transp. Infrastructure) | 6.000% | 10/1/09 | (1) | 11,940 | 12,518 |
| | | | | | |
District of Columbia (0.6%) | | | | | |
| District of Columbia GO | 5.500% | 6/1/08 | (2) | 10,000 | 10,119 |
| District of Columbia GO | 5.000% | 6/1/09 | (2) | 4,630 | 4,741 |
| District of Columbia GO | 5.000% | 1/1/10 | (3) | 4,000 | 4,119 |
| Washington DC Metro. Area Transit Auth. Rev. | 5.000% | 7/1/08 | (1) | 4,180 | 4,223 |
| | | | | | 23,202 |
Florida (9.2%) | | | | | |
| Broward County FL Resource Recovery Rev. | | | | | |
| (Wheelabrator Series A) | 5.500% | 12/1/08 | | 9,000 | 9,186 |
1 | Broward County FL School Board COP TOB VRDO | 3.520% | 11/7/07 | (3) | 9,100 | 9,100 |
| Citizens Property Insurance Corp. Florida | | | | | |
| (High Risk Account) | 5.000% | 3/1/09 | (1) | 30,605 | 31,216 |
| Citizens Property Insurance Corp. Florida | | | | | |
| (High Risk Account) | 5.000% | 3/1/10 | (1) | 28,405 | 29,344 |
| Collier County FL Water & Sewer Dist. Rev. | 5.000% | 7/1/10 | (4) | 2,920 | 3,033 |
| Dade County FL School Dist. GO | 5.000% | 8/1/09 | (1) | 8,595 | 8,826 |
| Florida Board of Educ. Capital Outlay | 5.000% | 6/1/08 | | 4,000 | 4,037 |
| Florida Board of Educ. Public Educ. | 5.000% | 6/1/09 | | 3,945 | 4,041 |
| Florida Board of Educ. Public Educ. | 5.250% | 6/1/10 | | 4,925 | 5,141 |
1,2 | Florida Board of Educ. Public Educ. TOB VRDO | 3.340% | 11/7/07 | | 34,400 | 34,400 |
1 | Florida Board of Educ. Public Educ. TOB VRDO | 3.510% | 11/7/07 | | 17,905 | 17,905 |
1 | Florida Board of Educ. Public Educ. TOB VRDO | 3.510% | 11/7/07 | | 17,905 | 17,905 |
| Florida Board of Educ. Rev. (Lottery Rev.) | 5.000% | 7/1/09 | (2) | 6,890 | 7,067 |
| Florida Dept. of Environmental | | | | | |
| Protection & Preservation Rev. | 5.000% | 7/1/09 | (1) | 5,000 | 5,128 |
| Florida Hurricane Catastrophe | | | | | |
| Fund Finance Corp. Rev. | 5.000% | 7/1/08 | | 17,945 | 18,128 |
| Florida Hurricane Catastrophe | | | | | |
| Fund Finance Corp. Rev. | 5.000% | 7/1/09 | | 44,700 | 45,760 |
| Florida Hurricane Catastrophe | | | | | |
| Fund Finance Corp. Rev. | 5.000% | 7/1/10 | | 24,550 | 25,428 |
| Florida Turnpike Auth. Rev. | 5.000% | 7/1/10 | (1) | 9,830 | 10,212 |
| Highlands County FL Health Fac. Auth. Rev. | | | | | |
| (Adventist Health System) ARS | 3.850% | 11/20/07 | | 19,550 | 19,550 |
| Highlands County FL Health Rev. | | | | | |
| (Adventist Health System) PUT | 5.000% | 11/16/09 | | 13,000 | 13,255 |
| Lakeland FL Energy Systems Rev. | 5.500% | 10/1/10 | (1)(Prere.) | 4,300 | 4,542 |
1 | Miami-Dade County FL Educ. Fac. Auth. Rev. | | | | | |
| (Univ. of Miami) TOB VRDO | 3.520% | 11/7/07 | (2) | 7,500 | 7,500 |
1 | Miami-Dade County FL Special | | | | | |
| Obligation TOB VRDO | 3.490% | 11/7/07 | (1) | 2,930 | 2,930 |
| Orlando & Orange County FL Expressway Auth. | 5.000% | 7/1/08 | (2) | 11,745 | 11,867 |
| Orlando FL Util. Comm. Water & Electric Rev. | 5.250% | 7/1/09 | | 21,000 | 21,620 |
| Orlando FL Waste Water System Rev. | 5.000% | 10/1/10 | (2) | 2,805 | 2,923 |
| South Miami FL Health Fac. Auth. Hosp. Rev. | | | | | |
| (Baptist Health South FL Obligated Group) | 5.000% | 8/15/11 | | 4,000 | 4,171 |
| Univ. Athletic Assn. Inc. Florida Capital | | | | | |
| Improvement Rev. PUT | 3.300% | 10/1/08 | LOC | 2,500 | 2,489 |
| Univ. Athletic Assn. Inc. Florida Capital | | | | | |
| Improvement Rev. PUT | 3.400% | 10/1/09 | LOC | 4,600 | 4,573 |
| | | | | | 381,277 |
Short-Term Tax-Exempt Fund
| | | | | Face | Market |
| | | Maturity | | Amount | Value• |
| | Coupon | Date | | ($000) | ($000) |
Georgia (3.6%) | | | | | |
1 | Atlanta GA Water & Wastewater Rev. TOB VRDO | 3.490% | 11/7/07 | (4) | 12,690 | 12,690 |
| Burke County GA Dev. Auth. PCR | | | | | |
| (Georgia Power Co. Plant Vogtle) PUT | 4.450% | 12/1/08 | | 9,300 | 9,372 |
| Carroll County GA School Dist. Sales Tax GO | 5.000% | 4/1/10 | | 2,000 | 2,073 |
| Coffee County GA School Dist. GO | 6.000% | 8/1/08 | | 1,890 | 1,926 |
| Coffee County GA School Dist. GO | 6.000% | 8/1/09 | | 3,060 | 3,193 |
| Georgia GO | 5.000% | 8/1/09 | | 15,995 | 16,434 |
| Henry County GA School Dist. GO | 5.000% | 4/1/09 | | 15,350 | 15,691 |
| Main Street Natural Gas Inc. | | | | | |
| Georgia Gas Project Rev. | 5.000% | 3/15/10 | | 12,000 | 12,309 |
| Main Street Natural Gas Inc. | | | | | |
| Georgia Gas Project Rev. | 5.000% | 3/15/10 | | 9,000 | 9,181 |
1 | Metro. Atlanta GA Rapid Transp. Auth. | | | | | |
| Georgia Sales Tax Rev. TOB VRDO | 3.490% | 11/7/07 | (3) | 24,545 | 24,545 |
1 | Metro. Atlanta GA Rapid Transp. Auth. | | | | | |
| Georgia Sales Tax Rev. TOB VRDO | 3.510% | 11/7/07 | (4) | 39,095 | 39,095 |
| | | | | | 146,509 |
Hawaii (1.1%) | | | | | |
| Hawaii GO | 5.250% | 2/1/08 | (4) | 10,000 | 10,045 |
| Hawaii GO | 5.000% | 4/1/08 | (1) | 10,000 | 10,066 |
| Honolulu HI City & County GO | 5.000% | 7/1/08 | (1) | 12,740 | 12,874 |
| Honolulu HI City & County GO | 5.000% | 7/1/10 | (1) | 3,980 | 4,136 |
| Honolulu HI City & County GO | 5.000% | 7/1/10 | (3) | 4,065 | 4,224 |
| Honolulu HI City & County GO | 5.000% | 7/1/10 | (1) | 4,515 | 4,692 |
| | | | | | 46,037 |
Illinois (6.1%) | | | | | |
| Chicago IL Board of Educ. (Westinghouse | | | | | |
| High School Project) | 5.000% | 12/1/10 | (1)(ETM) | 2,775 | 2,900 |
| Chicago IL Board of Educ. Lease Rev. | 6.250% | 1/1/11 | (1) | 3,000 | 3,239 |
| Chicago IL GO | 5.125% | 1/1/09 | (3)(Prere.) | 14,030 | 14,432 |
1 | Chicago IL GO TOB VRDO | 3.490% | 11/7/07 | (4) | 20,110 | 20,110 |
1 | Chicago IL GO TOB VRDO | 3.490% | 11/7/07 | (4) | 11,000 | 11,000 |
1 | Chicago IL GO TOB VRDO | 3.500% | 11/7/07 | (4) | 10,440 | 10,440 |
| Chicago IL Housing Auth. Capital Project Rev. | 5.000% | 7/1/08 | (4) | 5,355 | 5,408 |
| Chicago IL Housing Auth. Capital Project Rev. | 5.000% | 7/1/08 | (ETM) | 2,500 | 2,525 |
| Chicago IL Housing Auth. Capital Project Rev. | 5.000% | 7/1/09 | (4) | 2,670 | 2,734 |
| Chicago IL Metro. Water Reclamation Dist. GO | 5.250% | 12/1/10 | (ETM) | 10,000 | 10,522 |
| Chicago IL Park Dist. GO | 5.000% | 1/1/10 | (3) | 8,145 | 8,404 |
| Chicago IL Transit Auth. Rev. | 5.250% | 6/1/09 | (2) | 1,000 | 1,028 |
1 | Cook County IL GO TOB VRDO | 3.500% | 11/7/07 | (2) | 7,520 | 7,520 |
| Du Page & Cook Counties IL Community | | | | | |
| Consolidated School Dist. GO | 5.250% | 12/1/12 | (3)(Prere.) | 3,750 | 4,046 |
| Illinois Educ. Fac. Auth. Rev. (Univ. of Chicago) PUT | 4.050% | 7/1/09 | | 7,060 | 7,106 |
| Illinois Finance Auth. Rev. (Loyola Academy) PUT | 3.875% | 10/1/08 | LOC | 5,000 | 5,014 |
| Illinois GO | 5.000% | 1/1/08 | | 6,000 | 6,015 |
| Illinois GO | 5.000% | 3/1/09 | | 24,695 | 25,201 |
| Illinois GO | 4.250% | 6/1/09 | | 3,400 | 3,444 |
| Illinois GO | 5.000% | 6/1/09 | | 8,955 | 9,172 |
| Illinois GO | 5.250% | 8/1/09 | (1) | 2,135 | 2,201 |
| Illinois GO | 5.500% | 8/1/09 | | 8,610 | 8,913 |
| Illinois GO | 5.000% | 10/1/09 | | 14,800 | 15,233 |
| Illinois GO | 5.000% | 1/1/10 | | 6,000 | 6,191 |
1 | Illinois GO TOB VRDO | 3.490% | 11/7/07 | (4) | 14,360 | 14,360 |
| Illinois Sales Tax Rev. | 5.000% | 6/15/08 | | 3,000 | 3,029 |
Short-Term Tax-Exempt Fund
| | | | | Face | Market |
| | | Maturity | | Amount | Value• |
| | Coupon | Date | | ($000) | ($000) |
1 | Kendall Kane & Will Counties IL | | | | | |
| Community Unit School Dist. TOB VRDO | 3.520% | 11/7/07 | (1) | 8,400 | 8,400 |
| Metro. Pier & Exposition Auth. | | | | | |
| Illinois Dedicated Sales Tax Rev. | 0.000% | 6/15/08 | (3)(ETM) | 7,280 | 7,122 |
1 | Metro. Pier & Exposition Auth. | | | | | |
| Illinois Dedicated Sales Tax Rev. TOB VRDO | 3.510% | 11/7/07 | (1) | 11,395 | 11,395 |
| Univ. of Illinois (Util. Infrastructure Project) COP | 5.000% | 8/15/08 | (2) | 2,395 | 2,424 |
1 | Univ. of Illinois Univ. Rev. TOB VRDO | 3.510% | 11/7/07 | (1) | 10,950 | 10,950 |
| | | | | | 250,478 |
Indiana (2.2%) | | | | | |
| Indiana Bond Bank Advance Funding Program Notes | 4.250% | 1/31/08 | LOC | 24,335 | 24,371 |
| Indiana Bond Bank Rev. Revolving Funding Program | 5.600% | 8/1/10 | (Prere.) | 3,100 | 3,302 |
| Indiana Health & Educ. Fac. Financing Auth. Rev | | | | | |
| (Depauw Univ.) ARS | 3.950% | 11/9/07 | (1) | 19,100 | 19,100 |
| Indiana Health Fac. Auth. Finance Auth. Rev. | | | | | |
| (Ascension Health Credit Group) | 5.000% | 4/1/10 | | 17,565 | 18,092 |
| Indiana Office Building Comm. Rev. | | | | | |
| (Capitol Complex) | 5.000% | 7/1/10 | (4) | 6,535 | 6,772 |
| Indiana Univ. Rev. (Student Fee) | 5.000% | 8/1/08 | | 8,260 | 8,354 |
| Indiana Univ. Rev. (Student Fee) | 5.000% | 8/1/09 | | 9,270 | 9,510 |
| | | | | | 89,501 |
Iowa (0.1%) | | | | | |
1 | Des Moines IA Metro. Wastewater Auth. | | | | | |
| TOB VRDO | 3.500% | 11/7/07 | (1) | 5,000 | 5,000 |
| | | | | | |
Kansas (0.0%) | | | | | |
| Univ. of Kansas Hosp. Auth. Health System | 5.000% | 9/1/09 | | 750 | 765 |
| | | | | | |
Kentucky (1.2%) | | | | | |
| Kentucky Asset/Liability Comm. General Fund Rev. | 5.000% | 7/15/09 | (2) | 4,500 | 4,619 |
| Kentucky Asset/Liability Comm. General Fund Rev. | 5.000% | 9/1/09 | (1) | 14,455 | 14,865 |
1 | Kentucky Asset/Liability Comm. General Fund Rev. | | | | | |
| TOB VRDO | 3.510% | 11/7/07 | (3) | 5,415 | 5,415 |
| Kentucky Property & Building Comm. Rev. | 5.000% | 3/1/08 | | 1,250 | 1,256 |
| Kentucky Property & Building Comm. Rev. | 5.000% | 3/1/09 | (3) | 2,000 | 2,042 |
| Kentucky Property & Building Comm. Rev. | 5.000% | 3/1/10 | (3) | 2,190 | 2,266 |
| Kentucky Property & Building Comm. Rev. | 5.125% | 9/1/10 | (Prere.) | 5,955 | 6,222 |
| Kentucky Rural Water Finance Corp. Rev. | | | | | |
| (Public Project Construction Notes) PUT | 3.650% | 4/1/08 | | 12,000 | 11,998 |
| | | | | | 48,683 |
Louisiana (2.0%) | | | | | |
| Louisiana GO | 5.000% | 5/1/08 | (4) | 10,000 | 10,078 |
| Louisiana GO | 5.250% | 5/1/08 | (3) | 7,405 | 7,472 |
| Louisiana GO | 4.000% | 7/15/08 | (11) | 1,485 | 1,491 |
| Louisiana GO | 5.000% | 5/1/09 | (4) | 14,015 | 14,336 |
| Louisiana GO | 5.000% | 7/15/10 | (11) | 2,000 | 2,078 |
1 | Louisiana GO TOB VRDO | 3.520% | 11/7/07 | (4) | 14,375 | 14,375 |
1 | Louisiana Housing Finance Agency Single Family | | | | | |
| Mortgage Rev. Home Ownership TOB VRDO | 3.520% | 11/7/07 | | 15,980 | 15,980 |
| Louisiana Offshore Terminal Auth. Deep Water | | | | | |
| Port Rev. (LOOP LLC Project) PUT | 3.650% | 4/1/08 | | 5,000 | 5,001 |
| Louisiana Transp. Auth. Toll Rev. | 5.000% | 9/1/09 | | 10,000 | 10,242 |
| | | | | | 81,053 |
Short-Term Tax-Exempt Fund
| | | | | Face | Market |
| | | Maturity | | Amount | Value• |
| | Coupon | Date | | ($000) | ($000) |
Maine (0.4%) | | | | | |
1 | Maine State Turnpike Auth. Turnpike Rev. | | | | | |
| TOB VRDO | 3.510% | 11/7/07 | (2) | 14,770 | 14,770 |
| | | | | | |
Maryland (0.5%) | | | | | |
| Maryland GO | 5.250% | 3/1/08 | | 2,135 | 2,148 |
| Maryland GO | 5.000% | 3/15/10 | | 18,520 | 19,193 |
| | | | | | 21,341 |
Massachusetts (2.7%) | | | | | |
| Massachusetts GAN | 5.750% | 6/15/09 | | 10,900 | 11,300 |
| Massachusetts GO | 5.250% | 1/1/09 | | 10,000 | 10,211 |
| Massachusetts GO | 5.500% | 2/1/09 | (1) | 8,785 | 9,009 |
| Massachusetts GO | 5.000% | 11/1/09 | | 10,000 | 10,309 |
| Massachusetts GO | 5.875% | 2/1/10 | (Prere.) | 16,585 | 17,608 |
| Massachusetts GO | 5.875% | 2/1/10 | (Prere.) | 7,600 | 8,069 |
| Massachusetts GO | 5.750% | 6/1/10 | (Prere.) | 10,000 | 10,569 |
| Massachusetts GO | 5.250% | 8/1/10 | | 2,000 | 2,094 |
1 | Massachusetts GO TOB VRDO | 3.470% | 11/7/07 | (2) | 3,950 | 3,950 |
| Massachusetts School Building Auth. | | | | | |
| Dedicated Sales Tax Rev. | 5.000% | 8/15/08 | | 5,000 | 5,062 |
| Massachusetts School Building Auth. | | | | | |
| Dedicated Sales Tax Rev. | 5.000% | 8/15/09 | | 11,500 | 11,818 |
| Route 3 North Transp. Improvement Assn. | | | | | |
| Massachusetts Lease Rev. | 5.750% | 6/15/11 | (1) | 3,415 | 3,606 |
| Springfield MA GO | 5.000% | 8/1/09 | (1) | 5,660 | 5,814 |
| | | | | | 109,419 |
Michigan (2.6%) | | | | | |
| Detroit MI Capital Improvement GO | 5.000% | 4/1/08 | (4) | 7,275 | 7,322 |
| Detroit MI Capital Improvement GO | 5.000% | 4/1/09 | (4) | 6,135 | 6,269 |
| Detroit MI Sewer System Rev. | 6.000% | 7/1/09 | (1) | 5,000 | 5,205 |
| Detroit MI Sewer System Rev. | 5.000% | 7/1/10 | (4) | 5,690 | 5,907 |
| Greater Detroit MI Resource Recovery Auth. | 6.250% | 12/13/07 | (2) | 5,000 | 5,016 |
| Greater Detroit MI Resource Recovery Auth. | 6.250% | 12/13/07 | (2) | 6,070 | 6,089 |
| Greater Detroit MI Resource Recovery Auth. | 6.250% | 12/13/08 | (2) | 5,000 | 5,151 |
| Michigan (New Center Dev. Inc.) COP PUT | 5.000% | 9/1/11 | (1) | 6,250 | 6,538 |
| Michigan Building Auth. Rev. | 5.000% | 10/15/08 | (4) | 16,000 | 16,238 |
| Michigan Building Auth. Rev. | 5.000% | 10/15/09 | (4) | 5,000 | 5,149 |
| Michigan Building Auth. Rev. | 5.000% | 10/15/10 | (4) | 12,325 | 12,853 |
| Michigan Building Auth. Rev. | 5.250% | 10/15/10 | | 5,360 | 5,537 |
| Michigan Comprehensive Transp. Rev. | 5.500% | 5/15/10 | (4) | 2,070 | 2,172 |
| Michigan Strategic Fund (Detroit Edison) | 7.000% | 7/15/08 | (1) | 18,375 | 18,818 |
| | | | | | 108,264 |
Minnesota (0.9%) | | | | | |
| Minnesota GO | 5.000% | 11/1/08 | | 24,785 | 25,179 |
| Minnesota GO | 5.000% | 11/1/10 | | 10,000 | 10,450 |
| | | | | | 35,629 |
Mississippi (0.7%) | | | | | |
| Mississippi GO | 5.500% | 11/1/08 | | 6,455 | 6,586 |
| Mississippi GO | 5.000% | 10/1/09 | | 5,770 | 5,937 |
| Mississippi GO | 6.000% | 11/1/09 | (Prere.) | 10,800 | 11,330 |
1 | Mississippi GO TOB VRDO | 3.520% | 11/7/07 | (1) | 6,685 | 6,685 |
| | | | | | 30,538 |
Short-Term Tax-Exempt Fund
| | | | | Face | Market |
| | | Maturity | | Amount | Value• |
| | Coupon | Date | | ($000) | ($000) |
Missouri (0.9%) | | | | | |
| Bi-State Dev. Agency of the Missouri-Illinois Metro. | | | | | |
| Dist. (St. Clair County Metrolink Extension) PUT | 3.950% | 10/1/09 | LOC | 5,000 | 5,038 |
| Missouri Health & Educ. Fac. Auth. Rev. | | | | | |
| (Ascension Health) ARS | 4.000% | 11/7/07 | | 7,500 | 7,500 |
| Missouri Health & Educ. Fac. Auth. Rev. | | | | | |
| (Ascension Health) ARS | 4.000% | 11/7/07 | | 16,525 | 16,525 |
| Missouri Highways & Transp. Comm. Road Rev. | 5.000% | 5/1/09 | | 9,165 | 9,383 |
| | | | | | 38,446 |
Montana (0.1%) | | | | | |
| Forsyth MT PCR (Avista Corp.) PUT | 5.000% | 12/30/08 | (2) | 5,550 | 5,644 |
| | | | | | |
Nebraska (0.9%) | | | | | |
| Central Plains Energy Project | | | | | |
| Nebraska Gas Project No. 1 | 5.000% | 12/1/08 | | 5,000 | 5,057 |
| Nebraska Public Power Dist. Rev. | 5.250% | 1/1/08 | (1)(Prere.) | 15,870 | 16,073 |
| Nebraska Public Power Dist. Rev. | 5.250% | 1/1/09 | (1) | 4,130 | 4,183 |
1 | Omaha NE Public Power Dist. | | | | | |
| Electric Rev. TOB VRDO | 3.510% | 11/7/07 | (3) | 9,810 | 9,810 |
| | | | | | 35,123 |
Nevada (3.1%) | | | | | |
| Clark County NV Bond Bank GO | 5.000% | 11/1/09 | (2) | 6,010 | 6,193 |
| Clark County NV GO | 5.500% | 7/1/10 | (1)(Prere.) | 23,000 | 24,196 |
1 | Clark County NV GO TOB VRDO | 3.490% | 11/7/07 | (2) | 9,600 | 9,600 |
| Clark County NV School Dist. GO | 5.250% | 6/15/09 | (4)(Prere.) | 5,000 | 5,141 |
| Clark County NV School Dist. GO | 5.250% | 6/15/09 | (1) | 16,920 | 17,407 |
| Clark County NV School Dist. GO | 5.000% | 6/15/10 | (1) | 10,730 | 11,140 |
| Clark County NV School Dist. GO | 5.250% | 6/15/10 | (4) | 10,495 | 10,780 |
| Clark County NV School Dist. GO | 5.250% | 6/15/10 | (4) | 13,675 | 14,283 |
1 | Las Vegas Valley Water Dist. Nevada GO Water | | | | | |
| Improvement & Refunding TOB VRDO | 3.520% | 11/7/07 | (3) | 5,310 | 5,310 |
1 | Las Vegas Valley Water Dist. Nevada GO Water | | | | | |
| Improvement & Refunding TOB VRDO | 3.520% | 11/7/07 | (1) | 11,820 | 11,820 |
| Nevada GO | 6.000% | 5/15/09 | | 6,500 | 6,747 |
| Nevada Highway Improvement Rev. | | | | | |
| (Motor Vehicle Fuel Tax) | 5.000% | 12/1/09 | (1) | 5,000 | 5,159 |
| | | | | | 127,776 |
New Hampshire (0.1%) | | | | | |
| New Hampshire State Turnpike System Rev. | 5.000% | 5/1/08 | (2) | 4,445 | 4,480 |
| | | | | | |
New Jersey (2.5%) | | | | | |
| Cape May County NJ Muni. Util. Auth. Rev. | 6.000% | 1/1/10 | (4) | 6,495 | 6,839 |
| Garden State Preservation Trust New Jersey | 5.250% | 11/1/09 | (4) | 4,500 | 4,662 |
| New Jersey Econ. Dev. Auth. Rev. (Cigarette Tax) | 5.000% | 6/15/08 | | 3,000 | 3,013 |
| New Jersey Econ. Dev. Auth. Rev. (School Fac.) | 5.000% | 3/1/08 | | 2,500 | 2,512 |
| New Jersey Econ. Dev. Auth. Rev. (School Fac.) | 5.000% | 9/1/08 | | 16,085 | 16,291 |
| New Jersey Econ. Dev. Auth. Rev. (School Fac.) | 5.000% | 3/1/10 | | 1,000 | 1,032 |
1 | New Jersey Econ. Dev. Auth. Rev. (School Fac.) | | | | | |
| TOB VRDO | 3.540% | 11/7/07 | | 11,000 | 11,000 |
| New Jersey Econ. Dev. Auth. Rev. (Transp. Project) | 5.500% | 5/1/08 (4) | | 10,520 | 10,630 |
| New Jersey Educ. Fac. Auth. Rev. | | | | | |
| (Higher Education Trust Fund) | 5.000% | 9/1/08 | | 6,915 | 7,003 |
| New Jersey Educ. Fac. Auth. Rev. | | | | | |
| (Higher Education Trust Fund) | 5.000% | 9/1/09 | | 5,610 | 5,763 |
| New Jersey Educ. Fac. Auth. Rev. | | | | | |
| (Higher Education Trust Fund) | 5.000% | 9/1/10 | | 6,000 | 6,240 |
Short-Term Tax-Exempt Fund
| | | | | Face | Market |
| | | Maturity | | Amount | Value• |
| | Coupon | Date | | ($000) | ($000) |
| New Jersey Transp. Trust Fund Auth. Rev. | 5.000% | 12/15/07 | (1) | 9,400 | 9,418 |
| New Jersey Transp. Trust Fund Auth. Rev. | 6.000% | 12/15/11 | (1)(Prere.) | 2,025 | 2,218 |
1 | New Jersey Transp. Trust Fund Auth. Rev. | | | | | |
| TOB VRDO | 3.510% | 11/7/07 | (2)(1) | 17,475 | 17,475 |
| | | | | | 104,096 |
New Mexico (1.3%) | | | | | |
| Farmington NM PCR (Southern CA Edison | | | | | |
| Four Corners Project) PUT | 3.550% | 4/1/10 | (3) | 14,335 | 14,287 |
1 | New Mexico Finance Auth. Rev. TOB VRDO | 3.520% | 11/7/07 | (1) | 9,165 | 9,165 |
1 | New Mexico Finance Auth. Rev. TOB VRDO | 3.580% | 11/7/07 | (2) | 7,970 | 7,970 |
| New Mexico Highway Comm. Tax Rev. | 5.500% | 6/15/08 | | 2,335 | 2,364 |
| New Mexico Highway Comm. Tax Rev. | 5.500% | 6/15/08 | (ETM) | 415 | 420 |
| New Mexico Severance Tax Rev. | 5.000% | 7/1/09 | | 1,000 | 1,026 |
| New Mexico Severance Tax Rev. | 5.000% | 7/1/09 | (2) | 2,000 | 2,051 |
| New Mexico Severance Tax Rev. | 5.000% | 7/1/09 | | 15,755 | 16,159 |
| New Mexico Severance Tax Rev. | 5.000% | 7/1/10 | | 1,000 | 1,039 |
| | | | | | 54,481 |
New York (6.3%) | | | | | |
1 | Hudson Yards Infrastructure Corp. | | | | | |
| New York Rev. TOB VRDO | 3.500% | 11/7/07 | (3) | 17,000 | 17,000 |
| Metro. New York Transp. Auth. Rev. (Transit Rev.) | 5.250% | 11/15/08 | | 7,775 | 7,919 |
| Metro. New York Transp. Auth. Rev. (Transit Rev.) | 5.000% | 11/15/09 | | 2,755 | 2,840 |
| Metro. New York Transp. Auth. Rev. (Transit Rev.) | 5.250% | 11/15/09 | (ETM) | 22,260 | 23,046 |
| Metro. New York Transp. Auth. Rev. (Transit Rev.) | 5.000% | 11/15/10 | | 2,000 | 2,088 |
| Metro. New York Transp. Auth. Rev. (Transit Rev.) | 5.250% | 11/15/10 | | 12,730 | 13,382 |
1 | Metro. New York Transp. Auth. Rev. (Transit Rev.) | | | | | |
| TOB VRDO | 3.570% | 11/7/07 | | 6,625 | 6,625 |
1 | Metro. New York Transp. Auth. Rev. TOB VRDO | 3.490% | 11/7/07 | (2) | 15,000 | 15,000 |
| New York City NY GO | 5.000% | 6/1/08 | | 13,375 | 13,495 |
| New York City NY GO | 5.000% | 8/1/08 | | 29,000 | 29,333 |
| New York City NY GO | 5.000% | 8/1/08 | | 5,000 | 5,057 |
| New York City NY GO | 5.000% | 8/1/09 | | 6,895 | 7,073 |
| New York City NY GO | 5.000% | 8/1/09 | | 30 | 31 |
| New York City NY GO | 5.000% | 8/1/09 | (ETM) | 3,900 | 4,005 |
| New York City NY GO | 5.000% | 8/1/10 | | 3,000 | 3,115 |
| New York City NY GO | 5.250% | 11/1/10 | (2) | 7,715 | 8,112 |
| New York City NY Housing Dev. Corp. Rev. | 5.000% | 7/1/09 | (3) | 2,000 | 2,052 |
| New York City NY Transitional Finance Auth. Rev. | 5.500% | 11/1/11 | | 4,950 | 5,262 |
| New York City NY Transitional Finance Auth. Rev. | | | | | |
| Future Tax | 4.500% | 2/1/08 | (ETM) | 1,000 | 1,003 |
| New York City NY Transitional Finance Auth. Rev. | | | | | |
| Future Tax | 5.000% | 11/1/09 | (ETM) | 5,000 | 5,153 |
| New York State Dormitory Auth. Rev. (City Univ.) | 5.250% | 7/1/09 | (1) | 10,000 | 10,300 |
| New York State Dormitory Auth. Rev. (State Univ.) | 6.000% | 5/15/12 | (1) | 6,200 | 6,624 |
1 | New York State Thruway Auth. Rev. TOB VRDO | 3.500% | 11/7/07 | (3) | 16,920 | 16,920 |
1 | New York State Thruway Auth. Rev. TOB VRDO | 3.500% | 11/7/07 | (3) | 8,760 | 8,760 |
| New York State Urban Dev. Corp. Rev. | | | | | |
| (Correctional Fac.) PUT | 5.250% | 1/1/09 | | 21,105 | 21,515 |
| New York State Urban Dev. Corp. Rev. | | | | | |
| (Service Contract) | 5.000% | 1/1/10 | | 2,800 | 2,888 |
| Tobacco Settlement Financing Corp. New York Rev. | 5.000% | 6/1/08 | | 6,970 | 7,024 |
| Tobacco Settlement Financing Corp. New York Rev. | 5.000% | 6/1/08 | | 12,075 | 12,169 |
| | | | | | 257,791 |
Short-Term Tax-Exempt Fund
| | | | | Face | Market |
| | | Maturity | | Amount | Value• |
| | Coupon | Date | | ($000) | ($000) |
North Carolina (2.2%) | | | | | |
| Charlotte NC (Equipment Acquisition) COP | 4.000% | 3/1/08 | | 1,500 | 1,503 |
| Charlotte NC (Equipment Acquisition) COP | 5.000% | 3/1/09 | | 3,700 | 3,774 |
| Fayetteville NC Public Works Comm. Rev. | 3.550% | 1/15/08 | (4) | 3,380 | 3,379 |
| North Carolina GO | 4.600% | 4/1/09 | (Prere.) | 9,000 | 9,317 |
| North Carolina GO | 5.000% | 4/1/10 | | 4,000 | 4,147 |
1 | North Carolina Infrastructure Financial Corp. | | | | | |
| COP TOB VRDO | 3.490% | 11/7/07 | (4) | 16,145 | 16,145 |
| North Carolina Muni. Power Agency Rev. | 0.000% | 1/1/09 | (1) | 5,525 | 5,299 |
1 | North Carolina Muni. Power Agency Rev. TOB VRDO | 3.490% | 11/7/07 | (2) | 13,220 | 13,220 |
| Wake County NC Public Improvement GO | 5.000% | 3/1/09 | | 10,000 | 10,210 |
| Wake County NC Public Improvement GO | 5.000% | 3/1/10 | | 21,800 | 22,575 |
| | | | | | 89,569 |
Ohio (2.9%) | | | | | |
| American Muni. Power Ohio Inc. | | | | | |
| Electricity Purchase Rev. | 5.000% | 2/1/09 | | 8,000 | 8,101 |
| American Muni. Power Ohio Inc. | | | | | |
| Electricity Purchase Rev. | 5.000% | 2/1/10 | | 3,000 | 3,085 |
| Columbus OH GO | 5.000% | 6/15/09 | | 3,000 | 3,076 |
| Ohio Air Quality Dev. Auth. PCR ARS | 3.950% | 11/14/07 | (2) | 14,660 | 14,660 |
| Ohio Building Auth. Rev. | | | | | |
| (Administration Building Fund) | 5.000% | 10/1/08 | (1) | 4,580 | 4,645 |
| Ohio Building Auth. Rev. | | | | | |
| (Administration Building Fund) | 5.000% | 10/1/09 | (1) | 11,680 | 12,021 |
| Ohio Building Auth. Rev. | | | | | |
| (Administration Building Fund) | 5.000% | 10/1/09 | (1) | 11,580 | 11,918 |
| Ohio Building Auth. Rev. (State Correctional Fac.) | 5.000% | 10/1/08 | (1) | 1,110 | 1,126 |
| Ohio Building Auth. Rev. (State Correctional Fac.) | 5.000% | 4/1/09 | | 2,500 | 2,555 |
1 | Ohio Common Schools GO TOB VRDO | 3.470% | 11/7/07 | | 11,065 | 11,065 |
1 | Ohio GO TOB VRDO | 3.470% | 11/7/07 | | 7,975 | 7,975 |
| Ohio Higher Educ. Capital Fac. Rev. | 5.000% | 6/1/09 | | 5,000 | 5,122 |
| Ohio Higher Educ. Capital Fac. Rev. | 5.000% | 12/1/09 | | 10,000 | 10,319 |
| Ohio Highway Capital Improvements Rev. | 5.000% | 5/1/08 | | 4,000 | 4,032 |
| Ohio Infrastructure Improvement GO | 5.000% | 8/1/09 | | 4,400 | 4,518 |
| Ohio Refunding & Improvement Infrastructure | 5.000% | 8/1/10 | | 7,270 | 7,565 |
| Ohio State Dept. Administrative Services COP | | | | | |
| (Administrative Knowledge System) | 5.000% | 9/1/08 | (1) | 1,345 | 1,362 |
| Ohio State Univ. General Receipts Rev. | 5.000% | 6/1/08 | | 6,595 | 6,655 |
| | | | | | 119,800 |
Oklahoma (0.6%) | | | | | |
| Oklahoma Dev. Finance Auth. Rev. | | | | | |
| (Samuel Roberts Noble Foundation) | 5.000% | 5/1/10 | | 5,000 | 5,184 |
| Tulsa County OK Ind. Auth. Rev. | 5.000% | 5/15/08 | (4) | 4,700 | 4,740 |
| Tulsa County OK Ind. Auth. Rev. | 5.000% | 5/15/09 | (4) | 4,620 | 4,730 |
| Tulsa County OK Public Fac. Auth. Rev. | 5.000% | 6/1/09 | (2) | 11,725 | 12,010 |
| | | | | | 26,664 |
Oregon (0.3%) | | | | | |
| Oregon State Dept. Administrative Services | 5.000% | 9/1/10 | (4) | 5,000 | 5,211 |
| Portland OR Sewer System Rev. | 5.000% | 6/1/08 | | 6,750 | 6,812 |
| | | | | | 12,023 |
Pennsylvania (4.9%) | | | | | |
| Allegheny County PA Port Auth. Rev. | 6.000% | 3/1/09 | (1)(Prere.) | 2,565 | 2,673 |
| Allegheny County PA Port Auth. Rev. | 6.000% | 3/1/09 | (1)(Prere.) | 4,310 | 4,491 |
| Allegheny County PA Port Auth. Rev. | 6.250% | 3/1/09 | (1)(Prere.) | 3,740 | 3,909 |
| Erie PA School Dist. GO | 5.800% | 9/1/10 | (2)(Prere.) | 4,500 | 4,783 |
Short-Term Tax-Exempt Fund
| | | | | Face | Market |
| | | Maturity | | Amount | Value• |
| | Coupon | Date | | ($000) | ($000) |
| Lancaster County PA GO | 6.250% | 5/1/10 | (3)(Prere.) | 4,605 | 4,912 |
| Lancaster County PA GO | 6.250% | 5/1/10 | (3)(Prere.) | 4,370 | 4,662 |
| Pennsylvania GO | 5.250% | 2/1/08 | | 15,440 | 15,509 |
| Pennsylvania GO | 5.000% | 9/1/09 | | 8,235 | 8,467 |
2 | Pennsylvania GO | 5.250% | 10/15/10 | (Prere.) | 5,000 | 5,301 |
| Pennsylvania GO | 5.250% | 10/15/10 | (Prere.) | 8,850 | 9,374 |
| Pennsylvania GO | 5.250% | 10/15/10 | (Prere.) | 11,300 | 11,969 |
| Pennsylvania Higher Educ. Fac. Auth. Rev. | | | | | |
| (Rosemont College) PUT | 3.630% | 11/1/07 | LOC | 2,900 | 2,900 |
| Pennsylvania Higher Educ. Fac. Auth. Rev. | | | | | |
| (Univ. of Pennsylvania) | 5.500% | 7/15/08 | (Prere.) | 2,000 | 2,028 |
| Pennsylvania Intergovernmental | | | | | |
| Cooperation Auth. Rev. | 5.000% | 6/15/09 | (3) | 6,150 | 6,303 |
| Pennsylvania State Univ. Rev. | 5.000% | 3/1/08 | | 8,025 | 8,067 |
| Pennsylvania Turnpike Comm. BAN | 4.000% | 10/15/09 | (2) | 58,000 | 58,253 |
| Philadelphia PA GO | 5.000% | 8/1/09 | (11) | 4,775 | 4,895 |
| Philadelphia PA School Dist. GO | 5.250% | 4/1/09 | (1)(Prere.) | 3,000 | 3,074 |
1 | Philadelphia PA School Dist. TOB VRDO | 3.490% | 11/7/07 | (2) | 7,690 | 7,690 |
| Pittsburgh PA GO | 5.000% | 9/1/08 | (1) | 2,810 | 2,847 |
| Pittsburgh PA GO | 5.000% | 9/1/08 | (1)(ETM) | 11,615 | 11,762 |
| Pittsburgh PA GO | 5.750% | 9/1/09 | (3)(Prere.) | 4,505 | 4,682 |
| Pittsburgh PA GO | 6.000% | 9/1/09 | (3)(Prere.) | 4,450 | 4,645 |
| Pittsburgh PA School Dist. GO | 5.500% | 9/1/09 | (4)(Prere.) | 2,985 | 3,093 |
| Pittsburgh PA School Dist. GO | 5.500% | 9/1/09 | (4)(Prere.) | 2,680 | 2,777 |
| Southcentral Pennsylvania General Auth. Rev. PUT | 4.500% | 12/1/08 | (2) | 4,500 | 4,546 |
| | | | | | 203,612 |
Puerto Rico (1.1%) | | | | | |
| Puerto Rico Highway & Transp. Auth. Rev. | 5.250% | 7/1/09 | | 9,500 | 9,738 |
| Puerto Rico Muni. Finance Agency | 5.000% | 8/1/09 | | 5,000 | 5,110 |
1 | Puerto Rico Sales Tax Financing Corp. Rev. | | | | | |
| TOB VRDO | 3.680% | 11/7/07 | | 32,000 | 32,000 |
| | | | | | 46,848 |
South Carolina (0.7%) | | | | | |
1 | South Carolina Public Service Auth. Rev. | | | | | |
| TOB VRDO | 3.510% | 11/7/07 | (4) | 10,030 | 10,030 |
| South Carolina Transp. Infrastructure Rev. | 5.750% | 10/1/09 | (1)(Prere.) | 10,790 | 11,349 |
1 | South Carolina Transp. Infrastructure Rev. | | | | | |
| TOB VRDO | 3.510% | 11/7/07 | (2) | 8,345 | 8,345 |
| | | | | | 29,724 |
Tennessee (3.1%) | | | | | |
| Knox County TN GO | 5.000% | 4/1/09 | | 3,275 | 3,347 |
| Memphis TN Electric System Rev. | 5.000% | 12/1/08 | (4) | 15,000 | 15,253 |
| Memphis TN GO | 5.000% | 10/1/08 | | 4,705 | 4,770 |
1 | Memphis TN GO TOB VRDO | 3.490% | 11/7/07 | (3) | 16,965 | 16,965 |
| Metro. Govt. of Nashville & Davidson County TN GO | 5.000% | 8/1/10 | | 5,165 | 5,376 |
| Metro. Govt. of Nashville & Davidson County TN | | | | | |
| Health & Educ. Fac. (Vanderbilt Univ.) PUT | 5.000% | 4/1/09 | (1) | 2,000 | 2,037 |
| Metro. Govt. of Nashville & Davidson County TN | | | | | |
| Health & Educ. Fac. (Vanderbilt Univ.) PUT | 5.000% | 4/1/10 | (1) | 35,675 | 36,745 |
| Sevier County TN Public Building Auth. | | | | | |
| (Public Projects Construction Notes) PUT | 3.650% | 4/1/08 | | 4,000 | 3,999 |
| Tennessee Energy Acquisition Corp. Gas Rev. | 5.000% | 2/1/10 | | 5,000 | 5,108 |
| Tennessee Energy Acquisition Corp. Gas Rev. | 5.000% | 9/1/10 | | 18,965 | 19,477 |
| Tennessee GO | 5.250% | 3/1/10 | (Prere.) | 6,500 | 6,761 |
Short-Term Tax-Exempt Fund
| | | | | Face | Market |
| | | Maturity | | Amount | Value• |
| | Coupon | Date | | ($000) | ($000) |
| Tennessee Health, Educ. & Housing Fac. | | | | | |
| (Methodist Health System) PUT | 5.000% | 10/1/08 | | 5,720 | 5,768 |
| | | | | | 125,606 |
Texas (17.8%) | | | | | |
| Aledo TX Independent School Dist. PUT | 3.750% | 8/1/08 | | 6,675 | 6,689 |
| Arlington TX Independent School Dist. | 5.000% | 2/15/10 | | 10,105 | 10,446 |
| Austin TX Electric Util. System Rev. | 5.000% | 11/15/10 | (2) | 5,000 | 5,217 |
| Austin TX Public Improvement GO | 5.250% | 9/1/09 | | 7,545 | 7,587 |
| Comal TX Independent School Dist. | 5.750% | 8/1/09 | (Prere.) | 20,000 | 20,777 |
| Corpus Christi TX GO | 5.000% | 3/1/09 | (4) | 2,000 | 2,041 |
| Cypress-Fairbanks TX Independent School Dist. | | | | | |
| Unlimited Tax Schoolhouse PUT | 3.300% | 8/15/08 | | 10,000 | 9,972 |
| Cypress-Fairbanks TX Independent School Dist. | | | | | |
| Unlimited Tax Schoolhouse PUT | 5.000% | 8/15/09 | | 5,000 | 5,107 |
| Cypress-Fairbanks TX Independent School Dist. | | | | | |
| Unlimited Tax Schoolhouse PUT | 5.000% | 8/15/09 | | 27,810 | 28,405 |
| Dallas TX GO | 5.000% | 2/15/10 | | 5,000 | 5,170 |
| Dallas TX GO | 5.000% | 2/15/10 | | 8,965 | 9,268 |
| Denton TX Independent School Dist. GO | 5.200% | 8/15/08 | (Prere.) | 10,180 | 10,317 |
| Denton TX Independent School Dist. PUT | 3.000% | 2/1/08 | | 11,100 | 11,073 |
1 | Denton TX Independent School Dist. TOB VRDO | 3.580% | 11/7/07 | | 5,575 | 5,575 |
| El Paso TX Independent School Dist. GO | 5.375% | 8/15/08 | | 5,000 | 5,075 |
| Fort Bend TX Independent School Dist. GO PUT | 5.000% | 8/15/09 | | 15,200 | 15,554 |
| Fort Bend TX Independent School Dist. GO PUT | 5.000% | 8/15/09 | | 5,700 | 5,833 |
| Frisco TX GO | 5.000% | 2/15/09 | (4) | 2,950 | 3,008 |
| Grand Prairie TX Independent School Dist. | 3.760% | 8/1/08 | | 545 | 546 |
1 | Harris County TX GO TOB VRDO | 3.490% | 11/7/07 | (2) | 29,990 | 29,990 |
| Harris County TX Health Fac. Dev. Corp. Hosp. Rev. | | | | | |
| (Memorial Hermann Healthcare) ARS | 3.950% | 11/14/07 | (1) | 7,400 | 7,400 |
| Harris County TX Health Fac. Dev. Corp. Hosp. Rev. | | | | | |
| (Memorial Hermann Healthcare) ARS | 3.850% | 11/23/07 | (4) | 15,000 | 15,000 |
| Harris County TX Health Fac. Dev. Corp. Hosp. Rev. | | | | | |
| (Memorial Hermann Healthcare) ARS | 3.700% | 11/28/07 | (1) | 19,300 | 19,300 |
1 | Harris County TX Permanent Improvement & | | | | | |
| Refunding TOB VRDO | 3.520% | 11/7/07 | (4) | 13,160 | 13,160 |
| Harris County TX Toll Road Rev. | 5.000% | 8/15/08 | (3) | 9,355 | 9,469 |
| Harris County TX Toll Road Rev. PUT | 5.000% | 8/15/09 | (3) | 25,000 | 25,582 |
1 | Houston TX GO TOB VRDO | 3.490% | 11/7/07 | (4) | 6,300 | 6,300 |
1 | Houston TX GO TOB VRDO | 3.520% | 11/7/07 | (4) | 10,530 | 10,530 |
| Houston TX Hotel Occupancy Tax & Special Rev. | | | | | |
| (Convention & Entertainment) | 5.250% | 9/1/08 | (2) | 7,460 | 7,571 |
1 | Houston TX Hotel Occupancy Tax & Special Rev. | | | | | |
| (Convention & Entertainment) TOB VRDO | 3.290% | 11/7/07 | (2) | 9,510 | 9,510 |
| Houston TX Independent School Dist. GO | 5.000% | 2/15/09 | (Prere.) | 14,315 | 14,593 |
| Houston TX Independent School Dist. GO | 5.000% | 7/15/09 | (4) | 3,600 | 3,693 |
| Houston TX Independent School Dist. GO | 5.000% | 2/15/10 | | 8,585 | 8,869 |
| Houston TX Util. System Rev. | 5.250% | 5/15/10 | (1) | 2,300 | 2,398 |
1 | Houston TX Util. System Rev. TOB VRDO | 3.490% | 11/7/07 | (4) | 25,675 | 25,675 |
1 | Houston TX Util. System Rev. TOB VRDO | 3.510% | 11/7/07 | (4) | 9,930 | 9,930 |
1 | Houston TX Water & Sewer System Rev. TOB VRDO | 3.520% | 11/7/07 | | 5,960 | 5,960 |
| Irving TX Hosp. Auth. | | | | | |
| (Baylor Medical Center at Irving) | 5.000% | 7/1/08 | | 4,275 | 4,309 |
| Irving TX Hosp. Auth. | | | | | |
| (Baylor Medical Center at Irving) | 5.000% | 7/1/09 | | 3,990 | 4,064 |
| Irving TX Hosp. Auth. | | | | | |
| (Baylor Medical Center at Irving) | 5.000% | 7/1/10 | | 4,720 | 4,850 |
Short-Term Tax-Exempt Fund
| | | | | Face | Market |
| | | Maturity | | Amount | Value• |
| | Coupon | Date | | ($000) | ($000) |
1 | Longview TX Water & Sewer Rev. TOB VRDO | 3.520% | 11/7/07 | (1) | 9,215 | 9,215 |
| Mesquite TX Independent School Dist. GO PUT | 3.650% | 12/1/08 | | 16,810 | 16,843 |
| Montgomery County TX PUT | 5.000% | 9/1/08 | (4) | 3,000 | 3,037 |
| Montgomery County TX PUT | 5.000% | 9/1/10 | (4) | 2,500 | 2,585 |
1 | North Texas Muni. Water Dist. Texas | | | | | |
| Water System Rev. TOB VRDO | 3.510% | 11/7/07 | (3) | 10,345 | 10,345 |
| Northside TX Independent School Dist. PUT | 3.780% | 6/1/09 | | 10,000 | 10,022 |
| SA Energy Acquisition Public Fac. Corp. | | | | | |
| Texas Gas Supply Rev. | 5.000% | 8/1/08 | | 10,410 | 10,492 |
| SA Energy Acquisition Public Fac. Corp. | | | | | |
| Texas Gas Supply Rev. | 5.000% | 8/1/09 | | 19,950 | 20,307 |
| SA Energy Acquisition Public Fac. Corp. | | | | | |
| Texas Gas Supply Rev. | 5.000% | 8/1/10 | | 8,460 | 8,682 |
| San Antonio TX Electric & Gas Rev. | 5.250% | 2/1/09 | | 8,500 | 8,687 |
| San Antonio TX Electric & Gas Rev. | 5.000% | 2/1/10 | | 9,185 | 9,484 |
| San Antonio TX Electric & Gas Rev. | 5.250% | 2/1/10 | | 5,760 | 5,978 |
| Spring TX Independent School Dist. | | | | | |
| Schoolhouse GO PUT | 3.720% | 8/15/08 | (4) | 10,000 | 10,024 |
| Tarrant Regional Water Dist. TX Water Rev. | 5.000% | 3/1/09 | (4) | 2,885 | 2,943 |
| Texas A & M Univ. Rev. Financing System | 5.000% | 5/15/08 | | 2,865 | 2,889 |
| Texas A & M Univ. Rev. Financing System | 5.000% | 5/15/08 | | 1,655 | 1,669 |
| Texas A & M Univ. Rev. Financing System | 5.000% | 5/15/09 | | 5,065 | 5,185 |
| Texas A & M Univ. Rev. Financing System | 5.000% | 5/15/09 | | 2,000 | 2,047 |
| Texas A & M Univ. Rev. Financing System | 5.250% | 5/15/10 | | 10,000 | 10,434 |
| Texas A & M Univ. System CP | 3.700% | 11/1/07 | | 6,100 | 6,100 |
| Texas GO | 6.000% | 10/1/08 | (1) | 5,750 | 5,883 |
| Texas GO Public Finance Auth. | 5.000% | 10/1/09 | | 4,000 | 4,117 |
1 | Texas GO TOB VRDO | 3.520% | 11/7/07 | | 11,360 | 11,360 |
1 | Texas GO TOB VRDO | 3.520% | 11/7/07 | | 7,500 | 7,500 |
| Texas Muni. Gas Acquisition & Supply Corp. Rev. | 4.145% | 12/15/09 | | 10,000 | 9,850 |
| Texas Muni. Gas Acquisition & Supply Corp. Rev. | 4.215% | 9/15/10 | | 10,000 | 9,800 |
| Texas Muni. Gas Acquisition & Supply Corp. Rev. | 5.000% | 12/15/10 | | 13,370 | 13,719 |
| Texas Public Finance Auth. Rev. | 5.000% | 2/1/10 | (3) | 5,000 | 5,163 |
| Texas State Transp. Comm. First Tier | 5.000% | 4/1/09 | | 13,000 | 13,281 |
| Texas State Transp. Comm. First Tier | 5.000% | 4/1/10 | | 12,000 | 12,422 |
2 | Texas State Transp. Comm. First Tier | 5.000% | 4/1/12 | | 7,000 | 7,400 |
| Texas Turnpike Auth. Central Texas | | | | | |
| Turnpike System Rev. | 5.000% | 6/1/08 | | 14,865 | 15,002 |
| Univ. of Houston TX Rev. | 5.250% | 2/15/08 | (4) | 5,435 | 5,463 |
| Univ. of Houston TX Rev. | 5.500% | 2/15/10 | (1)(Prere.) | 5,500 | 5,747 |
| Univ. of Texas Permanent Univ. Fund Rev. | 5.000% | 8/15/08 | | 2,500 | 2,531 |
| Univ. of Texas Permanent Univ. Fund Rev. | 5.000% | 8/15/08 | | 7,000 | 7,086 |
| Univ. of Texas Permanent Univ. Fund Rev. | 5.000% | 8/15/10 | | 4,470 | 4,653 |
1 | Williamson County TX GO TOB VRDO | 3.510% | 11/7/07 (2) | | 15,025 | 15,025 |
1 | Williamson County TX GO TOB VRDO | 3.510% | 11/7/07 (2) | | 15,025 | 15,025 |
| | | | | | 733,808 |
Utah (0.3%) | | | | | |
| Intermountain Power Agency Utah | | | | | |
| Power Supply Rev. | 5.000% | 7/1/10 (4) | | 6,290 | 6,534 |
| Utah GO | 5.375% | 7/1/12 | | 5,000 | 5,389 |
| | | | | | 11,923 |
Vermont (0.1%) | | | | | |
| Vermont GO | 5.000% | 2/1/08 | | 4,855 | 4,875 |
Short-Term Tax-Exempt Fund
| | | | | Face | Market |
| | | Maturity | | Amount | Value• |
| | Coupon | Date | | ($000) | ($000) |
Virginia (1.0%) | | | | | |
| Peninsula Ports Auth. Virginia Rev. | | | | | |
| (Dominion Term Assn. Project) PUT | 3.300% | 10/1/08 | | 2,500 | 2,485 |
| Pocahontas Parkway Assn. Virginia | | | | | |
| Route 895 Connector Toll Road Rev. | 0.000% | 8/15/08 | (Prere.) | 5,800 | 1,092 |
| Rappahannock VA Regional Jail Auth Rev. GAN | 4.250% | 12/1/09 | | 5,000 | 5,035 |
| Virginia College Building Auth. Educ. Fac. Rev. | 5.000% | 2/1/08 | | 10,885 | 10,928 |
| Virginia Public Building Auth. Rev. | 5.000% | 8/1/09 | | 7,050 | 7,240 |
| Virginia Public Building Auth. Rev. | 5.000% | 8/1/10 | | 4,000 | 4,162 |
| Virginia Public School Auth. Rev. | 5.000% | 8/1/10 | | 6,000 | 6,245 |
| Virginia Public School Auth. Rev. | 5.500% | 8/1/10 | | 4,645 | 4,895 |
| | | | | | 42,082 |
Washington (4.9%) | | | | | |
| Energy Northwest Washington Electric | | | | | |
| Refunding Rev. (Project No. 1) | 5.000% | 7/1/09 | | 15,000 | 15,375 |
| Energy Northwest Washington Electric | | | | | |
| Refunding Rev. (Project No. 1) | 5.000% | 7/1/10 | | 42,450 | 44,067 |
| Energy Northwest Washington Electric | | | | | |
| Refunding Rev. (Project No. 3) | 5.000% | 7/1/09 | | 8,090 | 8,292 |
| King County WA (Bellevue School Dist.) GO | 5.000% | 12/1/10 | (4) | 2,965 | 3,096 |
| Port of Seattle WA Rev. | 5.000% | 3/1/09 | (4) | 3,415 | 3,485 |
| Port of Seattle WA Rev. | 5.000% | 3/1/10 | (4) | 3,230 | 3,340 |
| Seattle WA Drain & Wastewater Rev. | 4.000% | 2/1/08 | | 2,075 | 2,078 |
| Seattle WA Drain & Wastewater Rev. | 4.000% | 2/1/09 | | 2,170 | 2,185 |
1 | Seattle WA Refunding & Improvement | | | | | |
| GO TOB VRDO | 3.490% | 11/7/07 | | 5,920 | 5,920 |
| Washington GO | 4.000% | 7/1/08 | | 5,180 | 5,200 |
| Washington GO | 4.000% | 1/1/10 | (2) | 7,885 | 7,973 |
| Washington GO | 4.000% | 1/1/10 | | 4,055 | 4,099 |
| Washington GO | 5.000% | 7/1/10 | | 5,525 | 5,738 |
| Washington GO | 5.000% | 1/1/11 | (2) | 21,735 | 22,683 |
1 | Washington GO TOB VRDO | 3.490% | 11/7/07 | (4) | 9,245 | 9,245 |
1 | Washington GO TOB VRDO | 3.490% | 11/7/07 | (2) | 17,050 | 17,050 |
1 | Washington GO TOB VRDO | 3.490% | 11/7/07 | | 30,000 | 30,000 |
1 | Washington GO TOB VRDO | 3.520% | 11/7/07 | (2) | 10,430 | 10,430 |
| | | | | | 200,256 |
West Virginia (0.3%) | | | | | |
| West Virginia GO | 5.500% | 6/1/10 | (4) | 5,000 | 5,252 |
| West Virginia Higher Educ. Policy Comm. Rev. | 5.000% | 4/1/08 | (1) | 2,500 | 2,516 |
| West Virginia Water Dev. Auth. Rev. | 5.625% | 10/1/10 | (4)(Prere.) | 5,000 | 5,299 |
| | | | | | 13,067 |
Wisconsin (2.2%) | | | | | |
| Milwaukee WI GO | 5.000% | 2/15/09 | (4) | 5,835 | 5,951 |
| Milwaukee WI GO | 5.000% | 10/1/10 | (1) | 12,735 | 13,278 |
| Wisconsin Clean Water Rev. | 5.000% | 6/1/09 | | 3,175 | 3,252 |
| Wisconsin GO | 5.000% | 5/1/08 | | 8,055 | 8,118 |
| Wisconsin GO | 5.000% | 5/1/09 | | 13,745 | 14,062 |
| Wisconsin GO | 5.000% | 5/1/10 | (1) | 8,690 | 9,010 |
| Wisconsin GO | 5.000% | 5/1/10 | (1) | 14,405 | 14,935 |
1 | Wisconsin GO TOB VRDO | 3.520% | 11/7/07 | (4) | 11,195 | 11,195 |
| Wisconsin Transp. Rev. | 5.000% | 7/1/08 | (3) | 8,750 | 8,842 |
| | | | | | 88,643 |
Short-Term Tax-Exempt Fund
| | | | | Face | Market |
| | | Maturity | | Amount | Value• |
| | Coupon | Date | | ($000) | ($000) |
| Multiple States (0.1%) | | | | | |
1 | Various States TOB VRDO | 3.650% | 11/7/07 | | 1,420 | 1,420 |
1 | Various States TOB VRDO | 3.650% | 11/7/07 | (1)(2)(3)(4) | 2,280 | 2,280 |
| | | | | | 3,700 |
| Total Municipal Bonds (Cost $4,114,157) | | | | | 4,119,161 |
| | | | | Shares | |
| Temporary Cash Investment (0.2%) | | | | | |
3 | Vanguard Municipal Cash Management Fund | | | | | |
| (Cost $8,903) | 3.425% | | | 8,902,976 | 8,903 |
| Total Investments (100.2%) (Cost $4,123,060) | | | | | 4,128,064 |
| Other Assets and Liabilities (–0.2%) | | | | | |
| Other Assets—Note B | | | | | 55,811 |
| Liabilities | | | | | (66,292) |
| | | | | | (10,481) |
| Net Assets (100%) | | | | | 4,117,583 |
At October 31, 2007, net assets consisted of:4 | | |
| | Amount |
| | ($000) |
Paid-in Capital | | 4,124,656 |
Undistributed Net Investment Income | | — |
Accumulated Net Realized Losses | | (12,077) |
Unrealized Appreciation | | 5,004 |
Net Assets | | 4,117,583 |
| | |
Investor Shares—Net Assets | | |
Applicable to 66,553,095 outstanding $.001 par value shares of | | |
beneficial interest (unlimited authorization) | | 1,039,797 |
Net Asset Value Per Share—Investor Shares | | 15.62 |
| | |
Admiral Shares—Net Assets | | |
Applicable to 196,996,122 outstanding $.001 par value shares of | | |
beneficial interest (unlimited authorization) | | 3,077,786 |
Net Asset Value Per Share—Admiral Shares | | 15.62 |
• See Note A in Notes to Financial Statements.
1�� Security exempt from registration under Rule 144A of the Securities Act of 1933. Such securities may be sold in transactions exempt from registration, normally to qualified institutional buyers. At October 31, 2007, the aggregate value of these securities was $987,470,000, representing 24.0% of net assets.
2 Security purchased on a when-issued or delayed delivery basis for which the fund has not taken delivery as of October 31, 2007.
3 Affiliated money market fund available only to Vanguard funds and certain trusts and accounts managed by Vanguard. Rate shown is the 7-day yield.
4 See Note D in Notes to Financial Statements for the tax-basis components of net assets.
For key to abbreviations and other references, see back cover.
Limited-Term Tax-Exempt Fund
| | | | | Face | Market |
| | | Maturity | | Amount | Value• |
| | Coupon | Date | | ($000) | ($000) |
Municipal Bonds (99.1%) | | | | | |
Alabama (0.5%) | | | | | |
| Alabama Public School & College Auth. | 5.500% | 8/1/18 | (4) | 18,195 | 19,009 |
| Jefferson County AL Sewer Rev. | | | | | |
| (Capital Improvement) | 5.125% | 2/1/09 | (3)(Prere.) | 5,785 | 5,953 |
| Montgomery AL Baptist Medical Center | | | | | |
| (Baptist Health) | 0.000% | 11/15/08 | (4)(ETM) | 3,260 | 3,141 |
| Montgomery AL Baptist Medical Center | | | | | |
| (Baptist Health) | 0.000% | 11/15/09 | (4)(ETM) | 3,000 | 2,785 |
| Montgomery AL Baptist Medical Center | | | | | |
| (Baptist Health) | 0.000% | 11/15/10 | (4)(ETM) | 2,130 | 2,207 |
| Univ. of Alabama Birmingham Hosp. Rev. | 5.000% | 9/1/15 | | 1,005 | 1,047 |
| | | | | | 34,142 |
Alaska (0.4%) | | | | | |
1 | Alaska Housing Finance Corp. TOB VRDO | 3.500% | 11/7/07 | (1) | 7,965 | 7,965 |
1 | Anchorage AK GO TOB VRDO | 3.580% | 11/7/07 | (1) | 4,980 | 4,980 |
| North Slope Borough AK GO | 0.000% | 6/30/08 | (1) | 17,100 | 16,703 |
| | | | | | 29,648 |
Arizona (1.4%) | | | | | |
| Arizona Health Fac. Auth. Rev. (Banner Health) | 5.000% | 1/1/10 | | 4,055 | 4,169 |
| Arizona Health Fac. Auth. Rev. (Banner Health) | 5.000% | 1/1/11 | | 2,000 | 2,077 |
| Arizona Health Fac. Auth. Rev. (Banner Health) | 5.000% | 1/1/12 | | 2,000 | 2,090 |
| Maricopa County AZ Pollution Control Corp. PCR | | | | | |
| (Public Service Co. of New Mexico) PUT | 4.000% | 7/1/09 | | 9,500 | 9,507 |
| Maricopa County AZ Public Finance Corp. Lease Rev. | 5.500% | 7/1/09 | (2)(ETM) | 650 | 671 |
| Maricopa County AZ Public Finance Corp. Lease Rev. | 5.500% | 7/1/09 | (2) | 4,350 | 4,496 |
| Maricopa County AZ USD | 5.000% | 7/1/10 | (4) | 7,230 | 7,517 |
| Mesa AZ IDA Rev. Discovery Health Systems | 5.875% | 1/1/10 | (1)(Prere.) | 7,000 | 7,407 |
| Mesa AZ Util. System Rev. | 5.000% | 7/1/08 | (1) | 3,180 | 3,213 |
| Mesa AZ Util. System Rev. | 5.000% | 7/1/08 | (1)(ETM) | 3,320 | 3,354 |
| Mohave County AZ IDA Correctional Fac. | | | | | |
| Contract Rev. (Mohave Prison Project) | 5.000% | 4/1/10 | (10) | 5,090 | 5,269 |
| Phoenix AZ Civic Improvement Corp. | | | | | |
| Wastewater System Rev. | 5.000% | 7/1/10 | (1) | 5,600 | 5,822 |
| Phoenix AZ Civic Improvement Corp. | | | | | |
| Water System Rev. | 5.000% | 7/1/10 | (1) | 5,000 | 5,194 |
| Phoenix AZ Civic Improvement Corp. | | | | | |
| Water System Rev. | 5.000% | 7/1/12 | (1) | 5,000 | 5,298 |
| Phoenix AZ GO | 5.000% | 7/1/16 | | 10,000 | 10,757 |
1 | Phoenix AZ GO TOB VRDO | 3.520% | 11/7/07 | | 6,840 | 6,840 |
| Scottsdale AZ Refunding | 5.000% | 7/1/13 | | 5,000 | 5,358 |
| Univ. of Arizona Board of Regents | 5.900% | 6/1/08 | (4) | 4,095 | 4,154 |
| | | | | | 93,193 |
California (8.1%) | | | | | |
| California GO | 5.250% | 11/1/08 | | 10,000 | 10,177 |
| California GO | 5.000% | 6/1/09 | | 25,000 | 25,599 |
| California GO | 5.000% | 6/1/09 | | 14,095 | 14,433 |
| California GO | 5.000% | 5/1/13 | | 21,000 | 22,272 |
| California GO | 5.000% | 9/1/13 | | 32,125 | 34,170 |
| California GO | 5.000% | 8/1/16 | | 8,500 | 9,088 |
1,2 | California GO TOB VRDO | 3.530% | 11/7/07 | | 6,650 | 6,650 |
1 | California GO TOB VRDO | 3.530% | 11/7/07 | | 13,595 | 13,595 |
1 | California GO TOB VRDO | 3.550% | 11/7/07 | | 12,920 | 12,920 |
1 | California GO TOB VRDO | 3.550% | 11/7/07 | | 14,040 | 14,040 |
Limited-Term Tax-Exempt Fund
| | | | | Face | Market |
| | | Maturity | | Amount | Value• |
| | Coupon | Date | | ($000) | ($000) |
| California Health Fac. Finance Auth. Rev. | | | | | |
| (Catholic Healthcare West) | 5.000% | 7/1/09 | | 2,500 | 2,553 |
| California Health Fac. Finance Auth. Rev. | | | | | |
| (Catholic Healthcare West) | 5.000% | 7/1/10 | | 3,220 | 3,320 |
| California Health Fac. Finance Auth. Rev. | | | | | |
| (Cedars-Sinai Medical Center) | 5.000% | 11/15/10 | | 2,000 | 2,071 |
| California Health Fac. Finance Auth. Rev. | | | | | |
| (Cedars-Sinai Medical Center) | 5.000% | 11/15/12 | | 3,000 | 3,141 |
| California Public Works Board Lease Rev. | | | | | |
| (Regents of the Univ. of California) | 5.000% | 6/1/15 | (3) | 10,000 | 10,848 |
| California Public Works Board Lease Rev. | | | | | |
| (Univ. of California) | 5.000% | 5/1/11 | | 3,770 | 3,937 |
| California Public Works Board Lease Rev. | | | | | |
| (Univ. of California) | 5.000% | 5/1/12 | | 2,500 | 2,634 |
| California Public Works Board Lease Rev. | | | | | |
| (Univ. of California) | 5.000% | 5/1/13 | | 7,500 | 7,961 |
| California State Dept. of Water Resources | | | | | |
| Power Supply Rev. | 5.250% | 5/1/09 | (1) | 10,000 | 10,276 |
| California State Econ. Recovery Bonds | 5.000% | 7/1/09 | | 18,000 | 18,468 |
| California State Econ. Recovery Bonds | 5.250% | 1/1/11 | | 12,640 | 13,293 |
| California Statewide Communities Dev. Auth. PCR | | | | | |
| (Southern California Edison) PUT | 4.100% | 4/1/13 | (10) | 5,000 | 5,083 |
| California Statewide Community Dev. Auth. Rev. | | | | | |
| (Daughters of Charity Health) | 5.000% | 7/1/08 | | 1,000 | 1,007 |
| California Statewide Community Dev. Auth. Rev. | | | | | |
| (Daughters of Charity Health) | 5.000% | 7/1/09 | | 800 | 813 |
| California Statewide Community Dev. Auth. Rev. | | | | | |
| (Daughters of Charity Health) | 5.000% | 7/1/10 | | 1,100 | 1,125 |
| California Statewide Community Dev. Auth. Rev. | | | | | |
| (Irvine Apartments) PUT | 5.100% | 5/17/10 | | 4,000 | 4,073 |
| California Statewide Community Dev. Auth. Rev. | | | | | |
| (Kaiser Permanente) PUT | 2.625% | 5/1/08 | | 17,500 | 17,364 |
| California Statewide Community Dev. Auth. Rev. | | | | | |
| (Kaiser Permanente) PUT | 3.875% | 4/1/10 | | 19,600 | 19,696 |
| California Statewide Community Dev. Auth. Rev. | | | | | |
| (Kaiser Permanente) PUT | 3.450% | 5/1/11 | | 15,335 | 15,182 |
| California Statewide Community Dev. Auth. Rev. | | | | | |
| (Kaiser Permanente) PUT | 3.850% | 6/1/12 | | 10,000 | 10,000 |
| Desert Sands CA School District | 0.000% | 6/1/12 | (2) | 10,000 | 8,449 |
| Golden State Tobacco Securitization Corp. California | 6.250% | 6/1/33 | (Prere.) | 78,180 | 85,726 |
| Golden State Tobacco Securitization Corp. California | 5.000% | 6/1/09 | (ETM) | 3,000 | 3,068 |
| Golden State Tobacco Securitization Corp. California | 5.000% | 6/1/10 | (ETM) | 2,500 | 2,592 |
| Golden State Tobacco Securitization Corp. California | 5.000% | 6/1/11 | | 8,000 | 8,184 |
| Golden State Tobacco Securitization Corp. California | 5.000% | 6/1/12 | | 10,000 | 10,225 |
| Golden State Tobacco Securitization Corp. California | 5.000% | 6/1/13 | | 5,655 | 5,779 |
| Golden State Tobacco Securitization Corp. California | 6.750% | 6/1/13 | (Prere.) | 25,000 | 28,937 |
| Golden State Tobacco Securitization Corp. California | 7.900% | 6/1/13 | (Prere.) | 20,000 | 24,267 |
| Kings River Conservation Dist. California COP | 5.000% | 5/1/10 | | 4,000 | 4,091 |
| Los Angeles County CA Metro. Transp. Auth. Rev. | | | | | |
| (Capital Grant Receipts Gold Line Project) | 5.000% | 10/1/11 | (3) | 5,000 | 5,212 |
| Los Angeles County CA Metro. Transp. Auth. Rev. | | | | | |
| (Capital Grant Receipts Gold Line Project) | 5.000% | 10/1/12 | (3) | 8,000 | 8,339 |
| Los Angeles County CA Public Works | | | | | |
| Financing Auth. Rev. | 5.000% | 12/1/12 | (1) | 7,710 | 8,233 |
| Natomas CA USD COP PUT | 5.000% | 2/1/10 | (2) | 10,000 | 10,313 |
| Orange County CA Public Financing Lease Rev. | 5.000% | 7/1/12 | (1) | 3,165 | 3,362 |
| Univ. of California Rev. | 5.000% | 5/15/10 | (1) | 3,500 | 3,637 |
Limited-Term Tax-Exempt Fund
| | | | | Face | Market |
| | | Maturity | | Amount | Value• |
| | Coupon | Date | | ($000) | ($000) |
| Univ. of California Rev. | 5.000% | 5/15/11 | (1) | 2,500 | 2,629 |
| Univ. of California Rev. | 5.000% | 5/15/12 | (1) | 3,000 | 3,188 |
| | | | | | 542,020 |
Colorado (0.7%) | | | | | |
| Colorado Dept. of Transp. Rev. | 5.250% | 6/15/08 | | 2,530 | 2,558 |
| Colorado Springs CO Util. System Rev. | 5.250% | 11/15/07 | | 5,890 | 5,894 |
1 | Denver CO City & County Airport Rev. TOB VRDO | 3.520% | 11/7/07 | (10) | 14,395 | 14,395 |
1 | Denver Colorado City & County Water | | | | | |
| Commissioners Rev. TOB VRDO | 3.520% | 11/7/07 | (4) | 13,355 | 13,355 |
2 | Jefferson County CO School Dist. GO | 5.000% | 12/15/12 | (2) | 3,500 | 3,732 |
1 | Regional Transp. Dist. of Colorado CTFS | | | | | |
| Partner TOB VRDO | 3.520% | 11/7/07 | (2) | 5,800 | 5,800 |
| | | | | | 45,734 |
Connecticut (0.3%) | | | | | |
| Connecticut GO | 5.250% | 12/15/07 | | 7,370 | 7,386 |
| Connecticut GO | 5.000% | 11/15/08 | | 10,000 | 10,164 |
| | | | | | 17,550 |
Delaware (0.1%) | | | | | |
| Delaware GO | 5.000% | 8/1/15 | | 5,000 | 5,387 |
| | | | | | |
District of Columbia (1.5%) | | | | | |
| District of Columbia GO | 5.250% | 6/1/08 | (1) | 5,355 | 5,411 |
| District of Columbia GO | 5.500% | 6/1/08 | (4)(ETM) | 1,220 | 1,234 |
| District of Columbia GO | 5.500% | 6/1/08 | (4) | 3,530 | 3,572 |
| District of Columbia GO | 5.000% | 6/1/10 | (4) | 2,045 | 2,121 |
| District of Columbia GO | 5.500% | 6/1/10 | (4) | 10,000 | 10,495 |
| District of Columbia GO | 5.500% | 6/1/10 | (2) | 1,335 | 1,401 |
| District of Columbia GO | 5.750% | 6/1/10 | (1)(ETM) | 5,000 | 5,283 |
| District of Columbia GO | 5.000% | 6/1/11 | (4) | 2,500 | 2,621 |
| District of Columbia GO | 5.000% | 6/1/12 | (4) | 2,500 | 2,645 |
| District of Columbia GO | 5.500% | 6/1/12 | (4) | 10,000 | 10,387 |
| District of Columbia GO | 5.000% | 6/1/13 | (4) | 4,000 | 4,265 |
| District of Columbia GO | 5.000% | 6/1/14 | (1) | 4,900 | 5,207 |
| District of Columbia GO | 5.000% | 6/1/15 | (1) | 5,000 | 5,278 |
| District of Columbia GO ARS | 3.750% | 4/3/08 | (1) | 20,000 | 20,000 |
1 | District of Columbia GO TOB VRDO | 3.520% | 11/7/07 | (2) | 8,330 | 8,330 |
| District of Columbia Rev. (Catholic Univ. of America) | 5.500% | 10/1/09 | (2)(Prere.) | 1,590 | 1,664 |
| District of Columbia Rev. (Catholic Univ. of America) | 5.500% | 10/1/19 | (2) | 1,410 | 1,470 |
| District of Columbia Water & Sewer Auth. | | | | | |
| Public Util. Rev. ARS | 3.850% | 11/15/07 | (2) | 7,600 | 7,600 |
| | | | | | 98,984 |
Florida (7.7%) | | | | | |
| Broward County FL Resource Recovery Rev. | | | | | |
| (Wheelabrator Series A) | 5.375% | 12/1/10 | | 4,900 | 5,042 |
| Broward County FL Resource Recovery Rev. | | | | | |
| (Wheelabrator Series A) | 4.500% | 12/1/11 | | 5,900 | 6,004 |
| Broward County FL Resource Recovery Rev. | | | | | |
| (Wheelabrator-South) | 5.500% | 12/1/08 | | 22,980 | 23,454 |
| Broward County FL Resource Recovery Rev. | | | | | |
| (Wheelabrator-South) | 5.375% | 12/1/09 | | 2,000 | 2,058 |
| Broward County FL School Board COP | 5.000% | 7/1/11 | (2) | 4,460 | 4,669 |
| Citizens Property Insurance Corp. Florida | | | | | |
| (High Risk Account) | 5.000% | 3/1/10 | (1) | 10,000 | 10,331 |
| Citizens Property Insurance Corp. Florida | | | | | |
| (High Risk Account) | 5.000% | 3/1/11 | (1) | 10,000 | 10,445 |
Limited-Term Tax-Exempt Fund
| | | | | Face | Market |
| | | Maturity | | Amount | Value• |
| | Coupon | Date | | ($000) | ($000) |
| Citizens Property Insurance Corp. Florida | | | | | |
| (High Risk Account) | 5.000% | 3/1/12 | (1) | 15,000 | 15,816 |
| Citizens Property Insurance Corp. Florida | | | | | |
| (High Risk Account) | 5.000% | 3/1/15 | (1) | 11,000 | 11,803 |
1 | Collier County FL School Board COP TOB VRDO | 3.520% | 11/7/07 | (4) | 15,180 | 15,180 |
| Florida Board of Educ. Capital Outlay | 5.000% | 1/1/11 | | 6,810 | 7,109 |
| Florida Board of Educ. Capital Outlay | 5.000% | 1/1/12 | | 27,730 | 29,251 |
| Florida Board of Educ. Capital Outlay | 5.000% | 6/1/16 | | 5,065 | 5,427 |
| Florida Board of Educ. Public Educ. | 5.250% | 6/1/08 | | 5,055 | 5,108 |
| Florida Board of Educ. Public Educ. | 5.000% | 6/1/10 | | 16,120 | 16,728 |
| Florida Board of Educ. Public Educ. | 5.000% | 1/1/11 | | 25,080 | 26,182 |
| Florida Board of Educ. Public Educ. Capital Outlay | 5.000% | 6/1/10 | | 2,495 | 2,589 |
1 | Florida Board of Educ. Public Educ. TOB VRDO | 3.510% | 11/7/07 | | 31,130 | 31,130 |
| Florida Correctional Privatization Comm. COP | 5.250% | 8/1/08 | (1) | 4,335 | 4,390 |
| Florida Dept. of Environmental | | | | | |
| Protection & Preservation Rev. | 5.750% | 7/1/12 | (3) | 7,050 | 7,507 |
| Florida Dept. of Transp. | 6.375% | 7/1/10 | | 10,075 | 10,798 |
| Florida Hurricane Catastrophe Fund | | | | | |
| Finance Corp. Rev. | 5.000% | 7/1/08 | | 10,000 | 10,102 |
| Florida Hurricane Catastrophe Fund | | | | | |
| Finance Corp. Rev. | 5.250% | 7/1/12 | | 37,600 | 40,042 |
1 | Florida Turnpike Auth. Rev. TOB VRDO | 3.520% | 11/7/07 | (1) | 6,140 | 6,140 |
| Gainsville FL Util. System Rev. | 5.000% | 10/1/15 | (4)(Prere.) | 20,000 | 21,770 |
| Highlands County FL Health Fac. Auth. Rev. | | | | | |
| (Adventist Health System) ARS | 3.880% | 11/7/07 | (11) | 24,850 | 24,850 |
| Highlands County FL Health Rev. | | | | | |
| (Adventist Health System) PUT | 5.000% | 11/16/09 | | 25,000 | 25,490 |
| Jacksonville FL Electric Auth. Rev. | | | | | |
| (St. John’s River Power Park) | 5.000% | 10/1/08 | | 31,000 | 31,429 |
| Jacksonville FL Electric Auth. Water & Sewer Rev. | 5.000% | 10/1/11 | | 7,500 | 7,748 |
| Lee County FL IDA Health Care Fac. Rev. | | | | | |
| (Shell Point Village) | 5.000% | 11/15/08 | | 3,000 | 3,019 |
| Miami-Dade County FL School Board COP PUT | 5.000% | 5/1/11 | (1) | 15,000 | 15,670 |
1 | Miami-Dade County FL School Board TOB VRDO | 3.510% | 11/7/07 | (3) | 9,095 | 9,095 |
| Orlando FL Util. Comm. Water & Electric Rev. | 5.000% | 10/1/08 | | 4,835 | 4,904 |
| Orlando FL Util. Comm. Water & Electric Rev. | 5.250% | 7/1/09 | | 15,000 | 15,443 |
| Orlando FL Util. Comm. Water & Electric Rev. PUT | 5.000% | 10/1/08 | | 20,000 | 20,268 |
| South Florida Water Management Dist. | 5.000% | 10/1/10 | (2) | 3,000 | 3,119 |
| South Florida Water Management Dist. | 5.000% | 10/1/11 | (2) | 7,100 | 7,455 |
| South Florida Water Management Dist. | 5.000% | 10/1/12 | (2) | 2,150 | 2,275 |
| South Miami FL Health Fac. Auth. Hosp. Rev. | | | | | |
| (Baptist Health South FL Obligated Group) | 5.000% | 8/15/11 | | 4,990 | 5,203 |
| South Miami FL Health Fac. Auth. Hosp. Rev. | | | | | |
| (Baptist Health South FL Obligated Group) | 5.000% | 8/15/12 | | 3,000 | 3,141 |
| South Miami FL Health Fac. Auth. Hosp. Rev. | | | | | |
| (Baptist Health South FL Obligated Group) | 5.000% | 8/15/13 | | 2,500 | 2,626 |
| Univ. Athletic Assn. Inc. Florida | | | | | |
| Athletic Program Rev. PUT | 3.800% | 10/1/11 | LOC | 4,000 | 4,010 |
| Univ. Athletic Assn. Inc. Florida | | | | | |
| Capital Improvement Rev. PUT | 3.500% | 10/1/10 | LOC | 5,000 | 4,952 |
| | | | | | 519,772 |
Georgia (3.1%) | | | | | |
1 | Augusta GA Water & Sewer Rev. TOB VRDO | 3.510% | 11/7/07 | (4) | 6,790 | 6,790 |
1 | Augusta GA Water & Sewer Rev. TOB VRDO | 3.510% | 11/7/07 | (4) | 10,000 | 10,000 |
| Burke County GA Dev. Auth. PCR | | | | | |
| (Georgia Power Co. Plant Vogtle) PUT | 4.450% | 12/1/08 | | 37,000 | 37,287 |
Limited-Term Tax-Exempt Fund
| | | | | Face | Market |
| | | Maturity | | Amount | Value• |
| | Coupon | Date | | ($000) | ($000) |
| Coffee County GA School Dist. GO | 6.000% | 8/1/10 | | 1,000 | 1,066 |
| Fulton County GA Water & Sewer Rev. | 5.250% | 1/1/14 | (3) | 10,000 | 10,208 |
| Georgia GO | 5.250% | 12/1/10 | | 6,775 | 7,139 |
| Georgia GO | 5.000% | 8/1/11 | | 17,890 | 18,857 |
| Georgia GO | 5.500% | 7/1/15 | | 9,095 | 10,185 |
| Georgia GO | 5.500% | 7/1/16 | | 5,000 | 5,519 |
| Georgia Road & Tollway Auth. Rev. | | | | | |
| (Governor’s Transp. Choices) | 5.250% | 3/1/09 | | 10,355 | 10,606 |
| Gwinnett County GA School Dist. GO | 5.000% | 2/1/12 | | 10,000 | 10,581 |
| Gwinnett County GA School Dist. GO | 5.000% | 2/1/13 | | 10,000 | 10,667 |
| Main Street Natural Gas Inc. | | | | | |
| Georgia Gas Project Rev. | 5.000% | 3/15/12 | | 12,000 | 12,317 |
| Main Street Natural Gas Inc. | | | | | |
| Georgia Gas Project Rev. | 5.000% | 3/15/12 | | 15,000 | 15,565 |
| Metro. Atlanta GA Rapid Transp. Auth. | | | | | |
| Georgia Sales Tax Rev. | 6.250% | 7/1/08 | (1) | 4,000 | 4,074 |
1 | Metro. Atlanta GA Rapid Transp. Auth. | | | | | |
| Georgia Sales Tax Rev. TOB VRDO | 3.510% | 11/7/07 | (4) | 6,000 | 6,000 |
| Muni. Electric Auth. Georgia | | | | | |
| Subordinate Bonds Project One PUT | 5.000% | 1/1/09 | (2) | 12,500 | 12,703 |
| Paulding County GA School Dist. GO | 5.000% | 8/1/09 | | 1,500 | 1,541 |
| Paulding County GA School Dist. GO | 5.000% | 8/1/11 | | 1,000 | 1,053 |
| Private Colleges & Univ. Auth. of Georgia Rev. | | | | | |
| (Emory Univ.) | 5.500% | 11/1/07 | | 6,270 | 6,270 |
| Private Colleges & Univ. Auth. of Georgia Rev. | | | | | |
| (Emory Univ.) | 5.250% | 9/1/08 | | 10,000 | 10,153 |
| | | | | | 208,581 |
Hawaii (1.8%) | | | | | |
| Hawaii GO | 5.500% | 8/1/08 | (3) | 6,755 | 6,859 |
| Hawaii GO | 5.000% | 7/1/09 | (2) | 15,660 | 16,062 |
| Hawaii GO | 5.875% | 9/1/09 | (4)(Prere.) | 6,000 | 6,313 |
| Hawaii GO | 5.000% | 10/1/09 | (1) | 1,480 | 1,524 |
| Hawaii GO | 5.000% | 7/1/10 | (2) | 14,250 | 14,807 |
| Hawaii GO | 5.000% | 10/1/10 | (1) | 5,090 | 5,307 |
| Hawaii GO | 5.000% | 7/1/11 | (2) | 24,310 | 25,545 |
| Hawaii GO | 5.000% | 7/1/12 | (2) | 23,735 | 25,170 |
| Hawaii Highway Rev. | 5.375% | 7/1/11 | (4)(Prere.) | 5,125 | 5,451 |
| Honolulu HI City & County GO | 5.000% | 7/1/11 | (1) | 4,750 | 4,991 |
| Honolulu HI City & County GO | 5.250% | 7/1/11 | (3) | 3,900 | 4,131 |
| Honolulu HI City & County GO | 5.000% | 7/1/12 | (1) | 4,320 | 4,581 |
| | | | | | 120,741 |
Illinois (3.8%) | | | | | |
| Chicago IL Board of Educ. Capital Appreciation | | | | | |
| (School Reform) | 0.000% | 12/1/11 | (3) | 5,185 | 4,466 |
| Chicago IL Board of Educ. GO | 0.000% | 12/1/09 | (3) | 9,895 | 9,192 |
| Chicago IL Board of Educ. GO | 0.000% | 12/1/10 | (3) | 4,000 | 3,580 |
| Chicago IL GO | 5.700% | 7/1/10 | (3)(Prere.) | 9,655 | 10,294 |
| Chicago IL GO | 5.000% | 1/1/14 | (4) | 37,590 | 40,239 |
| Chicago IL Housing Auth. Capital Project Rev. | 5.000% | 7/1/09 | (ETM) | 8,265 | 8,466 |
| Chicago IL Housing Auth. Capital Project Rev. | 5.250% | 7/1/10 | (ETM) | 5,000 | 5,228 |
1 | Chicago IL Wastewater Transmission Rev. | | | | | |
| TOB VRDO | 3.490% | 11/7/07 | (3) | 3,900 | 3,900 |
1 | Chicago IL Wastewater Transmission Rev. | | | | | |
| TOB VRDO | 3.510% | 11/7/07 | (1) | 10,835 | 10,835 |
| Illinois Educ. Fac. Auth. Rev. (Univ. of Chicago) PUT | 4.050% | 7/1/09 | | 7,000 | 7,046 |
Limited-Term Tax-Exempt Fund
| | | | | Face | Market |
| | | Maturity | | Amount | Value• |
| | Coupon | Date | | ($000) | ($000) |
| Illinois Finance Auth. Rev. | | | | | |
| (Resurrection Health Care) PUT | 3.750% | 7/1/09 | | 4,000 | 3,976 |
| Illinois GO | 5.250% | 11/1/07 | (3) | 5,000 | 5,000 |
| Illinois GO | 5.000% | 10/1/08 | (4) | 7,000 | 7,101 |
| Illinois GO | 5.250% | 11/1/08 | (3) | 4,000 | 4,073 |
| Illinois GO | 5.750% | 1/1/09 | (3) | 3,000 | 3,079 |
| Illinois GO | 5.000% | 3/1/10 | | 6,300 | 6,515 |
| Illinois GO | 5.000% | 1/1/11 | | 7,000 | 7,305 |
| Illinois GO | 5.500% | 8/1/18 | (4) | 5,000 | 5,233 |
1 | Illinois GO TOB VRDO | 3.490% | 11/7/07 | | 1,380 | 1,380 |
| Illinois Health Fac. Auth. Rev. | | | | | |
| (Hosp. Sisters Services Inc.) PUT | 4.500% | 12/1/07 | (4) | 10,000 | 10,003 |
| Illinois Sales Tax Rev. | 5.000% | 6/15/10 | | 1,500 | 1,557 |
| Illinois Sales Tax Rev. | 5.250% | 6/15/12 | | 2,000 | 2,139 |
| Kendall Kane & Will Counties IL | | | | | |
| Community Unit School Dist. | 0.000% | 10/1/16 | (4) | 5,215 | 3,610 |
| Metro. Pier & Exposition Auth. | | | | | |
| Illinois Dedicated Sales Tax Rev. | 0.000% | 6/15/08 | (3)(ETM) | 1,220 | 1,194 |
| Metro. Pier & Exposition Auth. | | | | | |
| Illinois Dedicated Sales Tax Rev. | 0.000% | 6/15/08 | (3)(ETM) | 6,500 | 6,359 |
| Metro. Pier & Exposition Auth. | | | | | |
| Illinois Dedicated Sales Tax Rev. | 0.000% | 6/15/08 | (3) | 170 | 166 |
| Metro. Pier & Exposition Auth. | | | | | |
| Illinois Dedicated Sales Tax Rev. | 5.250% | 6/15/08 | (1) | 3,250 | 3,287 |
| Metro. Pier & Exposition Auth. | | | | | |
| Illinois Dedicated Sales Tax Rev. | 0.000% | 6/15/09 | (3)(ETM) | 18,625 | 17,562 |
| Metro. Pier & Exposition Auth. | | | | | |
| Illinois Dedicated Sales Tax Rev. | 0.000% | 12/15/11 | (1) | 20,000 | 17,202 |
1 | Metro. Pier & Exposition Auth. | | | | | |
| Illinois Dedicated Sales Tax Rev. TOB VRDO | 3.510% | 11/7/07 | (1) | 7,000 | 7,000 |
| Regional Transp. Auth. Cook, Du Page, Kane, | | | | | |
| Lake, McHenry, and Will Counties IL GO | 5.250% | 6/1/08 | (3) | 9,855 | 9,959 |
1 | Univ. of Illinois Univ. Rev. Auxiliary Fac. TOB VRDO | 3.490% | 11/7/07 | (1) | 5,185 | 5,185 |
1 | Will County IL Community School Dist. TOB VRDO | 3.530% | 11/7/07 | (4) | 12,350 | 12,350 |
| Winnebago & Bonne Counties IL School Dist. GO | 5.000% | 2/1/12 | (2) | 4,000 | 4,221 |
| Winnebago & Boone Counties IL School Dist. GO | 5.000% | 2/1/13 | (2) | 5,000 | 5,317 |
| | | | | | 254,019 |
Indiana (1.1%) | | | | | |
| Indiana Health Fac. Auth. Finance Auth. Rev. | | | | | |
| (Ascension Health Credit Group) | 5.000% | 10/1/09 | | 10,000 | 10,242 |
| Indiana Health Fac. Auth. Finance Auth. Rev. | | | | | |
| (Ascension Health Credit Group) | 5.000% | 4/1/10 | | 10,000 | 10,300 |
| Indiana Health Fac. Auth. Finance Auth. Rev. | | | | | |
| (Ascension Health Credit Group) | 5.000% | 11/1/10 | | 7,930 | 8,222 |
| Indiana Health Fac. Auth. Finance Auth. Rev. | | | | | |
| (Ascension Health Credit Group) | 5.000% | 11/1/11 | | 5,500 | 5,747 |
| Indiana Health Fac. Auth. Finance Auth. Rev. | | | | | |
| (Ascension Health Credit Group) | 5.000% | 5/1/13 | | 3,750 | 3,916 |
| Indiana Health Fac. Auth. Finance Auth. Rev. | | | | | |
| (Ascension Health Credit Group) ARS | 4.000% | 11/23/07 | | 20,000 | 20,000 |
| Indiana Health Fac. Auth. Finance Auth. Rev. | | | | | |
| (Clarian Health Obligation Group) | 5.000% | 2/15/10 | | 2,000 | 2,044 |
| Indiana Office Building Comm. Fac. Rev. | | | | | |
| (New Castle Correctional Fac.) | 5.250% | 7/1/08 | (3) | 3,040 | 3,075 |
| Rockport IN PCR (AEP Generating Co.) PUT | 4.150% | 7/15/11 | (2) | 10,000 | 10,130 |
| | | | | | 73,676 |
Limited-Term Tax-Exempt Fund
| | | | | Face | Market |
| | | Maturity | | Amount | Value• |
| | Coupon | Date | | ($000) | ($000) |
Kansas (0.6%) | | | | | |
| Kansas Dept. of Transp. Highway Rev. | 5.000% | 9/1/13 | | 32,590 | 34,947 |
| Univ. of Kansas Hosp. Auth. Health System | 5.000% | 9/1/12 | | 1,525 | 1,586 |
| Univ. of Kansas Hosp. Auth. Health System | 5.000% | 9/1/14 | | 1,000 | 1,044 |
| Univ. of Kansas Hosp. Auth. Health System | 5.000% | 9/1/15 | | 2,000 | 2,091 |
| | | | | | 39,668 |
Kentucky (1.4%) | | | | | |
| Kentucky Asset/Liability Comm. General Fund Rev. | 5.000% | 9/1/12 | (1) | 13,065 | 13,887 |
| Kentucky Property & Building Comm. Rev. | 5.500% | 8/1/08 | (ETM) | 7,290 | 7,400 |
| Kentucky Property & Building Comm. Rev. | 5.500% | 8/1/08 | | 210 | 213 |
| Kentucky Property & Building Comm. Rev. | 6.000% | 10/1/08 | | 10,000 | 10,226 |
| Kentucky Property & Building Comm. Rev. | 5.250% | 10/1/15 (4) | | 10,000 | 10,994 |
| Kentucky Turnpike Auth. Econ. Dev. Road Rev. | | | | | |
| (Revitalization Project) | 5.500% | 7/1/08 (2) | | 5,060 | 5,130 |
| Kentucky Turnpike Auth. Econ. Dev. Road Rev. | | | | | |
| (Revitalization Project) | 5.750% | 7/1/08 (4) | | 26,760 | 27,171 |
| Kentucky Turnpike Auth. Econ. Dev. Road Rev. | | | | | |
| (Revitalization Project) | 5.500% | 7/1/09 (2) | | 15,000 | 15,508 |
| Warren County KY Hosp. Fac. Rev. | | | | | |
| (Community Hosp. Corp. Project) | 5.000% | 8/1/11 | | 770 | 789 |
| Warren County KY Hosp. Fac. Rev. | | | | | |
| (Community Hosp. Corp. Project) | 5.000% | 8/1/12 | | 810 | 832 |
| Warren County KY Hosp. Fac. Rev. | | | | | |
| (Community Hosp. Corp. Project) | 5.000% | 8/1/13 | | 855 | 878 |
| Warren County KY Hosp. Fac. Rev. | | | | | |
| (Community Hosp. Corp. Project) | 5.000% | 8/1/16 | | 990 | 1,012 |
| | | | | | 94,040 |
Louisiana (1.3%) | | | | | |
| Lafayette LA Public Improvement Sales Tax Rev. | 5.000% | 3/1/10 (1) | | 1,980 | 2,047 |
| Lafayette LA Public Improvement Sales Tax Rev. | 5.000% | 3/1/11 (1) | | 2,085 | 2,180 |
| Louisiana GO | 5.000% | 5/1/10 (4) | | 16,980 | 17,597 |
| Louisiana GO | 5.250% | 8/1/16 (1) | | 5,000 | 5,440 |
| Louisiana Housing Finance Agency | | | | | |
| Single Family Mortgage Rev. Home Ownership | 5.850% | 6/1/38 | | 7,000 | 7,555 |
| Louisiana Offshore Terminal Auth. | | | | | |
| Deep Water Port Rev. (LOOP LLC Project) PUT | 4.000% | 9/1/08 | | 5,000 | 5,009 |
| Louisiana Offshore Terminal Auth. | | | | | |
| Deep Water Port Rev. (LOOP LLC Project) PUT | 4.250% | 10/1/10 | | 17,250 | 17,348 |
| Louisiana Public Fac. Auth. Rev. (Ochsner Clinic) | 5.000% | 5/15/13 | | 2,675 | 2,756 |
| Louisiana Public Fac. Auth. Rev. (Ochsner Clinic) | 5.000% | 5/15/14 | | 3,950 | 4,072 |
| Louisiana State Citizens Property | | | | | |
| Insurance Corp. Assessment Rev. | 5.250% | 6/1/14 (2) | | 5,000 | 5,426 |
| Louisiana Transp. Auth. Toll Rev. | 5.000% | 9/1/09 | | 15,000 | 15,363 |
| | | | | | 84,793 |
Maine (0.2%) | | | | | |
| Maine GO | 5.000% | 7/15/10 (2) | | 3,095 | 3,222 |
| Maine GO | 5.000% | 7/15/12 (2) | | 8,055 | 8,564 |
| Maine State Turnpike Auth. Turnpike Rev. | 5.375% | 7/1/13 (1) | | 2,130 | 2,176 |
| | | | | | 13,962 |
Maryland (2.1%) | | | | | |
| Maryland Dept. of Transp. | 5.000% | 5/1/10 | | 16,975 | 17,625 |
| Maryland Econ. Dev. Corp. Rev. | | | | | |
| (Chesapeake Bay Conference Center) | 4.750% | 12/1/11 | | 1,250 | 1,244 |
| Maryland GO | 5.000% | 2/1/09 | | 11,820 | 12,055 |
| Maryland GO | 5.250% | 2/15/10 | | 6,140 | 6,389 |
Limited-Term Tax-Exempt Fund
| | | | | Face | Market |
| | | Maturity | | Amount | Value• |
| | Coupon | Date | | ($000) | ($000) |
| Maryland GO | 5.000% | 3/15/11 | | 19,445 | 20,402 |
| Maryland GO | 5.000% | 8/1/11 | | 18,200 | 19,190 |
| Maryland GO | 5.000% | 3/15/12 | | 20,415 | 21,653 |
| Maryland GO | 5.000% | 3/15/13 | | 21,440 | 22,928 |
| Washington Suburban Sanitation Dist. | | | | | |
| Maryland Water Supply GO | 5.250% | 6/1/10 | | 5,000 | 5,228 |
| Washington Suburban Sanitation Dist. | | | | | |
| Maryland Water Supply GO | 5.250% | 6/1/10 | | 11,435 | 11,957 |
| | | | | | 138,671 |
Massachusetts (4.4%) | | | | | |
| Massachusetts GAN | 5.750% | 12/15/08 | | 16,210 | 16,629 |
| Massachusetts GO | 5.250% | 12/1/07 | | 10,000 | 10,015 |
| Massachusetts GO | 5.500% | 1/1/08 | | 6,165 | 6,186 |
| Massachusetts GO | 5.250% | 8/1/08 | (Prere.) | 7,945 | 8,126 |
| Massachusetts GO | 5.375% | 8/1/08 | | 10,000 | 10,147 |
| Massachusetts GO | 5.750% | 10/1/08 | | 6,710 | 6,852 |
| Massachusetts GO | 5.000% | 8/1/09 | | 37,715 | 38,736 |
| Massachusetts GO | 5.875% | 2/1/10 | (Prere.) | 10,000 | 10,617 |
| Massachusetts GO | 5.750% | 6/1/10 | (Prere.) | 25,045 | 26,469 |
| Massachusetts GO | 5.000% | 8/1/10 | | 38,955 | 40,535 |
| Massachusetts GO | 6.000% | 11/1/10 | | 10,015 | 10,736 |
| Massachusetts Health & Educ. Fac. Auth. Rev. | | | | | |
| (Caritas Christi Obligated Group) | 5.875% | 7/1/08 | | 6,000 | 6,060 |
| Massachusetts Health & Educ. Fac. Auth. Rev. | | | | | |
| (Partners Healthcare System) ARS | 4.250% | 11/21/07 | | 38,035 | 38,035 |
| Massachusetts Muni. Wholesale Electric Co. | | | | | |
| Power System Rev. | 5.500% | 7/1/08 | (1) | 15,400 | 15,613 |
| Massachusetts Muni. Wholesale Electric Co. | | | | | |
| Power System Rev. | 5.000% | 7/1/09 | (1) | 14,110 | 14,474 |
| Massachusetts School Building Auth. | | | | | |
| Dedicated Sales Tax Rev. | 5.000% | 8/15/11 | (4) | 12,000 | 12,637 |
| Massachusetts Special Obligation Rev. | 5.000% | 12/15/10 | (4) | 10,000 | 10,449 |
| Springfield MA GO | 5.000% | 8/1/11 | (1) | 3,500 | 3,684 |
| Univ. of Massachusetts Building Auth. Rev. | 5.000% | 11/1/11 | (2) | 6,905 | 7,291 |
| | | | | | 293,291 |
Michigan (3.3%) | | | | | |
| Detroit MI City School Dist. GO | 5.000% | 5/1/11 | (3) | 3,510 | 3,678 |
| Detroit MI Sewer System Rev. | 6.000% | 1/1/10 | (3)(Prere.) | 15,000 | 15,927 |
| Detroit MI Sewer System Rev. | 5.000% | 7/1/10 | (4) | 8,510 | 8,836 |
| Detroit MI Sewer System Rev. PUT | 5.500% | 1/1/12 | (1) | 20,000 | 21,298 |
| Kent Hosp. MI Finance Auth. Rev. (Spectrum Health) | 5.000% | 7/15/11 | | 23,000 | 23,993 |
| Michigan (New Center Dev. Inc.) COP PUT | 5.000% | 9/1/11 | (1) | 33,000 | 34,518 |
| Michigan Building Auth. Rev. | 5.500% | 10/15/08 | (ETM) | 6,790 | 6,918 |
| Michigan Building Auth. Rev. | 5.500% | 10/15/08 | (ETM) | 6,435 | 6,557 |
| Michigan Building Auth. Rev. | 5.500% | 10/15/09 | | 5,000 | 5,193 |
| Michigan Building Auth. Rev. | 5.000% | 10/15/12 | (2) | 5,615 | 5,969 |
| Michigan Building Auth. Rev. | 5.250% | 10/15/16 | (4) | 7,200 | 7,772 |
| Michigan Building Auth. Rev. PUT | 5.000% | 10/15/11 | (2) | 12,000 | 12,569 |
| Michigan Comprehensive Transp. Rev. | 5.000% | 5/15/08 | (4) | 1,230 | 1,240 |
1 | Michigan Environmental Program GO TOB VRDO | 3.510% | 11/7/07 | | 4,375 | 4,375 |
| Michigan Hosp. Finance Auth. Rev. | | | | | |
| (Ascension Health) | 5.000% | 5/1/12 | | 17,000 | 17,794 |
| Michigan Muni. Bond Auth. Rev. | 5.000% | 10/1/15 | | 2,315 | 2,504 |
| Michigan Muni. Bond Auth. Rev. | | | | | |
| (Clean Water Revolving Fund) | 5.000% | 10/1/10 | | 3,000 | 3,131 |
1 | Michigan State Univ. Rev. TOB VRDO | 3.290% | 11/7/07 | (2) | 9,975 | 9,975 |
Limited-Term Tax-Exempt Fund
| | | | | Face | Market |
| | | Maturity | | Amount | Value• |
| | Coupon | Date | | ($000) | ($000) |
| Michigan Trunk Line Rev. | 5.000% | 9/1/12 | (4) | 13,015 | 13,828 |
| Univ. of Michigan Univ. Rev. | 5.250% | 12/1/11 | | 5,000 | 5,320 |
| Univ. of Michigan Univ. Rev. | 5.250% | 12/1/12 | | 8,500 | 9,110 |
| | | | | | 220,505 |
Minnesota (1.5%) | | | | | |
| Maple Grove MN Health Care System Rev. | | | | | |
| (Maple Grove Hosp. Corp.) | 5.000% | 5/1/14 | | 1,000 | 1,036 |
| Maple Grove MN Health Care System Rev. | | | | | |
| (Maple Grove Hosp. Corp.) | 5.000% | 5/1/15 | | 1,245 | 1,290 |
| Minnesota GO | 5.000% | 8/1/10 | | 37,375 | 38,920 |
| Minnesota GO | 5.000% | 11/1/10 | | 8,845 | 9,243 |
| Minnesota GO | 5.250% | 11/1/12 | | 6,375 | 6,688 |
| Minnesota GO | 5.000% | 11/1/14 | | 18,230 | 19,730 |
| Minnesota Public Fac. Water PCR | 5.500% | 3/1/09 | | 4,500 | 4,622 |
| Rochester MN Health Care Fac. Rev. | | | | | |
| (Mayo Foundation) ARS | 4.000% | 11/28/07 | | 16,300 | 16,300 |
| Southern Minnesota Muni. Power Agency | | | | | |
| Power Supply System Rev. | 5.000% | 1/1/09 | (2) | 5,000 | 5,091 |
| | | | | | 102,920 |
Mississippi (0.9%) | | | | | |
| Madison County MS School Dist. | 5.000% | 9/1/10 | (3) | 4,370 | 4,548 |
| Mississippi GO | 5.750% | 11/1/07 | | 5,000 | 5,000 |
| Mississippi GO | 6.000% | 11/1/09 | (Prere.) | 7,250 | 7,606 |
| Mississippi GO | 5.250% | 12/1/10 | | 8,800 | 9,250 |
| Mississippi GO | 5.000% | 11/1/15 | (1) | 7,475 | 8,090 |
| Mississippi GO | 5.000% | 11/1/16 | (1) | 5,000 | 5,423 |
| Mississippi GO (Nissan Project) ARS | 3.900% | 11/7/07 | (3) | 18,700 | 18,700 |
| Mississippi Hosp. Equipment & Fac. Auth. Rev. | | | | | |
| (Baptist Health System) | 5.000% | 8/15/09 | | 500 | 509 |
| Mississippi Hosp. Equipment & Fac. Auth. Rev. | | | | | |
| (Baptist Health System) | 5.000% | 8/15/10 | | 500 | 513 |
| Mississippi Hosp. Equipment & Fac. Auth. Rev. | | | | | |
| (Baptist Health System) | 5.000% | 8/15/11 | | 1,000 | 1,031 |
| Mississippi Hosp. Equipment & Fac. Auth. Rev. | | | | | |
| (Baptist Health System) | 5.000% | 8/15/12 | | 1,000 | 1,035 |
| Mississippi Hosp. Equipment & Fac. Auth. Rev. | | | | | |
| (Baptist Health System) | 5.000% | 8/15/15 | | 1,500 | 1,555 |
| | | | | | 63,260 |
Missouri (0.7%) | | | | | |
| Bi-State Dev. Agency of the Missouri-Illinois Metro. | | | | | |
| Dist. (St. Clair County Metrolink Extension) PUT | 3.950% | 10/1/09 | LOC | 10,000 | 10,075 |
| Missouri Health & Educ. Fac. Auth. Rev. | | | | | |
| (Ascension Health) ARS | 4.000% | 11/7/07 | | 10,000 | 10,000 |
| Missouri Health & Educ. Fac. Auth. Rev. | | | | | |
| (Ascension Health) ARS | 4.000% | 11/7/07 | | 10,000 | 10,000 |
| Missouri Highways & Transp. Comm. Road Rev. | 5.000% | 2/1/12 | (Prere.) | 10,000 | 10,571 |
1 | Missouri Highways & Transp. Comm. Road Rev. | | | | | |
| TOB VRDO | 3.500% | 11/7/07 | | 6,915 | 6,915 |
| Missouri Jt. Muni. Electric Util. Comm. Power | | | | | |
| Project Rev. Plum Point Project | 5.000% | 1/1/12 | (1) | 2,000 | 2,103 |
| | | | | | 49,664 |
Montana (0.3%) | | | | | |
| Forsyth MT PCR (Avista Corp.) PUT | 5.000% | 12/30/08 | (2) | 20,500 | 20,847 |
Limited-Term Tax-Exempt Fund
| | | | | Face | Market |
| | | Maturity | | Amount | Value• |
| | Coupon | Date | | ($000) | ($000) |
Nebraska (0.8%) | | | | | |
| Central Plains Energy Project Nebraska Gas | | | | | |
| Project No. 1 | 4.048% | 12/1/10 | | 25,000 | 24,500 |
| Central Plains Energy Project Nebraska Gas | | | | | |
| Project No. 1 | 5.000% | 12/1/15 | | 5,000 | 5,155 |
1 | Nebraska Public Power Agency Rev. TOB VRDO | 3.500% | 11/7/07 | (2) | 5,645 | 5,645 |
| Nebraska Public Power Dist. Rev. | 5.000% | 1/1/10 | (3) | 11,635 | 12,010 |
| Nebraska Public Power Dist. Rev. | 5.000% | 1/1/11 | (3) | 3,560 | 3,717 |
| | | | | | 51,027 |
Nevada (2.0%) | | | | | |
| Clark County NV GO | 5.500% | 7/1/10 | (1)(Prere.) | 13,025 | 13,702 |
1 | Clark County NV GO TOB VRDO | 3.530% | 11/7/07 | (2) | 8,750 | 8,750 |
| Clark County NV School Dist. GO | 5.000% | 6/15/08 | (1) | 6,000 | 6,058 |
| Clark County NV School Dist. GO | 5.500% | 6/15/08 | (4) | 14,455 | 14,640 |
| Clark County NV School Dist. GO | 4.000% | 6/1/09 | (3) | 12,265 | 12,375 |
| Clark County NV School Dist. GO | 5.250% | 6/15/10 | (1) | 7,875 | 8,225 |
| Clark County NV School Dist. GO | 5.000% | 6/15/13 | (3) | 16,050 | 17,142 |
| Clark County NV School Dist. GO | 5.000% | 6/15/14 | (3) | 9,680 | 10,402 |
| Clark County NV Water Reclamation Dist. GO | 5.000% | 7/1/11 | (1) | 6,735 | 7,072 |
| Henderson NV Health Care Fac. Rev. | | | | | |
| (Catholic Healthcare West) | 5.000% | 7/1/09 | | 4,000 | 4,074 |
| Henderson NV Health Care Fac. Rev. | | | | | |
| (Catholic Healthcare West) | 5.000% | 7/1/14 | | 8,000 | 8,331 |
| Nevada GO | 5.000% | 3/1/08 | | 375 | 377 |
| Nevada Highway Improvement Rev. | | | | | |
| (Motor Vehicle Fuel Tax) | 5.000% | 12/1/12 | (1) | 14,495 | 15,443 |
1 | Washoe County NV School Dist. TOB VRDO | 3.580% | 11/7/07 | (4) | 4,900 | 4,900 |
| | | | | | 131,491 |
New Hampshire (0.3%) | | | | | |
| Manchester NH General Airport Rev. PUT | 5.000% | 1/15/10 | (2) | 14,000 | 14,375 |
| New Hampshire GO | 5.000% | 11/1/08 | | 6,000 | 6,095 |
| | | | | | 20,470 |
New Jersey (4.6%) | | | | | |
| New Jersey CTFS Partner Equipment | | | | | |
| Lease Purchase | 5.000% | 6/15/11 | | 4,000 | 4,183 |
| New Jersey Econ. Dev. Auth. Rev. (Cigarette Tax) | 5.000% | 6/15/10 | (4) | 7,000 | 7,264 |
| New Jersey Econ. Dev. Auth. Rev. (Cigarette Tax) | 5.625% | 6/15/17 | | 13,670 | 13,679 |
| New Jersey Econ. Dev. Auth. Rev. (School Fac.) | 5.000% | 3/1/10 | | 1,000 | 1,032 |
| New Jersey Econ. Dev. Auth. Rev. (School Fac.) | 5.000% | 3/1/11 | | 3,000 | 3,130 |
| New Jersey Econ. Dev. Auth. Rev. (School Fac.) ARS | 4.000% | 2/28/08 | (2) | 25,000 | 25,000 |
1 | New Jersey Econ. Dev. Auth. Rev. TOB VRDO | 3.500% | 11/7/07 | | 8,350 | 8,350 |
| New Jersey Environmental Infrastructure Trust | 5.500% | 9/1/08 | | 6,280 | 6,389 |
| New Jersey Highway Auth. Rev. | | | | | |
| (Garden State Parkway) | 6.200% | 1/1/10 | (2)(ETM) | 20,000 | 20,659 |
| New Jersey Transp. Corp. COP | 5.500% | 9/15/08 | (2) | 25,000 | 25,438 |
| New Jersey Transp. Trust Fund Auth. Rev. | 5.375% | 12/15/07 | | 25,530 | 25,587 |
| New Jersey Transp. Trust Fund Auth. Rev. | 5.250% | 12/15/11 | (3) | 30,000 | 31,986 |
| New Jersey Transp. Trust Fund Auth. Rev. | 5.000% | 6/15/12 | (3) | 4,200 | 4,447 |
| New Jersey Transp. Trust Fund Auth. Rev. | 5.000% | 6/15/15 | (4)(Prere.) | 19,130 | 20,768 |
1 | New Jersey Transp. Trust Fund Auth. Rev. | | | | | |
| TOB VRDO | 3.510% | 11/7/07 | (3) | 13,770 | 13,770 |
1 | New Jersey Transp. Trust Fund Auth. Rev. | | | | | |
| TOB VRDO | 3.580% | 11/7/07 | | 9,995 | 9,995 |
| New Jersey Turnpike Auth. Rev. | 5.625% | 1/1/10 | (1)(Prere.) | 5,000 | 5,227 |
| Newark NJ GO | 5.000% | 10/1/11 | (4) | 2,000 | 2,110 |
Limited-Term Tax-Exempt Fund
| | | | | Face | Market |
| | | Maturity | | Amount | Value• |
| | Coupon | Date | | ($000) | ($000) |
| Tobacco Settlement Financing Corp. New Jersey Rev. | 4.000% | 6/1/09 | | 1,400 | 1,399 |
| Tobacco Settlement Financing Corp. New Jersey Rev. | 4.125% | 6/1/10 | | 3,640 | 3,638 |
| Tobacco Settlement Financing Corp. New Jersey Rev. | 4.250% | 6/1/11 | | 4,905 | 4,897 |
| Tobacco Settlement Financing Corp. New Jersey Rev. | 4.250% | 6/1/12 | | 5,000 | 4,959 |
| Tobacco Settlement Financing Corp. New Jersey Rev. | 5.000% | 6/1/12 | (Prere.) | 10,200 | 10,794 |
| Tobacco Settlement Financing Corp. New Jersey Rev. | 6.125% | 6/1/12 | (Prere.) | 5,000 | 5,527 |
| Tobacco Settlement Financing Corp. New Jersey Rev. | 6.750% | 6/1/13 | (Prere.) | 40,000 | 46,276 |
| Tobacco Settlement Financing Corp. New Jersey Rev. | 5.000% | 6/1/15 | | 2,000 | 2,025 |
| | | | | | 308,529 |
New Mexico (0.7%) | | | | | |
| Albuquerque NM GO | 5.000% | 7/1/12 | (2) | 11,350 | 12,046 |
| Farmington NM PCR (El Paso Electric Co. Project) | | | | | |
| PUT | 4.000% | 8/1/12 | (3) | 8,000 | 8,020 |
| Farmington NM PCR (Southern CA Edison | | | | | |
| Four Corners Project) PUT | 3.550% | 4/1/10 | (3) | 20,000 | 19,934 |
| New Mexico Severance Tax Rev. | 5.000% | 7/1/10 | (2) | 2,000 | 2,078 |
| New Mexico Severance Tax Rev. | 5.000% | 7/1/11 | | 1,000 | 1,050 |
| New Mexico Severance Tax Rev. | 5.000% | 7/1/11 | (2) | 2,000 | 2,102 |
| New Mexico Severance Tax Rev. | 5.000% | 7/1/12 | | 1,550 | 1,644 |
| | | | | | 46,874 |
New York (10.1%) | | | | | |
| Battery Park City NY Auth. Rev. | 5.250% | 11/1/16 | | 14,275 | 15,480 |
| Erie County NY IDA School Fac. Rev. GO | 5.000% | 5/1/09 | (4) | 3,140 | 3,210 |
| Long Island NY Power Auth. Electric System Rev. | 0.000% | 6/1/11 | (4) | 16,690 | 14,651 |
| Long Island NY Power Auth. Electric System Rev. | 5.000% | 5/1/12 | (1) | 48,900 | 51,798 |
1 | Long Island NY Power Auth. Electric System Rev. | | | | | |
| TOB VRDO | 3.500% | 11/7/07 | (3) | 12,675 | 12,675 |
| Metro. New York Transp. Auth. Rev. (Transit Rev.) | 5.250% | 11/15/11 | | 22,080 | 23,506 |
| Metro. New York Transp. Auth. Rev. (Transit Rev.) | 5.000% | 11/15/12 | | 3,500 | 3,722 |
| Metro. New York Transp. Auth. Rev. (Transit Rev.) | 5.250% | 11/15/12 | | 14,110 | 15,167 |
| Metro. New York Transp. Auth. Rev. (Transit Rev.) | 5.000% | 11/15/13 | | 3,325 | 3,561 |
1 | Metro. New York Transp. Auth. Rev. (Transit Rev.) | | | | | |
| TOB VRDO | 3.570% | 11/7/07 | | 2,595 | 2,595 |
| New York City NY GO | 5.000% | 8/1/08 | | 13,535 | 13,690 |
| New York City NY GO | 5.250% | 8/1/08 | | 7,670 | 7,772 |
| New York City NY GO | 5.250% | 8/1/08 | (3) | 10,000 | 10,136 |
| New York City NY GO | 5.250% | 8/1/08 | (ETM) | 1,780 | 1,804 |
| New York City NY GO | 5.250% | 8/1/08 | | 14,670 | 14,865 |
| New York City NY GO | 5.000% | 8/1/09 | | 7,000 | 7,181 |
| New York City NY GO | 5.000% | 8/1/09 | | 14,700 | 15,080 |
| New York City NY GO | 5.250% | 8/1/09 | | 35,110 | 36,166 |
| New York City NY GO | 5.000% | 6/1/10 | | 8,000 | 8,290 |
| New York City NY GO | 5.000% | 8/1/10 | | 13,965 | 14,502 |
| New York City NY GO | 5.000% | 3/1/11 | | 6,000 | 6,261 |
| New York City NY GO | 5.750% | 8/1/11 | (1) | 15,750 | 16,797 |
| New York City NY GO | 5.000% | 8/1/12 | | 8,000 | 8,458 |
| New York City NY GO | 5.250% | 8/1/12 | | 4,230 | 4,473 |
| New York City NY GO | 5.750% | 8/1/14 | (2) | 7,785 | 8,499 |
1 | New York City NY GO TOB VRDO | 3.510% | 11/7/07 | | 236 | 236 |
| New York City NY Housing Dev. Corp. Rev. | 5.000% | 7/1/10 | (3) | 3,090 | 3,212 |
| New York City NY Housing Dev. Corp. Rev. | 5.000% | 7/1/12 | (3) | 5,000 | 5,302 |
| New York City NY IDA (USTA National Tennis Center) | 5.000% | 11/15/13 | (4) | 4,435 | 4,764 |
| New York City NY Transitional Finance Auth. Rev. | 5.500% | 11/1/11 | | 24,375 | 25,910 |
| New York City NY Transitional Finance Auth. Rev. | 5.250% | 2/1/29 | | 29,100 | 30,513 |
| New York City NY Transitional Finance Auth. Rev. | | | | | |
| Future Tax | 5.000% | 11/1/11 | | 14,370 | 15,174 |
Limited-Term Tax-Exempt Fund
| | | | | Face | Market |
| | | Maturity | | Amount | Value• |
| | Coupon | Date | | ($000) | ($000) |
| New York State Dormitory Auth. Rev. | 5.000% | 8/15/09 | (4) | 1,900 | 1,951 |
| New York State Dormitory Auth. Rev. (State Univ.) | 5.500% | 5/15/13 | (3) | 20,350 | 22,013 |
| New York State Dormitory Auth. Rev. Non State | | | | | |
| Supported Debt (New York Univ. Hosp.) | 5.000% | 7/1/09 | | 2,055 | 2,076 |
| New York State Dormitory Auth. Rev. Non State | | | | | |
| Supported Debt (New York Univ. Hosp.) | 5.000% | 7/1/11 | | 1,000 | 1,018 |
| New York State Dormitory Auth. Rev. Non State | | | | | |
| Supported Debt (New York Univ. Hosp.) | 5.000% | 7/1/12 | | 1,000 | 1,019 |
| New York State Dormitory Auth. Rev. PUT | 5.250% | 5/15/12 | (2) | 12,560 | 13,388 |
| New York State Energy Research & Dev. Auth. | | | | | |
| PCR (New York Electric & Gas) ARS | 3.245% | 1/19/10 | (1) | 14,650 | 14,440 |
| New York State GO | 5.000% | 4/15/09 | | 2,900 | 2,966 |
| New York State Muni. Bond Bank Agency Special | | | | | |
| School Purpose Rev. | 5.500% | 12/1/15 | | 5,410 | 5,866 |
| New York State Muni. Bond Bank Agency Special | | | | | |
| School Purpose Rev. | 5.250% | 6/1/18 | | 7,000 | 7,437 |
| New York State Muni. Bond Bank Agency Special | | | | | |
| School Purpose Rev. | 5.250% | 12/1/18 | | 8,415 | 8,941 |
| New York State Thruway Auth. Rev. | | | | | |
| (Highway & Bridge Trust Fund) | 5.250% | 4/1/08 | (1) | 3,730 | 3,758 |
| New York State Thruway Auth. Rev. | | | | | |
| (Highway & Bridge Trust Fund) | 5.250% | 4/1/08 | (2) | 13,220 | 13,321 |
| New York State Thruway Auth. Rev. | | | | | |
| (Highway & Bridge Trust Fund) | 5.000% | 4/1/09 | (1)(ETM) | 4,000 | 4,085 |
| New York State Thruway Auth. Rev. | | | | | |
| (Highway & Bridge Trust Fund) | 5.250% | 4/1/10 | (1) | 2,500 | 2,605 |
| New York State Thruway Auth. Rev. | | | | | |
| (Highway & Bridge Trust Fund) | 5.000% | 4/1/13 | (3) | 15,000 | 16,013 |
| New York State Thruway Auth. Rev. | | | | | |
| (Service Contract) | 5.250% | 4/1/10 | | 11,395 | 11,869 |
| New York State Thruway Auth. Rev. | | | | | |
| (Service Contract) | 5.500% | 4/1/13 | | 5,500 | 5,884 |
| New York State Urban Dev. Corp. Rev. | | | | | |
| (Service Contract) | 5.000% | 1/1/12 | | 6,500 | 6,846 |
| Tobacco Settlement Financing Corp. New York Rev. | 5.000% | 6/1/08 | | 5,000 | 5,039 |
| Tobacco Settlement Financing Corp. New York Rev. | 5.250% | 6/1/13 | | 4,325 | 4,360 |
| Tobacco Settlement Financing Corp. New York Rev. | 5.500% | 6/1/17 | | 14,950 | 15,758 |
| Tobacco Settlement Financing Corp. New York Rev. | 5.500% | 6/1/18 | | 20,000 | 21,270 |
| Tobacco Settlement Financing Corp. New York Rev. | 5.500% | 6/1/20 | | 25,000 | 26,717 |
| Tobacco Settlement Financing Corp. New York Rev. | 5.250% | 6/1/21 | (2) | 4,000 | 4,248 |
| Tobacco Settlement Financing Corp. New York Rev. | 5.500% | 6/1/21 | | 17,250 | 18,417 |
| Tobacco Settlement Financing Corp. New York Rev. | 5.250% | 6/1/22 | (2) | 15,000 | 15,906 |
| Triborough Bridge & Tunnel Auth. New York Rev. | 5.250% | 11/15/08 | | 14,000 | 14,263 |
| | | | | | 676,924 |
| North Carolina (4.1%) | | | | | |
| Durham NC COP | 5.000% | 6/1/10 | | 2,170 | 2,252 |
| Durham NC COP | 5.000% | 6/1/11 | | 1,080 | 1,133 |
| Durham NC COP | 5.000% | 6/1/13 | | 1,000 | 1,062 |
| Greensboro NC GO | 5.000% | 3/1/10 | | 5,425 | 5,618 |
| North Carolina Eastern Muni. Power Agency Rev. | 6.125% | 1/1/09 | | 12,870 | 13,200 |
| North Carolina Eastern Muni. Power Agency Rev. | 5.375% | 1/1/10 | | 25,745 | 26,515 |
| North Carolina Eastern Muni. Power Agency Rev. | 5.500% | 1/1/10 | | 6,900 | 7,124 |
| North Carolina Eastern Muni. Power Agency Rev. | 5.500% | 1/1/11 | | 15,500 | 16,189 |
| North Carolina Eastern Muni. Power Agency Rev. | 5.500% | 1/1/12 | | 9,000 | 9,495 |
| North Carolina Eastern Muni. Power Agency Rev. | | | | | |
| ARS | 3.950% | 11/15/07 | (1) | 29,475 | 29,475 |
Limited-Term Tax-Exempt Fund
| | | | | Face | Market |
| | | Maturity | | Amount | Value• |
| | Coupon | Date | | ($000) | ($000) |
| North Carolina GO | 5.000% | 3/1/08 | | 20,000 | 20,106 |
| North Carolina GO | 5.000% | 3/1/12 | | 13,980 | 14,816 |
| North Carolina GO | 5.000% | 3/1/13 | | 24,525 | 26,205 |
| North Carolina GO | 5.000% | 3/1/14 | | 24,625 | 26,536 |
| North Carolina Infrastructure Financial Corp. COP | | | | | |
| Capital Improvements | 5.000% | 2/1/08 | (4) | 10,000 | 10,038 |
| North Carolina Infrastructure Financial Corp. COP | | | | | |
| Capital Improvements | 5.000% | 2/1/09 | (4) | 10,000 | 10,191 |
| North Carolina Infrastructure Financial Corp. COP | | | | | |
| Capital Improvements | 5.000% | 2/1/10 | (4) | 10,000 | 10,328 |
| North Carolina Medical Care Comm. Health Care | | | | | |
| Fac. (Novant Health Obligated Group) | 5.000% | 11/1/10 | | 9,180 | 9,532 |
| North Carolina Medical Care Comm. Health Care | | | | | |
| Fac. (Novant Health Obligated Group) | 5.000% | 11/1/15 | | 7,370 | 7,709 |
| Wake County NC Public Improvement GO | 5.000% | 3/1/14 | | 23,000 | 24,785 |
| | | | | | 272,309 |
Ohio (3.3%) | | | | | |
| American Muni. Power Ohio Inc. | | | | | |
| Electricity Purchase Rev. | 5.000% | 2/1/13 | | 10,000 | 10,448 |
| Buckeye OH Tobacco Settlement | | | | | |
| Financing Corp. Rev. | 5.000% | 6/1/11 | | 5,000 | 5,115 |
| Buckeye OH Tobacco Settlement | | | | | |
| Financing Corp. Rev. | 5.000% | 6/1/12 | | 1,480 | 1,513 |
| Buckeye OH Tobacco Settlement | | | | | |
| Financing Corp. Rev. | 5.000% | 6/1/14 | | 5,495 | 5,587 |
| Cincinnati OH City School Dist. GO | 5.000% | 12/1/12 | (4) | 1,140 | 1,214 |
| Cincinnati OH City School Dist. GO | 5.000% | 12/1/13 | (4) | 2,000 | 2,146 |
| Cuyahoga County OH (Capital Improvement) GO | 0.000% | 10/1/09 | (1) | 4,200 | 3,919 |
| Franklin County OH Hosp. Rev. | | | | | |
| (OhioHealth Corp.) ARS | 4.000% | 11/16/07 | (1) | 31,475 | 31,475 |
| Lorain County OH Hosp. Fac. Rev. | | | | | |
| (Catholic Healthcare Partners) | 5.250% | 10/1/08 | | 6,945 | 7,043 |
| Ohio Air Quality Dev. Auth. PCR ARS | 3.950% | 11/14/07 | (2) | 40,825 | 40,825 |
| Ohio Building Auth. Rev. (Adult Correctional Building) | 5.000% | 4/1/12 | (4) | 3,055 | 3,229 |
| Ohio Building Auth. Rev. (Adult Correctional Building) | 5.250% | 4/1/14 | | 12,000 | 13,046 |
| Ohio Higher Educ. Capital Fac. Rev. | 5.500% | 12/1/07 | | 24,500 | 24,542 |
| Ohio Higher Educ. Capital Fac. Rev. | 5.500% | 12/1/08 | | 18,440 | 18,850 |
| Ohio Highway Capital Improvements GO | 5.000% | 5/1/12 | | 6,280 | 6,652 |
| Ohio Highway Capital Improvements GO | 5.000% | 5/1/13 | | 6,300 | 6,729 |
| Ohio Infrastructure Improvement GO | 5.000% | 3/1/10 | | 4,000 | 4,139 |
| Ohio Major New State Infrastructure Project Rev. | 5.000% | 6/15/08 | | 6,750 | 6,816 |
| Ohio State Dept. Administrative Services COP | | | | | |
| (Administrative Knowledge System) | 5.000% | 9/1/10 | (1) | 7,140 | 7,418 |
| Ohio State Dept. Administrative Services COP | | | | | |
| (Administrative Knowledge System) | 5.000% | 9/1/11 (1) | (1) | 3,800 | 3,987 |
1 | Ohio State Dept. Administrative Services COP | | | | | |
| TOB VRDO | 3.520% | 11/7/07 | (1) | 6,060 | 6,060 |
| Ohio Water Dev. Auth. PCR | 5.250% | 12/1/09 | | 3,625 | 3,760 |
| Ohio Water Dev. Auth. PCR | 5.000% | 6/1/13 | | 7,000 | 7,482 |
| | | | | | 221,995 |
Oklahoma (0.7%) | | | | | |
| Grand River Dam Auth. Oklahoma Rev. | 5.000% | 6/1/12 | (4) | 3,500 | 3,710 |
| Oklahoma State Capitol Improvement Auth. | | | | | |
| Fac. Rev. | 5.000% | 9/1/15 | (1) | 9,035 | 9,691 |
1 | Oklahoma State Capitol Improvement Auth. | | | | | |
| Fac. Rev. TOB VRDO | 3.510% | 11/7/07 | (2) | 9,000 | 9,000 |
Limited-Term Tax-Exempt Fund
| | | | | Face | Market |
| | | Maturity | | Amount | Value• |
| | Coupon | Date | | ($000) | ($000) |
| Oklahoma State Water Resource Board Rev. | 5.000% | 4/1/15 | | 8,640 | 9,271 |
| Tulsa County OK Ind. Auth. Rev. | 5.000% | 5/15/11 | | 10,000 | 10,499 |
| Tulsa County OK Ind. Auth. Rev. | 5.000% | 5/15/11 | (4) | 5,300 | 5,561 |
| | | | | | 47,732 |
Oregon (0.3%) | | | | | |
| Oregon State Dept. Administrative Services | 5.250% | 11/1/11 | (1) | 12,090 | 12,855 |
| Tri-County Metro. Transp. Dist. OR | | | | | |
| (Payroll Tax & Grant Project) | 5.000% | 5/1/12 | (1) | 5,000 | 5,296 |
| Tri-County Metro. Transp. Dist. OR | | | | | |
| (Payroll Tax & Grant Project) | 4.000% | 5/1/14 | (1) | 5,000 | 5,020 |
| | | | | | 23,171 |
Pennsylvania (2.6%) | | | | | |
| Allegheny County PA Port Auth. Rev. | 6.375% | 3/1/09 | (1)(Prere.) | 5,500 | 5,758 |
| Delaware County PA Hosp. Auth. Rev. | | | | | |
| (Crozer Keystone Obligated Group) | 5.000% | 12/15/10 | | 2,690 | 2,743 |
| Delaware County PA Hosp. Auth. Rev. | | | | | |
| (Crozer Keystone Obligated Group) | 5.000% | 12/15/12 | | 2,970 | 3,041 |
| Delaware County PA Hosp. Auth. Rev. | | | | | |
| (Crozer Keystone Obligated Group) | 5.000% | 12/15/14 | | 1,165 | 1,190 |
| Delaware County PA Hosp. Auth. Rev. | | | | | |
| (Crozer Keystone Obligated Group) | 5.000% | 12/15/14 | | 3,280 | 3,351 |
| Delaware County PA Hosp. Auth. Rev. | | | | | |
| (Crozer Keystone Obligated Group) | 5.000% | 12/15/15 | | 3,440 | 3,509 |
| Delaware County PA Hosp. Auth. Rev. | | | | | |
| (Crozer Keystone Obligated Group) | 5.000% | 12/15/15 | | 1,140 | 1,163 |
| Delaware County PA Hosp. Auth. Rev. | | | | | |
| (Crozer Keystone Obligated Group) | 5.000% | 12/15/16 | | 1,175 | 1,194 |
| Delaware County PA Hosp. Auth. Rev. | | | | | |
| (Crozer Keystone Obligated Group) | 5.000% | 12/15/16 | | 3,610 | 3,668 |
| Delaware River Joint Toll Bridge Comm. | | | | | |
| Pennsylvania & New Jersey Rev. | 5.000% | 7/1/08 | | 4,365 | 4,409 |
| Montgomery County PA IDA Auth. Retirement | | | | | |
| Community Rev. (ACTS Retirement– | | | | | |
| Life Communities Obligated Group) | 5.000% | 11/15/10 | | 2,500 | 2,554 |
| Montgomery County PA IDA Auth. Retirement | | | | | |
| Community Rev. (ACTS Retirement– | | | | | |
| Life Communities Obligated Group) | 5.000% | 11/15/11 | | 2,500 | 2,564 |
| Montgomery County PA IDA Auth. Retirement | | | | | |
| Community Rev. (ACTS Retirement– | | | | | |
| Life Communities Obligated Group) | 5.000% | 11/15/13 | | 5,675 | 5,833 |
| Pennsylvania GO | 5.000% | 10/1/10 | (3) | 22,485 | 23,463 |
| Pennsylvania GO | 5.500% | 2/1/12 | | 20,950 | 22,545 |
| Pennsylvania Higher Educ. Fac. Auth. Rev. | | | | | |
| (Drexel Univ.) | 6.000% | 5/1/09 | (Prere.) | 3,470 | 3,597 |
| Pennsylvania Higher Educ. Fac. Auth. Rev. | | | | | |
| (State System of Higher Educ.) | 5.000% | 8/15/08 | | 2,500 | 2,526 |
| Pennsylvania Higher Educ. Fac. Auth. Rev. | | | | | |
| (State System of Higher Educ.) | 5.000% | 8/15/11 | (2) | 4,000 | 4,208 |
| Pennsylvania Turnpike Comm. Rev. | 5.500% | 7/15/11 | (2)(Prere.) | 12,010 | 12,939 |
| Philadelphia PA Gas Works Rev. | 5.250% | 7/1/09 | (4) | 8,885 | 9,137 |
| Philadelphia PA Gas Works Rev. | 5.500% | 8/1/11 | (4)(Prere.) | 3,315 | 3,542 |
| Philadelphia PA GO | 5.000% | 8/1/11 | (11) | 5,495 | 5,758 |
| Philadelphia PA GO | 5.125% | 8/1/13 | (11) | 6,050 | 6,476 |
| Philadelphia PA School Dist. GO | 5.750% | 2/1/11 | (4)(Prere.) | 7,420 | 7,926 |
| Philadelphia PA School Dist. GO | 5.750% | 2/1/11 | (4)(Prere.) | 6,415 | 6,852 |
| Pittsburgh PA GO | 5.000% | 9/1/09 | (1)(ETM) | 11,650 | 11,970 |
Limited-Term Tax-Exempt Fund
| | | | | Face | Market |
| | | Maturity | | Amount | Value• |
| | Coupon | Date | | ($000) | ($000) |
| Pittsburgh PA GO | 5.000% | 9/1/09 | (1) | 2,815 | 2,894 |
| Southcentral Pennsylvania General Auth. Rev. PUT | 4.500% | 12/1/08 | (2) | 4,500 | 4,546 |
| Tredyffrin-Easttown PA School Dist. GO | 5.000% | 8/15/10 | (Prere.) | 5,175 | 5,387 |
| York County PA Solid Waste & Refuse Auth. Rev. | 5.250% | 12/1/08 | (3) | 2,485 | 2,533 |
| | | | | | 177,276 |
Puerto Rico (1.5%) | | | | | |
| Puerto Rico Convention Center Dist. Auth. | | | | | |
| Hotel Occupancy Tax Rev. | 5.000% | 7/1/11 | | 2,650 | 2,760 |
| Puerto Rico GO | 5.000% | 7/1/09 | (ETM) | 460 | 472 |
| Puerto Rico GO | 5.000% | 7/1/09 | (ETM) | 3,595 | 3,686 |
| Puerto Rico GO PUT | 5.000% | 7/1/12 | | 16,000 | 16,612 |
| Puerto Rico Govt. Dev. Bank CP | 4.700% | 11/7/07 | | 22,141 | 22,141 |
| Puerto Rico Infrastructure Financing Auth. | | | | | |
| Special Tax Rev. | 5.500% | 7/1/11 | (2) | 5,550 | 5,933 |
| Puerto Rico Infrastructure Financing Auth. | | | | | |
| Special Tax Rev. | 5.500% | 7/1/12 | (2) | 3,000 | 3,249 |
| Puerto Rico Muni. Finance Agency | 5.000% | 8/1/10 | | 5,000 | 5,168 |
| Puerto Rico Muni. Finance Agency | 5.000% | 8/1/11 | | 7,000 | 7,293 |
| Puerto Rico Public Finance Corp. PUT | 5.750% | 2/1/12 | LOC | 14,000 | 14,869 |
1 | Puerto Rico Sales Tax Financing Corp. Rev. | | | | | |
| TOB VRDO | 3.680% | 11/7/07 | | 15,000 | 15,000 |
| | | | | | 97,183 |
Rhode Island (0.1%) | | | | | |
| Providence RI GO PUT | 3.950% | 1/15/11 | (11) | 5,000 | 5,033 |
| Rhode Island State & Providence Plantations GO | 5.000% | 11/1/08 | (3) | 3,545 | 3,601 |
| | | | | | 8,634 |
South Carolina (1.2%) | | | | | |
| Charleston SC Educ. Excellence Financing Corp. Rev. | 5.000% | 12/1/08 | | 1,745 | 1,773 |
| Charleston SC Educ. Excellence Financing Corp. Rev. | 5.000% | 12/1/09 | | 2,245 | 2,313 |
| South Carolina GO | 5.500% | 4/1/08 | | 14,515 | 14,641 |
| South Carolina Jobs Econ. Dev. Auth. Hosp. | | | | | |
| Improvement Rev. (Palmetto Health Alliance) | 7.000% | 12/15/07 | (ETM) | 5,265 | 5,286 |
| South Carolina Transp. Infrastructure Rev. ARS | 3.950% | 11/8/07 | (10) | 7,925 | 7,925 |
| South Carolina Transp. Infrastructure Rev. ARS | 4.100% | 11/15/07 | (10) | 22,700 | 22,700 |
1 | South Carolina Transp. Infrastructure Rev. TOB VRDO | 3.490% | 11/7/07 | (2) | 7,055 | 7,055 |
1 | York County SC School Dist. (Rock Hill) TOB VRDO | 3.490% | 11/7/07 | (4) | 9,140 | 9,140 |
1 | York County SC School Dist. TOB VRDO | 3.520% | 11/7/07 | (4) | 13,020 | 13,020 |
| | | | | | 83,853 |
South Dakota (0.2%) | | | | | |
| South Dakota State Building Auth. Rev. | 5.000% | 12/1/09 | (2) | 5,955 | 6,144 |
| South Dakota State Building Auth. Rev. | 5.000% | 12/1/10 | (2) | 2,680 | 2,799 |
| South Dakota State Building Auth. Rev. | 5.000% | 12/1/11 | (2) | 1,000 | 1,055 |
| South Dakota State Building Auth. Rev. | 5.000% | 12/1/12 | (2) | 3,005 | 3,199 |
| | | | | | 13,197 |
Tennessee (2.5%) | | | | | |
| Memphis TN Electric System Rev. | 5.000% | 12/1/10 | (1) | 5,000 | 5,224 |
| Memphis TN Electric System Rev. | 5.000% | 12/1/11 | (1) | 17,000 | 17,949 |
| Metro. Govt. of Nashville & Davidson County TN GO | 5.000% | 10/15/08 | | 1,075 | 1,091 |
| Metro. Govt. of Nashville & Davidson County TN GO | 5.000% | 10/15/08 | | 3,925 | 3,984 |
| Metro. Govt. of Nashville & Davidson County TN | | | | | |
| Health & Educ. Fac. (Vanderbilt Univ.) PUT | 5.000% | 4/1/09 | (1) | 19,075 | 19,428 |
| Metro. Govt. of Nashville & Davidson County TN | | | | | |
| Health & Educ. Fac. (Vanderbilt Univ.) PUT | 5.000% | 4/1/10 | (1) | 30,890 | 31,816 |
| Shelby County TN Health Educ. & Housing Fac. | | | | | |
| Board Rev. (St. Jude Children’s Research Hospital) | 5.000% | 7/1/10 | | 2,570 | 2,657 |
Limited-Term Tax-Exempt Fund
| | | | | Face | Market |
| | | Maturity | | Amount | Value• |
| | Coupon | Date | | ($000) | ($000) |
| Shelby County TN Health Educ. & Housing Fac. | | | | | |
| Board Rev. (St. Jude Children’s Research Hospital) | 5.000% | 7/1/11 | | 2,230 | 2,325 |
| Shelby County TN Health Educ. & Housing Fac. | | | | | |
| Board Rev. (St. Jude Children’s Research Hospital) | 5.000% | 7/1/12 | | 2,300 | 2,410 |
| Shelby County TN Health Educ. & Housing Fac. | | | | | |
| Board Rev. (St. Jude Children’s Research Hospital) | 5.000% | 7/1/13 | | 3,600 | 3,786 |
| Shelby County TN Health Educ. & Housing Fac. | | | | | |
| Board Rev. (St. Jude Children’s Research Hospital) | 5.000% | 7/1/14 | | 4,805 | 5,069 |
| Shelby County TN Health Educ. & Housing Fac. | | | | | |
| Board Rev. (St. Jude Children’s Research Hospital) | 5.000% | 7/1/15 | | 5,390 | 5,692 |
| Shelby County TN Health Educ. & Housing Fac. | | | | | |
| Board Rev. (St. Jude Children’s Research Hospital) | 5.000% | 7/1/16 | | 2,500 | 2,635 |
| Tennessee Energy Acquisition Corp. Gas Rev. | 5.000% | 9/1/10 | | 10,000 | 10,270 |
| Tennessee Energy Acquisition Corp. Gas Rev. | 5.000% | 9/1/11 | | 5,000 | 5,153 |
| Tennessee Energy Acquisition Corp. Gas Rev. | 5.000% | 9/1/12 | | 10,000 | 10,324 |
| Tennessee Energy Acquisition Corp. Gas Rev. | 5.000% | 9/1/13 | | 28,000 | 28,888 |
| Tennessee Health, Educ. & Housing Fac. | | | | | |
| (Methodist Health System) PUT | 5.000% | 10/1/08 | | 10,000 | 10,084 |
| | | | | | 168,785 |
Texas (9.0%) | | | | | |
| Colorado River TX Muni. Water Dist. Water Rev. | 5.000% | 1/1/08 | (2) | 2,975 | 2,983 |
| Cypress-Fairbanks TX Independent School Dist. | | | | | |
| Unlimited Tax Schoolhouse PUT | 5.000% | 8/15/10 | | 5,000 | 5,172 |
| Dallas TX GO | 5.000% | 2/15/09 | | 6,540 | 6,670 |
| Dallas TX GO | 5.000% | 2/15/10 | | 6,540 | 6,761 |
| Dallas TX GO | 5.000% | 2/15/17 | | 8,475 | 9,065 |
| Dallas TX Waterworks & Sewer System Rev. | 5.000% | 10/1/10 | (4) | 5,950 | 6,204 |
| Dallas TX Waterworks & Sewer System Rev. | 5.250% | 10/1/10 | | 5,570 | 5,846 |
| Dallas TX Waterworks & Sewer System Rev. | 5.000% | 10/1/16 | (2) | 30,000 | 32,429 |
| El Paso TX GO | 5.500% | 8/15/08 | (4) | 2,465 | 2,504 |
| El Paso TX Water & Sewer Rev. | 5.000% | 3/1/14 | (4) | 2,175 | 2,330 |
| El Paso TX Water & Sewer Rev. | 5.000% | 3/1/15 | (4) | 1,500 | 1,613 |
| Fort Bend TX Independent School Dist. GO PUT | 5.000% | 8/15/09 | | 7,500 | 7,675 |
| Garland TX GO | 5.250% | 2/15/11 | (4) | 2,255 | 2,374 |
| Garland TX GO | 5.250% | 2/15/12 | (4) | 2,500 | 2,663 |
| Garland TX Independent School Dist. | 5.000% | 2/15/12 | | 4,210 | 4,443 |
| Grapevine-Colleyville TX Independent School Dist. | | | | | |
| School Building PUT | 4.000% | 8/1/12 | | 28,185 | 28,390 |
| Harlingen TX Independent School Dist. GO | 5.500% | 8/15/09 | (Prere.) | 4,000 | 4,142 |
| Harris County TX Flood Control Dist. GO | 5.000% | 10/1/11 | | 5,005 | 5,268 |
| Harris County TX Flood Control Dist. GO | 5.250% | 10/1/19 | | 8,360 | 8,954 |
| Harris County TX Health Fac. Dev. Corp. Hosp. Rev. | | | | | |
| (Memorial Hermann Healthcare) ARS | 3.950% | 11/14/07 | (1) | 11,000 | 11,000 |
| Harris County TX Health Fac. Dev. Corp. Rev. | | | | | |
| (St. Luke’s Episcopal Hosp.) | 5.250% | 2/15/08 | | 2,500 | 2,511 |
| Harris County TX Toll Road Rev. | 6.000% | 8/1/09 | (3) | 4,750 | 4,955 |
| Harris County TX Toll Road Rev. PUT | 5.000% | 8/15/12 | (4) | 24,250 | 25,642 |
| Houston TX GO | 5.000% | 3/1/10 | (1) | 5,120 | 5,294 |
| Houston TX GO | 5.500% | 9/1/10 | (4)(Prere.) | 10,885 | 11,483 |
| Houston TX Independent School Dist. GO | 0.000% | 2/15/12 | | 5,535 | 4,706 |
| Houston TX Independent School Dist. GO | 5.000% | 2/15/13 | | 9,000 | 9,574 |
| Houston TX Util. System Rev. | 5.250% | 5/15/10 | (1) | 2,700 | 2,815 |
| Houston TX Util. System Rev. | 5.250% | 11/15/11 | (4) | 4,425 | 4,707 |
| Houston TX Util. System Rev. | 5.000% | 11/15/12 | (4) | 4,270 | 4,541 |
| Houston TX Util. System Rev. | 5.250% | 5/15/16 | (1) | 10,000 | 10,824 |
| Houston TX Water & Sewer System Rev. | 5.500% | 12/1/07 | (4)(ETM) | 12,500 | 12,518 |
Limited-Term Tax-Exempt Fund
| | | | | Face | Market |
| | | Maturity | | Amount | Value• |
| | Coupon | Date | | ($000) | ($000) |
| Klein TX Independent School Dist. | | | | | |
| Unlimited Tax Schoolhouse GO | 5.000% | 8/1/11 | | 2,050 | 2,154 |
| Lewisville TX Independent School Dist. | 0.000% | 8/15/09 | | 2,430 | 2,277 |
| Lewisville TX Independent School Dist. | 0.000% | 8/15/10 | | 5,000 | 4,512 |
| Lewisville TX Independent School Dist. | 5.000% | 8/15/13 | | 8,225 | 8,790 |
1 | Lewisville TX Independent School Dist. TOB VRDO | 3.520% | 11/7/07 | | 6,990 | 6,990 |
| Lower Colorado River Auth. Texas Rev. | 5.875% | 5/15/17 | (2) | 17,195 | 17,946 |
| Montgomery County TX PUT | 5.000% | 9/1/10 | (4) | 3,000 | 3,102 |
| Montgomery County TX PUT | 5.000% | 9/1/10 | (4) | 9,000 | 9,307 |
1 | North East TX Independent School Dist. GO | | | | | |
| TOB VRDO | 3.490% | 11/7/07 | | 2,600 | 2,600 |
| North Texas Tollway Auth. (Dallas North Tollway) | | | | | |
| System Rev. | 5.000% | 7/1/08 | (2)(Prere.) | 365 | 369 |
| North Texas Tollway Auth. (Dallas North Tollway) | | | | | |
| System Rev. | 5.000% | 7/1/08 | (4)(Prere.) | 100 | 101 |
| North Texas Tollway Auth. (Dallas North Tollway) | | | | | |
| System Rev. PUT | 5.000% | 7/1/08 | (2) | 4,635 | 4,679 |
| North Texas Tollway Auth. (Dallas North Tollway) | | | | | |
| System Rev. PUT | 5.000% | 7/1/08 | (4) | 5,900 | 5,958 |
| Northside TX Independent School Dist. PUT | 3.600% | 8/1/09 | | 10,875 | 10,851 |
| Northside TX Independent School Dist. PUT | 3.700% | 8/1/10 | | 9,000 | 9,001 |
1 | Pearland TX GO TOB VRDO | 3.580% | 11/7/07 | (2) | 5,425 | 5,425 |
| Plano TX Independent School Dist. | 5.000% | 2/15/08 | | 6,300 | 6,328 |
| Round Rock TX Independent School Dist. GO | 0.000% | 8/15/09 | (1) | 6,750 | 6,326 |
| SA Energy Acquisition Public Fac. Corp. | | | | | |
| Texas Gas Supply Rev. | 5.250% | 8/1/13 | | 24,325 | 25,394 |
| SA Energy Acquisition Public Fac. Corp. | | | | | |
| Texas Gas Supply Rev. | 5.250% | 8/1/14 | | 12,360 | 12,921 |
| San Antonio TX Electric & Gas Rev. | 5.250% | 2/1/08 | | 2,045 | 2,054 |
| San Antonio TX Electric & Gas Rev. | 5.000% | 2/1/09 | | 7,400 | 7,541 |
| San Antonio TX Electric & Gas Rev. | 5.250% | 2/1/11 | | 4,350 | 4,575 |
| San Antonio TX Electric & Gas Rev. | 5.375% | 2/1/15 | | 7,210 | 7,922 |
| San Antonio TX GO | 5.000% | 2/1/08 | | 1,815 | 1,822 |
| San Antonio TX GO | 6.000% | 8/1/08 | | 2,145 | 2,185 |
| San Antonio TX Hotel Occupancy Tax Rev. PUT | 5.000% | 8/15/08 | (2) | 10,000 | 10,115 |
| Spring Branch TX Independent School Dist. GO | 5.000% | 2/1/13 | | 3,000 | 3,190 |
| Spring Branch TX Independent School Dist. GO | 5.000% | 2/1/14 | | 3,635 | 3,892 |
| Tarrant County TX Cultural Educ. Fac. Finance | | | | | |
| Corp. Rev. (Texas Health Resources) | 5.000% | 2/15/12 | | 3,500 | 3,655 |
| Tarrant County TX Cultural Educ. Fac. Finance | | | | | |
| Corp. Rev. (Texas Health Resources) | 5.000% | 2/15/13 | | 1,385 | 1,452 |
| Tarrant County TX Health Fac. Dev. Corp. Health | | | | | |
| System Rev. (Texas Health Resources System) | 5.250% | 2/15/08 | (1)(Prere.) | 9,500 | 9,735 |
| Texas A & M Univ. Rev. Financing System | 5.000% | 5/15/11 | | 4,210 | 4,414 |
| Texas A & M Univ. Rev. Financing System | 5.000% | 5/15/11 | | 4,830 | 5,064 |
1 | Texas GO TOB VRDO | 3.530% | 11/7/07 | (1) | 6,195 | 6,195 |
| Texas Muni. Gas Acquisition & Supply Corp. Rev. | 4.145% | 12/15/07 | | 25,560 | 25,177 |
| Texas Muni. Gas Acquisition & Supply Corp. Rev. | 4.215% | 12/15/07 | | 10,000 | 9,800 |
| Texas Muni. Gas Acquisition & Supply Corp. Rev. | 5.000% | 12/15/12 | | 5,000 | 5,152 |
| Texas Muni. Gas Acquisition & Supply Corp. Rev. | 5.000% | 12/15/13 | | 1,000 | 1,030 |
| Texas Muni. Power Agency Rev. | 4.400% | 9/1/11 | (3) | 10,185 | 10,192 |
| Texas State Transp. Comm. First Tier | 5.000% | 4/1/12 | | 9,605 | 10,153 |
| Texas State Transp. Comm. First Tier | 5.000% | 4/1/13 | | 12,000 | 12,786 |
| Texas State Transp. Comm. First Tier | 5.000% | 4/1/14 | | 27,410 | 29,396 |
| Texas Transp. Comm. Mobility Fund GO | 5.000% | 4/1/08 | | 3,000 | 3,020 |
| Texas Transp. Comm. Mobility Fund GO | 5.000% | 4/1/09 | | 1,415 | 1,446 |
Limited-Term Tax-Exempt Fund
| | | | | Face | Market |
| | | Maturity | | Amount | Value• |
| | Coupon | Date | | ($000) | ($000) |
2 | Tyler TX Health Fac. Dev. Corp. | | | | | |
| (East Texas Medical Center) | 5.000% | 11/1/08 | | 1,500 | 1,510 |
2 | Tyler TX Health Fac. Dev. Corp. | | | | | |
| (East Texas Medical Center) | 5.000% | 11/1/09 | | 2,125 | 2,151 |
| Univ. of Texas Permanent Univ. Fund Rev. | 5.000% | 8/15/09 | | 2,610 | 2,681 |
| Univ. of Texas Permanent Univ. Fund Rev. | 5.000% | 8/15/09 | | 2,500 | 2,568 |
| Univ. of Texas Permanent Univ. Fund Rev. | 5.000% | 7/1/10 | | 4,175 | 4,338 |
| Williamson County TX GO | 5.500% | 2/15/11 | (4)(Prere.) | 4,845 | 5,142 |
| | | | | | 601,440 |
Utah (0.4%) | | | | | |
| Salt Lake County UT GO | 5.500% | 12/15/07 | | 5,870 | 5,885 |
| Salt Lake County UT GO | 5.000% | 6/15/10 | | 9,100 | 9,460 |
| Utah Muni. Finance Coop. Local Govt. Rev. | 0.000% | 3/1/11 | (4) | 6,000 | 5,301 |
| Utah Transit Auth. Sales Tax Rev. | 5.000% | 12/15/12 | (4)(Prere.) | 4,425 | 4,725 |
| | | | | | 25,371 |
Virginia (1.2%) | | | | | |
| Loudoun County VA GO | 5.250% | 11/1/08 | | 4,410 | 4,491 |
| Pocahontas Parkway Assn. Virginia Route 895 | | | | | |
| Connector Toll Road Rev. | 0.000% | 8/15/08 | (Prere.) | 10,000 | 3,707 |
| Pocahontas Parkway Assn. Virginia Route 895 | | | | | |
| Connector Toll Road Rev. | 0.000% | 8/15/08 | (Prere.) | 10,000 | 2,429 |
| Pocahontas Parkway Assn. Virginia Route 895 | | | | | |
| Connector Toll Road Rev. | 0.000% | 8/15/08 | (Prere.) | 2,700 | 2,131 |
| Pocahontas Parkway Assn. Virginia Route 895 | | | | | |
| Connector Toll Road Rev. | 0.000% | 8/15/08 | (Prere.) | 1,845 | 950 |
| Pocahontas Parkway Assn. Virginia Route 895 | | | | | |
| Connector Toll Road Rev. | 0.000% | 8/15/08 | (Prere.) | 48,400 | 10,453 |
| Pocahontas Parkway Assn. Virginia Route 895 | | | | | |
| Connector Toll Road Rev. | 0.000% | 8/15/08 | (Prere.) | 1,125 | 615 |
1,2 | Richmond VA Public Util. Rev. TOB VRDO | 3.340% | 11/7/07 | (4) | 4,875 | 4,875 |
| Virginia College Building Auth. Educ. Fac. Rev. | | | | | |
| (21st Century College) | 5.000% | 2/1/10 | | 17,925 | 18,529 |
1 | Virginia College Building Auth. Educ. Fac. Rev. | | | | | |
| TOB VRDO | 3.500% | 11/7/07 | | 12,040 | 12,040 |
| Virginia Public School Auth. Rev. | 5.250% | 8/1/08 | | 6,950 | 7,045 |
| Virginia Public School Auth. Rev. | 5.000% | 8/1/09 | | 2,000 | 2,054 |
| Virginia Public School Auth. Rev. | 5.000% | 8/1/09 | | 2,720 | 2,794 |
| Virginia Public School Auth. Rev. | 5.000% | 8/1/10 | | 2,865 | 2,982 |
| Virginia Public School Auth. Rev. | 5.000% | 8/1/10 | | 2,500 | 2,602 |
| Virginia Public School Auth. Rev. | 5.000% | 8/1/11 | | 1,500 | 1,579 |
| | | | | | 79,276 |
Washington (5.5%) | | | | | |
| Central Puget Sound WA Regional Transit Auth. | | | | | |
| Sales & Use Tax Rev. | 5.000% | 11/1/14 | (2) | 8,125 | 8,752 |
| Douglas County WA Public Util. Dist. No. 1 Rev. | | | | | |
| (Wells Hydroelectric Project) | 5.000% | 9/1/08 | (1) | 1,250 | 1,266 |
| Energy Northwest Washington Electric | | | | | |
| Refunding Rev. (Columbia Generating Station) | 5.500% | 7/1/10 | (1) | 12,795 | 13,444 |
| Energy Northwest Washington Electric | | | | | |
| Refunding Rev. (Columbia Generating Station) | 5.000% | 7/1/15 | | 7,500 | 8,073 |
| Energy Northwest Washington Electric | | | | | |
| Refunding Rev. (Project No. 1) | 5.000% | 7/1/11 | | 45,365 | 47,590 |
| Energy Northwest Washington Electric | | | | | |
| Refunding Rev. (Project No. 1) | 5.000% | 7/1/12 | | 2,500 | 2,646 |
| Energy Northwest Washington Electric | | | | | |
| Refunding Rev. (Project No. 1) | 5.000% | 7/1/16 | | 10,000 | 10,764 |
Limited-Term Tax-Exempt Fund
| | | | | Face | Market |
| | | Maturity | | Amount | Value• |
| | Coupon | Date | | ($000) | ($000) |
| Energy Northwest Washington Electric | | | | | |
| Refunding Rev. (Project No. 1) | 5.500% | 7/1/17 | (1) | 8,000 | 8,580 |
| Energy Northwest Washington Electric | | | | | |
| Refunding Rev. (Project No. 1) | 6.000% | 7/1/17 | (1) | 7,300 | 8,016 |
| Energy Northwest Washington Electric | | | | | |
| Refunding Rev. (Project No. 3) | 5.000% | 7/1/15 | | 8,450 | 9,095 |
| Energy Northwest Washington Electric | | | | | |
| Refunding Rev. (Project No. 3) | 5.000% | 7/1/15 | | 6,000 | 6,458 |
| Energy Northwest Washington Electric | | | | | |
| Refunding Rev. (Project No. 3) | 6.000% | 7/1/16 | (2) | 9,000 | 9,883 |
| Energy Northwest Washington Electric | | | | | |
| Refunding Rev. (Project No. 3) | 6.000% | 7/1/16 | (4) | 10,000 | 10,981 |
| King County WA GO (Refunding Baseball Stadium) | 5.000% | 12/1/10 | | 12,385 | 12,935 |
| King County WA Sewer Rev. | 5.250% | 1/1/08 | (4) | 5,000 | 5,015 |
1 | Port of Seattle WA Passenger Fac. | | | | | |
| Charge Rev. TOB VRDO | 3.510% | 11/7/07 | (1) | 10,640 | 10,640 |
| Port of Seattle WA Rev. | 5.000% | 3/1/11 | (4) | 8,275 | 8,651 |
| Port of Seattle WA Rev. | 5.000% | 3/1/12 | (4) | 5,000 | 5,279 |
| Seattle WA Drain & Wastewater Rev. | 4.000% | 2/1/10 | (1) | 3,565 | 3,605 |
| Seattle WA Water System Rev. | 5.000% | 2/1/15 | (4) | 4,725 | 5,083 |
| Tacoma WA Electric System Rev. | 5.000% | 1/1/12 | (4) | 5,000 | 5,272 |
| Tacoma WA Electric System Rev. | 5.000% | 1/1/13 | (4) | 10,485 | 11,146 |
| Tacoma WA Electric System Rev. | 5.000% | 1/1/14 | (4) | 25,720 | 27,532 |
| Thurston County Washington School District GO | 5.000% | 12/1/15 | (4) | 7,100 | 7,518 |
| Washington GO | 5.500% | 9/1/08 | (4) | 4,650 | 4,729 |
| Washington GO | 6.250% | 9/1/08 | | 3,725 | 3,810 |
| Washington GO | 5.000% | 7/1/09 | | 5,520 | 5,660 |
| Washington GO | 5.000% | 7/1/12 | (2) | 11,530 | 12,217 |
1 | Washington GO TOB VRDO | 3.490% | 11/7/07 | | 33,505 | 33,505 |
1 | Washington GO TOB VRDO | 3.490% | 11/7/07 | (4) | 7,190 | 7,190 |
1 | Washington GO TOB VRDO | 3.510% | 11/7/07 | (1) | 15,000 | 15,000 |
1 | Washington GO TOB VRDO | 3.520% | 11/7/07 | (3) | 11,465 | 11,465 |
1 | Washington GO TOB VRDO | 3.530% | 11/7/07 | (3) | 8,370 | 8,370 |
1 | Washington GO TOB VRDO | 3.530% | 11/7/07 | (1) | 17,260 | 17,260 |
| | | | | | 367,430 |
West Virginia (0.0%) | | | | | |
| West Virginia GO | 5.500% | 6/1/08 | (4) | 3,000 | 3,036 |
| | | | | | |
Wisconsin (0.7%) | | | | | |
| Milwaukee WI GO | 5.000% | 8/1/08 | | 2,525 | 2,555 |
| Wisconsin GO | 5.000% | 5/1/10 | | 5,160 | 5,349 |
| Wisconsin GO | 5.000% | 5/1/12 | (1) | 15,775 | 16,703 |
1 | Wisconsin GO TOB VRDO | 3.520% | 11/7/07 | (4) | 10,190 | 10,190 |
| Wisconsin Health & Educ. Fac. Auth. Rev. | | | | | |
| (Milwaukee Institute) PUT | 5.000% | 1/1/10 | LOC | 3,185 | 3,268 |
1 | Wisconsin Public Power System Power Supply | | | | | |
| System Rev. TOB VRDO | 3.490% | 11/7/07 | (2) | 10,370 | 10,370 |
| | | | | | 48,435 |
Multiple States (0.1%) | | | | | |
1 | Tax-Exempt Muni. Infrastructure | | | | | |
| Improvement Trust TOB | 4.220% | 11/2/10 | LOC | 5,000 | 5,063 |
1 | Various States TOB VRDO | 3.650% | 11/7/07 | (1)(3)(4) | 2,795 | 2,795 |
1 | Various States TOB VRDO | 3.650% | 11/7/07 | | 2,040 | 2,040 |
| | | | | | 9,898 |
Total Municipal Bonds (Cost $6,648,562) | | | | | 6,649,404 |
Limited-Term Tax-Exempt Fund
| | | | Market |
| | | | Value• |
| | Coupon | Shares | ($000) |
Temporary Cash Investment (0.0%) | | | |
3 | Vanguard Municipal Cash Management Fund | | | |
| (Cost $36) | 3.425% | 36,373 | 36 |
Total Investments (99.1%) (Cost $6,648,598) | | | 6,649,440 |
Other Assets and Liabilities (0.9%) | | | |
Other Assets—Note B | | | 96,749 |
Liabilities | | | (33,717) |
| | | | 63,032 |
Net Assets (100%) | | | 6,712,472 |
At October 31, 2007, net assets consisted of:4
| Amount |
| ($000) |
Paid-in Capital | 6,797,873 |
Undistributed Net Investment Income | — |
Accumulated Net Realized Losses | (86,243) |
Unrealized Appreciation | 842 |
Net Assets | 6,712,472 |
| |
| |
Investor Shares—Net Assets | |
Applicable to 167,630,093 outstanding $.001 par value shares of | |
beneficial interest (unlimited authorization) | 1,798,410 |
Net Asset Value Per Share—Investor Shares | $10.73 |
| |
| |
Admiral Shares—Net Assets | |
Applicable to 458,040,726 outstanding $.001 par value shares of | |
beneficial interest (unlimited authorization) | 4,914,062 |
Net Asset Value Per Share—Admiral Shares | $10.73 |
• See Note A in Notes to Financial Statements.
1 Security exempt from registration under Rule 144A of the Securities Act of 1933. Such securities may be sold in transactions exempt from registration, normally to qualified institutional buyers. At October 31, 2007, the aggregate value of these securities was $553,324,000, representing 8.2% of net assets.
2 Security purchased on a when-issued or delayed-delivery basis for which the fund has not taken delivery as of October 31, 2007.
3 Affiliated money market fund available only to Vanguard funds and certain trusts and accounts managed by Vanguard. Rate shown is the 7-day yield.
4 See Note D in Notes to Financial Statements for the tax-basis components of net assets.
For key to abbreviations and other references, see back cover.
Intermediate-Term Tax-Exempt Fund
| | | | | Face | Market |
| | | Maturity | | Amount | Value• |
| | Coupon | Date | | ($000) | ($000) |
| Municipal Bonds (95.7%) | | | | | |
| Alabama (0.2%) | | | | | |
| Alabama GO | 5.250% | 6/1/12 | | 5,105 | 5,391 |
| Alabama GO | 5.250% | 6/1/13 | | 5,105 | 5,391 |
| Alabama GO | 5.250% | 6/1/14 | | 5,155 | 5,444 |
| Alabama GO | 5.250% | 6/1/15 | | 3,455 | 3,643 |
| Courtland AL Dev. Board Pollution Control Rev. | | | | | |
| (International Paper Co.) | 5.000% | 6/1/25 | | 5,000 | 4,897 |
| Jefferson County AL Sewer Rev. | | | | | |
| (Capital Improvement) | 5.000% | 8/1/12 | (3)(Prere.) | 15,040 | 15,991 |
| | | | | | 40,757 |
| Alaska (0.1%) | | | | | |
| Anchorage AK Electric Rev. | 8.000% | 12/1/11 | (1) | 5,395 | 6,284 |
| Matanuska-Susitna Borough AK GO | 5.500% | 3/1/12 | (3) | 6,000 | 6,355 |
| North Slope Borough AK GO | 0.000% | 6/30/10 | (1) | 8,000 | 7,251 |
| | | | | | 19,890 |
| Arizona (1.8%) | | | | | |
| Arizona School Fac. Board Rev. | | | | | |
| (State School Improvement) | 5.500% | 7/1/11 | (Prere.) | 11,030 | 11,779 |
| Arizona School Fac. Board Rev. | | | | | |
| (State School Improvement) | 5.500% | 7/1/11 | (Prere.) | 5,000 | 5,339 |
| Arizona School Fac. Board Rev. | | | | | |
| (State School Improvement) | 5.500% | 7/1/11 | (Prere.) | 5,500 | 5,873 |
| Arizona School Fac. Board Rev. COP | 5.000% | 9/1/11 | (1) | 10,000 | 10,515 |
| Arizona Transp. Board Highway Rev. | 6.000% | 7/1/10 | | 25,000 | 26,610 |
| Arizona Transp. Board Highway Rev. | 5.000% | 7/1/17 | | 11,960 | 12,844 |
| Arizona Transp. Board Highway Rev. | 5.250% | 7/1/18 | | 4,000 | 4,246 |
| Arizona Transp. Board Highway Rev. | 5.250% | 7/1/19 | | 4,110 | 4,359 |
| Arizona Transp. Board Highway Rev. | 5.000% | 7/1/22 | | 8,630 | 9,070 |
| Arizona Transp. Board Highway Rev. | 5.000% | 7/1/23 | | 8,180 | 8,537 |
| Arizona Transp. Board Highway Rev. | 5.000% | 7/1/24 | | 2,000 | 2,085 |
| Maricopa County AZ IDA Health Fac. Rev. | | | | | |
| (Catholic Healthcare West) | 5.000% | 7/1/16 | | 6,500 | 6,788 |
| Maricopa County AZ IDA Health Fac. Rev. | | | | | |
| (Catholic Healthcare West) | 5.000% | 7/1/17 | | 6,000 | 6,261 |
| Maricopa County AZ IDA Health Fac. Rev. | | | | | |
| (Catholic Healthcare West) | 5.000% | 7/1/18 | | 6,000 | 6,228 |
| Mesa AZ Util. System Rev. | 5.000% | 7/1/19 | (3) | 10,000 | 10,818 |
| Mesa AZ Util. System Rev. | 5.000% | 7/1/21 | (3) | 12,000 | 12,990 |
| Phoenix AZ Civic Improvement Corp. Airport Rev. | 5.250% | 7/1/09 | (4) | 4,795 | 4,897 |
| Phoenix AZ Civic Improvement Corp. Airport Rev. | 5.250% | 7/1/10 | (4) | 2,500 | 2,549 |
| Phoenix AZ Civic Improvement Corp. Airport Rev. | 5.250% | 7/1/11 | (4) | 3,000 | 3,059 |
| Phoenix AZ Civic Improvement Corp. | | | | | |
| Wastewater System Rev. | 5.375% | 7/1/12 | (3) | 9,645 | 10,224 |
| Phoenix AZ Civic Improvement Corp. | | | | | |
| Wastewater System Rev. | 5.375% | 7/1/13 | (3) | 5,000 | 5,300 |
| Phoenix AZ Civic Improvement Corp. | | | | | |
| Wastewater System Rev. | 5.375% | 7/1/14 | (3) | 6,820 | 7,230 |
| Phoenix AZ Civic Improvement Corp. | | | | | |
| Water System Rev. | 5.500% | 7/1/14 | (3) | 4,215 | 4,537 |
| Phoenix AZ GO | 7.500% | 7/1/08 | | 5,000 | 5,132 |
| Salt Verde Arizona Financial Project Rev. | 5.250% | 12/1/21 | | 3,500 | 3,627 |
| Salt Verde Arizona Financial Project Rev. | 5.250% | 12/1/22 | | 3,790 | 3,918 |
| Salt Verde Arizona Financial Project Rev. | 5.250% | 12/1/23 | | 3,335 | 3,437 |
| Salt Verde Arizona Financial Project Rev. | 5.250% | 12/1/24 | | 4,485 | 4,613 |
| Salt Verde Arizona Financial Project Rev. | 5.250% | 12/1/25 | | 10,000 | 10,259 |
Intermediate-Term Tax-Exempt Fund
| | | | | Face | Market |
| | | Maturity | | Amount | Value• |
| | Coupon | Date | | ($000) | ($000) |
| Salt Verde Arizona Financial Project Rev. | 5.250% | 12/1/26 | | 22,645 | 23,167 |
| Salt Verde Arizona Financial Project Rev. | 5.250% | 12/1/28 | | 22,910 | 23,231 |
| Scottsdale AZ Muni. Property Corp. Excise Tax Rev. | 5.000% | 7/1/16 | (Prere.) | 4,000 | 4,358 |
| Scottsdale AZ Muni. Property Corp. Excise Tax Rev. | 5.000% | 7/1/16 | (Prere.) | 7,350 | 8,007 |
| Scottsdale AZ Muni. Property Corp. Excise Tax Rev. | 5.000% | 7/1/16 | (Prere.) | 6,210 | 6,765 |
| Scottsdale AZ Muni. Property Corp. Excise Tax Rev. | 5.000% | 7/1/16 | (Prere.) | 7,780 | 8,476 |
| Tucson AZ GO | 7.375% | 7/1/13 | | 4,500 | 5,346 |
| | | | | | 292,474 |
| California (10.1%) | | | | | |
| Bay Area Toll Auth. CA Toll Bridge Rev. | 5.000% | 4/1/21 | | 20,195 | 21,403 |
| Bay Area Toll Auth. CA Toll Bridge Rev. | 5.000% | 4/1/22 | | 5,800 | 6,162 |
| Bay Area Toll Auth. CA Toll Bridge Rev. | 5.000% | 4/1/23 | | 28,000 | 29,492 |
| Bay Area Toll Auth. CA Toll Bridge Rev. | 5.000% | 4/1/23 | | 13,500 | 14,311 |
| Bay Area Toll Auth. CA Toll Bridge Rev. | 5.000% | 4/1/24 | | 29,930 | 31,417 |
| Bay Area Toll Auth. CA Toll Bridge Rev. | 5.000% | 4/1/24 | | 12,955 | 13,682 |
| Bay Area Toll Auth. CA Toll Bridge Rev. | 5.000% | 4/1/25 | | 17,000 | 17,808 |
| California GO | 5.750% | 8/1/08 | (3) | 855 | 860 |
| California GO | 6.300% | 9/1/10 | | 4,000 | 4,298 |
| California GO | 5.250% | 10/1/13 | (1) | 6,115 | 6,647 |
| California GO | 5.250% | 2/1/14 | | 20,000 | 21,439 |
| California GO | 5.250% | 11/1/14 | | 10,000 | 10,740 |
| California GO | 5.000% | 3/1/15 | | 11,910 | 12,664 |
| California GO | 5.250% | 11/1/15 | | 10,225 | 11,002 |
| California GO | 6.000% | 4/1/18 | | 11,980 | 13,872 |
| California GO | 5.000% | 12/1/18 | | 8,665 | 9,045 |
| California GO | 5.000% | 3/1/22 | (2) | 10,000 | 10,481 |
| California GO | 5.000% | 3/1/23 | | 38,920 | 39,926 |
| California GO | 5.000% | 3/1/23 | | 35,495 | 36,516 |
| California GO | 5.000% | 6/1/23 | (2) | 10,000 | 10,454 |
| California GO | 5.125% | 11/1/23 | | 7,000 | 7,333 |
| California GO | 5.000% | 3/1/24 | | 30,390 | 31,201 |
| California GO | 5.000% | 3/1/25 | | 14,125 | 14,472 |
| California GO | 5.000% | 8/1/26 | | 9,000 | 9,187 |
| California Health Fac. Finance Auth. Rev. | | | | | |
| (Cedars-Sinai Medical Center) | 5.000% | 11/15/17 | | 8,000 | 8,327 |
| California Health Fac. Finance Auth. Rev. | | | | | |
| (Cedars-Sinai Medical Center) | 5.000% | 11/15/19 | | 3,135 | 3,231 |
| California Health Fac. Finance Auth. Rev. | | | | | |
| (Cedars-Sinai Medical Center) | 5.000% | 11/15/20 | | 4,180 | 4,297 |
| California Health Fac. Finance Auth. Rev. | | | | | |
| (Cedars-Sinai Medical Center) | 5.000% | 11/15/21 | | 6,165 | 6,317 |
| California Public Works Board Lease Rev. | | | | | |
| (State Archives) | 5.375% | 12/1/09 | | 4,555 | 4,631 |
| California Public Works Board Lease Rev. | | | | | |
| (State Archives) | 5.375% | 12/1/10 | | 6,635 | 6,745 |
| California Public Works Board Lease Rev. | | | | | |
| (State Archives) | 5.375% | 12/1/12 | | 7,895 | 8,026 |
| California Public Works Board Lease Rev. | | | | | |
| (Univ. of California) | 5.000% | 5/1/14 | | 8,370 | 8,942 |
| California Public Works Board Lease Rev. | | | | | |
| (Univ. of California) | 5.000% | 5/1/15 | | 10,105 | 10,833 |
| California Public Works Board Lease Rev. | | | | | |
| (Univ. of California) | 5.000% | 5/1/16 | | 8,750 | 9,310 |
| California Public Works Board Lease Rev. | | | | | |
| (Univ. of California) | 5.000% | 5/1/17 | | 7,085 | 7,495 |
Intermediate-Term Tax-Exempt Fund
| | | | | Face | Market |
| | | Maturity | | Amount | Value• |
| | Coupon | Date | | ($000) | ($000) |
| California Public Works Board Lease Rev. | | | | | |
| (Univ. of California) | 5.000% | 5/1/18 | | 6,500 | 6,843 |
| California Public Works Board Lease Rev. | | | | | |
| (Univ. of California) | 5.000% | 5/1/19 | | 11,820 | 12,400 |
| California Public Works Board Lease Rev. | | | | | |
| (Univ. of California) | 5.000% | 5/1/20 | | 10,000 | 10,458 |
| California Public Works Board Lease Rev. | | | | | |
| (Univ. of California) | 5.000% | 5/1/21 | | 15,230 | 15,868 |
| California Public Works Board Lease Rev. | | | | | |
| (Univ. of California) | 5.000% | 5/1/22 | | 15,985 | 16,602 |
| California Public Works Board Lease Rev. | | | | | |
| (Univ. of California) | 5.000% | 5/1/23 | | 11,465 | 11,886 |
| California Public Works Board Lease Rev. | | | | | |
| (Univ. of California) | 5.000% | 5/1/24 | | 10,000 | 10,335 |
| California Public Works Board Lease Rev. | | | | | |
| (Univ. of California) | 5.000% | 5/1/25 | | 7,500 | 7,736 |
| California Public Works Board Lease Rev. | | | | | |
| (Univ. of California) | 5.000% | 5/1/26 | | 7,500 | 7,732 |
| California State Dept. of Water Resources | | | | | |
| Power Supply Rev. | 5.375% | 5/1/12 | (2)(Prere.) | 37,000 | 40,263 |
| California State Dept. of Water Resources | | | | | |
| Power Supply Rev. | 5.500% | 5/1/12 | (1) | 8,000 | 8,652 |
| California State Dept. of Water Resources | | | | | |
| Power Supply Rev. | 6.000% | 5/1/12 | (Prere.) | 15,000 | 16,710 |
| California State Dept. of Water Resources | | | | | |
| Power Supply Rev. | 6.000% | 5/1/13 | | 20,000 | 22,034 |
| California State Dept. of Water Resources | | | | | |
| Power Supply Rev. | 5.500% | 5/1/14 | (2) | 10,000 | 10,864 |
| California State Dept. of Water Resources | | | | | |
| Power Supply Rev. | 5.500% | 5/1/15 | (2) | 61,875 | 67,085 |
| California State Econ. Recovery Bonds | 5.000% | 7/1/15 | | 93,700 | 100,748 |
| California State Econ. Recovery Bonds | 5.000% | 7/1/16 | | 7,000 | 7,348 |
| California Statewide Community Dev. Auth. Rev. | | | | | |
| (Catholic Healthcare West) | 6.000% | 7/1/09 | (ETM) | 995 | 1,020 |
| California Statewide Community Dev. Auth. Rev. | | | | | |
| (Catholic Healthcare West) | 6.000% | 7/1/09 | (ETM) | 300 | 307 |
| California Statewide Community Dev. Auth. Rev. | | | | | |
| (Irvine Apartments) PUT | 4.900% | 5/15/08 | | 73,000 | 73,426 |
| California Statewide Community Dev. Auth. Rev. | | | | | |
| (Irvine Apartments) PUT | 5.100% | 5/17/10 | | 8,750 | 8,909 |
| California Statewide Community Dev. Auth. Rev. | | | | | |
| (Kaiser Permanente) PUT | 2.625% | 5/1/08 | | 30,000 | 29,767 |
| California Statewide Community Dev. Auth. Rev. | | | | | |
| (Kaiser Permanente) PUT | 4.700% | 6/1/09 | | 55,000 | 55,943 |
| California Statewide Community Dev. Auth. Rev. | | | | | |
| (Kaiser Permanente) PUT | 3.900% | 7/1/14 | | 23,550 | 23,557 |
| Contra Costa CA (Merrithew Memorial Hosp.) COP | 5.500% | 11/1/07 | (1)(Prere.) | 5,660 | 5,773 |
| East Bay CA Muni. Util. Dist. Water System Rev. | 5.250% | 6/1/11 | (1)(Prere.) | 8,110 | 8,606 |
| Fresno CA Sewer Rev. | 6.250% | 9/1/14 | (2) | 12,000 | 13,462 |
| Golden State Tobacco Securitization Corp. California | 6.250% | 6/1/13 | (Prere.) | 39,580 | 43,400 |
| Golden State Tobacco Securitization Corp. California | 6.750% | 6/1/13 | (Prere.) | 79,735 | 92,290 |
| Golden State Tobacco Securitization Corp. California | 5.000% | 6/1/14 | | 9,000 | 9,151 |
| Golden State Tobacco Securitization Corp. California | 5.000% | 6/1/15 | | 6,505 | 6,587 |
| Golden State Tobacco Securitization Corp. California | 5.000% | 6/1/16 | | 12,545 | 12,632 |
| Golden State Tobacco Securitization Corp. California | 5.000% | 6/1/17 | | 11,255 | 11,280 |
| Golden State Tobacco Securitization Corp. California | 5.000% | 6/1/21 | (2) | 15,000 | 15,486 |
Intermediate-Term Tax-Exempt Fund
| | | | | Face | Market |
| | | Maturity | | Amount | Value• |
| | Coupon | Date | | ($000) | ($000) |
| Golden State Tobacco Securitization Corp. California | 4.500% | 6/1/27 | | 13,410 | 12,499 |
| Golden State Tobacco Securitization Corp. California | 5.000% | 6/1/29 | (2) | 40,000 | 40,719 |
| Golden State Tobacco Securitization Corp. California | 5.000% | 6/1/30 | (2) | 20,000 | 20,389 |
| Los Angeles CA Dept. of Water & Power Rev. | 5.250% | 7/1/15 | | 20,000 | 21,130 |
| Los Angeles CA USD GO | 5.000% | 7/1/23 | (3) | 46,690 | 49,083 |
| Los Angeles CA USD GO | 5.000% | 7/1/23 | (3) | 24,035 | 25,400 |
| Los Angeles CA USD GO | 5.000% | 7/1/24 | (1) | 19,915 | 20,869 |
| Los Angeles County CA Transp. Comm. | | | | | |
| Sales Tax Rev. | 6.500% | 7/1/10 | (4) | 41,365 | 43,431 |
| Oakland CA Redev. Agency (Central Dist.) | 5.000% | 9/1/21 | (2) | 11,775 | 12,414 |
| Oakland CA Redev. Agency (Central Dist.) | 5.000% | 9/1/22 | (2) | 7,015 | 7,372 |
| Saddleback Valley CA USD | 5.000% | 8/1/23 | (4) | 5,460 | 5,721 |
| San Bernardino County CA Medical Center COP | 7.000% | 8/1/08 | (1) | 9,045 | 9,278 |
| San Bernardino County CA Medical Center COP | 7.000% | 8/1/09 | (1) | 9,705 | 10,278 |
| San Bernardino County CA Medical Center COP | 7.000% | 8/1/10 | (1) | 10,525 | 11,473 |
| San Diego CA USD GO | 5.500% | 7/1/24 | (4) | 6,620 | 7,541 |
| San Diego CA USD GO | 5.500% | 7/1/25 | (4) | 14,680 | 16,745 |
| San Diego CA USD GO | 5.500% | 7/1/26 | (4) | 23,990 | 27,424 |
| San Diego CA USD GO | 5.500% | 7/1/27 | | 17,695 | 20,213 |
| Univ. of California Rev. | 5.000% | 5/15/21 | | 11,125 | 11,815 |
| Univ. of California Rev. | 5.000% | 5/15/22 | | 10,000 | 10,584 |
| Univ. of California Rev. | 5.000% | 5/15/33 | (2) | 20,000 | 20,585 |
| | | | | | 1,652,689 |
Colorado (1.9%) | | | | | |
| Colorado Dept. of Transp. Rev. | 6.000% | 6/15/10 | (2)(Prere.) | 18,935 | 20,226 |
| Colorado Dept. of Transp. Rev. | 6.000% | 6/15/10 | (2)(Prere.) | 10,000 | 10,682 |
| Colorado Dept. of Transp. Rev. | 6.000% | 6/15/10 | (2)(Prere.) | 20,000 | 21,364 |
| Colorado Dept. of Transp. Rev. | 6.000% | 6/15/10 | (2)(Prere.) | 10,000 | 10,682 |
| Colorado Dept. of Transp. Rev. | 5.500% | 6/15/11 | (1)(Prere.) | 25,185 | 27,097 |
| Colorado Dept. of Transp. Rev. | 5.500% | 6/15/11 | (1)(Prere.) | 20,795 | 22,374 |
| Colorado Dept. of Transp. Rev. | 5.500% | 6/15/11 | (1)(Prere.) | 6,185 | 6,655 |
| Colorado Dept. of Transp. Rev. | 5.375% | 6/15/12 | (Prere.) | 8,500 | 9,232 |
| Colorado Dept. of Transp. Rev. | 5.500% | 6/15/12 | (1) | 11,780 | 12,741 |
| Colorado Dept. of Transp. Rev. | 5.500% | 6/15/13 | (1) | 14,500 | 15,868 |
| Colorado Health Fac. Auth. Rev. | | | | | |
| (Poudre Valley Health) | 6.000% | 12/1/09 | (4)(Prere.) | 5,500 | 5,827 |
| Colorado Health Fac. Auth. Rev. | | | | | |
| (Poudre Valley Health) | 6.000% | 12/1/09 | (4)(Prere.) | 5,185 | 5,493 |
| Colorado Health Fac. Auth. Rev. | | | | | |
| (Sisters of Charity Health System Inc.) | 5.250% | 12/1/09 | (1) | 2,965 | 3,025 |
| Colorado Health Fac. Auth. Rev. | | | | | |
| (Sisters of Charity Health System Inc.) | 5.250% | 12/1/10 | (1) | 1,740 | 1,773 |
| Colorado Health Fac. Auth. Rev. | | | | | |
| (Sisters of Charity Health System Inc.) | 5.250% | 12/1/11 | (1) | 3,415 | 3,478 |
| Colorado Springs CO Util. System Rev. | 5.000% | 11/15/09 | | 5,000 | 5,155 |
| Colorado Springs CO Util. System Rev. | 5.375% | 11/15/12 | | 12,620 | 13,465 |
| Colorado Springs CO Util. System Rev. | 5.375% | 11/15/14 | | 12,745 | 13,583 |
| Denver CO City & County GO (Justice System Fac.) | 5.000% | 8/1/18 | | 6,490 | 6,967 |
| Denver CO City & County GO (Justice System Fac.) | 5.000% | 8/1/19 | | 5,865 | 6,267 |
| Denver CO City & County GO (Justice System Fac.) | 5.000% | 8/1/20 | | 8,255 | 8,790 |
| Denver CO City & County GO (Medical Fac.) | 5.000% | 8/1/14 | | 7,065 | 7,543 |
| E-470 Public Highway Auth. Colorado Rev. | 0.000% | 9/1/10 | (1)(Prere.) | 8,100 | 6,613 |
| E-470 Public Highway Auth. Colorado Rev. | 0.000% | 9/1/11 | (1)(ETM) | 6,600 | 5,726 |
| E-470 Public Highway Auth. Colorado Rev. | 0.000% | 9/1/11 | (1) | 8,000 | 6,933 |
| E-470 Public Highway Auth. Colorado Rev. | 0.000% | 9/1/17 | (1) | 24,490 | 16,153 |
| E-470 Public Highway Auth. Colorado Rev. | 0.000% | 9/1/19 | (1) | 15,100 | 8,991 |
Intermediate-Term Tax-Exempt Fund
| | | | | Face | Market |
| | | Maturity | | Amount | Value• |
| | Coupon | Date | | ($000) | ($000) |
| E-470 Public Highway Auth. Colorado Rev. | 0.000% | 9/1/24 | (1) | 20,000 | 9,165 |
| Larimer County CO School Dist. No. R-1 Poudre GO | 5.000% | 12/15/16 | (4) | 10,135 | 10,992 |
| Northern Colorado Water Conservation Dist. Rev. | 6.350% | 12/1/07 | (2) | 4,155 | 4,165 |
| Univ. of Colorado Enterprise System Rev. | 5.000% | 6/1/21 | (3) | 6,605 | 6,958 |
| | | | | | 313,983 |
Connecticut (1.5%) | | | | | |
| Connecticut GO | 5.400% | 11/15/07 | | 685 | 686 |
| Connecticut GO | 5.000% | 4/15/08 | | 4,510 | 4,543 |
| Connecticut GO | 5.250% | 6/15/08 | | 7,000 | 7,080 |
| Connecticut GO | 5.000% | 4/15/09 | | 6,810 | 6,964 |
| Connecticut GO | 5.375% | 12/15/10 | (Prere.) | 6,165 | 6,515 |
| Connecticut GO | 5.375% | 6/15/11 | (Prere.) | 5,000 | 5,321 |
| Connecticut GO | 5.125% | 11/15/11 | (Prere.) | 25,375 | 26,945 |
| Connecticut GO | 5.125% | 11/15/11 | (Prere.) | 5,675 | 6,030 |
| Connecticut GO | 5.500% | 11/15/11 | (4) | 21,215 | 22,833 |
| Connecticut GO | 5.500% | 12/15/11 | (1) | 9,000 | 9,699 |
| Connecticut GO | 5.500% | 12/15/12 | (4) | 5,020 | 5,477 |
| Connecticut GO | 5.000% | 11/1/13 | | 10,000 | 10,738 |
| Connecticut GO | 5.125% | 11/15/13 | | 19,000 | 20,087 |
| Connecticut GO | 5.500% | 12/15/13 | | 4,705 | 5,187 |
| Connecticut GO | 5.500% | 12/15/14 | | 7,700 | 8,571 |
| Connecticut GO | 5.000% | 11/1/15 | | 5,000 | 5,433 |
| Connecticut GO | 5.000% | 12/15/15 | | 14,345 | 15,601 |
| Connecticut GO | 5.000% | 12/15/17 | | 5,400 | 5,852 |
| Connecticut GO | 5.000% | 12/15/18 | | 11,000 | 11,868 |
| Connecticut GO | 5.000% | 12/15/20 | | 23,650 | 25,311 |
| Connecticut Special Tax Obligation Rev. | | | | | |
| (Transp. Infrastructure) | 7.125% | 6/1/10 | | 12,000 | 12,740 |
| Connecticut Special Tax Obligation Rev. | | | | | |
| (Transp. Infrastructure) | 5.375% | 10/1/13 | (4) | 20,000 | 21,285 |
| Connecticut State Health & Educ. Fac. Auth. | | | | | |
| (Connecticut State Univ. System) | 5.000% | 11/1/12 | (4) | 6,275 | 6,709 |
| | | | | | 251,475 |
Delaware (0.1%) | | | | | |
| Delaware GO | 5.000% | 5/1/13 | | 8,675 | 9,288 |
| | | | | |
District of Columbia (0.9%) | | | | | |
| District of Columbia GO | 5.200% | 6/1/08 | (2) | 4,390 | 4,433 |
| District of Columbia GO | 5.250% | 6/1/08 | (1) | 7,855 | 7,937 |
| District of Columbia GO | 5.250% | 6/1/08 | (1)(ETM) | 2,145 | 2,167 |
| District of Columbia GO | 5.500% | 6/1/08 | (4)(ETM) | 1,275 | 1,290 |
| District of Columbia GO | 5.500% | 6/1/08 | (4) | 3,725 | 3,769 |
| District of Columbia GO | 5.500% | 6/1/09 | (4)(Prere.) | 1,890 | 1,967 |
| District of Columbia GO | 5.500% | 6/1/10 | (4) | 15,000 | 15,742 |
| District of Columbia GO | 5.500% | 6/1/10 | (2) | 10,490 | 11,009 |
| District of Columbia GO | 5.750% | 6/1/10 | (1) | 15,465 | 16,321 |
| District of Columbia GO | 6.000% | 6/1/11 | (1) | 6,550 | 7,083 |
| District of Columbia GO | 5.500% | 6/1/12 | (4) | 4,630 | 4,801 |
| District of Columbia GO | 0.000% | 6/1/13 | (1) | 10,945 | 8,822 |
| District of Columbia GO | 0.000% | 6/1/14 | (1) | 16,650 | 12,829 |
| District of Columbia Hosp. Rev. | | | | | |
| (Medlantic Health Group) | 6.000% | 8/15/08 | (1)(ETM) | 3,160 | 3,221 |
| District of Columbia Hosp. Rev. | | | | | |
| (Medlantic Health Group) | 6.000% | 8/15/10 | (1)(ETM) | 2,555 | 2,724 |
| District of Columbia Hosp. Rev. | | | | | |
| (Medlantic Health Group) | 6.000% | 8/15/12 | (1)(ETM) | 2,995 | 3,310 |
Intermediate-Term Tax-Exempt Fund
| | | | | Face | Market |
| | | Maturity | | Amount | Value• |
| | Coupon | Date | | ($000) | ($000) |
| District of Columbia Rev. (Georgetown Univ.) | 5.000% | 4/1/21 | (2) | 5,610 | 5,934 |
| District of Columbia Rev. (Georgetown Univ.) | 5.000% | 4/1/22 | (2) | 5,800 | 6,111 |
| District of Columbia Rev. (Georgetown Univ.) | 5.000% | 4/1/23 | (2) | 6,600 | 6,934 |
| District of Columbia Rev. (Georgetown Univ.) | 5.000% | 4/1/24 | (2) | 6,190 | 6,493 |
| District of Columbia Water & Sewer Auth. | | | | | |
| Public Util. Rev. | 5.500% | 10/1/23 | (4) | 15,115 | 17,061 |
| | | | | | 149,958 |
Florida (4.5%) | | | | | |
| Broward County FL Resource Recovery Rev. | | | | | |
| (Wheelabrator Series A) | 5.375% | 12/1/09 | | 15,885 | 16,348 |
| Broward County FL Resource Recovery Rev. | | | | | |
| (Wheelabrator-South) | 5.375% | 12/1/09 | | 2,000 | 2,058 |
| Broward County FL Resource Recovery Rev. | | | | | |
| (Wheelabrator-South) | 5.375% | 12/1/10 | | 21,330 | 21,949 |
| Broward County FL School Board COP | 5.250% | 7/1/20 (1) | | 4,155 | 4,424 |
| Citizens Property Insurance Corp. Florida | | | | | |
| (High Risk Account) | 5.000% | 3/1/14 | (1) | 35,000 | 37,398 |
| Florida Board of Educ. Capital Outlay | 5.250% | 1/1/08 | (Prere.) | 15,775 | 15,977 |
| Florida Board of Educ. Capital Outlay | 5.000% | 6/1/08 | | 5,000 | 5,046 |
| Florida Board of Educ. Capital Outlay | 6.000% | 6/1/10 | (Prere.) | 4,530 | 4,856 |
| Florida Board of Educ. Capital Outlay | 5.250% | 6/1/13 | | 3,845 | 4,145 |
| Florida Board of Educ. Public Educ. | 5.250% | 6/1/13 | (4) | 17,825 | 19,169 |
| Florida Board of Educ. Public Educ. | 5.375% | 6/1/13 | | 6,820 | 7,370 |
| Florida Board of Educ. Public Educ. | 5.000% | 6/1/14 | | 5,040 | 5,404 |
| Florida Board of Educ. Rev. (Lottery Rev.) | 5.250% | 7/1/10 | (3) | 5,800 | 5,922 |
| Florida Board of Educ. Rev. (Lottery Rev.) | 5.250% | 7/1/11 | (3) | 10,840 | 11,066 |
| Florida Board of Educ. Rev. (Lottery Rev.) | 5.250% | 7/1/12 | (3) | 11,410 | 11,647 |
| Florida Board of Educ. Rev. (Lottery Rev.) | 5.250% | 7/1/13 | (3) | 7,150 | 7,697 |
| Florida Board of Educ. Rev. (Lottery Rev.) | 5.250% | 7/1/13 | (2) | 18,200 | 19,658 |
| Florida Board of Educ. Rev. (Lottery Rev.) | 5.500% | 7/1/13 | (3) | 7,860 | 8,545 |
| Florida Board of Educ. Rev. (Lottery Rev.) | 5.500% | 7/1/13 | (2) | 10,875 | 11,670 |
| Florida Board of Educ. Rev. (Lottery Rev.) | 5.000% | 7/1/14 | (1) | 6,000 | 6,438 |
| Florida Board of Educ. Rev. (Lottery Rev.) | 5.250% | 7/1/14 | (3) | 3,700 | 3,980 |
| Florida Board of Educ. Rev. (Lottery Rev.) | 5.250% | 7/1/14 | (2) | 19,155 | 20,870 |
| Florida Board of Educ. Rev. (Lottery Rev.) | 5.000% | 7/1/15 | (1) | 10,240 | 10,979 |
| Florida Board of Educ. Rev. (Lottery Rev.) | 5.250% | 7/1/15 | (2) | 10,165 | 11,137 |
| Florida Board of Educ. Rev. (Lottery Rev.) | 5.375% | 7/1/15 | (3) | 5,000 | 5,273 |
| Florida Board of Educ. Rev. (Lottery Rev.) | 5.000% | 7/1/16 | (2) | 6,215 | 6,710 |
| Florida Board of Educ. Rev. (Lottery Rev.) | 5.375% | 7/1/17 | (3) | 6,000 | 6,448 |
| Florida Board of Educ. Rev. (Lottery Rev.) | 5.000% | 7/1/20 | (2) | 12,845 | 13,632 |
| Florida Board of Educ. Rev. (Lottery Rev.) | 5.000% | 7/1/21 | (2) | 13,390 | 14,161 |
| Florida Board of Educ. Rev. (Lottery Rev.) | 5.000% | 7/1/23 | (2) | 11,235 | 11,798 |
| Florida Dept. of Environmental | | | | | |
| Protection & Preservation Rev. | 5.000% | 7/1/09 | (4) | 18,580 | 19,057 |
| Florida Dept. of Environmental | | | | | |
| Protection & Preservation Rev. | 5.000% | 7/1/09 | (1) | 14,330 | 14,698 |
| Florida Dept. of Environmental | | | | | |
| Protection & Preservation Rev. | 5.750% | 7/1/10 | (3) | 3,615 | 3,824 |
| Florida Dept. of Environmental | | | | | |
| Protection & Preservation Rev. | 5.375% | 7/1/13 | (1) | 7,645 | 8,270 |
| Florida Dept. of Environmental | | | | | |
| Protection & Preservation Rev. | 5.500% | 7/1/13 | (4) | 11,920 | 13,026 |
| Florida Dept. of Transp. | 5.250% | 7/1/15 | | 4,000 | 4,147 |
| Florida Division Board Financial Dept. | | | | | |
| of General Services Systems Rev. | | | | | |
| (Dept. of Environmental Protection) | 6.000% | 7/1/12 | (2) | 11,500 | 12,655 |
Intermediate-Term Tax-Exempt Fund
| | | | | Face | Market |
| | | Maturity | | Amount | Value• |
| | Coupon | Date | | ($000) | ($000) |
| Florida Hurricane Catastrophe Fund Finance | | | | | |
| Corp. Rev. | 5.000% | 7/1/12 | | 40,000 | 42,173 |
| Florida Hurricane Catastrophe Fund Finance | | | | | |
| Corp. Rev. | 5.250% | 7/1/12 | | 17,865 | 19,025 |
| Florida Muni. Power Agency Rev. (Stanton Project) | 5.500% | 10/1/13 | (4) | 3,905 | 4,222 |
| Florida Turnpike Auth. Rev. | 5.250% | 7/1/11 | (3) | 2,185 | 2,230 |
| Florida Turnpike Auth. Rev. | 5.250% | 7/1/11 | (4) | 5,000 | 5,295 |
| Florida Turnpike Auth. Rev. | 5.000% | 7/1/16 | (4) | 10,000 | 10,634 |
| Florida Turnpike Auth. Rev. | 5.000% | 7/1/19 | (2) | 4,425 | 4,713 |
| Florida Turnpike Auth. Rev. | 5.000% | 7/1/20 | (2) | 4,645 | 4,930 |
| Florida Turnpike Auth. Rev. | 5.000% | 7/1/25 | (2) | 5,885 | 6,154 |
| Fort Myers FL Rev. | 5.000% | 12/1/25 | (1) | 7,340 | 7,661 |
| Highlands County FL Health Rev. | | | | | |
| (Adventist Health System) | 5.000% | 11/15/15 | (Prere.) | 820 | 884 |
| Highlands County FL Health Rev. | | | | | |
| (Adventist Health System) | 5.000% | 11/15/20 | | 1,000 | 1,029 |
| Highlands County FL Health Rev. | | | | | |
| (Adventist Health System) | 5.000% | 11/15/20 | | 1,000 | 1,029 |
| Highlands County FL Health Rev. | | | | | |
| (Adventist Health System) | 5.000% | 11/15/21 | | 280 | 287 |
| Highlands County FL Health Rev. | | | | | |
| (Adventist Health System) | 5.000% | 11/15/21 | | 1,000 | 1,025 |
| Highlands County FL Health Rev. | | | | | |
| (Adventist Health System) | 5.000% | 11/15/22 | | 1,000 | 1,023 |
| Highlands County FL Health Rev. | | | | | |
| (Adventist Health System) | 5.000% | 11/15/22 | | 1,000 | 1,023 |
| Highlands County FL Health Rev. | | | | | |
| (Adventist Health System) | 5.000% | 11/15/23 | | 500 | 510 |
| Highlands County FL Health Rev. | | | | | |
| (Adventist Health System) | 5.000% | 11/15/23 | | 1,500 | 1,531 |
| Highlands County FL Health Rev. | | | | | |
| (Adventist Health System) | 5.000% | 11/15/27 | | 10,000 | 10,112 |
| Hillsborough County FL School Board COP | 5.500% | 7/1/14 | (1) | 4,370 | 4,798 |
| Hillsborough County FL Util. Rev. | 5.500% | 8/1/13 | (2) | 10,000 | 10,928 |
| Jacksonville FL Electric Auth. Rev. | | | | | |
| (St. John’s River Power Park) | 5.000% | 10/1/19 | (1) | 5,000 | 5,266 |
| Jacksonville FL Electric Auth. Rev. | | | | | |
| (St. John’s River Power Park) | 5.000% | 10/1/20 | (1) | 5,000 | 5,249 |
| Jacksonville FL Sales Taxes Rev. | 5.500% | 10/1/13 | (3) | 3,045 | 3,335 |
| Lakeland FL Electric & Water Rev. | 6.050% | 10/1/12 | (4) | 10,000 | 11,076 |
| Miami-Dade County FL School Board COP | 5.250% | 8/1/09 | (2) | 11,320 | 11,574 |
| Miami-Dade County FL School Board COP | 5.250% | 8/1/10 | (2) | 12,140 | 12,413 |
| Miami-Dade County FL School Board COP | 5.000% | 11/1/21 | (2) | 3,280 | 3,445 |
| Miami-Dade County FL School Board COP | 5.000% | 11/1/22 | (2) | 3,155 | 3,297 |
| Miami-Dade County FL School Board COP | 5.000% | 11/1/23 | (2) | 2,500 | 2,611 |
| Miami-Dade County FL School Board COP | 5.000% | 11/1/25 | (2) | 5,025 | 5,224 |
| Orange County FL School Board COP | 5.000% | 8/1/23 | (3) | 9,000 | 9,388 |
| Orange County FL School Board COP | 5.000% | 8/1/24 | (3) | 4,000 | 4,164 |
| Orange County FL Tourist Dev. Rev. | 5.000% | 10/1/27 | (2) | 12,630 | 13,089 |
| Orlando & Orange County FL Expressway Auth. | 5.250% | 7/1/14 | (2) | 4,000 | 4,306 |
| Orlando FL Util. Comm. Water & Electric Rev. | 5.250% | 10/1/13 | (ETM) | 10,000 | 10,883 |
| Orlando FL Util. Comm. Water & Electric Rev. | 5.250% | 10/1/14 | (ETM) | 5,000 | 5,491 |
| Seminole County FL Water & Sewer Rev. | 5.000% | 10/1/23 | | 5,000 | 5,249 |
| Seminole County FL Water & Sewer Rev. | 5.000% | 10/1/24 | | 7,805 | 8,176 |
| South Florida Water Management Dist. | 5.000% | 10/1/13 | (2) | 5,000 | 5,322 |
| South Florida Water Management Dist. | 5.000% | 10/1/14 | (2) | 9,460 | 10,130 |
| South Florida Water Management Dist. | 5.000% | 10/1/15 | (2) | 5,800 | 6,229 |
Intermediate-Term Tax-Exempt Fund
| | | | | Face | Market |
| | | Maturity | | Amount | Value• |
| | Coupon | Date | | ($000) | ($000) |
| South Florida Water Management Dist. | 5.000% | 10/1/16 | (2) | 3,000 | 3,222 |
| Sunshine State Florida Govt. Financing | | | | | |
| Comm. Rev. VRDO | 3.640% | 11/1/07 | (2) | 3,500 | 3,500 |
| Tallahassee FL Health Fac. Rev. | | | | | |
| (Tallahassee Memorial Healthcare) | 6.250% | 12/1/20 | | 10,000 | 10,393 |
| Tampa FL Health System Rev. | | | | | |
| (Catholic Healthcare East) | 5.250% | 11/15/11 | (1) | 3,000 | 3,109 |
| Tampa-Hillsborough County FL | | | | | |
| Expressway Auth. Rev. | 5.000% | 7/1/24 | (2) | 15,350 | 16,063 |
| | | | | | 730,872 |
Georgia (4.6%) | | | | | |
| Atlanta GA Airport Fac. Rev. | 5.875% | 1/1/15 | (3) | 11,930 | 12,608 |
| Atlanta GA Airport Fac. Rev. | 5.875% | 1/1/16 | (3) | 5,000 | 5,285 |
| Atlanta GA Airport Passenger Charge Rev. | 5.000% | 1/1/33 | (4) | 9,000 | 9,214 |
| Atlanta GA Water & Wastewater Rev. | 5.500% | 11/1/10 | (3) | 10,000 | 10,526 |
| Atlanta GA Water & Wastewater Rev. | 5.500% | 11/1/11 | (3) | 10,000 | 10,667 |
| Atlanta GA Water & Wastewater Rev. | 5.750% | 11/1/25 | (4) | 10,000 | 11,721 |
| Atlanta GA Water & Wastewater Rev. | 5.750% | 11/1/26 | (4) | 15,460 | 18,195 |
| Atlanta GA Water & Wastewater Rev. | 5.750% | 11/1/27 | (4) | 6,635 | 7,808 |
| Atlanta GA Water & Wastewater Rev. | 5.750% | 11/1/28 | (4) | 7,500 | 8,844 |
| Burke County GA Dev. Auth. PCR | | | | | |
| (Georgia Power Co. Plant Vogtle) PUT | 4.450% | 12/1/08 | | 37,375 | 37,665 |
| DeKalb County GA Water & Sewer Rev. | 5.250% | 10/1/24 | | 9,000 | 10,043 |
| DeKalb County GA Water & Sewer Rev. | 5.250% | 10/1/25 | | 17,590 | 19,639 |
| DeKalb County GA Water & Sewer Rev. | 5.250% | 10/1/26 | | 21,310 | 23,853 |
| Fulton County GA COP | 5.750% | 11/1/11 | (2) | 6,000 | 6,426 |
| Fulton County GA COP | 6.000% | 11/1/12 | (2) | 5,985 | 6,447 |
| Fulton County GA COP | 6.000% | 11/1/13 | (2) | 6,325 | 6,814 |
| Fulton County GA COP | 6.000% | 11/1/14 | (2) | 4,675 | 5,036 |
| Fulton County GA School Dist. GO | 6.375% | 5/1/10 | | 11,540 | 12,005 |
| Georgia GO | 7.000% | 11/1/07 | | 17,960 | 17,960 |
| Georgia GO | 7.400% | 8/1/08 | (ETM) | 170 | 175 |
| Georgia GO | 7.400% | 8/1/08 | | 5,710 | 5,876 |
| Georgia GO | 7.400% | 8/1/08 | (ETM) | 20 | 21 |
| Georgia GO | 7.100% | 9/1/09 | | 7,900 | 8,407 |
| Georgia GO | 7.450% | 1/1/10 | | 4,000 | 4,327 |
| Georgia GO | 6.250% | 8/1/10 | | 7,800 | 8,372 |
| Georgia GO | 6.750% | 9/1/10 | | 8,000 | 8,706 |
| Georgia GO | 5.700% | 7/1/11 | | 4,470 | 4,813 |
| Georgia GO | 5.750% | 9/1/11 | | 2,500 | 2,705 |
| Georgia GO | 5.000% | 10/1/11 | | 18,810 | 19,869 |
| Georgia GO | 5.000% | 11/1/11 | (Prere.) | 15,570 | 16,441 |
| Georgia GO | 5.000% | 11/1/11 | (Prere.) | 16,500 | 17,423 |
| Georgia GO | 5.250% | 12/1/11 | | 18,320 | 19,565 |
| Georgia GO | 5.400% | 4/1/13 | | 7,525 | 8,194 |
| Georgia GO | 5.000% | 10/1/13 | | 21,050 | 22,619 |
| Georgia GO | 5.500% | 7/1/14 | | 15,750 | 17,479 |
| Georgia GO | 5.000% | 10/1/14 | | 19,250 | 20,844 |
| Georgia GO | 5.500% | 7/1/15 | | 10,000 | 11,199 |
| Georgia GO | 5.000% | 10/1/15 | | 21,910 | 23,857 |
| Georgia GO | 5.000% | 4/1/16 | | 15,590 | 16,967 |
| Georgia GO | 5.000% | 7/1/16 | | 10,000 | 10,902 |
| Georgia GO | 5.000% | 7/1/16 | | 8,000 | 8,650 |
| Georgia GO | 5.000% | 10/1/16 | | 24,515 | 26,770 |
| Georgia GO | 5.000% | 10/1/18 | | 20,735 | 22,409 |
| Georgia GO | 5.000% | 9/1/19 | | 7,580 | 8,075 |
Intermediate-Term Tax-Exempt Fund
| | | | | Face | Market |
| | | Maturity | | Amount | Value• |
| | Coupon | Date | | ($000) | ($000) |
| Georgia Road & Tollway Auth. Rev. | 5.000% | 10/1/21 | | 14,250 | 14,986 |
| Georgia Road & Tollway Auth. Rev. | 5.000% | 10/1/22 | | 10,355 | 10,890 |
| Georgia Road & Tollway Auth. Rev. | | | | | |
| (Governor’s Transp. Choices) | 5.375% | 3/1/14 | | 9,385 | 10,032 |
| Georgia Road & Tollway Auth. Rev. | | | | | |
| (Governor’s Transp. Choices) | 5.375% | 3/1/15 | | 8,775 | 9,373 |
| Georgia Road & Tollway Auth. Rev. | | | | | |
| (Governor’s Transp. Choices) | 5.375% | 3/1/16 | | 9,000 | 9,620 |
| Main Street Natural Gas Inc. Georgia | | | | | |
| Gas Project Rev. | 5.000% | 3/15/20 | | 23,970 | 24,435 |
| Main Street Natural Gas Inc. Georgia | | | | | |
| Gas Project Rev. | 5.000% | 3/15/21 | | 37,000 | 37,576 |
| Main Street Natural Gas Inc. Georgia | | | | | |
| Gas Project Rev. | 5.000% | 3/15/21 | | 12,500 | 12,391 |
1 | Metro. Atlanta GA Rapid Transp. Auth. | | | | | |
| Georgia Sales Tax Rev. TOB VRDO | 3.510% | 11/7/07 | (4) | 60,000 | 60,000 |
| Monroe County GA Dev. Auth. PCR | | | | | |
| (Oglethorpe Power Corp.) | 6.650% | 1/1/08 | (1) | 9,220 | 9,267 |
| | | | | | 753,991 |
Hawaii (1.2%) | | | | | |
| Hawaii GO | 5.625% | 9/1/09 | (4)(Prere.) | 3,510 | 3,678 |
| Hawaii GO | 6.000% | 12/1/09 | (3) | 3,550 | 3,733 |
| Hawaii GO | 5.750% | 10/1/10 | (1)(Prere.) | 115 | 122 |
| Hawaii GO | 5.875% | 10/1/10 | (1)(Prere.) | 2,000 | 2,133 |
| Hawaii GO | 6.000% | 11/1/10 | (4) | 10,000 | 10,717 |
| Hawaii GO | 5.750% | 10/1/11 | (1) | 2,095 | 2,223 |
| Hawaii GO | 5.375% | 8/1/12 | (3) | 14,200 | 15,096 |
| Hawaii GO | 5.375% | 8/1/12 | (3) | 14,490 | 15,394 |
| Hawaii GO | 5.625% | 9/1/12 | (4) | 1,490 | 1,557 |
| Hawaii GO | 5.750% | 10/1/12 | (1) | 2,130 | 2,257 |
| Hawaii GO | 5.375% | 8/1/13 | (3) | 16,595 | 17,613 |
| Hawaii GO | 5.375% | 8/1/13 | (3) | 14,700 | 15,602 |
| Hawaii GO | 5.375% | 8/1/14 | (3) | 11,650 | 12,364 |
| Hawaii GO | 5.375% | 8/1/14 | (3) | 17,985 | 19,088 |
| Hawaii GO | 5.750% | 2/1/15 | (4) | 5,000 | 5,622 |
| Hawaii GO | 5.000% | 7/1/17 | (2) | 45,235 | 48,580 |
| Hawaii GO | 5.000% | 10/1/22 | (1) | 7,000 | 7,361 |
| Hawaii GO | 5.000% | 10/1/23 | (1) | 5,000 | 5,241 |
| Honolulu HI City & County GO | 6.000% | 1/1/08 | | 5 | 5 |
| Honolulu HI City & County GO | 8.000% | 10/1/09 | (ETM) | 3,620 | 3,921 |
| Honolulu HI City & County GO | 5.000% | 7/1/23 | (1) | 10,000 | 10,472 |
| | | | | | 202,779 |
Illinois (2.3%) | | | | | |
| Chicago IL (City Colleges Improvement) GO | 0.000% | 1/1/12 | (3) | 26,000 | 22,253 |
| Chicago IL (City Colleges Improvement) GO | 0.000% | 1/1/13 | (3) | 32,670 | 26,841 |
| Chicago IL Board of Educ. VRDO | 3.590% | 11/1/07 | (4) | 3,200 | 3,200 |
| Chicago IL Housing Auth. Capital Project Rev. | 5.375% | 7/1/12 | (Prere.) | 5,540 | 5,974 |
| Chicago IL Housing Auth. Capital Project Rev. | 5.375% | 7/1/12 | (Prere.) | 13,425 | 14,476 |
| Chicago IL Housing Auth. Capital Project Rev. | 5.375% | 7/1/12 | (Prere.) | 15,715 | 16,945 |
| Chicago IL Housing Auth. Capital Project Rev. | 5.375% | 7/1/12 | (Prere.) | 7,150 | 7,709 |
| Chicago IL Metro. Water Reclamation Dist. GO | 6.050% | 12/1/09 | | 3,000 | 3,157 |
| Chicago IL Water Rev. | 5.500% | 11/1/11 | (2)(Prere.) | 3,595 | 3,860 |
| Chicago IL Water Rev. | 5.500% | 11/1/11 | (2)(Prere.) | 4,035 | 4,332 |
| Chicago IL Water Rev. | 5.500% | 11/1/11 | (2)(Prere.) | 2,000 | 2,147 |
| Chicago IL Water Rev. | 5.500% | 11/1/11 | (2)(Prere.) | 3,200 | 3,436 |
| Chicago IL Water Rev. | 0.000% | 11/1/14 | (2) | 7,460 | 5,654 |
Intermediate-Term Tax-Exempt Fund
| | | | | Face | Market |
| | | Maturity | | Amount | Value• |
| | Coupon | Date | | ($000) | ($000) |
| Chicago IL Water Rev. | 0.000% | 11/1/15 | (2) | 7,555 | 5,466 |
| Illinois GO | 5.000% | 10/1/10 | | 9,000 | 9,381 |
| Illinois GO | 5.375% | 7/1/12 | (1)(Prere.) | 5,500 | 5,930 |
| Illinois GO | 5.250% | 10/1/12 | | 14,000 | 15,032 |
| Illinois GO | 5.500% | 8/1/13 | (1) | 14,005 | 15,328 |
| Illinois GO | 5.375% | 7/1/14 | (1) | 5,000 | 5,356 |
| Illinois GO | 5.250% | 10/1/14 | | 40,000 | 43,167 |
| Illinois GO | 5.500% | 8/1/17 | (1) | 7,500 | 8,052 |
| Illinois GO | 5.500% | 8/1/18 | (1) | 6,000 | 6,447 |
| Illinois Health Fac. Auth. Rev. | | | | | |
| (Hosp. Sisters Services Inc.) | 5.250% | 6/1/10 | (1) | 5,000 | 5,095 |
| Illinois Health Fac. Auth. Rev. | | | | | |
| (Hosp. Sisters Services Inc.) | 5.250% | 6/1/11 | (1) | 4,000 | 4,074 |
| Illinois Health Fac. Auth. Rev. | | | | | |
| (Hosp. Sisters Services Inc.) | 5.250% | 6/1/12 | (1) | 4,280 | 4,360 |
| Illinois Health Fac. Auth. Rev. | | | | | |
| (Univ. of Chicago Hosp. & Health Systems) VRDO | 3.580% | 11/1/07 | (1) | 9,930 | 9,930 |
| Illinois Regional Transp. Auth. Rev. | 9.000% | 6/1/08 | (2) | 5,895 | 6,080 |
| Illinois Regional Transp. Auth. Rev. | 9.000% | 6/1/08 | (2) | 945 | 975 |
| Illinois Regional Transp. Auth. Rev. | 9.000% | 6/1/09 | (2) | 1,030 | 1,116 |
| Illinois Regional Transp. Auth. Rev. | 9.000% | 6/1/09 | (2) | 3,225 | 3,494 |
| Illinois Sales Tax Rev. | 6.125% | 6/15/10 | (Prere.) | 4,250 | 4,534 |
| Illinois Sales Tax Rev. | 6.125% | 6/15/14 | | 6,850 | 7,282 |
| Metro. Pier & Exposition Auth. Illinois | | | | | |
| Dedicated Sales Tax Rev. | 6.750% | 6/1/10 | (2) | 25,000 | 26,217 |
| Metro. Pier & Exposition Auth. Illinois | | | | | |
| Dedicated Sales Tax Rev. | 0.000% | 12/15/16 | (1) | 8,330 | 5,717 |
| Metro. Pier & Exposition Auth. Illinois | | | | | |
| Dedicated Sales Tax Rev. | 0.000% | 6/15/19 | (3) | 39,340 | 23,695 |
| Metro. Pier & Exposition Auth. Illinois | | | | | |
| Dedicated Sales Tax Rev. | 0.000% | 12/15/23 | (1) | 32,515 | 15,594 |
| Metro. Pier & Exposition Auth. Illinois | | | | | |
| Dedicated Sales Tax Rev. | 0.000% | 12/15/24 | (1) | 15,895 | 7,235 |
| Univ. of Illinois Univ. Rev. Auxiliary Fac. | 0.000% | 4/1/16 | (1) | 15,270 | 10,805 |
| | | | | | 370,346 |
Indiana (0.2%) | | | | | |
| Indiana Health Fac. Auth. Finance Auth. Rev. | | | | | |
| (Clarian Health Obligation Group) | 5.000% | 2/15/25 | | 11,000 | 11,081 |
| Indiana Health Fac. Auth. Finance Auth. Rev. | | | | | |
| (Clarian Health Obligation Group) | 5.000% | 2/15/26 | | 15,000 | 15,080 |
| Indiana Muni. Power Agency Rev. | 5.875% | 1/1/10 | (1) | 4,500 | 4,719 |
| | | | | | 30,880 |
Kansas (0.1%) | | | | | |
| Univ. of Kansas Hosp. Auth. Health System | 5.000% | 9/1/16 | | 1,250 | 1,305 |
| Univ. of Kansas Hosp. Auth. Health System | 5.000% | 9/1/17 | | 1,000 | 1,040 |
| Univ. of Kansas Hosp. Auth. Health System | 5.000% | 9/1/18 | | 1,000 | 1,035 |
| Univ. of Kansas Hosp. Auth. Health System | 5.000% | 9/1/19 | | 1,500 | 1,544 |
| Univ. of Kansas Hosp. Auth. Health System | 5.000% | 9/1/20 | | 1,500 | 1,541 |
| Univ. of Kansas Hosp. Auth. Health System | 5.000% | 9/1/21 | | 1,500 | 1,535 |
| Univ. of Kansas Hosp. Auth. Health System | 5.000% | 9/1/24 | | 6,505 | 6,616 |
| Univ. of Kansas Hosp. Auth. Health System | 5.000% | 9/1/26 | | 7,000 | 7,084 |
| | | | | | 21,700 |
Kentucky (0.6%) | | | | | |
| Kentucky Property & Building Comm. Rev. | 5.750% | 10/1/10 | (Prere.) | 6,135 | 6,523 |
| Kentucky Property & Building Comm. Rev. | 5.750% | 10/1/10 | (Prere.) | 3,500 | 3,721 |
Intermediate-Term Tax-Exempt Fund
| | | | | Face | Market |
| | | Maturity | | Amount | Value• |
| | Coupon | Date | | ($000) | ($000) |
| Kentucky Property & Building Comm. Rev. | 5.250% | 8/1/11 | (4)(Prere.) | 9,725 | 10,314 |
| Kentucky Property & Building Comm. Rev. | 5.250% | 8/1/11 | (4)(Prere.) | 11,815 | 12,531 |
| Kentucky Property & Building Comm. Rev. | 5.375% | 10/1/11 | (1)(Prere.) | 5,000 | 5,338 |
| Kentucky Property & Building Comm. Rev. | 5.500% | 8/1/12 | (4) | 10,000 | 10,836 |
| Kentucky Property & Building Comm. Rev. | 5.250% | 8/1/13 | (4) | 27,540 | 29,099 |
| Kentucky Property & Building Comm. Rev. | 5.250% | 8/1/15 | (4) | 15,480 | 16,356 |
| | | | | | 94,718 |
Louisiana (3.3%) | | | | | |
| Louisiana Gasoline and Fuel Tax Rev. | 5.250% | 5/1/20 | (3) | 6,200 | 6,640 |
| Louisiana Gasoline and Fuel Tax Rev. | 5.000% | 5/1/30 | (3) | 46,465 | 48,109 |
| Louisiana GO | 5.250% | 4/15/08 | (4)(Prere.) | 11,395 | 11,599 |
| Louisiana GO | 5.750% | 11/15/10 | (3)(Prere.) | 17,865 | 19,041 |
| Louisiana GO | 5.750% | 11/15/10 | (3)(Prere.) | 8,500 | 9,059 |
| Louisiana GO | 5.750% | 11/15/10 | (3)(Prere.) | 18,825 | 20,064 |
| Louisiana GO | 5.000% | 5/1/11 | (4) | 16,830 | 17,638 |
| Louisiana GO | 5.000% | 5/1/12 | (4) | 18,955 | 20,062 |
| Louisiana GO | 5.500% | 5/15/12 | (3) | 12,660 | 13,366 |
| Louisiana GO | 5.500% | 5/15/13 | (3) | 5,345 | 5,640 |
| Louisiana GO | 5.000% | 5/1/18 | (4) | 25,710 | 27,408 |
| Louisiana GO | 5.000% | 5/1/21 | (4) | 9,765 | 10,319 |
| Louisiana GO | 5.000% | 5/1/23 | (4) | 32,565 | 34,221 |
| Louisiana Public Fac. Auth. Hosp. Rev. | | | | | |
| (Franciscan Missionaries) | 5.375% | 7/1/08 | (1)(Prere.) | 4,990 | 5,101 |
| Louisiana Public Fac. Auth. Rev. (Ochsner Clinic) | 5.000% | 5/15/15 | | 4,055 | 4,175 |
| Louisiana Public Fac. Auth. Rev. (Ochsner Clinic) | 5.000% | 5/15/17 | | 3,000 | 3,073 |
| Louisiana Public Fac. Auth. Rev. (Ochsner Clinic) | 5.250% | 5/15/27 | | 31,665 | 32,067 |
| Louisiana Public Fac. Auth. Rev. (Ochsner Clinic) | 5.250% | 5/15/38 | | 28,360 | 28,129 |
| Louisiana Public Fac. Auth. Rev. (Ochsner Clinic) | 5.375% | 5/15/43 | | 48,295 | 48,351 |
| Louisiana State Citizens Property Insurance Corp. | | | | | |
| Assessment Rev. | 5.000% | 6/1/18 | (2) | 14,470 | 15,292 |
| Louisiana State Citizens Property Insurance Corp. | | | | | |
| Assessment Rev. | 5.000% | 6/1/21 | (2) | 20,000 | 20,951 |
| Louisiana State Citizens Property Insurance Corp. | | | | | |
| Assessment Rev. | 5.000% | 6/1/22 | (2) | 14,160 | 14,792 |
| Louisiana State Citizens Property Insurance Corp. | | | | | |
| Assessment Rev. | 5.000% | 6/1/23 | (2) | 10,000 | 10,417 |
| Saint John Baptist Parish Louisiana Rev. | | | | | |
| (Marathon Oil Corp.) | 5.125% | 6/1/37 | | 115,000 | 113,511 |
| | | | | | 539,025 |
Maryland (0.9%) | | | | | |
| Maryland Dept. of Transp. | 5.000% | 3/1/15 | | 7,600 | 8,226 |
| Maryland Dept. of Transp. | 5.000% | 3/1/16 | | 5,900 | 6,404 |
| Maryland GO | 5.500% | 7/15/09 | | 16,490 | 17,069 |
| Maryland GO | 5.000% | 8/1/12 | | 10,000 | 10,646 |
| Maryland GO | 5.000% | 8/1/13 | | 23,550 | 25,273 |
| Maryland GO | 5.500% | 3/1/16 | | 8,035 | 9,031 |
| Maryland GO | 5.000% | 3/15/17 | | 17,540 | 19,137 |
| Maryland GO | 5.000% | 8/1/17 | | 15,760 | 17,012 |
| Maryland Health & Higher Educ. Fac. Auth. Rev. | | | | | |
| (Lifebridge Health) | 5.000% | 7/1/15 | | 3,915 | 4,119 |
| Maryland Health & Higher Educ. Fac. Auth. Rev. | | | | | |
| (Lifebridge Health) | 5.000% | 7/1/16 | | 2,980 | 3,121 |
| Maryland Health & Higher Educ. Fac. Auth. Rev. | | | | | |
| (Univ. of Maryland Medical System) | 6.625% | 7/1/10 | (Prere.) | 4,000 | 4,358 |
| Maryland Transp. Auth. Rev. | 5.000% | 3/1/16 | | 2,500 | 2,704 |
| Maryland Transp. Auth. Rev. | 5.000% | 3/1/17 | | 5,000 | 5,417 |
Intermediate-Term Tax-Exempt Fund
| | | | | Face | Market |
| | | Maturity | | Amount | Value• |
| | Coupon | Date | | ($000) | ($000) |
| Montgomery County MD GO | 5.000% | 11/1/10 | | 9,770 | 10,215 |
| Washington Suburban Sanitation Dist. Maryland GO | 5.000% | 6/1/13 | | 7,800 | 8,357 |
| | | | | | 151,089 |
Massachusetts (7.4%) | | | | | |
| Boston MA Water & Sewer Comm. Rev. | 5.750% | 11/1/13 | | 5,785 | 6,192 |
| Chelsea MA GO | 5.500% | 6/15/09 | (2) | 3,000 | 3,099 |
| Chelsea MA GO | 5.500% | 6/15/11 | (2) | 5,000 | 5,108 |
| Chelsea MA GO | 5.500% | 6/15/12 | (2) | 5,000 | 5,108 |
| Massachusetts Bay Transp. Auth. Rev. | 5.500% | 7/1/21 | | 6,840 | 7,765 |
| Massachusetts Bay Transp. Auth. Rev. | 5.000% | 7/1/22 | | 13,000 | 14,100 |
| Massachusetts Bay Transp. Auth. Rev. | 5.000% | 7/1/23 | | 10,000 | 10,851 |
| Massachusetts Bay Transp. Auth. Rev. | 5.500% | 7/1/24 | (1) | 5,000 | 5,721 |
| Massachusetts Bay Transp. Auth. Rev. | 5.500% | 7/1/24 | | 10,525 | 12,043 |
| Massachusetts Bay Transp. Auth. Rev. | 5.250% | 7/1/28 | | 10,000 | 11,174 |
| Massachusetts Bay Transp. Auth. Rev. | 5.250% | 7/1/29 | | 5,000 | 5,589 |
| Massachusetts Bay Transp. Auth. Rev. | 5.250% | 7/1/30 | | 8,500 | 9,490 |
| Massachusetts Dev. Finance Agency | | | | | |
| Resource Recovery Rev. (SEMASS System) | 5.625% | 1/1/13 | (1) | 16,670 | 17,947 |
| Massachusetts Dev. Finance Agency | | | | | |
| Resource Recovery Rev. (SEMASS System) | 5.625% | 1/1/14 | (1) | 7,340 | 7,899 |
| Massachusetts Dev. Finance Agency | | | | | |
| Resource Recovery Rev. (SEMASS System) | 5.625% | 1/1/15 | (1) | 8,310 | 8,943 |
| Massachusetts Dev. Finance Agency | | | | | |
| Resource Recovery Rev. (SEMASS System) | 5.625% | 1/1/16 | (1) | 3,500 | 3,768 |
| Massachusetts GAN | 5.125% | 6/15/10 | | 10,755 | 11,040 |
| Massachusetts GAN | 5.250% | 6/15/10 | | 23,675 | 24,335 |
| Massachusetts GAN | 5.125% | 12/15/10 | | 5,000 | 5,133 |
| Massachusetts GAN | 5.250% | 12/15/10 | | 26,275 | 26,990 |
| Massachusetts GAN | 5.125% | 6/15/11 | | 8,555 | 8,778 |
| Massachusetts GAN | 5.250% | 6/15/11 | | 15,000 | 15,408 |
| Massachusetts GAN | 5.250% | 12/15/11 | | 14,820 | 15,223 |
| Massachusetts GAN | 5.750% | 12/15/11 | | 20,000 | 21,289 |
| Massachusetts GAN | 5.750% | 6/15/12 | | 11,280 | 11,979 |
| Massachusetts GAN | 5.125% | 12/15/12 | | 5,000 | 5,130 |
| Massachusetts GAN | 5.125% | 6/15/13 | | 5,000 | 5,130 |
| Massachusetts GAN | 5.750% | 6/15/13 | | 10,000 | 10,620 |
| Massachusetts GO | 6.000% | 2/1/10 | (Prere.) | 5,450 | 5,799 |
| Massachusetts GO | 5.750% | 6/1/10 | (Prere.) | 10,000 | 10,569 |
| Massachusetts GO | 5.500% | 11/1/16 | (ETM) | 25,000 | 28,255 |
| Massachusetts GO | 5.500% | 11/1/16 | (2) | 50,000 | 56,116 |
| Massachusetts GO | 5.500% | 11/1/16 | (1)(ETM) | 75,000 | 84,764 |
| Massachusetts GO | 5.500% | 11/1/17 | (1) | 20,000 | 22,528 |
| Massachusetts GO | 5.500% | 11/1/17 | (4) | 7,000 | 7,884 |
| Massachusetts GO | 5.500% | 10/1/18 | | 10,000 | 11,259 |
| Massachusetts GO | 5.250% | 8/1/21 | | 10,000 | 11,066 |
| Massachusetts GO | 5.250% | 8/1/21 | (2) | 19,985 | 22,181 |
| Massachusetts GO | 5.250% | 8/1/22 | | 20,000 | 22,174 |
| Massachusetts GO | 5.250% | 8/1/23 | | 20,000 | 22,229 |
| Massachusetts GO | 5.500% | 8/1/30 | (2) | 25,020 | 28,674 |
| Massachusetts Health & Educ. Fac. Auth. Rev. | | | | | |
| (Boston Medical Center) | 5.250% | 7/1/09 | (1) | 4,215 | 4,306 |
| Massachusetts Health & Educ. Fac. Auth. Rev. | | | | | |
| (Boston Medical Center) | 5.250% | 7/1/10 | (1) | 4,440 | 4,530 |
| Massachusetts Health & Educ. Fac. Auth. Rev. | | | | | |
| (Boston Medical Center) | 5.250% | 7/1/11 | (1) | 4,670 | 4,761 |
| Massachusetts Health & Educ. Fac. Auth. Rev. | | | | | |
| (Boston Medical Center) | 5.250% | 7/1/12 | (1) | 1,850 | 1,886 |
Intermediate-Term Tax-Exempt Fund
| | | | | Face | Market |
| | | Maturity | | Amount | Value• |
| | Coupon | Date | | ($000) | ($000) |
| Massachusetts Health & Educ. Fac. Auth. Rev. | | | | | |
| (Caritas Christi Obligated Group) | 6.500% | 7/1/12 | | 10,000 | 10,789 |
| Massachusetts Health & Educ. Fac. Auth. Rev. | | | | | |
| (Caritas Christi Obligated Group) | 5.625% | 7/1/20 | | 1,810 | 1,835 |
| Massachusetts Health & Educ. Fac. Auth. Rev. | | | | | |
| (Caritas Christi Obligated Group) | 5.750% | 7/1/28 | | 2,640 | 2,669 |
| Massachusetts Muni. Wholesale Electric Co. | | | | | |
| Power System Rev. | 5.250% | 7/1/12 | (1) | 22,865 | 24,492 |
| Massachusetts Muni. Wholesale Electric Co. | | | | | |
| Power System Rev. | 5.250% | 7/1/13 | (1) | 20,000 | 21,373 |
| Massachusetts School Building Auth. | | | | | |
| Dedicated Sales Tax Rev. | 5.000% | 8/15/21 | (4) | 41,095 | 43,229 |
| Massachusetts School Building Auth. | | | | | |
| Dedicated Sales Tax Rev. | 5.000% | 8/15/23 | (4) | 6,800 | 7,135 |
| Massachusetts Special Obligation | | | | | |
| Dedicated Tax Rev. | 5.250% | 1/1/14 | (3)(Prere.) | 8,685 | 9,431 |
| Massachusetts Special Obligation | | | | | |
| Dedicated Tax Rev. | 5.250% | 1/1/19 | (3) | 5,000 | 5,511 |
| Massachusetts Special Obligation | | | | | |
| Dedicated Tax Rev. | 5.500% | 1/1/26 | (3) | 32,360 | 37,042 |
| Massachusetts Special Obligation | | | | | |
| Dedicated Tax Rev. | 5.500% | 1/1/28 | (3) | 11,075 | 12,692 |
| Massachusetts Water Pollution Abatement Trust | 5.125% | 8/1/08 | (Prere.) | 2,565 | 2,621 |
| Massachusetts Water Pollution Abatement Trust | 5.125% | 8/1/08 | (Prere.) | 2,360 | 2,411 |
| Massachusetts Water Pollution Abatement Trust | 5.125% | 8/1/09 | | 435 | 445 |
| Massachusetts Water Pollution Abatement Trust | 6.000% | 8/1/09 | (Prere.) | 970 | 1,021 |
| Massachusetts Water Pollution Abatement Trust | 6.000% | 8/1/09 | (Prere.) | 1,165 | 1,227 |
| Massachusetts Water Pollution Abatement Trust | 6.000% | 8/1/09 | (Prere.) | 1,165 | 1,226 |
| Massachusetts Water Pollution Abatement Trust | 6.000% | 8/1/09) | (Prere. | 1,510 | 1,590 |
| Massachusetts Water Pollution Abatement Trust | 6.000% | 8/1/10 | | 3,835 | 4,034 |
| Massachusetts Water Pollution Abatement Trust | 5.250% | 8/1/11 | | 830 | 849 |
| Massachusetts Water Pollution Abatement Trust | 5.250% | 8/1/11 | (ETM) | 6,475 | 6,870 |
| Massachusetts Water Pollution Abatement Trust | 6.000% | 8/1/11 | | 3,180 | 3,342 |
| Massachusetts Water Pollution Abatement Trust | 5.250% | 8/1/12 | | 295 | 302 |
| Massachusetts Water Pollution Abatement Trust | 6.000% | 8/1/12 | | 4,945 | 5,195 |
| Massachusetts Water Pollution Abatement Trust | 6.000% | 8/1/13 | | 3,835 | 4,029 |
| Massachusetts Water Pollution Abatement Trust | 5.125% | 8/1/14 | | 140 | 143 |
| Massachusetts Water Pollution Abatement Trust | 5.250% | 8/1/20 | | 27,360 | 30,315 |
| Massachusetts Water Pollution Abatement Trust | 5.250% | 8/1/20 | | 7,500 | 8,310 |
| Massachusetts Water Pollution Abatement Trust | 5.250% | 2/1/21 | | 6,955 | 7,698 |
| Massachusetts Water Pollution Abatement Trust | 5.000% | 8/1/21 | | 13,955 | 15,127 |
| Massachusetts Water Pollution Abatement Trust | 5.250% | 8/1/21 | | 11,805 | 13,102 |
| Massachusetts Water Pollution Abatement Trust | 5.250% | 8/1/21 | | 6,500 | 7,214 |
| Massachusetts Water Pollution Abatement Trust | 5.250% | 8/1/25 | | 5,355 | 5,975 |
| Massachusetts Water Resources Auth. Rev. | 6.500% | 7/15/10 | (ETM) | 30,220 | 32,594 |
| Massachusetts Water Resources Auth. Rev. | 6.500% | 7/15/19 | (ETM) | 37,515 | 44,318 |
| Massachusetts Water Resources Auth. Rev. | 5.000% | 8/1/21 | (2) | 11,135 | 11,928 |
| Massachusetts Water Resources Auth. Rev. | 5.000% | 8/1/22 | (2) | 27,710 | 29,585 |
| Massachusetts Water Resources Auth. Rev. | 5.000% | 8/1/23 | (2) | 29,865 | 31,780 |
| Massachusetts Water Resources Auth. Rev. | 5.000% | 8/1/24 | (2) | 19,920 | 21,162 |
| Massachusetts Water Resources Auth. Rev. | 5.000% | 8/1/25 | (2) | 6,380 | 6,761 |
| Massachusetts Water Resources Auth. Rev. | 5.000% | 8/1/26 | (2) | 6,710 | 7,093 |
| Massachusetts Water Resources Auth. Rev. | 5.250% | 8/1/30 | (4) | 35,965 | 40,163 |
| Massachusetts Water Resources Auth. Rev. | 5.250% | 8/1/31 | (4) | 5,130 | 5,744 |
| Massachusetts Water Resources Auth. Rev. | 5.250% | 8/1/32 | (4) | 7,295 | 8,165 |
| Univ. of Massachusetts Building Auth. Rev. | 5.000% | 11/1/19 | (2) | 25,625 | 27,220 |
| | | | | | 1,210,590 |
Intermediate-Term Tax-Exempt Fund
| | | | | Face | Market |
| | | Maturity | | Amount | Value• |
| | Coupon | Date | | ($000) | ($000) |
Michigan (2.0%) | | | | | |
| Detroit MI Sewer System Rev. | 5.000% | 7/1/13 | (4)(Prere.) | 15,665 | 16,796 |
| Detroit MI Sewer System Rev. | 5.125% | 7/1/15 | (1)(Prere.) | 12,375 | 13,542 |
| Detroit MI Sewer System Rev. | 0.000% | 7/1/16 | (3) | 7,500 | 5,256 |
| Detroit MI Sewer System Rev. | 5.125% | 7/1/33 | (1) | 18,790 | 19,467 |
| Detroit MI Water Supply System | 5.000% | 7/1/19 | (1) | 5,000 | 5,295 |
| Detroit MI Water Supply System | 5.000% | 7/1/20 | (1) | 7,665 | 8,089 |
| Detroit MI Water Supply System | 5.000% | 7/1/20 | (4) | 8,535 | 9,033 |
| Detroit MI Water Supply System | 5.000% | 7/1/22 | (1) | 4,000 | 4,198 |
| Detroit MI Water Supply System | 5.000% | 7/1/23 | (1) | 4,000 | 4,186 |
| Detroit MI Water Supply System | 5.000% | 7/1/24 | (4) | 27,425 | 28,719 |
| Detroit MI Water Supply System | 5.000% | 7/1/25 | (4) | 9,955 | 10,403 |
| Michigan Building Auth. Rev. | 5.500% | 10/15/11 | (Prere.) | 8,440 | 9,055 |
| Michigan Building Auth. Rev. | 5.500% | 10/15/11 | (Prere.) | 6,010 | 6,448 |
| Michigan Building Auth. Rev. | 5.500% | 10/15/12 | | 6,695 | 7,129 |
| Michigan Building Auth. Rev. | 5.250% | 10/15/13 | (4) | 12,000 | 13,008 |
| Michigan Building Auth. Rev. | 5.250% | 10/15/13 | | 2,500 | 2,571 |
| Michigan Building Auth. Rev. | 5.500% | 10/15/13 | | 6,000 | 6,378 |
| Michigan Building Auth. Rev. | 5.250% | 10/15/14 | (4) | 15,000 | 16,202 |
| Michigan Building Auth. Rev. | 5.500% | 10/15/14 | | 10,000 | 10,630 |
| Michigan Building Auth. Rev. | 5.250% | 10/15/15 | (4) | 22,445 | 24,227 |
| Michigan Building Auth. Rev. | 5.500% | 10/15/15 | | 5,000 | 5,315 |
| Michigan Building Auth. Rev. | 5.250% | 10/15/16 | (4) | 9,000 | 9,714 |
| Michigan GO | 5.500% | 11/1/09 | (Prere.) | 5,395 | 5,608 |
| Michigan GO | 5.500% | 11/1/09 | | 5,120 | 5,322 |
| Michigan GO | 5.500% | 12/1/13 | | 6,125 | 6,732 |
| Michigan Hosp. Finance Auth. Rev. | | | | | |
| (Ascension Health) | 5.000% | 5/1/12 | | 9,595 | 10,043 |
| Michigan Hosp. Finance Auth. Rev. | | | | | |
| (Genesys Regional Medical Center) | 5.300% | 10/1/11 | (ETM) | 10,840 | 11,117 |
| Michigan Hosp. Finance Auth. Rev. | | | | | |
| (Genesys Regional Medical Center) | 5.375% | 10/1/13 | (ETM) | 4,000 | 4,104 |
| Michigan Hosp. Finance Auth. Rev. | | | | | |
| (Sparrow Obligated Group) | 5.000% | 11/15/26 | (1) | 13,115 | 13,615 |
| Michigan Muni. Bond Auth. Rev. | | | | | |
| (Clean Water Revolving Fund) | 5.750% | 10/1/10 | (Prere.) | 10,390 | 11,141 |
| Michigan Muni. Bond Auth. Rev. | | | | | |
| (Clean Water Revolving Fund) | 5.875% | 10/1/10 | (Prere.) | 7,680 | 8,262 |
| Michigan Muni. Bond Auth. Rev. | | | | | |
| (Clean Water Revolving Fund) | 5.875% | 10/1/10 | (Prere.) | 10,740 | 11,554 |
| | | | | | 323,159 |
Minnesota (3.5%) | | | | | |
| Minnesota GO | 5.000% | 11/1/09 | | 21,000 | 21,653 |
| Minnesota GO | 5.000% | 10/1/10 | | 28,175 | 29,408 |
| Minnesota GO | 5.000% | 11/1/10 | | 27,915 | 29,171 |
| Minnesota GO | 5.000% | 10/1/11 | | 26,795 | 28,283 |
| Minnesota GO | 5.000% | 11/1/11 | | 24,545 | 25,936 |
| Minnesota GO | 5.000% | 6/1/12 | | 18,000 | 19,106 |
| Minnesota GO | 5.000% | 10/1/12 | | 28,800 | 30,682 |
| Minnesota GO | 5.000% | 11/1/12 | | 21,920 | 23,375 |
| Minnesota GO | 5.000% | 11/1/12 | | 19,775 | 21,087 |
| Minnesota GO | 5.000% | 8/1/13 | | 5,780 | 6,194 |
| Minnesota GO | 5.000% | 10/1/13 | | 35,445 | 38,048 |
| Minnesota GO | 5.000% | 11/1/13 | | 28,270 | 30,373 |
| Minnesota GO | 5.000% | 11/1/13 | | 19,500 | 20,951 |
| Minnesota GO | 5.000% | 11/1/14 | | 19,775 | 21,402 |
Intermediate-Term Tax-Exempt Fund
| | | | | Face | Market |
| | | Maturity | | Amount | Value• |
| | Coupon | Date | | ($000) | ($000) |
| Minnesota GO | 5.000% | 11/1/15 | | 19,775 | 21,517 |
| Minnesota GO | 5.000% | 6/1/16 | | 3,000 | 3,264 |
| Minnesota GO | 5.000% | 11/1/16 | | 19,735 | 21,531 |
| Minnesota GO | 5.000% | 10/1/17 | | 8,225 | 8,890 |
| Minnesota GO | 5.000% | 8/1/19 | | 20,570 | 22,216 |
| Minnesota GO | 5.000% | 8/1/22 | | 23,370 | 25,006 |
| Minnesota GO | 5.000% | 8/1/23 | | 30,570 | 32,609 |
| Minnesota GO | 5.000% | 8/1/24 | | 22,070 | 23,506 |
| Minnesota GO | 5.000% | 8/1/25 | | 30,570 | 32,483 |
| Minnesota GO | 5.000% | 8/1/26 | | 15,530 | 16,476 |
| Northern Minnesota Muni. Power Agency | | | | | |
| Electric System Rev. | 5.250% | 1/1/12 | (4) | 6,000 | 6,235 |
| Univ. of Minnesota Special Purpose Rev. | 5.000% | 8/1/24 | | 5,000 | 5,253 |
| Univ. of Minnesota Special Purpose Rev. | 5.000% | 8/1/25 | | 6,755 | 7,076 |
| Western Minnesota Muni. Power Agency | 5.375% | 1/1/08 | (2) | 5,645 | 5,662 |
| | | | | | 577,393 |
Mississippi (0.5%) | | | | | |
| Mississippi GO | 6.000% | 11/1/09 | (Prere.) | 9,225 | 9,678 |
| Mississippi GO | 6.000% | 11/1/09 | (Prere.) | 9,725 | 10,202 |
| Mississippi GO | 5.750% | 11/1/10 | (Prere.) | 7,860 | 8,371 |
| Mississippi GO | 5.750% | 11/1/10 | (Prere.) | 5,205 | 5,543 |
| Mississippi GO | 5.750% | 11/1/10 | (Prere.) | 4,665 | 4,968 |
| Mississippi GO | 5.750% | 11/1/10 | (Prere.) | 4,825 | 5,139 |
| Mississippi GO | 5.750% | 11/1/10 | (Prere.) | 5,540 | 5,900 |
| Mississippi GO | 5.750% | 12/1/11 | | 6,000 | 6,497 |
| Mississippi GO | 5.500% | 9/1/12 | (4) | 5,000 | 5,422 |
| Mississippi GO | 5.500% | 12/1/16 | | 8,435 | 9,446 |
| Mississippi GO | 5.500% | 12/1/17 | | 4,000 | 4,494 |
| Mississippi GO | 5.250% | 11/1/22 | | 8,245 | 9,143 |
| | | | | | 84,803 |
Missouri (1.4%) | | | | | |
| Missouri Board Public Building | | | | | |
| Special Obligation Rev. | 5.250% | 10/15/09 | | 10,640 | 11,013 |
| Missouri Environmental Improvement & | | | | | |
| Energy Resource Auth. Water PCR | 5.500% | 7/1/12 | | 4,190 | 4,535 |
| Missouri Environmental Improvement & | | | | | |
| Energy Resource Auth. Water PCR | 5.500% | 7/1/13 | | 5,250 | 5,748 |
| Missouri Health & Educ. Fac. Auth. Health Fac. Rev. | | | | | |
| (St. Luke’s Episcopal–Presbyterian Hosp.) | 5.500% | 12/1/12 | (4) | 3,365 | 3,602 |
| Missouri Health & Educ. Fac. Auth. Health Fac. Rev. | | | | | |
| (St. Luke’s Episcopal–Presbyterian Hosp.) | 5.500% | 12/1/13 | (4) | 3,580 | 3,819 |
| Missouri Health & Educ. Fac. Auth. Health Fac. Rev. | | | | | |
| (St. Luke’s Episcopal–Presbyterian Hosp.) | 5.500% | 12/1/14 | (4) | 3,780 | 4,023 |
| Missouri Highways & Transp. Comm. Road Rev. | 5.625% | 2/1/11 | (Prere.) | 3,000 | 3,193 |
| Missouri Highways & Transp. Comm. Road Rev. | 5.625% | 2/1/11 | (Prere.) | 3,430 | 3,651 |
| Missouri Highways & Transp. Comm. Road Rev. | 5.625% | 2/1/11 | (Prere.) | 2,000 | 2,129 |
| Missouri Highways & Transp. Comm. Road Rev. | 5.250% | 2/1/12 | (Prere.) | 11,410 | 12,173 |
| Missouri Highways & Transp. Comm. Road Rev. | 5.000% | 5/1/22 | | 18,735 | 19,825 |
| Missouri Highways & Transp. Comm. Road Rev. | 5.000% | 5/1/23 | | 22,355 | 23,590 |
| Missouri Highways & Transp. Comm. Road Rev. | 5.000% | 5/1/24 | | 88,030 | 92,763 |
| Missouri Highways & Transp. Comm. Road Rev. | 5.000% | 5/1/26 | | 13,000 | 13,642 |
| St. Louis MO Airport Rev. Airport Dev. Program | 5.625% | 7/1/11 | (1)(Prere.) | 10,260 | 11,000 |
| St. Louis MO Airport Rev. Airport Dev. Program | 5.625% | 7/1/11 | (1)(Prere.) | 11,560 | 12,394 |
| | | | | | 227,100 |
Intermediate-Term Tax-Exempt Fund
| | | | | Face | Market |
| | | Maturity | | Amount | Value• |
| | Coupon | Date | | ($000) | ($000) |
Montana (0.1%) | | | | | |
| Montana Health Fac. Auth. Rev. | | | | | |
| (Sisters of Charity Health System) | 5.250% | 12/1/09 | (1) | 3,330 | 3,392 |
| Montana Health Fac. Auth. Rev. | | | | | |
| (Sisters of Charity Health System) | 5.250% | 12/1/10 | (1) | 2,445 | 2,492 |
| Montana Health Fac. Auth. Rev. | | | | | |
| (Sisters of Charity Health System) | 5.250% | 12/1/11 | (1) | 4,980 | 5,072 |
| Montana Health Fac. Auth. Rev. | | | | | |
| (Sisters of Charity Health System) | 5.250% | 12/1/12 | (1) | 2,725 | 2,775 |
| | | | | | 13,731 |
Nebraska (0.4%) | | | | | |
| Nebraska Public Power Dist. Rev. | 5.250% | 1/1/08 | (1)(Prere.) | 3,980 | 4,031 |
| Nebraska Public Power Dist. Rev. | 5.250% | 1/1/08 | (1)(Prere.) | 41,000 | 41,525 |
| Nebraska Public Power Dist. Rev. | 5.250% | 1/1/08 | (1)(Prere.) | 10,565 | 10,700 |
| Nebraska Public Power Dist. Rev. | 5.250% | 1/1/08 | (1)(Prere.) | 5,360 | 5,429 |
| Nebraska Public Power Dist. Rev. | 5.250% | 1/1/08 | (1)(Prere.) | 1,825 | 1,848 |
| Nebraska Public Power Dist. Rev. | 5.250% | 1/1/08 | (1)(Prere.) | 1,020 | 1,033 |
| Nebraska Public Power Dist. Rev. | 5.250% | 1/1/08 | (1)(Prere.) | 6,130 | 6,209 |
| Nebraska Public Power Dist. Rev. | 5.250% | 1/1/11 | (1) | 2,045 | 2,071 |
| | | | | | 72,846 |
Nevada (1.1%) | | | | | |
| Clark County NV Airport Improvement Rev. | 5.375% | 7/1/10 | (1) | 8,470 | 8,646 |
| Clark County NV Airport Improvement Rev. | 5.250% | 7/1/12 | (1) | 4,225 | 4,309 |
| Clark County NV GO | 8.000% | 6/1/08 | (2) | 5,285 | 5,421 |
| Clark County NV GO | 8.000% | 6/1/08 | (2) | 4,590 | 4,708 |
| Clark County NV GO | 7.500% | 6/1/09 | (2) | 1,115 | 1,183 |
| Clark County NV GO | 7.500% | 6/1/09 | (2) | 5,710 | 6,059 |
| Clark County NV Passenger Fac. Rev. | | | | | |
| (Las Vegas McCarran International Airport) | 5.375% | 7/1/10 | (1) | 6,435 | 6,576 |
| Clark County NV Passenger Fac. Rev. | | | | | |
| (Las Vegas McCarran International Airport) | 5.375% | 7/1/11 | (1) | 9,445 | 9,649 |
| Clark County NV Passenger Fac. Rev. | | | | | |
| (Las Vegas McCarran International Airport) | 5.375% | 7/1/12 | (1) | 8,295 | 8,474 |
| Clark County NV School Dist. GO | 5.375% | 6/15/12 | (1)(Prere.) | 29,765 | 32,074 |
| Clark County NV School Dist. GO | 5.375% | 6/15/12 | (1)(Prere.) | 28,385 | 30,587 |
| Henderson NV Health Care Fac. Rev. | 5.625% | 7/1/24 | | 5,000 | 5,247 |
| Las Vegas NV Convention & Visitors Auth. | 6.000% | 7/1/09 | (2)(Prere.) | 5,000 | 5,253 |
| Las Vegas NV Convention & Visitors Auth. | 6.000% | 7/1/09 | (2)(Prere.) | 4,500 | 4,727 |
| Las Vegas NV Convention & Visitors Auth. | 6.000% | 7/1/11 | (2) | 10,000 | 10,487 |
| Las Vegas Valley Water Dist. Nevada GO | 5.000% | 6/1/20 | (3) | 5,660 | 5,970 |
| Nevada GO | 6.000% | 5/15/10 | | 6,680 | 7,084 |
| Nevada GO | 5.250% | 5/15/11 | | 6,000 | 6,054 |
| Truckee Meadows NV Water Auth. Rev. | 5.500% | 7/1/12 | (4) | 5,335 | 5,684 |
| Truckee Meadows NV Water Auth. Rev. | 5.500% | 7/1/13 | (4) | 4,790 | 5,103 |
| | | | | | 173,295 |
New Jersey (7.1%) | | | | | |
| Essex County NJ Improvement Auth. Rev. | 5.500% | 10/1/24 | (1) | 6,000 | 6,820 |
| Essex County NJ Improvement Auth. Rev. | 5.500% | 10/1/26 | (1) | 3,500 | 3,991 |
| Essex County NJ Improvement Auth. Rev. | 5.500% | 10/1/30 | (1) | 10,000 | 11,436 |
| Garden State Preservation Trust New Jersey | 5.750% | 11/1/28 | (4) | 140,220 | 165,353 |
| Gloucester County NJ Improvement Auth. | | | | | |
| Solid Waste Resource Rev. PUT | 6.850% | 12/1/09 | | 4,000 | 4,206 |
| New Jersey Econ. Dev. Auth. Rev. (Cigarette Tax) | 5.625% | 6/15/18 | | 25,000 | 25,305 |
| New Jersey Econ. Dev. Auth. Rev. (Cigarette Tax) | 5.625% | 6/15/19 | | 14,000 | 14,225 |
| New Jersey Econ. Dev. Auth. Rev. (Cigarette Tax) | 5.500% | 6/15/24 | | 12,000 | 12,294 |
Intermediate-Term Tax-Exempt Fund
| | | | | Face | Market |
| | | Maturity | | Amount | Value• |
| | Coupon | Date | | ($000) | ($000) |
| New Jersey Econ. Dev. Auth. Rev. (School Fac.) | 5.500% | 9/1/23 | (1) | 81,630 | 93,094 |
| New Jersey Econ. Dev. Auth. Rev. (School Fac.) | 5.500% | 9/1/24 | (2) | 60,000 | 68,558 |
| New Jersey Econ. Dev. Auth. Rev. (School Fac.) | 5.500% | 9/1/25 | (4) | 18,130 | 20,746 |
| New Jersey GO | 5.500% | 8/1/11 | | 3,500 | 3,745 |
| New Jersey GO | 5.250% | 7/1/14 | (4) | 25,000 | 27,270 |
| New Jersey GO | 5.250% | 7/1/15 | (4) | 50,000 | 54,885 |
| New Jersey GO | 5.250% | 7/15/15 | (2) | 9,000 | 9,882 |
| New Jersey Health Care Fac. Financing Auth. Rev. | | | | | |
| (St. Barnabas Health Care) | 5.250% | 1/1/09 | (1)(Prere.) | 155 | 160 |
| New Jersey Health Care Fac. Financing Auth. Rev. | | | | | |
| (St. Barnabas Health Care) | 5.250% | 1/1/09 | (1)(Prere.) | 965 | 994 |
| New Jersey Health Care Fac. Financing Auth. Rev. | | | | | |
| (St. Barnabas Health Care) | 5.250% | 1/1/09 | (1)(Prere.) | 170 | 175 |
| New Jersey Health Care Fac. Financing Auth. Rev. | | | | | |
| (St. Barnabas Health Care) | 5.250% | 7/1/10 | (1) | 7,880 | 8,100 |
| New Jersey Health Care Fac. Financing Auth. Rev. | | | | | |
| (St. Barnabas Health Care) | 5.250% | 7/1/11 | (1) | 8,230 | 8,467 |
| New Jersey Health Care Fac. Financing Auth. Rev. | | | | | |
| (St. Barnabas Health Care) | 5.250% | 7/1/12 | (1) | 1,845 | 1,895 |
| New Jersey Health Care Fac. Financing Auth. Rev. | | | | | |
| (St. Barnabas Health Care) | 5.250% | 7/1/14 | (1) | 1,885 | 1,936 |
| New Jersey Transp. Corp. COP | 5.500% | 9/15/10 | (2) | 12,500 | 13,177 |
| New Jersey Transp. Corp. COP | 5.750% | 9/15/10 | (2) | 15,000 | 15,600 |
| New Jersey Transp. Corp. COP | 5.750% | 9/15/10 | (2)(Prere.) | 25,000 | 26,553 |
| New Jersey Transp. Corp. COP | 5.750% | 9/15/10 | (2)(Prere.) | 28,470 | 30,238 |
| New Jersey Transp. Corp. COP | 5.250% | 9/15/15 | (2) | 10,000 | 10,911 |
| New Jersey Transp. Corp. COP | 5.500% | 9/15/15 | (2) | 5,000 | 5,540 |
| New Jersey Transp. Trust Fund Auth. Rev. | 6.500% | 6/15/11 | (1)(ETM) | 7,510 | 8,270 |
| New Jersey Transp. Trust Fund Auth. Rev. | 6.500% | 6/15/11 | (1) | 12,490 | 13,727 |
| New Jersey Transp. Trust Fund Auth. Rev. | 6.000% | 12/15/11 | (1)(Prere.) | 30,000 | 32,855 |
| New Jersey Transp. Trust Fund Auth. Rev. | 6.000% | 12/15/11 | (1)(Prere.) | 20,000 | 21,903 |
| New Jersey Transp. Trust Fund Auth. Rev. | 6.000% | 12/15/11 | (1)(Prere.) | 19,720 | 21,596 |
| New Jersey Transp. Trust Fund Auth. Rev. | 6.000% | 12/15/11 | (1)(Prere.) | 10,280 | 11,258 |
| New Jersey Transp. Trust Fund Auth. Rev. | 7.000% | 6/15/12 | (1)(ETM) | 7,510 | 8,609 |
| New Jersey Transp. Trust Fund Auth. Rev. | 7.000% | 6/15/12 | (1) | 12,490 | 14,250 |
| New Jersey Transp. Trust Fund Auth. Rev. | 5.250% | 6/15/14 | (3)(Prere.) | 16,400 | 17,951 |
| New Jersey Transp. Trust Fund Auth. Rev. | 5.500% | 12/15/20 | (3) | 83,500 | 94,722 |
| New Jersey Transp. Trust Fund Auth. Rev. | 5.750% | 6/15/24 | (3) | 25,000 | 29,305 |
| New Jersey Turnpike Auth. Rev. | 6.500% | 1/1/09 | (2)(ETM) | 23,200 | 24,006 |
| New Jersey Turnpike Auth. Rev. | 5.625% | 1/1/10 | (1)(Prere.) | 3,440 | 3,596 |
| New Jersey Turnpike Auth. Rev. | 5.625% | 1/1/10 | (1)(Prere.) | 12,775 | 13,355 |
| New Jersey Turnpike Auth. Rev. | 5.750% | 1/1/10 | (1) | 27,745 | 29,071 |
| New Jersey Turnpike Auth. Rev. | 5.750% | 1/1/10 | (1)(ETM) | 7,475 | 7,834 |
| New Jersey Turnpike Auth. Rev. | 5.500% | 1/1/25 | (2) | 9,000 | 10,289 |
| New Jersey Turnpike Auth. Rev. | 5.250% | 1/1/26 | (4) | 10,000 | 11,162 |
| New Jersey Turnpike Auth. Rev. | 5.250% | 1/1/27 | (4) | 12,035 | 13,416 |
| New Jersey Turnpike Auth. Rev. | 5.250% | 1/1/28 | (4) | 12,000 | 13,388 |
| New Jersey Turnpike Auth. Rev. | 5.250% | 1/1/29 | (4) | 5,000 | 5,581 |
| Rutgers State Univ. New Jersey | 6.400% | 5/1/13 | | 4,675 | 5,057 |
| Tobacco Settlement Financing Corp. New Jersey Rev. | 4.250% | 6/1/12 | | 6,385 | 6,332 |
| Tobacco Settlement Financing Corp. New Jersey Rev. | 5.000% | 6/1/13 | | 14,945 | 15,273 |
| Tobacco Settlement Financing Corp. New Jersey Rev. | 5.000% | 6/1/15 | | 11,425 | 11,568 |
| Tobacco Settlement Financing Corp. New Jersey Rev. | 5.000% | 6/1/16 | | 14,585 | 14,686 |
| Tobacco Settlement Financing Corp. New Jersey Rev. | 5.000% | 6/1/17 | | 15,925 | 15,960 |
| Tobacco Settlement Financing Corp. New Jersey Rev. | 5.000% | 6/1/18 | | 16,475 | 16,421 |
| Tobacco Settlement Financing Corp. New Jersey Rev. | 5.000% | 6/1/19 | | 30,595 | 30,381 |
| | | | | | 1,167,378 |
Intermediate-Term Tax-Exempt Fund
| | | | | Face | Market |
| | | Maturity | | Amount | Value• |
| | Coupon | Date | | ($000) | ($000) |
New Mexico (0.8%) | | | | | |
| Farmington NM PCR (Southern CA Edison | | | | | |
| Four Corners Project) PUT | 3.550% | 4/1/10 | (3) | 30,000 | 29,900 |
| New Mexico Finance Auth. Transp. Rev. | 5.000% | 6/15/13 | (2) | 12,895 | 13,794 |
| New Mexico Finance Auth. Transp. Rev. | 5.250% | 6/15/20 | (1) | 30,525 | 32,706 |
| New Mexico Finance Auth. Transp. Rev. | 5.250% | 6/15/21 | (1) | 28,000 | 29,967 |
| New Mexico Highway Comm. Tax Rev. | 5.750% | 6/15/10 | (Prere.) | 16,310 | 17,246 |
| New Mexico Highway Comm. Tax Rev. | 6.000% | 6/15/10 | (Prere.) | 12,780 | 13,593 |
| | | | | | 137,206 |
New York (6.3%) | | | | | |
| Erie County NY IDA School Fac. Rev. GO | 5.750% | 5/1/23 | (4) | 7,000 | 7,746 |
| Erie County NY IDA School Fac. Rev. GO | 5.750% | 5/1/24 | (4) | 3,750 | 4,150 |
| Erie County NY IDA School Fac. Rev. GO | 5.750% | 5/1/25 | (4) | 3,000 | 3,320 |
| Long Island NY Power Auth. Electric System Rev. | 5.500% | 12/1/09 | (2) | 6,000 | 6,252 |
| Long Island NY Power Auth. Electric System Rev. | 5.250% | 6/1/12 | | 40,505 | 43,292 |
| Long Island NY Power Auth. Electric System Rev. | 5.000% | 12/1/18 | (1) | 27,900 | 29,965 |
| Long Island NY Power Auth. Electric System Rev. | 5.000% | 12/1/20 | (1) | 10,000 | 10,645 |
| Long Island NY Power Auth. Electric System Rev. | 5.000% | 12/1/21 | (3) | 10,000 | 10,614 |
| Long Island NY Power Auth. Electric System Rev. | 5.000% | 12/1/21 | (1) | 33,115 | 35,149 |
| Metro. New York Transp. Auth. Rev. (Commuter Fac.) | 5.000% | 1/1/12 | (1)(Prere.) | 8,100 | 8,573 |
| Metro. New York Transp. Auth. Rev. | | | | | |
| (Dedicated Petroleum Tax) | 5.500% | 10/1/10 | (1)(Prere.) | 4,500 | 4,759 |
| Metro. New York Transp. Auth. Rev. | | | | | |
| (Service Contract) | 0.000% | 7/1/11 | (ETM) | 21,200 | 18,600 |
| Metro. New York Transp. Auth. Rev. (Transit Rev.) | 7.000% | 7/1/09 | (2)(ETM) | 5,340 | 5,547 |
| Metro. New York Transp. Auth. Rev. (Transit Rev.) | 5.500% | 11/15/15 | (2) | 45,130 | 48,919 |
| Metro. New York Transp. Auth. Rev. (Transp. Fac.) | 5.250% | 7/1/09 | (4)(ETM) | 20,000 | 20,594 |
1 | Metro. New York Transp. Auth. Rev. TOB VRDO | 3.490% | 11/7/07 | (4) | 6,085 | 6,085 |
| Muni. Assistance Corp. for New York City NY | 5.000% | 7/1/08 | | 10,000 | 10,104 |
| New York City NY GO | 5.250% | 8/1/10 | | 27,000 | 28,213 |
| New York City NY GO | 5.250% | 8/1/11 | | 30,000 | 31,720 |
| New York City NY GO | 5.250% | 8/1/13 | | 18,015 | 19,407 |
| New York City NY GO | 5.750% | 8/1/13 | (2) | 8,500 | 9,279 |
| New York City NY GO | 5.750% | 8/1/15 | (2) | 38,000 | 41,414 |
| New York City NY Muni. Water Finance Auth. | | | | | |
| Water & Sewer System Rev. | 5.375% | 6/15/19 | | 7,500 | 8,016 |
| New York City NY Muni. Water Finance Auth. | | | | | |
| Water & Sewer System Rev. | 5.000% | 6/15/31 | | 5,000 | 5,163 |
1 | New York City NY Muni. Water Finance Auth. | | | | | |
| Water & Sewer System Rev. TOB VRDO | 3.490% | 11/7/07 | | 38,505 | 38,505 |
| New York City NY Sales Tax Asset Receivable Corp. | 5.000% | 10/15/24 | (1) | 12,500 | 13,105 |
| New York City NY Sales Tax Asset Receivable Corp. | 5.000% | 10/15/25 | (1) | 12,000 | 12,559 |
| New York City NY Transitional Finance Auth. Rev. | 5.000% | 5/15/08 | (Prere.) | 3,550 | 3,615 |
| New York City NY Transitional Finance Auth. Rev. | 5.000% | 5/15/08 | (Prere.) | 6,375 | 6,492 |
| New York City NY Transitional Finance Auth. Rev. | 5.500% | 5/15/08 | (Prere.) | 2,000 | 2,042 |
| New York City NY Transitional Finance Auth. Rev. | 5.125% | 5/1/09 | (Prere.) | 7,245 | 7,497 |
| New York City NY Transitional Finance Auth. Rev. | 5.125% | 5/1/09 | (Prere.) | 4,000 | 4,139 |
| New York City NY Transitional Finance Auth. Rev. | 5.125% | 5/1/09 | (Prere.) | 7,570 | 7,834 |
| New York City NY Transitional Finance Auth. Rev. | 5.125% | 5/15/09 | (3)(Prere.) | 5,195 | 5,378 |
| New York City NY Transitional Finance Auth. Rev. | 5.250% | 5/15/09 | (Prere.) | 5,000 | 5,186 |
| New York City NY Transitional Finance Auth. Rev. | 5.250% | 5/15/09 | (Prere.) | 12,585 | 13,054 |
| New York City NY Transitional Finance Auth. Rev. | 5.750% | 8/15/09 | (3)(Prere.) | 14,740 | 15,474 |
| New York City NY Transitional Finance Auth. Rev. | 5.500% | 2/15/10 | (Prere.) | 3,500 | 3,693 |
| New York City NY Transitional Finance Auth. Rev. | 5.750% | 2/15/10 | (Prere.) | 4,365 | 4,629 |
| New York City NY Transitional Finance Auth. Rev. | 5.750% | 2/15/10 | (Prere.) | 5,960 | 6,321 |
| New York City NY Transitional Finance Auth. Rev. | 5.875% | 5/1/10 | (Prere.) | 6,000 | 6,408 |
Intermediate-Term Tax-Exempt Fund
| | | | | Face | Market |
| | | Maturity | | Amount | Value• |
| | Coupon | Date | | ($000) | ($000) |
| New York City NY Transitional Finance Auth. Rev. | 5.375% | 2/1/13 | | 14,000 | 14,870 |
| New York City NY Transitional Finance Auth. Rev. | 5.375% | 2/1/14 | | 5,000 | 5,299 |
| New York City NY Transitional Finance Auth. Rev. | 5.250% | 8/1/18 | (2) | 5,000 | 5,323 |
| New York City NY Transitional Finance Auth. Rev. | | | | | |
| Future Tax | 5.250% | 5/1/09 | (Prere.) | 1,170 | 1,213 |
| New York City NY Transitional Finance Auth. Rev. | | | | | |
| Future Tax | 5.250% | 5/1/09 | (Prere.) | 70 | 73 |
| New York City NY Transitional Finance Auth. Rev. | | | | | |
| Future Tax | 5.250% | 5/1/09 | (Prere.) | 2,235 | 2,316 |
| New York City NY Transitional Finance Auth. Rev. | | | | | |
| Future Tax | 5.000% | 5/15/09 | (Prere.) | 315 | 326 |
| New York City NY Transitional Finance Auth. Rev. | | | | | |
| Future Tax | 5.000% | 5/15/09 | (Prere.) | 9,685 | 10,007 |
| New York City NY Transitional Finance Auth. Rev. | | | | | |
| Future Tax | 5.500% | 2/15/10 | (Prere.) | 5,945 | 6,272 |
| New York State Dormitory Auth. Rev. (City Univ.) | 5.500% | 7/1/11 | (1)(Prere.) | 4,090 | 4,376 |
| New York State Dormitory Auth. Rev. (City Univ.) | 5.750% | 7/1/13 | (1) | 11,500 | 12,406 |
| New York State Dormitory Auth. Rev. (City Univ.) | 5.750% | 7/1/13 | (1) | 14,645 | 15,770 |
| New York State Dormitory Auth. Rev. | | | | | |
| (Columbia Univ.) | 5.250% | 7/1/11 | | 4,160 | 4,427 |
| New York State Dormitory Auth. Rev. | | | | | |
| (Jewish Medical Center) | 5.250% | 7/1/08 | (1)(Prere.) | 4,000 | 4,086 |
| New York State Dormitory Auth. Rev. | | | | | |
| (Mental Health Services) | 5.250% | 8/15/08 | (1)(Prere.) | 5 | 5 |
| New York State Dormitory Auth. Rev. | | | | | |
| (Mental Health Services) | 5.250% | 8/15/08 | (1)(Prere.) | 5 | 5 |
| New York State Dormitory Auth. Rev. | | | | | |
| (Mental Health Services) | 5.250% | 2/15/11 | (1) | 7,360 | 7,519 |
| New York State Dormitory Auth. Rev. | | | | | |
| (Mental Health Services) | 5.000% | 2/15/23 | (3) | 6,415 | 6,681 |
| New York State Dormitory Auth. Rev. | | | | | |
| (Mental Health Services) | 5.000% | 2/15/24 | (3) | 6,740 | 7,002 |
| New York State Dormitory Auth. Rev. | | | | | |
| (Personal Income Tax) | 5.000% | 12/15/13 | | 2,135 | 2,295 |
| New York State Dormitory Auth. Rev. | | | | | |
| (Personal Income Tax) | 5.000% | 12/15/14 | | 3,250 | 3,510 |
| New York State Dormitory Auth. Rev. | | | | | |
| (Personal Income Tax) | 5.000% | 3/15/23 | | 5,000 | 5,241 |
| New York State Dormitory Auth. Rev. | | | | | |
| (Personal Income Tax) | 5.500% | 3/15/25 | (2) | 8,740 | 10,002 |
| New York State Dormitory Auth. Rev. | | | | | |
| (Second Hosp.) | 5.000% | 2/15/08 | (4)(Prere.) | 4,500 | 4,586 |
| New York State Dormitory Auth. Rev. | | | | | |
| (Second Hosp.) | 5.100% | 2/15/08 | (4)(Prere.) | 6,285 | 6,408 |
| New York State Dormitory Auth. Rev. | | | | | |
| (Second Hosp.) | 5.100% | 2/15/08 | (2)(Prere.) | 6,000 | 6,117 |
| New York State Dormitory Auth. Rev. | | | | | |
| (Second Hosp.) | 5.100% | 2/15/11 | (2) | 4,040 | 4,118 |
| New York State Dormitory Auth. Rev. | | | | | |
| (Upstate Community Colleges) | 5.250% | 7/1/10 | (2) | 3,920 | 4,068 |
| New York State Dormitory Auth. Rev. | | | | | |
| (Upstate Community Colleges) | 5.250% | 7/1/11 | (2) | 3,610 | 3,743 |
| New York State Power Auth. Rev. | 5.250% | 11/15/12 | (Prere.) | 20,710 | 22,391 |
| New York State Power Auth. Rev. | 5.250% | 11/15/12 | (Prere.) | 35,425 | 38,300 |
| New York State Thruway Auth. Rev. | 5.000% | 1/1/20 | (1) | 9,440 | 10,124 |
| New York State Thruway Auth. Rev. | 5.000% | 1/1/22 | (3) | 10,000 | 10,656 |
Intermediate-Term Tax-Exempt Fund
| | | | | Face | Market |
| | | Maturity | | Amount | Value• |
| | Coupon | Date | | ($000) | ($000) |
| New York State Thruway Auth. Rev. | 5.000% | 1/1/23 | (2) | 20,000 | 20,942 |
| New York State Thruway Auth. Rev. | | | | | |
| (Highway & Bridge Trust Fund) | 6.250% | 4/1/10 | (4)(ETM) | 6,725 | 7,166 |
| New York State Thruway Auth. Rev. | | | | | |
| (Highway & Bridge Trust Fund) | 5.250% | 4/1/11 | (3) | 4,000 | 4,068 |
| New York State Thruway Auth. Rev. | | | | | |
| (Highway & Bridge Trust Fund) | 5.250% | 4/1/12 | (3) | 6,220 | 6,325 |
| New York State Thruway Auth. Rev. | | | | | |
| (Highway & Bridge Trust Fund) | 5.500% | 4/1/12 | (1) | 20,000 | 21,581 |
| New York State Thruway Auth. Rev. | | | | | |
| (Personal Income Tax) | 5.500% | 3/15/12 | (1)(Prere.) | 3,000 | 3,244 |
| New York State Urban Dev. Corp. Rev. | | | | | |
| (Personal Income Tax) GO | 5.500% | 3/15/22 | (1) | 23,030 | 26,181 |
| Port Auth. of New York & New Jersey | | | | | |
| Special Obligation Rev. (Versatile Structure) VRDO | 3.500% | 11/1/07 | | 3,500 | 3,500 |
| Suffolk County NY Water Auth. Rev. | 6.800% | 6/1/12 | (ETM) | 10,060 | 10,935 |
| Triborough Bridge & Tunnel Auth. New York Rev. | 6.600% | 1/1/10 | (ETM) | 55,325 | 57,925 |
| Triborough Bridge & Tunnel Auth. New York Rev. | 5.500% | 1/1/12 | (ETM) | 18,920 | 19,664 |
| Triborough Bridge & Tunnel Auth. New York Rev. | 6.000% | 1/1/12 | (ETM) | 12,000 | 12,756 |
| Triborough Bridge & Tunnel Auth. New York Rev. | 5.250% | 11/15/17 | | 20,000 | 21,337 |
| | | | | | 1,028,616 |
North Carolina (3.6%) | | | | | |
| Cumberland County NC Hosp. Fac. Rev. | | | | | |
| (Cape Fear Hosp.) | 5.250% | 10/1/09 | (Prere.) | 10,000 | 10,417 |
| North Carolina Eastern Muni. Power Agency Rev. | 5.375% | 1/1/11 | | 25,000 | 26,019 |
| North Carolina Eastern Muni. Power Agency Rev. | 5.375% | 1/1/12 | | 14,875 | 15,623 |
| North Carolina Eastern Muni. Power Agency Rev. | 5.375% | 1/1/13 | | 25,000 | 26,445 |
| North Carolina Eastern Muni. Power Agency Rev. | 5.500% | 1/1/14 | | 15,000 | 16,066 |
| North Carolina Eastern Muni. Power Agency Rev. | 5.300% | 1/1/15 | | 4,000 | 4,193 |
| North Carolina Eastern Muni. Power Agency Rev. | 5.375% | 1/1/16 | | 3,000 | 3,148 |
| North Carolina Eastern Muni. Power Agency Rev. | 5.375% | 1/1/17 | | 4,700 | 4,918 |
| North Carolina GO | 5.000% | 6/1/09 | | 11,500 | 11,786 |
| North Carolina GO | 5.000% | 6/1/10 | | 13,820 | 14,362 |
| North Carolina GO | 5.250% | 6/1/11 | | 10,375 | 10,999 |
| North Carolina GO | 5.000% | 3/1/12 | | 7,400 | 7,842 |
| North Carolina GO | 5.000% | 4/1/14 | | 42,045 | 45,340 |
| North Carolina GO | 5.000% | 5/1/14 | | 30,280 | 32,342 |
| North Carolina GO | 5.000% | 3/1/15 | | 12,875 | 13,961 |
| North Carolina GO | 5.000% | 3/1/16 | | 23,510 | 25,573 |
| North Carolina GO | 5.000% | 9/1/16 | | 10,000 | 10,914 |
| North Carolina GO | 5.000% | 3/1/17 | | 10,000 | 10,900 |
| North Carolina GO | 5.000% | 3/1/18 | | 25,000 | 27,109 |
| North Carolina GO | 5.000% | 3/1/19 | | 22,520 | 24,295 |
| North Carolina GO | 5.000% | 3/1/20 | | 20,000 | 21,177 |
| North Carolina Infrastructure Financial Corp. COP | | | | | |
| Capital Improvements | 5.000% | 2/1/18 | (4) | 9,675 | 10,346 |
| North Carolina Infrastructure Financial Corp. COP | | | | | |
| Capital Improvements | 5.000% | 2/1/19 | (4) | 10,000 | 10,639 |
| North Carolina Infrastructure Financial Corp. COP | | | | | |
| Capital Improvements | 5.000% | 2/1/21 | (4) | 10,000 | 10,568 |
| North Carolina Muni. Power Agency Rev. | 5.250% | 1/1/09 | (1) | 8,500 | 8,679 |
| North Carolina Muni. Power Agency Rev. | 5.250% | 1/1/16 | (4) | 10,000 | 10,698 |
| North Carolina Muni. Power Agency Rev. | 5.250% | 1/1/17 | (4) | 15,290 | 16,276 |
| North Carolina Muni. Power Agency Rev. | 5.250% | 1/1/18 | (1) | 69,720 | 74,015 |
| North Carolina Muni. Power Agency Rev. | 5.250% | 1/1/19 | (1) | 38,600 | 40,941 |
| North Carolina Muni. Power Agency Rev. | 5.250% | 1/1/20 | (1) | 10,000 | 10,516 |
Intermediate-Term Tax-Exempt Fund
| | | Face | Market |
| | Maturity | Amount | Value• |
| Coupon | Date | ($000) | ($000) |
Wake County NC Public Improvement GO | 5.000% | 3/1/18 | 22,415 | 24,305 |
Winston-Salem NC Water & Sewer System Rev. | 5.500% | 6/1/11 (Prere.) | 1,970 | 2,119 |
Winston-Salem NC Water & Sewer System Rev. | 5.500% | 6/1/11 (Prere.) | 2,380 | 2,560 |
Winston-Salem NC Water & Sewer System Rev. | 5.500% | 6/1/13 | 1,500 | 1,609 |
Winston-Salem NC Water & Sewer System Rev. | 5.500% | 6/1/14 | 1,240 | 1,330 |
| | | | 588,030 |
Ohio (3.1%) | | | | |
Akron OH GO | 5.000% | 12/1/18 (2) | 5,300 | 5,663 |
Buckeye OH Tobacco Settlement | | | | |
Financing Corp. Rev. | 5.125% | 6/1/24 | 64,000 | 61,677 |
Cincinnati OH City School Dist. GO | 5.250% | 12/1/20 (3) | 7,000 | 7,771 |
Cincinnati OH City School Dist. GO | 5.250% | 12/1/21 (3) | 5,710 | 6,349 |
Cincinnati OH City School Dist. GO | 5.250% | 12/1/22 (3) | 10,000 | 11,140 |
Cincinnati OH City School Dist. GO | 5.250% | 12/1/23 (3) | 5,000 | 5,578 |
Cincinnati OH City School Dist. GO | 5.250% | 12/1/24 (3) | 10,000 | 11,167 |
Cincinnati OH GO | 5.250% | 12/1/13 (4)(Prere.) | 8,150 | 8,888 |
Cincinnati OH GO | 5.250% | 12/1/13 (4)(Prere.) | 14,710 | 16,042 |
Cincinnati OH GO | 5.250% | 12/1/13 (4)(Prere.) | 9,185 | 10,017 |
Cincinnati OH GO | 5.250% | 12/1/13 (4)(Prere.) | 5,000 | 5,453 |
Cleveland OH GO | 5.500% | 8/1/08 (1) | 6,295 | 6,388 |
Cleveland OH Public Power System Rev. | 5.000% | 11/15/21 (3) | 7,455 | 7,848 |
Cleveland OH Public Power System Rev. | 5.000% | 11/15/22 (3) | 14,065 | 14,763 |
Cleveland OH Public Power System Rev. | 5.000% | 11/15/23 (3) | 7,705 | 8,064 |
Cleveland OH Public Power System Rev. | 5.000% | 11/15/24 (3) | 7,350 | 7,681 |
Cleveland OH Water Works Rev. | 5.250% | 1/1/08 (4)(Prere.) | 1,160 | 1,175 |
Cleveland OH Water Works Rev. | 5.250% | 1/1/08 (4)(Prere.) | 3,255 | 3,297 |
Cleveland OH Water Works Rev. | 5.250% | 1/1/09 (4) | 1,340 | 1,357 |
Cleveland OH Water Works Rev. | 5.250% | 1/1/10 (4) | 3,745 | 3,793 |
Cleveland OH Water Works Rev. | 5.375% | 1/1/13 (4) | 3,455 | 3,683 |
Columbus OH City School Dist. School Fac. | | | | |
Construction & Improvement GO | 5.000% | 12/1/16 (4) | 6,000 | 6,516 |
Columbus OH GO | 5.500% | 7/1/10 | 10,380 | 10,925 |
Hamilton County OH Sales Tax Rev. | 5.000% | 12/1/18 (2) | 7,950 | 8,526 |
Hamilton County OH Sales Tax Rev. | 5.000% | 12/1/19 (2) | 22,380 | 23,894 |
Hamilton County OH Sales Tax Rev. | 5.000% | 12/1/23 (2) | 21,215 | 22,370 |
Lorain County OH Hosp. Fac. Rev. | | | | |
(Catholic Healthcare Partners) | 5.625% | 10/1/12 | 6,800 | 7,284 |
Lorain County OH Hosp. Fac. Rev. | | | | |
(Catholic Healthcare Partners) | 5.625% | 9/1/13 (1) | 3,000 | 3,064 |
Lorain County OH Hosp. Fac. Rev. | | | | |
(Catholic Healthcare Partners) | 5.625% | 10/1/13 | 6,810 | 7,268 |
Lorain County OH Hosp. Fac. Rev. | | | | |
(Catholic Healthcare Partners) | 5.625% | 10/1/14 | 6,000 | 6,387 |
Lorain County OH Hosp. Fac. Rev. | | | | |
(Catholic Healthcare Partners) | 5.625% | 10/1/15 | 4,000 | 4,244 |
Montgomery County OH Rev. | | | | |
(Catholic Health Initiatives) | 5.000% | 5/1/30 | 20,000 | 20,232 |
Ohio Building Auth. Rev. | | | | |
(Administration Building Fund) | 5.500% | 10/1/11 (4)(Prere.) | 6,605 | 7,082 |
Ohio Building Auth. Rev. (State Correctional Fac.) | 5.500% | 10/1/12 (4) | 5,000 | 5,344 |
Ohio Building Auth. Rev. (State Correctional Fac.) | 5.500% | 10/1/13 (4) | 3,000 | 3,206 |
Ohio Building Auth. Rev. (State Correctional Fac.) | 5.250% | 4/1/17 | 5,565 | 6,119 |
Ohio GO | 5.625% | 5/1/10 (Prere.) | 5,065 | 5,328 |
Ohio GO | 7.625% | 8/1/10 | 3,510 | 3,886 |
Ohio GO | 5.375% | 2/1/11 (Prere.) | 7,255 | 7,667 |
Ohio GO | 5.375% | 2/1/11 (Prere.) | 7,645 | 8,079 |
Intermediate-Term Tax-Exempt Fund
| | | Face | Market |
| | Maturity | Amount | Value• |
| Coupon | Date | ($000) | ($000) |
Ohio GO | 5.375% | 2/1/11 (Prere.) | 5,000 | 5,284 |
Ohio GO | 5.375% | 2/1/11 (Prere.) | 5,500 | 5,812 |
Ohio GO | 5.375% | 2/1/11 (Prere.) | 3,485 | 3,683 |
Ohio GO | 5.250% | 8/1/13 (4) | 12,435 | 13,483 |
Ohio GO | 5.500% | 8/1/13 | 2,945 | 3,228 |
Ohio GO | 5.500% | 11/1/14 | 11,185 | 12,412 |
Ohio GO | 5.000% | 9/15/18 | 12,755 | 13,638 |
Ohio GO | 5.000% | 11/1/18 | 7,710 | 8,251 |
Ohio Higher Educ. Capital Fac. Rev. | 5.250% | 11/1/14 | 3,710 | 3,970 |
Ohio Higher Educ. GO | 5.000% | 8/1/12 | 6,525 | 6,929 |
Ohio Higher Educ. GO | 5.000% | 11/1/23 | 8,905 | 9,377 |
Ohio Higher Educ. GO | 5.000% | 2/1/25 | 5,000 | 5,213 |
Ohio Highway Capital Improvements GO | 5.000% | 5/1/16 | 11,010 | 11,915 |
Ohio Infrastructure Improvement GO | 5.000% | 9/1/24 | 8,720 | 9,117 |
Ohio Water Dev. Auth. Rev. | | | | |
(Fresh Water Improvement) | 5.500% | 6/1/21 | 5,540 | 6,286 |
Ohio Water Dev. Auth. Rev. | | | | |
(Fresh Water Improvement) | 5.500% | 12/1/21 | 5,555 | 6,323 |
Univ. of Cincinnati OH General Receipts | 5.500% | 6/1/13 (3) | 2,700 | 2,898 |
Univ. of Cincinnati OH General Receipts | 5.500% | 6/1/14 (3) | 1,000 | 1,072 |
| | | | 504,106 |
Oklahoma (0.5%) | | | | |
Grand River Dam Auth. Oklahoma Rev. | 6.250% | 6/1/11 (2) | 7,600 | 8,282 |
Oklahoma State Capitol Improvement | | | | |
Auth. Fac. Rev. | 5.000% | 7/1/25 (2) | 15,070 | 15,742 |
Oklahoma State Capitol Improvement | | | | |
Auth. Fac. Rev. | 5.000% | 7/1/26 (2) | 12,000 | 12,511 |
Oklahoma State Capitol Improvement | | | | |
Auth. Fac. Rev. | 5.000% | 7/1/27 (2) | 20,110 | 20,940 |
Oklahoma State Capitol Improvement | | | | |
Auth. Fac. Rev. | 5.000% | 7/1/29 (2) | 13,930 | 14,477 |
Oklahoma Turnpike Auth. | 5.500% | 1/1/09 (3) | 6,000 | 6,145 |
| | | | 78,097 |
Oregon (0.7%) | | | | |
Clackamas County OR Hosp. Fac. Auth. Rev. | | | | |
(Legacy Health System) | 5.500% | 2/15/09 | 7,715 | 7,891 |
Clackamas County OR Hosp. Fac. Auth. Rev. | | | | |
(Legacy Health System) | 5.500% | 2/15/10 | 9,955 | 10,380 |
Clackamas County OR Hosp. Fac. Auth. Rev. | | | | |
(Legacy Health System) | 5.750% | 5/1/12 | 2,955 | 3,173 |
Clackamas County OR Hosp. Fac. Auth. Rev. | | | | |
(Legacy Health System) | 5.750% | 5/1/13 | 5,580 | 5,970 |
Clackamas County OR Hosp. Fac. Auth. Rev. | | | | |
(Legacy Health System) | 5.750% | 5/1/14 | 5,825 | 6,217 |
Clackamas County OR Hosp. Fac. Auth. Rev. | | | | |
(Legacy Health System) | 5.750% | 5/1/15 | 4,395 | 4,679 |
Oregon State Dept. Administrative Services | 5.750% | 4/1/09 (4)(Prere.) | 2,500 | 2,602 |
Oregon State Dept. Administrative Services | 5.750% | 4/1/09 (4)(Prere.) | 3,000 | 3,122 |
Oregon State Dept. Administrative Services | 5.750% | 4/1/09 (4)(Prere.) | 8,715 | 9,069 |
Oregon State Dept. Administrative Services | 5.750% | 4/1/10 (4) | 7,560 | 7,867 |
Oregon State Dept. Administrative Services | 5.000% | 4/1/25 (4) | 5,675 | 5,984 |
Oregon State Dept. Administrative Services | 5.000% | 4/1/26 (4) | 11,210 | 11,803 |
Portland OR Sewer System Rev. | 5.000% | 6/1/12 (1) | 27,230 | 28,889 |
| | | | 107,646 |
Intermediate-Term Tax-Exempt Fund
| | | | Face | Market |
| | | Maturity | Amount | Value• |
| | Coupon | Date | ($000) | ($000) |
Pennsylvania (4.8%) | | | | |
| Commonwealth Financing Auth. Pennsylvania Rev. | 5.000% | 6/1/24 (1) | 14,050 | 14,708 |
| Commonwealth Financing Auth. Pennsylvania Rev. | 5.000% | 6/1/25 (1) | 10,000 | 10,442 |
| Delaware County PA Hosp. Auth. Rev. | | | | |
| (Crozer Keystone Obligated Group) | 5.000% | 12/15/17 | 3,790 | 3,837 |
| Delaware County PA Hosp. Auth. Rev. | | | | |
| (Crozer Keystone Obligated Group) | 5.000% | 12/15/18 | 3,985 | 4,017 |
| Delaware County PA Hosp. Auth. Rev. | | | | |
| (Crozer Keystone Obligated Group) | 5.000% | 12/15/19 | 4,175 | 4,184 |
| Delaware County PA Hosp. Auth. Rev. | | | | |
| (Crozer Keystone Obligated Group) | 5.000% | 12/15/26 | 13,070 | 12,724 |
| Delaware County PA IDA Resource | | | | |
| Recovery Rev. (American Fuel) | 6.000% | 1/1/09 | 5,355 | 5,442 |
1 | Delaware River Joint Toll Bridge Comm. | | | | |
| Pennsylvania & New Jersey Rev. TOB VRDO | 3.510% | 11/7/07 (1) | 12,865 | 12,865 |
| Northampton County PA General Purpose Auth. | | | | |
| Univ. Rev. (Lehigh Univ.) VRDO | 3.450% | 11/7/07 | 23,500 | 23,500 |
| Pennsylvania Convention Center Auth. Rev. | 6.700% | 9/1/16 (3)(ETM) | 3,000 | 3,455 |
| Pennsylvania GO | 6.000% | 7/1/08 | 8,220 | 8,359 |
| Pennsylvania GO | 5.000% | 9/15/08 | 7,150 | 7,248 |
| Pennsylvania GO | 5.000% | 3/1/11 | 14,735 | 15,424 |
| Pennsylvania GO | 5.250% | 2/1/12 (3) | 5,000 | 5,336 |
| Pennsylvania GO | 5.000% | 3/1/12 | 24,335 | 25,733 |
| Pennsylvania GO | 5.500% | 5/1/12 (4)(Prere.) | 10,000 | 10,809 |
| Pennsylvania GO | 5.250% | 7/1/12 | 25,200 | 27,004 |
| Pennsylvania GO | 5.000% | 10/1/12 (3) | 9,430 | 10,042 |
| Pennsylvania GO | 5.000% | 7/1/14 (1) | 5,850 | 6,241 |
| Pennsylvania GO | 5.000% | 9/1/14 (4) | 25,000 | 26,972 |
| Pennsylvania GO | 5.250% | 7/1/15 | 49,130 | 53,896 |
| Pennsylvania GO | 5.375% | 7/1/18 (4) | 13,000 | 14,515 |
| Pennsylvania GO | 5.000% | 3/1/20 | 18,270 | 19,490 |
| Pennsylvania GO | 5.000% | 11/1/20 | 17,730 | 18,983 |
| Pennsylvania GO | 5.000% | 1/1/22 | 37,805 | 39,849 |
| Pennsylvania GO | 5.000% | 1/1/23 | 39,695 | 41,729 |
| Pennsylvania GO | 5.000% | 10/1/23 | 10,900 | 11,501 |
| Pennsylvania GO | 5.000% | 1/1/25 | 23,760 | 24,877 |
| Pennsylvania Higher Educ. Fac. Auth. Rev. | | | | |
| (Univ. of Pittsburgh Medical Center) | 5.250% | 8/1/11 (4) | 8,195 | 8,510 |
| Pennsylvania Higher Educ. Fac. Auth. Rev. | | | | |
| (Univ. of Pittsburgh Medical Center) | 5.250% | 8/1/12 (4) | 2,750 | 2,848 |
| Pennsylvania Higher Educ. Fac. Auth. Rev. | | | | |
| (Univ. of Pittsburgh Medical Center) | 5.250% | 8/1/13 (4) | 4,000 | 4,137 |
| Pennsylvania Intergovernmental | | | | |
| Cooperation Auth. Rev. | 5.250% | 6/15/11 (3) | 10,000 | 10,265 |
| Pennsylvania Intergovernmental | | | | |
| Cooperation Auth. Rev. | 5.250% | 6/15/12 (3) | 6,660 | 6,833 |
| Pennsylvania Intergovernmental | | | | |
| Cooperation Auth. Rev. | 5.250% | 6/15/13 (3) | 5,000 | 5,130 |
| Pennsylvania Public School Building Auth. | | | | |
| Lease Rev. (School Dist. of Philadelphia) | 5.000% | 6/1/23 (4) | 7,130 | 7,507 |
| Pennsylvania Public School Building Auth. | | | | |
| Lease Rev. (School Dist. of Philadelphia) | 5.000% | 6/1/23 (4) | 10,600 | 11,096 |
| Pennsylvania Public School Building Auth. | | | | |
| Lease Rev. (School Dist. of Philadelphia) | 5.000% | 6/1/24 (4) | 11,130 | 11,634 |
| Pennsylvania Public School Building Auth. | | | | |
| Lease Rev. (School Dist. of Philadelphia) | 5.000% | 6/1/24 (4) | 17,370 | 18,262 |
Intermediate-Term Tax-Exempt Fund
| | | Face | Market |
| | Maturity | Amount | Value• |
| Coupon | Date | ($000) | ($000) |
Pennsylvania Public School Building Auth. | | | | |
Lease Rev. (School Dist. of Philadelphia) | 5.000% | 6/1/25 (4) | 31,415 | 32,957 |
Pennsylvania Public School Building Auth. | | | | |
Lease Rev. (School Dist. of Philadelphia) | 5.000% | 6/1/25 (4) | 11,685 | 12,187 |
Pennsylvania Public School Building Auth. | | | | |
Lease Rev. (School Dist. of Philadelphia) | 5.000% | 6/1/26 (4) | 12,270 | 12,769 |
Pennsylvania Turnpike Comm. Oil Franchise Tax Rev. | 5.250% | 12/1/08 (2)(Prere.) | 1,495 | 1,538 |
Pennsylvania Turnpike Comm. Oil Franchise Tax Rev. | 5.250% | 12/1/08 (2)(Prere.) | 1,665 | 1,713 |
Pennsylvania Turnpike Comm. Oil Franchise Tax Rev. | 5.250% | 12/1/11 (2)(ETM) | 4,095 | 4,209 |
Pennsylvania Turnpike Comm. Oil Franchise Tax Rev. | 5.250% | 12/1/11 (2) | 460 | 473 |
Pennsylvania Turnpike Comm. Oil Franchise Tax Rev. | 5.250% | 12/1/11 (2) | 410 | 421 |
Pennsylvania Turnpike Comm. Oil Franchise Tax Rev. | 5.250% | 12/1/11 (2)(ETM) | 2,875 | 2,957 |
Pennsylvania Turnpike Comm. Oil Franchise Tax Rev. | 5.000% | 12/1/17 (2) | 5,155 | 5,557 |
Philadelphia PA Airport Parking Auth. | 5.250% | 9/1/10 (2) | 4,875 | 4,929 |
Philadelphia PA Gas Works Rev. | 5.500% | 7/1/09 (4) | 10,820 | 10,952 |
Philadelphia PA Gas Works Rev. | 5.250% | 7/1/10 (4) | 10,180 | 10,287 |
Philadelphia PA Gas Works Rev. | 5.250% | 7/1/11 (4) | 5,000 | 5,052 |
Philadelphia PA GO | 5.125% | 5/15/09 (3) | 2,000 | 2,051 |
Philadelphia PA GO | 5.250% | 3/15/10 (4) | 1,755 | 1,812 |
Philadelphia PA GO | 5.125% | 5/15/10 (3) | 11,695 | 12,095 |
Philadelphia PA GO | 5.250% | 3/15/11 (4) | 3,610 | 3,726 |
Philadelphia PA GO | 5.125% | 5/15/11 (3) | 12,290 | 12,694 |
Philadelphia PA GO | 5.250% | 3/15/12 (4) | 3,000 | 3,095 |
Philadelphia PA GO | 5.125% | 5/15/12 (3) | 4,975 | 5,136 |
Philadelphia PA GO | 5.125% | 5/15/13 (3) | 5,000 | 5,162 |
Philadelphia PA IDA Rev. | | | | |
(Philadelphia Airport System) | 5.750% | 6/15/11 (3) | 4,695 | 4,796 |
Philadelphia PA Muni. Auth. Rev. | 5.250% | 5/15/13 (4) | 11,105 | 11,990 |
Philadelphia PA Muni. Auth. Rev. | 5.250% | 11/15/14 (4) | 5,965 | 6,452 |
Philadelphia PA School Dist. GO | 6.250% | 9/1/08 (2) | 4,000 | 4,092 |
Philadelphia PA School Dist. GO | 5.250% | 4/1/09 (1)(Prere.) | 3,920 | 4,017 |
Philadelphia PA School Dist. GO | 6.250% | 9/1/09 (2) | 2,080 | 2,183 |
Philadelphia PA School Dist. GO | 5.500% | 8/1/12 (3) | 10,815 | 11,709 |
Philadelphia PA School Dist. GO | 5.000% | 8/1/20 (2) | 18,745 | 19,689 |
Philadelphia PA School Dist. GO | 5.000% | 8/1/21 (2) | 10,000 | 10,477 |
Sayre PA Health Care Fac. Auth. Rev. | | | | |
(Guthrie Health Care System) | 5.850% | 12/1/11 (Prere.) | 4,860 | 5,323 |
| | | | 781,904 |
Puerto Rico (2.4%) | | | | |
Puerto Rico Electric Power Auth. Rev. | 5.000% | 7/1/19 (1) | 35,430 | 37,699 |
Puerto Rico Electric Power Auth. Rev. | 5.000% | 7/1/19 (4) | 5,000 | 5,320 |
Puerto Rico Electric Power Auth. Rev. | 5.000% | 7/1/20 (1) | 18,245 | 19,408 |
Puerto Rico Electric Power Auth. Rev. | 5.000% | 7/1/21 (1) | 24,790 | 26,278 |
Puerto Rico Electric Power Auth. Rev. | 5.250% | 7/1/22 (1) | 17,800 | 19,809 |
Puerto Rico GO | 5.500% | 7/1/11 (4) | 8,500 | 9,086 |
Puerto Rico GO | 5.500% | 7/1/13 (1) | 5,000 | 5,477 |
Puerto Rico GO | 5.500% | 7/1/14 (1) | 5,000 | 5,537 |
Puerto Rico GO | 5.250% | 7/1/20 | 14,955 | 15,586 |
Puerto Rico Highway & Transp. Auth. Rev. | 6.250% | 7/1/11 (1) | 2,835 | 3,102 |
Puerto Rico Highway & Transp. Auth. Rev. | 6.250% | 7/1/13 (1) | 7,220 | 8,181 |
Puerto Rico Highway & Transp. Auth. Rev. | 6.250% | 7/1/15 (1) | 5,590 | 6,517 |
Puerto Rico Highway & Transp. Auth. Rev. | 5.250% | 7/1/16 (3) | 8,885 | 9,583 |
Puerto Rico Highway & Transp. Auth. Rev. | 5.250% | 7/1/22 (3) | 7,580 | 8,436 |
Puerto Rico Muni. Finance Agency | 5.875% | 8/1/09 (4)(Prere.) | 4,000 | 4,207 |
Puerto Rico Muni. Finance Agency | 5.750% | 8/1/12 (4) | 2,470 | 2,588 |
Puerto Rico Public Buildings Auth. Govt. Fac. Rev. | 0.000% | 7/1/11 (3) | 48,810 | 42,871 |
Intermediate-Term Tax-Exempt Fund
| | | Face | Market |
| | Maturity | Amount | Value• |
| Coupon | Date | ($000) | ($000) |
Puerto Rico Public Buildings Auth. Govt. Fac. Rev. | 0.000% | 7/1/12 (3) | 34,465 | 29,112 |
Puerto Rico Public Buildings Auth. Govt. Fac. Rev. | 5.500% | 7/1/17 (2) | 6,390 | 7,206 |
Puerto Rico Public Buildings Auth. Govt. Fac. Rev. | 5.500% | 7/1/18 (2) | 6,430 | 7,266 |
Puerto Rico Public Buildings Auth. Govt. Fac. Rev. | 5.250% | 7/1/29 | 25,000 | 25,893 |
Puerto Rico Public Finance Corp. | 6.000% | 8/1/26 (4)((ETM) | 19,980 | 24,291 |
Puerto Rico Public Finance Corp. | 6.000% | 8/1/26 (4)(ETM) | 17,110 | 20,802 |
Puerto Rico Public Finance Corp. PUT | 5.750% | 2/1/12 LOC | 43,740 | 46,455 |
| | | | 390,710 |
Rhode Island (0.3%) | | | | |
Rhode Island Depositors Econ. Protection Corp. | 6.550% | 8/1/10 (1)(ETM) | 18,465 | 19,614 |
Rhode Island Depositors Econ. Protection Corp. | 6.550% | 8/1/10 (1)(ETM) | 8,385 | 8,576 |
Rhode Island Econ. Dev. Corp. | | | | |
(Rhode Island Dept. of Transp.) | 5.250% | 6/15/09 (4) | 3,335 | 3,432 |
Rhode Island Econ. Dev. Corp. | | | | |
(Rhode Island Dept. of Transp.) | 5.250% | 6/15/10 (4) | 3,000 | 3,136 |
Rhode Island Econ. Dev. Corp. | | | | |
(Rhode Island Dept. of Transp.) | 5.250% | 6/15/11 (4) | 5,000 | 5,295 |
Rhode Island Econ. Dev. Corp. | | | | |
(Rhode Island Dept. of Transp.) | 5.250% | 6/15/12 (4) | 5,000 | 5,355 |
Rhode Island Health & Educ. Building Corp. Rev. | | | | |
(Hosp. Financing–Lifespan Obligation) | 5.000% | 5/15/26 (4) | 5,000 | 5,183 |
| | | | 50,591 |
South Carolina (1.1%) | | | | |
Charleston SC Educ. Excellence | | | | |
Financing Corp. Rev. | 5.250% | 12/1/26 | 10,000 | 10,482 |
Charleston SC Educ. Excellence | | | | |
Financing Corp. Rev. | 5.250% | 12/1/27 | 33,070 | 34,620 |
Charleston SC Educ. Excellence | | | | |
Financing Corp. Rev. | 5.250% | 12/1/28 | 5,330 | 5,572 |
Medical Univ. South Carolina Hosp. Auth. Hosp. | | | | |
Fac. Rev. | 6.250% | 8/15/12 (Prere.) | 13,000 | 14,508 |
Piedmont SC Muni. Power Agency Rev. | 0.000% | 1/1/22 (3) | 9,950 | 5,224 |
Piedmont SC Muni. Power Agency Rev. | 0.000% | 1/1/23 (3) | 8,780 | 4,366 |
South Carolina GO | 5.000% | 7/1/08 | 2,750 | 2,779 |
South Carolina GO | 5.000% | 11/1/15 | 7,190 | 7,823 |
South Carolina Jobs Econ. Dev. Auth. Hosp. | | | | |
Improvement Rev. (Palmetto Health Alliance) | 7.000% | 12/15/10 (ETM) | 10,500 | 11,133 |
South Carolina Jobs Econ. Dev. Auth. Hosp. | | | | |
Improvement Rev. (Palmetto Health Alliance) | 7.125% | 12/15/10 (Prere.) | 7,000 | 7,861 |
South Carolina Jobs Econ. Dev. Auth. Rev. | | | | |
(Bon Secours Health System) | 5.625% | 11/15/30 | 8,530 | 8,791 |
South Carolina Public Service Auth. Rev. | 5.375% | 1/1/13 (4) | 7,300 | 7,782 |
South Carolina Public Service Auth. Rev. | 5.500% | 1/1/13 (4) | 5,000 | 5,432 |
South Carolina Public Service Auth. Rev. | 5.000% | 1/1/21 (1) | 15,600 | 16,476 |
South Carolina Transp. Infrastructure Rev. | 5.750% | 10/1/09 (1)(Prere.) | 6,245 | 6,569 |
South Carolina Transp. Infrastructure Rev. | 5.750% | 10/1/09 (1)(Prere.) | 9,020 | 9,488 |
South Carolina Transp. Infrastructure Rev. | 5.750% | 10/1/09 (1)(Prere.) | 8,495 | 8,935 |
South Carolina Transp. Infrastructure Rev. | 5.750% | 10/1/11 (1) | 6,925 | 7,269 |
| | | | 175,110 |
Tennessee (2.3%) | | | | |
Knoxville TN Health, Educ. & Housing Board Rev. | | | | |
(Univ. Health System, Inc.) | 5.400% | 4/1/09 (Prere.) | 3,465 | 3,587 |
Knoxville TN Health, Educ. & Housing Board Rev. | | | | |
(Univ. Health System, Inc.) | 5.500% | 4/1/09 (Prere.) | 4,495 | 4,659 |
Knoxville TN Health, Educ. & Housing Board Rev. | | | | |
(Univ. Health System, Inc.) | 5.500% | 4/1/09 (Prere.) | 2,660 | 2,757 |
Intermediate-Term Tax-Exempt Fund
| | | Face | Market |
| | Maturity | Amount | Value• |
| Coupon | Date | ($000) | ($000) |
Knoxville TN Health, Educ. & Housing Board Rev. | | | | |
(Univ. Health System, Inc.) | 5.625% | 4/1/09 (Prere.) | 2,000 | 2,076 |
Knoxville TN Health, Educ. & Housing Board Rev. | | | | |
(Univ. Health System, Inc.) | 5.750% | 4/1/09 (Prere.) | 13,000 | 13,519 |
Memphis TN Electric System Rev. | 5.000% | 12/1/09 (1) | 60,140 | 62,058 |
Memphis TN Electric System Rev. | 5.000% | 12/1/10 (1) | 33,000 | 34,476 |
Memphis TN GO | 5.000% | 11/1/20 (1) | 16,000 | 16,951 |
Memphis TN GO | 5.000% | 11/1/21 (1) | 5,830 | 6,156 |
Memphis TN GO | 5.000% | 11/1/22 (1) | 5,000 | 5,266 |
Montgomery County TN Public | | | | |
Building Auth. Pooled Financial Rev. | | | | |
(Tennessee County Loan Pool) VRDO | 3.580% | 11/1/07 LOC | 11,255 | 11,255 |
Shelby County TN GO | 0.000% | 12/1/11 | 10,000 | 8,592 |
Shelby County TN Health Educ. & Housing Fac. | | | | |
Board Rev. (St. Jude Children’s Research Hospital) | 5.000% | 7/1/21 | 5,000 | 5,138 |
Shelby County TN Health Educ. & Housing Fac. | | | | |
Board Rev. (St. Jude Children’s Research Hospital) | 5.000% | 7/1/22 | 5,000 | 5,123 |
Shelby County TN Health Educ. & Housing Fac. | | | | |
Board Rev. (St. Jude Children’s Research Hospital) | 5.000% | 7/1/23 | 7,500 | 7,674 |
Shelby County TN Health Educ. & Housing Fac. | | | | |
Board Rev. (St. Jude Children’s Research Hospital) | 5.000% | 7/1/24 | 8,000 | 8,174 |
Shelby County TN Health Educ. & Housing Fac. | | | | |
Board Rev. (St. Jude Children’s Research Hospital) | 5.000% | 7/1/25 | 5,000 | 5,102 |
Shelby County TN Health Educ. & Housing Fac. | | | | |
Board Rev. (St. Jude Children’s Research Hospital) | 5.000% | 7/1/26 | 7,000 | 7,133 |
Tennessee Energy Acquisition Corp. Gas Rev. | 5.000% | 9/1/16 | 17,500 | 17,960 |
Tennessee Energy Acquisition Corp. Gas Rev. | 5.250% | 9/1/17 | 33,305 | 34,697 |
Tennessee Energy Acquisition Corp. Gas Rev. | 5.250% | 9/1/18 | 41,070 | 42,720 |
Tennessee Energy Acquisition Corp. Gas Rev. | 5.000% | 2/1/20 | 25,000 | 25,112 |
Tennessee Energy Acquisition Corp. Gas Rev. | 5.250% | 9/1/20 | 12,000 | 12,338 |
Tennessee Energy Acquisition Corp. Gas Rev. | 5.000% | 2/1/21 | 25,000 | 24,926 |
| | | | 367,449 |
Texas (7.8%) | | | | |
Austin TX Combined Util. System Rev. | 0.000% | 11/15/10 (2) | 5,000 | 4,470 |
Austin TX Combined Util. System Rev. | 0.000% | 11/15/11 (2) | 16,050 | 13,808 |
Austin TX Combined Util. System Rev. | 0.000% | 11/15/11 (1) | 18,100 | 15,572 |
Austin TX Combined Util. System Rev. | 5.125% | 5/15/14 (4) | 8,770 | 8,781 |
Austin TX Combined Util. System Rev. | 0.000% | 5/15/18 (3) | 25,215 | 16,031 |
Austin TX Combined Util. System Rev. | 0.000% | 5/15/19 (3) | 28,160 | 17,023 |
Austin TX Independent School Dist. GO | 5.000% | 8/1/13 | 10,000 | 10,682 |
Carrollton TX Independent School Dist. GO | 6.000% | 2/15/09 (Prere.) | 2,760 | 2,848 |
Carrollton TX Independent School Dist. GO | 6.000% | 2/15/09 (Prere.) | 3,105 | 3,204 |
Dallas TX GO | 5.000% | 2/15/19 | 11,675 | 12,315 |
Harris County TX Health Fac. Dev. Corp. Rev. | | | | |
(St. Luke’s Episcopal Hosp.) VRDO | 3.580% | 11/1/07 | 27,900 | 27,900 |
Harris County TX Sports Auth. Rev. | 0.000% | 11/15/23 (1) | 7,000 | 3,307 |
Harris County TX Toll Road Rev. | 5.375% | 8/15/12 (4) | 10,000 | 10,769 |
Houston TX Community College System Rev. | 5.000% | 4/15/21 (10) | 9,200 | 9,646 |
Houston TX GO | 7.000% | 3/1/08 | 15,860 | 16,003 |
Houston TX GO | 5.250% | 3/1/09 (Prere.) | 4,815 | 4,927 |
Houston TX GO | 5.750% | 9/1/10 (4)(Prere.) | 3,925 | 4,167 |
Houston TX GO | 5.750% | 9/1/10 (4)(Prere.) | 11,450 | 12,155 |
Houston TX GO | 5.250% | 3/1/11 | 1,185 | 1,208 |
Houston TX GO | 5.500% | 3/1/11 (4) | 1,050 | 1,105 |
Houston TX GO | 5.750% | 3/1/12 (4) | 1,105 | 1,169 |
Houston TX GO | 5.750% | 3/1/13 (4) | 375 | 397 |
Intermediate-Term Tax-Exempt Fund
| | | Face | Market |
| | Maturity | Amount | Value• |
| Coupon | Date | ($000) | ($000) |
Houston TX Hotel Occupancy Tax & Special Rev. | | | | |
(Convention & Entertainment) | 5.500% | 9/1/10 (2) | 9,155 | 9,649 |
Houston TX Hotel Occupancy Tax & Special Rev. | | | | |
(Convention & Entertainment) | 5.375% | 9/1/12 (2) | 9,995 | 10,617 |
Houston TX Hotel Occupancy Tax & Special Rev. | | | | |
(Convention & Entertainment) | 5.375% | 9/1/12 (2) | 4,460 | 4,738 |
Houston TX Hotel Occupancy Tax & Special Rev. | | | | |
(Convention & Entertainment) | 5.375% | 9/1/13 (2) | 10,545 | 11,201 |
Houston TX Hotel Occupancy Tax & Special Rev. | | | | |
(Convention & Entertainment) | 5.750% | 9/1/13 (2) | 13,840 | 14,885 |
Houston TX Hotel Occupancy Tax & Special Rev. | | | | |
(Convention & Entertainment) | 5.375% | 9/1/14 (2) | 6,190 | 6,575 |
Houston TX Hotel Occupancy Tax & Special Rev. | | | | |
(Convention & Entertainment) | 5.375% | 9/1/15 (2) | 10,750 | 11,419 |
Houston TX Hotel Occupancy Tax & Special Rev. | | | | |
(Convention & Entertainment) | 5.750% | 9/1/16 (2) | 5,540 | 5,961 |
Houston TX Hotel Occupancy Tax & Special Rev. | | | | |
(Convention & Entertainment) | 0.000% | 9/1/17 (2) | 13,760 | 9,085 |
Houston TX Hotel Occupancy Tax & Special Rev. | | | | |
(Convention & Entertainment) | 5.750% | 9/1/17 (2) | 5,855 | 6,276 |
Houston TX Independent School Dist. GO | 0.000% | 8/15/15 | 5,355 | 3,902 |
Houston TX Water & Sewer System Rev. | 0.000% | 12/1/10 (2) | 5,000 | 4,460 |
Houston TX Water & Sewer System Rev. | 5.750% | 12/1/12 (2)(Prere.) | 8,000 | 8,816 |
Houston TX Water & Sewer System Rev. | 5.500% | 12/1/14 (4) | 22,500 | 24,092 |
Houston TX Water & Sewer System Rev. | 5.500% | 12/1/15 (4) | 7,250 | 7,763 |
Lower Colorado River Auth. Texas Rev. | 5.750% | 5/15/09 (4)(Prere.) | 5 | 5 |
Lower Colorado River Auth. Texas Rev. | 5.875% | 5/15/09 (4)(Prere.) | 5 | 5 |
Lower Colorado River Auth. Texas Rev. | 5.375% | 5/15/11 (1)(Prere.) | 190 | 202 |
Lower Colorado River Auth. Texas Rev. | 5.375% | 5/15/11 (1)(Prere.) | 285 | 303 |
Lower Colorado River Auth. Texas Rev. | 5.375% | 5/15/11 (1)(Prere.) | 175 | 186 |
Lower Colorado River Auth. Texas Rev. | 5.375% | 5/15/11 (1)(Prere.) | 80 | 85 |
Lower Colorado River Auth. Texas Rev. | 5.375% | 5/15/11 (1)(Prere.) | 125 | 133 |
Lower Colorado River Auth. Texas Rev. | 5.375% | 5/15/11 (1)(Prere.) | 180 | 191 |
Lower Colorado River Auth. Texas Rev. | 5.375% | 5/15/11 (1)(Prere.) | 250 | 265 |
Lower Colorado River Auth. Texas Rev. | 5.750% | 5/15/11 (4) | 14,195 | 14,793 |
Lower Colorado River Auth. Texas Rev. | 5.000% | 1/1/12 (4)(ETM) | 2,520 | 2,661 |
Lower Colorado River Auth. Texas Rev. | 5.375% | 5/15/12 (1) | 3,725 | 3,942 |
Lower Colorado River Auth. Texas Rev. | 5.375% | 5/15/13 (1) | 2,810 | 2,972 |
Lower Colorado River Auth. Texas Rev. | 5.375% | 5/15/14 (1) | 4,190 | 4,432 |
Lower Colorado River Auth. Texas Rev. | 5.875% | 5/15/14 (4) | 5,000 | 5,217 |
Lower Colorado River Auth. Texas Rev. | 5.875% | 5/15/15 (4) | 23,995 | 25,035 |
Lower Colorado River Auth. Texas Rev. | 5.375% | 5/15/16 (1) | 1,875 | 1,983 |
Lower Colorado River Auth. Texas Rev. | 5.375% | 5/15/17 (1) | 2,825 | 2,977 |
Lower Colorado River Auth. Texas Rev. | 5.375% | 5/15/19 (1) | 2,820 | 2,967 |
Lower Colorado River Auth. Texas Rev. | 5.375% | 5/15/20 (1) | 1,920 | 2,020 |
North Texas Health Fac. Dev. | 5.750% | 2/15/08 (1)(Prere.) | 4,115 | 4,222 |
SA Energy Acquisition Public Fac. Corp. | | | | |
Texas Gas Supply Rev. | 5.250% | 8/1/17 | 16,500 | 17,186 |
SA Energy Acquisition Public Fac. Corp. | | | | |
Texas Gas Supply Rev. | 5.250% | 8/1/18 | 15,985 | 16,623 |
SA Energy Acquisition Public Fac. Corp. | | | | |
Texas Gas Supply Rev. | 5.500% | 8/1/19 | 16,500 | 17,420 |
San Antonio TX Electric & Gas Rev. | 5.250% | 2/1/09 (Prere.) | 5,910 | 6,096 |
San Antonio TX Electric & Gas Rev. | 5.250% | 2/1/09 (Prere.) | 2,985 | 3,079 |
San Antonio TX Electric & Gas Rev. | 5.250% | 2/1/09 (Prere.) | 6,140 | 6,275 |
San Antonio TX Electric & Gas Rev. | 5.250% | 2/1/09 (Prere.) | 2,110 | 2,176 |
San Antonio TX Electric & Gas Rev. | 5.750% | 2/1/10 (Prere.) | 20,440 | 21,462 |
Intermediate-Term Tax-Exempt Fund
| | | Face | Market |
| | Maturity | Amount | Value• |
| Coupon | Date | ($000) | ($000) |
San Antonio TX Electric & Gas Rev. | 5.750% | 2/1/10 (Prere.) | 10,205 | 10,715 |
San Antonio TX Electric & Gas Rev. | 5.750% | 2/1/10 (Prere.) | 12,100 | 12,705 |
San Antonio TX Electric & Gas Rev. | 5.750% | 2/1/10 (Prere.) | 9,200 | 9,660 |
San Antonio TX Electric & Gas Rev. | 5.500% | 2/1/11 | 12,225 | 12,950 |
San Antonio TX Electric & Gas Rev. | 5.000% | 2/1/12 (4) | 5,000 | 5,273 |
San Antonio TX Electric & Gas Rev. | 5.250% | 2/1/12 | 5,515 | 5,678 |
San Antonio TX Electric & Gas Rev. | 5.375% | 2/1/12 (Prere.) | 10,000 | 10,709 |
San Antonio TX Electric & Gas Rev. | 5.375% | 2/1/12 (Prere.) | 6,490 | 6,942 |
San Antonio TX Electric & Gas Rev. | 5.375% | 2/1/12 (Prere.) | 5,445 | 5,825 |
San Antonio TX Electric & Gas Rev. | 5.375% | 2/1/12 (Prere.) | 8,140 | 8,717 |
San Antonio TX Electric & Gas Rev. | 5.250% | 2/1/13 | 5,000 | 5,373 |
San Antonio TX Electric & Gas Rev. | 5.250% | 2/1/13 | 3,890 | 4,005 |
San Antonio TX Electric & Gas Rev. | 5.375% | 2/1/13 | 10,000 | 10,806 |
San Antonio TX Electric & Gas Rev. | 5.375% | 2/1/15 | 7,250 | 7,966 |
San Antonio TX Electric & Gas Rev. | 5.375% | 2/1/16 | 16,825 | 17,882 |
San Antonio TX Electric & Gas Rev. | 5.375% | 2/1/17 | 7,580 | 8,038 |
San Antonio TX Electric & Gas Rev. | 5.000% | 2/1/21 | 10,000 | 10,503 |
San Antonio TX Electric & Gas Rev. | 5.000% | 2/1/22 | 20,450 | 21,405 |
San Antonio TX Electric & Gas Rev. | 5.000% | 2/1/23 | 22,000 | 22,965 |
San Antonio TX Electric & Gas Rev. | 5.000% | 2/1/24 | 17,600 | 18,270 |
San Antonio TX Electric & Gas Rev. | 5.000% | 2/1/24 | 15,000 | 15,571 |
San Antonio TX Electric & Gas Rev. | 5.000% | 2/1/24 | 23,000 | 23,977 |
San Antonio TX Electric & Gas Rev. | 5.000% | 2/1/25 | 10,000 | 10,404 |
San Antonio TX Electric & Gas Rev. | 5.000% | 2/1/25 | 39,660 | 41,096 |
San Antonio TX Independent School Dist. GO | 5.000% | 8/15/16 | 8,460 | 9,067 |
Tarrant County TX Health Resources | 5.750% | 2/15/08 (1)(Prere.) | 7,670 | 7,870 |
Texas A & M Univ. Permanent Univ. Fund | 5.250% | 7/1/16 | 10,360 | 11,141 |
Texas A & M Univ. Permanent Univ. Fund | 5.250% | 7/1/17 | 10,000 | 10,722 |
Texas A & M Univ. Permanent Univ. Fund | 5.250% | 7/1/18 | 10,000 | 10,654 |
Texas A & M Univ. Rev. Financing System | 5.000% | 5/15/13 | 5,535 | 5,902 |
Texas GO Public Finance Auth. | 5.500% | 10/1/09 | 7,000 | 7,269 |
Texas GO Public Finance Auth. | 5.500% | 10/1/12 | 13,455 | 14,386 |
Texas GO Public Finance Auth. | 5.500% | 10/1/13 | 19,175 | 20,502 |
Texas GO Public Finance Auth. | 5.375% | 10/1/14 | 21,310 | 22,930 |
Texas Muni. Gas Acquisition & Supply Corp. Rev. | 4.215% | 9/15/10 | 55,000 | 53,900 |
Texas Muni. Power Agency Rev. | 0.000% | 9/1/10 (2) | 11,100 | 10,002 |
Texas Muni. Power Agency Rev. | 0.000% | 9/1/10 (2)(ETM) | 740 | 667 |
Texas Muni. Power Agency Rev. | 0.000% | 9/1/12 (2)(ETM) | 375 | 313 |
Texas Muni. Power Agency Rev. | 0.000% | 9/1/12 (2) | 4,800 | 4,000 |
Texas Muni. Power Agency Rev. | 0.000% | 9/1/13 (1)(ETM) | 125 | 100 |
Texas Muni. Power Agency Rev. | 0.000% | 9/1/13 (1) | 11,375 | 9,091 |
Texas Muni. Power Agency Rev. | 0.000% | 9/1/14 (1)(ETM) | 125 | 96 |
Texas Muni. Power Agency Rev. | 0.000% | 9/1/14 (1) | 5,540 | 4,235 |
Texas Muni. Power Agency Rev. | 0.000% | 9/1/15 (1)(ETM) | 110 | 81 |
Texas Muni. Power Agency Rev. | 0.000% | 9/1/15 (1) | 13,140 | 9,578 |
Texas Muni. Power Agency Rev. | 0.000% | 9/1/16 (1)(ETM) | 110 | 77 |
Texas Muni. Power Agency Rev. | 0.000% | 9/1/16 (1) | 22,795 | 15,822 |
Texas Muni. Power Agency Rev. | 0.000% | 9/1/17 (1)(ETM) | 415 | 275 |
Texas Muni. Power Agency Rev. | 0.000% | 9/1/17 (1) | 31,295 | 20,662 |
Texas State Transp. Comm. First Tier | 5.000% | 4/1/19 | 10,000 | 10,620 |
Texas State Transp. Comm. First Tier | 5.000% | 4/1/20 | 8,850 | 9,360 |
Texas State Transp. Comm. First Tier | 5.000% | 4/1/21 | 10,555 | 11,125 |
Texas State Transp. Comm. First Tier | 5.000% | 4/1/22 | 10,000 | 10,511 |
Texas State Transp. Comm. First Tier | 5.000% | 4/1/23 | 12,500 | 13,103 |
Texas State Transp. Comm. First Tier | 5.000% | 4/1/24 | 10,000 | 10,468 |
Texas State Transp. Comm. First Tier | 5.000% | 4/1/25 | 10,000 | 10,447 |
Texas State Transp. Comm. First Tier | 5.000% | 4/1/26 | 8,000 | 8,340 |
Intermediate-Term Tax-Exempt Fund
| | | Face | Market |
| | Maturity | Amount | Value• |
| Coupon | Date | ($000) | ($000) |
Texas Tech Univ. Rev. Refunding & Improvement | 5.000% | 2/15/23 (2) | 10,040 | 10,504 |
Texas Tech Univ. Rev. Refunding & Improvement | 5.000% | 2/15/24 (2) | 11,940 | 12,474 |
Texas Tech Univ. Rev. Refunding & Improvement | 5.000% | 2/15/25 (2) | 6,555 | 6,835 |
Texas Transp. Comm. Mobility Fund | 5.000% | 4/1/23 | 10,000 | 10,529 |
Texas Turnpike Auth. Central Texas | | | | |
Turnpike System Rev. | 5.000% | 6/1/08 | 53,195 | 53,686 |
Tomball TX Hosp. Auth. Rev. | 5.750% | 7/1/14 | 8,500 | 8,710 |
Tomball TX Hosp. Auth. Rev. | 6.000% | 7/1/19 | 3,600 | 3,684 |
Univ. of Houston TX Rev. | 5.250% | 2/15/09 (4) | 3,080 | 3,150 |
Univ. of Texas Permanent Univ. Fund Rev. | 5.375% | 8/15/11 (Prere.) | 8,290 | 8,834 |
Univ. of Texas Permanent Univ. Fund Rev. | 5.250% | 8/15/14 | 7,590 | 8,270 |
Univ. of Texas Permanent Univ. Fund Rev. | 5.000% | 8/15/20 | 9,785 | 10,389 |
| | | | 1,279,655 |
Utah (0.4%) | | | | |
Intermountain Power Agency Utah | | | | |
Power Supply Rev. | 5.250% | 7/1/09 (1)(ETM) | 5,180 | 5,327 |
Intermountain Power Agency Utah | | | | |
Power Supply Rev. | 5.250% | 7/1/09 (1) | 36,060 | 36,821 |
Utah GO | 5.000% | 7/1/08 (Prere.) | 10,700 | 10,810 |
Utah GO | 5.000% | 7/1/12 | 5,000 | 5,309 |
Utah Muni. Finance Coop. Local Govt. Rev. | 0.000% | 3/1/10 (4) | 7,000 | 6,425 |
| | | | 64,692 |
Virgin Islands (0.1%) | | | | |
Virgin Islands Public Finance Auth. Rev. | 6.375% | 10/1/19 | 5,865 | 6,317 |
| | | | |
Virginia (1.8%) | | | | |
Fairfax County VA Public Improvement GO | 5.000% | 10/1/08 | 12,455 | 12,637 |
Fairfax County VA Public Improvement GO | 5.000% | 10/1/10 | 35,195 | 36,755 |
Stafford County VA Econ. Dev. Auth. | | | | |
Hosp. Fac. Rev. (Medicorp Health System) | 5.250% | 6/15/26 | 2,425 | 2,487 |
Stafford County VA Econ. Dev. Auth. | | | | |
Hosp. Fac. Rev. (Medicorp Health System) | 5.250% | 6/15/31 | 22,515 | 22,841 |
Tobacco Settlement Financing Corp. Virginia Rev. | 5.625% | 6/1/15 (Prere.) | 31,190 | 34,931 |
Virginia Beach VA Refunding & Public Improvement | 5.250% | 8/1/08 (Prere.) | 1,950 | 1,995 |
Virginia Beach VA Refunding & Public Improvement | 5.250% | 8/1/08 (Prere.) | 610 | 624 |
Virginia Beach VA Refunding & Public Improvement | 5.250% | 8/1/08 (Prere.) | 580 | 593 |
Virginia Beach VA Refunding & Public Improvement | 5.250% | 8/1/08 (Prere.) | 1,010 | 1,033 |
Virginia Beach VA Refunding & Public Improvement | 5.250% | 8/1/10 | 7,740 | 7,917 |
Virginia Beach VA Refunding & Public Improvement | 5.250% | 8/1/11 | 3,990 | 4,080 |
Virginia Beach VA Refunding & Public Improvement | 5.250% | 8/1/12 | 2,390 | 2,444 |
Virginia Beach VA Refunding & Public Improvement | 5.250% | 8/1/13 | 1,170 | 1,196 |
Virginia College Building Auth. Educ. Fac. Rev. | | | | |
(21st Century College) | 5.000% | 2/1/17 | 10,935 | 11,842 |
Virginia College Building Auth. Educ. Fac. Rev. | | | | |
(21st Century College) | 5.000% | 2/1/18 | 10,595 | 11,406 |
Virginia College Building Auth. Educ. Fac. Rev. | | | | |
Public Higher Educ. | 5.750% | 9/1/10 (Prere.) | 4,310 | 4,578 |
Virginia College Building Auth. Educ. Fac. Rev. | | | | |
Public Higher Educ. | 5.750% | 9/1/11 | 4,085 | 4,328 |
Virginia College Building Auth. Educ. Fac. Rev. | | | | |
Public Higher Educ. Financing Program | 5.000% | 9/1/18 | 8,010 | 8,596 |
Virginia College Building Auth. Educ. Fac. Rev. | | | | |
Public Higher Educ. Financing Program | 5.000% | 9/1/19 | 8,430 | 9,006 |
Virginia College Building Auth. Educ. Fac. Rev. | | | | |
Public Higher Educ. Financing Program | 5.000% | 9/1/20 | 8,855 | 9,427 |
Intermediate-Term Tax-Exempt Fund
| | | Face | Market |
| | Maturity | Amount | Value• |
| Coupon | Date | ($000) | ($000) |
Virginia College Building Auth. Educ. Fac. Rev. | | | | |
Public Higher Educ. Financing Program | 5.000% | 9/1/21 | 9,320 | 9,893 |
Virginia College Building Auth. Educ. Fac. Rev. | | | | |
Public Higher Educ. Financing Program | 5.000% | 9/1/22 | 9,105 | 9,637 |
Virginia Commonwealth Transp. Board Transp. Rev. | | | | |
(U.S. Route 58 Corridor) | 5.000% | 5/15/17 | 12,985 | 14,084 |
Virginia Commonwealth Transp. Board Transp. Rev. | | | | |
(U.S. Route 58 Corridor) | 5.000% | 5/15/23 | 19,245 | 20,283 |
Virginia Commonwealth Transp. Board Transp. Rev. | | | | |
(U.S. Route 58 Corridor) | 5.000% | 5/15/24 | 20,205 | 21,266 |
Virginia GO | 5.000% | 6/1/15 | 10,000 | 10,761 |
Virginia GO | 5.000% | 6/1/16 | 5,000 | 5,448 |
Virginia Public School Auth. Rev. | 5.000% | 8/1/08 | 7,675 | 7,766 |
Virginia Public School Auth. Rev. | 5.250% | 8/1/08 | 5,585 | 5,661 |
| | | | 293,515 |
Washington (0.5%) | | | | |
Chelan County WA Public Util. Dist. | | | | |
(Rock Island Hydro) | 0.000% | 6/1/15 (1) | 10,000 | 7,256 |
King County WA School Dist. GO | 5.500% | 12/1/07 (3)(Prere.) | 5,635 | 5,643 |
Port of Seattle WA Rev. | 5.000% | 3/1/20 (1) | 9,035 | 9,487 |
Port of Seattle WA Rev. | 5.000% | 3/1/21 (1) | 5,000 | 5,237 |
Snohomish County WA Mukilteo School Dist. | 6.500% | 12/1/11 | 5,825 | 6,330 |
Washington GO | 5.500% | 7/1/10 (Prere.) | 6,755 | 7,106 |
Washington GO | 6.250% | 2/1/11 | 5,510 | 5,748 |
Washington GO | 5.700% | 10/1/15 (4) | 10,000 | 10,969 |
Washington GO | 5.000% | 7/1/21 (4) | 7,050 | 7,451 |
Washington GO | 5.000% | 7/1/21 (4) | 10,495 | 11,091 |
| | | | 76,318 |
West Virginia (0.1%) | | | | |
West Virginia Building Comm. Rev. | 5.250% | 7/1/08 (1) | 2,150 | 2,174 |
West Virginia GO | 5.250% | 6/1/09 (4)(Prere.) | 10,000 | 10,371 |
West Virginia GO | 5.750% | 6/1/09 (Prere.) | 5,000 | 5,224 |
| | | | 17,769 |
Wisconsin (1.3%) | | | | |
Wisconsin GO | 5.000% | 5/1/10 | 14,420 | 14,947 |
Wisconsin GO | 5.000% | 5/1/11 | 15,180 | 15,914 |
Wisconsin GO | 5.250% | 5/1/11 (1)(Prere.) | 5,000 | 5,277 |
Wisconsin GO | 5.750% | 5/1/11 (Prere.) | 20,000 | 21,463 |
Wisconsin GO | 5.750% | 5/1/11 (Prere.) | 18,000 | 19,305 |
Wisconsin GO | 5.750% | 5/1/11 (Prere.) | 20,315 | 21,801 |
Wisconsin GO | 5.250% | 5/1/12 | 15,975 | 17,073 |
Wisconsin GO | 5.250% | 5/1/13 | 16,810 | 18,142 |
Wisconsin GO | 5.500% | 5/1/13 (1) | 7,000 | 7,645 |
Wisconsin GO | 5.000% | 5/1/15 (1) | 14,975 | 16,155 |
Wisconsin GO | 5.500% | 5/1/15 (1) | 15,000 | 16,668 |
Wisconsin Health & Educ. Fac. Auth. Rev. | | | | |
(Ascension Health) | 5.000% | 11/15/31 | 27,900 | 28,203 |
Wisconsin Health & Educ. Fac. Auth. Rev. | | | | |
(Ascension Health) | 5.000% | 11/15/36 | 10,000 | 10,043 |
| | | | 212,636 |
Total Municipal Bonds (Cost $15,455,569) | | | | 15,636,576 |
Intermediate-Term Tax-Exempt Fund
| | | | Market |
| | | | Value• |
| | Coupon | Shares | ($000) |
Temporary Cash Investment (2.9%) | | | |
2 | Vanguard Municipal Cash Management Fund | | | |
| (Cost $473,363) | 3.425% | 473,362,722 | 473,363 |
Total Investments (98.6%) (Cost $15,928,932) | | | 16,109,939 |
Other Assets and Liabilities (1.4%) | | | |
Other Assets—Note B | | | 275,928 |
Liabilities | | | (51,276) |
| | | | 224,652 |
Net Assets (100%) | | | 16,334,591 |
At October 31, 2007, net assets consisted of:3
| Amount |
| ($000) |
Paid-in Capital | 16,261,489 |
Undistributed Net Investment Income | — |
Accumulated Net Realized Losses | (107,905) |
Unrealized Appreciation | 181,007 |
Net Assets | 16,334,591 |
| |
| |
Investor Shares—Net Assets | |
Applicable to 367,933,218 outstanding $.001 par value shares of | |
beneficial interest (unlimited authorization) | 4,851,105 |
Net Asset Value Per Share—Investor Shares | $13.18 |
| |
| |
Admiral Shares—Net Assets | |
Applicable to 870,966,944 outstanding $.001 par value shares of | |
beneficial interest (unlimited authorization) | 11,483,486 |
Net Asset Value Per Share—Admiral Shares | $13.18 |
• See Note A in Notes to Financial Statements.
1 Security exempt from registration under Rule 144A of the Securities Act of 1933. Such securities may be sold in transactions exempt from registration, normally to qualified institutional buyers. At October 31, 2007, the aggregate value of these securities was $117,455,000, representing 0.7% of net assets.
2 Affiliated money market fund available only to Vanguard funds and certain trusts and accounts managed by Vanguard. Rate shown is the 7-day yield.
3 See Note D in Notes to Financial Statements for the tax-basis components of net assets. For key to abbreviations and other references, see back cover.
Insured Long-Term Tax-Exempt Fund
| | | | Face | Market |
| | | Maturity | Amount | Value• |
| | Coupon | Date | ($000) | ($000) |
Municipal Bonds (99.3%) | | | | |
Alabama (2.8%) | | | | |
| Alabama Special Care Fac. Financing Auth. | | | | |
| Mobile Rev. (Ascension Health) | 5.000% | 11/15/39 | 42,610 | 42,751 |
| Houston County AL Health Care Auth. Rev. | 5.250% | 10/1/30 (2) | 9,000 | 9,473 |
| Mobile AL Water & Sewer Comm. | 5.000% | 1/1/31 (1) | 17,500 | 18,140 |
| Mobile AL Water & Sewer Comm. | 5.000% | 1/1/36 (1) | 24,610 | 25,391 |
| | | | | 95,755 |
Alaska (0.3%) | | | | |
| Anchorage AK Electric Rev. | 8.000% | 12/1/09 (1) | 2,565 | 2,794 |
| Anchorage AK Electric Rev. | 8.000% | 12/1/10 (1) | 2,960 | 3,339 |
| North Slope Borough AK GO | 0.000% | 6/30/10 (1) | 4,000 | 3,626 |
| | | | | 9,759 |
Arizona (2.0%) | | | | |
| Arizona State Univ. COP | 5.375% | 7/1/12 (1)(Prere.) | 4,905 | 5,284 |
| Arizona State Univ. COP | 5.375% | 7/1/12 (1)(Prere.) | 5,345 | 5,758 |
| Arizona State Univ. COP | 5.375% | 7/1/12 (1)(Prere.) | 4,460 | 4,805 |
| Arizona State Univ. COP | 5.375% | 7/1/12 (1)(Prere.) | 5,520 | 5,947 |
| Arizona State Univ. COP | 5.375% | 7/1/12 (1)(Prere.) | 2,285 | 2,462 |
| Arizona State Univ. COP | 5.375% | 7/1/12 (1)(Prere.) | 4,340 | 4,676 |
| Arizona State Univ. COP | 5.375% | 7/1/13 (1) | 2,905 | 3,114 |
| Maricopa County AZ IDA Health Fac. Rev. | | | | |
| (Catholic Healthcare West) | 5.250% | 7/1/32 | 8,170 | 8,331 |
| Maricopa County AZ Rev. (Samaritan Health Service) | 7.000% | 12/1/16 (1)(ETM) | 8,650 | 10,439 |
| Mesa AZ Util. System Rev. | 5.250% | 7/1/14 (3) | 10,000 | 10,902 |
| Tucson AZ Water System Rev. | 5.500% | 7/1/17 (3) | 4,850 | 5,296 |
| | | | | 67,014 |
Arkansas (0.2%) | | | | |
| North Little Rock AR Electric Rev. | 6.500% | 7/1/10 (1) | 2,230 | 2,331 |
| North Little Rock AR Electric Rev. | 6.500% | 7/1/15 (1) | 4,500 | 5,104 |
| | | | | 7,435 |
California (15.2%) | | | | |
| California Dept. of Water Resources | | | | |
| Water System Rev. (Central Valley) | 5.250% | 12/1/15 (3) | 14,740 | 15,913 |
| California Dept. of Water Resources | | | | |
| Water System Rev. (Central Valley) | 5.250% | 12/1/16 (3) | 10,000 | 10,796 |
| California Dept. of Water Resources | | | | |
| Water System Rev. (Central Valley) | 5.250% | 12/1/17 (3) | 10,050 | 10,850 |
| California Dept. of Water Resources | | | | |
| Water System Rev. (Central Valley) | 5.250% | 12/1/18 (3) | 7,890 | 8,420 |
| California Dept. of Water Resources | | | | |
| Water System Rev. (Central Valley) | 5.250% | 12/1/19 (3) | 5,310 | 5,666 |
| California GO | 5.000% | 2/1/14 (2)(Prere.) | 3,565 | 3,861 |
| California GO | 5.000% | 2/1/14 (2)(Prere.) | 1,500 | 1,624 |
1 | California GO | 5.000% | 11/1/18 (3) | 13,455 | 14,511 |
1 | California GO | 5.000% | 11/1/19 (1) | 20,000 | 21,482 |
| California GO | 4.500% | 10/1/36 | 30,000 | 27,675 |
| California Health Fac. Finance Auth. Rev. | | | | |
| (Pomona Valley Hosp.) | 5.750% | 7/1/15 (1) | 8,205 | 8,384 |
| California State Econ. Recovery Bonds | 5.250% | 7/1/14 (3) | 23,680 | 25,932 |
| Golden State Tobacco Securitization Corp. California | 5.000% | 6/1/13 (2)(Prere.) | 26,020 | 27,833 |
| Golden State Tobacco Securitization Corp. California | 5.000% | 6/1/35 (3) | 30,000 | 30,625 |
| Grossmont CA Healthcare Dist. GO | 5.000% | 7/15/37 (2) | 35,270 | 36,279 |
| Irvine CA USD Financing Auth. Special Tax | 5.000% | 9/1/38 (2) | 18,000 | 18,385 |
| Los Angeles CA USD GO | 5.250% | 7/1/13 (4)(Prere.) | 9,000 | 9,812 |
Insured Long-Term Tax-Exempt Fund
| | | Face | Market |
| | Maturity | Amount | Value• |
| Coupon | Date | ($000) | ($000) |
Los Angeles CA USD GO | 5.250% | 7/1/13 (4)(Prere.) | 9,000 | 9,812 |
Los Angeles CA USD GO | 5.000% | 7/1/25 (4) | 6,980 | 7,368 |
Los Angeles CA USD GO | 5.000% | 7/1/26 (4) | 7,435 | 7,843 |
Los Angeles CA USD GO | 5.000% | 7/1/26 (4) | 27,240 | 28,734 |
MSR California Public Power Agency Rev. | | | | |
(San Juan Project) | 6.125% | 7/1/13 (2) | 9,000 | 9,797 |
MSR California Public Power Agency Rev. | | | | |
(San Juan Project) | 6.750% | 7/1/20 (1)(ETM) | 10,915 | 12,897 |
Modesto CA Irrigation Dist. Finance Auth. Rev. | | | | |
(Woodland Project) | 6.500% | 10/1/22 (2)(ETM) | 20,225 | 24,249 |
Sacramento CA Financing Auth. Lease Rev. | 5.250% | 12/1/30 (2) | 45,395 | 49,872 |
Sacramento CA Muni. Util. Dist. Rev. | 6.500% | 9/1/13 (1) | 8,895 | 9,872 |
San Diego CA USD GO | 5.500% | 7/1/22 (1) | 9,160 | 10,378 |
Santa Clara CA Redev. Agency (Bayshore North) | 7.000% | 7/1/10 (2) | 1,275 | 1,345 |
Santa Rosa CA Waste Water Rev. | 6.000% | 9/1/15 (3) | 5,000 | 5,557 |
Ukiah CA Electric Rev. | 6.250% | 6/1/18 (1) | 6,330 | 7,236 |
Univ. of California Rev. | 4.500% | 5/15/31 (4) | 54,470 | 53,384 |
| | | | 516,392 |
Colorado (4.3%) | | | | |
Colorado Health Fac. Auth. Rev. | | | | |
(Catholic Health Initiatives) | 5.000% | 9/1/41 | 30,000 | 29,998 |
Colorado Springs CO Util. System Rev. | 5.375% | 11/15/16 (2) | 12,790 | 13,766 |
Colorado Springs CO Util. System Rev. | 5.375% | 11/15/17 (2) | 13,490 | 14,488 |
Colorado Springs CO Util. System Rev. | 5.375% | 11/15/18 (2) | 10,000 | 10,721 |
Colorado Springs CO Util. System Rev. | 5.000% | 11/15/43 | 17,725 | 18,039 |
E-470 Public Highway Auth. Colorado Rev. | 0.000% | 9/1/15 (1) | 5,795 | 4,224 |
E-470 Public Highway Auth. Colorado Rev. | 0.000% | 9/1/19 (1) | 8,000 | 4,763 |
E-470 Public Highway Auth. Colorado Rev. | 0.000% | 9/1/23 (1) | 35,275 | 17,010 |
Northwest Parkway Public Highway Auth. | | | | |
Colorado Convertible Rev. | 0.000% | 6/15/18 (4) | 5,960 | 5,524 |
Northwest Parkway Public Highway Auth. | | | | |
Colorado Convertible Rev. | 0.000% | 6/15/21 (2) | 15,000 | 13,932 |
Northwest Parkway Public Highway Auth. | | | | |
Colorado Convertible Rev. | 0.000% | 6/15/25 (4) | 16,000 | 14,806 |
| | | | 147,271 |
Connecticut (0.3%) | | | | |
Connecticut GO | 5.125% | 11/15/16 | 10,000 | 10,561 |
| | | | |
Florida (7.4%) | | | | |
Alachua County FL Health Fac. Auth. Rev. | | | | |
(Shands Healthcare Project) | 4.636% | 12/1/37 | 10,000 | 9,368 |
Brevard County FL School Board COP | 5.000% | 7/1/29 (2) | 5,000 | 5,138 |
Davie FL Water & Sewer Rev. | 6.375% | 10/1/12 (2) | 2,620 | 2,856 |
Florida Board of Educ. Rev. (Lottery Rev.) | 5.250% | 7/1/15 (2) | 10,000 | 10,956 |
Hillsborough County FL Aviation Auth. Rev. | | | | |
(Tampa International Airport) | 5.000% | 10/1/18 (1) | 7,855 | 8,199 |
Hillsborough County FL Aviation Auth. Rev. | | | | |
(Tampa International Airport) | 5.000% | 10/1/19 (1) | 6,390 | 6,648 |
Hillsborough County FL School Board COP | 5.250% | 7/1/16 (1) | 13,300 | 14,507 |
Jacksonville FL Electric Auth. Water & Sewer Rev. | 5.000% | 10/1/09 (4)(Prere.) | 1,850 | 1,903 |
Jacksonville FL Electric Auth. Water & Sewer Rev. | 5.000% | 10/1/39 (4) | 3,150 | 3,198 |
Lake County FL School Board COP | 5.000% | 6/1/31 (2) | 18,000 | 18,326 |
Miami-Dade County FL Expressway Auth. | | | | |
Toll System Rev. | 5.000% | 7/1/39 (2) | 39,015 | 40,109 |
Miami-Dade County FL School Board COP | 6.000% | 10/1/09 (4)(Prere.) | 5,765 | 6,036 |
Miami-Dade County FL School Board COP | 5.000% | 11/1/25 (2) | 7,570 | 7,870 |
Insured Long-Term Tax-Exempt Fund
| | | Face | Market |
| | Maturity | Amount | Value• |
| Coupon | Date | ($000) | ($000) |
Miami-Dade County FL School Board COP | 5.000% | 11/1/26 (2) | 5,270 | 5,467 |
Miami-Dade County FL School Board COP | 5.000% | 11/1/31 (2) | 10,000 | 10,270 |
Miami-Dade County FL School Board COP | 5.000% | 11/1/31 (2) | 5,000 | 5,135 |
Orlando & Orange County FL Expressway Auth. | 8.250% | 7/1/13 (3) | 9,695 | 11,925 |
Palm Beach County FL Criminal Justice Fac. Rev. | 7.200% | 6/1/15 (3) | 4,000 | 4,875 |
South Miami FL Health Fac. Auth. Hosp. Rev. | | | | |
(Baptist Health South FL Obligated Group) | 5.000% | 8/15/32 | 8,000 | 8,055 |
Sunshine State Florida Govt. Financing | | | | |
Comm. Rev. VRDO | 3.590% | 11/1/07 (2) | 21,000 | 21,000 |
Sunshine State Florida Govt. Financing | | | | |
Comm. Rev. VRDO | 3.640% | 11/1/07 (2) | 14,700 | 14,700 |
Tampa FL Util. Rev. | 6.750% | 10/1/10 (2) | 9,330 | 10,161 |
Tampa FL Util. Rev. | 6.750% | 10/1/11 (2) | 9,965 | 11,113 |
Tampa FL Util. Rev. | 6.750% | 10/1/12 (2) | 10,635 | 12,116 |
| | | | 249,931 |
Georgia (4.7%) | | | | |
Atlanta GA Water & Wastewater Rev. | 5.500% | 11/1/15 (3) | 8,500 | 9,386 |
Atlanta GA Water & Wastewater Rev. | 5.500% | 11/1/16 (3) | 7,000 | 7,755 |
Atlanta GA Water & Wastewater Rev. | 5.500% | 11/1/17 (3) | 8,000 | 8,789 |
Atlanta GA Water & Wastewater Rev. | 5.000% | 11/1/33 (1) | 32,425 | 33,002 |
Augusta GA Water & Sewer Rev. | 5.000% | 10/1/32 (4) | 24,000 | 24,587 |
Dalton County GA Dev. Auth. | | | | |
(Hamilton Health Care System) | 5.500% | 8/15/26 (1) | 12,000 | 13,413 |
Fulton DeKalb GA Hosp. Auth. | 5.250% | 1/1/14 (4) | 15,805 | 17,153 |
Henry County GA School Dist. GO | 6.450% | 8/1/11 (1) | 3,400 | 3,614 |
Main Street Natural Gas Inc. Georgia | | | | |
Gas Project Rev. | 5.500% | 9/15/25 | 20,000 | 20,504 |
Main Street Natural Gas Inc. Georgia | | | | |
Gas Project Rev. | 5.500% | 9/15/27 | 15,000 | 15,291 |
Private Colleges & Univ. Auth. of Georgia Rev. | | | | |
(Mercer Univ.) | 6.500% | 11/1/15 (1)(ETM) | 5,000 | 5,788 |
| | | | 159,282 |
Hawaii (1.9%) | | | | |
Hawaii Dept. of Budget & Finance | | | | |
(Hawaii Electric Co. Inc.) | 4.950% | 4/1/12 (1) | 15,000 | 15,720 |
Hawaii GO | 5.875% | 9/1/09 (4)(Prere.) | 5,110 | 5,377 |
Honolulu HI City & County GO | 8.000% | 10/1/10 (ETM) | 2,305 | 2,591 |
Honolulu HI City & County GO | 5.250% | 7/1/13 (3) | 3,000 | 3,245 |
Honolulu HI City & County GO | 5.250% | 7/1/14 (3) | 3,000 | 3,271 |
Honolulu HI City & County GO | 5.000% | 7/1/15 (3) | 3,075 | 3,320 |
Honolulu HI City & County GO | 5.250% | 7/1/18 (3) | 3,000 | 3,252 |
Honolulu HI City & County GO | 5.250% | 7/1/19 (3) | 2,000 | 2,166 |
Honolulu HI City & County GO | 5.000% | 7/1/21 (3) | 7,720 | 8,136 |
Honolulu HI City & County GO | 5.000% | 7/1/21 (3) | 8,270 | 8,716 |
Univ. of Hawaii Univ. System Rev. | 5.500% | 7/15/12 (3)(Prere.) | 4,615 | 5,004 |
Univ. of Hawaii Univ. System Rev. | 5.500% | 7/15/12 (3)(Prere.) | 2,330 | 2,526 |
| | | | 63,324 |
Idaho (0.2%) | | | | |
Boise State Univ. Idaho | 5.000% | 4/1/32 (1) | 3,000 | 3,121 |
Boise State Univ. Idaho | 5.000% | 4/1/37 (1) | 3,500 | 3,628 |
| | | | 6,749 |
Illinois (5.6%) | | | | |
Chicago IL Board of Educ. GO | 5.500% | 12/1/10 (3)(Prere.) | 7,000 | 7,416 |
Chicago IL GO | 5.500% | 1/1/11 (1)(Prere.) | 245 | 262 |
Chicago IL GO | 5.500% | 1/1/11 (1)(Prere.) | 18,110 | 19,342 |
Insured Long-Term Tax-Exempt Fund
| | | | Face | Market |
| | | Maturity | Amount | Value• |
| | Coupon | Date | ($000) | ($000) |
| Chicago IL GO | 0.000% | 1/1/16 (1)(Prere.) | 7,010 | 6,650 |
| Chicago IL GO | 0.000% | 1/1/16 (1)(Prere.) | 3,695 | 3,506 |
| Chicago IL GO | 0.000% | 1/1/16 (1)(Prere.) | 7,985 | 7,590 |
| Chicago IL GO | 0.000% | 1/1/20 (1) | 5,000 | 4,641 |
| Chicago IL GO | 0.000% | 1/1/22 (1) | 5,000 | 4,623 |
| Chicago IL GO | 0.000% | 1/1/24 (1) | 2,480 | 2,283 |
| Chicago IL GO | 0.000% | 1/1/25 (1) | 1,305 | 1,203 |
| Chicago IL GO | 0.000% | 1/1/28 (1) | 2,820 | 2,582 |
| Chicago IL GO | 5.000% | 1/1/28 (4) | 7,500 | 7,795 |
| Chicago IL GO | 5.500% | 1/1/38 (1) | 6,490 | 6,826 |
| Chicago IL Neighborhoods Alive GO | 5.750% | 7/1/10 (3)(Prere.) | 6,250 | 6,672 |
| Chicago IL Neighborhoods Alive GO | 5.500% | 1/1/11 (3)(Prere.) | 4,950 | 5,243 |
2 | Chicago IL Public Building Comm. GO | 7.000% | 1/1/20 (1)(ETM) | 21,500 | 27,103 |
| Chicago IL Water Rev. | 5.750% | 11/1/30 (2) | 12,000 | 14,116 |
| Cook County IL GO | 7.250% | 11/1/07 (1)(ETM) | 2,140 | 2,140 |
| Illinois Educ. Fac. Auth. Rev. (Univ. of Chicago) | 5.125% | 7/1/38 (1) | 11,995 | 12,195 |
| Illinois GO | 5.375% | 6/1/24 (3) | 14,710 | 15,178 |
| Illinois Health Fac. Auth. Rev. (Univ. of Chicago | | | | |
| Hosp. & Health Systems) VRDO | 3.580% | 11/1/07 (1) | 5,000 | 5,000 |
| Illinois Regional Transp. Auth. Rev. | 7.200% | 11/1/20 (2) | 24,000 | 29,353 |
| | | | | 191,719 |
Indiana (0.4%) | | | | |
| Indiana Muni. Power Agency Rev. | 6.125% | 1/1/13 (1)(ETM) | 13,250 | 14,086 |
| | | | | |
Kansas (0.4%) | | | | |
| Burlington KS PCR (Kansas Gas & Electric Co.) | 4.850% | 6/1/31 (1) | 7,500 | 7,552 |
| Kansas Dev. Finance Auth. Rev. | | | | |
| (Sisters of Charity) VRDO | 3.580% | 11/1/07 | 2,700 | 2,700 |
| Kansas Health System Dev. Auth. | | | | |
| (St. Luke Mission) | 5.375% | 11/15/16 (1) | 3,000 | 3,034 |
| | | | | 13,286 |
Kentucky (2.9%) | | | | |
| Jefferson County KY Health Fac. Rev. | | | | |
| (Jewish Hosp. Health) | 5.750% | 1/1/26 (2) | 3,000 | 3,058 |
| Kentucky Asset/Liability Comm. General Fund Rev. | 3.989% | 11/1/17 (3) | 13,550 | 13,494 |
| Kentucky Asset/Liability Comm. General Fund Rev. | 4.109% | 11/1/21 (3) | 24,845 | 24,682 |
| Louisville & Jefferson County KY Metro. Sewer Dist. | 6.000% | 5/15/31 (3) | 51,960 | 54,558 |
| Louisville & Jefferson County KY Metro. Sewer Dist. | 5.750% | 5/15/33 (3) | 2,335 | 2,440 |
| | | | | 98,232 |
Louisiana (2.3%) | | | | |
| Louisiana GO | 5.000% | 10/15/11 (2) | 20,015 | 21,092 |
| Louisiana GO | 5.000% | 7/15/24 (11) | 5,000 | 5,233 |
| Louisiana Gasoline and Fuel Tax Rev. | 5.000% | 5/1/23 (3) | 8,065 | 8,424 |
| Louisiana Univ. & Agriculture & | | | | |
| Mechanical College Board | 5.000% | 7/1/31 (3) | 12,000 | 12,470 |
| New Orleans LA GO | 0.000% | 9/1/10 (2) | 8,500 | 7,651 |
| New Orleans LA GO | 0.000% | 9/1/11 (2) | 10,475 | 9,067 |
| New Orleans LA GO | 0.000% | 9/1/13 (2) | 9,000 | 7,119 |
| Ouachita Parish LA Hosp. Service Dist. | | | | |
| (Glenwood Medical Center) | 5.700% | 5/15/10 (4)(Prere.) | 4,900 | 5,165 |
| Ouachita Parish LA Hosp. Service Dist. | | | | |
| (Glenwood Medical Center) | 5.750% | 5/15/10 (4)(Prere.) | 2,950 | 3,113 |
| | | | | 79,334 |
Insured Long-Term Tax-Exempt Fund
| | | Face | Market |
| | Maturity | Amount | Value• |
| Coupon | Date | ($000) | ($000) |
Maryland (2.3%) | | | | |
Baltimore County MD Rev. Catholic Health Initiatives | 4.500% | 9/1/33 | 7,000 | 6,651 |
Maryland Econ. Dev. Corp. Student Housing Rev. | | | | |
(Univ. of Maryland College Park) | 5.000% | 6/1/28 (11) | 2,000 | 2,075 |
Maryland Econ. Dev. Corp. Student Housing Rev. | | | | |
(Univ. of Maryland College Park) | 5.000% | 6/1/33 (11) | 4,250 | 4,380 |
Maryland Health & Higher Educ. Fac. Auth. Rev. | | | | |
(Medlantic/Helix) | 5.250% | 8/15/38 (4) | 32,055 | 35,128 |
Maryland Health & Higher Educ. Fac. Auth. Rev. | | | | |
(Univ. of Maryland Medical System) | 7.000% | 7/1/22 (3) | 12,025 | 15,271 |
Maryland Health & Higher Educ. Fac. Auth. Rev. | | | | |
(Western Maryland Health) | 5.000% | 7/1/34 (1) | 13,000 | 13,377 |
| | | | 76,882 |
Massachusetts (5.2%) | | | | |
Massachusetts Bay Transp. Auth. Rev. | 5.000% | 7/1/35 | 11,310 | 11,419 |
Massachusetts College Building Auth. Rev. | 0.000% | 5/1/17 (1)(ETM) | 7,460 | 5,044 |
Massachusetts GO | 7.000% | 7/1/09 (3)(ETM) | 14,865 | 15,393 |
Massachusetts GO | 5.500% | 11/1/12 (Prere.) | 14,155 | 15,409 |
Massachusetts GO | 5.500% | 11/1/12 (Prere.) | 19,275 | 20,983 |
Massachusetts GO | 5.250% | 8/1/22 | 6,775 | 7,511 |
Massachusetts GO | 5.500% | 12/1/22 (4) | 25,580 | 29,205 |
Massachusetts GO | 5.500% | 12/1/22 (2) | 11,665 | 13,318 |
Massachusetts Health & Educ. Fac. Auth. Rev. | | | | |
(Massachusetts General Hosp.) | 6.250% | 7/1/12 (2) | 14,560 | 15,478 |
Massachusetts Health & Educ. Fac. Auth. Rev. | | | | |
(Partners Healthcare System) VRDO | 3.430% | 11/7/07 | 5,100 | 5,100 |
Massachusetts Muni. Wholesale Electric Co. | | | | |
Power System Rev. | 5.250% | 7/1/14 (1) | 11,135 | 11,891 |
Massachusetts Special Obligation Dedicated Tax Rev. | 5.750% | 1/1/14 (3)(Prere.) | 10,000 | 11,132 |
Massachusetts Water Pollution Abatement Trust | 5.250% | 8/1/19 | 10,000 | 11,063 |
Massachusetts Water Resources Auth. Rev. VRDO | 3.240% | 11/7/07 (2) | 1,600 | 1,600 |
| | | | 174,546 |
Michigan (2.5%) | | | | |
Detroit MI Sewer System Rev. | 5.750% | 1/1/10 (3)(Prere.) | 5,000 | 5,283 |
Detroit MI Sewer System Rev. | 5.000% | 7/1/13 (4)(Prere.) | 7,180 | 7,698 |
Detroit MI Sewer System Rev. | 5.000% | 7/1/32 (4) | 2,820 | 2,890 |
Michigan Trunk Line Rev. | 5.000% | 11/1/26 (1) | 35,765 | 36,438 |
Monroe County MI Econ. Dev. Corp. | | | | |
(Detroit Edison) | 6.950% | 9/1/22 (3) | 25,000 | 32,061 |
| | | | 84,370 |
Minnesota (1.5%) | | | | |
Minneapolis MN Health Care System | | | | |
(Fairview Health Services) | 5.000% | 11/15/30 (2) | 9,000 | 9,294 |
St. Cloud MN Health Care Rev. | | | | |
(St. Cloud Hosp. Obligation Group) | 5.750% | 5/1/26 (4) | 37,665 | 39,572 |
St. Cloud MN Health Care Rev. | | | | |
(St. Cloud Hosp. Obligation Group) | 5.875% | 5/1/30 (4) | 2,500 | 2,634 |
| | | | 51,500 |
Mississippi (0.3%) | | | | |
Mississippi Dev. Bank Special Obligation Muni. | | | | |
Energy Agency Rev. | 5.000% | 3/1/36 (10) | 10,000 | 10,197 |
| | | | |
Missouri (0.2%) | | | | |
Missouri Health & Educ. Fac. Auth. Health Fac. Rev. | | | | |
(Lester Cox Medical Center) | 5.250% | 6/1/15 (1) | 5,000 | 5,335 |
Insured Long-Term Tax-Exempt Fund
| | | Face | Market |
| | Maturity | Amount | Value• |
| Coupon | Date | ($000) | ($000) |
Nebraska (0.6%) | | | | |
Central Plains Energy Project Nebraska | | | | |
Gas Project No. 1 | 5.250% | 12/1/20 | 5,000 | 5,143 |
Nebraska Public Power Dist. Rev. | 0.000% | 1/1/08 (1) | 15,000 | 14,912 |
| | | | 20,055 |
Nevada (0.5%) | | | | |
Clark County NV GO | 6.500% | 6/1/17 (2) | 5,000 | 5,952 |
Henderson NV Health Care Fac. Rev. | | | | |
(Catholic Healthcare West) | 5.250% | 7/1/31 | 11,710 | 11,922 |
| | | | 17,874 |
New Jersey (9.1%) | | | | |
Atlantic County NJ Public Fac. COP | 7.400% | 3/1/12 (3) | 4,335 | 4,977 |
Garden State Preservation Trust New Jersey | 5.750% | 11/1/28 (4) | 8,900 | 10,495 |
Hoboken-Union City-Weehawken | | | | |
NJ Sewerage Auth. Rev. | 6.250% | 8/1/14 (1) | 10,185 | 11,690 |
Hoboken-Union City-Weehawken | | | | |
NJ Sewerage Auth. Rev. | 6.250% | 8/1/15 (1) | 10,820 | 12,600 |
New Jersey Econ. Dev. Auth. Rev. (School Fac.) | 5.250% | 12/15/20 (2) | 25,000 | 27,706 |
New Jersey Econ. Dev. Auth. Rev. (School Fac.) | 5.000% | 9/1/36 | 15,000 | 15,508 |
New Jersey Health Care Fac. Financing Auth. Rev. | | | | |
(St. Barnabas Health Care) | 5.250% | 1/1/09 (1)(Prere.) | 1,955 | 2,013 |
New Jersey Health Care Fac. Financing Auth. Rev. | | | | |
(St. Barnabas Health Care) | 5.250% | 7/1/15 (1) | 3,795 | 3,899 |
New Jersey Health Care Fac. Financing Auth. Rev. | | | | |
(Virtua Health) | 5.250% | 7/1/14 (4) | 10,685 | 10,968 |
New Jersey Sports & Exposition Auth. Rev. | 6.500% | 3/1/13 (1)(ETM) | 2,995 | 3,289 |
New Jersey Sports & Exposition Auth. Rev. | 6.500% | 3/1/13 (1) | 3,000 | 3,294 |
New Jersey Transit Corp. Capital GAN | 5.500% | 2/1/10 (2) | 9,360 | 9,375 |
New Jersey Transp. Trust Fund Auth. Rev. | 5.500% | 12/15/21 (1) | 74,000 | 84,081 |
New Jersey Transp. Trust Fund Auth. Rev. | 5.250% | 12/15/22 (2) | 13,500 | 15,010 |
New Jersey Transp. Trust Fund Auth. Rev. | 5.250% | 12/15/23 (2) | 6,000 | 6,687 |
New Jersey Turnpike Auth. Rev. | 6.500% | 1/1/13 (1)(ETM) | 30,000 | 34,112 |
New Jersey Turnpike Auth. Rev. | 6.500% | 1/1/16 (1) | 790 | 907 |
New Jersey Turnpike Auth. Rev. | 6.500% | 1/1/16 (1)(ETM) | 3,940 | 4,537 |
New Jersey Turnpike Auth. Rev. | 6.500% | 1/1/16 (1)(ETM) | 270 | 311 |
New Jersey Turnpike Auth. Rev. | 5.000% | 1/1/21 (4) | 15,650 | 16,484 |
New Jersey Turnpike Auth. Rev. | 0.000% | 1/1/35 (2) | 23,500 | 16,928 |
New Jersey Turnpike Auth. Rev. | 5.000% | 1/1/35 (2) | 14,950 | 15,232 |
| | | | 310,103 |
New Mexico (0.1%) | | | | |
Farmington NM Util. System Rev. | 5.750% | 5/15/13 (3)(ETM) | 1,500 | 1,510 |
New Mexico Highway Comm. Tax Rev. | 6.000% | 6/15/10 (Prere.) | 3,000 | 3,191 |
| | | | 4,701 |
New York (5.7%) | | | | |
Hudson Yards Infrastructure Corp. New York Rev. | 4.500% | 2/15/47 (1) | 32,075 | 30,542 |
Long Island NY Power Auth. Electric System Rev. | 0.000% | 6/1/13 (4) | 11,000 | 8,939 |
Metro. New York Transp. Auth. Rev. | | | | |
(Dedicated Petroleum Tax) | 6.000% | 4/1/20 (1)(ETM) | 18,000 | 21,106 |
New York City NY GO VRDO | 3.490% | 11/1/07 LOC | 4,545 | 4,545 |
New York City NY GO VRDO | 3.500% | 11/1/07 (4) | 4,200 | 4,200 |
New York City NY Muni. Water Finance Auth. | | | | |
Water & Sewer System Rev. | 5.000% | 6/15/35 (1) | 14,780 | 15,137 |
New York City NY Muni. Water Finance Auth. | | | | |
Water & Sewer System Rev. | 5.000% | 6/15/36 | 28,700 | 29,570 |
Insured Long-Term Tax-Exempt Fund
| | | Face | Market |
| | Maturity | Amount | Value• |
| Coupon | Date | ($000) | ($000) |
New York State Dormitory Auth. Rev. | | | | |
(Personal Income Tax) | 5.000% | 3/15/32 | 11,000 | 11,450 |
New York State Housing Finance Agency Rev. | | | | |
(Nursing Home & Health Care) | 4.700% | 11/1/08 (1) | 5,435 | 5,501 |
New York State Housing Finance Agency Rev. | | | | |
(Nursing Home & Health Care) | 4.800% | 11/1/09 (1) | 10,485 | 10,724 |
New York State Housing Finance Agency Rev. | | | | |
(Nursing Home & Health Care) | 4.900% | 11/1/10 (1) | 3,490 | 3,572 |
Suffolk County NY Water Auth. Rev. | 5.750% | 6/1/13 (2)(ETM) | 7,345 | 7,982 |
Tobacco Settlement Financing Corp. New York Rev. | 5.250% | 6/1/21 (2) | 12,000 | 12,744 |
Tobacco Settlement Financing Corp. New York Rev. | 5.250% | 6/1/22 (2) | 5,000 | 5,302 |
Triborough Bridge & Tunnel Auth. New York Rev. | 5.250% | 1/1/22 (Prere.) | 12,325 | 13,808 |
Triborough Bridge & Tunnel Auth. New York Rev. | 5.500% | 1/1/22 (Prere.) | 7,000 | 8,010 |
| | | | 193,132 |
North Carolina (1.0%) | | | | |
North Carolina Medical Care Comm. | | | | |
Health Systems Rev. (Mission Health | | | | |
Combined Group) | 4.250% | 10/1/29 (4) | 11,735 | 10,986 |
North Carolina Medical Care Comm. | | | | |
Hosp. Rev. (Mission St. Joseph’s Health System) | 5.125% | 10/1/28 (1) | 7,355 | 7,495 |
North Carolina Medical Care Comm. | | | | |
Hosp. Rev. (Wake County Hosp.) | 5.250% | 10/1/17 (1) | 13,750 | 14,041 |
| | | | 32,522 |
Ohio (1.1%) | | | | |
Cleveland OH Airport System Rev. | 5.000% | 1/1/31 (4) | 18,000 | 18,614 |
Kent State Univ. Ohio Univ. Rev. VRDO | 3.230% | 11/7/07 (1) | 12,000 | 12,000 |
Ohio GO | 7.625% | 8/1/09 | 4,345 | 4,649 |
Ross County OH Hosp. Fac. Rev. | | | | |
(Adena Health System) VRDO | 3.580% | 11/1/07 (11) | 2,500 | 2,500 |
| | | | 37,763 |
Oklahoma (0.3%) | | | | |
Tulsa County OK Ind. Auth. Rev. | | | | |
(St. Francis Health System) | 5.000% | 12/15/36 | 10,000 | 10,043 |
| | | | |
Oregon (0.5%) | | | | |
Oregon State Dept. Administrative Services | 6.000% | 5/1/10 (2)(Prere.) | 6,190 | 6,623 |
Oregon State Dept. Administrative Services | 6.000% | 5/1/10 (2)(Prere.) | 3,175 | 3,397 |
Oregon State Dept. Administrative Services | 6.000% | 5/1/10 (2)(Prere.) | 6,565 | 7,025 |
| | | | 17,045 |
Pennsylvania (3.7%) | | | | |
Pennsylvania Convention Center Auth. Rev. | 6.700% | 9/1/16 (3)(ETM) | 9,970 | 11,482 |
Pennsylvania Convention Center Auth. Rev. | 6.000% | 9/1/19 (3)(ETM) | 10,000 | 11,739 |
Pennsylvania Higher Educ. Fac. Auth. | | | | |
Health Services Rev. (Allegheny/Delaware | | | | |
Valley Obligated Group) | 5.875% | 11/15/16 (1) | 10,000 | 10,116 |
Pennsylvania Higher Educ. Fac. Auth. | | | | |
Health Services Rev. (Allegheny/Delaware | | | | |
Valley Obligated Group) | 5.875% | 11/15/16 (1) | 10,000 | 10,117 |
Pennsylvania IDA Rev. (Econ. Dev.) | 5.500% | 7/1/15 (2) | 20,805 | 22,571 |
Pennsylvania Public School Building Auth. | | | | |
Lease Rev. (School Dist. of Philadelphia) | 5.000% | 6/1/31 (4) | 20,000 | 20,663 |
Philadelphia PA Water & Waste Water Rev. | 7.000% | 6/15/10 (3) | 15,000 | 16,280 |
Philadelphia PA Water & Waste Water Rev. | 7.000% | 6/15/11 (3) | 16,500 | 18,376 |
Pittsburgh PA Water & Sewer Auth. Rev. | 7.250% | 9/1/14 (3)(ETM) | 3,850 | 4,346 |
| | | | 125,690 |
Insured Long-Term Tax-Exempt Fund
| | | Face | Market |
| | Maturity | Amount | Value• |
| Coupon | Date | ($000) | ($000) |
Puerto Rico (2.4%) | | | | |
Puerto Rico Electric Power Auth. Rev. | 5.250% | 7/1/21 (1) | 5,000 | 5,564 |
Puerto Rico Electric Power Auth. Rev. | 5.250% | 7/1/22 (1) | 2,930 | 3,261 |
Puerto Rico Public Finance Corp. PUT | 5.250% | 2/1/12 (2)LOC | 40,000 | 42,512 |
Puerto Rico Sales Tax Financing Corp. Rev. | 0.000% | 8/1/54 (2) | 330,000 | 30,627 |
| | | | 81,964 |
Rhode Island (0.1%) | | | | |
Rhode Island Health & Educ. Building Corp. Rev. | | | | |
(Hosp. Financing–Lifespan Obligation) | 5.000% | 5/15/32 (4) | 3,000 | 3,082 |
| | | | |
South Carolina (0.5%) | | | | |
Charleston SC Educ. Excellence Financing Corp. Rev. | | | | |
(Charleston County School Dist.) | 5.000% | 12/1/26 | 10,580 | 10,915 |
South Carolina Public Service Auth. Rev. | 5.000% | 1/1/20 (1) | 4,500 | 4,766 |
| | | | 15,681 |
South Dakota (0.3%) | | | | |
South Dakota Health & Educ. Fac. Auth. Rev. | | | | |
(McKennan Hosp.) | 7.625% | 1/1/08 (1)(Prere.) | 8,890 | 8,949 |
| | | | |
Tennessee (0.2%) | | | | |
Metro. Govt. of Nashville & Davidson County | | | | |
TN Health & Educ. Fac. Board Rev. | | | | |
(Meharry Medical College) | 6.000% | 12/1/12 (2) | 3,405 | 3,767 |
Tennessee Health, Educ. & Housing Fac. | | | | |
(Methodist Health System) | 5.500% | 8/1/12 (1) | 1,685 | 1,790 |
Tennessee Health, Educ. & Housing Fac. | | | | |
(Methodist Health System) | 5.500% | 8/1/12 (1) | 815 | 816 |
| | | | 6,373 |
Texas (8.6%) | | | | |
Harris County TX GO | 0.000% | 10/1/15 (1) | 17,545 | 12,745 |
Harris County TX Health Fac. Dev. Corp. | | | | |
Hosp. Rev. (Texas Medical Center Project) VRDO | 3.580% | 11/1/07 (1) | 10,600 | 10,600 |
Harris County TX Health Fac. Dev. Corp. | | | | |
Rev. (Texas Medical Center) VRDO | 3.580% | 11/1/07 (1) | 5,000 | 5,000 |
Harris County TX Hosp. Dist. Rev. | 6.000% | 8/15/10 (1)(Prere.) | 12,910 | 13,761 |
Harris County TX Hosp. Dist. Rev. | 5.125% | 2/15/32 (1) | 10,000 | 10,370 |
Harris County TX Hosp. Dist. Rev. | 5.250% | 2/15/37 (1) | 10,190 | 10,638 |
Harris County TX Toll Road Rev. | 5.000% | 8/1/08 (Prere.) | 6,225 | 6,295 |
Harris County TX Toll Road Rev. | 5.250% | 8/15/10 (4)(Prere.) | 10,500 | 10,999 |
Houston TX Airport System Rev. | 5.500% | 7/1/10 (4)(Prere.) | 5,500 | 5,786 |
Houston TX GO | 5.375% | 3/1/11 (4)(Prere.) | 6,485 | 6,858 |
Houston TX GO | 5.375% | 3/1/11 (4)(Prere.) | 4,210 | 4,455 |
Houston TX GO | 5.375% | 3/1/13 (4) | 6,500 | 6,855 |
Houston TX GO | 5.500% | 3/1/15 (4) | 8,440 | 8,934 |
Houston TX GO | 5.500% | 3/1/16 (4) | 5,235 | 5,543 |
Houston TX Water & Sewer System Rev. | 5.500% | 12/1/16 (4) | 7,000 | 7,498 |
Houston TX Water Conveyance System COP | 6.800% | 12/15/10 (2) | 5,490 | 6,014 |
Lower Colorado River Auth. Texas Rev. | 5.625% | 1/1/15 (4)(Prere.) | 3,055 | 3,422 |
North Texas Tollway Auth. | | | | |
(Dallas North Tollway) System Rev. | 5.000% | 1/1/33 (2) | 8,050 | 8,207 |
Northeast Texas Hosp. Auth. | | | | |
(Northeast Medical Center) | 6.000% | 5/15/09 (4) | 3,945 | 4,093 |
Northeast Texas Hosp. Auth. | | | | |
(Northeast Medical Center) | 6.000% | 5/15/10 (4) | 2,000 | 2,121 |
Insured Long-Term Tax-Exempt Fund
| | | Face | Market |
| | Maturity | Amount | Value• |
| Coupon | Date | ($000) | ($000) |
Northeast Texas Hosp. Auth. | | | | |
(Northeast Medical Center) | 5.625% | 5/15/17 (4) | 7,425 | 7,584 |
Northeast Texas Hosp. Auth. | | | | |
(Northeast Medical Center) | 5.625% | 5/15/22 (4) | 7,110 | 7,261 |
Tarrant County TX Cultural Educ. Fac. | | | | |
Finance Corp. Rev. (Texas Health Resources) | 5.000% | 2/15/36 | 20,000 | 20,057 |
Texas Muni. Power Agency Rev. | 0.000% | 9/1/14 (1) | 34,250 | 26,182 |
Texas Muni. Power Agency Rev. | 0.000% | 9/1/15 (1) | 16,665 | 12,148 |
Texas Muni. Power Agency Rev. | 0.000% | 9/1/17 (1) | 19,600 | 12,940 |
Texas Turnpike Auth. Central Texas | | | | |
Turnpike System Rev. | 0.000% | 8/15/26 (2) | 10,000 | 4,162 |
Texas Turnpike Auth. Central Texas | | | | |
Turnpike System Rev. | 0.000% | 8/15/28 (2) | 30,005 | 11,216 |
Texas Turnpike Auth. Dallas Northway Rev. | | | | |
(President George Bush Turnpike) | 0.000% | 1/1/10 (2)(ETM) | 6,000 | 5,542 |
Texas Water Dev. Board GO | 5.750% | 8/1/32 | 10,380 | 10,999 |
Texas Water Dev. Board Rev. | 5.500% | 7/15/21 | 9,825 | 10,080 |
Texas Water Finance Assistance GO | 5.750% | 8/1/11 (Prere.) | 1,880 | 2,027 |
Texas Water Finance Assistance GO | 5.500% | 8/1/24 | 7,850 | 8,061 |
Texas Water Finance Assistance GO | 5.750% | 8/1/26 | 3,715 | 3,954 |
| | | | 292,407 |
Washington (0.6%) | | | | |
Chelan County WA Public Util. Dist. | | | | |
(Rock Island Hydro) | 0.000% | 6/1/09 (1) | 10,950 | 10,325 |
Chelan County WA Public Util. Dist. | | | | |
(Rock Island Hydro) | 0.000% | 6/1/15 (1) | 12,585 | 9,132 |
| | | | 19,457 |
West Virginia (1.1%) | | | | |
West Virginia Building Comm. Rev. | | | | |
(Jail & Correction Fac.) | 7.000% | 7/1/11 (1)(ETM) | 7,325 | 8,194 |
West Virginia Building Comm. Rev. | | | | |
(Jail & Correction Fac.) | 7.000% | 7/1/12 (1)(ETM) | 7,840 | 8,993 |
West Virginia Hosp. Finance Auth. Rev. | | | | |
(UTD Hosp. Center Inc. Project) | 5.250% | 6/1/41 (2) | 18,830 | 19,581 |
| | | | 36,768 |
Total Municipal Bonds (Cost $3,239,000) | | | | 3,366,569 |
Other Assets and Liabilities (0.7%) | | | | |
Other Assets—Note B | | | | 69,408 |
Liabilities | | | | (46,781) |
| | | | 22,627 |
Net Assets (100%) | | | | 3,389,196 |
Insured Long-Term Tax-Exempt Fund
At October 31, 2007, net assets consisted of:3
| Amount |
| ($000) |
Paid-in Capital | 3,282,910 |
Undistributed Net Investment Income | — |
Overdistributed Net Realized Gains | (20,510) |
Unrealized Appreciation (Depreciation) | |
Investment Securities | 127,569 |
Futures Contracts | (773) |
Net Assets | 3,389,196 |
| |
| |
Investor Shares—Net Assets | |
Applicable to 76,477,481 outstanding $.001 par value shares of | |
beneficial interest (unlimited authorization) | 946,767 |
Net Asset Value Per Share—Investor Shares | $12.38 |
| |
| |
Admiral Shares—Net Assets | |
Applicable to 197,293,452 outstanding $.001 par value shares of | |
beneficial interest (unlimited authorization) | 2,442,429 |
Net Asset Value Per Share—Admiral Shares | $12.38 |
• See Note A in Notes to Financial Statements.
1 Security purchased on a when-issued or delayed delivery basis for which the fund has not taken delivery as of October 31, 2007.
2 Securities with a value of $6,303,000 have been segregated as initial margin for open futures contracts.
3 See Note D in Notes to Financial Statements for the tax-basis components of net assets.
For key to abbreviations and other references, see back cover.
Long-Term Tax-Exempt Fund
| | | Face | Market |
| | Maturity | Amount | Value• |
| Coupon | Date | ($000) | ($000) |
Municipal Bonds (91.3%) | | | | |
Arizona (0.5%) | | | | |
Arizona Transp. Board Highway Rev. | 5.000% | 7/1/24 | 5,000 | 5,213 |
Scottsdale AZ Muni. Property Corp. Excise Tax Rev. | 5.000% | 7/1/16 (Prere.) | 7,115 | 7,751 |
| | | | 12,964 |
California (9.1%) | | | | |
Alameda CA Corridor Transp. Auth. Rev. | 0.000% | 10/1/30 (2) | 5,000 | 1,679 |
Anaheim CA Public Finance Auth. Lease Rev. | 6.000% | 9/1/14 (4) | 2,500 | 2,852 |
Bay Area Toll Auth. CA Toll Bridge Rev. | 5.000% | 4/1/31 | 4,300 | 4,458 |
California GO | 6.250% | 9/1/12 | 5,000 | 5,556 |
California GO | 5.250% | 11/1/21 | 2,000 | 2,126 |
California GO | 5.125% | 11/1/23 | 3,000 | 3,143 |
California GO | 5.000% | 8/1/25 (4) | 6,645 | 6,935 |
California Health Fac. Finance Auth. Rev. | | | | |
(Cedars-Sinai Medical Center) | 6.250% | 12/1/09 (Prere.) | 5,000 | 5,330 |
California Health Fac. Finance Auth. Rev. | | | | |
(Cedars-Sinai Medical Center) | 5.000% | 11/15/27 | 7,000 | 7,078 |
California Public Works Board Lease Rev. | | | | |
(Community College) | 5.625% | 3/1/16 (2) | 11,370 | 11,571 |
California Public Works Board Lease Rev. | | | | |
(Univ. of California) | 5.000% | 5/1/27 | 10,405 | 10,700 |
California State Dept. of Water Resources | | | | |
Power Supply Rev. | 5.375% | 5/1/12 (2)(Prere.) | 5,000 | 5,441 |
California State Dept. of Water Resources | | | | |
Power Supply Rev. | 6.000% | 5/1/12 (Prere.) | 2,500 | 2,785 |
California State Dept. of Water Resources | | | | |
Power Supply Rev. | 6.000% | 5/1/13 | 5,000 | 5,509 |
California State Dept. of Water Resources | | | | |
Power Supply Rev. | 5.500% | 5/1/15 (2) | 6,000 | 6,505 |
California State Econ. Recovery Bonds | 5.000% | 7/1/15 | 15,200 | 16,343 |
California Statewide Community Dev. Auth. Rev. | | | | |
(Irvine Apartments) PUT | 5.100% | 5/17/10 | 10,000 | 10,182 |
Golden State Tobacco Securitization Corp. California | 6.750% | 6/1/13 (Prere.) | 20,000 | 23,149 |
Golden State Tobacco Securitization Corp. California | 5.000% | 6/1/33 | 10,000 | 8,891 |
Los Angeles CA Dept. of Water & Power Rev. | 5.000% | 7/1/31 (4) | 12,500 | 12,942 |
Los Angeles CA USD GO | 5.000% | 7/1/25 (3) | 10,000 | 10,459 |
San Bernardino County CA Medical Center COP | 5.500% | 8/1/24 (1) | 11,295 | 11,310 |
San Bernardino County CA Medical Center COP | 6.875% | 8/1/24 (ETM) | 18,000 | 23,091 |
San Diego CA USD GO | 0.000% | 7/1/13 (3) | 7,160 | 5,791 |
San Diego CA USD GO | 5.500% | 7/1/27 (4) | 20,000 | 22,846 |
Southern California Public Power Auth. Rev. | | | | |
(Transmission Project) | 0.000% | 7/1/14 | 8,500 | 6,468 |
Univ. of California Rev. | 5.000% | 5/15/33 (2) | 5,000 | 5,146 |
| | | | 238,286 |
Colorado (2.9%) | | | | |
Colorado Dept. of Transp. Rev. | 6.000% | 6/15/10 (2)(Prere.) | 20,000 | 21,364 |
Colorado Dept. of Transp. Rev. | 5.500% | 6/15/11 (1)(Prere.) | 6,000 | 6,455 |
Douglas County CO School Dist. No. RE-1. | | | | |
(Douglas & Elbert Counties) | 5.000% | 12/15/16 (4) | 12,565 | 13,628 |
E-470 Public Highway Auth. Colorado Rev. | 0.000% | 9/1/13 (1) | 10,000 | 7,983 |
E-470 Public Highway Auth. Colorado Rev. | 0.000% | 9/1/16 (1) | 10,185 | 7,069 |
E-470 Public Highway Auth. Colorado Rev. | 0.000% | 9/1/19 (1) | 5,000 | 2,977 |
E-470 Public Highway Auth. Colorado Rev. | 0.000% | 9/1/20 (1) | 15,165 | 8,578 |
E-470 Public Highway Auth. Colorado Rev. | 0.000% | 9/1/25 (1) | 9,700 | 4,221 |
E-470 Public Highway Auth. Colorado Rev. | 0.000% | 9/1/30 (1) | 10,000 | 3,333 |
| | | | 75,608 |
Long-Term Tax-Exempt Fund
| | | Face | Market |
| | Maturity | Amount | Value• |
| Coupon | Date | ($000) | ($000) |
District of Columbia (0.1%) | | | | |
District of Columbia GO | 6.000% | 6/1/11 (1)(ETM) | 3,085 | 3,341 |
| | | | |
Florida (4.7%) | | | | |
Florida Board of Educ. Rev. (Lottery Rev.) | 5.000% | 7/1/16 (2) | 10,000 | 10,797 |
Florida Board of Educ. Rev. (Lottery Rev.) | 5.000% | 7/1/22 (2) | 12,995 | 13,800 |
Florida Educ. System Fac. Rev. | 5.000% | 5/1/35 (1) | 11,335 | 11,681 |
Florida Hurricane Catastrophe Fund | | | | |
Finance Corp. Rev. | 5.000% | 7/1/12 | 7,000 | 7,380 |
Highlands County FL Health Rev. | | | | |
(Adventist Health System) | 5.000% | 11/15/24 | 2,000 | 2,038 |
Highlands County FL Health Rev. | | | | |
(Adventist Health System) | 5.000% | 11/15/25 | 1,500 | 1,524 |
Highlands County FL Health Rev. | | | | |
(Adventist Health System) | 5.250% | 11/15/36 | 22,200 | 22,648 |
Key West FL Util. Board Election Rev. | 5.000% | 10/1/31 (1) | 10,000 | 10,304 |
Marion County FL Hosp. Dist. Rev. | | | | |
(Munroe Regional Health System) | 5.000% | 10/1/29 | 8,000 | 7,989 |
Orange County FL Health Fac. Auth. Rev. | | | | |
(Orlando Regional Healthcare) | 5.125% | 11/15/39 | 5,000 | 5,026 |
Orange County FL School Board COP | 5.000% | 8/1/31 (3) | 9,000 | 9,237 |
Sunrise FL Util. System Rev. | 5.500% | 10/1/18 (2) | 12,000 | 13,384 |
Tallahassee FL Health Fac. Rev. | | | | |
(Tallahassee Memorial Healthcare) | 6.375% | 12/1/30 | 6,000 | 6,217 |
| | | | 122,025 |
Georgia (4.2%) | | | | |
Atlanta GA Airport Fac. Rev. | 5.875% | 1/1/15 (3) | 7,750 | 8,191 |
Atlanta GA Airport Fac. Rev. | 5.875% | 1/1/17 (3) | 7,500 | 7,930 |
Atlanta GA Water & Wastewater Rev. | 5.500% | 11/1/22 (3) | 10,000 | 10,956 |
Atlanta GA Water & Wastewater Rev. | 5.750% | 11/1/25 (4) | 8,350 | 9,787 |
Atlanta GA Water & Wastewater Rev. | 5.750% | 11/1/30 (4) | 15,000 | 17,741 |
College Park GA IDA Lease Rev. (Civic Center) | 7.000% | 9/1/10 (ETM) | 7,360 | 7,773 |
Fulton County GA COP | 6.000% | 11/1/15 (2) | 4,815 | 5,188 |
Georgia GO | 5.000% | 7/1/17 | 15,000 | 16,381 |
Main Street Natural Gas Inc. Georgia | | | | |
Gas Project Rev. | 5.000% | 3/15/21 | 10,305 | 10,465 |
Metro. Atlanta GA Rapid Transp. Auth. | | | | |
Georgia Sales Tax Rev. | 6.250% | 7/1/18 | 12,170 | 13,962 |
| | | | 108,374 |
Hawaii (0.3%) | | | | |
Hawaii GO | 5.875% | 10/1/10 (1)(Prere.) | 2,860 | 3,051 |
Hawaii GO | 5.875% | 10/1/10 (1)(Prere.) | 3,220 | 3,435 |
| | | | 6,486 |
Illinois (4.5%) | | | | |
Chicago IL (City Colleges Improvement) GO | 0.000% | 1/1/16 (3) | 8,500 | 6,073 |
Chicago IL Board of Educ. GO | 0.000% | 12/1/13 (2) | 5,000 | 3,967 |
Chicago IL Board of Educ. GO | 0.000% | 12/1/14 (2) | 5,000 | 3,795 |
Chicago IL Metro. Water Reclamation Dist. GO | 7.000% | 1/1/11 (ETM) | 20,000 | 21,339 |
Chicago IL Neighborhoods Alive GO | 5.750% | 7/1/10 (3)(Prere.) | 16,690 | 17,816 |
Chicago IL Neighborhoods Alive GO | 5.500% | 1/1/11 (3)(Prere.) | 6,400 | 6,778 |
Chicago IL Public Building Comm. GO | 7.000% | 1/1/20 (1)(ETM) | 6,000 | 7,564 |
Chicago IL Skyway Toll Bridge | 5.500% | 1/1/11 (2)(Prere.) | 8,750 | 9,345 |
Illinois Finance Auth. Rev. (OSF Healthcare System) | 5.750% | 11/15/37 | 5,000 | 5,285 |
Illinois Sales Tax Rev. | 6.125% | 6/15/10 (Prere.) | 4,500 | 4,800 |
Long-Term Tax-Exempt Fund
| | | Face | Market |
| | Maturity | Amount | Value• |
| Coupon | Date | ($000) | ($000) |
Metro. Pier & Exposition Auth. Illinois | | | | |
Dedicated Sales Tax Rev. | 6.750% | 6/1/10 (1) | 6,000 | 6,282 |
Metro. Pier & Exposition Auth. Illinois | | | | |
Dedicated Sales Tax Rev. | 0.000% | 12/15/14 (1) | 16,100 | 12,202 |
Univ. of Illinois Univ. Rev. Auxiliary Fac. | 0.000% | 4/1/12 (1) | 5,795 | 4,905 |
Will County IL Community School Dist. | 0.000% | 11/1/13 (4) | 10,000 | 7,946 |
| | | | 118,097 |
Indiana (1.5%) | | | | |
Indiana Health Fac. Auth. Finance Auth. Rev. | | | | |
(Clarian Health Obligation Group) | 5.000% | 2/15/26 | 3,475 | 3,494 |
Indiana Health Fac. Auth. Finance Auth. Rev. | | | | |
(Clarian Health Obligation Group) | 5.000% | 2/15/39 | 24,045 | 23,485 |
Indiana Office Building Comm. Rev. | | | | |
(Capitol Complex) | 6.900% | 7/1/11 | 11,980 | 12,769 |
| | | | 39,748 |
Kansas (0.2%) | | | | |
Wyandotte County Kansas City KS Unified Govt. | | | | |
Util. System Rev. | 5.000% | 9/1/32 (4) | 5,000 | 5,139 |
| | | | |
Kentucky (1.0%) | | | | |
Kentucky Property & Building Comm. Rev. | 5.750% | 10/1/10 (Prere.) | 6,405 | 6,810 |
Kentucky Property & Building Comm. Rev. | 5.375% | 8/1/11 (4)(Prere.) | 8,050 | 8,573 |
Kentucky Property & Building Comm. Rev. | 5.375% | 8/1/16 (4) | 5,820 | 6,177 |
Louisville & Jefferson County KY Metro. Sewer Dist. | 5.750% | 5/15/33 (3) | 5,000 | 5,226 |
| | | | 26,786 |
Louisiana (3.4%) | | | | |
Louisiana Gasoline and Fuel Tax Rev. | 5.375% | 6/1/18 (2) | 5,000 | 5,307 |
Louisiana Gasoline and Fuel Tax Rev. | 5.000% | 5/1/24 (3) | 6,880 | 7,177 |
Louisiana Gasoline and Fuel Tax Rev. | 5.000% | 5/1/25 (3) | 5,000 | 5,206 |
Louisiana Gasoline and Fuel Tax Rev. | 5.000% | 5/1/27 (10) | 6,970 | 7,254 |
Louisiana Gasoline and Fuel Tax Rev. | 5.000% | 5/1/28 (10) | 2,500 | 2,598 |
Louisiana GO | 5.750% | 11/15/10 (3)(Prere.) | 9,855 | 10,504 |
Louisiana GO | 5.500% | 5/15/14 (3) | 6,180 | 6,521 |
Louisiana Public Fac. Auth. Rev. (Ochsner Clinic) | 5.375% | 5/15/43 | 20,000 | 20,023 |
New Orleans LA GO | 0.000% | 9/1/16 (2) | 5,785 | 3,967 |
Saint John Baptist Parish Louisiana Rev. | | | | |
(Marathon Oil Corp.) | 5.125% | 6/1/37 | 20,000 | 19,741 |
| | | | 88,298 |
Maryland (1.1%) | | | | |
Maryland Health & Higher Educ. Fac. Auth. Rev. | | | | |
(Medlantic/Helix) | 5.250% | 8/15/38 (4) | 6,100 | 6,685 |
Maryland Health & Higher Educ. Fac. Auth. Rev. | | | | |
(Medlantic/Helix) | 5.250% | 8/15/38 (2) | 13,475 | 14,767 |
Maryland Health & Higher Educ. Fac. Auth. Rev. | | | | |
(Univ. of Maryland Medical System) | 6.750% | 7/1/10 (Prere.) | 7,500 | 8,195 |
| | | | 29,647 |
Massachusetts (8.6%) | | | | |
Massachusetts Bay Transp. Auth. Rev. | 7.000% | 3/1/21 | 15,000 | 18,334 |
Massachusetts Bay Transp. Auth. Rev. | 5.500% | 7/1/29 (1) | 3,085 | 3,556 |
Massachusetts Bay Transp. Auth. Rev. | 5.250% | 7/1/34 | 9,030 | 10,105 |
Massachusetts GO | 5.375% | 10/1/10 (Prere.) | 10,000 | 10,513 |
Massachusetts GO | 5.250% | 8/1/22 | 5,000 | 5,543 |
Massachusetts Health & Educ. Fac. Auth. Rev. | | | | |
(Berklee College of Music) | 5.000% | 10/1/32 | 23,125 | 23,577 |
Long-Term Tax-Exempt Fund
| | | | Face | Market |
| | | Maturity | Amount | Value• |
| | Coupon | Date | ($000) | ($000) |
| Massachusetts Health & Educ. Fac. Auth. Rev. | | | | |
| (Caritas Christi Obligated Group) | 5.700% | 7/1/15 | 9,205 | 9,449 |
| Massachusetts Health & Educ. Fac. Auth. Rev. | | | | |
| (Lahey Clinic Medical Center) | 5.000% | 8/15/30 (3) | 7,460 | 7,687 |
| Massachusetts Health & Educ. Fac. Auth. Rev. (MIT) | 5.000% | 7/1/23 | 5,100 | 5,583 |
| Massachusetts Port Auth. Rev. | 5.000% | 7/1/08 (Prere.) | 3,500 | 3,570 |
| Massachusetts School Building Auth. | | | | |
| Dedicated Sales Tax Rev. | 5.000% | 8/15/30 (4) | 13,160 | 13,657 |
| Massachusetts Special Obligation | | | | |
| Dedicated Tax Rev. | 5.250% | 1/1/14 (3)(Prere.) | 7,295 | 7,921 |
| Massachusetts Special Obligation | | | | |
| Dedicated Tax Rev. | 5.500% | 1/1/27 (3) | 7,190 | 8,227 |
| Massachusetts Water Pollution Abatement Trust | 5.250% | 8/1/26 | 4,790 | 5,358 |
| Massachusetts Water Pollution Abatement Trust | 5.250% | 8/1/27 | 7,780 | 8,690 |
| Massachusetts Water Pollution Abatement Trust | 5.250% | 8/1/29 | 11,325 | 12,663 |
1 | Massachusetts Water Resources Auth. Rev. | 6.500% | 7/15/19 (ETM) | 32,000 | 37,803 |
| Massachusetts Water Resources Auth. Rev. | 5.000% | 8/1/31 (2) | 21,000 | 21,828 |
| Massachusetts Water Resources Auth. Rev. | 5.250% | 8/1/31 (4) | 10,000 | 11,197 |
| | | | | 225,261 |
Michigan (3.6%) | | | | |
| Detroit MI Sewer System Rev. | 5.750% | 1/1/10 (3)(Prere.) | 5,000 | 5,283 |
| Detroit MI Sewer System Rev. | 5.000% | 7/1/13 (4)(Prere.) | 7,755 | 8,315 |
| Detroit MI Sewer System Rev. | 5.125% | 7/1/15 (1)(Prere.) | 3,970 | 4,344 |
| Detroit MI Sewer System Rev. | 5.500% | 7/1/29 (3) | 18,000 | 20,637 |
| Detroit MI Sewer System Rev. | 5.000% | 7/1/32 (4) | 3,045 | 3,120 |
| Detroit MI Sewer System Rev. | 5.125% | 7/1/33 (1) | 6,030 | 6,247 |
| Grand Rapids MI Tax Increment Rev. | | | | |
| (Downtown Project) | 6.875% | 6/1/24 (1) | 7,500 | 7,794 |
| Michigan Building Auth. Rev. | 5.500% | 10/15/16 | 5,500 | 5,849 |
| Michigan Hosp. Finance Auth. Rev. | | | | |
| (Henry Ford Health System) | 5.250% | 11/15/46 | 14,000 | 14,128 |
| Michigan Muni. Bond Auth. Rev. | | | | |
| (Clean Water Revolving Fund) | 5.875% | 10/1/10 (Prere.) | 9,250 | 9,951 |
| Michigan Muni. Bond Auth. Rev. | | | | |
| (Clean Water Revolving Fund) | 5.875% | 10/1/10 (Prere.) | 7,980 | 8,585 |
| | | | | 94,253 |
Minnesota (0.5%) | | | | |
| Minnesota GO | 5.000% | 8/1/20 | 10,570 | 11,372 |
| | | | | |
Missouri (0.8%) | | | | |
| Missouri Health & Educ. Fac. Auth. Health Fac. Rev. | | | | |
| (St. Luke’s Episcopal–Presbyterian Hosp.) | 5.500% | 12/1/16 (4) | 4,195 | 4,435 |
| Missouri Highways & Transp. Comm. Road Rev. | 5.000% | 5/1/26 | 15,000 | 15,741 |
| | | | | 20,176 |
Nebraska (1.3%) | | | | |
| Omaha NE GO | 5.250% | 4/1/24 | 5,000 | 5,599 |
| Omaha NE GO | 5.250% | 4/1/25 | 7,500 | 8,406 |
| Omaha NE GO | 5.250% | 4/1/26 | 7,580 | 8,520 |
| Omaha NE GO | 5.250% | 4/1/27 | 10,730 | 12,062 |
| | | | | 34,587 |
Nevada (0.3%) | | | | |
| Henderson NV Health Care Fac. Rev. | 5.625% | 7/1/24 | 2,000 | 2,099 |
| Truckee Meadows NV Water Auth. Rev. | 5.500% | 7/1/11 (4)(Prere.) | 5,000 | 5,339 |
| | | | | 7,438 |
Long-Term Tax-Exempt Fund
| | | Face | Market |
| | Maturity | Amount | Value• |
| Coupon | Date | ($000) | ($000) |
New Hampshire (0.9%) | | | | |
Manchester NH General Airport Rev. | 5.625% | 1/1/10 (4)(Prere.) | 23,000 | 24,039 |
| | | | |
New Jersey (4.1%) | | | | |
Essex County NJ Improvement Auth. Rev. | 5.500% | 10/1/28 (1) | 10,680 | 12,196 |
Garden State Preservation Trust New Jersey | 5.750% | 11/1/28 (4) | 20,000 | 23,585 |
New Jersey Econ. Dev. Auth. Rev. (Cigarette Tax) | 5.500% | 6/15/24 | 10,000 | 10,245 |
New Jersey Econ. Dev. Auth. Rev. (School Fac.) | 5.500% | 9/1/26 (2) | 10,000 | 11,468 |
New Jersey Econ. Dev. Auth. Rev. (School Fac.) | 5.500% | 9/1/27 (3) | 9,000 | 10,313 |
New Jersey Sports & Exposition Auth. Rev. | 6.500% | 3/1/13 (4) | 1,900 | 2,086 |
New Jersey Transp. Corp. COP | 6.000% | 9/15/10 (2)(Prere.) | 13,000 | 13,896 |
New Jersey Transp. Trust Fund Auth. Rev. | 5.250% | 12/15/22 (2) | 5,000 | 5,559 |
New Jersey Transp. Trust Fund Auth. Rev. | 5.750% | 6/15/24 (3) | 5,795 | 6,793 |
New Jersey Turnpike Auth. Rev. | 5.625% | 1/1/10 (1)(Prere.) | 2,060 | 2,154 |
Tobacco Settlement Financing Corp. | | | | |
New Jersey Rev. | 4.625% | 6/1/26 | 10,000 | 8,813 |
| | | | 107,108 |
New Mexico (1.0%) | | | | |
New Mexico Finance Auth. Transp. Rev. | 5.250% | 6/15/21 (1) | 10,000 | 10,702 |
New Mexico Highway Comm. Tax Rev. | 6.000% | 6/15/10 (Prere.) | 3,000 | 3,191 |
New Mexico Hosp. Equipment Loan Council Hosp. | | | | |
System Rev. (Presbyterian Healthcare Services) | 5.500% | 8/1/11 (Prere.) | 10,000 | 10,759 |
| | | | 24,652 |
New York (7.2%) | | | | |
Babylon NY Waste Water Fac. GO | 9.000% | 8/1/08 (3) | 4,900 | 5,097 |
Babylon NY Waste Water Fac. GO | 9.000% | 8/1/09 (3) | 2,800 | 3,059 |
Babylon NY Waste Water Fac. GO | 9.000% | 8/1/10 (3) | 4,900 | 5,595 |
Erie County NY IDA School Fac. Rev. GO | 5.750% | 5/1/26 (4) | 4,200 | 4,647 |
Liberty NY Dev. Corp. Rev. | | | | |
(Goldman Sachs Headquarters) | 5.250% | 10/1/35 | 18,690 | 19,856 |
Metro. New York Transp. Auth. Rev. | | | | |
(Dedicated Petroleum Tax) | 5.250% | 10/1/10 (1)(Prere.) | 4,675 | 4,912 |
Metro. New York Transp. Auth. Rev. | | | | |
(Dedicated Petroleum Tax) | 6.000% | 4/1/20 (1)(ETM) | 6,165 | 7,229 |
New York City NY GO | 5.250% | 8/1/12 | 8,535 | 9,116 |
New York City NY Transitional Finance Auth. Rev. | 6.250% | 5/15/10 (Prere.) | 265 | 286 |
New York State Dormitory Auth. Rev. | | | | |
(Personal Income Tax) | 5.000% | 3/15/24 (2) | 10,000 | 10,457 |
New York State Dormitory Auth. Rev. | | | | |
(Personal Income Tax) | 5.500% | 3/15/25 (2) | 10,000 | 11,444 |
New York State Dormitory Auth. Rev. | | | | |
(Sloan-Kettering Cancer Center) | 5.750% | 7/1/20 (1) | 7,500 | 8,593 |
New York State Dormitory Auth. Rev. (State Univ.) | 7.500% | 5/15/11 | 7,335 | 8,043 |
New York State Environmental Fac. Corp. Rev. | | | | |
(Clean Water & Drinking Revolving Funds) | 5.250% | 6/15/20 | 37,090 | 39,397 |
New York State Urban Dev. Corp. Rev. | | | | |
(Personal Income Tax) GO | 5.500% | 3/15/25 (1) | 6,965 | 7,971 |
Port Auth. of New York & New Jersey Rev. | 5.000% | 7/15/30 | 12,215 | 12,621 |
Triborough Bridge & Tunnel Auth. New York Rev. | 5.250% | 11/15/17 | 10,000 | 10,669 |
Triborough Bridge & Tunnel Auth. New York Rev. | 6.125% | 1/1/21 (ETM) | 10,000 | 11,987 |
Triborough Bridge & Tunnel Auth. New York Rev. | 5.500% | 1/1/22 (Prere.) | 6,750 | 7,723 |
| | | | 188,702 |
North Carolina (1.6%) | | | | |
North Carolina Eastern Muni. Power Agency Rev. | 7.500% | 1/1/10 (ETM) | 4,935 | 5,292 |
North Carolina Eastern Muni. Power Agency Rev. | 6.500% | 1/1/18 (ETM) | 4,625 | 5,617 |
Long-Term Tax-Exempt Fund
| | | Face | Market |
| | Maturity | Amount | Value• |
| Coupon | Date | ($000) | ($000) |
North Carolina GO | 5.000% | 3/1/20 | 5,000 | 5,294 |
North Carolina Infrastructure Financial Corp. | | | | |
COP Capital Improvements | 5.000% | 2/1/22 (4) | 6,500 | 6,849 |
North Carolina Medical Care Comm. | | | | |
Health Care Fac. (Novant Health Obligated Group) | 5.000% | 11/1/34 | 15,000 | 15,119 |
Winston-Salem NC Water & Sewer System Rev. | 5.500% | 6/1/11 (Prere.) | 1,220 | 1,312 |
Winston-Salem NC Water & Sewer System Rev. | 5.500% | 6/1/16 | 1,780 | 1,908 |
| | | | 41,391 |
Ohio (3.1%) | | | | |
Buckeye OH Tobacco Settlement | | | | |
Financing Corp. Rev. | 5.125% | 6/1/24 | 14,400 | 13,877 |
Cincinnati OH City School Dist. GO | 5.250% | 12/1/27 (3) | 14,900 | 16,662 |
Erie County OH Hosp. Fac. Rev. | | | | |
(Firelands Regional Medical Center) | 5.250% | 8/15/46 | 6,080 | 6,138 |
Lorain County OH Hosp. Fac. Rev. | | | | |
(Catholic Healthcare Partners) | 5.625% | 10/1/16 | 3,000 | 3,171 |
Lorain County OH Hosp. Fac. Rev. | | | | |
(Catholic Healthcare Partners) | 5.625% | 10/1/17 | 2,260 | 2,380 |
Lorain County OH Hosp. Fac. Rev. | | | | |
(Catholic Healthcare Partners) | 5.400% | 10/1/21 | 8,000 | 8,307 |
Ohio Higher Educ. Fac. Comm. Rev. | | | | |
(Univ. Hospitals Health System) | 5.250% | 1/15/46 | 13,500 | 13,587 |
Ohio Higher Educ. GO | 5.000% | 2/1/25 | 5,000 | 5,213 |
Ohio Water Dev. Auth. PCR | 5.500% | 6/1/21 | 4,000 | 4,538 |
Ohio Water Dev. Auth. PCR | 5.500% | 12/1/22 | 6,355 | 7,256 |
| | | | 81,129 |
Oregon (0.6%) | | | | |
Umatilla County OR Hosp. Fac. Auth. Rev. | | | | |
(Catholic Health Initiative) | 5.000% | 5/1/22 | 14,880 | 15,169 |
| | | | |
Pennsylvania (2.1%) | | | | |
Delaware County PA Hosp. Auth. Rev. | | | | |
(Crozer Keystone Obligated Group) | 5.000% | 12/15/31 | 11,420 | 10,911 |
Pennsylvania GO | 5.000% | 9/1/14 (4) | 5,000 | 5,394 |
Philadelphia PA Water & Waste Water Rev. | 7.000% | 6/15/10 (3) | 20,000 | 21,707 |
Pittsburgh PA GO | 5.250% | 9/1/16 (3) | 3,845 | 3,895 |
Pittsburgh PA Water & Sewer Auth. Rev. | 6.500% | 9/1/13 (3) | 10,000 | 11,186 |
Sayre PA Health Care Fac. Auth. Rev. | | | | |
(Guthrie Health Care System) | 5.750% | 12/1/11 (Prere.) | 1,725 | 1,883 |
Sayre PA Health Care Fac. Auth. Rev. | | | | |
(Guthrie Health Care System) | 5.750% | 12/1/21 | 610 | 640 |
| | | | 55,616 |
Puerto Rico (1.3%) | | | | |
Puerto Rico Electric Power Auth. Rev. | 5.250% | 7/1/08 (4)(Prere.) | 2,000 | 2,054 |
Puerto Rico Electric Power Auth. Rev. | 5.250% | 7/1/14 (1) | 2,000 | 2,052 |
Puerto Rico GO | 5.000% | 7/1/33 | 3,600 | 3,628 |
Puerto Rico Infrastructure Financing Auth. | | | | |
Special Tax Rev. | 0.000% | 7/1/34 (2) | 15,305 | 4,223 |
Puerto Rico Public Buildings Auth. Govt. Fac. Rev. | 5.375% | 7/1/34 | 7,205 | 7,476 |
Puerto Rico Public Finance Corp. | 6.000% | 8/1/26 (ETM) | 10,060 | 12,071 |
Puerto Rico Public Finance Corp. | 6.000% | 8/1/26 (ETM) | 940 | 1,128 |
Puerto Rico Sales Tax Financing Corp. Rev. | 0.000% | 8/1/54 (2) | 25,000 | 2,320 |
| | | | 34,952 |
Long-Term Tax-Exempt Fund
| | | Face | Market |
| | Maturity | Amount | Value• |
| Coupon | Date | ($000) | ($000) |
South Carolina (2.4%) | | | | |
Charleston SC Educ. Excellence | | | | |
Financing Corp. Rev. | 5.250% | 12/1/28 | 20,000 | 20,910 |
Medical Univ. South Carolina Hosp. Auth. | | | | |
Hosp. Fac. Rev. | 6.375% | 8/15/12 (Prere.) | 7,750 | 8,691 |
Piedmont SC Muni. Power Agency Rev. | 6.500% | 1/1/15 (3)(ETM) | 2,035 | 2,391 |
Piedmont SC Muni. Power Agency Rev. | 6.500% | 1/1/15 (3) | 12,210 | 14,194 |
South Carolina Jobs Econ. Dev. Auth. Hosp. | | | | |
Improvement Rev. (Palmetto Health Alliance) | 7.125% | 12/15/10 (Prere.) | 5,000 | 5,615 |
South Carolina Jobs Econ. Dev. Auth. Rev. | | | | |
(Bon Secours Health System) | 5.625% | 11/15/30 | 10,000 | 10,307 |
| | | | 62,108 |
Tennessee (1.0%) | | | | |
Shelby County TN Health Educ. & Housing Fac. | | | | |
Board Rev. (St. Jude Children’s Research Hospital) | 5.000% | 7/1/31 | 25,000 | 25,297 |
| | | | |
Texas (10.7%) | | | | |
Austin TX Combined Util. System Rev. | 0.000% | 5/15/17 (3) | 4,900 | 3,277 |
Austin TX Water & Wastewater System Rev. | 5.000% | 5/15/28 (1) | 6,665 | 6,910 |
Harris County TX GO | 0.000% | 10/1/14 (1) | 5,550 | 4,229 |
Houston TX GO | 5.750% | 9/1/10 (4)(Prere.) | 2,735 | 2,904 |
Houston TX GO | 5.750% | 9/1/10 (4)(Prere.) | 4,105 | 4,358 |
Houston TX GO | 5.750% | 3/1/14 (4) | 260 | 275 |
Houston TX GO | 5.750% | 3/1/15 (4) | 265 | 280 |
Houston TX GO | 5.750% | 3/1/16 (4) | 395 | 418 |
Houston TX Hotel Occupancy Tax & Special Rev. | | | | |
(Convention & Entertainment) | 0.000% | 9/1/18 (2) | 16,285 | 10,220 |
Houston TX Hotel Occupancy Tax & Special Rev. | | | | |
(Convention & Entertainment) | 0.000% | 9/1/21 (2) | 22,720 | 12,226 |
Houston TX Water & Sewer System Rev. | 0.000% | 12/1/12 (2) | 20,500 | 16,906 |
Lewisville TX Independent School Dist. | 0.000% | 8/15/16 | 5,630 | 3,915 |
Lewisville TX Independent School Dist. | 0.000% | 8/15/17 | 6,940 | 4,591 |
Lower Colorado River Auth. Texas Rev. | 5.875% | 5/15/09 (4)(Prere.) | 10 | 10 |
Lower Colorado River Auth. Texas Rev. | 6.000% | 5/15/11 (4) | 12,605 | 13,183 |
Lower Colorado River Auth. Texas Rev. | 5.875% | 5/15/16 (4) | 27,490 | 28,686 |
Round Rock TX Independent School Dist. GO | 0.000% | 8/15/11 (1) | 5,000 | 4,343 |
San Antonio TX Electric & Gas Rev. | 5.750% | 2/1/10 (Prere.) | 11,435 | 12,007 |
San Antonio TX Electric & Gas Rev. | 5.375% | 2/1/12 (Prere.) | 10,000 | 10,709 |
San Antonio TX Electric & Gas Rev. | 5.000% | 2/1/25 | 15,500 | 16,126 |
San Antonio TX Electric & Gas Rev. | 5.000% | 2/1/32 | 15,000 | 15,493 |
Texas City TX IDA (ARCO Pipeline) | 7.375% | 10/1/20 | 17,000 | 21,565 |
Texas Muni. Power Agency Rev. | 0.000% | 9/1/13 (1)(ETM) | 940 | 752 |
Texas Muni. Power Agency Rev. | 0.000% | 9/1/13 (1) | 38,730 | 30,952 |
Texas Muni. Power Agency Rev. | 0.000% | 9/1/15 (1) | 16,405 | 11,958 |
Texas Muni. Power Agency Rev. | 0.000% | 9/1/15 (1)(ETM) | 335 | 245 |
Texas Muni. Power Agency Rev. | 0.000% | 9/1/17 (1) | 39,170 | 25,861 |
Texas Muni. Power Agency Rev. | 0.000% | 9/1/17 (1)(ETM) | 800 | 531 |
Texas Water Dev. Board Rev. VRDO | 3.570% | 11/1/07 | 17,933 | 17,933 |
| | | | 280,863 |
Utah (1.0%) | | | | |
Utah Transit Auth. Sales Tax Rev. | 5.000% | 6/15/35 (1) | 25,000 | 26,594 |
| | | | |
Virgin Islands (0.2%) | | | | |
Virgin Islands Public Finance Auth. Rev. | 6.500% | 10/1/10 (Prere.) | 5,000 | 5,469 |
Long-Term Tax-Exempt Fund
| | | | Face | Market |
| | | Maturity | Amount | Value• |
| | Coupon | Date | ($000) | ($000) |
Virginia (1.7%) | | | | |
| Stafford County VA Econ. Dev. Auth. | | | | |
| Hosp. Fac. Rev. (Medicorp Health System) | 5.250% | 6/15/37 | 16,755 | 16,928 |
| Tobacco Settlement Financing Corp. Virginia Rev. | 5.625% | 6/1/15 (Prere.) | 10,000 | 11,199 |
| Virginia College Building Auth. Educ. | | | | |
| Fac. Rev. (Washington & Lee Univ.) | 5.750% | 1/1/34 | 9,540 | 11,445 |
| Winchester VA IDA Hosp. Rev. | | | | |
| (Valley Health System) | 5.250% | 1/1/37 | 5,000 | 5,131 |
| | | | | 44,703 |
Washington (1.4%) | | | | |
| Chelan County WA Public Util. Dist. | | | | |
| (Rock Island Hydro) | 0.000% | 6/1/14 (1) | 5,000 | 3,803 |
| Chelan County WA Public Util. Dist. | | | | |
| (Rock Island Hydro) | 0.000% | 6/1/17 (1) | 11,685 | 7,697 |
| Chelan County WA Public Util. Dist. | | | | |
| (Rock Island Hydro) | 0.000% | 6/1/18 (1) | 10,000 | 6,261 |
| Port of Seattle WA Rev. | 5.625% | 8/1/10 (1)(Prere.) | 7,735 | 8,170 |
| Washington GO | 5.625% | 7/1/10 (Prere.) | 7,030 | 7,418 |
| Washington GO | 6.750% | 2/1/15 | 3,450 | 3,941 |
| | | | | 37,290 |
West Virginia (0.4%) | | | | |
| West Virginia Building Comm. Rev. | | | | |
| (Jail & Correction Fac.) | 7.000% | 7/1/14 (1)(ETM) | 8,975 | 10,734 |
| | | | | |
Wisconsin (2.0%) | | | | |
| Wisconsin Clean Water Rev. | 6.875% | 6/1/11 | 20,500 | 22,162 |
| Wisconsin GO | 5.750% | 5/1/11 (Prere.) | 10,000 | 10,732 |
| Wisconsin Health & Educ. Fac. Auth. Rev. | | | | |
| (Ascension Health) | 5.000% | 11/15/36 | 20,000 | 20,086 |
| | | | | 52,980 |
Total Municipal Bonds (Cost $2,298,789) | | | | 2,386,682 |
| | | | Shares | |
Temporary Cash Investment (7.3%) | | | | |
2 | Vanguard Municipal Cash Management Fund | | | | |
| (Cost $190,600) | 3.425% | 190,600,192 | 190,600 |
Total Investments (98.6%) (Cost $2,489,389) | | | | 2,577,282 |
Other Assets and Liabilities (1.4%) | | | | |
Other Assets—Note B | | | | 46,832 |
Liabilities | | | | (9,181) |
| | | | | 37,651 |
Net Assets (100%) | | | | 2,614,933 |
Long-Term Tax-Exempt Fund
At October 31, 2007, net assets consisted of:3
| Amount |
| ($000) |
Paid-in Capital | 2,541,997 |
Undistributed Net Investment Income | — |
Accumulated Net Realized Losses | (14,388) |
Unrealized Appreciation (Depreciation) | |
Investment Securities | 87,893 |
Futures Contracts | (569) |
Net Assets | 2,614,933 |
| |
| |
Investor Shares—Net Assets | |
Applicable to 58,951,410 outstanding $.001 par value shares of | |
beneficial interest (unlimited authorization) | 653,491 |
Net Asset Value Per Share—Investor Shares | $11.09 |
| |
| |
Admiral Shares—Net Assets | |
Applicable to 176,940,796 outstanding $.001 par value shares of | |
beneficial interest (unlimited authorization) | 1,961,442 |
Net Asset Value Per Share—Admiral Shares | $11.09 |
• See Note A in Notes to Financial Statements.
1 Securities with a value of $4,725,000 have been segregated as initial margin for open futures contracts.
2 Affiliated money market fund available only to Vanguard funds and certain trusts and accounts managed by Vanguard. Rate shown is the 7-day yield.
3 See Note D in Notes to Financial Statements for the tax-basis components of net assets.
High-Yield Tax-Exempt Fund
| | | | Face | Market |
| | | Maturity | Amount | Value• |
| | Coupon | Date | ($000) | ($000) |
Municipal Bonds (97.6%) | | | | |
Alabama (1.1%) | | | | |
| Alabama Special Care Fac. Financing Auth. | | | | |
| Birmingham Rev. (Ascension Health) | 5.000% | 11/15/39 | 29,855 | 29,953 |
| Camden AL Ind. Dev. Bank (Weyerhaeuser Co.) | 6.125% | 12/1/24 | 3,000 | 3,202 |
| Courtland AL Dev. Board Solid Waste Disposal Rev. | | | | |
| (Champion International Corp.) | 6.700% | 11/1/29 | 9,500 | 9,840 |
| Courtland AL Dev. Board Solid Waste Disposal Rev. | | | | |
| (International Paper Co.) | 5.200% | 6/1/25 | 10,000 | 9,750 |
| McIntosh AL IDR (Environmental Improvement) | 5.375% | 6/1/28 | 17,000 | 17,171 |
| | | | | 69,916 |
Arizona (2.0%) | | | | |
| Arizona Health Fac. Auth. Rev. | | | | |
| (Beatitudes Campus Project) | 4.750% | 10/1/10 | 4,250 | 4,201 |
| Arizona Health Fac. Auth. Rev. | | | | |
| (Beatitudes Campus Project) | 5.200% | 10/1/37 | 7,000 | 6,217 |
| Chandler AZ IDA Rev. ( Intel Corp. Project) PUT | 4.375% | 12/1/10 | 17,500 | 17,790 |
| Maricopa County AZ IDA Health Fac. Rev. | | | | |
| (Catholic Healthcare West) | 5.250% | 7/1/32 | 15,200 | 15,499 |
| Maricopa County AZ Pollution Control Corp. PCR | | | | |
| (Southern California Edison Co.) PUT | 2.900% | 3/2/09 | 16,500 | 16,264 |
| Salt Verde Arizona Financial Project Rev. | 5.250% | 12/1/27 | 22,000 | 22,411 |
| Salt Verde Arizona Financial Project Rev. | 5.000% | 12/1/32 | 10,000 | 9,653 |
| Univ. of Arizona Board of Regents | 6.200% | 6/1/16 | 26,660 | 30,300 |
| | | | | 122,335 |
Arkansas (0.1%) | | | | |
| North Little Rock AR Electric Rev. | 6.500% | 7/1/15 (1) | 3,450 | 3,913 |
| | | | | |
California (12.1%) | | | | |
| California Dept. of Water Resources | | | | |
| Water System Rev. (Central Valley) | 5.500% | 12/1/11 (Prere.) | 830 | 895 |
| California Dept. of Water Resources | | | | |
| Water System Rev. (Central Valley) | 5.500% | 12/1/11 (Prere.) | 1,670 | 1,801 |
| California Dept. of Water Resources | | | | |
| Water System Rev. (Central Valley) | 5.500% | 12/1/15 | 4,170 | 4,472 |
| California Dept. of Water Resources | | | | |
| Water System Rev. (Central Valley) | 5.500% | 12/1/17 | 8,330 | 8,939 |
1 | California GO | 5.000% | 11/1/21 | 32,545 | 33,977 |
| California GO | 5.000% | 8/1/23 (4) | 20,000 | 20,980 |
| California GO | 5.125% | 2/1/25 | 13,975 | 14,608 |
| California GO | 4.500% | 12/1/32 (4) | 10,000 | 9,640 |
| California GO | 4.500% | 10/1/36 | 56,500 | 52,121 |
| California GO | 5.000% | 6/1/37 | 30,000 | 30,386 |
| California Housing Finance Agency | | | | |
| Home Mortgage Rev. | 5.500% | 2/1/42 | 26,230 | 27,748 |
| California PCR Financing Auth. Solid Waste | | | | |
| Disposal Rev. (Republic Services) PUT | 5.250% | 12/1/17 | 32,155 | 32,992 |
| California PCR Financing Auth. Solid Waste | | | | |
| Disposal Rev. (Waste Management) | 5.400% | 4/1/25 | 3,000 | 3,020 |
| California PCR Financing Auth. Solid Waste | | | | |
| Disposal Rev. (Waste Management) | 5.000% | 7/1/27 | 6,185 | 5,905 |
| California Public Works Board Lease Rev. (Butterfield) | 5.000% | 6/1/21 | 7,675 | 7,954 |
| California Public Works Board Lease Rev. (Butterfield) | 5.000% | 6/1/22 | 5,000 | 5,156 |
| California Public Works Board Lease Rev. (Butterfield) | 5.000% | 6/1/23 | 2,870 | 2,950 |
| California Public Works Board Lease Rev. | | | | |
| (Dept. of Corrections) | 5.500% | 6/1/19 | 7,000 | 7,572 |
High-Yield Tax-Exempt Fund
| | | Face | Market |
| | Maturity | Amount | Value• |
| Coupon | Date | ($000) | ($000) |
California State Dept. of Water Resources | | | | |
Power Supply Rev. | 5.500% | 5/1/12 (1) | 25,000 | 27,036 |
California State Econ. Recovery Bonds | 5.250% | 7/1/12 | 10,000 | 10,711 |
California State Econ. Recovery Bonds | 5.250% | 7/1/14 | 30,000 | 32,687 |
California State Univ. Rev. Systemwide | 5.000% | 11/1/20 (2) | 20,995 | 22,253 |
California Statewide Community Dev. Auth. Rev. | | | | |
(Irvine Apartments) PUT | 5.050% | 5/15/08 | 2,500 | 2,514 |
California Statewide Community Dev. Auth. Rev. | | | | |
(Irvine Apartments) PUT | 5.100% | 5/17/10 | 22,000 | 22,400 |
California Statewide Community Dev. Auth. Rev. | | | | |
(Irvine Apartments) PUT | 5.250% | 5/15/13 | 37,785 | 38,504 |
California Statewide Community Dev. Auth. Rev. | | | | |
(Kaiser Permanente) | 5.250% | 3/1/45 | 50,000 | 50,602 |
Chula Vista CA IDR (San Diego Gas & Electric) | 5.250% | 12/1/27 | 20,000 | 20,475 |
City of Carlsbad, CA Assessment Dist. Ltd. | 5.150% | 9/2/29 | 2,170 | 2,093 |
City of Carlsbad, CA Assessment Dist. Ltd. | 5.200% | 9/2/35 | 2,715 | 2,599 |
Foothill/Eastern Corridor Agency California | | | | |
Toll Road Rev. | 0.000% | 1/15/28 (1) | 25,000 | 24,786 |
Golden State Tobacco Securitization Corp. California | 5.000% | 6/1/13 (2)(Prere.) | 20,885 | 22,340 |
Golden State Tobacco Securitization Corp. California | 5.625% | 6/1/13 (Prere.) | 7,000 | 7,707 |
Irving CA Special Tax Community Fac. Dist. | 5.200% | 9/1/26 | 750 | 743 |
Irving CA Special Tax Community Fac. Dist. | 5.250% | 9/1/36 | 2,000 | 1,939 |
Lincoln CA Special Tax Communities Fac. Dist. | 5.450% | 9/1/13 (Prere.) | 890 | 990 |
Lincoln CA Special Tax Communities Fac. Dist. | 5.750% | 9/1/13 (Prere.) | 885 | 998 |
Lincoln CA Special Tax Communities Fac. Dist. | 5.900% | 9/1/13 (Prere.) | 890 | 1,011 |
Lincoln CA Special Tax Communities Fac. Dist. | 5.950% | 9/1/13 (Prere.) | 3,555 | 4,047 |
Lincoln CA Special Tax Communities Fac. Dist. | 6.000% | 9/1/13 (Prere.) | 2,670 | 3,046 |
Los Angeles CA Dept. of Water & Power Rev. | 5.000% | 7/1/24 (4) | 11,175 | 11,688 |
Northstar Community Services Dist. CA | | | | |
Special Tax Community Fac. Dist. | 5.000% | 9/1/37 | 15,000 | 13,885 |
Poway CA USD Special Tax Community Fac. Dist. | 5.250% | 9/1/36 | 5,235 | 4,861 |
Rancho Mirage CA Joint Powers Financing | | | | |
Auth. Rev. (Eisenhower Medical Center) | 5.000% | 7/1/38 | 25,000 | 24,940 |
Roseville CA North Central Roseville | | | | |
Community Fac. Dist. | 5.400% | 9/1/08 | 1,850 | 1,864 |
Sacramento CA Financing Auth. Lease Rev. | 5.250% | 12/1/30 (2) | 19,000 | 20,874 |
San Bernardino County CA Medical Center COP | 7.000% | 8/1/20 | 12,180 | 15,176 |
San Bernardino County CA Medical Center COP | 6.875% | 8/1/24 (ETM) | 25,220 | 32,353 |
San Diego CA USD GO | 5.500% | 7/1/19 (1) | 10,140 | 11,435 |
San Diego CA USD GO | 5.500% | 7/1/21 (1) | 12,725 | 14,389 |
San Diego CA USD GO | 5.500% | 7/1/23 (1) | 7,500 | 8,527 |
San Francisco CA City & County COP | | | | |
(San Bruno Jail) | 5.250% | 10/1/33 (2) | 10,000 | 10,303 |
San Joaquin Hills CA Transp. Corridor | | | | |
Agency Toll Road Rev. | 0.000% | 1/15/09 (1) | 3,000 | 2,880 |
San Joaquin Hills CA Transp. Corridor | | | | |
Agency Toll Road Rev. | 0.000% | 1/15/25 (1) | 12,900 | 5,791 |
Santa Margarita CA Water Dist. Special Tax | | | | |
Community Fac. Dist. No. 99-1 | 6.000% | 9/1/13 (Prere.) | 3,000 | 3,387 |
| | | | 752,950 |
Colorado (3.7%) | | | | |
Colorado Health Fac. Auth. Rev. | | | | |
(Catholic Health Initiatives) | 5.250% | 9/1/11 (Prere.) | 10,000 | 10,596 |
Colorado Health Fac. Auth. Rev. | | | | |
(Catholic Health Initiatives) | 5.500% | 9/1/11 (ETM) | 7,775 | 8,308 |
High-Yield Tax-Exempt Fund
| | | Face | Market |
| | Maturity | Amount | Value• |
| Coupon | Date | ($000) | ($000) |
Colorado Health Fac. Auth. Rev. | | | | |
(Catholic Health Initiatives) | 5.500% | 9/1/11 (Prere.) | 3,000 | 3,206 |
Colorado Health Fac. Auth. Rev. | | | | |
(Catholic Health Initiatives) | 5.500% | 9/1/11 (Prere.) | 5,130 | 5,482 |
Colorado Health Fac. Auth. Rev. | | | | |
(Catholic Health Initiatives) | 5.500% | 9/1/11 (Prere.) | 8,200 | 8,762 |
Colorado Health Fac. Auth. Rev. | | | | |
(Catholic Health Initiatives) | 5.500% | 9/1/11 (Prere.) | 5,215 | 5,572 |
Colorado Health Fac. Auth. Rev. | | | | |
(Catholic Health Initiatives) | 4.500% | 9/1/38 | 25,000 | 23,304 |
Colorado Health Fac. Auth. Rev. | | | | |
(Catholic Health Initiatives) | 5.000% | 9/1/41 | 30,000 | 29,998 |
Colorado Health Fac. Auth. Rev. | | | | |
(Christian Living Communities) | 5.750% | 1/1/26 | 1,000 | 981 |
Colorado Health Fac. Auth. Rev. | | | | |
(Christian Living Communities) | 5.750% | 1/1/37 | 2,250 | 2,206 |
Colorado Health Fac. Auth. Rev. | | | | |
(Covenant Retirement Community Inc.) | 5.250% | 12/1/25 | 15,500 | 15,580 |
Denver CO City & County | | | | |
Single Family Mortgage Rev. | 4.700% | 12/1/39 | 5,998 | 6,286 |
E-470 Public Highway Auth. Colorado Rev. | 0.000% | 9/1/09 (1) | 14,195 | 13,282 |
E-470 Public Highway Auth. Colorado Rev. | 0.000% | 9/1/10 (1) | 7,185 | 6,469 |
E-470 Public Highway Auth. Colorado Rev. | 0.000% | 9/1/12 (1) | 26,795 | 22,306 |
E-470 Public Highway Auth. Colorado Rev. | 0.000% | 9/1/13 (1) | 5,000 | 3,991 |
E-470 Public Highway Auth. Colorado Rev. | 0.000% | 9/1/14 (1) | 8,000 | 6,103 |
E-470 Public Highway Auth. Colorado Rev. | 0.000% | 9/1/15 (1) | 5,000 | 3,645 |
E-470 Public Highway Auth. Colorado Rev. | 0.000% | 9/1/18 (1) | 5,000 | 3,135 |
E-470 Public Highway Auth. Colorado Rev. | 0.000% | 9/1/24 (1) | 29,225 | 13,392 |
E-470 Public Highway Auth. Colorado Rev. | 0.000% | 9/1/25 (1) | 14,900 | 6,484 |
E-470 Public Highway Auth. Colorado Rev. | 0.000% | 9/1/29 (1) | 56,600 | 19,923 |
Northwest Parkway Public Highway Auth. | | | | |
Colorado Convertible Rev. | 0.000% | 6/15/25 (4) | 10,000 | 9,254 |
| | | | 228,265 |
Connecticut (1.3%) | | | | |
Connecticut Dev. Auth. PCR | | | | |
(Connecticut Power & Light) | 5.850% | 9/1/28 | 35,250 | 36,219 |
Connecticut Dev. Auth. PCR | | | | |
(Connecticut Power & Light) PUT | 3.350% | 10/1/08 (2) | 8,000 | 7,962 |
Connecticut GO | 5.375% | 4/15/12 (Prere.) | 10,000 | 10,759 |
Connecticut GO | 5.375% | 4/15/12 (Prere.) | 5,000 | 5,384 |
Connecticut GO | 5.375% | 4/15/12 (Prere.) | 5,000 | 5,384 |
Connecticut GO | 5.375% | 4/15/12 (Prere.) | 7,180 | 7,725 |
Connecticut GO | 5.375% | 11/15/12 (Prere.) | 5,000 | 5,430 |
Connecticut GO | 5.375% | 11/15/12 (Prere.) | 5,000 | 5,430 |
| | | | 84,293 |
Delaware (0.1%) | | | | |
Delaware Housing Auth. Single | | | | |
Family Mortgage Rev. | 5.875% | 1/1/38 | 4,995 | 5,340 |
| | | | |
District of Columbia (0.4%) | | | | |
District of Columbia Rev. (World Wildlife Fund) | 6.000% | 7/1/30 (2) | 12,815 | 13,595 |
Metro. Washington Airports Auth. | | | | |
Airport System Rev. | 5.500% | 10/1/13 (1) | 2,500 | 2,668 |
Metro. Washington Airports Auth. | | | | |
Airport System Rev. | 5.500% | 10/1/16 (1) | 2,775 | 2,958 |
High-Yield Tax-Exempt Fund
| | | | Face | Market |
| | | Maturity | Amount | Value• |
| | Coupon | Date | ($000) | ($000) |
| Metro. Washington Airports Auth. | | | | |
| Airport System Rev. | 5.500% | 10/1/17 (1) | 2,000 | 2,119 |
| Metro. Washington Airports Auth. | | | | |
| Airport System Rev. | 5.500% | 10/1/18 (1) | 2,000 | 2,114 |
2 | Metro. Washington Airports Auth. | | | | |
| Airport System Rev. TOB VRDO | 3.550% | 11/7/07 (2) | 4,370 | 4,370 |
| | | | | 27,824 |
Florida (5.5%) | | | | |
| Alachua County FL IDR | | | | |
| (North Florida Retirement Village) | 5.625% | 11/15/22 | 5,000 | 4,928 |
| Alachua County FL IDR | | | | |
| (North Florida Retirement Village) | 5.875% | 11/15/36 | 10,000 | 9,979 |
| Beacon Lakes FL Community Dev. | 6.900% | 5/1/35 | 17,875 | 18,469 |
| Brevard County FL School Board COP | 5.000% | 7/1/27 (2) | 12,895 | 13,304 |
| Broward County FL School Board COP | 5.375% | 7/1/11 (4)(Prere.) | 8,240 | 8,764 |
| East Homestead Community Dev. Dist. | | | | |
| Florida Special Assessment Rev. | 5.000% | 5/1/11 | 3,560 | 3,503 |
| Escambia County FL Environmental | | | | |
| Improvement Rev. | 5.750% | 11/1/27 | 6,000 | 6,110 |
| Florida Housing Finance Agency Rev. | 5.750% | 1/1/37 | 29,850 | 32,077 |
| Florida Housing Finance Corp. Rev. | | | | |
| (Homeowner Mortgage) | 5.750% | 1/1/37 | 13,990 | 15,080 |
| Highlands County FL Health Rev. | | | | |
| (Adventist Health System) | 5.250% | 11/15/36 | 14,800 | 15,099 |
| Hillsborough County FL IDA | | | | |
| (Tampa General Hosp. Project) | 5.250% | 10/1/34 | 5,185 | 5,232 |
| Hillsborough County FL IDA | | | | |
| (Tampa General Hosp. Project) | 5.000% | 10/1/36 | 7,000 | 6,884 |
| Hillsborough County FL IDA | | | | |
| (Tampa General Hosp. Project) | 5.250% | 10/1/41 | 10,000 | 10,063 |
| Jacksonville FL Econ. Dev. Community | | | | |
| Health Care Fac. Rev. (Mayo Clinic) | 5.000% | 11/15/36 | 14,400 | 14,569 |
| Landmark at Doral Community Dev. Dist. | | | | |
| Florida Special Assessment | 5.200% | 5/1/15 | 6,680 | 6,242 |
| Lee County FL IDA Health Care Fac. Rev. | | | | |
| (Shell Point Village) | 5.750% | 11/15/09 (Prere.) | 1,475 | 1,553 |
| Lee County FL IDA Health Care Fac. Rev. | | | | |
| (Shell Point Village) | 5.750% | 11/15/09 (Prere.) | 1,000 | 1,053 |
| Lee County FL IDA Health Care Fac. Rev. | | | | |
| (Shell Point Village) | 5.125% | 11/15/36 | 2,500 | 2,341 |
| Lee Memorial Health System Florida Hosp. Rev. | 5.250% | 4/1/35 | 84,000 | 85,558 |
| Miami-Dade County FL Aviation– | | | | |
| Miami International Airport | 5.000% | 10/1/38 (11) | 8,770 | 8,770 |
| Miami-Dade County FL School Board COP | 5.250% | 10/1/18 (3) | 7,915 | 8,440 |
| Northern Palm Beach County FL Improvement | | | | |
| Dist. Water Control & Improvement Unit Dev. | 5.850% | 8/1/09 (Prere.) | 1,390 | 1,438 |
| Northern Palm Beach County FL Improvement | | | | |
| Dist. Water Control & Improvement Unit Dev. | 6.000% | 8/1/09 (Prere.) | 2,000 | 2,102 |
| Orange County FL Health Fac. Auth. Rev. | | | | |
| (Orlando Lutheran Healthcare) | 5.375% | 7/1/20 | 1,100 | 1,070 |
| Orange County FL Health Fac. Auth. Rev. | | | | |
| (Orlando Lutheran Healthcare) | 5.700% | 7/1/26 | 1,000 | 989 |
| Orange County FL Health Fac. Auth. Rev. | | | | |
| (Orlando Lutheran Tower) | 5.000% | 7/1/12 | 6,000 | 5,950 |
| Orange County FL Health Fac. Auth. Rev. | | | | |
| (Orlando Lutheran Tower) | 5.500% | 7/1/32 | 1,200 | 1,145 |
High-Yield Tax-Exempt Fund
| | | | Face | Market |
| | | Maturity | Amount | Value• |
| | Coupon | Date | ($000) | ($000) |
| Orange County FL Health Fac. Auth. Rev. | | | | |
| (Orlando Lutheran Tower) | 5.500% | 7/1/38 | 1,500 | 1,425 |
| Orlando FL Special Assessment Rev. | | | | |
| (Conroy Road Interchange) | 5.500% | 5/1/10 | 535 | 535 |
| Orlando FL Special Assessment Rev. | | | | |
| (Conroy Road Interchange) | 5.800% | 5/1/26 | 3,000 | 3,010 |
| Orlando FL Util. Comm. Water & Electric Rev. | 6.750% | 10/1/17 (ETM) | 2,200 | 2,594 |
| Palm Beach County FL Airport System Rev. | 5.750% | 10/1/12 (1)(ETM) | 2,340 | 2,571 |
| Palm Beach County FL Airport System Rev. | 5.750% | 10/1/12 (1) | 7,220 | 7,880 |
| Palm Beach County FL Airport System Rev. | 5.750% | 10/1/14 (1) | 6,440 | 7,187 |
| Palm Beach County FL Airport System Rev. | 5.750% | 10/1/14 (1)(ETM) | 2,060 | 2,325 |
| Palm Glades Comm. Dev. Dist. | | | | |
| (Florida Supplemental Assessment) | 4.850% | 8/1/11 | 2,405 | 2,362 |
| Tallahassee FL Health Fac. Rev. | | | | |
| (Tallahassee Memorial Healthcare) | 6.375% | 12/1/30 | 18,000 | 18,651 |
| Tampa Bay FL Water Util. System Rev. | 5.250% | 10/1/15 (3) | 1,180 | 1,294 |
| Tampa Bay FL Water Util. System Rev. | 5.250% | 10/1/16 (3) | 1,720 | 1,890 |
| | | | | 342,436 |
Georgia (1.5%) | | | | |
| Cartersville GA Water & Waste Water Fac. | | | | |
| (Anheuser-Busch Cos., Inc.) | 7.400% | 11/1/10 | 5,000 | 5,480 |
| Dalton County GA Dev. Auth. | | | | |
| (Hamilton Health Care System) | 5.500% | 8/15/17 (1) | 5,000 | 5,430 |
| Fulton County GA Residential Care Fac. | | | | |
| (Canterbury Court) | 6.125% | 2/15/34 | 2,000 | 2,030 |
| Georgia Housing Finance Auth. Rev. | 5.000% | 12/1/26 | 4,750 | 4,744 |
| Georgia Muni. Electric Power Auth. Rev. | 6.600% | 1/1/18 (1)(ETM) | 95 | 110 |
| Georgia Muni. Electric Power Auth. Rev. | 6.600% | 1/1/18 (1)(ETM) | 845 | 998 |
| Georgia Muni. Electric Power Auth. Rev. | 6.600% | 1/1/18 (1) | 4,060 | 4,708 |
| Main Street Natural Gas Inc. | | | | |
| Georgia Gas Project Rev. | 5.000% | 3/15/18 | 5,000 | 5,138 |
| Main Street Natural Gas Inc. | | | | |
| Georgia Gas Project Rev. | 5.000% | 3/15/19 | 15,000 | 15,352 |
| Main Street Natural Gas Inc. | | | | |
| Georgia Gas Project Rev. | 5.000% | 3/15/19 | 9,500 | 9,565 |
| Main Street Natural Gas Inc. | | | | |
| Georgia Gas Project Rev. | 5.500% | 9/15/28 | 12,195 | 12,422 |
| Richmond County GA Dev. Auth. | | | | |
| Environmental Improvement Rev. | 5.750% | 11/1/27 | 3,000 | 3,055 |
| Winder-Barrow County GA Joint Dev. | | | | |
| Auth. Solid Waste Disposal Rev. | | | | |
| (Republic Services Inc.) VRDO | 3.610% | 11/7/07 | 23,800 | 23,800 |
| | | | | 92,832 |
Guam (0.7%) | | | | |
1 | Guam Govt. GO | 5.000% | 11/15/23 | 7,500 | 7,259 |
1 | Guam Govt. GO | 5.125% | 11/15/27 | 7,400 | 7,096 |
1 | Guam Govt. GO | 5.250% | 11/15/37 | 22,500 | 21,424 |
| Guam Govt. Waterworks Auth. | | | | |
| Water & Wastewater System Rev. | 6.000% | 7/1/25 | 2,000 | 2,079 |
| Guam Govt. Waterworks Auth. | | | | |
| Water & Wastewater System Rev. | 5.875% | 7/1/35 | 5,000 | 5,116 |
| | | | | 42,974 |
Hawaii (1.1%) | | | | |
| Hawaii GO | 5.000% | 7/1/19 (2) | 14,055 | 14,898 |
| Hawaii GO | 5.000% | 7/1/20 (2) | 14,850 | 15,707 |
High-Yield Tax-Exempt Fund
| | | Face | Market |
| | Maturity | Amount | Value• |
| Coupon | Date | ($000) | ($000) |
Honolulu HI City & County GO | 5.250% | 7/1/12 (3) | 4,950 | 5,302 |
Honolulu HI City & County GO | 5.250% | 7/1/20 (3) | 15,360 | 16,617 |
Honolulu HI City & County GO | 5.000% | 7/1/22 (3) | 8,115 | 8,531 |
Honolulu HI City & County Waste Water GO | 0.000% | 7/1/17 (3) | 6,000 | 4,001 |
Honolulu HI City & County Waste Water GO | 0.000% | 7/1/18 (3) | 2,000 | 1,268 |
| | | | 66,324 |
Idaho (0.1%) | | | | |
Idaho Housing & Finance Assn. | | | | |
Single Family Mortgage Rev. | 5.125% | 1/1/29 | 3,100 | 3,186 |
Madison County ID Hosp. Rev. | 5.250% | 9/1/37 | 1,650 | 1,583 |
| | | | 4,769 |
Illinois (2.7%) | | | | |
Chicago IL GO | 5.125% | 1/1/09 (3)(Prere.) | 100 | 103 |
Chicago IL GO | 0.000% | 1/1/16 (1)(Prere.) | 7,795 | 7,400 |
Chicago IL GO | 0.000% | 1/1/16 (1)(Prere.) | 7,445 | 7,077 |
Chicago IL GO | 0.000% | 1/1/26 (1) | 2,755 | 2,533 |
Chicago IL GO | 0.000% | 1/1/27 (1) | 2,630 | 2,414 |
Chicago IL GO | 5.125% | 1/1/29 (3) | 6,730 | 6,876 |
Chicago IL Midway Airport Rev. | 5.500% | 1/1/14 (4) | 6,410 | 6,744 |
Chicago IL Midway Airport Rev. | 5.500% | 1/1/15 (4) | 4,760 | 5,009 |
Chicago IL Midway Airport Rev. | 5.500% | 1/1/16 (4) | 7,135 | 7,498 |
Chicago IL Midway Airport Rev. | 5.500% | 1/1/17 (4) | 7,525 | 7,898 |
Chicago IL Midway Airport Rev. | 5.500% | 1/1/18 (4) | 7,940 | 8,307 |
Chicago IL Public Building Comm. GO | 7.000% | 1/1/15 (1)(ETM) | 6,560 | 7,272 |
Chicago IL Public Building Comm. GO | 7.000% | 1/1/20 (1)(ETM) | 10,000 | 12,606 |
Illinois Dev. Finance Auth. Solid Waste | | | | |
Disp. Rev. (Waste Management) | 5.050% | 1/1/10 | 9,750 | 9,867 |
Illinois Educ. Fac. Auth. Rev. (Northwestern Univ.) | 5.500% | 8/15/43 | 20,500 | 21,472 |
Illinois Finance Auth. Rev. (OSF Healthcare System) | 5.750% | 11/15/37 | 17,000 | 17,969 |
Illinois Finance Auth. Rev. (Smith Village Project) | 6.125% | 11/15/25 | 7,635 | 7,797 |
Illinois Finance Auth. Rev. | | | | |
(Tabor Hills Supportive Living) | 5.250% | 11/15/36 | 3,000 | 2,834 |
Illinois Finance Auth. Student Housing Rev. | 5.125% | 6/1/35 | 4,000 | 3,398 |
Illinois Health Fac. Auth. Rev. | | | | |
(Centegra Health System) | 5.100% | 9/1/11 (2) | 3,105 | 3,174 |
Illinois Health Fac. Auth. Rev. | | | | |
(Centegra Health System) | 5.250% | 9/1/18 (2) | 2,500 | 2,550 |
Illinois Sales Tax Rev. | 5.500% | 6/15/16 (3) | 3,000 | 3,346 |
Illinois Sales Tax Rev. | 5.750% | 6/15/19 (3) | 5,000 | 5,722 |
Metro. Pier & Exposition Auth. | | | | |
Illinois Dedicated Sales Tax Rev. | 5.250% | 6/15/42 (1) | 10,000 | 10,379 |
| | | | 170,245 |
Indiana (2.2%) | | | | |
Indiana Health & Educ. Fac. Financing Auth. Rev. | | | | |
(Ascension Health Credit Group) | 5.000% | 11/15/39 | 46,395 | 46,514 |
Indiana Health Fac. Finance Auth. Rev. | | | | |
(Ancilla System, Inc.) | 7.375% | 7/1/23 (ETM) | 19,400 | 25,640 |
Indiana Office Building Comm. Rev. | | | | |
(Capitol Complex) | 6.900% | 7/1/11 | 11,115 | 11,847 |
Indianapolis IN Airport Auth. Rev. | | | | |
(Federal Express Corp.) | 5.100% | 1/15/17 | 21,000 | 21,406 |
Indianapolis IN Local Public Improvement Rev. | 6.750% | 2/1/14 | 21,500 | 24,084 |
Vigo County IN Econ. Dev. Rev. | | | | |
(Republic Services Inc.) VRDO | 3.610% | 11/7/07 | 10,000 | 10,000 |
| | | | 139,491 |
High-Yield Tax-Exempt Fund
| | | Face | Market |
| | Maturity | Amount | Value• |
| Coupon | Date | ($000) | ($000) |
Iowa (0.4%) | | | | |
Tobacco Settlement Financing Corp. Iowa Rev. | 0.000% | 6/1/34 | 25,000 | 23,188 |
| | | | |
Kansas (0.9%) | | | | |
Olathe Kansas Senior Living Fac. Rev. | | | | |
Catholic Care Campus Inc. | 6.000% | 11/15/26 | 2,000 | 2,015 |
Olathe Kansas Senior Living Fac. Rev. | | | | |
Catholic Care Campus Inc. | 6.000% | 11/15/38 | 2,000 | 2,004 |
Overland Park KS Convention Center & Hotel Project | 7.375% | 1/1/32 | 9,000 | 9,493 |
Overland Park KS Convention Center & Hotel Project | 9.000% | 1/1/32 | 21,100 | 21,648 |
Salina KS Hosp. Rev. (Salina Regional Health) | 4.500% | 10/1/26 | 1,000 | 943 |
Salina KS Hosp. Rev. (Salina Regional Health) | 4.625% | 10/1/31 | 1,000 | 942 |
Salina KS Hosp. Rev. (Salina Regional Health) | 5.000% | 10/1/36 | 825 | 825 |
Univ. of Kansas Hosp. Auth. Health System | 5.000% | 9/1/36 | 15,830 | 15,757 |
| | | | 53,627 |
Kentucky (1.0%) | | | | |
Jefferson County KY Health Fac. Rev. | | | | |
(Jewish Hosp. Health) | 5.650% | 1/1/17 (2) | 8,000 | 8,167 |
Jefferson County KY Health Fac. Rev. | | | | |
(Jewish Hosp. Health) | 5.700% | 1/1/21 (2) | 2,000 | 2,040 |
Kentucky Asset/Liability Comm. General Fund Rev. | 5.000% | 9/1/17 (1) | 7,500 | 8,035 |
Kentucky Property & Building Comm. Rev. | 5.250% | 10/1/15 (4) | 5,300 | 5,827 |
Kentucky Property & Building Comm. Rev. | 5.250% | 10/1/16 (4) | 7,000 | 7,714 |
Kentucky Property & Building Comm. Rev. | 5.000% | 10/1/17 (2) | 6,000 | 6,515 |
Kentucky Property & Building Comm. Rev. | 5.250% | 10/1/17 (4) | 2,000 | 2,207 |
Kentucky Turnpike Auth. Econ. Dev. Road Rev. | | | | |
(Revitalization Project) | 5.250% | 1/1/11 (4)(Prere.) | 6,000 | 6,310 |
Russell KY Rev. Bon Secours Health System | 5.625% | 11/15/30 | 16,000 | 16,455 |
| | | | 63,270 |
Louisiana (2.7%) | | | | |
Calcasieu Parish LA IDR PCR | | | | |
(Entergy Gulf States Inc.) | 5.450% | 7/1/10 | 5,000 | 5,004 |
East Baton Rouge LA Mortgage Fin. Auth. | | | | |
Single Family Rev. | 5.400% | 4/1/38 | 2,945 | 3,113 |
Ernest N. Morial - New Orleans LA | | | | |
Exhibit Hall Special Tax | 5.000% | 7/15/13 (2)(Prere.) | 27,000 | 28,933 |
Louisiana Housing Finance Agency | | | | |
Single Family Mortgage Rev. Home Ownership | 5.950% | 6/1/38 | 10,000 | 10,884 |
Louisiana Public Fac. Auth. Rev. (Ochsner Clinic) | 5.250% | 5/15/38 | 45,000 | 44,633 |
Saint John Baptist Parish Louisiana Rev. | | | | |
(Marathon Oil Corp.) | 5.125% | 6/1/37 | 75,000 | 74,029 |
| | | | 166,596 |
Maine (0.2%) | | | | |
Jay ME Solid Waste Disposal Rev. | 6.200% | 9/1/19 | 9,250 | 9,609 |
| | | | |
Maryland (2.7%) | | | | |
Maryland Dept. of Housing & Community Dev. Rev. | 5.750% | 3/1/41 | 13,100 | 13,985 |
Maryland Econ. Dev. Corp. | | | | |
(Chesapeake Bay Conference Center) | 7.750% | 12/1/09 (Prere.) | 25,000 | 27,306 |
Maryland Econ. Dev. Corp. Rev. | | | | |
(Chesapeake Bay Conference Center) | 5.000% | 12/1/16 | 3,000 | 2,972 |
Maryland Econ. Dev. Corp. Rev. | | | | |
(Chesapeake Bay Conference Center) | 5.000% | 12/1/31 | 12,000 | 10,972 |
Maryland Econ. Dev. Corp. Rev. | | | | |
(Chesapeake Bay Conference Center) | 5.250% | 12/1/31 | 2,000 | 1,894 |
High-Yield Tax-Exempt Fund
| | | Face | Market |
| | Maturity | Amount | Value• |
| Coupon | Date | ($000) | ($000) |
Maryland Health & Higher Educ. Fac. | | | | |
Auth. Rev. (King Farm Presbyterian Community) | 4.750% | 1/1/13 | 10,000 | 9,880 |
Maryland Health & Higher Educ. Fac. | | | | |
Auth. Rev. (King Farm Presbyterian Community) | 5.000% | 1/1/17 | 11,500 | 11,202 |
Maryland Health & Higher Educ. Fac. | | | | |
Auth. Rev. (Medlantic/Helix) | 5.250% | 8/15/38 (4) | 30,000 | 32,876 |
Maryland Health & Higher Educ. Fac. | | | | |
Auth. Rev. (Univ. of Maryland Medical System) | 6.750% | 7/1/10 (Prere.) | 15,000 | 16,391 |
Maryland Health & Higher Educ. Fac. | | | | |
Auth. Rev. (Univ. of Maryland Medical System) | 5.250% | 7/1/11 (Prere.) | 8,070 | 8,549 |
Maryland Health & Higher Educ. Fac. | | | | |
Auth. Rev. (Univ. of Maryland Medical System) | 5.250% | 7/1/11 (Prere.) | 15,500 | 16,420 |
Maryland Health & Higher Educ. Fac. | | | | |
Auth. Rev. (Univ. of Maryland Medical System) | 5.750% | 7/1/11 (Prere.) | 3,930 | 4,230 |
Maryland Health & Higher Educ. Fac. | | | | |
Auth. Rev. (Univ. of Maryland Medical System) | 6.000% | 7/1/12 (Prere.) | 6,500 | 7,182 |
Maryland Health & Higher Educ. Fac. | | | | |
Auth. Rev. (Univ. of Maryland Medical System) | 6.000% | 7/1/12 (Prere.) | 3,000 | 3,315 |
Maryland Ind. Dev. Financing Auth. Econ. | | | | |
Dev. Rev. (Our Lady of Good Counsel School) | 5.500% | 5/1/20 | 420 | 426 |
Maryland Ind. Dev. Financing Auth. Econ. | | | | |
Dev. Rev. (Our Lady of Good Counsel School) | 6.000% | 5/1/35 | 2,000 | 2,042 |
| | | | 169,642 |
Massachusetts (3.1%) | | | | |
Massachusetts Dev. Finance Agency Resource | | | | |
Recovery Rev. (Waste Management Inc.) PUT | 6.900% | 12/1/09 | 2,000 | 2,095 |
Massachusetts Dev. Finance Agency Rev. | | | | |
(Linden Ponds Inc.) | 5.750% | 11/15/35 | 3,700 | 3,624 |
Massachusetts Dev. Finance Agency Rev. | | | | |
(Linden Ponds Inc.) | 5.750% | 11/15/42 | 3,800 | 3,699 |
Massachusetts GO | 5.250% | 8/1/22 (1) | 25,000 | 27,805 |
Massachusetts Health & Educ. Fac. Auth. Rev. | | | | |
(Caritas Christi Obligated Group) | 5.700% | 7/1/15 | 22,500 | 23,095 |
Massachusetts Health & Educ. Fac. Auth. Rev. | | | | |
(Harvard Univ.) | 5.000% | 7/15/35 | 15,110 | 15,383 |
Massachusetts Health & Educ. Fac. Auth. Rev. | | | | |
(Univ. of Massachusetts Memorial Health Care Inc.) | 6.500% | 7/1/11 | 5,685 | 5,999 |
Massachusetts Health & Educ. Fac. Auth. Rev. | | | | |
(Univ. of Massachusetts Memorial Health Care Inc.) | 6.625% | 7/1/32 | 17,000 | 17,864 |
* Massachusetts Ind. Finance Agency Solid Waste | | | | |
Disposal Rev. (Massachusetts Paper Co.) | 8.500% | 11/1/12 | 5,098 | 5 |
Massachusetts Muni. Wholesale Electric Co. | | | | |
Power System Rev. | 5.250% | 7/1/15 (1) | 7,535 | 8,013 |
Massachusetts Special Obligation Dedicated Tax Rev. | 5.750% | 1/1/14 (3)(Prere.) | 15,000 | 16,698 |
Massachusetts Water Pollution Abatement Trust | 5.000% | 8/1/20 | 13,920 | 15,081 |
Massachusetts Water Resources Auth. Rev. | 6.500% | 7/15/19 (ETM) | 43,700 | 51,625 |
| | | | 190,986 |
Michigan (1.2%) | | | | |
Delta County MI Econ. Dev. Corp. Rev. | | | | |
(Mead Westvaco) | 6.250% | 4/15/12 (Prere.) | 11,000 | 12,180 |
Michigan Hosp. Finance Auth. Rev. | | | | |
(Henry Ford Health System) | 5.250% | 11/15/32 | 5,000 | 5,090 |
Michigan Hosp. Finance Auth. Rev. | | | | |
(Henry Ford Health System) | 5.250% | 11/15/46 | 55,000 | 55,503 |
| | | | 72,773 |
High-Yield Tax-Exempt Fund
| | | Face | Market |
| | Maturity | Amount | Value• |
| Coupon | Date | ($000) | ($000) |
Minnesota (1.5%) | | | | |
Breckenridge MN Rev. (Catholic Health Initiatives) | 5.000% | 5/1/30 | 3,000 | 3,037 |
Maple Grove MN Health Care System Rev. | | | | |
(Maple Grove Hosp. Corp.) | 5.250% | 5/1/28 | 4,500 | 4,577 |
Maple Grove MN Health Care System Rev. | | | | |
(Maple Grove Hosp. Corp.) | 5.250% | 5/1/37 | 16,000 | 16,179 |
Minneapolis & St. Paul MN Metro. Airport | 5.200% | 1/1/08 (2)(Prere.) | 7,000 | 7,089 |
Minneapolis MN Health Care System | | | | |
(Allina Health System) | 5.750% | 11/15/12 (Prere.) | 39,000 | 42,851 |
Minneapolis MN Health Care System | | | | |
(Allina Health System) | 6.000% | 11/15/12 (Prere.) | 7,000 | 7,771 |
Rochester MN Health Care Fac. Rev. | | | | |
(Mayo Foundation) | 5.375% | 11/15/18 | 8,850 | 9,009 |
Rochester MN Health Care Fac. Rev. | | | | |
(Mayo Foundation) | 5.500% | 11/15/27 | 4,500 | 4,580 |
| | | | 95,093 |
Mississippi (0.3%) | | | | |
Mississippi Dev. Bank Special Obligation Muni. | | | | |
Energy Agency Rev. | 5.000% | 3/1/31 (10) | 11,365 | 11,644 |
Mississippi Home Corp. Single Family Rev. | 5.500% | 6/1/38 | 3,990 | 4,242 |
| | | | 15,886 |
Missouri (1.3%) | | | | |
Missouri Dev. Finance Board Infrastructure Fac. | | | | |
Branson Landing Rev. | 5.000% | 6/1/35 | 4,000 | 3,810 |
Missouri Health & Educ. Fac. Auth. Health Fac. | | | | |
Rev. (St. Luke’s Mission Health System) | 5.375% | 11/15/16 (1) | 7,000 | 7,079 |
Missouri Housing Dev. Corp. Single | | | | |
Family Mortgage Rev. | 6.050% | 3/1/37 | 11,920 | 12,797 |
Missouri Housing Dev. Corp. Single | | | | |
Family Mortgage Rev. | 6.000% | 3/1/38 | 4,600 | 5,009 |
Missouri Housing Dev. Corp. Single | | | | |
Family Mortgage Rev. | 5.600% | 9/1/38 | 8,500 | 9,190 |
Missouri Jt. Muni. Electric Util. Comm. Power | | | | |
Project Rev. Plum Point Project | 5.000% | 1/1/28 (1) | 5,000 | 5,176 |
St. Louis MO Airport Rev. Lambert-St. Louis | | | | |
International Airport | 5.500% | 7/1/27 (1) | 10,000 | 11,338 |
St. Louis MO Airport Rev. Lambert-St. Louis | | | | |
International Airport | 5.500% | 7/1/28 (1) | 10,000 | 11,379 |
St. Louis MO Airport Rev. Lambert-St. Louis | | | | |
International Airport | 5.500% | 7/1/29 (1) | 6,000 | 6,834 |
Sugar Creek MO IDR Lafarge North America | 5.650% | 6/1/37 | 11,000 | 11,052 |
| | | | 83,664 |
Montana (0.1%) | | | | |
Montana Board Housing | | | | |
(Single Family Mortgage) Rev. | 5.750% | 12/1/37 | 6,410 | 6,813 |
| | | | |
Nebraska (0.8%) | | | | |
Lancaster County NE Hosp. Auth. Rev. | | | | |
(BryanLGH Medical Center) | 5.250% | 6/1/11 (2)(Prere.) | 5,500 | 5,819 |
Lincoln NE Lincoln Electric System Rev. | 5.250% | 9/1/11 (Prere.) | 22,370 | 23,737 |
Lincoln NE Lincoln Electric System Rev. | 5.250% | 9/1/11 (Prere.) | 21,345 | 22,649 |
| | | | 52,205 |
High-Yield Tax-Exempt Fund
| | | Face | Market |
| | Maturity | Amount | Value• |
| Coupon | Date | ($000) | ($000) |
Nevada (0.7%) | | | | |
Clark County NV Airport Improvement Rev. | 5.000% | 7/1/08 | 8,000 | 8,067 |
Clark County NV PCR | | | | |
(Southern California Edison Co.) PUT | 3.250% | 3/2/09 | 12,500 | 12,355 |
Henderson NV Health Care Fac. Rev. | | | | |
(Catholic Healthcare West) | 5.250% | 7/1/31 | 21,750 | 22,145 |
| | | | 42,567 |
New Hampshire (0.3%) | | | | |
New Hampshire Business Finance Auth. PCR | | | | |
(United Illuminating) PUT | 3.500% | 2/1/09 | 20,925 | 20,771 |
| | | | |
New Jersey (6.6%) | | | | |
Gloucester County NJ Improvement Auth. | | | | |
Solid Waste Resource Rev. PUT | 6.850% | 12/1/09 | 5,000 | 5,257 |
Gloucester County NJ Improvement Auth. | | | | |
Solid Waste Resource Rev. PUT | 7.000% | 12/1/09 | 1,500 | 1,574 |
Hudson County NJ Improvement Auth. | | | | |
Solid Waste Systems Rev. | 6.125% | 1/1/19 | 2,000 | 2,007 |
Hudson County NJ Improvement Auth. | | | | |
Solid Waste Systems Rev. | 6.000% | 1/1/29 | 7,500 | 7,600 |
Hudson County NJ Improvement Auth. | | | | |
Solid Waste Systems Rev. | 6.125% | 1/1/29 | 10,000 | 10,012 |
Hudson County NJ Improvement Auth. | | | | |
Solid Waste Systems Rev. | 6.125% | 1/1/29 | 2,000 | 2,002 |
New Jersey Econ. Dev. Auth. Retirement | | | | |
Community Rev. (Seabrook Village Inc.) | 5.250% | 11/15/26 | 2,000 | 1,892 |
New Jersey Econ. Dev. Auth. Retirement | | | | |
Community Rev. (Seabrook Village Inc.) | 5.250% | 11/15/36 | 2,000 | 1,844 |
New Jersey Econ. Dev. Auth. Rev. (Cigarette Tax) | 5.750% | 6/15/29 | 20,000 | 20,950 |
New Jersey Econ. Dev. Auth. Rev. (Cigarette Tax) | 5.500% | 6/15/31 | 6,500 | 6,696 |
New Jersey Econ. Dev. Auth. Rev. | | | | |
(Kapkowski Road Landfill - DST Project Elizabeth) | 6.375% | 5/15/14 (Prere.) | 2,250 | 2,598 |
New Jersey Econ. Dev. Auth. Rev. | | | | |
(Kapkowski Road Landfill - DST Project Elizabeth) | 6.375% | 5/15/14 (Prere.) | 30,500 | 35,219 |
New Jersey Econ. Dev. Auth. Rev. | | | | |
(Lions Gate Project) | 5.000% | 1/1/15 | 825 | 802 |
New Jersey Econ. Dev. Auth. Rev. | | | | |
(Lions Gate Project) | 5.750% | 1/1/25 | 710 | 717 |
New Jersey Econ. Dev. Auth. Rev. | | | | |
(Lions Gate Project) | 5.875% | 1/1/37 | 1,230 | 1,231 |
New Jersey Econ. Dev. Auth. Rev. | | | | |
(Motor Vehicle Comm.) | 5.250% | 7/1/24 (1) | 18,055 | 20,080 |
New Jersey Econ. Dev. Auth. Rev. | | | | |
(Presbyterian Home at Montgomery) | 6.375% | 11/1/31 | 10,000 | 10,220 |
New Jersey Econ. Dev. Auth. Rev. (School Fac.) | 5.500% | 12/15/19 (2) | 25,000 | 28,290 |
New Jersey Econ. Dev. Auth. Special Fac. Rev. | | | | |
(Continental Airlines, Inc.) | 6.625% | 9/15/12 | 14,000 | 14,447 |
New Jersey Sports & Exposition Auth. Rev. | 6.500% | 3/1/13 | 2,410 | 2,646 |
New Jersey Sports & Exposition Auth. Rev. | 6.500% | 3/1/13 (ETM) | 2,390 | 2,624 |
New Jersey Transit Corp. Capital GAN | 5.500% | 2/1/09 (2) | 61,405 | 61,503 |
New Jersey Transp. Corp. COP | 5.750% | 9/15/15 | 26,620 | 28,504 |
New Jersey Transp. Trust Fund Auth. Rev. | 5.500% | 6/15/13 (Prere.) | 16,000 | 17,560 |
New Jersey Transp. Trust Fund Auth. Rev. | 5.500% | 6/15/13 (Prere.) | 20,000 | 21,950 |
New Jersey Transp. Trust Fund Auth. Rev. | 4.250% | 12/15/22 (4) | 2,000 | 1,963 |
New Jersey Transp. Trust Fund Auth. Rev. | 5.750% | 6/15/23 (3) | 10,000 | 11,687 |
New Jersey Turnpike Auth. Rev. | 5.000% | 1/1/22 (4) | 16,630 | 17,475 |
High-Yield Tax-Exempt Fund
| | | Face | Market |
| | Maturity | Amount | Value• |
| Coupon | Date | ($000) | ($000) |
New Jersey Turnpike Auth. Rev. | 0.000% | 1/1/35 (2) | 32,495 | 23,407 |
Tobacco Settlement Financing Corp. | | | | |
New Jersey Rev. | 4.500% | 6/1/23 | 9,305 | 8,681 |
Tobacco Settlement Financing Corp. | | | | |
New Jersey Rev. | 4.625% | 6/1/26 | 46,750 | 41,200 |
| | | | 412,638 |
New Mexico (1.5%) | | | | |
New Mexico Finance Auth. Transp. Rev. | 5.000% | 12/15/25 | 22,550 | 23,660 |
New Mexico Finance Auth. Transp. Rev. | 5.000% | 12/15/26 | 8,000 | 8,375 |
New Mexico Highway Comm. Tax Rev. | 6.000% | 6/15/10 (Prere.) | 11,000 | 11,700 |
New Mexico Hosp. Equipment Loan | | | | |
Council Hosp. System Rev. | | | | |
(Presbyterian Healthcare Services) | 5.500% | 8/1/11 (Prere.) | 27,550 | 29,640 |
New Mexico Mortgage Finance Auth. | | | | |
Single Family Mortgage | 5.600% | 7/1/38 | 9,500 | 10,144 |
New Mexico Mortgage Finance Auth. | | | | |
Single Family Mortgage | 5.300% | 1/1/39 | 6,500 | 6,858 |
Univ. of New Mexico Univ. Rev. | 5.000% | 7/1/32 (4) (7) | 3,500 | 3,591 |
| | | | 93,968 |
New York (7.4%) | | | | |
Erie County NY IDA School Fac. Rev. GO | 5.750% | 5/1/20 (4) | 5,000 | 5,536 |
Erie County NY IDA School Fac. Rev. GO | 5.750% | 5/1/21 (4) | 3,745 | 4,144 |
Erie County NY IDA School Fac. Rev. GO | 5.750% | 5/1/22 (4) | 4,500 | 4,979 |
Essex County NY IDA Solid Waste | | | | |
Disposal Rev. (International Paper) | 5.200% | 12/1/23 | 2,750 | 2,723 |
Hudson Yards Infrastructure Corp. New York Rev. | 4.500% | 2/15/47 (1) | 30,000 | 28,566 |
Long Island NY Power Auth. Electric System Rev. | 0.000% | 6/1/12 (4) | 10,000 | 8,449 |
Metro. New York Transp. Auth. Rev. | | | | |
(Dedicated Petroleum Tax) | 6.000% | 4/1/20 (1)(ETM) | 18,000 | 21,106 |
Metro. New York Transp. Auth. Rev. | | | | |
(Service Contract) | 7.375% | 7/1/08 (ETM) | 4,465 | 4,567 |
Metro. New York Transp. Auth. Rev. | | | | |
(Service Contract) | 5.500% | 7/1/14 | 15,460 | 17,023 |
Metro. New York Transp. Auth. Rev. | | | | |
(Service Contract) | 5.500% | 7/1/15 | 28,165 | 31,243 |
Metro. New York Transp. Auth. Rev. (Transit Rev.) | 5.500% | 11/15/18 (2) | 5,000 | 5,650 |
New York City NY IDA Special Fac. Rev. | 5.500% | 1/1/17 | 3,250 | 3,488 |
New York City NY IDA Special Fac. Rev. | 5.500% | 1/1/18 | 3,500 | 3,739 |
New York City NY IDA Special Fac. Rev. | 5.500% | 1/1/19 | 4,500 | 4,792 |
New York City NY IDA Special Fac. Rev. | 5.500% | 1/1/20 | 4,000 | 4,243 |
New York City NY IDA Special Fac. Rev. | 7.750% | 8/1/31 | 15,000 | 17,008 |
New York City NY Muni. Water Finance | | | | |
Auth. Water & Sewer System Rev. | 5.000% | 6/15/35 (1) | 24,635 | 25,231 |
New York State Dormitory Auth. Rev. (City Univ.) | 7.500% | 7/1/10 | 3,050 | 3,232 |
New York State Dormitory Auth. Rev. | | | | |
(Long Island Jewish) | 5.000% | 11/1/34 | 5,000 | 4,985 |
New York State Dormitory Auth. Rev. | | | | |
(Personal Income Tax) | 5.000% | 3/15/17 (4) | 8,000 | 8,590 |
New York State Dormitory Auth. Rev. | | | | |
(Personal Income Tax) | 5.500% | 3/15/19 (2) | 10,000 | 11,262 |
New York State Dormitory Auth. Rev. | | | | |
(Personal Income Tax) | 5.000% | 3/15/22 (4) | 5,500 | 5,788 |
New York State Dormitory Auth. Rev. (State Univ.) | 7.500% | 5/15/13 | 13,380 | 15,830 |
New York State Dormitory Auth. Rev. | | | | |
Non State Supported Debt (Long Island | | | | |
Jewish Obligated Group) | 4.319% | 5/1/18 | 23,370 | 23,077 |
High-Yield Tax-Exempt Fund
| | | Face | Market |
| | Maturity | Amount | Value• |
| Coupon | Date | ($000) | ($000) |
New York State Dormitory Auth. Rev. | | | | |
Non State Supported Debt (Long Island | | | | |
Jewish Obligated Group) | 5.000% | 5/1/37 | 10,000 | 10,060 |
New York State Housing Finance Agency Rev. | | | | |
(Nursing Home & Health Care) | 4.900% | 11/1/10 (1) | 7,535 | 7,711 |
New York State Housing Finance Agency Rev. | | | | |
(Nursing Home & Health Care) | 5.000% | 11/1/11 (1) | 6,780 | 6,941 |
New York State Housing Finance Agency Rev. | | | | |
(Nursing Home & Health Care) | 5.100% | 11/1/12 (1) | 8,445 | 8,646 |
New York State Thruway Auth. Rev. | | | | |
(Highway & Bridge Trust Fund) | 5.500% | 4/1/20 (2) | 20,000 | 22,619 |
Niagara County NY IDA | | | | |
Solid Waste Disposal Rev. PUT | 5.450% | 11/15/12 | 16,000 | 16,311 |
Niagara County NY IDA | | | | |
Solid Waste Disposal Rev. PUT | 5.550% | 11/15/13 | 12,500 | 12,760 |
Niagara County NY IDA | | | | |
Solid Waste Disposal Rev. PUT | 5.625% | 11/15/14 | 3,000 | 3,051 |
Port Auth. of New York & New Jersey Rev. | 6.000% | 10/15/32 (1) | 8,725 | 8,819 |
Port Auth. of New York & New Jersey | | | | |
Special Obligation Rev. (JFK International Airport) | 6.250% | 12/1/08 (1) | 4,000 | 4,111 |
Triborough Bridge & Tunnel Auth. New York Rev. | 5.500% | 1/1/17 (ETM) | 10,000 | 11,075 |
Triborough Bridge & Tunnel Auth. New York Rev. | 5.250% | 11/15/18 | 15,000 | 15,982 |
Triborough Bridge & Tunnel Auth. New York Rev. | 5.500% | 11/15/20 (1) | 10,000 | 11,360 |
Triborough Bridge & Tunnel Auth. New York Rev. | | | | |
(Convention Center Project) | 7.250% | 1/1/10 | 6,595 | 6,856 |
Ulster County NY IDA Rev. | 6.000% | 9/15/37 | 10,500 | 10,341 |
Ulster County NY IDA Rev. | 6.000% | 9/15/42 | 7,000 | 6,869 |
Westchester County NY Health Care Corp. Rev. | 5.875% | 11/1/25 | 11,500 | 11,747 |
Westchester County NY Health Care Corp. Rev. | 6.000% | 11/1/30 | 20,000 | 20,373 |
| | | | 460,883 |
North Carolina (3.1%) | | | | |
North Carolina Capital Fac. Finance Agency Rev. | | | | |
(Duke Univ.) | 5.250% | 10/1/11 (Prere.) | 28,355 | 30,156 |
North Carolina Capital Fac. Finance Agency Rev. | | | | |
(Duke Univ.) | 5.250% | 10/1/39 | 6,645 | 6,913 |
North Carolina Eastern Muni. Power Agency Rev. | 5.375% | 1/1/13 | 17,455 | 18,464 |
North Carolina Eastern Muni. Power Agency Rev. | 5.500% | 1/1/14 | 6,000 | 6,426 |
North Carolina Eastern Muni. Power Agency Rev. | 5.500% | 1/1/15 | 8,000 | 8,459 |
North Carolina Eastern Muni. Power Agency Rev. | 5.500% | 1/1/16 | 3,000 | 3,165 |
North Carolina Eastern Muni. Power Agency Rev. | 5.500% | 1/1/17 | 2,000 | 2,104 |
North Carolina Eastern Muni. Power Agency Rev. | 6.500% | 1/1/18 (ETM) | 6,665 | 8,095 |
North Carolina Housing Finance Agency | | | | |
Homeownership Rev. | 5.500% | 1/1/38 | 4,000 | 4,220 |
North Carolina Housing Finance Agency | | | | |
Homeownership Rev. | 5.500% | 7/1/38 | 9,000 | 9,515 |
North Carolina Medical Care Comm. | | | | |
Health Care Fac. (Novant Health Obligated Group) | 5.000% | 11/1/39 | 15,000 | 15,082 |
North Carolina Medical Care Comm. | | | | |
Health Care Fac. (Pennbyrn) | 6.125% | 10/1/35 | 12,500 | 12,683 |
North Carolina Medical Care Comm. | | | | |
Health Care Fac. (Presbyterian Homes) | 6.875% | 10/1/10 (Prere.) | 4,000 | 4,370 |
North Carolina Medical Care Comm. | | | | |
Health Care Fac. (Presbyterian Homes) | 7.000% | 10/1/10 (Prere.) | 15,000 | 16,592 |
North Carolina Medical Care Comm. | | | | |
Health Care Fac. (Salemtowne) | 5.000% | 10/1/23 | 1,850 | 1,738 |
High-Yield Tax-Exempt Fund
| | | | Face | Market |
| | | Maturity | Amount | Value• |
| | Coupon | Date | ($000) | ($000) |
| North Carolina Medical Care Comm. | | | | |
| Health Care Fac. (Salemtowne) | 5.100% | 10/1/30 | 1,155 | 1,061 |
| North Carolina Medical Care Comm. | | | | |
| Health Systems Rev. (Mission Health | | | | |
| Combined Group) | 4.250% | 10/1/29 (4) | 21,000 | 19,660 |
| North Carolina Medical Care Comm. | | | | |
| Retirement Fac. Rev. (Givens Estates) | 5.000% | 7/1/27 | 2,750 | 2,602 |
| North Carolina Medical Care Comm. | | | | |
| Retirement Fac. Rev. (Givens Estates) | 5.000% | 7/1/33 | 3,000 | 2,760 |
| North Carolina Medical Care Comm. | | | | |
| Retirement Fac. Rev. (United Methodist | | | | |
| Retirement Home) | 7.250% | 10/1/09 (Prere.) | 13,000 | 13,939 |
| North Carolina Medical Care Comm. | | | | |
| Retirement Fac. Rev. (Village at Brookwood) | 5.250% | 1/1/32 | 3,500 | 3,226 |
| North Carolina Muni. Power Agency Rev. | 5.500% | 1/1/15 (1) | 3,500 | 3,877 |
| | | | | 195,107 |
Northern Mariana Islands (0.2%) | | | | |
3 | Northern Mariana Islands GO | 7.375% | 6/1/10 (Prere.) | 10,500 | 11,507 |
| | | | | |
Ohio (2.7%) | | | | |
| American Muni. Power Ohio Inc. | | | | |
| Electricity Purchase Rev. | 5.000% | 2/1/12 | 27,000 | 28,028 |
| American Muni. Power Ohio Inc. | | | | |
| Electricity Purchase Rev. | 5.000% | 2/1/13 | 7,000 | 7,314 |
| Buckeye OH Tobacco Settlement | | | | |
| Financing Corp. Rev. | 0.000% | 6/1/37 | 50,000 | 36,612 |
| Montgomery County OH Hosp. Fac. Rev. | | | | |
| (Grandview Hosp.) | 5.750% | 12/1/07 (9)(ETM) | 3,300 | 3,305 |
| Montgomery County OH Hosp. Fac. Rev. | | | | |
| (Grandview Hosp.) | 5.350% | 12/1/08 (9)(ETM) | 4,615 | 4,703 |
| Montgomery County OH Hosp. Fac. Rev. | | | | |
| (Grandview Hosp.) | 5.400% | 12/1/09 (9)(ETM) | 3,850 | 3,993 |
| Ohio Higher Educ. Fac. Comm. Rev. | | | | |
| (Kenyon College) | 5.000% | 7/1/41 | 21,000 | 21,234 |
| Ohio Higher Educ. Fac. Comm. Rev. | | | | |
| (Univ. Hospitals Health System) | 5.250% | 1/15/46 | 20,000 | 20,129 |
| Ohio Solid Waste Rev. | | | | |
| (Waste Management Inc.) PUT | 4.670% | 11/1/07 | 15,465 | 15,465 |
| Ohio Water Dev. Auth. PCR | 5.500% | 12/1/21 | 10,440 | 11,883 |
| Parma OH Hosp. Improvement Rev. | | | | |
| (Parma Community General Hosp.) | 5.350% | 11/1/08 (Prere.) | 2,500 | 2,569 |
| Scioto County OH Marine Terminal Fac. | | | | |
| (Norfolk Southern Corp.) | 5.300% | 8/15/13 | 14,750 | 15,244 |
| | | | | 170,479 |
Oklahoma (1.2%) | | | | |
| Oklahoma County OK Finance Auth. Rev. | | | | |
| Retirement Fac. | 6.125% | 11/15/25 | 2,000 | 2,004 |
| Oklahoma County OK Finance Auth. Rev. | | | | |
| Retirement Fac. | 6.000% | 11/15/38 | 7,500 | 7,375 |
| Oklahoma Housing Finance Agency Single Family | | | | |
| Mortgage Rev. Homeownership Loan Program | 5.750% | 9/1/36 | 6,685 | 7,155 |
| Oklahoma Housing Finance Agency Single Family | | | | |
| Mortgage Rev. Homeownership Loan Program | 5.800% | 9/1/37 | 4,250 | 4,590 |
| Oklahoma Housing Finance Agency Single Family | | | | |
| Mortgage Rev. Homeownership Loan Program | 5.875% | 9/1/37 | 6,210 | 6,739 |
High-Yield Tax-Exempt Fund
| | | Face | Market |
| | Maturity | Amount | Value• |
| Coupon | Date | ($000) | ($000) |
Oklahoma Housing Finance Agency Single Family | | | | |
Mortgage Rev. Homeownership Loan Program | 5.950% | 9/1/37 | 9,000 | 9,888 |
Oklahoma State Capitol Improvement Auth. Fac. Rev. | 5.000% | 7/1/20 (2) | 4,250 | 4,495 |
Oklahoma State Capitol Improvement Auth. Fac. Rev. | 5.000% | 7/1/21 (2) | 4,510 | 4,753 |
Tulsa County OK Ind. Auth. Rev. | | | | |
(St. Francis Health System) | 5.000% | 12/15/36 | 12,000 | 12,052 |
Tulsa OK Muni. Airport Transp. Rev. | | | | |
(American Airlines) PUT | 5.650% | 12/1/08 | 15,500 | 15,448 |
| | | | 74,499 |
Oregon (0.2%) | | | | |
Clackamas County OR Hosp. Fac. Auth. Rev. | | | | |
(Legacy Health System) | 5.250% | 5/1/21 | 5,000 | 5,166 |
Umatilla County OR Hosp. Fac. Auth. Rev. | | | | |
(Catholic Health Initiative) | 5.750% | 12/1/20 | 1,595 | 1,674 |
Umatilla County OR Hosp. Fac. Auth. Rev. | | | | |
(Catholic Health Initiative) | 5.750% | 12/1/20 (ETM) | 1,405 | 1,493 |
Umatilla County OR Hosp. Fac. Auth. Rev. | | | | |
(Catholic Health Initiative) | 5.000% | 5/1/32 | 3,000 | 3,023 |
| | | | 11,356 |
Pennsylvania (2.6%) | | | | |
Allegheny County PA Airport Rev. | | | | |
(Pittsburgh International Airport) | 5.750% | 1/1/11 (1) | 6,000 | 6,360 |
Bucks County PA IDA Retirement Community Rev. | | | | |
(Ann’s Choice) | 6.250% | 1/1/35 | 3,000 | 3,077 |
Geisinger Health System Auth. of Pennsylvania Rev. | | | | |
(Penn State Geisinger Health System) | 5.500% | 8/15/23 | 27,700 | 30,507 |
Lebanon County PA Health Fac. Auth. | | | | |
(Pleasant View Retirement) | 5.125% | 12/15/20 | 1,000 | 956 |
Lebanon County PA Health Fac. Auth. | | | | |
(Pleasant View Retirement) | 5.300% | 12/15/26 | 500 | 470 |
Montgomery County PA IDA Auth. Retirement | | | | |
Community Rev. (ACTS Retirement– | | | | |
Life Communities Obligated Group) | 5.000% | 11/15/22 | 3,000 | 2,994 |
Pennsylvania Econ. Dev. Auth. Rev. (Colver Project) | 5.000% | 12/1/14 (2) | 6,000 | 6,352 |
Pennsylvania Econ. Dev. Auth. Rev. (Colver Project) | 5.000% | 12/1/15 (2) | 3,500 | 3,705 |
Pennsylvania Econ. Dev. Auth. Rev. (Colver Project) | 4.625% | 12/1/18 (2) | 10,500 | 10,502 |
Pennsylvania Econ. Dev. Financing Auth. Fac. Rev. | | | | |
(Reliant Energy Seward Project) | 6.750% | 12/1/36 | 10,000 | 10,712 |
Pennsylvania Higher Educ. Fac. Auth. Rev. | | | | |
(Univ. of Pennsylvania Health System) | 5.000% | 8/15/14 (2) | 10,000 | 10,760 |
Philadelphia PA Muni. Auth. Rev. | 5.250% | 11/15/14 (4) | 10,000 | 10,817 |
Philadelphia PA Water & Waste Water Rev. | 7.000% | 6/15/11 (3) | 21,500 | 23,945 |
Sayre PA Health Care Fac. Auth. Rev. | | | | |
(Guthrie Health Care System) | 4.389% | 12/1/17 | 42,210 | 41,295 |
| | | | 162,452 |
Puerto Rico (3.3%) | | | | |
Puerto Rico GO | 5.000% | 7/1/33 | 8,400 | 8,465 |
Puerto Rico Muni. Finance Agency | 5.250% | 8/1/18 (4) | 23,570 | 26,144 |
Puerto Rico Public Buildings Auth. Govt. Fac. Rev. | 5.500% | 7/1/24 | 17,040 | 18,112 |
Puerto Rico Public Buildings Auth. Govt. Fac. Rev. | 5.250% | 7/1/33 | 24,750 | 25,463 |
Puerto Rico Public Buildings Auth. Govt. Fac. Rev. | 5.375% | 7/1/34 | 17,200 | 17,847 |
Puerto Rico Public Buildings Auth. Govt. Fac. Rev. PUT | 5.000% | 7/1/12 (2) | 33,000 | 34,909 |
Puerto Rico Public Finance Corp. PUT | 5.750% | 2/1/12 LOC | 34,000 | 36,111 |
Puerto Rico Sales Tax Financing Corp. Rev. | 0.000% | 8/1/54 (2) | 62,390 | 5,790 |
Puerto Rico Sales Tax Financing Corp. Rev. | 0.000% | 8/1/56 | 450,000 | 35,132 |
| | | | 207,973 |
High-Yield Tax-Exempt Fund
| | | Face | Market |
| | Maturity | Amount | Value• |
| Coupon | Date | ($000) | ($000) |
South Carolina (3.3%) | | | | |
Charleston SC Educ. Excellence Financing Corp. Rev. | 5.000% | 12/1/27 | 11,120 | 11,455 |
Charleston SC Educ. Excellence Financing Corp. Rev. | 5.250% | 12/1/29 | 22,500 | 23,524 |
Charleston SC Educ. Excellence Financing Corp. Rev. | 5.000% | 12/1/31 | 11,500 | 11,778 |
Charleston SC Educ. Excellence Financing Corp. Rev. | | | | |
(Charleston County School Dist.) | 5.250% | 12/1/25 | 5,000 | 5,248 |
Greenville County SC School Dist. GO | 5.000% | 12/1/27 | 35,000 | 36,212 |
Greenville County SC School Dist. GO | 5.000% | 12/1/28 | 12,480 | 12,894 |
Lancaster County SC Assessment Rev. | 5.450% | 12/1/37 | 1,650 | 1,436 |
Lexington County SC Health Services | | | | |
Dist. Inc. Hospital Rev. | 5.000% | 11/1/32 | 30,000 | 29,788 |
Richland County SC (International Paper) | 6.100% | 4/1/23 | 22,750 | 23,761 |
South Carolina Jobs Econ. Dev. Auth. | | | | |
Health Care Fac. Rev. (Lutheran Homes) | 5.375% | 5/1/21 | 1,500 | 1,434 |
South Carolina Jobs Econ. Dev. Auth. | | | | |
Health Care Fac. Rev. (Lutheran Homes) | 5.500% | 5/1/28 | 1,100 | 1,043 |
South Carolina Jobs Econ. Dev. Auth. | | | | |
Health Care Fac. Rev. (Lutheran Homes) | 5.625% | 5/1/42 | 1,000 | 943 |
South Carolina Jobs Econ. Dev. Auth. Hosp. | | | | |
Improvement Rev. (Palmetto Health Alliance) | 7.375% | 12/15/10 (Prere.) | 19,500 | 22,047 |
South Carolina Public Service Auth. Rev. | 5.000% | 1/1/17 (1) | 4,000 | 4,323 |
South Carolina Public Service Auth. Rev. | 5.000% | 1/1/18 (1) | 6,000 | 6,486 |
South Carolina Public Service Auth. Rev. | 5.000% | 1/1/19 (1) | 10,000 | 10,809 |
| | | | 203,181 |
Tennessee (4.2%) | | | | |
Memphis TN Electric System Rev. | 5.000% | 12/1/16 (1) | 40,000 | 42,321 |
Memphis-Shelby County TN Airport Auth. Rev. | 5.050% | 9/1/12 | 5,100 | 5,241 |
Memphis-Shelby County TN Airport Auth. Rev. | 6.000% | 3/1/24 (2) | 7,450 | 7,816 |
Metro. Govt. of Nashville & | | | | |
Davidson County TN Electric Rev. | 5.200% | 5/15/23 | 17,000 | 17,455 |
Metro. Govt. of Nashville & | | | | |
Davidson County TN GO | 5.500% | 10/15/11 (3)(Prere.) | 10,865 | 11,657 |
Metro. Govt. of Nashville & | | | | |
Davidson County TN GO | 5.500% | 10/15/11 (3)(Prere.) | 9,235 | 9,908 |
Metro. Govt. of Nashville & | | | | |
Davidson County TN GO | 5.500% | 10/15/15 (3) | 4,070 | 4,351 |
Metro. Govt. of Nashville & | | | | |
Davidson County TN GO | 5.500% | 10/15/16 (3) | 4,310 | 4,609 |
Metro. Govt. of Nashville & | | | | |
Davidson County TN GO | 5.000% | 1/1/19 (1) | 8,395 | 8,870 |
Springfield TN Health & Educ. Fac. Board | | | | |
Hosp. Rev. (Northcrest Medical Center) | 4.900% | 8/1/08 | 670 | 673 |
Sullivan County TN Health & Housing Fac. | | | | |
Board Hosp. Rev. Wellmont Health System | 5.250% | 9/1/26 | 3,500 | 3,512 |
Sullivan County TN Health & Housing Fac. | | | | |
Board Hosp. Rev. Wellmont Health System | 5.250% | 9/1/36 | 12,000 | 11,806 |
Tennessee Energy Acquisition Corp. Gas Rev. | 5.000% | 9/1/14 | 25,370 | 26,163 |
Tennessee Energy Acquisition Corp. Gas Rev. | 5.000% | 9/1/15 | 30,495 | 31,423 |
Tennessee Energy Acquisition Corp. Gas Rev. | 5.000% | 2/1/19 | 25,865 | 26,152 |
Tennessee Energy Acquisition Corp. Gas Rev. | 5.000% | 2/1/20 | 10,000 | 10,045 |
Tennessee Housing Dev. Agency | | | | |
(Homeownership Program) | 5.750% | 1/1/37 | 15,775 | 16,786 |
Tennessee Housing Dev. Agency | | | | |
(Homeownership Program) | 5.750% | 7/1/37 | 20,000 | 21,298 |
| | | | 260,086 |
High-Yield Tax-Exempt Fund
| | | Face | Market |
| | Maturity | Amount | Value• |
| Coupon | Date | ($000) | ($000) |
Texas (5.3%) | | | | |
Bexar County TX Health Fac. Dev. Corp. Rev. | | | | |
(Army Retirement Residence) | 5.000% | 7/1/27 | 1,000 | 971 |
Bexar County TX Health Fac. Dev. Corp. Rev. | | | | |
(Army Retirement Residence) | 5.000% | 7/1/33 | 760 | 723 |
Brazos River Auth. Texas Rev. (Reliant Energy Inc.) | 7.750% | 12/1/18 | 5,000 | 5,171 |
Brazos River TX Harbor Navigation Dist. | | | | |
Brazoria County Environmental | | | | |
(Dow Chemical Co. Project) PUT | 5.200% | 5/15/08 | 35,200 | 35,413 |
Harris County TX GO | 0.000% | 10/1/13 (1) | 9,630 | 7,672 |
Harris County TX Hosp. Dist. Rev. | 7.400% | 2/15/10 (2)(ETM) | 1,735 | 1,794 |
Harris County TX Hosp. Dist. Rev. | 7.400% | 2/15/10 (2) | 5,140 | 5,376 |
Harris County TX Hosp. Dist. Rev. | 6.000% | 8/15/10 (1)(Prere.) | 13,985 | 14,907 |
Houston TX Water & Sewer System Rev. | 0.000% | 12/1/10 (2) | 5,000 | 4,460 |
Houston TX Water & Sewer System Rev. | 0.000% | 12/1/11 (2) | 24,810 | 21,302 |
Houston TX Water & Sewer System Rev. | 0.000% | 12/1/12 (2) | 26,000 | 21,442 |
Lower Colorado River Auth. Texas PCR | | | | |
(Samsung Austin Semiconductor LLC) | 6.950% | 4/1/30 | 12,350 | 13,014 |
Matagorda County TX Navigation Dist. PCR | | | | |
(Centerpoint Energy) | 5.600% | 3/1/27 | 7,500 | 7,781 |
Mesquite TX Health Fac. Dev. | | | | |
Christian Care Center Rev. | 5.500% | 2/15/25 | 2,100 | 2,114 |
Mesquite TX Health Fac. Dev. | | | | |
Christian Care Center Rev. | 5.625% | 2/15/35 | 3,400 | 3,401 |
Mission TX Econ. Dev. Corp. Solid | | | | |
Waste Disposal Rev. (Allied Waste Inc. Project) | 5.200% | 4/1/18 | 4,000 | 3,935 |
San Antonio TX Electric & Gas Rev. | 5.000% | 2/1/17 (ETM) | 2,560 | 2,737 |
Texas A & M Univ. Rev. Financing System | 5.000% | 5/15/13 | 5,240 | 5,588 |
Texas A & M Univ. Rev. Financing System | 5.000% | 5/15/14 | 5,000 | 5,364 |
Texas A & M Univ. Rev. Financing System | 5.000% | 5/15/15 | 5,550 | 5,977 |
Texas A & M Univ. Rev. Financing System | 5.000% | 5/15/15 | 7,080 | 7,625 |
Texas A & M Univ. Rev. Financing System | 5.000% | 5/15/16 | 5,000 | 5,354 |
Texas A & M Univ. Rev. Financing System | 5.000% | 5/15/16 | 3,245 | 3,475 |
Texas Dept. of Housing & Community | | | | |
Affairs Single Mortgage Rev. | 5.625% | 3/1/39 | 8,000 | 8,549 |
Texas Muni. Gas Acquisition & Supply Corp. Rev. | 4.515% | 9/15/17 | 40,000 | 39,150 |
Texas Muni. Gas Acquisition & Supply Corp. Rev. | 5.250% | 12/15/17 | 8,400 | 8,728 |
Texas Muni. Gas Acquisition & Supply Corp. Rev. | 5.250% | 12/15/19 | 22,500 | 23,171 |
Texas Muni. Gas Acquisition & Supply Corp. Rev. | 5.250% | 12/15/20 | 22,500 | 23,013 |
Texas Muni. Power Agency Rev. | 0.000% | 9/1/16 (1)(ETM) | 280 | 195 |
Texas Transp. Comm. Mobility Fund GO | 5.000% | 4/1/13 | 2,500 | 2,663 |
Texas Transp. Comm. Mobility Fund GO | 5.000% | 4/1/14 | 6,650 | 7,128 |
Texas Turnpike Auth. Dallas Northway Rev. | | | | |
(President George Bush Turnpike) | 0.000% | 1/1/11 (2)(ETM) | 7,000 | 6,225 |
Texas Water Finance Assistance GO | 5.750% | 8/1/31 | 21,395 | 22,670 |
| | | | 327,088 |
Virgin Islands (0.8%) | | | | |
Virgin Islands Public Finance Auth. Rev. | 6.000% | 10/1/08 | 4,915 | 4,976 |
Virgin Islands Public Finance Auth. Rev. | 5.200% | 10/1/09 | 3,065 | 3,128 |
Virgin Islands Public Finance Auth. Rev. | 5.750% | 10/1/13 | 11,000 | 11,193 |
Virgin Islands Public Finance Auth. Rev. | 5.875% | 10/1/18 | 19,000 | 19,297 |
Virgin Islands Public Finance Auth. Rev. | 6.375% | 10/1/19 | 10,000 | 10,771 |
| | | | 49,365 |
Virginia (1.9%) | | | | |
Albemarle County VA IDA Residential Care Fac. Rev. | | | | |
(Westminster-Canterbury Blue Ridge) | 5.000% | 1/1/31 | 1,250 | 1,167 |
High-Yield Tax-Exempt Fund
| | | | Face | Market |
| | | Maturity | Amount | Value• |
| | Coupon | Date | ($000) | ($000) |
2 | Alexandria VA Redev. & Housing Auth. Rev. | | | | |
| (Portals West) | 7.250% | 10/1/31 | 5,605 | 5,938 |
2 | Alexandria VA Redev. & Housing Auth. Rev. | | | | |
| (Portals West) | 8.250% | 4/1/32 | 475 | 515 |
| Chesterfield County VA Mortgage Rev. | | | | |
| (Brandermill Woods) | 6.500% | 1/1/28 | 14,719 | 15,205 |
| Fairfax County VA Econ. Dev. Auth. | | | | |
| Residential Care Fac. Rev. (Goodwin House Inc.) | 5.000% | 10/1/22 | 4,000 | 4,018 |
| Fairfax County VA Econ. Dev. Auth. | | | | |
| Residential Care Fac. Rev. (Goodwin House Inc.) | 5.000% | 10/1/27 | 3,375 | 3,312 |
| Fairfax County VA Econ. Dev. Auth. | | | | |
| Residential Care Fac. Rev. (Goodwin House Inc.) | 5.125% | 10/1/37 | 5,000 | 4,855 |
| Henrico County VA Econ. Dev. (Bon Secours) | 5.600% | 11/15/30 | 7,600 | 7,824 |
| Lynchburg VA IDA Healthcare Fac. Rev. | | | | |
| (Centra Health) | 5.200% | 1/1/08 (Prere.) | 2,985 | 3,023 |
| Lynchburg VA IDA Healthcare Fac. Rev. | | | | |
| (Centra Health) | 5.200% | 1/1/18 | 515 | 521 |
| Norfolk VA Redev. Housing Auth. Rev. | 6.000% | 1/1/25 | 500 | 502 |
| Norfolk VA Redev. Housing Auth. Rev. | 6.125% | 1/1/35 | 1,100 | 1,101 |
| Stafford County VA Econ. Dev. Auth. | | | | |
| Hosp. Fac. Rev. (Medicorp Health System) | 5.250% | 6/15/37 | 40,000 | 40,412 |
| Tobacco Settlement Financing Corp. Virginia Rev. | 5.625% | 6/1/15 (Prere.) | 10,000 | 11,199 |
| Tobacco Settlement Financing Corp. Virginia Rev. | 0.000% | 6/1/46 | 9,500 | 6,331 |
| Virginia Beach VA Dev. Auth. Residential Care Fac. | | | | |
| Mortgage Rev. (Westminster Canterbury) | 7.250% | 11/1/09 (Prere.) | 9,000 | 9,813 |
| | | | | 115,736 |
Washington (0.8%) | | | | |
| Chelan County WA Public Util. Dist. | | | | |
| (Rock Island Hydro) | 0.000% | 6/1/10 (1) | 19,550 | 17,734 |
| Chelan County WA Public Util. Dist. | | | | |
| (Rock Island Hydro) | 0.000% | 6/1/11 (1) | 11,400 | 9,927 |
| Chelan County WA Public Util. Dist. | | | | |
| (Rock Island Hydro) | 0.000% | 6/1/12 (1) | 19,650 | 16,381 |
| Port of Seattle WA GO | 5.000% | 11/1/10 (4) | 6,675 | 6,939 |
| | | | | 50,981 |
West Virginia (0.6%) | | | | |
| Mason County WV PCR Appalachian | | | | |
| Power Co. Project | 5.500% | 10/1/22 | 20,000 | 20,181 |
| Pleasants County West VA Pollution Control Rev. | 5.250% | 10/15/37 | 10,000 | 10,031 |
| West Virginia Building Comm. Rev. | | | | |
| (Jail & Correction Fac.) | 7.000% | 7/1/13 (1)(ETM) | 8,390 | 9,845 |
| | | | | 40,057 |
Wisconsin (0.1%) | | | | |
| Wisconsin Health & Educ. Fac. Auth. Rev. | | | | |
| (Beaver Dam Community Hosp.) | 6.750% | 8/15/34 | 3,500 | 3,726 |
Total Municipal Bonds (Cost $5,963,132) | | | | 6,071,679 |
| | | | Shares | |
Temporary Cash Investment (1.8%) | | | | |
4 | Vanguard Municipal Cash Management Fund | | | | |
| (Cost $113,292) | 3.425% | 113,292,032 | 113,292 |
Total Investments (99.4%) (Cost $6,076,424) | | | | 6,184,971 |
High-Yield Tax-Exempt Fund
| Market |
| Value• |
| ($000) |
Other Assets and Liabilities (0.6%) | |
Other Assets—Note B | 129,089 |
Liabilities | (92,459) |
| 36,630 |
Net Assets (100%) | 6,221,601 |
At October 31, 2007, net assets consisted of:5
| Amount |
| ($000) |
Paid-in Capital | 6,206,053 |
Undistributed Net Investment Income | — |
Accumulated Net Realized Losses | (94,410) |
Unrealized Appreciation | |
Investment Securities | 108,547 |
Futures Contracts | 1,411 |
Net Assets | 6,221,601 |
| |
| |
Investor Shares—Net Assets | |
Applicable to 185,014,172 outstanding $.001 par value shares of | |
beneficial interest (unlimited authorization) | 1,965,472 |
Net Asset Value Per Share—Investor Shares | $10.62 |
| |
| |
Admiral Shares—Net Assets | |
Applicable to 400,638,581 outstanding $.001 par value shares of | |
beneficial interest (unlimited authorization) | 4,256,129 |
Net Asset Value Per Share—Admiral Shares | $10.62 |
• See Note A in Notes to Financial Statements.
* Non-income-producing security—interest payments in default.
1 Security purchased on a when-issued or delayed-delivery basis for which the fund has not taken delivery as of October 31, 2007.
2 Security exempt from registration under Rule 144A of the Securities Act of 1933. Such securities may be sold in transactions exempt from registration, normally to qualified institutional buyers. At October 31, 2007, the aggregate value of these securities was $10,823,000, representing 0.2% of net assets.
3 Securities with a value of $9,863,000 have been segregated as initial margin for open futures contracts.
4 Affiliated money market fund available only to Vanguard funds and certain trusts and accounts managed by Vanguard. Rate shown is the 7-day yield.
5 See Note D in Notes to Financial Statements for the tax-basis components of net assets.
For key to abbreviations and other references, see back cover.
This page intentionally left blank.
This page intentionally left blank.
This page intentionally left blank.
Key to Abbreviations
ARS—Auction Rate Security. | |
BAN—Bond Anticipation Note. | |
COP—Certificate of Participation. | |
CP—Commercial Paper. | |
FR—Floating Rate. | |
GAN—Grant Anticipation Note. | |
GO—General Obligation Bond. | |
IDA—Industrial Development Authority Bond. | |
IDR—Industrial Development Revenue Bond. | |
PCR—Pollution Control Revenue Bond. | |
PUT—Put Option Obligation. | |
RAN—Revenue Anticipation Note. | |
TAN—Tax Anticipation Note. | |
TOB—Tender Option Bond. | |
TRAN—Tax Revenue Anticipation Note. | |
UFSD—Union Free School District. | |
USD—United School District. | |
VRDO—Variable Rate Demand Obligation. | |
(ETM)—Escrowed to Maturity. | |
(Prere.)—Prerefunded. | |
| |
| |
Scheduled principal and interest payments are guaranteed by: |
(1) MBIA (Municipal Bond Insurance Association). |
(2) AMBAC (Ambac Assurance Corporation). |
(3) FGIC (Financial Guaranty Insurance Company). |
(4) FSA (Financial Security Assurance). |
(5) BIGI (Bond Investors Guaranty Insurance). |
(6) Connie Lee Inc. |
(7) FHA (Federal Housing Authority). |
(8) CapMAC (Capital Markets Assurance Corporation). |
(9) American Capital Access Financial Guaranty Corporation. |
(10) XL Capital Assurance Inc. |
(11) CIFG (CDC IXIS Financial Guaranty). |
The insurance does not guarantee the market value of the municipal bonds. |
|
|
LOC—Scheduled principal and interest payments are guaranteed by bank letter of credit. |
© 2007 The Vanguard Group, Inc.
All rights reserved.
Vanguard Marketing Corporation, Distributor.
F950 122007
Item 2: Code of Ethics. The Registrant has adopted a code of ethics that applies to the Registrant’s principal executive officer, principal financial officer, principal accounting officer or controller or persons performing similar functions. The Code of Ethics was amended during the reporting period covered by this report to make certain technical, non-material changes.
Item 3: Audit Committee Financial Expert. The following members of the Audit Committee have been determined by the Registrant’s Board of Trustees to be Audit Committee Financial Experts serving on its Audit Committee, and to be independent: Charles D. Ellis, Rajiv L. Gupta, JoAnn Heffernan Heisen, André F. Perold, Alfred M. Rankin, Jr., and J. Lawrence Wilson.
Item 4: Principal Accountant Fees and Services.
(a) Audit Fees.
Audit Fees of the Registrant
Fiscal Year Ended October 31, 2007: $154,000
Fiscal Year Ended October 31, 2006: $155,000
Aggregate Audit Fees of Registered Investment Companies in the Vanguard Group.
Fiscal Year Ended October 31, 2007: $2,835,320
Fiscal Year Ended October 31, 2006: $2,347,620
(b) Audit-Related Fees.
Fiscal Year Ended October 31, 2007: $630,400
Fiscal Year Ended October 31, 2006: $530,000
Includes fees billed in connection with assurance and related services provided to the Registrant, The Vanguard Group, Inc., Vanguard Marketing Corporation, and other registered investment companies in the Vanguard Group.
(c) Tax Fees.
Fiscal Year Ended October 31, 2007: $215,900
Fiscal Year Ended October 31, 2006: $101,300
Includes fees billed in connection with tax compliance, planning and advice services provided to the Registrant, The Vanguard Group, Inc., Vanguard Marketing Corporation, and other registered investment companies in the Vanguard Group and related to income and excise taxes.
(d) All Other Fees.
Fiscal Year Ended October 31, 2007: $0
Fiscal Year Ended October 31, 2006: $0
Includes fees billed for services related to risk management and privacy matters. Services were provided to the Registrant, The Vanguard Group, Inc., Vanguard Marketing Corporation, and other registered investment companies in the Vanguard Group.
(e) (1) Pre-Approval Policies. The policy of the Registrant’s Audit Committee is to consider and, if appropriate, approve before the principal accountant is engaged for such services, all specific audit and non-audit services provided to: (1) the Registrant; (2) The Vanguard Group, Inc.; (3) other entities controlled by The Vanguard Group, Inc. that provide ongoing services to the Registrant; and (4) other
registered investment companies in the Vanguard Group. In making a determination, the Audit Committee considers whether the services are consistent with maintaining the principal accountant’s independence.
In the event of a contingency situation in which the principal accountant is needed to provide services in between scheduled Audit Committee meetings, the Chairman of the Audit Committee would be called on to consider and, if appropriate, pre-approve audit or permitted non-audit services in an amount sufficient to complete services through the next Audit Committee meeting, and to determine if such services would be consistent with maintaining the accountant’s independence. At the next scheduled Audit Committee meeting, services and fees would be presented to the Audit Committee for formal consideration, and, if appropriate, approval by the entire Audit Committee. The Audit Committee would again consider whether such services and fees are consistent with maintaining the principal accountant’s independence.
The Registrant’s Audit Committee is informed at least annually of all audit and non-audit services provided by the principal accountant to the Vanguard complex, whether such services are provided to: (1) the Registrant; (2) The Vanguard Group, Inc.; (3) other entities controlled by The Vanguard Group, Inc. that provide ongoing services to the Registrant; or (4) other registered investment companies in the Vanguard Group.
(2) No percentage of the principal accountant’s fees or services were approved pursuant to the waiver provision of paragraph (c)(7)(i)(C) of Rule 2-01 of Regulation S-X.
(f) For the most recent fiscal year, over 50% of the hours worked under the principal accountant’s engagement were not performed by persons other than full-time, permanent employees of the principal accountant.
(g) Aggregate Non-Audit Fees.
Fiscal Year Ended October 31, 2007: $215,900
Fiscal Year Ended October 31, 2006: $101,300
Includes fees billed for non-audit services provided to the Registrant, The Vanguard Group, Inc., Vanguard Marketing Corporation, and other registered investment companies in the Vanguard Group.
(h) For the most recent fiscal year, the Audit Committee has determined that the provision of all non-audit services was consistent with maintaining the principal accountant’s independence.
Item 5: Not Applicable.
Item 6: Not Applicable.
Item 7: Not Applicable.
Item 8: Not Applicable.
Item 9: Not Applicable.
Item 10: Not Applicable.
Item 11: Controls and Procedures.
(a) Disclosure Controls and Procedures. The Principal Executive and Financial Officers concluded that the Registrant's Disclosure Controls and Procedures are effective based on their evaluation of the Disclosure Controls and Procedures as of a date within 90 days of the filing date of this report.
(b) Internal Control Over Financial Reporting. There were no significant changes in Registrant’s Internal Control Over Financial Reporting or in other factors that could significantly affect this control subsequent to the date of the evaluation, including any corrective actions with regard to significant deficiencies and material weaknesses.
Item 12: Exhibits.
(a) Code of Ethics.
(b) Certifications.
Pursuant to the requirements of the Securities Exchange Act of 1934 and the Investment Company Act of 1940, the registrant has duly caused this report to be signed on its behalf by the undersigned, thereunto duly authorized.
VANGUARD MUNICIPAL BOND FUNDS |
BY: | (signature) |
| (HEIDI STAM) |
| JOHN J. BRENNAN* |
| CHIEF EXECUTIVE OFFICER |
Date: December 11, 2007
Pursuant to the requirements of the Securities Exchange Act of 1934 and the Investment Company Act of 1940, this report has been signed below by the following persons on behalf of the registrant and in the capacities and on the dates indicated.
VANGUARD MUNICIPAL BOND FUNDS |
BY: | (signature) |
| (HEIDI STAM) |
| JOHN J. BRENNAN* |
| CHIEF EXECUTIVE OFFICER |
Date: December 11, 2007
VANGUARD MUNICIPAL BOND FUNDS |
BY: | (signature) |
| (HEIDI STAM) |
| THOMAS J. HIGGINS* |
| TREASURER |
Date: December 11, 2007
*By Power of Attorney. See File Number 333-145624, filed on August 22, 2007. Incorporated by Reference.