UNITED STATES
SECURITIES AND EXCHANGE COMMISSION
Washington, D.C. 20549
FORM N-CSR
CERTIFIED SHAREHOLDER REPORT
OF
REGISTERED MANAGEMENT INVESTMENT COMPANIES
Investment Company Act file number: 811-2687
Name of Registrant: Vanguard Municipal Bond Funds
Address of Registrant:
P.O. Box 2600
Valley Forge, PA 19482
Name and address of agent for service:
Heidi Stam, Esquire
P.O. Box 876
Valley Forge, PA 19482
Registrant’s telephone number, including area code: (610) 669-1000
Date of fiscal year end: October 31
Date of reporting period: November 1, 2007–October 31, 2008
Item 1: Reports to Shareholders

> For the 2008 fiscal year, the Vanguard Municipal Bond Funds posted returns ranging from 3.76% to –8.20% in a volatile market.
> All seven funds outperformed the average returns of their peer groups.
> At the end of the period, municipal bond yields were higher than those of U.S. Treasuries, an inversion of the expected relationship. On a taxable-equivalent basis, municipal yields were especially high.
Contents | |
| |
Your Fund’s Total Returns | 1 |
President’s Letter | 2 |
Advisor’s Report | 6 |
Tax-Exempt Money Market Fund | 7 |
Short-Term Tax-Exempt Fund | 14 |
Limited-Term Tax-Exempt Fund | 22 |
Intermediate-Term Tax-Exempt Fund | 30 |
Insured Long-Term Tax-Exempt Fund | 38 |
Long-Term Tax-Exempt Fund | 46 |
High-Yield Tax-Exempt Fund | 54 |
About Your Fund’s Expenses | 63 |
Glossary | 65 |
Please note: The opinions expressed in this report are just that—informed opinions. They should not be considered promises or advice. Also, please keep in mind that the information and opinions cover the period through the date on the front of this report. Of course, the risks of investing in your fund are spelled out in the prospectus.
Your Fund’s Total Returns
Fiscal Year Ended October 31, 2008 | | | | | |
| | | | | | Taxable- |
| Ticker | Total | Income | Capital | | Equivalent |
Vanguard Tax-Exempt Fund | Symbol | Return | Return | Return | Yield1 | Yield2 |
Money Market | VMSXX | 2.63% | 2.63% | 0.00% | 1.96% | 3.02% |
Short-Term | | | | | | |
Investor Shares | VWSTX | 3.68 | 3.30 | 0.38 | 3.33 | 5.12 |
Admiral™ Shares3 | VWSUX | 3.76 | 3.38 | 0.38 | 3.40 | 5.23 |
Limited-Term | | | | | | |
Investor Shares | VMLTX | 2.68 | 3.43 | –0.75 | 3.66 | 5.63 |
Admiral Shares3 | VMLUX | 2.75 | 3.50 | –0.75 | 3.73 | 5.74 |
Intermediate-Term | | | | | | |
Investor Shares | VWITX | –0.49 | 3.99 | –4.48 | 4.39 | 6.75 |
Admiral Shares3 | VWIUX | –0.42 | 4.06 | –4.48 | 4.46 | 6.86 |
Insured Long-Term | | | | | | |
Investor Shares | VILPX | –4.85 | 4.28 | –9.13 | 4.83 | 7.43 |
Admiral Shares3 | VILQX | –4.78 | 4.35 | –9.13 | 4.90 | 7.54 |
Long-Term | | | | | | |
Investor Shares | VWLTX | –4.74 | 4.28 | –9.02 | 4.89 | 7.52 |
Admiral Shares3 | VWLUX | –4.68 | 4.34 | –9.02 | 4.96 | 7.63 |
High-Yield | | | | | | |
Investor Shares | VWAHX | –8.20 | 4.32 | –12.52 | 5.47 | 8.42 |
Admiral Shares3 | VWALX | –8.14 | 4.38 | –12.52 | 5.54 | 8.52 |
An investment in a money market fund is not insured or guaranteed by the Federal Deposit Insurance Corporation or any other government agency. Although the fund seeks to preserve the value of your investment at $1 per share, it is possible to lose money by investing in the fund. All of Vanguard’s money market funds have agreed to participate in the U.S. Treasury’s Temporary Guarantee Program for Money Market Funds. The program provides a guarantee to participating money market mutual fund shareholders based on the number of shares invested in the fund at the close of business on September 19, 2008. Any increase in the number of shares an investor holds after the close of business on September 19, 2008, will not be guaranteed. If a customer closes his or her account with a fund or broker-dealer, any future investment in the fund will not be guaranteed. If the number of shares an investor holds fluctuates over the period, the investor will be covered for either the number of shares held as of the close of business on September 19, 2008, or the current amount, whichever is less. The program expires on April 30, 2009, unless extended by the U.S. Treasury.
1 7-day SEC yield for the Tax-Exempt Money Market Fund; 30-day SEC yield for the other funds.
2 This calculation, which assumes a typical itemized tax return, is based on the maximum federal income tax rate of 35%. State and local taxes were not considered. Please see the prospectus for a detailed explanation of the calculation.
3 A lower-cost class of shares available to many longtime shareholders and to those with significant investments in the fund.
1
President’s Letter

Dear Shareholder,
Municipal securities experienced unusual volatility during the past 12 months as the global credit crunch reverberated through this typically sedate segment of the fixed income markets.
The seven Vanguard Municipal Bond Funds posted returns for the period ranging from a high of 3.76% for the Admiral Shares of the Short-Term Tax-Exempt Fund to a low of –8.20% for the Investor Shares of the High-Yield Tax-Exempt Fund. In these unsettled markets, the funds fared better than their typical peers, a tribute to the funds’ advisor—Vanguard Fixed Income Group—and its customary emphasis on high-quality, liquid securities.
With the exception of the Tax-Exempt Money Market and Short-Term Tax-Exempt Funds, the Municipal Bond Funds’ yields rose over the 12 months ended October 31, 2008. In the case of the High-Yield Fund, for example, the 30-day SEC yield of the Admiral Shares at the fiscal year-end was 5.54%, up from 4.42% at the start. Taxable-equivalent yields for all funds are listed in the table on page 1.
Bond market averages masked disparate returns
The broad U.S. taxable bond market registered a return of 0.30% for the 12 months, but this unremarkable result obscured extreme dislocations within the market. The strong performance of U.S. Treasury and government securities was offset by double-digit declines in the corporate bond market. These dynamics led to unusually large differences between the yields of Treasuries and their corresponding private-sector securities—both a reflection and a cause of the credit market’s distress.
Despite their generally high credit-worthiness, municipal bonds also fell in price, driving yields higher. The broad tax-exempt market registered a 12-month return of –3.30%. At the close of the period, municipal securities yielded more than U.S. Treasuries of similar maturities, an inversion of the typical relationship. On a taxable-equivalent basis, municipal yields were unusually high.
The U.S. Federal Reserve Board responded to the turmoil with new lending programs and a dramatic easing of monetary policy. Over the full 12 months, the Fed reduced its target for the federal funds rate from 4.50% to 1.00%.
Market Barometer | | | |
| | Average Annual Total Returns |
| | Periods Ended October 31, 2008 |
| One Year | Three Years | Five Years |
Bonds | | | |
Lehman U.S. Aggregate Bond Index (Broad taxable market) | 0.30% | 3.60% | 3.48% |
Lehman Municipal Bond Index | –3.30 | 1.71 | 2.73 |
Citigroup 3-Month Treasury Bill Index | 2.31 | 3.93 | 3.10 |
| | | |
| | | |
Stocks | | | |
Russell 1000 Index (Large-caps) | –36.80% | –5.51% | 0.37% |
Russell 2000 Index (Small-caps) | –34.16 | –4.79 | 1.57 |
Dow Jones Wilshire 5000 Index (Entire market) | –36.43 | –5.10 | 0.81 |
MSCI All Country World Index ex USA (International) | –48.27 | –3.93 | 5.05 |
| | | |
| | | |
CPI | | | |
Consumer Price Index | 3.66% | 2.83% | 3.20% |
2
Stock prices fell sharply in a global upheaval
Global stock markets started the 12-month period near all-time highs, but then declined sharply, laid low by the financial crisis that originated in the fixed income markets. The descent traced a series of jagged ups and downs. During the week ended October 10, for example, the U.S. stock market returned about –18%. When Wall Street opened the following Monday, stocks surged, returning more than 10% over the next six and a half hours.
For the full 12 months, the broad U.S. stock market returned –36.43%; international stocks returned –48.27%. The pain was especially acute in emerging markets—among the strongest performers in recent years—as investors became increasingly risk-averse.
Credit crunch reverberated through the muni market
A year ago, trouble in the fixed income markets seemed largely contained to securities backed by subprime mortgages, which came under severe pressure as the housing market deteriorated. As the depth and extent of the subprime market’s weakness became clear, however, distress spread to just about every segment of the fixed income market, including municipal securities.
Prices fell, and yields rose, for all but the shortest-term municipal securities. The performance of the seven Vanguard Municipal Bond Funds reflected these dynamics. The Short-Term, Limited-Term, and Money Market Tax-Exempt Funds produced positive 12-month returns; the rest of the portfolios delivered negative returns, as declining share prices more than offset the funds’ income returns.
Although the funds’ absolute returns were generally disappointing, all seven outperformed the average returns of their peer groups by substantial margins. These differences reflect Vanguard Fixed Income Group’s long-standing focus on high-quality securities and prudent portfolio management strategies, which helped protect shareholders from the worst of the market’s upheaval during the past year.
Vanguard High-Yield Tax-Exempt Fund’s Investor Shares returned –8.20% (Admiral Shares, –8.14%), the worst 12-month performance of the group. As investors retreated from risk, higher-yielding securities, which are generally issued by weaker borrowers, were hit hard, both in the taxable and tax-exempt markets.
Investors also hesitated to lock up their capital in longer-term securities. The share prices of the Insured Long-Term Tax-Exempt and Long-Term Tax-Exempt Funds fell by about –9%. After accounting for their income, the Insured Long-Term Fund’s Investor Shares returned –4.85% (Admiral Shares, –4.78%), and the Long-Term Fund’s Investor Shares returned –4.74% (Admiral Shares, –4.68%). The Intermediate-Term Tax-Exempt Fund registered a modestly negative return.
After the close of the period, we announced that the Insured Long-Term Tax-Exempt Fund would merge with the Long-Term Tax-Exempt Fund on December 12. The ratings agencies downgraded several municipal bond insurers during the past year, and the yields of insured and uninsured high-quality bonds began to converge, suggesting that investors were placing virtually no value on the insurance. The situation created little incentive for issuers to obtain insurance, and limited the benefits of a fund focused solely on insured bonds.
Vanguard Short-Term Tax-Exempt Fund’s Investor Shares returned 3.68% (Admiral Shares, +3.76%), the best 12-month result of the seven funds, followed by the Limited-Term Tax-Exempt Fund and the Tax-Exempt Money Market Fund, respectively. In October, the Vanguard Money Market Funds, including the Tax-Exempt Money Market Fund, elected to participate in the U.S. Treasury’s Temporary Guarantee Program for Money Market Funds. We have the highest confidence in the stability and liquidity of our money market funds, and we do not believe the funds will ever need support. We reasoned that our participation in the program could help bring stability to the credit markets, a development that would help Vanguard and other money market investors.
Prudent management and low costs have delivered strong returns
Just as they did during the past 12 months, the advisor’s diligent credit analysis, emphasis on high quality and liquidity, and efforts to keep the portfolios’ exposure to interest rate risk generally in line with that of their respective market segments have led to peer-beating returns over the past ten years.
The funds’ performance has also benefited from the funds’ low costs, which enhance your share of the funds’ rewards.
A sensible allocation plan for unsettling times
As stock markets have tumbled, and even typically staid segments of the investment markets such as municipal securities have experienced high levels of volatility, the temptation to “do something” has no doubt been strong. Our experience suggests that, more often than not, acting on such an emotional response is counterproductive.
3
We’ve found that a sensible approach to turbulent markets—and it’s worth noting that, while extreme, the recent turmoil is not unprecedented—is to determine a mix of stock, bond, and money market funds appropriate for your goals and circumstances, and then stick with it through the good times and bad. A balanced, well-diversified portfolio provides you with both some protection from the stock market’s deepest swoons and the opportunity to participate in its potential for long-term growth.
The Vanguard Municipal Bond Funds can play an important role in such a portfolio, particularly for investors in high tax brackets.
Thank you for investing with Vanguard.
Sincerely,

F. William McNabb III
President and Chief Executive Officer
November 17, 2008
Total Returns | | |
Fiscal Year Ended October 31, 2008 | | |
| | Average |
| Vanguard | Competing |
Tax-Exempt Fund Investor Shares | Fund | Fund1 |
Money Market | 2.63% | 2.04% |
Short-Term | 3.68 | –1.84 |
Limited-Term | 2.68 | 0.58 |
Intermediate-Term | –0.49 | –2.07 |
Insured Long-Term | –4.85 | –5.39 |
Long-Term | –4.74 | –7.75 |
High-Yield | –8.20 | –18.83 |
Total Returns | | |
Ten Years Ended October 31, 2008 | | |
| Average Annual Return |
| | Average |
| Vanguard | Competing |
Tax-Exempt Fund Investor Shares | Fund | Fund1 |
Money Market | 2.52% | 1.97% |
Short-Term | 3.08 | 2.39 |
Limited-Term | 3.48 | 2.80 |
Intermediate-Term | 3.81 | 3.18 |
Insured Long-Term | 3.94 | 2.91 |
Long-Term | 3.85 | 2.68 |
High-Yield | 3.37 | 1.50 |
The figures shown represent past performance, which is not a guarantee of future results. (Current performance may be lower or higher than the performance data cited. For performance data current to the most recent month-end, visit our website at www.vanguard.com/performance.) Note, too, that both investment returns and principal value can fluctuate widely, so an investor’s shares, when sold, could be worth more or less than their original cost.
1 Derived from data provided by Lipper Inc.
4
Expense Ratios1 | | | |
Your Fund Compared With Its Peer Group | | | |
| | | Peer-Group |
| Investor | Admiral | Expense |
Tax-Exempt Fund | Shares | Shares | Ratio2 |
Money Market | 0.10% | — | 0.72% |
Short-Term | 0.15 | 0.08% | 0.77 |
Limited-Term | 0.15 | 0.08 | 0.86 |
Intermediate-Term | 0.15 | 0.08 | 0.89 |
Insured Long-Term | 0.15 | 0.08 | 1.15 |
Long-Term | 0.15 | 0.08 | 1.09 |
High-Yield | 0.15 | 0.08 | 1.16 |
Your Fund’s Performance at a Glance |
October 31, 2007–October 31, 2008 | | | | |
| | | Distributions Per Share |
| Starting | Ending | Income | Capital |
Tax-Exempt Fund | Share Price | Share Price | Dividends | Gains |
Money Market | $1.00 | $1.00 | $0.026 | $0.000 |
Short-Term | | | | |
Investor Shares | 15.62 | 15.68 | 0.509 | 0.000 |
Admiral Shares | 15.62 | 15.68 | 0.520 | 0.000 |
Limited-Term | | | | |
Investor Shares | 10.73 | 10.65 | 0.366 | 0.000 |
Admiral Shares | 10.73 | 10.65 | 0.374 | 0.000 |
Intermediate-Term | | | | |
Investor Shares | 13.18 | 12.59 | 0.535 | 0.000 |
Admiral Shares | 13.18 | 12.59 | 0.544 | 0.000 |
Insured Long-Term | | | | |
Investor Shares | 12.38 | 11.25 | 0.553 | 0.000 |
Admiral Shares | 12.38 | 11.25 | 0.562 | 0.000 |
Long-Term | | | | |
Investor Shares | 11.09 | 10.09 | 0.497 | 0.000 |
Admiral Shares | 11.09 | 10.09 | 0.504 | 0.000 |
High-Yield | | | | |
Investor Shares | 10.62 | 9.29 | 0.494 | 0.000 |
Admiral Shares | 10.62 | 9.29 | 0.501 | 0.000 |
1 The fund expense ratios shown are from the prospectus dated July 29, 2008. For the fiscal year ended October 31, 2008, the Tax-Exempt Money Market Fund’s expense ratio was 0.11%. The Short-Term
Tax-Exempt Fund’s expense ratios were 0.15% for Investor Shares and 0.08% for Admiral Shares. The Limited-Term Tax-Exempt Fund’s expense ratios were 0.15% for Investor Shares and 0.08% for Admiral Shares. The Intermediate-Term Tax-Exempt Fund’s expense ratios were 0.15% for Investor Shares and 0.08% for Admiral Shares. The Insured Long-Term Tax-Exempt Fund’s expense ratios were 0.15% for Investor Shares and 0.08% for Admiral Shares. The Long-Term Tax-Exempt Fund’s expense ratios were 0.15% for Investor Shares and 0.08% for Admiral Shares. The High-Yield Tax-Exempt Fund’s expense ratios were 0.15% for Investor Shares and 0.08% for Admiral Shares.
2 Peer groups are: for the Tax-Exempt Money Market Fund, the Average Tax-Exempt Money Market Fund; for the Short-Term Tax-Exempt Fund, the Average 1–2 Year Municipal Fund; for the Limited-Term Tax-Exempt Fund, the Average 1–5 Year Municipal Fund; for the Intermediate-Term Tax-Exempt Fund, the Average Intermediate Municipal Fund; for the Insured Long-Term Tax-Exempt Fund, the Average Insured Municipal Fund; for the Long-Term Tax-Exempt Fund, the Average General Municipal Fund; and for the High-Yield Tax-Exempt Fund, the Average High-Yield Municipal Fund. Peer-group expense ratios are derived from data provided by Lipper Inc. and capture data through year-end 2007.
5
Advisor’s Report
For the fiscal year ended October 31, 2008, the Vanguard Municipal Bond Funds posted returns that ranged from a high of 3.76% for the Admiral Shares of the Short-Term Tax-Exempt Fund to a low of –8.20% for the Investor Shares of the High-Yield Tax-Exempt Fund. All seven funds outperformed the average returns of their peers.
The investment environment
Although market liquidity began to deteriorate in late 2007, significant changes in the municipal bond market started in early 2008 with downgrades in the credit ratings of the monoline municipal bond insurers, a reflection of their exposure to complex mortgage securities that lost significant value. At that time, roughly 50% of the outstanding market was guaranteed by an “AAA” insurance wrap underwritten by the insurers. As the insurers were downgraded, the prices of municipal bonds quickly traded to reflect the underlying credit quality, essentially discounting the value of the insurance.
This change had a ripple effect across the municipal market. Nontraditional investors, such as hedge funds that had bought previously AAA-rated municipal bonds with borrowed money, were forced to sell these assets (to meet margin requirements) as bond prices drifted lower. This selling, in turn, put additional pressure on prices. The auction-rate preferred market, a mechanism that had helped issuers borrow long-term money at shorter-term rates, essentially shut down, draining more liquidity from the market.
The net effect was a sell-off in municipals. It created a bifurcated market, with adequate liquidity for AA or higher-rated general obligation bonds and essential service credits, but scarce interest in lower-rated securities. The difference between the yields of higher- and lower-quality bonds widened. A by-product of these developments was a sharp drop in new issuance.
The municipal market’s turbulence also led to a historic increase in the ratio of municipal bond yields to those of U.S. Treasuries. At the end of October, for example, a 5-year AAA-rated general-obligation municipal bond yielded about 20% more than a 5-year Treasury. On an after-tax basis, the muni’s advantage was even greater. The municipal market’s significant value relative to Treasuries led to a surge in buying by individual investors.
Management of the funds
Vanguard Fixed Income Group has always looked through the insurance wrapper to the underlying quality of the municipal issuer. As the monoline insurers were downgraded, this long-standing approach proved beneficial, limiting our exposure to bonds that were repriced by the market to reflect their lower underlying credit quality. As usual, we maintained a robust credit-analysis process and quality bias in our purchases, which helped us avoid some of the market’s pitfalls for the fiscal year.
Although we had a small amount of negative performance from our attempts to exploit the unusually large spread between municipal and Treasury yields, the funds didn’t pursue leveraged strategies or wade into lower-quality issues in an effort to enhance income. For the year, the funds’ durations were slightly below their typical levels. This positioning had a small impact on relative performance.
Outlook
As of the close of fiscal 2008, the municipals market was returning to a more normalized environment. Over the past 12 months, much of the volatility has been driven by liquidity constraints in a selling market. Going forward, we will have to pay close attention to credit dynamics. Many state and local governments are dealing with tax shortfalls and budget gaps. Issuer credit quality will become more of a focus for the market over the coming year. Also, there is a backlog in new issuance, which could lead to a big increase in supply over the next few months.
We approach the new fiscal year confident that shareholders can rely on the Vanguard Municipal Bond Funds’ broad diversification and our experienced credit-research team to take advantage of the opportunities that arise in the municipal market. And as always, the muni funds’ low expense ratios enhance our clients’ share of the returns produced by these efforts.
Marlin G. Brown, Portfolio Manager
John M. Carbone, Principal,
Portfolio Manager
Reid O. Smith, CFA, Principal,
Portfolio Manager
Pamela Wisehaupt Tynan, Principal,
Portfolio Manager
Michael G. Kobs, Portfolio Manager
Vanguard Fixed Income Group
November 20, 2008
Yields of Municipal Bonds | | |
(AAA-Rated General-Obligation Issues) | | |
| October 31, | October 31, |
Maturity | 2007 | 2008 |
2 years | 3.33% | 2.48% |
5 years | 3.47 | 3.39 |
10 years | 3.81 | 4.31 |
30 years | 4.40 | 5.36 |
Source: Vanguard.
6
Tax-Exempt Money Market Fund
Fund Profile
As of October 31, 2008
Financial Attributes | |
| |
Yield1 | 2.0% |
Average Weighted Maturity | 36 days |
Average Quality2 | MIG-1 |
Expense Ratio (10/31/2007)3 | 0.10% |
Largest State Concentrations4 | |
| |
Texas | 14.6% |
Illinois | 6.1 |
Florida | 5.9 |
North Carolina | 4.1 |
Michigan | 3.8 |
Massachusetts | 3.7 |
Colorado | 3.6 |
Indiana | 3.2 |
Tennessee | 3.0 |
Washington | 2.8 |
Top Ten | 50.8% |
Distribution by Credit Quality5 (% of portfolio) |
| |
MIG-1/SP-1+ | 93.5% |
A-1/P-1 | 5.6 |
AAA/AA | 0.9 |
1 7-day SEC yield. See the Glossary.
2 Moody’s Investors Service.
3 The expense ratio shown is from the prospectus dated July 29, 2008. For the fiscal year ended October 31, 2008, the expense ratio was 0.11%.
4 Percentages of total net assets, excluding any futures contracts.
5 Ratings: Moody’s Investors Service, Standard & Poor’s, and Fitch.
7
Tax-Exempt Money Market Fund
Performance Summary
Investment returns will fluctuate. All of the returns in this report represent past performance, which is not a guarantee of future results that may be achieved by the fund. (Current performance may be lower or higher than the performance data cited. For performance data current to the most recent month-end, visit our website at www.vanguard.com/performance.) The returns shown do not reflect taxes that a shareholder would pay on fund distributions. An investment in a money market fund is not insured or guaranteed by the Federal Deposit Insurance Corporation or any other government agency. Although the fund seeks to preserve the value of your investment at $1 per share, it is possible to lose money by investing in the fund. The annualized yield shown reflects the current earnings of the fund more closely than do the average annual returns.
Cumulative Performance: October 31, 1998–October 31, 2008
Initial Investment of $10,000

| Average Annual Total Returns | Final Value |
| Periods Ended October 31, 2008 | of a $10,000 |
| One Year | Five Years | Ten Years | Investment |
Tax-Exempt Money Market Fund1 | 2.63% | 2.54% | 2.52% | $12,831 |
Average Tax-Exempt Money Market Fund2 | 2.04 | 1.93 | 1.97 | 12,153 |
1 Total returns do not include the account service fee that may be applicable to certain accounts with balances below $10,000.
2 Returns for the Average Tax-Exempt Money Market Fund are derived from data provided by Lipper Inc.
8
Tax-Exempt Money Market Fund
Fiscal-Year Total Returns (%): October 31, 1998–October 31, 2008 |
| | Average1 |
| | Fund |
Fiscal | Total | Total |
Year | Return | Return |
1999 | 3.1% | 2.6% |
2000 | 3.9 | 3.4 |
2001 | 3.2 | 2.6 |
2002 | 1.5 | 0.9 |
2003 | 1.0 | 0.5 |
2004 | 1.0 | 0.5 |
2005 | 2.1 | 1.5 |
2006 | 3.3 | 2.7 |
2007 | 3.6 | 3.0 |
2008 | 2.6 | 2.0 |
7-day SEC yield (10/31/2008): 1.96% | | |
Average Annual Total Returns: Periods Ended September 30, 2008
This table presents average annual total returns through the latest calendar quarter—rather than through the end of the fiscal period. Securities and Exchange Commission rules require that we provide this information.
| | | | | | Ten Years |
| Inception Date | One Year | Five Years | Capital | Income | Total |
Tax-Exempt Money Market2 | 6/10/1980 | 2.65% | 2.49% | 0.00% | 2.52% | 2.52% |
1 Returns for the Average Tax-Exempt Money Market Fund are derived from data provided by Lipper Inc.
2 Total returns do not include the account service fee that may be applicable to certain accounts with balances below $10,000.
Note: See Financial Highlights table for dividend and capital gains information.
9
Tax-Exempt Money Market Fund
Financial Statements
The Statement of Net Assets—an integral part of the Financial Statements for Vanguard Tax-Exempt Money Market Fund—is included as an insert to this report.
Statement of Operations
| Year Ended |
| October 31, 2008 |
| ($000) |
Investment Income | |
Income | |
Interest1 | 623,662 |
Total Income | 623,662 |
Expenses | |
The Vanguard Group—Note B | |
Investment Advisory Services | 2,166 |
Management and Administrative | 15,302 |
Marketing and Distribution | 5,902 |
Money Market Guarantee Program | 1,092 |
Custodian Fees | 169 |
Auditing Fees | 18 |
Shareholders’ Reports | 91 |
Trustees’ Fees and Expenses | 26 |
Total Expenses | 24,766 |
Expenses Paid Indirectly | (103) |
Net Expenses | 24,663 |
Net Investment Income | 598,999 |
Realized Net Gain (Loss) on | |
Investment Securities Sold | 496 |
Net Increase (Decrease) in Net Assets | |
Resulting from Operations | 599,495 |
Statement of Changes in Net Assets
| Year Ended October 31, |
| 2008 | 2007 |
| ($000) | ($000) |
Increase (Decrease) in Net Assets | | |
Operations | | |
Net Investment Income | 598,999 | 732,524 |
Realized Net Gain (Loss) | 496 | 550 |
Net Increase (Decrease) in Net Assets Resulting from Operations | 599,495 | 733,074 |
Distributions | | |
Net Investment Income | (598,999) | (732,524) |
Realized Capital Gain | — | — |
Total Distributions | (598,999) | (732,524) |
Capital Share Transactions (at $1.00) | | |
Issued | 25,171,541 | 20,617,898 |
Issued in Lieu of Cash Distributions | 569,649 | 693,545 |
Redeemed | (23,879,626) | (18,409,309) |
Net Increase (Decrease) from Capital Share Transactions | 1,861,564 | 2,902,134 |
Total Increase (Decrease) | 1,862,060 | 2,902,684 |
Net Assets | | |
Beginning of Period | 22,019,130 | 19,116,446 |
End of Period | 23,881,190 | 22,019,130 |
1 Interest income from an affiliated company of the fund was $23,097,000.
See accompanying Notes, which are an integral part of the Financial Statements.
10
Tax-Exempt Money Market Fund
Financial Highlights
| | | | |
For a Share Outstanding | Year Ended October 31, |
Throughout Each Period | 2008 | 2007 | 2006 | 2005 | 2004 |
Net Asset Value, Beginning of Period | $1.00 | $1.00 | $1.00 | $1.00 | $1.00 |
Investment Operations | | | | | |
Net Investment Income | .026 | .036 | .032 | .021 | .010 |
Net Realized and Unrealized Gain (Loss) | | | | | |
on Investments | — | — | — | — | — |
Total from Investment Operations | .026 | .036 | .032 | .021 | .010 |
Distributions | | | | | |
Dividends from Net Investment Income | (.026) | (.036) | (.032) | (.021) | (.010) |
Distributions from Realized Capital Gains | — | — | — | — | — |
Total Distributions | (.026) | (.036) | (.032) | (.021) | (.010) |
Net Asset Value, End of Period | $1.00 | $1.00 | $1.00 | $1.00 | $1.00 |
| | | | | |
| | | | | |
Total Return1 | 2.63% | 3.65% | 3.26% | 2.13% | 1.03% |
| | | | | |
| | | | | |
Ratios/Supplemental Data | | | | | |
Net Assets, End of Period (Millions) | $23,881 | $22,019 | $19,116 | $17,362 | $14,936 |
Ratio of Total Expenses to | | | | | |
Average Net Assets | 0.11% | 0.10% | 0.13% | 0.13% | 0.13% |
Ratio of Net Investment Income to | | | | | |
Average Net Assets | 2.59% | 3.59% | 3.22% | 2.12% | 1.03% |
1 Total returns do not include the account service fee that may be applicable to certain accounts with balances below $10,000.
See accompanying Notes, which are an integral part of the Financial Statements.
11
Tax-Exempt Money Market Fund
Notes to Financial Statements
Vanguard Tax-Exempt Money Market Fund is registered under the Investment Company Act of 1940 as an open-end investment company, or mutual fund. The fund invests in debt instruments of many municipal issuers; the issuers’ abilities to meet their obligations may be affected by economic and political developments in a specific state or region.
A. The following significant accounting policies conform to generally accepted accounting principles for U.S. mutual funds. The fund consistently follows such policies in preparing its financial statements.
1. Security Valuation: Investment securities are valued at amortized cost, which approximates market value. Investments in Vanguard Municipal Cash Management Fund are valued at that fund’s net asset value.
2. Federal Income Taxes: The fund intends to continue to qualify as a regulated investment company and distribute all of its income. Management has analyzed the fund’s tax positions taken on federal income tax returns for all open tax years (tax years ended October 31, 2005–2008), and has concluded that no provision for federal income tax is required in the fund’s financial statements.
3. Distributions: Dividends from net investment income are declared daily and paid on the first business day of the following month.
4. Other: Interest income includes income distributions received from Vanguard Municipal Cash Management Fund and is accrued daily. Premiums and discounts on debt securities purchased are amortized and accreted, respectively, to interest income over the lives of the respective securities. Security transactions are accounted for on the date securities are bought or sold. Costs used to determine realized gains (losses) on the sale of investment securities are those of the specific securities sold.
B. The Vanguard Group furnishes at cost investment advisory, corporate management, administrative, marketing, and distribution services. The costs of such services are allocated to the fund under methods approved by the board of trustees. The fund has committed to provide up to 0.40% of its net assets in capital contributions to Vanguard. At October 31, 2008, the fund had contributed capital of $2,153,000 to Vanguard (included in Other Assets), representing 0.01% of the fund’s net assets and 2.15% of Vanguard’s capitalization. The fund’s trustees and officers are also directors and officers of Vanguard.
C. The fund’s custodian bank has agreed to reduce its fees when the fund maintains cash on deposit in the non-interest-bearing custody account. For the year ended October 31, 2008, custodian fee offset arrangements reduced the fund’s expenses by $103,000 (an annual rate of 0.00% of average net assets).
D. In September 2006, the Financial Accounting Standards Board issued Statement of Financial Accounting Standards No. 157 (“FAS 157”), “Fair Value Measurements.” FAS 157 establishes a framework for measuring fair value and expands disclosures about fair value measurements in financial statements.
The various inputs that may be used to determine the value of the fund’s investments are summarized in three broad levels. The inputs or methodologies used for valuing securities are not necessarily an indication of the risk associated with investing in those securities.
Level 1—Quoted prices in active markets for identical securities.
Level 2—Other significant observable inputs (including quoted prices for similar securities, interest rates, prepayment speeds, credit risk, etc.).
Level 3—Significant unobservable inputs (including the fund’s own assumptions used to determine the fair value of investments).
12
Tax-Exempt Money Market Fund
The following table summarizes the fund’s investments as of October 31, 2008, based on the inputs used to value them:
| Investments |
| in Securities |
Valuation Inputs | ($000) |
Level 1—Quoted prices | 1,043,461 |
Level 2—Other significant observable inputs | 22,613,686 |
Level 3—Significant unobservable inputs | — |
Total | 23,657,147 |
The majority of the fund’s investments were valued using amortized cost, in accordance with rules under the Investment Company Act of 1940. Amortized cost approximates the current fair value of a security, but since the value is not obtained from a quoted price in an active market, securities valued at amortized cost are considered to be valued using Level 2 inputs.
E. On October 7, 2008, the board of trustees approved the fund’s participation in a temporary program introduced by the U.S. Treasury to guarantee the account values of shareholders in a money market fund in the event the fund’s net asset value falls below $0.995 and the fund’s trustees decide to liquidate the fund. The program covers the lesser of a shareholder’s account value on September 19, 2008, or on the date of liquidation. To participate, the fund is required to pay a fee of 0.01% of its net assets as of September 19, 2008, for coverage that lasts until December 18, 2008. The fund is accruing this expense over the period October 7–December 18, 2008. Through October 31, 2008, the fund has accrued $1,092,000, resulting in a 0.005% increase in the fund’s expense ratio for the year ended October 31, 2008. In December 2008, the U.S. Treasury extended the program through April 30, 2009, and the fund’s trustees approved the fund’s continuing participation in the program. To continue coverage for the period December 19, 2008–April 30, 2009, the fund will be required to pay an additional 0.015% of its net assets as of September 19, 2008.
13
Short-Term Tax-Exempt Fund
Fund Profile
As of October 31, 2008
Financial Attributes | | | |
| | Comparative | Broad |
| Fund | Index1 | Index2 |
Number of Issues | 541 | 6,152 | 44,143 |
Yield3 | | 3.3% | 4.8% |
Investor Shares | 3.3% | | |
Admiral Shares | 3.4% | | |
Yield to Maturity | 3.1%4 | 3.3% | 4.8% |
Average Coupon | 4.6% | 5.1% | 5.0% |
Average Effective | | | |
Maturity | 1.2 years | 3.0 years | 12.9 years |
Average Quality | AA | AA1 | AA2 |
Average Duration | 1.1 years | 2.7 years | 8.0 years |
Expense Ratio | | | |
(10/31/2007)5 | | — | — |
Investor Shares | 0.15% | | |
Admiral Shares | 0.08% | | |
Short-Term Reserves | 23.3% | — | — |
Largest State Concentrations6 | |
| |
Texas | 13.8% |
New York | 8.2 |
Florida | 7.7 |
Georgia | 5.9 |
Nevada | 4.9 |
Pennsylvania | 4.8 |
New Jersey | 4.5 |
Illinois | 4.4 |
Washington | 3.7 |
Massachusetts | 3.6 |
Top Ten | 61.5% |
Volatility Measures7 | |
| Fund Versus | Fund Versus |
| Comparative Index1 | Broad Index2 |
R-Squared | 0.93 | 0.62 |
Beta | 0.40 | 0.14 |
Distribution by Maturity (% of portfolio) | |
| |
Under 1 Year | 49.7% |
1–3 Years | 40.3 |
3–5 Years | 10.0 |
Over 5 Years | 0.0 |
Distribution by Credit Quality (% of portfolio) |
| |
AAA | 37.4% |
AA | 51.7 |
A | 8.8 |
BBB | 0.7 |
Other | 1.4 |
Investment Focus
1 Lehman 3 Year Municipal Bond Index.
2 Lehman Municipal Bond Index.
3 30-day SEC yield for the fund; index yield assumes that all bonds are called or prepaid at the earliest possible dates. See the Glossary.
4 Before expenses.
5 The expense ratios shown are from the prospectus dated July 29, 2008. For the fiscal year ended October 31, 2008, the expense ratios were 0.15% for Investor Shares and 0.08% for Admiral Shares.
6 Percentages of total net assets, excluding any futures contracts.
7 For an explanation of R-squared, beta, and other terms used here, see the Glossary.
14
Short-Term Tax-Exempt Fund
Performance Summary
All of the returns in this report represent past performance, which is not a guarantee of future results that may be achieved by the fund. (Current performance may be lower or higher than the performance data cited. For performance data current to the most recent month-end, visit our website at www.vanguard.com/performance.) Note, too, that both investment returns and principal value can fluctuate widely, so an investor’s shares, when sold, could be worth more or less than their original cost. The returns shown do not reflect taxes that a shareholder would pay on fund distributions or on the sale of fund shares.
Cumulative Performance: October 31, 1998–October 31, 2008
Initial Investment of $10,000

| Average Annual Total Returns | Final Value |
| Periods Ended October 31, 2008 | of a $10,000 |
| One Year | Five Years | Ten Years | Investment |
Short-Term Tax-Exempt Fund Investor Shares1 | 3.68% | 2.62% | 3.08% | $13,540 |
Lehman Municipal Bond Index | –3.30 | 2.73 | 4.14 | 14,996 |
Lehman 3 Year Municipal Bond Index | 4.26 | 2.78 | 3.81 | 14,537 |
Average 1–2 Year Municipal Fund2 | –1.84 | 1.33 | 2.39 | 12,666 |
| | | | Final Value |
| | | Since | of a $100,000 |
| One Year | Five Years | Inception3 | Investment |
Short-Term Tax-Exempt Fund Admiral Shares | 3.76% | 2.69% | 2.86% | $124,343 |
Lehman Municipal Bond Index | –3.30 | 2.73 | 3.92 | 134,582 |
Lehman 3 Year Municipal Bond Index | 4.26 | 2.78 | 3.55 | 130,915 |
1 Total returns do not include the account service fee that may be applicable to certain accounts with balances below $10,000.
2 Derived from data provided by Lipper Inc.
3 Performance for the fund’s Admiral Shares and comparative standards is calculated since the Admiral Shares’ inception: February 12, 2001.
15
Short-Term Tax-Exempt Fund
Fiscal-Year Total Returns (%): October 31, 1998–October 31, 2008 |
| | | | |
| Investor Shares | Lehman1 |
Fiscal | Capital | Income | Total | Total |
Year | Return | Return | Return | Return |
1999 | –1.0% | 3.7% | 2.7% | 2.2% |
2000 | 0.1 | 4.1 | 4.2 | 4.9 |
2001 | 1.5 | 4.2 | 5.7 | 8.7 |
2002 | –0.1 | 2.9 | 2.8 | 4.8 |
2003 | 0.3 | 2.0 | 2.3 | 3.9 |
2004 | –0.6 | 1.8 | 1.2 | 2.2 |
2005 | –0.9 | 2.2 | 1.3 | 0.3 |
2006 | 0.3 | 2.9 | 3.2 | 3.1 |
2007 | 0.3 | 3.4 | 3.7 | 4.0 |
2008 | 0.4 | 3.3 | 3.7 | 4.3 |
Average Annual Total Returns: Periods Ended September 30, 2008
This table presents average annual total returns through the latest calendar quarter—rather than through the end of the fiscal period. Securities and Exchange Commission rules require that we provide this information.
| | | | | | Ten Years |
| Inception Date | One Year | Five Years | Capital | Income | Total |
Investor Shares2 | 9/1/1977 | 3.62% | 2.52% | 0.02% | 3.06% | 3.08% |
Admiral Shares | 2/12/2001 | 3.69 | 2.59 | 0.003 | 2.843 | 2.843 |
1 Lehman 3 Year Municipal Bond Index.
2 Total returns do not include the account service fee that may be applicable to certain accounts with balances below $10,000.
3 Return since inception.
Note: See Financial Highlights tables for dividend and capital gains information.
16
Short-Term Tax-Exempt Fund
Financial Statements
The Statement of Net Assets—an integral part of the Financial Statements for Vanguard Short-Term Tax-Exempt Fund—is included as an insert to this report.
Statement of Operations
| Year Ended |
| October 31, 2008 |
| ($000) |
Investment Income | |
Income | |
Interest1 | 153,492 |
Total Income | 153,492 |
Expenses | |
The Vanguard Group—Note B | |
Investment Advisory Services | 421 |
Management and Administrative | |
Investor Shares | 1,302 |
Admiral Shares | 1,508 |
Marketing and Distribution | |
Investor Shares | 288 |
Admiral Shares | 842 |
Custodian Fees | 29 |
Auditing Fees | 23 |
Shareholders’ Reports | |
Investor Shares | 33 |
Admiral Shares | 10 |
Trustees’ Fees and Expenses | 5 |
Total Expenses | 4,461 |
Net Investment Income | 149,031 |
Realized Net Gain (Loss) | |
Investment Securities Sold | 3,825 |
Futures Contracts | 239 |
Realized Net Gain (Loss) | 4,064 |
Change in Unrealized Appreciation | |
(Depreciation) | |
Investment Securities | 5,188 |
Futures Contracts | (485) |
Change in Unrealized Appreciation | |
(Depreciation) | 4,703 |
Net Increase (Decrease) in Net Assets | |
Resulting from Operations | 157,798 |
Statement of Changes in Net Assets
| Year Ended October 31, |
| 2008 | 2007 |
| ($000) | ($000) |
Increase (Decrease) in Net Assets | | |
Operations | | |
Net Investment Income | 149,031 | 138,653 |
Realized Net Gain (Loss) | 4,064 | (2,945) |
Change in Unrealized Appreciation (Depreciation) | 4,703 | 15,485 |
Net Increase (Decrease) in Net Assets Resulting from Operations | 157,798 | 151,193 |
Distributions | | |
Net Investment Income | | |
Investor Shares | (37,573) | (36,049) |
Admiral Shares | (111,458) | (102,604) |
Realized Capital Gain | | |
Investor Shares | — | — |
Admiral Shares | — | — |
Total Distributions | (149,031) | (138,653) |
Capital Share Transactions | | |
Investor Shares | 276,856 | (101,961) |
Admiral Shares | 638,548 | 99,627 |
Net Increase (Decrease) from Capital Share Transactions | 915,404 | (2,334) |
Total Increase (Decrease) | 924,171 | 10,206 |
Net Assets | | |
Beginning of Period | 4,117,583 | 4,107,377 |
End of Period | 5,041,754 | 4,117,583 |
1 Interest income from an affiliated company of the fund was $1,496,000.
See accompanying Notes, which are an integral part of the Financial Statements.
17
Short-Term Tax-Exempt Fund
Financial Highlights
Investor Shares | | | | | |
| | | | | |
| | | | |
For a Share Outstanding | Year Ended October 31, |
Throughout Each Period | 2008 | 2007 | 2006 | 2005 | 2004 |
Net Asset Value, Beginning of Period | $15.62 | $15.58 | $15.53 | $15.67 | $15.77 |
Investment Operations | | | | | |
Net Investment Income | .509 | .526 | .443 | .340 | .292 |
Net Realized and Unrealized Gain (Loss) | | | | | |
on Investments | .060 | .040 | .050 | (.140) | (.100) |
Total from Investment Operations | .569 | .566 | .493 | .200 | .192 |
Distributions | | | | | |
Dividends from Net Investment Income | (.509) | (.526) | (.443) | (.340) | (.292) |
Distributions from Realized Capital Gains | — | — | — | — | — |
Total Distributions | (.509) | (.526) | (.443) | (.340) | (.292) |
Net Asset Value, End of Period | $15.68 | $15.62 | $15.58 | $15.53 | $15.67 |
| | | | | |
| | | | | |
Total Return1 | 3.68% | 3.70% | 3.22% | 1.29% | 1.23% |
| | | | | |
| | | | | |
Ratios/Supplemental Data | | | | | |
Net Assets, End of Period (Millions) | $1,319 | $1,040 | $1,139 | $1,382 | $2,198 |
Ratio of Total Expenses to | | | | | |
Average Net Assets | 0.15% | 0.15% | 0.16% | 0.16% | 0.14% |
Ratio of Net Investment Income to | | | | | |
Average Net Assets | 3.23% | 3.37% | 2.85% | 2.16% | 1.86% |
Portfolio Turnover Rate | 32% | 51% | 49% | 30% | 10% |
Admiral Shares | | | | | |
| | | | | |
| | | | |
For a Share Outstanding | Year Ended October 31, |
Throughout Each Period | 2008 | 2007 | 2006 | 2005 | 2004 |
Net Asset Value, Beginning of Period | $15.62 | $15.58 | $15.53 | $15.67 | $15.77 |
Investment Operations | | | | | |
Net Investment Income | .520 | .537 | .455 | .351 | .300 |
Net Realized and Unrealized Gain (Loss) | | | | | |
on Investments | .060 | .040 | .050 | (.140) | (.100) |
Total from Investment Operations | .580 | .577 | .505 | .211 | .200 |
Distributions | | | | | |
Dividends from Net Investment Income | (.520) | (.537) | (.455) | (.351) | (.300) |
Distributions from Realized Capital Gains | — | — | — | — | — |
Total Distributions | (.520) | (.537) | (.455) | (.351) | (.300) |
Net Asset Value, End of Period | $15.68 | $15.62 | $15.58 | $15.53 | $15.67 |
| | | | | |
| | | | | |
Total Return | 3.76% | 3.77% | 3.30% | 1.37% | 1.28% |
| | | | | |
| | | | | |
Ratios/Supplemental Data | | | | | |
Net Assets, End of Period (Millions) | $3,723 | $3,078 | $2,969 | $2,871 | $2,433 |
Ratio of Total Expenses to | | | | | |
Average Net Assets | 0.08% | 0.08% | 0.09% | 0.09% | 0.09% |
Ratio of Net Investment Income to | | | | | |
Average Net Assets | 3.30% | 3.44% | 2.92% | 2.26% | 1.91% |
Portfolio Turnover Rate | 32% | 51% | 49% | 30% | 10% |
1 Total returns do not include the account service fee that may be applicable to certain accounts with balances below $10,000. See accompanying Notes, which are an integral part of the Financial Statements.
18
Short-Term Tax-Exempt Fund
Notes to Financial Statements
Vanguard Short-Term Tax-Exempt Fund is registered under the Investment Company Act of 1940 as an open-end investment company, or mutual fund. The fund invests in debt instruments of many municipal issuers; the issuers’ abilities to meet their obligations may be affected by economic and political developments in a specific state or region. The fund offers two classes of shares, Investor Shares and Admiral Shares. Investor Shares are available to any investor who meets the fund’s minimum purchase requirements. Admiral Shares are designed for investors who meet certain administrative, service, tenure, and account-size criteria.
A. The following significant accounting policies conform to generally accepted accounting principles for U.S. mutual funds. The fund consistently follows such policies in preparing its financial statements.
1. Security Valuation: Bonds, and temporary cash investments acquired over 60 days to maturity, are valued using the latest bid prices or using valuations based on a matrix system (which considers such factors as security prices, yields, maturities, and ratings), both as furnished by independent pricing services. Investments in Vanguard Municipal Cash Management Fund are valued at that fund’s net asset value. Other temporary cash investments are valued at amortized cost, which approximates market value. Securities for which market quotations are not readily available, or whose values have been affected by events occurring before the fund’s pricing time but after the close of the securities’ primary markets, are valued by methods deemed by the board of trustees to represent fair value.
2. Futures Contracts: The fund uses futures contracts to invest in fixed income asset classes with greater efficiency and lower cost than is possible through direct investment, to add value when these instruments are attractively priced, or to adjust sensitivity to changes in interest rates. The primary risks associated with the use of futures contracts are imperfect correlation between changes in market values of bonds held by the fund and the prices of futures contracts, and the possibility of an illiquid market.
Futures contracts are valued based upon their quoted daily settlement prices. The aggregate principal amounts of the contracts are not recorded in the Statement of Net Assets. Fluctuations in the value of the contracts are recorded in the Statement of Net Assets as an asset (liability) and in the Statement of Operations as unrealized appreciation (depreciation) until the contracts are closed, when they are recorded as realized futures gains (losses).
3. Federal Income Taxes: The fund intends to continue to qualify as a regulated investment company and distribute all of its income. Management has analyzed the fund’s tax positions taken on federal income tax returns for all open tax years (tax years ended October 31, 2005–2008), and has concluded that no provision for federal income tax is required in the fund’s financial statements.
4. Distributions: Distributions from net investment income are declared daily and paid on the first business day of the following month. Annual distributions from realized capital gains, if any, are recorded on the ex-dividend date.
5. Other: Interest income includes income distributions received from Vanguard Municipal Cash Management Fund and is accrued daily. Premiums and discounts on debt securities purchased are amortized and accreted, respectively, to interest income over the lives of the respective securities. Security transactions are accounted for on the date securities are bought or sold. Costs used to determine realized gains (losses) on the sale of investment securities are those of the specific securities sold.
Each class of shares has equal rights as to assets and earnings, except that each class separately bears certain class-specific expenses related to maintenance of shareholder accounts (included in Management and Administrative expenses) and shareholder reporting. Marketing and distribution expenses are allocated to each class of shares based on a method approved by the board of trustees. Income, other non-class-specific expenses, and gains and losses on investments are allocated to each class of shares based on its relative net assets.
B. The Vanguard Group furnishes at cost investment advisory, corporate management, administrative, marketing, and distribution services. The costs of such services are allocated to the fund under methods approved by the board of trustees. The fund has committed to provide up to 0.40% of its net assets in capital contributions to Vanguard. At October 31, 2008, the fund had contributed capital of $470,000 to Vanguard (included in Other Assets), representing 0.01% of the fund’s net assets and 0.47% of Vanguard’s capitalization. The fund’s trustees and officers are also directors and officers of Vanguard.
19
Short-Term Tax-Exempt Fund
C. Capital gain distributions are determined on a tax basis and may differ from realized capital gains for financial reporting purposes. Differences may be permanent or temporary. Permanent differences are reclassified among capital accounts in the financial statements to reflect their tax character. Temporary differences arise when gains or losses are recognized in different periods for financial statement and tax purposes; these differences will reverse at some time in the future.
For tax purposes, at October 31, 2008, the fund had available realized losses of $8,100,000 to offset future net capital gains of $1,354,000 through October 31, 2013, $3,801,000 through October 31, 2014, and $2,945,000 through October 31, 2015.
The fund had realized losses totaling $397,000 through October 31, 2008, which are deferred for tax purposes and reduce the amount of tax-basis unrealized appreciation on investment securities.
At October 31, 2008, the cost of investment securities for tax purposes was $5,044,315,000. Net unrealized appreciation of investment securities for tax purposes was $9,795,000, consisting of unrealized gains of $26,259,000 on securities that had risen in value since their purchase and $16,464,000 in unrealized losses on securities that had fallen in value since their purchase.
At October 31, 2008, the aggregate settlement value of open futures contracts expiring in December 2008 and the related unrealized appreciation (depreciation) were:
| | | ($000) |
| Number of | Aggregate | Unrealized |
| Long (Short) | Settlement | Appreciation |
Futures Contracts | Contracts | Value | (Depreciation) |
2-Year U.S. Treasury Note | (176) | 37,810 | (485) |
Unrealized appreciation (depreciation) on open futures contracts is required to be treated as realized gain (loss) for tax purposes.
D. During the year ended October 31, 2008, the fund purchased $1,857,468,000 of investment securities and sold $1,052,971,000 of investment securities, other than temporary cash investments.
E. Capital share transactions for each class of shares were:
| | | Year Ended October 31, |
| | 2008 | | | 2007 |
| Amount | Shares | | Amount | Shares |
| ($000) | (000) | | ($000) | (000) |
Investor Shares | | | | | |
Issued | 865,779 | 55,031 | | 380,978 | 24,462 |
Issued in Lieu of Cash Distributions | 32,059 | 2,039 | | 30,545 | 1,961 |
Redeemed | (620,982) | (39,485) | | (513,484) | (32,967) |
Net Increase (Decrease)—Investor Shares | 276,856 | 17,585 | | (101,961) | (6,544) |
Admiral Shares | | | | | |
Issued | 2,182,911 | 138,725 | | 1,130,745 | 72,604 |
Issued in Lieu of Cash Distributions | 91,703 | 5,832 | | 84,673 | 5,436 |
Redeemed | (1,636,066) | (104,076) | | (1,115,791) | (71,644) |
Net Increase (Decrease)—Admiral Shares | 638,548 | 40,481 | | 99,627 | 6,396 |
20
Short-Term Tax-Exempt Fund
F. In September 2006, the Financial Accounting Standards Board issued Statement of Financial Accounting Standards No. 157 (“FAS 157”), “Fair Value Measurements.” FAS 157 establishes a framework for measuring fair value and expands disclosures about fair value measurements in financial statements.
The various inputs that may be used to determine the value of the fund’s investments are summarized in three broad levels. The inputs or methodologies used for valuing securities are not necessarily an indication of the risk associated with investing in those securities.
Level 1—Quoted prices in active markets for identical securities.
Level 2—Other significant observable inputs (including quoted prices for similar securities, interest rates, prepayment speeds, credit risk, etc.).
Level 3—Significant unobservable inputs (including the fund’s own assumptions used to determine the fair value of investments).
The following table summarizes the fund’s investments as of October 31, 2008, based on the inputs used to value them.
| Investments | Futures |
| in Securities | Contracts |
Valuation Inputs | ($000) | ($000) |
Level 1—Quoted prices | 361 | (485) |
Level 2—Other significant observable inputs | 5,053,749 | — |
Level 3—Significant unobservable inputs | — | — |
Total | 5,054,110 | (485) |
21
Limited-Term Tax-Exempt Fund
Fund Profile
As of October 31, 2008
Financial Attributes | | | |
| | Comparative | Broad |
| Fund | Index1 | Index2 |
Number of Issues | 802 | 6,152 | 44,143 |
Yield3 | | 3.3% | 4.8% |
Investor Shares | 3.7% | | |
Admiral Shares | 3.7% | | |
Yield to Maturity | 3.6%4 | 3.3% | 4.8% |
Average Coupon | 4.7% | 5.1% | 5.0% |
Average Effective | | | |
Maturity | 2.5 years | 3.0 years | 12.9 years |
Average Quality | AA | AA1 | AA2 |
Average Duration | 2.4 years | 2.7 years | 8.0 years |
Expense Ratio | | | |
(10/31/2007)5 | | — | — |
Investor Shares | 0.15% | | |
Admiral Shares | 0.08% | | |
Short-Term Reserves | 12.4% | — | — |
Largest State Concentrations6 | |
| |
New York | 11.8% |
Texas | 11.2 |
California | 8.4 |
Florida | 7.7 |
New Jersey | 5.0 |
Pennsylvania | 4.4 |
Illinois | 4.3 |
Washington | 3.8 |
Massachusetts | 3.5 |
Michigan | 3.3 |
Top Ten | 63.4% |
Volatility Measures7 | |
| Fund Versus | Fund Versus |
| Comparative Index1 | Broad Index2 |
R-Squared | 0.95 | 0.80 |
Beta | 0.91 | 0.37 |
Distribution by Maturity (% of portfolio) | |
| |
Under 1 Year | 22.0% |
1–3 Years | 27.2 |
3–5 Years | 31.3 |
Over 5 Years | 19.5 |
Distribution by Credit Quality (% of portfolio) |
| |
AAA | 38.8% |
AA | 46.6 |
A | 10.1 |
BBB | 4.0 |
Other | 0.5 |
Investment Focus

1 Lehman 3 Year Municipal Bond Index.
2 Lehman Municipal Bond Index.
3 30-day SEC yield for the fund; index yield assumes that all bonds are called or prepaid at the earliest possible dates. See the Glossary.
4 Before expenses.
5 The expense ratios shown are from the prospectus dated July 29, 2008. For the fiscal year ended October 31, 2008, the expense ratios were 0.15% for Investor Shares and 0.08% for Admiral Shares.
6 Percentages of total net assets, excluding any futures contracts.
7 For an explanation of R-squared, beta, and other terms used here, see the Glossary.
22
Limited-Term Tax-Exempt Fund
Performance Summary
All of the returns in this report represent past performance, which is not a guarantee of future results that may be achieved by the fund. (Current performance may be lower or higher than the performance data cited. For performance data current to the most recent month-end, visit our website at www.vanguard.com/performance.) Note, too, that both investment returns and principal value can fluctuate widely, so an investor’s shares, when sold, could be worth more or less than their original cost. The returns shown do not reflect taxes that a shareholder would pay on fund distributions or on the sale of fund shares.
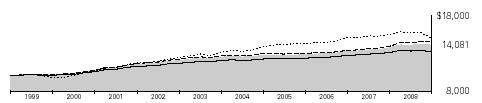
Cumulative Performance: October 31, 1998–October 31, 2008
Initial Investment of $10,000
| Average Annual Total Returns | Final Value |
| Periods Ended October 31, 2008 | of a $10,000 |
| One Year | Five Years | Ten Years | Investment |
Limited-Term Tax-Exempt Fund Investor Shares1 | 2.68% | 2.43% | 3.48% | $14,081 |
Lehman Municipal Bond Index | –3.30 | 2.73 | 4.14 | 14,996 |
Lehman 3 Year Municipal Bond Index | 4.26 | 2.78 | 3.81 | 14,537 |
Average 1–5 Year Municipal Fund2 | 0.58 | 1.83 | 2.80 | 13,184 |
| | | | Final Value |
| | | Since | of a $100,000 |
| One Year | Five Years | Inception3 | Investment |
Limited-Term Tax-Exempt Fund Admiral Shares | 2.75% | 2.50% | 3.24% | $127,873 |
Lehman Municipal Bond Index | –3.30 | 2.73 | 3.90 | 134,398 |
Lehman 3 Year Municipal Bond Index | 4.26 | 2.78 | 3.55 | 130,915 |
1 Total returns do not include the account service fee that may be applicable to certain accounts with balances below $10,000.
2 Derived from data provided by Lipper Inc.
3 Performance for the fund’s Admiral Shares and comparative standards is calculated since the Admiral Shares’ inception: February 12, 2001.
23
Limited-Term Tax-Exempt Fund
Fiscal-Year Total Returns (%): October 31, 1998–October 31, 2008 | | |
| | | | |
| Investor Shares | Lehman1 |
Fiscal | Capital | Income | Total | Total |
Year | Return | Return | Return | Return |
1999 | –2.4% | 4.2% | 1.8% | 2.2% |
2000 | 0.5 | 4.5 | 5.0 | 4.9 |
2001 | 3.3 | 4.6 | 7.9 | 8.7 |
2002 | 0.1 | 3.9 | 4.0 | 4.8 |
2003 | 0.7 | 3.3 | 4.0 | 3.9 |
2004 | –1.1 | 2.9 | 1.8 | 2.2 |
2005 | –2.3 | 3.0 | 0.7 | 0.3 |
2006 | 0.1 | 3.3 | 3.4 | 3.1 |
2007 | 0.1 | 3.5 | 3.6 | 4.0 |
2008 | –0.7 | 3.4 | 2.7 | 4.3 |
Average Annual Total Returns: Periods Ended September 30, 2008
This table presents average annual total returns through the latest calendar quarter—rather than through the end of the fiscal period. Securities and Exchange Commission rules require that we provide this information.
| | | | | | Ten Years |
| Inception Date | One Year | Five Years | Capital | Income | Total |
Investor Shares2 | 8/31/1987 | 2.87% | 2.37% | –0.17% | 3.68% | 3.51% |
Admiral Shares | 2/12/2001 | 2.95 | 2.44 | –0.243 | 3.503 | 3.263 |
1 Lehman 3 Year Municipal Bond Index.
2 Total returns do not include the account service fee that may be applicable to certain accounts with balances below $10,000.
3 Return since inception.
Note: See Financial Highlights tables for dividend and capital gains information.
24
Limited-Term Tax-Exempt Fund
Financial Statements
The Statement of Net Assets—an integral part of the Financial Statements for Vanguard Limited-Term Tax-Exempt Fund—is included as an insert to this report.
Statement of Operations
| Year Ended |
| October 31, 2008 |
| ($000) |
Investment Income | |
Income | |
Interest1 | 259,473 |
Total Income | 259,473 |
Expenses | |
The Vanguard Group—Note B | |
Investment Advisory Services | 681 |
Management and Administrative | |
Investor Shares | 2,180 |
Admiral Shares | 2,484 |
Marketing and Distribution | |
Investor Shares | 493 |
Admiral Shares | 1,269 |
Custodian Fees | 47 |
Auditing Fees | 21 |
Shareholders’ Reports | |
Investor Shares | 66 |
Admiral Shares | 15 |
Trustees’ Fees and Expenses | 8 |
Total Expenses | 7,264 |
Net Investment Income | 252,209 |
Realized Net Gain (Loss) | |
Investment Securities Sold | (5,237) |
Futures Contracts | (3,366) |
Realized Net Gain (Loss) | (8,603) |
Change in Unrealized Appreciation | |
(Depreciation) | |
Investment Securities | (66,998) |
Futures Contracts | 6,076 |
Change in Unrealized Appreciation | |
(Depreciation) | (60,922) |
Net Increase (Decrease) in Net Assets | |
Resulting from Operations | 182,684 |
Statement of Changes in Net Assets
| Year Ended October 31, |
| 2008 | 2007 |
| ($000) | ($000) |
Increase (Decrease) in Net Assets | | |
Operations | | |
Net Investment Income | 252,209 | 233,672 |
Realized Net Gain (Loss) | (8,603) | (11,656) |
Change in Unrealized Appreciation (Depreciation) | (60,922) | 15,524 |
Net Increase (Decrease) in Net Assets Resulting from Operations | 182,684 | 237,540 |
Distributions | | |
Net Investment Income | | |
Investor Shares | (66,165) | (64,936) |
Admiral Shares | (186,044) | (168,736) |
Realized Capital Gain | | |
Investor Shares | — | — |
Admiral Shares | — | — |
Total Distributions | (252,209) | (233,672) |
Capital Share Transactions | | |
Investor Shares | 313,896 | (185,519) |
Admiral Shares | 881,361 | 228,759 |
Net Increase (Decrease) from Capital Share Transactions | 1,195,257 | 43,240 |
Total Increase (Decrease) | 1,125,732 | 47,108 |
Net Assets | | |
Beginning of Period | 6,712,472 | 6,665,364 |
End of Period | 7,838,204 | 6,712,472 |
1 Interest income from an affiliated company of the fund was $3,317,000.
See accompanying Notes, which are an integral part of the Financial Statements.
25
Limited-Term Tax-Exempt Fund
Financial Highlights
Investor Shares | | | | | |
| | | | | |
| | | | |
For a Share Outstanding | Year Ended October 31, |
Throughout Each Period | 2008 | 2007 | 2006 | 2005 | 2004 |
Net Asset Value, Beginning of Period | $10.73 | $10.72 | $10.71 | $10.96 | $11.08 |
Investment Operations | | | | | |
Net Investment Income | .366 | .371 | .344 | .326 | .318 |
Net Realized and Unrealized Gain (Loss) | | | | | |
on Investments | (.080) | .010 | .010 | (.250) | (.120) |
Total from Investment Operations | .286 | .381 | .354 | .076 | .198 |
Distributions | | | | | |
Dividends from Net Investment Income | (.366) | (.371) | (.344) | (.326) | (.318) |
Distributions from Realized Capital Gains | — | — | — | — | — |
Total Distributions | (.366) | (.371) | (.344) | (.326) | (.318) |
Net Asset Value, End of Period | $10.65 | $10.73 | $10.72 | $10.71 | $10.96 |
| | | | | |
| | | | | |
Total Return1 | 2.68% | 3.62% | 3.37% | 0.71% | 1.82% |
| | | | | |
| | | | | |
Ratios/Supplemental Data | | | | | |
Net Assets, End of Period (Millions) | $2,094 | $1,798 | $1,983 | $2,351 | $3,553 |
Ratio of Total Expenses to | | | | | |
Average Net Assets | 0.15% | 0.15% | 0.16% | 0.16% | 0.14% |
Ratio of Net Investment Income to | | | | | |
Average Net Assets | 3.38% | 3.46% | 3.23% | 3.01% | 2.89% |
Portfolio Turnover Rate | 23% | 32% | 27% | 17% | 8% |
Admiral Shares | | | | | |
| | | | | |
| | | | |
For a Share Outstanding | Year Ended October 31, |
Throughout Each Period | 2008 | 2007 | 2006 | 2005 | 2004 |
Net Asset Value, Beginning of Period | $10.73 | $10.72 | $10.71 | $10.96 | $11.08 |
Investment Operations | | | | | |
Net Investment Income | .374 | .378 | .352 | .334 | .324 |
Net Realized and Unrealized Gain (Loss) | | | | | |
on Investments | (.080) | .010 | .010 | (.250) | (.120) |
Total from Investment Operations | .294 | .388 | .362 | .084 | .204 |
Distributions | | | | | |
Dividends from Net Investment Income | (.374) | (.378) | (.352) | (.334) | (.324) |
Distributions from Realized Capital Gains | — | — | — | — | — |
Total Distributions | (.374) | (.378) | (.352) | (.334) | (.324) |
Net Asset Value, End of Period | $10.65 | $10.73 | $10.72 | $10.71 | $10.96 |
| | | | | |
| | | | | |
Total Return | 2.75% | 3.69% | 3.45% | 0.78% | 1.87% |
| | | | | |
| | | | | |
Ratios/Supplemental Data | | | | | |
Net Assets, End of Period (Millions) | $5,744 | $4,914 | $4,682 | $4,481 | $3,395 |
Ratio of Total Expenses to | | | | | |
Average Net Assets | 0.08% | 0.08% | 0.09% | 0.09% | 0.09% |
Ratio of Net Investment Income to | | | | | |
Average Net Assets | 3.45% | 3.53% | 3.30% | 3.08% | 2.95% |
Portfolio Turnover Rate | 23% | 32% | 27% | 17% | 8% |
1 Total returns do not include the account service fee that may be applicable to certain accounts with balances below $10,000. See accompanying Notes, which are an integral part of the Financial Statements.
26
Limited-Term Tax-Exempt Fund
Notes to Financial Statements
Vanguard Limited-Term Tax-Exempt Fund is registered under the Investment Company Act of 1940 as an open-end investment company, or mutual fund. The fund invests in debt instruments of many municipal issuers; the issuers’ abilities to meet their obligations may be affected by economic and political developments in a specific state or region. The fund offers two classes of shares, Investor Shares and Admiral Shares. Investor Shares are available to any investor who meets the fund’s minimum purchase requirements. Admiral Shares are designed for investors who meet certain administrative, service, tenure, and account-size criteria.
A. The following significant accounting policies conform to generally accepted accounting principles for U.S. mutual funds. The fund consistently follows such policies in preparing its financial statements.
1. Security Valuation: Bonds, and temporary cash investments acquired over 60 days to maturity, are valued using the latest bid prices or using valuations based on a matrix system (which considers such factors as security prices, yields, maturities, and ratings), both as furnished by independent pricing services. Investments in Vanguard Municipal Cash Management Fund are valued at that fund’s net asset value. Other temporary cash investments are valued at amortized cost, which approximates market value. Securities for which market quotations are not readily available, or whose values have been affected by events occurring before the fund’s pricing time but after the close of the securities’ primary markets, are valued by methods deemed by the board of trustees to represent fair value.
2. Futures Contracts: The fund uses futures contracts to invest in fixed income asset classes with greater efficiency and lower cost than is possible through direct investment, to add value when these instruments are attractively priced, or to adjust sensitivity to changes in interest rates. The primary risks associated with the use of futures contracts are imperfect correlation between changes in market values of bonds held by the fund and the prices of futures contracts, and the possibility of an illiquid market.
Futures contracts are valued based upon their quoted daily settlement prices. The aggregate principal amounts of the contracts are not recorded in the Statement of Net Assets. Fluctuations in the value of the contracts are recorded in the Statement of Net Assets as an asset (liability) and in the Statement of Operations as unrealized appreciation (depreciation) until the contracts are closed, when they are recorded as realized futures gains (losses).
3. Federal Income Taxes: The fund intends to continue to qualify as a regulated investment company and distribute all of its income. Management has analyzed the fund’s tax positions taken on federal income tax returns for all open tax years (tax years ended October 31, 2005–2008), and has concluded that no provision for federal income tax is required in the fund’s financial statements.
4. Distributions: Distributions from net investment income are declared daily and paid on the first business day of the following month. Annual distributions from realized capital gains, if any, are recorded on the ex-dividend date.
5. Other: Interest income includes income distributions received from Vanguard Municipal Cash Management Fund and is accrued daily. Premiums and discounts on debt securities purchased are amortized and accreted, respectively, to interest income over the lives of the respective securities. Security transactions are accounted for on the date securities are bought or sold. Costs used to determine realized gains (losses) on the sale of investment securities are those of the specific securities sold.
Each class of shares has equal rights as to assets and earnings, except that each class separately bears certain class-specific expenses related to maintenance of shareholder accounts (included in Management and Administrative expenses) and shareholder reporting. Marketing and distribution expenses are allocated to each class of shares based on a method approved by the board of trustees. Income, other non-class-specific expenses, and gains and losses on investments are allocated to each class of shares based on its relative net assets.
B. The Vanguard Group furnishes at cost investment advisory, corporate management, administrative, marketing, and distribution services. The costs of such services are allocated to the fund under methods approved by the board of trustees. The fund has committed to provide up to 0.40% of its net assets in capital contributions to Vanguard. At October 31, 2008, the fund had contributed capital of $731,000 to Vanguard (included in Other Assets), representing 0.01% of the fund’s net assets and 0.73% of Vanguard’s capitalization. The fund’s trustees and officers are also directors and officers of Vanguard.
27
Limited-Term Tax-Exempt Fund
C. Capital gain distributions are determined on a tax basis and may differ from realized capital gains for financial reporting purposes. Differences may be permanent or temporary. Permanent differences are reclassified among capital accounts in the financial statements to reflect their tax character. Temporary differences arise when gains or losses are recognized in different periods for financial statement and tax purposes; these differences will reverse at some time in the future.
For tax purposes, at October 31, 2008, the fund had available realized losses of $85,753,000 to offset future net capital gains of $815,000 through October 31, 2009, $31,765,000 through October 31, 2011, $1,396,000 through October 31, 2012, $20,383,000 through October 31, 2013, $16,166,000 through October 31, 2014, $12,485,000 through October 31, 2015, and $2,743,000 through October 31, 2016. Capital loss carryforward of $2,880,000 expired on October 31, 2008; accordingly, such losses have been reclassified from accumulated net realized losses to paid-in capital.
The fund had realized losses totaling $137,000 through October 31, 2008, which are deferred for tax purposes and reduce the amount of tax-basis unrealized appreciation on investment securities.
At October 31, 2008, the cost of investment securities for tax purposes was $7,835,469,000. Net unrealized depreciation of investment securities for tax purposes was $66,293,000, consisting of unrealized gains of $31,004,000 on securities that had risen in value since their purchase and $97,297,000 in unrealized losses on securities that had fallen in value since their purchase.
At October 31, 2008, the aggregate settlement value of open futures contracts expiring in December 2008 and the related unrealized appreciation (depreciation) were:
| | | ($000) |
| Number of | Aggregate | Unrealized |
| Long (Short) | Settlement | Appreciation |
Futures Contracts | Contracts | Value | (Depreciation) |
10-Year U.S. Treasury Note | (3,240) | 366,373 | 7,298 |
5-Year U.S. Treasury Note | (1,522) | 172,379 | (1,222) |
Unrealized appreciation (depreciation) on open futures contracts is required to be treated as realized gain (loss) for tax purposes.
D. During the year ended October 31, 2008, the fund purchased $2,608,305,000 of investment securities and sold $1,460,815,000 of investment securities, other than temporary cash investments.
E. Capital share transactions for each class of shares were:
| | | Year Ended October 31, |
| | 2008 | | | 2007 |
| Amount | Shares | | Amount | Shares |
| ($000) | (000) | | ($000) | (000) |
Investor Shares | | | | | |
Issued | 1,130,769 | 104,594 | | 595,187 | 55,678 |
Issued in Lieu of Cash Distributions | 56,844 | 5,269 | | 55,007 | 5,143 |
Redeemed | (873,717) | (80,948) | | (835,713) | (78,168) |
Net Increase (Decrease)—Investor Shares | 313,896 | 28,915 | | (185,519) | (17,347) |
Admiral Shares | | | | | |
Issued | 2,407,300 | 222,699 | | 1,508,998 | 141,138 |
Issued in Lieu of Cash Distributions | 147,628 | 13,684 | | 134,376 | 12,564 |
Redeemed | (1,673,567) | (155,285) | | (1,414,615) | (132,312) |
Net Increase (Decrease)—Admiral Shares | 881,361 | 81,098 | | 228,759 | 21,390 |
| | | | | | |
28
Limited-Term Tax-Exempt Fund
F. In September 2006, the Financial Accounting Standards Board issued Statement of Financial Accounting Standards No. 157 (“FAS 157”), “Fair Value Measurements.” FAS 157 establishes a framework for measuring fair value and expands disclosures about fair value measurements in financial statements.
The various inputs that may be used to determine the value of the fund’s investments are summarized in three broad levels. The inputs or methodologies used for valuing securities are not necessarily an indication of the risk associated with investing in those securities.
Level 1—Quoted prices in active markets for identical securities.
Level 2—Other significant observable inputs (including quoted prices for similar securities, interest rates, prepayment speeds, credit risk, etc.).
Level 3—Significant unobservable inputs (including the fund’s own assumptions used to determine the fair value of investments).
The following table summarizes the fund’s investments as of October 31, 2008, based on the inputs used to value them:
| Investments | Futures |
| in Securities | Contracts |
Valuation Inputs | ($000) | ($000) |
Level 1—Quoted prices | 74,723 | 6,076 |
Level 2—Other significant observable inputs | 7,694,453 | — |
Level 3—Significant unobservable inputs | — | — |
Total | 7,769,176 | 6,076 |
29
Intermediate-Term Tax-Exempt Fund
Fund Profile
As of October 31, 2008
Financial Attributes | | | |
| | Comparative | Broad |
| Fund | Index1 | Index2 |
Number of Issues | 1,626 | 4,174 | 44,143 |
Yield3 | | 4.3% | 4.8% |
Investor Shares | 4.4% | | |
Admiral Shares | 4.5% | | |
Yield to Maturity | 4.5%4 | 4.3% | 4.8% |
Average Coupon | 4.9% | 5.0% | 5.0% |
Average Effective | | | |
Maturity | 7.7 years | 7.0 years | 12.9 years |
Average Quality | AA | AA1 | AA2 |
Average Duration | 5.7 years | 5.5 years | 8.0 years |
Expense Ratio | | | |
(10/31/2007)5 | | — | — |
Investor Shares | 0.15% | | |
Admiral Shares | 0.08% | | |
Short-Term Reserves | 6.0% | — | — |
Largest State Concentrations6 | |
| |
California | 12.4% |
Texas | 11.2 |
Florida | 7.8 |
New York | 6.8 |
New Jersey | 6.1 |
Massachusetts | 5.9 |
Pennsylvania | 4.1 |
Illinois | 3.7 |
Georgia | 3.2 |
Ohio | 3.0 |
Top Ten | 64.2% |
Volatility Measures7 | |
| Fund Versus | Fund Versus |
| Comparative Index1 | Broad Index2 |
R-Squared | 0.91 | 0.97 |
Beta | 1.06 | 0.87 |
Distribution by Maturity (% of portfolio) | |
| |
Under 1 Year | 9.2% |
1–5 Years | 30.0 |
5–10 Years | 26.3 |
10–20 Years | 33.4 |
20–30 Years | 0.9 |
Greater than 30 Years | 0.2 |
Distribution by Credit Quality (% of portfolio) |
| |
AAA | 32.0% |
AA | 52.8 |
A | 11.3 |
BBB | 3.5 |
Other | 0.4 |
Investment Focus
1 Lehman 7 Year Municipal Bond Index.
2 Lehman Municipal Bond Index.
3 30-day SEC yield for the fund; index yield assumes that all bonds are called or prepaid at the earliest possible dates. See the Glossary.
4 Before expenses.
5 The expense ratios shown are from the prospectus dated July 29, 2008. For the fiscal year ended October 31, 2008, expense ratios were 0.15% for Investor Shares and 0.08% for Admiral Shares.
6 Percentages of total net assets, excluding any futures contracts.
7 For an explanation of R-squared, beta, and other terms used here, see the Glossary.
30
Intermediate-Term Tax-Exempt Fund
Performance Summary
All of the returns in this report represent past performance, which is not a guarantee of future results that may be achieved by the fund. (Current performance may be lower or higher than the performance data cited. For performance data current to the most recent month-end, visit our website at www.vanguard.com/performance.) Note, too, that both investment returns and principal value can fluctuate widely, so an investor’s shares, when sold, could be worth more or less than their original cost. The returns shown do not reflect taxes that a shareholder would pay on fund distributions or on the sale of fund shares.
Cumulative Performance: October 31, 1998–October 31, 2008
Initial Investment of $10,000

| Average Annual Total Returns | Final Value |
| Periods Ended October 31, 2008 | of a $10,000 |
| One Year | Five Years | Ten Years | Investment |
Intermediate-Term Tax-Exempt Fund | | | | |
Investor Shares1 | –0.49% | 2.62% | 3.81% | $14,538 |
Lehman Municipal Bond Index | –3.30 | 2.73 | 4.14 | 14,996 |
Lehman 7 Year Municipal Bond Index | 1.91 | 3.15 | 4.41 | 15,402 |
Average Intermediate Municipal Fund2 | –2.07 | 1.83 | 3.18 | 13,681 |
| | | | Final Value |
| | | Since | of a $100,000 |
| One Year | Five Years | Inception3 | Investment |
Intermediate-Term Tax-Exempt Fund Admiral Shares | –0.42% | 2.69 | 3.56 | $130,944 |
Lehman Municipal Bond Index | –3.30 | 2.73 | 3.89 | 134,292 |
Lehman 7 Year Municipal Bond Index | 1.91 | 3.15 | 4.24 | 137,790 |
1 Total returns do not include the account service fee that may be applicable to certain accounts with balances below $10,000.
2 Derived from data provided by Lipper Inc.
3 Performance for the fund’s Admiral Shares and comparative standards is calculated since the Admiral Shares’ inception: February 12, 2001.
31
Intermediate-Term Tax-Exempt Fund
Fiscal-Year Total Returns (%): October 31, 1998–October 31, 2008 |
| | | | |
| Investor Shares | Lehman1 |
Fiscal | Capital | Income | Total | Total |
Year | Return | Return | Return | Return |
1999 | –5.2% | 4.8% | –0.4% | 0.0% |
2000 | 2.0 | 5.3 | 7.3 | 6.8 |
2001 | 4.3 | 5.1 | 9.4 | 9.9 |
2002 | –0.2 | 4.6 | 4.4 | 6.3 |
2003 | 0.5 | 4.2 | 4.7 | 5.8 |
2004 | 0.7 | 4.1 | 4.8 | 4.6 |
2005 | –3.0 | 4.0 | 1.0 | 0.6 |
2006 | 0.8 | 4.3 | 5.1 | 5.0 |
2007 | –1.4 | 4.1 | 2.7 | 3.6 |
2008 | –4.5 | 4.0 | –0.5 | 1.9 |
Average Annual Total Returns: Periods Ended September 30, 2008
This table presents average annual total returns through the latest calendar quarter—rather than through the end of the fiscal period. Securities and Exchange Commission rules require that we provide this information.
| | | | | | Ten Years |
| Inception Date | One Year | Five Years | Capital | Income | Total |
Investor Shares2 | 9/1/1977 | –0.33% | 2.47% | –0.64% | 4.45% | 3.81% |
Admiral Shares | 2/12/2001 | –0.26 | 2.54 | –0.753 | 4.333 | 3.583 |
1 Lehman 7 Year Municipal Bond Index.
2 Total returns do not include the account service fee that may be applicable to certain accounts with balances below $10,000.
3 Return since inception.
Note: See Financial Highlights tables for dividend and capital gains information.
32
Intermediate-Term Tax-Exempt Fund
Financial Statements
The Statement of Net Assets—an integral part of the Financial Statements for Vanguard Intermediate-Term Tax-Exempt Fund—is included as an insert to this report.
Statement of Operations
| Year Ended |
| October 31, 2008 |
| ($000) |
Investment Income | |
Income | |
Interest1 | 768,756 |
Total Income | 768,756 |
Expenses | |
The Vanguard Group—Note B | |
Investment Advisory Services | 1,690 |
Management and Administrative | |
Investor Shares | 5,954 |
Admiral Shares | 6,170 |
Marketing and Distribution | |
Investor Shares | 1,345 |
Admiral Shares | 2,769 |
Custodian Fees | 81 |
Auditing Fees | 24 |
Shareholders’ Reports | |
Investor Shares | 152 |
Admiral Shares | 37 |
Trustees’ Fees and Expenses | 21 |
Total Expenses | 18,243 |
Net Investment Income | 750,513 |
Realized Net Gain (Loss) | |
Investment Securities Sold | (6,630) |
Futures Contracts | (10,303) |
Realized Net Gain (Loss) | (16,933) |
Change in Unrealized Appreciation | |
(Depreciation) | |
Investment Securities | (916,240) |
Futures Contracts | 25,066 |
Change in Unrealized Appreciation | |
(Depreciation) | (891,174) |
Net Increase (Decrease) in Net Assets | |
Resulting from Operations | (157,594) |
Statement of Changes in Net Assets
| Year Ended October 31, |
| 2008 | 2007 |
| ($000) | ($000) |
Increase (Decrease) in Net Assets | | |
Operations | | |
Net Investment Income | 750,513 | 642,176 |
Realized Net Gain (Loss) | (16,933) | (3,059) |
Change in Unrealized Appreciation (Depreciation) | (891,174) | (206,232) |
Net Increase (Decrease) in Net Assets Resulting from Operations | (157,594) | 432,885 |
Distributions | | |
Net Investment Income | | |
Investor Shares | (217,265) | (201,124) |
Admiral Shares | (533,248) | (441,052) |
Realized Capital Gain | | |
Investor Shares | — | — |
Admiral Shares | — | — |
Total Distributions | (750,513) | (642,176) |
Capital Share Transactions | | |
Investor Shares | 936,982 | 24,273 |
Admiral Shares | 2,498,536 | 2,179,027 |
Net Increase (Decrease) from Capital Share Transactions | 3,435,518 | 2,203,300 |
Total Increase (Decrease) | 2,527,411 | 1,994,009 |
Net Assets | | |
Beginning of Period | 16,334,591 | 14,340,582 |
End of Period | 18,862,002 | 16,334,591 |
1 Interest income from an affiliated company of the fund was $5,584,000.
See accompanying Notes, which are an integral part of the Financial Statements.
33
Intermediate-Term Tax-Exempt Fund
Financial Highlights
Investor Shares | | | | | |
| | | | | |
| | | | |
For a Share Outstanding | Year Ended October 31, |
Throughout Each Period | 2008 | 2007 | 2006 | 2005 | 2004 |
Net Asset Value, Beginning of Period | $13.18 | $13.37 | $13.26 | $13.67 | $13.58 |
Investment Operations | | | | | |
Net Investment Income | .535 | .548 | .556 | .548 | .551 |
Net Realized and Unrealized Gain (Loss) | | | | | |
on Investments | (.590) | (.190) | .110 | (.410) | .090 |
Total from Investment Operations | (.055) | .358 | .666 | .138 | .641 |
Distributions | | | | | |
Dividends from Net Investment Income | (.535) | (.548) | (.556) | (.548) | (.551) |
Distributions from Realized Capital Gains | — | — | — | — | — |
Total Distributions | (.535) | (.548) | (.556) | (.548) | (.551) |
Net Asset Value, End of Period | $12.59 | $13.18 | $13.37 | $13.26 | $13.67 |
| | | | | |
| | | | | |
Total Return1 | –0.49% | 2.74% | 5.14% | 1.02% | 4.82% |
| | | | | |
| | | | | |
Ratios/Supplemental Data | | | | | |
Net Assets, End of Period (Millions) | $5,524 | $4,851 | $4,895 | $4,745 | $6,858 |
Ratio of Total Expenses to | | | | | |
Average Net Assets | 0.15% | 0.15% | 0.17% | 0.16% | 0.14% |
Ratio of Net Investment Income to | | | | | |
Average Net Assets | 4.08% | 4.14% | 4.19% | 4.06% | 4.05% |
Portfolio Turnover Rate | 23% | 12% | 8% | 12% | 10% |
Admiral Shares | | | | | |
| | | | | |
| | | | |
For a Share Outstanding | Year Ended October 31, |
Throughout Each Period | 2008 | 2007 | 2006 | 2005 | 2004 |
Net Asset Value, Beginning of Period | $13.18 | $13.37 | $13.26 | $13.67 | $13.58 |
Investment Operations | | | | | |
Net Investment Income | .544 | .557 | .566 | .558 | .559 |
Net Realized and Unrealized Gain (Loss) | | | | | |
on Investments | (.590) | (.190) | .110 | (.410) | .090 |
Total from Investment Operations | (.046) | .367 | .676 | .148 | .649 |
Distributions | | | | | |
Dividends from Net Investment Income | (.544) | (.557) | (.566) | (.558) | (.559) |
Distributions from Realized Capital Gains | — | — | — | — | — |
Total Distributions | (.544) | (.557) | (.566) | (.558) | (.559) |
Net Asset Value, End of Period | $12.59 | $13.18 | $13.37 | $13.26 | $13.67 |
| | | | | |
| | | | | |
Total Return | –0.42% | 2.81% | 5.22% | 1.09% | 4.88% |
| | | | | |
| | | | | |
Ratios/Supplemental Data | | | | | |
Net Assets, End of Period (Millions) | $13,338 | $11,484 | $9,445 | $7,990 | $5,145 |
Ratio of Total Expenses to | | | | | |
Average Net Assets | 0.08% | 0.08% | 0.09% | 0.09% | 0.09% |
Ratio of Net Investment Income to | | | | | |
Average Net Assets | 4.15% | 4.21% | 4.27% | 4.13% | 4.11% |
Portfolio Turnover Rate | 23% | 12% | 8% | 12% | 10% |
1 Total returns do not include the account service fee that may be applicable to certain accounts with balances below $10,000. See accompanying Notes, which are an integral part of the Financial Statements.
34
Intermediate-Term Tax-Exempt Fund
Notes to Financial Statements
Vanguard Intermediate-Term Tax-Exempt Fund is registered under the Investment Company Act of 1940 as an open-end investment company, or mutual fund. The fund invests in debt instruments of many municipal issuers; the issuers’ abilities to meet their obligations may be affected by economic and political developments in a specific state or region. The fund offers two classes of shares, Investor Shares and Admiral Shares. Investor Shares are available to any investor who meets the fund’s minimum purchase requirements. Admiral Shares are designed for investors who meet certain administrative, service, tenure, and account-size criteria.
A. The following significant accounting policies conform to generally accepted accounting principles for U.S. mutual funds. The fund consistently follows such policies in preparing its financial statements.
1. Security Valuation: Bonds, and temporary cash investments acquired over 60 days to maturity, are valued using the latest bid prices or using valuations based on a matrix system (which considers such factors as security prices, yields, maturities, and ratings), both as furnished by independent pricing services. Investments in Vanguard Municipal Cash Management Fund are valued at that fund’s net asset value. Other temporary cash investments are valued at amortized cost, which approximates market value. Securities for which market quotations are not readily available, or whose values have been affected by events occurring before the fund’s pricing time but after the close of the securities’ primary markets, are valued by methods deemed by the board of trustees to represent fair value.
2. Futures Contracts: The fund uses futures contracts to invest in fixed income asset classes with greater efficiency and lower cost than is possible through direct investment, to add value when these instruments are attractively priced, or to adjust sensitivity to changes in interest rates. The primary risks associated with the use of futures contracts are imperfect correlation between changes in market values of bonds held by the fund and the prices of futures contracts, and the possibility of an illiquid market.
Futures contracts are valued based upon their quoted daily settlement prices. The aggregate principal amounts of the contracts are not recorded in the Statement of Net Assets. Fluctuations in the value of the contracts are recorded in the Statement of Net Assets as an asset (liability) and in the Statement of Operations as unrealized appreciation (depreciation) until the contracts are closed, when they are recorded as realized futures gains (losses).
3. Federal Income Taxes: The fund intends to continue to qualify as a regulated investment company and distribute all of its income. Management has analyzed the fund’s tax positions taken on federal income tax returns for all open tax years (tax years ended October 31, 2005–2008), and has concluded that no provision for federal income tax is required in the fund’s financial statements.
4. Distributions: Distributions from net investment income are declared daily and paid on the first business day of the following month. Annual distributions from realized capital gains, if any, are recorded on the ex-dividend date.
5. Other: Interest income includes income distributions received from Vanguard Municipal Cash Management Fund and is accrued daily. Premiums and discounts on debt securities purchased are amortized and accreted, respectively, to interest income over the lives of the respective securities. Security transactions are accounted for on the date securities are bought or sold. Costs used to determine realized gains (losses) on the sale of investment securities are those of the specific securities sold.
Each class of shares has equal rights as to assets and earnings, except that each class separately bears certain class-specific expenses related to maintenance of shareholder accounts (included in Management and Administrative expenses) and shareholder reporting. Marketing and distribution expenses are allocated to each class of shares based on a method approved by the board of trustees. Income, other non-class-specific expenses, and gains and losses on investments are allocated to each class of shares based on its relative net assets.
B. The Vanguard Group furnishes at cost investment advisory, corporate management, administrative, marketing, and distribution services. The costs of such services are allocated to the fund under methods approved by the board of trustees. The fund has committed to provide up to 0.40% of its net assets in capital contributions to Vanguard. At October 31, 2008, the fund had contributed capital of $1,747,000 to Vanguard (included in Other Assets), representing 0.01% of the fund’s net assets and 1.75% of Vanguard’s capitalization. The fund’s trustees and officers are also directors and officers of Vanguard.
35
Intermediate-Term Tax-Exempt Fund
C. Capital gain distributions are determined on a tax basis and may differ from realized capital gains for financial reporting purposes. Differences may be permanent or temporary. Permanent differences are reclassified among capital accounts in the financial statements to reflect their tax character. Temporary differences arise when gains or losses are recognized in different periods for financial statement and tax purposes; these differences will reverse at some time in the future.
For tax purposes, at October 31, 2008, the fund had available realized losses of $87,199,000 to offset future net capital gains of $19,291,000 through October 31, 2011, $22,706,000 through October 31, 2013, $32,718,000 through October 31, 2014, $2,439,000 through October 31, 2015, and $10,045,000 through October 31, 2016.
The fund had realized losses totaling $12,573,000 through October 31, 2008, which are deferred for tax purposes and reduce the amount of tax-basis unrealized appreciation on investment securities.
At October 31, 2008, the cost of investment securities for tax purposes was $19,559,727,000. Net unrealized depreciation of investment securities for tax purposes was $747,806,000, consisting of unrealized gains of $126,778,000 on securities that had risen in value since their purchase and $874,584,000 in unrealized losses on securities that had fallen in value since their purchase.
At October 31, 2008, the aggregate settlement value of open futures contracts expiring in December 2008 and the related unrealized appreciation (depreciation) were:
| | | ($000) |
| Number of | Aggregate | Unrealized |
| Long (Short) | Settlement | Appreciation |
Futures Contracts | Contracts | Value | (Depreciation) |
10-Year U.S. Treasury Note | (5,148) | 582,126 | 16,328 |
5-Year U.S. Treasury Note | (2,638) | 298,774 | (1,867) |
30-Year U.S. Treasury Bond | (2,176) | 246,160 | 10,605 |
Unrealized appreciation (depreciation) on open futures contracts is required to be treated as realized gain (loss) for tax purposes.
D. During the year ended October 31, 2008, the fund purchased $7,210,262,000 of investment securities and sold $3,958,618,000 of investment securities, other than temporary cash investments.
E. Capital share transactions for each class of shares were:
| | | Year Ended October 31, |
| | 2008 | | | 2007 |
| Amount | Shares | | Amount | Shares |
| ($000) | (000) | | ($000) | (000) |
Investor Shares | | | | | |
Issued | 2,773,232 | 211,915 | | 1,633,549 | 123,274 |
Issued in Lieu of Cash Distributions | 173,566 | 13,295 | | 162,360 | 12,261 |
Redeemed | (2,009,816) | (154,206) | | (1,771,636) | (133,823) |
Net Increase (Decrease)—Investor Shares | 936,982 | 71,004 | | 24,273 | 1,712 |
Admiral Shares | | | | | |
Issued | 5,295,355 | 404,264 | | 3,514,276 | 265,378 |
Issued in Lieu of Cash Distributions | 380,144 | 29,119 | | 321,955 | 24,326 |
Redeemed | (3,176,963) | (244,589) | | (1,657,204) | (125,324) |
Net Increase (Decrease)—Admiral Shares | 2,498,536 | 188,794 | | 2,179,027 | 164,380 |
36
Intermediate-Term Tax-Exempt Fund
F. In September 2006, the Financial Accounting Standards Board issued Statement of Financial Accounting Standards No. 157 (“FAS 157”), “Fair Value Measurements.” FAS 157 establishes a framework for measuring fair value and expands disclosures about fair value measurements in financial statements.
The various inputs that may be used to determine the value of the fund’s investments are summarized in three broad levels. The inputs or methodologies used for valuing securities are not necessarily an indication of the risk associated with investing in those securities.
Level 1—Quoted prices in active markets for identical securities.
Level 2—Other significant observable inputs (including quoted prices for similar securities, interest rates, prepayment speeds, credit risk, etc.).
Level 3—Significant unobservable inputs (including the fund’s own assumptions used to determine the fair value of investments).
The following table summarizes the fund’s investments as of October 31, 2008, based on the inputs used to value them.
| Investments | Futures |
| in Securities | Contracts |
Valuation Inputs | ($000) | ($000) |
Level 1—Quoted prices | 87,029 | 25,066 |
Level 2—Other significant observable inputs | 18,724,892 | — |
Level 3—Significant unobservable inputs | — | — |
Total | 18,811,921 | 25,066 |
37
Insured Long-Term Tax-Exempt Fund
Fund Profile
As of October 31, 2008
Financial Attributes | | | |
| | Comparative | Broad |
| Fund | Index1 | Index2 |
Number of Issues | 317 | 7,554 | 44,143 |
Yield3 | | 4.9% | 4.8% |
Investor Shares | 4.8% | | |
Admiral Shares | 4.9% | | |
Yield to Maturity | 5.0%4 | 4.9% | 4.8% |
Average Coupon | 4.5% | 5.0% | 5.0% |
Average Effective | | | |
Maturity | 12.3 years | 9.9 years | 12.9 years |
Average Quality | AA+ | AA2 | AA2 |
Average Duration | 7.0 years | 7.4 years | 8.0 years |
Expense Ratio | | | |
(10/31/2007)5 | | — | — |
Investor Shares | 0.15% | | |
Admiral Shares | 0.08% | | |
Short-Term Reserves | 4.2% | — | — |
Largest State Concentrations6 | |
| |
California | 16.2% |
Texas | 11.2 |
Florida | 9.4 |
New Jersey | 8.4 |
Georgia | 5.5 |
Illinois | 5.2 |
New York | 4.1 |
Colorado | 3.6 |
Pennsylvania | 2.9 |
Massachusetts | 2.9 |
Top Ten | 69.4% |
Volatility Measures7 | |
| Fund Versus | Fund Versus |
| Comparative Index1 | Broad Index2 |
R-Squared | 0.93 | 0.99 |
Beta | 1.14 | 1.09 |
Distribution by Maturity (% of portfolio) | |
| |
Under 1 Year | 7.1% |
1–5 Years | 25.5 |
5–10 Years | 15.4 |
10–20 Years | 25.2 |
20–30 Years | 24.9 |
Over 30 Years | 1.9 |
Distribution by Credit Quality (% of portfolio) |
| |
AAA | 40.1% |
AA | 54.7 |
A | 4.8 |
BBB | 0.4 |
Investment Focus
1 Lehman 10 Year Municipal Bond Index.
2 Lehman Municipal Bond Index.
3 30-day SEC yield for the fund; index yield assumes that all bonds are called or prepaid at the earliest possible dates. See the Glossary.
4 Before expenses.
5 The expense ratios shown are from the prospectus dated July 29, 2008. For the fiscal year ended October 31, 2008, the expense ratios were 0.15% for Investor Shares and 0.08% for Admiral Shares.
6 Percentages of total net assets, excluding any futures contracts.
7 For an explanation of R-squared, beta, and other terms used here, see the Glossary.
38
Insured Long-Term Tax-Exempt Fund
Performance Summary
All of the returns in this report represent past performance, which is not a guarantee of future results that may be achieved by the fund. (Current performance may be lower or higher than the performance data cited. For performance data current to the most recent month-end, visit our website at www.vanguard.com/performance.) Note, too, that both investment returns and principal value can fluctuate widely, so an investor’s shares, when sold, could be worth more or less than their original cost. The returns shown do not reflect taxes that a shareholder would pay on fund distributions or on the sale of fund shares.
Cumulative Performance: October 31, 1998–October 31, 2008
Initial Investment of $10,000
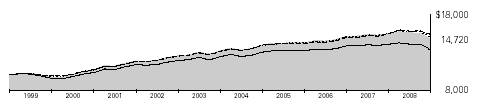
| | | |
| | | | |
| Average Annual Total Returns | Final Value |
| Periods Ended October 31, 2008 | of a $10,000 |
| One Year | Five Years | Ten Years | Investment |
Insured Long-Term Tax-Exempt Fund | | | | |
Investor Shares1 | –4.85% | 2.17% | 3.94% | $14,720 |
Lehman Municipal Bond Index | –3.30 | 2.73 | 4.14 | 14,996 |
Lehman 10 Year Municipal Bond Index | –0.63 | 3.19 | 4.38 | 15,354 |
Average Insured Municipal Fund2 | –5.39 | 1.42 | 2.91 | 13,317 |
| | | | Final Value |
| | | Since | of a $100,000 |
| One Year | Five Years | Inception3 | Investment |
Insured Long-Term Tax-Exempt Fund Admiral Shares | –4.78% | 2.24% | 3.59% | $131,266 |
Lehman Municipal Bond Index | –3.30 | 2.73 | 3.88 | 134,168 |
Lehman 10 Year Municipal Bond Index | –0.63 | 3.19 | 4.17 | 137,165 |
1 Total returns do not include the account service fee that may be applicable to certain accounts with balances below $10,000.
2 Derived from data provided by Lipper Inc.
3 Performance for the fund’s Admiral Shares and comparative standards is calculated since the Admiral Shares’ inception: February 12, 2001.
39
Insured Long-Term Tax-Exempt Fund
Fiscal-Year Total Returns (%): October 31, 1998–October 31, 2008 |
| | | | |
| Investor Shares | Lehman1 |
Fiscal | Capital | Income | Total | Total |
Year | Return | Return | Return | Return |
1999 | –7.7% | 5.0% | –2.7% | –1.2% |
2000 | 3.8 | 5.9 | 9.7 | 8.2 |
2001 | 5.6 | 5.4 | 11.0 | 10.2 |
2002 | 0.9 | 4.8 | 5.7 | 6.2 |
2003 | 1.0 | 4.6 | 5.6 | 4.9 |
2004 | 1.0 | 4.8 | 5.8 | 6.3 |
2005 | –2.5 | 4.5 | 2.0 | 1.2 |
2006 | 1.3 | 4.7 | 6.0 | 6.0 |
2007 | –2.2 | 4.5 | 2.3 | 3.2 |
2008 | –9.1 | 4.2 | –4.9 | –0.6 |
Average Annual Total Returns: Periods Ended September 30, 2008
This table presents average annual total returns through the latest calendar quarter—rather than through the end of the fiscal period. Securities and Exchange Commission rules require that we provide this information.
| | | | | | Ten Years |
| Inception Date | One Year | Five Years | Capital | Income | Total |
Investor Shares2 | 9/30/1984 | –3.35% | 2.32% | –0.81% | 4.85% | 4.04% |
Admiral Shares | 2/12/2001 | –3.28 | 2.39 | –0.933 | 4.733 | 3.803 |
1 Lehman 10 Year Municipal Bond Index.
2 Total returns do not include the account service fee that may be applicable to certain accounts with balances below $10,000.
3 Return since inception.
Note: See Financial Highlights tables for dividend and capital gains information.
40
Insured Long-Term Tax-Exempt Fund
Financial Statements
The Statement of Net Assets—an integral part of the Financial Statements for Vanguard Insured Long-Term Tax-Exempt Fund—is included as an insert to this report.
Statement of Operations
| Year Ended |
| October 31, 2008 |
| ($000) |
Investment Income | |
Income | |
Interest | 161,904 |
Total Income | 161,904 |
Expenses | |
The Vanguard Group—Note B | |
Investment Advisory Services | 325 |
Management and Administrative | |
Investor Shares | 1,029 |
Admiral Shares | 1,297 |
Marketing and Distribution | |
Investor Shares | 209 |
Admiral Shares | 464 |
Custodian Fees | 25 |
Auditing Fees | 24 |
Shareholders’ Reports | |
Investor Shares | 24 |
Admiral Shares | 6 |
Trustees’ Fees and Expenses | 4 |
Total Expenses | 3,407 |
Expenses Paid Indirectly | (34) |
Net Expenses | 3,373 |
Net Investment Income | 158,531 |
Realized Net Gain (Loss) | |
Investment Securities Sold | (7,429) |
Futures Contracts | (5,022) |
Realized Net Gain (Loss) | (12,451) |
Change in Unrealized Appreciation | |
(Depreciation) | |
Investment Securities | (315,544) |
Futures Contracts | 4,860 |
Change in Unrealized Appreciation | |
(Depreciation) | (310,684) |
Net Increase (Decrease) in Net Assets | |
Resulting from Operations | (164,604) |
Statement of Changes in Net Assets
| Year Ended October 31, |
| 2008 | 2007 |
| ($000) | ($000) |
Increase (Decrease) in Net Assets | | |
Operations | | |
Net Investment Income | 158,531 | 150,504 |
Realized Net Gain (Loss) | (12,451) | 2,625 |
Change in Unrealized Appreciation (Depreciation) | (310,684) | (75,183) |
Net Increase (Decrease) in Net Assets Resulting from Operations | (164,604) | 77,946 |
Distributions | | |
Net Investment Income | | |
Investor Shares | (41,227) | (42,731) |
Admiral Shares | (117,304) | (107,773) |
Realized Capital Gain1 | | |
Investor Shares | — | (1,448) |
Admiral Shares | — | (3,467) |
Total Distributions | (158,531) | (155,419) |
Capital Share Transactions | | |
Investor Shares | (25,808) | 13,178 |
Admiral Shares | 195,342 | 265,817 |
Net Increase (Decrease) from Capital Share Transactions | 169,534 | 278,995 |
Total Increase (Decrease) | (153,601) | 201,522 |
Net Assets | | |
Beginning of Period | 3,389,196 | 3,187,674 |
End of Period | 3,235,595 | 3,389,196 |
1 Includes fiscal 2007 short-term gain distributions totaling $3,471,000. Short-term gain distributions are treated as ordinary income dividends for tax purposes. See accompanying Notes, which are an integral part of the Financial Statements.
41
Insured Long-Term Tax-Exempt Fund
Financial Highlights
Investor Shares | | | | | |
| | | | | |
| | | | |
For a Share Outstanding | Year Ended October 31, |
Throughout Each Period | 2008 | 2007 | 2006 | 2005 | 2004 |
Net Asset Value, Beginning of Period | $12.38 | $12.68 | $12.56 | $12.90 | $12.89 |
Investment Operations | | | | | |
Net Investment Income | .553 | .569 | .577 | .578 | .587 |
Net Realized and Unrealized Gain (Loss) | | | | | |
on Investments | (1.130) | (.281) | .157 | (.321) | .134 |
Total from Investment Operations | (.577) | .288 | .734 | .257 | .721 |
Distributions | | | | | |
Dividends from Net Investment Income | (.553) | (.569) | (.577) | (.578) | (.587) |
Distributions from Realized Capital Gains | — | (.019) | (.037) | (.019) | (.124) |
Total Distributions | (.553) | (.588) | (.614) | (.597) | (.711) |
Net Asset Value, End of Period | $11.25 | $12.38 | $12.68 | $12.56 | $12.90 |
| | | | | |
| | | | | |
Total Return1 | –4.85% | 2.34% | 6.00% | 2.01% | 5.76% |
| | | | | |
| | | | | |
Ratios/Supplemental Data | | | | | |
Net Assets, End of Period (Millions) | $838 | $947 | $956 | $1,043 | $1,880 |
Ratio of Total Expenses to | | | | | |
Average Net Assets | 0.15% | 0.15% | 0.16% | 0.16% | 0.15% |
Ratio of Net Investment Income to | | | | | |
Average Net Assets | 4.57% | 4.55% | 4.60% | 4.52% | 4.50% |
Portfolio Turnover Rate | 23% | 34% | 19% | 15% | 18% |
Admiral Shares | | | | | |
| | | | | |
| | | | |
For a Share Outstanding | Year Ended October 31, |
Throughout Each Period | 2008 | 2007 | 2006 | 2005 | 2004 |
Net Asset Value, Beginning of Period | $12.38 | $12.68 | $12.56 | $12.90 | $12.89 |
Investment Operations | | | | | |
Net Investment Income | .562 | .578 | .586 | .587 | .594 |
Net Realized and Unrealized Gain (Loss) | | | | | |
on Investments | (1.130) | (.281) | .157 | (.321) | .134 |
Total from Investment Operations | (.568) | .297 | .743 | .266 | .728 |
Distributions | | | | | |
Dividends from Net Investment Income | (.562) | (.578) | (.586) | (.587) | (.594) |
Distributions from Realized Capital Gains | — | (.019) | (.037) | (.019) | (.124) |
Total Distributions | (.562) | (.597) | (.623) | (.606) | (.718) |
Net Asset Value, End of Period | $11.25 | $12.38 | $12.68 | $12.56 | $12.90 |
| | | | | |
| | | | | |
Total Return | –4.78% | 2.41% | 6.08% | 2.08% | 5.82% |
| | | | | |
| | | | | |
Ratios/Supplemental Data | | | | | |
Net Assets, End of Period (Millions) | $2,398 | $2,442 | $2,232 | $1,987 | $1,076 |
Ratio of Total Expenses to | | | | | |
Average Net Assets | 0.08% | 0.08% | 0.09% | 0.09% | 0.09% |
Ratio of Net Investment Income to | | | | | |
Average Net Assets | 4.64% | 4.62% | 4.67% | 4.58% | 4.56% |
Portfolio Turnover Rate | 23% | 34% | 19% | 15% | 18% |
1 Total returns do not include the account service fee that may be applicable to certain accounts with balances below $10,000. See accompanying Notes, which are an integral part of the Financial Statements.
42
Insured Long-Term Tax-Exempt Fund
Notes to Financial Statements
Vanguard Insured Long-Term Tax-Exempt Fund is registered under the Investment Company Act of 1940 as an open-end investment company, or mutual fund. The fund invests in debt instruments of many municipal issuers; the issuers’ abilities to meet their obligations may be affected by economic and political developments in a specific state or region. The fund offers two classes of shares, Investor Shares and Admiral Shares. Investor Shares are available to any investor who meets the fund’s minimum purchase requirements. Admiral Shares are designed for investors who meet certain administrative, service, tenure, and account-size criteria.
A. The following significant accounting policies conform to generally accepted accounting principles for U.S. mutual funds. The fund consistently follows such policies in preparing its financial statements.
1. Security Valuation: Bonds, and temporary cash investments acquired over 60 days to maturity, are valued using the latest bid prices or using valuations based on a matrix system (which considers such factors as security prices, yields, maturities, and ratings), both as furnished by independent pricing services. Other temporary cash investments are valued at amortized cost, which approximates market value. Securities for which market quotations are not readily available, or whose values have been affected by events occurring before the fund’s pricing time but after the close of the securities’ primary markets, are valued by methods deemed by the board of trustees to represent fair value.
2. Futures Contracts: The fund uses futures contracts to invest in fixed income asset classes with greater efficiency and lower cost than is possible through direct investment, to add value when these instruments are attractively priced, or to adjust sensitivity to changes in interest rates. The primary risks associated with the use of futures contracts are imperfect correlation between changes in market values of bonds held by the fund and the prices of futures contracts, and the possibility of an illiquid market.
Futures contracts are valued based upon their quoted daily settlement prices. The aggregate principal amounts of the contracts are not recorded in the Statement of Net Assets. Fluctuations in the value of the contracts are recorded in the Statement of Net Assets as an asset (liability) and in the Statement of Operations as unrealized appreciation (depreciation) until the contracts are closed, when they are recorded as realized futures gains (losses).
3. Federal Income Taxes: The fund intends to continue to qualify as a regulated investment company and distribute all of its income. Management has analyzed the fund’s tax positions taken on federal income tax returns for all open tax years (tax years ended October 31, 2005–2008), and has concluded that no provision for federal income tax is required in the fund’s financial statements.
4. Distributions: Distributions from net investment income are declared daily and paid on the first business day of the following month. Annual distributions from realized capital gains, if any, are recorded on the ex-dividend date.
5. Other: Interest income is accrued daily. Premiums and discounts on debt securities purchased are amortized and accreted, respectively, to interest income over the lives of the respective securities. Security transactions are accounted for on the date securities are bought or sold. Costs used to determine realized gains (losses) on the sale of investment securities are those of the specific securities sold.
Each class of shares has equal rights as to assets and earnings, except that each class separately bears certain class-specific expenses related to maintenance of shareholder accounts (included in Management and Administrative expenses) and shareholder reporting. Marketing and distribution expenses are allocated to each class of shares based on a method approved by the board of trustees. Income, other non-class-specific expenses, and gains and losses on investments are allocated to each class of shares based on its relative net assets.
B. The Vanguard Group furnishes at cost investment advisory, corporate management, administrative, marketing, and distribution services. The costs of such services are allocated to the fund under methods approved by the board of trustees. The fund has committed to provide up to 0.40% of its net assets in capital contributions to Vanguard. At October 31, 2008, the fund had contributed capital of $305,000 to Vanguard (included in Other Assets), representing 0.01% of the fund’s net assets and 0.30% of Vanguard’s capitalization. The fund’s trustees and officers are also directors and officers of Vanguard.
43
Insured Long-Term Tax-Exempt Fund
C. The fund’s investment advisor may direct new-issue purchases, subject to obtaining the best price and execution, to underwriters who have agreed to rebate or credit to the fund part of the underwriting fees generated. Such rebates or credits are used solely to reduce the fund’s management and administrative expenses. The fund’s custodian bank has also agreed to reduce its fees when the fund maintains cash on deposit in the non-interest-bearing custody account. For the year ended October 31, 2008, these arrangements reduced the fund’s management and administrative expenses by $16,000 and custodian fees by $18,000. The total expense reduction represented an annual effective rate of 0.00% of the fund’s average net assets.
D. Capital gain distributions are determined on a tax basis and may differ from realized capital gains for financial reporting purposes. Differences may be permanent or temporary. Permanent differences are reclassified among capital accounts in the financial statements to reflect their tax character. Temporary differences arise when gains or losses are recognized in different periods for financial statement and tax purposes; these differences will reverse at some time in the future.
For tax purposes, at October 31, 2008, the fund had available realized losses of $14,857,000 to offset future net capital gains through October 31, 2016.
The fund had realized losses totaling $14,017,000 through October 31, 2008, which are deferred for tax purposes and reduce the amount of tax-basis unrealized appreciation on investment securities.
At October 31, 2008, the cost of investment securities for tax purposes was $3,394,512,000. Net unrealized depreciation of investment securities for tax purposes was $201,992,000, consisting of unrealized gains of $52,084,000 on securities that had risen in value since their purchase and $254,076,000 in unrealized losses on securities that had fallen in value since their purchase.
At October 31, 2008, the aggregate settlement value of open futures contracts expiring in December 2008 and the related unrealized appreciation (depreciation) were:
| | | ($000) |
| Number of | Aggregate | Unrealized |
| Long (Short) | Settlement | Appreciation |
Futures Contracts | Contracts | Value | (Depreciation) |
10-Year U.S. Treasury Note | (767) | 86,731 | 2,674 |
5-Year U.S. Treasury Note | (383) | 43,378 | (315) |
30-Year U.S. Treasury Bond | (353) | 39,933 | 1,728 |
Unrealized appreciation (depreciation) on open futures contracts is required to be treated as realized gain (loss) for tax purposes.
E. During the year ended October 31, 2008, the fund purchased $861,887,000 of investment securities and sold $761,202,000 of investment securities, other than temporary cash investments.
F. Capital share transactions for each class of shares were:
| | | Year Ended October 31, |
| | 2008 | | | 2007 |
| Amount | Shares | | Amount | Shares |
| ($000) | (000) | | ($000) | (000) |
Investor Shares | | | | | |
Issued | 242,612 | 20,200 | | 217,636 | 17,436 |
Issued in Lieu of Cash Distributions | 29,790 | 2,480 | | 32,379 | 2,592 |
Redeemed | (298,210) | (24,641) | | (236,837) | (18,954) |
Net Increase (Decrease)—Investor Shares | (25,808) | (1,961) | | 13,178 | 1,074 |
Admiral Shares | | | | | |
Issued | 696,756 | 57,984 | | 526,842 | 42,330 |
Issued in Lieu of Cash Distributions | 77,932 | 6,494 | | 72,061 | 5,769 |
Redeemed | (579,346) | (48,570) | | (333,086) | (26,789) |
Net Increase (Decrease)—Admiral Shares | 195,342 | 15,908 | | 265,817 | 21,310 |
44
Insured Long-Term Tax-Exempt Fund
G. In September 2006, the Financial Accounting Standards Board issued Statement of Financial Accounting Standards No. 157 (“FAS 157”), “Fair Value Measurements.” FAS 157 establishes a framework for measuring fair value and expands disclosures about fair value measurements in financial statements.
The various inputs that may be used to determine the value of the fund’s investments are summarized in three broad levels. The inputs or methodologies used for valuing securities are not necessarily an indication of the risk associated with investing in those securities.
Level 1—Quoted prices in active markets for identical securities.
Level 2—Other significant observable inputs (including quoted prices for similar securities, interest rates, prepayment speeds, credit risk, etc.).
Level 3—Significant unobservable inputs (including the fund’s own assumptions used to determine the fair value of investments).
The following table summarizes the fund’s investments as of October 31, 2008, based on the inputs used to value them:
| Investments | Futures |
| in Securities | Contracts |
Valuation Inputs | ($000) | ($000) |
Level 1—Quoted prices | — | 4,087 |
Level 2—Other significant observable inputs | 3,192,520 | — |
Level 3—Significant unobservable inputs | — | — |
Total | 3,192,520 | 4,087 |
H. As of the close of business on December 12, 2008, all the net assets of the fund were acquired by Vanguard Long-Term Tax-Exempt Fund pursuant to a plan of reorganization approved by the fund’s board of trustees. The acquisition was accomplished by a tax-free exchange of 304,848,000 shares of the Long-Term Tax-Exempt Fund for 274,107,000 shares of the fund outstanding as of the close of business on December 12, 2008. Each class of shares of the fund was exchanged for the like class of shares of the Long-Term Tax-Exempt Fund. The fund’s net assets of $2,935,954,000, including $328,828,000 of unrealized depreciation, were combined with the Long-Term Tax-Exempt Fund’s net assets of $2,825,457,000, resulting in Long-Term Tax-Exempt Fund net assets of $5,761,411,000 immediately following the acquisition of the fund.
Long-Term Tax-Exempt Fund
Fund Profile
As of October 31, 2008
Financial Attributes | | | |
| | Comparative | Broad |
| Fund | Index1 | Index2 |
Number of Issues | 348 | 7,554 | 44,143 |
Yield3 | | 4.9% | 4.8% |
Investor Shares | 4.9% | | |
Admiral Shares | 5.0% | | |
Yield to Maturity | 4.9%4 | 4.9% | 4.8% |
Average Coupon | 4.5% | 5.0% | 5.0% |
Average Effective | | | |
Maturity | 12.7 years | 9.9 years | 12.9 years |
Average Quality | AA | AA2 | AA2 |
Average Duration | 7.0 years | 7.4 years | 8.0 years |
Expense Ratio | | | |
(10/31/2007)5 | | — | — |
Investor Shares | 0.15% | | |
Admiral Shares | 0.08% | | |
Short-Term Reserves | 6.8% | — | — |
Largest State Concentrations6
California | 14.5% |
Texas | 11.5 |
New York | 10.1 |
Massachusetts | 6.0 |
Florida | 5.8 |
Illinois | 4.2 |
New Jersey | 3.9 |
Pennsylvania | 3.8 |
South Carolina | 3.3 |
Georgia | 3.2 |
Top Ten | 66.3% |
Volatility Measures7 | |
| Fund Versus | Fund Versus |
| Comparative Index1 | Broad Index2 |
R-Squared | 0.94 | 0.99 |
Beta | 1.17 | 1.10 |
Distribution by Maturity (% of portfolio) | |
| |
Under 1 Year | 9.1% |
1–5 Years | 26.1 |
5–10 Years | 13.8 |
10–20 Years | 20.9 |
20–30 Years | 23.9 |
Over 30 Years | 6.2 |
Distribution by Credit Quality (% of portfolio) |
| |
AAA | 27.3% |
AA | 51.0 |
A | 15.9 |
BBB | 5.6 |
Other | 0.2 |
Investment Focus
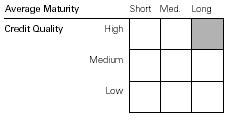
1 Lehman 10 Year Municipal Bond Index.
2 Lehman Municipal Bond Index.
3 30-day SEC yield for the fund; index yield assumes that all bonds are called or prepaid at the earliest possible dates. See the Glossary.
4 Before expenses.
5 The expense ratios shown are from the prospectus dated July 29, 2008. For the fiscal year ended October 31, 2008, the expense ratios were 0.15% for Investor Shares and 0.08% for Admiral Shares.
6 Percentages of total net assets, excluding any futures contracts.
7 For an explanation of R-squared, beta, and other terms used here, see the Glossary.
46
Long-Term Tax-Exempt Fund
Performance Summary
All of the returns in this report represent past performance, which is not a guarantee of future results that may be achieved by the fund. (Current performance may be lower or higher than the performance data cited. For performance data current to the most recent month-end, visit our website at www.vanguard.com/performance.) Note, too, that both investment returns and principal value can fluctuate widely, so an investor’s shares, when sold, could be worth more or less than their original cost. The returns shown do not reflect taxes that a shareholder would pay on fund distributions or on the sale of fund shares.
Cumulative Performance: October 31, 1998–October 31, 2008
Initial Investment of $10,000

| Average Annual Total Returns | Final Value |
| Periods Ended October 31, 2008 | of a $10,000 |
| One Year | Five Years | Ten Years | Investment |
Long-Term Tax-Exempt Fund Investor Shares1 | –4.74% | 2.24% | 3.85% | $14,590 |
Lehman Municipal Bond Index | –3.30 | 2.73 | 4.14 | 14,996 |
Lehman 10 Year Municipal Bond Index | –0.63 | 3.19 | 4.38 | 15,354 |
Average General Municipal Fund2 | –7.75 | 1.17 | 2.68 | 13,031 |
| | | | Final Value |
| | | Since | of a $100,000 |
| One Year | Five Years | Inception3 | Investment |
Long-Term Tax-Exempt Fund Admiral Shares | –4.68% | 2.31% | 3.57% | $131,076 |
Lehman Municipal Bond Index | –3.30 | 2.73 | 3.90 | 134,327 |
Lehman 10 Year Municipal Bond Index | –0.63 | 3.19 | 4.17 | 137,050 |
1 Total returns do not include the account service fee that may be applicable to certain accounts with balances below $10,000.
2 Derived from data provided by Lipper Inc.
3 Performance for the fund’s Admiral Shares and comparative standards is calculated since the Admiral Shares’ inception: February 12, 2001.
47
Long-Term Tax-Exempt Fund
Fiscal-Year Total Returns (%): October 31, 1998–October 31, 2008 |
| | | | |
| Investor Shares | Lehman1 |
Fiscal | Capital | Income | Total | Total |
Year | Return | Return | Return | Return |
1999 | –8.3% | 4.8% | –3.5% | –1.2% |
2000 | 3.8 | 5.8 | 9.6 | 8.2 |
2001 | 6.1 | 5.4 | 11.5 | 10.2 |
2002 | 0.1 | 4.9 | 5.0 | 6.2 |
2003 | 0.7 | 4.7 | 5.4 | 4.9 |
2004 | 1.4 | 4.7 | 6.1 | 6.3 |
2005 | –2.8 | 4.5 | 1.7 | 1.2 |
2006 | 1.4 | 4.7 | 6.1 | 6.0 |
2007 | –2.2 | 4.6 | 2.4 | 3.2 |
2008 | –9.0 | 4.3 | –4.7 | –0.6 |
Average Annual Total Returns: Periods Ended September 30, 2008
This table presents average annual total returns through the latest calendar quarter—rather than through the end of the fiscal period. Securities and Exchange Commission rules require that we provide this information.
| | | | | | Ten Years |
| Inception Date | One Year | Five Years | Capital | Income | Total |
Investor Shares2 | 9/1/1977 | –2.70% | 2.42% | –0.87% | 4.85% | 3.98% |
Admiral Shares | 2/12/2001 | –2.63 | 2.49 | –0.933 | 4.763 | 3.833 |
1 Lehman 10 Year Municipal Bond Index.
2 Total returns do not include the account service fee that may be applicable to certain accounts with balances below $10,000.
3 Return since inception.
Note: See Financial Highlights tables for dividend and capital gains information.
48
Long-Term Tax-Exempt Fund
Financial Statements
The Statement of Net Assets—an integral part of the Financial Statements for Vanguard Long-Term Tax-Exempt Fund—is included as an insert to this report.
Statement of Operations
| Year Ended |
| October 31, 2008 |
| ($000) |
Investment Income | |
Income | |
Interest1 | 136,117 |
Total Income | 136,117 |
Expenses | |
The Vanguard Group—Note B | |
Investment Advisory Services | 270 |
Management and Administrative | |
Investor Shares | 765 |
Admiral Shares | 1,026 |
Marketing and Distribution | |
Investor Shares | 176 |
Admiral Shares | 491 |
Custodian Fees | 12 |
Auditing Fees | 24 |
Shareholders’ Reports | |
Investor Shares | 22 |
Admiral Shares | 5 |
Trustees’ Fees and Expenses | 3 |
Total Expenses | 2,794 |
Net Investment Income | 133,323 |
Realized Net Gain (Loss) | |
Investment Securities Sold | (13,309) |
Futures Contracts | (1,973) |
Realized Net Gain (Loss) | (15,282) |
Change in Unrealized Appreciation | |
(Depreciation) | |
Investment Securities | (264,375) |
Futures Contracts | 3,651 |
Change in Unrealized Appreciation | |
(Depreciation) | (260,724) |
Net Increase (Decrease) in Net Assets | |
Resulting from Operations | (142,683) |
Statement of Changes in Net Assets
| Year Ended October 31, |
| 2008 | 2007 |
| ($000) | ($000) |
Increase (Decrease) in Net Assets | | |
Operations | | |
Net Investment Income | 133,323 | 114,284 |
Realized Net Gain (Loss) | (15,282) | 3,609 |
Change in Unrealized Appreciation (Depreciation) | (260,724) | (58,489) |
Net Increase (Decrease) in Net Assets Resulting from Operations | (142,683) | 59,404 |
Distributions | | |
Net Investment Income | | |
Investor Shares | (31,621) | (29,420) |
Admiral Shares | (101,702) | (84,864) |
Realized Capital Gain | | |
Investor Shares | — | — |
Admiral Shares | — | — |
Total Distributions | (133,323) | (114,284) |
Capital Share Transactions | | |
Investor Shares | 99,194 | 27,242 |
Admiral Shares | 428,510 | 315,533 |
Net Increase (Decrease) from Capital Share Transactions | 527,704 | 342,775 |
Total Increase (Decrease) | 251,698 | 287,895 |
Net Assets | | |
Beginning of Period | 2,614,933 | 2,327,038 |
End of Period | 2,866,631 | 2,614,933 |
1 Interest income from an affiliated company of the fund was $1,834,000.
See accompanying Notes, which are an integral part of the Financial Statements.
49
Long-Term Tax-Exempt Fund
Financial Highlights
Investor Shares | | | | | |
| | | | | |
| | | | |
For a Share Outstanding | Year Ended October 31, |
Throughout Each Period | 2008 | 2007 | 2006 | 2005 | 2004 |
Net Asset Value, Beginning of Period | $11.09 | $11.34 | $11.23 | $11.55 | $11.39 |
Investment Operations | | | | | |
Net Investment Income | .497 | .512 | .516 | .513 | .522 |
Net Realized and Unrealized Gain (Loss) | | | | | |
on Investments | (1.000) | (.250) | .153 | (.320) | .160 |
Total from Investment Operations | (.503) | .262 | .669 | .193 | .682 |
Distributions | | | | | |
Dividends from Net Investment Income | (.497) | (.512) | (.516) | (.513) | (.522) |
Distributions from Realized Capital Gains | — | — | (.043) | — | — |
Total Distributions | (.497) | (.512) | (.559) | (.513) | (.522) |
Net Asset Value, End of Period | $10.09 | $11.09 | $11.34 | $11.23 | $11.55 |
| | | | | |
| | | | | |
Total Return1 | –4.74% | 2.37% | 6.14% | 1.69% | 6.14% |
| | | | | |
| | | | | |
Ratios/Supplemental Data | | | | | |
Net Assets, End of Period (Millions) | $686 | $653 | $641 | $640 | $1,122 |
Ratio of Total Expenses to | | | | | |
Average Net Assets | 0.15% | 0.15% | 0.16% | 0.16% | 0.15% |
Ratio of Net Investment Income to | | | | | |
Average Net Assets | 4.56% | 4.57% | 4.61% | 4.49% | 4.57% |
Portfolio Turnover Rate | 26% | 13% | 8% | 17% | 11% |
Admiral Shares | | | | | |
| | | | | |
| | | | |
For a Share Outstanding | Year Ended October 31, |
Throughout Each Period | 2008 | 2007 | 2006 | 2005 | 2004 |
Net Asset Value, Beginning of Period | $11.09 | $11.34 | $11.23 | $11.55 | $11.39 |
Investment Operations | | | | | |
Net Investment Income | .504 | .520 | .524 | .521 | .528 |
Net Realized and Unrealized Gain (Loss) | | | | | |
on Investments | (1.000) | (.250) | .153 | (.320) | .160 |
Total from Investment Operations | (.496) | .270 | .677 | .201 | .688 |
Distributions | | | | | |
Dividends from Net Investment Income | (.504) | (.520) | (.524) | (.521) | (.528) |
Distributions from Realized Capital Gains | — | — | (.043) | — | — |
Total Distributions | (.504) | (.520) | (.567) | (.521) | (.528) |
Net Asset Value, End of Period | $10.09 | $11.09 | $11.34 | $11.23 | $11.55 |
| | | | | |
| | | | | |
Total Return | –4.68% | 2.44% | 6.22% | 1.76% | 6.19% |
| | | | | |
| | | | | |
Ratios/Supplemental Data | | | | | |
Net Assets, End of Period (Millions) | $2,180 | $1,962 | $1,686 | $1,390 | $823 |
Ratio of Total Expenses to | | | | | |
Average Net Assets | 0.08% | 0.08% | 0.09% | 0.09% | 0.09% |
Ratio of Net Investment Income to | | | | | |
Average Net Assets | 4.63% | 4.64% | 4.68% | 4.55% | 4.62% |
Portfolio Turnover Rate | 26% | 13% | 8% | 17% | 11% |
1 Total returns do not include the account service fee that may be applicable to certain accounts with balances below $10,000. See accompanying Notes, which are an integral part of the Financial Statements.
50
Long-Term Tax-Exempt Fund
Notes to Financial Statements
Vanguard Long-Term Tax-Exempt Fund is registered under the Investment Company Act of 1940 as an open-end investment company, or mutual fund. The fund invests in debt instruments of many municipal issuers; the issuers’ abilities to meet their obligations may be affected by economic and political developments in a specific state or region. The fund offers two classes of shares, Investor Shares and Admiral Shares. Investor Shares are available to any investor who meets the fund’s minimum purchase requirements. Admiral Shares are designed for investors who meet certain administrative, service, tenure, and account-size criteria.
A. The following significant accounting policies conform to generally accepted accounting principles for U.S. mutual funds. The fund consistently follows such policies in preparing its financial statements.
1. Security Valuation: Bonds, and temporary cash investments acquired over 60 days to maturity, are valued using the latest bid prices or using valuations based on a matrix system (which considers such factors as security prices, yields, maturities, and ratings), both as furnished by independent pricing services. Investments in Vanguard Municipal Cash Management Fund are valued at that fund’s net asset value. Other temporary cash investments are valued at amortized cost, which approximates market value. Securities for which market quotations are not readily available, or whose values have been affected by events occurring before the fund’s pricing time but after the close of the securities’ primary markets, are valued by methods deemed by the board of trustees to represent fair value.
2. Futures Contracts: The fund uses futures contracts to invest in fixed income asset classes with greater efficiency and lower cost than is possible through direct investment, to add value when these instruments are attractively priced, or to adjust sensitivity to changes in interest rates. The primary risks associated with the use of futures contracts are imperfect correlation between changes in market values of bonds held by the fund and the prices of futures contracts, and the possibility of an illiquid market.
Futures contracts are valued based upon their quoted daily settlement prices. The aggregate principal amounts of the contracts are not recorded in the Statement of Net Assets. Fluctuations in the value of the contracts are recorded in the Statement of Net Assets as an asset (liability) and in the Statement of Operations as unrealized appreciation (depreciation) until the contracts are closed, when they are recorded as realized futures gains (losses).
3. Federal Income Taxes: The fund intends to continue to qualify as a regulated investment company and distribute all of its income. Management has analyzed the fund’s tax positions taken on federal income tax returns for all open tax years (tax years ended October 31, 2005–2008), and has concluded that no provision for federal income tax is required in the fund’s financial statements.
4. Distributions: Distributions from net investment income are declared daily and paid on the first business day of the following month. Annual distributions from realized capital gains, if any, are recorded on the ex-dividend date.
5. Other: Interest income includes income distributions received from Vanguard Municipal Cash Management Fund and is accrued daily. Premiums and discounts on debt securities purchased are amortized and accreted, respectively, to interest income over the lives of the respective securities. Security transactions are accounted for on the date securities are bought or sold. Costs used to determine realized gains (losses) on the sale of investment securities are those of the specific securities sold.
Each class of shares has equal rights as to assets and earnings, except that each class separately bears certain class-specific expenses related to maintenance of shareholder accounts (included in Management and Administrative expenses) and shareholder reporting. Marketing and distribution expenses are allocated to each class of shares based on a method approved by the board of trustees. Income, other non-class-specific expenses, and gains and losses on investments are allocated to each class of shares based on its relative net assets.
B. The Vanguard Group furnishes at cost investment advisory, corporate management, administrative, marketing, and distribution services. The costs of such services are allocated to the fund under methods approved by the board of trustees. The fund has committed to provide up to 0.40% of its net assets in capital contributions to Vanguard. At October 31, 2008, the fund had contributed capital of $268,000 to Vanguard (included in Other Assets), representing 0.01% of the fund’s net assets and 0.27% of Vanguard’s capitalization. The fund’s trustees and officers are also directors and officers of Vanguard.
51
Long-Term Tax-Exempt Fund
C. Capital gain distributions are determined on a tax basis and may differ from realized capital gains for financial reporting purposes. Differences may be permanent or temporary. Permanent differences are reclassified among capital accounts in the financial statements to reflect their tax character. Temporary differences arise when gains or losses are recognized in different periods for financial statement and tax purposes; these differences will reverse at some time in the future.
For tax purposes, at October 31, 2008, the fund had available realized losses of $17,501,000 to offset future net capital gains through October 31, 2016.
The fund had realized losses totaling $9,074,000 through October 31, 2008, which are deferred for tax purposes and reduce the amount of tax-basis unrealized appreciation on investment securities.
At October 31, 2008, the cost of investment securities for tax purposes was $3,052,527,000. Net unrealized depreciation of investment securities for tax purposes was $185,556,000, consisting of unrealized gains of $39,876,000 on securities that had risen in value since their purchase and $225,432,000 in unrealized losses on securities that had fallen in value since their purchase.
At October 31, 2008, the aggregate settlement value of open futures contracts expiring in December 2008 and the related unrealized appreciation (depreciation) were:
| | | ($000) |
| Number of | Aggregate | Unrealized |
| Long (Short) | Settlement | Appreciation |
Futures Contracts | Contracts | Value | (Depreciation) |
5-Year U.S. Treasury Note | (334) | 37,828 | (374) |
10-Year U.S. Treasury Note | (625) | 70,674 | 1,877 |
30-Year U.S. Treasury Bond | (279) | 31,561 | 1,579 |
Unrealized appreciation (depreciation) on open futures contracts is required to be treated as realized gain (loss) for tax purposes.
D. During the year ended October 31, 2008, the fund purchased $1,291,726,000 of investment securities and sold $712,615,000 of investment securities, other than temporary cash investments.
E. Capital share transactions for each class of shares were:
| | | Year Ended October 31, |
| | 2008 | | | 2007 |
| Amount | Shares | | Amount | Shares |
| ($000) | (000) | | ($000) | (000) |
Investor Shares | | | | | |
Issued | 353,279 | 32,767 | | 189,806 | 16,979 |
Issued in Lieu of Cash Distributions | 24,832 | 2,302 | | 22,529 | 2,015 |
Redeemed | (278,917) | (25,983) | | (185,093) | (16,577) |
Net Increase (Decrease)—Investor Shares | 99,194 | 9,086 | | 27,242 | 2,417 |
Admiral Shares | | | | | |
Issued | 1,000,903 | 92,801 | | 597,314 | 53,513 |
Issued in Lieu of Cash Distributions | 68,527 | 6,349 | | 58,823 | 5,263 |
Redeemed | (640,920) | (59,940) | | (340,604) | (30,529) |
Net Increase (Decrease)—Admiral Shares | 428,510 | 39,210 | | 315,533 | 28,247 |
52
Long-Term Tax-Exempt Fund
F. In September 2006, the Financial Accounting Standards Board issued Statement of Financial Accounting Standards No. 157 (“FAS 157”), “Fair Value Measurements.” FAS 157 establishes a framework for measuring fair value and expands disclosures about fair value measurements in financial statements.
The various inputs that may be used to determine the value of the fund’s investments are summarized in three broad levels. The inputs or methodologies used for valuing securities are not necessarily an indication of the risk associated with investing in those securities.
Level 1—Quoted prices in active markets for identical securities.
Level 2—Other significant observable inputs (including quoted prices for similar securities, interest rates, prepayment speeds, credit risk, etc.).
Level 3—Significant unobservable inputs (including the fund’s own assumptions used to determine the fair value of investments).
The following table summarizes the fund’s investments as of October 31, 2008, based on the inputs used to value them:
| Investments | Futures |
| in Securities | Contracts |
Valuation Inputs | ($000) | ($000) |
Level 1—Quoted prices | 40,002 | 3,082 |
Level 2—Other significant observable inputs | 2,826,969 | — |
Level 3—Significant unobservable inputs | — | — |
Total | 2,866,971 | 3,082 |
G. As of the close of business on December 12, 2008, the fund acquired all the net assets of Vanguard Insured Long-Term Tax-Exempt Fund pursuant to a plan of reorganization approved by the fund’s board of trustees. The acquisition was accomplished by a tax-free exchange of 304,848,000 shares of the fund for 274,107,000 shares of the Insured Long-Term Tax-Exempt Fund outstanding as of the close of business on December 12, 2008. Each class of shares of the Insured Long-Term Tax-Exempt Fund was exchanged for the like class of shares of the fund. The Insured Long-Term Tax-Exempt Fund’s net assets as of the close of business on December 12, 2008, of $2,935,954,000, including $323,828,000 of unrealized depreciation, were combined with the fund’s net assets. The net assets of the fund immediately before the acquisition were $2,825,457,000. The net assets of the fund immediately following the acquisition were $5,761,411,000.
53
High-Yield Tax-Exempt Fund
Fund Profile
As of October 31, 2008
Financial Attributes | | | |
| | Comparative | Broad |
| Fund | Index1 | Index2 |
Number of Issues | 570 | 7,554 | 44,143 |
Yield3 | | 4.9% | 4.8% |
Investor Shares | 5.5% | | |
Admiral Shares | 5.5% | | |
Yield to Maturity | 5.9%4 | 4.9% | 4.8% |
Average Coupon | 4.6% | 5.0% | 5.0% |
Average Effective | | | |
Maturity | 14.6 years | 9.9 years | 12.9 years |
Average Quality | A | AA2 | AA2 |
Average Duration | 7.3 years | 7.4 years | 8.0 years |
Expense Ratio | | | |
(10/31/2007)5 | | — | — |
Investor Shares | 0.15% | | |
Admiral Shares | 0.08% | | |
Short-Term Reserves | 4.1% | — | — |
Largest State Concentrations6 | |
| |
California | 12.6% |
Florida | 7.8 |
New York | 7.8 |
Texas | 6.3 |
New Jersey | 5.1 |
Colorado | 4.2 |
Puerto Rico | 3.5 |
Ohio | 3.5 |
South Carolina | 3.4 |
Pennsylvania | 3.4 |
Top Ten | 57.6% |
Volatility Measures7 | |
| Fund Versus | Fund Versus |
| Comparative Index1 | Broad Index2 |
R-Squared | 0.84 | 0.91 |
Beta | 1.16 | 1.11 |
Distribution by Maturity (% of portfolio) | |
| |
Under 1 Year | 7.6% |
1–5 Years | 18.9 |
5–10 Years | 15.7 |
10–20 Years | 21.3 |
20–30 Years | 30.2 |
Over 30 Years | 6.3 |
Distribution by Credit Quality (% of portfolio) |
| |
AAA | 16.3% |
AA | 39.2 |
A | 20.5 |
BB | 0.6 |
Below B/Other | 7.7 |
Investment Focus
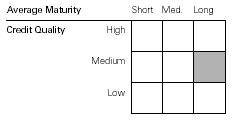
1 Lehman 10 Year Municipal Bond Index.
2 Lehman Municipal Bond Index.
3 30-day SEC yield for the fund; index yield assumes that all bonds are called or prepaid at the earliest possible dates. See the Glossary.
4 Before expenses.
5 The expense ratios shown are from the prospectus dated July 29, 2008. For the fiscal year ended October 31, 2008, the expense ratios were 0.15% for Investor Shares and 0.08% for Admiral Shares.
6 Percentages of total net assets, excluding any futures contracts.
7 For an explanation of R-squared, beta, and other terms used here, see the Glossary.
54
High-Yield Tax-Exempt Fund
Performance Summary
All of the returns in this report represent past performance, which is not a guarantee of future results that may be achieved by the fund. (Current performance may be lower or higher than the performance data cited. For performance data current to the most recent month-end, visit our website at www.vanguard.com/performance.) Note, too, that both investment returns and principal value can fluctuate widely, so an investor’s shares, when sold, could be worth more or less than their original cost. The returns shown do not reflect taxes that a shareholder would pay on fund distributions or on the sale of fund shares.
Cumulative Performance: October 31, 1998–October 31, 2008
Initial Investment of $10,000
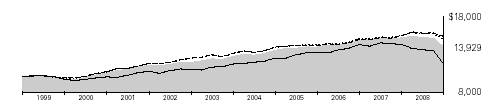
| Average Annual Total Returns | Final Value |
| Periods Ended October 31, 2008 | of a $10,000 |
| One Year | Five Years | Ten Years | Investment |
High-Yield Tax-Exempt Fund Investor Shares1 | –8.20% | 1.85% | 3.37% | $13,929 |
Lehman Municipal Bond Index | –3.30 | 2.73 | 4.14 | 14,996 |
Lehman 10 Year Municipal Bond Index | –0.63 | 3.19 | 4.38 | 15,354 |
Average High-Yield Municipal Fund2 | –18.83 | –0.19 | 1.50 | 11,602 |
| | | | Final Value |
| | | Since | of a $100,000 |
| One Year | Five Years | Inception3 | Investment |
High-Yield Tax-Exempt Fund Admiral Shares | –8.14% | 1.92% | 2.74% | $120,738 |
Lehman Municipal Bond Index | –3.30 | 2.73 | 3.31 | 125,462 |
Lehman 10 Year Municipal Bond Index | –0.63 | 3.19 | 3.86 | 130,221 |
1 Total returns do not include the account service fee that may be applicable to certain accounts with balances below $10,000.
2 Derived from data provided by Lipper Inc.
3 Performance for the fund’s Admiral Shares and comparative standards is calculated since the Admiral Shares’ inception: November 12, 2001.
55
High-Yield Tax-Exempt Fund
Fiscal-Year Total Returns (%): October 31, 1998–October 31, 2008 |
| | | | |
| Investor Shares | Lehman1 |
Fiscal | Capital | Income | Total | Total |
Year | Return | Return | Return | Return |
1999 | –7.8% | 5.0% | –2.8% | –1.2% |
2000 | 1.8 | 6.0 | 7.8 | 8.2 |
2001 | 4.0 | 5.8 | 9.8 | 10.2 |
2002 | –1.7 | 5.4 | 3.7 | 6.2 |
2003 | 1.4 | 5.1 | 6.5 | 4.9 |
2004 | 1.6 | 4.9 | 6.5 | 6.3 |
2005 | –1.4 | 4.6 | 3.2 | 1.2 |
2006 | 1.9 | 4.7 | 6.6 | 6.0 |
2007 | –2.7 | 4.6 | 1.9 | 3.2 |
2008 | –12.5 | 4.3 | –8.2 | –0.6 |
Average Annual Total Returns: Periods Ended September 30, 2008
This table presents average annual total returns through the latest calendar quarter—rather than through the end of the fiscal period. Securities and Exchange Commission rules require that we provide this information.
| | | | | | Ten Years |
| Inception Date | One Year | Five Years | Capital | Income | Total |
Investor Shares2 | 12/27/1978 | –4.10% | 2.64% | –1.27% | 5.05% | 3.78% |
Admiral Shares | 11/12/2001 | –4.03 | 2.71 | –1.493 | 4.873 | 3.383 |
1 Lehman 10 Year Municipal Bond Index.
2 Total returns do not include the account service fee that may be applicable to certain accounts with balances below $10,000.
3 Return since inception.
Note: See Financial Highlights tables for dividend and capital gains information.
56
High-Yield Tax-Exempt Fund
Financial Statements
The Statement of Net Assets—an integral part of the Financial Statements for Vanguard High-Yield Tax-Exempt Fund—is included as an insert to this report.
Statement of Operations
| Year Ended |
| October 31, 2008 |
| ($000) |
Investment Income | |
Income | |
Interest1 | 303,192 |
Total Income | 303,192 |
Expenses | |
The Vanguard Group—Note B | |
Investment Advisory Services | 586 |
Management and Administrative | |
Investor Shares | 2,109 |
Admiral Shares | 2,027 |
Marketing and Distribution | |
Investor Shares | 501 |
Admiral Shares | 904 |
Custodian Fees | 49 |
Auditing Fees | 24 |
Shareholders’ Reports | |
Investor Shares | 63 |
Admiral Shares | 13 |
Trustees’ Fees and Expenses | 7 |
Total Expenses | 6,283 |
Expenses Paid Indirectly | (67) |
Net Expenses | 6,216 |
Net Investment Income | 296,976 |
Realized Net Gain (Loss) | |
Investment Securities Sold | (11,615) |
Futures Contracts | (2,605) |
Realized Net Gain (Loss) | (14,220) |
Change in Unrealized Appreciation | |
(Depreciation) | |
Investment Securities | (799,487) |
Futures Contracts | 6,897 |
Change in Unrealized Appreciation | |
(Depreciation) | (792,590) |
Net Increase (Decrease) in Net Assets | |
Resulting from Operations | (509,834) |
Statement of Changes in Net Assets
| Year Ended October 31, |
| 2008 | 2007 |
| ($000) | ($000) |
Increase (Decrease) in Net Assets | | |
Operations | | |
Net Investment Income | 296,976 | 278,543 |
Realized Net Gain (Loss) | (14,220) | (20,064) |
Change in Unrealized Appreciation (Depreciation) | (792,590) | (140,080) |
Net Increase (Decrease) in Net Assets Resulting from Operations | (509,834) | 118,399 |
Distributions | | |
Net Investment Income | | |
Investor Shares | (91,582) | (88,943) |
Admiral Shares | (205,394) | (189,600) |
Realized Capital Gain | | |
Investor Shares | — | — |
Admiral Shares | — | — |
Total Distributions | (296,976) | (278,543) |
Capital Share Transactions | | |
Investor Shares | (57,874) | 188,393 |
Admiral Shares | 72,312 | 626,294 |
Net Increase (Decrease) from Capital Share Transactions | 14,438 | 814,687 |
Total Increase (Decrease) | (792,372) | 654,543 |
Net Assets | | |
Beginning of Period | 6,221,601 | 5,567,058 |
End of Period | 5,429,229 | 6,221,601 |
1 Interest income from an affiliated company of the fund was $1,458,000.
See accompanying Notes, which are an integral part of the Financial Statements.
57
High-Yield Tax-Exempt Fund
Financial Highlights
Investor Shares | | | | | |
| | | | | |
| | | | |
For a Share Outstanding | Year Ended October 31, |
Throughout Each Period | 2008 | 2007 | 2006 | 2005 | 2004 |
Net Asset Value, Beginning of Period | $10.62 | $10.91 | $10.71 | $10.86 | $10.69 |
Investment Operations | | | | | |
Net Investment Income | .494 | .497 | .491 | .492 | .506 |
Net Realized and Unrealized Gain (Loss) | | | | | |
on Investments | (1.330) | (.290) | .200 | (.150) | .170 |
Total from Investment Operations | (.836) | .207 | .691 | .342 | .676 |
Distributions | | | | | |
Dividends from Net Investment Income | (.494) | (.497) | (.491) | (.492) | (.506) |
Distributions from Realized Capital Gains | — | — | — | — | — |
Total Distributions | (.494) | (.497) | (.491) | (.492) | (.506) |
Net Asset Value, End of Period | $9.29 | $10.62 | $10.91 | $10.71 | $10.86 |
| | | | | |
| | | | | |
Total Return1 | –8.20% | 1.94% | 6.61% | 3.20% | 6.48% |
| | | | | |
| | | | | |
Ratios/Supplemental Data | | | | | |
Net Assets, End of Period (Millions) | $1,660 | $1,965 | $1,830 | $1,753 | $2,728 |
Ratio of Total Expenses to | | | | | |
Average Net Assets | 0.15% | 0.15% | 0.17% | 0.16% | 0.15% |
Ratio of Net Investment Income to | | | | | |
Average Net Assets | 4.78% | 4.61% | 4.56% | 4.55% | 4.71% |
Portfolio Turnover Rate | 24% | 22% | 15% | 15% | 24% |
Admiral Shares | | | | | |
| | | | | |
| | | | |
For a Share Outstanding | Year Ended October 31, |
Throughout Each Period | 2008 | 2007 | 2006 | 2005 | 2004 |
Net Asset Value, Beginning of Period | $10.62 | $10.91 | $10.71 | $10.86 | $10.69 |
Investment Operations | | | | | |
Net Investment Income | .501 | .505 | .499 | .500 | .512 |
Net Realized and Unrealized Gain (Loss) | | | | | |
on Investments | (1.330) | (.290) | .200 | (.150) | .170 |
Total from Investment Operations | (.829) | .215 | .699 | .350 | .682 |
Distributions | | | | | |
Dividends from Net Investment Income | (.501) | (.505) | (.499) | (.500) | (.512) |
Distributions from Realized Capital Gains | — | — | — | — | — |
Total Distributions | (.501) | (.505) | (.499) | (.500) | (.512) |
Net Asset Value, End of Period | $9.29 | $10.62 | $10.91 | $10.71 | $10.86 |
| | | | | |
| | | | | |
Total Return | –8.14% | 2.01% | 6.69% | 3.27% | 6.54% |
| | | | | |
| | | | | |
Ratios/Supplemental Data | | | | | |
Net Assets, End of Period (Millions) | $3,769 | $4,256 | $3,737 | $3,121 | $1,652 |
Ratio of Total Expenses to | | | | | |
Average Net Assets | 0.08% | 0.08% | 0.09% | 0.09% | 0.10% |
Ratio of Net Investment Income to | | | | | |
Average Net Assets | 4.85% | 4.68% | 4.64% | 4.60% | 4.76% |
Portfolio Turnover Rate | 24% | 22% | 15% | 15% | 24% |
1 Total returns do not include the account service fee that may be applicable to certain accounts with balances below $10,000. See accompanying Notes, which are an integral part of the Financial Statements.
58
High-Yield Tax-Exempt Fund
Notes to Financial Statements
Vanguard High-Yield Tax-Exempt Fund is registered under the Investment Company Act of 1940 as an open-end investment company, or mutual fund. The fund invests in debt instruments of many municipal issuers; the issuers’ abilities to meet their obligations may be affected by economic and political developments in a specific state or region. The fund offers two classes of shares, Investor Shares and Admiral Shares. Investor Shares are available to any investor who meets the fund’s minimum purchase requirements. Admiral Shares are designed for investors who meet certain administrative, service, tenure, and account-size criteria.
A. The following significant accounting policies conform to generally accepted accounting principles for U.S. mutual funds. The fund consistently follows such policies in preparing its financial statements.
1. Security Valuation: Bonds, and temporary cash investments acquired over 60 days to maturity, are valued using the latest bid prices or using valuations based on a matrix system (which considers such factors as security prices, yields, maturities, and ratings), both as furnished by independent pricing services. Investments in Vanguard Municipal Cash Management Fund are valued at that fund’s net asset value. Other temporary cash investments are valued at amortized cost, which approximates market value. Securities for which market quotations are not readily available, or whose values have been affected by events occurring before the fund’s pricing time but after the close of the securities’ primary markets, are valued by methods deemed by the board of trustees to represent fair value.
2. Futures Contracts: The fund uses futures contracts to invest in fixed income asset classes with greater efficiency and lower cost than is possible through direct investment, to add value when these instruments are attractively priced, or to adjust sensitivity to changes in interest rates. The primary risks associated with the use of futures contracts are imperfect correlation between changes in market values of bonds held by the fund and the prices of futures contracts, and the possibility of an illiquid market.
Futures contracts are valued based upon their quoted daily settlement prices. The aggregate principal amounts of the contracts are not recorded in the Statement of Net Assets. Fluctuations in the value of the contracts are recorded in the Statement of Net Assets as an asset (liability) and in the Statement of Operations as unrealized appreciation (depreciation) until the contracts are closed, when they are recorded as realized futures gains (losses).
3. Federal Income Taxes: The fund intends to continue to qualify as a regulated investment company and distribute all of its income. Management has analyzed the fund’s tax positions taken on federal income tax returns for all open tax years (tax years ended October 31, 2005–2008), and has concluded that no provision for federal income tax is required in the fund’s financial statements.
4. Distributions: Distributions from net investment income are declared daily and paid on the first business day of the following month. Annual distributions from realized capital gains, if any, are recorded on the ex-dividend date.
5. Other: Interest income includes income distributions received from Vanguard Municipal Cash Management Fund and is accrued daily. Premiums and discounts on debt securities purchased are amortized and accreted, respectively, to interest income over the lives of the respective securities. Security transactions are accounted for on the date securities are bought or sold. Costs used to determine realized gains (losses) on the sale of investment securities are those of the specific securities sold.
Each class of shares has equal rights as to assets and earnings, except that each class separately bears certain class-specific expenses related to maintenance of shareholder accounts (included in Management and Administrative expenses) and shareholder reporting. Marketing and distribution expenses are allocated to each class of shares based on a method approved by the board of trustees. Income, other non-class-specific expenses, and gains and losses on investments are allocated to each class of shares based on its relative net assets.
B. The Vanguard Group furnishes at cost investment advisory, corporate management, administrative, marketing, and distribution services. The costs of such services are allocated to the fund under methods approved by the board of trustees. The fund has committed to provide up to 0.40% of its net assets in capital contributions to Vanguard. At October 31, 2008, the fund had contributed capital of $545,000 to Vanguard (included in Other Assets), representing 0.01% of the fund’s net assets and 0.54% of Vanguard’s capitalization. The fund’s trustees and officers are also directors and officers of Vanguard.
59
High-Yield Tax-Exempt Fund
C. The fund’s investment advisor may direct new-issue purchases, subject to obtaining the best price and execution, to underwriters who have agreed to rebate or credit to the fund part of the underwriting fees generated. Such rebates or credits are used solely to reduce the fund’s management and administrative expenses. The fund’s custodian bank has also agreed to reduce its fees when the fund maintains cash on deposit in the non-interest-bearing custody account. For the year ended October 31, 2008, these arrangements reduced the management and administrative expenses by $63,000 and custodian fees by $4,000. The total expense reduction represented an effective annual rate of 0.00% of average net assets.
D. Capital gain distributions are determined on a tax basis and may differ from realized capital gains for financial reporting purposes. Differences may be permanent or temporary. Permanent differences are reclassified among capital accounts in the financial statements to reflect their tax character. Temporary differences arise when gains or losses are recognized in different periods for financial statement and tax purposes; these differences will reverse at some time in the future.
For tax purposes, at October 31, 2008, the fund had available realized losses of $92,008,000 to offset future net capital gains of $49,222,000 through October 31, 2011, $21,859,000 through October 31, 2015, and $20,927,000 through October 31, 2016.
The fund had realized losses totaling $7,436,000 through October 31, 2008, which are deferred for tax purposes and reduce the amount of tax-basis unrealized appreciation on investment securities.
At October 31, 2008, the cost of investment securities for tax purposes was $6,020,120,000. Net unrealized depreciation of investment securities for tax purposes was $699,254,000, consisting of unrealized gains of $62,828,000 on securities that had risen in value since their purchase and $762,082,000 in unrealized losses on securities that had fallen in value since their purchase.
At October 31, 2008, the aggregate settlement value of open futures contracts expiring in December 2008 and the related unrealized appreciation (depreciation) were:
| | | ($000) |
| Number of | Aggregate | Unrealized |
| Long (Short) | Settlement | Appreciation |
Futures Contracts | Contracts | Value | (Depreciation) |
5-Year U.S. Treasury Note | (771) | 87,322 | (271) |
10-Year U.S. Treasury Note | (1,509) | 170,635 | 5,117 |
30-Year U.S. Treasury Bond | (647) | 73,192 | 3,462 |
Unrealized appreciation (depreciation) on open futures contracts is required to be treated as realized gain (loss) for tax purposes.
E. During the year ended October 31, 2008, the fund purchased $1,397,488,000 of investment securities and sold $1,519,682,000 of investment securities, other than temporary cash investments.
F. Capital share transactions for each class of shares were:
| | | Year Ended October 31, |
| | 2008 | | | 2007 |
| Amount | Shares | | Amount | Shares |
| ($000) | (000) | | ($000) | (000) |
Investor Shares | | | | | |
Issued | 699,291 | 67,827 | | 808,735 | 75,000 |
Issued in Lieu of Cash Distributions | 72,811 | 7,126 | | 70,332 | 6,539 |
Redeemed | (829,976) | (81,328) | | (690,674) | (64,265) |
Net Increase (Decrease)—Investor Shares | (57,874) | (6,375) | | 188,393 | 17,274 |
Admiral Shares | | | | | |
Issued | 1,341,454 | 129,822 | | 1,283,561 | 119,306 |
Issued in Lieu of Cash Distributions | 138,940 | 13,604 | | 128,605 | 11,958 |
Redeemed | (1,408,082) | (138,398) | | (785,872) | (73,260) |
Net Increase (Decrease)—Admiral Shares | 72,312 | 5,028 | | 626,294 | 58,004 |
| | | | | | |
60
High-Yield Tax-Exempt Fund
G. In September 2006, the Financial Accounting Standards Board issued Statement of Financial Accounting Standards No. 157 (“FAS 157”), “Fair Value Measurements.” FAS 157 establishes a framework for measuring fair value and expands disclosures about fair value measurements in financial statements.
The various inputs that may be used to determine the value of the fund’s investments are summarized in three broad levels. The inputs or methodologies used for valuing securities are not necessarily an indication of the risk associated with investing in those securities.
Level 1—Quoted prices in active markets for identical securities.
Level 2—Other significant observable inputs (including quoted prices for similar securities, interest rates, prepayment speeds, credit risk, etc.).
Level 3—Significant unobservable inputs (including the fund’s own assumptions used to determine the fair value of investments).
The following table summarizes the fund’s investments as of October 31, 2008, based on the inputs used to value them:
| Investments | Futures |
| in Securities | Contracts |
Valuation Inputs | ($000) | ($000) |
Level 1—Quoted prices | 30,394 | 8,308 |
Level 2—Other significant observable inputs | 5,290,472 | — |
Level 3—Significant unobservable inputs | — | — |
Total | 5,320,866 | 8,308 |
61
Report of Independent Registered
Public Accounting Firm
To the Trustees of Vanguard Municipal Bond Funds and the Shareholders of Vanguard Tax-Exempt Money Market Fund, Vanguard Short-Term Tax-Exempt Fund, Vanguard Limited-Term Tax-Exempt Fund, Vanguard Intermediate-Term Tax-Exempt Fund, Vanguard Insured Long-Term Tax-Exempt Fund, Vanguard Long-Term Tax-Exempt Fund and Vanguard High-Yield Tax-Exempt Fund:
In our opinion, the accompanying statements of net assets appearing in the insert to this Annual Report and the accompanying related statements of operations and of changes in net assets and the financial highlights present fairly, in all material respects, the financial position of Vanguard Tax-Exempt Money Market Fund, Vanguard Short-Term Tax-Exempt Fund, Vanguard Limited-Term Tax-Exempt Fund, Vanguard Intermediate-Term Tax-Exempt Fund, Vanguard Insured Long-Term Tax-Exempt Fund, Vanguard Long-Term Tax-Exempt Fund and Vanguard High-Yield Tax-Exempt Fund (separate portfolios of Vanguard Municipal Bond Funds, hereafter referred to as the “Funds”) at October 31, 2008, the results of each of their operations for the year then ended, the changes in each of their net assets for each of the two years in the period then ended and the financial highlights for each of the five years in the period then ended, in conformity with accounting principles generally accepted in the United States of America. These financial statements and financial highlights (hereafter referred to as “financial statements”) are the responsibility of the Funds’ management; our responsibility is to express an opinion on these financial statements based on our audits. We conducted our audits of these financial statements in accordance with the standards of the Public Company Accounting Oversight Board (United States). Those standards require that we plan and perform the audit to obtain reasonable assurance about whether the financial statements are free of material misstatement. An audit includes examining, on a test basis, evidence supporting the amounts and disclosures in the financial statements, assessing the accounting principles used and significant estimates made by management, and evaluating the overall financial statement presentation. We believe that our audits, which included confirmation of securities at October 31, 2008 by correspondence with the custodian and brokers, and by agreement to the underlying ownership records for Vanguard Municipal Cash Management Fund, provide a reasonable basis for our opinion.
PricewaterhouseCoopers LLP
Philadelphia, Pennsylvania
December 19, 2008
Special 2008 tax information (unaudited) for Vanguard Municipal Bond Funds
This information for the fiscal year ended October 31, 2008, is included pursuant to provisions of the Internal Revenue Code.
Each fund designates 100% of its income dividends as exempt-interest dividends.
62
About Your Fund’s Expenses
As a shareholder of the fund, you incur ongoing costs, which include costs for portfolio management, administrative services, and shareholder reports (like this one), among others. Operating expenses, which are deducted from a fund’s gross income, directly reduce the investment return of the fund.
A fund’s expenses are expressed as a percentage of its average net assets. This figure is known as the expense ratio. The following examples are intended to help you understand the ongoing costs (in dollars) of investing in your fund and to compare these costs with those of other mutual funds. The examples are based on an investment of $1,000 made at the beginning of the period shown and held for the entire period.
The accompanying table illustrates your fund’s costs in two ways:
• Based on actual fund return. This section helps you to estimate the actual expenses that you paid over the period. The “Ending Account Value” shown is derived from the fund’s actual return, and the third column shows the dollar amount that would have been paid by an investor who started with $1,000 in the fund. You may use the information in this table, together with the amount you invested, to estimate the expenses that you paid over the period.
To do so, simply divide your account value by $1,000 (for example, an $8,600 account value divided by $1,000 = 8.6), then multiply the result by the number given for your fund under the heading “Expenses Paid During Period.”
• Based on hypothetical 5% yearly return. This section is intended to help you compare your fund’s costs with those of other mutual funds. It assumes that the fund had a yearly return of 5% before expenses, but that the expense ratio is unchanged. In this case—because the return used is not the fund’s actual return—the results do not apply to your investment. The example is useful in making comparisons because the Securities and Exchange Commission requires all mutual funds to calculate expenses based on a 5% return. You can assess your fund’s costs by comparing this hypothetical example with the hypothetical examples that appear in shareholder reports of other funds.
Note that the expenses shown in the table are meant to highlight and help you compare ongoing costs only and do not reflect transaction costs incurred by the fund for buying and selling securities. Further, the expenses do not include the account service fee described in the prospectus. If such a fee were applied to your account, your costs would be higher. Your fund does not charge transaction fees, such as purchase or redemption fees, nor does it carry a “sales load.”
The calculations assume no shares were bought or sold during the period. Your actual costs may have been higher or lower, depending on the amount of your investment and the timing of any purchases or redemptions.
You can find more information about the fund’s expenses, including annual expense ratios, in the Financial Statements section of this report. For additional information on operating expenses and other shareholder costs, please refer to your fund’s current prospectus.
63
Six Months Ended October 31, 2008 | | | |
| Beginning | Ending | Expenses |
| Account Value | Account Value | Paid During |
Tax-Exempt Fund | 4/30/2008 | 10/31/2008 | Period1 |
Based on Actual Fund Return | | | |
Money Market | $1,000.00 | $1,011.91 | $0.56 |
Short-Term | | | |
Investor Shares | 1,000.00 | 1,011.53 | 0.76 |
Admiral Shares | 1,000.00 | 1,011.89 | 0.41 |
Limited-Term | | | |
Investor Shares | 1,000.00 | 1,000.09 | 0.76 |
Admiral Shares | 1,000.00 | 1,000.45 | 0.40 |
Intermediate-Term | | | |
Investor Shares | 1,000.00 | 974.37 | 0.75 |
Admiral Shares | 1,000.00 | 974.71 | 0.40 |
Insured Long-Term | | | |
Investor Shares | 1,000.00 | 944.58 | 0.74 |
Admiral Shares | 1,000.00 | 944.91 | 0.39 |
Long-Term | | | |
Investor Shares | 1,000.00 | 943.38 | 0.73 |
Admiral Shares | 1,000.00 | 942.71 | 0.39 |
High-Yield | | | |
Investor Shares | 1,000.00 | 917.35 | 0.72 |
Admiral Shares | 1,000.00 | 917.67 | 0.39 |
Based on Hypothetical 5% Yearly Return | | | |
Money Market | $1,000.00 | $1,024.65 | $0.56 |
Short-Term | | | |
Investor Shares | 1,000.00 | 1,024.45 | 0.77 |
Admiral Shares | 1,000.00 | 1,024.80 | 0.41 |
Limited-Term | | | |
Investor Shares | 1,000.00 | 1,024.45 | 0.77 |
Admiral Shares | 1,000.00 | 1,024.80 | 0.41 |
Intermediate-Term | | | |
Investor Shares | 1,000.00 | 1,024.45 | 0.77 |
Admiral Shares | 1,000.00 | 1,024.80 | 0.41 |
Insured Long-Term | | | |
Investor Shares | 1,000.00 | 1,024.45 | 0.77 |
Admiral Shares | 1,000.00 | 1,024.80 | 0.41 |
Long-Term | | | |
Investor Shares | 1,000.00 | 1,024.45 | 0.77 |
Admiral Shares | 1,000.00 | 1,024.80 | 0.41 |
High-Yield | | | |
Investor Shares | 1,000.00 | 1,024.45 | 0.77 |
Admiral Shares | 1,000.00 | 1,024.80 | 0.41 |
1 The calculations are based on expenses incurred in the most recent six-month period. The funds’ annualized six-month expense ratios for that period are: for the Tax-Exempt Money Market Fund, 0.11%; for the Short-Term Tax-Exempt Fund, 0.15% for Investor Shares and 0.08% for Admiral Shares; for the Limited-Term Tax-Exempt Fund, 0.15% for Investor Shares and 0.08% for Admiral Shares; for the Intermediate-Term Tax-Exempt Fund, 0.15% for Investor Shares and 0.08% for Admiral Shares; for the Insured Long-Term Tax-Exempt Fund, 0.15% for Investor Shares and 0.08% for Admiral Shares; for the Long-Term Tax-Exempt Fund, 0.15% for Investor Shares and 0.08% for Admiral Shares; and for the High-Yield Tax-Exempt Fund, 0.15% for Investor Shares and 0.08% for Admiral Shares. The dollar amounts shown as “Expenses Paid” are equal to the annualized expense ratio multiplied by the average account value over the period, multiplied by the number of days in the most recent six-month period, then divided by the number of days in the most recent 12-month period.
64
Glossary
Average Coupon. The average interest rate paid on the fixed income securities held by a fund. It is expressed as a percentage of face value.
Average Duration. An estimate of how much the value of the bonds held by a fund will fluctuate in response to a change in interest rates. To see how the value could change, multiply the average duration by the change in rates. If interest rates rise by 1 percentage point, the value of the bonds in a fund with an average duration of five years would decline by about 5%. If rates decrease by a percentage point, the value would rise by 5%.
Average Effective Maturity. The average length of time until fixed income securities held by a fund reach maturity and are repaid, taking into consideration the possibility that the issuer may call the bond before its maturity date. The figure reflects the proportion of fund assets represented by each security; it also reflects any futures contracts held. In general, the longer the average effective maturity, the more a fund’s share price will fluctuate in response to changes in market interest rates.
Average Quality. An indicator of credit risk, this figure is the average of the ratings assigned to a fund’s holdings by credit-rating agencies. The agencies make their judgment after appraising an issuer’s ability to meet its obligations. Quality is graded on a scale, with AAA indicating the most creditworthy bond issuers and MIG-1, A-1+, SP-1+, and F-1+ indicating the most creditworthy issuers of money market securities.
Average Weighted Maturity. The average length of time until fixed income securities held by a fund reach maturity and are repaid. The figure reflects the proportion of fund assets represented by each security.
Beta. A measure of the magnitude of a fund’s past share-price fluctuations in relation to the ups and downs of a given market index. The index is assigned a beta of 1.00. Compared with a given index, a fund with a beta of 1.20 typically would have seen its share price rise or fall by 12% when the index rose or fell by 10%. For this report, beta is based on returns over the past 36 months for both the fund and the index. Note that a fund’s beta should be reviewed in conjunction with its R-squared (see definition). The lower the R-squared, the less correlation there is between the fund and the index, and the less reliable beta is as an indicator of volatility.
Equity Exposure. A measure that reflects a fund’s investments in stocks and stock futures. Any holdings in short-term reserves are excluded.
Expense Ratio. The percentage of a fund’s average net assets used to pay its annual administrative and advisory expenses. These expenses directly reduce returns to investors.
Inception Date. The date on which the assets of a fund (or one of its share classes) are first invested in accordance with the fund’s investment objective. For funds with a subscription period, the inception date is the day after that period ends. Investment performance is measured from the inception date.
R-Squared. A measure of how much of a fund’s past returns can be explained by the returns from the market in general, as measured by a given index. If a fund’s total returns were precisely synchronized with an index’s returns, its R-squared would be 1.00. If the fund’s returns bore no relationship to the index’s returns, its R-squared would be 0. For this report, R-squared is based on returns over the past 36 months for both the fund and the index.
Short-Term Reserves. The percentage of a fund invested in highly liquid, short-term securities that can be readily converted to cash.
Yield. A money market fund’s 7-day SEC yield is calculated by annualizing its income distributions for the previous seven days, as required by the U.S. Securities and Exchange Commission. For other funds, 30-day SEC yield is derived using a formula specified by the commission. Under the formula, data related to the fund’s security holdings in the previous 30 days are used to calculate the fund’s hypothetical net income for that period, which is then annualized and divided by the fund’s estimated average net assets over the calculation period. For the purposes of this calculation, a security’s income is based on its current market yield to maturity (in the case of bonds) or its projected dividend yield (for stocks). Because the SEC yield represents hypothetical annualized income, it will differ—at times significantly—from the fund’s actual experience. As a result, the fund’s income distributions may be higher or lower than implied by the SEC yield.
Yield to Maturity. The rate of return an investor would receive if the fixed income securities held by a fund were held to their maturity dates.
65
This page intentionally left blank.
This page intentionally left blank.
This page intentionally left blank.
The People Who Govern Your Fund
The trustees of your mutual fund are there to see that the fund is operated and managed in your best interests since, as a shareholder, you are a part owner of the fund. Your fund trustees also serve on the board of directors of The Vanguard Group, Inc., which is owned by the Vanguard funds and provides services to them on an at-cost basis.
A majority of Vanguard’s board members are independent, meaning that they have no affiliation with Vanguard or the funds they oversee, apart from the sizable personal investments they have made as private individuals. The independent board members have distinguished backgrounds in business, academia, and public service.
Each trustee serves a fund until its termination; or until the trustee’s retirement, resignation, or death; or otherwise as specified in the fund’s organizational documents. Any trustee may be removed at a shareholders’ meeting by a vote representing two-thirds of the net asset value of all shares of the fund together with shares of other Vanguard funds organized within the same trust. The table below shows information for each trustee and executive officer of the fund. The mailing address of the trustees and officers is P.O. Box 876, Valley Forge, PA 19482.
Chairman of the Board and Trustee |
| |
John J. Brennan1 | |
Born 1954 | Principal Occupation(s) During the Past Five Years: |
Trustee Since May 1987; | Chairman of the Board and Director/Trustee of |
Chairman of the Board | The Vanguard Group, Inc., and of each of the |
156 Vanguard Funds Overseen | investment companies served by The Vanguard |
| Group; Chief Executive Officer and President of |
| The Vanguard Group and each of the investment |
| companies served by The Vanguard Group |
| (1996–2008). |
| |
Independent Trustees | |
| |
Charles D. Ellis | |
Born 1937 | Principal Occupation(s) During the Past Five Years: |
Trustee Since January 2001 | Applecore Partners (pro bono ventures in education); |
156 Vanguard Funds Overseen | Senior Advisor to Greenwich Associates (international |
| business strategy consulting); Successor Trustee |
| of Yale University; Overseer of the Stern School of |
| Business at New York University; Trustee of the |
| Whitehead Institute for Biomedical Research. |
| |
Emerson U. Fullwood | |
Born 1948 | Principal Occupation(s) During the Past Five Years: |
Trustee Since January 2008 | Executive Chief Staff and Marketing Officer for |
156 Vanguard Funds Overseen | North America since 2004 and Corporate Vice |
| President of Xerox Corporation (photocopiers and |
| printers); Director of SPX Corporation (multi- |
| industry manufacturing), of the United Way of |
| Rochester, and of the Boy Scouts of America. |
| |
Rajiv L. Gupta | |
Born 1945 | Principal Occupation(s) During the Past Five Years: |
Trustee Since December 20012 | Chairman, President, and Chief Executive Officer |
156 Vanguard Funds Overseen | of Rohm and Haas Co. (chemicals); Board Member |
| of the American Chemistry Council; Director of |
| Tyco International, Ltd. (diversified manufacturing |
| and services), since 2005. |
| |
Amy Gutmann | |
Born 1949 | Principal Occupation(s) During the Past Five Years: |
Trustee Since June 2006 | President of the University of Pennsylvania since |
156 Vanguard Funds Overseen | 2004; Professor in the School of Arts and Sciences, |
| Annenberg School for Communication, and |
| Graduate School of Education of the University |
| of Pennsylvania since 2004; Provost (2001–2004) |
| and Laurance S. Rockefeller Professor of Politics |
| and the University Center for Human Values |
| (1990–2004), Princeton University; Director of |
| Carnegie Corporation of New York since 2005 |
| and of Schuylkill River Development Corporation |
| and Greater Philadelphia Chamber of Commerce |
| since 2004; Trustee of the National Constitution |
| Center since 2007. |
| |
JoAnn Heffernan Heisen | |
Born 1950 | Principal Occupation(s) During the Past Five Years: |
Trustee Since July 1998 | Corporate Vice President and Chief Global Diversity |
156 Vanguard Funds Overseen | Officer since 2006, Vice President and Chief |
| Information Officer (1997–2005), and Member of |
| the Executive Committee of Johnson & Johnson |
| (pharmaceuticals/consumer products); Director of |
| the University Medical Center at Princeton and |
| Women’s Research and Education Institute. |
André F. Perold | |
Born 1952 | Principal Occupation(s) During the Past Five Years: |
Trustee Since December 2004 | George Gund Professor of Finance and Banking, |
156 Vanguard Funds Overseen | Harvard Business School; Senior Associate Dean |
| and Director of Faculty Recruiting, Harvard Business |
| School; Director and Chairman of UNX, Inc. |
| (equities trading firm); Chair of the Investment |
| Committee of HighVista Strategies LLC (private |
| investment firm) since 2005. |
| |
Alfred M. Rankin, Jr. | |
Born 1941 | Principal Occupation(s) During the Past Five Years: |
Trustee Since January 1993 | Chairman, President, Chief Executive Officer, |
156 Vanguard Funds Overseen | and Director of NACCO Industries, Inc. (forklift |
| trucks/housewares/lignite); Director of Goodrich |
| Corporation (industrial products/aircraft systems |
| and services). |
| |
J. Lawrence Wilson | |
Born 1936 | Principal Occupation(s) During the Past Five Years: |
Trustee Since April 1985 | Retired Chairman and Chief Executive Officer |
156 Vanguard Funds Overseen | of Rohm and Haas Co. (chemicals); Director |
| of Cummins Inc. (diesel engines) and |
| AmerisourceBergen Corp. (pharmaceutical |
| distribution); Trustee of Vanderbilt University |
| and of Culver Educational Foundation. |
| |
Executive Officers1 | |
| |
Thomas J. Higgins | |
Born 1957 | Principal Occupation(s) During the Past Five Years: |
Chief Financial Officer | Principal of The Vanguard Group, Inc.; Treasurer |
Since September 2008 | of each of the investment companies served by |
Treasurer Since July 1998 | The Vanguard Group. Chief Financial Officer of |
156 Vanguard Funds Overseen | each of the investment companies served by |
| The Vanguard Group since 2008. |
| |
F. William McNabb III | |
Born 1957 | Principal Occupation(s) During the Past Five Years: |
Chief Executive Officer | Chief Executive Officer, Director, and President of |
Since August 31, 2008 | The Vanguard Group, Inc., since 2008; Chief |
President Since March 2008 | Executive Officer and President of each of the |
156 Vanguard Funds Overseen | investment companies served by The Vanguard |
| Group since 2008; Director of Vanguard Marketing |
| Corporation; Managing Director of The Vanguard |
| Group (1995–2008). |
| |
Heidi Stam | |
Born 1956 | Principal Occupation(s) During the Past Five Years: |
Secretary Since July 2005 | Managing Director of The Vanguard Group, Inc., |
156 Vanguard Funds Overseen | since 2006; General Counsel of The Vanguard |
| Group since 2005; Secretary of The Vanguard |
| Group, and of each of the investment companies |
| served by The Vanguard Group, since 2005; |
| Director and Senior Vice President of Vanguard |
| Marketing Corporation since 2005; Principal of |
| The Vanguard Group (1997–2006). |
| |
Vanguard Senior Management Team |
R. Gregory Barton | Paul A. Heller | Ralph K. Packard |
Mortimer J. Buckley | Michael S. Miller | Glenn W. Reed |
Kathleen C. Gubanich | James M. Norris | George U. Sauter |
| |
Founder | |
| |
John C. Bogle | |
Chairman and Chief Executive Officer, 1974–1996 |
1 These individuals are “interested persons” as defined in the Investment Company Act of 1940.
2 December 2002 for Vanguard Equity Income Fund, Vanguard Growth Equity Fund, the Vanguard Municipal Bond Funds, and the Vanguard State Tax-Exempt Funds.
More information about the trustees is in the Statement of Additional Information, available from The Vanguard Group.

P. O. Box 2600
Valley Forge, PA 19482-2600
Connect with Vanguard® > www.vanguard.com
Fund Information > 800-662-7447 | CFA® is a trademark owned by CFA Institute. |
| |
Direct Investor Account Services > 800-662-2739 | The funds or securities referred to herein are not sponsored, |
| endorsed, or promoted by MSCI, and MSCI bears no liability |
Institutional Investor Services > 800-523-1036 | |
| with respect to any such funds or securities. For any such funds |
Text Telephone for People | or securities, the prospectus or the Statement of Additional |
With Hearing Impairment > 800-952-3335 | Information contains a more detailed description of the limited |
| relationship MSCI has with The Vanguard Group and any |
| related funds. |
| |
This material may be used in conjunction with | Russell is a trademark of The Frank Russell Company. |
the offering of shares of any Vanguard fund only | |
if preceded or accompanied by the fund’s current | All comparative mutual fund data are from Lipper Inc. or |
prospectus. | Morningstar, Inc., unless otherwise noted. |
| |
| You can obtain a free copy of Vanguard’s proxy voting guidelines |
| by visiting our website, www.vanguard.com, and searching for |
| “proxy voting guidelines,” or by calling Vanguard at 800-662-2739. |
| The guidelines are also available from the SEC’s website, |
| www.sec.gov. In addition, you may obtain a free report on how your |
| fund voted the proxies for securities it owned during the 12 months |
| ended June 30. To get the report, visit either www.vanguard.com |
| or www.sec.gov. |
| |
| You can review and copy information about your fund at the SEC’s |
| Public Reference Room in Washington, D.C. To find out more about |
| this public service, call the SEC at 202-551-8090. Information about |
| your fund is also available on the SEC’s website, and you can |
| receive copies of this information, for a fee, by sending a request in |
| either of two ways: via e-mail addressed to publicinfo@sec.gov or |
| via regular mail addressed to the Public Reference Section, |
| Securities and Exchange Commission, Washington, DC 20549-0102. |
| |
| |
| |
| |
| |
| |
| |
| © 2008 The Vanguard Group, Inc. |
| All rights reserved. |
| Vanguard Marketing Corporation, Distributor. |
| |
| Q950 122008 |
Vanguard® Municipal Bond Funds
Statement of Net Assets
As of October 31, 2008
The Statement of Net Assets should be read in conjunction with each fund’s Statement of Operations,
Statement of Changes in Net Assets, Financial Highlights, and Notes to Financial Statements, all of which appear in the accompanying report.
Each fund provides a complete list of its holdings four times in each fiscal year, at the quarter-ends. For the second and fourth fiscal quarters, the lists appear in the fund’s semiannual and annual reports to shareholders. For the first and third fiscal quarters, the fund files the lists with the Securities and Exchange Commission on Form N-Q. Shareholders can look up the fund’s Forms N-Q on the SEC’s website at www.sec.gov. Forms N-Q may also be reviewed and copied at the SEC’s Public Reference Room (see the back cover of the accompanying report for further information).
Contents | |
| |
Tax-Exempt Money Market Fund | 1 |
Short-Term Tax-Exempt Fund | 22 |
Limited-Term Tax-Exempt Fund | 32 |
Intermediate-Term Tax-Exempt Fund | 46 |
Insured Long-Term Tax-Exempt Fund | 71 |
Long-Term Tax-Exempt Fund | 78 |
High-Yield Tax-Exempt Fund | 85 |
Key to Abbreviations | Back cover |
Tax-Exempt Money Market Fund
| | | | | Face | Market |
| | | Maturity | | Amount | Value• |
| | Coupon | Date | | ($000) | ($000) |
Tax-Exempt Municipal Bonds (94.7%) | | | | | |
Alabama (0.5%) | | | | | |
1 | Alabama Public School & College Auth. TOB VRDO | 1.600% | 11/7/08 | | 5,000 | 5,000 |
1 | Alabama Special Care Fac. Financing Auth. TOB VRDO | 1.830% | 11/7/08 | | 6,775 | 6,775 |
| Birmingham AL Public Educ. Building Student Housing Rev. (Univ. Alabama Project) VRDO | 2.320% | 11/7/08 | LOC | 17,835 | 17,835 |
| Jefferson County AL Sewer Rev. (Capital Improvement) | 5.000% | 2/1/09 | (Prere.) | 4,475 | 4,544 |
| Jefferson County AL Sewer Rev. (Capital Improvement) | 5.000% | 2/1/09 | (Prere.) | 3,760 | 3,818 |
| Jefferson County AL Sewer Rev. (Capital Improvement) | 5.375% | 2/1/09 | (Prere.) | 14,015 | 14,244 |
| Jefferson County AL Sewer Rev. (Capital Improvement) | 5.750% | 2/1/09 | (Prere.) | 5,000 | 5,098 |
| Mobile AL IDR (Kimberly-Clark Tissue Co.) VRDO | 2.000% | 11/7/08 | | 33,550 | 33,550 |
1 | Univ. of Alabama General Rev. TOB VRDO | 2.030% | 11/7/08 | (13) | 28,710 | 28,710 |
| | | | | | 119,574 |
Alaska (0.4%) | | | | | |
| Alaska Housing Finance Corp. (State Capital) VRDO | 4.800% | 11/7/08 | | 54,175 | 54,175 |
1 | Alaska Housing Finance Corp. Home Mortgage TOB VRDO | 2.420% | 11/7/08 | | 8,750 | 8,750 |
1 | Alaska Housing Finance Corp. TOB PUT | 1.780% | 11/7/08 | LOC | 5,015 | 5,015 |
1 | Alaska Housing Finance Corp. TOB VRDO | 2.420% | 11/7/08 | | 5,060 | 5,060 |
| Alaska Industrial Dev. & Export Auth. Rev. VRDO | 2.000% | 11/7/08 | LOC | 17,930 | 17,930 |
1 | Anchorage AK Water Rev. TOB VRDO | 2.270% | 11/7/08 | | 15,375 | 15,375 |
| | | | | | 106,305 |
Arizona (2.1%) | | | | | |
| Arizona Board Regents Arizona State Univ. System Rev. VRDO | 1.420% | 11/7/08 | LOC | 7,300 | 7,300 |
| Arizona Board Regents Arizona State Univ. System Rev. VRDO | 1.800% | 11/7/08 | LOC | 6,500 | 6,500 |
| Arizona Health Fac. Auth. Rev. (Banner Health) | 5.000% | 1/1/09 | | 2,000 | 2,010 |
| Arizona Health Fac. Auth. Rev. (Banner Health) VRDO | 1.750% | 11/7/08 | LOC | 12,500 | 12,500 |
| Arizona Health Fac. Auth. Rev. (Banner Health) VRDO | 1.750% | 11/7/08 | LOC | 37,500 | 37,500 |
| Arizona Health Fac. Auth. Rev. (Banner Health) VRDO | 2.000% | 11/7/08 | LOC | 12,700 | 12,700 |
| Arizona Health Fac. Auth. Rev. (Banner Health) VRDO | 2.000% | 11/7/08 | LOC | 46,000 | 46,000 |
| Arizona Health Fac. Auth. Rev. (Catholic West) VRDO | 1.450% | 11/7/08 | LOC | 23,200 | 23,200 |
| Arizona Health Fac. Auth. Rev. (Catholic West) VRDO | 1.450% | 11/7/08 | LOC | 20,000 | 20,000 |
| Arizona Health Fac. Auth. Rev. (Catholic West) VRDO | 1.730% | 11/7/08 | LOC | 28,500 | 28,500 |
| Arizona Health Fac. Auth. Rev. (Catholic West) VRDO | 1.730% | 11/7/08 | LOC | 14,800 | 14,800 |
| Arizona Sports & Tourism Auth. VRDO | 1.730% | 11/7/08 | LOC | 5,000 | 5,000 |
1 | Arizona Transp. Board Excise Tax Rev. TOB VRDO | 1.830% | 11/7/08 | | 4,805 | 4,805 |
1 | Arizona Transp. Board Highway Rev. TOB VRDO | 1.830% | 11/7/08 | | 4,805 | 4,805 |
1 | Arizona Transp. Board Highway Rev. TOB VRDO | 1.860% | 11/7/08 | | 7,365 | 7,365 |
1 | Gilbert AZ GO TOB VRDO | 1.850% | 11/7/08 | | 26,930 | 26,930 |
| Glendale AZ IDA (Midwestern Univ.) VRDO | 1.770% | 11/7/08 | LOC | 5,000 | 5,000 |
1 | Maricopa County AZ IDA Health Fac. Rev. (Catholic Healthcare West) TOB VRDO | 1.870% | 11/7/08 | LOC | 100,465 | 100,465 |
1 | Maricopa County AZ Public Finance Corp. Lease Rev. TOB VRDO | 1.700% | 11/7/08 | | 8,480 | 8,480 |
1 | Phoenix AZ Civic Improvement Corp. Airport Rev. TOB VRDO | 1.820% | 11/7/08 | | 5,000 | 5,000 |
1 | Phoenix AZ Civic Improvement Corp. Airport Rev. TOB VRDO | 1.820% | 11/7/08 | | 8,990 | 8,990 |
1 | Phoenix AZ Civic Improvement Corp. Transit Rev. TOB VRDO | 1.600% | 11/7/08 | LOC | 24,155 | 24,155 |
1 | Phoenix AZ Civic Improvement Corp. Wastewater System Rev. TOB VRDO | 1.600% | 11/7/08 | LOC | 10,350 | 10,350 |
1
1 | Phoenix AZ GO TOB VRDO | 1.600% | 11/7/08 | | 16,640 | 16,640 |
| Pima County AZ COP | 5.000% | 6/1/09 | | 8,000 | 8,127 |
1 | Salt River Project Arizona Agricultural Improvement & Power Dist. Rev. TOB VRDO | 1.830% | 11/7/08 | | 6,450 | 6,450 |
1 | Salt River Project Arizona Agricultural Improvement & Power Dist. Rev. TOB VRDO | 1.830% | 11/7/08 | | 8,500 | 8,500 |
1 | Salt River Project Arizona Agricultural Improvement & Power Dist. Rev. TOB VRDO | 1.860% | 11/7/08 | | 16,000 | 16,000 |
| Tempe AZ Transit Excise Tax Rev. VRDO | 1.700% | 11/7/08 | | 14,645 | 14,645 |
| Yavapai County AZ IDA (Allied Waste North America) VRDO | 1.580% | 11/7/08 | LOC | 5,000 | 5,000 |
| | | | | | 497,717 |
Arkansas (0.3%) | | | | | |
| Arkansas Federal Highway Grant | 5.250% | 8/1/09 | | 13,725 | 14,080 |
| Osceola AR Solid Waste Disp Rev. (Plum Point Energy Assoc. LLC) VRDO | 1.600% | 11/7/08 | LOC | 19,800 | 19,800 |
| Pulaski County AR Health Fac. St. Vincent Infirmary (Catholic Health Initiatives) VRDO | 1.800% | 11/7/08 | | 31,900 | 31,900 |
| | | | | | 65,780 |
California (0.7%) | | | | | |
| California Communities NT Program NT Participation TRAN | 3.000% | 6/30/09 | | 48,000 | 48,425 |
1 | California GO TOB PUT | 2.080% | 12/29/08 | (4) | 39,025 | 39,025 |
| California School Cash Reserve Program Auth. Pool COP TRAN | 3.000% | 7/6/09 | LOC | 50,000 | 50,454 |
1 | Golden State Tobacco Securitization Corp. Rev. California TOB VRDO | 1.900% | 11/7/08 | (13) | 6,750 | 6,750 |
| Orange County CA Teeter Plan Notes | 3.000% | 6/30/09 | | 10,000 | 10,002 |
1 | San Francisco CA Bay Area Rapid Transit Rev. TOB VRDO | 1.800% | 11/7/08 | | 5,605 | 5,605 |
| | | | | | 160,261 |
Colorado (3.6%) | | | | | |
| Aurora CO Water Improvement Rev. VRDO | 2.250% | 11/7/08 | | 33,070 | 33,070 |
1 | Board of Governors of the Colorado State University System Rev. TOB PUT | 1.780% | 11/7/08 | LOC | 21,995 | 21,995 |
1 | Board of Governors of the Colorado State University System Rev. TOB VRDO | 2.570% | 11/7/08 | (4) | 17,820 | 17,820 |
| Castle Rock CO COP VRDO | 1.600% | 11/7/08 | LOC | 11,000 | 11,000 |
| Colorado Educ. & Cultural Fac. Auth. Nature Conservancy Project VRDO | 2.000% | 11/7/08 | | 11,609 | 11,609 |
| Colorado Educ. & Cultural Fac. Auth. Rev. (National Jewish Board Program) VRDO | 1.250% | 11/3/08 | LOC | 9,550 | 9,550 |
| Colorado Educ. & Cultural Fac. Auth. Rev. (National Jewish Board Program) VRDO | 1.250% | 11/3/08 | LOC | 8,000 | 8,000 |
| Colorado Educ. & Cultural Fac. Auth. Rev. (National Jewish Board Program) VRDO | 1.250% | 11/3/08 | LOC | 30,990 | 30,990 |
| Colorado Educ. & Cultural Fac. Auth. Rev. (National Jewish Board Program) VRDO | 1.250% | 11/3/08 | LOC | 11,700 | 11,700 |
| Colorado Educ. & Cultural Fac. Auth. Rev. (YMCA Rockies Project) VRDO | 0.800% | 11/3/08 | LOC | 19,220 | 19,220 |
| Colorado General Fund TRAN | 3.000% | 6/26/09 | | 60,000 | 60,499 |
| Colorado Health Fac. Auth. Rev. (Catholic Health Initiatives) VRDO | 1.780% | 11/7/08 | | 37,540 | 37,540 |
1 | Colorado Health Fac. Auth. Rev. (Colorado Catholic Initiatives) TOB VRDO | 1.820% | 11/7/08 | | 2,975 | 2,975 |
| Colorado Health Fac. Auth. Rev. (NCMC Inc. Project) VRDO | 1.250% | 11/3/08 | LOC | 13,085 | 13,085 |
1 | Colorado Health Fac. Auth. Rev. (Poudre Valley Medical Center) TOB VRDO | 1.850% | 11/7/08 | LOC | 46,000 | 46,000 |
1 | Colorado Health Fac. Auth. Rev. (Poudre Valley Medical Center) TOB VRDO | 1.850% | 11/7/08 | LOC | 29,990 | 29,990 |
| Colorado Health Fac. Auth. Rev. (Sisters of Charity Leavenworth) VRDO | 1.780% | 11/7/08 | | 39,300 | 39,300 |
| Colorado Housing & Finance Auth. Multi-Family Mortgage Bonds VRDO | 2.000% | 11/7/08 | | 19,825 | 19,825 |
| Colorado Housing & Finance Auth. Multi-Family Mortgage Bonds VRDO | 2.150% | 11/7/08 | | 69,790 | 69,790 |
| Colorado Housing & Finance Auth. Single Family Mortgage Bonds VRDO | 2.000% | 11/7/08 | | 23,000 | 23,000 |
| Colorado Housing & Finance Auth. Single Family Mortgage Bonds VRDO | 2.000% | 11/7/08 | | 12,690 | 12,690 |
| Colorado Housing & Finance Auth. Single Family Mortgage Bonds VRDO | 2.150% | 11/7/08 | | 40,000 | 40,000 |
| Colorado Housing & Finance Auth. Single Family Mortgage Bonds VRDO | 2.150% | 11/7/08 | | 9,680 | 9,680 |
| Colorado Housing & Finance Auth. Single Family Mortgage Bonds VRDO | 2.200% | 11/7/08 | | 16,610 | 16,610 |
| Colorado Housing & Finance Auth. Single Family Mortgage Bonds VRDO | 2.200% | 11/7/08 | | 50,000 | 50,000 |
| Colorado Housing & Finance Auth. Single Family Mortgage Bonds VRDO | 3.500% | 11/7/08 | | 2,355 | 2,355 |
| Colorado Housing & Finance Auth. Single Family Mortgage Bonds VRDO | 3.500% | 11/7/08 | | 20,170 | 20,170 |
| Colorado Housing & Finance Auth. Single Family Mortgage Bonds VRDO | 3.500% | 11/7/08 | | 9,290 | 9,290 |
| Colorado Housing & Finance Auth. Single Family Mortgage Bonds VRDO | 3.650% | 11/7/08 | | 32,800 | 32,800 |
| Colorado Housing & Finance Auth. Single Family Mortgage Bonds VRDO | 3.650% | 11/7/08 | | 27,425 | 27,425 |
| Colorado Housing & Finance Auth. Single Family Mortgage Bonds VRDO | 3.650% | 11/7/08 | | 16,800 | 16,800 |
| Colorado School Mines Enterprise Rev. VRDO | 4.500% | 11/7/08 | LOC | 6,000 | 6,000 |
| Denver CO City & County COP VRDO | 1.250% | 11/3/08 | | 63,000 | 63,000 |
| Denver CO Urban Renewal Auth. Tax Increment Rev. (Stapleton) VRDO | 1.770% | 11/7/08 | LOC | 15,000 | 15,000 |
| Lowry Econ. Redev. Auth. Colorado Rev. VRDO | 1.800% | 11/7/08 | LOC | 3,215 | 3,215 |
1 | Univ. of Colorado Enterprise System Rev. TOB VRDO | 2.360% | 11/7/08 | (4) | 4,620 | 4,620 |
| Univ. of Colorado Hosp. Auth. Rev. VRDO | 9.000% | 11/7/08 | LOC | 9,640 | 9,640 |
| | | | | | 856,253 |
Connecticut (0.2%) | | | | | |
| Connecticut GO | 5.000% | 4/15/09 | | 6,810 | 6,889 |
1 | Connecticut State Health & Educ. Fac. Auth. (Yale Univ.) TOB VRDO | 1.600% | 11/7/08 | | 7,300 | 7,300 |
1 | Connecticut State Health & Educ. Fac. Auth. (Yale Univ.) TOB VRDO | 1.780% | 11/7/08 | | 3,575 | 3,575 |
1 | Connecticut State Health & Educ. Fac. Auth. (Yale Univ.) TOB VRDO | 1.780% | 11/7/08 | | 3,865 | 3,865 |
1 | Connecticut State Health & Educ. Fac. Auth. (Yale Univ.) TOB VRDO | 1.860% | 11/7/08 | | 14,850 | 14,850 |
1 | Connecticut State Health & Educ. Fac. Auth. Rev. (Yale Univ.) TOB VRDO | 2.470% | 11/7/08 | | 11,995 | 11,995 |
| New Britain CT BAN | 4.000% | 3/31/09 | | 4,250 | 4,285 |
| | | | | | 52,759 |
2
Delaware (0.4%) | | | | | |
| Delaware GO | 5.000% | 3/1/09 | | 7,115 | 7,182 |
| Delaware Health Fac. Auth. Rev. VRDO | 1.600% | 11/7/08 | | 10,000 | 10,000 |
1 | Delaware Housing Auth. Rev. TOB VRDO | 1.920% | 11/7/08 | | 9,170 | 9,170 |
1 | Delaware Housing Auth. Rev. TOB VRDO | 2.050% | 11/7/08 | | 8,900 | 8,900 |
1 | Delaware Housing Auth. Single Family Mortgage Rev. TOB VRDO | 1.980% | 11/7/08 | | 4,075 | 4,075 |
| New Castle County DE Airport Fac. Rev. (FlightSafety) VRDO | 1.900% | 11/7/08 | | 24,665 | 24,665 |
| Wilmington DE Rev. (Delaware Art Museum) VRDO | 1.800% | 11/7/08 | LOC | 24,800 | 24,800 |
| | | | | | 88,792 |
District of Columbia (2.0%) | | | | | |
1 | District of Columbia COP TOB VRDO | 1.780% | 11/7/08 | LOC | 17,665 | 17,665 |
1 | District of Columbia GO TOB VRDO | 1.820% | 11/7/08 | OC | 4,600 | 4,600 |
1 | District of Columbia GO TOB VRDO | 1.820% | 11/7/08 | 13) | 3,305 | 3,305 |
| District of Columbia GO VRDO | 1.500% | 11/7/08 | LOC | 4,280 | 4,280 |
| District of Columbia GO VRDO | 1.500% | 11/7/08 | LOC | 15,625 | 15,625 |
| District of Columbia GO VRDO | 4.000% | 11/7/08 | LOC | 23,000 | 23,000 |
| District of Columbia Rev. (American College of Cardiology) VRDO | 1.850% | 11/7/08 | LOC | 13,000 | 13,000 |
| District of Columbia Rev. (American Univ.) VRDO | 1.500% | 11/7/08 | LOC | 7,400 | 7,400 |
| District of Columbia Rev. (American Univ.) VRDO | 1.500% | 11/7/08 | LOC | 17,000 | 17,000 |
| District of Columbia Rev. (Council Foreign Relations) VRDO | 1.500% | 11/7/08 | LOC | 62,680 | 62,680 |
| District of Columbia Rev. (Georgetown Day School) VRDO | 1.850% | 11/7/08 | LOC | 14,700 | 14,700 |
| District of Columbia Rev. (Henry J. Kaiser Family Foundation) VRDO | 1.820% | 11/7/08 | | 12,000 | 12,000 |
| District of Columbia Rev. (Howard Univ.) VRDO | 1.750% | 11/7/08 | LOC | 31,525 | 31,525 |
| District of Columbia Rev. (Society for Neuroscience) VRDO | 1.500% | 11/7/08 | LOC | 12,000 | 12,000 |
| District of Columbia Rev. (The Pew Charitable Trust) VRDO | 1.680% | 11/7/08 | LOC | 31,000 | 31,000 |
| District of Columbia Rev. (Washington Drama Society) VRDO | 1.500% | 11/7/08 | LOC | 15,000 | 15,000 |
1 | District of Columbia Rev. TOB VRDO | 1.950% | 11/7/08 | (13) | 8,375 | 8,375 |
| District of Columbia Rev. VRDO | 1.900% | 11/3/08 | LOC | 14,125 | 14,125 |
| District of Columbia Rev. VRDO | 1.460% | 11/7/08 | LOC | 15,550 | 15,550 |
| District of Columbia Rev. VRDO | 1.460% | 11/7/08 | LOC | 14,475 | 14,475 |
| District of Columbia Rev. VRDO | 1.680% | 11/7/08 | LOC | 6,730 | 6,730 |
1 | District of Columbia Water & Sewer Auth. Public Util. Rev. TOB VRDO | 1.600% | 11/7/08 | LOC | 12,895 | 12,895 |
1 | District of Columbia Water & Sewer Auth. Public Util. Rev. TOB VRDO | 2.330% | 11/7/08 | (4) | 27,225 | 27,225 |
1 | District of Columbia Water & Sewer Auth. Public Util. Rev. TOB VRDO | 2.350% | 11/7/08 | (4) | 4,000 | 4,000 |
1 | District of Columbia Water & Sewer Auth. Public Util. Rev. TOB VRDO | 2.350% | 11/7/08 | (4) | 19,800 | 19,800 |
1 | Metro. Washington Airports Auth. Airport System Rev. TOB VRDO | 2.110% | 11/7/08 | | 19,000 | 19,000 |
1 | Metro. Washington Airports Auth. Airport System Rev. TOB VRDO | 2.410% | 11/7/08 | (4) | 50,000 | 50,000 |
1 | Metro. Washington Airports Auth. Airport System Rev. TOB VRDO | 2.430% | 11/7/08 | (4) | 6,000 | 6,000 |
1 | Metro. Washington Airports Auth. Airport System Rev. TOB VRDO | 2.720% | 11/7/08 | (4) | 3,495 | 3,495 |
| | | | | | 486,450 |
Florida (5.9%) | | | | | |
1 | Brevard County FL School Board COP TOB VRDO | 1.780% | 11/7/08 | LOC | 13,970 | 13,970 |
1 | Broward County FL Professional Sports Facs. Tax Rev. COP TOB VRDO | 2.820% | 11/7/08 | (4) | 5,800 | 5,800 |
1 | Broward County FL School Board COP TOB VRDO | 1.780% | 11/7/08 | LOC | 34,785 | 34,785 |
| Citizens Property Insurance Corp. Florida (High Risk Account) RAN | 4.500% | 6/1/09 | | 250,000 | 251,412 |
1 | Florida Board of Educ. Public Educ. Capital Outlay TOB VRDO | 1.820% | 11/7/08 | | 18,925 | 18,925 |
1 | Florida Board of Educ. Public Educ. Capital Outlay TOB VRDO | 1.830% | 11/7/08 | | 4,370 | 4,370 |
1 | Florida Board of Educ. Public Educ. Capital Outlay TOB VRDO | 1.860% | 11/7/08 | | 15,000 | 15,000 |
1 | Florida Board of Educ. Public Educ. TOB VRDO | 1.600% | 11/7/08 | | 12,900 | 12,900 |
1 | Florida Board of Educ. Public Educ. TOB VRDO | 1.850% | 11/7/08 | | 9,600 | 9,600 |
1 | Florida Board of Educ. Public Educ. TOB VRDO | 1.900% | 11/7/08 | | 19,550 | 19,550 |
1 | Florida Board of Educ. Public Educ. TOB VRDO | 2.350% | 11/7/08 | (4) | 7,920 | 7,920 |
1 | Florida Board of Educ. Rev. (Lottery Rev.) TOB VRDO | 2.050% | 11/7/08 | (13) | 13,425 | 13,425 |
1 | Florida Board of Educ. TOB VRDO | 1.830% | 11/7/08 | | 5,000 | 5,000 |
| Florida Dept. of Environmental Protection & Preservation Rev. VRDO | 4.000% | 11/7/08 | (12) | 49,015 | 49,015 |
| Florida Higher Educ. Fac. Finance Auth. Rev. (Ringling College) VRDO | 1.850% | 11/7/08 | LOC | 15,000 | 15,000 |
1 | Florida Housing Finance Corp. Rev. TOB VRDO | 2.000% | 11/7/08 | | 12,100 | 12,100 |
1 | Florida Housing Finance Corp. Rev. TOB VRDO | 2.000% | 11/7/08 | | 5,390 | 5,390 |
1 | Florida Housing Finance Corp. Rev. TOB VRDO | 2.500% | 11/7/08 | | 6,415 | 6,415 |
1 | Florida Keys Aqueduct Auth. Rev. TOB VRDO | 2.150% | 11/7/08 | (12) | 6,720 | 6,720 |
| Florida Keys Aqueduct Auth. Rev. VRDO | 1.420% | 11/7/08 | LOC | 10,500 | 10,500 |
1 | Florida State Dept. Transp. Rev. TOB VRDO | 1.830% | 11/7/08 | | 8,225 | 8,225 |
1 | Florida Turnpike Auth. Rev. TOB VRDO | 2.020% | 11/7/08 | | 16,340 | 16,340 |
| Gainsville FL Util. System Rev. VRDO | 1.500% | 11/7/08 | | 7,335 | 7,335 |
| Gainsville FL Util. System Rev. VRDO | 1.830% | 11/7/08 | | 106,005 | 106,005 |
| Highlands County FL Health Rev. (Adventist Health System) VRDO | 1.850% | 11/7/08 | LOC | 5,000 | 5,000 |
| Highlands County FL Health Rev. (Adventist Health System) VRDO | 1.850% | 11/7/08 | LOC | 6,000 | 6,000 |
| Hillsborough County FL Capital Improvement Program CP | 2.100% | 11/20/08 | LOC | 11,355 | 11,355 |
| Hillsborough County FL School Board COP (Master Lease Program) VRDO | 1.250% | 11/3/08 | LOC | 34,155 | 34,155 |
| Jacksonville FL Captial Project Rev. VRDO | 1.850% | 11/7/08 | LOC | 13,160 | 13,160 |
| Jacksonville FL Electric Auth. Electric System Rev. VRDO | 1.400% | 11/7/08 | | 34,930 | 34,930 |
| Jacksonville FL Electric Auth. Electric System Rev. VRDO | 1.400% | 11/7/08 | | 23,280 | 23,280 |
3
| Jacksonville FL Electric Auth. Electric System Rev. VRDO | 1.400% | 11/7/08 | | 8,250 | 8,250 |
| Jacksonville FL Electric Auth. Electric System Rev. VRDO | 1.500% | 11/7/08 | | 30,000 | 30,000 |
| Jacksonville FL Electric Auth. Electric System Rev. VRDO | 1.600% | 11/7/08 | | 30,555 | 30,555 |
| Jacksonville FL Electric Auth. Electric System Rev. VRDO | 1.600% | 11/7/08 | | 5,700 | 5,700 |
| Jacksonville FL Electric Auth. Water & Sewer Rev. VRDO | 1.470% | 11/7/08 | | 14,680 | 14,680 |
| Jacksonville FL Electric Auth. Water & Sewer Rev. VRDO | 1.600% | 11/7/08 | | 28,275 | 28,275 |
| Jacksonville FL Electric Auth. Water & Sewer Rev. VRDO | 1.750% | 11/7/08 | | 15,000 | 15,000 |
| Jacksonville FL Electric Auth. Water & Sewer Rev. VRDO | 1.750% | 11/7/08 | | 24,500 | 24,500 |
| Jacksonville FL Health Fac. Auth. Hosp. Rev. (Baptist Medical Center) VRDO | 1.600% | 11/7/08 | LOC | 5,875 | 5,875 |
| Jacksonville FL Transp. Rev. VRDO | 5.450% | 11/7/08 | | 13,500 | 13,500 |
1 | Lake County FL School Board COP TOB VRDO | 1.950% | 11/7/08 | (4)(13) | 18,400 | 18,400 |
1 | Lee Memorial Health System Florida Hosp. Rev. TOB VRDO | 1.600% | 11/7/08 | LOC | 14,635 | 14,635 |
1 | Miami-Dade County FL Aviation TOB VRDO | 1.960% | 11/7/08 | (13) | 9,900 | 9,900 |
1 | Miami-Dade County FL Educ. Fac. Auth. Rev. (Univ. of Miami) TOB VRDO | 1.820% | 11/7/08 | (12) | 5,070 | 5,070 |
1 | Miami-Dade County FL Educ. Fac. Auth. Rev. (Univ. of Miami) TOB VRDO | 1.950% | 11/7/08 | (13) | 23,165 | 23,165 |
1 | Miami-Dade County FL Educ. Fac. Auth. Rev. (Univ. of Miami) TOB VRDO | 1.950% | 11/7/08 | (13) | 19,800 | 19,800 |
1 | Miami-Dade County FL Expressway Auth. Toll System Rev. TOB VRDO | 1.950% | 11/7/08 | (13) | 74,000 | 74,000 |
1 | Miami-Dade County FL School Board COP TOB VRDO | 1.950% | 11/7/08 | (13) | 11,880 | 11,880 |
1 | Miami-Dade County FL School Board COP TOB VRDO | 1.960% | 11/7/08 | (4)(13) | 36,630 | 36,630 |
1 | Miami-Dade County FL School Board TOB VRDO | 2.320% | 11/7/08 | (12) | 6,920 | 6,920 |
| Miami-Dade County FL Special Obligation VRDO | 1.440% | 11/7/08 | LOC | 18,600 | 18,600 |
| Monroe County FL Airport Rev. Var-Key West International Airport VRDO | 2.250% | 11/7/08 | LOC | 24,265 | 24,265 |
| Orange County FL Educ. Fac. Auth. Rev. (Rollins College) VRDO | 1.200% | 11/3/08 | LOC | 12,925 | 12,925 |
| Orange County FL Educ. Fac. Auth. Rev. (Rollins College) VRDO | 1.500% | 11/7/08 | LOC | 3,625 | 3,625 |
| Orange County FL Health Fac. Auth. Rev. (Orlando Regional Healthcare) VRDO | 1.850% | 11/7/08 | LOC | 5,500 | 5,500 |
| Orange County FL Health Fac. Auth. Rev. (Orlando Regional Healthcare) VRDO | 4.500% | 11/7/08 | LOC | 5,500 | 5,500 |
1 | Orange County FL Housing Finance Auth. Homeowner Rev. TOB VRDO | 2.050% | 11/7/08 | | 4,635 | 4,635 |
1 | Orange County FL School Board COP TOB VRDO | 1.600% | 11/7/08 | LOC | 9,200 | 9,200 |
| Orange County FL School Board VRDO | 1.390% | 11/7/08 | LOC | 11,700 | 11,700 |
1 | Orlando & Orange County FL Expressway Auth. TOB VRDO | 1.950% | 11/7/08 | (13)(4) | 11,300 | 11,300 |
| Orlando & Orange County FL Expressway Auth. VRDO | 2.300% | 11/7/08 | LOC | 28,400 | 28,400 |
| Palm Beach County FL Educ. Fac. Auth. Rev. (Atlantic Univ. Inc.) VRDO | 1.500% | 11/7/08 | LOC | 20,500 | 20,500 |
| Palm Beach County FL Rev. (Children's Home Society Project) VRDO | 1.500% | 11/7/08 | LOC | 12,395 | 12,395 |
| Palm Beach County FL Rev. (Community Foundation Palm Beach Project) VRDO | 1.700% | 11/7/08 | LOC | 5,700 | 5,700 |
| Palm Beach County FL Rev. (Norton Gallery) VRDO | 1.850% | 11/7/08 | LOC | 12,500 | 12,500 |
1 | Palm Beach County FL Water & Sewer TOB VRDO | 1.830% | 11/7/08 | | 3,315 | 3,315 |
| Pembroke Pines FL Charter School Rev. VRDO | 1.800% | 11/7/08 | (12) | 11,210 | 11,210 |
1 | Polk County FL Util. System Rev. TOB VRDO | 1.950% | 11/7/08 | (13) | 19,305 | 19,305 |
1 | Volusia County FL Rev. TOB VRDO | 1.820% | 11/7/08 | LOC | 14,390 | 14,390 |
| | | | | | 1,415,282 |
Georgia (1.9%) | | | | | |
1 | Atlanta GA Airport Passenger Charge Rev. TOB VRDO | 2.590% | 11/7/08 | (4) | 13,500 | 13,500 |
| Atlanta GA Wastewater Rev. CP | 1.850% | 2/6/09 | | 4,262 | 4,262 |
| Atlanta GA Water & Wastewater Rev. | 1.850% | 2/6/09 | LOC | 13,462 | 13,462 |
1 | Augusta GA Water & Sewer Rev. TOB VRDO | 2.590% | 11/7/08 | | 8,685 | 8,685 |
| Bartow County GA School Dist. GO | 5.000% | 11/1/09 | | 10,135 | 10,449 |
1 | Bartow County GA TAN | 3.000% | 12/31/08 | | 4,000 | 4,006 |
| Coweta County GA Dev. Auth. Rev. (Metro Atlanta YMCA Project) VRDO | 1.850% | 11/7/08 | LOC | 7,500 | 7,500 |
| Dalton County GA Dev. Auth. (Hamilton Health Care System) VRDO | 1.500% | 11/7/08 | LOC | 9,110 | 9,110 |
1 | DeKalb County GA Water & Sewer Rev. TOB VRDO | 1.820% | 11/7/08 | (4)LOC | 16,565 | 16,565 |
| Floyd County GA Dev. Auth. Rev. (Berry College) VRDO | 1.850% | 11/7/08 | LOC | 12,000 | 12,000 |
| Floyd County GA Dev. Auth. Rev. (Berry College) VRDO | 1.850% | 11/7/08 | LOC | 19,100 | 19,100 |
| Floyd County GA Dev. Auth. Rev. (Berry College) VRDO | 1.850% | 11/7/08 | LOC | 8,300 | 8,300 |
| Fulco GA Hosp. Auth. Rev. (Piedmont Hosp.) VRDO | 1.800% | 11/7/08 | LOC | 16,060 | 16,060 |
| Fulco GA Hosp. Auth. Rev. (Shepherd Center) VRDO | 5.000% | 11/7/08 | LOC | 12,540 | 12,540 |
| Fulton County GA Dev. Auth. (GA Tech Fac. Project) VRDO | 1.750% | 11/7/08 | LOC | 9,200 | 9,200 |
| Fulton County GA Dev. Auth. (Pace Academy Inc. Project) VRDO | 1.500% | 11/7/08 | LOC | 4,500 | 4,500 |
| Fulton County GA Dev. Auth. (Piedmont Healthcare Inc. Project) VRDO | 1.850% | 11/7/08 | LOC | 10,000 | 10,000 |
| Fulton County GA Dev. Auth. (Woodward Academy Project) VRDO | 1.850% | 11/7/08 | LOC | 6,000 | 6,000 |
| Fulton County GA Dev. Auth. (Woodward Academy Project) VRDO | 1.850% | 11/7/08 | LOC | 14,570 | 14,570 |
1 | Fulton County GA Water & Sewer Rev. TOB VRDO | 1.970% | 11/7/08 | | 3,300 | 3,300 |
1 | Georgia GO TOB VRDO | 1.830% | 11/7/08 | | 31,250 | 31,250 |
1 | Georgia GO TOB VRDO | 1.830% | 11/7/08 | | 4,245 | 4,245 |
| Georgia Port Auth. Rev. (Garden City Terminal Project) VRDO | 1.850% | 11/7/08 | LOC | 9,200 | 9,200 |
| Georgia Road & Tollway Auth. Rev. (Governor's Transp. Choices) | 5.250% | 3/1/09 | | 10,355 | 10,455 |
| Georgia Road & Tollway Auth. Rev. GAN | 5.000% | 6/1/09 | | 12,270 | 12,476 |
| Gwinnett County GA Hosp. Auth. Rev. (Gwinnett Hosp. System Inc.) VRDO | 1.800% | 11/7/08 | LOC | 7,000 | 7,000 |
| Gwinnett County GA Hosp. Auth. Rev. (Gwinnett Hosp. System Inc.) VRDO | 1.800% | 11/7/08 | LOC | 10,000 | 10,000 |
1 | Gwinnett County GA School Dist. GO TOB VRDO | 1.600% | 11/7/08 | | 12,385 | 12,385 |
1 | Gwinnett County GA School Dist. GO TOB VRDO | 1.830% | 11/7/08 | | 7,045 | 7,045 |
4
1 | Gwinnett County GA School Dist. TOB VRDO | 1.820% | 11/7/08 | | 4,500 | 4,500 |
| Macon-Bibb County GA Hosp. Auth. (Medical Center of Cenrtal Georgia) VRDO | 4.350% | 11/7/08 | | 52,900 | 52,900 |
| Macon-Bibb County GA Hosp. Auth. (Medical Center of Central Georgia) VRDO | 1.850% | 11/7/08 | LOC | 20,100 | 20,100 |
1 | Metro. Atlanta GA Rapid Transp. Auth. Georgia Sales Tax Rev. TOB VRDO | 2.260% | 11/7/08 | (4) | 5,000 | 5,000 |
1 | Private Colleges & Univ. Auth. Georgia (Emory Univ.) TOB VRDO | 1.600% | 11/7/08 | | 5,000 | 5,000 |
1 | Private Colleges & Univ. Auth. of Georgia Rev. (Emory Univ.) TOB VRDO | 1.830% | 11/7/08 | | 4,440 | 4,440 |
| Private Colleges & Univ. Auth. of Georgia Rev. (Emory Univ.) VRDO | 1.150% | 11/7/08 | | 7,500 | 7,500 |
| Private Colleges & Univ. Auth. of Georgia Rev. (Emory Univ.) VRDO | 1.150% | 11/7/08 | | 7,400 | 7,400 |
| Private Colleges & Univ. Auth. of Georgia Rev. (Emory Univ.) VRDO | 1.300% | 11/7/08 | | 5,060 | 5,060 |
| Richmond County GA Hosp. Auth. (Univ. of Health Services) VRDO | 1.850% | 11/7/08 | LOC | 29,300 | 29,300 |
| | | | | | 448,365 |
Hawaii (0.3%) | | | | | |
1 | Hawaii GO TOB VRDO | 2.350% | 11/7/08 | (4) | 8,100 | 8,100 |
1 | Hawaii State GO TOB VRDO | 1.830% | 11/7/08 | | 11,245 | 11,245 |
| Honolulu HI City & County GO | 8.000% | 10/1/09 | | 26,940 | 28,335 |
1 | Honolulu HI City & County TOB VRDO | 2.350% | 11/7/08 | (4) | 12,500 | 12,500 |
1 | Honolulu HI City & County Waste Water GO TOB VRDO | 2.020% | 11/7/08 | | 9,900 | 9,900 |
1 | University of Hawaii Rev. TOB VRDO | 1.820% | 11/7/08 | LOC | 12,930 | 12,930 |
| | | | | | 83,010 |
Idaho (2.6%) | | | | | |
| Idaho Health Facs. Auth. Rev. (Ascension Health) VRDO | 1.150% | 11/7/08 | | 6,000 | 6,000 |
| Idaho Health Facs. Auth. Rev. (St. Lukes Medical Center) VRDO | 4.000% | 11/3/08 | (4) | 79,935 | 79,935 |
| Idaho Housing & Finance Assn. (College of Idaho Project) VRDO | 1.700% | 11/7/08 | LOC | 6,455 | 6,455 |
| Idaho Housing & Finance Assn. Single Family Mortgage Rev. VRDO | 2.000% | 11/7/08 | | 13,500 | 13,500 |
| Idaho Housing & Finance Assn. Single Family Mortgage Rev. VRDO | 2.000% | 11/7/08 | | 12,000 | 12,000 |
| Idaho Housing & Finance Assn. Single Family Mortgage Rev. VRDO | 2.150% | 11/7/08 | | 8,000 | 8,000 |
| Idaho Housing & Finance Assn. Single Family Mortgage Rev. VRDO | 2.150% | 11/7/08 | | 12,105 | 12,105 |
| Idaho Housing & Finance Assn. Single Family Mortgage Rev. VRDO | 2.150% | 11/7/08 | | 10,405 | 10,405 |
| Idaho Housing & Finance Assn. Single Family Mortgage Rev. VRDO | 2.150% | 11/7/08 | | 11,260 | 11,260 |
| Idaho Housing & Finance Assn. Single Family Mortgage Rev. VRDO | 2.150% | 11/7/08 | | 12,290 | 12,290 |
| Idaho Housing & Finance Assn. Single Family Mortgage Rev. VRDO | 2.150% | 11/7/08 | | 15,680 | 15,680 |
| Idaho Housing & Finance Assn. Single Family Mortgage Rev. VRDO | 2.150% | 11/7/08 | | 16,250 | 16,250 |
| Idaho Housing & Finance Assn. Single Family Mortgage Rev. VRDO | 2.150% | 11/7/08 | | 16,525 | 16,525 |
| Idaho Housing & Finance Assn. Single Family Mortgage Rev. VRDO | 2.150% | 11/7/08 | | 6,145 | 6,145 |
| Idaho Housing & Finance Assn. Single Family Mortgage Rev. VRDO | 2.150% | 11/7/08 | | 17,500 | 17,500 |
| Idaho Housing & Finance Assn. Single Family Mortgage Rev. VRDO | 2.150% | 11/7/08 | | 20,000 | 20,000 |
| Idaho Housing & Finance Assn. Single Family Mortgage Rev. VRDO | 2.150% | 11/7/08 | | 20,000 | 20,000 |
| Idaho Housing & Finance Assn. Single Family Mortgage Rev. VRDO | 2.150% | 11/7/08 | | 15,275 | 15,275 |
| Idaho Housing & Finance Assn. Single Family Mortgage Rev. VRDO | 2.150% | 11/7/08 | | 15,500 | 15,500 |
| Idaho Housing & Finance Assn. Single Family Mortgage Rev. VRDO | 2.150% | 11/7/08 | | 5,800 | 5,800 |
| Idaho Housing & Finance Assn. Single Family Mortgage Rev. VRDO | 2.150% | 11/7/08 | | 14,120 | 14,120 |
| Idaho Housing & Finance Assn. Single Family Mortgage Rev. VRDO | 2.150% | 11/7/08 | | 16,450 | 16,450 |
| Idaho Housing & Finance Assn. Single Family Mortgage Rev. VRDO | 2.150% | 11/7/08 | | 17,500 | 17,500 |
| Idaho Housing & Finance Assn. Single Family Mortgage Rev. VRDO | 2.150% | 11/7/08 | | 7,500 | 7,500 |
| Idaho Housing & Finance Assn. Single Family Mortgage Rev. VRDO | 2.150% | 11/7/08 | | 28,750 | 28,750 |
| Idaho Housing & Finance Assn. Single Family Mortgage Rev. VRDO | 2.150% | 11/7/08 | | 24,000 | 24,000 |
| Idaho Housing & Finance Assn. Single Family Mortgage Rev. VRDO | 2.150% | 11/7/08 | | 30,000 | 30,000 |
| Idaho Housing & Finance Assn. Single Family Mortgage Rev. VRDO | 2.150% | 11/7/08 | | 33,750 | 33,750 |
| Idaho Housing & Finance Assn. Single Family Mortgage Rev. VRDO | 2.150% | 11/7/08 | | 27,000 | 27,000 |
| Idaho Housing & Finance Assn. Single Family Mortgage Rev. VRDO | 2.650% | 11/7/08 | | 8,490 | 8,490 |
| Idaho Housing & Finance Assn. Single Family Mortgage Rev. VRDO | 2.650% | 11/7/08 | | 7,100 | 7,100 |
| Idaho Housing & Finance Assn. Single Family Mortgage Rev. VRDO | 2.650% | 11/7/08 | | 10,595 | 10,595 |
| Idaho Housing & Finance Assn. Single Family Mortgage Rev. VRDO | 2.650% | 11/7/08 | | 10,540 | 10,540 |
| Idaho Housing & Finance Assn. Single Family Mortgage Rev. VRDO | 2.650% | 11/7/08 | | 7,320 | 7,320 |
| Idaho Housing & Finance Assn. Single Family Mortgage Rev. VRDO | 2.650% | 11/7/08 | | 6,085 | 6,085 |
| Idaho Housing & Finance Assn. Single Family Mortgage Rev. VRDO | 2.650% | 11/7/08 | | 9,855 | 9,855 |
| Idaho TAN | 3.000% | 6/30/09 | | 50,000 | 50,416 |
| | | | | | 630,096 |
Illinois (6.1%) | | | | | |
1 | Aurora IL Single Family Mortage Rev. TOB VRDO | 1.930% | 11/7/08 | | 68,165 | 68,165 |
| Bartlett IL Special Services Area (Bluff City LLC) VRDO | 1.700% | 11/7/08 | LOC | 14,760 | 14,760 |
1 | Chicago IL Board of Educ. TOB VRDO | 2.570% | 11/7/08 | (4) | 6,660 | 6,660 |
1 | Chicago IL GO TOB VRDO | 1.900% | 11/7/08 | (4) | 4,950 | 4,950 |
1 | Chicago IL GO TOB VRDO | 2.340% | 11/7/08 | (4) | 9,900 | 9,900 |
1 | Chicago IL GO TOB VRDO | 2.570% | 11/7/08 | (4) | 8,250 | 8,250 |
1 | Chicago IL Metro. Water Reclamation Dist. GO TOB VRDO | 1.820% | 11/7/08 | | 8,710 | 8,710 |
1 | Chicago IL Metro. Water Reclamation Dist. GO TOB VRDO | 1.850% | 11/7/08 | | 5,005 | 5,005 |
1 | Chicago IL Metro. Water Reclamation Dist. GO TOB VRDO | 1.850% | 11/7/08 | | 5,000 | 5,000 |
1 | Chicago IL O'Hare International Airport Rev. TOB VRDO | 1.600% | 11/7/08 | LOC | 13,855 | 13,855 |
1 | Chicago IL O'Hare International Airport Rev. TOB VRDO | 3.320% | 11/7/08 | (4) | 11,495 | 11,495 |
| Chicago IL Sales Tax Rev. VRDO | 1.250% | 11/3/08 | | 17,400 | 17,400 |
5
1 | Chicago IL Single Family Mortgage TOB VRDO | 2.050% | 11/7/08 | | 3,595 | 3,595 |
1 | Chicago IL Single Family Mortgage TOB VRDO | 2.050% | 11/7/08 | | 4,460 | 4,460 |
| Chicago IL Wastewater Transmission Rev. VRDO | 1.250% | 11/3/08 | LOC | 10,500 | 10,500 |
1 | Chicago Illinois O'Hare International Airport Rev.TOB VRDO | 1.820% | 11/7/08 | | 14,885 | 14,885 |
| Cook County IL GO TAN | 3.000% | 8/3/09 | | 17,500 | 17,684 |
1 | Cook County IL GO TOB PUT | 1.770% | 11/7/08 | LOC | 6,850 | 6,850 |
1 | Cook County IL GO TOB VRDO | 2.270% | 11/7/08 | | 7,460 | 7,460 |
| Cook County IL GO VRDO | 1.650% | 11/7/08 | | 7,500 | 7,500 |
| Illinois Dev. Finance Auth. Hosp. Rev. (Evanston Northwestern Healthcare Corp.) VRDO | 1.780% | 11/7/08 | | 33,045 | 33,045 |
| Illinois Dev. Finance Auth. Rev. (Chicago Horticultural Society) VRDO | 1.700% | 11/7/08 | LOC | 20,000 | 20,000 |
| Illinois Dev. Finance Auth. Rev. (Loyola Academy) VRDO | 1.700% | 11/7/08 | LOC | 16,245 | 16,245 |
1 | Illinois Dev. Finance Auth. TOB VRDO | 1.600% | 11/7/08 | | 5,145 | 5,145 |
| Illinois Educ. Fac. Auth. Rev. (Adler Planetarium) VRDO | 2.550% | 11/7/08 | LOC | 22,300 | 22,300 |
| Illinois Educ. Fac. Auth. Rev. (Columbia College Chicago) VRDO | 1.470% | 11/7/08 | LOC | 9,505 | 9,505 |
| Illinois Educ. Fac. Auth. Rev. (Field Museum of Natural History) VRDO | 1.750% | 11/7/08 | LOC | 26,400 | 26,400 |
1 | Illinois Educ. Fac. Auth. Rev. (Northwestern Univ.) TOB VRDO | 1.820% | 11/7/08 | | 7,005 | 7,005 |
1 | Illinois Educ. Fac. Auth. Rev. (Northwestern Univ.) TOB VRDO | 1.830% | 11/7/08 | | 3,470 | 3,470 |
1 | Illinois Educ. Fac. Auth. Rev. (Northwestern Univ.) TOB VRDO | 1.850% | 11/7/08 | | 4,795 | 4,795 |
| Illinois Educ. Fac. Auth. Rev. (Northwestern Univ.) VRDO | 1.400% | 11/7/08 | | 10,800 | 10,800 |
| Illinois Educ. Fac. Auth. Rev. (Univ. of Chicago) PUT | 1.950% | 5/5/09 | | 18,000 | 18,000 |
1 | Illinois Educ. Fac. Auth. Rev. (Univ. of Chicago) TOB VRDO | 1.820% | 11/7/08 | | 9,185 | 9,185 |
1 | Illinois Educ. Fac. Auth. Rev. (Univ. of Chicago) TOB VRDO | 1.830% | 11/7/08 | | 5,135 | 5,135 |
1 | Illinois Educ. Fac. Auth. Rev. (Univ. of Chicago) TOB VRDO | 1.830% | 11/7/08 | | 4,375 | 4,375 |
| Illinois Educ. Fac. Auth. Rev. (Univ. of Chicago) VRDO | 1.500% | 11/7/08 | | 32,677 | 32,677 |
| Illinois Educ. Fac. Auth. Rev. (Univ. of Chicago) VRDO | 1.500% | 11/7/08 | | 17,816 | 17,816 |
| Illinois Finance Auth. IDR (Guesto Packing Company Inc. Project) Rev. VRDO | 1.750% | 11/7/08 | LOC | 7,780 | 7,780 |
| Illinois Finance Auth. Pollution Commonwealth Edison Co. VRDO | 1.800% | 11/7/08 | LOC | 18,200 | 18,200 |
| Illinois Finance Auth. Rev. (Advocate Health) VRDO | 1.440% | 11/7/08 | | 12,500 | 12,500 |
| Illinois Finance Auth. Rev. (Advocate Health) VRDO | 1.490% | 11/7/08 | | 8,000 | 8,000 |
| Illinois Finance Auth. Rev. (Advocate Health) VRDO | 1.490% | 11/7/08 | | 44,000 | 44,000 |
| Illinois Finance Auth. Rev. (Bradley Univ.) PUT | 2.000% | 4/1/09 | LOC | 8,695 | 8,695 |
| Illinois Finance Auth. Rev. (Bradley Univ.) VRDO | 1.850% | 11/7/08 | LOC | 10,000 | 10,000 |
| Illinois Finance Auth. Rev. (Central Dupage Health) VRDO | 1.500% | 11/3/08 | | 20,980 | 20,980 |
| Illinois Finance Auth. Rev. (Chicago Horticulture Project) VRDO | 1.700% | 11/7/08 | LOC | 9,000 | 9,000 |
| Illinois Finance Auth. Rev. (Chicago Symphony Orchestra) VRDO | 1.700% | 11/7/08 | LOC | 8,000 | 8,000 |
| Illinois Finance Auth. Rev. (Elmhurst Memorial Healthcare) VRDO | 1.250% | 11/3/08 | LOC | 34,650 | 34,650 |
| Illinois Finance Auth. Rev. (Elmhurst Memorial Healthcare) VRDO | 2.000% | 11/7/08 | LOC | 46,000 | 46,000 |
| Illinois Finance Auth. Rev. (Hosp. Sister Services Inc.) CP | 2.350% | 11/5/08 | | 27,410 | 27,410 |
| Illinois Finance Auth. Rev. (Hosp. Sister Services Inc.) CP | 1.850% | 11/12/08 | | 10,000 | 10,000 |
| Illinois Finance Auth. Rev. (Little Co. Mary Hospital) VRDO | 1.550% | 11/7/08 | LOC | 29,300 | 29,300 |
| Illinois Finance Auth. Rev. (North Park Univ. Project) VRDO | 2.000% | 11/7/08 | LOC | 10,000 | 10,000 |
| Illinois Finance Auth. Rev. (Northwestern Community Hosp.) VRDO | 1.400% | 11/7/08 | LOC | 5,700 | 5,700 |
| Illinois Finance Auth. Rev. (Northwestern Memorial Hosp.) VRDO | 1.250% | 11/3/08 | | 34,300 | 34,300 |
| Illinois Finance Auth. Rev. (Northwestern Memorial Hosp.) VRDO | 1.400% | 11/7/08 | | 12,500 | 12,500 |
| Illinois Finance Auth. Rev. (Northwestern Memorial Hosp.) VRDO | 1.400% | 11/7/08 | | 11,500 | 11,500 |
| Illinois Finance Auth. Rev. (Northwestern Memorial Hosp.) VRDO | 1.780% | 11/7/08 | | 28,625 | 28,625 |
| Illinois Finance Auth. Rev. (Northwestern Memorial Hosp.) VRDO | 1.780% | 11/7/08 | | 33,625 | 33,625 |
1 | Illinois Finance Auth. Rev. (Northwestern Univ.) TOB VRDO | 1.860% | 11/7/08 | | 8,165 | 8,165 |
| Illinois Finance Auth. Rev. (Northwestern Univ.) VRDO | 1.150% | 11/7/08 | | 10,350 | 10,350 |
| Illinois Finance Auth. Rev. (Northwestern Univ.) VRDO | 1.650% | 11/7/08 | | 5,000 | 5,000 |
| Illinois Finance Auth. Rev. (OSF Healthcare System) VRDO | 6.000% | 11/3/08 | LOC | 8,795 | 8,795 |
| Illinois Finance Auth. Rev. (Resurrection Health Care) VRDO | 2.000% | 11/7/08 | LOC | 10,500 | 10,500 |
| Illinois Finance Auth. Rev. (Swedish Covenant) VRDO | 2.000% | 11/7/08 | LOC | 8,500 | 8,500 |
| Illinois Finance Auth. Rev. (Univ. of Chicago) VRDO | 1.500% | 11/7/08 | | 60,387 | 60,387 |
| Illinois Finance Auth. Rev. (Wesleyan Univ.) VRDO | 1.500% | 11/7/08 | LOC | 5,160 | 5,160 |
| Illinois Finance Auth. Rev. (Xavier Univ.) VRDO | 1.500% | 11/7/08 | LOC | 5,000 | 5,000 |
| Illinois GO | 5.000% | 3/1/09 | | 24,695 | 24,950 |
1 | Illinois GO TOB VRDO | 1.600% | 11/7/08 | LOC | 14,355 | 14,355 |
1 | Illinois GO TOB VRDO | 1.820% | 11/7/08 | | 12,990 | 12,990 |
1 | Illinois GO TOB VRDO | 1.850% | 11/7/08 | (13) | 12,480 | 12,480 |
1 | Illinois GO TOB VRDO | 1.850% | 11/7/08 | | 6,090 | 6,090 |
1 | Illinois GO TOB VRDO | 1.860% | 11/7/08 | | 23,225 | 23,225 |
1 | Illinois GO TOB VRDO | 2.340% | 11/7/08 | (4) | 23,080 | 23,080 |
1 | Illinois GO TOB VRDO | 2.350% | 11/7/08 | (4) | 9,900 | 9,900 |
1 | Illinois GO TOB VRDO | 2.570% | 11/7/08 | (4) | 14,295 | 14,295 |
| Illinois Health Fac. Auth. Rev. (Elmhurst Memorial Hosp.) VRDO | 1.430% | 11/7/08 | LOC | 8,600 | 8,600 |
| Illinois Health Fac. Auth. Rev. (Revolving Fund Pooled) VRDO | 1.250% | 11/3/08 | | 12,600 | 12,600 |
1 | Illinois Housing Dev. Auth. TOB VRDO | 2.050% | 11/7/08 | | 9,145 | 9,145 |
1 | Illinois Regional Transp. Auth. Rev. TOB PUT | 2.000% | 11/21/08 | | 14,495 | 14,495 |
1 | Illinois Regional Transp. Auth. Rev. TOB PUT | 2.000% | 11/21/08 | | 21,440 | 21,440 |
1 | Illinois Regional Transp. Auth. Rev. TOB PUT | 2.000% | 11/26/08 | (13) | 11,410 | 11,410 |
1 | Illinois Regional Transp. Auth. Rev. TOB VRDO | 3.320% | 11/7/08 | | 5,195 | 5,195 |
1 | Illinois Regional Transp. Auth. Rev. TOB VRDO | 3.500% | 11/7/08 | (4)LOC | 18,495 | 18,495 |
6
1 | Illinois Sales Tax Rev. TOB VRDO | 1.820% | 11/7/08 | | 3,500 | 3,500 |
1 | Illinois Sales Tax Rev. TOB VRDO | 1.880% | 11/7/08 | | 9,180 | 9,180 |
| Illinois State Tollway Highway Auth. Toll Highway Rev. VRDO | 2.700% | 11/7/08 | | 26,000 | 26,000 |
| Illinois State Tollway Highway Auth. Toll Highway Rev. VRDO | 2.700% | 11/7/08 | | 37,300 | 37,300 |
1 | Metro. Pier & Exposition Auth. Illinois Dedicated Sales Tax Rev. TOB VRDO | 1.950% | 11/7/08 | (4) | 9,325 | 9,325 |
1 | Metro. Pier & Exposition Auth. Illinois Dedicated Sales Tax Rev. TOB VRDO | 2.020% | 11/7/08 | | 5,060 | 5,060 |
1 | Metro. Pier & Exposition Auth. Illinois Dedicated Sales Tax Rev. TOB VRDO | 2.030% | 11/7/08 | | 10,380 | 10,380 |
1 | Schaumburg IL GO TOB VRDO | 2.360% | 11/7/08 | (4) | 6,000 | 6,000 |
| Univ. of Illinois (Util. Infrastructure Project) COP VRDO | 2.000% | 11/7/08 | | 43,618 | 43,618 |
1 | Univ. of Illinois Univ. Rev. TOB VRDO | 2.030% | 11/7/08 | | 14,660 | 14,660 |
| | | | | | 1,453,372 |
Indiana (3.2%) | | | | | |
| Indiana Bond Bank Advance Funding Program Notes TAN | 3.000% | 1/30/09 | LOC | 105,000 | 105,189 |
| Indiana Bond Bank Advance Funding Program Notes TAN | 3.000% | 5/28/09 | LOC | 130,000 | 130,857 |
| Indiana Dev. Finance Auth. Rev. (Children's Museum) VRDO | 1.800% | 11/7/08 | | 29,200 | 29,200 |
| Indiana Dev. Finance Auth. Rev. (Indianapolis Museum of Art) VRDO | 1.800% | 11/7/08 | LOC | 19,100 | 19,100 |
| Indiana Educ. Fac. Auth. (Wabash College) VRDO | 1.830% | 11/7/08 | LOC | 29,940 | 29,940 |
| Indiana Finance Auth. Health System Rev. (Sisters St. Francis) VRDO | 1.470% | 11/7/08 | LOC | 11,500 | 11,500 |
| Indiana Finance Auth. Health System Rev. (Sisters St. Francis) VRDO | 1.470% | 11/7/08 | LOC | 7,000 | 7,000 |
| Indiana Finance Auth. Health System Rev. (Sisters St. Francis) VRDO | 1.500% | 11/7/08 | LOC | 5,000 | 5,000 |
| Indiana Finance Auth. Health System Rev. (Sisters St. Francis) VRDO | 1.500% | 11/7/08 | LOC | 5,250 | 5,250 |
| Indiana Finance Auth. Health System Rev. (Sisters St. Francis) VRDO | 1.750% | 11/7/08 | LOC | 11,000 | 11,000 |
| Indiana Finance Auth. Health System Rev. (Sisters St. Francis-A) VRDO | 1.750% | 11/7/08 | LOC | 18,730 | 18,730 |
| Indiana Finance Auth. Health System Rev. (Sisters St. Francis-B) VRDO | 1.400% | 11/7/08 | LOC | 10,900 | 10,900 |
| Indiana Finance Auth. Hosp. Rev. (Clarian Health) VRDO | 1.430% | 11/7/08 | LOC | 7,500 | 7,500 |
| Indiana Finance Auth. Hosp. Rev. (Clarian Health) VRDO | 1.730% | 11/7/08 | LOC | 12,400 | 12,400 |
| Indiana Finance Auth. Hosp. Rev. (Clarian Health) VRDO | 1.750% | 11/7/08 | LOC | 15,305 | 15,305 |
| Indiana Finance Auth. Rev. TOB VRDO | 1.780% | 11/7/08 | | 10,035 | 10,035 |
1 | Indiana Finance Auth. Rev. VRDO | 1.770% | 11/7/08 | | 22,100 | 22,100 |
| Indiana Finance Auth. Rev. VRDO | 1.800% | 11/7/08 | LOC | 26,660 | 26,660 |
| Indiana Finance Auth. Rev. VRDO | 2.000% | 11/7/08 | LOC | 18,280 | 18,280 |
| Indiana Finance Auth. Rev. VRDO | 2.000% | 11/7/08 | | 10,000 | 10,000 |
| Indiana Finance Auth. Rev. VRDO | 5.000% | 11/7/08 | | 31,000 | 31,000 |
| Indiana Finance Auth. Rev. VRDO | 6.000% | 11/7/08 | | 11,700 | 11,700 |
| Indiana Finance Auth. Rev. VRDO | 6.000% | 11/7/08 | | 10,800 | 10,800 |
| Indiana Health & Educ. Fac. Financing Auth. Rev. (Clarian Health Obligated Group) VRDO | 1.750% | 11/7/08 | LOC | 9,000 | 9,000 |
| Indiana Health & Educ. Fac. Financing Auth. Rev. (St. Francis) ARS | 2.000% | 11/7/08 | (4) | 16,500 | 16,500 |
| | | | | | | | |
1 | Indiana Health Fac. Fin. Auth. Hosp. Rev. (Community Hosp. Project) Rev. TOB VRDO | 1.780% | 11/7/08 | LOC | 6,430 | 6,430 |
1 | Indiana Health Fac. Finance Auth. Rev. TOB VRDO | 2.350% | 11/7/08 | (4) | 8,085 | 8,085 |
1 | Indiana Housing & Community Dev. Auth. Single Family Mortgage Rev. TOB VRDO | 2.000% | 11/7/08 | | 7,615 | 7,615 |
1 | Indianapolis IN Local Public Improvement Rev. TOB VRDO | 3.820% | 11/7/08 | | 8,480 | 8,480 |
| Lawrenceburg IN Pollution Control Rev. VRDO | 1.800% | 11/7/08 | LOC | 10,000 | 10,000 |
| Lawrenceburg IN Pollution Control Rev. VRDO | 1.850% | 11/7/08 | LOC | 6,500 | 6,500 |
1 | New Albany Floyd County IN Industrial School Dist. Rev. TOB VRDO | 2.350% | 11/7/08 | (4) | 7,890 | 7,890 |
| Noblesville IN Econ. Dev. Rev. (Greystone Apartments Project) VRDO | 1.750% | 11/7/08 | LOC | 11,050 | 11,050 |
| Purdue IN Univ. CP | 2.500% | 11/3/08 | | 18,000 | 18,000 |
| Purdue Univ. Indiana Univ. Rev. VRDO | 1.250% | 11/7/08 | | 18,250 | 18,250 |
| Purdue Univ. Indiana Univ. Rev. VRDO | 1.250% | 11/7/08 | | 37,230 | 37,230 |
| St. Joseph County IN (Univ. of Notre Dame du Lac Project) VRDO | 1.250% | 11/7/08 | | 18,000 | 18,000 |
1 | Wayne Township IN School Building Corp. Marion County Solar Eclipse TOB VRDO | 1.820% | 11/7/08 | LOC | 21,705 | 21,705 |
| | | | | | 764,181 |
Iowa (0.7%) | | | | | |
1 | Des Moines IA Metro. Wastewater Reclamation Auth. Sewer. Rev. TOB VRDO | 1.600% | 11/7/08 | LOC | 6,450 | 6,450 |
| Iowa Finance Auth. Health Fac. Rev. (Great River Medical Center Project) VRDO | 1.450% | 11/3/08 | LOC | 7,000 | 7,000 |
| Iowa Finance Auth. Rev. (Health Care Fac.) VRDO | 1.700% | 11/7/08 | | 5,330 | 5,330 |
| Iowa Finance Auth. Rev. (Health Care Fac.) VRDO | 1.750% | 11/7/08 | (12) | 9,100 | 9,100 |
| Iowa Finance Auth. Rev. (Health Care Fac.) VRDO | 1.750% | 11/7/08 | (12) | 22,700 | 22,700 |
| Iowa Finance Auth. Rev. (Health Care Fac.) VRDO | 1.750% | 11/7/08 | (12) | 20,000 | 20,000 |
| Iowa Finance Auth. Single Family Rev. VRDO | 1.600% | 11/7/08 | | 11,500 | 11,500 |
| Iowa Finance Auth. Single Family Rev. VRDO | 1.830% | 11/7/08 | | 12,000 | 12,000 |
| Iowa Higher Educ. Loan Auth. Rev. Private College Fac. (Grinnell College Project) VRDO | 1.680% | 11/7/08 | | 37,500 | 37,500 |
| Iowa School Cash Anticipation Program Rev. | 3.500% | 6/25/09 | (4) | 29,000 | 29,324 |
| | | | | | 160,904 |
Kansas (0.7%) | | | | | |
1 | Kansas Dept. of Transp. Highway Rev. TOB VRDO | 1.600% | 11/7/08 | | 6,315 | 6,315 |
| Kansas Dept. of Transp. Highway Rev. VRDO | 2.300% | 11/7/08 | | 38,100 | 38,100 |
| Kansas Dept. of Transp. Highway Rev. VRDO | 2.300% | 11/7/08 | | 38,900 | 38,900 |
| Kansas Dept. of Transp. Highway Rev. VRDO | 2.310% | 11/7/08 | | 23,000 | 23,000 |
| Kansas Dev. Finance Auth. Rev. (Sisters of Charity) VRDO | 1.250% | 11/3/08 | | 7,200 | 7,200 |
1 | Sedgwick & Shawnee Counties KS Single Family Mortgage Rev. TOB VRDO | 2.100% | 11/7/08 | | 435 | 435 |
1 | Sedgwick & Shawnee County KS VRDO | 2.050% | 11/7/08 | | 3,265 | 3,265 |
| Sedgwick County KS Airport Fac. Rev. (FlightSafety) VRDO | 1.900% | 11/7/08 | | 34,000 | 34,000 |
| | | | | | | | |
7
| Wichita KS Airport Facs. Rev. VRDO | 1.900% | 11/7/08 | | 11,170 | 11,170 |
1 | Wyandotte County Kansas City KS Unified Govt. Util. System Rev. TOB VRDO | 1.950% | 11/7/08 | | 6,000 | 6,000 |
| | | | | | 168,385 |
Kentucky (1.3%) | | | | | |
| Christian County KY Association County Leasing Program Rev. VRDO | 1.200% | 11/3/08 | LOC | 27,430 | 27,430 |
| Christian County KY Association County Leasing Program Rev. VRDO | 1.200% | 11/3/08 | LOC | 4,535 | 4,535 |
| Christian County KY Association County Leasing Program Rev. VRDO | 1.200% | 11/3/08 | LOC | 30,000 | 30,000 |
| Jeffersontown KY Lease Program (Kentucky League of Cities Funding) VRDO | 1.750% | 11/7/08 | LOC | 3,400 | 3,400 |
| Kenton County KY Airport Board Special Fac. Rev. (Flightsafety International Inc.) VRDO | 1.900% | 11/7/08 | (13) | 4,600 | 4,600 |
| Kenton County KY Airport Board Special Fac. Rev. (Flightsafety International Inc.) VRDO | 1.930% | 11/7/08 | | 17,900 | 17,900 |
| Kentucky Asset/Liability Comm. General Fund Rev. TRAN | 3.000% | 6/25/09 | | 35,000 | 35,272 |
| Kentucky Econ. Dev. Finance Auth. Medical Center Rev. (Ashland Hosp. Corp.) PUT | 4.000% | 12/18/08 | LOC | 5,000 | 5,000 |
| Kentucky Econ. Dev. Finance Auth. Medical Center Rev. (Ashland Hosp. Corp.) PUT | 4.000% | 12/18/08 | LOC | 25,000 | 25,000 |
| Kentucky Higher Educ. Student Loan Corp. Student Loan Rev. VRDO | 1.850% | 11/7/08 | LOC | 41,700 | 41,700 |
1 | Kentucky Turnpike Auth. Econ. Dev. Road Rev. (Revitalization Project) TOB VRDO | 1.600% | 11/7/08 | | 7,860 | 7,860 |
1 | Louisville & Jefferson County KY Metro. Sewer Dist. TOB VRDO | 1.950% | 11/7/08 | (13) | 28,000 | 28,000 |
| Richmond KY League of Cities Funding Lease Program Rev. VRDO | 1.850% | 11/7/08 | LOC | 9,900 | 9,900 |
| Warren County KY Rev. (Western Kentucky Univ. Student Life) VRDO | 1.800% | 11/7/08 | LOC | 58,775 | 58,775 |
| Williamstown KY League of Cities VRDO | 1.850% | 11/7/08 | LOC | 5,000 | 5,000 |
| | | | | | 304,372 |
Louisiana (1.8%) | | | | | | |
| Lafayette Parish LA School Board Rev. | 5.000% | 4/1/09 | (4) | 2,000 | 2,022 |
| Lake Charles LA HBR & Term Dist. Cogeneration Project PUT | 2.250% | 3/15/09 | | 200,000 | 200,000 |
1 | Louisiana Gasoline and Fuel Tax Rev. TOB VRDO | 2.350% | 11/7/08 | | 9,900 | 9,900 |
1 | Louisiana Gasoline and Fuel Tax Rev. TOB VRDO | 2.350% | 11/7/08 | (4) | 27,225 | 27,225 |
1 | Louisiana GO TOB VRDO | 2.330% | 11/7/08 | (4) | 30,000 | 30,000 |
| Louisiana GO VRDO | 1.400% | 11/7/08 | LOC | 24,000 | 24,000 |
| Louisiana Public Fac. Auth. Hosp. Rev. (Franciscan Missionaries) VRDO | 1.500% | 11/7/08 | LOC | 10,000 | 10,000 |
| Louisiana Public Fac. Auth. Hosp. Rev. (Franciscan Missionaries) VRDO | 2.000% | 11/7/08 | LOC | 9,000 | 9,000 |
| Louisiana Public Fac. Auth. Rev. (International Matex Tank Terminals) VRDO | 1.850% | 11/7/08 | LOC | 17,500 | 17,500 |
1 | Louisiana Public Fac. Auth. Rev. TOB VRDO | 2.500% | 11/7/08 | LOC | 44,345 | 44,345 |
1 | Louisiana Public Fac. Auth. Rev. TOB VRDO | 2.500% | 11/7/08 | LOC | 42,645 | 42,645 |
| St. James Parish Louisiana Rev. (Nustar Logistics LP Project) VRDO | 1.850% | 11/7/08 | LOC | 15,000 | 15,000 |
| St. Tammany Parish LA Dev. Dist. Rev. VRDO | 1.850% | 11/7/08 | LOC | 6,000 | 6,000 |
| | | | | | 437,637 |
Maine (0.5%) | |
| Maine Health & Higher Educ. Fac. Auth. Rev. VRDO | 6.000% | 11/7/08 | (4) | 50,900 | 50,900 |
| | | | | | | | | | | |
1 | Maine Housing Auth. General Rev. TOB VRDO | 2.050% | 11/7/08 | | 28,980 | 28,980 |
1 | Maine Housing Auth. Mortgage Rev. TOB VRDO | 2.050% | 11/7/08 | | 3,720 | 3,720 |
| Maine Housing Auth. Mortgage Rev. VRDO | 2.000% | 11/7/08 | | 5,000 | 5,000 |
| Maine Housing Auth. Mortgage Rev. VRDO | 2.000% | 11/7/08 | | 5,000 | 5,000 |
| Maine Housing Auth. Mortgage Rev. VRDO | 2.000% | 11/7/08 | | 6,500 | 6,500 |
| Maine Housing Auth. Mortgage Rev. VRDO | 2.050% | 11/7/08 | | 6,000 | 6,000 |
| Maine Housing Auth. Mortgage Rev. VRDO | 2.550% | 11/7/08 | | 6,500 | 6,500 |
1 | Maine Housing Auth. Mortgage Rev. VRDO | 2.550% | 11/7/08 | | 6,900 | 6,900 |
| | | | | | 119,500 |
Maryland (1.7%) | |
| Baltimore County MD Metro. Dist. CP | 1.700% | 2/6/09 | | 23,000 | 23,000 |
| Chestertown MD Econ. Dev. Washington College VRDO | 1.770% | 11/7/08 | LOC | 9,000 | 9,000 |
| District of Columbia Rev. (National Academy of Sciences Project) CP | 1.660% | 1/20/09 | LOC | 20,000 | 20,000 |
1 | Maryland Dept. of Housing & Community Dev. Rev. TOB VRDO | 1.980% | 11/7/08 | | 2,360 | 2,360 |
1 | Maryland Dept. of Housing & Community Dev. Rev. TOB VRDO | 1.980% | 11/7/08 | | 3,695 | 3,695 |
| Maryland Dept. of Housing & Community Dev. Rev. VRDO | 1.600% | 11/7/08 | | 45,000 | 45,000 |
| Maryland Dept. of Housing & Community Dev. Rev. VRDO | 1.850% | 11/7/08 | | 10,000 | 10,000 |
1 | Maryland Dept. of Housing & Community Dev. TOB VRDO | 2.560% | 11/7/08 | | 1,110 | 1,110 |
�� | Maryland GO | 5.000% | 2/1/09 | | 2,000 | 2,016 |
| Maryland GO | 5.500% | 8/1/09 | | 1,000 | 1,024 |
1 | Maryland GO TOB VRDO | 1.850% | 11/7/08 | | 7,200 | 7,200 |
| Maryland Health & Higher Educ. Fac. Auth. Rev. (Gilman School) VRDO | 1.800% | 11/7/08 | LOC | 8,000 | 8,000 |
1 | Maryland Health & Higher Educ. Fac. Auth. Rev. (John Hopkins) TOB VRDO | 1.600% | 11/7/08 | | 3,850 | 3,850 |
| Maryland Health & Higher Educ. Fac. Auth. Rev. (Johns Hopkins Hosp.) VRDO | 1.580% | 11/7/08 | LOC | 8,000 | 8,000 |
| Maryland Health & Higher Educ. Fac. Auth. Rev. (Johns Hopkins Univ.) CP | 1.550% | 12/10/08 | | 10,641 | 10,641 |
| Maryland Health & Higher Educ. Fac. Auth. Rev. (Johns Hopkins Univ.) VRDO | 0.800% | 11/7/08 | | 14,765 | 14,765 |
| Maryland Health & Higher Educ. Fac. Auth. Rev. (Johns Hopkins Univ.) VRDO | 1.580% | 11/7/08 | LOC | 5,000 | 5,000 |
| Maryland Health & Higher Educ. Fac. Auth. Rev. (Loyola College) VRDO | 1.450% | 11/7/08 | LOC | 22,000 | 22,000 |
| Maryland Health & Higher Educ. Fac. Auth. Rev. (Mercy Medical Center) VRDO | 1.750% | 11/7/08 | LOC | 12,065 | 12,065 |
| Maryland Health & Higher Educ. Fac. Auth. Rev. (Stevenson Univ.) VRDO | 1.450% | 11/7/08 | LOC | 23,500 | 23,500 |
| Maryland Health & Higher Educ. Fac. Auth. Rev. (Univ. of Maryland Medical System) VRDO | 1.580% | 11/7/08 | LOC | 5,000 | 5,000 |
| Maryland Health & Higher Educ. Fac. Auth. Rev. (Univ. Of Maryland Medical System) VRDO | 1.600% | 11/7/08 | LOC | 18,250 | 18,250 |
| Maryland Health & Higher Educ. Fac. Auth. Rev. (Univ. of Maryland Medical System) VRDO | 1.800% | 11/7/08 | LOC | 7,000 | 7,000 |
| Maryland Health & Higher Educ. Fac. Auth. Rev. (Univ. Of Maryland Medical System) VRDO | 1.900% | 11/7/08 | LOC | 7,000 | 7,000 |
8
1 | Maryland State Transp. Auth. Rev. TOB VRDO | 1.600% | 11/7/08 | (4) | 5,000 | 5,000 |
1 | Maryland Transp. Auth. Rev. TOB VRDO | 1.860% | 11/7/08 | (4) | 29,800 | 29,800 |
1 | Maryland Transp. Auth. Rev. TOB VRDO | 2.340% | 11/7/08 | (4) | 13,860 | 13,860 |
| Washington Suburban Sanitation Dist. Maryland VRDO | 1.950% | 11/7/08 | | 28,700 | 28,700 |
| Washington Suburban Sanitation Dist. Maryland VRDO | 2.000% | 11/7/08 | | 33,700 | 33,700 |
| Washington Suburban Sanitation Dist. Maryland VRDO | 2.000% | 11/7/08 | | 20,000 | 20,000 |
| | | | | | 400,536 |
Massachusetts (3.7%) | | | | | |
| Massachusetts Bay Transp. Auth. Rev. CP | 1.750% | 12/1/08 | | 25,750 | 25,750 |
1 | Massachusetts Bay Transp. Auth. Rev. Sales Tax TOB VRDO | 1.780% | 11/7/08 | | 5,025 | 5,025 |
1 | Massachusetts Bay Transp. Auth. Rev. TOB PUT | 2.080% | 12/29/08 | | 13,850 | 13,850 |
1 | Massachusetts Bay Transp. Auth. Rev. TOB PUT | 2.080% | 5/14/09 | | 21,745 | 21,745 |
1 | Massachusetts Bay Transp. Auth. Rev. TOB VRDO | 1.770% | 11/7/08 | | 13,000 | 13,000 |
1 | Massachusetts Bay Transp. Auth. Rev. TOB VRDO | 4.000% | 11/7/08 | | 6,670 | 6,670 |
1 | Massachusetts Dev. Finance Agency Rev. (Boston Univ.) TOB VRDO | 1.830% | 11/7/08 | (13) | 9,900 | 9,900 |
| Massachusetts Dev. Finance Agency Rev. (Clark Univ.) VRDO | 2.050% | 11/7/08 | LOC | 5,000 | 5,000 |
| Massachusetts Dev. Finance Agency Rev. (Fay School Issue) VRDO | 1.920% | 11/7/08 | LOC | 5,400 | 5,400 |
| Massachusetts Dev. Finance Agency Rev. (Shady Hill) VRDO | 1.920% | 11/7/08 | LOC | 10,000 | 10,000 |
| Massachusetts Dev. Finance Agency Rev. (Simmons College) VRDO | 1.250% | 11/7/08 | LOC | 9,000 | 9,000 |
| Massachusetts Dev. Finance Agency Rev. (Wentworth Institute of Technology) VRDO | 1.800% | 11/7/08 | LOC | 17,600 | 17,600 |
1 | Massachusetts Dev. Finance Agency Rev. TOB VRDO | 1.850% | 11/7/08 | | 5,690 | 5,690 |
| Massachusetts GAN | 5.250% | 6/15/09 | | 10,000 | 10,061 |
| Massachusetts GO | 5.000% | 8/1/09 | | 6,000 | 6,144 |
| Massachusetts GO | 5.750% | 8/1/09 | | 1,300 | 1,330 |
| Massachusetts GO RAN | 4.000% | 4/30/09 | | 55,000 | 55,482 |
| Massachusetts GO RAN | 4.000% | 5/29/09 | | 50,000 | 50,509 |
1 | Massachusetts GO TOB PUT | 2.000% | 11/7/08 | | 23,935 | 23,935 |
1 | Massachusetts GO TOB PUT | 2.000% | 11/7/08 | | 36,740 | 36,740 |
1 | Massachusetts GO TOB VRDO | 1.840% | 11/7/08 | | 28,635 | 28,635 |
1 | Massachusetts GO TOB VRDO | 1.900% | 11/7/08 | | 31,235 | 31,235 |
1 | Massachusetts GO TOB VRDO | 2.520% | 11/7/08 | (4) | 1,850 | 1,850 |
1 | Massachusetts GO TOB VRDO | 3.500% | 11/7/08 | (4)LOC | 10,340 | 10,340 |
1 | Massachusetts GO TOB VRDO | 3.500% | 11/7/08 | (4)LOC | 16,090 | 16,090 |
1 | Massachusetts GO TOB VRDO | 3.500% | 11/7/08 | (4)LOC | 12,920 | 12,920 |
| Massachusetts Health & Edec. Fac. Auth. Rev. (Harvard Univ.) CP | 1.670% | 12/4/08 | | 35,648 | 35,648 |
| Massachusetts Health & Educ. Fac. Auth. Rev. (Amherst College) PUT | 2.850% | 7/9/09 | | 9,700 | 9,700 |
| Massachusetts Health & Educ. Fac. Auth. Rev. (Baystate Medical Center) VRDO | 1.450% | 11/7/08 | LOC | 21,100 | 21,100 |
| Massachusetts Health & Educ. Fac. Auth. Rev. (Harvard Univ.) CP | 3.250% | 3/26/09 | | 10,000 | 10,000 |
| Massachusetts Health & Educ. Fac. Auth. Rev. (Harvard Univ.) CP | 3.350% | 6/15/09 | | 40,000 | 40,000 |
| | | | | | | | |
1 | Massachusetts Health & Educ. Fac. Auth. Rev. (Harvard Univ.) TOB VRDO | 1.850% | 11/7/08 | | 15,000 | 15,000 |
1 | Massachusetts Health & Educ. Fac. Auth. Rev. (Havard Univ.) TOB VRDO | 1.850% | 11/7/08 | | 7,395 | 7,395 |
| Massachusetts Health & Educ. Fac. Auth. Rev. (Northeastern Univ.) VRDO | 1.000% | 11/3/08 | LOC | 25,350 | 25,350 |
| Massachusetts Health & Educ. Fac. Auth. Rev. (Wellesley College) VRDO | 1.000% | 11/7/08 | | 3,000 | 3,000 |
1 | Massachusetts Housing Finance Agency Housing Rev. TOB VRDO | 1.950% | 11/7/08 | | 10,105 | 10,105 |
| Massachusetts Port Auth. Rev. VRDO | 1.450% | 11/7/08 | LOC | 12,185 | 12,185 |
| Massachusetts Port Auth. Rev. VRDO | 1.630% | 11/7/08 | LOC | 45,420 | 45,420 |
| Massachusetts School Building Auth Rev. CP | 3.000% | 12/4/08 | LOC | 28,000 | 28,000 |
1 | Massachusetts School Building Auth. Dedicated Sales Tax Rev. TOB VRDO | 1.600% | 11/7/08 | (4) | 2,240 | 2,240 |
1 | Massachusetts School Building Auth. Dedicated Sales Tax Rev. TOB VRDO | 2.010% | 11/7/08 | | 7,595 | 7,595 |
1 | Massachusetts School Building Auth. Dedicated Sales Tax Rev. TOB VRDO | 2.340% | 11/7/08 | (4) | 32,135 | 32,135 |
1 | Massachusetts Water Pollution Abatement Trust TOB VRDO | 1.800% | 11/7/08 | | 3,240 | 3,240 |
1 | Massachusetts Water Resources Auth. Rev. TOB VRDO | 1.600% | 11/7/08 | | 8,190 | 8,190 |
1 | Massachusetts Water Resources Auth. Rev. TOB VRDO | 2.330% | 11/7/08 | (4) | 3,095 | 3,095 |
1 | Massachusetts Water Resources Auth. Rev. TOB VRDO | 2.340% | 11/7/08 | (4) | 7,300 | 7,300 |
1 | Massachusetts Water Resources Auth. Rev. TOB VRDO | 3.500% | 11/7/08 | (4) | 39,055 | 39,055 |
1 | Massachusetts Water Resources Auth. Rev. TOB VRDO | 3.500% | 11/7/08 | (4) | 30,225 | 30,225 |
| Massachusetts Water Resources Auth. Rev. VRDO | 1.200% | 11/7/08 | | 18,400 | 18,400 |
| Univ. of Massachusetts Building Auth. Rev. VRDO | 1.450% | 11/7/08 | LOC | 31,700 | 31,700 |
| | | | | | 879,979 |
Michigan (3.8%) | | | | | |
1 | Detroit MI City School Dist. TOB VRDO | 1.820% | 11/7/08 | (4)LOC | 26,185 | 26,185 |
1 | Detroit MI Water Supply System TOB VRDO | 3.320% | 11/7/08 | (4) | 4,490 | 4,490 |
| Grand Valley MI State Univ. VRDO | 1.710% | 11/7/08 | LOC | 5,600 | 5,600 |
| Grand Valley MI State Univ. VRDO | 1.850% | 11/7/08 | LOC | 14,240 | 14,240 |
| Green Lake Township MI Econ. Dev. Corp. Rev. (Interlochen Center Project) VRDO | 1.250% | 11/3/08 | LOC | 20,900 | 20,900 |
| Jackson County MI Hosp. Finance Auth. Rev. (W.A. Foote Memorial Hosp.) VRDO | 1.800% | 11/7/08 | (12) | 10,000 | 10,000 |
| Kent Hosp. MI Finance Auth. Rev. (Spectrum Health) VRDO | 1.420% | 11/7/08 | LOC | 12,000 | 12,000 |
| Kent Hosp. MI Finance Auth. Rev. (Spectrum Health) VRDO | 1.720% | 11/7/08 | LOC | 15,000 | 15,000 |
| Michigan Building Auth. CP | 1.600% | 11/6/08 | LOC | 36,745 | 36,745 |
| Michigan Building Auth. CP | 3.750% | 11/6/08 | LOC | 23,200 | 23,200 |
1 | Michigan Building Auth. Rev. TOB VRDO | 2.580% | 11/7/08 | (4) | 14,100 | 14,100 |
1 | Michigan Building Auth. Rev. TOB VRDO | 2.580% | 11/7/08 | | 10,100 | 10,100 |
| | | | | | | | |
9
1 | Michigan Higher Educ. Student Loan Auth. Rev. TOB VRDO | 2.500% | 11/7/08 | LOC | 59,245 | 59,245 |
1 | Michigan Higher Educ. Student Loan Auth. Rev. TOB VRDO | 2.500% | 11/7/08 | LOC | 66,995 | 66,995 |
1 | Michigan Higher Educ. Student Loan Auth. Rev. TOB VRDO | 2.500% | 11/7/08 | LOC | 67,945 | 67,945 |
1 | Michigan Higher Educ. Student Loan Auth. Rev. TOB VRDO | 2.500% | 11/7/08 | LOC | 36,545 | 36,545 |
| Michigan Hosp. Finance Auth. Rev. (Ascension Health) VRDO | 1.100% | 11/7/08 | | 10,000 | 10,000 |
| Michigan Hosp. Finance Auth. Rev. (Ascension Health) VRDO | 1.100% | 11/7/08 | | 10,500 | 10,500 |
| Michigan Hosp. Finance Auth. Rev. (Ascension Health) VRDO | 1.100% | 11/7/08 | | 6,100 | 6,100 |
| Michigan Hosp. Finance Auth. Rev. (Ascension Health) VRDO | 1.100% | 11/7/08 | | 26,000 | 26,000 |
| Michigan Hosp. Finance Auth. Rev. (Ascension Health) VRDO | 1.150% | 11/7/08 | | 15,520 | 15,520 |
| Michigan Hosp. Finance Auth. Rev. (Ascension Health) VRDO | 1.150% | 11/7/08 | | 17,600 | 17,600 |
| Michigan Hosp. Finance Auth. Rev. (Henry Ford Health System) VRDO | 1.750% | 11/7/08 | LOC | 100 | 100 |
| Michigan Hosp. Finance Auth. Rev. (Holland Community Hosp.) VRDO | 1.870% | 11/7/08 | LOC | 7,000 | 7,000 |
| Michigan Hosp. Finance Auth. Rev. (McClaren Health) VRDO | 1.450% | 11/7/08 | LOC | 17,000 | 17,000 |
| Michigan Housing Dev. Auth. Rev. (Rental Housing) VRDO | 2.250% | 11/7/08 | | 27,810 | 27,810 |
| Michigan Housing Dev. Auth. Rev. (Rental Housing) VRDO | 2.250% | 11/7/08 | | 28,800 | 28,800 |
| Michigan Housing Dev. Auth. Single Family Mortgage Rev. PUT | 1.900% | 11/6/08 | | 35,000 | 35,000 |
| Michigan Muni. Bond Auth. Rev. | 3.000% | 8/20/09 | | 98,315 | 99,377 |
1 | Michigan Muni. Bond Auth. Rev. TOB VRDO | 1.830% | 11/7/08 | | 4,725 | 4,725 |
1 | Michigan Muni. Bond Auth. Rev. TOB VRDO | 1.850% | 11/7/08 | | 5,100 | 5,100 |
1 | Michigan Muni. Bond Auth. Rev. TOB VRDO | 1.860% | 11/7/08 | | 3,845 | 3,845 |
| Michigan Public Educ. Fac. Auth. Rev. | 3.000% | 7/20/09 | LOC | 6,000 | 6,046 |
| Michigan Strategic Fund (Detroit Edison) VRDO | 1.600% | 11/7/08 | LOC | 15,000 | 15,000 |
| Michigan Strategic Fund Limited Obligation Rev. (Consumer's Energy Co.) VRDO | 1.600% | 11/7/08 | LOC | 5,700 | 5,700 |
| Univ. of Michigan Hosp. Rev. (Medical Service Plan) VRDO | 0.900% | 11/3/08 | | 6,200 | 6,200 |
| Univ. of Michigan Hosp. Rev. VRDO | 0.900% | 11/3/08 | | 5,000 | 5,000 |
| Univ. of Michigan Hosp. Rev. VRDO | 0.900% | 11/3/08 | | 4,000 | 4,000 |
| Univ. of Michigan Hosp. Rev. VRDO | 1.150% | 11/7/08 | | 57,375 | 57,375 |
| Univ. of Michigan Univ. Rev. VRDO | 1.150% | 11/7/08 | | 76,165 | 76,165 |
1 | Wayne MI Univ. of Michigan Univ. Rev. TOB VRDO | 2.570% | 11/7/08 | (4) | 1,905 | 1,905 |
| | | | | | 915,158 |
Minnesota (1.2%) | | | | | |
1 | Hennepin County MN Sales Tax Rev. TOB PUT | 2.300% | 11/7/08 | | 23,640 | 23,640 |
| Minneapolis & St. Paul Housing & Redev. Auth. Health Care System (Allina Health Care) TOB VRDO | 1.200% | 11/7/08 | LOC | 30,000 | 30,000 |
| Minneapolis & St. Paul Housing & Redev. Auth. Health Care System (Allina Health Care) TOB VRDO | 1.650% | 11/7/08 | LOC | 10,000 | 10,000 |
| Minneapolis & St. Paul MN Metro. Airport | 5.125% | 1/1/09 | (Prere.) | 39,710 | 40,290 |
| Minneapolis MN Health Care System (Fairview Health Services) VRDO | 1.550% | 11/7/08 | LOC | 2,500 | 2,500 |
| | | | | | | |
| Minneapolis MN Health Care System (Fairview Health Services) VRDO | 1.550% | 11/7/08 | LOC | 5,800 | 5,800 |
| Minneapolis MN Health Care System (Fairview Health Services) VRDO | 1.550% | 11/7/08 | LOC | 9,000 | 9,000 |
| Minnesota GO | 5.000% | 11/1/08 | | 24,785 | 24,785 |
| Minnesota GO | 5.000% | 6/1/09 | | 17,975 | 18,284 |
| Minnesota GO | 5.500% | 6/1/09 | | 8,730 | 8,900 |
| Minnesota GO | 5.000% | 8/1/09 | | 7,000 | 7,174 |
| Minnesota GO | 5.000% | 11/1/09 | | 12,000 | 12,315 |
1 | Minnesota Housing Finance Agency Limited Obligation Bonds TOB VRDO | 1.820% | 11/7/08 | | 12,960 | 12,960 |
1 | Minnesota Housing Finance Agency Limited Obligation Bonds TOB VRDO | 1.870% | 11/7/08 | | 25,000 | 25,000 |
| Minnesota Housing Finance Agency Residential Housing Finance Rev. | 3.300% | 12/18/08 | | 7,200 | 7,200 |
| Minnesota Housing Finance Agency Residential Housing Finance VRDO | 1.820% | 11/7/08 | | 8,500 | 8,500 |
| Minnesota School Dist. Tax & Aid Borrowing Program COP | 3.000% | 9/4/09 | | 12,000 | 12,134 |
| Saint Louis Park MN Rev. (Park Nicollet) VRDO | 1.600% | 11/7/08 | LOC | 15,000 | 15,000 |
| Saint Louis Park MN Rev. (Park Nicollet) VRDO | 1.750% | 11/7/08 | LOC | 7,500 | 7,500 |
| St. Cloud MN Health Care Rev. (Centracare Health System) VRDO | 1.700% | 11/7/08 | (12) | 5,000 | 5,000 |
| St. Cloud MN Health Care Rev. (Centracare Health System) VRDO | 1.730% | 11/7/08 | (12) | 5,305 | 5,305 |
| | | | | | 291,287 |
Mississippi (0.5%) | | | | | |
| Jackson County MS Port Fac. (Chevron USA Inc.) VRDO | 0.750% | 11/3/08 | | 8,455 | 8,455 |
| Medical Center Educ. Building Corp. Mississippi Rev. VRDO | 1.250% | 11/3/08 | | 14,375 | 14,375 |
1 | Mississippi Dev. Bank Special Obligation Rev. TOB PUT | 1.820% | 11/7/08 | LOC | 5,000 | 5,000 |
| Mississippi Dev. Bank Special Obligation Rev. VRDO | 1.500% | 11/7/08 | LOC | 37,000 | 37,000 |
| Mississippi GO | 5.500% | 11/1/08 | | 6,455 | 6,455 |
| Mississippi GO | 5.900% | 11/15/08 | | 9,600 | 9,609 |
1 | Mississippi Home Corp. Single Family Mortgage Rev. TOB VRDO | 2.820% | 11/7/08 | | 4,500 | 4,500 |
1 | Mississippi Hosp. Equipment & Fac. Auth. Rev. (Baptist Memorial Health Care) TOB VRDO | 2.820% | 11/7/08 | (4) | 18,635 | 18,635 |
1 | Mississippi Housing Finance Corp. Single Family Mortgage Purchase Rev. TOB VRDO | 2.000% | 11/7/08 | | 7,090 | 7,090 |
| | | | | | 111,119 |
Missouri (2.1%) | | | | | |
1 | Columbia MO Special Oblig. Electrical Improvement Rev. TOB VRDO | 1.820% | 11/7/08 | LOC | 16,855 | 16,855 |
| Curators of the Univ. of Missouri System Fac. Rev. | 3.000% | 6/30/09 | | 50,000 | 50,256 |
| Curators of the Univ. of Missouri System Fac. Rev. VRDO | 1.700% | 11/7/08 | | 69,210 | 69,210 |
| Kansas City MO Special Obligation VRDO | 1.480% | 11/7/08 | LOC | 11,625 | 11,625 |
| Missouri Board Public Building Special Obligation Rev. | 5.250% | 10/15/09 | | 10,640 | 10,929 |
| Missouri Dev. Finance Board Cultural Fac. Rev. (Kauffman Center Performing) VRDO | 0.750% | 11/3/08 | | 16,500 | 16,500 |
10
| Missouri Health & Educ. Fac. Auth. (Assemblies of God College) VRDO | 1.500% | 11/7/08 | LOC | 10,580 | 10,580 |
| Missouri Health & Educ. Fac. Auth. (Saint Louis Univ.) VRDO | 1.200% | 11/3/08 | LOC | 8,300 | 8,300 |
| Missouri Health & Educ. Fac. Auth. (Saint Louis Univ.) VRDO | 1.200% | 11/3/08 | LOC | 3,200 | 3,200 |
| Missouri Health & Educ. Fac. Auth. Health Fac. Rev. (BJC Health System) VRDO | 1.200% | 11/7/08 | | 8,000 | 8,000 |
| Missouri Health & Educ. Fac. Auth. Health Fac. Rev. (BJC Health System) VRDO | 1.630% | 11/7/08 | | 27,100 | 27,100 |
| Missouri Health & Educ. Fac. Auth. Health Fac. Rev. (Childrens Mercy Hosp.) VRDO | 1.800% | 11/7/08 | LOC | 7,400 | 7,400 |
| Missouri Health & Educ. Fac. Auth. Health Fac. Rev. (Cox Health) CP | 3.250% | 11/4/08 | LOC | 8,000 | 8,000 |
| Missouri Health & Educ. Fac. Auth. Health Fac. Rev. (SSM Health System) VRDO | 1.450% | 11/7/08 | | 17,200 | 17,200 |
| Missouri Health & Educ. Fac. Auth. Health Fac. Rev. (SSM Health System) VRDO | 1.480% | 11/7/08 | LOC | 15,500 | 15,500 |
| Missouri Health & Educ. Fac. Auth. Health Fac. Rev. (SSM Health System) VRDO | 1.480% | 11/7/08 | LOC | 6,800 | 6,800 |
| Missouri Health & Educ. Fac. Auth. Health Fac. Rev. (SSM Health System) VRDO | 1.750% | 11/7/08 | | 22,725 | 22,725 |
| Missouri Health & Educ. Fac. Auth. Health Fac. Rev. (St. Luke's Health System) VRDO | 1.750% | 11/7/08 | | 8,325 | 8,325 |
| Missouri Health & Educ. Fac. Auth. Health Fac. Rev. (St. Luke's Health System) VRDO | 1.750% | 11/7/08 | | 7,500 | 7,500 |
| Missouri Health & Educ. Fac. Auth. Health Fac. Rev. (St. Luke's Health System) VRDO | 1.750% | 11/7/08 | | 7,500 | 7,500 |
| Missouri Health & Educ. Fac. Auth. Rev. (Cox Health) VRDO | 1.750% | 11/7/08 | LOC | 11,000 | 11,000 |
1 | Missouri Health & Educ. Fac. Auth. Rev. (Washington Univ.) TOB VRDO | 1.850% | 11/7/08 | | 22,485 | 22,485 |
1 | Missouri Health & Educ. Fac. Auth. TOB VRDO | 1.860% | 11/7/08 | | 8,000 | 8,000 |
| Missouri Higher Educ. Student Loan Auth. VRDO | 1.750% | 11/7/08 | LOC | 56,250 | 56,250 |
1 | Missouri Highways & Transp. Comm. Road Rev. TOB VRDO | 1.600% | 11/7/08 | | 3,315 | 3,315 |
1 | Missouri Highways & Transp. Comm. Road Rev. TOB VRDO | 1.830% | 11/7/08 | | 2,435 | 2,435 |
1 | Missouri Highways & Transp. Comm. Road Rev. TOB VRDO | 1.860% | 11/7/08 | | 5,000 | 5,000 |
| Missouri Highways & Transp. Comm. Road Rev. VRDO | 1.850% | 11/7/08 | LOC | 11,400 | 11,400 |
1 | Missouri Highways & Transp. Commission Rev. (State Road) TOB VRDO | 1.600% | 11/7/08 | | 15,595 | 15,595 |
1 | Missouri Housing Dev. Corp. Single Family Mortgage Rev. TOB VRDO | 2.070% | 11/7/08 | | 6,280 | 6,280 |
1 | Missouri State Health & Educ. Fac. Auth. Rev. TOB VRDO | 1.600% | 11/7/08 | | 4,065 | 4,065 |
| St. Louis MO TRAN | 3.250% | 6/30/09 | | 15,700 | 15,851 |
| | | | | | 495,181 |
Multiple States (1.2%) | | | | | |
1 | Tax Exempt Multifamily Housing Pool Eagle Trust TOB VRDO | 1.920% | 11/7/08 | | 199,805 | 199,805 |
1 | Tax Exempt Multifamily Housing Pool Freddie Mac TOB VRDO | 1.920% | 11/7/08 | LOC | 88,300 | 88,300 |
| | | | | | 288,105 |
Nebraska (1.4%) | | | | | |
| American Public Energy Agency Nebraska (National Public Gas Agency) VRDO | 2.250% | 11/7/08 | | 33,852 | 33,852 |
1 | Douglas County NE Hosp. Auth. Rev. (Nebraska Methodist Health System) Rev. TOB VRDO | 1.930% | 11/7/08 | (13) | 15,980 | 15,980 |
| | | | | | | | |
| Lancaster County NE Hosp. Auth. Rev. (BryanLGH Medical Center) VRDO | 1.450% | 11/3/08 | LOC | 15,000 | 15,000 |
| Lincoln NE Lincoln Electric System CP | 5.000% | 11/3/08 | | 4,000 | 4,000 |
| Lincoln NE Lincoln Electric System CP | 2.250% | 11/6/08 | | 25,500 | 25,500 |
| Nebraska Educ. Finance Auth. Rev. (Creighton Univ.) VRDO | 1.200% | 11/3/08 | LOC | 6,850 | 6,850 |
1 | Nebraska Investment Finance Auth. Single Family Housing Rev. TOB VRDO | 2.050% | 11/7/08 | | 3,705 | 3,705 |
| Nebraska Investment Finance Auth. Single Family Housing Rev. VRDO | 1.950% | 11/7/08 | | 36,090 | 36,090 |
| Nebraska Investment Finance Auth. Single Family Housing Rev. VRDO | 1.950% | 11/7/08 | | 25,000 | 25,000 |
| Nebraska Investment Finance Auth. Single Family Housing Rev. VRDO | 1.950% | 11/7/08 | | 18,825 | 18,825 |
| Nebraska Investment Finance Auth. Single Family Housing Rev. VRDO | 1.950% | 11/7/08 | | 18,970 | 18,970 |
| Nebraska Investment Finance Auth. Single Family Housing Rev. VRDO | 1.950% | 11/7/08 | | 18,020 | 18,020 |
1 | Nebraska Public Power Dist. Rev. TOB VRDO | 1.600% | 11/7/08 | (4) | 9,950 | 9,950 |
1 | Nebraska Public Power Dist. Rev. TOB VRDO | 1.950% | 11/7/08 | | 9,380 | 9,380 |
1 | Nebraska Public Power Dist. Rev. TOB VRDO | 1.960% | 11/7/08 | (13) | 15,995 | 15,995 |
1 | Omaha NE Public Power Dist. Electric Rev. TOB VRDO | 1.600% | 11/7/08 | | 10,185 | 10,185 |
1 | Omaha NE Public Power Dist. Electric Rev. TOB VRDO | 1.830% | 11/7/08 | | 6,975 | 6,975 |
1 | Omaha NE Public Power Dist. Electric Rev. TOB VRDO | 1.950% | 11/7/08 | (13) | 34,610 | 34,610 |
1 | Omaha NE TOB VRDO | 1.850% | 11/7/08 | | 8,020 | 8,020 |
1 | Omaha NE TOB VRDO | 1.860% | 11/7/08 | | 8,000 | 8,000 |
| | | | | | 324,907 |
Nevada (0.7%) | | | | | |
| Clark County NV Airport Improvement Rev. VRDO | 2.150% | 11/7/08 | (4) | 50,000 | 50,000 |
1 | Clark County NV GO TOB PUT | 2.300% | 11/7/08 | | 8,375 | 8,375 |
| Clark County NV Highway Rev. (Sales and Excise Tax) CP | 1.680% | 11/6/08 | LOC | 6,600 | 6,600 |
| Clark County NV Highway Rev. (Sales and Excise Tax) CP | 2.400% | 11/13/08 | | 7,500 | 7,500 |
1 | Clark County NV School Dist. GO TOB VRDO | 1.600% | 11/7/08 | | 6,295 | 6,295 |
1 | Clark County NV School Dist. GO TOB VRDO | 1.820% | 11/7/08 | | 7,459 | 7,459 |
1 | Clark County NV School Dist. GO TOB VRDO | 1.850% | 11/7/08 | | 4,990 | 4,990 |
1 | Clark County NV School Dist. GO TOB VRDO | 1.850% | 11/7/08 | | 5,150 | 5,150 |
1 | Clark County NV School Dist. GO TOB VRDO | 1.850% | 11/7/08 | | 12,640 | 12,640 |
1 | Clark County NV TOB VRDO | 1.820% | 11/7/08 | | 9,770 | 9,770 |
| Las Vegas Valley Water Dist. Nevada CP | 3.000% | 11/5/08 | | 20,250 | 20,250 |
1 | Las Vegas Valley Water Dist. Nevada TOB VRDO | 2.570% | 11/7/08 | (4) | 4,575 | 4,575 |
1 | Nevada GO TOB VRDO | 1.830% | 11/7/08 | | 5,085 | 5,085 |
1 | Nevada Higher Education Rev. TOB VRDO | 2.270% | 11/7/08 | | 9,555 | 9,555 |
| Nevada Housing Division Multi-Unit Housing City Center VRDO | 1.950% | 11/7/08 | LOC | 7,440 | 7,440 |
| | | | | | 165,684 |
| | | | | | | | |
11
New Hampshire (0.3%) | | | | | |
| New Hampshire Business Finance Auth. Rev. (VY Regional Hospital) VRDO | 1.200% | 11/3/08 | LOC | 26,260 | 26,260 |
| New Hampshire Health & Educ. Fac. Auth. Rev. (St. Anselm College) VRDO | 1.450% | 11/3/08 | LOC | 19,000 | 19,000 |
| New Hampshire Health & Educ. Fac. Auth. Rev. (St. Paul's School) VRDO | 1.670% | 11/7/08 | | 23,800 | 23,800 |
| | | | | | 69,060 |
New Jersey (1.2%) | | | | | |
| New Jersey TRAN | 3.000% | 6/25/09 | | 280,000 | 282,279 |
| | | | | | |
New Mexico (0.6%) | | | | | |
| Alamogordo NM Hosp. Rev. (Gerald Regional) VRDO | 1.500% | 11/7/08 | LOC | 20,000 | 20,000 |
| New Mexico Educ. Assistance Fundation Rev. VRDO | 1.850% | 11/7/08 | LOC | 10,000 | 10,000 |
| New Mexico Educ. Assistance Fundation Rev. VRDO | 1.850% | 11/7/08 | LOC | 10,000 | 10,000 |
| New Mexico Finance Auth. Transp. Rev. VRDO | 1.500% | 11/7/08 | LOC | 10,700 | 10,700 |
| New Mexico Finance Auth. Transp. Rev. VRDO | 1.750% | 11/7/08 | | 84,800 | 84,800 |
| | | | | | 135,500 |
New York (2.6%) | | | | | |
| Half Hollow Hills NY Central School Dist. Huntington & Babylon TAN | 3.000% | 6/30/09 | | 36,000 | 36,306 |
1 | Metro. New York Transp. Auth. Rev. TOB VRDO | 1.940% | 11/7/08 | (13) | 29,700 | 29,700 |
1 | Metro. New York Transp. Auth. Rev. TOB VRDO | 1.940% | 11/7/08 | | 9,605 | 9,605 |
| New York City NY GO | 4.000% | 8/1/09 | | 15,000 | 15,247 |
| New York City NY GO VRDO | 1.300% | 11/7/08 | | 12,500 | 12,500 |
| New York City NY GO VRDO | 1.360% | 11/7/08 | LOC | 16,600 | 16,600 |
| New York City NY Housing Dev. Corp. Rev. (Multi-Family Rent Housing - 201 Pearl Street) VRDO | 1.750% | 11/7/08 | LOC | 13,500 | 13,500 |
| New York City NY Housing Dev. Corp. Rev. (Multi-Family Rent Housing - Atlantic Court) VRDO | 1.500% | 11/7/08 | LOC | 12,300 | 12,300 |
| New York City NY Muni. Water Finance Auth. CP | 1.650% | 11/14/08 | | 25,000 | 25,000 |
| New York City NY Muni. Water Finance Auth. Water & Sewer System CP | 2.500% | 11/3/08 | | 21,500 | 21,500 |
1 | New York City NY Muni. Water Finance Auth. Water & Sewer System Rev. TOB VRDO | 1.840% | 11/7/08 | | 17,325 | 17,325 |
1 | New York City NY Muni. Water Finance Auth. Water & Sewer System Rev. TOB VRDO | 1.840% | 11/7/08 | | 10,180 | 10,180 |
1 | New York City NY Muni. Water Finance Auth. Water & Sewer System Rev. TOB VRDO | 1.840% | 11/7/08 | | 13,055 | 13,055 |
1 | New York City NY Muni. Water Finance Auth. Water & Sewer System Rev. TOB VRDO | 1.840% | 11/7/08 | | 8,000 | 8,000 |
1 | New York City NY Muni. Water Finance Auth. Water & Sewer System Rev. TOB VRDO | 1.840% | 11/7/08 | | 4,200 | 4,200 |
1 | New York City NY Muni. Water Finance Auth. Water & Sewer System Rev. TOB VRDO | 2.340% | 11/7/08 | (4) | 9,900 | 9,900 |
| New York City NY Muni. Water Finance Auth. Water & Sewer System Rev. VRDO | 1.100% | 11/3/08 | | 5,950 | 5,950 |
1 | New York City NY Transitional Finance Auth. Rev. TOB VRDO | 1.840% | 11/7/08 | | 13,700 | 13,700 |
1 | New York City NY Transitional Finance Auth. Rev. TOB VRDO | 1.870% | 11/7/08 | | 12,475 | 12,475 |
| New York City NY Transitional Finance Auth. Rev. VRDO | 1.700% | 11/7/08 | | 33,120 | 33,120 |
| New York State Dormitory Auth. Rev. Non State Supported Debt (Fordham Univ.) VRDO | 1.250% | 11/7/08 | LOC | 15,400 | 15,400 |
| New York State Dormitory Auth. Rev. Non State Supported Debt (Fordham Univ.) VRDO | 1.250% | 11/7/08 | LOC | 9,900 | 9,900 |
| New York State Dormitory Auth. Rev. Non State Supported Debt (St. John's Univ.) VRDO | 1.350% | 11/7/08 | LOC | 67,760 | 67,760 |
| New York State Dormitory Auth. Rev. Non State Supported Debt (St. John's Univ.) VRDO | 1.750% | 11/7/08 | LOC | 27,490 | 27,490 |
1 | New York State Dormitory Auth. Rev. TOB VRDO | 1.800% | 11/7/08 | | 10,285 | 10,285 |
1 | New York State Dormitory Auth. Rev. TOB VRDO | 1.830% | 11/7/08 | | 20,000 | 20,000 |
1 | New York State Dormitory Auth. Rev. TOB VRDO | 1.830% | 11/7/08 | | 13,585 | 13,585 |
1 | New York State Dormitory Auth. Rev. TOB VRDO | 1.840% | 11/7/08 | | 5,000 | 5,000 |
| New York State Energy Research & Dev. Auth. (Con Edison) VRDO | 5.000% | 11/7/08 | LOC | 24,200 | 24,200 |
1 | New York State Environmental Fac. Corp. Water & Sewer System Rev. TOB VRDO | 1.800% | 11/7/08 | | 18,700 | 18,700 |
| New York State Local Govt. Assistance Corp. VRDO | 1.650% | 11/7/08 | | 8,100 | 8,100 |
1 | New York State Thruway Auth. Rev. TOB VRDO | 1.600% | 11/7/08 | LOC | 30,015 | 30,015 |
1 | New York State Thruway Auth. Rev. TOB VRDO | 2.340% | 11/7/08 | (4) | 22,630 | 22,630 |
| Webster NY Central School Dist. BAN | 3.500% | 10/9/09 | | 24,000 | 24,164 |
| | | | | | 617,392 |
North Carolina (4.1%) | | | | | |
| Board of Governors of Univ. of NC Chapel Hill & NC State Univ. of Raleigh CP | 1.650% | 11/3/08 | | 10,200 | 10,200 |
1 | Charlotte NC (Governmental Facilities Project) COP TOB VRDO | 1.850% | 11/7/08 | | 5,030 | 5,030 |
| Concord NC Util. System Rev. VRDO | 5.000% | 11/7/08 | (4) | 20,080 | 20,080 |
| Guilford County NC GO VRDO | 3.250% | 11/7/08 | | 18,440 | 18,440 |
| Mecklenburg County NC GO VRDO | 1.600% | 11/7/08 | | 8,200 | 8,200 |
| Mecklenburg County NC GO VRDO | 1.600% | 11/7/08 | | 8,200 | 8,200 |
| Mecklenburg County NC GO VRDO | 1.600% | 11/7/08 | | 8,200 | 8,200 |
| Mecklenburg County NC GO VRDO | 1.600% | 11/7/08 | | 9,000 | 9,000 |
| Mecklenburg County NC GO VRDO | 1.600% | 11/7/08 | | 7,000 | 7,000 |
| Mecklenburg County NC GO VRDO | 1.600% | 11/7/08 | | 7,000 | 7,000 |
| Mecklenburg County NC GO VRDO | 1.600% | 11/7/08 | | 7,000 | 7,000 |
| Mecklenburg County NC GO VRDO | 1.600% | 11/7/08 | | 10,000 | 10,000 |
| Mecklenburg County NC GO VRDO | 1.600% | 11/7/08 | | 13,500 | 13,500 |
| Mecklenburg County NC GO VRDO | 2.300% | 11/7/08 | | 41,265 | 41,265 |
| Mecklenburg County NC GO VRDO | 2.300% | 11/7/08 | | 70,875 | 70,875 |
1 | North Carolina Capital Fac. Finance Agency Rev. (Duke Univ.) TOB VRDO | 1.860% | 11/7/08 | | 12,000 | 12,000 |
1 | North Carolina Capital Fac. Finance Agency Rev. (Duke Univ.) TOB VRDO | 1.860% | 11/7/08 | | 11,200 | 11,200 |
1 | North Carolina Capital Fac. Finance Agency Rev. TOB VRDO | 1.600% | 11/7/08 | | 6,045 | 6,045 |
1 | North Carolina Capital Fac. Finance Agency Rev. TOB VRDO | 1.830% | 11/7/08 | | 18,900 | 18,900 |
1 | North Carolina Capital Fac. Finance Agency Rev. TOB VRDO | 1.860% | 11/7/08 | | 15,700 | 15,700 |
12
1 | North Carolina Capital Fac. Finance Agency Rev. TOB VRDO | 1.940% | 11/7/08 | | 17,100 | 17,100 |
| North Carolina Capital Fac. Financial Solid Waste Disposal Rev. (Allied Waste North America) VRDO | 1.580% | 11/7/08 | LOC | 6,650 | 6,650 |
1 | North Carolina Capital Improvement TOB VRDO | 1.830% | 11/7/08 | | 10,480 | 10,480 |
1 | North Carolina Eastern Muni. Power Agency Rev. TOB VRDO | 1.830% | 11/7/08 | (ETM) | 19,990 | 19,990 |
| North Carolina GO | 4.600% | 4/1/09 | (Prere.) | 9,000 | 9,268 |
| North Carolina GO | 5.000% | 6/1/09 | | 15,000 | 15,236 |
| North Carolina GO VRDO | 1.600% | 11/7/08 | | 11,100 | 11,100 |
1 | North Carolina Infrastructure Financial Corp. COP TOB VRDO | 1.780% | 11/7/08 | (4) | 29,085 | 29,085 |
1 | North Carolina Medical Care Comm. Health Care Fac. (Duke Univ. Health System) TOB VRDO | 1.920% | 11/7/08 | | 32,000 | 32,000 |
| North Carolina Medical Care Comm. Health Care Fac. (Duke Univ. Health System) VRDO | 1.460% | 11/7/08 | | 29,400 | 29,400 |
| North Carolina Medical Care Comm. Health Care Fac. Rev. (Novant Health) VRDO | 1.730% | 11/7/08 | | 48,045 | 48,045 |
| North Carolina Medical Care Comm. Health Care Fac. Rev. (Novant Health) VRDO | 1.730% | 11/7/08 | | 30,500 | 30,500 |
| North Carolina Medical Care Comm. Health Care Fac. Rev. (Wake Forest Univ.) VRDO | 1.500% | 11/7/08 | LOC | 5,100 | 5,100 |
| North Carolina Medical Care Comm. Health Care Fac. Rev. (Wake Forest Univ.) VRDO | 1.580% | 11/7/08 | LOC | 7,870 | 7,870 |
1 | North Carolina Medical Care Comm. Health Care Fac. TOB VRDO | 1.850% | 11/7/08 | | 7,330 | 7,330 |
| North Carolina Medical Care Comm. Hosp. (Moses H. Cone Memorial Hosp.) VRDO | 1.750% | 11/7/08 | | 12,320 | 12,320 |
| North Carolina Medical Care Comm. Hosp. Rev. (Pooled Equipment Finance Project) VRDO | 1.700% | 11/7/08 | LOC | 11,000 | 11,000 |
| North Carolina Medical Care Comm. Hosp. VRDO | 2.300% | 11/7/08 | | 32,330 | 32,330 |
1 | North Carolina State Capital Improvement TOB VRDO | 1.600% | 11/7/08 | | 5,000 | 5,000 |
| North Carolina State Educ. Assistance Rev. Student Loan VRDO | 1.850% | 11/7/08 | LOC | 50,000 | 50,000 |
| North Carolina State Grant Antic Rev. | 5.000% | 3/1/09 | | 22,805 | 23,051 |
| North Carolina State Univ. Raleigh Rev. VRDO | 1.460% | 11/7/08 | | 38,000 | 38,000 |
| Raleigh NC Combined Enterprise System Rev. VRDO | 2.350% | 11/7/08 | | 46,275 | 46,275 |
1 | Sampson County NC TOB PUT | 1.820% | 11/7/08 | LOC | 5,000 | 5,000 |
1 | The Charlotte-Mecklenburg Hospital North Carolina Health Care Auth. TOB VRDO | 1.820% | 11/7/08 | | 16,335 | 16,335 |
| Univ. of North Carolina Chapel Hill Foundation VRDO | 2.300% | 11/7/08 | | 27,420 | 27,420 |
1 | Univ. of North Carolina Univ. Rev. TOB VRDO | 1.820% | 11/7/08 | | 6,900 | 6,900 |
1 | Univ. of North Carolina Univ. Rev. TOB VRDO | 1.850% | 11/7/08 | | 4,990 | 4,990 |
1 | Univ. of North Carolina Univ. Rev. TOB VRDO | 1.860% | 11/7/08 | | 72,710 | 72,710 |
| Wake County NC Public Improvement GO VRDO | 1.650% | 11/7/08 | | 17,300 | 17,300 |
| Winston-Salem NC COP VRDO | 2.830% | 11/7/08 | | 9,000 | 9,000 |
| Winston-Salem NC Water & Sewer System Rev. VRDO | 3.000% | 11/7/08 | | 19,400 | 19,400 |
| Winston-Salem NC Water & Sewer System Rev. VRDO | 7.000% | 11/7/08 | | 5,000 | 5,000 |
| | | | | | 989,020 |
North Dakota (0.2%) | | | | | |
| North Dakota State Housing Fin. Agency Rev. | 3.000% | 4/14/09 | | 18,775 | 18,817 |
| North Dakota State Housing Fin. Agency Rev. VRDO | 1.490% | 11/7/08 | | 21,850 | 21,850 |
| | | | | | 40,667 |
Ohio (2.5%) | | | | | |
| Allen County OH Hosp. Fac. Rev. (Catholic Healthcare) VRDO | 1.250% | 11/3/08 | LOC | 7,000 | 7,000 |
| Allen County OH Hosp. Fac. Rev. (Catholic Healthcare) VRDO | 1.750% | 11/7/08 | LOC | 5,000 | 5,000 |
| Columbus OH Regional Airport Auth. Airport Refunding Rev. | | | | | |
| (Oasbo Expanded Asset Program) VRDO | 1.770% | 11/7/08 | LOC | 45,000 | 45,000 |
| Cuyahoga County OH Hosp. Rev. (Cleveland Clinic Foundation) CP | 3.250% | 11/20/08 | | 16,800 | 16,800 |
| Lancaster Port Auth. Ohio Gas Rev. VRDO | 1.750% | 11/7/08 | | 19,860 | 19,860 |
1 | Lorain County OH Hosp. Fac. Rev. (Catholic Healthcare Partners) TOB VRDO | 1.860% | 11/7/08 | (4) | 20,015 | 20,015 |
1 | Ohio Air Quality Dev. Rev. TOB VRDO | 2.050% | 11/7/08 | (13) | 5,320 | 5,320 |
| Ohio Air Quality Dev. Rev. VRDO | 1.200% | 11/3/08 | LOC | 37,900 | 37,900 |
| Ohio Common Schools GO VRDO | 1.150% | 11/7/08 | | 15,225 | 15,225 |
| Ohio Common Schools GO VRDO | 1.150% | 11/7/08 | | 17,605 | 17,605 |
| Ohio Common Schools GO VRDO | 1.600% | 11/7/08 | | 27,245 | 27,245 |
1 | Ohio GO TOB VRDO | 1.830% | 11/7/08 | | 5,250 | 5,250 |
1 | Ohio GO TOB VRDO | 1.880% | 11/7/08 | | 8,790 | 8,790 |
| Ohio GO VRDO | 1.500% | 11/7/08 | | 40,035 | 40,035 |
| Ohio Higher Educ. Capital Fac. Rev. | 5.500% | 12/1/08 | | 8,440 | 8,461 |
| Ohio Higher Educ. Capital Fac. Rev. | 5.000% | 6/1/09 | | 6,705 | 6,811 |
| Ohio Higher Educ. Fac. Comm. Rev. (Case Western Reserve Univ.) CP | 3.500% | 11/12/08 | | 10,000 | 10,000 |
| Ohio Higher Educ. Fac. Comm. Rev. (Case Western Reserve Univ.) VRDO | 1.750% | 11/7/08 | | 5,935 | 5,935 |
| Ohio Higher Educ. Fac. Comm. Rev. (Cleveland Health Clinic) VRDO | 1.100% | 11/3/08 | | 30,550 | 30,550 |
| Ohio Higher Educ. Fac. Comm. Rev. (Marietta College) VRDO | 1.780% | 11/7/08 | LOC | 7,100 | 7,100 |
| Ohio Highway Capital Improvements GO | 5.250% | 5/1/09 | | 5,000 | 5,086 |
1 | Ohio Housing Finance Agency Mortgage Rev. TOB VRDO | 2.070% | 11/7/08 | | 5,790 | 5,790 |
| Ohio Housing Finance Agency Mortgage Rev. VRDO | 1.630% | 11/7/08 | | 100,000 | 100,000 |
| Ohio Infrastructure Improvement GO VRDO | 1.250% | 11/7/08 | | 9,750 | 9,750 |
| Ohio State Univ. General Receipts Rev. PUT | 3.750% | 1/14/09 | | 40,000 | 40,000 |
| Ohio Water Dev. Auth. PCR (FirstEnergy) VRDO | 1.950% | 11/7/08 | LOC | 10,000 | 10,000 |
| Ohio Water Dev. Auth. Rev. (Fresh Water) CP | 1.800% | 12/4/08 | | 22,500 | 22,500 |
| Ohio Water Dev. Auth. Rev. (Fresh Water) CP | 2.750% | 2/11/09 | | 40,000 | 40,000 |
| Ohio Water Dev. Auth. Rev. (Pure Water) VRDO | 2.050% | 11/7/08 | | 9,780 | 9,780 |
13
1 | Toledo Lucas County OH Port Auth. VRDO | 1.930% | 11/7/08 | (13) | 10,300 | 10,300 |
| Union Township OH BAN | 3.000% | 9/15/09 | | 13,270 | 13,384 |
| | | | | | 606,492 |
Oklahoma (0.9%) | | | | | |
1 | Grand River Dam Auth. Oklahoma Rev. TOB VRDO | 1.950% | 11/7/08 | (13) | 14,100 | 14,100 |
| Oklahoma Dev. Finance Auth. Health System Rev. (Integris Baptist) VRDO | 1.800% | 11/7/08 | | 16,830 | 16,830 |
| Oklahoma Dev. Finance Auth. Health System Rev. (Integris Baptist) VRDO | 3.000% | 11/7/08 | (12) | 16,825 | 16,825 |
| Oklahoma Dev. Finance Auth. Rev. (Integris) VRDO | 3.000% | 11/7/08 | (12) | 24,565 | 24,565 |
1 | Oklahoma Housing Finance Agency Single Family Mortgage Rev. TOB VRDO | 2.050% | 11/7/08 | | 8,600 | 8,600 |
| Oklahoma Student Loan Auth. VRDO | 1.950% | 11/7/08 | LOC | 10,305 | 10,305 |
| Oklahoma Turnpike Auth. VRDO | 1.710% | 11/7/08 | | 62,360 | 62,360 |
| Oklahoma Turnpike Auth. VRDO | 1.710% | 11/7/08 | | 31,845 | 31,845 |
| Oklahoma Turnpike Auth. VRDO | 3.000% | 11/7/08 | | 6,670 | 6,670 |
| Oklahoma Turnpike Auth. VRDO | 3.000% | 11/7/08 | | 9,415 | 9,415 |
1 | Tulsa County OK Ind. Auth. Rev. TOB VRDO | 1.820% | 11/7/08 | | 6,760 | 6,760 |
| | | | | | 208,275 |
Oregon (2.4%) | | | | | |
| Clackamas County OR Hosp. Fac. (Providence Health System) CP | 2.000% | 1/13/09 | | 8,000 | 8,000 |
| Clackamas County OR Hosp. Fac. (Providence Health System) CP | 2.100% | 1/13/09 | | 22,325 | 22,325 |
| Gilliam County OR Solid Waste Disposal Rev. (Waste Management Incorporated Project) VRDO | 1.750% | 11/7/08 | LOC | 17,150 | 17,150 |
1 | Jackson County OR School Dist. TOB VRDO | 1.820% | 11/7/08 | | 6,000 | 6,000 |
| Medford OR Hosp. Fac. Auth. Rev. VRDO | 2.000% | 11/7/08 | LOC | 24,175 | 24,175 |
1 | Multnomah County OH Hosp. Fac. Auth. Rev. TOB VRDO | 1.820% | 11/7/08 | | 5,895 | 5,895 |
| Oregon GO (Veterans Welfare) VRDO | 2.250% | 11/7/08 | | 12,000 | 12,000 |
| Oregon Health Sciences Univ. Rev. (OSHU Medical Group Project) VRDO | 1.900% | 11/7/08 | LOC | 7,700 | 7,700 |
| Oregon Housing & Community Service Dept. Single Family Mortgage Rev. VRDO | 1.630% | 11/7/08 | | 15,000 | 15,000 |
| Oregon Housing & Community Service Dept. Single Family Mortgage Rev. VRDO | 1.630% | 11/7/08 | | 5,000 | 5,000 |
| Oregon Housing & Community Service Dept. Single Family Mortgage Rev. VRDO | 1.930% | 11/7/08 | | 5,000 | 5,000 |
| Oregon State Dept. Administrative Services | 5.000% | 9/1/09 | (4) | 13,195 | 13,459 |
| Oregon State Dept. Transp. Highway Usertax Rev. VRDO | 2.250% | 11/7/08 | | 40,000 | 40,000 |
| Oregon State Dept. Transp. Highway Usertax Rev. VRDO | 2.250% | 11/7/08 | | 29,735 | 29,735 |
| Oregon State Facs. Auth. Rev. (PeaceHealth) VRDO | 1.350% | 11/7/08 | LOC | 15,800 | 15,800 |
| Oregon State Facs. Auth. Rev. (PeaceHealth) VRDO | 1.350% | 11/7/08 | LOC | 12,520 | 12,520 |
| Oregon State Facs. Auth. Rev. (PeaceHealth) VRDO | 1.350% | 11/7/08 | LOC | 8,000 | 8,000 |
| Oregon State Facs. Auth. Rev. (PeaceHealth) VRDO | 1.650% | 11/7/08 | LOC | 13,000 | 13,000 |
| Oregon State Facs. Auth. Rev. (Reed College Projects) VRDO | 1.800% | 11/7/08 | | 20,000 | 20,000 |
| Oregon State Housing & Community Services Dept. Mortgage Rev. VRDO | 1.410% | 11/7/08 | | 6,190 | 6,190 |
| Oregon State Housing & Community Services Dept. Mortgage Rev. VRDO | 1.500% | 11/7/08 | | 34,650 | 34,650 |
| Oregon State Housing & Community Services Dept. Mortgage Rev. VRDO | 1.570% | 11/7/08 | | 19,600 | 19,600 |
| Oregon State Housing & Community Services Dept. Mortgage Rev. VRDO | 1.570% | 11/7/08 | | 30,000 | 30,000 |
| Oregon State Housing & Community Services Dept. Mortgage Rev. VRDO | 2.000% | 11/7/08 | | 5,000 | 5,000 |
| Oregon State Housing & Community Services Dept. Mortgage Rev. VRDO | 2.050% | 11/7/08 | | 30,000 | 30,000 |
| Oregon State Veteran Welfare Services VRDO | 2.250% | 11/7/08 | | 10,100 | 10,100 |
| Oregon TAN | 3.000% | 6/30/09 | | 147,500 | 148,748 |
| Port Auth. of Portland OR Airport Rev. (Portland International Airport) VRDO | 1.750% | 11/7/08 | LOC | 11,000 | 11,000 |
| Port Auth. of Portland OR Airport Rev. (Portland International Airport) VRDO | 1.950% | 11/7/08 | LOC | 10,000 | 10,000 |
| | | | | | 586,047 |
Rhode Island (0.5%) | | | | | |
1 | Narragansett RI Commission WasteWater System Rev. TOB VRDO | 1.600% | 11/7/08 | LOC | 11,955 | 11,955 |
| Rhode Island Health & Educ. (Roger Williams Univ.) VRDO | 1.500% | 11/7/08 | LOC | 9,300 | 9,300 |
| Rhode Island Health & Educ. Building Corp. CP | 2.400% | 2/5/09 | | 21,000 | 21,000 |
| Rhode Island Health & Educ. Building Corp. Rev. (Care New England) VRDO | 1.500% | 11/7/08 | LOC | 5,000 | 5,000 |
| Rhode Island Health & Educ. Building Corp. Rev. (Care New England) VRDO | 1.500% | 11/7/08 | LOC | 4,000 | 4,000 |
| Rhode Island Health & Educ. VRDO | 1.500% | 11/7/08 | LOC | 11,500 | 11,500 |
| Rhode Island Health & Educ. VRDO | 1.500% | 11/7/08 | LOC | 10,965 | 10,965 |
1 | Rhode Island Housing & Mortgage Fin. Corp. TOB VRDO | 2.020% | 11/7/08 | | 5,000 | 5,000 |
1 | Rhode Island Student Loan Auth. Student Loan Rev. TOB VRDO | 3.170% | 11/7/08 | | 14,125 | 14,125 |
| Rhode Island Student Loan Auth. Student Loan Rev. VRDO | 1.620% | 11/7/08 | LOC | 10,000 | 10,000 |
| Rhode Island Student Loan Auth. Student Loan Rev. VRDO | 1.620% | 11/7/08 | LOC | 7,000 | 7,000 |
| | | | | | 109,845 |
South Carolina (1.7%) | | | | | |
| Beaufort County SC School Dist. GO | 5.000% | 4/1/09 | | 3,370 | 3,408 |
| Charleston SC Waterworks & Sewer Rev. Capital Improvement VRDO | 1.500% | 11/7/08 | | 48,250 | 48,250 |
| Charleston SC Waterworks & Sewer Rev. Capital Improvement VRDO | 1.500% | 11/7/08 | | 24,190 | 24,190 |
| Greenville County SC Hosp. Fac. Rev. VRDO | 1.500% | 11/7/08 | LOC | 9,000 | 9,000 |
| Greenville County SC Hosp. Fac. Rev. VRDO | 1.800% | 11/7/08 | LOC | 7,000 | 7,000 |
| Greenville County SC Hosp. Fac. Rev. VRDO | 2.300% | 11/7/08 | LOC | 89,915 | 89,915 |
| Greenville County SC Hosp. Fac. Rev. VRDO | 5.450% | 11/7/08 | LOC | 31,400 | 31,400 |
1 | Greenville County SC School Dist. Rev. TOB VRDO | 1.830% | 11/7/08 | | 13,865 | 13,865 |
| South Carolina Jobs Econ. Dev. Auth. Hosp. Improvement Rev. (Palmetto Health Alliance) VRDO | 2.000% | 11/7/08 | LOC | 13,000 | 13,000 |
| South Carolina Jobs Econ. Dev. Auth. Hosp. Improvement Rev. (Palmetto Health Alliance) VRDO | 2.000% | 11/7/08 | LOC | 16,450 | 16,450 |
14
1 | South Carolina Public Service Auth. Rev. TOB VRDO | 2.030% | 11/7/08 | | 23,150 | 23,150 |
1 | South Carolina Public Service Auth. Rev. TOB VRDO | 2.270% | 11/7/08 | | 5,520 | 5,520 |
1 | South Carolina Public Service Auth. Rev. TOB VRDO | 2.340% | 11/7/08 | (4) | 10,030 | 10,030 |
1 | South Carolina Public Service Auth. Rev. TOB VRDO | 2.360% | 11/7/08 | (4) | 11,000 | 11,000 |
| South Carolina Transp. Infrastructure Rev. VRDO | 1.600% | 11/7/08 | LOC | 16,500 | 16,500 |
| Spartanburg County SC Regional Health Services Dist. Rev. VRDO | 1.750% | 11/7/08 | (12) | 20,270 | 20,270 |
1 | York County SC School Dist. (Rock Hill) TOB VRDO | 2.570% | 11/7/08 | (4) | 9,770 | 9,770 |
| York County SC School Dist. (York) BAN | 3.000% | 9/4/09 | | 50,000 | 50,551 |
| | | | | | 403,269 |
South Dakota (0.2%) | | | | | |
| South Dakota Health & Educ. Fac. Auth. Rev. (Avera Health) VRDO | 1.750% | 11/7/08 | LOC | 10,000 | 10,000 |
| South Dakota Health & Educ. Fac. Auth. Rev. (Sioux Valley Hosp. & Health System) VRDO | 1.870% | 11/7/08 | LOC | 15,000 | 15,000 |
| South Dakota Health & Educ. Fac. Auth. Rev. (Sioux Valley Hosp. & Health System) VRDO | 1.870% | 11/7/08 | LOC | 13,180 | 13,180 |
1 | South Dakota Housing Dev. Auth. TOB VRDO | 1.980% | 11/7/08 | | 3,650 | 3,650 |
| | | | | | 41,830 |
Tennessee (3.0%) | | | | | |
| Clarksville TN Public Building Auth. Rev. (Murfreesboro) VRDO | 1.850% | 11/7/08 | LOC | 6,200 | 6,200 |
| Clarksville TN Public Building Auth. Rev. (Pooled Financing) VRDO | 0.800% | 11/3/08 | LOC | 19,860 | 19,860 |
| Clarksville TN Public Building Auth. Rev. (Pooled Financing) VRDO | 0.800% | 11/3/08 | LOC | 43,835 | 43,835 |
| Clarksville TN Public Building Auth. Rev. (Pooled Financing) VRDO | 0.800% | 11/3/08 | LOC | 7,285 | 7,285 |
1 | Knoxville TN Waste Water System Rev. TOB VRDO | 2.270% | 11/7/08 | | 14,985 | 14,985 |
| Memphis TN Electric System Rev. | 5.000% | 12/1/08 | (4) | 15,000 | 15,035 |
| Memphis-Shelby County TN Airport Auth. Rev. | 5.000% | 3/1/09 | (4) | 2,000 | 2,014 |
| Metro. Govt. of Nashville & Davidson County TN CP | 3.500% | 11/10/08 | | 15,000 | 15,000 |
| Metro. Govt. of Nashville & Davidson County TN CP | 1.600% | 12/11/08 | | 16,000 | 16,000 |
| Metro. Govt. of Nashville & Davidson County TN CP | 1.850% | 2/9/09 | | 17,375 | 17,375 |
| Metro. Govt. of Nashville & Davidson County TN CP | 3.000% | 2/12/09 | | 15,000 | 15,000 |
1 | Metro. Govt. of Nashville & Davidson County TN GO TOB VRDO | 2.340% | 11/7/08 | | 6,185 | 6,185 |
| Metro. Govt. of Nashville & Davidson County TN Health & Educ. Fac. (Vanderbilt Univ.) VRDO | 1.300% | 11/7/08 | | 13,600 | 13,600 |
| Metro. Govt. of Nashville & Davidson County TN Ind. Dev. Board | | | | | |
| (Country Music Hall of Fame) VRDO | 1.850% | 11/7/08 | LOC | 13,850 | 13,850 |
| Montgomery County TN Public Building Auth. Pooled Financial Rev. | | | | | |
| (Tennessee County Loan Pool) VRDO | 0.800% | 11/3/08 | LOC | 36,150 | 36,150 |
| Montgomery County TN Public Building Auth. Pooled Financial Rev. | | | | | |
| (Tennessee County Loan Pool) VRDO | 0.800% | 11/3/08 | LOC | 14,925 | 14,925 |
| Shelby County TN GO VRDO | 1.450% | 11/7/08 | | 141,490 | 141,490 |
| Shelby County TN GO VRDO | 1.800% | 11/7/08 | | 10,500 | 10,500 |
| Shelby County TN GO VRDO | 3.000% | 11/7/08 | | 17,355 | 17,355 |
| Shelby County TN GO VRDO | 3.000% | 11/7/08 | | 148,600 | 148,600 |
| Shelby County TN Health Educ. & Housing Fac. Board Rev. (Methodist Le Bonheur) VRDO | 1.500% | 11/7/08 | (12) | 20,000 | 20,000 |
| Shelby County TN Health Educ. & Housing Fac. Board Rev. (Methodist Le Bonheur) VRDO | 1.700% | 11/7/08 | (12) | 30,000 | 30,000 |
| Tennessee GO | 3.000% | 9/1/09 | | 3,145 | 3,180 |
1 | Tennessee Housing Dev. Agency TOB VRDO | 1.570% | 11/7/08 | | 9,440 | 9,440 |
| Tennessee Local Dev. Auth. Rev. BAN | 3.000% | 6/24/09 | | 56,345 | 56,774 |
| Tennessee School Board Auth. Higher Educ. Fac. CP | 1.700% | 2/5/09 | | 6,000 | 6,000 |
| Tennessee School Board Auth. Higher Educ. Fac. CP | 1.730% | 2/5/09 | | 15,000 | 15,000 |
| | | | | | 715,638 |
Texas (14.6%) | | | | | |
1 | Austin TX Public Improvement GO TOB VRDO | 1.500% | 11/7/08 | | 5,295 | 5,295 |
1 | Austin TX Public Improvement GO TOB VRDO | 1.830% | 11/7/08 | | 5,350 | 5,350 |
1 | Austin TX Rev. TOB VRDO | 1.900% | 11/7/08 | (13) | 18,245 | 18,245 |
1 | Austin TX Rev. TOB VRDO | 1.900% | 11/7/08 | (13) | 10,000 | 10,000 |
1 | Austin TX Water & Wastewater System Rev. TOB PUT | 1.780% | 11/7/08 | LOC | 16,835 | 16,835 |
1 | Austin TX Water & Wastewater System Rev. TOB VRDO | 1.820% | 11/7/08 | | 6,600 | 6,600 |
1 | Austin TX Water & Wastewater System Rev. TOB VRDO | 2.570% | 11/7/08 | (4) | 12,450 | 12,450 |
| Austin TX Water & Wastewater System Rev. VRDO | 3.500% | 11/7/08 | LOC | 15,400 | 15,400 |
1 | Beaumont TX Independent School District School Building TOB VRDO | 1.600% | 11/7/08 | | 3,350 | 3,350 |
1 | Bexar County TX Combined Flood Control GO TOB VRDO | 2.400% | 11/7/08 | | 11,380 | 11,380 |
1 | Bexar County TX Combined Flood Control TOB VRDO | 1.850% | 11/7/08 | | 28,515 | 28,515 |
| Bexar TX Metro. Water Dist. CP | 3.550% | 11/13/08 | LOC | 25,000 | 25,000 |
| Bexar TX Metro. Water Dist. CP | 1.700% | 2/5/09 | LOC | 11,084 | 11,084 |
| Board of Regents of the Univ. of Texas System Permanent Univ. Fund CP | 1.600% | 11/6/08 | | 18,000 | 18,000 |
| Board of Regents of the Univ. of Texas System Rev. Financing System CP | 1.650% | 2/6/09 | | 11,500 | 11,500 |
1 | Board of Regents of the Univ. of Texas System Rev. TOB VRDO | 1.600% | 11/7/08 | | 5,110 | 5,110 |
1 | Board of Regents of the Univ. of Texas System Rev. TOB VRDO | 1.830% | 11/7/08 | | 11,875 | 11,875 |
1 | Board of Regents of the Univ. of Texas System Rev. TOB VRDO | 2.400% | 11/7/08 | | 11,650 | 11,650 |
1 | Carrollton TX GO TOB VRDO | 2.270% | 11/7/08 | | 5,945 | 5,945 |
1 | Clear Creek TX Independent School Dist. GO TOB PUT | 1.770% | 11/7/08 | LOC | 13,340 | 13,340 |
1 | Clear Creek TX Independent School Dist. GO TOB VRDO | 1.850% | 11/7/08 | | 7,790 | 7,790 |
1 | Comal TX Independent School Dist. TOB VRDO | 1.820% | 11/7/08 | LOC | 10,440 | 10,440 |
1 | Conroe TX Independent School Dist. TOB VRDO | 1.850% | 11/7/08 | | 2,110 | 2,110 |
| | | | | | | |
15
1 | Dallas TX Area Rapid Transit TOB VRDO | 1.600% | 11/7/08 | LOC | 9,855 | 9,855 |
1 | Dallas TX Area Rapid Transit TOB VRDO | 1.850% | 11/7/08 | | 7,700 | 7,700 |
1 | Dallas TX Area Rapid Transit TOB VRDO | 2.330% | 11/7/08 | (4) | 18,575 | 18,575 |
1 | Dallas TX Area Rapid Transit TOB VRDO | 3.320% | 11/7/08 | | 8,610 | 8,610 |
1 | Dallas TX GO TOB VRDO | 1.850% | 11/7/08 | | 10,260 | 10,260 |
1 | Dallas TX Independent School Dist. GO TOB PUT | 2.300% | 11/7/08 | | 14,720 | 14,720 |
1 | Dallas TX Waterworks & Sewer System Rev. TOB VRDO | 1.830% | 11/7/08 | | 1,845 | 1,845 |
1 | Dallas-Fort Worth TX International Airport Rev. TOB VRDO | 2.650% | 11/7/08 | (4) | 7,500 | 7,500 |
1 | De Soto TX Independent School Dist. TOB VRDO | 1.860% | 11/7/08 | | 15,345 | 15,345 |
1 | Denton TX Independent School Dist. TOB VRDO | 1.600% | 11/7/08 | | 10,570 | 10,570 |
1 | Denton TX Independent School Dist. TOB VRDO | 1.850% | 11/7/08 | | 3,700 | 3,700 |
1 | Denton TX Independent School Dist. TOB VRDO | 1.850% | 11/7/08 | | 3,470 | 3,470 |
| Denton TX Independent School Dist. VRDO | 1.800% | 11/7/08 | | 18,305 | 18,305 |
| Denton TX Independent School Dist. VRDO | 1.850% | 11/7/08 | | 15,450 | 15,450 |
1 | Edinburg TX Consolidated Independant School Dist. COP TOB VRDO | 1.850% | 11/7/08 | | 12,035 | 12,035 |
1 | Fort Bend TX Independent School Dist. GO TOB VRDO | 2.400% | 11/7/08 | | 16,685 | 16,685 |
| Frisco TX GO | 5.000% | 2/15/09 | (4) | 2,950 | 2,976 |
1 | Galveston County TX GO TOB PUT | 2.300% | 11/7/08 | | 6,100 | 6,100 |
1 | Grand Prairie TX Independent School Dist. TOB VRDO | 1.850% | 11/7/08 | | 7,210 | 7,210 |
1 | Greater East Texas Higher Educ. Auth. Student Loan Rev. VRDO | 2.000% | 11/7/08 | LOC | 35,000 | 35,000 |
1 | Greater East Texas Higher Educ. Auth. Student Loan Rev. VRDO | 2.000% | 11/7/08 | LOC | 46,700 | 46,700 |
1 | Greater East Texas Higher Educ. Auth. Student Loan Rev. VRDO | 2.000% | 11/7/08 | LOC | 40,000 | 40,000 |
1 | Greater East Texas Higher Educ. Auth. Student Loan Rev. VRDO | 2.000% | 11/7/08 | LOC | 10,000 | 10,000 |
| Harris County TX Cultural Educ. Fac. Finance Corp. Rev. (Methodist Hosp. System) PUT | 1.600% | 11/18/08 | | 50,000 | 50,000 |
| Harris County TX Cultural Educ. Fac. Finance Corp. Rev. (Methodist Hosp. System) PUT | 1.600% | 11/18/08 | | 50,000 | 50,000 |
| Harris County TX Cultural Educ. Fac. Finance Corp. Rev. (Texas Medical Center) VRDO | 1.900% | 11/7/08 | LOC | 4,850 | 4,850 |
1 | Harris County TX Flood Control Dist. TOB VRDO | 1.840% | 11/7/08 | | 33,300 | 33,300 |
| Harris County TX Flood Control Dist. VRDO | 5.000% | 11/7/08 | | 64,700 | 64,700 |
| Harris County TX GO | 4.500% | 10/1/09 | | 4,750 | 4,847 |
| Harris County TX GO CP | 2.100% | 11/3/08 | | 49,152 | 49,152 |
| Harris County TX GO CP | 2.100% | 11/3/08 | | 120,408 | 120,408 |
| Harris County TX GO CP | 1.550% | 11/13/08 | | 18,548 | 18,548 |
| Harris County TX GO CP | 3.000% | 11/19/08 | | 50,000 | 50,000 |
1 | Harris County TX GO TOB VRDO | 1.830% | 11/7/08 | | 7,995 | 7,995 |
1 | Harris County TX GO TOB VRDO | 1.850% | 11/7/08 | | 5,100 | 5,100 |
1 | Harris County TX GO TOB VRDO | 1.950% | 11/7/08 | (13) | 30,000 | 30,000 |
1 | Harris County TX GO TOB VRDO | 2.360% | 11/7/08 | | 5,575 | 5,575 |
1 | Harris County TX GO VRDO | 1.850% | 11/7/08 | | 10 | 10 |
| Harris County TX Health Fac. Dev. Corp. Hosp. Rev. (Baylor College Medicine) VRDO | 1.600% | 11/7/08 | LOC | 5,000 | 5,000 |
| Harris County TX Health Fac. Dev. Corp. Hosp. Rev. (Texas Children's Hosp.) VRDO | 1.250% | 11/3/08 | | 74,530 | 74,530 |
| Harris County TX Health Fac. Dev. Corp. Hosp. Rev. (Texas Children's Hosp.) VRDO | 1.650% | 11/7/08 | | 65,000 | 65,000 |
| Harris County TX Health Fac. Dev. Corp. Rev. (Methodist Hosp.) VRDO | 1.100% | 11/3/08 | | 3,500 | 3,500 |
| Harris County TX Health Fac. Dev. Corp. Rev. (Methodist Hosp.) VRDO | 1.100% | 11/3/08 | | 37,100 | 37,100 |
| Harris County TX Health Fac. Dev. Corp. Rev. (Methodist Hosp.) VRDO | 1.250% | 11/3/08 | (4) | 12,200 | 12,200 |
| Harris County TX Health Fac. Dev. Corp. Rev. (Methodist Hosp.) VRDO | 1.250% | 11/3/08 | (4) | 6,700 | 6,700 |
| Harris County TX Health Fac. Dev. Corp. Rev. (St. Luke's Episcopal Hosp.) VRDO | 3.000% | 11/7/08 | | 44,400 | 44,400 |
| Harris County TX Health Fac. Dev. Corp. Rev. (St. Luke's Episcopal Hosp.) VRDO | 3.800% | 11/7/08 | | 25,000 | 25,000 |
1 | Harris County TX Health Fac. Dev. Corp. Rev. TOB VRDO | 1.900% | 11/7/08 | | 8,085 | 8,085 |
1 | Harris County TX Health Fac. Dev. Corp. Thermal Util. Rev. TOB VRDO | 2.150% | 11/7/08 | (12) | 5,060 | 5,060 |
1 | Harris County TX Toll Road Rev. TOB VRDO | 1.830% | 11/7/08 | | 7,675 | 7,675 |
1 | Harris County TX Toll Road Rev. TOB VRDO | 1.920% | 11/7/08 | (4)(Prere.) | 3,845 | 3,845 |
1 | Houston TX Community College TOB VRDO | 1.600% | 11/7/08 | (4) | 4,150 | 4,150 |
| Houston TX GO | 5.250% | 3/1/09 | (Prere.) | 4,815 | 4,865 |
1 | Houston TX GO TOB VRDO | 2.020% | 11/7/08 | | 10,050 | 10,050 |
1 | Houston TX Higher Educ. Finance Corp. Rev. TOB VRDO | 1.840% | 11/7/08 | | 5,000 | 5,000 |
1 | Houston TX Higher Educ. Finance Corp. Rev. TOB VRDO | 1.850% | 11/7/08 | | 8,540 | 8,540 |
1 | Houston TX Higher Educ. Finance Corp. Rev. TOB PUT | 2.300% | 11/7/08 | | 22,155 | 22,155 |
1 | Houston TX Housing Finance Corp. TOB VRDO | 2.050% | 11/7/08 | | 3,555 | 3,555 |
| Houston TX Independent School Dist. GO PUT | 1.850% | 6/15/09 | | 50,000 | 50,000 |
1 | Houston TX Independent School Dist. GO TOB VRDO | 1.850% | 11/7/08 | | 6,450 | 6,450 |
1 | Houston TX Independent School Dist. GO TOB VRDO | 1.850% | 11/7/08 | | 4,205 | 4,205 |
1 | Houston TX Independent School Dist. GO TOB VRDO | 2.570% | 11/7/08 | (4) | 4,500 | 4,500 |
1 | Houston TX Independent School Dist. TOB VRDO | 1.850% | 11/7/08 | | 4,655 | 4,655 |
| Houston TX Util. System Rev. CP | 5.000% | 11/3/08 | | 15,000 | 15,000 |
1 | Houston TX Util. System Rev. TOB VRDO | 1.780% | 11/7/08 | LOC | 9,000 | 9,000 |
1 | Houston TX Util. System Rev. TOB VRDO | 1.820% | 11/7/08 | LOC | 10,320 | 10,320 |
1 | Houston TX Util. System Rev. TOB VRDO | 2.570% | 11/7/08 | (4) | 3,310 | 3,310 |
| Houston TX Util. System Rev. VRDO | 1.500% | 11/7/08 | LOC | 25,000 | 25,000 |
| Houston TX Util. System Rev. VRDO | 1.500% | 11/7/08 | LOC | 6,200 | 6,200 |
| Houston TX Util. System Rev. VRDO | 3.500% | 11/7/08 | LOC | 19,000 | 19,000 |
1 | Houston TX Water & Sewer System Rev. TOB VRDO | 2.340% | 11/7/08 | (4)(Prere.) | 23,890 | 23,890 |
| Humble TX Independent School Dist. School Building PUT | 2.000% | 7/1/09 | | 47,025 | 47,025 |
16
1 | Katy TX Independent School Dist. GO TOB VRDO | 1.850% | 11/7/08 | | 3,880 | 3,880 |
1 | Lamar TX Independent School Dist. TOB VRDO | 1.850% | 11/7/08 | | 5,120 | 5,120 |
1 | Leander TX Independent School Dist. GO TOB VRDO | 1.850% | 11/7/08 | | 15,445 | 15,445 |
1 | Leander TX Independent School Dist. GO TOB VRDO | 2.400% | 11/7/08 | | 14,410 | 14,410 |
1 | Lower Colorado River Auth. Texas Rev. TOB VRDO | 1.960% | 11/7/08 | (4)(13) | 11,880 | 11,880 |
| Lubbock TX Health Fac. (St. Joseph) VRDO | 1.750% | 11/7/08 | | 6,900 | 6,900 |
| Lubbock TX Independent School Dist. VRDO | 4.000% | 11/3/08 | LOC | 49,760 | 49,760 |
| Lubbock TX Independent School Dist. VRDO | 1.750% | 11/7/08 | | 14,800 | 14,800 |
1 | Mansfield TX Independent School Dist. TOB VRDO | 1.850% | 11/7/08 | | 5,165 | 5,165 |
1 | McKinney TX ISD TOB VRDO | 1.820% | 11/7/08 | LOC | 10,300 | 10,300 |
| Mesquite TX Independent School Dist. School Building VRDO | 1.800% | 11/7/08 | | 5,325 | 5,325 |
| Montgomery County TX PUT | 3.000% | 9/1/09 | | 10,000 | 10,098 |
1 | North East TX Independent School Dist. GO TOB VRDO | 1.780% | 11/7/08 | LOC | 5,000 | 5,000 |
1 | North East TX Independent School Dist. GO TOB VRDO | 1.840% | 11/7/08 | | 26,805 | 26,805 |
1 | North East TX Independent School Dist. GO TOB VRDO | 1.850% | 11/7/08 | | 2,800 | 2,800 |
1 | North Texas Health Fac. Dev. Corp. (United Regional Health Care System) TOB VRDO | 1.780% | 11/7/08 | LOC | 13,320 | 13,320 |
| North Texas Higher Educ. Auth. Student Loan VRDO | 1.850% | 11/7/08 | LOC | 26,000 | 26,000 |
| North Texas Higher Educ. Auth. Student Loan VRDO | 1.850% | 11/7/08 | LOC | 18,000 | 18,000 |
| North Texas Higher Educ. Auth. Student Loan VRDO | 1.850% | 11/7/08 | LOC | 31,840 | 31,840 |
1 | North Texas Muni. Water Dist. Texas Water System Rev. TOB VRDO | 1.820% | 11/7/08 | | 5,460 | 5,460 |
1 | North Texas Muni. Water Dist. Texas Water System Rev. TOB VRDO | 1.830% | 11/7/08 | | 4,490 | 4,490 |
1 | North Texas Muni. Water Dist. Texas Water System Rev. TOB VRDO | 2.020% | 11/7/08 | | 7,295 | 7,295 |
1 | North Texas Muni. Water Dist. Texas Water System Rev. TOB VRDO | 2.270% | 11/7/08 | | 3,810 | 3,810 |
| North Texas Tollway Auth. BAN | 4.125% | 11/19/08 | | 33,715 | 33,715 |
1 | North Texas Tollway Auth. Capital Appreciation System TOB VRDO | 1.600% | 11/7/08 | LOC | 11,340 | 11,340 |
1 | Northside TX Independent School Dist. GO TOB VRDO | 1.850% | 11/7/08 | | 14,550 | 14,550 |
1 | Northside TX Independent School Dist. GO TOB PUT | 2.300% | 11/7/08 | | 17,315 | 17,315 |
| Pasadena TX Independent School Dist. VRDO | 1.750% | 11/7/08 | | 20,200 | 20,200 |
| Pasadena TX Independent School Dist. VRDO | 5.000% | 11/7/08 | (4) | 40,975 | 40,975 |
1 | Pearland TX GO TOB VRDO | 1.600% | 11/7/08 | LOC | 10,240 | 10,240 |
1 | Pearland TX Independent School Dist. (Austin) TOB VRDO | 1.820% | 11/7/08 | | 9,000 | 9,000 |
1 | Plano TX GO TOB VRDO | 1.600% | 11/7/08 | | 5,830 | 5,830 |
1 | Plano TX Independent School Dist. TOB VRDO | 1.860% | 11/7/08 | | 14,055 | 14,055 |
| Red River TX Educ. Finance Rev. (Texas Christian Univ.) VRDO | 1.750% | 11/7/08 | | 31,000 | 31,000 |
| San Antonio TX Educ. Facilities Corp. Rev. Higher Educ. (Trinity Univ.) VRDO | 1.250% | 11/3/08 | | 17,800 | 17,800 |
| San Antonio TX Electric & Gas Rev. | 5.000% | 2/1/09 | | 7,400 | 7,443 |
| San Antonio TX Electric & Gas Rev. | 5.250% | 2/1/09 | (Prere.) | 3,510 | 3,571 |
| San Antonio TX Electric & Gas Rev. | 5.250% | 2/1/09 | | 3,000 | 3,023 |
| San Antonio TX Electric & Gas Rev. | 5.250% | 2/1/09 | (Prere.) | 5,910 | 6,014 |
| San Antonio TX Electric & Gas Rev. | 5.250% | 2/1/09 | (Prere.) | 2,985 | 3,038 |
| San Antonio TX Electric & Gas Rev. | 5.250% | 2/1/09 | (Prere.) | 2,110 | 2,147 |
| San Antonio TX Electric & Gas Rev. | 5.250% | 2/1/09 | (Prere.) | 6,140 | 6,187 |
1 | San Antonio TX Electric & Gas Rev. TOB VRDO | 1.600% | 11/7/08 | | 5,395 | 5,395 |
1 | San Antonio TX Electric & Gas Rev. TOB VRDO | 1.830% | 11/7/08 | | 7,165 | 7,165 |
1 | San Antonio TX Electric & Gas Rev. TOB VRDO | 1.850% | 11/7/08 | | 5,115 | 5,115 |
1 | San Antonio TX Electric & Gas Rev. TOB VRDO | 1.860% | 11/7/08 | | 10,250 | 10,250 |
| San Antonio TX Electric & Gas Rev. VRDO | 2.050% | 11/7/08 | | 46,900 | 46,900 |
| San Antonio TX Electric & Gas System Rev. CP | 1.700% | 11/3/08 | | 38,000 | 38,000 |
| San Antonio TX Electric & Gas System Rev. CP | 4.500% | 11/6/08 | | 10,050 | 10,050 |
| San Antonio TX Electric & Gas System Rev. CP | 1.720% | 2/5/09 | | 13,100 | 13,100 |
1 | San Antonio TX GO TOB VRDO | 2.400% | 11/7/08 | | 18,240 | 18,240 |
1 | San Antonio TX Independent School Dist. GO TOB VRDO | 1.850% | 11/7/08 | | 17,710 | 17,710 |
1 | San Antonio TX Water Rev. TOB VRDO | 1.820% | 11/7/08 | LOC | 11,205 | 11,205 |
1 | San Antonio TX Water Rev. TOB VRDO | 2.350% | 11/7/08 | (4) | 10,000 | 10,000 |
1 | Sheldon TX Independent School Dist. TOB VRDO | 1.850% | 11/7/08 | | 5,220 | 5,220 |
1 | Socorro TX Independent School Dist. GO TOB VRDO | 1.850% | 11/7/08 | | 4,985 | 4,985 |
| Southwest Texas Higher Educ. Auth. Inc. Rev. (Southern Methodist Univ.) VRDO | 1.750% | 11/7/08 | LOC | 1,700 | 1,700 |
| Tarrant County TX Cultural Educ. Fac. Finance Corp. Rev. (Texas Health Resources) VRDO | 1.550% | 11/7/08 | | 5,310 | 5,310 |
| Tarrant County TX Cultural Educ. Fac. Finance Corp. Rev. (Texas Health Resources) VRDO | 1.550% | 11/7/08 | | 6,500 | 6,500 |
| Tarrant County TX Cultural Educ. Fac. Finance Corp. Rev. (Texas Health Resources) VRDO | 1.650% | 11/7/08 | | 10,775 | 10,775 |
1 | Tarrant County TX Cultural Educ. Fac. Finance Corp. Rev. TOB VRDO | 1.820% | 11/7/08 | | 5,795 | 5,795 |
1 | Tarrant County TX Cultural Educ. Fac. Finance Corp. Rev. TOB VRDO | 1.820% | 11/7/08 | | 4,375 | 4,375 |
| Tarrant County TX Cultural Educ. Fac. Finance Corp. Rev. VRDO | 1.400% | 11/7/08 | LOC | 17,900 | 17,900 |
| Tarrant County TX Cultural Educ. Fac. Finance Corp. Rev. VRDO | 2.000% | 11/7/08 | LOC | 32,400 | 32,400 |
1 | Texas A & M Univ. System Rev. Financing Bonds TOB VRDO | 1.850% | 11/7/08 | | 4,895 | 4,895 |
1 | Texas A & M Univ. System Rev. TOB VRDO | 1.830% | 11/7/08 | | 4,595 | 4,595 |
1 | Texas A & M Univ. System Rev. TOB VRDO | 1.850% | 11/7/08 | | 4,990 | 4,990 |
1 | Texas Dept. of Housing & Community Affairs Multifamily Housing Rev. TOB VRDO | 2.050% | 11/7/08 | | 3,650 | 3,650 |
| Texas Dept. of Transp. State Highway Fund Rev. CP | 4.500% | 11/6/08 | LOC | 30,000 | 30,000 |
| Texas Dept. of Transp. State Highway Fund Rev. CP | 1.600% | 11/7/08 | LOC | 29,000 | 29,000 |
| Texas GO Public Finance Auth. | 5.500% | 10/1/09 | | 7,000 | 7,198 |
17
1 | Texas GO TOB VRDO | 1.820% | 11/7/08 | | 4,695 | 4,695 |
1 | Texas GO TOB VRDO | 1.830% | 11/7/08 | | 1,365 | 1,365 |
1 | Texas GO TOB VRDO | 1.830% | 11/7/08 | | 2,290 | 2,290 |
1 | Texas GO TOB VRDO | 1.850% | 11/7/08 | | 8,685 | 8,685 |
1 | Texas GO TOB VRDO | 1.850% | 11/7/08 | | 7,585 | 7,585 |
1 | Texas GO TOB VRDO | 1.860% | 11/7/08 | | 7,500 | 7,500 |
1 | Texas GO TOB VRDO | 1.860% | 11/7/08 | | 21,560 | 21,560 |
1 | Texas GO TOB VRDO | 1.860% | 11/7/08 | | 33,800 | 33,800 |
| Texas GO Veterans Housing Assistance Program Fund II VRDO | 1.950% | 11/7/08 | | 3,925 | 3,925 |
| Texas GO Veterans Housing Assistance Program VRDO | 1.470% | 11/7/08 | | 29,510 | 29,510 |
1 | Texas Muni. Gas Acquisition & Supply Corp. Rev. TOB VRDO | 1.830% | 11/7/08 | | 3,865 | 3,865 |
| Texas Public Finance Auth. Rev. CP | 1.550% | 11/13/08 | | 2,540 | 2,540 |
| Texas Small Business IDA IDR (Texas Public Fac. Capital Access) VRDO | 2.050% | 11/7/08 | LOC | 21,700 | 21,700 |
| Texas State Transp. Comm. First Tier | 5.000% | 4/1/09 | | 3,950 | 4,003 |
| Texas State Transp. Comm. First Tier VRDO | 1.470% | 11/7/08 | | 7,300 | 7,300 |
1 | Texas State Transp. Comm. Highway Fund First Tier Rev. TOB VRDO | 1.860% | 11/7/08 | | 5,000 | 5,000 |
1 | Texas State Transp. Comm. TOB VRDO | 1.600% | 11/7/08 | | 6,970 | 6,970 |
1 | Texas State Transp. Comm. TOB VRDO | 1.830% | 11/7/08 | | 3,670 | 3,670 |
1 | Texas State Transp. Comm. TOB VRDO | 1.850% | 11/7/08 | | 6,100 | 6,100 |
1 | Texas State Transp. Comm. TOB VRDO | 1.850% | 11/7/08 | | 19,000 | 19,000 |
1 | Texas State Univ. Student Loan GO TOB VRDO | 1.910% | 11/7/08 | | 20,065 | 20,065 |
| Texas State Veterans Housing VRDO | 1.580% | 11/7/08 | | 31,970 | 31,970 |
| Texas TRAN | 3.000% | 8/28/09 | | 300,000 | 303,344 |
1 | Texas Transp. Comm. Mobility Fund GO TOB VRDO | 1.830% | 11/7/08 | | 10,200 | 10,200 |
1 | Texas Transp. Comm. Mobility Fund GO TOB VRDO | 1.860% | 11/7/08 | | 21,925 | 21,925 |
1 | Texas Transp. Comm. Mobility Fund TOB VRDO | 1.830% | 11/7/08 | | 8,500 | 8,500 |
1 | Texas Transp. Comm. Mobility Fund TOB VRDO | 1.830% | 11/7/08 | | 4,525 | 4,525 |
1 | Texas Transp. Comm. Mobility Fund TOB VRDO | 1.830% | 11/7/08 | | 12,630 | 12,630 |
1 | Texas Transp. Comm. Mobility Fund TOB VRDO | 1.830% | 11/7/08 | | 8,400 | 8,400 |
1 | Texas Transp. Comm. Mobility Fund TOB VRDO | 1.830% | 11/7/08 | | 4,530 | 4,530 |
| Texas Transp. Comm. Mobility Fund VRDO | 1.400% | 11/7/08 | | 78,830 | 78,830 |
1 | Texas Transp. Comm. Rev. TOB VRDO | 1.830% | 11/7/08 | | 7,500 | 7,500 |
1 | Texas Water Dev. Board Rev. TOB VRDO | 1.820% | 11/7/08 | | 5,000 | 5,000 |
1 | Texas Water Dev. Board Rev. TOB VRDO | 2.450% | 11/7/08 | | 5,180 | 5,180 |
| Texas Water Dev. Board Rev. VRDO | 1.000% | 11/3/08 | | 9,439 | 9,439 |
1 | Travis County TX GO TOB VRDO | 1.600% | 11/7/08 | | 11,050 | 11,050 |
| Trinity River Auth. Texas Regional Wastewater Rev. | 5.000% | 8/1/09 | | 6,265 | 6,390 |
| Univ. of Houston TX Rev. VRDO | 1.800% | 11/7/08 | | 13,365 | 13,365 |
| Univ. of Texas Permanent Univ. Fund Rev. CP | 2.250% | 11/4/08 | | 20,000 | 20,000 |
1 | Univ. of Texas Permanent Univ. Fund Rev. TOB VRDO | 1.850% | 11/7/08 | | 3,590 | 3,590 |
1 | Univ. of Texas Permanent Univ. Fund Rev. TOB VRDO | 1.850% | 11/7/08 | | 6,000 | 6,000 |
1 | Univ. of Texas Rev. TOB PUT | 2.300% | 11/7/08 | | 33,215 | 33,215 |
| Waco TX Educ. Finance Corp. (Baylor Univ.) VRDO | 1.800% | 11/7/08 | | 54,550 | 54,550 |
| West Side Calhoun County TX Dev. (British Petroleum) VRDO | 1.250% | 11/3/08 | | 11,900 | 11,900 |
| | | | | | 3,490,250 |
Utah (0.8%) | | | | | |
| Davis County UT School Dist. TAN | 3.000% | 6/30/09 | | 27,000 | 27,214 |
| Intermountain Power Agency Utah Power Supply Rev. PUT | 2.350% | 12/1/08 | | 12,000 | 12,000 |
| | | | | | | | |
| Intermountain Power Agency Utah Power Supply Rev. PUT | 2.350% | 12/1/08 | | 12,000 | 12,000 |
| Murray UT Hosp. Rev. (IHC Health Services) VRDO | 1.230% | 11/7/08 | | 20,700 | 20,700 |
| Murray UT Hosp. Rev. (IHC Health Services) VRDO | 1.250% | 11/3/08 | | 10,300 | 10,300 |
| Murray UT Hosp. Rev. (IHC Health Services) VRDO | 1.760% | 11/7/08 | | 10,000 | 10,000 |
1 | Utah Housing Corp. Single Family Mortgage Rev. TOB VRDO | 1.980% | 11/7/08 | | 12,090 | 12,090 |
| Utah Housing Corp. Single Family Mortgage Rev. VRDO | 2.150% | 11/7/08 | | 12,250 | 12,250 |
| Utah Housing Corp. Single Family Mortgage Rev. VRDO | 2.150% | 11/7/08 | | 16,450 | 16,450 |
| Utah Housing Corp. Single Family Mortgage Rev. VRDO | 2.650% | 11/7/08 | | 9,780 | 9,780 |
| Utah Housing Corp. Single Family Mortgage Rev. VRDO | 2.650% | 11/7/08 | | 12,260 | 12,260 |
| Utah Housing Finance Auth. (Single Family Mortgage) VRDO | 2.150% | 11/7/08 | | 7,285 | 7,285 |
| Utah Housing Finance Auth. (Single Family Mortgage) VRDO | 2.650% | 11/7/08 | | 5,605 | 5,605 |
1 | Utah Transit Auth. Sales Tax Rev. TOB VRDO | 1.600% | 11/7/08 | | 5,755 | 5,755 |
1 | Utah Transit Auth. Sales Tax Rev. TOB VRDO | 1.830% | 11/7/08 | | 5,000 | 5,000 |
1 | Utah Transit Auth. Sales Tax Rev. TOB VRDO | 2.250% | 11/7/08 | (4) | 10,690 | 10,690 |
1 | Utah Transit Auth. Sales Tax Rev. TOB VRDO | 3.500% | 11/7/08 | (4)LOC | 7,010 | 7,010 |
| | | | | | 196,389 |
Vermont (0.1%) | | | | | |
| Vermont Educ. & Health Buildings Finance Agency Rev. (Fletcher Allen Health) VRDO | 1.430% | 11/7/08 | LOC | 9,120 | 9,120 |
1 | Vermont Housing Finance Agency Single Family TOB VRDO | 2.050% | 11/7/08 | (4) | 5,825 | 5,825 |
| | | | | | 14,945 |
Virginia (1.5%) | | | | | |
| Albemarle County VA Econ. Dev. Auth. Hosp. Rev. (Martha Jefferson Hosp.) VRDO | 1.550% | 11/7/08 | LOC | 6,000 | 6,000 |
| | | | | | | | |
18
| Capital Beltway Funding Corp. VA Toll Rev. VRDO | 1.550% | 11/7/08 | LOC | 15,000 | 15,000 |
| Capital Beltway Funding Corp. VA Toll Rev. VRDO | 1.560% | 11/7/08 | LOC | 16,000 | 16,000 |
| Fairfax County VA IDA Rev. VRDO | 1.550% | 11/7/08 | | 6,530 | 6,530 |
1 | Hampton VA Roads Sanitation Dist Wastewater Rev. TOB VRDO | 1.600% | 11/7/08 | | 7,735 | 7,735 |
| Hanover County VA Econ. Dev. Auth. Rev. (Bon Secours Health) VRDO | 1.420% | 11/7/08 | LOC | 6,800 | 6,800 |
| Norfolk VA Econ. Dev. Auth. Hosp. Fac. Rev. (Sentara Healthcare) VRDO | 4.350% | 11/7/08 | (4) | 68,450 | 68,450 |
| Norfolk VA GO | 4.000% | 4/1/09 | | 6,530 | 6,590 |
| Norfolk VA GO VRDO | 1.910% | 11/7/08 | | 12,180 | 12,180 |
| Peninsula Ports Auth. Virginia Health System Rev. (Riverside Health System Project) VRDO | 2.000% | 11/7/08 | | 34,115 | 34,115 |
| Rector & Visitors of the Univ. of Virginia CP | 2.350% | 1/8/09 | | 5,000 | 5,000 |
1 | Richmond VA Public Util. Rev. TOB VRDO | 2.340% | 11/7/08 | (4) | 4,875 | 4,875 |
1 | Suffolk VA Econ. Dev. Auth. Rev. TOB VRDO | 1.990% | 11/7/08 | | 31,000 | 31,000 |
1 | Univ. of Virginia TOB VRDO | 1.600% | 11/7/08 | | 7,570 | 7,570 |
1 | Univ. of Virginia TOB VRDO | 1.830% | 11/7/08 | | 2,880 | 2,880 |
1 | Univ. of Virginia TOB VRDO | 1.860% | 11/7/08 | | 3,300 | 3,300 |
1 | Univ. of Virginia TOB VRDO | 1.860% | 11/7/08 | | 12,000 | 12,000 |
| Virginia College Building Auth. Educ. Fac. Rev. (21st Century College) | 5.000% | 2/1/09 | | 9,670 | 9,745 |
1 | Virginia College Building Auth. Educ. Fac. Rev. Public Higher Educ. Financing Program TOB VRDO | 1.600% | 11/7/08 | | 9,315 | 9,315 |
1 | Virginia Housing Dev. Auth. Rev. Commonwealth Mortgage TOB VRDO | 2.000% | 11/7/08 | | 19,105 | 19,105 |
1 | Virginia Housing Dev. Auth. Rev. TOB VRDO | 1.900% | 11/7/08 | | 13,735 | 13,735 |
1 | Virginia Public School Auth. Rev. TOB VRDO | 1.850% | 11/7/08 | | 7,545 | 7,545 |
1 | Virginia Public School Auth. Rev. TOB VRDO | 2.570% | 11/7/08 | (4) | 10,020 | 10,020 |
1 | Virginia Resources Auth. Clean Water Rev. TOB VRDO | 1.600% | 11/7/08 | | 5,000 | 5,000 |
1 | Winchester VA IDA Hosp. Rev. TOB VRDO | 1.950% | 11/7/08 | (13) | 44,735 | 44,735 |
| | | | | | 365,225 |
Washington (2.8%) | | | | | |
1 | Bellevue WA GO TOB VRDO | 2.390% | 11/7/08 | (4) | 12,100 | 12,100 |
1 | Central Puget Sound WA Regional Transit Auth. Sales & Use Tax Rev. TOB VRDO | 1.600% | 11/7/08 | | 6,210 | 6,210 |
1 | Central Puget Sound WA Regional Transit Auth. Sales & Use Tax Rev. TOB VRDO | 2.270% | 11/7/08 | | 5,850 | 5,850 |
| Chelan County WA Public Util. Dist. VRDO | 2.200% | 11/7/08 | | 92,880 | 92,880 |
1 | Energy Northwest WA Electric Rev. TOB VRDO | 1.830% | 11/7/08 | | 5,120 | 5,120 |
| Everett WA Ind. Dev. Corp. (Kimberly-Clark Corp.) VRDO | 2.250% | 11/7/08 | | 6,400 | 6,400 |
1 | King County WA Sewer Rev. TOB VRDO | 1.600% | 11/7/08 | LOC | 10,005 | 10,005 |
1 | King County WA Sewer Rev. TOB VRDO | 1.780% | 11/7/08 | LOC | 7,640 | 7,640 |
1 | King County WA Sewer Rev. TOB VRDO | 1.830% | 11/7/08 | | 4,870 | 4,870 |
| Port of Seattle WA Rev. CP | 1.700% | 2/6/09 | LOC | 26,935 | 26,935 |
1 | Port of Seattle WA Rev. TOB VRDO | 2.000% | 11/7/08 | (4) | 15,140 | 15,140 |
1 | Port of Seattle WA Rev. TOB VRDO | 2.420% | 11/7/08 | | 7,425 | 7,425 |
1 | Port of Seattle WA Rev. TOB VRDO | 2.440% | 11/7/08 | (4) | 12,100 | 12,100 |
| Port of Tacoma WA Rev. VRDO | 2.250% | 11/7/08 | LOC | 30,000 | 30,000 |
1 | Seattle WA Drain & Wastewater Rev. TOB VRDO | 2.220% | 11/7/08 | (4) | 9,000 | 9,000 |
1 | Seattle WA Refunding & Improvement GO TOB VRDO | 1.830% | 11/7/08 | | 2,895 | 2,895 |
1 | Seattle WA Water System Rev. TOB VRDO | 1.780% | 11/7/08 | LOC | 12,895 | 12,895 |
2 | Snohomish County WA Public Util. Dist. | 3.750% | 8/5/09 | | 9,000 | 9,096 |
| Tacoma WA Housing Auth. Rev. (Sunset Apartment Projects) VRDO | 2.100% | 11/7/08 | | 12,250 | 12,250 |
1 | Thurston County WA School District GO TOB VRDO | 2.270% | 11/7/08 | | 3,725 | 3,725 |
| | | | | | | | |
| Washington Econ. Dev. Finance Auth. Econ. Dev. Rev. (Puget Sound Blood Center) VRDO | 1.650% | 11/7/08 | LOC | 5,125 | 5,125 |
1 | Washington GO TOB PUT | 2.000% | 11/21/08 | | 11,825 | 11,825 |
1 | Washington GO TOB VRDO | 1.600% | 11/7/08 | LOC | 11,085 | 11,085 |
1 | Washington GO TOB VRDO | 1.780% | 11/7/08 | LOC | 8,660 | 8,660 |
1 | Washington GO TOB VRDO | 1.790% | 11/7/08 | | 10,700 | 10,700 |
1 | Washington GO TOB VRDO | 1.830% | 11/7/08 | | 5,740 | 5,740 |
1 | Washington GO TOB VRDO | 1.840% | 11/7/08 | | 6,075 | 6,075 |
1 | Washington GO TOB VRDO | 1.850% | 11/7/08 | | 12,000 | 12,000 |
1 | Washington GO TOB VRDO | 1.870% | 11/7/08 | | 3,090 | 3,090 |
1 | Washington GO TOB VRDO | 2.020% | 11/7/08 | | 4,300 | 4,300 |
1 | Washington GO TOB VRDO | 2.340% | 11/7/08 | (4) | 6,780 | 6,780 |
1 | Washington GO TOB VRDO | 2.350% | 11/7/08 | (4) | 4,695 | 4,695 |
1 | Washington GO TOB VRDO | 2.570% | 11/7/08 | (4) | 7,995 | 7,995 |
1 | Washington GO TOB VRDO | 2.570% | 11/7/08 | (4) | 1,000 | 1,000 |
1 | Washington GO TOB VRDO | 2.570% | 11/7/08 | (4) | 11,640 | 11,640 |
| Washington Health Care Fac. Auth. (Catholic Health Initiatives) VRDO | 1.780% | 11/7/08 | | 40,330 | 40,330 |
| Washington Health Care Fac. Auth. (Catholic Health Initiatives) VRDO | 2.300% | 11/7/08 | (4) | 17,900 | 17,900 |
| Washington Health Care Fac. Auth. (Catholic Health Initiatives) VRDO | 2.800% | 11/7/08 | (4) | 20,000 | 20,000 |
| Washington Health Care Fac. Auth. (Children's Hospital) VRDO | 1.500% | 11/7/08 | LOC | 11,000 | 11,000 |
| Washington Health Care Fac. Auth. (Children’s Hospital) VRDO | 1.500% | 11/7/08 | LOC | 16,960 | 16,960 |
| Washington Health Care Fac. Auth. (Fred Hutchinson Cancer Research Center) VRDO | 2.000% | 11/7/08 | LOC | 23,125 | 23,125 |
| Washington Health Care Fac. Auth. (Multicare Health System) VRDO | 1.550% | 11/3/08 | (4) | 32,000 | 32,000 |
| Washington Health Care Fac. Auth. (Multicare Health System) VRDO | 1.800% | 11/7/08 | (12) | 9,000 | 9,000 |
| Washington Health Care Fac. Auth. (Multicare Health System) VRDO | 2.000% | 11/7/08 | (12) | 9,000 | 9,000 |
| Washington Health Care Fac. Auth. (Peace Health) VRDO | 1.350% | 11/7/08 | LOC | 5,000 | 5,000 |
| Washington Health Care Fac. Auth. (Peace Health) VRDO | 1.350% | 11/7/08 | LOC | 5,400 | 5,400 |
19
1 | Washington Health Care Fac. Auth. (Providence Health) TOB VRDO | 2.250% | 11/7/08 | (4) | 12,475 | 12,475 |
1 | Washington Health Care Fac. Auth. (Providence Health) TOB VRDO | 2.260% | 11/7/08 | (4) | 8,610 | 8,610 |
| Washington Housing Finance Comm. Multi Family Housing Rev. (Vintage Silverdale) VRDO | 1.750% | 11/7/08 | | 15,570 | 15,570 |
1 | Washington St. Health Care Fac. Auth. Rev. (Peace Health) TOB VRDO | 1.880% | 11/7/08 | | 19,995 | 19,995 |
1 | Washington State GO TOB VRDO | 1.600% | 11/7/08 | | 5,325 | 5,325 |
1 | Washington State GO TOB VRDO | 1.600% | 11/7/08 | | 11,554 | 11,554 |
| | | | | | 666,490 |
West Virginia (0.4%) | | | | | |
| Brooke County WV Community Dev. Rev. (Bethany College Project) VRDO | 1.680% | 11/7/08 | LOC | 4,050 | 4,050 |
| West Virginia Econ. Dev. Auth. PCR (Ohio Power) VRDO | 1.800% | 11/7/08 | LOC | 10,000 | 10,000 |
| West Virginia Hosp. Finance Auth. Rev. (Cabell Hospital) VRDO | 1.600% | 11/7/08 | LOC | 10,000 | 10,000 |
| West Virginia Hosp. Finance Auth. Rev. (Charleston Medical Center) VRDO | 0.800% | 11/3/08 | LOC | 30,420 | 30,420 |
| West Virginia Hosp. Finance Auth. Rev. (Charleston Medical Center) VRDO | 1.600% | 11/7/08 | LOC | 11,000 | 11,000 |
| West Virginia Hosp. Finance Auth. Rev. (Charleston Medical Center) VRDO | 1.750% | 11/7/08 | LOC | 18,250 | 18,250 |
| West Virginia Parkway Econ. Dev. & Tourism Auth. Rev. VRDO | 5.500% | 11/7/08 | | 19,700 | 19,700 |
| | | | | | 103,420 |
Wisconsin (2.7%) | | | | | | |
| Madison WI Metro. School Dist. TRAN | 3.000% | 9/4/09 | | 64,000 | 64,700 |
| Oak Creek City WI (Wisconsin Electric Power Company Project) VRDO | 1.800% | 11/7/08 | LOC | 18,000 | 18,000 |
| Pleasant Prairie Village WI PCR Refunding Bonds Rev. (Wisconsin Electric Power Company) VRDO | 1.800% | 11/7/08 | LOC | 9,100 | 9,100 |
| Univ. of Wisconsin Hosp. & Clinics Auth. Rev. VRDO | 1.200% | 11/3/08 | LOC | 9,600 | 9,600 |
| Wisconsin GO CP | 1.900% | 2/11/09 | | 16,000 | 16,000 |
1 | Wisconsin GO TOB VRDO | 1.600% | 11/7/08 | | 6,405 | 6,405 |
1 | Wisconsin GO TOB VRDO | 1.950% | 11/7/08 | | 8,500 | 8,500 |
1 | Wisconsin GO TOB VRDO | 2.520% | 11/7/08 | (4) | 11,150 | 11,150 |
| Wisconsin Health & Educ. Fac. Auth. Rev. (Felician Services Incorporated) VRDO | 2.000% | 11/7/08 | LOC | 19,000 | 19,000 |
| Wisconsin Health & Educ. Fac. Auth. Rev. (Felician Services) VRDO | 2.000% | 11/7/08 | LOC | 8,200 | 8,200 |
| Wisconsin Health & Educ. Fac. Auth. Rev. (Gundersen Lutheran) VRDO | 1.600% | 11/7/08 | LOC | 7,500 | 7,500 |
| Wisconsin Health & Educ. Fac. Auth. Rev. (Hosp. Sisters Services) VRDO | 2.000% | 11/7/08 | (4) | 25,500 | 25,500 |
| Wisconsin Health & Educ. Fac. Auth. Rev. (Medical College Wisconsin) VRDO | 1.450% | 11/7/08 | LOC | 15,500 | 15,500 |
| Wisconsin Health & Educ. Fac. Auth. Rev. (St. Norbert College Inc.) VRDO | 1.700% | 11/7/08 | LOC | 7,250 | 7,250 |
1 | Wisconsin Housing & Econ. Dev. Auth. Home Ownership Rev. TOB VRDO | 1.980% | 11/7/08 | | 3,820 | 3,820 |
| Wisconsin Housing & Econ. Dev. Auth. Home Ownership Rev. VRDO | 1.950% | 11/7/08 | | 52,305 | 52,305 |
| Wisconsin Housing & Econ. Dev. Auth. Home Ownership Rev. VRDO | 1.950% | 11/7/08 | | 53,230 | 53,230 |
| Wisconsin Housing & Econ. Dev. Auth. Home Ownership Rev. VRDO | 1.950% | 11/7/08 | | 34,000 | 34,000 |
| Wisconsin Housing & Econ. Dev. Auth. Home Ownership Rev. VRDO | 1.950% | 11/7/08 | | 1,410 | 1,410 |
| Wisconsin Housing & Econ. Dev. Auth. Home Ownership Rev. VRDO | 1.950% | 11/7/08 | (4) | 8,470 | 8,470 |
| Wisconsin Housing & Econ. Dev. Auth. Home Ownership Rev. VRDO | 1.950% | 11/7/08 | | 94,595 | 94,595 |
| Wisconsin Housing & Econ. Dev. Auth. Home Ownership Rev. VRDO | 2.000% | 11/7/08 | | 14,780 | 14,780 |
| Wisconsin Housing & Econ. Dev. Auth. Home Ownership Rev. VRDO | 2.250% | 11/7/08 | | 18,645 | 18,645 |
| Wisconsin Housing & Econ. Dev. Auth. Home Ownership Rev. VRDO | 2.250% | 11/7/08 | | 10,000 | 10,000 |
| Wisconsin Housing & Econ. Dev. Auth. Home Ownership Rev. VRDO | 2.300% | 11/7/08 | | 2,265 | 2,265 |
| Wisconsin Housing & Econ. Dev. Auth. Home Ownership Rev. VRDO | 2.800% | 11/7/08 | (4) | 5,625 | 5,625 |
| Wisconsin Housing & Econ. Dev. Auth. Home Ownership Rev. VRDO | 8.950% | 11/7/08 | | 45,430 | 45,430 |
| Wisconsin Housing & Econ. Dev. Auth. Single Family Rev. VRDO | 1.950% | 11/7/08 | | 10,180 | 10,180 |
| Wisconsin Housing & Econ. Dev. Auth. Single Family Rev. VRDO | 1.950% | 11/7/08 | | 10,950 | 10,950 |
| Wisconsin Housing & Econ. Dev. Auth. Single Family Rev. VRDO | 1.950% | 11/7/08 | | 5,175 | 5,175 |
1 | Wisconsin Public Power Inc. Rev. (Power Supply System) TOB VRDO | 1.600% | 11/7/08 | LOC | 10,235 | 10,235 |
| Wisconsin School Dist. Cash Flow Management Program COP TRAN | 3.000% | 9/17/09 | LOC | 7,450 | 7,527 |
| Wisconsin State Health & Educ. Fac. Auth Rev. (Hosp. Sister Services, Inc) CP | 5.000% | 11/3/08 | (4) | 15,475 | 15,475 |
1 | Wisconsin State Helath & Educ. Fac. Auth. TOB VRDO | 1.870% | 11/7/08 | | 11,775 | 11,775 |
1 | Wisconsin Transp. Rev. TOB VRDO | 2.450% | 11/7/08 | | 9,355 | 9,355 |
| | | | | | 651,652 |
Wyoming (0.1%) | | | | | |
| Wyoming Community Dev. Auth. Housing Rev. VRDO | 2.250% | 11/7/08 | | 12,000 | 12,000 |
| Wyoming Community Dev. Auth. Housing Rev. VRDO | 2.250% | 11/7/08 | | 6,050 | 6,050 |
| Wyoming Community Dev. Auth. Housing Rev. VRDO | 2.250% | 11/7/08 | | 3,000 | 3,000 |
| Wyoming Community Dev. Auth. Housing Rev. VRDO | 2.250% | 11/7/08 | | 8,000 | 8,000 |
| | | | | | 29,050 |
Total Tax-Exempt Municipal Bonds (Cost $22,613,686) | | | | | 22,613,686 |
| | | | | | |
| | | | | | |
| | | | | Shares | |
Temporary Cash Investment (4.4%) | | | | | |
3 | Vanguard Municipal Cash Management Fund (Cost $1,043,461) | 1.701% | | | 1,043,461,337 | 1,043,461 |
Total Investments (99.1%) (Cost $23,657,147) | | | | | 23,657,147 |
20
| Market |
| Value• |
| ($000) |
Other Assets and Liabilities (0.9%) | |
Other Assets | 364,689 |
Liabilities | (140,646) |
| 224,043 |
Net Assets (100%) | |
Applicable to 23,880,552,116 outstanding $.001 par value shares of beneficial interest (unlimited authorization) | 23,881,190 |
Net Asset Value Per Share | $1.00 |
| |
| |
| |
At October 31, 2008, net assets consisted of: | |
| Amount |
| ($000) |
Paid-in Capital | 23,881,234 |
Undistributed Net Investment Income | — |
Accumulated Net Realized Losses | (44) |
Net Assets | 23,881,190 |
• See Note A in Notes to Financial Statements.
1 Security exempt from registration under Rule 144A of the Securities Act of 1933. Such securities may be sold in transactions exempt from registration, normally to qualified institutional buyers. At October 31, 2008, the aggregate value of these securities was $6,331,134,000, representing 26.5% of net assets.
2 Security purchased on a when-issued or delayed-delivery basis for which the fund has not taken delivery as of October 31, 2008.
3 Affiliated money market fund available only to Vanguard funds and certain trusts and accounts managed by Vanguard. Rate shown is the 7-day yield. For key to abbreviations and other references, see back cover.
See accompanying Notes, which are an integral part of the Financial Statements.
21
Short-Term Tax-Exempt Fund
| | | | | Face | Market |
| | | Maturity | | Amount | Value• |
| | Coupon | Date | | ($000) | ($000) |
Tax-Exempt Municipal Bonds (100.2%) | | | | | |
Alabama (1.4%) | | | | | |
| Alabama Public School & College Auth. | 5.000% | 12/1/09 | | 14,820 | 15,313 |
| Chatom AL Ind. Dev. Board Gulf Opportunity Zone (Powersouth Energy Coop Project) PUT | 2.000% | 11/14/08 | | 12,000 | 12,000 |
| Jefferson County AL Sewer Rev. (Capital Improvement) | 5.125% | 2/1/09 | (3)(Prere.) | 5,785 | 5,887 |
| Jefferson County AL Sewer Rev. (Capital Improvement) | 5.125% | 2/1/09 | (3)(Prere.) | 29,405 | 29,926 |
| Jefferson County AL Sewer Rev. (Capital Improvement) | 5.375% | 2/1/09 | (3)(Prere.) | 5,270 | 5,369 |
| | | | | | 68,495 |
Alaska (0.0%) | | | | | |
| Anchorage AK GO | 5.125% | 12/1/09 | (3) | 2,000 | 2,068 |
| | | | | | |
Arizona (2.1%) | | | | | |
| Arizona Health Fac. Auth. Rev. (Banner Health) | 5.000% | 1/1/09 | | 4,690 | 4,708 |
| Arizona Health Fac. Auth. Rev. (Banner Health) | 5.000% | 1/1/10 | | 2,000 | 2,033 |
| Arizona Health Fac. Auth. Rev. (Banner Health) | 5.000% | 1/1/11 | | 2,000 | 2,039 |
| Arizona Health Fac. Auth. Rev. (Banner Health) | 5.000% | 1/1/12 | | 3,000 | 3,035 |
| Arizona Transp. Board Highway Rev. | 6.000% | 7/1/10 | | 25,000 | 26,381 |
| Phoenix AZ Civic Improvement Corp. Airport Rev. | 5.000% | 7/1/09 | (2) | 5,500 | 5,616 |
| Pima County AZ COP | 5.000% | 6/1/10 | | 7,300 | 7,496 |
| Salt River Project Arizona Agricultural Improvement & Power Dist. Rev. | 5.500% | 1/1/10 | (1) | 15,000 | 15,549 |
| Salt River Project Arizona Agricultural Improvement & Power Dist. Rev. | 5.000% | 1/1/11 | | 12,500 | 13,093 |
1 | Salt River Project Arizona Agricultural Improvement & Power Dist. Rev. TOB VRDO | 1.900% | 11/7/08 | | 24,790 | 24,790 |
| | | | | | 104,740 |
Arkansas (0.1%) | | | | | |
| Fort Smith AR Sales & Use Tax Rev. | 5.000% | 9/1/10 | (3) | 3,000 | 3,110 |
| | | | | | |
California (3.3%) | | | | | |
| California Communities NT Program NT Participation TRAN | 3.000% | 7/31/09 | | 15,000 | 15,092 |
| California GO | 5.000% | 3/1/09 | | 22,400 | 22,615 |
| California Health Fac. Finance Auth. Rev. (Cedars-Sinai Medical Center) | 5.000% | 11/15/08 | | 1,065 | 1,066 |
| California Health Fac. Finance Auth. Rev. (Stanford Hospital) PUT | 3.450% | 6/15/11 | | 5,000 | 5,007 |
| California Health Fac. Finance Auth. Rev. (Sutter Health) | 5.000% | 8/15/09 | | 3,000 | 3,054 |
| California Health Fac. Finance Auth. Rev. (Sutter Health) | 5.000% | 8/15/10 | | 3,000 | 3,074 |
| California Health Fac. Finance Auth. Rev. (Sutter Health) | 5.000% | 8/15/11 | | 5,000 | 5,127 |
| California Infrastructure & Econ. Dev. Bank Rev. | 5.000% | 2/1/11 | | 10,000 | 10,401 |
| California State Econ. Recovery Bonds PUT | 5.000% | 3/1/10 | | 16,000 | 16,350 |
| California State Econ. Recovery Bonds PUT | 5.000% | 7/1/10 | | 16,000 | 16,395 |
| California State Econ. Recovery Bonds PUT | 5.000% | 7/1/11 | | 8,000 | 8,251 |
| California Statewide Community Dev. Auth. Rev. (Kaiser Permanente) PUT | 3.875% | 4/1/10 | | 5,000 | 5,035 |
| Foothill/Eastern Corridor Agency California Toll Road Rev. | 7.150% | 1/1/10 | (Prere.) | 5,000 | 5,387 |
| Golden State Tobacco Securitization Corp. California | 5.500% | 6/1/13 | (Prere.) | 10,000 | 10,761 |
| Golden State Tobacco Securitization Corp. California | 5.625% | 6/1/13 | (Prere.) | 5,000 | 5,407 |
| Golden State Tobacco Securitization Corp. California | 6.250% | 6/1/13 | (Prere.) | 15,000 | 16,019 |
| Northern California Power Agency (Geothermal Project) | 5.000% | 7/1/09 | (ETM) | 5,415 | 5,521 |
| San Joaquin County CA Transp. Auth. Rev. Notes | 5.000% | 4/1/11 | | 10,000 | 10,308 |
| | | | | | 164,870 |
Colorado (1.7%) | | | | | |
| Colorado Dept. of Transp. Rev. RAN | 5.250% | 6/15/11 | | 10,000 | 10,560 |
| Colorado Educ. & Cultural Fac. Auth. Rev. (National Jewish Board Program) VRDO | 1.250% | 11/3/08 | | 15,630 | 15,630 |
| Colorado Health Fac. Auth. Rev. (Catholic Health Initiatives) PUT | 3.950% | 11/10/10 | | 15,000 | 15,049 |
1 | Colorado Health Fac. Auth. Rev. (Catholic Health Initiatives) TOB VRDO | 2.570% | 11/7/08 | (4) | 10,000 | 10,000 |
| E-470 Public Highway Auth. Colorado Rev. PUT | 5.000% | 9/1/11 | (1) | 15,000 | 15,213 |
1 | Jefferson County CO School Dist. GO TOB VRDO | 2.570% | 11/7/08 | (4) | 4,210 | 4,210 |
1 | Jefferson County CO School Dist. GO TOB VRDO | 2.570% | 11/7/08 | (4) | 13,660 | 13,660 |
| Platte River Power Auth. Colorado Power Rev. | 5.000% | 6/1/10 | | 2,500 | 2,595 |
| | | | | | 86,917 |
Connecticut (1.0%) | | | | | |
2 | Connecticut GO | 5.000% | 11/1/10 | | 3,000 | 3,143 |
| Connecticut GO VRDO | 4.500% | 11/7/08 | | 25,000 | 25,000 |
| Connecticut Revolving Fund | 5.000% | 2/1/11 | | 4,130 | 4,337 |
| Connecticut Revolving Fund | 5.000% | 2/1/12 | | 4,000 | 4,232 |
| Connecticut Special Tax Obligation Rev. (Transp. Infrastructure) | 6.000% | 10/1/09 | (1) | 11,940 | 12,385 |
| | | | | | 49,097 |
District of Columbia (0.6%) | | | | | |
| District of Columbia GO | 5.000% | 6/1/09 | (2) | 4,630 | 4,708 |
| District of Columbia GO | 5.000% | 1/1/10 | (3) | 4,000 | 4,084 |
3 | District of Columbia GO | 5.500% | 6/1/10 | (4) | 10,000 | 10,421 |
1 | District of Columbia GO TOB VRDO | 2.570% | 11/7/08 | (4) | 9,980 | 9,980 |
| | | | | | 29,193 |
22
Florida (7.7%) | | | | | |
| Broward County FL Resource Recovery Rev. (Wheelabrator Series A) | 5.500% | 12/1/08 | | 9,000 | 9,024 |
| Citizens Property Insurance Corp. Florida (High Risk Account) | 5.000% | 3/1/09 | (1) | 30,605 | 30,806 |
| Citizens Property Insurance Corp. Florida (High Risk Account) | 5.000% | 3/1/10 | (1) | 28,405 | 28,904 |
| Citizens Property Insurance Corp. Florida (High Risk Account) | 5.000% | 6/1/11 | | 25,000 | 25,505 |
| Collier County FL Water & Sewer Dist. Rev. | 5.000% | 7/1/10 | (4) | 2,920 | 3,027 |
| Dade County FL School Dist. GO | 5.000% | 8/1/09 | (1) | 8,595 | 8,786 |
| Florida Board of Educ. Public Educ. | 5.000% | 6/1/09 | | 2,855 | 2,908 |
| Florida Board of Educ. Public Educ. | 5.000% | 6/1/10 | | 16,120 | 16,715 |
| Florida Board of Educ. Public Educ. | 5.250% | 6/1/10 | | 4,925 | 5,124 |
| Florida Board of Educ. Rev. (Lottery Rev.) | 5.000% | 7/1/09 | (2) | 6,890 | 7,022 |
1 | Florida Board of Educ. Rev. (Lottery Rev.) TOB VRDO | 2.400% | 11/7/08 | (13) | 14,195 | 14,195 |
| Florida Dept. of Environmental Protection & Preservation Rev. | 5.000% | 7/1/09 | (1) | 5,000 | 5,078 |
| Florida Dept. of Environmental Protection & Preservation Rev. | 5.000% | 7/1/11 | | 5,280 | 5,452 |
| Florida Dept. of Environmental Protection & Preservation Rev. | 5.000% | 7/1/12 | | 5,545 | 5,738 |
| Florida Hurricane Catastrophe Fund Finance Corp. Rev. | 5.000% | 7/1/09 | | 29,700 | 30,237 |
| Florida Hurricane Catastrophe Fund Finance Corp. Rev. | 5.000% | 7/1/10 | | 24,550 | 25,382 |
| Florida Hurricane Catastrophe Fund Finance Corp. Rev. | 5.000% | 7/1/13 | | 10,000 | 10,443 |
| Florida Rural Util. Financing Comm. Rev. | 3.250% | 2/1/11 | | 5,000 | 5,000 |
| Florida Rural Util. Financing Comm. Rev. | 3.500% | 11/1/11 | | 6,000 | 5,934 |
| Florida Turnpike Auth. Rev. | 5.000% | 7/1/10 | (1) | 9,830 | 10,197 |
| Highlands County FL Health Rev. (Adventist Health System) PUT | 5.000% | 11/16/09 | | 13,000 | 13,156 |
| Jacksonville FL Electric Auth. Electric System Rev | 5.000% | 10/1/10 | | 5,380 | 5,565 |
| Jacksonville FL Electric Auth. Electric System Rev | 5.000% | 10/1/11 | | 12,000 | 12,507 |
| Jacksonville FL Electric Auth. Electric System Rev | 5.000% | 10/1/12 | | 12,000 | 12,519 |
| Lakeland FL Energy Systems Rev. | 5.500% | 10/1/10 | (1)(Prere.) | 4,300 | 4,548 |
| Miami-Dade County FL Health Fac. Auth. Hosp. Rev. PUT | 4.125% | 8/1/11 | (1) | 5,000 | 4,957 |
| Ocala FL Water & Sewer Rev. | 5.750% | 10/1/11 | (3)(Prere.) | 13,605 | 14,835 |
1 | Orlando & Orange County FL Expressway Auth. TOB VRDO | 3.320% | 11/7/08 | (4) | 10,730 | 10,730 |
| Orlando FL Util. Comm. Water & Electric Rev. | 5.250% | 7/1/09 | | 21,000 | 21,462 |
| Orlando FL Waste Water System Rev. | 5.000% | 10/1/10 | (2) | 2,805 | 2,923 |
| South Miami FL Health Fac. Auth. Hosp. Rev. (Baptist Health South FL Obligated Group) | 5.000% | 8/15/11 | | 4,000 | 4,068 |
| Univ. Athletic Assn. Inc. Florida Capital Improvement Rev. PUT | 3.400% | 10/1/09 | LOC | 4,600 | 4,659 |
| Univ. of South Florida Financing Corp. VRDO | 2.350% | 11/7/08 | | 20,000 | 20,000 |
| | | | | | 387,406 |
Georgia (5.9%) | | | | | |
1 | Atlanta GA Airport Fac. Rev. TOB VRDO | 3.320% | 11/7/08 | (4) | 11,170 | 11,170 |
1 | Atlanta GA Airport Passenger Charge Rev. TOB VRDO | 3.320% | 11/7/08 | (4) | 18,600 | 18,600 |
1 | Atlanta GA Water & Wastewater Rev. TOB VRDO | 1.960% | 11/7/08 | (13) | 9,600 | 9,600 |
1 | Augusta GA Water & Sewer Rev. TOB VRDO | 2.590% | 11/7/08 | (4) | 1,315 | 1,315 |
| Burke County GA Dev. Auth. PCR (Georgia Power Co. Plant Vogtle) PUT | 4.450% | 12/1/08 | | 9,300 | 9,299 |
| Burke County GA Dev. Auth. PCR (Georgia Power Co. Plant Vogtle) PUT | 3.750% | 7/14/09 | | 10,000 | 10,000 |
| Burke County GA Dev. Auth. PCR (Georgia Power Co. Plant Vogtle) PUT | 3.750% | 1/12/12 | | 9,880 | 9,773 |
| Burke County GA Dev. Auth. PCR (Georgia Power Co.Plant Vogtle) PUT | 3.750% | 1/12/12 | | 5,000 | 4,946 |
| Burke County GA Dev. Auth. PCR (Oglethorpe Power Corp.) PUT | 4.750% | 4/1/11 | (1) | 7,500 | 7,464 |
| Carroll County GA School Dist. Sales Tax GO | 5.000% | 4/1/10 | | 2,000 | 2,075 |
| Coffee County GA School Dist. GO | 6.000% | 8/1/09 | | 3,060 | 3,154 |
| DeKalb County GA School Dist. GO | 5.000% | 2/1/12 | | 30,000 | 31,678 |
1 | Fulton County GA Water & Sewer Rev. TOB VRDO | 1.970% | 11/7/08 | (13) | 4,295 | 4,295 |
| Georgia GO | 5.000% | 8/1/09 | | 15,995 | 16,396 |
| Georgia GO | 5.000% | 12/1/09 | | 9,445 | 9,774 |
| Georgia GO | 5.000% | 10/1/10 | | 7,620 | 7,984 |
| Georgia GO | 5.000% | 12/1/10 | | 9,985 | 10,497 |
1 | Georgia GO TOB VRDO | 1.880% | 11/7/08 | | 10,020 | 10,020 |
1 | Georgia GO TOB VRDO | 1.880% | 11/7/08 | | 13,115 | 13,115 |
| Henry County GA School Dist. GO | 5.000% | 4/1/09 | | 15,350 | 15,553 |
| Main Street Natural Gas Inc. Georgia Gas Project Rev. | 5.000% | 3/15/10 | | 9,000 | 8,790 |
| Main Street Natural Gas Inc. Georgia Gas Project Rev. | 5.000% | 3/15/10 | | 12,000 | 11,874 |
| Muni. Electric Auth. Georgia (Project One Sub) Rev. | 5.000% | 1/1/12 | | 3,010 | 3,090 |
| Muni. Electric Auth. Georgia CP | 6.000% | 11/5/08 | | 47,731 | 47,731 |
| Muni. Electric Auth. Georgia Subordinate Bonds Project One PUT | 5.000% | 1/1/09 | (2) | 12,500 | 12,538 |
| Private Colleges & Univ. Auth. of Georgia Rev. (Emory Univ.) | 5.000% | 9/1/11 | | 5,000 | 5,273 |
| | | | | | 296,004 |
Hawaii (0.4%) | | | | | |
| Honolulu HI City & County GO | 5.000% | 7/1/10 | (3) | 4,065 | 4,222 |
| Honolulu HI City & County GO | 5.000% | 7/1/10 | (1) | 4,515 | 4,690 |
| Honolulu HI City & County GO | 5.000% | 7/1/10 | (1) | 3,980 | 4,135 |
1 | Honolulu HI City & County Waste Water GO TOB VRDO | 3.320% | 11/7/08 | (4) | 4,995 | 4,995 |
| | | | | | 18,042 |
23
Illinois (4.4%) | | | | | |
| Chicago IL Board of Educ. (Westinghouse High School Project) | 5.000% | 12/1/10 | (1)(ETM) | 2,775 | 2,919 |
| Chicago IL Board of Educ. Lease Rev. | 6.250% | 1/1/11 | (1) | 3,000 | 3,189 |
1 | Chicago IL Board of Educ. TOB VRDO | 2.570% | 11/7/08 | (4) | 8,695 | 8,695 |
| Chicago IL GO | 5.125% | 1/1/09 | (3)(Prere.) | 14,030 | 14,248 |
| Chicago IL Housing Auth. Capital Project Rev. | 5.000% | 7/1/09 | (4) | 2,670 | 2,722 |
| Chicago IL Metro. Water Reclamation Dist. GO | 5.250% | 12/1/10 | (ETM) | 10,000 | 10,554 |
1 | Chicago IL O'Hare International Airport Rev. TOB VRDO | 3.740% | 11/7/08 | (1) | 9,330 | 9,330 |
| Chicago IL Park Dist. GO | 5.000% | 1/1/10 | (3) | 8,145 | 8,387 |
| Chicago IL Transit Auth. Rev. | 5.250% | 6/1/09 | (2) | 1,000 | 1,018 |
1 | Chicago IL Water Rev. TOB VRDO | 2.450% | 11/7/08 | (4) | 5,205 | 5,205 |
1 | Chicago IL Water Rev. TOB VRDO | 2.570% | 11/7/08 | (4) | 7,495 | 7,495 |
1 | Cook County IL Community High School Dist. (NilesTownship) GO VRDO | 2.450% | 11/7/08 | (4) | 4,915 | 4,915 |
1 | Cook County IL GO TOB VRDO | 2.270% | 11/7/08 | | 5,640 | 5,640 |
| Du Page & Cook Counties IL Community Consolidated School Dist. GO | 5.250% | 12/1/12 | (3)(Prere.) | 3,750 | 4,053 |
| Illinois Dev. Finance Auth. Hosp. Rev. (Evanston Northwestern Healthcare Corp.) VRDO | 1.780% | 11/7/08 | | 12,000 | 12,000 |
| Illinois Educ. Fac. Auth. Rev. (Univ. of Chicago) PUT | 4.050% | 7/1/09 | | 7,060 | 7,155 |
| Illinois Finance Auth. Rev. (Resurrection Health Care) | 5.000% | 5/15/10 | (4) | 3,600 | 3,701 |
| Illinois Finance Auth. Rev. (Resurrection Health Care) | 5.000% | 5/15/10 | (4) | 3,800 | 3,906 |
| Illinois Finance Auth. Rev. (Resurrection Health Care) | 5.000% | 5/15/11 | (4) | 3,490 | 3,606 |
| Illinois Finance Auth. Rev. (Resurrection Health Care) | 5.000% | 5/15/11 | (4) | 4,000 | 4,133 |
| Illinois Finance Auth. Rev. (Resurrection Health Care) | 5.000% | 5/15/12 | (4) | 4,200 | 4,353 |
| Illinois GO | 4.250% | 6/1/09 | | 3,400 | 3,449 |
| Illinois GO | 5.000% | 6/1/09 | | 8,955 | 9,122 |
| Illinois GO | 5.250% | 8/1/09 | (1) | 2,135 | 2,190 |
| Illinois GO | 5.500% | 8/1/09 | | 8,610 | 8,847 |
| Illinois GO | 5.000% | 10/1/09 | | 14,800 | 15,228 |
| Illinois GO | 5.000% | 1/1/10 | | 6,000 | 6,180 |
1 | Illinois GO TOB VRDO | 2.400% | 11/7/08 | | 30,605 | 30,605 |
| Illinois Health Fac. Auth. Rev. (Revolving Fund Pooled) VRDO | 1.250% | 11/3/08 | | 17,400 | 17,400 |
1 | Illinois Regional Transp. Auth. Rev. TOB VRDO | 3.320% | 11/7/08 | | 2,600 | 2,600 |
| | | | | | 222,845 |
Indiana (3.3%) | | | | | |
| Indiana Bond Bank Rev. Revolving Funding Program | 5.600% | 8/1/10 | (Prere.) | 3,100 | 3,302 |
| Indiana Finance Auth. Health System Rev. (Sisters St. Francis) | 5.000% | 11/1/11 | | 1,000 | 1,017 |
| Indiana Finance Auth. Health System Rev. (Sisters St. Francis) | 5.000% | 11/1/12 | | 1,700 | 1,715 |
| Indiana Finance Auth. Rev. | 5.000% | 11/1/12 | | 12,130 | 12,659 |
| Indiana Finance Auth. Rev. (Ascension Health) PUT | 3.500% | 11/15/09 | | 4,000 | 4,010 |
| Indiana Finance Auth. Rev. (Ascension Health) PUT | 3.500% | 12/15/09 | | 10,000 | 9,994 |
| Indiana Finance Auth. Rev. (Ascension Health) PUT | 3.500% | 12/15/09 | | 5,000 | 5,013 |
| Indiana Finance Auth. Rev. VRDO | 6.000% | 11/7/08 | | 10,000 | 10,000 |
| Indiana Finance Auth. Rev. VRDO | 6.000% | 11/7/08 | | 30,800 | 30,800 |
| Indiana Health Fac. Auth. Finance Auth. Rev. (Ascension Health Credit Group) | 5.000% | 4/1/10 | | 17,565 | 17,840 |
1 | Indiana Muni. Power Agency Rev. TOB VRDO | 2.720% | 11/7/08 | (1) | 31,620 | 31,620 |
| Indiana Office Building Comm. Rev. (Capitol Complex) | 5.000% | 7/1/10 | (4) | 6,535 | 6,788 |
| Indiana Univ. Rev. (Student Fee) | 5.000% | 8/1/09 | | 9,270 | 9,491 |
1 | Indianapolis IN Local Public Improvement Rev. TOB VRDO | 3.820% | 11/7/08 | | 8,480 | 8,480 |
2 | St. Joseph County IN Educ. Fac. Rev. (Univ. of Notre Dame) PUT | 3.875% | 3/1/12 | | 12,500 | 12,500 |
| | | | | | 165,229 |
Kansas (1.1%) | | | | | |
| Univ. of Kansas Hosp. Auth. Health System | 5.000% | 9/1/09 | | 750 | 759 |
| Wyandotte County Kansas City KS Unified Govt. GO | 5.000% | 3/1/10 | | 45,460 | 45,100 |
1 | Wyandotte County Kansas City KS Unified Govt. Util. System Rev. TOB VRDO | 1.950% | 11/7/08 | (13) | 9,730 | 9,730 |
| | | | | | 55,589 |
Kentucky (0.8%) | | | | | |
| Kentucky Asset/Liability Comm. General Fund Rev. | 5.000% | 7/15/09 | (2) | 4,500 | 4,594 |
| Kentucky Asset/Liability Comm. General Fund Rev. | 5.000% | 9/1/09 | (1) | 14,455 | 14,832 |
| Kentucky Econ. Dev. Finance Auth. Rev. (Catholic Health) PUT | 3.500% | 11/10/10 | | 5,000 | 4,973 |
| Kentucky Property & Building Comm. Rev. | 5.000% | 3/1/09 | (3) | 2,000 | 2,019 |
| Kentucky Property & Building Comm. Rev. | 5.000% | 3/1/10 | (3) | 2,190 | 2,255 |
| Kentucky Property & Building Comm. Rev. | 5.125% | 9/1/10 | (Prere.) | 5,955 | 6,247 |
1 | Louisville & Jefferson County KY Metro. Sewer Dist. TOB VRDO | 1.950% | 11/7/08 | (13) | 6,640 | 6,640 |
| | | | | | 41,560 |
Louisiana (0.8%) | | | | | |
1 | Louisiana Gasoline and Fuel Tax Rev. TOB VRDO | 2.350% | 11/7/08 | (4) | 9,900 | 9,900 |
| Louisiana GO | 5.000% | 5/1/09 | (4) | 14,015 | 14,237 |
| Louisiana GO | 5.000% | 7/15/10 | (11) | 2,000 | 2,070 |
1 | Louisiana Public Fac. Auth. Hosp. Rev. (Franciscan Missionaries) TOB VRDO | 3.320% | 11/7/08 | (4) | 4,995 | 4,995 |
| Louisiana Transp. Auth. Toll Rev. | 5.000% | 9/1/09 | | 10,000 | 10,239 |
| | | | | | 41,441 |
24
Maine (0.3%) | | | | | |
| Maine Housing Auth. Mortgage Rev. VRDO | 3.800% | 11/7/08 | | 13,000 | 13,000 |
| | | | | | |
Maryland (0.5%) | | | | | |
| Maryland GO | 5.000% | 3/15/10 | | 18,520 | 19,203 |
| Maryland Health & Higher Educ. Fac. Auth. Rev. (Johns Hopkins Health System) PUT | 5.000% | 11/15/11 | | 5,000 | 5,159 |
| Maryland Health & Higher Educ. Fac. Auth. Rev. (Univ. of Maryland Medical System) | 4.000% | 7/1/11 | | 750 | 741 |
| Maryland Health & Higher Educ. Fac. Auth. Rev. (Univ. of Maryland Medical System) | 5.000% | 7/1/12 | | 1,000 | 1,002 |
| | | | | | 26,105 |
Massachusetts (3.6%) | | | | | |
1 | Massachusetts College Building Auth. Rev. TOB VRDO | 2.400% | 11/7/08 | | 13,095 | 13,095 |
| Massachusetts GAN | 5.750% | 6/15/09 | | 10,900 | 11,173 |
| Massachusetts GO | 5.250% | 1/1/09 | | 10,000 | 10,057 |
| Massachusetts GO | 5.500% | 2/1/09 | (1) | 8,785 | 8,865 |
| Massachusetts GO | 5.000% | 11/1/09 | | 10,000 | 10,308 |
| Massachusetts GO | 5.875% | 2/1/10 | (Prere.) | 16,585 | 17,492 |
| Massachusetts GO | 5.875% | 2/1/10 | (Prere.) | 7,600 | 8,016 |
| Massachusetts GO | 5.750% | 6/1/10 | (Prere.) | 35,045 | 36,928 |
| Massachusetts GO | 6.000% | 6/1/10 | (Prere.) | 10,000 | 10,576 |
| Massachusetts GO | 5.250% | 8/1/10 | | 2,000 | 2,089 |
1 | Massachusetts GO TOB VRDO | 3.320% | 11/7/08 | (2) | 3,950 | 3,950 |
| Massachusetts Health & Educ. Fac. Auth. Rev. (Caregroup) | 5.000% | 7/1/12 | | 3,000 | 2,883 |
| Massachusetts Health & Educ. Fac. Auth. Rev. (Harvard Univ.) CP | 3.250% | 3/26/09 | | 10,000 | 10,066 |
| Massachusetts Health & Educ. Fac. Auth. Rev. (Northeastern Univ.) | 4.000% | 10/1/12 | | 5,000 | 4,983 |
| Massachusetts School Building Auth. Dedicated Sales Tax Rev. | 5.000% | 8/15/09 | | 11,500 | 11,786 |
| Massachusetts Water Pollution Abatement Trust | 6.000% | 8/1/10 | | 3,835 | 3,974 |
1 | Massachusetts Water Pollution Abatement Trust TOB VRDO | 2.520% | 11/7/08 | (4) | 3,920 | 3,920 |
| Route 3 North Transp. Improvement Assn. Massachusetts Lease Rev. | 5.750% | 6/15/11 | (1) | 3,415 | 3,545 |
| Springfield MA GO | 5.000% | 8/1/09 | (1) | 5,660 | 5,783 |
| | | | | | 179,489 |
Michigan (2.5%) | | | | | |
| Detroit MI Capital Improvement GO | 5.000% | 4/1/09 | (4) | 6,135 | 6,210 |
| Detroit MI GO | 5.000% | 4/1/11 | (12) | 8,465 | 8,723 |
| Detroit MI GO | 5.000% | 4/1/12 | (12) | 8,860 | 9,146 |
| Detroit MI Sewer System Rev. | 6.000% | 7/1/09 | (1) | 5,000 | 5,107 |
| Detroit MI Sewer System Rev. | 6.000% | 1/1/10 | (3)(Prere.) | 10,000 | 10,491 |
| Detroit MI Sewer System Rev. | 5.000% | 7/1/10 | (4) | 5,690 | 5,887 |
| Greater Detroit MI Resource Recovery Auth. | 6.250% | 12/13/08 | (2) | 5,000 | 5,024 |
| Michigan (New Center Dev. Inc.) COP PUT | 5.000% | 9/1/11 | (1) | 6,250 | 6,525 |
| Michigan Building Auth. Rev. | 5.000% | 10/15/09 | (4) | 5,000 | 5,130 |
| Michigan Building Auth. Rev. | 5.000% | 10/15/10 | (4) | 12,325 | 12,764 |
| Michigan Building Auth. Rev. | 5.250% | 10/15/10 | | 5,360 | 5,467 |
1 | Michigan Building Auth. Rev. TOB VRDO | 2.580% | 11/7/08 | (4) | 9,090 | 9,090 |
| Michigan Comprehensive Transp. Rev. | 5.500% | 5/15/10 | (4) | 2,070 | 2,159 |
| Michigan GO | 5.000% | 5/1/11 | | 5,000 | 5,230 |
1 | Michigan Hosp. Finance Auth. Rev. (Ascension Health) TOB VRDO | 2.400% | 11/7/08 | | 26,000 | 26,000 |
| Michigan Muni. Bond Auth. Rev. (Clean Water Revolving Fund) | 3.550% | 10/1/11 | | 3,000 | 3,047 |
| | | | | | 126,000 |
Minnesota (0.9%) | | | | | |
| Minnesota GO | 5.000% | 10/1/10 | | 18,175 | 19,034 |
| Minnesota GO | 5.000% | 11/1/10 | | 10,000 | 10,490 |
| Southern Minnesota Muni. Power Agency Power Supply System Rev. | 5.000% | 1/1/09 | (2) | 5,000 | 5,024 |
| St. Louis Park MN Health Care Facs. Rev. (Park Nicollet Health Services) | 5.500% | 7/1/09 | | 2,800 | 2,831 |
| St. Louis Park MN Health Care Facs. Rev. (Park Nicollet Health Services) | 5.500% | 7/1/11 | | 2,000 | 2,041 |
| St. Louis Park MN Health Care Facs. Rev. (Park Nicollet Health Services) | 5.500% | 7/1/12 | | 5,000 | 5,057 |
| | | | | | 44,477 |
Mississippi (0.4%) | | | | | |
| Jackson State Univ. Educ. Building Corp. PUT | 5.000% | 3/1/11 | | 5,000 | 5,084 |
| Mississippi GO | 5.000% | 10/1/09 | | 5,770 | 5,937 |
| Mississippi GO | 6.000% | 11/1/09 | (Prere.) | 10,800 | 11,260 |
| | | | | | 22,281 |
Missouri (1.3%) | | | | | |
| Bi-State Dev. Agency of the Missouri-Illinois Metro. Dist. | | | | | |
| (St. Clair County Metrolink Extension) PUT | 3.950% | 10/1/09 | LOC | 5,000 | 5,091 |
| Missouri Health & Educ. Fac. Auth. Health Fac. Rev. (St. Luke's Health System) VRDO | 1.750% | 11/7/08 | | 6,000 | 6,000 |
| Missouri Health & Educ. Fac. Auth. Health Fac. Rev. (St. Luke's Health System) VRDO | 1.750% | 11/7/08 | | 14,250 | 14,250 |
| Missouri Health & Educ. Fac. Auth. Health Fac. Rev. (St. Luke's Health System) VRDO | 1.750% | 11/7/08 | | 15,000 | 15,000 |
| Missouri Health & Educ. Fac. Auth. Rev. (Ascension Health) PUT | 3.500% | 11/15/09 | | 10,000 | 10,054 |
| Missouri Health & Educ. Fac. Auth. Rev. (Ascension Health) PUT | 3.500% | 11/15/09 | | 5,000 | 5,039 |
| Missouri Highways & Transp. Comm. Road Rev. | 5.000% | 5/1/09 | | 9,165 | 9,318 |
| | | | | | 64,752 |
25
Nebraska (0.2%) | | | | | |
| Central Plains Energy Project Nebraska Gas Project No. 1 | 5.000% | 12/1/08 | | 5,000 | 4,994 |
| Nebraska Public Power Dist. Rev. | 5.250% | 1/1/09 | (1) | 4,130 | 4,152 |
1 | Nebraska Public Power Dist. Rev. TOB VRDO | 1.950% | 11/7/08 | (13) | 3,455 | 3,455 |
| | | | | | 12,601 |
Nevada (4.9%) | | | | | |
| Clark County NV Bond Bank GO | 5.000% | 11/1/09 | (2) | 6,010 | 6,196 |
| Clark County NV Bond Bank GO | 5.000% | 6/1/12 | | 5,000 | 5,277 |
| Clark County NV GO | 7.500% | 6/1/09 | (2) | 5,710 | 5,895 |
| Clark County NV GO | 5.500% | 7/1/10 | (1)(Prere.) | 23,000 | 24,188 |
| Clark County NV GO | 5.000% | 11/1/11 | | 7,315 | 7,706 |
| Clark County NV GO | 5.000% | 11/1/12 | | 6,755 | 7,154 |
| Clark County NV Highway Improvement Motor Vehicle Fuel Tax | 5.000% | 7/1/11 | (2) | 7,120 | 7,456 |
| Clark County NV Passenger Fac. Rev. (Las Vegas McCarran International Airport) | 5.000% | 7/1/10 | | 1,500 | 1,542 |
| Clark County NV Passenger Fac. Rev. (Las Vegas McCarran International Airport) | 5.000% | 7/1/11 | | 3,595 | 3,712 |
| Clark County NV Passenger Fac. Rev. (Las Vegas McCarran International Airport) | 5.000% | 7/1/12 | | 2,700 | 2,794 |
| Clark County NV School Dist. GO | 5.250% | 6/15/09 | (4)(Prere.) | 5,000 | 5,111 |
| Clark County NV School Dist. GO | 5.250% | 6/15/09 | (1) | 16,920 | 17,280 |
| Clark County NV School Dist. GO | 4.500% | 6/15/10 | (2) | 20,110 | 20,723 |
| Clark County NV School Dist. GO | 5.000% | 6/15/10 | (1) | 10,730 | 11,138 |
| Clark County NV School Dist. GO | 5.250% | 6/15/10 | (4) | 10,495 | 10,666 |
| Clark County NV School Dist. GO | 5.250% | 6/15/10 | (4) | 13,675 | 14,247 |
| Clark County NV School Dist. GO | 5.500% | 12/15/11 | (4)(Prere.) | 6,000 | 6,472 |
| Las Vegas Valley Water Dist. Nevada GO Water Improvement & Refunding | 5.000% | 2/1/10 | | 6,120 | 6,313 |
| Las Vegas Valley Water Dist. Nevada GO Water Improvement & Refunding | 5.000% | 2/1/11 | | 2,925 | 3,059 |
1 | Las Vegas Valley Water Dist. Nevada TOB VRDO | 2.400% | 11/7/08 | | 56,325 | 56,325 |
| Nevada Capital Improvement & Cultural Affairs GO | 5.000% | 3/1/11 | (4) | 6,215 | 6,523 |
| Nevada GO | 6.000% | 5/15/09 | | 6,500 | 6,644 |
1 | Nevada Higher Education Rev. TOB VRDO | 2.270% | 11/7/08 | | 7,590 | 7,590 |
| Nevada Highway Improvement Rev. (Motor Vehicle Fuel Tax) | 5.000% | 12/1/09 | (1) | 5,000 | 5,164 |
| | | | | | 249,175 |
New Jersey (4.4%) | | | | | |
| Cape May County NJ Muni. Util. Auth. Rev. | 6.000% | 1/1/10 | (4) | 6,495 | 6,760 |
| Garden State Preservation Trust New Jersey | 5.250% | 11/1/09 | (4) | 4,500 | 4,647 |
| New Jersey Building Auth. Rev. | 5.000% | 6/15/10 | | 7,505 | 7,759 |
| New Jersey CTFS Partner Equipment Lease Purchase | 5.000% | 6/15/12 | | 7,570 | 7,871 |
| New Jersey Econ. Dev. Auth. Rev. (School Fac.) | 4.000% | 9/1/09 | (4) | 1,190 | 1,209 |
| New Jersey Econ. Dev. Auth. Rev. (School Fac.) | 4.000% | 9/1/09 | (4) | 3,300 | 3,351 |
| New Jersey Econ. Dev. Auth. Rev. (School Fac.) | 4.000% | 9/1/09 | (4) | 11,455 | 11,645 |
| New Jersey Econ. Dev. Auth. Rev. (School Fac.) | 4.000% | 3/1/10 | (4) | 6,225 | 6,329 |
| New Jersey Econ. Dev. Auth. Rev. (School Fac.) | 5.000% | 3/1/10 | | 1,000 | 1,031 |
| New Jersey Econ. Dev. Auth. Rev. (School Fac.) | 4.000% | 9/1/10 | (4) | 2,000 | 2,041 |
| New Jersey Econ. Dev. Auth. Rev. (School Fac.) | 4.000% | 9/1/10 | (4) | 7,015 | 7,173 |
| New Jersey Econ. Dev. Auth. Rev. (School Fac.) | 5.000% | 3/1/11 | | 5,055 | 5,250 |
| New Jersey Econ. Dev. Auth. Rev. (School Fac.) | 5.000% | 9/1/11 | | 4,500 | 4,697 |
| New Jersey Educ. Fac. Auth. Rev. (Higher Education Trust Fund) | 5.000% | 9/1/09 | | 5,610 | 5,747 |
| New Jersey Educ. Fac. Auth. Rev. (Higher Education Trust Fund) | 5.000% | 9/1/10 | | 10,000 | 10,396 |
2 | New Jersey Educ. Fac. Auth. Rev. (Princeton Univ.) | 5.000% | 7/1/10 | | 2,980 | 3,107 |
| New Jersey Health Care Fac. Financing Auth. Rev. | 5.000% | 10/1/09 | | 2,330 | 2,376 |
| New Jersey Health Care Fac. Financing Auth. Rev. | 5.000% | 10/1/11 | | 3,200 | 3,272 |
| New Jersey Health Care Fac. Financing Auth. Rev. | 5.000% | 10/1/12 | | 3,995 | 4,065 |
| New Jersey Transp. Trust Fund Auth. Rev. | 6.000% | 12/15/11 | (1)(Prere.) | 2,025 | 2,215 |
| New Jersey Turnpike Auth. Rev. VRDO | 7.750% | 11/7/08 | LOC | 75,000 | 75,000 |
| Tobacco Settlement Financing Corp. New Jersey Rev. | 5.750% | 6/1/12 | (Prere.) | 5,000 | 5,328 |
| Tobacco Settlement Financing Corp. New Jersey Rev. | 6.000% | 6/1/12 | (Prere.) | 5,000 | 5,474 |
| Tobacco Settlement Financing Corp. New Jersey Rev. | 6.125% | 6/1/12 | (Prere.) | 35,885 | 37,711 |
| | | | | | 224,454 |
New Mexico (1.4%) | | | | | |
| Farmington NM PCR (Southern CA Edison Four Corners Project) PUT | 3.550% | 4/1/10 | (3) | 14,335 | 14,175 |
1 | New Mexico Finance Auth. Transp. Rev. TOB VRDO | 2.400% | 11/7/08 | | 25,135 | 25,135 |
| New Mexico GO | 5.000% | 3/1/13 | | 5,535 | 5,894 |
| New Mexico Severance Tax Rev. | 5.000% | 7/1/09 | (2) | 2,000 | 2,042 |
| New Mexico Severance Tax Rev. | 5.000% | 7/1/09 | | 15,755 | 16,091 |
| New Mexico Severance Tax Rev. | 5.000% | 7/1/09 | | 1,000 | 1,021 |
| New Mexico Severance Tax Rev. | 5.000% | 7/1/10 | | 1,000 | 1,039 |
1 | Univ. of New Mexico Univ. Rev. TOB VRDO | 2.570% | 11/7/08 | (4) | 4,965 | 4,965 |
| | | | | | 70,362 |
New York (8.1%) | | | | | |
1 | Hudson Yards Infrastructure Corp. New York Rev. TOB VRDO | 4.000% | 11/7/08 | (1) | 24,570 | 24,570 |
1 | Metro. New York Transp. Auth. Rev. (Dedicated Petroleum Tax) TOB VRDO | 1.940% | 11/7/08 | (13) | 11,385 | 11,385 |
26
| Metro. New York Transp. Auth. Rev. (Transit Rev.) | 5.250% | 11/15/08 | | 7,775 | 7,784 |
| Metro. New York Transp. Auth. Rev. (Transit Rev.) | 5.000% | 11/15/09 | | 2,755 | 2,830 |
| Metro. New York Transp. Auth. Rev. (Transit Rev.) | 5.250% | 11/15/09 | (ETM) | 22,260 | 23,095 |
| Metro. New York Transp. Auth. Rev. (Transit Rev.) | 5.000% | 11/15/10 | | 2,000 | 2,074 |
| Metro. New York Transp. Auth. Rev. (Transit Rev.) | 5.250% | 11/15/10 | | 12,730 | 13,266 |
| Metro. New York Transp. Auth. Rev. (Transit Rev.) PUT | 5.000% | 11/15/12 | | 20,000 | 20,632 |
1 | Metro. New York Transp. Auth. Rev. TOB VRDO | 1.940% | 11/7/08 | (4) | 5,245 | 5,245 |
1 | Metro. New York Transp. Auth. Rev. TOB VRDO | 1.940% | 11/7/08 | (13) | 11,780 | 11,780 |
1 | Metro. New York Transp. Auth. Rev. TOB VRDO | 2.560% | 11/7/08 | (4) | 8,275 | 8,275 |
| Nassau County NY Interim Finance Auth. VRDO | 4.000% | 11/7/08 | | 25,000 | 25,000 |
| New York City NY Cultural Resources Rev. (Museum of Modern Art) | 5.000% | 10/1/10 | | 4,000 | 4,167 |
| New York City NY GO | 4.000% | 8/1/09 | | 5,765 | 5,845 |
| New York City NY GO | 5.000% | 8/1/09 | | 6,895 | 7,041 |
| New York City NY GO | 5.000% | 8/1/09 | (ETM) | 3,900 | 3,997 |
| New York City NY GO | 5.000% | 8/1/09 | | 30 | 31 |
| New York City NY GO | 5.500% | 8/1/09 | (ETM) | 3,070 | 3,158 |
| New York City NY GO | 5.500% | 8/1/09 | | 18,310 | 18,760 |
| New York City NY GO | 5.000% | 8/1/10 | | 3,000 | 3,103 |
| New York City NY GO | 5.250% | 11/1/10 | (2) | 7,715 | 8,033 |
| New York City NY GO | 5.000% | 8/1/12 | | 27,760 | 28,886 |
| New York City NY Housing Dev. Corp. Rev. | 5.000% | 7/1/09 | (3) | 2,000 | 2,033 |
| New York City NY Transitional Finance Auth. Rev. | 5.500% | 11/1/26 | | 4,950 | 5,162 |
| New York City NY Transitional Finance Auth. Rev. | 5.250% | 2/1/29 | | 4,000 | 4,119 |
| New York City NY Transitional Finance Auth. Rev. Future Tax | 5.000% | 11/1/09 | (ETM) | 5,000 | 5,164 |
| New York State Dormitory Auth. Rev. (City Univ.) | 5.250% | 7/1/09 | (1) | 10,000 | 10,218 |
| New York State Dormitory Auth. Rev. (State Univ.) | 6.000% | 5/15/12 | (1) | 6,200 | 6,503 |
| New York State Thruway Auth. Rev. (Highway & Bridge Trust Fund) | 5.000% | 4/1/11 | | 4,280 | 4,474 |
| New York State Thruway Auth. Rev. (Highway & Bridge Trust Fund) | 5.000% | 4/1/12 | | 3,770 | 3,957 |
| New York State Urban Dev. Corp. Rev. (Correctional Fac.) PUT | 5.250% | 1/1/09 | | 21,105 | 21,195 |
| New York State Urban Dev. Corp. Rev. (Service Contract) | 5.000% | 1/1/10 | | 2,800 | 2,878 |
| Tobacco Settlement Financing Corp. New York Rev. | 5.000% | 6/1/10 | | 32,500 | 33,588 |
| Triborough Bridge & Tunnel Auth. New York Rev. | 6.600% | 1/1/10 | (ETM) | 55,325 | 56,975 |
| Triborough Bridge & Tunnel Auth. New York Rev. VRDO | 4.500% | 11/7/08 | | 10,780 | 10,780 |
| Troy County NY IDA Civic Fac. Rev. (Rensselaer Polytechnic Institute) PUT | 5.000% | 9/1/10 | | 5,000 | 5,045 |
| | | | | | 411,048 |
North Carolina (3.0%) | | | | | |
| Charlotte NC (Equipment Acquisition) COP | 5.000% | 3/1/09 | | 3,700 | 3,739 |
| Mecklenburg County NC GO VRDO | 2.300% | 11/7/08 | | 13,000 | 13,000 |
| North Carolina GO | 5.000% | 4/1/10 | | 4,000 | 4,152 |
| North Carolina GO | 5.500% | 3/1/11 | | 16,510 | 17,568 |
| North Carolina Medical Care Comm. Health Care Fac. (Duke Univ. Health System) VRDO | 5.500% | 11/7/08 | | 55,380 | 55,380 |
| North Carolina Muni. Power Agency Rev. | 0.000% | 1/1/09 | (1) | 5,525 | 5,503 |
| North Carolina Muni. Power Agency Rev. | 4.000% | 1/1/10 | | 2,000 | 2,013 |
| North Carolina Muni. Power Agency Rev. | 5.250% | 1/1/13 | | 6,000 | 6,173 |
| North Carolina Muni. Power Agency Rev. | 5.500% | 1/1/13 | | 10,000 | 10,383 |
| Wake County NC Public Improvement GO | 5.000% | 3/1/09 | | 10,000 | 10,112 |
| Wake County NC Public Improvement GO | 5.000% | 3/1/10 | | 21,800 | 22,591 |
| | | | | | 150,614 |
Ohio (3.0%) | | | | | |
| American Muni. Power Ohio Inc. Electricity Purchase Rev. | 5.000% | 2/1/09 | | 8,000 | 7,976 |
| American Muni. Power Ohio Inc. Electricity Purchase Rev. | 5.000% | 2/1/10 | | 3,000 | 2,938 |
| Columbus OH GO | 5.000% | 6/15/09 | | 3,000 | 3,062 |
| Columbus OH GO | 5.500% | 7/1/10 | | 10,380 | 10,901 |
| Columbus OH GO | 5.000% | 9/1/11 | | 5,605 | 5,923 |
| Columbus OH GO | 5.000% | 9/1/11 | | 5,440 | 5,749 |
| Franklin County OH Hosp. Rev. (OhioHealth Corp.) VRDO | 1.470% | 11/7/08 | | 17,000 | 17,000 |
| Ohio Building Auth. Rev. (Administration Building Fund) | 5.000% | 10/1/09 | (1) | 11,580 | 11,909 |
| Ohio Building Auth. Rev. (Administration Building Fund) | 5.000% | 10/1/09 | (1) | 11,680 | 12,012 |
| Ohio Building Auth. Rev. (State Correctional Fac.) | 5.000% | 4/1/09 | | 2,500 | 2,533 |
| Ohio Higher Educ. Capital Fac. Rev. | 5.000% | 6/1/09 | | 5,000 | 5,095 |
| Ohio Higher Educ. Capital Fac. Rev. | 5.000% | 12/1/09 | | 10,000 | 10,327 |
| Ohio Higher Educ. Fac. Comm. Rev. (Kenyon College) VRDO | 1.350% | 11/3/08 | | 20,100 | 20,100 |
| Ohio Infrastructure Improvement GO | 5.000% | 8/1/09 | | 4,400 | 4,507 |
| Ohio Major New State Infrastructure Project Rev. | 5.000% | 6/15/10 | | 10,465 | 10,856 |
| Ohio Major New State Infrastructure Project Rev. | 5.000% | 6/15/12 | | 10,000 | 10,544 |
| Ohio Refunding & Improvement Infrastructure | 5.000% | 8/1/10 | | 7,270 | 7,574 |
| Scioto County OH Hosp. Rev. (Southern Ohio Medical Center) | 5.000% | 2/15/10 | | 2,380 | 2,405 |
| Scioto County OH Hosp. Rev. (Southern Ohio Medical Center) | 5.000% | 2/15/11 | | 2,500 | 2,523 |
| | | | | | 153,934 |
Oklahoma (1.3%) | | | | | |
| Oklahoma Dev. Finance Auth. Health System Rev. (Integris Baptist) | 5.000% | 8/15/12 | | 1,875 | 1,905 |
| Oklahoma Dev. Finance Auth. Health System Rev. (Integris Baptist) VRDO | 1.800% | 11/7/08 | (12) | 16,900 | 16,900 |
27
| Oklahoma Dev. Finance Auth. Rev. (Integris) VRDO | 1.250% | 11/3/08 | (12) | 10,000 | 10,000 |
| Oklahoma Dev. Finance Auth. Rev. (Samuel Roberts Noble Foundation) | 5.000% | 5/1/10 | | 5,000 | 5,182 |
| Oklahoma Muni Power Auth. Power Supply System Rev. PUT | 3.875% | 7/1/12 | (4) | 5,000 | 5,013 |
| Oklahoma Transp. Auth. Turnpike System Rev. Refunding | 5.375% | 1/1/12 | (2) | 11,900 | 12,684 |
| Tulsa County OK Ind. Auth. Rev. | 5.000% | 5/15/09 | (4) | 4,620 | 4,700 |
| Tulsa County OK Public Fac. Auth. Rev. | 5.000% | 6/1/09 | (2) | 11,725 | 11,941 |
| | | | | | 68,325 |
Oregon (0.3%) | | | | | |
| Metro. Oregon GO | 5.000% | 6/1/10 | | 10,730 | 11,167 |
| Oregon State Dept. Administrative Services | 5.000% | 9/1/10 | (4) | 5,000 | 5,218 |
| | | | | | 16,385 |
Pennsylvania (4.8%) | | | | | |
| Allegheny County PA Hosp. Dev. Auth. Rev. (Univ. of Pittsburgh Medical Center) | 5.000% | 9/1/09 | | 6,715 | 6,836 |
| Allegheny County PA Hosp. Dev. Auth. Rev. (Univ. of Pittsburgh Medical Center) | 5.000% | 9/1/10 | | 14,400 | 14,728 |
| Allegheny County PA Hosp. Dev. Auth. Rev. (Univ. of Pittsburgh Medical Center) | 5.000% | 6/15/11 | | 1,750 | 1,784 |
| Allegheny County PA Hosp. Dev. Auth. Rev. (Univ. of Pittsburgh Medical Center) | 5.000% | 6/15/12 | | 2,000 | 2,030 |
| Allegheny County PA Port Auth. Rev. | 6.000% | 3/1/09 | (1)(Prere.) | 2,565 | 2,627 |
| Allegheny County PA Port Auth. Rev. | 6.000% | 3/1/09 | (1)(Prere.) | 4,310 | 4,414 |
| Allegheny County PA Port Auth. Rev. | 6.250% | 3/1/09 | (1)(Prere.) | 3,740 | 3,834 |
| Allegheny County PA TRAN | 4.000% | 12/31/08 | | 20,000 | 20,048 |
| Beaver County PA IDA PCR (First Energy) PUT | 3.375% | 10/1/09 | | 9,000 | 8,989 |
| Delaware County PA IDA PCR (PECO Energy Co.) | 4.000% | 12/1/12 | | 10,000 | 9,722 |
| Erie PA School Dist. GO | 5.800% | 9/1/10 | (2)(Prere.) | 4,500 | 4,775 |
| Lancaster County PA GO | 6.250% | 5/1/10 | (3)(Prere.) | 4,370 | 4,624 |
| Lancaster County PA GO | 6.250% | 5/1/10 | (3)(Prere.) | 4,605 | 4,873 |
| Pennsylvania GO | 5.250% | 10/15/10 | (Prere.) | 8,850 | 9,412 |
| Pennsylvania GO | 5.250% | 10/15/10 | (Prere.) | 5,000 | 5,317 |
| Pennsylvania GO | 5.250% | 10/15/10 | (Prere.) | 11,300 | 12,018 |
| Pennsylvania Higher Educ. Fac. Auth. Rev. | 5.000% | 6/15/10 | | 1,140 | 1,184 |
| Pennsylvania IDA Rev. (Econ. Dev.) | 5.000% | 7/1/09 | | 4,000 | 4,061 |
| Pennsylvania IDA Rev. (Econ. Dev.) | 5.000% | 7/1/10 | | 5,000 | 5,129 |
| Pennsylvania IDA Rev. (Econ. Dev.) | 5.000% | 7/1/11 | | 5,000 | 5,149 |
| Pennsylvania Intergovernmental Cooperation Auth. Rev. | 5.000% | 6/15/09 | (3) | 6,150 | 6,250 |
| Pennsylvania Turnpike Comm. BAN | 4.000% | 10/15/09 | (2) | 58,000 | 58,020 |
| Philadelphia PA Airport Parking Auth. | 5.000% | 9/1/11 | | 3,000 | 3,089 |
| Philadelphia PA Airport Parking Auth. | 5.000% | 9/1/12 | | 3,000 | 3,087 |
| Philadelphia PA GO | 5.000% | 8/1/09 | (11) | 4,775 | 4,856 |
| Philadelphia PA School Dist. GO | 5.250% | 4/1/09 | (1)(Prere.) | 3,000 | 3,044 |
| Pittsburgh PA GO | 5.750% | 9/1/09 | (3)(Prere.) | 4,505 | 4,657 |
| Pittsburgh PA GO | 6.000% | 9/1/09 | (3)(Prere.) | 4,450 | 4,609 |
| Pittsburgh PA School Dist. GO | 5.500% | 9/1/09 | (4)(Prere.) | 2,985 | 3,081 |
| Pittsburgh PA School Dist. GO | 5.500% | 9/1/09 | (4)(Prere.) | 2,680 | 2,766 |
2 | Southcentral Pennsylvania General Auth. Rev. (Wellspan Health) | 4.000% | 6/1/09 | | 3,025 | 3,044 |
2 | Southcentral Pennsylvania General Auth. Rev. (Wellspan Health) | 5.000% | 6/1/10 | | 4,000 | 4,073 |
2 | Southcentral Pennsylvania General Auth. Rev. (Wellspan Health) | 5.000% | 6/1/11 | | 5,000 | 5,097 |
| Southcentral Pennsylvania General Auth. Rev. PUT | 4.500% | 12/1/08 | (2) | 4,500 | 4,505 |
| | | | | | 241,732 |
Puerto Rico (0.3%) | | | | | |
| Puerto Rico Highway & Transp. Auth. Rev. | 5.250% | 7/1/09 | | 9,500 | 9,624 |
| Puerto Rico Muni. Finance Agency | 5.000% | 8/1/09 | | 5,000 | 5,060 |
| | | | | | 14,684 |
South Carolina (0.7%) | | | | | |
1 | Anderson County SC School Dist. TOB VRDO | 2.450% | 11/7/08 | (4) | 7,880 | 7,880 |
| Greenville County SC Hosp. Fac. Rev. | 5.000% | 5/1/11 | | 2,610 | 2,662 |
| Greenville County SC Hosp. Fac. Rev. | 5.000% | 5/1/12 | | 5,275 | 5,357 |
| South Carolina Transp. Infrastructure Rev. | 5.750% | 10/1/09 | (1)(Prere.) | 10,790 | 11,292 |
| South Carolina Transp. Infrastructure Rev. | 5.100% | 10/1/11 | (2)(Prere.) | 7,000 | 7,442 |
| | | | | | 34,633 |
Tennessee (2.5%) | | | | | |
| Jackson TN Hosp. Rev. (Jackson Madison Hosp.) | 5.000% | 4/1/12 | | 500 | 499 |
| Jackson TN Hosp. Rev. (Jackson Madison Hosp.) | 5.000% | 4/1/13 | | 645 | 639 |
| Knox County TN GO | 5.000% | 4/1/09 | | 3,275 | 3,321 |
1 | Knoxville TN Waste Water System Rev. TOB VRDO | 2.270% | 11/7/08 | | 7,495 | 7,495 |
1 | Metro. Govt. of Nashville & Davidson County TN Electric Rev. TOB VRDO | 1.880% | 11/7/08 | | 22,690 | 22,690 |
| Metro. Govt. of Nashville & Davidson County TN GO | 5.000% | 8/1/10 | | 5,165 | 5,383 |
1 | Metro. Govt. of Nashville & Davidson County TN GOV TOB VRDO | 2.340% | 11/7/08 | (4) | 6,230 | 6,230 |
| Metro. Govt. of Nashville & Davidson County TN Health & Educ. Fac. (Vanderbilt Univ.) PUT | 5.000% | 4/1/09 | (1) | 2,000 | 2,018 |
| Metro. Govt. of Nashville & Davidson County TN Health & Educ. Fac. (Vanderbilt Univ.) PUT | 5.000% | 4/1/10 | (1) | 35,675 | 36,422 |
| Shelby County TN Health Educ. & Housing Fac. Board Rev. | 5.000% | 6/1/09 | | 2,000 | 2,011 |
| Shelby County TN Health Educ. & Housing Fac. Board Rev. | 5.000% | 6/1/11 | | 3,300 | 3,313 |
| Shelby County TN Health Educ. & Housing Fac. Board Rev. | 5.000% | 6/1/12 | | 5,000 | 4,947 |
28
| Tennessee Energy Acquisition Corp. Gas Rev. | 5.000% | 2/1/10 | | 5,000 | 4,896 |
| Tennessee Energy Acquisition Corp. Gas Rev. | 5.000% | 9/1/10 | | 18,965 | 18,316 |
| Tennessee GO | 5.250% | 3/1/10 | (Prere.) | 6,500 | 6,757 |
| | | | | | 124,937 |
Texas (13.8%) | | | | | |
| Arlington TX Independent School Dist. | 5.000% | 2/15/10 | | 10,105 | 10,450 |
| Austin TX Electric Util. System Rev. | 5.000% | 11/15/10 | (2) | 5,000 | 5,195 |
1 | Austin TX Water & Wastewater System Rev. TOB VRDO | 2.450% | 11/7/08 | (4) | 8,920 | 8,920 |
| Comal TX Independent School Dist. | 5.750% | 8/1/09 | (Prere.) | 20,000 | 20,608 |
| Cypress-Fairbanks TX Independent School Dist. Unlimited Tax Schoolhouse PUT | 5.000% | 8/15/09 | | 5,000 | 5,104 |
| Cypress-Fairbanks TX Independent School Dist. Unlimited Tax Schoolhouse PUT | 5.000% | 8/15/09 | | 27,810 | 28,387 |
| Dallas TX GO | 5.000% | 2/15/10 | | 5,000 | 5,168 |
| Dallas TX GO | 5.000% | 2/15/10 | | 8,965 | 9,266 |
1 | Dallas TX Waterworks & Sewer System Rev. TOB VRDO | 2.270% | 11/7/08 | | 3,330 | 3,330 |
1 | Denton TX Independent School Dist. TOB VRDO | 2.190% | 11/7/08 | | 5,575 | 5,575 |
| Fort Bend TX Independent School Dist. GO PUT | 5.000% | 8/15/09 | | 5,700 | 5,799 |
| Fort Bend TX Independent School Dist. GO PUT | 5.000% | 8/15/09 | | 15,200 | 15,465 |
| Garland TX Independent School Dist. PUT | 2.150% | 6/15/09 | | 9,500 | 9,530 |
| Harris County TX Cultural Educ. Fac. Finance Corp. Rev. (Methodist Hosp.) | 5.250% | 12/1/12 | | 15,000 | 15,244 |
| Harris County TX Flood Control Dist. VRDO | 5.000% | 11/7/08 | | 12,165 | 12,165 |
1 | Harris County TX GO TOB VRDO | 2.360% | 11/7/08 | (4) | 5,580 | 5,580 |
| Harris County TX Health Fac. Dev. Corp. Rev. (Methodist Hosp.) VRDO | 1.250% | 11/3/08 | (4) | 10,500 | 10,500 |
| Harris County TX Toll Road Rev. PUT | 5.000% | 8/15/09 | (3) | 25,000 | 25,411 |
| Houston TX Independent School Dist. GO | 5.000% | 2/15/09 | (Prere.) | 14,315 | 14,451 |
| Houston TX Independent School Dist. GO | 5.000% | 7/15/09 | (4) | 3,600 | 3,684 |
| Houston TX Independent School Dist. GO | 5.000% | 2/15/10 | | 8,585 | 8,875 |
| Houston TX Util. System Rev. | 5.250% | 5/15/10 | (1) | 2,300 | 2,384 |
| Houston TX Util. System Rev. PUT | 5.000% | 5/15/11 | (2) | 8,000 | 8,249 |
1 | Houston TX Util. System Rev. TOB VRDO | 2.270% | 11/7/08 | (1) | 15,560 | 15,560 |
1 | Houston TX Util. System Rev. TOB VRDO | 2.270% | 11/7/08 | (1) | 9,995 | 9,995 |
1 | Houston TX Util. System Rev. TOB VRDO | 2.570% | 11/7/08 | (4) | 25,635 | 25,635 |
| Irving TX Hosp. Auth. (Baylor Medical Center at Irving) | 5.000% | 7/1/09 | | 3,990 | 4,020 |
| Irving TX Hosp. Auth. (Baylor Medical Center at Irving) | 5.000% | 7/1/10 | | 4,720 | 4,774 |
| Mansfield TX Independent School Dist. VRDO | 5.750% | 11/7/08 | | 9,370 | 9,370 |
1 | Matagorda County TX Navigation Dist. PCR (AEP Texas Central Co. Project) TOB PUT | 4.750% | 3/2/09 | (2) | 20,995 | 20,995 |
| Matagorda County TX Navigation Dist. PCR (Central Power & Light) PUT | 5.125% | 6/1/11 | | 7,500 | 7,504 |
| Mesquite TX Independent School Dist. GO PUT | 3.650% | 12/1/08 | | 16,810 | 16,827 |
| Montgomery County TX PUT | 5.000% | 9/1/10 | (4) | 2,500 | 2,596 |
1 | North Harris TX Montgomery Community College Dist. TOB VRDO | 2.270% | 11/7/08 | | 4,790 | 4,790 |
| North Texas Tollway Auth. BAN | 4.125% | 11/19/08 | | 3,665 | 3,668 |
| North Texas Tollway Auth. Rev. | 5.000% | 1/1/09 | | 4,950 | 4,968 |
| North Texas Tollway Auth. Rev. | 4.500% | 1/1/10 | | 2,500 | 2,533 |
| North Texas Tollway Auth. Rev. | 5.000% | 1/1/11 | | 5,745 | 5,880 |
| North Texas Tollway Auth. Rev. PUT | 5.000% | 1/1/10 | | 25,000 | 25,071 |
| North Texas Tollway Auth. Rev. PUT | 5.000% | 1/1/10 | | 30,000 | 30,143 |
| North Texas Tollway Auth. Rev. PUT | 5.250% | 1/1/12 | | 5,000 | 5,027 |
| North Texas Tollway Auth. Rev. PUT | 5.000% | 1/1/13 | | 20,000 | 19,551 |
1 | North Texas Tollway Auth. Rev. TOB VRDO | 1.950% | 11/7/08 | (13) | 17,455 | 17,455 |
| Northside TX Independent School Dist. PUT | 3.780% | 6/1/09 | | 10,000 | 10,089 |
| SA Energy Acquisition Public Fac. Corp. Texas Gas Supply Rev. | 5.000% | 8/1/09 | | 19,950 | 19,773 |
| SA Energy Acquisition Public Fac. Corp. Texas Gas Supply Rev. | 5.000% | 8/1/10 | | 8,460 | 8,188 |
| San Antonio TX Electric & Gas Rev. | 5.250% | 2/1/09 | | 8,500 | 8,572 |
| San Antonio TX Electric & Gas Rev. | 5.000% | 2/1/10 | | 9,185 | 9,472 |
| San Antonio TX Electric & Gas Rev. | 5.250% | 2/1/10 | | 5,760 | 5,957 |
| San Antonio TX Electric & Gas System PUT | 3.625% | 12/1/10 | | 30,000 | 29,981 |
| Tarrant County TX Cultural Educ. Fac. Finance Corp. Rev. | 5.000% | 8/15/12 | | 2,745 | 2,771 |
| Tarrant Regional Water Dist. TX Water Rev. | 5.000% | 3/1/09 | (4) | 2,885 | 2,915 |
1 | Temple TX GO TOB VRDO | 2.400% | 11/7/08 | (4) | 11,085 | 11,085 |
| Texas A & M Univ. Rev. Financing System | 5.250% | 5/15/10 | | 10,000 | 10,404 |
| Texas GO Public Finance Auth. | 5.000% | 10/1/09 | | 4,000 | 4,118 |
| Texas GO Public Finance Auth. | 5.000% | 10/1/10 | | 7,250 | 7,576 |
| Texas GO Public Finance Auth. | 5.000% | 10/1/11 | | 4,000 | 4,221 |
| Texas Muni. Gas Acquisition & Supply Corp. Rev. | 2.219% | 12/15/09 | | 10,000 | 9,400 |
| Texas Muni. Gas Acquisition & Supply Corp. Rev. | 2.289% | 9/15/10 | | 5,010 | 4,634 |
| Texas Muni. Gas Acquisition & Supply Corp. Rev. | 5.000% | 12/15/10 | | 13,370 | 12,812 |
| Texas Public Finance Auth. Rev. | 5.000% | 2/1/10 | (3) | 5,000 | 5,143 |
| Texas State Transp. Comm. First Tier | 5.000% | 4/1/09 | | 13,000 | 13,172 |
| Texas State Transp. Comm. First Tier | 5.000% | 4/1/10 | | 12,000 | 12,417 |
| Texas State Transp. Comm. First Tier | 5.000% | 4/1/12 | | 7,000 | 7,377 |
| Texas State Univ. System Rev. | 5.000% | 3/15/10 | | 1,000 | 1,034 |
| Texas State Univ. System Rev. | 5.000% | 3/15/11 | | 3,000 | 3,141 |
1 | Texas Water Dev. Board Rev. TOB VRDO | 2.400% | 11/7/08 | | 4,475 | 4,475 |
29
| Titus County TX Fresh Water Supply Dist. Rev. | 4.500% | 7/1/11 | | 3,500 | 3,428 |
| Univ. of Houston TX Rev. | 5.500% | 2/15/10 | (1)(Prere.) | 5,500 | 5,726 |
| Univ. of Texas Permanent Univ. Fund Rev. | 5.000% | 8/15/10 | | 4,470 | 4,660 |
| | | | | | 698,243 |
Utah (0.4%) | | | | | |
| Intermountain Power Agency Utah Power Supply Rev. | 5.000% | 7/1/10 | (4) | 6,290 | 6,534 |
| Utah GO | 5.375% | 7/1/12 | | 11,000 | 11,845 |
| | | | | | 18,379 |
Virginia (1.4%) | | | | | |
| New River Valley VA Jail Auth. Fac. GAN | 4.000% | 4/1/11 | | 10,000 | 10,066 |
| Rappahannock VA Regional Jail Auth Rev. GAN | 4.250% | 12/1/09 | | 5,000 | 5,009 |
1 | Suffolk VA Econ. Dev. Auth. Rev. TOB VRDO | 1.990% | 11/7/08 | | 8,610 | 8,610 |
| Virginia College Building Auth. Educ. Fac. Rev. Public Higher Educ. Financing Program | 5.000% | 9/1/09 | | 6,305 | 6,472 |
| Virginia Commonwealth Transp. Board Federal Highway Rev. | 5.500% | 10/1/10 | | 16,345 | 17,206 |
| Virginia Public Building Auth. Rev. | 5.000% | 8/1/09 | | 7,050 | 7,222 |
| Virginia Public Building Auth. Rev. | 5.000% | 8/1/10 | | 4,000 | 4,166 |
| Virginia Public School Auth. Rev. | 5.000% | 8/1/10 | | 6,000 | 6,254 |
| Virginia Public School Auth. Rev. | 5.500% | 8/1/10 | | 4,645 | 4,878 |
| | | | | | 69,883 |
Washington (3.7%) | | | | | |
1 | Central Puget Sound WA Regional Transit Auth. Sales & Use Tax Rev. TOB VRDO | 2.570% | 11/7/08 | (4) | 8,280 | 8,280 |
| Energy Northwest Washington Electric Refunding Rev. (Project No. 1) | 5.000% | 7/1/09 | | 15,000 | 15,315 |
| Energy Northwest Washington Electric Refunding Rev. (Project No. 1) | 5.000% | 7/1/10 | | 42,450 | 44,072 |
| Energy Northwest Washington Electric Refunding Rev. (Project No. 3) | 5.000% | 7/1/09 | | 8,090 | 8,260 |
1 | Grant County WA Public Util. Dist. No. 002 TOB VRDO | 2.350% | 11/7/08 | (4) | 8,225 | 8,225 |
| King County WA (Bellevue School Dist.) GO | 5.000% | 12/1/10 | (4) | 2,965 | 3,104 |
| King County WA School Dist. GO | 5.000% | 6/1/12 | | 6,700 | 7,074 |
| Port of Seattle WA Rev. | 5.000% | 3/1/09 | (4) | 3,415 | 3,451 |
| Port of Seattle WA Rev. | 5.000% | 3/1/10 | (4) | 3,230 | 3,337 |
| Seattle WA Drain & Wastewater Rev. | 4.000% | 2/1/09 | | 2,170 | 2,182 |
1 | Thurston County WA School District GO TOB VRDO | 2.270% | 11/7/08 | | 3,185 | 3,185 |
| Washington GO | 4.000% | 1/1/10 | | 11,985 | 12,210 |
| Washington GO | 4.000% | 1/1/10 | (2) | 7,885 | 8,033 |
| Washington GO | 4.000% | 1/1/10 | | 4,055 | 4,131 |
| Washington GO | 5.000% | 7/1/10 | | 5,525 | 5,738 |
| Washington GO | 5.000% | 1/1/11 | | 11,155 | 11,197 |
| Washington GO | 5.000% | 1/1/11 | (2) | 21,735 | 22,714 |
| Washington GO (Motor Vehicle Fuel Tax) | 5.000% | 7/1/11 | | 3,295 | 3,460 |
| Washington GO (Motor Vehicle Fuel Tax) | 5.000% | 7/1/12 | | 5,555 | 5,870 |
| Washington Health Care Fac. Auth. (Multicare Health System) VRDO | 1.550% | 11/3/08 | (4) | 7,310 | 7,310 |
| | | | | | 187,148 |
West Virginia (0.2%) | | | | | |
| West Virginia GO | 5.500% | 6/1/10 | (4) | 5,000 | 5,231 |
| West Virginia Water Dev. Auth. Rev. | 5.625% | 10/1/10 | (4)(Prere.) | 5,000 | 5,300 |
| | | | | | 10,531 |
Wisconsin (1.7%) | | | | | |
| Milwaukee WI GO | 5.000% | 2/15/09 | (4) | 5,835 | 5,889 |
| Milwaukee WI GO | 5.000% | 10/1/10 | (1) | 12,735 | 13,290 |
| Wisconsin Clean Water Rev. | 5.000% | 6/1/09 | | 3,175 | 3,234 |
| Wisconsin GO | 5.000% | 5/1/09 | | 13,745 | 13,963 |
| Wisconsin GO | 5.000% | 5/1/10 | (1) | 8,690 | 9,005 |
| Wisconsin GO | 5.000% | 5/1/10 | (1) | 14,405 | 14,926 |
| Wisconsin Health & Educ. Fac. Auth. Rev. (Ministry Health Care) | 4.000% | 8/1/09 | (4) | 1,000 | 1,013 |
| Wisconsin Health & Educ. Fac. Auth. Rev. (Ministry Health Care) | 4.000% | 8/1/10 | (4) | 1,000 | 1,014 |
| Wisconsin Health & Educ. Fac. Auth. Rev. (Ministry Health Care) | 4.000% | 8/1/11 | (4) | 1,215 | 1,228 |
| Wisconsin Health & Educ. Fac. Auth. Rev. (Ministry Health Care) | 4.000% | 8/1/12 | (4) | 1,330 | 1,332 |
| Wisconsin Health & Educ. Fac. Auth. Rev. (Ministry Health Care) | 4.000% | 8/1/13 | (4) | 1,320 | 1,308 |
| Wisconsin Health & Educ. Fac. Auth. Rev. (Wheaton Franciscan Services) | 5.750% | 2/15/12 | (Prere.) | 5,000 | 5,460 |
| Wisconsin Transp. Rev. | 5.000% | 7/1/10 | | 1,500 | 1,558 |
| Wisconsin Transp. Rev. | 5.000% | 7/1/11 | | 1,000 | 1,050 |
1 | Wisconsin Transp. Rev. TOB VRDO | 1.830% | 11/7/08 | | 9,740 | 9,701 |
| | | | | | 83,971 |
Total Tax-Exempt Municipal Bonds (Cost $5,043,557) | | | | 5,053,749 |
30
| | | Market |
| | | Value• |
| Coupon | Shares | ($000) |
Temporary Cash Investment (0.0%) | | | |
Money Market Fund (0.0%) | | | |
4 Vanguard Municipal Cash Management Fund (Cost $361) | 1.701% | 361,369 | 361 |
Total Investments (100.2%) (Cost $5,043,918) | | | 5,054,110 |
Other Assets and Liabilities (–0.2%) | | | |
Other Assets | | | 73,987 |
Liabilities | | | (86,343) |
| | | (12,356) |
Net Assets (100%) | | | 5,041,754 |
| | | |
| | | |
| | | |
| | | |
At October 31, 2008, net assets consisted of: | | | |
| | | Amount |
| | | ($000) |
Paid-in Capital | | | 5,040,060 |
Undistributed Net Investment Income | | | — |
Accumulated Net Realized Losses | | | (8,013) |
Unrealized Appreciation (Depreciation) | | | |
Investment Securities | | | 10,192 |
Futures Contracts | | | (485) |
Net Assets | | | 5,041,754 |
| | | |
| | | |
Investor Shares—Net Assets | | | |
Applicable to 84,138,521 outstanding $.001 par value shares of beneficial interest (unlimited authorization) | | 1,318,983 |
Net Asset Value Per Share—Investor Shares | | | $15.68 |
| | | |
| | | |
Admiral Shares—Net Assets | | | |
Applicable to 237,477,215 outstanding $.001 par value shares of beneficial interest (unlimited authorization) | | 3,722,771 |
Net Asset Value Per Share—Admiral Shares | | | $15.68 |
• See Note A in Notes to Financial Statements.
1 Security exempt from registration under Rule 144A of the Securities Act of 1933. Such securities may be sold in transactions exempt from registration, normally to qualified institutional buyers. At October 31, 2008, the aggregate value of these securities was $736,996,000, representing 14.6% of net assets.
2 Security purchased on a when-issued or delayed-delivery basis for which the fund has not taken delivery as of October 31, 2008.
3 Securities with a value of $1,563,000 have been segregated as initial margin for open futures contracts.
4 Affiliated money market fund available only to Vanguard funds and certain trusts and accounts managed by Vanguard. Rate shown is the 7-day yield. For key to abbreviations and other references, see back cover.
See accompanying Notes, which are an integral part of the Financial Statements.
31
Limited-Term Tax-Exempt Fund
| | | | | Face | Market |
| | | Maturity | | Amount | Value• |
| | Coupon | Date | | ($000) | ($000) |
Tax-Exempt Municipal Bonds (98.2%) | | | | | |
Alabama (1.0%) | | | | | |
| Alabama Public School & College Auth. | 5.000% | 5/1/13 | (4) | 10,000 | 10,380 |
| Alabama Public School & College Auth. | 5.000% | 12/1/13 | | 35,840 | 38,117 |
| Alabama Public School & College Auth. | 5.500% | 8/1/18 | (4) | 18,195 | 18,744 |
| Montgomery AL Baptist Medical Center (Baptist Health) | 0.000% | 11/15/08 | (4)(ETM) | 3,260 | 3,257 |
| Montgomery AL Baptist Medical Center (Baptist Health) | 0.000% | 11/15/09 | (4)(ETM) | 3,000 | 2,931 |
| Montgomery AL Baptist Medical Center (Baptist Health) | 5.000% | 11/15/10 | (4)(ETM) | 2,130 | 2,237 |
| Univ. of Alabama Birmingham Hosp. Rev. | 5.000% | 9/1/15 | | 1,005 | 976 |
| | | | | | 76,642 |
Alaska (0.1%) | | | | | |
1 | Alaska Housing Finance Corp. TOB VRDO | 2.270% | 11/7/08 | (1) | 6,925 | 6,925 |
| | | | | | |
Arizona (2.0%) | | | | | |
| Arizona COP | 5.000% | 9/1/14 | (4) | 4,800 | 5,021 |
| Arizona COP | 5.000% | 9/1/15 | (4) | 4,000 | 4,158 |
| Arizona Health Fac. Auth. Rev. (Banner Health) | 5.000% | 1/1/10 | | 4,055 | 4,122 |
| Arizona Health Fac. Auth. Rev. (Banner Health) | 5.000% | 1/1/11 | | 2,000 | 2,039 |
| Arizona Health Fac. Auth. Rev. (Banner Health) | 5.000% | 1/1/12 | | 2,000 | 2,023 |
| Arizona Health Fac. Auth. Rev. (Catholic West) VRDO | 1.730% | 11/7/08 | LOC | 17,400 | 17,400 |
| Arizona School Fac. Board Rev. COP | 5.250% | 9/1/12 | (4) | 12,350 | 13,180 |
| Arizona Transp. Board Highway Rev. | 5.000% | 7/1/14 | | 9,075 | 9,682 |
| Maricopa County AZ Pollution Control Corp. PCR (Public Service Co. of New Mexico) PUT | 4.000% | 7/1/09 | | 9,500 | 9,475 |
| Maricopa County AZ Public Finance Corp. Lease Rev. | 5.500% | 7/1/09 | (2)(ETM) | 650 | 667 |
| Maricopa County AZ Public Finance Corp. Lease Rev. | 5.500% | 7/1/09 | (2) | 4,350 | 4,456 |
| Maricopa County AZ USD | 5.000% | 7/1/10 | (4) | 7,230 | 7,522 |
| Mesa AZ IDA Rev. Discovery Health Systems | 5.875% | 1/1/10 | (1)(Prere.) | 7,000 | 7,329 |
| Mohave County AZ IDA Correctional Fac. Contract Rev. (Mohave Prison Project) | 5.000% | 4/1/10 | (10) | 5,090 | 5,177 |
| Phoenix AZ Civic Improvement Corp. Airport Rev. | 5.000% | 7/1/12 | | 5,075 | 5,310 |
| Phoenix AZ Civic Improvement Corp. Airport Rev. | 5.000% | 7/1/13 | | 3,660 | 3,835 |
| Phoenix AZ Civic Improvement Corp. Rev. | 5.000% | 7/1/11 | (1) | 5,215 | 5,473 |
| Phoenix AZ Civic Improvement Corp. Wastewater System Rev. | 5.000% | 7/1/10 | (1) | 5,600 | 5,817 |
| Phoenix AZ Civic Improvement Corp. Water System Rev. | 5.000% | 7/1/10 | (1) | 5,000 | 5,193 |
| Phoenix AZ Civic Improvement Corp. Water System Rev. | 5.000% | 7/1/12 | (1) | 5,000 | 5,279 |
| Pima County AZ COP | 5.000% | 6/1/11 | | 5,000 | 5,163 |
| Salt River Project Arizona Agricultural Improvement & Power Dist. Rev. | 5.500% | 1/1/10 | (1) | 10,000 | 10,366 |
| Salt River Project Arizona Agricultural Improvement & Power Dist. Rev. | 5.000% | 1/1/11 | | 12,585 | 13,182 |
| Scottsdale AZ Refunding | 5.000% | 7/1/13 | | 5,000 | 5,349 |
| | | | | | 157,218 |
California (8.4%) | | | | | |
| California GO | 5.250% | 11/1/08 | | 10,000 | 10,000 |
| California GO | 5.000% | 6/1/09 | | 25,000 | 25,416 |
| California GO | 5.000% | 6/1/09 | | 14,095 | 14,329 |
| California GO | 5.000% | 5/1/13 | | 21,000 | 21,883 |
| California GO | 5.000% | 9/1/13 | | 32,125 | 33,512 |
| California GO | 5.000% | 4/1/15 | | 21,300 | 22,055 |
| California Health Fac. Finance Auth. Rev. (Catholic Healthcare West) | 5.000% | 7/1/09 | | 2,500 | 2,520 |
| California Health Fac. Finance Auth. Rev. (Catholic Healthcare West) | 5.000% | 7/1/10 | | 3,220 | 3,260 |
| California Health Fac. Finance Auth. Rev. (Cedars-Sinai Medical Center) | 5.000% | 11/15/10 | | 2,000 | 2,043 |
| California Health Fac. Finance Auth. Rev. (Cedars-Sinai Medical Center) | 5.000% | 11/15/12 | | 3,000 | 3,025 |
| California Health Fac. Finance Auth. Rev. (Stanford Hospital) PUT | 3.450% | 6/15/11 | | 7,000 | 7,010 |
| California Health Fac. Finance Auth. Rev. (Stanford Hospital) VRDO | 5.000% | 11/7/08 | (4) | 22,955 | 22,955 |
| California Health Fac. Finance Auth. Rev. (Sutter Health) | 5.000% | 8/15/12 | | 5,000 | 5,105 |
| California Health Fac. Finance Auth. Rev. (Sutter Health) | 5.000% | 8/15/13 | | 2,210 | 2,248 |
| California Health Fac. Finance Auth. Rev. (Sutter Health) | 5.000% | 8/15/14 | | 5,000 | 5,061 |
| California Infrastructure & Econ. Dev. Bank Rev. | 5.000% | 2/1/11 | | 10,000 | 10,400 |
| California Infrastructure & Econ. Dev. Bank Rev. | 5.000% | 2/1/12 | | 5,000 | 5,217 |
| California Public Works Board Lease Rev. (Regents of the Univ. of California) | 5.000% | 6/1/15 | (3) | 10,000 | 10,466 |
| California Public Works Board Lease Rev. (Univ. of California) | 5.000% | 5/1/11 | | 3,770 | 3,932 |
| California Public Works Board Lease Rev. (Univ. of California) | 5.000% | 5/1/12 | | 2,500 | 2,622 |
| California Public Works Board Lease Rev. (Univ. of California) | 5.000% | 5/1/13 | | 7,500 | 7,884 |
| California State Dept. of Water Resources Power Supply Rev. | 5.250% | 5/1/09 | (1) | 10,000 | 10,163 |
| California State Dept. of Water Resources Power Supply Rev. | 5.500% | 5/1/12 | (2)(Prere.) | 10,955 | 11,988 |
| California State Econ. Recovery Bonds | 5.000% | 7/1/09 | | 18,000 | 18,370 |
| California State Econ. Recovery Bonds | 5.250% | 1/1/11 | | 12,640 | 13,243 |
| California State Econ. Recovery Bonds PUT | 5.000% | 3/1/10 | | 24,000 | 24,525 |
| California State Econ. Recovery Bonds PUT | 5.000% | 7/1/10 | | 24,000 | 24,593 |
| California State Econ. Recovery Bonds PUT | 5.000% | 7/1/11 | | 12,000 | 12,377 |
| California Statewide Communities Dev. Auth. PCR (Southern California Edison) PUT | 4.100% | 4/1/13 | (10) | 5,000 | 4,741 |
| California Statewide Community Dev. Auth. Rev. (Daughters of Charity Health) | 5.000% | 7/1/09 | | 800 | 795 |
| California Statewide Community Dev. Auth. Rev. (Daughters of Charity Health) | 5.000% | 7/1/10 | | 1,100 | 1,078 |
32
| California Statewide Community Dev. Auth. Rev. (Kaiser Permanente) PUT | 3.875% | 4/1/10 | | 19,600 | 19,737 |
| California Statewide Community Dev. Auth. Rev. (Kaiser Permanente) PUT | 3.450% | 5/1/11 | | 15,335 | 15,246 |
| California Statewide Community Dev. Auth. Rev. (Kaiser Permanente) PUT | 3.850% | 6/1/12 | | 10,000 | 9,931 |
| Desert Sands CA School District | 0.000% | 6/1/12 | (2) | 10,000 | 8,650 |
| Golden State Tobacco Securitization Corp. California | 5.000% | 6/1/09 | (ETM) | 3,000 | 3,056 |
| Golden State Tobacco Securitization Corp. California | 5.000% | 6/1/10 | (ETM) | 2,500 | 2,600 |
| Golden State Tobacco Securitization Corp. California | 5.000% | 6/1/11 | | 8,000 | 7,837 |
| Golden State Tobacco Securitization Corp. California | 5.000% | 6/1/12 | | 10,000 | 9,599 |
| Golden State Tobacco Securitization Corp. California | 5.000% | 6/1/13 | | 5,655 | 5,344 |
| Golden State Tobacco Securitization Corp. California | 5.500% | 6/1/13 | (Prere.) | 27,210 | 29,280 |
| Golden State Tobacco Securitization Corp. California | 5.625% | 6/1/13 | (Prere.) | 21,410 | 23,151 |
| Golden State Tobacco Securitization Corp. California | 6.750% | 6/1/13 | (Prere.) | 25,000 | 28,209 |
| Golden State Tobacco Securitization Corp. California | 7.900% | 6/1/13 | (Prere.) | 20,000 | 23,477 |
| Golden State Tobacco Securitization Corp. California | 6.250% | 6/1/13 | (Prere.) | 72,940 | 77,897 |
| Kings River Conservation Dist. California COP | 5.000% | 5/1/10 | | 4,000 | 4,019 |
| Los Angeles County CA Metro. Transp. Auth. Rev. (Capital Grant Receipts Gold Line Project) | 5.000% | 10/1/11 | (3) | 5,000 | 5,154 |
| Los Angeles County CA Metro. Transp. Auth. Rev. (Capital Grant Receipts Gold Line Project) | 5.000% | 10/1/12 | (3) | 8,000 | 8,202 |
| Los Angeles County CA Public Works Financing Auth. Rev. | 5.000% | 12/1/12 | (1) | 7,710 | 7,922 |
| Natomas CA USD COP PUT | 5.000% | 2/1/10 | (2) | 10,000 | 10,038 |
| Northern California Power Agency (Hydroelectric Project) | 5.000% | 7/1/14 | (12) | 2,760 | 2,917 |
| Northern California Power Agency (Hydroelectric Project) | 5.000% | 7/1/15 | (12) | 4,000 | 4,215 |
| Orange County CA Public Financing Lease Rev. | 5.000% | 7/1/12 | (1) | 3,165 | 3,317 |
| Univ. of California Rev. | 5.000% | 5/15/10 | (1) | 3,500 | 3,625 |
| Univ. of California Rev. | 5.000% | 5/15/11 | (1) | 2,500 | 2,621 |
| Univ. of California Rev. | 5.000% | 5/15/12 | (1) | 3,000 | 3,169 |
| | | | | | 662,029 |
Colorado (0.5%) | | | | | |
| Colorado Housing & Finance Auth. Single Family Mortgage Bonds VRDO | 2.500% | 11/7/08 | | 21,900 | 21,900 |
| E-470 Public Highway Auth. Colorado Rev. PUT | 5.000% | 9/1/13 | (1) | 11,485 | 11,392 |
| Jefferson County CO School Dist. GO | 5.000% | 12/15/12 | (2) | 3,500 | 3,713 |
| | | | | | 37,005 |
Connecticut (0.3%) | | | | | |
| Connecticut GO | 5.000% | 11/15/08 | | 10,000 | 10,013 |
| Connecticut GO | 5.500% | 12/15/11 | | 5,435 | 5,834 |
| Connecticut GO | 5.000% | 4/1/12 | (3) | 9,190 | 9,736 |
| | | | | | 25,583 |
Delaware (0.1%) | | | | | |
| Delaware GO | 5.000% | 8/1/15 | | 5,000 | 5,322 |
| | | | | | |
District of Columbia (0.5%) | | | | | |
| District of Columbia GO | 5.000% | 6/1/10 | (4) | 2,045 | 2,116 |
| District of Columbia GO | 5.500% | 6/1/10 | (2) | 1,335 | 1,391 |
| District of Columbia GO | 5.750% | 6/1/10 | (1)(ETM) | 5,000 | 5,266 |
| District of Columbia GO | 5.000% | 6/1/11 | (4) | 2,500 | 2,612 |
| District of Columbia GO | 5.000% | 6/1/12 | (4) | 2,500 | 2,622 |
| District of Columbia GO | 5.500% | 6/1/12 | (4) | 10,000 | 10,245 |
| District of Columbia GO | 5.000% | 6/1/13 | (4) | 4,000 | 4,201 |
| District of Columbia GO | 5.000% | 6/1/14 | (1) | 4,900 | 5,105 |
| District of Columbia GO | 5.000% | 6/1/15 | (1) | 5,000 | 5,163 |
| District of Columbia Rev. (Catholic Univ. of America) | 5.500% | 10/1/09 | (2)(Prere.) | 1,590 | 1,660 |
| District of Columbia Rev. (Catholic Univ. of America) | 5.500% | 10/1/19 | (2) | 1,410 | 1,429 |
| | | | | | 41,810 |
Florida (7.7%) | | | | | |
| Broward County FL Resource Recovery Rev. (Wheelabrator Series A) | 5.375% | 12/1/10 | | 4,900 | 4,957 |
| Broward County FL Resource Recovery Rev. (Wheelabrator Series A) | 4.500% | 12/1/11 | | 5,900 | 5,953 |
| Broward County FL Resource Recovery Rev. (Wheelabrator-South) | 5.500% | 12/1/08 | | 22,980 | 23,042 |
| Broward County FL Resource Recovery Rev. (Wheelabrator-South) | 5.375% | 12/1/09 | | 2,000 | 2,025 |
| Broward County FL School Board COP | 5.000% | 7/1/11 | (2) | 4,460 | 4,596 |
| Citizens Property Insurance Corp. Florida (High Risk Account) | 5.000% | 3/1/10 | (1) | 10,000 | 10,176 |
| Citizens Property Insurance Corp. Florida (High Risk Account) | 5.000% | 3/1/11 | (1) | 10,000 | 10,196 |
| Citizens Property Insurance Corp. Florida (High Risk Account) | 5.000% | 6/1/11 | | 25,000 | 25,506 |
| Citizens Property Insurance Corp. Florida (High Risk Account) | 5.000% | 3/1/12 | (1) | 15,000 | 15,268 |
| Citizens Property Insurance Corp. Florida (High Risk Account) | 5.000% | 3/1/15 | (1) | 11,000 | 10,992 |
1 | Duval County FL School Board COP TOB VRDO | 2.570% | 11/7/08 | (4) | 13,740 | 13,740 |
| Florida Board of Educ. Capital Outlay | 5.000% | 6/1/14 | | 4,225 | 4,469 |
| Florida Board of Educ. Public Educ. | 5.000% | 1/1/11 | | 25,080 | 26,194 |
| Florida Board of Educ. Public Educ. | 5.000% | 1/1/11 | | 6,810 | 7,112 |
| Florida Board of Educ. Public Educ. | 5.000% | 1/1/12 | | 27,730 | 29,118 |
| Florida Board of Educ. Public Educ. | 5.000% | 6/1/16 | | 5,065 | 5,264 |
| Florida Board of Educ. Public Educ. Capital Outlay | 5.000% | 6/1/10 | | 2,495 | 2,587 |
33
Florida Board of Educ. Rev. (Lottery Rev.) | 5.000% | 7/1/12 | | 7,630 | 8,031 |
Florida Board of Educ. Rev. (Lottery Rev.) | 5.000% | 7/1/13 | | 8,010 | 8,452 |
Florida Board of Educ. Rev. (Lottery Rev.) | 5.000% | 7/1/14 | | 8,410 | 8,871 |
Florida Board of Educ. Rev. (Lottery Rev.) | 5.000% | 7/1/15 | | 8,830 | 9,289 |
Florida Board of Educ. Rev. (Lottery Rev.) | 5.000% | 7/1/15 | (1) | 9,555 | 9,927 |
Florida Dept. of Environmental Protection & Preservation Rev. | 5.750% | 7/1/12 | (3) | 7,050 | 7,352 |
Florida Dept. of Environmental Protection & Preservation Rev. | 5.000% | 7/1/13 | | 5,820 | 6,015 |
Florida Dept. of Environmental Protection & Preservation Rev. | 5.000% | 7/1/14 | | 6,110 | 6,295 |
Florida Dept. of Environmental Protection & Preservation Rev. | 5.000% | 7/1/15 | | 6,415 | 6,564 |
Florida Dept. of Transp. | 6.375% | 7/1/10 | | 10,075 | 10,669 |
Florida Hurricane Catastrophe Fund Finance Corp. Rev. | 5.250% | 7/1/12 | | 37,600 | 39,553 |
Florida Hurricane Catastrophe Fund Finance Corp. Rev. | 5.000% | 7/1/14 | | 22,000 | 22,946 |
Florida Rural Util. Financing Comm. Rev. | 4.000% | 2/1/11 | | 15,500 | 15,502 |
Florida Rural Util. Financing Comm. Rev. | 3.500% | 11/1/11 | | 9,000 | 8,901 |
Florida Turnpike Auth. Rev. | 5.000% | 7/1/15 | (4) | 5,000 | 5,255 |
Highlands County FL Health Rev. (Adventist Health System) PUT | 5.000% | 11/16/09 | | 25,000 | 25,299 |
Hillsborough County FL IDA PUT | 5.150% | 9/1/13 | | 8,000 | 7,922 |
Jacksonville FL Electric Auth. Water & Sewer Rev. | 5.000% | 10/1/11 | | 7,500 | 7,685 |
Jacksonville FL Health Fac. Auth. Hosp. Rev. (Baptist Medical Center) VRDO | 1.250% | 11/3/08 | LOC | 24,100 | 24,100 |
Jacksonville FL Health Fac. Auth. Hosp. Rev. VRDO | 1.200% | 11/3/08 | LOC | 4,200 | 4,200 |
Lee County FL Hosp. Board of Directors Hosp. Rev. (Memorial Health System) VRDO | 6.000% | 11/7/08 | | 12,700 | 12,700 |
Lee County FL IDA Health Care Fac. Rev. (Shell Point Village) | 5.000% | 11/15/08 | | 3,000 | 2,998 |
Miami-Dade County FL Health Fac. Auth. Hosp. Rev. PUT | 4.550% | 8/1/13 | (1) | 5,000 | 4,867 |
Miami-Dade County FL School Board COP | 5.000% | 5/1/15 | (12) | 4,000 | 4,158 |
Miami-Dade County FL School Board COP PUT | 5.000% | 5/1/11 | (1) | 15,000 | 15,638 |
Orlando FL Util. Comm. Water & Electric Rev. | 5.250% | 7/1/09 | | 15,000 | 15,330 |
Palm Beach County FL School Board COP | 5.375% | 8/1/12 | (4)(Prere.) | 4,430 | 4,785 |
Palm Beach County FL School Board COP | 5.375% | 8/1/12 | (4)(Prere.) | 8,190 | 8,845 |
Palm Beach County FL School Board COP | 5.375% | 8/1/12 | (4)(Prere.) | 4,500 | 4,860 |
South Florida Water Management Dist. | 5.000% | 10/1/10 | (2) | 3,000 | 3,115 |
South Florida Water Management Dist. | 5.000% | 10/1/11 | (2) | 7,100 | 7,428 |
South Florida Water Management Dist. | 5.000% | 10/1/12 | (2) | 2,150 | 2,253 |
South Miami FL Health Fac. Auth. Hosp. Rev. (Baptist Health South FL Obligated Group) | 5.000% | 8/15/11 | | 4,990 | 5,075 |
South Miami FL Health Fac. Auth. Hosp. Rev. (Baptist Health South FL Obligated Group) | 5.000% | 8/15/12 | | 3,000 | 3,025 |
South Miami FL Health Fac. Auth. Hosp. Rev. (Baptist Health South FL Obligated Group) | 5.500% | 2/1/13 | (Prere.) | 10,000 | 10,874 |
South Miami FL Health Fac. Auth. Hosp. Rev. (Baptist Health South FL Obligated Group) | 5.000% | 8/15/13 | | 2,500 | 2,512 |
Univ. Athletic Assn. Inc. Florida Athletic Program Rev. PUT | 3.800% | 10/1/11 | LOC | 4,000 | 3,988 |
Univ. Athletic Assn. Inc. Florida Capital Improvement Rev. PUT | 3.500% | 10/1/10 | LOC | 5,000 | 5,047 |
Univ. of South Florida Financing Corp. VRDO | 2.350% | 11/7/08 | | 44,250 | 44,250 |
| | | | | 605,771 |
Georgia (2.5%) | | | | | |
Burke County GA Dev. Auth. PCR (Georgia Power Co. Plant Vogtle) PUT | 4.450% | 12/1/08 | | 37,000 | 36,994 |
Burke County GA Dev. Auth. PCR (Georgia Power Co. Plant Vogtle) PUT | 3.750% | 1/12/12 | | 5,000 | 4,946 |
Burke County GA Dev. Auth. PCR (Georgia Power Co. Plant Vogtle) PUT | 3.750% | 1/12/12 | | 10,000 | 9,892 |
Burke County GA Dev. Auth. PCR (Oglethorpe Power Corp.) PUT | 4.750% | 4/1/11 | (1) | 14,500 | 14,431 |
Coffee County GA School Dist. GO | 6.000% | 8/1/10 | | 1,000 | 1,056 |
Fulton County GA Water & Sewer Rev. | 5.250% | 1/1/14 | (3) | 10,000 | 10,116 |
Georgia GO | 5.250% | 12/1/10 | | 6,775 | 7,156 |
Georgia GO | 5.000% | 8/1/11 | | 17,890 | 18,907 |
Georgia GO | 5.500% | 7/1/14 | | 4,000 | 4,388 |
Georgia GO | 5.500% | 7/1/15 | | 9,095 | 10,003 |
Georgia GO | 5.500% | 7/1/16 | | 5,000 | 5,366 |
Georgia Road & Tollway Auth. Rev. (Governor's Transp. Choices) | 5.375% | 3/1/13 | | 5,260 | 5,594 |
Gwinnett County GA School Dist. GO | 5.000% | 2/1/12 | | 10,000 | 10,597 |
Gwinnett County GA School Dist. GO | 5.000% | 2/1/13 | | 10,000 | 10,657 |
Main Street Natural Gas Inc. Georgia Gas Project Rev. | 5.000% | 3/15/12 | | 12,000 | 11,042 |
Main Street Natural Gas Inc. Georgia Gas Project Rev. | 5.000% | 3/15/12 | | 15,000 | 14,401 |
Muni. Electric Auth. Georgia (Project One Sub) Rev. | 5.000% | 1/1/14 | | 4,995 | 5,104 |
Muni. Electric Auth. Georgia (Project One Sub) Rev. | 5.000% | 1/1/15 | | 3,685 | 3,741 |
Muni. Electric Auth. Georgia Rev. (General Resolution Projects) Rev. | 5.000% | 1/1/15 | | 2,060 | 2,092 |
Paulding County GA School Dist. GO | 5.000% | 8/1/09 | | 1,500 | 1,536 |
Paulding County GA School Dist. GO | 5.000% | 8/1/11 | | 1,000 | 1,052 |
Private Colleges & Univ. Auth. of Georgia Rev. (Emory Univ.) | 5.000% | 9/1/11 | | 10,000 | 10,545 |
| | | | | 199,616 |
Hawaii (1.4%) | | | | | |
Hawaii GO | 5.000% | 7/1/09 | (2) | 15,660 | 16,001 |
Hawaii GO | 5.000% | 10/1/09 | (1) | 1,480 | 1,524 |
Hawaii GO | 5.000% | 7/1/10 | (2) | 14,250 | 14,822 |
Hawaii GO | 5.000% | 10/1/10 | (1) | 5,090 | 5,320 |
Hawaii GO | 5.000% | 7/1/11 | (2) | 24,310 | 25,591 |
Hawaii GO | 5.000% | 7/1/12 | (2) | 23,735 | 25,167 |
34
| Hawaii Highway Rev. | 5.375% | 7/1/11 | (4)(Prere.) | 5,125 | 5,471 |
| Honolulu HI City & County GO | 5.000% | 7/1/11 | (1) | 4,750 | 4,988 |
| Honolulu HI City & County GO | 5.250% | 7/1/11 | (3) | 3,900 | 4,117 |
| Honolulu HI City & County GO | 5.000% | 7/1/12 | (1) | 4,320 | 4,564 |
| | | | | | 107,565 |
Illinois (4.3%) | | | | | |
| Chicago IL Board of Educ. Capital Appreciation (School Reform) | 0.000% | 12/1/11 | (3) | 5,185 | 4,601 |
| Chicago IL Board of Educ. GO | 0.000% | 12/1/09 | (3) | 9,895 | 9,624 |
| Chicago IL Board of Educ. GO | 0.000% | 12/1/10 | (3) | 4,000 | 3,735 |
1 | Chicago IL Board of Educ. TOB VRDO | 2.570% | 11/7/08 | (4) | 11,165 | 11,165 |
| Chicago IL GO | 5.700% | 7/1/10 | (3)(Prere.) | 9,655 | 10,273 |
| Chicago IL GO | 5.000% | 1/1/14 | (4) | 37,590 | 39,704 |
| Chicago IL GO | 5.000% | 1/1/14 | (4)(Prere.) | 4,135 | 4,402 |
1 | Chicago IL GO TOB VRDO | 2.350% | 11/7/08 | (4) | 2,400 | 2,400 |
| Chicago IL Housing Auth. Capital Project Rev. | 5.000% | 7/1/09 | (ETM) | 8,265 | 8,447 |
| Chicago IL Housing Auth. Capital Project Rev. | 5.250% | 7/1/10 | (ETM) | 5,000 | 5,238 |
| Chicago IL O'Hare International Airport Rev. | 5.000% | 1/1/12 | (4) | 2,500 | 2,603 |
| Chicago IL O'Hare International Airport Rev. | 5.000% | 1/1/13 | (4) | 4,200 | 4,374 |
| Chicago IL O'Hare International Airport Rev. | 5.000% | 1/1/14 | (4) | 2,500 | 2,598 |
| Du Page & Will Counties IL Community School Dist. GO | 5.500% | 12/30/11 | (Prere.) | 4,725 | 5,101 |
| Illinois Dev. Finance Auth. Hosp. Rev. (Evanston Northwestern Healthcare Corp.) VRDO | 1.780% | 11/7/08 | | 35,000 | 35,000 |
| Illinois Educ. Fac. Auth. Rev. (Univ. of Chicago) PUT | 4.050% | 7/1/09 | | 7,000 | 7,094 |
| Illinois Finance Auth. Rev. (Central Dupage Health) VRDO | 1.200% | 11/3/08 | | 2,300 | 2,300 |
| Illinois Finance Auth. Rev. (Elmhurst Memorial Healthcare) VRDO | 1.250% | 11/3/08 | LOC | 41,000 | 41,000 |
| Illinois Finance Auth. Rev. (Loyola Univ. Health) VRDO | 1.800% | 11/7/08 | LOC | 13,000 | 13,000 |
| Illinois Finance Auth. Rev. (Resurrection Health Care) | 5.000% | 5/15/12 | (4) | 4,200 | 4,353 |
| Illinois Finance Auth. Rev. (Resurrection Health Care) | 5.000% | 5/15/13 | (4) | 4,275 | 4,429 |
| Illinois Finance Auth. Rev. (Resurrection Health Care) | 5.000% | 5/15/13 | (4) | 4,300 | 4,454 |
| Illinois Finance Auth. Rev. (Resurrection Health Care) PUT | 3.750% | 7/1/09 | | 4,000 | 4,032 |
| Illinois GO | 5.250% | 11/1/08 | (3) | 4,000 | 4,000 |
| Illinois GO | 5.000% | 3/1/10 | | 6,300 | 6,510 |
| Illinois GO | 5.000% | 1/1/11 | | 7,000 | 7,315 |
| Illinois GO | 5.500% | 8/1/14 | | 7,275 | 7,511 |
| Illinois GO | 5.500% | 8/1/18 | (4) | 5,000 | 5,101 |
| Illinois Sales Tax Rev. | 5.000% | 6/15/10 | | 1,500 | 1,557 |
| Illinois Sales Tax Rev. | 5.250% | 6/15/12 | | 2,000 | 2,128 |
| Illinois State Tollway Highway Auth. Toll Highway Rev. | 5.000% | 1/1/15 | (4) | 17,970 | 18,943 |
| Metro. Pier & Exposition Auth. Illinois Dedicated Sales Tax Rev. | 0.000% | 6/15/09 | (3)(ETM) | 18,625 | 18,375 |
| Metro. Pier & Exposition Auth. Illinois Dedicated Sales Tax Rev. | 0.000% | 12/15/11 | (1) | 20,000 | 17,807 |
1 | Univ. of Illinois Univ. Rev. Auxiliary Fac. TOB VRDO | 2.270% | 11/7/08 | (1) | 9,455 | 9,455 |
| Winnebago & Bonne Counties IL School Dist. GO | 5.000% | 2/1/12 | (2) | 4,000 | 4,151 |
| Winnebago & Boone Counties IL School Dist. GO | 5.000% | 2/1/13 | (2) | 5,000 | 5,193 |
| | | | | | 337,973 |
Indiana (1.4%) | | | | | |
| Indiana Finance Auth. Health System Rev. (Sisters St. Francis) | 5.000% | 11/1/13 | | 3,000 | 3,001 |
| Indiana Finance Auth. Health System Rev. (Sisters St. Francis) | 5.000% | 11/1/14 | | 3,485 | 3,453 |
| Indiana Finance Auth. Health System Rev. (Sisters St. Francis) | 5.000% | 11/1/15 | | 3,570 | 3,496 |
| Indiana Finance Auth. Rev. VRDO | 6.000% | 11/7/08 | | 5,325 | 5,325 |
| Indiana Health Fac. Auth. Finance Auth. Rev. (Ascension Health Credit Group) | 5.000% | 5/1/13 | | 3,750 | 3,727 |
| Indiana Health Fac. Auth. Finance Auth. Rev. (Ascension Health Credit Group) PUT | 5.000% | 10/1/09 | | 10,000 | 10,177 |
| Indiana Health Fac. Auth. Finance Auth. Rev. (Ascension Health Credit Group) PUT | 5.000% | 4/1/10 | | 10,000 | 10,157 |
| Indiana Health Fac. Auth. Finance Auth. Rev. (Ascension Health Credit Group) PUT | 5.000% | 11/1/10 | | 7,930 | 8,083 |
| Indiana Health Fac. Auth. Finance Auth. Rev. (Ascension Health Credit Group) PUT | 5.000% | 11/1/11 | | 5,500 | 5,563 |
| Indiana Health Fac. Auth. Finance Auth. Rev. (Clarian Health Obligation Group) | 5.000% | 2/15/10 | | 2,000 | 2,012 |
| Indiana Housing Finance Auth. Lease Rev. | 5.000% | 11/1/13 | | 10,585 | 11,046 |
1 | Indianapolis IN Thermal Energy System TOB VRDO | 1.960% | 11/7/08 | (13) | 9,890 | 9,890 |
| Rockport IN PCR (AEP Generating Co.) PUT | 4.150% | 7/15/11 | (2) | 10,000 | 10,129 |
2 | St. Joseph County IN Educ. Fac. Rev. (Univ. of Notre Dame) PUT | 3.875% | 3/1/12 | | 7,500 | 7,500 |
1 | Tri-Creek Middle School Building Corp. TOB VRDO | 2.340% | 11/7/08 | (4) | 14,210 | 14,210 |
| | | | | | 107,769 |
Kansas (0.5%) | | | | | |
| Kansas Dept. of Transp. Highway Rev. | 5.000% | 9/1/13 | | 32,590 | 34,719 |
| Univ. of Kansas Hosp. Auth. Health System | 5.000% | 9/1/12 | | 1,525 | 1,530 |
| Univ. of Kansas Hosp. Auth. Health System | 5.000% | 9/1/14 | | 1,000 | 987 |
| Univ. of Kansas Hosp. Auth. Health System | 5.000% | 9/1/15 | | 2,000 | 1,945 |
| | | | | | 39,181 |
Kentucky (1.0%) | | | | | |
| Kentucky Asset/Liability Comm. General Fund Rev. | 5.000% | 9/1/12 | (1) | 13,065 | 13,808 |
| Kentucky Property & Building Comm. Rev. | 5.250% | 10/1/15 | (4) | 40,000 | 42,844 |
| Kentucky Turnpike Auth. Econ. Dev. Road Rev. (Revitalization Project) | 5.500% | 7/1/09 | (2) | 15,000 | 15,364 |
| Warren County KY Hosp. Fac. Rev. (Community Hosp. Corp. Project) | 5.000% | 8/1/11 | | 770 | 769 |
35
Warren County KY Hosp. Fac. Rev. (Community Hosp. Corp. Project) | 5.000% | 8/1/12 | | 810 | 796 |
Warren County KY Hosp. Fac. Rev. (Community Hosp. Corp. Project) | 5.000% | 8/1/13 | | 855 | 829 |
Warren County KY Hosp. Fac. Rev. (Community Hosp. Corp. Project) | 5.000% | 8/1/16 | | 990 | 912 |
| | | | | 75,322 |
Louisiana (1.0%) | | | | | |
Lafayette LA Public Improvement Sales Tax Rev. | 5.000% | 3/1/10 | (1) | 1,980 | 2,044 |
Lafayette LA Public Improvement Sales Tax Rev. | 5.000% | 3/1/11 | (1) | 2,085 | 2,181 |
Louisiana GO | 5.000% | 5/1/10 | (4) | 16,980 | 17,591 |
Louisiana GO | 5.250% | 8/1/16 | (1) | 5,000 | 5,258 |
Louisiana Housing Finance Agency Single Family Mortgage Rev. Home Ownership | 5.850% | 6/1/38 | | 6,905 | 7,137 |
Louisiana Offshore Terminal Auth. Deep Water Port Rev. (LOOP LLC Project) PUT | 4.250% | 10/1/10 | | 17,250 | 17,579 |
Louisiana Public Fac. Auth. Rev. (Ochsner Clinic) | 5.000% | 5/15/13 | | 2,675 | 2,633 |
Louisiana Public Fac. Auth. Rev. (Ochsner Clinic) | 5.000% | 5/15/14 | | 3,950 | 3,843 |
Louisiana State Citizens Property Insurance Corp. Assessment Rev. | 5.250% | 6/1/14 | (2) | 5,000 | 5,087 |
Louisiana Transp. Auth. Toll Rev. | 5.000% | 9/1/09 | | 15,000 | 15,358 |
| | | | | 78,711 |
Maine (0.3%) | | | | | |
Maine GO | 5.000% | 7/15/10 | (2) | 3,095 | 3,224 |
Maine GO | 5.000% | 7/15/12 | (2) | 8,055 | 8,559 |
Maine Housing Auth. Mortgage Rev. VRDO | 3.800% | 11/7/08 | | 12,000 | 12,000 |
| | | | | 23,783 |
Maryland (2.2%) | | | | | |
Maryland Dept. of Transp. | 5.000% | 5/1/10 | | 16,975 | 17,638 |
Maryland Econ. Dev. Corp. Rev. (Chesapeake Bay Conference Center) | 4.750% | 12/1/11 | | 830 | 786 |
Maryland GO | 5.250% | 2/15/10 | | 6,140 | 6,373 |
Maryland GO | 5.000% | 3/15/11 | | 19,445 | 20,478 |
Maryland GO | 5.000% | 8/1/11 | | 18,200 | 19,240 |
Maryland GO | 5.000% | 3/15/12 | | 20,415 | 21,672 |
Maryland GO | 5.000% | 8/1/14 | | 10,000 | 10,733 |
Maryland Health & Higher Educ. Fac. Auth. Rev. (Johns Hopkins Health System) PUT | 5.000% | 5/15/13 | | 3,000 | 3,093 |
Maryland Health & Higher Educ. Fac. Auth. Rev. (Univ. of Maryland Medical System) | 5.000% | 7/1/13 | | 2,395 | 2,386 |
Maryland Health & Higher Educ. Fac. Auth. Rev. (Univ. of Maryland Medical System) | 5.000% | 7/1/14 | | 3,150 | 3,116 |
Maryland Health & Higher Educ. Fac. Auth. Rev. (Univ. of Maryland Medical System) | 5.000% | 7/1/15 | | 5,900 | 5,775 |
Maryland Transp. Auth. Rev. | 5.000% | 7/1/13 | | 9,085 | 9,683 |
Maryland Transp. Auth. Rev. | 5.000% | 7/1/14 | | 9,615 | 10,273 |
Maryland Transp. Auth. Rev. | 5.000% | 7/1/15 | | 9,995 | 10,677 |
Montgomery County MD GO | 5.000% | 5/1/14 | | 12,310 | 13,190 |
Washington Suburban Sanitation Dist. Maryland Water Supply GO | 5.250% | 6/1/10 | | 11,435 | 11,949 |
Washington Suburban Sanitation Dist. Maryland Water Supply GO | 5.250% | 6/1/10 | | 5,000 | 5,225 |
| | | | | 172,287 |
Massachusetts (3.5%) | | | | | |
Massachusetts GAN | 5.750% | 12/15/08 | | 16,210 | 16,290 |
Massachusetts GAN | 5.750% | 12/15/10 | | 3,000 | 3,190 |
Massachusetts GO | 5.000% | 8/1/09 | | 37,715 | 38,609 |
Massachusetts GO | 5.875% | 2/1/10 | (Prere.) | 10,000 | 10,547 |
Massachusetts GO | 5.750% | 6/1/10 | (Prere.) | 8,545 | 9,004 |
Massachusetts GO | 5.000% | 8/1/10 | | 38,955 | 40,525 |
Massachusetts GO | 6.000% | 11/1/10 | | 10,015 | 10,643 |
Massachusetts GO | 5.500% | 11/1/11 | (4) | 24,300 | 26,016 |
Massachusetts GO | 5.000% | 8/1/14 | | 11,965 | 12,716 |
Massachusetts GO | 5.000% | 3/1/15 | (Prere.) | 10,000 | 10,810 |
Massachusetts GO | 5.000% | 9/1/15 | (Prere.) | 5,000 | 5,421 |
Massachusetts GO | 5.500% | 10/1/15 | | 5,000 | 5,449 |
Massachusetts Health & Educ. Fac. Auth. Rev. (Harvard Univ.) | 6.000% | 7/1/10 | (Prere.) | 5,825 | 6,232 |
Massachusetts Muni. Wholesale Electric Co. Power System Rev. | 5.000% | 7/1/09 | (1) | 14,110 | 14,375 |
Massachusetts School Building Auth. Dedicated Sales Tax Rev. | 5.000% | 8/15/11 | (4) | 12,000 | 12,623 |
Massachusetts Special Obligation Dedicated Tax Rev. | 5.250% | 1/1/14 | (3)(Prere.) | 10,000 | 10,384 |
Massachusetts Special Obligation Rev. | 5.000% | 12/15/10 | (4) | 10,000 | 10,473 |
Massachusetts Special Obligation Rev. | 5.500% | 6/1/12 | | 10,000 | 10,733 |
Massachusetts Water Pollution Abatement Trust | 5.250% | 8/1/13 | | 7,550 | 8,127 |
Springfield MA GO | 5.000% | 8/1/11 | (1) | 3,500 | 3,660 |
Univ. of Massachusetts Building Auth. Rev. | 5.000% | 11/1/11 | (2) | 6,905 | 7,231 |
| | | | | 273,058 |
Michigan (3.3%) | | | | | |
Clarkston MI Community School GO | 5.000% | 5/1/14 | (4) | 5,180 | 5,476 |
Detroit MI City School Dist. GO | 5.000% | 5/1/11 | (3) | 3,510 | 3,642 |
Detroit MI GO | 5.000% | 4/1/13 | (12) | 9,345 | 9,643 |
Detroit MI GO | 5.000% | 4/1/14 | (12) | 2,735 | 2,814 |
Detroit MI Sewer System Rev. | 6.000% | 1/1/10 | (3)(Prere.) | 15,000 | 15,736 |
Detroit MI Sewer System Rev. | 5.000% | 7/1/10 | (4) | 8,510 | 8,804 |
Detroit MI Sewer System Rev. PUT | 5.500% | 1/1/12 | (1) | 20,000 | 20,601 |
36
| Kent Hosp. MI Finance Auth. Rev. (Spectrum Health) | 5.000% | 7/15/11 | | 23,000 | 23,435 |
| Kent Hosp. MI Finance Auth. Rev. PUT | 5.000% | 1/15/12 | | 25,000 | 25,118 |
| Michigan (New Center Dev. Inc.) COP PUT | 5.000% | 9/1/11 | (1) | 33,000 | 34,451 |
| Michigan Building Auth. Rev. | 5.500% | 10/15/09 | | 5,000 | 5,153 |
| Michigan Building Auth. Rev. | 5.000% | 10/15/12 | (2) | 5,615 | 5,884 |
| Michigan Building Auth. Rev. | 5.250% | 10/15/16 | (4) | 7,200 | 7,472 |
| Michigan Building Auth. Rev. PUT | 5.000% | 10/15/11 | (2) | 12,000 | 12,502 |
| Michigan GO | 5.000% | 9/15/11 | (4) | 4,755 | 4,987 |
| Michigan GO | 5.000% | 5/1/14 | | 12,000 | 12,662 |
| Michigan Hosp. Finance Auth. Rev. (Ascension Health) PUT | 5.000% | 5/1/12 | | 17,000 | 17,381 |
| Michigan Muni. Bond Auth. Rev. | 5.000% | 10/1/15 | | 2,315 | 2,470 |
| Michigan Muni. Bond Auth. Rev. (Clean Water Revolving Fund) | 5.000% | 10/1/10 | | 3,000 | 3,135 |
| Michigan Muni. Bond Auth. Rev. (Clean Water Revolving Fund) | 3.550% | 10/1/11 | | 6,700 | 6,806 |
| Michigan Trunk Line Rev. | 5.000% | 9/1/12 | (4) | 13,015 | 13,741 |
| Univ. of Michigan Univ. Rev. | 5.250% | 12/1/11 | | 5,000 | 5,237 |
| Univ. of Michigan Univ. Rev. | 5.250% | 12/1/12 | | 8,500 | 8,918 |
| | | | | | 256,068 |
Minnesota (1.6%) | | | | | |
| Maple Grove MN Health Care System Rev. (Maple Grove Hosp. Corp.) | 5.000% | 5/1/14 | | 1,000 | 996 |
| Maple Grove MN Health Care System Rev. (Maple Grove Hosp. Corp.) | 5.000% | 5/1/15 | | 1,245 | 1,229 |
| Minneapolis MN Health Care System (Allina Health System) | 5.750% | 11/15/12 | (Prere.) | 39,000 | 42,755 |
| Minneapolis MN Health Care System (Allina Health System) | 6.000% | 11/15/12 | (Prere.) | 4,000 | 4,423 |
| Minnesota GO | 5.000% | 8/1/10 | | 37,375 | 39,016 |
| Minnesota GO | 5.000% | 11/1/10 | | 8,845 | 9,278 |
| Minnesota GO | 5.250% | 11/1/12 | | 6,375 | 6,639 |
| Minnesota GO | 5.000% | 8/1/14 | | 6,970 | 7,470 |
| Minnesota Public Fac. Water PCR | 5.500% | 3/1/09 | | 4,500 | 4,557 |
| St. Louis Park MN Health Care Facs. Rev. (Park Nicollet Health Services) | 5.500% | 7/1/13 | | 7,825 | 7,872 |
| St. Louis Park MN Health Care Facs. Rev. (Park Nicollet Health Services) | 5.500% | 7/1/14 | | 5,250 | 5,245 |
| | | | | | 129,480 |
Mississippi (0.5%) | | | | | |
| Madison County MS School Dist. | 5.000% | 9/1/10 | (3) | 4,370 | 4,504 |
| Mississippi GO | 6.000% | 11/1/09 | (Prere.) | 7,250 | 7,559 |
| Mississippi GO | 5.250% | 12/1/10 | | 8,800 | 9,252 |
| Mississippi GO | 5.250% | 11/1/14 | | 8,970 | 9,624 |
| Mississippi GO | 5.000% | 11/1/15 | (1) | 7,475 | 7,960 |
| Mississippi Hosp. Equipment & Fac. Auth. Rev. (Baptist Health System) | 5.000% | 8/15/09 | | 500 | 506 |
| Mississippi Hosp. Equipment & Fac. Auth. Rev. (Baptist Health System) | 5.000% | 8/15/10 | | 500 | 508 |
| Mississippi Hosp. Equipment & Fac. Auth. Rev. (Baptist Health System) | 5.000% | 8/15/11 | | 1,000 | 1,013 |
| Mississippi Hosp. Equipment & Fac. Auth. Rev. (Baptist Health System) | 5.000% | 8/15/12 | | 1,000 | 1,002 |
| Mississippi Hosp. Equipment & Fac. Auth. Rev. (Baptist Health System) | 5.000% | 8/15/15 | | 1,500 | 1,466 |
| | | | | | 43,394 |
Missouri (0.5%) | | | | | |
| Bi-State Dev. Agency of the Missouri-Illinois Metro. Dist. | | | | | |
| (St. Clair County Metrolink Extension) PUT | 3.950% | 10/1/09 | LOC | 10,000 | 10,182 |
| Curators of the Univ. of Missouri System Fac. Rev. | 5.000% | 11/1/13 | (Prere.) | 15,320 | 16,519 |
| Missouri Highways & Transp. Comm. Road Rev. | 5.000% | 2/1/12 | (Prere.) | 10,000 | 10,611 |
| Missouri Jt. Muni. Electric Util. Comm. Power Project Rev. Plum Point Project | 5.000% | 1/1/12 | (1) | 2,000 | 2,035 |
| | | | | | 39,347 |
Montana (0.1%) | | | | | |
| Montana State Board of Regents Higher Educ. Rev. VRDO | 1.250% | 11/3/08 | LOC | 4,800 | 4,800 |
| | | | | | |
Multiple State (0.1%) | | | | | |
1 | Tax-Exempt Muni. Infrastructure Improvement Trust TOB | 4.220% | 11/2/10 | LOC | 5,000 | 5,092 |
| | | | | | |
Nebraska (0.6%) | | | | | |
| Central Plains Energy Project Nebraska Gas Project No. 1 | 2.193% | 12/1/10 | | 25,000 | 22,750 |
| Central Plains Energy Project Nebraska Gas Project No. 1 | 5.000% | 12/1/15 | | 5,000 | 4,187 |
| Nebraska Public Power Dist. Rev. | 5.000% | 1/1/10 | (3) | 11,635 | 11,945 |
| Nebraska Public Power Dist. Rev. | 5.000% | 1/1/11 | (3) | 3,560 | 3,691 |
| Omaha NE Public Power Dist. Electric Rev. | 5.500% | 2/1/14 | | 5,000 | 5,279 |
| | | | | | 47,852 |
Nevada (1.7%) | | | | | |
| Clark County NV Bond Bank GO | 5.500% | 7/1/10 | (1)(Prere.) | 13,025 | 13,698 |
| Clark County NV Passenger Fac. Rev. (Las Vegas McCarran International Airport) | 5.000% | 7/1/13 | | 6,355 | 6,568 |
| Clark County NV Passenger Fac. Rev. (Las Vegas McCarran International Airport) | 5.000% | 7/1/14 | | 6,100 | 6,275 |
| Clark County NV School Dist. GO | 4.000% | 6/1/09 | (3) | 12,265 | 12,422 |
| Clark County NV School Dist. GO | 5.250% | 6/15/10 | (1) | 7,875 | 8,204 |
| Clark County NV School Dist. GO | 5.500% | 12/15/11 | (4)(Prere.) | 5,000 | 5,394 |
| Clark County NV School Dist. GO | 5.000% | 6/15/12 | | 10,115 | 10,679 |
37
| Clark County NV School Dist. GO | 5.000% | 6/15/13 | (3) | 16,050 | 16,980 |
| Clark County NV School Dist. GO | 5.000% | 6/15/14 | (3) | 9,680 | 10,235 |
| Clark County NV Water Reclamation Dist. GO | 5.000% | 7/1/11 | (1) | 6,735 | 7,070 |
| Henderson NV Health Care Fac. Rev. (Catholic Healthcare West) | 5.000% | 7/1/09 | | 4,000 | 4,029 |
| Henderson NV Health Care Fac. Rev. (Catholic Healthcare West) | 5.000% | 7/1/14 | | 8,000 | 7,845 |
| Nevada Highway Improvement Rev. (Motor Vehicle Fuel Tax) | 5.000% | 12/1/12 | (1) | 14,495 | 15,361 |
| Nevada Highway Improvement Rev. (Motor Vehicle Fuel Tax) | 5.500% | 12/1/14 | (3) | 5,905 | 6,395 |
| | | | | | 131,155 |
New Hampshire (0.3%) | | | | | |
| Manchester NH General Airport Rev. PUT | 5.000% | 1/15/10 | (2) | 14,000 | 14,132 |
| New Hampshire GO | 5.000% | 11/1/08 | | 6,000 | 6,000 |
| | | | | | 20,132 |
New Jersey (5.0%) | | | | | |
| New Jersey Building Auth. Rev. | 5.000% | 6/15/11 | | 15,090 | 15,746 |
| New Jersey Building Auth. Rev. | 5.000% | 6/15/12 | | 11,465 | 12,004 |
| New Jersey Building Auth. Rev. | 5.000% | 6/15/14 | | 6,790 | 7,106 |
| New Jersey Building Auth. Rev. | 5.000% | 6/15/15 | | 7,650 | 7,975 |
| New Jersey CTFS Partner Equipment Lease Purchase | 5.000% | 6/15/11 | | 4,000 | 4,148 |
| New Jersey CTFS Partner Equipment Lease Purchase | 5.000% | 6/15/14 | | 7,000 | 7,265 |
| New Jersey CTFS Partner Equipment Lease Purchase | 5.000% | 6/15/15 | | 5,420 | 5,600 |
| New Jersey Econ. Dev. Auth. Rev. (Cigarette Tax) | 5.000% | 6/15/10 | (4) | 7,000 | 7,202 |
| New Jersey Econ. Dev. Auth. Rev. (Cigarette Tax) | 5.625% | 6/15/17 | | 1,350 | 1,183 |
| New Jersey Econ. Dev. Auth. Rev. (School Fac.) | 5.000% | 3/1/10 | | 1,000 | 1,031 |
| New Jersey Econ. Dev. Auth. Rev. (School Fac.) | 5.000% | 3/1/11 | | 3,000 | 3,131 |
| New Jersey Econ. Dev. Auth. Rev. (School Fac.) | 5.000% | 3/1/13 | | 14,670 | 15,302 |
| New Jersey Econ. Dev. Auth. Rev. (School Fac.) | 5.000% | 3/1/14 | | 14,565 | 15,182 |
| New Jersey Econ. Dev. Auth. Rev. (School Fac.) PUT | 5.000% | 9/1/14 | (4) | 10,000 | 10,364 |
| New Jersey Econ. Dev. Auth. Rev. (Transp. Project) | 5.000% | 5/1/14 | | 11,165 | 11,642 |
| New Jersey Econ. Dev. Auth. Rev. (Transp. Project) | 5.000% | 5/1/15 | | 11,255 | 11,700 |
1 | New Jersey Econ. Dev. Auth. Rev. TOB VRDO | 1.840% | 11/7/08 | | 8,350 | 8,350 |
| New Jersey Health Care Fac. Financing Auth. Rev. (AHS Hospital) | 5.000% | 7/1/12 | | 6,955 | 6,980 |
| New Jersey Highway Auth. Rev. (Garden State Parkway) | 6.200% | 1/1/10 | (2)(ETM) | 14,705 | 15,334 |
| New Jersey Sports & Exposition Auth. Rev. | 5.000% | 9/1/14 | | 6,540 | 6,788 |
| New Jersey Transp. Trust Fund Auth. Rev. | 5.250% | 12/15/11 | (3) | 30,000 | 31,631 |
| New Jersey Transp. Trust Fund Auth. Rev. | 5.000% | 6/15/12 | (3) | 4,200 | 4,380 |
| New Jersey Transp. Trust Fund Auth. Rev. | 5.750% | 12/15/12 | (4) | 8,000 | 8,620 |
| New Jersey Transp. Trust Fund Auth. Rev. | 5.000% | 6/15/15 | (4)(Prere.) | 19,130 | 20,651 |
| New Jersey Turnpike Auth. Rev. | 5.625% | 1/1/10 | (1)(Prere.) | 5,000 | 5,195 |
| New Jersey Turnpike Auth. Rev. VRDO | 7.750% | 11/7/08 | LOC | 50,000 | 50,000 |
| Newark NJ GO | 5.000% | 10/1/11 | (4) | 2,000 | 2,109 |
| Tobacco Settlement Financing Corp. New Jersey Rev. | 4.000% | 6/1/09 | | 1,400 | 1,391 |
| Tobacco Settlement Financing Corp. New Jersey Rev. | 4.125% | 6/1/10 | | 3,640 | 3,570 |
| Tobacco Settlement Financing Corp. New Jersey Rev. | 4.250% | 6/1/11 | | 4,905 | 4,718 |
| Tobacco Settlement Financing Corp. New Jersey Rev. | 4.250% | 6/1/12 | | 5,000 | 4,681 |
| Tobacco Settlement Financing Corp. New Jersey Rev. | 5.000% | 6/1/12 | (Prere.) | 10,200 | 10,824 |
| Tobacco Settlement Financing Corp. New Jersey Rev. | 5.750% | 6/1/12 | (Prere.) | 19,345 | 20,612 |
| Tobacco Settlement Financing Corp. New Jersey Rev. | 6.125% | 6/1/12 | (Prere.) | 20,000 | 21,018 |
| Tobacco Settlement Financing Corp. New Jersey Rev. | 6.250% | 6/1/13 | (Prere.) | 4,600 | 5,160 |
| Tobacco Settlement Financing Corp. New Jersey Rev. | 7.000% | 6/1/13 | (Prere.) | 17,705 | 20,413 |
| Tobacco Settlement Financing Corp. New Jersey Rev. | 5.000% | 6/1/15 | | 2,000 | 1,812 |
| | | | | | 390,818 |
New Mexico (0.7%) | | | | | |
| Albuquerque NM GO | 5.000% | 7/1/12 | (2) | 11,350 | 12,071 |
| Farmington NM PCR (El Paso Electric Co. Project) PUT | 4.000% | 8/1/12 | (3) | 8,000 | 7,778 |
| Farmington NM PCR (Southern CA Edison Four Corners Project) PUT | 3.550% | 4/1/10 | (3) | 20,000 | 19,777 |
| New Mexico GO | 5.000% | 3/1/13 | | 8,000 | 8,519 |
| New Mexico Severance Tax Rev. | 5.000% | 7/1/10 | (2) | 2,000 | 2,076 |
| New Mexico Severance Tax Rev. | 5.000% | 7/1/11 | | 1,000 | 1,050 |
| New Mexico Severance Tax Rev. | 5.000% | 7/1/11 | (2) | 2,000 | 2,098 |
| New Mexico Severance Tax Rev. | 5.000% | 7/1/12 | | 1,550 | 1,638 |
| | | | | | 55,007 |
New York (11.8%) | | | | | |
3 | Battery Park City NY Auth. Rev. | 5.250% | 11/1/16 | | 14,275 | 15,138 |
| Erie County NY IDA School Fac. Rev. GO | 5.000% | 5/1/09 | (4) | 3,140 | 3,183 |
| Long Island NY Power Auth. Electric System Rev. | 0.000% | 6/1/11 | (4) | 16,690 | 15,220 |
| Long Island NY Power Auth. Electric System Rev. | 5.000% | 5/1/12 | (1) | 48,900 | 50,494 |
| Metro. New York Transp. Auth. Rev. (Dedicated Petroleum Tax) | 5.250% | 10/1/10 | (1)(Prere.) | 7,900 | 8,336 |
1 | Metro. New York Transp. Auth. Rev. (Dedicated Petroleum Tax) TOB VRDO | 1.940% | 11/7/08 | (13) | 27,980 | 27,980 |
1 | Metro. New York Transp. Auth. Rev. (Dedicated Petroleum Tax) TOB VRDO | 1.940% | 11/7/08 | (13) | 42,605 | 42,605 |
| Metro. New York Transp. Auth. Rev. (Transit Rev.) | 5.250% | 11/15/11 | | 22,080 | 23,236 |
| Metro. New York Transp. Auth. Rev. (Transit Rev.) | 5.000% | 11/15/12 | | 3,500 | 3,659 |
38
| Metro. New York Transp. Auth. Rev. (Transit Rev.) | 5.250% | 11/15/12 | | 14,110 | 14,880 |
| Metro. New York Transp. Auth. Rev. (Transit Rev.) | 5.000% | 11/15/13 | | 3,325 | 3,476 |
| Metro. New York Transp. Auth. Rev. (Transit Rev.) PUT | 5.000% | 11/15/14 | | 50,000 | 51,374 |
| Nassau County NY Interim Finance Auth. VRDO | 4.000% | 11/7/08 | | 30,055 | 30,055 |
| New York City NY GO | 5.000% | 6/1/10 | | 8,000 | 8,257 |
| New York City NY GO | 5.000% | 8/1/10 | | 13,965 | 14,444 |
| New York City NY GO | 5.000% | 3/1/11 | | 6,000 | 6,212 |
| New York City NY GO | 5.750% | 8/1/11 | (1) | 15,750 | 16,609 |
| New York City NY GO | 5.000% | 8/1/12 | | 8,000 | 8,324 |
| New York City NY GO | 5.000% | 8/1/12 | | 8,450 | 8,793 |
| New York City NY GO | 5.250% | 8/1/12 | | 4,230 | 4,410 |
| New York City NY GO | 5.000% | 8/1/14 | | 25,000 | 25,888 |
| New York City NY GO | 5.750% | 8/1/14 | (2) | 7,785 | 8,317 |
| New York City NY GO | 5.000% | 8/15/14 | | 12,890 | 13,349 |
| New York City NY GO | 5.000% | 9/1/14 | | 16,860 | 17,462 |
| New York City NY GO | 5.000% | 8/1/15 | | 7,885 | 8,083 |
| New York City NY GO | 5.000% | 8/1/15 | | 26,260 | 27,020 |
| New York City NY GO | 5.000% | 8/15/15 | | 17,910 | 18,428 |
| New York City NY GO | 5.000% | 9/1/15 | | 21,325 | 21,940 |
| New York City NY GO VRDO | 1.200% | 11/3/08 | | 5,300 | 5,300 |
| New York City NY Health & Hosp. Corp. Rev. | 5.000% | 2/15/12 | | 6,665 | 6,742 |
| New York City NY Housing Dev. Corp. Rev. | 5.000% | 7/1/10 | (3) | 3,090 | 3,173 |
| New York City NY Housing Dev. Corp. Rev. | 5.000% | 7/1/12 | (3) | 5,000 | 5,174 |
| New York City NY IDA (USTA National Tennis Center) | 5.000% | 11/15/13 | (4) | 4,435 | 4,711 |
| New York City NY Transitional Finance Auth. Rev. | 5.500% | 11/1/26 | | 24,375 | 25,420 |
| New York City NY Transitional Finance Auth. Rev. | 5.250% | 2/1/29 | | 37,600 | 38,722 |
| New York City NY Transitional Finance Auth. Rev. Future Tax | 5.000% | 11/1/11 | | 14,370 | 15,151 |
1 | New York City NY Transitional Finance Auth. Rev. TOB VRDO | 2.340% | 11/7/08 | (4) | 5,000 | 5,000 |
| New York State Dormitory Auth. Rev. | 5.000% | 8/15/09 | (4) (7) | 1,900 | 1,941 |
| New York State Dormitory Auth. Rev. (City Univ.) | 5.750% | 7/1/10 | (3)(Prere.) | 2,215 | 2,343 |
| New York State Dormitory Auth. Rev. (City Univ.) | 5.750% | 7/1/10 | (3)(Prere.) | 4,475 | 4,733 |
| New York State Dormitory Auth. Rev. (State Univ.) | 5.500% | 5/15/13 | (3) | 20,350 | 21,416 |
| New York State Dormitory Auth. Rev. Non State Supported Debt (New York Univ. Hosp.) | 5.000% | 7/1/09 | | 2,055 | 2,021 |
| New York State Dormitory Auth. Rev. Non State Supported Debt (New York Univ. Hosp.) | 5.000% | 7/1/11 | | 1,000 | 937 |
| New York State Dormitory Auth. Rev. Non State Supported Debt (New York Univ. Hosp.) | 5.000% | 7/1/12 | | 1,000 | 917 |
| New York State Dormitory Auth. Rev. PUT | 5.250% | 5/15/12 | (2) | 12,560 | 12,868 |
1 | New York State Dormitory Auth. Rev. TOB VRDO | 2.520% | 11/7/08 | (4) | 10,950 | 10,950 |
| New York State Energy Research & Dev. Auth. PCR (New York Electric & Gas) ARS | 3.245% | 1/19/10 | (1) | 14,650 | 14,639 |
| New York State GO | 5.000% | 4/15/09 | | 2,900 | 2,941 |
| New York State Local Govt. Assistance Corp. VRDO | 4.500% | 11/7/08 | | 45,000 | 45,000 |
| New York State Muni. Bond Bank Agency Special School Purpose Rev. | 5.500% | 12/1/15 | | 5,410 | 5,722 |
| New York State Muni. Bond Bank Agency Special School Purpose Rev. | 5.250% | 6/1/18 | | 7,000 | 7,057 |
| New York State Muni. Bond Bank Agency Special School Purpose Rev. | 5.250% | 12/1/18 | | 8,415 | 8,576 |
| New York State Thruway Auth. Rev. (Highway & Bridge Trust Fund) | 5.000% | 4/1/09 | (1)(ETM) | 4,000 | 4,058 |
| New York State Thruway Auth. Rev. (Highway & Bridge Trust Fund) | 5.250% | 4/1/10 | (1) | 2,500 | 2,590 |
| New York State Thruway Auth. Rev. (Highway & Bridge Trust Fund) | 5.500% | 4/1/11 | (3)(Prere.) | 2,000 | 2,150 |
| New York State Thruway Auth. Rev. (Highway & Bridge Trust Fund) | 5.500% | 4/1/11 | (3)(Prere.) | 3,000 | 3,225 |
| New York State Thruway Auth. Rev. (Highway & Bridge Trust Fund) | 5.250% | 10/1/11 | (1)(Prere.) | 7,500 | 8,013 |
| New York State Thruway Auth. Rev. (Highway & Bridge Trust Fund) | 5.000% | 4/1/13 | (3) | 15,000 | 15,778 |
| New York State Thruway Auth. Rev. (Service Contract) | 5.250% | 4/1/10 | | 11,395 | 11,811 |
| New York State Thruway Auth. Rev. (Service Contract) | 5.500% | 4/1/13 | | 5,500 | 5,816 |
1 | New York State Thruway Auth. Rev. TOB VRDO | 2.400% | 11/7/08 | (2) | 15,370 | 15,370 |
| New York State Urban Dev. Corp. Rev. (Service Contract) | 5.000% | 1/1/12 | | 6,500 | 6,811 |
| Tobacco Settlement Financing Corp. New York Rev. | 5.000% | 6/1/10 | | 5,145 | 5,317 |
| Tobacco Settlement Financing Corp. New York Rev. | 4.000% | 6/1/12 | | 10,000 | 10,104 |
| Tobacco Settlement Financing Corp. New York Rev. | 5.000% | 6/1/12 | | 7,000 | 7,306 |
| Tobacco Settlement Financing Corp. New York Rev. | 5.250% | 6/1/13 | | 1,925 | 1,925 |
| Tobacco Settlement Financing Corp. New York Rev. | 5.500% | 6/1/17 | | 14,950 | 15,078 |
| Tobacco Settlement Financing Corp. New York Rev. | 5.500% | 6/1/18 | | 20,000 | 20,141 |
| Triborough Bridge & Tunnel Auth. New York Rev. | 5.250% | 11/15/08 | | 14,000 | 14,018 |
| Triborough Bridge & Tunnel Auth. New York Rev. | 5.000% | 1/1/14 | (ETM) | 2,045 | 2,198 |
| Triborough Bridge & Tunnel Auth. New York Rev. | 5.000% | 11/15/14 | | 11,690 | 12,460 |
| Troy County NY IDA Civic Fac. Rev. (Rensselaer Polytechnic Institute) PUT | 5.000% | 9/1/10 | | 9,000 | 9,081 |
| | | | | | 921,876 |
North Carolina (2.3%) | | | | | |
| Durham NC COP | 5.000% | 6/1/10 | | 2,170 | 2,240 |
| Durham NC COP | 5.000% | 6/1/11 | | 1,080 | 1,125 |
| Durham NC COP | 5.000% | 6/1/13 | | 1,000 | 1,044 |
| North Carolina Eastern Muni. Power Agency Rev. | 6.125% | 1/1/09 | | 12,870 | 12,927 |
| North Carolina Eastern Muni. Power Agency Rev. | 5.375% | 1/1/10 | | 25,745 | 26,164 |
| North Carolina Eastern Muni. Power Agency Rev. | 5.500% | 1/1/10 | | 6,900 | 7,020 |
39
North Carolina Eastern Muni. Power Agency Rev. | 5.500% | 1/1/11 | | 15,500 | 15,867 |
North Carolina Eastern Muni. Power Agency Rev. | 5.500% | 1/1/12 | | 9,000 | 9,201 |
North Carolina Eastern Muni. Power Agency Rev. | 5.000% | 1/1/14 | | 5,000 | 4,953 |
North Carolina Eastern Muni. Power Agency Rev. | 5.000% | 1/1/15 | | 20,000 | 19,522 |
North Carolina GO | 5.000% | 3/1/12 | | 13,980 | 14,844 |
North Carolina Infrastructure Financial Corp. COP Capital Improvements | 5.000% | 2/1/09 | (4) | 10,000 | 10,080 |
North Carolina Infrastructure Financial Corp. COP Capital Improvements | 5.000% | 2/1/10 | (4) | 10,000 | 10,316 |
North Carolina Medical Care Comm. Health Care Fac. (Novant Health Obligated Group) | 5.000% | 11/1/10 | | 9,180 | 9,393 |
North Carolina Medical Care Comm. Health Care Fac. (Novant Health Obligated Group) | 5.000% | 11/1/14 | | 2,775 | 2,752 |
North Carolina Medical Care Comm. Health Care Fac. (Novant Health Obligated Group) | 5.000% | 11/1/15 | (4) | 7,370 | 7,238 |
Wake County NC Public Improvement GO | 5.000% | 3/1/14 | | 23,000 | 24,649 |
| | | | | 179,335 |
Ohio (2.9%) | | | | | |
American Muni. Power Ohio Inc. Electricity Purchase Rev. | 5.000% | 2/1/13 | | 10,000 | 8,986 |
Buckeye OH Tobacco Settlement Financing Corp. Rev. | 5.000% | 6/1/11 | | 5,000 | 4,892 |
Buckeye OH Tobacco Settlement Financing Corp. Rev. | 5.000% | 6/1/12 | | 1,480 | 1,418 |
Buckeye OH Tobacco Settlement Financing Corp. Rev. | 5.000% | 6/1/14 | | 5,495 | 5,070 |
Cincinnati OH City School Dist. GO | 5.000% | 12/1/12 | (4) | 1,140 | 1,212 |
Cincinnati OH City School Dist. GO | 5.000% | 12/1/13 | (4) | 2,000 | 2,133 |
Cincinnati OH City School Dist. GO | 5.000% | 12/1/13 | (4)(Prere.) | 5,525 | 5,964 |
Columbus OH GO | 5.000% | 9/1/11 | | 5,000 | 5,284 |
Columbus OH GO | 5.000% | 6/15/12 | | 7,955 | 8,454 |
Columbus OH GO | 5.000% | 9/1/12 | | 5,600 | 5,963 |
Columbus OH GO | 5.000% | 9/1/13 | | 5,600 | 5,989 |
Columbus OH GO | 5.000% | 9/1/13 | | 10,430 | 11,155 |
Cuyahoga County OH (Capital Improvement) GO | 0.000% | 10/1/09 | (1) | 4,200 | 4,109 |
Lorain County OH Hosp. Fac. Rev. (Catholic Healthcare Partners) | 5.000% | 4/1/14 | (4) | 4,500 | 4,685 |
Lorain County OH Hosp. Fac. Rev. (Catholic Healthcare Partners) | 5.000% | 4/1/14 | (4) | 4,500 | 4,685 |
Lorain County OH Hosp. Fac. Rev. (Catholic Healthcare Partners) | 5.000% | 4/1/15 | (4) | 5,200 | 5,380 |
Montgomery County OH Rev. (Catholic Health Initiatives) PUT | 4.100% | 11/10/11 | | 12,000 | 12,204 |
Ohio Building Auth. Rev. (Administration Building Fund) | 5.250% | 10/1/15 | (1) | 11,780 | 12,581 |
Ohio Building Auth. Rev. (Adult Correctional Building) | 5.000% | 4/1/12 | (4) | 3,055 | 3,216 |
Ohio Building Auth. Rev. (Adult Correctional Building) | 5.250% | 4/1/14 | | 5,000 | 5,342 |
Ohio Building Auth. Rev. (State Correctional Fac.) | 5.750% | 4/1/10 | (Prere.) | 2,000 | 2,116 |
Ohio Building Auth. Rev. (State Correctional Fac.) | 5.500% | 10/1/10 | (4) | 11,510 | 12,105 |
Ohio Higher Educ. Capital Fac. Rev. | 5.250% | 12/1/11 | | 6,115 | 6,484 |
Ohio Higher Educ. Fac. Comm. Rev. (Case Western Reserve Univ.) | 5.500% | 10/1/12 | (Prere.) | 5,000 | 5,432 |
Ohio Higher Educ. GO | 5.250% | 11/1/11 | | 5,000 | 5,319 |
Ohio Higher Educ. GO | 5.000% | 8/1/12 | | 6,525 | 6,900 |
Ohio Highway Capital Improvements GO | 5.000% | 5/1/12 | | 6,280 | 6,649 |
Ohio Highway Capital Improvements GO | 5.000% | 5/1/13 | | 6,300 | 6,695 |
Ohio Highway Capital Improvements Rev. | 5.250% | 5/1/12 | | 6,805 | 7,277 |
Ohio Infrastructure Improvement GO | 5.000% | 3/1/10 | | 4,000 | 4,138 |
Ohio State Dept. Administrative Services COP (Administrative Knowledge System) | 5.000% | 9/1/10 | (1) | 7,140 | 7,397 |
Ohio State Dept. Administrative Services COP (Administrative Knowledge System) | 5.000% | 9/1/11 | (1) | 3,800 | 3,962 |
Ohio Water Dev. Auth. PCR | 5.250% | 12/1/09 | | 3,625 | 3,758 |
Ohio Water Dev. Auth. PCR | 5.000% | 6/1/13 | | 7,000 | 7,465 |
Ohio Water Dev. Auth. Rev. (Fresh Water Improvement) | 5.000% | 6/1/14 | (Prere.) | 6,300 | 6,770 |
Ohio Water Dev. Auth. Rev. (Pure Water) VRDO | 2.050% | 11/7/08 | | 10,000 | 10,000 |
Scioto County OH Hosp. Rev. (Southern Ohio Medical Center) | 5.000% | 2/15/12 | | 2,625 | 2,623 |
Scioto County OH Hosp. Rev. (Southern Ohio Medical Center) | 5.000% | 2/15/13 | | 2,760 | 2,739 |
Scioto County OH Hosp. Rev. (Southern Ohio Medical Center) | 5.000% | 2/15/14 | | 2,895 | 2,840 |
| | | | | 229,391 |
Oklahoma (1.1%) | | | | | |
Grand River Dam Auth. Oklahoma Rev. | 6.250% | 6/1/11 | (2) | 10,000 | 10,597 |
Grand River Dam Auth. Oklahoma Rev. | 5.000% | 6/1/12 | (4) | 3,500 | 3,709 |
Oklahoma Dev. Finance Auth. Health System Rev. (Integris Baptist) | 5.000% | 8/15/13 | | 2,000 | 2,023 |
Oklahoma Dev. Finance Auth. Health System Rev. (Integris Baptist) | 5.000% | 8/15/14 | | 4,900 | 4,930 |
Oklahoma Dev. Finance Auth. Health System Rev. (Integris Baptist) | 5.000% | 8/15/15 | | 4,670 | 4,652 |
Oklahoma State Capitol Improvement Auth. Fac. Rev. | 5.000% | 9/1/15 | (1) | 9,035 | 9,460 |
Oklahoma State Water Resource Board Rev. | 5.000% | 4/1/15 | | 8,640 | 9,156 |
Oklahoma Turnpike Auth. VRDO | 1.710% | 11/7/08 | | 29,615 | 29,615 |
Tulsa County OK Ind. Auth. Rev. | 5.000% | 5/15/11 | | 10,000 | 10,380 |
Tulsa County OK Ind. Auth. Rev. | 5.000% | 5/15/11 | (4) | 5,300 | 5,562 |
| | | | | 90,084 |
Oregon (0.3%) | | | | | |
Oregon State Dept. Administrative Services | 5.250% | 11/1/11 | (1) | 12,090 | 12,786 |
Tri-County Metro. Transp. Dist. OR (Payroll Tax & Grant Project) | 5.000% | 5/1/12 | (1) | 5,000 | 5,231 |
Tri-County Metro. Transp. Dist. OR (Payroll Tax & Grant Project) | 4.000% | 5/1/14 | (1) | 5,000 | 4,997 |
| | | | | 23,014 |
40
Pennsylvania (4.4%) | | | | | |
| Allegheny County PA Hosp. Dev. Auth. Rev. (Univ. of Pittsburgh Medical Center) | 5.000% | 9/1/14 | | 36,000 | 36,142 |
| Allegheny County PA Port Auth. Rev. | 6.375% | 3/1/09 | (1)(Prere.) | 5,500 | 5,640 |
| Beaver County PA IDA PCR (First Energy) PUT | 3.375% | 10/1/09 | | 5,000 | 4,994 |
| Chester County PA GO | 5.000% | 5/15/15 | (Prere.) | 13,355 | 14,410 |
| Delaware County PA Hosp. Auth. Rev. (Crozer Keystone Obligated Group) | 5.000% | 12/15/10 | | 2,690 | 2,583 |
| Delaware County PA Hosp. Auth. Rev. (Crozer Keystone Obligated Group) | 5.000% | 12/15/12 | | 2,970 | 2,735 |
| Delaware County PA Hosp. Auth. Rev. (Crozer Keystone Obligated Group) | 5.000% | 12/15/14 | | 1,165 | 1,032 |
| Delaware County PA Hosp. Auth. Rev. (Crozer Keystone Obligated Group) | 5.000% | 12/15/14 | | 3,280 | 2,905 |
| Delaware County PA Hosp. Auth. Rev. (Crozer Keystone Obligated Group) | 5.000% | 12/15/15 | | 1,140 | 990 |
| Delaware County PA Hosp. Auth. Rev. (Crozer Keystone Obligated Group) | 5.000% | 12/15/15 | | 3,440 | 2,989 |
| Delaware County PA Hosp. Auth. Rev. (Crozer Keystone Obligated Group) | 5.000% | 12/15/16 | | 1,175 | 1,002 |
| Delaware County PA Hosp. Auth. Rev. (Crozer Keystone Obligated Group) | 5.000% | 12/15/16 | | 3,510 | 2,993 |
| Delaware County PA IDA PCR (BP Exploration & Oil)VRDO | 1.300% | 11/3/08 | LOC | 4,000 | 4,000 |
| Delaware County PA IDA PCR (PECO Energy Co.) | 4.000% | 12/1/12 | | 17,000 | 16,527 |
| Delaware County PA IDA Solid Waste Rev. (Scott Paper Co.) VRDO | 2.000% | 11/7/08 | | 24,490 | 24,490 |
| Lancaster County PA Convention Center Auth. Rev. (Hotel Room) VRDO | 2.300% | 11/7/08 | LOC | 10,000 | 10,000 |
| Montgomery County PA IDA Auth. Retirement Community Rev. (ACTS Retirement— | | | | | |
| Life Communities Obligated Group) | 5.000% | 11/15/10 | | 2,500 | 2,488 |
| Montgomery County PA IDA Auth. Retirement Community Rev. (ACTS Retirement— | | | | | |
| Life Communities Obligated Group) | 5.000% | 11/15/11 | | 2,500 | 2,457 |
| Montgomery County PA IDA Auth. Retirement Community Rev. (ACTS Retirement— | | | | | |
| Life Communities Obligated Group) | 5.000% | 11/15/13 | | 5,675 | 5,380 |
| Pennsylvania GO | 5.500% | 2/1/12 | | 20,950 | 22,429 |
| Pennsylvania Higher Educ. Fac. Auth. Rev. (Drexel Univ.) | 6.000% | 5/1/09 | (Prere.) | 3,470 | 3,544 |
| Pennsylvania Higher Educ. Fac. Auth. Rev. (State System of Higher Educ.) | 5.000% | 8/15/11 | (2) | 4,000 | 4,184 |
| Pennsylvania IDA Rev. (Econ. Dev.) | 5.000% | 7/1/13 | | 5,630 | 5,790 |
| Pennsylvania Turnpike Comm. Rev. | 5.375% | 7/15/11 | (2)(Prere.) | 7,550 | 8,125 |
| Pennsylvania Turnpike Comm. Rev. | 5.375% | 7/15/11 | (2)(Prere.) | 6,370 | 6,855 |
| Pennsylvania Turnpike Comm. Rev. | 5.500% | 7/15/11 | (2)(Prere.) | 12,010 | 12,964 |
| Philadelphia PA Airport Parking Auth. | 5.000% | 9/1/14 | | 2,355 | 2,409 |
| Philadelphia PA Airport Parking Auth. | 5.000% | 9/1/15 | | 4,570 | 4,638 |
| Philadelphia PA Gas Works Rev. | 5.250% | 7/1/09 | (4) | 8,885 | 9,055 |
| Philadelphia PA Gas Works Rev. | 5.500% | 8/1/11 | (4)(Prere.) | 3,315 | 3,550 |
| Philadelphia PA GO | 5.000% | 8/1/11 | (11) | 5,495 | 5,663 |
| Philadelphia PA GO | 5.000% | 8/1/13 | (4) | 19,000 | 19,797 |
| Philadelphia PA GO | 5.125% | 8/1/13 | (11) | 6,050 | 6,257 |
| Philadelphia PA GO | 5.000% | 8/1/14 | (4) | 20,385 | 21,159 |
| Philadelphia PA School Dist. GO | 5.750% | 2/1/11 | (4)(Prere.) | 7,420 | 7,910 |
| Philadelphia PA School Dist. GO | 5.750% | 2/1/11 | (4)(Prere.) | 6,415 | 6,839 |
| Philadelphia PA School Dist. GO | 5.500% | 8/1/11 | (4) | 5,100 | 5,367 |
| Philadelphia PA Water & Waste Water Rev. | 5.000% | 8/1/15 | (2) | 1,500 | 1,529 |
| Pittsburgh PA GO | 5.000% | 9/1/09 | (1)(ETM) | 11,650 | 11,977 |
| Pittsburgh PA GO | 5.000% | 9/1/09 | (1) | 2,815 | 2,867 |
2 | Southcentral Pennsylvania General Auth. Rev. (Wellspan Health) | 5.250% | 6/1/13 | | 6,265 | 6,357 |
2 | Southcentral Pennsylvania General Auth. Rev. (Wellspan Health) | 5.250% | 6/1/14 | | 5,470 | 5,517 |
2 | Southcentral Pennsylvania General Auth. Rev. (Wellspan Health) | 5.500% | 6/1/15 | | 5,000 | 5,051 |
| Southcentral Pennsylvania General Auth. Rev. PUT | 4.500% | 12/1/08 | (2) | 4,500 | 4,504 |
| Tredyffrin-Easttown PA School Dist. GO | 5.000% | 8/15/10 | (Prere.) | 5,175 | 5,413 |
| York County PA Solid Waste & Refuse Auth. Rev. | 5.250% | 12/1/08 | (3) | 2,485 | 2,492 |
| | | | | | 345,999 |
Puerto Rico (1.0%) | | | | | |
| Puerto Rico Convention Center Dist. Auth. Hotel Occupancy Tax Rev. | 5.000% | 7/1/11 | | 2,650 | 2,688 |
| Puerto Rico Electric Power Auth. Rev. | 5.000% | 7/1/12 | | 4,510 | 4,541 |
| Puerto Rico Electric Power Auth. Rev. | 5.250% | 7/1/13 | | 4,000 | 4,044 |
| Puerto Rico GO | 5.000% | 7/1/09 | (ETM) | 460 | 470 |
| Puerto Rico GO | 5.000% | 7/1/09 | (ETM) | 3,595 | 3,676 |
| Puerto Rico GO PUT | 5.000% | 7/1/12 | | 16,000 | 15,768 |
| Puerto Rico Infrastructure Financing Auth. Special Tax Rev. | 5.500% | 7/1/11 | (2) | 5,550 | 5,698 |
| Puerto Rico Infrastructure Financing Auth. Special Tax Rev. | 5.500% | 7/1/12 | (2) | 3,000 | 3,073 |
| Puerto Rico Muni. Finance Agency | 5.000% | 8/1/10 | | 5,000 | 5,073 |
| Puerto Rico Muni. Finance Agency | 5.000% | 8/1/11 | | 7,000 | 7,088 |
| Puerto Rico Public Finance Corp. PUT | 5.750% | 2/1/12 | LOC | 23,265 | 22,995 |
| | | | | | 75,114 |
Rhode Island (0.1%) | | | | | |
| Providence RI GO PUT | 3.950% | 1/15/11 | (11) | 5,000 | 5,079 |
| Rhode Island State & Providence Plantations GO | 5.000% | 11/1/08 | (3) | 3,545 | 3,545 |
| | | | | | 8,624 |
41
South Carolina (0.9%) | | | | | |
| Charleston SC Educ. Excellence Financing Corp. Rev. | 5.000% | 12/1/08 | | 1,745 | 1,749 |
| Charleston SC Educ. Excellence Financing Corp. Rev. | 5.000% | 12/1/09 | | 2,245 | 2,305 |
1 | Charleston SC Educ. Excellence Financing Corp. Rev. (Charleston County School Dist.) TOB VRDO | 1.850% | 11/7/08 | | 33,000 | 33,000 |
| Greenville County SC Hosp. Fac. Rev. | 5.000% | 5/1/13 | | 8,575 | 8,676 |
| Greenville County SC Hosp. Fac. Rev. | 5.000% | 5/1/14 | | 9,355 | 9,407 |
| Greenville County SC Hosp. Fac. Rev. | 5.000% | 5/1/15 | | 7,380 | 7,347 |
| South Carolina Transp. Infrastructure Rev. | 5.100% | 10/1/11 | (2)(Prere.) | 10,000 | 10,631 |
| | | | | | 73,115 |
South Dakota (0.2%) | | | | | |
| South Dakota State Building Auth. Rev. | 5.000% | 12/1/09 | (2) | 5,955 | 6,148 |
| South Dakota State Building Auth. Rev. | 5.000% | 12/1/10 | (2) | 2,680 | 2,803 |
| South Dakota State Building Auth. Rev. | 5.000% | 12/1/11 | (2) | 1,000 | 1,054 |
| South Dakota State Building Auth. Rev. | 5.000% | 12/1/12 | (2) | 3,005 | 3,181 |
| | | | | | 13,186 |
Tennessee (2.4%) | | | | | |
| Clarksville TN Public Building Auth. Rev. (Pooled Financing) VRDO | 0.800% | 11/3/08 | LOC | 9,200 | 9,200 |
| Clarksville TN Public Building Auth. Rev. (Pooled Financing) VRDO | 0.800% | 11/3/08 | LOC | 6,100 | 6,100 |
| Jackson TN Hosp. Rev. (Jackson Madison Hosp.) | 5.250% | 4/1/14 | | 1,500 | 1,487 |
| Jackson TN Hosp. Rev. (Jackson Madison Hosp.) | 5.250% | 4/1/15 | | 1,390 | 1,360 |
| Memphis TN Electric System Rev. | 5.000% | 12/1/10 | (1) | 5,000 | 5,206 |
| Memphis TN Electric System Rev. | 5.000% | 12/1/11 | (1) | 17,000 | 17,794 |
| Metro. Govt. of Nashville & Davidson County TN Health & Educ. Fac. (Vanderbilt Univ.) | 5.000% | 10/1/14 | | 15,000 | 15,958 |
| Metro. Govt. of Nashville & Davidson County TN Health & Educ. Fac. (Vanderbilt Univ.) PUT | 5.000% | 4/1/09 | (1) | 19,075 | 19,243 |
| Metro. Govt. of Nashville & Davidson County TN Health & Educ. Fac. (Vanderbilt Univ.) PUT | 5.000% | 4/1/10 | (1) | 30,890 | 31,537 |
| Montgomery County TN Public Building Auth. Pooled Financial Rev. | | | | | |
| (Tennessee County Loan Pool) VRDO | 0.800% | 11/3/08 | LOC | 4,000 | 4,000 |
| Montgomery County TN Public Building Auth. Pooled Financial Rev. | | | | | |
| (Tennessee County Loan Pool) VRDO | 0.800% | 11/3/08 | LOC | 2,600 | 2,600 |
| Shelby County TN Health Educ. & Housing Fac. Board Rev. (Methodist Le Bonheur) | 5.000% | 6/1/13 | | 4,500 | 4,403 |
| Shelby County TN Health Educ. & Housing Fac. Board Rev. (St. Jude Children's Research Hospital) | 5.000% | 7/1/10 | | 2,570 | 2,645 |
| Shelby County TN Health Educ. & Housing Fac. Board Rev. (St. Jude Children's Research Hospital) | 5.000% | 7/1/11 | | 2,230 | 2,309 |
| Shelby County TN Health Educ. & Housing Fac. Board Rev. (St. Jude Children's Research Hospital) | 5.000% | 7/1/12 | | 2,300 | 2,378 |
| Shelby County TN Health Educ. & Housing Fac. Board Rev. (St. Jude Children's Research Hospital) | 5.000% | 7/1/13 | | 3,600 | 3,714 |
| Shelby County TN Health Educ. & Housing Fac. Board Rev. (St. Jude Children's Research Hospital) | 5.000% | 7/1/14 | | 4,805 | 4,936 |
| Shelby County TN Health Educ. & Housing Fac. Board Rev. (St. Jude Children's Research Hospital) | 5.000% | 7/1/15 | | 5,390 | 5,487 |
| Shelby County TN Health Educ. & Housing Fac. Board Rev. (St. Jude Children's Research Hospital) | 5.000% | 7/1/16 | | 2,500 | 2,522 |
| Tennessee Energy Acquisition Corp. Gas Rev. | 5.000% | 9/1/10 | | 10,000 | 9,658 |
| Tennessee Energy Acquisition Corp. Gas Rev. | 5.000% | 9/1/11 | | 5,000 | 4,695 |
| Tennessee Energy Acquisition Corp. Gas Rev. | 5.000% | 9/1/12 | | 10,000 | 9,084 |
| Tennessee Energy Acquisition Corp. Gas Rev. | 5.000% | 9/1/13 | | 28,000 | 24,845 |
| | | | | | 191,161 |
Texas (11.2%) | | | | | |
| Board of Regents of the Univ. of Texas System Rev. Financing System CP | 5.250% | 8/15/14 | | 2,855 | 3,079 |
| Cypress-Fairbanks TX Independent School Dist. Unlimited Tax Schoolhouse PUT | 5.000% | 8/15/10 | | 5,000 | 5,158 |
| Dallas TX GO | 5.000% | 2/15/09 | | 6,540 | 6,602 |
| Dallas TX GO | 5.000% | 2/15/10 | | 6,540 | 6,759 |
| Dallas TX GO | 5.000% | 2/15/12 | | 26,935 | 28,436 |
| Dallas TX Waterworks & Sewer System Rev. | 5.000% | 10/1/10 | (4) | 5,950 | 6,206 |
| Dallas TX Waterworks & Sewer System Rev. | 5.250% | 10/1/10 | | 5,570 | 5,844 |
| El Paso TX Water & Sewer Rev. | 5.000% | 3/1/14 | (4) | 2,175 | 2,297 |
| El Paso TX Water & Sewer Rev. | 5.000% | 3/1/15 | (4) | 1,500 | 1,580 |
| Fort Bend TX Independent School Dist. GO PUT | 5.000% | 8/15/09 | | 7,500 | 7,631 |
| Garland TX GO | 5.250% | 2/15/11 | (4) | 2,255 | 2,372 |
| Garland TX GO | 5.250% | 2/15/12 | (4) | 2,500 | 2,651 |
| Garland TX Independent School Dist. | 5.000% | 2/15/12 | | 4,210 | 4,447 |
| Grapevine-Colleyville TX Independent School Dist. School Building PUT | 4.000% | 8/1/12 | | 27,465 | 27,620 |
| Harlingen TX Independent School Dist. GO | 5.500% | 8/15/09 | (Prere.) | 4,000 | 4,120 |
| Harris County TX Cultural Educ. Fac. Finance Corp. Rev. (Methodist Hosp.) | 5.250% | 12/1/13 | | 15,000 | 15,152 |
| Harris County TX Cultural Educ. Fac. Finance Corp. Rev. (Methodist Hosp.) | 5.250% | 12/1/14 | | 11,000 | 11,025 |
| Harris County TX Cultural Educ. Fac. Finance Corp. Rev. (Methodist Hosp.) | 5.250% | 12/1/15 | | 6,530 | 6,478 |
| Harris County TX Cultural Educ. Fac. Finance Corp. Rev. (Texas Medical Center) VRDO | 1.250% | 11/3/08 | LOC | 4,875 | 4,875 |
| Harris County TX Flood Control Dist. GO | 5.000% | 10/1/11 | | 5,005 | 5,264 |
| Harris County TX Flood Control Dist. GO | 5.250% | 10/1/14 | (Prere.) | 8,360 | 9,117 |
| Harris County TX Health Fac. Dev. Corp. Hosp. Rev. (Texas Children's Hosp.) VRDO | 1.250% | 11/3/08 | | 24,845 | 24,845 |
| Harris County TX Health Fac. Dev. Corp. Rev. (Methodist Hosp.) VRDO | 1.250% | 11/3/08 | (4) | 9,400 | 9,400 |
| Harris County TX Health Fac. Dev. Corp. Rev. (Methodist Hosp.) VRDO | 1.250% | 11/3/08 | (4) | 11,500 | 11,500 |
| Harris County TX Toll Road Rev. | 6.000% | 8/1/09 | (3) | 4,750 | 4,895 |
| Harris County TX Toll Road Rev. PUT | 5.000% | 8/15/12 | (4) | 24,250 | 25,330 |
1 | Houston TX Airport System Rev. TOB VRDO | 2.580% | 11/7/08 | (4) | 13,200 | 13,200 |
| Houston TX GO | 5.000% | 3/1/10 | (1) | 5,120 | 5,288 |
42
3 | Houston TX GO | 5.500% | 9/1/10 | (4)(Prere.) | 10,885 | 11,492 |
| Houston TX Independent School Dist. GO | 0.000% | 2/15/12 | | 5,535 | 4,894 |
| Houston TX Independent School Dist. GO | 5.000% | 2/15/13 | | 9,000 | 9,539 |
| Houston TX Util. System Rev. | 5.250% | 5/15/10 | (1) | 2,700 | 2,799 |
| Houston TX Util. System Rev. | 5.250% | 11/15/11 | (4) | 4,425 | 4,668 |
| Houston TX Util. System Rev. | 5.000% | 11/15/12 | (4) | 4,270 | 4,489 |
| Houston TX Util. System Rev. | 5.250% | 5/15/16 | (1) | 10,000 | 10,358 |
| Houston TX Util. System Rev. PUT | 5.000% | 5/15/11 | (2) | 12,000 | 12,374 |
1 | Houston TX Util. System Rev. TOB VRDO | 2.570% | 11/7/08 | (4) | 8,000 | 8,000 |
| Klein TX Independent School Dist. Unlimited Tax Schoolhouse GO | 5.000% | 8/1/11 | | 2,050 | 2,160 |
| Lewisville TX Independent School Dist. | 0.000% | 8/15/09 | | 2,430 | 2,384 |
| Lewisville TX Independent School Dist. | 0.000% | 8/15/10 | | 5,000 | 4,727 |
| Lewisville TX Independent School Dist. | 5.000% | 8/15/13 | | 8,225 | 8,704 |
| Lower Colorado River Auth. Texas Rev. | 5.875% | 5/15/17 | (2) | 17,195 | 17,628 |
| Lubbock TX Independent School Dist. VRDO | 4.000% | 11/3/08 | LOC | 41,000 | 41,000 |
1 | Matagorda County TX Navigation Dist. PCR (AEP Texas Central Co. Project) TOB PUT | 4.750% | 3/2/09 | (2) | 39,000 | 39,000 |
| Matagorda County TX Navigation Dist. PCR (Central Power & Light) PUT | 5.125% | 6/1/11 | | 17,500 | 17,510 |
| Montgomery County TX PUT | 5.000% | 9/1/10 | (4) | 3,000 | 3,115 |
| Montgomery County TX PUT | 5.000% | 9/1/10 | (4) | 9,000 | 9,346 |
| North Texas Tollway Auth. (Dallas North Tollway) System Rev. | 5.000% | 1/1/15 | (4)(Prere.) | 10,000 | 10,614 |
| North Texas Tollway Auth. Rev. | 5.000% | 1/1/12 | | 5,580 | 5,704 |
| North Texas Tollway Auth. Rev. | 5.250% | 1/1/12 | | 71,215 | 71,601 |
| North Texas Tollway Auth. Rev. PUT | 5.000% | 1/1/13 | | 31,190 | 30,489 |
| Northside TX Independent School Dist. PUT | 3.780% | 6/1/09 | | 10,000 | 10,089 |
| Northside TX Independent School Dist. PUT | 3.600% | 8/1/09 | | 10,305 | 10,347 |
| Northside TX Independent School Dist. PUT | 3.700% | 8/1/10 | | 8,500 | 8,518 |
| Round Rock TX Independent School Dist. GO | 0.000% | 8/15/09 | (1) | 6,750 | 6,623 |
| SA Energy Acquisition Public Fac. Corp. Texas Gas Supply Rev. | 5.250% | 8/1/13 | | 24,325 | 21,859 |
| SA Energy Acquisition Public Fac. Corp. Texas Gas Supply Rev. | 5.250% | 8/1/14 | | 12,360 | 10,849 |
| San Antonio TX Electric & Gas Rev. | 5.250% | 2/1/11 | | 4,350 | 4,570 |
| San Antonio TX Electric & Gas Rev. | 5.000% | 2/1/14 | | 10,115 | 10,679 |
| San Antonio TX Electric & Gas Rev. | 5.375% | 2/1/15 | | 7,210 | 7,738 |
| San Antonio TX Electric & Gas System PUT | 3.625% | 12/1/10 | | 22,000 | 21,986 |
| Spring Branch TX Independent School Dist. GO | 5.000% | 2/1/13 | | 3,000 | 3,179 |
| Spring Branch TX Independent School Dist. GO | 5.000% | 2/1/14 | | 3,635 | 3,861 |
| Spring TX Independent School Dist. Schoolhouse GO PUT | 5.000% | 8/15/09 | (4) | 10,000 | 10,126 |
| Spring TX Independent School Dist. Schoolhouse GO PUT | 5.000% | 8/15/09 | (4) | 10,000 | 10,126 |
| Tarrant County TX Cultural Educ. Fac. Finance Corp. Rev. (Texas Health Resources) | 5.000% | 2/15/12 | | 3,500 | 3,538 |
| Tarrant County TX Cultural Educ. Fac. Finance Corp. Rev. (Texas Health Resources) | 5.000% | 2/15/13 | | 1,385 | 1,390 |
| Texas A & M Univ. Rev. Financing System | 5.000% | 5/15/11 | | 4,210 | 4,416 |
| Texas A & M Univ. Rev. Financing System | 5.000% | 5/15/11 | | 4,830 | 5,066 |
| Texas Muni. Gas Acquisition & Supply Corp. Rev. | 2.219% | 12/15/09 | | 25,560 | 24,026 |
| Texas Muni. Gas Acquisition & Supply Corp. Rev. | 2.289% | 9/15/10 | | 5,005 | 4,630 |
| Texas Muni. Gas Acquisition & Supply Corp. Rev. | 5.000% | 12/15/12 | | 5,000 | 4,505 |
| Texas Muni. Gas Acquisition & Supply Corp. Rev. | 5.000% | 12/15/13 | | 1,000 | 882 |
| Texas Muni. Power Agency Rev. | 4.400% | 9/1/11 | (3) | 10,185 | 10,194 |
| Texas State Transp. Comm. First Tier | 5.000% | 4/1/12 | | 9,605 | 10,122 |
| Texas State Transp. Comm. First Tier | 5.000% | 4/1/13 | | 12,000 | 12,678 |
| Texas State Transp. Comm. First Tier | 5.000% | 4/1/14 | | 27,410 | 29,006 |
| Texas State Univ. System Rev. | 5.000% | 3/15/12 | | 2,380 | 2,506 |
| Texas State Univ. System Rev. | 5.000% | 3/15/15 | | 7,005 | 7,381 |
| Texas Transp. Comm. Mobility Fund GO | 5.000% | 4/1/09 | | 1,415 | 1,434 |
| Titus County TX Fresh Water Supply Dist. Rev. | 4.500% | 7/1/11 | | 3,500 | 3,428 |
| Tyler TX Health Fac. Dev. Corp. (East Texas Medical Center) | 5.000% | 11/1/08 | | 1,500 | 1,500 |
| Tyler TX Health Fac. Dev. Corp. (East Texas Medical Center) | 5.000% | 11/1/09 | | 2,125 | 2,129 |
| Univ. of Texas Permanent Univ. Fund Rev. | 5.000% | 8/15/09 | | 2,610 | 2,677 |
| Univ. of Texas Permanent Univ. Fund Rev. | 5.000% | 8/15/09 | | 2,500 | 2,564 |
| Univ. of Texas Permanent Univ. Fund Rev. | 5.000% | 7/1/10 | | 4,175 | 4,342 |
| Williamson County TX GO | 5.500% | 2/15/11 | (4)(Prere.) | 4,845 | 5,140 |
| | | | | | 877,870 |
Utah (0.6%) | | | | | |
| Murray UT Hosp. Rev. (IHC Health Services) VRDO | 1.250% | 11/3/08 | | 21,400 | 21,400 |
| Murray UT Hosp. Rev. (IHC Health Services) VRDO | 1.760% | 11/7/08 | | 7,200 | 7,200 |
| Salt Lake County UT GO | 5.000% | 6/15/10 | | 9,100 | 9,476 |
| Utah Muni. Finance Coop. Local Govt. Rev. | 0.000% | 3/1/11 | (4) | 6,000 | 5,516 |
| Utah Transit Auth. Sales Tax Rev. | 5.000% | 12/15/12 | (4)(Prere.) | 4,425 | 4,724 |
| | | | | | 48,316 |
Virginia (1.1%) | | | | | |
| Chesapeake VA Econ. Dev. Auth. PUT | 3.600% | 2/1/13 | | 5,000 | 4,864 |
| Fairfax County VA Water Auth. Rev. | 5.000% | 4/1/14 | (Prere.) | 21,535 | 23,039 |
| Loudoun County VA GO | 5.250% | 11/1/08 | | 4,410 | 4,410 |
43
| New River Valley VA Jail Auth. Fac. Rev. | 4.000% | 4/1/11 | | 5,810 | 5,849 |
| Tobacco Settlement Financing Corp. Virginia Rev. | 5.625% | 6/1/15 | (Prere.) | 5,000 | 5,465 |
| Virginia College Building Auth. Educ. Fac. Rev. (21st Century College) | 5.000% | 2/1/10 | | 17,925 | 18,496 |
| Virginia GO | 5.000% | 6/1/14 | | 8,750 | 9,390 |
| Virginia Public Building Auth. Rev. | 5.000% | 8/1/13 | | 5,000 | 5,319 |
| Virginia Public School Auth. Rev. | 5.000% | 8/1/09 | | 2,000 | 2,049 |
| Virginia Public School Auth. Rev. | 5.000% | 8/1/09 | | 2,720 | 2,787 |
| Virginia Public School Auth. Rev. | 5.000% | 8/1/10 | | 2,500 | 2,606 |
| Virginia Public School Auth. Rev. | 5.000% | 8/1/10 | | 2,865 | 2,986 |
| Virginia Public School Auth. Rev. | 5.000% | 8/1/11 | | 1,500 | 1,581 |
| | | | | | 88,841 |
Washington (3.8%) | | | | | |
| Central Puget Sound WA Regional Transit Auth. Sales & Use Tax Rev. | 5.000% | 11/1/14 | (2) | 8,125 | 8,600 |
| Energy Northwest Washington Electric Refunding Rev. (Columbia Generating Station) | 5.500% | 7/1/10 | (1) | 12,795 | 13,385 |
| Energy Northwest Washington Electric Refunding Rev. (Columbia Generating Station) | 5.000% | 7/1/15 | | 7,500 | 7,899 |
| Energy Northwest Washington Electric Refunding Rev. (Project No. 1) | 5.000% | 7/1/11 | | 45,365 | 47,588 |
| Energy Northwest Washington Electric Refunding Rev. (Project No. 1) | 5.000% | 7/1/12 | | 2,500 | 2,638 |
| Energy Northwest Washington Electric Refunding Rev. (Project No. 1) | 5.500% | 7/1/17 | (1) | 8,000 | 8,326 |
| Energy Northwest Washington Electric Refunding Rev. (Project No. 1) | 6.000% | 7/1/17 | (1) | 7,300 | 7,751 |
| Energy Northwest Washington Electric Refunding Rev. (Project No. 3) | 5.000% | 7/1/15 | | 6,000 | 6,319 |
| Energy Northwest Washington Electric Refunding Rev. (Project No. 3) | 5.000% | 7/1/15 | | 8,450 | 8,899 |
| Energy Northwest Washington Electric Refunding Rev. (Project No. 3) | 6.000% | 7/1/16 | (2) | 9,000 | 9,556 |
| Energy Northwest Washington Electric Refunding Rev. (Project No. 3) | 6.000% | 7/1/16 | (4) | 10,000 | 10,695 |
| King County WA (Bellevue School Dist.) GO | 5.000% | 12/1/11 | | 18,000 | 18,987 |
| King County WA GO (Refunding Baseball Stadium) | 5.000% | 12/1/10 | | 12,385 | 12,964 |
1 | King County WA Sewer Rev. TOB VRDO | 2.020% | 11/7/08 | (1) | 10,890 | 10,890 |
| Port of Seattle WA Rev. | 5.000% | 3/1/11 | (4) | 8,275 | 8,665 |
| Port of Seattle WA Rev. | 5.000% | 3/1/12 | (4) | 5,000 | 5,269 |
| Seattle WA Drain & Wastewater Rev. | 4.000% | 2/1/10 | (1) | 3,565 | 3,633 |
| Seattle WA Water System Rev. | 5.000% | 2/1/15 | (4) | 4,725 | 4,982 |
| Tacoma WA Electric System Rev. | 5.000% | 1/1/12 | (4) | 5,000 | 5,246 |
| Tacoma WA Electric System Rev. | 5.000% | 1/1/13 | (4) | 10,485 | 11,027 |
| Tacoma WA Electric System Rev. | 5.000% | 1/1/14 | (4) | 25,720 | 27,043 |
| Thurston County Washington School District GO | 5.000% | 12/1/15 | (4) | 7,100 | 7,360 |
| Washington GO | 5.000% | 7/1/09 | | 5,520 | 5,636 |
| Washington GO | 4.000% | 1/1/11 | | 12,585 | 12,895 |
| Washington GO | 5.000% | 7/1/12 | (2) | 11,530 | 12,185 |
1 | Washington GO TOB VRDO | 2.020% | 11/7/08 | | 10,700 | 10,700 |
1 | Washington GO TOB VRDO | 2.450% | 11/7/08 | (4) | 7,805 | 7,805 |
| | | | | | 296,943 |
West Virginia (0.3%) | | | | | |
| West Virginia Econ. Dev. Auth. PCR (Appalachian Power Company) PUT | 4.850% | 9/4/13 | | 6,000 | 5,719 |
| West Virginia Hosp. Finance Auth. Rev. (Charleston Medical Center) VRDO | 0.800% | 11/3/08 | LOC | 16,000 | 16,000 |
| | | | | | 21,719 |
Wisconsin (0.7%) | | | | | |
| Wisconsin GO | 5.000% | 5/1/10 | | 5,160 | 5,347 |
| Wisconsin GO | 5.000% | 5/1/12 | (1) | 15,775 | 16,648 |
| Wisconsin Health & Educ. Fac. Auth. Rev. (Milwaukee Institute) PUT | 5.000% | 1/1/10 | LOC | 3,185 | 3,240 |
| Wisconsin Health & Educ. Fac. Auth. Rev. (Ministry Health Care) | 5.000% | 8/1/14 | (4) | 5,000 | 5,136 |
| Wisconsin Health & Educ. Fac. Auth. Rev. (Ministry Health Care) | 5.000% | 8/1/15 | (4) | 2,000 | 2,034 |
| Wisconsin Public Power System Power Supply System Rev. | 5.000% | 7/1/14 | (4) | 4,145 | 4,390 |
| Wisconsin Public Power System Power Supply System Rev. | 5.000% | 7/1/15 | (4) | 11,390 | 12,023 |
| Wisconsin Transp. Rev. | 5.000% | 7/1/12 | | 1,000 | 1,056 |
| Wisconsin Transp. Rev. | 5.000% | 7/1/13 | | 1,100 | 1,165 |
| Wisconsin Transp. Rev. | 5.000% | 7/1/15 | | 2,000 | 2,111 |
| | | | | | 53,150 |
Total Tax-Exempt Municipal Bonds (Cost $7,760,609) | | | | | 7,694,453 |
| | | | | | |
| | | | | | |
| | | | | Shares | |
Temporary Cash Investment (0.9%) | | | | | |
4 | Vanguard Municipal Cash Management Fund (Cost $74,723) | 1.701% | | | 74,722,668 | 74,723 |
Total Investments (99.1%) (Cost $7,835,332) | | | | | 7,769,176 |
Other Assets and Liabilities (0.9%) | | | | | |
Other Assets | | | | | 120,798 |
Liabilities | | | | | (51,770) |
| | | | | | 69,028 |
Net Assets (100%) | | | | | 7,838,204 |
44
At October 31, 2008, net assets consisted of: | |
| Amount |
| ($000) |
Paid-in Capital | 7,990,250 |
Undistributed Net Investment Income | — |
Accumulated Net Realized Losses | (91,966) |
Unrealized Appreciation (Depreciation) | |
Investment Securities | (66,156) |
Futures Contracts | 6,076 |
Net Assets | 7,838,204 |
| |
| |
Investor Shares—Net Assets | |
Applicable to 196,544,715 outstanding $.001 par value shares of beneficial interest (unlimited authorization) | 2,094,049 |
Net Asset Value Per Share—Investor Shares | $10.65 |
| |
| |
Admiral Shares—Net Assets | |
Applicable to 539,138,254 outstanding $.001 par value shares of beneficial interest (unlimited authorization) | 5,744,155 |
Net Asset Value Per Share—Admiral Shares | $10.65 |
• See Note A in Notes to Financial Statements.
1 Security exempt from registration under Rule 144A of the Securities Act of 1933. Such securities may be sold in transactions exempt from registration, normally to qualified institutional buyers. At October 31, 2008, the aggregate value of these securities was $305,727,000, representing 3.9% of net assets.
2 Security purchased on a when-issued or delayed-delivery basis for which the fund has not taken delivery as of October 31, 2008.
3 Securities with a value of $12,515,000 have been segregated as initial margin for open futures contracts.
4 Affiliated money market fund available only to Vanguard funds and certain trusts and accounts managed by Vanguard. Rate shown is the 7-day yield. For key to abbreviations and other references, see back cover.
See accompanying Notes, which are an integral part of the Financial Statements.
45
Intermediate-Term Tax-Exempt Fund
| | | | | Face | Market |
| | | Maturity | | Amount | Value• |
| | Coupon | Date | | ($000) | ($000) |
Tax-Exempt Municipal Bonds (99.3%) | | | | | |
Alabama (1.3%) | | | | | |
| Alabama GO | 5.250% | 6/1/12 | | 5,105 | 5,343 |
| Alabama GO | 5.250% | 6/1/13 | | 5,105 | 5,323 |
| Alabama GO | 5.250% | 6/1/14 | | 5,155 | 5,375 |
| Alabama GO | 5.250% | 6/1/15 | | 3,455 | 3,595 |
| Alabama Public School & College Auth. | 5.000% | 12/1/19 | | 58,350 | 59,306 |
| Alabama Public School & College Auth. | 5.000% | 12/1/20 | | 60,660 | 61,106 |
| Alabama Public School & College Auth. | 5.000% | 12/1/21 | | 63,100 | 63,073 |
| Alabama Public School & College Auth. | 5.000% | 12/1/22 | | 14,095 | 13,999 |
| Courtland AL Dev. Board Pollution Control Rev. (International Paper Co.) | 5.000% | 6/1/25 | | 5,000 | 3,455 |
| Jefferson County AL Sewer Rev. (Capital Improvement) | 5.000% | 8/1/12 | (3)(Prere.) | 15,040 | 16,045 |
| | | | | | 236,620 |
Alaska (0.1%) | | | | | |
| Anchorage AK Electric Rev. | 8.000% | 12/1/11 | (1) | 5,395 | 6,110 |
| Matanuska-Susitna Borough AK GO | 5.500% | 3/1/12 | (3) | 6,000 | 6,252 |
| North Slope Borough AK GO | 0.000% | 6/30/10 | (1) | 8,000 | 7,566 |
| | | | | | 19,928 |
Arizona (1.9%) | | | | | |
| Arizona COP | 5.000% | 9/1/25 | (4) | 10,000 | 9,392 |
| Arizona COP | 5.000% | 9/1/27 | (4) | 5,000 | 4,631 |
| Arizona Health Fac. Auth. Rev. (Banner Health) | 5.000% | 1/1/24 | | 10,000 | 8,875 |
| Arizona Health Fac. Auth. Rev. (Banner Health) | 5.000% | 1/1/25 | | 8,000 | 7,043 |
| Arizona School Fac. Board Rev. (State School Improvement) | 5.500% | 7/1/11 | (Prere.) | 5,500 | 5,883 |
| Arizona School Fac. Board Rev. (State School Improvement) | 5.500% | 7/1/11 | (Prere.) | 5,000 | 5,348 |
| Arizona School Fac. Board Rev. COP | 5.000% | 9/1/11 | (1) | 10,000 | 10,512 |
| Arizona Transp. Board Excise Tax Rev. | 5.000% | 7/1/18 | | 10,000 | 10,283 |
| Arizona Transp. Board Excise Tax Rev. | 5.000% | 7/1/19 | | 10,000 | 10,168 |
| Arizona Transp. Board Excise Tax Rev. | 5.000% | 7/1/20 | | 11,500 | 11,584 |
| Arizona Transp. Board Excise Tax Rev. | 5.000% | 7/1/21 | | 16,300 | 16,316 |
| Arizona Transp. Board Excise Tax Rev. | 5.000% | 7/1/24 | | 10,000 | 9,808 |
| Arizona Transp. Board Excise Tax Rev. | 5.000% | 7/1/25 | | 8,040 | 7,844 |
| Arizona Transp. Board Highway Rev. | 5.000% | 7/1/17 | | 11,960 | 12,269 |
| Arizona Transp. Board Highway Rev. | 5.250% | 7/1/18 | | 4,000 | 4,125 |
| Arizona Transp. Board Highway Rev. | 5.250% | 7/1/19 | | 4,110 | 4,218 |
| Arizona Transp. Board Highway Rev. | 5.000% | 7/1/23 | | 8,180 | 8,199 |
| Arizona Transp. Board Highway Rev. | 5.000% | 7/1/24 | | 2,000 | 1,998 |
| Arizona Transp. Board Highway Rev. | 5.000% | 7/1/25 | | 5,000 | 4,966 |
| Arizona Transp. Board Highway Rev. | 5.000% | 7/1/27 | | 5,000 | 4,922 |
| Maricopa County AZ IDA Health Fac. Rev. (Catholic Healthcare West) | 5.000% | 7/1/16 | | 6,500 | 6,243 |
| Maricopa County AZ IDA Health Fac. Rev. (Catholic Healthcare West) | 5.000% | 7/1/17 | | 10,000 | 9,480 |
| Maricopa County AZ IDA Health Fac. Rev. (Catholic Healthcare West) | 5.000% | 7/1/18 | | 6,000 | 5,598 |
| Mesa AZ Util. System Rev. | 5.000% | 7/1/19 | (3) | 10,000 | 9,573 |
| Mesa AZ Util. System Rev. | 5.000% | 7/1/21 | (3) | 12,000 | 11,713 |
| Phoenix AZ Civic Improvement Corp. Airport Rev. | 5.000% | 7/1/14 | | 5,110 | 5,351 |
| Phoenix AZ Civic Improvement Corp. Airport Rev. | 5.000% | 7/1/15 | | 5,000 | 5,218 |
| Phoenix AZ Civic Improvement Corp. Airport Rev. | 5.000% | 7/1/16 | | 3,055 | 3,171 |
| Phoenix AZ Civic Improvement Corp. Airport Rev. | 5.000% | 7/1/23 | | 5,000 | 4,838 |
| Phoenix AZ Civic Improvement Corp. Airport Rev. | 5.000% | 7/1/24 | | 2,235 | 2,146 |
| Phoenix AZ Civic Improvement Corp. Airport Rev. | 5.000% | 7/1/25 | | 5,000 | 4,766 |
| Phoenix AZ Civic Improvement Corp. Airport Rev. | 5.000% | 7/1/27 | | 9,530 | 8,978 |
| Phoenix AZ Civic Improvement Corp. Excise Tax Rev. | 4.750% | 7/1/23 | | 5,005 | 4,692 |
| Phoenix AZ Civic Improvement Corp. Excise Tax Rev. | 4.750% | 7/1/24 | | 7,805 | 7,241 |
| Phoenix AZ Civic Improvement Corp. Wastewater System Rev. | 5.375% | 7/1/12 | (3) | 9,645 | 10,055 |
| Phoenix AZ Civic Improvement Corp. Wastewater System Rev. | 5.375% | 7/1/13 | (3) | 5,000 | 5,184 |
| Phoenix AZ Civic Improvement Corp. Wastewater System Rev. | 5.375% | 7/1/14 | (3) | 6,820 | 7,058 |
1 | Phoenix AZ Civic Improvement Corp. Wastewater System Rev. | 5.500% | 7/1/24 | | 2,500 | 2,552 |
| Phoenix AZ Civic Improvement Corp. Water System Rev. | 5.500% | 7/1/14 | (3) | 4,215 | 4,420 |
| Salt River Project Arizona Agricultural Improvement & Power Dist. Rev. | 5.000% | 1/1/23 | | 4,000 | 4,014 |
| Salt River Project Arizona Agricultural Improvement & Power Dist. Rev. | 5.000% | 1/1/26 | | 2,755 | 2,727 |
| Salt River Project Arizona Agricultural Improvement & Power Dist. Rev. | 5.000% | 1/1/27 | | 3,365 | 3,314 |
| Salt River Project Arizona Agricultural Improvement & Power Dist. Rev. | 5.000% | 1/1/28 | | 2,500 | 2,446 |
| Salt Verde Arizona Financial Project Rev. | 5.250% | 12/1/21 | | 3,500 | 2,534 |
| Salt Verde Arizona Financial Project Rev. | 5.250% | 12/1/22 | | 3,790 | 2,714 |
| Salt Verde Arizona Financial Project Rev. | 5.250% | 12/1/23 | | 8,335 | 5,851 |
| Salt Verde Arizona Financial Project Rev. | 5.250% | 12/1/24 | | 4,485 | 3,102 |
| Salt Verde Arizona Financial Project Rev. | 5.250% | 12/1/25 | | 18,880 | 12,835 |
| Salt Verde Arizona Financial Project Rev. | 5.250% | 12/1/26 | | 22,645 | 15,365 |
| Scottsdale AZ Muni. Property Corp. Excise Tax Rev. | 5.000% | 7/1/16 | (Prere.) | 4,000 | 4,308 |
46
Scottsdale AZ Muni. Property Corp. Excise Tax Rev. | 5.000% | 7/1/16 | (Prere.) | 7,350 | 7,916 |
Scottsdale AZ Muni. Property Corp. Excise Tax Rev. | 5.000% | 7/1/16 | (Prere.) | 7,780 | 8,379 |
Scottsdale AZ Muni. Property Corp. Excise Tax Rev. | 5.000% | 7/1/16 | (Prere.) | 6,210 | 6,688 |
Tucson AZ GO | 7.375% | 7/1/13 | | 3,750 | 4,367 |
| | | | | 363,221 |
California (12.4%) | | | | | |
Bay Area Toll Auth. CA Toll Bridge Rev. | 5.000% | 4/1/21 | | 7,000 | 7,021 |
Bay Area Toll Auth. CA Toll Bridge Rev. | 5.000% | 4/1/21 | | 20,195 | 20,250 |
Bay Area Toll Auth. CA Toll Bridge Rev. | 5.000% | 4/1/22 | | 5,800 | 5,776 |
Bay Area Toll Auth. CA Toll Bridge Rev. | 5.000% | 4/1/23 | | 28,000 | 27,659 |
Bay Area Toll Auth. CA Toll Bridge Rev. | 5.000% | 4/1/23 | | 13,500 | 13,336 |
Bay Area Toll Auth. CA Toll Bridge Rev. | 5.000% | 4/1/24 | | 29,930 | 29,361 |
Bay Area Toll Auth. CA Toll Bridge Rev. | 5.000% | 4/1/24 | | 12,955 | 12,709 |
Bay Area Toll Auth. CA Toll Bridge Rev. | 5.000% | 4/1/25 | | 17,000 | 16,590 |
California Dept. of Water Resources Water System Rev. (Central Valley) | 5.000% | 12/1/25 | | 7,520 | 7,351 |
California GO | 6.300% | 9/1/10 | | 4,000 | 4,231 |
California GO | 5.250% | 10/1/13 | (1) | 6,115 | 6,457 |
California GO | 5.250% | 2/1/14 | | 20,000 | 20,906 |
California GO | 5.000% | 6/1/14 | (Prere.) | 8,580 | 9,148 |
California GO | 5.250% | 11/1/14 | | 10,000 | 10,448 |
California GO | 5.000% | 3/1/15 | | 11,910 | 12,303 |
California GO | 5.250% | 11/1/15 | | 10,225 | 10,597 |
California GO | 6.000% | 2/1/16 | | 2,000 | 2,173 |
California GO | 5.000% | 4/1/16 | | 10,000 | 10,289 |
California GO | 5.000% | 4/1/17 | | 10,000 | 10,196 |
California GO | 6.000% | 4/1/18 | | 11,980 | 12,922 |
California GO | 5.000% | 9/1/18 | | 34,300 | 34,452 |
California GO | 5.000% | 12/1/18 | | 85 | 85 |
California GO | 5.000% | 8/1/20 | | 21,070 | 20,687 |
California GO | 5.000% | 12/1/21 | | 16,365 | 15,893 |
California GO | 5.000% | 3/1/22 | (2) | 10,000 | 9,797 |
California GO | 5.000% | 12/1/22 | | 13,080 | 12,619 |
California GO | 5.000% | 3/1/23 | | 38,920 | 37,340 |
California GO | 5.000% | 3/1/23 | | 35,495 | 34,054 |
California GO | 5.000% | 6/1/23 | (2) | 10,000 | 9,747 |
California GO | 5.125% | 11/1/23 | | 7,000 | 6,797 |
California GO | 5.000% | 3/1/24 | | 30,390 | 28,918 |
California GO | 5.000% | 11/1/24 | | 6,630 | 6,301 |
California GO | 5.000% | 12/1/24 | | 14,260 | 13,548 |
California GO | 5.000% | 3/1/25 | | 14,125 | 13,340 |
California GO | 5.000% | 8/1/26 | | 9,000 | 8,435 |
California GO | 5.500% | 8/1/26 | | 30,115 | 30,045 |
California GO | 5.000% | 9/1/27 | | 4,140 | 3,848 |
California GO | 5.000% | 11/1/27 | | 8,000 | 7,434 |
California Health Fac. Finance Auth. Rev. (Catholic Healthcare West) | 5.125% | 7/1/22 | | 16,000 | 15,179 |
California Health Fac. Finance Auth. Rev. (Cedars-Sinai Medical Center) | 5.000% | 11/15/17 | | 8,000 | 7,681 |
California Health Fac. Finance Auth. Rev. (Cedars-Sinai Medical Center) | 5.000% | 11/15/19 | | 3,135 | 2,910 |
California Health Fac. Finance Auth. Rev. (Cedars-Sinai Medical Center) | 5.000% | 11/15/20 | | 4,180 | 3,793 |
California Health Fac. Finance Auth. Rev. (Cedars-Sinai Medical Center) | 5.000% | 11/15/21 | | 6,165 | 5,490 |
California Health Fac. Finance Auth. Rev. (Scripps Health) | 5.000% | 10/1/19 | | 8,080 | 7,482 |
California Health Fac. Finance Auth. Rev. (Scripps Health) | 5.500% | 10/1/20 | | 4,000 | 3,811 |
California Health Fac. Finance Auth. Rev. (Scripps Health) | 5.000% | 10/1/21 | | 7,110 | 6,284 |
California Health Fac. Finance Auth. Rev. (Scripps Health) | 5.000% | 10/1/22 | | 3,250 | 2,837 |
California Health Fac. Finance Auth. Rev. (Sutter Health) | 5.000% | 8/15/15 | | 7,550 | 7,564 |
California Health Fac. Finance Auth. Rev. (Sutter Health) | 5.500% | 8/15/16 | | 5,000 | 5,104 |
California Health Fac. Finance Auth. Rev. (Sutter Health) | 5.500% | 8/15/17 | | 5,000 | 5,076 |
California Infrastructure & Econ. Dev. Bank Rev. | 5.000% | 2/1/14 | | 9,000 | 9,414 |
California Public Works Board Lease Rev. (Dept. of Corrections) | 5.000% | 6/1/25 | | 3,100 | 2,860 |
California Public Works Board Lease Rev. (State Archives) | 5.375% | 12/1/09 | | 4,555 | 4,565 |
California Public Works Board Lease Rev. (State Archives) | 5.375% | 12/1/10 | | 6,635 | 6,647 |
California Public Works Board Lease Rev. (State Archives) | 5.375% | 12/1/12 | | 7,895 | 7,909 |
California Public Works Board Lease Rev. (Univ. of California) | 5.000% | 5/1/14 | | 8,370 | 8,802 |
California Public Works Board Lease Rev. (Univ. of California) | 5.000% | 5/1/15 | | 10,105 | 10,574 |
California Public Works Board Lease Rev. (Univ. of California) | 5.000% | 5/1/16 | | 8,750 | 9,061 |
California Public Works Board Lease Rev. (Univ. of California) | 5.000% | 5/1/17 | | 7,085 | 7,275 |
California Public Works Board Lease Rev. (Univ. of California) | 5.000% | 5/1/18 | | 6,500 | 6,595 |
California Public Works Board Lease Rev. (Univ. of California) | 5.000% | 5/1/19 | | 11,820 | 11,881 |
California Public Works Board Lease Rev. (Univ. of California) | 5.000% | 5/1/20 | | 10,000 | 9,914 |
California Public Works Board Lease Rev. (Univ. of California) | 5.000% | 5/1/21 | | 15,230 | 14,929 |
California Public Works Board Lease Rev. (Univ. of California) | 5.000% | 5/1/22 | | 15,985 | 15,522 |
47
| California Public Works Board Lease Rev. (Univ. of California) | 5.000% | 5/1/23 | | 11,465 | 11,030 |
| California Public Works Board Lease Rev. (Univ. of California) | 5.000% | 5/1/24 | | 10,000 | 9,543 |
| California Public Works Board Lease Rev. (Univ. of California) | 5.000% | 5/1/25 | | 7,500 | 7,112 |
| California Public Works Board Lease Rev. (Univ. of California) | 5.000% | 5/1/26 | | 7,500 | 7,058 |
| California State Dept. of Water Resources Power Supply Rev. | 5.375% | 5/1/12 | (2)(Prere.) | 37,000 | 40,336 |
| California State Dept. of Water Resources Power Supply Rev. | 5.500% | 5/1/12 | (1) | 8,000 | 8,517 |
| California State Dept. of Water Resources Power Supply Rev. | 6.000% | 5/1/12 | (Prere.) | 15,000 | 16,662 |
| California State Dept. of Water Resources Power Supply Rev. | 6.000% | 5/1/13 | | 20,000 | 21,618 |
| California State Dept. of Water Resources Power Supply Rev. | 5.500% | 5/1/14 | (2) | 10,000 | 10,580 |
| California State Dept. of Water Resources Power Supply Rev. | 5.500% | 5/1/15 | (2) | 61,875 | 65,071 |
| California State Dept. of Water Resources Power Supply Rev. | 5.000% | 5/1/17 | | 10,000 | 10,364 |
| California State Dept. of Water Resources Power Supply Rev. | 5.000% | 5/1/18 | | 12,000 | 12,301 |
| California State Econ. Recovery Bonds | 5.000% | 7/1/15 | | 93,700 | 98,017 |
| California State Econ. Recovery Bonds | 5.000% | 7/1/16 | | 7,000 | 7,232 |
| California State Econ. Recovery Bonds PUT | 5.000% | 3/1/10 | | 155,000 | 158,393 |
| California State Econ. Recovery Bonds PUT | 5.000% | 7/1/10 | | 155,000 | 158,827 |
| California Statewide Community Dev. Auth. Rev. (Catholic Healthcare West) | 6.000% | 7/1/09 | (ETM) | 155 | 159 |
| California Statewide Community Dev. Auth. Rev. (Catholic Healthcare West) | 6.000% | 7/1/09 | (ETM) | 515 | 528 |
| California Statewide Community Dev. Auth. Rev. (Kaiser Permanente) PUT | 4.700% | 6/1/09 | | 55,000 | 55,802 |
| California Statewide Community Dev. Auth. Rev. (Kaiser Permanente) PUT | 3.900% | 7/1/14 | | 23,550 | 21,988 |
| East Bay CA Muni. Util. Dist. Water System Rev. | 5.250% | 6/1/11 | (1)(Prere.) | 8,110 | 8,642 |
| Fresno CA Sewer Rev. | 6.250% | 9/1/14 | (2) | 12,000 | 12,733 |
| Fresno CA Sewer Rev. | 5.000% | 9/1/25 | (12) | 4,775 | 4,616 |
| Fresno CA Sewer Rev. | 5.000% | 9/1/26 | (12) | 7,625 | 7,320 |
| Fresno CA Sewer Rev. | 5.000% | 9/1/27 | (12) | 7,835 | 7,467 |
| Golden State Tobacco Securitization Corp. California | 6.750% | 6/1/13 | (Prere.) | 79,735 | 89,970 |
| Golden State Tobacco Securitization Corp. California | 5.000% | 6/1/14 | | 9,000 | 8,324 |
| Golden State Tobacco Securitization Corp. California | 5.000% | 6/1/15 | | 6,505 | 5,895 |
| Golden State Tobacco Securitization Corp. California | 5.000% | 6/1/16 | | 12,545 | 11,121 |
| Golden State Tobacco Securitization Corp. California | 5.000% | 6/1/21 | (2) | 15,000 | 13,274 |
| Golden State Tobacco Securitization Corp. California | 4.500% | 6/1/27 | | 12,605 | 10,035 |
| Golden State Tobacco Securitization Corp. California | 5.000% | 6/1/29 | (2) | 40,000 | 31,635 |
| Golden State Tobacco Securitization Corp. California | 5.000% | 6/1/30 | (2) | 20,000 | 15,579 |
| Golden State Tobacco Securitization Corp. California | 6.250% | 6/1/13 | (Prere.) | 106,840 | 114,101 |
| Long Beach CA USD GO | 0.000% | 8/1/23 | (12) | 1,995 | 872 |
| Long Beach CA USD GO | 0.000% | 8/1/26 | (12) | 2,925 | 1,049 |
| Los Angeles CA Dept. of Airports International Airport Rev. | 5.000% | 5/15/23 | | 3,115 | 2,972 |
| Los Angeles CA Dept. of Airports International Airport Rev. | 5.000% | 5/15/26 | | 3,250 | 3,030 |
| Los Angeles CA Dept. of Airports International Airport Rev. | 5.000% | 5/15/27 | | 3,250 | 3,013 |
| Los Angeles CA Dept. of Airports International Airport Rev. | 5.000% | 5/15/28 | | 3,960 | 3,645 |
| Los Angeles CA Dept. of Water & Power Rev. | 5.250% | 7/1/15 | | 20,000 | 20,810 |
| Los Angeles CA USD GO | 5.000% | 7/1/21 | (4) | 5,825 | 5,861 |
| Los Angeles CA USD GO | 5.000% | 7/1/21 | (4) | 10,000 | 10,062 |
| Los Angeles CA USD GO | 5.000% | 7/1/22 | (4) | 22,410 | 22,416 |
| Los Angeles CA USD GO | 5.000% | 7/1/23 | (3) | 46,690 | 45,224 |
| Los Angeles CA USD GO | 5.000% | 7/1/23 | (3) | 24,035 | 23,281 |
| Los Angeles CA USD GO | 5.000% | 7/1/23 | (4) | 6,425 | 6,378 |
| Los Angeles CA USD GO | 5.000% | 7/1/24 | (1) | 19,915 | 19,304 |
| Los Angeles CA USD GO | 5.000% | 7/1/25 | (4) | 7,330 | 7,191 |
| Los Angeles CA USD GO | 5.000% | 7/1/25 | (4) | 5,000 | 4,905 |
| Los Angeles County CA Transp. Comm. Sales Tax Rev. | 6.500% | 7/1/10 | (4) | 31,030 | 32,197 |
| Northern California Power Agency (Hydroelectric Project) | 5.000% | 7/1/24 | (12) | 6,000 | 5,859 |
| Oakland CA Redev. Agency (Central Dist.) | 5.000% | 9/1/21 | (2) | 11,775 | 10,963 |
| Oakland CA Redev. Agency (Central Dist.) | 5.000% | 9/1/22 | (2) | 7,015 | 6,473 |
| Palmdale CA Community Redev. Agency | 5.000% | 9/1/28 | (1) | 11,690 | 10,935 |
| Redding CA Electric System COP | 5.000% | 6/1/23 | (4) | 6,875 | 6,715 |
| Redding CA Electric System COP | 5.000% | 6/1/25 | (4) | 7,860 | 7,576 |
| Redding CA Electric System COP | 5.000% | 6/1/27 | (4) | 4,660 | 4,427 |
| Saddleback Valley CA USD | 5.000% | 8/1/23 | (4) | 5,460 | 5,332 |
| San Bernardino County CA Medical Center COP | 7.000% | 8/1/09 | (1) | 9,705 | 10,003 |
| San Bernardino County CA Medical Center COP | 7.000% | 8/1/10 | (1) | 10,525 | 11,130 |
| San Diego CA USD GO | 5.500% | 7/1/24 | (4) | 6,620 | 6,917 |
| San Diego CA USD GO | 5.500% | 7/1/25 | (4) | 14,680 | 15,299 |
| San Diego CA USD GO | 5.500% | 7/1/27 | (4) | 17,695 | 18,323 |
| San Diego CA Water Auth. Rev. COP | 5.250% | 5/1/18 | (3) | 14,690 | 15,319 |
| San Joaquin Hills CA Transp. Corridor Agency Toll Road Rev. | 0.000% | 1/15/21 | (1) | 12,385 | 5,850 |
| San Jose CA Redev. Agency | 5.000% | 8/1/20 | (2) | 20,000 | 19,100 |
| San Jose CA Redev. Agency | 5.000% | 8/1/23 | (2) | 25,000 | 23,197 |
| San Jose CA Redev. Agency | 5.000% | 8/1/24 | (1) | 30,000 | 27,570 |
1 | San Jose CA Redev. Agency | 6.500% | 8/1/28 | | 26,085 | 25,431 |
| San Mateo County CA Joint Powers Auth. Lease Rev. | 4.625% | 7/15/25 | | 2,000 | 1,771 |
| San Mateo County CA Joint Powers Auth. Lease Rev. | 5.250% | 7/15/28 | | 2,000 | 1,899 |
48
| Santa Clara County CA Financing Auth. Lease Rev. | 5.000% | 11/15/19 | | 13,825 | 13,896 |
| Santa Clara County CA Financing Auth. Lease Rev. | 5.000% | 11/15/20 | | 10,000 | 9,897 |
| Santa Rosa CA Waste Water Rev. | 0.000% | 9/1/27 | (2) | 11,125 | 3,484 |
| Univ. of California Rev. | 5.000% | 5/15/21 | | 11,125 | 11,127 |
| Univ. of California Rev. | 5.000% | 5/15/22 | | 10,000 | 9,918 |
1 | Ventura County CA Community College Dist. GO | 0.000% | 8/1/23 | | 6,155 | 2,552 |
1 | Ventura County CA Community College Dist. GO | 0.000% | 8/1/24 | | 8,050 | 3,115 |
1 | Ventura County CA Community College Dist. GO | 0.000% | 8/1/25 | | 8,000 | 2,891 |
1 | Ventura County CA Community College Dist. GO | 0.000% | 8/1/26 | | 8,500 | 2,866 |
1 | Ventura County CA Community College Dist. GO | 0.000% | 8/1/27 | | 11,000 | 3,463 |
| West Basin CA Muni. Water Dist. Rev. COP | 5.000% | 8/1/25 | (12) | 5,500 | 5,242 |
| West Basin CA Muni. Water Dist. Rev. COP | 5.000% | 8/1/27 | (12) | 5,000 | 4,709 |
| | | | | | 2,329,531 |
Colorado (1.5%) | | | | | |
| Colorado Dept. of Transp. Rev. | 5.375% | 6/15/12 | (Prere.) | 8,500 | 9,238 |
| Colorado Dept. of Transp. Rev. | 5.500% | 6/15/12 | (1) | 11,780 | 12,620 |
| Colorado Dept. of Transp. Rev. | 5.500% | 6/15/13 | (1) | 14,500 | 15,633 |
| Colorado Dept. of Transp. Rev. | 5.000% | 12/15/15 | (3) | 57,325 | 60,383 |
| Colorado Educ. & Cultural Fac. Auth. Rev. (National Jewish Board Program) VRDO | 1.250% | 11/3/08 | LOC | 9,025 | 9,025 |
| Colorado Health Fac. Auth. Rev. (Poudre Valley Health) | 6.000% | 12/1/09 | (4)(Prere.) | 5,185 | 5,474 |
| Colorado Health Fac. Auth. Rev. (Poudre Valley Health) | 6.000% | 12/1/09 | (4)(Prere.) | 5,500 | 5,807 |
| Colorado Health Fac. Auth. Rev. (Sisters of Charity Health System Inc.) | 5.250% | 12/1/09 | (1) | 2,965 | 3,000 |
| Colorado Health Fac. Auth. Rev. (Sisters of Charity Health System Inc.) | 5.250% | 12/1/10 | (1) | 1,740 | 1,755 |
| Colorado Health Fac. Auth. Rev. (Sisters of Charity Health System Inc.) | 5.250% | 12/1/11 | (1) | 3,415 | 3,431 |
| Colorado Springs CO Util. System Rev. | 5.000% | 11/15/09 | | 5,000 | 5,160 |
| Colorado Springs CO Util. System Rev. | 5.375% | 11/15/12 | | 12,620 | 13,328 |
| Colorado Springs CO Util. System Rev. | 5.375% | 11/15/14 | | 12,745 | 13,336 |
| Denver CO City & County Airport Rev. | 5.000% | 11/15/23 | (10) | 10,000 | 9,232 |
| Denver CO City & County Airport Rev. | 5.000% | 11/15/24 | (10) | 10,000 | 9,142 |
| Denver CO City & County GO (Medical Fac.) | 5.000% | 8/1/14 | | 7,065 | 7,479 |
| E-470 Public Highway Auth. Colorado Rev. | 0.000% | 9/1/10 | (1)(Prere.) | 8,100 | 6,955 |
| E-470 Public Highway Auth. Colorado Rev. | 0.000% | 9/1/11 | (1) | 8,000 | 7,078 |
| E-470 Public Highway Auth. Colorado Rev. | 0.000% | 9/1/11 | (1)(ETM) | 6,600 | 6,008 |
| E-470 Public Highway Auth. Colorado Rev. | 0.000% | 9/1/17 | (1) | 24,490 | 14,750 |
| E-470 Public Highway Auth. Colorado Rev. | 5.250% | 9/1/18 | (1) | 7,850 | 7,619 |
| E-470 Public Highway Auth. Colorado Rev. | 5.250% | 9/1/18 | (1) | 6,355 | 6,168 |
| E-470 Public Highway Auth. Colorado Rev. | 0.000% | 9/1/19 | (1) | 15,100 | 7,653 |
| E-470 Public Highway Auth. Colorado Rev. | 0.000% | 9/1/24 | (1) | 20,000 | 6,885 |
| E-470 Public Highway Auth. Colorado Rev. | 5.500% | 9/1/24 | (1) | 10,000 | 9,338 |
| E-470 Public Highway Auth. Colorado Rev. | 5.500% | 9/1/24 | (1) | 10,000 | 9,338 |
| E-470 Public Highway Auth. Colorado Rev. | 5.500% | 9/1/24 | (1) | 5,000 | 4,669 |
| Larimer County CO School Dist. No. R-1 Poudre GO | 5.000% | 12/15/16 | (4) | 10,135 | 10,604 |
| Univ. of Colorado Enterprise System Rev. | 5.000% | 6/1/21 | (3) | 6,605 | 6,599 |
| | | | | | 287,707 |
Connecticut (2.0%) | | | | | |
| Connecticut GO | 5.375% | 12/15/10 | (Prere.) | 6,165 | 6,522 |
| Connecticut GO | 5.375% | 6/15/11 | (Prere.) | 5,000 | 5,287 |
| Connecticut GO | 5.125% | 11/15/11 | (Prere.) | 5,675 | 6,064 |
| Connecticut GO | 5.125% | 11/15/11 | (Prere.) | 25,375 | 26,816 |
| Connecticut GO | 5.500% | 11/15/11 | (4) | 21,215 | 22,773 |
| Connecticut GO | 5.500% | 12/15/11 | (1) | 9,000 | 9,675 |
| Connecticut GO | 5.500% | 12/15/12 | (4) | 5,020 | 5,452 |
| Connecticut GO | 5.000% | 4/15/13 | | 9,745 | 10,356 |
| Connecticut GO | 5.000% | 11/1/13 | | 10,000 | 10,671 |
| Connecticut GO | 5.125% | 11/15/13 | | 19,000 | 19,818 |
| Connecticut GO | 5.500% | 12/15/13 | | 4,705 | 5,132 |
| Connecticut GO | 5.000% | 4/15/14 | | 13,690 | 14,581 |
| Connecticut GO | 5.500% | 12/15/14 | | 7,700 | 8,432 |
| Connecticut GO | 5.000% | 4/15/15 | | 16,155 | 17,195 |
| Connecticut GO | 5.000% | 11/1/15 | | 5,000 | 5,334 |
| Connecticut GO | 5.000% | 12/15/15 | | 14,345 | 15,311 |
| Connecticut GO | 5.000% | 4/15/16 | | 13,725 | 14,569 |
| Connecticut GO | 5.000% | 5/1/16 | | 10,000 | 10,616 |
| Connecticut GO | 5.000% | 4/15/17 | | 17,095 | 18,026 |
| Connecticut GO | 5.000% | 12/15/17 | | 5,400 | 5,669 |
| Connecticut GO | 5.000% | 12/15/18 | | 11,000 | 11,410 |
| Connecticut GO VRDO | 4.500% | 11/7/08 | | 86,225 | 86,225 |
| Connecticut Special Tax Obligation Rev. (Transp. Infrastructure) | 7.125% | 6/1/10 | | 8,270 | 8,598 |
| Connecticut Special Tax Obligation Rev. (Transp. Infrastructure) | 5.375% | 10/1/13 | (4) | 20,000 | 20,974 |
| Connecticut State Health & Educ. Fac. Auth. (Connecticut State Univ. System) | 5.000% | 11/1/12 | (4) | 6,275 | 6,678 |
| | | | | | 372,184 |
49
Delaware (0.1%) | | | | | |
Delaware Transp. Auth. Transp. System Rev. | 5.000% | 7/1/14 | | 1,625 | 1,733 |
Delaware Transp. Auth. Transp. System Rev. | 5.000% | 7/1/15 | | 14,220 | 15,155 |
| | | | | 16,888 |
District of Columbia (1.0%) | | | | | |
District of Columbia GO | 5.500% | 6/1/09 | (4)(Prere.) | 1,890 | 1,947 |
District of Columbia GO | 5.500% | 6/1/10 | (2) | 10,490 | 10,929 |
District of Columbia GO | 5.500% | 6/1/10 | (4) | 15,000 | 15,632 |
District of Columbia GO | 5.750% | 6/1/10 | (1) | 15,465 | 16,081 |
District of Columbia GO | 6.000% | 6/1/11 | (1) | 6,550 | 6,985 |
District of Columbia GO | 5.500% | 6/1/12 | (4) | 4,630 | 4,743 |
District of Columbia GO | 0.000% | 6/1/13 | (1) | 10,945 | 8,889 |
District of Columbia GO | 0.000% | 6/1/14 | (1) | 16,650 | 12,725 |
District of Columbia GO | 5.000% | 6/1/19 | (4) | 5,325 | 5,381 |
District of Columbia GO | 5.000% | 6/1/20 | (4) | 11,940 | 11,946 |
District of Columbia GO | 5.000% | 6/1/21 | (4) | 10,880 | 10,800 |
District of Columbia Hosp. Rev. (Medlantic Health Group) | 6.000% | 8/15/10 | (1)(ETM) | 2,555 | 2,714 |
District of Columbia Hosp. Rev. (Medlantic Health Group) | 6.000% | 8/15/12 | (1)(ETM) | 2,995 | 3,295 |
District of Columbia Rev. (American Univ.) VRDO | 0.800% | 11/3/08 | LOC | 24,000 | 24,000 |
District of Columbia Rev. (Georgetown Univ.) | 5.000% | 4/1/21 | (2) | 5,610 | 5,307 |
District of Columbia Rev. (Georgetown Univ.) | 5.000% | 4/1/22 | (2) | 5,800 | 5,433 |
District of Columbia Rev. (Georgetown Univ.) | 5.000% | 4/1/23 | (2) | 6,600 | 6,131 |
District of Columbia Rev. (Georgetown Univ.) | 5.000% | 4/1/24 | (2) | 6,190 | 5,695 |
District of Columbia Rev. (Georgetown Univ.) PUT | 4.700% | 4/1/18 | | 23,500 | 21,789 |
District of Columbia Water & Sewer Auth. Public Util. Rev. | 5.500% | 10/1/23 | (4) | 15,115 | 15,613 |
| | | | | 196,035 |
Florida (7.8%) | | | | | |
Brevard County FL School Board COP | 5.000% | 7/1/23 | (12) | 4,615 | 4,283 |
Brevard County FL School Board COP | 5.000% | 7/1/24 | (12) | 4,850 | 4,458 |
Brevard County FL School Board COP | 5.000% | 7/1/25 | (12) | 5,090 | 4,638 |
Broward County FL Resource Recovery Rev. (Wheelabrator Series A) | 5.375% | 12/1/09 | | 15,885 | 16,082 |
Broward County FL Resource Recovery Rev. (Wheelabrator-South) | 5.375% | 12/1/09 | | 2,000 | 2,025 |
Broward County FL Resource Recovery Rev. (Wheelabrator-South) | 5.375% | 12/1/10 | | 21,330 | 21,580 |
Broward County FL School Board COP | 5.375% | 7/1/18 | (4) | 6,000 | 6,041 |
Broward County FL School Board COP | 5.250% | 7/1/20 | (1) | 4,155 | 4,045 |
Broward County FL School Board COP | 5.250% | 7/1/24 | (4) | 12,480 | 12,015 |
Broward County FL School Board COP | 5.250% | 7/1/25 | (4) | 12,235 | 11,710 |
Citizens Property Insurance Corp. Florida (High Risk Account) | 5.000% | 3/1/14 | (1) | 35,000 | 35,232 |
Florida Board of Educ. Capital Outlay | 6.000% | 6/1/10 | (Prere.) | 4,530 | 4,824 |
Florida Board of Educ. Capital Outlay | 5.000% | 6/1/13 | | 8,395 | 8,876 |
Florida Board of Educ. Capital Outlay | 5.000% | 6/1/13 | | 3,720 | 3,933 |
Florida Board of Educ. Capital Outlay | 5.250% | 6/1/13 | | 5,045 | 5,385 |
Florida Board of Educ. Capital Outlay | 5.250% | 6/1/13 | | 3,845 | 4,104 |
Florida Board of Educ. Capital Outlay | 5.000% | 6/1/14 | | 3,910 | 4,135 |
Florida Board of Educ. Capital Outlay | 5.000% | 6/1/15 | | 4,105 | 4,332 |
Florida Board of Educ. Public Educ. | 5.250% | 6/1/13 | (4) | 17,825 | 18,944 |
Florida Board of Educ. Public Educ. | 5.375% | 6/1/13 | | 6,820 | 7,267 |
Florida Board of Educ. Public Educ. | 5.000% | 6/1/14 | | 5,040 | 5,325 |
Florida Board of Educ. Public Educ. | 5.375% | 6/1/15 | | 11,000 | 11,559 |
Florida Board of Educ. Rev. (Lottery Rev.) | 5.250% | 7/1/10 | (3) | 5,800 | 5,869 |
Florida Board of Educ. Rev. (Lottery Rev.) | 5.250% | 7/1/11 | (3) | 10,840 | 10,966 |
Florida Board of Educ. Rev. (Lottery Rev.) | 5.250% | 7/1/12 | (3) | 11,410 | 11,543 |
Florida Board of Educ. Rev. (Lottery Rev.) | 5.250% | 7/1/13 | (3) | 7,150 | 7,536 |
Florida Board of Educ. Rev. (Lottery Rev.) | 5.250% | 7/1/13 | (2) | 18,200 | 19,214 |
Florida Board of Educ. Rev. (Lottery Rev.) | 5.500% | 7/1/13 | (2) | 10,875 | 11,389 |
Florida Board of Educ. Rev. (Lottery Rev.) | 5.500% | 7/1/13 | (3) | 7,860 | 8,351 |
Florida Board of Educ. Rev. (Lottery Rev.) | 5.000% | 7/1/14 | (1) | 6,000 | 6,273 |
Florida Board of Educ. Rev. (Lottery Rev.) | 5.250% | 7/1/14 | (3) | 3,700 | 3,881 |
Florida Board of Educ. Rev. (Lottery Rev.) | 5.250% | 7/1/14 | (2) | 19,155 | 20,218 |
Florida Board of Educ. Rev. (Lottery Rev.) | 5.000% | 7/1/15 | (1) | 10,240 | 10,615 |
Florida Board of Educ. Rev. (Lottery Rev.) | 5.250% | 7/1/15 | (2) | 10,165 | 10,701 |
Florida Board of Educ. Rev. (Lottery Rev.) | 5.375% | 7/1/15 | (3) | 5,000 | 5,175 |
Florida Board of Educ. Rev. (Lottery Rev.) | 5.000% | 7/1/16 | (2) | 6,215 | 6,408 |
Florida Board of Educ. Rev. (Lottery Rev.) | 5.375% | 7/1/17 | (3) | 6,000 | 6,181 |
Florida Board of Educ. Rev. (Lottery Rev.) | 5.000% | 7/1/20 | (2) | 12,845 | 12,567 |
Florida Board of Educ. Rev. (Lottery Rev.) | 5.000% | 7/1/21 | (2) | 13,390 | 12,986 |
Florida Board of Educ. Rev. (Lottery Rev.) | 5.000% | 7/1/23 | (2) | 11,235 | 10,717 |
Florida Board of Educ. Rev. (Lottery Rev.) | 5.000% | 7/1/24 | | 13,700 | 13,279 |
Florida Board of Educ. Rev. (Lottery Rev.) | 5.000% | 7/1/24 | | 11,385 | 11,035 |
Florida Board of Educ. Rev. (Lottery Rev.) | 5.000% | 7/1/25 | | 14,385 | 13,864 |
Florida Board of Educ. Rev. (Lottery Rev.) | 5.000% | 7/1/25 | | 13,215 | 12,736 |
50
| Florida Board of Educ. Rev. (Lottery Rev.) | 5.000% | 7/1/26 | | 13,875 | 13,308 |
| Florida Board of Educ. Rev. (Lottery Rev.) | 5.000% | 7/1/27 | | 15,855 | 15,114 |
2 | Florida Board of Educ. Rev. (Lottery Rev.) TOB VRDO | 2.650% | 11/7/08 | | 16,805 | 16,805 |
| Florida Dept. of Environmental Protection & Preservation Rev. | 5.000% | 7/1/09 | (4) | 18,580 | 18,939 |
| Florida Dept. of Environmental Protection & Preservation Rev. | 5.000% | 7/1/09 | (1) | 14,330 | 14,607 |
| Florida Dept. of Environmental Protection & Preservation Rev. | 5.750% | 7/1/10 | (3) | 3,615 | 3,775 |
| Florida Dept. of Environmental Protection & Preservation Rev. | 5.375% | 7/1/13 | (1) | 7,645 | 8,090 |
| Florida Dept. of Environmental Protection & Preservation Rev. | 5.500% | 7/1/13 | (4) | 11,920 | 12,710 |
| Florida Dept. of Environmental Protection & Preservation Rev. | 5.000% | 7/1/19 | | 5,855 | 5,715 |
| Florida Dept. of Environmental Protection & Preservation Rev. | 5.000% | 7/1/23 | | 8,595 | 8,026 |
| Florida Dept. of Environmental Protection & Preservation Rev. | 5.000% | 7/1/24 | (1) | 10,000 | 9,509 |
| Florida Dept. of Environmental Protection & Preservation Rev. | 5.000% | 7/1/24 | | 9,025 | 8,349 |
| Florida Dept. of Environmental Protection & Preservation Rev. | 5.000% | 7/1/24 | (1) | 10,045 | 9,552 |
| Florida Dept. of Environmental Protection & Preservation Rev. | 5.000% | 7/1/24 | | 10,025 | 9,274 |
| Florida Dept. of Environmental Protection & Preservation Rev. | 5.000% | 7/1/25 | (1) | 6,700 | 6,254 |
| Florida Dept. of Environmental Protection & Preservation Rev. | 5.000% | 7/1/25 | | 9,475 | 8,690 |
| Florida Dept. of Environmental Protection & Preservation Rev. | 5.000% | 7/1/25 | | 10,525 | 9,653 |
| Florida Dept. of Environmental Protection & Preservation Rev. | 5.000% | 7/1/26 | (1) | 10,045 | 9,310 |
| Florida Dept. of Environmental Protection & Preservation Rev. | 5.000% | 7/1/26 | | 9,950 | 9,056 |
| Florida Dept. of Environmental Protection & Preservation Rev. | 5.000% | 7/1/26 | | 11,055 | 10,062 |
| Florida Dept. of Environmental Protection & Preservation Rev. | 5.000% | 7/1/27 | | 5,445 | 4,923 |
| Florida Dept. of Environmental Protection & Preservation Rev. | 5.000% | 7/1/27 | | 11,605 | 10,493 |
| Florida Dept. of Environmental Protection & Preservation Rev. | 5.000% | 7/1/28 | | 10,970 | 9,841 |
| Florida Dept. of Transp. | 6.375% | 7/1/11 | | 10,635 | 11,502 |
| Florida Dept. of Transp. | 5.250% | 7/1/15 | | 4,000 | 4,109 |
| Florida Division Board Financial Dept. of General Services Systems Rev. | | | | | |
| (Dept. of Environmental Protection) | 6.000% | 7/1/12 | (2) | 11,500 | 12,419 |
| Florida Hurricane Catastrophe Fund Finance Corp. Rev. | 5.000% | 7/1/12 | | 40,000 | 41,738 |
| Florida Hurricane Catastrophe Fund Finance Corp. Rev. | 5.250% | 7/1/12 | | 17,865 | 18,793 |
| Florida Hurricane Catastrophe Fund Finance Corp. Rev. | 5.000% | 7/1/13 | | 38,000 | 39,683 |
| Florida Hurricane Catastrophe Fund Finance Corp. Rev. | 5.000% | 7/1/14 | | 14,000 | 14,602 |
| Florida Muni. Power Agency Rev. | 5.000% | 10/1/27 | | 12,500 | 11,770 |
| Florida Muni. Power Agency Rev. (Stanton Project) | 5.500% | 10/1/13 | (4) | 3,905 | 4,142 |
| Florida Turnpike Auth. Rev. | 5.250% | 7/1/11 | (3) | 2,185 | 2,210 |
| Florida Turnpike Auth. Rev. | 5.250% | 7/1/11 | (4) | 5,000 | 5,279 |
| Florida Turnpike Auth. Rev. | 5.000% | 7/1/16 | (4) | 10,000 | 10,381 |
| Florida Turnpike Auth. Rev. | 5.000% | 7/1/19 | (2) | 4,425 | 4,454 |
| Florida Turnpike Auth. Rev. | 5.000% | 7/1/20 | (2) | 4,645 | 4,633 |
| Florida Turnpike Auth. Rev. | 5.000% | 7/1/25 | (2) | 5,885 | 5,672 |
| Fort Myers FL Rev. | 5.000% | 12/1/25 | (1) | 7,340 | 6,975 |
| Highlands County FL Health Rev. (Adventist Health System) | 5.000% | 11/15/15 | (Prere.) | 820 | 877 |
| Highlands County FL Health Rev. (Adventist Health System) | 5.000% | 11/15/15 | (Prere.) | 125 | 134 |
| Highlands County FL Health Rev. (Adventist Health System) | 5.000% | 11/15/15 | (Prere.) | 145 | 155 |
| Highlands County FL Health Rev. (Adventist Health System) | 5.000% | 11/15/15 | (Prere.) | 260 | 278 |
| Highlands County FL Health Rev. (Adventist Health System) | 5.000% | 11/15/15 | (Prere.) | 190 | 203 |
| Highlands County FL Health Rev. (Adventist Health System) | 5.000% | 11/15/20 | | 1,000 | 880 |
| Highlands County FL Health Rev. (Adventist Health System) | 5.000% | 11/15/20 | | 875 | 770 |
| Highlands County FL Health Rev. (Adventist Health System) | 5.000% | 11/15/21 | | 1,000 | 859 |
| Highlands County FL Health Rev. (Adventist Health System) | 5.000% | 11/15/21 | | 135 | 116 |
| Highlands County FL Health Rev. (Adventist Health System) | 5.000% | 11/15/22 | | 1,000 | 848 |
| Highlands County FL Health Rev. (Adventist Health System) | 5.000% | 11/15/22 | | 740 | 627 |
| Highlands County FL Health Rev. (Adventist Health System) | 5.000% | 11/15/23 | | 500 | 418 |
| Highlands County FL Health Rev. (Adventist Health System) | 5.000% | 11/15/23 | | 1,310 | 1,096 |
| Highlands County FL Health Rev. (Adventist Health System) | 5.000% | 11/15/27 | | 10,000 | 8,003 |
| Hillsborough County FL Assement Rev. | 5.000% | 3/1/22 | (12) | 6,260 | 5,865 |
| Hillsborough County FL IDA Rev. (Tampa Electric Co. Project) PUT | 5.000% | 3/15/12 | (2) | 8,000 | 8,048 |
| Hillsborough County FL IDA (Univ. Community Hosp.) | 5.500% | 8/15/17 | | 3,650 | 3,326 |
| Hillsborough County FL School Board COP | 5.500% | 7/1/14 | (1) | 4,370 | 4,597 |
| Hillsborough County FL Util. Rev. | 5.500% | 8/1/13 | (2) | 10,000 | 10,616 |
| Jacksonville FL Electric Auth. Rev. (St. John's River Power Park) | 5.000% | 10/1/19 | (1) | 5,000 | 5,025 |
| Jacksonville FL Electric Auth. Rev. (St. John's River Power Park) | 5.000% | 10/1/20 | (1) | 5,000 | 4,986 |
| Jacksonville FL Health Fac. Auth. Hosp. Rev. (Baptist Medical Center) VRDO | 1.250% | 11/3/08 | LOC | 24,000 | 24,000 |
| Jacksonville FL Sales Taxes Rev. | 5.500% | 10/1/13 | (3) | 3,045 | 3,246 |
| Jacksonville FL Sales Taxes Rev. | 5.000% | 10/1/23 | | 5,415 | 5,126 |
| Jacksonville FL Sales Taxes Rev. | 5.000% | 10/1/24 | | 5,685 | 5,346 |
| Jacksonville FL Sales Taxes Rev. | 5.000% | 10/1/25 | | 5,970 | 5,581 |
| Jacksonville FL Sales Taxes Rev. | 4.750% | 10/1/28 | | 13,280 | 11,479 |
2 | Jacksonville FL Transp. Rev. TOB VRDO | 3.320% | 11/7/08 | (1) | 6,330 | 6,330 |
| Lakeland FL Electric & Water Rev. | 6.050% | 10/1/12 | (4) | 10,000 | 10,855 |
| Miami-Dade County FL Aviation—Miami International Airport | 5.000% | 10/1/10 | (3) | 2,540 | 2,607 |
| Miami-Dade County FL Aviation—Miami International Airport | 5.000% | 10/1/23 | (12) | 2,500 | 2,340 |
| Miami-Dade County FL Educ. Fac. Auth. Rev. (Univ. of Miami) | 5.000% | 4/1/14 | (2)(Prere.) | 13,760 | 14,707 |
51
| Miami-Dade County FL Educ. Fac. Auth. Rev. (Univ. of Miami) | 5.000% | 4/1/14 | (2)(Prere.) | 10,910 | 11,661 |
| Miami-Dade County FL Educ. Fac. Auth. Rev. (Univ. of Miami) | 5.000% | 4/1/24 | (2) | 5,275 | 4,854 |
| Miami-Dade County FL School Board COP | 5.250% | 8/1/09 | (2) | 11,320 | 11,457 |
| Miami-Dade County FL School Board COP | 5.000% | 8/1/11 | (2) | 6,845 | 7,064 |
| Miami-Dade County FL School Board COP | 5.000% | 8/1/12 | (2) | 8,525 | 8,803 |
| Miami-Dade County FL School Board COP | 5.000% | 8/1/13 | (2) | 10,000 | 10,310 |
| Miami-Dade County FL School Board COP | 5.000% | 5/1/16 | (12) | 9,335 | 9,655 |
| Miami-Dade County FL School Board COP | 5.000% | 11/1/21 | (2) | 3,280 | 3,090 |
| Miami-Dade County FL School Board COP | 5.000% | 11/1/22 | (2) | 3,155 | 2,950 |
| Miami-Dade County FL School Board COP | 5.250% | 5/1/23 | (12) | 25,200 | 24,848 |
| Miami-Dade County FL School Board COP | 5.000% | 11/1/23 | (2) | 2,500 | 2,318 |
| Miami-Dade County FL School Board COP | 5.250% | 5/1/24 | (12) | 29,650 | 29,035 |
| Miami-Dade County FL School Board COP | 5.250% | 5/1/25 | (12) | 14,225 | 13,842 |
| Miami-Dade County FL School Board COP | 5.000% | 11/1/25 | (2) | 5,025 | 4,574 |
| Miami-Dade County FL School Board COP | 5.250% | 5/1/26 | (12) | 15,980 | 15,448 |
| Miami-Dade County FL School Board COP | 5.250% | 5/1/27 | (12) | 15,760 | 15,165 |
| Miami-Dade County FL School Board COP | 5.250% | 5/1/28 | (12) | 15,530 | 14,872 |
| Miami-Dade County FL Water & Sewer Rev. | 5.250% | 10/1/21 | | 20,000 | 19,741 |
| Miami-Dade County FL Water & Sewer Rev. | 5.000% | 10/1/26 | (1) | 8,000 | 7,226 |
| North Brevard County FL Hosp. Dist. Rev. (Parrish Medical Center Project) | 5.500% | 10/1/28 | | 5,000 | 4,158 |
| Orange County FL IDA Ind. Dev. Rev. (Catholic Charities) VRDO | 1.200% | 11/3/08 | LOC | 7,100 | 7,100 |
| Orange County FL School Board COP | 5.000% | 8/1/23 | (3) | 9,000 | 8,317 |
| Orange County FL School Board COP | 5.000% | 8/1/24 | (3) | 4,000 | 3,661 |
| Orange County FL School Board COP | 4.500% | 8/1/26 | | 10,000 | 8,660 |
| Orange County FL School Board COP | 4.500% | 8/1/27 | | 10,000 | 8,597 |
| Orange County FL Tourist Dev. Rev. | 5.000% | 10/1/20 | (1) | 25,345 | 24,172 |
| Orange County FL Tourist Dev. Rev. | 5.000% | 10/1/21 | (1) | 16,605 | 15,653 |
| Orange County FL Tourist Dev. Rev. | 5.000% | 10/1/27 | (2) | 12,630 | 11,331 |
| Orlando & Orange County FL Expressway Auth. | 5.250% | 7/1/14 | (2) | 4,000 | 4,133 |
| Orlando & Orange County FL Expressway Auth. VRDO | 5.000% | 11/7/08 | (4) | 29,970 | 29,970 |
| Orlando FL Util. Comm. Water & Electric Rev. | 5.250% | 10/1/13 | (ETM) | 10,000 | 10,888 |
| Orlando FL Util. Comm. Water & Electric Rev. | 5.250% | 10/1/14 | (ETM) | 5,000 | 5,453 |
| Pinellas County FL Health Fac. Auth. Rev. (Bayfront Hosp.) VRDO | 1.200% | 11/3/08 | LOC | 4,900 | 4,900 |
| Putman County FL Auth. PCR PUT | 5.350% | 5/1/18 | (2) | 7,500 | 7,063 |
| Seminole County FL Water & Sewer Rev. | 5.000% | 10/1/23 | | 5,000 | 4,857 |
| Seminole County FL Water & Sewer Rev. | 5.000% | 10/1/24 | | 7,805 | 7,531 |
| South Florida Water Management Dist. | 5.000% | 10/1/13 | (2) | 5,000 | 5,244 |
| South Florida Water Management Dist. | 5.000% | 10/1/14 | (2) | 9,460 | 9,911 |
| South Florida Water Management Dist. | 5.000% | 10/1/15 | (2) | 5,800 | 6,055 |
| South Florida Water Management Dist. | 5.000% | 10/1/16 | (2) | 3,000 | 3,113 |
| South Florida Water Management Dist. | 5.000% | 10/1/24 | (2) | 4,000 | 3,839 |
| South Florida Water Management Dist. | 5.000% | 10/1/25 | (2) | 8,000 | 7,622 |
| Tallahassee FL Health Fac. Rev. (Tallahassee Memorial Healthcare) | 6.250% | 12/1/20 | | 10,000 | 8,982 |
| Tampa FL Health System Rev. (Catholic Healthcare East) | 5.250% | 11/15/11 | (1) | 3,000 | 2,995 |
| Tampa-Hillsborough County FL Expressway Auth. Rev. | 5.000% | 7/1/24 | (2) | 15,350 | 14,111 |
| Univ. of North Florida Foundation Incorporated Rev. VRDO | 1.300% | 11/3/08 | LOC | 5,700 | 5,700 |
| | | | | | 1,462,987 |
Georgia (3.2%) | | | | | |
| Atlanta GA Airport Fac. Rev. | 5.875% | 1/1/15 | (3) | 11,930 | 12,202 |
| Atlanta GA Airport Fac. Rev. | 5.875% | 1/1/16 | (3) | 5,000 | 5,104 |
| Atlanta GA Water & Wastewater Rev. | 5.500% | 11/1/10 | (4) | 10,000 | 10,513 |
| Atlanta GA Water & Wastewater Rev. | 5.500% | 11/1/11 | (4) | 10,000 | 10,624 |
| Atlanta GA Water & Wastewater Rev. | 5.750% | 11/1/25 | (4) | 10,000 | 10,252 |
| Atlanta GA Water & Wastewater Rev. | 5.750% | 11/1/26 | (4) | 15,460 | 15,827 |
| Atlanta GA Water & Wastewater Rev. | 5.750% | 11/1/27 | (4) | 6,635 | 6,774 |
| Burke County GA Dev. Auth. PCR (Georgia Power Co. Plant Vogtle) PUT | 4.450% | 12/1/08 | | 37,375 | 37,369 |
| Fulton County GA COP | 5.750% | 11/1/11 | (2) | 6,000 | 6,323 |
| Fulton County GA COP | 6.000% | 11/1/12 | (2) | 5,985 | 6,325 |
| Fulton County GA COP | 6.000% | 11/1/13 | (2) | 6,325 | 6,684 |
| Fulton County GA COP | 6.000% | 11/1/14 | (2) | 4,675 | 4,941 |
| Fulton County GA School Dist. GO | 6.375% | 5/1/10 | | 8,095 | 8,367 |
| Georgia GO | 7.450% | 1/1/10 | | 4,000 | 4,231 |
| Georgia GO | 6.750% | 9/1/10 | | 8,000 | 8,598 |
| Georgia GO | 5.700% | 7/1/11 | | 4,470 | 4,798 |
| Georgia GO | 5.750% | 9/1/11 | | 2,500 | 2,693 |
| Georgia GO | 5.000% | 11/1/11 | (Prere.) | 15,570 | 16,546 |
| Georgia GO | 5.000% | 4/1/12 | | 8,520 | 9,046 |
| Georgia GO | 5.000% | 10/1/13 | | 20,595 | 22,080 |
| Georgia GO | 5.500% | 7/1/14 | | 10,750 | 11,794 |
3 | Georgia GO | 5.000% | 10/1/14 | | 18,250 | 19,610 |
| Georgia GO | 5.500% | 7/1/15 | | 10,000 | 10,998 |
52
| Georgia GO | 5.000% | 10/1/15 | | 21,910 | 23,530 |
| Georgia GO | 5.000% | 4/1/16 | | 15,590 | 16,669 |
| Georgia GO | 5.000% | 7/1/16 | | 10,000 | 10,702 |
| Georgia GO | 5.000% | 7/1/16 | | 8,000 | 8,497 |
| Georgia GO | 5.000% | 10/1/16 | | 24,515 | 26,250 |
| Georgia GO | 5.000% | 9/1/19 | | 7,580 | 7,811 |
| Georgia Road & Tollway Auth. Rev. | 5.000% | 6/1/15 | | 31,260 | 33,121 |
| Georgia Road & Tollway Auth. Rev. | 5.000% | 6/1/16 | | 41,105 | 43,343 |
| Georgia Road & Tollway Auth. Rev. | 5.000% | 6/1/17 | | 36,000 | 37,699 |
| Georgia Road & Tollway Auth. Rev. (Governor's Transp. Choices) | 5.375% | 3/1/14 | | 9,385 | 9,915 |
| Georgia Road & Tollway Auth. Rev. (Governor's Transp. Choices) | 5.375% | 3/1/15 | | 8,775 | 9,214 |
| Georgia Road & Tollway Auth. Rev. (Governor's Transp. Choices) | 5.375% | 3/1/16 | | 9,000 | 9,455 |
| Georgia Road & Tollway Auth. Rev. GAN | 5.000% | 6/1/14 | | 32,895 | 34,892 |
| Main Street Natural Gas Inc. Georgia Gas Project Rev. | 5.000% | 3/15/20 | | 23,970 | 19,042 |
| Main Street Natural Gas Inc. Georgia Gas Project Rev. | 5.000% | 3/15/21 | | 12,500 | 9,129 |
| Main Street Natural Gas Inc. Georgia Gas Project Rev. | 5.000% | 3/15/21 | | 37,000 | 28,715 |
| Metro. Atlanta GA Rapid Transp. Auth. Georgia Sales Tax Rev. | 5.000% | 7/1/27 | (4) | 22,445 | 21,651 |
| Muni. Electric Auth. Georgia (Project One Sub) Rev. | 5.250% | 1/1/16 | | 6,580 | 6,725 |
| Muni. Electric Auth. Georgia Rev. (General Resolution Projects) Rev. | 5.250% | 1/1/16 | | 3,480 | 3,557 |
| | | | | | 611,616 |
Hawaii (1.4%) | | | | | |
| Hawaii GO | 5.625% | 9/1/09 | (4)(Prere.) | 3,510 | 3,659 |
| Hawaii GO | 6.000% | 12/1/09 | (3) | 3,550 | 3,704 |
| Hawaii GO | 5.750% | 10/1/10 | (1)(Prere.) | 115 | 122 |
| Hawaii GO | 5.875% | 10/1/10 | (1)(Prere.) | 2,000 | 2,128 |
| Hawaii GO | 6.000% | 11/1/10 | (4) | 10,000 | 10,646 |
| Hawaii GO | 5.750% | 10/1/11 | (1) | 2,095 | 2,200 |
| Hawaii GO | 5.375% | 8/1/12 | (3) | 13,900 | 14,596 |
| Hawaii GO | 5.375% | 8/1/12 | (3) | 14,490 | 15,216 |
| Hawaii GO | 5.625% | 9/1/12 | (4) | 1,490 | 1,539 |
| Hawaii GO | 5.750% | 10/1/12 | (1) | 2,130 | 2,226 |
| Hawaii GO | 5.375% | 8/1/13 | (3) | 16,595 | 17,327 |
| Hawaii GO | 5.375% | 8/1/13 | (3) | 14,700 | 15,348 |
| Hawaii GO | 5.375% | 8/1/14 | (3) | 17,985 | 18,744 |
| Hawaii GO | 5.375% | 8/1/14 | (3) | 11,650 | 12,142 |
| Hawaii GO | 5.750% | 2/1/15 | (4) | 5,000 | 5,515 |
| Hawaii GO | 5.000% | 7/1/17 | (2) | 45,235 | 46,770 |
| Hawaii GO | 5.000% | 10/1/22 | (1) | 7,000 | 6,944 |
| Hawaii GO | 5.000% | 10/1/23 | (1) | 5,000 | 4,933 |
| Hawaii GO | 5.000% | 10/1/24 | (1) | 3,000 | 2,942 |
| Honolulu HI City & County GO | 8.000% | 10/1/09 | (ETM) | 3,620 | 3,826 |
1 | Honolulu HI City & County GO | 5.250% | 7/1/14 | (4) | 10,000 | 10,682 |
1 | Honolulu HI City & County GO | 5.250% | 7/1/15 | (4) | 7,500 | 8,018 |
1 | Honolulu HI City & County GO | 5.250% | 7/1/16 | (4) | 7,500 | 7,971 |
1 | Honolulu HI City & County GO | 5.250% | 7/1/17 | (4) | 7,625 | 8,066 |
1 | Honolulu HI City & County GO | 5.250% | 7/1/18 | (4) | 9,110 | 9,546 |
| Honolulu HI City & County GO | 5.000% | 7/1/21 | (4) | 4,000 | 4,001 |
| Honolulu HI City & County GO | 5.000% | 7/1/23 | (1) | 10,000 | 9,866 |
| Honolulu HI City & County GO | 5.000% | 7/1/23 | (4) | 3,625 | 3,577 |
| Honolulu HI City & County GO | 5.000% | 7/1/24 | (4) | 5,070 | 4,967 |
| | | | | | 257,221 |
Idaho (0.1%) | | | | | |
1 | Idaho Health Facs. Auth. Rev. (Trinity Health Group) | 6.125% | 12/1/28 | | 12,500 | 12,308 |
| | | | | | |
Illinois (3.7%) | | | | | |
| Berwyn IL GO | 5.000% | 12/1/25 | (4) | 5,000 | 4,773 |
| Chicago IL (City Colleges Improvement) GO | 0.000% | 1/1/12 | (3) | 26,000 | 22,978 |
| Chicago IL (City Colleges Improvement) GO | 0.000% | 1/1/13 | (3) | 32,670 | 27,508 |
| Chicago IL Board of Educ. GO | 5.000% | 12/1/16 | (4) | 1,985 | 2,081 |
| Chicago IL Board of Educ. GO | 5.000% | 12/1/18 | (4) | 2,500 | 2,565 |
| Chicago IL Board of Educ. GO | 5.000% | 12/1/19 | (4) | 6,130 | 6,221 |
| Chicago IL Board of Educ. GO | 5.000% | 12/1/24 | (4) | 10,000 | 9,752 |
| Chicago IL Board of Educ. GO | 5.250% | 12/1/24 | (4) | 33,765 | 33,816 |
| Chicago IL Board of Educ. GO | 5.000% | 12/1/26 | (4) | 12,640 | 11,963 |
| Chicago IL GO | 5.000% | 1/1/21 | (4) | 18,155 | 18,197 |
| Chicago IL GO | 5.000% | 1/1/26 | (4) | 10,000 | 9,697 |
| Chicago IL GO | 5.000% | 1/1/27 | (1) | 10,000 | 9,451 |
| Chicago IL GO | 5.000% | 1/1/28 | (1) | 10,000 | 9,434 |
| Chicago IL GO VRDO | 1.200% | 11/3/08 | | 7,925 | 7,925 |
| Chicago IL Housing Auth. Capital Project Rev. | 5.375% | 7/1/12 | (Prere.) | 5,540 | 5,962 |
| Chicago IL Housing Auth. Capital Project Rev. | 5.375% | 7/1/12 | (Prere.) | 13,425 | 14,446 |
53
| Chicago IL Housing Auth. Capital Project Rev. | 5.375% | 7/1/12 | (Prere.) | 7,150 | 7,694 |
| Chicago IL Housing Auth. Capital Project Rev. | 5.375% | 7/1/12 | (Prere.) | 15,715 | 16,911 |
| Chicago IL Metro. Water Reclamation Dist. GO | 6.050% | 12/1/09 | | 3,000 | 3,133 |
| Chicago IL O'Hare International Airport Rev. | 5.000% | 1/1/12 | (1) | 10,000 | 10,345 |
| Chicago IL O'Hare International Airport Rev. | 5.000% | 1/1/18 | (4) | 2,850 | 2,846 |
| Chicago IL O'Hare International Airport Rev. | 5.000% | 1/1/19 | (4) | 6,640 | 6,556 |
| Chicago IL O'Hare International Airport Rev. | 5.000% | 1/1/21 | (4) | 15,960 | 15,422 |
| Chicago IL O'Hare International Airport Rev. | 5.000% | 1/1/22 | (4) | 18,595 | 17,747 |
| Chicago IL O'Hare International Airport Rev. | 5.000% | 1/1/23 | (4) | 15,475 | 14,646 |
| Chicago IL O'Hare International Airport Rev. | 5.000% | 1/1/24 | (4) | 20,000 | 18,763 |
| Chicago IL Transit Auth. Capital Grant Receipts Rev. | 5.250% | 6/1/24 | (12) | 5,000 | 4,979 |
| Chicago IL Transit Auth. Capital Grant Receipts Rev. | 5.250% | 6/1/25 | (12) | 11,000 | 10,915 |
| Chicago IL Transit Auth. Capital Grant Receipts Rev. | 5.250% | 6/1/26 | (12) | 8,260 | 8,176 |
| Chicago IL Water Rev. | 5.500% | 11/1/11 | (2)(Prere.) | 3,200 | 3,443 |
| Chicago IL Water Rev. | 5.500% | 11/1/11 | (2)(Prere.) | 4,035 | 4,342 |
| Chicago IL Water Rev. | 5.500% | 11/1/11 | (2)(Prere.) | 2,000 | 2,152 |
| Chicago IL Water Rev. | 5.500% | 11/1/11 | (2)(Prere.) | 3,595 | 3,869 |
| Chicago IL Water Rev. | 0.000% | 11/1/14 | (2) | 7,460 | 5,638 |
| Chicago IL Water Rev. | 0.000% | 11/1/15 | (2) | 7,555 | 5,387 |
| Illinois Finance Auth. Rev. (Central Dupage Health) VRDO | 1.200% | 11/3/08 | | 87,105 | 87,105 |
| Illinois Finance Auth. Rev. (Childrens Memorial Hosp.) | 5.500% | 8/15/28 | | 25,260 | 21,665 |
| Illinois Finance Auth. Rev. (Northwestern Community Hosp.) | 5.250% | 7/1/28 | | 8,500 | 7,527 |
| Illinois Finance Auth. Rev. (Rush Univ. Medical Center) | 5.000% | 11/1/23 | (1) | 5,000 | 4,254 |
| Illinois Finance Auth. Rev. (Rush Univ. Medical Center) | 5.750% | 11/1/28 | (1) | 3,000 | 2,685 |
| Illinois GO | 5.000% | 10/1/10 | | 9,000 | 9,393 |
| Illinois GO | 5.375% | 7/1/12 | (1)(Prere.) | 5,500 | 5,932 |
| Illinois GO | 5.250% | 10/1/12 | | 14,000 | 14,945 |
| Illinois GO | 5.500% | 8/1/13 | (1) | 14,005 | 15,137 |
| Illinois GO | 5.375% | 7/1/14 | (1) | 5,000 | 5,223 |
| Illinois GO | 5.250% | 10/1/14 | | 40,000 | 42,467 |
| Illinois GO | 5.500% | 8/1/17 | (1) | 7,500 | 7,817 |
| Illinois GO | 5.500% | 8/1/18 | (1) | 6,000 | 6,121 |
2 | Illinois GO TOB VRDO | 1.930% | 11/7/08 | (4) | 3,995 | 3,995 |
| Illinois Regional Transp. Auth. Rev. | 9.000% | 6/1/09 | (2) | 3,225 | 3,356 |
| Illinois Regional Transp. Auth. Rev. | 9.000% | 6/1/09 | (2) | 1,030 | 1,072 |
| Illinois Sales Tax Rev. | 6.125% | 6/15/10 | (Prere.) | 4,250 | 4,507 |
| Illinois Sales Tax Rev. | 6.125% | 6/15/14 | | 6,850 | 7,158 |
| Illinois Sales Tax Rev. | 5.000% | 6/15/28 | (1) | 6,000 | 5,684 |
| Metro. Pier & Exposition Auth. Illinois Dedicated Sales Tax Rev. | 6.750% | 6/1/10 | (2) | 16,775 | 17,458 |
| Metro. Pier & Exposition Auth. Illinois Dedicated Sales Tax Rev. | 0.000% | 12/15/16 | (1) | 8,330 | 5,650 |
| Metro. Pier & Exposition Auth. Illinois Dedicated Sales Tax Rev. | 0.000% | 6/15/19 | (3) | 39,340 | 22,362 |
| Metro. Pier & Exposition Auth. Illinois Dedicated Sales Tax Rev. | 0.000% | 12/15/21 | (1) | 6,000 | 2,899 |
| Metro. Pier & Exposition Auth. Illinois Dedicated Sales Tax Rev. | 0.000% | 12/15/23 | (1) | 32,515 | 13,878 |
| Metro. Pier & Exposition Auth. Illinois Dedicated Sales Tax Rev. | 0.000% | 12/15/24 | (1) | 15,895 | 6,363 |
| Univ. of Illinois Univ. Rev. Auxiliary Fac. | 0.000% | 4/1/16 | (1) | 15,270 | 10,810 |
| Univ. of Illinois Univ. Rev. Auxiliary Fac. | 5.500% | 4/1/24 | (2) | 5,870 | 6,011 |
| | | | | | 701,207 |
Indiana (0.6%) | | | | | |
| Indiana Finance Auth. Health System Rev. (Sisters St. Francis) | 5.000% | 11/1/20 | | 4,370 | 4,022 |
| Indiana Finance Auth. Health System Rev. (Sisters St. Francis) | 5.000% | 11/1/23 | | 3,570 | 3,181 |
| Indiana Finance Auth. Health System Rev. (Sisters St. Francis) | 5.250% | 11/1/24 | | 10,855 | 9,879 |
| Indiana Finance Auth. Health System Rev. (Sisters St. Francis) | 5.250% | 11/1/25 | | 13,895 | 12,561 |
| Indiana Finance Auth. Health System Rev. (Sisters St. Francis) | 5.250% | 11/1/26 | | 14,425 | 12,980 |
| Indiana Finance Auth. Health System Rev. (Sisters St. Francis) | 5.250% | 11/1/27 | | 8,615 | 7,718 |
| Indiana Finance Auth. Highway Rev. | 4.500% | 12/1/25 | (3) | 10,000 | 8,515 |
| Indiana Finance Auth. Highway Rev. | 4.500% | 6/1/29 | (3) | 11,000 | 8,996 |
| Indiana Finance Auth. Rev. VRDO | 5.000% | 11/7/08 | | 7,000 | 7,000 |
| Indiana Health Fac. Auth. Finance Auth. Rev. (Clarian Health Obligation Group) | 5.000% | 2/15/25 | | 11,000 | 8,727 |
| Indiana Health Fac. Auth. Finance Auth. Rev. (Clarian Health Obligation Group) | 5.000% | 2/15/26 | | 15,000 | 11,802 |
| Indiana Muni. Power Agency Rev. | 5.875% | 1/1/10 | (1) | 4,500 | 4,640 |
| Indiana Transp. Finance Auth. Highway Rev. | 5.000% | 12/1/12 | (3) | 5,000 | 5,275 |
| | | | | | 105,296 |
Kansas (0.3%) | | | | | |
| Cowley County KS USD GO | 4.750% | 9/1/26 | (4) | 3,680 | 3,369 |
| Cowley County KS USD GO | 4.750% | 9/1/27 | (4) | 3,500 | 3,175 |
| Kansas Dept. of Transp. Highway Rev. | 5.000% | 9/1/12 | | 7,400 | 7,858 |
| Kansas Dept. of Transp. Highway Rev. | 5.000% | 9/1/23 | | 6,000 | 6,032 |
| Kansas Dept. of Transp. Highway Rev. | 5.000% | 9/1/24 | | 5,000 | 5,004 |
| Sedgwick County KS USD | 5.000% | 9/1/23 | (12) | 2,775 | 2,738 |
| Sedgwick County KS USD | 5.000% | 9/1/24 | (12) | 2,535 | 2,483 |
| Sedgwick County KS USD | 5.000% | 9/1/25 | (12) | 3,000 | 2,923 |
54
Sedgwick County KS USD | 5.000% | 9/1/26 | (12) | 2,500 | 2,422 |
Sedgwick County KS USD | 5.000% | 9/1/27 | (12) | 2,500 | 2,405 |
Univ. of Kansas Hosp. Auth. Health System | 5.000% | 9/1/16 | | 1,250 | 1,196 |
Univ. of Kansas Hosp. Auth. Health System | 5.000% | 9/1/17 | | 1,000 | 944 |
Univ. of Kansas Hosp. Auth. Health System | 5.000% | 9/1/18 | | 1,000 | 928 |
Univ. of Kansas Hosp. Auth. Health System | 5.000% | 9/1/19 | | 1,500 | 1,366 |
Univ. of Kansas Hosp. Auth. Health System | 5.000% | 9/1/20 | | 1,500 | 1,339 |
Univ. of Kansas Hosp. Auth. Health System | 5.000% | 9/1/21 | | 1,500 | 1,310 |
Univ. of Kansas Hosp. Auth. Health System | 5.000% | 9/1/24 | | 6,505 | 5,463 |
Univ. of Kansas Hosp. Auth. Health System | 5.000% | 9/1/26 | | 7,000 | 5,772 |
| | | | | 56,727 |
Kentucky (1.1%) | | | | | |
Kentucky Property & Building Comm. Rev. | 5.750% | 10/1/10 | (Prere.) | 6,135 | 6,518 |
Kentucky Property & Building Comm. Rev. | 5.750% | 10/1/10 | (Prere.) | 3,500 | 3,718 |
Kentucky Property & Building Comm. Rev. | 5.250% | 8/1/11 | (4)(Prere.) | 9,725 | 10,352 |
Kentucky Property & Building Comm. Rev. | 5.250% | 8/1/11 | (4)(Prere.) | 11,815 | 12,576 |
Kentucky Property & Building Comm. Rev. | 5.375% | 10/1/11 | (1)(Prere.) | 5,000 | 5,354 |
Kentucky Property & Building Comm. Rev. | 5.500% | 8/1/12 | (4) | 10,000 | 10,743 |
Kentucky Property & Building Comm. Rev. | 5.250% | 8/1/13 | (4) | 27,540 | 28,541 |
Kentucky Property & Building Comm. Rev. | 5.250% | 10/1/13 | (4) | 14,965 | 16,047 |
Kentucky Property & Building Comm. Rev. | 5.250% | 8/1/15 | (4) | 15,480 | 16,042 |
Kentucky Property & Building Comm. Rev. | 5.000% | 11/1/23 | (4) | 5,120 | 5,056 |
Kentucky Property & Building Comm. Rev. | 5.000% | 11/1/24 | (4) | 5,000 | 4,903 |
Kentucky Property & Building Comm. Rev. | 5.000% | 11/1/26 | (4) | 8,500 | 8,245 |
Kentucky Turnpike Auth. Econ. Dev. Road Rev. (Revitalization Project) | 5.000% | 7/1/23 | | 9,890 | 9,768 |
Kentucky Turnpike Auth. Econ. Dev. Road Rev. (Revitalization Project) | 5.000% | 7/1/24 | | 7,065 | 6,929 |
Kentucky Turnpike Auth. Econ. Dev. Road Rev. (Revitalization Project) | 5.000% | 7/1/25 | | 7,000 | 6,830 |
Louisville & Jefferson County KY Metro. Health Fac Rev. | 5.750% | 2/1/27 | | 10,000 | 8,361 |
Louisville & Jefferson County KY Metro. Sewer Dist. VRDO | 2.500% | 11/7/08 | (4) | 47,285 | 47,285 |
| | | | | 207,268 |
Louisiana (1.9%) | | | | | |
Louisiana Gasoline and Fuel Tax Rev. | 5.250% | 5/1/20 | (3) | 6,200 | 6,153 |
Louisiana Gasoline and Fuel Tax Rev. | 5.000% | 5/1/30 | (3) | 24,250 | 22,106 |
Louisiana GO | 5.000% | 5/1/11 | (4) | 16,830 | 17,645 |
Louisiana GO | 5.000% | 5/1/12 | (4) | 18,955 | 19,989 |
Louisiana GO | 5.250% | 5/1/12 | (3) | 10,000 | 10,517 |
Louisiana GO | 5.500% | 5/15/12 | (3) | 12,660 | 13,198 |
Louisiana GO | 5.500% | 5/15/13 | (3) | 5,345 | 5,542 |
Louisiana GO | 5.000% | 8/1/14 | (1) | 45,750 | 47,985 |
Louisiana GO | 5.000% | 5/1/18 | (4) | 25,710 | 26,307 |
Louisiana GO | 5.000% | 5/1/21 | (4) | 9,765 | 9,775 |
Louisiana GO | 5.000% | 5/1/23 | (4) | 32,565 | 32,136 |
Louisiana Public Fac. Auth. Rev. (Ochsner Clinic) | 5.000% | 5/15/15 | | 4,055 | 3,888 |
Louisiana Public Fac. Auth. Rev. (Ochsner Clinic) | 5.000% | 5/15/17 | | 3,000 | 2,781 |
Louisiana Public Fac. Auth. Rev. (Ochsner Clinic) | 5.250% | 5/15/27 | | 31,665 | 26,044 |
Louisiana Public Fac. Auth. Rev. (Ochsner Clinic) | 5.250% | 5/15/38 | | 26,360 | 20,000 |
Louisiana Public Fac. Auth. Rev. (Ochsner Clinic) | 5.375% | 5/15/43 | | 46,295 | 35,349 |
Louisiana State Citizens Property Insurance Corp. Assessment Rev. | 5.000% | 6/1/18 | (2) | 14,470 | 13,954 |
Louisiana State Citizens Property Insurance Corp. Assessment Rev. | 5.000% | 6/1/21 | (2) | 20,000 | 18,896 |
Louisiana State Citizens Property Insurance Corp. Assessment Rev. | 5.000% | 6/1/22 | (2) | 14,160 | 13,256 |
Louisiana State Citizens Property Insurance Corp. Assessment Rev. | 5.000% | 6/1/23 | (2) | 10,000 | 9,284 |
| | | | | 354,805 |
Maryland (1.0%) | | | | | |
Maryland Dept. of Transp. | 5.000% | 3/1/15 | | 7,600 | 8,129 |
Maryland Dept. of Transp. | 5.000% | 3/1/16 | | 5,900 | 6,291 |
Maryland GO | 5.000% | 8/1/12 | | 10,000 | 10,658 |
Maryland GO | 5.000% | 8/1/12 | | 10,000 | 10,659 |
Maryland GO | 5.000% | 2/15/13 | | 59,765 | 63,740 |
Maryland GO | 5.000% | 8/1/13 | | 10,685 | 11,444 |
Maryland GO | 5.500% | 3/1/16 | | 8,035 | 8,826 |
Maryland GO | 5.000% | 8/1/17 | | 15,760 | 16,382 |
Maryland Health & Higher Educ. Fac. Auth. Rev. | 5.500% | 7/1/24 | (2) | 10,000 | 9,099 |
Maryland Health & Higher Educ. Fac. Auth. Rev. | 5.250% | 7/1/28 | (2) | 10,000 | 8,534 |
Maryland Health & Higher Educ. Fac. Auth. Rev. (Johns Hopkins Health System) PUT | 5.000% | 5/15/15 | | 3,500 | 3,568 |
Maryland Health & Higher Educ. Fac. Auth. Rev. (Lifebridge Health) | 5.000% | 7/1/14 | (Prere.) | 3,915 | 4,152 |
Maryland Health & Higher Educ. Fac. Auth. Rev. (Lifebridge Health) | 5.000% | 7/1/14 | (Prere.) | 2,980 | 3,161 |
Maryland Health & Higher Educ. Fac. Auth. Rev. (Univ. of Maryland Medical System) | 6.625% | 7/1/10 | (Prere.) | 3,780 | 4,080 |
Maryland Health & Higher Educ. Fac. Auth. Rev. (Univ. of Maryland Medical System) | 5.000% | 7/1/16 | | 3,895 | 3,762 |
Maryland Health & Higher Educ. Fac. Auth. Rev. (Univ. of Maryland Medical System) | 5.000% | 7/1/17 | | 3,000 | 2,854 |
Maryland Health & Higher Educ. Fac. Auth. Rev. (Univ. of Maryland Medical System) | 5.000% | 7/1/18 | | 2,500 | 2,341 |
Maryland Health & Higher Educ. Fac. Auth. Rev. (Univ. of Maryland Medical System) | 5.250% | 7/1/19 | | 1,700 | 1,599 |
55
Maryland Health & Higher Educ. Fac. Auth. Rev. (Univ. of Maryland Medical System) | 4.500% | 7/1/20 | | 1,500 | 1,283 |
Maryland Health & Higher Educ. Fac. Auth. Rev. (Univ. of Maryland Medical System) | 5.250% | 7/1/21 | | 2,000 | 1,897 |
Maryland Health & Higher Educ. Fac. Auth. Rev. (Univ. of Maryland Medical System) | 4.750% | 7/1/23 | | 1,000 | 876 |
Maryland Transp. Auth. Rev. | 5.000% | 3/1/16 | | 2,500 | 2,657 |
Maryland Transp. Auth. Rev. | 5.000% | 3/1/17 | | 5,000 | 5,286 |
| | | | | 191,278 |
Massachusetts (5.9%) | | | | | |
Boston MA Water & Sewer Comm. Rev. | 5.750% | 11/1/13 | | 4,950 | 5,235 |
Chelsea MA GO | 5.500% | 6/15/09 | (2) | 3,000 | 3,071 |
Chelsea MA GO | 5.500% | 6/15/11 | (2) | 5,740 | 5,810 |
Chelsea MA GO | 5.500% | 6/15/12 | (2) | 5,000 | 5,061 |
Massachusetts Bay Transp. Auth. Rev. | 5.500% | 7/1/21 | | 6,840 | 7,303 |
Massachusetts Bay Transp. Auth. Rev. | 5.000% | 7/1/22 | | 13,000 | 13,212 |
Massachusetts Bay Transp. Auth. Rev. | 5.000% | 7/1/23 | | 10,000 | 10,124 |
Massachusetts Bay Transp. Auth. Rev. | 5.500% | 7/1/24 | | 10,525 | 11,162 |
Massachusetts Bay Transp. Auth. Rev. | 5.500% | 7/1/24 | (1) | 5,000 | 5,286 |
Massachusetts Dev. Finance Agency Resource Recovery Rev. (SEMASS System) | 5.625% | 1/1/13 | (1) | 16,670 | 17,563 |
Massachusetts Dev. Finance Agency Resource Recovery Rev. (SEMASS System) | 5.625% | 1/1/14 | (1) | 7,340 | 7,691 |
Massachusetts Dev. Finance Agency Resource Recovery Rev. (SEMASS System) | 5.625% | 1/1/15 | (1) | 8,310 | 8,667 |
Massachusetts Dev. Finance Agency Resource Recovery Rev. (SEMASS System) | 5.625% | 1/1/16 | (1) | 3,500 | 3,645 |
Massachusetts Dev. Finance Agency Rev. (Draper Laboratory) | 5.750% | 9/1/25 | | 6,865 | 6,670 |
Massachusetts GAN | 5.125% | 6/15/10 | | 10,755 | 10,893 |
Massachusetts GAN | 5.250% | 6/15/10 | | 23,675 | 23,981 |
Massachusetts GAN | 5.125% | 12/15/10 | | 5,000 | 5,064 |
Massachusetts GAN | 5.250% | 12/15/10 | | 26,275 | 26,625 |
Massachusetts GAN | 5.125% | 6/15/11 | | 8,555 | 8,663 |
Massachusetts GAN | 5.250% | 6/15/11 | | 15,000 | 15,200 |
Massachusetts GAN | 5.250% | 12/15/11 | | 14,820 | 15,017 |
Massachusetts GAN | 5.750% | 12/15/11 | | 20,000 | 21,022 |
Massachusetts GAN | 5.750% | 6/15/12 | | 11,280 | 11,807 |
Massachusetts GAN | 5.125% | 12/15/12 | | 5,000 | 5,063 |
Massachusetts GAN | 5.125% | 6/15/13 | | 5,000 | 5,063 |
Massachusetts GAN | 5.750% | 6/15/13 | | 10,000 | 10,467 |
Massachusetts GO | 6.000% | 2/1/10 | (Prere.) | 5,450 | 5,720 |
Massachusetts GO | 5.500% | 11/1/13 | (3) | 8,605 | 9,325 |
Massachusetts GO | 5.500% | 11/1/16 | (ETM) | 25,000 | 27,883 |
Massachusetts GO | 5.500% | 11/1/16 | (1)(ETM) | 75,000 | 83,648 |
Massachusetts GO | 5.500% | 11/1/16 | (2) | 50,000 | 55,765 |
Massachusetts GO | 5.500% | 11/1/17 | (1) | 20,000 | 21,667 |
Massachusetts GO | 5.500% | 11/1/17 | (4) | 7,000 | 7,583 |
Massachusetts GO | 5.500% | 10/1/18 | | 10,000 | 10,747 |
Massachusetts GO | 5.250% | 8/1/21 | | 10,000 | 10,442 |
Massachusetts GO | 5.250% | 8/1/22 | | 20,000 | 20,823 |
Massachusetts GO | 5.250% | 8/1/23 | | 20,000 | 20,770 |
Massachusetts GO | 5.250% | 9/1/23 | (4) | 39,680 | 41,214 |
Massachusetts Health & Educ. Fac. Auth. Rev. (Boston Medical Center) | 5.250% | 7/1/09 | (1) | 4,215 | 4,241 |
Massachusetts Health & Educ. Fac. Auth. Rev. (Boston Medical Center) | 5.250% | 7/1/10 | (1) | 4,440 | 4,475 |
Massachusetts Health & Educ. Fac. Auth. Rev. (Boston Medical Center) | 5.250% | 7/1/11 | (1) | 4,670 | 4,676 |
Massachusetts Health & Educ. Fac. Auth. Rev. (Boston Medical Center) | 5.250% | 7/1/12 | (1) | 1,850 | 1,826 |
Massachusetts Health & Educ. Fac. Auth. Rev. (Boston Medical Center) | 5.000% | 7/1/28 | | 18,000 | 13,014 |
Massachusetts Health & Educ. Fac. Auth. Rev. (Caregroup) | 5.375% | 7/1/23 | | 3,500 | 2,857 |
Massachusetts Health & Educ. Fac. Auth. Rev. (Caregroup) | 5.375% | 7/1/24 | | 5,500 | 4,411 |
Massachusetts Health & Educ. Fac. Auth. Rev. (Caregroup) | 5.375% | 7/1/25 | | 3,500 | 2,759 |
Massachusetts Health & Educ. Fac. Auth. Rev. (Caritas Christi Obligated Group) | 6.500% | 7/1/12 | | 10,000 | 10,046 |
Massachusetts Health & Educ. Fac. Auth. Rev. (Caritas Christi Obligated Group) | 5.625% | 7/1/20 | | 1,810 | 1,584 |
Massachusetts Health & Educ. Fac. Auth. Rev. (Caritas Christi Obligated Group) | 5.750% | 7/1/28 | | 2,640 | 2,145 |
Massachusetts Health & Educ. Fac. Auth. Rev. (Museum Fine) VRDO | 0.700% | 11/3/08 | | 10,000 | 10,000 |
Massachusetts Health & Educ. Fac. Auth. Rev. (Northeastern Univ.) | 5.000% | 10/1/23 | | 3,435 | 3,169 |
Massachusetts Health & Educ. Fac. Auth. Rev. (Northeastern Univ.) | 5.000% | 10/1/25 | | 1,460 | 1,332 |
Massachusetts Health & Educ. Fac. Auth. Rev. (Northeastern Univ.) | 5.000% | 10/1/26 | | 2,000 | 1,817 |
Massachusetts Health & Educ. Fac. Auth. Rev. (Northeastern Univ.) | 5.000% | 10/1/28 | | 1,155 | 1,035 |
Massachusetts Muni. Wholesale Electric Co. Power System Rev. | 5.250% | 7/1/12 | (1) | 22,865 | 23,814 |
Massachusetts Muni. Wholesale Electric Co. Power System Rev. | 5.250% | 7/1/13 | (1) | 20,000 | 20,670 |
Massachusetts School Building Auth. Dedicated Sales Tax Rev. | 5.000% | 8/15/21 | (4) | 41,095 | 41,421 |
Massachusetts School Building Auth. Dedicated Sales Tax Rev. | 5.000% | 8/15/23 | (4) | 6,800 | 6,815 |
Massachusetts Special Obligation Dedicated Tax Rev. | 5.250% | 1/1/14 | (3)(Prere.) | 8,685 | 9,018 |
Massachusetts Special Obligation Dedicated Tax Rev. | 5.250% | 1/1/19 | (3) | 5,000 | 4,961 |
Massachusetts Special Obligation Dedicated Tax Rev. | 5.500% | 1/1/26 | (3) | 32,360 | 32,536 |
Massachusetts Special Obligation Dedicated Tax Rev. | 5.500% | 1/1/28 | (3) | 11,075 | 11,048 |
Massachusetts Water Pollution Abatement Trust | 5.125% | 8/1/09 | | 435 | 441 |
Massachusetts Water Pollution Abatement Trust | 6.000% | 8/1/09 | (Prere.) | 1,580 | 1,647 |
56
| Massachusetts Water Pollution Abatement Trust | 6.000% | 8/1/09 | (Prere.) | 970 | 1,011 |
| Massachusetts Water Pollution Abatement Trust | 6.000% | 8/1/09 | (Prere.) | 1,510 | 1,574 |
| Massachusetts Water Pollution Abatement Trust | 6.000% | 8/1/09 | (Prere.) | 1,165 | 1,215 |
| Massachusetts Water Pollution Abatement Trust | 5.250% | 8/1/11 | (ETM) | 6,475 | 6,896 |
| Massachusetts Water Pollution Abatement Trust | 5.250% | 8/1/11 | | 830 | 840 |
| Massachusetts Water Pollution Abatement Trust | 6.000% | 8/1/11 | | 3,180 | 3,295 |
| Massachusetts Water Pollution Abatement Trust | 5.250% | 8/1/12 | | 295 | 299 |
| Massachusetts Water Pollution Abatement Trust | 6.000% | 8/1/12 | | 4,945 | 5,125 |
| Massachusetts Water Pollution Abatement Trust | 6.000% | 8/1/13 | | 3,835 | 3,974 |
| Massachusetts Water Pollution Abatement Trust | 5.125% | 8/1/14 | | 140 | 142 |
| Massachusetts Water Pollution Abatement Trust | 5.250% | 8/1/20 | | 7,500 | 7,898 |
| Massachusetts Water Pollution Abatement Trust | 5.250% | 8/1/20 | | 27,360 | 28,811 |
| Massachusetts Water Pollution Abatement Trust | 5.250% | 2/1/21 | | 6,955 | 7,293 |
| Massachusetts Water Pollution Abatement Trust | 5.000% | 8/1/21 | | 13,955 | 14,309 |
| Massachusetts Water Pollution Abatement Trust | 5.250% | 8/1/21 | | 6,500 | 6,819 |
| Massachusetts Water Pollution Abatement Trust | 5.250% | 8/1/21 | | 11,805 | 12,385 |
| Massachusetts Water Pollution Abatement Trust | 5.250% | 8/1/25 | | 5,355 | 5,561 |
| Massachusetts Water Resources Auth. Rev. | 6.500% | 7/15/10 | (ETM) | 30,220 | 32,328 |
| Massachusetts Water Resources Auth. Rev. | 6.500% | 7/15/19 | (ETM) | 37,515 | 42,598 |
| Massachusetts Water Resources Auth. Rev. | 5.000% | 8/1/21 | (2) | 11,135 | 11,185 |
| Massachusetts Water Resources Auth. Rev. | 5.000% | 8/1/22 | (2) | 27,710 | 27,648 |
| Massachusetts Water Resources Auth. Rev. | 5.000% | 8/1/23 | (2) | 29,865 | 29,647 |
| Massachusetts Water Resources Auth. Rev. | 5.000% | 8/1/24 | (2) | 19,920 | 19,641 |
| Massachusetts Water Resources Auth. Rev. | 5.000% | 8/1/25 | (2) | 6,380 | 6,259 |
| Massachusetts Water Resources Auth. Rev. | 5.000% | 8/1/26 | (2) | 6,710 | 6,548 |
| Univ. of Massachusetts Building Auth. Rev. | 5.000% | 11/1/19 | (2) | 25,625 | 25,745 |
| | | | | | 1,115,756 |
Michigan (1.9%) | | | | | |
| Detroit MI GO | 5.000% | 4/1/14 | (12) | 9,780 | 10,062 |
3 | Detroit MI GO | 5.000% | 4/1/15 | (12) | 7,970 | 8,145 |
| Detroit MI GO | 5.000% | 4/1/16 | (12) | 3,440 | 3,489 |
| Detroit MI GO | 5.000% | 4/1/17 | (12) | 3,580 | 3,592 |
| Detroit MI Sewer System Rev. | 5.000% | 7/1/13 | (4)(Prere.) | 15,665 | 16,835 |
| Detroit MI Sewer System Rev. | 5.125% | 7/1/15 | (1)(Prere.) | 12,375 | 13,453 |
| Detroit MI Sewer System Rev. | 0.000% | 7/1/16 | (3) | 7,500 | 4,979 |
| Detroit MI Water Supply System | 5.000% | 7/1/19 | (1) | 5,000 | 4,857 |
| Detroit MI Water Supply System | 5.000% | 7/1/20 | (1) | 7,665 | 7,325 |
| Detroit MI Water Supply System | 5.000% | 7/1/20 | (4) | 8,535 | 8,375 |
| Detroit MI Water Supply System | 5.000% | 7/1/22 | (1) | 4,000 | 3,744 |
| Detroit MI Water Supply System | 5.000% | 7/1/23 | (1) | 4,000 | 3,713 |
| Detroit MI Water Supply System | 5.000% | 7/1/24 | (4) | 27,425 | 25,995 |
| Detroit MI Water Supply System | 5.000% | 7/1/25 | (4) | 9,955 | 9,384 |
| Green Lake Township MI Econ. Dev. Corp. Rev. (Interlochen Center Project) VRDO | 1.250% | 11/3/08 | LOC | 2,000 | 2,000 |
| Kent Hosp. MI Finance Auth. Rev. (Metro. Hosp.) PUT | 5.500% | 1/15/15 | | 11,500 | 11,503 |
| Kent Hosp. MI Finance Auth. Rev. PUT | 5.250% | 1/15/14 | | 10,000 | 9,970 |
| Michigan Building Auth. Rev. | 5.500% | 10/15/11 | (Prere.) | 8,440 | 9,047 |
| Michigan Building Auth. Rev. | 5.500% | 10/15/11 | (Prere.) | 6,010 | 6,442 |
| Michigan Building Auth. Rev. | 5.500% | 10/15/12 | | 6,695 | 7,011 |
| Michigan Building Auth. Rev. | 5.250% | 10/15/13 | | 2,500 | 2,547 |
| Michigan Building Auth. Rev. | 5.250% | 10/15/13 | (4) | 12,000 | 12,627 |
| Michigan Building Auth. Rev. | 5.500% | 10/15/13 | | 6,000 | 6,241 |
| Michigan Building Auth. Rev. | 5.250% | 10/15/14 | (4) | 15,000 | 15,648 |
| Michigan Building Auth. Rev. | 5.500% | 10/15/14 | | 10,000 | 10,402 |
| Michigan Building Auth. Rev. | 5.250% | 10/15/15 | (4) | 22,445 | 23,473 |
| Michigan Building Auth. Rev. | 5.500% | 10/15/15 | | 5,000 | 5,201 |
| Michigan Building Auth. Rev. | 5.250% | 10/15/16 | (4) | 9,000 | 9,340 |
| Michigan GO | 5.500% | 11/1/09 | (Prere.) | 5,120 | 5,311 |
| Michigan GO | 5.500% | 11/1/09 | (Prere.) | 5,395 | 5,597 |
| Michigan GO | 5.500% | 12/1/13 | | 6,125 | 6,617 |
| Michigan GO | 5.000% | 5/1/17 | | 33,880 | 35,138 |
| Michigan GO | 5.000% | 5/1/18 | | 13,485 | 13,834 |
| Michigan Hosp. Finance Auth. Rev. (Ascension Health) | 5.000% | 5/1/12 | | 9,595 | 9,810 |
| Michigan Hosp. Finance Auth. Rev. (Genesys Regional Medical Center) | 5.300% | 10/1/11 | (ETM) | 10,840 | 10,971 |
| Michigan Hosp. Finance Auth. Rev. (Genesys Regional Medical Center) | 5.375% | 10/1/13 | (ETM) | 4,000 | 4,049 |
| Michigan Hosp. Finance Auth. Rev. (Sparrow Obligated Group) | 5.000% | 11/15/26 | (1) | 13,115 | 11,642 |
| | | | | | 358,369 |
Minnesota (1.9%) | | | | | |
| Minneapolis & St. Paul MN Metro. Airport | 5.000% | 1/1/24 | (2) | 4,970 | 4,682 |
| Minnesota GO | 5.000% | 10/1/11 | | 26,795 | 28,349 |
| Minnesota GO | 5.000% | 11/1/11 | | 24,545 | 26,001 |
| Minnesota GO | 5.000% | 6/1/12 | | 21,700 | 23,060 |
57
Minnesota GO | 5.000% | 11/1/12 | | 21,920 | 23,387 |
Minnesota GO | 5.000% | 11/1/12 | | 19,775 | 21,099 |
Minnesota GO | 5.000% | 8/1/13 | | 5,780 | 6,180 |
Minnesota GO | 5.000% | 10/1/13 | | 35,445 | 37,950 |
Minnesota GO | 5.000% | 11/1/13 | | 28,270 | 30,288 |
Minnesota GO | 5.000% | 11/1/13 | | 19,500 | 20,892 |
Minnesota GO | 5.000% | 11/1/14 | | 19,775 | 21,227 |
Minnesota GO | 5.000% | 11/1/15 | | 19,775 | 21,209 |
Minnesota GO | 5.000% | 6/1/16 | | 3,000 | 3,204 |
Minnesota GO | 5.000% | 11/1/16 | | 19,735 | 21,093 |
Minnesota GO | 5.000% | 10/1/17 | | 8,225 | 8,554 |
Northern Minnesota Muni. Power Agency Electric System Rev. | 5.250% | 1/1/12 | (4) | 6,000 | 6,140 |
St. Louis Park MN Health Care Facs. Rev. (Park Nicollet Health Services) | 5.500% | 7/1/15 | | 5,675 | 5,609 |
St. Louis Park MN Health Care Facs. Rev. (Park Nicollet Health Services) | 5.500% | 7/1/16 | | 11,775 | 11,466 |
St. Louis Park MN Health Care Facs. Rev. (Park Nicollet Health Services) | 5.500% | 7/1/23 | | 25,000 | 22,213 |
St. Louis Park MN Health Care Facs. Rev. (Park Nicollet Health Services) | 5.625% | 7/1/26 | | 6,000 | 5,275 |
Univ. of Minnesota Special Purpose Rev. | 5.000% | 8/1/24 | | 5,000 | 4,951 |
Univ. of Minnesota Special Purpose Rev. | 5.000% | 8/1/25 | | 6,755 | 6,649 |
| | | | | 359,478 |
Mississippi (0.3%) | | | | | |
Mississippi GO | 5.750% | 12/1/11 | | 6,000 | 6,451 |
Mississippi GO | 5.500% | 9/1/12 | (4) | 5,000 | 5,388 |
Mississippi GO | 5.500% | 12/1/16 | | 8,435 | 9,112 |
Mississippi GO | 5.500% | 12/1/17 | | 4,000 | 4,303 |
Mississippi GO | 5.000% | 12/1/20 | | 10,000 | 10,154 |
Mississippi GO | 5.000% | 12/1/21 | | 16,890 | 17,039 |
Mississippi GO | 5.250% | 11/1/22 | | 8,245 | 8,537 |
| | | | | 60,984 |
Missouri (0.7%) | | | | | |
Cape Girardeau County MO IDA Health Care Facs. Rev. | 5.625% | 6/1/12 | (Prere.) | 5,655 | 6,090 |
Kansas City MO Airport Rev. | 5.000% | 9/1/13 | | 11,550 | 11,940 |
Kansas City MO Airport Rev. | 5.000% | 9/1/14 | | 10,000 | 10,302 |
Kansas City MO GO | 4.750% | 2/1/25 | | 6,470 | 6,132 |
Missouri Board Public Building Special Obligation Rev. | 5.000% | 10/15/27 | | 13,275 | 12,941 |
Missouri Environmental Improvement & Energy Resource Auth. Water PCR | 5.500% | 7/1/12 | | 4,190 | 4,522 |
Missouri Environmental Improvement & Energy Resource Auth. Water PCR | 5.500% | 7/1/13 | | 5,250 | 5,710 |
Missouri Health & Educ. Fac. Auth. Health Fac. Rev. (St. Luke's Episcopal–Presbyterian Hosp.) | 5.500% | 12/1/12 | (4) | 3,365 | 3,530 |
Missouri Health & Educ. Fac. Auth. Health Fac. Rev. (St. Luke's Episcopal–Presbyterian Hosp.) | 5.500% | 12/1/13 | (4) | 3,580 | 3,737 |
Missouri Health & Educ. Fac. Auth. Health Fac. Rev. (St. Luke's Episcopal–Presbyterian Hosp.) | 5.500% | 12/1/14 | (4) | 3,260 | 3,388 |
Missouri Highways & Transp. Comm. Road Rev. | 5.625% | 2/1/11 | (Prere.) | 3,000 | 3,190 |
Missouri Highways & Transp. Comm. Road Rev. | 5.625% | 2/1/11 | (Prere.) | 3,430 | 3,647 |
Missouri Highways & Transp. Comm. Road Rev. | 5.625% | 2/1/11 | (Prere.) | 2,000 | 2,127 |
Missouri Highways & Transp. Comm. Road Rev. | 5.250% | 2/1/12 | (Prere.) | 11,410 | 12,195 |
Missouri Jt. Muni. Electric Util. Comm. Power Project Rev. (Prairie Project) | 5.000% | 1/1/24 | (2) | 12,225 | 11,258 |
Missouri Jt. Muni. Electric Util. Comm. Power Project Rev. (Prairie Project) | 5.000% | 1/1/26 | (2) | 15,730 | 14,245 |
St. Louis MO Airport Rev. Airport Dev. Program | 5.625% | 7/1/11 | (1)(Prere.) | 11,560 | 12,390 |
St. Louis MO Airport Rev. Airport Dev. Program | 5.625% | 7/1/11 | (1)(Prere.) | 10,260 | 10,997 |
| | | | | 138,341 |
Montana (0.1%) | | | | | |
Montana Health Fac. Auth. Rev. (Sisters of Charity Health System) | 5.250% | 12/1/09 | (1) | 3,330 | 3,369 |
Montana Health Fac. Auth. Rev. (Sisters of Charity Health System) | 5.250% | 12/1/10 | (1) | 2,445 | 2,465 |
Montana Health Fac. Auth. Rev. (Sisters of Charity Health System) | 5.250% | 12/1/11 | (1) | 4,980 | 5,004 |
Montana Health Fac. Auth. Rev. (Sisters of Charity Health System) | 5.250% | 12/1/12 | (1) | 2,725 | 2,732 |
| | | | | 13,570 |
Nebraska (0.2%) | | | | | |
Nebraska Public Power Dist. Rev. | 5.000% | 1/1/24 | | 8,000 | 7,560 |
Nebraska Public Power Dist. Rev. | 5.000% | 1/1/25 | | 14,245 | 13,357 |
Nebraska Public Power Dist. Rev. | 5.000% | 1/1/26 | | 14,960 | 13,930 |
Nebraska Public Power Dist. Rev. | 5.000% | 1/1/27 | | 5,705 | 5,281 |
Nebraska Public Power Dist. Rev. | 5.000% | 1/1/28 | | 6,000 | 5,513 |
| | | | | 45,641 |
Nevada (1.4%) | | | | | |
Clark County NV Airport Improvement Rev. | 5.375% | 7/1/10 | (1) | 8,470 | 8,568 |
Clark County NV GO | 7.500% | 6/1/09 | (2) | 1,115 | 1,151 |
Clark County NV Passenger Fac. Rev. (Las Vegas McCarran International Airport) | 5.000% | 7/1/15 | | 6,525 | 6,666 |
Clark County NV Passenger Fac. Rev. (Las Vegas McCarran International Airport) | 5.000% | 7/1/16 | | 5,575 | 5,649 |
Clark County NV School Dist. GO | 5.375% | 6/15/12 | (1)(Prere.) | 28,385 | 30,596 |
Clark County NV School Dist. GO | 5.375% | 6/15/12 | (1)(Prere.) | 29,765 | 32,083 |
Clark County NV School Dist. GO | 5.000% | 6/15/15 | | 22,120 | 23,334 |
Clark County NV School Dist. GO | 5.000% | 6/15/18 | | 8,000 | 8,226 |
58
| Clark County NV School Dist. GO | 5.000% | 6/15/19 | | 13,750 | 13,984 |
| Clark County NV School Dist. GO | 5.000% | 6/15/20 | | 14,335 | 14,435 |
| Clark County NV School Dist. GO | 5.000% | 6/15/21 | | 14,980 | 14,988 |
| Clark County NV School Dist. GO | 5.000% | 6/15/22 | | 14,655 | 14,541 |
| Clark County NV School Dist. GO | 5.000% | 6/15/23 | | 16,360 | 16,142 |
| Clark County NV School Dist. GO | 5.000% | 6/15/24 | (4) | 17,240 | 16,891 |
1 | Clark County NV Water Reclamation Dist. GO | 5.375% | 7/1/27 | | 2,985 | 2,940 |
| Henderson NV Health Care Fac. Rev. | 5.625% | 7/1/24 | | 5,000 | 4,479 |
| Las Vegas NV Convention & Visitors Auth. | 6.000% | 7/1/09 | (2)(Prere.) | 5,000 | 5,193 |
| Las Vegas NV Convention & Visitors Auth. | 6.000% | 7/1/09 | (2)(Prere.) | 4,500 | 4,674 |
| Las Vegas NV Convention & Visitors Auth. | 6.000% | 7/1/11 | (2) | 10,000 | 10,275 |
| Las Vegas Valley Water Dist. Nevada GO | 5.000% | 6/1/20 | (3) | 5,660 | 5,659 |
| Nevada Capital Improvement & Cultural Affairs GO | 5.000% | 12/1/26 | (3) | 4,875 | 4,812 |
| Nevada GO | 6.000% | 5/15/10 | | 6,680 | 7,017 |
| Reno NV Hosp. Rev. (Washoe Med. Center) | 5.500% | 6/1/28 | (2) | 1,750 | 1,524 |
| Truckee Meadows NV Water Auth. Rev. | 5.500% | 7/1/12 | (4) | 5,335 | 5,617 |
| Truckee Meadows NV Water Auth. Rev. | 5.500% | 7/1/13 | (4) | 4,790 | 5,025 |
| | | | | | 264,469 |
New Jersey (6.1%) | | | | | |
| Camden County NJ Improvement Auth. Lease Rev. | 5.500% | 9/1/10 | (4)(Prere.) | 1,470 | 1,552 |
| Essex County NJ Improvement Auth. Rev. | 5.500% | 10/1/23 | (1) | 12,065 | 12,437 |
| Essex County NJ Improvement Auth. Rev. | 5.000% | 12/15/23 | (2) | 14,000 | 13,723 |
| Essex County NJ Improvement Auth. Rev. | 5.250% | 12/15/23 | (2) | 3,635 | 3,703 |
| Essex County NJ Improvement Auth. Rev. | 5.500% | 10/1/24 | (1) | 12,725 | 13,079 |
| Essex County NJ Improvement Auth. Rev. | 5.250% | 12/15/24 | (2) | 3,820 | 3,874 |
| Essex County NJ Improvement Auth. Rev. | 5.500% | 10/1/25 | (1) | 11,630 | 11,940 |
| Essex County NJ Improvement Auth. Rev. | 5.500% | 10/1/26 | (1) | 10,000 | 10,264 |
| Essex County NJ Improvement Auth. Rev. | 5.500% | 10/1/27 | (1) | 5,895 | 6,013 |
| Gloucester County NJ Improvement Auth. Solid Waste Resource Rev. PUT | 6.850% | 12/1/09 | | 4,000 | 4,013 |
| Marlboro Township NJ Board of Educ. GO | 5.250% | 7/15/09 | (4)(Prere.) | 2,625 | 2,691 |
| Marlboro Township NJ Board of Educ. GO | 5.250% | 7/15/09 | (4)(Prere.) | 2,790 | 2,860 |
| New Jersey Casino Reinvestment Dev. Auth. Rev. (Hotel Room Fee) | 5.250% | 1/1/23 | (2) | 3,900 | 3,716 |
| New Jersey Casino Reinvestment Dev. Auth. Rev. (Hotel Room Fee) | 5.250% | 1/1/24 | (2) | 3,500 | 3,307 |
| New Jersey Econ. Dev. Auth. Rev. (Cigarette Tax) | 5.625% | 6/15/18 | | 25,000 | 21,578 |
| New Jersey Econ. Dev. Auth. Rev. (Cigarette Tax) | 5.625% | 6/15/19 | | 14,000 | 11,953 |
| New Jersey Econ. Dev. Auth. Rev. (Cigarette Tax) | 5.500% | 6/15/24 | | 12,000 | 9,513 |
| New Jersey Econ. Dev. Auth. Rev. (School Fac.) | 5.000% | 9/1/13 | | 12,315 | 12,867 |
| New Jersey Econ. Dev. Auth. Rev. (School Fac.) | 5.000% | 9/1/14 | | 10,900 | 11,371 |
| New Jersey Econ. Dev. Auth. Rev. (School Fac.) | 5.500% | 9/1/23 | (1) | 81,630 | 83,964 |
| New Jersey Econ. Dev. Auth. Rev. (School Fac.) | 5.500% | 9/1/24 | (2) | 60,000 | 61,529 |
| New Jersey Econ. Dev. Auth. Rev. (School Fac.) | 5.500% | 9/1/25 | (4) | 18,130 | 18,672 |
| New Jersey Econ. Dev. Auth. Rev. (School Fac.) PUT | 5.000% | 9/1/14 | (4) | 40,955 | 42,446 |
| New Jersey Econ. Dev. Auth. Rev. (Transp. Project) | 5.000% | 5/1/13 | | 7,215 | 7,531 |
| New Jersey GO | 5.500% | 8/1/11 | | 3,500 | 3,724 |
| New Jersey GO | 5.250% | 7/1/14 | (4) | 25,000 | 26,910 |
| New Jersey GO | 5.250% | 7/1/15 | (4) | 50,000 | 53,804 |
| New Jersey GO | 5.250% | 7/15/15 | (2) | 9,000 | 9,654 |
| New Jersey Health Care Fac. Financing Auth. Rev. | 5.500% | 10/1/23 | | 12,860 | 12,403 |
| New Jersey Health Care Fac. Financing Auth. Rev. (AHS Hospital) | 5.000% | 7/1/16 | | 8,420 | 8,149 |
| New Jersey Health Care Fac. Financing Auth. Rev. (AHS Hospital) | 5.000% | 7/1/17 | | 8,875 | 8,460 |
| New Jersey Health Care Fac. Financing Auth. Rev. (St. Barnabas Health Care) | 5.250% | 1/1/09 | (1)(Prere.) | 170 | 173 |
| New Jersey Health Care Fac. Financing Auth. Rev. (St. Barnabas Health Care) | 5.250% | 1/1/09 | (1)(Prere.) | 155 | 157 |
| New Jersey Health Care Fac. Financing Auth. Rev. (St. Barnabas Health Care) | 5.250% | 1/1/09 | (1)(Prere.) | 965 | 980 |
| New Jersey Health Care Fac. Financing Auth. Rev. (St. Barnabas Health Care) | 5.250% | 7/1/10 | (1) | 7,880 | 7,918 |
| New Jersey Health Care Fac. Financing Auth. Rev. (St. Barnabas Health Care) | 5.250% | 7/1/11 | (1) | 8,230 | 8,291 |
| New Jersey Health Care Fac. Financing Auth. Rev. (St. Barnabas Health Care) | 5.250% | 7/1/12 | (1) | 1,845 | 1,830 |
| New Jersey Health Care Fac. Financing Auth. Rev. (St. Barnabas Health Care) | 5.250% | 7/1/14 | (1) | 1,885 | 1,825 |
| New Jersey Sports & Exposition Auth. Rev. | 4.500% | 9/1/24 | | 2,155 | 1,898 |
| New Jersey Transp. Corp. COP | 5.500% | 9/15/10 | (2) | 12,500 | 12,978 |
| New Jersey Transp. Corp. COP | 5.750% | 9/15/10 | (2) | 15,000 | 15,303 |
| New Jersey Transp. Corp. COP | 5.750% | 9/15/10 | (2)(Prere.) | 25,000 | 26,497 |
| New Jersey Transp. Corp. COP | 5.750% | 9/15/10 | (2)(Prere.) | 28,470 | 30,175 |
| New Jersey Transp. Corp. COP | 5.250% | 9/15/15 | (2) | 10,000 | 10,339 |
| New Jersey Transp. Corp. COP | 5.500% | 9/15/15 | (4) | 5,000 | 5,242 |
| New Jersey Transp. Trust Fund Auth. Rev. | 6.500% | 6/15/11 | (1)(ETM) | 7,510 | 8,216 |
| New Jersey Transp. Trust Fund Auth. Rev. | 6.500% | 6/15/11 | (1) | 12,490 | 13,477 |
| New Jersey Transp. Trust Fund Auth. Rev. | 7.000% | 6/15/12 | (1)(ETM) | 7,510 | 8,510 |
| New Jersey Transp. Trust Fund Auth. Rev. | 7.000% | 6/15/12 | (1) | 12,490 | 13,887 |
| New Jersey Transp. Trust Fund Auth. Rev. | 5.250% | 6/15/14 | (3)(Prere.) | 16,400 | 17,828 |
| New Jersey Transp. Trust Fund Auth. Rev. | 5.000% | 12/15/17 | | 15,000 | 15,333 |
| New Jersey Transp. Trust Fund Auth. Rev. | 5.250% | 12/15/19 | | 20,000 | 20,322 |
59
| New Jersey Transp. Trust Fund Auth. Rev. | 5.500% | 12/15/20 | (3) | 83,500 | 85,357 |
| New Jersey Transp. Trust Fund Auth. Rev. | 5.500% | 12/15/21 | (12)(1) | 25,000 | 25,804 |
| New Jersey Transp. Trust Fund Auth. Rev. | 5.750% | 6/15/24 | (3) | 25,000 | 25,807 |
| New Jersey Transp. Trust Fund Auth. Rev. | 0.000% | 12/15/25 | (2) | 15,000 | 5,519 |
| New Jersey Transp. Trust Fund Auth. Rev. | 0.000% | 12/15/26 | (2) | 35,065 | 12,026 |
| New Jersey Turnpike Auth. Rev. | 5.625% | 1/1/10 | (1)(Prere.) | 2,775 | 2,883 |
| New Jersey Turnpike Auth. Rev. | 5.625% | 1/1/10 | (1)(Prere.) | 3,440 | 3,574 |
| New Jersey Turnpike Auth. Rev. | 5.750% | 1/1/10 | (1)(ETM) | 7,475 | 7,777 |
| New Jersey Turnpike Auth. Rev. | 5.750% | 1/1/10 | (1) | 27,745 | 28,745 |
| New Jersey Turnpike Auth. Rev. | 5.500% | 1/1/25 | (2) | 14,000 | 14,346 |
| New Jersey Turnpike Auth. Rev. | 5.250% | 1/1/26 | (4) | 10,000 | 10,011 |
| New Jersey Turnpike Auth. Rev. | 5.250% | 1/1/27 | (4) | 12,035 | 11,964 |
| New Jersey Turnpike Auth. Rev. VRDO | 7.750% | 11/7/08 | LOC | 30,000 | 30,000 |
| Rutgers State Univ. New Jersey | 6.400% | 5/1/13 | | 4,015 | 4,283 |
| Tobacco Settlement Financing Corp. New Jersey Rev. | 4.250% | 6/1/12 | | 6,385 | 5,977 |
| Tobacco Settlement Financing Corp. New Jersey Rev. | 6.125% | 6/1/12 | (Prere.) | 40,000 | 42,036 |
| Tobacco Settlement Financing Corp. New Jersey Rev. | 5.000% | 6/1/13 | | 14,945 | 14,124 |
| Tobacco Settlement Financing Corp. New Jersey Rev. | 5.000% | 6/1/15 | | 11,425 | 10,353 |
| Tobacco Settlement Financing Corp. New Jersey Rev. | 5.000% | 6/1/16 | | 14,585 | 12,929 |
| Tobacco Settlement Financing Corp. New Jersey Rev. | 5.000% | 6/1/17 | | 15,925 | 13,848 |
| Tobacco Settlement Financing Corp. New Jersey Rev. | 5.000% | 6/1/18 | | 16,475 | 14,026 |
| Tobacco Settlement Financing Corp. New Jersey Rev. | 5.000% | 6/1/19 | | 30,595 | 25,427 |
| Univ. of Medicine & Dentistry New Jersey Rev. | 5.500% | 12/1/23 | (2) | 7,330 | 7,362 |
| Univ. of Medicine & Dentistry New Jersey Rev. | 5.500% | 12/1/27 | (2) | 10,100 | 9,189 |
| | | | | | 1,142,246 |
New Mexico (0.7%) | | | | | |
| Farmington NM PCR (Southern CA Edison Four Corners Project) PUT | 3.550% | 4/1/10 | (3) | 30,000 | 29,665 |
| New Mexico Finance Auth. Transp. Rev. | 5.000% | 6/15/13 | (2) | 12,895 | 13,603 |
| New Mexico Finance Auth. Transp. Rev. | 5.250% | 6/15/20 | (1) | 30,525 | 31,058 |
| New Mexico Finance Auth. Transp. Rev. | 5.250% | 6/15/21 | (1) | 28,000 | 28,297 |
| New Mexico Highway Comm. Tax Rev. | 5.750% | 6/15/10 | (Prere.) | 16,310 | 17,197 |
| New Mexico Highway Comm. Tax Rev. | 6.000% | 6/15/10 | (Prere.) | 12,780 | 13,526 |
| | | | | | 133,346 |
New York (6.8%) | | | | | |
| Erie County NY IDA School Fac. Rev. GO | 5.750% | 5/1/23 | (4) | 7,000 | 7,180 |
| Erie County NY IDA School Fac. Rev. GO | 5.750% | 5/1/24 | (4) | 3,750 | 3,835 |
| Erie County NY IDA School Fac. Rev. GO | 5.750% | 5/1/25 | (4) | 3,000 | 3,059 |
| Long Island NY Power Auth. Electric System Rev. | 5.500% | 12/1/09 | (2) | 8,000 | 8,240 |
| Long Island NY Power Auth. Electric System Rev. | 5.250% | 6/1/12 | | 40,505 | 42,583 |
| Long Island NY Power Auth. Electric System Rev. | 5.000% | 12/1/18 | (1) | 27,900 | 27,416 |
| Long Island NY Power Auth. Electric System Rev. | 5.000% | 12/1/20 | (1) | 10,000 | 9,533 |
| Long Island NY Power Auth. Electric System Rev. | 5.000% | 12/1/21 | (3) | 10,000 | 9,389 |
| Long Island NY Power Auth. Electric System Rev. | 5.000% | 12/1/21 | (1) | 33,115 | 31,209 |
1 | Long Island NY Power Auth. Electric System Rev. | 5.750% | 4/1/25 | | 20,000 | 19,831 |
| Metro. New York Transp. Auth. Rev. | 5.000% | 11/15/23 | (4) | 10,000 | 9,773 |
| Metro. New York Transp. Auth. Rev. (Commuter Fac.) | 5.000% | 1/1/12 | (1)(Prere.) | 8,100 | 8,608 |
| Metro. New York Transp. Auth. Rev. (Dedicated Petroleum Tax) | 6.000% | 4/1/20 | (1)(ETM) | 21,500 | 23,787 |
| Metro. New York Transp. Auth. Rev. (Service Contract) | 0.000% | 7/1/11 | (ETM) | 21,200 | 19,494 |
| Metro. New York Transp. Auth. Rev. (Transit Rev.) | 7.000% | 7/1/09 | (2)(ETM) | 2,755 | 2,845 |
| Metro. New York Transp. Auth. Rev. (Transit Rev.) | 4.750% | 7/1/12 | (4)(Prere.) | 25,835 | 27,420 |
| Metro. New York Transp. Auth. Rev. (Transit Rev.) | 5.500% | 11/15/15 | (2) | 45,130 | 46,493 |
| Metro. New York Transp. Auth. Rev. (Transit Rev.) | 5.500% | 11/15/16 | (2) | 38,075 | 38,986 |
| New York City NY GO | 5.250% | 8/1/10 | | 27,000 | 28,022 |
| New York City NY GO | 5.000% | 8/1/11 | | 8,000 | 8,304 |
| New York City NY GO | 5.250% | 8/1/11 | | 30,000 | 31,311 |
| New York City NY GO | 5.250% | 8/1/13 | | 18,015 | 18,896 |
| New York City NY GO | 5.750% | 8/1/13 | (2) | 8,500 | 9,125 |
| New York City NY GO | 5.750% | 8/1/15 | (2) | 38,000 | 40,540 |
| New York City NY GO | 5.000% | 8/1/19 | | 12,630 | 12,455 |
| New York City NY GO | 5.000% | 8/1/20 | | 10,000 | 9,733 |
| New York City NY GO | 5.000% | 8/1/21 | | 10,000 | 9,688 |
| New York City NY GO | 5.250% | 9/1/21 | | 20,000 | 19,814 |
| New York City NY GO | 5.000% | 8/1/22 | | 10,000 | 9,621 |
| New York City NY GO | 5.250% | 8/15/22 | | 25,250 | 24,917 |
| New York City NY GO | 5.250% | 8/15/23 | | 21,820 | 21,466 |
| New York City NY GO | 5.250% | 8/15/24 | | 26,445 | 25,860 |
| New York City NY Muni. Water Finance Auth. Water & Sewer System Rev. | 5.375% | 6/15/19 | | 7,500 | 7,742 |
| New York City NY Sales Tax Asset Receivable Corp. | 5.000% | 10/15/26 | (1) | 10,000 | 9,837 |
| New York City NY Transitional Finance Auth. Rev. | 5.500% | 2/15/10 | (Prere.) | 3,500 | 3,678 |
| New York City NY Transitional Finance Auth. Rev. | 5.750% | 2/15/10 | (Prere.) | 4,365 | 4,601 |
| New York City NY Transitional Finance Auth. Rev. | 5.375% | 2/1/13 | | 14,000 | 14,683 |
60
New York City NY Transitional Finance Auth. Rev. | 5.375% | 2/1/14 | | 5,000 | 5,220 |
New York City NY Transitional Finance Auth. Rev. | 5.250% | 8/1/18 | (2) | 5,000 | 5,118 |
New York City NY Transitional Finance Auth. Rev. | 5.000% | 1/15/25 | (3) | 10,170 | 9,670 |
New York City NY Transitional Finance Auth. Rev. | 5.000% | 1/15/26 | (3) | 7,620 | 7,207 |
New York City NY Transitional Finance Auth. Rev. Future Tax | 5.250% | 5/1/09 | (Prere.) | 70 | 72 |
New York City NY Transitional Finance Auth. Rev. Future Tax | 5.000% | 5/15/09 | (Prere.) | 315 | 323 |
New York City NY Transitional Finance Auth. Rev. Future Tax | 5.000% | 8/1/21 | | 51,100 | 51,318 |
New York State Dormitory Auth. Rev. (City Univ.) | 5.500% | 7/1/11 | (1)(Prere.) | 4,090 | 4,386 |
New York State Dormitory Auth. Rev. (City Univ.) | 5.750% | 7/1/13 | (1) | 11,500 | 12,022 |
New York State Dormitory Auth. Rev. (City Univ.) | 5.750% | 7/1/13 | (1) | 14,645 | 15,421 |
New York State Dormitory Auth. Rev. (Columbia Univ.) | 5.250% | 7/1/11 | | 4,160 | 4,417 |
New York State Dormitory Auth. Rev. (Cornell Univ.) VRDO | 1.050% | 11/3/08 | | 9,550 | 9,550 |
New York State Dormitory Auth. Rev. (Mental Health Services) | 5.250% | 2/15/11 | (1) | 725 | 734 |
New York State Dormitory Auth. Rev. (Mental Health Services) | 5.000% | 2/15/23 | (3) | 6,415 | 6,161 |
New York State Dormitory Auth. Rev. (Mental Health Services) | 5.000% | 2/15/24 | (3) | 6,740 | 6,421 |
New York State Dormitory Auth. Rev. (Personal Income Tax) | 5.000% | 12/15/13 | | 2,135 | 2,276 |
New York State Dormitory Auth. Rev. (Personal Income Tax) | 5.000% | 12/15/14 | | 3,250 | 3,465 |
New York State Dormitory Auth. Rev. (Personal Income Tax) | 5.000% | 3/15/20 | | 33,000 | 33,477 |
New York State Dormitory Auth. Rev. (Personal Income Tax) | 5.000% | 3/15/21 | | 34,650 | 34,896 |
New York State Dormitory Auth. Rev. (Personal Income Tax) | 5.000% | 3/15/23 | | 5,000 | 4,979 |
New York State Dormitory Auth. Rev. (Personal Income Tax) | 5.000% | 3/15/23 | | 36,950 | 36,798 |
New York State Dormitory Auth. Rev. (Personal Income Tax) | 5.000% | 3/15/25 | | 16,820 | 16,542 |
New York State Dormitory Auth. Rev. (Personal Income Tax) | 5.500% | 3/15/25 | (2) | 8,740 | 9,065 |
New York State Dormitory Auth. Rev. (Personal Income Tax) | 5.000% | 3/15/26 | | 13,000 | 12,733 |
New York State Dormitory Auth. Rev. (Second Hosp.) | 5.100% | 2/15/11 | (2) | 4,040 | 4,105 |
New York State Dormitory Auth. Rev. (State Univ.) | 6.000% | 5/15/13 | (1) | 10,000 | 10,489 |
New York State Dormitory Auth. Rev. (Upstate Community Colleges) | 5.250% | 7/1/10 | (2) | 3,920 | 4,020 |
New York State Dormitory Auth. Rev. (Upstate Community Colleges) | 5.250% | 7/1/11 | (2) | 3,610 | 3,699 |
New York State Environmental Fac. Corp. Rev. (Clean Water & Drinking Revolving Funds) | 5.375% | 6/15/15 | | 7,650 | 8,008 |
New York State Environmental Fac. Corp. Rev. (Clean Water & Drinking Revolving Funds) | 5.375% | 6/15/16 | | 6,000 | 6,281 |
New York State Local Govt. Assistance Corp. VRDO | 2.700% | 11/7/08 | (4) | 5,100 | 5,100 |
New York State Power Auth. Rev. | 5.250% | 11/15/12 | (Prere.) | 2,600 | 2,810 |
New York State Power Auth. Rev. | 5.250% | 11/15/12 | (Prere.) | 20,710 | 22,380 |
New York State Thruway Auth. Rev. | 5.000% | 1/1/20 | (1) | 9,440 | 9,467 |
New York State Thruway Auth. Rev. | 5.000% | 1/1/22 | (3) | 10,000 | 9,829 |
New York State Thruway Auth. Rev. | 5.000% | 1/1/23 | (2) | 20,000 | 19,601 |
New York State Thruway Auth. Rev. (Highway & Bridge Trust Fund) | 6.250% | 4/1/10 | (4)(ETM) | 6,725 | 7,107 |
New York State Thruway Auth. Rev. (Highway & Bridge Trust Fund) | 5.500% | 4/1/12 | (1) | 20,000 | 21,304 |
New York State Thruway Auth. Rev. (Highway & Bridge Trust Fund) | 5.000% | 4/1/14 | | 12,055 | 12,678 |
New York State Thruway Auth. Rev. (Highway & Bridge Trust Fund) | 5.000% | 4/1/23 | | 15,100 | 14,736 |
New York State Thruway Auth. Rev. (Personal Income Tax) | 5.500% | 3/15/12 | (1)(Prere.) | 3,000 | 3,234 |
New York State Urban Dev. Corp. Rev. (Personal Income Tax) GO | 5.500% | 3/15/22 | (1) | 23,030 | 24,322 |
Port Auth. of New York & New Jersey Rev. | 4.500% | 7/15/28 | | 19,030 | 16,882 |
Suffolk County NY Water Auth. Rev. | 6.800% | 6/1/12 | (ETM) | 9,330 | 10,045 |
Tobacco Settlement Financing Corp. New York Rev. | 5.000% | 6/1/10 | | 10,000 | 10,335 |
Tobacco Settlement Financing Corp. New York Rev. | 4.000% | 6/1/12 | | 50,000 | 50,519 |
Triborough Bridge & Tunnel Auth. New York Rev. | 5.500% | 1/1/12 | (ETM) | 15,530 | 16,226 |
Triborough Bridge & Tunnel Auth. New York Rev. | 6.000% | 1/1/12 | (ETM) | 12,000 | 12,679 |
Triborough Bridge & Tunnel Auth. New York Rev. PUT | 5.000% | 11/15/14 | | 20,000 | 20,721 |
Triborough Bridge & Tunnel Auth. New York Rev. PUT | 5.000% | 11/15/15 | | 20,000 | 20,516 |
| | | | | 1,289,338 |
North Carolina (2.6%) | | | | | |
Charlotte-Mecklenberg NC Hosp. Auth. Rev. (Healthcare System Rev.) | 4.625% | 1/15/26 | | 11,460 | 9,730 |
Cumberland County NC Hosp. Fac. Rev. (Cape Fear Hosp.) | 5.250% | 10/1/09 | (Prere.) | 10,000 | 10,407 |
Guilford County NC GO VRDO | 3.250% | 11/7/08 | | 40,010 | 40,010 |
North Carolina Capital Fac. Finance Agency Rev. (Lenior-Rhyne College) VRDO | 2.330% | 11/7/08 | LOC | 16,785 | 16,785 |
North Carolina Eastern Muni. Power Agency Rev. | 5.375% | 1/1/11 | | 25,000 | 25,543 |
North Carolina Eastern Muni. Power Agency Rev. | 5.375% | 1/1/12 | | 14,875 | 15,166 |
North Carolina Eastern Muni. Power Agency Rev. | 5.375% | 1/1/13 | | 25,000 | 25,413 |
North Carolina Eastern Muni. Power Agency Rev. | 5.500% | 1/1/14 | | 15,000 | 15,207 |
North Carolina Eastern Muni. Power Agency Rev. | 5.300% | 1/1/15 | | 4,000 | 3,976 |
North Carolina Eastern Muni. Power Agency Rev. | 5.000% | 1/1/16 | | 4,000 | 3,839 |
North Carolina Eastern Muni. Power Agency Rev. | 5.375% | 1/1/16 | | 3,000 | 2,959 |
North Carolina Eastern Muni. Power Agency Rev. | 5.375% | 1/1/17 | | 4,700 | 4,547 |
North Carolina GO | 5.000% | 3/1/12 | | 7,400 | 7,857 |
North Carolina GO | 5.000% | 5/1/14 | | 20,280 | 21,513 |
North Carolina GO | 5.000% | 3/1/15 | | 12,875 | 13,809 |
North Carolina GO | 5.000% | 3/1/16 | | 23,510 | 25,175 |
North Carolina GO | 5.000% | 9/1/16 | | 10,000 | 10,726 |
North Carolina GO | 5.000% | 3/1/17 | | 10,000 | 10,651 |
North Carolina GO | 5.000% | 3/1/18 | | 25,000 | 26,303 |
61
| North Carolina Infrastructure Financial Corp. COP Capital Improvements | 5.000% | 2/1/18 | (4) | 9,675 | 9,941 |
| North Carolina Infrastructure Financial Corp. COP Capital Improvements | 5.000% | 2/1/19 | (4) | 10,000 | 10,172 |
| North Carolina Infrastructure Financial Corp. COP Capital Improvements | 5.000% | 2/1/21 | (4) | 10,000 | 10,022 |
| North Carolina Muni. Power Agency Rev. | 5.250% | 1/1/09 | (1) | 8,500 | 8,534 |
| North Carolina Muni. Power Agency Rev. | 5.250% | 1/1/16 | (4) | 10,000 | 10,300 |
| North Carolina Muni. Power Agency Rev. | 5.250% | 1/1/17 | (4) | 15,290 | 15,594 |
| North Carolina Muni. Power Agency Rev. | 5.250% | 1/1/18 | (1) | 69,720 | 69,115 |
| North Carolina Muni. Power Agency Rev. | 5.250% | 1/1/18 | | 5,000 | 4,957 |
| North Carolina Muni. Power Agency Rev. | 5.250% | 1/1/19 | (1) | 38,600 | 37,736 |
| North Carolina Muni. Power Agency Rev. | 5.250% | 1/1/19 | | 3,085 | 3,016 |
| North Carolina Muni. Power Agency Rev. | 5.250% | 1/1/20 | (1) | 10,000 | 9,623 |
| North Carolina Muni. Power Agency Rev. | 5.250% | 1/1/20 | | 2,000 | 1,925 |
| Winston-Salem NC Water & Sewer System Rev. | 5.500% | 6/1/11 | (Prere.) | 2,380 | 2,564 |
| Winston-Salem NC Water & Sewer System Rev. | 5.500% | 6/1/11 | (Prere.) | 1,970 | 2,122 |
| Winston-Salem NC Water & Sewer System Rev. | 5.500% | 6/1/13 | | 1,500 | 1,585 |
| Winston-Salem NC Water & Sewer System Rev. | 5.500% | 6/1/14 | | 1,240 | 1,311 |
| | | | | | 488,133 |
Ohio (3.0%) | | | | | |
| Akron OH GO | 5.000% | 12/1/18 | (2) | 5,300 | 5,427 |
| Allen County OH Hosp. Fac. Rev. (Catholic Healthcare) VRDO | 0.700% | 11/3/08 | LOC | 16,000 | 16,000 |
| American Muni. Power Ohio Inc. | 5.000% | 2/15/16 | | 4,000 | 4,115 |
| American Muni. Power Ohio Inc. | 5.000% | 2/15/17 | | 6,770 | 6,903 |
| Buckeye OH Tobacco Settlement Financing Corp. Rev. | 5.125% | 6/1/24 | | 73,070 | 56,991 |
| Cincinnati OH City School Dist. GO | 5.250% | 12/1/20 | (3) | 7,000 | 7,139 |
| Cincinnati OH City School Dist. GO | 5.250% | 12/1/21 | (3) | 5,710 | 5,754 |
| Cincinnati OH City School Dist. GO | 5.250% | 12/1/22 | (3) | 10,000 | 10,050 |
| Cincinnati OH City School Dist. GO | 5.250% | 12/1/23 | (3) | 5,000 | 5,000 |
| Cincinnati OH City School Dist. GO | 5.250% | 12/1/24 | (3) | 10,000 | 9,967 |
3 | Cincinnati OH GO | 5.250% | 12/1/13 | (4)(Prere.) | 14,710 | 16,049 |
| Cincinnati OH GO | 5.250% | 12/1/13 | (4)(Prere.) | 9,185 | 10,021 |
| Cincinnati OH GO | 5.250% | 12/1/13 | (4)(Prere.) | 5,000 | 5,455 |
| Cincinnati OH GO | 5.250% | 12/1/13 | (4)(Prere.) | 8,150 | 8,892 |
| Cleveland OH Public Power System Rev. | 5.000% | 11/15/21 | (3) | 7,455 | 6,996 |
| Cleveland OH Public Power System Rev. | 5.000% | 11/15/22 | (3) | 14,065 | 13,096 |
| Cleveland OH Public Power System Rev. | 5.000% | 11/15/23 | (3) | 7,705 | 7,114 |
| Cleveland OH Public Power System Rev. | 5.000% | 11/15/24 | (3) | 7,350 | 6,720 |
| Cleveland OH Water Works Rev. | 5.250% | 1/1/09 | (4) | 795 | 800 |
| Cleveland OH Water Works Rev. | 5.250% | 1/1/10 | (4) | 2,745 | 2,778 |
| Cleveland OH Water Works Rev. | 5.375% | 1/1/13 | (4) | 3,455 | 3,635 |
| Columbus OH City School Dist. School Fac. Construction & Improvement GO | 5.000% | 12/1/16 | (4) | 6,000 | 6,367 |
| Franklin County OH Hosp. Rev. (OhioHealth Corp.) VRDO | 0.000% | 11/7/08 | | | — |
| Hamilton County OH Sales Tax Rev. | 5.000% | 12/1/18 | (2) | 7,950 | 7,812 |
| Hamilton County OH Sales Tax Rev. | 5.000% | 12/1/19 | (2) | 22,380 | 21,669 |
| Hamilton County OH Sales Tax Rev. | 5.000% | 12/1/23 | (2) | 21,215 | 19,664 |
| Lorain County OH Hosp. Fac. Rev. (Catholic Healthcare Partners) | 5.625% | 10/1/12 | | 6,800 | 6,999 |
| Lorain County OH Hosp. Fac. Rev. (Catholic Healthcare Partners) | 5.625% | 9/1/13 | (1) | 3,000 | 3,036 |
| Lorain County OH Hosp. Fac. Rev. (Catholic Healthcare Partners) | 5.625% | 10/1/13 | | 6,810 | 7,016 |
| Lorain County OH Hosp. Fac. Rev. (Catholic Healthcare Partners) | 5.625% | 10/1/14 | | 6,000 | 6,158 |
| Lorain County OH Hosp. Fac. Rev. (Catholic Healthcare Partners) | 5.625% | 10/1/15 | | 4,000 | 4,079 |
| Lorain County OH Hosp. Fac. Rev. (Catholic Healthcare Partners) | 5.000% | 4/1/16 | (4) | 6,200 | 6,368 |
| Lorain County OH Hosp. Fac. Rev. (Catholic Healthcare Partners) | 5.000% | 4/1/16 | (4) | 6,200 | 6,368 |
| Lorain County OH Hosp. Fac. Rev. (Catholic Healthcare Partners) | 5.000% | 4/1/17 | (4) | 6,600 | 6,740 |
| Lorain County OH Hosp. Fac. Rev. (Catholic Healthcare Partners) | 5.000% | 4/1/17 | (4) | 6,600 | 6,740 |
| Lorain County OH Hosp. Fac. Rev. (Catholic Healthcare Partners) | 5.000% | 4/1/18 | (4) | 7,300 | 7,371 |
| Lorain County OH Hosp. Fac. Rev. (Catholic Healthcare Partners) | 5.000% | 4/1/18 | (4) | 7,300 | 7,371 |
| Ohio Air Quality Dev. Auth. PCR (Ohio Edison Co.) VRDO | 2.250% | 11/3/08 | LOC | 46,465 | 46,465 |
| Ohio Building Auth. Rev. (Administration Building Fund) | 5.500% | 10/1/11 | (4)(Prere.) | 6,605 | 7,095 |
| Ohio Building Auth. Rev. (State Correctional Fac.) | 5.500% | 10/1/12 | (4) | 5,000 | 5,281 |
| Ohio Building Auth. Rev. (State Correctional Fac.) | 5.500% | 10/1/13 | (4) | 3,000 | 3,156 |
| Ohio Building Auth. Rev. (State Correctional Fac.) | 5.250% | 4/1/17 | | 5,565 | 5,884 |
| Ohio GO | 5.625% | 5/1/10 | (Prere.) | 5,065 | 5,313 |
| Ohio GO | 7.625% | 8/1/10 | | 3,510 | 3,811 |
| Ohio GO | 5.250% | 8/1/13 | (4) | 12,435 | 13,374 |
| Ohio GO | 5.500% | 8/1/13 | | 2,945 | 3,208 |
| Ohio GO | 5.500% | 11/1/14 | | 7,000 | 7,658 |
| Ohio GO | 5.000% | 9/15/18 | | 12,755 | 13,198 |
| Ohio GO | 5.000% | 11/1/18 | | 7,710 | 7,978 |
| Ohio Higher Educ. Capital Fac. Rev. | 5.250% | 11/1/14 | | 3,710 | 3,904 |
| Ohio Higher Educ. GO | 5.000% | 11/1/23 | | 8,905 | 8,933 |
| Ohio Higher Educ. GO | 5.000% | 2/1/25 | | 1,160 | 1,152 |
| Ohio Highway Capital Improvements GO | 5.000% | 5/1/16 | | 11,010 | 11,681 |
62
1 | Ohio Housing Finance Agency Mortgage Rev. | 6.125% | 9/1/28 | | 5,500 | 5,484 |
| Ohio Infrastructure Improvement GO | 5.000% | 9/1/24 | | 8,720 | 8,710 |
| Ohio Water Dev. Auth. Rev. (Drinking Water Fund) | 5.000% | 12/1/19 | | 3,605 | 3,728 |
| Ohio Water Dev. Auth. Rev. (Drinking Water Fund) | 5.000% | 12/1/20 | | 3,785 | 3,872 |
| Ohio Water Dev. Auth. Rev. (Drinking Water Fund) | 5.000% | 12/1/21 | | 3,980 | 4,044 |
| Ohio Water Dev. Auth. Rev. (Fresh Water Improvement) | 5.500% | 6/1/21 | | 5,540 | 5,942 |
| Ohio Water Dev. Auth. Rev. (Fresh Water Improvement) | 5.500% | 12/1/21 | | 5,555 | 5,964 |
| Ross County OH Hosp. Fac. Rev. (Adena Health System) | 5.500% | 12/1/28 | | 9,000 | 7,684 |
| Scioto County OH Hosp. Rev. (Southern Ohio Medical Center) | 5.000% | 2/15/15 | | 3,040 | 2,940 |
| Scioto County OH Hosp. Rev. (Southern Ohio Medical Center) | 5.000% | 2/15/16 | | 3,190 | 3,032 |
| Scioto County OH Hosp. Rev. (Southern Ohio Medical Center) | 5.000% | 2/15/17 | | 3,350 | 3,137 |
| Scioto County OH Hosp. Rev. (Southern Ohio Medical Center) | 5.000% | 2/15/18 | | 3,520 | 3,241 |
| Scioto County OH Hosp. Rev. (Southern Ohio Medical Center) | 5.000% | 2/15/19 | | 3,195 | 2,887 |
| Scioto County OH Hosp. Rev. (Southern Ohio Medical Center) | 5.000% | 2/15/20 | | 3,680 | 3,263 |
| Scioto County OH Hosp. Rev. (Southern Ohio Medical Center) | 5.500% | 2/15/28 | | 17,000 | 14,594 |
| Univ. of Cincinnati OH General Receipts | 5.500% | 6/1/13 | (3) | 2,700 | 2,829 |
| Univ. of Cincinnati OH General Receipts | 5.500% | 6/1/14 | (3) | 1,000 | 1,044 |
| | | | | | 563,146 |
Oklahoma (0.5%) | | | | | |
| Grand River Dam Auth. Oklahoma Rev. | 6.250% | 6/1/11 | (2) | 7,600 | 8,054 |
| Oklahoma Dev. Finance Auth. Health System Rev. (Integris Baptist) | 5.000% | 8/15/24 | | 12,500 | 11,282 |
| Oklahoma Dev. Finance Auth. Rev. (Integris) VRDO | 1.250% | 11/3/08 | (12) | 17,600 | 17,600 |
| Oklahoma State Capitol Improvement Auth. Fac. Rev. | 5.000% | 7/1/25 | (2) | 18,070 | 17,300 |
| Oklahoma State Capitol Improvement Auth. Fac. Rev. | 5.000% | 7/1/26 | (2) | 12,000 | 11,444 |
| Oklahoma State Capitol Improvement Auth. Fac. Rev. | 5.000% | 7/1/27 | (2) | 20,110 | 19,034 |
| Oklahoma State Muni Power Auth. Power Supply System Rev. | 5.875% | 1/1/28 | | 1,145 | 1,156 |
| Oklahoma Turnpike Auth. | 5.500% | 1/1/09 | (3) | 6,000 | 6,037 |
| | | | | | 91,907 |
Oregon (0.6%) | | | | | |
| Clackamas County OR Hosp. Fac. Auth. Rev. (Legacy Health System) | 5.500% | 2/15/09 | | 7,715 | 7,776 |
| Clackamas County OR Hosp. Fac. Auth. Rev. (Legacy Health System) | 5.500% | 2/15/10 | | 9,955 | 10,190 |
| Clackamas County OR Hosp. Fac. Auth. Rev. (Legacy Health System) | 5.750% | 5/1/12 | | 2,955 | 3,055 |
| Clackamas County OR Hosp. Fac. Auth. Rev. (Legacy Health System) | 5.750% | 5/1/13 | | 5,580 | 5,724 |
| Clackamas County OR Hosp. Fac. Auth. Rev. (Legacy Health System) | 5.750% | 5/1/14 | | 5,825 | 5,935 |
| Clackamas County OR Hosp. Fac. Auth. Rev. (Legacy Health System) | 5.750% | 5/1/15 | | 4,395 | 4,452 |
| Oregon State Dept. Administrative Services | 5.750% | 4/1/09 | (4)(Prere.) | 8,715 | 8,949 |
| Oregon State Dept. Administrative Services | 5.750% | 4/1/09 | (4)(Prere.) | 2,500 | 2,567 |
| Oregon State Dept. Administrative Services | 5.750% | 4/1/09 | (4)(Prere.) | 3,000 | 3,081 |
| Oregon State Dept. Administrative Services | 5.750% | 4/1/10 | (4) | 7,560 | 7,735 |
| Oregon State Dept. Administrative Services | 5.000% | 4/1/25 | (4) | 5,675 | 5,643 |
| Oregon State Dept. Administrative Services | 5.000% | 4/1/26 | (4) | 11,210 | 11,107 |
| Oregon State Var-Veterans Welfare VRDO | 1.900% | 11/3/08 | | 4,900 | 4,900 |
| Portland OR Sewer System Rev. | 5.000% | 6/1/12 | (1) | 27,230 | 28,756 |
| Portland OR Sewer System Rev. | 5.000% | 8/1/18 | (4) | 11,470 | 11,943 |
| | | | | | 121,813 |
Pennsylvania (4.1%) | | | | | |
| Commonwealth Financing Auth. Pennsylvania Rev. | 5.000% | 6/1/24 | (1) | 14,050 | 13,722 |
| Commonwealth Financing Auth. Pennsylvania Rev. | 5.000% | 6/1/25 | (1) | 10,000 | 9,714 |
| Delaware County PA Hosp. Auth. Rev. (Crozer Keystone Obligated Group) | 5.000% | 12/15/17 | | 3,790 | 3,168 |
| Delaware County PA Hosp. Auth. Rev. (Crozer Keystone Obligated Group) | 5.000% | 12/15/18 | | 3,985 | 3,245 |
| Delaware County PA Hosp. Auth. Rev. (Crozer Keystone Obligated Group) | 5.000% | 12/15/19 | | 4,175 | 3,308 |
| Delaware County PA Hosp. Auth. Rev. (Crozer Keystone Obligated Group) | 5.000% | 12/15/26 | | 13,070 | 9,053 |
| Delaware County PA IDA PCR (PECO Energy Co.) | 4.000% | 12/1/12 | | 25,000 | 24,304 |
| Delaware County PA IDA Resource Recovery Rev. (American Fuel) | 6.000% | 1/1/09 | | 5,355 | 5,337 |
| Delaware River Joint Toll Bridge Comm. Pennsylvania & New Jersey Rev. VRDO | 6.000% | 11/7/08 | LOC | 12,000 | 12,000 |
| Lancaster County PA Convention Center Auth. Rev. (Hotel Room) VRDO | 2.300% | 11/7/08 | LOC | 20,000 | 20,000 |
| Northampton County PA General Purpose Auth. Univ. Rev. (Saint Lukes Hosp. Project) | 5.000% | 8/15/20 | | 1,000 | 807 |
| Northampton County PA General Purpose Auth. Univ. Rev. (Saint Lukes Hosp. Project) | 5.125% | 8/15/21 | | 1,000 | 802 |
| Northampton County PA Hosp. Auth. Rev. (Saint Lukes Hosp.) | 5.250% | 8/15/22 | | 1,000 | 800 |
| Northampton County PA Hosp. Auth. Rev. (Saint Lukes Hosp.) | 5.250% | 8/15/23 | | 1,500 | 1,180 |
| Northampton County PA Hosp. Auth. Rev. (Saint Lukes Hosp.) | 5.250% | 8/15/24 | | 3,000 | 2,321 |
| Pennsylvania Convention Center Auth. Rev. | 6.700% | 9/1/16 | (3)(ETM) | 3,000 | 3,391 |
| Pennsylvania GO | 5.000% | 3/1/11 | | 14,735 | 15,465 |
| Pennsylvania GO | 5.250% | 2/1/12 | (3) | 8,500 | 9,035 |
| Pennsylvania GO | 5.000% | 3/1/12 | | 24,335 | 25,719 |
| Pennsylvania GO | 5.500% | 5/1/12 | (4)(Prere.) | 10,000 | 10,801 |
| Pennsylvania GO | 5.250% | 7/1/12 | | 25,200 | 26,937 |
| Pennsylvania GO | 5.000% | 10/1/12 | (3) | 9,430 | 10,014 |
| Pennsylvania GO | 5.000% | 7/1/14 | (1) | 5,850 | 6,175 |
| Pennsylvania GO | 5.000% | 9/1/14 | (4) | 25,000 | 26,688 |
63
| Pennsylvania GO | 5.250% | 7/1/15 | | 49,130 | 53,078 |
| Pennsylvania GO | 5.375% | 7/1/18 | (4) | 13,000 | 13,925 |
| Pennsylvania GO | 5.000% | 11/1/20 | | 17,730 | 18,058 |
2 | Pennsylvania GO TOB VRDO | 2.400% | 11/7/08 | | 30,565 | 30,565 |
| Pennsylvania Higher Educ. Fac. Auth. Rev. (College of Optometry) VRDO | 2.330% | 11/7/08 | LOC | 12,035 | 12,035 |
| Pennsylvania Higher Educ. Fac. Auth. Rev. (Univ. of Pittsburgh Medical Center) | 5.250% | 8/1/11 | (4) | 8,195 | 8,384 |
| Pennsylvania Higher Educ. Fac. Auth. Rev. (Univ. of Pittsburgh Medical Center) | 5.250% | 8/1/12 | (4) | 2,750 | 2,821 |
| Pennsylvania Higher Educ. Fac. Auth. Rev. (Univ. of Pittsburgh Medical Center) | 5.250% | 8/1/13 | (4) | 4,000 | 4,099 |
| Pennsylvania IDA Rev. (Econ. Dev.) | 5.500% | 7/1/20 | | 12,180 | 12,096 |
| Pennsylvania IDA Rev. (Econ. Dev.) | 5.500% | 7/1/23 | | 20,000 | 19,411 |
| Pennsylvania Intergovernmental Cooperation Auth. Rev. | 5.250% | 6/15/11 | (3) | 10,000 | 10,131 |
| Pennsylvania Intergovernmental Cooperation Auth. Rev. | 5.250% | 6/15/12 | (3) | 6,660 | 6,747 |
| Pennsylvania Intergovernmental Cooperation Auth. Rev. | 5.250% | 6/15/13 | (3) | 5,000 | 5,066 |
| Pennsylvania Public School Building Auth. Lease Rev. (School Dist. of Philadelphia) | 5.000% | 6/1/23 | (4) | 7,130 | 6,721 |
| Pennsylvania Public School Building Auth. Lease Rev. (School Dist. of Philadelphia) | 5.000% | 6/1/23 | (4) | 10,600 | 10,470 |
| Pennsylvania Public School Building Auth. Lease Rev. (School Dist. of Philadelphia) | 5.000% | 6/1/24 | (4) | 17,370 | 16,227 |
| Pennsylvania Public School Building Auth. Lease Rev. (School Dist. of Philadelphia) | 5.000% | 6/1/24 | (4) | 11,130 | 10,917 |
| Pennsylvania Public School Building Auth. Lease Rev. (School Dist. of Philadelphia) | 5.000% | 6/1/25 | (4) | 31,415 | 29,170 |
| Pennsylvania Public School Building Auth. Lease Rev. (School Dist. of Philadelphia) | 5.000% | 6/1/25 | (4) | 11,685 | 11,402 |
| Pennsylvania Public School Building Auth. Lease Rev. (School Dist. of Philadelphia) | 5.000% | 6/1/26 | (4) | 12,270 | 11,906 |
| Pennsylvania Turnpike Comm. Oil Franchise Tax Rev. | 5.250% | 12/1/08 | (2)(Prere.) | 1,665 | 1,686 |
| Pennsylvania Turnpike Comm. Oil Franchise Tax Rev. | 5.250% | 12/1/11 | (2)(ETM) | 2,875 | 2,910 |
| Pennsylvania Turnpike Comm. Oil Franchise Tax Rev. | 5.250% | 12/1/11 | (2)(ETM) | 4,095 | 4,144 |
| Pennsylvania Turnpike Comm. Oil Franchise Tax Rev. | 5.250% | 12/1/11 | (2) | 460 | 465 |
| Pennsylvania Turnpike Comm. Oil Franchise Tax Rev. | 5.250% | 12/1/11 | (2) | 410 | 415 |
| Pennsylvania Turnpike Comm. Oil Franchise Tax Rev. | 5.000% | 12/1/17 | (2) | 5,155 | 5,295 |
| Pennsylvania Turnpike Comm. Rev. | 5.000% | 6/1/25 | (12) | 5,000 | 4,857 |
| Pennsylvania Turnpike Comm. Rev. | 5.000% | 6/1/26 | (12) | 2,105 | 2,033 |
| Pennsylvania Turnpike Comm. Rev. | 5.000% | 6/1/27 | (12) | 5,575 | 5,347 |
| Pennsylvania Turnpike Comm. Rev. | 5.250% | 6/1/27 | | 12,345 | 11,836 |
| Philadelphia PA Airport Parking Auth. | 5.000% | 9/1/16 | | 3,000 | 3,017 |
| Philadelphia PA Gas Works Rev. | 5.500% | 7/1/09 | (4) | 10,820 | 10,848 |
| Philadelphia PA Gas Works Rev. | 5.250% | 7/1/10 | (4) | 10,180 | 10,199 |
| Philadelphia PA Gas Works Rev. | 5.250% | 7/1/11 | (4) | 5,000 | 5,008 |
| Philadelphia PA GO | 5.250% | 3/15/09 | (4)(Prere.) | 3,610 | 3,693 |
| Philadelphia PA GO | 5.125% | 5/15/09 | (3) | 2,000 | 2,026 |
| Philadelphia PA GO | 5.125% | 5/15/10 | (3) | 11,695 | 11,918 |
| Philadelphia PA GO | 5.125% | 5/15/11 | (3) | 12,290 | 12,494 |
| Philadelphia PA GO | 5.125% | 5/15/12 | (3) | 4,975 | 5,049 |
| Philadelphia PA GO | 5.125% | 5/15/13 | (3) | 5,000 | 5,069 |
| Philadelphia PA GO | 5.000% | 8/1/15 | (4) | 23,000 | 23,706 |
| Philadelphia PA GO | 5.250% | 8/1/16 | (4) | 13,110 | 13,593 |
| Philadelphia PA IDA Rev. (Philadelphia Airport System) | 5.750% | 6/15/11 | (3) | 4,695 | 4,749 |
| Philadelphia PA Muni. Auth. Rev. | 5.250% | 5/15/13 | (4) | 11,105 | 11,192 |
| Philadelphia PA Muni. Auth. Rev. | 5.250% | 11/15/14 | (4) | 5,965 | 5,950 |
| Philadelphia PA School Dist. GO | 6.250% | 9/1/09 | (2) | 2,080 | 2,139 |
| Philadelphia PA School Dist. GO | 5.500% | 8/1/12 | (3) | 10,815 | 11,512 |
| Philadelphia PA School Dist. GO | 5.000% | 8/1/20 | (2) | 18,745 | 18,377 |
| Philadelphia PA School Dist. GO | 5.000% | 8/1/21 | (2) | 10,000 | 9,703 |
| Sayre PA Health Care Fac. Auth. Rev. (Guthrie Health Care System) | 5.850% | 12/1/11 | (Prere.) | 4,860 | 5,304 |
1 | Southcentral Pennsylvania General Auth. Rev. (Wellspan Health) | 6.000% | 6/1/25 | | 30,000 | 28,931 |
| | | | | | 780,680 |
Puerto Rico (1.8%) | | | | | |
| Puerto Rico Electric Power Auth. Rev. | 5.250% | 7/1/14 | | 4,420 | 4,441 |
| Puerto Rico Electric Power Auth. Rev. | 5.250% | 7/1/15 | | 4,500 | 4,475 |
| Puerto Rico Electric Power Auth. Rev. | 5.500% | 7/1/16 | | 5,000 | 5,021 |
| Puerto Rico Electric Power Auth. Rev. | 5.000% | 7/1/19 | (1) | 35,430 | 33,022 |
| Puerto Rico Electric Power Auth. Rev. | 5.000% | 7/1/19 | (4) | 5,000 | 4,875 |
| Puerto Rico Electric Power Auth. Rev. | 5.000% | 7/1/20 | (1) | 18,245 | 16,772 |
| Puerto Rico Electric Power Auth. Rev. | 5.000% | 7/1/21 | (1) | 24,790 | 22,528 |
| Puerto Rico Electric Power Auth. Rev. | 5.250% | 7/1/22 | (1) | 17,800 | 16,409 |
| Puerto Rico GO | 5.500% | 7/1/11 | (4) | 8,500 | 8,863 |
| Puerto Rico GO | 5.500% | 7/1/13 | (1) | 5,000 | 5,103 |
| Puerto Rico GO | 5.500% | 7/1/14 | (1) | 5,000 | 5,075 |
| Puerto Rico GO | 5.250% | 7/1/20 | | 14,955 | 13,862 |
| Puerto Rico Highway & Transp. Auth. Rev. | 6.250% | 7/1/11 | (1) | 2,835 | 2,956 |
| Puerto Rico Highway & Transp. Auth. Rev. | 6.250% | 7/1/13 | (1) | 7,220 | 7,579 |
| Puerto Rico Highway & Transp. Auth. Rev. | 6.250% | 7/1/15 | (1) | 5,590 | 5,875 |
| Puerto Rico Highway & Transp. Auth. Rev. | 5.250% | 7/1/16 | (3) | 8,885 | 8,769 |
| Puerto Rico Highway & Transp. Auth. Rev. | 5.250% | 7/1/22 | (3) | 7,580 | 6,948 |
| Puerto Rico Muni. Finance Agency | 5.750% | 8/1/12 | (4) | 2,470 | 2,523 |
64
Puerto Rico Public Buildings Auth. Govt. Fac. Rev. | 0.000% | 7/1/11 | (3) | 48,810 | 43,202 |
Puerto Rico Public Buildings Auth. Govt. Fac. Rev. | 0.000% | 7/1/12 | (3) | 34,465 | 28,736 |
Puerto Rico Public Buildings Auth. Govt. Fac. Rev. | 5.250% | 7/1/14 | (Prere.) | 13,600 | 14,475 |
Puerto Rico Public Buildings Auth. Govt. Fac. Rev. | 5.500% | 7/1/17 | (2) | 6,390 | 6,329 |
Puerto Rico Public Buildings Auth. Govt. Fac. Rev. | 5.500% | 7/1/18 | (2) | 6,430 | 6,274 |
Puerto Rico Public Buildings Auth. Govt. Fac. Rev. | 5.250% | 7/1/29 | | 11,400 | 9,919 |
Puerto Rico Public Finance Corp. | 6.000% | 8/1/26 | (4)(12)(ETM) | 17,110 | 18,724 |
Puerto Rico Public Finance Corp. PUT | 5.750% | 2/1/12 | LOC | 43,740 | 43,233 |
| | | | | 345,988 |
Rhode Island (0.3%) | | | | | |
Rhode Island Depositors Econ. Protection Corp. | 6.550% | 8/1/10 | (1)(ETM) | 18,465 | 19,355 |
Rhode Island Econ. Dev. Corp. (Rhode Island Dept. of Transp.) | 5.250% | 6/15/09 | (4) | 3,335 | 3,406 |
Rhode Island Econ. Dev. Corp. (Rhode Island Dept. of Transp.) | 5.250% | 6/15/10 | (4) | 3,000 | 3,121 |
Rhode Island Econ. Dev. Corp. (Rhode Island Dept. of Transp.) | 5.250% | 6/15/11 | (4) | 5,000 | 5,279 |
Rhode Island Econ. Dev. Corp. (Rhode Island Dept. of Transp.) | 5.250% | 6/15/12 | (4) | 5,000 | 5,321 |
Rhode Island Health & Educ. Building Corp. Rev. | 4.500% | 5/15/25 | (4) | 2,880 | 2,498 |
Rhode Island Health & Educ. Building Corp. Rev. | 4.625% | 5/15/26 | (4) | 3,210 | 2,832 |
Rhode Island Health & Educ. Building Corp. Rev. | 4.750% | 5/15/29 | (4) | 6,460 | 5,623 |
Rhode Island Health & Educ. Building Corp. Rev. (Hosp. Financing–Lifespan Obligation) | 5.000% | 5/15/26 | (4) | 5,000 | 4,636 |
Rhode Island State & Providence Plantations GO | 4.625% | 11/1/24 | | 6,595 | 5,989 |
Rhode Island State & Providence Plantations GO | 4.700% | 11/1/25 | | 3,645 | 3,325 |
| | | | | 61,385 |
South Carolina (1.1%) | | | | | |
Charleston SC Educ. Excellence Financing Corp. Rev. | 5.250% | 12/1/26 | | 12,610 | 11,960 |
Charleston SC Educ. Excellence Financing Corp. Rev. | 5.250% | 12/1/27 | | 33,070 | 31,314 |
Charleston SC Educ. Excellence Financing Corp. Rev. | 5.250% | 12/1/28 | | 5,230 | 4,909 |
Greenville County SC Hosp. Fac. Rev. | 5.000% | 5/1/16 | | 5,000 | 4,926 |
Greenville County SC Hosp. Fac. Rev. | 4.125% | 5/1/17 | | 8,565 | 7,780 |
Greenville County SC Hosp. Fac. Rev. | 5.000% | 5/1/18 | | 2,655 | 2,563 |
Medical Univ. South Carolina Hosp. Auth. Hosp. Fac. Rev. | 6.250% | 8/15/12 | (Prere.) | 13,000 | 14,418 |
Piedmont SC Muni. Power Agency Rev. | 0.000% | 1/1/22 | (3) | 9,950 | 4,146 |
Piedmont SC Muni. Power Agency Rev. | 0.000% | 1/1/23 | (3) | 8,780 | 3,395 |
Piedmont SC Muni. Power Agency Rev. | 5.000% | 1/1/24 | | 13,620 | 11,691 |
South Carolina GO | 5.000% | 11/1/15 | | 7,190 | 7,725 |
South Carolina Jobs Econ. Dev. Auth. Hosp. Facs. Rev. (Palmetto Health) | 5.250% | 8/1/23 | (4) | 6,275 | 5,971 |
South Carolina Jobs Econ. Dev. Auth. Hosp. Facs. Rev. (Palmetto Health) | 5.250% | 8/1/24 | (4) | 5,000 | 4,738 |
South Carolina Jobs Econ. Dev. Auth. Hosp. Facs. Rev. (Palmetto Health) | 5.250% | 8/1/25 | (4) | 6,925 | 6,534 |
South Carolina Jobs Econ. Dev. Auth. Hosp. Facs. Rev. (Palmetto Health) | 5.250% | 8/1/27 | (4) | 13,550 | 12,718 |
South Carolina Jobs Econ. Dev. Auth. Hosp. Improvement Rev. (Palmetto Health Alliance) | 7.000% | 12/15/10 | (ETM) | 10,500 | 11,029 |
South Carolina Jobs Econ. Dev. Auth. Hosp. Improvement Rev. (Palmetto Health Alliance) | 7.125% | 12/15/10 | (Prere.) | 7,000 | 7,763 |
South Carolina Jobs Econ. Dev. Auth. Rev. (Bon Secours Health System) | 5.625% | 11/15/12 | (Prere.) | 1,775 | 1,938 |
South Carolina Jobs Econ. Dev. Auth. Rev. (Bon Secours Health System) | 5.625% | 11/15/30 | | 6,645 | 5,633 |
South Carolina Public Service Auth. Rev. | 5.375% | 1/1/13 | (4) | 7,300 | 7,680 |
South Carolina Public Service Auth. Rev. | 5.500% | 1/1/13 | (4) | 5,000 | 5,360 |
South Carolina Public Service Auth. Rev. | 5.000% | 1/1/21 | (1) | 15,600 | 15,529 |
South Carolina Public Service Auth. Rev. | 5.375% | 1/1/28 | | 3,500 | 3,469 |
South Carolina Transp. Infrastructure Rev. | 5.750% | 10/1/11 | (1) | 6,925 | 7,112 |
South Carolina Transp. Infrastructure Rev. | 5.250% | 10/1/25 | (2) | 7,620 | 7,133 |
| | | | | 207,434 |
Tennessee (2.5%) | | | | | |
Jackson TN Hosp. Rev. (Jackson Madison Hosp.) | 5.250% | 4/1/23 | | 8,280 | 7,172 |
Jackson TN Hosp. Rev. (Jackson Madison Hosp.) | 5.375% | 4/1/28 | | 11,000 | 9,219 |
Knoxville TN Health, Educ. & Housing Board Rev. (Univ. Health System, Inc.) | 5.400% | 4/1/09 | (Prere.) | 3,465 | 3,552 |
Knoxville TN Health, Educ. & Housing Board Rev. (Univ. Health System, Inc.) | 5.500% | 4/1/09 | (Prere.) | 2,660 | 2,728 |
Knoxville TN Health, Educ. & Housing Board Rev. (Univ. Health System, Inc.) | 5.500% | 4/1/09 | (Prere.) | 4,495 | 4,610 |
Knoxville TN Health, Educ. & Housing Board Rev. (Univ. Health System, Inc.) | 5.625% | 4/1/09 | (Prere.) | 2,000 | 2,052 |
Knoxville TN Health, Educ. & Housing Board Rev. (Univ. Health System, Inc.) | 5.750% | 4/1/09 | (Prere.) | 13,000 | 13,345 |
Memphis TN Electric System Rev. | 5.000% | 12/1/09 | (1) | 60,140 | 61,942 |
Memphis TN Electric System Rev. | 5.000% | 12/1/10 | (1) | 33,000 | 34,359 |
Memphis TN GO | 5.250% | 10/1/18 | (1) | 9,365 | 9,724 |
Memphis TN GO | 5.000% | 11/1/20 | (1) | 16,000 | 16,084 |
Memphis TN GO | 5.000% | 11/1/21 | (1) | 5,830 | 5,824 |
Memphis TN GO | 5.000% | 11/1/22 | (1) | 5,000 | 4,960 |
Metro. Govt. of Nashville & Davidson County TN GO | 5.000% | 1/1/25 | | 23,345 | 23,190 |
Metro. Govt. of Nashville & Davidson County TN Health & Educ. Fac. (Vanderbilt Univ.) | 5.000% | 10/1/14 | | 15,000 | 15,958 |
Metro. Govt. of Nashville & Davidson County TN Health & Educ. Fac. (Vanderbilt Univ.) | 5.000% | 10/1/15 | | 15,000 | 15,931 |
Metro. Govt. of Nashville & Davidson County TN Health & Educ. Fac. (Vanderbilt Univ.) | 5.000% | 10/1/15 | | 15,000 | 15,931 |
Montgomery County TN Public Building Auth. Pooled Financial Rev. | | | | | |
(Tennessee County Loan Pool) VRDO | 0.800% | 11/3/08 | LOC | 34,025 | 34,025 |
Shelby County TN GO | 0.000% | 12/1/11 | | 10,000 | 8,953 |
65
| Shelby County TN Health Educ. & Housing Fac. Board Rev. | 5.250% | 6/1/14 | | 13,995 | 13,699 |
| Shelby County TN Health Educ. & Housing Fac. Board Rev. (Methodist Le Bonheur) | 5.000% | 6/1/13 | | 4,865 | 4,760 |
| Shelby County TN Health Educ. & Housing Fac. Board Rev. (St. Jude Children's Research Hospital) | 5.000% | 7/1/21 | | 5,000 | 4,745 |
| Shelby County TN Health Educ. & Housing Fac. Board Rev. (St. Jude Children's Research Hospital) | 5.000% | 7/1/22 | | 5,000 | 4,697 |
| Shelby County TN Health Educ. & Housing Fac. Board Rev. (St. Jude Children's Research Hospital) | 5.000% | 7/1/23 | | 7,500 | 7,010 |
| Tennessee Energy Acquisition Corp. Gas Rev. | 5.000% | 9/1/16 | | 17,500 | 14,394 |
| Tennessee Energy Acquisition Corp. Gas Rev. | 5.250% | 9/1/17 | | 33,305 | 27,211 |
| Tennessee Energy Acquisition Corp. Gas Rev. | 5.250% | 9/1/18 | | 63,070 | 50,278 |
| Tennessee Energy Acquisition Corp. Gas Rev. | 5.000% | 2/1/20 | | 25,000 | 18,790 |
| Tennessee Energy Acquisition Corp. Gas Rev. | 5.250% | 9/1/20 | | 12,000 | 9,124 |
| Tennessee Energy Acquisition Corp. Gas Rev. | 5.000% | 2/1/21 | | 25,000 | 18,303 |
| | | | | | 462,570 |
Texas (11.2%) | | | | | |
| Austin TX Combined Util. System Rev. | 0.000% | 11/15/10 | (2) | 5,000 | 4,649 |
| Austin TX Combined Util. System Rev. | 0.000% | 11/15/11 | (1) | 18,100 | 16,093 |
| Austin TX Combined Util. System Rev. | 0.000% | 11/15/11 | (2) | 16,050 | 14,241 |
| Austin TX Combined Util. System Rev. | 0.000% | 5/15/18 | (3) | 25,215 | 14,740 |
| Austin TX Combined Util. System Rev. | 0.000% | 5/15/19 | (3) | 28,160 | 15,310 |
| Austin TX Independent School Dist. GO | 5.000% | 8/1/13 | | 10,000 | 10,616 |
| Brownsville TX Util. System Rev. | 5.000% | 9/1/23 | (4) | 11,445 | 10,958 |
| Camino Real Mobility Auth. Rev. | 5.250% | 2/15/18 | | 11,960 | 11,715 |
| Camino Real Mobility Auth. Rev. | 5.250% | 8/15/18 | | 11,770 | 11,506 |
| Camino Real Mobility Auth. Rev. | 5.250% | 2/15/19 | | 12,595 | 12,203 |
| Camino Real Mobility Auth. Rev. | 5.250% | 8/15/19 | | 12,925 | 12,498 |
| Camino Real Mobility Auth. Rev. | 5.250% | 2/15/20 | | 13,265 | 12,696 |
| Camino Real Mobility Auth. Rev. | 5.250% | 8/15/20 | | 13,580 | 12,974 |
| Camino Real Mobility Auth. Rev. | 5.000% | 2/15/21 | | 5,970 | 5,495 |
| Camino Real Mobility Auth. Rev. | 5.000% | 8/15/21 | | 6,320 | 5,803 |
| Camino Real Mobility Auth. Rev. | 5.000% | 2/15/22 | | 6,170 | 5,615 |
| Carrollton TX Independent School Dist. GO | 6.000% | 2/15/09 | (Prere.) | 2,760 | 2,794 |
| Carrollton TX Independent School Dist. GO | 6.000% | 2/15/09 | (Prere.) | 3,105 | 3,143 |
| Dallas County TX Util. & Reclamation Dist. GO | 5.250% | 2/15/25 | (2) | 11,245 | 10,158 |
| Dallas County TX Util. & Reclamation Dist. GO | 5.250% | 2/15/25 | (2) | 11,245 | 10,158 |
| Dallas TX Area Rapid Transit Rev. | 4.500% | 12/1/25 | (2) | 15,160 | 13,417 |
| Dallas TX Area Rapid Transit Rev. | 4.500% | 12/1/26 | | 13,985 | 12,540 |
| Dallas TX Area Rapid Transit Rev. | 4.500% | 12/1/27 | | 14,630 | 13,044 |
| Dallas TX GO | 5.000% | 2/15/19 | | 11,675 | 11,838 |
| Dallas TX GO | 5.000% | 2/15/22 | | 6,540 | 6,583 |
| Dallas TX Waterworks & Sewer System Rev. | 5.000% | 10/1/23 | | 4,875 | 4,844 |
| Dallas TX Waterworks & Sewer System Rev. | 5.000% | 10/1/24 | | 5,125 | 5,064 |
| Dallas TX Waterworks & Sewer System Rev. | 5.000% | 10/1/25 | | 5,390 | 5,299 |
| Dallas TX Waterworks & Sewer System Rev. | 5.000% | 10/1/26 | | 5,665 | 5,547 |
| Dallas TX Waterworks & Sewer System Rev. | 5.000% | 10/1/27 | | 5,955 | 5,791 |
| Dallas TX Waterworks & Sewer System Rev. | 5.000% | 10/1/27 | (4) | 8,970 | 8,630 |
| Harris County TX Cultural Educ. Fac. Finance Corp. Rev. (Methodist Hosp.) | 5.250% | 12/1/15 | | 10,000 | 9,921 |
| Harris County TX Cultural Educ. Fac. Finance Corp. Rev. (Methodist Hosp.) | 5.250% | 12/1/16 | | 12,000 | 11,780 |
| Harris County TX Cultural Educ. Fac. Finance Corp. Rev. (Methodist Hosp.) | 5.250% | 12/1/17 | | 17,000 | 16,561 |
| Harris County TX Health Fac. Dev. Corp. Rev. (Methodist Hosp.) VRDO | 1.100% | 11/3/08 | | 2,200 | 2,200 |
| Harris County TX Health Fac. Dev. Corp. Rev. (Methodist Hosp.) VRDO | 1.250% | 11/3/08 | (4) | 9,300 | 9,300 |
| Harris County TX Health Fac. Dev. Corp. Rev. (Methodist Hosp.) VRDO | 1.250% | 11/3/08 | (4) | 27,800 | 27,800 |
| Harris County TX Health Fac. Dev. Corp. Rev. (Methodist Hosp.) VRDO | 1.250% | 11/3/08 | (4) | 10,000 | 10,000 |
| Harris County TX Health Fac. Dev. Corp. Rev. (Methodist Hosp.) VRDO | 1.250% | 11/3/08 | (4) | 14,700 | 14,700 |
| Harris County TX Health Fac. Dev. Corp. Rev. (St. Luke's Episcopal Hosp.) VRDO | 1.200% | 11/3/08 | | 32,300 | 32,300 |
| Harris County TX Health Fac. Dev. Corp. Rev. (St. Luke's Episcopal Hosp.) VRDO | 3.000% | 11/7/08 | | 43,600 | 43,600 |
| Harris County TX Rev. | 5.000% | 8/15/14 | | 1,000 | 1,056 |
| Harris County TX Rev. | 5.000% | 8/15/15 | | 2,335 | 2,457 |
| Harris County TX Rev. | 5.000% | 8/15/23 | | 5,230 | 5,128 |
| Harris County TX Rev. | 5.000% | 8/15/24 | | 5,970 | 5,817 |
| Harris County TX Rev. | 5.000% | 8/15/25 | | 6,280 | 6,085 |
| Harris County TX Rev. | 5.000% | 8/15/26 | | 5,350 | 5,160 |
| Harris County TX Rev. | 5.000% | 8/15/28 | | 3,295 | 3,120 |
| Harris County TX Sports Auth. Rev. | 0.000% | 11/15/23 | (1) | 7,000 | 2,561 |
| Harris County TX Toll Road Rev. | 5.375% | 8/15/12 | (4) | 10,000 | 10,700 |
| Houston TX Community College System Rev. | 5.000% | 4/15/21 | (10) | 9,200 | 8,982 |
| Houston TX GO | 5.750% | 9/1/10 | (4)(Prere.) | 11,450 | 12,139 |
| Houston TX GO | 5.750% | 9/1/10 | (4)(Prere.) | 3,925 | 4,161 |
| Houston TX GO | 5.250% | 3/1/11 | | 1,185 | 1,195 |
| Houston TX GO | 5.500% | 3/1/11 | (4) | 1,050 | 1,095 |
| Houston TX GO | 5.750% | 3/1/12 | (4) | 1,105 | 1,153 |
| Houston TX GO | 5.750% | 3/1/13 | (4) | 375 | 391 |
1 | Houston TX GO | 5.250% | 3/1/27 | | 20,000 | 19,882 |
| Houston TX Hotel Occupancy Tax & Special Rev. (Convention & Entertainment) | 5.500% | 9/1/10 | (2) | 9,155 | 9,501 |
66
Houston TX Hotel Occupancy Tax & Special Rev. (Convention & Entertainment) | 5.375% | 9/1/12 | (2) | 4,460 | 4,614 |
Houston TX Hotel Occupancy Tax & Special Rev. (Convention & Entertainment) | 5.375% | 9/1/12 | (2) | 9,995 | 10,340 |
Houston TX Hotel Occupancy Tax & Special Rev. (Convention & Entertainment) | 5.375% | 9/1/13 | (2) | 10,545 | 10,816 |
Houston TX Hotel Occupancy Tax & Special Rev. (Convention & Entertainment) | 5.750% | 9/1/13 | (2) | 13,840 | 14,377 |
Houston TX Hotel Occupancy Tax & Special Rev. (Convention & Entertainment) | 5.375% | 9/1/14 | (2) | 6,190 | 6,374 |
Houston TX Hotel Occupancy Tax & Special Rev. (Convention & Entertainment) | 5.375% | 9/1/15 | (2) | 10,750 | 10,883 |
Houston TX Hotel Occupancy Tax & Special Rev. (Convention & Entertainment) | 5.750% | 9/1/16 | (2) | 5,540 | 5,683 |
Houston TX Hotel Occupancy Tax & Special Rev. (Convention & Entertainment) | 0.000% | 9/1/17 | (2) | 13,760 | 8,607 |
Houston TX Hotel Occupancy Tax & Special Rev. (Convention & Entertainment) | 5.750% | 9/1/17 | (2) | 5,855 | 5,939 |
Houston TX Independent School Dist. GO | 0.000% | 8/15/15 | | 5,355 | 3,964 |
Houston TX Independent School Dist. GO | 5.000% | 7/15/17 | (4) | 5,225 | 5,403 |
Houston TX Independent School Dist. GO | 5.000% | 7/15/18 | (4) | 10,090 | 10,338 |
Houston TX Util. System Rev. | 5.000% | 11/15/27 | (4) | 8,130 | 7,793 |
Houston TX Util. System Rev. | 5.000% | 11/15/27 | (4) | 7,805 | 7,472 |
Houston TX Water & Sewer System Rev. | 0.000% | 12/1/10 | (2) | 5,000 | 4,668 |
Houston TX Water & Sewer System Rev. | 5.750% | 12/1/12 | (2)(Prere.) | 8,000 | 8,739 |
Houston TX Water & Sewer System Rev. | 5.500% | 12/1/14 | (4) | 22,500 | 23,725 |
Houston TX Water & Sewer System Rev. | 5.500% | 12/1/15 | (4) | 7,250 | 7,645 |
Lower Colorado River Auth. Texas Rev. | 5.750% | 5/15/09 | (4)(Prere.) | 5 | 5 |
Lower Colorado River Auth. Texas Rev. | 5.750% | 5/15/09 | (4)(Prere.) | 35 | 36 |
Lower Colorado River Auth. Texas Rev. | 5.875% | 5/15/09 | (4)(Prere.) | 5 | 5 |
Lower Colorado River Auth. Texas Rev. | 5.875% | 5/15/09 | (4)(Prere.) | 55 | 57 |
Lower Colorado River Auth. Texas Rev. | 5.875% | 5/15/09 | (4)(Prere.) | 10 | 10 |
Lower Colorado River Auth. Texas Rev. | 5.375% | 5/15/11 | (1)(Prere.) | 250 | 266 |
Lower Colorado River Auth. Texas Rev. | 5.375% | 5/15/11 | (1)(Prere.) | 190 | 202 |
Lower Colorado River Auth. Texas Rev. | 5.375% | 5/15/11 | (1)(Prere.) | 285 | 303 |
Lower Colorado River Auth. Texas Rev. | 5.375% | 5/15/11 | (1)(Prere.) | 125 | 133 |
Lower Colorado River Auth. Texas Rev. | 5.375% | 5/15/11 | (1)(Prere.) | 175 | 186 |
Lower Colorado River Auth. Texas Rev. | 5.375% | 5/15/11 | (1)(Prere.) | 180 | 192 |
Lower Colorado River Auth. Texas Rev. | 5.375% | 5/15/11 | (1)(Prere.) | 80 | 85 |
Lower Colorado River Auth. Texas Rev. | 5.750% | 5/15/11 | (4) | 14,160 | 14,501 |
Lower Colorado River Auth. Texas Rev. | 5.000% | 1/1/12 | (4)(ETM) | 2,520 | 2,669 |
Lower Colorado River Auth. Texas Rev. | 5.375% | 5/15/12 | (1) | 3,725 | 3,882 |
Lower Colorado River Auth. Texas Rev. | 5.375% | 5/15/13 | (1) | 2,810 | 2,891 |
Lower Colorado River Auth. Texas Rev. | 5.375% | 5/15/14 | (1) | 4,190 | 4,311 |
Lower Colorado River Auth. Texas Rev. | 5.875% | 5/15/14 | (4) | 4,990 | 5,104 |
Lower Colorado River Auth. Texas Rev. | 5.875% | 5/15/15 | (4) | 23,940 | 24,456 |
Lower Colorado River Auth. Texas Rev. | 5.375% | 5/15/16 | (1) | 1,875 | 1,918 |
Lower Colorado River Auth. Texas Rev. | 5.375% | 5/15/17 | (1) | 2,825 | 2,856 |
Lower Colorado River Auth. Texas Rev. | 5.375% | 5/15/19 | (1) | 2,820 | 2,846 |
Lower Colorado River Auth. Texas Rev. | 5.375% | 5/15/20 | (1) | 1,920 | 1,930 |
Matagorda County TX Navigation Dist. PCR (Central Power & Light) PUT | 5.125% | 6/1/11 | | 26,500 | 26,515 |
North Harris County TX Regional Water Auth. Rev. | 5.125% | 12/15/23 | | 7,410 | 6,974 |
North Harris County TX Regional Water Auth. Rev. | 5.125% | 12/15/24 | | 5,895 | 5,499 |
North Harris County TX Regional Water Auth. Rev. | 5.125% | 12/15/25 | | 5,250 | 4,863 |
North Harris County TX Regional Water Auth. Rev. | 5.125% | 12/15/26 | | 6,225 | 5,724 |
North Harris County TX Regional Water Auth. Rev. | 5.125% | 12/15/27 | | 8,920 | 8,162 |
North Harris County TX Regional Water Auth. Rev. | 5.125% | 12/15/28 | | 8,040 | 7,302 |
North Texas Tollway Auth. Rev. | 5.500% | 1/1/17 | | 5,000 | 5,115 |
North Texas Tollway Auth. Rev. | 5.500% | 1/1/18 | | 4,000 | 4,046 |
North Texas Tollway Auth. Rev. | 6.000% | 1/1/19 | | 15,000 | 15,478 |
North Texas Tollway Auth. Rev. | 6.000% | 1/1/20 | | 22,100 | 22,519 |
North Texas Tollway Auth. Rev. | 6.000% | 1/1/21 | | 40,000 | 40,389 |
North Texas Tollway Auth. Rev. | 6.000% | 1/1/22 | | 25,045 | 25,148 |
North Texas Tollway Auth. Rev. | 6.000% | 1/1/24 | | 20,000 | 19,900 |
North Texas Tollway Auth. Rev. | 6.000% | 1/1/25 | | 11,140 | 10,936 |
North Texas Tollway Auth. Rev. | 6.000% | 1/1/25 | | 7,775 | 7,632 |
North Texas Tollway Auth. Rev. | 6.000% | 1/1/26 | | 5,000 | 4,895 |
North Texas Tollway Auth. Rev. | 6.000% | 1/1/27 | | 5,000 | 4,875 |
North Texas Tollway Auth. Rev. PUT | 5.250% | 1/1/12 | | 25,000 | 25,135 |
North Texas Tollway Auth. Rev. PUT | 5.750% | 1/1/16 | | 75,000 | 76,092 |
SA Energy Acquisition Public Fac. Corp. Texas Gas Supply Rev. | 5.250% | 8/1/17 | | 16,500 | 13,503 |
SA Energy Acquisition Public Fac. Corp. Texas Gas Supply Rev. | 5.250% | 8/1/18 | | 15,985 | 12,760 |
SA Energy Acquisition Public Fac. Corp. Texas Gas Supply Rev. | 5.500% | 8/1/19 | | 16,500 | 13,222 |
Sabine River Auth. Texas PCR (Southwestern Elec. Co.) | 4.950% | 3/1/18 | (1) | 16,000 | 15,046 |
San Antonio TX Electric & Gas Rev. | 5.750% | 2/1/10 | (Prere.) | 20,440 | 21,320 |
San Antonio TX Electric & Gas Rev. | 5.750% | 2/1/10 | (Prere.) | 10,205 | 10,644 |
San Antonio TX Electric & Gas Rev. | 5.750% | 2/1/10 | (Prere.) | 12,100 | 12,621 |
San Antonio TX Electric & Gas Rev. | 5.750% | 2/1/10 | (Prere.) | 9,200 | 9,596 |
San Antonio TX Electric & Gas Rev. | 5.500% | 2/1/11 | | 12,225 | 12,907 |
San Antonio TX Electric & Gas Rev. | 5.000% | 2/1/12 | (4) | 5,000 | 5,254 |
San Antonio TX Electric & Gas Rev. | 5.250% | 2/1/12 | | 5,515 | 5,602 |
67
San Antonio TX Electric & Gas Rev. | 5.375% | 2/1/12 | (Prere.) | 8,140 | 8,695 |
San Antonio TX Electric & Gas Rev. | 5.375% | 2/1/12 | (Prere.) | 10,000 | 10,682 |
San Antonio TX Electric & Gas Rev. | 5.375% | 2/1/12 | (Prere.) | 6,490 | 6,932 |
San Antonio TX Electric & Gas Rev. | 5.375% | 2/1/12 | (Prere.) | 5,445 | 5,816 |
San Antonio TX Electric & Gas Rev. | 5.250% | 2/1/13 | | 3,890 | 3,952 |
San Antonio TX Electric & Gas Rev. | 5.250% | 2/1/13 | | 5,000 | 5,322 |
San Antonio TX Electric & Gas Rev. | 5.375% | 2/1/13 | | 10,000 | 10,693 |
San Antonio TX Electric & Gas Rev. | 5.375% | 2/1/15 | | 7,250 | 7,781 |
San Antonio TX Electric & Gas Rev. | 5.375% | 2/1/16 | | 16,825 | 17,531 |
San Antonio TX Electric & Gas Rev. | 5.375% | 2/1/17 | | 7,580 | 7,882 |
San Antonio TX Electric & Gas Rev. | 5.000% | 2/1/21 | | 10,000 | 10,008 |
San Antonio TX Electric & Gas Rev. | 5.000% | 2/1/22 | | 25,450 | 25,224 |
San Antonio TX Electric & Gas Rev. | 5.000% | 2/1/23 | | 22,000 | 21,668 |
San Antonio TX Electric & Gas Rev. | 5.000% | 2/1/24 | | 15,000 | 14,686 |
San Antonio TX Electric & Gas Rev. | 5.000% | 2/1/24 | | 17,600 | 17,231 |
San Antonio TX Electric & Gas Rev. | 5.000% | 2/1/24 | | 23,000 | 22,518 |
San Antonio TX Electric & Gas Rev. | 5.000% | 2/1/25 | | 39,660 | 38,624 |
San Antonio TX Electric & Gas Rev. | 5.000% | 2/1/25 | | 10,000 | 9,739 |
San Antonio TX Electric & Gas Rev. | 5.000% | 2/1/25 | | 26,065 | 25,384 |
San Antonio TX GO | 5.000% | 8/1/15 | | 8,890 | 9,435 |
San Antonio TX GO | 5.000% | 8/1/19 | | 5,685 | 5,821 |
San Antonio TX GO | 5.000% | 8/1/20 | | 6,030 | 6,111 |
San Antonio TX GO | 5.000% | 8/1/22 | | 6,590 | 6,605 |
San Antonio TX GO | 5.000% | 8/1/23 | | 4,975 | 4,964 |
San Antonio TX GO | 5.000% | 8/1/25 | | 3,895 | 3,838 |
San Antonio TX Hotel Occupancy Tax Rev. VRDO | 2.350% | 11/7/08 | LOC | 91,000 | 91,000 |
San Antonio TX Independent School Dist. GO | 5.000% | 8/15/16 | | 8,460 | 8,906 |
Tarrant County TX Cultural Educ. Fac. Finance Corp. Rev. | 5.250% | 8/15/28 | | 4,000 | 3,549 |
Texas A & M Univ. Permanent Univ. Fund | 5.250% | 7/1/16 | | 10,360 | 10,807 |
Texas A & M Univ. Permanent Univ. Fund | 5.250% | 7/1/17 | | 10,000 | 10,261 |
Texas A & M Univ. Permanent Univ. Fund | 5.250% | 7/1/24 | | 14,925 | 15,040 |
Texas A & M Univ. Rev. Financing System | 5.000% | 5/15/13 | | 5,535 | 5,853 |
Texas GO | 5.000% | 4/1/24 | | 13,595 | 13,565 |
Texas GO Public Finance Auth. | 5.500% | 10/1/12 | | 13,455 | 14,228 |
Texas GO Public Finance Auth. | 5.500% | 10/1/13 | | 19,175 | 20,218 |
Texas GO Public Finance Auth. | 5.375% | 10/1/14 | | 21,310 | 22,534 |
Texas Muni. Gas Acquisition & Supply Corp. Rev. | 2.289% | 9/15/10 | | 27,550 | 25,484 |
Texas Muni. Gas Acquisition & Supply Corp. Rev. | 6.250% | 12/15/26 | | 5,000 | 3,957 |
Texas Muni. Power Agency Rev. | 0.000% | 9/1/10 | (2)(ETM) | 900 | 853 |
Texas Muni. Power Agency Rev. | 0.000% | 9/1/10 | (2) | 11,100 | 10,417 |
Texas Muni. Power Agency Rev. | 0.000% | 9/1/12 | (2)(ETM) | 375 | 326 |
Texas Muni. Power Agency Rev. | 0.000% | 9/1/12 | (2) | 4,800 | 4,083 |
Texas Muni. Power Agency Rev. | 0.000% | 9/1/13 | (1)(ETM) | 125 | 104 |
Texas Muni. Power Agency Rev. | 0.000% | 9/1/13 | (1) | 11,375 | 9,175 |
Texas Muni. Power Agency Rev. | 0.000% | 9/1/14 | (1)(ETM) | 125 | 99 |
Texas Muni. Power Agency Rev. | 0.000% | 9/1/14 | (1) | 5,540 | 4,211 |
Texas Muni. Power Agency Rev. | 0.000% | 9/1/15 | (1)(ETM) | 110 | 82 |
Texas Muni. Power Agency Rev. | 0.000% | 9/1/15 | (1) | 13,140 | 9,362 |
Texas Muni. Power Agency Rev. | 0.000% | 9/1/16 | (1)(ETM) | 110 | 77 |
Texas Muni. Power Agency Rev. | 0.000% | 9/1/16 | (1) | 22,795 | 15,232 |
Texas Muni. Power Agency Rev. | 0.000% | 9/1/17 | (1)(ETM) | 415 | 275 |
Texas Muni. Power Agency Rev. | 0.000% | 9/1/17 | (1) | 31,295 | 19,575 |
Texas State Transp. Comm. First Tier | 5.000% | 4/1/19 | | 10,000 | 10,192 |
Texas State Transp. Comm. First Tier | 5.000% | 4/1/20 | | 8,850 | 8,939 |
Texas State Transp. Comm. First Tier | 5.000% | 4/1/21 | | 10,555 | 10,597 |
Texas State Transp. Comm. First Tier | 5.000% | 4/1/21 | | 23,405 | 23,508 |
Texas State Transp. Comm. First Tier | 5.000% | 4/1/22 | | 10,000 | 9,998 |
Texas State Transp. Comm. First Tier | 5.000% | 4/1/22 | | 30,000 | 29,993 |
Texas State Transp. Comm. First Tier | 4.750% | 4/1/24 | | 10,000 | 9,537 |
Texas State Transp. Comm. First Tier | 5.000% | 4/1/24 | | 10,000 | 9,873 |
Texas State Transp. Comm. First Tier | 5.000% | 4/1/25 | | 10,000 | 9,813 |
Texas State Transp. Comm. First Tier | 5.000% | 4/1/26 | | 8,000 | 7,827 |
Texas Tech Univ. Rev. Refunding & Improvement | 5.000% | 2/15/23 | (2) | 10,040 | 9,848 |
Texas Tech Univ. Rev. Refunding & Improvement | 5.000% | 2/15/24 | (2) | 11,940 | 11,640 |
Texas Tech Univ. Rev. Refunding & Improvement | 5.000% | 2/15/25 | (2) | 6,555 | 6,356 |
Texas Water Dev. Board Rev. VRDO | 1.000% | 11/3/08 | | 15,000 | 15,000 |
Texas Water Finance Assistance GO | 5.000% | 8/1/26 | | 5,710 | 5,650 |
Texas Water Finance Assistance GO | 5.000% | 8/1/27 | | 6,500 | 6,398 |
Tomball TX Hosp. Auth. Rev. | 5.750% | 7/1/14 | | 8,500 | 8,240 |
Tomball TX Hosp. Auth. Rev. | 6.000% | 7/1/19 | | 3,600 | 3,327 |
68
| Univ. of Houston TX Rev. | 5.250% | 2/15/09 | (4) | 3,080 | 3,110 |
| Univ. of Texas Permanent Univ. Fund Rev. | 5.375% | 8/15/11 | (Prere.) | 8,290 | 8,858 |
| Univ. of Texas Permanent Univ. Fund Rev. | 5.000% | 8/15/20 | | 9,785 | 9,951 |
| | | | | | 2,105,675 |
Utah (0.1%) | | | | | |
| Intermountain Power Agency Utah Power Supply Rev. | 5.250% | 7/1/09 | (1)(ETM) | 5,180 | 5,302 |
| Utah Muni. Finance Coop. Local Govt. Rev. | 0.000% | 3/1/10 | (4) | 7,000 | 6,712 |
| | | | | | 12,014 |
Vermont (0.1%) | | | | | |
| Vermont Educ. & Health Buildings Finance Agency Rev. (Fletcher Allen Health) | 5.000% | 12/1/22 | (4) | 8,000 | 7,448 |
| Vermont Educ. & Health Buildings Finance Agency Rev. (Fletcher Allen Health) | 5.500% | 12/1/28 | (4) | 4,400 | 4,229 |
| | | | | | 11,677 |
Virgin Islands (0.0%) | | | | | |
| Virgin Islands Public Finance Auth. Rev. | 6.375% | 10/1/19 | | 5,865 | 5,937 |
| | | | | | |
Virginia (1.7%) | | | | | |
| Charlottesville VA IDA Fac. (Univ. Virginia Foundation Projects) VRDO | 2.300% | 11/7/08 | LOC | 57,785 | 57,785 |
| Norfolk VA Econ. Dev. Auth. Hosp. Fac. Rev. (Bon Secours) VRDO | 1.440% | 11/7/08 | LOC | 4,800 | 4,800 |
| Stafford County VA Econ. Dev. Auth. Hosp. Fac. Rev. (Medicorp Health System) | 5.250% | 6/15/26 | | 2,425 | 2,064 |
| Stafford County VA Econ. Dev. Auth. Hosp. Fac. Rev. (Medicorp Health System) | 5.250% | 6/15/31 | | 22,265 | 17,978 |
| Tobacco Settlement Financing Corp. Virginia Rev. | 5.625% | 6/1/15 | (Prere.) | 42,520 | 46,470 |
| Virginia Beach VA Dev. Auth. Public Fac. | 5.000% | 7/15/23 | | 5,125 | 5,067 |
| Virginia Beach VA Dev. Auth. Public Fac. | 5.000% | 7/15/24 | | 5,335 | 5,238 |
| Virginia Beach VA Dev. Auth. Public Fac. | 5.000% | 7/15/25 | | 5,665 | 5,533 |
| Virginia Beach VA Dev. Auth. Public Fac. | 5.000% | 7/15/26 | | 5,955 | 5,784 |
| Virginia College Building Auth. Educ. Fac. Rev. (21st Century College) | 5.000% | 2/1/17 | | 10,935 | 11,465 |
| Virginia College Building Auth. Educ. Fac. Rev. (21st Century College) | 5.000% | 2/1/18 | | 10,595 | 10,967 |
| Virginia College Building Auth. Educ. Fac. Rev. (21st Century College) VRDO | 1.250% | 11/3/08 | | 20,750 | 20,750 |
| Virginia College Building Auth. Educ. Fac. Rev. Public Higher Educ. | 5.750% | 9/1/10 | (Prere.) | 4,310 | 4,548 |
| Virginia College Building Auth. Educ. Fac. Rev. Public Higher Educ. | 5.750% | 9/1/11 | | 4,085 | 4,280 |
| Virginia College Building Auth. Educ. Fac. Rev. Public Higher Educ. Financing Program | 5.000% | 9/1/18 | | 8,010 | 8,261 |
| Virginia College Building Auth. Educ. Fac. Rev. Public Higher Educ. Financing Program | 5.000% | 9/1/19 | | 8,430 | 8,606 |
| Virginia College Building Auth. Educ. Fac. Rev. Public Higher Educ. Financing Program | 5.000% | 9/1/20 | | 8,855 | 8,957 |
| Virginia College Building Auth. Educ. Fac. Rev. Public Higher Educ. Financing Program | 5.000% | 9/1/21 | | 9,320 | 9,371 |
| Virginia College Building Auth. Educ. Fac. Rev. Public Higher Educ. Financing Program | 5.000% | 9/1/22 | | 9,105 | 9,118 |
| Virginia Commonwealth Transp. Board Transp. Rev. (U.S. Route 58 Corridor) | 5.000% | 5/15/17 | | 12,985 | 13,789 |
| Virginia Commonwealth Transp. Board Transp. Rev. (U.S. Route 58 Corridor) | 5.000% | 5/15/23 | | 12,745 | 12,864 |
| Virginia Commonwealth Transp. Board Transp. Rev. (U.S. Route 58 Corridor) | 5.000% | 5/15/24 | | 16,955 | 17,050 |
| Virginia Public School Auth. Rev. | 5.000% | 8/1/13 | | 5,560 | 5,915 |
| Virginia Public School Auth. Rev. | 5.000% | 8/1/14 | | 5,635 | 6,006 |
| Virginia Public School Auth. Rev. | 5.000% | 8/1/16 | | 5,810 | 6,159 |
| Virginia Public School Auth. Rev. | 5.000% | 8/1/17 | | 4,510 | 4,750 |
| Virginia Public School Auth. Rev. | 5.000% | 8/1/20 | | 6,210 | 6,326 |
| | | | | | 319,901 |
Washington (1.2%) | | | | | |
2 | Bellvue WA GO TOB VRDO | 3.320% | 11/7/08 | (1) | 5,445 | 5,445 |
| Chelan County WA Public Util. Dist. (Rock Island Hydro) | 0.000% | 6/1/15 | (1) | 10,000 | 7,243 |
| Energy Northwest Washington Electric Refunding Rev. (Project No. 1) | 5.250% | 7/1/16 | | 42,825 | 45,456 |
| Energy Northwest Washington Electric Refunding Rev. (Project No. 1) | 5.000% | 7/1/17 | | 24,350 | 25,285 |
| King County WA School Dist. GO | 5.000% | 12/1/24 | (4) | 12,710 | 12,448 |
2 | King County WA Sewer Rev. TOB VRDO | 2.400% | 11/7/08 | | 24,275 | 24,275 |
| Port of Seattle WA Rev. | 5.000% | 3/1/20 | (1) | 9,035 | 8,813 |
| Port of Seattle WA Rev. | 5.000% | 3/1/21 | (1) | 5,000 | 4,827 |
| Snohomish County WA Mukilteo School Dist. | 6.500% | 12/1/11 | | 5,825 | 6,199 |
| Washington GO | 5.500% | 7/1/10 | (Prere.) | 6,755 | 7,096 |
| Washington GO | 6.250% | 2/1/11 | | 4,265 | 4,426 |
| Washington GO | 5.700% | 10/1/15 | (4) | 10,000 | 10,642 |
| Washington GO | 5.000% | 7/1/21 | (4) | 10,495 | 10,541 |
| Washington GO | 5.000% | 7/1/21 | (4) | 7,050 | 7,081 |
| Washington Health Care Fac. Auth. (Multicare Health System) | 5.250% | 8/15/23 | (4) | 3,425 | 3,285 |
| Washington Health Care Fac. Auth. (Multicare Health System) | 5.250% | 8/15/24 | (4) | 3,550 | 3,392 |
| Washington Health Care Fac. Auth. (Multicare Health System) | 5.250% | 8/15/25 | (4) | 3,675 | 3,497 |
| Washington Health Care Fac. Auth. (Multicare Health System) | 5.250% | 8/15/25 | (4) | 3,625 | 3,450 |
| Washington Health Care Fac. Auth. (Multicare Health System) | 5.250% | 8/15/26 | (4) | 3,550 | 3,369 |
| Washington Health Care Fac. Auth. (Multicare Health System) | 5.250% | 8/15/26 | (4) | 3,800 | 3,606 |
| Washington Health Care Fac. Auth. (Multicare Health System) | 5.250% | 8/15/27 | (4) | 3,925 | 3,718 |
| Washington Health Care Fac. Auth. (Peace Health) | 5.000% | 11/1/18 | | 30,000 | 27,732 |
| | | | | | 231,826 |
69
West Virginia (0.1%) | | | | | |
| West Virginia Econ. Dev. Auth. PCR (Appalachian Power Company) PUT | 4.850% | 9/4/13 | | 3,000 | 2,859 |
| West Virginia Econ. Dev. Auth. PCR PUT | 4.850% | 9/4/13 | | 10,000 | 9,531 |
| West Virginia GO | 5.750% | 6/1/09 | (Prere.) | 5,000 | 5,169 |
| | | | | | 17,559 |
Wisconsin (1.0%) | | | | | |
| Wisconsin GO | 5.000% | 5/1/10 | | 14,420 | 14,942 |
| Wisconsin GO | 5.000% | 5/1/11 | | 15,180 | 15,923 |
| Wisconsin GO | 5.250% | 5/1/11 | (1)(Prere.) | 5,000 | 5,293 |
| Wisconsin GO | 5.750% | 5/1/11 | (Prere.) | 18,000 | 19,304 |
| Wisconsin GO | 5.750% | 5/1/11 | (Prere.) | 20,315 | 21,786 |
| Wisconsin GO | 5.250% | 5/1/12 | | 15,975 | 16,990 |
| Wisconsin GO | 5.250% | 5/1/13 | | 16,810 | 17,965 |
| Wisconsin GO | 5.500% | 5/1/13 | (1) | 7,000 | 7,547 |
| Wisconsin GO | 5.000% | 5/1/15 | (1) | 14,975 | 15,863 |
| Wisconsin GO | 5.500% | 5/1/15 | (1) | 15,000 | 16,288 |
| Wisconsin GO | 5.000% | 5/1/19 | | 7,135 | 7,307 |
| Wisconsin GO | 5.000% | 5/1/21 | | 7,865 | 7,908 |
| Wisconsin GO | 5.000% | 5/1/22 | | 8,260 | 8,264 |
| Wisconsin GO | 5.000% | 5/1/23 | | 8,675 | 8,631 |
| Wisconsin Public Power System Power Supply System Rev. | 5.000% | 7/1/24 | (4) | 5,240 | 5,134 |
| Wisconsin Public Power System Power Supply System Rev. | 5.000% | 7/1/25 | (4) | 3,835 | 3,737 |
| | | | | | 192,882 |
Total Tax-Exempt Municipal Bonds (Cost $19,460,125) | | | | | 18,724,892 |
| | | | | | |
| | | | | | |
| | | | | Shares | |
Temporary Cash Investment (0.4%) | | | | | |
Money Market Fund (0.4%) | | | | | |
4 | Vanguard Municipal Cash Management Fund (Cost $87,029) | 1.701% | | | 87,028,627 | 87,029 |
Total Investments (99.7%) (Cost $19,547,154) | | | | | 18,811,921 |
Other Assets and Liabilities (0.3%) | | | | | |
Other Assets | | | | | 349,738 |
Liabilities | | | | | (299,657) |
| | | | | | 50,081 |
Net Assets (100%) | | | | | 18,862,002 |
At October 31, 2008, net assets consisted of: | |
| Amount |
| ($000) |
Paid-in Capital | 19,697,007 |
Undistributed Net Investment Income | — |
Accumulated Net Realized Losses | (124,838) |
Unrealized Appreciation (Depreciation) | |
Investment Securities | (735,233) |
Futures Contracts | 25,066 |
Net Assets | 18,862,002 |
| |
| |
Investor Shares—Net Assets | |
Applicable to 438,936,814 outstanding $.001 par value shares of beneficial interest (unlimited authorization) | 5,524,301 |
Net Asset Value Per Share—Investor Shares | $12.59 |
| |
| |
Admiral Shares—Net Assets | |
Applicable to 1,059,760,694 outstanding $.001 par value shares of beneficial interest (unlimited authorization) | 13,337,701 |
Net Asset Value Per Share—Admiral Shares | $12.59 |
• See Note A in Notes to Financial Statements.
1 Security purchased on a when-issued or delayed-delivery basis for which the fund has not taken delivery as of October 31, 2008.
2 Security exempt from registration under Rule 144A of the Securities Act of 1933. Such securities may be sold in transactions exempt from registration, normally to qualified institutional buyers. At October 31, 2008, the aggregate value of these securities was $87,415,000, representing 0.5% of net assets.
3 Securities with a value of $25,716,000 have been segregated as initial margin for open futures contracts.
4 Affiliated money market fund available only to Vanguard funds and certain trusts and accounts managed by Vanguard. Rate shown is the 7-day yield. For key to abbreviations and other references, see back cover.
See accompanying Notes, which are an integral part of the Financial Statements.
70
Insured Long-Term Tax-Exempt Fund
| | | | Face | Market |
| | Maturity | | Amount | Value• |
| Coupon | Date | | ($000) | ($000) |
Tax-Exempt Municipal Bonds (98.7%) | | | | | |
Alabama (1.6%) | | | | | |
Alabama Special Care Fac. Financing Auth. Mobile Rev. (Ascension Health) | 5.000% | 11/15/39 | (1) | 7,610 | 6,608 |
Houston County AL Health Care Auth. Rev. | 5.250% | 10/1/30 | (2) | 9,000 | 6,908 |
Mobile AL Water & Sewer Comm. | 5.000% | 1/1/31 | (1) | 17,500 | 16,071 |
Mobile AL Water & Sewer Comm. | 5.000% | 1/1/36 | (1) | 24,610 | 21,901 |
| | | | | 51,488 |
Alaska (0.3%) | | | | | |
Anchorage AK Electric Rev. | 8.000% | 12/1/09 | (1) | 2,565 | 2,724 |
Anchorage AK Electric Rev. | 8.000% | 12/1/10 | (1) | 2,960 | 3,257 |
North Slope Borough AK GO | 0.000% | 6/30/10 | (1) | 4,000 | 3,783 |
| | | | | 9,764 |
Arizona (2.4%) | | | | | |
Arizona COP | 5.000% | 9/1/23 | (4) | 12,140 | 11,564 |
Arizona State Univ. COP | 5.375% | 7/1/12 | (1)(Prere.) | 2,285 | 2,456 |
Arizona State Univ. COP | 5.375% | 7/1/12 | (1)(Prere.) | 5,520 | 5,934 |
Arizona State Univ. COP | 5.375% | 7/1/12 | (1)(Prere.) | 4,460 | 4,794 |
Arizona State Univ. COP | 5.375% | 7/1/12 | (1)(Prere.) | 5,345 | 5,746 |
Arizona State Univ. COP | 5.375% | 7/1/12 | (1)(Prere.) | 4,905 | 5,273 |
Arizona State Univ. COP | 5.375% | 7/1/12 | (1)(Prere.) | 4,340 | 4,666 |
Arizona State Univ. COP | 5.375% | 7/1/13 | (1) | 2,905 | 3,030 |
Maricopa County AZ IDA Health Fac. Rev. (Catholic Healthcare West) | 5.250% | 7/1/32 | | 3,170 | 2,567 |
Maricopa County AZ Rev. (Samaritan Health Service) | 7.000% | 12/1/16 | (1)(ETM) | 8,650 | 10,120 |
Mesa AZ Util. System Rev. | 5.250% | 7/1/14 | (3) | 10,000 | 10,560 |
Phoenix AZ GO | 4.500% | 7/1/24 | | 8,000 | 7,253 |
Tucson AZ Water System Rev. | 5.500% | 7/1/17 | (3) | 4,850 | 5,029 |
| | | | | 78,992 |
Arkansas (0.2%) | | | | | |
North Little Rock AR Electric Rev. | 6.500% | 7/1/10 | (1) | 1,535 | 1,586 |
North Little Rock AR Electric Rev. | 6.500% | 7/1/15 | (1) | 4,500 | 4,885 |
| | | | | 6,471 |
California (16.3%) | | | | | |
Anaheim CA Public Finance Auth. Electric System Rev. | 5.000% | 10/1/31 | (4) | 18,735 | 17,046 |
California Dept. of Water Resources Water System Rev. (Central Valley) | 5.250% | 6/1/13 | (3)(Prere.) | 200 | 218 |
California Dept. of Water Resources Water System Rev. (Central Valley) | 5.250% | 6/1/13 | (3)(Prere.) | 135 | 147 |
California Dept. of Water Resources Water System Rev. (Central Valley) | 5.250% | 6/1/13 | (3)(Prere.) | 135 | 147 |
California Dept. of Water Resources Water System Rev. (Central Valley) | 5.250% | 6/1/13 | (3)(Prere.) | 110 | 120 |
California Dept. of Water Resources Water System Rev. (Central Valley) | 5.250% | 6/1/13 | (3)(Prere.) | 75 | 82 |
California Dept. of Water Resources Water System Rev. (Central Valley) | 5.250% | 12/1/15 | (3) | 14,540 | 15,270 |
California Dept. of Water Resources Water System Rev. (Central Valley) | 5.250% | 12/1/16 | (3) | 9,865 | 10,335 |
California Dept. of Water Resources Water System Rev. (Central Valley) | 5.250% | 12/1/17 | (3) | 9,915 | 10,292 |
California Dept. of Water Resources Water System Rev. (Central Valley) | 5.250% | 12/1/18 | (3) | 7,780 | 7,980 |
California Dept. of Water Resources Water System Rev. (Central Valley) | 5.250% | 12/1/19 | (3) | 5,235 | 5,348 |
California GO | 5.000% | 2/1/14 | (2)(Prere.) | 1,500 | 1,595 |
California GO | 5.000% | 2/1/14 | (2)(Prere.) | 3,565 | 3,791 |
California GO | 5.000% | 11/1/18 | (3) | 13,455 | 13,513 |
California GO | 4.500% | 10/1/36 | | 30,000 | 22,848 |
California Health Fac. Finance Auth. Rev. (Pomona Valley Hosp.) | 5.750% | 7/1/15 | (1) | 8,205 | 8,207 |
California State Econ. Recovery Bonds | 5.250% | 7/1/14 | (3) | 23,680 | 25,241 |
Golden State Tobacco Securitization Corp. California | 5.000% | 6/1/13 | (2)(Prere.) | 26,020 | 27,456 |
Golden State Tobacco Securitization Corp. California | 5.000% | 6/1/35 | (3) | 30,000 | 22,687 |
Grossmont CA Healthcare Dist. GO | 5.000% | 7/15/37 | (2) | 35,270 | 31,525 |
Irvine CA USD Financing Auth. Special Tax | 5.000% | 9/1/38 | (2) | 18,000 | 14,521 |
Los Angeles CA USD GO | 5.250% | 7/1/13 | (4)(Prere.) | 9,000 | 9,842 |
Los Angeles CA USD GO | 5.250% | 7/1/13 | (4)(Prere.) | 9,000 | 9,842 |
Los Angeles CA USD GO | 5.000% | 7/1/25 | (4) | 6,980 | 6,848 |
Los Angeles CA USD GO | 5.000% | 7/1/26 | (4) | 7,435 | 7,247 |
Los Angeles CA USD GO | 5.000% | 7/1/26 | (4) | 27,240 | 26,552 |
Modesto CA Irrigation Dist. Finance Auth. Rev. (Woodland Project) | 6.500% | 10/1/22 | (2)(ETM) | 20,225 | 22,837 |
MSR California Public Power Agency Rev. (San Juan Project) | 6.125% | 7/1/13 | (2) | 9,000 | 9,526 |
MSR California Public Power Agency Rev. (San Juan Project) | 6.750% | 7/1/20 | (1)(ETM) | 10,365 | 11,933 |
Riverside CA USD GO | 5.250% | 8/1/38 | (12) | 11,475 | 10,692 |
Sacramento CA Financing Auth. Lease Rev. | 5.250% | 12/1/30 | (2) | 45,395 | 42,043 |
Sacramento CA Muni. Util. Dist. Rev. | 6.500% | 9/1/13 | (1) | 8,895 | 9,522 |
San Diego CA Community College Dist. GO | 5.000% | 8/1/30 | (4) | 19,015 | 17,793 |
San Diego CA USD GO | 5.500% | 7/1/22 | (1) | 9,160 | 9,476 |
San Juan CA USD GO | 5.000% | 8/1/31 | (13) | 10,000 | 9,233 |
Santa Clara CA Redev. Agency (Bayshore North) | 7.000% | 7/1/10 | (2) | 880 | 915 |
Santa Rosa CA Waste Water Rev. | 6.000% | 9/1/15 | (4) | 5,000 | 5,352 |
State Center California Community College Dist. GO | 5.000% | 8/1/31 | (4) | 16,100 | 14,943 |
71
| Ukiah CA Electric Rev. | 6.250% | 6/1/18 | (1) | 6,330 | 6,830 |
| Univ. of California Rev. | 4.500% | 5/15/31 | (4) | 54,470 | 45,266 |
| West Basin CA Muni. Water Dist. Rev. COP | 5.000% | 8/1/23 | (12) | 6,000 | 5,805 |
| West Basin CA Muni. Water Dist. Rev. COP | 5.000% | 8/1/24 | (12) | 5,000 | 4,799 |
| | | | | | 525,665 |
Colorado (3.6%) | | | | | |
| Colorado Springs CO Util. System Rev. | 5.375% | 11/15/16 | (2) | 12,790 | 13,372 |
| Colorado Springs CO Util. System Rev. | 5.375% | 11/15/17 | (2) | 13,490 | 13,954 |
| Colorado Springs CO Util. System Rev. | 5.375% | 11/15/18 | (2) | 10,000 | 10,216 |
| Colorado Springs CO Util. System Rev. | 5.000% | 11/15/43 | | 17,725 | 15,634 |
| E-470 Public Highway Auth. Colorado Rev. | 0.000% | 9/1/15 | (1) | 5,795 | 4,004 |
| E-470 Public Highway Auth. Colorado Rev. | 0.000% | 9/1/19 | (1) | 8,000 | 4,054 |
| E-470 Public Highway Auth. Colorado Rev. | 0.000% | 9/1/23 | (1) | 35,275 | 13,120 |
| E-470 Public Highway Auth. Colorado Rev. | 0.000% | 9/1/27 | (1) | 13,425 | 3,668 |
| E-470 Public Highway Auth. Colorado Rev. | 0.000% | 9/1/28 | (1) | 13,425 | 3,410 |
| Northwest Parkway Public Highway Auth. Colorado Convertible Rev. | 0.000% | 6/15/16 | (2)(Prere.) | 15,000 | 14,178 |
| Northwest Parkway Public Highway Auth. Colorado Convertible Rev. | 0.000% | 6/15/16 | (4)(Prere.) | 16,000 | 15,187 |
| Regional Transp. Dist. of Colorado Sales Tax Rev. | 4.500% | 11/1/34 | (4) | 7,195 | 5,783 |
| | | | | | 116,580 |
Connecticut (0.5%) | | | | | |
| Connecticut GO | 5.500% | 11/15/12 | (4) | 16,170 | 17,543 |
| | | | | | |
Florida (9.4%) | | | | | |
| Alachua County FL Health Fac. Auth. Rev. (Shands Healthcare Project) | 2.753% | 12/1/37 | | 10,000 | 6,600 |
| Brevard County FL School Board COP | 5.000% | 7/1/29 | (2) | 5,000 | 4,412 |
| Broward County FL School Board COP | 5.500% | 7/1/18 | (4) | 10,000 | 10,127 |
| Broward County FL School Board COP | 5.375% | 7/1/19 | (4) | 4,000 | 4,007 |
| Davie FL Water & Sewer Rev. | 6.375% | 10/1/12 | (2)(ETM) | 2,620 | 2,831 |
| Florida Board of Educ. Rev. (Lottery Rev.) | 5.250% | 7/1/15 | (2) | 10,000 | 10,527 |
| Hillsborough County FL Aviation Auth. Rev. (Tampa International Airport) | 5.000% | 10/1/18 | (1) | 7,855 | 7,692 |
| Hillsborough County FL Aviation Auth. Rev. (Tampa International Airport) | 5.000% | 10/1/19 | (1) | 6,390 | 6,165 |
| Hillsborough County FL School Board COP | 5.250% | 7/1/16 | (1) | 13,300 | 14,019 |
| Jacksonville FL Electric Auth. Water & Sewer Rev. | 5.000% | 10/1/09 | (4)(Prere.) | 1,850 | 1,906 |
| Jacksonville FL Electric Auth. Water & Sewer Rev. | 5.000% | 10/1/39 | (4) | 3,150 | 2,777 |
| Lake County FL School Board COP | 5.000% | 6/1/31 | (2) | 18,000 | 15,688 |
| Miami FL GO | 5.500% | 1/1/12 | (1)(Prere.) | 3,000 | 3,222 |
| Miami FL GO | 5.500% | 1/1/12 | (1)(Prere.) | 7,015 | 7,534 |
| Miami-Dade County FL Expressway Auth. Toll System Rev. | 5.000% | 7/1/26 | (2) | 17,240 | 15,585 |
| Miami-Dade County FL Expressway Auth. Toll System Rev. | 5.000% | 7/1/39 | (2) | 10,000 | 8,290 |
| Miami-Dade County FL School Board COP | 6.000% | 10/1/09 | (4)(Prere.) | 5,765 | 5,991 |
| Miami-Dade County FL School Board COP | 5.000% | 11/1/25 | (2) | 7,570 | 6,890 |
| Miami-Dade County FL School Board COP | 5.000% | 11/1/26 | (2) | 5,270 | 4,759 |
| Miami-Dade County FL School Board COP | 5.250% | 5/1/29 | (12) | 14,850 | 14,169 |
| Miami-Dade County FL School Board COP | 5.250% | 5/1/30 | (12) | 15,000 | 14,241 |
| Miami-Dade County FL School Board COP | 5.000% | 11/1/31 | (2) | 5,000 | 4,353 |
| Miami-Dade County FL School Board COP | 5.000% | 11/1/31 | (2) | 10,000 | 8,705 |
| Miami-Dade County FL Water & Sewer Rev. | 5.000% | 10/1/14 | (4) | 10,000 | 10,476 |
| Miami-Dade County FL Water & Sewer Rev. | 5.000% | 10/1/15 | (4) | 10,000 | 10,427 |
| Orlando & Orange County FL Expressway Auth. | 8.250% | 7/1/13 | (3) | 9,695 | 11,174 |
| Orlando & Orange County FL Expressway Auth. | 5.000% | 7/1/32 | (4) | 10,000 | 9,048 |
| Palm Beach County FL Criminal Justice Fac. Rev. | 7.200% | 6/1/15 | (3) | 4,000 | 4,638 |
| Palm Beach County FL School Board COP VRDO | 5.450% | 11/7/08 | (4) | 1,000 | 1,000 |
| Pasco County FL Water & Sewer Rev. | 5.000% | 10/1/36 | (4) | 3,000 | 2,655 |
| Port St. Lucie FL Rev. | 6.250% | 9/1/27 | (12) | 8,000 | 8,017 |
| Port St. Lucie FL Special Assessment Rev. (Southwest Annexation Dist.) | 5.000% | 7/1/27 | (1) | 11,405 | 10,017 |
| Port St. Lucie FL Special Assessment Rev. (Southwest Annexation Dist.) | 5.000% | 7/1/33 | (1) | 9,000 | 7,515 |
| South Miami FL Health Fac. Auth. Hosp. Rev. (Baptist Health South FL Obligated Group) | 5.000% | 8/15/32 | | 8,000 | 6,515 |
| Tampa FL Util. Rev. | 6.750% | 10/1/10 | (2) | 9,330 | 9,966 |
| Tampa FL Util. Rev. | 6.750% | 10/1/11 | (2) | 9,965 | 10,852 |
| Tampa FL Util. Rev. | 6.750% | 10/1/12 | (2) | 10,635 | 11,764 |
| Univ. of South Florida Financing Corp. VRDO | 2.350% | 11/7/08 | | 9,300 | 9,300 |
| | | | | | 303,854 |
Georgia (5.5%) | | | | | |
| Atlanta GA Airport Fac. Rev. | 5.000% | 1/1/30 | (4) | 18,285 | 16,912 |
| Atlanta GA Airport Passenger Charge Rev. | 5.000% | 1/1/33 | (4) | 10,020 | 9,081 |
1 | Atlanta GA Water & Wastewater Rev. | 5.500% | 11/1/15 | (4) | 8,500 | 9,123 |
| Atlanta GA Water & Wastewater Rev. | 5.500% | 11/1/16 | (4) | 7,000 | 7,472 |
| Atlanta GA Water & Wastewater Rev. | 5.500% | 11/1/17 | (4) | 8,000 | 8,495 |
| Atlanta GA Water & Wastewater Rev. | 5.000% | 11/1/33 | (1) | 32,425 | 27,880 |
| Atlanta GA Water & Wastewater Rev. VRDO | 4.500% | 11/3/08 | (4) | 22,200 | 22,200 |
| Augusta GA Water & Sewer Rev. | 5.000% | 10/1/32 | (4) | 18,900 | 17,115 |
72
Dalton County GA Dev. Auth. (Hamilton Health Care System) | 5.500% | 8/15/26 | (1) | 12,000 | 9,960 |
Fulton DeKalb GA Hosp. Auth. | 5.250% | 1/1/14 | (4) | 15,805 | 16,885 |
Henry County GA School Dist. GO | 6.450% | 8/1/11 | (1) | 2,765 | 2,915 |
Main Street Natural Gas Inc. Georgia Gas Project Rev. | 5.500% | 9/15/25 | | 20,000 | 14,693 |
Main Street Natural Gas Inc. Georgia Gas Project Rev. | 5.500% | 9/15/27 | | 15,000 | 10,750 |
Private Colleges & Univ. Auth. of Georgia Rev. (Mercer Univ.) | 6.500% | 11/1/15 | (1)(ETM) | 5,000 | 5,664 |
| | | | | 179,145 |
Hawaii (1.1%) | | | | | |
Hawaii Dept. of Budget & Finance (Hawaii Electric Co. Inc.) | 4.950% | 4/1/12 | (1) | 15,000 | 15,330 |
Honolulu HI City & County GO | 8.000% | 10/1/10 | (ETM) | 2,305 | 2,544 |
Honolulu HI City & County GO | 5.250% | 7/1/13 | (3) | 3,000 | 3,207 |
Honolulu HI City & County GO | 5.250% | 7/1/14 | (3) | 3,000 | 3,210 |
Honolulu HI City & County GO | 5.000% | 7/1/15 | (3) | 3,075 | 3,242 |
Univ. of Hawaii Univ. System Rev. | 5.500% | 7/15/12 | (3)(Prere.) | 4,615 | 5,001 |
Univ. of Hawaii Univ. System Rev. | 5.500% | 7/15/12 | (3)(Prere.) | 2,330 | 2,525 |
| | | | | 35,059 |
Idaho (0.1%) | | | | | |
Boise State Univ. Idaho | 5.000% | 4/1/32 | (1) | 3,000 | 2,734 |
| | | | | |
Illinois (5.2%) | | | | | |
Chicago IL GO | 5.500% | 1/1/11 | (1)(Prere.) | 245 | 262 |
Chicago IL GO | 0.000% | 1/1/16 | (1)(Prere.) | 7,985 | 7,762 |
Chicago IL GO | 0.000% | 1/1/16 | (1)(Prere.) | 3,695 | 3,585 |
Chicago IL GO | 0.000% | 1/1/16 | (1)(Prere.) | 7,010 | 6,800 |
Chicago IL GO | 0.000% | 1/1/20 | (1) | 5,000 | 4,567 |
Chicago IL GO | 0.000% | 1/1/22 | (1) | 5,000 | 4,531 |
Chicago IL GO | 0.000% | 1/1/24 | (1) | 2,480 | 2,246 |
Chicago IL GO | 0.000% | 1/1/25 | (1) | 1,305 | 1,178 |
Chicago IL GO | 0.000% | 1/1/28 | (1) | 2,820 | 2,519 |
Chicago IL GO | 5.000% | 1/1/28 | (4) | 7,500 | 7,152 |
Chicago IL GO | 5.000% | 1/1/34 | (1) | 11,040 | 9,904 |
Chicago IL GO | 5.500% | 1/1/38 | (1) | 6,490 | 6,191 |
Chicago IL Neighborhoods Alive GO | 5.500% | 1/1/11 | (3)(Prere.) | 1,950 | 2,061 |
Chicago IL O'Hare International Airport Rev. | 5.000% | 1/1/25 | (4) | 21,525 | 20,075 |
Chicago IL O'Hare International Airport Rev. | 5.000% | 1/1/26 | (4) | 17,600 | 16,334 |
Chicago IL Public Building Comm. GO | 7.000% | 1/1/20 | (1)(ETM) | 21,500 | 25,258 |
Chicago IL Water Rev. | 5.750% | 11/1/30 | (2) | 12,000 | 11,274 |
Illinois GO | 5.375% | 6/1/24 | (3) | 9,710 | 9,755 |
Illinois Regional Transp. Auth. Rev. | 7.200% | 11/1/20 | (2) | 24,000 | 27,449 |
| | | | | 168,903 |
Indiana (0.4%) | | | | | |
Indiana Muni. Power Agency Rev. | 6.125% | 1/1/13 | (1)(ETM) | 11,355 | 12,090 |
| | | | | |
Kansas (0.8%) | | | | | |
Burlington KS PCR (Kansas Gas & Electric Co.) | 4.850% | 6/1/31 | (1) | 7,500 | 5,918 |
Kansas Health System Dev. Auth. (St. Luke Mission) | 5.375% | 11/15/16 | (1) | 3,000 | 3,006 |
Overland Park KS Convention Center & Hotel Project | 5.250% | 1/1/32 | (2) | 20,000 | 16,569 |
| | | | | 25,493 |
Kentucky (2.6%) | | | | | |
Jefferson County KY Health Fac. Rev. (Jewish Hosp. Health) | 5.750% | 1/1/26 | (2) | 3,000 | 2,729 |
Kentucky Asset/Liability Comm. General Fund Rev. | 2.276% | 11/1/17 | (3) | 13,550 | 9,858 |
Kentucky Asset/Liability Comm. General Fund Rev. | 2.396% | 11/1/21 | (3) | 24,845 | 15,217 |
Louisville & Jefferson County KY Metro. Sewer Dist. | 6.000% | 5/15/31 | (3) | 51,960 | 52,316 |
Louisville & Jefferson County KY Metro. Sewer Dist. | 5.750% | 5/15/33 | (3) | 2,335 | 2,326 |
| | | | | 82,446 |
Louisiana (2.2%) | | | | | |
Louisiana Gasoline and Fuel Tax Rev. | 5.000% | 5/1/23 | (3) | 8,065 | 7,806 |
Louisiana GO | 5.000% | 10/15/11 | (2) | 20,015 | 20,942 |
Louisiana Univ. & Agriculture & Mechanical College Board | 5.000% | 7/1/31 | (3) | 10,000 | 8,420 |
New Orleans LA GO | 0.000% | 9/1/10 | (2) | 8,500 | 7,927 |
New Orleans LA GO | 0.000% | 9/1/11 | (2) | 10,475 | 9,291 |
New Orleans LA GO | 0.000% | 9/1/13 | (2) | 9,000 | 7,108 |
Ouachita Parish LA Hosp. Service Dist. (Glenwood Medical Center) | 5.700% | 5/15/10 | (4)(Prere.) | 4,900 | 5,148 |
Ouachita Parish LA Hosp. Service Dist. (Glenwood Medical Center) | 5.750% | 5/15/10 | (4)(Prere.) | 2,950 | 3,102 |
| | | | | 69,744 |
Maryland (1.5%) | | | | | |
Baltimore County MD Rev. Catholic Health Initiatives | 4.500% | 9/1/33 | | 1,000 | 792 |
Maryland Econ. Dev. Corp. Student Housing Rev. (Univ. of Maryland College Park) | 5.000% | 6/1/28 | (11) | 2,000 | 1,661 |
Maryland Econ. Dev. Corp. Student Housing Rev. (Univ. of Maryland College Park) | 5.000% | 6/1/33 | (11) | 4,250 | 3,359 |
Maryland Health & Higher Educ. Fac. Auth. Rev. (Medlantic/Helix) | 5.250% | 8/15/38 | (4) | 30,055 | 26,563 |
73
Maryland Health & Higher Educ. Fac. Auth. Rev. (Univ. of Maryland Medical System) | 7.000% | 7/1/22 | (3) | 12,025 | 12,192 |
Maryland Health & Higher Educ. Fac. Auth. Rev. (Univ. of Maryland Medical System) | 5.000% | 7/1/31 | (2) | 2,500 | 1,988 |
Maryland Health & Higher Educ. Fac. Auth. Rev. (Western Maryland Health) | 5.000% | 7/1/34 | (1)(7) | 3,000 | 2,205 |
| | | | | 48,760 |
Massachusetts (2.9%) | | | | | |
Massachusetts Bay Transp. Auth. Rev. | 5.000% | 7/1/35 | | 11,310 | 10,216 |
Massachusetts College Building Auth. Rev. | 0.000% | 5/1/17 | (1)(ETM) | 7,460 | 5,028 |
Massachusetts GO | 7.000% | 7/1/09 | (3)(ETM) | 7,430 | 7,658 |
Massachusetts GO | 5.500% | 11/1/12 | (Prere.) | 19,275 | 20,690 |
Massachusetts GO | 5.500% | 11/1/12 | (Prere.) | 14,155 | 15,194 |
Massachusetts Health & Educ. Fac. Auth. Rev. (Massachusetts General Hosp.) | 6.250% | 7/1/12 | (2) | 12,020 | 12,649 |
Massachusetts Muni. Wholesale Electric Co. Power System Rev. | 5.250% | 7/1/14 | (1) | 11,135 | 11,442 |
Massachusetts Special Obligation Dedicated Tax Rev. | 5.750% | 1/1/14 | (3)(Prere.) | 10,000 | 10,804 |
| | | | | 93,681 |
Michigan (2.7%) | | | | | |
Detroit MI GO | 5.000% | 4/1/15 | (12) | 2,875 | 2,938 |
Detroit MI GO | 5.000% | 4/1/16 | (12) | 3,015 | 3,058 |
Detroit MI GO | 5.000% | 4/1/17 | (12) | 3,170 | 3,181 |
Detroit MI Sewer System Rev. | 5.750% | 1/1/10 | (3)(Prere.) | 5,000 | 5,231 |
Detroit MI Sewer System Rev. | 5.000% | 7/1/13 | (4)(Prere.) | 7,180 | 7,716 |
Detroit MI Sewer System Rev. | 5.000% | 7/1/32 | (4) | 2,820 | 2,535 |
Michigan Trunk Line Rev. | 5.000% | 11/1/26 | (1) | 35,765 | 34,171 |
Monroe County MI Econ. Dev. Corp. (Detroit Edison) | 6.950% | 9/1/22 | (3) | 25,000 | 27,431 |
| | | | | 86,261 |
Minnesota (1.4%) | | | | | |
Minneapolis MN Health Care System (Fairview Health Services) | 5.000% | 11/15/30 | (2) | 9,000 | 7,692 |
St. Cloud MN Health Care Rev. (St. Cloud Hosp. Obligation Group) | 5.750% | 5/1/26 | (4) | 37,665 | 35,986 |
St. Cloud MN Health Care Rev. (St. Cloud Hosp. Obligation Group) | 5.875% | 5/1/30 | (4) | 2,500 | 2,351 |
| | | | | 46,029 |
Mississippi (0.2%) | | | | | |
Mississippi Dev. Bank Special Obligation Muni. Energy Agency Rev. | 5.000% | 3/1/36 | (10) | 10,000 | 7,788 |
| | | | | |
Missouri (0.3%) | | | | | |
Missouri Health & Educ. Fac. Auth. Health Fac. Rev. (Lester Cox Medical Center) | 5.250% | 6/1/15 | (1) | 5,000 | 5,162 |
Missouri Jt. Muni. Electric Util. Comm. Power Project Rev. (Prairie Project) | 5.000% | 1/1/27 | (2)(12) | 5,535 | 4,978 |
| | | | | 10,140 |
Nebraska (0.1%) | | | | | |
Central Plains Energy Project Nebraska Gas Project No. 1 | 5.250% | 12/1/20 | | 5,000 | 3,782 |
| | | | | |
Nevada (0.9%) | | | | | |
Clark County NV GO | 6.500% | 6/1/17 | (2) | 5,000 | 5,700 |
Henderson NV Health Care Fac. Rev. (Catholic Healthcare West) | 5.250% | 7/1/31 | | 11,710 | 9,341 |
Nevada Highway Improvement Rev. (Motor Vehicle Fuel Tax) | 5.000% | 12/1/23 | (4) | 5,000 | 4,932 |
Nevada Highway Improvement Rev. (Motor Vehicle Fuel Tax) | 5.000% | 12/1/25 | (4) | 10,255 | 9,990 |
| | | | | 29,963 |
New Jersey (8.4%) | | | | | |
Atlantic County NJ Public Fac. COP | 7.400% | 3/1/12 | (3) | 4,335 | 4,850 |
Hoboken-Union City-Weehawken NJ Sewerage Auth. Rev. | 6.250% | 8/1/14 | (1) | 10,185 | 11,342 |
Hoboken-Union City-Weehawken NJ Sewerage Auth. Rev. | 6.250% | 8/1/15 | (1) | 10,820 | 12,107 |
New Jersey Econ. Dev. Auth. Rev. (School Fac.) | 5.250% | 12/15/20 | (2) | 25,000 | 25,427 |
New Jersey Econ. Dev. Auth. Rev. (School Fac.) PUT | 5.000% | 9/1/15 | (4) | 22,000 | 22,604 |
New Jersey Educ. Fac. Auth. Rev. (William Paterson Univ.) | 4.750% | 7/1/34 | (12) | 5,500 | 4,855 |
New Jersey Health Care Fac. Financing Auth. Rev. (St. Barnabas Health Care) | 5.250% | 1/1/09 | (1)(Prere.) | 1,955 | 1,986 |
New Jersey Health Care Fac. Financing Auth. Rev. (St. Barnabas Health Care) | 5.250% | 7/1/15 | (1) | 3,795 | 3,622 |
New Jersey Health Care Fac. Financing Auth. Rev. (Virtua Health) | 5.250% | 7/1/14 | (4) | 10,685 | 10,830 |
New Jersey Sports & Exposition Auth. Rev. | 6.500% | 3/1/13 | (1)(ETM) | 2,570 | 2,782 |
New Jersey Sports & Exposition Auth. Rev. | 6.500% | 3/1/13 | (1) | 2,580 | 2,770 |
New Jersey Transp. Trust Fund Auth. Rev. | 5.500% | 12/15/15 | (1) | 7,000 | 7,406 |
New Jersey Transp. Trust Fund Auth. Rev. | 5.500% | 12/15/21 | (1) | 24,000 | 24,473 |
New Jersey Transp. Trust Fund Auth. Rev. | 5.500% | 12/15/21 | (1)(12) | 50,000 | 51,608 |
New Jersey Transp. Trust Fund Auth. Rev. | 5.250% | 12/15/22 | (2) | 13,500 | 13,406 |
New Jersey Transp. Trust Fund Auth. Rev. | 5.250% | 12/15/23 | (2) | 6,000 | 5,938 |
New Jersey Turnpike Auth. Rev. | 6.500% | 1/1/13 | (1)(ETM) | 30,000 | 33,832 |
New Jersey Turnpike Auth. Rev. | 6.500% | 1/1/16 | (1)(ETM) | 270 | 315 |
New Jersey Turnpike Auth. Rev. | 6.500% | 1/1/16 | (1) | 790 | 895 |
New Jersey Turnpike Auth. Rev. | 6.500% | 1/1/16 | (1)(ETM) | 3,940 | 4,389 |
New Jersey Turnpike Auth. Rev. | 0.000% | 1/1/35 | (2) | 23,500 | 14,328 |
Tobacco Settlement Financing Corp. New Jersey Rev. | 5.750% | 6/1/12 | (Prere.) | 10,585 | 11,278 |
| | | | | 271,043 |
74
New Mexico (0.1%) | | | | | |
Farmington NM Util. System Rev. | 5.750% | 5/15/13 | (3)(ETM) | 1,220 | 1,226 |
New Mexico Highway Comm. Tax Rev. | 6.000% | 6/15/10 | (Prere.) | 3,000 | 3,175 |
| | | | | 4,401 |
New York (4.1%) | | | | | |
Hudson Yards Infrastructure Corp. New York Rev. | 4.500% | 2/15/47 | (1) | 19,575 | 13,828 |
Long Island NY Power Auth. Electric System Rev. | 0.000% | 6/1/13 | (4) | 11,000 | 9,111 |
Metro. New York Transp. Auth. Rev. (Dedicated Petroleum Tax) | 6.000% | 4/1/20 | (1)(ETM) | 12,000 | 13,277 |
New York City NY Muni. Water Finance Auth. Water & Sewer System Rev. | 5.000% | 6/15/36 | | 28,700 | 25,994 |
New York State Dormitory Auth. Rev. (New York Univ.) | 5.750% | 7/1/27 | (1) | 17,000 | 17,836 |
New York State Dormitory Auth. Rev. (Personal Income Tax) | 5.000% | 3/15/32 | | 11,000 | 10,240 |
New York State Housing Finance Agency Rev. (Nursing Home & Health Care) | 4.700% | 11/1/08 | (1) | 5,185 | 5,185 |
New York State Housing Finance Agency Rev. (Nursing Home & Health Care) | 4.800% | 11/1/09 | (1) | 10,000 | 10,116 |
New York State Housing Finance Agency Rev. (Nursing Home & Health Care) | 4.900% | 11/1/10 | (1) | 3,325 | 3,361 |
Suffolk County NY Water Auth. Rev. | 5.750% | 6/1/13 | (2)(ETM) | 7,345 | 7,994 |
Tobacco Settlement Financing Corp. New York Rev. | 5.250% | 6/1/21 | (2) | 12,000 | 11,519 |
Tobacco Settlement Financing Corp. New York Rev. | 5.250% | 6/1/22 | (2) | 5,000 | 4,766 |
| | | | | 133,227 |
North Carolina (0.6%) | | | | | |
North Carolina Medical Care Comm. Hosp. Rev. (Mission St. Joseph's Health System) | 5.125% | 10/1/28 | (1) | 7,355 | 6,434 |
North Carolina Medical Care Comm. Hosp. Rev. (Wake County Hosp.) | 5.250% | 10/1/17 | (1) | 13,750 | 12,661 |
| | | | | 19,095 |
Ohio (0.9%) | | | | | |
Cleveland OH Airport System Rev. | 5.000% | 1/1/31 | (4) | 18,000 | 16,132 |
Ohio GO | 7.625% | 8/1/09 | | 4,345 | 4,535 |
Univ. of Akron OH General Receipts Rev. | 5.000% | 1/1/38 | (4) | 8,125 | 7,133 |
| | | | | 27,800 |
Oklahoma (0.2%) | | | | | |
Tulsa County OK Ind. Auth. Rev. (St. Francis Health System) | 5.000% | 12/15/36 | | 10,000 | 7,715 |
| | | | | |
Oregon (0.5%) | | | | | |
Oregon State Dept. Administrative Services | 6.000% | 5/1/10 | (2)(Prere.) | 6,565 | 6,960 |
Oregon State Dept. Administrative Services | 6.000% | 5/1/10 | (2)(Prere.) | 3,175 | 3,366 |
Oregon State Dept. Administrative Services | 6.000% | 5/1/10 | (2)(Prere.) | 6,190 | 6,562 |
| | | | | 16,888 |
Pennsylvania (2.9%) | | | | | |
Norwin PA School Dist. GO | 3.250% | 4/1/31 | (4) | 8,915 | 5,631 |
Pennsylvania Convention Center Auth. Rev. | 6.700% | 9/1/16 | (3)(ETM) | 9,970 | 11,269 |
Pennsylvania IDA Rev. (Econ. Dev.) | 5.500% | 7/1/12 | (2)(Prere.) | 775 | 843 |
Pennsylvania IDA Rev. (Econ. Dev.) | 5.500% | 7/1/15 | (2) | 20,030 | 20,735 |
Pennsylvania Public School Building Auth. Lease Rev. (School Dist. of Philadelphia) | 5.000% | 6/1/31 | (4) | 20,000 | 18,448 |
Philadelphia PA Water & Waste Water Rev. | 7.000% | 6/15/10 | (3) | 15,000 | 15,784 |
Philadelphia PA Water & Waste Water Rev. | 7.000% | 6/15/11 | (3) | 16,500 | 17,697 |
Pittsburgh PA Water & Sewer Auth. Rev. | 7.250% | 9/1/14 | (3)(ETM) | 3,390 | 3,785 |
| | | | | 94,192 |
Puerto Rico (1.7%) | | | | | |
Puerto Rico Electric Power Auth. Rev. | 5.250% | 7/1/21 | (1) | 5,000 | 4,653 |
Puerto Rico Electric Power Auth. Rev. | 5.250% | 7/1/22 | (1) | 2,930 | 2,701 |
Puerto Rico Public Finance Corp. PUT | 5.250% | 2/1/12 | (2)LOC | 40,000 | 39,347 |
Puerto Rico Sales Tax Financing Corp. Rev. | 0.000% | 8/1/54 | (2) | 159,500 | 6,645 |
| | | | | 53,346 |
Rhode Island (0.2%) | | | | | |
Rhode Island Health & Educ. Building Corp. Rev. | 4.500% | 5/15/23 | (4) | 2,565 | 2,264 |
Rhode Island Health & Educ. Building Corp. Rev. | 4.500% | 5/15/24 | (4) | 2,975 | 2,601 |
Rhode Island Health & Educ. Building Corp. Rev. (Hosp. Financing - Lifespan Obligation) | 5.000% | 5/15/32 | (4) | 3,000 | 2,687 |
| | | | | 7,552 |
South Carolina (1.1%) | | | | | |
Charleston SC Educ. Excellence Financing Corp. Rev. (Charleston County School Dist.) | 5.000% | 12/1/26 | | 10,580 | 9,717 |
South Carolina Transp. Infrastructure Rev. | 5.250% | 10/1/21 | (2) | 27,170 | 26,230 |
| | | | | 35,947 |
Tennessee (0.5%) | | | | | |
Metro. Govt. of Nashville & Davidson County TN Health & Educ. Fac. Board Rev. | | | | | |
(Meharry Medical College) | 6.000% | 12/1/12 | (2) | 3,405 | 3,456 |
Shelby County TN Health Educ. & Housing Fac. Board Rev. | 5.250% | 9/1/27 | (4) | 10,000 | 9,743 |
Tennessee Health, Educ. & Housing Fac. (Methodist Health System) | 5.500% | 8/1/12 | (1) | 1,685 | 1,787 |
| | | | | 14,986 |
75
Texas (11.2%) | | | | | |
Brownsville TX Util. System Rev. | 5.000% | 9/1/20 | (4) | 10,055 | 9,878 |
Dallas County TX Util. & Reclamation Dist. GO | 5.375% | 2/15/29 | (2) | 5,000 | 4,614 |
Dallas TX Area Rapid Transit Rev. | 4.500% | 12/1/24 | (2) | 10,000 | 8,941 |
Dallas TX Area Rapid Transit Rev. | 4.500% | 12/1/25 | (2) | 10,000 | 8,850 |
Harris County TX GO | 0.000% | 10/1/15 | (1) | 17,545 | 12,907 |
Harris County TX Health Fac. Dev. Corp. Rev. (Methodist Hosp.) VRDO | 1.250% | 11/3/08 | (4) | 4,975 | 4,975 |
Harris County TX Health Fac. Dev. Corp. Rev. (Methodist Hosp.) VRDO | 1.250% | 11/3/08 | (4) | 36,600 | 36,600 |
Harris County TX Health Fac. Dev. Corp. Rev. (Methodist Hosp.) VRDO | 1.250% | 11/3/08 | (4) | 4,000 | 4,000 |
Harris County TX Hosp. Dist. Rev. | 6.000% | 8/15/10 | (1)(Prere.) | 12,910 | 13,524 |
Harris County TX Hosp. Dist. Rev. | 5.125% | 2/15/32 | (1) | 10,000 | 8,573 |
Harris County TX Hosp. Dist. Rev. | 5.250% | 2/15/37 | (1) | 10,190 | 8,643 |
Houston TX GO | 5.375% | 3/1/11 | (4)(Prere.) | 6,485 | 6,869 |
Houston TX GO | 5.375% | 3/1/13 | (4) | 6,500 | 6,758 |
Houston TX GO | 5.500% | 3/1/15 | (4) | 8,440 | 8,798 |
Houston TX GO | 5.500% | 3/1/16 | (4) | 5,235 | 5,423 |
Houston TX Water & Sewer System Rev. | 5.500% | 12/1/16 | (4) | 7,000 | 7,381 |
Houston TX Water Conveyance System COP | 6.800% | 12/15/10 | (2) | 5,490 | 5,819 |
Lower Colorado River Auth. Texas Rev. | 5.625% | 1/1/15 | (4)(Prere.) | 3,055 | 3,392 |
Lubbock TX Independent School Dist. VRDO | 4.000% | 11/3/08 | LOC | 16,000 | 16,000 |
North Texas Tollway Auth. (Dallas North Tollway) System Rev. | 5.000% | 1/1/33 | (2) | 8,050 | 6,937 |
North Texas Tollway Auth. Rev. | 5.125% | 1/1/28 | (1) | 27,335 | 24,804 |
Northeast Texas Hosp. Auth. (Northeast Medical Center) | 6.000% | 5/15/09 | (4) | 3,945 | 4,020 |
Northeast Texas Hosp. Auth. (Northeast Medical Center) | 6.000% | 5/15/10 | (4) | 2,000 | 2,081 |
Northeast Texas Hosp. Auth. (Northeast Medical Center) | 5.625% | 5/15/17 | (4) | 7,425 | 7,514 |
Northeast Texas Hosp. Auth. (Northeast Medical Center) | 5.625% | 5/15/22 | (4) | 7,110 | 7,093 |
Tarrant County TX Cultural Educ. Fac. Finance Corp. Rev. (Texas Health Resources) | 5.000% | 2/15/36 | | 15,000 | 12,109 |
Texas Muni. Power Agency Rev. | 0.000% | 9/1/14 | (1) | 34,250 | 26,035 |
Texas Muni. Power Agency Rev. | 0.000% | 9/1/15 | (1) | 16,665 | 11,873 |
Texas Muni. Power Agency Rev. | 0.000% | 9/1/17 | (1) | 19,600 | 12,260 |
Texas Turnpike Auth. Central Texas Turnpike System Rev. | 0.000% | 8/15/26 | (2) | 10,000 | 2,961 |
Texas Turnpike Auth. Central Texas Turnpike System Rev. | 0.000% | 8/15/28 | (2) | 30,005 | 7,645 |
Texas Turnpike Auth. Dallas Northway Rev. (President George Bush Turnpike) | 0.000% | 1/1/10 | (2)(ETM) | 6,000 | 5,811 |
Texas Water Dev. Board GO | 5.750% | 8/1/32 | | 10,380 | 10,452 |
Texas Water Dev. Board Rev. | 5.500% | 7/15/21 | | 9,825 | 9,938 |
Texas Water Finance Assistance GO | 5.750% | 8/1/11 | (Prere.) | 1,880 | 2,026 |
Univ. of Texas Rev. Finance Systems | 5.000% | 8/15/13 | (Prere.) | 24,900 | 26,794 |
| | | | | 362,298 |
Vermont (0.2%) | | | | | |
Vermont Educ. & Health Buildings Finance Agency Rev. (Fletcher Allen Health) | 5.000% | 12/1/34 | (4) | 7,500 | 6,473 |
| | | | | |
Washington (2.4%) | | | | | |
Chelan County WA Public Util. Dist. (Rock Island Hydro) | 0.000% | 6/1/15 | (1) | 12,585 | 9,115 |
Washington Health Care Fac. Auth. (Multicare Health System) | 5.250% | 8/15/31 | (4) | 5,000 | 4,666 |
Washington Health Care Fac. Auth. (Multicare Health System) | 5.250% | 8/15/34 | (4) | 27,000 | 24,357 |
Washington Health Care Fac. Auth. (Multicare Health System) VRDO | 1.550% | 11/3/08 | (4) | 40,500 | 40,500 |
| | | | | 78,638 |
West Virginia (1.0%) | | | | | |
West Virginia Building Comm. Rev. (Jail & Correction Fac.) | 7.000% | 7/1/11 | (1)(ETM) | 7,325 | 8,112 |
West Virginia Building Comm. Rev. (Jail & Correction Fac.) | 7.000% | 7/1/12 | (1)(ETM) | 7,840 | 8,892 |
West Virginia Hosp. Finance Auth. Rev. (UTD Hosp. Center Inc. Project) | 5.250% | 6/1/41 | (2) | 18,830 | 14,351 |
| | | | | 31,355 |
Wisconsin (0.5%) | | | | | |
Wisconsin Transp. Rev. | 4.500% | 7/1/26 | (3) | 17,470 | 15,189 |
Total Tax-Exempt Municipal Bonds (Cost $3,380,495) | | | | | 3,192,520 |
Other Assets and Liabilities (1.3%) | | | | | |
Other Assets | | | | | 55,919 |
Liabilities | | | | | (12,844) |
| | | | | 43,075 |
Net Assets (100%) | | | | | 3,235,595 |
76
At October 31, 2008, net assets consisted of: | |
| Amount |
| ($000) |
Paid-in Capital | 3,452,444 |
Undistributed Net Investment Income | — |
Accumulated Net Realized Losses | (32,961) |
Unrealized Appreciation (Depreciation) | |
Investment Securities | (187,975) |
Futures Contracts | 4,087 |
Net Assets | 3,235,595 |
| |
| |
Investor Shares—Net Assets | |
Applicable to 74,516,440 outstanding $.001 par value shares of beneficial interest (unlimited authorization) | 837,993 |
Net Asset Value Per Share—Investor Shares | $11.25 |
| |
| |
Admiral Shares—Net Assets | |
Applicable to 213,201,033 outstanding $.001 par value shares of beneficial interest (unlimited authorization) | 2,397,602 |
Net Asset Value Per Share—Admiral Shares | $11.25 |
• See Note A in Notes to Financial Statements.
1 Securities with a value of $4,293,000 have been segregated as initial margin for open futures contracts. For key to abbreviations and other references, see back cover.
See accompanying Notes, which are an integral part of the Financial Statements.
77
Long-Term Tax-Exempt Fund
| | | | | Face | Market |
| | | Maturity | | Amount | Value• |
| | Coupon | Date | | ($000) | ($000) |
Tax-Exempt Municipal Bonds (98.6%) | | | | | |
Alabama (0.3%) | | | | | |
| East AL Health Care Auth. Rev. (Health Care Facs.) | 5.000% | 9/1/13 | | 5,000 | 4,733 |
| Univ. of Alabama Birmingham Hosp. Rev. | 5.250% | 9/1/25 | | 3,500 | 2,998 |
| | | | | | 7,731 |
Arizona (1.9%) | | | | | |
| Arizona Health Fac. Auth. Rev. (Banner Health) | 5.500% | 1/1/38 | | 15,500 | 13,447 |
| Arizona Transp. Board Excise Tax Rev. | 5.000% | 7/1/13 | | 2,415 | 2,561 |
| Arizona Transp. Board Excise Tax Rev. | 5.000% | 7/1/14 | | 5,600 | 5,937 |
| Arizona Transp. Board Excise Tax Rev. | 5.000% | 7/1/15 | | 5,025 | 5,310 |
| Arizona Transp. Board Excise Tax Rev. | 5.000% | 7/1/16 | | 7,015 | 7,365 |
| Arizona Transp. Board Excise Tax Rev. | 5.000% | 7/1/17 | | 3,500 | 3,650 |
| Arizona Transp. Board Highway Rev. | 5.000% | 7/1/24 | | 5,000 | 4,994 |
| Phoenix AZ Civic Improvement Corp. Airport Rev. | 5.000% | 7/1/33 | | 4,500 | 4,074 |
| Scottsdale AZ Muni. Property Corp. Excise Tax Rev. | 5.000% | 7/1/16 | (Prere.) | 7,115 | 7,663 |
| | | | | | 55,001 |
California (14.5%) | | | | | |
| Alameda CA Corridor Transp. Auth. Rev. | 0.000% | 10/1/30 | (2) | 5,000 | 1,257 |
| Anaheim CA Public Finance Auth. Lease Rev. | 6.000% | 9/1/14 | (4) | 2,500 | 2,763 |
| Bay Area Toll Auth. CA Toll Bridge Rev. | 5.000% | 4/1/31 | | 4,300 | 3,968 |
| California Dept. of Water Resources Water System Rev. (Central Valley) | 5.000% | 12/1/27 | | 7,560 | 7,281 |
| California GO | 6.250% | 9/1/12 | | 5,000 | 5,295 |
| California GO | 5.250% | 11/1/21 | | 2,000 | 1,989 |
| California GO | 5.000% | 8/1/25 | (4) | 6,645 | 6,382 |
| California GO | 5.500% | 8/1/26 | | 10,000 | 9,977 |
| California GO | 5.125% | 4/1/33 | | 8,500 | 7,766 |
| California GO | 5.250% | 3/1/38 | | 38,150 | 35,005 |
| California Health Fac. Finance Auth. Rev. (Catholic Healthcare West) | 5.625% | 7/1/35 | | 5,000 | 4,454 |
| California Health Fac. Finance Auth. Rev. (Cedars-Sinai Medical Center) | 6.250% | 12/1/09 | (Prere.) | 5,000 | 5,294 |
| California Health Fac. Finance Auth. Rev. (Cedars-Sinai Medical Center) | 5.000% | 11/15/27 | | 7,000 | 5,896 |
| California Health Fac. Finance Auth. Rev. (Sutter Health) | 5.000% | 8/15/38 | | 4,000 | 3,277 |
| California Public Works Board Lease Rev. (Community College) | 5.625% | 3/1/16 | (2) | 11,370 | 11,388 |
| California Public Works Board Lease Rev. (Univ. of California) | 5.000% | 5/1/27 | | 10,405 | 9,714 |
| California State Dept. of Water Resources Power Supply Rev. | 5.375% | 5/1/12 | (2)(Prere.) | 5,000 | 5,451 |
| California State Dept. of Water Resources Power Supply Rev. | 6.000% | 5/1/13 | | 5,000 | 5,405 |
| California State Dept. of Water Resources Power Supply Rev. | 5.500% | 5/1/15 | (2) | 6,000 | 6,310 |
| California State Econ. Recovery Bonds | 5.000% | 7/1/15 | | 15,200 | 15,900 |
| California State Econ. Recovery Bonds PUT | 5.000% | 3/1/10 | | 25,000 | 25,547 |
| California State Econ. Recovery Bonds PUT | 5.000% | 7/1/10 | | 25,000 | 25,617 |
| California Statewide Community Dev. Auth. Rev. (Irvine Univ. of California East LLC) | 5.750% | 5/15/32 | | 4,000 | 3,224 |
| California Statewide Community Dev. Auth. Rev. (Kaiser Permanente) | 5.250% | 3/1/45 | | 9,000 | 7,178 |
| Golden State Tobacco Securitization Corp. California | 6.750% | 6/1/13 | (Prere.) | 20,000 | 22,567 |
| Golden State Tobacco Securitization Corp. California | 5.000% | 6/1/33 | | 10,000 | 6,201 |
| Golden State Tobacco Securitization Corp. California | 6.250% | 6/1/13 | (Prere.) | 20,000 | 21,359 |
| Los Angeles CA Community College Dist. GO | 5.000% | 8/1/28 | | 6,600 | 6,335 |
| Los Angeles CA Dept. of Water & Power Rev. | 5.000% | 7/1/31 | (4) | 12,500 | 11,423 |
| Los Angeles CA USD GO | 5.000% | 7/1/25 | (3) | 10,000 | 9,553 |
| Modesto CA Irrigation Dist. COP | 5.500% | 7/1/35 | | 5,700 | 5,224 |
| Northern California Power Agency (Hydroelectric Project) | 5.000% | 7/1/19 | (12) | 4,000 | 4,059 |
| San Bernardino County CA Medical Center COP | 5.500% | 8/1/24 | (1) | 11,295 | 11,294 |
| San Bernardino County CA Medical Center COP | 6.875% | 8/1/24 | (ETM) | 18,000 | 20,984 |
| San Diego CA USD GO | 0.000% | 7/1/13 | (3) | 7,160 | 5,868 |
| San Francisco CA City & County Public Util. Comm. Rev. | 4.500% | 11/1/31 | (4) | 6,000 | 4,898 |
| San Jose CA Redev. Agency | 5.000% | 8/1/20 | (2) | 11,415 | 10,901 |
| San Jose CA Redev. Agency | 5.000% | 8/1/27 | (1) | 5,000 | 4,488 |
| San Mateo County CA Joint Powers Auth. Lease Rev. | 5.000% | 7/15/33 | | 5,000 | 4,454 |
| Simi Valley CA School Financing Auth. Rev. | 5.000% | 8/1/27 | (4) | 10,000 | 9,577 |
| Southern California Public Power Auth. Rev. (Transmission Project) | 0.000% | 7/1/14 | | 8,500 | 6,613 |
| Univ. of California Rev. | 4.500% | 5/15/26 | (4) | 10,000 | 8,904 |
| Univ. of California Rev. | 4.500% | 5/15/35 | (4) | 17,225 | 13,952 |
1 | Ventura County CA Community College Dist. GO | 5.500% | 8/1/33 | | 12,000 | 11,714 |
| | | | | | 416,706 |
Colorado (1.8%) | | | | | |
| Denver CO City & County Airport Rev. | 6.000% | 11/15/12 | (1) | 7,000 | 7,458 |
2 | Douglas County CO School Dist. No. RE-1. (Douglas & Elbert Counties) | 5.000% | 12/15/16 | (4) | 12,565 | 13,182 |
| E-470 Public Highway Auth. Colorado Rev. | 0.000% | 9/1/13 | (1) | 10,000 | 7,864 |
| E-470 Public Highway Auth. Colorado Rev. | 0.000% | 9/1/16 | (1) | 10,185 | 6,567 |
| E-470 Public Highway Auth. Colorado Rev. | 0.000% | 9/1/19 | (1) | 5,000 | 2,534 |
78
| E-470 Public Highway Auth. Colorado Rev. | 0.000% | 9/1/20 | (1) | 15,165 | 7,128 |
| E-470 Public Highway Auth. Colorado Rev. | 0.000% | 9/1/25 | (1) | 9,700 | 3,096 |
| E-470 Public Highway Auth. Colorado Rev. | 0.000% | 9/1/30 | (1) | 16,500 | 3,574 |
| | | | | | 51,403 |
Connecticut (0.6%) | | | | | |
| Connecticut State Health & Educ. Fac. Auth. (Quinnipiac Univ.) CP | 5.000% | 7/1/36 | (2) | 18,875 | 16,093 |
| | | | | | |
District of Columbia (0.3%) | | | | | |
| District of Columbia GO | 6.000% | 6/1/11 | (1)(ETM) | 3,085 | 3,333 |
| District of Columbia Rev. (Georgetown Univ.) | 5.500% | 4/1/36 | | 5,000 | 4,481 |
| | | | | | 7,814 |
Florida (5.7%) | | | | | |
| Florida Board of Educ. Rev. (Lottery Rev.) | 5.000% | 7/1/16 | (2) | 10,000 | 10,311 |
| Florida Board of Educ. Rev. (Lottery Rev.) | 5.000% | 7/1/22 | (2) | 12,995 | 12,490 |
| Florida Dept. of Environmental Protection & Preservation Rev. | 5.000% | 7/1/21 | | 8,610 | 8,175 |
| Florida Dept. of Environmental Protection & Preservation Rev. | 5.000% | 7/1/28 | | 4,000 | 3,588 |
| Florida Educ. System Fac. Rev. | 5.000% | 5/1/35 | (1) | 11,335 | 10,129 |
| Florida Hurricane Catastrophe Fund Finance Corp. Rev. | 5.000% | 7/1/12 | | 7,000 | 7,304 |
| Florida Hurricane Catastrophe Fund Finance Corp. Rev. | 5.000% | 7/1/13 | | 7,000 | 7,310 |
| Highlands County FL Health Rev. (Adventist Health System) | 5.000% | 11/15/15 | (Prere.) | 245 | 262 |
| Highlands County FL Health Rev. (Adventist Health System) | 5.000% | 11/15/15 | (Prere.) | 185 | 198 |
| Highlands County FL Health Rev. (Adventist Health System) | 5.250% | 11/15/16 | (Prere.) | 245 | 265 |
| Highlands County FL Health Rev. (Adventist Health System) | 5.000% | 11/15/24 | | 1,755 | 1,448 |
| Highlands County FL Health Rev. (Adventist Health System) | 5.000% | 11/15/25 | | 1,315 | 1,071 |
| Highlands County FL Health Rev. (Adventist Health System) | 5.250% | 11/15/36 | | 9,755 | 7,553 |
| Jacksonville FL Health Fac. Auth. Hosp. Rev. VRDO | 1.200% | 11/3/08 | LOC | 13,500 | 13,500 |
| Key West FL Util. Board Election Rev. | 5.000% | 10/1/31 | (1) | 10,000 | 8,707 |
| Lee County FL Hosp. Board of Directors Hosp. Rev. (Memorial Health System) VRDO | 6.000% | 11/7/08 | | 5,700 | 5,700 |
| Lee County FL IDA Health Care Fac. Rev. (Shell Point Village) | 5.500% | 11/15/09 | (Prere.) | 11,925 | 12,486 |
| Marion County FL Hosp. Dist. Rev. (Munroe Regional Health System) | 5.000% | 10/1/29 | | 8,000 | 5,905 |
| Orange County FL Health Fac. Auth. Rev. (Orlando Regional Healthcare) | 5.125% | 11/15/39 | | 5,000 | 3,705 |
| Orange County FL School Board COP | 5.000% | 8/1/31 | (3) | 9,000 | 7,800 |
| Polk County FL Public Fac. Rev. | 5.000% | 12/1/30 | (1) | 17,835 | 15,628 |
| Putman County FL Auth. PCR PUT | 5.350% | 5/1/18 | (2) | 4,300 | 4,049 |
| Sunrise FL Util. System Rev. | 5.500% | 10/1/18 | (2) | 12,000 | 12,270 |
| Tallahassee FL Health Fac. Rev. (Tallahassee Memorial Healthcare) | 6.375% | 12/1/30 | | 6,000 | 4,980 |
| | | | | | 164,834 |
Georgia (3.2%) | | | | | |
| Atlanta GA Airport Fac. Rev. | 5.875% | 1/1/15 | (3) | 7,750 | 7,926 |
| Atlanta GA Airport Fac. Rev. | 5.875% | 1/1/17 | (3) | 7,500 | 7,636 |
| Atlanta GA Water & Wastewater Rev. | 5.500% | 11/1/22 | (4) | 10,000 | 9,728 |
| Atlanta GA Water & Wastewater Rev. | 5.750% | 11/1/25 | (4) | 4,450 | 4,562 |
| Atlanta GA Water & Wastewater Rev. | 5.750% | 11/1/30 | (4) | 15,000 | 15,075 |
| Burke County GA Dev. Auth. PCR (Oglethorpe Power Corp.) | 5.500% | 1/1/33 | | 3,000 | 2,687 |
| College Park GA IDA Lease Rev. (Civic Center) | 7.000% | 9/1/10 | (ETM) | 5,070 | 5,340 |
| Fulton County GA COP | 6.000% | 11/1/15 | (2) | 4,815 | 5,088 |
| Main Street Natural Gas Inc. Georgia Gas Project Rev. | 5.000% | 3/15/21 | | 10,305 | 7,998 |
| Metro. Atlanta GA Rapid Transp. Auth. Georgia Sales Tax Rev. | 6.250% | 7/1/18 | | 12,170 | 13,173 |
| Muni. Electric Auth. Georgia (Project One Sub) Rev. | 5.250% | 1/1/18 | | 7,000 | 6,999 |
| Muni. Electric Auth. Georgia Rev. (General Resolution Projects) Rev. | 5.250% | 1/1/19 | | 5,000 | 4,934 |
| | | | | | 91,146 |
Hawaii (0.2%) | | | | | |
| Hawaii GO | 5.875% | 10/1/10 | (1)(Prere.) | 3,220 | 3,427 |
| Hawaii GO | 5.875% | 10/1/10 | (1)(Prere.) | 2,860 | 3,043 |
| | | | | | 6,470 |
Idaho (0.2%) | | | | | |
1 | Idaho Health Facs. Auth. Rev. (Trinity Health Group) | 6.250% | 12/1/33 | | 6,000 | 5,808 |
| | | | | | |
Illinois (4.2%) | | | | | |
| Chicago IL (City Colleges Improvement) GO | 0.000% | 1/1/16 | (3) | 8,500 | 6,050 |
| Chicago IL Board of Educ. GO | 0.000% | 12/1/13 | (2) | 5,000 | 4,005 |
| Chicago IL Board of Educ. GO | 0.000% | 12/1/14 | (2) | 5,000 | 3,781 |
| Chicago IL Metro. Water Reclamation Dist. GO | 7.000% | 1/1/11 | (ETM) | 20,000 | 20,978 |
| Chicago IL Public Building Comm. GO | 7.000% | 1/1/20 | (1)(ETM) | 6,000 | 7,049 |
| Chicago IL Skyway Toll Bridge | 5.500% | 1/1/11 | (2)(Prere.) | 8,750 | 9,339 |
3 | Illinois Educ. Fac. Auth. Rev. TOB VRDO | 2.380% | 11/7/08 | | 7,685 | 7,685 |
| Illinois Finance Auth. Rev. (Childrens Memorial Hosp.) | 5.375% | 8/15/39 | | 13,000 | 10,209 |
| Illinois Finance Auth. Rev. (Elmhurst Memorial) | 5.625% | 1/1/37 | | 11,000 | 8,943 |
| Illinois Finance Auth. Rev. (Northwestern Community Hosp.) | 5.375% | 7/1/33 | | 3,000 | 2,574 |
| Illinois Finance Auth. Rev. (OSF Healthcare System) | 5.750% | 11/15/37 | | 5,000 | 3,966 |
79
| Illinois Sales Tax Rev. | 6.125% | 6/15/10 | (Prere.) | 4,500 | 4,772 |
| Metro. Pier & Exposition Auth. Illinois Dedicated Sales Tax Rev. | 6.750% | 6/1/10 | (1) | 4,680 | 4,864 |
| Metro. Pier & Exposition Auth. Illinois Dedicated Sales Tax Rev. | 0.000% | 12/15/14 | (1) | 16,100 | 12,277 |
| Univ. of Illinois Univ. Rev. Auxiliary Fac. | 0.000% | 4/1/12 | (1) | 5,795 | 5,084 |
| Will County IL Community School Dist. | 0.000% | 11/1/13 | (4) | 10,000 | 8,070 |
| | | | | | 119,646 |
Indiana (1.2%) | | | | | |
| Indiana Finance Auth. Rev. VRDO | 5.000% | 11/7/08 | | 5,500 | 5,500 |
| Indiana Health Fac. Auth. Finance Auth. Rev. (Clarian Health Obligation Group) | 5.000% | 2/15/26 | | 3,475 | 2,734 |
| Indiana Health Fac. Auth. Finance Auth. Rev. (Clarian Health Obligation Group) | 5.000% | 2/15/39 | | 24,045 | 16,889 |
| Indiana Office Building Comm. Rev. (Capitol Complex) | 6.900% | 7/1/11 | | 9,275 | 9,793 |
| | | | | | 34,916 |
Kentucky (0.4%) | | | | | |
| Kentucky Property & Building Comm. Rev. | 5.375% | 8/1/16 | (4) | 5,820 | 6,052 |
| Louisville & Jefferson County KY Metro. Sewer Dist. | 5.750% | 5/15/33 | (3) | 5,000 | 4,980 |
| | | | | | 11,032 |
Louisiana (2.0%) | | | | | |
| Louisiana Gasoline and Fuel Tax Rev. | 5.375% | 6/1/18 | (2) | 5,000 | 5,063 |
| Louisiana Gasoline and Fuel Tax Rev. | 5.000% | 5/1/24 | (3) | 6,880 | 6,607 |
| Louisiana Gasoline and Fuel Tax Rev. | 5.000% | 5/1/25 | (3) | 5,000 | 4,773 |
| Louisiana Gasoline and Fuel Tax Rev. | 5.000% | 5/1/27 | (10) | 5,000 | 4,718 |
| Louisiana Gasoline and Fuel Tax Rev. | 5.000% | 5/1/28 | (10) | 2,500 | 2,335 |
| Louisiana GO | 5.500% | 5/15/14 | (3) | 4,180 | 4,324 |
| Louisiana Public Fac. Auth. Rev. (Ochsner Clinic) | 5.375% | 5/15/43 | | 20,000 | 15,271 |
| New Orleans LA GO | 0.000% | 9/1/16 | (2) | 5,785 | 3,767 |
| Saint John Baptist Parish Louisiana Rev. (Marathon Oil Corp.) | 5.125% | 6/1/37 | | 16,000 | 9,943 |
| | | | | | 56,801 |
Maryland (1.8%) | | | | | |
| Maryland Econ. Dev. Corp. (Chesapeake Bay Conference Center) | 7.750% | 12/1/09 | (Prere.) | 25,000 | 26,826 |
| Maryland Health & Higher Educ. Fac. Auth. Rev. (Medlantic/Helix) | 5.250% | 8/15/38 | (4) | 6,100 | 5,391 |
| Maryland Health & Higher Educ. Fac. Auth. Rev. (Medlantic/Helix) | 5.250% | 8/15/38 | (2) | 13,475 | 10,749 |
| Maryland Health & Higher Educ. Fac. Auth. Rev. (Univ. of Maryland Medical System) | 6.750% | 7/1/10 | (Prere.) | 7,500 | 8,111 |
| | | | | | 51,077 |
Massachusetts (6.0%) | | | | | |
| Massachusetts Bay Transp. Auth. Rev. | 7.000% | 3/1/21 | | 15,000 | 17,022 |
| Massachusetts Bay Transp. Auth. Rev. | 5.500% | 7/1/29 | (1) | 3,085 | 3,185 |
| Massachusetts GO | 5.375% | 10/1/10 | (Prere.) | 10,000 | 10,458 |
| Massachusetts GO | 5.500% | 12/1/23 | (2) | 3,055 | 3,245 |
| Massachusetts Health & Educ. Fac. Auth. Rev. (Berklee College of Music) | 5.000% | 10/1/32 | | 21,125 | 17,961 |
| Massachusetts Health & Educ. Fac. Auth. Rev. (Boston Medical Center) | 5.750% | 7/1/31 | | 20,000 | 15,687 |
| Massachusetts Health & Educ. Fac. Auth. Rev. (Caregroup) | 5.125% | 7/1/38 | | 2,000 | 1,348 |
| Massachusetts Health & Educ. Fac. Auth. Rev. (Caritas Christi Obligated Group) | 5.700% | 7/1/15 | | 9,205 | 8,768 |
| Massachusetts Health & Educ. Fac. Auth. Rev. (Lahey Clinic Medical Center) | 5.000% | 8/15/30 | (3) | 7,460 | 6,350 |
| Massachusetts School Building Auth. Dedicated Sales Tax Rev. | 5.000% | 8/15/30 | (4) | 13,160 | 12,473 |
| Massachusetts Special Obligation Dedicated Tax Rev. | 5.250% | 1/1/14 | (3)(Prere.) | 7,295 | 7,575 |
| Massachusetts Special Obligation Dedicated Tax Rev. | 5.500% | 1/1/27 | (3) | 7,190 | 7,198 |
| Massachusetts Water Pollution Abatement Trust | 5.250% | 8/1/26 | | 4,790 | 4,958 |
| Massachusetts Water Resources Auth. Rev. | 6.500% | 7/15/19 | (ETM) | 32,000 | 36,336 |
| Massachusetts Water Resources Auth. Rev. | 5.000% | 8/1/31 | (2) | 21,000 | 19,516 |
| | | | | | 172,080 |
Michigan (2.7%) | | | | | |
| Detroit MI Sewer System Rev. | 5.750% | 1/1/10 | (3)(Prere.) | 5,000 | 5,231 |
| Detroit MI Sewer System Rev. | 5.000% | 7/1/13 | (4)(Prere.) | 7,755 | 8,334 |
| Detroit MI Sewer System Rev. | 5.125% | 7/1/15 | (1)(Prere.) | 3,970 | 4,316 |
| Detroit MI Sewer System Rev. | 5.500% | 7/1/29 | (3) | 18,000 | 16,739 |
| Detroit MI Sewer System Rev. | 5.000% | 7/1/32 | (4) | 3,045 | 2,737 |
| Detroit MI Sewer System Rev. | 5.125% | 7/1/33 | (1) | 6,030 | 5,285 |
| Grand Rapids MI Tax Increment Rev. (Downtown Project) | 6.875% | 6/1/24 | (1) | 7,500 | 7,737 |
| Michigan Building Auth. Rev. | 5.500% | 10/15/16 | | 5,500 | 5,713 |
| Michigan Hosp. Finance Auth. Rev. (Henry Ford Health System) | 5.250% | 11/15/46 | | 14,000 | 10,418 |
| Michigan Muni. Bond Auth. Rev. (Clean Water Revolving Fund) | 5.875% | 10/1/10 | (Prere.) | 7,980 | 8,574 |
| Michigan Tobacco Settlement Financing Auth. Rev. | 6.875% | 6/1/42 | | 5,000 | 3,718 |
| | | | | | 78,802 |
Mississippi (0.3%) | | | | | |
| Warren County MS Golf Opportunity Zone Rev. | 6.500% | 9/1/32 | | 10,000 | 7,893 |
| | | | | | |
Missouri (0.8%) | | | | | |
| Missouri Dev. Finance Board Infrastructure Fac. Branson Landing Rev. | 5.000% | 6/1/35 | | 3,500 | 2,336 |
1 | Missouri Health & Educ. Fac. Auth. (Washington Univ.) | 5.375% | 3/15/39 | | 8,000 | 7,970 |
| Missouri Health & Educ. Fac. Auth. Health Fac. Rev. | 5.000% | 6/1/36 | | 4,000 | 3,301 |
80
| Missouri Health & Educ. Fac. Auth. Health Fac. Rev. (Cox Health) | 5.250% | 11/15/29 | | 3,500 | 2,801 |
| Missouri Health & Educ. Fac. Auth. Health Fac. Rev. (Cox Health) | 5.500% | 11/15/33 | | 3,500 | 2,870 |
| Missouri Health & Educ. Fac. Auth. Health Fac. Rev. (St. Luke's Episcopal—Presbyterian Hosp.) | 5.500% | 12/1/16 | (4) | 4,195 | 4,307 |
| | | | | | 23,585 |
Nebraska (0.8%) | | | | | |
| Omaha NE Public Power Dist. Electric Rev. | 5.000% | 2/1/39 | | 20,075 | 17,770 |
1 | Omaha NE Public Power Dist. Electric Rev. | 5.500% | 2/1/39 | | 5,000 | 4,821 |
| | | | | | 22,591 |
Nevada (1.2%) | | | | | |
| Clark County NV School Dist. GO | 5.000% | 6/15/13 | | 12,305 | 13,029 |
| Clark County NV School Dist. GO | 5.000% | 6/15/14 | | 8,295 | 8,779 |
| Clark County NV School Dist. GO VRDO | 1.200% | 11/3/08 | (4) | 6,900 | 6,900 |
| Henderson NV Health Care Fac. Rev. | 5.625% | 7/1/24 | | 2,000 | 1,791 |
| Truckee Meadows NV Water Auth. Rev. | 5.500% | 7/1/11 | (4)(Prere.) | 5,000 | 5,347 |
| | | | | | 35,846 |
New Hampshire (0.8%) | | | | | |
| Manchester NH General Airport Rev. | 5.625% | 1/1/10 | (4)(Prere.) | 23,000 | 23,896 |
| | | | | | |
New Jersey (3.9%) | | | | | |
| Essex County NJ Improvement Auth. Rev. | 5.500% | 10/1/28 | (1) | 10,680 | 10,874 |
| Garden State Preservation Trust New Jersey | 5.750% | 11/1/28 | (4) | 10,000 | 10,849 |
| New Jersey Econ. Dev. Auth. Rev. (Cigarette Tax) | 5.500% | 6/15/24 | | 10,000 | 7,927 |
| New Jersey Econ. Dev. Auth. Rev. (School Fac.) | 5.500% | 9/1/26 | (2) | 10,000 | 10,228 |
| New Jersey Econ. Dev. Auth. Rev. (School Fac.) | 5.500% | 9/1/27 | (3) | 9,000 | 9,084 |
| New Jersey Educ. Fac. Auth. Rev. (New Jersey City Univ.) | 5.000% | 7/1/35 | (12) | 6,500 | 6,013 |
1 | New Jersey Housing & Mortgage Finance Agency Rev. | 6.500% | 10/1/38 | | 2,330 | 2,352 |
| New Jersey Sports & Exposition Auth. Rev. | 6.500% | 3/1/13 | (4)(ETM) | 1,370 | 1,483 |
| New Jersey Sports & Exposition Auth. Rev. | 6.500% | 3/1/13 | (4) | 260 | 279 |
| New Jersey Transp. Corp. COP | 6.000% | 9/15/10 | (2)(Prere.) | 13,000 | 13,838 |
| New Jersey Transp. Trust Fund Auth. Rev. | 5.250% | 12/15/22 | (2) | 5,000 | 4,965 |
| New Jersey Transp. Trust Fund Auth. Rev. | 5.750% | 6/15/24 | (3) | 5,795 | 5,982 |
| New Jersey Transp. Trust Fund Auth. Rev. | 0.000% | 12/15/25 | (2) | 15,000 | 5,519 |
| New Jersey Transp. Trust Fund Auth. Rev. | 0.000% | 12/15/26 | (2) | 19,000 | 6,516 |
| New Jersey Turnpike Auth. Rev. | 5.625% | 1/1/10 | (1)(Prere.) | 2,060 | 2,140 |
| New Jersey Turnpike Auth. Rev. | 0.000% | 1/1/35 | (2) | 11,000 | 6,707 |
| Tobacco Settlement Financing Corp. New Jersey Rev. | 4.625% | 6/1/26 | | 10,000 | 7,140 |
| | | | | | 111,896 |
New Mexico (0.8%) | | | | | |
| New Mexico Finance Auth. Transp. Rev. | 5.250% | 6/15/21 | (1) | 10,000 | 10,106 |
| New Mexico Highway Comm. Tax Rev. | 6.000% | 6/15/10 | (Prere.) | 3,000 | 3,175 |
| New Mexico Hosp. Equipment Loan Council Hosp. System Rev. (Presbyterian Healthcare Services) | 5.500% | 8/1/11 | (Prere.) | 10,000 | 10,649 |
| | | | | | 23,930 |
New York (10.1%) | | | | | |
| Babylon NY Waste Water Fac. GO | 9.000% | 8/1/09 | (3) | 2,800 | 2,937 |
| Babylon NY Waste Water Fac. GO | 9.000% | 8/1/10 | (3) | 4,900 | 5,382 |
| Erie County NY IDA School Fac. Rev. GO | 5.750% | 5/1/26 | (4) | 4,200 | 4,284 |
| Liberty NY Dev. Corp. Rev. (Goldman Sachs Headquarters) | 5.250% | 10/1/35 | | 25,690 | 20,809 |
| Metro. New York Transp. Auth. Rev. | 4.500% | 11/15/38 | | 24,060 | 18,814 |
| Metro. New York Transp. Auth. Rev. (Dedicated Petroleum Tax) | 5.250% | 10/1/10 | (1)(Prere.) | 4,675 | 4,933 |
| Metro. New York Transp. Auth. Rev. (Dedicated Petroleum Tax) | 6.000% | 4/1/20 | (1)(ETM) | 4,165 | 4,608 |
| New York City NY GO | 5.250% | 8/1/12 | | 8,535 | 8,946 |
| New York City NY GO VRDO | 1.200% | 11/3/08 | | 33,200 | 33,200 |
| New York City NY Muni. Water Finance Auth. Water & Sewer System Rev. | 5.000% | 6/15/39 | | 5,000 | 4,498 |
| New York City NY Muni. Water Finance Auth. Water & Sewer System Rev. VRDO | 1.050% | 11/3/08 | | 6,100 | 6,100 |
| New York City NY Transitional Finance Auth. Rev. | 6.250% | 5/15/10 | (Prere.) | 265 | 283 |
| New York City NY Transitional Finance Auth. Rev. | 5.000% | 1/15/34 | | 20,000 | 17,645 |
| New York State Dormitory Auth. Rev. (Personal Income Tax) | 5.000% | 3/15/24 | (2) | 10,000 | 9,862 |
| New York State Dormitory Auth. Rev. (Personal Income Tax) | 5.500% | 3/15/25 | (2) | 10,000 | 10,372 |
| New York State Dormitory Auth. Rev. (Sloan-Kettering Cancer Center) | 5.750% | 7/1/20 | (1) | 7,500 | 7,757 |
| New York State Dormitory Auth. Rev. (State Univ.) | 7.500% | 5/15/11 | | 5,575 | 6,075 |
| New York State Thruway Auth. Rev. (Highway & Bridge Trust Fund) | 5.000% | 4/1/27 | | 5,000 | 4,757 |
| New York State Urban Dev. Corp. Rev. | 5.000% | 1/1/23 | | 7,785 | 7,434 |
| New York State Urban Dev. Corp. Rev. (Personal Income Tax) GO | 5.500% | 3/15/25 | (1) | 6,965 | 7,303 |
| Suffolk NY TOB Asset Securitization Corp. Rev. | 0.000% | 6/1/44 | | 5,500 | 3,448 |
| Suffolk NY TOB Asset Securitization Corp. Rev. | 6.000% | 6/1/48 | | 4,000 | 3,063 |
| Tobacco Settlement Financing Corp. New York Rev. | 5.500% | 6/1/14 | | 12,770 | 12,807 |
| Tobacco Settlement Financing Corp. New York Rev. | 5.500% | 6/1/15 | | 20,000 | 20,156 |
| Tobacco Settlement Financing Corp. New York Rev. | 5.500% | 6/1/18 | | 15,410 | 15,519 |
81
| Tobacco Settlement Financing Corp. New York Rev. | 5.500% | 6/1/20 | | 12,565 | 12,569 |
| Triborough Bridge & Tunnel Auth. New York Rev. | 5.250% | 11/15/17 | | 5,000 | 5,227 |
| Triborough Bridge & Tunnel Auth. New York Rev. | 6.125% | 1/1/21 | (ETM) | 10,000 | 11,136 |
| Triborough Bridge & Tunnel Auth. New York Rev. | 5.250% | 11/15/38 | | 12,500 | 11,919 |
| Triborough Bridge & Tunnel Auth. New York Rev. VRDO | 4.500% | 11/7/08 | | 8,000 | 8,000 |
| | | | | | 289,843 |
North Carolina (2.6%) | | | | | |
| Charlotte-Mecklenberg NC Hosp. Auth. Rev. (Healthcare System Rev.) | 4.500% | 1/15/25 | | 7,000 | 5,886 |
| Charlotte-Mecklenberg NC Hosp. Auth. Rev. (Healthcare System Rev.) | 5.000% | 1/15/47 | | 9,000 | 7,213 |
| North Carolina Eastern Muni. Power Agency Rev. | 7.500% | 1/1/10 | (ETM) | 4,935 | 5,204 |
| North Carolina Eastern Muni. Power Agency Rev. | 5.000% | 1/1/23 | | 5,000 | 4,304 |
| North Carolina Infrastructure Financial Corp. COP Capital Improvements | 5.000% | 2/1/22 | (4) | 6,500 | 6,455 |
| North Carolina Medical Care Comm. Health Care Fac. (Novant Health Obligated Group) | 5.000% | 11/1/34 | | 15,000 | 12,606 |
| North Carolina Medical Care Comm. Health Care Fac. Rev. | | | | | |
| (Deerfield Episcopal Retirement Community) | 6.125% | 11/1/38 | | 2,500 | 2,074 |
| North Carolina Muni. Power Agency Rev. | 5.250% | 1/1/16 | | 10,000 | 10,148 |
| North Carolina Muni. Power Agency Rev. | 5.250% | 1/1/17 | | 15,000 | 15,068 |
| North Carolina Muni. Power Agency Rev. | 5.250% | 1/1/20 | | 4,000 | 3,849 |
| Winston-Salem NC Water & Sewer System Rev. | 5.500% | 6/1/11 | (Prere.) | 1,220 | 1,314 |
| Winston-Salem NC Water & Sewer System Rev. | 5.500% | 6/1/16 | | 1,780 | 1,873 |
| | | | | | 75,994 |
Ohio (2.6%) | | | | | |
| American Muni. Power Ohio Inc. | 5.000% | 2/15/38 | | 8,000 | 6,971 |
| Buckeye OH Tobacco Settlement Financing Corp. Rev. | 5.125% | 6/1/24 | | 13,985 | 10,908 |
| Cincinnati OH City School Dist. GO | 5.250% | 12/1/27 | (3) | 14,900 | 14,687 |
| Lorain County OH Hosp. Fac. Rev. (Catholic Healthcare Partners) | 5.625% | 10/1/16 | | 3,000 | 3,038 |
| Lorain County OH Hosp. Fac. Rev. (Catholic Healthcare Partners) | 5.625% | 10/1/17 | | 2,260 | 2,277 |
| Lorain County OH Hosp. Fac. Rev. (Catholic Healthcare Partners) | 5.400% | 10/1/21 | | 8,000 | 7,686 |
| Ohio Common Schools GO | 5.000% | 3/15/14 | | 7,020 | 7,395 |
| Ohio Higher Educ. Fac. Comm. Rev. (Univ. Hospitals Health System) | 5.250% | 1/15/46 | | 10,000 | 7,660 |
| Ohio Housing Finance Agency Mortgage Rev. | 5.250% | 9/1/28 | | 4,000 | 3,590 |
3 | Ohio State Higher Educ. Fac. TOB VRDO | 1.830% | 11/7/08 | | 3,700 | 3,700 |
| Scioto County OH Hosp. Rev. (Southern Ohio Medical Center) | 5.750% | 2/15/38 | | 3,500 | 2,954 |
| Univ. of Akron OH General Receipts Rev. | 5.000% | 1/1/33 | (4) | 3,000 | 2,686 |
| | | | | | 73,552 |
Oregon (0.5%) | | | | | |
| Umatilla County OR Hosp. Fac. Auth. Rev. (Catholic Health Initiative) | 5.000% | 5/1/22 | | 14,880 | 13,672 |
| | | | | | |
Pennsylvania (3.8%) | | | | | |
| Delaware County PA Hosp. Auth. Rev. (Crozer Keystone Obligated Group) | 5.000% | 12/15/31 | | 11,420 | 7,403 |
| Northampton County PA General Purpose Auth. Univ. Rev. (St. Lukes Hosp. Project) | 5.500% | 8/15/35 | | 2,500 | 1,801 |
| Northampton County PA General Purpose Auth. Univ. Rev. (St. Lukes Hosp. Project) | 5.500% | 8/15/40 | | 3,500 | 2,469 |
| Pennsylvania GO | 5.000% | 9/1/14 | (4) | 5,000 | 5,338 |
| Pennsylvania Turnpike Comm. Rev. | 5.500% | 6/1/33 | | 5,000 | 4,786 |
| Pennsylvania Turnpike Comm. Rev. | 5.250% | 6/1/36 | | 4,000 | 3,613 |
| Pennsylvania Turnpike Comm. Rev. | 5.000% | 6/1/38 | (12) | 14,000 | 12,533 |
| Philadelphia PA GO | 5.250% | 8/1/17 | (4) | 12,665 | 13,017 |
| Philadelphia PA GO | 5.000% | 8/1/18 | (4) | 17,440 | 17,392 |
1 | Philadelphia PA School Dist. GO | 6.000% | 9/1/38 | | 7,000 | 6,810 |
| Philadelphia PA Water & Waste Water Rev. | 7.000% | 6/15/10 | (3) | 20,000 | 21,045 |
| Pittsburgh PA Water & Sewer Auth. Rev. | 6.500% | 9/1/13 | (3)(ETM) | 4,455 | 4,908 |
| Pittsburgh PA Water & Sewer Auth. Rev. | 6.500% | 9/1/13 | (3) | 5,545 | 5,835 |
| Sayre PA Health Care Fac. Auth. Rev. (Guthrie Health Care System) | 5.750% | 12/1/11 | (Prere.) | 1,725 | 1,878 |
| Sayre PA Health Care Fac. Auth. Rev. (Guthrie Health Care System) | 5.750% | 12/1/21 | | 610 | 566 |
| | | | | | 109,394 |
Puerto Rico (1.7%) | | | | | |
| Puerto Rico Electric Power Auth. Rev. | 5.250% | 7/1/14 | (1) | 2,000 | 2,032 |
| Puerto Rico Electric Power Auth. Rev. | 5.000% | 7/1/28 | | 5,000 | 4,288 |
| Puerto Rico GO | 6.000% | 7/1/27 | (1) | 7,000 | 6,823 |
| Puerto Rico Infrastructure Financing Auth. Special Tax Rev. | 0.000% | 7/1/34 | (2) | 15,305 | 2,657 |
| Puerto Rico Public Buildings Auth. Govt. Fac. Rev. | 5.375% | 7/1/14 | (Prere.) | 7,205 | 7,714 |
| Puerto Rico Public Finance Corp. | 6.000% | 8/1/26 | (ETM) | 940 | 1,029 |
| Puerto Rico Public Finance Corp. | 6.000% | 8/1/26 | (ETM) | 10,060 | 10,814 |
| Puerto Rico Public Finance Corp. PUT | 5.750% | 2/1/12 | LOC | 10,000 | 9,884 |
| Puerto Rico Sales Tax Financing Corp. Rev. | 0.000% | 8/1/47 | (2) | 45,000 | 3,157 |
| Puerto Rico Sales Tax Financing Corp. Rev. | 0.000% | 8/1/54 | (2) | 25,000 | 1,041 |
| Puerto Rico Sales Tax Financing Corp. Rev. | 0.000% | 8/1/56 | | 22,200 | 834 |
| | | | | | 50,273 |
82
South Carolina (3.3%) | | | | | |
Charleston SC Educ. Excellence Financing Corp. Rev. | 5.250% | 12/1/28 | | 20,000 | 18,772 |
Medical Univ. South Carolina Hosp. Auth. Hosp. Fac. Rev. | 6.375% | 8/15/12 | (Prere.) | 7,750 | 8,630 |
Piedmont SC Muni. Power Agency Rev. | 6.500% | 1/1/15 | (3)(ETM) | 2,035 | 2,357 |
Piedmont SC Muni. Power Agency Rev. | 6.500% | 1/1/15 | (3) | 12,210 | 13,272 |
South Carolina Jobs Econ. Dev. Auth. Hosp. Improvement Rev. (Palmetto Health Alliance) | 7.125% | 12/15/10 | (Prere.) | 5,000 | 5,545 |
South Carolina Jobs Econ. Dev. Auth. Rev. (Bon Secours Health System) | 5.625% | 11/15/12 | (Prere.) | 2,080 | 2,270 |
South Carolina Jobs Econ. Dev. Auth. Rev. (Bon Secours Health System) | 5.625% | 11/15/30 | | 7,920 | 6,713 |
South Carolina Public Service Auth. Rev. | 5.500% | 1/1/38 | | 10,000 | 9,539 |
South Carolina Transp. Infrastructure Rev. | 5.250% | 10/1/20 | (2) | 20,840 | 20,326 |
Univ. of South Carolina Higher Educ. Rev. | 5.250% | 6/1/38 | (4) | 6,610 | 6,232 |
| | | | | 93,656 |
Tennessee (0.7%) | | | | | |
Jackson TN Hosp. Rev. (Jackson Madison Hosp.) | 5.500% | 4/1/33 | | 8,000 | 6,533 |
Shelby County TN Health Educ. & Housing Fac. Board Rev. (St. Jude Children's Research Hospital) | 5.000% | 7/1/31 | | 14,000 | 12,308 |
| | | | | 18,841 |
Texas (11.5%) | | | | | |
Austin TX Combined Util. System Rev. | 0.000% | 5/15/17 | (3) | 4,900 | 3,117 |
Austin TX Water & Wastewater System Rev. | 5.000% | 5/15/28 | (1) | 6,665 | 6,284 |
Dallas TX Area Rapid Transit Rev. | 5.250% | 12/1/48 | | 10,000 | 9,335 |
Harris County TX GO | 0.000% | 10/1/14 | (1) | 5,550 | 4,312 |
Harris County TX Health Fac. Dev. Corp. Rev. (Methodist Hosp.) VRDO | 1.250% | 11/3/08 | (4) | 19,950 | 19,950 |
Harris County TX Health Fac. Dev. Corp. Rev. (St. Luke's Episcopal Hosp.) VRDO | 3.800% | 11/7/08 | | 22,500 | 22,500 |
Harris County TX Rev. | 5.000% | 8/15/22 | | 2,000 | 1,972 |
Houston TX GO | 5.750% | 9/1/10 | (4)(Prere.) | 4,105 | 4,352 |
Houston TX GO | 5.750% | 9/1/10 | (4)(Prere.) | 2,735 | 2,900 |
Houston TX GO | 5.750% | 3/1/14 | (4) | 260 | 271 |
Houston TX GO | 5.750% | 3/1/15 | (4) | 265 | 277 |
Houston TX GO | 5.750% | 3/1/16 | (4) | 395 | 412 |
Houston TX Hotel Occupancy Tax & Special Rev. (Convention & Entertainment) | 0.000% | 9/1/18 | (2) | 16,285 | 9,431 |
Houston TX Hotel Occupancy Tax & Special Rev. (Convention & Entertainment) | 0.000% | 9/1/21 | (2) | 22,720 | 10,640 |
Houston TX Water & Sewer System Rev. | 0.000% | 12/1/12 | (2) | 20,500 | 17,369 |
Lower Colorado River Auth. Texas Rev. | 5.875% | 5/15/09 | (4)(Prere.) | 10 | 10 |
Lower Colorado River Auth. Texas Rev. | 5.875% | 5/15/09 | (4)(Prere.) | 65 | 67 |
Lower Colorado River Auth. Texas Rev. | 6.000% | 5/15/09 | (4)(Prere.) | 30 | 31 |
Lower Colorado River Auth. Texas Rev. | 6.000% | 5/15/11 | (4) | 12,575 | 12,908 |
Lower Colorado River Auth. Texas Rev. | 5.875% | 5/15/16 | (4) | 27,425 | 28,016 |
North Texas Tollway Auth. Rev. | 6.125% | 1/1/31 | | 4,000 | 3,684 |
North Texas Tollway Auth. Rev. | 5.625% | 1/1/33 | | 30,000 | 26,853 |
Round Rock TX Independent School Dist. GO | 0.000% | 8/15/11 | (1) | 5,000 | 4,530 |
San Antonio TX Electric & Gas Rev. | 5.750% | 2/1/10 | (Prere.) | 11,435 | 11,927 |
San Antonio TX Electric & Gas Rev. | 5.375% | 2/1/12 | (Prere.) | 10,000 | 10,682 |
San Antonio TX Electric & Gas Rev. | 5.000% | 2/1/25 | | 15,500 | 15,095 |
San Antonio TX Electric & Gas Rev. | 5.000% | 2/1/32 | | 15,000 | 13,764 |
Texas City TX IDA (ARCO Pipeline) | 7.375% | 10/1/20 | | 17,000 | 19,335 |
Texas Muni. Power Agency Rev. | 0.000% | 9/1/13 | (1)(ETM) | 940 | 780 |
Texas Muni. Power Agency Rev. | 0.000% | 9/1/13 | (1) | 38,730 | 31,239 |
Texas Muni. Power Agency Rev. | 0.000% | 9/1/15 | (1)(ETM) | 335 | 250 |
Texas Muni. Power Agency Rev. | 0.000% | 9/1/15 | (1) | 16,405 | 11,688 |
Texas Muni. Power Agency Rev. | 0.000% | 9/1/17 | (1)(ETM) | 800 | 529 |
Texas Muni. Power Agency Rev. | 0.000% | 9/1/17 | (1) | 39,170 | 24,501 |
| | | | | 329,011 |
Utah (1.4%) | | | | | |
Intermountain Power Agency Utah Power Supply Rev. | 5.250% | 7/1/21 | | 17,395 | 17,422 |
Utah Transit Auth. Sales Tax Rev. VRDO | 0.950% | 11/3/08 | LOC | 22,460 | 22,460 |
| | | | | 39,882 |
Vermont (0.2%) | | | | | |
Vermont Educ. & Health Buildings Finance Agency Rev. (Fletcher Allen Health) | 5.000% | 12/1/34 | (4) | 7,500 | 6,473 |
| | | | | |
Virgin Islands (0.2%) | | | | | |
Virgin Islands Public Finance Auth. Rev. | 6.500% | 10/1/10 | (Prere.) | 5,000 | 5,430 |
| | | | | |
Virginia (0.8%) | | | | | |
Stafford County VA Econ. Dev. Auth. Hosp. Fac. Rev. (Medicorp Health System) | 5.250% | 6/15/37 | | 10,000 | 8,056 |
Tobacco Settlement Financing Corp. Virginia Rev. | 5.625% | 6/1/15 | (Prere.) | 10,000 | 10,929 |
Winchester VA IDA Hosp. Rev. (Valley Health System) | 5.250% | 1/1/37 | | 5,000 | 4,282 |
| | | | | 23,267 |
83
Washington (2.0%) | | | | | |
| Chelan County WA Public Util. Dist. (Rock Island Hydro) | 0.000% | 6/1/09 | (1) | 10,950 | 10,777 |
| Chelan County WA Public Util. Dist. (Rock Island Hydro) | 0.000% | 6/1/14 | (1) | 5,000 | 3,840 |
| Chelan County WA Public Util. Dist. (Rock Island Hydro) | 0.000% | 6/1/17 | (1) | 11,685 | 7,439 |
| Chelan County WA Public Util. Dist. (Rock Island Hydro) | 0.000% | 6/1/18 | (1) | 10,000 | 5,901 |
| Port of Seattle WA Rev. | 5.625% | 8/1/10 | (1)(Prere.) | 7,735 | 8,167 |
| Washington GO | 6.750% | 2/1/15 | | 3,450 | 3,805 |
| Washington Health Care Fac. Auth. (Multicare Health System) | 5.500% | 8/15/38 | (4) | 5,000 | 4,754 |
| Washington Health Care Fac. Auth. (Multicare Health System) | 5.500% | 8/15/43 | (12) | 5,490 | 5,041 |
| Washington Health Care Fac. Auth. (Peace Health) | 5.000% | 11/1/18 | | 7,000 | 6,471 |
| | | | | | 56,195 |
West Virginia (0.4%) | | | | | |
| West Virginia Building Comm. Rev. (Jail & Correction Fac.) | 7.000% | 7/1/14 | (1)(ETM) | 8,975 | 10,546 |
| | | | | | |
Wisconsin (1.2%) | | | | | |
| Wisconsin Clean Water Rev. | 6.875% | 6/1/11 | | 20,500 | 21,664 |
| Wisconsin Health & Educ. Fac. Auth. Rev. (Ascension Health) | 5.000% | 11/15/36 | | 15,000 | 12,279 |
| | | | | | 33,943 |
Total Tax-Exempt Municipal Bonds (Cost $3,003,451) | | | | | 2,826,969 |
| | | | | Shares | |
Temporary Cash Investment (1.4%) | | | | | |
Money Market Fund (1.4%) | | | | | |
4 | Vanguard Municipal Cash Management Fund (Cost $40,002) | 1.701% | | | 40,002,263 | 40,002 |
Total Investments (100.0%) (Cost $3,043,453) | | | | | 2,866,971 |
Other Assets and Liabilities (0.0%) | | | | | |
Other Assets | | | | | 48,152 |
Liabilities | | | | | (48,492) |
| | | | | | (340) |
Net Assets (100%) | | | | | 2,866,631 |
At October 31, 2008, net assets consisted of: | |
| Amount |
| ($000) |
Paid-in Capital | 3,069,688 |
Undistributed Net Investment Income | — |
Accumulated Net Realized Losses | (29,657) |
Unrealized Appreciation (Depreciation) | |
Investment Securities | (176,482) |
Futures Contracts | 3,082 |
Net Assets | 2,866,631 |
| |
| |
Investor Shares—Net Assets | |
Applicable to 68,037,202 outstanding $.001 par value shares of beneficial interest (unlimited authorization) | 686,298 |
Net Asset Value Per Share—Investor Shares | $10.09 |
| |
| |
Admiral Shares—Net Assets | |
Applicable to 216,150,504 outstanding $.001 par value shares of beneficial interest (unlimited authorization) | 2,180,333 |
Net Asset Value Per Share—Admiral Shares | $10.09 |
• See Note A in Notes to Financial Statements.
1 Security purchased on a when-issued or delayed-delivery basis for which the fund has not taken delivery as of October 31, 2008.
2 Securities with a value of $7,554,000 have been segregated as initial margin for open futures contracts.
3 Security exempt from registration under Rule 144A of the Securities Act of 1933. Such securities may be sold in transactions exempt from registration, normally to qualified institutional buyers. At October 31, 2008, the aggregate value of these securities was $11,385,000, representing 0.4% of net assets.
4 Affiliated money market fund available only to Vanguard funds and certain trusts and accounts managed by Vanguard. Rate shown is the 7-day yield. For key to abbreviations and other references, see back cover.
See accompanying Notes, which are an integral part of the Financial Statements.
84
High-Yield Tax-Exempt Fund
| | | | Face | Market |
| | Maturity | | Amount | Value• |
| Coupon | Date | | ($000) | ($000) |
Tax-Exempt Municipal Bonds (97.4%) | | | | | |
Alabama (0.9%) | | | | | |
Alabama Special Care Fac. Financing Auth. Birmingham Rev. (Ascension Health) | 5.000% | 11/15/39 | | 19,855 | 16,117 |
Camden AL Ind. Dev. Bank (Weyerhaeuser Co.) | 6.125% | 12/1/13 | (Prere.) | 3,000 | 3,336 |
Courtland AL Dev. Board Solid Waste Disposal Rev. (Champion International Corp.) | 6.700% | 11/1/29 | | 9,500 | 7,653 |
Courtland AL Dev. Board Solid Waste Disposal Rev. (International Paper Co.) | 5.200% | 6/1/25 | | 10,000 | 6,443 |
McIntosh AL IDR (Environmental Improvement) | 5.375% | 6/1/28 | | 17,000 | 13,162 |
| | | | | 46,711 |
Arizona (2.2%) | | | | | |
Arizona Health Fac. Auth. Rev. (Banner Health) | 5.500% | 1/1/38 | | 11,500 | 9,977 |
Arizona Health Fac. Auth. Rev. (Beatitudes Campus Project) | 4.750% | 10/1/10 | | 4,250 | 4,068 |
Arizona Health Fac. Auth. Rev. (Beatitudes Campus Project) | 5.200% | 10/1/37 | | 7,000 | 4,267 |
Chandler AZ IDA Rev. (Intel Corp. Project) PUT | 4.375% | 12/1/10 | | 17,500 | 17,962 |
Maricopa County AZ IDA Health Fac. Rev. (Catholic Healthcare West) | 5.250% | 7/1/32 | | 10,200 | 8,260 |
Maricopa County AZ Pollution Control Corp. PCR (Southern California Edison Co.) PUT | 2.900% | 3/2/09 | | 16,500 | 16,473 |
Phoenix AZ Civic Improvement Corp. Airport Rev. | 5.000% | 7/1/33 | | 8,000 | 7,243 |
Salt Verde Arizona Financial Project Rev. | 5.250% | 12/1/27 | | 22,000 | 14,979 |
Salt Verde Arizona Financial Project Rev. | 5.000% | 12/1/32 | | 10,000 | 6,238 |
Univ. of Arizona Board of Regents | 6.200% | 6/1/16 | | 26,660 | 29,082 |
| | | | | 118,549 |
Arkansas (0.1%) | | | | | |
North Little Rock AR Electric Rev. | 6.500% | 7/1/15 | (1) | 3,450 | 3,745 |
| | | | | |
California (12.6%) | | | | | |
California Dept. of Water Resources Water System Rev. (Central Valley) | 5.500% | 12/1/11 | (Prere.) | 1,670 | 1,808 |
California Dept. of Water Resources Water System Rev. (Central Valley) | 5.500% | 12/1/11 | (Prere.) | 830 | 899 |
California Dept. of Water Resources Water System Rev. (Central Valley) | 5.500% | 12/1/11 | (Prere.) | 30 | 33 |
California Dept. of Water Resources Water System Rev. (Central Valley) | 5.500% | 12/1/11 | (Prere.) | 85 | 92 |
California Dept. of Water Resources Water System Rev. (Central Valley) | 5.500% | 12/1/15 | | 3,290 | 3,458 |
California Dept. of Water Resources Water System Rev. (Central Valley) | 5.000% | 12/1/28 | | 5,375 | 5,139 |
California Dept. of Water Resources Water System Rev. (Central Valley) | 5.000% | 12/1/29 | | 11,435 | 10,794 |
California GO | 5.000% | 11/1/21 | | 29,045 | 28,215 |
California GO | 5.125% | 2/1/25 | | 13,975 | 13,387 |
California GO | 4.500% | 12/1/32 | (4) | 15,000 | 12,138 |
California GO | 5.125% | 4/1/33 | | 16,500 | 15,074 |
California GO | 4.500% | 10/1/36 | | 56,500 | 43,031 |
California GO | 5.000% | 6/1/37 | | 10,500 | 9,267 |
California GO | 5.250% | 3/1/38 | | 9,000 | 8,258 |
California Health Fac. Finance Auth. Rev. (Sutter Health) | 5.000% | 8/15/38 | | 6,000 | 4,915 |
California Housing Finance Agency Home Mortgage Rev. | 5.500% | 2/1/42 | | 24,415 | 21,928 |
California Housing Finance Agency Home Mortgage Rev. VRDO | 1.000% | 11/3/08 | | 13,300 | 13,300 |
California PCR Financing Auth. Solid Waste Disposal Rev. (Republic Services) PUT | 5.250% | 12/1/17 | | 32,155 | 24,945 |
California PCR Financing Auth. Solid Waste Disposal Rev. (Waste Management) | 5.400% | 4/1/25 | | 3,000 | 2,180 |
California PCR Financing Auth. Solid Waste Disposal Rev. (Waste Management) | 5.000% | 7/1/27 | | 6,185 | 4,137 |
California Public Works Board Lease Rev. (Butterfield) | 5.000% | 6/1/21 | | 7,675 | 7,324 |
California Public Works Board Lease Rev. (Butterfield) | 5.000% | 6/1/22 | | 5,000 | 4,733 |
California Public Works Board Lease Rev. (Butterfield) | 5.000% | 6/1/23 | | 2,870 | 2,694 |
California Public Works Board Lease Rev. (Dept. of Corrections) | 5.500% | 6/1/19 | | 7,000 | 7,115 |
California State Dept. of Water Resources Power Supply Rev. | 5.500% | 5/1/12 | (1) | 25,000 | 26,614 |
California State Econ. Recovery Bonds | 5.250% | 7/1/12 | | 10,000 | 10,607 |
California State Econ. Recovery Bonds | 5.250% | 7/1/14 | | 30,000 | 32,008 |
California State Univ. Rev. Systemwide | 5.000% | 11/1/20 | (2) | 20,995 | 21,099 |
California Statewide Community Dev. Auth. Rev. (Irvine Univ. of California East LLC) | 5.750% | 5/15/32 | | 8,000 | 6,448 |
California Statewide Community Dev. Auth. Rev. (Kaiser Permanente) | 5.250% | 3/1/45 | | 28,000 | 22,333 |
Chula Vista CA IDR (San Diego Gas & Electric) | 5.250% | 12/1/27 | | 20,000 | 16,290 |
City of Carlsbad, CA Assessment Dist. Ltd. | 5.150% | 9/2/29 | | 2,170 | 1,577 |
City of Carlsbad, CA Assessment Dist. Ltd. | 5.200% | 9/2/35 | | 2,710 | 1,879 |
Foothill/Eastern Corridor Agency California Toll Road Rev. | 0.000% | 1/15/28 | (1) | 25,000 | 23,957 |
Irving CA Special Tax Community Fac. Dist. | 5.200% | 9/1/26 | | 750 | 576 |
Irving CA Special Tax Community Fac. Dist. | 5.250% | 9/1/36 | | 2,000 | 1,391 |
Lincoln CA Special Tax Communities Fac. Dist. | 5.450% | 9/1/13 | (Prere.) | 890 | 988 |
Lincoln CA Special Tax Communities Fac. Dist. | 5.750% | 9/1/13 | (Prere.) | 885 | 994 |
Lincoln CA Special Tax Communities Fac. Dist. | 5.900% | 9/1/13 | (Prere.) | 890 | 1,006 |
Lincoln CA Special Tax Communities Fac. Dist. | 5.950% | 9/1/13 | (Prere.) | 3,555 | 4,024 |
Lincoln CA Special Tax Communities Fac. Dist. | 6.000% | 9/1/13 | (Prere.) | 2,670 | 3,028 |
Los Angeles CA Community College Dist. GO | 5.000% | 8/1/24 | | 3,430 | 3,382 |
Los Angeles CA Community College Dist. GO | 5.000% | 8/1/25 | | 4,620 | 4,532 |
Los Angeles CA Community College Dist. GO | 5.000% | 8/1/27 | | 6,215 | 6,009 |
Los Angeles CA Dept. of Airports International Airport Rev. | 5.375% | 5/15/30 | | 15,000 | 13,121 |
Los Angeles CA Dept. of Water & Power Rev. | 5.000% | 7/1/24 | (4) | 11,175 | 10,832 |
Modesto CA Irrigation Dist. COP | 5.500% | 7/1/35 | | 11,300 | 10,356 |
85
| Napa Valley CA USD Election GO | 4.500% | 8/1/37 | (4) | 12,035 | 9,692 |
1 | Northern California Power Agency (Hydroelectric Project) | 5.000% | 7/1/20 | (12) | 9,305 | 9,311 |
| Northstar Community Services Dist. CA Special Tax Community Fac. Dist. | 5.000% | 9/1/37 | | 15,000 | 9,959 |
| Rancho Mirage CA Joint Powers Financing Auth. Rev. (Eisenhower Medical Center) | 5.000% | 7/1/38 | | 23,000 | 17,098 |
| Redding CA Electric System COP | 5.000% | 6/1/30 | (4) | 7,500 | 6,914 |
| San Bernardino County CA Medical Center COP | 7.000% | 8/1/20 | | 12,180 | 13,069 |
| San Bernardino County CA Medical Center COP | 6.875% | 8/1/24 | (ETM) | 25,220 | 29,400 |
| San Diego CA USD GO | 5.500% | 7/1/19 | (1) | 10,140 | 10,766 |
| San Diego CA USD GO | 5.500% | 7/1/21 | (1) | 12,725 | 13,183 |
| San Diego CA USD GO | 4.500% | 7/1/29 | (4) | 10,870 | 9,297 |
| San Francisco CA City & County COP (San Bruno Jail) | 5.250% | 10/1/33 | (2) | 10,000 | 9,304 |
| San Francisco CA City & County International Airport Rev. | 5.750% | 5/1/19 | | 20,295 | 18,955 |
| San Francisco CA City & County International Airport Rev. | 5.750% | 5/1/20 | | 26,405 | 24,316 |
| San Joaquin Hills CA Transp. Corridor Agency Toll Road Rev. | 0.000% | 1/15/09 | (1) | 3,000 | 2,984 |
| San Joaquin Hills CA Transp. Corridor Agency Toll Road Rev. | 0.000% | 1/15/25 | (1) | 12,900 | 4,455 |
| Santa Margarita CA Water Dist. Special Tax Community Fac. Dist. No. 99-1 | 6.000% | 9/1/13 | (Prere.) | 3,000 | 3,379 |
| Simi Valley CA School Financing Auth. Rev. | 5.000% | 8/1/27 | (4) | 10,000 | 9,577 |
| Southern California Public Power Auth. Rev. (Transmission Project) | 5.000% | 7/1/20 | | 10,505 | 10,381 |
| West Contra Costa CA USD | 6.000% | 8/1/27 | | 3,000 | 2,963 |
| | | | | | 682,918 |
Colorado (4.2%) | | | | | |
| Colorado Health Fac. Auth. Rev. (Catholic Health Initiatives) | 5.250% | 9/1/11 | (Prere.) | 10,000 | 10,605 |
| Colorado Health Fac. Auth. Rev. (Catholic Health Initiatives) | 5.500% | 9/1/11 | (Prere.) | 3,000 | 3,202 |
| Colorado Health Fac. Auth. Rev. (Catholic Health Initiatives) | 5.500% | 9/1/11 | (Prere.) | 8,200 | 8,752 |
| Colorado Health Fac. Auth. Rev. (Catholic Health Initiatives) | 5.500% | 9/1/11 | (ETM) | 7,775 | 8,315 |
| Colorado Health Fac. Auth. Rev. (Catholic Health Initiatives) | 5.500% | 9/1/11 | (Prere.) | 5,130 | 5,475 |
| Colorado Health Fac. Auth. Rev. (Catholic Health Initiatives) | 5.500% | 9/1/11 | (Prere.) | 5,215 | 5,566 |
| Colorado Health Fac. Auth. Rev. (Catholic Health Initiatives) | 4.500% | 9/1/38 | | 25,000 | 18,297 |
| Colorado Health Fac. Auth. Rev. (Catholic Health Initiatives) | 5.000% | 9/1/41 | | 10,000 | 8,170 |
| Colorado Health Fac. Auth. Rev. (Christian Living Communities) | 5.750% | 1/1/26 | | 1,000 | 738 |
| Colorado Health Fac. Auth. Rev. (Christian Living Communities) | 5.750% | 1/1/37 | | 2,250 | 1,525 |
| Colorado Health Fac. Auth. Rev. (Covenant Retirement Community Inc.) | 5.250% | 12/1/25 | | 15,500 | 11,985 |
| Denver CO City & County Airport Rev. | 5.000% | 11/15/12 | (3) | 4,205 | 4,122 |
| Denver CO City & County Airport Rev. PUT | 5.250% | 5/15/10 | | 15,000 | 15,083 |
| Denver CO City & County Airport Rev. PUT | 5.250% | 5/15/11 | | 10,000 | 10,077 |
| Denver CO City & County Single Family Mortgage Rev. | 5.550% | 12/1/39 | | 5,349 | 4,725 |
| E-470 Public Highway Auth. Colorado Rev. | 0.000% | 9/1/09 | (1) | 14,195 | 13,825 |
| E-470 Public Highway Auth. Colorado Rev. | 0.000% | 9/1/10 | (1) | 7,185 | 6,690 |
| E-470 Public Highway Auth. Colorado Rev. | 0.000% | 9/1/12 | (1) | 26,795 | 22,359 |
| E-470 Public Highway Auth. Colorado Rev. | 0.000% | 9/1/13 | (1) | 5,000 | 3,932 |
| E-470 Public Highway Auth. Colorado Rev. | 0.000% | 9/1/14 | (1) | 8,000 | 5,907 |
| E-470 Public Highway Auth. Colorado Rev. | 0.000% | 9/1/15 | (1) | 5,000 | 3,455 |
| E-470 Public Highway Auth. Colorado Rev. | 0.000% | 9/1/18 | (1) | 5,000 | 2,761 |
| E-470 Public Highway Auth. Colorado Rev. | 0.000% | 9/1/24 | (1) | 29,225 | 10,060 |
| E-470 Public Highway Auth. Colorado Rev. | 0.000% | 9/1/25 | (1) | 14,900 | 4,756 |
| E-470 Public Highway Auth. Colorado Rev. | 0.000% | 9/1/27 | (1) | 36,465 | 9,962 |
| E-470 Public Highway Auth. Colorado Rev. | 0.000% | 9/1/29 | (1) | 56,600 | 13,283 |
| E-470 Public Highway Auth. Colorado Rev. | 0.000% | 9/1/30 | (1) | 14,200 | 3,076 |
| Northwest Parkway Public Highway Auth. Colorado Convertible Rev. | 0.000% | 6/15/16 | (4)(Prere.) | 10,000 | 9,492 |
| | | | | | 226,195 |
Connecticut (0.8%) | | | | | |
| Connecticut Dev. Auth. PCR (Connecticut Power & Light) | 5.850% | 9/1/28 | | 35,250 | 27,713 |
| Connecticut GO | 5.375% | 4/15/12 | (Prere.) | 7,180 | 7,648 |
| Connecticut GO | 5.375% | 4/15/12 | (Prere.) | 10,000 | 10,651 |
| | | | | | 46,012 |
Delaware (0.1%) | | | | | |
| Delaware Housing Auth. Single Family Mortgage Rev. | 5.875% | 1/1/38 | | 4,645 | 4,255 |
| | | | | | |
District of Columbia (0.4%) | | | | | |
| District of Columbia Rev. (World Wildlife Fund) | 6.000% | 7/1/30 | (2) | 12,815 | 12,948 |
| Metro. Washington Airports Auth. Airport System Rev. | 5.500% | 10/1/13 | (1) | 2,500 | 2,518 |
| Metro. Washington Airports Auth. Airport System Rev. | 5.500% | 10/1/16 | (1) | 2,775 | 2,712 |
| Metro. Washington Airports Auth. Airport System Rev. | 5.500% | 10/1/17 | (1) | 2,000 | 1,928 |
| Metro. Washington Airports Auth. Airport System Rev. | 5.500% | 10/1/18 | (1) | 2,000 | 1,893 |
| | | | | | 21,999 |
Florida (7.8%) | | | | | |
| Alachua County FL IDR (North Florida Retirement Village) | 5.625% | 11/15/22 | | 5,000 | 3,729 |
| Alachua County FL IDR (North Florida Retirement Village) | 5.875% | 11/15/36 | | 10,000 | 6,796 |
| Beacon Lakes FL Community Dev. | 6.900% | 5/1/35 | | 16,585 | 13,159 |
| Brevard County FL School Board COP | 5.000% | 7/1/27 | (2) | 12,895 | 11,578 |
| East Homestead Community Dev. Dist. Florida Special Assessment Rev. | 5.000% | 5/1/11 | | 3,190 | 2,963 |
86
Escambia County FL Environmental Improvement Rev. | 5.750% | 11/1/27 | | 6,000 | 4,165 |
Florida Board of Educ. Public Educ. Capital Outlay | 4.500% | 6/1/36 | (4) | 27,860 | 22,327 |
Florida Dept. of Environmental Protection & Preservation Rev. | 5.000% | 7/1/20 | | 8,175 | 7,853 |
Florida Dept. of Environmental Protection & Preservation Rev. | 5.000% | 7/1/28 | | 8,185 | 7,342 |
Florida Housing Finance Agency Rev. | 5.750% | 1/1/37 | | 27,955 | 25,428 |
Florida Housing Finance Corp. Rev. (Homeowner Mortgage) | 5.750% | 1/1/37 | | 13,155 | 11,966 |
Florida Housing Finance Corp. Rev. (Homeowner Mortgage) | 5.500% | 7/1/48 | | 15,000 | 13,450 |
Florida Hurricane Catastrophe Fund Finance Corp. Rev. | 5.000% | 7/1/14 | | 14,000 | 14,602 |
Highlands County FL Health Rev. (Adventist Health System) | 5.250% | 11/15/16 | (Prere.) | 365 | 395 |
Highlands County FL Health Rev. (Adventist Health System) | 5.250% | 11/15/36 | | 14,435 | 11,176 |
Hillsborough County FL Aviation Auth. Rev. | 5.375% | 10/1/33 | (12) | 5,330 | 4,260 |
Hillsborough County FL IDA (Tampa General Hosp. Project) | 5.250% | 10/1/34 | | 5,185 | 3,692 |
Hillsborough County FL IDA (Tampa General Hosp. Project) | 5.000% | 10/1/36 | | 7,000 | 4,772 |
Hillsborough County FL IDA (Tampa General Hosp. Project) | 5.250% | 10/1/41 | | 10,000 | 6,976 |
Hillsborough County FL IDA (Univ. Community Hosp.) | 5.625% | 8/15/29 | | 7,000 | 5,493 |
Hillsborough County FL School Board COP (Master Lease Program) VRDO | 1.250% | 11/3/08 | (1)LOC | 34,200 | 34,200 |
Jacksonville FL Econ. Dev. Community Health Care Fac. Rev. (Mayo Clinic) | 5.000% | 11/15/36 | | 14,400 | 11,382 |
Landmark at Doral Community Dev. Dist. Florida Special Assessment | 5.200% | 5/1/15 | | 6,680 | 4,909 |
Lee County FL IDA Health Care Fac. Rev. (Shell Point Village) | 5.750% | 11/15/09 | (Prere.) | 1,475 | 1,548 |
Lee County FL IDA Health Care Fac. Rev. (Shell Point Village) | 5.750% | 11/15/09 | (Prere.) | 1,000 | 1,050 |
Lee County FL IDA Health Care Fac. Rev. (Shell Point Village) | 5.125% | 11/15/36 | | 2,500 | 1,598 |
Lee Memorial Health System Florida Hosp. Rev. | 5.250% | 4/1/35 | (1) | 84,000 | 74,584 |
Miami-Dade County FL Aviation - Miami International Airport | 5.125% | 10/1/24 | (1) | 18,575 | 15,263 |
Miami-Dade County FL Aviation - Miami International Airport | 5.000% | 10/1/38 | (11) | 8,770 | 6,241 |
Miami-Dade County FL School Board COP | 5.250% | 10/1/18 | (3) | 7,915 | 7,915 |
Miami-Dade County FL School Board COP | 5.000% | 11/1/31 | (2) | 20,000 | 17,410 |
Northern Palm Beach County FL Improvement Dist. Water Control & Improvement Unit Dev. | 5.850% | 8/1/09 | (Prere.) | 1,190 | 1,230 |
Northern Palm Beach County FL Improvement Dist. Water Control & Improvement Unit Dev. | 6.000% | 8/1/09 | (Prere.) | 2,000 | 2,083 |
Orange County FL Health Fac. Auth. Rev. (Orlando Lutheran Healthcare) | 5.375% | 7/1/20 | | 1,100 | 825 |
Orange County FL Health Fac. Auth. Rev. (Orlando Lutheran Healthcare) | 5.700% | 7/1/26 | | 1,000 | 710 |
Orange County FL Health Fac. Auth. Rev. (Orlando Lutheran Tower) | 5.000% | 7/1/12 | | 6,000 | 5,541 |
Orange County FL Health Fac. Auth. Rev. (Orlando Lutheran Tower) | 5.500% | 7/1/32 | | 1,200 | 790 |
Orange County FL Health Fac. Auth. Rev. (Orlando Lutheran Tower) | 5.500% | 7/1/38 | | 1,500 | 952 |
Orlando FL Special Assessment Rev. (Conroy Road Interchange) | 5.500% | 5/1/10 | | 370 | 361 |
Orlando FL Special Assessment Rev. (Conroy Road Interchange) | 5.800% | 5/1/26 | | 3,000 | 2,470 |
Orlando FL Util. Comm. Water & Electric Rev. | 6.750% | 10/1/17 | (ETM) | 2,200 | 2,489 |
Palm Beach County FL Airport System Rev. | 5.750% | 10/1/12 | (1)(ETM) | 2,340 | 2,566 |
Palm Beach County FL Airport System Rev. | 5.750% | 10/1/12 | (1) | 7,220 | 7,652 |
Palm Beach County FL Airport System Rev. | 5.750% | 10/1/14 | (1)(ETM) | 2,060 | 2,301 |
Palm Beach County FL Airport System Rev. | 5.750% | 10/1/14 | (1) | 6,440 | 6,862 |
Palm Glades Comm. Dev. Dist. (Florida Supplemental Assessment) | 4.850% | 8/1/11 | | 2,245 | 2,047 |
Putman County FL Auth. PCR PUT | 5.350% | 5/1/18 | (2) | 8,700 | 8,193 |
Tallahassee FL Health Fac. Rev. (Tallahassee Memorial Healthcare) | 6.375% | 12/1/30 | | 18,000 | 14,941 |
Tampa Bay FL Water Util. System Rev. | 5.250% | 10/1/15 | (3) | 1,180 | 1,250 |
Tampa Bay FL Water Util. System Rev. | 5.250% | 10/1/16 | (3) | 1,720 | 1,814 |
| | | | | 423,299 |
Georgia (1.1%) | | | | | |
Burke County GA Dev. Auth. PCR (Oglethorpe Power Corp.) | 5.500% | 1/1/33 | | 5,000 | 4,478 |
Cartersville GA Water & Waste Water Fac. (Anheuser-Busch Cos., Inc.) | 7.400% | 11/1/10 | | 5,000 | 5,217 |
Dalton County GA Dev. Auth. (Hamilton Health Care System) | 5.500% | 8/15/17 | (1) | 5,000 | 5,214 |
Fulton County GA Residential Care Fac. (Canterbury Court) | 6.125% | 2/15/34 | | 2,000 | 1,439 |
Georgia Housing Finance Auth. Rev. | 5.000% | 12/1/26 | | 4,750 | 3,855 |
Georgia Muni. Electric Power Auth. Rev. | 6.600% | 1/1/15 | (1)(Prere.) | 95 | 108 |
Georgia Muni. Electric Power Auth. Rev. | 6.600% | 1/1/18 | (1) | 4,060 | 4,346 |
Georgia Muni. Electric Power Auth. Rev. | 6.600% | 1/1/18 | (1)(ETM) | 845 | 969 |
Main Street Natural Gas Inc. Georgia Gas Project Rev. | 5.000% | 3/15/18 | | 5,000 | 4,194 |
Main Street Natural Gas Inc. Georgia Gas Project Rev. | 5.000% | 3/15/19 | | 15,000 | 12,249 |
Main Street Natural Gas Inc. Georgia Gas Project Rev. | 5.500% | 9/15/28 | | 12,195 | 8,641 |
Marietta GA Dev. Auth. Rev. | 7.000% | 6/15/30 | | 4,000 | 3,345 |
Marietta GA Dev. Auth. Rev. | 7.000% | 6/15/39 | | 6,000 | 4,881 |
Richmond County GA Dev. Auth. Environmental Improvement Rev. | 5.750% | 11/1/27 | | 3,000 | 2,062 |
| | | | | 60,998 |
Guam (0.6%) | | | | | |
Guam Govt. GO | 5.000% | 11/15/23 | | 7,500 | 5,637 |
Guam Govt. GO | 5.125% | 11/15/27 | | 7,400 | 5,206 |
Guam Govt. GO | 5.250% | 11/15/37 | | 22,500 | 14,996 |
Guam Govt. Waterworks Auth. Water & Wastewater System Rev. | 6.000% | 7/1/25 | | 2,000 | 1,607 |
Guam Govt. Waterworks Auth. Water & Wastewater System Rev. | 5.875% | 7/1/35 | | 5,000 | 3,702 |
| | | | | 31,148 |
87
Hawaii (0.4%) | | | | | |
Hawaii Dept. of Budget & Finance Surplus Purpose Rev. | 8.000% | 11/15/33 | | 8,750 | 8,222 |
Honolulu HI City & County GO | 5.250% | 7/1/12 | (3) | 4,950 | 5,266 |
Honolulu HI City & County GO | 5.000% | 7/1/22 | (3) | 3,000 | 3,014 |
Honolulu HI City & County Waste Water GO | 0.000% | 7/1/17 | (3) | 6,000 | 3,776 |
Honolulu HI City & County Waste Water GO | 0.000% | 7/1/18 | (3) | 2,000 | 1,166 |
| | | | | 21,444 |
Idaho (0.1%) | | | | | |
Idaho Housing & Finance Assn. Single Family Mortgage Rev. | 5.125% | 1/1/29 | | 3,100 | 2,781 |
Madison County ID Hosp. Rev. | 5.250% | 9/1/37 | | 1,650 | 1,129 |
| | | | | 3,910 |
Illinois (3.3%) | | | | | |
Chicago IL (City Colleges Improvement) GO | 0.000% | 1/1/29 | (3) | 20,085 | 6,121 |
Chicago IL GO | 5.125% | 1/1/09 | (3)(Prere.) | 100 | 101 |
Chicago IL GO | 0.000% | 1/1/16 | (1)(Prere.) | 7,795 | 7,567 |
Chicago IL GO | 0.000% | 1/1/16 | (1)(Prere.) | 7,445 | 7,237 |
Chicago IL GO | 0.000% | 1/1/26 | (1) | 2,755 | 2,482 |
Chicago IL GO | 0.000% | 1/1/27 | (1) | 2,630 | 2,363 |
Chicago IL GO | 5.125% | 1/1/29 | (3) | 6,730 | 6,362 |
Chicago IL Midway Airport Rev. | 5.500% | 1/1/14 | (4) | 6,410 | 6,381 |
Chicago IL Midway Airport Rev. | 5.500% | 1/1/15 | (4) | 4,760 | 4,674 |
Chicago IL Midway Airport Rev. | 5.500% | 1/1/16 | (4) | 7,135 | 6,913 |
Chicago IL Midway Airport Rev. | 5.500% | 1/1/17 | (4) | 7,525 | 7,186 |
Chicago IL Midway Airport Rev. | 5.500% | 1/1/18 | (4) | 7,940 | 7,476 |
Chicago IL Public Building Comm. GO | 7.000% | 1/1/15 | (1)(ETM) | 5,925 | 6,508 |
Chicago IL Public Building Comm. GO | 7.000% | 1/1/20 | (1)(ETM) | 10,000 | 11,748 |
Chicago IL Water Rev. | 5.250% | 11/1/38 | | 15,000 | 13,481 |
Illinois Dev. Finance Auth. Solid Waste Disp. Rev. (Waste Management) | 5.050% | 1/1/10 | | 9,750 | 9,593 |
Illinois Educ. Fac. Auth. Rev. (Northwestern Univ.) | 5.500% | 8/15/14 | (Prere.) | 500 | 546 |
Illinois Finance Auth. Rev. (Childrens Memorial Hosp.) | 5.375% | 8/15/39 | | 27,000 | 21,203 |
Illinois Finance Auth. Rev. (Elmhurst Memorial) | 5.625% | 1/1/37 | | 19,000 | 15,447 |
Illinois Finance Auth. Rev. (Northwestern Community Hosp.) | 5.375% | 7/1/33 | | 6,000 | 5,149 |
Illinois Finance Auth. Rev. (OSF Healthcare System) | 5.750% | 11/15/37 | | 17,000 | 13,484 |
Illinois Finance Auth. Rev. (Tabor Hills Supportive Living) | 5.250% | 11/15/36 | | 3,000 | 1,909 |
Illinois Finance Auth. Student Housing Rev. | 5.125% | 6/1/35 | | 4,000 | 2,200 |
Illinois Health Fac. Auth. Rev. (Centegra Health System) | 5.100% | 9/1/11 | (2) | 3,105 | 3,138 |
Illinois Health Fac. Auth. Rev. (Centegra Health System) | 5.250% | 9/1/18 | (2) | 2,500 | 2,460 |
Metro. Pier & Exposition Auth. Illinois Dedicated Sales Tax Rev. | 5.250% | 6/15/42 | (1) | 10,000 | 9,446 |
| | | | | 181,175 |
Indiana (2.3%) | | | | | |
Indiana Health Fac. Finance Auth. Rev. (Ancilla System, Inc.) | 7.375% | 7/1/23 | (ETM) | 19,400 | 23,264 |
Indiana Office Building Comm. Rev. (Capitol Complex) | 6.900% | 7/1/11 | | 8,605 | 9,086 |
Indianapolis IN Airport Auth. Rev. (Federal Express Corp.) | 5.100% | 1/15/17 | | 21,000 | 16,865 |
Indianapolis IN Local Public Improvement Rev. | 6.750% | 2/1/14 | | 21,500 | 23,259 |
Indianapolis IN Local Public Improvement Rev. VRDO | 7.000% | 11/7/08 | (4) | 50,000 | 50,000 |
| | | | | 122,474 |
Iowa (0.3%) | | | | | |
Tobacco Settlement Financing Corp. Iowa Rev. | 5.600% | 6/1/34 | | 25,000 | 17,308 |
| | | | | |
Kansas (0.9%) | | | | | |
Olathe Kansas Senior Living Fac. Rev. Catholic Care Campus Inc. | 6.000% | 11/15/26 | | 2,000 | 1,513 |
Olathe Kansas Senior Living Fac. Rev. Catholic Care Campus Inc. | 6.000% | 11/15/38 | | 2,000 | 1,397 |
Overland Park KS Convention Center & Hotel Project | 7.375% | 1/1/11 | (Prere.) | 9,000 | 9,897 |
Overland Park KS Convention Center & Hotel Project | 9.000% | 1/1/11 | (Prere.) | 21,100 | 23,776 |
Salina KS Hosp. Rev. (Salina Regional Health) | 4.500% | 10/1/26 | | 1,000 | 775 |
Salina KS Hosp. Rev. (Salina Regional Health) | 4.625% | 10/1/31 | | 1,000 | 743 |
Univ. of Kansas Hosp. Auth. Health System | 5.000% | 9/1/36 | | 15,830 | 11,925 |
| | | | | 50,026 |
Kentucky (1.0%) | | | | | |
Jefferson County KY Health Fac. Rev. (Jewish Hosp. Health) | 5.650% | 1/1/17 | (2) | 8,000 | 7,929 |
Jefferson County KY Health Fac. Rev. (Jewish Hosp. Health) | 5.700% | 1/1/21 | (2) | 2,000 | 1,880 |
Kentucky Asset/Liability Comm. General Fund Rev. | 5.000% | 9/1/17 | (1) | 7,500 | 7,641 |
Kentucky Housing Corp. Rev. | 5.250% | 7/1/32 | | 10,130 | 8,953 |
Kentucky Property & Building Comm. Rev. | 5.250% | 10/1/15 | (4) | 5,300 | 5,677 |
Kentucky Property & Building Comm. Rev. | 5.000% | 10/1/17 | (2) | 6,000 | 6,200 |
Russell KY Rev. Bon Secours Health System | 5.625% | 11/15/30 | | 16,000 | 14,033 |
| | | | | 52,313 |
88
Louisiana (2.3%) | | | | | |
Calcasieu Parish LA IDR PCR (Entergy Gulf States Inc.) | 5.450% | 7/1/10 | | 5,000 | 5,008 |
East Baton Rouge LA Mortgage Fin. Auth. Single Family Rev. | 5.400% | 4/1/38 | | 2,805 | 2,763 |
Ernest N. Morial - New Orleans LA Exhibit Hall Special Tax | 5.000% | 7/15/13 | (2)(Prere.) | 27,000 | 28,944 |
Louisiana Housing Finance Agency Single Family Mortgage Rev. Home Ownership | 5.950% | 6/1/38 | | 9,860 | 9,071 |
Louisiana Public Fac. Auth. Rev. (Ochsner Clinic) | 5.250% | 5/15/38 | | 44,000 | 33,385 |
Saint John Baptist Parish Louisiana Rev. (Marathon Oil Corp.) | 5.125% | 6/1/37 | | 66,000 | 41,016 |
Tobacco Settlement Financing Corp. Louisiana Rev. | 5.875% | 5/15/39 | | 10,000 | 7,113 |
| | | | | 127,300 |
Maine (0.1%) | | | | | |
Jay ME Solid Waste Disposal Rev. | 6.200% | 9/1/19 | | 9,250 | 7,681 |
| | | | | |
Maryland (2.4%) | | | | | |
Baltimore MD Special Obligation Rev. | 7.000% | 9/1/38 | | 8,000 | 6,256 |
Maryland Dept. of Housing & Community Dev. Rev. | 5.750% | 3/1/41 | | 12,125 | 11,029 |
Maryland Econ. Dev. Corp. Rev. (Chesapeake Bay Conference Center) | 5.000% | 12/1/16 | | 3,000 | 2,542 |
Maryland Econ. Dev. Corp. Rev. (Chesapeake Bay Conference Center) | 5.000% | 12/1/31 | | 12,000 | 7,154 |
Maryland Econ. Dev. Corp. Rev. (Chesapeake Bay Conference Center) | 5.250% | 12/1/31 | | 2,000 | 1,240 |
Maryland Health & Higher Educ. Fac. Auth. Rev. (King Farm Presbyterian Community) | 4.750% | 1/1/13 | | 10,000 | 8,813 |
Maryland Health & Higher Educ. Fac. Auth. Rev. (King Farm Presbyterian Community) | 5.000% | 1/1/17 | | 11,500 | 9,002 |
Maryland Health & Higher Educ. Fac. Auth. Rev. (Medlantic/Helix) | 5.250% | 8/15/38 | (4) | 30,000 | 26,515 |
Maryland Health & Higher Educ. Fac. Auth. Rev. (Univ. of Maryland Medical System) | 6.750% | 7/1/10 | (Prere.) | 15,000 | 16,221 |
Maryland Health & Higher Educ. Fac. Auth. Rev. (Univ. of Maryland Medical System) | 5.250% | 7/1/11 | (Prere.) | 8,070 | 8,527 |
Maryland Health & Higher Educ. Fac. Auth. Rev. (Univ. of Maryland Medical System) | 5.250% | 7/1/11 | (Prere.) | 15,500 | 16,378 |
Maryland Health & Higher Educ. Fac. Auth. Rev. (Univ. of Maryland Medical System) | 5.750% | 7/1/11 | (Prere.) | 3,930 | 4,203 |
Maryland Health & Higher Educ. Fac. Auth. Rev. (Univ. of Maryland Medical System) | 6.000% | 7/1/12 | (Prere.) | 3,000 | 3,274 |
Maryland Health & Higher Educ. Fac. Auth. Rev. (Univ. of Maryland Medical System) | 6.000% | 7/1/12 | (Prere.) | 6,500 | 7,094 |
Maryland Ind. Dev. Financing Auth. Econ. Dev. Rev. (Our Lady of Good Counsel School) | 5.500% | 5/1/20 | | 420 | 332 |
Maryland Ind. Dev. Financing Auth. Econ. Dev. Rev. (Our Lady of Good Counsel School) | 6.000% | 5/1/35 | | 2,000 | 1,401 |
| | | | | 129,981 |
Massachusetts (2.1%) | | | | | |
Massachusetts Dev. Finance Agency Resource Recovery Rev. (Waste Management Inc.) PUT | 6.900% | 12/1/09 | | 2,000 | 2,009 |
Massachusetts Health & Educ. Fac. Auth. Rev. (Boston Medical Center) | 5.250% | 7/1/38 | | 30,000 | 20,690 |
Massachusetts Health & Educ. Fac. Auth. Rev. (Caregroup) | 5.125% | 7/1/38 | | 2,000 | 1,348 |
Massachusetts Health & Educ. Fac. Auth. Rev. (Caritas Christi Obligated Group) | 5.700% | 7/1/15 | | 22,500 | 21,431 |
Massachusetts Health & Educ. Fac. Auth. Rev. (Harvard Univ.) | 5.000% | 7/15/35 | | 13,110 | 12,678 |
Massachusetts Health & Educ. Fac. Auth. Rev. (Museum Fine) VRDO | 0.700% | 11/3/08 | | 14,700 | 14,700 |
Massachusetts Health & Educ. Fac. Auth. Rev. (Univ. of Massachusetts Memorial Health Care Inc.) | 6.500% | 7/1/11 | | 4,395 | 4,588 |
Massachusetts Health & Educ. Fac. Auth. Rev. (Univ. of Massachusetts Memorial Health Care Inc.) | 6.625% | 7/1/32 | | 17,000 | 14,905 |
Massachusetts Muni. Wholesale Electric Co. Power System Rev. | 5.250% | 7/1/15 | (1) | 7,535 | 7,683 |
Massachusetts Special Obligation Dedicated Tax Rev. | 5.750% | 1/1/14 | (3)(Prere.) | 15,000 | 16,206 |
| | | | | 116,238 |
Michigan (1.2%) | | | | | |
Delta County MI Econ. Dev. Corp. Rev. (Mead Westvaco) | 6.250% | 4/15/12 | (Prere.) | 11,000 | 12,042 |
Michigan Hosp. Finance Auth. Rev. (Henry Ford Health System) | 5.250% | 11/15/32 | | 4,900 | 3,852 |
Michigan Hosp. Finance Auth. Rev. (Henry Ford Health System) | 5.250% | 11/15/46 | | 44,500 | 33,116 |
Michigan Tobacco Settlement Financing Auth. Rev | 6.000% | 6/1/48 | | 9,775 | 6,331 |
Michigan Tobacco Settlement Financing Auth. Rev. | 6.875% | 6/1/42 | | 10,000 | 7,436 |
| | | | | 62,777 |
Minnesota (0.5%) | | | | | |
Dakota County MN Community Dev. Agency Multifamily Housing Rev. (Highview Hills) | 7.000% | 8/1/45 | | 8,000 | 6,243 |
Maple Grove MN Health Care System Rev. (Maple Grove Hosp. Corp.) | 5.250% | 5/1/28 | | 4,500 | 3,883 |
Maple Grove MN Health Care System Rev. (Maple Grove Hosp. Corp.) | 5.250% | 5/1/37 | | 16,000 | 13,015 |
St. Louis Park MN Health Care Facs. Rev. (Park Nicollet Health Services) | 5.750% | 7/1/30 | | 5,000 | 4,343 |
| | | | | 27,484 |
Mississippi (0.2%) | | | | | |
Mississippi Dev. Bank Special Obligation Muni. Energy Agency Rev. | 5.000% | 3/1/31 | (10) | 11,365 | 9,244 |
Mississippi Home Corp. Single Family Rev. | 5.500% | 6/1/38 | | 3,800 | 3,478 |
| | | | | 12,722 |
Missouri (1.6%) | | | | | |
Missouri Dev. Finance Board Infrastructure Fac. Branson Landing Rev. | 5.000% | 6/1/35 | | 9,000 | 6,008 |
Missouri Health & Educ. Fac. Auth. Health Fac. Rev. | 5.000% | 6/1/36 | | 8,000 | 6,602 |
Missouri Health & Educ. Fac. Auth. Health Fac. Rev. (Cox Health) | 5.250% | 11/15/29 | | 6,500 | 5,202 |
Missouri Health & Educ. Fac. Auth. Health Fac. Rev. (Cox Health) | 5.500% | 11/15/33 | | 6,500 | 5,329 |
Missouri Health & Educ. Fac. Auth. Health Fac. Rev. (St. Luke's Mission Health System) | 5.375% | 11/15/16 | (1) | 7,000 | 6,864 |
Missouri Housing Dev. Corp. Single Family Mortgage Rev. | 6.050% | 3/1/37 | | 10,680 | 10,161 |
Missouri Housing Dev. Corp. Single Family Mortgage Rev. | 6.000% | 3/1/38 | | 4,375 | 4,112 |
89
Missouri Housing Dev. Corp. Single Family Mortgage Rev. | 5.600% | 9/1/38 | | 8,270 | 7,622 |
Missouri Jt. Muni. Electric Util. Comm. Power Project Rev. Plum Point Project | 5.000% | 1/1/28 | (1) | 5,000 | 4,248 |
St. Louis MO Airport Rev. Lambert-St. Louis International Airport | 5.500% | 7/1/27 | (1) | 10,000 | 9,108 |
St. Louis MO Airport Rev. Lambert-St. Louis International Airport | 5.500% | 7/1/28 | (1) | 10,000 | 9,021 |
St. Louis MO Airport Rev. Lambert-St. Louis International Airport | 5.500% | 7/1/29 | (1) | 6,000 | 5,366 |
Sugar Creek MO IDR Lafarge North America | 5.650% | 6/1/37 | | 11,000 | 7,540 |
| | | | | 87,183 |
Montana (0.1%) | | | | | |
Montana Board Housing (Single Family Mortgage) Rev. | 5.750% | 12/1/37 | | 5,935 | 5,511 |
| | | | | |
Nebraska (0.6%) | | | | | |
Lancaster County NE Hosp. Auth. Rev. (BryanLGH Medical Center) | 5.250% | 6/1/11 | (2)(Prere.) | 5,500 | 5,840 |
Nebraska Public Power Dist. Rev. | 5.000% | 1/1/38 | | 6,500 | 5,665 |
Washington County NE Ind. Dev. Rev. (Cargill Dow Polymers LLC) VRDO | 2.400% | 11/3/08 | LOC | 20,000 | 20,000 |
| | | | | 31,505 |
Nevada (0.5%) | | | | | |
Clark County NV PCR (Southern California Edison Co.) PUT | 3.250% | 3/2/09 | | 12,500 | 12,406 |
Henderson NV Health Care Fac. Rev. (Catholic Healthcare West) | 5.250% | 7/1/31 | | 11,750 | 9,372 |
Sparks NV Local Improvement Dist. Rev. | 6.500% | 9/1/20 | | 3,435 | 3,050 |
Sparks NV Local Improvement Dist. Rev. | 6.750% | 9/1/27 | | 3,785 | 3,221 |
| | | | | 28,049 |
New Hampshire (0.4%) | | | | | |
New Hampshire Business Finance Auth. PCR (United Illuminating) PUT | 3.500% | 2/1/09 | | 20,925 | 20,972 |
| | | | | |
New Jersey (5.1%) | | | | | |
Gloucester County NJ Improvement Auth. Solid Waste Resource Rev. PUT | 6.850% | 12/1/09 | | 5,000 | 5,017 |
Gloucester County NJ Improvement Auth. Solid Waste Resource Rev. PUT | 7.000% | 12/1/09 | | 1,500 | 1,508 |
Hudson County NJ Improvement Auth. Solid Waste Systems Rev. | 6.125% | 1/1/19 | | 2,000 | 1,621 |
Hudson County NJ Improvement Auth. Solid Waste Systems Rev. | 6.000% | 1/1/29 | | 7,500 | 5,510 |
Hudson County NJ Improvement Auth. Solid Waste Systems Rev. | 6.125% | 1/1/29 | | 10,000 | 7,427 |
Hudson County NJ Improvement Auth. Solid Waste Systems Rev. | 6.125% | 1/1/29 | | 2,000 | 1,438 |
New Jersey Econ. Dev. Auth. Retirement Community Rev. (Seabrook Village Inc.) | 5.250% | 11/15/26 | | 2,000 | 1,358 |
New Jersey Econ. Dev. Auth. Retirement Community Rev. (Seabrook Village Inc.) | 5.250% | 11/15/36 | | 2,000 | 1,238 |
New Jersey Econ. Dev. Auth. Rev. (Cigarette Tax) | 5.750% | 6/15/29 | | 20,000 | 15,522 |
New Jersey Econ. Dev. Auth. Rev. (Cigarette Tax) | 5.500% | 6/15/31 | | 6,500 | 4,791 |
New Jersey Econ. Dev. Auth. Rev. (Kapkowski Road Landfill - DST Project Elizabeth) | 6.375% | 5/15/14 | (Prere.) | 2,250 | 2,562 |
New Jersey Econ. Dev. Auth. Rev. (Kapkowski Road Landfill - DST Project Elizabeth) | 6.375% | 5/15/14 | (Prere.) | 30,500 | 34,724 |
New Jersey Econ. Dev. Auth. Rev. (Lions Gate Project) | 5.000% | 1/1/15 | | 825 | 712 |
New Jersey Econ. Dev. Auth. Rev. (Lions Gate Project) | 5.750% | 1/1/25 | | 710 | 527 |
New Jersey Econ. Dev. Auth. Rev. (Lions Gate Project) | 5.875% | 1/1/37 | | 1,230 | 843 |
New Jersey Econ. Dev. Auth. Rev. (Motor Vehicle Comm.) | 5.250% | 7/1/24 | (1) | 18,055 | 17,902 |
New Jersey Econ. Dev. Auth. Rev. (Presbyterian Home at Montgomery) | 6.375% | 11/1/31 | | 10,000 | 7,522 |
New Jersey Econ. Dev. Auth. Rev. (School Fac.) | 5.500% | 12/15/19 | (2) | 25,000 | 26,255 |
New Jersey Econ. Dev. Auth. Special Fac. Rev. (Continental Airlines, Inc.) | 6.625% | 9/15/12 | | 14,000 | 11,481 |
New Jersey Educ. Fac. Auth. Rev. (Richard Stockton College) | 5.375% | 7/1/38 | | 3,395 | 3,102 |
New Jersey Sports & Exposition Auth. Rev. | 6.500% | 3/1/13 | (ETM) | 2,050 | 2,219 |
New Jersey Sports & Exposition Auth. Rev. | 6.500% | 3/1/13 | | 2,065 | 2,217 |
New Jersey Transp. Corp. COP | 5.750% | 9/15/15 | | 26,620 | 27,240 |
New Jersey Transp. Trust Fund Auth. Rev. | 5.250% | 12/15/19 | | 14,000 | 14,226 |
New Jersey Transp. Trust Fund Auth. Rev. | 5.750% | 6/15/23 | (3) | 10,000 | 10,350 |
New Jersey Transp. Trust Fund Auth. Rev. | 0.000% | 12/15/25 | (2) | 30,000 | 11,037 |
New Jersey Turnpike Auth. Rev. | 5.000% | 1/1/22 | (4) | 5,370 | 5,384 |
New Jersey Turnpike Auth. Rev. | 0.000% | 1/1/35 | (2) | 21,495 | 13,106 |
Tobacco Settlement Financing Corp. New Jersey Rev. | 4.500% | 6/1/23 | | 8,595 | 6,921 |
Tobacco Settlement Financing Corp. New Jersey Rev. | 4.625% | 6/1/26 | | 46,750 | 33,377 |
| | | | | 277,137 |
New Mexico (1.2%) | | | | | |
New Mexico Finance Auth. Transp. Rev. | 5.000% | 12/15/26 | | 8,000 | 7,804 |
New Mexico Highway Comm. Tax Rev. | 6.000% | 6/15/10 | (Prere.) | 11,000 | 11,642 |
New Mexico Hosp. Equipment Loan Council Hosp. System Rev. (Presbyterian Healthcare Services) | 5.500% | 8/1/11 | (Prere.) | 27,550 | 29,338 |
New Mexico Mortgage Finance Auth. Single Family Mortgage | 5.600% | 7/1/38 | | 8,945 | 8,245 |
New Mexico Mortgage Finance Auth. Single Family Mortgage | 5.300% | 1/1/39 | | 6,350 | 5,766 |
| | | | | 62,795 |
New York (7.8%) | | | | | |
Erie County NY IDA School Fac. Rev. GO | 5.750% | 5/1/20 | (4) | 5,000 | 5,223 |
Erie County NY IDA School Fac. Rev. GO | 5.750% | 5/1/21 | (4) | 3,745 | 3,873 |
Erie County NY IDA School Fac. Rev. GO | 5.750% | 5/1/22 | (4) | 4,500 | 4,624 |
Hudson Yards Infrastructure Corp. New York Rev. | 4.500% | 2/15/47 | (1) | 16,500 | 11,656 |
Long Island NY Power Auth. Electric System Rev. | 0.000% | 6/1/12 | (4) | 10,000 | 8,693 |
90
| Long Island NY Power Auth. Electric System Rev. | 5.000% | 9/1/35 | | 10,500 | 9,272 |
| Metro. New York Transp. Auth. Rev. | 5.125% | 11/15/31 | | 12,205 | 11,136 |
| Metro. New York Transp. Auth. Rev. (Dedicated Petroleum Tax) | 6.000% | 4/1/20 | (1)(ETM) | 9,000 | 9,957 |
| Metro. New York Transp. Auth. Rev. (Service Contract) | 5.500% | 7/1/14 | | 15,460 | 16,280 |
| Metro. New York Transp. Auth. Rev. (Service Contract) | 5.500% | 7/1/15 | | 17,815 | 18,684 |
| Metro. New York Transp. Auth. Rev. (Transit Rev.) | 5.500% | 11/15/18 | (2) | 5,000 | 5,108 |
| Nassau County NY IDA Continuing Care Retirement Rev. | 6.500% | 1/1/27 | | 2,500 | 2,037 |
| Nassau County NY IDA Continuing Care Retirement Rev. | 6.700% | 1/1/43 | | 9,000 | 7,084 |
| New York City NY GO VRDO | 1.200% | 11/3/08 | | 7,700 | 7,700 |
| New York City NY IDA Special Fac. Rev. | 5.500% | 1/1/16 | | 3,250 | 3,009 |
| New York City NY IDA Special Fac. Rev. | 5.500% | 1/1/16 | | 3,500 | 3,173 |
| New York City NY IDA Special Fac. Rev. | 5.500% | 1/1/16 | | 4,500 | 4,017 |
| New York City NY IDA Special Fac. Rev. | 5.500% | 1/1/16 | | 4,000 | 3,532 |
| New York City NY IDA Special Fac. Rev. | 7.750% | 8/1/31 | | 15,000 | 10,313 |
| New York City NY Muni. Water Finance Auth. Water & Sewer System Rev. | 5.000% | 6/15/35 | (1) | 24,635 | 22,100 |
| New York City NY Muni. Water Finance Auth. Water & Sewer System Rev. | 4.500% | 6/15/38 | | 11,250 | 9,019 |
| New York City NY Transitional Finance Auth. Rev. | 5.000% | 1/15/34 | | 10,000 | 8,822 |
| New York State Dormitory Auth. Rev. (City Univ.) | 7.500% | 7/1/10 | | 2,105 | 2,201 |
| New York State Dormitory Auth. Rev. (Personal Income Tax) | 5.500% | 3/15/19 | (2) | 10,000 | 10,610 |
| New York State Dormitory Auth. Rev. (Personal Income Tax) | 5.000% | 3/15/22 | (4) | 5,500 | 5,473 |
| New York State Dormitory Auth. Rev. (State Univ.) | 7.500% | 5/15/13 | | 13,380 | 15,419 |
| New York State Dormitory Auth. Rev. Non State Supported Debt | | | | | |
| (Long Island Jewish Obligated Group) | 2.606% | 5/1/18 | | 23,280 | 17,344 |
| New York State Dormitory Auth. Rev. Non State Supported Debt (New York Univ. Hosp.) | 5.250% | 7/1/24 | | 4,250 | 3,121 |
| New York State Dormitory Auth. Rev. Non State Supported Debt (New York Univ. Hosp.) | 5.625% | 7/1/37 | | 8,750 | 6,173 |
| New York State Housing Finance Agency Rev. (Nursing Home & Health Care) | 4.900% | 11/1/10 | (1) | 7,195 | 7,274 |
| New York State Housing Finance Agency Rev. (Nursing Home & Health Care) | 5.000% | 11/1/11 | (1) | 6,470 | 6,534 |
| New York State Housing Finance Agency Rev. (Nursing Home & Health Care) | 5.100% | 11/1/12 | (1) | 8,135 | 8,200 |
| New York State Thruway Auth. Rev. (Highway & Bridge Trust Fund) | 5.500% | 4/1/20 | (2) | 20,000 | 21,026 |
| New York State Urban Dev. Corp. Rev. | 5.000% | 1/1/22 | | 10,410 | 10,020 |
| Niagara County NY IDA Solid Waste Disposal Rev. PUT | 5.450% | 11/15/12 | | 16,000 | 14,902 |
| Niagara County NY IDA Solid Waste Disposal Rev. PUT | 5.550% | 11/15/13 | | 12,500 | 11,424 |
| Niagara County NY IDA Solid Waste Disposal Rev. PUT | 5.625% | 11/15/14 | | 3,000 | 2,703 |
| Port Auth. of New York & New Jersey Rev. | 5.750% | 3/15/35 | | 25,000 | 23,485 |
2 | Port Auth. of New York & New Jersey Rev. TOB VRDO | 2.550% | 11/7/08 | (4) | 3,050 | 3,050 |
| Port Auth. of New York & New Jersey Special Obligation Rev. (JFK International Airport) | 6.250% | 12/1/08 | (1) | 4,000 | 4,001 |
| Suffolk NY TOB Asset Securitization Corp. Rev. | 5.375% | 6/1/28 | | 6,500 | 5,021 |
| Suffolk NY TOB Asset Securitization Corp. Rev. | 0.000% | 6/1/44 | | 4,500 | 2,821 |
| Suffolk NY TOB Asset Securitization Corp. Rev. | 6.000% | 6/1/48 | | 3,500 | 2,680 |
| Triborough Bridge & Tunnel Auth. New York Rev. | 5.500% | 11/15/20 | (1) | 10,000 | 10,406 |
| Triborough Bridge & Tunnel Auth. New York Rev. (Convention Center Project) | 7.250% | 1/1/10 | | 4,545 | 4,669 |
| Ulster County NY IDA Rev. | 6.000% | 9/15/37 | | 10,500 | 7,494 |
| Ulster County NY IDA Rev. | 6.000% | 9/15/42 | | 7,000 | 4,892 |
| Westchester County NY Health Care Corp. Rev. | 5.875% | 11/1/25 | | 11,500 | 9,750 |
| Westchester County NY Health Care Corp. Rev. | 6.000% | 11/1/30 | | 20,000 | 16,532 |
| | | | | | 422,537 |
North Carolina (2.2%) | | | | | |
| Charlotte-Mecklenberg NC Hosp. Auth. Rev. (Healthcare System Rev.) | 5.250% | 1/15/24 | | 6,750 | 6,365 |
| Charlotte-Mecklenberg NC Hosp. Auth. Rev. (Healthcare System Rev.) | 5.000% | 1/15/47 | | 8,000 | 6,412 |
| North Carolina Eastern Muni. Power Agency Rev. | 5.375% | 1/1/13 | | 17,455 | 17,743 |
| North Carolina Eastern Muni. Power Agency Rev. | 5.500% | 1/1/14 | | 6,000 | 6,083 |
| North Carolina Eastern Muni. Power Agency Rev. | 5.500% | 1/1/15 | | 8,000 | 8,026 |
| North Carolina Eastern Muni. Power Agency Rev. | 5.500% | 1/1/16 | | 3,000 | 2,982 |
| North Carolina Eastern Muni. Power Agency Rev. | 5.500% | 1/1/17 | | 2,000 | 1,954 |
| North Carolina Housing Finance Agency Homeownership Rev. | 5.500% | 1/1/38 | | 3,890 | 3,637 |
| North Carolina Housing Finance Agency Homeownership Rev. | 5.500% | 7/1/38 | | 8,845 | 8,112 |
| North Carolina Medical Care Comm. Health Care Fac. (Pennbyrn) | 6.125% | 10/1/35 | | 9,500 | 6,475 |
| North Carolina Medical Care Comm. Health Care Fac. (Presbyterian Homes) | 6.875% | 10/1/10 | (Prere.) | 4,000 | 4,340 |
| North Carolina Medical Care Comm. Health Care Fac. (Presbyterian Homes) | 7.000% | 10/1/10 | (Prere.) | 15,000 | 16,392 |
| North Carolina Medical Care Comm. Health Care Fac. (Salemtowne) | 5.000% | 10/1/23 | | 1,850 | 1,335 |
| North Carolina Medical Care Comm. Health Care Fac. (Salemtowne) | 5.100% | 10/1/30 | | 1,155 | 741 |
| North Carolina Medical Care Comm. Health Care Fac. Rev. | | | | | |
| (Deerfield Episcopal Retirement Community) | 6.125% | 11/1/38 | | 4,500 | 3,733 |
| North Carolina Medical Care Comm. Retirement Fac. Rev. (Givens Estates) | 5.000% | 7/1/27 | | 2,750 | 2,043 |
| North Carolina Medical Care Comm. Retirement Fac. Rev. (Givens Estates) | 5.000% | 7/1/33 | | 3,000 | 2,064 |
| North Carolina Medical Care Comm. Retirement Fac. Rev. (United Methodist Retirement Home) | 7.250% | 10/1/09 | (Prere.) | 13,000 | 13,737 |
| North Carolina Medical Care Comm. Retirement Fac. Rev. (Village at Brookwood) | 5.250% | 1/1/32 | | 3,500 | 2,162 |
| North Carolina Muni. Power Agency Rev. | 5.500% | 1/1/15 | (1) | 3,500 | 3,622 |
| | | | | | 117,958 |
Northern Mariana Islands (0.2%) | | | | | |
| Northern Mariana Islands GO | 7.375% | 6/1/10 | (Prere.) | 10,500 | 11,316 |
91
Ohio (3.5%) | | | | | |
| American Muni. Power Ohio Inc. | 5.000% | 2/15/38 | | 17,000 | 14,814 |
| American Muni. Power Ohio Inc. Electricity Purchase Rev. | 5.000% | 2/1/12 | | 27,000 | 24,925 |
| American Muni. Power Ohio Inc. Electricity Purchase Rev. | 5.000% | 2/1/13 | | 7,000 | 6,290 |
| Buckeye OH Tobacco Settlement Financing Corp. Rev. | 0.000% | 6/1/37 | | 50,000 | 24,858 |
| Montgomery County OH Hosp. Fac. Rev. (Grandview Hosp.) | 5.350% | 12/1/08 | (9)(ETM) | 4,615 | 4,627 |
| Montgomery County OH Hosp. Fac. Rev. (Grandview Hosp.) | 5.400% | 12/1/09 | (9)(ETM) | 3,850 | 3,998 |
| Ohio Air Quality Dev. Auth. PCR (Ohio Edison Co.) VRDO | 2.500% | 11/3/08 | LOC | 23,000 | 23,000 |
| Ohio Air Quality Dev. Auth. PCR PUT | 4.850% | 5/1/12 | (1) | 13,500 | 13,275 |
| Ohio Common Schools GO | 4.500% | 9/15/25 | | 13,700 | 12,289 |
| Ohio GO | 4.500% | 9/15/22 | (1) | 5,000 | 4,575 |
| Ohio Higher Educ. Fac. Comm. Rev. (Denison Univ.) | 5.000% | 11/1/32 | | 3,595 | 3,357 |
| Ohio Higher Educ. Fac. Comm. Rev. (Kenyon College) | 5.000% | 7/1/41 | | 15,750 | 13,504 |
| Ohio Higher Educ. Fac. Comm. Rev. (Univ. Hospitals Health System) | 5.250% | 1/15/46 | | 16,000 | 12,255 |
| Parma OH Hosp. Improvement Rev. (Parma Community General Hosp.) | 5.350% | 11/1/08 | (Prere.) | 2,500 | 2,525 |
| Ross County OH Hosp. Fac. Rev. (Adena Health System) | 5.750% | 12/1/35 | | 7,000 | 5,936 |
| Scioto County OH Hosp. Rev. (Southern Ohio Medical Center) | 5.750% | 2/15/38 | | 6,500 | 5,486 |
| Scioto County OH Marine Terminal Fac. (Norfolk Southern Corp.) | 5.300% | 8/15/13 | | 14,750 | 14,842 |
| | | | | | 190,556 |
Oklahoma (1.2%) | | | | | |
| Oklahoma County OK Finance Auth. Rev. Retirement Fac. | 6.125% | 11/15/25 | | 2,000 | 1,495 |
| Oklahoma County OK Finance Auth. Rev. Retirement Fac. | 6.000% | 11/15/38 | | 7,500 | 5,099 |
| Oklahoma Housing Finance Agency Single Family Mortgage Rev. Homeownership Loan Program | 5.750% | 9/1/36 | | 6,015 | 5,585 |
| Oklahoma Housing Finance Agency Single Family Mortgage Rev. Homeownership Loan Program | 5.800% | 9/1/37 | | 4,080 | 3,798 |
| Oklahoma Housing Finance Agency Single Family Mortgage Rev. Homeownership Loan Program | 5.875% | 9/1/37 | | 5,790 | 5,076 |
| Oklahoma Housing Finance Agency Single Family Mortgage Rev. Homeownership Loan Program | 5.950% | 9/1/37 | | 8,665 | 7,638 |
| Oklahoma State Capitol Improvement Auth. Fac. Rev. | 5.000% | 7/1/20 | (2) | 4,250 | 4,222 |
| Oklahoma State Capitol Improvement Auth. Fac. Rev. | 5.000% | 7/1/21 | (2) | 4,510 | 4,441 |
| Oklahoma State Muni Power Auth. Power Supply System Rev. | 6.000% | 1/1/38 | | 4,500 | 4,475 |
| Tulsa County OK Ind. Auth. Rev. (St. Francis Health System) | 5.000% | 12/15/36 | | 12,000 | 9,258 |
| Tulsa OK Muni. Airport Transp. Rev. (American Airlines) PUT | 5.650% | 12/1/08 | | 15,500 | 15,384 |
| | | | | | 66,471 |
Oregon (0.1%) | | | | | |
| Clackamas County OR Hosp. Fac. Auth. Rev. (Legacy Health System) | 5.250% | 5/1/21 | | 5,000 | 4,685 |
| Umatilla County OR Hosp. Fac. Auth. Rev. (Catholic Health Initiative) | 5.750% | 12/1/20 | (ETM) | 1,405 | 1,469 |
| | | | | | 6,154 |
Pennsylvania (3.4%) | | | | | |
| Allegheny County PA Airport Rev. (Pittsburgh International Airport) | 5.750% | 1/1/11 | (1) | 6,000 | 6,091 |
| Bucks County PA IDA Retirement Community Rev. (Ann's Choice) | 6.250% | 1/1/35 | | 3,000 | 2,145 |
| Delaware County PA IDA PCR (PECO Energy Co.) | 4.000% | 12/1/12 | | 15,000 | 14,583 |
| Geisinger Health System Auth. of Pennsylvania Rev. (Penn State Geisinger Health System) | 5.500% | 8/15/23 | | 27,700 | 26,880 |
| Lancaster County PA Hosp. Auth. Rev. (Brethren VLG Project) | 6.250% | 7/1/26 | | 1,250 | 1,010 |
| Lancaster County PA Hosp. Auth. Rev. (Brethren VLG Project) | 6.375% | 7/1/30 | | 1,000 | 786 |
| Lancaster County PA Hosp. Auth. Rev. (Brethren VLG Project) | 6.500% | 7/1/40 | | 2,750 | 2,122 |
| Lebanon County PA Health Fac. Auth. (Pleasant View Retirement) | 5.125% | 12/15/20 | | 1,000 | 750 |
| Lebanon County PA Health Fac. Auth. (Pleasant View Retirement) | 5.300% | 12/15/26 | | 500 | 344 |
| Montgomery County PA IDA Auth. Retirement Community Rev. | | | | | |
| (ACTS Retirement—Life Communities Obligated Group | 5.000% | 11/15/22 | | 3,000 | 2,380 |
| Northampton County PA General Purpose Auth. Univ. Rev. (St. Lukes Hosp. Project) | 5.500% | 8/15/35 | | 5,000 | 3,603 |
| Northampton County PA General Purpose Auth. Univ. Rev. (St. Lukes Hosp. Project) | 5.500% | 8/15/40 | | 6,500 | 4,585 |
| Pennsylvania Econ. Dev. Auth. Rev. (Colver Project) | 5.000% | 12/1/14 | (2) | 6,000 | 5,780 |
| Pennsylvania Econ. Dev. Auth. Rev. (Colver Project) | 5.000% | 12/1/15 | (2) | 3,500 | 3,323 |
| Pennsylvania Econ. Dev. Auth. Rev. (Colver Project) | 4.625% | 12/1/18 | (2) | 10,500 | 9,114 |
| Pennsylvania Econ. Dev. Financing Auth. Fac. Rev. (Reliant Energy Seward Project) | 6.750% | 12/1/36 | | 10,000 | 6,629 |
| Pennsylvania Higher Educ. Fac. Auth. Rev. (Univ. of Pennsylvania Health System) | 5.000% | 8/15/14 | (2) | 10,000 | 10,489 |
| Philadelphia PA IDA Rev. (Philadelphia Airport System) | 5.400% | 7/1/22 | (3) | 10,000 | 8,647 |
| Philadelphia PA Muni. Auth. Rev. | 5.250% | 11/15/14 | (4) | 10,000 | 9,976 |
3 | Philadelphia PA School Dist. GO | 6.000% | 9/1/38 | | 13,000 | 12,647 |
| Philadelphia PA Water & Waste Water Rev. | 7.000% | 6/15/11 | (3) | 21,500 | 23,059 |
| Sayre PA Health Care Fac. Auth. Rev. (Guthrie Health Care System) | 2.533% | 12/1/17 | | 37,930 | 28,447 |
| | | | | | 183,390 |
Puerto Rico (3.5%) | | | | | |
| Puerto Rico Aqueduct & Sewer Auth. Rev. | 0.000% | 7/1/24 | | 25,000 | 20,626 |
| Puerto Rico Electric Power Auth. Rev. | 5.250% | 7/1/33 | | 15,000 | 12,565 |
| Puerto Rico Muni. Finance Agency | 5.250% | 8/1/18 | (4) | 23,570 | 23,720 |
| Puerto Rico Public Buildings Auth. Govt. Fac. Rev. | 5.250% | 7/1/14 | (Prere.) | 365 | 388 |
| Puerto Rico Public Buildings Auth. Govt. Fac. Rev. | 5.375% | 7/1/14 | (Prere.) | 17,200 | 18,415 |
| Puerto Rico Public Buildings Auth. Govt. Fac. Rev. | 5.500% | 7/1/14 | (Prere.) | 17,040 | 18,350 |
| Puerto Rico Public Buildings Auth. Govt. Fac. Rev. | 5.250% | 7/1/33 | | 24,385 | 20,426 |
92
Puerto Rico Public Buildings Auth. Govt. Fac. Rev. PUT | 5.000% | 7/1/12 | (2) | 33,000 | 32,105 |
Puerto Rico Public Finance Corp. PUT | 5.750% | 2/1/12 | LOC | 34,000 | 33,606 |
Puerto Rico Sales Tax Financing Corp. Rev. | 0.000% | 8/1/54 | (2) | 62,390 | 2,599 |
Puerto Rico Sales Tax Financing Corp. Rev. | 0.000% | 8/1/56 | | 251,000 | 9,433 |
| | | | | 192,233 |
South Carolina (3.4%) | | | | | |
Charleston SC Educ. Excellence Financing Corp. Rev. | 5.000% | 12/1/27 | | 11,120 | 10,185 |
Charleston SC Educ. Excellence Financing Corp. Rev. | 5.250% | 12/1/29 | | 22,500 | 20,850 |
Charleston SC Educ. Excellence Financing Corp. Rev. | 5.000% | 12/1/31 | | 11,500 | 10,072 |
Charleston SC Educ. Excellence Financing Corp. Rev. (Charleston County School Dist.) | 5.250% | 12/1/25 | | 5,000 | 4,756 |
Greenville County SC School Dist. GO | 5.000% | 12/1/27 | | 35,000 | 32,555 |
Greenville County SC School Dist. GO | 5.000% | 12/1/28 | | 12,480 | 11,499 |
Lancaster County SC Assessment Rev. | 5.450% | 12/1/37 | | 1,650 | 1,063 |
Lexington County SC Health Services Dist. Inc. Hospital Rev. | 5.000% | 11/1/32 | | 28,000 | 21,192 |
Piedmont SC Muni. Power Agency Rev. | 5.250% | 1/1/19 | | 14,565 | 13,741 |
Richland County SC (International Paper) | 6.100% | 4/1/23 | | 12,750 | 9,787 |
South Carolina Jobs Econ. Dev. Auth. Health Care Fac. Rev. (Lutheran Homes) | 5.375% | 5/1/21 | | 1,500 | 1,119 |
South Carolina Jobs Econ. Dev. Auth. Health Care Fac. Rev. (Lutheran Homes) | 5.500% | 5/1/28 | | 1,100 | 757 |
South Carolina Jobs Econ. Dev. Auth. Health Care Fac. Rev. (Lutheran Homes) | 5.625% | 5/1/42 | | 1,000 | 636 |
South Carolina Jobs Econ. Dev. Auth. Hosp. Improvement Rev. (Palmetto Health Alliance) | 7.375% | 12/15/10 | (Prere.) | 19,500 | 21,722 |
South Carolina Public Service Auth. Rev. | 5.000% | 1/1/19 | (1) | 10,000 | 10,135 |
South Carolina Public Service Auth. Rev. | 5.500% | 1/1/38 | | 15,000 | 14,308 |
| | | | | 184,377 |
Tennessee (3.3%) | | | | | |
Jackson TN Hosp. Rev. (Jackson Madison Hosp.) | 5.625% | 4/1/38 | | 17,000 | 13,903 |
Memphis TN Electric System Rev. | 5.000% | 12/1/16 | (1) | 40,000 | 40,802 |
Memphis-Shelby County TN Airport Auth. Rev. | 6.000% | 3/1/24 | (2) | 7,450 | 6,775 |
Metro. Govt. of Nashville & Davidson County TN GO | 5.500% | 10/15/16 | (3) | 4,310 | 4,519 |
Sullivan County TN Health & Housing Fac. Board Hosp. Rev. Wellmont Health System | 5.250% | 9/1/26 | | 3,500 | 2,520 |
Sullivan County TN Health & Housing Fac. Board Hosp. Rev. Wellmont Health System | 5.250% | 9/1/36 | | 12,000 | 7,835 |
Tennessee Energy Acquisition Corp. Gas Rev. | 5.000% | 9/1/14 | | 25,370 | 21,923 |
Tennessee Energy Acquisition Corp. Gas Rev. | 5.000% | 9/1/15 | | 30,495 | 25,676 |
Tennessee Energy Acquisition Corp. Gas Rev. | 5.000% | 2/1/19 | | 25,865 | 20,052 |
Tennessee Energy Acquisition Corp. Gas Rev. | 5.000% | 2/1/20 | | 10,000 | 7,516 |
Tennessee Housing Dev. Agency (Homeownership Program) | 5.750% | 1/1/37 | | 14,055 | 13,051 |
Tennessee Housing Dev. Agency (Homeownership Program) | 5.750% | 7/1/37 | | 18,195 | 16,895 |
| | | | | 181,467 |
Texas (6.3%) | | | | | |
Bexar County TX Health Fac. Dev. Corp. Rev. (Army Retirement Residence) | 5.000% | 7/1/27 | | 1,000 | 687 |
Bexar County TX Health Fac. Dev. Corp. Rev. (Army Retirement Residence) | 5.000% | 7/1/33 | | 760 | 534 |
Brazos River TX Harbor Individual Dev. Corp. Environmental Fac. Rev. PUT | 5.900% | 5/1/28 | | 10,000 | 7,701 |
Brazos River TX Harbor Navigation Dist. Brazoria County Environmental (Dow Chemical Co. Project) | 5.950% | 5/15/33 | | 15,000 | 11,330 |
Dallas TX Area Rapid Transit Rev. | 5.250% | 12/1/48 | | 20,000 | 18,669 |
Dallas TX Waterworks & Sewer System Rev. | 5.000% | 10/1/30 | | 6,920 | 6,507 |
Harris County TX GO | 0.000% | 10/1/13 | (1) | 9,630 | 7,894 |
Harris County TX Health Fac. Dev. Corp. Rev. (Methodist Hosp.) VRDO | 1.250% | 11/3/08 | (4) | 16,000 | 16,000 |
Harris County TX Hosp. Dist. Rev. | 7.400% | 2/15/10 | (2)(ETM) | 1,000 | 1,026 |
Harris County TX Hosp. Dist. Rev. | 7.400% | 2/15/10 | (2) | 3,640 | 3,755 |
Harris County TX Hosp. Dist. Rev. | 6.000% | 8/15/10 | (1)(Prere.) | 13,985 | 14,650 |
Houston TX Water & Sewer System Rev. | 0.000% | 12/1/10 | (2) | 5,000 | 4,668 |
Houston TX Water & Sewer System Rev. | 0.000% | 12/1/11 | (2) | 24,810 | 22,133 |
Houston TX Water & Sewer System Rev. | 0.000% | 12/1/12 | (2) | 26,000 | 22,029 |
Lower Colorado River Auth. Texas PCR (Samsung Austin Semiconductor LLC) | 6.950% | 4/1/30 | | 12,350 | 10,583 |
Lower Colorado River Auth. Texas PCR (Samsung Austin Semiconductor) | 6.375% | 4/1/27 | | 11,970 | 9,529 |
Matagorda County TX Navigation Dist. PCR (Centerpoint Energy) | 5.600% | 3/1/27 | | 7,500 | 5,442 |
Mesquite TX Health Fac. Dev. Christian Care Center Rev. | 5.500% | 2/15/25 | | 2,100 | 1,593 |
Mesquite TX Health Fac. Dev. Christian Care Center Rev. | 5.625% | 2/15/35 | | 3,400 | 2,400 |
Mission TX Econ. Dev. Corp. Solid Waste Disposal Rev. (Allied Waste Inc. Project) | 5.200% | 4/1/18 | | 4,000 | 2,845 |
North Texas Tollway Auth. Rev. | 6.125% | 1/1/31 | | 7,000 | 6,447 |
North Texas Tollway Auth. Rev. | 5.625% | 1/1/33 | | 33,290 | 29,798 |
North Texas Tollway Auth. Rev. | 5.750% | 1/1/38 | | 32,000 | 26,843 |
San Antonio TX Electric & Gas Rev. | 5.000% | 2/1/17 | (ETM) | 2,460 | 2,546 |
Tarrant County TX Cultural Educ. Fac. Finance Corp. Rev. | 5.250% | 8/15/28 | | 4,000 | 3,549 |
Texas Dept. of Housing & Community Affairs Single Mortgage Rev. | 5.625% | 3/1/39 | | 7,990 | 7,485 |
Texas Muni. Gas Acquisition & Supply Corp. Rev. | 2.589% | 9/15/17 | | 40,000 | 34,400 |
Texas Muni. Gas Acquisition & Supply Corp. Rev. | 5.250% | 12/15/17 | | 8,400 | 6,825 |
Texas Muni. Gas Acquisition & Supply Corp. Rev. | 5.250% | 12/15/19 | | 22,500 | 17,498 |
Texas Muni. Gas Acquisition & Supply Corp. Rev. | 5.250% | 12/15/20 | | 22,500 | 17,007 |
93
| Texas Muni. Power Agency Rev. | 0.000% | 9/1/16 | (1)(ETM) | 280 | 197 |
| Texas Turnpike Auth. Dallas Northway Rev. (President George Bush Turnpike) | 0.000% | 1/1/11 | (2)(ETM) | 7,000 | 6,536 |
| Texas Water Finance Assistance GO | 5.750% | 8/1/31 | | 13,145 | 13,243 |
| | | | | | 342,349 |
Utah (0.5%) | | | | | |
| Intermountain Power Agency Utah Power Supply Rev. | 5.250% | 7/1/20 | | 11,000 | 11,062 |
| Intermountain Power Agency Utah Power Supply Rev. | 5.250% | 7/1/22 | | 18,960 | 18,922 |
| | | | | | 29,984 |
Virgin Islands (0.8%) | | | | | |
| Virgin Islands Public Finance Auth. Rev. | 5.200% | 10/1/09 | | 3,065 | 3,092 |
| Virgin Islands Public Finance Auth. Rev. | 5.750% | 10/1/13 | | 11,000 | 10,788 |
| Virgin Islands Public Finance Auth. Rev. | 5.875% | 10/1/18 | | 19,000 | 17,249 |
| Virgin Islands Public Finance Auth. Rev. | 6.375% | 10/1/19 | | 10,000 | 10,122 |
| | | | | | 41,251 |
Virginia (1.4%) | | | | | |
| Albemarle County VA IDA Residential Care Fac. Rev. (Westminster-Canterbury Blue Ridge) | 5.000% | 1/1/31 | | 1,250 | 823 |
2 | Alexandria VA Redev. & Housing Auth. Rev. (Portals West) | 7.250% | 10/1/31 | | 5,485 | 4,679 |
2 | Alexandria VA Redev. & Housing Auth. Rev. (Portals West) | 8.250% | 4/1/32 | | 475 | 402 |
| Chesterfield County VA Mortgage Rev. (Brandermill Woods) | 6.500% | 1/1/28 | | 14,019 | 10,885 |
| Fairfax County VA Econ. Dev. Auth. Residential Care Fac. Rev. (Goodwin House Inc.) | 5.000% | 10/1/22 | | 4,000 | 3,299 |
| Fairfax County VA Econ. Dev. Auth. Residential Care Fac. Rev. (Goodwin House Inc.) | 5.000% | 10/1/27 | | 3,375 | 2,608 |
| Fairfax County VA Econ. Dev. Auth. Residential Care Fac. Rev. (Goodwin House Inc.) | 5.125% | 10/1/37 | | 5,000 | 3,551 |
| Henrico County VA Econ. Dev. Auth. Rev. (Bon Secours Health System) | 5.600% | 11/15/12 | (Prere.) | 315 | 344 |
| Henrico County VA Econ. Dev. Auth. Rev. (Bon Secours Health System) | 5.600% | 11/15/30 | | 7,285 | 6,363 |
| Lynchburg VA IDA Healthcare Fac. Rev. (Centra Health) | 5.200% | 1/1/18 | | 515 | 491 |
| Stafford County VA Econ. Dev. Auth. Hosp. Fac. Rev. (Medicorp Health System) | 5.250% | 6/15/37 | | 34,500 | 27,793 |
| Tobacco Settlement Financing Corp. Virginia Rev. | 5.625% | 6/1/15 | (Prere.) | 10,000 | 10,929 |
| Tobacco Settlement Financing Corp. Virginia Rev. | 0.000% | 6/1/46 | | 9,500 | 4,349 |
| | | | | | 76,516 |
Washington (1.6%) | | | | | |
| Chelan County WA Public Util. Dist. (Rock Island Hydro) | 0.000% | 6/1/10 | (1) | 19,550 | 18,521 |
| Chelan County WA Public Util. Dist. (Rock Island Hydro) | 0.000% | 6/1/11 | (1) | 11,400 | 10,323 |
| Chelan County WA Public Util. Dist. (Rock Island Hydro) | 0.000% | 6/1/12 | (1) | 19,650 | 16,885 |
| Port of Seattle WA GO | 5.000% | 11/1/10 | (4) | 6,675 | 6,805 |
2 | Port of Seattle WA Rev. TOB VRDO | 2.440% | 11/7/08 | (4) | 4,140 | 4,140 |
| Washington Health Care Fac. Auth. (Multicare Health System) | 5.500% | 8/15/38 | (4) | 10,000 | 9,508 |
| Washington Health Care Fac. Auth. (Multicare Health System) | 5.500% | 8/15/43 | (12) | 10,000 | 9,183 |
| Washington Health Care Fac. Auth. (Peace Health) | 5.000% | 11/1/18 | | 13,000 | 12,017 |
| | | | | | 87,382 |
West Virginia (0.6%) | | | | | |
| Mason County WV PCR Appalachian Power Co. Project | 5.500% | 10/1/11 | | 20,000 | 17,119 |
| Pleasants County West VA Pollution Control Rev. | 5.250% | 10/15/37 | | 10,000 | 7,237 |
| West Virginia Building Comm. Rev. (Jail & Correction Fac.) | 7.000% | 7/1/13 | (1)(ETM) | 8,390 | 9,734 |
| | | | | | 34,090 |
Wisconsin (0.2%) | | | | | |
| Wisconsin GO | 5.000% | 5/1/26 | | 7,980 | 7,807 |
| Wisconsin Health & Educ. Fac. Auth. Rev. (Beaver Dam Community Hosp.) | 6.750% | 8/15/34 | | 3,500 | 2,820 |
| | | | | | 10,627 |
Total Tax-Exempt Municipal Bonds (Cost $5,981,412) | | | | 5,290,472 |
| | | | | | |
| | | | | | |
| | | | | Shares | |
Temporary Cash Investment (0.6%) | | | | | |
Money Market Fund (0.6%) | | | | | |
4 | Vanguard Municipal Cash Management Fund (Cost $30,394) | 1.701% | | | 30,393,895 | 30,394 |
Total Investments (98.0%) (Cost $6,011,806) | | | | | 5,320,866 |
Other Assets and Liabilities (2.0%) | | | | | |
Other Assets | | | | | 150,124 |
Liabilities | | | | | (41,761) |
| | | | | | 108,363 |
Net Assets (100%) | | | | | 5,429,229 |
94
At October 31, 2008, net assets consisted of: | |
| Amount |
| ($000) |
Paid-in Capital | 6,220,491 |
Undistributed Net Investment Income | — |
Accumulated Net Realized Losses | (108,630) |
Unrealized Appreciation (Depreciation) | |
Investment Securities | (690,940) |
Futures Contracts | 8,308 |
Net Assets | 5,429,229 |
| |
| |
Investor Shares—Net Assets | |
Applicable to 178,639,590 outstanding $.001 par value shares of beneficial interest (unlimited authorization) | 1,659,875 |
Net Asset Value Per Share—Investor Shares | $9.29 |
| |
| |
Admiral Shares—Net Assets | |
Applicable to 405,666,307 outstanding $.001 par value shares of beneficial interest (unlimited authorization) | 3,769,354 |
Net Asset Value Per Share—Admiral Shares | $9.29 |
• See Note A in Notes to Financial Statements.
1 Securities with a value of $8,306,000 have been segregated as initial margin for open futures contracts.
2 Security exempt from registration under Rule 144A of the Securities Act of 1933. Such securities may be sold in transactions exempt from registration, normally to qualified institutional buyers. At October 31, 2008, the aggregate value of these securities was $12,271,000, representing 0.2% of net assets.
3 Security purchased on a when-issued or delayed delivery basis for which the fund has not taken delivery as of October 31, 2008.
4 Affiliated money market fund available only to Vanguard funds and certain trusts and accounts managed by Vanguard. Rate shown is the 7-day yield. For key to abbreviations and other references, see back cover.
See accompanying Notes, which are an integral part of the Financial Statements.
95
Key to Abbreviations |
|
ARS—Auction Rate Security. |
BAN—Bond Anticipation Note. |
COP—Certificate of Participation. |
CP—Commercial Paper. |
FR—Floating Rate. |
GAN—Grant Anticipation Note. |
GO—General Obligation Bond. |
IDA—Industrial Development Authority Bond. |
IDR—Industrial Development Revenue Bond. |
PCR—Pollution Control Revenue Bond. |
PUT—Put Option Obligation. |
RAN—Revenue Anticipation Note. |
TAN—Tax Anticipation Note. |
TOB—Tender Option Bond. |
TRAN—Tax Revenue Anticipation Note. |
UFSD—Union Free School District. |
USD—United School District. |
VRDO—Variable Rate Demand Obligation. |
(ETM)—Escrowed to Maturity. |
(Prere.)—Prerefunded. |
|
Scheduled principal and interest payments are guaranteed by: |
(1) MBIA (Municipal Bond Insurance Association). |
(2) AMBAC (Ambac Assurance Corporation). |
(3) FGIC (Financial Guaranty Insurance Company). |
(4) FSA (Financial Security Assurance). |
(5) BIGI (Bond Investors Guaranty Insurance). |
(6) Connie Lee Inc. |
(7) FHA (Federal Housing Authority). |
(8) CapMAC (Capital Markets Assurance Corporation). |
(9) American Capital Access Financial Guaranty Corporation. |
(10) XL Capital Assurance Inc. |
(11) CIFG (CDC IXIS Financial Guaranty). |
(12) Assured Guaranty Corp. |
(13) National Indemnity Co. (Berkshire Hathaway). |
The insurance does not guarantee the market value of the municipal bonds. |
|
LOC—Scheduled principal and interest payments are guaranteed by bank letter of credit. |
© 2008 The Vanguard Group, Inc. |
All rights reserved. |
Vanguard Marketing Corporation, Distributor. |
|
F950 122008 |
Item 2: Code of Ethics. The Registrant has adopted a code of ethics that applies to the Registrant’s principal executive officer, principal financial officer, principal accounting officer or controller or persons performing similar functions. The Code of Ethics was amended during the reporting period covered by this report to make certain technical, non-material changes.
Item 3: Audit Committee Financial Expert. The following members of the Audit Committee have been determined by the Registrant’s Board of Trustees to be Audit Committee Financial Experts serving on its Audit Committee, and to be independent: Charles D. Ellis, Rajiv L. Gupta, JoAnn Heffernan Heisen, André F. Perold, Alfred M. Rankin, Jr., and J. Lawrence Wilson.
Item 4: Principal Accountant Fees and Services.
(a) Audit Fees.
Audit Fees of the Registrant
Fiscal Year Ended October 31, 2008: $158,000
Fiscal Year Ended October 31, 2007: $154,000
Aggregate Audit Fees of Registered Investment Companies in the Vanguard Group.
Fiscal Year Ended October 31, 2008: $3,055,590
Fiscal Year Ended October 31, 2007: $2,835,320
(b) Audit-Related Fees.
Fiscal Year Ended October 31, 2008: $626,240
Fiscal Year Ended October 31, 2007: $630,400
Includes fees billed in connection with assurance and related services provided to the Registrant, The Vanguard Group, Inc., Vanguard Marketing Corporation, and other registered investment companies in the Vanguard Group.
(c) Tax Fees.
Fiscal Year Ended October 31, 2008: $230,400
Fiscal Year Ended October 31, 2007: $215,900
Includes fees billed in connection with tax compliance, planning and advice services provided to the Registrant, The Vanguard Group, Inc., Vanguard Marketing Corporation, and other registered investment companies in the Vanguard Group and related to income and excise taxes.
(d) All Other Fees.
Fiscal Year Ended October 31, 2008: $0
Fiscal Year Ended October 31, 2007: $0
Includes fees billed for services related to risk management and privacy matters. Services were provided to the Registrant, The Vanguard Group, Inc., Vanguard Marketing Corporation, and other registered investment companies in the Vanguard Group.
(e) (1) Pre-Approval Policies. The policy of the Registrant’s Audit Committee is to consider and, if appropriate, approve before the principal accountant is engaged for such services, all specific audit and non-audit services provided to: (1) the Registrant; (2) The Vanguard Group, Inc.; (3) other entities controlled by The Vanguard Group, Inc. that provide ongoing services to the Registrant; and (4) other registered investment companies in the Vanguard Group. In making a determination, the Audit Committee considers whether the services are consistent with maintaining the principal accountant’s independence.
In the event of a contingency situation in which the principal accountant is needed to provide services in between scheduled Audit Committee meetings, the Chairman of the Audit Committee would be called on to consider and, if appropriate, pre-approve audit or permitted non-audit services in an amount sufficient to complete services through the next Audit Committee meeting, and to determine if such services would be consistent with maintaining the accountant’s independence. At the next scheduled Audit Committee meeting, services and fees would be presented to the Audit Committee for formal consideration, and, if appropriate, approval by the entire Audit Committee. The Audit Committee would again consider whether such services and fees are consistent with maintaining the principal accountant’s independence.
The Registrant’s Audit Committee is informed at least annually of all audit and non-audit services provided by the principal accountant to the Vanguard complex, whether such services are provided to: (1) the Registrant; (2) The Vanguard Group, Inc.; (3) other entities controlled by The Vanguard Group, Inc. that provide ongoing services to the Registrant; or (4) other registered investment companies in the Vanguard Group.
(2) No percentage of the principal accountant’s fees or services were approved pursuant to the waiver provision of paragraph (c)(7)(i)(C) of Rule 2-01 of Regulation S-X.
(f) For the most recent fiscal year, over 50% of the hours worked under the principal accountant’s engagement were not performed by persons other than full-time, permanent employees of the principal accountant.
(g) Aggregate Non-Audit Fees.
Fiscal Year Ended October 31, 2008: $230,400
Fiscal Year Ended October 31, 2007: $215,900
Includes fees billed for non-audit services provided to the Registrant, The Vanguard Group, Inc., Vanguard Marketing Corporation, and other registered investment companies in the Vanguard Group.
(h) For the most recent fiscal year, the Audit Committee has determined that the provision of all non-audit services was consistent with maintaining the principal accountant’s independence.
Item 5: Not Applicable.
Item 6: Not Applicable.
Item 7: Not Applicable.
Item 8: Not Applicable.
Item 9: Not Applicable.
Item 10: Not Applicable.
Item 11: Controls and Procedures.
(a) Disclosure Controls and Procedures. The Principal Executive and Financial Officers concluded that the Registrant's Disclosure Controls and Procedures are effective based on their evaluation of the Disclosure Controls and Procedures as of a date within 90 days of the filing date of this report.
(b) Internal Control Over Financial Reporting. There were no significant changes in Registrant’s Internal Control Over Financial Reporting or in other factors that could significantly affect this control subsequent to the date of the evaluation, including any corrective actions with regard to significant deficiencies and material weaknesses.
Item 12: Exhibits.
(a) Code of Ethics.
(b) Certifications.
Pursuant to the requirements of the Securities Exchange Act of 1934 and the Investment Company Act of 1940, the registrant has duly caused this report to be signed on its behalf by the undersigned, thereunto duly authorized.
VANGUARD MUNICIPAL BOND FUNDS |
BY: | /s/ F. WILLIAM MCNABB III* |
F. WILLIAM MCNABB III |
CHIEF EXECUTIVE OFFICER |
Date: December 16, 2008
Pursuant to the requirements of the Securities Exchange Act of 1934 and the Investment Company Act of 1940, this report has been signed below by the following persons on behalf of the registrant and in the capacities and on the dates indicated.
VANGUARD MUNICIPAL BOND FUNDS |
BY: | /s/ F. WILLIAM MCNABB III* |
F. WILLIAM MCNABB III |
CHIEF EXECUTIVE OFFICER |
Date: December 16, 2008
VANGUARD MUNICIPAL BOND FUNDS |
BY: | /s/ THOMAS J. HIGGINS* |
THOMAS J. HIGGINS |
CHIEF FINANCIAL OFFICER |
Date: December 16, 2008
* By: /s/ Heidi Stam
Heidi Stam, pursuant to a Power of Attorney filed on January 18, 2008, see file Number 2-29601, Incorporated by Reference; and pursuant to a Power of Attorney filed on September 26, 2008, see File Number 2-47371, Incorporated by Reference.